CORRECTIONS: A CONSTITUTIONAL CHALLENGE TO FLORIDA'S DRUG LAW
Upload
independentCategory
view
1download
0
SUNLIGHT TRANSMISSION THROUGH DESERT DUSTAND MARINE AEROSOLS: DIFFUSE LIGHTCORRECTIONS TO SUN PHOTOMETRY AND
PYRHELIOMETRY
Russell, P. B., Livingston, J. M., Dubovik, O., Ramirez, S. A., Wang, J.,Redemann, J., Schmid, B., Box, M., and Holben, B. N.
Published inJ. Geophys. Res.
[vol. 109, D08207, doi:10.1029/2003JD004292 (2004)]
Environmental Sciences DepartmentAtmospheric Sciences Division
Brookhaven National LaboratoryP.O. Box 5000
Upton, NY 11973-5000www.bnl.gov

Sunlight transmission through desert dust and marine aerosols:
Diffuse light corrections to Sun photometry and pyrheliometry
P. B. Russell,1 J. M. Livingston,2 O. Dubovik,3 S. A. Ramirez,4 J. Wang,5 J. Redemann,4
B. Schmid,4 M. Box,6 and B. N. Holben7
Received 27 October 2003; revised 30 January 2004; accepted 26 February 2004; published 27 April 2004.
[1] Desert dust and marine aerosols are receiving increased scientific attention because oftheir prevalence on intercontinental scales and their potentially large effects on Earthradiation, climate, other aerosols, clouds, and precipitation. The relatively large size ofdust and marine aerosol particles produces scattering phase functions that are stronglyforward peaked. Hence Sun photometry and pyrheliometry of these aerosols are moresubject to diffuse light errors than is the case for smaller aerosols. We quantify thesediffuse light effects for common Sun photometer and pyrheliometer fields of view (FOV),using data on dust and marine aerosols from (1) Aerosol Robotic Network (AERONET)measurements of sky radiance and solar beam transmission and (2) in situ measurementsof aerosol layer size distribution and chemical composition. Accounting for particlenonsphericity is important when deriving dust size distribution from both AERONET andin situ aerodynamic measurements. We obtain correction factors that can be applied to Sunphotometer or pyrheliometer results for aerosol optical depth (AOD) or direct beamtransmission. The corrections are negligible (less than �1% of AOD) for Sun photometerswith narrow FOV (half-angle h < �1�), but they can be as large as 10% of AOD at 354 nmwavelength for Sun photometers with h = 1.85�. For pyrheliometers (which can have hup to �2.8�), corrections can be as large as 16% at 354 nm. AOD correction factorsare well correlated with AOD wavelength dependence (hence Angstrom exponent). Weprovide best fit equations for determining correction factors from Angstrom exponents ofuncorrected AOD spectra, and we demonstrate their application to vertical profiles ofmultiwavelength AOD. INDEX TERMS: 0305 Atmospheric Composition and Structure: Aerosols and
particles (0345, 4801); 0345 Atmospheric Composition and Structure: Pollution—urban and regional (0305);
0360 Atmospheric Composition and Structure: Transmission and scattering of radiation; 0365
Atmospheric Composition and Structure: Troposphere—composition and chemistry; 0394 Atmospheric
Composition and Structure: Instruments and techniques; KEYWORDS: Sun photometer, aerosol, diffuse
Citation: Russell, P. B., J. M. Livingston, O. Dubovik, S. A. Ramirez, J. Wang, J. Redemann, B. Schmid, M. Box, and B. N. Holben
(2004), Sunlight transmission through desert dust and marine aerosols: Diffuse light corrections to Sun photometry
and pyrheliometry, J. Geophys. Res., 109, D08207, doi:10.1029/2003JD004292.
1. Introduction
[2] Recent studies have focused renewed attention on theproperties and effects of desert dust and marine aerosols.Plumes of desert dust extending downwind from continentsare a prominent feature of satellite imagery [Chiapello et al.,1999; Moulin et al., 2001; Prospero et al., 2002]. Satellite
data analyses also reveal the important role of marine sea-salt aerosols [Haywood et al., 1999]. Both desert dust andmarine aerosols can have significant effects on Earth radia-tion balance and climate [Sokolik and Toon, 1996; Tegen etal., 1996; Haywood et al., 2001a, 2001b; Jacobson, 2001],and they can modify the properties and effects of otheraerosols, clouds and precipitation [Jones and Slingo,1996; O’Dowd et al., 1999; Li-Jones and Prospero, 1998;Rosenfeld, 2000; Rosenfeld et al., 2002]. Consequently,measurements of desert dust and marine aerosol propertiesand radiative effects from surface, air, and space have beenemphasized in several recent experiments, including ACE-2[Raes et al., 2000; Russell and Heintzenberg, 2000],SHADE [Haywood et al., 2001a, 2001b, 2003], PRIDE[Reid et al., 2003], and ACE-Asia [Huebert et al., 2003].Among the fundamental properties targeted in these cam-paigns is the wavelength-dependent aerosol optical depth,derived from Sun-photometer-measured solar beam trans-missions and satellite-measured reflectances. Important
JOURNAL OF GEOPHYSICAL RESEARCH, VOL. 109, D08207, doi:10.1029/2003JD004292, 2004
1NASA Ames Research Center, Moffett Field, California, USA.2SRI International, Menlo Park, California, USA.3Goddard Earth Sciences and Technology Center, NASA Goddard
Space Flight Center, Greenbelt, Maryland, USA.4Bay Area Environmental Research Institute, Sonoma, California, USA.5Brookhaven National Laboratory, Upton, New York, USA.6School of Physics, University of New South Wales, Sydney, New
South Wales, Australia.7Laboratory for Atmospheres, NASA Goddard Space Flight Center,
Greenbelt, Maryland, USA.
Copyright 2004 by the American Geophysical Union.0148-0227/04/2003JD004292$09.00
D08207 1 of 13

effects include not only those on total (diffuse plus direct)solar fluxes, but also on the energy in the direct solar beam,as measured by pyrheliometers and cavity radiometers[Halthore et al., 1997].[3] As noted by many studies [e.g., Grassl, 1971; Box
and Deepak, 1979; Russell et al., 1993a, 1993b; Shiobaraand Asano, 1994; Kinne et al., 1997; Eck et al., 1999], Sunphotometers and pyrheliometers have nonzero fields ofview that accept some diffuse light in addition to the directsolar beam. As a result, uncorrected Sun photometer meas-urements can overestimate direct beam transmission T andunderestimate optical depth t.[4] The previous studies mentioned above have quanti-
fied the diffuse light effect for several types of aerosols andclouds and for different Sun photometer fields of view(FOV). In general, the effect increases with particle sizeand instrument FOV. Representative results from previousstudies are shown in Table 1. As an example, Kinne et al.[1997] give results for two aerosol models with effective(area-weighted) radii Reff = 0.2 and 0.5 mm, several cloudmodels with Reff = 6–177 mm, and FOV half angles h = 1�,1.2�, and 2.5�. They found that the correction factor C,defined as
C � t=t0; ð1Þ
where t and t0 are true and apparent optical depths, was1.02 or less for their aerosol models and FOV half angle upto 2.5�, but that it could be as large as 2.47 for their cloudmodels. Similarly, Shiobara and Asano [1994] foundcorrection factors C of only 1.009 and 1.03 for their twoaerosol models (which had Reff = 0.07 and 0.39 mm,respectively), but 1.96 for their cirrus cloud phase function(all results for wavelength l = 0.5 mm, h = 1.2�). Russell etal. [1993b] found that post-Pinatubo stratospheric aerosolsize distributions with Reff = 0.2–0.6 mm had correctionfactors C < 1.02 for l = 0.38 to 1.02 mm and h up to 2.2�.However, a size distribution with Reff = 0.9 mm had C = 1.05at l = 0.38 mm and h = 2.2�.[5] Box and Deepak [1979] give correction factors for a
wide range of power law and unimodal modified gammadistributions. However, their results are not given as a
function of Reff. Also, it is now recognized that manyaerosol size distributions have two or more size modesand are often not well represented by power law or uni-modal distributions. Hence it is difficult to translate theabove results to the aerosol conditions of specific Sunphotometer measurements: especially conditions of desertdust and marine haze, where particle sizes can significantlyexceed the aerosol sizes in, e.g., the studies of Kinne et al.[1997] and Shiobara and Asano [1994]. The nonsphericalshape of desert dust particles also raises questions about theapplicability of the above aerosol results, which assumedspherical aerosol particles [cf. Dubovik et al., 2002a, 2002b;Kalashnikova and Sokolik, 2002].
2. Data Sources
[6] Recent measurements by the Aerosol Robotic Net-work (AERONET) of Sun/sky radiometers [Holben et al.,1998] have produced a large body of data on desert dustand maritime aerosols, including optical depth spectra,scattering phase functions, size distributions, complexrefractive indices, and single-scattering albedos. Theseparameters are retrieved from combined measurements ofscattered light (skylight) and direct beam transmissionusing the algorithm of Dubovik and King [2000]. Theresults [e.g., Tanre et al., 2001; Dubovik et al., 2002a;Levy et al., 2003; Smirnov et al., 2002] show that desertdust and maritime aerosols typically have bimodal sizedistributions with coarse-mode Reff = 1.1–3.2 mm. Thesecoarse-mode aerosols thus fall in a gap between theaerosol and cloud models cited above (aerosol Reff =0.2–0.9 mm; cloud Reff = 6–177 mm). Because they arebased on, and consistent with, measurements of theangular distribution of diffuse skylight, these AERONETresults provide a very useful basis for deriving diffuse lightcorrection factors.[7] We will also supplement the AERONET results with
size distributions and compositions measured by airborneinstrumentation specially designed to admit large particlesat aircraft speeds [Wang et al., 2002]. These in situ resultshave been shown to produce aerosol layer optical depthspectra that agree with layer optical depth spectra measured
Table 1. Diffuse Light Correction Factors Derived by Previous Studies
Method
FOVHalf-Angle h,
degWavelength,
mm Particle ModelaCorrection
Factor C � t/t0 Reference
AerosolsMonte Carlo and analytical fit 1.0, 1.2, 2.5 aerosol, Reff = 0.2 mm �1.01 Kinne et al. [1997]Monte Carlo and analytical fit 1.0, 1.2, 2.5 haze-L, Reff = 0.5 mm �1.02 Kinne et al. [1997]Monte Carlo and analytical fit 1.2 0.55 aerosol, n(r) = r�v, v = 4, 3.5
(Reff = 0.07, 0.39 mm)1.009, 1.03 Shiobara and Asano [1994]
Reagan et al. [1992] andBox and Deepak [1979]
�2.2 �0.38 post-Pinatubo volcanic aerosol,Reff = 0.2–0.6 mm
�1.02 Russell et al. [1993b]
Reagan et al. [1992] andBox and Deepak [1979]
�2.2 �0.38 post-Pinatubo volcanic aerosol,Reff = 0.9 mm
�1.05 Russell et al. [1993b]
Analytical with approximations �8 any various aerosols, n(r) = r�v, v = 5 to 2(Reff = 0.02 to 7.5 mm)
1.0–1.8 Box and Deepak [1979]
Analytical with approximations �8 0.55 various aerosols, modified gamma 1.0–2.0 Box and Deepak [1979]Clouds
Monte Carlo and analytical fit 1.0, 1.2, 2.5 various clouds, Reff = 6–177 mm 1.2–2.5 Kinne et al. [1997]Monte Carlo and analytical fit 1.2 0.55 cirrostratus clouds 2.0 Shiobara and Asano [1994]
aReff is the effective (area-weighted) radius.
D08207 RUSSELL ET AL.: DIFFUSE LIGHT CORRECTIONS FOR DUST
2 of 13
D08207
by tracking Sun photometer on the same aircraft [Wang etal., 2002; Schmid et al., 2003].
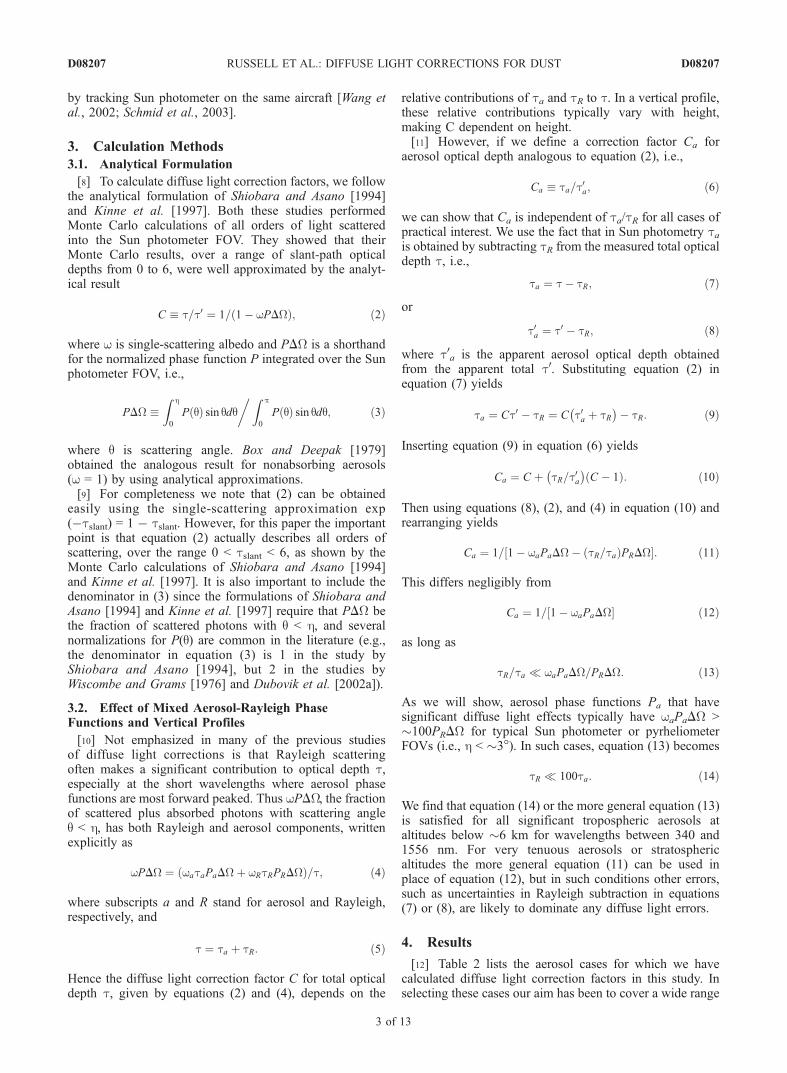
3. Calculation Methods
3.1. Analytical Formulation
[8] To calculate diffuse light correction factors, we followthe analytical formulation of Shiobara and Asano [1994]and Kinne et al. [1997]. Both these studies performedMonte Carlo calculations of all orders of light scatteredinto the Sun photometer FOV. They showed that theirMonte Carlo results, over a range of slant-path opticaldepths from 0 to 6, were well approximated by the analyt-ical result
C � t=t0 ¼ 1= 1� wPDWð Þ; ð2Þ
where w is single-scattering albedo and PDW is a shorthandfor the normalized phase function P integrated over the Sunphotometer FOV, i.e.,
PDW �Z h
0
P qð Þ sin qdq�Z p
0
P qð Þ sin qdq; ð3Þ
where q is scattering angle. Box and Deepak [1979]obtained the analogous result for nonabsorbing aerosols(w = 1) by using analytical approximations.[9] For completeness we note that (2) can be obtained
easily using the single-scattering approximation exp(�tslant) = 1 � tslant. However, for this paper the importantpoint is that equation (2) actually describes all orders ofscattering, over the range 0 < tslant < 6, as shown by theMonte Carlo calculations of Shiobara and Asano [1994]and Kinne et al. [1997]. It is also important to include thedenominator in (3) since the formulations of Shiobara andAsano [1994] and Kinne et al. [1997] require that PDW bethe fraction of scattered photons with q < h, and severalnormalizations for P(q) are common in the literature (e.g.,the denominator in equation (3) is 1 in the study byShiobara and Asano [1994], but 2 in the studies byWiscombe and Grams [1976] and Dubovik et al. [2002a]).
3.2. Effect of Mixed Aerosol-Rayleigh PhaseFunctions and Vertical Profiles
[10] Not emphasized in many of the previous studiesof diffuse light corrections is that Rayleigh scatteringoften makes a significant contribution to optical depth t,especially at the short wavelengths where aerosol phasefunctions are most forward peaked. Thus wPDW, the fractionof scattered plus absorbed photons with scattering angleq < h, has both Rayleigh and aerosol components, writtenexplicitly as
wPDW ¼ wataPaDWþ wRtRPRDWð Þ=t; ð4Þ
where subscripts a and R stand for aerosol and Rayleigh,respectively, and
t ¼ ta þ tR: ð5Þ
Hence the diffuse light correction factor C for total opticaldepth t, given by equations (2) and (4), depends on the
relative contributions of ta and tR to t. In a vertical profile,these relative contributions typically vary with height,making C dependent on height.[11] However, if we define a correction factor Ca for
aerosol optical depth analogous to equation (2), i.e.,
Ca � ta=t0a; ð6Þ
we can show that Ca is independent of ta/tR for all cases ofpractical interest. We use the fact that in Sun photometry tais obtained by subtracting tR from the measured total opticaldepth t, i.e.,
ta ¼ t� tR; ð7Þ
or
t0a ¼ t0 � tR; ð8Þ
where t0a is the apparent aerosol optical depth obtainedfrom the apparent total t0. Substituting equation (2) inequation (7) yields
ta ¼ Ct0 � tR ¼ C t0a þ tR� �
� tR: ð9Þ
Inserting equation (9) in equation (6) yields
Ca ¼ C þ tR=t0a� �
C � 1ð Þ: ð10Þ
Then using equations (8), (2), and (4) in equation (10) andrearranging yields
Ca ¼ 1= 1� waPaDW� tR=tað ÞPRDW½ �: ð11Þ
This differs negligibly from
Ca ¼ 1= 1� waPaDW½ � ð12Þ
as long as
tR=ta waPaDW=PRDW: ð13Þ
As we will show, aerosol phase functions Pa that havesignificant diffuse light effects typically have waPaDW >�100PRDW for typical Sun photometer or pyrheliometerFOVs (i.e., h < �3�). In such cases, equation (13) becomes
tR 100ta: ð14Þ
We find that equation (14) or the more general equation (13)is satisfied for all significant tropospheric aerosols ataltitudes below �6 km for wavelengths between 340 and1556 nm. For very tenuous aerosols or stratosphericaltitudes the more general equation (11) can be used inplace of equation (12), but in such conditions other errors,such as uncertainties in Rayleigh subtraction in equations(7) or (8), are likely to dominate any diffuse light errors.
4. Results
[12] Table 2 lists the aerosol cases for which we havecalculated diffuse light correction factors in this study. Inselecting these cases our aim has been to cover a wide range
D08207 RUSSELL ET AL.: DIFFUSE LIGHT CORRECTIONS FOR DUST
3 of 13
D08207

Table
2.AerosolMeasurementsandRetrieved
Values
Usedin
ThisStudy
Characteristic
l,nm
Asian
Dust,AERONET
Asian
Aerosol,In
Situ
African
Dust,AERONET
Maritim
eAerosol,AERONET
Asian
Spheroid
Dynam
icModel
Jeju
11April
2250UT
Case3
Jeju
11April
2226UT
Spheroid
Jeju
11April
2341UT
Spheroid
Wanget
al.
[2002]
Boundary
Layer
Wanget
al.[2002]
Pollution
Layer
Wanget
al.[2002]
Free
Troposphere
Doublet
Cape
Verde
RR
10July
1430UT
Case3a
RR
16July
1430UT
Case3a
RR
21July
1831UT
Case3a
Lanai
Nauru
TahitiBermudaAscension
OpticaldepthsandAngstrom
coefficients
t a(l)
1020
0.36
0.35
0.34
0.01
0.30
0.18
0.80
0.24
0.19
0.47
a(l,1020)
380
0.41–1.85
0.88
0.40
0.43
1.65
0.52
0.03
0.16
0.27
0.28
0.52
1.00
0.31
0.95
1.22
0.89
a(l,1020)
500
0.32–1.95
0.58
0.33
0.38
1.76
0.51
0.02
0.07
0.22
0.20
0.39
0.93
0.20
0.78
1.13
0.75
Complexrefractiveindices
n(l)
440
1.50
1.48
1.58
1.60
1.50–1.56b1.40–1.55b1.51–1.56b
1.48
1.48
1.48
1.48
1.36
1.36
1.36
1.36
1.36
n(l)
670
1.50
1.48
1.55
1.60
1.50–1.56b1.40–1.55b1.51–1.56b
1.48
1.48
1.48
1.48
1.36
1.36
1.36
1.36
1.36
n(l)
870
1.50
1.48
1.52
1.56
1.50–1.56b1.40–1.55b1.51–1.56b
1.48
1.48
1.48
1.48
1.36
1.36
1.36
1.36
1.36
n(l)
1020
1.50
1.48
1.50
1.53
1.50–1.56b1.40–1.55b1.51–1.56b
1.48
1.48
1.48
1.48
1.36
1.36
1.36
1.36
1.36
k(l)
440
0.0025
0.0023
0.0027
0.0036
0.0000
0–0.047b
0–0.0028b0.0023
0.0023
0.0023
0.0023
0.00150.00150.0015
0.0015
0.0015
k(l)
670
0.0025
0.0007
0.0023
0.0034
0.0000
0–0.047b
0–0.0028b0.0006
0.0007
0.0007
0.0006
0.00150.00150.0015
0.0015
0.0015
k(l)
870
0.0025
0.0006
0.0026
0.0041
0.0000
0–0.047b
0–0.0028b0.0006
0.0006
0.0006
0.0006
0.00150.00150.0015
0.0015
0.0015
k(l)
1020
0.0025
0.0006
0.0027
0.0043
0.0000
0–0.047b
0–0.0028b0.0006
0.0006
0.0006
0.0006
0.00150.00150.0015
0.0015
0.0015
Single-scatteringalbedos
wa(l)
440
seetext
0.94
0.92
0.91
1.00
0.81
0.94
0.93
0.94
0.95
0.95
0.97
0.94
0.96
0.98
0.97
wa(l)
670
seetext
0.98
0.94
0.92
1.00
0.83
0.95
0.98
0.98
0.98
0.99
0.97
0.95
0.96
0.97
0.96
wa(l)
870
seetext
0.98
0.94
0.92
1.00
0.86
0.96
0.99
0.99
0.99
0.99
0.97
0.96
0.96
0.97
0.97
wa(l)
1020
seetext
0.98
0.95
0.92
1.00
0.87
0.97
0.99
0.99
0.99
0.99
0.97
0.97
0.96
0.97
0.97
Param
etersofcolumnandlayer
size
distributions
r Vf,mm
0.14
0.08
0.13
0.15
0.15
0.18
0.14
0.13
0.11
0.15
0.12
0.15
0.13
0.12
0.14
0.13
r Vc,mm
2.43
2.48
2.53
2.46
1.19
1.74
1.36
1.90
1.86
2.28
1.50
2.74
2.93
3.29
2.55
2.62
s Vf
0.47
0.32
0.73
0.70
0.62
0.49
0.41
0.47
0.36
0.54
0.41
0.57
0.49
0.38
0.46
0.40
s Vc
0.67
0.58
0.58
0.59
0.31
0.55
0.61
0.56
0.68
0.69
0.54
0.74
0.72
0.78
0.83
0.78
CV,mm
3/mm
20.025–0.22
0.48
0.36
0.32
0.01
0.19
0.10
0.66
0.19
0.17
0.32
0.05
0.05
0.04
0.07
0.09
CVc/C
V0.39–0.93
0.74
0.92
0.92
0.22
0.85
0.97
0.95
0.88
0.87
0.85
0.71
0.92
0.77
0.63
0.76
Reff,mm
0.20–0.97
0.27
0.80
0.81
0.15
0.64
0.89
0.99
0.59
0.67
0.49
0.39
0.94
0.42
0.30
0.42
Reff-f,mm
0.13
0.08
0.11
0.12
0.13
0.16
0.13
0.11
0.11
0.13
0.11
0.13
0.12
0.11
0.13
0.12
Reff-c,mm
1.94
2.08
2.12
2.05
1.13
1.49
1.13
1.62
1.48
1.81
1.30
2.08
2.26
2.43
1.81
1.93
Diffuse
lightcorrectionfactors
C(0.6�,l)
440
1.00–1.01
1.01
1.01
1.01
1.000
1.003
1.004
1.01
1.00
1.01
1.00
1.005
1.012
1.008
1.004
1.006
C(1.85�,l)
440
1.01–1.07
1.05
1.07
1.06
1.004
1.030
1.037
1.06
1.04
1.05
1.03
1.036
1.091
1.053
1.026
1.042
C(2.85�,l)
440
1.02–1.11
1.08
1.12
1.11
1.008
1.055
1.074
1.12
1.08
1.08
1.06
1.060
1.151
1.083
1.043
1.069
aRR,RooseveltRoadsNaval
AirStation,Puerto
Rico.
bSizedependent.
D08207 RUSSELL ET AL.: DIFFUSE LIGHT CORRECTIONS FOR DUST
4 of 13
D08207

of realistic cases of practical interest. Table 2 includes Asianand African aerosols containing varying proportions of dust,as well as maritime aerosols from five island sites. Thesymbols in the first column of Table 2 are defined asfollows:
ta(l) aerosol optical depth at wavelength l;a(l1, l2) Angstrom exponent;
n, k real, imaginary refractive index;w single-scattering albedo;
rVf, rVc volume median radius for fine andcoarse modes, respectively;
sVf, sVc standard deviation about volume medianradius, for fine and coarse modes;
CV, CVc volume concentration for total distributionand coarse mode, respectively;
Reff-f, Reff-c effective (area-weighted) radius for fineand coarse modes, respectively.
The Angstrom exponent above is defined by
a l1;l2ð Þ � � ln ta l1ð Þ=ta l2ð Þ½ �= ln l1=l2ð Þ: ð15Þ
[13] Dubovik et al. [2002a] give equations for computingthe above size distribution parameters rVi, sVi, CVi for anarbitrary size distribution or a given mode. For conveniencethese equations are repeated in Appendix A of this paper.We emphasize that neither these equations nor individualAERONET retrievals assume any particular functionalform. However, the AERONET retrievals usually yieldshapes that are bimodal, a result also found by other studies[e.g., Whitby, 1978; Shettle and Fenn, 1979; Remer andKaufman, 1998].[14] Figure 1 shows representative column and layer size
distributions from Table 2. Note that apart from thedistributions labeled ‘‘model,’’ none of the distributionsis exactly lognormal, but they are roughly bimodal. Thisincludes both the in situ results of Wang et al. [2002] andthe individual AERONET retrievals. Applying the equa-tions of Dubovik et al. [2002a] (reproduced in our Ap-pendix A) to these distributions yielded the parameters inTable 2.
4.1. Particle Shape and Phase Functions
[15] The maritime aerosol size distributions and complexrefractive indices in Table 2 were all derived by Smirnov etal. [2002] from AERONET measurements. The Asianaerosol cases include three from airborne in situ measure-ments by Wang et al. [2002] (see also below), plus a varietyof retrievals from AERONET measurements. When dustwas present during the Asian AERONET measurements,use of spherical particle phase functions had a strongtendency to produce the retrieval artifacts described byDubovik et al. [2002a, 2002b], i.e., an artificially strongsmall-particle mode and real refractive indices that areartificially small at short wavelengths (sometimes nonphysi-cally small, i.e., less than the real refractive index of water).Therefore most of the Asian aerosol AERONET retrievalswere done with spheroidal phase functions [Mishchenko etal., 1997], which, as shown by Dubovik et al. [2002a,2002b], produce retrievals without these artifacts. Dustretrievals in Table 2 (both African and Asian) that usedspherical phase functions have been screened and adjustedto minimize artifacts (e.g., by checking small-mode ampli-tude and adjusting short-wavelength real refractive indicesto values found for dust retrievals with scattering anglesless than �30�, which are not susceptible to effects ofnonsphericity).[16] We used a large number of AERONET retrievals (all
done with spheroidal phase functions) from measurementsat Chinhae, Anmyon, Jeju and Seoul in South Korea, andShirahama and Osaka in Japan, to derive a dynamic modelof the mixed Asian aerosol, in which the amplitude of thecoarse mode varies to reflect different amounts of dust.Parameters of this Asian dynamic model are summarized inthe leftmost Asian dust column of Table 2, and two examplecolumnar size distributions are shown in Figure 1. OtherAERONET dust cases are included in our study (Table 2,with examples in Figure 1) to show the degree of variationwith respect to the model, which tends to capture averagebehavior.[17] Dust nonsphericity also can affect in situ aerosol
measurements. For example, in the free troposphere mea-surements of Wang et al. [2002], dust nonsphericity causedparticles to be undersized in the aerodynamic particle sizer.Wang et al. [2002] corrected this aerodynamic undersizingby modeling the dust particles as doublet spheres (hence thedesignation ‘‘Free Troposphere Doublet’’ in Table 2). Afterthis correction, Wang et al. [2002] found that multiwave-length extinction spectra calculated from the in situ mea-surements agreed with spectra from airborne Sunphotometry [Schmid et al., 2003], which is not subject tothese aerodynamic sizing issues.[18] Figure 2 illustrates the similarities and differences
between phase functions for spheres and spheroids, in thiscase for the size distribution retrieved from AERONETSun-sky measurements at Jeju, Korea, 11 April 2001,2341 UT. (The retrieval itself used spheroidal phase func-tions, to obtain the most accurate size distribution.) Theresults, which are for spheres and spheroids having the samevolume-versus-size distribution (plotted in Figure 1, withparameters listed in Table 2), show that phase functions forspheres and equal-volume spheroids can differ significantlyfor scattering angles >40�, but that they are quite similar inthe forward scattering peak. Differences between phase
Figure 1. Volume-versus-size distributions for representa-tive aerosol columns and layers selected from Table 2.
D08207 RUSSELL ET AL.: DIFFUSE LIGHT CORRECTIONS FOR DUST
5 of 13
D08207

functions for spheres and volume-equivalent spheroids forthis case are <14% in the forward peak. Also, the forwardpeak integrals determining diffuse light corrections (e.g., inequation (3)) differ even less (by <7% for FOV angles ofpractical interest), because of the weighting by sin q inequation (3). Furthermore, when these integrals are used inequation (12) to obtain diffuse light correction factors Ca,resulting Ca values for spheres and volume-equivalentspheroids differ by <1% for the aerosol cases and FOVangles in this paper. Differences between results for spheresand equal-area spheroids are even less than the differencesgiven here between spheres and equal-volume spheroids.[19] To summarize, dust nonsphericity can cause signif-
icant errors in size distributions determined in situ byaerodynamic methods, as well as significant errors in bothsize distributions and refractive indices retrieved fromAERONET measurements, unless analysis methods ac-count for this nonsphericity. However, once accurate sizedistribution and complex refractive index have been de-termined by suitable analyses, the use of spherical-particlephase functions in equation (3) can produce accuratediffuse light corrections, because of the similarity between
spherical and nonspherical phase functions in the forwardpeak. In this paper, we have followed this approach. Thatis, we have used analysis methods that produce accuratesize distribution and complex refractive index for particlesthat may be nonspherical, and then used spherical-particlephase functions in the forward peak to calculate diffuselight effects.[20] Figure 2 and the above discussion of phase functions
are based on using a model of spheroids (ellipsoids ofrevolution) to represent nonspherical particles. Recently,Kalashnikova and Sokolik [2002] have shown that dustparticles with angular, sharp-edged shapes have phasefunctions with forward peaks as much as 1.5 times thoseof volume-equivalent spheres. We have not used the phasefunctions of such angular, sharp-edged particles in thisstudy, partly because of the computational burden, but alsobecause of a variety of evidence that dust particles in theatmosphere, especially at significant distances from theirsources, may scatter light more like spheroids than angular,sharp-edged particles. This evidence includes (1) resultsshowing that dust particles often acquire coatings (e.g.,sulfates or organics) as they are transported downwind[e.g., Krueger et al., 2003], and (2) consistency betweendust characteristics retrieved assuming spheroidal phasefunctions and determined by other means [e.g., Sinyuk etal., 2003]. However, when evaluating diffuse light effects ofdust near sources, where angular, sharp-edged shapes arelikely to be more dominant, it may be appropriate to adjustthe results of this study to account for these shapes (e.g., byincreasing Ca � 1 by as much as 50%, to account for thefactor 1.5 forward peak difference noted above). See alsosection 5.
4.2. Diffuse Light Correction Factors
[21] Using equations (12) and (3), we have calculateddiffuse light correction factors Ca(l, h) for each of the
Figure 2. Phase functions at selected wavelengths for theaerosol size distribution retrieved from AERONET Sun-skymeasurements at Jeju, Korea, 11 April 2001, 2341 UT. Thesize distribution retrieval assumed spheroidal kernels, usingthe method of Dubovik et al. [2002b]. Aerosol phasefunctions Pa(q) shown were calculated for this single sizedistribution, assuming either spheroids or equal-volumespheres. Rayleigh phase function PR(q) is shown forcomparison.
Figure 3. Single-scattering albedo SSA and diffuse lightcorrection factors Ca for the aerosol size distributionretrieved from AERONET Sun-sky measurements atJeju, Korea, 11 April 2001, 2341 UT. This case has a(380,1020) = 0.429, a(1020, 1558) = 0.091.
D08207 RUSSELL ET AL.: DIFFUSE LIGHT CORRECTIONS FOR DUST
6 of 13
D08207

aerosol cases in Table 2, for wavelengths l = 354 to1558 nm and FOV half-angles h = 0.5� to 3.0�. Figure 3illustrates the dependence of Ca on l and h, for the samecase as used in the phase function examples of Figure 2 (i.e.,size distribution and complex refractive indices retrievedfrom AERONET Sun-sky measurements at Jeju, Korea,11 April 2001, 2341 UT, listed in the fourth column ofAsian dust in Table 2). Also shown is single-scatteringalbedo SSA, which affects Ca via equation (12). Theincrease in Ca with decreasing wavelength is caused bythe increased forward peaking of phase functions withdecreasing wavelength, shown in Figure 2. However, thisincrease can be reduced or even reversed if SSA decreasesfast enough with decreasing wavelength (compare equation(12)). FOV half-angles h for specific instruments are shownby heavy lines in Figure 3; i.e., (1) h = 0.6� for theAERONET Cimel Sun-sky photometers [Holben et al.,1998; Eck et al., 1999], (2) h = 1.85� for the NASA Amesairborne Sun photometers (AATS-6 and AATS-14 [e.g.,Livingston et al., 2003; Redemann et al., 2003; Schmid etal., 2003]), and (3) h = 2.85� for the normal incidencepyranometer (NIP) [Halthore et al., 1997].[22] The results for Ca and SSA shown in Figure 3 and
elsewhere in this study use the complex refractive indicesshown in Table 2, linearly interpolated between the fourwavelengths used in AERONET retrievals, 440, 670, 870,and 1020 nm. For shorter wavelengths (i.e., at 354 and380 nm), complex refractive index was linearly extrapolated.For longer wavelengths (i.e., at 1059, 1241, and 1558 nm),complex refractive index was set equal to that at the nearestlimit of AERONET retrieval wavelengths (i.e., 1020 nm).This extension of complex refractive index introduces littleuncertainty into Ca, because the extension in the UV (from440 to 354 nm) covers a relatively small wavelength interval,and because Ca values are themselves relatively small in theIR extension region (1020–1558 nm). However, it does
introduce significant uncertainty into Angstrom exponentsthat have one or both wavelengths in the IR extensionregion. This is discussed further in section 5.
4.3. Correlation of Diffuse Light CorrectionFactors With Reff and Angstrom Exponents
[23] Results for diffuse light correction factors Ca(l, h)for l = 440 nm and the above three h values are shown inthe lower rows of Table 2. Figure 4 shows results for l =380 nm, h = 1.85� as scatterplots versus several parameters.For convenience of display these are shown as
f � Ca � 1: ð16Þ
Different groups of aerosols from Table 2 are plottedwith different symbols in Figure 4, to aid in showingwhether different groups have significantly differentrelationships to the parameters plotted on the x axes. (Seealso section 5.)[24] The left frame of Figure 4 shows that f(380 nm,
1.85�) (and hence Ca(380 nm, 1.85�)) is correlated with Reff.The square of the correlation coefficient, R2, is 0.75 and0.78 for linear and power law fits, respectively. (R2 is thefraction of the variance that is accounted for by the fit [e.g.,Edwards, 1976]. Figure C-3 of Bevington [1969] shows thatthe probability of obtaining such large values of R2 from anuncorrelated population with N = 22 is <0.001.) Thus,within the set of aerosol cases in Table 2, knowledge ofReff can be used to determine Ca(380 nm, 1.85�) with usefulaccuracy (RMS deviation of data points from the linear andpower law fits is 0.011 and 0.012, respectively). Unfortu-nately, in most Sun photometer measurements, Reff of theviewed aerosol is not known. However, the Angstromexponent, defined by equation (15) above, can be deter-mined directly from a Sun-photometer-measured spectrumta(l), and it is known to be an indicator of aerosol size.Therefore, in the remaining frames of Figure 4 we show
Figure 4. Scatterplots of correction factors f versus Reff and Angstrom exponents, with fitting equationsand measures of fit. Short-dashed lines in the middle and right frames show RMS deviation of pointsfrom fit.
D08207 RUSSELL ET AL.: DIFFUSE LIGHT CORRECTIONS FOR DUST
7 of 13
D08207
scatterplots of f(380 nm, 1.85�) versus Angstrom exponentfor two wavelength pairs: 380, 1020 nm (middle frame) and1020, 1558 nm (right frame). Also shown are exponentialbest fit curves of the form
f ¼ Ca � 1 ¼ A exp �Bað Þ: ð17Þ
Notice that the correlation between f(380 nm, 1.85�) anda(380 nm, 1020 nm), R2 = 0.73 (middle frame), is similar tothat between Ca(380 nm, 1.85�) and Reff (left frame).Moreover, the correlation is even stronger (R2 = 0.91, rightframe) versus Angstrom exponent at the longer-wavelengthpair, a(1020 nm, 1558 nm). This is an example of a generalresult of our calculations: that the correction factors werewell correlated with Angstrom exponent and that thecorrelation improved as wavelengths l1 and l2 increased.(Evidently, this is because longer wavelengths are moresensitive to the larger particles in a distribution, and thelarger particles are responsible for the diffuse light effects.)
4.4. Parameters of Fitting Equations forCorrection Factors
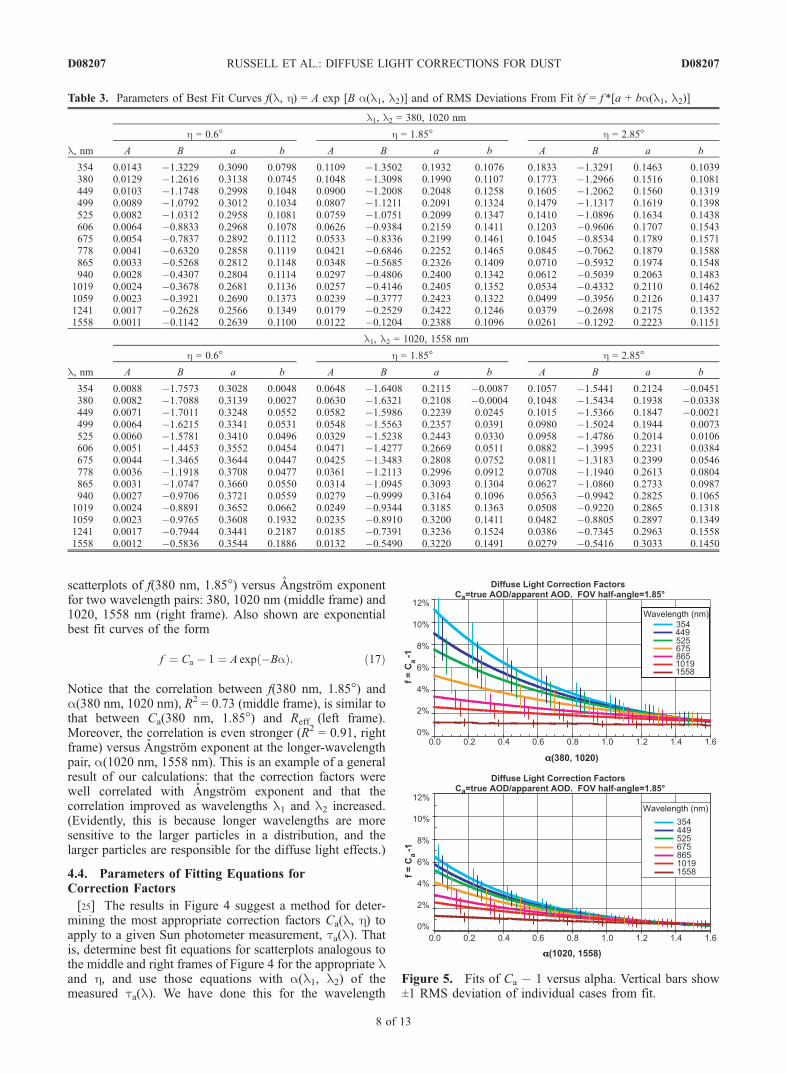
[25] The results in Figure 4 suggest a method for deter-mining the most appropriate correction factors Ca(l, h) toapply to a given Sun photometer measurement, ta(l). Thatis, determine best fit equations for scatterplots analogous tothe middle and right frames of Figure 4 for the appropriate land h, and use those equations with a(l1, l2) of themeasured ta(l). We have done this for the wavelength
Table 3. Parameters of Best Fit Curves f(l, h) = A exp [B a(l1, l2)] and of RMS Deviations From Fit df = f *[a + ba(l1, l2)]
l, nm
l1, l2 = 380, 1020 nm
h = 0.6� h = 1.85� h = 2.85�
A B a b A B a b A B a b
354 0.0143 �1.3229 0.3090 0.0798 0.1109 �1.3502 0.1932 0.1076 0.1833 �1.3291 0.1463 0.1039380 0.0129 �1.2616 0.3138 0.0745 0.1048 �1.3098 0.1990 0.1107 0.1773 �1.2966 0.1516 0.1081449 0.0103 �1.1748 0.2998 0.1048 0.0900 �1.2008 0.2048 0.1258 0.1605 �1.2062 0.1560 0.1319499 0.0089 �1.0792 0.3012 0.1034 0.0807 �1.1211 0.2091 0.1324 0.1479 �1.1317 0.1619 0.1398525 0.0082 �1.0312 0.2958 0.1081 0.0759 �1.0751 0.2099 0.1347 0.1410 �1.0896 0.1634 0.1438606 0.0064 �0.8833 0.2968 0.1078 0.0626 �0.9384 0.2159 0.1411 0.1203 �0.9606 0.1707 0.1543675 0.0054 �0.7837 0.2892 0.1112 0.0533 �0.8336 0.2199 0.1461 0.1045 �0.8534 0.1789 0.1571778 0.0041 �0.6320 0.2858 0.1119 0.0421 �0.6846 0.2252 0.1465 0.0845 �0.7062 0.1879 0.1588865 0.0033 �0.5268 0.2812 0.1148 0.0348 �0.5685 0.2326 0.1409 0.0710 �0.5932 0.1974 0.1548940 0.0028 �0.4307 0.2804 0.1114 0.0297 �0.4806 0.2400 0.1342 0.0612 �0.5039 0.2063 0.14831019 0.0024 �0.3678 0.2681 0.1136 0.0257 �0.4146 0.2405 0.1352 0.0534 �0.4332 0.2110 0.14621059 0.0023 �0.3921 0.2690 0.1373 0.0239 �0.3777 0.2423 0.1322 0.0499 �0.3956 0.2126 0.14371241 0.0017 �0.2628 0.2566 0.1349 0.0179 �0.2529 0.2422 0.1246 0.0379 �0.2698 0.2175 0.13521558 0.0011 �0.1142 0.2639 0.1100 0.0122 �0.1204 0.2388 0.1096 0.0261 �0.1292 0.2223 0.1151
l, nm
l1, l2 = 1020, 1558 nm
h = 0.6� h = 1.85� h = 2.85�
A B a b A B a b A B a b
354 0.0088 �1.7573 0.3028 0.0048 0.0648 �1.6408 0.2115 �0.0087 0.1057 �1.5441 0.2124 �0.0451380 0.0082 �1.7088 0.3139 0.0027 0.0630 �1.6321 0.2108 �0.0004 0.1048 �1.5434 0.1938 �0.0338449 0.0071 �1.7011 0.3248 0.0552 0.0582 �1.5986 0.2239 0.0245 0.1015 �1.5366 0.1847 �0.0021499 0.0064 �1.6215 0.3341 0.0531 0.0548 �1.5563 0.2357 0.0391 0.0980 �1.5024 0.1944 0.0073525 0.0060 �1.5781 0.3410 0.0496 0.0329 �1.5238 0.2443 0.0330 0.0958 �1.4786 0.2014 0.0106606 0.0051 �1.4453 0.3552 0.0454 0.0471 �1.4277 0.2669 0.0511 0.0882 �1.3995 0.2231 0.0384675 0.0044 �1.3465 0.3644 0.0447 0.0425 �1.3483 0.2808 0.0752 0.0811 �1.3183 0.2399 0.0546778 0.0036 �1.1918 0.3708 0.0477 0.0361 �1.2113 0.2996 0.0912 0.0708 �1.1940 0.2613 0.0804865 0.0031 �1.0747 0.3660 0.0550 0.0314 �1.0945 0.3093 0.1304 0.0627 �1.0860 0.2733 0.0987940 0.0027 �0.9706 0.3721 0.0559 0.0279 �0.9999 0.3164 0.1096 0.0563 �0.9942 0.2825 0.10651019 0.0024 �0.8891 0.3652 0.0662 0.0249 �0.9344 0.3185 0.1363 0.0508 �0.9220 0.2865 0.13181059 0.0023 �0.9765 0.3608 0.1932 0.0235 �0.8910 0.3200 0.1411 0.0482 �0.8805 0.2897 0.13491241 0.0017 �0.7944 0.3441 0.2187 0.0185 �0.7391 0.3236 0.1524 0.0386 �0.7345 0.2963 0.15581558 0.0012 �0.5836 0.3544 0.1886 0.0132 �0.5490 0.3220 0.1491 0.0279 �0.5416 0.3033 0.1450
Figure 5. Fits of Ca � 1 versus alpha. Vertical bars show±1 RMS deviation of individual cases from fit.
D08207 RUSSELL ET AL.: DIFFUSE LIGHT CORRECTIONS FOR DUST
8 of 13
D08207

range 354–1556 nm. Table 3 lists the best fit parameters ofthe fitting equation (17). Also given are the RMS deviationsof the data points from the fit, which indicate the 1suncertainty of this approach. These diffuse light uncertain-ties can be included in the overall AOD uncertainty byusing equation (A22b) of Russell et al. [1993a]. Figure 5shows these best fit curves for h = 1.85�, which is the FOVhalf-angle of the NASA Ames airborne Sun photometers(AATS-6 and AATS-14). At l = 1558 nm these correctionsare <1% of AOD for all a. However, for the shorterwavelengths and smaller a values they are significant,ranging up to 10% of AOD for l = 354 nm anda(380 nm, 1020 nm) = 0.[26] Because f and C decrease with increasing wavelength,
applying these corrections to an apparent AOD spectrum,t0a(l), changes its slope, increasing its Angstrom exponents(i.e., a(l1, l2) > a0(l1, l2), where a
0 and a are the Angstromexponents of the apparent and corrected AOD spectra, t0a(l),ta(l), respectively. This raises the question of whetherthe correction made using an initial, apparent Angstrom
exponent a(l1, l2) is an overcorrection, and whether it isnecessary to iterate using the Angstrom exponent of thecorrected AOD spectrum. We have conducted such iterativesolutions for example cases. In all cases we found thatiteration was not necessary, because the first correctedspectrum, ta(l), was virtually identical to the spectrum foundin all subsequent iterations (AOD differences < 0.001).
4.5. Applications
[27] Figure 6 illustrates the application of the correctionfactors in Table 3 and Figure 5 to vertical profiles ofapparent AOD t0a(l) measured in ACE-Asia. The top rowis a case measured by the 14-channel Ames AirborneTracking Sunphotometer (AATS-14) on the Twin Otteraircraft; the bottom row is from measurements by its6-channel counterpart, AATS-6 on the C-130 aircraft. InACE-Asia, the prevalence of dust relative to smaller aerosolparticles tended to increase with altitude. This is reflected inthe vertical profiles of Angstrom exponent shown in themiddle frame of each row: Angstrom exponent generally
Figure 6. Examples of applying the diffuse light correction factors in Table 3 and Figure 5 to verticalprofiles of optical depth measured in ACE-Asia.
D08207 RUSSELL ET AL.: DIFFUSE LIGHT CORRECTIONS FOR DUST
9 of 13
D08207

decreases in going from the near-surface pollution layer(�0.3 km to 1 or 2 km) to the layer 1 or 2 km above. Inaddition, the 17 April 2001 example in the top row ofFigure 6 shows Angstrom exponent decreasing in movingdownward from �0.3 km and 0.1 km, possibly because of anear-surface layer with enhanced sea salt. The verticalprofiles of Angstrom exponent in each row of Figure 6were used with the coefficients of Table 3 (equivalently, thecurves of Figure 5) to obtain the vertical profiles ofcorrection factors shown in the right frame of each row ofFigure 6. Applying these correction factor profiles to theprofiles of apparent AOD t0a(l) in the left frames yields thecorresponding profiles of corrected AOD ta(l) also shownin the left frames.[28] In ACE-Asia, dust frequently occurred with pollution,
even in the same layers aloft. Hence effective radii wereusually smaller, and Angstrom coefficients larger, thanwould be the case for pure dust. This is reflected by theAngstrom exponent profiles in Figure 6: The minimumAngstrom exponents attained are a(1020 nm, 1558 nm) =�0.2 and a(380 nm, 1020 nm) =�0.4. Hence the maximumcorrection factors Ca � 1 are �5% of AOD at the shortestwavelengths. Although these are less than the Ca � 1values of �6–10% for the smallest Angstrom exponents inFigure 5, they nevertheless produce AOD changes thatare clearly evident in Figure 6 for the shorter wavelengthsat altitudes below �3–4 km. For example, at wavelength354 nm below�0.5 km in the top row of Figure 6, the diffuselight correction increases AOD by �0.03. This is significantcompared to the typical AOD uncertainty of �0.01–0.02in well-calibrated Sun photometer measurements.[29] Rayleigh optical depths tR are shown in Figure 6
along with the aerosol optical depths ta. This is to illustratethe point made in section 3.2, that tR is small compared to100ta for altitudes below �6 km for wavelengths as short as340 nm. Hence the approximation of equation (12) for Ca isvalid.[30] Analogous diffuse light corrections have been ap-
plied by Livingston et al. [2003] to AODs obtained byAATS-6 in the Puerto Rico Dust Experiment (PRIDE) andby Redemann et al. [2003] and Schmid et al. [2003] toAODs obtained by AATS-6 and AATS-14 in the Asian-Pacific Regional Aerosol Characterization Experiment(ACE-Asia). The PRIDE measurements focused on Saharandust aerosols transported across the Atlantic to the Carib-bean. Diffuse light correction factors were based on alimited set of aerosol size distributions and complex refrac-tive indices: essentially the cases under the header ‘‘AfricanDust, AERONET’’ in Table 2. Despite the exclusion of theother cases in Table 2 (i.e., Asian dust and Asian mixedaerosols, plus maritime aerosols), the correction factorsapplied to the PRIDE AODs were very similar to thosefound here for the PRIDE range of a(380 nm, 1020 nm):�0.2–0.5. Values of Ca � 1 ranged from a maximum of�6% at 380 nm to a minimum of �2% at 1021 nm[Livingston et al., 2003]. The diffuse light correction factorsapplied to ACE-Asia AODs by Redemann et al. [2003] andSchmid et al. [2003] were based on a larger subset ofaerosol columnar size distributions and complex refractiveindices: essentially all the cases in Table 2 except thoseunder the header ‘‘Maritime Aerosol, AERONET.’’ BothSaharan and Asian aerosols were included because we
found no significant, systematic differences between the f-versus-a scatterplots for the two, and we sought a robustrelationship applicable to dust and mixed dust-pollutionaerosols from both sources.[31] For the study reported here, we sought a relationship
still more widely applicable, to both dust and maritimeaerosols. Therefore we extended the data set further, toinclude the cases headed ‘‘Maritime Aerosol, AERONET’’in Table 2, which use columnar size distributions andcomplex refractive indices found by Smirnov et al.[2002]. Inspection of Figure 4 suggests that inclusion ofthe maritime cases increases the best fit curves of f-versus-a, with the increase larger for f-versus-a(380, 1020) (mid-dle frame of Figure 4) than for f-versus-a(1020, 1558) (rightframe of Figure 4). To quantify this increase, we havesolved for the best fit f-versus-a curves with and withoutthe inclusion of the maritime cases. We found differences<0.012 in f(354 nm)-versus-a(380, 1020), <0.003 inf (354 nm) versus-a(1020, 1558), and still smaller at alllonger wavelengths. All differences between best fit curveswere less than the RMS difference between individualpoints and best fit curves. (These RMS differences areshown by the short-dashed curves in Figure 4 and the errorbars in Figure 5.) For AODs less than 0.8 the differencesbetween best fit curves produce AOD differences less thanthe typical Sun photometer AOD measurement uncertaintyof 0.01–0.02. Therefore we have retained the combinationof dust and maritime cases, and we recommend using theresulting best fit curves (shown in Figure 5, with parameterslisted in Table 3) for either dust or maritime cases.
5. Discussion and Cautions
[32] We mentioned in section 2 that the coarse mode ofdust and maritime aerosols typically has Reff = 1.1–3.2 mm,a range that falls into a gap between results of the previousstudies cited in section 1 and listed in Table 1. (Theseprevious results were Reff = 0.2–0.9 mm for aerosol andReff = 6–177 mm for cloud). Indeed, the coarse modes of theaerosol cases included in this study fall into this gap (see theReff-c row of Table 2, which has values from 1.13 to2.43 mm). Notice, however, that the presence of the finemode causes Reff of the overall distribution to be consider-ably less than that of the coarse mode. This can be seen fromthe Reff row of Table 2 and the horizontal coordinates of thepoints in the left frame of Figure 4: Overall Reff values rangefrom 0.15 to 0.99. Reff of the overall distribution is a goodpredictor of Ca (see the left frame of Figure 4). Therefore thepresence of the fine mode significantly reduces the diffuselight effect below what it would be if only the coarse modewere present. Figure 1 shows that this bimodality is apersistent feature of both the in situ and AERONET-retrieved size distributions. Its effect in reducing diffuselight effects is noteworthy.[33] Considerations of effective radius are also important
in distinguishing between diffuse light effects for clouds andfor aerosols. Both Reff and C values for clouds are muchlarger than those found in this study for dust and maritimeaerosols. We caution that the approach of using Angstromexponent a to predict C (as in Figure 5, in the middle andright frames of Figure 4, and in Table 3) will fail for clouds.This is because clouds will have a � 0, but cloud C values
D08207 RUSSELL ET AL.: DIFFUSE LIGHT CORRECTIONS FOR DUST
10 of 13
D08207

will be much larger than predicted by the f-versus-arelationships in Figures 4 and 5 and Table 3.[34] We also caution that our f-versus-a(1020, 1558)
relationships are dependent on our adoption of a wave-length-independent complex refractive index over the range1020–1558 nm. We made this assumption because of ascarcity of information on typical wavelength dependenceof complex refractive index in this region. Better refractiveindex information is needed in this region. However, we didnot make such an assumption in calculating our f-versus-a(380, 1020) relationships, instead using complex refractiveindices either from AERONET retrievals [Dubovik et al.,2002a, 2002b; Smirnov et al., 2002] or from chemicalinformation [Wang et al., 2002]. We have found that usingour f-versus-a(380, 1020) relationships gives very similarresults to using our f-versus-a(1020, 1558) relationships(i.e., the resulting f values differ by <0.03, with very rareexceptions). This is because all the dust-containing casesused to calculate those relationships have curved spectra of lnAOD versus ln l, with a(1020, 1558) < a(380, 1020), andwe find this same relationship, a(1020, 1558) < a(380,1020), for our ACE-Asia AATS-14 measurements of AOD,again with very rare exceptions [Schmid et al., 2003; B.Schmid, personal communication, 2003]. This same curva-ture of dust AOD spectra was previously found by Eck et al.[1999] in the wavelength range 380–1020 nm. The attractionof the f-versus-a(1020, 1558) relationships is that they havesmaller RMS deviation of individual cases from the best fitcurves (Figures 4 and 5). However, this must be balanced bythe above caution about unknown refractive index wave-length dependence over the range 1020–1558 nm.[35] Another caution relating to unknown refractive index
wavelength dependence concerns the upper limit of theamplitude of the coarse-particle mode. Specifically, in usingthe dynamic model of Asian dust given by the first Asiandust column of Table 2, we limited the maximum ratio ofcoarse-to-total volume, CVc/CV, to 0.93. We did this becauselarger ratios, coupled with wavelength-independent com-plex refractive index between 1020 and 1558 nm, producedcomputed AOD spectra that curved upward between thosewavelengths (i.e., a(1020,1558) < �0.02), and we haverarely measured such spectra. However, it is possible thatthose same size distributions, with CVc/CV > 0.93, coupledwith a wavelength-dependent complex refractive index,could yield a(1020, 1558) > � = 0, in accord with theAOD spectra measured by AATS-14. Such size distribu-tions would have larger Ca than those shown in Figures 4–6and Table 3. Again we emphasize that systematic refractiveindex measurements are needed at wavelengths >1020 nm.[36] Finally, we repeat the caution noted in section 4.1:
When evaluating diffuse light effects of dust near sources,where angular, sharp-edged shapes are likely to be moredominant, it may be appropriate to adjust the results of thisstudy to account for these shapes (e.g., by increasing Ca � 1by as much as 50%, to account for the forward peakdifference noted by Kalashnikova and Sokolik [2002]).
6. Summary and Conclusions
[37] The relatively large size of desert dust and maritimeaerosols makes Sun photometry of these aerosols moresubject to diffuse light effects than is the case for smaller
aerosols. We have calculated AOD correction factors Ca forthese effects, by applying the analytical expression ofShiobara and Asano [1994] and Kinne et al. [1997] to awide range of aerosol size distributions and complexrefractive indices, using a range of photometer FOV half-angles h and wavelengths l which are representative of a setof currently operational Sun photometers and pyrheliome-ters. The size distributions and complex refractive indicesare based on a wide range of retrievals from AERONETmeasurements, plus several cases from in situ airbornemeasurements. Effects of dust nonsphericity have beentaken into account to obtain accurate size distributions andrefractive indices. Having obtained these accurate sizedistributions, we calculated diffuse light correction factorsusing spherical-particle phase functions, because of thesimilarity of these phase functions to those of spheroidalparticles in the forward scattering peak. However, wecaution that results may have to be increased if the aerosolis dominated by the angular, sharp-edged shapes studied byKalashnikova and Sololik [2002]. This is more likely tooccur near dust sources, before dust particles have acquiredcoatings of sulfate, organics, or other materials.[38] We found that the correction factors were well corre-
lated with Angstrom exponent a(l1, l2), and that thecorrelation improved as wavelengths l1 and l2 increased.Evidently this is because longer wavelengths are moresensitive to the larger particles in a distribution, and thelarger particles are responsible for the diffuse light effects.We found that the correction factors for Asian mixed dust-pollution aerosols, when arrayed as a function of Angstromexponent, did not differ significantly from those for Saharandust, or even for maritime aerosols (both similarly arrayed).These size distributions have coarse modes with effectiveradii ranging from 1.1 to 2.4 mm. However, the persistentpresence of a fine-particle mode significantly reducesthe effective radius of the overall distribution, withcorresponding reductions in diffuse light correction factors.[39] We find that the corrections are negligible (less than
�1% of AOD) for Sun photometers with narrow FOV (half-angle h < �1�), but that they can be as large as 10% ofAOD at 354 nm wavelength for Sun photometers with h =1.85�. For pyrheliometers (which can have h up to �2.8�),corrections can be as large as 16% at 354 nm. We find thatAOD correction factors are well correlated with AODwavelength dependence (hence Angstrom exponent). Wehave provided best fit equations for determining correctionfactors from Angstrom exponents of uncorrected AODspectra, and we demonstrate their application to verticalprofiles of multiwavelength AOD.
Appendix A: Equations Used to Calculate SizeDistribution Parameters
[40] Volume median radius (mean logarithm of the radi-us), computed for both fine and coarse modes, is
ln rV ¼
Zrmax
rmin
ln rdV rð Þd ln r
d ln r
Zrmax
rmin
dV rð Þd ln r
d ln r
; ðA1Þ
D08207 RUSSELL ET AL.: DIFFUSE LIGHT CORRECTIONS FOR DUST
11 of 13
D08207
where dV(r)/dln r is the distribution of a given mode, andrmin and rmax are the limits of that mode. Standard deviationabout the volume median radius is
sV ¼
ffiffiffiffiffiffiffiffiffiffiffiffiffiffiffiffiffiffiffiffiffiffiffiffiffiffiffiffiffiffiffiffiffiffiffiffiffiffiffiffiffiffiffiffiffiffiffiffiffiffiffiffiffiffiffiffiffiffiZrmax
rmin
ln r � ln rVð Þ2dV rð Þd ln r
d ln r
Zrmax
rmin
dV rð Þd ln r
d ln r
vuuuuuuuuuut: ðA2Þ
Volume concentration (mm3/mm2) is
CV ¼Zrmax
rmin
dV rð Þd ln r
d ln r: ðA3Þ
These equations are general in that their formulation doesnot assume any function for the size distribution dV(r)/dln r.Nevertheless, they are formulated so that they give theparameters of a lognormal size distribution if dV(r)/dln r is atrue lognormal, i.e., if, for a given mode,
dV rð Þd ln r
¼ CVffiffiffiffiffiffi2p
psV
exp � ln r � ln rVð Þ2
2s2V
" #: ðA4Þ
[41] Acknowledgments. This research was supported by NASA’sEarth Observing System Inter-Disciplinary Science (EOS-IDS) Program,NASA’s Radiation Sciences Program, and the National Oceanic andAtmospheric Administration’s Aerosol-Climate Interactions Program. Keyportions were conducted as part of the Asian Pacific Regional AerosolCharacterization Experiment (ACE-Asia).
ReferencesBevington, P. R. (1969), Data Reduction and Error Analysis for thePhysical Sciences, McGraw-Hill, New York.
Box, M. A., and A. Deepak (1979), Atmospheric corrections to solar radio-metry, Appl. Opt., 12, 1941–1949.
Chiapello, I., J. M. Prospero, J. R. Herman, and N. C. Hsu (1999), Detec-tion of mineral dust over the North Atlantic Ocean and Africa with theNimbus 7 TOMS, J. Geophys. Res., 104, 9277–9291.
Dubovik, O., and M. D. King (2000), A flexible inversion algorithm forretrieval of aerosol optical properties from Sun and sky radiance mea-surements, J. Geophys. Res., 105, 20,673–20,696.
Dubovik, O., B. N. Holben, T. F. Eck, A. Smirnov, Y. J. Kaufman, M. D.King, D. Tanre, and I. Slutsker (2002a), Variability of absorption andoptical properties of key aerosol types observed in worldwide locations,J. Atmos. Sci., 59, 590–608.
Dubovik, O., B. N. Holben, T. Lapyonok, A. Sinyuk, M. I. Mishchenko,P. Yang, and I. Slutsker (2002b), Non-spherical aerosol retrieval methodemploying light scattering by spheroids, Geophys. Res. Lett., 29(10),1415, doi:10.1029/2001GL014506.
Eck, T. F., B. N. Holben, J. S. Reid, O. Dubovik, A. Smirnov, N. T. O’Neill,I. Slutsker, and S. Kinne (1999), Wavelength dependence of the opticaldepth of biomass burning, urban, and desert dust aerosols, J. Geophys.Res., 104, 31,333–31,349.
Edwards, A. L. (1976), The correlation coefficient, in An Introduction toLinear Regression and Correlation, chap. 4, pp. 33–46, W. H. Freeman,New York.
Grassl, H. (1971), Calculated circumsolar radiation as a function of aerosoltype, field of view, wavelength, and optical depth, Appl. Opt., 10, 2542–2543.
Halthore, R. N., S. E. Schwartz, J. I. Michalsky, G. P. Anderson, R. A.Ferrare, B. N. Holben, and H. M. Ten Brink (1997), Comparison ofmodel estimated and measured direct-normal solar irradiance, J. Geo-phys. Res., 102, 29,991–30,002.
Haywood, J. M., V. Ramaswamy, and B. J. Soden (1999), Troposphericaerosol climate forcing in clear-sky satellite observations over the oceans,Science, 283, 1299–1303.
Haywood, J. M., P. N. Francis, M. D. Glew, and J. P. Taylor (2001a),Optical properties and direct radiative effect of Saharan dust: A casestudy of two Saharan dust outbreaks using aircraft data, J. Geophys.Res., 106, 18,417–18,430.
Haywood, J. M., P. N. Francis, I. Geogdzhayev, M. Mishchenko, andR. Frey (2001b), Comparison of Saharan dust aerosol optical depthsretrieved using aircraft mounted pyranometers and 2-channel AVHRRalgorithms, Geophys. Res. Lett., 28, 2393–2396.
Haywood, J., P. Francis, S. Osborne, M. Glew, N. Loeb, E. Highwood,D. Tanre, G. Myhre, P. Formenti, and E. Hirst (2003), Radiative proper-ties and direct radiative effect of Saharan dust measured by the C-130aircraft during SHADE: 1. Solar spectrum, J. Geophys. Res., 108(D18),8577, doi:10.1029/2002JD002687.
Holben, B. N., et al. (1998), AERONET: A federated instrument network anddata archive for aerosol characterization, Remote Sens. Environ., 66, 1–16.
Huebert, B. J., T. Bates, P. B. Russell, G. Shi, Y. J. Kim, K. Kawamura,G. Carmichael, and T. Nakajima (2003), An overview of ACE-Asia:Strategies for quantifying the relationships between Asian aerosols andtheir climatic impacts, J. Geophys. Res., 108(D23), 8633, doi:10.1029/2003JD003550.
Jacobson, M. Z. (2001), Global direct radiative forcing due to multicom-ponent anthropogenic and natural aerosols, J. Geophys. Res., 106, 1551–1568.
Jones, A., and A. Slingo (1996), Predicting cloud-droplet effective radiusand indirect sulphate aerosol forcing using a general circulation model,Q. J. R. Meteorol. Soc., 122, 1573–1595.
Kalashnikova, O. V., and I. N. Sokolik (2002), Importance of shapes andcompositions of wind-blown dust particles for remote sensing at solarwavelengths, Geophys. Res. Lett., 29(10), 1398, doi:10.1029/2002GL014947.
Kinne, S., T. P. Ackerman, M. Shiobara, A. Uchiyama, A. J. Heymsfield,L. Milosevich, J. Wendell, E. W. Eloranta, C. Purgold, and R. W.Bergstrom (1997), Cirrus cloud radiative and microphysical propertiesfrom ground observations and in situ measurements during FIRE 1991and their application to exhibit problems in cirrus solar radiative transfermodeling, J. Atmos. Sci., 54, 2320–2344.
Krueger, B. J., V. H. Grassian, A. Laskin, and J. P. Cowin (2003), Thetransformation of solid atmospheric particles into liquid droplets throughheterogeneous chemistry: Laboratory insights into the processing of cal-cium containing mineral dust aerosol in the troposphere, Geophys. Res.Lett., 30(3), 1148, doi:10.1029/2002GL016563.
Levy, R. C. L. Remer, D. Tanre, Y. Kaufman, C. Ichoku, B. Holben,J. Livingston, P. Russell, and H. Maring (2003), Evaluation of theMODIS retrievals of dust aerosol over the ocean during PRIDE, J. Geo-phys. Res., 108(D19), 8594, doi:10.1029/2002JD002460.
Li-Jones, X., and J. M. Prospero (1998), Variations in the size distributionof non-sea-salt sulphate aerosol in the marine boundary layer at Barba-dos: Impact of African dust, J. Geophys. Res., 103, 16,073–16,084.
Livingston, J. M., et al. (2003), Airborne sunphotometer measurementsof aerosol optical depth and columnar water vapor during the PuertoRico Dust Experiment, and comparison with land, aircraft, and satellitemeasurements, J. Geophys. Res., 108(D19), 8588, doi:10.1029/2002JD002520.
Mishchenko, M. I., L. D. Travis, R. A. Kahn, and R. A. West (1997),Modeling phase functions for dustlike tropospheric aerosols using ashape mixture of randomly oriented polydisperse spheroids, J. Geophys.Res., 102, 16,831–16,847.
Moulin, C., H. R. Gordon, V. F. Banzon, and R. H. Evans (2001), Assess-ment of Saharan dust absorption in the visible from SeaWiFS imagery,J. Geophys. Res., 106, 18,239–18,249.
O’Dowd, C. D., J. A. Lowe, and M. H. Smith (1999), Coupling sea-salt andsulphate interactions and its impact on cloud droplet concentration pre-dictions, Geophys. Res. Lett., 26, 1311–1314.
Prospero, J. M., P. Ginoux, O. Torres, S. E. Nicholson, and T. E. Gill(2002), Environmental characterization of global sources of atmosphericsoil dust identified with the Nimbus 7 Total Ozone Mapping Spectro-meter (TOMS) absorbing aerosol product, Rev. Geophys., 40(1), 1002,doi:10.1029/2000RG000095.
Raes, F., T. Bates, F. Mcgovern, and M. van Liedekerke (2000), The 2ndAerosol Characterization Experiment (ACE-2): General overview andmain results, Tellus, Ser. B, 52(2), 111–125.
Reagan, J. A., Q. Gao, B. M. Herman, T. Caudill, and D. Flittner (1992),Aureole corrections to optical depths determined by solar photometryunder turbid volcanic conditions, paper presented at Chapman Confer-ence on Climate, Volcanism, and Global Change, Hilo, Hawaii, AGU,Washington, D.C., 23 –27 March .
Redemann, J., S. Masonis, B. Schmid, T. Anderson, P. Russell, J. Livingston,O. Dubovik, and A. Clarke (2003), Clear-column closure studies ofaerosols and water vapor aboard the NCAR C-130 in ACE-Asia, 2001,J. Geophys. Res., 108(D23), 8655, doi:10.1029/2003JD003442.
D08207 RUSSELL ET AL.: DIFFUSE LIGHT CORRECTIONS FOR DUST
12 of 13
D08207

Reid, J. S., et al. (2003), Analysis of measurements of Saharan dust byairborne and ground-based remote sensing methods during the PuertoRico Dust Experiment (PRIDE), J. Geophys. Res., 108(D19), 8586,doi:10.1029/2002JD002493.
Remer, L., and Y. Kaufman (1998), Dynamic aerosol model: Urban/indus-trial aerosol, J. Geophys. Res., 103, 13,859–13,871.
Rosenfeld, D. (2000), Suppression of rain and snow by urban and industrialair pollution, Science, 287, 1793–1796.
Rosenfeld, D., R. Lahav, A. P. Khain, and M. Pinsky (2002), The role ofsea-spray in cleansing air pollution over ocean via cloud processes,Science, 297, 1667–1670.
Russell, P. B., and J. Heintzenberg (2000), An overview of the ACE 2 ClearSky Column Closure Experiment (CLEARCOLUMN), Tellus, Ser. B, 52,463–483.
Russell, P. B., et al. (1993a), Pinatubo and pre-Pinatubo optical-depth spec-tra: Mauna Loa measurements, comparisons, inferred particle size distri-butions, radiative effects, and relationship to lidar data, J. Geophys. Res.,98, 22,969–22,985.
Russell, P. B., et al. (1993b), Post-Pinatubo optical depth spectra vs. latitudeand vortex structure: Airborne tracking sunphotometer measurements inAASE II, Geophys. Res. Lett., 20, 2571–2574.
Schmid, B., et al. (2003), Column closure studies of lower troposphericaerosol and water vapor during ACE-Asia using airborne Sun photo-meter, airborne in situ and ship-based lidar measurements, J. Geophys.Res., 108(D23), 8656, doi:10.1029/2002JD003361.
Shettle, E. P., and R. W. Fenn (1979), Models of aerosols of lower tropo-sphere and the effect of humidity variations on their optical properties,U.S. Air Force Cambridge Res. Lab. Tech. Rep., AFCRL-TR 79 0214,100 pp.
Shiobara, M., and S. Asano (1994), Estimation of cirrus optical thicknessfrom Sun photometer measurements, J. Appl. Meteorol., 33, 672–681.
Sinyuk, S., O. Torres, and O. Dubovik (2003), Combined use of satelliteand surface observations to infer the imaginary part of refractiveindex of Saharan dust, Geophys. Res. Lett., 30(2), 1081, doi:10.1029/2002GL016189.
Smirnov, A., B. N. Holben, Y. J. Kaufman, O. Dubovik, T. F. Eck,I. Slutsker, C. Pietras, and R. N. Halthore (2002), Optical properties ofatmospheric aerosol in maritime environments, J. Atmos. Sci., 59, 501–523.
Sokolik, I. N., and O. B. Toon (1996), Direct radiative forcing by anthro-pogenic mineral aerosols, Nature, 381, 681–683.
Tanre, D., Y. J. Kaufman, B. N. Holben, B. Chatenet, A. Karnieli,F. Lavenu, L. Blarel, O. Dubovik, L. A. Remer, and A. Smirnov(2001), Climatology of dust aerosol size distribution and optical proper-ties derived from remotely sensed data in the solar spectrum, J. Geophys.Res., 106, 18,205–18,217.
Tegen, I., A. A. Lacis, and I. Fung (1996), The influence on climate forcingof mineral aerosols from disturbed soils, Nature, 380, 419–422.
Wang, J., et al. (2002), Clear-column radiative closure during ACE-Asia:Comparison of multiwavelength extinction derived from particle size andcomposition with results from sunphotometry, J. Geophys. Res.,107(D23), 4688, doi:10.1029/2002JD002465.
Whitby, K. T. (1978), The physical characteristics of sulfur aerosols, Atmos.Environ., 12, 135–159.
Wiscombe, W. J., and G. W. Grams (1976), The backscattered fraction intwo-stream approximations, J. Atmos. Sci., 33, 2440–2451.
�����������������������M. Box, School of Physics, University of New South Wales, Sydney,
New South Wales 2052, Australia. ([email protected])O. Dubovik, Goddard Earth Sciences and Technology Center, NASA
Goddard Space Flight Center, Code 912, Greenbelt, MD 20771, USA.([email protected])B. N. Holben, Laboratory for Atmospheres, NASA Goddard Space Flight
Center, Code 912, Greenbelt, MD 20771, USA. ([email protected])J. M. Livingston, SRI International, 333 Ravenswood Avenue, Menlo
Park, CA 94025, USA. ([email protected])S. A. Ramirez, J. Redemann, and B. Schmid, Bay Area Environmental
Research Institute, 560 3rd Street West, Sonoma, CA 95476, USA.([email protected]; [email protected]; [email protected])P. B. Russell, NASA Ames Research Center, MS 245-5, Moffett Field,
CA 94035-1000, USA. ([email protected])J. Wang, Brookhaven National Laboratory, Upton, NY 11973, USA.
D08207 RUSSELL ET AL.: DIFFUSE LIGHT CORRECTIONS FOR DUST
13 of 13
D08207
Copyright © 2022 FDOKUMEN