State of the art radiometer standards for NASA's Earth Observing System

Radio Science, Volume 36, Number 4, Pages 621-638, July/August 2001
Microwave Radiometer for Cloud Carthography: A 22-channel ground-based microwave radiometer for atmospheric research
Susanne Crewell, Harald Czekala, 1 Ulrich L6hnert, and Clemens Simmer Meteorological Institute, University of Bonn, Bonn, Germany
Thomas Rose, Ralf Zimmermann, and Rtidiger Zimmermann Radiometer Physics GmbH, Meckenheim, Germany
Abstract. A 22-channel Microwave Radiometer for Cloud Carthography (MICCY) for the profiling of tropospheric temperature, humidity, and cloud liquid water has been developed. The radiometer has 10 channels along the high-frequency wing of the 22.235 GHz water vapor line, 10 channels along the low-frequency side of the 60 GHz oxygen complex, and 2 channels at 90 GHz. Two features make the radiometer a unique tool for the observation of small-scale structures related to cloud processes: (1) Atmospheric brightness temperatures are measured simultaneously at all channels with an integration time of 1 s. (2) A Cassegrain system including a 90 cm off-axis parabolic mirror leads to a spatial resolution better than 1 ø full width at half maximum for all frequencies. The necessity of these features for cloud observations is demonstrated. Algorithms for the retrieval of integrated water vapor, integrated cloud liquid water, and the profiles of temperature and humidity were developed on the basis of artificial neural networks. Measurement examples, including comparisons with radiosondes, demonstrate the systems capabilities for high-resolution atmospheric monitoring.
1. Introduction
Atmospheric profiles of temperature, humidity, wind direction, and speed are typically measured by radiosondes launched from facilities maintained by the national weather services. Their operation is costly and requires extended logistics, and hence results in a poor spatial (several hundred kilometers at best) and temporal (about twice a day) coverage. Remote sensing of temperature and humidity profiles from satellites yields better spatial coverage especially over oceans and sparsely populated land
•Now at Department of Applied Physics, Columbia University, NASA Foddard Institute for Space Studies, New York.
Copyright 2001 by the American Geophysical Union.
Paper number 2000RS002396. 0048-6604/01/2000RS002396511.00
621
areas; however, the obtained horizontal and temporal resolution is coarse. Because of their viewing geometry the vertical resolution is good in the upper troposphere but deteriorates toward the surface. Since clouds strongly absorb in the infrared spectral region several satellite instruments (e.g., the Advanced Microwave Sounding Unit (AMSU) and the Special Sensor Microwave/Temperature (SSM/T) sounder) operate in the microwave region where clouds are semitransparent. Profiling is achieved by measuring the atmospheric emission along the wings of pressure-broadened rotational lines. The 60 GHz oxygen absorption complex is typically used for temperature profiling while the 183 GHz water vapor line is used for the humidity profile. Because the atmospheric opacity is high for both bands, the problem of the unknown surface emission is eliminated, but lower tropospheric information is not well retrieved.
The usefulness of ground-based microwave radiometry for the retrieval of temperature and

622 CREWELL ET AL.: MICROWAVE RADIOMETER FOR CLOUD CARTHOGRAPHY
humidity profiles has been proven for quite some time [e.g., Westwater, 1965; Decker et al., 1978; Askne and Westwater, 1986]. Because of the low maintenance cost of microwave radiometers, continuous atmospheric profiles can be measured, which show the best vertical resolution close to the
ground in the planetary boundary layer. This feature is extremely important for the evaluation of and assimilation into high-resolution numerical weather forecast models of the future. In the last few years technical improvements and the intensifying search for alternatives to radiosondes lead to the
development of multichannel microwave radiometers for the operational profiling of tropospheric temperature and humidity [Del Frate and Schiavon, 1998; Solheim et al., 1998].
An additional advantage of ground-based microwave radiometers is their sensitivity to cloud liquid water. Overland passive microwave remote sensing is by far the most accurate method to measure the vertically integrated liquid water content (liquid water path (LWP)), except for sporadic and expensive in situ measurements from research aircraft. The high accuracy in the retrieved LWP and the integrated water vapor content (IWV) achieved by two-channel radiometers has been shown more than two decades ago [Westwater, 1978]. In the last years, approaches to further improve the LWP retrieval were directed toward the inclusion of
additional microwave channels [Bosisio and Mallet, 1998] and the combination of microwave radiometer measurements with other ground-based instrumen- tation [Han and Westwater, 1995; Crewell et al., 1999a]. The potential of deriving cloud liquid water profiles, rather than just the column amount, from multichannel measurements has been suggested by Solheim et al. [ 1998].
Satellite-based remote sensing of LWP over the oceans is a well-established method [Grody, 1993]; however, the inhomogeneous distribution of clouds within the satellite's field of view (typically several kilometers), can lead to substantial errors (L. von Bremen, private communications, 2000). This effect has mostly been neglected for ground-based radiometers, whose viewing geometry is often assumed to behave as a pencil beam although the spatial and temporal variability of clouds is high even on scales below the resolution of most radiometers
[Rogers and Yau, 1989]. With a typical wavelength of--1 cm, practical considerations about the antenna
aperture size (-10 cm) lead to half-power beam widths from 3 ø to 9 ø for conventional radiometers
[e.g., Solheim and Godwin, 1998; Peter and K•impfer, 1992; M•itzler, 1992]. These beam widths correspond to footprints of up to several 100 m at typical cloud base heights.
In this paper we present the Microwave Radiometer for Cloud Carthography (MICCY), which is especially designed to resolve the small temporal and spatial scales connected with cloud processes. This feature is important not only when direct cloud parameters, e.g., LWP or the liquid water profile, are derived but also when the temperature and humidity profiles are determined in the presence of clouds.
The radiometer design and the special features which allow the detection of small-scale cloud
processes are described in section 2. Section 3 presents the calibration method, together with an assessment of the radiometric accuracy. The retrieval method for the atmospheric profiles, which is based on artificial neural networks (ANN), is presented in section 4. Measurement examples are given in section 5. Section 6 includes a summary and an outlook for further studies possible with this unique radiometer.
2. Radiometer Design As mentioned in section 1, MICCY was especially
designed to investigate cloud-related processes. Several features have been included in the system to make it a flexible tool for a range of applications which will be described in section 3. Additional information can also be obtained from the MICCY
home page of the Meteorological Institute, University of Bonn, at http://www.meteo.uni-bonn.de/Deutsch/ Forschung/Gruppen/miccy/miccy.html.
The standard atmospheric parameters, which can be derived from MICCY observations, are the cloud liquid water path (LWP), integrated water vapor content (IWV), and the temperature and water vapor profile. For this purpose the radiometer comprises 22 channels located in 3 frequency bands, which are shown together with a typical atmospheric extinction spectrum for a cloudy atmosphere in Figure 1. Ten channels are located along the high-frequency wing of the water vapor absorption line at 22.235 GHz, 10 channels are located along the low-frequency wing of the oxygen absorption complex around 60 GHz, and 2 channels are located at 90 GHz. Details on exact

CREWELL ET AL.' MICROWAVE RADIOMETER FOR CLOUD CARTHOGRAPHY 623
o o
t- o
o
....
10.000
1.000
0.100
0.010
0.001
Cloudy Atmosphere, LWC•= 0.2 gm '3, 900.•hPa
A B. C :!
2o 40 60 80 lOO Frequency [GHz]
Figure 1. Extinction coefficient in the microwave region for a cloudy atmosphere (liquid water content (LWC) = 0.2 gm -3, pressure p = 900 hPa). The single contributions from cloud water (dash- dotted line), water vapor (dashed line), and oxygen (dotted line) are shown. The three MICCY frequency bands A, B, and C are marked by the thick lines.
frequency distribution and bandwidths can be taken from Table 1.
The profile information about the atmospheric water vapor originates from the channels covering 6 GHz of the high-frequency wing of the pressure- broadened, relatively weak water vapor line. With a pressure-broadening coefficient of-3 MHz(hPa) '• and a frequency spacing of 750 MHz between channels, information about the lower atmosphere (below 250 hPa) can be resolved with the spectral measurements. In the center of the oxygen absorption complex the atmosphere is optically thick, and the radiation measurement stems from regions close to the radiometer. For frequencies farther away from the line center the atmosphere becomes more transparent, and the channels receive radiation which originates from regions more distant to the radiometer. The effect is quantified by the weighting functions normalized by their maximum value, shown in Figure 2a. Because of the known mixing ratio and the temperature dependence of the absorption coefficient of oxygen, information about the vertical temperature distribution is contained in the channels scanning the
8 GHz of the low-frequency wing. To illustrate the vertical resolution, which can be achieved from these channels, the difference weighting functions between two neighboring channels are given in Figure 2b. For a radiometer with an elevation angle of 90 ø, well- defined peaks between 0.5 and 2.5 km are visible. If the elevation angle is lowered, and hence the atmospheric path is increased, the peaks shift to lower altitudes. This demonstrates the radiometer's
advantage in the temperature retrieval of the planetary boundary layer. The contribution of cloud liquid water to the microwave signal increases roughly with the frequency squared. It depends on temperature and is proportional to the third moment of drop size distribution. Therefore measurements at two channels, one influenced mainly by the water vapor line and one in the 30 GHz window region, lead to good estimates of LWP and IWV [e.g., Westwater, 1978]. For the investigation of more complex features, like the vertical and horizontal distribution of liquid water, size and shape of hydrometeors, etc., the radiometer design includes the additional features described in sections 2.1-2.5.

624 CREWELL ET AL.: MICROWAVE RADIOMETER FOR CLOUD CARTHOGRAPHY
• ",,• 51.8 GHz t I :. ". \• ..... 52.8 GHz]
6 I i :. ",. \• ..... 53.8 GHz-• 3 • ',, \• .... 54.8 GHz-•
• • ',, \• - - 55.8 GHz• . : • --- 56.8GHz•
• ', • "',• -.-57.8GHz• 1
'½ . -. - _
(a) 0.0 0.2 0.4 0.6 0.8 1.0
Normalized weighting functions
i i i
0.0 0.2 0.4 0.6 0.8 1.0
(b) Normalized difference weighting functions
Figure 2. (a) Temperature weighting functions (normalized by maximum value) for the nine MICCY frequencies of band B. (b) Differences in temperattire weighting functions between adjacent frequency channels (normalized by maximum value). The labels always correspond to the lower frequency channel.
2.1. Mobility and Operation and it weighs -1800 kg. The radiometer can be fully
The radiometer is designed to be used under computer controlled, thus enabling stand-alone outdoor conditions with temperatures ranging operation. between about-20 ø and +40øC. To ensure high measurement stability over this range a three-stage 2.2. Scanning Capabilities temperature control is implemented. All receivers, The system is mounted on a rotational device low-power electronics, optical elements, and which enables continuous scanning of the full calibration targets are protected from harsh azimuth range (00-360 ø ) with -3 rpm. The environmental factors by a thermally insulating atmosphere can be observed under elevation angles radome which is stabilized by a 3 kW air between 0 ø and +90 ø by scanning a 1.0 x 1.4 rn conditioning system. A second temperature control planar mirror (see Figure 4a). The mirror can also be stage keeps the radiometer box (comprising the scanned to couple the hot and cold calibration targets quasioptical multiplexer and all receiver boards) at into the Cassegrain system. Observation of the 35ø+0.1øC, which is achieved by using high-power ground is possible down to a maximum zenith angle Peltier elements in combination with proportional of 147 ø. This is important for radiative transfer integral differential (PID) controllers. In addition, studies involving soil and vegetation [Wigneron et each receiver board (two boards for the first 10 al., 1996]. An infrared radiometer with a narrow channels, two boards for the oxygen line channels, beam (0.7 ø full width at half maximum (FWHM)) and one board for the 90 GHz channels) is and a video camera are mounted on the same axis as independently stabilized. The atmospheric radiation the planar mirror (but outside the radome, see Figure enters the radiometer through a microwave 3) to observe the atmosphere with the same direction translucent foil, whose losses are negligible at the and resolution as the microwave channels. From the radiometer's frequencies. In order to allow easy measured infrared (9.5-11.6 gm)sky temperature transportation to other measurement sites the whole (Ti0 the temperature of the cloud base (Tc0 can be system is mounted on a trailer (see Figure 3). The derived by subtracting the atmospheric contribution radiometer's dimensions are 3.4 rn x 3.4 rn x 1.7 m, from Ti•. This contribution is typically between 2 and

CREWELL ET AL.' MICROWAVE RADIOMETER FOR CLOUD CARTHOGRAPHY 625
Figure 3. Photograph of the transportable microwave radiometer MICCY. The position of the infrared radiometer mounted on the antenna axis is indicated.
10 K, depending on the actual temperature and humidity profile, and can be estimated from the microwave brightness temperatures.
2.3. Spatial Resolution
As can be seen from Table 1 all frequency channels show a spatial resolution of better than 0.9 ø FWHM. This resolution translates to a footprint of less than 10 m for a cloud at 500 m altitude. For that
purpose a quasi-optical system was designed with a Cassegrain system, including a 90 cm diameter off- axis paraboloidal mirror (shown in Figure 4a) as the element limiting the beam width. Between the Cassegrain system and the horn antennas of the band A, B, and C receivers, the incoming radiation is split into the different frequency bands by a quasi-optical multiplexer, shown in Figure 4b, using dichroic plates with a loss of less than 0.4 dB each. Elliptical mirrors are used for refocusing and matching of the beams.
To illustrate the advantage of this high beam resolution, Figure 5 shows the smoothing effect on the measured atmospheric brightness temperatures
when a one-dimensional cloud is observed with
different resolutions. The cloud has a width of 200 m, and a liquid water path of 0.4 kgm -2 is embedded in a standard atmosphere. The antenna pattern (only considered in one plane) is assumed to be Gaussian, and the reduction of the measured brightness temperature to the real signal is calculated depending on the cloud base height and angular resolution. The reduction effect is most pronounced at frequencies where cloud water absorption is strongest at window frequencies (28 and 90 GHz) and the absorption of water vapor and oxygen is small. Clouds with a base of less than 800 m are not affected as well as
measurements with a better resolution than 1 ø.
However, for broader beams the reduction can be quite significant, e.g., reduced to 70% when the cloud base is 2.5 km and the beam width is 5 ø.
2.4. Temporal Resolution
The atmospheric emission is measured at the same time for all frequencies with an integration time of 1 s instead of a sequential measurement as is used in synthesizer controlled receivers [Solheim and

626 CREWELL ET AL.: MICROWAVE RADIOMETER FOR CLOUD CARTHOGRAPHY
Godwin, 1998]. The importance of parallel measurements is illustrated in Figure 6, which considers the same model cloud as in Figure 5 with the addition that the cloud is assumed to be moving
with a velocity of 10 ms -• over the radiometer's field of view. Algorithms for the determination of atmospheric parameters combine measurements at different frequencies. The effect of temporal delays

CREWELL ET AL.: MICROWAVE RADIOMETER FOR CLOUD CARTHOGRAPHY 627
Table 1. Specifications of the Microwave Radiometer MICCY
Band A Band B Band C
Frequency range, GHz 22.235-28.235 50.8-58.8 90 Number of channels 10 10 2 Channel bandwidth, GHz 0.250 0.250 1 Distance between channels, GHz 0.75 1 - Noise temperature, K -600 - 1000 -3000 Beam width FWHM, deg 0.9 0.55 0.4 Polarization • 5 H, 5 V 5 H, 5 V 1 H, 1 V
•H, horizontal; V, vertical.
between these measurements, which combine information from different parts of the cloud, is investigated for LWP retrievals. For that purpose, simulated measurements of the model cloud at 23 and
28 GHz were used for the retrieval. The combined
error resulting from the time lag between both measurements and the spatial resolution is shown. Especially for broad beams, a time lag of 5 s can reduce the retrieved LWP by a factor of 2 for clouds higher than 2000 m. Therefore high-resolution, parallel measurements are necessary when cloud variability is investigated.
That this artificial case is a common case in reality is demonstrated in Figure 7 where a 50 s time series of the brightness temperatures measured in the 10 channels of band A is shown. Within less than 15 s a
single cloud passes the radiometer's field of view with a maximum amplitude of 7 K in the highest- frequency channel. As an example the LWP is calculated again from the 23 and 28 GHz measurements for time tl (102 gm -2) and t2 (188 gm -2) which are only 5 s apart. When the 23 GHz measurement at tl is combined with the 28 GHz measurement at t2, the resulting LWP is
overestimated to 211 gm -2, while combining the 28 GHz measurement at tl with the 23 GHz measurement at t2 results in an underestimation with LWP = 79 gm -2. It is obvious that temporal delays between frequency measurements can result in errors in the retrieval not only for cloud parameters, as shown here for the LWP, but also for other
atmospheric parameters in the presence of clouds.
2.5. Polarization
To cover the 6 and 8 GHz bandwidth of band's A
and B, respectively, both bands are split into the two orthogonal polarizations by orthomode transducers at the feedhorn antenna's waveguide output port (see Figure 8 for band A). Each subband employs a separate mixer to down-convert the lower and upper 3 GHz (band A) and 4 GHz (band B) to the IF detection frequencies. In both bands the subband containing the lower frequency channels has horizontal polarization, and the one with the higher- frequency channels has vertical polarization. The channel frequencies are chosen in such a way that the highest frequency of the lower subband and the lowest frequency of the upper subband are identical.
Figure 4. Quasi-optical design of the microwave radiometer MICCY. (a) The Cassegrain system (900 mm paraboloidal and hyperboloidal subreflector) is located on top of the radiometer box. A 1.0 x 1.4 m planar scanning mirror reflects the atmospheric radiation into the Cassegrain system but is also used to switch to the calibration targets needed for an absolute system calibration. The vertically mounted load is operated at ambient temperature (stabilized by the radome air condition) while the cold load on the bottom plate is cooled with liquid nitrogen. Also shown are the radome support structure and high- power electronics box. (b) MICCY's quasi-optical multiplexer. A quasi-optical high-pass filter separates the 90 GHz beam from the other bands. This filter is realized by a metal plate perforated with hundreds of holes (circular waveguides), also known as a dichroic plate. These filters offer a sharp cutoff and low transmission losses (<0.4 dB). A second dichroic splits bands A and B. Elliptical mirrors refocus the beams into the corrugated feedhorn apertures. The beam contours shown are the -10 dB power levels to indicate the different illumination angles for the Cassegrain subreflector. The optical elements of the multiplexer are sized to cover a -30 dB power level.

628 CREWELL ET AL.' MICROWAVE RADIOMETER FOR CLOUD CARTHOGRAPHY
3000
2000
1000
0
0
90 deg Elevation, Frequency: 23.0 ! ,•. , . i , , .
. . . ! . . . ! . . . . . . . i . . .
2 4 6 8 10
Angle resolution (FWHM) / deg
90 deg Elevation, Frequency: 28 0 4OOO
3000
2000
1000
0
0
.• 'cO ' "½- x
, , , i , , , ! , , , i , , , i , , ,
2 4 6 8
Angle resolution (FWHM) / deg 10
90 deg Elevation, Frequency' 50.8 4000
3000
2000-
1000
0
0
ß . . i . . . i . . . ! . . . ! . . .
2 4 6 8
Angle resolution (FWHM) / deg 10
3000
2000
1000
0
0
90 deg Elevation, Frequency: 90.0 4000 ' ' ,• 'x, ' "0 '
, , , i , , , i , , , i , , , i , , ,
2 4 6 8 10
Angle resolution (FWHM) / deg
Figure 5. Reduction of measured cloud brightness temperature due to the beam width of the observing radiometer. A one-dimensional model cloud with a liquid water path of 400 gm-2 and a width of 200 m is considered. The cloud base height varies between 100 and 4000 m.
Therefore the radiometer measures the atmosphere receiver noise temperature, and Tsc is scene for both linear polarizations independently at 25.235 brightness temperature. With the typical receiver and 54.8 GHz. Additionally, at 90 GHz both noise temperatures and channel bandwidths given in polarizations are detected separately. The polarization Table 1 and the integration time ß- 1 s, very low sensitive measurements are intended to investigate values between 0.02 and 0.2 K are achieved. polarization effects arising from nonspherical However, more severe factors limiting the radiometer particles, which can give information about the size accuracy are bias errors introduced by the absolute and shape of the liquid particles [Czekala et al., 1999; calibration and long-term receiver gain drifts. Czekala and Simmer, 1998]. Standard calibration procedures for microwave
radiometers involve two calibration loads at well-
3. Calibration and Accuracy Assessment defined temperatures and assume a linear relationship 3.1. Absolute Calibration between the detected microwave power and the
physical blackbody temperatures of the calibration The RMS noise in the measured brightness targets. This assumption is questionable for two
temperatures can be calculated for a total power reasons: (1) The Rayleigh Jeans approximation of the radiometer like MICCY from the radiometer noise blackbody radiation spectrum at microwave formula ATa - (Tree + T•c)/X/(Z AV), where z is frequencies leads to errors of several tenths of a integration time, Av is channel bandwidth, Trec is Kelvin even at 25 GHz. The problem occurs in

CREWELL ET AL.' MICROWAVE RADIOMETER FOR CLOUD CARTHOGRAPHY 629
4000
3000
2000
1000
•.o o.• \ o.•
.......... ,...x., • : ii..o..:• ' .................................................. '.. .... 0.6 ................ '"'"...
0.8 ...... '"..'..?. - -. ::--..
•.'•; ............................... •d'""--. ' .......... ;". .'"'-.. o , , , , , , , , , , , ,
0 2 4 6 8 10
Time delay between channels / s
Figure 6. Reduction of liquid water path derived using two channel (23 and 28 GHz) measurements due to a time delay in the measurement of both channels. The same cloud as in Figure 5 is considered, which now moves with a velocity of 10 ms-1 over the radiometer's field of view. Calculations were performed for radiometer beam widths of 1 o (solid lines), 4 ø (dotted lines), and 8 ø (dashed lines).
particular at very low brightness temperatures of a few Kelvin which, in fact, is the temperature range of band A. The calibration error should be eliminated by calculating the brightness temperatures from the precise Planck law. (2) The detector diode response is not perfectly linear even when the detector is operated in the square law power level regime (less than -27 dBm input power). Extended tests utilizing additional noise injection while terminating a receiver with blackbodies at different physical temperatures [Kazama et al., 1999] resulted in maximum brightness temperature errors of several Kelvin.
In order to take the nonlinearity response of the detector diodes (see Figure 9) into account we perform an absolute calibration involving four temperature points instead of only two. The nonlinearity is more accurately modeled by the relationship [Kazama et al., 1999]
U = GP • 0.9 <_ ct <_ 1, (1)
where U is the measured detector voltage, G is the receiver gain coefficient, P is the total noise power at
the detector input, and cr is a nonlinearity factor. P = Prec + Psc includes the power generated by the system noise temperature Tre• and the scene temperature Tsc.
The nonlinearity becomes more significant for a receiver with a low noise temperature Trec as can be seen from Figure 9. If T•c is on the order of a few hundred Kelvin, its magnitude is comparable to the scene temperature range (0-400 K) which occupies about half of the detector curve. For T• values several times as high as the scene range, the latter is only a small fraction of the curve and can be fitted by a more linear function (ct close to 1).
The problem is how to determine G, a; and T•c, experimentally (three unknowns cannot be calculated from a measurement of two standards). A solution is to generate four temperature points for calibration by additional noise injection of unknown power Pn, which leads to four independent equations with four unknowns.
The initial calibration is performed with absolute standards, which leads to the voltages U• and U3. After the injection of additional noise to the detector

T1 T2
32
30
28
26
24
32
30
28
26
24
34
32
30
28
32
• 30 • 28
(D 36
(/) 32 • 30
• 28
I'I"1 40 38
36
5O
48
46
44
42
54
52
5O
48
46
56
54
52
5O
48
,
28.235GHz
' ' , ........ 27.•85'GHz'• AAAAAA
....
, , AAAAAA
AAAA•
AAAAAAAAAAAAAAAAAAAAAA• ......... 25.235' GHz' - AASAAAAAAAAAAAAAA ,
; AAAAAA] ,
' ' ' 2•.•85'GHz , AAAAAAAAAAAAAAAAAAAAAA• ,
,
,
' ' i i ........ i ......
23.735 :
,
,
,
A
AAA ,AAAAAAA AAA
0 10 20 30
Seconds past 28 September 1999 11 '33'40 UTC Figure 7. Time series of 40 s showing the brightness temperatures in l0 channels of band A measured by the MICCY radiometer during a cloud passage. The spacing of the vertical axis is 10 K for each frequency channel.

CREWELL ET AL.' MICROWAVE RADIOMETER FOR CLOUD CARTHOGRAPHY 631
ISO•'• (usB 32-35 GHz) IF-Amp.
•'• LNA ISO •gat• • F•d
• , !_hodz. Polarisation • -T -'• DRO 30 GHz
GHz • • HPFiEer DRO 20 GHz Noise-Diode /• (LSB •s •.z) •'•
LNA
,• • ISO
x• '• ISO
.O
I -I IF-Amp.
I
2.00 GHz
Detector &
2.75 GHz
3.50 GHz
i•-Y R _•_ •11• • • [ ] C H 8 4.25 GHz
I* 5.00 GHz
> I 5.00 GHz
5.•i -td- CH5 4.25 GHz
3.50 GHz
>1 2.75 GHz
2.00 GHz
Figure 8. Band A receiver layout. The feedhorn signal is split into vertical and horizontal polarization subbands by the orthomode transducer (OMT). After single-sideband (SSB) filtering and low-noise amplification (LNA) the signals are down-converted to corresponding IF bands. Digital reference oscillators (DRO) serve as local oscillator). The additional noise source signal (NG) can be injected into the IF chain's input ports by a computer-controlled pin switch. Further amplification and power splitting is followed by band-pass filtering to define the channel's bandwidth and center frequency. Each channel (CH) has a separate detector circuit and dc amplifier.
input signal the voltages U2 and U4 are described by
U2 = G(Prec + Pcold + Pn) •,
U4 = G(Prec + Phot + P.)a, (2)
where Pcold is the power related to the radiometric temperature of the cold load Tco•a by (3) and Phot is the corresponding value for the hot load. The evaluation of the corresponding equations for U•, U3, and U4 results in the determination of Tree, G, cz, and Pn. It is important to notice that the knowledge of the noise injection power Pn is not needed for the calibration algorithm. It is only assumed that Pn is constant during the measurement of Ut-U4 (approximately 1 min).
The calibrated noise powers P are related to an equivalent noise temperature T by Planck's law
1 e o• . (3)
e(hV)/(kr)_l
The absolute standards are realized by a hot (ambient temperature) and a cold (liquid nitrogen boiling temperature) target using pyramid-shaped, carbon- loaded absorber materials. For noise injection a highly stable noise diode is implemented for each frequency band (see Figure 8). The diode's signal can be turned on and off by a computer-controlled pin switch.
We have analyzed the 14 absolute calibrations taken over the course of seven months using the method described above. For selected frequency channels, Table 2 shows the mean values and
standard deviation of Trec and o•. Typically, the variation in o• is on the order of a few percent, indicating the stability of the detector's nonlinearity. To investigate the significance of this nonlinearity effect, we compared the calibration results of the four-point method to the ones from the traditional two-point (hot/cold) method. For International Civil

632 CREWELL ET AL.: MICROWAVE RADIOMETER FOR CLOUD CARTHOGRAPHY
U4
U•
U1
I i
I I
I I
Figure 9. Detector response as a function of total noise power for the four-point calibration. Prec is the receiver noise power, Pn is the additionally injected noise, Pc is the total noise when the radiometer is terminated with a cold load (e.g., liquid-nitrogen-cooled absorber) and Ph is the corresponding noise power for the ambient temperature (hot) load. The detector voltages U measured at the four calibration points are shown.
Aviation Organization (ICAO) standard atmospheric conditions the difference between both methods and
its standard deviation over the different calibrations
AT4_2 was calculated. The most pronounced effect with -1 K is obtained for 22.235 GHz. When the
atmospheric brightness temperature is close to one calibration load (e.g., 56.8 GHz) the difference is negligible. The nonlinearity effect is also low when the noise temperature is high (e.g., 90 GHz). The sign of AT4_2 depends on whether the atmospheric brightness temperature is between the hot and cold load temperatures or outside this range. It should be noted that this efffect is small but can induce
systematic errors. An advantage of this absolute calibration method is
that all optical elements are included in the calibration. The temperature of the hot load is measured by two gauged thermal sensors offering an absolute accuracy of about +0.05 K. Because of the hot load's dimensions (1.2 x 1.2 m) the temperature
is measured at opposite comers, and the mean value is taken. With a realistic error assumption of AT = 0.5 K for the measurement of the calibration load
brightness temperatures the calibrated brightness temperatures have an absolute accuracy of-1 K.
At the frequencies of band A the atmosphere is optically thin, allowing a second absolute calibration method, the so-called tipping curve scheme [Hogg et al., 1983; Han and Westwater, 2000]. This method can only be perfomed in the case of clear-sky conditions assuming horizontal homogeneity of the atmosphere. Limited comparisons between both methods have shown an agreement of better than 0.5 K in the calibrated zenith brightness temperatures. Because absolute calibration using the four-point method involves the filling of the cold load with approximately 80 liter of liquid nitrogen, it is desirable to perform it as seldom as possible. In order to eliminate the receiver drifts between two absolute
calibrations, periodic adjustments of the radiometer
CREWELL ET AL.' MICROWAVE RADIOMETER FOR CLOUD CARTHOGRAPHY 633
Table 2. Mean Values and Standard Deviation of Calibration Parameters of Selected Frequency Channels Determined from 14 Absolute Calibrations Performed During a Period of Seven Months a
Frequency, GHz Trec, K c• (Trec), K ot c• (or) AT4_2, K c• (AT4_2), K
22.235 550.2 11.5 0.902 0.010 1.07 0.14
22.985 725.3 14.3 0.942 0.006 0.50 0.06
25.235 657.9 30.7 0.989 0.009 0.13 0.11
28.235 717.8 5.1 0.966 0.004 0.38 0.05
52.8 1421.0 11.8 0.903 0.008 -0.35 0.05
56.8 1056.4 20.2 0.951 0.016 -0.05 0.03
90.0 3369.1 323.3 0.881 0.068 0.15 0.15
aAr4_ 2 gives the difference of the brightness temperatures for standard atmospheric conditions once calibrated using the four-point and once calibrated using the two-point method. Here, ct, non- linearity factor; Trec receiver noise temperature.
gain are performed using a measurement of the reference (hot) load (relative calibration). It has been shown that with this method, continuous operation of more than one rnonth between absolute calibrations is
possible while maintaining the radiometer's accuracy.
3.2. Spectral Accuracy
Another problem which needs to be considered is the spectral representativeness of the channel central frequencies. While radiative transfer calculations which are used for the development of retrieval algorithms are performed Ibr a discrete frequency, a
microwave radiometer measurement includes
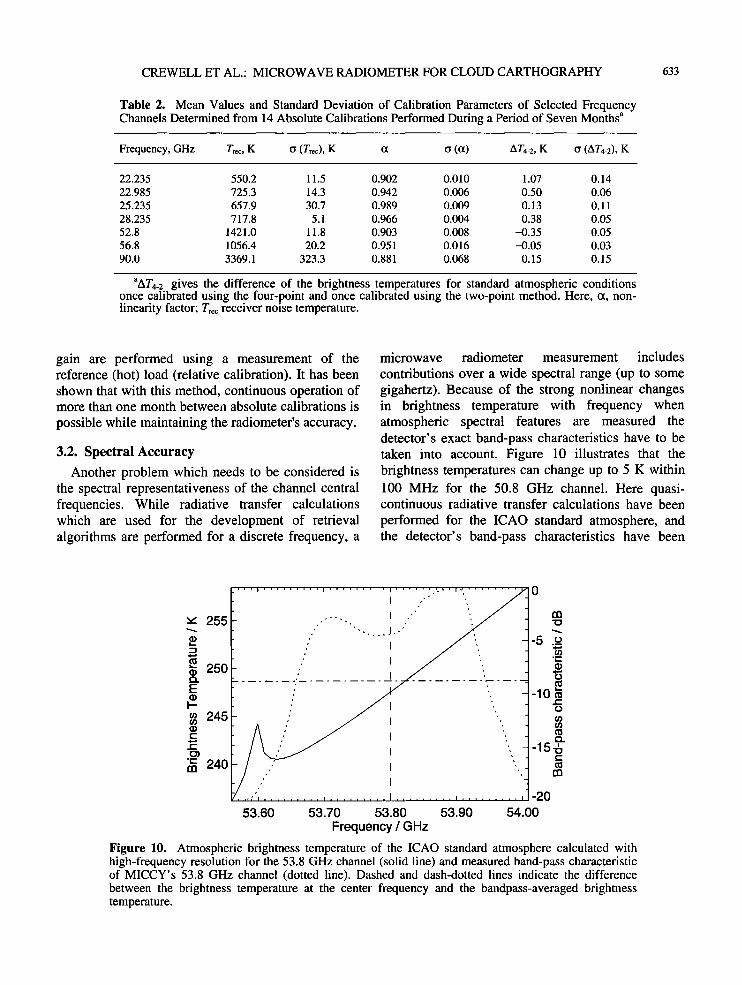
contributions over a wide spectral range (up to some gigahertz). Because of the strong nonlinear changes in brightness temperature with frequency when atmospheric spectral features are measured the detector's exact band-pass characteristics have to be taken into account. Figure 10 illustrates that the brightness temperatures can change up to 5 K within 100 MHz for the 50.8 GHz channel. Here quasi- continuous radiative transfer calculations have been
performed for the ICAO standard atmosphere, and the detector's band-pass characteristics have been
'," 255
"- 250
E
o• 245
.g
'-- 240
ß
i.&'•'l i i i i i i i i i I .... ,, ,. i i i i ....... I .........
53.60 53.90
-10 m o
-15-b
53.70 53.80
Frequency / GHz
-20
54.00
Figure 10. Atmospheric brightness temperature of the ICAO standard atmosphere calculated with high-frequency resolution for the 53.8 GHz channel (solid line) and measured band-pass characteristic of MICCY's 53.8 GHz channel (dotted line). Dashed and dash-dotted lines indicate the difference between the brightness temperature at the center frequency and the bandpass-averaged brightness temperature.

634 CREWELL ET AL.: MICROWAVE RADIOMETER FOR CLOUD CARTHOGRAPHY
measured with 1 MHz resolution. The bandpass- namely, that they can only be applied to the range of averaged mean radiation temperature differs from the atmospheric conditions which is included in the radiation temperature at the nominal frequency of training data set. When extrapolations beyond the 50.8 GHz by -1.5 K. A simple correction scheme states included in the algorithm development are which is only based on the brightness temperature made, ANNs can behave in an uncontrolled way, itself can correct the effect with an accuracy of better while simple linear regressions will still give a than 0.1 K. The lowest frequency channel in band B reasonable, although erroneous, result. shows the strongest correction factor.
Additionally, calculations have been performed to 5. Results address the problem of a shift of the channel center 5.1. Accuracy of Integrated Quantities frequency, which has been addressed as a major source of uncertainty for Gunn-based radiometers by Algorithms for LWP and IWV have been Solheim and Godwin [1998]. Because of the three- developed and evaluated using the procedure stage thermal control of the radio frequency described in section 4 for different input parameters components the measured frequency stability of and zenith observation. A lower elevation angle MICCY's Gunn oscillators is less than 3 MHz, which increases the atmospheric path, leading to a reduced results in a maximum error of 0.1 K in the bandpass- contribution of the radiometric noise in the weighted brightness temperature. measurement, and hence reduces the RMS in the
retrieved quantity. However, because of the problematic assumption about horizontal
4. Retrieval of Atmospheric Variables homogeneity we further on only assess the zenith Artificial neural networks (ANN)are increasingly observations. The algorithm results (Table 3) show
used for the retrieval of geophysical parameters from that using four channels instead of the conventional measured brightness temperatures [e.g., Del Frate two channels reduces the LWP RMS from 29 to -11 and Schiavon, 1998; Solheim et al., 1998; Churnside gm -2. When more microwave frequencies are et al.; 1994]. They can easily adapt to nonlinear considered, the improvement by additional problems such as the radiative transfer in the cloudy frequencies is only marginal when direct zenith atmosphere. Additionally, input parameters of diverse observations are taken. We also investigated the natures can be easily incorporated into neural possibility to improve LWP measurements by adding networks. information from a laser ceilometer Zc• and an
We use a standard feed forward neural network infrared radiometer Tcl to the retrieval. The fewer
[Jung et al., 1997] with simulated brightness microwave channels are used, the stronger is the temperatures for the MICCY frequencies as input. improvement for LWP by adding additional Radiative transfer calculations were performed for a information. For the dual-channel retrieval the RMS
-2
large set of atmospheric states using the Microwave is reduced from 29 to 21 gm . However, the Model (MWMOD) [Simmer, 1994; Fuhrhop et al., inclusion of a third frequency channel instead of the 1998]. Random noise (normally distributed with a ceilometer-infrared radiometer information leads to standard deviation of 1 K) was added to the resulting an even stronger improvement. This fact is of interest brightness temperatures to simulate radiometric when an existing system should be improved. The noise. Realistic noise was also added to the other same behavior as described for LWP is true for the
potential input parameters like the standard meteorological measurements (ground level Table 3. LWP Retrieval Accuracy for Different temperature Tgr, pressure Pgr, relative humidity qgr), Combinations of MICCY Brightness Temperatures a the cloud base altitude Zc• as measured by a laser ceilometer, and the cloud base temperature Tc• as 23 and 28 23, 28, and 51 23, 28, 51, GHz GHz and 90 GHz derived by an infrared radiometer. The ANN was trained and evaluated for the different atmospheric TBonly 29 18 12 variables of interest (LWP, IWV, temperature, or rB+rc•+Zc• 21 15 11
humidity profile) according to Jung et al. [ 1997]. aResults including the altitude (Zc0 and the temperature (Tc0 of It should be noted that a limitation to ANN the cloud base height are also given. LWP retrieval accuracy is in
algorithm, as to all statistical algorithms, exists, g m '2.

CREWELL ET AL.: MICROWAVE RADIOMETER FOR CLOUD CARTHOGRAPHY 635
E
10
8
6
4
2
I
I
I
I
i I I
I I I
I
I
%
%
%
%
lO
E 8
0 2 4 6 8
Temperature / K 0.0 0.5 1.0 1.5 2.0 2.5 3.0
Water Vapor pressure / gm Figure 11. Accuracies of temperature and humidity profiles determined frog; the 22-channel MICCY measurements (normal distributed noise • = 1 K was added to brightness temperatures) by ANN algorithms (solid lines). The heights are above ground level (AGL). The retrieval including in situ measurements of ground level temperature and humidity is shown by the dotted lines. The measurement error's were assumed to be 1 K and 0.3 gm '3 respectively The dashed lines indicate the standard deviation of the data set used for the evaluation of the accuracies.
integrated water vapor with best values better than 0.5 kgm -2. The influence of additional information, the cloud model used in the radiative transfer, and the
radiometric accuracy are analyzed in more detail by Crewell et al. [ 1999b].
5.2. Accuracy of Temperature and Humidity Profiles
For the profile retrievals all frequency channels from MICCY were input parameters to the neural network. The output profiles have a vertical resolution of 0.2 km in the first kilometer above
ground and a resolution of 0.5 km up to 5 km. As displayed in Figure 11 the retrieved temperature
e' I I ,• I 1'* .1 Ilklb I%IVI• pro,he as evmuateo •roin the test data set e•ors of less than 2 K at altitudes lower than 5 km
and less than 1 gm -3 for the water vapor density profile. All algorithms are for cloud and cloud-free conditions. If ground-based measurements of temperature and water vapor density, respectively, with RMS e•ors of 1 K and 0.3 gm -3, respectively, are included in the retrieval, the temperature retrieval
is only improved at ground level, while the humidity profile is also improved within the lower 700 m. These accuracies correspond to the ones given by Solheim et al. [1998] and Del Frate and Schiavon [1998] for their 12 and 7 channel radiometers, respectively. However, both assume a radiometric noise of 0.5 K in their brightness temperatures, while the results shown in this paper are derived with a noise error of 1 K. As we have shown in section 3 the radiometric noise is much lower; however, the absolute accuracy in the brightness temperature for a well-calibrated system is closer to 1 K.
To illustrate the retrieval capabilities from actual MICCY measurements, retrieved atmospheric --•^•:'• •^• ,..., •,,,•.•,•n ,•.,•u,.l..,.oo are t.,,,o,,,,..• ,•,, a day ..,;•t, t.,.,.v.. ,.•,-,,,a',,..oo shown in Figure 12. The differences to the closest radio sounding are well within the retrieval error (Figure 11). As expected from the weighting functions (Figure 2) the temperature retrieval is best in the planetary boundary layer. Some of the discrepancies might also be explained by differences of 1.5 hours and- 100 km in the measurements.

636 CREWELL ET AL.' MICROWAVE RADIOMETER FOR CLOUD CARTHOGRAPHY
lO
4
2
... . Schleswig 12 UTC lO
4
, 0
220 240 260 280 300 0
Temperature (K)
Schleswig 12 UTC
....... MICCY 13:30 UTC
_
2 4 6 8
Specific humidity (g/kg) Figure 12. Comparison of temperature and humidity profile on September 28, 1999, measured by MICCY (solid lines) at 1330 UTC in Geesthacht compared with the closest radiosonde profile at 1200 UTC from Schleswig (dotted lines, distance-100 km).
lO
6. Conclusion
We presented a new microwave radiometer (MICCY) for the measurement of LWP, IWV, and temperature and humidity profiles. The high spatial and temporal resolution make it a promising tool for the observation of clouds. We have shown that the
high angular resolution avoids reductions of the maximum cloud brightness temperatures (Figure 5) compared to the normally used larger beam widths. Calculations and measurements have also
demonstrated the necessity of parallel measurements on all channels (Figure 6). These features are quite important when three-dimensional cloud inhomogeneities are investigated, which are one candidate for the still unsolved problem of "anomalous absorption" in clouds (e.g., Cess et al., 1995).
LWP retrieval algorithms using different combinations of microwave frequencies and information from other sensors (lidar ceilometer and infrared radiometer) were evaluated. The results clearly show that the largest increase in LWP accuracy can be gained by including a third (fourth) channel in the retrieval. This is important to know when an existing two- (three-) channel radiometer should be updated. The best accuracy in the retrieved LWP from all radiometer channels is better than 10
-2
gm . Because the vertical distribution of the liquid water can only be poorly retrieved from the 22 microwave frequency measurements [Crewell et al., 1999b], a combination with the measurements of the radar reflectivity profile by a cloud radar is a promising approach [LOhnert et al., 1999].
The radiometer was designed to provide measurements for additional research topics: (1) The simultaneous detection of both orthogonal polarizations at three frequencies can be used to detect scattering by nonspherical particles. This could lead to a new technique to separate the liquid water content of cloud water droplets and precipitating particles which are simultaneously evident within clouds [Czekala et al., 1999]. (2) The possibility to observe the ground can be used to validate microwave radiative transfer models for soil and
vegetation. This step is necessary when algorithms for soil moisture are developed.
MICCY will be used in a number of experimental campaigns in the future. The first will be the enhanced observation period August-September 2000 within the Baltic Sea Experiment (BALTEX) Cloud Liquid Water Network (CLIWA-NET) project, which aims at the evaluation-improvement of cloud parameterizations in weather and climate forecast models.

CREWELL ET AL.: MICROWAVE RADIOMETER FOR CLOUD CARTHOGRAPHY 637
Acknowledgments. The authors would like to thank Natalie Selbach for performing extensive neural network runs and Dirk Meetschen for his help on several programming problems. The radiometer development was funded by the Land Nordrhein-Westfalen, Germany. The work on the retrieval algorithm was supported by the Deutsche Forschungsgemeinschaft under CR 111/2-1.
References
Askne, J., and E. Westwater, A review of ground-based remote sensing of temperature and moisture by passive microwave radiometers, IEEE Trans. Geosci. Remote Sens., GE-24, 340-352, 1986.
Bosisio, A. V., and C. Mallet, Influence of cloud temperature on brightness temperature and consequences for water retrieval, Radio Sci., 33, 929- 939, 1998.
Cess, R. D., et al., Absorption of solar radiation by clouds: Observation versus models, Science, 267, 496-499, 1995.
Churnside, J. H., T. A. Stermitz, and J. A. Schroeder, Temperature profiling with neural network inversion of microwave radiometer data, J. Atmos. Oceanic Technol., 11,105-109, 1994.
Crewell, S., G. Haase, U. L6hnert, H. Mebold, and C. Simmer, A ground based multi-sensor system for the remote sensing of clouds, Phys. Chem. Earth, Part B.' Hydrol. Oceans Atmos., 24, 207-211, 1999a.
Crewell, S., U. L6hnert, and C. Simmer, Remote sensing of cloud liquid water profiles using microwave radiometry, in Remote Sensing of Clouds: Retrieval and Validation, pp. 45-50, Int. Res. Cent. for Telecommun. Trans- mission and Radar, Fac. of Electr. Eng., Delft Univ. of Technol., Delft, Netherlands, 1999b.
Czekala, H., and C. Simmer, Microwave radiative transfer with non-spherical precipitating hydrometeors, J. Quant. Spectrosc. Radiat. Transfer, 60, 365-374, 1998.
Czekala, H., A. Thiele, A.Hornborstel, A. Schroth, and C. Simmer, Polarized microwave radiation from
nonspherical cloud and precipitation particles, in Remote Sensing of Clouds: Retrieval and Validation, pp. 71-76, Int. Res. Cent. for Telecommun. Transmission and
Radar, Fac. of Electr. Eng., Delft Univ. of Technol., Delft, Netherlands, 1999.
Decker, M. T., E. R. Westwater, and F. O. Guiraud, Experimental evaluation of ground-based microwave radiometric sensing of atmospheric temperature and water vapor profiles, J. Appl. Meteorol., 17, 1788-1795, 1978.
Del Frate, F., and G. Schiavon, A combined natural orthogonal functions/neural network technique for the radiometric estimation of atmospheric profiles, Radio Sci., 33, 405-410, 1998.
Fuhrhop, R., T. C. Greenfell, G. Heygster, K.-P. Johnson,
P. Schliissel, M. Schrader, and C. Simmer, A combined radiative transfer model for sea-ice, open-ocean and atmosphere, Radio Sci., 33, 303-306, 1998.
Grody, N. C., Remote sensing of the atmosphere from satellites using microwave radiometry, in Atmospheric Remote Sensing by Microwave Radiometry, edited by M. A. Janssen, pp. 259-334, John Wiley, New York, 1993.
Han, Y., and E. Westwater, Remote sensing of tropospheric water vapor and cloud liquid water by integrated ground-based sensors, J. Atmos. Oceanic Technol., !2, 1050-1059, 1995.
Han, Y., and E. Westwater, Analysis and improvement of tipping calibration for ground-based microwave radiometers, IEEE Trans. Geosci. Remote Sens., 38, 1260-1276, 2000.
Hogg, D.C., F. O. Guiraud, J. B. Snider, M. T. Decker, and E. R. Westwater, A steerable dual-channel microwave radiometer for measurement of water vapor and liquid in the troposphere, J. Clim. Appl. Meteorol., 22, 789-806, 1983.
Jung, T., E. Ruprecht, and F. Wagner, Determination of cloud liquid water path over the oceans from SSM/I data using neural networks, J. Appl. Meteorol., 37, 832-844, 1997.
Kazama, S., T. Rose, R. Zimmermann, and R.
Zimmermann, A precision autocalibrating 7 channel radiometer for environmental research applications, Jpn. J. for Remote Sens., 19, 37-45, 1999.
L6hnert, U., S. Crewell, and C. Simmer, Combining cloud radar, passive microwave radiometer and a cloud model to obtain cloud liquid water, in Remote Sensing of Clouds: Retrieval and Validation, pp. 101-106, Int. Res. Cent. for Telecommun. Transmission and Radar, Fac. of Electr. Eng., Delft Univ. of Technol., Delft, Nether- lands, 1999.
M•itzler, C., Ground-based observation of atmospheric radiation at five frequencies between 4.9 and 94 GHz, Radio Sci., 27, 403-415, 1992.
Peter, R., and N. K•impfer, Radiometric determination of water vapor and liquid water and its validation with other techniques, J. Geophys. Res., 97, 18,173-18,183, 1992.
Rogers, R. R., and M. K. Yau, A Short Course in Cloud Physics, 3rd Ed., Int. Ser. Nat. Philos., vol. 113,290 pp., Pergamon, Tarrytown, N.Y., 1989.
Simmer, C., Satellitenfernerkundung hydrologischer Parameter der Atmosph•.re mit Mikrowellen, 313 pp., Kovac Verlag, Hamburg, Germany, 1994.
Solheim, F., and J. Godwin, Passive ground-based remote sensing of atmospheric temperature, water vapor, and cloud liquid water profiles by a frequency synthesized microwave radiometer, Meteorol. Z., N.F. 7, 370-376, 1998.

638 CREWELL ET AL.: MICROWAVE RADIOMETER FOR CLOUD CARTHOGRAPHY
Solheim, F., J. Godwin, E. R. Westwater, Y. Han, S. Keihm, K. Marsh, and R. Ware, Radiometric profiling of temperature, water vapor and cloud liquid water using various inversion methods, Radio Sci., 33, 393-404, 1998.
Westwater, E., Ground-based passive probing using the microwave spectrum of oxygen, Radio Sci., 69D, 1201- 1211, 1965.
Westwater, E., The accuracy of water vapor and cloud liquid determination by dual-frequency ground-based microwave radiometry, Radio Sci., 13,667-685, 1978.
Wigneron, J.-P., B. Combal, U. Wegmtiller, and C. M•itzler, Estimation of microwave parameters of crops from radiometric measurements, Int. J. Remote Sens.,
17, 2875-2880, 1996.
S. Crewell, U. LOhnert, C. Simmer, Meteorologisches Institut, Auf dem H0gel 20, 53121 Bonn, Germany. ([email protected]; [email protected]; csimmer@ uni-bonn.de)
H. Czekala, NASA Goddard Institute for Space Studies, Armstrong Hall, 2880 Broadway, New York, NY 10025. (hczekala @ giss.nasa.gov)
T. Rose, R. Zimmermann, and R. Zimmermann, Radiometer Physics GmbH, Birkenmaarstrasse 10, 53340 Meckenheim, Germany. ([email protected])
(Received May 22, 2000; revised November 3, 2000; accepted November 7, 2000.)
Copyright © 2022 FDOKUMEN