Microplastic Pollution in California
68
Microplastic Pollution in California: A PRECAUTIONARY FRAMEWORK AND SCIENTIFIC GUIDANCE TO ASSESS AND ADDRESS RISK TO THE MARINE ENVIRONMENT APRIL 2021
-
Upload
khangminh22 -
Category
Documents
-
view
2 -
download
0
Transcript of Microplastic Pollution in California

Microplastic Pollution in California:
A P R E C A U T I O N A R Y F R A M E W O R K A N D S C I E N T I F I C G U I D A N C E T O A S S E S S A N D A D D R E S S
R I S K T O T H E M A R I N E E N V I R O N M E N T
A P R I L 2 0 2 1
About This Document
Responding to State legislation (S.B. 1263) to develop a
Statewide Microplastics Strategy, the California Ocean
Protection Council (OPC) funded the California Ocean
Science Trust (OST) to convene a Working Group
of scientific experts to develop a risk assessment
framework for microplastic pollution in California’s
marine environment and provide scientific guidance
to inform source reduction activities. This document
represents the resulting risk assessment framework,
constructed within the bounds of the current state
of scientific knowledge, as well as scientific guidance
for assessing and addressing microplastic pollution
in California’s marine environment. We thank the
Policy Advisory Committee and External Advisors for
their thoughtful advice and feedback throughout this
process, as well as Dr. Albert Koelmans and Dr. Wayne
Landis for their independent review of the full report.
C O N T R I B U T O R S
Working Group Members
Susanne BranderOregon State University (Co-Chair)
Eunha Hoh San Diego State University (Co-Chair)
Kenneth Unice Cardno ChemRisk (Co-Chair)
Anna-Marie Cook U.S. Environmental Protection Agency (Retired)
Rusty Holleman University of California, Davis
Chelsea Rochman University of Toronto
Julie Thayer Farallon Institute
Project Team
Dominique Kone California Ocean Science Trust
Kiya Bibby California Ocean Science Trust
Anthony Rogers California Ocean Science Trust
Policy Advisory Committee
Scott Coffin California State Water Resources Control Board
Evan Johnson CalRecycle
Thomas Mumley San Francisco Bay Regional Water Quality Control Board
Wesley Smith California Office of Environmental Health Hazard Assessment
Holly Wyer California Ocean Protection Council
External Advisors
Diana Lin San Francisco Estuary Institute
Steve Weisberg Southern California Coastal Water Research Project
S U G G E S T E D C I T A T I O N Brander, S.M.*, Hoh, E.*, Unice, K.M.*, Bibby, K.R., Cook, A.M., Holleman, R.C., Kone, D.V., Rochman, C.M., Thayer, J.A.. Microplastic Pollution in California: A Precautionary Framework and Scientific Guidance to Assess and Address Risk to the Marine Environment. 2021. California Ocean Science Trust, Sacramento, California, USA.
(*Working Group Co-Chairs)
F U N D I N G
Funding was provided by the California Ocean Protection Council.
M I C R O P L A S T I C P O L L U T I O N I N C A L I F O R N I A
A B O U T T H I S D O C U M E N T | 2
• We, the Working Group, recommend a precautionary approach to assess
the risk of and manage microplastic pollution risk, based on microplastic
persistence, lack of feasible cleanup options, projected rate of increased
concentrations in the environment, and evidence that microplastics
contaminate and may lead to adverse effects in organisms and humans.
• Managing and assessing microplastic pollution risk using a particulate
approach is recommended over a toxicant approach, until California-
specific data are available and the chemical effects of microplastics are fully
understood.
• Future microplastic risk assessments, using the precautionary framework,
should focus on the following high priority & most prevalent components:
• Particle Morphology: microfibers and fragments
• Polymer Types: microfibers and tire & road wear particles
• Fate & Transport Pathways: stormwater runoff (urban, agricultural), aerial
deposition, and wastewater
• Sources: unknown in California, but international literature suggests tire &
road wear, laundry & textiles, and plastic litter from aquaculture & fishing
• Priority Endpoints: microplastic internalization for benthic mollusks, large
crustaceans, and lower and upper trophic level fish
• Apply the risk prioritization tool, proposed here, using a weight-of-evidence
approach to characterize and rank risk associated with the highest priority
and most prevalent components of microplastic pollution.
• True source reduction of plastic materials may be the most effective
precautionary strategy to reduce and prevent microplastic pollution, given
lack of feasible microplastic cleanup strategies.
• The top research need is an inventory of the top sources of macro- and micro-
plastic loading in California that investigates the contribution of agricultural
sources relative to urban and industrial runoff, as well as wastewater.
• Given rapidly evolving science, we recommend revisiting this risk assessment
framework in five (5) years to assess if effects data are sufficient to suggest a
quantitative effects risk assessment.
Key Recommendations
M I C R O P L A S T I C P O L L U T I O N I N C A L I F O R N I A
K E Y R E C O M M E N D A T I O N S | 3

In 2018, the Ocean Protection Council (OPC)
was tasked by state legislation (S.B. 1263) to
develop a Statewide Microplastics Strategy (“the
Strategy”) with the goal of increasing the State’s
understanding of the scale and risk of microplastics
(1 nm - 5 mm) on the marine environment and
identifying proposed solutions to address their
impacts. A key component of the Strategy is the
development of a risk assessment framework for
microplastic pollution in California, to be used to
evaluate options, including source reduction and
product stewardship techniques, barriers, costs,
and benefits. The Ocean Science Trust (OST)
convened an OPC Science Advisory Team (OPC
SAT) Microplastic Working Group to develop the
framework and provide scientific guidance to assist
the State in understanding the risks microplastics
pose to marine ecosystems in California.
We, the Working Group, recommend applying
a precautionary approach to management of
microplastic pollution. This report empowers
the State to move toward source reduction and
mitigation immediately, even under existing
uncertainties, while concurrently addressing key
knowledge gaps that will advance the precautionary
framework and/or a quantitative risk assessment
specific to California. While existing scientific
knowledge on microplastic exposure is rapidly
growing, our understanding of the effects of
microplastics, as well as California-specific data
on the occurrence, environmental transformations,
and bioavailability of chemical constituents of
microplastics, is currently limited to a few polymer
types and shapes. Execution of a state-specific
quantitative risk assessment is hindered without
immediately available data for this complex class
of pollutants. Therefore, efforts to characterize
microplastics risk in the short term should focus
primarily on their physical characteristics (i.e.
particulate approach), as opposed to chemical (i.e.
toxicant approach). A number of reliable studies
were identified, demonstrating that adverse
ecological effects are possible in taxa found in
California marine waters with certain exposure
concentrations.
We adopted a precautionary risk assessment
framework, including a risk prioritization tool
that focuses on assessing microplastic exposure
data to characterize and rank risk to aid decision-
makers with diverse expertise in prioritizing
source reduction activities. The precautionary
framework consists of step-wise instructions and
recommendations, based on the best available
science, for completing three phases in any future
microplastic risk assessment:
(1) Problem Formulation:
a preliminary assessment of key factors to be
considered in the risk assessment, including an
examination of scientific evidence, an assessment
of the feasibility, scope, and objectives of the risk
assessment; a process for selecting and prioritizing
endpoints based on ecological significance,
susceptibility, and management relevance.
Recommendations: future microplastic risk
assessments, using the precautionary framework,
should focus on the following high priority & most
prevalent components:
• Particle Morphology: microfibers and fragments
• Polymer Types: microfibers and tire & road wear
particles
• Fate & Transport Pathways: stormwater runoff
(i.e. urban and agricultural), aerial deposition,
and wastewater
• Sources: unknown in California, but international
literature suggests tire & road wear, laundry &
textiles, and plastic litter from aquaculture &
fishing
• Priority Endpoints: microplastic internalization in
benthic mollusks, large crustaceans, and lower
and upper trophic level fish
Executive Summary
M I C R O P L A S T I C P O L L U T I O N I N C A L I F O R N I A
E X E C U T I V E S U M M A R Y | 4

M I C R O P L A S T I C P O L L U T I O N I N C A L I F O R N I A
E X E C U T I V E S U M M A R Y | 5
(2) Risk Characterization & Ranking:
an assessment of relevant exposure data to priority endpoints to characterize
and rank the relative risk of potential adverse effects by source, polymer type,
and taxon as indicated by surrogate measures of microplastic internalization and
source tonnage.
Recommendations: apply the risk prioritization tool, proposed here, using a
weight-of-evidence approach to characterize and rank risk associated with the
highest priority and most prevalent components of microplastic pollution.
(3) Risk Evaluation & Source Reduction Prioritization:
a determination of whether characterized risk warrants State action and
mitigation, and scientific guidance to aid prioritization of source reduction
activities.
Recommendations: due to the complexities of the microplastic stream and
uncertainties around intervention strategy efficacy, true source reduction of
plastic materials, either through reducing production, safe-by-design engineering,
or curbing societal use, may be the most effective precautionary strategy to
reduce and prevent microplastic pollution.
We identified knowledge gaps associated with developing and implementing the
precautionary framework and a quantitative effects risk assessment. The highest
priority research questions to inform research and mitigation and apply the
precautionary framework are: (1) What are the highest emitting sources of macro-
(> 5 mm) and micro- plastic material to the marine environment in California? (2)
What does monitoring reveal about trends in the concentrations of microplastic
pollution within California’s marine environment? And 3) How do we associate and
directly link microplastic particles sampled in the marine environment to sources
of concern through the development and use of new methods, technologies,
and tools? Addressing these important questions will allow decision-makers to
prioritize sources for reduction activities immediately, instead of waiting to act
when the necessary effects data and relevant risk frameworks become available.
In five (5) years, we recommend reassessing the state of the knowledge to
then support a state-specific quantitative effects risk assessment, especially
considering ongoing efforts of other agencies and bridge organizations within
the state. In the meantime, effects data gaps need to be filled, including a hazard
analysis recognizing the multi-dimensionality of microplastics as a diverse class of
contaminants is needed, followed by a risk assessment considering both current
and future concentrations of microplastic mixtures in the environment.
Table of Contents
1 . I N T R O D U C T I O N
2 . A P R E C A U T I O N A R Y R I S K A S S E S S M E N T F R A M E W O R KEvaluating Existing Ecotoxicology ApproachesAdopting a Particulate ApproachHow to Use the Precautionary Framework
3 . P H A S E I : P R O B L E M F O R M U L A T I O N Step 1: Focus Risk Assessment on Highest Priority and Most Prevalent ComponentsStep 2: Use the Four Priority Endpoints
4 . P H A S E I I : R I S K C H A R A C T E R I Z A T I O N & R A N K I N GStep 1: Select Appropriate Source And Polymer Type Associated with Priority EndpointsStep 2: Compile Evidence for and Rate Source Tonnage PotentialStep 3: Compile Evidence for and Rate Organism Microplastics Internalization PotentialStep 4: Characterize And Rank Risk
5 . E X A M P L E : M O L L U S K S , M I C R O F I B E R S , A N D T E X T I L E S
6 . P H A S E I I I : R I S K E V A L U A T I O N & S O U R C E R E D U C T I O N P R I O R I T I Z A T I O NStep 1: Evaluate Risk(s) for Preliminary PrioritizationStep 2: Prioritize Source Reduction Activities for Sources Without Intervention Strategies
7 . P R E C A U T I O N A R Y F R A M E W O R K K N O W L E D G E G A P S & R E S E A R C H R E C O M M E N D A T I O N S
8 . E F F E C T S K N O W L E D G E G A P S & R E S E A R C H R E C O M M E N D A T I O N S
9 . L O O K I N G F O R W A R D
R E F E R E N C E S
A P P E N D I C E SAppendix 1: The Process (i.e. Phases) for an Ecological Risk AssessmentAppendix 2: The Process (i.e. Phases) for a Risk-Based Decision- Making FrameworkAppendix 3: Full Conceptual ModelAppendix 4: Endpoints Prioritization ProcessAppendix 5: Unique Endpoint Entities & AttributesAppendix 6: Scientific Evidence To Establish Harm
7
1 01 31 41 5
1 61 8
2 2
2 42 7
2 73 0
3 2
3 4
4 34 44 6
4 7
5 0
5 2
5 3
6 46 46 4
6 56 66 76 8
M I C R O P L A S T I C P O L L U T I O N I N C A L I F O R N I A
T A B L E O F C O N T E N T S | 6

I N T R O D U C T I O N | 7
Commercial “plastic” materials with potential ecological
relevance identified in recent scientific studies have generally
been considered to be articles manufactured from synthetic
materials with additives, fillers, or other added materials, and can
include conventional plastics, as well as textile or rubber materials.
Plastic pollution is a growing environmental concern that threatens
marine ecosystem health. Plastic debris has been observed
across most marine habitats, including coastal and open oceans,
estuaries, and benthic sediments (Barnes et al. 2009, Andrady
2011, Cole et al. 2011, GESAMP 2016). Large plastics (> 5 mm) have
even been shown to negatively impact marine organisms such as
impeding movement via entanglements and obstructing digestive
tracts (Bucci et al. 2019).
1. Introduction

Because of the persistent nature of plastics and
their inability to degrade on meaningful ecological
timescales (e.g. high density polyethylene (HDPE)
bottles and pipes have a half-life of 58 and 1200
years, respectively, in the marine environment
(Chamas et al. 2020)), plastic pollution is not only
a current concern, but one that extends into the
future. Anthropogenic mass already exceeds living
biomass (Elhacham et al. 2020). By 2030, annual
emissions are predicted to reach at least 20 million
metric tons per year unless we fundamentally alter
our plastic economy (Borrelle et al. 2020). Many
plastic materials are fossil fuel-based, and with
projected increased production, the associated
greenhouse gas emissions (projected to account for
10–13% of the global carbon budget by 2050 (Shen
et al. 2020)) have potentially significant implications
for climate change and environmental justice (Zheng
& Suh 2019). The U.S. produces more plastic waste
than any other country, a portion of which (0.15 to
0.99 Mt in 2016) is inadequately managed through
exports to other countries (Law et al. 2020). Thus,
plastic pollution is not only a regional issue, but one
of global importance that extends far beyond the
bounds of the marine environment. Microplastic
pollution will not only persist into the foreseeable
future, but will be greatly magnified if unaddressed.
The scientific knowledge of large plastic debris
impacts is quite advanced. Far less progress
has been made on the risk characterization and
management of weathered plastic particles, which
fragment and degrade from large plastics to
form nanometer- to millimeter-sized secondary
microplastics. Microplastics have been intensely
studied for a decade, and scientific understanding
on their prevalence and occurrence across
environmental matrices is rapidly growing. However,
due to their complexity and variability in chemical
and physical composition, a holistic understanding
of the potential effects of both primary microplastics
(which are manufactured to be small) and secondary
microplastics (formed from wear, weathering, etc)
has been slower to progress and more challenging
to achieve.
Nevertheless, concerns over the impacts of
microplastics to the environment are growing.
In response to these concerns, various types
of intervention strategies (e.g. plastic material
reduction, collection and capture, clean up and
recycling) have been implemented to prevent or
reduce release into the environment. For example:
(1) statewide bans prohibit sales of single-use
plastics bags at large retail stores as a material
reduction strategy (S.B. 270), (2) filters on washing
machines trap microfibers before they’re flushed
(McIlwraith et al. 2019), (3) rain gardens capture
microplastic particles transported in stormwater
before they enter the marine environment (Gilbreath
et al. 2019), and (4) technologies collect and remove
macroplastics already in the marine environment,
which could help to prevent further fragmentation
into microplastics (Schmaltz et al. 2020). Steps
have been taken in the U.S. to begin to regulate
intentionally manufactured primary microplastics
less than 5 mm in size, such as the Congressional
Microbead-Free Waters Act of 2015 amendment
to the Federal Food, Drug and Cosmetic Act
(Microbead-Free Waters Act of 2015).
At the state level, California is active in microplastic
pollution research and regulation. In 2015, the
California state legislature prohibited the sales
of personal care products containing plastic
microbeads in rinse-off products (A.B. 888). In
response to the California Safe Drinking Water Act:
Microplastics of 2018 (S.B. 1422), the California
State Water Resources Control Board (the California
Waterboards) adopted the first definition for
microplastics in drinking water in 2020 (State
Water Resources Control Board 2020) and plans
to adopt a standardized methodology for testing
microplastics in drinking water in 2021. Recent and
ongoing research efforts in California include an
assessment by the San Francisco Estuary Institute
(SFEI) and 5 Gyres Institute, which characterized
microplastics and microparticles in the San
Francisco Estuary (Sutton et al. 2019, Miller et al.
2021). The Ocean Protection Council (OPC) has built
on this work by funding two research projects to
enhance the state’s understanding of microplastics
in stormwater and wastewater, and how to best
remove them from these pathways. Additionally, The
Southern California Coastal Water Research Project
(SCCWRP), along with the California Waterboards,
SFEI, and the University of Toronto, hosted a
webinar series on microplastics health effects in
I N T R O D U C T I O N | 8
M I C R O P L A S T I C P O L L U T I O N I N C A L I F O R N I A
fall 2020 and are working through 2021 to develop standardized methodologies
for monitoring microplastics in drinking water, as well as a toxicity database that
facilitates probabilistic approaches for the assessment of risk and determination of
thresholds for aquatic organisms.
In 2018, the California state legislature tasked the California Ocean Protection
Council with developing a Statewide Microplastics Strategy to address and
understand the scale and risk of microplastic pollution on the marine environment.
A major component of the Strategy is the development of a risk assessment
framework for microplastics, based on the best available information on the
exposure of microplastics to marine organisms and humans through pathways that
impact the marine environment. This framework will be used to evaluate options,
including source reduction and product stewardship techniques, barriers, costs,
and benefits (S.B. 1263).
In collaboration with the OPC, the California Ocean Science Trust (OST) convened
an interdisciplinary group of expert scientists, the OPC Science Advisory Team
Microplastic Working Group (“We”), to develop a risk assessment framework
for microplastic pollution in California, and to provide scientific guidance to
assist the State in understanding the sources, fate and transport, toxicological
impacts, marine species impacts, and ecosystem and human health impacts of
microplastics. Our charge was to:
• Develop a, or adapt from a pre-existing, risk assessment framework for
microplastic pollution in California to be used by the State to understand
and assess the risk of microplastic pollution, and to be incorporated into the
Statewide Microplastics Strategy.
• Develop qualitative descriptions of the various known pathways, sources,
behaviors, and observed and hypothesized effects of microplastics on the
marine environment (i.e. species, habitats, ecosystems) and human health in
California.
• Identify knowledge gaps associated with the pathways, sources, behaviors,
and effects of microplastics in California.
• Develop a list of methods, tools, and data (research questions) needed
to address such knowledge gaps and inform future research endeavors in
California.
This information is critical for the State to evaluate and prioritize reduction
solutions and move toward timely and well-informed action on this emerging
issue. This report details our efforts, recommendations, and work to provide this
information and guidance.
I N T R O D U C T I O N | 9
M I C R O P L A S T I C P O L L U T I O N I N C A L I F O R N I A
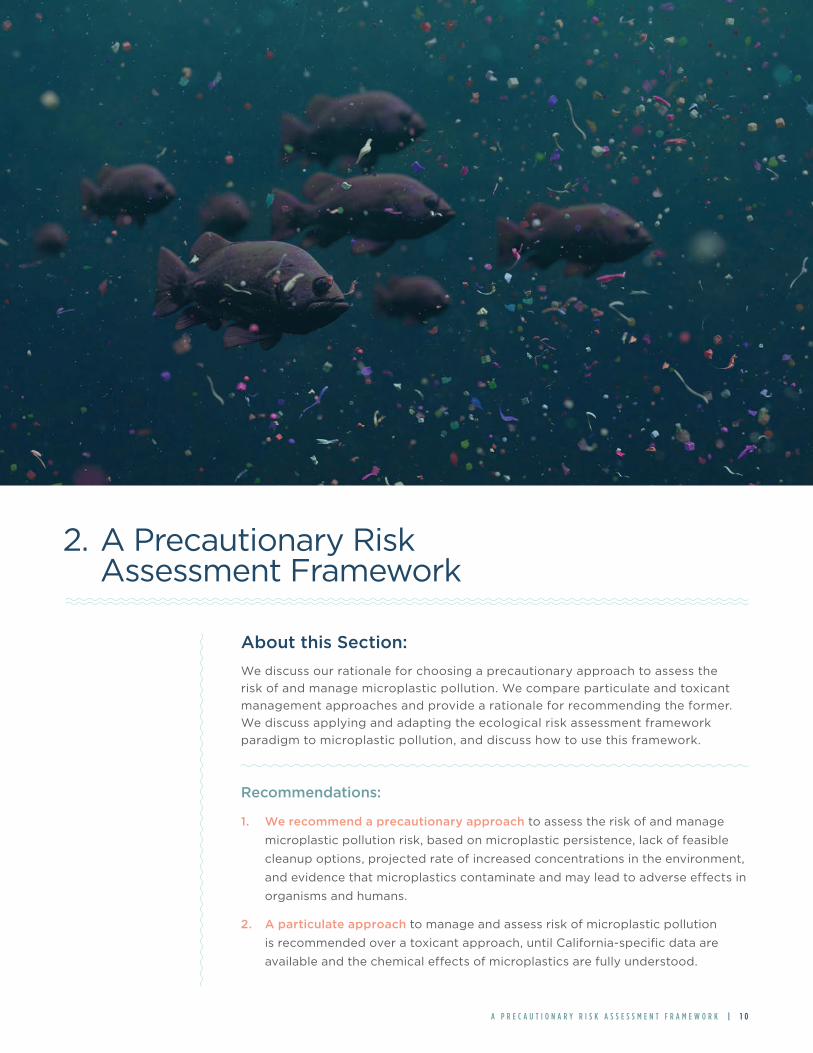
About this Section:
We discuss our rationale for choosing a precautionary approach to assess the
risk of and manage microplastic pollution. We compare particulate and toxicant
management approaches and provide a rationale for recommending the former.
We discuss applying and adapting the ecological risk assessment framework
paradigm to microplastic pollution, and discuss how to use this framework.
Recommendations:
1. We recommend a precautionary approach to assess the risk of and manage
microplastic pollution risk, based on microplastic persistence, lack of feasible
cleanup options, projected rate of increased concentrations in the environment,
and evidence that microplastics contaminate and may lead to adverse effects in
organisms and humans.
2. A particulate approach to manage and assess risk of microplastic pollution
is recommended over a toxicant approach, until California-specific data are
available and the chemical effects of microplastics are fully understood.
2. A Precautionary Risk Assessment Framework
A P R E C A U T I O N A R Y R I S K A S S E S S M E N T F R A M E W O R K | 1 0
The State will use this risk assessment framework to (1) assess the risk of marine
microplastic pollution to both the marine environment and human health and (2)
evaluate options, including source reduction and product stewardship techniques,
barriers, costs, and benefits (S.B. 1263). This framework will primarily be used by
California state resource managers, agency staff, and scientists to assess microplastic
pollution risk at the entire California state-level using publicly-available data and
resources. Given the framework’s intended use and target audiences, we developed
and recommend use of a pragmatic and scientifically sound precautionary risk
assessment framework that makes use of currently available microplastic exposure
data, as specified in the legislative mandate, and allows for prioritization of source
reduction activities. We adapted the precautionary framework from the U.S. EPA risk
assessment paradigm (Appendix 1) to include scientific guidance that informs risk
prioritization and evaluation (Box 1, Fig. 1):
M I C R O P L A S T I C P O L L U T I O N I N C A L I F O R N I A
A P R E C A U T I O N A R Y R I S K A S S E S S M E N T F R A M E W O R K | 1 1
(1) Problem Formulation:
a preliminary assessment of key factors to be
considered in the risk assessment, including an
examination of scientific evidence, data gaps,
policy and regulatory issues, and an assessment
of the feasibility, scope, and objectives of the risk
assessment
(2) Risk Characterization & Ranking*: an assessment of relevant exposure data to priority
endpoints to characterize and rank the relative risk
of potential adverse effects by source, polymer type,
and taxon as indicated by surrogate measures of
microplastic internalization and source tonnage
(3) Risk Evaluation & Source
Reduction Prioritization*:
a determination of whether characterized risk
warrants State action and mitigation, and scientific
guidance to aid prioritization of source reduction
solutions
BOX 1:
The process (i.e. phases) for the precautionary microplastics risk assessment framework (adapted from USEPA 1992 & 1998, NRC 2009).
*Phases adapted from U.S. EPA ecological risk assessment and risk-based decision-making frameworks, specific to assessing the risk of microplastic pollution.

M I C R O P L A S T I C P O L L U T I O N I N C A L I F O R N I A
A P R E C A U T I O N A R Y R I S K A S S E S S M E N T F R A M E W O R K | 1 2Figure 1
Figure 1. The precautionary risk assessment framework for microplastic pollution, including phases (1–3; left column) and steps and Working Group recommendations (right column) associated with each phase. Steps, key terms, and recommendations will be described in more detail later in the report. See Figure 2 in Phase II: Risk Characterization & Ranking for a more detailed explanation of this phase. MP = microplastic.
Problem FormulationPriority Components
Assess key factors to be considered in the risk assessment and select and prioritize endpoints
IParticle
MorphologyPolymer
Types
Fate/TransportPathways
Sources
Risk Characterization& Ranking
Assess relevant exposure data to priority endpoints to characterize and rank risk
II
Risk Ranking & Prioritization Tool
Risk Evaluation & Source Reduction Prioritization
Determine whether risk warrants State action and mitigation
III
1
2
3
4 Characterize & rank risk
Rate MP internalization
Rate source tonnage
Select source and polymer type
1
2 Objective risk
Hazard potential
Evaluate Risk for Preliminary
Prioritization
Consider InterventionStrategies
Prioritize source reduction activities on sources without
adequate intervention strategies
PriorityEndpoints
ocean science trust // microplastics report // figures // final // 04 21 21
Figure 1. The precautionary risk assessment framework for microplastic pollution, including phases (1–3; left
column) and steps and Working Group recommendations (right column) associated with each phase.
Steps, key terms, and recommendations will be described in more detail later in the report.
See Figure 2 in Phase II: Risk Characterization & Ranking for a more detailed explanation of this phase.
MP = microplastic.
Risk assessments are well-established scientific
processes that evaluate the likelihood of adverse
effects to valued environmental entities (e.g. species,
habitats) as a result of exposure to one or more
stressors (USEPA 1992 & 1998, NRC 2009). Generally,
risk is characterized by combining estimates of
duration and magnitude of exposure from a stressor
to a receptor (e.g. valued environmental entity)
and characterizing resulting effects to the receptor
from that exposure. These assessments are a
valuable tool to help decision-makers understand
and address potential uncertainty for a range of
environmental issues (e.g. sustainable fisheries
management, hazardous storms and natural
disasters, human health impacts, etc.) (Mckenzie et
al. 2012, Muralikrishna & Manickam 2017, Armaroli &
Duo 2018, Samhouri et al. 2019). Risk assessors aim
to clearly distinguish risk assessment, which assesses
how “signals of harm” relate to the probability
and consequence of an adverse effect, from risk
management, which evaluates management options
to reduce identified hazards or exposures using the
risk assessment to provide insights into the merits of
the management options (US EPA 1998, NRC 2009).
As there is an increasing need for risk assessments
to inform decision-making and to incorporate many
different types of expertise (e.g. natural sciences,
social sciences), it is necessary to consider more
flexible frameworks, such as risk-based decision-
making frameworks (NRC 2009). These risk-based
decision-making frameworks follow the U.S. EPA risk
assessment paradigm, but include additional steps
for planning within the appropriate decision-making
contexts and assessing options for managing risk
(Appendix 2, NRC 2009).
Evaluating existing ecotoxicology approaches
After evaluating the current state of knowledge,
existing ecotoxicological approaches, and previous
microplastics risk assessment efforts, we recommend
the State use a prospective precautionary risk
assessment framework to assess microplastic
pollution risk in California because of a lack of
ecotoxicity threshold data specific to California
marine ecosystems (studies and explanation
provided below). Sufficient hazard information
(e.g. exposure data and limited effect data) was
available on primary and secondary microplastics
to recommend a precautionary risk assessment
framework supporting immediate source reduction
and product stewardship activities.
Due to the complex physical and chemical
composition of microplastics, some experts have
suggested that an ecotoxicological approach to
risk characterization, such as a risk quotient (RQ =
PEC/PNEC) based on environmental concentrations
(PEC = predicted environmental concentration)
and effects thresholds (PNEC = predicted no effect
concentration), is appropriate (Besseling et al. 2019,
Gouin et al. 2019, Everaert et al. 2018). In line with
the risk assessment paradigm (NRC 1983, USEPA
1992, USEPA 1998), this method relies on the explicit
demonstration and observation of adverse effects
to drive policy and management decisions (i.e.
burden of proof). To date, efforts have been made to
propose and implement methodologies consistent
with the risk assessment paradigm for microplastic
pollution (Koelmans et al. 2017, Everaert et al. 2018,
Besseling et al. 2019, Gouin et al. 2019, Everaert et
al. 2020, Koelmans et al. 2020, Adams et al. 2021).
These efforts provide a potential quantitative risk
characterization approach with preliminary scientific
insight into how “signals of harm” relate to the
likelihood of consequences (Everaert et al. 2018,
Besseling et al. 2019, Everaert et al. 2020, Koelmans
et al. 2020). However, the effects threshold data
available for these methods remain somewhat
limited, and validated or consensus test guidelines
are still in the process of being agreed upon.
Therefore, in these published examples, globally-
sourced data are supplemented by assumptions
to correct for the lack of standardization or low
availability of information on occurrence or toxicity
of particular polymer types and morphologies (e.g.
fibers, tire wear particles).
At the California state-level, which is the
geographical focus of our efforts, these limitations
currently hinder the preparation of regulatorily
validated relationships between environmental
concentrations of microplastic particles and
observed adverse effects (i.e. dose-response
relationships). Thus, the currently available threshold
M I C R O P L A S T I C P O L L U T I O N I N C A L I F O R N I A
A P R E C A U T I O N A R Y R I S K A S S E S S M E N T F R A M E W O R K | 1 3
data make it difficult to quantitatively characterize
risk to the marine environment in California in
accordance with the risk assessment paradigm. We
understand that ecotoxicological datasets are rapidly
maturing, that efforts to advance test standardization
are progressing, and new studies on microplastics are
published daily. For example, Koelmans et al. 2020
provided a potential rescaling method to address
the misalignment of methods used to assess and
report microplastics environmental concentrations
and morphologies and effects with a high degree
of certainty, which has the potential to solve some
of these issues of imprecise effects threshold data
(Koelmans et al. 2020). However, the degree to which
state and federal regulatory agencies will adopt
or accept “rescaling” or “read across” methods in
microplastic risk assessments is unknown at the time
of the preparation of this framework, particularly
due to concerns about specific polymer types (e.g.
high prevalence of tire wear particles). Moreover,
without effects threshold data assessed for the
applicability to environmental conditions associated
with microplastic exposures in California specifically,
a state-specific quantitative effects risk assessment
will continue to be hindered. We instead recommend
focused data-collection to address data gaps specific
to California, so a statewide risk assessment following
the approaches put forth by the publications referred
to above (e.g. Koelmans et al. 2020, Everaert et al.
2020, etc.) can be conducted.
Adopting a Particulate Approach
We recommend the State adopt a particulate
management (PM) approach to assessing and
managing microplastic pollution risk based on
the current state of knowledge. Uncertainties
in how many of dimensions of effect thresholds
(e.g. test-standardization, species, duration, size,
shape, polymer and endpoint) will be harmonized
in regulatory microplastic risk assessments, as well
as future environmental concentrations given the
persistence of plastics materials, hinder our ability
to immediately characterize State-level risk with
quantitative dose-response techniques. Yet, they do
not preclude State action and timely decisions to
address ecological harm attributable to microplastics
and mitigate potentially irreversible losses of
M I C R O P L A S T I C P O L L U T I O N I N C A L I F O R N I A
A P R E C A U T I O N A R Y R I S K A S S E S S M E N T F R A M E W O R K | 1 4
biodiversity in State marine resources. We note
that the Intergovernmental Science-Policy Platform
on Biodiversity and Ecosystem Services Global
Assessment has identified pollution, “including
plastics” as a “direct driver” of “global declines in
nature” (IPBES 2019).
A particulate management approach is consistent
with established science and risks of small
particulates in the environment. This approach
is analogous to the particulate matter (PM) risk
framework for PM10 and PM2.5, which is used to
assess air quality for the protection of human health
(Kurt et al. 2016). Parallels with air particulates
include: (1) their widespread occurrence in the
environment (Law 2017, Rillig & Lehmann 2020,
Evangeliou et al. 2020), (2) their tendency to
fragment into smaller micro- and nano- particles
through continuous degradation (Song et al. 2020,
Enfrin et al. 2020), (3) a lack of feasible cleanup
strategies (e.g. particularly primary microplastics;
Ogunola et al. 2018, Hohn et al. 2020), and (4) the
projected increased rates of plastic production
and resulting increased entry (release) into the
environment (Borrelle et al 2020, Everaert et al.
2020). Our recommendation to currently adopt a
particulate management approach is not meant to
exclude future considerations of chemical-specific
toxicant approaches as sufficient information for
California-specific assessments becomes available.
Instead, we recommend that this particulate
approach be conducted for microplastics first
to establish a baseline, similar to approaches for
air quality, which can and should be followed up
with a toxicant management approach when the
toxicity knowledge and data becomes available to
reduce these multidimensional uncertainties and
complexities.
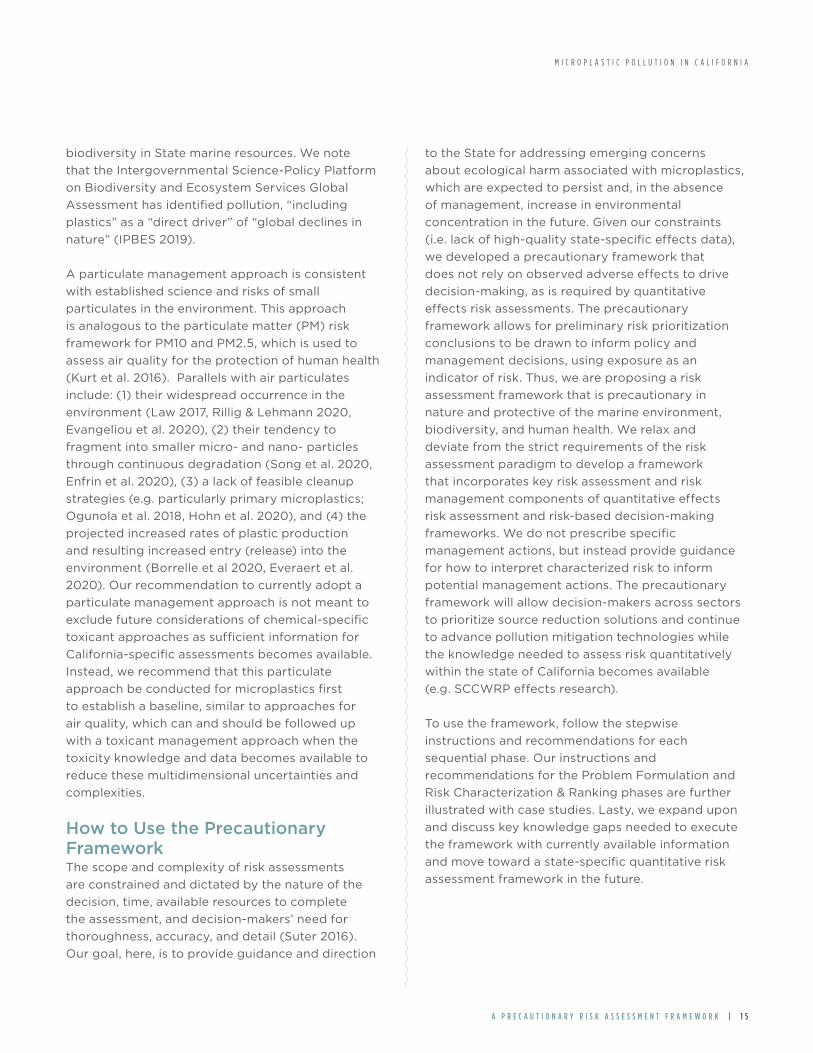
How to Use the Precautionary FrameworkThe scope and complexity of risk assessments
are constrained and dictated by the nature of the
decision, time, available resources to complete
the assessment, and decision-makers’ need for
thoroughness, accuracy, and detail (Suter 2016).
Our goal, here, is to provide guidance and direction
to the State for addressing emerging concerns
about ecological harm associated with microplastics,
which are expected to persist and, in the absence
of management, increase in environmental
concentration in the future. Given our constraints
(i.e. lack of high-quality state-specific effects data),
we developed a precautionary framework that
does not rely on observed adverse effects to drive
decision-making, as is required by quantitative
effects risk assessments. The precautionary
framework allows for preliminary risk prioritization
conclusions to be drawn to inform policy and
management decisions, using exposure as an
indicator of risk. Thus, we are proposing a risk
assessment framework that is precautionary in
nature and protective of the marine environment,
biodiversity, and human health. We relax and
deviate from the strict requirements of the risk
assessment paradigm to develop a framework
that incorporates key risk assessment and risk
management components of quantitative effects
risk assessment and risk-based decision-making
frameworks. We do not prescribe specific
management actions, but instead provide guidance
for how to interpret characterized risk to inform
potential management actions. The precautionary
framework will allow decision-makers across sectors
to prioritize source reduction solutions and continue
to advance pollution mitigation technologies while
the knowledge needed to assess risk quantitatively
within the state of California becomes available
(e.g. SCCWRP effects research).
To use the framework, follow the stepwise
instructions and recommendations for each
sequential phase. Our instructions and
recommendations for the Problem Formulation and
Risk Characterization & Ranking phases are further
illustrated with case studies. Lasty, we expand upon
and discuss key knowledge gaps needed to execute
the framework with currently available information
and move toward a state-specific quantitative risk
assessment framework in the future.
M I C R O P L A S T I C P O L L U T I O N I N C A L I F O R N I A
A P R E C A U T I O N A R Y R I S K A S S E S S M E N T F R A M E W O R K | 1 5

About this Section:
We provide steps that narrow the scope of the microplastic problem and discuss
how we applied a traditional risk assessment problem formulation approach to
microplastic pollution. We identify priority elements based on available science
and discuss the evidence and process leading to these recommendations.
Recommendations:
1. The following high priority & most prevalent components of microplastic
pollution:
• Particle Morphology: microfibers and fragments
• Polymer Types: microfibers and tire & road wear particles
• Fate & Transport Pathways: stormwater runoff (urban, agricultural), aerial
deposition, and wastewater
• Sources: unknown in California, but international literature suggests tire &
road wear, laundry & textiles, and plastic litter from aquaculture & fishing
2. The following priority endpoints in the California marine environment:
microplastic internalization for benthic mollusks, large crustaceans, and
lower and upper trophic level fishare available and the chemical effects of
microplastics are fully understood.
3. Phase I: Problem Formulation
P H A S E I : P R O B L E M F O R M U L A T I O N | 1 6
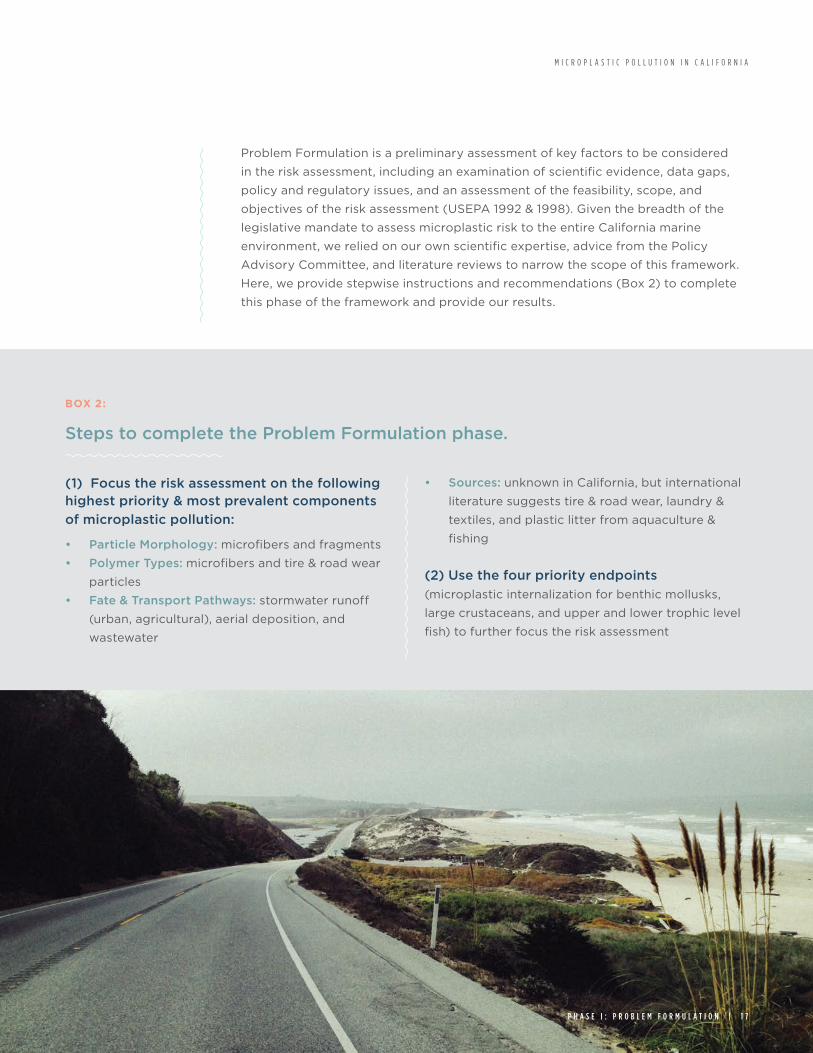
Problem Formulation is a preliminary assessment of key factors to be considered
in the risk assessment, including an examination of scientific evidence, data gaps,
policy and regulatory issues, and an assessment of the feasibility, scope, and
objectives of the risk assessment (USEPA 1992 & 1998). Given the breadth of the
legislative mandate to assess microplastic risk to the entire California marine
environment, we relied on our own scientific expertise, advice from the Policy
Advisory Committee, and literature reviews to narrow the scope of this framework.
Here, we provide stepwise instructions and recommendations (Box 2) to complete
this phase of the framework and provide our results.
(1) Focus the risk assessment on the following highest priority & most prevalent components
of microplastic pollution:
• Particle Morphology: microfibers and fragments
• Polymer Types: microfibers and tire & road wear
particles
• Fate & Transport Pathways: stormwater runoff
(urban, agricultural), aerial deposition, and
wastewater
• Sources: unknown in California, but international
literature suggests tire & road wear, laundry &
textiles, and plastic litter from aquaculture &
fishing
(2) Use the four priority endpoints
(microplastic internalization for benthic mollusks,
large crustaceans, and upper and lower trophic level
fish) to further focus the risk assessment
BOX 2:
Steps to complete the Problem Formulation phase.
M I C R O P L A S T I C P O L L U T I O N I N C A L I F O R N I A
P H A S E I : P R O B L E M F O R M U L A T I O N | 1 7
Particle Morphology & Polymer Types:
unique physical and chemical attributes of
microplastic particles to describe polymer types
(e.g. microfibers, tire wear)
Sources:
the origin of microplastics for the purposes
of an exposure assessment, focusing
on where particles originate; including
primary microplastics that are intentionally
manufactured to be small in size (e.g. nurdles,
plastics in personal care products) and
secondary plastics from wear and tear or
weathering and breakdown of larger plastic
products (e.g. tire tread, textiles, litter & food
packaging)
Fate & Transport Pathways:
the course (i.e. movement and chemical
alteration) microplastics take from a source
to an environmental entity (e.g. taxa, species,
habitat) in the environment
Endpoints:
an explicit expression of the valued
environmental entity that is to be protected;
operationally expressed as an entity and
relevant attribute (e.g. crustacean survival)
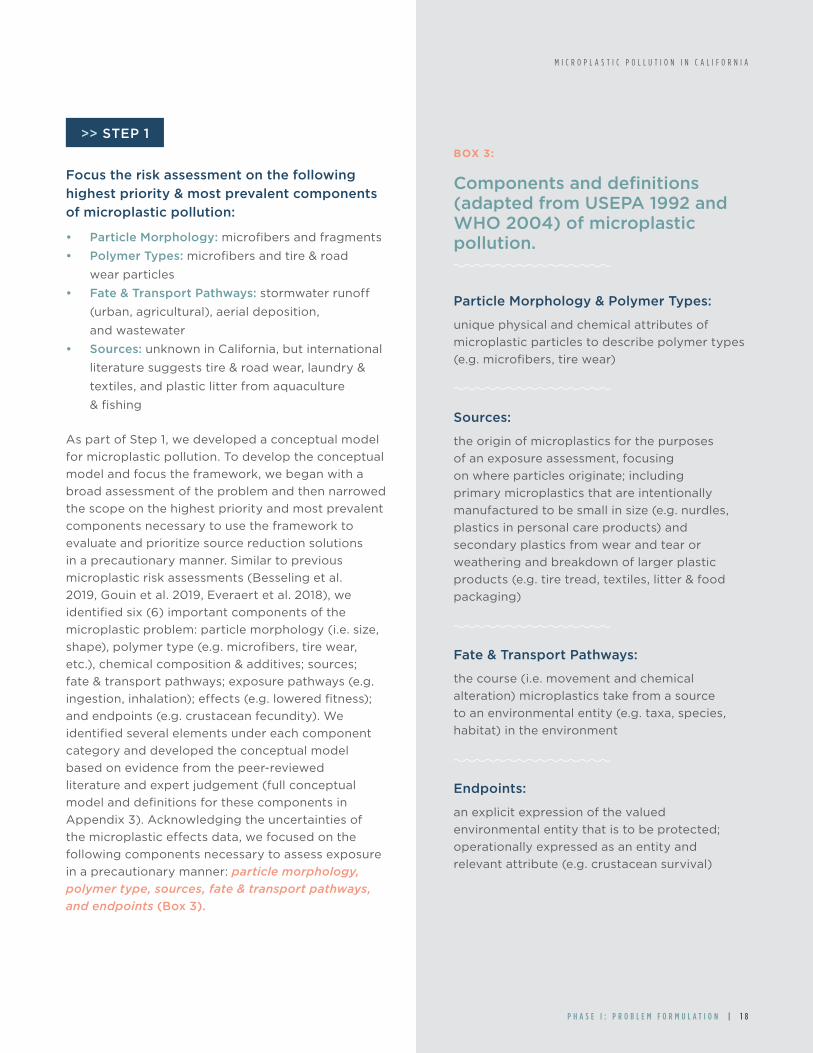
BOX 3:
Components and definitions (adapted from USEPA 1992 and WHO 2004) of microplastic pollution.
Focus the risk assessment on the following
highest priority & most prevalent components
of microplastic pollution:
• Particle Morphology: microfibers and fragments
• Polymer Types: microfibers and tire & road
wear particles
• Fate & Transport Pathways: stormwater runoff
(urban, agricultural), aerial deposition,
and wastewater
• Sources: unknown in California, but international
literature suggests tire & road wear, laundry &
textiles, and plastic litter from aquaculture
& fishing
As part of Step 1, we developed a conceptual model
for microplastic pollution. To develop the conceptual
model and focus the framework, we began with a
broad assessment of the problem and then narrowed
the scope on the highest priority and most prevalent
components necessary to use the framework to
evaluate and prioritize source reduction solutions
in a precautionary manner. Similar to previous
microplastic risk assessments (Besseling et al.
2019, Gouin et al. 2019, Everaert et al. 2018), we
identified six (6) important components of the
microplastic problem: particle morphology (i.e. size,
shape), polymer type (e.g. microfibers, tire wear,
etc.), chemical composition & additives; sources;
fate & transport pathways; exposure pathways (e.g.
ingestion, inhalation); effects (e.g. lowered fitness);
and endpoints (e.g. crustacean fecundity). We
identified several elements under each component
category and developed the conceptual model
based on evidence from the peer-reviewed
literature and expert judgement (full conceptual
model and definitions for these components in
Appendix 3). Acknowledging the uncertainties of
the microplastic effects data, we focused on the
following components necessary to assess exposure
in a precautionary manner: particle morphology,
polymer type, sources, fate & transport pathways,
and endpoints (Box 3).
>> STEP 1
M I C R O P L A S T I C P O L L U T I O N I N C A L I F O R N I A
P H A S E I : P R O B L E M F O R M U L A T I O N | 1 8
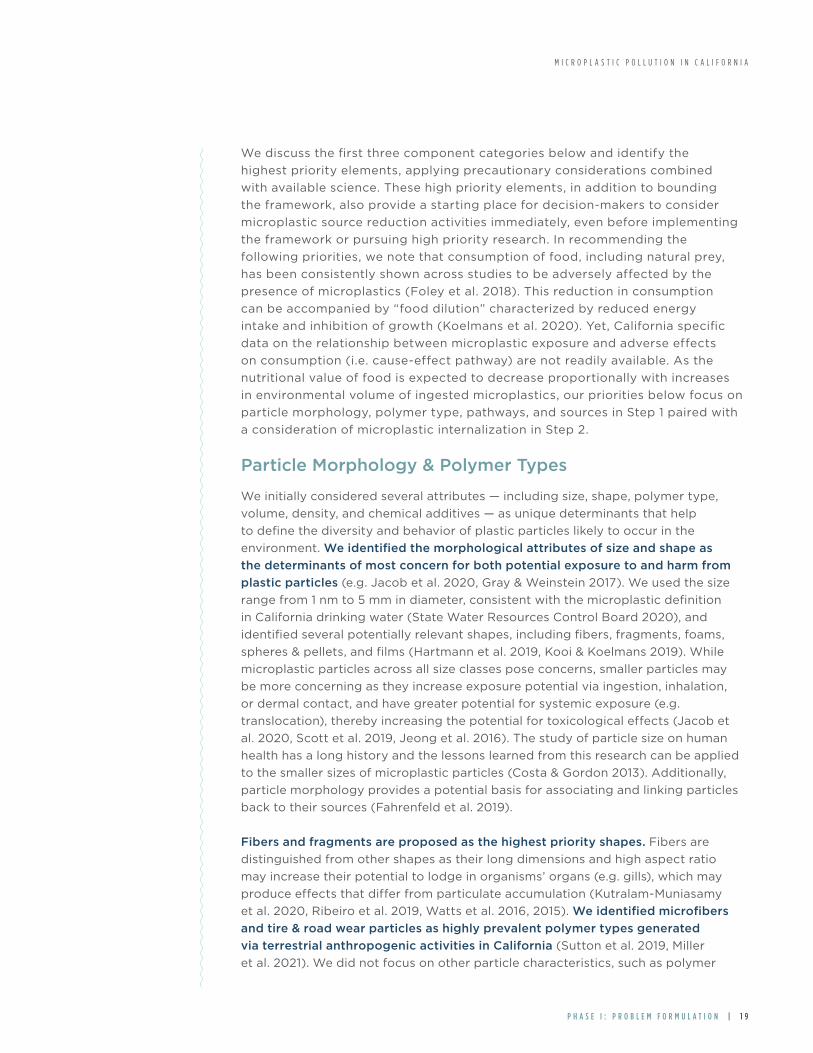
We discuss the first three component categories below and identify the
highest priority elements, applying precautionary considerations combined
with available science. These high priority elements, in addition to bounding
the framework, also provide a starting place for decision-makers to consider
microplastic source reduction activities immediately, even before implementing
the framework or pursuing high priority research. In recommending the
following priorities, we note that consumption of food, including natural prey,
has been consistently shown across studies to be adversely affected by the
presence of microplastics (Foley et al. 2018). This reduction in consumption
can be accompanied by “food dilution” characterized by reduced energy
intake and inhibition of growth (Koelmans et al. 2020). Yet, California specific
data on the relationship between microplastic exposure and adverse effects
on consumption (i.e. cause-effect pathway) are not readily available. As the
nutritional value of food is expected to decrease proportionally with increases
in environmental volume of ingested microplastics, our priorities below focus on
particle morphology, polymer type, pathways, and sources in Step 1 paired with
a consideration of microplastic internalization in Step 2.
Particle Morphology & Polymer Types
We initially considered several attributes — including size, shape, polymer type,
volume, density, and chemical additives — as unique determinants that help
to define the diversity and behavior of plastic particles likely to occur in the
environment. We identified the morphological attributes of size and shape as
the determinants of most concern for both potential exposure to and harm from
plastic particles (e.g. Jacob et al. 2020, Gray & Weinstein 2017). We used the size
range from 1 nm to 5 mm in diameter, consistent with the microplastic definition
in California drinking water (State Water Resources Control Board 2020), and
identified several potentially relevant shapes, including fibers, fragments, foams,
spheres & pellets, and films (Hartmann et al. 2019, Kooi & Koelmans 2019). While
microplastic particles across all size classes pose concerns, smaller particles may
be more concerning as they increase exposure potential via ingestion, inhalation,
or dermal contact, and have greater potential for systemic exposure (e.g.
translocation), thereby increasing the potential for toxicological effects (Jacob et
al. 2020, Scott et al. 2019, Jeong et al. 2016). The study of particle size on human
health has a long history and the lessons learned from this research can be applied
to the smaller sizes of microplastic particles (Costa & Gordon 2013). Additionally,
particle morphology provides a potential basis for associating and linking particles
back to their sources (Fahrenfeld et al. 2019).
Fibers and fragments are proposed as the highest priority shapes. Fibers are
distinguished from other shapes as their long dimensions and high aspect ratio
may increase their potential to lodge in organisms’ organs (e.g. gills), which may
produce effects that differ from particulate accumulation (Kutralam-Muniasamy
et al. 2020, Ribeiro et al. 2019, Watts et al. 2016, 2015). We identified microfibers
and tire & road wear particles as highly prevalent polymer types generated
via terrestrial anthropogenic activities in California (Sutton et al. 2019, Miller
et al. 2021). We did not focus on other particle characteristics, such as polymer
M I C R O P L A S T I C P O L L U T I O N I N C A L I F O R N I A
P H A S E I : P R O B L E M F O R M U L A T I O N | 1 9
composition or chemical additives, in the framework
as other priorities are more urgent. Moreover, models
and empirical data suggest that sorbed chemicals
may not be as bioavailable as initially thought (e.g.
Koelmans et al. 2016), and that even though data
suggest that some additives and sorbed pollutants
may be harmful depending on the size and surface
area of the microplastic particle (e.g. Ma et al. 2016,
Wang et al. 2018). Our decision, here, does not claim
that particle composition and chemical additives
are unimportant in understanding risk. For example,
it has recently been shown that 6-PPD quinone, a
potential tire rubber-derived oxidation product, is
lethally toxic to salmonids at sufficient dose (Tian
et al. 2021). Rather, in line with our particulate
management recommendation, we chose to not
focus on these characteristics currently as more
data are needed to facilitate incorporation into a
risk prioritization or assessment strategy. However,
additives and other plastic-associated pollutants
could be considered in the future.
Fate & Transport Pathways
We determined fate & transport pathways were an
important component of evaluating source reduction
solutions as they help provide a direct link between
particles emitted from sources and exposure and
contact to our endpoints. We identified several fate
& transport pathways, but highlight stormwater
runoff (i.e. agricultural and urban) as a top priority,
and aerial deposition and wastewater to a lesser
extent. Our conclusion is in line with previous work,
where investigations in the San Francisco Bay
found concentrations of microparticles in urban
stormwater runoff (1.3 – 30 microparticles/L, mean
9.2) to be significantly higher than wastewater
(0.008-0.2 microparticles/L, mean 0.06). The study
went further to extrapolate loadings from these
two pathways from simple models and estimated
loadings from urban stormwater runoff to be up to
two orders of magnitude higher than wastewater
to San Francisco Bay (Sutton et al. 2019, Miller et al.
2021). Further, while we lack precise estimates of
microplastic loading from agricultural runoff, the size
of California’s agricultural sector and its potential
to emit high amounts of microplastic loading via
agricultural runoff cannot be ignored.
The plastic types transported in stormwater runoff
are directly associated with site-specific land-
use patterns (e.g. urban, rural, agricultural) and,
therefore, depending on which sources are of most
interest, either urban or agricultural runoff could
be selected as a focus for a risk assessment. For
example, if one were to assess tire wear or litter,
one might consider assessing urban runoff, whereas
if fibers were of interest, one might assess both
agricultural (via biosolids) and urban runoff (via
textiles) (e.g. Gray et al. 2018, Crossman et al. 2020,
Grbić et al. 2020). While further research is needed
to understand relative contributions, wastewater in
the San Francisco Bay area appears to contribute an
appreciable but somewhat lower microplastics load
than urban stormwater runoff (Sutton et al. 2019).
Most recent studies point to aerial deposition
as another substantial pathway to the marine
environment (Zhang et al. 2020). Yet, without
fully understanding the relative contribution of
aerial deposition and having limited intervention
potential, we did not focus on this pathway in
the framework, but rather raise this concern
as a potential focus for greater research and
management attention going forward.
Sources
We identified several sources as macroplastic
material types (e.g. litter, textiles, personal care
products, tire & road wear particles) and, in some
cases, the human activities (e.g. transportation,
agriculture and industrial activities, leisure activity)
associated with those materials. To make the
framework more targeted and provide guidance for
source reduction, we intended to narrow the scope
to the largest emitters (i.e. by tonnage) of plastic
material to the marine environment in California.
However, knowledge on the largest sources in
California and the science to trace sampled particles
back to their original sources is currently not
adequate for most polymer types.
We can, however, take advantage of plastic loading
inventories from the international literature and
make informed assumptions on the potential largest
sources in California. Some common large sources
M I C R O P L A S T I C P O L L U T I O N I N C A L I F O R N I A
P H A S E I : P R O B L E M F O R M U L A T I O N | 2 0

from European Union microplastics inventories, which we will prioritize and
focus our framework, include: tire & road wear, laundry, and plastic litter from
fisheries & aquaculture gear (Sundt et al. 2014, Verschoor et al. 2014, Lassen et al.
2015, Magnusson et al. 2016). A recent review found that the U.S. was the largest
generator of plastic waste internationally, with a meaningful fraction of this waste
illegally discharged domestically or mismanaged in countries that import U.S. waste
(Law et al. 2020).
Identifying California-specific large sources for inclusion in a risk assessment would
require (1) considering site-specific land-use patterns (e.g. urban, rural, agricultural)
and local human population densities, as these factors will likely influence the
amount and types of macroplastics potentially reaching the marine environment,
and (2) determining whether those sources have adequate and available
intervention strategies to assess if reduction would have a meaningful impact. The
size and scale of California’s agricultural industry and transportation systems (i.e.
roads, number of personal vehicles) warrants their consideration and inclusion as
potential top sources, and supports the framework’s focus on microfibers, from
agricultural biosolids, and tire & road wear particles. Any differences between
European and Californian wastewater treatment systems should also be considered.
In California, there are primary, secondary, and tertiary wastewater treatments
prior to discharge of treated wastewater to the ocean. Although primary treatment
seems to remove a majority of microplastic via sludge (Sun et al. 2019), studies
show further treatment can reduce microplastic content (Sutton et al. 2019). In
addition, removal efficacy varies across microplastic sizes and shapes (Sun et al.
2019). We expand upon these considerations and our final selection of California
sources to focus the framework later in the Risk Characterization & Ranking phase.
P H A S E I : P R O B L E M F O R M U L A T I O N | 2 1
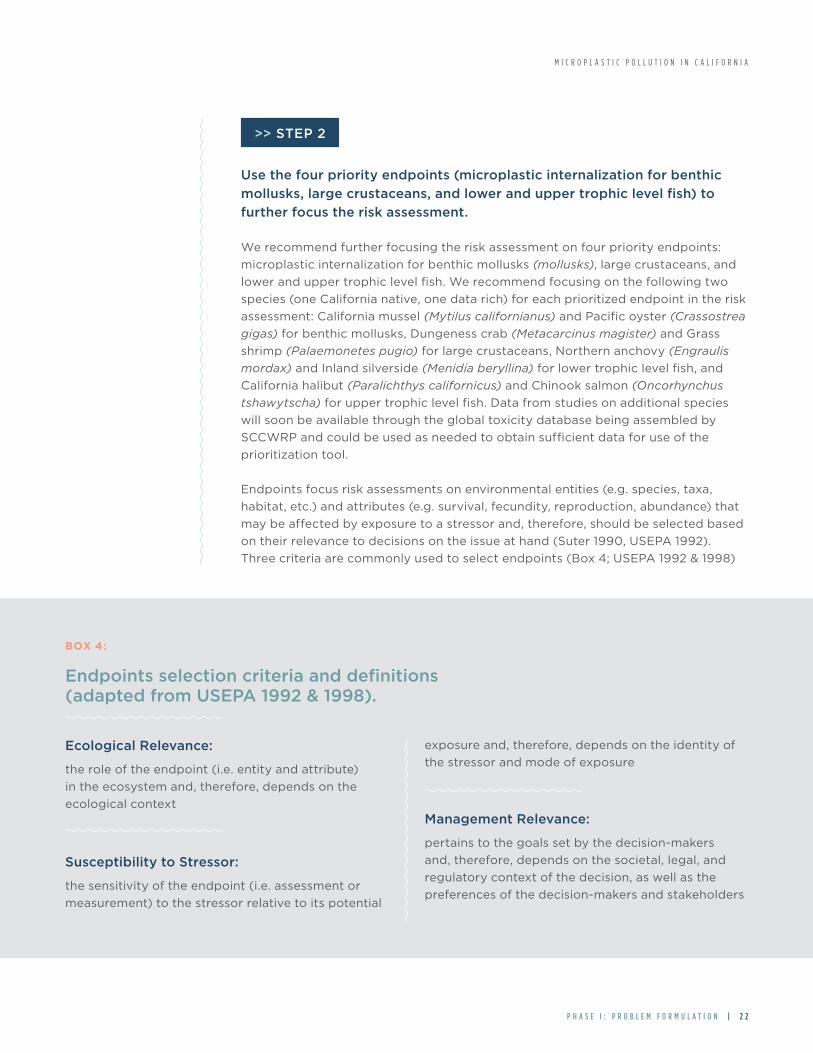
Use the four priority endpoints (microplastic internalization for benthic
mollusks, large crustaceans, and lower and upper trophic level fish) to
further focus the risk assessment.
We recommend further focusing the risk assessment on four priority endpoints:
microplastic internalization for benthic mollusks (mollusks), large crustaceans, and
lower and upper trophic level fish. We recommend focusing on the following two
species (one California native, one data rich) for each prioritized endpoint in the risk
assessment: California mussel (Mytilus californianus) and Pacific oyster (Crassostrea
gigas) for benthic mollusks, Dungeness crab (Metacarcinus magister) and Grass
shrimp (Palaemonetes pugio) for large crustaceans, Northern anchovy (Engraulis
mordax) and Inland silverside (Menidia beryllina) for lower trophic level fish, and
California halibut (Paralichthys californicus) and Chinook salmon (Oncorhynchus
tshawytscha) for upper trophic level fish. Data from studies on additional species
will soon be available through the global toxicity database being assembled by
SCCWRP and could be used as needed to obtain sufficient data for use of the
prioritization tool.
Endpoints focus risk assessments on environmental entities (e.g. species, taxa,
habitat, etc.) and attributes (e.g. survival, fecundity, reproduction, abundance) that
may be affected by exposure to a stressor and, therefore, should be selected based
on their relevance to decisions on the issue at hand (Suter 1990, USEPA 1992).
Three criteria are commonly used to select endpoints (Box 4; USEPA 1992 & 1998)
Ecological Relevance:
the role of the endpoint (i.e. entity and attribute)
in the ecosystem and, therefore, depends on the
ecological context
Susceptibility to Stressor:
the sensitivity of the endpoint (i.e. assessment or
measurement) to the stressor relative to its potential
exposure and, therefore, depends on the identity of
the stressor and mode of exposure
Management Relevance:
pertains to the goals set by the decision-makers
and, therefore, depends on the societal, legal, and
regulatory context of the decision, as well as the
preferences of the decision-makers and stakeholders
BOX 4:
Endpoints selection criteria and definitions (adapted from USEPA 1992 & 1998).
>> STEP 2
M I C R O P L A S T I C P O L L U T I O N I N C A L I F O R N I A
P H A S E I : P R O B L E M F O R M U L A T I O N | 2 2
We applied the U.S. Environmental Protection
Agency’s (EPA) criteria in a case-study endpoints
prioritization process to narrow the scope of the
microplastic pollution issue while meeting the
legislative mandate (S.B. 1263) to address exposure
to marine organisms and humans. This criterion
(Box 4) was applied to prioritize endpoints using a
combination of professional judgement from both
us, the Working Group, and the Policy Advisory
Committee, as well as a literature review.
Our case-study management goal was to assess the
risk of marine microplastic to ecologically-important
taxa and human health (via human consumption
of those taxa). By focusing our framework on
taxa of economic importance (endpoints) likely
to be consumed by people, we indirectly account
for potential effects of microplastics to human
health due to ingestion of contaminated seafood
(Smith et al. 2018). While it is possible to integrate
human health and well-being into ecological
risk assessments (Harris et al. 2017), we do not
explicitly include human health endpoints due to the
complexities and lack of feasibility with assessing
microplastic exposure and effects to humans.
Furthermore, focusing on taxa likely to be consumed
by higher trophic levels (e.g. predators) also allows
for broader ecosystem and food web effects to
be detected, but these broader effects were not
explicitly included in this framework.
Microplastic internalization (e.g. particle presence/
absence or concentration in organisms) is a
precursor to organismal- and population-level
effects, such as decreased survival, reproduction,
or abundance (Bucci et al. 2019). A focus on
microplastic internalization is consistent with the
precautionary approach selected in this Problem
Formulation, is in alignment with data on “food
dilution” being used to parameterize current risk
assessment models (e.g. Koelmans et al. 2020),
and allows management to move forward despite
existing knowledge gaps. Therefore, we argue
microplastic internalization may serve as an
adequate effect (and endpoint) to be included
in any future risk assessment. We recommend
future microplastic risk assessments, using this
precautionary framework, focus on microplastic
internalization instead of other effects due to
its measurement feasibility and undesirable
occurrence. We provide an examination of
the scientific evidence to establish harm from
microplastic internalization, furthering our position
that microplastic internalization in organisms is
undesirable, and justify using the risk prioritization
tool in the Appendices (Appendix 6). While we use
a concentration-based measure of internalization,
volume of internalized particles could be used
to address chemical exposure via microplastics,
but this is beyond the scope of this effort and our
particulate approach.
This endpoints prioritization process may be
iterated to select other taxa and species of interest
that are most relevant to any management and
policy objective at hand, including stakeholders
interest. Incorporating and considering stakeholder
interests is a key component of any risk assessment
(USEPA 1998, NCR 2009), but was beyond the
scope of this effort and should be a focus for future
risk assessments. Full details of the prioritization
process are in Appendix 4 and a full list of identified
endpoints is provided in Appendix 5.
M I C R O P L A S T I C P O L L U T I O N I N C A L I F O R N I A
P H A S E I : P R O B L E M F O R M U L A T I O N | 2 3
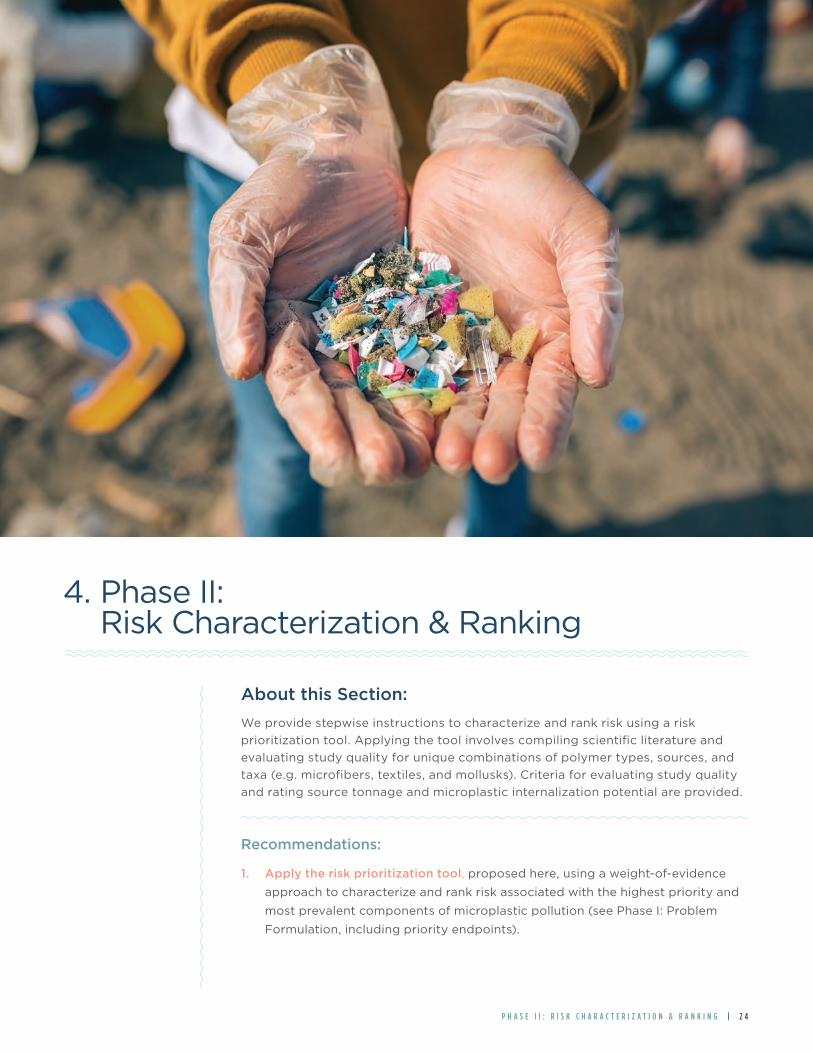
About this Section:
We provide stepwise instructions to characterize and rank risk using a risk
prioritization tool. Applying the tool involves compiling scientific literature and
evaluating study quality for unique combinations of polymer types, sources, and
taxa (e.g. microfibers, textiles, and mollusks). Criteria for evaluating study quality
and rating source tonnage and microplastic internalization potential are provided.
Recommendations:
1. Apply the risk prioritization tool, proposed here, using a weight-of-evidence
approach to characterize and rank risk associated with the highest priority and
most prevalent components of microplastic pollution (see Phase I: Problem
Formulation, including priority endpoints).
4. Phase II: Risk Characterization & Ranking
P H A S E I I : R I S K C H A R A C T E R I Z A T I O N & R A N K I N G | 2 4
Considering the State’s objective of evaluating
source reduction solutions, we recommend and
propose that the most appropriate and feasible
risk characterization method, at this point in
time, is a risk prioritization tool that relies entirely
on exposure data to characterize and rank risk.
This approach relies on quantitative data from
the peer-reviewed literature, and qualitative
rates of both source tonnage and microplastic
internalization potential using a weight-of-evidence
approach. We recommend that the State focus
on the potential largest sources in California to
assess source tonnage potential and presence of
microplastic particles (e.g. fibers, tire & road wear)
in our recommended taxa and representative
species of interests (e.g. benthic mollusks, large
crustaceans, and lower and upper trophic level
fish) for microplastic internalization potential. This
prioritization tool is preferable to a quantitative risk
assessment as it relies on potential major sources in
California to focus source reduction management
activities and resources, and overcomes limitations
and uncertainties in the effects data.
We recommend this phase, and steps (Fig. 2), be
conducted for unique combinations of polymer
types, sources, and taxa (e.g. microfibers, textiles,
and large crustaceans) identified as high priority
in the Problem Formulation phase. Therefore, this
approach should be primarily focused on polymer
types most likely to occur in organisms and large
sources most likely to benefit from mitigation.
However, this phase can be adapted to other
polymer types, sources, and taxa if State priorities
change in the future. Lastly, we recognize risk may
vary by location, and while this tool is intended to
assess risk at the entire state level, we provide short
instructions within these steps for assessing risk
at finer spatial scales (e.g. regions or sites) if the
required data is available.
M I C R O P L A S T I C P O L L U T I O N I N C A L I F O R N I A
P H A S E I I : R I S K C H A R A C T E R I Z A T I O N & R A N K I N G | 2 5

Figure 2
Figure 2. Steps to complete the Risk Characterization & Ranking phase.
Select appropriate source & polymer type associated with priority endpoints
Use case studies and subject matter expert consultations to make selection
1
Compile evidence for and rate source tonnage potential
2
2.1 Collect studies on microplastic inventories & loading
2.2 Assess data quality (Table 1) to assign overall study quality (Table 2)
2.3 Rate source tonnage potential (Table 3)
Compile evidence for and rate organism microplastic internalization potential
3
3.1 Collect studies on particles within taxa
3.2 Assess data quality (Table 4) to assign overall study quality (Table 5)
3.3 Rate microplastics internalization potential (Table 6)
Characterize & rank risk by relating source tonnage & microplastic internalization potential ratings
4 Characterize and rank risks for potential State action (Table 7)
ocean science trust // microplastics report // figures // final // 04 21 21
Figure 2. Steps to complete the Risk Characterization & Ranking phase.
M I C R O P L A S T I C P O L L U T I O N I N C A L I F O R N I A
P H A S E I I : R I S K C H A R A C T E R I Z A T I O N & R A N K I N G | 2 6
P H A S E I I : R I S K C H A R A C T E R I Z A T I O N & R A N K I N G | 2 7
M I C R O P L A S T I C P O L L U T I O N I N C A L I F O R N I A
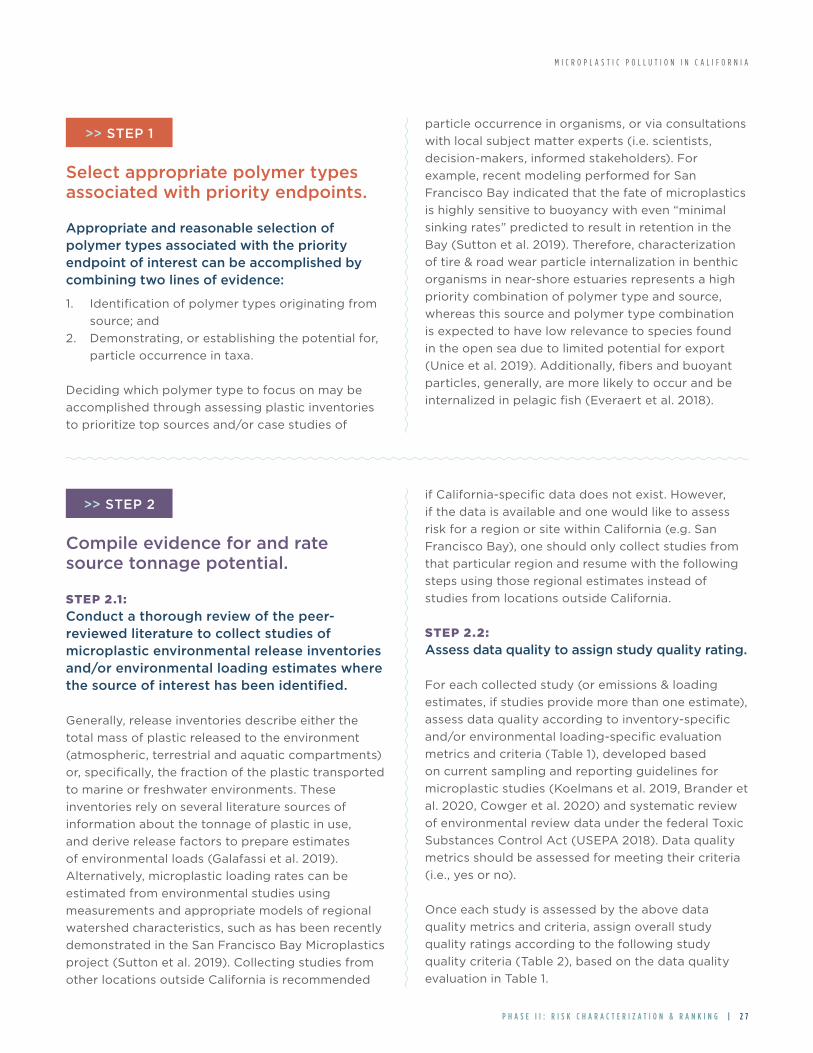
Select appropriate polymer types associated with priority endpoints.
Appropriate and reasonable selection of polymer types associated with the priority endpoint of interest can be accomplished by combining two lines of evidence:
1. Identification of polymer types originating from
source; and
2. Demonstrating, or establishing the potential for,
particle occurrence in taxa.
Deciding which polymer type to focus on may be
accomplished through assessing plastic inventories
to prioritize top sources and/or case studies of
particle occurrence in organisms, or via consultations
with local subject matter experts (i.e. scientists,
decision-makers, informed stakeholders). For
example, recent modeling performed for San
Francisco Bay indicated that the fate of microplastics
is highly sensitive to buoyancy with even “minimal
sinking rates” predicted to result in retention in the
Bay (Sutton et al. 2019). Therefore, characterization
of tire & road wear particle internalization in benthic
organisms in near-shore estuaries represents a high
priority combination of polymer type and source,
whereas this source and polymer type combination
is expected to have low relevance to species found
in the open sea due to limited potential for export
(Unice et al. 2019). Additionally, fibers and buoyant
particles, generally, are more likely to occur and be
internalized in pelagic fish (Everaert et al. 2018).
Compile evidence for and rate source tonnage potential.
STEP 2.1:
Conduct a thorough review of the peer-reviewed literature to collect studies of microplastic environmental release inventories and/or environmental loading estimates where the source of interest has been identified.
Generally, release inventories describe either the
total mass of plastic released to the environment
(atmospheric, terrestrial and aquatic compartments)
or, specifically, the fraction of the plastic transported
to marine or freshwater environments. These
inventories rely on several literature sources of
information about the tonnage of plastic in use,
and derive release factors to prepare estimates
of environmental loads (Galafassi et al. 2019).
Alternatively, microplastic loading rates can be
estimated from environmental studies using
measurements and appropriate models of regional
watershed characteristics, such as has been recently
demonstrated in the San Francisco Bay Microplastics
project (Sutton et al. 2019). Collecting studies from
other locations outside California is recommended
if California-specific data does not exist. However,
if the data is available and one would like to assess
risk for a region or site within California (e.g. San
Francisco Bay), one should only collect studies from
that particular region and resume with the following
steps using those regional estimates instead of
studies from locations outside California.
STEP 2.2:
Assess data quality to assign study quality rating.
For each collected study (or emissions & loading
estimates, if studies provide more than one estimate),
assess data quality according to inventory-specific
and/or environmental loading-specific evaluation
metrics and criteria (Table 1), developed based
on current sampling and reporting guidelines for
microplastic studies (Koelmans et al. 2019, Brander et
al. 2020, Cowger et al. 2020) and systematic review
of environmental review data under the federal Toxic
Substances Control Act (USEPA 2018). Data quality
metrics should be assessed for meeting their criteria
(i.e., yes or no).
Once each study is assessed by the above data
quality metrics and criteria, assign overall study
quality ratings according to the following study
quality criteria (Table 2), based on the data quality
evaluation in Table 1.
>> STEP 1
>> STEP 2

METRIC CRITERIA (YES OR NO)
Criteria Applicable to Inventory and Loading Studies
MethodologyInventory or study published in peer-reviewed literature, critically reviewed and accepted in peer-reviewed literature, or reviewed by external reviewers (e.g. scientific advisory panel)
Accessibility and clarity Methodology for tabulating plastic usage and release factors transparently described
Geographic scope - international
Prepared for OECD* Country
Geographic scope - regional
Prepared for California
ApplicabilityInventory or loading estimate reflects a release of identified source (inventory studies) or polymer type (loading studies) to marine environment (as opposed to a non-specific total release or amount used)
Temporality Inventory estimate or loading measurement prepared within the last 5 years
Variability and uncertainty**
Variability and uncertainty discussed and considered in the inventory (such as seasonal variability or measurement error)
Criteria Applicable only to Loading Studies
Quality assurance and quality control (i.e. QA/QC)
Study incorporated appropriate QA/QC measures, such as any of the following (Cowger et al. 2020): Error propagation, replicates, limit of detection and polymer identification (considering plastic morphology, size, color, and polymer), blank controls, positive control, and mitigation of contamination
Sample size Loading estimates based on multiple sampling sites (n ≥ 3 sites)
*OECD = Organisation for Economic Cooperation and Development**Variability represents true heterogeneity, which may not be reducible by further study; uncertainty represents a lack of knowledge, which can include errors in communication or data description, data gaps, parameter uncertainty, and model uncertainty (Regan et al. 2003, USEPA 1998).
Table 1. Data quality evaluation guidelines for source tonnage studies.
P H A S E I I : R I S K C H A R A C T E R I Z A T I O N & R A N K I N G | 2 8
M I C R O P L A S T I C P O L L U T I O N I N C A L I F O R N I A

Table 2. Study quality ratings according to combined data quality metrics and criteria.
STUDY QUALITY RATING
Methodology
CRITERIA (number of data quality metrics that met their data quality criteria, i.e. yes)
Inventory Studies Loading Studies
High Quality (HQ) 7 9
Medium Quality (MQ) 5 - 6 6 - 8
Low Quality (LQ) 0 - 4 0 - 5
STEP 2.2:
Assign source tonnage potential rating based on quality of studies and number of locations (e.g. countries) with source of interest identified as a major contributor of microplastics to the marine environment in those studies (Table 3).
Only consider and include studies rated as either HQ or MQ when rating source
tonnage potential. Only include sources considered to be major contributors where
an appreciable tonnage of plastic is estimated to release to the aquatic environment
or when sources are ranked highly in source inventories.
Based on currently available information, major contributors on a mass basis are
considered to be those that release ≥ 1 g/person/yr of plastic (Galafassi et al. 2019)
to the marine environment. Annual mass release estimates (e.g. g/yr) should be
converted to per-capita estimates (g/person/yr) using contemporaneous human
population estimates to normalize releases between areas of the world. Watershed
scale estimates for fibers are limited with varying methods, but a recent study
conducted in the Paris Megacity portion of the Seine watershed suggests that
sources on the order of 10 million fibers/km2/yr or 1000 fibers/person/yr should be
considered major sources, as well (Dris et al. 2018). The approach described here
is intended to operationalize a prioritization scheme based on reasonably available
present-day information. As more sophisticated modeling approaches or California-
specific data become available, such as additional data on the occurrence of smaller
size fractions that may be more likely to translocate (< 10 µm), it is anticipated that
the approach could potentially be refined to relate particle mass and degradation
processes to particle size and count in the aquatic environment.
P H A S E I I : R I S K C H A R A C T E R I Z A T I O N & R A N K I N G | 2 9
M I C R O P L A S T I C P O L L U T I O N I N C A L I F O R N I A

SOURCE TONNAGE POTENTIAL RATING
CRITERIA
High Potential ≥ 3 locations identified as major contributor
Medium Potential 2 locations identified as major contributor
Low Potential 1 location identified as major contributor
Not Considered No evidence*
Table 3. Source tonnage potential rating based on number of locations
identified as major contributors.
Compile evidence for and rate organism microplastics internalization potential.
STEP 3.1:
Conduct a thorough review of the peer-reviewed literature to collect studies showing polymers of interest occurring in taxa of interest (e.g. microfibers in mollusks).
To maximize the number of studies, users of the framework may need to collect
studies on multiple species within the taxa of interest, in addition to those
identified as high priority in the Problem Formulation phase. Studies presenting
particle occurrence in organisms are sufficient to demonstrate internalization, and
this evidence may be measured as particle presence or absence, prevalence or
occurrence (percent of individuals with particles), or concentration (particles per
individual, mass, or volume). Similar to our instructions for adapting source tonnage
potential to specific regions, if one would like to assess microplastic internalization
for specific taxa or species within a California region (e.g. San Francisco Bay) or
site, one can simply compile data from studies of microplastic internalization within
species and taxa that are similar to those of interest within the California region
with regards to taxonomic group, trophic level, and habitat type (e.g. Rainbow Trout
is similar to Chinook Salmon). Once these studies are collected, proceed with the
following steps in the prioritization tool.
>> STEP 3
P H A S E I I : R I S K C H A R A C T E R I Z A T I O N & R A N K I N G | 3 0
M I C R O P L A S T I C P O L L U T I O N I N C A L I F O R N I A
* If HQ studies do not identify particle shape or polymer type, consider lowering rating.

TABLE 4: Data quality evaluation guidelines for microplastics internalization
studies (adapted from Hermsen et al. 2018).
TABLE 5: Study quality ratings according to combined data quality metrics
and criteria.
METRIC CRITERIA (YES OR NO)
Particles observed and measured in organisms
Particle presence measured as: (1) average number of particles per individual or gram (i.e. mass) and (2) percent of individuals with particles present
Quality Assurance vs Quality Control (i.e. QA/QC)
Estimation of particles and laboratory procedures for collection used: blanks used, contamination described, and clean work spaces used (i.e. cotton coats, hoods)
Analytical Identification Method
A representative subsample of of particles identified chemically (e.g., FTIR, Raman, Pyr-GC-MS)
STUDY QUALITY RATING
CRITERIA (i.e. number of data quality metrics that met
their data quality criteria, i.e. yes)**
High Quality (HQ) 3
Medium Quality (MQ) 2
Low Quality (LQ)* 0 - 1
* If neither NR or spectroscopy was used to identify particles (i.e. Analytical Identification Method), study should automatically be rated as LQ.**We use a simple yes/no (i.e. 0 or 1) scoring scheme, instead of the 0, 1, 2 scheme reported in the literature, for user simplicity and consistency with the scoring scheme in Table 2.
P H A S E I I : R I S K C H A R A C T E R I Z A T I O N & R A N K I N G | 3 1
M I C R O P L A S T I C P O L L U T I O N I N C A L I F O R N I A
STEP 3.2:
Assess data quality and assign study quality rating.
For each collected study (or microplastic internalization estimates, if studies
provide more than 1 estimate), assess data quality according to the following
evaluation metrics and criteria (Table 4). Data quality metrics should be assessed
for meeting their criteria (i.e. yes or no).
Once each study is assessed by the above data quality metrics and criteria, sum the total
number of data quality metrics that met (i.e. yes) their data quality criteria in Table 4.
Assign overall study quality ratings according to the following requirements (Table 5).
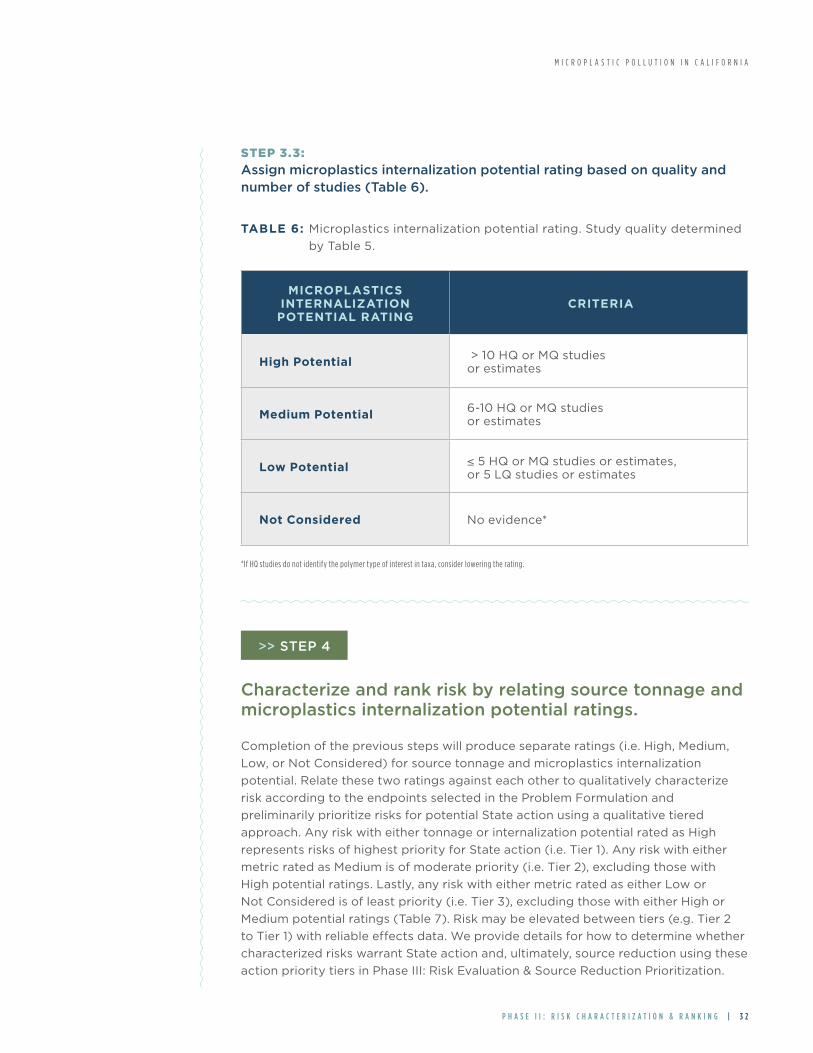
STEP 3.3:
Assign microplastics internalization potential rating based on quality and number of studies (Table 6).
TABLE 6: Microplastics internalization potential rating. Study quality determined
by Table 5.
MICROPLASTICS INTERNALIZATION
POTENTIAL RATING CRITERIA
High Potential > 10 HQ or MQ studies or estimates
Medium Potential6-10 HQ or MQ studies or estimates
Low Potential ≤ 5 HQ or MQ studies or estimates, or 5 LQ studies or estimates
Not Considered No evidence*
*If HQ studies do not identify the polymer type of interest in taxa, consider lowering the rating.
Characterize and rank risk by relating source tonnage and microplastics internalization potential ratings.
Completion of the previous steps will produce separate ratings (i.e. High, Medium,
Low, or Not Considered) for source tonnage and microplastics internalization
potential. Relate these two ratings against each other to qualitatively characterize
risk according to the endpoints selected in the Problem Formulation and
preliminarily prioritize risks for potential State action using a qualitative tiered
approach. Any risk with either tonnage or internalization potential rated as High
represents risks of highest priority for State action (i.e. Tier 1). Any risk with either
metric rated as Medium is of moderate priority (i.e. Tier 2), excluding those with
High potential ratings. Lastly, any risk with either metric rated as either Low or
Not Considered is of least priority (i.e. Tier 3), excluding those with either High or
Medium potential ratings (Table 7). Risk may be elevated between tiers (e.g. Tier 2
to Tier 1) with reliable effects data. We provide details for how to determine whether
characterized risks warrant State action and, ultimately, source reduction using these
action priority tiers in Phase III: Risk Evaluation & Source Reduction Prioritization.
>> STEP 4
P H A S E I I : R I S K C H A R A C T E R I Z A T I O N & R A N K I N G | 3 2
M I C R O P L A S T I C P O L L U T I O N I N C A L I F O R N I A
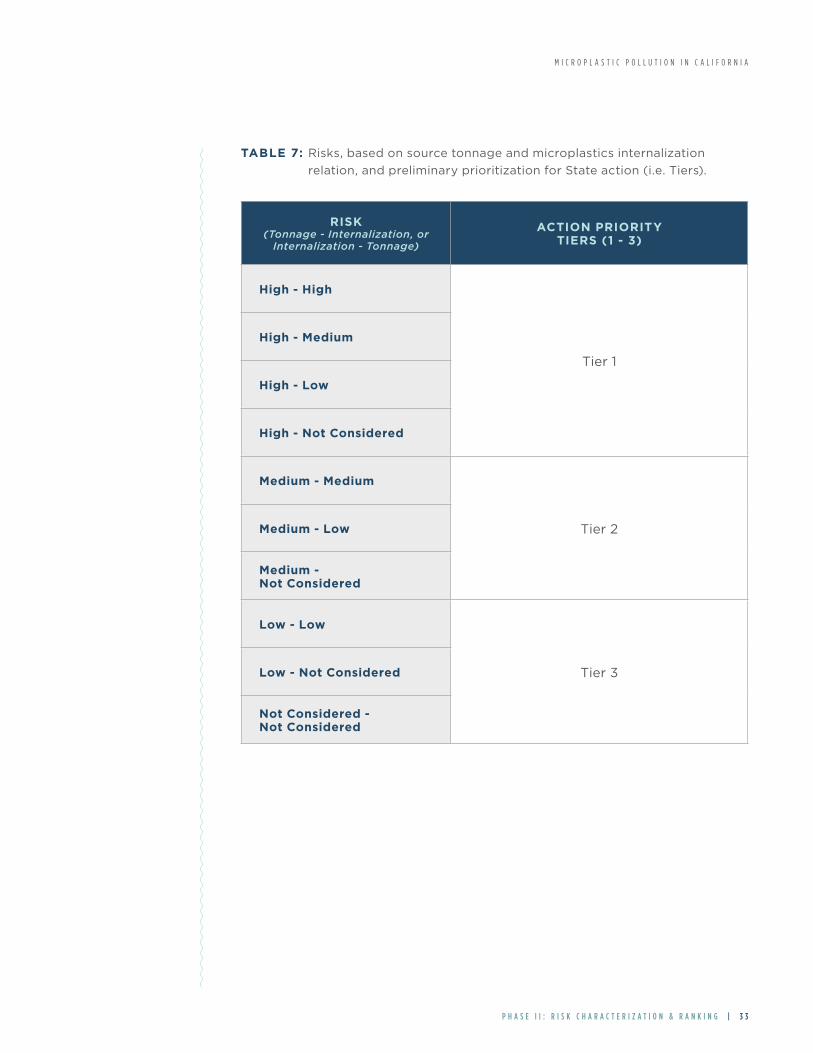
TABLE 7: Risks, based on source tonnage and microplastics internalization
relation, and preliminary prioritization for State action (i.e. Tiers).
RISK (Tonnage - Internalization, or
Internalization - Tonnage)
ACTION PRIORITY TIERS (1 - 3)
High - High
Tier 1
High - Medium
High - Low
High - Not Considered
Medium - Medium
Tier 2Medium - Low
Medium - Not Considered
Low - Low
Tier 3Low - Not Considered
Not Considered - Not Considered
P H A S E I I : R I S K C H A R A C T E R I Z A T I O N & R A N K I N G | 3 3
M I C R O P L A S T I C P O L L U T I O N I N C A L I F O R N I A

About this Section:
We provide a demonstration of how to apply the risk ranking tool described in the
previous Risk Characterization & Ranking phase. As an example to illustrate the method
of rating the risk for one combination of polymer type, source, and taxa of interest,
we assess the risk that microfibers, from textile sources, pose to mollusks (Fig. 3).
Recommendations:
1. According to our action priority tiers (Table 7), the risk of microfibers from
textiles to mollusks is ranked as the highest possible action priority tier
(i.e. Tier 1). organisms and humans.
2. To determine whether characterized risk warrants State action, risk of
microfibers from textiles to mollusks should be compared with other
combinations (e.g. road & tire wear, tires, crustaceans) to determine which
risk is of relative higher priority for State action and, ultimately, source
reduction activities.
5. Example: Mollusks, Microfibers, and Textiles
E X A M P L E : M O L L U S K S , M I C R O F I B E R S , A N D T E X T I L E S | 3 4
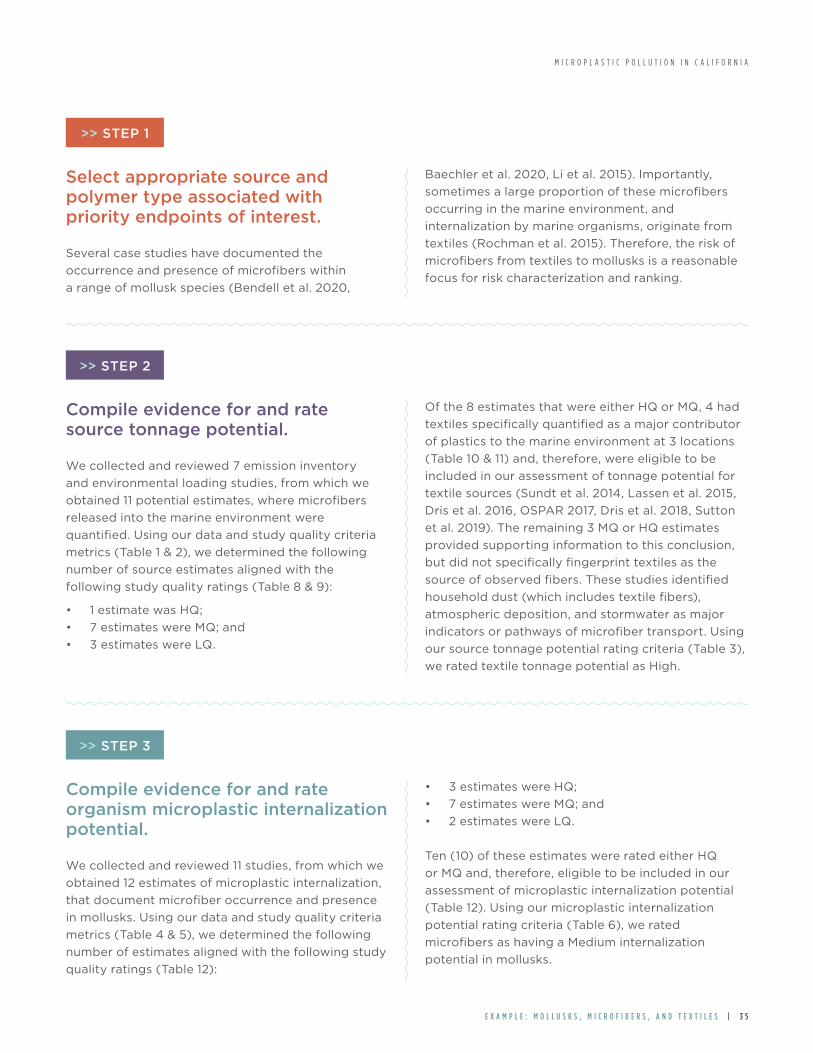
Select appropriate source and polymer type associated with priority endpoints of interest.
Several case studies have documented the
occurrence and presence of microfibers within
a range of mollusk species (Bendell et al. 2020,
Baechler et al. 2020, Li et al. 2015). Importantly,
sometimes a large proportion of these microfibers
occurring in the marine environment, and
internalization by marine organisms, originate from
textiles (Rochman et al. 2015). Therefore, the risk of
microfibers from textiles to mollusks is a reasonable
focus for risk characterization and ranking.
Compile evidence for and rate source tonnage potential.
We collected and reviewed 7 emission inventory
and environmental loading studies, from which we
obtained 11 potential estimates, where microfibers
released into the marine environment were
quantified. Using our data and study quality criteria
metrics (Table 1 & 2), we determined the following
number of source estimates aligned with the
following study quality ratings (Table 8 & 9):
• 1 estimate was HQ;
• 7 estimates were MQ; and
• 3 estimates were LQ.
Of the 8 estimates that were either HQ or MQ, 4 had
textiles specifically quantified as a major contributor
of plastics to the marine environment at 3 locations
(Table 10 & 11) and, therefore, were eligible to be
included in our assessment of tonnage potential for
textile sources (Sundt et al. 2014, Lassen et al. 2015,
Dris et al. 2016, OSPAR 2017, Dris et al. 2018, Sutton
et al. 2019). The remaining 3 MQ or HQ estimates
provided supporting information to this conclusion,
but did not specifically fingerprint textiles as the
source of observed fibers. These studies identified
household dust (which includes textile fibers),
atmospheric deposition, and stormwater as major
indicators or pathways of microfiber transport. Using
our source tonnage potential rating criteria (Table 3),
we rated textile tonnage potential as High.
Compile evidence for and rate organism microplastic internalization potential.
We collected and reviewed 11 studies, from which we
obtained 12 estimates of microplastic internalization,
that document microfiber occurrence and presence
in mollusks. Using our data and study quality criteria
metrics (Table 4 & 5), we determined the following
number of estimates aligned with the following study
quality ratings (Table 12):
• 3 estimates were HQ;
• 7 estimates were MQ; and
• 2 estimates were LQ.
Ten (10) of these estimates were rated either HQ
or MQ and, therefore, eligible to be included in our
assessment of microplastic internalization potential
(Table 12). Using our microplastic internalization
potential rating criteria (Table 6), we rated
microfibers as having a Medium internalization
potential in mollusks.
>> STEP 1
>> STEP 2
>> STEP 3
M I C R O P L A S T I C P O L L U T I O N I N C A L I F O R N I A
E X A M P L E : M O L L U S K S , M I C R O F I B E R S , A N D T E X T I L E S | 3 5
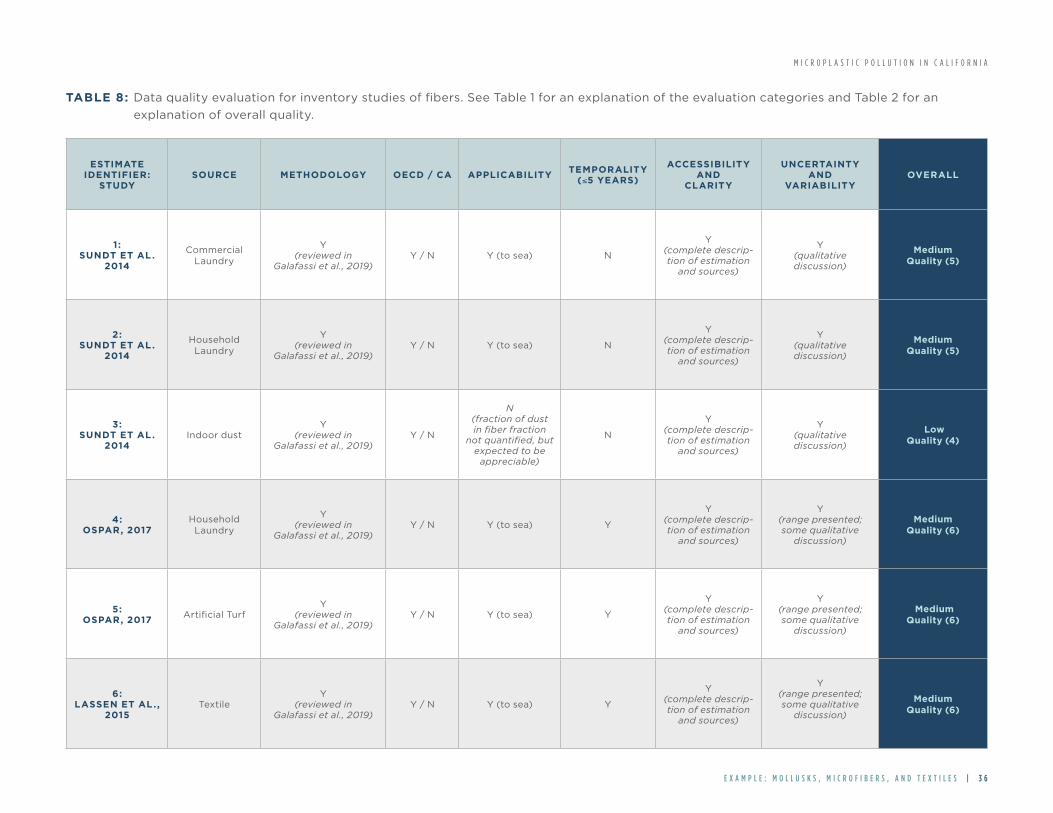
M I C R O P L A S T I C P O L L U T I O N I N C A L I F O R N I A
E X A M P L E : M O L L U S K S , M I C R O F I B E R S , A N D T E X T I L E S | 3 6
TABLE 8: Data quality evaluation for inventory studies of fibers. See Table 1 for an explanation of the evaluation categories and Table 2 for an
explanation of overall quality.
ESTIMATE IDENTIFIER:
STUDYSOURCE METHODOLOGY OECD / CA APPLICABILITY
TEMPORALITY (≤5 YEARS)
ACCESSIBILITY AND
CLARITY
UNCERTAINTY AND
VARIABILITYOVERALL
1: SUNDT ET AL.
2014
Commercial Laundry
Y (reviewed in
Galafassi et al., 2019)Y / N Y (to sea) N
Y(complete descrip-tion of estimation
and sources)
Y(qualitative discussion)
Medium Quality (5)
2: SUNDT ET AL.
2014
Household Laundry
Y (reviewed in
Galafassi et al., 2019)Y / N Y (to sea) N
Y(complete descrip-tion of estimation
and sources)
Y(qualitative discussion)
Medium Quality (5)
3: SUNDT ET AL.
2014Indoor dust
Y (reviewed in
Galafassi et al., 2019)Y / N
N (fraction of dust in fiber fraction
not quantified, but expected to be
appreciable)
N
Y(complete descrip-tion of estimation
and sources)
Y(qualitative discussion)
Low Quality (4)
4: OSPAR, 2017
Household Laundry
Y (reviewed in
Galafassi et al., 2019)Y / N Y (to sea) Y
Y(complete descrip-tion of estimation
and sources)
Y (range presented; some qualitative
discussion)
Medium Quality (6)
5: OSPAR, 2017
Artificial TurfY
(reviewed in Galafassi et al., 2019)
Y / N Y (to sea) Y
Y(complete descrip-tion of estimation
and sources)
Y (range presented; some qualitative
discussion)
Medium Quality (6)
6: LASSEN ET AL.,
2015Textile
Y (reviewed in
Galafassi et al., 2019)Y / N Y (to sea) Y
Y(complete descrip-tion of estimation
and sources)
Y (range presented; some qualitative
discussion)
Medium Quality (6)

M I C R O P L A S T I C P O L L U T I O N I N C A L I F O R N I A
E X A M P L E : M O L L U S K S , M I C R O F I B E R S , A N D T E X T I L E S | 3 7
TABLE 9: Data evaluation for environmental loading studies for fibers. See Table 1 for an explanation of the evaluation categories and Table 2 for
an explanation of overall quality.
ESTIMATE IDENTIFIER:
STUDYPATHWAY METHODOLOGY QA/QC
OECD / CA
APPLICABILITYTEMPORALITY
(≤5 YEARS)ACCESSIBILITY AND CLARITY
SAMPLE SIZE
UNCERTAINTY AND
VARIABILITYOVERALL
7: DRIS ET AL. 2016 & 2018
Atmospheric Deposition
Y (published mass balance approach based on some
sampling with assumptions; fraction of fibers analyzed
by FTIR)
Y (blank
analysis)Y / N
N (general estimate
of aerial deposition of synthetic fibers from all sources)
Y
Y (complete
description of estimation and
sources)
N (2 sites)
Y (ranges pre-sented with
some discus-sion)
Medium Quality (6)
8: DRIS ET AL. 2015 & 2018
Wastewater effluent with
assumed removal
efficiency
Y (published mass balance
approach based on some sampling with
assumptions; no protocol for fiber identification)
N (limited)
Y / N
N (general estimate
for wastewater treatment plants,
but no particle identification)
Y
Y (complete
description of estimation and
sources)
N (2 WWTP effluents)
Y (ranges pre-sented with
some discussion)
Low Quality (5)
9: DRIS ET AL. 2015 & 2018
Combined sewer
overflow
Y (published mass balance
approach based on some sampling with
assumptions; no protocol for fiber identification)
N (limited)
Y / N
N (general estimate for CSO, but no
particle identifica-tion)
Y
Y (complete
description of estimation and
sources)
N (1 site)
N (limited con-sideration of
variability and uncertainty)
Low Quality (4)
10: SUTTON ET
AL. 2019
Stormwa-ter from 12 tributaries
representing 11% of drain-age area and
6% of flow
N (mass balance approach with sample design incorporating knowledge of watershed and
calibrated loading model; fraction of fibers identified by FTIR or Raman; study
had external advisors, but loading estimate calibration
method has not been described in peer-reviewed
literature)*
Y (recovery, field and
laboratory blanks, field duplicates)
Y / Y
Y (estimates provid-ed for specific por-tion of watershed,
with additional categorization by
land use)
Y
Y (complete
description of estimation and
sources)
Y (12 sites
according to a con-ceptual model)
Y (extensive ana-lytical QA/QC with discussion
of results in context of pri-
or studies)
Medium Quality (8)
11: SUTTON ET
AL. 2019
Wastewa-ter from 8 facilities
representing 70% of flow
Y (sample design addressed 24-hour discharge and re-
peat measurements; fraction of fibers identified by FTIR or Raman; study had exter-
nal advisors; preceding pilot study peer-reviewed)
Y (recovery, field and
laboratory blanks, field duplicates)
Y / Y
Y (based on mea-surements from
identified facilities in summer and fall
months)
Y
Y (complete
description of sampling plan and methods)
Y (8 facilities represent-
ing 70% of treated
flow)
Y (extensive an-alytical QA/QC with discussion
of results in context of pri-
or studies)
High Quality (9)
*Measurement methodology met data quality evaluation guidelines. However, the loading model calibration had not yet been described in detail in the peer reviewed literature at the time of preparation of this example. Thus, the overall quality for loading was scored as medium.
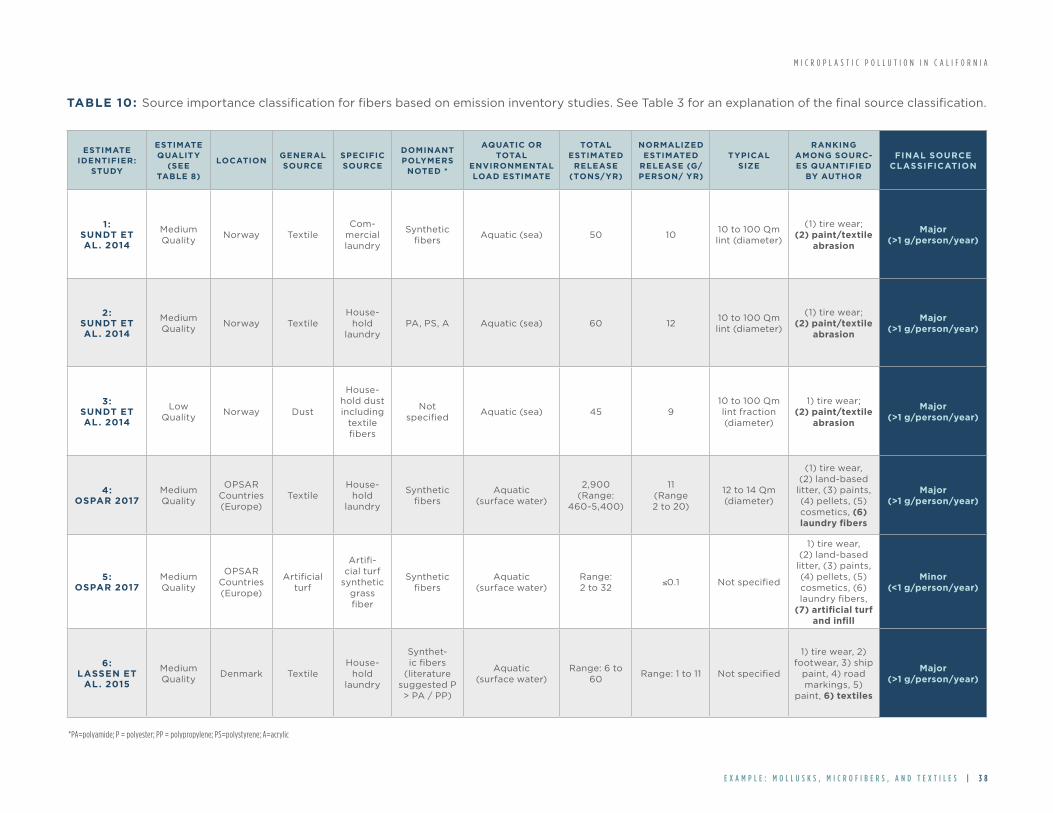
M I C R O P L A S T I C P O L L U T I O N I N C A L I F O R N I A
E X A M P L E : M O L L U S K S , M I C R O F I B E R S , A N D T E X T I L E S | 3 8
TABLE 10: Source importance classification for fibers based on emission inventory studies. See Table 3 for an explanation of the final source classification.
ESTIMATE IDENTIFIER:
STUDY
ESTIMATE QUALITY
(SEE TABLE 8)
LOCATIONGENERAL SOURCE
SPECIFIC SOURCE
DOMINANT POLYMERS
NOTED *
AQUATIC OR TOTAL
ENVIRONMENTAL LOAD ESTIMATE
TOTAL ESTIMATED
RELEASE (TONS/YR)
NORMALIZED ESTIMATED
RELEASE (G/PERSON/ YR)
TYPICAL SIZE
RANKING AMONG SOURC-ES QUANTIFIED
BY AUTHOR
FINAL SOURCE CLASSIFICATION
1: SUNDT ET AL. 2014
Medium Quality
Norway TextileCom-
mercial laundry
Synthetic fibers
Aquatic (sea) 50 1010 to 100 µm lint (diameter)
(1) tire wear; (2) paint/textile
abrasion
Major (>1 g/person/year)
2: SUNDT ET AL. 2014
Medium Quality
Norway TextileHouse-
hold laundry
PA, PS, A Aquatic (sea) 60 1210 to 100 µm lint (diameter)
(1) tire wear; (2) paint/textile
abrasion
Major (>1 g/person/year)
3: SUNDT ET AL. 2014
Low Quality
Norway Dust
House-hold dust including
textile fibers
Not specified
Aquatic (sea) 45 910 to 100 µm lint fraction (diameter)
1) tire wear; (2) paint/textile
abrasion
Major (>1 g/person/year)
4: OSPAR 2017
Medium Quality
OPSAR Countries (Europe)
TextileHouse-
hold laundry
Synthetic fibers
Aquatic (surface water)
2,900 (Range:
460-5,400)
11 (Range 2 to 20)
12 to 14 µm (diameter)
(1) tire wear, (2) land-based
litter, (3) paints, (4) pellets, (5) cosmetics, (6) laundry fibers
Major (>1 g/person/year)
5: OSPAR 2017
Medium Quality
OPSAR Countries (Europe)
Artificial turf
Artifi-cial turf
synthetic grass fiber
Synthetic fibers
Aquatic (surface water)
Range: 2 to 32
≤0.1 Not specified
1) tire wear, (2) land-based
litter, (3) paints, (4) pellets, (5) cosmetics, (6) laundry fibers,
(7) artificial turf and infill
Minor (<1 g/person/year)
6: LASSEN ET
AL. 2015
Medium Quality
Denmark TextileHouse-
hold laundry
Synthet-ic fibers
(literature suggested P > PA / PP)
Aquatic (surface water)
Range: 6 to 60
Range: 1 to 11 Not specified
1) tire wear, 2) footwear, 3) ship
paint, 4) road markings, 5)
paint, 6) textiles
Major (>1 g/person/year)
*PA=polyamide; P = polyester; PP = polypropylene; PS=polystyrene; A=acrylic
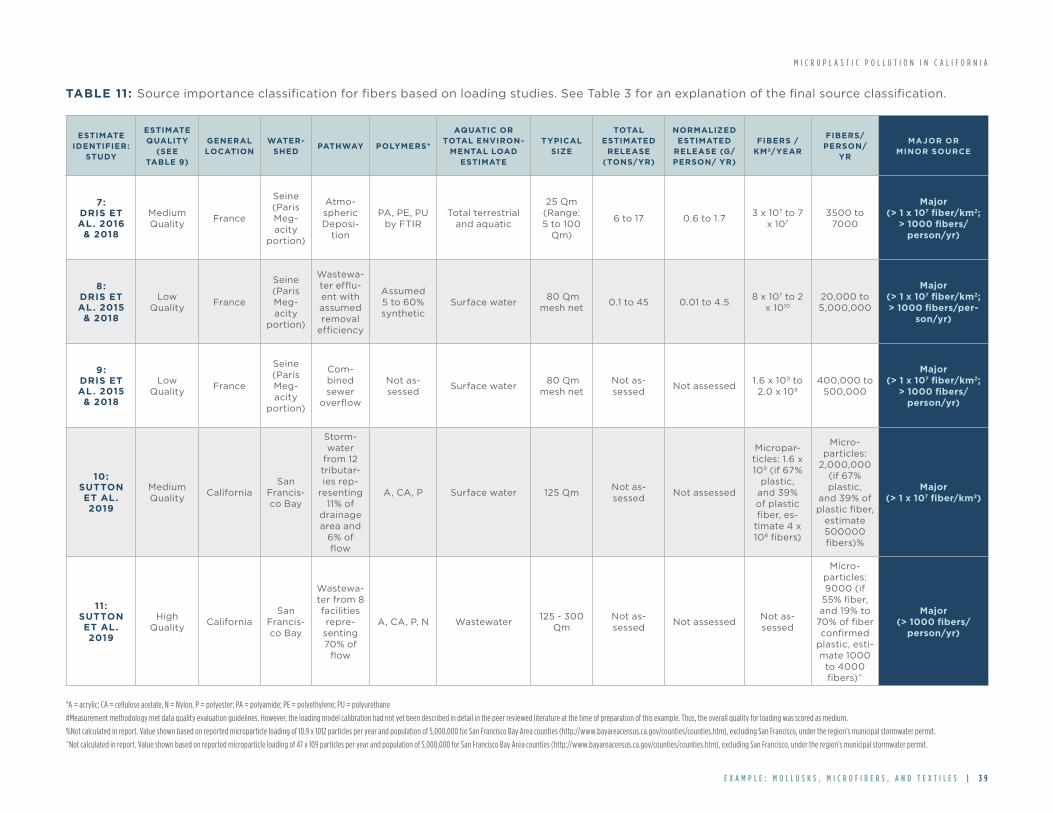
M I C R O P L A S T I C P O L L U T I O N I N C A L I F O R N I A
E X A M P L E : M O L L U S K S , M I C R O F I B E R S , A N D T E X T I L E S | 3 9
TABLE 11: Source importance classification for fibers based on loading studies. See Table 3 for an explanation of the final source classification.
ESTIMATE IDENTIFIER:
STUDY
ESTIMATE QUALITY
(SEE TABLE 9)
GENERAL LOCATION
WATER-SHED
PATHWAY POLYMERS*
AQUATIC OR TOTAL ENVIRON-
MENTAL LOAD ESTIMATE
TYPICAL SIZE
TOTAL ESTIMATED
RELEASE (TONS/YR)
NORMALIZED ESTIMATED
RELEASE (G/PERSON/ YR)
FIBERS / KM2/YEAR
FIBERS/PERSON/
YR
MAJOR OR MINOR SOURCE
7: DRIS ET AL. 2016
& 2018
Medium Quality
France
Seine (Paris Meg-acity
portion)
Atmo-spheric Deposi-
tion
PA, PE, PU by FTIR
Total terrestrial and aquatic
25 µm (Range: 5 to 100
µm)
6 to 17 0.6 to 1.73 x 10⁷ to 7
x 107
3500 to 7000
Major (> 1 x 10⁷ fiber/km2;
> 1000 fibers/ person/yr)
8: DRIS ET AL. 2015 & 2018
Low Quality
France
Seine (Paris Meg-acity
portion)
Wastewa-ter efflu-ent with assumed removal
efficiency
Assumed 5 to 60% synthetic
Surface water 80 µm
mesh net0.1 to 45 0.01 to 4.5
8 x 10⁷ to 2 x 10¹⁰
20,000 to 5,000,000
Major (> 1 x 10⁷ fiber/km2; > 1000 fibers/per-
son/yr)
9: DRIS ET AL. 2015 & 2018
Low Quality
France
Seine (Paris Meg-acity
portion)
Com-bined sewer
overflow
Not as-sessed
Surface water 80 µm
mesh netNot as-sessed
Not assessed1.6 x 109 to 2.0 x 10⁹
400,000 to 500,000
Major (> 1 x 10⁷ fiber/km2;
> 1000 fibers/ person/yr)
10: SUTTON ET AL. 2019
Medium Quality
CaliforniaSan
Francis-co Bay
Storm-water
from 12 tributar-ies rep-
resenting 11% of
drainage area and
6% of flow
A, CA, P Surface water 125 µmNot as-sessed
Not assessed
Micropar-ticles: 1.6 x 10⁹ (if 67%
plastic, and 39% of plastic fiber, es-
timate 4 x 10⁸ fibers)
Micro-particles:
2,000,000 (if 67% plastic,
and 39% of plastic fiber,
estimate 500000 fibers)%
Major (> 1 x 10⁷ fiber/km2)
11: SUTTON ET AL. 2019
High Quality
CaliforniaSan
Francis-co Bay
Wastewa-ter from 8 facilities repre-senting 70% of
flow
A, CA, P, N Wastewater125 - 300
µmNot as-sessed
Not assessedNot as-sessed
Micro-particles: 9000 (if
55% fiber, and 19% to
70% of fiber confirmed
plastic, esti-mate 1000
to 4000 fibers)^
Major (> 1000 fibers/
person/yr)
*A = acrylic; CA = cellulose acetate, N = Nylon, P = polyester; PA = polyamide; PE = polyethylene; PU = polyurethane
#Measurement methodology met data quality evaluation guidelines. However, the loading model calibration had not yet been described in detail in the peer reviewed literature at the time of preparation of this example. Thus, the overall quality for loading was scored as medium.
%Not calculated in report. Value shown based on reported microparticle loading of 10.9 x 10¹² particles per year and population of 5,000,000 for San Francisco Bay Area counties (http://www.bayareacensus.ca.gov/counties/counties.htm), excluding San Francisco, under the region’s municipal stormwater permit.
^Not calculated in report. Value shown based on reported microparticle loading of 47 x 109 particles per year and population of 5,000,000 for San Francisco Bay Area counties (http://www.bayareacensus.ca.gov/counties/counties.htm), excluding San Francisco, under the region’s municipal stormwater permit.
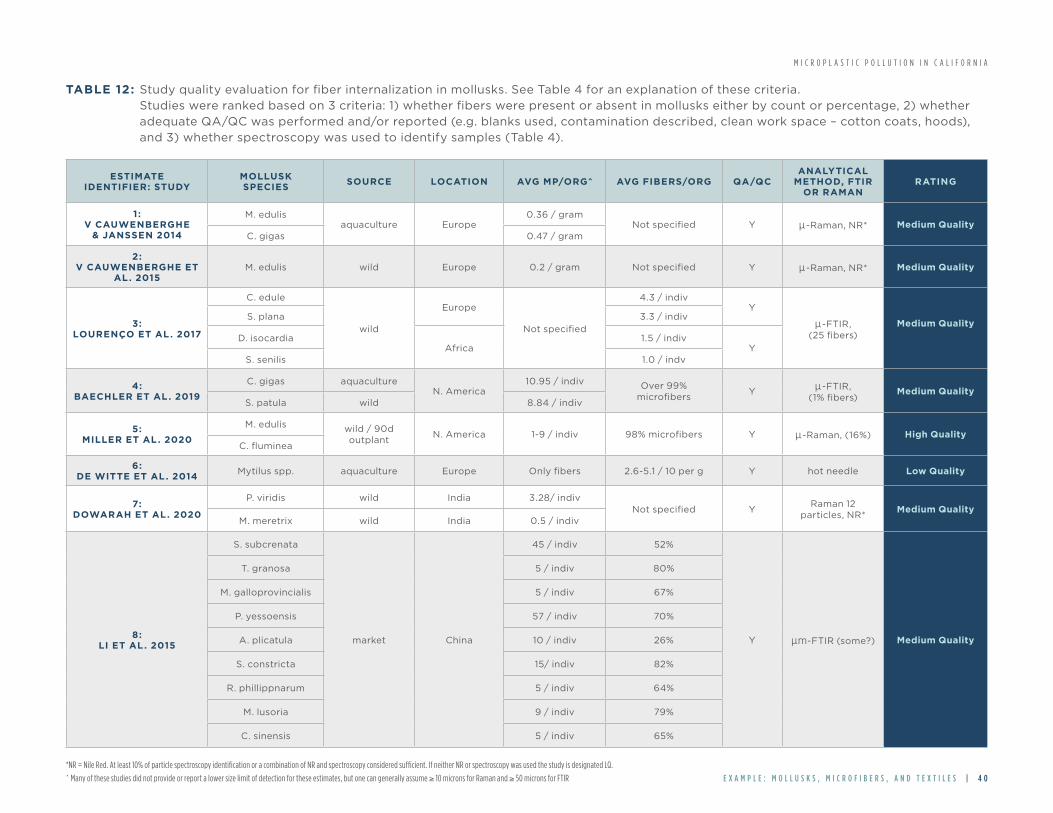
M I C R O P L A S T I C P O L L U T I O N I N C A L I F O R N I A
E X A M P L E : M O L L U S K S , M I C R O F I B E R S , A N D T E X T I L E S | 4 0
TABLE 12: Study quality evaluation for fiber internalization in mollusks. See Table 4 for an explanation of these criteria. Studies were ranked based on 3 criteria: 1) whether fibers were present or absent in mollusks either by count or percentage, 2) whether adequate QA/QC was performed and/or reported (e.g. blanks used, contamination described, clean work space – cotton coats, hoods), and 3) whether spectroscopy was used to identify samples (Table 4).
ESTIMATE IDENTIFIER: STUDY
MOLLUSK SPECIES
SOURCE LOCATION AVG MP/ORG^ AVG FIBERS/ORG QA/QCANALYTICAL
METHOD, FTIR OR RAMAN
RATING
1: V CAUWENBERGHE
& JANSSEN 2014
M. edulisaquaculture Europe
0.36 / gramNot specified Y μ-Raman, NR* Medium Quality
C. gigas 0.47 / gram
2:V CAUWENBERGHE ET
AL. 2015M. edulis wild Europe 0.2 / gram Not specified Y μ-Raman, NR* Medium Quality
3: LOURENÇO ET AL. 2017
C. edule
wild
Europe
Not specified
4.3 / indivY
μ-FTIR, (25 fibers)
Medium QualityS. plana 3.3 / indiv
D. isocardiaAfrica
1.5 / indivY
S. senilis 1.0 / indv
4: BAECHLER ET AL. 2019
C. gigas aquacultureN. America
10.95 / indiv Over 99% microfibers
Y μ-FTIR, (1% fibers)
Medium QualityS. patula wild 8.84 / indiv
5: MILLER ET AL. 2020
M. edulis wild / 90d outplant
N. America 1-9 / indiv 98% microfibers Y μ-Raman, (16%) High QualityC. fluminea
6: DE WITTE ET AL. 2014
Mytilus spp. aquaculture Europe Only fibers 2.6-5.1 / 10 per g Y hot needle Low Quality
7: DOWARAH ET AL. 2020
P. viridis wild India 3.28/ indivNot specified Y
Raman 12 particles, NR*
Medium QualityM. meretrix wild India 0.5 / indiv
8: LI ET AL. 2015
S. subcrenata
market China
45 / indiv 52%
Y μm-FTIR (some?) Medium Quality
T. granosa 5 / indiv 80%
M. galloprovincialis 5 / indiv 67%
P. yessoensis 57 / indiv 70%
A. plicatula 10 / indiv 26%
S. constricta 15/ indiv 82%
R. phillippnarum 5 / indiv 64%
M. lusoria 9 / indiv 79%
C. sinensis 5 / indiv 65%
*NR = Nile Red. At least 10% of particle spectroscopy identification or a combination of NR and spectroscopy considered sufficient. If neither NR or spectroscopy was used the study is designated LQ.
^ Many of these studies did not provide or report a lower size limit of detection for these estimates, but one can generally assume ≥ 10 microns for Raman and ≥ 50 microns for FTIR
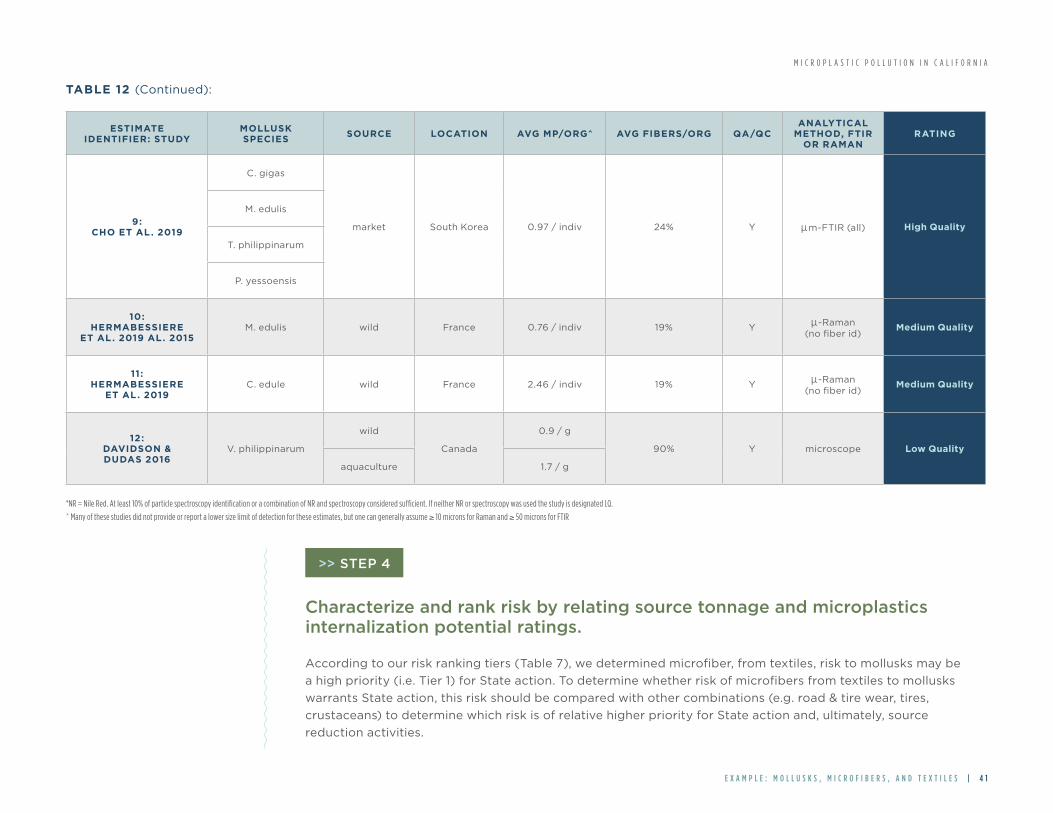
M I C R O P L A S T I C P O L L U T I O N I N C A L I F O R N I A
E X A M P L E : M O L L U S K S , M I C R O F I B E R S , A N D T E X T I L E S | 4 1
TABLE 12 (Continued):
*NR = Nile Red. At least 10% of particle spectroscopy identification or a combination of NR and spectroscopy considered sufficient. If neither NR or spectroscopy was used the study is designated LQ.
^ Many of these studies did not provide or report a lower size limit of detection for these estimates, but one can generally assume ≥ 10 microns for Raman and ≥ 50 microns for FTIR
ESTIMATE IDENTIFIER: STUDY
MOLLUSK SPECIES
SOURCE LOCATION AVG MP/ORG^ AVG FIBERS/ORG QA/QCANALYTICAL
METHOD, FTIR OR RAMAN
RATING
9: CHO ET AL. 2019
C. gigas
market South Korea 0.97 / indiv 24% Y μm-FTIR (all) High Quality
M. edulis
T. philippinarum
P. yessoensis
10: HERMABESSIERE
ET AL. 2019 AL. 2015M. edulis wild France 0.76 / indiv 19% Y μ-Raman
(no fiber id)Medium Quality
11: HERMABESSIERE
ET AL. 2019C. edule wild France 2.46 / indiv 19% Y μ-Raman
(no fiber id)Medium Quality
12: DAVIDSON & DUDAS 2016
V. philippinarum
wild
Canada
0.9 / g
90% Y microscope Low Quality
aquaculture 1.7 / g
Characterize and rank risk by relating source tonnage and microplastics internalization potential ratings.
According to our risk ranking tiers (Table 7), we determined microfiber, from textiles, risk to mollusks may be
a high priority (i.e. Tier 1) for State action. To determine whether risk of microfibers from textiles to mollusks
warrants State action, this risk should be compared with other combinations (e.g. road & tire wear, tires,
crustaceans) to determine which risk is of relative higher priority for State action and, ultimately, source
reduction activities.
>> STEP 4
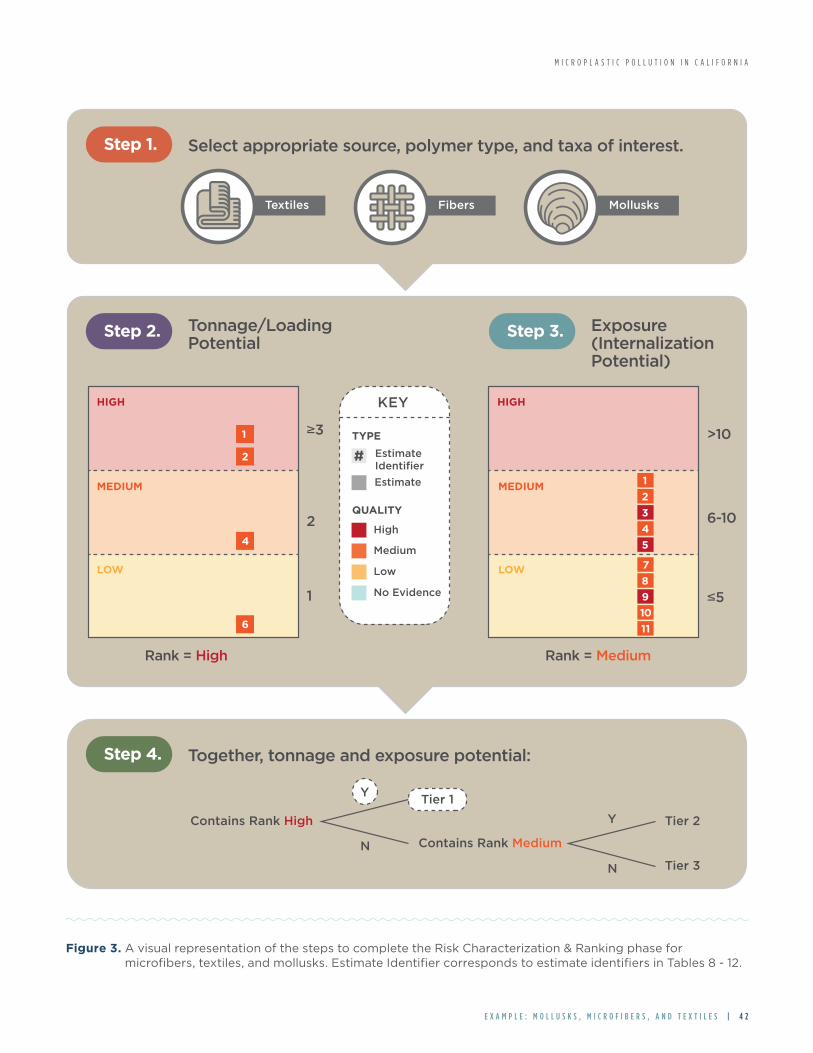
Figure 3
Figure 3. A visual representation of the steps to complete the Risk Characterization & Ranking phase for microfibers, textiles, and mollusks. Estimate Identifier corresponds to estimate identifiers in Tables 8 - 12.
Step 2. Tonnage/Loading Potential
Step 3. Exposure (Internalization Potential)
HIGH
MEDIUM
LOW
MEDIUM
LOW
Rank = High
2
1
≥3
6
4
2
1
HIGH
Rank = Medium
6-10
≤5
>10
5
4
3
2
1
11
10
9
8
7
KEY
TYPE
Estimate
QUALITY
High
Medium
Low
No Evidence
EstimateIdentifier
#
Step 4. Together, tonnage and exposure potential:
Contains Rank High
Tier 1Y
N Contains Rank Medium
Tier 2
Tier 3
Y
N
Step 1. Select appropriate source, polymer type, and taxa of interest.
Textiles Fibers Mollusks
ocean science trust // microplastics report // figures // final // 04 21 21
Figure 3. A visual representation of the steps to complete the Risk Characterization & Ranking phase for microfibers, textiles, and mollusks. Estimate Identifier corresponds to estimate identifiers in Tables 8 - 12.
M I C R O P L A S T I C P O L L U T I O N I N C A L I F O R N I A
E X A M P L E : M O L L U S K S , M I C R O F I B E R S , A N D T E X T I L E S | 4 2
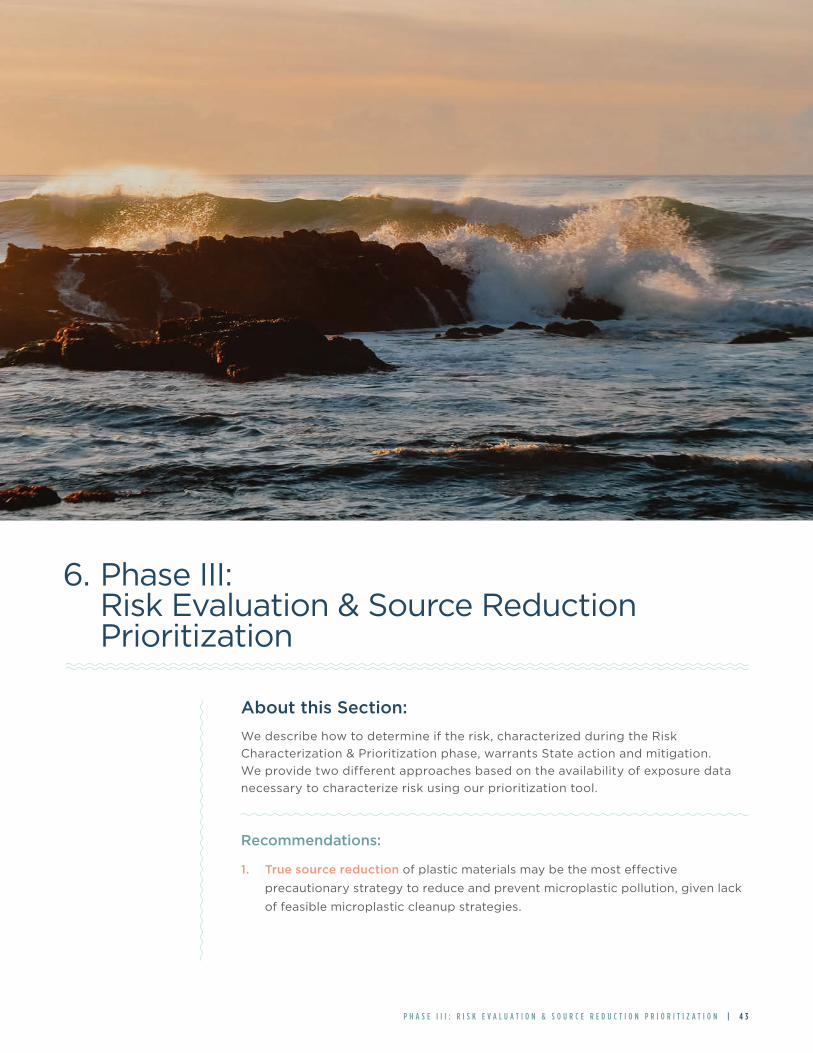
About this Section:
We describe how to determine if the risk, characterized during the Risk
Characterization & Prioritization phase, warrants State action and mitigation.
We provide two different approaches based on the availability of exposure data
necessary to characterize risk using our prioritization tool.
Recommendations:
1. True source reduction of plastic materials may be the most effective
precautionary strategy to reduce and prevent microplastic pollution, given lack
of feasible microplastic cleanup strategies.
6. Phase III: Risk Evaluation & Source Reduction Prioritization
P H A S E I I I : R I S K E V A L U A T I O N & S O U R C E R E D U C T I O N P R I O R I T I Z A T I O N | 4 3

The Risk Evaluation & Source Reduction Prioritization phase determines whether
characterized risk warrants State action and mitigation. We recommend two
different approaches for decision-makers to consider for evaluating risk,
determining when management action might be required, and prioritizing source
reduction activities. Here, we provide two approaches to account for potential data
gaps, needed to execute the precautionary framework, as well as to account for
sources decision-makers may preliminarily determine to not need a risk assessment
to make effective management decisions. These approaches should be combined
with other key considerations to prioritize source reduction (Box 5).
(1) Evaluate preliminary prioritization of source
reduction using one or both approaches:
(a) Objective Risk: prioritize source reduction
solutions based on a characterized risk’s action
priority tiers (1 -3) following the Risk Characterization
& Ranking phase.
(b) Hazard Potential: prioritize source reduction
solutions based on high priority and prevalent
sources, fate & transport pathways, and polymer
types and morphology following the Problem
Formulation phase.
(2) Prioritize source reduction activities for
sources, and/or associated fate & transport
pathway and polymer types, without effective
intervention strategies.
BOX 5:
Steps to complete the Risk Evaluation & Source Reduction Prioritization phase.
P H A S E I I I : R I S K E V A L U A T I O N & S O U R C E R E D U C T I O N P R I O R I T I Z A T I O N | 4 4
M I C R O P L A S T I C P O L L U T I O N I N C A L I F O R N I A
Evaluate risk(s) for preliminary prioritization of source reduction solutions using one or both approaches.
Objective Risk
If the required exposure data is available, we recommend completing the Risk
Characterization & Ranking phase and prioritizing sources for State action based on
their action priority tiers. Risks classified as High in either tonnage or microplastic
internalization potential are deemed highest priority (i.e. Tier 1) for the State to
address. If neither metric potential is rated High, risk may not be as pressing to
mitigate, but could still be considered for reduction. Importantly, the action priority
tiers do not exclude or determine when State action is not required, but rather
provide a justifiable means to identify risk most in need for mitigation, beginning
with Tier 1 (most in need) and ending with Tier 3 (least in need).
>> STEP 1
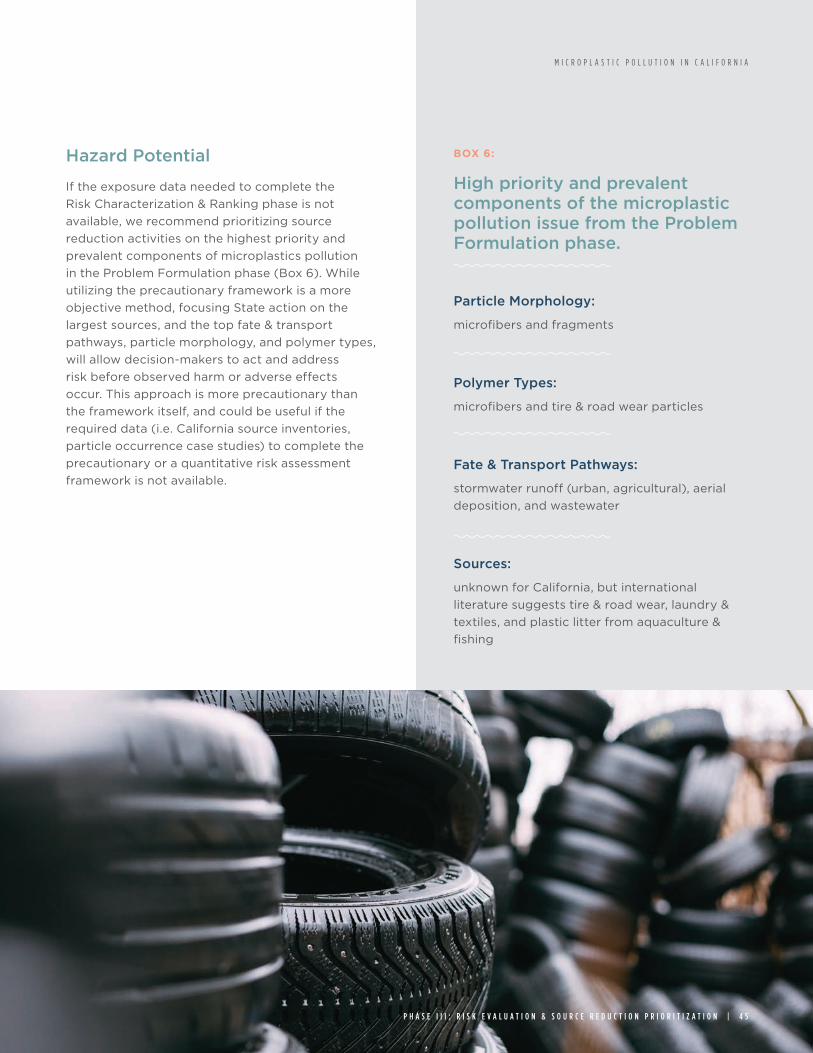
Hazard Potential
If the exposure data needed to complete the
Risk Characterization & Ranking phase is not
available, we recommend prioritizing source
reduction activities on the highest priority and
prevalent components of microplastics pollution
in the Problem Formulation phase (Box 6). While
utilizing the precautionary framework is a more
objective method, focusing State action on the
largest sources, and the top fate & transport
pathways, particle morphology, and polymer types,
will allow decision-makers to act and address
risk before observed harm or adverse effects
occur. This approach is more precautionary than
the framework itself, and could be useful if the
required data (i.e. California source inventories,
particle occurrence case studies) to complete the
precautionary or a quantitative risk assessment
framework is not available.
Particle Morphology:
microfibers and fragments
Polymer Types:
microfibers and tire & road wear particles
Fate & Transport Pathways:
stormwater runoff (urban, agricultural), aerial
deposition, and wastewater
Sources:
unknown for California, but international
literature suggests tire & road wear, laundry &
textiles, and plastic litter from aquaculture &
fishing
BOX 6:
High priority and prevalent components of the microplastic pollution issue from the Problem Formulation phase.
P H A S E I I I : R I S K E V A L U A T I O N & S O U R C E R E D U C T I O N P R I O R I T I Z A T I O N | 4 5
M I C R O P L A S T I C P O L L U T I O N I N C A L I F O R N I A
P H A S E I I I : R I S K E V A L U A T I O N & S O U R C E R E D U C T I O N P R I O R I T I Z A T I O N | 4 6
M I C R O P L A S T I C P O L L U T I O N I N C A L I F O R N I A
Prioritize source reduction activities for sources, and/or associated fate & transport pathways and polymer types, without effective intervention strategies.
We recommend prioritizing source reduction activities on sources for which
there are currently no adequate intervention strategies to reduce or prevent
microplastic release into the environment. Final prioritization and selection of
source reduction solutions should consider whether the associated sources, fate
& transport pathways, and particles have adequate intervention strategies already
in place to address risk and prevent potential harm from exposure. Intervention
strategies may vary in their efficacy to mitigate microplastic pollution. For
example, while some cleanup strategies (e.g. community-based beach and coastal
cleanup events) help to remove macroplastic materials from the environment,
they are not designed to remove microplastics, specifically, especially relatively
small size ranges that are most hazardous (Ogunola et al. 2018). Other capture
and collection strategies, such as those focused on preventing transport (e.g. rain
gardens for stormwater, wastewater treatment plants), are relatively effective at
capturing and removing microplastics (Gilbreath et al. 2019, Sun et al. 2019), but
decision-makers must consider the fate of particles after capture and whether
those recycled materials are potentially re-entering the marine environment (or
even entering the terrestrial environment) via another source or fate & transport
pathway. For example, plastic materials captured in rain gardens are sometimes
recycled into agricultural biosolids and, therefore, may re-enter the environment
via agricultural runoff.
Other fate & transport pathways, such as aerial deposition, do not currently
have any adequate intervention strategies to prevent pollution. Importantly,
however, we cannot ignore the potential for aerial deposition to contribute
microplastic particles to other sources and fate & transport pathways that may
currently have adequate or inadequate intervention strategies. Yet, it is difficult to
determine what proportion of microplastic input to these other sources and fate
& transport pathways derive from aerial deposition. Due to the complexities of
the microplastic stream and uncertainties around intervention strategy efficacy,
true source reduction of plastic materials, either through reducing production or
curbing societal use, may be the most effective precautionary strategy to reduce
and prevent microplastic pollution.
>> STEP 2
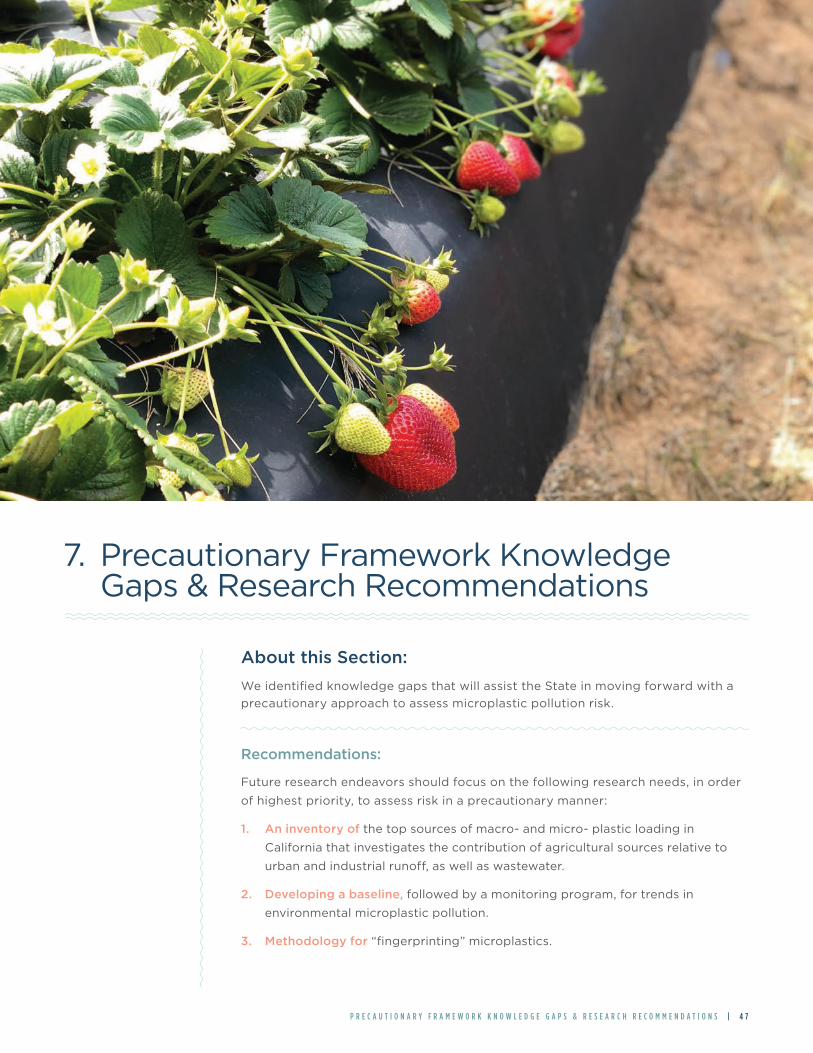
About this Section:
We identified knowledge gaps that will assist the State in moving forward with a
precautionary approach to assess microplastic pollution risk.
Recommendations:
Future research endeavors should focus on the following research needs, in order
of highest priority, to assess risk in a precautionary manner:
1. An inventory of the top sources of macro- and micro- plastic loading in
California that investigates the contribution of agricultural sources relative to
urban and industrial runoff, as well as wastewater.
2. Developing a baseline, followed by a monitoring program, for trends in
environmental microplastic pollution.
3. Methodology for “fingerprinting” microplastics.
7. Precautionary Framework Knowledge Gaps & Research Recommendations
P R E C A U T I O N A R Y F R A M E W O R K K N O W L E D G E G A P S & R E S E A R C H R E C O M M E N D A T I O N S | 4 7

We recommend three (3) knowledge gaps and
associated research questions as the most immediate
research needs to address, with the remaining
knowledge gaps discussed below.
1. An inventory of the top sources of macro- and micro- plastic loading in California that investigates the contribution of agricultural sources relative to urban and industrial runoff, as well as wastewater
Research Questions:
What are the highest emitting sources of plastic
material to the marine environment in California?
What is the contribution of agricultural runoff relative
to urban and industrial runoff and wastewater
effluent pathways?
Potential Research Description:
An inventory of plastic loading in tonnage per capita,
including: (1) regional estimates of relative loading;
(2) an estimation of release fractions into the marine
and terrestrial environment, spatially; and (3) an
estimation of the relative contribution of agriculture
(including improved estimates of urban runoff
and wastewater loading), inland agriculture, and
agricultural biosolids relative to other major sources
and pathways.
Justification:
As the highest priority knowledge gap, we
recommend that the State conduct an inventory of
plastic loading to California’s marine and aquatic
ecosystems. Establishing a baseline for loading can
inform source reduction activities by the State in
the near term and can be used to measure progress
towards exposure reduction goals. Initially, it is
envisioned that steps taken to prepare a California-
specific inventory will supplement rather than
replace the information available from international
inventories. As the inventory becomes more refined
over time, it is expected that the statewide geospatial
extent of each source will be taken into account
when differentiating major and minor sources.
This research will better target the precautionary
framework for a California assessment by slowly
removing dependency on European inventories.
Given the significance of agriculture in California
(CDFA 2019), understanding the relative loading from
this source needs to be investigated.
2. Developing a baseline, followed by a monitoring program, for trends in environmental microplastic pollution
Research Questions:
What does monitoring reveal about trends of
microplastic pollution within California’s marine
environment? What techniques and technologies will
improve monitoring feasibility for particles of lower
size classes (i.e. down to 1 micron)?
Potential Research Description:
A monitoring program that measures (1) regional and
seasonal patterns of environmental concentrations
of microplastics down to 1 micron in size within
critical marine habitats (i.e. frontal zones, seagrass
beds, benthos, etc.), (2) microplastics emitted from
sources identified in the report, and (3) microplastics
internalized within species representative of the
prioritized endpoints. Additionally, clear monitoring
goals (e.g. for intervention or risk assessment) will
need to be developed, along with methods that
improve monitoring feasibility and measurement of
particles down to 1 micron in size.
Justification:
We recommend that the State consider developing
a microplastic monitoring program to clarify
source contributions, measure exposure (critical
to a risk assessment), and provide a baseline for
tracking future inputs and interventions. Improved
understanding of concentrations in different habitats
will answer how exposure varies by species and life
stages, supporting the development of targeted site-
specific risk assessments. While existing monitoring
efforts may omit smaller particles (< 20 microns
in size; ASTM method), we believe monitoring still
has the potential to provide critical information
M I C R O P L A S T I C P O L L U T I O N I N C A L I F O R N I A
P R E C A U T I O N A R Y F R A M E W O R K K N O W L E D G E G A P S & R E S E A R C H R E C O M M E N D A T I O N S | 4 8

for managers. This knowledge gap is linked to the
development of better technologies for measuring
ambient concentrations of even smaller particles
down to 1 micron in size, which we currently don’t
have any technologies or instruments available to
detect particles below this size threshold. Notably,
SCCWRP has been working to standardize Raman
spectroscopy sampling and detection methods for
particles down to 1 micron in size, which will be a
valuable addition to current monitoring efforts.
3. Methodology for “fingerprinting” microplastics
Research Questions:
How (i.e. methods, technologies, tools) do we associate
and directly link microplastic particles sampled in the
marine environment to sources of concern?
Potential Research Description:
Technologies and methods needed for source
identification beyond just polymer types, such as
(1) fingerprinting through imaging, AI, or isotopes,
(2) non-targeted analysis techniques for source
identification, (3) use of chemical signatures to
identify if a microplastic is derived from textile
or packaging, (4) high throughput ID technology,
(4) translation between the units of production
(tonnage) to counts in the environment.
Justification:
We recommend developing and/or investigating new
methods, technologies, and tools to determine the
sources of the highest concentration particles found
in the environment. This understanding will be critical
to inform State action and source reduction activities
and is also an important link for this precautionary
framework. Few efforts are attempting to do this.
Other knowledge gaps and research needs to support a precautionary approach include:
Understanding the conditions that create tire & road wear to inform mitigation
Given the large scale of California’s transportation
system, the number of automobiles, and expected
tire & road wear particle loading into the State’s
marine environment, we suggest investigating
the types of roads or conditions (e.g. locations of
acceleration & deceleration, turning) that facilitate
particle shedding. Data on how tire & road wear
particles transport from generation to waterways,
including aerial transport, short- and long-range
transport, plastic additives to asphalt, and runoff is
also lacking, but will help inform source reduction.
Additionally, more methods development is needed
to strengthen the connection between microparticles
and tire & road wear sources.
Improving technology to characterize aerial deposition
The relative contribution of aerial deposition to
micro- and nano-plastic and fiber loading into the
marine and terrestrial environments is unknown. To
understand the magnitude of microplastic pollution,
new methods, technology, and techniques will need
to be developed to measure plastics at nano scales.
Standardization of methods for detecting microplastics
While in-progress research (SCCWRP) will help
standardize methods of measuring microplastics in
the lab, we encourage the State to ensure that all labs
have access to these new technologies or techniques.
Relatedly, labs and research teams should coordinate
to follow the same field sampling methods to further
improve comparison of results across research
efforts and studies.
Agricultural loading & human exposure
Microplastics are sometimes reused in mulch,
or retained in sludge that is treated and used in
agricultural biosolids, presenting the possibility for
microplastics removed from the marine environment
to be taken up by crops, or to run off into waterways
and transported to marine habitats during storms,
as has been suggested by early studies (Wang et
al. 2019, Li et al. 2020, Taylor et al. 2020). Yet, more
research is needed to investigate whether or to
what degree wildlife and humans are exposed to
microplastics via this pathway.
M I C R O P L A S T I C P O L L U T I O N I N C A L I F O R N I A
P R E C A U T I O N A R Y F R A M E W O R K K N O W L E D G E G A P S & R E S E A R C H R E C O M M E N D A T I O N S | 4 9
About this Section:
We identified effects-related knowledge gaps that will assist the State in moving
towards quantitative effects risk assessments.
Recommendations:
Future research endeavors should focus on the following research needs, in order
of highest priority, to assess risk in a precautionary manner:
1. Hazard analysis of microplastics multi-dimensionality and mixtures
2. Toxicity analysis of present-day ambient and future concentrations of
microplastics mixtures
8. Effects Knowledge Gaps & Research Recommendations
E F F E C T S K N O W L E D G E G A P S & R E S E A R C H R E C O M M E N D A T I O N S | 5 0

M I C R O P L A S T I C P O L L U T I O N I N C A L I F O R N I A
If the State is interested in advancing the understanding of effects, specifically, we
recommend the following top two prioritized knowledge gaps that, if filled, would
move the field forward. First, a hazard analysis of microplastic characteristics (e.g.
size, shape, density, chemical additives, and polymer type) across concentrations
is needed to better understand which features pose the greatest potential
hazard to marine organisms and humans. This research will form the basis of
toxicant tests that will provide the concentration-response curves needed for risk
assessments. Second, concentration-response effects studies of environmentally-
relevant concentrations and mixtures of microplastics is a top priority. To
date, most studies have focused on laboratory experiments using one type of
microplastic, such as plastic spheres of a single size. It is important to understand
the effects of microplastics as they are found in nature (i.e. in a mixture of fibers,
fragments, tire particles, dyes, etc.), at environmentally relevant concentrations
and as a mixture of microplastics with multi-dimensional complexity (Bucci et
al. 2019). Addressing this knowledge gap will help us conduct a state-specific
quantitative risk assessment.
Focusing limited resources on understanding microplastic exposure and reducing
sources is advised from a precautionary standpoint. Yet, more research is needed
to understand the full picture of how microplastics in the marine environment
affect marine organisms and humans. This knowledge will be critical to advancing
the microplastic field toward the development of a robust quantitative risk
assessment, using both effects and exposure data (for a brief discussion
summarizing microplastics effects, see Phase I, Step 3, pg 18). Additionally,
obtaining reliable effects data will encourage future safer-by-design product
development initiatives and help support environmental justice objectives.
As the science develops, it will be important to understand how or if organismal
effects (including cumulative effects over time) translate to impacts at the
ecosystem and population level, such as trophic cascades, food web impacts,
biodiversity loss, or decreased ecosystem resilience. The relative vulnerability
of different species, life history strategies, or life stages also needs to be better
understood. The science of ecosystem-level effects may be several years away,
at minimum. Although we do not yet understand how microplastics affect
human health, we know humans are exposed via sea salt, seafood, and drinking
water (Yang et al. 2015, Smith et al. 2018, Shen et al. 2020). It may be difficult to
identify potential human health effects specifically associated with the marine
environment because humans are likely exposed to microplastics through many
other pathways (e.g., dust). An important knowledge gap is how human exposure
to microplastics varies based on socioeconomic factors, and we highlight the
likely environmental justice implications for communities disproportionately
exposed to microplastic pollution.
An effort is currently underway, led by the Southern California Coastal Water
Project, San Francisco Estuary Institute, and University of Toronto, to compile
a database of effects within marine organisms. The results of this effort will
complement this precautionary framework and support eventual effects-based
risk assessments for both marine organisms and humans.
E F F E C T S K N O W L E D G E G A P S & R E S E A R C H R E C O M M E N D A T I O N S | 5 1
Recommendation:
Given rapidly evolving science, we recommend revisiting this risk assessment
framework in five (5) years to assess if effects data (e.g. SCCWRP effects research)
are sufficient to suggest a state-specific quantitative effects risk assessment.
9. Looking Forward
This precautionary risk assessment framework relies on available exposure data
and includes multiple approaches for evaluating risk and prioritizing source
reduction solutions based on scientific guidance concerning the highest priority
and most prevalent components of microplastics pollution. The framework
provides evidence-based guidance that will allow decision-makers to act now
under uncertainty.
Knowledge gaps include those revealed by developing the precautionary
framework, which should be addressed immediately to use the framework, as well
as those (i.e. effects-specific) needed to advance a state-specific quantitative
effects risk assessment in the future. Immediate research investments should
focus on an inventory of micro- and macro- plastic loading in California,
followed by developing monitoring programs and source-identification method
development. This work would support the Statewide Microplastics Strategy and
assist the State in understanding and addressing this emerging issue, now.
We recommend revisiting this framework in five (5) years to re-evaluate, based
on new data and knowledge obtained by addressing these knowledge gaps.
We recommend that if the necessary effects (e.g. SCCWRP health effects) and
exposure (e.g. California inventory, ambient concentrations across particle size
range) data are collected within the next five years, the State can then revisit
updating the precautionary framework. Five years should provide sufficient time
to implement new policies and evaluate the effectiveness of potential intervention
strategies informed by this report. In the interim, there is still a substantial amount
of California-specific data that needs to be collected to thoroughly understand
and assess risk of microplastic pollution.
Finally, given the state of the science and uncertainties and limitations around
intervention strategies (e.g. cleanup) once plastics are already in the environment,
focusing future reduction efforts on preventing plastics from entering the
environment may be the best solution to address risk and prevent potential harm
to the marine environment.
M I C R O P L A S T I C P O L L U T I O N I N C A L I F O R N I A
L O O K I N G F O R W A R D | 5 2
A.B. 888, 2015 Biennium, 2015 Assemb. Sess. (Cal. 2015). https://leginfo.legislature.ca.gov/faces/billTextClient.xhtml?bill_id=201520160AB888
Adam, V., von Wyl, A., & Nowack, B. (2021). Probabilistic environmental risk assessment of microplastics in marine habitats. Aquatic Toxicology, 230, 105689. https://doi.org/10.1016/j.aquatox.2020.105689
Andrady, A. L. (2011). Microplastics in the marine environment. Marine Pollution Bulletin, 62(8), 1596–1605. https://doi.org/10.1016/j.marpolbul.2011.05.030
Armaroli, C., & Duo, E. (2018). Validation of the coastal storm risk assessment framework along the Emilia-Romagna coast. Coastal Engineering, 134, 159–167. https://doi.org/10.1016/j.coastaleng.2017.08.014
Athey, S. N., Albotra, S. D., Gordon, C. A., Monteleone, B., Seaton, P., Andrady, A. L., Taylor, A. R., & Brander, S. M. (2020). Trophic transfer of microplastics in an estuarine food chain and the effects of a sorbed legacy pollutant. Limnology and Oceanography Letters, 5(1), 154–162. https://doi.org/10.1002/lol2.10130
Au, S. Y., Bruce, T. F., Bridges, W. C., & Klaine, S. J. (2015). Responses of Hyalella azteca to acute and chronic microplastic exposures. Environmental Toxicology and Chemistry, 34(11), 2564–2572. https://doi.org/10.1002/etc.3093
Avio, C. G., Gorbi, S., Milan, M., Benedetti, M., Fattorini, D., d’Errico, G., Pauletto, M., Bargelloni, L., & Regoli, F. (2015). Pollutants bioavailability and toxicological risk from microplastics to marine mussels. Environmental Pollution, 198, 211–222. https://doi.org/10.1016/j.envpol.2014.12.021
Baechler, B. R., Granek, E. F., Hunter, M. V., & Conn, K. E. (2020). Microplastic concentrations in two Oregon bivalve species: Spatial, temporal, and species variability. Limnology and Oceanography Letters, 5(1), 54–65. https://doi.org/10.1002/lol2.10124
Barnes, D. K. A., Galgani, F., Thompson, R. C., & Barlaz, M. (2009). Accumulation and fragmentation of plastic debris in global environments. Philosophical Transactions of the Royal Society B: Biological Sciences, 364(1526), 1985–1998. https://doi.org/10.1098/rstb.2008.0205
Batel, A., Linti, F., Scherer, M., Erdinger, L., & Braunbeck, T. (2016). Transfer of benzo[a]pyrene from microplastics to Artemia nauplii and further to zebrafish via a trophic food web experiment: CYP1A induction and visual tracking of persistent organic pollutants. Environmental Toxicology and Chemistry, 35(7), 1656–1666. https://doi.org/10.1002/etc.3361
Bendell, L. I., LeCadre, E., & Zhou, W. (2020). Use of sediment dwelling bivalves to biomonitor plastic particle pollution in intertidal regions; A review and study. PLOS ONE, 15(5), e0232879. https://doi.org/10.1371/journal.pone.0232879
Besseling, E., Redondo-Hasselerharm, P., Foekema, E. M., & Koelmans, A. A. (2019). Quantifying ecological risks of aquatic micro- and nanoplastic. Critical Reviews in Environmental Science and Technology, 49(1), 32–80. https://doi.org/10.1080/10643389.2018.1531688
References
R E F E R E N C E S | 5 3
M I C R O P L A S T I C P O L L U T I O N I N C A L I F O R N I A

Borrelle, S. B., Ringma, J., Law, K. L., Monnahan, C. C., Lebreton, L., McGivern, A., Murphy, E., Jambeck, J., Leonard, G. H., Hilleary, M. A., Eriksen, M., Possingham, H. P., Frond, H. D., Gerber, L. R., Polidoro, B., Tahir, A., Bernard, M., Mallos, N., Barnes, M., & Rochman, C. M. (2020). Predicted growth in plastic waste exceeds efforts to mitigate plastic pollution. Science, 369(6510), 1515–1518. https://doi.org/10.1126/science.aba3656
Browne, M. A., Dissanayake, A., Galloway, T. S., Lowe, D. M., & Thompson, R. C. (2008). Ingested Microscopic Plastic Translocates to the Circulatory System of the Mussel, Mytilus edulis (L.). Environmental Science & Technology, 42(13), 5026–5031. https://doi.org/10.1021/es800249a
Bucci, K., Tulio, M., & Rochman, C. M. (2020). What is known and unknown about the effects of plastic pollution: A meta-analysis and systematic review. Ecological Applications, 30(2), e02044. https://doi.org/10.1002/eap.2044
Burns, E. E., & Boxall, A. B. A. (2018). Microplastics in the aquatic environment: Evidence for or against adverse impacts and major knowledge gaps. Environmental Toxicology and Chemistry, 37(11), 2776–2796. https://doi.org/10.1002/etc.4268
California Department of Food and Agriculture (CDFA). (2019). California Agricultural Production Statistics. California Department of Food and Agriculture. Retrieved from: https://www.cdfa.ca.gov/Statistics/#:~:text=California’s%20agricultural%20abundance%20includes%20more,the%20nation’s%20total%20agricultural%20value.
Chamas, A., Moon, H., Zheng, J., Qiu, Y., Tabassum, T., Jang, J. H., Abu-Omar, M., Scott, S. L., & Suh, S. (2020). Degradation Rates of Plastics in the Environment. ACS Sustainable Chemistry & Engineering, 8(9), 3494–3511. https://doi.org/10.1021/acssuschemeng.9b06635
Cho, Y., Shim, W. J., Jang, M., Han, G. M., & Hong, S. H. (2019). Abundance and characteristics of microplastics in market bivalves from South Korea. Environmental Pollution, 245, 1107–1116. https://doi.org/10.1016/j.envpol.2018.11.091
Choi, J. S., Hong, S. H., & Park, J.-W. (2020). Evaluation of microplastic toxicity in accordance with different sizes and exposure times in the marine copepod Tigriopus japonicus. Marine Environmental Research, 153, 104838. https://doi.org/10.1016/j.marenvres.2019.104838
Cole, M., Lindeque, P., Halsband, C., & Galloway, T. S. (2011). Microplastics as contaminants in the marine environment: A review. Marine Pollution Bulletin, 62(12), 2588–2597. https://doi.org/10.1016/j.marpolbul.2011.09.025
Cole, M., Lindeque, P., Fileman, E., Halsband, C., & Galloway, T. S. (2015). The Impact of Polystyrene Microplastics on Feeding, Function and Fecundity in the Marine Copepod Calanus helgolandicus. Environmental Science & Technology, 49(2), 1130–1137. https://doi.org/10.1021/es504525u
Collard, F., Gilbert, B., Compère, P., Eppe, G., Das, K., Jauniaux, T., & Parmentier, E. (2017). Microplastics in livers of European anchovies (Engraulis encrasicolus, L.). Environmental Pollution, 229, 1000–1005. https://doi.org/10.1016/j.envpol.2017.07.089
Costa, D. L., & Gordon, T. (2013). Genetic Toxicology. In Klaassen CD (eds) Casarett and Doull’s Toxicology: The Basic Science of Poisons, 8e. AccessPharmacy | McGraw-Hill Education.
R E F E R E N C E S | 5 4
M I C R O P L A S T I C P O L L U T I O N I N C A L I F O R N I A
Cowger, W., Booth, A. M., Hamilton, B. M., Thaysen, C., Primpke, S., Munno, K., Lusher, A. L., Dehaut, A., Vaz, V. P., Liboiron, M., Devriese, L. I., Hermabessiere, L., Rochman, C., Athey, S. N., Lynch, J. M., Lynch, J. M., Frond, H. D., Gray, A., Jones, O. A. H., … Nel, H. (2020). Reporting Guidelines to Increase the Reproducibility and Comparability of Research on Microplastics. Applied Spectroscopy, 74(9), 1066–1077.
Crossman, J., Hurley, R. R., Futter, M., & Nizzetto, L. (2020). Transfer and transport of microplastics from biosolids to agricultural soils and the wider environment. Science of The Total Environment, 724, 138334. https://doi.org/10.1016/j.scitotenv.2020.138334
Cui, R., Kim, S. W., & An, Y.-J. (2017). Polystyrene nanoplastics inhibit reproduction and induce abnormal embryonic development in the freshwater crustacean Daphnia galeata. Scientific Reports, 7(1), 12095. https://doi.org/10.1038/s41598-017-12299-2
Daniel, D. B., Ashraf, P. M., & Thomas, S. N. (2020). Microplastics in the edible and inedible tissues of pelagic fishes sold for human consumption in Kerala, India. Environmental Pollution, 266, 115365. https://doi.org/10.1016/j.envpol.2020.115365
Davidson, K., & Dudas, S. E. (2016). Microplastic Ingestion by Wild and Cultured Manila Clams (Venerupis philippinarum) from Baynes Sound, British Columbia. Archives of Environmental Contamination and Toxicology, 71(2), 147–156. https://doi.org/10.1007/s00244-016-0286-4
De Witte, B., Devriese, L., Bekaert, K., Hoffman, S., Vandermeersch, G., Cooreman, K., & Robbens, J. (2014). Quality assessment of the blue mussel (Mytilus edulis): Comparison between commercial and wild types. Marine Pollution Bulletin, 85(1), 146–155. https://doi.org/10.1016/j.marpolbul.2014.06.006
Dowarah, K., Patchaiyappan, A., Thirunavukkarasu, C., Jayakumar, S., & Devipriya, S. P. (2020). Quantification of microplastics using Nile Red in two bivalve species Perna viridis and Meretrix meretrix from three estuaries in Pondicherry, India and microplastic uptake by local communities through bivalve diet. Marine Pollution Bulletin, 153, 110982. https://doi.org/10.1016/j.marpolbul.2020.110982
Dris, R., Gasperi, J., Rocher, V., Saad, M., Renault, N., Tassin, B., Dris, R., Gasperi, J., Rocher, V., Saad, M., Renault, N., & Tassin, B. (2015). Microplastic contamination in an urban area: A case study in Greater Paris. Environmental Chemistry, 12(5), 592–599. https://doi.org/10.1071/EN14167
Dris, R., Gasperi, J., Rocher, V., & Tassin, B. (2018). Synthetic and non-synthetic anthropogenic fibers in a river under the impact of Paris Megacity: Sampling methodological aspects and flux estimations. Science of The Total Environment, 618, 157–164. https://doi.org/10.1016/j.scitotenv.2017.11.009
Dris, R., Gasperi, J., Saad, M., Mirande, C., & Tassin, B. (2016). Synthetic fibers in atmospheric fallout: A source of microplastics in the environment? Marine Pollution Bulletin, 104(1), 290–293. https://doi.org/10.1016/j.marpolbul.2016.01.006
Duis, K., & Coors, A. (2016). Microplastics in the aquatic and terrestrial environment: Sources (with a specific focus on personal care products), fate and effects. Environmental Sciences Europe, 28(1), 2. https://doi.org/10.1186/s12302-015-0069-y
Elhacham, E., Ben-Uri, L., Grozovski, J., Bar-On, Y. M., & Milo, R. (2020). Global human-made mass exceeds all living biomass. Nature, 588(7838), 442–444. https://doi.org/10.1038/s41586-020-3010-5
R E F E R E N C E S | 5 5
M I C R O P L A S T I C P O L L U T I O N I N C A L I F O R N I A
Enfrin, M., Lee, J., Gibert, Y., Basheer, F., Kong, L., & Dumée, L. F. (2020). Release of hazardous nanoplastic contaminants due to microplastics fragmentation under shear stress forces. Journal of Hazardous Materials, 384, 121393. https://doi.org/10.1016/j.jhazmat.2019.121393
Evangeliou, N., Grythe, H., Klimont, Z., Heyes, C., Eckhardt, S., Lopez-Aparicio, S., & Stohl, A. (2020). Atmospheric transport is a major pathway of microplastics to remote regions. Nature Communications, 11(1), 3381. https://doi.org/10.1038/s41467-020-17201-9
Everaert, G., De Rijcke, M., Lonneville, B., Janssen, C. R., Backhaus, T., Mees, J., van Sebille, E., Koelmans, A. A., Catarino, A. I., & Vandegehuchte, M. B. (2020). Risks of floating microplastic in the global ocean. Environmental Pollution, 267, 115499. https://doi.org/10.1016/j.envpol.2020.115499
Everaert, Gert, Van Cauwenberghe, L., De Rijcke, M., Koelmans, A. A., Mees, J., Vandegehuchte, M., & Janssen, C. R. (2018). Risk assessment of microplastics in the ocean: Modelling approach and first conclusions. Environmental Pollution, 242, 1930–1938. https://doi.org/10.1016/j.envpol.2018.07.069
Fahrenfeld, N. L., Arbuckle-Keil, G., Naderi Beni, N., & Bartelt-Hunt, S. L. (2019). Source tracking microplastics in the freshwater environment. TrAC Trends in Analytical Chemistry, 112, 248–254. https://doi.org/10.1016/j.trac.2018.11.030
Farrell, P., & Nelson, K. (2013). Trophic level transfer of microplastic: Mytilus edulis (L.) to Carcinus maenas (L.). Environmental Pollution, 177, 1–3. https://doi.org/10.1016/j.envpol.2013.01.046
Foley, C. J., Feiner, Z. S., Malinich, T. D., & Höök, T. O. (2018). A meta-analysis of the effects of exposure to microplastics on fish and aquatic invertebrates. Science of The Total Environment, 631–632, 550–559. https://doi.org/10.1016/j.scitotenv.2018.03.046
Frère, L., Paul-Pont, I., Moreau, J., Soudant, P., Lambert, C., Huvet, A., & Rinnert, E. (2016). A semi-automated Raman micro-spectroscopy method for morphological and chemical characterizations of microplastic litter. Marine Pollution Bulletin, 113(1), 461–468. https://doi.org/10.1016/j.marpolbul.2016.10.051
Galafassi, S., Nizzetto, L., & Volta, P. (2019). Plastic sources: A survey across scientific and grey literature for their inventory and relative contribution to microplastics pollution in natural environments, with an emphasis on surface water. Science of The Total Environment, 693, 133499. https://doi.org/10.1016/j.scitotenv.2019.07.305
GESAMP. (2015). Sources, fate and effects of microplastics in the marine environment: a global assessment. (Kershaw, P. J., ed.). IMO/FAO/UNESCO-IOC/UNIDO/WMO/IAEA/UN/UNEP/- UNDP Joint Group of Experts on the Scientific Aspects of Marine Environmental Protection. Rep. Stud. GESAMP No. 90, 96 p.
GESAMP. (2016). Sources, fate and effects of microplastics in the marine environment: part two of a global assessment. (Kershaw, P.J., and Rochman, C.M., eds). IMO/FAO/UNESCO- IOC/UNIDO/WMO/IAEA/UN/UNEP/UNDP. Joint Group of Experts on the Scientific Aspects of Marine Environmental Protection). Rep. Stud. GESAMP No. 93, 220 p.
Gilbreath, A., McKee, L., Shimabuku, I., Lin ,D., Werbowski, L. M., Zhu, X., Grbić, J., & Rochman, C. (2019). Multiyear Water Quality Performance and Mass Accumulation of PCBs, Mercury, Methylmercury, Copper, and Microplastics in a Bioretention Rain Garden. Journal of Sustainable Water in the Built Environment, 5(4), 04019004. https://doi.org/10.1061/JSWBAY.0000883
R E F E R E N C E S | 5 6
M I C R O P L A S T I C P O L L U T I O N I N C A L I F O R N I A
Gouin, T., Becker, R. A., Collot, A.-G., Davis, J. W., Howard, B., Inawaka, K., Lampi, M., Ramon, B. S., Shi, J., & Hopp, P. W. (2019). Toward the Development and Application of an Environmental Risk Assessment Framework for Microplastic. Environmental Toxicology and Chemistry, 38(10), 2087–2100. https://doi.org/10.1002/etc.4529
Gouin, T. (2020). Toward an Improved Understanding of the Ingestion and Trophic Transfer of Microplastic Particles: Critical Review and Implications for Future Research. Environmental Toxicology and Chemistry, 39(6), 1119–1137. https://doi.org/10.1002/etc.4718
Gray, A. D., & Weinstein, J. E. (2017). Size- and shape-dependent effects of microplastic particles on adult daggerblade grass shrimp (Palaemonetes pugio). Environmental Toxicology and Chemistry, 36(11), 3074–3080. https://doi.org/10.1002/etc.3881
Gray, A. D., Wertz, H., Leads, R. R., & Weinstein, J. E. (2018). Microplastic in two South Carolina Estuaries: Occurrence, distribution, and composition. Marine Pollution Bulletin, 128, 223–233. https://doi.org/10.1016/j.marpolbul.2018.01.030
Grbić, J., Helm, P., Athey, S., & Rochman, C. M. (2020). Microplastics entering northwestern Lake Ontario are diverse and linked to urban sources. Water Research, 174, 115623. https://doi.org/10.1016/j.watres.2020.115623
Güven, O., Gökdağ, K., Jovanović, B., & Kıdeyş, A. E. (2017). Microplastic litter composition of the Turkish territorial waters of the Mediterranean Sea, and its occurrence in the gastrointestinal tract of fish. Environmental Pollution, 223, 286–294. https://doi.org/10.1016/j.envpol.2017.01.025
Harris, M. J., Stinson, J., & Landis, W. G. (2017). A Bayesian Approach to Integrated Ecological and Human Health Risk Assessment for the South River, Virginia Mercury-Contaminated Site. Risk Analysis, 37(7), 1341–1357. https://doi.org/10.1111/risa.12691
Hartmann, N. B., Hüffer, T., Thompson, R. C., Hassellöv, M., Verschoor, A., Daugaard, A. E., Rist, S., Karlsson, T., Brennholt, N., Cole, M., Herrling, M. P., Hess, M. C., Ivleva, N. P., Lusher, A. L., & Wagner, M. (2019). Are We Speaking the Same Language? Recommendations for a Definition and Categorization Framework for Plastic Debris. Environmental Science & Technology, 53(3), 1039–1047. https://doi.org/10.1021/acs.est.8b05297
Hermabessiere, L., Paul-Pont, I., Cassone, A.-L., Himber, C., Receveur, J., Jezequel, R., El Rakwe, M., Rinnert, E., Rivière, G., Lambert, C., Huvet, A., Dehaut, A., Duflos, G., & Soudant, P. (2019). Microplastic contamination and pollutant levels in mussels and cockles collected along the channel coasts. Environmental Pollution, 250, 807–819. https://doi.org/10.1016/j.envpol.2019.04.051
Hermsen, E., Mintenig, S. M., Besseling, E., & Koelmans, A. A. (2018). Quality Criteria for the Analysis of Microplastic in Biota Samples: A Critical Review. Environmental Science & Technology, 52(18), 10230–10240. https://doi.org/10.1021/acs.est.8b01611
Hohn, S., Acevedo-Trejos, E., Abrams, J. F., Fulgencio de Moura, J., Spranz, R., & Merico, A. (2020). The long-term legacy of plastic mass production. Science of The Total Environment, 746, 141115. https://doi.org/10.1016/j.scitotenv.2020.141115
R E F E R E N C E S | 5 7
M I C R O P L A S T I C P O L L U T I O N I N C A L I F O R N I A

IPBES. (2019): Summary for policymakers of the global assessment report on biodiversity and ecosystem services of the Intergovernmental Science-Policy Platform on Biodiversity and Ecosystem Services. S. Díaz, J. Settele, E. S. Brondízio E.S., H. T. Ngo, M. Guèze, J. Agard, A. Arneth, P. Balvanera, K. A. Brauman, S. H. M. Butchart, K. M. A. Chan, L. A. Garibaldi, K. Ichii, J. Liu, S. M. Subramanian, G. F. Midgley, P. Miloslavich, Z. Molnár, D. Obura, A. Pfaff, S. Polasky, A. Purvis, J. Razzaque, B. Reyers, R. Roy Chowdhury, Y. J. Shin, I. J. Visseren-Hamakers, K. J. Willis, and C. N. Zayas (eds.). IPBES secretariat, Bonn, Germany. 56 pages.
Jacob, H., Besson, M., Swarzenski, P. W., Lecchini, D., & Metian, M. (2020). Effects of Virgin Micro- and Nanoplastics on Fish: Trends, Meta-Analysis, and Perspectives. Environmental Science & Technology, 54(8), 4733–4745. https://doi.org/10.1021/acs.est.9b05995
Jeong, C.-B., Won, E.-J., Kang, H.-M., Lee, M.-C., Hwang, D.-S., Hwang, U.-K., Zhou, B., Souissi, S., Lee, S.-J., & Lee, J.-S. (2016). Microplastic Size-Dependent Toxicity, Oxidative Stress Induction, and p-JNK and p-p38 Activation in the Monogonont Rotifer (Brachionus koreanus). Environmental Science & Technology, 50(16), 8849–8857. https://doi.org/10.1021/acs.est.6b01441
Koelmans, A. A., Bakir, A., Burton, G. A., & Janssen, C. R. (2016). Microplastic as a Vector for Chemicals in the Aquatic Environment: Critical Review and Model-Supported Reinterpretation of Empirical Studies. Environmental Science & Technology, 50(7), 3315–3326. https://doi.org/10.1021/acs.est.5b06069
Koelmans, A. A., Mohamed Nor, N. H., Hermsen, E., Kooi, M., Mintenig, S. M., & De France, J. (2019). Microplastics in freshwaters and drinking water: Critical review and assessment of data quality. Water Research, 155, 410–422. https://doi.org/10.1016/j.watres.2019.02.054
Koelmans, A. A., Redondo-Hasselerharm, P. E., Mohamed Nor, N. H., & Kooi, M. (2020). Solving the Nonalignment of Methods and Approaches Used in Microplastic Research to Consistently Characterize Risk. Environmental Science & Technology, 54(19), 12307–12315. https://doi.org/10.1021/acs.est.0c02982
Kooi, M., & Koelmans, A. A. (2019). Simplifying Microplastic via Continuous Probability Distributions for Size, Shape, and Density. Environmental Science & Technology Letters, 6(9), 551–557. https://doi.org/10.1021/acs.estlett.9b00379
Kurt, O. K., Zhang, J., & Pinkerton, K. E. (2016). Pulmonary Health Effects of Air Pollution. Current Opinion in Pulmonary Medicine, 22(2), 138–143. https://doi.org/10.1097/MCP.0000000000000248
Kutralam-Muniasamy, G., Pérez-Guevara, F., Elizalde-Martínez, I., & Shruti, V. C. (2020). An overview of recent advances in micro/nano beads and microfibers research: Critical assessment and promoting the less known. Science of The Total Environment, 740, 139991. https://doi.org/10.1016/j.scitotenv.2020.139991
Lassen, C., Hansen, S. F., Magnusson, K., Hartmann, N. B., Rehne Jensen, P., Nielsen, T. G., & Brinch, A. (2015). Microplastics: Occurrence, effects and sources of releases to the environment in Denmark. Danish Environmental Protection Agency. Retrieved from: http://mst.dk/service/publikationer/publikationsarkiv/2015/nov/rapport-ommikroplast
Law, K. L. (2017). Plastics in the Marine Environment. Annual Review of Marine Science, 9(1), 205–229. https://doi.org/10.1146/annurev-marine-010816-060409
Law, K. L., Starr, N., Siegler, T. R., Jambeck, J. R., Mallos, N. J., & Leonard, G. H. (2020). The United States’ contribution of plastic waste to land and ocean. Science Advances, 6(44), eabd0288. https://doi.org/10.1126/sciadv.abd0288
R E F E R E N C E S | 5 8
M I C R O P L A S T I C P O L L U T I O N I N C A L I F O R N I A
Li, J., Yang, D., Li, L., Jabeen, K., & Shi, H. (2015). Microplastics in commercial bivalves from China. Environmental Pollution, 207, 190–195. https://doi.org/10.1016/j.envpol.2015.09.018
Li, L., Luo, Y., Li, R., Zhou, Q., Peijnenburg, W. J. G. M., Yin, N., Yang, J., Tu, C., & Zhang, Y. (2020). Effective uptake of submicrometre plastics by crop plants via a crack-entry mode. Nature Sustainability, 3(11), 929–937. https://doi.org/10.1038/s41893-020-0567-9
Liu, Z., Yu, P., Cai, M., Wu, D., Zhang, M., Chen, M., & Zhao, Y. (2019). Effects of microplastics on the innate immunity and intestinal microflora of juvenile Eriocheir sinensis. Science of The Total Environment, 685, 836–846. https://doi.org/10.1016/j.scitotenv.2019.06.265
Lourenço, P. M., Serra-Gonçalves, C., Ferreira, J. L., Catry, T., & Granadeiro, J. P. (2017). Plastic and other microfibers in sediments, macroinvertebrates and shorebirds from three intertidal wetlands of southern Europe and west Africa. Environmental Pollution, 231, 123–133. https://doi.org/10.1016/j.envpol.2017.07.103
Lu, Y., Zhang, Y., Deng, Y., Jiang, W., Zhao, Y., Geng, J., Ding, L., & Ren, H. (2016). Uptake and Accumulation of Polystyrene Microplastics in Zebrafish (Danio rerio) and Toxic Effects in Liver. Environmental Science & Technology, 50(7), 4054–4060. https://doi.org/10.1021/acs.est.6b00183
Lusher, A. L., McHugh, M., & Thompson, R. C. (2013). Occurrence of microplastics in the gastrointestinal tract of pelagic and demersal fish from the English Channel. Marine Pollution Bulletin, 67(1), 94–99. https://doi.org/10.1016/j.marpolbul.2012.11.028
Lusher, A.L., Hollman, P.C.H., & Mendoza-Hill, J.J. (2017). Microplastics in fisheries and aquaculture: status of knowledge on their occurrence and implications for aquatic organisms and food safety. FAO Fisheries and Aquaculture Technical Paper. No. 615. Rome, Italy
Magnusson, K., Eliasson, K., Frame, A., Kaikonen, K., Hulten, J., Olshammar…& Voisin, A. (2016). Swedish sources and pathways for microplastics to the marine environment. Swedish Environmental Protection Agency. Number C 183.
McIlwraith, H. K., Lin, J., Erdle, L. M., Mallos, N., Diamond, M. L., & Rochman, C. M. (2019). Capturing microfibers – marketed technologies reduce microfiber emissions from washing machines. Marine Pollution Bulletin, 139, 40–45. https://doi.org/10.1016/j.marpolbul.2018.12.012
McKenzie, L. M., Witter, R. Z., Newman, L. S., & Adgate, J. L. (2012). Human health risk assessment of air emissions from development of unconventional natural gas resources. Science of The Total Environment, 424, 79–87. https://doi.org/10.1016/j.scitotenv.2012.02.018
Microbead-Free Waters Act of 2015, H.R. 1321, 114th Congress (2015) https://www.congress.gov/bill/114th-congress/house-bill/1321/text
Miller, E., Sedlak, M., Lin, D., Box, C., Holleman, C., Rochman, C. M., & Sutton, R. (2021). Recommended best practices for collecting, analyzing, and reporting microplastics in environmental media: Lessons learned from comprehensive monitoring of San Francisco Bay. Journal of Hazardous Materials, 409, 124770. https://doi.org/10.1016/j.jhazmat.2020.124770
Miller, M. E., Hamann, M., & Kroon, F. J. (2020). Bioaccumulation and biomagnification of microplastics in marine organisms: A review and meta-analysis of current data. PLOS ONE, 15(10), e0240792. https://doi.org/10.1371/journal.pone.0240792
R E F E R E N C E S | 5 9
M I C R O P L A S T I C P O L L U T I O N I N C A L I F O R N I A
Muralikrishna, IV., & Manickam, V. (2017). Environmental Risk Management. In Butterworth-Heinemann (eds) Environmental Management: Science and Engineering for Industry. Elsevier, p 135-152.
Murray, F., & Cowie, P. R. (2011). Plastic contamination in the decapod crustacean Nephrops norvegicus (Linnaeus, 1758). Marine Pollution Bulletin, 62(6), 1207–1217. https://doi.org/10.1016/j.marpolbul.2011.03.032
Naidoo, T., & Glassom, D. (2019). Decreased growth and survival in small juvenile fish, after chronic exposure to environmentally relevant concentrations of microplastic. Marine Pollution Bulletin, 145, 254–259. https://doi.org/10.1016/j.marpolbul.2019.02.037
National Research Council (NRC). (1983). Risk Assessment in the Federal Government: Managing the Process. Washington, DC: The National Academies Press. https://doi.org/10.17226/366.
National Research Council (NRC). (2009). Science and Decisions: Advancing Risk Assessment. Washington, DC: The National Academies Press. https://doi.org/10.17226/12209.
Nobre, C. R., Santana, M. F. M., Maluf, A., Cortez, F. S., Cesar, A., Pereira, C. D. S., & Turra, A. (2015). Assessment of microplastic toxicity to embryonic development of the sea urchin Lytechinus variegatus (Echinodermata: Echinoidea). Marine Pollution Bulletin, 92(1), 99–104. https://doi.org/10.1016/j.marpolbul.2014.12.050
Ogunola, O. S., Onada, O. A., & Falaye, A. E. (2018). Mitigation measures to avert the impacts of plastics and microplastics in the marine environment (a review). Environmental Science and Pollution Research, 25(10), 9293–9310. https://doi.org/10.1007/s11356-018-1499-z
Ory, N. C., Gallardo, C., Lenz, M., & Thiel, M. (2018). Capture, swallowing, and egestion of microplastics by a planktivorous juvenile fish. Environmental Pollution, 240, 566–573. https://doi.org/10.1016/j.envpol.2018.04.093
OSPAR. (2017). Assessment document of land-based inputs of microplastics in the marine environment. OSPAR Commission. Environmental Impact of Human Activities Series. Retrieved from: https://www.ospar.org/documents?v=38018
Qiao, R., Deng, Y., Zhang, S., Wolosker, M. B., Zhu, Q., Ren, H., & Zhang, Y. (2019). Accumulation of different shapes of microplastics initiates intestinal injury and gut microbiota dysbiosis in the gut of zebrafish. Chemosphere, 236, 124334. https://doi.org/10.1016/j.chemosphere.2019.07.065
Regan, H. M., Akçakaya, H. R., Ferson, S., Root, K. V., Carroll, S., & Ginzburg, L. R. (2003). Treatments of Uncertainty and Variability in Ecological Risk Assessment of Single-Species Populations. Human and Ecological Risk Assessment: An International Journal, 9(4), 889–906. https://doi.org/10.1080/713610015
Ribeiro, F., O’Brien, J. W., Galloway, T., & Thomas, K. V. (2019). Accumulation and fate of nano- and micro-plastics and associated contaminants in organisms. TrAC Trends in Analytical Chemistry, 111, 139–147. https://doi.org/10.1016/j.trac.2018.12.010
Rillig, M. C., & Lehmann, A. (2020). Microplastic in terrestrial ecosystems. Science, 368(6498), 1430. https://doi.org/10.1126/science.abb5979
Rochman, C. M., Tahir, A., Williams, S. L., Baxa, D. V., Lam, R., Miller, J. T., Teh, F.-C., Werorilangi, S., & Teh, S. J. (2015). Anthropogenic debris in seafood: Plastic debris and fibers from textiles in fish and bivalves sold for human consumption. Scientific Reports, 5(1), 14340. https://doi.org/10.1038/srep14340
R E F E R E N C E S | 6 0
M I C R O P L A S T I C P O L L U T I O N I N C A L I F O R N I A

S.B. 1263, 2017 Biennium, 2017 S. Sess. (Cal 2017). https://leginfo.legislature.ca.gov/faces/billTextClient.xhtml?bill_id=201720180SB1263
S.B. 207, 2013 Biennium, 2014 S. Sess. (Cal 201). https://leginfo.legislature.ca.gov/faces/billNavClient.xhtml?bill_id=201320140SB270
Samhouri, J. F., Ramanujam, E., Bizzarro, J. J., Carter, H., Sayce, K., & Shen, S. (2019). An ecosystem-based risk assessment for California fisheries co-developed by scientists, managers, and stakeholders. Biological Conservation, 231, 103–121. https://doi.org/10.1016/j.biocon.2018.12.027
Schmaltz, E., Melvin, E. C., Diana, Z., Gunady, E. F., Rittschof, D., Somarelli, J. A., Virdin, J., & Dunphy-Daly, M. M. (2020). Plastic pollution solutions: Emerging technologies to prevent and collect marine plastic pollution. Environment International, 144, 106067. https://doi.org/10.1016/j.envint.2020.106067
Scott, N., Porter, A., Santillo, D., Simpson, H., Lloyd-Williams, S., & Lewis, C. (2019). Particle characteristics of microplastics contaminating the mussel Mytilus edulis and their surrounding environments. Marine Pollution Bulletin, 146, 125–133. https://doi.org/10.1016/j.marpolbul.2019.05.041
Setälä, O., Fleming-Lehtinen, V., & Lehtiniemi, M. (2014). Ingestion and transfer of microplastics in the planktonic food web. Environmental Pollution, 185, 77–83. https://doi.org/10.1016/j.envpol.2013.10.013
Shen, M., Huang, W., Chen, M., Song, B., Zeng, G., & Zhang, Y. (2020). (Micro)plastic crisis: Un-ignorable contribution to global greenhouse gas emissions and climate change. Journal of Cleaner Production, 254, 120138. https://doi.org/10.1016/j.jclepro.2020.120138
Shen, M., Song, B., Zhu, Y., Zeng, G., Zhang, Y., Yang, Y., Wen, X., Chen, M., & Yi, H. (2020). Removal of microplastics via drinking water treatment: Current knowledge and future directions. Chemosphere, 251, 126612. https://doi.org/10.1016/j.chemosphere.2020.126612
Smith, M., Love, D. C., Rochman, C. M., & Neff, R. A. (2018). Microplastics in Seafood and the Implications for Human Health. Current Environmental Health Reports, 5(3), 375–386. https://doi.org/10.1007/s40572-018-0206-z
Song, Y. K., Hong, S. H., Eo, S., Han, G. M., & Shim, W. J. (2020). Rapid Production of Micro- and Nanoplastics by Fragmentation of Expanded Polystyrene Exposed to Sunlight. Environmental Science & Technology, 54(18), 11191–11200. https://doi.org/10.1021/acs.est.0c02288
State Water Resources Control Board. (2020). Adoption of Definition of Microplastics in Drinking Water. Resolution No. 2020-0021. https://www.waterboards.ca.gov/board_decisions/adopted_orders/resolutions/2020/rs2020_0021.pdf
Sun, J., Dai, X., Wang, Q., van Loosdrecht, M. C. M., & Ni, B.-J. (2019). Microplastics in wastewater treatment plants: Detection, occurrence and removal. Water Research, 152, 21–37. https://doi.org/10.1016/j.watres.2018.12.050
Sundt, P., Schulze, P., & Syversen, F. (2014). Sources of microplastic-pollution to the marine environment. Norwegian Environment Agency (Miljødirektoratet). Mepex. Retrieved from: https://www.miljodirektoratet.no/globalassets/publikasjoner/M321/M321.pdf
R E F E R E N C E S | 6 1
M I C R O P L A S T I C P O L L U T I O N I N C A L I F O R N I A

Sussarellu, R., Suquet, M., Thomas, Y., Lambert, C., Fabioux, C., Pernet, M. E. J., Goïc, N. L., Quillien, V., Mingant, C., Epelboin, Y., Corporeau, C., Guyomarch, J., Robbens, J., Paul-Pont, I., Soudant, P., & Huvet, A. (2016). Oyster reproduction is affected by exposure to polystyrene microplastics. Proceedings of the National Academy of Sciences, 113(9), 2430–2435. https://doi.org/10.1073/pnas.1519019113
Sutton, R., Lin, D., Sedlak, M., Box, C., Gilbreath, A., Holleman, R., Miller, L., Wong, A., Munno, K., Zhu, X., et al. (2019). Understanding Microplastic Levels, Pathways, and Transport in the San Francisco Bay Region. SFEI Contribution No. 950. San Francisco Estuary Institute: Richmond, CA.
Suter, G. W. (1990). Endpoints for regional ecological risk assessments. Environmental Management, 14(1), 9–23. https://doi.org/10.1007/BF02394015
Taylor, S. E., Pearce, C. I., Sanguinet, K. A., Hu, D., Chrisler, W. B., Kim, Y.-M., Wang, Z., & Flury, M. (2020). Polystyrene nano- and microplastic accumulation at Arabidopsis and wheat root cap cells, but no evidence for uptake into roots. Environmental Science: Nano, 7(7), 1942–1953. https://doi.org/10.1039/D0EN00309C
Tian, Z., Zhao, H., Peter, K. T., Gonzalez, M., Wetzel, J., Wu, C., Hu, X., Prat, J., Mudrock, E., Hettinger, R., Cortina, A. E., Biswas, R. G., Kock, F. V. C., Soong, R., Jenne, A., Du, B., Hou, F., He, H., Lundeen, R., … Kolodziej, E. P. (2021). A ubiquitous tire rubber–derived chemical induces acute mortality in coho salmon. Science, 371(6525), 185–189. https://doi.org/10.1126/science.abd6951
Tosetto, L., Williamson, J. E., & Brown, C. (2017). Trophic transfer of microplastics does not affect fish personality. Animal Behaviour, 123, 159–167. https://doi.org/10.1016/j.anbehav.2016.10.035
Unice, K. M., Weeber, M. P., Abramson, M. M., Reid, R. C. D., van Gils, J. A. G., Markus, A. A., Vethaak, A. D., & Panko, J. M. (2019). Characterizing export of land-based microplastics to the estuary - Part I: Application of integrated geospatial microplastic transport models to assess tire and road wear particles in the Seine watershed. Science of The Total Environment, 646, 1639–1649. https://doi.org/10.1016/j.scitotenv.2018.07.368
U.S. Environmental Protection Agency (USEPA). (1992). Framework for ecological risk assessment. Washington, DC: Risk Assessment Forum, U.S. Environmental Protection Agency. EPA/630/R-92/001.
U.S. Environmental Protection Agency (USEPA). (1998). Guidelines for ecological risk assessment. Washington, DC: Risk Assessment Forum, U.S. Environmental Protection Agency. EPA/630/R-95/002F.
U.S. Environmental Protection Agency (USEPA). (2018). Application of systematic review in TSCA evaluations. Washington, DC: Office of Chemical Safety and Pollution Prevention, U.S. Environmental Protection Agency. EPA/740/P1/8001.
Van Cauwenberghe, L., Claessens, M., Vandegehuchte, M. B., & Janssen, C. R. (2015). Microplastics are taken up by mussels (Mytilus edulis) and lugworms (Arenicola marina) living in natural habitats. Environmental Pollution, 199, 10–17. https://doi.org/10.1016/j.envpol.2015.01.008
Van Cauwenberghe, L., & Janssen, C. R. (2014). Microplastics in bivalves cultured for human consumption. Environmental Pollution, 193, 65–70. https://doi.org/10.1016/j.envpol.2014.06.010
Verschoor, A., de Poorter, L., Roex, E., & Bellert, B. (2014). Quick scan and prioritization of microplastic sources and emissions. National Institute for Public Health and the Environment. RIVM Letter Report 2014-0156. Retrieved from: https://www.rivm.nl/bibliotheek/rapporten/2014-0156.pdf
R E F E R E N C E S | 6 2
M I C R O P L A S T I C P O L L U T I O N I N C A L I F O R N I A
von Moos, N., Burkhardt-Holm, P., & Köhler, A. (2012). Uptake and Effects of Microplastics on Cells and Tissue of the Blue Mussel Mytilus edulis L. after an Experimental Exposure. Environmental Science & Technology, 46(20), 11327–11335. https://doi.org/10.1021/es302332w
Wang, F., Wong, C. S., Chen, D., Lu, X., Wang, F., & Zeng, E. Y. (2018). Interaction of toxic chemicals with microplastics: A critical review. Water Research, 139, 208–219. https://doi.org/10.1016/j.watres.2018.04.003
Wang, J., Liu, X., Li, Y., Powell, T., Wang, X., Wang, G., & Zhang, P. (2019). Microplastics as contaminants in the soil environment: A mini-review. Science of The Total Environment, 691, 848–857. https://doi.org/10.1016/j.scitotenv.2019.07.209
Wang, Y., Mao, Z., Zhang, M., Ding, G., Sun, J., Du, M., Liu, Q., Cong, Y., Jin, F., Zhang, W., & Wang, J. (2019). The uptake and elimination of polystyrene microplastics by the brine shrimp, Artemia parthenogenetica, and its impact on its feeding behavior and intestinal histology. Chemosphere, 234, 123–131. https://doi.org/10.1016/j.chemosphere.2019.05.267
Watts, A. J. R., Lewis, C., Goodhead, R. M., Beckett, S. J., Moger, J., Tyler, C. R., & Galloway, T. S. (2014). Uptake and Retention of Microplastics by the Shore Crab Carcinus maenas. Environmental Science & Technology, 48(15), 8823–8830. https://doi.org/10.1021/es501090e
World Health Organization (WHO). (2004). IPCS Risk Assessment Terminology. IPCS Harmonization Project. International Programme on Chemical Safety. World Health Organization. Geneva, Switzerland. Retrieved from: https://www.who.int/ipcs/methods/harmonization/areas/ipcsterminologyparts1and2.pdf
Yang, D., Shi, H., Li, L., Li, J., Jabeen, K., & Kolandhasamy, P. (2015). Microplastic Pollution in Table Salts from China. Environmental Science & Technology, 49(22), 13622–13627. https://doi.org/10.1021/acs.est.5b03163
Zhang, Y., Kang, S., Allen, S., Allen, D., Gao, T., & Sillanpää, M. (2020). Atmospheric microplastics: A review on current status and perspectives. Earth-Science Reviews, 203, 103118. https://doi.org/10.1016/j.earscirev.2020.103118
Zheng, J., & Suh, S. (2019). Strategies to reduce the global carbon footprint of plastics. Nature Climate Change, 9(5), 374–378. https://doi.org/10.1038/s41558-019-0459-z
R E F E R E N C E S | 6 3
M I C R O P L A S T I C P O L L U T I O N I N C A L I F O R N I A
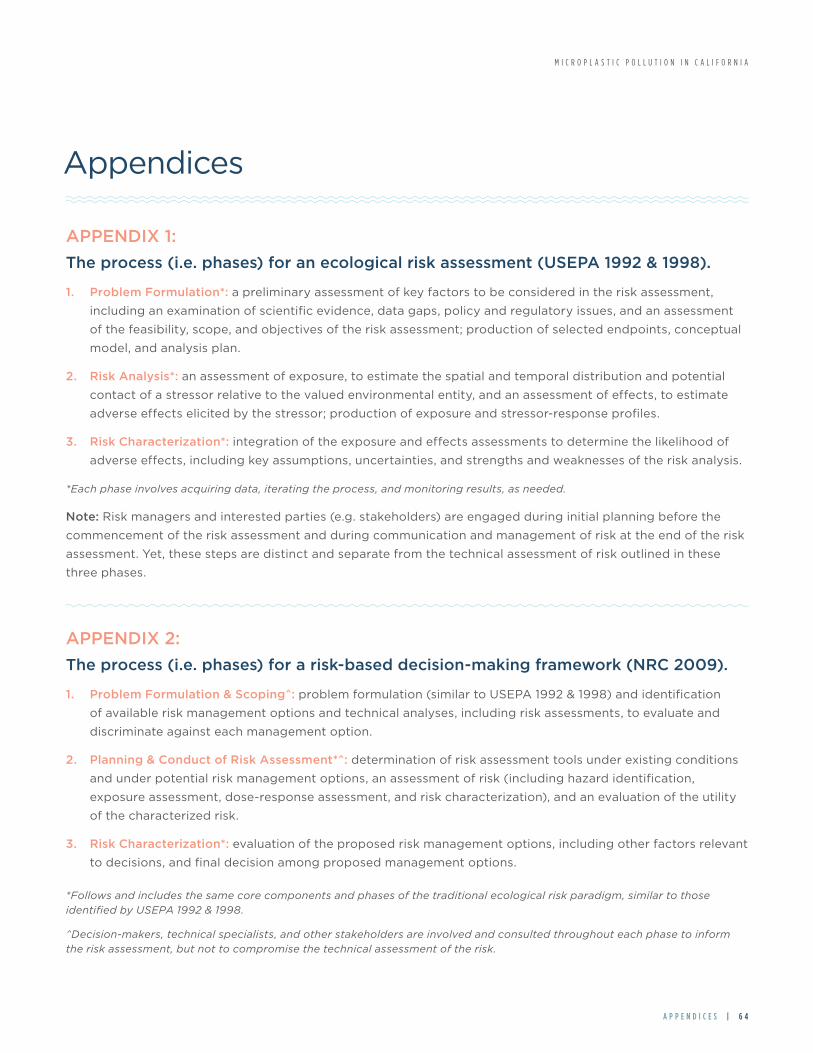
Appendices
M I C R O P L A S T I C P O L L U T I O N I N C A L I F O R N I A
APPENDIX 1:
The process (i.e. phases) for an ecological risk assessment (USEPA 1992 & 1998).
1. Problem Formulation*: a preliminary assessment of key factors to be considered in the risk assessment,
including an examination of scientific evidence, data gaps, policy and regulatory issues, and an assessment
of the feasibility, scope, and objectives of the risk assessment; production of selected endpoints, conceptual
model, and analysis plan.
2. Risk Analysis*: an assessment of exposure, to estimate the spatial and temporal distribution and potential
contact of a stressor relative to the valued environmental entity, and an assessment of effects, to estimate
adverse effects elicited by the stressor; production of exposure and stressor-response profiles.
3. Risk Characterization*: integration of the exposure and effects assessments to determine the likelihood of
adverse effects, including key assumptions, uncertainties, and strengths and weaknesses of the risk analysis.
*Each phase involves acquiring data, iterating the process, and monitoring results, as needed.
Note: Risk managers and interested parties (e.g. stakeholders) are engaged during initial planning before the
commencement of the risk assessment and during communication and management of risk at the end of the risk
assessment. Yet, these steps are distinct and separate from the technical assessment of risk outlined in these
three phases.
APPENDIX 2:
The process (i.e. phases) for a risk-based decision-making framework (NRC 2009).
1. Problem Formulation & Scoping^: problem formulation (similar to USEPA 1992 & 1998) and identification
of available risk management options and technical analyses, including risk assessments, to evaluate and
discriminate against each management option.
2. Planning & Conduct of Risk Assessment*^: determination of risk assessment tools under existing conditions
and under potential risk management options, an assessment of risk (including hazard identification,
exposure assessment, dose-response assessment, and risk characterization), and an evaluation of the utility
of the characterized risk.
3. Risk Characterization*: evaluation of the proposed risk management options, including other factors relevant
to decisions, and final decision among proposed management options.
*Follows and includes the same core components and phases of the traditional ecological risk paradigm, similar to those identified by USEPA 1992 & 1998.
^Decision-makers, technical specialists, and other stakeholders are involved and consulted throughout each phase to inform the risk assessment, but not to compromise the technical assessment of the risk.
A P P E N D I C E S | 6 4
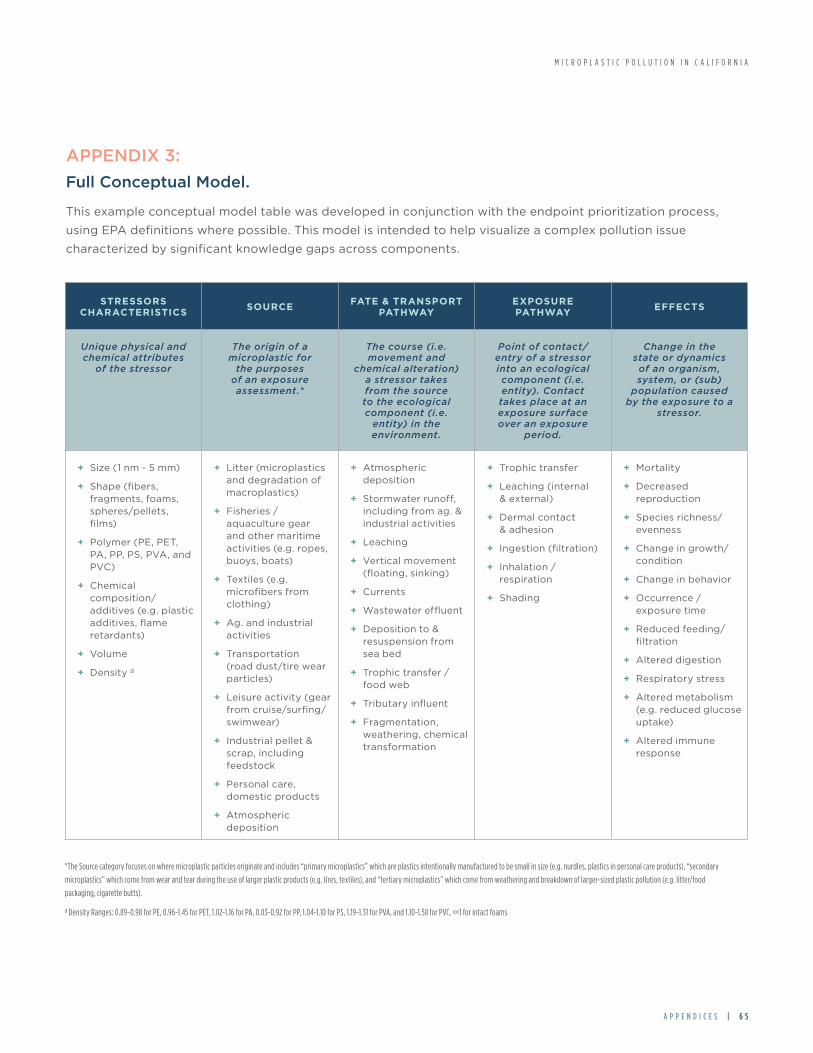
APPENDIX 3:
Full Conceptual Model.
This example conceptual model table was developed in conjunction with the endpoint prioritization process,
using EPA definitions where possible. This model is intended to help visualize a complex pollution issue
characterized by significant knowledge gaps across components.
STRESSORS CHARACTERISTICS
SOURCEFATE & TRANSPORT
PATHWAYEXPOSURE PATHWAY
EFFECTS
Unique physical and chemical attributes
of the stressor
The origin of a microplastic for
the purposes of an exposure assessment.*
The course (i.e. movement and
chemical alteration) a stressor takes from the source to the ecological component (i.e.
entity) in the environment.
Point of contact/entry of a stressor into an ecological component (i.e. entity). Contact takes place at an exposure surface over an exposure
period.
Change in the state or dynamics of an organism, system, or (sub)
population caused by the exposure to a
stressor.
+ Size (1 nm - 5 mm)
+ Shape (fibers, fragments, foams, spheres/pellets, films)
+ Polymer (PE, PET, PA, PP, PS, PVA, and PVC)
+ Chemical composition/additives (e.g. plastic additives, flame retardants)
+ Volume
+ Density a
+ Litter (microplastics and degradation of macroplastics)
+ Fisheries / aquaculture gear and other maritime activities (e.g. ropes, buoys, boats)
+ Textiles (e.g. microfibers from clothing)
+ Ag. and industrial activities
+ Transportation (road dust/tire wear particles)
+ Leisure activity (gear from cruise/surfing/swimwear)
+ Industrial pellet & scrap, including feedstock
+ Personal care, domestic products
+ Atmospheric deposition
+ Atmospheric deposition
+ Stormwater runoff, including from ag. & industrial activities
+ Leaching
+ Vertical movement (floating, sinking)
+ Currents
+ Wastewater effluent
+ Deposition to & resuspension from sea bed
+ Trophic transfer / food web
+ Tributary influent
+ Fragmentation, weathering, chemical transformation
+ Trophic transfer
+ Leaching (internal & external)
+ Dermal contact & adhesion
+ Ingestion (filtration)
+ Inhalation / respiration
+ Shading
+ Mortality
+ Decreased reproduction
+ Species richness/evenness
+ Change in growth/condition
+ Change in behavior
+ Occurrence / exposure time
+ Reduced feeding/filtration
+ Altered digestion
+ Respiratory stress
+ Altered metabolism (e.g. reduced glucose uptake)
+ Altered immune response
*The Source category focuses on where microplastic particles originate and includes “primary microplastics” which are plastics intentionally manufactured to be small in size (e.g. nurdles, plastics in personal care products), “secondary
microplastics” which come from wear and tear during the use of larger plastic products (e.g. tires, textiles), and “tertiary microplastics” which come from weathering and breakdown of larger-sized plastic pollution (e.g. litter/food
packaging, cigarette butts).
a Density Ranges: 0.89-0.98 for PE, 0.96-1.45 for PET, 1.02-1.16 for PA, 0.83-0.92 for PP, 1.04-1.10 for PS, 1.19-1.31 for PVA, and 1.10-1.58 for PVC, <<1 for intact foams
M I C R O P L A S T I C P O L L U T I O N I N C A L I F O R N I A
A P P E N D I C E S | 6 5

Altogether, these aspects of microplastic pollution help to describe how microplastic exposure may lead
to observed adverse effects (i.e. causality pathways). In short, microplastic particles, described by unique
stressor characteristics, originate from some source before entering the marine environment. Once in the
marine environment, these particles travel through the environment (i.e. fate & transport pathway) until they
come into contact with or enter (i.e. exposure pathway) an environmental entity. Once these environmental
entities are exposed to these particles, they elicit an observed adverse effect specific to the assessment and/or
measurement endpoint being assessed.
APPENDIX 4:
Endpoints Prioritization Process for Microplastics Risk Assessment.
We developed 58 total endpoints across 12 entities, defined as taxa or trophic groups, representing key
components of the California marine environment at risk from microplastic pollution. For each taxa, we identified
assessment endpoints at both the organismal (n = 5) and population/community level (n = 4) (Appendix 3). We
used EPA (USEPA 1992, Suter 1990) definitions with the exception of population assessment endpoints, to which
cross-trophic and community-levels were added. We identified measurement endpoints specific to the entity and
assessment endpoint.
Using EPA prioritization criteria, we prioritized four endpoints to narrow the scope and focus the precautionary
framework for our particular case-study management goal. Per EPA guidance, rankings were applied based
on professional expertise and, in some cases, our decisions were justified with evidence from the peer-review
literature. Ecological relevance and susceptibility were rated “low”, “medium”, “high”, or “unknown” by us, the
Working Group, while management relevance was rated by the Policy Advisory Committee, which included
representatives from the California Ocean Protection Council, the Office of Environmental Health Hazard
Assessment, the California State Water Resources Control Board, and CalRecycle.
We ranked Ecological Relevance considering the whole ecosystem (e.g. food web, trophic levels, species
interactions), but Management Relevance considered state priorities only (i.e. < 3 nautical miles of shore). The
final list of priority endpoints were selected based on a rank of “high” in both management relevance and
susceptibility, as well as “medium” or “high” in ecological relevance.
M I C R O P L A S T I C P O L L U T I O N I N C A L I F O R N I A
A P P E N D I C E S | 6 6
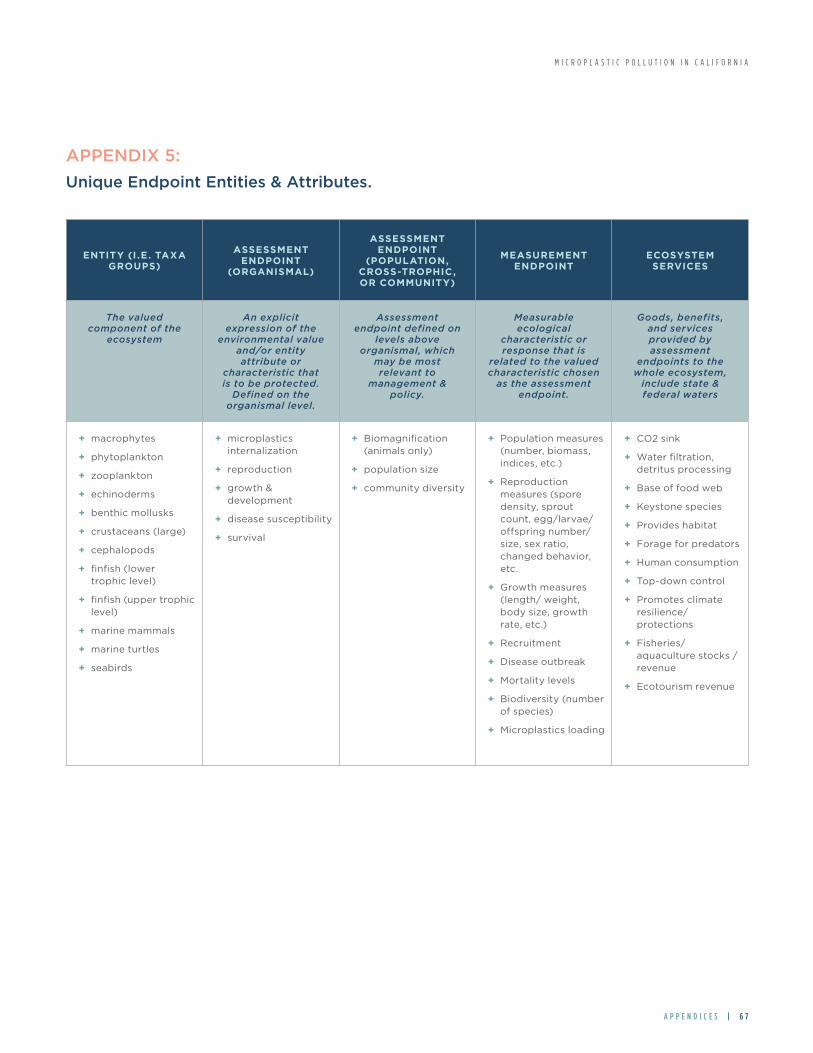
APPENDIX 5:
Unique Endpoint Entities & Attributes.
ENTITY (I.E. TAXA GROUPS)
ASSESSMENT ENDPOINT
(ORGANISMAL)
ASSESSMENT ENDPOINT
(POPULATION, CROSS-TROPHIC, OR COMMUNITY)
MEASUREMENT ENDPOINT
ECOSYSTEM SERVICES
The valued component of the
ecosystem
An explicit expression of the
environmental value and/or entity attribute or
characteristic that is to be protected.
Defined on the organismal level.
Assessment endpoint defined on
levels above organismal, which
may be most relevant to
management & policy.
Measurable ecological
characteristic or response that is
related to the valued characteristic chosen
as the assessment endpoint.
Goods, benefits, and services provided by assessment
endpoints to the whole ecosystem,
include state & federal waters
+ macrophytes
+ phytoplankton
+ zooplankton
+ echinoderms
+ benthic mollusks
+ crustaceans (large)
+ cephalopods
+ finfish (lower trophic level)
+ finfish (upper trophic level)
+ marine mammals
+ marine turtles
+ seabirds
+ microplastics internalization
+ reproduction
+ growth & development
+ disease susceptibility
+ survival
+ Biomagnification (animals only)
+ population size
+ community diversity
+ Population measures (number, biomass, indices, etc.)
+ Reproduction measures (spore density, sprout count, egg/larvae/offspring number/size, sex ratio, changed behavior, etc.
+ Growth measures (length/ weight, body size, growth rate, etc.)
+ Recruitment
+ Disease outbreak
+ Mortality levels
+ Biodiversity (number of species)
+ Microplastics loading
+ CO2 sink
+ Water filtration, detritus processing
+ Base of food web
+ Keystone species
+ Provides habitat
+ Forage for predators
+ Human consumption
+ Top-down control
+ Promotes climate resilience/ protections
+ Fisheries/aquaculture stocks / revenue
+ Ecotourism revenue
M I C R O P L A S T I C P O L L U T I O N I N C A L I F O R N I A
A P P E N D I C E S | 6 7
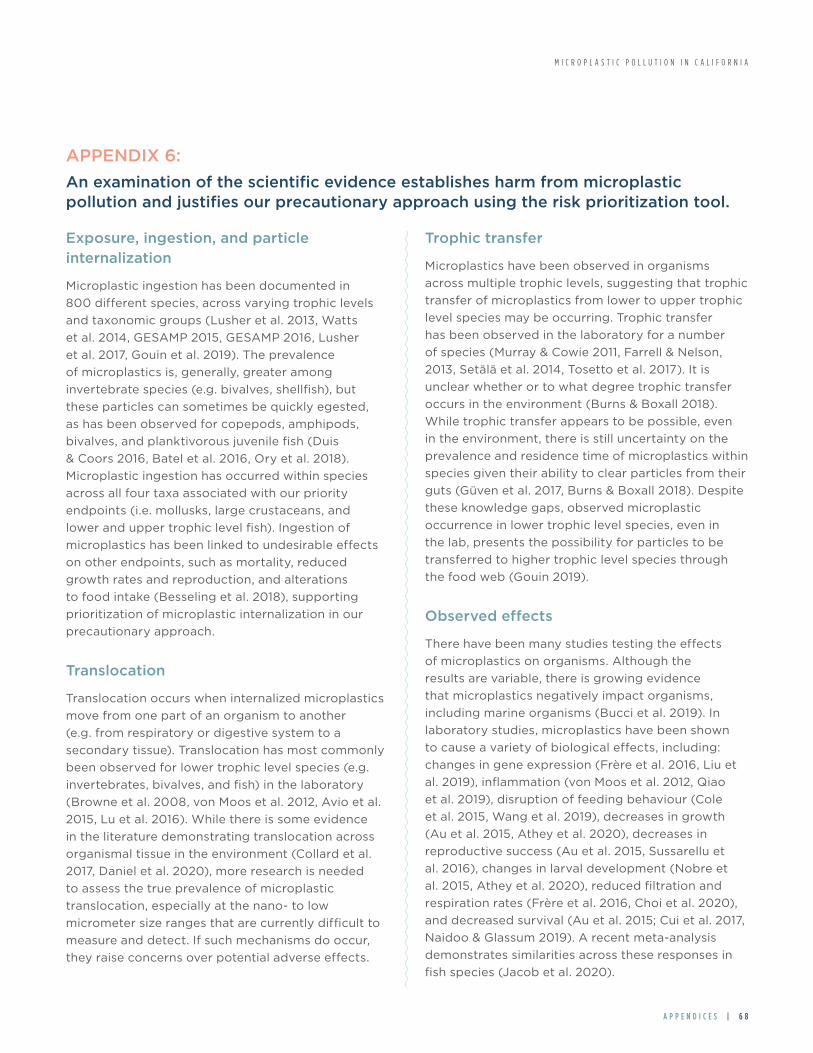
APPENDIX 6:
An examination of the scientific evidence establishes harm from microplastic pollution and justifies our precautionary approach using the risk prioritization tool.
Exposure, ingestion, and particle internalization
Microplastic ingestion has been documented in
800 different species, across varying trophic levels
and taxonomic groups (Lusher et al. 2013, Watts
et al. 2014, GESAMP 2015, GESAMP 2016, Lusher
et al. 2017, Gouin et al. 2019). The prevalence
of microplastics is, generally, greater among
invertebrate species (e.g. bivalves, shellfish), but
these particles can sometimes be quickly egested,
as has been observed for copepods, amphipods,
bivalves, and planktivorous juvenile fish (Duis
& Coors 2016, Batel et al. 2016, Ory et al. 2018).
Microplastic ingestion has occurred within species
across all four taxa associated with our priority
endpoints (i.e. mollusks, large crustaceans, and
lower and upper trophic level fish). Ingestion of
microplastics has been linked to undesirable effects
on other endpoints, such as mortality, reduced
growth rates and reproduction, and alterations
to food intake (Besseling et al. 2018), supporting
prioritization of microplastic internalization in our
precautionary approach.
Translocation
Translocation occurs when internalized microplastics
move from one part of an organism to another
(e.g. from respiratory or digestive system to a
secondary tissue). Translocation has most commonly
been observed for lower trophic level species (e.g.
invertebrates, bivalves, and fish) in the laboratory
(Browne et al. 2008, von Moos et al. 2012, Avio et al.
2015, Lu et al. 2016). While there is some evidence
in the literature demonstrating translocation across
organismal tissue in the environment (Collard et al.
2017, Daniel et al. 2020), more research is needed
to assess the true prevalence of microplastic
translocation, especially at the nano- to low
micrometer size ranges that are currently difficult to
measure and detect. If such mechanisms do occur,
they raise concerns over potential adverse effects.
Trophic transfer
Microplastics have been observed in organisms
across multiple trophic levels, suggesting that trophic
transfer of microplastics from lower to upper trophic
level species may be occurring. Trophic transfer
has been observed in the laboratory for a number
of species (Murray & Cowie 2011, Farrell & Nelson,
2013, Setälä et al. 2014, Tosetto et al. 2017). It is
unclear whether or to what degree trophic transfer
occurs in the environment (Burns & Boxall 2018).
While trophic transfer appears to be possible, even
in the environment, there is still uncertainty on the
prevalence and residence time of microplastics within
species given their ability to clear particles from their
guts (Güven et al. 2017, Burns & Boxall 2018). Despite
these knowledge gaps, observed microplastic
occurrence in lower trophic level species, even in
the lab, presents the possibility for particles to be
transferred to higher trophic level species through
the food web (Gouin 2019).
Observed effects
There have been many studies testing the effects
of microplastics on organisms. Although the
results are variable, there is growing evidence
that microplastics negatively impact organisms,
including marine organisms (Bucci et al. 2019). In
laboratory studies, microplastics have been shown
to cause a variety of biological effects, including:
changes in gene expression (Frère et al. 2016, Liu et
al. 2019), inflammation (von Moos et al. 2012, Qiao
et al. 2019), disruption of feeding behaviour (Cole
et al. 2015, Wang et al. 2019), decreases in growth
(Au et al. 2015, Athey et al. 2020), decreases in
reproductive success (Au et al. 2015, Sussarellu et
al. 2016), changes in larval development (Nobre et
al. 2015, Athey et al. 2020), reduced filtration and
respiration rates (Frère et al. 2016, Choi et al. 2020),
and decreased survival (Au et al. 2015; Cui et al. 2017,
Naidoo & Glassum 2019). A recent meta-analysis
demonstrates similarities across these responses in
fish species (Jacob et al. 2020).
M I C R O P L A S T I C P O L L U T I O N I N C A L I F O R N I A
A P P E N D I C E S | 6 8