Low-frequency meandering of the Atlantic North Equatorial Countercurrent
12
JOURNAL OF GEOPHYSICAL RESEARCH, VOL. 94, NO. C2, PAGES 2079-2090, FEBRUARY 15, 1989 Low-Frequency Meandering of the Atlantic North Equatorial Countercurrent SlLVIA GARZOLI Lamont-Doherty GeologicalObservatory, Columbia University, Palisades, New York PHILIP L. RICHARDSON Woods Hole Oceanographic Institution, Woods Hole, Massachusetts Four 19-month time seriesof indirect measurements of dynamic height were obtained in the tropical Atlantic along 28øW at if, 3ø, 6ø, and 9øN with three inverted echo sounders and one current meter mooring. The series were analyzed to study the time-latitude variability of the North Equatorial Countercurrent (NECC). The eastward flow associated with the NECC was present at 28øW from 3ø to 9•N during most of the observed period except in March-April 1983 and April-May 1984, periods that coincided with the onset of the wind at the equator. The amplitude of the NECC's annual cycle was maximum at 6:N and was larger in 1983 than in 1984. The analysis of the time-latitude variability of differences in dynamic height showsa long-period meridional shift of the NECC. The core of the current attains its northernmost location during August-September in both years and its southernmost location during March-April in 1983 and March in 1984. The location of the core is directly related to the position of the intertropical convergence zone. From the time series of dynamic height obtained from the indirect measurements, geostrophic velocities and transports wereestimated and compared with direct observations of currents and values obtained from hydrographic casts. 1. INTRODUCTION The North Equatorial Countercurrent (NECC) is a major component of the current system in the tropical Atlantic. A surfacecurrent (the flow is contained in the upper 250 m), the NECC flows eastward at latitudes from 3 ø to 10øN between two main westward flows: the South Equatorial Current (SEC) and the North Equatorial Current (NEC). Aside from historical ship drift observations, the first intensive direct measurement of the NECC was made during the GARP At- lantic Tropical Experiment (GATE) in 1974 [Bubnov and E•to- rikhin, 1979]. Garzoli and Katz [1983] analyzed the dynamics of the climatological NECC using historical data (for the ocean and atmosphere) and a simple theoretical model. Two main conclusions derived from this work are that (1) west of 20"W the NECC reverses from February through June (during these periods the flow is toward the west) and (2) in the in- terior of the basin the trade winds are responsible for the reversal of the NECC through the combined mechanisms of local Ekman pumping and the divergenceof the geostrophic currents. Data from the First GARP Global Experiment (FGGE) year were analyzed, and these results were shown to be valid [Garzoli and Richardson, 1984; Molinari et al., 1986]; the westernboundary for reversalof the flow in this particular year shifted 5ø to the west. Measuring the NECC over nearly two seasonalcycleswas one of the main objectives of the Seasonal Response of the Equatorial Atlantic program and the Programme Franqais Ocean et Climat dans l'Atlantique Equatorial (SEQUAL/FO- CAL) [Katz and Garzoli, 1984; Richardson, 1984a, b; Hdnin and Hisard, 1984]. As part of this combined effort (Figure 1), an array of inverted echo sounders(IES) [Katz, 1987; Garzoli, 1987] and a current meter mooring were deployed and main- tained in the area, surface drifters were launched and tracked Copyright 1989by the American Geophysical Union. Paper number 88JC03927. 0148-0227/89/88JC-03927505.00 [Richardson and Reverdin, 1987], and seasonal cruises along 23øW were performed [Ht;nin and Hisard, 1984, 1987]. Data from the array of inverted echo sounders have been described and analyzed for low-frequency motion by Katz and Garzoli [1984] and Katz [1987]. According to these analyses, the reversal of the NECC occurs along 38øW. Along 28øW, however, the flow is observed toward the east during the entire period of observations. On the other hand, direct veloci- ty measurements obtained with the mooring deployed at 6øN, 28øW show westward flow during March-April 1983 and April-May 1984 [Richardsonand Ret;erdin,1987]. An annual reversal of the NECC during spring was also observed near 28øW with satellite-trackeddrifters and historical ship drifts [Richardson and Ret•erdin, 1987]. The characteristics of the winds in the Equatorial Atlantic can be described in a simplified manner by the intertropical convergence zone (ITCZ) which separates the trade winds that prevail west of 10øW: northeast trades north of the ITCZ; southeast trades south of the ITCZ. In February the ITCZ is near the equator, but by August it moves 10 ø farther north. Associated with the northward migration of the ITCZ, the zonal windsin the western Atlantic along the equator sudden- ly increase (onset) usually in the month of May. During the period of observations to be discussed, a meteorological sta- tion was deployed and maintained at St. Peter and St. Paul Rocks(SPP, I•N, 29øW) [Garzoli and Katz, 1984]. The analy- sisof the data showed [Colin and Garzoli, 1987] that the onset of the zonal component of the wind stressoccured at SPP on April 10, 1983, and on May 17, 1984. In this paper, data obtained during the SEQUAL/FOCAL program are combined and analyzed to study the time- dependent structure of the NECC along 28øW and its relation to atmospheric forcing. From the time series obtained, the variability during the observed 20 monthsis analyzed, and the interannual variability is discussed. The ocean is represented by time series of indirect measurements of dynamic height as obtained with inverted echo sounders, direct measurements of current and temperature obtained at the mooring, and hydro- 2O79
-
Upload
independent -
Category
Documents
-
view
0 -
download
0
Transcript of Low-frequency meandering of the Atlantic North Equatorial Countercurrent

JOURNAL OF GEOPHYSICAL RESEARCH, VOL. 94, NO. C2, PAGES 2079-2090, FEBRUARY 15, 1989
Low-Frequency Meandering of the Atlantic North Equatorial Countercurrent
SlLVIA GARZOLI
Lamont-Doherty Geological Observatory, Columbia University, Palisades, New York
PHILIP L. RICHARDSON
Woods Hole Oceanographic Institution, Woods Hole, Massachusetts
Four 19-month time series of indirect measurements of dynamic height were obtained in the tropical Atlantic along 28øW at if, 3 ø, 6 ø, and 9øN with three inverted echo sounders and one current meter mooring. The series were analyzed to study the time-latitude variability of the North Equatorial Countercurrent (NECC). The eastward flow associated with the NECC was present at 28øW from 3 ø to 9•N during most of the observed period except in March-April 1983 and April-May 1984, periods that coincided with the onset of the wind at the equator. The amplitude of the NECC's annual cycle was maximum at 6:N and was larger in 1983 than in 1984. The analysis of the time-latitude variability of differences in dynamic height shows a long-period meridional shift of the NECC. The core of the current attains its northernmost location during August-September in both years and its southernmost location during March-April in 1983 and March in 1984. The location of the core is directly related to the position of the intertropical convergence zone. From the time series of dynamic height obtained from the indirect measurements, geostrophic velocities and transports were estimated and compared with direct observations of currents and values obtained from hydrographic casts.
1. INTRODUCTION
The North Equatorial Countercurrent (NECC) is a major component of the current system in the tropical Atlantic. A surface current (the flow is contained in the upper 250 m), the NECC flows eastward at latitudes from 3 ø to 10øN between
two main westward flows: the South Equatorial Current (SEC) and the North Equatorial Current (NEC). Aside from historical ship drift observations, the first intensive direct measurement of the NECC was made during the GARP At- lantic Tropical Experiment (GATE) in 1974 [Bubnov and E•to- rikhin, 1979]. Garzoli and Katz [1983] analyzed the dynamics of the climatological NECC using historical data (for the ocean and atmosphere) and a simple theoretical model. Two main conclusions derived from this work are that (1) west of 20"W the NECC reverses from February through June (during these periods the flow is toward the west) and (2) in the in- terior of the basin the trade winds are responsible for the reversal of the NECC through the combined mechanisms of local Ekman pumping and the divergence of the geostrophic currents. Data from the First GARP Global Experiment (FGGE) year were analyzed, and these results were shown to be valid [Garzoli and Richardson, 1984; Molinari et al., 1986]; the western boundary for reversal of the flow in this particular year shifted 5 ø to the west.
Measuring the NECC over nearly two seasonal cycles was one of the main objectives of the Seasonal Response of the Equatorial Atlantic program and the Programme Franqais Ocean et Climat dans l'Atlantique Equatorial (SEQUAL/FO- CAL) [Katz and Garzoli, 1984; Richardson, 1984a, b; Hdnin and Hisard, 1984]. As part of this combined effort (Figure 1), an array of inverted echo sounders (IES) [Katz, 1987; Garzoli, 1987] and a current meter mooring were deployed and main- tained in the area, surface drifters were launched and tracked
Copyright 1989 by the American Geophysical Union.
Paper number 88JC03927. 0148-0227/89/88JC-03927505.00
[Richardson and Reverdin, 1987], and seasonal cruises along 23øW were performed [Ht;nin and Hisard, 1984, 1987].
Data from the array of inverted echo sounders have been described and analyzed for low-frequency motion by Katz and Garzoli [1984] and Katz [1987]. According to these analyses, the reversal of the NECC occurs along 38øW. Along 28øW, however, the flow is observed toward the east during the entire period of observations. On the other hand, direct veloci- ty measurements obtained with the mooring deployed at 6øN, 28øW show westward flow during March-April 1983 and April-May 1984 [Richardson and Ret;erdin, 1987]. An annual reversal of the NECC during spring was also observed near 28øW with satellite-tracked drifters and historical ship drifts [Richardson and Ret•erdin, 1987].
The characteristics of the winds in the Equatorial Atlantic can be described in a simplified manner by the intertropical convergence zone (ITCZ) which separates the trade winds that prevail west of 10øW: northeast trades north of the ITCZ; southeast trades south of the ITCZ. In February the ITCZ is near the equator, but by August it moves 10 ø farther north. Associated with the northward migration of the ITCZ, the zonal winds in the western Atlantic along the equator sudden- ly increase (onset) usually in the month of May. During the period of observations to be discussed, a meteorological sta- tion was deployed and maintained at St. Peter and St. Paul Rocks (SPP, I•N, 29øW) [Garzoli and Katz, 1984]. The analy- sis of the data showed [Colin and Garzoli, 1987] that the onset of the zonal component of the wind stress occured at SPP on April 10, 1983, and on May 17, 1984.
In this paper, data obtained during the SEQUAL/FOCAL program are combined and analyzed to study the time- dependent structure of the NECC along 28øW and its relation to atmospheric forcing. From the time series obtained, the variability during the observed 20 months is analyzed, and the interannual variability is discussed. The ocean is represented by time series of indirect measurements of dynamic height as obtained with inverted echo sounders, direct measurements of
current and temperature obtained at the mooring, and hydro-
2O79

2080 GARZOLI AND RICHARDSON: NORTH EQUATORIAL COUNTERCURRENT
20 e N
IO o
O o
10 ø
20øS
700W 60 ø
O o
10*
ß
. 20os '
70 ø W 60 ø ,50 ø 40 ø :50 ø 20* lO ø E
Fig. 1. Location of the inverted echo sounders (triangles) and the current meter mooring (star) whose data are analyzed in the present paper. The total observed period was February 1983 through October 1984. The arrows represent mean velocities in 1 latitude by 3 • longitude boxes based on the historical ship drift data.
graphic sections along 28':'•W. The atmospheric forcing is given by the SEQUAL/FOCAL level 2b wind field product (V. Car- done and I. Tourre, personal communication, 1988), and the location of the ITCZ is provided by satellite observations of maximum cloud coverage [Guillot et al., 1986].
2. OBSERVATIONS AND METHODS
The present analysis is based on SEQUAL/FOCAL data obtained along 28">W in the mid-Atlantic during February 1983 through November 1984 (Figure 1). The observations consist of (1) a meridional array of inverted echo sounders deployed along 28•:W at the equator, 3øN, and 9øN, which is a subset of the larger SEQUAL sounder array [Garzoli, 1987; Katz, 1987];(2) a surface mooring deployed at 6øN containing a vertical array of current meters and thermistors at 20, 50, 75, and 150 m [Richardson and Reverdin, 1987], (3) two hydro- graphic sections based on conductivity-temperature-depth (CTD) casts obtained during July 1983 [Perkins and Saunders, 1984] and November 1984 [H•nin et al., 1986], (4) expendable
bathythermograph (XBT) sections along 28øW, and (5) the SEQUAL/FOCAL level 2b wind field, as prepared by Car- done and Tourre (personal communication, 1988).
The time series of inverted echo sounders and current
meters started on February 13, 1983, and ended on October 23, 1984. The travel time series obtained with the inverted
echo sounders at 0 c•, 3 •, and 9øN were transformed to dynamic height using the historical data file [Garzoli and Katz, 1983] and CTD and XBT observations obtained during the SEQUAL and FOCAL cruises. A linear regression of dynamic height on computed travel time from the historical data file gives a slope of 7.89 dyn cm m s-• with a standard error of the slope equal to 0.26. The error of the estimate of dynamic height from travel time is 2.3 dyn cm. With the above slope, each travel time time series can be expressed as a relative dynamic height. To obtain the absolute value of dynamic height• the in situ hydrographic observations were used. A detailed explanation of the procedure is given by Katz ['1987], who concluded that the IES can usually estimate dynamic
GARZOLI AND RICHARDSON' NORTH EQUATORIAL COUNTERCURRENT 2081
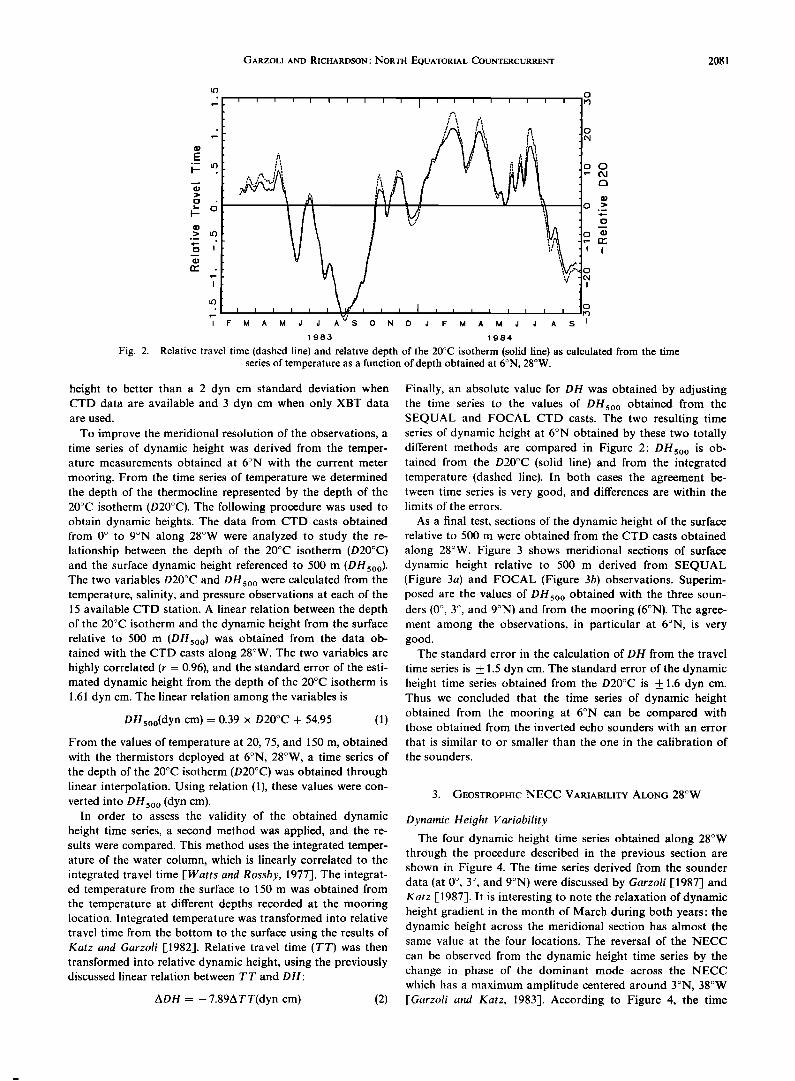
Fig. 2.
I [ I I I I I I I I ] I I I I [ I I I
M A M J J A S 0 N D J F M A M J J A S
1983 1984.
Relative travel time (dashed line) and relative depth of the 20øC isotherm (solid line) as calculated from the time series of temperature as a function of depth obtained at 6øN, 28øW.
height to better than a 2 dyn cm standard deviation when CTD data are available and 3 dyn cm when only XBT data are used.
To improve the meridional resolution of the observations, a time series of dynamic height was derived from the temper- ature measurements obtained at 6øN with the current meter
mooring. From the time series of temperature we determined the depth of the thermocline represented by the depth of the 20øC isotherm (D20øC). The following procedure was used to obtain dynamic heights. The data from CTD casts obtained from 0 ø to 9øN along 28øW were analyzed to study the re- lationship between the depth of the 20øC isotherm (D20øC) and the surface dynamic height referenced to 500 m (DH5oo). The two variables D20øC and DH5o o were calculated from the temperature, salinity, and pressure observations at each of the 15 available CTD station. A linear relation between the depth of the 20øC isotherm and the dynamic height from the surface relative to 500 m (DHsoo) was obtained from the data ob- tained with the CTD casts along 28øW. The two variables are highly correlated (r = 0.96), and the standard error of the esti- mated dynamic height from the depth of the 20øC isotherm is 1.61 dyn cm. The linear relation among the variables is
DHsoo(dyn cm)--0.39 x D20øC + 54.95 (1)
From the values of temperature at 20, 75, and 150 m, obtained with the thermistors deployed at 6øN, 28øW, a time series of the depth of the 20øC isotherm (D20øC) was obtained through linear interpolation. Using relation (1), these values were con- verted into DHso o (dyn cm).
In order to assess the validity of the obtained dynamic height time series, a second method was applied, and the re- sults were compared. This method uses the integrated temper- ature of the water column, which is linearly correlated to the integrated travel time [Watts and Rossby, 1977]. The integrat- ed temperature from the surface to 150 m was obtained from the temperature at different depths recorded at the mooring location. Integrated temperature was transformed into relative travel time from the bottom to the surface using the results of Katz and Garzoli [1982]. Relative travel time (TT) was then transformed into relative dynamic height, using the previously discussed linear relation between TT and DH:
ADH = -- 7.89ATT(dyn cm) (2)
Finally, an absolute value for DH was obtained by adjusting the time series to the values of DH5o o obtained from the SEQUAL and FOCAL CTD casts. The two resulting time series of dynamic height at 6ON obtained by these two totally different methods are compared in Figure 2' DH5o o is ob- tained from the D20øC (solid line) and from the integrated temperature (dashed line). In both cases the agreement be- tween time series is very good, and differences are within the limits of the errors.
As a final test, sections of the dynamic height of the surface relative to 500 m were obtained from the CTD casts obtained
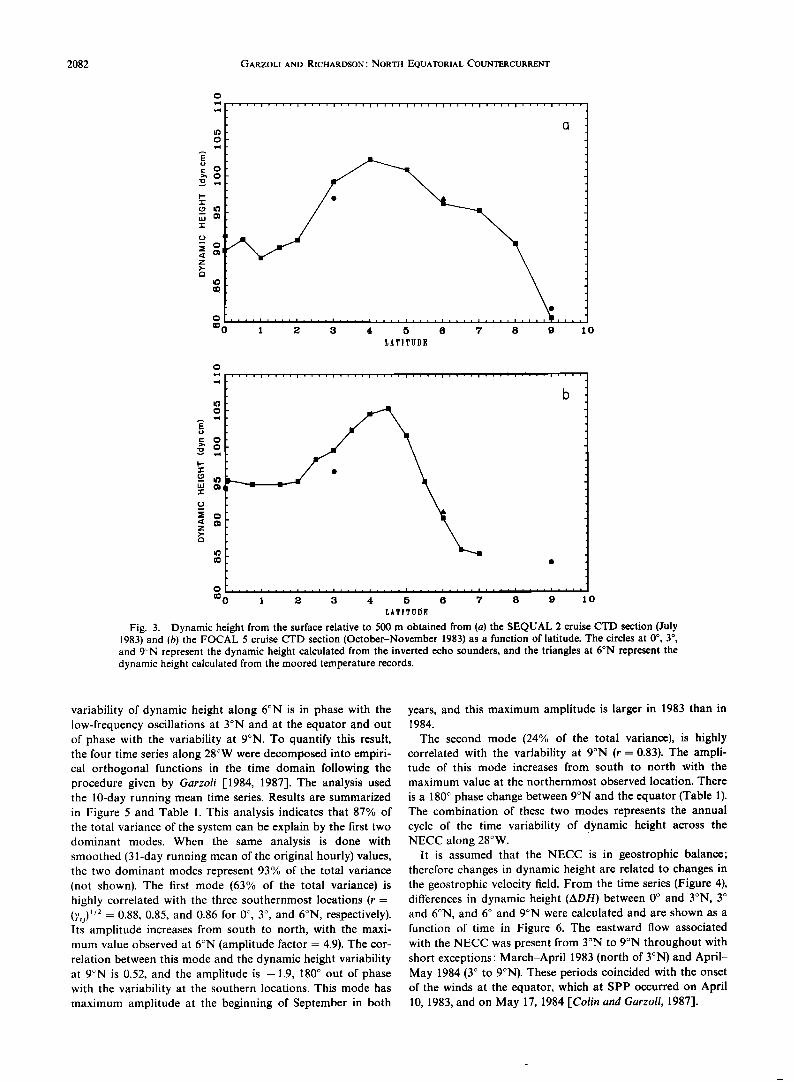
along 28':W. Figure 3 shows meridional sections of surface dynamic height relative to 500 m derived from SEQUAL (Figure 3a) and FOCAL (Figure 3b) observations. Superim- posed are the values of DH5o o obtained with the three soun- ders (0 •, 3 •, and 9'•N) and from the mooring (6øN). The agree- ment among the observations, in particular at 6øN, is very good.
The standard error in the calculation of DH from the travel
time series is + 1.5 dyn cm. The standard error of the dynamic height time series obtained from the D20øC is + 1.6 dyn cm. Thus we concluded that the time series of dynamic height obtained from the mooring at 6øN can be compared with those obtained from the inverted echo sounders with an error
that is similar to or smaller than the one in the calibration of
the sounders.
3. GEOSTROPHIC NECC VARIABILITY ALONG 28øW
Dynamic Height Variability
The four dynamic height time series obtained along 28øW through the procedure described in the previous section are shown in Figure 4. The time series derived from the sounder data (at 0:', 3 ø, and 9øN) were discussed by Garzoli [1987] and Katz [ 1987]. It is interesting to note the relaxation of dynamic height gradient in the month of March during both years: the dynamic height across the meridional section has almost the same value at the four locations. The reversal of the NECC
can be observed from the dynamic height time series by the change in phase of the dominant mode across the NECC which has a maximum amplitude centered around 3øN, 38øW [Garzoli and Katz, 1983]. According to Figure 4, the time
2082 GARZOLI AND RICHARDSON: NORTH EQUATORIAL COUNTERCURRENT
I 2 3 4 õ 6 ? 8 9 10
LATITUDE
C• .... i , , , , i , , , , i , , , , i , , , , i , , , i i , , , , i , , , • i i , , , i , , , ,
•0 I ;• :] 4 õ 6 ? 8 9 10 LATITUDe,
Fig. 3. Dynamic height from the surface relative to 500 m obtained from (a) the SEQUAL 2 cruise CTD section (July 1983) and (b) the FOCAL 5 cruise CTD section (October-November 1983) as a function of latitude. The circles at 0% 3 ø, and 9'-•N represent the dynamic height calculated from the inverted echo sounders, and the triangles at 6øN represent the dynamic height calculated from the moored temperature records.
variability of dynamic height along 6øN is in phase with the low-frequency oscillations at 3øN and at the equator and out of phase with the variability at 9øN. To quantify this result, the four time series along 28øW were decomposed into empiri- cal orthogonal functions in the time domain following the procedure given by Garzoli [1984, 1987]. The analysis used the 10-day running mean time series. Results are summarized in Figure 5 and Table 1. This analysis indicates that 87% of the total variance of the system can be explain by the first two dominant modes. When the same analysis is done with smoothed (31-day running mean of the original hourly) values, the two dominant modes represent 93% of the total variance (not shown). The first mode (63% of the total variance) is highly correlated with the three southernmost locations (r = (3,•) •/2 = 0.88, 0.85, and 0.86 for 0 ø, 3 ø, and 6•'N, respectively). Its amplitude increases from south to north, with the maxi- nlunl value observed at 6•N (amplitude factor = 4.9). The cor- relation between this mode and the dynamic height variability at 9øN is 0.52, and the amplitude is --1.9, 180 ø out of phase with the variability at the southern locations. This mode has maximum amplitude at the beginning of September in both
years, and this maximum amplitude is larger in 1983 than in 1984.
The second mode (24% of the total variance), is highly correlated with the variability at 9øN (r = 0.83). The ampli- tude of this mode increases from south to north with the maximum value at the northernmost observed location. There
is a 180 • phase change between 9øN and the equator (Table 1). The combination of these two modes represents the annual cycle of the time variability of dynamic height across the NECC along 28øW.
It is assumed that the NECC is in geostrophic balance; therefore changes in dynamic height are related to changes in the geostrophic velocity field. From the time series (Figure 4), differences in dynamic height (ADH) between 0 ø and 3øN, 3 ø and 6øN, and 6 ø and 9ON were calculated and are shown as a function of time in Figure 6. The eastward flow associated with the NECC was present from 3øN to 9øN throughout with short exceptions: March-April 1983 (north of 3øN) and April- May 1984 (3 ø to 9øN). These periods coincided with the onset of the winds at the equator, which at SPP occurred on April 10, 1983, and on May 17, 1984 [Colin and Garzoli, 1987].

GARZOLI AND RICHARDSON: NORTH EQUATORIAL COUNTERCURRENT 2083
11o
lO5
"• lOO
.? 90
'• 85
t=1 8o
75
M A M J S O N D J F M J J A S
I I I I J A A M
1983 1984
Fig. 4. Dynamic height as a function of time at 0 ø, 3 ø, 6 ø, and 9øN. The thicker line corresponds to 9øN.
The most interesting result of the time-latitude variability of the meridional differences in dynamic height, is the presence of a long-period meridional shifting of the NECC. The core of the current attained its northernmost position (north of 6øN) during the months of August-September for both monitored years and its southernmost position (south of 6øN) during March-April 1983 and in March 1984.
H•nin and Hisard [1984] analyzed data from hydrographic stations obtained during the seasonal FOCAL cruises along 23øW. From the calculated dynamic height values, they con- cluded that the meridionhl extension of the NECC along 23øW varies on a seasonal cycle: the NECC was widest in July of 1983 and 1984 (from 4ø30'N to north of 14øN) and was relatively narrow in January (from 4 ø to 8ø30'N in 1983 and from 3ø30'N to 7øN in 1984). The present array does not cover the same meridional extent as the hydrographic cruises, but
Figure 6 along, 28øW shows similar behavior. Also, the two hydrographic sections along 28øW show that in July 1983 (Figure 3b) the NECC was wider than during October- November 1983 (Figure 3a). This variability in the width of the NECC follows the low-frequency meandering as described previously and is present both at 23øW and at 28øW.
The tropical Atlantic responds rapidly to the seasonal vary- ing winds. The winds in the equatorial Atlantic have been described in a simplified manner by the movement of the ITCZ separating the northeast from the southeast trade winds. According to the Ekman pumping theory, the thermocline is raised north of the ITCZ and depressed south of it. A change in the sign of the curl of the wind stress originates the reversal of the flow; far from the boundaries, the mechanism that con- trols the NECC is the combination of the Ekman pumping and the divergence of the geostrophic currents which, in a first
145
135 130 -
120 125
/ 115
11o M A M J J A S O N D J F M A M J J A S
1983 1984
Fig. 5. Time variability of the two dominant modes from the EOF decomposition in the time domain of the four time series along 28øW.

2084
TABLE 1.
GARZOLI AND RICHARDSON: NORTH EQUATORIAL COUNTERCURRENT
Decomposition in the Time Domain of the 19-Month Time Series of Dynamic Height at 0 ø, 3 ø, 6 ø, and 9 ø N Along 28øW
Mode
0øN 3ON 6ON 9ON
Amplitude Amplitude Amplitude Amplitude Variance, % 3'u Factor 3'ii Factor % Factor %.¾ Factor
1 62.7 0.78 2.7 0.72 3.2 0.74 4.9 0.27 - 1.9 2 24.2 0.03 -0.5 0.18 1.6 0.06 1.4 0.69 3.1
Here, 3'•/is the fraction of the variance of the jth station explained by the ith mode.
approximation, equals the vorticity (--curl(r/f)) [Garzoli and Katz, 1983]. Therefore it is expected that the meridional shift- ing or the long-term meandering of the NECC could be relat- ed to the migration of the ITCZ. To relate this meridional motion of the NECC to the synoptic wind field, the divergence of the winds (div V --- c•u/•x - c•v/•y) and the curl of the wind stress (•zY/•x - c•z'•/•y) along 28øW were calculated from the SEQUAL/FOCAL level 2b wind product (Figure 7). The time-latitude variability of the divergence of the wind velocity is shown in Figure 7a; the location of the ITCZ should be related to the zone of maximum convergence. Maximum con- vergence was observed south of 3øN during March-April 1983 and May-June 1984. The meridional motion is evident, as are the differences in the timing of the reversal of the trades be- tween 1983 and 1984 related to the interannual variability of the onset of the wind at the equator in both years [Colin and Garzoli, 1987].
The zero line of the curl of the wind stress is shown in
Figure 7b, superimposed with the region of maximum cloudi- ness which is another way to define the position of the ITCZ [see Gulllot et al., 1986]. Figure 7b shows the position of the ITCZ derived from observed clouds for the period covered by the oceanic observations (J. Citeau, personal communication, 1988). It is interesting to note that the two different realiza- tions for the location of the ITCZ (Figures 7a and 7b) show similar results. Some differences are apparent in the onset of the northward motion and in the timing of the northernmost extension. While the cloud-derived product shows a clear in- terannual variability, the ITCZ reaching further north during
September 1983 than in 1984, this is not evident in the diver- gence of the winds from the SEQUAL/FOCAL product. On the other hand, the zero line for the curl of the wind stress
(Figure 7b) shows the onset of the northward motion at ap- proximately the same time as the onset of the winds at the equator (i.e., the northward migration of the ITCZ), and this zero line reaches lower latitudes during 1984 than 1983.
A comparison of Figures 6 and 7 shows a direct correlation between the low-period meandering of the NECC and the position of the ITCZ. The maximum core of the current fol- lows the motion of the maximum convergence of the winds. Maximum convergence was observed south of 3øN during March-April 1983 and May-June 1984, in direct correlation with the southward extension of the NECC as determined by ADH (Figure 6). The same is valid for the northward location of maximum convergence (north of 9øN) and maximum inten- sity of the NECC during the months of August-September in both years.
Therefore it is possible to conclude that just as the reversal of the NECC was related to the curl of the wind stress [Gar- zoli and Katz, 1983], the location of the core of the NECC can be tracked by the position of the ITCZ.
Geostrophic Velocities
This section analyzes the zonal geostrophic velocities (Ug) calculated from differences in dynamic height and compares the results with those obtained from the SEQUAL/FOCAL CTD casts and the in situ measurements of direct current
observations obtained with the mooring deployed at 6øN,
9øN
--a 0
3oN
\\
0 o I I I I I I I I I 4/1 5/1 6/1 7/1 $/1 9/1 10/1 II/1 12/1 4/1 5/1 6/1 7/1 8/1 9/1
1983 1984 YEAR, MONTH
Fig. 6. Meridional differences in dynamic height between time series located at 0 ø, 3 ø, 6 ø, and 9øN as a function of time and latitude. Positive differences in dynamic height indicate an eastward flow, and negative values indicate a westward flow.

GARZOLI AND RICHARDSON' NORTH EQUATORIAL COUNTERCURRENT 2085
9øN
I I 1 4/1 5/1 6/1
• I I I I I I I I I I I I I ,, I 7'/1 8/1 9/1 10/I 11/1 1;>/1 I/1 2/1 3/I 4/1 5/1 6/1 7/1 8/! 9/1
1983 1984 YEAR, MONTH
9ON
x
3øN x -
x•x b 0 o I I I I I i i I I I I I I I I I 1
4/1 5/I 6/1 7/1 8/1 9/1 10/I I1/1 12/1 1/1 2/1 •/1 4/1 5/1 6/1 7/1 8/1 9/1
1983 1984 YEAR, MONTH
Fi•. ?. (a) Divergence of the winds as a function of time and latitude as obtained from the S•UAL/FOCAL ]eve] 2b wind product. Negative values indicate convergence. (b) Position of the ]TCZ (crosses) as derived from observed maximum cloud coverage (from J. Citcau, personal communication, ]988), superimposed on the zero line for the wind stress curl (circles).
28'-'W. The geostrophic velocity between stations was obtained by the relation'
Ug = ADH/fAy (3)
where ADH is the difference of dynamic height between two stations,./' is obtained at the midpoint of the distance between the locations, and y is the distance measured from the equator. Considering that the dynamic height is calculated with an error of __+ 1.6 at 9øN to + 12.6 cm s- • at 3øN). The resultant time series of geostrophic velocities are given in Figure 8. Maximum eastward geostrophic velocities were reached be- tween 6 ø and 9øN (Figure 8a), during September in both years. Geostrophic velocities reached values of 40 cm s- • on Sep- tember 12, 1983, and 33 cm s -2 on September 6, 1984. Nega- tive values (westward flow) were observed in April-May 1983 and April-May 1984, and these are both associated with a southward displacement of the NECC. Further south (Figure 8b), between 3 ø and 6øN the flow was eastward for most of the observed period, with maximum values about half of these observed further north. Westward flow was observed at this
location during the months of August and September both years. This is due to the northward displacement of the NECC, which during this period of time is located at its northernmost position. Close to the equator, between 3 ø and 0•>N (Figure 8c), predominantly westward flow is observed. Even though geostrophy at these latitudes can be seriously questioned and the errors are large, the observed values are in coarse agreement with those obtained with the general circu- lation model developed for the area by Philander and Paca- nowski [1986]. It is interesting to note the oscillations of about 30- to 40-day period with maximum amplitude during May. These oscillations may be instability waves caused by the shear between the NECC and the SEC [Cox, 1980; Weisberg, 1984; Garzoli, 1987]; the maximum amplitude of these waves is located near the equator in May.
Figure 9 shows the variability of geostrophic velocity as a function of time and latitude. Results are a 31-day running mean of the original values to better distinguish the large-scale characteristics of the described motions. Values at 1.5øN are
shown in a qualitative sense only; at this latitude the values of

2086 GARZOLI AND RICHARDSON' NORTH EQUATORIAL COUNTERCURRENT
40 I I I I I I I ! ! ' 65
2O
• -s
øe o - I I I I I I I I I I I I I I I I I I (.0 -15
-35 M A M J J A S O N D J F M A M J J A S
1983 1984
40 I I I I I I I I I I I I I I ! I ! I 65
b --
--
--
I I I I I I I I i I I I I I I I I !
2O
•, lO
o • o
o
.lO
-2o
M A M J J A S O N D J F M A M J J A S
1983 1984
25
O 15
-15
-25
-35
40 70
3O
'•' 20
i:: •o • lO
o
• -1o O -10 O • -20 -•0 (/)
• -40 • -70 m O
m -90 O •. e -110 O .70
• -1•0
.1•
M A M J J A S O N D J F M A M J J A S 1983 19•
Fi•. •. •costrophic vcloc]t• •nd transport •s • •unct]on o• time estimated from diScfences in d•namic height between (•) •'• a•d •-•, (h) 3 • and 5•, •nd (c) 0• a•d 3• ß the lines around zero represent the error bars in each case, and arc tmnsport• c•]cul•tcd from the CTD casts.
Ug shown might be higher than actual values because of the proximity to the equator (f•-, 0). In addition to the values of Ug centered at 1.5':, 4.5 ø, and 7.5øN using relation (3), the surface velocity observed with the current meter mooring,
from which the wind-correlated part has been subtracted, has been included at 6•N to draw Figure 9. The wind-correlated part of the velocity was subtracted by means of an EOF analysis in the time domain in which the input files were four

GARZOLI AND RICHARDSON' NORTH EQUATORIAL COUNTERCURRENT 2087
9øN
6øN
$øN
0 o
Fig. 9.
/o// / ,o ,o
5/1 •/1 7/1 8/1 •/1 10/1 I1/I 12/1 1/1 2/1 •/1 4/1 5/1 •/1 7/1 B/1
1•8• 1•84 YEAR, UONTH
Eastward g•ostrophic v•locity calculated from m•ridional gradients in dynamic h•ight inferred from th• four tim• s•ri•s at 0 •, 3 •, 6 •, and 9ON as a function of time and latitude.
i 9/1
time series' the two wind stress components at the location of the mooring and the two velocity components at 20 m. From the empirical decomposition of the four time series, a domi- nant mode that represents the wind-correlated part of the ve- locity was obtained and subtracted from the original time series of surface currents. The "corrected" direct observations
agree remarkably well with the values of Ug inferred from the D H time series. In order to verify the validity of the correction, the "corrected" velocities were compared with available data. The first comparison was done with results from CTD obser- vations from the SEQUAL and FOCAL cruises described pre- viously. Results show that for day 199, 1983, the corrected velocity is 30 cm s-•, while the geostrophic velocity obtained from the CTD stations nearby the mooring is 30 cm s-•. For day 305, 1983, values are 10 and 13 cm s-•, respectively. Even though the comparison is based on only two points, the agree- ment is very good.
Further validation was made with the IES data. Time series
of geostrophic velocities between 3 ø and 9øN were calculated and compared with the corrected velocities from the mooring. A simple statistic for the two time series, (1) corrected from the current meters and (2) derived from the sounders measure- ments, gives the following values respectively' mean, 9.23 and 9.27 cm s- •' maximum value, 12.8 and 19.1 cm s- •' minimum value, -1.5 and -2.0 cm s-•' standard deviation, 4.98 and 5.36 cm s-•. A direct linear regression between the two ob- tained time series gives a coefficient correlation of 0.7. As we will see later, owing to the meridional motion of the core of the NECC, a direct comparison between these two repre- sentation will yield to an underestimation in the correlation. During the periods of time when the NECC is located be- tween 3 ø and 9øN, a good agreement is expected, while when the core is located at its northward position, the agreement should decrease. A simple statistic performed for the segments of the series during the period of time when the current is located mainly between 3 and 9øN increases the coefficient correlation to 0.9.
The NECC was present in the basin along 28øW at 6øN from May 1, 1983, through April 20, 1984, and from May 1, 1984, to the end of the record. Maximum values of Ug were reached in May-June 1983 between 3 ø and 6øN (Ug -- 25-35 cm s-•) when the ITCZ was at 6øN ß north of 7.5øN during
September 1983 (Ug = 40 cm s -•) when the ITCZ was at 10øN; and at 6øN in June-July 1984 (Ug > 40 cm s-•) when the ITCZ was between 5 ø and 7øN.
This analysis (Figure 9) confirms the results obtained in the previous section concerning the long-term meandering of the NECC and the relationship between the location of the maxi- mum core and the position of the ITCZ. Figure 9 shows, with better meridional resolution, the interannual variability in the timing of the reversal of the flow along 28øW and the long- term meandering associated with the meridional motion of the ITCZ. Also evident is the interannual variability in the inten- sity and location of the maximum eastward flow that is lo- cated at 6øN during September-October 1984 south of its 1983 position.
Estimated Geostrophic Transport
This section presents the geostrophic transport, relative to 500 m, calculated from the time series of dynamic height, and compares it with similar values obtained from the CTD casts and calculated from the current meter mooring. The geo- strophic transport in the upper 250 m between stations at 9ø-6øN and 6ø-3øN (Figure 8, right-hand axis) was calculated from the time series of geostrophic velocities. Superimposed on the time series, single values of transport from the CTD casts are shown. The transport from the current measurements was calculated for the upper 250 m assuming that the NECC has an average meridional extent of 5 ø. To compare with the transport estimated at 6øN from the sounder records, a similar calculation was done between stations at 3 ø and 9øN. Results
of these two last calculations are shown in Figure 10. Transport between stations at 6 ø and 9øN (Figure 8a)
reaches a maximum value of 65 Sv (1 Sv = 10 6 m 3 s-•) during September 1983. At the same time of the year in 1984, a maximum of 55 Sv is observed. At this location, between 6 ø and 9øN, the error in the geostrophic velocity is +2 cm s-•. This translates to an error for the estimated transport of + 1.7 Sv. Difference in transport between September 1983 and 1984 are therefore significant. The maximum value of the westward transport (-22 Sv) was observed during May 1983, when ac- cording to Figure 8b the eastward transport was mostly be- tween stations at 3 ø and 6øN. The mean transport for the observed period is 18 Sv between the two northernmost sta-

2088 GARZOLI AND RICHARDSON' NORTH EQUATORIAL COUNTERCURRENT
55
35
v) 25
0 15
-5
-15
-25
-$5
I I I I I I I I I I I I I I Q
I I I I I I I I I I I I I I A S 0 N D J F' M A M J J A S
983 1984
55
35
v) 25 •
15 o
-5
-15
-35
Fig. 10.
o
25 (4
15 Q.
.lO
.2o
-5
-15
25
M A M J J A S 0 N O J F M A M J J A S
1983 1984
Eastward water transport based on (a) current meter records at 6øN and (b) dynamic height time series at 3 ø and 9øN.
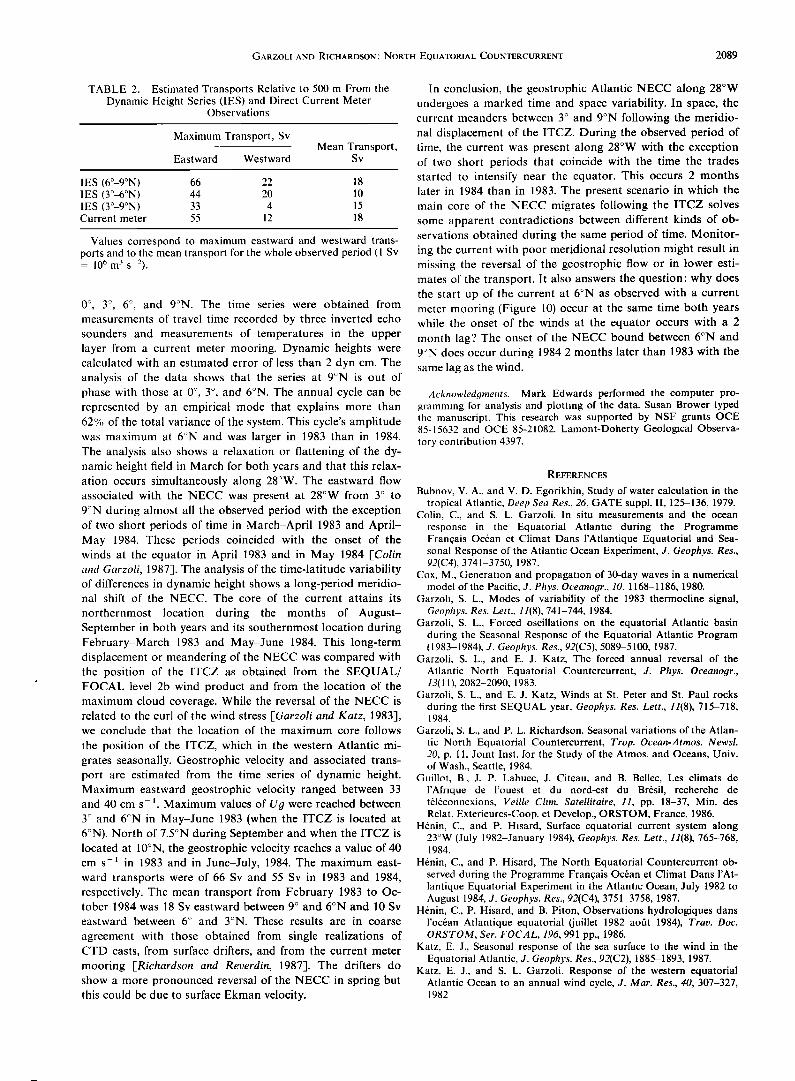
tions (6 ø and 9øN) and 10 Sv between 3 ø and 6øN. The trans- port estimated from a single point of current measurements (Figure 10) is similar to the geostrophic one calculated from the dynamic height series between 3 ø and 9øN. The main dif- ference between the two realizations is that the mooring mea- sured larger values of transport for 1984 than for 1983. Ac- cording to the previous analysis, when the main core of the NECC is located north of 6øN (September of both years), the transport estimated from the direct current observations is lower than that obtained at 7.5øN from differences in dynamic height. The estimated geostrophic transport between 3 ø and 9øN (i.e., at 6øN) does not show the westward flow observed with the current meter mooring during March and April 1984. Results of the comparison are given in Table 2.
Another interesting point that comes out of this analysis based on the scenario that the NECC meanders following the ITCZ is the following: The current meter data show at 6øN the onset of the NECC occurring at the same time during May in both years (Figure 10a). This is in agreement with the NECC representation provided by the difference in dynamic height as observed with IES data at 3 ø and 9øN. But the onset of the winds at the equator does not occur at the same time in
both years; there is a 2-month lag between 1983 and 1984 [Colin and Garzoli, 1987]. The same lag occurs for the posi- tion of the line of maximum convergence of the winds and of the zero curl of wind stress as shown in Figures 7a and 7b. Both realizations for the position of the ITCZ, maximum con- vergence and cloud coverage, show that the ITCZ is located closest to the equator in April 1983 and in June 1984. If the NECC reversal and the meridional migration of its maximum core is directed by the wind curl and convergence, respectively, this lag in time between years should be reflected in the onset of the current. The previous analysis, which improves the me- ridional resolution obtained with the sounders and gives a spatial distribution to the observations obtained at a single point with the current meter mooring, allowed us to solve the contradiction. When the location of the main core of the cur-
rent is established and the transport is calculated at that point, then the onset of the NECC (Figure 8a) occurs in mid-May 1983 and in June 1984 following the winds.
4. SUMMARY AND CONCLUSIONS
The time-latitude variability of the NECC along 28øW was studied with four 19-month time series of dynamic height at
GARZOLI AND RICHARDSON' NORTH EQUATORIAL COUNTERCURRENT 2089
TABLE 2. Estimated Transports Relative to 500 m From the Dynamic Height Series (IES) and Direct Current Meter
Observations
Maximum Transport, Sv Mean Transport,
Eastward Westward Sv
IES (6ø-9øN) 66 22 18 IES (3ø-6øN) 44 20 10 IES (3ø-9øN) 33 4 15 Current meter 55 12 18
Values correspond to maximum eastward and westward trans- ports and to the mean transport for the whole observed period (1 Sv = 106 m 3 s-2).
if', 3 r', 6 :•, and 9<'N. The time series were obtained from
measurements of travel time recorded by three inverted echo sounders and measurements of temperatures in the upper layer from a current meter mooring. Dynamic heights were calculated with an estimated error of less than 2 dyn cm. The analysis of the data shows that the series at 9-N is out of phase with those at 0 k', 3 •-', and 6øN. The annual cycle can be represented by an empirical mode that explains more than 62% of the total variance of the system. This cycle's amplitude was maximum at 6-'N and was larger in 1983 than in 1984. The analysis also shows a relaxation or flattening of the dy- namic height field in March for both years and that this relax- ation occurs simultaneously along 28•W. The eastward flow associated with the NECC was present at 28øW from 3 ø to 9"N during almost all the observed period with the exception of two short periods of time in March-April 1983 and April- May 1984. These periods coincided with the onset of the winds at the equator in April 1983 and in May 1984 [Colin and Garzoli, 1987]. The analysis of the time-latitude variability of differences in dynamic height shows a long-period meridio- nal shift of the NECC. The core of the current attains its
northernmost location during the months of August- September in both years and its southernmost location during February-March 1983 and May-June 1984. This long-term displacement or meandering of the NECC was compared with the position of the ITCZ as obtained from the SEQUAL/ FOCAL level 2b wind product and from the location of the maximum cloud coverage. While the reversal of the NECC is related to the curl of the wind stress [Garzoli and Katz, 1983], we conclude that the location of the maximum core follows
the position of the ITCZ, which in the western Atlantic mi- grates seasonally. Geostrophic velocity and associated trans- port are estimated from the time series of dynamic height. Maximum eastward geostrophic velocity ranged between 33 and 40 cm s-•. Maximum values of U•/were reached between 3 •' and 6øN in May-June 1983 (when the ITCZ is located at 6•'N). North of 7.5•N during September and when the ITCZ is located at 10:N, the geostrophic velocity reaches a value of 40 cm s-• in 1983 and in June-July, 1984. The maximum east- ward transports were of 66 Sv and 55 Sv in 1983 and 1984, respectively. The mean transport from February 1983 to Oc- tober 1984 was 18 Sv eastward between 9 ø and 6øN and 10 Sv
eastward between 6: and 3øN. These results are in coarse
agreement with those obtained from single realizations of CTD casts, from surface drifters, and from the current meter
mooring [Richardson and Reverdin, 1987]. The drifters do show a more pronounced reversal of the NECC in spring but this could be due to surface Ekman velocity.
In conclusion, the geostrophic Atlantic NECC along 28øW undergoes a marked time and space variability. In space, the current meanders between 3 • and 9øN following the meridio- nal displacement of the ITCZ. During the observed period of time, the current was present along 28øW with the exception of two short periods that coincide with the time the trades started to intensify near the equator. This occurs 2 months later in 1984 than in 1983. The present scenario in which the main core of the NECC migrates following the ITCZ solves some apparent contradictions between different kinds of ob- servations obtained during the same period of time. Monitor- ing the current with poor meridional resolution might result in ntissing the reversal of the geostrophic flow or in lower esti- mates of the transport. It also answers the question: why does the start up of the current at 6øN as observed with a current meter mooring (Figure 10) occur at the same time both years while the onset of the winds at the equator occurs with a 2 month lag? The onset of the NECC bound between 6øN and 9•N does occur during 1984 2 months later than 1983 with the same lag as the wind.
Acknowled,qments. Mark Edwards performed the computer pro- gramming for analysis and plotting of the data. Susan Brower typed the manuscript. This research was supported by NSF grants OCE 85-15632 and OCE 85-21082. Lamont-Doherty Geological Observa- tory contribution 4397.
REFERENCES
Bubnov, V. A., and V. D. Egorikhin, Study of water calculation in the tropical Atlantic, Deep Sea Res., 26, GATE suppl. II, 125-136, 1979.
Colin, C., and S. L. Garzoli. In situ measurements and the ocean response in the Equatorial Atlantic during the Programme Frangais Oc6an et Climat Dans l'Atlantique Equatorial and Sea- sonal Response of the Atlantic Ocean Experiment, d. Geophys. Res., 92(C4), 3741-3750, 1987.
Cox, M., Generation and propagation of 30-day waves in a numerical model of the Pacific, d. Phys. Oceano,qr., 10, 1168-1186, 1980.
Garzoli, S. L., Modes of variability of the 1983 thermocline signal, Geophys. Res. Lett., 11(8), 741-744, 1984.
Garzoli, S. L., Forced oscillations on the equatorial Atlantic basin during the Seasonal Response of the Equatorial Atlantic Program (1983-1984), d. Geophys. Res., 92(C5), 5089-5100, 1987.
Garzoli, S. L., and E. J. Katz, The forced annual reversal of the
Atlantic North Equatorial Countercurrent, d. Phys. Oceano•lr., 13( 11 ), 2082-2090, 1983.
Garzoli, S. L.. and E. J. Katz, Winds at St. Peter and St. Paul rocks during the first SEQUAL year, Geophys. Res. Lett., 11(8), 715-718, 1984.
Garzoli, S. L., and P. L. Richardson. Seasonal variations of the Atlan- tic North Equatorial Countercurrent, Trop. Ocean-Atmos. Newsl. 20, p. 11, Joint Inst. for the Study of the Atmos. and Oceans, Univ. of Wash., Seattle, 1984.
Guillot, B., J.P. Lahuec, J. Citeau, and B. Bellec, Les climats de l'Afrique de l'ouest et du nord-est du Br•sil, recherche de tfilficonnexions, Veille Clim. $atellitaire, 11, pp. 18-37, Min. des Relat. Exterieures-Coop. et Develop., ORSTOM, France, 1986.
H6nin, C.. and P. Hisard. Surface equatorial current system along 23•'W (July 1982-January 1984), Geophys. Res. Lett., 11(8), 765-768, 1984.
H•nin, C., and P. Hisard, The North Equatorial Countercurrent ob- served during the Programme Frangais Ocean et Climat Dans l'At- lantique Equatorial Experiment in the Atlantic Ocean, July 1982 to August 1984, d. Geophys. Res., 92(C4), 3751-3758, 1987.
H•nin, C., P. Hisard, and B. Piton, Observations hydrologiques dans l'oc6an Atlantique equatorial (juillet 1982-aofit 1984), Tray. Doc. ORSTOM, Set. FOCAL, 196, 991 pp., 1986.
Katz. E. J., Seasonal response of the sea surface to the wind in the Equatorial Atlantic, d. Geophys. Res., 92(C2), 1885-1893, 1987.
Katz, E. J., and S. L. Garzoli. Response of the western equatorial Atlantic Ocean to an annual wind cycle, d. Mar. Res., 40, 307-327, 1982.
2090 GARZOLI AND RICHARDSON.' NORTH EQUATORIAL COUNTERCURRENT
Katz, E. J., and S. L. Garzoli. Thermocline displacement across the Atlantic North Equatorial Countercurrent during 1983, Geophys. Res. Lett., 11{8), 737-740, 1984.
Molinari, R. L., S. L. Garzoli, E. J. Katz, D. E. Harrison, P. L. Richardson, and G. Reverdin, A synthesis of the First GARP Global Experiment (FGGE) in the equatorial Atlantic Ocean, Prog. Oceano.qr., 16(2), 91-112. 1986.
Perkins, H., and K. Saunders, Atlantic equatorial sections during July 1983, Geophys. Res. Lett., ••(8), 769-772, 1984.
Philander, S. G. H., and R. C. Pacanowski. A model of the seasonal cycle in the tropical Atlantic Ocean. J. Geophys. Res., 91,N(C12), 14,192-14,206, 1986.
Richardson, P. L., Drifting buoy trajectories in the Atlantic North Equatorial Countercurrent during 1983, Geophys. Res. Lett., 11(8), 745-752, 1984a.
Richardson, P. L., Moored current meter measurements in the Atlan- tic North Equatorial Countercurrent during 1983, Geophys. Res. Lett., 11(8), 749-752, 1984b.
Richardson, P. L_ and G. Reverdin, Seasonal cycle of velocity in the
Atlantic North Equatorial Countercurrent as measured by surface drifters, current meters, and ship drifts, d. Geophys. Res., 92(C4), 3691-3708, 1987.
Watts, D. R., and H. T. Rossby. Measuring dynamic heights with inverted echo sounders: Results from MODE, d. Phys. Res., 7, 345-358, 1977.
Weisberg, R. H., Instability waves observed on the equator in the Atlantic Ocean during 1983, Geophys. Res. Lett., 11(8), 753-756, 1984.
S. Garzoli, Lamont-Doherty Geological Observatory, Columbia University, Palisades, NY 10964.
P. L. Richardson, Woods Hole Oceanographic Institution, Woods Hole, MA 02543.
(Received June 8, 1988; revised July 13, 1988;
accepted October 18, 1988.)