Recent changes in fish communities of the equatorial Lake Naivasha, Kenya
10
Vol. 5(4), pp. 45-54, April, 2013 DOI: 10.5897/IJFA11.037 ISSN 2006-9839 ©2013 Academic Journals http://www.academicjournals.org/IJFA International Journal of Fisheries and Aquaculture Full Length Research Paper Recent changes in fish communities of the equatorial Lake Naivasha, Kenya Aloo P. A. 1 *, Oyugi D. O. 2 , Morara G. N. 3 and Owuor M. A. 4 1 Department of Aquaculture and Fisheries Management, Karatina University, P. O. Box 1957-10101, Karatina, Kenya. 2 Kenya Wildlife Service Training Institute, Kenyatta Avenue, P. O. Box 842, Naivasha, Kenya. 3 Kenya Marine and Fisheries Research Institute, Mombasa Station, P. O. Box 81651-80100, Mombasa , Kenya. 4 Department of Applied Limnology and Marine Sciences, South Eastern University College, P. O. Box 170-90200 Kitui, Kenya. Accepted 15 March, 2013 Changes in fish species composition and abundance in Lake Naivasha were investigated monthly for a period of 12 months. Data were obtained both from experimental surveys as well as commercial fish landings. The structure metrics considered included species abundance and composition, length- frequency and physico-chemical attributes. Results of the study showed that the fishery is currently dominated by the recently introduced common carp, Cyprinus carpio accounting for over 95% of the total fish landings, with the naturalized fish populations performing dismally both in terms of abundance as well as health conditions. The entry of the common carp into Lake Naivasha may have completely transformed the lake’s ecosystem integrity, driving the initially abundant tilapiine species to near local extinction. The study also confirms a restricted distribution of Micropterus salmoides to rocky-bottomed habitats of Hippo Point and Crescent Lake. Conversely, the long-fin barb, Barbus paludinosus, initially confined to the north swamp and the mouth of River Malewa, currently exhibits a lake-wide distribution. The changing climatic conditions as manifested in the lake level recessions may be a real threat to the fish stocks in the lake. Human activities in the catchment areas may also have contributed to the recent ecological changes witnessed in Lake Naivasha. This study proposes a number of recommendations with a view to ensuring ecosystem integrity and consequent sustainable fisheries of Lake Naivasha. Key words: Ecosystem integrity, habitat preference, species introductions, sustainable fisheries, fish population, equatorial lake. INTRODUCTION Lake Naivasha, the only freshwater lake in the Eastern part of the Gregory Rift Valley is situated about 100 km north-west of Nairobi, Kenya. At present, the fish fauna in the lake is made primarily of five teleostean species, which are mainly a framework of allodiversity. These are: Common carp Cyprinus carpio (L.), blue-spotted tilapia Oreochromis leucostictus (Trewavas), largemouth bass Micropterus salmoides (Lacepédé), red-bellied tilapia Tilapia zillii (Gervais) and longfin barb Barbus paludinosus (Boulenger) (Hickley et al., 2004; Ojuok et al., 2007). Common carp, which is the latest introduction, was swept into the lake by the El nino rains of 1997/98 from an aquaculture farm in the catchment area. The fish was first recorded in the lake in 2000 (Hickley et al., 2004) together with its other two sub-species mirror carp C. carpio specularis and leather carp, C. carpio coiaceus. The two tilapiine species were introduced from Lake Victoria (Kenya) basin in 1959 (Muchiri and Hickley, *Corresponding author. E-mail: [email protected].
-
Upload
kisiiuniversity -
Category
Documents
-
view
1 -
download
0
Transcript of Recent changes in fish communities of the equatorial Lake Naivasha, Kenya

Vol. 5(4), pp. 45-54, April, 2013
DOI: 10.5897/IJFA11.037
ISSN 2006-9839 ©2013 Academic Journals
http://www.academicjournals.org/IJFA
International Journal of Fisheries and Aquaculture
Full Length Research Paper
Recent changes in fish communities of the equatorial Lake Naivasha, Kenya
Aloo P. A.1*, Oyugi D. O.2, Morara G. N.3 and Owuor M. A.4
1Department of Aquaculture and Fisheries Management, Karatina University, P. O. Box 1957-10101, Karatina, Kenya.
2Kenya Wildlife Service Training Institute, Kenyatta Avenue, P. O. Box 842, Naivasha, Kenya.
3Kenya Marine and Fisheries Research Institute, Mombasa Station, P. O. Box 81651-80100, Mombasa , Kenya.
4Department of Applied Limnology and Marine Sciences, South Eastern University College, P. O. Box 170-90200 Kitui,
Kenya.
Accepted 15 March, 2013
Changes in fish species composition and abundance in Lake Naivasha were investigated monthly for a period of 12 months. Data were obtained both from experimental surveys as well as commercial fish landings. The structure metrics considered included species abundance and composition, length- frequency and physico-chemical attributes. Results of the study showed that the fishery is currently dominated by the recently introduced common carp, Cyprinus carpio accounting for over 95% of the total fish landings, with the naturalized fish populations performing dismally both in terms of abundance as well as health conditions. The entry of the common carp into Lake Naivasha may have completely transformed the lake’s ecosystem integrity, driving the initially abundant tilapiine species to near local extinction. The study also confirms a restricted distribution of Micropterus salmoides to rocky-bottomed habitats of Hippo Point and Crescent Lake. Conversely, the long-fin barb, Barbus paludinosus, initially confined to the north swamp and the mouth of River Malewa, currently exhibits a lake-wide distribution. The changing climatic conditions as manifested in the lake level recessions may be a real threat to the fish stocks in the lake. Human activities in the catchment areas may also have contributed to the recent ecological changes witnessed in Lake Naivasha. This study proposes a number of recommendations with a view to ensuring ecosystem integrity and consequent sustainable fisheries of Lake Naivasha. Key words: Ecosystem integrity, habitat preference, species introductions, sustainable fisheries, fish population, equatorial lake.
INTRODUCTION Lake Naivasha, the only freshwater lake in the Eastern part of the Gregory Rift Valley is situated about 100 km north-west of Nairobi, Kenya. At present, the fish fauna in the lake is made primarily of five teleostean species, which are mainly a framework of allodiversity. These are: Common carp Cyprinus carpio (L.), blue-spotted tilapia Oreochromis leucostictus (Trewavas), largemouth bass Micropterus salmoides (Lacepédé), red-bellied tilapia Tilapia zillii (Gervais) and longfin barb Barbus paludinosus
(Boulenger) (Hickley et al., 2004; Ojuok et al., 2007). Common carp, which is the latest introduction, was swept into the lake by the El nino rains of 1997/98 from an aquaculture farm in the catchment area. The fish was first recorded in the lake in 2000 (Hickley et al., 2004) together with its other two sub-species mirror carp C. carpio specularis and leather carp, C. carpio coiaceus. The two tilapiine species were introduced from Lake Victoria (Kenya) basin in 1959 (Muchiri and Hickley,
*Corresponding author. E-mail: [email protected].

46 Int. J. Fish. Aquaculture. 1991), while the largemouth bass was introduced from North America via South Africa as a sport fish in 1929 and in 1946 (Aloo, 1988; Dadzie and Aloo, 1990; Muchiri and Hickley, 1991).The red swamp crayfish Procambarus clarkii, which was introduced from Louisiana in 1950s to provide forage for the bass is also present in the lake. Rainbow trout Oncorhynchus mykiss (Walbaum) has occasionally been reported in the lake especially during dry seasons when the lake water is reasonably clear. Recently, one piece of the African sharp-tooth catfish Clarias gariepinus was caught by researchers during routine monthly monitoring survey at the Crescent Island. Currently, C. carpio is the mainstay for commercial fishery which was initially (before the year 2000) mainly based on tilapiine fishery. Today, most of the other fish species occur scantly in the lake.
The initial four fish species, Barbus paludinosus, M. salmoides, O. leucostictus and T. zillii that occurred abundantly in the lake have been reported to show habitat preference in their distribution with O. leucostictus, T. zillii and B. paludinosus occurring in large numbers in the Oserian Bay while M. salmoides has a preference for rocky habitats of Hippo Point to the west of the lake and the Crescent Island Lake (Oyugi, unpub. data). On the other hand, C. carpio has been reported to exhibit ubiquity in distribution in the lake. Various aspects of the ecology of these fish are well documented (Muchiri and Hickley, 1991; Muchiri et al., 1995; Hickley et al., 2004; Britton et al., 2007; Oyugi et al., 2011). However, with regard to species composition in the lake, the only reports available are those of Siddiqui (1977) while a snapshot on their distribution was provided by Aloo (1988).
Since the aforementioned studies, the lake has experienced marked environmental changes and subsequent fish stock transformations (Oyugi et al., 2011). This work was, therefore carried out to establish the changes in fish species composition, abundance and their response to the recent limnological changes in the lake. This paper consequently suggests some recommendations on how to uphold the lake’s ecosystem integrity and subsequent sustainability of its fisheries resources. MATERIALS AND METHODS Lake Naivasha is situated at the eastern arm of the Great Gregory Rift Valley at 0º 45′ S: 36º 21′ E, and approximately 1890 m.a.s.l. Its area fluctuates between 100 to 160 km
2 depending on rainfall
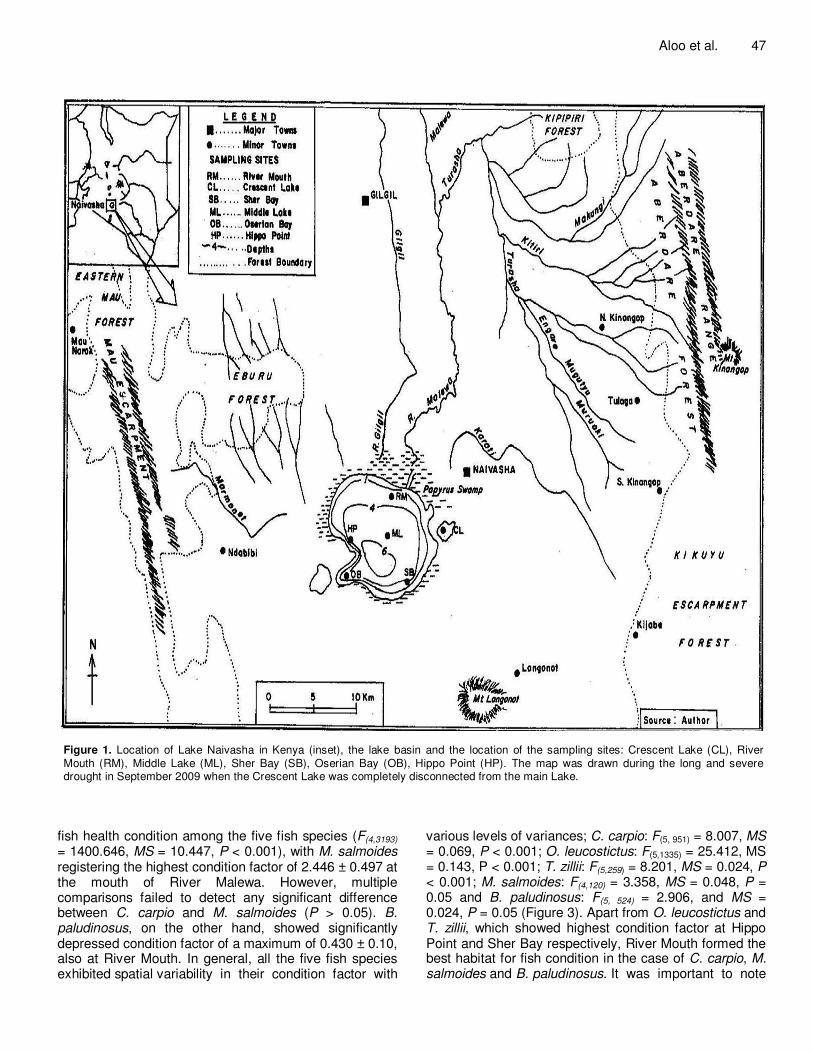
regimes. Fish samples from the lake were collected monthly over a period of 12 months from July 2008 to June 2009 from six sampling stations fundamentally covering the predominant habitat types of the lake (that is, rocky shores, semi-isolated lagoons, fringing sedges and submerged macrophytes, river mouth and open waters). The sites were approximately four kilometers apart and are hereafter identified as: River Mouth (RM), Crescent Lake (CL), Middle Lake (ML), Sher Bay (SB), Hippo Point (HP) and Oserian Bay (OB) (Figure 1).
A fleet of 10 gillnets of different mesh sizes ranging from 1½", 2",
2½", 3", 3½", 4", 4½", 5", 5 ½ " to 6" were set monthly at each station both in the day and at night for 4 h each, giving a total of 8 h fishing effort, following Hickley et al. (2002) protocol. On lifting the gears, fish species were sorted and their total numbers enumerated to establish the abundance at each site. Total length (LT) in mm, body depth (DB) in mm and total weight (WT) to the nearest 0.1 g, were recorded using a measuring board and a digital weighing balance respectively. During open fishing seasons (that is, September to June), the composition, abundance and fishing effort data from the research survey were supplemented by commercial landing data from Fisheries Department mainly collected from three landing beaches namely Central, Kamere and Tarambete. Changes in fish size conditions were established through determination of length-frequency parameters for all the species spread across the entire lake. To establish health status of each fish species, a three dimensional function of total condition factor (KT) was adopted as modified from Richter et al. (2000):
Where: WT = total weight of fish (g); DB = Body depth of fish (mm); LT = total length of fish (mm).
To determine species composition across the main habitat types, relative abundance was estimated from Catch Per Unit Effort (CPUE) computed as number of individual fish caught from survey samples divided by total number of fishing hours (that is, 8 h). For commercially caught fish, CPUE was calculated as total weight of fish (kg) divided by total number of operating boats in each month. The commercial landings were pooled to represent the general lake species composition, and not by sites.
Environmental and limnological parameters such as surface water temperature, pH, total dissolved solids and electrical conductivity were also determined in triplicate at each sampling site using Combo HI 98129 pH and EC Meter. Lake turbidity was determined by measuring light extinction using Secchi disc (250 mm diameter). Dissolved oxygen concentration was determined by use of the original Winkler titration method described in Entz (2008). Chlorophyll a was quantified by hot extraction method of water samples filtered onto GFC filter paper according to Harper (1991). Actual water depths were determined using a fabricated and graduated rope. Lake level data was obtained from Water Resources Management Authority (WRMA), Naivasha District Office. All statistical analyses were performed by Statistica Computer Program Version 7 and unless stated, error margins considered as standard error, and α = 0.05.
RESULTS
Length frequency distribution
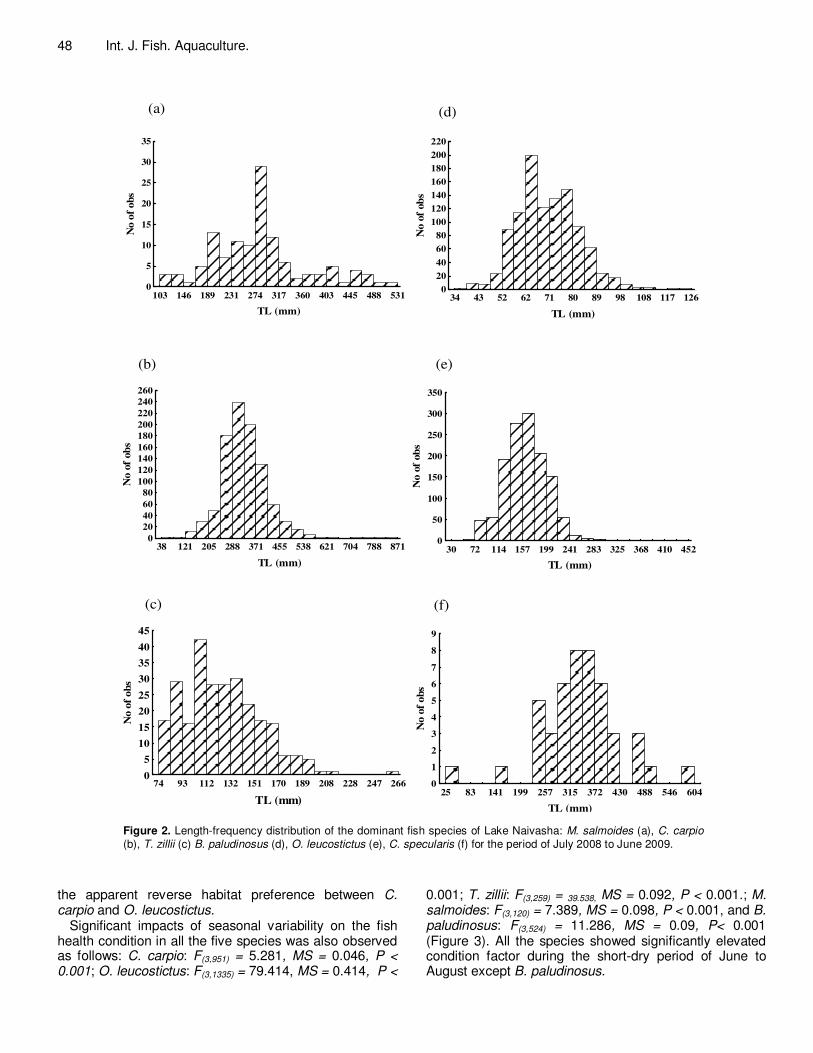
A total of 1063, 1300, 11, 46, 123, 962 and 265 individuals were collected representing B. paludinosus, C. carpio, C. coiaceus, C. specularis, M. salmoides, O. leucostictus and T. zillii respectively. Apart from O. leucostictus and T. zillii which showed right-skewed length distribution, LT for all the other four species were normally distributed with modal lengths largely varying (Figure 2).
Fish health condition
The study observed an overall significant difference in
TB
T
T
LD
WK
*=
Aloo et al. 47
Figure 1. Location of Lake Naivasha in Kenya (inset), the lake basin and the location of the sampling sites: Crescent Lake (CL), River Mouth (RM), Middle Lake (ML), Sher Bay (SB), Oserian Bay (OB), Hippo Point (HP). The map was drawn during the long and severe drought in September 2009 when the Crescent Lake was completely disconnected from the main Lake.
fish health condition among the five fish species (F(4,3193) = 1400.646, MS = 10.447, P < 0.001), with M. salmoides registering the highest condition factor of 2.446 ± 0.497 at the mouth of River Malewa. However, multiple comparisons failed to detect any significant difference between C. carpio and M. salmoides (P > 0.05). B. paludinosus, on the other hand, showed significantly depressed condition factor of a maximum of 0.430 ± 0.10, also at River Mouth. In general, all the five fish species exhibited spatial variability in their condition factor with
various levels of variances; C. carpio: F(5, 951) = 8.007, MS = 0.069, P < 0.001; O. leucostictus: F(5,1335) = 25.412, MS = 0.143, P < 0.001; T. zillii: F(5,259) = 8.201, MS = 0.024, P < 0.001; M. salmoides: F(4,120) = 3.358, MS = 0.048, P = 0.05 and B. paludinosus: F(5, 524) = 2.906, and MS = 0.024, P = 0.05 (Figure 3). Apart from O. leucostictus and T. zillii, which showed highest condition factor at Hippo Point and Sher Bay respectively, River Mouth formed the best habitat for fish condition in the case of C. carpio, M. salmoides and B. paludinosus. It was important to note
48 Int. J. Fish. Aquaculture.
Figure 2. Length-frequency distribution of the dominant fish species of Lake Naivasha: M. salmoides (a), C. carpio (b), T. zillii (c) B. paludinosus (d), O. leucostictus (e), C. specularis (f) for the period of July 2008 to June 2009.
the apparent reverse habitat preference between C. carpio and O. leucostictus.
Significant impacts of seasonal variability on the fish health condition in all the five species was also observed as follows: C. carpio: F(3,951) = 5.281, MS = 0.046, P < 0.001; O. leucostictus: F(3,1335) = 79.414, MS = 0.414, P <
0.001; T. zillii: F(3,259) = 39.538, MS = 0.092, P < 0.001.; M. salmoides: F(3,120) = 7.389, MS = 0.098, P < 0.001, and B. paludinosus: F(3,524) = 11.286, MS = 0.09, P< 0.001 (Figure 3). All the species showed significantly elevated condition factor during the short-dry period of June to August except B. paludinosus.
CC
38 121 205 288 371 455 538 621 704 788 871
TL (mm)
0
20
40
60
80
100
120
140
160
180
200
220
240
260
No o
f ob
sMS
103 146 189 231 274 317 360 403 445 488 531
TL (mm)
0
5
10
15
20
25
30
35
No o
f ob
sBA
34 43 52 62 71 80 89 98 108 117 126
TL (mm)
0
20
40
60
80
100
120
140
160
180
200
220
No o
f ob
s
OL
30 72 114 157 199 241 283 325 368 410 452
TL (mm)
0
50
100
150
200
250
300
350
No o
f ob
s
TZ
74 93 112 132 151 170 189 208 228 247 266
TL (mm)
0
5
10
15
20
25
30
35
40
45
No o
f ob
s
CS
25 83 141 199 257 315 372 430 488 546 604
TL (mm)
0
1
2
3
4
5
6
7
8
9
No o
f ob
s
(a)
(f) (c)
(e) (b)
(d)

Aloo et al. 49
Figure 3. Mean (±SE) condition factor by space (left column) and season (right column) of (a) C.
carpio, (b) O. leucostictus, (c) T. zillii, (d) M. salmoides and (e) B. paludinosus from Lake Naivasha for the period of July 2008 to June 2009. Survey seasons include: Long-dry (LD), Long-wet (LW), Short-dry (SD) and Short-wet (SW).
Species composition and abundance Commercial fish catches have shown tremendous transformation in species composition. Common carp has virtually taken over commercial landings. By the close of the year 2009, common carp C. carpio and mirror carp C.
carpio specularis contributed 97% while the remaining species contributed 3% of the total relative abundance computed from CPUE of the commercial catches. Thus the carps have almost effectively displaced all the original fish stocks. The commercial landings, which were exclusively constituted by the carps in 2009 drastically,
0.60
0.65
0.70
0.75
0.80
0.85
0.90
0.95
RM CL SB ML OB HP
1.3
1.4
1.5
1.6
1.7
1.8
1.9
RM CL SB ML OB HP
1.3
1.4
1.5
1.6
1.7
1.8
1.9
LD LW SD SW
0.6
0.7
0.8
0.9
1.0
1.1
1.2
RM CL SB ML OB HP0.6
0.7
0.8
0.9
1.0
1.1
1.2
LD LW SD SW
0.60
0.65
0.70
0.75
0.80
0.85
0.90
0.95
LD LW SD SW
0.0
0.5
1.0
1.5
2.0
2.5
3.0
RM CL SB ML OB HP
0.0
0.5
1.0
1.5
2.0
2.5
3.0
LD LW SD SW
0.20
0.25
0.30
0.35
0.40
0.45
0.50
RM CL SB ML OB HP0.20
0.25
0.30
0.35
0.40
0.45
0.50
LD LW SD SW
(a)
(e)
(d)
(c)
(b)
Survey sites Survey seasons
Kn
Kn
Kn
Kn
Kn

50 Int. J. Fish. Aquaculture.
Figure 4. Species composition computed as relative abundance of catch per unit effort (CPUE)
from commercial data of the dominant fish species. , C. carpio; , O. leucostictus; , T.
zillii; , M. salmoides; *, C. specularlis of Lake Naivasha for the period of 1999 to 2009.
shot up doubling that of the previous year (Figure 4). However, the multi-mesh survey resulted in different species composition spread out across the different habitat types. Whereas B. paludinosus, C. carpio and O. leucostictus, remained relatively persistent across the habitat types (P > 0.05), the contributions of M. salmoides, T. zillii, C. coiaceus and C. specularis varied significantly across the habitat types (P < 0.01) (Figure 5). Fish distribution and physico-chemical parameters Conductivity, temperature, pH, dissolved oxygen and total dissolved solids were observed to vary between the stations. The highest mean conductivity recorded was at Crescent Island (384.3 ± 6.9) and the lowest at the mouth of River Malewa (350.3 ± 23.8). Mean value of dissolved oxygen was lowest at Hippo point (5.4 ± 1.6 mgL
-1) while
highest at the mouth of River Malewa (7.1 ± 1.0 mgL-1
). Mean pH values remained relatively consistent across the lake, although Sher Bay recorded the lowest (8.3 ± 1.1). Table 1 shows a comparison of the 2009 mean physico-chemical parameters with the past years.
Between 2004 and 2009, water level changes of Lake Naivasha were significant among the years (ANOVA: F(1,5) = 4.870; P < 0.0001), but not among the months
(F(1,11) = 0.142; P >0.05) (Figure 6). The lowest lake levels were recorded during the year 2009, with the month of December recording the lowest readings. A significant correlation was found between fish abundance and water depth. O. leucostictus in particular, were predominantly abundant in shallow waters (r
2 = 0.886; P
< 0.01) characterized by high levels of total dissolved solids (r
2 = 0.605; P < 0.05). On the other hand, B.
paludinosus abundance was significantly high in deep waters (r
2 = 0.544; P < 0.05). The distribution and
abundance of the C. carpio and M. salmoides did not show any significant relationship with water depth.
DISCUSSION
For more than three decades, the abundance and sizes of the natural fish populations in Lake Naivasha have declined tremendously. For instance, female T. zillii which used to be mature at the LT of 130 mm in 1970s (Siddiqui, 1977), currently only matures at 108 mm (Oyugi et al., 2010). The scenario may even get more precarious with the additional stress emanating from the ecological adversities of the recently introduced C. carpio. As predicted by many authors, the carp found a huge benthic food reserve (Mavuti, 1990; Muchiri and Hickley,
0
200
400
600
800
1000
1200
1400
1600
1999 2000 2002 2003 2004 2005 2006 2007 2008 2009
Survey period
CP
UE
(Kg/B
oat)
OL MS TZ CC MC
0
200
400
600
800
1000
1200
1400
1600
1999 2000 2002 2003 2004 2005 2006 2007 2008 2009
Survey period
CP
UE
(Kg/B
oat)
OL MS TZ CC MC
0
200
400
600
800
1000
1200
1400
1600
1999 2000 2002 2003 2004 2005 2006 2007 2008 2009
Survey period
CP
UE
(Kg/B
oat)
OL MS TZ CC MC
0
200
400
600
800
1000
1200
1400
1600
1999 2000 2002 2003 2004 2005 2006 2007 2008 2009
Survey period
CP
UE
(Kg/B
oat)
OL MS TZ CC MC

Aloo et al. 51
Figure 5. Spatial relative abundance computed as catch per unit effort (CPUE) of the dominant fish species of Lake Naivasha between 1999 and 2009. MS, M. salmoides; BP, B. paludinosus; C. CC carpio, OL, O. leucostictus; TZ, T. zillii; MC, Mirror carp; LC, Leather carp.
CL
BA
40%
CC
28%
OL
16%
MS
7%TZ
8%
LC
0%MC
1%
RM
CC
17%OL
58%
BA
22%
MS
0%TZ
3%
LC
0%
MC
0%
ML
BA
54%CC
34%
OL
9%
MS
0%
TZ
0%
LC
0%MC
3%
SB
BA
43%
CC
14%
OL
38%
MS
0%
TZ
5%
LC
0%
MC
0%
OB
CC
17%
OL
49%
BA
16%
MS
0%TZ
17%
LC
0%MC
1%
HP
BA
24%
CC
30%
OL
31%
MS
10%
TZ
1%
LC
1%
MC
3%
BP
22%
BP
40&
BP
16&
BP
24&
BP
54&
BP
43&

52 Int. J. Fish. Aquaculture.
Table 1. A summary of annual variation in the physico-chemical parameters of Lake Naivasha pooled from all the sampling stations representing different habitat types.
Parameter Period
Previous studies 2009 2008 2007 2002
Temperature (°C ) 22.1±1.5 21.8±1.0 22.9±0.4 21.6±1.6 18.9-22 (1979)
pH 9.2±0.1 8.0±0.4 7.4±0.1 8.6±0.6 7.7-8.9 (1977)
D.O (mgl-1
) 6.6±1.2 6.0±1.3 5.1±0.2 7.2±1.4 8-9 (1992)
Transparency (cm) 24.5±20.2 48±10 56±11.4 67.6±46 60 (1995)
Conductivity (µScm-1) 362.4±12.6 259.2±23.2 265±8 322±70 350 (1984)
Chlorophyll a (µg/L-1
) 48.8±3.2 32.6±13.4 26.7±2.6 26.4±13.6 25 (1992)
Mean depth (m) 1.83±1.0 3.1±.1.2 3.5±1.4 2.2±1.1 3-6 (2002)
Previous data sources: Milbrink (1977), Litterick et al. (1979), Harper (1984), Harper (1992), and Hickley and Harper (2002).
Figure 6. Changes in lake water level (m.a.s.l) between 2004 and 2009. Dotted black line shows mean lake level for the stated period. Data Source: Water Resources Management Authority (WRMA), Naivasha District Office.
1991; Britton et al., 2007; Ojuok et al., 2007) which it has taken advantage of resulting into excellent health condition at the detriment of the initial fish stocks of the lake. The poor health condition of T. zillii in particular, may be a strong indicator of a depressed fish population that has also been reflected in their declining abundance (Britton et al., 2007; Ojuok et al., 2007; Oyugi et al., 2010). In his study, Oyugi (2011) also recorded depressed health condition of the fish which he attributed
to decline in prey items during the long dry season. This coincided with severe massive fish kill in February, 2010 which though many people speculatively related to possible chemical pollution from flower farms, were largely caused by hypoxia. Crescent Lake (CL) is not a preferred feeding ground for all the fish species except M. salmoides (Oyugi, 2011). According to him, the other fish species prefer foraging around the River Mouth (RM) and at Oserian Bay (OB). This would probably explain the
1884.0
1884.2
1884.4
1884.6
1884.8
1885.0
1885.2
1885.4
1885.6
1885.8
1886.0
1886.2
1886.4
1886.6
1886.8
1887.0
1887.2
Jan Feb Mar Apr May Jun Jul Aug Sep Oct Nov Dec
Months of the year
Lak
e L
evel
(m
.a.s
.l)
2004 2005 2006 2007 2008 2009
1884.0
1884.2
1884.4
1884.6
1884.8
1885.0
1885.2
1885.4
1885.6
1885.8
1886.0
1886.2
1886.4
1886.6
1886.8
1887.0
1887.2
Jan Feb Mar Apr May Jun Jul Aug Sep Oct Nov Dec
Months of the year
Lak
e L
evel
(m
.a.s
.l)
2004 2005 2006 2007 2008 2009
1884.0
1884.2
1884.4
1884.6
1884.8
1885.0
1885.2
1885.4
1885.6
1885.8
1886.0
1886.2
1886.4
1886.6
1886.8
1887.0
1887.2
Jan Feb Mar Apr May Jun Jul Aug Sep Oct Nov Dec
Months of the year
Lak
e L
evel
(m
.a.s
.l)
2004 2005 2006 2007 2008 2009
1884.0
1884.2
1884.4
1884.6
1884.8
1885.0
1885.2
1885.4
1885.6
1885.8
1886.0
1886.2
1886.4
1886.6
1886.8
1887.0
1887.2
Jan Feb Mar Apr May Jun Jul Aug Sep Oct Nov Dec
Months of the year
Lak
e L
evel
(m
.a.s
.l)
2004 2005 2006 2007 2008 2009

poor health condition recorded at CL.
A study by Oyugi et al. (2011) indicated the relative decline in the abundance of the two tilapiine species. Whereas this was initially (that is, 1975-1999) as a result of heavy fishing pressure, the currently worrying decline of the two tilapia species is mainly driven by fluctuation of lake level (Oyugi et al., 2011) and probably the level of illegal fishing especially at the shores of the lake which is apparently the preferred habitat for the two tilapias (Oyugi Unpub. Data). The entry of C. carpio into the lake has also shown significant initial disruption on life-history traits particularly for T. zillii (Oyugi Unpublised data). The dynamics of nutrients loading and the subsequent increase in turbidity of the lake (Kitaka et al., 2002) may be part of the drivers of such a rapid decline. For instance, fish species such as T. zillii depend on submerged macrophyte areas for breeding, thus the reduction in the water level and increase in turbidity leads to loss of such habitats (Muchiri, 1990). Preliminary investigations by Oyugi (unpub) indicate elements of competition for food and space between the carps and the naturalized tilapiine species. Since the entry of the carp into the lake in the late 1990s (Hickley et al., 2004) and its subsequent proliferation, the reproductive investment and consequent abundance of the tilappiines has significantly declined. For example, the fecundity of T. zillii has declined from over 6000 to only about 3000 oocytes (Oyugi et al., 2010). This may be attributable to the rapidly deteriorating environmental conditions. The feeding habit of the carp which mainly churns the sediment thereby straining breeding ecology of T. zillii and M. salmoides both being nest builders may be a strong driver of the drastic decline of the two species. Similar impacts of the alien carp have been reported in Western Australia (Khan et al., 2003; Brown et al., 2005).
Additionally, the changing environmental templates in the lake probably due to the entry of the carp, may have also resulted into the shifting of the bass’s feeding habit from the initially predominant cray fish diet to B. paludinosus (Aloo, 1988; Hickley et al., 1994; Britton et al., 2010) as a result of the reduced submerged marcophytes which used to favor high abundance of the crayfish (Harper et al., 1990). In the late 2009 and early 2010 the lake level severely declined leaving only a pool of water in the middle of the lake. The remnant fish stocks which were mainly carps (estimated at 100% dominance) were consequently confined to the pool of water at the middle of the lake from where fishermen, most of whom used excessive fishing effort literally scooped them. This resulted into sky rocketing landings of the carps effectively doubling the 2008 figures (Annual Fisheries Bulletin, 2009).
The riverine B. paludinosus initially only abundant around the north swamp at the entrance of River Malewa and around Crescent Island is currently spread across the entire lake which may be an element of continued adaptation. M. salmoides occurred abundantly at Hippo
Aloo et al. 53 Point in the main lake and at the Crescent Island Lake. In both sites, the fish was found in shallow rocky areas, as was also observed from an earlier work by Aloo (1988). The same distributional scenario was observed by Cady (1945) in North America. CONCLUSIONS AND RECOMMENDATIONS This study has given an overview of the current status and distribution of fish species composition in Lake Naivasha. Common carp has effectively taken over the fisheries productions in the lake accounting to over 95% of the total fish catch. Its two subspecies; mirror and leather carp also show increasingly high potential with the former fundamentally surpassing the naturalized fish population in the recent landings. Whereas largemouth bass M. salmoides is mainly restricted to rocky-bottomed habitats of Hippo Point and Crescent Lake, the long fin barbus B. paludinosus which was initially only found at the north swamp and around River Malewa is currently almost evenly distributed in the lake and is increasingly becoming more abundant. This can be attributed to the reduction in lake level. Changing climatic conditions seen in terms of lake level recession as a surrogate, may be a real threat to the fish stocks of Lake Naivasha. Apart from the blue-spotted tilapia O. leucostictus, the seasonal variability of the lake’s abiotic factors significantly affect the fish health condition in the lake. In line with the findings of this study, the authors wish to recommend the following: 1. More work should be carried out on the common carp to establish its effects on the Lake Naivasha ecosystem, besides its long term fishery sustainability. There is need to review the co-management approach of Beach Management Unit (BMU) especially to strengthen their responsiveness to the ensuing changes in climatic conditions and the ever increasing human population, 2. More effort should be devoted to upholding integrated water resources management approaches to capture the entire catchment of the lake. This could be achieved by the government enhancing conservation measures through the implementation of the Lake Naivasha Management Plan, considering that the lake is a Ramsar site, 3. Future species introduction into Lake Naivasha should be prohibited unless thorough studies are carried out on the biology and ecology of any preferred candidate species. ACKNOWLEDGEMENTS The success of this work is largely owed to the strong support from Karatina University, Fisheries Department, the Kenya Marine and Fisheries Research Institute, South

54 Int. J. Fish. Aquaculture. Eastern University College and the Water Resources Management Authority. Our appreciation is also due to The British Council for supporting part of this work. The authors would also like to particularly thank Vincent I. Kinyua for providing very useful commercial data and Kenya Wildlife Service Training Institute for providing a working space for part of this work. REFERENCES Aloo PA (1988). Studies of the ecology of the blackbass Micropterus
salmoides (Lacepédé) in Lake Naivasha, Kenya. MSC. Thesis University of Nairobi.
Annual Fisheries Bulletin (2009). Annual Fisheries report, for Naivasha District., p.90.
Britton JR, Boar RR, Grey J, Foster J, Lugonzo J, Harper DM (2007). From introduction to fishery dominance: The initial impact of the invasive carp Cyprinus carpio in Lake Naivasha, Kenya, 1999 to 2006. J. Fish Biol. 71:239-257.
Britton JR, Harper DM, Oyugi DO, Grey J (2010). The introduced Micropterus salmoides in an equatorial lake: a paradoxical loser in an invasion meltdown scenario? Biological Invasions DOI: 10.1007/s10530-010-9742-9747.
Brown GP, Sivakumaran KP, Stoessel D, Giles A (2005). Population biology of carp (Cyprinus carpio L.) in the mid-Murray River and Barmah Forest Wetlands, Australia. Marine Freshwater Res. 56:1151-1164.
Cady ER (1945). Fish Distribution in Norrisk Reservoir, Tennesse, (1943). I. Depth distribution of fish in Norrish Reservoir. J. Tenn. Acad. Sci., 20(1): 103-114.
Dadzie S, Aloo PA (1990). Reproduction of the North American black bass, Micropterus salmoides (Lacepede) in equatorial Lake Naivasha. Aquacult. Fisheries Manage. 21:49-58.
Entz B (2008). The dissolved oxygen determination method is 120 years old in memoriam Lajos Winkler (1863-1939) and Rezso Maucha (1882-1964). Acta Zool Hung. 54(1):7-11.
Harper DM (1984). Recent changes in the ecology of Lake Naivasha, Kenya, Ver. Internat. Verein. Limnol. 22:1193–1197.
Harper DM, Mavuti KM, Muchiri SM (1990). Ecology and management of Lake Naivasha, Kenya, in relation to climatic change, alien species introduction and agricultural development. Environ. Conserv. 17:328-336.
Harper DM (1992). The ecological relationships of aquatic plants at Lake Naivasha, Kenya. Hydrobiologia 232:65–71.
Hickley P, North ER, Muchiri SM, Harper DM (1994). The diet of largemouth bass, 424 Micropterus salmoides, in Lake Naivasha, Kenya. J. Fish Biol. 44:607-619.
Hickley P, Harper DM (2002). Fish community and habitat changes in the artificially stocked fishery of Lake Naivasha, Kenya. In: Management & Ecology of Lake and Reservoir Fisheries (Cowx, I.G., ed.) Oxford: Blackwell Scientific Publications. pp. 242-254.
Hickley PR, Bailey DM, Harper RK, Muchiri M, North R, Taylor A (2002). The status and future of Lake Naivasha fishes, Kenya. Hydrobiologia 488:181-190.
Hickley P, Muchiri SM, Britton JR, Boar RR (2004). Discovery of carp, Cyprinus carpio, in already stressed fishery of Lake Naivasha, Kenya.
Fish. Manag. Ecol. 11:139–142.
Khan TA, Wilson ME, Khan MT (2003). Evidence of invasive carp
mediated trophic cascade in shallow lakes of western Victoria, Australia. Hydrobiology 505:465-472.
Kitaka N, Harper DM, Mavuti KM (2002). Phosphorus inputs to Lake Naivasha, Kenya, from its catchment and the trophic status of the lake. Hydrobiologia 488:73-80.
Litterick MR, Gaudet, J.J, Kalff J, Melack JM (1979). The limnology of an African lake, Lake Naivasha, Kenya. SIL-UNEP. Workshop on African Limnology.
Mavuti KM (1990). Ecology and role of zooplankton in the fisheries of Lake Naivasha. Hydrobiology 208:131-140.
Milbrink G (1977). On the limnology of two alkaline lakes (Nakuru and Naivasha) in the East rift valley system in Kenya. Int. Rev. Gas. Hydrobiol. 62:1-17.
Muchiri SM (1990). The feeding ecology of tilapia and the fishery of Lake Naivasha, Kenya. PhD. Thesis University of Leicester, United Kingdom. p. 233.
Muchiri SM Hickley P (1991). The fishery of Lake Naivasha, Kenya. In:
Cowx , I.G. (Ed.): Catch effort sampling strategies: their application in fresh water fisheries management. Oxford, Blackwell Scientific Publications. pp. 382-392.
Muchiri SM, Hart JBP, Harper DM (1995). The persistence of two introduced tilapia species in Lake Naivasha Kenya in the face of environmental variability and fishing pressure. In Pitcher, T.J. & P.J.B. Hart (eds). The impact of species changes in African lakes. Chapman & Hall. pp. 299-320.
Ojuok J, Njiru M, Mugo J, Morara G, Wakwabi E, Ngugi C (2007). Increased dominance of common carp, Cyprinus carpio (L): the boon or the bane of Lake Naivasha fisheries, Afr. J. Ecol. 46: 445-448.
Oyugi DO, Ntiba JM, Kisia SM, Britton RJ (2010). Are shifts in the reproductive traits of Tilapia zillii between 1974 and 2009 in Lake Naivasha, Kenya, indicators of a stressed population? Proceedings of the 13th World Lakes Conference, Wuhan, China.
Oyugi DO, Harper DM, Ntiba JM, Kisia SM, Britton JR (2011). Management implications of the response of two tilapiine cichlids to long-term changes in lake level, allodiversity and exploitation in an equatorial lake. Ambio DOI: 10.1007/s13280-011-0139-3.
Oyugi DO (2011). Ecological and economic impacts of the invasive common carp (Cyprinus carpio L. 1758), in Lake Naivasha Kenya. Unpublished PhD Thesis, University of Nairobi. p. 279.
Richter H, Luckstadt C, Focken UL, Becker C (2000). An improved procedure to assess fish condition on the basis of length-weight relationships. Arch. Fish. Mar. Res., 48:226-235.
Siddiqui AQ (1977). Lake Naivasha fishery, Kenya, and its management together with a note on feeding habits of fishes. Biol. Conserv. 12:217-227.