Aspects of the biodiversity of the rivers in the Lake Naivasha catchment
13
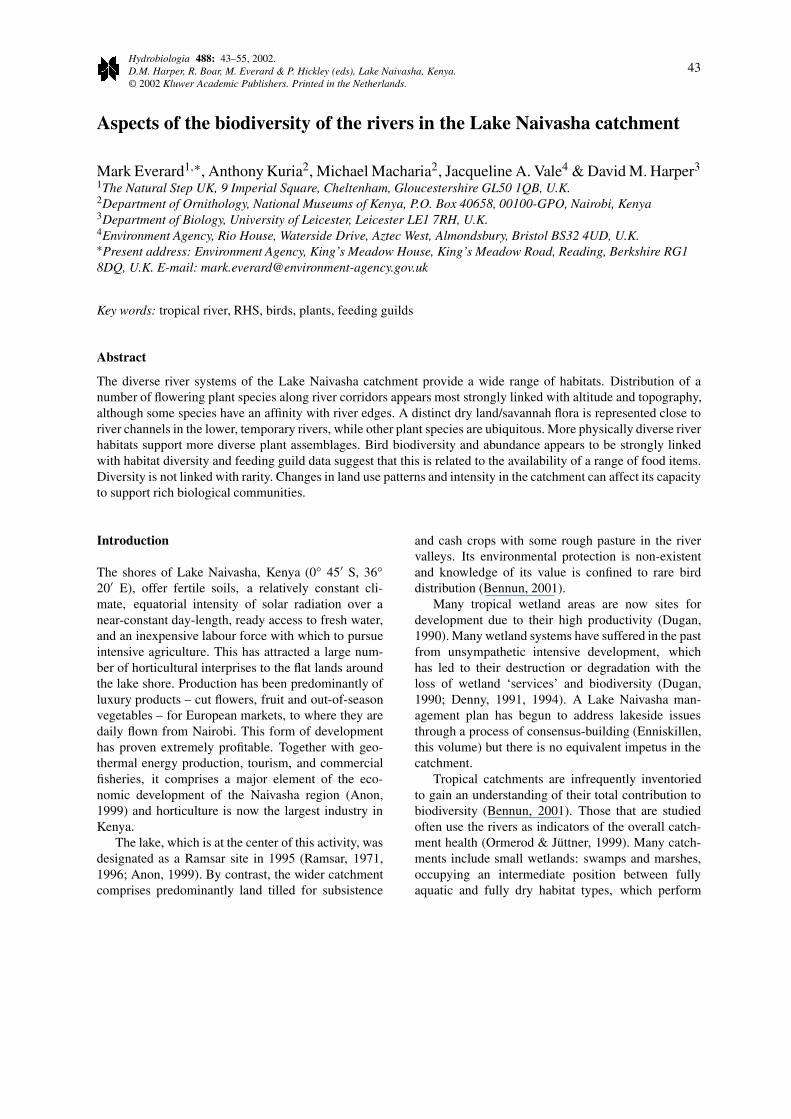
Hydrobiologia 488: 43–55, 2002. D.M. Harper, R. Boar, M. Everard & P. Hickley (eds), Lake Naivasha, Kenya. © 2002 Kluwer Academic Publishers. Printed in the Netherlands. 43 Aspects of the biodiversity of the rivers in the Lake Naivasha catchment Mark Everard 1,∗ , Anthony Kuria 2 , Michael Macharia 2 , Jacqueline A. Vale 4 & David M. Harper 3 1 The Natural Step UK, 9 Imperial Square, Cheltenham, Gloucestershire GL50 1QB, U.K. 2 Department of Ornithology, National Museums of Kenya, P.O. Box 40658, 00100-GPO, Nairobi, Kenya 3 Department of Biology, University of Leicester, Leicester LE1 7RH, U.K. 4 Environment Agency, Rio House, Waterside Drive, Aztec West, Almondsbury, Bristol BS32 4UD, U.K. ∗ Present address: Environment Agency, King’s Meadow House, King’s Meadow Road, Reading, Berkshire RG1 8DQ, U.K. E-mail: [email protected] Key words: tropical river, RHS, birds, plants, feeding guilds Abstract The diverse river systems of the Lake Naivasha catchment provide a wide range of habitats. Distribution of a number of flowering plant species along river corridors appears most strongly linked with altitude and topography, although some species have an affinity with river edges. A distinct dry land/savannah flora is represented close to river channels in the lower, temporary rivers, while other plant species are ubiquitous. More physically diverse river habitats support more diverse plant assemblages. Bird biodiversity and abundance appears to be strongly linked with habitat diversity and feeding guild data suggest that this is related to the availability of a range of food items. Diversity is not linked with rarity. Changes in land use patterns and intensity in the catchment can affect its capacity to support rich biological communities. Introduction The shores of Lake Naivasha, Kenya (0 ◦ 45 S, 36 ◦ 20 E), offer fertile soils, a relatively constant cli- mate, equatorial intensity of solar radiation over a near-constant day-length, ready access to fresh water, and an inexpensive labour force with which to pursue intensive agriculture. This has attracted a large num- ber of horticultural interprises to the flat lands around the lake shore. Production has been predominantly of luxury products – cut flowers, fruit and out-of-season vegetables – for European markets, to where they are daily flown from Nairobi. This form of development has proven extremely profitable. Together with geo- thermal energy production, tourism, and commercial fisheries, it comprises a major element of the eco- nomic development of the Naivasha region (Anon, 1999) and horticulture is now the largest industry in Kenya. The lake, which is at the center of this activity, was designated as a Ramsar site in 1995 (Ramsar, 1971, 1996; Anon, 1999). By contrast, the wider catchment comprises predominantly land tilled for subsistence and cash crops with some rough pasture in the river valleys. Its environmental protection is non-existent and knowledge of its value is confined to rare bird distribution (Bennun, 2001). Many tropical wetland areas are now sites for development due to their high productivity (Dugan, 1990). Many wetland systems have suffered in the past from unsympathetic intensive development, which has led to their destruction or degradation with the loss of wetland ‘services’ and biodiversity (Dugan, 1990; Denny, 1991, 1994). A Lake Naivasha man- agement plan has begun to address lakeside issues through a process of consensus-building (Enniskillen, this volume) but there is no equivalent impetus in the catchment. Tropical catchments are infrequently inventoried to gain an understanding of their total contribution to biodiversity (Bennun, 2001). Those that are studied often use the rivers as indicators of the overall catch- ment health (Ormerod & Jüttner, 1999). Many catch- ments include small wetlands: swamps and marshes, occupying an intermediate position between fully aquatic and fully dry habitat types, which perform
-
Upload
independent -
Category
Documents
-
view
0 -
download
0
Transcript of Aspects of the biodiversity of the rivers in the Lake Naivasha catchment
Hydrobiologia 488: 43–55, 2002.D.M. Harper, R. Boar, M. Everard & P. Hickley (eds), Lake Naivasha, Kenya.© 2002 Kluwer Academic Publishers. Printed in the Netherlands.
43
Aspects of the biodiversity of the rivers in the Lake Naivasha catchment
Mark Everard1,∗, Anthony Kuria2, Michael Macharia2, Jacqueline A. Vale4 & David M. Harper3
1The Natural Step UK, 9 Imperial Square, Cheltenham, Gloucestershire GL50 1QB, U.K.2Department of Ornithology, National Museums of Kenya, P.O. Box 40658, 00100-GPO, Nairobi, Kenya3Department of Biology, University of Leicester, Leicester LE1 7RH, U.K.4Environment Agency, Rio House, Waterside Drive, Aztec West, Almondsbury, Bristol BS32 4UD, U.K.∗Present address: Environment Agency, King’s Meadow House, King’s Meadow Road, Reading, Berkshire RG18DQ, U.K. E-mail: [email protected]
Key words: tropical river, RHS, birds, plants, feeding guilds
Abstract
The diverse river systems of the Lake Naivasha catchment provide a wide range of habitats. Distribution of anumber of flowering plant species along river corridors appears most strongly linked with altitude and topography,although some species have an affinity with river edges. A distinct dry land/savannah flora is represented close toriver channels in the lower, temporary rivers, while other plant species are ubiquitous. More physically diverse riverhabitats support more diverse plant assemblages. Bird biodiversity and abundance appears to be strongly linkedwith habitat diversity and feeding guild data suggest that this is related to the availability of a range of food items.Diversity is not linked with rarity. Changes in land use patterns and intensity in the catchment can affect its capacityto support rich biological communities.
Introduction
The shores of Lake Naivasha, Kenya (0◦ 45′ S, 36◦20′ E), offer fertile soils, a relatively constant cli-mate, equatorial intensity of solar radiation over anear-constant day-length, ready access to fresh water,and an inexpensive labour force with which to pursueintensive agriculture. This has attracted a large num-ber of horticultural interprises to the flat lands aroundthe lake shore. Production has been predominantly ofluxury products – cut flowers, fruit and out-of-seasonvegetables – for European markets, to where they aredaily flown from Nairobi. This form of developmenthas proven extremely profitable. Together with geo-thermal energy production, tourism, and commercialfisheries, it comprises a major element of the eco-nomic development of the Naivasha region (Anon,1999) and horticulture is now the largest industry inKenya.
The lake, which is at the center of this activity, wasdesignated as a Ramsar site in 1995 (Ramsar, 1971,1996; Anon, 1999). By contrast, the wider catchmentcomprises predominantly land tilled for subsistence
and cash crops with some rough pasture in the rivervalleys. Its environmental protection is non-existentand knowledge of its value is confined to rare birddistribution (Bennun, 2001).
Many tropical wetland areas are now sites fordevelopment due to their high productivity (Dugan,1990). Many wetland systems have suffered in the pastfrom unsympathetic intensive development, whichhas led to their destruction or degradation with theloss of wetland ‘services’ and biodiversity (Dugan,1990; Denny, 1991, 1994). A Lake Naivasha man-agement plan has begun to address lakeside issuesthrough a process of consensus-building (Enniskillen,this volume) but there is no equivalent impetus in thecatchment.
Tropical catchments are infrequently inventoriedto gain an understanding of their total contribution tobiodiversity (Bennun, 2001). Those that are studiedoften use the rivers as indicators of the overall catch-ment health (Ormerod & Jüttner, 1999). Many catch-ments include small wetlands: swamps and marshes,occupying an intermediate position between fullyaquatic and fully dry habitat types, which perform
44
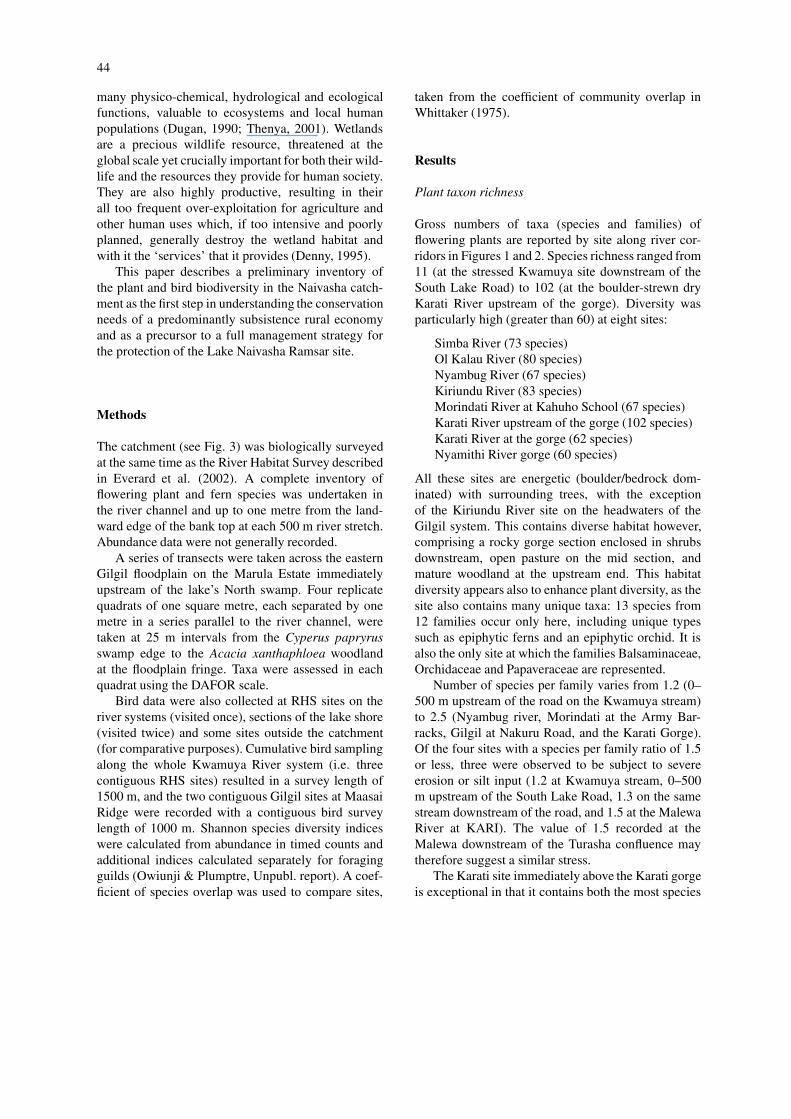
many physico-chemical, hydrological and ecologicalfunctions, valuable to ecosystems and local humanpopulations (Dugan, 1990; Thenya, 2001). Wetlandsare a precious wildlife resource, threatened at theglobal scale yet crucially important for both their wild-life and the resources they provide for human society.They are also highly productive, resulting in theirall too frequent over-exploitation for agriculture andother human uses which, if too intensive and poorlyplanned, generally destroy the wetland habitat andwith it the ‘services’ that it provides (Denny, 1995).
This paper describes a preliminary inventory ofthe plant and bird biodiversity in the Naivasha catch-ment as the first step in understanding the conservationneeds of a predominantly subsistence rural economyand as a precursor to a full management strategy forthe protection of the Lake Naivasha Ramsar site.
Methods
The catchment (see Fig. 3) was biologically surveyedat the same time as the River Habitat Survey describedin Everard et al. (2002). A complete inventory offlowering plant and fern species was undertaken inthe river channel and up to one metre from the land-ward edge of the bank top at each 500 m river stretch.Abundance data were not generally recorded.
A series of transects were taken across the easternGilgil floodplain on the Marula Estate immediatelyupstream of the lake’s North swamp. Four replicatequadrats of one square metre, each separated by onemetre in a series parallel to the river channel, weretaken at 25 m intervals from the Cyperus papryrusswamp edge to the Acacia xanthaphloea woodlandat the floodplain fringe. Taxa were assessed in eachquadrat using the DAFOR scale.
Bird data were also collected at RHS sites on theriver systems (visited once), sections of the lake shore(visited twice) and some sites outside the catchment(for comparative purposes). Cumulative bird samplingalong the whole Kwamuya River system (i.e. threecontiguous RHS sites) resulted in a survey length of1500 m, and the two contiguous Gilgil sites at MaasaiRidge were recorded with a contiguous bird surveylength of 1000 m. Shannon species diversity indiceswere calculated from abundance in timed counts andadditional indices calculated separately for foragingguilds (Owiunji & Plumptre, Unpubl. report). A coef-ficient of species overlap was used to compare sites,
taken from the coefficient of community overlap inWhittaker (1975).
Results
Plant taxon richness
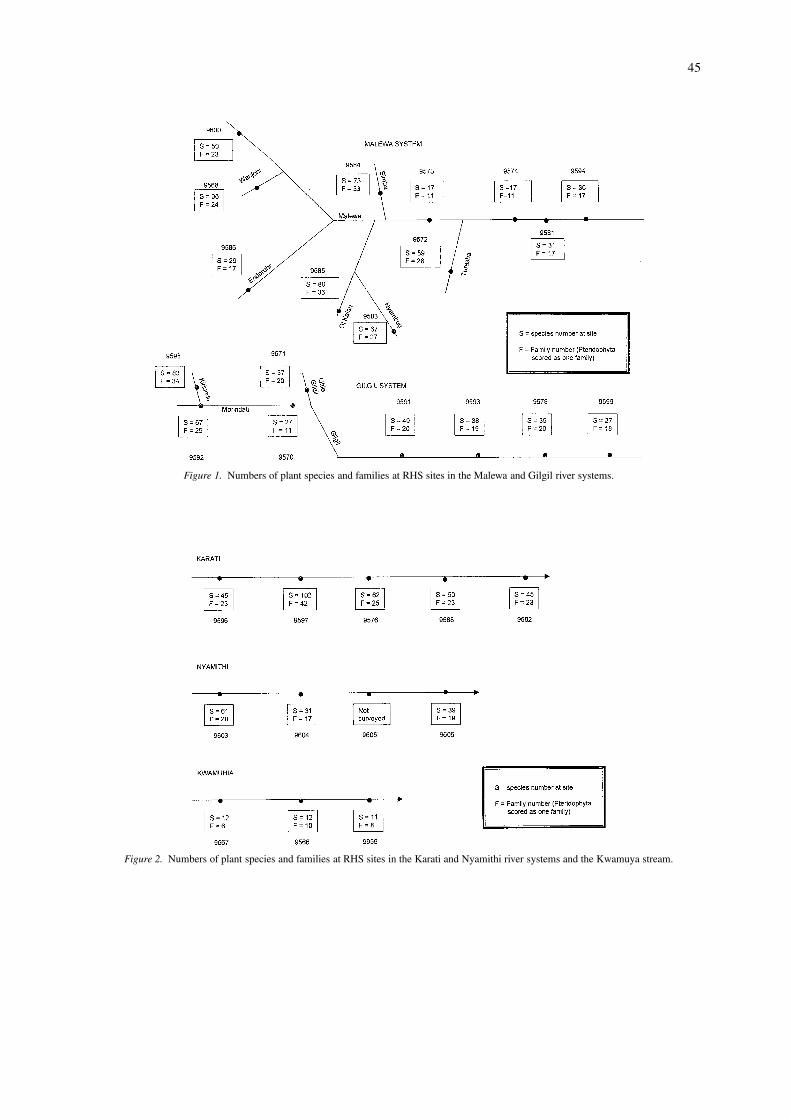
Gross numbers of taxa (species and families) offlowering plants are reported by site along river cor-ridors in Figures 1 and 2. Species richness ranged from11 (at the stressed Kwamuya site downstream of theSouth Lake Road) to 102 (at the boulder-strewn dryKarati River upstream of the gorge). Diversity wasparticularly high (greater than 60) at eight sites:
Simba River (73 species)Ol Kalau River (80 species)Nyambug River (67 species)Kiriundu River (83 species)Morindati River at Kahuho School (67 species)Karati River upstream of the gorge (102 species)Karati River at the gorge (62 species)Nyamithi River gorge (60 species)
All these sites are energetic (boulder/bedrock dom-inated) with surrounding trees, with the exceptionof the Kiriundu River site on the headwaters of theGilgil system. This contains diverse habitat however,comprising a rocky gorge section enclosed in shrubsdownstream, open pasture on the mid section, andmature woodland at the upstream end. This habitatdiversity appears also to enhance plant diversity, as thesite also contains many unique taxa: 13 species from12 families occur only here, including unique typessuch as epiphytic ferns and an epiphytic orchid. It isalso the only site at which the families Balsaminaceae,Orchidaceae and Papaveraceae are represented.
Number of species per family varies from 1.2 (0–500 m upstream of the road on the Kwamuya stream)to 2.5 (Nyambug river, Morindati at the Army Bar-racks, Gilgil at Nakuru Road, and the Karati Gorge).Of the four sites with a species per family ratio of 1.5or less, three were observed to be subject to severeerosion or silt input (1.2 at Kwamuya stream, 0–500m upstream of the South Lake Road, 1.3 on the samestream downstream of the road, and 1.5 at the MalewaRiver at KARI). The value of 1.5 recorded at theMalewa downstream of the Turasha confluence maytherefore suggest a similar stress.
The Karati site immediately above the Karati gorgeis exceptional in that it contains both the most species
45
Figure 1. Numbers of plant species and families at RHS sites in the Malewa and Gilgil river systems.
Figure 2. Numbers of plant species and families at RHS sites in the Karati and Nyamithi river systems and the Kwamuya stream.
46
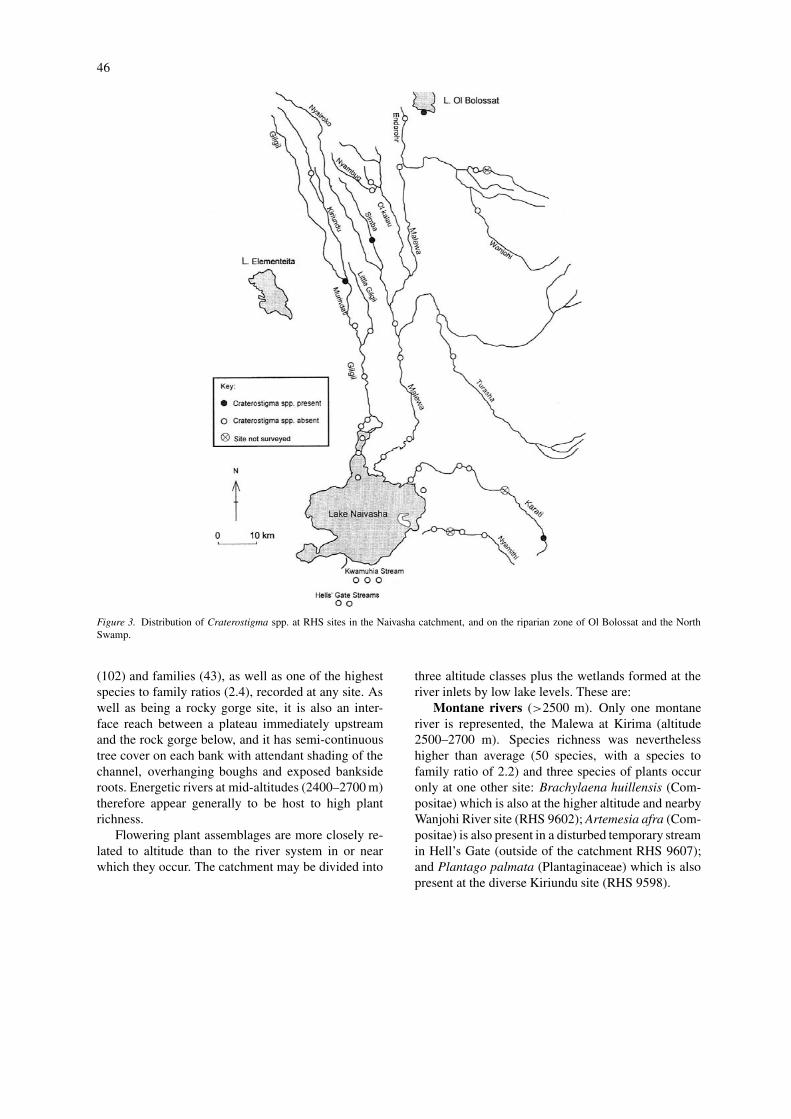
Figure 3. Distribution of Craterostigma spp. at RHS sites in the Naivasha catchment, and on the riparian zone of Ol Bolossat and the NorthSwamp.
(102) and families (43), as well as one of the highestspecies to family ratios (2.4), recorded at any site. Aswell as being a rocky gorge site, it is also an inter-face reach between a plateau immediately upstreamand the rock gorge below, and it has semi-continuoustree cover on each bank with attendant shading of thechannel, overhanging boughs and exposed banksideroots. Energetic rivers at mid-altitudes (2400–2700 m)therefore appear generally to be host to high plantrichness.
Flowering plant assemblages are more closely re-lated to altitude than to the river system in or nearwhich they occur. The catchment may be divided into
three altitude classes plus the wetlands formed at theriver inlets by low lake levels. These are:
Montane rivers (>2500 m). Only one montaneriver is represented, the Malewa at Kirima (altitude2500–2700 m). Species richness was neverthelesshigher than average (50 species, with a species tofamily ratio of 2.2) and three species of plants occuronly at one other site: Brachylaena huillensis (Com-positae) which is also at the higher altitude and nearbyWanjohi River site (RHS 9602); Artemesia afra (Com-positae) is also present in a disturbed temporary streamin Hell’s Gate (outside of the catchment RHS 9607);and Plantago palmata (Plantaginaceae) which is alsopresent at the diverse Kiriundu site (RHS 9598).
47
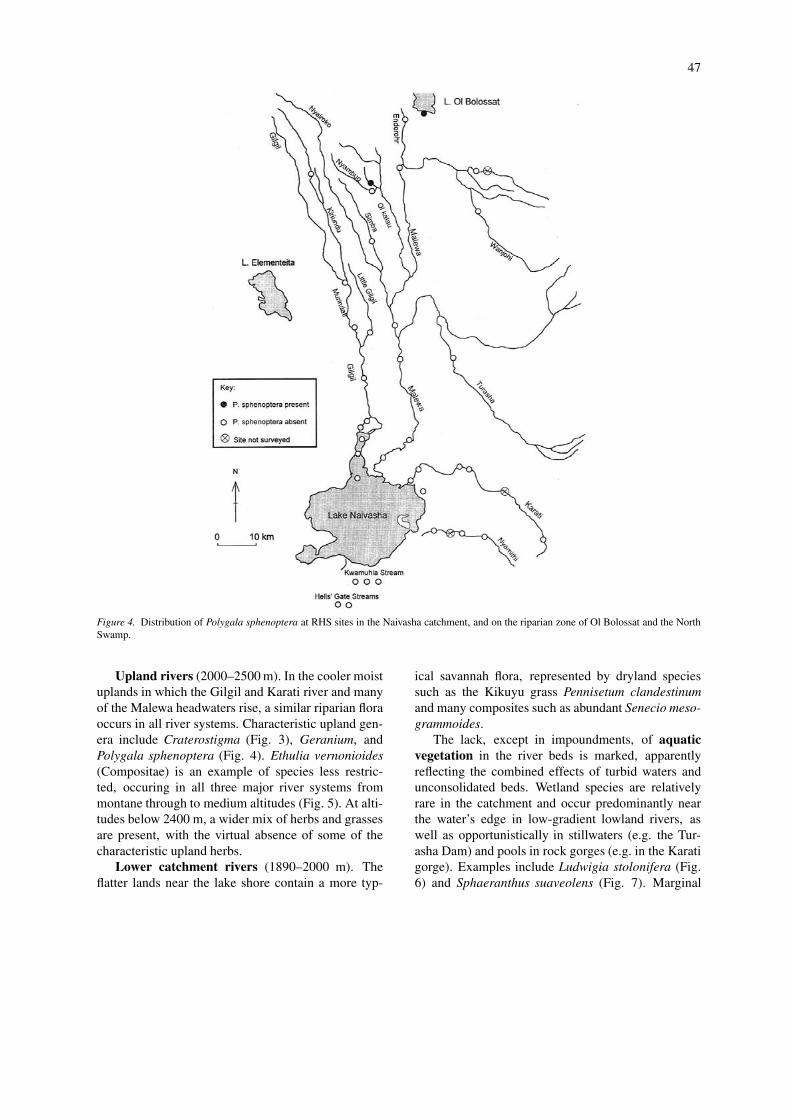
Figure 4. Distribution of Polygala sphenoptera at RHS sites in the Naivasha catchment, and on the riparian zone of Ol Bolossat and the NorthSwamp.
Upland rivers (2000–2500 m). In the cooler moistuplands in which the Gilgil and Karati river and manyof the Malewa headwaters rise, a similar riparian floraoccurs in all river systems. Characteristic upland gen-era include Craterostigma (Fig. 3), Geranium, andPolygala sphenoptera (Fig. 4). Ethulia vernonioides(Compositae) is an example of species less restric-ted, occuring in all three major river systems frommontane through to medium altitudes (Fig. 5). At alti-tudes below 2400 m, a wider mix of herbs and grassesare present, with the virtual absence of some of thecharacteristic upland herbs.
Lower catchment rivers (1890–2000 m). Theflatter lands near the lake shore contain a more typ-
ical savannah flora, represented by dryland speciessuch as the Kikuyu grass Pennisetum clandestinumand many composites such as abundant Senecio meso-grammoides.
The lack, except in impoundments, of aquaticvegetation in the river beds is marked, apparentlyreflecting the combined effects of turbid waters andunconsolidated beds. Wetland species are relativelyrare in the catchment and occur predominantly nearthe water’s edge in low-gradient lowland rivers, aswell as opportunistically in stillwaters (e.g. the Tur-asha Dam) and pools in rock gorges (e.g. in the Karatigorge). Examples include Ludwigia stolonifera (Fig.6) and Sphaeranthus suaveolens (Fig. 7). Marginal

48
Figure 5. Distribution of Ethulia vernonioides at RHS sites in the Naivasha catchment, and on the riparian zone of 01 Bolossat and the NorthSwamp.
emergent vegetation was frequent however, with op-portunist amphibious species such as Justicia betonicaor Commelina spp.
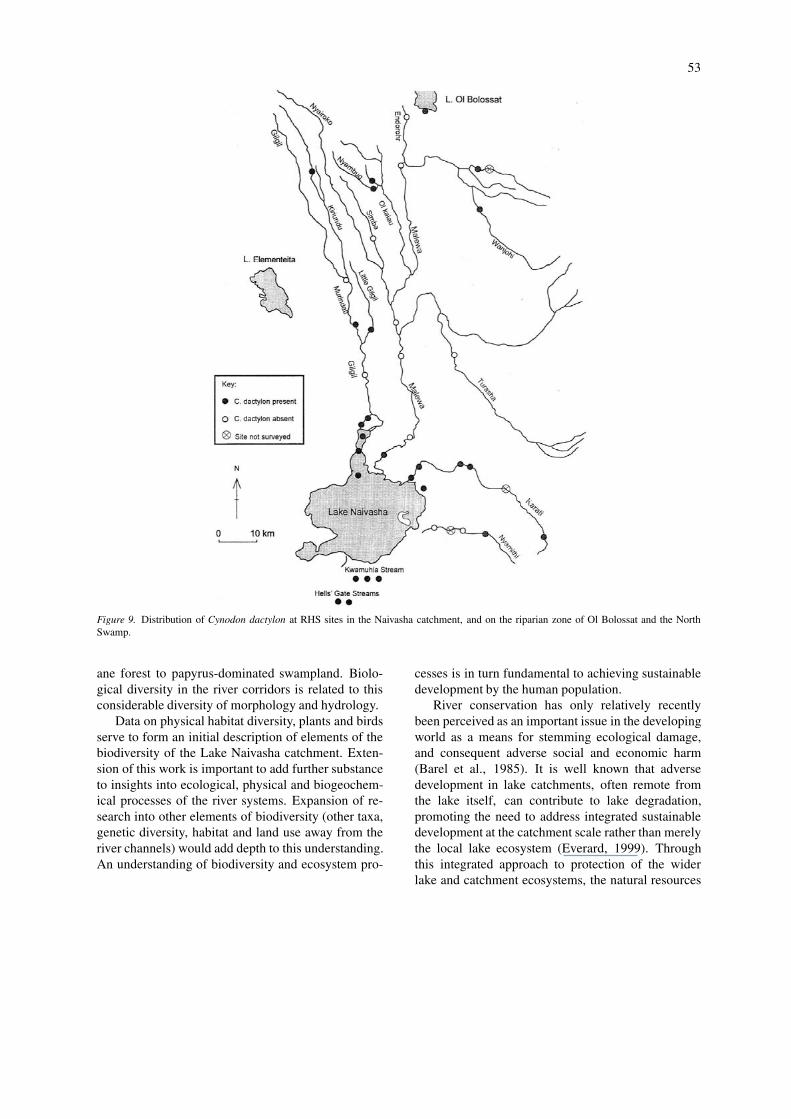
Ruderal ‘weed’ species such as Mexican MarigoldTagetes minuta (Fig. 8) and the Gallant Soldier Gal-insoga parviflora are common throughout the catch-ment, right up into the cooler and less populated up-lands where subsistence agriculture is extensive alongriver valleys. A few species such as the star grass, Cy-nodon dactylon (Fig. 9), occur ubiquitously across thecatchment.
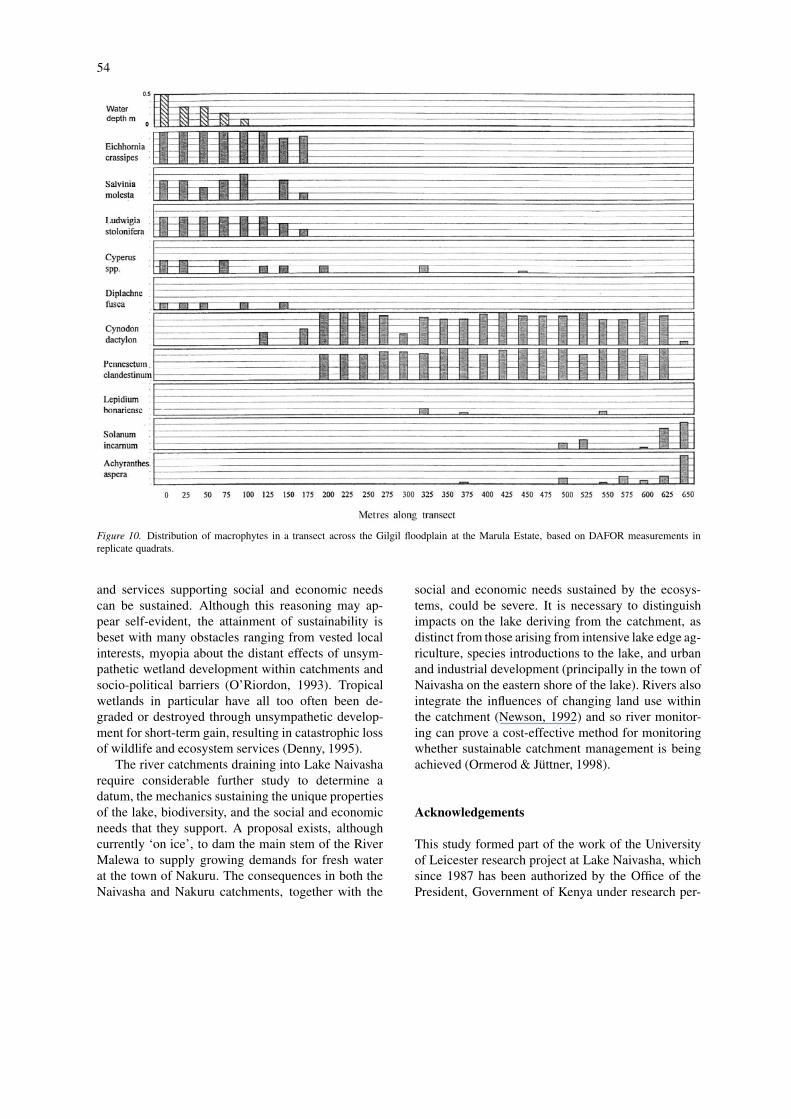
In the floodplain of the Gilgil on former lake bed(Fig. 3 shows the extent of the lake at its highestwater levels) there were 27 species representing 18
families (Fig. 10). The data illustrate distributionand dominance patterns across the floodplain. Fullyaquatic vegetation (Eichhornia crassipes and L. sto-lonifera) occur only where water is present or close.Semi-aquatics, such as Diplachne fusca occur inthe grassland zone near the water’s edge. Furtheracross the floodplain, C. dactylon and P. clandestinum-dominated grassland, with opportunist species suchas the crucifer Lepidium bonariense, were extensive,grading into Achyranthes aspera/Solanum incarnumscrub before reaching mature A. xanthophloea wood-land. The relatively low flowering plant species di-versity therefore masks the structural diversity.

49
Figure 6. Distribution of Ludwigia stolonifera at RHS sites in the Naivasha catchment, and on the riparian zone of Ol Bolossat and the NorthSwamp.
Bird richess and diversity
One hundred and thirty species of birds were recor-ded, belonging to 17 orders and 45 families (Table 1).These included the Jackson’s Widowbird (Euplectesjacksoni), a near-threatened species in Kenya, recor-ded at the Turasha Dam site. Feral lovebirds, whichoriginally occurred only around the lake, were foundat many sites along the Gilgil and Karati rivers farfrom the lake edge. Long-toed Lapwing (Vanelluscrassirostris), once described as common (Henderson& Harper, 1992), were quite rare, recorded only twicealong the lake edge.
Little grebe (Podiceps ruficollis), moorhen (Gallin-ula chloropus), African black duck (Anas sparsa),giant kingfisher (Cerlye maxima) and black crake(Limnocorax flavirostra) represent some of the waterspecies recorded at the Turasha Dam. Other import-ant species included Hautlaub’s Turaco (Tauraco har-tilaubi) recorded along the Gilgil riverine sites wherefruiting trees were common and Grey Crowned Cranes(Balearica regulorum), a wetland indicator species, re-corded at the Marula site on the Gilgil floodplain andLake Ol Bolossat.
The KARI site on the Malewa system had thehighest richness (34 species) followed by the MarulaFloodplain site on the Gilgil River (29). The Gilgil

50
Figure 7. Distribution of Sphaeranthus suaveolens at RHS sites in the Naivasha catchment, and on the riparian zone of Ol Bolossat and theNorth Swamp.
site at Maasai Ridge and the Kwamuya river eachhad a total of 25 recorded species. The Gilgil riversite at the Army Barracks was species-poor (only 8species) whereas the poorest score of all was at theKarati site at Kinangop (4). The Kwamuya River hadthe highest bird species diversity (2.9) followed by theKarati North Swamp (2.4) then Malewa Pumphousesite (2.3). The Gilgil floodplain at the Marula Estatewas the least diverse (0.31) despite having 29 species.No diversity index was calculated for the KARI site onthe Malewa as numbers observed were not accuratelyrecorded.
Grouping sites along rivers, the Kwamuya Riverhad the highest diversity index (2.9), but on a mean
basis (excluding the Kwamuya channel), Malewa siteswere the most diverse (2.1) while the lake was the least(1.1). However, there was no significant difference inthe mean species diversity between the river locations(Kruskal–Wallis test: H (4, N = 15) = 8.02667, P >
0.05).The species data converted into feeding category,
yielded 8 ‘forage’ guilds (Table 2). The mean forageguild diversity index (FGDI) for all sites combinedwas 0.53, with a range of 0.44–0.67 at the Malewamouth and the Turasha Dam respectively (Table 1).Karati River sites grouped together had the highestmean forage guild diversity (0.56) while the lake (openwater) had lowest mean (0.46). The Kwamuya sys-

51
Figure 8. Distribution of Tagetes minuta at RHS sites in the Naivasha catchment, and on the riparian zone of Ol Bolossat and the North Swamp.
tem, with an effort of one, had an FGDI of 0.54. Nosignificant difference in FGDI emerged between thefive general locations sampled (Kruskal–Wallis test: H(4, N = 16) − 5.325736, P > 0.05). Insects werethe most abundant food items (insectivores; FGDI =2.42) followed by seeds (gramnivores; FGDI = 2.06)over the whole study area. Amongst the least abund-ant foragers were ‘scavengers’ (0.10) and ‘carnivores’(0.49).
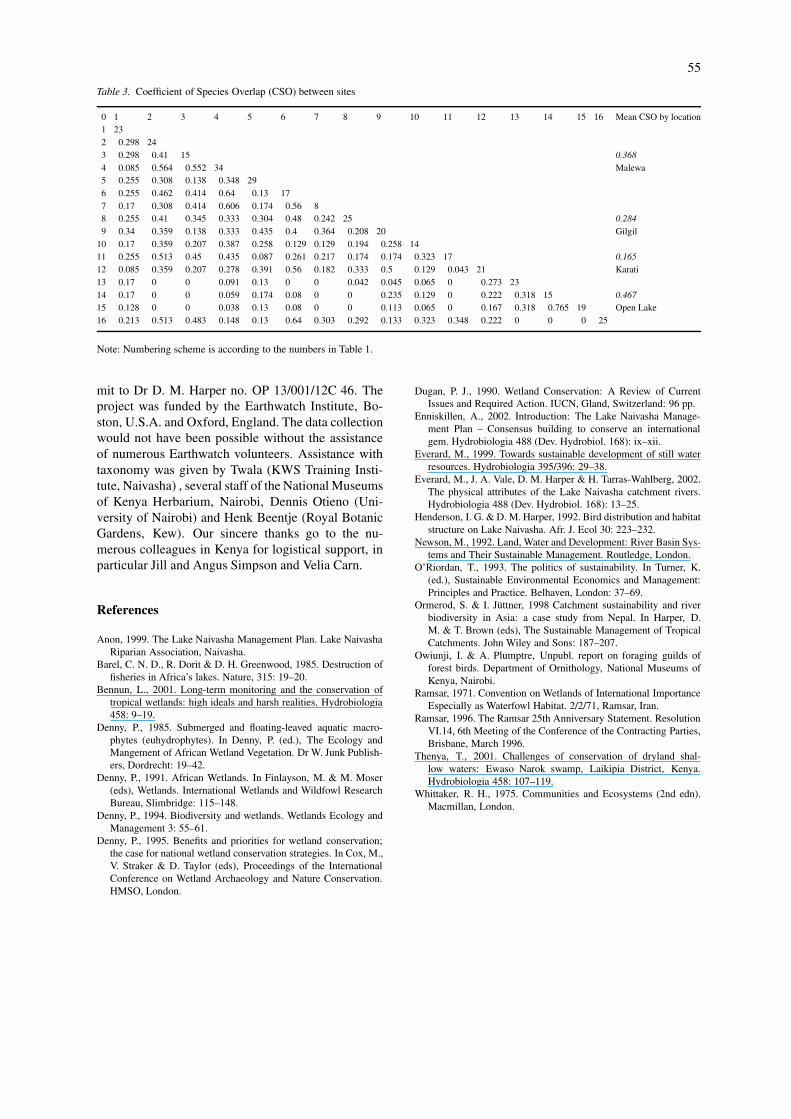
The data above, recalculated as Coefficients ofSpecies Overlap (CSOs) (Table 3), showed strongoverlap (0.77) between the Gilgil Mouth and theMalewa mouth sites but only weak link with the otherlake edge site (the KWS Fishery Annex site). Rel-atively strong overlap (0.64) occurred between Little
Gilgil and the Malewa site at KARI and the Kwamuyasites, and the Little Gilgil and the Karati site at theNorth Swamp and the Gilgil sites the Army Barracks(0.56). Within river systems, the two Malewa sites atthe Pumphouse and KARI and the two Gilgil systemsites at Little Gilgil and the Army Barracks had rel-atively strong species overlap coefficient (each 0.56)between them. Mean coefficient of species overlapfrom a combination of sites on discrete lake/river sys-tem locations revealed fairly strong overlap within thelake (0.47) followed by the Malewa (0.37). Overlapalong the Karati River was poorest (0.17), perhaps re-flecting the diverse topography of that river system.The Pumphouse and below the Turasha confluence

52
Table 1. Bird species richness and indices
Location and site number No. of species Richness FGDI CSO
index
Malewa River (96) 2.03 0.54 0.37
Turasha Dam (1) 23 2.19 0.67
Malewa Pumphouse (2) 24 2.28 0.46
Malewa Below Turasha (3) 15 1.63 0.53
Malewa at KARI (4) 34 – 0.51
Gilgil River (99) 1.13 0.55 0.33
Gilgil Floodplain at Marula (5) 29, ((9.7)) 0.31 0.46
Little Gilgil (6) 17 1.06 0.52
Gilgil at Army Barracks (7) 8 1.57 0.62
Gilgil Maasai Ridge (2 sites) (8) 25, ((12.5)) 0.64 0.51
Gilgil below Lake Road (9) 20 2.1 0.61
Karati River (52) 1.95 0.56 0.17
Karati at Kinangop (10) 4 1.37 0.58
Karati gorge (11) 17 2.08 0.53
Karati North Swamp (12) 21 2.41 0.56
Lake Open Water (57) 1.12 0.46 0.47
KWS Fishery Annex (13) 23 1.56 0.47
North Swamp, Gilgil Mouth (14) 15 1.13 0.47
North Swamp, Malewa Mouth (15) 19 0.67 0.44
Kwamuya (16) (25) ((11.4)) 2.89 0.54
Notes:All are mean figures by location.() total number of birds recorded in that river.(()) extended figure for extent of sample distance.FGDI = Forage Guild Diversity Index.CSO = coefficient of species overlap (from Whitaker, 1975, coefficient of community overlap).
Table 2. Foraging guilds and indices for birds recorded in the LakeNaivasha catchment
Foraging guild FGDI (Guild Diversity Index)
INS (Insectivores) 2.42
GRA (Gramnivores) 2.06
CAR (Carnivores) 0.49
NEC (Nectarinivores) 1.19
HER (Herbivores) 0.38
FRU (Frugivores) 0.96
SCA (Scavengers) 0.10
PSI (Piscivores) 0.87
sites on the Malewa system, the Karati gorge, and theGilgil site at the Army Barracks had no overlap.
The data demonstrate considerable richness of birdspecies within the catchment, and between habitattypes within the catchment. Hotspots of bird diversitydo not necessarily overlap strongly with those of plant
diversity. For example the Karati site above the gorge,which contained the maximum diversity of both spe-cies and families of plants, had the second-lowestscore for both bird abundance and species diversity.Conversely, the Kiriundu site, which had extraordin-ary proportions of rare plants, also held the highestdiversity of bird species as well as the third highestabundance.
Discussion
The initial purpose of the Naivasha catchment re-search programme was to establish a baseline, identify‘hotspots’ of biological interest and problems, thussupporting land use decisions. Diverse river flow typesand flow regimes stem from the local Rift Valley to-pography and microclimate, ranging from perennialto ephemeral channels, open confluences to the laketo blind channel endings, erosive rocky gorges andcascades to slack depositional channels, and mont-
53
Figure 9. Distribution of Cynodon dactylon at RHS sites in the Naivasha catchment, and on the riparian zone of Ol Bolossat and the NorthSwamp.
ane forest to papyrus-dominated swampland. Biolo-gical diversity in the river corridors is related to thisconsiderable diversity of morphology and hydrology.
Data on physical habitat diversity, plants and birdsserve to form an initial description of elements of thebiodiversity of the Lake Naivasha catchment. Exten-sion of this work is important to add further substanceto insights into ecological, physical and biogeochem-ical processes of the river systems. Expansion of re-search into other elements of biodiversity (other taxa,genetic diversity, habitat and land use away from theriver channels) would add depth to this understanding.An understanding of biodiversity and ecosystem pro-
cesses is in turn fundamental to achieving sustainabledevelopment by the human population.
River conservation has only relatively recentlybeen perceived as an important issue in the developingworld as a means for stemming ecological damage,and consequent adverse social and economic harm(Barel et al., 1985). It is well known that adversedevelopment in lake catchments, often remote fromthe lake itself, can contribute to lake degradation,promoting the need to address integrated sustainabledevelopment at the catchment scale rather than merelythe local lake ecosystem (Everard, 1999). Throughthis integrated approach to protection of the widerlake and catchment ecosystems, the natural resources
54
Figure 10. Distribution of macrophytes in a transect across the Gilgil floodplain at the Marula Estate, based on DAFOR measurements inreplicate quadrats.
and services supporting social and economic needscan be sustained. Although this reasoning may ap-pear self-evident, the attainment of sustainability isbeset with many obstacles ranging from vested localinterests, myopia about the distant effects of unsym-pathetic wetland development within catchments andsocio-political barriers (O’Riordon, 1993). Tropicalwetlands in particular have all too often been de-graded or destroyed through unsympathetic develop-ment for short-term gain, resulting in catastrophic lossof wildlife and ecosystem services (Denny, 1995).
The river catchments draining into Lake Naivasharequire considerable further study to determine adatum, the mechanics sustaining the unique propertiesof the lake, biodiversity, and the social and economicneeds that they support. A proposal exists, althoughcurrently ‘on ice’, to dam the main stem of the RiverMalewa to supply growing demands for fresh waterat the town of Nakuru. The consequences in both theNaivasha and Nakuru catchments, together with the
social and economic needs sustained by the ecosys-tems, could be severe. It is necessary to distinguishimpacts on the lake deriving from the catchment, asdistinct from those arising from intensive lake edge ag-riculture, species introductions to the lake, and urbanand industrial development (principally in the town ofNaivasha on the eastern shore of the lake). Rivers alsointegrate the influences of changing land use withinthe catchment (Newson, 1992) and so river monitor-ing can prove a cost-effective method for monitoringwhether sustainable catchment management is beingachieved (Ormerod & Jüttner, 1998).
Acknowledgements
This study formed part of the work of the Universityof Leicester research project at Lake Naivasha, whichsince 1987 has been authorized by the Office of thePresident, Government of Kenya under research per-
55
Table 3. Coefficient of Species Overlap (CSO) between sites
0 1 2 3 4 5 6 7 8 9 10 11 12 13 14 15 16 Mean CSO by location1 232 0.298 243 0.298 0.41 15 0.368
4 0.085 0.564 0.552 34 Malewa5 0.255 0.308 0.138 0.348 296 0.255 0.462 0.414 0.64 0.13 177 0.17 0.308 0.414 0.606 0.174 0.56 88 0.255 0.41 0.345 0.333 0.304 0.48 0.242 25 0.284
9 0.34 0.359 0.138 0.333 0.435 0.4 0.364 0.208 20 Gilgil10 0.17 0.359 0.207 0.387 0.258 0.129 0.129 0.194 0.258 1411 0.255 0.513 0.45 0.435 0.087 0.261 0.217 0.174 0.174 0.323 17 0.165
12 0.085 0.359 0.207 0.278 0.391 0.56 0.182 0.333 0.5 0.129 0.043 21 Karati13 0.17 0 0 0.091 0.13 0 0 0.042 0.045 0.065 0 0.273 2314 0.17 0 0 0.059 0.174 0.08 0 0 0.235 0.129 0 0.222 0.318 15 0.46715 0.128 0 0 0.038 0.13 0.08 0 0 0.113 0.065 0 0.167 0.318 0.765 19 Open Lake16 0.213 0.513 0.483 0.148 0.13 0.64 0.303 0.292 0.133 0.323 0.348 0.222 0 0 0 25
Note: Numbering scheme is according to the numbers in Table 1.
mit to Dr D. M. Harper no. OP 13/001/12C 46. Theproject was funded by the Earthwatch Institute, Bo-ston, U.S.A. and Oxford, England. The data collectionwould not have been possible without the assistanceof numerous Earthwatch volunteers. Assistance withtaxonomy was given by Twala (KWS Training Insti-tute, Naivasha) , several staff of the National Museumsof Kenya Herbarium, Nairobi, Dennis Otieno (Uni-versity of Nairobi) and Henk Beentje (Royal BotanicGardens, Kew). Our sincere thanks go to the nu-merous colleagues in Kenya for logistical support, inparticular Jill and Angus Simpson and Velia Carn.
References
Anon, 1999. The Lake Naivasha Management Plan. Lake NaivashaRiparian Association, Naivasha.
Barel, C. N. D., R. Dorit & D. H. Greenwood, 1985. Destruction offisheries in Africa’s lakes. Nature, 315: 19–20.
Bennun, L., 2001. Long-term monitoring and the conservation oftropical wetlands: high ideals and harsh realities. Hydrobiologia458: 9–19.
Denny, P., 1985. Submerged and floating-leaved aquatic macro-phytes (euhydrophytes). In Denny, P. (ed.), The Ecology andMangement of African Wetland Vegetation. Dr W. Junk Publish-ers, Dordrecht: 19–42.
Denny, P., 1991. African Wetlands. In Finlayson, M. & M. Moser(eds), Wetlands. International Wetlands and Wildfowl ResearchBureau, Slimbridge: 115–148.
Denny, P., 1994. Biodiversity and wetlands. Wetlands Ecology andManagement 3: 55–61.
Denny, P., 1995. Benefits and priorities for wetland conservation;the case for national wetland conservation strategies. In Cox, M.,V. Straker & D. Taylor (eds), Proceedings of the InternationalConference on Wetland Archaeology and Nature Conservation.HMSO, London.
Dugan, P. J., 1990. Wetland Conservation: A Review of CurrentIssues and Required Action. IUCN, Gland, Switzerland: 96 pp.
Enniskillen, A., 2002. Introduction: The Lake Naivasha Manage-ment Plan – Consensus building to conserve an internationalgem. Hydrobiologia 488 (Dev. Hydrobiol. 168): ix–xii.
Everard, M., 1999. Towards sustainable development of still waterresources. Hydrobiologia 395/396: 29–38.
Everard, M., J. A. Vale, D. M. Harper & H. Tarras-Wahlberg, 2002.The physical attributes of the Lake Naivasha catchment rivers.Hydrobiologia 488 (Dev. Hydrobiol. 168): 13–25.
Henderson, I. G. & D. M. Harper, 1992. Bird distribution and habitatstructure on Lake Naivasha. Afr. J. Ecol 30: 223–232.
Newson, M., 1992. Land, Water and Development: River Basin Sys-tems and Their Sustainable Management. Routledge, London.
O’Riordan, T., 1993. The politics of sustainability. In Turner, K.(ed.), Sustainable Environmental Economics and Management:Principles and Practice. Belhaven, London: 37–69.
Ormerod, S. & I. Jüttner, 1998 Catchment sustainability and riverbiodiversity in Asia: a case study from Nepal. In Harper, D.M. & T. Brown (eds), The Sustainable Management of TropicalCatchments. John Wiley and Sons: 187–207.
Owiunji, I. & A. Plumptre, Unpubl. report on foraging guilds offorest birds. Department of Ornithology, National Museums ofKenya, Nairobi.
Ramsar, 1971. Convention on Wetlands of International ImportanceEspecially as Waterfowl Habitat. 2/2/71, Ramsar, Iran.
Ramsar, 1996. The Ramsar 25th Anniversary Statement. ResolutionVI.14, 6th Meeting of the Conference of the Contracting Parties,Brisbane, March 1996.
Thenya, T., 2001. Challenges of conservation of dryland shal-low waters: Ewaso Narok swamp, Laikipia District, Kenya.Hydrobiologia 458: 107–119.
Whittaker, R. H., 1975. Communities and Ecosystems (2nd edn).Macmillan, London.