Saudi Arabian Gasoline Retailers Margin uplift supports ...
25
We initiate coverage on Aldrees and SASCO; favor Aldrees on compelling valuation The recent 67% uplift in gasoline retailer margins to SAR0.15 from the long fixed margin of SAR0.09 since 2006 on 91-octane and 95-octane fuel came as a direct step to combat mounting cost pressures and entice foreign investor appetite to the gasoline retailer industry. We initiate coverage on Saudi Arabia’s two gasoline retailers: Aldrees with a FV of SAR71/share and a Buy rating and SASCO with a FV of SAR31/share and a Buy rating. Being among the 20 qualified gasoline retailers by the Saudi Ministry of Municipal and Rural Affairs (MOMRA), we expect both Aldrees (5% market share in terms of stations) and SASCO (2% market share) to record a 5-year core earnings CAGR of c8% and c14%, respectively. We favor Aldrees for its wider scale, stronger operating margins, and compelling valuation (2020e PE of 19.1x) versus SASCO (44.2x). Yet, we expect SASCO’s PE to converge to 12.1x, close to Aldrees’ multiple, by the end of the forecast period, on an expected double-digit earnings CAGR. COVID-19 repercussions to hit 2020e, but expect strong rebound in 2021e In our view, the wide quarantine measures imposed during March and April, in addition to the current suspension of pilgrimage and the Hajj will take a toll on the throughput/station for both Aldrees and SASCO, dragging it to drop c10% y-o-y in 2020e versus growth of c6% in 2019 for each. Consequently, we expect core earnings to drop c18% y-o-y for Aldrees and c47% y-o-y for SASCO in 2020e. However, we expect a solid rebound in 2021e for both companies by c47% y-o-y and c89% y-o-y, respectively. OPEC+ deal to end oil price war; upward revision of gasoline prices on the cards While per liter margins are fixed in absolute terms at SAR0.15, the earnings of Aldrees and SASCO are vulnerable, to a lesser extent, to a monthly revision of Saudi gasoline prices (earnings decline c0.5% for every 1% increase in octane prices). On 8 April 2020, Saudi Arabia reduced the prices of 91-octane and 95-octane fuel by c16% and c28%, respectively, in its monthly gasoline price revision. This came following the oil price war that erupted amid widespread lower demand for oil on the COVID-19 outbreak, which drove later OPEC+ members to pull off a historic deal to cut global petroleum output by nearly a tenth throughout the months of May and June. This should provide slight elevation in oil prices supported by expected demand recovery within the coming few months. Accordingly, we expect a subsequent upward revision of Saudi gasoline prices starting July, under the monthly revision mechanism implemented starting February 2020. New qualification measures to drive growing consolidation wave supported by margin uplift Due to the higher cost of compliance of the new measures imposed by MOMRA under the Masar program to ensure higher quality service of fuel-operating companies, the government has permitted only 20 companies, out of the widely fragmented Saudi gasoline market, to continue to operate under the recently amended bylaws. The Saudi Ministry of Energy (MOE) raised absolute margins of qualified operators for both octane and diesel products to SAR0.15/liter (up c67%) and SAR0.05/liter (up c43%), respectively, starting 23 August 2018. The new measures imposed have driven a recent wave of consolidation, luring direct investment in the industry by not only local investors but also foreign counterparts. In this regard, Saudi Aramco and Total jointly acquired Tas’helat Marketing Company (TMC) and Sahel Transport Company (STC) (with a 3% market share) and plan to invest around USD1bn over the next 6 years in fuel-operating companies. Also the UAE’s ENOC plans to expand its fuel retail network in Saudi Arabia to 45 service stations by 2023 up from 16 stations currently. Moreover, UAE-based ADNOC entered the Saudi market in 2018, currently operating 2 stations. Please see the investment ratings and important disclosures contained on the last page of this report Saudi Arabian Gasoline Retailers Margin uplift supports performance as COVID-19 impact subsides Consumers | Saudi Arabia Initiation of Coverage | Sector Note 4 May 2020 Aldrees Rating: Buy FV: SAR71 Upside: 22% MKT price: SAR 58.2 Free float: 96.2% MKT cap: SAR 3,492mn *as of 30 April 2020 SASCO Rating: Buy FV: SAR31 Upside: 21% MKT price: SAR 25.8 Free float: 88% MKT cap: SAR 1,551mn. *as of 30 April 2020 Ingy El-Diwany, CFA ieldiwany@beltonefinancial.com | +2 02 2461 6428 Mohamed Hamza mhamza@beltonefinancial.com | +2 02 2461 6382 1
-
Upload
khangminh22 -
Category
Documents
-
view
5 -
download
0
Transcript of Saudi Arabian Gasoline Retailers Margin uplift supports ...

We initiate coverage on Aldrees and SASCO; favor Aldrees on compelling valuation
The recent 67% uplift in gasoline retailer margins to SAR0.15 from the long fixed margin of SAR0.09 since 2006 on 91-octane and 95-octane fuel came as a direct step to combat mounting cost pressures and entice foreign investor appetite to the gasoline retailer industry. We initiate coverage on Saudi Arabia’s two gasoline retailers: Aldrees with a FV of SAR71/share and a Buy rating and SASCO with a FV of SAR31/share and a Buy rating. Being among the 20 qualified gasoline retailers by the Saudi Ministry of Municipal and Rural Affairs (MOMRA), we expect both Aldrees (5% market share in terms of stations) and SASCO (2% market share) to record a 5-year core earnings CAGR of c8% and c14%, respectively. We favor Aldrees for its wider scale, stronger operating margins, and compelling valuation (2020e PE of 19.1x) versus SASCO (44.2x). Yet, we expect SASCO’s PE to converge to 12.1x, close to Aldrees’ multiple, by the end of the forecast period, on an expected double-digit earnings CAGR.
COVID-19 repercussions to hit 2020e, but expect strong rebound in 2021e
In our view, the wide quarantine measures imposed during March and April, in addition to the current suspension of pilgrimage and the Hajj will take a toll on the throughput/station for both Aldrees and SASCO, dragging it to drop c10% y-o-y in 2020e versus growth of c6% in 2019 for each. Consequently, we expect core earnings to drop c18% y-o-y for Aldrees and c47% y-o-y for SASCO in 2020e. However, we expect a solid rebound in 2021e for both companies by c47% y-o-y and c89% y-o-y, respectively.
OPEC+ deal to end oil price war; upward revision of gasoline prices on the cards
While per liter margins are fixed in absolute terms at SAR0.15, the earnings of Aldrees and SASCO are vulnerable, to a lesser extent, to a monthly revision of Saudi gasoline prices (earnings decline c0.5% for every 1% increase in octane prices). On 8 April 2020, Saudi Arabia reduced the prices of 91-octane and 95-octane fuel by c16% and c28%, respectively, in its monthly gasoline price revision. This came following the oil price war that erupted amid widespread lower demand for oil on the COVID-19 outbreak, which drove later OPEC+ members to pull off a historic deal to cut global petroleum output by nearly a tenth throughout the months of May and June. This should provide slight elevation in oil prices supported by expected demand recovery within the coming few months. Accordingly, we expect a subsequent upward revision of Saudi gasoline prices starting July, under the monthly revision mechanism implemented starting February 2020.
New qualification measures to drive growing consolidation wave supported by margin uplift
Due to the higher cost of compliance of the new measures imposed by MOMRA under the Masar program to ensure higher quality service of fuel-operating companies, the government has permitted only 20 companies, out of the widely fragmented Saudi gasoline market, to continue to operate under the recently amended bylaws. The Saudi Ministry of Energy (MOE) raised absolute margins of qualified operators for both octane and diesel products to SAR0.15/liter (up c67%) and SAR0.05/liter (up c43%), respectively, starting 23 August 2018. The new measures imposed have driven a recent wave of consolidation, luring direct investment in the industry by not only local investors but also foreign counterparts. In this regard, Saudi Aramco and Total jointly acquired Tas’helat Marketing Company (TMC) and Sahel Transport Company (STC) (with a 3% market share) and plan to invest around USD1bn over the next 6 years in fuel-operating companies. Also the UAE’s ENOC plans to expand its fuel retail network in Saudi Arabia to 45 service stations by 2023 up from 16 stations currently. Moreover, UAE-based ADNOC entered the Saudi market in 2018, currently operating 2 stations.
Please see the investment ratings and important disclosures contained on the last page of this report
Saudi Arabian Gasoline RetailersMargin uplift supports performance as COVID-19 impact subsidesConsumers | Saudi Arabia
Initiation of Coverage | Sector Note 4 May 2020
Aldrees
Rating: Buy FV: SAR71
Upside: 22%MKT price: SAR 58.2
Free float: 96.2%MKT cap:SAR 3,492mn
*as of 30 April 2020
SASCO
Rating: Buy FV: SAR31
Upside: 21%MKT price:SAR 25.8
Free float: 88%MKT cap: SAR 1,551mn.
*as of 30 April 2020
Ingy El-Diwany, [email protected] | +2 02 2461 6428
Mohamed Hamza [email protected] | +2 02 2461 6382
1

4 May 2020Table of Content
I. Investment thesis and key risks 3
II. Operational and comparative analysis 6
III. Saudi Arabia’s solid demographics to provide healthy growth momentum 9
IV. Companies 12
1. Aldrees Petroleum & Transport Services 13
2. Saudi Automotive Services Company (SASCO) 18
2

Saudi Arabian Gasoline Retailers 4 May 2020
3
I. Investment thesis and key risks
Initiate coverage on Saudi gasoline retailers; Aldrees offers compelling valuation and SASCO to exhibit double-digit growth
We initiate coverage on two Saudi gasoline retailers, namely Aldrees, and SASCO. We have Buy ratings on both names given the recent market sell off.
Saudi Arabia enjoys healthy demand drivers for the gasoline retail industry, backed by its healthy demographics, extensive geographical reach, and minimal available public transportation, along with low level of motorization rates in the kingdom compared to other countries with similar GDP/capita. This is in addition to the government lifting the ban on women driving, the wide infrastructure spending on its road networks, and the restoration of the level of foreign employment. We expect throughput/station to decline c10% in 2020e given the wide quarantine measures imposed by the kingdom during March and April as well as the suspension of the pilgrimage, with growth to resume in 2021e, driving top line to grow at a 2020–24 CAGR of c15% for Aldrees and c17% for SASCO.
While margins for the non-fuel segments (such as transportation) for the companies under coverage are close to 7x higher than the margins of the fuel retail segment, revenue sustainability of the non-fuel segment is difficult to assure as it is subject to contract terminations and risk of renewals.
We favor Aldrees for its wider scaler, stronger operating margins, higher FCFF and compelling valuation (2020e PE of 19.1x) versus SASCO (44.2x). However we expect SASCO’s PE to converge to 12.1x, close to Aldrees’ multiple, by the end of the forecast period, on expected double-digit earnings CAGR.
Figure 1: Companies’ main highlights
Aldrees SASCO
Main activities
(i) Owning, operating, and leasing
gas stations, and workshops,
(ii) Transportation segment
offers transport of fuel, liquefied
chemicals, and grains besides
offering on-site and off-site logistics
services, custom clearances, and
warehouse lease and management.
(i) Owning, operating, and leasing
gas station, stores, and workshops,
(ii) Transporting fuel and cargo,
(iii) Operating motels,
(iv) Importing and selling spare
parts, and
(v) Issuing cross-border
documentation for travelling trucks
and international driving licenses
for travelling citizens.
Market share (FY19) 5% 2%
Number of stations (FY19) 482 198
Fuel gross margin (FY19) 6.4% 5.8%
Number of trucks and trailers
(FY19)3,645 270
Transportation gross margin
(FY19)31.9% 29.5%
Source: Company disclosures
Figure 2: 52-week share price performance (rebased)
60
80
100
120
140
160
180
200
Apr-19 May-19 Jun-19 Jul-19 Aug-19 Oct-19 Nov-19 Dec-19 Jan-20 Feb-20 Mar-20 Apr-20
TASI ALDREES SASCO
Source: Bloomberg
YTD
TASI -15%
Aldrees -6%
SASCO -12%

4
Saudi Arabian Gasoline Retailers 4 May 2020
Saudi Arabia provides ample growth opportunities, despite key challenges such as:
1. Possible resumption of lockdown measures post the holy month of Ramadan could further drag station throughput in 2020
To limit the spread of COVID-19, Saudi Arabia has imposed curfew measures across the kingdom since the virus outbreak including:
– A 24-hour daily curfew in Mecca and Medina (effective 2 April), and in Riyadh, Tabuk, Dammam, Dhahran, and Hofuf and throughout the governorates of Jeddah, Taif, Qatif, and Khobar (effective 6 April). This was imposed until the partial lifting of the lockdown from 9:00AM to 5:00PM starting 26 April through 13 May, while keeping a 24-hour curfew in Mecca and adjacent neighborhoods.
– Suspensions of domestic flights, trains, buses, and taxis, effective 21 March until further notice. Commercial transport trains and cargo ships continue to operate normally.
– The kingdom banned residents from entering or exiting Riyadh, Mecca, and Medina effective 26 March.
– The current suspension of pilgrimage and the Hajj.
Extension of these curfew measures post the holy month of Ramadan could further drag down our overall throughput/station beyond the c10% y-o-y estimated decline in 2020e.
(To see full regulation measures imposed by the kingdom, please refer to our Macro & Strategy note entitled Earth takes a Breather, corporates take a hit by clicking here.)
2. Potential Rebounding of Brent prices to likely reflect in higher octane prices going forward
Global demand for oil has sharply contracted amid lockdowns and stalled industrial activity, driven by the onset of COVID-19 at the beginning of the year in China and elsewhere in the world by March 2020. This, besides the supply glut and the long standoff between Saudi Arabia and Russia over supply cuts, caused a devastating oil price war to erupt. This drove OPEC+ members to strike a historic deal, by virtue of which, 9.7 million barrels per day are cut starting May 1st, and will extend through the end of June. Nonetheless, Saudi Arabia and Kuwait started cutting production prior to the deadline of May 1st in response to market conditions. Accordingly, we expect slight elevation in oil prices on potential supply cuts and expected demand recovery within the coming few months. This in our view will drive the Saudi government to gradually revise Octane prices higher in its monthly revisions starting July. We expect prices of Octane 91 and Octane 95 to grow at a 5-year CAGR of 6% and 3%, respectively over 2019-2024e.
We run a sensitivity analysis to detect the impact of changes of gasoline prices on our FV of both companies, assuming all other factors remain constant. While per liter margins are fixed in absolute terms at SAR0.15, earnings of Aldrees and SASCO are vulnerable, to a lesser extent, to the monthly revision of Saudi gasoline prices (earnings decline 0.5% for every 1% increase in octane prices).
Figure 3: Different scenarios for Brent assumptions (USD/barrel) and its impact on FV (SAR/share)
41.7
52.255.0
37.5
46.9849.5
45.87
57.4260.50
35
40
45
50
55
60
2020 2021 2022 Fair Value SASCO Fair Value Aldrees
Brent Base Case Brent Bearish Brent Bullish
71
7534.5
28
31
67
*Brent prices in USD/barrelSource: Bloomberg, Beltone Estimates

5
Saudi Arabian Gasoline Retailers 4 May 2020
Figure 4: Different scenarios for Brent prices and its impact on 91-octane and 95-Octane and per share FV
2020 2021 2022 2023 2024 Aldrees SASCO
Bearish scenario
Brent (USD/barrel) 37.5 47.0 49.5 54.0 58.5
FV
SAR 75
FV
SAR 34.5
91-octane (SAR/liter) 1.3 1.3 1.4 1.5 1.7
95-octane (SAR/liter) 1.5 1.7 1.8 2.0 2.1
Diesel (SAR/liter) 0.4 0.4 0.4 0.4 0.4
Base case
Brent (USD/barrel) 41.7 52.2 55.0 60.0 65.0
FV
SAR 71
FV
SAR 31
91-octane (SAR/liter) 1.4 1.5 1.6 1.7 1.9
95-octane (SAR/liter) 1.7 1.9 2.0 2.2 2.4
Diesel (SAR/liter) 0.4 0.4 0.4 0.4 0.4
Bullish scenario
Brent (USD/barrel) 45.9 57.4 60.5 66.0 71.5
FV
SAR 67
FV
SAR 28
91-octane (SAR/liter) 1.5 1.6 1.7 1.9 2.0
95-octane (SAR/liter) 1.9 2.1 2.2 2.4 2.6
Diesel (SAR/liter) 0.4 0.4 0.4 0.4 0.4
* Octane and diesel prices are ex-vatSource: Bloomberg, Beltone Estimates,
Also, given that Saudi Arabia’s octane and diesel retail prices are lower when compared with regional peers, we believe it is more likely that gasoline prices will be revised higher.
Figure 5: While most GCC countries have phased out subsidies on gasoline over the last few years…
Figure 6: …gasoline prices in Saudi Arabia are one of the lowest in the GCC
0.15
0.25
0.35
0.45
0.55
0.65
KSA UAE Qatar Kuwait Oman Bahrain
USD91-octane
2016 2017 2018 2019
-
0.20
0.40
0.60
Diesel 91-octane 95-octaneKuwait KSA Bahrain Qatar Oman UAE
USD2019
Source: Official media sources Source: Official media sources
3. Less frequent margin revisions of gasoline retailers
Saudi Arabia recently raised gasoline retailer margins to SAR0.15/liter, the first since 2006, as a direct step to combat mounting cost pressures and entice foreign investor appetite to the gasoline retailer industry. Based on our calculations, gas-operating stations could barely breakeven before the latest margin lift on high cost pressures related to labor employment, lease expenses, and cost of compliance to the new measures. Accordingly, we believe more frequent margin revisions of gasoline operators are essential to compensate retailers for ongoing rising costs. Compared to neighboring markets, gasoline retailer margins are currently an average 11% of selling prices in Saudi Arabia, compared to 15% in the UAE and 5% in Qatar.
4. Development of mass transportation
Saudi Arabia has started developing integrated and modern public transportation systems across major cities, starting with Riyadh, with a 6-line metro and bus rapid transit (BRT) lines to be launched towards the end of 2020.
5. Growing use of electric vehicles and hydrogen-based engines
Under the Saudi Vision 2030, the Saudi government is promoting a shift towards the adoption of hydrogen-based engines and electric vehicles. The transportation sector in Saudi Arabia uses nearly a quarter of its total energy, with consumption levels projected to rise in the coming years. Electric vehicles would help meet the goal of cutting reliance on oil, increasing energy efficiency of cars, and reducing pollution. The number of electric vehicles in the kingdom is quite limited for the time being.

6
Saudi Arabian Gasoline Retailers 4 May 2020
II. Operational and comparative analysis
We favor Aldrees on its fundamentals given its wider scale, stronger margins, and higher FCFF yield.
Figure 7: Number of gasoline stations of Aldrees is double SASCO’s…
Figure 8: with equal throughput per station (mn liters); SASCO has lower Diesel contribution
482 497 507 517 527 537
198 203 213 223 233 243
0
100
200
300
400
500
600
2019
a
2020
e
2021
e
2022
e
2023
e
2024
e
No. o
f sta
tions
Aldrees SASCO
6.3 6.8 5.4 5.8 6.2 6.7 6.5 7.0 6.8 7.4
3.5 2.5 3.5 2.5
3.5 2.6 3.6 2.6 3.7 2.7
-
2.0
4.0
6.0
8.0
10.0
12.0
Aldr
ees
SASC
O
Aldr
ees
SASC
O
Aldr
ees
SASC
O
Aldr
ees
SASC
O
Aldr
ees
SASC
O
2019a 2020e 2021e 2022e 2023em
illion
lite
rs
Octane 91 Octane 95 Diesel
Source: Company disclosures, Beltone estimates Source: Company disclosures, Beltone estimates
Figure 9: Aldrees’ transportation fleet is stronger Figure 10: Revenues of SASCO are expected to grow at a 5-year CAGR of 14% vs Aldrees of 10%
- 500
1,000 1,500 2,000 2,500 3,000 3,500 4,000
Aldr
ees
SASC
O
Aldr
ees
SASC
O
Aldr
ees
SASC
O
Aldr
ees
SASC
O
Aldr
ees
SASC
O
2019a 2020e 2021e 2022e 2023e
Trucks Trailers
5,372
2,434
4,972
2,614
6,031
3,213
6,724
3,673
7,719
4,243
309
49
309
53
305
58
297
64
304
71
- 1,000 2,000 3,000 4,000 5,000 6,000 7,000 8,000
Aldr
ees
SASC
O
Aldr
ees
SASC
O
Aldr
ees
SASC
O
Aldr
ees
SASC
O
Aldr
ees
SASC
O
2019a 2020e 2021e 2022e 2023e
Petroleum (SAR mn) Transportation & others (SAR mn)
Source: Company disclosures, Beltone estimates Source: Company disclosures, Beltone estimates
Figure 11: Non-fuel business of Aldrees drives higher Gross margins (including depreciation)...
Figure 12 : ...which ultimately fuels higher earnings growth
8.1%
6.3%
7.7%
4.7%
8.0%
5.2%
7.6%
5.3%
7.1%
5.4%
2.0%
3.0%
4.0%
5.0%
6.0%
7.0%
8.0%
9.0%
-
100
200
300
400
500
600
Aldr
ees
SASC
O
Aldr
ees
SASC
O
Aldr
ees
SASC
O
Aldr
ees
SASC
O
Aldr
ees
SASC
O
2019a 2020e 2021e 2022e 2023e
Petroleum (SAR mn) Transportation & others (SAR mn) GPM %
223 122
182 57
267
83
279
100
300
117
3.9%
4.9%
3.4%
2.3%
4.2%
2.5%
3.9%
2.6%
3.7%
2.7%
2.0%2.5%3.0%3.5%4.0%4.5%5.0%5.5%
- 50
100 150 200 250 300 350 400 450
Aldr
ees
SASC
O
Aldr
ees
SASC
O
Aldr
ees
SASC
O
Aldr
ees
SASC
O
Aldr
ees
SASC
O
2019a 2020e 2021e 2022e 2023e
Net Income (SAR mn) Net margin
Source: Company disclosures, Beltone estimates Source: Company disclosures, Beltone estimates

7
Saudi Arabian Gasoline Retailers 4 May 2020
Figure 13: We expect Aldrees to have a higher payout ratio…
Figure 14: …providing decent dividend yield
2.0%12.0%22.0%32.0%42.0%52.0%62.0%72.0%
0.000.501.001.502.002.503.003.504.00
Aldr
ees
SASC
O
Aldr
ees
SASC
O
Aldr
ees
SASC
O
Aldr
ees
SASC
O
Aldr
ees
SASC
O2019a 2020e 2021e 2022e 2023e
DPS (SAR/share) Dividend payout ratio
0%
2%
4%
6%
8%
10%
12%
Aldr
ees
SASC
O
Aldr
ees
SASC
O
Aldr
ees
SASC
O
Aldr
ees
SASC
O
Aldr
ees
SASC
O
2020e 2021e 2022e 2023e 2024e
Dividend yield Free cash flow yield
Source: Company disclosures, Beltone estimates Source: Company disclosures, Beltone estimates
Figure 15: Overall, Aldrees generates a high ROIC and ROAE
Figure 16: Aldrees maintains a healthier ACC (days)
0%
5%
10%
15%
20%
25%
30%
Aldr
ees
SASC
O
Aldr
ees
SASC
O
Aldr
ees
SASC
O
Aldr
ees
SASC
O
2020e 2021e 2022e 2023e
ROIC ROAE
28 15
28 15
28 15
28 15
5
8
5
8
5
8
5
8
5 24 5 23 5 23 5 23
(16) (8) (16) (9) (16) (10) (16) (11)
(21) (30) (21) (30) (21) (30) (21) (30)
(40) (30) (20) (10) - 10 20 30 40
Aldr
ees
SASC
O
Aldr
ees
SASC
O
Aldr
ees
SASC
O
Aldr
ees
SASC
O
2020e 2021e 2022e 2023e
A/R Inventory other Current AssetsA/P A/Expenses Other Current liabilities
Source: Company disclosures, Beltone estimates Source: Company disclosures, Beltone estimates

8
Saudi Arabian Gasoline Retailers 4 May 2020
We favor Aldrees on comparative valuations as well
Figure 17: Aldrees and SASCO vs global peers’ multiples
Company name Ticker CountryMC
(MnUSD)P/E P/BV EV/EBITDA EBITDA margin
Earnings CAGR
Dividend yield
2019 2020e 2021e 2020e 2021e 2019 2020e 2021e 2019 2020e 2021e 19/22 2019 2020e 2021e
ABU DHABI NATIONAL
OIL CO FOADNOCDIST UH UAE 9,359 15.0 14.6 13.4 9.9 9.5 11.9 12.2 11.0 13.7% 14.3% 14.4% 4.2% 6.7% 7.8% 7.8%
QATAR FUEL QSC QFLS QD Qatar 4,388 13.2 18.6 12.7 N/A N/A 9.5 13.8 9.0 4.9% 4.4% 4.8% 1.3% 5.0% 5.0% 5.0%
SUNOCO SUN USUnited
States2,254 7.8 9.5 7.9 2.9 3.2 8.1 8.3 7.8 3.9% 4.5% 4.3% 1.1% 13.9% 13.9% 13.9%
AKRA AKRA IJ Indonesia 522 9.8 9.3 8.3 0.9 0.8 8.8 7.9 7.1 6.6% 8.3% 8.5% 9.1% 5.2% 3.4% 3.9%
CALTEX AUSTRALIA LTD CTX AU Australia 3,570 16.9 20.1 12.7 1.8 1.7 7.5 8.4 6.3 4.6% 4.6% 5.5% 16.3% 3.5% 3.0% 4.8%
Z ENERGY LTD ZEL NZ New
Zealand744 10.6 17.9 9.2 1.6 1.5 7.1 9.5 7.1 8.0% 8.1% 8.7% 6.5% 8.2% 6.0% 12.3%
POLSKI KONCERN
NAFTOWY ORLENPKN PW Poland 6,183 5.5 14.0 7.5 0.7 0.6 3.4 5.2 3.6 8.7% 8.6% 9.5% -3.3% 5.9% 4.6% 4.8%
PARKLAND FUEL CORP PKI CN Canada 3,021 15.5 53.0 17.2 2.4 2.8 6.5 9.1 7.3 6.9% 5.6% 6.2% -3.8% 3.9% 4.0% 4.0%
PETRONAS DAGANGAN PETD MK Malaysia 4,626 21.7 27.8 22.9 3.3 3.1 10.5 12.2 10.7 5.5% 5.2% 5.5% -0.9% 3.5% 3.0% 3.4%
Peers average
multiples12.9 20.5 12.4 2.9 2.9 8.2 9.6 7.8 7.0% 7.1% 7.5% 3.39% 6.2% 5.6% 6.7%
Aldrees* ALDREES AB KSA 904 15.6 19.1 13.1 4.1 3.7 8.9 9.4 8.0 10.9% 11.2% 10.9% 8% 2.6% 3.4% 5.0%
SASCO* SACO AB KSA 400 23.7 44.2 23.4 1.7 1.6 12.8 13.7 11.8 8.8% 8.0% 7.1% 6% 2.0% 1.7% 2.5%
* Aldrees and SASCO earnings CAGR is based on core earnings
** Closing price as of 30 April 2020
Source: Bloomberg, Beltone estimates
Figure 18: SASCO’s implied PE will converge with Aldrees’ by the end of the forecast period
010203040506070
2016
2017
2018
2019
2020
e
2021
e
2022
e
2023
e
2024
eSAR/Liter
Aldrees Implied PE SASCO Implied PE
* From 2016-2019 is based on historical prices, and FV is used to calculate implied PE from 2020 and onwardsSource: Beltone estimates

9
Saudi Arabian Gasoline Retailers 4 May 2020
III. Saudi Arabia’s solid demographics to provide healthy growth momentum
Largest market in the GCC with favorable demographics, extended landscape, and limited mass transportation
Spanning 2.15mn sqkm and home to over 33mn residents, Saudi Arabia represents the largest country in the GCC region with the highest per capita daily oil consumption, driven by the transportation segment, which represents a quarter of oil consumption in the country. On the global scale, Saudi Arabia ranks sixth for oil consumption, accounting for about 3.4% of the world’s total consumption of 97.1mn bpd. Transportation in Saudi Arabia relies mainly on light vehicles given the limited options for buses and other public transportation.
Figure 19: Per capita daily oil consumption in the GCC (liters)
Figure 20: Premium gasoline and diesel consumption in Saudi Arabia
19.4 18.3 17.3
12.4
8.3 7.8
Saud
i Ara
bia
UAE
Kuw
ait
Qata
r
Bahr
ain
Oman
Source: www.worldometers.infoSource: Ministry of Energy, Industry and Mineral Re-sources
High oil reserves support the Kingdom economic strength and stability
Saudi Arabia holds the second-largest proven oil reserve in the world, after Venezuela, making the country exceedingly reliant on oil proceeds. Being highly dependent on global prices as seen in FY15 has led the Saudi government to run into a budget deficit of SAR3.8mn after global oil prices fell over 35% y-o-y. In an effort to reduce its reliance on oil export proceeds and diversify its revenue base, the country has implemented imperative initiatives under the Saudi Vision 2030 program. Among the initiatives implemented were the imposition of levies on expats, value-added tax (VAT), and most importantly cutting gasoline subsidies.
Figure 21: Strong oil reserves Figure 22: Saudi Arabia state revenue breakdown
303266
167 156 147
102 98 8048
050
100150200250300350
Vene
zuel
a
KSA
Cana
da
Iran Iraq
Kuw
ait
UAE
Russ
ia
Liby
a
mn bpd
Oil, 68%
Taxes, 18%
Other revenues,
14%
Source: US Energy Information Administration (EIA) Source: Saudi Arabia Ministry of Finance

10
Saudi Arabian Gasoline Retailers 4 May 2020
Subsidy removal on oil prices under Saudi Vision 2030 program
Gasoline prices (95-octane and 91-octane) were pegged at SAR0.60/liter and SAR0.45/liter, respectively, for a long time. It was not until January 2016 that the Saudi government decided to gradually phase out gasoline subsidies, resulting in the subsequent increases of 95-octane and 91-octane gasoline prices. Following the second price hike in 2018, the Saudi MOE announced a quarterly revision of local prices in coordination with global crude oil export prices. Later in February 2020, Saudi Aramco announced that prices would be reviewed on a monthly basis going forward.
Figure 23: Gasoline price are now reviewed on a monthly basis
Figure 24: Government raised retailer margins in 2019 after consecutive increases in octane prices
0
0.5
1
1.5
2
2.5
4Q15
1Q16
1Q18
2Q18
3Q18
4Q18
1Q19
2Q19
3Q19
4Q19
1Q20
2Q20
SAR/Liter
95-octane 91-octane Diesel
17% 17% 17% 17%
11% 11%
7%
11% 10%
2012
2013
2014
2015
2016
2017
2018
2019
2020
e
Blended margin for Octane & Diesel
Margins lifted to SAR 0.15/liter
Margins remained fixed at SAR 0.09/liter since 2006
Source: Saudi Aramco Source: Company reports, Beltone estimates
New qualification measures rewarded by margin uplift
The fuel-stations market in Saudi Arabia is highly fragmented, with some 10,000 stations currently operating. The top 4 fuel stations hold 12% market share, while other small-scale operating companies (mostly privately-owned) have an 88% share. This has made it difficult for small-scale operators to comply with the state qualification measures imposed by the Saudi MOMRA under the Masar program to modernize gas stations and ensure higher quality of service to end-users starting 2016. Accordingly, the government qualified only 20 companies to operate and has raised the absolute margins of octane and diesel products to SAR0.15/liter and SAR0.05/liter, respectively, starting 23 August 2018. Over 83 stations have been shutdown in December 2019 on failure to comply with new regulations, according to reports.
Figure 25: Expenses on utilities represents c25% of household expenditures
Figure 26: Fragmented gasoline retailer market
Utilities, 25%
F&B, 22%
Transportation, 17%
Eduction, 12%
Furniture, 8%
Others, 7%
Apparel, 6%
Medical Care, 2%
Aldrees, 5%
Al-Tashelat, 3%
NAFT, 2%SASCO, 2%
Privately-owned, 88%
Source: General Authority for Statistics. Source: Company reports
Rising consolidation and FDI wave by local and foreign players
The new measures imposed have driven the recent wave of consolidation and lured direct investment in the industry not only by local investors but also foreign counterparts. In this regard, Saudi Aramco and Total jointly acquired Tas’helat Marketing Company (TMC) and Sahel Transport Company (STC) (with a 3% market share) and plan to invest around USD1bn over the next 6 years in fuel-operating companies. UAE-based ENOC entered the market in 2013 and aims to increase its retail fuel network in Saudi Arabia to 45 service stations by 2023 up from an existing 16 petrol stations, via operating existing fuel stations instead of entering in greenfield, which should save 30%–50% of the investment cost. Also, UAE-based ADNOC entered the market in 2018, operating 2 fuel stations currently.

11
Saudi Arabian Gasoline Retailers 4 May 2020
Growth drivers
Low motorization rate in Saudi Arabia and lifting ban on women driving to fuel automotive sales growth
Saudi Arabia’s motorization rate, at 21%, one of the lowest in the MENA, should continue to grow on recovering foreign employment in 2019 and the lift of the ban on women driving starting June 2018. Close to 1mn women are expected to become driving motorists in the coming 3 years.
Figure 27: Motorization rate in Saudi Arabia vs international countries
Figure 28: Growth in vehicles in use supported by addition of women to pool of motorists
OmanKSA UAE
BahrainQatar
KuwaitSouth Korea
Japan
Russia
Greece
Italy
AustriaCanada
EgyptJordan
0
100
200
300
400
500
600
700
- 20,000 40,000 60,000 80,000
Vehi
cles
in U
se (P
er 1
000
inha
bita
nt)
GPD Per Capita (Current Prices USD)
0.01.02.03.04.05.06.07.08.09.0
2012
a
2013
a
2014
a
2015
a
2016
a
2017
a
2018
a
2019
e
2020
e
2021
e
2022
e
2023
e
Milli
ons
Male owners Female owners
Source: www.nationmaster.com. Source: Statistica, Beltone estimates
Figure 29: Imports of vehicles in KSA Figure 30: Registration/sales of new vehicles (All types)
53,675
34,820
25,72819,773
25,443
2015
2016
2017
2018
2019
SAR Million
- 100,000 200,000 300,000 400,000 500,000 600,000 700,000 800,000 900,000
2005
2006
2007
2008
2009
2010
2011
2012
2013
2014
2015
2016
2017
2018
2019
units
Source: Monthly Statistical Bulletin, SAMA Source: Organisation Internationale des Constructeurs d’Automobiles (OICA)
Wide infrastructure spending in the kingdom
The wide infrastructure spending in Saudi Arabia, with over 8 highway roads set to be established over the coming years, should drive the need for more qualified petrol stations to be in place, with priority for the highways connecting Riyad and Damam and El Kassem and Medina . This in addition to the cross-country projects, such as the Saudi-Oman highway, Mashreq-Ghuwaifat international highway (UAE-Saudi Arabia), and the King Fahd causeway connecting Bahrain and Saudi Arabia. There is currently a change in the perception of gas stations now to a destination of services on major highways.

12
Companies

13
*Closing as of 30 April 2020
Initiate coverage with a FV of SAR71/share and a Buy rating Having been in the retail fuel industry for close to 60 years, Aldrees has developed to become the largest retailer of gas stations in Saudi Arabia with a market share of 5% based on number of stations (482 stations) and 10% in terms of sales volumes. The company is engaged in 2 complementary segments, the cash generating fuel segment (c95% of net revenue) and the high margin transportation segment (c25% of total gross profit). In this regard, we value Aldrees using the sum-of-the parts (SOTP) valuation method, reaching a FV of SAR71/share, with our discounted cash flow (DCF) valuation yielding 22% upside given the recent market sell off, warranting a Buy rating.
Throughput/station to decline in 2020e amid imposed quarantine measures; transportation segment to remain solid; expect a rebound in 2021e Amid the COVID-19 outbreak, the Saudi government has implemented strict curfew measures and lockdowns in major cities across the kingdom since late 1Q20, with the lockdown partially lifted starting 26 April through 13 May. We believe this should limit road traffic and accordingly pressure the throughput of Aldrees’ 482 stations. That said, revenue of the fuel segment declined c80% y-o-y during April 2020. Also, the suspension of pilgrimages and the possible cancelation of the Hajj in 2020 could likely impact the throughput of gasoline stations in the Western Province (Mecca, Medina, and Jeddah) where c19% of the company’s stations are located. Accordingly, we believe this will reflect on 7% lower y-o-y sales of Aldrees in 2020e. On the transportation front, the segment is expected to remain solid during the year given the existing contracts signed in the grains and the liquefied chemicals sectors. We expect core earnings to drop c18% y-o-y in 2020e, but we expect a c47% solid rebound in 2021e.
Rehabilitation and expansion plans to continue in 2020e, but at a slower paceIn compliance with the Saudi government’s regulation measures, Aldrees had initially planned before the outbreak of COVID-19 to continue its rehabilitation plan in 2020, with 148 stations were expected to be renovated in 2020 with an expected CAPEX of SAR192mn, which would have brought total CAPEX spent on the rehabilitation plan since 2016 for its stations inside the cities and on the highways to SAR543mn. However, we believe given the lockdown imposed in the kingdom, the renovation plan will likely be altered and expanded over the coming 3 years, with an average of 45 stations renovated annually. We also expect a delay in the company’s initial expansion plan of adding 50 stations this year, which we estimate will stand at 15 new stations in 2020e. This, in our view, is likely to be achievable in light of the potential freeing-up of cash on Aldrees’ negotiations with Saudi Aramco to defer its monthly settlement bill from 30 days to 90 days.
Higher margins offset prevalent cost escalations; earnings to remain supportedThe uplift in gasoline margins, which Aldrees accounted for retroactively starting 28 August 2018, based on the official decree released by MOMRA on 1 October 2019, drove 2019 earnings to grow 4.4x y-o-y. Given that Aldrees has not received the official declaration from Saudi Aramco on the volumes eligible for the higher margins, Aldrees booked provisions of SAR17.4mn in 4Q19 to offset any contingent liability that may arise. New gasoline margins have helped shore up overall margins after 2 consecutive years of margin decline on higher gasoline prices besides the high rent and labor costs. Going forward, we expect core earnings to grow at a 5-year CAGR of c8%, driven by a growing top line.
Stock data
Reuters 4200.SE
Bloomberg ALDREES AB
Shares (mn) 60
MKT cap (mn) SAR3,492/ USD931
3M avg. daily
liquidityUSD7.4 mn
52-week high/low SAR66/SAR32
Free float 96.2%
Main financial highlights (FY end December.)In SAR mn, unless otherwise stated 2019a 2020e 2021e 2022eRevenue 5,681 5,281 6,336 7,020 EBITDA 619 590 692 713 Recurring net income* 223 182 267 279 EPS (SAR)* 3.7 3.0 4.5 4.7 P/E (x)* 15.6 19.1 13.1 12.5 EV/EBITDA (x) 8.9 9.4 8.0 7.7 Net debt (cash)/equity 2.6 2.4 2.2 1.9 ROAE 31.3% 22.4% 30.0% 28.3%*Based on core earnings (excluding appropriations and one-offs)Source: Company, Beltone estimates
Rating: Buy
Fair value: SAR71
Market price: SAR 58.2
Upside: 22%
Aldrees Petroleum & Transport ServicesFavored on strong fundamentals and compelling valuationConsumers | Saudi Arabia
Initiation of Coverage 4 May 2020
15
35
55
75
Apr-1
9
May
-19
Jun-
19
Jul-1
9
Aug-
19
Sep-
19
Oct-1
9
Nov-
19
Dec-
19
Jan-
20
Feb-
20
Mar
-20
Apr-2
0
SAR ALDREES TASI
Ingy El-Diwany, [email protected] | +2 02 2461 6428
Mohamed Hamza [email protected] | +2 02 2461 6382
Shareholder structure
Others Free-Float93%
Hamad Mohamed Saad Aldrees
4%
Vanguard Group 2% Norges Bank
1%

14
4 May 2020Aldrees
Investment summary
Established in 1962, Aldrees is considered the largest single gas station retailer in Saudi Arabia with a market share of 5% based on number of stations (482 stations) and 10% in terms of sales volumes. Aldrees is engaged in the fuel and transportation segments with the former segment generating c95% of total revenue in 2019 and c75% of gross profit. In the Fuel segment, Aldrees had 482 stations in 2019, 16 of which are owned and the remaining rented under revocable contracts with an average 10-year tenor. Over 20% of the lease contracts will be renewed within the coming 4 years. The stations are strategically located with more than half of them in the Central Province. Aldrees entered in the transportation segment originally as a complementary service to its gasoline station business, with almost 2% of the owned 1,255 trucks used to serve the fuel segment and the remaining fleet engaged in transporting liquefied chemicals and grains. Most of the contracts in the segment have a 3–5 year tenor while the Maaden SAR597mn contract has a tenor of 4 years, expiring in July 2021.
Valuation methodology and risks
We have a Buy rating on Aldrees with a FV estimate of SAR71/share using a SOTP methodology with a 5-year DCF, discounted at a WACC of 7.2%, and a terminal growth rate of 2% for each of the fuel segment (65% of value) and the transportation segment (35%). Key downside risks to our forecasts include (i) escalating lease expenses of gasoline stations amid less frequent margin revisions by the kingdom, (ii) changes in consumption patterns in case of a prolonged quarantine measures amid the COVID-19 outbreak, and (iii) competition within the gasoline retailer industry.
Financial statement | FY end December (SARmn)
Income statement 2019a 2020e 2021e 2022e
Total revenue 5,681 5,281 6,336 7,020
Operating costs (4,914) (4,550) (5,486) (6,137)
Gross profit 767 731 851 883
SG&A expenses (148) (141) (159) (169)
EBITDA 619 590 692 713
Depreciation and amortization (305) (324) (343) (352)
Operating profit 314 265 349 361
Net financing income/(cost) (74) (78) (75) (75)
Income from investments 2 1 1 1
Other income/(expense) 66 - - -
EBT 308 188 275 288
Income taxes (16) (5) (7) (7)
NPAT 292 183 268 280
Appropriations (2) (2) (2) (2)
Net income 290 181 266 278
Core earnings* 223 182 267 279
Balance sheet 2019a 2020e 2021e 2022e
Cash and Equivalents 98 23 55 44
Accounts receivables 390 405 486 539
Inventory 72 69 82 91
Other assets 152 142 170 188
Total current assets 713 638 793 862
Fixed assets 1,090 1,148 1,204 1,215
Investments in Joint Venture 27 27 27 27
Deferred Costs 12 8 4 -
Present value of Rights of Use Asset 1,743 1,796 1,830 1,868
Total non-current assets 2,872 2,980 3,065 3,110
Total Assets 3,585 3,618 3,858 3,973
Banks Short Term Borrowings 335 340 350 270
CPLTD 71 45 15 -
CPLTD of Lease Liability 219 219 219 219
Account payables 226 211 252 281
Creditors and other credit balances 401 409 519 564
Total current liabilities 1,253 1,224 1,355 1,334
Long Term Debt 60 15 - -
Lease Liability 1,424 1,468 1,499 1,539
Provision for End of Service
Benefits 66 66 66 66
Total non-current liabilities 1,550 1,549 1,565 1,605
Paid-in Capital 600 600 600 600
Reserves 66 66 66 66
Retained Earnings 117 180 272 369
Total equity 783 845 936 1,032
Total liabilities and equity 3,585 3,618 3,858 3,973
Cash flow 2019a 2020e 2021e 2022e
Cash flow from operations 536 471 584 618
Cash flow from investing (160) (432) (428) (397)
Cash flow from financing (324) (114) (124) (232)
Change in cash 52 (75) 32 (11)
Main Ratios 2019a 2020e 2021e 2022e Per-share data
EPS (SAR)* 3.7 3.0 4.5 4.7
BVPS (SAR) 13.0 14.1 15.6 17.2
DPS (SAR) 1.5 2.0 2.9 3.0
EV (SAR) 91.7 92.6 92.0 91.3
Valuation data
Share Price 58 58 58 58
P/E (x)* 15.6 19.1 13.1 12.5
P/BV (x) 4.5 4.1 3.7 3.4
Dividend yield 2.6% 3.4% 5.0% 5.2%
FCF yield 10.8% 1.1% 4.5% 6.3%
EV/EBITDA (x) 8.9 9.4 8.0 7.7
Growth (y-o-y)
Revenue 9.7% -7.0% 20.0% 10.8%
EBITDA 37.2% -4.7% 17.3% 3.1%
Earnings 336.1% -37.2% 46.3% 4.6%
Recurring earnings* 251.5% -18.3% 46.5% 4.6%
Profitability
Gross profit margin (GPM) 13.5% 13.8% 13.4% 12.6%
EBITDA margin 10.9% 11.2% 10.9% 10.2%
EBIT margin 5.5% 5.0% 5.5% 5.1%
Net profit margin (NPM) 3.9% 3.5% 4.2% 4.0%
ROAA* 6.4% 5.1% 7.1% 7.1%
ROAE* 31.3% 22.4% 30.0% 28.3%
ROAIC* 7.9% 6.2% 8.9% 9.1%
Leverage
Net debt/equity 2.6 2.4 2.2 1.9
Net debt/EBITDA 3.2 3.5 2.9 2.8
* Based on core net income (excluding appropriations and one-offs)Source: Company, Beltone estimates

15
4 May 2020Aldrees
I. Valuation
We have a Buy recommendation on Aldrees with a FV of SAR71/share, implying a 22% upside potential. We reach this value using a SOTP valuation methodology, where each of the fuel and the transportation segments are valued separately using a DCF model.
We utilize a WACC of 7.2% and a cost of equity of 8.5% derived from (i) a risk free rate of 2.9% (using a 7-year sovereign sukkuk yield after zakat), (ii) equity market risk premium (ERP) of 6.2% (US market risk premium plus an additional country risk premium), and (iii) a beta of 0.9. Our WACC calculations are based on a 63% weight of equity and 37% weight of debt and lease after accounting for IFRS 16 accounting standards. We also use a terminal growth rate of 2%.
Figure 1: Sum-of-the parts DCF valuation for Aldrees
Discounted Cash Flow (SARmn) 2020e 2021e 2022e 2023e 2024e
1.Fuel
NOPLAT 184 256 289 317 344
BOD and employee remunerations (1) (1) (1) (1) (1)
Depreciation and amortization 277 293 301 310 322
CAPEX (117) (126) (120) (98) (104)
Change in working capital (35) (26) (13) (20) (24)
Change in capital leased assets (263) (251) (258) (262) (267)
FCFF 45 145 196 245 270
Terminal Value 5,331
PV OF FCFF 43 129 163 190 195
Sum of PV of FCFF 721
PV of terminal value 3,860
Enterprise Value (EV) 4,581
Net cash (debt) (based on 31 Dec19) (1,816)
Equity value of Petroleum segment 2,765
FV/share, SAR 46 65% of FV
2. Transportation segment
NOPLAT 77 86 65 58 59
BOD and employee remunerations (1) (1) (1) (1) (1)
Depreciation and amortization 47 50 51 52 53
CAPEX (46) (46) (19) (19) (20)
Change in working capital (2) (1) (1) (1) (1)
FCFF 76 88 96 89 90
Terminal Value 1,777
PV OF FCFF 73 79 80 69 65
Sum of PV of FCFF 366
PV of terminal value 1,287
Enterprise value (EV) 1,653
Net cash (debt) (based on 31 Dec19) (168)
Equity value of transportation segment 1,485
FV/share, SAR 24 35% of FV
Total equity value 4,251
Shares outstanding, mn 60.0
SOTP value per share, SAR 71
Figure 2: Sensitivity of our FV to changes in the cost of equity and terminal growth rate
Term
inal
gro
wth
rat
e
Cost of equity
71 6.5% 7.5% 8.5% 9.5% 10.5%
0% 45.7 45.7 45.7 45.6 45.6
1% 56.2 56.2 56.2 56.2 56.2
2% 70.9 70.8 70.8 70.8 70.8
3% 92.5 92.5 92.5 92.5 92.5
4% 127.8 127.8 127.8 127.8 127.8
Source: Beltone estimates

16
4 May 2020Aldrees
II. Operations overview
1. Petrol division (95% of revenue)
Expected CAPEX of SAR117mn in 2020e to meet government’s qualifications measures
Pursuant to the Saudi government regulation measures on gasoline retailers, Aldrees has spent some SAR351mn since 2016 as part of its rehabilitation plan for its stations inside the cities and on highways. This drove Aldrees to reduce the net number of its stations from 478 in 2014 to 445 in 2018. According to the company’s initial plan, some 148 stations were slated for renovation in 2020 with an expected CAPEX of SAR192mn. However, given the lockdown imposed in the country, we assume the renovation plan will likely be altered and expanded over the coming 3 years, with an average of 45 stations renovated annually. Currently, 359 of Aldrees’ stations have implemented the electronic fuel system (WAIE) program to allow for more control measures over payments, which the company considers a convenient and secure service for customers, especially governmental entities. WAIE allows for better services offered to the company’s customers with a prepayment option to ensure cash availability to repay its monthly dues to Saudi Aramco. The company is also looking into adding electric car chargers at its stations as well as the addition of new mobile stations that could provide an additional revenue stream.
2. Transportation segment (5% of revenue)
High concentration in Maaden contract; likely renewal upon contract termination
The company’s transportation segment is engaged in a wide array of commodity transport, with 40% of revenue generated from the 4-year, SAR597mn contract signed with Maaden that expires in July 2021. Aldrees established 300 tanks designed specifically to fulfill the contract, with 120 double stainless steel tanks to transfer molten sulphur from Saudi Aramco’s factories in the Eastern Province to Maaden Waad Al Shamal Phosphate Company, and to transfer phosphoric acid from Waad A Shamal to Ras al-Khair Industrial City utilizing 178 double-driver tanks to enjoy the high margins. According to Maaden’s policy, 25% of the volumes of molten sulphur and phosphoric acid should be transferred through Aldrees, with the balance to be transferred through the Saudi railway, which is a cheaper mean of transportation. According to the contract, Aldrees charges Maaden a monthly standby penalty of SAR18k for a maximum of 12 months for the unutilized trucks. Aldrees’ management expects the contract to be renewed upon its expiration, though at relatively lower terms. Despite market competition, Aldrees’ tanks have better specs than its competitors, with thermal insulation systems, double thickness, and a 31-ton load compared to local peers’ 24-ton load steel tanks.
An estimated SAR50mn bill to comply with Saudi Aramco’s requirement to convert fuel
transportation tanks to aluminum
Saudi Aramco is requiring all fuel steel transportation tanks to be converted to aluminium by 2023, which is safer, lighter, and less likely to crack. Based on the company’s guidance of a SAR230k CAPEX per tank, we believe that Aldrees will have to spend close to SAR50mn on renewing its fuel tanks.

17
4 May 2020Aldrees
Figure 3: Revenue expected to grow at 2019–24 CAGR of c10%
Figure 4: EBIT to grow at a 2019–24 CAGR of c6%
5,681 5,281 6,336
7,020 8,023
9,130
-
2,000
4,000
6,000
8,000
10,000
2019
2020
e
2021
e
2022
e
2023
e
2024
eTransportation sales (SAR mn) Petroleum sales (SAR mn)Total sales (SAR mn)
6%5%
6%5%
5% 4%
0%
1%
2%
3%
4%
5%
6%
- 50
100 150 200 250 300 350 400 450
2019
2020
e
2021
e
2022
e
2023
e
2024
e
Petroleum (SAR mn) Transportation (SAR mn) EBIT Margin
Source: Company Disclosure, Beltone estimates Source: Company Disclosure, Beltone estimates
Figure 5: Volume breakdown (% of total) Figure 6: Rental income to offset mounting cost/liter
0%
20%
40%
60%
80%
100%
2019
2020
e
2021
e
2022
e
2023
e
2024
e
Octane 91 Octane 95 Diesel
- 0.02 0.04 0.06 0.08 0.10 0.12 0.14 0.16 0.18
Reve
nue
Cost
Reve
nue
Cost
Reve
nue
Cost
Reve
nue
Cost
Reve
nue
Cost
Reve
nue
Cost
2018 2019 2020e 2021e 2022e 2023e
Rental Income (SAR/ Liter)Weighed average Margin per liter of octane (SAR /Liter)
Source: Company Disclosure, Beltone estimates Source: Company Disclosure, Beltone estimates
Figure 7: Transportation revenue to stabilize (SAR 000)
Figure 8: Asset conversion cycle is balanced (days)
- 100,000 200,000 300,000 400,000
2019
2020e
2021e
2022e
2023e
2024e
A. Fuel Oil B. Grains & othersC. Chemicals D. United Sugar BulkSupply Chain Operations
25 28 28 28 28 28
(16) (16) (16) (16) (16) (16)
(21) (21) (21) (21) (21) (21)
(50) (40) (30) (20) (10) - 10 20 30 40 50
2019 2020e 2021e 2022e 2023e 2024e
A/R DoH Inventory DoH Advance PaymentA/P DoH A/E DoH
Source: Company Disclosure, Beltone estimates Source: Company Disclosure, Beltone estimates

18
*Closing as of 30 April 2020
Initiate coverage with a FV of SAR31/share and a Buy recommendationWith a 2% market share in terms of number of stations, SASCO’s core business evolves around fuel refilling services (198 stations) and store management (80 stores). Collectively, both constitute c98% of FY19 sales. Additionally, SASCO owns diversified and higher margin business segments that include (i) transportation fleet management (1.2% of FY19 sales), (ii) hospitality management (0.2% of FY19 sales), and (iii) travel document issuance (0.4% of FY19 sales). Using a SOTP approach, we arrive at a FV estimate of SAR31.0/share, which translates to c21% upside and a Buy recommendation.
Margin relief subdued by COVID-19 impact; FY21e to see the lightFollowing years of lower operational margins, SASCO was selected as one of the 20 companies authorized by MOMRA to continue operating under its recently amended bylaws in February 2020. These measures were required to ease off pressure on gas station retailers’ margins as well as enhance client experience. Consequently, we believe SASCO will greatly benefit as fuel sales will continue to dominate revenue growth, attributed by the increased number of unqualified stations leased to SASCO. However due to the widespread of COVID-19 in March 2020, household movement was limited to certain curfew hours and in some cases complete lockdowns have caused gas stations to shut down temporarily. As a result, we believe SASCO will take a hit in FY20e as fuel sales drop c5% y-o-y on the back of c11% y-o-y drop in station throughput. Going forward, as the pandemic fades, we believe sales will pick up pace at a CAGR of c19% from FY20–24e. Our growth assumption entails number of operating stations will potentially reach 243 in FY24e, up from 198 in FY19. On a group level, we project core earnings will fall c47% y-o-y in FY20e, however press forward with a c89% y-o-y surge in FY21e.
Revenue diversification goes hand-in-hand with core businessBy virtue of the strategic partnership signed with multinational and local establishments that specialize in managing restaurants and maintenance workshops, we believe SASCO will focus on inaugurating more stores in the coming period. As for non-fuel operations, we expect SASCO’s high margin transportation segment to continue supporting overall GPM (with an average GPM of over 30% between 2017 and 2019). We believe the company’s transportation revenue will grow at a 5-year CAGR of c10%, driven by the expected expansion of its fleet reaching 205 trucks and 215 trailers by FY24e, up from 127 trucks and 143 trailers in FY19. Meanwhile, SASCO’s other revenue segments, which include hospitality management and issuance of cross-border documentation, will be greatly impacted in FY20e as a result of the spread of COVID-19 before potentially normalizing in the following years.
CAPEX heavily linked to station expansions With over c68% of CAPEX allocated to new station leases and building improvements over our forecast horizon, we believe our estimates are in line with SASCO’s strategy to add 5 new stations in FY20 and 10 new stations annually from 2021–24. As a result, SASCO should maintain a CAPEX/sales ratio of 1.9% on average, while retaining a debt/equity average of c50% from FY20–24e given the company’s capital structure, on our numbers.
Stock data
Reuters 4050.SE
Bloomberg SACO AB
Shares 60 mn
MKT cap (mn)SAR1,548 mn/
USD414 mn
3M avg. daily liquidity USD 3.5 mn
52-week high/low SAR31.0/SAR14.1
Free float 88%
Main financial highlights (FY end December.)In SAR mn, unless otherwise stated 2019a 2020e 2021e 2022eRevenue 2,483 2,491 3,045 3,477 EBITDA 217 201 239 268 Recurring net income* 65 35 66 84 EPS (SAR)* 1.1 0.6 1.1 1.4 P/E (x)* 23.6 44.2 23.4 18.4 EV/EBITDA (x) 12.9 13.8 11.6 10.2 Net debt (cash)/equity 1.5 1.4 1.3 1.2 ROAE* 8.2% 4.0% 7.3% 8.8%*Based on core net attributable income (excluding appropriations, one-offs and volatile expenses)Source: Company, Beltone estimates
Rating: Buy
Fair value: SAR31
Market price: SAR25.8
Upside: 21%
Saudi Automotive Services Company (SASCO)
Fuel station expansions to drive strong growth profileConsumers | Saudi Arabia
Initiation of Coverage 4 May 2020
Ingy El-Diwany, [email protected] | +2 02 2461 6428
Mohamed Hamza [email protected] | +2 02 2461 6382
0
10
20
30
40
Apr-1
9
May
-19
Jun-
19
Jul-1
9
Aug-
19
Sep-
19
Oct-1
9
Nov-
19
Dec-
19
Jan-
20
Feb-
20
Mar
-20
Apr-2
0
SAR SASCO TASI
Free Float88%
Ibrahim El Hodaithy
12%
Shareholder structure

19
4 May 2020SASCO
Investment summary
Operating in Saudi Arabia since 1982 in both fuel and non-fuel segments, SASCO ranks third with a market share of 2% in a fragmented market of over 10,000 fuel stations in the country. For the fuel segment (which constitutes over 98% of total FY19 revenue), SASCO operates and owns 198 state-of-the-art gas stations that provide fuel re-filling services and mini-supermarkets. Customers are also offered vehicle maintenance services in rented workshops within station premises. As for the non-fuel segment business (which constitutes over 2% of total FY19 revenue) SASCO operates a fleet of 270 trucks and trailers as of FY19 that transport water, fuel, and third-party cargo. In effort to diversify its business and utilize its wide-scale premises, SASCO added the management of 10 hotels and motels to its portfolio, which offer its traveling customers overnight stays and easy access to highways. Additionally, SASCO issues travel documents for transportation vehicles as well as international driving licenses for traveling residents. We expect the company’s core earnings to grow at a 2019–24e CAGR of c14%, driven by (i) leased station additions as independent private fuel station owners fail to comply with MOMRA regulations to operation gas stations, leading them to lease their stations to approved companies such as SASCO, (ii) an increased fuel retail margin, which came into effect on February 2020, and (iii) maintaining higher-margin operations such as transportation, where average historical GPM recorded 30%.
Valuation methodology and risks
We have a Buy rating on SASCO with a FV estimate of SAR31/share using a SOTP methodology with a 5-year DCF, discounted at a WACC of 5.8%, and a terminal growth rate of 2% for each of the fuel segment (89% of value) and the transportation and other segments (11%). Key downside risks to our forecasts include (i) escalating lease expenses of gasoline stations amid less frequent margin revisions by the kingdom, (ii) changes in consumption patterns in case of a prolonged quarantine measures amid the COVID-19 outbreak, and (iii) competition within the gasoline retailer industry.
Financial statement | FY end December (SARmn)
Income statement 2019a 2020e 2021e 2022e
Total revenue 2,483 2,491 3,045 3,477
Operating costs (2,211) (2,235) (2,739) (3,132)
Gross profit 272 255 306 344
SG&A expenses (55) (55) (67) (77)
EBITDA 217 201 239 268
Depreciation and amortization (115) (131) (136) (145)
Operating profit 102 70 103 123
Net financing income/(cost) (33) (8) (7) (7)
Income from investments 22 22 22 22
Other income/(expense) 34 - - -
EBT 125 83 118 139
Income taxes (3) (1) (2) (3)
NPAT 122 82 116 136
Appropriations - - - -
Net attributable income 122 82 116 136
Core net attributable income* 65 35 66 84
Balance sheet 2019a 2020e 2021e 2022e
Cash and equivalents 65 50 64 123
Accounts receivables 102 103 126 143
Inventory 49 50 61 70
Advance Payments 172 164 192 219
Other assets 0 0 0 0
Total current assets 389 367 443 556
Fixed assets 1,097 1,094 1,091 1,090
Investments 185 185 185 185
Projects Under Consutrction 61 61 61 61
Present value of Rights of Use Asset 720 733 780 824
Other non-current assets 10 10 10 10
Total non-current assets 2,072 2,081 2,127 2,169
Total Assets 2,461 2,448 2,570 2,725
Banks Short Term Borrowings 105 105 129 147
CPLTD 88 88 50 50
CPLTD of Lease Liability 53 53 53 53
Account payables 45 51 70 88
Creditors and other credit balances 231 232 279 314
Total current liabilities 523 530 580 652
Long Term Debt 388 300 250 200
Lease Liability 684 721 795 871
Provision for End of Service Benefits 15 15 15 15
Total non-current liabilities 1,087 1,036 1,060 1,085
Paid-in Capital 600 600 600 600
Reserves 56 56 56 56
Unrealized Gain on Investments 127 127 127 127
Retained Earnings 69 100 148 205
Total equity 851 882 930 987
Total liabilities and equity 2,461 2,448 2,570 2,725
Cash flow 2019a 2020e 2021e 2022e
Cash flow from operations 232 200 228 250
Cash flow from investing (57) (50) (54) (58)
Cash flow from financing (91) (167) (158) (133)
Change in cash 84 (16) 16 59
Main Ratios 2019a 2020e 2021e 2022e Per-share data
EPS (SAR)* 1.1 0.6 1.1 1.4
BVPS (SAR) 14.2 14.7 15.5 16.4
DPS (SAR) 0.5 0.4 0.7 0.8
EV (SAR) 46.3 45.7 45.6 45.4
Valuation data
Share Price 25.8 25.8 25 .8 25.8
P/E (x)* 23.3 44.2 23.4 18.4
P/BV (x) 1.8 1.8 1.7 1.6
Dividend yield 2.0% 1.7% 2.6% 3.2%
FCF yield 15.2% 9.8% 11.2% 12.5%
EV/EBITDA (x) 12.8 13.8 11.6 10.2
Growth (y-o-y)
Revenue 20.8% 0.3% 22.3% 14.2%
EBITDA 163.7% -7.7% 19.1% 12.2%
Earnings 243.6% -32.7% 41.0% 17.5%
Recurring earnings* 144.0% -46.5% 89.2% 26.9%
Profitability
Gross profit margin (GPM) 11.0% 10.3% 10.0% 9.9%
EBITDA margin 8.8% 8.1% 7.8% 7.7%
EBIT margin 4.1% 2.8% 3.4% 3.5%
Net profit margin (NPM) 2.6% 1.4% 2.2% 2.4%
ROAA* 3.2% 1.4% 2.6% 3.2%
ROAE* 8.2% 4.0% 7.3% 8.8%
ROAIC* 3.8% 1.6% 3.0% 3.8%
Leverage
Net debt/equity 1.5 1.4 1.3 1.2
Net debt/EBITDA 5.8 6.1 5.1 4.5
* based on core attributable net income (excluding one-offs and volatile items)Source: Company, Beltone estimates

20
4 May 2020SASCOI. Valuation
We have a Buy rating on SASCO with a FV estimate of SAR31/share using a SOTP methodology, where each of the fuel (FV:SAR28) and the non-fuel segments (FV:SAR3) are valued separately using a DCF model. We utilize a WACC of 5.8% and a cost of equity of 6.6% derived from (i) a risk free rate of 2.9% derived from a 7-year sovereign sukuk yield after zakat, (ii) equity market risk premium (ERP) of 6.20%, and (iii) beta of 0.6. Our WACC calculations are based on a 55% weight of equity and 45% weight of debt and lease after accounting for IFRS 16 accounting standards. We also use a terminal growth rate of 2%.
Figure 1: SOTP DCF valuation for SASCO
DCF (SAR mn) 2020e 2021e 2022e 2023e 2024e
1. Fuel
NOPAT 63 96 115 134 162
Depreciation and amortization 114 117 124 132 139
CAPEX (34) (37) (39) (42) (46)
Change in working capital 13 3 0 (4) 1
Increase in capital lease assets (91) (127) (128) (134) (138)
FCFF 65 52 71 86 118
Terminal value 3,128
PV of FCFF 62 47 61 70 91
Sum of PV of FCFF 332
PV of terminal value 2,405
EV 2,737
Net debt(cash) (based on 31 Dec19) 1,061
Equity value of fuel segment 1,676
FV/share, SAR 28 89% of FV
2. Non-fuel segment
NOPLAT 6 5 6 7 7
Depreciation and amortization 17 19 20 22 24
CAPEX (16) (17) (19) (21) (23)
Change in working capital 1 0 0 (0) 0
FCFF 8 7 7 8 9
Terminal value 227
PV of FCFF 7 6 6 6 7
Sum of PV of FCFF 33
PV of terminal value 174
EV 207
Net debt(cash) (based on 31 Dec19) 7
Equity value of non-fuel segment 200
FV/share, SAR 3 11% of FV
Total equity value 1,876
Shares outstanding, mn 60
SOTP value per share, SAR 31
Figure 2: Sensitivity of our FV to changes in the cost of equity and terminal growth rate
Perp
etu
al g
row
th
Cost of equity
5% 6% 7% 8% 9%
0% 22 19 16 14 12
1% 32 26 22 19 16
2% 48 38 31 26 22
3% 84 61 47 37 31
4% 213 118 79 58 45
Source: Beltone estimates
21
4 May 2020SASCO
II. Operations overview
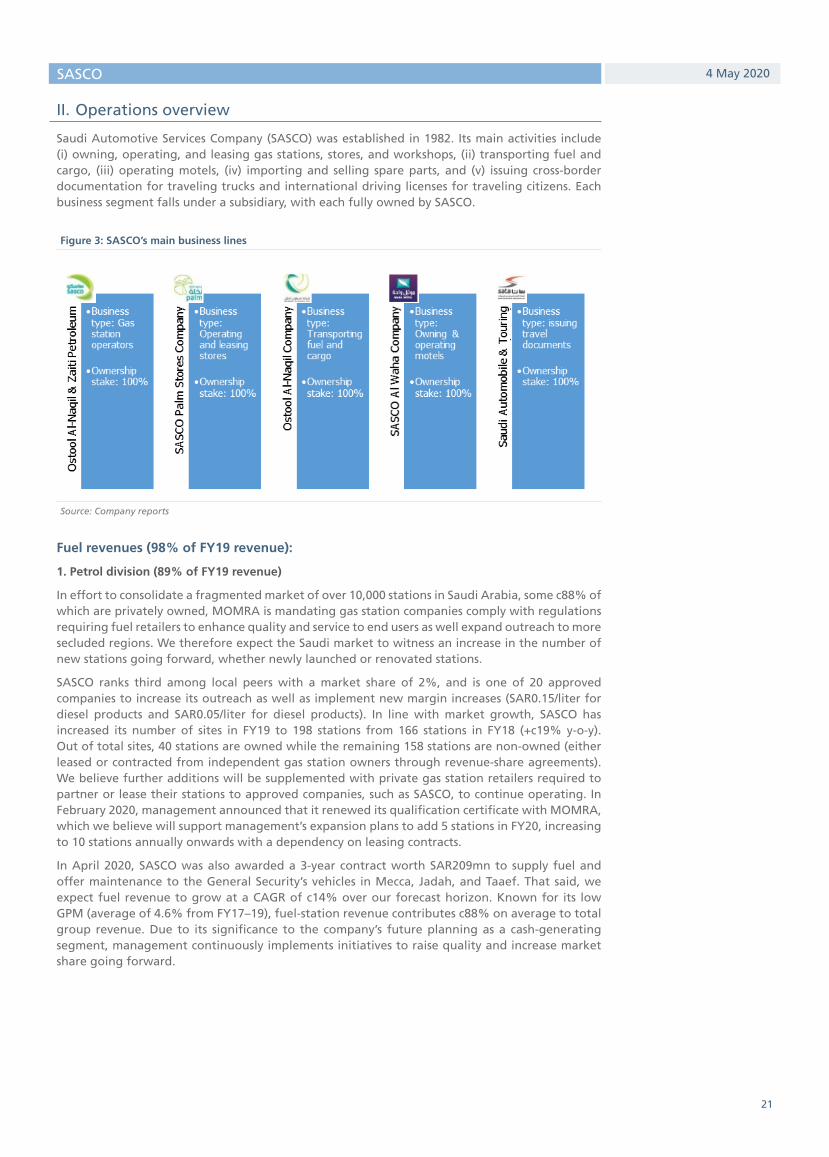
Saudi Automotive Services Company (SASCO) was established in 1982. Its main activities include (i) owning, operating, and leasing gas stations, stores, and workshops, (ii) transporting fuel and cargo, (iii) operating motels, (iv) importing and selling spare parts, and (v) issuing cross-border documentation for traveling trucks and international driving licenses for traveling citizens. Each business segment falls under a subsidiary, with each fully owned by SASCO.
Figure 3: SASCO’s main business lines
Source: Company reports
Fuel revenues (98% of FY19 revenue):
1. Petrol division (89% of FY19 revenue)
In effort to consolidate a fragmented market of over 10,000 stations in Saudi Arabia, some c88% of which are privately owned, MOMRA is mandating gas station companies comply with regulations requiring fuel retailers to enhance quality and service to end users as well expand outreach to more secluded regions. We therefore expect the Saudi market to witness an increase in the number of new stations going forward, whether newly launched or renovated stations.
SASCO ranks third among local peers with a market share of 2%, and is one of 20 approved companies to increase its outreach as well as implement new margin increases (SAR0.15/liter for diesel products and SAR0.05/liter for diesel products). In line with market growth, SASCO has increased its number of sites in FY19 to 198 stations from 166 stations in FY18 (+c19% y-o-y). Out of total sites, 40 stations are owned while the remaining 158 stations are non-owned (either leased or contracted from independent gas station owners through revenue-share agreements). We believe further additions will be supplemented with private gas station retailers required to partner or lease their stations to approved companies, such as SASCO, to continue operating. In February 2020, management announced that it renewed its qualification certificate with MOMRA, which we believe will support management’s expansion plans to add 5 stations in FY20, increasing to 10 stations annually onwards with a dependency on leasing contracts.
In April 2020, SASCO was also awarded a 3-year contract worth SAR209mn to supply fuel and offer maintenance to the General Security’s vehicles in Mecca, Jadah, and Taaef. That said, we expect fuel revenue to grow at a CAGR of c14% over our forecast horizon. Known for its low GPM (average of 4.6% from FY17–19), fuel-station revenue contributes c88% on average to total group revenue. Due to its significance to the company’s future planning as a cash-generating segment, management continuously implements initiatives to raise quality and increase market share going forward.

22
4 May 2020SASCO
2. Stores (9% of revenue)
SASCO also operates convenience stores under the SASCO Palm Stores (SPS) brand to serve customers while fueling their vehicles or waiting for maintenance work to be completed. To expand its reach, management also operates SPS outside gas station perimeters to act as a mini-supermarket for out-of-reach areas in the kingdom. As of the end of FY19, management increased the number of stores to 80 from 69 in FY18 (+c16% y-o-y), which has resulted in retail space increasing c6% y-o-y. In addition, the client basket grew from SAR21.04/customer in FY18 to SAR22.42/customer (+6.6% y-o-y) in FY19. Accordingly, revenue/sqm increased from SAR15,300 in FY18 to SAR47,600 in FY19. We project additional stores to be launched in the coming periods supported by the government’s efforts to enhance quality and service of gas stations as well expand scope to more secluded regions, especially on highway roads. Second in line regarding revenue contribution, SPS contributes 10.6% on average to total group revenue, with GPM recording an average of 5.2% from FY17–19.
Transportation and other revenue (2% of revenue):
1. Transportation segment (1.2% of FY19 revenue)
SASCO’s highest margin contributor, Ostool Al-Naqil Company, offers fuel, water, and sewage transportation services to its own sites as well as serving retail and distribution businesses with fuel and cargo. With the majority of the segment’s workforce being expatriate workers, the growth in liters transported dropped to single digits (+c8% y-o-y) in FY18 compared to c33% on average from FY14 to FY17. Management attributed the fall to lack of visa approvals in 2017 and 2018 as part of efforts to increase Saudi employment. However, due to increased demand for transportation services, showcased by SASCO’s transportation units surpassing 15mn km in FY19 versus 14mn km in FY18 (+7.1% y-o-y), and return of entry visas for non-saudis in 2019, SASCO accumulated over 127 trucks (+c18% y-o-y) and 143 trailers (+c8% y-o-y) by 2019. With a CAPEX plan of 30 additional units per year (with an average cost of SAR285,000/ truck and SAR205,000/trailer), we believe trucks and trailers owned will reach 205 and 215, respectively, by FY24e, growing at a CAGR of 9.2% over our forecast horizon. As a result, we project revenue per unit to reach SAR231,000 by FY24e versus SAR212,000 in FY19, with GPM maintained at 26% on average as management has yet to announce any new contracts in the previous 2 years.
2. Hospitality (0.2% of FY19 revenue)
The Saudi government launched its new tourism program that includes permitting tourist visas to over 49 nationalities, marking a major shift from initially granting visas to exclusively to pilgrims, businesspersons, and expatriate workers. This comes in an effort to diversify the kingdom’s economy, which is heavily reliant on crude oil, targeting to increase tourism revenue to 10% of GDP from current levels of 3%. This is supported by the Saudi Vision 2030 program, which entails the establishment of 144 new hotels and 56,106 rooms by 2021 and amassing 100mn annual visits by 2030. To coincide with its strategy to serve travellers, SASCO established Al-Waha Company to manage and operate 9 motels (Waha Motels), along with its sole hotel under the brand name of Super8. Al Waha Company’s revenue growth of c40% y-o-y in FY19 as well as Super8 recording an occupancy rate of c92% by the end of FY19 suggests substantial development awaits in the coming period (par the impact of COVID-19), in our view. This coincides with Smith Travel Research’s (STR), a leading provider of global hospitality sectors analytics, latest findings on Saudi hotels located in Jeddah and Riyadh as illustrated below:
Figure 4: Increased interest in Saudi hospitality market
Indicators Jeddah (as of Jan20) Riyadh (as of Oct19)
Supply +3.9% y-o-y +15.2% y-o-y
Demand +36.4% y-o-y +34.7% y-o-y
Revenue per available room (RevPAR) +19.6% y-o-y +25.8% y-o-y
Occupancy Rate63.7%
(up from 32.4% in Jan19)
76.2%
(up from 59.2% in Oct18)
Source: Smith Travel Research

23
Saudi Arabian Gasoline Retailers 4 May 2020
To profit from the increased interest in hotels, the company’s management has shifted its focus to adding new hotels (bigger premises) versus motels (smaller premises). Accordingly, SASCO plans to establish a new 100-bed Super8 hotel (expected to be finalized by 2021). As a result, Al-Waha Company will record improved revenue as the number of beds/rooms increase as well as higher room rates recorded in Saudi Arabia. On the other hand, the government’s announcement of a total lockdown due to the spread of COVID-19 will result in decreased occupancy rates in FY20 due to mass pilgrimage cancellations and continued travel restrictions, in our view. We believe both hotel and motel operations will recover by mid-FY21e to demonstrate higher occupancy rates, along with increased capacities for hotels as mentioned before.
3. Saudi Automobile & Touring Association (SATA) (0.2% of FY19 revenue)
SATA was established to offer customs documents for vehicles departing from Saudi Arabia. To operate under international standards, SATA signed an agreement with the General Authority of Customs in October 2018 to operate under the TIR (Transports Internationaux Routiers) system, which is a universal customs transit system that permits ease of import delivery across road borders. In February 2020, SASCO announced that it had extended its customer base to other notable ports to include Al Batha, Al Khafji, Al Reqai, Hadithah, Halat Ammar, Jeddah Islamic, King Abdulaziz in Dammam, Duba and Riyadh Dry Port. Additionally, SASCO issues international driving permits for traveling residents through its operating outlets. Despite efforts to broaden its base, SATA’s contribution to group revenue continues to be retained at 0.6% from 2018–19 due to (i) political restrictions with neighboring countries such as Yemen and (ii) increased competition from peer clubs. We believe SATA’s marginal contribution will continue to be recorded in FY20e and FY21e as a result of (i) continued unrest from the Yemeni civil war and (ii) the recent COVID-19 outbreak, potentially halting residents’ plan to travel abroad as well as leading to higher imposed restrictions on custom screenings.

24
Saudi Arabian Gasoline Retailers 4 May 2020
Figure 5: Revenue expected to grow at a 2019–24 CAGR of c14%
Figure 6: Gross profit to grow at a 2019–24 CAGR of c12%
2,483 2,503 3,061
3,496 4,024
4,699
-
1,000
2,000
3,000
4,000
5,000
-
1,000
2,000
3,000
4,000
5,000
2019
2020
e
2021
e
2022
e
2023
e
2024
e
Fuel Revenue (SAR mn) Non-fuel Revenue (SAR mn)Total (SAR mn)
6.3%
5.0%5.6% 5.7% 5.8% 5.9%
0%1%2%3%4%5%6%7%
- 50
100 150 200 250 300
2019
2020
e
2021
e
2022
e
2023
e
2024
e
Non-fuel Gross Profit (SAR mn) Fuel Gross Profit (SAR mn)Gross Profit Margin
Source: Company disclosure, Beltone estimates Source: Company disclosure, Beltone estimates
Figure 7: Volumes breakdown Figure 8: Rental income to offset mounting cost/liter
- 1,000 2,000 3,000
2019
2020e
2021e
2022e
2023e
2024e
Octane 91 Volume (liters mn) Octane 95 (liters mn)Diesel (liters mn)
- 0.05 0.10 0.15 0.20 0.25 0.30 0.35 0.40
Reve
nue
Cost
Reve
nue
Cost
Reve
nue
Cost
Reve
nue
Cost
Reve
nue
Cost
Reve
nue
Cost
Reve
nue
Cost
2018 2019 2020e 2021e 2022e 2023e 2024e
Rental Income (SAR/ Liter)Weighed average Margin per liter of octane (SAR /Liter)
Source: Company disclosure, Beltone estimates Source: Company disclosure, Beltone estimates
Figure 9: Transportation revenue to grow in line with 30 annual vehicle additions
Figure 10: Stable working capital over our forecast horizon (days)
270300
330360
390420
050100150200250300350400450
0
10
20
30
40
50
60
2019 2020e 2021e 2022e 2023e 2024e
Transportation Revenue (SAR mn) Total Trucks & Trailers
(60)
(40)
(20)
-
20
40
60
2018 2019 2020e 2021e 2022e 2023e 2024e
A/R Inventory other Current Assets A/P A/Expenses
Source: Company disclosure, Beltone estimates Source: Company disclosure, Beltone estimates

DisclaimerImportant Notice and Disclosures
1. Author, Regulator and Responsibility This document has been issued by Beltone Securities Brokerage S.A.E (“Beltone”) which is incorporated in the Arab Republic of Egypt (“Egypt”) and authorized and regulated by the Financial Regulatory Authority (“FRA”) to carry on financial services in and from the Egyptian Exchange (“EGX”). Beltone Financial Holding, or any of its subsidiaries or officers (other than the authors of this report) may have a financial interest in one or any of the securities that are the subject of this report. Funds managed by Beltone Holding and its subsidiaries (together and separately, “Beltone”) for third parties may own the securities that are the subject of this report. Beltone may own shares in one or more of the aforementioned funds, or in funds managed by third parties. The author(s) of this report may own shares in funds open to the public that invest in the securities mentioned in this report as part of a diversified portfolio, over which the author(s) has/have no discretion. The Investment Banking division of Beltone may be in the process of soliciting or executing fee-earning mandates for companies (or affiliates of companies) that are either the subject of this report or are mentioned in this report. Research reports issued by Beltone are prepared and issued in accordance with the requirements of the local exchange conduct of business rules, where the stock is primarily listed.
2. Analyst Certification We,Ingy El-Diwany, CFA and Mohamed Hamza in our capacity as the authors, hereby certify that the views expressed in this document accurately reflect our personal views about the securities and companies that are the subject of this report. We also certify that neither we nor our spouse(s) or dependents (if relevant) hold a beneficial interest in the securities that are subject of this report. We also certify that no part of our respective compensations, was, is, or will be directly or indirectly related to the specific ratings or view expressed in this research report.
3. PurposeThis document is provided for informational purposes only and has been produced by marketing personnel for marketing purposes to professional investors. It does not constitute independent research and nothing should be construed as a solicitation or offer, or recommendation to acquire or dispose of any investment or to engage in any other transaction or, to provide any investment advice or service whether investment related, legal, tax or other guidance.
4. SuitabilityThe general capabilities of Beltone and investment related information may be disclosed in this document, but nothing should be construed as client specific advice and no account has been taken of the investment objectives, preferences, risk tolerances, finances or other needs of any particular person. In regulatory terms, client specific advice has therefore not been provided and no suitability obligations are owed to any person. Investors should, before relying and/or acting on this document, independently evaluate any investments and strategies referred to herein and make their own determination as to whether they are appropriate or suitable in light of their own financial circumstances, objectives and other matters important to them.
5. Accuracy of InformationThe information contained in this document is based on current trade, statistical and other public information we consider reliable. Any statements that are not historical facts are forward-looking statements. Forward-looking statements are based on current expectations, estimates and projections, and rely on beliefs and assumptions. They are not guarantees of future performance and involve certain risks, uncertainties and assumptions which are difficult to predict. Therefore, actual outcomes and returns may differ materially from what is expressed or forecasted in such forward-looking statements. Any pricing is indicative and does not, and is not intended to, constitute an offer to buy or sell or a representation that a purchase or sale can be executed at that price. Past performance is not indicative of future results. Any mention of market rumours has been derived from the markets and is not purported to be fact or reflect our opinions. Beltone has no obligation to update, modify or amend this document or to otherwise notify a recipient thereof in the event that any opinion, forecast or estimate set forth herein, changes or subsequently becomes inaccurate. Beltone does not represent or warrant that such information is accurate or complete and it should not be relied upon as such.
6. ValidityAll opinions and estimates included in this report constitute our judgment as of this date and are subject to change without prior notice. Readers should understand that fair values, financial projections, all value and price estimates, and statements regarding future prospects may not be realized throughout the three-month validity of this issuance. Beltone has no obligation to update, modify, or amend this report or to otherwise notify a recipient thereof if any opinion, forecast, or estimate contained herein changes or subsequently becomes inaccurate. Coverage and the frequency of changes in market conditions and in both general and company specific economic prospects make it difficult to update research at defined intervals. Updates are at the sole discretion of Beltone and as such the majority of reports are published at irregular intervals.
7. Recipients and Sales and Marketing RestrictionsThis document is addressed to and/or directed at Professional Clients and not Retail Clients as defined in Beltone rules. Any investments or financial products referred to herein will only be made available to clients, who qualifies as Professional Clients, as per Beltone’s discretion. Any other persons in receipt of this document must not rely upon or otherwise act upon it. This document is only being distributed to investors who meet certain qualifications and to whom an investment or service may be offered or promoted in accordance with relevant country restrictions. This excludes the US except for SEC registered broker-dealers (or banks in permissable”broker” or “dealer” capacity) acting on a principal or agency capacity, and major US institutional investors in accordance with SEC Rules 15a-6(a)(2). In reliance on the exemption from registration provided by Rule 15a-6 of the Exchange Act and interpretations thereof by the SEC in order to conduct certain business with Major Institutional Investors, Beltone has entered into an agreement with a U.S. registered broker-dealer, Auerbach Grayson and Company LLC (“Auerbach Grayson”). Transactions in securities discussed in this research report should be effected through Auerbach Grayson or another U.S. registered broker dealer. Particularly to EU investors, the content of this promotion has not been approved by an authorized person within the meaning of the Markets in Financial Instruments Directive 2004. In relation to UK investors in particular, the content of this promotion has not been approved by an authorized person within the meaning of the Financial Services and Markets Act 2000. Reliance on this promotion for the purpose of engaging in any investment activity may expose an individual to a significant risk of losing all of the property or other assets invested. Recipients of this document shall thoroughly review, study and apply such restrictions and should not rely upon or otherwise act upon this document where it is unlawful to make to such person such an offer or invitation or recommendation without compliance with any authorisation, registration or other legal requirements.
8. Foreign Collective Investment Funds (“FCIFs”)Any foreign collective investment funds (as stipulated in Beltone’s rules) mentioned herein is not subject to any form of regulation or approval by the FRA. The FRA has no responsibility for reviewing or verifying any document or other documents in connection with FCIFs. Accordingly, the FRA has not approved any information about FCIFs or any other associated documents nor taken any steps to verify the information set out in this document, and has no responsibility for it. Any FCIFs mentioned herein may be illiquid and/or subject to restrictions on their resale. Prospective purchasers of any FCIF units, mentioned in this document, should conduct their own due diligence on the FCIF.
9. Risk WarningsAny prices, valuations or forecasts are indicative and are not intended to predict actual results, which may differ substantially from those reflected. The value of an investment may go up as well as down. The value of and income from any investment may fluctuate from day to day as a result of changes in relevant economic markets (including, without limitation, foreseeable or unforeseeable changes in interest rates, foreign exchange rates, default rates, prepayment rates, political or financial conditions, etc.). Past performance is not indicative of future results. Any opinions, estimates, valuations or projections (target prices and ratings in particular) are inherently imprecise and a matter of judgement. They are statements of opinion and not of fact, based on current expectations, estimates and projections, and rely on beliefs and assumptions. Actual outcomes and returns may differ materially from what is expressed or forecasted. There are no guarantees of future performance. Certain transactions, including those involving futures, options, and other derivatives, give rise to substantial risk and are not suitable for all investors. This document does not propose to identify or to suggest all of the risks (direct or indirect) which may be associated with the investments and strategies referred to herein.
10. Conflicts InterestBeltone, or any of its subsidiaries, does and seeks to do business with companies mentioned in its research reports or any of their affiliates. As a result, investors should be aware that the firm, or any of its subsidiaries, may have a material conflict of interest that could affect the objectivity of this report.Beltone provides non-banking financial services and its directors, officers and employees, may take positions which conflict with the views expressed in this document. Our salespeople, traders, and other professionals may provide oral or written market commentary or trading strategies to our clients and our proprietary trading desks that reflect opinions that are contrary to the opinions expressed in this document.
11. No Warranty Beltone makes no representations or warranties and, to the fullest extent permitted by applicable law, we hereby expressly disclaim any and all express, implied and statutory representations and warranties of any kind, including, without limitation, any warranty as to accuracy, timeliness, completeness, merchantability, and fitness for a particular purpose and/or non-infringement.
12. No LiabilityBeltone shall not be liable in any event including (without limitation) negligence for any damages or loss of any kind, including (without limitation) direct, indirect, incidental, special or consequential damages, expenses or losses arising out of, or in connection with your use or inability to use this document, or in connection with any error, omission, defect, computer virus or system failure, or loss of any profit, goodwill or reputation, even if expressly advised of the possibility of such loss or damages, arising out of or in connection with your use of this document.
13. Copyright and ConfidentialityThe entire content of this document is subject to copyright with all rights reserved and the information is private and confidential for your own personal use only. This document and the information contained herein may not be reproduced, distributed or transmitted to any other person or incorporated in any way into another document or other material without our prior written consent.
14. Governing LawEgyptian law governs this document and these disclaimers and any dispute in relation thereto shall be exclusively referred to the Egyptian Courts.
15. ContactsBeltone, Head Quarter, Nile City Towers, North Tower, 33rd Floor, Corniche El-Nil 2005 A, Cairo, Egypt | 11221, [email protected]://www.beltonefinancial.comAuerbach Grayson and Company LLC, Head Quarter, 25 West 45th Street, New York, NY 10036, USA, [email protected]://www.agco.com
Sales and TradingInstitutional Sales TeamWafik Dawood
Mohamed Waked
Institutional Trading TeamNadin Mustafa
Tamer Salama
Wagih Sharaf
Rating systemBeltone financial research is based on fundamental analyses of companies and their associated sectors, and the local/economic environment they are exposed to.
Our rating system is based on a 12-month expected return to our Fair Value (FV) estimate. Please find below our rating scale in percentage terms:
Rating Market price upside / (downside) potential to our FV (%)
Buy Above 20%
Hold Between (10%) and 20%
Sell Below (10%)
Beltone financial Research’s policy is to maintain up-to-date research reports based on fundamental changes. However, in special cases, the return on our FV may vary from the rating according to the above criteria, due to share price volatility. Despite this discrepancy, analysts may not necessarily update their rating until this movement is sustained over a period of at least 30 days. In such cases, analysts will disclose their outlook and explain their rationale to Beltone financial clients.
Beltone Financial2005C Nile City Towers
North Tower, 33rd floor
Cairo 11221, Egypt
Tel.: +202 24616300
Fax: +202 24619848