Livestock manure treatment for nutrients removal - AIR Unimi
222
Livestock manure treatment for nutrients removal: consolidated techniques, emerging problems and new approaches CATTANEO Martina (R11379) PhD Thesis Tutor: Prof. Giorgio Provolo PhD course coordinator: Prof. Nicola Saino PhD in Environmental Sciences XXXI° Cycle Academic year: 2017-2018
-
Upload
khangminh22 -
Category
Documents
-
view
0 -
download
0
Transcript of Livestock manure treatment for nutrients removal - AIR Unimi

Livestock manure treatment for nutrients removal: consolidated
techniques, emerging problems and new approaches
CATTANEO Martina
(R11379)
PhD Thesis
Tutor: Prof. Giorgio Provolo
PhD course coordinator: Prof. Nicola Saino
PhD in Environmental Sciences
XXXI° Cycle
Academic year: 2017-2018


Per te nonna Rina,
ti penso sempre.


Abstract
Intensive farming practices and their continuous spread
generate a large amount of livestock manure that cannot be disposed
properly. This can cause water, air and soil contamination. Therefore, the
identification of strategies for correct management of livestock manure is
necessary for limiting environmental pollution.
Nitrification/denitrification process (NDN) represents one of the
most applied solutions. However, at real scale, many of those facilities that
adopt this process suffer from managing issues and malfunctioning.
Recently, alternative techniques have been applied to the
recovery of nutrients along with their removal. An example is solid/liquid
separation using chemicals to remove phosphorus and concentrate it into
solid fraction, easier to handle.
Other concerns are ammonia and greenhouse gases emissions
derived from the management and the treatment of livestock manure. Their
assessment is the first step to identify and apply proper mitigation strategies
focused on limiting emissions.
In this thesis, the application of biological processes for the
removal of nitrogen from livestock manure was investigated to find possible
improvements.
First, a review of the state of the art of nitrification/denitrification process
applied in the sequencing batch reactor system (SBR) to livestock manure
was carried out to produce an overview on the SBR technology, monitoring
parameters and process optimization. This can help the identification of SBR
strengths and weaknesses when these systems are adopted for the livestock
manure treatment and can support the definition of the best operation
settings to adopt for reaching desired removal rates.
Several treatment plants were monitored to attest operational and removal
efficiencies achieved. The aim of these monitoring campaigns was the
identification of possible improvements for NDN
(nitrification/denitrification) plants.
Eventually, the application of the NDN process in laboratory SBR systems
was analysed to study how the nitrogen removal rate changes with the

variation of the slurry inlet characteristics and of the applied operational
settings.
Concerning emissions, the use of different types of dynamic
hoods and static chamber for estimating GHGs and NH3 emissions derived
from livestock manure was investigated.
Regarding recovery of phosphorus (P), the dissertation dealt
with the evaluation of the effect of two additives (calcium hydroxide
Ca(OH)2 and aluminium sulfate Al2(SO4)3) on the solid/liquid separation
process of P, Copper and Zinc from raw slurry and co-digested slurry before
and after a physico-chemical ammonia stripping treatment.
The results outlined that the performance of monitored SBR
treatment plants at real scale are less than expected. Rarely TAN removal
exceeds 50% even if at lab-scale observed removal rates were higher (up to
95%).
Pre-treatments are necessary to improve performance of treatment plants.
Moreover, the upgrading of proper process control system and its correct
use are required.
These should be considered also if a new SBR is designed.
Ammonia and GHGs emissions occur during the entire livestock
manure management chain and their evaluation is possible applying the
direct method. In particular, dynamic hoods can be useful tool for
measuring site-specific NH3 and GHGs emissions except for CH4.
The application of solid/liquid separation process for phosphorus
removal using aluminium sulphate allowed to reach removal rates higher
than 70%. This additive enhanced also the removal of suspended solids
(58%), copper (up to 94%) and zinc (up to 93%).

7
Index
Index _________________________________________________________________________________________ 7
Index of Figures _______________________________________________________________________________ 11
Index of Tables ________________________________________________________________________________ 15
SECTION 1 - INTRODUCTION AND BACKGROUND ______________________________________ 19
1. The management of animal slurry for environmental sustainability _________________________________ 19
1.1. The central role of nitrogen in agriculture __________________________________________________ 20
1.2. Environmental issues related to livestock manure ____________________________________________ 22
1.3. Main legislation concerning the prevention of environmental pollution caused by the management of
livestock manure ____________________________________________________________________________ 27
1.3.1. European Directives _______________________________________________________________ 27
1.3.2. Italian regulations _________________________________________________________________ 30
1.4. Existing treatments for nutrients reduction and removal from livestock manure ____________________ 31
1.4.1. Solid-liquid separation treatments ____________________________________________________ 33
1.4.2. Other physico-chemical treatments ___________________________________________________ 35
1.4.3. Biological treatments ______________________________________________________________ 37
1.5. References ___________________________________________________________________________ 39
2. Motivation and goals of this dissertation _______________________________________________________ 43
SECTION 2 - BIOLOGICAL TREATMENT FOR NITROGEN REMOVAL FROM LIVESTOCK MANURE:
PROCESS OPTIMIZATION AND ENVIRONMENTAL SUSTAINABILITY _________________________ 47
3. Sequencing Batch Reactor for nutrients removal from livestock manure: a review _____________________ 47
3.1. Introduction _________________________________________________________________________ 47
3.2. Sequencing Batch Reactor: general aspects _________________________________________________ 49
3.2.1. SBR main sizing project parameters ___________________________________________________ 51
3.3. Nitrogen biological removal applied in SBR _________________________________________________ 53
3.4. Characterization of raw animal slurries ____________________________________________________ 55
3.5. Typical SBRs control parameters __________________________________________________________ 59
3.6. Operational strategies of SBRs applied to livestock manure for nitrogen and phosphorus removal ______ 65
3.7. Discussion and observations _____________________________________________________________ 77

8
3.8. References ___________________________________________________________________________ 78
4. Monitoring of real scale treatment plants for nitrogen removal and for the enhancement of effluents _____ 85
4.1. Description of different plants ___________________________________________________________ 85
4.1.1. Plant TP _________________________________________________________________________ 85
4.1.2. Plant TO ________________________________________________________________________ 89
4.1.3. Plant NA ________________________________________________________________________ 91
4.1.4. Plant VA ________________________________________________________________________ 94
4.1.5. Plant RR ________________________________________________________________________ 95
4.2. Materials and methods _________________________________________________________________ 97
4.2.1. Monitoring plan for all treatment plants _______________________________________________ 97
4.2.2. Analytical methods ________________________________________________________________ 97
4.3. Results of monitoring campaigns _________________________________________________________ 98
4.3.1. Plant TP _________________________________________________________________________ 98
4.3.2. Plant TO _______________________________________________________________________ 103
4.3.3. Plant NA _______________________________________________________________________ 109
4.3.4. Plant VA _______________________________________________________________________ 112
4.3.5. Plant RR _______________________________________________________________________ 114
4.4. Treatment plants’ evaluation and possible improvements_____________________________________ 118
4.5. References __________________________________________________________________________ 120
5. Biological process for nitrogen removal in SBR applied at laboratory scale ___________________________ 121
5.1. Aim of the experiments ________________________________________________________________ 121
5.2. Materials and methods ________________________________________________________________ 122
5.2.1. Laboratory-scale prototypes construction and operation _________________________________ 122
5.2.2. Experimental plan ________________________________________________________________ 127
5.2.3. Analytical methods _______________________________________________________________ 129
5.3. Test 1 and Test 2 (influence of nitrogen loading rate and slurry characteristics on the nitrogen removal
efficiency) _________________________________________________________________________________ 129
5.3.1. Livestock manure characteristics ____________________________________________________ 131
5.3.2. Experiments’ results: Test 1 ________________________________________________________ 132
5.3.3. Experiments’ results: Test 2 ________________________________________________________ 140
5.4. Test 3 and Test 4 (influence of operational parameters on removal efficiency) ____________________ 148
5.4.1. Livestock manure and activated sludge characteristics ___________________________________ 148
5.4.2. Experiments’ results: Test 3 ________________________________________________________ 149
5.4.3. Experiments’ results: Test 4 ________________________________________________________ 158
5.5. General final observation ______________________________________________________________ 160
5.5.1. Test 1 and Test 2 _________________________________________________________________ 160
5.5.2. Test 3 and Test 4 _________________________________________________________________ 161

9
5.6. References __________________________________________________________________________ 162
SECTION 3 - LIVESTOCK MANURE TREATMENT: THE PROBLEM OF AMMONIA AND GREENHOUSE
GASES EMISSIONS AND THEIR EVALUATION _________________________________________ 165
6. Assessing NH3 and GHG emissions from livestock manure storage: comparison of measurements with dynamic
and static chambers ___________________________________________________________________________ 165
6.1. Introduction ________________________________________________________________________ 165
6.2. Materials and methods ________________________________________________________________ 168
6.2.1. Experiments set-up _______________________________________________________________ 168
6.2.2. Equipment used _________________________________________________________________ 170
6.2.3. Emissions sampling and calculation __________________________________________________ 172
6.2.4. Analytical methods _______________________________________________________________ 174
6.3. Results and discussion _________________________________________________________________ 175
6.3.1. Ammonia emissions from synthetic ammonia solution ___________________________________ 175
6.3.2. Ammonia and GHGs emissions from livestock manure slurries _____________________________ 178
6.4. Conclusions _________________________________________________________________________ 183
6.5. References __________________________________________________________________________ 183
SECTION 4 - PHYSICO-CHEMICAL TREATMENT FOR PHOSPHORUS RECOVERING AND REMOVAL FROM
LIVESTOCK MANURE __________________________________________________________ 187
7. Effect of additives on phosphorus, copper and zinc separation from raw and treated animal slurries _____ 187
7.1. Introduction ________________________________________________________________________ 188
7.2. Materials and methods ________________________________________________________________ 190
7.2.1. Slurries and ammonia stripping _____________________________________________________ 190
7.2.2. Determination of optimal chemical doses _____________________________________________ 191
7.2.3. Solid liquid separation test _________________________________________________________ 192
7.2.4. Analytical methods _______________________________________________________________ 192
7.2.5. Calculation and statistical analyses __________________________________________________ 192
7.3. Results and discussion _________________________________________________________________ 193
7.3.1. Slurry characteristics _____________________________________________________________ 193
7.3.2. Determination of chemical dose ____________________________________________________ 194
7.3.3. Influence of additives on physical-chemical characteristics and separation efficiency of solid,
phosphorus, copper and zinc from slurries _____________________________________________________ 196
7.4. Conclusions _________________________________________________________________________ 203
7.5. References __________________________________________________________________________ 204

10
SECTION 5 - A POSSIBLE TREATMENT LINE FOR NITROGEN REMOVAL FROM LIVESTOCK MANURE 209
8. Livestock manure treatment line for biological removal of nutrients and GHGs emissions control ________ 209
8.1. References __________________________________________________________________________ 217
GENERAL CONCLUSIONS _______________________________________________________ 219
9. Conclusions and future perspectives _________________________________________________________ 219
ACKNOWLEDGMENTS _________________________________________________________________________ 221

Index of Figures
FIGURE 1 N-CYCLE (ADAPTED FROM “ECOLOGIA COURSE”, GATTO M.; CASAGRANDE R., POLITECNICO DI MILANO). _______________ 20
FIGURE 2 MAJOR NITROGEN LOSSES DURING THE MANAGEMENT OF LIVESTOCK MANURE. IN THE LEFT-HAND SIDE DASHED BOX ARE REPORTED
DIFFERENT SUBCOMPONENTS OF AGRICULTURE PRODUCTIVE SYSTEM. IN THE RIGHT-HAND SIDE ARE REPORTED DIFFERENT POLLUTANTS
FOR EACH ENVIRONMENT COMPARTMENT. ADAPTED FROM BURTON ET AL., 2003. _________________________________ 21
FIGURE 3 GLOBAL EMISSIONS BY SOURCE. RELATIVE CONTRIBUTION OF MAIN SOURCES OF EMISSIONS FROM GLOBAL LIVESTOCK SUPPLY CHAINS.
GLEAM 2.0 - ASSESSMENT OF GREENHOUSE GAS EMISSIONS AND MITIGATION POTENTIAL. FAO, 2017 ___________________ 23
FIGURE 4 TOTAL REACTIVE N INPUT TO THE HYDROSPHERE (RIVERS AND GROUNDWATER) IN EU-27 FOR THE YEAR 2002. THE MAP SHOWS
TOTAL N R POINT SOURCES FROM SEWERAGE SYSTEMS AND DIFFUSE SOURCES FROM AGRICULTURE AND FOREST SOILS AND ATMOSPHERIC
N R DEPOSITION TO INLAND WATER SURFACES FOR A GRID AT OF 1 KM × 1 KM. THE VALUES ARE IN KG N PER TOTAL PIXEL AREA [KG
N/KM2/YR. TOTAL AREA]. THE PIE DIAGRAM AT THE RIGHT SIDE GIVES THE SPLIT OF N INPUT TO THE HYDROSPHERE [GG N/YEAR,
ROUNDED TO 10 GG N/YEAR] FOR EU27: POINT SOURCES (SEWAGE SYSTEMS) AND DIFF USE SOURCES (AGRICULTURE LEACHING, RUN-
OFF, AND FOREST SOILS). THE HISTOGRAM SHOWS THE SPLIT OF N R INPUT TO THE HYDROSPHERE [GG N/ YEAR] BY COUNTRY. BASIS:
SEWAGE SYSTEMS AND AGRICULTURE: INDICATOR DATABASE FOR EUROPEAN AGRICULTURE V1, 2009; FOREST SOILS: INTEGRATOR,
2009. LEIP ET AL., 2009. ______________________________________________________________________ 25
FIGURE 5 DIFFERENT POSSIBLE TREATMENT LINES FOR NUTRIENTS MANAGING FOR LIVESTOCK MANURE. 1: SEPARATION THROUGH SEPARATOR
(E.G. VERTICAL HELICAL SEPARATOR); 2: CENTRIFUGATION; 3: FLOTATION SYSTEM; 4: CHEMICAL PROCESS FOR P-PRECIPITATION; 5:
NITRIFICATION/DENITRIFICATION PROCESS IN A CONVENTIONAL SCHEME; 6: SEQUENCING BATCH REACTOR SYSTEM; 7: TREATMENT
USING MICROALGAE; 8: STRIPPING PROCESS. WITH “E” ARE IDENTIFY THE POTENTIAL PROBLEMS CONNECTED WITH EMISSIONS OF GHG
AND AMMONIA. _____________________________________________________________________________ 32
FIGURE 6. NITROGEN CYCLE (A) CLASSICAL N-CYCLE, (B) SHARON PROCESS, (C) NITROSOMONAS AEROBIC DENITRIFICATION OR AEROBIC DE-
AMMONIFICATION, (D) NITROSOMONAS DENITRIFICATION, (E) ANAEROBIC AMMONIUM OXIDATION AND (F) OVERALL NITROGEN WEB.
AHN 2006 ________________________________________________________________________________ 38
FIGURE 7 ORGANIZATION AND STRUCTURE OF THE DISSERTATION. _________________________________________________ 45
FIGURE 8 SCHEMATIC CONFIGURATION OF SBR OPERATION. ____________________________________________________ 50
FIGURE 9 VARIATIONS OF OXIDIZATION–REDUCTION POTENTIAL (ORP), PH AND NH4+-N, NO2
--N, NO3--N DURING ONE TYPICAL CYCLE IN
FIVE SETS;(A) SET1; (B) SET2; (C) SET3; (D) SET4;(E) SET5; NH4+-N; □ NO2
--N; NO3--N; ● ORP; — PH. NA, NON-
AERATION PHASE, A, AERATION PHASE; S&D, SETTLING AND DISCHARGING; Α, NITRATE KNEE; Β, AMMONIA VALLEY; Γ, NITROGEN BREAK
POINT. HAN ET AL., (2008). _____________________________________________________________________ 61
FIGURE 10 REMOVAL RATE OF TAN VARYING THE TEMPERATURE (DATA ELABORATION FROM OBAJA ET AL., 2003). _______________ 69
FIGURE 11 PLANT OVERVIEW WITH DIFFERENT ZONE (GOOGLE MAPS ®). ____________________________________________ 85
FIGURE 12 FLOW SCHEME OF TP PLANT. µ REPRESENTS THE THEORETICAL REMOVAL RATE. ________________________________ 86
FIGURE 13 FLOATATION SYSTEM OF PLANT TP: A) CHEMICAL DOSING, B) SUPERFICIAL CHAIN SCRAPER, C) LIQUID FRACTION OBTAINED AND D)
THE “SOLID” FRACTION OBTAINED. _________________________________________________________________ 87
FIGURE 14 A) THE RECIRCULATION APPARATUS, B) MIXING TANKS WHERE DENITRIFICATION OCCURS AND B) AERATION PHASE FOR
NITRIFICATION PROCESS. ________________________________________________________________________ 88
FIGURE 15 BLOCK SCHEME OF TO PLANT. µ REPRESENTS THE THEORETICAL REMOVAL RATE. _______________________________ 89

12
FIGURE 16 SBR TANK. IN THE FIGURE A) IT IS POSSIBLE TO SEE THE PIPE THAT CONNECT THE SBR’S OUTLET WITH A STORAGE TANK, WHERE THE
EFFLUENT IS COLLECTED AND STORED FOR FURTHER UTILIZATION. IN FIGURE B) A PARTICULAR OF INLET AND AERATION SYSTEM. ____ 90
FIGURE 17 PARTICULAR OF SBR AERATION SYSTEM VENTURI A) AND THE OVERFLOW FOR EFFLUENT’S OUTLET B). _________________ 91
FIGURE 18 OVERVIEW OF PLANT NA: 1 AND 2 ARE TWO INLET POINTS, WHERE THE SLURRY IS CHARGE AND ENTERS IN THE PLANT; 1,2: ARE
TWO INLETS POINTS; 3: STORAGE OF DIGESTATE AFTER AD PROCESS; 4: LIQUID FRACTION OF DIGESTATE; 5:SOLID FRACTION OF
DIGESTATE; 6 SBR; 7 FINAL STORAGE TANK. ___________________________________________________________ 92
FIGURE 19 BLOK SCHEME OF NA PLANT. µ REPRESENTS THE THEORETICAL REMOVAL RATE. ________________________________ 93
FIGURE 20 THE OVERVIEW OF THE PLANT VA. 1: INLET POINTS; 2: TANK FOR PRELIMINARY STORAGE; 3: LIQUID FRACTION AFTER SOLID/LIQUID
SEPARATION; 4: SOLID FRACTION; 5 SBR PLANT; 6,7,8: STORAGE TANKS. _______________________________________ 94
FIGURE 21 SCHEME OF VA PLANT. µ REPRESENTS THE THEORETICAL REMOVAL RATE. ____________________________________ 95
FIGURE 22 A) THE PRE-STORAGE TANK OF VA PLANT; B: THE SOLID/LIQUID SEPARATION SYSTEM; C: SBR TANK, DURING AERATION PHASE. _ 95
FIGURE 23 THE OVERVIEW OF THE PLANT RR. 1: INLET POINTS AND PRELIMINARY STORAGE; 2: ANAEROBIC DIGESTER; 3: S/L SEPARATION AND
ACCUMULATION; 4: SBR PLANT; 5: FINAL STORAGE TANKS._________________________________________________ 96
FIGURE 24 SCHEME OF PLANT RR. µ REPRESENTS THE THEORETICAL REMOVAL RATE. ____________________________________ 97
FIGURE 25 PATTERNS OF AMMONIA AND TKN CONTENT DURING SAMPLING CAMPAIGN FOR EACH SAMPLING POINT IN TP PLANT. _____ 101
FIGURE 26 PATTERN OF TOTAL SOLIDS CONTENT AND THE PERCENTAGE OF VOLATILE SOLIDS ON TOTAL SOLIDS, CONTENT DURING SAMPLING
CAMPAIGN FOR EACH SAMPLING POINT IN TP PLANT. ____________________________________________________ 102
FIGURE 27 THE INLET FLOW MEASURED BY PLANT’S INSTRUMENT (FLOW METER) (A), THE DO CONCENTRATION MEASURED BY ON OXYGEN
PROBE (B) AND THE REDOX REGISTERED DURING SAMPLING CAMPAIGN (C). _____________________________________ 105
FIGURE 28 PATTERN OF REDOX AND OXYGEN DETECTED DURING ONE OPERATION DAY (20/05/2017) IN TO PLANT. _____________ 106
FIGURE 29 PATH OF TAN AND TKN CONCENTRATION AND SOLIDS CONTENT DURING SAMPLING CAMPAIGN FOR EACH SAMPLING POINT IN
PLANT TO. ________________________________________________________________________________ 107
FIGURE 30 MASS BALANCE AND N (TKN) BALANCE IN MARCH FOR PLANT NA. _______________________________________ 110
FIGURE 31 MASS BALANCE AND N (TKN) BALANCE IN MARCH (A) AND APRIL (B) FOR PLANT RR.___________________________ 116
FIGURE 32 EXAMPLE OF A LOW FREQUENCY RADAR METER (SIEMENS ®) ___________________________________________ 119
FIGURE 33 AN EXAMPLE OF APPLICABLE MACHINERY FOR SOLID/LIQUID SEPARATION (PIERALISI S.P.A). _______________________ 119
FIGURE 34 DESIGN AND CONSTRUCTION PHASE OF SBR PROTOTYPES, TEST AND THE PROJECT OF BEARING STRUCTURE, THE PROJECT AND
REALIZATION OF THE TOP COVER OF SBR. ___________________________________________________________ 122
FIGURE 35 SCHEMATIZATION OF THE REACTOR AND ITS COMPONENTS (A); FUNCTIONING SYSTEM OF SIX REACTORS (B) OPERATING WITH 3
DIFFERENT INLETS. ___________________________________________________________________________ 123
FIGURE 36 AN OUTPUT WINDOW OF ACQUISITION SYSTEM ____________________________________________________ 125
FIGURE 37 PERISTALTIC PUMPS THAT WERE CHOSEN AND INSTALLED FOR FEEDING AND DISCHARGING OF SLUDGE DURING A PRELIMINARY
FUNCTIONING TEST. __________________________________________________________________________ 126
FIGURE 38 OPERATIVE SYSTEM OF SIX REACTORS AFTER THE INSTALLATION OF WEIGHT SYSTEM AND MIXING SYSTEM FOR THE INLET VESSEL
(INDICATED WITH YELLOW ARROWS). ______________________________________________________________ 126
FIGURE 39 VARIATION OF THE SLURRY INLET FLOW, AND TAN CONCENTRATION ATTESTED DURING TEST 1 FOR MAINTAINING THE CONSTANT
NITROGEN LOAD.____________________________________________________________________________ 132

13
FIGURE 40 NITROGEN CONCENTRATION DETECTED IN INLET AND OUTLET SAMPLES FOR REACTORS R1AB (A), R2AB (B), R3AB (C) DURING
TEST 1. __________________________________________________________________________________ 133
FIGURE 41 TREND OF PARAMETERS MONITORED FOR REACTORS PAIR R1A R1B DURING ONE DAY (24H), IN PARTICULAR: AT THE BEGINNING OF
EXPERIMENT (TEST 1), AFTER 1 MONTH OF OPERATION, AFTER 2 MONTHS OF OPERATION AND AT THE END OF EXPERIMENT. ____ 135
FIGURE 42 TREND OF PARAMETERS MONITORED FOR REACTORS PAIR R2A R2B DURING ONE DAY (24H), IN PARTICULAR: AT THE BEGINNING OF
EXPERIMENT (TEST 1), AFTER 1 MONTH OF OPERATION, AFTER 2 MONTHS OF OPERATION AND AT THE END OF EXPERIMENT. ____ 136
FIGURE 43 TREND OF PARAMETERS MONITORED FOR REACTORS PAIR R3A R3B DURING ONE DAY (24H), IN PARTICULAR: AT THE BEGINNING OF
EXPERIMENT (TEST 1), AFTER 1 MONTH OF OPERATION, AFTER 2 MONTHS OF OPERATION AND AT THE END OF EXPERIMENT. ____ 137
FIGURE 44 A) TYPICAL VARIATIONS OF DO, PH, AND ORP VALUE AND CONCENTRATIONS OF NH4-N, NO2-N, AND NO3-N DURING
NITRIFICATION AND DENITRIFICATION PROCESS IN A CONVENTIONAL SBR (DUTTA ET AL., 2015). B) REAL-TIME CONTROL POINTS IN HIGH
C=N RATION LOAD CYCLES (TOC/TN RATIO OF THE INFLUENT: 1.4) A: FEEDING, B: NITRATE KNEE POINT, C AND C: BEGINNING OF THE
OXIC PHASE, E: AMMONIA VALLEY POINT, F: END OF THE OXIC PHASE. _________________________________________ 139
FIGURE 45 CHARACTERISTICS OF INLET AND OUTLET SAMPLES FOR REACTORS R1AB (A), R2AB (B), R3AB (C) DURING TEST 2. _______ 142
FIGURE 46 TREND OF PARAMETERS MONITORED FOR REACTORS PAIR R1A E R1B DURING ONE DAY (24H), IN PARTICULAR: AT THE BEGINNING
OF EXPERIMENT (TEST 2), AFTER ABOUT 1 MONTH OF OPERATION, AFTER ABOUT 2 AND 3 MONTHS OF OPERATION. __________ 144
FIGURE 47 TREND OF PARAMETERS MONITORED FOR REACTORS PAIR R2A R2B DURING ONE DAY (24H), IN PARTICULAR: AT THE BEGINNING OF
EXPERIMENT (TEST 2), AFTER ABOUT 1 MONTH OF OPERATION, AFTER ABOUT 2 AND 3 MONTHS OF OPERATION. ____________ 145
FIGURE 48 PARAMETER TRENDS MONITORED FOR REACTOR PAIRS R3A R3B DURING ONE DAY (24H), IN PARTICULAR: AT THE BEGINNING OF
EXPERIMENT (TEST 2), AFTER ABOUT 1 MONTH OF OPERATION, AFTER ABOUT 2 AND 3 MONTHS OF OPERATION. ____________ 146
FIGURE 49 TREND OF PARAMETERS MONITORED FOR REACTORS PAIR R1A R1B DURING ONE DAY (24H), IN PARTICULAR: A) AT THE BEGINNING
OF EXPERIMENT (TEST 3); B) DURING 23/01/2018; C) DURING 30/01/2018 AND D) AT THE END OF EXPERIMENT 06/02/2018. 153
FIGURE 50 TREND OF PARAMETERS MONITORED FOR REACTORS PAIR R2A R2B DURING ONE DAY (24H), IN PARTICULAR: A) AT THE BEGINNING
OF EXPERIMENT (TEST 3); B) DURING 23/01/2018; C) DURING 30/01/2018 AND D) AT THE END OF EXPERIMENT 06/02/2018. 154
FIGURE 51 TREND OF PARAMETERS MONITORED FOR REACTORS PAIR R3A R3B DURING ONE DAY (24H), IN PARTICULAR : A) AT THE BEGINNING
OF EXPERIMENT (TEST 3); B) DURING 23/01/2018; C) DURING 26/01/2018 AND D) AT THE END OF EXPERIMENT 06/02/2018. 155
FIGURE 52 THE PERFORMANCE OF THE ACTIVATED SLUDGE-WATER INTERFACE DURING THE TIME FOR EACH PAIR OF REACTORS ON DIFFERENT
DAYS: A) 18/12/2018, B) 23/01/2018, C) 30/01/2018, D) 06/02/2012. __________________________________ 157
FIGURE 53 NITROGEN CONCENTRATION DETECTED IN INLET AND OUTLET SAMPLES FOR REACTOR R1AB (A), R2AB (B), R3AB (C) DURING TEST
4. _____________________________________________________________________________________ 159
FIGURE 54 ORP AND NITROGEN PROFILES UNDER VARIOUS LOADING RATES DURING ONE SUB-CYCLE DURING SBR OPERATION (FROM POO ET
AL., 2005). _______________________________________________________________________________ 162
FIGURE 55 SCHEME OF LINDVALL HOOD DIMENSIONS (A) AND ITS SCHEME (B)- IRTA DOCUMENTS. _________________________ 171
FIGURE 56 TWO HOLES IN THE STATIC HOOD (SH) USED FOR WITHDRAWING AIR SAMPLE AND FOR MEASURING TEMPERATURE INSIDE THE
HOOD. __________________________________________________________________________________ 172
FIGURE 57 LINEAR REGRESSION OF RESULTS OBTAINED FOR EACH HOOD (BARS ERROR REPRESENTS STANDARD DEVIATION). __________ 178
FIGURE 58 NH3, N2O (A) AND CO2, CH4 (B) EMISSION RATES FOR ALL CONSIDERED SLURRIES. C: COMPOST, LFD: LIQUID FRACTION OF
DIGESTATE, SFPS: SOLID FRACTION OF PIG SLURRY. _____________________________________________________ 182

14
FIGURE 59 EXAMPLE OF RESULTS FROM JAR TESTS USED TO DETERMINE OPTIMAL DOSES (D) OF CA(OH)2 (CAH) AND AL2(SO4)3. (ALS) FOR
“CATTLE AND PIG DIGESTATE”: A) PH AND EC RESPONSES TO CAH; B) PH AND EC RESPONSES TO ALS; C) LEVEL OF SOLID/LIQUID
INTERFACE (HC) AND FOAM FRACTION (HF) IN RESPONSE TO ALS; D) FLOCK DIMENSION IN RESPONSE TO ALS. THE LOWEST VALUE OF
EC (DENOTED BY THE RED CIRCLE) WAS USED TO IDENTIFY D FOR CAH. THE REFERENCE DOSE OF ALS SELECTED CORRESPONDED TO THE
AL3+
CONCENTRATION BEYOND WHICH THE FLOCK DIMENSION DID NOT CHANGE AND THE FOAM LEVEL REMAINED RELATIVELY CONSTANT.
_______________________________________________________________________________________ 195
FIGURE 60 SEPARATION EFFICIENCIES ACHIEVED USING AND AL2(SO4)3 (LEFT) AND CA(OH)2 (RIGHT) AS ADDITIVES TO DIFFERENT SLURRY
TYPES: A) TOTAL SOLIDS (TS); B) PHOSPHORUS (P); C) COPPER (CU); D) ZINC (ZN). N: NULL DOSE; SO: SUB-OPTIMAL DOSE; O: OPTIMAL
DOSE. PS: PIG SLURRY; PD: PIG DIGESTATE; PDS: PIG DIGESTATE STRIPPED; (C+P)D: CATTLE AND PIG DIGESTATE; (C+P)DS: CATTLE AND
PIG DIGESTATE STRIPPED. ______________________________________________________________________ 197
FIGURE 61. VARIATION OF PH-PATTERNS (LEFT) AND EC-PATTERNS (RIGHT) IN DIFFERENT SLURRY TYPES WITH AN INCREASE DOSE OF CAH
(ABOVE) AND ALS (BELOW) FOR DIFFERENT SLURRIES. 1 CORRESPOND TO NULL DOSE 0 MG/L, 5 TO OPTIMAL DOSE AND 4 TO DOSE SUB-
OPTIMAL DOSE. DATA REPORTED ARE MEANS AND THE ERROR BARS REPRESENT STANDARD DEVIATION OF DATA. _____________ 200
FIGURE 62 REDUCED SEPARATION INDEXES RESULTING FROM CA(OH)2 (CAH) AND AL2(SO4)3 (ALS) FOR A): TOTAL SOLIDS (TS); B)
PHOSPHORUS (P); C) COPPER (CU); AND D) ZINC (ZN). PS: PIG SLURRY; PD: PIG DIGESTATE; PDS: PIG DIGESTATE STRIPPED; (C+P)D:
CATTLE AND PIG DIGESTATE; (C+P)DS: CATTLE AND PIG DIGESTATE STRIPPED. ___________________________________ 202
FIGURE 63 A POSSIBLE TREATMENT LINE THAT INCLUDES BIOLOGICAL PROCESS APPLIED IN A SEQUENCING BATCH REACTOR AND AMMONIA
EMISSIONS AND GHGS EMISSIONS CONTROL. _________________________________________________________ 211
FIGURE 64 TWO DIFFERENT POSSIBILITIES THAT CAN BE ADOPTED FOR THE DOSAGE OF POLYMER. THE DOTS LINE REPRESENTS THE CONTROL
CONNECTION. ______________________________________________________________________________ 212
FIGURE 65 COAGULATION/FLOCCULATION PHASE THAT CAN SUBSTITUTE THE SEPARATION USING CENTRIFUGE. DOT LINES REPRESENT THE
CONTROL WIRE. ____________________________________________________________________________ 216

15
Index of Tables
TABLE 1 ANIMAL SLURRY MANAGEMENT CONTRIBUTES TO ENVIRONMENTAL POLLUTION AT LOCAL, REGIONAL AND GLOBAL SCALE, DEPENDING
ON THE SUBSTANCES INVOLVED (SOMMER ET AL. 2013). .................................................................................................20
TABLE 2 CATEGORIES OF MAJOR WATER POLLUTANTS IN AGRICULTURE AND THE RELATIVE CONTRIBUTIONS OF THE THREE MAIN AGRICULTURAL
PRODUCTION SYSTEMS (MATEO-SAGASTA ET AL., 2017). *: LOW CONTRIBUTE; ** MEDIUM CONTRIBUTE; ***: HIGH CONTRIBUTE. ..26
TABLE 3 SEPARATION EFFICIENCY REACHABLE WITH DIFFERENT TYPE OF SEPARATOR (PROVOLO ET AL., 2016). .......................................34
TABLE 4 CHARACTERISTICS OF DIFFERENT TYPE OF FILTRATIONS (ADAPTED FROM “SUPPLY WATER TREATMENT COURSE”. NURIZZO C.,
POLITECNICO DI MILANO) .........................................................................................................................................36
TABLE 5 CHARACTERISTICS OF SUBSTRATES USED IN SEVERAL RESEARCH. SDP: SUPERNATANT OF DIGESTED PIGGERY WASTEWATER; SP:
SUPERNATANT OF NON-DIGESTED PIGGERY SLURRY; SDPC: SUPERNATANT OF DIGESTED PIGGERY WASTEWATER AFTER
CENTRIFUGATION SW: SWINE PRE-TREATED WASTEWATER; SWSS: SWINE WASTEWATER SCREENED/SIEVED; DSW: DIGESTED
(UASB) SWINE WASTEWATER; DRS: DILUTED RAW SLURRY; SRS: SWINE RAW SLURRY. ........................................................73
TABLE 6 THE SUMMARY OF CONSIDERED STUDIES (W: WASTEWATER, SW: SYNTHETIC WASTEWATER; DPS: DIGESTED PIG SLURRY; P: PIG
SLURRY; PDPS: PARTIALLY PIG DIGESTED; BS: BENCH SCALE; SRPS: SUPERNATANT OF RAW MANURE FINISHING BARN PIGS; SP: SOWN;
AD: ANAEROBIC DIGESTION; AT: ANAEROBIC TREATMENT; S/L :SOLID LIQUID SEPARATION; C/F COAGULATION/FLOCCULATION; DI:
DILUTION; OPC: OPERATIONAL CONDITIONS. ................................................................................................................74
TABLE 7 CHARACTERISTICS OF SUBSTRATE USED IN THE STUDIES. .................................................................................................75
TABLE 8 SETTINGS OF REACTOR OPERATION USED IN THE RESEARCHES CONSIDERED. W_L: WORKING VOLUME; O: OXIC; ANA: ANAEROBIC;
ANOX: ANOXIC; SED: SEDIMENTATION; R: IN THE REACTOR; W: RAW WASTEWATER; RT: REAL TIME; VA: VARIABLE; +: AT THE
BEGINNING 1H, AFTER OXIC PHASE ADDING EXTERNAL CARBON SOURCE (25% INTERNAL 75% EXTERNAL FOR EXP 1, 50% INTERNAL
50% EXTERNAL FOR EXP. 2, 100% INTERNAL 0% EXTERNAL FOR EXP. 3), AFTER THIS PHASE EACH 30 MIN. 6 TIMES ADDITION OF
EXTERNAL CARBON SOURCE. ......................................................................................................................................76
TABLE 9 THE REMOVAL RATE OBTAINED FOR DIFFERENT STUDIES. W: WASTEWATER, SW: SYNTHETIC WASTEWATER; DPS: DIGESTED PIG
SLURRY; P: PIG SLURRY; PDPS: PARTIALLY PIG DIGESTED; BS: BENCH SCALE; SRPS: SUPERNATANT OF RAW MANURE FINISHING BARN
PIGS; SP: SOWN; AD: ANAEROBIC DIGESTION; AT: ANAEROBIC TREATMENT; S/L: SOLID LIQUID SEPARATION..................................77
TABLE 10 DATA OF FLOWS PROCESSED IN PLANT NA................................................................................................................93
TABLE 11 CHARACTERISTICS OF MONITORING PLAN FOR ALL CONSIDERED PLANTS............................................................................98
TABLE 12 DATA OF FLOWS PROCESSED IN PLANT TP (PROJECT DATA). ..........................................................................................99
TABLE 13 MONITORING RESULT OBTAINED FOR EACH SAMPLING POINTS OF PLANT TP......................................................................99
TABLE 14 MONITORING RESULT OBTAINED FOR EACH SAMPLING POINTS OF PLANT TO. .................................................................. 104
TABLE 15 CHEMICAL-PHYSICAL CHARACTERISTICS FOR THREE DIFFERENT PERIODS. ......................................................................... 108
TABLE 16 REMOVAL RATES OBTAIN IN EACH PERIOD, AND THE AVERAGE ONE. .............................................................................. 108
TABLE 17 MONITORING RESULTS OBTAINED FOR PLANT NA..................................................................................................... 109
TABLE 18 VERIFICATION OF SOLID SEPARATION EFFICIENCY FOR PLANT NA. ................................................................................. 111
TABLE 19 DIMENSION OF AIR SUPPLY FOR PLANT NA. ............................................................................................................ 111
TABLE 20 CHARACTERISTICS OF SLURRY DURING MONITORING PERIOD OF PLANT VA. ..................................................................... 112
TABLE 21 VERIFICATION OF SOLID SEPARATION EFFICIENCY FOR PLANT VA .................................................................................. 113

16
TABLE 22 SIZING (PRELIMINARY) OF AIR SUPPLY FOR PLANT NA. .............................................................................................. 114
TABLE 23 CHARACTERISTICS OF SLURRY DURING MONITORING PERIOD OF PLANT RR. ..................................................................... 115
TABLE 24 VERIFICATION OF SOLID SEPARATION EFFICIENCY FOR PLANT RR .................................................................................. 117
TABLE 25 DIMENSION OF AIR SUPPLY FOR PLANT RR. ............................................................................................................ 117
TABLE 26 MAIN FEATURES OF MONITORED PLANTS. .............................................................................................................. 118
TABLE 27 SIZING DATA OF ONE REACTOR (FIRST HYPOTHESIS). .................................................................................................. 124
TABLE 28 MAIN CHARACTERISTICS OF PLANT 0. .................................................................................................................... 127
TABLE 29 GENERAL INFORMATION REGARDING THE EXPERIMENTS. ............................................................................................ 128
TABLE 30 EXPERIMENTS GENERAL SETTINGS. ....................................................................................................................... 128
TABLE 31 MAIN CHARACTERISTICS OF 3 SLUDGES USED FOR EXPERIMENTS (TEST 1); A: AVERAGE DATA, SD: STANDARD DEVIATION. ......... 131
TABLE 32 CHARACTERISTICS OF THE INPUT AND OUTPUT IN TERMS OF DAILY LOAD FOR 3 PAIRS OF REACTORS DURING TEST 1 (A: AVERAGE; SD:
STANDARD DEVIATION). ......................................................................................................................................... 140
TABLE 33 SOME CHARACTERISTICS OF THE ACTIVATED SLUDGE INSIDE THE REACTORS BEFORE TO START THE TEST 2 . .............................. 141
TABLE 34 MAIN CHARACTERISTICS OF 3 SLURRYS USED FOR EXPERIMENTS (TEST 2). A: AVERAGE, SD: STANDARD DEVIATION. ................. 141
TABLE 35 CHARACTERISTICS OF THE INPUT AND OUTPUT IN TERMS OF DAILY LOAD FOR 3 PAIRS OF REACTORS DURING TEST 2 OF EXPERIMENT
(A: AVERAGE; SD: STANDARD DEVIATION). ................................................................................................................. 147
TABLE 36 CHARACTERISTICS OF ACTIVATED SLUDGE USED DURING TEST 3 AND 4........................................................................... 149
TABLE 37 CHARACTERISTICS OF INLET SLURRY USED DURING EXPERIMENT (TEST 3). (A: AVERAGE; SD: STANDARD DEVIATION). ................ 149
TABLE 38 CHARACTERISTICS OF ACTIVATED MIXED SLUDGE DETECTED DURING EXPERIMENT (TEST 3) FOR EACH REACTOR’S PAIR. A: AVERAGE,
SD: STANDARD DEVIATION. ..................................................................................................................................... 150
TABLE 39 CHARACTERISTICS OF OUTLET OF EACH REACTOR DETECTED DURING EXPERIMENT (TEST 3) FOR EACH REACTOR’S PAIR. A: AVERAGE,
SD: STANDARD DEVIATION. ..................................................................................................................................... 151
TABLE 40 REMOVAL RATE REACHED DURING TEST 3. ............................................................................................................. 151
TABLE 41 NITROGEN (AS TAN ) AND COD LOADING RATE FOR EACH REACTOR DURING TEST 3......................................................... 152
TABLE 42 CHARACTERISTICS OF THE INPUT AND OUTPUT IN TERMS OF CONCENTRATION FOR 3 PAIRS OF REACTORS DURING TEST 4 (A:
AVERAGE; SD: STANDARD DEVIATION). ...................................................................................................................... 158
TABLE 43 SUMMARY OF ALL EXPERIMENTS. DH1: DYNAMIC HOOD1, DH2: DYNAMIC HOOD 2; SH1: STATIC HOOD 1. C: COMPOST, LFD:
LIQUID FRACTION OF DIGESTATE; SFPS: SOLID FRACTION OF PIG SLURRY. ............................................................................ 169
TABLE 44 CHARACTERISTICS OF DIFFERENT HOODS AND STATIC CHAMBER USED IN THE TESTS. .......................................................... 170
TABLE 45 CHARACTERISTICS OF ANALYSED EFFLUENTS AND SLUDGE. LFD: LIQUID FRACTION OF DIGESTATE; C: COMPOST; SFPS: SOLID
FRACTION OF PIG SLURRY. ....................................................................................................................................... 175
TABLE 46 CHARACTERISTICS OF EXPERIMENTS WITH AMMONIA SOLUTION AND EMISSIONS VALUE MEASURED DURING DIFFERENT EXPERIMENTS
BY THE DIFFERENT HOODS. DH1: DYNAMIC HOOD1; DH2: DYNAMIC HOOD 2; SH: STATIC CHAMBER. N: WITHOUT ADDING ANY BUFFER
COMPOUND, Y: USING OF BUFFER COMPOUND. ............................................................................................................ 177
TABLE 47 SLURRY CHARACTERISTICS DURING EXPERIMENTS AND EMISSIONS OBTAINED FOR DIFFERENT HOODS DH1: DYNAMIC HOOD1;DH2:
DYNAMIC HOOD2; SH: STATIC CHAMBER. * MEANS THAT THAT TESTS WERE CARRIED OUT WITH REAL WASTE BUT FROM AN ARTIFICIAL
BASIN AND NOT IN THE REAL TREATMENT PLANT. .......................................................................................................... 181
17
TABLE 48 EMISSION FLUX OF GHGS DETECTED FOR SLURRIES AND AGRO-INDUSTRIAL WASTE. DH1: DYNAMIC HOOD1; DH2: DYNAMIC
HOOD2; SH: STATIC CHAMBER. * MEANS THAT THAT TESTS WERE CARRIED OUT WITH REAL WASTE BUT FROM AN ARTIFICIAL BASIN AND
NOT IN THE REAL TREATMENT PLANT. ......................................................................................................................... 181
TABLE 49 MAIN CHARACTERISTICS OF FIVE SLURRIES USED IN THE TESTS. ..................................................................................... 194
TABLE 50. OPTIMAL DOSE (D) OF CA(OH)2 (IN TERMS OF CA2+) AND AL2(SO4)3 (IN TERMS OF AL
3+) FOR DIFFERENT TYPES OF ANIMAL
MANURE SLURRIES. THE NUMBERS IN BRACKETS IDENTIFY SPECIFIC REPETITIONS.................................................................... 196
TABLE 51 SIGNIFICANCE OF THE FACTORS CONSIDERED IN THE STATISTICAL ANALYSIS OF SEPARATION EFFICIENCY................................... 199
TABLE 52 SIGNIFICANCE OF THE FACTORS CONSIDERED IN THE STATISTICAL ANALYSIS OF REDUCED SEPARATION EFFICIENCY. ..................... 203
TABLE 53 CALCULATION FOR DIMENSIONING THE STORAGE TANK. ............................................................................................. 213
TABLE 54 CHARACTERISTICS OF FARM PRODUCED SLURRY CONSIDERING THE BREEDING TYPE AND TYPE OF MANURE REMOVAL. ................ 213
TABLE 55 HOW CALCULATE NITROGEN REMOVAL SPEED (IN RED CELLS THE IMPOSED VALUES, IN GREY THE CALCULATED VALUES). ............. 214
TABLE 56 CALCULATION OF OXYGEN DEMAND, WITHOUT A SPECIFIC DEFINITION OF REQUIRED PARAMETERS. THESE REPRESENT ONLY
ESTIMATION. ....................................................................................................................................................... 215
TABLE 57 DIVISION OF CYCLE’S DURATION IN DIFFERENT PHASES. .............................................................................................. 215

18

19
SECTION 1 - INTRODUCTION AND
BACKGROUND
1. The management of animal slurry for
environmental sustainability
Growing populations, rising affluence and urbanization are translating into increased demand for livestock
products, particularly in developing countries.
An increase of 70% of these products is foreseen to feed a population estimated to reach 9,6 billion by 2050
(FAO, 2018).
The emerging larger, more regionally intensive and more specialized animal production system can result in
the possibility of manure mismanagement. This, consequently, can lead to a risk of pollution (Sommer et al.,
2013). In addition, the intensive livestock production generates a large amount of manure that cannot be
disposed properly.
Livestock manure represent any organic material that supplies organic matter to soils together with plant
nutrients, usually in lower concentrations compared to inorganic fertilizer, produced by housed livestock.
Typically, is a mixture of faces and urine with or without bedding material, depending on the type of animal
housing system (Pain et al., 2011).
Often, the produced volume exceeds the capacity of environment around the livestock facilities to absorb
nutrients contained in manure. One effect is that crops receive an amount of nutrients that exceeds the
dosage required for their growth. Overall, there is an increased risk of salinization in semi-arid regions, and
of water pollution (both surface and underground) and soil.
Uncontrolled and excessive manure applications and incorrect and inefficient manure management practices
may severely damage environment. Negative effects affect multiple scales, ranging from the aforementioned
local and regional contamination of water and soil to the global emission of greenhouse gases
(GHGs)(FAO,2018) (Table 1).
The following sections illustrate an overview of different environmental impacts derived from the erroneous
manure management.

20
Table 1 Animal slurry management contributes to environmental pollution at local, regional and global scale, depending on the substances involved (Sommer et al. 2013).
Scale of Environmental impact
Substance Local Regional Global
Odour, H2S +
Nitrate + +
Phosphorus + +
Ammonia + +
Greenhouse gases
+
Heavy metals + +
Pathogens + +
1.1. The central role of nitrogen in agriculture
Nitrogen (N) is needed for growth and survival of all organisms.
It has indeed a major role as a nutrient in the agricultural production system. Nevertheless, the extensive use
of nitrogen raises environmental concern (Burton et al., 2003). Besides, in some parts of the world, it led to
an excess of food and unhealthy diets (Galloway et al., 2008).
The natural biological cycle of nitrogen (Figure 1) is a complex sequence of chemical transformations
involving nitrogen in organic and inorganic compounds. This cycle takes place between the atmosphere and
the living world and also includes an inner cycle between plants, animals and bacteria.
Figure 1 N-cycle (Adapted from “Ecologia course”, Gatto M.; Casagrande R., Politecnico di Milano).
21
Over time, nitrogen is transferred from the atmosphere (N2) to the biosphere. Thanks to natural fixation
processes, atmospheric elemental nitrogen is turned into ammonium or nitrate ions, i.e., the only forms that
are useful to plants. The ammonium taken by plants (a small fraction of that obtained from atmospheric
nitrogen, though) is incorporated into many organic molecules by an assimilative reduction. These molecules
are subsequently ingested by consumers of various orders. Nitrogen is then released to soil by means of the
decomposition of plant debris and corpses of animals. Here, through the ammonification process, nitrogen
returns to the form of ammonium ion. It is then transformed into nitrate by the nitrifying bacteria of the soil,
and thus made available again for plants. If the soil is poor of oxygen, denitrifying bacteria can further
transform nitrate into nitrite and, subsequently, nitrite into elemental nitrogen, which goes back in the
atmosphere.
Nitrogen production is increasing every year. The demand comes dominantly from agricultural activities,
followed by fossil fuel energy, and, more recently, bio-fuels (Galloway et al., 2008).
Impact of human activity on the N-cycle is unmistakable.
In areas with negligible human influence, nitrogen deposition to ecosystems generally amounts to about
0,5 kgN/ha/yr or less. Instead, there are now large regions of the world where average N deposition rates
exceed 10 kg N/ha/yr, greater than an order of magnitude increase compared with natural rates. Being the
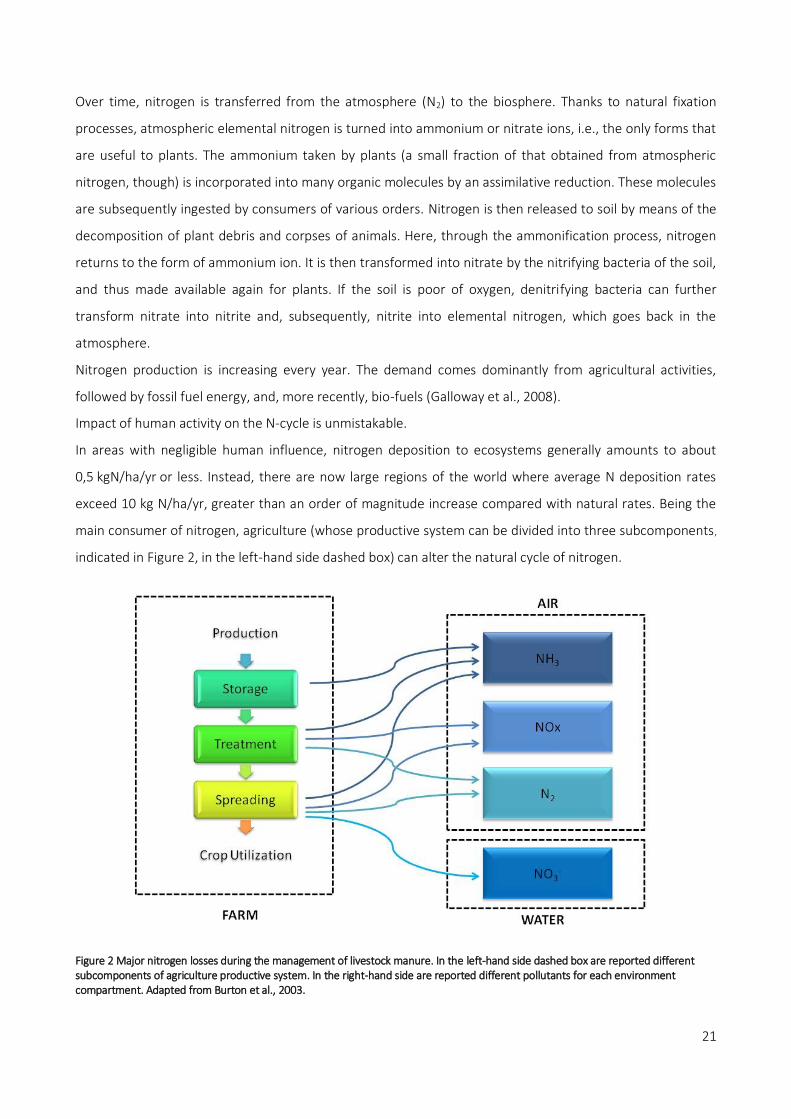
main consumer of nitrogen, agriculture (whose productive system can be divided into three subcomponents,
indicated in Figure 2, in the left-hand side dashed box) can alter the natural cycle of nitrogen.
Figure 2 Major nitrogen losses during the management of livestock manure. In the left-hand side dashed box are reported different subcomponents of agriculture productive system. In the right-hand side are reported different pollutants for each environment compartment. Adapted from Burton et al., 2003.

22
The input of nitrogen to agriculture comes from the diet of animals, in particular from proteins contained in
feed or grazed grassland. Only a part of the ingested nitrogen is metabolized by the animals, which
consequently expel the excess N through urine and dung. In these residues, nitrogen is found both as urea
and as other organic compounds (proteins and peptides).
The excretion of nitrogen is the input of the manure storage subsystem (Figure 2). The manure is excreted
and subsequently transported to the manure storage areas where it comes into contact with the air. The
naturally occurring enzyme urease degrades the urea into ammonia (NH3), that, in the can volatilize.
Volatilization is related to the amount of inorganic nitrogen in the slurry. All the housing conditions also have
influence on the loss of ammonia, as well as the type of accumulation expected, the storage time, the size of
the structures used for it etc.
The amount of nitrogen remained in manure when it is distributed to field is called N-manure. Applied
spreading methods obviously influence the degree of volatilization that can occurs during and after manure
application. Nitrogen not used by plants, called N-surplus, can be divided into N-leached, N-volatilized and N-
denitrified. There is also a part that is run-off. The loss of nitrogen in the atmosphere that can occur in the
first steps of the management of slurry represents a decrease in the potential benefit of proper use and
recycling of nitrogen through crop production (Burton et al., 2003). Therefore, the correct management of
livestock manure is necessary to limit the incorrect and uncontrolled nitrogen introduction in the
environment (in its various impacting forms).
1.2. Environmental issues related to livestock manure
As reported by FAO organization, the livestock sector has an important role in climate change; in fact, it is
estimated to emit 7,1 gigatones of carbon dioxide equivalent (CO2-eq/year, representing 14,5 percent of all
human-induced emissions). In particular, the milk and beef production have a biggest emission contribution
(19% and 41%) rather than pig meat and poultry meat and eggs production that contribute respectively 9%
and 8% to the sector's emissions (FAO, 2018).
In Europe agriculture sector contributes for 10,1% of greenhouse gases emissions (the first source is Energy
with 78% of contribute) (European Environmental Agency, 2016).
In the year 2014, CH4, N2O and CO2 emissions from agriculture sector were 23,3%, 34,7%, and 0,13% of total
EU28+ISL CH4, N2O, and CO2 emissions, respectively. Total emissions from agriculture were 436 Mt CO2-eq
with contributions from CH4, N2O, and CO2 of 237 Mt CO2-eq, 188 Mt CO2-eq and 10,2 Mt CO2-eq,
respectively. Thus, CH4, N2O, and CO2 contributed with 23%, 35% and 0,13% total EU28+ISL GHG emissions.
Agriculture can be considered as the most important source of anthropogenic CH4 source.

23
CH4 methane is estimated to have a global warming potential (GWP) of 28–36 over 100 years. The normal
metabolic activities of ruminants produce significant amounts of CH4. The production of CH4 involves
degradation and hydrolysis of organic material to organic compounds, which are then degraded to long-
chain acids, proteins or alcohols (Perazzolo, 2015). The amount of CH4 generated by a specific manure
management system is affected by the extent of anaerobic conditions present, the temperature of the
system, and the retention time of organic material in the system (Santonja, G. G., 2017).
Figure 3 Global emissions by source. Relative contribution of main sources of emissions from global livestock supply chains. GLEAM 2.0 - Assessment of greenhouse gas emissions and mitigation potential. FAO, 2017
In addition, some manure treatment approaches can lead to rise of CH4 emissions (Chadwick et al., 2011).
Storage systems are also sources of CH4 because the environment in these stores, if not actively aerated,
favours methanogenesis or if it mostly stored over long period. Pig slurry generally has the potential to emit

24
more CH4 than cattle slurry, because it has a higher content of degradable organic matter than cattle slurry
(Moller et al., 2004).
Nitrous Oxide (N2O) has a GWP 265–298 times that of CO2 for a 100-year timescale.
In nature, emissions of N2O results also from a variety of agricultural practices and activities as the use of
synthetic and organic fertilizers, the cultivation of organic soils, the production of nitrogen-fixing crops and
from the application of livestock manure to cropland and pasture (Perazzolo, 2015).
Main sources of N2O emissions are manure management and the application and deposition of manure
(Montes et al., 2013).
Although not a GHG, NH3 (and its ionized form, NH4+) is an important component of the environment
because it is the dominant gaseous base specie in the atmosphere. Its properties (e.g., water solubility) make
NH3 important in atmospheric chemistry and physics. Once released into the atmosphere, NH3 has a lifetime
of less than 1 day to 5 days (Aneja et al., 2001). It will, therefore, most likely deposit to the Earth's surface
closed to its source. However, part of NH3 can react with acidic species such as sulphuric acid (H2SO4), nitric
acid (HNO3), and hydrochloric acid (HCl) to form ammonium sulfate, ammonium nitrate, or ammonium
chloride, respectively. In Europe and the US approximately 75% of NH3 emissions derive from livestock
production (Webb et al., 2005). The N collected in manure is in reduced form such as ammonium (NH4+),
proteins and urea. For these reasons, the livestock manure management is a strategic sector for the
reduction of ammonia emissions
Concerning other environmental sector, is evident that the biggest problems of twenty-first century are
related to water quantity and/or water quality issues (Schwarzenbach et al., 2010). Obviously, these
problems are strictly connected with climate change that aggravates the already precarious situation of the
quality, availability and accessibility of the water resource.
The incorrect livestock manure management is one of the main reasons for water pollution (diffuse source)
and eutrophication. This is also due to an inappropriate and extensive use of some chemical products as
fertilizers, pesticides or directly the erroneously use of manure, sludge and compost, both agronomic
practices that promote the release of these in the environment (Mateo-Sagasta, J., et al., 2017,2018).
Leaching and runoff of manure nutrients applied to fields can reach surface water and groundwater with a
possible consequent contamination (Figure 4).
In addition, animal diets can contain much higher trace metal concentrations than plants used for animal
feeding, for responding to necessity of animal to take different essential nutrients elements. For example, Cu

25
is added to pigs’ diet as a cost-effective method of enhancing performance and as an anti-bacterial agent. In
addition, Zinc is added to animal feed for weaned pigs for control of post-weaning scours (Sommer et al.,
2013).
The risk to health caused by poor manure management includes different pathogens transfer pathways.
These can be diffused in the environment through air, water, crops and vegetables. Pollution of shallow
drinking water wells is a considerable risk to human and animal health. Therefore, the dumping of animal
manure into rivers can pose a much greater risk of infection than careful recycling of manure in agricultural
land with adequate precautions during spreading (Sommer et al., 2013).
Figure 4 Total reactive N input to the hydrosphere (rivers and groundwater) in EU-27 for the year 2002. The map shows total N r point sources from sewerage systems and diffuse sources from agriculture and forest soils and atmospheric N r deposition to inland water surfaces for a grid at of 1 km × 1 km. The values are in kg N per total pixel area [kg N/km2/yr. total area]. The pie diagram at the right side gives the split of N input to the hydrosphere [Gg N/year, rounded to 10 Gg N/year] for EU27: point sources (sewage systems) and diff use sources (agriculture leaching, run-off, and forest soils). The histogram shows the split of N r input to the hydrosphere [Gg N/ year] by country. Basis: Sewage systems and agriculture: Indicator Database for European Agriculture V1, 2009; forest soils: INTEGRATOR, 2009. Leip et al., 2009.
Nowadays, also due to emerging problems of scarcity of resources, the recovery of nitrogen (N) and other
elements (phosphorus, heavy metals etc.) is strategic for economic and environmental reasons considering
that manure represents one of the most significant contributors to nitrogen (N) sources.
26
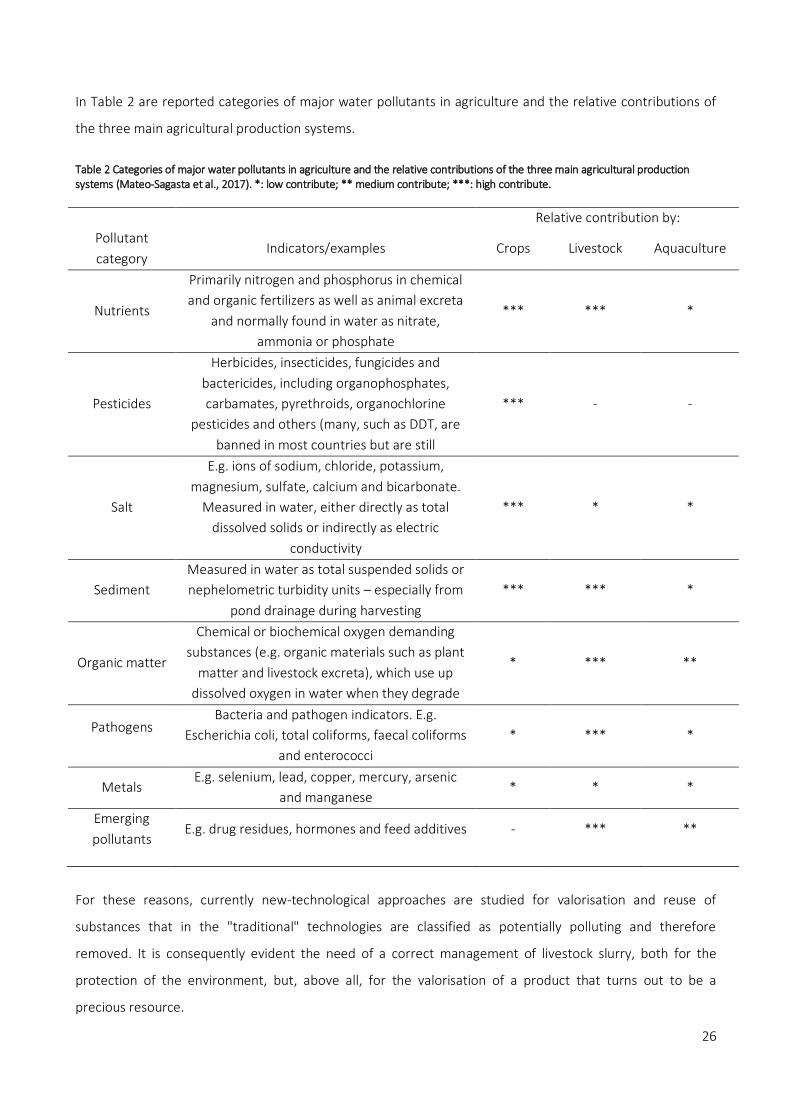
In Table 2 are reported categories of major water pollutants in agriculture and the relative contributions of
the three main agricultural production systems.
Table 2 Categories of major water pollutants in agriculture and the relative contributions of the three main agricultural production systems (Mateo-Sagasta et al., 2017). *: low contribute; ** medium contribute; ***: high contribute.
Relative contribution by:
Pollutant
category Indicators/examples Crops Livestock Aquaculture
Nutrients
Primarily nitrogen and phosphorus in chemical
and organic fertilizers as well as animal excreta
and normally found in water as nitrate,
ammonia or phosphate
*** *** *
Pesticides
Herbicides, insecticides, fungicides and
bactericides, including organophosphates,
carbamates, pyrethroids, organochlorine
pesticides and others (many, such as DDT, are
banned in most countries but are still
*** - -
Salt
E.g. ions of sodium, chloride, potassium,
magnesium, sulfate, calcium and bicarbonate.
Measured in water, either directly as total
dissolved solids or indirectly as electric
conductivity
*** * *
Sediment
Measured in water as total suspended solids or
nephelometric turbidity units – especially from
pond drainage during harvesting
*** *** *
Organic matter
Chemical or biochemical oxygen demanding
substances (e.g. organic materials such as plant
matter and livestock excreta), which use up
dissolved oxygen in water when they degrade
* *** **
Pathogens Bacteria and pathogen indicators. E.g.
Escherichia coli, total coliforms, faecal coliforms
and enterococci
* *** *
Metals E.g. selenium, lead, copper, mercury, arsenic
and manganese * * *
Emerging
pollutants E.g. drug residues, hormones and feed additives - *** **
For these reasons, currently new-technological approaches are studied for valorisation and reuse of
substances that in the "traditional" technologies are classified as potentially polluting and therefore
removed. It is consequently evident the need of a correct management of livestock slurry, both for the
protection of the environment, but, above all, for the valorisation of a product that turns out to be a
precious resource.

27
1.3. Main legislation concerning the prevention of
environmental pollution caused by the
management of livestock manure
Environmental protection is nowadays a primary global interest issue.
Environmental problems related to the management of livestock manures are commonly the result of
ignorance, negligence or not calculated risk. Therefore, as long as no preventive measures or measures of
mitigation are taken, environmental problems will continue to exist (Sommer et al., 2013).
In response to the problems of society, where culture, markets and the pressure of civil society collectively
fail to find a resolution, public or government policy can intervene to solve certain problems. Government
policy aims to change the individual behaviour to achieve society goals. Among the available policy tools
there are: regulatory or command and control instruments, economic or market-based instruments and
communicative or persuasive tools. Multilateral environmental agreements (conventions and protocols) as
well as intergovernmental organizations have largely contributed to consider seriously many of the known
environmental problems.
The main European directives concerning the management of livestock manures are related to the
protection of water and to the prevention and control of pollution, such as pollutants air emission.
1.3.1. European Directives
A good example of joint of regional and national regulation can be found in European Union. Environmental
European policy is mostly established through Directives that imposed to member states environmental
objectives to be achieved (Sommer et al., 2013). In general, the communitarian directives concerning
management of livestock manure are related to protection, prevention and control of pollution, including air
pollution resulting from greenhouse gas emissions and water pollution caused by over-nutrient content and
by the presence of micro-pollutants. Here below some of most important directives are reported and briefly
explained.
1.3.1.1. 2010/75/EC Directive on Industrial Emissions concerning Integrated Pollution Prevention and Control (IED).
This Directive has substituted the 2008/1/CE, which in turn had replaced Directive 96/61/EC. The upgrade
integrates the Directive of 2008 with other 6 directives concerning the industrial emissions. It establishes a
permit procedure and lays down requirements, in particular about emissions

28
The IED directive concerns industrial and agricultural activities with high polluting potential.
Introduces the innovative concept of the integrated approach to the prevention and reduction of emissions
in the air, water and soil, waste management and energy efficiency. It provides for the gradual adoption of
technical solutions available on the market (plant engineering, management and control), with the aim of
preventing, reducing and, as much as possible, eliminating pollution due to industrial activities.
The objective of directive is to avoid or minimize polluting emissions in the atmosphere, water and soil, as
well as waste from industrial and agricultural installations, with the aim of achieving a high level of
environmental and health protection.
The industrial activities indicated in the IED Directive, to ensure the prevention and reduction of pollution,
must operate only if they are in possession of an authorization.
To gain a permit operator must show that no significant pollution is caused and that the BATs (best available
technologies) are applied, considering the technical characteristics, geographical locations and local
environmental circumstances of the installations concerned.
"Best" means the most effective to achieve a high overall level of overall environmental protection.
"Available" means those techniques that have been developed on a scale that allows implementation in
economically and technically viable conditions but does not necessarily mean that the technique must be an
industry standard or actually widely available, since the IED's intention it is about changing practices to new,
less polluting alternatives.
“Techniques” includes both the technology used how the installation is designed, built, maintained, operated
and decommissioned. The EU member states' authorities and industries cooperate on the development of
so-called “BAT” reference documents (BREFs). A BREF assists the regulatory authorities and those apply ing
for licenses by describing reference techniques and reference levels for a specific economical sector. One of
the BREFs is dedicated to installations for intensive livestock production (entitled 'Intensive Rearing of
Poultry or Pigs’). This document covers intensive livestock farms with more than 40 000 places for poultry, or
2000 places for production pigs over 30 kg, or 750 places for sows. The BREF discusses good agricultural
practice, nutritional management, housing systems, water and energy use, manure storage, manure
processing, and land spreading of manure.
1.3.1.2. 2016/2284/EU National Emissions Ceiling (NEC) Directive.
The latest NEC ("National Emission Ceiling") directive of December 14, 2016 n. 2016/2284 / EU, introduced
by the European Union concerning the reduction of national emissions of certain atmospheric pollutants,
amends Directive 2003/35 / EC and repeals Directive 2001/81 / EC (1).

29
The new NEC Directive sets 2020 and 2030 emission reduction commitments for five main air pollutants:
sulphur dioxide (SO2), nitrogen oxides (NOx), non-methane volatile organic compounds (NMVOC), ammonia
(NH3) and fine particulate matter (PM2,5).
Furthermore, it requires the development, adoption and implementation of national air pollution control
programs and that the emissions of these pollutants and other pollutants listed in Annex I, as well as their
impacts, are monitored and reported.
The main objective of this directive is to combat acidification, achieving long-term goals by taking the years
2010 and 2020 as a reference.
This Directive establishes the maximum limits for total emissions responsible for the acidification of these 5
pollutants for each Member State for emissions responsible for acidification, eutrophication and ground-
level ozone pollution, but leaves Member States the freedom to adopt reduction measures. The directive is
basically the EU translation of the Göteborg protocol.
Furthermore, Member States have to prepare and update national inventories of emissions and sulphur
dioxide emissions, nitric oxide, volatile organic compounds and ammonia. These inventories and projections
must be reported to the Commission and the European Environment Agency each year by 31 December.
1.3.1.3. 2000/60/EC Water Framework Directive
This Directive aims at maintaining and improving the aquatic environment in the Community.
The aim of directive is to protect superficial, deep, transaction, coastal waters. Defence and reduction of
pollution, promotion of a sustainable water use, environment protection, improvement of aquatic
ecosystems and mitigation of flood and drought effects.
1.3.1.4. 91/676/CEE Nitrates Directive
The EU Nitrates Directives now an integral part of the Water Framework Directive and is one of the key
instruments for protecting water against agricultural pressures. Furthermore, it has also affected the control
of greenhouse gas emissions.
The aim of this directive is “to reduce water pollution caused or induced by nitrates from agricultural sources
and prevent further such pollution”.
The Nitrates Directive (91/676/EEC) requires Member States (MS) to:
Monitor water quality and Identify polluted waters or water at risk of pollution (trophic status);
Designate the vulnerable zones (NVZ);
Establish codes of good agricultural practices (CGAP) (voluntary implementation outside
NVZ/obligatory within NVZ) and action programmer;

30
Every 4 years review the designation of vulnerable zones and action program. The measures concern
the correct use of nitrogenous fertilizers in general and livestock manure.
The definition of polluted or potentially threatened waters is attributed if nitrate concentrations in
groundwater and surface waters could be higher than 50 mg NO3-/L if no action is taken, or if surface
waters. Including fresh water bodies, estuaries, costal and marine waters, are found to eutrophic or
in the near future may become eutrophic if no action is taken.
In order to reduce pollution, the action programs must comprehend obligatory measures connecting to:
a period during which the spreading of animal manure and fermenters is prohibited;
Capacity and construction of livestock effluent storage, including measures to prevent water
pollution caused by flow and infiltration into ground and surface waters of liquids containing
livestock manure and effluents from plant material such as silage fodder;
Limits to the amounts of animal manure and fertilisers applied to land, which balanced fertilisation.
The Nitrate Directive has had an enormous impact on the management of effluents in the EU-27 countries,
therefore in this area there is a more effective and advanced management of animal livestock compared to
the one applied in the United States, Japan and China.
1.3.2. Italian regulations
1.3.2.1. D.Lgs. 152/2006 “Testo Unico Ambientale”
Numerous European directives have been implemented in this law, which repeals old decrees.
This act regulates the following subjects:
in second part, the procedures for the strategic environmental assessment (SEA), for the
environmental impact assessment (EIA) and for the integrated environmental authorization (IPPC);
in the third part, the protection of the soil and the fight against desertification, the protection of
water from pollution and the management of water resources;
in the fourth part, the waste management and remediation of contaminated sites;
in the fifth part, the protection of the air and the reduction of emissions into the atmosphere;
In the sixth part, the compensation protection against damage to the environment.
Its primary objective the promotion of the levels of quality of human life, to be achieved through the
preservation and improvement of environmental conditions and the prudent and rational use of natural
resources. For this purpose, it affords reorganization, coordination and integration of the environment laws.
In that decree the vulnerable zone introduce in Nitrate Directive are identified and the required criteria for
agronomic use are given, delegating to the regions the laws actuation. Once the zones have been defined,

31
the implementation of the action plan, which must follow the directions of the directive, is the responsibility
of the region.
1.4. Existing treatments for nutrients reduction and
removal from livestock manure
Many options and treatments can be used for the correct handling of livestock waste. Manure processing
applied for improving manageability and utilization of livestock manure can be modulated according to the
needs of the individual farms in order to respond to specific needs. It is not possible to identify univocal
solution valid in all situations.
It is necessary to consider every single reality and the choice of treatment must be carefully evaluated.
The decision on which treatment has to be applied must include three aspects: environmental protection,
economic feasibility and agronomic needs.
The first point regards the objectives of atmosphere emissions reduction (which includes NH3, odours, GHG,
etc.), the water protection (e.g. compliance with Nitrate Directive), the removal of pathogens, or the removal
of xenobiotic compounds (emerging pollutants). Economic applicability regards the need to match
environmental needs and expendable costs or the possibility of spending reduction. Finally, the need to
apply treatment that balancing the quantity of nutrients remaining in the treated livestock manure with the
crop requirements, for returning the organic matter and nutrients to land in a more controlled way and
improving the stability and plant availability of nitrogen and phosphorus. A processing strategy can consist of
a single process or a combination of various unitary processes.
In the Figure 5 are shown various alternative treatment lines, which foresee the use in sequence of different
chemical, physical and biological treatments that are currently in use or that can be potentially applied. Not
all the treatments have been reported. It has been chosen to represent the treatments that widespread
applied, and some treatments that today represent a novelty in the field of waste manure treatment.
In some contexts, treatment is not strictly required, and the produced livestock waste is stored in a tank and
used at the appropriate time. In this case, as evidenced by the literature, problems related with GHG
emissions occur (in the Figure 5 “emission problems” are identified with an “E”). For example, the storage of
solid manure has also been shown to be a source of CH4, with losses from cattle heaps representing between
0,4 -9,7 % of the total C content of small heaps, end loss can be higher in larger field scale heaps (Chadwick
et al., 2005).

32
Figure 5 Different possible treatment lines for nutrients managing for livestock manure. 1: Separation through separator (e.g. vertical helical separator); 2: Centrifugation; 3: Flotation system; 4: Chemical process for P-precipitation; 5: Nitrification/denitrification process in a conventional scheme; 6: Sequencing batch reactor system; 7: treatment using microalgae; 8: stripping process. With “E” are identify the potential problems connected with emissions of GHG and ammonia.

33
In animal house with slurry collection, the manure remains in a predominantly anaerobic state with little
opportunity for the NH4 +
to be nitrified. Here N2O may theoretically be produced at air liquid interface of
stored slutty or on slats and solid floors where urine and faeces are deposited. In general, emissions of N2O
are a function of production and consumption of N2O and the air exchange rate in the heap. Thus emissions
of N2O typically range from less than 1% to 4,3% of the total N in stored cattle and pig manure heaps. In
addition, ammonia emissions can occur in a storage system.
Emissions from slurry stores may be reduced by decreasing or eliminating the airflow across the surface by
installing a floating cover (different types), by allowing the formation of a surface crust, or by reducing the
surface area per unit volume of the slurry store (Perazzolo, 2015).
For these reasons and obviously for those farms that do not have enough land on which they can spread the
nitrogen load produced (Nitrate Directive), a further treatment is expected. There are different technologies
based on chemical-physical or biological process finalized to the correctly livestock management or to the
elimination of nitrogen compounds (and in general of nutrients).
1.4.1. Solid-liquid separation treatments
Among the chemical-physical processes, the solid-liquid separation is a frequently used treatment for
managing livestock manure. This technique consists in the partial removal of suspended particles (both
coarse and small) from the liquid manure.
The final goal of this treatment is to obtain two fractions: liquid one, characterized by a lower content of DM
(dry matter), lower concentration of nutrient (P and N), heavy metals, and a solid fraction with a high
concentration of DM (from about 15 to 30% depending on the technique used and the incoming material)
and nutrients.
Due to their completely different composition and consistence, the two fractions can be used in different
ways. The liquid fraction can be used directly on the crops, for fertigation, but it can be further treated
through membrane filtration (Masse et al., 2007), evaporation (Veeken et al., 2004), crystallization and
struvite precipitation (Hjorth et al., 2010).
With that kind of treatment, it is possible to reach the more suitable N/P ratio for the crops requirements
and reduce P losses. Appling solid/liquid separation, the TAN /TN ratio (TAN: total ammonia nitrogen; TN:
total nitrogen) in liquid fraction also increases, so more N is readily available for plants. Obviously, this
treatment makes the liquid manure easier to handle, dropping also the consequent risks of blockages in
pipelines (Møller et al., 2002) and reduces the cost and energy consumption.
The same benefit can be obtained by handling the solid fraction that, thanks to its texture, SF (solid fraction)
can be transported with low costs and energy consumption. In addition, although the low quantity, after the
S/L treatment solid fraction results rich in DM, phosphorus and organic matter (Møller et al., 2002). It may

34
also be used for green energy production through anaerobic digestion, or can be used for composting
treatment, as improver of soils, or as input material to produce mineral fertilizer.
In order to carry out solid liquid separation, there are many different options:
- filtration;
- drainage;
- centrifugation;
- sedimentation;
- flotation.
The combination of physical and mechanical separations can be applied for reaching highest separation
efficiency. As example, in a Table 3 are reported results of separation efficiency, reachable with different
types of separator.
Table 3 Separation efficiency reachable with different type of separator (Provolo et al., 2016).
ST % Total
Solid
SV % Volatile
Solids TN % TAN % P2O5
% K2O % Volume (%)
Coarse
Solids
Sieve 20÷25 25÷30 4÷7 5 8÷12 5÷10 5÷20
Cylindrical 28÷48 32÷55 8÷15 5÷10 30÷42 5÷10 5÷20
Helicoidal 30÷48 35÷45 10÷20 5÷10 28÷42 5÷10 5÷15
Small
particles
Sedimentation 55÷60 70÷80 25÷35 20÷30 41÷57 - 15÷25
Flotation 70÷90 80÷95 30÷40 15÷20 70÷90 - 20÷50
Centrifuge 45÷70 60÷75 20÷40 16÷26 62÷80 5÷20 15÷30
Belt press 42÷47 55÷62 24÷33 20÷30 60÷80 20÷30 20÷30
Specifically, the percentage represents the ratio between the amount of element in the solid fraction and
that contained in the sewage entering the treatment obtainable with different types of separator. In
literature, there are many works and research aimed at optimization of solid/liquid separation that, as
explained before, allows livestock waste’s volume reduction and optimized management of the fractions
obtained. Separation is also performed to reduce the risk of phosphorus accumulation on agricultural land,
after livestock manure disposal. The type of separation technique depends to the goal of treatment. When it
is necessary to achieve the maximum level of pollutant’s removal (ex. discharge into surface waters) many
stages of separation are planned and different S/L separation processes in cascade are foreseen.
In the Figure 5, as example is reported a possible line of sequence of separation treatments that remove
ever finer material at each step (1-2-3-4).

35
Nevertheless, even in these cases there is high risk of incurring high emissions of ammonia, (Loyon et al.,
2007).
The solid fraction produced by the treatment has characteristics like untreated solid manure and has been
shown to produce higher N2O emissions during storage, compared to this latter due to the mixture of
aerobic/anaerobic conditions on solid heap. The storage of the liquid fraction can lead to a lower N2O
emission than the untreated slurry. Regarding CH4 emissions, it is difficult to say whether the separation of
sewage increases or decreases it, since it depends mainly on the conditions of conservation and the
characteristics of the obtained slurry fractions (Petersen et al., 2013). Likewise, the combined emissions of
CH4 and N2O from storage of both fractions usually, but not always, were lower than those of the untreated
fertilizer (Dinuccio et al., 2008). Additionally, slurry separation not always resulted in decreasing the NH3
emissions. For example, when an emissions increment is observed, it is caused by the presence of a liquid
fraction characterized by a higher TAN/TKN ratio and a lower TS% content, which slows the crust formation.
This separation treatment is not enough for the objectives set (Nitrate directive), unless the separate solid
obtained is exported. Therefore, often, the fractions obtained are sent to further dealings, which may
include other S/L separation processes, or, more often, may involve other types of processes.
1.4.2. Other physico-chemical treatments
In order to handle livestock manure, other type of treatment can be applied, for example:
- membrane filtration,
- reverse osmosis,
- air stripping (in the Figure 5, n°8).
Membrane filtration and reverse osmosis are processes that can be defined as an “upgrade” of the s implest
liquid solid separation process. The main difference is that, in this case, the separation occurs thanks to
application of a driving force that allows the passage of the liquid through permeable membranes that
retains the solid part. Based on membrane permeability, there are: microfiltration, ultra-filtration, nano-
filtration and reverse osmosis. These treatments are often applied in cascade: in this way, micro-filtration is a
pre-treatment for ultra-filtration, which is considered a pre-treatment for nano-filtration.
This type of process can be applied either when the usual solid / liquid separation treatments do not allow
reaching the request solid removal rate necessary for subsequent treatments, or as separate process, maybe
applied at the end of treatment line for removing the finest particles.
In addition, these processes allow producing a concentrated flow of nutrients that can be further use and
which can be commercialized.

36
In the Table 4 the characteristics of different process are summarized, differentiated according to the
applied pressure and a membrane cut off. This type of processes, however, have a series of operational
problems related to the difficult management of filtering membranes that are very sensitive to wear and
clogging phenomena (fouling).
Table 4 Characteristics of different type of filtrations (adapted from “Supply water treatment course”. Nurizzo C., Politecnico di Milano)
MF micro-filtration UF ultra-filtration NF Nano-filtration RO reverse osmosis
Pressure 1 bar 2÷5 bar 5÷15 bar >10 bar (variable)
Cut-off ≈ 50000 Da ≥ 500000 Da
(for fine membrane) 2000÷80000 Da 200÷5000 Da < 100 Da
Solid
dimension
retained
≥ 0,1 µ ≥ 0,003 µ ≥10-3 µ ≥10-4 µ
What holds?
Bacteria, organic waste,
flocks’ algae, protozoa;
emulsion
low molecular
weight organic
molecules; proteins;
bacteria; virus
Turbidity; colour;
microbiological load;
water hardness;
emulsion
All organic
molecules; ions;
microbiological and
viral load;
In fact, the presence of colloidal suspended solids, organic macromolecules, microorganisms as well as salt
precipitation, the high-applied pressure and the high concentration of the incoming effluent can cause a
change in the operating conditions due to the obstruction of the membrane pores. Even if the application of
that kind of filtration allows reaching high level of removal rate, in the livestock treatment filed they are not
widespread.
Changing type of process, the stripping process is a valid alterative for nutrient managing in livestock manure
treatment. Simplifying process complexity, ammonia stripping is a physical process of removing a compound
from liquid phase, using a gaseous carrier medium. It takes place based on the specific chemical-physical
characteristics of the compound and on the elevation of the total contact surface of the liquid phase with
the surrounding medium. This process, widely widespread in a chemical sector, it was adapted and applied
to livestock treatment sector; it usually exploits use of high temperature and use of chemical products for
rise pH in order to improve ammonia volatilization. Since that treatment is focused to removal N as
ammonia, can be well applied to that kind of slurry that contains high concentration of TAN, as digestate,
namely the product obtained downstream of the anaerobic degradation processes, which will be mentioned.
With an optimized treatment, it is possible to obtain removal efficiency higher than 60% of TAN (considering
only the stripping phase). Recently, possible simplification modifications of the "classic" industrial stripping
37
process have been studied to best adapt it context in order to treat correctly livestock manure, allowing
economic sustainability, as well as management and implementation simplicity (Provolo et al., 2017).
1.4.3. Biological treatments
As said before, in order to reduce nitrogen and nutrients in livestock manure biological treatments can be
applied. These last include conventional nitrification and denitrification processes (NDN), simultaneous
nitrification-denitrification process, short-cut nitrogen removal process, anammox process, enhanced
biological phosphorus removal (EBPR), simultaneous removal of nitrogen and phosphorus. Nowadays there
are also new approaches, for example based on the use of microalgae.
In conventional treatment plants (Figure 5, n° 5), biological removal of nitrogen occurs in two-step process,
involving nitrification followed by denitrification process. Each reaction takes place through the biological
activity of different bacteria. The final aim is that the nitrogen as ammonia in the slurry is converted in N2
and re-enter the N-cycle. In this kind of treatment plants, there is neither the recovery of energy nor of
matter. In fact, the last metabolic step envisages the release of nitrogen as N2 which is naturally a gas.
Leaving the slurry and entering again in the atmosphere the nitrogen released will be again available for the
N-cycle. In this way nitrogen is somehow lost and wasted. The same consideration can be done for
carbonaceous compound that are used in metabolic reactions and returns in the environment as CO2.
Another inconvenient for these types of treatments are the high-energy consumptions and costs that often
discourage the adoption of these plants by farmers. In addition, in these systems it is necessary to install
suitable equipment and instrumentation, as well as to control continuously the process to ensure its correct
operation: the mishandling of these plants can lead to the failure of prefixed objectives set and, indeed, to a
waste of energy, money and resources.
In the recent years, mainly for economic aspects connected with the energy request for operation of NDN
process, different kind of process have been developed, as a system for nitrogen removal based on partial
nitritation with Anammox. This process does not require external carbon addition (necessary for post-
denitrification treatment), has a negligible sludge production and need less energy and oxygen than the
conventional process (Ahn 2006). A scheme reported in Figure 6 explains different nitrogen cycle re-
classified according to potential biochemical pathway (Ahn 2006). During the biological processes, emissions
can occur, mostly due to aeration of slurry during nitrification phase. In fact, the air blown into the slurry can
primarily promote the stripping of ammonia, with the additional risk of producing N2O emissions.
Another biological process widely applied to livestock waste is anaerobic digestion (AD) (Figure 5). This is not
aimed at removing nutrients, rather at the energy recover from effluents, control of odours and stabilization
of effluents before their agronomic reuse.

38
Figure 6. Nitrogen cycle (a) Classical N-cycle, (b) Sharon process, (c) Nitrosomonas aerobic denitrification or aerobic de-ammonification, (d) Nitrosomonas denitrification, (e) anaerobic ammonium oxidation and (f) overall nitrogen web. Ahn 2006

39
In particular, the overall objective of anaerobic digestion process is to convert organic waste into two
categories of valuable products: biogas, a renewable fuel used further to produce green electricity, heat or
vehicle fuel, and the digested substrate, commonly called digestate that can be used as fertilizer in
agriculture. Digestate can undergo further treatments for the recovery of other products.
The process of anaerobic digestion can potentially increase the emission of NH3 due to particular conditions
that occur during the process as a higher concentration of TAN (Total Ammonium Nitrogen) and a higher pH.
Besides the increase of the concentration of TAN, AD (anaerobic digestion) reduces the concentration of
volatile fatty acids (VFA) and increases the concentration of total inorganic carbon (Sommer, 1997).
Another possible technology that can be applied for nitrogen removal and, in general, for nutrients reduction
is the use of microalgae (Figure 5, n°8). In fact, piggery wastewater, as other livestock manure and digestate,
containing high ammonia nitrogen and phosphorus as well as having a high COD content (considering
untreated sludge). These pollutants, however, can serve as nutrients for the growth of some microalgae,
which use N, phosphorus (P) etc. contained in the slurry for their growth, removing them from the effluent.
Furthermore, microalgae produced can provide an additional by-product, which can be re-used as feed in
aquaculture, plant fertilizer or intended to produce bio-fuels (Ayre et al., 2017)
Composting is another potential treatment that can be applied to livestock manure. It is a biological aerobic
process that uses naturally occurring microorganisms to convert biodegradable organic matter in a product
similar to humus. The process it destroys pathogens, converts nitrogen from the unstable ammonia to stable
organic forms and reduces the volume of waste. Some limits of this process are connected with the
increased risk of incurring emissions of ammonia, greenhouse gases including, especially methane and
nitrous oxide.
Another applied treatment are wetlands and them can be natural or constructed wetlands (CWs). This
method takes advantage of using of plants (macrophytes) and is managed as water quality improvement
systems. The reduction of pollutants in wetlands is obtained by a combination of physical, chemical and
biological processes: sedimentation, filtration, precipitation, absorption, absorption of plants, microbial
decomposition and microbes nitrogen transformations; the application of constructed wetlands can treat a
large quantity of livestock manure (Poach et al.2003; Meers et al., 2004).
1.5. References
Ahn, Y. H. (2006). Sustainable nitrogen elimination biotechnologies: a review. Process
Biochemistry, 41(8), 1709-1721.

40
Ayre, J. M., Moheimani, N. R., & Borowitzka, M. A. (2017). Growth of microalgae on undiluted
anaerobic digestate of piggery effluent with high ammonium concentrations. Algal Research, 24, 218-226.
Burton, C. H., & Turner, C. (2003). Manure management: Treatment strategies for sustainable
agriculture. Editions Quae.
Chadwick D., Sommer, S.G., Thorman, R., Fangueiro, D., Cardenas, L., Amon, B., Misselbrook, T.
(2011). Manure management: implications for greenhouse gas emissions. Animal Feed Science Technology.
p. 514-531.
Chadwick D.. (2005). Emissions of ammonia, nitrous oxide and methane from cattle manure
heaps: effect of compaction and covering. Atmospheric Environment. Vol. 39 - p., 787-799.
Dinuccio E., Berg W., Balsari P. (2008). Gaseous emissions from the storage of untreated slurries
and the fractions obtained after mechanical separation Atmospheric Environment 42 2448–2459.
European Environment Agency EMEP/EEA air pollutant emission inventory guidebook 2016;
European 519 Environment Agency, Ed.; Luxembourg: Publications Office of the European Union, 2016; ISBN
978-92-520 9213-806-6.
FAO “Nitrogen inputs to agricultural soils from livestock manure. New statistics”(2018).
http://www.fao.org/3/I8153EN/i8153en.pdf
FAO. 2017. Global Livestock Environmental Assessment Model (GLEAM) [online]. Rome. [Cited 18
May 2017]. www.fao.org/gleam/en/
FAO., 2018.
http://www.fao.org/ag/againfo/resources/en/publications/tackling_climate_change/index.htm
Galloway, J. N., Townsend, A. R., Erisman, J. W., Bekunda, M., Cai, Z., Freney, J. R., ... & Sutton, M.
A. (2008). Transformation of the nitrogen cycle: recent trends, questions, and potential
solutions. Science, 320(5878), 889-892.
Hjorth M., Christensen K. V, Christensen M. L., & Sommer S. G.. (2010). Solid-liquid separation of
animal slurry in theory and practice. A review. Agronomy for Sustainable Development, 30(1), 153–180.
http://doi.org/10.1051/agro/2009010
Holm-Nielsen J.B., Al Seadi T., Oleskowicz-Popiel P. (2009). The future of anaerobic digestion and
biogas utilization. Bioresource Technology, Volume 100, Issue 22, Pages 5478-5484.
https://eur-lex.europa.eu/legal-content/EN/TXT/HTML/?uri=CELEX:32016L2284&from=EN
Leip A.. (2010). Integrating nitrogen fluxes at the European scale. Included in: The European
Nitrogen Assessment, ed. Mark A. Sutton, Clare M. Howard, Jan Willem Erisman, Gilles Billen, Albert Bleeker,
Peringe Grennfelt, Hans van Grinsven and Bruna Grizzetti. Published by Cambridge University Press. ©
Cambridge University Press, with sections © authors/European Union.
41
Loyon, L., Guiziou, F., Beline, F., & Peu, P. (2007). Gaseous emissions (NH3, N2O, CH4 and CO2)
from the aerobic treatment of piggery slurry—comparison with a conventional storage system. Biosystems
engineering, 97(4), 472-480.
Masse L., Massè D. I., Beaudette V., & Muir M. (2005). Size distribution and composition of
particles in raw and anaerobically digested swine manure. Transactions of the ASAE, 48(5), 1943–1949.
http://doi.org/10.13031/2013.20003
Mateo-Sagasta, J., Zadeh, S. M., Turral, H., & Burke, J. (2017). Water pollution from agriculture: a
global review. Executive summary. Rome, Italy: FAO Colombo, Sri Lanka: International Water Management
Institute (IWMI). CGIAR Research Program on Water, Land and Ecosystems (WLE).
Mateo-Sagasta, J., Zadeh, S. M., & Turral, H. (Eds.). (2018). More people, more food, worse
water?: a global review of water pollution from agriculture. Rome, Italy: FAO Colombo, Sri Lanka:
International Water Management Institute (IWMI). CGIAR Research Program on Water, Land and Ecosystems
(WLE).
Meers, E., Rousseau, D. P., Blomme, N., Lesage, E., Du Laing, G., Tack, F. M., & Verloo, M. G.
(2005). Tertiary treatment of the liquid fraction of pig manure with Phragmites australis. Water, air, and soil
pollution, 160(1-4), 15-26.
Møller H. B., Sommer S. G., & Ahring B. K. (2002). Separation efficiency and particle size
distribution in relation to manure type and storage conditions. Bioresource Technology, 85(2), 189–196.
http://doi.org/10.1016/S0960-8524(02)00047-0.
Montes F., Meinen R., Dell C., , Rotz A., Hristov A.N., Oh J., Waghorn G., Gerber P.J., Henderson B.,
Makkar, H.P.S., Dijkstra,J. (2013). Mitigation of methane and nitrous oxide emissions from animal operations:
II. A review of manure management mitigation options. Journal of animal society. Vol. 91.
Mosier, A., Syers, J. K., & Freney, J. R. (Eds.). (2013). Agriculture and the nitrogen cycle: assessing
the impacts of fertilizer use on food production and the environment (Vol. 65). Island Press
Official Journal of the European Communities; Council directive of 12 December 1991 concerning
the protection of waters against pollution caused by nitrates from agricultural sources. https://eur-
lex.europa.eu/legal-content/EN/TXT/PDF/?uri=CELEX:31991L0676&from=EN
Official Journal of the European Communities; DIRECTIVE (EU) 2016/2284 of the European
parliament and of the council of of 14 December 2016 on the reduction of national emissions of certain
atmospheric pollutants, amending Directive 2003/35/EC and repealing Directive 2001/81/EC
Official Journal of the European Communities; DIRECTIVE 2000/60/EC of the European Parliament
and of the council of 23 October 2000 establishing a framework for Community action in the field of water
policy.https://eur-lex.europa.eu/resource.html?uri=cellar:5c835afb-2ec6-4577-bdf8-
756d3d694eeb.0004.02/DOC_1&format=PDF

42
Pain, B., & Menzi, H. (2011). Recycling agricultural, municipal, and industrial residues in agriculture
network. Glossary of Terms on Livestock Manure Management.
Perazzolo F., (2014). Effects of slurry treatments on gaseous emissions from storage and
evaluation of models to predict ammonia release. PhD thesis.
Petersen, S. O., Dorno, N., Lindholst, S., Feilberg, A., & Eriksen, J. (2013). Emissions of CH 4, N 2 O,
NH 3 and odorants from pig slurry during winter and summer storage. Nutrient cycling in
Agroecosystems, 95(1), 103-113.
Poach, M. E., Hunt, P. G., Vanotti, M. B., Stone, K. C., Matheny, T. A., Johnson, M. H., & Sadler, E. J.
(2003). Improved nitrogen treatment by constructed wetlands receiving partially nitrified liquid swine
manure. Ecological Engineering, 20(2), 183-197.
Provolo G., Perazzolo F., Mattachini G., Finzi A., Naldi E., Riva E. (2017). Nitrogen removal from
digested slurries using a simplified ammonia stripping technique, Waste Management, Volume 69, Pages
154-161.
Provolo, G., & Perazzolo, F. (2016). Effluenti zootecnici. In Fertilizzazione sostenibile. Principi,
tecnologie ed esempi operative di Grignani C. (cur.) published by Edagricole-New Business Media.
Santonja, G. G., Georgitzikis, K., Scalet, B. M., Montobbio, P., Roudier, S., & Sancho, L. D. 2017.
Best Available Techniques (BAT) Reference Document for the Intensive Rearing of Poultry or Pigs. Industrial
Emissions Directive 2010/75/EU (Integrated Pollution Prevention and Control)
Sommer, S. G., Christensen, M. L., Schmidt, T., Jensen, L. S., eds. (2013). In Animal Manure
Recycling: Treatment and Management. John Wiley & Sons Ltd. Chichester, UK.
Veeken A.H., de Wilde V., Willers H.C. and Hamelers H.V. (2004). Odour abatement in the
integrated reactor concept for simultaneous treatment of liquid and solid pig manure fractions. Water Sci
Technol 50, 327–334.
Webb, J., Sorensen, P., Velthof, G. L., Amon, B., Pinto, M., Rodhe, L., ... & Reid, J. E. (2011).Study
on variation of manure N efficiency throughout Europe
Zhu N..2006, Composting of high moisture content swine manure with corncob in a pilot-scale
aerated static bin system. Bioresource Technology, 97,1870–1875

43
2. Motivation and goals of this dissertation
Currently, many information may be found concerning livestock manure treatment (see paragraph 1.3)
although there is still the necessity to investigate deeper some aspects to improve the available best
practices and eventually investigate new ones.
Despite the wide attention given to this theme, there are issues that, if solved, would allow achieving the
desired results and therefore process optimization.
The major aim of this thesis was to investigate some issues regarding (1) nitrification and denitrification
treatment, which still arise interest, as they are involved in the proper management of livestock manures.
In fact, in Italy, many nitrification/denitrification treatment plants were installed at farm facilities but very
few showed a correct functioning. These malfunctions prevent farms to achieve the nitrogen removal goals,
with furthermore potential risks in terms of emissions of ammonia and greenhouse gases.
In addition, due to rising interest in the new approaches finalized to nutrients recovery and not only to their
removal, this work is also finalized (2) to study a possible application of solid/liquid treatment aimed to
recovery of phosphorus, that is considered a scares resource.
As also say before, other theme (3) that rising worries and interest is the problem of ammonia emissions and
greenhouse gases emissions. Emissions along the whole handling and treating process represent an
undesirable problem that must be solved and contained, either with a correct mitigation solution or with an
appropriate treatment. In this context for a correct emission evaluation, it is necessary to use a valid method
to estimate the ammonia and greenhouse gases emissions. Therefore, the PhD research is also aimed to
compare different instrument for measure emissions.
In particular, the dissertation is divided into different sections, each of which delves into a theme of interest
in the aforementioned area (Figure 7).
Especially, first contextualization part (Chapter 3), is focused on the description and analysis’s results of the
state of the art of biological process treatment (nitrification/denitrification process mainly) applied in
sequencing batch reactor systems. In particular, studying scientific literature on this theme, operational and
management settings that guarantee excellent nutrient removal yields from livestock manure were
identified, both on a laboratory scale and on a real scale. This research was done also for recognizing the
possible control strategies useful for optimizing the achievable results. With the results obtained, the
operative problems that occur at real scale and how they can be solved were inspected.
The followed part, instead, contains the experimental activity were carried out:

44
a) (Chapter 4) different monitoring campaigns of real scale treatment plants (both SBR and
nitrification/denitrification “classic” plants) have been conducted and different experimental trials
were been carried out. In particular, in order to understand how the SBR plants in Lombardy work
and what are the applied strategies of management of these systems, 5-treatment plants located in
different provinces in Lombardy were monitored. All the analysis concerned this part were
conducted at Università di Milano.
b) (Chapter 5) Always at Università di Milano, 6 lab-scaled SBR prototypes were designed and built, in
order to study in a controlled environment, the biological process applied to livestock manure for
nitrogen removal. In particular, 4 different experiment sets were performed in order to analyze how
the removal rates changed with the variation of some operational parameters.
c) (Chapter 6) Different experiments concerning gas emission measurements were carried out during a
PhD abroad period, that was conducted at IRTA (Institut de Recerca i Tecnologia Agroalimentàries),
and in particular in collaboration with the GIRO group, (Organic Waste Integral Management
Programme). Trails were performed in order to analyse the complex problem of NH3 and GHGs
emissions that can occur during different steps of livestock manure treatment chain. For these
reasons, within the thesis’s research, the application of dynamic method, in particular the use of
different type of dynamic hoods and static chamber for estimating GHGs and NH3 emissions was
investigated.
d) Then (Chapter 7), phosphorus recovery treatment was analysed. In particular, phosphorus
precipitation/flocculation trials were carried out using different chemical compounds before and
after a simplified ammonia stripping process. The aim is to analyse how phosphorus precipitation
process can advantage following treatment and how phosphorus can be recovered. These
experiments were conducted within the ReNeWal project. All the analysis concerned this part were
conducted at Università di Milano.
e) Finally (Chapter 8), considering main results of different research that were carried out, a general
pointing about the correct development of biological livestock treatment process finalizing to reduce
ammonia emission and optimize reachable nitrogen removal rate was given. In particular a
treatment line for pig manure was proposed. It foresees 2 solid liquid/separation processes, an SBR
system and an alternative separation treatment focused on phosphorus recovery.

45
Figure 7 Organization and structure of the dissertation.

46

47
SECTION 2 - BIOLOGICAL TREATMENT FOR
NITROGEN REMOVAL FROM LIVESTOCK
MANURE: PROCESS OPTIMIZATION AND
ENVIRONMENTAL SUSTAINABILITY
3. Sequencing Batch Reactor for nutrients
removal from livestock manure: a review
The content of this chapter will be used for preparing an article Review that will be submitted.
3.1. Introduction
Intensive farming practices and their continuous spread generate a large amount of biological waste, which
need proper management in order to avoid a negative impact on the environment (Bernal et al., 2009).
In order to maintain a sustainable local and global environmental balance and for securing a renewable
source of nitrogen and phosphorus, is necessary to remove and recover nutrients from agricultural runoffs
and animal manure, which are characterized by high load of nitrogen and phosphorus.
When livestock manure are applied to the soil, the excess of nutrients contents, besides other kind of micro-
pollutants or heavy metals, through runoff and leaching, could contaminate surface watercourses and
potentially led to arouse serious groundwater contamination or eutrophication of surface water (Han, Wu,
Zhu, & Chen, 2008).
This nutrients imbalance between the crop requirements and livestock nutrients contents forces to find a
viable alternatives for the direct use of manure as fertilizer ( Deng et al., 2008; Magrí & Flotats, 2008).
The problem concerning nitrogen and nutrient pollution connected with the livestock manure utilization
changes a lot considering different country, farms, restrictions concerning the quality of discharged
effluents, way of breeding, etc.. In EU regions, for example, the limit imposed by the European directive
“Nitrates Directive” for nitrogen utilization on land is 170 kg N/ha/y in Nitrate Vulnerable Zones –NVZ, and in
several regions, there is a significant nitrogen surplus (European Commission, 1991). Accordingly, that the

48
correct management of livestock manure production appears as a necessity, with attention to nitrogen and
phosphorus contents.
Among the different possibility to reduce the nitrogen load, such as the transport of nutrient surplus to other
areas, the introduction of a treatment for removing nutrients excess might be a suitable solution.
There are different technologies finalized to the elimination of nitrogen compounds based on chemical-
physical processes (reverse osmosis, air stripping, membrane filtration, ion exchange, and breakpoint
chlorination) or biological processes. These last include nitrification and denitrification processes (NDN),
simultaneous nitrification-denitrification process, short-cut nitrogen removal process, anammox process,
enhanced biological phosphorus removal (EBPR), simultaneous removal of nitrogen and phosphorus.
Nevertheless, NDN process generally provides the most economical and efficient means for controlling
nitrogen in wastewater effluents, transferring nitrogen to the atmosphere as N2 (Azhdarpoor et al., 2015;
Otawa et al., 2006). For example, up to 60% of total nitrogen initially present in pig slurry can be remove
with NDN (Magrí & Flotats, 2008).
The nitrification/denitrification process applied in the sequencing batch reactor (SBR), currently, is widely
used process for wastewater treatment of domestic and industrial wastewater from a variety of industrial
categories.
Initially, SBR systems were applied to manure for removing only organic compounds aerobically, but that
requirement it was soon transformed into the will and the need to remove also nutrients (Bortone C.H.,
1992). Subsequently, the sequencing batch reactor is soon extended to remove nitrogen and phosphorus by
applying intermittent aeration. With this goal, different process (suspended versus retained biomass) and
configurations (single reactors versus series of reactors) were tested (Magrí & Flotats, 2008). The studies on
SBR systems were then moved on the process layout: different kinds of reactors and configuration have
been tested.
The latest scientific researchers are still focused on these issues, but mostly of the recent ones are
concentrated on the process optimization applied for ensuring appropriate removal rates and guarantee
energy and money saving. In fact, the great success and development of SBR system in many sectors is due
not only to its design flexibility, but also to the development of modern technology, which allows better
process control.
The global attention on SBR technology is also attested by the real allocation of SBR WWTPs (wastewater
treatment plants), which processing industrial and civil wastewater, operating successfully in Japan, in the
United States, Australia and in China, where new constructed wastewater plants have adopted the SBR
process (Yang et al., 2010). This technique has been widely applied also to pig slurries and co-digested
slurries (Choi et al., 2004; Deng et al., 2007; Deng et al., 2008; Lo & Liao, 2007; Magrí & Flotats, 2008; Poo et
al., 2005).

49
Despite other type of biological processes (for example anammox process) currently succeed to the NDN
applied to SBR technology, there is still much to be investigated on the process optimization and on process
optimization tools easy to use, especially for the treatment of livestock manure. In fact, the application to of
biological nitrogen removal to livestock slurry was considered as BAT (best available technology) and also for
this reason, a lot of real scale farms, have applied this kind of treatment. Consequently, although the new
plants will probably be built by applying other technologies, the existing ones need to function at their best.
In addition, although the NDN process operated in SBR has been widely studied, modelled and optimized
especially in the field of urban wastewater, it is necessary to do further investigation on the application and
optimization of this kind of system applied to livestock manure treatment and to the possibility of adapting
this technology to more and more stringent limits and emerging issues in the field of new pollutants.
In this review, numerous studies on SBR systems used for biological nutrient removal from livestock manure
are analysed. The aim of this work, besides to produce an overview on the SBR technology and SBR
monitoring parameters and process optimization, is to individuate its strengths and weaknesses of when is
applied and used for treating livestock manure. This study can be useful also to understand how improve ad
optimize nitrification/denitrification process carried out in real scale SBR systems present on the territory
that are been built for livestock slurry treatment and which do not always reach the intended target
3.2. Sequencing Batch Reactor: general aspects
The Sequencing Batch Reactor is a system where biological degradation of organic matter, nitrogen and
phosphorus occurs in batch instead that in stationary continuous flow condition. In these systems, as well as
for the continuous activated sludge process, the reduction of nutrients from wastewater and in general from
effluents, can be obtained through microorganism activity. That solution represents one of the possible
process tooled in an SBR system (Flores-Tlacuahuac & Pedraza-Segura, 2016).
Differently from a common activated sludge process, in the SBR the reactions occur in a single tank (or
multiple, if is foreseen more lines) and the different biological processes are engineered based on temporal
distribution rather than spatial distribution (Dutta & Sarkar, 2015). In this way, the duration of each phase
can be adjusted in order to meet the different treatment needs, such as low COD (Chemical oxygen demand)
in the effluent.
SBR systems can be defined as unsteady-state activated sludge process (Flores-Tlacuahuac & Pedraza-
Segura, 2016).

50
SBR operates with biological nitrogen removal is an activated sludge system operating with a fill and draw
sequence (cycle) that is repeated over time. Each cycle is composed of various consecutive phases (fill,
reaction phase-anoxic/oxic reaction-, settle, draw and idle) that may overlap depending on the treatment
goal (Han et al., 2008; Magrí & Flotats, 2008; Yang et al., 2010) (Figure 8).
The cyclical trend of SBR operation, based on nutrient removal, confers to this system flexibility for treating
effluent of various kind, including the liquid fraction of pig slurry (Magrí & Flotats, 2008). The time of each
cycle that spans the duration between beginning of fill and end of idle phase for a single tank SBR system, is
essential for the proper optimization of SBR system; to this parameter is connected the number of cycle and
duration of different phases (filling phase, reaction phase, settling phase, draw phase and idle phase).
During the Fill phase, raw wastewater enters the tank and is mixed with the active biomass, which remains
inside the tank at the end of previous cycle.
Figure 8 Schematic configuration of SBR operation.
This phase can be accomplished in different way, in a single time or in a multiple phase (for example as in the
fed step strategy). In particular, depending on the wastewater characteristics and the target nutrient
removal it is possible to define the filling phase as:
- Static fill: influent wastewater is added without mixing; resembling almost a plug flow situation creating
a high food to microorganisms (F/M) ratio, similar to a selector compartment used in an activated
sludge process, and in that way promote the growth of floc-forming bacteria by suppressing the
filamentous ones (Dutta et el., 2015). In addition, due to high F/M ratio it is possible to select that type
of fill when a biological phosphorus removal process is foreseen. This kind of filling can be useful if is
denitrification phase occurs immediately after the feeding.
INLET
FILL REACTION(ANAEROBIC/ANOXIC/AEROBIC)
REACTION
(ANAEROBIC/ANOXIC/AEROBIC)
SETTLEDRAW
OUTLET
IDLE
SLUDGE

51
- Mixed fill: influent wastewater and organics is mixing with the biomass, which initiates biological
reactions (EPA, 1999). During mixed fill, bacteria biologically degrade the organics and use residual
oxygen or alternative electron acceptors. In this environment, denitrification may occur.
- Aerated filling: this type of filling is characterized by the simultaneous aeration of the sewage and the
entry of new sewage. In this way, the aerobic reactions that will be completed in the Reaction phase are
initialized. This type of filling can reduce the air requirement of the reaction phase.
During React phase, the core of SBR operation, the completion of the biological reactions responsible
primarily for the degradation of organic compound and nutrients occur. The treatment is controlled by air
that is on and off for producing anaerobic, anoxic, or aerobic conditions. Obviously, the react phase
operation depend on the requirement and on the type of biological process applied.
During the Settle phase, the reactor tank acts as a batch clarifier, without any inflow or outflow. This phase is
aimed to separate the flock of activated sludge to the clarified effluents, that will be discharge. This phase
usually lasts 0,75-1 h.
In Draw phase, the treated supernatant is withdrawn. Is necessary to leave in the thank over the active
settled sludge a portion of supernatant.
Idle phase is the pause between the draw and the following fill phase. The introduction of this phase can be
useful, for example, when there are several parallel working reactors and it serves as buffer in time. During
this phase, mixing of the biomass to condition the reactive contents, and wasting of excess sludge, may be
taken up, depending on the operating strategy (EPA, 1999).
In order to optimize the duration of the single phase for each case, a proper design of the time cycle is
necessary. The permanence of the biomass in the system depends on SRT (Sludge Retention Time),
consequently the efficiency of removal of nutrients. Generally, too high SRT lead to an inert environment,
with accumulation of non-activated sludge and lower SRT mean that the biomass that has to slow growth
times (such as nitrifying bacteria) is washed away. Various advantages are offered by SBR systems where
nitrification and denitrification process is carried out, as the elimination of settling tank, the less space
requirements and the possibility of modifications of process setting during the trial phases thanks to the
great compatibility of SBR to automation (Artan et al., 2003).
3.2.1. SBR main sizing project parameters
For the correct design of any treatment plant, the first thing to be defined is the characterization of the inlet
flow that have to be treated and the second one is defined the effluent’s characteristics that are being
achieved.

52
Sequencing batch reactor systems allow infinite combinations of sequences aimed at achieving optimal
operation based on the characteristics of the slurry that will be treated.
During operation, some phases are always present as settling and withdrawal; other phases, such as filling
and reaction phases can be present or one phase can exclude the other.
Here below are reported, the main parameters generally necessary for sizing correctly of an SBR system, and
which characterize its design and project (Sirini et al., 2006).
Time of Cycle Tc, spans the duration between beginning of Fill and end of Idle phase for a single tank
SBR system. Represent the duration of each cycle:
Equation 1
where n is the number of cycles [cycle/day]; Tc can be expressed also as 1/n as “fraction for day”.
Time of cycle can be also defined as follow:
Equation 2
where TF is Filling Phase, TR is Reaction Phase, TS is Settling Phase, TD is Draw Phase and TI is the Idle Phase.
The duration of Fill and React phases can be adjusted to impart the SBR system a CSTR-like or ideal PFR-like
treatment characteristics (Dutta and Sarkar, 2015).
VF, volume feed in each cycle:
Equation 3
where Q is daily flow, feed in SBR reactor.
The overall volume of the reactor consists in two volumetric fractions: V0 and VF, where V0 represents the
volume where remains the settled sludge, and volumetric fraction VF, the volume feeds and discharges in
each cycle of operation.
Θ, HRT, hydraulic retention time:
Equation 4
where VT = VF + V0 , and Q= n* VF; the equation 4 becomes:
Equation 5
If V0/VF is defined as recycle ratio R, Θ can be defined as follow:
Equation 6

53
VF/VT can be also defined as volumetric exchange ratio; consequently, the hydraulic retention time, can be
expresses as follow:
Equation 7
VER allows to identify easily the volume percentage which will be treated.
FTR -fill time ratio-:
Equation 8
Sludge Retention Time SRT, is defined as follow:
Equation 9
where x is concentration of biological mass in the reactor; xr is biological mass in the sludge and xe the
biological mass in the effluent; qs is the purged flow of sludge.
Sludge Retention Time for autotrophic biomass SRTA, is defined as follow:
Equation 10
where TAe represents the duration of aerobic phase, which one involved in the growth of autotrophic
biomass. Usually, a SBR cycle can last 6-8 h (4-3 cycles/day) (Obaja et al., 2003, 2005) but its duration can
reach 24 hours. A low cycle’s time needs higher volume; too many cycles for day lead to an incomplete
reaction phase: in fact, if sedimentation time, extraction (withdrawn), have fixed time, the reaction time
have to be reduce for reducing cycle length (Masotti 2011). Obaja et al., 2005, support that the time cycle
and the duration of each single phase within the time cycle, must be designed properly in order to optimize
the removal of nutrients, arguing that the choice of hydraulic residence time (HRT) and solid retention time
(SRT) will depend of this optimization.
3.3. Nitrogen biological removal applied in SBR
In the livestock manure, as for civil wastewater, nitrogen is mainly present in organic form (proteins) and
urea contained in the urine; in both cases, these substances undergo to a rapid process of ammonification
that lead to ammonia nitrogen formation. Among different treatments, nitrogen biological removal can be

54
achieved through nitrification/denitrification process that transforms ammonia present in the slurry to
nitrogen gas.
Specifically, nitrification is a two-step process that is catalysed by aerobic chemoautotrophic AOB (Ammonia-
Oxidizing Bacteria) and nitrite-oxidizing bacteria (NOB). In the first step, knows named nitritation, according
to reactions 11a and 11b AOB, often Nitromonas spp, through aerobic autotrophic process, oxide
ammonium NH4+ to nitrite NO2
−. During this step approximately 75% of the oxygen needed to complete the
oxidation of ammonium is used and the maximum rate of nitrification has been observed to occur at a DO
(dissolved oxygen) level greater than 2,0 mg/L (Dutta & Sarkar, 2015).
In the second phase, nitratation process, NOB bacteria, often Nitrobacterspp, oxide nitrite to nitrate NO3−,
according to reactions 11c).
The complete reaction is reported in equation 11d.
a)
Equation 11
b)
c)
d)
The nitritation phase is empirically the rate-limiting step in the nitrification process, and AOB therefore play
an important role in ammonia removal in wastewater treatment processes. In a properly functioning plant,
oxidation rate of ammonia to nitrite is lower than the oxidation rate of nitrate to nitrites. For this reason, it is
very difficult for nitrites to accumulate inside the nitrification tank.
Assuming a cellular composition of the bacteria equal to C5H7O2N and considering the corresponding cell
growth rates, the nitrification process can be globally represented in the following terms which express the
overall weight ratios for the oxidation and synthesis reactions (equation 12).
Equation 12
from this formulation it is possible to observe that: (1) the synthesis of nitrifying bacteria is very limited
compared to the quantity of oxidized ammonia (0,16 g of new cells for each g of oxidized ammonia
nitrogen); (2) that alkalinity is required in the ammonia-nitrate oxidation process is equal to 7,14 mg CaCO3
to 1 mg of N-NH4+ and that (3) the oxygen consumption for respiration is very high (4,2 gCaCO3 for 1 g of
1 mg of N-NH4+ oxidized).

55
If the concentration of oxygen is too low (<0,5 mg /L), the nitrification process can be inhibited, with a
greater effect on oxidizing nitrite bacteria rather than ammonium oxidants.
As also shown before, the nitrification phase implies proton formation and, in consequence, the potential pH
decrease, this depends on buffer capacity of wastewater or slurries. The rate of nitrification drops to 50% of
the optimum if the pH rises over 9,8 and goes under 7,5 (Kim et al., 2004).
Temperature conditions affect the values of the equilibrium and solubility constants, and kinetics. The
influence of temperature on nitrification process can be expressed by Van't Hoff Arrhenius equation.
Nitrate generated during nitritation are reduced to molecular nitrogen (N2) that leaves the aqueous phase
(schematic formula is reported here below (Equation 13), considering as source of C, waste or wastewater)
by denitrification process, which involves the anaerobic heterotrophic bacteria (more common are
Pseudomonas). Denitrification bacteria are both autotrophic and heterotrophic. Most of them are chemio-
heterotrophic, and take energy from chemical reactions and use the organic compounds as an electron
donor and as a carbon source for cellular synthesis; as electron acceptor, under anoxic or anaerobic
conditions, they use nitrates and produce N2 as refused gaseous catabolite.
In equation 13 is reported reduction equation using as electron donor the internal carbon (yet present in the
wastewater/slurry).
Equation 13
Alternatively, it is possible to add external source of readily biodegradable organic compounds (methanol or
acetic acid).
Denitrification therefore leads to the simultaneous elimination of degradable organic matter and nitrates.
Denitrification kinetics considered as zero order reaction if the concentration of organic substrate is much
higher than the constant of semi-saturation. So, when the carbon is present in excess of the theoretical
demand for nitrate removal, the process is independent of both substrate and nitrate concentration.
Denitrification process is effective at anoxic conditions when DO level is below 0,5 mg/l: if DO concentration
is higher than 1,0 mg/l, the denitrification process is inhibited. For this process, the optimum pH is between
6,5 and 9 (Dutta & Sarkar, 2015). The two main inhibitors of the nitrification process is nitrous acid HNO2 and
ammonia NH3, the first more than ammonium (Yan et al., 2013).
3.4. Characterization of raw animal slurries
As also said before (Paragraph 3.2.1), the characteristics of inlet slurry is the first thing to consider for a
correct design of SBR operation. Livestock manure have different chemical physical characteristics than civil

56
wastewater. For example, are characterized by concentration of ammonia nitrogen ten times higher and
chemical oxygen demand varies from 2 to 51 g/L. Therefore, it is necessary to consider these types of waste
as something different in comparison with domestic effluents, resulting in some differentiation in modelling
of biological process that are involved.
This can lead also to the need to set SBR operation differently.
IN fact, the physical and chemical characteristics of livestock manure have a key role in their management.
Actually, manure characteristics definition is crucial to define, at first the treatment purpose, and then for
the proper process definition and application.
It is very difficult to generalize the characteristics of livestock manure, because, as known, animal slurry is
composed not only of mixture of urine and faeces, but also of bedding materials and process water.
Moreover, animal manure characteristics also depend on the different animals considered (i.e. pigs, cattle,
poultry etc.) and for the same animal, those change with countries, farms, alimentation etc. (Boursier et al.,
2005; Hjorth et al., 2010).
However, for some parameters, it is possible to do several generalizations, which enables an understanding
of the main biochemical processes that will be involved.
Considering biological process, for its proper operation, the pH value must be considered; in fact, the
optimal range for bacteria metabolism ranges between 6,5-7,5. Animal manure is buffered to pH 7 – 8,4
(Sommer et al., 2013).
Focusing on activated sludge process, the wastewater/effluent characteristics that must be considered for its
correct design can be grouped into the following categories: (1) carbonaceous constituents, (2) nitrogenous
compounds, (3) phosphorus compounds, (4) total and volatile suspended solids (TSS and VSS), and (5)
alkalinity (Metcalf & Eddy, 1991).
About animal slurry, organic matter, ranged typically from 70 to 85% of total solids (Burton, 2007; Hjorth et
al., 2009), is essential for the biological process, because microorganisms use it for removing and reducing
the nutrients from the slurry. Thus, total solids, volatile solids, biological oxygen demand BOD5 and chemical
oxygen demand COD are important parameters for defining organic matter in the slurry.
BOD is an unspecific parameter for carbon that is oxidized by the microorganisms present during
standardized incubation (e.g., time, 5 days; temperature, 20°C).
The difference between the BOD5 and the COD values reflects the difference between the various
components: the first is related to the more readily digestible carbonaceous material, COD is the oxygen
required to chemically degrade the oxidizable organic substance present in sample.

57
A large part of COD (more than 50%) can be considered as no biodegradable; this fraction is linked with the
coarse material in the slurry (Burton C.H., 1992). In a typical animal raw slurry, the COD contents can vary
from 1 g/L to 20 g/L. However, is also reported that can happen that only a part of the total organic
substrates (45%) are aerobically biodegradable (BOD5/BOD=0,88) (Magrí & Flotats, 2008). In the study of
Magrì et al. (2008), who obtained results comparable with the study of Boursier et al. 2005 is attested that,
although VFAs (volatile fatty acids) concentration, which represent source of readily biodegradable organic
substance, in liquid fraction of pig slurry reach values up to 6 gO2/L, the assessment of readily biodegradable
organic substrates through respirometry gave only half of this value: they concluded that VFA which were
not directly degraded were supposedly stored inside cells prior to degradation, but cannot be used as
carbonaceous source.
The content of total nitrogen is another essential parameter, which must be considered in animal slurry for
its treatment: an accurate quantification of different fraction and total N is necessary to select and design
the most appropriate treatment to apply. In animal slurry N concentration is related to the protein contents
of diet. Farm animals consume a considerable amount of protein and other nitrogen N-substances with their
feed. The animal absorption of N contents in dietary is often inefficient and 50 to 80% of the N consumed is
excreted. For example, pigs and cattle excrete more than 50 to 60% of the N by urine respectively (70% of
the N in the urine is urea-N). Therefore, the contents of N in manure is a variable characteristic.
The liquid total ammonia N (TAN = NH3 + NH4+) in pig and cattle urine and faces is lower (trace), but during
manure storage urea and organic N or acid uric are transformed to TAN, that is dissolved in liquid (Sommer
et al., 2013). Nitrogen as TAN is approximately 2-5 g/Kgmanure in the pig slurries (lowest value for sows) and
1,7-5,3 g/Kgmanure in the dairy cow slurry. For the latest value, it must be considered that the ammonia
contents differ with the variation of housing. Concerning total nitrogen, in pigs’ slurry N is about 3,8-
6,7 g/Kgmanure and regarding dairy cows (depending on housing type) changing from 3,2 g/Kgmanure to
28,1 g/Kgmanure (Sommer et al., 2013).
Multiple studies have demonstrated the importance of the definition of the content of organic matter and
nitrogen in manure and especially of their ratio. In fact, although these two parameters individually are not
easy to monitor continuously at real scale, their ratio provides important initial information on the potential
of the nitrogen removal treatment, as explain below.
The C/N ratio, expressing carbon contents as COD or BOD in their different fractions, is one of the most
important parameters controlling the removal efficiency of nitrogen during biological treatment, and it can
be used to help the definition of the sequence of different phases in a SBR operation. This because the
catabolic reaction of bacterial population, can occur only if ratios between carbon, nitrogen and phosphorus
(BOD5:N:P) are respected. Indicatively, for denitrification this is equal to 6-8 gCODbiod/gN-NO3-.
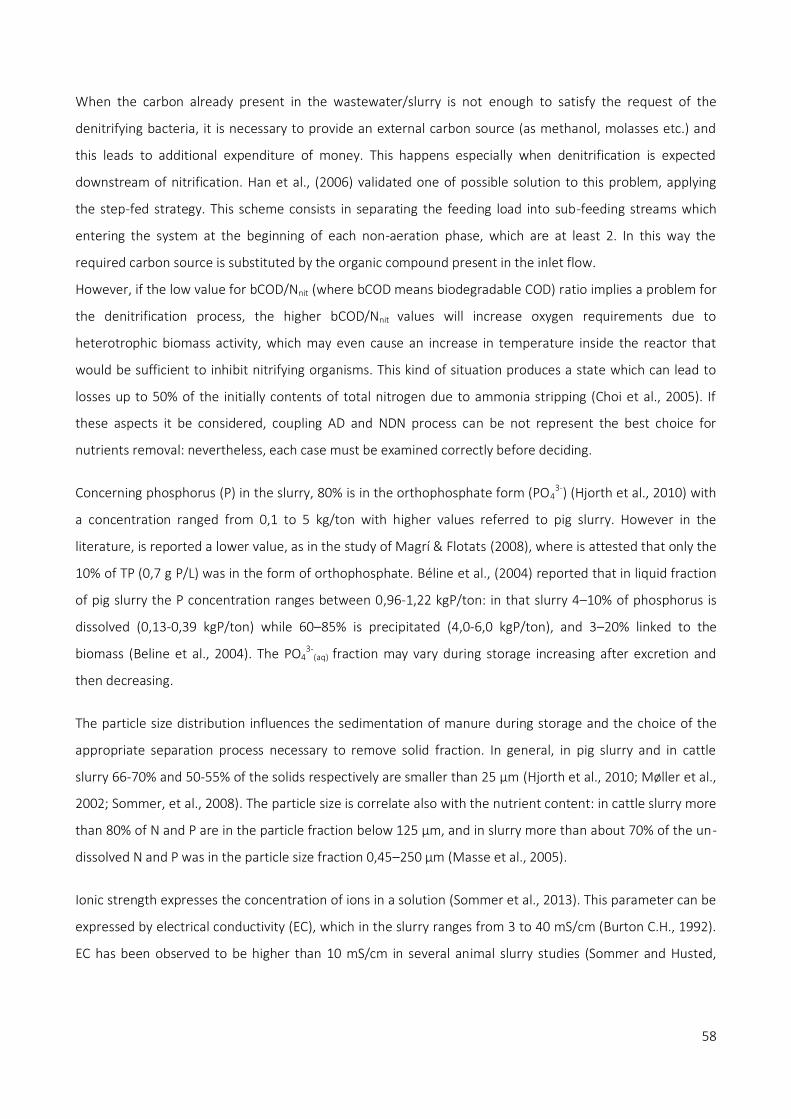
58
When the carbon already present in the wastewater/slurry is not enough to satisfy the request of the
denitrifying bacteria, it is necessary to provide an external carbon source (as methanol, molasses etc.) and
this leads to additional expenditure of money. This happens especially when denitrification is expected
downstream of nitrification. Han et al., (2006) validated one of possible solution to this problem, applying
the step-fed strategy. This scheme consists in separating the feeding load into sub-feeding streams which
entering the system at the beginning of each non-aeration phase, which are at least 2. In this way the
required carbon source is substituted by the organic compound present in the inlet flow.
However, if the low value for bCOD/Nnit (where bCOD means biodegradable COD) ratio implies a problem for
the denitrification process, the higher bCOD/Nnit values will increase oxygen requirements due to
heterotrophic biomass activity, which may even cause an increase in temperature inside the reactor that
would be sufficient to inhibit nitrifying organisms. This kind of situation produces a state which can lead to
losses up to 50% of the initially contents of total nitrogen due to ammonia stripping (Choi et al., 2005). If
these aspects it be considered, coupling AD and NDN process can be not represent the best choice for
nutrients removal: nevertheless, each case must be examined correctly before deciding.
Concerning phosphorus (P) in the slurry, 80% is in the orthophosphate form (PO43-) (Hjorth et al., 2010) with
a concentration ranged from 0,1 to 5 kg/ton with higher values referred to pig slurry. However in the
literature, is reported a lower value, as in the study of Magrí & Flotats (2008), where is attested that only the
10% of TP (0,7 g P/L) was in the form of orthophosphate. Béline et al., (2004) reported that in liquid fraction
of pig slurry the P concentration ranges between 0,96-1,22 kgP/ton: in that slurry 4–10% of phosphorus is
dissolved (0,13-0,39 kgP/ton) while 60–85% is precipitated (4,0-6,0 kgP/ton), and 3–20% linked to the
biomass (Beline et al., 2004). The PO43-
(aq) fraction may vary during storage increasing after excretion and
then decreasing.
The particle size distribution influences the sedimentation of manure during storage and the choice of the
appropriate separation process necessary to remove solid fraction. In general, in pig slurry and in cattle
slurry 66-70% and 50-55% of the solids respectively are smaller than 25 μm (Hjorth et al., 2010; Møller et al.,
2002; Sommer, et al., 2008). The particle size is correlate also with the nutrient content: in cattle slurry more
than 80% of N and P are in the particle fraction below 125 μm, and in slurry more than about 70% of the un-
dissolved N and P was in the particle size fraction 0,45–250 μm (Masse et al., 2005).
Ionic strength expresses the concentration of ions in a solution (Sommer et al., 2013). This parameter can be
expressed by electrical conductivity (EC), which in the slurry ranges from 3 to 40 mS/cm (Burton C.H., 1992).
EC has been observed to be higher than 10 mS/cm in several animal slurry studies (Sommer and Husted,

59
1995; Christensen et al., 2009, Hjorth et al., 2010; Masse et al., 2010). Liquid fraction of animal slurry
typically that have a high ionic strength and high salinity levels, which can affect some treatments.
Obviously, the different treatments that are applied to animal slurries can change some physic-chemical
characteristics and consequently influenced the choice of the final disposal of treated effluent or their
further treatments. For example, the main variation brought by anaerobic digestion (AD), which is one of the
most widespread treatment applied to livestock manure for the energy recover, is the reduction of the dry
matter concentration, changes of the particle size distribution and not least on the breakdown of organic
matter and nutrients. Into the digestate, there are the non-digested recalcitrant organic fraction, besides
micro- and macronutrients. When raw pig slurry undergoes to AD, more than 80% of the total N becomes
available as NH4+ (Vaneeckhaute et al., 2017). Effluent of anaerobic digestion has a highest concentration of
TAN (1000–3000 mg/L as ammonium), smaller carbon to nitrogen ratios (C:N ratios) and reduced viscosities
than undigested animal manures (Möller et al., 2012). It can be use directly or, in the most cases, needs
further treated before utilization (Sui, et al., 2014). The species NH4 + ↔ NH3, CO2 ↔ HCO3
− ↔ CO32−, and
CH3COOH ↔ CH3COO− mainly control the digestate pH value (Möller et al., 2012). During anaerobic
digestion, different reactions occurs and some of them (e.g. precipitation of carbonates; precipitation of
Fe2+, phosphates releases protons, struvite formation) decrease the pH, and other (e.g. formation of
ammonium carbonate ((NH4)2CO3) and the removal of CO2, the rising of concentration of basic cations,
mineralization and reduction of multivalent ions in feedstock) increase the pH. Overall, the pH after a
digestion process is higher than in an untreated slurry. In comparison with a pH of slurry, the median
digestate pH amounts to 8,3 (Vaneeckhaute et al., 2017). AD changes also the contents of the amount of
reactive phosphorus and magnesium, which are increased.
3.5. Typical SBRs control parameters
There are also physical-chemical parameters that play a fundamental role not only in the definition of the
process but also in its correct functioning.
The first is Oxidation Reduction Potential- ORP or RedOx- that generally gives a measure of the oxidative
state in aqueous system, gages the electrical potential required to transfer electrons from one compounds
or element to another compounds or element. ORP is measured in mill volts: the negative value indicating a
tendency to reduce compounds (elements) and positive values indicating a tendency to oxidize compounds
(elements).
ORP has been shown to be a helpful tool for representing the biological state of a system. It can be used for
its correlation with biological reactions between anoxic and anaerobic conditions, or as monitoring

60
parameter to ménage biological nitrogen removal in SBR system (Akin & Ugurlu, 2005). In particular ORP is
very useful to detect different phases of the SBR cycle (anaerobic, aerobic and anoxic) as reported in several
studies (Dutta & Sarkar, 2015; Obaja et al., 2003; Ra, Lo, & Mavinic, 1999).
The normal range of values of ORP is:
0 to 50 mV in aerobic stages;
0 to -300 mV in anoxic stages;
Below -300 mV for anaerobic environment (Dutta & Sarkar, 2015).
In the study of Kishida et al., (2003) the final ORP at the end of the non-aeration phase was within the range
from -300 to -400 mV. This value attest the end of denitrification phase, and is very similar to those observed
in the study of Han et al., (2008), where the minimal concentrations of N-NO3- (< 12 mgN/L) were observed
in the ORP range from -320 to -412 mV.
In a biological process applied for nutrients removal, during anoxic condition, ORP has a continuous dropping
profile with respect to time. Along this, it is possible to identify a particular point, known as nitrate knee,
(Figure 9) which corresponds to the end of nitrates removal and so, to the end of denitrification: when this
situation occurs, it is safe to stop anoxic phase and start the next step (Dutta & Sarkar, 2015; Kocijan & Hvala,
2013; Zhu et al., 2006).
As explain in the study of Han et al., (2008), the ORP has a significantly decrease throughout the non-
aeration phase when microbes have reduced oxides: denitrifies reducing NO3- to nitrogen gas and sulphate-
reducing bacteria (SRB) reducing SO42- to S2
-. In addition, Han et al., (2008), highlighted as sulphides have a
great impact on ORP: a 0,07mgsulfide-S/L concentration increase, induces a 100 mV fall of the ORP value.
Instead, there is an increase of ORP during the aeration phase due to oxides production catalysed by aerobes
in the presence of DO (dissolved oxygen).
Even if the ORP can be a useful tool for monitoring denitrification process, its application can lead to an
incorrect result. In fact, as shown in the same study it is possible that the nitrate knee on the ORP profile is
missed. This is probably due to a sharp drop in the ORP profile following the feeding, which covers the
nitrate knee.
Also during the oxic period, ORP can be useful indicator. On its pattern, it is possible to identify the nitrogen
break point (Figure 9), which represents the end of nitrification. Even in this case, the appearance of this
point is not certain: the absence of ORP nitrogen break point in the case of a complete nitrification could be
due to excess aeration for the instantaneous oxygen demand. In the step-fed SBR process (please also see
par. 3.6), with the excess of aeration, the DO concentration at the end of aeration before feeding could
increase and could lead to an aerobic waste of organic matters contained in the influent.

61
Figure 9 Variations of oxidization–reduction potential (ORP), pH and NH4+-N, NO2
--N, NO3--N during one typical cycle in five SETs;(a)
SET1; (b) SET2; (c) SET3; (d) SET4;(e) SET5; NH4+-N; □ NO2
--N; NO3--N; ● ORP; — pH. NA, non-aeration phase, A, aeration phase;
S&D, settling and discharging; α, nitrate knee; β, ammonia valley; γ, nitrogen break point. Han et al., (2008).

62
With the aim to have a helpful feedback indicator for regulating the, the appearance of the ORP nitrogen
break point can be considered in order to avoid organic matter loss and reduce energy waste.
It is also possible to use the consistent increasing and decreasing of ORP to diagnostic the problem occurring
during aeration phase, which represents a critical issue for aerobic bacteria.
The use of ORP can be applied also for monitoring the phosphorus removal, when SBR is configured with this
aim. Also a relation between ORP and DO is individuated; in particular, it was found that the ORP value is
correlated with the logarithm of the DO concentration in a linear relationship (Akin & Ugurlu, 2005).
The characteristics curve and the abovementioned bending points of ORP’s path is highly dependent to the
denitrification/nitrification rate of nutrient components in wastewater/slurry. For these reasons the
effectiveness of each bending point of ORP functioning as the control point varies in different SBR systems.
Another important parameter connected with biological system that responds to microbial reaction is pH. Its
variation can be used as indication of the ongoing biological reaction, even if this parameter has a more
complex profile than ORP (Han et al., 2008). The optimum pH value is consider to be equal to 8,0 in order to
allow biological growth regardless of the kind of involved organism in microbial reaction (Magrí & Flotats,
2008).
As well as the ORP value, also the pH trend can be identified significant points: at the end of the nitrification
in the aerobic phase, can be distinguished the pH ammonia valley (Figure 9). Furthermore, pH shapes the end
of the denitrification in the anoxic phase through the pH nitrate apex, which indicates the shift from the
anoxic to the anaerobic conditions, necessary for phosphorus removal.
Ammonia valley is an evident point along the pH profile, during aeration phase: its appearance is linked with
nitritation (the first step of nitrification), during which acid is produces and pH tends to decline gradually at
the beginning of nitrification. When all the ammonia has been oxidized and transformed into nitrite, which
concentration produces a peak, the acid production lined with ammonia conversion is stopped and pH
profile shows a concomitant minimum known as ammonia valley. The complete removal of ammonia
indicates also the end of alkalinity consumption in the wastewater (Akin & Ugurlu, 2005; Han et al., 2008;
Kim et al., 2004).
During the anoxic stage, contrary, the pH growths and produces a continuously rising profile. The maximum
is reached when the total nitrate is converted to nitrogen, indicating an end of denitrification stage: this
point is called nitrate apex and corresponds exactly with nitrate knee as observed through ORP profile (Akin
& Ugurlu, 2005).
Although researchers argue that pH profile is the best indicator of the changes in the microbes profile
occurring inside a SBR reactor, the alkalinity present in the wastewater often has a robust buffering capacity
that contracts noticeable the pH variation (Dutta & Sarkar, 2015).

63
For example, Kocijan & Hvala (2013), observed in their study that pH ammonia valley and the pH nitrate apex
were difficult or even impossible to observe also for this reason. In addition, they claimed that the chemical
background of this characteristic pattern is still unclear, and so the pH was used only as an additional regress
or to the DO and ORP signals. Nevertheless, in most studies, pH is used as a powerful indicator; for example,
in the study of Han et al., (2008), a correlation between pH and NH4+-N is found in a power function during
nitrification occurring in the first aeration phases of their experiment. On the contrary, in the same research,
it is established that there is not a significant correlation was found between nitrogen oxides and pH. Also in
this case, the use of pH trend for controlling SBR operation is useful not only for the nitrogen removal but
also for the phosphorus deletion. For example, Akin & Ugurlu, (2004) concluded that through pH path beside
the individuation of the end of nitrification, it is possible to recognize significant points the such as
phosphate release and completion of phosphate uptake.
The dissolved oxygen DO is an important parameter that shall be verified during biological process, since it
serves as an electron acceptor in nitrification and acts as a limiting factor in denitrification. Between the
various operating conditions that may be changed in SBR systems, the aeration profile it is one of the most
important control variables (Spagni & Marsili-Libelli, 2009).
During aerobic phase, in order to guarantee nitrification, a high DO concentration is requested. In this phase,
it is possible to use the DO concentration for process control, because the end of nitrification can be
deduced from the DO time history. This is achievable because the respiratory activity of the biomass
decreases when the nutrients are exhausted in the reactor. Consequently, at the DO breakpoint, DO
increases as a result of the process transition from a high to a low oxygen-uptake rate (Kocijan& Hvala,
2013). A significant zero DO level was present at the beginning of the aerobic phase, however, the DO level
increased to 2,3 –2,7 mg/L at the end of the same phase. The maximum rate of nitrification has been
observed to occur at a DO level greater than 2,0 mg/L and denitrification process is effective at anoxic
conditions when DO level falls below 0,5 mg/L and at greater than 1,0 mg/L, the denitrification process is
inhibited. As well as other parameters, also DO can be used for monitoring phosphorus elimination. For
example, in the study conducted by Akin & Ugurlu, (2005) was observed that it is possible to control
phosphorus uptake and nitrification by using DO profile (in aerobic condition), but the same consideration
cannot be made during anaerobic phase. During this phase the nitrification rate could be used for aeration
control as referenced parameter due to its likeness of the aeration and NH4+-N loading rates (Han et al.,
2007).
The increase of DO concentration affects phosphorus uptake in the biological phosphorus removal process:
excessive aeration may affect the reduction of biological phosphorus removal and can lead to the stop of
phosphorus uptake. This fact results of the gradual depletion of poly-β-hydroxybutyrate (PHB). When
64
nitrogen and phosphorus are targeted, biological phosphorus elimination is interfered with the final or
intermediary products of nitrification-denitrification, as nitrite, nitrate, and nitrous acid, which are closely
associated with the DO level.
It is crucial to consider also the influence of loading rates with the oxygen demand. In some studies, in fact, it
was observed that nitrification process is accomplished at DO levels lower than 0,5 mg/L at short sludge ages
in activated sludge system operates with low organic loading rates.
The intensity of aeration during aerobic phases has an important role for definition the proper DO
concentration and significantly influences the performance of the overall process (Han et al., 2007). In
addition, DO concentration is a very important parameter for controlling the SBR operational costs (Han et
al., 2007). The aeration phase, in fact, require the greatest part of energy.
Concerning other process parameters, SBR correct operations can be carried out without any special
concern at temperatures higher than 16 C° (Obaja et al., 2003). However, temperature parameter is
fundamental for a proper development of microbiological metabolism and often imposes some limitations
for reaching acceptable nitrification rate.
Also the knowledge about microbial population involved in activated sludge processes has an important role
for understanding the biological process and to handle correctly the treatment plant. The chemical-physical
approach for analysing the waste composition does not allow evaluating the activity of the biomass and the
various kinetic parameters necessary for modelling the process. The chemical and physical methods have
little use for the application of simulation models and process control unless combined with biological
measures.
The Oxygen Uptake Rate OUR, ammonium nitrogen concentration AUR, the Nitrate Utilization Rate NUR
tests are efficient tools for characterizing biomass in sludge in SBR systems. Routine performance of the AUR
and NUR tests can be a useful tool for estimating any problem arising from the process (for instance, low
temperatures). In addition, it is observed that values of AUR, NUR and OUR increase with substrate
concentration and that is possible to identify a correlation between these parameters and average nutrient
removal rates observed during SBR operation (Obaja et al., 2003).
The ammonium-oxidizing bacteria –AOB- community structure, which are responsible of the ammonia
transformation, is influenced by the ammonium nitrogen concentration, pH, DO (dissolved oxygen), C/N
(carbon-nitrogen) ratio, organic carbon concentration and inorganic carbon concentration (Sui et al., 2014).
AUR (Ammonium Utilization Rate) allows studying autotrophic bacteria activity, measuring the consumption
of ammonium made by bacteria, during the time.

65
NUR (Nitrate Utilization Rate) allows to study denitrifying bacteria activity, measures the consumption of
ammonium made by bacteria, during the time.
OUR (Oxygen Uptake Rate) represents the oxygen utilization speed by microorganism community. The
measurement of OUR, which can be measured with respirometry techniques, is commonly used for the
compositional typification of waste water and the calibration of bio-kinetic models (Zonta et al., 2014).
3.6. Operational strategies of SBRs applied to
livestock manure for nitrogen and phosphorus
removal
SBR, compared with other system, has attracted even more attention for its high efficiency in removing
nutrients from animal slurries (Bernet et al., 2000; Bortone C.H. 1992; Obaja , Mace et al., 2003; Obaja, 2005;
Zhu, et al., 2006). Since 1980s, scientific articles attest the interest relating to the use of SBR for pig slurry
treatment (Choi et al., 2004; Deng et al., 2008; Poo et al., 2005). The earliest experiments reported in the
literature about the treatment of livestock manure using a laboratory-scale SBR are dated from the late
1980s (Magrí & Flotats, 2008). Nowadays, there is evidence of operative and serviceable SBR reactors for
treatment of liquid fraction of pig slurry in several countries, at both pilot-scale (Poo et al., 2005) and full-
scale (Deng et al., 2007; Lo & Liao, 2007, Magrí & Flotats, 2008).
As say before (paragraphs 3.4), the characteristics of animal slurry are very different from the other type of
wastewater. In Table 5 are reported data about the characteristics of livestock slurries, which are used as
substrates in that several scientific researches. Most of them used as substrate for experiments pre-treated
pig slurries or anaerobic digested pig slurries; in some studies, the substrate undergone to liquid solid
separation and/or dilution before to be used in the experiments. The pH of substrates range is between 7,1
and 9. The carbon content (as COD) varied from 1 g/L to 50 g/L. The concentration of nitrogen ranged
between 1,0-3,5 g/L as TKN and 0,16-3,8 g/L as N-NH4+. Nevertheless, the content of ammonium nitrogen in
most of considered researches were lower than 1 g/L. This parameter is also important because the
reachable removal rate of nitrogen depend also by the initial concentration of nitrogen in the slurry. For
example, as observed by Obaja et al., (2005), the maximum initial NH4+-N concentration that could be
treated in SBR was 1500 mg NH4+ -N/l day.
Then, in the following, deeper analysis about the studies and researches concerning nitrification and
denitrification process and biological phosphorus removal carried out in SBR system for treating livestock
manure is done.

66
In Table 6, 7, 8 and 9 the main characteristics and results obtained by different studies are reported.
Among the studies analyzed, the values of nitrogen removal yields (such as TAN) are very high both when the
treated wastewater was a liquid fraction of pig slurry and when it was a liquid fraction of digestate.
Nevertheless, for these substrates the lowest removal values are attested (71% for a wastewater pre-treated
in a UASB reactor and 68% for an anaerobically pre-treated slurry).
Regarding COD removal rate, the smallest removal yields were observed for a liquid fraction of digested and
for a swine effluent pre-treated through a coagulation/flocculation treatment. However, as will be explained
in the previous paragraphs, the characteristics of the treated wastewater are fundamental for the success of
the removal process, but the operational parameters of the process are equally important.
Since the characteristics of the animal manure produce by farms are very inconstant, the first problem
addressed and analysed here concerns HRT.
Studies affirmed that the fixed hydraulic retention time (HRT) used in traditional treatment processes
frequently results in poor control over the quality of the effluent and in extended treatment that is
inefficient in terms of energy consumption. In fact, the high nitrogen contents of animal slurry leads to the
application of long hydraulic residence times (HRT) for reaching the removal required result, even if this
problem could be solved, in some cases, with the addition of external carbon source (Obaja et al., 2003).
Anaerobically digested swine slurries (or wastewater), had high concentration of ammonium nitrogen and a
low C/N ratio and so, also for this kind of substrate it is necessary to apply a long hydraulic retention time
(HRT) in order to reach the required removal rate (Obaja et al., 2003, 2005; Sui et al., 2014). Nevertheless, in
the analysed studies (Table 6,7,8, and 9) that used SBR lab-scale prototype, and applied fix HRT, this
parameter ranged between 0,1 and 3 days. Among the studies analyzed, only in one case that studied at real
scale the nitrification/denitrification process applied in one tank, the fixed HRT is equal to 9,4 days (Riano et
al., 2014).
In fact, as known, another process parameter defines the permanence of biomass in the reactor: the sludge
retention time (SRT). The SRT, besides its importance in correct process definition, is strictly connected with
the biomass activity. Regarding the SBR applied to treatment of livestock manure, Akin & Ugurlu, 2004
observed significant changes in the effluent concentrations of phosphate, ammonium, and oxide nitrogen
with changing SRT. In particular, through their experiment, they attested that SRT could influence
phosphorus uptake and release and the nitrogen removal rate. They detected that concentration of
ammonium nitrogen in the effluent increased with decreasing SRT. Besides, in experiment of Akin & Ugurlu,
(2005) it was observed that there is discrepancy between the optimum SRT applied for P removal and for N
removal: the highest efficiency occurred with a SRT of 10 d and 25 d for P removal and nitrification rate
achievement respectively. In fact, with the growing of SRT, attained by increasing the mixed liquor

67
suspended solids (MLSS) concentration in the reactor, it is possible to increase concentration of nitrifiers and
consequently the nitrification rate.
For modifying SRT another possibility is the application of low inlet flow rate. Among the investigated
researchers, only in one case the SRT was lower than 11 d (Akin et al., 2003). In the other studies, the N-NH4+
removal rate is higher than 68% regardless of the applied SRT.
Actually, as also indicated in the paragraph 3, not only HRT and SRT influenced the removal yields achievable.
In the study of Akin et al., (2003), in which was applied constant SRT, the obtained removal rate changed a
lot varying the way of influent feeding.
Also the duration of each phase as an important influence on removal rates: in the study of Han et al.,
(2008), it was observed that the duration of the non-aeration phase played a key role in improving
denitrification efficiency. In fact, a prolonged non-aeration phase enables denitrifies to use its cellular-stored
carbon to accomplish a endogenous denitrification. Akin & Ugurlu, (2004) attested that phosphate release
(about 6%) occurs at the end of the settling phase. This fact shows as a long settling period kept for their
experiment (1,5 h), resulted in the establishment of anaerobic conditions. In order to reduce the phosphorus
release and to improve sludge settling characteristics a shorter settling period (30 min) was applied in their
experiment.
In the studies considered, the operation setting, and in particular the duration of each phase, were very
changeable. When an SBR is used for nutrients removal, the most applied time cycle is equal to 8 hours; in
few cases the cycle’s duration is higher than 24 h or lower than 4 h. In many application cases, the
denitrification phase was preceded to the phase of the need to exploit the naturally occurring carbon in the
wastewater/slurries used. About that, considering livestock manure slurries and wastewater, but also for
other type of wastewater, the definition of the of organic matter and nitrogen contents and especially of
their ratio (paragraph 3.4) is essential. Considering the analysed studies, COD/TKN, BOD/TKN, BOD/COD and
BOD/TAN are defined (where possible) (Table 5). COD/TKN is always higher than 4,2 and only in one case
TOC/TN ration is lower than 2 (1,2). Anyway, in this specific case, the aim of the research was to develop a
real-time control strategy to respond to cases in which the ratio between carbon and nitrogen was not
enough to allow complete denitrification of NO3- products. The removal yields achieved was 94,7% for the
TOC and 96% for the TN (Kim et al., 2004). Obaja et al. (2003) support that C/N ratio as (C–acetic/NOx–N),
must be equal to or higher than 1,7 to obtain complete denitrification to molecular nitrogen; the data found
by other researches, even expressed in a different way, were different. Henze et al. (1995), identified
minimum values of 5–6 to ensure complete denitrification, as supported also by Choi et al., (2004), which
indicated that COD/TN rate greater than 6 and the Alk/TN ratio higher than 3,6 are required to have higher
removal efficiency. As shown in the Tables 6,7,8,9, the lowest observed removal rate for TAN (68%)

68
correspond to a BOD/TN=2,09. In the study of Mees et al., 2014, whose characteristics were not reported in
Tables (6, 7, 8 and 9), SBR was applied for treating bird slaughterhouse and cold storage processing
wastewater (135 mg/L of NH4+-N), the ratio value C/N (COD/N-NO2
-+ N−NO3-) shall be ranged from 6 to 9 for
obtaining the highest value of inorganic nitrogen efficiency removal.
In the study of Magrí & Flotats, (2008), was indicated that a lack of biodegradable organic carbon,
represented by a BCOD/TKN ratio equal to 3,9, may limit denitrification potential. The authors suggested
considering carefully the adoption of other ratios that do not contemplate the biodegradability of organic
carbon, such as the COD/TKN ratio (8,8), as they may lead to erroneous interpretations.
Some of analysed researches were focused on acting on the way of reactor feeding, or on the possible
modification of the inlet sludge composition for changing the ratio between biodegradable chemical oxygen
demand and nitrificable nitrogen (BCOD/Nnit). For increasing the BCOD/Nnit ratio due to the lack of internal
carbon source, Lee et al., (1997) and Obaja et al., (2005) proposed to use as external carbon source matter
already available on farms (e.g. Pig Raw Slurry). This allowed to not increase system operating costs,
obtaining the desired removal yields. Otherwise, Zhu et al., (2006) analyzed the variation of C/N value
operating on addition of synthetic organic supplements and concluded that, contrary to other researches,
the global TKN removal rates, with or without acetate addition, were similar, indicating that most of TKN
could be decomposed by microorganism using the carbon presents in the slurry.
Further studies are focused on optimizing the addition of the external carbon source under low C/N load
cycles in order to enhance nitrogen removal (Kim et al., 2004).
Other observations regard the relation between the C/N ratio and the nature of reactor’s influent. In fact,
differently from some types of manure (as pig slurry), BCOD/Nnit ratio is lower if the sludge was previous
subjected to anaerobic digestion (Deng et al., 2007; Kim et al., 2004; Magrí & Flotats, 2008). As reported in
the study of Otawa et al.,(2006), in the anaerobically digested swine wastewater, COD/TN ratio is equal to 1–
3, and in their study this resulted insufficient for TN removal.
In many studies, the operation of reactors occurred at controlled temperature to optimize bacterial activity
(above 20°C). Appling simplified Van't Hoff Arrhenius equation (equation 14), where μT is the maximum
growth rate at the operating temperature T and μ20° the reference speed assumed equal to 20°C, it is evident
that the bacterial growth increases with temperature. Θ is the constant of adjustment, that assumes
different values depending on the biological processes considered. In an activated sludge system θ is worth
1,06-1,12 for the nitrification process and 1,03-1,12 for the denitrification process.
Equation 14

69
Nevertheless, some studies analyzed deeper how the removal rate changed varying the operational
temperature applied. In the study of Deng et al., (2007) is observed that, although the air temperature fell
below 10°C in winter, with water temperature ranging from 10 to 15 °C, SBR still showed good removal of
COD and NH4+-N.
To establish the temperature limits, Obaja et al., (2003) done a series of experiments applying nine different
temperatures from 8 to 25°C. At the lower temperatures tested, substantial reduction in removal percentage
occurred. This phenomenon was especially evident below 16°C. Under 16°C the ammonium removal yields
was unacceptable in most of the practical situations (Figure 10) but a signify decrease in the yield of the
process did not occur until 8–10 °C (Dutta & Sarkar, 2015). Contrary, temperature does not affect
denitrification reaction.
Figure 10 Removal rate of TAN varying the temperature (Data elaboration from Obaja et al., 2003).
The content of dissolved oxygen in the reactor during nitrification and consequently the aeration flow has an
important role in the reaching the desired nutrients removal yields, as also explained in the previous
paragraphs. Han et al., (2007), for example, observed that, using swine wastewater with a COD
concentration of 5,9 g/L and COD/TN/TP ratio of 100/21/1, the suitable aeration intensity was 4,2 L/m3/s for
the twice-fed SBR tested (HRT: 3,3 d; SRT: 27 d) in order to achieve optimal nitrogen and carbon removal
rate and prevent a phosphorus accumulation with minimal energy consumption. Wu et al., (2015) indicated
that an anoxic stage in SBR reactor could be maintained during aeration phase when air was supplied at
0,06 LAIR/LSLUDGE/min-1.
In real SBR installations, the on line control of direct parameters such as COD or BOD, TSS, and various forms
of nitrate and phosphate (NO3-, NH4
+, PO43-) is often expensive and difficult to achieve with the current
0
20
40
60
80
100
0 5 10 15 20 25 30 35
µTA
N %
TEMPERATURE °C
N-NH4+ removal

70
available technology (Akin & Ugurlu, 2005). These direct measurements cannot be frequently performed
through an on-line monitoring system mainly for the economic costs. For this reason, the process control
operation, as happen for the development of algorithm used for this scope, are often based on indirect
process variables, which usually comprise pH, ORP and DO. These parameters, are explained in the previous
paragraphs, are well linked to the path of biodegradation processes, which can be inferred from these
measurements (Ga & Ra, 2009; Gu, Wang, Yang, Yang, & Peng, 2012; Kishida et al., 2003; Won & Ra, 2011)
and can be can be used for developing a proficiently process and a correct control strategy for livestock
manure treatment.
Generally, the control strategy plays a key role in the process optimization not only for the nutrient removal,
but also for the limitation of energy and operational cost. Is reported that SBR process automation, can also
afford to save more than 60% of the operating cost required in a conventional activated sludge process
applied to wastewater and guarantees high effluent quality with a shorter aeration time (Dutta & Sarkar,
2015; Yang et al., 2010).
A lot of scientific researches, both in the field of livestock manure treatment both and wastewater
treatment, are aimed to study the application of adjustment of SBR cycle length or other process parameters
by using real-time control and common probes (Kim et al., 2004; Kishida et al., 2003; Won & Ra, 2011; Poo et
al., 2005; Han et al., 2008; Han et al., 2007).
In general, control strategy applied in that specific case to SBR systems, can be divided into fixed-time
control strategies, based on the set “fixed” duration of each phase, and real-time control strategies, which
adjust the duration of the phase on-line, during process. In the latter case, each operational period should be
concluded when the desired biodegradation processes in the considered phase are finished. For example,
the aerobic phase should be stopped when all the ammonia is converted into nitrate, while the anoxic phase
should be completed when the nitrate has been denitrified and all the available organic carbon has been
used in the process. For this goal, the use of process parameter is necessary.
Won & Ra, 2011 at the SBR farm-scale studied a process with newly designed real-time control strategy
using ORP and pH (mV)-time profiles: they evaluated its practicality and analysed the operational
characteristics of the real-time control. Using this strategy, the duration of the anoxic and aerobic phases
was flexible from cycle to cycle. As attested in their study, through this control, a very high nitrogen removal
efficiency was achieved (100% NH4+-N and 98% soluble N) despite high N loading rate variations. They
underline that the most evident advantage of real-time process control over a fixed-time cycle mode of
operation is the complete removal of contaminants in the wastewater by the achievement of a flexible
hydraulic retention time (HRT). In particular among their test, they reached the higher removal rates with
cycle duration time average equal to 14,6 h, having 4,01 h of air-OFF (mixer-ON) and 8 h of air-ON.

71
Comparing that result with ones obtained with the fixed-time operation (24 h cycle) they fund an energy
usage saving about 39%.
Using as a control parameter the pH value, Akin & Ugurlu, (2004) observed that during the shorter settle
phase set in their experiment (0,5 h), a decrease of pH value occurred due to CO2 accumulation when oxygen
was used up in respiration. Therefore, pH can be a useful tool for defining the correct duration of
sedimentation phase. In addition, the same authors, in other study (Akin & Ugurlu, 2005) observed that,
during a P-removal process the oxic phase can be ended after the achievement of pH plateau: a confirmation
of the potentiality of this parameter for controlling the process.
There are also studies focused on establish operating strategies suitable for the fluctuations of influent loads;
for example the research of Kim et al., (2004) aimed to study an integrated strategy of real-time control.
They set an integrated real-time control strategy, feeding the reactor pulsing swine waste only when the
nitrate breakpoint occurred in the ORP-time profile. This approach enables the optimization of swine waste
addition.
Other studies, even though do not concern livestock slurries, are focused on the optimization of a particular
phase of SBR cycle as in the study of Flores-Tlacuahuac & Pedraza-Segura, (2016) where the nonlinear
continuous optimization formulation is proposed.
Recently, computational intelligence methods for SBR control and decision-making have proved to be very
useful for on- line control. Some researchers studied different methods like artificial neural networks, fuzzy
logic, neural fuzzy model and similar used for the inference of the operation-phase ends (Hong et al., 2007;
Dias and Ferreira, 2009; Huang et al., 2010; Marsili-Libelli, 2006; Marsili-Libelli et al., 2008; Sottara et al.,
2009; Sottara et al., 2007). Statistical methods and probabilistic methods are used too (Villez et al. 2010,
Sottara et al. 2009; Zonta et al. 2014). For example, Poo et al., (2005) in their study presented the local
control techniques such as the diagnosis of influent loading rate and determination of aeration period
centred on ORP and DO profile. In addition, they described the remote management system that can be
accomplished by the fuzzy inferred system and artificial neural network (ANN) that allows reaching the
complete removal of TAN.
There are no doubts that the best removal yields, and the best saving of energy and economic resources is
obtained with the application of real-time control of the duration of the process and the phases. In this
strategy, an HRT that is not pre-established but varies over time optimized using ORP or pH, and DO.
Concerning not only the process control strategy, but also the modelling of biological process, despite the
numerous studies relating to the modelling of urban wastewater treatment (for example, the ASM1 model

72
that have been developed and edited by the International Water Association, and their following variation-
ASM2, ASM2d, ASM3), there are not many researches focused on modelling of livestock waste treatment
using SBR system. Furthermore, for the correct utilization of ASM models it is necessary to know a lot of
input parameters besides kinetics and stoichiometric parameters. As explain before, standardization of
livestock slurry characteristics is very difficult as well as summed up this in synthetic parameters for applying
it to different cases. Also for these reasons the direct use of these models for simulating the treatment of
concentrated streams as piggery wastewaters, may not be a suitable option (Magrí & Flotats, 2008).
Nevertheless, there are studies that purpose to establish and calibrate a model for the simulation of the NDN
process applied for the treatment of the liquid fraction of piggery sludge in an SBR. In that model, developed
by Magrí & Flotats, 2008, nitrification and denitrification were considered as two-step processes, and pH was
considered a state variable. Sensitivity analysis was also conducted to identify those parameters that affects
mostly the response of the model under test conditions.
It is interesting to note that among the parameter considered for the model, the average of values of the
parameters related to aerobic hydrolysis (kh, hydrolysis rate constant and KX, particulate COD) were
estimated to be 4,13 1/d and 0,17 mgCOD/mg COD, respectively. Typical values given in ASM1/2 for urban
wastewaters treatment are lower than estimated one [kh= 3,00, KX =0,03/0,10]. Indeed, parameter values
may vary significantly according to the origin of the wastewaters.
Béline et al., (2007) have studied and proposed a version of the ASM1, which uses data from a pilot-scale
SBR for calibration procedure. The whole objective of their work was to develop and to calibrate a
mathematical model for the simulation of the modified SBR, treating piggery wastewaters. That latter
evolution introduces an intermediate step: nitrite was considered as an intermediate in both the nitrification
and denitrification processes. During nitrification, temperature and DO concentration were recognized as
significant factors, which induce nitrite accumulation during nitrification.
It is therefore clear that modelling the process can be a powerful tool; however, it must be used taking into
account that the input parameters and variables must be related with livestock manure and wastewater and
that therefore the default values normally used may not represent exhaustively any specific case.

73
Table 5 Characteristics of substrates used in several research. SDP: Supernatant of digested piggery wastewater; SP: Supernatant of NON-digested piggery slurry; SDPC: Supernatant of digested piggery wastewater after centrifugation SW: Swine pre-treated Wastewater; SWSS: Swine Wastewater Screened/Sieved; DSW: Digested (UASB) Swine Wastewater; DRS: Diluted Raw Slurry; SRS: Swine Raw Slurry.
Parameters U.M.
Magrì
et al.,
2008
Magrì et al.,
2009
Obaja
et al.,
2003
Obaja et al.
2005
Kimshida et al.
2003
Kim et al.,
2004
Poo et
al., 2005
Han et
al. 2007
Han
et al.
2008
Wu et
al.
2015
Deng et
al. 2008
Zhu et
al.
2006
Qing et
al., 2011
Beline et al.,
2007
Substrate - SDP SP SP SDPC SDPC SP SW SRS SW SRS SW SP SW SWSS DSW DRS - SWSS
(1)
SWSS
(2)
pH - 8,0 8,4 8,42 8,45 8,9 - - 8,7 - - 7,1 - 7,4 7,6 - -
EC dS/m 18,2 - - - - - - - - - - - - - - -
TKN g/L 3,4 2,7 3,4 - - - - - - - 1,3 1,2 - - 1,22 - - -
TN gN/L - 1,7 1,65 0,79 1,13 3,7 0,72 4,53 - - - 1,2 0,83 - - 4,6 4,3
NH4+-N/TAN gN/L 2,6 2,0 2,6 1,6 1,60 0,72 1,12 - 0,589 3,8 1,2 1,2 0,9 0,75 0,86 0,17 3,0 3,4
NO2− mgN/L - 0,0 0,0 0,0 <0,1 - - - 0 n.d - - 0,0 0,06 0,0 0,0
NO3− mgN/L - 0,0 0,0 0,0 <0,1 - n.d - 0 n.d - - 0,0 0,65 0,0 0,0
BOD gN/L 11,4 - - - - - - - - - 3,7 - 3,66 - - -
BOD5 gN/L - 1,73 1,73 3,25 2,96 97,3 3,2 90,28 8,0 2,98 3,57 - 0,26 - - - -
COD (45 µm) gN/L 30,1 18,7 30,1 3,97 3,09 7,45 - - - - 5,94 6,13 8,8 1,19 8,80 1,5-2 50,60 39,40
CODs gN/L 8,0 - - - - - - 11,0 - - - - - - 21,80 14,80
TOC mg/L - - - - 1230 - 864 26,17 - - - - - - - - -
DP mg/L - - - - - - - - 46,7 44,7 56 - 39,9 - - -
TP mg/L 722 1100 700 171 - - 20,8 2780 46,0 2,6 20,0 59,1 59,2 601 46,4 601 - - -
PO43− -P mg/L 75,0 200 100 147 147 120 4,6 - 18,0 - - - - - - - - -
TS g/L 24,9 26,5 24,9 11,2 11,2 13,4 - - - - - - 10,5 - 10,5 - 54,0 31,1
TSS g/L 17,7 2,58 2,58 3,10 0,31 115,7 0,92 0,917 1,5 - - - - 7,66 - - -
VS g/L 15,3 5,35 5,35 6,23 - - - - - - - - 5,40 - 42,50 20,10
VSS g/L - 1,96 1,96 2,20 - - - - - - - - 4,42 - - -
Alkal3,53 gN/L - 5,23 5,23 6,53 - - - - - - - - - - - -
Alkal7,74 gN/L - 1,18 1,18 1,45 - - - 13 - - - - - - - -
VFA gN/L - 2,1 6,4 - 1,05 5,28 - - - - - - - - - 10,70 6,20

74
Table 6 The summary of considered studies (W: wastewater, SW: synthetic wastewater; DPS: digested pig slurry; P: pig slurry; PDPS: partially pig digested; BS: bench scale; SRPS: supernatant of raw manure finishing barn pigs; SP: sown; AD: anaerobic digestion; at: anaerobic treatment; S/L :solid liquid separation; C/F coagulation/flocculation; DI: Dilution; OPC: operational conditions.
SLURRY TYPE
PRE-TREATMENT
TREATMENT SCALE SCOPE
Tilche A., 2001 P S/L SBR NDN REAL MONITORING- MODEL VALIDATION CALIBRATION
Wu et al., 2017 P S/L+ D SBR NDN+P LAB 1,2 STUDY STEP FEED INFLUENCE ON C,N,P REMOVAL EFFICIENCY AND INFLUNECE OF N(IN) ON C/NTOT (ORG, NO3-, NO2-, NH4+) AND CORRELATION BETWEEN C/N AND N REDUCTION
Riaño et al., 2014 SP S/L+ C/F NDN IN 1 TANK REAL STUDY INFLUENCE OF DIFFERENT PROCESS ON N-, OM-,ME- AND PATOGENS REMOVAL RATE. COST'S ANALYSIS
Deng et al., 2008
DPS
S/L +AT (UASB)
SBR NDN LAB 1,2, 3
STUDY DIIFERENT WAY TO ADD CARBON SOURCE FOR THE TREATMENT OF DIGESTED SLURRY
DPS +ALK
DPS+ RW
Deng et al., 2007 PDPS REAL ANARWIA PROCESS DEMOSTRATION
Deng et al., 2006 PDPS S/L + AT (UASB)
IC-SBR NDN LAB STUDY THE APPLICATIONOF ANAEROBIC DIGESTION FOLLOWING BY IC-SBR FOR TREATING SWINE WASTEWATER
Akin et al., 2003 SW -
SBR NDN +P BS1 STUDY SBR (ANAEROBIC-ANOXIC-AEROBIC) FOR REMOVING NUTRIENTS (N & P); TEST DIFFERENT SRT
SBR NDN +P DIFFERENT FEEDING TYPE
BS2
STUDY SBR (ANAEROBIC-ANOXIC-AEROBIC) FOR REMOVING NUTRIENTS (N & P); TEST DIFFERENT SRT
SBR NDN +P DIFFERENT OPC
BS3
SBR NDN +P DIFFERENT OPC
BS4
Han et al., 2008 SRPS S/L SBR FED STEP BS 1, 2, 3, 4
STUDY ORP-AND PH-TIME PROFILES FOR STEP-STRATEGY FOR OPTIMIZATION N-REMOVAL
Obaja et al., 2003 DPS AD+ S/L+ D (1:10)
SBR
LAB 1, 2, 3, 4
STUDY THE POSSIBILITY TO TREAT ANAEROBICALLY DIGESTED PIGGERY WASTEWATER. STUDY INFLUENCE OF TEMPERATURE ON NUTRIENT REMOVAL RATE
Obaja et al., 2002 DPS AD+ S/L+ D (1:10)
SBR
LAB 1, 2, 3, 4
STUDY THE INFLUENCE OF CYCLE LENGHT ON NITRIFICATION RATE REACHABLE
Obaja et al., 2005 DPS AD+ S/L+ D (1:10)
SBR LAB 5,6,7
STUDY THE POSSIBILITY TO REMOVING NUTRIENTS FROM DIGESTED PIG SLURRY ISING AS CAROBON SOURCE THE UN-DIGESTED PIG SLURRY
Kim et al., 2004 P (+W)
S/L + D(C/N: 1,22-1,53)
SBR LAB 1,2 STUDY IF IT POSIBLE TO ESTABILISH AN INTEGRATED SWINE WASTEWATER TREATMNT SYSTEM AND OPERATING STRATEGIES SUITABLE FOR INFLUENT FLUCTUATIONS P (+W)
S/L + C/F (C/N 0,45-0,79)+ D
Magrì et al., 2008 P S/L SBR LAB 1,2 TO ESTABLISH AND CALIBRATE A MODEL FOR THE SIMULATION OF THE NDN PROCESS APPLIED FOR THE TREATMENT OF THE LFPS IN A SBR TYPE REACTOR.
Zhu et al., 2006 P S/L + D1% TS (AN/AX)2 SBR LAB1, 2
STUDY NEW PROCES APPLIED IN SBR WITH USE OF EXTERNAL USE OF CARBON SOURCE
Poo et al. 2005 PW - SBR (INTERMITTENT FEED)
REAL STUDY 3 DIFFERENT CONTROL METHODS BASED ON OXIDATION REDUCTION POTENTIAL (ORP) AND DISSOLVED OXYGEN (DO) FOR DETERMINING AERATION TIME
Lo & Liao, 2007 DPS AD+ S/L SBR (AEROBIC ONLY) REAL THE TREATMENT RESULTS AND IMPLICATIONS OF THIS FULL-SCALE SBR SYSTEM IN TREATING SWINE WASTEWATER
Won et al. 2011 PW - SBR FARM (PILOT)
STUDY THE OPERATION OF A FARM SCALE SBR OPERATING WITHA REAL TIME CONTROL
Han et al., 2007 SRPS S/L SBR FEED STEP LAB 1, 2, 3
STUDY ORP-AND PH-TIME PROFILES FOR STEP-STRATEGY FOR OPTIMIZATION N-REMOVAL

75
Table 7 characteristics of substrate used in the studies.
SLURRY TYPE
TS,i (g/L)
VS,i (g/L)
TSS,i (g/L)
BOD5,i (g/L)
COD,i (g/L)
TKNi (g/L)
TAN,i (g/L)
TN,i (g/L)
Ptot,i (mg/L)
CODsol,i (g/L)
TOC,i (g/L)
Psol,i (mg/L)
NO3-,i
(mg/L) NO2
- ,i (mg/L)
COD/ TKN
BOD/ TKN
BOD/COD
COD/ TAN
BOD/TN
BOD/ TAN
Tilche A., 2001 P 6,0 2,6 1,9 6,02 0,68 0,52 91 8,83 11,5
Wu et al., 2017 P 4,3 3,6 0,68 3,56 31,4 0,00 0,00
Wu et al., 2017 P 4,3 3,5 0,70 3,39 30,8 0,00 0,00
Riaño et al., 2014 SP 5,3 2,5 4,5 1,05 1,01 46 3,6 44 4,28 4,47
Deng et al., 2008 DPS 0,26 1,2 0,75 0,83 46,4 0,22 1,59 0,32 0,35
Deng et al., 2008 DPS +Alk 0,26 1,2 0,75 0,83 46,4 0,22 1,59 0,32 0,35
Deng et al., 2008 DPS+ RW 0,26 1,2 0,75 0,83 46,4 0,22 1,59 0,32 0,35
Deng et al., 2007 PDPS 0,74 0,22 1,2 0,609 0,75 0,19 1,89 0,30 0,37
Deng et al., 2006 PDPS
Akin et al., 2003 SW 0,4 0,5 20 0,80
Akin et al., 2003 SW 0,4 0,5 20 0,80
Akin et al., 2003 SW 0,4 0,5 20 0,80
Akin et al., 2003 SW 0,4 0,5 20 0,80
Han et al., 2008 SRPS 3,0 6,03 1,25 1,2 60,9 44,1 N.D N.D 4,81 2,41 0,50 5,03 2,52
Han et al., 2008 SRPS 3,0 5,92 1,26 1,21 56,8 45,4 N.D N.D 4,70 2,37 0,50 4,91 2,47
Han et al., 2008 SRPS 2,9 5,86 1,26 1,22 53,6 50,7 N.D N.D 4,66 2,33 0,50 4,80 2,40
Han et al., 2008 SRPS 4,1 6,35 1,21 1,06 53 23,2 N.D N.D 5,25 3,39 0,65 5,99 3,87
Han et al., 2008 SRPS 4,8 6,48 1,22 1,20 71 60,1 N.D N.D 5,32 3,96 0,74 5,39 4,02
Obaja et al., 2003 DPS 2,26 0,91 88,7 2,48
Obaja et al., 2003 DPS 2,96 1,19 117,3 2,48
Obaja et al., 2003 DPS 3,74 1,51 144 2,48
Obaja et al., 2003 DPS 3,74 1,51 144 2,48
Obaja et al., 2005 DPS 0,3
Obaja et al., 2005 DPS 0,3
Obaja et al., 2005 DPS 0,3
Kim et al., 2004 P (+W) 0,9 3,2 0,59 0,72 46 0,86 18 1,20 3,70 4,44 5,43
Kim et al., 2004 P (+W) 0,9 3,2 0,59 0,72 46 0,86 18 1,20 3,70 4,44 5,43
Magrì et al., 2008 P 24,9 15,3 17,7 11,4 3,4 2,60 722 8,00 75 4,38
Magrì et al., 2008 P 24,9 15,3 17,7 11,4 3,4 2,60 722 8,00 75 4,38
Zhu et al., 2006 P 10,5 5,4 7,6 3,7 8,8 1,22 0,86 601 39,9 0,00 0,00 7,21 3,00 0,42 10,23 4,26
Zhu et al., 2006 P 10,5 5,4 7,6 3,7 8,8 1,22 0,86 601 39,9 0,00 0,00 7,21 3,00 0,42 10,23 4,26
Poo et al. 2005 PW 1,5 8,0 3,80 20 11,00 2,11
Lo & Liao, 2007 DPS 4,4 3,2 2.1
600
1.52
2,09
Won et al. 2011 PW 5,1 2,5 0,95 1,19 1,62 23,5 1,20 0,00
Han et al., 2007 SRPS 3,0 6,03 1,25 1,20 60,9 44,1 0,00 0,00 4,81 2,41 0,50 5,03 2,52
Han et al., 2007 SRPS 3,0 5,92 1,26 1,21 56,8 45,4 0,00 0,00 4,70 2,37 0,50 4,91 2,47
Han et al., 2007 SRPS 2,9 5,86 1,26 1,22 59,6 50,7 0,00 0,00 4,66 2,33 0,50 4,80 2,40

76
Table 8 Settings of reactor operation used in the researches considered. W_L: working volume; O: oxic; ANA: anaerobic; ANOx: anoxic; Sed: sedimentation; R: in the reactor; W: raw wastewater; RT: real time; VA: variable; +: at the beginning 1h, after Oxic phase adding external carbon source (25% internal 75% external for exp 1, 50% internal 50% external for exp. 2, 100% internal 0% external for exp. 3), after this phase each 30 min. 6 times addition of external carbon source.
SLURRY
TYPE V m3 W_V L
Q_feed L/d
O2 (Air) L/min
O2 SET
mg/L
HRT d
SRT d No.
Cycle/d
No-
Reaction period/cy
cle
No- ANA/ reaction period
No- O
/reaction
period
No- ANOx/reaction period
ANA h Oxic h ANOx h Sed h SST (R)
g/L
Tilche A., 2001 P 1250 315000
5,0 - 1,0 1,0 - 2,00 2,00
Wu et al., 2017 P
8,0 0,6+0,2 0,5 3,3 23,0 3,0 2,0 2,0 2,0 1,25 (1) 0,5 (2) 2,75 (1) 2(2) 7,50
Wu et al., 2017 P
8,0 0,4+0,4 0,5 3,3 23,0 3,0 2,0 2,0 2,0 1,25 (1) 0,5 (2) 2,75 (1) 2(2) 7,50
Riaño et al., 2014 SP 350 37248 9,4 n.a - - 12,0 12,0 1,5 0,67 3
Deng et al., 2008 DPS 10,0 3,0 15 3,0 3,3 3,0 1,0 1,0 2 (FILL + IDLE) 4 2 1 3-5
Deng et al., 2008 DPS +Alk 10,0 3,0 15 3,3 3,0 1,0 1,0 2 (FILL + IDLE) 4 2 1 3-5
Deng et al., 2008 DPS+ RW 10,0 3,0 15 3,3 3,0 1,0 1,0 2 (FILL + IDLE) 4 2 1 3-8
Deng et al., 2007 PDPS 1800 3,0 1,0 1,0 2 (FILL + IDLE) 4 2 1
Deng et al., 2006 PDPS
18,0 3,0 30,0 2,0 1,0 2,0 2 (FILL + IDLE) 3
Akin et al., 2003 SW 10,0 5,0 >2 2,0 25,0 2,0 1,0 1,0 1,0 2,0 4+1,5 (o/ana ) 6 0,5 1,5 3,81
Akin et al., 2003 SW 10,0 5,0 >2 2,0 25,0 2,0 1,0 1,0 1,0 2,0 4 + 1,5 (o/ana ) 6 0,5 1,5 3,81
Akin et al., 2003 SW 10,0 5,0 >2 2,0 15,0 2,0 1,0 1,0 1,0 2,0 4 + 1,5 (o/ana ) 7 0,5 0,5 3,81
Akin et al., 2003 SW 10,0 5,0 >2 2,0 10,0 2,0 1,0 1,0 1,0 2,0 4 + 1,5 (o/ana ) 7 0,5 0,5 3,81
Han et al., 2008 SRPS 8,0 1,8+0,6 1,0 3,3 25,0 3,0 1,0 - 2,0 2,0 - 2,75+2 1,25+1,5 14,7
Han et al., 2008 SRPS 8,0 1,8+0,6 2,0 3,3 25,0 3,0 1,0 - 2,0 2,0 - 2,75+2 1,25+1,5 16,6
Han et al., 2008 SRPS 8,0 1,8+0,6 3,0 3,3 25,0 3,0 1,0 - 2,0 2,0 - 2,75+2 1,25+1,5 14,1
Han et al., 2008 SRPS 8,0 1,2+0,6 1,5 4,4 25,0 3,0 1,0 - 2,0 2,0 - 3,25+2 1,25+2 12,6
Han et al., 2008 SRPS 8,0 1,1+0,4 2,0 5,6 25,0 3,0 1,0 - 2,0 2,0 - 2,75+2,5 1,25+2,5 15,7
Obaja et al., 2003 DPS 3,0 3,0 1,0 11,0 3,0 1,0 - 1,0 1 +1 acetic acid 1,3 g/L - 4 2+1 <1 2,16
Obaja et al., 2003 DPS 3,0 3,0 1,0 11,0 3,0 1,0 - 1,0 1 +1 acetic acid 1,7 g/L - 4 2+1 <1 3,39
Obaja et al., 2003 DPS 3,0 3,0 1,0 11,0 3,0 1,0 - 1,0 1 +1 acetic acid 2,16 g/L - 4 2+1 <1 2,42
Obaja et al., 2003 DPS 3,0 3,0 1,0 11,0 3,0 1,0 - 1,0 1 +1 acetic acid 2,16 g/L - 4 2+1 <1 2,42
Obaja et al., 2005 DPS 3,0 3,4 0,9 11,0 3,4 1,0 8* 2 1+1+ (6*0,5) <1
Obaja et al., 2005 DPS 3,0 3,4 0,9 11,0 3,4 1,0 8* 2 1+1+ (6*0,5) <1
Obaja et al., 2005 DPS 3,0 3,4 0,9 11,0 3,4 1,0 8* 2 1+1+ (6*0,5) <1
Kim et al., 2004 P (+W) 9,0 2,4 VA 32,0 VA AUTOMATICALLY CONTROLLED BY THE COMPUTER DEPENDING ON THE VARIABLE PROCESS 0,83 7
Kim et al., 2004 P (+W) 9,0 2,40 VA 32,00 VA AUTOMATICALLY CONTROLLED BY THE COMPUTER DEPENDING ON THE VARIABLE PROCESS 0,83 7,00
Magrì et al., 2008 P 20,0
Magrì et al., 2008 P 20,0
Zhu et al., 2006 P 0,01 8,00 0,72 3,30 20,80 3,00 1,00 1,00 - 2 (with aeration) 1,50 - 2,75+2 0,50
Zhu et al., 2006 P 0,01 8,00 0,72 3,30 20,80 3,00 1,00 1,00 - 2 (with aeration) 1,50 - 2,75+2 0,50
Poo et al. 2005 PW 20000 3640 VA 5,00 - 1,00 1,00 - RT 1,00
Lo & Liao, 2007 DPS 130,2 108800 22000 4,90 4,00 1,00 - 1,00 - - 4,50 - 0,75
Won et al. 2011 PW 24,2 18000 VA 1,00 1,00 1,00 1,00 3,00 pH_RT ORP_RT 2,00
Han et al., 2007 SRPS 8,00 0,6+0,2 1,00 3,30 27,00 3,00 1,00 - 2,00 2,00 - 2,75+2 1,25+1,5 0,25 10,00
Han et al., 2007 SRPS 8,00 0,6+0,2 2,00 3,30 27,00 3,00 1,00 - 2,00 2,00 - 2,75+2 1,25+1,5 0,25 10,00
Han et al., 2007 SRPS 8,00 0,6+0,2 3,00 3,30 27,00 3,00 1,00 - 2,00 2,00 - 2,75+2 1,25+1,5 0,25 10,00
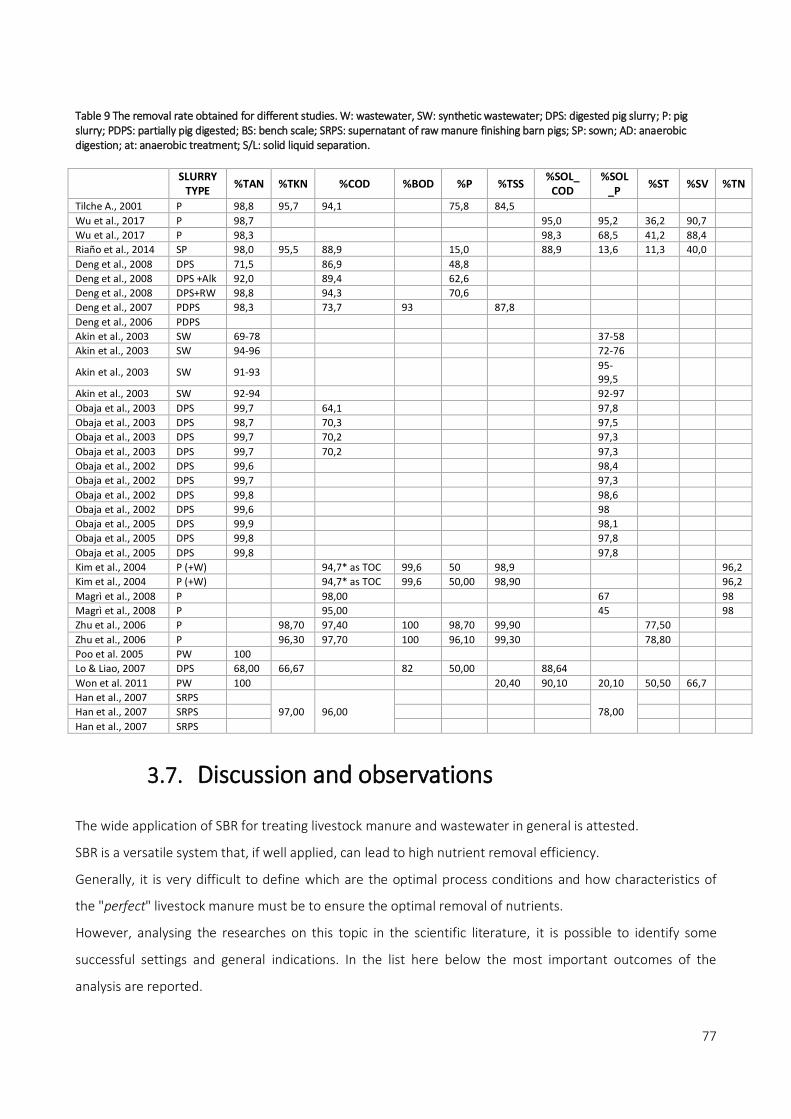
77
Table 9 The removal rate obtained for different studies. W: wastewater, SW: synthetic wastewater; DPS: digested pig slurry; P: pig slurry; PDPS: partially pig digested; BS: bench scale; SRPS: supernatant of raw manure finishing barn pigs; SP: sown; AD: anaerobic digestion; at: anaerobic treatment; S/L: solid liquid separation.
SLURRY
TYPE %TAN %TKN %COD %BOD %P %TSS
%SOL_ COD
%SOL_P
%ST %SV %TN
Tilche A., 2001 P 98,8 95,7 94,1
75,8 84,5
Wu et al., 2017 P 98,7
95,0 95,2 36,2 90,7
Wu et al., 2017 P 98,3
98,3 68,5 41,2 88,4
Riaño et al., 2014 SP 98,0 95,5 88,9
15,0
88,9 13,6 11,3 40,0
Deng et al., 2008 DPS 71,5
86,9
48,8
Deng et al., 2008 DPS +Alk 92,0
89,4
62,6
Deng et al., 2008 DPS+RW 98,8
94,3
70,6
Deng et al., 2007 PDPS 98,3
73,7 93
87,8
Deng et al., 2006 PDPS
Akin et al., 2003 SW 69-78
37-58
Akin et al., 2003 SW 94-96
72-76
Akin et al., 2003 SW 91-93
95-99,5
Akin et al., 2003 SW 92-94
92-97
Obaja et al., 2003 DPS 99,7
64,1
97,8
Obaja et al., 2003 DPS 98,7
70,3
97,5
Obaja et al., 2003 DPS 99,7
70,2
97,3
Obaja et al., 2003 DPS 99,7
70,2
97,3
Obaja et al., 2002 DPS 99,6
98,4
Obaja et al., 2002 DPS 99,7
97,3
Obaja et al., 2002 DPS 99,8
98,6
Obaja et al., 2002 DPS 99,6
98
Obaja et al., 2005 DPS 99,9
98,1
Obaja et al., 2005 DPS 99,8
97,8
Obaja et al., 2005 DPS 99,8
97,8
Kim et al., 2004 P (+W)
94,7* as TOC 99,6 50 98,9
96,2
Kim et al., 2004 P (+W)
94,7* as TOC 99,6 50,00 98,90
96,2
Magrì et al., 2008 P
98,00
67
98
Magrì et al., 2008 P
95,00
45
98
Zhu et al., 2006 P
98,70 97,40 100 98,70 99,90
77,50
Zhu et al., 2006 P
96,30 97,70 100 96,10 99,30
78,80
Poo et al. 2005 PW 100
Lo & Liao, 2007 DPS 68,00 66,67
82 50,00
88,64
Won et al. 2011 PW 100
20,40 90,10 20,10 50,50 66,7
Han et al., 2007 SRPS
97,00 96,00
78,00
Han et al., 2007 SRPS
Han et al., 2007 SRPS
3.7. Discussion and observations
The wide application of SBR for treating livestock manure and wastewater in general is attested.
SBR is a versatile system that, if well applied, can lead to high nutrient removal efficiency.
Generally, it is very difficult to define which are the optimal process conditions and how characteristics of
the "perfect" livestock manure must be to ensure the optimal removal of nutrients.
However, analysing the researches on this topic in the scientific literature, it is possible to identify some
successful settings and general indications. In the list here below the most important outcomes of the
analysis are reported.

78
- First, the TAN removal yield is always higher than 68% and in the in most searches, reaches value
above 98%.
The COD-removal yields are always high than 65%. The lowest removal rate is observed for solids
content.
- P-removal rates can be very high when the biological process is set to achieve the anaerobic
conditions.
- Is possible to model biological process applied in SBR even if the substrate considered has very
variable characteristics; however, it is necessary to calibrate correctly the model for adapting it
to the considered influent. Nevertheless, the inputs needed to get a good output are numerous.
- Applying the fixed-time control strategies, based on the set duration of each phase, the most
applied time cycle is 8h.
- Applying the fixed-time control strategies, the denitrification process is applied before the
aeration one in order to exploit the content of carbon content in the slurry.
- The feed step strategy resulted a good fixed control strategy for improving removal rate
reachable.
- The real time control strategy based on ORP and pH allows reaching the complete removal of
nitrogen with the minimal waste of energy.
- All slurries used in the analysed researches before to be fed the biological reactor are undergone
to pre-treatment process. In fact, is necessary to remove solid, mostly the inert part of them to
not overload biological system.
3.8. References
Akin, B. S., & Ugurlu, A. (2004). The effect of an anoxic zone on biological phosphorus removal by a
sequential batch reactor. Bioresource Technology, 94(1), 1–7. http://doi.org/10.1016/j.biortech.2003.11.022
Akin, B. S., & Ugurlu, A. (2005). Monitoring and control of biological nutrient removal in a
Sequencing Batch Reactor. Process Biochemistry, 40(8), 2873–2878.
http://doi.org/10.1016/j.procbio.2005.01.001
Artan, N., Yagci, N. O., Artan, S. R., & Orhon, D. (2003). Design of sequencing batch reactors for
biological nitrogen removal from high strength wastewaters. Journal of Environmental Science and Health
Part a-Toxic/Hazardous Substances & Environmental Engineering, 38(10), 2125–2134. http://doi.org/Doi
10.1081/Ese-120023340
Azhdarpoor, A., Mohammadi, P., & Dehghani, M. (2015). Simultaneous removal of nutrients in a
novel anaerobic–anoxic/aerobic sequencing reactor: removal of nutrients in a novel reactor. International

79
Journal of Environmental Science and Technology, 13(AUGUST), 543–550. http://doi.org/10.1007/s13762-
015-0871-5
Béline, F., Boursier, H., Daumer, M. L., Guiziou, F., & Paul, E. (2007). Modelling of biological
processes during aerobic treatment of piggery wastewater aiming at process optimisation. Bioresource
Technology, 98(17), 3298–3308. http://doi.org/10.1016/j.biortech.2006.07.004
Béline, F., Daumer, M. L., & Guiziou, F. (2004). Biological aerobic treatment of pig slurry in France:
Nutrients removal efficiency and separation performances. Amecrican Society of Agricultural Engineers,
47(1), 857–864.
Bernal, M. P., Alburquerque, J. A., & Moral, R. (2009). Composting of animal manures and chemical
criteria for compost maturity assessment. A review. Bioresource Technology, 100(22), 5444–5453.
http://doi.org/10.1016/j.biortech.2008.11.027
Bernet, N., Delgenes, N., Akunna, J. C., Delgenes, J. P., & Moletta, R. (2000). Combined anaerobic-
aerobic SBR for the treatment of piggery wastewater. Water Research, 34(2), 611–619.
http://doi.org/10.1016/S0043-1354(99)00170-0
Bortone, G., Gemelli, S., Rambaldi, A., & Tilche, A. (1992). Nitrification, denitrification and
biological phosphate removal in sequencing batch reactors treating piggery wastewater. Water Science and
Technology, 26(5-6), 977-985.
Boursier, H., Béline, F., & Paul, E. (2005). Piggery wastewater characterisation for biological
nitrogen removal process design. Bioresource Technology, 96(3), 351–358.
http://doi.org/10.1016/j.biortech.2004.03.007
Burton, C. H. (2007). The potential contribution of separation technologies to the management of
livestock manure. Livestock Science, 112(3), 208–216. http://doi.org/10.1016/j.livsci.2007.09.004
Choi, E., Eum, Y., Gil, K. I., & Oa, S. W. (2004). High strength nitrogen removal from nightsoil and
piggery wastes. Water Science and Technology, 49(5–6), 97–104.
Deng, L., Cai, C., & Chen, Z. (2007). The treatment of pig slurry by a full-scale Anaerobic-Adding
Raw Wastewater-Intermittent Aeration Process. Biosystems Engineering, 98(3), 327–334.
http://doi.org/10.1016/j.biosystemseng.2007.08.001
Deng, L., Zheng, P., Chen, Z., & Mahmood, Q. (2008). Improvement in post-treatment of digested
swine wastewater. Bioresource Technology, 99(8), 3136–3145.
http://doi.org/10.1016/j.biortech.2007.05.061
Dutta, A., & Sarkar, S. (2015). Sequencing Batch Reactor for Wastewater Treatment: Recent
Advances. Current Pollution Reports, 1(3), 177–190. http://doi.org/10.1007/s40726-015-0016-y
EPA, 1999 Wastewater Technology Fact Sheet Sequencing Batch Reactors.

80
Flores-Tlacuahuac, A., & Pedraza-Segura, L. (2016). Optimal model-based aeration control policies
in a sequencing batch reactor. Computers & Chemical Engineering, 85, 124–135.
http://doi.org/10.1016/j.compchemeng.2015.11.001
Ga, C. H., & Ra, C. S. (2009). Real-time control of oxic phase using pH (mV)-time profile in swine
wastewater treatment. Journal of Hazardous Materials, 172(1), 61–67.
http://doi.org/10.1016/j.jhazmat.2009.06.133
Gu, S., Wang, S., Yang, Q., Yang, P., & Peng, Y. (2012). Start up partial nitrification at low
temperature with a real-time control strategy based on blower frequency and pH. Bioresource Technology,
112, 34–41. http://doi.org/10.1016/j.biortech.2011.12.028
Han, Z., Wu, W., Chen, Y., & Zhu, J. (2007). Characteristics of a twice-fed sequencing batch reactor
treating swine wastewater under control of aeration intensity. Journal of Environmental Science and Health.
Part A, Toxic/hazardous Substances & Environmental Engineering, 42(732451974), 361–370.
http://doi.org/10.1080/10934520601144667
Han, Z., Wu, W., Zhu, J., & Chen, Y. (2008). Oxidization-reduction potential and pH for optimization
of nitrogen removal in a twice-fed sequencing batch reactor treating pig slurry. Biosystems Engineering,
99(2), 273–281. http://doi.org/10.1016/j.biosystemseng.2007.09.013
Hjorth, M., Christensen, K. V, Christensen, M. L., & Sommer, S. G. (2010). Solid-liquid separation of
animal slurry in theory and practice. A review. Agronomy for Sustainable Development, 30(1), 153–180.
http://doi.org/10.1051/agro/2009010
Hjorth, M., Nielsen, A. M., Nyord, T., Hansen, M. N., Nissen, P., & Sommer, S. G. (2009). Nutrient
value, odour emission and energy production of manure as influenced by anaerobic digestion and
separation. Agronomy for Sustainable Development, 29(2), 329–338. http://doi.org/10.1051/agro:2008047
Hong, S. H., Lee, M. W., Lee, D. S., & Park, J. M. (2007). Monitoring of sequencing batch reactor for
nitrogen and phosphorus removal using neural networks. Biochemical Engineering Journal, 35(3), 365–370.
http://doi.org/10.1016/j.bej.2007.01.033
Kim, J. H., Chen, M., Kishida, N., & Sudo, R. (2004). Integrated real-time control strategy for
nitrogen removal in swine wastewater treatment using sequencing batch reactors. Water Res, 38(14–15),
3340–3348. http://doi.org/10.1016/j.watres.2004.05.006\rS0043-1354(04)00250-7
Kishida, N., Kim, J., Chen, M., Sasaki, H., & Sud, R. (2003). Effectiveness of Oxidation-Reduction
Potential and pH as Monitoring and Control Parameters for Nitrogen Removal in Swine Wastewater
Treatment by Sequencing Batch Reactors, 96(3).
Kocijan, J., & Hvala, N. (2013). Sequencing batch-reactor control using Gaussian-process models.
Bioresource Technology, 137, 340–348. http://doi.org/10.1016/j.biortech.2013.03.138

81
Lo, K. V, & Liao, P. H. (2007). A full-scale sequencing batch reactor system for swine wastewater
treatment. J Environ Sci Health B, 42(2), 237–240. http://doi.org/769954669
[pii]\r10.1080/03601230601125651
Magrí, A., & Flotats, X. (2008). Modelling of biological nitrogen removal from the liquid fraction of
pig slurry in a sequencing batch reactor. Biosystems Engineering, 101(2), 239–259.
http://doi.org/10.1016/j.biosystemseng.2008.08.003
Marsili-Libelli, S. (2006). Control of SBR switching by fuzzy pattern recognition. Water Research,
40(5), 1095–1107. http://doi.org/10.1016/j.watres.2006.01.011
Masotti L. (2012) Depurazione delle acque; tecniche ed impianti per il trattamento delle acque di
rifiuto. Ed. Calderini.
Masse, L., Massè, D. I., Beaudette, V., & Muir, M. (2005). Size distribution and composition of
particles in raw and anaerobically digested swine manure. Transactions of the ASAE, 48(5), 1943–1949.
http://doi.org/10.13031/2013.20003
Mees, J. B. R., Gomes, S. D., Hasan, S. D. M., Gomes, B. M., & Boas, M. A. V. (2014). Nitrogen
removal in a SBR operated with and without pre-denitrification: effect of the carbon: nitrogen ratio and the
cycle time. Environmental Technology, 35(1–4), 115–23. http://doi.org/10.1080/09593330.2013.816373
Metcalf, E., & Eddy, M. (1991). Wastewater Engineering–Treatment, Disposal, Reuse. McGraw-
Hill. Inc., New York.
Møller, H. B., Sommer, S. G., & Ahring, B. K. (2002). Separation efficiency and particle size
distribution in relation to manure type and storage conditions. Bioresource Technology, 85(2), 189–196.
http://doi.org/10.1016/S0960-8524(02)00047-0
Möller, K., & Müller, T. (2012). Effects of anaerobic digestion on digestate nutrient availability and
crop growth: a review. Engineering in Life Sciences, 12(3), 242-257.
Obaja, D., Macè, S., & Mata-Alvarez, J. (2005). Biological nutrient removal by a sequencing batch
reactor (SBR) using an internal organic carbon source in digested piggery wastewater. Bioresource
Technology, 96(1), 7–14. http://doi.org/10.1016/j.biortech.2004.03.002
Obaja, D., Mace, S., Costa, J., Sans, C., & Mata-Alvarez, J. (2003). Nitrification, denitrification and
biological phosphorus removal in piggery wastewater using a sequencing batch reactor. Bioresource
Technology, 87(1), 103–111. http://doi.org/10.1016/s0960-8524(02)00229-8
Otawa, K., Asano, R., Ohba, Y., Sasaki, T., Kawamura, E., Koyama, F., … Nakai, Y. (2006). Molecular
analysis of ammonia-oxidizing bacteria community in intermittent aeration sequencing batch reactors used
for animal wastewater treatment. Environmental Microbiology, 8(11), 1985–1996.
http://doi.org/10.1111/j.1462-2920.2006.01078.x

82
Perazzolo, F., Mattachini, G., Riva, E., & Provolo, G. (2017). Nutrient Losses during Winter and
Summer Storage of Separated and Unseparated Digested Cattle Slurry. Journal of environmental quality,
46(4), 879-888.
Perazzolo, F., Mattachini, G., Tambone, F., Misselbrook, T., & Provolo, G. 2015. Effect of
mechanical separation on emissions during storage of two anaerobically codigested animal slurries.
Agriculture, Ecosystems & Environment, 207, 1-9.
Poo, K. M., Im, J. H., Ko, J. H., Kim, Y. J., Woo, H. J., & Kim, C. W. (2005). Control and nitrogen load
estimation of aerobic stage in full-scale sequencing batch reactor to treat strong nitrogen swine wastewater.
Korean Journal of Chemical Engineering, 22(5), 666–670. http://doi.org/10.1007/BF02705780
Ra, C. S., Lo, K. V, & Mavinic, D. S. (1999). Control of a swine manure treatment process using a
specific feature of oxidation reduction potential, 70.
Sirini P., Chiavola A. (2006). Criteri di dimensionamento dei reattori sequenziali discontinue.
Sommer, S. G., Maahn, M., Poulsen, H. D., Hjorth, M., & Sehested, J. (2008). Interactions Between
Phosphorus Feeding Strategies for Pigs and Dairy Cows and Separation Efficiency of Slurry. Environmental
Technology, 29(1), 75–80. http://doi.org/10.1080/09593330802009287
Spagni, A., & Marsili-Libelli, S. (2009). Nitrogen removal via nitrite in a sequencing batch reactor
treating sanitary landfill leachate. Bioresource Technology, 100(2), 609–614.
http://doi.org/10.1016/j.biortech.2008.06.064
Spellman, F. R. Whiting Nancy E. (2007).Environmental Management of Concentrated Animal
Feeding Operations (CAFOs).
Sommer, S. G., Christensen, M. L., Schmidt, T., Jensen, L. S., eds. 2013. In Animal Manure
Recycling: Treatment and Management. John Wiley & Sons Ltd. Chichester, UK.
Sui, Q., Liu, C., Dong, H., & Zhu, Z. (2014). Effect of ammonium nitrogen concentration on the
ammonia-oxidizing bacteria community in a membrane bioreactor for the treatment of anaerobically
digested swine wastewater. Journal of Bioscience and Bioengineering, 118(3), 277–283.
http://doi.org/10.1016/j.jbiosc.2014.02.017
Torrellas, M.; Burgos, L.; Tey, L.; Arias, J.; Riau, V.; Palatsi, J.; Antón, A. & Flotats, X. & Bonmatí, A..
(2018). Different approaches to assess the environmental performance of a cow manure biogas plant.
Atmospheric Environment. 177. 10.1016/j.atmosenv.2018.01.023.
Vaneeckhaute, C., Lebuf, V., Michels, E., Belia, E., Vanrolleghem, P. A., Tack, F. M., & Meers, E.
(2017). Nutrient recovery from digestate: systematic technology review and product classification. Waste
and Biomass Valorization, 8(1), 21-40.

83
Won, S. G., & Ra, C. S. (2011). Biological nitrogen removal with a real-time control strategy using
moving slope changes of pH(mV)- and ORP-time profiles. Water Research, 45(1), 171–178.
http://doi.org/10.1016/j.watres.2010.08.030
Wu, X., Zhu, J., Cheng, J., & Zhu, N. (2015). Optimization of Three Operating Parameters for a Two-
Step Fed Sequencing Batch Reactor (SBR) System to Remove Nutrients from Swine Wastewater. Applied
Biochemistry and Biotechnology, 175(6), 2857–2871. http://doi.org/10.1007/s12010-014-1467-0
Yan, L., Liu, Y., Ren, Y., Wang, X., Liang, H., & Zhang, Y. (2013). The effect of pH on the efficiency of
an SBR processing piggery wastewater. Biotechnology and Bioprocess Engineering, 18(6), 1230–1237.
http://doi.org/10.1007/s12257-013-0292-6
Yang, Q., Gu, S., Peng, Y., Wang, S., & Liu, X. (2010). Progress in the development of control
strategies for the SBR process. Clean - Soil, Air, Water, 38(8), 732–749.
http://doi.org/10.1002/clen.201000015
Zhang, Z., Zhu, J., King, J., & Li, W. (2006). A two-step fed SBR for treating swine manure. Process
Biochemistry, 41(4), 892–900. http://doi.org/10.1016/j.procbio.2005.11.005
Zhu, J., Zhang, Z., & Miller, C. (2006). A Laboratory Scale Sequencing Batch Reactor with the
Addition of Acetate to remove Nutrient and Organic Matter in Pig Slurry. Biosystems Engineering, 93(4),
437–446. http://doi.org/10.1016/j.biosystemseng.2006.01.010

84
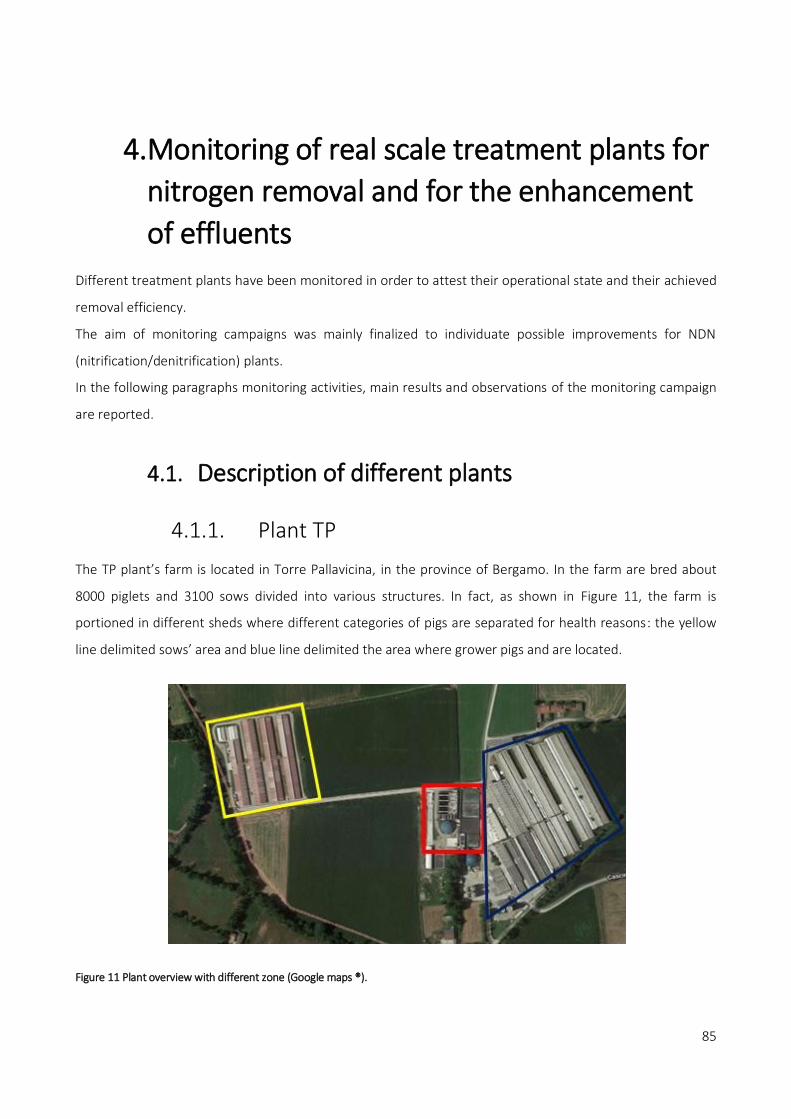
85
4. Monitoring of real scale treatment plants for
nitrogen removal and for the enhancement
of effluents
Different treatment plants have been monitored in order to attest their operational state and their achieved
removal efficiency.
The aim of monitoring campaigns was mainly finalized to individuate possible improvements for NDN
(nitrification/denitrification) plants.
In the following paragraphs monitoring activities, main results and observations of the monitoring campaign
are reported.
4.1. Description of different plants
4.1.1. Plant TP
The TP plant’s farm is located in Torre Pallavicina, in the province of Bergamo. In the farm are bred about
8000 piglets and 3100 sows divided into various structures. In fact, as shown in Figure 11, the farm is
portioned in different sheds where different categories of pigs are separated for health reasons: the yellow
line delimited sows’ area and blue line delimited the area where grower pigs and are located.
Figure 11 Plant overview with different zone (Google maps ®).

86
The farm owns its biological treatment plant (indicated in Figure 11 with red line), that works with a standard
NDN (nitrification-denitrification) process. The flow scheme of the plant is represented in Figure 12.
Figure 12 Flow scheme of TP plant. µ represents the theoretical removal rate.
The plant’s influent, collected from various sheds, is made of a mixture of sewage, manure, water, litter and
other components.
The first step of slurry treatment consists in slurry’s transfer from a collection channel to a collection tank;
from here, an installed pump conveys stored slurry to mechanical treatment that consists in a solid liquid
separation through a rotary sieve aim to removing coarse solids. The liquid fraction obtained, using pump is
send in another tank that has a volume equal to 57,4 m3. Then, liquid fraction that is continuously mixed, is
pumped by submerging pump to the further flotation treatment (Figure 13). This kind of chemical-physical
process allows removing the smallest particles size from slurry using different chemical products and an air
bubble system. In this plant, aluminium sulfate (Al2(SO4)3) as coagulant and polyelectrolyte as flocculants are
used. Mixing the inlet slurry with Al2(SO4)3 the negative charges of colloidal particles are destabilized and can
be re-aggregated, thanks to polyelectrolyte, in bigger light flocks that can be separate through air bubble. In
TP plant, coagulant and flocculants are added to the slurry before Venturi’s system that mixed the blend of
slurry and chemicals with air bubbles; the aerated slurry mixed with chemicals enters subsequent tank,
where the flakes that have formed bringing to the surface and are removed by superficial chain scraper. The
floating material accumulated on the surface of the tank is removed (Figure 13,d), while the liquid fraction
continues to the following biological treatment.

87
The effluent of floating system enters through a concrete sluice gate the first biological phase: denitrification
phase occurs in a bigger concrete tank equipped with 3 mixers, positioned in 3 different central points in the
middle of the tank. Mixers blend and homogenize the inlet flow with the activated sludge already present in
the tank, allowing the transformation of nitrates into a N2 (denitrification phase).
a)
b)
c)
d)
Figure 13 Floatation system of plant TP: a) chemical dosing, b) superficial chain scraper, c) liquid fraction obtained and d) the “solid” fraction obtained.
Nitrates arrive in denitrification thank through a recirculation flow (Figure 14a). As usual, the denitrification
phase occurs before the nitrification phase in order to allow to denitrifying bacteria (that are heterotrophic)
to use the readily degradable organic matter as source of carbon. In fact, if that phase will be worsened next
to nitrification phase, an external source of carbon is requested.

88
The hydraulic retention time of denitrification (and whole biological process) is imposed by the operation of
the floatation system and by the gate used for re-circulate the flow: in fact, the flow entering the biological
treatment is constant but can be adjust through the volume of sludge pumping at in the separation
treatment and so, to the duration of flotation system phase and the quantity of re-circulated flow is imposed
by the high of the weir (Figure 14a).
a)
b)
c)
Figure 14 a) the recirculation apparatus, b) mixing tanks where denitrification occurs and b) aeration phase for nitrification process.

89
Unfortunately, the control system of the plant has a lot of problem, and even if the pump flow enters the
biological phase, the working time of the system is not correctly managed and controlled.
Finally, the denitrified effluent passes into the following concrete tank through a weir. Here, through a
blower, air diffusion system dissolves the necessary amount of oxygen in the water in order to establish
nitrification of the ammonia nitrogen present in the effluent (Figure 14,c), which is oxidized to nitrite and
then to nitrate that are re-circulated to the denitrification phase. Also in this case, the automation system
does not foresee any control on airflow furnished.
The treated effluent than arrives into the sedimentation thank, always by gravity, where the solid and
activated sludge are separated. The clarified effluent where finally accumulated in a storage tank and will be
used and distribute to the land as fertilizer according to imposed regulation.
Plant TP, as also explained before, does not have a well-appointed and complete control system. Despite all
the process is automated, tanks are not equipped with any type of probe (e.g. pH, RedOx, O2 etc.) and in any
point of the piping system is not present the flow control instrumentation. This fact makes process control
difficult to monitoring and not allow a correct operation of all system. This plant, given its continuous
operation, has been selected to monitor its performance, and, if possible, it was chosen for trying to
individuate some possible improvements to apply.
4.1.2. Plant TO
Farm TO is a fatteners pig farm located in the province of Brescia. In this farm, the pig slurry is treated in a
SBR (sequencing batch reactor) system for biological nitrogen removal before its reuse in agriculture.
In the Figure 15 a flow scheme of the plant is reported.
Figure 15 Block Scheme of TO plant. µ represents the theoretical removal rate.

90
a)
b)
Figure 16 SBR tank. In the Figure a) it is possible to see the pipe that connect the SBR’s outlet with a storage tank, where the effluent is collected and stored for further utilization. In Figure b) a particular of inlet and aeration system.
The clarified slurry enters the reactor during the filling phase without any type of mixing or aeration (static
filling) since the required level. Then, alternatively, aeration phase and mixing phase are provided. Also for
this plant, the usual operation of biological treatment foresees a pre-denitrification phase, and a subsequent
nitrification phase. Aeration, which allows ammonia nitrification, occurs through a Venturi system (Figure
17a) that transferred 460,0 Nm3/h of air to the sludge, ensuring an oxygen transfer of 21,0%. Two blowers of
540,0 m3/h of total capacity, guarantee the air supply. Before entering in the tank, the installed system
provides the well mixed of air bubble and slurry.
The mixing phase instead occurs thought the same system of aeration, with the difference that in this case,
the air is not mixed with the sludge, but the slurry is re-circulated through injection system to ensure a good
homogenization of the active sludge present in the tank and the fresh clarified slurry.
Finally, is foreseen a sedimentation phase that allows the separation of the activated sludge and heavy flocks
to reach the bottom of the tank from the clarified slurry. At the end of the sedimentation phase, the clarified
sewage is discharged through the overflow (Figure 17b) in the final accumulation tank. That mechanism is

91
one of the most delicate points of the system, because is necessary guarantee the good quality of the
effluent avoiding the discharge of biomass or the dragging of suspended solids.
The removal of the activated sludge accumulated in the bottom of the tank, is carried out at the same time
of the loading of other fresh slurry.
In the plant TO the control of operations is completely automated, using PLC (programmable logic
controller), with whom the duration of the various treatment phases and the operation of all
electromechanical equipment (compressors, mixers, pumps etc.) are managed. Biological tank is also
provided with a level transmitter (ultrasonic type), an instrument for foam level control, a RedOx probe and
dissolved oxygen control probe.
All these instrumentations allow managing all the phases of operation and, in case of malfunction,
intervening for correction. This plant, given its continuous operation and its useful control system, has been
selected to monitor its performance.
a) b)
Figure 17 Particular of SBR aeration system Venturi a) and the overflow for effluent’s outlet b).
4.1.3. Plant NA
That plant, located in the municipality of Dovera (CR), is managed by an S.r.l. composed by six associate
companies, of which four produce cereals and two deal with animal husbandry. That plant is more complex
(e.g. foresees more stages of treatment) in comparison with the TP and TO plants. In fact, all slurries
produced in the different farms are treated for energy recover in an anaerobic digester before to be treat for
nitrogen removing. That solution is very widespread in Po valley also for the economic support received from
the Italian state for biogas production (D.Lgs 387/03 and D.Lgs 28/2011).

92
A scheme of plant is reported in Figure 18 and in Figure 19 the block scheme of plant is shown.
Besides the slurry produce by the associated farms, approximately 67 m3/d of external slurry (predominantly
cattle and pigs’ slurries) and 27 t/d of biomass (corn and shredded silo) are fed to the plant by means of
truck. The inlet slurry and other biomass entering the plant are treated for energy recovery in a 630 kW
Thöni plant. The first part of the plant consists of two anaerobic digesters: the feeds of anaerobic digester 1
is delivered into a pre-tank (if necessary, the feed of the tank can be ground with the use of a shredder). In
that digester, biomass is also supplied. Digester 2 only receives bovine / swine (mainly bovine) sewage.
After a digestion process, the digestate from the digester 1 is sent to the digester 2. The digestate from the
energy recovery (digester 2) is further treated for nitrogen removal before to be spread. The treatment
provides, as a first step, the mechanical separation of coarse material with helical separator (0,75 mm): the
resulting liquid fraction is sent to intermediate storage tank and then should undergo further separation by
centrifugation.
Figure 18 Overview of Plant NA: 1 and 2 are two inlet points, where the slurry is charge and enters in the plant; 1,2: are two inlets points; 3: storage of digestate after AD process; 4: liquid fraction of digestate; 5:solid fraction of digestate; 6 SBR; 7 final storage tank.
This kind of treatment is focused to removal of fine particles allowing sending to biological nitrogen removal
a slurry with a low load of carbonaceous compound that would over-load the biological process
unnecessarily.

93
Figure 19 Blok Scheme of NA plant. µ represents the theoretical removal rate.
Regrettably, during a period of monitoring, centrifuge was not in use.
The solid fraction separated by helical separator is accumulated in storage slab and the liquid fraction in a
collection tank (point 4 in Figure 18), from which it is drawn to feed the SBR where nitrification-
denitrification process occurs. Concrete tank for biological treatment has a diameter and high equal to 12,5
m and 6,0 m respectively, to which correspond a geometrical volume of 736,3 m3 and an operative volume
equal to 674,9 m3. During monitoring period, SBR does not operate at full capacity. As explain in paragraph
3.1 also in this SBR an alternative phase of mixing and aeration occur for transform nitrogen in a non-
polluting form. For the duration of biological nitrogen removal (nitrification-denitrification), ORP, O2, pH and
temperature are monitored using different probes. The plant does not have an autonomous data acquisition
system. In Table 10 is reported fluxes data of plant NA, furnished by the plant’s owner.
Table 10 Data of flows processed in plant NA.
Date m3 TQ/d m3 SBR/d m3 solid fraction/d
October 65,70 30,95 -
November 63,89 56,98 6,90
December 62,96 59,00 3,95
January 67,32 62,61 4,7
February 70,46 64,67 5,58
March 67,62 62,33 5,27

94
This system, although ready to be used, in the period designated for monitoring, was not 100% functional for
various management and performance problems. For this reason, the monitoring was aimed not at verifying
its performance, but also at detecting which critical issues it presents and how its correct functioning could
be assisted.
4.1.4. Plant VA
The plant VA treats pig slurry from a fattening pigs’ farm. It is located in Camisano (Cremona); in Figure 20 is
reported the overview of the plant, and in Figure 21 the flux scheme of that plant.
The plant does not provide energy recovery (i.e. anaerobic digestion, AD), but consists in a mechanical
separation of solid fraction (medium and big ones) and subsequent nitrogen removal applied in sequencing
batch reactor (SBR), where a nitrification/denitrification reaction takes place.
Figure 20 The overview of the plant VA. 1: inlet points; 2: tank for preliminary storage; 3: liquid fraction after solid/liquid separation; 4: solid fraction; 5 SBR plant; 6,7,8: storage tanks.
In particular, the raw slurry collected from the different sheds arrives by gravity in a pre-storage tank
(Figure 22,a) that is equipped with a pump and a mixer. That pump is manually switch on and feeds a vertical
helical separator (0,5 mm) (Figure 22,b) that allows a separation of liquid fraction from solid particles. Solid
fraction is accumulated in storage slab; instead, the liquid fraction is accumulated in a storage tank before to
be send to the SBR plant. The flow rate fed to the separator will be equal to 2,4 m3/min (from data read on
the flow meter installed on the pipe that feeds the separator).

95
SBR has a diameter of 13,5 m and high of 5 m that correspond to a geometrical volume equal to 715,7 m3
and an operational volume equal to 644,1 m3
Figure 21 Scheme of VA plant. µ represents the theoretical removal rate.
SBR system, although ready to be used, in the designated period for monitoring was not 100% functional for
various management and performance problems. For this reason, also for that plant, the monitoring was
aimed not at verifying its performance, but at identifying which critical issues it presents and in how correct
functioning could be reached.
a) b) c) Figure 22 a) the pre-storage tank of VA plant; b: the solid/liquid separation system; c: SBR tank, during aeration phase.
4.1.5. Plant RR
Plant RR is located in Credera Rubbiano (Cremona). That plant treat slurry from dairy farms (sewage and
manure). In Figure 23 is reported the overview of the plant while in Figure 24 is reported a flow scheme of
the plant. The particularity of that plant is that all slurry that enter in arrived through a system of

96
underground pipes and only a small part (solid fraction) arrive to the plant by trucks. This allows to reduce
consumption of fuel and, consequently, environmental impact.
Theoretically, 80 m3 of slurry and 13 m3 of manure should be conferred to the plant; however, only 5 m3 of
manure are treated during the monitoring period.
Also in that case, as for the plant NA, the plant is not only focused on the nitrogen removal but also to
energy recovery.
First, the slurry is treated in anaerobic digester. The scheme provides that, at the exit of the digester, (that
has not had an overflow), a pump brings the slurry directly to the solid/liquid separator. The pipe that
collects digester with solid/liquid separation unit is furnished with a flow meter.
After the solid fraction is removed from the digestate, the liquid fraction is fed to a sequencing batch reactor
system equipped with a level sensor (piezoelectric sensors), an ultrasonic sensor, probe for monitoring O2,
and RedOx.
Figure 23 The overview of the plant RR. 1: inlet points and preliminary storage; 2: anaerobic digester; 3: S/L separation and accumulation; 4: SBR plant; 5: final storage tanks.
The SBR cycle length varying based on slurry collected: an aeration and mixing phase are always foreseen for
nitrification/denitrification aims. The plant does not have an autonomous data acquisition system. For this
plant, we do not have dimensional parameter. This plant, given its continuous operation, has been selected
to monitor its performance.
3
4
1
2
5

97
Figure 24 Scheme of Plant RR. µ represents the theoretical removal rate.
4.2. Materials and methods
4.2.1. Monitoring plan for all treatment plants
In Table 11 are reported data about monitoring plan for all plants: the length of monitoring period, the
selected sampling points for each plant, and analysis carried out for each sampling point.
The sampling points have been chosen in order to have an a
Where possible and foreseen, also the parameter logged by the plants are recorded and analysed. The short
period of monitoring for plant NA, VA, RR is also linked with a lot of management problems and many
malfunctions that forced the plant operators to stop them and try to solve the problems.
4.2.2. Analytical methods
Each sample was characterized for Total Kjeldahl Nitrogen (TKN), electrical conductivity (EC), total ammonia
nitrogen (TAN), pH, dry matter content (TS) and volatile solid (VS), which were determined using Standard
procedures (APHA, 2014). For plant TO also RedOx potential have been measured. For plant TP and TO also
NO2- + NO3
- are measured for sampling withdrawn from biological process (APHA, 2014).

98
Table 11 Characteristics of monitoring plan for all considered plants.
Sampling period Sampling points Lab Analyses
TP Plant 5 months: from January 2017 to June 2017
- INLET: the liquid fraction after the first treatment finalized to solids removal;
- LIQUID FRACTION: the liquid fraction after removal of small particles (flotation);
- SOLID FRACTION: the solid fraction of flotation treatment;
- DENITRIFICATION: an homogenize sample of denitrification slurry (sampled in 3 different points in the tank);
- NITRIFICATION: an homogenize sample of nitrification slurry (sampled in 3 different points in the tank);
- OUTLET: the treated slurry from the sedimentation tank.
- pH; - EC Electrical
conductivity; - TKN Total Kjeldahl
Nitrogen; - TAN total
ammonia nitrogen; - ST total solid; - SV volatile solid; - RedOx (for plant TO)
TO Plant 5 months: from June 2017- to September 2017
- INLET: the liquid fraction after the first treatment finalized to solids removal;
- OUTLET: the treated slurry.
NA Plant
March-April 2016
- IN 1: INLET 1 (RAW SLURRY); - IN 1: INLET 2 (RAW SLURRY); - DIG: outlet of anaerobic digestion 2; - SLIQU: liquid fraction after solid/liquid separation; - SSOL: solid fraction after solid/liquid separation; - SBR: sample taken from the biological reactor; - OUT: treated slurry, withdraw from a final storage tank
VA Plant
- IN: Inlet point 1, slurry withdraw from the sluice gate of the piggery.
- IN*: Inlet point 2, withdraw from the pre-storage tank - SLIQU: liquid fraction after solid/liquid separation; - SSOL: solid fraction after solid/liquid separation; - OUT: treated slurry, withdraw from a final storage tank
RR plant
- IN: raw slurry; - DIG: DIG: outlet of anaerobic digestion 2; - SLIQU: liquid fraction after solid/liquid separation; - SSOL: solid fraction after solid/liquid separation; - SBR: sample taken from the biological reactor; - OUT: treated slurry, withdraw from a final storage tank
4.3. Results of monitoring campaigns
4.3.1. Plant TP
Regarding TP plant is necessary to know that during all monitoring period, regardless the unstopped plant
operation, a lot of management problem occurred: as the blocking of some equipment, the malfunction of
scum dosing system etc.

99
As explain, the absence of any acquisition system or PLC, is makes almost impossible know all events and
problems that happened in the plant and the quantity of treated influent.
Nevertheless, thanks to preliminary tests, the pump flow that feeds separation treatment was calculated,
and resulted equal to 31 m3/h. However, due to the lack of information about other data’s flow, it would not
be possible to do a correct mass balance of the plant, to measure and check the flow of the plant and,
consequently, to calculate the removal rate reachable.
The only things that it can be done is monitored the concentration of the nutrients along the treatment line
and calculate the potential removal treatment reachable considering the project flow (Table 12).
Table 12 Data of flows processed in plant TP (project data).
SAMPLING POINT VOULME (m3) FLOW (m3/d)
RAW SLURRY 28400 77,81
INLET 27200 74,52
LIQUID FRACTION 21200 58,08
DENITRIFICATION 21200 58,08
NITRIFICATION 21200 58,08
OUTLET 21200 58,08
SOLID FRACTION 6000 16,44
In Table 13, is reported average and standard deviation of chemical-physical characteristics of each sample
withdrawn for each sampling point in plant TP.
Table 13 Monitoring result obtained for each sampling points of plant TP.
Sample NH4 (g/kg) TKN (g/kg) ST% SV/ST% EC
(mS/cm) pH
TP_INLET A 0,69 1,14 1,00 67,76 7,03 7,45
SD 0,24 0,37 0,36 4,36 1,84 0,23
TP_LIQUID FRACTION A 0,63 0,72 0,38 45,40 6,70 7,26
SD 0,22 0,33 0,17 9,86 1,74 0,28
TP_DENITRIFICATION A 0,11 0,21 0,48 44,28 4,41 7,00
SD 0,06 0,07 0,23 14,07 0,65 0,71
TP_NITRIFICATION A 0,10 0,29 0,60 53,33 4,35 6,88
SD 0,06 0,08 0,10 3,94 0,65 0,73
TP_OUTLET A 0,11 0,17 0,34 30,77 4,42 7,24
SD 0,06 0,04 0,06 5,03 0,65 0,56
TP_SOLID FRACTION A 1,04 3,67 6,98 75,03 8,77 7,12
SD 0,38 1,33 1,61 3,48 8,11 0,30

100
In addition, in Figure 25, are reported the graphs representing the trend of value observed during the
sampling period. The same consideration has been done for solid content (Figure 26). Regarding pH, for all
sampling points, the value is around 7, an optimal pH for the for the establishment of biological processes
(Sommer et al., 2013).
The concentration of nitrogen compounds in the inlet flow has an inconstant trend (for both the ammonia
and TKN). This trend can be explained by the non-uniformity of the characteristics of faces: in fact, the
sewage comes from a breeding of sows and fattening pigs. The latter, due to the variation of the feed during
the fattening period, produce different waste with the consequence that the sewage entering the plant does
not have constant characteristics. Nevertheless, the most plausible explanation of these variations is
connected to precipitation: the homogenization tank from which the slurry is taken before being sent to the
separator, receives rainwater, which causes a dilution effect on the treated sewage. Moreover, at the TP
plant, a considerable amount of water is used to wash some areas of the plant or with the purpose of
defusing the sample: all this quantity of water is poured into the slurry accumulation tank and results in an
alteration of the characteristics of the slurry itself.
Downstream of the solid/liquid separation treatment, as expected, the concentration of nitrogen content of
both TKN and ammonia decreases, even if the latter has a lower drop. In fact, assuming that there are no
nitrites and nitrates (since the conditions for which nitrification processes cannot occur), the separation
process allows removing fine and coarse particles in which organic nitrogen is concentrated, and that
therefore through this treatment removed; small particles are often associated to nutrients, especially N and
P. In particular, about the 70,0% of un-dissolved N and P is related to particle size 0,45-250 µm (Masse et al.,
2005).
Considering the concentrations’ values obtain during sampling campaign, the removal rate reachable (based
on average concentration measured and project flow) through solid/liquid separation, regarding the solid
content and nitrogen content are respectively 28,2% (TAN), 50,8% (TKN) and 70,5% (ST), 80,2% (SV).
Lacking the analysis of the specific content of nitrates and nitrites (the conducted analysis regarding the
oxidized nitrogen returned a total value and not specified) as well as of suspended solids (index of the
biomass present in the tank), it is not possible to elaborate deep considerations regarding the performance
of the nitrification and denitrification phase. In addition, no analyses are been conducted for the
recirculation flow. Nevertheless, it is possible to calculate the removal rate reachable always considered the
average concentration value. The solid content in denitrification and nitrification samples are higher than
that one observed in the liquid fraction: this is due to the sampling; in fact, due to mixing and aeration of the
tank, the influent, with a low solid content is mixed with activated sludge, that rises this parameter. The
removal rates reachable through biological process is equal to 87,6% (TAN) and 59,1% (TKN).

101
Figure 25 Patterns of ammonia and TKN content during sampling campaign for each sampling point in TP plant.
-
0,20
0,40
0,60
0,80
1,00
1,20
1,40
1,60
1,80
2,00 1
2/0
1/2
01
7
26
/01
/20
17
09
/02
/20
17
23
/02
/20
17
09
/03
/20
17
23
/03
/20
17
06
/04
/20
17
20
/04
/20
17
04
/05
/20
17
18
/05
/20
17
01
/06
/20
17
g/K
g (T
AN
; TK
N)
INLET
TAN (g/kg) TKN (g/kg)
-
0,20
0,40
0,60
0,80
1,00
1,20
1,40
1,60
1,80
2,00
12
/01
/20
17
26
/01
/20
17
09
/02
/20
17
23
/02
/20
17
09
/03
/20
17
23
/03
/20
17
06
/04
/20
17
20
/04
/20
17
04
/05
/20
17
18
/05
/20
17
01
/06
/20
17
g/K
g (T
AN
; TK
N)
LIQUID FRACTION TAN (g/kg) TKN (g/kg)
0
0,005
0,01
0,015
0,02
0,025
0,03
0,035
0,04
0,045
0,05
-
0,05
0,10
0,15
0,20
0,25
0,30
0,35
0,40
0,45
0,50
12
/01
/20
17
26
/01
/20
17
09
/02
/20
17
23
/02
/20
17
09
/03
/20
17
23
/03
/20
17
06
/04
/20
17
20
/04
/20
17
04
/05
/20
17
18
/05
/20
17
01
/06
/20
17
g/K
g (N
O2-
+N
O3-
)
g/K
g (T
AN
; TK
N)
DENTIRIFICATION TAN (g/kg)
TKN (g/kg)
NO2+NO3
0
0,005
0,01
0,015
0,02
0,025
0,03
0,035
0,04
0,045
0,05
-
0,05
0,10
0,15
0,20
0,25
0,30
0,35
0,40
0,45
0,50
12
/01
/20
17
26
/01
/20
17
09
/02
/20
17
23
/02
/20
17
09
/03
/20
17
23
/03
/20
17
06
/04
/20
17
20
/04
/20
17
04
/05
/20
17
18
/05
/20
17
01
/06
/20
17
g/K
g (N
O2-
+N
O3-
)
g/K
g (T
AN
; TK
N)
NITRIFICATION TAN (g/kg) TKN (g/kg) NO2+NO3
0
0,02
0,04
0,06
0,08
0,1
0,12
0,14
-
0,05
0,10
0,15
0,20
0,25
0,30
12
/01
/20
17
26
/01
/20
17
09
/02
/20
17
23
/02
/20
17
09
/03
/20
17
23
/03
/20
17
06
/04
/20
17
20
/04
/20
17
04
/05
/20
17
18
/05
/20
17
01
/06
/20
17
g/K
g (N
O2-
+N
O3-
)
g/K
g (T
AN
; TK
N)
OUTLET TAN (g/kg) TKN (g/kg) NO2+NO3
-
1,00
2,00
3,00
4,00
5,00
6,00
12
/01
/20
17
26
/01
/20
17
09
/02
/20
17
23
/02
/20
17
09
/03
/20
17
23
/03
/20
17
06
/04
/20
17
20
/04
/20
17
04
/05
/20
17
18
/05
/20
17
01
/06
/20
17
g/K
g (T
AN
; TK
N)
SOLID FRACTION TAN (g/kg)
TKN (g/kg)

102
Figure 26 Pattern of total solids content and the percentage of volatile solids on total solids, content during sampling campaign for each sampling point in TP plant.
0,00
10,00
20,00
30,00
40,00
50,00
60,00
70,00
80,00
90,00
0,00
0,20
0,40
0,60
0,80
1,00
1,20
1,40
1,60 1
/12
/20
17
1/2
6/2
01
7
2/9
/20
17
2/2
3/2
01
7
3/9
/20
17
3/2
3/2
01
7
4/6
/20
17
4/2
0/2
01
7
5/4
/20
17
5/1
8/2
01
7
6/1
/20
17
SV/S
T%
ST%
INLET ST% SV/ST%
0,00
10,00
20,00
30,00
40,00
50,00
60,00
70,00
80,00
90,00
0,00
0,20
0,40
0,60
0,80
1,00
1,20
1,40
1,60
1/1
2/2
01
7
1/2
6/2
01
7
2/9
/20
17
2/2
3/2
01
7
3/9
/20
17
3/2
3/2
01
7
4/6
/20
17
4/2
0/2
01
7
5/4
/20
17
5/1
8/2
01
7
6/1
/20
17
SV/S
T%
ST%
LIQUID FRACTION
0,00
10,00
20,00
30,00
40,00
50,00
60,00
70,00
80,00
90,00
0,00
0,25
0,50
0,75
1,00
1,25
1,50
1/1
2/2
01
7
1/2
6/2
01
7
2/9
/20
17
2/2
3/2
01
7
3/9
/20
17
3/2
3/2
01
7
4/6
/20
17
4/2
0/2
01
7
5/4
/20
17
5/1
8/2
01
7
6/1
/20
17
SV/S
T%
ST%
DENITRIFICATION ST% SV/ST%
0,00
10,00
20,00
30,00
40,00
50,00
60,00
70,00
80,00
90,00
0,00
0,25
0,50
0,75
1,00
1,25
1,50
1/1
2/2
01
7
1/2
6/2
01
7
2/9
/20
17
2/2
3/2
01
7
3/9
/20
17
3/2
3/2
01
7
4/6
/20
17
4/2
0/2
01
7
5/4
/20
17
5/1
8/2
01
7
6/1
/20
17
SV/S
T%
ST%
NITIRIFCATION
0,00
10,00
20,00
30,00
40,00
50,00
60,00
70,00
80,00
90,00
0,00
0,05
0,10
0,15
0,20
0,25
0,30
0,35
0,40
0,45
1/1
2/2
01
7
1/2
6/2
01
7
2/9
/20
17
2/2
3/2
01
7
3/9
/20
17
3/2
3/2
01
7
4/6
/20
17
4/2
0/2
01
7
5/4
/20
17
5/1
8/2
01
7
6/1
/20
17
SV/S
T%
ST%
OUTLET ST% SV/ST%
0,00
10,00
20,00
30,00
40,00
50,00
60,00
70,00
80,00
90,00
0,00
1,00
2,00
3,00
4,00
5,00
6,00
7,00
8,00
9,00
10,00
1/1
2/2
01
7
1/2
6/2
01
7
2/9
/20
17
2/2
3/2
01
7
3/9
/20
17
3/2
3/2
01
7
4/6
/20
17
4/2
0/2
01
7
5/4
/20
17
5/1
8/2
01
7
6/1
/20
17
SV/S
T%
ST%
SOLID FRACTION

103
The absence of nitrite and nitrate in the nitrification tank it may be due to the absence of a correct
nitrification process; in fact, that process should transform the ammonia nitrogen entering the system into
nitrites and nitrates, which then feed, through the recirculation flow, the denitrification tank.
Overall, considering all the process the removal rates reachable are equal to 28,2% (TAN), 50,8% (TKN) and
70,5% (ST), 80,2% (SV).
Considering TAN and TKN parameters, the characteristics of the outlet is comparable with those one
observed in nitrification tank; regarding solid content, since the effluent is withdrawn after sedimentation,
the concentration is the lowest observed.
Regarding the characteristics of solid fraction, it is interested to underline that, right now, in the plant, the
solid fraction (ST= 7%) (combined with the solid fraction comes from the pre-treatment of separation-please
see paragraph 4.1.1), doesn’t be used and needs to be sent for further treatment.
The solid fraction obtained downstream of the flotation cannot be defined solid, but may be pumped to the
anaerobic digestion for energy recovering or to a phosphorus recovering treatment, in order to move on the
positivity, the energy balance and cost of the plant.
Although the data obtained seems to attest high efficiency of the denitrification/nitrification treatment plant
TP, it is necessary to consider that the influent is much diluted and that a part of ammonia can be leave the
tank through ammonia emissions and not thanks to biological removal. In addition, the continuous
management problems of the plant and the lack of conscious management of the system, make these
results only indicative and not representative. Therefore, it is necessary to install a control system and to
control always the correct operation of the plant.
4.3.2. Plant TO
The plant TO was on operation during all monitored period. In Table 14 are reported the average and the
standard deviation of concentration data collected for that plant.
The point “RIC” represent characteristics of the recirculation flow that is not monitored always during
sampling campaign.
Regarding this plant, the PLC installed allows checking and measuring not only RedOx and DO but also an
inlet flow. The inlet flow changing and decreasing during the monitoring campaign. In the Figure 27 is
possible to individuate 3 periods: during the first one (red line) the inlet flow was on average equal to
36,8 m3/d; during the second period (yellow line) was 18,7 m3/d and it was characterized by a high
variability, and, during the last period, equal to 5,01 m3/d. That last phase (26/6/2017 - 25/9/2017) coincides
with the end of the production cycle of pigs and their sale and to the consequent drop of slurry production.

104
Table 14 Monitoring result obtained for each sampling points of plant TO.
Sample N-NH4 (g/kg) TKN (g/kg) ST% SV/ST pH EC
(mS/cm) RedOx
IN A 1,40 1,89 1,17 41,44 7,89 15,97 -202,75
SD 0,80 1,02 0,78 10,91 0,28 6,13 189,81
RIC A 0,21 0,33 0,58 40,46 6,95 7,84 59,60
SD 0,16 0,22 0,21 6,11 0,69 3,28 124,72
OUT A 0,51 0,68 0,90 40,18 7,34 10,64 -52,90
SD 0,56 0,56 0,32 6,46 0,93 4,33 154,73
The so imposing variation of the flow fed to the plant, that have been design for treat 45 m3/d, certainly has
repercussions on the performance and consumption of the same; despite the versatility of these types of
SBR systems, if the volume in the tank remains the same, feeding a lower flow rate will affect SRT and HRT.
When the inlet flow is equal to 5 m3/d the system was not be considered to working correctly. In addition,
since level in the tank is very low during this period, the oxygen probe was not immersed in the sewage; this,
in addition to returning false data (with the oxygen data> of 9 mg/L), can compromise the functioning of the
probe. Due to its operational setting, it is possible to consider that the inlet flow is equal to outlet flow; so,
the removal rate during the monitored period can be calculated.
Concerning O2 content, is interesting to underline the differences between the 3 periods. In fact, as shown in
Figure 27, the concentration of dissolved oxygen during first period concentration of O2 is lower always than
2 mg/L (maximum value registered in the plant). Usually, in order to guarantee nitrification process at least
concentration 1,5-2 mg/L of dissolved oxygen is request.
In some studies, the request oxygen concentration reaches also 3 mg/L (please see Chapter 3). Therefore,
with this dissolved oxygen concentration it is possible that a correct nitrogen oxidation did not occur.
Nevertheless, it also probable that, since RedOx potential assumed variable values, the probe is dirty and for
this reason does not allow reading the correct values. Other option is that the rising in RedOx potential
observed is related to an absence of proper biomass in the sludge able to nitrify (SRT not adequate). In that
same period, in fact, the RedOx potential had a “conventional trend”, with minimum value observed below
zero, corresponding to the non-aeration phase, and higher than zero when blower is turned on.
During the second period, the value has a different behaviour: in fact, the maximum value of oxygen
concentration is higher. Nevertheless, due to the discontinuity plant operation, with strongly variable flow
rates, the detected data cannot be considered as an average operating condition.

105
a)
b)
c)
Figure 27 The inlet flow measured by plant’s instrument (flow meter) (a), the DO concentration measured by on oxygen probe (b) and the RedOx registered during sampling campaign (c).
0
5
10
15
20
25
30
35
40
45 4
/6/2
01
7
4/1
1/2
01
7
4/1
6/2
01
7
4/2
1/2
01
7
4/2
6/2
01
7
5/1
/20
17
5/6
/20
17
5/1
1/2
01
7
5/1
6/2
01
7
5/2
1/2
01
7
5/2
6/2
01
7
5/3
1/2
01
7
6/5
/20
17
6/1
0/2
01
7
6/1
5/2
01
7
6/2
0/2
01
7
6/2
5/2
01
7
6/3
0/2
01
7
7/5
/20
17
7/1
0/2
01
7
7/1
5/2
01
7
7/2
0/2
01
7
7/2
5/2
01
7
7/3
0/2
01
7
8/4
/20
17
8/9
/20
17
8/1
4/2
01
7
8/1
9/2
01
7
8/2
4/2
01
7
8/2
9/2
01
7
9/3
/20
17
9/8
/20
17
9/1
3/2
01
7
9/1
8/2
01
7
9/2
3/2
01
7
m3/d
Inlet Flow
0
1
2
3
4
5
6
7
8
9
10
4/5
/20
17
4/1
0/2
01
7
4/1
5/2
01
7
4/2
0/2
01
7
4/2
5/2
01
7
4/3
0/2
01
7
5/5
/20
17
5/1
0/2
01
7
5/1
5/2
01
7
5/2
0/2
01
7
5/2
5/2
01
7
5/3
0/2
01
7
6/4
/20
17
6/9
/20
17
6/1
4/2
01
7
6/1
9/2
01
7
6/2
4/2
01
7
6/2
9/2
01
7
7/4
/20
17
7/9
/20
17
7/1
4/2
01
7
7/1
9/2
01
7
7/2
4/2
01
7
7/2
9/2
01
7
8/3
/20
17
8/8
/20
17
8/1
3/2
01
7
8/1
8/2
01
7
8/2
3/2
01
7
8/2
8/2
01
7
9/2
/20
17
9/7
/20
17
9/1
2/2
01
7
9/1
7/2
01
7
9/2
2/2
01
7
mg/
L
O2 O2 (Max)
O2 (Min)
-400
-300
-200
-100
0
100
200
300
400
4/5
/20
17
4/1
0/2
01
7
4/1
5/2
01
7
4/2
0/2
01
7
4/2
5/2
01
7
4/3
0/2
01
7
5/5
/20
17
5/1
0/2
01
7
5/1
5/2
01
7
5/2
0/2
01
7
5/2
5/2
01
7
5/3
0/2
01
7
6/4
/20
17
6/9
/20
17
6/1
4/2
01
7
6/1
9/2
01
7
6/2
4/2
01
7
6/2
9/2
01
7
7/4
/20
17
7/9
/20
17
7/1
4/2
01
7
7/1
9/2
01
7
7/2
4/2
01
7
7/2
9/2
01
7
8/3
/20
17
8/8
/20
17
8/1
3/2
01
7
8/1
8/2
01
7
8/2
3/2
01
7
8/2
8/2
01
7
9/2
/20
17
9/7
/20
17
9/1
2/2
01
7
9/1
7/2
01
7
9/2
2/2
01
7
mV
RedOx RedOx (max)
RedOx (min)

106
The same conclusions can also be reached in period 3, where, as mentioned, the level of operation of the
tank was lower than that one observed during normal operation. In fact, since the oxygen probe was not
correctly immersed in the liquid (for the lower level) the recorded oxygen values are always higher than
5 mg/L. Regarding the RedOx potential, the maximum and minimum values never fall below the value 0,
since the quantity of air supplied is the same and the volume of slurry in the tank is lower, the oxygen
transfer was more efficient. However, the energy consumption of the plant grew a lot, making inefficient and
expensive a system that, if properly managed, allows reaching the required removal rates with a limited cost.
In order to better evaluation of the behaviour of oxygen concentration, RedOx and results obtained, it is
necessary to analyse a single SBR’s cycle. In Figure 28 is reported an example of pattern of RedOx and
dissolved oxygen during one day (20/05/2017) belong to first period: in particular is reported the
parameters’ variation during 6 hours.
The trend of RedOx and oxygen are not comparable with the conventional graphs obtained in a sequencing
batch reactor (please see Chapter 3). Nevertheless, the minimum in oxygen graph, correspond to a lowest
RedOx potential value. It is possible to individuate the duration of cycle equal to 40 minute, very short time
compare with those one applied usually in that type of plant (see Chapter 4).
Figure 28 Pattern of RedOx and oxygen detected during one operation day (20/05/2017) in TO plant.
0
0,2
0,4
0,6
0,8
1
1,2
1,4
1,6
1,8
2
-220
-170
-120
-70
-20
30
00
:00
:00
00
:10
:00
00
:20
:00
00
:30
:00
00
:40
:00
00
:50
:00
01
:00
:00
01
:10
:00
01
:20
:00
01
:30
:00
01
:40
:00
01
:50
:00
02
:00
:00
02
:10
:00
02
:20
:00
02
:30
:00
02
:40
:00
02
:50
:00
03
:00
:00
03
:10
:00
03
:20
:00
03
:30
:00
03
:40
:00
03
:50
:00
04
:00
:00
04
:10
:00
04
:20
:00
04
:30
:00
04
:40
:00
04
:50
:00
05
:00
:00
05
:10
:00
05
:20
:00
05
:30
:00
05
:40
:00
05
:50
:00
06
:00
:00
O2
mg/
L
Re
dO
x m
V
RedOx Oxygen

107
In Figure 29, is reported the concentrations of nitrogen compounds and solid compounds along all
monitored period in plant TO.
Figure 29 Path of TAN and TKN concentration and solids content during sampling campaign for each sampling point in plant TO.
The inlet concentration of nitrogen compounds varying between 0,53 g/L and 2,8 g/L (TAN) and 0,67 g/L and
3,77 g/L concerning TKN. Relating to solid content the minimum value observed for total solid and volatile
solid were 4,3 g/L and 1,5 g/L and the maximum are 32,7 g/L and 23,8 g/L respectively. Also in this case, the
faces of the pig changing during the fettering period. In addition, also in this plant, there is not a cover for
the different tanks, and so the rain (copious in some days) may diluted the slurry. At the output, the
concentration observed of solids has a more constant trend, and the nitrogen content did not show a
constant trend. This can be a result of the change in the inlet flow quantity and quality.
0,0
0,1
0,1
0,2
0,2
0,3
0,3
0,4
0,4
0,5
0,5
0,0
0,5
1,0
1,5
2,0
2,5
3,0
3,5
4,0
07
/12
/20
16
07
/01
/20
17
07
/02
/20
17
07
/03
/20
17
07
/04
/20
17
07
/05
/20
17
07
/06
/20
17
07
/07
/20
17
07
/08
/20
17
07
/09
/20
17
g/K
g N
O2
- +
NO
3-
g/K
g (T
AN
; TK
N)
INLET TAN TKN N-(NO2- + NO3-)
0,0
0,1
0,1
0,2
0,2
0,3
0,3
0,4
0,4
0,5
0,5
0,00
0,50
1,00
1,50
2,00
2,50
3,00
3,50
4,00
07
/12
/20
16
07
/01
/20
17
07
/02
/20
17
07
/03
/20
17
07
/04
/20
17
07
/05
/20
17
07
/06
/20
17
07
/07
/20
17
07
/08
/20
17
07
/09
/20
17
g/K
g N
O2
- +
NO
3-
g/K
g (T
AN
; TK
N)
OUTLET TAN TKN N-(NO2- + NO3-)
0
10
20
30
40
50
60
70
0,0
0,5
1,0
1,5
2,0
2,5
3,0
3,5
07
/12
/20
16
07
/01
/20
17
07
/02
/20
17
07
/03
/20
17
07
/04
/20
17
07
/05
/20
17
07
/06
/20
17
07
/07
/20
17
07
/08
/20
17
07
/09
/20
17
SV/S
T%
ST%
INLET SV/ST% ST%
0
10
20
30
40
50
60
70
0,0
0,5
1,0
1,5
2,0
2,5
3,0
3,5
07
/12
/20
16
07
/01
/20
17
07
/02
/20
17
07
/03
/20
17
07
/04
/20
17
07
/05
/20
17
07
/06
/20
17
07
/07
/20
17
07
/08
/20
17
07
/09
/20
17
SV/S
T%
ST%
OUTLET
SV/ST% ST%

108
The mass balance and the removal rate definition were done for 3 periods. In Table 15 and 16 are reported
results of detected concentrations and removal rates obtained.
Average removal rates are calculated using an average flow 21,4 m3/d.
As well in that plant, data about the activated sludge was not be present. For this reason, it cannot be
possible to understand if the denitrification process occurs correctly.
Table 15 Chemical-physical characteristics for three different periods.
N-NH4+
(g/kg)
N (N02-+NO3
-)
(g/kg)
TKN
(g/kg) pH EC (mS/cm) T°C ST% SV/ST
PERIOD
1
IN 1,57 0,01 2,18 7,81 16,60 8,34 1,34 46,69
0,84 0,01 1,06 0,27 6,59 8,91 0,92 9,28
OUT 0,55 0,13 0,68 7,65 8,53 8,21 0,79 43,48
0,62 0,22 0,59 0,80 4,01 8,82 0,35 4,94
PERIOD
2
IN 2,21 0,01 2,55 8,37 24,05 0,00 1,15 37,29
- - - - - - - -
OUT 1,44 0,00 1,80 8,71 17,78 0,00 1,19 40,99
- - - - - - - -
PERIOD
3
IN 0,78 0,01 1,00 7,97 12,40 0,00 0,78 29,34
0,20 0,00 0,24 0,18 2,21 0,00 0,11 1,98
OUT 0,24 0,01 0,46 6,53 13,71 0,00 1,09 33,98
0,05 0,00 0,13 0,35 0,36 0,00 0,10 4,54
Also in this case, the nitrogen removal rate is higher than 60% but, considering that part of ammonia can
leave the system as ammonia emissions, it can be useful to check the amount of ammonia leave the system
and how is biologically removed.
Table 16 Removal rates obtain in each period, and the average one.
N-NH4
+ REMOVAL RATE% TKN REMOVAL RATE % ST REMOVAL RATE %
PERIOD 1 65,0 68,6 41,2
PERIOD 2 34,7 29,4 -3,6
PERIOD 3 69,1 54,3 -40,6
AVERAGE 64,0 64,1 23,1

109
For this plant, that is well furnished of control system and any type of probe, optimal operation would be
expected.
4.3.3. Plant NA
In Table 17 are reported concentration data (average and standard deviation) obtained for plant NA.
As first step and where all data are available, a mass balance is conducted (Figure 30).
For plant NA, it was hypothesized that all the produced digestate (NA-DIG) is sent to the following phase
aimed at biological nitrogen removing (NA-SBR).
Table 17 Monitoring results obtained for plant NA.
Sample (A) NH4
+
(g/kg)
TKN
(g/kg) ST (%)
SV
(%ST) pH EC
NA-IN1 A 1,19 2,99 7,37 80,56 7,05 12,64
SD 0,11 0,47 1,07 0,21 0,06 2,25
NA-IN2 A 1,23 2,96 7,53 81,08 7,09 16,03
SD 0,08 0,13 0,11 0,63 0,13 0,69
NA-DIG A 2,01 4,06 6,49 70,37 7,93 13,65
SD 0,01 0,07 0,04 1,57 0,03 0,37
NA-SLIQ A 1,99 3,94 5,15 67,00 8,13 22,57
SD 0,03 0,13 0,11 0,13 0,08 0,53
NA-SBR A 2,05 3,94 5,00 65,25 8,10 22,20
SD 0,00 0,06 0,03 1,84 0,01 2,62
NA-OUT (STOC) A 1,91 3,49 4,78 64,91 7,84 22,32
SD 0,11 0,06 0,03 0,30 0,01 0,58
NA-SSOL A 1,62 5,94 22,64 77,82 - -
SD 0,04 0,32 0,56 7,99 - -
The data provided by plant operators attest that 67,6 m3/d of slurry are fed into the plant (NA-IN) and that
62,3 m3/d of digested slurry reaches the SBR tank. If the input data (NA-IN) represents the total flow of both
the treated slurry and the added biomass, anaerobic digestion feed was equal to 67,6 m3/d.
Considering that, the 62,2 m3/d treated by the SBR came from mechanical separator (NA-SLIQU), the
separate liquid of the helical separator is equal to 62,3 m3/d.

110
A mass balance for nitrogen content was also conducted (Figure 30). It was supposed that N concentration
(as TKN) in silage and hay were equal to 8,5 gTKN/L and 2,0 gTKN/L respectively. For TKN balance, data
collected in March are used, because represent a correct operation of the plant.
The samples collected from two different inputs of the NA plant have similar characteristics in terms of dry
matter and volatile solids, as well as for the nitrogenous components. The concentration of ammonia after
the anaerobic digestion increases but remains almost unchanged after the SBR treatment until storage,
before distribution. As observed for TKN, an increase in concentration downstream of anaerobic digestion
was observed for the addition of biomass.
The plant’s operators attested that on average 25 m3/d of chopped and hay (as also reported in the mass
balance) entered the plant. The data about concentration of the TKN related to storage, compared with the
characterization of the slurry taken in the SBR, were slightly lower for probable phenomena of emissions
(losses) that occurred. Samples of solid fraction had ammonia nitrogen and TKN values in line with the
characteristic data of separate solid. The total solids concentration shows how the process of anaerobic
digestion causes a decrease in the percentage of total solids (hydrolysis phase, and catabolic reactions).
Figure 30 Mass balance and N (TKN) balance in March for plant NA.
For the plant NA, a verification of the separation efficiency in terms of total solids was determined.
Considering the concentrations of solids detected with laboratory analysis and the flow rates declared by the
Hay: 9 ton/d 18,00 kg TKN/d
Silage: 16 ton/d 136,00 kg TKN/d

111
plant, it is possible to verify the percentage of solids entering the SBR plant. The results obtained are
reported in Table 18.
Table 18 Verification of solid separation efficiency for Plant NA.
SEPARATION
PHASE
VERIFICATION
Qin,S/L separator [m3/d] 67,6
Cin,ST concentration in the feed of separator [%] 6,5
Cout,ST concentration in the outlet of separator [%] 5,2
Cout,sol,concentration in the outlet of separator (solid fraction) [%] 22,6
Qout,liq [m3/d] 62,3
Qout, sol [m3/d] 5,27
µ vol % 7,8%
µ solid % 26,9%
Min,ST [kg/d] 4388,5
Mout,sol ST [kg/d] 1192,9
Mout, liqu ST [kg/d] 3210,0
The separation efficiency in terms of volume was equal to 8%. This data is not so high but in line with those
ones reported in literature (5-20%). Nevertheless, the total solids content in the separator effluent was very
high, and this fact can affect negatively the proper functioning of the SBR. It would be advisable to start to
use, as also foresees by the plant operators, the installation of a machine that removes the total solids as the
centrifuge. Moreover, with some simplifying hypotheses, the aeration system has been sized necessary to
reach nitrogen removal levels > 60%. The results obtained are shown in Table 19.
Table 19 Dimension of air supply for Plant NA.
Energy consumption for air
supply
Qin inflow of SBR [m3/d] 62,3
Cin,N TKN concentration [gN/kg] 3,9
Cin,N TAN concentration[gN/kg] 2,0
Qin,TKN [kg/d] 245,6
Qin,TAN [kg/d] 124,0
TAN/TKN 0,5
μ nitrogen removal required [%] 60%
Qout, TKN [kg/d] 98,2
TAN that is necessary remove in the SBR [kg/d] ** 147,3
kgO2/g N-NH4+; 4,3
O2 required for ammonification [kgO2/d] 626,2
Oxygenation yield for a bubble system kgO2/kWh (0,8-1,3) 1,1
kWh 596,4
kW machine for a functioning of 14 h day 42,6
**hypotheses: due to the TAN/TKN rate in the slurry, is < 60%, the hypotheses is that part of Norg in the sludge is mineralize during the process.

112
It is essential to consider that the nitrogen to be removed for nitrification is ammonia, since it is this
component that can be oxidized to nitrates and subsequently transformed into molecular nitrogen.
This consideration is done for all plants here described.
The data recorded in the phase sequence reactor (SBR) confirm what the system has declared: the SBR is not
working. In fact, the chemical / physical parameters upstream and downstream have not changed.
4.3.4. Plant VA
The Table 20 here below shows the data collected for the different samples for plant VA.
The only data about the flow treated slurry by the plant is calculated starting from the number of pigs owned
and the total amount of slurry produces during a pervious observed period. In fact, considering that in 6
months, the slurry production was about 6000 m3 TQ.
Considering a volume separation efficiency of 10% (hypothesis), the SBR system treats 5400 m3 TQ.
Considering 30 days per month, an average of 30,0 m3/d can be obtained. Since the reading of the flow
meter that feeds the helical separator, was equal to 2,4 m3/min (from data read on the flow meter), it is
possible to calculate the time of operation of the feed pump equal to 12,5 min/ day.
Table 20 characteristics of slurry during monitoring period of plant VA.
Sample pH EC NH4+ (g/kg) TKN (g/kg) ST (%) SV (%ST)
VA-IN A 7,81 35,23 3,17 3,99 2,83 50,45
SD 0,12 0,35 0,28 0,39 0,57 2,80
VA-IN* A 7,61 33,25 3,41 5,44 6,92 63,90
SD - - - - - -
VA-SILQ A 7,75 33,45 3,53 5,19 5,56 59,49
SD 0,21 1,37 0,18 0,28 0,81 0,01
VA-OUT A 8,26 24,07 1,57 1,82 1,48 36,51
SD - - - - - -
VA-SSOL A - - 2,06 8,29 30,90 74,71
SD - - 0,74 0,99 2,66 6,54
In the plant VA, there is a discrepancy of the definition points “INLET” considered for sampling. In fact,
having detected during first campaign an inequality between the characteristics of the incoming slurry (B-IN)
(especially in terms of total solids) taken downstream of the pig-shade and the separate liquid (B-SLIQU)
sampled at downstream of the solid/liquid separator, it was decided to define as “INLET” the slurry
withdrawn from the accumulation tank located upstream of the separator (B-IN *). Actually, due to longest
accumulation period, the characteristics of total solids and volatile solids can change during storage.
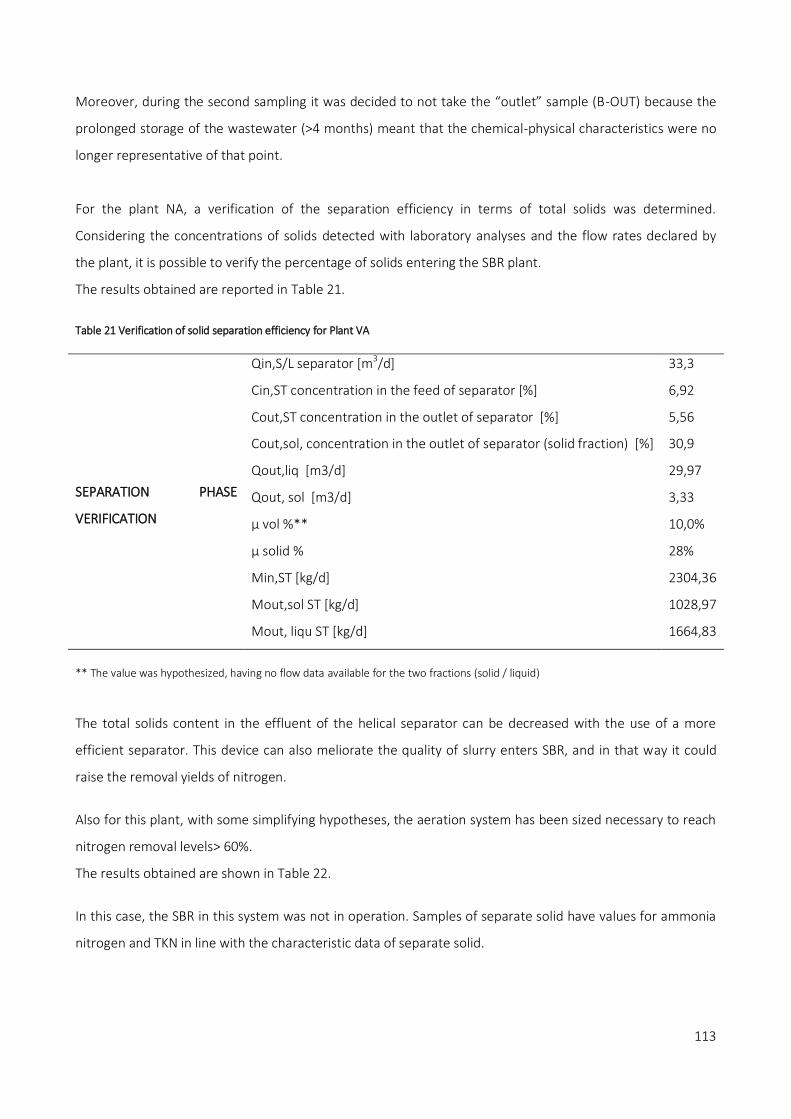
113
Moreover, during the second sampling it was decided to not take the “outlet” sample (B-OUT) because the
prolonged storage of the wastewater (>4 months) meant that the chemical-physical characteristics were no
longer representative of that point.
For the plant NA, a verification of the separation efficiency in terms of total solids was determined.
Considering the concentrations of solids detected with laboratory analyses and the flow rates declared by
the plant, it is possible to verify the percentage of solids entering the SBR plant.
The results obtained are reported in Table 21.
Table 21 Verification of solid separation efficiency for Plant VA
SEPARATION PHASE
VERIFICATION
Qin,S/L separator [m3/d] 33,3
Cin,ST concentration in the feed of separator [%] 6,92
Cout,ST concentration in the outlet of separator [%] 5,56
Cout,sol, concentration in the outlet of separator (solid fraction) [%] 30,9
Qout,liq [m3/d] 29,97
Qout, sol [m3/d] 3,33
µ vol %** 10,0%
µ solid % 28%
Min,ST [kg/d] 2304,36
Mout,sol ST [kg/d] 1028,97
Mout, liqu ST [kg/d] 1664,83
** The value was hypothesized, having no flow data available for the two fractions (solid / liquid)
The total solids content in the effluent of the helical separator can be decreased with the use of a more
efficient separator. This device can also meliorate the quality of slurry enters SBR, and in that way it could
raise the removal yields of nitrogen.
Also for this plant, with some simplifying hypotheses, the aeration system has been sized necessary to reach
nitrogen removal levels> 60%.
The results obtained are shown in Table 22.
In this case, the SBR in this system was not in operation. Samples of separate solid have values for ammonia
nitrogen and TKN in line with the characteristic data of separate solid.

114
Table 22 Sizing (preliminary) of air supply for Plant NA.
Energy consumption for
air supply
Qin inflow of SBR [m3/d] 30,00
Cin,N TKN concentration [gN/kg] 5,19
Cin,N TAN concentration[gN/kg] 3,53
Qin,TKN [kg/d] 155,70
Qin,TAN [kg/d] 105,90
TAN/TKN 68%
h nitrogen removal required [%] 60%
Qout,TKN [kg/d] 62,28
TAN that is necessary remove in the SBR [kg/d] 93,42
kgO2/g N-NH4+; 4,25
O2 required for ammonification [kgO2/d] 397,04
Oxygenation yield for a bubble system kgO2/kWh (0,8-1,3) 1,05
kWh 378,13
kW machine for a functioning of 14 h day 27,01
4.3.5. Plant RR
The Table 23 here below shows the concentration’s data collected for the different samples for plant RR.
Observing the trend of ammonia concentration downstream of anaerobic digestion there is an increase of
0,5 g/L, and undergoes a sharp decrease during the SBR process. However, in the sample taken from the
storage tank, the concentration rises again. This observation leads to consider a possible by-pass of slurry for
the separation treatment to the storage tank. This deduction can also be corroborated by TKN data, and
relative to solids, for which, in storage, an increase in concentration can be noted. The SBR process, as
mentioned, seems to bring about a substantial reduction of TAN. However, since there is no information
regarding the phase in which the sampling was carried out no detailed considerations can be made. In
addition, as for plant TP, TO, NA and VA, no data about activity of activated sludge are defined and verified.
Also for this reason, any consideration done about nitrifying and denitrifying bacteria activity is not possible.
Visually, it was understood that the sampling was withdrawn during the sedimentation or denitrification
phase, since there was no air blowing.
Since in plant RR the flow rates have changed during the monitoring period, the reported mass balances are
distinguished for the 2 months considered (Figure 31).

115
In order to make the mass balance of the plant, a nitrogen concentration (TKN) of 2,0 g/was assumed for the
manure.
Table 23 Characteristics of slurry during monitoring period of plant RR.
Sample pH EC NH4+ (g/kg) TKN (g/kg) ST (%) SV (%ST)
RR-IN A 7,02 14,00 1,52 3,53 8,87 80,81
SD 0,10 4,70 0,06 0,14 0,12 2,61
RR-DIG A 7,96 16,55 1,94 3,46 5,31 69,85
SD 0,17 4,73 0,18 0,20 0,48 1,36
RR-SLIQ A 8,02 21,38 1,93 3,40 4,17 62,84
SD 0,08 2,05 0,13 0,25 0,31 4,31
RR-SBR A 8,19 13,06 0,45 1,52 3,22 57,36
SD 0,42 0,83 0,18 0,45 0,67 6,17
RR-OUT (STOC) A 7,65 17,64 1,54 2,85 4,04 60,01
SD 0,17 0,88 0,38 0,40 0,11 5,40
RR-SSOL A - - 1,67 5,54 26,37 89,72
SD - - 0,04 0,22 1,62 0,29
In April, in fact, as the flow rates were lowered, the mass balance is different (Figure 31), and with it also the
efficiency of the SBR that was equal to 67%.
In April, during the plant’s monitoring, it was considered the possibility that the slurry inside the SBR was
settling for a long time, being the level quite low and the foam completely absent. Moreover, always during
sampling, it was clear that there was a displacement of slurry’s flow starting from an intermediate storage
tank to an unknown point, since the level in the SBR did not change during the handling of that liquid flow
(encountered by the noises). So, it was plausible to think that the digested slurry (or the liquid separated),
was partly by-passed. From the obtained data, it is possible to calculate a nitrogen removal efficiency (as
TKN) of the RR plant in the month of March: this is equal to 43,2%. Although the data obtained seems to
attest to a high efficiency of the SBR, it is necessary to consider that at the output of the plant we find an
effluent having TKN much higher than that detected in the SBR. Moreover, as already stated, although the
efficiency of the plant seems high, considering storage as a final point, the efficiency drops considerably from
the "theoretical" 43% and 67% (in the months of March April-respectively), to a real 20,2% 12,3% (in the
months of March April-respectively). The variability of the data, which is more marked for the samples taken
downstream of the liquid separator, in the SBR and downstream of the same, can be traced back to the
different feeding of the plant in the two months in which the sampling was carried out.
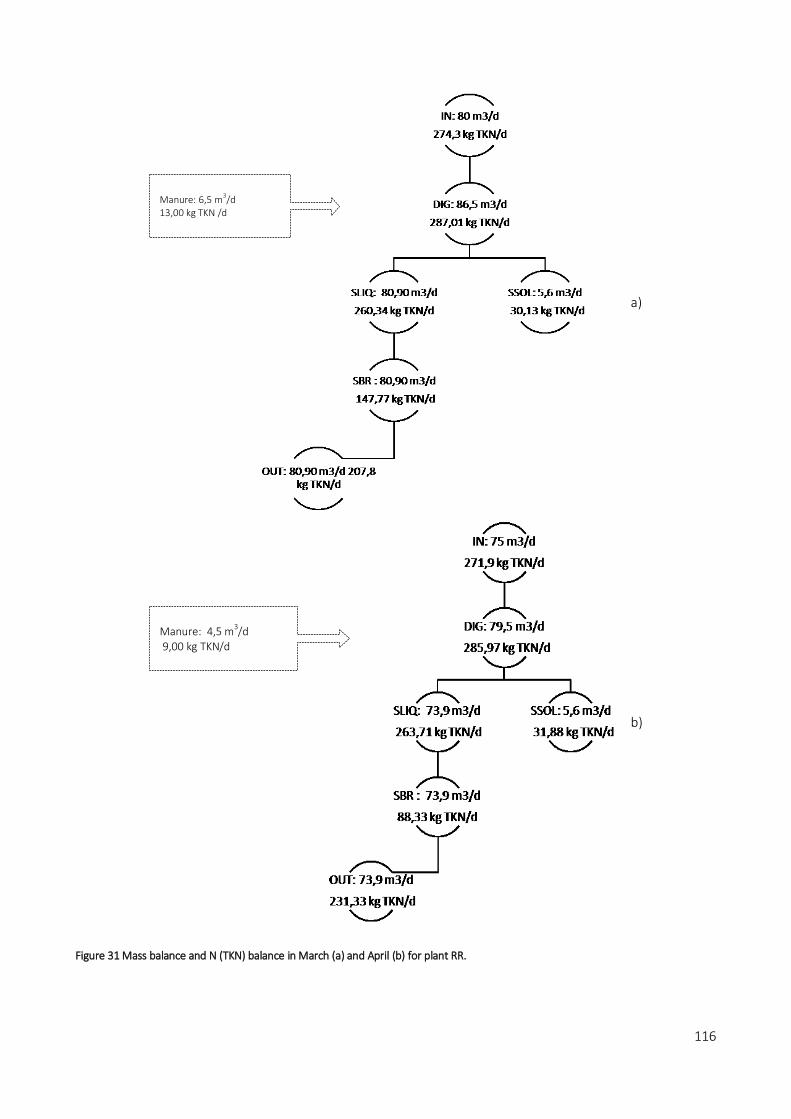
116
a)
b)
Figure 31 Mass balance and N (TKN) balance in March (a) and April (b) for plant RR.
Manure: 4,5 m3/d 9,00 kg TKN/d
Manure: 6,5 m3/d
13,00 kg TKN /d

117
Considering the concentrations of solids detected and the flow rates declared by the plant, it is also possible
to verify the percentage of solids entering the SBR plant as be done for other plants. The results obtained are
reported in Table 24.
Also for this plant, with some simplifying hypotheses, the aeration system has been sized necessary to reach
nitrogen removal levels> 60%. The results obtained are shown in Table 25.
Table 24 Verification of solid separation efficiency for Plant RR
SEPARATION
PHASE
VERIFICATION
Qin,S/L separator [m3/d] 86,5 Cin,ST concentration in the feed of separator [%] 5,3
Cout,ST concentration in the outlet of separator [%] 4,2
Cout,sol, concentration in the outlet of separator (solid fraction) [%] 26,4
Qout,liq [m3/d] 80,9
Qout, sol [m3/d] 5,6
µ vol %** 6,5%
µ solid % 27,0%
Min,ST [kg/d] 4593,2
Mout,sol ST [kg/d] 1476,4
Mout, liqu ST [kg/d] 3373,5
Table 25 Dimension of air supply for Plant RR.
Energy consumption for air
supply
Qin inflow of SBR [m3/d] 80,90
Cin,N TKN concentration [gN/kg] 3,40
Cin,N TAN concentration[gN/kg] 1,93
Qin,TKN [kg/d] 275,06
Qin,TAN [kg/d] 156,14
TAN/TKN 57%
μ nitrogen removal required [%] 60%
Qout,TKN [kg/d] 110,02
TAN that is necessary remove in the SBR [kg/d] 165,04
kgO2/g N-NH4+; 4,25
O2 required for ammonification [kgO2/d] 701,40
Oxygenation yield for a bubble system kgO2/kWh (0,8-1,3) 1,05
kWh 668,00
kW machine for a functioning of 14 h day 47,71
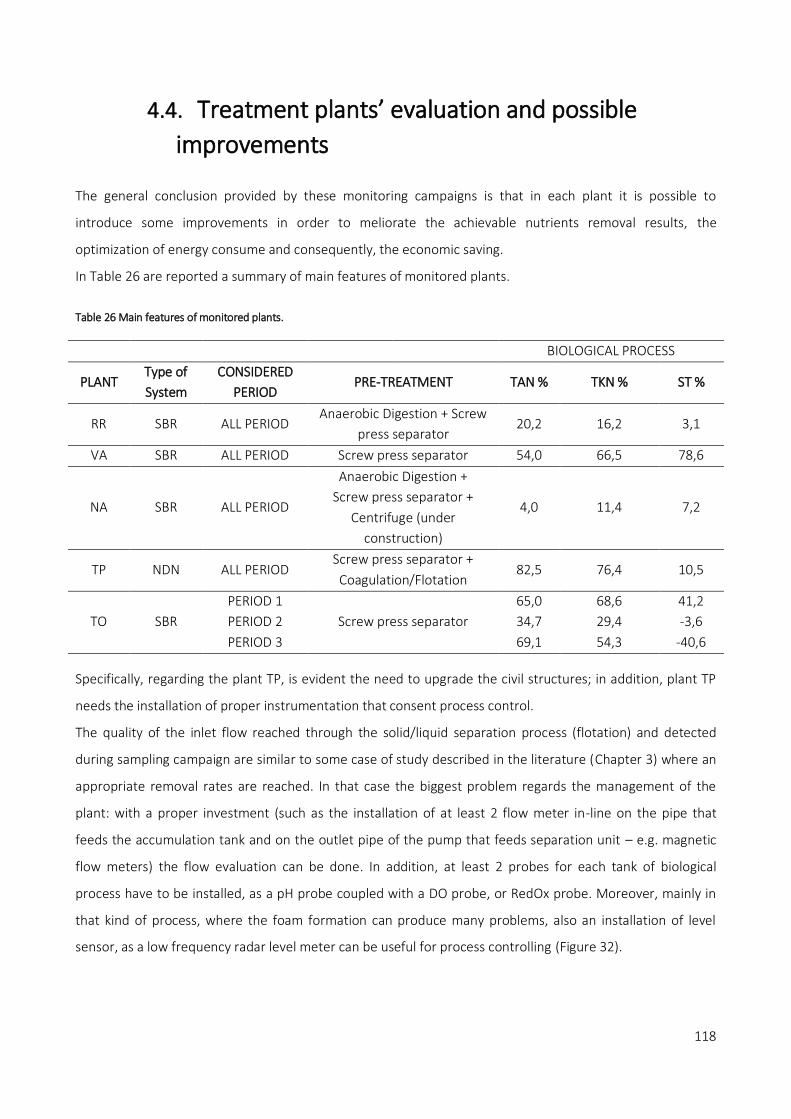
118
4.4. Treatment plants’ evaluation and possible
improvements
The general conclusion provided by these monitoring campaigns is that in each plant it is possible to
introduce some improvements in order to meliorate the achievable nutrients removal results, the
optimization of energy consume and consequently, the economic saving.
In Table 26 are reported a summary of main features of monitored plants.
Table 26 Main features of monitored plants.
BIOLOGICAL PROCESS
PLANT Type of
System
CONSIDERED
PERIOD PRE-TREATMENT TAN % TKN % ST %
RR SBR ALL PERIOD Anaerobic Digestion + Screw
press separator 20,2 16,2 3,1
VA SBR ALL PERIOD Screw press separator 54,0 66,5 78,6
NA SBR ALL PERIOD
Anaerobic Digestion +
Screw press separator +
Centrifuge (under
construction)
4,0 11,4 7,2
TP NDN ALL PERIOD Screw press separator +
Coagulation/Flotation 82,5 76,4 10,5
TO SBR
PERIOD 1
Screw press separator
65,0 68,6 41,2
PERIOD 2 34,7 29,4 -3,6
PERIOD 3 69,1 54,3 -40,6
Specifically, regarding the plant TP, is evident the need to upgrade the civil structures; in addition, plant TP
needs the installation of proper instrumentation that consent process control.
The quality of the inlet flow reached through the solid/liquid separation process (flotation) and detected
during sampling campaign are similar to some case of study described in the literature (Chapter 3) where an
appropriate removal rates are reached. In that case the biggest problem regards the management of the
plant: with a proper investment (such as the installation of at least 2 flow meter in-line on the pipe that
feeds the accumulation tank and on the outlet pipe of the pump that feeds separation unit – e.g. magnetic
flow meters) the flow evaluation can be done. In addition, at least 2 probes for each tank of biological
process have to be installed, as a pH probe coupled with a DO probe, or RedOx probe. Moreover, mainly in
that kind of process, where the foam formation can produce many problems, also an installation of level
sensor, as a low frequency radar level meter can be useful for process controlling (Figure 32).

119
Furthermore, it would be advisable to provide for a revamping of the installed machines, where these are
obsolete. For the monitoring of the system, it would be advisable to provide a continuous and programmed
control of the characteristics of the samples taken at different points of the plant.
The situation in the plant TO is different. This plant, in fact, has all the necessary equipment for a process
control. For a cost reduction and for optimization of the process it is possible to propose the application, for
example, of the real-time control of the aeration provided based on the parameters detected or the control
of the biological process based on RedOx and oxygen trend or on pH and DO trends. Also for this plant, the
results obtained lead to the conclusion that it is not sufficient to have a furnished and well-designed plant to
obtain good results, but it is necessary to manage it correctly.
Figure 32 Example of a low frequency radar meter (Siemens ®)
In this plant, with the purpose of improve the desired yields, tests could be carried out to optimize the
duration of the operating cycles; in addition, also an installation of more advanced pre-treatments that allow
the entry of nutrient-laden slurry, but poor in inert components. An example of a very good S/L treatment is
represented by a centrifuge (Figure 33).
Figure 33 An example of applicable machinery for solid/liquid separation (Pieralisi S.p.A).
The plant NA, VA and RR have a lot of functioning problem. The first two plants are to be considered
practically inoperative and, even if the observed period is very short, the evidence for managing problems
occurred.
The SBR plant of the NA farm is new and has all the features necessary for its proper functioning.
Improvements aimed at the removal of solid ends using a centrifuge will certainly bring about a noticeable
improvement in the quality of the wastewater. Also in this plant, the highest step to overcome is correct
plant management and operational optimization to limit energy waste and costs.

120
For plant VA, as observed for plant TP, is necessary to foresee at first a plant revamping. One of the
peculiarities of this plant is the large number of tanks for slurry storage. However, the SBR plant receives a
total solids-rich slurry, that may represent a limit in achieving good nitrogen yields, as demonstrated also by
the collected data. To improve the performance of the SBR, and without making too much impact on the
system, it was proposed to prepare a still pipe inside the storage tank of the separated liquid. In particular, it
was planned to insert a 1,5 m height concrete pipe inside the tank in which the submerged pump will be
installed. In that way, the slurry with a lower solid content, which will go to accumulate in the lower area of
the tank, enter this calm zone, and be sent to the SBR with an inferior load of total solids. Also in the VA
plant, the probes installed in the SBR tank are damaged and would need to be replaced. Finally, as regards
the VA system, it is necessary to set a correct operating cycle of the SBR, and, perhaps, to provide for the
start-up of the system using an inoculum of activated sludge coming from a functioning plant.
The RR plant is the most modern and new. In this case, in order to achieve the required improvements, it is
necessary to focus on the actual functioning of the SBR system. This is the only system where there is a
person employed in the management and control of the plant. This could represent the keystone for
obtaining the desired removal yields.
General, for all considered plants, once put in proper function, the further sampling campaign have to be
focused on the deepest characterization of inlet flow and on the biological biomass present in the tanks.
These can help the comprehension of the real operation of biological process, whose “heart” is in the
activated biomass. It is not enough to have a good-quality influent but is necessary to establish the right
microbiological activity. For all these reasons, an experimental activity has to be started in order to try to
understand if the common NDN and SBR plant’s management for livestock treatment allows reaching the
wanted nitrogen and nutrients removal rates, or is indispensable to change and meliorate it.
4.5. References
APHA, AWWA, and WEF. (2014). Standard methods for the examination of water and
wastewater.21st ed. American Public Health Association, Washington, D.C.
Masse, L., Massè, D. I., Beaudette, V., & Muir, M. (2005). Size distribution and composition of
particles in raw and anaerobically digested swine manure. Transactions of the ASAE, 48(5), 1943–1949.
http://doi.org/10.13031/2013.20003
Sommer, S. G., Christensen, M. L., Schmidt, T., Jensen, L. S., eds. 2013. In Animal Manure
Recycling: Treatment and Management. John Wiley & Sons Ltd. Chichester, UK.

121
5. Biological process for nitrogen removal in
SBR applied at laboratory scale
According to the nitrate directive (91/676/CEE), in Italy and in particular in Po valley, many of existing farms
need to treat livestock manure prior to its land spreading.
Besides the solid liquid separation and other possible treatments and despite the diffusion of new
technology focused on the recovery of nutrient rather than their simple removal, the existing plants in
Lombardy mostly apply the nitrification-denitrification process for nutrients removal. This kind of treatment
at real scale mostly occurs both in a “classical” scheme (NDN plants) and in sequencing batch reactor
systems (SBRs).
As also attested by real monitoring plant activities (please see Chapter 4), in that kind of treatment plants
management problems occurs and often the required nutrients removal rate cannot be reached.
For these reasons, NDN process applied in SBR system at lab scale for nutrient removal from livestock waste
was analysed in order to study how the nitrogen removal rate changing with the variation of inlet
characteristics and operational settings. Regarding the state of the art related to the topic discussed below,
please refer to Chapter 3.
5.1. Aim of the experiments
The process performance of biological nitrogen removal was investigated in a sequencing batch reactor
(SBR) at lab scale. The general aim is to understand how the operating settings applied in the SBRs systems
can influence the desired nutrient removal yields and how the characteristics of the different types of slurry
can influence the obtainable quality of the final effluent. For doing that, 4 experiments were set up.
In particular:
The first batch of experiments Test 1 was aimed to the identification of the SBR systems’ responses
using different types of slurry (pig slurries form different farms after separation process) and
applying the same nitrogen loading rate (gTAN/Lreactor/d). In that case, the duration of the whole
cycle was the same for all reactors but loading and discharging times and consequently the hydraulic
retention time (HRT) change with the varying of slurry’s type in order to maintain constant the
nitrogen load. Accordingly, loading and discharging time is different for each type of slurry.
Test 2, was aimed to the identification of the SBR systems’ responses using different inlet sludge (pig
slurries form different farms after separation process and liquid fraction of digestate), but with the
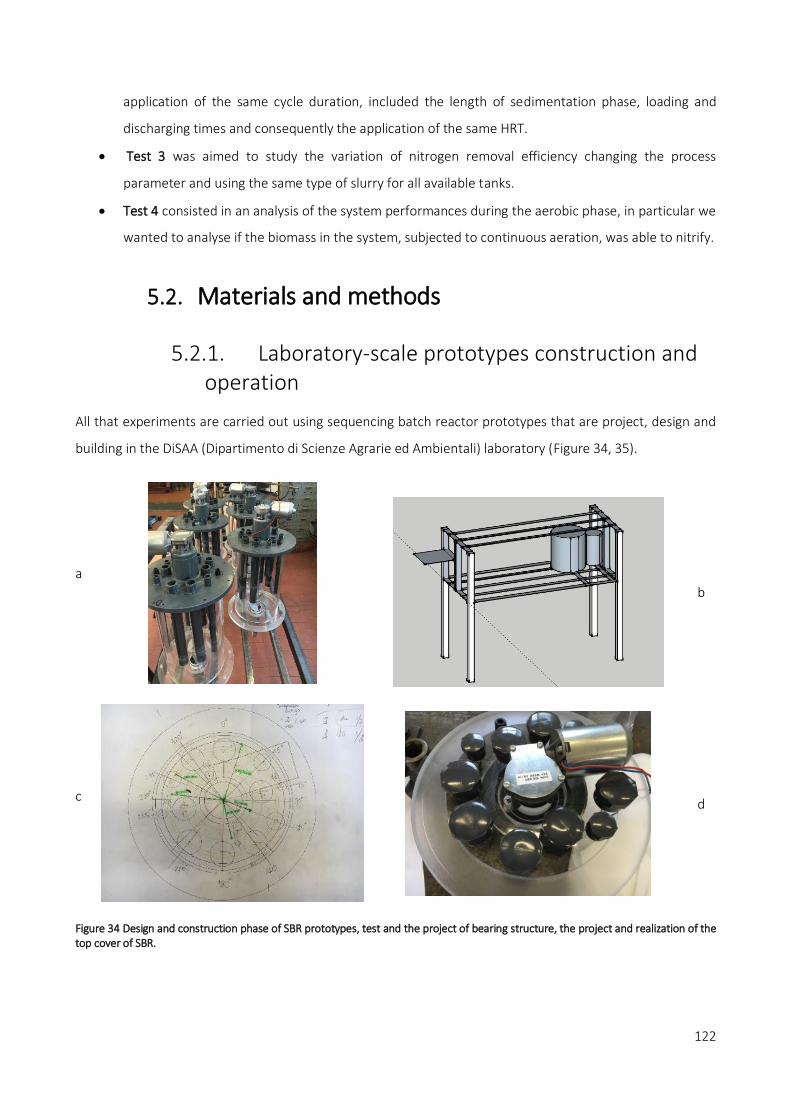
122
application of the same cycle duration, included the length of sedimentation phase, loading and
discharging times and consequently the application of the same HRT.
Test 3 was aimed to study the variation of nitrogen removal efficiency changing the process
parameter and using the same type of slurry for all available tanks.
Test 4 consisted in an analysis of the system performances during the aerobic phase, in particular we
wanted to analyse if the biomass in the system, subjected to continuous aeration, was able to nitrify.
5.2. Materials and methods
5.2.1. Laboratory-scale prototypes construction and operation
All that experiments are carried out using sequencing batch reactor prototypes that are project, design and
building in the DiSAA (Dipartimento di Scienze Agrarie ed Ambientali) laboratory (Figure 34, 35).
a
b
c
d
Figure 34 Design and construction phase of SBR prototypes, test and the project of bearing structure, the project and realization of the top cover of SBR.

123
a
b
Figure 35 Schematization of the reactor and its components (a); functioning system of six reactors (b) operating with 3 different inlets.

124
In Table 27 are reported sizing data of one reactor.
Table 27 Sizing data of one reactor (first hypothesis).
DESIGN Reactor- Rev. 01 U.M.
Geometrical high (Hg) cm 35,0
Internal diameter cm 23,0
Area (Ab) cm2 415,5
I; Ab/Hg - 0,7
Internal radius cm 11,5
Geometrical volume L 14,5
Net volume L 10,0
Net high cm 24,1
SRT (first hypothesis) d 20,0
HRT (to be defined) d 15,0
Qin-Qout L/d 0,5
Cycle time h 8,0
Number of cycles cycle/d 3,0
Qin/cycle L/cycle 0,18
Overflow level cm 0,43
Q l/ week L/week 3,7
Q l/2 weeks L/week 7,5
Pumps
Qin/cycle L 0,18
Q pump L/min 0,56
Pump operation time min 0,32
The lab scale treatment system used in the study consists of six Poly(methyl methacrylate) reactors, each
with a geometric volume of 14,5 L (35 cm height and 23 cm internal diameter).
Prototypes were provided with a fitting polyvinylchloride lid (Figure 34) with ports for sampling and inserting
probes.
Each reactor has an air inlet regulated by a flow meter (2–30 L/min, Key Instruments, Trevose, PA, USA), 2
outlet holes for promoting the air exchange and other 2 air connections in order to permits to measure air
gas outlet, if necessary. All the holes, as also shown in the Figure 34, are provided with a cap in case the gas
measurement reactor is to be sealed.
Aeration was performed using an air membrane pump (EVO30 series, ELECTRO A.D., Barcelona, Spain) that
was set in order to ensure the level of required dissolved oxygen concentration.

125
Air entered the reactor through a SS316L tube, screwed with two-gas diffuser stones (Scubla S.r.l) placed at
the bottom of each reactor that allowed blowing and spreading fine air bubbles in the sludge.
The pH (SZ161, B&C Electronics, Italy) and Redox potential (SZ251S B&C Electronics, Italy) were continuously
monitored using a computer coupled with LabView Software (National Instruments, Austin, USA) (Figure 36).
Figure 36 An output window of acquisition system
All the probes were positioned inside a protection PVC tube (Figure 37,b) approximately 10 cm beneath the
surface of the reactor contents and connected to pH and RedOx circuits (Atlas Scientific LLC, New York, USA
and tentacle card, 4 channel) in order to communicate with software. With the same software, the dissolved
oxygen in the sludge was spotted measured using oxygen sensor (VisiWater DO sensors, Hamilton). The
temperature of reactors was monitored by a temperature probe (DS 18 B 20) immersed in the liquid’s
reactor.
Each reactor was also provided with a mechanical stirrer consists of two horizontal blades mount on a
vertical shaft (SS316L) and oriented to push down the liquid. The mixer was driven by an electrical motor
(Elvi S.r.l) with a gearbox and with a shaft rotation of 60 rpm.
The feed and discharge of different livestock manure occurred with 2 peristaltic pumps (24VDC pump,
Verdeflex, 82 rpm, 8X2,4 mm Verderprene piping, flow rate approximately equal to 0,8 L/ min) installed on
each reactor. One of the pump, during some preliminary test for setting the operation of the geared motor
are shown in Figure 37,a. Also the mixing, feeding, and discharging of the reactor were automatically
controlled through Arduino® mega and management with a computer program developed by LabView
Software. The six reactors named R1A, R1B, R2A, R2B, R3A, and R3B were placed on an iron structure, as also
shown in Figure 35. The reactors worked in pairs in order to have double experimental units contextually.
When working with different type of slurry, each couple of reactors had its own inlet tank, from which the
peristaltic pumps withdrawn. Excess sludge discharging occurs manually in order to maintain the required
SRT. The reactors are equipped with a 2 1/2" PVC ball valve to be able to empty them easily.
During the experimental tests, 3 and 4, the system of charge and discharge of manure was implemented.

126
A balance system is mounted under each SBR tank in order to manage the inlet and the outlet of the slurry
based on the weight of each tank. For doing this, a program was implemented with LabView.
a) b)
Figure 37 Peristaltic pumps that were chosen and installed for feeding and discharging of sludge during a preliminary functioning test.
In addition, in order to allow the correct homogenization of the inlet slurry (that in the previous experiments
was do manually), a system for automatic mixing (mixer in one tank) was added; before to charge the inlet
flow, the mixer was turned on. In the Figure 38 is reported the implemented system used for the
experiments.
Figure 38 Operative system of six reactors after the installation of weight system and mixing system for the inlet vessel (indicated with yellow arrows).

127
5.2.2. Experimental plan
First, a series of preliminary tests with water and then with real sludge were performed for attesting the
correct operation of the systems, the hardware and the software. This period of settlement lasted 2 months
In order to accomplish the SBR tests, activated sludge needed for starting biological activity rapidly was
collected by an operative NDN plant (“PLANT 0”) located in Casaletto di Sopra (CR). That decision had been
made because this plant discharges the effluent in surface water body respecting the stringent laws of D.Lgs.
152/06 (see also paragraph 1.3.2). Therefore, the observance of these limits leads to assume that the plant
has a correct functioning and therefore that the activated sludge has a good quality.
Some of the main characteristics of the plant 0 are resumed in Table 28.
Table 28 Main characteristics of plant 0.
Plant 0 Characteristics
SRT (Sludge Retention Time)_Bioprocess 7 - 15 d NOTE
SRT (Sludge Retention Time)_Nitrification 5,83 d
x (biomass concentration in the tank) 4 - 6 gSST/L
x 2 - 4 gSSV/L 1
CF (carbon load) 0,09 kgBOD5/KgSST/d
CF 0,15 kgBOD5/KgSSV/d 1
CN (nitrogen load) 0,03 kgN/KgSST/d
CN (nitrogen load) 0,05 kgN/KgSSv/d 1
CODin 3150 mg/L
TANin (as N) 850 mg/L
NOTE 1) Empirical calculation considering SSV/SST = 0,6
After the correct starting of the systems, all six reactors were filled with 7 L of diluted activated sludge: 5 L of
activated sludge from the plant 0 and 2 L of tap water. Overall, the concentration of total solids (ST) in the
tank was equal to 4,5 g/L. During preliminary test, the fed of the system was done with the influent of the
same plant 0. This choice was made to attest the lab-system's responses thanks to compare obtained results
with those observed at the real plant. After 15 days of tests, some problems related with sedimentation
phase occurred: the level of sediment sludge is very high, and the clarified sludge was not visible in the
reactor due to high mixed liquor concentration. For these reasons, reactor’s content was diluted with
distilled water in order to have a mixed liquor concentration equal to 4 g/L (for 6 reactors: R1A: 4,1 g/L, R1B:
3,99 g/L, R2A: 3,99 g/L, R2B: 3,99 g/L, R3A: 4,1 g/L, R3B: 4,0 g/L).
In Table 29 and 30 are reported the main data regarding all experiments that we carried out.

128
Table 29 General information regarding the experiments.
Experiment Number of used
inlet slurry Type of sludge Variable parameters Duration of experiments
Test 1 3 Pig slurries pre-treated with different S/L HRT+ Qin+ type of slurry from 04/2017 to 07/2017
Test 2 3 Pig slurries pre-treated with different S/L + digestate Type of slurry from 07/2017 to 10/2017
Test 3 1 Pig slurry Number of cycle/day + setting of the cycle from 12/2017 to 02/2018
Test 4 1 Pig slurry All reactors work equally from 02/2018 to 04/2018
Table 30 Experiments general settings.
TAN loading
rate
(gN/Lreactor/d)
Working
Volume (L)
Number of
daily cycles HRT (d)
SRT
(d)
Volume Load
(L/cycle)
Duration
anaerobic
phase (h)
Duration of
aerobic
phase (h)
Air insufflations (L/min)
Duration of
sedimentati
on phase
(h)
TEST 1
preliminary
R1AB
0,1 7 3 * Variable,
depending
on the
nitrogen
load
25 Variable,
depending
on the
nitrogen
load
3 3,5 10 <1 R2AB
R3AB
TEST 1
R1AB
0,2 † 7 3 25 3 3,5 12 ≈1,5 R2AB
R3AB
Test 2
R1AB
0,2 7 3 15 25 0,47 3 4,3 Air insufflations:
based on the
measured O2
concentration
<1 R2AB
R3AB
Test 3
R1AB
Variable
7 3 8 35 0,29 3 4,3‡ 0,69
R2AB 7 3 8 35 0,29 2.5 5,3 0,2
R3AB 7 2 8 35 0,44 2.6 7,4 2
* Tilche et al., 1999; Ra et al., 2000
†† Poo et al., 2005
‡ Also with mixing

129
For all reactors and all the experiments carried out, pre-denitrification process (and not post-denitrification)
was applied, in order to be able to provide the denitrifying bacteria with the COD present in the incoming
slurries and avoid the use of external sources of carbon.
The specific features of those experiments are reported in the following paragraphs.
For all experiments, whenever a new batch of waste was used, it was chemically and physically
characterized. Furthermore, once a week the inlet and outlet of each reactor were analyzed. Monitoring of
RedOx and pH was continuous for all reactors.
5.2.3. Analytical methods
All inlet samples were analysed for TKN (Total Kjeldhal Nitrogen), total ammonia nitrogen (TAN), nitrates and
nitrites (NO3-, NO2
-), pH, dry matter content (total solids, TS), volatile solids content (VS) and electrical
conductivity (EC), which were determined using standard procedures (APHA, 2014).
Additionally, COD -chemical oxygen demand- was measured in the inlet flow and outlet flow by the reactor
digestion method using COD digestion vials (Nanocolor®, MACHEREY-NAGEL GmbH & Co. KG). During the
experimental period, weekly a sample of inlet and outlet (treated effluent) from each reactor was collected
and analysed for TAN, EC, and pH to identify the transformation of slurry over time. Reached the stability of
operation system (e.g. TAN value constant) all chemical-physical analysis were performed.
Biological oxygen demand (BOD) was defined using BOD Sensor BOD Analysis (Velp Scientifica).
The sludge sedimentation was evaluated taking a sludge sample from each reactor and check how the level
of the activated sludge changes within a graduated cylinder over time (30 min).
5.3. Test 1 and Test 2 (influence of nitrogen loading
rate and slurry characteristics on the nitrogen
removal efficiency)
In order to study and evaluate the relationship between nitrogen loading rate, type of influent and nitrogen
removal rate achievable, the nitrogen load imposed for this part of test is equal to 0,1 gN (TAN)/L/d (Magrì et
al., 2008). Three different influent sludge A, B, C were used:
Liquid fraction of pig slurry A obtained after a separation treatment achieved through a rotating
rotary screen and a floating system, (Farm 1); fed in reactorR1A and R1B;

130
Liquid fraction of pig slurry B obtained after a separation treatment achieved through a rotating
rotary screen and a flotation system, (Farm 2); fed in reactorR2A and R2B;
Liquid fraction of pig slurry C obtained after a separation treatment achieved through a rotating
rotary screen (Farm 2), fed in reactor R3A and R3B.
After a short operation period, it was decided to replace two of the three inlets used with others with higher
nitrogen concentration and with the most representative characteristics of the livestock slurry (see also
chapters 3). Then, slurry A and slurry B were substituted respectively with other two types of sludge:
Liquid fraction of pig slurry E obtained after a separation treatment achieved through a rotating
rotary screen (Farm 4) fed to reactor R1A and R1B;
Liquid fraction of pig slurry D obtained after a separation treatment achieved through a rotating
rotary screen (Farm 3), fed to reactor R2A and R2B;
The imposed nitrogen loading rate 0,1 gN(TAN)/L /d has led to continuous variations in the duration of the
cycles (in particular loading and unloading time) since it was necessary to maintain that parameter constant
despite variations in the inlet sewage.
The removal yields achieved with the application of 0,7 gTAN/d were high and, furthermore, the nitrogen
detected in the output sample was low and did not respect the detection limit of analytical method used.
Therefore, we decided to increase the nitrogen load enters the SBR systems, acting on the duration of the
flow rate charged and discharged by each reactor. In particular, nitrogen loading is imposed to
0,2 gN(TAN)/L/d. Also for this experiment slurries C, D, E was used.
At the university, it is impossible to stock a large amount of sludge in proper barrels, so was necessary to
withdraw each 15 days new sludge from each farm. Every time that new sludge was sampled to be added to
the inlet tank, the operational set of each SBR was changed in order to maintain the desired nitrogen load.
The Test 2 started after a period of stand-by for all reactors: during 10 days, a “pause” cycle was imposed
and foresee only a fed step, a discharge step, a period of 1 h of aeration and 0,5 h of mixing.
Concerning the type of sludge, for these experiments were used:
Liquid fraction of pig slurry E obtained after a separation treatment achieved through a rotating
rotary screen (Farm 4);
Liquid fraction of pig slurry D obtained after a separation treatment achieved through a rotating
rotary screen (Farm 3);
Liquid fraction of co-digested pig slurry and corn silage (slurry F) after a separation treatment
achieved through a rotating rotary screen (Farm 5).

131
During these tests, an operational change was done: after a period of monitoring of dissolved oxygen, the
airflow rate insufflate has been set to maintain an oxygen level > 3,5 mg / L.
5.3.1. Livestock manure characteristics
As explain in the previous paragraph, 3 different slurries were used for the Test 1 (named C, D, E) whose
characteristics are reported in Table 31.
Table 31 Main characteristics of 3 sludges used for experiments (Test 1); A: average data, SD: standard deviation.
TAN g/Kg
TKN
g/Kg
EC
mS/cm pH
ALK
gCaCO3/L
ST
%
SV/ST
%
BOD
O2g/L COD O2g/L
R1AB_IN
(slurry E)
A 3,42 4,51 26,24 7,91 17,16 3,47 52,41 14,19 31,97
SD 0,43 0,72 6,25 0,16 2,56 0,80 4,55 0,82 7,63
R2AB_IN
(slurry D)
A 2,54 3,41 21,58 7,64 11,71 1,89 55,01 9,52 25,25
SD 0,22 0,37 3,72 0,27 1,32 1,25 8,24 2,84 3,57
R3AB_IN
(slurry C)
A 0,65 1,21 5,92 7,36 4,88 1,00 69,03 4,28 9,82
SD 0,16 0,19 2,15 0,16 2,80 0,35 2,87 0,42 0,83
The used slurries E and D had comparable characteristics contrary to slurry C. The differences are also
related to the “origin” of the slurry. In fact, farm 2 differs from the others since farms 3 and 4 are closed-
cycle pig breeding, instead the farm 2 has also a pig production section. Moreover, in this plant, the use of
water is conspicuous, with the result that the collecting livestock waste used for laboratory tests has a low
content of TAN, as well as of TKN, total solids, BOD and COD in comparison with the characteristics observed
for the slurry C and D. Anyway, all types of slurries have typical characteristics of livestock waste (please see
also paragraph. 3.4).
For all inlet sludge used, the ratio between the content of carbonaceous compound (COD) and nitrogen
compound (in this case, TKN) is higher than 7 (in particular for couples 1AB: 7,1, 2AB: 7,36, 3AB is 8,18). This
means that the system could be able to denitrify correctly and reach higher removal rate (Obaja et al., 2003),
as also explain in chapter 3.
In Figure 39 the variation of inlet flow for each reactor that occurred during all the Test 1 of the tests is
reported.
Once again, is evident the importance of definition of slurry characteristics for correct slurry management.
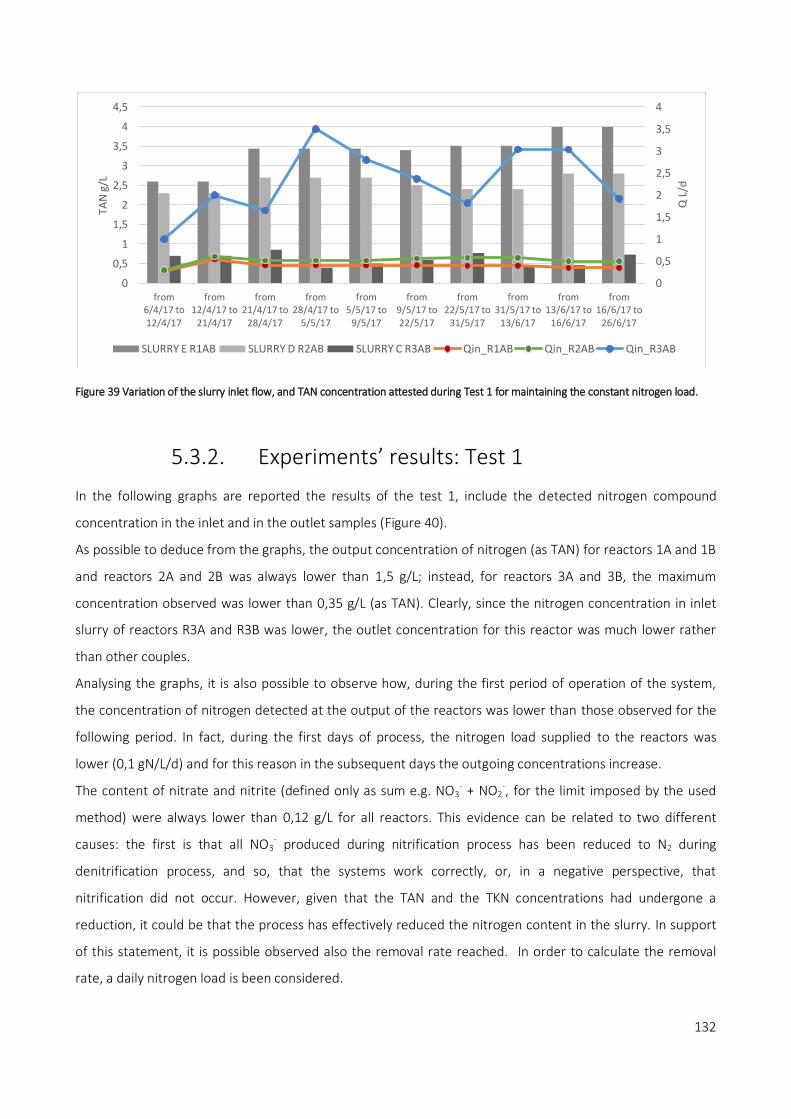
132
Figure 39 Variation of the slurry inlet flow, and TAN concentration attested during Test 1 for maintaining the constant nitrogen load.
5.3.2. Experiments’ results: Test 1
In the following graphs are reported the results of the test 1, include the detected nitrogen compound
concentration in the inlet and in the outlet samples (Figure 40).
As possible to deduce from the graphs, the output concentration of nitrogen (as TAN) for reactors 1A and 1B
and reactors 2A and 2B was always lower than 1,5 g/L; instead, for reactors 3A and 3B, the maximum
concentration observed was lower than 0,35 g/L (as TAN). Clearly, since the nitrogen concentration in inlet
slurry of reactors R3A and R3B was lower, the outlet concentration for this reactor was much lower rather
than other couples.
Analysing the graphs, it is also possible to observe how, during the first period of operation of the system,
the concentration of nitrogen detected at the output of the reactors was lower than those observed for the
following period. In fact, during the first days of process, the nitrogen load supplied to the reactors was
lower (0,1 gN/L/d) and for this reason in the subsequent days the outgoing concentrations increase.
The content of nitrate and nitrite (defined only as sum e.g. NO3- + NO2
-, for the limit imposed by the used
method) were always lower than 0,12 g/L for all reactors. This evidence can be related to two different
causes: the first is that all NO3- produced during nitrification process has been reduced to N2 during
denitrification process, and so, that the systems work correctly, or, in a negative perspective, that
nitrification did not occur. However, given that the TAN and the TKN concentrations had undergone a
reduction, it could be that the process has effectively reduced the nitrogen content in the slurry. In support
of this statement, it is possible observed also the removal rate reached. In order to calculate the removal
rate, a daily nitrogen load is been considered.
0
0,5
1
1,5
2
2,5
3
3,5
4
0
0,5
1
1,5
2
2,5
3
3,5
4
4,5
from 6/4/17 to 12/4/17
from 12/4/17 to
21/4/17
from 21/4/17 to
28/4/17
from 28/4/17 to
5/5/17
from 5/5/17 to
9/5/17
from 9/5/17 to 22/5/17
from 22/5/17 to
31/5/17
from 31/5/17 to
13/6/17
from 13/6/17 to
16/6/17
from 16/6/17 to
26/6/17
Q L
/d
TAN
g/L
SLURRY E R1AB SLURRY D R2AB SLURRY C R3AB Qin_R1AB Qin_R2AB Qin_R3AB

133
a)
b)
c)
Figure 40 Nitrogen concentration detected in inlet and outlet samples for reactors R1AB (a), R2AB (b), R3AB (c) during Test 1.
0,00
0,05
0,10
0,15
0,00
1,00
2,00
3,00
4,00
5,00
6,00
g/L
(NO
3-+
NO
2-)
g/L
(TA
N, T
KN
)
R1AB Nitrogen compound variation during TEST 1
TAN g/L IN TKN g/L IN TAN R1A OUT TAN R1B OUT TKN R1A OUT TKN R1B OUT NO3- R1A OUT NO3- R1B
0,00
0,05
0,10
0,15
0,00
1,00
2,00
3,00
4,00
5,00
6,00
g/L
(NO
3-+
NO
2-)
g/L
(TA
N, T
KN
)
R2AB Nitrogen compound variation during TEST 1
TAN g/L IN TKN g/L IN TAN R2A OUT TAN R2B OUT TKN R2A OUT TKN R2B OUT NO3- R2A OUT NO3- R2B OUT
0,00
0,05
0,10
0,15
0,00
1,00
2,00
3,00
4,00
5,00
6,00 g/
L (N
O3
-+N
O2
-)
g/L
(TA
N, T
KN
)
R3AB Nitrogen compound variation during TEST 1
TAN g/L IN TKN g/L IN TAN R3A OUT TAN R3B OUT TKN R3A OUT TKN R3B OUT NO3- R3A OUT NO3- R3B OUT

134
For the evaluated period (experiment-Test 1) the minimum and maximum removal rate for TAN achieved for
the reactors 1A & 1B were 70,8%-98,5% and 68,5%- 99,5% respectively, for reactors 2A & 2B 64,8%-99,3%
and 56,3%- 100% respectively, and for reactors 3A & 3B 70,4%-100% and 25,7%- 100% respectively. TKN
removal yields, on the other hand, were lower and on average stand at 65% for R1AB reactors, 58% for R2AB
reactors and 43% for reactors R3AB. It should be noted that, despite the operation of the two reactors is
identical for each pair, the results obtained are not always equal. This could be due to temporary
malfunctions that affected only one of the two reactors (such as software blocks during the research) or
differences in air diffusion, or due to the bacterial consortium created in each individual reactor.
For a better comprehension of obtained results, it would be very interesting and useful also to analyse
microbiologically the contents of the reactors. Anyway, only referred to nitrogen, in all three systems, even
each of them worked with different slurry type, guarantee high removal rate.
Nevertheless, to enhanced understand it is necessary to analyse not only removal yields but also the pH and
RedOx trends.
In order to explain the variation of pH and RedOx, parameters detected during one day of functioning at the
beginning of the experiments, after 1 month, after 2 months and at the end of the tests, are considered for
all pairs of reactors (Figures 41, 42, 43). The reported pH and RedOx value recorded every 15 seconds during
one day of operation.
Regarding the reactors R1A and R1B, as possible to see in Figure 41, the trend of ORP and pH did not always
coincide for the reactors of the couple. As explain above, this can be caused by multiple factors related to
both operation problems occurred and differences in the slurry inside the reactor.
Anyway, as expected, the path of ORP increased during aeration period, reaching value over the 0 mV; the
highest observed peak was 200 mV and the lowest reached values was below -500 mV.
The two parameters’ evolution changed over time during the experiment: the modification of inlet load may
influence the operation of the system. In the first period (Figure 41,a) the systems R1A and R1B reached very
high TAN removal rate (>98%): the very low nitrogen load allowed to the system, already acclimatized and
working, to better remove nitrogen.
The lowers removal value reached (77%) was attested in the day 11/05/2017 represented in the Figure 41, b.
In that case, the reported graph is very “un-normal” compared with the classical output of a conventional
SBR system operating with a NDN process (Figure 44). In fact, the pH remains always on basic value
(pH>9,25) and did not have a real modification and during an aeration period.
.

135
a)
b)
c)
d)
Figure 41 Trend of parameters monitored for reactors pair R1A R1B during one day (24h), in particular: at the beginning of experiment (TEST 1), after 1 month of operation, after 2 months of operation and at the end of experiment.
7
7,5
8
8,5
9
9,5
-600
-500
-400
-300
-200
-100
0
100
200
pH
OR
P m
V
R1AB - Monitored ORP and pH during (TEST 1) 11 04 '17
R1A - ORP_A R1B - ORP_A R1A - pH_A R1B - pH_A
7
7,5
8
8,5
9
9,5
-600
-500
-400
-300
-200
-100
0
100
200
pH
OR
P m
V
R1AB - Monitored ORP and pH during (TEST 1) 11 05 '17
R1A - ORP_A R1B - ORP_A R1A - pH_A R1B - pH_A
7
7,5
8
8,5
9
9,5
-600
-500
-400
-300
-200
-100
0
100
200
pH
OR
P m
V
R1AB - Monitored ORP and pH during (TEST 1) 11 06 '17
R1A - ORP_A R1B - ORP_A R1A - pH_A R1B - pH_A
7
7,5
8
8,5
9
9,5
-600
-500
-400
-300
-200
-100
0
100
200
pH
OR
P m
V
R1AB- Monitored ORP and pH during (TEST 1) 26 06 '17
R1A - ORP_A R1B - ORP_A R1A - pH_A R1B - pH_A

136
a)
b)
c)
d)
Figure 42 Trend of parameters monitored for reactors pair R2A R2B during one day (24h), in particular: at the beginning of experiment (TEST 1), after 1 month of operation, after 2 months of operation and at the end of experiment.
6
6,5
7
7,5
8
8,5
9
9,5
-550
-450
-350
-250
-150
-50
50
150
250
350
pH
OR
P m
V
R2AB - Monitored ORP and pH during (TEST 1) 11 04 '17
R2A - ORP_A R2B - ORP_A R2A - pH_A R2B - pH_A
6
6,5
7
7,5
8
8,5
9
9,5
-550
-450
-350
-250
-150
-50
50
150
250
350
pH
OR
P m
V
R2AB - Monitored ORP and pH during (TEST 1) 11 05 '17
R2A - ORP_A R2B - ORP_A R2A - pH_A R2B - pH_A
6
6,5
7
7,5
8
8,5
9
9,5
-550
-450
-350
-250
-150
-50
50
150
250
350
pH
OR
P m
V
R2AB - Monitored ORP and pH during (TEST 1) 11 06 '17
R2A - ORP_A R2B - ORP_A R2A - pH_A R2B - pH_A
6
6,5
7
7,5
8
8,5
9
9,5
-550
-450
-350
-250
-150
-50
50
150
250
350
pH
OR
P m
V
R2AB- Monitored ORP and pH during (TEST 1) 26 06 '17
R2A - ORP_A R2B - ORP_A R2A - pH_A R2B - pH_A

137
a)
b)
c)
d)
Figure 43 Trend of parameters monitored for reactors pair R3A R3B during one day (24h), in particular: at the beginning of experiment (TEST 1), after 1 month of operation, after 2 months of operation and at the end of experiment.
6
6,5
7
7,5
8
8,5
9
-550
-450
-350
-250
-150
-50
50
150
pH
OR
P m
V
R3AB - Monitored ORP and pH during (part A) 11 04 '17
R3A - ORP_A R3B - ORP_A R3A - pH_A R3B - pH_A
6
6,5
7
7,5
8
8,5
9
-550
-450
-350
-250
-150
-50
50
150
pH
OR
P m
V
R3AB - Monitored ORP and pH during (part A) 11 05 '17
R3A - ORP_A R3B - ORP_A R3A - pH_A R3B - pH_A
6
6,5
7
7,5
8
8,5
9
-550
-450
-350
-250
-150
-50
50
150
pH
OR
P m
V
R3AB- Monitored ORP and pH during (part A) 11 06 '17
R3A - ORP_A R3B - ORP_A R3A - pH_A R3B - pH_A
6
6,5
7
7,5
8
8,5
9
-550
-450
-350
-250
-150
-50
50
150
pH
OR
P m
V
R3AB - Monitored ORP and pH during (part A) 26 06 '17
R3A - ORP_A R3B - ORP_A R3A - pH_A R3B - pH_A

138
If the functioning of the system was correct, during the mixing phase a reduction of the RedOx potential
should be observed, with a simultaneous increase in the pH due to the production of alkalinity during
denitrification phase; vice versa, during the aeration phase, the pH should decrease, for the production of
hydrogenions.
For reactor R1A and B, it may also happen that the ammonia present in the slurry was stripped by the airflow
supplied to the system, assisted by the very high pH. Also during the day 11/06/17, the pH-trend is not as
expected. In addition, in the final period of observation, R1A has an unconventional ORP’s trend: in fact, ORP
remained always below the 0, indicating that the oxygen furnished did not reach suitable values for
nitrification to take place (please refer also to Chapter 3). Nevertheless, the removal rate reached is anyway
above 90% (R1A); so is also possible that the ORP probe was dirty and did not read correctly the values. This
fact can happen also at real scale: for these reasons it is very important to make maintenance of the plants,
to guarantee their removal rates wanted. The strange step that is visible in Figure 41,c is related to a manual
control of fed phase (please see the red circle in the figure).
Regarding the reactors R2A and R2B, the obtained trends of pH and ORP are reported in Figure 42.
Also in that case, the trend of two parameters changed over time and, considering the couple of reactors,
and did not always coincide. During first examined day (Figure 42,a) the pH of reactor 2A had a strange
behaviour and increased during aeration/nitrification, contrary to expectations. Nevertheless, the removal
yield of TAN reached is > 99%. The lowest removal rate recorded (<60% for the reactor 2B and <66% for
reactor 2A) correspond to the graph of 11st May 2017 (Figure 42, b). The very high pH value, which did not
have variation during all the three cycles of the day, is a symptom that the system was inhibited and, in any
case, that it was not working correctly. An anomaly is also visible during the day 11/06 where the RedOx
potential of the rector R2A did not remain negative after the loading of new waste as should. In fact, the load
of fresh waste enhanced a reducing environment (Zhu et al., 2006). In that case (R2A), a negative RedOx
peak was observed due to the addition of fresh waste, but the value, in a short time, returns to positive
levels, remaining in this window of values until the next slurry load. It is therefore possible that, in these
cycles, the nitrogen-reducing bacteria did not work properly, and denitrification of the nitrate ion present in
the slurry did not occur. However, the pH during the denitrification phase had a slightly increasing trend, in
line with what expected; this is true also for nitrification phase, where the pH decreased. The yields achieved
by the two reactors in this period are> 86%.
During the last day of operation (Figure 42,d), both reactors reached high removal rate of TAN (>70%), but
lower than those one observed for reactor R1AB.
Regarding the reactors R3A and R3B, the situation seems a little be different (Figure 43) and in any case, the
pH graph is not flat and devoid of variations: this could mean that for these reactors the anomaly observed

139
for the 2AB and 1AB couples was not observed. In addition, even if is very difficult to identify the typical
significant control points on the ORP and pH curve (Figure 44), during the 11/06/17 for the R3A reactor it
seems possible to recognize the ammonia valley (namely the end of the nitrification in the aerobic phase)
indicated with the red circle on the figure.
a) b)
Figure 44 a) Typical variations of DO, pH, and ORP value and concentrations of NH4-N, NO2-N, and NO3-N during nitrification and denitrification process in a conventional SBR (Dutta et al., 2015). b) Real-time control points in high C=N ration load cycles (TOC/TN ratio of the influent: 1.4) A: Feeding, B: Nitrate knee point, C and c: Beginning of the oxic phase, e: Ammonia valley point, f: End of the oxic phase.
Using the slurry C that has the lowest content of total solid and the highest COD (BOD)/TAN ration, the
reached removal rate over time are very high, with the maximum observed for first day (lowest load) and in
any case with values always higher than 85%. Only during one day, the nitrogen removal for reactor 3B was
very low (48%), and this malfunction can also be found in the pH chart (Figure 43,b). During the last
operating period the pH inside the R3AB reactors (Figure 43,d) dropped a lot, perhaps also due to the lower
amount of alkalinity brought by the fresh effluent entered the reactor at each cycle, not sufficient to buffer
the production of H+ ions during nitrification. As already said, the understanding of what happens during a
biological process is much more complex than what can be expected.
In Table 32, are reported data concerning the input and output of each reactor during Test 1 in term of daily
load. Despite all considerations done for nitrogen, is very interesting also to note what occur for solids
content: also these characteristics has a great contribute to the reachable nutrient removal.

140
Table 32 Characteristics of the input and output in terms of daily load for 3 pairs of reactors during Test 1 (A: average; SD: standard deviation).
TAN (g/d) TKN (g/d) ST (g/d) SV (g/d)
A SD A SD A SD A SD
R1AB IN 1,34 0,20 1,77 0,30 14,02 3,44 7,48 2,17
R1A OUT1 0,21 0,14 0,62 0,23 10,66 2,12 5,14 1,26
R1B OUT2 0,25 0,12 0,63 0,20 10,76 3,82 5,51 1,43
R2AB IN 1,35 0,21 1,81 0,33 10,53 7,61 6,28 5,18
R2A OUT1 0,23 0,17 0,71 0,27 8,12 1,52 4,18 1,36
R2B OUT2 0,24 0,20 0,84 0,32 10,38 2,00 6,06 1,88
R3AB IN 1,33 0,20 1,76 1,13 20,53 5,65 14,24 4,22
R3A OUTA 0,09 0,09 1,02 1,02 9,46 3,42 5,07 2,71
R3B OUTB 0,23 0,29 0,98 0,66 9,05 4,40 4,86 3,59
For reactors R1AB and R2AB the solid daily loaded are comparable for input and output samples. This means
that the sedimentation phase did not work correctly. In fact, if the activated sludge in the reactor had a good
characteristic of sedimentation, only the clarified part is discharged. Barely for the couple of reactors 3AB
the withdrawn sample has a total solids and volatile solids content of 56% and 65% lower than the input,
respectively. For the other couples, this does not occur. It can be useful to evaluate if the sedimentation time
applied is correct for reaching the quality effluent requested. The high content of solids can also mean that a
lot of organic material (volatile solid) it is released with the effluent and is not used by the bacterial biomass.
Since manure C had the lowest concentration of nitrogen, the reactors 3A and B, which treated the same
nitrogen load that the other couples but had a higher flow rate with only "more diluted" characteristics,
achieved better removal rates and quality of the effluent discharged.
Nevertheless, as already widely repeated, slurry C does not represent very well the characteristics of typical
slurry normally sampled and treated at the real scale.
5.3.3. Experiments’ results: Test 2
For the reasons provided before and for the difficulties occurred during the Test 1 caused mainly by the
continuous variations of loading and unloading, it was decided to modify the experiment setting.
In particular, the experiment 2 was focused on the application of same HRT, using 3 different sludge.
Before to start the new experiment, the “0 condition” was defined: the activated slurry inside the reactor
was characterized for content of TAN, total solid and volatile solid (Table 33). Each reactor was filled with a
volume of 7 L.

141
Table 33 Some characteristics of the activated sludge inside the reactors before to start the Test 2 .
REACTOR TAN g/L ST% SV/ST%
R1A 0,55 6,10 54,47
R1B 0,42 4,99 53,09
R2A 0,14 2,12 52,53
R2B 0,20 2,20 52,62
R3A 0,43 3,33 66,06
R3B 0,12 3,51 65,24
The characterization of slurries used in the second part of the Test 2, are reported in Table 34.
Table 34 Main characteristics of 3 slurrys used for experiments (Test 2). A: average, SD: standard deviation.
TAN g/Kg
TKN
g/Kg
EC
mS/cm pH
ALK
gCaCO3/L
ST
%
SV/ST
%
BOD
O2g/L
COD
O2g/L
R1AB_IN
(slurry E)
A 2,53 3,69 22,30 8,47 12,90 1,77 33,27 3621,3 14502,4
SD 0,27 0,69 8,28 0,16 2,50 0,38 4,00 - -
R2AB_IN
(slurry D)
A 1,30 1,43 16,54 8,44 12,08 0,96 26,74 1510,5 5402,7
SD 0,34 0,14 7,88 0,00 82,41 0,10 8,77 - -
R3AB_IN
(slurry F)
A 2,17 3,10 24,40 8,22 11,21 2,90 49,33 5970,4 31787,8
SD 0,22 0,45 0,91 0,078 5,40 0,62 7,63 - -
Is very interesting to note how the slurries E and D have different characteristics from previous test (TAN
slurry E during Test 1 is equal to 3,4 g/L and in the second part 2,5 g/L, for example). This difference is due to
the high variability of the slurry: in fact, as explain before and as observed at real scale monitoring activity
(see Chapter 4), the pig slurry characteristics change a lot during the time of pig breeding. In addition, it is
possible to explain these differences (also pH is very different) for the storage time: the second batch of
slurry, before to be used, are stored and it can be led to modification of chemical-physical characteristics
(Perazzolo et al., 2017). Even if the new introduced slurry is a digestate, the pH is comparable with those one
of other 2 types of slurry, as alkalinity, electrical conductivity. The main difference regards the chemical
oxygen demand, and the content of solids. The ratio between BOD and COD is lower than 20%, this may
mean that only a small part of organic compound is biodegradable: this can affect the ability of the
denitrifying bacteria to transform NO3- into N2. In addition, the percentage of volatile solids content in slurry
D is very strange, and lower than those observed during Test 1. In the following graphs are reported
concentration of nitrogen compound detected in the inlet and in the outlet samples withdrawn during Test 2
(Figure 45).

142
a)
b)
c)
Figure 45 Characteristics of inlet and outlet samples for reactors R1AB (a), R2AB (b), R3AB (c) during Test 2.
0
0,1
0,2
0,3
0,4
0,5
0,6
0,7
0,8
0,9
1
0
0,5
1
1,5
2
2,5
3
3,5
4
4,5
g/L
(NO
3-+
NO
2-)
g/L
(TA
N,
TKN
)
R1AB Nitrogen compound variation during TEST 2
TAN IN R1AB TAN R1A OUT TAN R1B OUT TKN R1AB TKN 1A OUT TKN 1B OUT NO3- R1AOUT NO3- R1B OUT
0
0,1
0,2
0,3
0,4
0,5
0,6
0,7
0,8
0,9
1
0
0,5
1
1,5
2
2,5
3
3,5
4
4,5
g/L
(NO
3-+
NO
2-)
g/L
(TA
N,
TKN
)
R2AB Nitrogen compound variation during TEST 2
TAN g/L TAN R2A OUT TAN R2B OUT TKN g/L TKN R2A OUT TKN R2B OUT NO3- R2AOUT NO3- R2B OUT
0
0,1
0,2
0,3
0,4
0,5
0,6
0,7
0,8
0,9
1
0
0,5
1
1,5
2
2,5
3
3,5
4
4,5
g/L
(NO
3-+
NO
2-)
g/L
(TA
N,
TKN
)
R3AB Nitrogen compound variation during TEST 2
TAN 3AB TAN R3A OUT TAN R3B OUT TKN 3AB IN TKN R3A OUT TKN R3B OUT NO3- R3AOUT NO3- R3B OUT

143
Also for the considered period (Test 2), since the inlet flow rate was equal to the output flow rate, the
minimum and maximum nitrogen yields removal achieved for the 1A & 1B reactors were 86,2%-99,1% and
81,6%- 99,0% respectively, for reactors 2A & 2B 91,35%-98,82% and 94,5%- 100% respectively, and for
reactors 3A & B 90,28%-99,3% and 82,4%- 99,6% respectively.
Removal rate’s range for all reactors remains above 85% during all the tests, contrary to what observed for
Test 1. TKN removal yields, on the other hand, are lower and on average stand at 75% for R1AB reactors,
71% for R2AB reactors and 62% for R3AB reactors, but anyway higher than that observed in the first part of
the tests.
In order to study the variation of pH and RedOx, the parameters detected during one day of functioning at
the beginning of the experiments approximately, after 20 days, after approximately 2 months and at the end
the test are considered for all pairs of reactors (Figure 46, 47, 48). The reported pH and RedOx value
recorded every 15 seconds during one day of operation.
During the first period of operation, all reactors’ pairs shown ORP and pH graphs with a strange path: the pH
value did not change over time, and remained settled on very basic pH values. The trends of the RedOx
potential during the 12th of July (Figure 46,a) for R1AB reactors were very strange and is reasonable that an
operational malfunction occurred: it seems that the loading phase (negative peak of RedOx) was followed by
the aeration phase and not by the mixing (denitrification one).
Although this problem did not occur and the loading phase was followed by the mixing one, even for the
other reactor pairs (2AB and 3AB), the value of the RedOx potential increases without reaching values above
0, and thus guaranteeing (theoretically) the conditions to make denitrification takes place.
The removal rate reached during initial period (Figure 46,a) is equal to 86% and 92% for reactors R1A and B
respectively. At the beginning of August 2017 the RedOx potential never reached value below 0 (Figure
46,b). This situation remains until September, when, as shown by the graph (Figure 46, c), the value reached,
during denitrification phase, negative values. Nevertheless, the pH shown a peak after the start of aeration
(red circle) and then a drop, as expected from nitrification.
The initial rise on the pH curve is caused by carbon dioxide stripping from the system and the rapid
consumption of VFA that is produced during the anoxic phase (Kim et al, 2004). Still in the last phase of
operation, the performance of the parameters remains almost the same, even if the pH varies in a more
acidic range: this could mean the occurrence of nitrification. During time, despite the pauses imposed on the
system (as explain in the paragraph Materials Methods) the yields increase and reach values of 99-97% for
the 2 reactors. Concerning the pair of reactors R2AB, the removal rate reached during initial period is equal
to 95% and 96% for reactor A and B respectively. The same considerations made for this operational phase
for reactors R1AB remain valid also for R2AB. Also for that system, at the beginning of August, the value of
RedOx potential never reached value below 0 (Figure 47, b).

144
a)
b)
c)
d)
Figure 46 Trend of parameters monitored for reactors pair R1A e R1B during one day (24h), in particular: at the beginning of experiment (TEST 2), after about 1 month of operation, after about 2 and 3 months of operation.
6,5
7
7,5
8
8,5
9
9,5
-350
-250
-150
-50
50
150
250
pH
OR
P m
V
R1AB - Monitored ORP and pH during (TEST 2) 12 07 '17
R1A - ORP_A R1B - ORP_A R1A - pH_A R1B - pH_A
6,5
7
7,5
8
8,5
9
9,5
-350
-250
-150
-50
50
150
250
pH
OR
P m
V
R1AB- Monitored ORP and pH during (TEST 2) 01 08 '17
R1A - ORP_A R1B - ORP_A R1A - pH_A R1B - pH_A
6,5
7
7,5
8
8,5
9
9,5
-350
-250
-150
-50
50
150
250
pH
OR
P m
V
R1AB- Monitored ORP and pH during (TEST 2) 01 09 '17
R1A - ORP_A R1B - ORP_A R1A - pH_A R1B - pH_A
6,5
7
7,5
8
8,5
9
9,5
-350
-250
-150
-50
50
150
250
pH
OR
P m
V
R1AB- Monitored ORP and pH during (TEST 2) 26 09 '17
R1A - ORP_A R1B - ORP_A R1A - pH_A R1B - pH_A

145
a)
b)
c)
d)
Figure 47 Trend of parameters monitored for reactors pair R2A R2B during one day (24h), in particular: at the beginning of experiment (TEST 2), after about 1 month of operation, after about 2 and 3 months of operation.
6
6,5
7
7,5
8
8,5
9
-200
-150
-100
-50
0
50
100
150
200
250
300
pH
OR
P m
V
R2AB- Monitored ORP and pH during (TEST 2) 12 07 '17
R2A - ORP_A R2B - ORP_A R2A - pH_A R2B - pH_A
6
6,5
7
7,5
8
8,5
9
-200
-150
-100
-50
0
50
100
150
200
250
300
pH
OR
P m
V
R2AB- Monitored ORP and pH during (TEST 2) 01 08 '17
R2A - ORP_A R2B - ORP_A R2A - pH_A R2B - pH_A
6
6,5
7
7,5
8
8,5
9
-200
-150
-100
-50
0
50
100
150
200
250
300
pH
OR
P m
V
R2AB- Monitored ORP and pH during (TEST 2) 01 09 '17
R2A - ORP_A R2B - ORP_A R2A - pH_A R2B - pH_A
6
6,5
7
7,5
8
8,5
9
-200
-150
-100
-50
0
50
100
150
200
250
300
pH
OR
P
R2AB- Monitored ORP and pH during (TEST 2) 26 09 '7
R2A - ORP_A R2B - ORP_A R2A - pH_A R2B - pH_A

146
a)
b)
c)
d)
Figure 48 Parameter trends monitored for reactor pairs R3A R3B during one day (24h), in particular: at the beginning of experiment (TEST 2), after about 1 month of operation, after about 2 and 3 months of operation.
7
7,5
8
8,5
9
9,5
-150
-100
-50
0
50
100
150
200
pH
OR
P m
V
R3AB- Monitored ORP and pH during (TEST 2) 12 07 '17
R3A - ORP_A R3B - ORP_A R3A - pH_A R3B - pH_A
7
7,5
8
8,5
9
9,5
-150
-100
-50
0
50
100
150
200
pH
OR
P m
V
R3AB - Monitored ORP and pH during (TEST 2) 01 08 '17
R3A - ORP_A R3B - ORP_A R3A - pH_A R3B - pH_A
7
7,5
8
8,5
9
9,5
-150
-100
-50
0
50
100
150
200
pH
OR
P m
V
R3AB- Monitored ORP and pH during (TEST 2) 01 09 '17
R3A - ORP_A R3B - ORP_A R3A - pH_A R3B - pH_A
7
7,5
8
8,5
9
9,5
-150
-100
-50
0
50
100
150
200
pH
OR
P m
V
R3AB- Monitored ORP and pH during (TEST 2)) 26 09 '17
R3A - ORP_A R3B - ORP_A R3A - pH_A R3B - pH_A
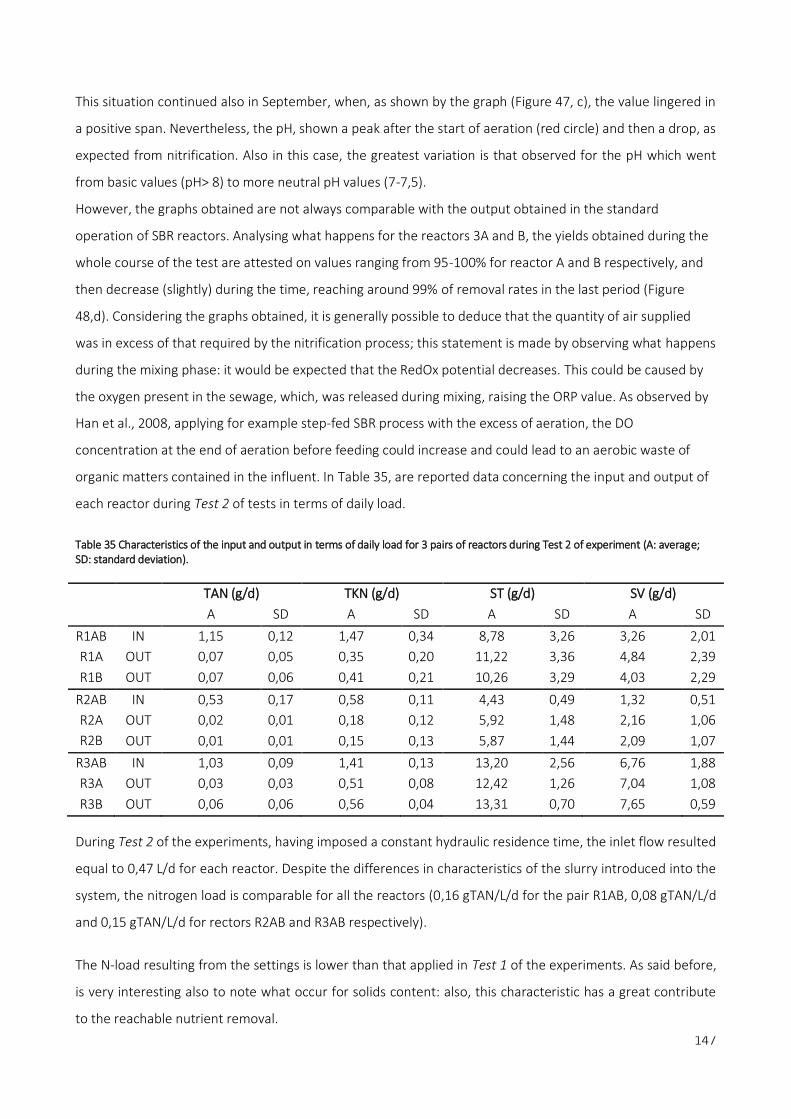
147
This situation continued also in September, when, as shown by the graph (Figure 47, c), the value lingered in
a positive span. Nevertheless, the pH, shown a peak after the start of aeration (red circle) and then a drop, as
expected from nitrification. Also in this case, the greatest variation is that observed for the pH which went
from basic values (pH> 8) to more neutral pH values (7-7,5).
However, the graphs obtained are not always comparable with the output obtained in the standard
operation of SBR reactors. Analysing what happens for the reactors 3A and B, the yields obtained during the
whole course of the test are attested on values ranging from 95-100% for reactor A and B respectively, and
then decrease (slightly) during the time, reaching around 99% of removal rates in the last period (Figure
48,d). Considering the graphs obtained, it is generally possible to deduce that the quantity of air supplied
was in excess of that required by the nitrification process; this statement is made by observing what happens
during the mixing phase: it would be expected that the RedOx potential decreases. This could be caused by
the oxygen present in the sewage, which, was released during mixing, raising the ORP value. As observed by
Han et al., 2008, applying for example step-fed SBR process with the excess of aeration, the DO
concentration at the end of aeration before feeding could increase and could lead to an aerobic waste of
organic matters contained in the influent. In Table 35, are reported data concerning the input and output of
each reactor during Test 2 of tests in terms of daily load.
Table 35 Characteristics of the input and output in terms of daily load for 3 pairs of reactors during Test 2 of experiment (A: average; SD: standard deviation).
TAN (g/d) TKN (g/d) ST (g/d) SV (g/d)
A SD A SD A SD A SD
R1AB IN 1,15 0,12 1,47 0,34 8,78 3,26 3,26 2,01
R1A OUT 0,07 0,05 0,35 0,20 11,22 3,36 4,84 2,39
R1B OUT 0,07 0,06 0,41 0,21 10,26 3,29 4,03 2,29
R2AB IN 0,53 0,17 0,58 0,11 4,43 0,49 1,32 0,51
R2A OUT 0,02 0,01 0,18 0,12 5,92 1,48 2,16 1,06
R2B OUT 0,01 0,01 0,15 0,13 5,87 1,44 2,09 1,07
R3AB IN 1,03 0,09 1,41 0,13 13,20 2,56 6,76 1,88
R3A OUT 0,03 0,03 0,51 0,08 12,42 1,26 7,04 1,08
R3B OUT 0,06 0,06 0,56 0,04 13,31 0,70 7,65 0,59
During Test 2 of the experiments, having imposed a constant hydraulic residence time, the inlet flow resulted
equal to 0,47 L/d for each reactor. Despite the differences in characteristics of the slurry introduced into the
system, the nitrogen load is comparable for all the reactors (0,16 gTAN/L/d for the pair R1AB, 0,08 gTAN/L/d
and 0,15 gTAN/L/d for rectors R2AB and R3AB respectively).
The N-load resulting from the settings is lower than that applied in Test 1 of the experiments. As said before,
is very interesting also to note what occur for solids content: also, this characteristic has a great contribute
to the reachable nutrient removal.

148
For all reactors the solid daily loaded are comparable for input and output samples. This fact means that the
sedimentation phase did not work correctly. In fact, if the activated sludge in the reactor had a good
sedimentation, only the clarified part is discharged. The high content of solids can also mean that a lot of
organic material (volatile solid) it is released with the effluent and is not used by the bacterial biomass.
5.4. Test 3 and Test 4 (influence of operational
parameters on removal efficiency)
After attested and examined the results obtained in the previous part of experiment (paragraph 5.3.), we
decide to vary the operational set of SBR in order to study how different phases’ length influences the
nitrogen removal rate (Test 3). For doing that, all reactors were fed with the same slurry: in particular, we
decided to continue only with the new waste G: a liquid fraction of pig slurry taken from a fattening pig
breeding. That choice was done for focused the attention not on the characteristics of influent but on the
duration of phases. In addition, the selection of using that type of slurry is a consequence of a consideration
made on the chemical-physical characteristics of this waste: in fact, given that it was an out stream of at a
closed-cycle farm, from the point of view of the composition, this guarantees a greater consistency along
time. For all reactors an HRT equal to 8 days (corresponding to 0,875 L/d feed and draw) was imposed and
SRT (sludge retention time was set equal to 35 d (corresponding to a sludge withdraw equal to 0,2 L/d).
Phase duration for reactor pairs R1AB is the same applied during Test 2. Instead, the reaction phase of
reactor R2AB was modified: the aeration phase lengthening to check if nitrification is enough to convert all
nitrogen in NO3-. About the adjustment done for reactor R3A and B, the number of cycles is decreased and
the influent was fractionated. The discharge for all reactors’ pairs must be carried out in two different
phases: 7 seconds just after the aeration phase and the remaining 25 s after the sedimentation. The first
phase of discharging is necessary in order to respect the SRT imposed: during this phase, in fact, with the
effluent also the activated sludge was drained.
The second part of that slot of experiments (Test 4) is aimed to reduce the reactor load and to leave them in
a long aeration phase in order to see if the nitrification phase takes place correctly. Besides all analysis done
for check the reactors operation, during Test 3 and 4, the evaluation of sedimentation time for activated
sludge was done.
5.4.1. Livestock manure and activated sludge characteristics
In the following paragraphs, the characteristics of used activated sludge and the inlet slurry used during
experiment (Test 3 and 4) are shown in Table 36 and 37 respectively. The activated slurry had the same

149
origin as that used in Test 1 and 2, but in order to re-start the different tests without any interference on the
possible obtainable results, the new experiment was performed with a new batch of activated sludge. In
comparison with the activated sludge used during the Test 1 and 2 (paragraph 5.3.3), the content of TAN and
ST is much lower.
Table 36 Characteristics of activated sludge used during Test 3 and 4.
N-NH4+ (g/L) N-(N02
-+ NO3-) (g/L) TKN (g/L) pH EC (mS/cm) RedOx (mV) ST% SV/ST COD mg/L
0,02 0,01 0,32 7,63 3,11 -169,0 0,56 59,74 4800
The chemical-physical composition of pig slurry used as inlet (Table 37) is comparable with the literature
data. Linked with the slurry used in the previous tests, the content of TAN is lower, as the TKN and total
solids.
Table 37 Characteristics of inlet slurry used during experiment (Test 3). (A: average; SD: standard deviation).
TAN
(g/L)
N-N0X
(g/L)
TKN
(g/L) pH
EC
(mS/cm)
RedOx
(mV) ST% SV/ST
SS
(%tq)
SS
(%ST)
COD
g/L
A 1,74 0,06 2,75 7,34 16,21 - 417,27 2,24 69,15 1,40 0,66 45,59
SD 0,12 0,02 0,26 0,26 3,44 20,96 0,66 2,26 0,50 0,06 13,55
The ratio between the COD and TAN and between COD and TKN is equal to 26 and 16,6 respectively: these
values attest to the presence of carbonaceous substances useful for biological processes. Any consideration
cannot be made on the biodegradability of wastewater, as BOD values are not available. In this part of tests,
in fact, BOD analysis did not carry out. The process outputs obtained during the preliminary operation period
did not give valuable results, and for these reasons are not reported. The malfunctioning of the systems
attested in the first month was linked with the higher solid content accumulated in the reactor. In addition,
during that period, the level of dissolved oxygen detected in each tank and value of RedOx potential were
incongruous: the high values read by the DO probe were higher than 2 mg/L but the RedOx potential are
lower than -200 mV. For these reasons, some system’s check was done and the experiment was restarted.
Test 3 ended in February 2018 and Test 4, started immediately after Test 3, only lasted a month.
5.4.2. Experiments’ results: Test 3
During Test 3 not only the inlet and outlet sample are withdrawn but also the mixed liquor during the mixing
phase (defined with _M). The results obtained are reported in Table 38. During the sampling of activated
sludge, the reactor was in denitrification phase.

150
Table 38 Characteristics of activated mixed sludge detected during experiment (Test 3) for each reactor’s pair. A: average, SD: standard deviation.
N-NH4+ (g/L) N-N0X (g/L) TKN (g/L) ST% SV/ST SS (%tq)
R1A_M A 0,71 0,07 0,91 63,04 0,59
SD 0,24 0,05 0,13 1,30 0,13
R1B_M A 0,83 0,08 1,19 0,98 62,89 0,63
SD 0,10 0,03 - 0,16 1,06 0,08
R2A_M A 0,47 0,06 0,94 0,87 62,79 0,53
SD 0,02 0,01 - 0,16 1,22 0,12
R2B_M A 0,79 0,05 1,02 0,91 63,21 0,57
SD 0,18 0,00 - 0,20 0,63 0,14
R3A_M A 0,42 0,04 0,85 0,79 57,63 0,36
SD 0,09 0,01 - 0,20 12,94 0,15
R3B_M A 0,59 0,04 1,05 0,75 64,73 0,43
SD 0,028 0,003 - 0,16 5,79 0,14
The most interested value that need an explanation is the content of suspended solids in the reactors. In
fact, considering that the common measure detected in activated sludge system is 3-5 gSST/L, the values
here reported are higher, except for what observed for the pair of reactors 3A and B. This fat can affect the
quality of sedimentation of the sludge.
In Table 39 instead, are reported the effluents’ characteristics for each reactor. First, considering each pair,
the characteristics of the outputs of the two reactors are comparable. TKN and TAN parameters were lower
than 1 g/L for all reactors and the concentration of solids content was lower than 5,4 g/L. In addition, the
concentration of suspended solids was very low (< 1 g/L) and the percentage of the volatile solids compared
to that one detected in the inlet flow was reduced, indicating that a degradation process has occurred.
Since the time of sedimentation is longer for the 3A and B reactors, a RedOx was expected to be more
negative than those found in the other reactors: however, the measure in that case was higher. This can also
be explained considering that, for the last couple of reactors, the aeration period length was almost double
than others, and therefore the "residual" oxygen that remained in the activated sludge at the end of the
anoxic period can explain the value of the RedOx.
The pH of outlet samples was in a neutral range, and electrical conductivity is about 7 mS/cm for all samples,
much lower than those one detected in the inlet flow. In order to calculate the removal rate (Table 40)
reached during Test 3 of these experiments, the daily load of each components have been defined.
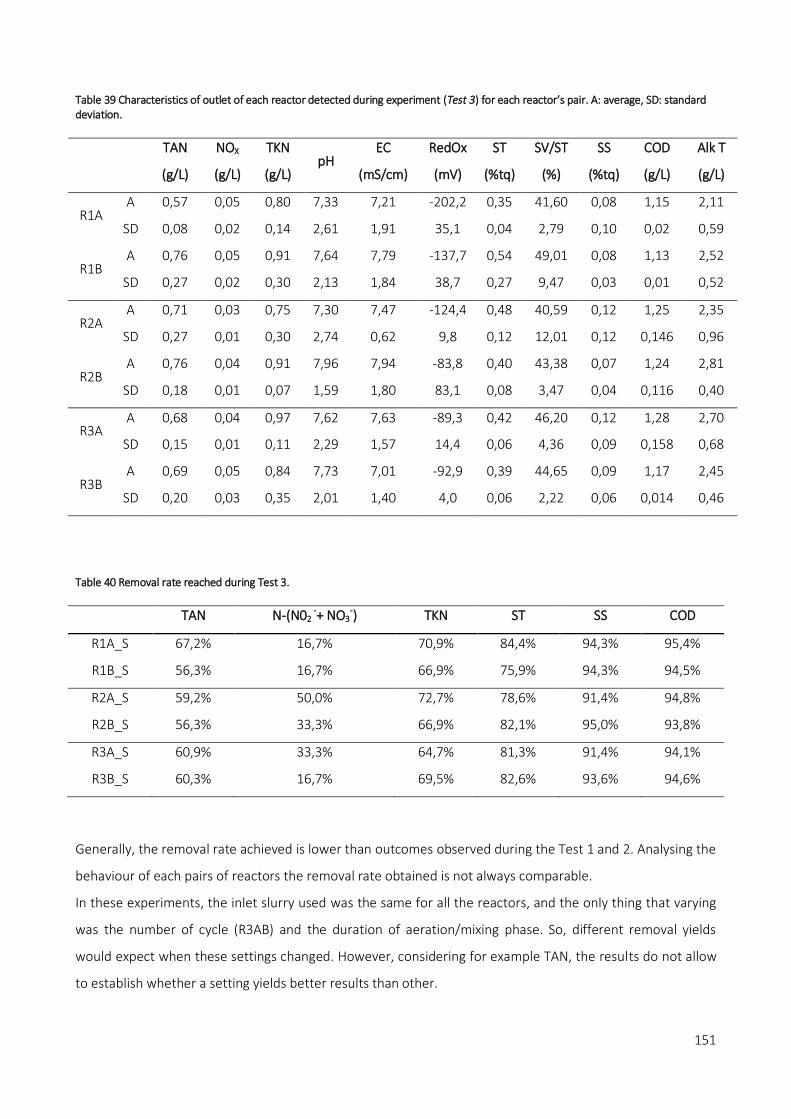
151
Table 39 Characteristics of outlet of each reactor detected during experiment (Test 3) for each reactor’s pair. A: average, SD: standard deviation.
TAN
(g/L)
NOX
(g/L)
TKN
(g/L) pH
EC
(mS/cm)
RedOx
(mV)
ST
(%tq)
SV/ST
(%)
SS
(%tq)
COD
(g/L)
Alk T
(g/L)
R1A A 0,57 0,05 0,80 7,33 7,21 -202,2 0,35 41,60 0,08 1,15 2,11
SD 0,08 0,02 0,14 2,61 1,91 35,1 0,04 2,79 0,10 0,02 0,59
R1B A 0,76 0,05 0,91 7,64 7,79 -137,7 0,54 49,01 0,08 1,13 2,52
SD 0,27 0,02 0,30 2,13 1,84 38,7 0,27 9,47 0,03 0,01 0,52
R2A A 0,71 0,03 0,75 7,30 7,47 -124,4 0,48 40,59 0,12 1,25 2,35
SD 0,27 0,01 0,30 2,74 0,62 9,8 0,12 12,01 0,12 0,146 0,96
R2B A 0,76 0,04 0,91 7,96 7,94 -83,8 0,40 43,38 0,07 1,24 2,81
SD 0,18 0,01 0,07 1,59 1,80 83,1 0,08 3,47 0,04 0,116 0,40
R3A A 0,68 0,04 0,97 7,62 7,63 -89,3 0,42 46,20 0,12 1,28 2,70
SD 0,15 0,01 0,11 2,29 1,57 14,4 0,06 4,36 0,09 0,158 0,68
R3B A 0,69 0,05 0,84 7,73 7,01 -92,9 0,39 44,65 0,09 1,17 2,45
SD 0,20 0,03 0,35 2,01 1,40 4,0 0,06 2,22 0,06 0,014 0,46
Table 40 Removal rate reached during Test 3.
TAN N-(N02
-+ NO3-) TKN ST SS COD
R1A_S 67,2% 16,7% 70,9% 84,4% 94,3% 95,4%
R1B_S 56,3% 16,7% 66,9% 75,9% 94,3% 94,5%
R2A_S 59,2% 50,0% 72,7% 78,6% 91,4% 94,8%
R2B_S 56,3% 33,3% 66,9% 82,1% 95,0% 93,8%
R3A_S 60,9% 33,3% 64,7% 81,3% 91,4% 94,1%
R3B_S 60,3% 16,7% 69,5% 82,6% 93,6% 94,6%
Generally, the removal rate achieved is lower than outcomes observed during the Test 1 and 2. Analysing the
behaviour of each pairs of reactors the removal rate obtained is not always comparable.
In these experiments, the inlet slurry used was the same for all the reactors, and the only thing that varying
was the number of cycle (R3AB) and the duration of aeration/mixing phase. So, different removal yields
would expect when these settings changed. However, considering for example TAN, the results do not allow
to establish whether a setting yields better results than other.

152
Considering the average yield obtained from the reactor pair, the highest removal rate for total solids is
81,95% for reactor 3A and B: this can also be explained by the longer sedimentation time applied for these
reactors compared to the other pairs.
Regarding the removal yields obtained for carbonaceous substance, the maximum removal yields was
94,95% for couple R1AB. This can be signified that the aeration phase length for couple 1 was not sufficient
for the establishment of the nitrification process: heterotrophic bacteria degrade the carbonaceous
substances, but the autotrophic ones are unable to carry out their activity. The increase in the aeration time
imposed for R2AB reactors (1 h) compared to R1AB reactors does not allow considering the quality of the
effluent obtained significantly different. The settling time of 0,2 h applied for the R2AB pair was enough for
obtaining a clarified waste with a solids content equal to 4-5 g/L. The fewest number of cycles imposed for
the 3AB pair (2 cycle/day), does not seem to be the best solution.
Considering the times allocated for the different phases (please also see Chapter 3), the significant points
that allow the eventual application of real time control of the process do not appear in the graphs.
The load fed at 0,214 gTAN/L/d (or 5,7 gCOD /L /d) was too high to allow removal of the nitrogen load > 60%.
In the Table 41 are reported nitrogen (as TAN) and COD load for each reactor.
Table 41 Nitrogen (as TAN ) and COD loading rate for each reactor during Test 3.
gTAN/gSST/d gCOD/gSST/d
R1A_M 0,04 0,97
R1B_M 0,03 0,90
R2A_M 0,04 1,08
R2B_M 0,04 1,00
R3A_M 0,06 1,58
R3B_M 0,05 1,33
Also for Test 3, in order to study the variation of pH and RedOx, parameters detected during one day of
functioning at the beginning of the experiments and during its operations are considered for all pairs of
reactors (Figures 49, 50, 51). The reported pH and RedOx value recorded every 15 seconds during one day of
operation.
For reactors R1A and B is possible to recognize the 3 cycles per day that occurred, even if, as shown during
the first day of operation (Figure 49,a) a malfunctioning occurred during last cycle of the day.
The system R1A and R1B shown always a pH trend very flat, without any noticeable change.

153
a)
b)
c)
d)
Figure 49 Trend of parameters monitored for reactors pair R1A R1B during one day (24h), in particular: a) at the beginning of experiment (TEST 3); b) during 23/01/2018; c) during 30/01/2018 and d) at the end of experiment 06/02/2018.
8
8,2
8,4
8,6
8,8
9
9,2
9,4
-550
-450
-350
-250
-150
-50
50
pH
OR
P m
V
R1AB-Monitored ORP and pH during (TEST 3) 18 01 '18
R1A - ORP_A R1B - ORP_A R1A - pH_A R1B - pH_A
8
8,2
8,4
8,6
8,8
9
9,2
9,4
-550
-450
-350
-250
-150
-50
50
pH
OR
P m
V
R1AB-Monitored ORP and pH during (TEST 3) 23 01 '18
R1A - ORP_A R1B - ORP_A R1A - pH_A R1B - pH_A
8
8,2
8,4
8,6
8,8
9
9,2
9,4
-550
-450
-350
-250
-150
-50
50
pH
OR
P m
V
R1AB-Monitored ORP and pH during (TEST 3) 30 01 '18
R1A - ORP_A R1B - ORP_A R1A - pH_A R1B - pH_A
8
8,2
8,4
8,6
8,8
9
9,2
9,4
-550
-450
-350
-250
-150
-50
50
pH
OR
P m
V
R1AB-Monitored ORP and pH during (TEST 3) 06 02 '18
R1A - ORP_A R1B - ORP_A R1A - pH_A R1B - pH_A

154
a)
b)
c)
d)
Figure 50 Trend of parameters monitored for reactors pair R2A R2B during one day (24h), in particular: a) at the beginning of experiment (TEST 3); b) during 23/01/2018; c) during 30/01/2018 and d) at the end of experiment 06/02/2018.
7,5
7,7
7,9
8,1
8,3
8,5
8,7
8,9
9,1
9,3
9,5
-550
-500
-450
-400
-350
-300
-250
-200
-150
-100
-50
0
50
pH
OR
P m
V
R2AB-Monitored ORP and pH during (TEST 3) 18 01 '18
R2A - ORP_A R2B - ORP_A R2A - pH_A R2B - pH_A
7,5
7,7
7,9
8,1
8,3
8,5
8,7
8,9
9,1
9,3
9,5
-550
-500
-450
-400
-350
-300
-250
-200
-150
-100
-50
0
50
pH
OR
P m
V
R2AB-Monitored ORP and pH during (TEST 3) 23 01 '18
R2A - ORP_A R2B - ORP_A R2A - pH_A R2B - pH_A
7,5
7,7
7,9
8,1
8,3
8,5
8,7
8,9
9,1
9,3
9,5
-550
-500
-450
-400
-350
-300
-250
-200
-150
-100
-50
0
50
pH
OR
P m
V
R2AB-Monitored ORP and pH during (TEST 3) 30 01 '18
R2A - ORP_A R2B - ORP_A R2A - pH_A R2B - pH_A
7,5
7,7
7,9
8,1
8,3
8,5
8,7
8,9
9,1
9,3
9,5
-550
-500
-450
-400
-350
-300
-250
-200
-150
-100
-50
0
50
pH
OR
P m
V
R2AB-Monitored ORP and pH during (TEST 3) 06 02 '18
R2A - ORP_A R2B - ORP_A R2A - pH_A R2B - pH_A
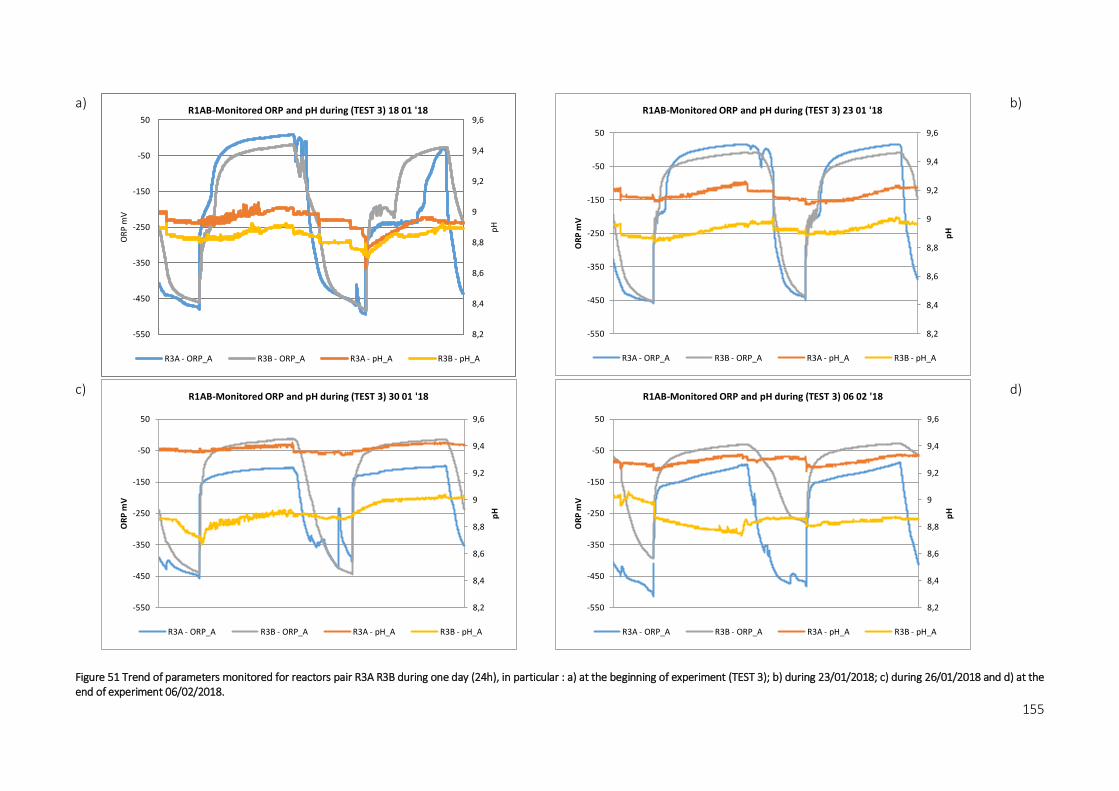
155
a)
b)
c)
d)
Figure 51 Trend of parameters monitored for reactors pair R3A R3B during one day (24h), in particular : a) at the beginning of experiment (TEST 3); b) during 23/01/2018; c) during 26/01/2018 and d) at the end of experiment 06/02/2018.
8,2
8,4
8,6
8,8
9
9,2
9,4
9,6
-550
-450
-350
-250
-150
-50
50
pH
OR
P m
V
R1AB-Monitored ORP and pH during (TEST 3) 18 01 '18
R3A - ORP_A R3B - ORP_A R3A - pH_A R3B - pH_A
8,2
8,4
8,6
8,8
9
9,2
9,4
9,6
-550
-450
-350
-250
-150
-50
50
pH
OR
P m
V
R1AB-Monitored ORP and pH during (TEST 3) 23 01 '18
R3A - ORP_A R3B - ORP_A R3A - pH_A R3B - pH_A
8,2
8,4
8,6
8,8
9
9,2
9,4
9,6
-550
-450
-350
-250
-150
-50
50
pH
OR
P m
V
R1AB-Monitored ORP and pH during (TEST 3) 30 01 '18
R3A - ORP_A R3B - ORP_A R3A - pH_A R3B - pH_A
8,2
8,4
8,6
8,8
9
9,2
9,4
9,6
-550
-450
-350
-250
-150
-50
50
pH
OR
P m
V
R1AB-Monitored ORP and pH during (TEST 3) 06 02 '18
R3A - ORP_A R3B - ORP_A R3A - pH_A R3B - pH_A

156
Only in the final part of experiment (Figure 49,d) it is possible to distinguee the decrease in pH in conjunction
with the aeration period. During other days, the path was not as expected: during denitrification phase, the
pH increase, maybe for the stripping process that involved NH3.
The ORP was always negative during denitrification phase, until reach values lower than -450 mV. Contrary,
during the aeration phase, positive values were attested.
Also concerning R2A and B reactors (Figure 50), the situation seems similar, even if the air phase duration is
longer. The pH does not show the expected typical trend during any day of observation.
The "ammonia valley" does not appear and the ORP, despite having positive values, for a short time remains
above 0 mV: the aeration period may not be adequately long. This can also be deduced from the high values
of removal of the carbonaceous substance: the nitrification phase didn’t start and only the deterioration of
the COD occurs. Also in this case the process seems to have undergone a change during the last period of
operation (Figure 50,d).
The same considerations can be made for the R3AB pair (Figure 51), even if the differences between the
setting operations is completely different: also in this case, the longer duration of aeration phase does not
allow observing the occurrence of typical hot points. For reactors R3A and B, during last period of operation
is detected a difference in the pH and ORP path: the two reactors had different behaviour. Nevertheless, as
seen above, the removal values of the nitrogen compounds are higher than 56%.
In order to understand better different situations, as said before, during Test 3 also the activated sludge
characteristics was monitored.
At the beginning of this series of experiments, although the initial settings were the same, the activated
sludge showed a different sedimentation capacity (Figure 52). In addition, the two reactors of the pair,
shown different behaviours. The reactors 1A and 2A in 1 hour can reach Mohlman index equal to 37 mL/SS
and 41 mL/g that indicated a good quality of the sludge.
The same cannot be said for reactors 1B and 2B, which have a worse quality of sludge sedimentation.
Furthermore, the reactors 3 exhibited the worst quality of the sludge.
Nevertheless, acting on the regulation of the air entering the reactors in order to ensure a suitable content
of dissolved oxygen (an operation that was done daily), the sludge presents a gradually better quality during
the course of the experiment, reaching levels almost comparable in all and 6 reactors.
At the end of experiment, the situation was completely different in comparison with the beginning of
experiment: the reactors 3AB had the best SVI index.
Also concerning that pairs, during the 30/01/2018 something has happened in the reactor A, and the and the
quality of the activated sludge was very bad.

157
18/01/18
a
23/01/18
b
30/01/18
c
6/02/18
d
Figure 52 The performance of the activated sludge-water interface during the time for each pair of reactors on different days: a) 18/12/2018, b) 23/01/2018, c) 30/01/2018, d) 06/02/2012.
0
20
40
60
80
100
5 10 15 20 25 30 35 45 60
mL
R1A R1B
0
20
40
60
80
100
5 10 15 20 25 30 35 45 60
R2A R2B
0
20
40
60
80
100
5 10 15 20 25 30 35 45 60
R3A R3B
0
20
40
60
80
100
5 10 15 20 25 30
mL
R1A R1B
0
20
40
60
80
100
5 10 15 20 25 30
R2A R2B
0
20
40
60
80
100
5 10 15 20 25 30
R3A R3B
0
20
40
60
80
100
5 10 15 20 25 30 120
R1A R1B
0
20
40
60
80
100
5 10 15 20 25 30 120
R2A R2B
0
20
40
60
80
100
5 10 15 20 25 30 120
R3A R3B
0
20
40
60
80
100
5 10 15 20 25 30
mL
R1A R1B
0
20
40
60
80
100
5 10 15 20 25 30
R2A R2B
0
20
40
60
80
100
5 10 15 20 25 30
R3A R3B

158
However, by correcting the amount of air supplied, in a week, the sedimentation of the activated sludge
returned to improve. These malfunctions could be caused by the presence of filamentous bacteria that
interfere with the good sedimentation of the sludge. These bacteria form colonies with a high
surface/volume ratio and therefore with a reduced tendency to sedimentation. This phenomenon is
favoured by situations of substrate limitations or as more plausible in this case, of oxygen lacks.
5.4.3. Experiments’ results: Test 4
During Test 4, a long aeration phase was applied. The results of the characteristics detected for the inlet flow
and for the outlet flow of each reactors were reported in Tables 42.
Table 42 Characteristics of the input and output in terms of concentration for 3 pairs of reactors during Test 4 (A: average; SD: standard deviation).
TAN
(g/L)
NOX
(g/L)
TKN
(g/L) pH
EC
(mS/cm)
ST
(%tq)
SV/ST
(%)
SS
(%tq)
COD
(g/L)
Alk T
(g/L)
Alk VFA
(g/L)
IN A 1,00 0,01 1,36 7,59 4,85 0,93 66,03 0,63 11,92 4,39 2,15
SD - - - - - 0,33 6,40 0,42 - - -
R1A A 0,07 0,05 0,36 7,25 2,43 0,81 61,06 0,56 2,58 0,21 0,07
SD 0,03 0,03 - 0,83 - 0,13 1,87 0,19 3,63 0,30 0,10
R1B A 0,06 0,02 0,39 7,51 2,26 0,93 61,93 0,65 2,70 0,52 0,17
SD 0,04 0,02 - 0,64 - 0,07 1,85 0,14 3,81 0,74 0,24
R2A A 0,08 0,01 0,42 7,46 2,35 0,85 61,27 0,60 2,80 0,28 0,10
SD 0,03 0,01 - 0,88 - 0,10 2,07 0,16 3,95 0,40 0,14
R2B A 0,06 0,01 0,44 7,67 2,15 0,88 60,15 0,76 3,52 0,45 0,15
SD 0,03 0,01 - 0,37 - 0,25 7,49 0,11 4,96 0,64 0,21
R3A A 0,10 0,01 0,45 7,50 2,57 0,97 62,56 0,73 3,30 0,32 0,10
SD 0,06 0,00 - 0,51 - 0,21 2,32 0,25 4,66 0,45 0,14
R3B A 0,08 0,01 0,40 7,55 2,32 1,03 64,97 0,51 3,00 0,30 0,09
SD 0,04 0,00 - 0,68 - 0,76 11,84 0,07 4,23 0,43 0,12
In the following are reported concentration of nitrogen compound detected in the inlet and in the outlet
samples withdrawn during Test 4 (Figure 53).
In order to calculate the removal yields reached during that part of experiment, the inlet and outlet load are
considered.
The removal rate for TAN are higher for couples of reactors, and always greater than 90%. The long period of
aeration was sufficient to allow nitrification to be established and, therefore, to considerably reduce the
amount of ammonia nitrogen. Also the nitrogen removal was very high and always greater than the 66%.
Concerning the removal of carbonaceous compounds was attested above 70%.

159
a)
b)
c)
Figure 53 Nitrogen concentration detected in inlet and outlet samples for reactor R1AB (a), R2AB (b), R3AB (c) during Test 4.
0,00
0,01
0,02
0,03
0,04
0,05
0,06
0,07
0,08
0,09
0,10
-
0,20
0,40
0,60
0,80
1,00
g/L
(NO
3-+
NO
2-)
g/L
(TA
N,
TKN
)
R1AB Nitrogen compound variation during TEST 4
R1A_TAN (g/L) R1B_TAN (g/L) IN_TAN (g/L) R1A_NOX (g/L) R1B_NOX (g/L) IN_NOX (g/L)
-
0,01
0,02
0,03
0,04
0,05
0,06
0,07
0,08
0,09
0,10
-
0,20
0,40
0,60
0,80
1,00
g/L
(NO
3-+
NO
2-)
g/L
(TA
N,
TKN
)
R2AB Nitrogen compound variation during TEST 4
R2A_TAN (g/L) R2B_TAN (g/L) IN_TAN (g/L) R2A_NOX (g/L) R2B_NOX (g/L) IN_NOX (g/L)
-
0,01
0,02
0,03
0,04
0,05
0,06
0,07
0,08
0,09
0,10
-
0,20
0,40
0,60
0,80
1,00
g/L
(NO
3-+
NO
2-)
g/L
(TA
N,
TKN
)
R3AB Nitrogen compound variation during TEST 4
R3A_TAN (g/L) R3B_TAN (g/L) IN_TAN (g/L) R3A_NOX (g/L) R3B_NOX (g/L) IN_NOX (g/L)
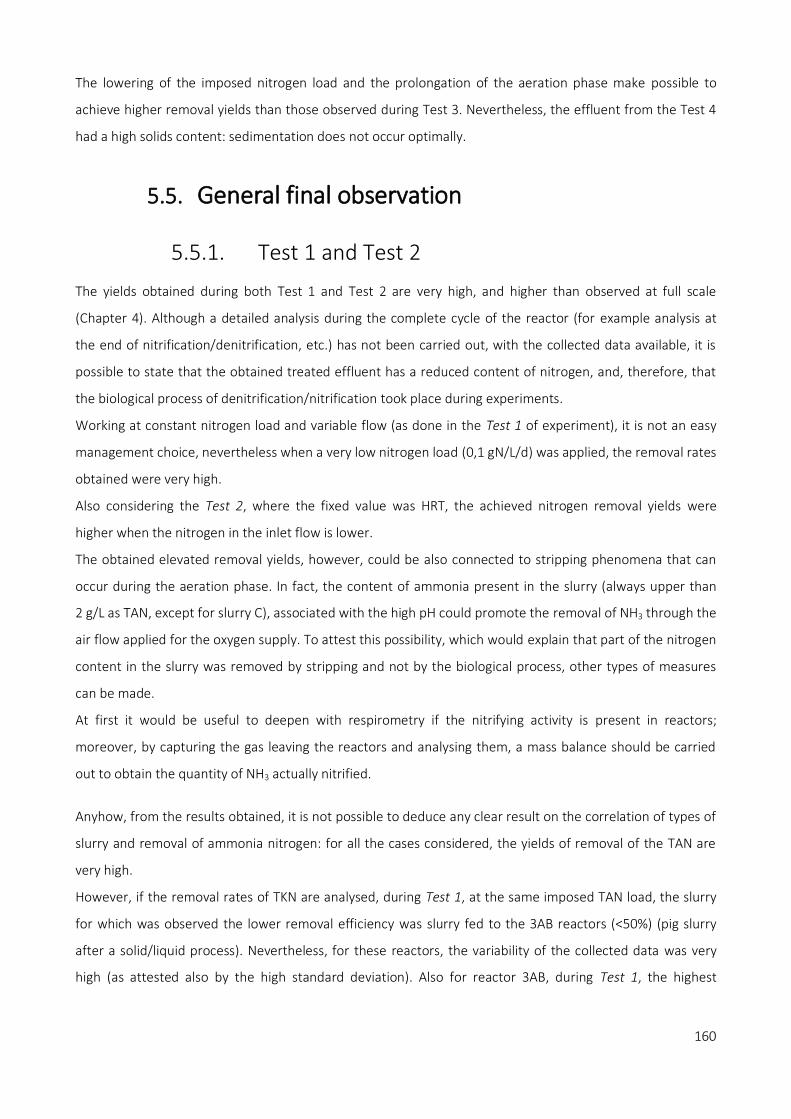
160
The lowering of the imposed nitrogen load and the prolongation of the aeration phase make possible to
achieve higher removal yields than those observed during Test 3. Nevertheless, the effluent from the Test 4
had a high solids content: sedimentation does not occur optimally.
5.5. General final observation
5.5.1. Test 1 and Test 2
The yields obtained during both Test 1 and Test 2 are very high, and higher than observed at full scale
(Chapter 4). Although a detailed analysis during the complete cycle of the reactor (for example analysis at
the end of nitrification/denitrification, etc.) has not been carried out, with the collected data available, it is
possible to state that the obtained treated effluent has a reduced content of nitrogen, and, therefore, that
the biological process of denitrification/nitrification took place during experiments.
Working at constant nitrogen load and variable flow (as done in the Test 1 of experiment), it is not an easy
management choice, nevertheless when a very low nitrogen load (0,1 gN/L/d) was applied, the removal rates
obtained were very high.
Also considering the Test 2, where the fixed value was HRT, the achieved nitrogen removal yields were
higher when the nitrogen in the inlet flow is lower.
The obtained elevated removal yields, however, could be also connected to stripping phenomena that can
occur during the aeration phase. In fact, the content of ammonia present in the slurry (always upper than
2 g/L as TAN, except for slurry C), associated with the high pH could promote the removal of NH3 through the
air flow applied for the oxygen supply. To attest this possibility, which would explain that part of the nitrogen
content in the slurry was removed by stripping and not by the biological process, other types of measures
can be made.
At first it would be useful to deepen with respirometry if the nitrifying activity is present in reactors;
moreover, by capturing the gas leaving the reactors and analysing them, a mass balance should be carried
out to obtain the quantity of NH3 actually nitrified.
Anyhow, from the results obtained, it is not possible to deduce any clear result on the correlation of types of
slurry and removal of ammonia nitrogen: for all the cases considered, the yields of removal of the TAN are
very high.
However, if the removal rates of TKN are analysed, during Test 1, at the same imposed TAN load, the slurry
for which was observed the lower removal efficiency was slurry fed to the 3AB reactors (<50%) (pig slurry
after a solid/liquid process). Nevertheless, for these reactors, the variability of the collected data was very
high (as attested also by the high standard deviation). Also for reactor 3AB, during Test 1, the highest

161
efficiency of total solids removal is attested, which, as said, is evidence of a good sedimentation of the
activated sludge.
With the change of systems’ operation, and of type of slurry (digestate instead liquid fraction of pig slurry)
the obtained result of TKN removal rate was higher for all pairs of reactors, even if the removal rate of solids
content remains intangible. During Test 2, the operation was more constant, without too much variation,
and as underline, the TAN removal was higher. The best results occurred for slurry D.
In addition, as underlined before, the system in any set operation (except for reactor 3AB during Test 1),
cannot remove the solids content. This is surly related to both the very high solid contents of the slurries (3-4
time higher than the classical concentration of typical activated sludge system e.g. 3 gSSV/L), and to
sedimentation time that can be too short for the proper activated sludge sedimentation. In order to obtain a
good quality of outlet slurry in terms of solids content, the definition of this phase of SBR operation is crucial.
Ammonia valley and nitrate knee (which appeared during the NDN process in the SBR reactor is widely
explained and reported in Chapter 3) are not easily identifiable in our experiments.
In conclusion, despite the good results attested during the different experiments, is necessary to analyse and
characterize not only the input and output flows enter and exit the reactors, but also what happen during
the cycle. For this reason, it could be useful to examine the content of nitrogen as TAN, NO3- during the
operation of single phase: they would be indicators of the actual progress of the process (nitrification and
denitrification).
5.5.2. Test 3 and Test 4
The removal rate reached is lower than those observed using other type of slurry (see Test 1 and 2).
Nevertheless, although a detailed analysis of what happens during the complete cycle of the reactor has not
been carried out, with the collected data available for each reactor, the effluents have a reduced content of
nitrogen.
The different operating settings of the 3 reactors pairs during test C did not allow to define which one of the
three operational settings was the best applicable configuration.
Nevertheless, the solution applied to the reactors 3A and 3B, which provides 2 cycles per day with the very
long aeration phase, is the least indicated solution. Operating shorter cycles, splitting the total flow fed to
the plant daily, as they also attest to scientific literature, is the most frequent choice.
162
Increasing settling times to the detriment of the denitrification phase (as applied for R2A and B reactors),
does not make significant changes to the quality of the output flow, compared to lower settling times (R1AB)
and greater denitrification times.
The HRT applied in that experiments (Test 3 and 4) was lower than that applied for other experiments.
However, since during the experimentation A the variability of the HRT was very high (1 d- 20d, depending
on the type of slurry) and the yields obtained were still greater than those observed for Test 3, the lower
nitrogen removal rate was not immediately attributed to this parameter.
As also attested during Test 1 and Test 2, the highest nitrogen-loading rate applied in Test 3 caused a lowest
removal rate achievable. This observation is comparable with those one done by Poo et al., 2005: they found
that when the loading became very high (about more than 0,5 kgNH4+-N/m3/d), the ORP was depicted
abnormally. The explanation of this phenomenon is might be the high suspended solids concentration of
13 g/l accompanied with high NH4+-N loading (Figure 54).
Figure 54 ORP and nitrogen profiles under various loading rates during one sub-cycle during SBR operation (From Poo et al., 2005).
5.6. References
Dutta, A., & Sarkar, S. (2015). Sequencing Batch Reactor for Wastewater Treatment: Recent
Advances. Current Pollution Reports, 1(3), 177–190. http://doi.org/10.1007/s40726-015-0016-y.

163
Magrí, A., & Flotats, X. (2008). Modelling of biological nitrogen removal from the liquid fraction of
pig slurry in a sequencing batch reactor. Biosystems Engineering, 101(2), 239–259.
http://doi.org/10.1016/j.biosystemseng.2008.08.003
Obaja, D., Mace, S., Costa, J., Sans, C., & Mata-Alvarez, J. (2003). Nitrification, denitrification and
biological phosphorus removal in piggery wastewater using a sequencing batch reactor. Bioresource
Technology, 87(1), 103–111. http://doi.org/10.1016/s0960-8524(02)00229-8
Perazzolo, F., Mattachini, G., Riva, E., & Provolo, G. (2017). Nutrient Losses during Winter and
Summer Storage of Separated and Unseparated Digested Cattle Slurry. Journal of environmental
quality, 46(4), 879-888.
Poo, K. M., Im, J. H., Ko, J. H., Kim, Y. J., Woo, H. J., & Kim, C. W. (2005). Control and nitrogen load
estimation of aerobic stage in full-scale sequencing batch reactor to treat strong nitrogen swine wastewater.
Korean Journal of Chemical Engineering, 22(5), 666–670. http://doi.org/10.1007/BF02705780
Provolo G., & Perazzolo F. (2016). Effluenti zootecnici. In Fertilizzazione sostenibile. Principi,
tecnologie ed esempi operative di Grignani C. (cur.) published by Edagricole-New Business Media.
Obaja, D., Macè, S., & Mata-Alvarez, J. (2005). Biological nutrient removal by a sequencing batch
reactor (SBR) using an internal organic carbon source in digested piggery wastewater. Bioresource
Technology, 96(1), 7–14. http://doi.org/10.1016/j.biortech.2004.03.002
Obaja, D., Mace, S., Costa, J., Sans, C., & Mata-Alvarez, J. (2003). Nitrification, denitrification and
biological phosphorus removal in piggery wastewater using a sequencing batch reactor. Bioresource
Technology, 87(1), 103–111. http://doi.org/10.1016/s0960-8524(02)00229-8
Zhu, J., Zhang, Z., & Miller, C. (2006). A Laboratory Scale Sequencing Batch Reactor with the
Addition of Acetate to remove Nutrient and Organic Matter in Pig Slurry. Biosystems Engineering, 93(4),
437–446. http://doi.org/10.1016/j.biosystemseng.2006.01.010

164

165
SECTION 3 - LIVESTOCK MANURE
TREATMENT: THE PROBLEM OF
AMMONIA AND GREENHOUSE GASES
EMISSIONS AND THEIR EVALUATION
6. Assessing NH3 and GHG emissions from
livestock manure storage: comparison of
measurements with dynamic and static
chambers
The content of this chapter is used for preparing an article that will be submitted in “Atmospheric Environment”.
6.1. Introduction
Although animal manure represents precious nutrients for plants, it can be considered cause of soil,
water and air pollution if incorrectly handled (Sommer et al., 2003).
Regarding air pollution, agriculture represents the mainly source of anthropogenic ammonia (NH3)
emission (90%) (Seidel et al., 2017), malodors gases, such as sulphur compound organic acids,
phenolic compounds and indoles (Sommer et al., 2013).
In 2014, agriculture was the great emitter of NH3 (94% of total emission in EU-28) and represents the
sector providing the minor emission reduction (only 7% from 2000 to 2014) (EEA, 2016). Gaseous
ammonia in the atmosphere leads also to formation of secondary inorganic aerosol, the main
constituents of anthropogenic PM2.5 emissions. Fine particulate matter lead to onset of lung cancer
and cardiopulmonary disease (Bauer et al., 2016). Indirectly, the NH3 emissions also contribute to N2O
emissions (Sommer et al, 2013).

166
Emissions from livestock manure and in general livestock production regard greenhouse gases (GHGs)
which include methane (CH4) and nitrous oxide (N2O).
The quantification of emissions from the agricultural sector and especially from livestock manures is
relevant for inventory purpose and to assess the reduction that can be obtained adopting mitigation
techniques (Provolo et al., 2017; Misselbrok et al., 2016). Therefore, suitable methods for the
determination of emission from manures are required.
Several devices can be used to obtain volumetric concentration of ammonia. However, in order to
define ammonia emissions (emission rate) the ammonia mass concentration and airflow rates are also
required.
There are different methods to estimate the emissions rate among which it is possible to count
(Parker et al. 2013):
(1) the mass balance approach, based on the difference of the ammonia nitrogen manure content and
composition of manure before and after the emission period considered;
(2) indirect methods, that use dispersion models and measured ambient concentrations for the
calculation of source emission rates. Among indirect methods, there are also micrometeorological
techniques that foresees gas emission calculation from a large footprint using tower-based
instrumentation (e.g., gradient methods, eddy covariance, backwards Lagrange dispersion model);
(3) IPCC approaches;
(4) direct methods, where the fluxes measure and calculation are made with portable wind tunnels or
flux chambers.
As underlined by other authors, the different approaches do not give comparable emission rates and
the variances among methods can be greater than one order of magnitude (Parker et al., 2013).
Usually in order to select the appropriate method to measure emissions, besides the final purpose, is
necessary to evaluate different factors like the type of gas compounds considered, the range of
measurements, and the homogeneity of the source.
The direct methods are commonly applied for earth-atmosphere and water-atmosphere fluxes of
various compounds including ammonia, biogenic sulphur, nitrogen oxides, and methane and generally
greenhouse gases (Pumpanen et al., 2004; Pihlatie et al., 2013; Dennehy et al., 2017).
The direct used techniques applied are mainly two: the closed static chamber (no steady- state
chamber) and the open dynamic chamber (steady-state chamber).

167
The first one is a physical enclosure that create a limited headspace over the surface from which is
necessary to estimate emission. Inside the chamber the only flux presents is generated by gradient
concentration between the source and the headspace and will be quantified during time in order to
obtain the undisturbed flux into or out of the emissions source (Pihlatie et al., 2013). The
concentration gradient decreases during time until reaches a saturation condition. In this case, the
emission is calculated considering the curve before it reaches saturation.
Many studies use this direct method for emission’s measure (Miola et al. ,2015; Zhang et al., 2011;
Pumpanen et al., 2004; Rochette et al., 1992).
Differently, in the open dynamic chambers an air flux passing through the hood, flushing out the
headspace over the chamber. Airflow can be natural (environmental wind) but in most cases is
generated artificially with a fan. Also in this case is possible to find in literature many studies that apply
this methods for measuring emission flux (Perazzolo et al., 2015; Dinuccio et al., 2008; Shah et al.,
2006; Parker et al., 2009; Yang 2017; Zhang et al., 2011).
Direct method technique (both static and dynamic) presents some limitation linked with a possible
disturbance inducing for example by spatial variability of emission source, chamber size, air velocity (di
Perta et al. 2016; Saha et al. 2006), alteration of natural gradient between atmosphere and emissions
source. Moreover, the use of chambers cannot allow obtaining representative emission rates of
absolute value of gas emissions from a given source, being the measurements connected with the site,
time, specific condition, sampling campaign etc. Nevertheless, the errors introduced by using of
chambers can be diminished with correct chamber designs, the proper data analyses, and spatial and
temporal sampling regimes (Davidson et al., 2002). In addition, the advantage in using chambers is to
associate a particular emission site to its measurable array of physical, chemical, and microbiological
properties with emissions of particular compounds or their reaction products (Aneja et al., 2006). As
well, the investment cost of flux chambers is low and their use are generally easy (Ogink et al., 2013).
Nevertheless, for testing ammonia volatilization models, wind tunnels are more suitable than static
chambers because better mimic natural airflow, even if cannot be mimic wind condition. Wind tunnels
technique can be applied at small-scale range. However, the investment cost for wind tunnels are high
(Yang et al., 2017) and the obtained results are related to a fixed and immobile time scale.
Compared with an indirect method, for example with IPCC guidebook, direct methods allow to
consider specific situations for which the guides do not provide specific emission factors (as emissions
derive from by-product storage from a processing plant) (Torrellas et al., 2018).
The numerous and variety existing techniques for measuring NH3 and greenhouse gases
concentrations under agricultural field conditions show as a uniquely known technique is not yet

168
defined and used. However, the choice of proper ammonia emission evaluation method is crucial and
the need to rely on the data obtained from the gases measurements is fundamental both for the
research aims and mostly for the proper definition of mitigation techniques and interventions aimed
at reducing emissions.
The overall goal of this study was the evaluation and comparison of the use of different technologies
applying direct methods (two steady-state chambers and one static chamber) for the monitoring of
ammonia and greenhouse gas emissions. The comparison of the results obtained applying direct
evaluation methods was done for an ammonia solution and for stored slurry in three different full-
scale treatment plants.
6.2. Materials and methods
6.2.1. Experiments set-up
In order to evaluate and compare the use of different hoods for measuring ammonia and other
emission gases, two different types of experiment were carried out.
The first group of tests were performed using a synthetic source of ammonia (synthetic ammonia
solution) in order to assess and study ammonia emission in a controlled condition without any
disturbance induced by the complex characteristic of animal slurry.
The second group of experiments, which goals was also the comparison of the obtained results using
synthetic ammonia solution, were carried out at filed condition, applying the use of hoods for
measuring ammonia and GHGs emissions from animal slurries and agro-industrial waste.
The experiments in controlled conditions were carried out at IRTA (Institut de Recerca i Tecnologia
Agroalimentàries), located in Caldes de Montbui, Barcelona (41,612140, 2,169617). For these
experiments, an ammonia solution was prepared adding ammonium hydroxide extra pure, 25%
solution in water (≥25% as NH3) (Acros Organics) to different amounts of water in order to obtain the
desired ammonia concentration. Trials were performed in a period of 6 months.
The ammonia solution is placed inside a heavy-duty PVC and polyester square containers with triple-
layer side walls enclosed in a metal frame (1,22 m x 1,22 m; A: 1,49 m2). Specifically, the plastic vessel
is filled with 30 L of tap water mixed with a defined amount of NH4OH, based on the required
ammonia concentration. In addition, a group of tests was performed with ammonia solution added
with an amount of sulphuric acid 95-97% in order to drop pH from 12 to 7,8 and sodium bicarbonate

169
for simulating the buffer capacity of the slurry (NaHCO3) (concentration: 0,1 mol TIC/L, where TIC is
total inorganic carbon defined as : TIC= CO2 aq +HCO3- aq + H2CO3 ).
During all experiments, the content of ammonia was determined also analytically.
In every sampling campaign carried out at field conditions, the chamber and hoods were placed in the
same point.
A summary of experiments carried out both with ammonia solution and using animal slurries and
agro-industrial waste is reported in Table 43.
Table 43 Summary of all experiments. DH1: dynamic hood1, DH2: dynamic hood 2; SH1: static hood 1. C: compost, LFD: liquid fraction of digestate; SFPS: solid fraction of pig slurry.
Hood Request
concentration mgN-NH
3/L
Buffer (y/n)
Exp. Replicates
Hood Type of slurry
Buffer (y/n)
Exp. Replicates
AMMONIA SOLUTION ANIMAL SLURRIES AND AGRO-INDUSTRIAL WASTES
DH1 0,5 n 3 DH1 C - 3 1 n 3 LFD - 3 2 n 3 SFPS - 3
y 3 DH2 C - 3 3 n 3 LFD - 3
DH2 0,5 n 6 SFPS - 3 1 n 6 SH1 C - 3 2 n 6 LFD - 3
y 3 SFPS - 3 3 n 3
SH1 0,5 n 1 1 n 1 2 n 4
y 3 3 n 3
Trials at full scale, using different hoods for estimating emission from livestock manure were
performed:
- (a) in a biogas production plant located in north of Catalunya, Spain, where cow slurry is
digested together with other co-substrates, agri-food wastes, sludge from wastewater
treatment plant etc.; here the emissions of ammonia, CO2, CH4 and N2O were analysed from a
pile where the thick phase of the digestate is composted (Compost, C);
- b) using liquid fraction of digested produced in the same plant of case a). For this experiment,
a volume of 45 L of digestate is put in a plastic basin for performing analysis (Liquid Fraction of
Digestate, LFD).

170
- c) in a biological treatment plant located in Vic, Catalunya, Spain, where pig slurry were
biological treats for removing nitrogen. In that case, NH3, CO2, CH4 and N2O are measured
from a stored pile of solid fraction after Solid/Liquid separation (Solid fraction of pig slurry,
SFPS).
6.2.2. Equipment used
Three different hoods have been used in the experiments. Two of them were dynamic hoods and the
third was a static hood. The dimensions of each equipment are reported in the Table 44.
Table 44 Characteristics of different hoods and static chamber used in the tests.
L1 length
(m)
L2 width
(m)
D Diameter
connection (m)
H height
(m)
Emitting surface
(m2)
Volume
(m3)
DH1 0,96 0,96 0,1 m 0,15 0,92 0,14
DH2 1,03 0,53 - 0,25 0,55 0,14
SH 0,40 0,41 - 0,75 0,16 0,12
The first dynamic hood (DH1) is a Lindvall Hood (Figure 55).
The use of DH1 foreseen the application of float system when it was used in a real tank for avoiding
the drawing of the instrumentation. The air sampling was done through a fitting pipe inserted in the
middle of the outlet hole of the DH1.
The flow velocity required inside the dynamic hood should be between 0,2 - 0,3 m/s (EPA 2001). To
obtain wanted air speed inside the hood, a blower was connected to the inlet port of the Lindvall
Hood with nalophane pipe. The air speed velocity was evaluated by means of thermal anemometer
flow rate device at the outlet port of the hood. In order to define the air flow that must be maintained
at the outlet of the hood for ensuring 0,2 – 0,3 m/s inside the DH1, a mass balance was applied
(equation 15, and equation 16).
Equation 15
where:
S1= hood’s surface, S1=L1*L2 [m2];
v1= air speed inside the hood [m/s];
S2= outlet surface, S2= ( D/2)2 [m2];

171
D= outlet diameter [m];
In this way v2 can be calculated as:
Equation 16
Therefore, the measured velocity at the outlet of the hood must be around 0,8 m/s.
To estimate the emission rate for DH1, it is also necessary to define the hood factor w, which can be
calculated according to equation 17 and hood dimensions.
Equation 17
a) b)
Figure 55 Scheme of Lindvall Hood dimensions (a) and its scheme (b)- IRTA documents.
In DH1 hood, gas samples were collected via a cross-sectional sampling tube at the outlet point of the
hood.
The second dynamic hood (DH2) (Odournet ventilating hood), which dimensions are reported in Table
44, consists of two radial fans that ensuring with a constant volumetric flow. In that case, the air
velocity cannot be checked inside the hood and the flux is set by the equipment producer (30 m3/h,
Odurnet Technical brochure), that corresponding to an airflow equal to 0,005 m3/s. Also for DH2
application, the its use at full scale required a floating system to allow the sailing of the hood when it is
out
in

172
positioned on a liquid surface. A pressure sealing connection on the structure allowed plugging the
PTFE pipe to the hood for air catching and sampling. In DH2 hood, gas samples were collected using
the special connection (DH2) foresees in this model of hood.
The static hood (SH) (Figure 56) is a plastic enclosure, with a self-regulating pressure system that
allows to avoid a vacuum effect. That hood is provided with two holes, one to insert the temperature
probe and other one used as air connection. When was used on solid manure, that chamber was
introduced 2 cm into the heap for guaranteeing hood’s sealing.
Figure 56 Two holes in the static hood (SH) used for withdrawing air sample and for measuring temperature inside the hood.
6.2.3. Emissions sampling and calculation
Sampling procedure
The measured emissions were NH3 and GHGs (N2O, CH4 and CO2).
For the quantification of ammonia-N emitted for both dynamic hoods and static chamber, a wet direct
method was applied.
Ammonia nitrogen (NH3-N) content in the sample were trapped bubbling with a low flow rate pump
(Universal PCXR8, 1000 ml/min, time accuracy ± 0,05%, SKT, Pennsylvania, USA) a known volume (5 L
and 1 L for dynamic hoods and static hood respectively) into two serial glass impingers containing
10 mL of sulphuric acid 0,1 N each.
Each measure was repeated in triplicate.
Air flushing time was equal to 5 minutes for dynamic hood, as defined by preliminary tests.
Concerning static hood SH, sampling volume is equal to 1 L (< of 1% of the volume exchange rate
inside the chamber) and so, sampling time is equal to 1 minute.

173
Nitrous oxide, CO2 and CH4 sampling were made with a syringe (200 mL) taking a gas sample (10 mL)
from the pipe connected with the hood outlet; then was inject into an vacutainer tube with butyl
rubber stopper.
For static chamber, during sampling period of lab-trial experiment each air sample was collected from
the chamber headspace at 0, 10, 20, 30 and 40 min. The concentration of gases obtained during the
experiment were used to construct the curve needed to calculate the emission factor (please also see
paragraph “Emissions rate calculation”). Two more sampling time was added for full-scale tests
(50 min and 60 min) in order to check if the concentration had reached saturation condition or not.
The concentration of NH3 (Cg, mg/L) was calculated according to equation 18:
Equation 18
Where:
C (mg) is ammonia concentration in air sampled;
V is the volume (L) of air sampled.
All NH3 and GHGs measurements were done also for the inlet flow for background concentration.
Emission rate calculation
Emission rate (E) calculation for each of the hood was performed as follows.
Regarding DH1, the specific emission rate E1 can be calculated according to Equation 19.
Equation 19
Where:
E1 is the flux expressed in terms of mg/m2/s;
Cout,j is the NH3, N2O, CH4 or CO2 concentration of air outlet from each chamber in mg/m3;
Cin,i is the NH3, N2O, CH4 or CO2 concentration of air inlet into each chamber in mg/m3;
v is the air speed expressed in (m/s);
w is hood factor (-).
The ammonia and GHGs fluxes E2 in the dynamic chamber DH2 were calculated as follow.
Equation 20
Where:
E2 is the flux expressed in terms of mg/m2/s;

174
Cout,j is the NH3, N2O, CH4 or CO2 concentration of air outlet from each chamber in mg/m3;
Cin,i is the NH3, N2O, CH4 or CO2 concentration of air inlet into each chamber in mg/m3;
Q is the airflow expressed in m3/ s;
A is emitting surface (m2).
Using static chamber SH, in order to calculate the ammonia emission and GHG emissions flux is
necessary to build a saturation curve and defined the regression coefficient γ.
γ was calculated for each experiment using linear regression based on the concentration change as a
function of collection time for the 5 or 7 samples (Hernandez-Ramirez Get al., 2010; Duchemin et al.,
1999).
In order to define potential emission flow rate, the applied calculation was as follow:
Equation 21
Where:
E3 is the flux expressed in terms of mg/m2/s;
γ= Δ gas/ Δ t is angular coefficient of the curve (mg measured gas/m3/s);
V is volume of chamber’s headspace (m3);
A is emitting surface (m2).
6.2.4. Analytical methods
Compost, digestate and pig slurry solid fraction using as emission source in the trials were
characterized for total Kjeldahl nitrogen (TKN) (4500-Norg C), ammonium nitrogen (NH4+-N) (4500-NH3
B C), pH (4500- H + B), electrical conductivity (EC), total solids (TS) (2540 B), volatile solids (VS) (2540
E), (APHA, 2014), and the chemical oxygen demand (COD) following de method described in Noguerol-
Arias et al., (2012). NO2-, NO3
-, SO43-, PO4
3- were analysed by ionic chromatography following Standard
Method 4110. Total phosphorus (P) was analysed by colorimetric Standard Method 4500-P C.
During all experiments, liquid temperature and air temperature (inside and outside of the chamber for
SH) were monitored.
Regarding ammonia concentration in the air samples, a colorimetric analysis method was applied
(Spectroquant ® kit), analogues to phenate method, APHA 4500-F. Then, the samples were read in a
spectrophotometer (Hach Lange, USA) using wavelength equal to 640 nm.
GHGs concentration was performed using a gas chromatograph coupled with a flame ionization
detector and an electron capture detector. CH4 was determined using a THERMO TRACE 2000
(Thermo Fisher Scientific, USA) gas chromatograph equipped with a flame ionization detector (FID).

175
N2O and CO2 emissions were determined with an Agilent 7820A (Agilent, USA) GC system using an
electron capture detector (ECD).
6.3. Results and discussion
Table 45 summarizes the main characteristics of the 3 different types of manure used as emissions
source during full scale trails. The characteristics of different slurry were typical of that kind of sludge
(Torrellas et al., 2018). The solid fraction of pig slurry had the same characteristics that those ones
reported in the study of Dinuccio et al., 2008 even if nitrogen content (TAN and TKN) are 25% lower.
This can be due to the dilution of the sample caused by the rain fell in the days before the sampling. In
fact, in the monitored plant the storage tank was not covered.
Table 45 Characteristics of analysed effluents and sludge. LFD: liquid fraction of digestate; C: compost; SFPS: solid fraction of pig slurry.
Parameter U.M. LFD C SFPS
pH - 7,86 8,62 8,80
EC mS/cm 20,60 4,10 2,73
ST % 5,43 28,45 27,75
SV % 3,68 24,91 23,96
N-NH4+ gN/L 3,05 2,89 1,96
TKN gN/kg 4,33 8,36 3,68
NO2- mgN/kg 0,00 0,00 763,00
NO3- mgN/kg 0,00 0,00 578,00
COD mg O2/kg 58,55 459,85 412,20
SO42- mg/kg - 313,00 -
PO43- mg/kg 62,00 73,00 -
Ptot g/kg 0,43 0,85 1,15
6.3.1. Ammonia emissions from synthetic ammonia solution
Table 46 shows results concerning experiments using ammonia solution at different concentrations.
Regarding physico-chemical parameters, data average is referred to different measurements carried

176
out during the same experiment for each hood. All the samples have been analysed at least in
duplicate.
The ammonia emissions obtained by using the water and ammonia solution as an emission source
grew with the increase of ammonia concentration (as nitrogen) in the water. Therefore, due to the
proportionality of emission flow to the size of the chamber and the regression coefficient γ, it is
expected that emissions will have the same behaviour. In fact, as shown in Table 46, the ammonia
emission rates increase with the increase of ammonium concentration in emission source.
However, emissions data obtained using an addition of buffer compound to synthetic ammonia
solution were much lower. Indeed, NH3 emissions from the slurry surface is strongly dependent on pH
(Misselbrook et al., 2016), on buffer capacity (Sommer et al., 2013) and the ionic strength that has an
inverse proportionality to ammonia emission (Sommer et al., 2003).
The main conclusion was that using SH, achieved emissions were lower than one order of magnitude
than those detected using dynamic hoods, in any given situation, with or without buffer. Those results
are supported by the ones observed in other studies where using steady state chambers, an
underestimation until 50% was observed (Norman et al., 1997; Pumpanen et al., 2004). Also
comparing use of static chamber with other methods as the periodic IHF technique (Shah S.B.et
al.2006, Sommer et al., 2004) or boundary layer equation (Duchemin et al., 1999) the emissions of
gases measured were much lower.
The possible causes of disparity in the results obtained can be in the (1) the mode of transport of the
dissolved gases, (2) air temperature and water temperature, and (3) wind speed (Duchemin et al.,
1999). These conditions can be resulted by the higher resistance to atmospheric vertical transfer in
absence or under low headspace air movement (Miola E.C.C et al., 2016). The underestimation may
also derive from a linear model applied for calculate ammonia flux (and other gas flux) that cannot
accurately represent fundamental physics of the diffused gas transport in static chambers (Livingstone
et al., 2006).
Emissions rate obtained with the two dynamic hoods DH1 and DH2, were comparable in all executed
experiments. The greatest difference between the emission rates detected by the dynamic chambers
was observed with higher nitrogen concentrations in the emissive source (33%).

177
Table 46 Characteristics of experiments with ammonia solution and emissions value measured during different experiments by the different hoods. DH1: dynamic hood1; DH2: dynamic hood 2; SH: static chamber. n: without adding any buffer compound, y: using of buffer compound.
Buffer
N. of
repetition
DH1
N. of
repetition
DH2
N. of
repetition
SH
Environmental
Temperature
°C
Slurry
Temperature
°C
TAN
gN-NH4+/L
pH
solution
Emission
DH1
mg/m2/s
Emission
DH2
mg/m2/s
Emission
SH
mg/m2/s
n 3 3 3 10,96 ± 1,99 11,33 ± 1,39 2,26 ± 0,3 11,32 ± 0,08 1,85± 0,12 2,14± 0,18 0,35
n 3 3 1 12,37 ± 0,2 10,52 ± 0,08 1,88 ± 0,14 10,72 ± 0,12 1,6± 0,02 1,1± 0,02 0,1
n - - 3 13,02 ± 3,06 10,8 ± 1,43 1,26 ± 0,27 11,67 ± 0,31 - - 0,12
n - 3 - 13,25 ± 0,07 13,3 ± 0,14 1,1 ± 0,01 10,92 ± 0,04 - 1,2 ± 0,06 -
n 3 3 1 13,72 ± 0,37 11,72 ± 0,47 0,77 ± 0,03 10,33 ± 0,08 0,5± 0,03 0,5± 0,01 0,1
n 3 3 1 14,17 ± 0,10 12,05 ± 0,14 0,29± 0,06 11,1 ± 0,06 0,3± 0,03 0,3± 0,04 0
n - 3 - 14,2 ± 1,13 13,5 ± 0,42 0,5 ± 0,01 10,56 ± 0,03 - 0,5 ± 0,004 -
n - 3 - 17,35 ± 0,92 13,5 ± 0,28 0,31 ± 0,01 10,38 ± 0,05 - 0,3± 0,03 -
y 3 3 - 9,03 ± 0,76 13,77 ± 0,83 2,36 ± 0,05 8,3 ± 0,13 0,35± 0,07 0,37± 0,09 -
y - - 1 18,94 ± 3 15,96 ± 2,05 1,76 8,7 - - 0,01
y - - 3 13,38 ± 1,49 12,72 ± 0,94 1,44 ± 0,04 8,53 ± 0,06 - - 0

178
To compare the three hoods, a linear regression of ammonia emission rate in front of concentration of
the emissions source was done (Figure 57). As can be seen in Figure 57, R2 of regression is greater
than 0,8 for all hoods. The regression lines for DH1 and DH2 were similar but seems that the obtains
value is more different when ammonia source’s concentration is higher. That situation could be due to
the analytical determination and not to substantial differences between the use of two hoods.
In this case, the difference between the emission rate of the static chamber and the dynamic hoods
increased with the raise of the ammonia concentration in the emission source.
At low concentration, the results of measures using two dynamic hoods DH1, DH2 and the static
chamber SH are less dissimilar. From these results, it may be concluded that at low concentration of
emission source, all the chambers are suitable to estimate emissions rates.
Figure 57 Linear regression of results obtained for each hood (bars error represents standard deviation).
6.3.2. Ammonia and GHGs emissions from livestock manure slurries
Ammonia emissions
Table 47 shows results of ammonia emissions measured from stored slurries as emissions sources.
Similarly to the emissions measured from ammonia solution in controlled conditions, emissions rates
calculated with dynamic hoods DH1 and DH2, gave similar emission rates. In addition, ammonia
emission rate resulting from livestock slurries and agro-industrial waste measurements with different
yDH1 = 0,7783x - 0,0184 R² = 0,9926
yDH2 = 0,8648x + 0,0271 R² = 0,8339
ySH1 = 0,1701x - 0,0785 R² = 0,8008
0,0 0,2 0,4 0,6 0,8 1,0 1,2 1,4 1,6 1,8 2,0 2,2 2,4 2,6 2,8 3,0
0,00 0,20 0,40 0,60 0,80 1,00 1,20 1,40 1,60 1,80 2,00 2,20 2,40 2,60 2,80
E m
g/m
2/s
gN-NH4+/L
Emission from ammonia solution
DH1 DH2 SH

179
hoods and chamber were similar to those obtain using the ammonia solution with buffer (Table 47
and Table 48). Anyway, similar behaviour for the hoods were observed for both emissions resulted
from ammonia solution at different concentrations and from different slurries and waste.
Instead, at real scale, considering the amount of emission rates observed, with a given concentration
of ammonia in the emission source (both in the ammonia solution and slurries and waste), the
emission rate was different compared with those observed in the experiment executed in a control
condition. It is reasonable to consider that, even if the ammonium content in the livestock slurry or
agro-industrial waste exceeded 2 g/L, the emissive flows of ammonia is lower than those observed for
ammonia solution for which the volatilization of ammonia was higher. The explanation is connected
also with the slurry buffer capacity for the reasons explains in Paragraphs 6.1 and 6.3.1.
The ammonia emissions resulted from digestate storage obtained using dynamic hoods were lower
than those one observed in the study of Sommer et al., 2000 (up to 30 gNH3/m2/d), even if in that
study the technique used was micrometeorological mass balance methods. Contrary, always
considering digestate, the results obtained with DH1 and DH2 were similar to those observed in the
study of Perazzolo et al., 2015 (cattle digestate liquid fraction 300 mg/Nm2/h at the beginning of
storage period).
Emissions from solid fraction of pig slurry in this research were more than twice times higher than
those observed in the study Dinuccio et al., 2008 (60-180 mg/m2/h (min-max) @5°C and 20-280
mg/m2/h (min-max) @ 25°C). These differences can be attributable to the composition of slurry (as
the content of nitrogen, 4,05 g/Kg as TAN and 12,2 g/Kg as TKN, and pH- 8,82).
The highest ammonia emissions were detected for compost, and the lowest for liquid fraction of
digestate (C > SFPS > LFD).
Besides ammonia content, ammonia emissions resulted were influenced by the temperature of
considered slurry/waste that has a direct influence on emission; moreover, as attested by the study of
Pagans et al., (2006), which regards the determination of ammonia emissions coming from the
composting process of three typical wastes, the total amount of ammonia emitted was directly related
to the C/N ratio of the waste. In addition, there is a strong influence of pH on ammonia emission
(Perazzolo et al., 2015) and also in this research, the trend of flux measured attested that the lower
NH3 emission correspond with the lowest pH. As well, the texture of solid fraction and compost
facilitate ammonia volatilization allowing the passage of air through porous.
Greenhouse gases emissions
The measures of GHGs emission were performed only for slurries and for agro-industrial waste.

180
The use of hoods for defining of GHGs emission gave different outcomes than those observed for
ammonia emission.
Relating to N2O, in all tests the emission flux observed was very low and the use of static chamber,
similar to what observed for ammonia emission, gave results two orders of magnitude lower. As said
before, the emission of N2O is related to incomplete ammonium oxidation or to incomplete
denitrification process. So, in the considered slurries, neither of the two process was involved.
In the study of Petersen et al., (2013) a dynamic method was used for measuring ammonia and GHGs
emissions. They found that stored of pig slurry resulted in total GHG emissions of up to
1,3 kg CO2 eq/m2/d during summer. No N2O emissions were observed from pig slurry
during storage in any period of observations except in the presence of a crust, during which N2O
emissions was c. 80 mg/m2/h.
In this study the maximum emission value detected for liquid fraction of digestate was
11,6 mgN2O/m2/h, measured with DH2. Nevertheless, this value is comparable with the ones obtained
using DH1. Also in the study of Perazzolo et al., (2015) no N2O emissions were observed before 32
days of storage period. In literature are reported cases of N20 emission also from stored slurries, but in
that cases the emissions were imputable to a crust presence (Sommer et al., 2000). In the study of
Fukumoto et al., (2003), that analyzed emission produced from composting of pig slurry, the N2O
emissions started only when the NH3 emissions and temperature of the compost material began to
decline.
Despite CO2 is a greenhouse gas, in the context of manure management, its emissions are considered
as biogenetic and are not computed as GHGs. In that study, CO2 emissions measured from compost
and liquid fraction of digestate using different dynamic hoods gave comparable results; instead, also in
this case, the use of SH1 measured emission one order of magnitude lower. Considering the solid
fraction of pig slurry, CO2 emissions detected with different hoods were similar despite the different
type of the hood considered.
As reported in the study of Pumpanen et al., (2004), the use of static chamber can be appropriate for
detecting CO2 flux until 0,015 mg CO2/m2/s: so, as also observed when static hood is applied to
synthetic ammonia solution, this technique can be applied when low emissions have to be detected.
For all chambers, CH4 emissions were comparable for all dynamic hoods and static chamber (same
order of magnitude). As observed in the study of Perazzolo et al., (2015) the C lost via CH4 was lower
than the lost via CO2. The smallest emission was observed using DH2 for solid fraction of pig slurry, the
highest one was detected by DH1 for compost. Digestate (liquid fraction) produced lower CH4
emission fluxes than compost.

181
Table 47 Slurry characteristics during experiments and emissions obtained for different hoods DH1: dynamic hood1;DH2: dynamic hood2; SH: static chamber. * means that that tests were carried out with real waste but from an artificial basin and not in the real treatment plant.
Emission
Source
N. of
repetition
DH1
N. of
repetition
DH2
N. of
repetition
SH
Environmental
Temperature °C
Slurry
Temperature
°C
Ammonia
Slurry
gN-NH4+/L
pH
solution
Emission
DH1
mg/m2/s
Emission
DH2
mg/m2/s
Emission
SH1
mg/m2/s
Stored
Compost 3 3 2 16,04 ± 2,27 25,56 ± 3,32 3,05 8,62 0,5±0,05 0,51±0,23 0,03
Liquid
Fraction of
Digestate*
3 3 2 17,21 ± 2,93 14,39 ± 3,06 2,95 ±
0,04 7,86 0,12±0,02 0,09±0,02 0,02
Solid fraction
of pig slurries 3 3 2 6,43 ± 1,59 13,70 1,96 8,8 0,22±0,03 0,33±0,03 0,02
Table 48 Emission flux of GHGs detected for slurries and agro-industrial waste. DH1: dynamic hood1; DH2: dynamic hood2; SH: static chamber. * means that that tests were carried out with real waste but from an artificial basin and not in the real treatment plant.
Emission source E mgN-N2O/m2/min E mgCO2/m2/min E mgCH4/m2/min
DH1 DH2 SH DH1 DH2 SH DH1 DH2 SH
Compost 0,2 0,2 0,0 201,2 158,7 24,1 1,1 0,5 0,5
Liquid Fraction of Digestate* 0,2 0,2 0,0 152,8 150,3 9,2 0,4 0,4 0,3
Solid fraction of pig slurries 0,0 0,0 0,0 75,4 30,3 67,4 0,2 0,1 0,6

182
As explained in Paragraph 6.2.1, the digestate collected at the plant was then transferred into heavy-duty
PVC and polyester square containers at experimental site, where the emission analyses were carried out.
Certainly, if the analyses were carried out on "fresh" separated slurry, the emissions obtained would have
been higher. In fact, the high emission of CH4 are observed at the beginning of storage and decreasing over
time. In Figure 58 is shown the emission of nitrogen compounds and carbon compounds from different type
of source.
a) b)
Figure 58 NH3, N2O (a) and CO2, CH4 (b) emission rates for all considered slurries. C: compost, LFD: liquid fraction of digestate, SFPS: solid fraction of pig slurry.
The comparison of NH3 and GHG emissions from stored slurries and agro-industrial waste was very difficult
not only for the differences between the characteristics of the effluents analysed, but also for the unique
features of environmental conditions and site-specific characteristics. Actually, the use of dynamic hoods
imposed a constant value of “wind speed” far from reality condition; as well, this method does not consider
some contribution as rainfall, creating, as defined by Miola E.C.C et al., (2015), an “oasis effect”. Also, for
these reasons, evaluation of full-scale ammonia or GHG emissions can be realized through other approaches,
as IPCC approaches, that can be consider more appropriate for its completeness in considering a general
environmental aspect, bigger scale and that is not site-specific. In spite of this, the results obtained with
direct method technique were closer to those reported in literature, obtained with other indirect methods.
In addition, the emissions measured applying direct methods allow having emission factors closer to
punctual reality. For this reason, this data, could be used as a “correction factor” for the output of general
model. For example, equation used for evaluating emission that are applied in indirect methods can be
0,0
5,0
10,0
15,0
20,0
25,0
30,0
35,0
40,0
0,0
0,1
0,1
0,2
0,2
0,3
0,3
C LFD SFPS
mgN
-NH
3/m
2/m
in
mgN
-N2O
/m2/m
in
NH3_DH1 NH3_DH2 NH3_SH
N2O_DH1 N2O_DH2 N20_SH
0,0
0,2
0,4
0,6
0,8
1,0
1,2
0,0
50,0
100,0
150,0
200,0
250,0
C LFD SFPS
mgC
H4/m
2/m
in
mgC
O2/m
2/m
in
CO2_DH1 CO2_DH2 CO2_SH
CH4_DH1 CH4_DH2 CH4_SH

183
incorporated with a punctual emission obtained using direct emission measurements, in order to provide a
less generalize output.
6.4. Conclusions
In this study a comparison of ammonia and GHG emissions measurements were carried out using two
different technologies both applying direct methods: dynamic hoods and static chamber.
The use of two dynamic hoods, despite the different size, operation, applied air flux, present comparable
emissions rate results when used for estimating emissions from ammonia solution and slurry; the same
consideration can be done also for GHG emissions. The obtained results shown how the use of dynamic
hoods and static chamber can be consider valuable techniques for comparing ammonia emission rate at full
scale.
6.5. References
Aneja V.P.,Blunden,J., Caliborn, S.C.,Rogers, H.H. 2006. Dynamic Chamber System to Measure Gaseous
Compounds Emissions and Atmospheric-Biospheric Interactions. Environmental Simulation Chambers:
Application to Atmospheric Chemical Processes. - p. 97-109.
APHA, 2014. Standard Methods for the Examination of Water and Wastewater, twenty second ed. APHA
(American Public Health Association), AWWA (American Public Health Association), WEP (Water
Environment Federation), Whasington, DC.
Bauer S.E., Tsigaridis K., and Ron Miller R. 2016. Significant atmospheric aerosol pollution caused by
world food cultivation, Geophys. Res. Lett., 43, 5394–5400, doi: 10.1002/2016GL068354.
Davidson E.A., K. Savage K., Verchot L.V., Navarro R. 2002. Minimizing artifacts and biases in chamber-
based measurements of soil respiration Agricultural and Forest Meteorology 113, 21–37
Dennehy C., Lawlor P.G., Jiang Y., Gardiner G.E., Xie S., Nghiem L.D., Zhan X.. Greenhouse gas emissions
from different pig manure management techniques: a critical analysis. Front Env Sci Eng. 2017;11(3):11.
di Perta, E. S., Agizza, M. A., Sorrentino, G., Boccia, L., & Pindozzi, S. 2016. Study of aerodynamic
performances of different wind tunnel configurations and air inlet velocities, using computational fluid
dynamics (CFD). Computers and Electronics in Agriculture, 125, 137-148.
Dinuccio E., Berg W., Balsari P. 2008. Gaseous emissions from the storage of untreated slurries and the
fractions obtained after mechanical separation Atmospheric Environment 42 2448–2459.

184
Ducheminv E., Lucotte M., and Canuel R. 1999. Comparison of Static Chamber and Thin Boundary
Layer Equation Methods for Measuring Greenhouse Gas Emissions from Large Water Bodies Environ. Sci.
Technol. 33, 2, 350-357
EEA Report (2016) Air quality in Europe — 2016 report - Luxembourg: Publications Office of the
European Union, 2016 ISSN 1977-8449 Available on line: http://www.eea.europa.eu//publications/air-
quality-in-europe-2016. Accessed 20.02.17)
EPA, 2001. Environmental Protection Agency. Odour Impacts and Odour Emission Control Measures for
Intensive Agriculture. Final report. Environmental Research. R &D Report Series No. 14, Johnstown Castle
Estate, Wexford, Ireland. 1-84095-075-7.
Harper, L. A. (2005). Ammonia: measurement issues. Micrometeorology in Agricultural Systems (2005)
Agronomy Monograph no. 47: 345-379.
Hernandez-Ramirez G, Brouder S M, Smith D R, Van Scoyoc G E. Greenhouse gas fluxes in an eastern
Corn Belt soil: weather, nitrogen source, and rotation. Journal of Environmental Quality, 2009, 38(3): 841–
854
Holly Michael A., Larson Rebecca A., Powell Mark J., Ruark Matthew D., Aguirre-Villegas Horacio. (2017).
Greenhouse gas and ammonia emissions from digested and separated dairy manure during storage and after
land application. Agriculture, Ecosystems and Environment 239 410–419
Hornig G., Turk, M.,Wanka, U. Slurry Covers to reduce Ammonia Emission and Odour Nuisance.
Agricultural Engineering Resource - 1999. - p. 73, 151-157.
Livingston G.P., Hutchinson G.L., Spartalian K. 2006. Trace gas emission in chambers: a non-steady-state
diffusion model Soil Sci. Soc. Am. J., 70, pp. 1459-1469
Lovanh N., Warren j., Sistani k., (2010). Determination of ammonia and greenhouse gas emissions from
land application of swine slurry: A comparison of three application methods Bioresource Technology 1662-
1667.
Loyon L., Guiziou F., Beline F., Peu P.. 2007,Gaseous Emissions (NH3, N2O, CH4 and CO2) from the
aerobic treatment of piggery slurry—Comparison with a conventional storage system. Biosystem
Engineering, 97, 472 – 480.
Maurer D.L., Koziel J. A., Bruning K. 2017.Field scale measurement of greenhouse gas emissions from
land applied swine manure. Front. Environ. Sci. Eng. 11(3): 1 DOI 10.1007/s11783-017-0915-9
McGinn, S. M., Janzen, H. H. and Coates, T. Atmospheric ammonia, volatile fatty acids, and other
odorants near beef feedlots. J. Environ. Qual. 2003. 32: 1173–1182.
Misselbrook T., Hunt J., Perazzolo F., Provolo G. Greenhouse gas and ammonia emissions from slurry
storage: Impacts of temperature and potential mitigation through covering (pig slurry) or acidification (cattle
slurry) Journal of Environmental Quality. 2016; 45:1520–1530.

185
Miola, E. C., Aita, C., Rochette, P., Chantigny, M. H., Angers, D. A., Bertrand, N., & Gasser, M. O. (2015).
Static chamber measurements of ammonia volatilization from manured soils: impact of deployment duration
and manure characteristics. Soil Science Society of America Journal, 79(1), 305-313.
Ni J. Mechanistic models of ammonia release from liquid manure: a review. Journal of Agricultural
Engineering Resource., 1999. - Vol. 72. - p. 1-17.
Noguerol-Arias, J., Rodríguez-Abalde, A., Romero-Merino, E., Flotats, X., 2012. Determination of chemical
oxygen demand in heterogeneous solid or semisolid samples using a novel method combining solid dilutions
as a preparation step followed by optimized closed reflux and colorimetric measurement. Anal. Chem. 84,
5548–5555.
Ogink N.W.M. , Mosquera J. , Calvet S. , Zhang G., 2013. Methods for measuring gas emissions from
naturally ventilated livestock buildings: developments over the last decade and perspectives for
improvement Biosyst. Eng., 116 (2013), pp. 297-308
Pacholski, A., Cai, G., Nieder, R., Richter, J., Fan, X., Zhu, Z., Roelcke, M., 2006. Calibration of a simple
method for determining ammonia volatilization in the field e comparative measurements in Henan Province,
China. Nutrient Cycling in Agroecosystems 74, 259e273.
Parker, D., Cole, N., Casey, K., Galvin, G., Ormerod, R., Paris, C., Caraway, E., Rhoades, M., 2009. Wind
tunnels vs. flux chambers: area source emission measurements and the necessity for VOC and odour
correction factors. In: Proceedings 19th International Clean Air and Environment Conference. September 6e9.
Perth, Western Australia.
Parker, D., Ham, J., Woodbury, B., Cai, L., Spiehs, M., Rhoades, M., ... & Cole, A. 2013. Standardization of
flux chamber and wind tunnel flux measurements for quantifying volatile organic compound and ammonia
emissions from area sources at animal feeding operations. Atmospheric Environment, 66, 72-83.
Perazzolo, F., Mattachini, G., Tambone, F., Misselbrook, T., & Provolo, G. 2015. Effect of mechanical
separation on emissions during storage of two anaerobically codigested animal slurries. Agriculture,
Ecosystems & Environment, 207, 1-9.
Petersen, S. O., Dorno, N., Lindholst, S., Feilberg, A., & Eriksen, J. 2013. Emissions of CH 4, N 2 O, NH 3
and odorants from pig slurry during winter and summer storage. Nutrient cycling in Agroecosystems, 95(1),
103-113.
Pihlatie, M. K., Christiansen, J. R., Aaltonen, H., Korhonen, J. F., Nordbo, A., Rasilo, T., Benanti, G.,
Giebels, M., Helmy, M., Sheehy, J., Jones, S., Juszczak, R., Klefoth, R., Lobo-do-Vale, R., Rosa, A. Schreiber, P.,
Serca, D., Vicca, S., Wolf, B., and Pumpanen, J. 2013. Comparison of static chambers to measure CH4
emissions from soils, Agr. Forest. Meteorol., 171, 124–136.
Pumpanen, J., Kolari, P., Ilvesniemi, H., Minkkinen, K., Vesala, T., Niinisto¨ , S., Lohila, A., Larmola, T.,
Morero, M., Pihlatie, M., Janssens, I., Yuste, J. C., Gru¨ nzweig, J. M., Reth, S., Subke, J.-A, Savage, K., Kutsch,

186
W., Ostreng, G., Ziegler, W., Anthoni, P., Lindroth, A., Hari, P. (2004): Comparison of different chamber
techniques for measuring soil CO2 efflux. Agric. For. Meteorol. 123, 159–176.
Rochette P., Gregorich E.G., Des Jardins R.L. 1992. Comparison of static and dynamic closed chambers
for measurement of soil respiration under field conditions. Can J Soil Sci 72:605–609
Sánchez, A.; Artola, A.; Font, X.; Gea, T.; Barrena, R.; Gabriel, D.; Sánchez-Monedero, M.Á.; Roig, A.;
Cayuela, M.L.; Mondini, C. Greenhouse gas from organic waste composting: Emissions and measurement.
In CO2 Sequestration, Biofuels and Depollution; Springer: Berlin/Heidelberg, Germany, 2015; pp. 33–70.
Seidel A., Pacholski A., Nyord T., Vestergaard A., Pahlmann I., Herrmann A., Kage H.. 2017. Effects of
acidification and injection of pasture applied cattle slurry on ammonia losses, N2O emissions and crop N
uptake. Agriculture, Ecosystems & Environment, Volume 247, Pages 23-32, ISSN 0167-
8809,https://doi.org/10.1016/j.agee.2017.05.030.
Shah Sanjay B., Westerman Philip W. & Arogo J., 2006. Measuring Ammonia Concentrations and
Emissions from Agricultural Land and Liquid Surfaces: A Review, Journal of the Air & Waste Management
Association, 56:7, 945-960, DOI: 10.1080/10473289.2006.10464512
Sommer S.G., Génermont S., Cellier P., Hutchings N.J., Olesen J.E., Morvan T., (2003). Processes
controlling ammonia emission from livestock slurry in the field, European Journal of Agronomy, 19, 465–486.
Sommer, S. G., Christensen, M. L., Schmidt, T., Jensen, L. S., eds. 2013. In Animal Manure Recycling:
Treatment and Management. John Wiley & Sons Ltd. Chichester, UK.
Sommer, S. G., McGinn S.M., Hao X., Larney F.J. 2004.Techniques for measuring gas emissions from a
composting stockpile of cattle manure Atmospheric Environment 38, 4643–4652
Sommer, S.G., Møller, H.B., 1999. Emission of greenhouse gases during composting of deep litter from
pig production––effect of straw content. J. Agric. Sci. Cambridge 134, 327–335.
Szyłak-Szydłowski, M. (2017). Validation of odor concentration from mechanical-biological treatment
piles using static chamber and wind tunnel with different wind speed values. Journal of the Air & Waste
Management Association, 67(9), 1046-1054.
Torrellas, M.; Burgos, L.; Tey, L.; Arias, J.; Riau, V.; Palatsi, J.; Antón, A. & Flotats, X. & Bonmatí, A.. (2018).
Different approaches to assess the environmental performance of a cow manure biogas plant. Atmospheric
Environment. 177. 10.1016/j.atmosenv.2018.01.023.
Yang J., Y Jiao Y., Yang W.Z., Gu P., Bai S.G., Liu L. 2017. Review of methods for determination of
ammonia volatilization in farmland. IOP Conf. Ser.: Earth Environ. Sci. 113 012022
Zhang Y., Liu J., Mu Y., Pei S., Lun X., Chai F. 2011.Emissions of nitrous oxide, nitrogen oxides and
ammonia from a maize field in the North China Plain Atmospheric Environment 45, 2956-2961

187
SECTION 4 - PHYSICO-CHEMICAL
TREATMENT FOR PHOSPHORUS
RECOVERING AND REMOVAL FROM
LIVESTOCK MANURE
The content of this chapter will be used for preparing an article that will be submitted in “Science of Total Environment”.
7. Effect of additives on phosphorus, copper
and zinc separation from raw and treated
animal slurries
Animal excreta is not just waste material that need to be through away but represents raw material that can
be used for plant production essential to feed and nourish a growing world population (Sommer et al.,
2003).
Currently, there is an increasing interest in finding the most suitable treatments necessary not only to reduce
the environmental problems related to the management of animal manure, but also to allow the recovery of
those elements of which the manure is rich.
The phosphorus separation using chemicals represents an example of this kind of approach.
This treatment can be applied stand-alone for removing phosphorus (for example in a wastewater treatment
plant where a chemical phosphorus precipitation is often performed for respecting the law threshold limits)
or can be applied as a pre- or post-treatment for removing not only P but also a suspended solid.
In this chapter, a possible application of phosphorus separation using chemicals is analysed. In particular, a
possible use of calcium hydroxide and aluminium salt were applied for removing and recovering phosphorus
compound from different slurries. In addition, the possible coupling of the separation treatment with a
stripping process was considered.

188
7.1. Introduction
As much as 40 million tons of phosphorus (P) as P2O5 is consumed by human population each year; this has
impact on P demand that will increase by 1,5% annually (Harris et al. 2008). The artificial phosphorus
fertilizers production from phosphate rock is also energy intensive and lead to significant emissions of
carbon, radioactive by-products and heavy metals (Cordell et al., 2009; Tervahauta et al. 2014). Furthermore,
the rock phosphate is not a renewable resource: it is predicted that could be exhausted in 100–250 years
(Grigatti et al. 2015; Tervahauta et al. 2014). It is therefore necessary to limit unnecessary use and find
alternative to mining phosphate rock improving the recycling and recovery of P from wastes and other waste
products. As an alternative, P can be obtained for example from civil wastewater, livestock wastewater,
livestock slurry (Tervahauta et al. 2014).
Recovered P in an easily dewatered form could be stored and applied as a slow-release fertilizer in
accordance with crop needs (Taddeo et al. 2016).
Reducing nutrient emissions from agro-industrial sources and the need to recycle nitrogen (N) and
phosphorus (P) are important for improving agro-industrial management and environmental protection. In
fact, surplus nutrients (N and P) can be transported from watersheds by surface runoff or base flow of
contaminated groundwater and cause water eutrophication (Taddeo, Kolppo, and Lepistö 2016). Because of
the imbalance in the amounts of N and P in animal manure relative to crop needs, P is often applied in
excess of crop requirements, increasing the P concentration in soils and consequently the potential for P
movement to water resources. Thus, removing P from manure can reduce environmental pollution and
represent a source of renewable P to be used as fertilizer in agriculture.
Besides the need to recover P from livestock manure to avoid its over application especially in intensive
livestock areas, some concerns in correct disposal of livestock manure are also related to heavy metals,
especially copper (Cu) and zinc (Zn).
Heavy metals are present in low-concentration in livestock diets and can be added to certain foods for health
and wellbeing or as growth promoters (Nicholson et al. 2003; Sommer et al. 2013). Nevertheless, only a
small percentage of ingested heavy metals are absorbed by animals, the remaining is excreted in the faces or
urine, as the 15-40% of the phosphorus (Suzuki et al., 2010). In this way the excess of elements not used by
the plants can cause soil and water pollution. Approximately 40% of total annual input of Zn and Cu to
agricultural land is derived from livestock manures (Marcato et al., 2003; Suzuki et al., 2010) and the
continuous application of manure can lead to an increase of the concentration of Cu and Zn in soils and in
the food chain (Provolo et al. 2018).
One possibility for recovering P and removing heavy metals from animal manure is solid-liquid separation.
This physical treatment technique produces a solid fraction having a high dry matter (DM) content that is
189
rich in nutrients, as well as a dilute liquid fraction; the fractions can be managed separately. The solid
fraction, which has a relatively small volume, contains high concentrations of carbon (C) and nutrients,
particularly N and P. The liquid fraction has a relatively lower nutrient content, but can be easily transported
and spread to fields (Burton 2007).
Physical and mechanical separation technology is used also for P removal from animal manure and digestate
and represents a critical step in the sustainable and correct use of nutrient. Even if solid/liquid separation
can be considered a suitable method to remove these elements (Møller et al., 2007), higher removal
efficiencies can be reached only with the use of chemical additives, flocculants and/or coagulants (Fernandes
et al., 2011; Vanotti et al. 2017).
Among the possible separation treatments, there are some, as coagulation process, that removes not only
phosphorus in the form of phosphate, but also dissolved organic matter, colloids and particulates which can
be coagulated (Duan and Gregory 2003).
Some successful studies at laboratory scale attempted to recycle P in the form of struvite [MgNH4 (PO4)
6H2O] from the liquid phase of manure (Cerrillo et al. 2015). However, struvite formation requires a special
chemical condition that can be difficult to achieve (Fernandes et al. 2011). P recovery also can be achieved
by thermo-chemical processes, such as incineration, sintering or smelting sewage sludge or animal wastes
(Cabeza et al. 2011).
In hydroxide precipitation process, the addition of coagulants such as alum, iron salts, and organic polymers
can enhance the removal of heavy metals from wastewater (Fu and Wang 2011). Concerning chemical
precipitation, several types of additives have been studied to coagulate manure, to flocculate it or to remove
orthophosphate (PO43-). Experimental and actual applications have used iron (Fe), aluminium (Al) and
calcium (Ca) salts, several types of polyacrylamides and clay as coagulants/flocculants (Christensen, Hjorth, &
Keiding, 2009; Hjorth & Christensen, 2008; Møller et al. 2007; Vanotti et al. 2002).
Aluminium sulfate (Al2(SO4)3) is one of the most use chemical compound for coagulation process. According
to the Al2(SO4)3 stoichiometric reaction, 0,87 g of chemical is required for 1 g of P present in a mixture.
However, many side reactions occur and increase the required amount of reagents compared to the
stoichiometric values. In fact, Al3+ as Fe3+ dose in liquid manure can reach 2 to 3 for the molar ration of metal
to P in order to achieve over 95% removal (Lin et al., 2013).
The best pH condition for P-removal using aluminium is 5,5-6,5; this condition can achieve by exploiting the
acid hydrolysis of Al2(SO4)3. Concerning the use of aluminium salt, in the study of Szabo et al., 2008 it is
reported that for a concentration ranges between 0,5 to 6 mg/L of soluble phosphorus (PO4-P) is necessary
doses above 1,5 to 2,0 Medose/Pini (where Me/P is molar ratio between the metal and soluble phosphorus) for
reaching 80-98% of removal rate. The application of Ca compounds for P removal may initially precipitate a
number of Ca phosphate minerals (brushite, monetite, octacalcium phosphate, hydroxyl apatite, or
190
amorphous calcium phosphate) (Szogi, et al., 2015). By increasing pH with Ca(OH)2 soluble P can be
precipitated as amorphous calcium phosphate (ACP, Ca3(PO4)2·xH2O) but also calcite (CaCO3). In addition,
when calcium hydroxide is added to liquid manure, the hydroxide reacts with the existing bicarbonate to
form carbonate, with NH4 + to form NH3, and with phosphate to form phosphate precipitate compounds
(Szogi et al., 2015). Also for these reasons the dosage of Ca compounds be define independently from the P-
content.
Concerning use of Ca components, results presented in the study of Harris et al., (2008) showed an
interactive effect of CO3-2 and Mg2+ on Ca phosphate precipitation when they co-exist; i.e., addition of MgSO4
can suppress carbonate precipitation and enhance Ca3(PO4)2 precipitation at elevated pH (>9). Vanotti et al.,
(2003), attested that P removal efficiency for a lagoon swine wastewater after nitrification pre-treatment
reached 98% with a molar ration Ca:P of 2.5.
While there are several experiences reporting the P removal efficiencies from livestock manure using
mechanical separation with or without additives, the effect of these treatments on Cu and Zn removal is not
adequately addressed, especially with regard to digestate from anaerobically digested animal manure.
Moreover, there is little information about P, Cu and Zn removal efficiencies from animal slurries pre-treated
using a N removal process based on ammonia stripping process.
The objective of this study was to evaluate how different doses of Al2(SO4)3 and Ca(OH)2 added to a solid-
liquid separation treatment can affect P, Cu and Zn separation efficiencies from raw pig slurry and co-
digested slurry before and after ammonia stripping treatment. The overall goals of the research are (1) the
evaluation of the separation efficiency for possible phosphorus-recovery and for the removal of heavy
metals and (2) if that treatment can be coupled with a novel stripping process aimed to N-recovery. In
particular, we assessed how the type of slurry, the used pre-treatment (stripping process and physico-
chemical treatment) and the dose of additives influence the separation efficiencies of these elements.
7.2. Materials and methods
7.2.1. Slurries and ammonia stripping
Laboratory scale solid-liquid separation experiments were conducted on manure slurries using two additives
Ca(OH)2, hereafter shortened to CaH, and Al2(SO4)3, hereafter shortened to AlS, to study the effect of
different doses of the additives on removals of total solids (TS), P, Cu and Zn.
Three types of animal slurries were used, two of which were tested both before and after being subjected to
an ammonia stripping process. The three types of slurries were:

191
- liquid fraction of pig slurry extracted from raw slurry using a screw press mechanical separator
(designated “pig slurry, PS”), collected from a fattening pig farm;
- liquid fraction (from a screw press separator) of anaerobically co-digested pig slurry and corn
silage before being subjected to a stripping process for ammonia removal (“pig digestate, PD”)
and after stripping (“pig digestate stripped, PDS”); and
- liquid fraction (from a screw press separator) of anaerobically digested slurry from 25000 pigs
and 1800 dairy cattle before being subjected to a stripping process for ammonia removal
(“cattle and pig digestate, (C+P)D”) and after (“cattle and pig digestate stripped, (C+P)DS”).
All slurries were collected from farms located in the province of Bergamo (Italy).
The laboratory scale stripping process was carried out in 50 L reactors, each having a hydraulic residence
time of 12 days. During the process the reactor temperature was maintained at 40°C and slurries were mixed
at 50 rpm. The airflow was set at 20 L/min. In the first 2 days, 33% of the airflow was provided from the bottom
of the reactor through air stones and the rest was introduced into the headspace. Subsequently, 100% of the
aeration was introduced into the headspace. The stripping process achieved an N removal efficiency of
approximately 80% (Provolo et al. 2017).
7.2.2. Determination of optimal chemical doses
In order to define the correct dose of CaH and for AlS for precipitation and separation treatment, preliminary
tests were executed. An appropriate dose (D) of two chemicals were individuated with studies of pH and EC
patterns with the addition of increasing doses of each additive in a 500 mL of each slurry analysed.
As noted in paragraph 7.1, there is no direct relation between P concentration in animal manure slurries and
the CaH dose necessary for its precipitation. In addition, P precipitation using CaH occurs only after the
precipitation of carbonate. With the addition of CaH the carbonate ions precipitate massively as confirmed
by the decreasing of conductivity. Then, the conductivity decreases until the carbonate concentration
becomes limiting and prevents the solubility limit of this salt from being exceed. The finest dose of CaH for
carbonate precipitation corresponds to a maximum reduction of conductivity. Above this dose all inorganic
carbon being consumed and the excess of the optimum dose introduced in the solution results in the
increase in Ca2+ content and thus in conductivity (Renou et al., 2008). For this reason, it was decided that the
reference dose D is the one to which corresponds EC minimum value.
Regarding AlS, in addition to observing pH and EC, evaluation of produced foam level and the flock
dimension were carried out. For this last evaluation, constant amounts of chemical were added in 500 ml of
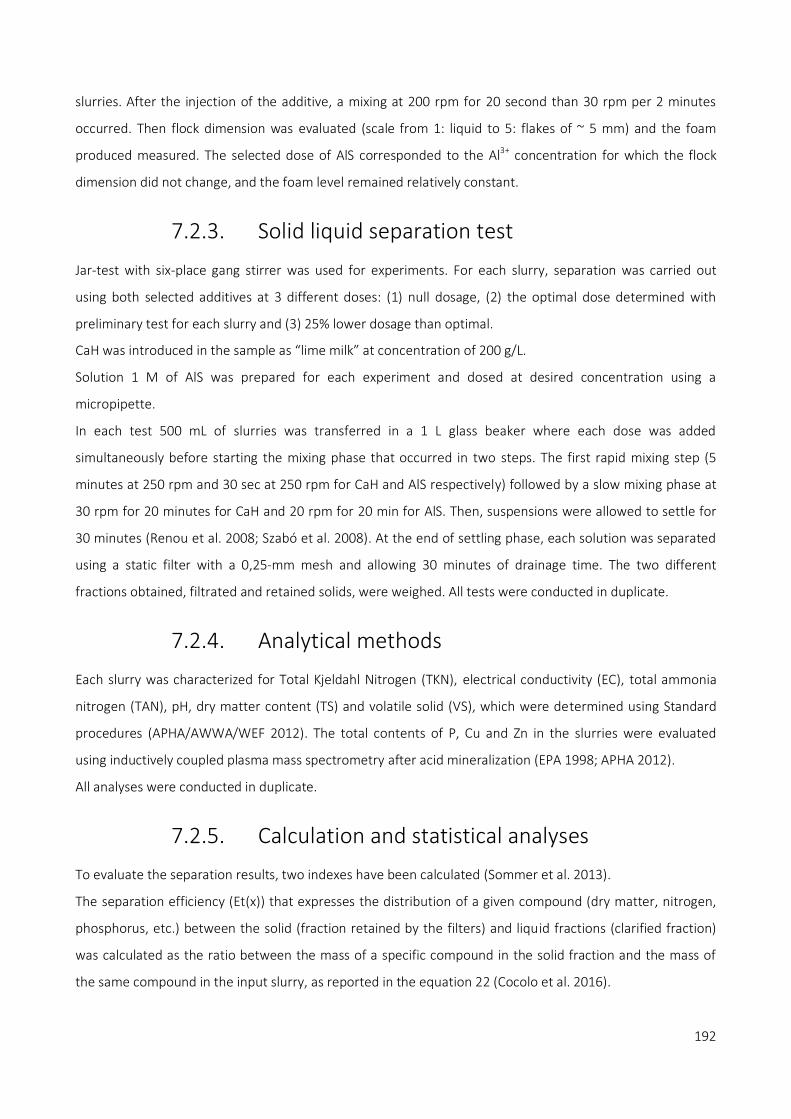
192
slurries. After the injection of the additive, a mixing at 200 rpm for 20 second than 30 rpm per 2 minutes
occurred. Then flock dimension was evaluated (scale from 1: liquid to 5: flakes of ~ 5 mm) and the foam
produced measured. The selected dose of AlS corresponded to the Al3+ concentration for which the flock
dimension did not change, and the foam level remained relatively constant.
7.2.3. Solid liquid separation test
Jar-test with six-place gang stirrer was used for experiments. For each slurry, separation was carried out
using both selected additives at 3 different doses: (1) null dosage, (2) the optimal dose determined with
preliminary test for each slurry and (3) 25% lower dosage than optimal.
CaH was introduced in the sample as “lime milk” at concentration of 200 g/L.
Solution 1 M of AlS was prepared for each experiment and dosed at desired concentration using a
micropipette.
In each test 500 mL of slurries was transferred in a 1 L glass beaker where each dose was added
simultaneously before starting the mixing phase that occurred in two steps. The first rapid mixing step (5
minutes at 250 rpm and 30 sec at 250 rpm for CaH and AlS respectively) followed by a slow mixing phase at
30 rpm for 20 minutes for CaH and 20 rpm for 20 min for AlS. Then, suspensions were allowed to settle for
30 minutes (Renou et al. 2008; Szabó et al. 2008). At the end of settling phase, each solution was separated
using a static filter with a 0,25-mm mesh and allowing 30 minutes of drainage time. The two different
fractions obtained, filtrated and retained solids, were weighed. All tests were conducted in duplicate.
7.2.4. Analytical methods
Each slurry was characterized for Total Kjeldahl Nitrogen (TKN), electrical conductivity (EC), total ammonia
nitrogen (TAN), pH, dry matter content (TS) and volatile solid (VS), which were determined using Standard
procedures (APHA/AWWA/WEF 2012). The total contents of P, Cu and Zn in the slurries were evaluated
using inductively coupled plasma mass spectrometry after acid mineralization (EPA 1998; APHA 2012).
All analyses were conducted in duplicate.
7.2.5. Calculation and statistical analyses
To evaluate the separation results, two indexes have been calculated (Sommer et al. 2013).
The separation efficiency (Et(x)) that expresses the distribution of a given compound (dry matter, nitrogen,
phosphorus, etc.) between the solid (fraction retained by the filters) and liquid fractions (clarified fraction)
was calculated as the ratio between the mass of a specific compound in the solid fraction and the mass of
the same compound in the input slurry, as reported in the equation 22 (Cocolo et al. 2016).

193
Equation 22
The simple separation index gives no indication of an increase in concentration of compound x in the solid
fraction; therefore, the reduced separation index, E’t(x), also was calculated (Cocolo et al. 2016):
Equation 23
where msolid and mslurry are the total masses (g) of solid fraction and separated slurry, respectively.
Equation 23 has all requirements for an efficiency definition: assumes value 0 when no separation takes
place and 1 when separation is complete (Moller et al., 2000). In particular, E’t(x) ranges from -1 to +1:
positive values indicate an increase in concentration of x in the solid fraction compared with the raw slurry
and negative values indicate an increase in concentration of x in the liquid fraction.
Statistical analyses were completed using SPSS v. 25 software (IBM Corp., Armonk, NY, USA). A descriptive
statistical analysis was performed on all the data, and the results were expressed as means and standard
deviations. The data were also subjected to analysis of variance (ANOVA) using a full factorial model (fixed
factors: dose, additive and slurry type). The homogeneity of the variances has been checked with
the Levene’s test. The significant treatments were compared by utilizing Tukey’s HSD multiple range test
(p < 0.05).
7.3. Results and discussion
7.3.1. Slurry characteristics
The physico-chemical characteristics of the five slurries used are summarized in Table 49.
The P concentrations in raw pig slurry and digestates were comparable to those reported by Finzi et al.,
(2015) and Møller et al. (2007); the Cu and Zn contents are similar to those reported in the study of
Nicholson et al., (2003), even if found values for Cu and Zn concentration are higher than those results from
other study (Suzuki et al., 2010).
The increase in concentrations of heavy metals and other elements after the stripping process can be
explained as consequence of water evaporation that occurs during the treatment (at 40°C). The same
explanation applies for solids content: without considering evaporation, the stripping process increased the
TS concentration by 16% and 19% for pig and cattle digestate and pig digestate, respectively.

194
Table 49 Main characteristics of five slurries used in the tests.
Pig slurry Pig digestate
Pig digestate
stripped Mix digestate
Cattle and pig
digestate
stripped
pH 6,75 (±0,18) 8,1(±0,08) 7,6 (±0,03) 8,2 (±0,24) 8,4 (±0,04)
EC 25,84 (±0,32) 29,7 (±1,15) 15,8(±0,13) 20,9 (±1,2) 12,0 (±0,23)
TKN (g/kgTQ) 3,93 4,6 2,2 2,4 1,2
N-NH4+
(g/kgTQ) 2,26 3,4 0,6 1,9 0,2
TS (%) 2,5 (±0,18) 4,2 (±0,44) 5,0 (±0,23) 2,5 3,1 (±0,49)
VS (as % TS) 63,0(±2,28) 58,2 (±0,89) 55,7 (±2,41) 59,5 51,1 (±8,78)
Alkalinity
(mg CaCO3/L) 17102,0 (±1734,1) 18542,6 (±3464,1) 9175,7 (±629,7) 18463,6 (±9494,5) 8554,8 (±2645)
P (mg/kgTQ) 370,6 (±43,0) 1137,4 (±354,6) 1508,9 (±30,8) 451,8 (±50,6) 612,7 (±98,7)
Cu (mg/kgTQ) 12,9 (±1,6) 6,8 (±2,4) 10 (±0,9) 5,1 (±0,5) 6,6 (±0,5)
Zn (mg/kgTQ) 20,4 (±2,8) 41,5 (±12,1) 61,7 (±3,9) 25,1 (±3,2) 31,6 (±4,8)
Al (mg/kgTQ) 10,6 (±1,5) 54,5 (±7,3) 71,2 (±4,2) 85,2 (±12,6) 136,0 (±18,9)
Ca (mg/kgTQ) 761,3 (±81,8) 2845,9 (±698,6) 3433,7 (±195,4) 1014,1 (±69,0) 1298,4 (±159,7)
Mg (mg/kgTQ) 344,6 (±34,8) 563,3 (±272,8) 671,5 (±11,1) 275,6 (±30,9) 422,0 (±78,0)
Fe (mg/kgTQ) 42,9 (±6,4) 495,2 (±123,4) 699,4 (±36,9) 91,1 (±15,4) 135,4 (±16,9)
K (mg/kgTQ) 2964,6 (±251,7) 2777,1 (±1069,2) 5058,0 (±425,3) 2779,3 (±178,0) 3628,2 (±321,5)
Cr (mg/kgTQ) 0,1 (±0,1) 1,0 (±0,2) 1,5 (±0,1) 0,3 (±0,0) 0,4 (±0,0)
Notably, VS content (expressed as percentage of TS) decreased: probably, in the digested slurry there were
still biodegradable components that were degraded during the process. In addition, alkalinity decreased
after ammonia stripping: in fact, that kind of process affected the content of carbon dioxide, ammonia
nitrogen, which are strictly connected with alkalinity concentration. As expected, the main effect of the
stripping process was a reduction of TAN concentration, and TKN concentration.
7.3.2. Determination of chemical dose
In the Figure 59 are reported some examples of results obtained during preliminary tests for determining
chemical doses.
In particular, for liquid fraction of pig and cattle digested slurry, as optimal dose equals to 7,58 g/L of Ca+ was
identified, corresponding to an EC value of 7,4 mS/cm and a pH value of 11,5 (Figure 59a).

195
Concerning Al3+, the optimum dose of 1,25 g Al3+/L corresponded to pH 6,68 and, EC 18,06 mS/cm, a foam
level of 400 mL and floc dimension slightly larger than 2,5 mm (Figure 59b, 59c and 59d).
Figure 59 Example of results from jar tests used to determine optimal doses (D) of Ca(OH)2 (CaH) and Al2(SO4)3. (AlS) for “cattle and pig digestate”: a) pH and EC responses to CaH; b) pH and EC responses to AlS; c) Level of solid/liquid interface (HC) and foam fraction (HF) in response to AlS; d) Flock dimension in response to AlS. The lowest value of EC (denoted by the red circle) was used to identify D for CaH. The reference dose of ALS selected corresponded to the Al3+ concentration beyond which the flock dimension did not change and the foam level remained relatively constant.
a) b)
c) d)
The optimal identified doses for each slurry are reported in Table 50.
It can be observed that for CaH the optimal dose is lower for both types of stripped digestate than for raw
digestate. This was due to the decreased alkalinity concentration resulting from the stripping process, which
in turn decreased the amount of CaH required to precipitate carbonate.
0
2
4
6
8
10
12
14
16
18
20
0
2
4
6
8
10
12
14
0,0 1,08 2,16 3,25 4,33 5,41 6,49 7,58 8,66
EC,
mS/
cm
pH
Ca2+, g/L
pH EC
0
2
4
6
8
10
12
14
16
18
20
0
2
4
6
8
10
12
14
0,00 0,25 0,50 0,75 1,00 1,25 1,50 1,75 2,00
EC, m
S/cm
pH
Al3+, g/L
pH EC
0,00 0,25 0,50 0,75 1,00 1,25 1,50 1,75 2,00
0
200
400
600
800
1000
1200
Al3+, g/L
mL
HC HF
0
0,5
1
1,5
2
2,5
3
3,5
0,00 0,25 0,50 0,75 1,00 1,25 1,50 1,75 2,00
mm
Al 3+ , g/L

196
Table 50. Optimal dose (D) of Ca(OH)2 (in terms of Ca2+) and Al2(SO4)3 (in terms of Al3+) for different types of animal manure slurries. The numbers in brackets identify specific repetitions.
DOSE D
Slurry types Al3+ g/L Ca2+ g/L
PIG DIGESTED SLURRY (1) 1,5 11,91
PIG DIGESTED SLURRY (2,3) 1,5 10,82
PIG SLURRY (1,2) 1,5 6,49
MIXED DIGESTED SLURRY (1) 1,25 7,58
MIXED DIGESTED SLURRY (2,3) 1,25 8,12
PIG DIGESTED STRIPPED (1,2) 1,5 3,25
MIXED DIGESTED STRIPPED (1,2) 1,5 3,79
7.3.3. Influence of additives on physical-chemical characteristics and separation efficiency of solid, phosphorus, copper and zinc from slurries
The separation efficiencies obtained for total solids, P, Cu and Zn are reported in Figure 60. The addition of
AlS generally improved the separation efficiencies for all parameters for all the slurries tested.
The separation efficiencies, however, varied consistently for different elements and different slurries.
The separation efficiencies for TS varied according to slurry type. Regarding cattle and pig digestate,
observed removal rate ranged between 58-60% without application of chemicals. For this slurry, the
maximum solid removal efficiency is reached with AlS (79%). After the stripping process, the TS separation
efficiency for cattle and pig digestate without chemicals was very low (29–40%). These differences could be
due to the physical-chemical changes in the slurries caused by the stripping treatment.
Interestingly, in relation to CaH for cattle and pig digestate (both before and after stripping), the TS
separation efficiency seemed to increase as the dosage of CaH increased. However, this difference was not
statistically significant (Table 51).
The separation of TS from pig digestate was quite dissimilar to that from pig and cattle digestate. In fact,
using AlS highest TS separation efficiency is attested for slurry after ammonia stripping process (92%). In
contrast, the opposite response was observed when using CaH, and the maximum separation efficiency
(63%) was achieved at the sub-optimal dose applied to untreated (not stripped) pig digestate. Using CaH, the
lowest TS separation efficiency among all slurry types occurred with pig slurry, both at null dose (< 10% TS

197
separation) and when additives were used. The P separation efficiencies (Figure 60b) from all slurry types
were higher when AlS was added than when CaH was used.
a
b
c
d
Figure 60 Separation efficiencies achieved using and Al2(SO4)3 (left) and Ca(OH)2 (right) as additives to different slurry types: a) total solids (TS); b) phosphorus (P); c) copper (Cu); d) zinc (Zn). N: null dose; SO: sub-optimal dose; O: optimal dose. PS: pig slurry; PD: pig digestate; PDS: pig digestate stripped; (C+P)D: cattle and pig digestate; (C+P)DS: cattle and pig digestate stripped.
0,0
0,2
0,4
0,6
0,8
1,0
N SO O N SO O N SO O N SO O N SO O
PS PD PDS (C+P)D (C+P)DS
ST s
epar
atio
n e
ffic
ien
cy %
Additive: Aluminum Sulfate
0,0
0,2
0,4
0,6
0,8
1,0
N SO O N SO O N SO O N SO O N SO O
PS PD PDS (C+P)D (C+P)DS
ST s
epar
atio
n e
ffic
ien
cy %
Additive: Calcium Hydroxide
0,0
0,2
0,4
0,6
0,8
1,0
N SO O N SO O N SO O N SO O N SO O
PS PD PDS (C+P)D (C+P)DS
P s
epar
atio
n e
ffic
ien
cy
0,0
0,2
0,4
0,6
0,8
1,0
N SO O N SO O N SO O N SO O N SO O
PS PD PDS (C+P)D (C+P)DS
P s
epar
atio
n e
ffic
ien
cy
0,0
0,2
0,4
0,6
0,8
1,0
N SO O N SO O N SO O N SO O N SO O
PS PD PDS (C+P)D (C+P)DS
Cu
sep
arat
ion
eff
icie
ncy
0,0
0,2
0,4
0,6
0,8
1,0
N SO O N SO O N SO O N SO O N SO O
PS PD PDS (C+P)D (C+P)DS
Cu
sep
arat
ion
eff
icie
ncy
0,0
0,2
0,4
0,6
0,8
1,0
N SO O N SO O N SO O N SO O N SO O
PS PD PDS (C+P)D (C+P)DS
Zn s
epar
atio
n e
ffic
ien
cy
0,0
0,2
0,4
0,6
0,8
1,0
N SO O N SO O N SO O N SO O N SO O
PS PD PDS (C+P)D (C+P)DS
Zn s
epar
atio
n e
ffic
ien
cy

198
Furthermore, both chemicals achieved higher P separation efficiencies from most slurry types (excepting pig
plus cattle digestate) than were obtained without the addition of chemicals, even if the optimal dose did not
always significantly improve P separation compared with the sub-optimal dose.
P-separation rate obtained for ammonia-stripped slurries (both pig and cattle digestate and pig digestate)
using AlS were comparable to those obtained for the same non-treated slurry (except with the sub-optimal
dose for pig digestate), despite the applied doses being lower for the stripped digestates. The maximum P-
separation efficiency obtained with AlS was 93% for pig digestate stripped, with application of a sub-optimal
dose(0,75D).
For two digestates (pig digested slurry and pig and cattle digested slurry) P-separation efficiency seemed to
be unaffected by the use of CaH. Nevertheless, the maximum P separation efficiency (71%) was achieved
from the pig plus cattle digestate at the optimal CaH dose after ammonia stripping.
For the pig digestate (before and after stripping), the maximum P separation efficiencies were 64% and 52%
respectively, with the application of sub-optimal dose, and optimal dose of CaH. However, the two
efficiencies were not significantly different (Table 51). This difference may also be caused by the content of
TS, which are present in higher concentrations in pig digested after stripping.
The P-separation efficiency achieved from pig digestate without the use of chemicals were significantly lower
(45-51%).
The P-separation efficiency in pig slurry was not particularly high: 72% using AlS and 39% using CaH;
however, the results using AlS were comparable with those obtained by Ndegwa et al., (2001). In their
research, the addition of aluminium sulfate to swine manure prior to the quiescent natural sedimentation
were approximately 78% and 65% at dosages of 1,5 and 2,0 g/L, respectively. In contrast, the P separation
efficiency obtained using CaH in present study, was lower than that observed by Szogi et al., (2009). In fact,
in that research, the Ca(OH)2 concentration range (0,17–0,89 g/L) used to treat swine wastewater raw or
pre-treated in a nitrification process was lower than in this study; yet the doses achieved P removal
efficiencies ranging from 20% to 100%.
Both AlS and CaH produced greater differences in P separation efficiencies for pig slurry than for other slurry
types.
In addition, this observation is also true for Cu and Zn. For this slurry, the use of chemicals was effective:
copper separation increased from 1% without chemical to 44% and 79% for CaH and AlS, respectively.
Similarly, without the application of chemicals the Cu separation efficiency for cattle and pig digestate before
and after the stripping process was 54–59% and 31–39%, respectively. The Cu maximum separation
efficiency was observed for stripped slurries, with the application of optimal dose AlS, but it is not
significantly different from which observed sub-optimal one.

199
Table 51 Significance of the factors considered in the statistical analysis of separation efficiency.
ST P Cu Zn
Slurry type
Cattle and pig digestate stripped
Mean 0,56 0,65 0,56 0,63
Statistical significance b a ab a
Cattle and pig digestate
Mean 0,69 0,66 0,61 0,63
Statistical significance a a a a
Pig digestate Mean 0,58 0,62 0,51 0,58
Statistical significance b ab b a
Pig digestate stripped
Mean 0,44 0,59 0,36 0,50
Statistical significance c b c b
Pig slurry Mean 0,28 0,33 0,35 0,44
Statistical significance d c c c
Dose
null Mean 0,31 0,39 0,25 0,36
Statistical significance b b b b
Sub-optimal dose Mean 0,60 0,66 0,59 0,65
Statistical significance a a a a
Optimal dose Mean 0,62 0,67 0,61 0,67
Statistical significance a a a a
Chemical
CaH Mean 0,42 0,48 0,35 0,44
Statistical significance b b b b
AlS Mean 0,61 0,67 0,61 0,68
Statistical significance a a a a
Using CaH, separation efficiency in cattle and pig digestate was not influenced by increasing chemical dose;
contrarily for the same slurry after stripping process, separation depend on the dose applied.
Regarding achievable Cu-separation efficiency, the use of AlS led to higher separation efficiency for digested
pig slurry stripped and cattle and pig digestate stripped, and, for these slurries the difference between
removal rate with and without application of chemical was higher (22%-93% and 31%-81%, respectively).
Using CaH, pig digested slurry treated shown the lowest separation efficiency. Notably, in cattle and pig-
digestate before stripping, Cu separation efficiency decreased with the increasing of the dose.
Analysing the results obtained for Zinc separation efficiency, the general behaviour was comparable with
that observed for Cu but the Zn separation efficiency obtained for all slurry types using both chemicals were
higher than those observed for Cu. As reported by Marcato et al., (2009), the Zn is much more sensitive to

200
pH than Cu, so it is possible that the chemical characteristics of different slurries influenced differently the Zn
separation efficiency. It should also be noted that in all slurry types, Zn content was higher than copper
(Table 49). Olatuyi et al., (2014), studied the heavy metals removal efficiencies obtainable with different
separation methods and its speciation, found that the use of centrifugation (with flocculants) achieved
separation efficiency of 65% and 45% for Cu and Zn respectively. Because Cu, Zn and also P are mostly
present in the solid fraction, an increase in the separation efficiencies of P, Cu and Zn is expected as the TS
removal increases. Moreover, as deeply stud by Szogi at al., (2009), which developed multi stage process in
order to reduce inorganic buffering in slurry before the addition of CaH, similarly, the ammonia-stripping
process in this study decreased NH3, alkalinity in all slurry types, thus lowering the required chemical dosage.
As shown in Figure 61, in all type of slurries, chemical additive used at increasing dose influenced the pH and
EC values.
CaH
AlS
Figure 61. Variation of pH-patterns (left) and EC-patterns (right) in different slurry types with an increase dose of CaH (above) and AlS (below) for different slurries. 1 correspond to null dose 0 mg/L, 5 to optimal dose and 4 to dose Sub-optimal dose. Data reported are means and the error bars represent standard deviation of data.
5,00
7,00
9,00
11,00
13,00
15,00
1 4 5
pH
Dose
Cattle and Pig Digestate-pH Cattle and Pig Digestate Stripped-pH
Pig Digestate-pH Pig Digestate Stripped-pH
Pig Slurry-pH
5,00
10,00
15,00
20,00
25,00
30,00
35,00
1 4 5
EC m
S/cm
Dose
Cattle and Pig Digestate Digestate-EC Cattle and Pig Digestate Stripped-EC
Pig Digestate-EC Pig Digestate Stripped-EC
Pig Slurry-EC
5,00
7,00
9,00
11,00
13,00
1 4 5
pH
Dose
Cattle and Pig Digestate-pH Cattle and Pig Digestate Stripped-pH
Pig Digestate-pH Pig Digestate Stripped-pH
Pig Slurry-pH
5,00
10,00
15,00
20,00
25,00
30,00
35,00
1 4 5
EC m
S/cm
Dose Cattle and Pig Digestate Digestate-EC Cattle and Pig Digestate Stripped-EC
Pig Digestate-EC Pig Digestate Stripped-EC
Pig Slurry-EC

201
In general, for all slurry types, solid-liquid separation without the use of chemicals produced a liquid fraction
having a pH slightly higher than that observed for the raw slurry. With the use of AlS, the EC increased as the
dosage increased and (as expected) pH decreased. At the maximum dose of Al3+, pH decreased to less than
5,5. Contrary, using CaH, the pH of liquid fraction increased due to of OH- ions (Renou et al., 2008), and pH
reached values higher than 12 with application of the maximal dose of chemicals. Surprisingly, the optimal
dose of CaH determined during preliminary tests did not give the minimum EC in cattle and pig digestate
during separation tests.
Values of the reduced separation index (Et’(x)) at the optimal dose (Figure 62) attest that the solid fraction
increased in concentration more when AlS was used than when CaH was used.
The results concerning P-reduced separation index show that a marked increase (17–67%) occurred when
AlS was used on raw or stripped slurries. A lower reduced index was observed only when AlS was added to
cattle and pig digestate before the digestate was subjected to stripping.
The use of AlS a greater increase in P-reduced separation index (up to 67%), that were higher than those
observed with CaH with the exception of cattle and pig digested.
The reduced separation index for Cu and Zn, showed that the concentrations of these elements increased in
the solid fraction of pig slurry and all digestates after the stripping process (Figure 62). This variation is
mainly observed using AlS than CaH, for which the Et’ (x) was lower (8-28%).
After the application of ammonia-stripping process, the use of CaH produced a decrease in reduced
separation index for pig digestate for both Cur and Zn.
The only case in which the reduced index had a negative value was that of Cu when CaH was applied for
digestate after ammonia stripping.
In contrast, compared to the reduced separation indexes for both Cu and Zn when CaH was used, the
indexes were significantly larger when AlS was added to raw pig slurry (Et’(x) 60-70%) and to the ammonia-
stripped digestates (Et’(x) of 70%-80%). The high values for raw slurry might be partly explained by the
relatively low pH (6,7) compared to digestate (pH>8). However, the same consideration cannot be applied to
stripped digestate for which the pH values were similar to that observed in the un-stripped digestate. Rather,
the stripping process might modify the concentrations of the soluble fraction of these heavy metals.
Although the stripping process almost always increased the reduced separation efficiencies for TS, P, Cu and
Zn, the differences between un-stripped and stripped digestates were not statistically significant.
Nevertheless, the stripping process produced allowed reaching higher concentration of elements (P, Cu, Zn)
in the solid fraction (Table 52). For this reason, stripping process can be considered as an appropriate
treatment to apply before solid/liquid separation with CaH and AlS as chemicals.

202
In addition, the stripping process allows using lower dose of chemical to rich given removal rate compared to
what is needed for un-stripped slurry types.
a
b
c
d
Figure 62 Reduced separation indexes resulting from Ca(OH)2 (CaH) and Al2(SO4)3 (AlS) for a): total solids (TS); b) phosphorus (P); c) copper (Cu); and d) zinc (Zn). PS: pig slurry; PD: pig digestate; PDS: pig digestate stripped; (C+P)D: cattle and pig digestate; (C+P)DS: cattle and pig digestate stripped.
0,00
0,20
0,40
0,60
0,80
1,00
PS PD PDS (C+P)D (C+P)DS
E' T
S
Reduced TS-separation index
CaH AlS
0,671
0,337
0,650
0,172
0,673
0,00
0,20
0,40
0,60
0,80
1,00
PS PD PDS (C+P)D (C+P)DS
E' P
Reduced P-separation index
-0,40
-0,20
0,00
0,20
0,40
0,60
0,80
1,00
PS PD PDS (C+P)D (C+P)DS
E' C
u
Reduced Cu separation index
0,00
0,20
0,40
0,60
0,80
1,00
PS PD PDS (C+P)D (C+P)DS
E' Z
n
Reduced Zn separation index
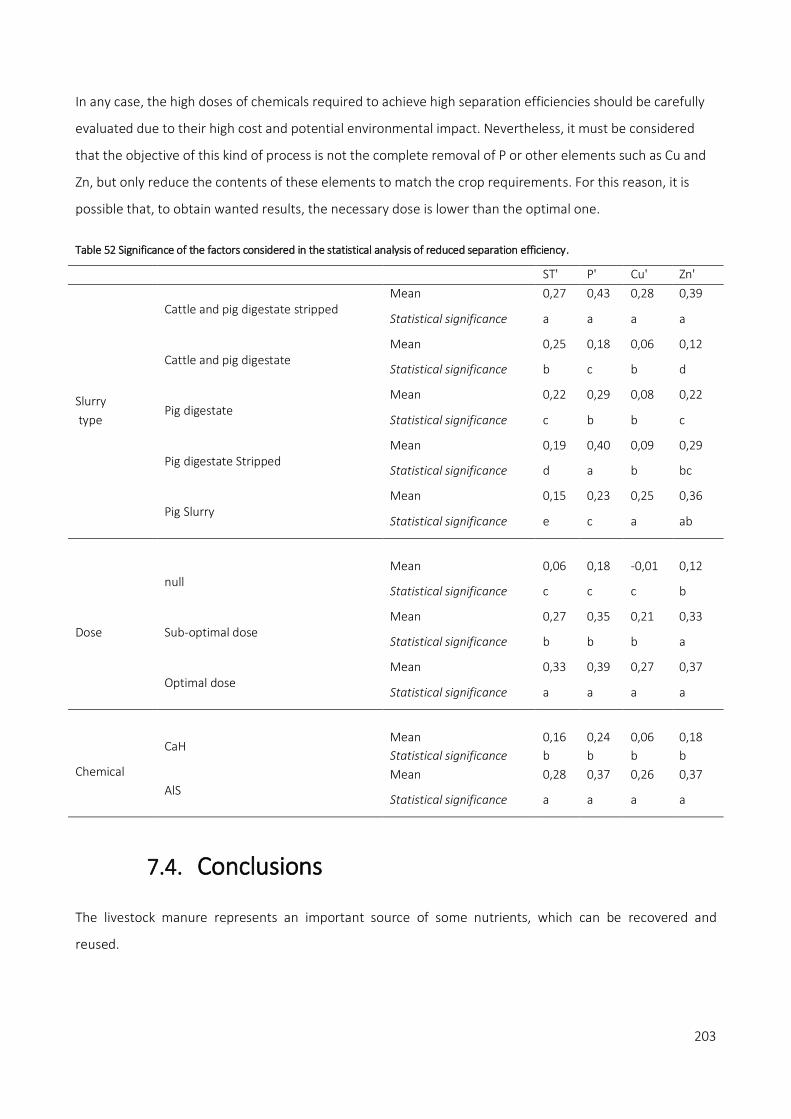
203
In any case, the high doses of chemicals required to achieve high separation efficiencies should be carefully
evaluated due to their high cost and potential environmental impact. Nevertheless, it must be considered
that the objective of this kind of process is not the complete removal of P or other elements such as Cu and
Zn, but only reduce the contents of these elements to match the crop requirements. For this reason, it is
possible that, to obtain wanted results, the necessary dose is lower than the optimal one.
Table 52 Significance of the factors considered in the statistical analysis of reduced separation efficiency.
ST' P' Cu' Zn'
Slurry
type
Cattle and pig digestate stripped Mean 0,27 0,43 0,28 0,39
Statistical significance a a a a
Cattle and pig digestate Mean 0,25 0,18 0,06 0,12
Statistical significance b c b d
Pig digestate Mean 0,22 0,29 0,08 0,22
Statistical significance c b b c
Pig digestate Stripped Mean 0,19 0,40 0,09 0,29
Statistical significance d a b bc
Pig Slurry Mean 0,15 0,23 0,25 0,36
Statistical significance e c a ab
Dose
null Mean 0,06 0,18 -0,01 0,12
Statistical significance c c c b
Sub-optimal dose Mean 0,27 0,35 0,21 0,33
Statistical significance b b b a
Optimal dose Mean 0,33 0,39 0,27 0,37
Statistical significance a a a a
Chemical
CaH Mean 0,16 0,24 0,06 0,18
Statistical significance b b b b
AlS Mean 0,28 0,37 0,26 0,37
Statistical significance a a a a
7.4. Conclusions
The livestock manure represents an important source of some nutrients, which can be recovered and
reused.

204
The study attests suitability of the application of solid/liquid separation for recovering a solid fraction rich in
phosphorus from different type of slurries.
The results obtained confirm the possibility to increase the removal efficiency of P, Cu and Zn with the use of
additives. In particular, the use of AlS gives removal rates that are higher than those one obtained with CaH.
The maximum efficiencies achievable using chemicals to remove P, Cu and Zn from animal manure slurries
depend on the type of slurry and the additive used. In general, of the types evaluated in this study, raw
(untreated) pig slurry yielded the lowest separation efficiencies.
Pig digestate and the cattle and pig digestate allow reaching higher than raw pig slurry, but ammonia
stripping treatment did not produce significantly better results. Nevertheless, solid/liquid separation
complemented with the addition of chemicals and coupled with stripping process can be used for producing
a liquid fraction from livestock manure slurries that can be directly use in the field, as well as a solid fraction
that is rich in P.
The application of suboptimal and optimal doses of CaH and AlS do not give significantly different results in
the separation efficiency of P, Cu and Zn, even though the higher dose does increase the concentration of
these elements in the solid fraction. Therefore, the utilization of the suboptimal doses can achieve
acceptable results at lower cost compared to those achieved using the optimal dose.
The solid liquid separation of livestock manure using chemicals might increase the concentration of heavy
metals in the solid fraction. Therefore, the agriculture use of this should be carefully evaluated in order to
avoid over application of this element and their possible negative effects on environment quality and human
health.
7.5. References
APHA/AWWA/WEF. 2012. “Standard Methods for the Examination of Water and Wastewater.” Standard Methods, 541. https://doi.org/ISBN 9780875532356.
APHA. 2012. Standard Methods for the Examination of Water and Wastewater. Edited by L.S. Clescer E.W. Rice, R.B. Baird, A.D. Eaton. American Public Health Association, American Water Works Association, Water Environment Federation.
Burton, C. H. 2007. “The Potential Contribution of Separation Technologies to the Management of Livestock Manure.” Livestock Science 112 (3): 208–16. https://doi.org/10.1016/j.livsci.2007.09.004.
Cabeza, Ricardo, Bernd Steingrobe, Wilhelm Römer, and Norbert Claassen. 2011. “Effectiveness of Recycled P Products as P Fertilizers, as Evaluated in Pot Experiments.” Nutrient Cycling in Agroecosystems 91 (2): 173–84. https://doi.org/10.1007/s10705-011-9454-0.
Cerrillo, Míriam, Jordi Palatsi, Jordi Comas, Jaume Vicens, and August Bonmatí. 2015. “Struvite Precipitation as a Technology to Be Integrated in a Manure Anaerobic Digestion Treatment Plant - Removal Efficiency, Crystal Characterization and Agricultural Assessment.” Journal of Chemical Technology and

205
Biotechnology 90 (6): 1135–43. https://doi.org/10.1002/jctb.4459.
Christensen, Morten Lykkegaard, Maibritt Hjorth, and Kristian Keiding. 2009. “Characterization of Pig Slurry with Reference to Flocculation and Separation.” Water Research 43 (3): 773–83. https://doi.org/10.1016/j.watres.2008.11.010.
Cocolo, G., M. Hjorth, A. Zarebska, and G. Provolo. 2016. “Effect of Acidification on Solid-Liquid Separation of Pig Slurry.” Biosystems Engineering 143: 20–27. https://doi.org/10.1016/j.biosystemseng.2015.11.004.
Cordell, Dana, Jan Olof Drangert, and Stuart White. 2009. “The Story of Phosphorus: Global Food Security and Food for Thought.” Global Environmental Change 19 (2): 292–305. https://doi.org/10.1016/j.gloenvcha.2008.10.009.
Duan, J., and J Gregory. 2003. “Coagulation by Hydrolyzing Metal Salts.” Advances in Colloid and Interface Science 475–502 (1): 100–102.
EPA. 1998. Method EPA 3051. Microwave Assisted Acid Digestion of Sediments, Sludges, Soils and Oils. Washington DC.
Fernandes, Gabriela Wendler, Airton Kunz, Ricardo Luís Radis Steinmetz, Ariel Szogi, Matias Vanotti, Erico Marlon De Moraes Flores, and Valderi Luiz Dressler. 2011. “Chemical Phosphorus Removal: A Clean Strategy for Piggery Wastewater Management in Brazil.” Environmental Technology 33 (13–15): 1677–83. https://doi.org/10.1080/09593330.2011.642896.
Finzi, A., Oberti, R., Negri, A. S., Perazzolo, F., Cocolo, G., Tambone, F., ... & Provolo, G. (2015). Effects of measurement technique and sample preparation on NIR spectroscopy analysis of livestock slurry and digestates. Biosystems Engineering, 134, 42-54.
Fu, Fenglian, and Qi Wang. 2011. “Removal of Heavy Metal Ions from Wastewaters: A Review.” Journal of Environmental Management 92 (3): 407–18. https://doi.org/10.1016/j.jenvman.2010.11.011.
Grigatti, M, E Boanini, L Cavani, C Ciavatta, and C Marzadori. 2015. “Phosphorus in Digestate-Based Compost: Chemical Speciation and Plant-Availability.” Waste and Biomass Valorization 6 (4): 481–93. https://doi.org/10.1007/s12649-015-9383-2.
Güngör, Kerem, and K. G. Karthikeyan. 2008. “Phosphorus Forms and Extractability in Dairy Manure: A Case Study for Wisconsin on-Farm Anaerobic Digesters.” Bioresource Technology 99 (2): 425–36. https://doi.org/10.1016/j.biortech.2006.11.049.
Harris, Willie G., Ann C. Wilkie, Xinde Cao, and Roy Sirengo. 2008. “Bench-Scale Recovery of Phosphorus from Flushed Dairy Manure Wastewater.” Bioresource Technology 99 (8): 3036–43. https://doi.org/10.1016/j.biortech.2007.06.065.
He, Zhongqi, and Hailin Zhang. 2014. Applied Manure and Nutrient Chemistry for Sustainable Agriculture and Environment Edited by Zhongqi He, Hailin Zhang. https://doi.org/10.1007/978-94-017-8807-6.
Hjorth, M, K V Christensen, M L Christensen, and S G Sommer. 2010. “Solid-Liquid Separation of Animal Slurry in Theory and Practice. A Review.” Agronomy for Sustainable Development 30 (1): 153–80. https://doi.org/10.1051/agro/2009010.
Hjorth, M, and M L Christensen. 2008. “Evaluation of Methods to Determine Flocculation Procedure for Manure Separation.” Transactions Of The Asabe 51 (6): 2093–2103.
Lin, H., Gan, J., Rajendran, A., Reis, C. E. R., & Hu, B. (2015). Phosphorus removal and recovery from digestate
206
after biogas production. In Biofuels-status and perspective. InTech.
Marcato, Claire E., Eric Pinelli, Philippe Pouech, Peter Winterton, and Maritxu Guiresse. 2008. “Particle Size and Metal Distributions in Anaerobically Digested Pig Slurry.” Bioresource Technology 99 (7): 2340–48. https://doi.org/10.1016/j.biortech.2007.05.013.
Møller, H. B., Lund, I., & Sommer, S. G. (2000). Solid–liquid separation of livestock slurry: efficiency and cost. Bioresource technology, 74(3), 223-229.
Moller, H. B., Hansen, J. D., & Sorensen, C. A. G. (2007). Nutrient recovery by solid-liquid separation and methane productivity of solids. Transactions of the ASABE, 50(1), 193-200.
Møller, H. B., Jensen H. S. , Tobiasen L. & Hansen M. N. (2007). Heavy metal and phosphorus content of
fractions from manure treatment and incineration. Environmental Technology 28.12 1403-1418.
http://dx.doi.org/10.1080/09593332808618900
Nicholson, F. A., S. R. Smith, B. J. Alloway, C. Carlton-Smith, and B. J. Chambers. 2003. “An Inventory of Heavy Metals Inputs to Agricultural Soils in England and Wales.” Science of the Total Environment 311 (1–3): 205–19. https://doi.org/10.1016/S0048-9697(03)00139-6.
Ndegwa, P. M., Zhu, J., & Luo, A. (2001). Effects of solid levels and chemical additives on removal of solids and phosphorus in swine manure. Journal of Environmental Engineering, 127(12), 1111-1115.
Olatuyi, S. O., Kumaragamage, D., Akinremi, O. O., & Grieger, L. (2014). Heavy-Metal Fractions in Solid and Liquid Separates of Swine Slurry Separated using Different Technologies. Journal of environmental quality, 43(5), 1779-1789.
Petersen, S.O., S.G. Sommer, F. Béline, C. Burton, J. Dach, J.Y. Dourmad, A. Leip, et al. 2007. “Recycling of Livestock Manure in a Whole-Farm Perspective.” Livestock Science 112 (3): 180–91. https://doi.org/10.1016/j.livsci.2007.09.001.
Provolo, G., G. Manuli, A. Finzi, G. Lucchini, E. Riva, and G.A. Sacchi. 2018. “Effect of Pig and Cattle Slurry Application on Heavy Metal Composition of Maize Grown on Different Soils.” Sustainability (Switzerland) 10 (8). https://doi.org/10.3390/su10082684.
Provolo, G., F. Perazzolo, G. Mattachini, A. Finzi, E. Naldi, and E. Riva. 2017. “Nitrogen Removal from Digested Slurries Using a Simplified Ammonia Stripping Technique.” Waste Management 69: 154–61. https://doi.org/10.1016/j.wasman.2017.07.047.
Renou, S., S. Poulain, J. G. Givaudan, and P. Moulin. 2008. “Treatment Process Adapted to Stabilized Leachates: Lime Precipitation-Prefiltration-Reverse Osmosis.” Journal of Membrane Science 313 (1–2): 9–22. https://doi.org/10.1016/j.memsci.2007.11.023.
Sommer, S.G., M.L. Christensen, T. Schmidt, and L.S. Jensen. 2013. Animal Manure Recycling: Treatment and Management. Animal Manure Recycling: Treatment and Management. https://doi.org/10.1002/9781118676677.
Suzuki, Kazuyoshi, Miyoko Waki, Tomoko Yasuda, Yasuyuki Fukumoto, Kazutaka Kuroda, Takahiro Sakai, Naoto Suzuki, Ryoji Suzuki, and Kenji Matsuba. 2010. “Distribution of Phosphorus, Copper and Zinc in Activated Sludge Treatment Process of Swine Wastewater.” Bioresource Technology 101 (23): 9399–9404. https://doi.org/10.1016/j.biortech.2010.07.014.
Szabó, a, I Takács, S Murthy, G T Daigger, I Licskó, and S Smith. 2008. “Significance of Design and Operational

207
Variables in Chemical Phosphorus Removal.” Water Environment Research : A Research Publication of the Water Environment Federation 80 (5): 407–16. https://doi.org/10.2175/106143008X268498.
Szogi, A. A., & Vanotti, M. B. 2009. Removal of phosphorus from livestock effluents. Journal of environmental quality, 38(2), 576-586.
Szogi, Ariel a., Matias B. Vanotti, and Kyoung S. Ro. 2015. “Methods for Treatment of Animal Manures to Reduce Nutrient Pollution Prior to Soil Application.” Current Pollution Reports 1 (1): 47–56. https://doi.org/10.1007/s40726-015-0005-1.
Taddeo, Raffaele, Kari Kolppo, and Raghida Lepistö. 2016. “Sustainable Nutrients Recovery and Recycling by Optimizing the Chemical Addition Sequence for Struvite Precipitation from Raw Swine Slurries.” Journal of Environmental Management 180: 52–58. https://doi.org/10.1016/j.jenvman.2016.05.009.
Tervahauta, Taina, Renata D. van der Weijden, Roberta L. Flemming, Lucía Hernández Leal, Grietje Zeeman, and Cees J N Buisman. 2014. “Calcium Phosphate Granulation in Anaerobic Treatment of Black Water: A New Approach to Phosphorus Recovery.” Water Research 48 (1): 632–42. https://doi.org/10.1016/j.watres.2013.10.012.
Vanotti, M.B., P.J. Dube, A.A. Szogi, and M.C. García-González. 2017. “Recovery of Ammonia and Phosphate Minerals from Swine Wastewater Using Gas-Permeable Membranes.” Water Research 112. https://doi.org/10.1016/j.watres.2017.01.045.
Vanotti, M. B., D. M. C. Rashash, and P. G. Hunt. 2002. Solid–liquid separation of flushed swine manure with
PAM: effect of wastewater strength. Transactions of the ASAE 45.6 :1959.
Vanotti, M. B., Szogi, A. A., & Hunt, P. G. 2003. Extraction of soluble phosphorus from swine wastewater.
Transactions of the ASAE, 46(6), 1665.

208

209
SECTION 5 - A POSSIBLE TREATMENT LINE
FOR NITROGEN REMOVAL FROM
LIVESTOCK MANURE
In this chapter a possible treatment line suitable for the biologically nitrogen removal
(denitrification/nitrification process applied in SBR) with attention to ammonia and greenhouse gas
emissions control is described.
The proposed treatment line applies a biological nitrification/denitrification process which foresees a
conspicuous energy expenditure, as well as a "waste" of nitrogen as N2 .For this reason, if it is decided to
build a new plant, and not to modernize an existing plant, the applicable technologies to be preferred would
be those aimed at recovering nutrients and not just their removal and that favouring solutions without too
much effort of energy or high investment’s cost.
In general, to decide which treatment or line represents the best option to design, the first consideration to
make is the declaration of what should be the removal yield to be achieved, what type of waste must be
treated and, also, if the application context is such as to guarantee the correct functioning of the line.
The proposed treatment line has as its final objective the application of the SBR system and appropriate pre-
treatments applied to assist the functioning of the biological process. This line, in addition to ensuring
maximum environmental protection, aims to achieve acceptable removal of nutrients with adequate
investment and operating costs.
8. Livestock manure treatment line for
biological removal of nutrients and GHGs
emissions control
The treatment line proposed can be a solution for a pig farm that does not have enough land to spread the
nutrients produced respecting the limits imposed by the Nitrates Directive.

210
Main objectives of this treatment line are: 1) obtain two products to use for agronomic purposes (L: liquid
fraction, S: solid fraction to be send to an anaerobic process for energy recovery); 2) reducing the nitrogen
content to respect the limits; 3) limiting the greenhouse gases and ammonia emissions; 4) proposed
different kind of machines, instruments and control devices to make management of the plant easier; 5)
optionally, provide phosphorus removal treatment as possible pre-treatment instead of “classical”
solid/liquid separation techniques. The considered fattening pig farm is located in Lombardy and has about
3000 pig places.
Using data contained in Ministerial Decree, the quantities of slurry produced, and its characteristics are
estimated. In particular, the average weight of each animal is equal to 90 kg and every kg of live weight of
the animal corresponds to 37 tons of slurry produced: consequently, in one year the production of livestock
slurry in analysed farm is equal to 9990 m3.
In addition, considering the type of floor installed in the pig-housing structure, it is possible to calculate the
annual nitrogen production, which is equal to 35,9 ton.
As pre-treatment of final biological process, it was decided to use two-separation equipment in series in
order to obtain a liquid fraction with limited content in solids and organic matter.
The treatment line consists in (Figure 63):
- A reception pit, dimensioned for a capacity of 7 days of production and covered to reduce ammonia
emissions;
- A screw press solid-liquid separator with an installed power of 4-12 kW, a flow rate of 40-70 m3/h
and 8 hours/day of working time;
A flow meter is installed in the pump line feeding the separator in order to control the amount of
slurry processed;
- A reception pit of the liquid fraction from the screw press separator with a capacity of 2 days of
production;
- The solid fraction (around 10% of the initial volume) is collected on a concrete platform and then
moved to the main solid storage;
- A centrifuge to further remove solids with the addition of polymers. Among the various options
available, the most commonly used are counter-current drum centrifuges.
The centrifuge, the feeding pump and the station for the preparation and dosing of the polymers
(Figure 64) are controlled by a PLC (Control Local Panel) and the relevant information are recorded
in order to control and monitor the process; The solid fraction obtained during this separation phase
(20% of the entering volume on average) is temporally collected and then moved to the main solid
storage.

211
Figure 63 A possible treatment line that includes biological process applied in a sequencing batch reactor and ammonia emissions and GHGs emissions control.

212
Figure 64 Two different possibilities that can be adopted for the dosage of polymer. The dots line represents the control connection.
- An equalization/buffer tank to receive the liquid fraction from the centrifuge, with a capacity of 2
days. From this tank, the liquid is pumped through a pipeline equipped of a flow meter to feed the
biological stage.
- Nitrification/denitrification process occurs in a SBR system, that will be provided with:
o aeration system, which includes diffuser in an appropriate material (preferably membrane
diffusers), connected with a blower that will furnish air. The system is design for be
maintained easily: an injection point of acid solution for cleaning pips is provided;
o mixing system, composed by 2 lateral mixers installed with a proper inclination in order to
guarantee the complete homogenization of activated sludge;
o emptying wells to be able to easily empty the reactor in case of maintenance;
o loading and unloading pumps;
o pH detection probe;
o OD detection probe (dissolved oxygen);
o temperature detection probe;
o RedOx potential detection probe; (alternatively, multi-analysis control units are available)
o Level probe (low frequency radar meter) and detection system with an overflow control for
the level of the tank (i.e. the pumps that feed the tank will be automatically turned off when,
due to some malfunctioning, the permitted level is exceeded);
- End-product storages.

213
Two identical storage tanks are sized to accommodate each 90 d of produced slurry, 180 d on total, as
required by legislation. The calculation for storage tanks dimensioning are reported in Table 53.
Table 53 Calculation for dimensioning the storage tank.
Storage Tank 1,2
Material Concrete, Above ground
Shape Circular
Cover yes
Type of cover HDPE cover
V1,2 - Volume for storage at least 90 d (m3) 2497,5 (LFPS/360*180)/2
D3- Tank's diameter (m) 23,8
A1- Tank's area (m2) 444,9
h-Tanks high only for storage (m) 5,6
H- Tanks high construction (m) 6,0
Each storage tank is covered with HDPE sheets that rest on a frame of polyethylene pipes that traces the
shape of the same storage tank. The choice to cover the storages derives from the need to limit at best of
ammonia and greenhouse gases emissions. With this kind of solution, it is possible to limit emissions up to
80% for NH3 and up to 90% for greenhouse gases compared to the non-covering of tanks. If an existing
storage tank has to be used, the hard coverage sometimes cannot be adopted. Nevertheless, there are other
valid alternatives to limit emissions, such as the application of flexible covers (light materials, plastic pellets,
floating straw tiles), as well as other measures that can be applied (for example acidification of sludge, the
cooling of sludge, etc.). Nevertheless, in this case the tank will be sizing in a different way for taking in
account the volume of rain that can enter the tank. The different characteristics of the pig slurry, the liquid
fraction obtained and the stored slurry that will be sent to subsequent treatments are reported in Table 54.
Table 54 Characteristics of farm produced slurry considering the breeding type and type of manure removal.
Volume
(m3)
TKN
(Kg/m3)
TAN
(Kg/m3)
DM
(Kg/m3)
VS
(Kg/m3)
K
(Kg/m3) P (Kg/m3)
Pig Manure 9990 3,6 2,0 108,5 83,8 3,2 2,0
Liquid fraction 6968 2,6 2,4 38,8 22,3 3,7 0,5
In the storage 9990 3,1 2,3 104,3 79,6 3,2 2,0
A possible solution for calculating the volume of biological reactor is to define the quantity of nitrogen that
need to be removed and nitrification speed. An example of calculation of nitrification speed is reported in
Table 55. In that specific case, is necessary to remove 16335,4 kg/year – 44,75 kg/d (option B, 12705,3
kg/year – 34,81 kg/d) of TKN for reaching removal rate equivalent to 90% of TKN present in the slurry (option

214
B is 70%). In this preliminary project, instead, the volume defined is INDICATIVE and will be calculated
imposing the hydraulic retention time.
Table 55 How calculate nitrogen removal speed (in red cells the imposed values, in grey the calculated values).
vT Nitrification speed (vN)20*TKN/(TKN+KTKN)*O.D/(O.D+KO.D)*θ(T-20)
(vN)20 Maximum Nitrification speed at 20°C 3 KgTKN/(KgSSv*d)
θ Constant of temperature adjustment 1,07 -
T Temperature 12 °C
TKN/(TKN+KTKN) (option a) - 0,996 -
TKN/(TKN+KTKN) (option b) - 0,999 -
O.D/(O.D+KO.D) - 0,71 -
θ^(T-20) - 0,58 -
KTKN Semi-saturation constant (TKN) 1,00 mgTKN/L
KO.D Semi-saturation constant (O2) 1,00 mgO2/L
O.D Dissolved Oxygen 2,50 mgO2/L
TKNe (option a) TKN a@ output 260,5 mgTKN/L
TKNe (option b) TKN b@ output 781,5 mgTKN/L
vT a Nitrification speed 1,24 KgTKN/(KgSSv*d)
vTb Nitrification speed 1,25 KgTKN/(KgSSv*d)
X,tank Biomass concentration 3,00 KgSST/m3
SSV/SST - 0,70 -
vT a,1 Nitrification speed 2,61 KgTKN/(m3*d)
vTb,1 Nitrification speed 2,62 KgTKN/(m3*d)
Fixing HRT of 15 d, the tank volume will be equal to 300 m3. Considering a concrete tank with circular shape,
and high of 4,5 m, the diameter is equal to 2,5 m. The tank is slightly oversized in order to guarantee possible
changes in the quantity of manure to be treated, as well as in the need to modify the process parameters to
cope with unexpected fluctuations in the characteristics of the slurry. Furthermore, in order to be sure that
the designed reactor is adequate for plant engineering needs, it is necessary to define the SRT, the
production of daily sludge, the nitrifying biomass in the system and the biomass activating the system.
Considering that, the oxygen consumption is equal to 4,6 kg O2 per kg N oxidized, it is possible to calculate
approximately the required oxygen quantity to be supplied to the activated sludge. Obviously, this quantity
must be increased with active-respiration contribution (that is connected to the oxidation and synthesis
reactions) and with the endogenous respiration contribution.
Once the quantity of oxygen necessary for nitrification has been defined, the oxygenation capacity of an
aeration system must also be estimated in order to choose the proper aeration system. In that case,
considering owned data, the quantity of O2 required is equal to 206 kgO2/d and to 160 kgO2/d respectively
for removal rate of 90% and for 70%. The calculations are reported in Table 56.
To summarize, in order to size properly and correctly an aeration system it is necessary to define:
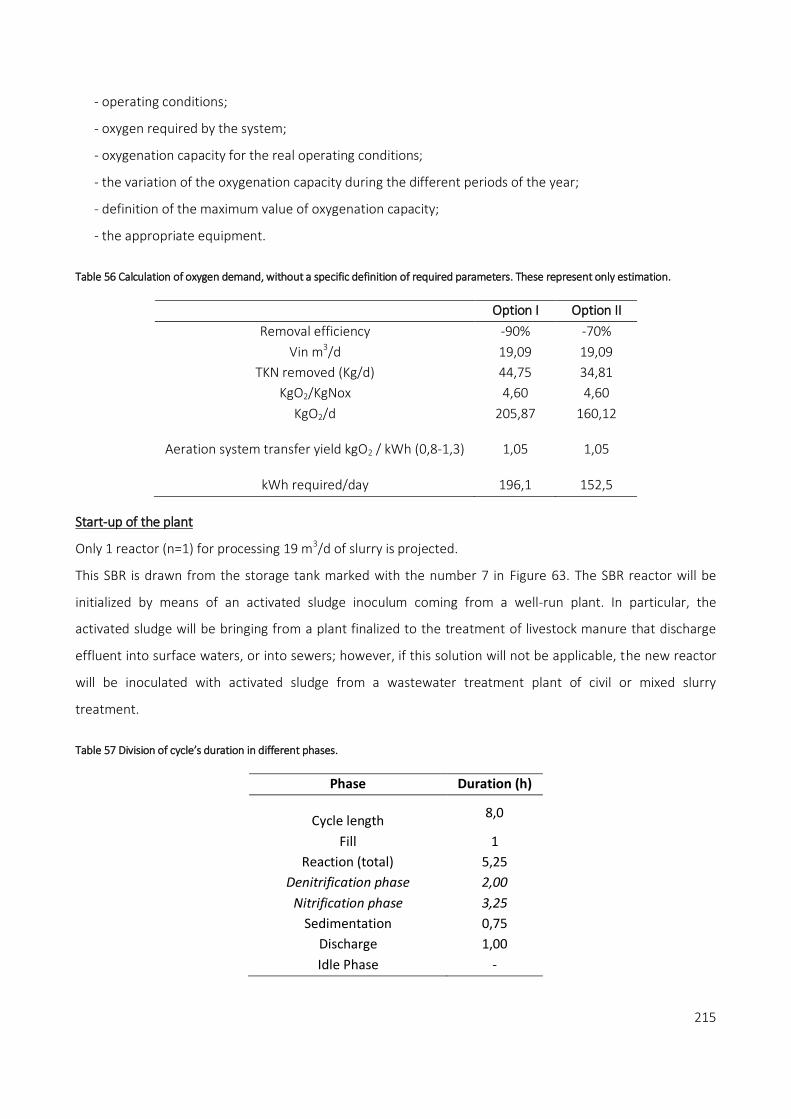
215
- operating conditions;
- oxygen required by the system;
- oxygenation capacity for the real operating conditions;
- the variation of the oxygenation capacity during the different periods of the year;
- definition of the maximum value of oxygenation capacity;
- the appropriate equipment.
Table 56 Calculation of oxygen demand, without a specific definition of required parameters. These represent only estimation.
Option I Option II
Removal efficiency -90% -70%
Vin m3/d 19,09 19,09
TKN removed (Kg/d) 44,75 34,81
KgO2/KgNox 4,60 4,60
KgO2/d 205,87 160,12
Aeration system transfer yield kgO2 / kWh (0,8-1,3) 1,05 1,05
kWh required/day 196,1 152,5
Start-up of the plant
Only 1 reactor (n=1) for processing 19 m3/d of slurry is projected.
This SBR is drawn from the storage tank marked with the number 7 in Figure 63. The SBR reactor will be
initialized by means of an activated sludge inoculum coming from a well-run plant. In particular, the
activated sludge will be bringing from a plant finalized to the treatment of livestock manure that discharge
effluent into surface waters, or into sewers; however, if this solution will not be applicable, the new reactor
will be inoculated with activated sludge from a wastewater treatment plant of civil or mixed slurry
treatment.
Table 57 Division of cycle’s duration in different phases.
Phase Duration (h)
Cycle length 8,0
Fill 1
Reaction (total) 5,25
Denitrification phase 2,00
Nitrification phase 3,25
Sedimentation 0,75
Discharge 1,00
Idle Phase -

216
A cycle length equal to 8 hours is imposed: this value was used both for laboratory tests (Chapter 5), both in
some analysed researches (Chapter 3). The cycle setting is reported in Table 57.
The general subdivision of the operational phases of the SBR reactor will include: static filling phase, the
anoxic phase (in that way denitrification occurs using the internal carbon compounds and, theoretically,
avoids the addition of external carbon), oxic phase, sedimentation, discharge of liquid fraction and discharge
of sludge (sometimes). In order to feed and empty the biological system, two volumetric pumps will be
installed. The flow rate of each pump is the same, as consequently the charge and discharge time. The
selected pump will have a flow rate equal to 6,5 m3/h: in that way the charge and discharge time will be
equal to 1 h.
Alternative for P-recovering
As explained in chapter 7, the processes aimed at the recovery of elements whose concentrations are quite
high in livestock slurry are taking hold. For this reason, as alternative to one of the separation processes, and
in particular to the separation phase 2 (centrifuge), is represented by a coagulation/flocculation process,
using as chemicals aluminium sulphate and a natural polymer. This kind of treatment allows removing and
recovering a semi-solid fraction rich in phosphorus and heavy metals. This fraction can be ceded to an
industry dedicates in P-recovery or use it on the land that need P and micronutrients. In addition, the high
removal solid reachable with this treatment allows obtaining more clarified slurry, that can permit the better
operation of SBR. An solid/liquid separation option could be the one proposed in Figure 65.
Figure 65 Coagulation/flocculation phase that can substitute the separation using centrifuge. Dot lines represent the control wire.

217
The proposed treatment line is only one of the possible solutions for a correct management of livestock
manure, that allows to respect law requirements, to protect environmental, to limit emissions and try to
recover nutrients (phosphorus in particular) from livestock manure.
8.1. References
Santonja, G. G., Georgitzikis, K., Scalet, B. M., Montobbio, P., Roudier, S., & Sancho, L. D. (2017). Best Available Techniques (BAT) Reference Document for the Intensive Rearing of Poultry or Pigs.

218

219
GENERAL CONCLUSIONS
9. Conclusions and future perspectives
Livestock manure treatment plays a key role in protecting environment when the amount of nutrients
contained in that product is higher than the field capacity to receive them.
Many of the treatments commonly used are aimed at “only” removing nutrients (N and P) from livestock
manure. However, is worth considering the application of treatments that allow also producing valuable by-
products: the animal slurry, therefore, if properly treated, becomes a resource rather than a waste.
Currently, in the context of livestock manure treatment, nitrification/denitrification process aimed to only
removal of nitrogen is widely applied.
Nowadays, the treatment plants sizing is often done by applying standard procedures and not considering
specific situations. This choice leads to the implementation of systems that do not allow achieving the
desired results in terms of removal efficiencies and costs.
Nevertheless, scientific literature reports the possibility to achieve very high removal efficiencies if the
treatment plants are properly designed.
A very important stage along treatment chain is represented by the pre-treatment application for removing
coarse and fine solids from slurries before the biological process. Furthermore, it is necessary an excellent
knowledge of the applied process, its development and control in order to obtain the expected
performances, as also attested by scientific literature and by pilot/lab scale experiments carried out.
The use of RedOx, pH, dissolved oxygen probes etc. represents a necessity for a successful process control.
Consequently, the maintenance and the proper use of these tools is required.
Thinking about the future of SBR systems applied for livestock manure treatment, one possibility could be to
merge biological process applied in SBR with other kind of chemical-physical processes focused on recover of
nutrients. For example, since during biological process nitrogen can be lost during aeration phase, if an SBR
system is coupled with gas capture system (maybe also from storage along the treatment line), the nitrogen
losses during aeration phase and during slurry storage can be collected and recovered. In this way, the desire
removal rate will be reached, the environment will be protected and the costs will be reduced maybe selling
the recovered products. This kind of solution will also reduce other problems connected with biological

220
treatment plants, as NH3 and GHGs emissions that usually required the application some mitigation
techniques.
It may be possible to apply the same principle and combine biological process already present in a farm with
other type of technology. It could be promising to combine SBR or other biological process with recovering
of phosphorus, which is considered more scarce resource than nitrogen. In this way, even if the nitrogen
would be "lost" as N2, the phosphorus would be recovered.
Considering the final goal of livestock manure treatment for nutrients removal, in the future it will be
necessary to face with further environmental pollution problems. This fact will lead to the imposition of
increasingly stringent regulatory limits that will be applied not only to civil and industrial wastewater, but,
probably, to other pollution’s source.
Besides nitrogen and phosphorus, it will be mandatory to limit the environmental risk connected also with
emerging pollutants as antibiotics or heavy metals present in the animal livestock manure. In fact, livestock
manure generated by confined animal feeding operations represent a major source of antimicrobials and
antimicrobial resistance genes (ARGs) in the environment. Also in this case, the commingling and the
integration of several treatments could represent a solution for these emerging problems.
221
ACKNOWLEDGMENTS
“Ringraziamenti”
Grazie. Gracias. Merci.
a voi, che mi avete fatto ridere durante questi tre anni,
a voi, che mi avete permesso di imparare,
a voi, che mi avete dedicato il vostro tempo,
a voi, che mi avete ascoltato,
a voi, che mi avete supportato, sempre,
a voi, che mi avete trasmesso la passione per ciò che fate ogni giorno,
a los compañeros de IRTA, os extraño muchissimos,
agli amici - a los amigos, viejos y nuevos, (il tesoro più grande),
ai colleghi..diventati amici,
ai miei ingegneri,
alle mie Amiche,
alle Amiche.. diventate colleghe,
a mio padre,
a mia madre,
a chi amo,

222
“Il miglior riconoscimento per la fatica fatta non è ciò che se ne ricava, ma ciò che si diventa grazie
ad essa”
J. Ruskin