Chapter 8 - Nutrients - CORE
208
Glime, J. M. 2017. Nutrient Relations: Requirements and Sources. Chapt. 8-1. In: Glime, J. M. Bryophyte Ecology. Volume 1. 8-1-1 Physiological Ecology. Ebook sponsored by Michigan Technological University and the International Association of Bryologists. Last updated 3 March 2017 and available at <http://digitalcommons.mtu.edu/bryophyte-ecology/>. CHAPTER 8-1 NUTRIENT RELATIONS: REQUIREMENTS AND SOURCES TABLE OF CONTENTS What Do Bryophytes Require? ........................................................................................................................... 8-1-2 Nutrient Requirements ........................................................................................................................................ 8-1-2 Macronutrients ............................................................................................................................................. 8-1-4 Nitrogen ................................................................................................................................................ 8-1-4 Phosphorus ............................................................................................................................................ 8-1-5 N:P Ratios ............................................................................................................................................. 8-1-6 Calcium and Magnesium ...................................................................................................................... 8-1-6 Iron........................................................................................................................................................ 8-1-7 Micronutrients .............................................................................................................................................. 8-1-7 Boron .................................................................................................................................................... 8-1-7 Copper................................................................................................................................................... 8-1-7 Heavy Metals ........................................................................................................................................ 8-1-9 Nutrient Content ................................................................................................................................................ 8-1-10 Habitat Differences .................................................................................................................................... 8-1-10 Streams ............................................................................................................................................... 8-1-10 Bogs and Fens ..................................................................................................................................... 8-1-10 Forests ................................................................................................................................................. 8-1-11 Arctic and Alpine ................................................................................................................................ 8-1-12 Species Differences .................................................................................................................................... 8-1-12 Adaptability and Acclimation .................................................................................................................... 8-1-13 Plant Nutrient Locations.................................................................................................................................... 8-1-14 Cell Wall Sites ........................................................................................................................................... 8-1-15 Intracellular Sites ....................................................................................................................................... 8-1-16 Vertical Distribution .................................................................................................................................. 8-1-16 Nutrient Sources ................................................................................................................................................ 8-1-17 Precipitation ............................................................................................................................................... 8-1-17 Bogs .................................................................................................................................................... 8-1-18 Atmospheric Dust ...................................................................................................................................... 8-1-18 Soil ............................................................................................................................................................. 8-1-19 Micronutrients ............................................................................................................................................ 8-1-19 Litter and the Role of Trees ....................................................................................................................... 8-1-21 Decomposition ........................................................................................................................................... 8-1-22 Snow .......................................................................................................................................................... 8-1-22 The Salmon Story and Other Animals ....................................................................................................... 8-1-23 Fungal Partners .......................................................................................................................................... 8-1-24 pH Relationships ............................................................................................................................................... 8-1-25 Protective Devices............................................................................................................................................. 8-1-25 Seasonal Nutrient Behavior............................................................................................................................... 8-1-27 Effects on Species Composition........................................................................................................................ 8-1-27 Summary ........................................................................................................................................................... 8-1-28 Acknowledgments ............................................................................................................................................. 8-1-28 Literature Cited ................................................................................................................................................. 8-1-28
-
Upload
khangminh22 -
Category
Documents
-
view
1 -
download
0
Transcript of Chapter 8 - Nutrients - CORE

Glime, J. M. 2017. Nutrient Relations: Requirements and Sources. Chapt. 8-1. In: Glime, J. M. Bryophyte Ecology. Volume 1. 8-1-1 Physiological Ecology. Ebook sponsored by Michigan Technological University and the International Association of Bryologists. Last updated 3 March 2017 and available at <http://digitalcommons.mtu.edu/bryophyte-ecology/>.
CHAPTER 8-1 NUTRIENT RELATIONS: REQUIREMENTS
AND SOURCES
TABLE OF CONTENTS What Do Bryophytes Require? ........................................................................................................................... 8-1-2 Nutrient Requirements ........................................................................................................................................ 8-1-2 Macronutrients ............................................................................................................................................. 8-1-4 Nitrogen ................................................................................................................................................ 8-1-4 Phosphorus............................................................................................................................................ 8-1-5 N:P Ratios............................................................................................................................................. 8-1-6 Calcium and Magnesium ...................................................................................................................... 8-1-6 Iron........................................................................................................................................................ 8-1-7 Micronutrients.............................................................................................................................................. 8-1-7 Boron .................................................................................................................................................... 8-1-7 Copper................................................................................................................................................... 8-1-7 Heavy Metals ........................................................................................................................................ 8-1-9 Nutrient Content................................................................................................................................................ 8-1-10 Habitat Differences .................................................................................................................................... 8-1-10 Streams ............................................................................................................................................... 8-1-10 Bogs and Fens..................................................................................................................................... 8-1-10 Forests................................................................................................................................................. 8-1-11 Arctic and Alpine................................................................................................................................ 8-1-12 Species Differences.................................................................................................................................... 8-1-12 Adaptability and Acclimation .................................................................................................................... 8-1-13 Plant Nutrient Locations.................................................................................................................................... 8-1-14 Cell Wall Sites ........................................................................................................................................... 8-1-15 Intracellular Sites ....................................................................................................................................... 8-1-16 Vertical Distribution .................................................................................................................................. 8-1-16 Nutrient Sources................................................................................................................................................ 8-1-17 Precipitation ............................................................................................................................................... 8-1-17 Bogs .................................................................................................................................................... 8-1-18 Atmospheric Dust ...................................................................................................................................... 8-1-18 Soil ............................................................................................................................................................. 8-1-19 Micronutrients............................................................................................................................................ 8-1-19 Litter and the Role of Trees ....................................................................................................................... 8-1-21 Decomposition ........................................................................................................................................... 8-1-22 Snow .......................................................................................................................................................... 8-1-22 The Salmon Story and Other Animals ....................................................................................................... 8-1-23 Fungal Partners .......................................................................................................................................... 8-1-24 pH Relationships ............................................................................................................................................... 8-1-25 Protective Devices............................................................................................................................................. 8-1-25 Seasonal Nutrient Behavior............................................................................................................................... 8-1-27 Effects on Species Composition........................................................................................................................ 8-1-27 Summary ........................................................................................................................................................... 8-1-28 Acknowledgments............................................................................................................................................. 8-1-28 Literature Cited ................................................................................................................................................. 8-1-28

8-1-2 Chapter 8-1: Nutrient Relations: Requirements
CHAPTER 8-1 NUTRIENT RELATIONS: REQUIREMENTS
Figure 1. Mosses growing on an old iron stove, demonstrating their rather low nutrient requirements. Photo by Janice Glime.
What Do Bryophytes Require? Bowen (1933) claimed that bryophytes are necessarily
limited in nutrient supply by their poikilohydric (state of hydration controlled by environment) method of water regulation. Their method of receipt of water – predominantly from rainfall and, for most bryophytes, almost nothing from ground water – relegates them to receive nutrients that are dissolved in rainwater or that accumulate as dust. After the first few minutes of rainfall, those nutrient concentrations are extremely small compared to soil nutrients and are biased in their relative concentrations in very different ways. Therefore, it is not surprising that culture conditions designed for tracheophytes are often unsuitable for bryophytes. But is this what the bryophytes "prefer"? Or are these conditions they tolerate and that provide them relatively less competition from tracheophytes? And do they gain any nutrients from the soil?
Nutrient Requirements Even in the slow-growing bryophytes, nutrients can be
a major determinant of both species composition and diversity (Raabe et al. 2010; Stevens et al. 2010; Schrijver et al. 2011). For tracheophytes, we know that the trace
elements (micronutrients) (Fe, Zn, Mn, Cu, Ni, B, Mo, and Cl) are essential (Welch 1995). These seem to be important for bryophytes as well, but in lower concentrations. Nevertheless, the levels of requirements and tolerance can vary widely not only among species, but also within species (Shaw 1988).
Most knowledge about nutrient requirements of bryophytes comes from culturing them (Voth 1943; Brown 1982), although more recently we have learned much through the effects of atmospheric pollution. We soon learned that concentrations that favored the growth of tracheophytes in the laboratory were too strong for the poikilohydric bryophytes, and dilutions of 10:1 seemed more satisfactory.
Hoffman (1966) performed a complex set of experiments on the moss Funaria hygrometrica (Figure 2) in which he determined anion (N:P:S) and cation (K:Ca:Mg) combination effects. In his anion experiments, the absence of any of the three nutrients caused poor protonemal growth and no gametophores. On the other hand, the protonemata responded quite differently from the responses of the gametophores to the various cation combinations. This suggests that our usual descriptions of

Chapter 8-1: Nutrient Relations: Requirements 8-1-3
conditions based on leafy plants may not provide us with any useful information on requirements needed for establishment. Even spores and gemmae may have different requirements (Brown 1982).
Figure 2. Funaria hygrometrica, a species of disturbed
habitats that requires N, P, and S among its nutrients. Photo by Michael Lüth, with permission.
Bryophytes seem to require the same nutrients, mostly for the same purposes, as do the tracheophytes. An easy way to remember the macronutrients (those needed in large quantities) is with the acronym C'HOPKNS Mg CaFe, read as See Hopkin's mighty good cafe. These essential metabolic nutrients are maintained within the cell in relatively consistent high concentrations. The inconsistencies often found in measurements generally result when the bound portion on the cell surface is included. Table 1 lists the concentrations of macro- and micronutrients typical of various tracheophyte groups.
One factor that plays a major role in bryophyte nutrient needs and toxicity is the osmotic effect. Lacking an epidermis (except some thallose taxa) and having little wax
on their surfaces, most bryophytes are especially susceptible to osmotic shock. Voth (1943) used Marchantia polymorpha (Figure 3) to show that a concentrated nutrient solution could kill the tips and wings of a growing thallus while reducing dry biomass and production of gemmae cups. At intermediate concentrations that retained the same nutrient ratio, the liverwort increased in size, produced a darker color, had more ascending tips, and developed more rhizoids, especially at the lower end of that concentration range. At the lowest set of concentrations, the rhizoids, scales, and lower epidermis had a more intense red-purple color, rhizoids were quite numerous, and gemmae cups diminished in number. Cell walls were especially thin in the strongest solutions and many cells collapsed, whereas in the most dilute solutions the cell walls were thickest.
Figure 3. Marchantia polymorpha, a species that is
sensitive to high nutrient concentrations. Photo by David T. Holyoak, with permission.
Table 1. Average mineral element content among plants of several habits. (All data are in parts per thousand). Based on published compilations included in Larcher 1983 and Epstein 1965 for agricultural plants.
Element Land Plants Stored in Marine Sea Water Agricultural (g·kg-1 dry matter) Soil Organisms Plants (g·kg-1 DM) (g·kg-1 DM) (g·L-1) (g·kg-1 DM) Range Mean Mean Mean
N 10-50 20 1 50 0.0003 15 P 1-8 2 0.7 6 0.00003 2 S 0.5-8 1 0.7 10 0.9 1 K 5-50 10 14 10 0.4 10 Ca 5-50 10 14 5 0.4 5 Mg 1-10 2 5 4 1.3 2 Fe 0.05-1 0.1 38 0.4 0.00005 0.1 Mn 0.02-0.3 0.05 0.9 0.02 0.000005 0.05 Zn 0.01-0.1 0.02 0.05 0.2 0.000005 0.02 Cu 0.002-0.02 0.006 0.02 0.05 0.00001 0.006 Mo 0.0001-0.001 0.0002 0.002 0.0001 B 0.005-0.1 0.02 0.01 0.02 0.005 0.02 Cl 0.2-10 0.1 0.1 40 19.3 0.1

8-1-4 Chapter 8-1: Nutrient Relations: Requirements
Considering these osmotic responses, it is not surprising to find that the same species of bryophytes from different habitats can respond quite differently to various concentrations of nutrients and heavy metals (Brown & Beckett 1985). If a plant has grown from spores at a certain nutrient/ion level, then its osmotic potential is more likely to be adjusted to that of its environment. The same is likely to be true for plants grown from fragments and other propagules. Moving a plant to another location can strongly affect that balance. Hence, monitoring studies that move bryophytes from one location to another need to account for normal ambient ion differences. Taxonomists likewise need to account for ionic differences in the environment because these can alter the morphology of the plants (Brown & Beckett 1985; Glime unpub. data).
The needs of young shoots are typically greater than those of older shoots; thus N, P, and K are found in young shoots in their highest concentrations (Tamm 1953). Nitrogen and phosphorus are essential in making proteins and DNA, and phosphorus is needed in ATP to maintain energy. A relatively high content of potassium is believed to be needed for the normal folding of cytoplasmic enzymes (Bates 2000). Magnesium is needed in chlorophyll and as an activator of several enzymes. Calcium acts as a messenger and is rarely present in the cytoplasm; it is, however, needed to maintain integrity of the plant by being part of the "glue" that cements the cell walls together. Calcium is not easily translocated and accumulates in older segments. However, its increasing concentration in older tissues is partly due to the recalcitrance of the cell wall, where Ca is concentrated, and the loss of dry biomass from older cells, increasing the ratio of Ca to leaf biomass (Bates 1979).
Macronutrients Some macronutrients often are bound in rocks,
unavailable to most plants. Nevertheless, bryophytes and lichens can affect biogeochemical cycles by surface weathering (Porada et al. 2014). Porada and coworkers calculated the degree of obtaining N and P from the rock substrate by quantifying the amounts needed by the organisms to account for their biomass increase. Using this indirect method, they estimated that these cryptogams contributed to chemical weathering of 0.058 to 1.1 Km3 yr-1 of rock.
Nitrogen Nitrogen (N) relationships for bryophytes are complex.
For that reason, most of the discussion of this important nutrient are treated in a separate subchapter on nitrogen.
Nitrogen is essential for amino acids, proteins, DNA, and RNA. For bryophytes, slow growth means that requirements are low. Bryophytes are able to use both nitrate and ammonium, with differences among species. Nevertheless, some can use both (Schuler et al. 1955; Burkholder 1959). Others may have abnormalities in development in media with ammonium (Killian 1923; Southorn 1977).
On the other hand, the aquatic moss Fontinalis antipyretica preferentially assimilates ammonium ions (Schwoerbel & Tillmanns 1974). Others have shown that nitrate reductase only forms in the light (Fries 1945; Schwoerbel & Tillmanns 1974). This might explain why nitrate is the best source of N for Funaria and Weissia
controversa protonemata in the light (Dietert 1979). Nevertheless, growth on a nitrate medium requires the bryophytes to convert it to ammonium ions before they can assimilate it (Brown 1982). In some habitats, at least some species are able to use amino acids for their N source (Simola 1975). (See Chapter on nitrogen in this volume.)
When bryophytes are co-existing with tracheophytes, the tracheophytes can benefit from added nitrogen, growing faster and out-competing the bryophytes (Berendse et al. 2001; Malmer & Wallén 2005). On the other hand, high levels of N in the environment can cause the decrease of both tracheophytes and bryophytes (Dupré et al. 2010). In this case, low soil pH seems to contribute to the loss of species, but high N levels seem to be more important in the decline of diversity. These results are similar to those of Ferris et al. (2000) in coniferous plantations in Britain. In their study, both bryophyte and tracheophyte diversity decreased as available nitrogen increased, but in this case, the pH, calcium, and nitrate increased, whereas ammonia decreased.
Schrijver et al. (2011) stated that "elevated inputs of biologically reactive nitrogen (N) are considered to be one of the most substantial threats to biodiversity in terrestrial ecosystems." We know that high N levels can be detrimental to bryophytes. This has been demonstrated for Leucobryum juniperoideum (Figure 4) (Wang et al. 2014) and Sphagnum spp. (Figure 10, Figure 24-Figure 25) (Bragazza et al. 2004). Arróniz-Crespo et al. (2008) reported decline in bryophyte biomass production and cover in grasslands. Armitage et al. (2010) likewise noted that alpine bryophytes have reduced biomass production and reduced cover under high N concentrations. Using transplants of Racomitrium lanuginosum (Figure 5) they determined that at least this moss has the ability to recover when the high loading of N is gone.
Figure 4. Leucobryum juniperoideum, a species sensitive to
high N levels. Photo by Michael Lüth, with permission.
In the Arctic, Gordon et al. (2001) found that added nitrogen caused a decrease in lichen cover but did not affect other functional types of plants. Rather, 10 kg ha-1 yr-1 increased the proportion of active bryophyte shoots while decreasing their nitrate assimilation capacity, suggesting that the critical load is less than 10 kg ha-1 yr-1. It is important to note that not all species responded the same way.

Chapter 8-1: Nutrient Relations: Requirements 8-1-5
Figure 5. Racomitrium lanuginosum, a species that is able
to recover from high N loadings. Photo by Michael Lüth, with permission.
To complicate our understanding of suitable levels of N, we find that when N is no longer limiting, P and K can become limiting, as shown for Sphagnum (Figure 10, Figure 24-Figure 25) (Bragazza et al. 2004). Furthermore, the increased atmospheric N deposition can cause a reduction in the retention of Ca and Mg, a condition that was accompanied by a decrease in stem volumetric density in Sphagnum hummocks. Weber and Wiersma (1998) found that in two forested watersheds, the leafy liverwort Bazzania trilobata (Figure 6) and moss Dicranum fulvum (Figure 7) had elevated N concentrations in the watershed treated with (NH4)2SO4 while simultaneously expressing a depression of other nutrients (Al, B, Ca, Cu, Fe, K, Mg, Mn, N, P, Zn).
Figure 6. Bazzania trilobata, a species that is able to
accumulate elevated N. Photo by Robert Klips, with permission.
Figure 7. Dicranum fulvum, a rock-dwelling species that is
able to accumulate elevated N. Photo by Michael Lüth, with permission.
Phosphorus
Like nitrogen, phosphorus (P) is essential for amino acids, proteins, DNA, and RNA. As in the algae, luxury uptake of P occurs, at least in some mosses, e.g. Pseudoscleropodium purum (Figure 8) (Bates 1987), but in these experiments there was significant luxury uptake, followed by storage, in excess of that is needed) only when plots were fertilized to 50% above the control.
We have seen that P can interact with nitrogen. Ellwood and Whitton (2007) found that the aquatic moss Warnstorfia fluitans (Figure 9) uses only organic phosphate, including P from DNA. Cellular P content is important in influencing phosphatase activities.
Figure 8. Pseudoscleropodium purum with capsules, a
species that is able to take in luxury P when it is increased by at least 50%. Photo by Des Callaghan, with permission.
Figure 9. Warnstorfia fluitans, a species that is able to take
in luxury P. Photo by Misha Ignatov, with permission.
Gordon et al. (2001) found that not only N, but also P changed both the composition and cover of individual species of bryophytes in a high Arctic heath. They pointed out that the species differed in their response to fertilization, warning that the bryophytes should not be
8-1-6 Chapter 8-1: Nutrient Relations: Requirements
considered as a single functional group, a concept likewise warned by Turetsky (2003) in her review of the role of bryophytes in carbon and nitrogen cycling.
Benner and Vitousek (2007) found that increasing P on the epiphytic community had a strong effect on N-fixing lichens in Hawaii, but mosses and non-N-fixing lichens also increased somewhat in both abundance and diversity. Increased N, however, had no effect on the epiphytic communities.
N:P Ratios
One of the interesting aspects of nitrogen deficiency is that it can be offset by phosphorus (Gordon et al. 2001). That is, these two nutrients are colimiting, so the critical load of nitrogen is lower when available phosphorus is greater. On the other hand, Riis et al. (2010) found that the growth rate of Warnstorfia fluitans (Figure 9) increased when the moss had increased P content, but did not with increased N content.
Jirousek et al. (2011) used a nitrogen deposition gradient in Sphagnum (Figure 10, Figure 24-Figure 25) in a highly polluted region of Central-East Europe to assess the N:P ratio. A higher P concentration in the capitula resulted in a lower N:P ratio for these mosses in most of the bogs, despite their N saturation, causing N to still be limiting. Conversely where there was higher atmospheric N deposition, the N:P ratio increased significantly. Species in the Cuspidata section (Figure 10) of Sphagnum demonstrated significantly lower N:P ratios in locations with low N deposition.
Figure 10. Sphagnum cuspidatum, a species with low N:P
ratios when N deposition is low. Photo by Michael Lüth, with permission.
Arróniz-Crespo et al. (2008) assessed the effects of enhanced N deposition on Pseudoscleropodium purum (Figure 8) and Rhytidiadelphus squarrosus (Figure 11) in an acidic grassland. The enhanced N deposition caused up to 90% loss of bryophyte cover, with no recovery after 22 months of no further deposition. The N:P ratios increased up to 3X under the enhanced N loading. Activity of the enzyme phosphomonoesterase showed good recovery, especially in P. purum. P limitation appears to be the key factor in bryophyte loss in these grasslands.
Calcium and Magnesium
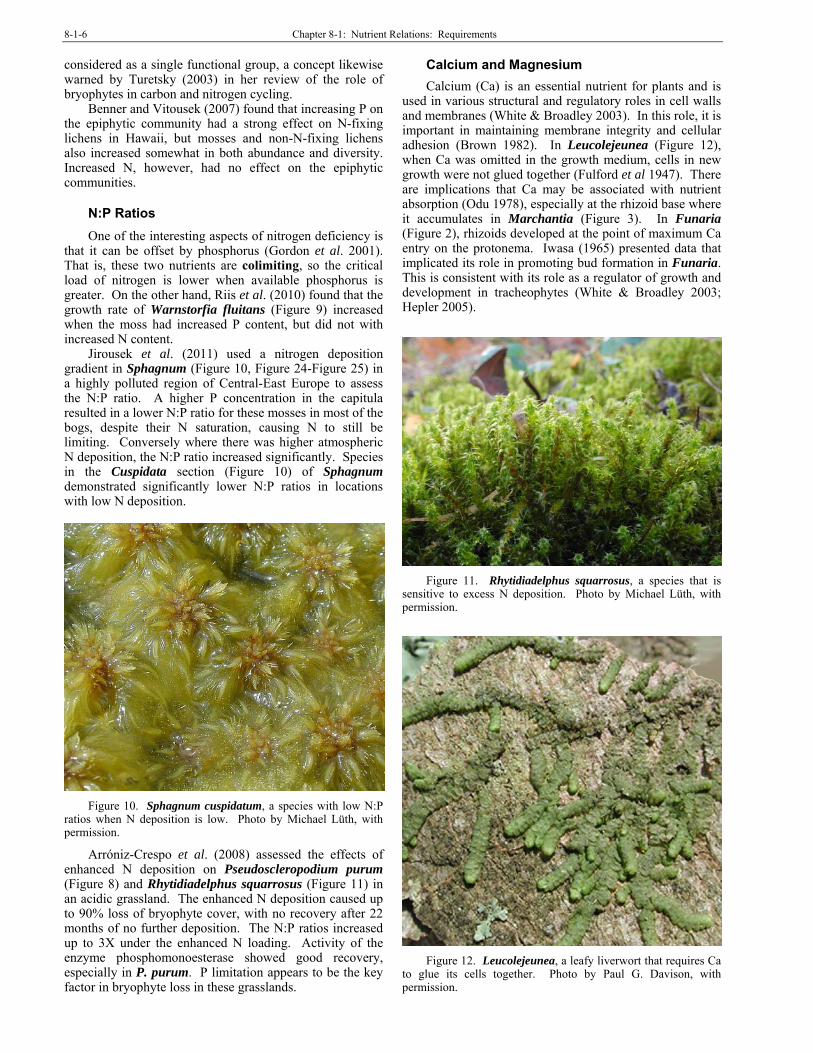
Calcium (Ca) is an essential nutrient for plants and is used in various structural and regulatory roles in cell walls and membranes (White & Broadley 2003). In this role, it is important in maintaining membrane integrity and cellular adhesion (Brown 1982). In Leucolejeunea (Figure 12), when Ca was omitted in the growth medium, cells in new growth were not glued together (Fulford et al 1947). There are implications that Ca may be associated with nutrient absorption (Odu 1978), especially at the rhizoid base where it accumulates in Marchantia (Figure 3). In Funaria (Figure 2), rhizoids developed at the point of maximum Ca entry on the protonema. Iwasa (1965) presented data that implicated its role in promoting bud formation in Funaria. This is consistent with its role as a regulator of growth and development in tracheophytes (White & Broadley 2003; Hepler 2005).
Figure 11. Rhytidiadelphus squarrosus, a species that is
sensitive to excess N deposition. Photo by Michael Lüth, with permission.
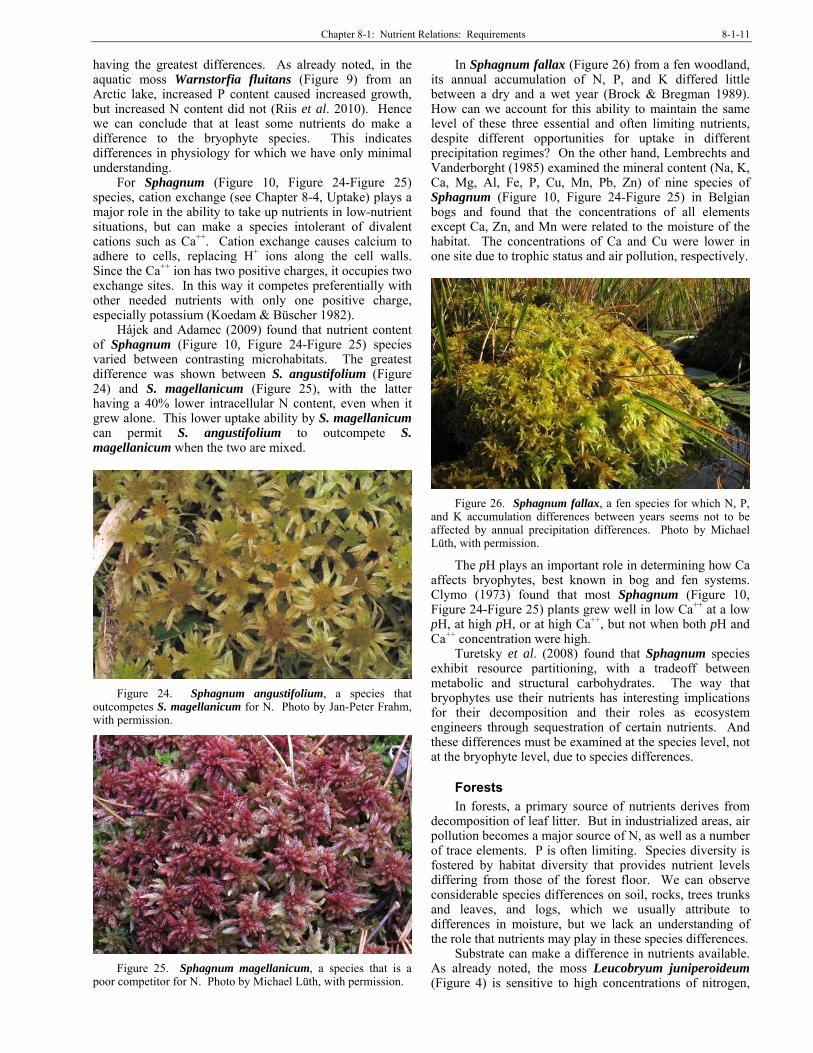
Figure 12. Leucolejeunea, a leafy liverwort that requires Ca
to glue its cells together. Photo by Paul G. Davison, with permission.

Chapter 8-1: Nutrient Relations: Requirements 8-1-7
Uptake of Ca in plants is passive, requiring no energy. Since Ca is insoluble, once it resides in a cell it will normally stay there and not move to other parts of the plant. In tracheophytes, it is carried to its destination by the xylem. In bryophytes, it is probably carried primarily externally and may accumulate at the tips of stems and branches where it occupies all available exchange sites and makes a visible crunchy, off-white deposit (pers. obs.).
Calcium can be effective in keeping other ions off the exchange sites. In this role, it can cause nutrient deficiencies. This is particularly noticeable in many species of Sphagnum (Figure 10, Figure 24-Figure 26).
Magnesium (Mg) is essential as the center of the chlorophyll molecule as well as other plant processes. Sources for this nutrient include bedrock and soil, with alkaline and humus-rich soils containing more than acidic soils. Its dynamics are often intertwined with those of calcium. Because both are cations, they compete for binding sites in cation exchange (CEC). In other cases (Canadian mires), however, they may be taken up in proportion to their concentrations in the environment (Malmer et al. 1992). In rich fens, both of these nutrients are supplemented from ions dissolved in surface water. Based on their field data, Malmer and coworkers suggested that Ca could give the brown mosses, typical of rich fens, a competitive advantage over Sphagnum (Figure 10, Figure 24-Figure 26).
Iron
Iron (Fe) can be a micronutrient, but in other species it is a macronutrient. It seems premature to make any generalizations about this in bryophytes.
Iron is important in plants in many enzymes and in the production of chlorophyll. Bryophytes can collect iron in dustfall (Gorham & Tilton 1978), but may also obtain it in water that carries it to and around the plant. It is likely that some can also obtain it from rock substrata.
In low oxygen of deep water, iron forms soluble ferric compounds that can be absorbed by bryophytes. In oxygenated streams, this form quickly oxidizes. Instead of being absorbed, it forms plates on the plants, soon covering them sufficiently to block photosynthesis (pers. obs.).
Micronutrients Tracheophytes require significant quantities of
macronutrients and considerably less of those called micronutrients (Mn, Cu, Zn, Mo, Ni, Cl, B). Although comprehensive studies of nutrient deficiency for bryophytes are lacking, we have no reason to believe they would have different requirements than these, but nutrients may be required in different proportions, and certainly in different concentrations.
Most micronutrients will not be limiting in most habitats in nature, but must be included for long-term growth in artificial media. For short periods, bryophytes can generally call upon their stored nutrients and those in surface dust until returned to a natural medium.
Rühling and Tyler (1970) found the sorption and retention relationship of the moss Hylocomium splendens (Figure 41) to be Cu, Pb>Ni>Co>Zn, Mn. This series has likewise been observed in other bryophyte studies (Brown 1982).
There are many questions about micronutrients for which we have no answers, or have them for very few
species. Can they substitute one micronutrient for another? What processes and structures use these micronutrients? Can the presence, absence, or deficiency of a nutrient change the form of the bryophyte? Can such differences make them look like different species in different habitats? What are their deficiency symptoms?
Boron
Boron (B) is used in plant cell walls and affects nucleic acid and carbohydrate metabolism (Pilbeam & Kirby 1983). Boron is important in maintaining membrane structural integrity. As in monocots, bryophytes do not have a strong requirement for boron. Known symptoms of boron deficiency are usually secondary effects of changes in permeability of the membranes.
Boron is essential in the plant process of making lignin, which is, in turn, essential for tracheophyte vascular tissue (Lewis 1980). Thus, before tracheophytes could evolve, a means for uptake and incorporation of boron was necessary. But we know that uptake of boron is present in bryophytes. Sameka-Cymerman et al. (1991) found that boron, among other minerals, was taken up from the water by Scapania uliginosa (Figure 13). On the other hand, the amount incorporated into bryophyte cell walls is considerably less than that in tracheophytes (Matsunaga et al. 2004). To date, it is not clear that bryophytes actually require boron.
Figure 13. Scapania uliginosa, a species that extracts
minerals from the water, including boron. Photo by Michael Lüth, with permission.
As for iron, bryophytes can collect boron from dustfall (Sabovljević et al. 2005). However, at least some, including Sphagnum (Figure 10, Figure 24-Figure 25) species, may not accumulate it to the same degree as do trees (Gorham & Tilton 1978). Obviously, trees have a much greater need for boron because they must make lignin, and they do not generally rely on dust for their nutrients.
Copper Copper (Cu), like iron, is important in enzymes in
plants. As such, it facilitates many plant processes (Yruela 2005). But copper is needed only in small quantities and becomes toxic in larger quantities. This heavy metal is available in soil and can be carried with water that moves up the bryophyte.

8-1-8 Chapter 8-1: Nutrient Relations: Requirements
Copper can be limiting in some aquatic habitats, and probably some terrestrial ones as well. In their studies on Fontinalis dalecarlica (Figure 14), Glime and Keen (1984) found that natural Lake Superior water had less than ideal copper concentrations for maximum chlorophyll concentration, with 0.01 mg per liter providing the best chlorophyll (Figure 15). At higher concentrations, chloroplasts lost their green color and at 10 mg / L the cells became brown (Figure 16). With increasing concentrations, the tips of F. antipyretica became yellow (Figure 19).
Figure 14. Fontinalis dalecarlica, a species that can, in
some environments, be copper deficient. Photo by Janice Glime.
Figure 15. Effect of copper concentration on chlorophyll a
and b concentrations in the aquatic moss Fontinalis dalecarlica. Redrawn from Glime & Keen 1984.
Figure 16. Comparison of cell contents and colors in leaves
of Fontinalis dalecarlica subjected to concentrations 0.01 mg/L, 1.0 mg/L, 10 mg/L) of copper as copper foil, Lake Superior water as control,. Photos by Janice Glime.
Claveri and Mouvet (1995) found that the aquatic moss Platyhypnidium riparioides (Figure 17) suffered from denaturation of chlorophyll pigments after spending 12 days in a copper concentration of 80 μg L-1. They found that uptake of copper was not related to photosynthesis, permitting it to continue uptake even when the chlorophyll was damaged. Furthermore, its uptake does not appear to be influenced by temperature, whereas its damage to chlorophyll increases with temperature. Similar damage to chlorophyll occurs in the aquatic moss Fontinalis (Figure 50) (Glime & Keen 1984). But this is not just an aquatic phenomenon. It is known also in Thuidium spp. (Figure 18) (Shakya et al. 2008) and is likely to be the case in all except perhaps the copper mosses.
Figure 17. Platyhypnidium riparioides, a species that loses
its chlorophyll in excess copper. Photo by Michael Lüth, with permission.
Figure 18. Thuidium delicatulum, member of a genus that
is known to be sensitive to copper. Photo by Janice Glime.

Chapter 8-1: Nutrient Relations: Requirements 8-1-9
Figure 19. Effects of various concentrations of copper (as copper foil) on the general appearance of Fontinalis antipyretica (see
also Figure 50). Note the yellowed tips at 1.5 mg/L and above. Photo by Janice Glime.
Heavy Metals It is perhaps more likely that micronutrients,
particularly the heavy metals, will be toxic at greater than trace amounts. Many bryophytes have means of sequestering these in ways that are not toxic. The moss that seems to have the greatest tolerance in many polluted and otherwise heavy metal situations is Pohlia nutans (Figure 20-Figure 21), a species with known tolerance to copper, zinc, and nickel (Shaw 1989).
Figure 20. Pohlia nutans below old mine. Photo by Michael
Lüth, with permission.
Figure 21. Pohlia nutans, a heavy metal tolerator. Photo by
J. C. Schou, with permission.
Some heavy metals in the environment have no known use by plants, including bryophytes. One such heavy metal is cadmium, a toxic by-product of mining and smelting, among other things. In our experiments with Fontinalis duriaei, cells became plasmolyzed at 100 μg Cd per liter (Figure 22) (Glime & Keen 1984). At 1000 μg, the cells deplasmolyzed in a way that suggested membranes were damaged.

8-1-10 Chapter 8-1: Nutrient Relations: Requirements
Figure 22. Effects of cadmium on cell contents in Fontinalis
duriaei. At 100 µg per liter, cells become plasmolyzed. At 1000 µg per liter, the cells deplasmolyze, demonstrating membrane damage. Photos by Janice Glime, based on Glime & Keen 1984.
Nutrient Content
What is normal nutrient content for bryophytes? Or is there one? In the scattered literature that addresses nutrients outside the laboratory, we find that content can depend on habitat, season, uptake ability, and source. But our understanding of bryophyte mechanisms for regulating their nutrient content is meager at best.
Habitat Differences
Habitats can range widely in nutrient availability. These differences can serve as limiting factors for bryophytes, but for most species we do not understand these limitations. In his discussion of Sphagnum (Figure 10, Figure 24-Figure 25), Malmer (1988) considered that the concentration differences among the species are mainly caused by differences in growth pattern and site conditions. The concentrations in the living moss and those in the underlying dead peat are not related.
Streams
In streams, phosphorus is typically a limiting nutrient, not to mention CO2 limitations. On the other hand, pollution, including phosphate from such sources as agricultural fertilizers, can often cause bryophytes to disappear or begin to look unhealthy. One problem for stream bryophytes in high nutrient conditions, whether natural or from pollution, is that the high nutrient level may promote the growth of the periphyton living on their surfaces (Glime, unpublished), causing them to suffer from CO2 and light competition.
Phosphorus often occurs as agricultural pollution or sewage waste. Frequently it arrives in streams, changing the N:P ratio of those streams. Steinman (1994) examined the effect of phosphorus enrichment on the leafy liverwort Porella pinnata (Figure 23) in two woodland streams of eastern Tennessee, USA. Not surprisingly, the N:P ratio decreased significantly, and the P:C ratio increased significantly in the liverworts. In this case, the expected epiphyte structure and abundance in the liverworts were not significantly affected, perhaps due to greater grazing by snails.
Figure 23. Porella pinnata, a species that can incorporate
added phosphate into its cells. Photo by Des Callaghan, with permission.
Christmas and Whitton (1998) compared the phosphorus content of the stream mosses Fontinalis antipyretica (Figure 50) and Platyhypnidium riparioides (Figure 17) to that in the River Swale-Ouse in NE England. They found that both P and N concentrations increased with downstream distance. The mosses likewise showed their lowest concentrations at the headwater site, with increasing levels of both elements with distance downstream. More interesting was the change in N:P ratio with distance downstream, decreasing from 14.9:1 to 6.8:1 in F. antipyretica and from 12.5:1 to 5.5:1 for P. riparioides, suggesting luxury uptake of P. The PMEase (phosphomonoesterase) was greatest at the lower pH (5.5) compared to the higher pH values. The enzyme decreased at all three pH values with distance downstream. Nevertheless, mean primary production increased by only 15% following enrichment, a difference that was not statistically significant.
Bogs and Fens We know that by definition, bogs and poor fens have
low nutrient content, intermediate fens are characterized by intermediate nutrient levels, and rich fens have the highest nutrient levels among these habitats. The bogs and poor fens have similar nutrient concentrations and similar bryophyte species, but differ in their nutrient sources, whereas the species of bryophytes in the intermediate and rich fens differ from each other and from those of the bogs and poor fens. Wojtuń (1994) found that N, P, K, Ca, Mg, and Na were in significantly higher concentrations in Sphagnum (Figure 10, Figure 24-Figure 25) from the minerotrophic (nutrient-rich) fens than from the ombrotrophic (low-nutrient) bogs and fens, with K and P
Chapter 8-1: Nutrient Relations: Requirements 8-1-11
having the greatest differences. As already noted, in the aquatic moss Warnstorfia fluitans (Figure 9) from an Arctic lake, increased P content caused increased growth, but increased N content did not (Riis et al. 2010). Hence we can conclude that at least some nutrients do make a difference to the bryophyte species. This indicates differences in physiology for which we have only minimal understanding.
For Sphagnum (Figure 10, Figure 24-Figure 25) species, cation exchange (see Chapter 8-4, Uptake) plays a major role in the ability to take up nutrients in low-nutrient situations, but can make a species intolerant of divalent cations such as Ca++. Cation exchange causes calcium to adhere to cells, replacing H+ ions along the cell walls. Since the Ca++ ion has two positive charges, it occupies two exchange sites. In this way it competes preferentially with other needed nutrients with only one positive charge, especially potassium (Koedam & Büscher 1982).
Hájek and Adamec (2009) found that nutrient content of Sphagnum (Figure 10, Figure 24-Figure 25) species varied between contrasting microhabitats. The greatest difference was shown between S. angustifolium (Figure 24) and S. magellanicum (Figure 25), with the latter having a 40% lower intracellular N content, even when it grew alone. This lower uptake ability by S. magellanicum can permit S. angustifolium to outcompete S. magellanicum when the two are mixed.
Figure 24. Sphagnum angustifolium, a species that
outcompetes S. magellanicum for N. Photo by Jan-Peter Frahm, with permission.
Figure 25. Sphagnum magellanicum, a species that is a
poor competitor for N. Photo by Michael Lüth, with permission.
In Sphagnum fallax (Figure 26) from a fen woodland, its annual accumulation of N, P, and K differed little between a dry and a wet year (Brock & Bregman 1989). How can we account for this ability to maintain the same level of these three essential and often limiting nutrients, despite different opportunities for uptake in different precipitation regimes? On the other hand, Lembrechts and Vanderborght (1985) examined the mineral content (Na, K, Ca, Mg, Al, Fe, P, Cu, Mn, Pb, Zn) of nine species of Sphagnum (Figure 10, Figure 24-Figure 25) in Belgian bogs and found that the concentrations of all elements except Ca, Zn, and Mn were related to the moisture of the habitat. The concentrations of Ca and Cu were lower in one site due to trophic status and air pollution, respectively.
Figure 26. Sphagnum fallax, a fen species for which N, P,
and K accumulation differences between years seems not to be affected by annual precipitation differences. Photo by Michael Lüth, with permission.
The pH plays an important role in determining how Ca affects bryophytes, best known in bog and fen systems. Clymo (1973) found that most Sphagnum (Figure 10, Figure 24-Figure 25) plants grew well in low Ca++ at a low pH, at high pH, or at high Ca++, but not when both pH and Ca++ concentration were high.
Turetsky et al. (2008) found that Sphagnum species exhibit resource partitioning, with a tradeoff between metabolic and structural carbohydrates. The way that bryophytes use their nutrients has interesting implications for their decomposition and their roles as ecosystem engineers through sequestration of certain nutrients. And these differences must be examined at the species level, not at the bryophyte level, due to species differences.
Forests In forests, a primary source of nutrients derives from
decomposition of leaf litter. But in industrialized areas, air pollution becomes a major source of N, as well as a number of trace elements. P is often limiting. Species diversity is fostered by habitat diversity that provides nutrient levels differing from those of the forest floor. We can observe considerable species differences on soil, rocks, trees trunks and leaves, and logs, which we usually attribute to differences in moisture, but we lack an understanding of the role that nutrients may play in these species differences.
Substrate can make a difference in nutrients available. As already noted, the moss Leucobryum juniperoideum (Figure 4) is sensitive to high concentrations of nitrogen,
8-1-12 Chapter 8-1: Nutrient Relations: Requirements
preferring the lower N levels on rocks and logs in some locations with high N in the soil, whereas in others the soil has a low enough concentration to be suitable (Wang et al. 2014).
In the highly polluted region of Central-East Europe, Jirousek et al. (2011) found that local forestry practice affected the N-limitation experienced in areas with high P and N saturation.
Arctic and Alpine Bryophytes can be very important in sequestering P in
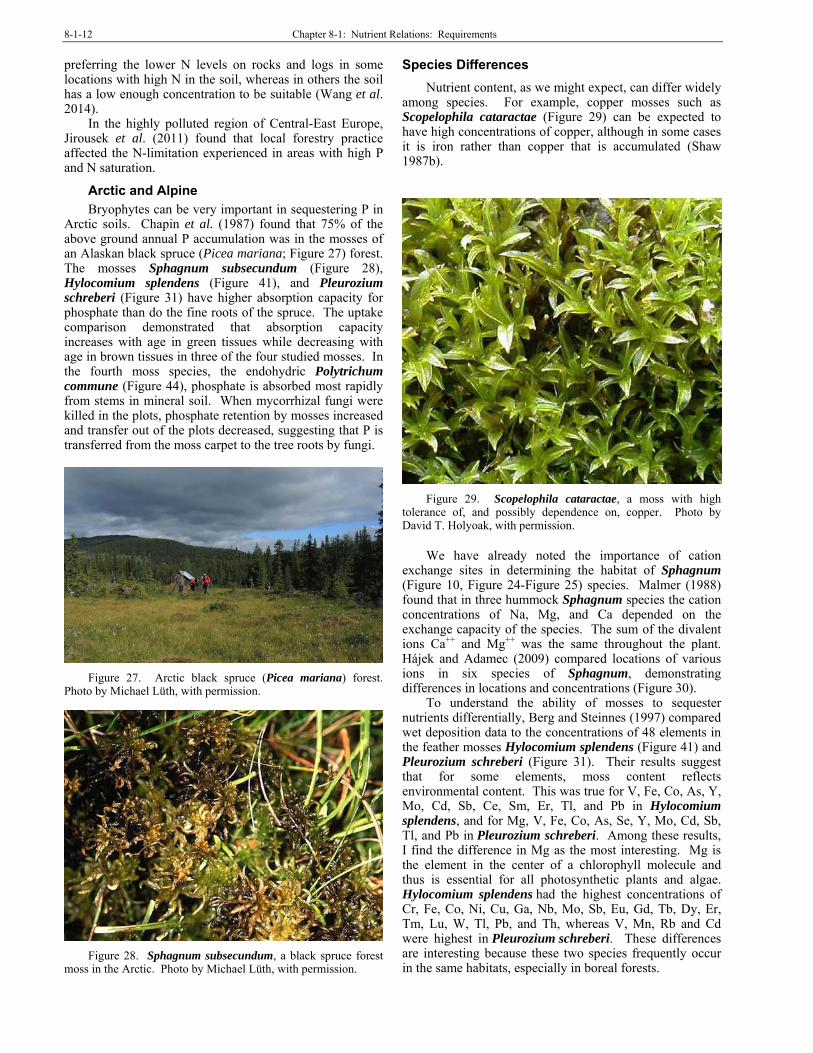
Arctic soils. Chapin et al. (1987) found that 75% of the above ground annual P accumulation was in the mosses of an Alaskan black spruce (Picea mariana; Figure 27) forest. The mosses Sphagnum subsecundum (Figure 28), Hylocomium splendens (Figure 41), and Pleurozium schreberi (Figure 31) have higher absorption capacity for phosphate than do the fine roots of the spruce. The uptake comparison demonstrated that absorption capacity increases with age in green tissues while decreasing with age in brown tissues in three of the four studied mosses. In the fourth moss species, the endohydric Polytrichum commune (Figure 44), phosphate is absorbed most rapidly from stems in mineral soil. When mycorrhizal fungi were killed in the plots, phosphate retention by mosses increased and transfer out of the plots decreased, suggesting that P is transferred from the moss carpet to the tree roots by fungi.
Figure 27. Arctic black spruce (Picea mariana) forest.
Photo by Michael Lüth, with permission.
Figure 28. Sphagnum subsecundum, a black spruce forest
moss in the Arctic. Photo by Michael Lüth, with permission.
Species Differences
Nutrient content, as we might expect, can differ widely among species. For example, copper mosses such as Scopelophila cataractae (Figure 29) can be expected to have high concentrations of copper, although in some cases it is iron rather than copper that is accumulated (Shaw 1987b).
Figure 29. Scopelophila cataractae, a moss with high
tolerance of, and possibly dependence on, copper. Photo by David T. Holyoak, with permission.
We have already noted the importance of cation
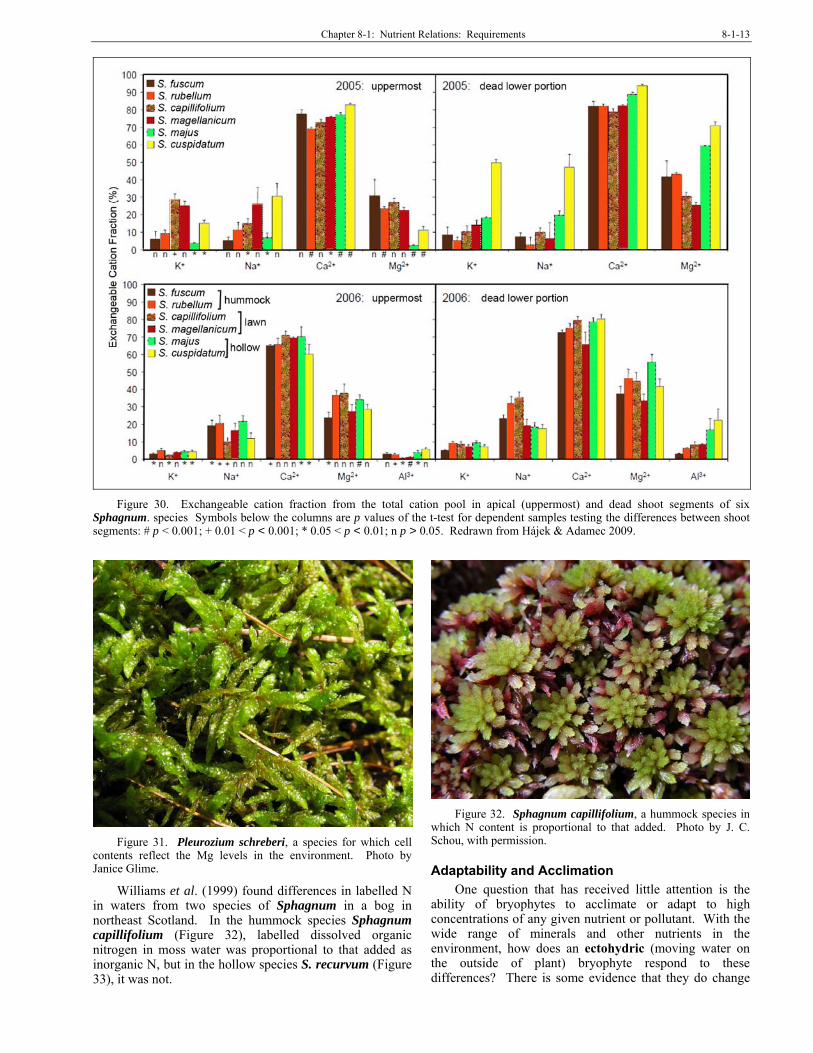
exchange sites in determining the habitat of Sphagnum (Figure 10, Figure 24-Figure 25) species. Malmer (1988) found that in three hummock Sphagnum species the cation concentrations of Na, Mg, and Ca depended on the exchange capacity of the species. The sum of the divalent ions Ca++ and Mg++ was the same throughout the plant. Hájek and Adamec (2009) compared locations of various ions in six species of Sphagnum, demonstrating differences in locations and concentrations (Figure 30).
To understand the ability of mosses to sequester nutrients differentially, Berg and Steinnes (1997) compared wet deposition data to the concentrations of 48 elements in the feather mosses Hylocomium splendens (Figure 41) and Pleurozium schreberi (Figure 31). Their results suggest that for some elements, moss content reflects environmental content. This was true for V, Fe, Co, As, Y, Mo, Cd, Sb, Ce, Sm, Er, Tl, and Pb in Hylocomium splendens, and for Mg, V, Fe, Co, As, Se, Y, Mo, Cd, Sb, Tl, and Pb in Pleurozium schreberi. Among these results, I find the difference in Mg as the most interesting. Mg is the element in the center of a chlorophyll molecule and thus is essential for all photosynthetic plants and algae. Hylocomium splendens had the highest concentrations of Cr, Fe, Co, Ni, Cu, Ga, Nb, Mo, Sb, Eu, Gd, Tb, Dy, Er, Tm, Lu, W, Tl, Pb, and Th, whereas V, Mn, Rb and Cd were highest in Pleurozium schreberi. These differences are interesting because these two species frequently occur in the same habitats, especially in boreal forests.
Chapter 8-1: Nutrient Relations: Requirements 8-1-13
Figure 30. Exchangeable cation fraction from the total cation pool in apical (uppermost) and dead shoot segments of six
Sphagnum. species Symbols below the columns are p values of the t-test for dependent samples testing the differences between shoot segments: # p < 0.001; + 0.01 < p < 0.001; * 0.05 < p < 0.01; n p > 0.05. Redrawn from Hájek & Adamec 2009.
Figure 31. Pleurozium schreberi, a species for which cell
contents reflect the Mg levels in the environment. Photo by Janice Glime.
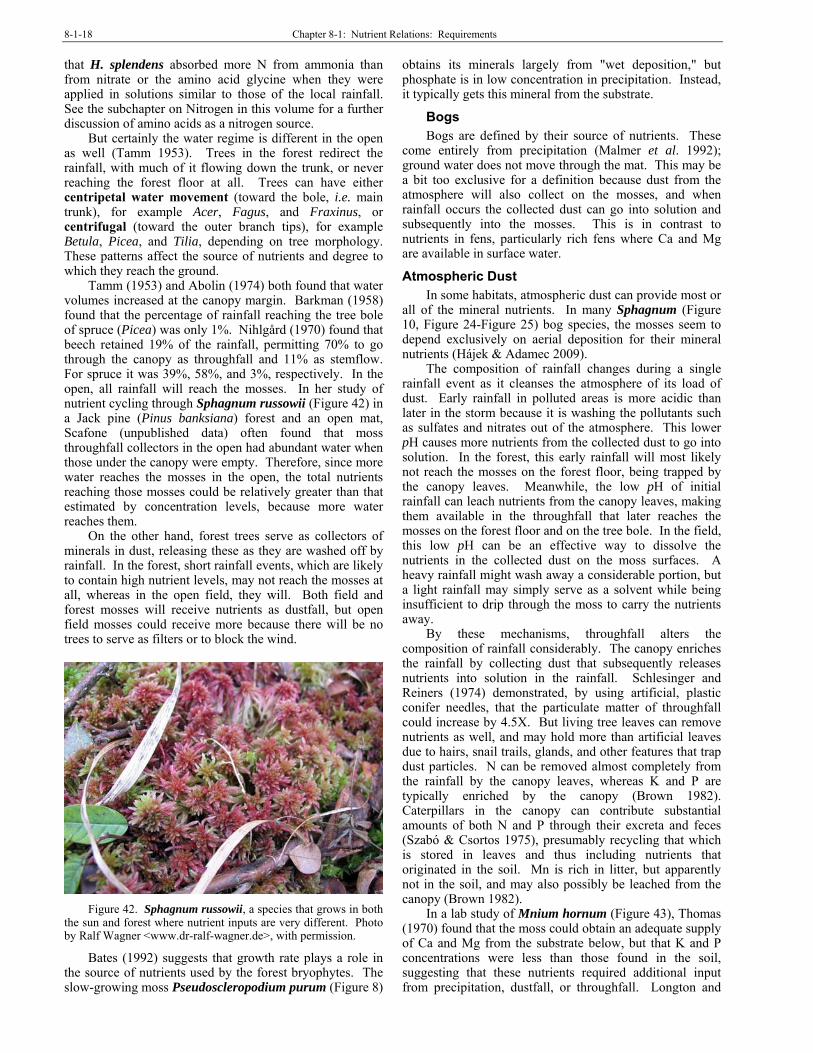
Williams et al. (1999) found differences in labelled N in waters from two species of Sphagnum in a bog in northeast Scotland. In the hummock species Sphagnum capillifolium (Figure 32), labelled dissolved organic nitrogen in moss water was proportional to that added as inorganic N, but in the hollow species S. recurvum (Figure 33), it was not.
Figure 32. Sphagnum capillifolium, a hummock species in
which N content is proportional to that added. Photo by J. C. Schou, with permission.
Adaptability and Acclimation One question that has received little attention is the
ability of bryophytes to acclimate or adapt to high concentrations of any given nutrient or pollutant. With the wide range of minerals and other nutrients in the environment, how does an ectohydric (moving water on the outside of plant) bryophyte respond to these differences? There is some evidence that they do change

8-1-14 Chapter 8-1: Nutrient Relations: Requirements
their tolerance. Shaw (1987a) showed that protonemata responded to pretreatment with copper and zinc more than did the stems of Funaria hygrometrica (Figure 2). But overall, genetic differences had a greater role than acclimation through pretreatment, with some individuals showing a significant response and others showing little or none.
Figure 33. Sphagnum recurvum, a hollow species in which
N concentrations do not reflect those of the atmosphere. Photo by Malcolm Storey, <www.discoverlife.com>, through Creative Commons.
In culture conditions, Shaw (1988) demonstrated that populations exhibited a wide range of tolerances in the protonemal and stem stages. To confound the story, Shaw found that in experiments with copper and zinc the populations of Funaria hygrometrica expressed a greater similarity among environmental correlations than among genotypic correlations, suggesting some sort of acclimation.
A genetic ability to survive and even require some heavy metals such as copper is exhibited by Scopelophila cataractae (Figure 29) (Shaw 1987b). Out of six populations in eastern USA, five were associated with high copper concentrations. The sixth was associated with high iron concentrations. When cultivated, these populations grew best on soil contaminated with copper, lead, and zinc. It is interesting that this species lacks sexual reproduction in North America. Could that be related?
Plant Nutrient Locations Nutrients not only have different purposes, but also are
located in different positions within the plant and within the cells they occupy. Some are needed structurally and some are used constitutively (always present, such as defense compounds). For example, potassium, a highly soluble and mobile nutrient, is present in Grimmia donniana (Figure 34) and Calliergonella cuspidata (Figure 35) in a soluble form within the cell, whereas the calcium is primarily in extracellular locations in exchangeable form (Brown & Buck 1985; see also Brehm 1968; Bates 1992; Bates & Brown 1974; Brown & Buck 1979, 1985). Magnesium and zinc, on the other hand, were intermediate, with their locations depending on the species and concentrations. Turetsky et al. (2008) demonstrated that a tradeoff between structural and constitutive use of nutrients, especially C and
N, in Sphagnum species gave hummock species the ability to maintain their hummocks by putting more nutrients in recalcitrant structural forms that did not decompose easily.
Figure 34. Grimmia donniana, a species with soluble K in
its cells. Photo by Henk Greven, with permission.
Figure 35. Calliergonella cuspidata growing among sedges.
Photos by Michael Lüth, with permission.
Wojtuń (1994) determined that N, P, and K accumulate in the upper parts of Sphagnum (Figure 10, Figure 24-Figure 25) through active uptake; all three are typically found within the cell, being used in cell metabolism rather than cell wall metabolism (Brown & Wells 1990b). On the other hand, Ca, Mg, and Na are obtained through passive cation exchange. These and other elements acquired through cation exchange tend to accumulate in the lower parts of the plants. The concentration of iron either does not correlate or correlates negatively with the other

Chapter 8-1: Nutrient Relations: Requirements 8-1-15
elements (Wojtuń 1994). Contents of N, P, K, Ca, Mg, and Na were significantly higher in mosses from minerotrophic (high nutrient) habitats than in those from ombrotrophic (low nutrient) habitats. The greatest difference among species were for K and P.
Brown and Wells (1990a) showed that heavy metals could alter ion locations, for example by causing potassium leakage due to membrane damage. It is interesting that in the liverwort Dumortiera hirsuta (Figure 36), pretreatment with 80 mM KNO3 actually stimulated cadmium uptake, presumably because the potassium removed potentially competing cations from the exchange sites, thus permitting more Cd to bind and be taken up by the cells (Mautsoe & Beckett 1996). This suggests that potassium ions are able to occupy environmentally exposed exchange sites as well as their interior sites. Such locations could make these ions readily available when needed by the cells.
Figure 36. Dumortiera hirsuta, a species in which K+
removes competing cations from exchange sites, permitting Cd++ to bind and then enter cells. Photo by Michael Lüth, with permission.
Ron et al. (1999) used Hookeria lucens (Figure 37) to observe the cause of reddish-brown deposits of minerals in the cells. They identified the minerals bohemite, calcite, diaspore, feldspar, ferrihydrite, gibbsite, jarosite, lepidocrocite, opal, pirolusite, and quartz inside the hydrom (unit of water-conducting cells), cortex, and leaf cells. Since not all of these minerals were present in the soil substrate, they hypothesized that the additional ones were derived from a biomineralization process inside the moss cells from such elements as Mn and S, and from those in the soil on which the mosses were growing.
Bates (1987) found that in Pseudoscleropodium purum (Figure 8) fertilization caused a small net increase in Mg, but shoot N had no significant change in the plant. Ions held on exchange sites did not increase much with fertilizer addition in the field, but in the laboratory, a 30-minute exposure to these caused Ca++ and Mg++ concentrations to rise notably, whereas exchangeable K+ fell. But the disappearance of these exchange site nutrients when the mosses were returned to the field caused Bates to question the utility of the exchange sites. Could they serve to keep a ready supply while at the same time preventing excess within the cells? Weekly watering with fertilizer caused maximum net uptake of P, Mg, and Ca. Pulse watering with more concentrated solutions at greater intervals had the least uptake.
Figure 37. Hookeria lucens, a species that can be discolored
by minerals in the hydrom, cortex, and leaf cells. Photo by Michael Lüth, with permission.
Determination of the interior location of plant elements has been complicated by damage to the cell membranes during the measurement technique (Brown & Wells 1990b). When this damage happens, ions are released and may become bound to newly exposed cell walls on the insides of the cells.
Cell Wall Sites
The cell walls of tracheophyte roots have exchange sites that permit binding of nutrient ions and facilitate uptake. Similar, and very active, exchange sites are well known on Sphagnum (Figure 10, Figure 24-Figure 25) leaves (Clymo 1963; Spearing 1972; Schwarzmaier & Brehm 1975). But other bryophytes can have exchange sites as well (Brown & Buck 1979; Glime et al. 1982). Unfortunately, this capacity has scarcely been examined for non-Sphagnum bryophytes. Nevertheless, as described above, it appears that such sites exist to varying degrees among the bryophytes in general.
Brown and Buck (1979) reported that in bryophytes Ca++ is bound to exchange sites in the cell wall and is insoluble within the cell. The quantity of an element bound to such sites depends on the concentration of that element. The ability of a cation (positive ion) to reach a stable equilibrium is relatively rapid, whereas its departure rate when the external supply is removed and replaced with a solution free of the element is often slower, the former taking only about 4.5 minutes to reach half maximum extracellular uptake for 100 µM L-1 Cd in Rhytidiadelphus squarrosus (Figure 11) (Brown & Beckett 1985), but taking days at lower concentrations of <0.13 µM L-1 Cd in some aquatic species (Mouvet 1987).
Vázquez Castro et al. (1999) examined the location of heavy metals in three aquatic mosses. They found that most of the metal uptake was to the extracellular compartment compared to the intracellular fraction. Scapania undulata (Figure 48) in particular has a high exchange site affinity for the heavy metals, whereas Fissidens polyphyllus (Figure 38) has a relatively low attraction. On the other hand, F. polyphyllus has the highest intracellular contents.

8-1-16 Chapter 8-1: Nutrient Relations: Requirements
Figure 38. Fissidens polyphyllus in limestone cave, a
species with low affinity for heavy metals. Photo by Janice Glime.
The mechanism of cation exchange is discussed in the subchapter on Uptake (Chapter 8-4 of this volume). Binding preferences vary with concentrations and can be determined based on availability of the ions, previous filling of the exchange sites, type of ligand in the exchange site, and type of ions (Brown & Wells 1990b). For example, potassium, calcium, and magnesium prefer oxygen-rich ligands (ion or molecule that binds to a central metal atom to form a complex) such as carboxylic groups (Nieboer & Richardson 1980). Others such as mercury, lead, and gold prefer sulfur- and nitrogen-rich ligands. Some are borderline and have intermediate preferences with heavier elements tending to prefer the sulfur- and nitrogen-rich ligands.
Intracellular Sites Brown and Wells (1990b) reminded us of the need to
separate the locations of the elements within the cells. They furthermore pointed out that many of the elements became bound into compounds, onto membranes, or onto the interior of the cell walls. Others could be stored in vacuoles. Not only potassium, aluminium, and nitrogen occurred inside cells of Sphagnum (Figure 10, Figure 24-Figure 25), but also magnesium and sodium (Hájek & Adamec 2009). Magnesium is stored in the chlorophyll molecule, where it is essential for that molecule to function in photosynthesis (Brown and Wells 1990b). Sodium has no known use in bryophytes.
Brown and Buck (1979) found that potassium is mainly dissolved within the bryophyte cells. Magnesium is found not only in the cells but also adhering to exchange sites and cell membranes. Hájek and Adamec (2009) looked at nutrient locations in Sphagnum (Figure 10, Figure 24-Figure 25) and reported that K, Mg, N, Al, and Na occurred within cells, although Mg and Na also could be found on exchange sites. (Note, Al and Na are generally not considered to be plant nutrients.)
Microhabitats and species differences seem to account for nutrient content in Sphagnum (Figure 10, Figure 24-Figure 25) (Hájek & Adamec 2009). For example, Sphagnum magellanicum (Figure 25), a hummock species, had an intracellular nitrogen content that was about 40% lower than that in associated species. Such unequal
competition for N, even when compared to S. magellanicum grown alone, suggests its inability to compete for N in mixed patches.
Vertical Distribution
The base of the plant has different concentrations of most elements compared to the apex (Brown & Wells 1990b; Hajek & Adamec 2009). For example, potassium, a soluble and translocatable nutrient, is most concentrated in the actively growing apex of the plant and is intracellular (Figure 39) (Brown & Wells 1990b). Other cellular metabolic components such as nitrogen and phosphorus are likewise concentrated in the growing apex (Brown & Wells 1990b; Hájek & Adamec 2009 – see Figure 30).
Figure 39. Location of four elements in 2-cm sections from
new apical segment to base along the stems of laboratory-grown Rhytidiadelphus squarrosus (Figure 11). Redrawn from Brown & Wells 1990b.
As in tracheophytes, bryophytes are able to move at least some of their nutrients to actively growing tissue. In Hylocomium splendens (Figure 41) less new growth occurred when branches of mature segments were removed (Brümelis & Brown 1997). The metals K, Mg, Ca, and Zn in new growth correlated with the initial contents in the juvenile plus mature segments but not with the levels in the pre-experimental segments, suggesting the importance of moving nutrients to growing tissues.
Those elements that are predominantly bound to extracellular sites tend to accumulate in the basal regions of the plant (Brown & Wells 1990b). These include the heavy metals. Their accumulation at the base may be the result of cell death in that region, exposing exchange sites on the cell interiors. Those elements such as manganese that are poorly bound to exchange sites may move upward through evaporative water movement and accumulate at the apex (Lötschert & Wandtner 1982; Malmer 1988), a phenomenon sometimes referred to as transpiration transport.
Malmer (1988) divided three hummock Sphagnum (Figure 24-Figure 25) species into four segments for nutrient and growth analysis. As one might expect, weight increases mostly in the capitulum, but length increases further down. To facilitate this growth, N, P, and K accumulate in the upper parts of the mosses. The trace elements Al, Fe, Zn, Cd, and Pb increase with the age of the plants. Both Ca++ and Mg++ are at first bound to exchange sites on the outside the plant and the sum of these two minerals is consistent throughout the Sphagnum plant.

Chapter 8-1: Nutrient Relations: Requirements 8-1-17
Nutrient Sources Mineral nutrients result from weathering and
atmospheric deposition (Bates & Farmer 1992). Bryophytes can use five major sources of nutrients: soil, stream water, atmospheric dust, precipitation (including throughfall), and litter (Babb & Whitefield 1977; Parker 1983; Frego & Carleton 1995). For saxicolous (rock-dwelling) bryophytes, the only feasible sources are dust and precipitation (Rieley et al. 1979), especially for potassium (Bates 1976), although Hébrard et al. (1974) demonstrated the ability of Grimmia orbicularis (Figure 40) to obtain radiolabelled 90Sr from an artificial rock. For pleurocarpous taxa and taxa living in the forest, the atmosphere (dust and precipitation) is generally considered to be the major nutrient source (Brown 1982), but as we shall see, this may not be the whole story. More to the point, what can we expect in uptake of the macronutrients such as phosphorus, nitrogen, and potassium, and are these values controlled, or are they determined by the concentrations in the ecosystem?
Figure 40. Grimmia orbicularis, a species with the ability to
take up minerals from its rock substrate. Michael Lüth, with permission.
In a study of bog mosses, Malmer (1988) found that variations in S, Cu, Zn, Cd, and Pb are the results of varying man-made emissions. Na and Mg variations can be traced to oceanic influence. P, Na, Mg, and Ca also seem to vary with moss productivity. Al and Fe are greatest near agricultural and industrialized regions. Unlike the other elements, Mn concentrations are related primarily to the soil and bedrock.
Precipitation Clearly rainwater has a very different chemical
makeup than soil. Some elements are more abundant, whereas others, like Mg, are virtually absent in the open. Hence, mosses that grow in the open and do not get any leachates from canopy trees are likely to be very deficient in some elements. Could the lack of Mg in Funaria hygrometrica (Figure 2), a species of open sites, explain why it is so short, or might being short be an adaptation to living there?
Larsen (1980) describes the mosses in the boreal forest as growing vigorously, using nutrients that they receive in throughfall, and Weetman (1968) likewise found that feather mosses in a black spruce (Picea mariana; Figure 27) forest relied on dust and precipitation for both nutrients and moisture. Tamm (1953, 1964) found that rainwater was sufficient to account for all the nutrients needed by the
feather moss Hylocomium splendens (Figure 41). Weetman and Timmer (1967) concluded the same thing for Pleurozium schreberi (Figure 31) in the black spruce forest, where N, K, Ca, and Mg were leached from the canopy. This canopy throughfall source annually supplied 9 kg of N per hectare to the moss. In fact, the spruce trees are known to be N-deficient and root prolifically at the base of the green layer of mosses. Since feather mosses such as Pleurozium schreberi and Hylocomium splendens are known to mineralize nitrogen, they interpreted this to mean that the moss layer provided the major source of nitrogen for the trees. It is likely that mosses also held a portion of rainfall N in interstitial spaces among leaves in this layer, retaining it where tree roots could absorb it during the time that there was sufficient moisture for them to grow. It is also likely that in late summer when nutrients in the soil are depleted, rehydrating mosses could release nutrients collected as dust, but also from cells with membranes damaged by the drought (Leary & Glime 2005).
Figure 41. Hylocomium splendens gametophytes. Photo by
Janice Glime.
Nutrient availability from precipitation can vary widely, depending on the canopy, with the lowest nutrient concentrations occurring in the open. Tamm (1953) showed that Hylocomium splendens (Figure 41) grew more under the canopy than in the open, and that its annual dry biomass increments under the canopy increased with distance from the tree trunk. He attributed these differences to light intensity increases outward from the trunk, whereas in the open he considered there to be insufficient nutrients due to lack of canopy trapping and leaching. However, despite the differences in precipitation nutrient concentrations, tissues of those Hylocomium splendens plants located in the open had the same nutrient concentrations as did the ones under the canopy, suggesting that they must have obtained their nutrients from something other than rainfall (Brown 1982), but also grew more slowly, thus requiring lower concentrations from the environment.
Forsum et al. (2006) not only compared the forms of nitrogen use by Hylocomium splendens (Figure 41), but also analyzed the nitrogen components of rain. Typically, amino acids in the rainfall are ignored, but Forsum and coworkers found that rain in their boreal forest study site had 78% of its nitrogen in ammonia (NH4
+), 17% in amino acids, and 5% in nitrates (NO3
- ). Furthermore, they found
8-1-18 Chapter 8-1: Nutrient Relations: Requirements
that H. splendens absorbed more N from ammonia than from nitrate or the amino acid glycine when they were applied in solutions similar to those of the local rainfall. See the subchapter on Nitrogen in this volume for a further discussion of amino acids as a nitrogen source.
But certainly the water regime is different in the open as well (Tamm 1953). Trees in the forest redirect the rainfall, with much of it flowing down the trunk, or never reaching the forest floor at all. Trees can have either centripetal water movement (toward the bole, i.e. main trunk), for example Acer, Fagus, and Fraxinus, or centrifugal (toward the outer branch tips), for example Betula, Picea, and Tilia, depending on tree morphology. These patterns affect the source of nutrients and degree to which they reach the ground.
Tamm (1953) and Abolin (1974) both found that water volumes increased at the canopy margin. Barkman (1958) found that the percentage of rainfall reaching the tree bole of spruce (Picea) was only 1%. Nihlgård (1970) found that beech retained 19% of the rainfall, permitting 70% to go through the canopy as throughfall and 11% as stemflow. For spruce it was 39%, 58%, and 3%, respectively. In the open, all rainfall will reach the mosses. In her study of nutrient cycling through Sphagnum russowii (Figure 42) in a Jack pine (Pinus banksiana) forest and an open mat, Scafone (unpublished data) often found that moss throughfall collectors in the open had abundant water when those under the canopy were empty. Therefore, since more water reaches the mosses in the open, the total nutrients reaching those mosses could be relatively greater than that estimated by concentration levels, because more water reaches them.
On the other hand, forest trees serve as collectors of minerals in dust, releasing these as they are washed off by rainfall. In the forest, short rainfall events, which are likely to contain high nutrient levels, may not reach the mosses at all, whereas in the open field, they will. Both field and forest mosses will receive nutrients as dustfall, but open field mosses could receive more because there will be no trees to serve as filters or to block the wind.
Figure 42. Sphagnum russowii, a species that grows in both
the sun and forest where nutrient inputs are very different. Photo by Ralf Wagner <www.dr-ralf-wagner.de>, with permission.
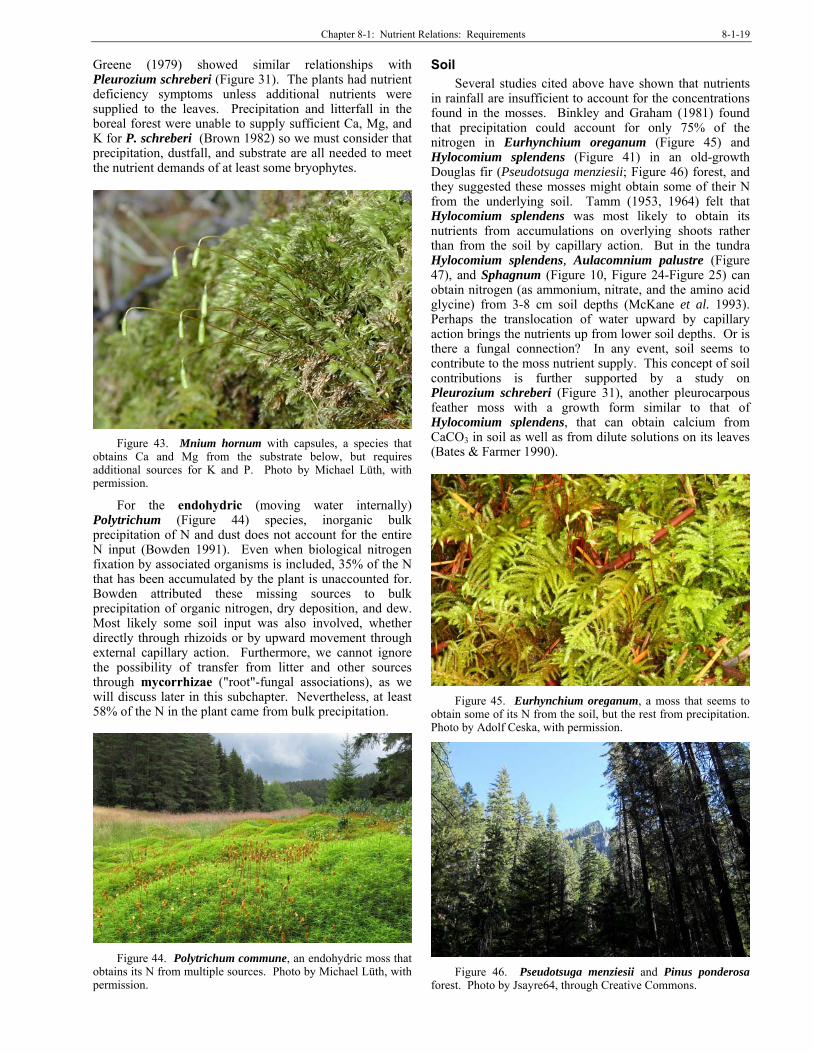
Bates (1992) suggests that growth rate plays a role in the source of nutrients used by the forest bryophytes. The slow-growing moss Pseudoscleropodium purum (Figure 8)
obtains its minerals largely from "wet deposition," but phosphate is in low concentration in precipitation. Instead, it typically gets this mineral from the substrate.
Bogs Bogs are defined by their source of nutrients. These
come entirely from precipitation (Malmer et al. 1992); ground water does not move through the mat. This may be a bit too exclusive for a definition because dust from the atmosphere will also collect on the mosses, and when rainfall occurs the collected dust can go into solution and subsequently into the mosses. This is in contrast to nutrients in fens, particularly rich fens where Ca and Mg are available in surface water.
Atmospheric Dust In some habitats, atmospheric dust can provide most or
all of the mineral nutrients. In many Sphagnum (Figure 10, Figure 24-Figure 25) bog species, the mosses seem to depend exclusively on aerial deposition for their mineral nutrients (Hájek & Adamec 2009).
The composition of rainfall changes during a single rainfall event as it cleanses the atmosphere of its load of dust. Early rainfall in polluted areas is more acidic than later in the storm because it is washing the pollutants such as sulfates and nitrates out of the atmosphere. This lower pH causes more nutrients from the collected dust to go into solution. In the forest, this early rainfall will most likely not reach the mosses on the forest floor, being trapped by the canopy leaves. Meanwhile, the low pH of initial rainfall can leach nutrients from the canopy leaves, making them available in the throughfall that later reaches the mosses on the forest floor and on the tree bole. In the field, this low pH can be an effective way to dissolve the nutrients in the collected dust on the moss surfaces. A heavy rainfall might wash away a considerable portion, but a light rainfall may simply serve as a solvent while being insufficient to drip through the moss to carry the nutrients away.
By these mechanisms, throughfall alters the composition of rainfall considerably. The canopy enriches the rainfall by collecting dust that subsequently releases nutrients into solution in the rainfall. Schlesinger and Reiners (1974) demonstrated, by using artificial, plastic conifer needles, that the particulate matter of throughfall could increase by 4.5X. But living tree leaves can remove nutrients as well, and may hold more than artificial leaves due to hairs, snail trails, glands, and other features that trap dust particles. N can be removed almost completely from the rainfall by the canopy leaves, whereas K and P are typically enriched by the canopy (Brown 1982). Caterpillars in the canopy can contribute substantial amounts of both N and P through their excreta and feces (Szabó & Csortos 1975), presumably recycling that which is stored in leaves and thus including nutrients that originated in the soil. Mn is rich in litter, but apparently not in the soil, and may also possibly be leached from the canopy (Brown 1982).
In a lab study of Mnium hornum (Figure 43), Thomas (1970) found that the moss could obtain an adequate supply of Ca and Mg from the substrate below, but that K and P concentrations were less than those found in the soil, suggesting that these nutrients required additional input from precipitation, dustfall, or throughfall. Longton and
Chapter 8-1: Nutrient Relations: Requirements 8-1-19
Greene (1979) showed similar relationships with Pleurozium schreberi (Figure 31). The plants had nutrient deficiency symptoms unless additional nutrients were supplied to the leaves. Precipitation and litterfall in the boreal forest were unable to supply sufficient Ca, Mg, and K for P. schreberi (Brown 1982) so we must consider that precipitation, dustfall, and substrate are all needed to meet the nutrient demands of at least some bryophytes.
Figure 43. Mnium hornum with capsules, a species that
obtains Ca and Mg from the substrate below, but requires additional sources for K and P. Photo by Michael Lüth, with permission.
For the endohydric (moving water internally) Polytrichum (Figure 44) species, inorganic bulk precipitation of N and dust does not account for the entire N input (Bowden 1991). Even when biological nitrogen fixation by associated organisms is included, 35% of the N that has been accumulated by the plant is unaccounted for. Bowden attributed these missing sources to bulk precipitation of organic nitrogen, dry deposition, and dew. Most likely some soil input was also involved, whether directly through rhizoids or by upward movement through external capillary action. Furthermore, we cannot ignore the possibility of transfer from litter and other sources through mycorrhizae ("root"-fungal associations), as we will discuss later in this subchapter. Nevertheless, at least 58% of the N in the plant came from bulk precipitation.
Figure 44. Polytrichum commune, an endohydric moss that
obtains its N from multiple sources. Photo by Michael Lüth, with permission.
Soil Several studies cited above have shown that nutrients
in rainfall are insufficient to account for the concentrations found in the mosses. Binkley and Graham (1981) found that precipitation could account for only 75% of the nitrogen in Eurhynchium oreganum (Figure 45) and Hylocomium splendens (Figure 41) in an old-growth Douglas fir (Pseudotsuga menziesii; Figure 46) forest, and they suggested these mosses might obtain some of their N from the underlying soil. Tamm (1953, 1964) felt that Hylocomium splendens was most likely to obtain its nutrients from accumulations on overlying shoots rather than from the soil by capillary action. But in the tundra Hylocomium splendens, Aulacomnium palustre (Figure 47), and Sphagnum (Figure 10, Figure 24-Figure 25) can obtain nitrogen (as ammonium, nitrate, and the amino acid glycine) from 3-8 cm soil depths (McKane et al. 1993). Perhaps the translocation of water upward by capillary action brings the nutrients up from lower soil depths. Or is there a fungal connection? In any event, soil seems to contribute to the moss nutrient supply. This concept of soil contributions is further supported by a study on Pleurozium schreberi (Figure 31), another pleurocarpous feather moss with a growth form similar to that of Hylocomium splendens, that can obtain calcium from CaCO3 in soil as well as from dilute solutions on its leaves (Bates & Farmer 1990).
Figure 45. Eurhynchium oreganum, a moss that seems to
obtain some of its N from the soil, but the rest from precipitation. Photo by Adolf Ceska, with permission.
Figure 46. Pseudotsuga menziesii and Pinus ponderosa
forest. Photo by Jsayre64, through Creative Commons.
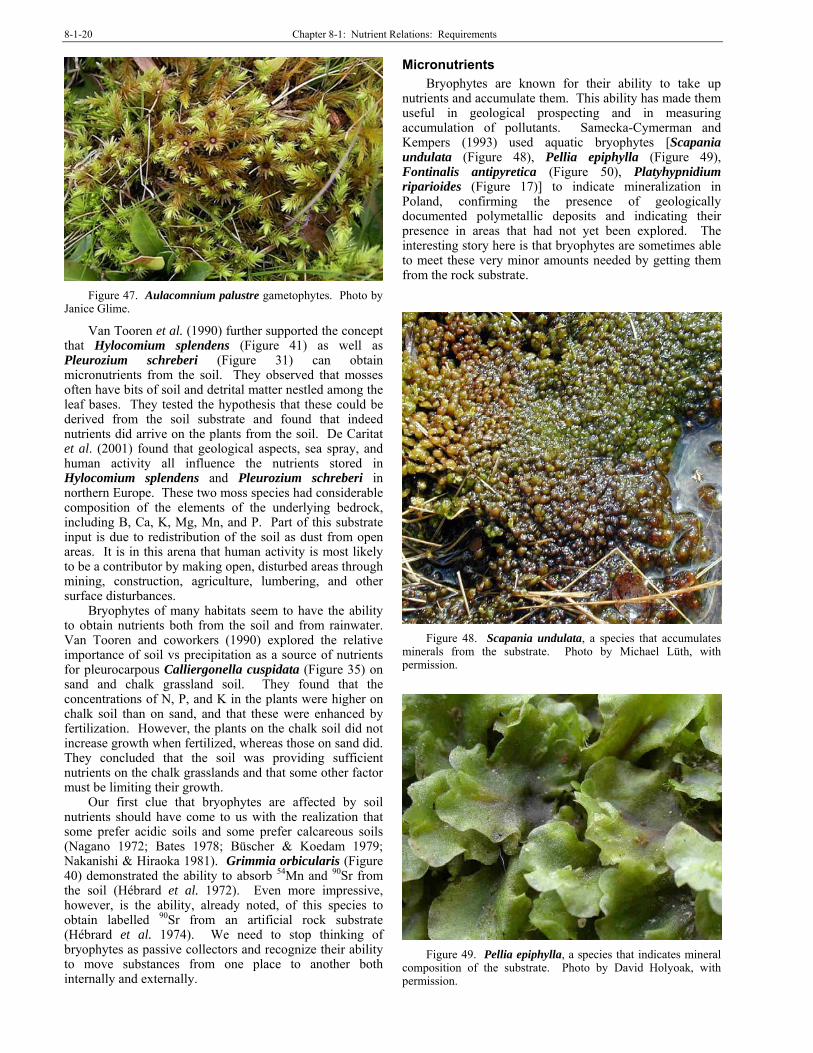
8-1-20 Chapter 8-1: Nutrient Relations: Requirements
Figure 47. Aulacomnium palustre gametophytes. Photo by
Janice Glime.
Van Tooren et al. (1990) further supported the concept that Hylocomium splendens (Figure 41) as well as Pleurozium schreberi (Figure 31) can obtain micronutrients from the soil. They observed that mosses often have bits of soil and detrital matter nestled among the leaf bases. They tested the hypothesis that these could be derived from the soil substrate and found that indeed nutrients did arrive on the plants from the soil. De Caritat et al. (2001) found that geological aspects, sea spray, and human activity all influence the nutrients stored in Hylocomium splendens and Pleurozium schreberi in northern Europe. These two moss species had considerable composition of the elements of the underlying bedrock, including B, Ca, K, Mg, Mn, and P. Part of this substrate input is due to redistribution of the soil as dust from open areas. It is in this arena that human activity is most likely to be a contributor by making open, disturbed areas through mining, construction, agriculture, lumbering, and other surface disturbances.
Bryophytes of many habitats seem to have the ability to obtain nutrients both from the soil and from rainwater. Van Tooren and coworkers (1990) explored the relative importance of soil vs precipitation as a source of nutrients for pleurocarpous Calliergonella cuspidata (Figure 35) on sand and chalk grassland soil. They found that the concentrations of N, P, and K in the plants were higher on chalk soil than on sand, and that these were enhanced by fertilization. However, the plants on the chalk soil did not increase growth when fertilized, whereas those on sand did. They concluded that the soil was providing sufficient nutrients on the chalk grasslands and that some other factor must be limiting their growth.
Our first clue that bryophytes are affected by soil nutrients should have come to us with the realization that some prefer acidic soils and some prefer calcareous soils (Nagano 1972; Bates 1978; Büscher & Koedam 1979; Nakanishi & Hiraoka 1981). Grimmia orbicularis (Figure 40) demonstrated the ability to absorb 54Mn and 90Sr from the soil (Hébrard et al. 1972). Even more impressive, however, is the ability, already noted, of this species to obtain labelled 90Sr from an artificial rock substrate (Hébrard et al. 1974). We need to stop thinking of bryophytes as passive collectors and recognize their ability to move substances from one place to another both internally and externally.
Micronutrients Bryophytes are known for their ability to take up
nutrients and accumulate them. This ability has made them useful in geological prospecting and in measuring accumulation of pollutants. Samecka-Cymerman and Kempers (1993) used aquatic bryophytes [Scapania undulata (Figure 48), Pellia epiphylla (Figure 49), Fontinalis antipyretica (Figure 50), Platyhypnidium riparioides (Figure 17)] to indicate mineralization in Poland, confirming the presence of geologically documented polymetallic deposits and indicating their presence in areas that had not yet been explored. The interesting story here is that bryophytes are sometimes able to meet these very minor amounts needed by getting them from the rock substrate.
Figure 48. Scapania undulata, a species that accumulates
minerals from the substrate. Photo by Michael Lüth, with permission.
Figure 49. Pellia epiphylla, a species that indicates mineral
composition of the substrate. Photo by David Holyoak, with permission.

Chapter 8-1: Nutrient Relations: Requirements 8-1-21
Figure 50. Fontinalis antipyretica, a species that has been
used to indicate metal deposits. Photo by Michael Lüth, with permission.
Litter and the Role of Trees Parker (1983) suggested that atmospheric nutrients
include both dry and wet deposition that not only can provide nutrients to the mosses directly but that also can enrich the litter (and leaves on the trees), permitting the leaves to provide nutrients to the mosses secondarily (see Table 2). Brachythecium rutabulum (Figure 51) achieved its greatest biomass gain when it was in contact with the stem litter of Urtica dioica, apparently intercepting the nutrients in decay products. In a different study, Bates (1992) has related nutrient source to growth rate, concluding that in the rapid-growing species Brachythecium rutabulum, mineral inputs from seasonally deposited tracheophyte litter are especially important.
Figure 51. Brachythecium rutabulum, a species that obtains
nutrients from tracheophyte litter. Photo by Michael Lüth, with permission.
Table 2. Nutrient inputs and moss accumulation in an oakwood in Wales. Based on Rieley et al. (1979).
mg m-2 yr-1 K Ca Mg Na throughfall 1900 1000 1390 10380 litterfall 1920 2100 420 310 bryophyte accumulation 1430 410 390 160
Dicranum polysetum (Figure 52), Ptilidium ciliare (Figure 53), and Ptilium crista-castrensis (Figure 54) intermixed in a mat of Pleurozium schreberi (Figure 31) all experienced enhanced growth from an application of thick needle litter (Frego & Carleton 1995). But we must again question if fungi have a role here, taking from the litter and supplying to the moss. Nevertheless, litter seems to play an important role in providing a nutrient supply.
Figure 52. Dicranum polysetum with capsules and litter that
serves as a source of its nutrients. Photo by Janice Glime.
Figure 53. Ptilidium ciliare, a species that benefits from
nutrients in needle litter. Photo by Janice Glime.
Figure 54. Ptilium crista-castrensis, a species that benefits
from nutrients in conifer needles. Photo by Adolf Ceska, with permission.

8-1-22 Chapter 8-1: Nutrient Relations: Requirements
Although epiphytic bryophytes (those living on other plants) do not penetrate their substrate to obtain nutrients, they can benefit from nutrients flowing down the bole (main trunk) of a tree, some of which are derived from internal metabolites of that tree. Hoffman (1972) found that bryophytes and lichens at the bases of Liriodendron tulipifera (tulip tree) recovered 9% of labelled cesium that had been injected into the tree trunk. This illustrates the cycling of nutrients from the tree, probably through leachates (solution that percolates through canopy), to the bryophyte layer. The tree base likewise is the recipient of considerable stemflow that carries with it nutrients washed off the leaves and branches. Hence, the bryophytes at the tree base benefit from both leachates from the leaves and from accumulated dust that may contain important nutrients (Figure 55). Fluctuations in K, Ca, and Mg in nature suggested that appreciable quantities are absorbed by bryophytes during autumn from leaf leachates (Bates 1989). Of course, this also makes epiphytes vulnerable to concentrated pollutants in areas where the tree leaves are able to collect these.
Figure 55. Dicranum scoparium growing at tree base where
it collects stemflow nutrients and escapes burial by leaf litter. Photo by Janice Glime.
Even in bogs, the critical nutrient potassium, as well as manganese, becomes available to Sphagnum (Figure 10, Figure 24-Figure 25) in ombrotrophic bogs through litter decomposition (Malmer 1988).
The more we learn about bryophyte nutrient relationships, the more we realize that they are no simpler than are those of the tracheophytes. Each nutrient and each species must be examined for its own uniqueness, and thus far, we lack sufficient evidence to correlate functional groupings (those having similar roles in the ecosystem) with taxonomic or morphological groupings.
Decomposition The phenomenon that keeps the Earth from running
out of nutrients is decomposition. Through a series of breakdowns, organisms return their nutrients to the soil or other substrate. Even bryophytes participate in this process, albeit usually slowly. Rather than losing leaves annually like trees, or dying back and regrowing from underground parts, most bryophytes die from the base while still growing at the tips.
In the taiga, bryophytes form the dominant cover and provide considerable primary productivity in the scheme of things (Oechel & Van Cleve 1986). With this dominance in the ground cover, they play a major role in rapid nutrient absorption, thereby having a large role in controlling ecosystem function. They are able to collect nutrients from dust, incorporate it, and release it slowly. In this way, bryophytes act as nutrient sinks.
In a study to understand the effect of climate change on Arctic ecosystems, Lang et al. (2009) measured decomposition rates of bryophytes, lichens, and tracheophytes over a 2-year period. Mass loss (decomposition) in tracheophytes was 56%, lichens 44%, and bryophytes a paltry 11%. Nevertheless, percentage loss in cryptogams (bryophytes and lichens) varied considerably among species. In particular, Sphagnum (Figure 10, Figure 24-Figure 25) loss was much slower than that of other mosses and liverworts. Mass loss of non-Sphagnum mosses correlated with the initial N in the plants, a phenomenon that may relate to their nutritive value to the decomposers.
Brock and Bregman (1989) likewise found that organic weight loss during decomposition of the fen moss Sphagnum fallax (Figure 26) was low. However, the release of N, P, and K (especially) was in greater proportion than that of organic matter loss. These soluble nutrients could easily leak out from damaged membranes of dead or desiccated cells. But despite this, N and P remained as a large proportion of remaining tissues even 12 months after decay initiated. Instead, they found that after a year of death, the cells demonstrated little damage and were poorly colonized by microorganisms.
The same sequestration seen in the Arctic is also present in the tropics. Tropical epiphytic bryophytes are known to sequester N collected from dust and the atmosphere, putting it into recalcitrant forms that remain in the canopy (Clark et al. 1998a, b).
What seems to be a common theme in bryophyte decomposition is that it is slow: Russell 1990 – tundra; Verhoeven & Toth 1995 – Sphagnum (Figure 10, Figure 24-Figure 25); Hobbie 1996 – tundra; Sand-Jenson et al. 1999 – Arctic lakes; Liu et al. 2000 – montane moist evergreen broad-leaved forest; Moore et al. 2007 – temperate peatlands; Turetsky et al. 2008 – Sphagnum in boreal peatlands; Lang et al. 2009 – subArctic. This makes the bryophytes a nutrient sink compared to other plant species in most ecosystems. This implies that they get most of their decomposition nutrients from litter decomposition of tracheophytes, not from recycled nutrients from their own tissues.
Snow
We know that snow forms around dust particles in the atmosphere and thus brings nutrients to the soil, efficiently removing them from the atmosphere (Woolgrove & Woodin 1996). As snow partially melts throughout the winter, melt water supplies nutrients to the soil below. When the weather warms in the spring and the snow melts quickly, it typically melts in a flush.
But what role does it have in supplying nutrients to the bryophytes? Are they able to take up nutrients at these near-freezing temperatures? Can they store nutrients to prepare for their spring flush of growth? And what role

Chapter 8-1: Nutrient Relations: Requirements 8-1-23
does spring melt play in providing a flush of nutrients to be grabbed by mosses before they can reach the soil? Do mosses then serve as sinks, releasing nutrients later as the summer warms and the mosses become desiccated and leak their precious nutrient supply? Or are the mosses damaged and leaking themselves, unable to take advantage of this flush until they have accomplished their own new growth?
If the mosses are able to trap cations on exchange sites, even though they cannot yet absorb and use them, this could later provide a nutrient supply to the roots of tracheophytes at a time when their resources are dwindling, but when they are still actively growing and needing them. Or, bryophytes could deprive them of these atmospheric nutrients by trapping and holding them for an extended period of time – or indefinitely. And how are the important anions held, like NO3
- and PO4
-3? Certainly nitrogen compounds arrive in this way, suggesting that mosses may take them in immediately if they are removing them from the system.
Woolgrove and Woodin (1996) examined the effect of snowmelt and nitrate uptake in the moss Kiaeria starkei (Figure 56) at a snowbed in the Cairngorm Mountains of Scotland. They found that although the conditions under the snow are unsuitable for photosynthetic activity due to the low light intensity, this moss is capable of photosynthesis as soon as the snow cover is removed. Tissue chlorophyll increases by 250% and carbohydrate concentrations increase 60% within only two weeks. This moss is also capable of nitrate reductase activity at temperatures as low as 2ºC and is thus able to assimilate more than 90% of the high levels of pollutant nitrate released during the melting season.
Figure 56. Kiaeria starkei, a moss capable of nitrate
reductase activity at 2°C. Photo by Michael Lüth, with permission.
On the other hand, in my moss garden in Houghton, Michigan, USA, in an area characterized by northern deciduous forest, the mosses and even the liverwort Marchantia polymorpha (Figure 3) are brown and appear dead when the snow recedes. Obviously there are still living tissues there because the mosses and the liverwort both produce new growth within a few weeks, dependent on adequate rainfall and temperature. But under these conditions, it would appear that the mosses should be more
poised to lose nutrients from these brown tissues than to gain them. Certainly more research is needed on the role of individual bryophyte species in sequestering and later releasing nutrients collected during a season of heavy snow. And what effect does a loading of heavy metals, sulfates, and nitrates have on the survival of the bryophyte layer following a sudden snowmelt release?
A further problem occurs once the snow melts in my moss garden. The snow melt water can be gone in a week, and instead of spring rains, this is typically followed by an extended dry period. In some years, it appears that this wet period is insufficient for them to recover before the drought and they can remain largely brown the entire growing season.
The Salmon Story and Other Animals
The salmon (Oncorhynchus spp.) are fish, so when I read the title of an article on uptake of salmon-derived nitrogen by mosses and liverworts, I was expecting a story about aquatic mosses (Wilkinson et al. 2005). However, instead I was soon reminded of the massive midge outbreaks in Iceland that bring the rich geothermal nutrient source of Icelandic lakes to the terrestrial scene, because these salmon are brought to land by their predators and the remains of the carcasses provide a nitrogen source. In both cases, an aquatic nutrient source is brought to land.
It appears that in at least one forested watershed in coastal British Columbia, Canada, the percent N in moss tissues, especially the common moss Rhytidiadelphus loreus (Figure 57), is higher in forest mosses below the falls where the salmon are than above the falls, where they are not. N content was higher in mosses near bony remains from previous years and near wildlife trails (Wilkinson et al. 2005). Seven of the eight bryophyte species examined exhibited decreasing N uptake with distance from the spawning region; the exception was Rhizomnium glabrescens (Figure 58), an epiphytic species that showed no relationship. Below the falls, the thallose liverworts Conocephalum conicum (Figure 59) and Pellia neesiana (Figure 60), both indicators of soil rich in nitrogen and calcium, had the greatest cover. Even species richness was higher in forest areas near the salmon stream than elsewhere.
Figure 57. Rhytidiadelphus loreus, a species that gets some
of its nutrients from salmon dropped on land by predators. Photo by Michael Lüth, with permission.

8-1-24 Chapter 8-1: Nutrient Relations: Requirements
Figure 58. Rhizomnium glabrescens, an epiphytic species
that does not benefit from salmon prey dropped on land. Photo by Matt Goff <www.sitkanature.org>, with permission.
Figure 59. Conocephalum conicum, a species that indicates
soil rich in N. Photo by Janice Glime.
Figure 60. Pellia neesiana, a species that indicates soil rich
in N. Photo by Jan-Peter Frahm, with permission.
Hilderbrand et al. (1999) determined that adult female brown bears (Figure 61) excrete as urine 97% of the N consumed from salmon. This most likely is distributed primarily along the wildlife trails. Thus, wolves, bears, and river otters contribute to the success of the bryophytes by bringing their dinner into the forest and leaving the scraps, but also as they venture through the forest by distributing the N as urine and possibly feces.
Figure 61. Brown bear catching salmon that will be carried
ashore to be eaten. Photo by Brian W. Schaller, through Creative Commons.
Fungal Partners
A long-neglected aspect of bryophyte nutrient uptake is that of mycorrhizal (fungal-"root" symbiosis) associations. This has gotten somewhat recent attention and needs to be considered in understanding bryophyte nutrient relations. Details of studies will be covered in Volume 2 on Interactions – Fungi.
We know that conifers and orchids depend on fungal partners to obtain nutrients, and indeed it may be the case for all forest trees. Now we know that it is a part of some bryophyte relationships, but we lack sufficient data to determine how widespread it is.
In the boreal forest, mycorrhizae are therefore of critical importance. And that forest floor is dominated by feather mosses. Mosses can release significant quantities of N and P from their shoots, especially after drying (Carleton & Read 1991). More of this is released from dead and senescent (growing old) parts than from the green parts. Leakage of the sugars glucose, fructose, and sucrose from dry moss shoots is sufficient to support growth of three mycorrhizal fungi in pure culture, so we might hypothesize that the bryophytes at least are capable of enhancing the growth of the tree mycorrhizal fungi. When moss shoots were added to the cultures, the fungi readily colonized them, especially in the senescent regions. Labelled phosphate and carbon previously "fed" to the moss shoots were absorbed by the mycorrhizae and transferred across centimeters to roots infected with these fungi. The extent to which the bryophytes are important in this relationship remains to be investigated.
This raises the question of the value of mycorrhizae to bryophytes. The achlorophyllous (lacking chlorophyll) liverwort Cryptothallus mirabilis (Figure 62) is unable to fix its own carbon through photosynthesis. Both this species and its photosynthetic sister species Aneura pinguis (Figure 63) interact with endophytic (living within a plant) Basidiomycetes – the group of fungi responsible for producing all the mushrooms (Ligrone et al. 1993). In Cryptothallus, the young fungal hyphae contain abundant glycogen (carbohydrate – polysaccharide that forms glucose on hydrolysis) and sometimes amyloid (starch-like protein) deposits within the Cryptothallus. The fungi associated with both genera very closely match those of orchids – a group with obligate mycorrhizal associates.

Chapter 8-1: Nutrient Relations: Requirements 8-1-25
Figure 62. Cryptothallus mirabilis, a species that obtains its
carbon and most likely other nutrients through a fungal partner. Photo by David Holyoak, with permission.
Figure 63. Aneura pinguis, a photosynthetic close relative
of Cryptothallus mirabilis, that has similar mycorrhizal fungi. Photo by Michael Lüth, with permission.
pH Relationships It is not unusual to find bryophytes in habitats with low
pH. Merunkova and Chytry (2012) reported that bryophytes in upland grasslands of the southern Czech Republic were mostly on the low-pH soils that were low in Ca and P, as well as on organic soils. Underwater bryophytes are relatively rare in limestone streams where the carbon is present as carbonate and not as free CO2 (pers. obs.). This is discussed further in the subchapter on CO2 in this volume.
The pH not only affects the nutrient uptake ability of the bryophytes, but also can affect the toxicity of such minerals as aluminium (Al) (Bates 1992). Low pH makes many minerals, including Al, more soluble. In most cases, this increases the ability of the minerals to enter the bryophyte along with water. Bates found that in woodland soil and on rock substrates, the bryophyte cation exchange capacity (CEC) decreased with decreased Ca and the pH in the substrate.
On the margins of forested stream channels, Hylander and Dynesius (2006) found that mosses were more influenced by the pH than were liverworts. They furthermore found that having pockets with higher pH increased the bryophyte richness. Corrales et al. (2010)
found that pH was one of three factors in determining bryophyte distribution in secondary and planted montane forests in the Central Cordillera of Colombia. Low pH is a major factor in making nutrients available.
Protective Devices As already seen, not all minerals are good minerals.
At low pH levels, aluminium becomes soluble – and toxic. For some heavy metals the cation exchange sites serve as protection, binding the metals and thus immobilizing them.
The toxic heavy metal lead is accumulated in large quantities in cell walls, but also can occur in the cytoplasm (Basile et al. 1994). In bryophytes it accumulates preferentially in gametophyte hydroids (water-conducting cells in mosses), sporophyte hydroids at the foot, and transfer cells adjoining the sporophyte. It also occurs in the cytoplasm, chloroplasts, mitochondria, vacuoles, and cytoplasmic reticulum. In Funaria hygrometrica (Figure 2), the lead is sequestered in tissues, preventing it from reaching the seta and capsules where it could damage developing spores. The placenta that joins the gametophyte and sporophyte blocks the transfer of lead to the sporophyte.
Seasonal Nutrient Behavior Seasonal differences in available nutrients result from
litter fall, snow melt, flooding, runoff, available moisture, and seasonal deposition from some kinds of pollution. Nutrient availability may be further mediated by changes in biological needs during the changing life cycle stages of the bryophytes and the tracheophytes that surround them.
Bryophytes, like tracheophytes, have different needs for nutrients in different seasons, and their uptake and movement of those nutrients likewise differs with the seasons. For example, in the boreal feather moss Hylocomium splendens (Figure 41), airborne nutrients dominate uptake to the growing tissues during winter in a pine forest in Latvia; Ca and Mg are held in green tissues (Brümelis et al. 2000). During the relatively dry autumn, Mg is transferred from older brown and decaying tissues upward to the young tissues, but Ca is not.
Snow concentrates nutrients and releases them in a spring pulse (Brümelis et al. 2000). Yet, despite the fluctuations of availability of nutrients in the surrounding environment, there is no evidence that bryophytes suffer leaching as a means of maintaining chemical equilibrium with their environment. The cell membranes must therefore control the entry and exit of ions.
The forest floor moss Brachythecium rutabulum (Figure 51) exploits seasonally deposited vascular plant litter (Bates 1992). Pseudoscleropodium purum (Figure 8) seems to depend largely on wet deposition for minerals, making its greatest nutrient availability during the season(s) with the most rainfall. But in their study of Hylocomium splendens (Figure 41) and Pleurozium schreberi (Figure 31), Berg and Steinnes (1997) found no variations in the element concentrations on different dates in the sampling season. This again raises the question of whether bryophytes are able to regulate their nutrient concentrations, and if so, how?
Markert and Weckert (1989) examined minor elements in Polytrichastrum formosum (Figure 64), a weedy species in Europe but somewhat rare in North America. They

8-1-26 Chapter 8-1: Nutrient Relations: Requirements
found considerable variation between stands as well as between seasons. K had little seasonal variation; Al, Fe, Cr, Mg, Pb, and Ti had roughly 80% variation, with their highest concentrations in winter and lowest in summer.
Figure 64. Polytrichastrum formosum with capsules, a
species that has considerable variation in nutrient content among locations. Photo by David T. Holyoak, with permission.
Because of their ability to take up large quantities of heavy metals, bryophytes have been used for monitoring heavy metal pollution, as has been discussed already in several books. These bryophytes often exhibit symptoms of excess, including chlorosis (loss of chlorophyll), brown tips (Figure 19), and plasmolysis (shrinkage of protoplast of plant cell resulting from loss of water from cell; results in space between cell membrane and cell wall) (Figure 22). In other cases, the damage is so great that membrane integrity is lost and the cells exhibit deplasmolysis (swelling of the cytoplasm of a previously plasmolyzed cell; reversal of plasmolysis) (Figure 22).
Richardson (1981) suggested that there are greater seasonal fluctuations in ectohydric mosses like Aulacomnium sp. (Figure 47) than in endohydric ones like Polytrichum (Figure 44) due to the ability of ectohydric mosses to absorb nutrients throughout the plant. In the black spruce forests (Figure 27) of Alaska, Polytrichum (Polytrichastrum?) had its highest phosphate uptake rates in below-ground portions. But we must also consider that this moss has ectohydric movement of water that carries water and nutrients to the apex where they are absorbed. The leaves rehydrate slowly, suggesting that they are more water repellant than absorptive.
Williams et al. (1999) compared the seasonal nitrogen dynamics in two Sphagnum species: S. capillifolium (Figure 32) occupying hummocks and S. recurvum (Figure 33) in hollows. Rather than rely on natural sources, the researchers added labelled NH4NO3 at the levels in the ecosystem where the mosses lived. The proportion of labelled N in the mosses ranged from 11 to 100% during the 14-month study. The lowest measurements occurred in October when the water table reached the surface of the mosses. This was particularly true for S. recurvum. A very small amount of the labelled N was detected as dissolved organic nitrogen in the moss water. There were also times when they could not account for a large proportion of the added N.
In Sphagnum (Figure 10, Figure 24-Figure 25) in the southern Alps, Na, Mg, and to a lesser extent Ca, became progressively more concentrated in the tissues as the growing season progressed; N, and to a lesser extent, P, were enriched in the photosynthetic cells during this period of intense growth, but were leaked from the cells when the growth rate slowed (Gerdol 1990). Likewise, during cold months, Na, Mg, and Ca were leached from the cell walls.
Bryophyte growth periodicity can differ between years, being influenced by precipitation (Brock & Bregman 1989). And surprisingly, capsules of Sphagnum fallax (Figure 26) in a fen woodland were formed only during the dry year, somewhat reminiscent of flowering plants that bloom in response to drying conditions or algae that reproduce sexually when nutrients begin to diminish in the water.
Streams have seasonal pulses in nutrients, with the largest usually corresponding to snowmelt and spring runoff. In an acidic stream in Northeast England, Ellwood and Whitton (2007) found that organic phosphate, the form used by those bryophytes, reaches a high peak in late spring. In the moss Warnstorfia fluitans (Figure 9) this peak coincided with higher concentrations of organic P.
On the other hand, in their study of the aquatic mosses Fontinalis antipyretica (Figure 50) and F. squamosa (Figure 65) in a mountain stream in Spain, Mártínez Abaigar and coworkers (2002) found that concentrations of K, Fe, P, and N increased in every portion of the plant through summer and autumn and decreased through winter and spring. Since these concentrations did not track the concentrations of the stream water, they presumed that the concentrations of the mobile elements depended on the growth cycle. Na increased in the plants in winter, presumably as a result of winter deicing salts. Ca and Mg seemed to fluctuate randomly throughout the plant.
Figure 65. Fontinalis squamosa, a species that increases its
concentrations of K, Fe, P, and N throughout the plant in summer and autumn. Photo by Janice Glime.
It is hard to generalize from the few studies presented here (see Table 3), but it appears that minor elements may be high in the plants in winter when they are not being used and that the three major elements (N, P, K) are relatively conserved throughout the year. Translocation can provide mobile nutrients from older parts to younger parts prior to and during early stages of growth, thus maintaining sufficient nutrient supply to support the relatively slow growth rate of a bryophyte.

27
Table 3. Seasons of uptake and loss of nutrients in bryophytes from different habitats. + indicates uptake for that group; - indicates loss for group; no symbol indicates season of highest concentration. These positions should not be interpreted as representative as so few bryophytes have been evaluated seasonally.
Species Spring Summer Autumn Winter Reference Hylocomium +Ca,Mg Brümelis et al. splendens 2000 Fontinalis +K,Fe,P,N +K,Fe,P,N +K,Fe,P,N Na Mártínez Abaigar antipyretica et al. 2002 Sphagnum +N,Na,Mg,Ca +P,Na,Mg,Ca -N,P,Ca,Mg,Na Gerdol 1990 Polytrichastrum K Ba,Ca,Cd,Cu,Sr,Mg,Zn Markert & Weckert formosum Al,Fe,Cr,Mg,Pb,Ti, 1989
Effects on Species Composition When nutrients increase, it is not unusual for
bryophyte cover to decline and even disappear (Arróniz-Crespo et al. 2008). In an acidic grassland, Arróniz-Crespo and coworkers found that up to 90% of the bryophyte cover was lost due to enhanced nitrogen deposition. The tissue N:P ratio increased up to three times the original levels. They concluded that it was the limitation by phosphorus that caused damage to photosystem II and consequently caused loss of bryophyte biomass. Pigment concentrations and chlorophyll fluorescence were also affected.
We have seen that bryophytes often do not benefit from added N. Armitage et al. (2010) found that high N concentrations in alpine mosses can lead to a decline in production of biomass, reducing the cover of bryophytes. In Sphagnum (Figure 10, Figure 24-Figure 25) bogs, higher N can increase productivity of tracheophytes and consequently reduce the competitiveness of the bryophytes (Berendse et al. 2001). On the other hand, Sphagnum is a major sink for the sequestration of carbon in the Northern Hemisphere. Elevated CO2 has little effect on Sphagnum biomass and N depresses it due to increased competitive growth of tracheophytes and the moss Polytrichum strictum (Figure 66). Loss of Sphagnum can reduce the sequestration of carbon.
Figure 66. Polytrichum strictum, a species that can
outcompete Sphagnum when given an enhanced N source. Photo by Michael Lüth, with permission.
When Armitage et al. (2010) did transplant experiments with alpine Racomitrium lanuginosum
(Figure 5), they found that after 2 years, tissue N in transplants from high N sites to a lower site only partially equilibrated to its new N availability. On the other hand, reciprocal transplants to the higher N regions almost matched the N concentrations of the native plants. The surprise was that mosses experienced greater shoot growth when stimulated by higher N deposition. In the lower N site, moss depth and biomass increased in transplants, apparently due to a lower C:N ratio that slowed decomposition.
Summary Although there seems to be little in the way of a
comprehensive summary of bryophyte nutrient processes in nature, there are many pieces from which a somewhat clear picture emerges. First off, bryophytes can receive their nutrients from the substrate as well as from precipitation and dust. Those forming thick but horizontal mats are more likely to depend predominantly on precipitation, whereas acrocarpous mosses may receive considerable input from the substrate through upward movement externally and subsequent internal movement.
Bryophytes can suffer osmotic shock when transferred to substrates with high nutrients and most lack sufficient wax in the cuticle to help slow the process. They require the same nutrients as tracheophytes (CHOPKNS Mg CaFe), but in lower concentrations. Needs of young shoots are greater than those of older shoots and nutrients may be moved from old to young tissues. Bryophytes trap nutrients leached from the canopy and may provide it to roots of trees, especially spruce trees, possibly through mycorrhizae. Ca and Mg can be obtained from the soil, but K and P require additional sources. Litter of herbaceous and woody plants may supply some of the needed nutrients, provided they don't bury the plants or damage them with tannic acid. Snow collects dust particles and these go into solution as the snow melts, dripping down on the bryophytes. Fungal partners may transfer nutrients into the bryophytes or from the bryophyte mat to tree roots. Even salmon, dragged ashore by bears and other predators, contribute to bryophyte nutrients.
Nutrients tend to increase in bryophyte tissues in late summer and fall, then decrease in winter and spring when the plants are growing, but this varies with the
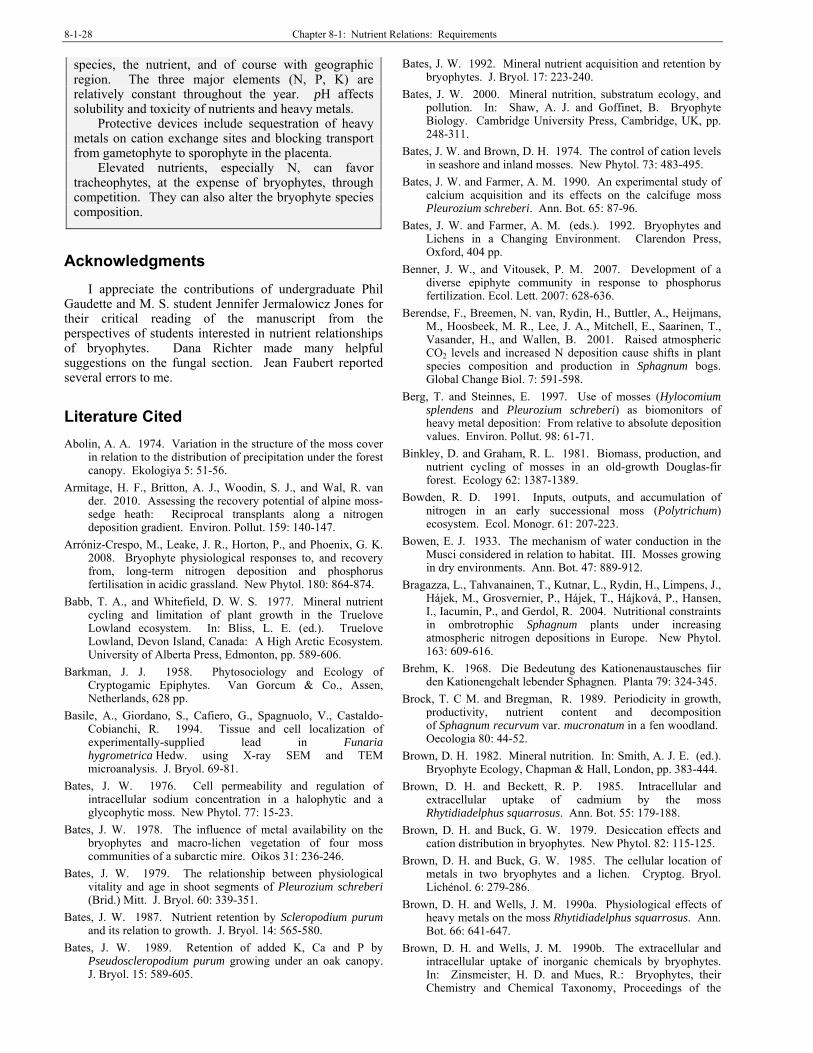
8-1-28 Chapter 8-1: Nutrient Relations: Requirements
species, the nutrient, and of course with geographic region. The three major elements (N, P, K) are relatively constant throughout the year. pH affects solubility and toxicity of nutrients and heavy metals.
Protective devices include sequestration of heavy metals on cation exchange sites and blocking transport from gametophyte to sporophyte in the placenta.
Elevated nutrients, especially N, can favor tracheophytes, at the expense of bryophytes, through competition. They can also alter the bryophyte species composition.
Acknowledgments
I appreciate the contributions of undergraduate Phil Gaudette and M. S. student Jennifer Jermalowicz Jones for their critical reading of the manuscript from the perspectives of students interested in nutrient relationships of bryophytes. Dana Richter made many helpful suggestions on the fungal section. Jean Faubert reported several errors to me.
Literature Cited Abolin, A. A. 1974. Variation in the structure of the moss cover
in relation to the distribution of precipitation under the forest canopy. Ekologiya 5: 51-56.
Armitage, H. F., Britton, A. J., Woodin, S. J., and Wal, R. van der. 2010. Assessing the recovery potential of alpine moss-sedge heath: Reciprocal transplants along a nitrogen deposition gradient. Environ. Pollut. 159: 140-147.
Arróniz-Crespo, M., Leake, J. R., Horton, P., and Phoenix, G. K. 2008. Bryophyte physiological responses to, and recovery from, long-term nitrogen deposition and phosphorus fertilisation in acidic grassland. New Phytol. 180: 864-874.
Babb, T. A., and Whitefield, D. W. S. 1977. Mineral nutrient cycling and limitation of plant growth in the Truelove Lowland ecosystem. In: Bliss, L. E. (ed.). Truelove Lowland, Devon Island, Canada: A High Arctic Ecosystem. University of Alberta Press, Edmonton, pp. 589-606.
Barkman, J. J. 1958. Phytosociology and Ecology of Cryptogamic Epiphytes. Van Gorcum & Co., Assen, Netherlands, 628 pp.
Basile, A., Giordano, S., Cafiero, G., Spagnuolo, V., Castaldo-Cobianchi, R. 1994. Tissue and cell localization of experimentally-supplied lead in Funaria hygrometrica Hedw. using X-ray SEM and TEM microanalysis. J. Bryol. 69-81.
Bates, J. W. 1976. Cell permeability and regulation of intracellular sodium concentration in a halophytic and a glycophytic moss. New Phytol. 77: 15-23.
Bates, J. W. 1978. The influence of metal availability on the bryophytes and macro-lichen vegetation of four moss communities of a subarctic mire. Oikos 31: 236-246.
Bates, J. W. 1979. The relationship between physiological vitality and age in shoot segments of Pleurozium schreberi (Brid.) Mitt. J. Bryol. 60: 339-351.
Bates, J. W. 1987. Nutrient retention by Scleropodium purum and its relation to growth. J. Bryol. 14: 565-580.
Bates, J. W. 1989. Retention of added K, Ca and P by Pseudoscleropodium purum growing under an oak canopy. J. Bryol. 15: 589-605.
Bates, J. W. 1992. Mineral nutrient acquisition and retention by bryophytes. J. Bryol. 17: 223-240.
Bates, J. W. 2000. Mineral nutrition, substratum ecology, and pollution. In: Shaw, A. J. and Goffinet, B. Bryophyte Biology. Cambridge University Press, Cambridge, UK, pp. 248-311.
Bates, J. W. and Brown, D. H. 1974. The control of cation levels in seashore and inland mosses. New Phytol. 73: 483-495.
Bates, J. W. and Farmer, A. M. 1990. An experimental study of calcium acquisition and its effects on the calcifuge moss Pleurozium schreberi. Ann. Bot. 65: 87-96.
Bates, J. W. and Farmer, A. M. (eds.). 1992. Bryophytes and Lichens in a Changing Environment. Clarendon Press, Oxford, 404 pp.
Benner, J. W., and Vitousek, P. M. 2007. Development of a diverse epiphyte community in response to phosphorus fertilization. Ecol. Lett. 2007: 628-636.
Berendse, F., Breemen, N. van, Rydin, H., Buttler, A., Heijmans, M., Hoosbeek, M. R., Lee, J. A., Mitchell, E., Saarinen, T., Vasander, H., and Wallen, B. 2001. Raised atmospheric CO2 levels and increased N deposition cause shifts in plant species composition and production in Sphagnum bogs. Global Change Biol. 7: 591-598.
Berg, T. and Steinnes, E. 1997. Use of mosses (Hylocomium splendens and Pleurozium schreberi) as biomonitors of heavy metal deposition: From relative to absolute deposition values. Environ. Pollut. 98: 61-71.
Binkley, D. and Graham, R. L. 1981. Biomass, production, and nutrient cycling of mosses in an old-growth Douglas-fir forest. Ecology 62: 1387-1389.
Bowden, R. D. 1991. Inputs, outputs, and accumulation of nitrogen in an early successional moss (Polytrichum) ecosystem. Ecol. Monogr. 61: 207-223.
Bowen, E. J. 1933. The mechanism of water conduction in the Musci considered in relation to habitat. III. Mosses growing in dry environments. Ann. Bot. 47: 889-912.
Bragazza, L., Tahvanainen, T., Kutnar, L., Rydin, H., Limpens, J., Hájek, M., Grosvernier, P., Hájek, T., Hájková, P., Hansen, I., Iacumin, P., and Gerdol, R. 2004. Nutritional constraints in ombrotrophic Sphagnum plants under increasing atmospheric nitrogen depositions in Europe. New Phytol. 163: 609-616.
Brehm, K. 1968. Die Bedeutung des Kationenaustausches fiir den Kationengehalt lebender Sphagnen. Planta 79: 324-345.
Brock, T. C M. and Bregman, R. 1989. Periodicity in growth, productivity, nutrient content and decomposition of Sphagnum recurvum var. mucronatum in a fen woodland. Oecologia 80: 44-52.
Brown, D. H. 1982. Mineral nutrition. In: Smith, A. J. E. (ed.). Bryophyte Ecology, Chapman & Hall, London, pp. 383-444.
Brown, D. H. and Beckett, R. P. 1985. Intracellular and extracellular uptake of cadmium by the moss Rhytidiadelphus squarrosus. Ann. Bot. 55: 179-188.
Brown, D. H. and Buck, G. W. 1979. Desiccation effects and cation distribution in bryophytes. New Phytol. 82: 115-125.
Brown, D. H. and Buck, G. W. 1985. The cellular location of metals in two bryophytes and a lichen. Cryptog. Bryol. Lichénol. 6: 279-286.
Brown, D. H. and Wells, J. M. 1990a. Physiological effects of heavy metals on the moss Rhytidiadelphus squarrosus. Ann. Bot. 66: 641-647.
Brown, D. H. and Wells, J. M. 1990b. The extracellular and intracellular uptake of inorganic chemicals by bryophytes. In: Zinsmeister, H. D. and Mues, R.: Bryophytes, their Chemistry and Chemical Taxonomy, Proceedings of the

Chapter 8-1: Nutrient Relations: Requirements 8-1-29
Phytochemical Society of Europe 29, Oxford University Press, Oxford, pp. 299-318.
Brümelis, G. and Brown, D. H. 1997. Movement of metals to new growing tissue in the moss Hylocomium splendens (Hedw.) BSG. Ann. Bot. 79: 679-686.
Brümelis, G., Lapina, L., and Tabors, G. 2000. Uptake of Ca, Mg and K during growth of annual segments of the moss Hylocomium splendens in the field. J. Bryol. 22: 163-174.
Burkholder, P. R. 1959. Organic nutrition of some mosses growing in pure culture. Bryologist 62: 6-15.
Büscher, P. and Koedam, N. 1979. Ecological aspects of cation adsorption of several mosses and ferns. Bull. Soc. Roy. Bot. Belg. 122: 216-229.
Caritat, P. De, Reimann, C., Bogatyrev, I., Chekushin, V., Finne, T. E, Halleraker, J. H., Kashulina, G., Niskavaara, H., Pavlov, V., and Aeyraes, M. 2001. Regional distribution of Al, B, Ba, Ca, K, La, Mg, Mn, Na, P, Rb, Si, Sr, Th, U and Y in terrestrial moss within a 188,000 km2 area of the central Barents region: Influence of geology, seaspray and human activity. Appl. Geochem. 16(2): 137-159.
Carleton, T. J. and Read, D. J. 1991. Ectomycorrhizas and nutrient transfer in conifer feather moss ecosystems. Can. J. Bot. 69: 778-785.
Chapin, F. S. III, Oechel, W. C., Cleve, K. van, and Lawrence, W. 1987. The role of mosses in the phosphorus cycling of an Alaskan black spruce forest. Oecologia 74: 310-315.
Christmas, M. and Whitton, B. A. 1998. Phosphorus and aquatic bryophytes in the Swale-Ouse river system, north-east England. 1. Relationship between ambient phosphate, internal N:P ratio and surface phosphatase activity. Sci. Tot. Environ. 210/211: 389-399.
Clark, K. L., Nadkarni, N. M., Schaefer, D., and Gholz, H. L. 1998a. Atmospheric deposition and net retention of ions by the canopy in a tropical montane forest, Monteverde, Costa Rica. J. Trop. Ecol. 14: 27-45.
Clark, D. L., Nadkarni, N. M., and Gholz, H. L. 1998b. Growth, net production, litter decomposition, and net nitrogen accumulation by epiphytic bryophytes in a tropical montane forest. Biotropica 30: 12-23.
Claveri, B. and Mouvet, C. 1995. Temperature effects on copper uptake and CO2 assimilation by the aquatic moss Rhynchostegium riparioides. Arch. Environ. Contam. Toxicol. 28: 314-320.
Clymo, R. S. 1963. Ion exchange in Sphagnum and its relation to bog ecology. Ann. Bot. N. S. 27: 309-324.
Clymo, R. S. 1973. The growth of Sphagnum: Some effects of environment. J. Ecol. 61: 849-869.
Corrales, A., Duque, A., Uribe, J. , and Londono, V. 2010. Abundance and diversity patterns of terrestrial bryophyte species in secondary and planted montane forests in the northern portion of the Central Cordillera of Colombia. Bryologist 113: 8-21.
Dietert, M. F. 1979. Some experiments with mosses cultured in the dark. Bryologist 82: 417-432.
Duprè, C., Stevens, C. J., Ranke, T., Bleeker, A., Peppler-Lisbach, C., Gowing, D. J. G., Dise, N. B., Dorland, E., Bobbink, R., and Diekmann, M. 2010. Changes in species richness and composition in European acidic grasslands over the past 70 years: The contribution of cumulative atmospheric nitrogen deposition. Global Change Biol. 16: 344-357.
Ellwood, N. T. W. and Whitton, B. A. 2007. Phosphatase activities of the aquatic moss Warnstorfia fluitans (Hedw.) Loeske from an acidic stream in North-East England. Hydrobiologia 575: 95-107.
Epstein, E. 1965. Mineral metabolism. In: Bonner, J. and Varner, J. E. (eds.). Plant Biochemistry. Academic Press, NY & London, pp. 438-466.
Ferris, R., Peace, A. J., Humphrey, J. W., and Broome, A. C. 2000. Relationships between vegetation, site type and stand structure in coniferous plantations in Britain. Forest Ecol. Mgmt. 163: 35-51.
Forsum, Å., Dahlman, L., Näsholm, T., and Nordin, A. 2006. Nitrogen utilization by Hylocomium splendens in a boreal forest fertilization experiment. Funct. Ecol. 20: 421-426.
Frego, K. A. and Carleton, T. J. 1995. Microsite tolerance of four bryophytes in a mature black spruce. Bryologist 98: 452-458.
Fries, N. 1945. Some experiments with mosses cultured in the dark. Bot. Not. 1945: 417-424.
Fulford, M., Carroll, G., and Cobbe, T. 1947. The response of Leucolejeunea clypeata to variations in the nutrient solution. Bryologist 50: 50: 131-146.
Gerdol, R. 1990. Seasonal variations in the element concentrations in mire water and in Sphagnum mosses on an ombrotrophic bog in the southern Alps. Lindbergia 16: 44-50.
Glime, J. M. and Keen, R. E. 1984. The importance of bryophytes in a man-centered world. J. Hattori Bot. Lab. 55: 133-146.
Glime, J. M., Wetzel, R. G., and Kennedy, B. J. 1982. The effects of bryophytes on succession from alkaline marsh to Sphagnum bog. Amer. Midl. Nat. 108: 209-223.
Gordon, C., Wynn, J. M., and Woodin, S. J. 2001. Impacts of increased nitrogen supply on high Arctic heath: The importance of bryophytes and phosphorus availability. New Phytol. 149: 461-471.
Gorham, E. and Tilton, D. L. 1978. The mineral content of Sphagnum fuscum as affected by human settlement. Can. J. Bot. 56: 2755-2759.
Hájek, T. and Adamec, L. 2009. Mineral nutrient economy in competing species of Sphagnum mosses. Ecol. Res. 24: 291-302.
Hébrard, J. P., Foulquier, L., and Grauby, A. 1972. L'utilisation d'une mousse terrestre (Grimmia orbicularis Bruch) comme indicateur de la présence de manganèse 54, de caesium 137 et de strontium 90. Radioprotection 7: 159-177.
Hébrard, J. P., Foulquier, L., and Grauby, A. 1974. Approche expérimentale sur les possibilités de transfert du 90Sr d'un substrat solide à une mousse terrestre: Grimmia orbicularis Bruch. Bull. Soc. Bot. France 121: 235-250.
Hepler, P. K. 2005. Calcium: A central regulator of plant growth and development. Plant Cell 17: 2142-2155.
Hilderbrand, G. V., Hanley, T. A., Robbins, C. T., and Schwartz, C. C. 1999. Role of brown bears (Ursus arctos) in the flow of marine nitrogen into a terrestrial ecosystem. Oecologia 121: 546-550.
Hobbie, S. E. 1996. Temperature and plant species control over litter decomposition in Alaskan tundra. Ecol. Monogr. 66: 503-522.
Hoffman, G. R. 1966. Ecological studies of Funaria hygrometrica (L.) Hedw. in eastern Washington and northern Idaho. Ecol. Monogr. 36: 157-180.
Hoffman, G. R. 1972. The accumulation of cesium-137 by cryptogams in a Liriodendron tulipifera forest. Bot. Gaz. (Crawfordsville) 133: 107-119.
Hylander, K. and Dynesius, M. 2006. Causes of the large variation in bryophyte species richness and composition among boreal streamside forests. J. Veg. Sci. 17: 333-346.
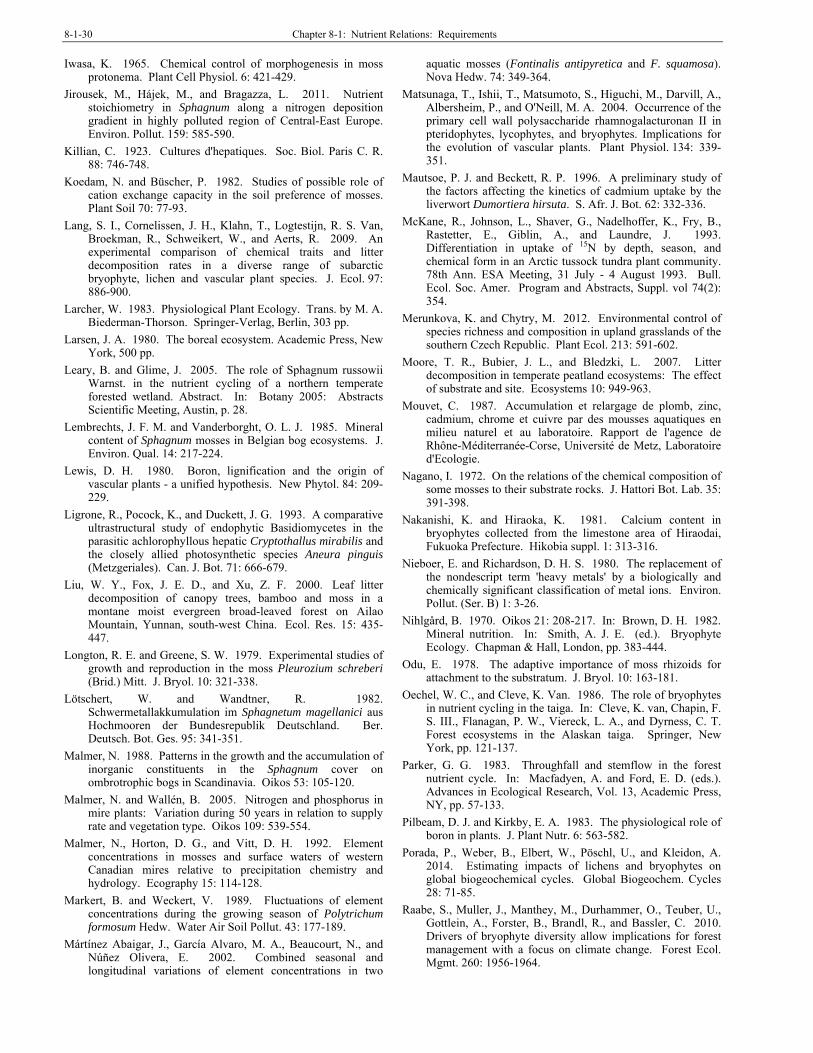
8-1-30 Chapter 8-1: Nutrient Relations: Requirements
Iwasa, K. 1965. Chemical control of morphogenesis in moss protonema. Plant Cell Physiol. 6: 421-429.
Jirousek, M., Hájek, M., and Bragazza, L. 2011. Nutrient stoichiometry in Sphagnum along a nitrogen deposition gradient in highly polluted region of Central-East Europe. Environ. Pollut. 159: 585-590.
Killian, C. 1923. Cultures d'hepatiques. Soc. Biol. Paris C. R. 88: 746-748.
Koedam, N. and Büscher, P. 1982. Studies of possible role of cation exchange capacity in the soil preference of mosses. Plant Soil 70: 77-93.
Lang, S. I., Cornelissen, J. H., Klahn, T., Logtestijn, R. S. Van, Broekman, R., Schweikert, W., and Aerts, R. 2009. An experimental comparison of chemical traits and litter decomposition rates in a diverse range of subarctic bryophyte, lichen and vascular plant species. J. Ecol. 97: 886-900.
Larcher, W. 1983. Physiological Plant Ecology. Trans. by M. A. Biederman-Thorson. Springer-Verlag, Berlin, 303 pp.
Larsen, J. A. 1980. The boreal ecosystem. Academic Press, New York, 500 pp.
Leary, B. and Glime, J. 2005. The role of Sphagnum russowii Warnst. in the nutrient cycling of a northern temperate forested wetland. Abstract. In: Botany 2005: Abstracts Scientific Meeting, Austin, p. 28.
Lembrechts, J. F. M. and Vanderborght, O. L. J. 1985. Mineral content of Sphagnum mosses in Belgian bog ecosystems. J. Environ. Qual. 14: 217-224.
Lewis, D. H. 1980. Boron, lignification and the origin of vascular plants - a unified hypothesis. New Phytol. 84: 209-229.
Ligrone, R., Pocock, K., and Duckett, J. G. 1993. A comparative ultrastructural study of endophytic Basidiomycetes in the parasitic achlorophyllous hepatic Cryptothallus mirabilis and the closely allied photosynthetic species Aneura pinguis (Metzgeriales). Can. J. Bot. 71: 666-679.
Liu, W. Y., Fox, J. E. D., and Xu, Z. F. 2000. Leaf litter decomposition of canopy trees, bamboo and moss in a montane moist evergreen broad-leaved forest on Ailao Mountain, Yunnan, south-west China. Ecol. Res. 15: 435-447.
Longton, R. E. and Greene, S. W. 1979. Experimental studies of growth and reproduction in the moss Pleurozium schreberi (Brid.) Mitt. J. Bryol. 10: 321-338.
Lötschert, W. and Wandtner, R. 1982. Schwermetallakkumulation im Sphagnetum magellanici aus Hochmooren der Bundesrepublik Deutschland. Ber. Deutsch. Bot. Ges. 95: 341-351.
Malmer, N. 1988. Patterns in the growth and the accumulation of inorganic constituents in the Sphagnum cover on ombrotrophic bogs in Scandinavia. Oikos 53: 105-120.
Malmer, N. and Wallén, B. 2005. Nitrogen and phosphorus in mire plants: Variation during 50 years in relation to supply rate and vegetation type. Oikos 109: 539-554.
Malmer, N., Horton, D. G., and Vitt, D. H. 1992. Element concentrations in mosses and surface waters of western Canadian mires relative to precipitation chemistry and hydrology. Ecography 15: 114-128.
Markert, B. and Weckert, V. 1989. Fluctuations of element concentrations during the growing season of Polytrichum formosum Hedw. Water Air Soil Pollut. 43: 177-189.
Mártínez Abaigar, J., García Alvaro, M. A., Beaucourt, N., and Núñez Olivera, E. 2002. Combined seasonal and longitudinal variations of element concentrations in two
aquatic mosses (Fontinalis antipyretica and F. squamosa). Nova Hedw. 74: 349-364.
Matsunaga, T., Ishii, T., Matsumoto, S., Higuchi, M., Darvill, A., Albersheim, P., and O'Neill, M. A. 2004. Occurrence of the primary cell wall polysaccharide rhamnogalacturonan II in pteridophytes, lycophytes, and bryophytes. Implications for the evolution of vascular plants. Plant Physiol. 134: 339-351.
Mautsoe, P. J. and Beckett, R. P. 1996. A preliminary study of the factors affecting the kinetics of cadmium uptake by the liverwort Dumortiera hirsuta. S. Afr. J. Bot. 62: 332-336.
McKane, R., Johnson, L., Shaver, G., Nadelhoffer, K., Fry, B., Rastetter, E., Giblin, A., and Laundre, J. 1993. Differentiation in uptake of 15N by depth, season, and chemical form in an Arctic tussock tundra plant community. 78th Ann. ESA Meeting, 31 July - 4 August 1993. Bull. Ecol. Soc. Amer. Program and Abstracts, Suppl. vol 74(2): 354.
Merunkova, K. and Chytry, M. 2012. Environmental control of species richness and composition in upland grasslands of the southern Czech Republic. Plant Ecol. 213: 591-602.
Moore, T. R., Bubier, J. L., and Bledzki, L. 2007. Litter decomposition in temperate peatland ecosystems: The effect of substrate and site. Ecosystems 10: 949-963.
Mouvet, C. 1987. Accumulation et relargage de plomb, zinc, cadmium, chrome et cuivre par des mousses aquatiques en milieu naturel et au laboratoire. Rapport de l'agence de Rhône-Méditerranée-Corse, Université de Metz, Laboratoire d'Ecologie.
Nagano, I. 1972. On the relations of the chemical composition of some mosses to their substrate rocks. J. Hattori Bot. Lab. 35: 391-398.
Nakanishi, K. and Hiraoka, K. 1981. Calcium content in bryophytes collected from the limestone area of Hiraodai, Fukuoka Prefecture. Hikobia suppl. 1: 313-316.
Nieboer, E. and Richardson, D. H. S. 1980. The replacement of the nondescript term 'heavy metals' by a biologically and chemically significant classification of metal ions. Environ. Pollut. (Ser. B) 1: 3-26.
Nihlgård, B. 1970. Oikos 21: 208-217. In: Brown, D. H. 1982. Mineral nutrition. In: Smith, A. J. E. (ed.). Bryophyte Ecology. Chapman & Hall, London, pp. 383-444.
Odu, E. 1978. The adaptive importance of moss rhizoids for attachment to the substratum. J. Bryol. 10: 163-181.
Oechel, W. C., and Cleve, K. Van. 1986. The role of bryophytes in nutrient cycling in the taiga. In: Cleve, K. van, Chapin, F. S. III., Flanagan, P. W., Viereck, L. A., and Dyrness, C. T. Forest ecosystems in the Alaskan taiga. Springer, New York, pp. 121-137.
Parker, G. G. 1983. Throughfall and stemflow in the forest nutrient cycle. In: Macfadyen, A. and Ford, E. D. (eds.). Advances in Ecological Research, Vol. 13, Academic Press, NY, pp. 57-133.
Pilbeam, D. J. and Kirkby, E. A. 1983. The physiological role of boron in plants. J. Plant Nutr. 6: 563-582.
Porada, P., Weber, B., Elbert, W., Pöschl, U., and Kleidon, A. 2014. Estimating impacts of lichens and bryophytes on global biogeochemical cycles. Global Biogeochem. Cycles 28: 71-85.
Raabe, S., Muller, J., Manthey, M., Durhammer, O., Teuber, U., Gottlein, A., Forster, B., Brandl, R., and Bassler, C. 2010. Drivers of bryophyte diversity allow implications for forest management with a focus on climate change. Forest Ecol. Mgmt. 260: 1956-1964.

Chapter 8-1: Nutrient Relations: Requirements 8-1-31
Richardson, D. H. S. 1981. The Biology of Mosses. John Wiley & Sons, Inc., N. Y., xii + 220 pp.
Rieley, J. O., Richards, P. W., and Bebbington, A. D. L. 1979. The ecological role of bryophytes in a North Wales woodland. J. Ecol. 67: 497-527.
Riis, T., Olesen, B., Katborg, C. K., and Christoffersen, K. S. 2010. Growth rate of an aquatic bryophyte (Warnstorfia fluitans (Hedw.) Loeske) from a high arctic lake: Effect of nutrient concentration. Arctic 63: 100-106.
Ron, E., Estébanez, B., Alfayate, C., Marfil, R., and Cortella, A. 1999. Mineral deposits in cells of Hookeria lucens. J. Bryol. 21: 281-288.
Rühling, Å. and Tyler, G. 1970. Sorption and retention of heavy metals in the woodland moss Hylocomium splendens (Hedw.) Br. et Sch. Oikos 21: 92-97.
Russell, S. 1990. Bryophyte production and decomposition in tundra ecosystems. Bot. J. Linn. Soc. 104: 3-22.
Sabovljević, M., Vukojević, V., Mihajlović, N., Dražić, G., and Vučinić, Ž. 2005. Determination of heavy metal deposition in the County of Obrenovac (Serbia). Using mosses as bioindicators. I. Aluminum (Al), Arsenic (As), and Boron (B). Arch. Biol. Sci. 57: 205-212.
Samecka-Cymerman, A. and Kempers, A. J. 1993. Scapania undulata (L.) Dum. and other aquatic bryophytes as indicators of mineralization in Poland. J. Geochem. Explor. 46: 325-334.
Samecka-Cymerman, A., Kempers, A. J., and Bodelier, P. L. E. 1991. Preliminary investigations into the background levels of various metals and boron in the aquatic liverwort Scapania uliginosa (Sw.) Dum. Aquat. Bot. 39: 345-352.
Sand-Jenson, K., Riis, T., Markager, S., and Vincent, W. F. 1999. Slow growth and decomposition of mosses in Arctic lakes. Can. J. Fish. Aquat. Sci. 56: 388-393.
Schlesinger, W. H. and Reiners, W. A. 1974. Deposition of water and cations on artificial foliar collectors in fir krummholz of New England mountains. Ecology 55: 378-386.
Schrijver, A. D., Frenne, P. D., Ampoorter, E., Nevel, L. V., Demey, A., and Wuyts, K. 2011. Cumulative nitrogen input drives species loss in terrestrial ecosystems. Global Ecol. Biogeogr. 20: 803-816.
Schuler, J. F., Diller, V. M., Fulford, M., and Kerstein, H. J. 1955. Culture studies on Sphaerocarpos. III. The utilization of nitrogen by Sphaerocarpos texanus. Plant Physiol. 30: 478-482.
Schwarzmaier, U. and Brehm, K. 1975. Detailed characterization of the cation exchanger in Sphagnum magellanicum Brid. Z. Pflanzenphysiol. 75: 250-255.
Schwoerbel, J. and Tillmanns, G. C. 1974. Assimilation of nitrogen from the medium and nitrate reductase activity in submerged macrophytes: Fontinalis antipyretica L. Arch. Hydrobiol. 47: 282-294.
Shakya, K., Chettri, M. K., and Sawidis, T. 2008. Impact of heavy metals (copper, zinc, and lead) on the chlorophyll content of some mosses. Arch. Environ. Contam. Toxicol. 54: 412-421.
Shaw, A. J. 1987a. Effect of environmental pretreatment on tolerance to copper and zinc in the moss Funaria hygrometrica. Amer. J. Bot. 74: 1466-1475.
Shaw, A. J. 1987b. Evolution of heavy metal tolerance in bryophytes II. An ecological and experimental investigation of the 'copper moss,' Scopelophila cataractae (Pottiaceae). Amer. J. Bot. 74: 813-821.
Shaw, A. J. 1988. Genetic variation for tolerance to copper and zinc within and among populations of the moss, Funaria hygrometrica Hedw. New Phytol. 109: 211-222.
Shaw, A. J. 1989. Metal tolerance in bryophytes. Chapt. 10. In: Shaw, A. J. (ed.). Heavy Metal Tolerance in Plants: Evolutionary Aspects. CRC Press, Boca Raton, FL, pp. 133-152.
Simola, L. K. 1975. The effect of several protein amino acids and some inorganic nitrogen sources on the growth of Sphagnum nemoreum. Physiol. Plant. 35: 194-199.
Southorn, A. D. L. 1977. Bryophyte recolonization of burnt ground with particular reference to Funaria hygrometrica. II. The nutrient requirements of Funaria hygrometrica. J. Bryol. 9: 361-373.
Spearing, A. M. 1972. Cation-exchange capacity and galacturonic acid content of several species of Sphagnum in Sandy Ridge Bog, central New York state Bryologist 75: 154-158.
Steinman, A. D. 1994. The influence of phosphorus enrichment on lotic bryophytes. Freshwat. Biol. 31: 53-63.
Stevens, C. J., Duprè, C., Dorland, E., Gaudnik, C., Gowing, D. J. G., Bleeker, A., Diekmann, M., Alard, D., Bobbink, R., Fowler, D., Corcket, E., Mountford, J. O., Vandvik, V., Aarrestad, P. A., Muller, S., and Disem, N. B. 2010. Nitrogen deposition threatens species richness of grasslands across Europe. Environ. Pollut. 158: 2940-2945.
Szabó, M. and Csortos, Cs. 1975. Acta Bot. Acad. Sci. Hung. 21: 419-432. In: Brown, D. H. 1982. Mineral nutrition. In: Smith, A. J. E. (ed.). Bryophyte Ecology. Chapman & Hall, London, New York, pp. 383-444.
Tamm, C. O. 1953. Growth, yield and nutrition in carpets of a forest moss (Hylocomium splendens). Medd. Stat. Skogsforskningsinst. 43: 124 pp.
Tamm, C. O. 1964. Growth of Hylocomium splendens in relation to tree canopy. Bryologist 67: 423-426.
Thomas, H. 1970. Ph. D. Thesis, University of Bristol.
Tooren, B. F. Van, Dam, D. Van, and During, H. J. 1990. The relative importance of precipitation and soil as sources of nutrients for Calliergonella cuspidata (Hedw.) Loeske in chalk grassland. Funct. Ecol. 4: 101-107.
Turetsky, M. R. 2003. The role of bryophytes in carbon and nitrogen cycling. Bryologist 106: 395-409.
Turetsky, M. R., Crow, S. E., Evans, R. J., Vitt, D. H., Wieder, R. K. 2008. Trade-offs in resource allocation among moss species control decomposition in boreal peatlands. J. Ecol. 96: 1297-1305.
Vázquez Castro, M. D., López, J., and Carballeira, A. 1999. Uptake of heavy metals to the extracellular and intracellular compartments in three species of aquatic bryophytes. Ecotoxicol. Environ. Safety Environ. Res. B 44: 12-24.
Verhoeven, J. T A. and Toth, E.. 1995. Decomposition of Carex and Sphagnum litter in fens: effect of litter quality and inhibition by living tissue homogenates. Soil Biol. Biochem. 27: 271-275.
Voth, P. D. 1943. Effects of nutrient-solution concentration on the growth of Marchantia polymorpha. Bot. Gaz. 104: 591-601.
Wang, C., Yin, L. J., and Zhu, R. L. 2014. The role of soil nitrogen and phosphorus in the distribution of Leucobryum juniperoideum in the Tianmu Mountain National Nature Reserve, Zhejiang, China. Bryologist 117: 54-61.
Weber, K. L. and Wiersma, G. B. 1998. Trace element concentrations in mosses collected from a treated experimental forest watershed. Toxicol. Environ. Chem. 65: 17-29.

8-1-32 Chapter 8-1: Nutrient Relations: Requirements
Weetman, G. F. 1968. The relationship between feather moss growth and the nutrition of black spruce. In: Lafleur, C. and Butler, J. (eds.). Proc. 3rd International Peat Congress, Quebec. Natl. Res. Council Canada, Ottawa, pp. 366-370.
Weetman, G. F. and Timmer, V. 1967. Feather moss growth and nutrient content under upland black spruce. Woodlands Research Index, Pulp and Paper Research Institute of Canada, Pointe Claire, P. Q., Canada 138: 1-38.
Welch, R. M. 1995. Micronutrient nutrition of plants. Crit. Rev. Plant Sci. 14: 49-82.
White, P. J. and Broadley, M. R. 2003. Calcium in plants. Ann. Bot. 92: 487-511.
Williams, B., Silcock, D., and Young, M. 1999. Seasonal dynamics of N in two Sphagnum moss species and the
underlying peat treated with 15NH4 15NO3. Biogeochem 45:
285-302.
Wilkinson, C. E., Hocking, M. D., and Reimchen, T. E. 2005. Uptake of salmon-derived nitrogen by mosses and liverworts in coastal British Columbia. Oikos 108: 85-98.
Wojtuń, B. 1994. Element contents of Sphagnum mosses of peat bogs of lower Silesia (Poland). Bryologist 97: 284-295.
Woolgrove, C. E. and Woodin, S. J. 1996. Ecophysiology of a snow-bed bryophyte Kiaeria starkei during snowmelt and uptake of nitrate from meltwater. Can. J. Bot. 74: 1095-1103.
Yruela, I. 2005. Copper in plants. Braz. J. Plant Physiol. 17: 145-156.

Glime, J. M. 2017. Nutrient Relations: CO2. Chapt. 8-2. In: Glime, J. M. Bryophyte Ecology. Volume 1. Physiological Ecology. 8-2-1 Ebook sponsored by Michigan Technological University and the International Association of Bryologists. Last updated 7 March 2017 and available at <http://digitalcommons.mtu.edu/bryophyte-ecology/>.
CHAPTER 8-2
NUTRIENT RELATIONS: CO2
TABLE OF CONTENTS CO2 Sources and Limitations .............................................................................................................................. 8-2-2 Early Carbon Relations ................................................................................................................................ 8-2-2 Relationships Today..................................................................................................................................... 8-2-2 Structural Adaptations .......................................................................................................................... 8-2-6 Soil CO2 ....................................................................................................................................................... 8-2-6 CO2-Concentrating Mechanisms......................................................................................................................... 8-2-7 Aquatic CO2 ...................................................................................................................................................... 8-2-10 Role of pH.................................................................................................................................................. 8-2-12 Bogs .................................................................................................................................................................. 8-2-12 Methane ..................................................................................................................................................... 8-2-14 CO2 and Desiccation Tolerance ........................................................................................................................ 8-2-14 Translocation..................................................................................................................................................... 8-2-14 Importance of Bryophytes in C Cycling............................................................................................................ 8-2-15 Summary ........................................................................................................................................................... 8-2-15 Acknowledgments............................................................................................................................................. 8-2-15 Literature Cited ................................................................................................................................................. 8-2-15

8-2-2 Chapter 8-2: Nutrient Relations: CO2
CHAPTER 8-2
NUTRIENT RELATIONS: CO2
Figure 1. Peat moss, Sphagnum fimbriatum, covering the largest area of carbon sink in the world. Photo by Michael Lüth, with
permission.
CO2 Sources and Limitations
Early Carbon Relations
Colonization of life on the land of Earth began billions of years ago (Graham et al. 2014). Evidence suggests that bacteria, then eukaryotic (having a nucleus) algae, then bryophytes ventured to endure those early conditions. These early forms made possible the development of the first organic soils. To understand this progression and continuation of life, it is prudent to understand carbon cycling. For most terrestrial plants and algae, the source of this carbon is carbon dioxide (CO2). Both green algae and bryophytes produce a degradation-resistant form of carbon from that CO2 that is consequently sequestered. This, in turn, reduces the CO2 in the atmosphere, having an important impact on the Earth's carbon cycle for 40-100 million years.
This early atmosphere was high in CO2 compared to levels today (Raven & Edwards 2014). Isotope comparisons using liverwort fossils indicate that in the mid-Cretaceous in the Antarctic, CO2 concentrations ranged 1000-1400 ppm, agreeing generally with
independent proxy data and long-term carbon cycle models (Fletcher et al. 2005). Furthermore, the concentration gradient from the atmosphere to the carboxylase in the plant would further drive CO2 into the plant (Raven & Edwards 2014). This additional CO2 would permit higher photosynthetic rates per surface area of plant. Later adaptations included increasing the surface area of photosynthetic tissue through development of complex structures and air spaces to permit greater harvesting of light.
Proctor (2010) suggested that in the early atmosphere of plant evolution in the mid-Palaeozoic, the atmosphere had 10X its present concentration of CO2. It is thus unlikely that these early plants were CO2 limited. Rather they may have increased their cuticularization, then increased their air spaces to permit them to take up more CO2 and compensate for the blockage by the cuticle.
Relationships Today In 1958, the CO2 in the atmosphere had a concentration
of 315 ppm (Scripps CO2 Program 2016). In December

Chapter 8-2: Nutrient Relations: CO2 8-2-3
2016 it had grown to 404 ppm. Elbert et al. (2012) estimated that cryptogams (including Cyanobacteria, algae, fungi, lichens, and bryophytes) extract ~3.9 Pg carbon per year, or around 7% of the net production of terrestrial vegetation. Thus, the CO2 uptake by bryophytes is an important component of global carbon cycling and a necessary contributor to climate modelling.
Normally we don't think of carbon as a limiting resource, although experiments on higher plants have shown that increased carbon dioxide usually increases productivity. Mosses are typically C3 plants with high CO2 compensation points (CO2 concentration at which net CO2 fixation is zero) (Raven et al. 1998). In other words, they require high levels of CO2 to balance the CO2 lost to respiration. C3 plants are those plants that have no special mechanism for storing carbon from CO2 temporarily in a compound such as malate or oxalate. Instead, they put all their CO2 directly into the photosynthetic pathway in a 3-carbon compound, hence the term C3. This pathway is less efficient because the enzyme Rubisco (Ribulose bisphosphate carboxylase/oxidase) is much less effective at binding the atmospheric CO2 into a 3-C compound within the cell than is PEP carboxylase, the enzyme used in the C4 and CAM pathways to put the carbon in temporary storage C4 compounds for later use in photosynthesis. However, mosses are not limited by guard cell closure in obtaining CO2 and thus should be able to obtain CO2 any time of the day.
In examining 32 terrestrial C3 plants, Bauer and Martha (1981) found an average CO2 compensation point of 36.2 μl L-1 (=71 mg m-3). However, among these two mosses showed a somewhat higher CO2 compensation point of ~43 μl L-1. The compensation point for tracheophytes ranged 31-40 μl L-1. Bain and Proctor (1980) found that the CO2 compensation point of the aquatic bryophytes they studied were over 100 times higher than those of the C3 aquatic tracheophyte Elodea and the alga Chara. They were likewise somewhat higher than those of terrestrial bryophytes reported by Dilks (1976).
Among tracheophytes, CAM plants, convert CO2 to malate at night and store it to be used in the daytime, permitting the plants to conserve water by keeping stomata closed in the daytime. In C4 plants a bundle sheath permits plants to convert CO2 to a 4-carbon compound for use later. This likewise permits the plants to conserve water by closing stomata when the air is dry but to continue using CO2 derived from the stored 4-C compounds for photosynthesis.
Bryophytes must live in a delicate balance between sufficient moisture and sufficient CO2. When leaves are wet on the outside, that water offers significant resistance to CO2 diffusion. Surprisingly, a thin cuticle permits greater diffusion than even a thin film of water, so mosses living in very wet habitats often are protected from waterlogging by well-developed waxes or other cuticular material (Proctor 1984). Polytrichum commune (Figure 2) and P. strictum (Figure 3) are good examples of this, but less obvious examples are P. wahlenbergii (Figure 4), Pohlia cruda (Figure 5), Philonotis (Figure 6), Schistostega pennata (Figure 7), Saelania glaucescens (Figure 8), and Bartramia pomiformis (Figure 9), all with a whitish appearance to the naked eye (Proctor 1984).
Figure 2. Polytrichum commune showing its somewhat
waxy leaves. Photo by Michael Lüth, with permission.
Figure 3. Polytrichum strictum showing waxy leaves.
Photo by Janice Glime.
Figure 4. Pohlia wahlenbergii var glacialis showing its
whitish color due to a thin cuticle. Photo by Michael Lüth, with permission.

8-2-4 Chapter 8-2: Nutrient Relations: CO2
Figure 5. Pohlia cruda showing its whitish color due to a
thin cuticle. Photo by Michael Lüth, with permission.
Figure 6. Philonotis fontana showing its waxy leaves.
Photo by Michael Lüth, with permission.
Figure 7. Schistostega pennata showing waxy leaf surface.
Photo courtesy of Martine Lapointe.
Figure 8. Waxy-looking leaves of Saelania glaucescens.
Photo by Ivanov, with permission.
Figure 9. Bartramia pomiformis showing waxy leaves.
Photo by Jan-Peter Frahm, with permission.
Sphagnum (Figure 1) partially solves this balance by having water-holding cells (hyaline cells) that bathe the photosynthetic cells (Figure 10), while exposing at least one surface (in most) of the photosynthetic cell to the atmosphere. Furthermore, air bubbles become trapped among the leaves and between the leaves and the stem, thus providing an additional source of CO2. Robinson (1985) considered that no CO2 was obtained from the hyaline (water-holding) cells because all the chloroplasts of the cells were positioned along the wall most exposed to light. On the other hand, members of Leucobryum (Figure 11-Figure 14) do indeed trap air bubbles in their colorless cells (Robinson 1985), providing an internal source of CO2 for the chlorophyllous cells residing there and causing these plants to somewhat mimic the internal structure of a seed plant. This same character seems to be present throughout the Leucobryaceae family, permitting their multi-layered leaves to function photosynthetically.

Chapter 8-2: Nutrient Relations: CO2 8-2-5
Figure 10. Sphagnum cells indicating the hyaline cells with
pores, holding water, and chlorophyllose (photosynthetic) cells exposed to atmosphere. Photo with from Botany Website, UBC, with permission.
Figure 11. Leucobryum glaucum showing whitish color
caused by hyaline cells that surround the photosynthetic cells. Photo by David T. Holyoak.
Figure 12. Leucobryum glaucum leaf cells in lamina view,
showing hyaline and photosynthetic cells. Photo by Ralf Wagner <www.dr-ralf-wagner.de>.
Figure 13. Leucobryum glaucum leaf cross section showing
the photosynthetic cells surrounded by hyaline cells. Photo by Ralf Wagner <www.dr-ralf-wagner.de>.
Figure 14. Whitish leaves due to hyaline cells of
Leucobryum juniperoideum. Photo by Michael Lüth.
Shinde et al. (2015) determined that the moss Physcomitrella patens (Figure 15) has 814 genes that are affected by elevated CO2 (1500 ppmV). These affect transcriptional reprogramming, photosynthetic regulation, carbon metabolism, and stress responses. CO2 relationships are not simple!
Figure 15. Physcomitrella patens, demonstrating its whitish
appearance due to a thin cuticle. Photo by Michael Lüth, with permission.

8-2-6 Chapter 8-2: Nutrient Relations: CO2
Structural Adaptations
Proctor (2010) explains that the maximum rate of CO2 diffusion is limited by the difference between the external CO2 concentration and the CO2 compensation point (level of O2 at which respiration = photosynthesis), as well as the resistance of the moist external bryophyte cell wall to the liquid-phase diffusion of the CO2. This is limited by the thickness of the external cell walls. Structural differences can increase the plant uptake. A large, simple thallose liverwort provides a single flat photosynthetic surface. This is improved in an epiphyte such as Metzgeria (Figure 16) that exposes both surfaces. Marchantia (Figure 17) further increases the uptake surface by its system of internal chambers with photosynthetic cells arranged like tissues of a sponge (Figure 18).
Figure 16. Metzgeria furcata showing thalli exposed on
both sides, thus doubling its CO2-absorbing surfaces. Photo by Michael Lüth, with permission.
Figure 17. Marchantia polymorpha pores and gemmae
cups. Photo by Ralf Wagner <www.dr-ralf-wagner.de>, with permission.
Figure 18. Marchantia polymorpha cs showing pore and
underlying spongy chlorophyllose cells. Photo by Walter Obermayer, with permission.
Perhaps the most obvious adaptation of plants to intake of CO2 is having stomata in leaves. This apparatus permits tracheophyte leaves to regulate moisture concentration in the leaves. However, when they are closed to conserve water, they are also closed to atmospheric CO2 that is vitally needed for photosynthesis. Mosses and leafy liverworts lack stomata in their leaves, but generally have leaves that are only one cell thick, thus exposing two sides of the cell for absorption of CO2. Some thallose liverworts, on the other hand, have a plant body that consists of multiple layers. These typically have a chambered interior with sponge-like tissues that provide lots of surface area. For these to obtain atmospheric CO2, the chambers connect to the exterior atmosphere through pores that permit its diffusion into the chamber. Raven (2002) suggested that "stomata evolved from pores in the epidermis of plant organs which were at least three cell layers thick and had intercellular gas spaces and a cuticle."
But does this sponge-like interior make a difference? Meyer et al. (2008) demonstrated that both external and internal conductances, as well as water use efficiency, were higher in the ventilated (spongy) liverworts and hornworts. Within these two taxonomic groups, however, the values were similar, suggesting that various factors must serve to optimize the involved species for that life form.
Soil CO2
Šimůnek and Suarez (1993) modelled the CO2 transport and production in soil. CO2 can be transported in the unsaturated zone in both the liquid and gas form. Both root and microbial respiration contribute to soil CO2. The rate of this respiration is affected by water content, temperature, growth, salinity, and plant and soil characteristics.
In a temperate rainforest of New Zealand, bryophytes form a nearly continuous cover (62%) on the forest floor, with a depth less than 30 mm (DeLucia et al. 2003). The CO2 was elevated relative to the atmosphere, presumably due to bacterial and fungal respiration. The net CO2 exchange was very dependent on water content. Although the CO2 uptake was quite variable, the annual net carbon uptake by the forest floor bryophytes was 103 g m-2, compared to annual loss of carbon from the forest floor (bryophyte and soil respiration) of -1010 g m-2. This

Chapter 8-2: Nutrient Relations: CO2 8-2-7
accounted for a reclamation of ~10% of the forest floor CO2 emitted by respiration.
Tarnawski et al. (1994) measured 24-hour changes in atmospheric CO2 concentrations within and above cryptogam stands in a New Zealand temperate rainforest. They found that CO2 levels within the forest exceeded those in the open by 30 ppm and had a more variable diel (denoting a period of 24 hours) pattern (up to 70 ppm). The mean CO2 level at a depth of 25 mm in the moss layer was 50% higher than those in the clearing and were higher than in the air of the rainforest.
In the Arctic tundra, there are definite differences in soil respiration rates related to microscale topography, mainly due to differences of soil water table and soil temperatures (Sommerkorn et al. 1999). The moss layer serves as a high impact modifier of the CO2 emission, assimilating 51% to 98% of the daily amount CO2 released from wet tundra soils.
For most forest floor mosses, the CO2 should be ample to supply the slow-growing mosses due to production of CO2 from litter decay. In the tropics, the CO2 concentrations on the forest floor are greater than those above the canopy (Holtum & Winter 2001), but that enriched supply is still limiting. At 10 cm above the soil the CO2 level is somewhat higher.
Because CO2 is often limiting, even in the terrestrial system, increasing levels of CO2 on the Earth could positively affect the bryophytes. Strain and Cure (1985) reported that the rate of photosynthesis in tracheophytes increases with a rise of atmospheric CO2. Because bryophytes are C3 plants, they are able to take advantage of high CO2 levels. The increased temperatures that accompany the higher CO2 through the greenhouse effect will cause greater below ground respiratory processes of roots, bacteria, and other organisms (Heal 1979; Silvola 1985). Bryophytes on the soil surface are the first photosynthetic organisms to have an opportunity to use this increased CO2. Csintalan et al. (1997) found a small, but significant increase in CO2 uptake in the drought-tolerant moss Syntrichia ruralis (Figure 19) when grown in a concentration of 700 ppm compared to that at the ambient level at that time of 350 ppm.
Figure 19. Syntrichia ruralis hydrated, a species that
benefits from higher levels of CO2. Photo by Misha Ignatov, with permission.
Sonesson et al. (1992) were able to show that the boreal forest moss Hylocomium splendens (Figure 20-Figure 21) can adapt to higher ambient CO2 concentrations and utilize higher CO2. Increasing CO2 levels to 600 ppm (compared to 350 ppm), resulted in a significant increase in its photosynthesis and growth (Sonneson et al. 1996). Botting and Fredeen (2006) similarly showed that CO2 (430 ppm) was limiting to moss productivity on the sub-boreal forest floor in central British Columbia, Canada.
Figure 20. Hylocomium splendens showing its extensive
cover in the boreal forest. Photo by Andrew Spink, with permission.
Figure 21. Hylocomium splendens, a species that can
benefit from a higher CO2. Photo by Chmee through Creative Commons.
CO2-Concentrating Mechanisms CO2-concentrating mechanisms are familiar in
tracheophytes. In tracheophytes, allowing CO2 into the leaf through stomata means allowing water vapor out (Hanson et al. 2014). Even chloroplasts leak water as they allow CO2 in because both require the same pore size.
Bryophytes have neither of these carbon-storing mechanisms and it seems that all bryophytes are C3 plants. But it appears that at least some do have a means to concentrate CO2 (Meyer et al. 2008). Like members of the green algae, many hornworts (Anthocerotophyta; Figure 22-Figure 23) have pyrenoids (protein bodies in chloroplasts of some algae and hornworts) associated with the chloroplasts (Hanson et al. 2002, 2014). These

8-2-8 Chapter 8-2: Nutrient Relations: CO2
pyrenoids are able to maintain a pool of dissolved inorganic carbon (DIC) of 19-108 nmol mg-1 chlorophyll (Hanson et al. 2002).
Figure 22. Anthoceros agrestis (Anthocerotophyta),
representing a phylum in which many members have pyrenoids. Photo by Michael Lüth, with permission.
Figure 23. Hornwort (Anthocerotophyta) pyrenoids – the
dark circles in the cells. Photo by Chris Lobban, with permission.
Villareal and Renner (2012) remind us of the important role of enzyme Rubisco (Ribulose-1,5-Biphosphate-carboxylase-oxygenase) in carbon fixation. But Rubisco is slow compared to PEP carboxylase, which they lack. These researchers noted that many scientists have hypothesized that carbon-concentration mechanisms evolved during periods of low CO2 to concentrate CO2 around the enzyme. But the cladistic analyses of Villareal and Renner do not support this hypothesis; pyrenoids have come and gone in the Anthocerotophyta (Figure 22-Figure 23) clades multiple times and do not always coincide with low CO2.
Raven and coworkers (1998) have suggested that some aquatic mosses might have a "CO2 concentrating mechanism" that differs from a typical C3 pathway. The Anthocerotophyta use pyrenoids to accomplish CO2 concentration, with the exception of Megaceros (Figure 24), in which there is no pyrenoid, but the mechanism in aquatic mosses is unknown. In evaluating a number of taxa, Raven's group found no evidence of C4 or CAM pathways in bryophytes, but Salvucci and Bowes (1981) found that two aquatic taxa, Fontinalis antipyretica (Figure 25) and Fissidens cf. mahatonensis, seem to be
able to concentrate CO2. What is even more interesting, it appears that it might be facultative. When they measured the CO2 compensation point of F. cf mahatonensis in the cool Florida winter (12°C, 10 h day length), the compensation point was consistent with that expected for a C3 pathway. However, when they measured it for the hot Florida summer (30°C, 14 h day length), the CO2 compensation point was much lower, although not as low as in a C4 pathway. They found similar summer/winter CO2 compensation point relationships in all the aquatic bryophytes tested from Florida. This would be a very beneficial adaptive feature since the CO2 is easily lost from water at high temperatures. The Section below on Aquatic CO2 will detail what we know about obtaining CO2 in water.
Figure 24. Megaceros (Anthocerotophyta), a genus that
lacks pyrenoids. Photo by Juan Larrain, with permission.
Figure 25. Fontinalis antipyretica, an aquatic moss that
must get its CO2 from that dissolved in water. Photo by Andrew Spink, with permission.
Bryophytes may be able to use fixed carbon compounds that are different from those used by tracheophytes. Simola (1969) experimented with Sphagnum nemoreum (syn of S. capillifolium; Figure 26) in sterile culture and found that whereas mannose [hexose monosaccharide (6-carbon sugar) with a structure very similar to glucose] and its 6-carbon derivative, rhamnose, are toxic to many flowering plants, mannose promotes the growth of Sphagnum nemoreum. On the other hand, other common sugars such as arabinose, galactose, ribose, and

Chapter 8-2: Nutrient Relations: CO2 8-2-9
xylose are toxic to Sphagnum. While the literature is not as complete as that on tracheophytes, we know that at least Funaria hygrometrica (Figure 27) can use the sugars fructose, glucose, maltose, and sucrose as internal carbon compounds (Simola 1969).
Figure 26. Sphagnum capillifolium (nemoreum), a species
for which mannose promotes growth. Photo by Bernd Haynold, through Creative Commons.
Figure 27. Funaria hygrometrica with young sporophytes, a
species that can use the sugars fructose, glucose, maltose, and sucrose internally. Photo by Andrew Spink, with permission.
Further evidence of differences in carbon usage by Sphagnum come from studies on carbon isotope discrimination. In three species that occupy hollows (S. recurvum – Error! Reference source not found.), carpets (S. palustre – Figure 29), and hummocks (S. tenerum), the delta 13C values (indicating their ability to discriminate CO2 on the basis of the 12C or 13C isotope) ranged from 19.0 to 27.1, but were unrelated to species (Rice 2000). Rather, they differed significantly (p<0.001) with season. In the spring, discrimination was lower (mean 22.5), with the highest discrimination in winter (24.7). This difference was mainly due to low photosynthetic rates in winter that reduce the effects of diffusional resistance on carbon isotope discrimination. Microhabitat differences that were present in the field disappeared in the common garden and eliminated any doubt about species differences in ability to discriminate. The observed seasonal differences in carbon isotope discrimination appear to be different from those of
tracheophytes, where water limitation lowers chloroplastic demand and increases resistance to C uptake. In Sphagnum, water limitation lowers the chloroplastic demand but also decreases the resistance to C uptake, suggesting that the moss continues to incorporate carbon as it dries.
Figure 28. Sphagnum recurvum, a species of hollows.
Photo by Tryon Life Community Farm, through Creative Commons.
Figure 29. Sphagnum palustre, a species of carpets. Photo
by Bernd Haynold, through Wikimedia Commons.
Carbon isotope ratios have been used for dating all sorts of biological materials, including the age of peatlands. Using carbon isotope technology, MacDonald et al. (1987) found that peatland mosses consistently registered carbon ages that were considerably older than those of the macrofossils of the same layer. They found ages that ranged 1400 to 6400 years older than that of their contemporary tracheophytes, and even the live Drepanocladus crassicostatus had a 14C content that was only 85% that of other present-day taxa. They explained this moss phenomenon as an isotope exchange with older sediments, the formation of CO2 from bicarbonate by chemical processes, and the metabolic production of CO2, presumably including bacterial decomposition, especially by mycobacteria.

8-2-10 Chapter 8-2: Nutrient Relations: CO2
Aquatic CO2 In aquatic systems, CO2 is not very soluble, is easily
lost to the atmosphere at warm temperatures, and availability is pH-dependent, so it can indeed be limiting. The diffusion coefficient for CO2 in water is only 10-4 times that found in air. The boundary layer between the moss and the flowing water reduces that availability even more. Aquatic bryophytes have high CO2 compensation points (> 50 µl L-1), higher than that of typical of C3 tracheophytes (Bain & Proctor 1980).
Raven et al. (1998) indicate that stream mosses such as Fontinalis antipyretica (Figure 25) have very little CO2 limitation because of the constantly flowing water that renews CO2 and the reduced boundary layer resulting from water flow. On the other hand, in deep, quiet water, this species has much more difficulty getting CO2, despite higher concentrations, due to the increased boundary layer surrounding the moss.
Unlike many aquatic tracheophytes, mosses are apparently unable to use bicarbonates as a source of CO2 (Bain & Proctor 1980; Allen & Spence 1981). Ruttner (1947) first demonstrated this limitation quantitatively in the mosses Calliergon giganteum (Figure 30), Cratoneuron filicinum (Figure 31), Eucladium verticillatum (Figure 32-Figure 33), Fissidens rufulus (Figure 34-Figure 35), Hylocomium splendens (Figure 20-Figure 21), and Neckera crispa (Figure 36) and the thallose liverwort Marchantia polymorpha (Figure 17), and Steeman Nielsen (1947) found the same in Fontinalis antipyretica (Figure 25), even though F. antipyretica has the enzyme carbonic anhydrase needed for the conversion of bicarbonate to CO2. Bain and Proctor (1980) further examined mosses from alkaline habitats, yet were unable to demonstrate any use at all of bicarbonates; Allen and Spence (1981) independently determined this once more for Fontinalis antipyretica.
Figure 30. Calliergon giganteum, a species that cannot use
bicarbonate as a carbon source. Photo by Misha Ignatov, with permission.
Figure 31. Cratoneuron filicinum, a species that is unable
to use bicarbonate as a carbon source. Photo by Barry Stewart, with permission.
Figure 32. Eucladium verticillatum in its wet habitat. Photo
by Proyecto Musgo, through Creative Commons.
Figure 33. Eucladium verticillatum, a species that is unable
to use bicarbonates as a carbon source. Photo by Barry Stewart, with permission.

Chapter 8-2: Nutrient Relations: CO2 8-2-11
Figure 34. Fissidens rufulus habitat. Photo by Michael
Lüth, with permission.
Figure 35. Fissidens rufulus, a species that is unable to use
bicarbonate as a carbon source. Photo by Michael Lüth, with permission.
Figure 36. Neckera crispa, a species that is unable to use
bicarbonate as a carbon source. Photo by Barry Stewart, with permission.
Therefore, in aquatic systems at higher levels of pH, when the CO2 equilibrium shifts toward bicarbonate or carbonate, CO2 becomes unavailable. In these conditions, perhaps the CO2 is transformed from bicarbonates in some taxa by lower pH values at the moss-water interface, but no experimental evidence has verified this hypothesis. Thus, the number of mosses growing in alkaline waters is limited, and it seems that many of the ones that do occur in alkaline
waters are adapted to growing in the highly aerated water of waterfalls and rapids, as, for example, Fissidens grandifrons (Figure 37) (pers. obs.). Some grow in very cold glacial meltwater in which more CO2 is soluble (Vitt et al. 1986). Others are restricted to the splash zone at the edge of the water, where CO2 is trapped as the water moves through the air, as in Cratoneuron (Figure 38) species (Vitt et al. 1986; Glime & Vitt 1987).
Figure 37. Fissidens grandifrons, in fast-flowing water
where there is more CO2 than in quiet water. Photo by Janice Glime.
Figure 38. Cratoneuron commutatum var fluctuans at the
edge of water. Photo by Michael Lüth, with permission.
When mosses live at great depths, light and temperature can be low. The ability of mosses to grow slowly reduces their need for CO2 and light. In great depths of Lake Grane Langos, Denmark, Sphagnum subsecundum (Figure 39) and Drepanocladus exannulatus (Figure 40) grew faster in deep water than in shallow water! (Riis & Sand-Jensen 1997). Riis and Sand-Jensen concluded that this more rapid growth at greater depths was possible due to lower temperatures that permitted more CO2 to remain dissolved, CO2 supersaturation, and nutrient enrichment from the sediments below the thermocline.
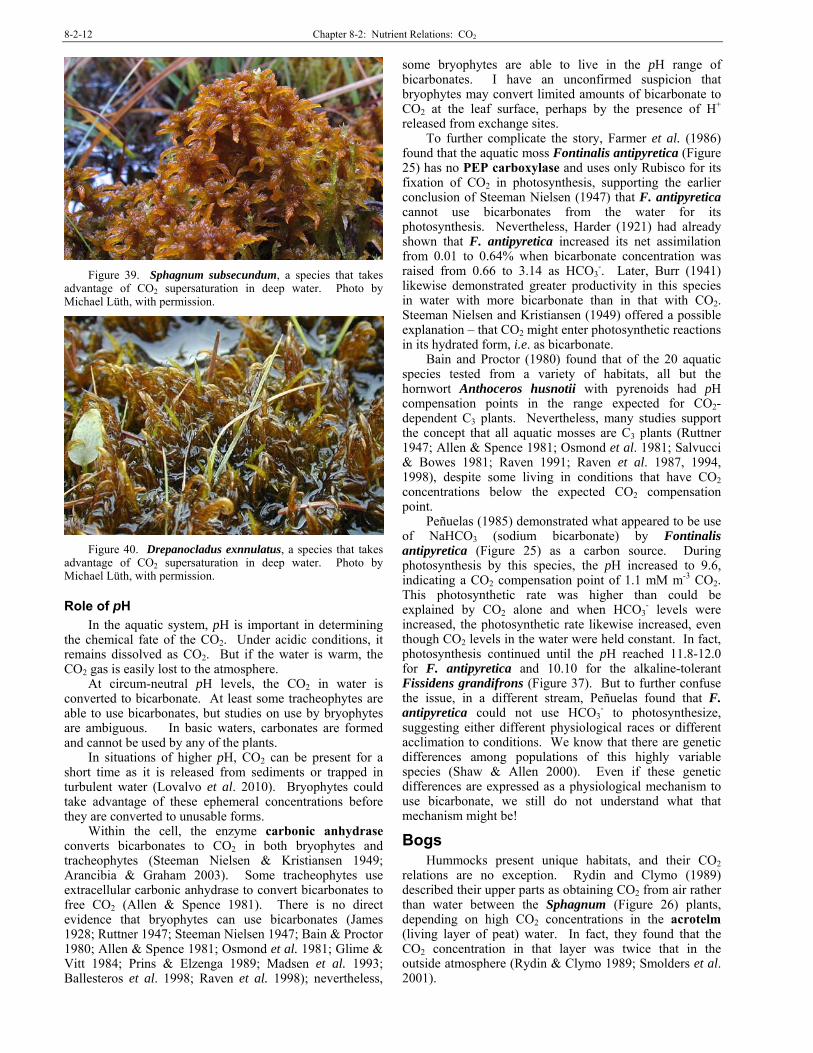
8-2-12 Chapter 8-2: Nutrient Relations: CO2
Figure 39. Sphagnum subsecundum, a species that takes
advantage of CO2 supersaturation in deep water. Photo by Michael Lüth, with permission.
Figure 40. Drepanocladus exnnulatus, a species that takes
advantage of CO2 supersaturation in deep water. Photo by Michael Lüth, with permission.
Role of pH In the aquatic system, pH is important in determining
the chemical fate of the CO2. Under acidic conditions, it remains dissolved as CO2. But if the water is warm, the CO2 gas is easily lost to the atmosphere.
At circum-neutral pH levels, the CO2 in water is converted to bicarbonate. At least some tracheophytes are able to use bicarbonates, but studies on use by bryophytes are ambiguous. In basic waters, carbonates are formed and cannot be used by any of the plants.
In situations of higher pH, CO2 can be present for a short time as it is released from sediments or trapped in turbulent water (Lovalvo et al. 2010). Bryophytes could take advantage of these ephemeral concentrations before they are converted to unusable forms.
Within the cell, the enzyme carbonic anhydrase converts bicarbonates to CO2 in both bryophytes and tracheophytes (Steeman Nielsen & Kristiansen 1949; Arancibia & Graham 2003). Some tracheophytes use extracellular carbonic anhydrase to convert bicarbonates to free CO2 (Allen & Spence 1981). There is no direct evidence that bryophytes can use bicarbonates (James 1928; Ruttner 1947; Steeman Nielsen 1947; Bain & Proctor 1980; Allen & Spence 1981; Osmond et al. 1981; Glime & Vitt 1984; Prins & Elzenga 1989; Madsen et al. 1993; Ballesteros et al. 1998; Raven et al. 1998); nevertheless,
some bryophytes are able to live in the pH range of bicarbonates. I have an unconfirmed suspicion that bryophytes may convert limited amounts of bicarbonate to CO2 at the leaf surface, perhaps by the presence of H+ released from exchange sites.
To further complicate the story, Farmer et al. (1986) found that the aquatic moss Fontinalis antipyretica (Figure 25) has no PEP carboxylase and uses only Rubisco for its fixation of CO2 in photosynthesis, supporting the earlier conclusion of Steeman Nielsen (1947) that F. antipyretica cannot use bicarbonates from the water for its photosynthesis. Nevertheless, Harder (1921) had already shown that F. antipyretica increased its net assimilation from 0.01 to 0.64% when bicarbonate concentration was raised from 0.66 to 3.14 as HCO3
-. Later, Burr (1941) likewise demonstrated greater productivity in this species in water with more bicarbonate than in that with CO2. Steeman Nielsen and Kristiansen (1949) offered a possible explanation – that CO2 might enter photosynthetic reactions in its hydrated form, i.e. as bicarbonate.
Bain and Proctor (1980) found that of the 20 aquatic species tested from a variety of habitats, all but the hornwort Anthoceros husnotii with pyrenoids had pH compensation points in the range expected for CO2-dependent C3 plants. Nevertheless, many studies support the concept that all aquatic mosses are C3 plants (Ruttner 1947; Allen & Spence 1981; Osmond et al. 1981; Salvucci & Bowes 1981; Raven 1991; Raven et al. 1987, 1994, 1998), despite some living in conditions that have CO2 concentrations below the expected CO2 compensation point.
Peñuelas (1985) demonstrated what appeared to be use of NaHCO3 (sodium bicarbonate) by Fontinalis antipyretica (Figure 25) as a carbon source. During photosynthesis by this species, the pH increased to 9.6, indicating a CO2 compensation point of 1.1 mM m-3 CO2. This photosynthetic rate was higher than could be explained by CO2 alone and when HCO3
- levels were increased, the photosynthetic rate likewise increased, even though CO2 levels in the water were held constant. In fact, photosynthesis continued until the pH reached 11.8-12.0 for F. antipyretica and 10.10 for the alkaline-tolerant Fissidens grandifrons (Figure 37). But to further confuse the issue, in a different stream, Peñuelas found that F. antipyretica could not use HCO3
- to photosynthesize, suggesting either different physiological races or different acclimation to conditions. We know that there are genetic differences among populations of this highly variable species (Shaw & Allen 2000). Even if these genetic differences are expressed as a physiological mechanism to use bicarbonate, we still do not understand what that mechanism might be!
Bogs Hummocks present unique habitats, and their CO2
relations are no exception. Rydin and Clymo (1989) described their upper parts as obtaining CO2 from air rather than water between the Sphagnum (Figure 26) plants, depending on high CO2 concentrations in the acrotelm (living layer of peat) water. In fact, they found that the CO2 concentration in that layer was twice that in the outside atmosphere (Rydin & Clymo 1989; Smolders et al. 2001).

Chapter 8-2: Nutrient Relations: CO2 8-2-13
As the atmospheric levels of CO2 rise and N deposition provides critical and often limiting nutrients, the composition of plant communities changes. This is particularly true in Sphagnum (Figure 41-Figure 46) bogs (Berendse et al. 2001). In this case, we expect productivity of tracheophytes to increase as they benefit from greater CO2, often decreasing the competitiveness of the bryophytes and causing tracheophyte expansion. Sphagnum is one of the most important groups of plants to serve as a carbon sink in the Northern Hemisphere, facilitated by its slow decomposition. But when Berendse and coworkers studied the effects of raised CO2 and N on Sphagnum and other plants in four locations in Western Europe, the elevated CO2 had no effect on Sphagnum biomass increase. N, on the other hand, caused a decrease in Sphagnum growth due to competition.
In a bog in the Netherlands, Sphagnum magellanicum (Figure 41) benefitted from elevated CO2 by exhibiting increased growth in height in the second and third growing seasons (Heijmans et al. 2001). Tracheophytes that grew close to the more rapidly growing S. magellanicum were affected negatively by the increased Sphagnum height. Mitchell et al. (2002) found that on one harvested peatland the initial colonizer was Polytrichum strictum (Figure 3). Under a treatment of added CO2 (560 ppm), the later colonizer Sphagnum fallax (Figure 42) was able to successfully compete with the P. strictum.
Figure 41. Sphagnum magellanicum, a species that
increases in height growth when living in higher CO2 levels. Photo by David Holyoak, with permission.
Figure 42. Sphagnum fallax, a species that competes better
in an atmosphere with higher CO2. Photo by Michael Lüth, with permission.
Van der Heijden et al. (2000a) found that not all Sphagnum had the same response to elevated CO2. Sphagnum papillosum (Figure 43), an oligo-mesotrophic species, benefitted in growth from elevated CO2 (720 ppm). On the other hand, the ombrotrophic S. balticum (Figure 44) received no growth benefit, despite elevated sugar in stems and capitula in both species. Unlike many of the studies discussed in subchapter 8-1, in this case additional N along with elevated CO2 benefitted S. papillosum, but it had no effect on S. balticum. Doubling CO2 without N addition cause lower N levels in both species.
Figure 43. Sphagnum papillosum with sundew. Photo by
Michael Lüth.
Figure 44. Sphagnum balticum, a species that does not
benefit when additional N accompanies elevated CO2. Photo by Michael Lüth, with permission.
The response of Sphagnum recurvum var. mucronatum (Figure 45) may explain the elevated sugars (van der Heijden et al. 2000b). Initially, elevated CO2 stimulated photosynthesis, but after 3 days of exposure it was down-regulated to pre-elevation values. However, the elevated CO2 continued to cause reduced dark respiration. At the same time there was a continuous increase in soluble sugar in the capitula. Doubling the CO2 caused a decrease of N in the capitula, but not in the stems. This N reduction was coupled with a decrease in amino acids but did not affect soluble protein levels, causing a shift in N partitioning.
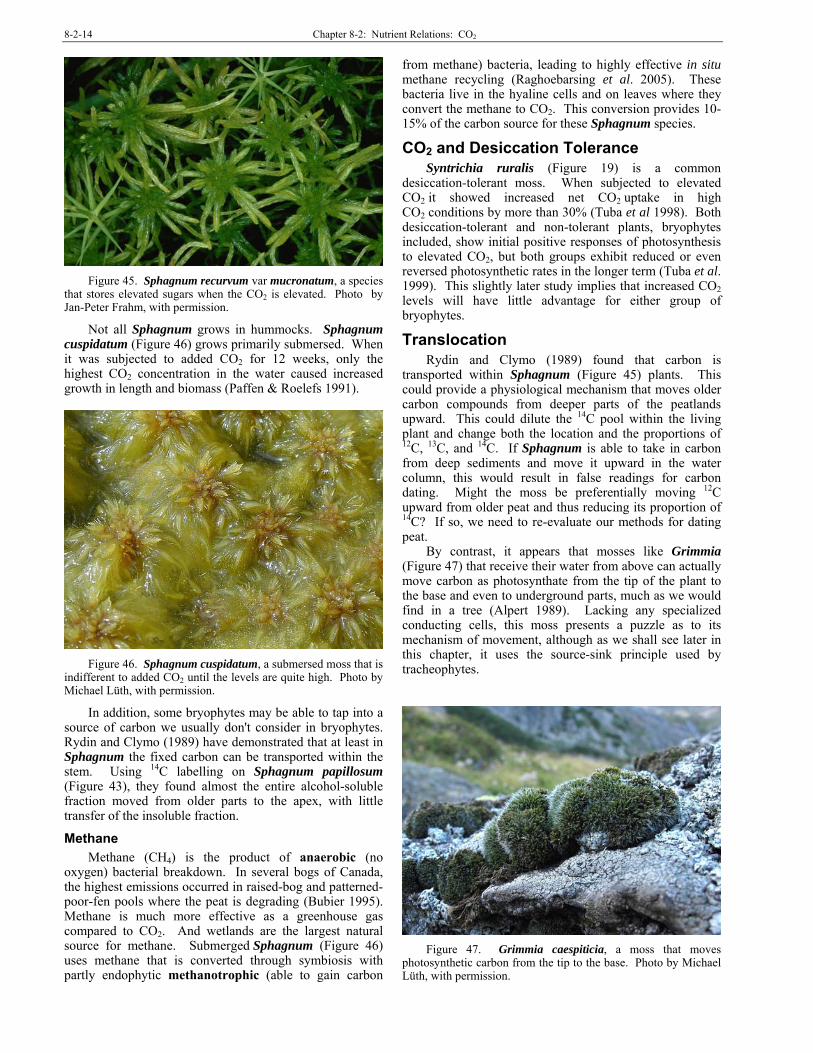
8-2-14 Chapter 8-2: Nutrient Relations: CO2
Figure 45. Sphagnum recurvum var mucronatum, a species
that stores elevated sugars when the CO2 is elevated. Photo by Jan-Peter Frahm, with permission.
Not all Sphagnum grows in hummocks. Sphagnum cuspidatum (Figure 46) grows primarily submersed. When it was subjected to added CO2 for 12 weeks, only the highest CO2 concentration in the water caused increased growth in length and biomass (Paffen & Roelefs 1991).
Figure 46. Sphagnum cuspidatum, a submersed moss that is
indifferent to added CO2 until the levels are quite high. Photo by Michael Lüth, with permission.
In addition, some bryophytes may be able to tap into a source of carbon we usually don't consider in bryophytes. Rydin and Clymo (1989) have demonstrated that at least in Sphagnum the fixed carbon can be transported within the stem. Using 14C labelling on Sphagnum papillosum (Figure 43), they found almost the entire alcohol-soluble fraction moved from older parts to the apex, with little transfer of the insoluble fraction.
Methane
Methane (CH4) is the product of anaerobic (no oxygen) bacterial breakdown. In several bogs of Canada, the highest emissions occurred in raised-bog and patterned-poor-fen pools where the peat is degrading (Bubier 1995). Methane is much more effective as a greenhouse gas compared to CO2. And wetlands are the largest natural source for methane. Submerged Sphagnum (Figure 46) uses methane that is converted through symbiosis with partly endophytic methanotrophic (able to gain carbon
from methane) bacteria, leading to highly effective in situ methane recycling (Raghoebarsing et al. 2005). These bacteria live in the hyaline cells and on leaves where they convert the methane to CO2. This conversion provides 10-15% of the carbon source for these Sphagnum species.
CO2 and Desiccation Tolerance Syntrichia ruralis (Figure 19) is a common
desiccation-tolerant moss. When subjected to elevated CO2 it showed increased net CO2 uptake in high CO2 conditions by more than 30% (Tuba et al 1998). Both desiccation-tolerant and non-tolerant plants, bryophytes included, show initial positive responses of photosynthesis to elevated CO2, but both groups exhibit reduced or even reversed photosynthetic rates in the longer term (Tuba et al. 1999). This slightly later study implies that increased CO2 levels will have little advantage for either group of bryophytes.
Translocation Rydin and Clymo (1989) found that carbon is
transported within Sphagnum (Figure 45) plants. This could provide a physiological mechanism that moves older carbon compounds from deeper parts of the peatlands upward. This could dilute the 14C pool within the living plant and change both the location and the proportions of 12C, 13C, and 14C. If Sphagnum is able to take in carbon from deep sediments and move it upward in the water column, this would result in false readings for carbon dating. Might the moss be preferentially moving 12C upward from older peat and thus reducing its proportion of 14C? If so, we need to re-evaluate our methods for dating peat.
By contrast, it appears that mosses like Grimmia (Figure 47) that receive their water from above can actually move carbon as photosynthate from the tip of the plant to the base and even to underground parts, much as we would find in a tree (Alpert 1989). Lacking any specialized conducting cells, this moss presents a puzzle as to its mechanism of movement, although as we shall see later in this chapter, it uses the source-sink principle used by tracheophytes.
Figure 47. Grimmia caespiticia, a moss that moves
photosynthetic carbon from the tip to the base. Photo by Michael Lüth, with permission.

Chapter 8-2: Nutrient Relations: CO2 8-2-15
Importance of Bryophytes in C Cycling Porada et al. (2013) estimated that the terrestrial net
uptake of carbon by bryophytes and lichens is 0.34 to 3.3 Gt yr-1. This appears to be small until you consider bogs and Arctic habitats where bryophytes dominate the vegetation. In those location, the bryophytes are significant carbon sinks.
Summary The early atmosphere had considerably more CO2
than the current one. However, in the last 60 years, CO2 concentrations have risen from 315 to 404 ppm in the atmosphere.
Soils release CO2 through respiration by bacteria, fungi, and other soil organisms. Bryophytes are able to trap much of this CO2 before it reaches the atmosphere.
Thallose liverworts may have a spongy interior with pores to facilitate exposure of internal photosynthetic cells to CO2. Mosses are C3 plants that benefit from high CO2 concentrations and cool to moderate temperatures (up to 25ºC). They have difficulty obtaining CO2 when they are wet and the presence of cuticular waxes in species such as Polytrichum spp. and Saelania glaucescens facilitates the absorption of CO2 by repelling water. Sphagnum keeps its photosynthetic cells moist on 2-3 sides while permitting 1-2 sides to be exposed to the atmosphere.
Hornworts may have pyrenoids that concentrate CO2 around the enzyme Rubisco, facilitating photosynthesis. Some aquatic mosses may be able to concentrate CO2 and this may be facultative, being enhanced on hot days. In acid conditions they use CO2 dissolved in the water, but some evidence suggests that in the mid-pH range some species may be able to use bicarbonates.
Some bryophytes can use amino acids. At least some Sphagnum species use methane as a carbon source. And some species can move C up or down within the plant.
Bryophytes, especially in wet habitats, may be able to move water up from sediments, taking advantage of decompositional carbon. Others may move photosynthate from actively growing apical parts to lower parts for storage.
Bryophytes may serve as carbon sinks, especially in peatlands.
Acknowledgments I appreciate the contributions of undergraduate Phil
Gaudette and M. S. student Jennifer Jermalowicz Jones for their critical reading of the manuscript from the perspectives of students interested in nutrient relationships of bryophytes. Stephen Rice helped to clarify the carbon discussion.
Literature Cited Allen, E. D. and Spence, D. H. N. 1981. The differential ability
of aquatic plants to utilize the inorganic carbon supply in fresh waters. New Phytol. 87: 269-283.
Alpert, P. 1989. Translocation in the nonpolytrichaceous moss Grimmia laevigata. Amer. J. Bot. 76: 1524-1529.
Arancibia, P. and Graham, L. 2003. Carbonic anhydrase in Charophyceae and bryophytes. Abstract, p. 65. Botany 2003, Aquatic and Wetland Plants: Wet & Wild, Botanical Society of America, Mobile.
Bain, J. T. and Proctor, M. C. F. 1980. The requirement of aquatic bryophytes for free CO2 as an inorganic carbon source: Some experimental evidence. New Phytol. 86: 393-400.
Ballesteros, D., García-Sánchez, M. J., Heredia, M. A., Felle, H., and Fernández, J. A. 1998. Inorganic carbon acquisition in Riccia fluitans L. J. Exper. Bot. 49: 1741-1747.
Berendse, F., Breemen, N. van, Rydin, H., Buttler, A., Heijmans, M., Hoosbeek, M. R., Lee, J. A., Mitchell, E., Saarinen, T., Vasander, H., and Wallen, B. 2001. Raised atmospheric CO2 levels and increased N deposition cause shifts in plant species composition and production in Sphagnum bogs. Global Change Biology 7: 591-598.
Botting, R. S. and Fredeen, A. L. 2006. Net ecosystem CO2
exchange for moss and lichen dominated forest floors of old-growth sub-boreal spruce forests in central British Columbia, Canada. Forest Ecol. Mgmt. 235: 240-251.
Bubier, J. L. 1995. The relationship of vegetation to methane emission and hydrochemical gradients in northern peatlands. J. Ecol. 83: 403-420.
Burr, G. O. 1941. Photosynthesis of algae and other aquatic plants. In: Needham, J. G. Symposium on Hydrobiology, pp 163-181. Univ Wisc Press, Madison.
Csintalan, Z., Takács, A., Tuba, Z., Proctor, M. C. F., Smirnoff, N., and Grace, J. 1997. Desiccation tolerant grassland cryptogams, under elevated CO2, preliminary findings. Abstr. Biol. 21: 309-315.
DeLucia, E. H., Turnbull, M. H., Walcroft, A. S., Griffins, K. L., Tissue, D. T., Glenny, D., McSeveny, T. M., and Whitehead, D. 2003. The contribution of bryophytes to the carbon exchange for a temperate rainforest. Global Change Biol. 9: 1158-1170.
Dilks, T. J. K. 1976. Measurement of the carbon dioxide compensation point and rate of loss of 14CO2 in the light and dark in some bryophytes. J. Exper. Bot. 27: 98-104.
Elbert, W., Weber, B., Burrows, S., Steinkamp, J., Jüdel, B., Meinrat, O. A., and Pöschl, L. 2012. Contribution of cryptogamic covers to the global cycles of carbon and nitrogen. Nat. Geosci. 5: 459-462.
Farmer, A. M., Maberly, S. C., and Bowes, G. 1986. Activities of carboxylation enzymes in freshwater macrophytes. J. Exper. Bot. 37: 1568-1573.
Fletcher, B. J., Beerling, D. J., and Brentnall, S. J. 2005. Fossil bryophytes as recorders of ancient CO2 levels: Experimental evidence and a Cretaceous case study. Global Biogeochem. Cycles 19: GB2012.
Glime, J. M. and Vitt, D. H. 1984. The physiological adaptations of aquatic Musci. Lindbergia 10: 41-52.
Glime, J. M. and Vitt, D. H. 1987. A comparison of bryophyte species diversity and niche structure of montane streams and stream banks. Can. J. Bot. 65: 1824-1837.
Graham, L., Lewis, L. A., Taylor, W., Wellman, C., and Cook, M. 2014. Early terrestrialization: Transition from algal to bryophyte grade. In: Hanson, D. T. and Rice, S. K. (eds.). Photosynthesis in Bryophytes and Early Land Plants. Advances in Photosynthesis and Respiration 37: 9-28.
Hanson, D., Andrews, T. J., and Badger, M. R. 2002. Variability of the pyrenoid-based CO2 concentrating mechanism in

8-2-16 Chapter 8-2: Nutrient Relations: CO2
hornworts (Anthocerotophyta). Funct. Plant Biol. 29: 407-416.
Hanson, D. T., Renzaglia, K., and Villarreal, J. C. 2014. In tracheophytes, Diffusion limitation and CO2 concentrating mechanisms in bryophytes. In: Hanson, D. T. and Rice, S. K. (eds.). Photosynthesis in Bryophytes and Early Land Plants. Advances in Photosynthesis and Respiration 37: 95-111.
Harder, R. 1921. Kritische Versuche zu Blackmans Theorie der begrenzenden Faktoren bei der Kohlensaureassimilation. Jahrb. Wiss. Bot. 60: 531-571.
Heal, O. W. 1979. The decomposition and nutrient release in even-aged plantations. In: Ford, E. D., Malcolm, D. C, and Atterson, J. (eds.). The Ecology of Even-aged Forest Plantations. Institute of Terrestrial Ecology, Cambridge, pp. 257-291.
Heijden, E. van der, Jauiananen, J., Silvola, J., Vasanden, H., and Kuiper, R. J. P. 2000a. Effects of elevated atmospheric CO2 concentration and increased nitrogen deposition on growth and chemical composition of ombrotrophic Sphagnum balticum and oligo-mesotrophic Sphagnum papillosum. J. Bryol. 22: 175-182.
Heijden, E. van der, Verbeek, S. K., and Kuiper, R. J. P. 2000b. Elevated atmospheric CO2 and increased nitrogen deposition: Effects of C and N metabolism and growth of the peat moss Sphagnum recurvum P. Beauv. var. mucronatum (Russ.) Warnst. Global Change Biol. 6: 201-212.
Heijmans, M. M. P. D., Berendse, F., Arp, W. J., Maaseliuk, A. K., Klees, H., Visser, W. De, and Breeman, N. van. 2001. Effects of elevated carbon dioxide and increased nitrogen deposition on bog vegetation in the Netherlands. J. Ecol. 89: 269-279.
Holtum, J. A. M. and Winter, K. 2001. Are plants growing close to the floors of tropical forests exposed to markedly elevated concentrations of carbon dioxide? Austral. J. Bot. 49: 629-636.
James, W. O. 1928. Experimental researches on vegetable assimilation and respiration. XIX. The effect of variations of carbon dioxide supply upon the rate of assimilation of submerged water plants. Proc. Royal Soc. London Ser B 103: 1-42.
Lovalvo, D., Clingenpeel, S. R., McGinnis, S, Macur, R. E., Varley, J. D., Inskeep, W. P., Glime, J., Nealson, K., and McDermott, T. R. 2010. A geothermal-linked biological oasis in Yellowstone Lake, Yellowstone National Park, Wyoming. Geobiology 8: 327-336.
MacDonald, G. M., Beukens, R. P., Kieser, W. E., and Vitt, D. H. 1987. Comparative radiocarbon dating of terrestrial plant macrofossils and aquatic moss from the "ice-free corridor" of western Canada. Geology 15: 837-840.
Madsen, T. V., Enevoldsen, H. O., and Jorgensen, T. B. 1993. Effects of water velocity on photosynthesis and dark respiration in submerged stream macrophytes. Plant Cell Environ. 16: 317-322.
Meyer, M., Seibt, U., and Griffiths, H. 2008. To concentrate or ventilate? Carbon acquisition, isotope discrimination and physiological ecology of early land plant life. Philosoph. Trans. Royal Soc. B-Biol. Sci. 363: 2767-2778.
Mitchell, E. A., Buttler, A., Grosvernier, P., Rydin, H., Siegenthaler, A., and Gobat, J. M. 2002. Contrasted effects of increased N and CO2 supply on two keystone species in peatland restoration and implications for global change. J. Ecol. 90: 529-533.
Osmond, C. B., Valanne, N., Haslam, S. M., Votila, P., and Roksandic, Z. 1981. Comparisons of δ13C values in leaves
of aquatic macrophytes from different habitats in Britain and Finland: Some implications for photosynthetic processes in aquatic plants. Oecologia 50: 117-124.
Paffen, B. G. P. and Roelefs, J. G. M. 1991. Impact of carbon dioxide and ammonium on the growth of submerged Sphagnum cuspidatum. Aquat. Bot. 40: 61-71.
Peñuelas, J. 1985. HCO3- as an exogenous carbon source for
aquatic bryophytes Fontinalis antipyretica and Fissidens grandifrons. J. Exper. Bot. 36: 441-448.
Porada, P., Weber, B., Elbert, W., Pöschl, U., and Kleidon, A. 2013. Estimating global carbon uptake by lichens and bryophytes with a process-based model. Biogeosciences 10: 6989-7033.
Prins, H. B. A. and Elzenga, J.T .M 1989. Bicarbonate utilization: Function and mechanism. Aquat. Bot. 34: 59-83.
Proctor, M. C. F. 1984. Structure and ecological adaptation. In: Dyer, A. F. and Duckett, J. G. (eds.). The Experimental Biology of Bryophytes. Academic Press, London, pp 9-37.
Proctor, M. C. F. 2010. Trait correlations in bryophytes: Exploring an alternative world. New Phytol. 185: 1-3.
Raghoebarsing, A. A., Smolders, A. J., Schmid, M. C., Rijpstra, W. I. C., Wolters-Arts, M., Derksen, J., Jetten, M. S. M., Schouten, S., Damste, J. S. S., Lamers, L. P. M., Toelofs, J. G. M., Camp, H. J. M. Op den, and Strous, M. 2005. Methanotrophic symbionts provide carbon for photosynthesis in peat bogs. Nature 436: 1153-1156.
Raven, J. A. 1991. Implications of inorganic carbon utilization: Ecology, evolution, and geochemistry. Can. J. Bot. 69: 908-924.
Raven, J. A. 2002. Selection pressures on stomatal evolution. New Phytol. 153: 371-386.
Raven, J. A. and Edwards, D. 2014. Photosynthesis in early land plants: Adapting to the terrestrial environment. In: Hanson, D. T. and Rice, S. K. (eds.). Photosynthesis in Bryophytes and Early Land Plants. Advances in Photosynthesis and Respiration 37: 9-28.
Raven, J. A., MacFarlane, J. J., and Griffiths, H 1987. The application of carbon isotope techniques. In: Crawford R. M. M. (ed.). Plant Life in Aquatic and Amphibious Habitats, pp 129-144. British Ecological Society Special Symposium, Blackwell, Oxford.
Raven, J. A., Johnson, A. M., Newman, J. R., and Scrimgeour, C. M. 1994. Inorganic carbon acquisition by aquatic photolithotrophs of the Dighty Burn, Angus, UK: Uses and limitations of natural abundance measurements of carbon isotopes. New Phytol. 127: 271-286.
Raven, J. A., Griffiths, H., Smith, E. C., and Vaughn, K. C. 1998. New perspectives in the biophysics and physiology of bryophytes. In: Bates, J. W., Ashton, N. W., and Duckett, J. G. (eds.). Bryology in the Twenty-first Century. Maney Publishing and the British Bryological Society, UK, pp. 261-275.
Rice, S. K. 2000. Variation in carbon isotope discrimination within and among Sphagnum species in a temperate wetland. Oecologia 123: 1-8.
Riis, T. and Sand-Jensen, K. 1997. Growth reconstruction and photosynthesis of aquatic mosses: Influence of light, temperature and carbon dioxide at depth. J. Ecol. 85: 359-372.
Robinson, H. 1985. The structure and significance of the leucobryaceous leaf. Monogr. Syst. Bot. Missouri Bot. Gard. 11: 111-120.
Ruttner, F. 1947. Zur Frage der Karbonatassimilation der Wasserpflanzen, I. Österr. Bot. Zeits. 94: 265-294.

Chapter 8-2: Nutrient Relations: CO2 8-2-17
Rydin, H. and Clymo, R. S. 1989. Transport of carbon and phosphorus compounds about Sphagnum. Proc. Roy. Soc. London B 237: 63-84.
Salvucci, M. E. and Bowes, G. 1981. Induction of reduced photorespiration activity in submersed and amphibious aquatic macrophytes. Plant Physiol. 67: 335-340.
Scripps CO2 Program 2016. Accessed 19 January 2017 at <http://scrippsco2.ucsd.edu/research/atmospheric_co2>
Shaw, A. J. and Allen, B. 2000. Phylogenetic relationships, morphological incongruence, and geographic speciation in the Fontinalaceae (Bryophyta). Molec. Phylog. Evol. 16: 225-237
Shinde, S., Behpouri, A., McElwain, J. C., and Ng, C. K.-Y. 2015. Genome-wide transcriptomic analysis of the effects of sub-ambient oxygen and elevated atmospheric carbon dioxide levels on gametophytes of the moss, Physcomitrella patens. J. Exper. Bot. 66: 4001-4012.
Silvola, J. 1985. CO2 dependence of photosynthesis in certain forest and peat mosses and simulated photosynthesis at various actual and hypothetical CO2 concentrations. Lindbergia 11: 86-93.
Simola, L. K. 1969. The effect of various mono- and disaccharides on the growth of Sphagnum nemoreum thalli in sterile cultures. Physiol. Plant. 22: 1079-1084.
Šimůnek, J. and Suarez, D. L. 1993. Carbon dioxide transport and production in soil. 1. Model development. Water Res. Res. 29: 487-497.
Smolders, A. J. P., Tomasson, H. B. H., Pijnappel, H. W., Lamers, L. P. H., and Roelefs, J. G. M. 2001. Substrate derived CO2 is important in the development of Sphagnum spp. New Phytol. 152: 325-332.
Sommerkorn, M., Bõlter, M., and Kappen, L. 1999. Carbon dioxide fluxes of soils and mosses in wet tundra of Taimyr Peninsula, Siberia: Controlling factors and contribution of net system fluxes of CO2 from soil respiration and moss respiration. Polar Res. 18: 253-260.
Sonesson, M., Carola, G., and Martin, T. 1992. CO2
environment, microclimate and photosynthetic characteristics of the moss Hylocomium splendens in a subarctic habitat. Oecologia 92: 23-29.
Sonneson, M., Callaghan, T. V., and Carlson, B. Å. 1996. Effect of enhanced ultraviolet radiation and carbon dioxide concentration on the moss Hylocomium splendens. Global Change Biol. 2: 67-73.
Steeman Nielsen, E. 1947. Photosynthesis of aquatic plants with special reference to the carbon sources. Dansk Bot. Ark. 12: 5-71.
Steeman Nielsen, E. and Kristiansen, J. 1949. Carbonic anhydrase in submersed autotrophic plants. Physiol. Plant. 2: 325-331.
Strain, B. R., and Cure, J. D. (eds.). 1985. Direct effects on increasing carbon dioxide on vegetation. U. S. Dept. of Energy, Office of Energy Research, Durham, N.C.
Tarnawski, M. G., Green, T. G. A., Buedel, B., Meyer, A., Zellner, J., and Lange, O. L. 1994. Diel changes of atmospheric CO2 concentrations within, and above, cryptogam stands in a New Zealand temperate rainforest. N. Z. J. Bot. 32: 329-336.
Tuba, Z., Csintalen, Z., Szente, K., Nagy, Z., and Grace, J. 1998. Carbon gains by desiccation-tolerant plants at elevated CO2. Funct. Ecol. 12: 39-44.
Tuba, Z., Proctor, M. C. F., and Takács, Z. 1999. Desiccation-tolerant plants under elevated air CO2: A review. Zeit. Natur. 54c: 788-796.
Villarreal, J. C. and Renner, S. S. 2012. Hornwort pyrenoids, carbon-concentrating structures, evolved and were lost at least five times during the last 100 million years. Proc. Natl. Acad. Sci.109: 18873-18878.
Vitt, D. H., Glime, J. M., and LaFarge-England, C. 1986. Bryophyte vegetation and habitat gradients of montane streams in western Canada. Hikobia 9: 367-385.

8-2-18 Chapter 8-2: Nutrient Relations: CO2
Glime, J. M. 2017. Nutrient Relations: Nitrogen. Chapt. 8-3. In: Glime, J. M. Bryophyte Ecology. Volume 1. Physiological 8-3-1 Ecology. Ebook sponsored by Michigan Technological University and the International Association of Bryologists. Last updated 3 March 2017 and available at < http://digitalcommons.mtu.edu/bryophyte-ecology/ >.
CHAPTER 8-3 NUTRIENT RELATIONS: NITROGEN
TABLE OF CONTENTS N Forms............................................................................................................................................................... 8-3-2 Nitrate and Ammonium ............................................................................................................................... 8-3-2 Physiology of Nitrate and Ammonium ................................................................................................. 8-3-3 Morphological Anomalies .................................................................................................................... 8-3-3 Benefit or Detriment? ........................................................................................................................... 8-3-4 Species Differences............................................................................................................................... 8-3-5 Long-term Effects ................................................................................................................................. 8-3-6 Organic Nitrogen ......................................................................................................................................... 8-3-6 Nitrogen Uptake ................................................................................................................................................ 8-3-11 Nitrogen Fixation .............................................................................................................................................. 8-3-13 Arctic, Antarctic, and Alpine ..................................................................................................................... 8-3-17 Arctic and Subarctic............................................................................................................................ 8-3-17 Antarctic and SubAntarctic................................................................................................................. 8-3-19 Alpine and Subalpine.......................................................................................................................... 8-3-19 Peatland Associations ................................................................................................................................ 8-3-20 Boreal Forests ............................................................................................................................................ 8-3-21 Tropics ....................................................................................................................................................... 8-3-21 Epiphylls .................................................................................................................................................... 8-3-22 Liverwort Symbiosis .................................................................................................................................. 8-3-22 Hornwort Associations............................................................................................................................... 8-3-23 Lunar Rocks ............................................................................................................................................... 8-3-25 Other Stressful Habitats ............................................................................................................................. 8-3-25 Nitrogen Translocation...................................................................................................................................... 8-3-26 N Sequestering .................................................................................................................................................. 8-3-26 N Deficiency Effects ......................................................................................................................................... 8-3-27 N Enrichment .................................................................................................................................................... 8-3-28 Habitat Relations............................................................................................................................................... 8-3-31 Nutrient Cycling................................................................................................................................................ 8-3-31 Summary ........................................................................................................................................................... 8-3-31 Acknowledgments............................................................................................................................................. 8-3-32 Literature Cited ................................................................................................................................................. 8-3-32
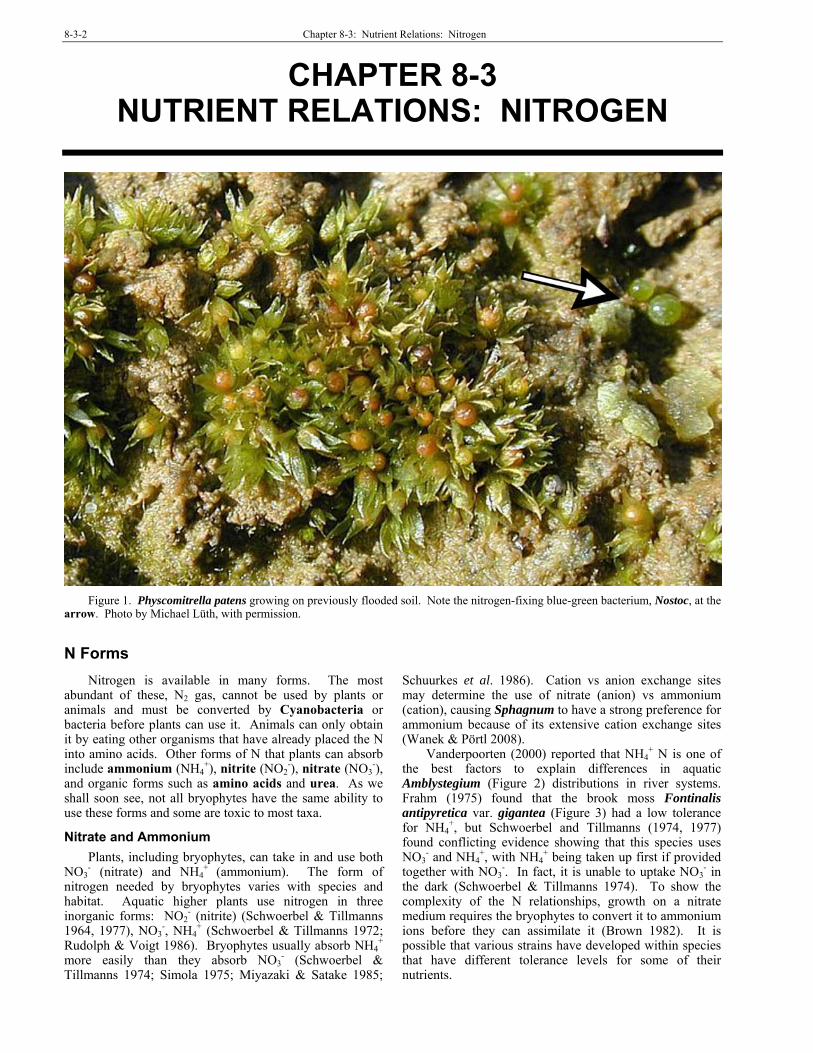
8-3-2 Chapter 8-3: Nutrient Relations: Nitrogen
CHAPTER 8-3 NUTRIENT RELATIONS: NITROGEN
Figure 1. Physcomitrella patens growing on previously flooded soil. Note the nitrogen-fixing blue-green bacterium, Nostoc, at the
arrow. Photo by Michael Lüth, with permission.
N Forms
Nitrogen is available in many forms. The most abundant of these, N2 gas, cannot be used by plants or animals and must be converted by Cyanobacteria or bacteria before plants can use it. Animals can only obtain it by eating other organisms that have already placed the N into amino acids. Other forms of N that plants can absorb include ammonium (NH4
+), nitrite (NO2-), nitrate (NO3
-), and organic forms such as amino acids and urea. As we shall soon see, not all bryophytes have the same ability to use these forms and some are toxic to most taxa.
Nitrate and Ammonium
Plants, including bryophytes, can take in and use both NO3
- (nitrate) and NH4+ (ammonium). The form of
nitrogen needed by bryophytes varies with species and habitat. Aquatic higher plants use nitrogen in three inorganic forms: NO2
- (nitrite) (Schwoerbel & Tillmanns 1964, 1977), NO3
-, NH4+ (Schwoerbel & Tillmanns 1972;
Rudolph & Voigt 1986). Bryophytes usually absorb NH4+
more easily than they absorb NO3- (Schwoerbel &
Tillmanns 1974; Simola 1975; Miyazaki & Satake 1985;
Schuurkes et al. 1986). Cation vs anion exchange sites may determine the use of nitrate (anion) vs ammonium (cation), causing Sphagnum to have a strong preference for ammonium because of its extensive cation exchange sites (Wanek & Pörtl 2008).
Vanderpoorten (2000) reported that NH4+ N is one of
the best factors to explain differences in aquatic Amblystegium (Figure 2) distributions in river systems. Frahm (1975) found that the brook moss Fontinalis antipyretica var. gigantea (Figure 3) had a low tolerance for NH4
+, but Schwoerbel and Tillmanns (1974, 1977) found conflicting evidence showing that this species uses NO3
- and NH4+, with NH4
+ being taken up first if provided together with NO3
-. In fact, it is unable to uptake NO3- in
the dark (Schwoerbel & Tillmanns 1974). To show the complexity of the N relationships, growth on a nitrate medium requires the bryophytes to convert it to ammonium ions before they can assimilate it (Brown 1982). It is possible that various strains have developed within species that have different tolerance levels for some of their nutrients.

Chapter 8-3: Nutrient Relations: Nitrogen 8-3-3
Figure 2. Amblystegium fluviatile, an aquatic moss sensitive
to ammonium levels. Photo by Michael Lüth, with permission.
Figure 3. Fontinalis antipyretica var. gigantea dry, a moss
with mixed responses to ammonium as its nitrogen source. Photo by Janice Glime.
Physiology of Nitrate and Ammonium
Assuming that bryophytes operate as do tracheophytes (lignified vascular plants), NO3
-, once in the plant, is converted to NH4
+. In leaves, the intermediate product, NO2
-, is reduced by nitrite reductase (enzyme that facilitates addition of hydrogen and loss of oxygen from NO2
- during photosynthetic electron transport process). No intermediate product is released and the final product is NH4
+. Since photosynthesis provides the NADH (nicotinamide adenine dinucleotide + H, the active coenzyme form of vitamin B3) and ferredoxin needed for conversion of nitrogen oxides to NH4
+, the conversion process is enhanced by the same things that enhance photosynthesis – high light and warm temperatures (Salisbury & Ross 1978). Thus, more ammonium is produced.
nitrite reductase NO3
- NO2- NH4
+
nitrate nitrite ammonium
Morphological Anomalies
Brown (1982) suggested that the pH or alkalinity affects availability of N for plants, with NO3
- being more available in neutral or alkaline soils and NH4
+ in acidic soils and water. But NH4
+ is usually toxic to plants in any appreciable quantity. Sironval (1947) found that NH4
+ ions caused degeneration of the caulonema (part of protonema from which buds arise) of Funaria hygrometrica (Figure 4) and Southorn (1977) found they caused morphological abnormalities in the same species. Killian (1923) likewise found morphological abnormalities in the leafy liverwort Scapania (Figure 5). On the other hand, Burkholder (1959) found that cultured bryophytes did equally well on both NO3
- and NH4+ salts.
Figure 4. Funaria hygrometrica protonema showing
caulonema, a stage that seems to degenerate when ammonium ions are added. Photo by Janice Glime.
Figure 5. Scapania undulata, an aquatic leafy liverwort that
exhibits morphological abnormalities when ammonium concentrations are too high. Photo by David T. Holyoak, with permission.
An interesting consequence of pH differences was suggested by Machlis (1962). In Sphaerocarpos texanus (Figure 6), male plants are smaller than females in the field. Machlis attributed this to the ability of male plants to absorb NH4
+ ions more readily than females, causing them to have a lower pH, which could suppress growth. He supported this suggestion by growing the plants on potassium, which caused no pH change, and likewise no reduction in the size of male plants.

8-3-4 Chapter 8-3: Nutrient Relations: Nitrogen
Figure 6. Sphaerocarpos texanus, a thallose liverwort in
which male plants absorb NH4+ ions more readily than do
females, causing males to have a lower pH, possibly accounting for growth suppression and smaller males. Photo by Martin Hutten, with permission.
Benefit or Detriment?
In a study designed to determine the effects of various forms of N on bryophyte function, Alghamdi (2003) studied the popular, fast-growing aquarium moss Taxiphyllum barbieri (Java moss, Figure 7). He found that the benefit to the moss depends on what parameter you measure (Figure 8). For example, dry biomass increase was greatest in high NO3
- concentrations (30 mg L-1 N), whereas the greatest increase in length occurred in high NH4
+ concentrations (30 mg L-1 N). This difference resulted in the least biomass increase per stem length in high NH4
+ concentrations, despite the relatively high increase in length in that treatment. The overall appearance of the mosses in high NH4
+, then, was to appear long and thin compared to those in other treatments, but not dissimilar to the plants in the control (standard nutrient solution but with no N source). Based on the lower growth in the NH4NO3 media, Alghamdi reasoned that in the presence of NH4
+, the NO3- became unusable because of
the inhibition of nitrate reductase by NH4+ (see Syrett &
Morris 1963; Orebamjo & Stewart 1975). At the same time, the lower concentration of NH4
+ (15 mg L-1 N) in combination compared to NH4
+ alone (30 mg L-1 N) reduced the growth. This relationship was consistent with much greater growth at 30 mg L-1 N than at 10 mg L-1 N as NH4
+ (Figure 8).
Figure 7. Taxiphyllum barbieri, an aquarium moss
subjected to high ammonia concentrations from fish waste products. Photo by Tan Sze Wei, Aquamoss website <www.aquamoss.net>, with permission.
NO2- caused only modest improvements in biomass
and length over N-free controls (Figure 8), but caused considerable increase in chlorophyll a (Alghamdi 2003; Figure 10). The chlorophyll a:b ratio was highest in the high NO3
- treatment, due to mosses in that treatment having the least chlorophyll b per biomass of moss, a concentration even lower than that of controls (Figure 10). In fact, effects of inorganic N form on chlorophyll b resulted in either no improvement over N-free controls, or depressed levels of chlorophyll b. However, chlorophyll a was higher in nearly all nitrogen treatments than in controls. Baxter et al. (1992) found a similar but slight decrease in total chlorophyll concentration in Sphagnum cuspidatum (Figure 9), typically a submersed species, with increasing levels of NH4
+, but in Alghamdi's experiments, Taxiphyllum barbieri (Figure 7) actually had total chlorophyll increase, although not statistically significant, with increase from 1 to 30 mg L-1 N as NH4
+ (Figure 10).
Figure 8. Effects of various forms of inorganic N (control =
no N) on growth in length (l) and biomass (d m) of Taxiphyllum barbieri. Box mean (dot) and median (horizontal line); bottom of box is first quartile and top is third quartile. Whiskers represent lowest and highest observations still inside region defined by lower limit Q1-1.5 (Q3-Q1) and upper limit Q3+1.5 (Q3-Q1); *represents outliers that extend beyond whiskers; n=15 sets of 3 stems. Means with same letters are not significantly different from each other (DNMRT, α = 0.05). Based on Alghamdi 2003.
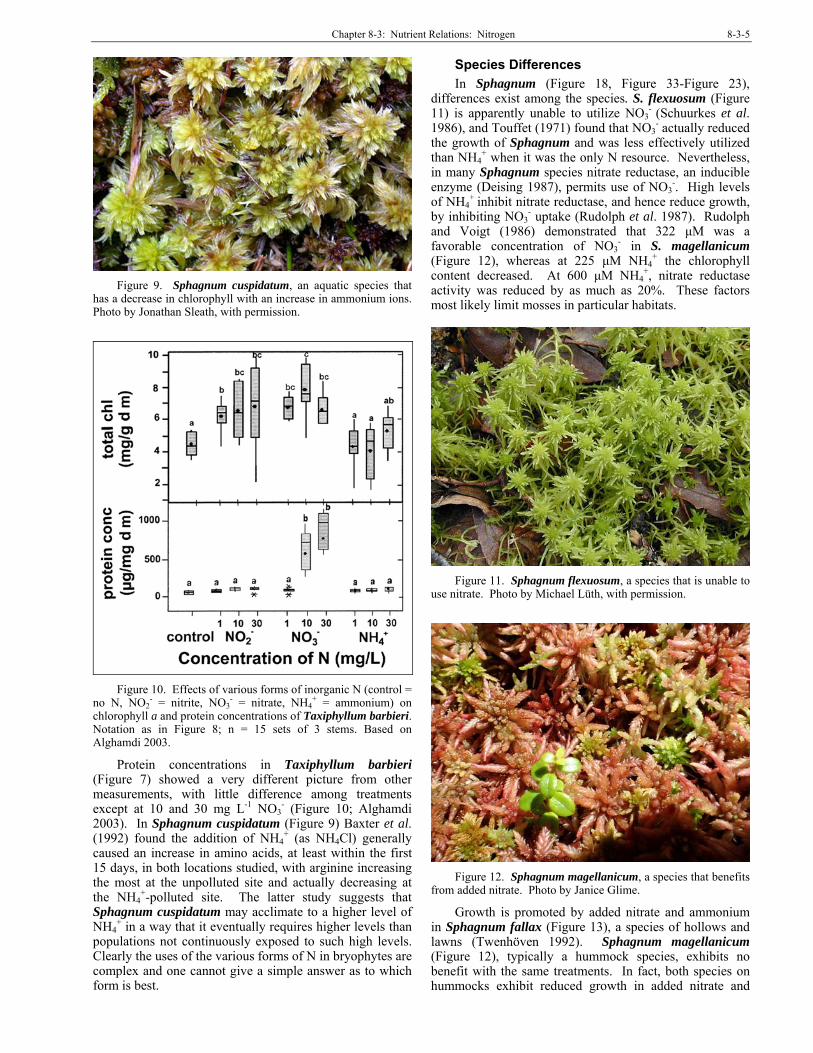
Chapter 8-3: Nutrient Relations: Nitrogen 8-3-5
Figure 9. Sphagnum cuspidatum, an aquatic species that
has a decrease in chlorophyll with an increase in ammonium ions. Photo by Jonathan Sleath, with permission.
Figure 10. Effects of various forms of inorganic N (control =
no N, NO2- = nitrite, NO3
- = nitrate, NH4+ = ammonium) on
chlorophyll a and protein concentrations of Taxiphyllum barbieri. Notation as in Figure 8; n = 15 sets of 3 stems. Based on Alghamdi 2003.
Protein concentrations in Taxiphyllum barbieri (Figure 7) showed a very different picture from other measurements, with little difference among treatments except at 10 and 30 mg L-1 NO3
- (Figure 10; Alghamdi 2003). In Sphagnum cuspidatum (Figure 9) Baxter et al. (1992) found the addition of NH4
+ (as NH4Cl) generally caused an increase in amino acids, at least within the first 15 days, in both locations studied, with arginine increasing the most at the unpolluted site and actually decreasing at the NH4
+-polluted site. The latter study suggests that Sphagnum cuspidatum may acclimate to a higher level of NH4
+ in a way that it eventually requires higher levels than populations not continuously exposed to such high levels. Clearly the uses of the various forms of N in bryophytes are complex and one cannot give a simple answer as to which form is best.
Species Differences
In Sphagnum (Figure 18, Figure 33-Figure 23), differences exist among the species. S. flexuosum (Figure 11) is apparently unable to utilize NO3
- (Schuurkes et al. 1986), and Touffet (1971) found that NO3
- actually reduced the growth of Sphagnum and was less effectively utilized than NH4
+ when it was the only N resource. Nevertheless, in many Sphagnum species nitrate reductase, an inducible enzyme (Deising 1987), permits use of NO3
-. High levels of NH4
+ inhibit nitrate reductase, and hence reduce growth, by inhibiting NO3
- uptake (Rudolph et al. 1987). Rudolph and Voigt (1986) demonstrated that 322 μM was a favorable concentration of NO3
- in S. magellanicum (Figure 12), whereas at 225 μM NH4
+ the chlorophyll content decreased. At 600 μM NH4
+, nitrate reductase activity was reduced by as much as 20%. These factors most likely limit mosses in particular habitats.
Figure 11. Sphagnum flexuosum, a species that is unable to
use nitrate. Photo by Michael Lüth, with permission.
Figure 12. Sphagnum magellanicum, a species that benefits
from added nitrate. Photo by Janice Glime.
Growth is promoted by added nitrate and ammonium in Sphagnum fallax (Figure 13), a species of hollows and lawns (Twenhöven 1992). Sphagnum magellanicum (Figure 12), typically a hummock species, exhibits no benefit with the same treatments. In fact, both species on hummocks exhibit reduced growth in added nitrate and

8-3-6 Chapter 8-3: Nutrient Relations: Nitrogen
ammonium. On the other hand, growth is reduced in levels that are lower than the levels resulting from the present atmospheric inputs, suggesting that these bogs were originally N limited. This changes the competitive status of these two species. Sphagnum fallax is typically competitive, whereas S. magellanicum is stress tolerant. When N deposition is elevated in previously N-limited conditions, S. fallax is able to outcompete S. magellanicum.
In the sub-Antarctic on Marion Island, increased NH4+
caused an increase in CO2 assimilation for four moss species, but NO3
- had a greater effect. Cl- added with the NH4
+ may have caused the lesser increase with NH4+
additions (Smith 1993). These increases are significant in this habitat with such low soil nutrient levels.
Figure 13. Sphagnum fallax, a competitive species, with
capsules. Photo by David T. Holyoak, with permission.
Long Term Effects
The negative effects of elevated nitrate and ammonia in fens are demonstrated in Dutch fens (Paulissen et al. 2004). These researchers found that Scorpidium scorpioides (Figure 14) and other brown mosses declined, whereas Sphagnum squarrosum (Figure 15) and Polytrichum commune (Figure 16-Figure 17) increased, lowering the pH. Scorpidium scorpioides did best on nitrate; ammonium nitrate decreased its growth somewhat, and ammonium itself was very toxic. Sphagnum squarrosum and Polytrichum commune experienced little affect from the N treatment.
Figure 14. Scorpidium scorpioides, a species that declines
when nitrates and ammonia are supplemented. Photo by Jan-Peter Frahm, with permission.
Figure 15. Sphagnum squarrosum, a species that declines
when nitrates and ammonia are supplemented. Photo by Janice Glime.
Figure 16. Polytrichum commune, a species that increases
when fertilized with nitrate and ammonium. Photo by Michael Lüth, with permission.
Figure 17. Polytrichum commune, with capsules. This is a
bog competitor that benefits from added nitrate and ammonium. Photo by Michael Lüth, with permission.
Organic Nitrogen
Most agricultural plants seem to absorb their nitrogen in the form of NH4
+ or NO3-, but it seems that bryophytes
have more options. Sphagnum (Figure 18, Figure 23, Figure 33) is able to use urea (along with phosphate) in the

Chapter 8-3: Nutrient Relations: Nitrogen 8-3-7
Alaskan wetlands, resulting in an increase in biomass compared to controls (Sanville 1988). In nature, amino acids likewise can be abundant, present as breakdown products of plant and animal wastes, litter, and corpses. Yet few culture studies or field tracer studies have included these organic forms until recently. Is it possible that bryophytes can use this organic N as their primary source? If so, they may benefit from organic leachates in early stages of litter decomposition of a soil environment.
In bogs and poor fens, NH4+ seems to be the
predominant form of available N (Rosswall & Granhall 1980). NO3
- is often lost through denitrification (Hemond 1983). Not surprisingly, some studies show that Sphagnum seems to require most of its inorganic N as NH4
+ (Schuurkes et al. 1986). But Simola (1975, 1979) showed that Sphagnum nemoreum (=S. capillifolium; Figure 18) and S. fimbriatum (Figure 19-Figure 20) both could use amino acids. Simola (1975) examined the effects of common peat amino acids – those most likely to be available to the Sphagnum. For Sphagnum nemoreum NH4NO3 proved to be the best N source, with the ammonium ion being used more effectively than nitrate. The amino acids arginine and alanine as the only N source proved to provide satisfactory growth. On the other hand, this species made no use of the amino acids leucine, lysine, isoleucine, or methionine. Lysine actually inhibited growth. This species is more tolerant to organic nitrogen than are tracheophytes, especially of the non-proteinogenic amino acid hydroxyproline. More recently, McKane (1993), using tracer studies, found that for Sphagnum, Aulacomnium palustre (Figure 21), and Hylocomium splendens (Figure 22), the amino acid glycine was actually the preferred form of nitrogen over NH4
+ and NO3-.
Figure 18. Sphagnum nemoreum, a species that can use
amino acids as a nitrogen source. Photo by Michael Lüth, with permission.
It appears that in Arctic ecosystems, organic nitrogen (amino acids, especially glycine) may actually be the preferred source of N for some bryophytes, including Sphagnum rubellum (Figure 23) (Kielland 1997). Even amino acids with higher molecular weights, such as aspartate and glutamate, can be absorbed at higher rates than inorganic N. Kielland suggested that the high capacity for absorbing amino acids might be an adaptation to the low inorganic N availability in the Arctic.
Figure 19. Sphagnum fimbriatum habitat, a species that can
use amino acids, most likely available from decomposing leaf litter in its habitat. Photo by Dick Haaksma, with permission.
Figure 20. Sphagnum fimbriatum, a species that can use
amino acids as a nitrogen source. Photo by Michael Lüth, with permission.
Figure 21. Aulacomnium palustre, a species that "prefers"
glycine over ammonium and nitrate. Photo by Janice Glime.

8-3-8 Chapter 8-3: Nutrient Relations: Nitrogen
Figure 22. Hylocomium splendens, a species that "prefers"
glycine over ammonium and nitrate. Photo by Michael Lüth, with permission.
Figure 23. Sphagnum rubellum, a species that exhibited
decreased growth when receiving elevated ammonium nitrate. Photo by Michael Lüth, with permission.
The Arctic is not the only place where amino acids can provide N for bryophytes. Hylocomium splendens (Figure 22) in the boreal forest can utilize glycine (Forsum et al. 2006). When ammonium, nitrate, and glycine were applied in spray solutions similar to the concentrations in precipitation, this moss took up the greatest labelled N compared to other concentrations. This included a 17% contribution from amino acid N.
Even floodplain bryophytes can use amino acids. Schuler et al. (1955) found that in culture the thallose liverwort Sphaerocarpos texanus (Figure 6) grew more typically on a mix of amino acids than it did on NH4NO3 alone.
Burkholder (1959) examined the effects of 20 amino acids (0.0001 M AA to 0.0016 M AA) with and without the addition of NH4NO3 on the color and growth of Atrichum undulatum (Figure 24). Glycine, L-cystine, L-cysteine, and L-tyrosine were the only treatments with amino acids alone in which the moss retained its green color. Others were yellow-green, brown-green, or brown (in DL-serine and DL-tryptophan). When grown in combination of each of these 20 amino acids with NH4NO3, plants in all treatments grew more than in any of the amino acids alone except in the highest concentration (0.0016 M) of DL-tryptophan. Growth was generally greatest in the lower concentration of amino acid (0.0001 M) plus NH4NO3.
Figure 24. Atrichum undulatum with capsules, a species
that is able to use some amino acids, but not others. Photo by Andrew Hodgson, with permission.
The report of amino acid utilization by the aquatic Java moss (Taxiphyllum barbieri, Figure 7) (Alghamdi 2003), seems unusual among the aquatic mosses and may somehow relate to its ability to live in aquaria and tropical streams where most other bryophytes seem unable to survive. Could this in some way relate to the higher annual temperatures of its tropical habitat? Or is the lack of evidence for amino acid usage in many other species simply a lack of testing?
Alghamdi (2003) chose common soil water-soluble amino acids (glycine, methionine, serine, arginine, and alanine) to compare their effects on growth, branching, chlorophyll, and protein on the aquatic moss Taxiphyllum barbieri (Figure 7). He found that four of these amino acids induced branching, relative to the controls, but no branching appeared in any of the methionine treatments (Figure 25).
Figure 25. Effects of water soluble amino acids on number
of branches in the Java moss, Taxiphyllum barbieri. cont = control, gly = glycine, meth = methionine, ser = serine, arg = arginine, ala = alanine. From Alghamdi 2003.
Methionine proved to be inhibitory to growth in length whereas serine caused an increase in both dry biomass and length relative to controls (Figure 26;

Chapter 8-3: Nutrient Relations: Nitrogen 8-3-9
Alghamdi 2003). Arginine as the only N source at 1, 10, and 30 mg L-1 caused a striking increase in the biomass and ratio of dry biomass to length, but maintained a length somewhat less than that of the N-free controls (Figure 26). This resulted in unusually short, wide plants, combined with high protein concentrations but below normal chlorophyll concentrations at the lowest level applied (1 mg L-1; Figure 27).
Figure 26. Effect of water soluble amino acids on the
biomass, length, and robustness (wt:length) of the Java moss, Taxiphyllum barbieri. Cont = control, Gly = glycine, Meth = methionine, Ser = serine, Arg = arginine, Ala = alanine. Length and biomass represent sum of 3 stems; n = 10 sets of 3 stems. Notation as in Figure 8. Based on Alghamdi 2003.
Methionine likewise caused an increase in biomass and decrease in length growth with concentration increase (1, 10, 30 mg L-1). Alanine caused an increase in both length and biomass with concentration, with the overall effect being one of a more robust plant at higher concentrations, having a higher biomass to length ratio than that of the controls. The mosses responded to 1 mg L-1 glycine much as they did to the N-free medium, but at higher concentrations (20 and 30 mg L-1) their length and biomass both increased considerably over that of controls.
Alghamdi (2003) then compared the effects of glycine, which seemed to produce the "healthiest" plants, to those of the inorganic forms of N. This aquatic moss did less well on the inorganic forms NH4NO3 or NO3
- than on NH4
+ alone or NH4
+ + the amino acid glycine and did best on glycine alone, producing more biomass, longer stems, and
more branches (Figure 28, Figure 29). In fact, glycine seemed to induce branching (Table 1).
Figure 27. Effect of water soluble amino acids on the protein
content and total chlorophyll concentration of the Java moss, Taxiphyllum barbieri. cont = control, gly = glycine, meth = methionine, ser = serine, arg = arginine, ala = alanine. n = 10 sets of 3 stems. Notation as in Figure 8. From Alghamdi 2003.
In the same series of experiments, Alghamdi (2003) examined the effects of inorganic N and glycine on the chlorophyll and protein content of Taxiphyllum barbieri. Glycine, both alone and in combination with NH4
+, resulted in the highest protein concentrations (Figure 30). The effects on chlorophyll were less clear, but the highest total chlorophyll occurred in the highest glycine concentration (Figure 30). NH4
+ at 20 mg L-1, however, produced similar chlorophyll concentrations, but at 30 mg L-1 the chlorophyll content decreased.
Figure 28. Effect of N source as nitrate (NO3
+), ammonium (NH4
+), glycine (gly), and combinations at two concentrations on number of branches in Taxiphyllum barbieri. The combinations have half the total N from each source. From Alghamdi 2003.

8-3-10 Chapter 8-3: Nutrient Relations: Nitrogen
Figure 29. Effect of nitrate (NO3
+), ammonium (NH4+),
glycine (gly), and combinations on the increase in biomass (d m) and length (l) and robustness (wt:length) of the Java moss, Taxiphyllum barbieri. Notation as in Figure 8; n = 10 sets of 3 stems. From Alghamdi 2003.
Table 1. Effect of various N forms on moss branching in Taxiphyllum barbieri. From Alghamdi 2003.
Treatment Moss Branching
glycine long with many short branches
NO3- short and no branches
NH4+ long and few short branches
glycine + NH4
+ long with many short branches and slightly thin
NH4NO3 short, thin and few short branches
Other organic compounds, such as nucleic acids, are
also released from organism tissues as they decay. Based on his data showing that Atrichum undulatum (Figure 24) had good growth in a medium with yeast nucleic acids as its N source, Burkholder (1959) tested growth of this species on the nucleic acid bases. Growth of leafy shoots was good in adenine and guanine, but there was no growth
in uracil or thymine. Growth in xanthine, uric acid, and cytosine was less than that in NH4NO3.
Figure 30. Effects of inorganic N compared to glycine on
the protein and chlorophyll content of Java moss (Taxiphyllum barbieri). Notation as in Figure 8; n = 10 sets of 3 stems. From Alghamdi 2003.
Both uracil (in the presence of NH4NO3) and aspartic acid caused Sphagnum squarrosum (Figure 15) to become thalloid (resembling its protonema), as did hydroxyproline + glycine, occasionally (Burkholder 1959). Not all mosses responded in the same way. Growth of Leptobryum pyriforme (Figure 31) and Splachnum sphaericum (Figure 32) and others was "excellent" on a medium with NH4NO3 plus uracil, but was poor in Sphagnum squarrosum. On the other hand, while growth of Leptobryum pyriforme was good with uric acid and cytosine, Splachnum sphaericum had poor growth. The ability to use nucleic acids, amino acids, and other organic N compounds could permit bryophytes to take advantage of partially decomposed litter in which these nitrogen sources leak from the dead tissues.
Figure 31. Leptobryum pyriforme, a species that grows well
with uric acid and cytosine. Photo by Michael Lüth, with permission.

Chapter 8-3: Nutrient Relations: Nitrogen 8-3-11
Figure 32. Splachnum sphaericum with capsules, a species
with good growth on NH4NO3 plus uracil, but poor growth with uric acid and cytosine. Photo by Michael Lüth, with permission.
When N (as NH4NO3) was added to a mire in central Sweden, Sphagnum fuscum (Figure 33), S. magellanicum (Figure 12), and S. rubellum (Figure 23) exhibited increased concentrations of amino acids in the capitulum (Nordin & Gunnarsson 2000). But the growth in length decreased at the same time. The researchers demonstrated that when the amino acid N concentrations exceeded 2.0 mg N g-1 dry mass, growth was negatively affected. The amino acid N concentrations did not serve as a good measure of N deposition rates when the deposition rates were less than 1.0 g m-2 yr-1.
Brown (1982) suggested that in low N environments the mosses may be able to move organic molecules containing N from dying and dead cells to the growing apex. It is very likely that these molecules would be amino acids, as well as dipeptides and other organic compounds.
Some amino acids, leaking into the environment from decaying vegetation, could cause developmental anomalies leading to abnormal growth forms in bryophytes. For example, amino acids, such as hydroxyproline, can cause desuppression in the development of underleaves in liverworts (Basile & Basile 1980; Basile et al. 1988), causing them to look like normal leaves. In the moss Atrichum (Figure 24), amino acids inhibited leafy shoot development (Burkholder 1959). This might be another example of the Gaia hypothesis (Lovelock, 1988), wherein the ecosystem behaves like a superorganism and species depend on other species for their biochemical needs during development. The N relationships of bryophytes are proving to be more complex than we previously thought.
Figure 33. Sphagnum fuscum, a species that exhibited
decreased growth when receiving elevated ammonium nitrate. Photo by Jutta Kapfer, with permission.
Nitrogen Uptake With the variety in forms of N used by various species,
we might expect sites and mechanisms of uptake to vary as well. Atmospheric deposition of N serves as the major source of N for many bryophytes (Soares & Pearson 1997). These researchers raised concerns about the ability of increased levels of these N sources in pollution to inhibit nitrate reductase and affect cation, total N, and organic acid concentrations.
Using Racomitrium lanuginosum (Figure 34), Rhytidiadelphus loreus (Figure 35), and Philonotis fontana (Figure 36) and a single field misting with 3 mol m-3 NH4
+ and NO3- Soares and Pearson (1997) found a 20%
increase in tissue N after 48 hours. Labelled N experiments on R. lanuginosum revealed N partitioning, with the highest N uptake in the upper stem and leaves. High concentrations of N resulted in reduced N uptake efficiency. The ammonium decreased nitrogen reductase activity and caused organic acids and cations to decline. However, nitrate treatments cause the opposite response.
Figure 34. Racomitrium lanuginosum, a species has
elevated N in the upper stems and leaves following added ammonium and nitrate. Photo by Michael Lüth, with permission.
Figure 35. Rhytidiadelphus loreus, a species that rapidly
takes up added N in the first 48 hours. Photo by Michael Lüth, with permission.

8-3-12 Chapter 8-3: Nutrient Relations: Nitrogen
Figure 36. Philonotis fontana, a species that rapidly takes
up added N in the first 48 hours. Photo by Michael Lüth, with permission.
What controls the rate of uptake in various species? Jauhiainen et al. (1998) found that among seven Sphagnum species, the greatest uptake rate was by individuals (not species) that had the largest capitula and a high number of ion exchange sites. These species were the lawn species S. pulchrum (Figure 37), S. fallax (Figure 13), S. papillosum (Figure 38), and S. magellanicum (Figure 12). However, when compared on the basis of dry mass, the most effective species were the hummock species S. fuscum (Figure 33) and S. rubellum (Figure 23). These species were also the most effective ones in retaining available nitrogen.
Figure 37. Sphagnum pulchrum, a lawn species with a
large capitulum and high nitrogen uptake. Photo by Michael Lüth, with permission.
Kopáček and Blažzka (1994) examined ammonium uptake in alpine streams of the High Tatra Mountains, Slovakia. Maximum uptake rates of ammonium N by bryophytes ranged 6-11 mg m-2 h-1. The uptake rate did not seem to relate to pH during 3- to 5-hour testing periods. Nevertheless, nitrification of ~50% of the NH4
+-N added occurred in non-acidified streams, but was negligible in acidified streams.
In the aquatic liverworts Jungermannia vulcanicola (Figure 39-Figure 40) and Scapania undulata (Figure 5,
Figure 41), uptake activities were similar (Miyazaki & Satake 1985). Uptake was greatest at the plant tips and decreased toward the base. Uptake of ammonium at the tip was between 1.9 X 10⁻⁵ and 5.8 X 10⁻⁵ g N g dry wt-1 h-1. Nitrate uptake was less than that of ammonium.
Figure 38. Sphagnum papillosum, a lawn species with a
large capitulum and high nitrogen uptake. Photo by Michael Lüth, with permission.
Figure 39. Jungermannia vulcanicola, a Japanese species
with a high tolerance for acid. Photo by Angela Ares, with permission.
Figure 40. Jungermannia vulcanicola, a species in which N
uptake is greatest at the plant tips and decreases toward the base. Photo by Angela Ares, with permission.

Chapter 8-3: Nutrient Relations: Nitrogen 8-3-13
Figure 41. Scapania undulata, showing a typical habitat.
Photo by Michael Lüth, with permission.
Bryophytes have a variety of options for obtaining N. In the Antarctic, Bryum pseudotriquetrum (Figure 42-Figure 43) and Sarconeurum glaciale (Figure 44) are able to retain more of the N from precipitation than does the dry soil of the fellfields where they live (Greenfield 1992). The N forms are retained by ion exchange and chelation, enabling them to supplement the low nutrient levels in the rocks and poor-nutrient soils.
Figure 42. Bryum pseudotriquetrum in the Antarctic, a
species that retains N from precipitation. Photo courtesy of Catherine Beard.
Figure 43. Bryum pseudotriquetrum, a moss that retains N
from precipitation. Photo by Barry Stewart, with permission.
Figure 44. Sarconeurum glaciale with the lichen Xanthoria
mawsonii on it. Sarconeurum glaciale retains N from precipitation. Photo from Australian Antarctic Data Centre, through Creative Commons.
Bryophytes are diverse in their abilities and physiologies. We have often assumed that they are unable to take N from the soil. However, Ayres et al. (2006) demonstrated clearly that mosses are able to derive N from the soil. In fact, they suggested that uptake from soil might be common among mosses, but this prediction needs to be tested.
Nitrogen Fixation
With 78% of our atmosphere being composed of nitrogen and only about 5% of biomass being nitrogen, one would expect this element to be no problem for living systems to obtain. But unlike phosphorus, it cannot normally be obtained from bedrock. And just as you and I can make no use of the free, gaseous nitrogen we breathe, most plants can't either. Instead, plants require their nitrogen fixed into ammonium (NH4
+) or nitrate (NO3-)
salts (or converted to amino acids) before they can obtain and convert it to specific amino acids and proteins they need.
Nitrogen fixation is the process of trapping atmospheric nitrogen and converting it to NH4
+ and in some cases, converting it to NO3
-. Elbert et al. (2012) estimated that cryptogamic covers, including Cyanobacteria, algae, fungi, lichens, and bryophytes, account for nearly half of biological N fixation in terrestrial communities. Bryophytes play a crucial contributor in many communities by providing suitable habitat for the N-fixers.
N fixation by Cyanobacteria associations with bryophytes may be important in many ecosystems where it has hardly been recognized (Cullimore & McCann 1972; Madhusoodanan & Dominic 1996). Nitrogen fixation is a major source of usable nitrogen for bryophytes, particularly in bogs and fens. Like many tracheophytes, bryophytes can use N released by N fixation from associated bacteria and Cyanobacteria. The heterocysts (large, transparent, thick-walled cell in filaments of some Cyanobacteria; site of nitrogen fixation; Figure 45) of Cyanobacteria make them a rich source of amino acids as a result of their nitrogen-fixing activity. That is, they are able to convert atmospheric N to a form usable by other living organisms.

8-3-14 Chapter 8-3: Nutrient Relations: Nitrogen
Figure 45. Anabaena (Cyanobacteria) showing heterocyst
in middle lower part of picture. Photo by Janice Glime.
In the process of nitrogen fixation in Cyanobacteria, the simple CH2O group from sugars, fixed by cells adjacent to the heterocyst, is moved into the heterocyst (Figure 46). Atmospheric nitrogen (N2) enters adjacent cells and is passed to the heterocyst. In the heterocyst nitrogen reductase (enzyme that catalyzes addition of H+ to N to form NH4
+) catalyzes the transformation of N2 to the reduced NH4
+ with H+ obtained from the CH2O group.
Figure 46. Nitrogen fixation in Cyanobacteria, with
atmospheric nitrogen entering an adjacent cell and being transferred to the heterocyst, where it is converted to ammonium (NH4
+). The ammonium is then moved to the adjacent cell where it is converted into organic compounds, typically amino acids. Diagram by Janice Glime.
Many studies have shown that some bryophytes,
especially peatland bryophytes, obtain N through N fixation processes of surface-dwelling Cyanobacteria (Figure 47) as well as other bacteria (Cullimore & McCann 1972; Granhall & Selander 1973; Alexander et al. 1974; Basilier et al. 1978; Smith & Ashton 1981; Smith 1984; Nakatsubo & Ino 1986, 1987; Bentley 1987; Given 1987; Bergman et al. 1993; Madhusoodanan & Dominic 1996). In the Cyanobacteria, the most significant contributions come from taxa such as Nostoc (Figure 1, Figure 48), Anabaena (Figure 49), and Calothrix (Figure 50) that have the special cells called heterocysts. These cells provide a "safe" environment for nitrogen fixation because they lack the oxygen-generating reactions of photosystem II. The enzyme nitrogen reductase is unable to make the conversion in an aerobic environment, hence requiring a location where photosynthetic oxygen is not available. Since only the Cyanobacteria and some true bacteria are able to use the abundant atmospheric nitrogen, this conversion makes a significant contribution to usable nitrogen in the ecosystem.
Figure 47. Cyanobacteria on Campylopus at geothermal
vent in New Zealand. Photo by Janice Glime.
Figure 48. Nostoc, a typical N-fixing Cyanobacterium that
can be found associated with bryophytes. Note the enlarged heterocysts. Photo by Janice Glime.
Figure 49. Anabaena, a common N-fixing symbiont that
lives among bryophyte leaves. Photo by Yuuji Tsukii, with permission.
The Cyanobacteria fix more nitrogen than is essential for their own needs and release the excess to their environment. Significant contributions of N through N fixation by Cyanobacteria occur in grasslands (Vlassak et al. 1973), boulder communities (Snyder & Wullstein 1973a, Jones & Wilson 1978), tropical forests, especially in

Chapter 8-3: Nutrient Relations: Nitrogen 8-3-15
epiphyllous communities (those growing on a leaf) (Bentley 1987), poor Sphagnum (Figure 18, Figure 23, Figure 33) mires (Basilier 1979), boreal forests (DeLuca et al. 2002; Gundale et al. 2011), and polar turfs (Alexander 1975; Alexander et al. 1978).
Figure 50. Calothrix, a nitrogen-fixing Cyanobacterium
that can live in association with Phaeoceros. Note the heterocyst at the base of each filament. Photo by Yuuji Tsukii, with permission.
In the terrestrial moss Hymenostylium recurvirostre (Figure 51), association with Nostoc (Figure 48) is common. Labelled 15N from N gas, converted by Nostoc, resulted in the highest concentrations in the new rhizoids, then new shoots, then old shoots and old rhizoids (Jones & Wilson 1978). Jones and Wilson suggest that these locations indicate the nitrogen is being translocated from old to young tissues. Not only is free NH4
+ available, but also large quantities of extracellular amino acid leakage is associated with this Nostoc. In view of the discussion above on bryophyte use of amino acids, it is likely that the moss and its neighbors might be using these amino acids as part of their N source.
Figure 51. Hymenostylium recurvirostrum with capsules, a
species that commonly has Nostoc associates. Photo by Michael Lüth, with permission.
In some of the liverworts and hornworts, Cyanobacteria seem to behave symbiotically (Saxena 1981), but more frequently it seems to be only a matter of suitable habitat. For example, in the moist Pacific northwest, approximately 85% of the sampled epiphytic leafy liverwort Porella navicularis (Figure 52-Figure 53)
harbors Nostoc (Cyanobacteria; Figure 48) in distinct colonies under the leaf curled margins and in other plant crevices (Dalton & Chatfield 1985). Nitrogen fixation is measured by the acetylene reduction method, and the product C2H2 is used as the measure of fixation. The production of fixed N on P. navicularis resulted in a mean of 53.5 nmol C2H2 g
-1 d m h-1 and reached up to 316 nmol C2H2 g-1 d m h-1. Dalton and Chatfield (1985) at first thought the Porella association was symbiotic, but the low number of heterocysts (3-7%) is typical of free-living Nostoc; symbiotic ones typically have a frequency of 30-40%. In either case, the effect is the same; by providing a suitable habitat for Cyanobacteria, the mosses facilitate an increase of available N in the system.
Figure 52. Porella navicularis on tree. Photo from Botany
website, UBC, with permission.
Figure 53. Porella navicularis, a suitable substrate for
Nostoc and N fixation. Photo from Botany website, UBC, with permission.

8-3-16 Chapter 8-3: Nutrient Relations: Nitrogen
Temperate bryophytes often have associated Cyanobacteria, especially Nostoc. Soil associations with bryophytes can benefit the ecosystem in several ways. Not only do they provide additional usable N to the ecosystem, as in the Hymenostylium recurvirostre (Figure 51) association in Upper Teesdale (Wilson 1975), but they also provide a buffer against erosion and leaching of nutrients already in the upper soil layers.
Few studies have quantitatively addressed the role of micro-organisms in bryophyte communities, particularly in peatlands where their role is significant (Gilbert et al. 1999). Nevertheless, these micro-organisms are undoubtedly key players in nutrient cycling through the microbial loop.
Table 2. Comparison of N fixation rates by Cyanobacteria associated with bryophytes in various habitats. Rates converted to nmol N using the 3:1 ratio of reduced acetylene to fixed N given by Nakatsubo and Ino (1987) and Vlassak et al. (1973). gfm = grams fresh mass; gdm = grams dry mass. Table compiled by Medora Burke-Scoll.
Location Habitat Bryophyte and Cyanobacteria partner Rate Reference
Tropical Lava and on volcanic island Funaria hygrometrica + Nostoc & Anabaena 0.42 nmol N cm-2 hr-1 Rodgers & Henriksson
1976
Tropical Undisturbed forest floor Chiloscyphus coalitus + Anabaena &/or Nostoc 1.87 nmol N gdm-1 hr-1 Brasell et al. 1986
Tropical Undisturbed forest floor Chiloscyphus fissistipus + Anabaena &/or
Nostoc 8.2 nmol N gdm-1 hr-1 Brasell et al. 1986
Tropical Undisturbed forest floor Bazzania adnexa + Anabaena &/or Nostoc 1.23 nmol N gdm-1 hr-1 Brasell et al. 1986
Tropical Undisturbed forest floor Hypnum chrysogaster + Anabaena &/or Nostoc 3.1 nmol N gdm-1 hr-1 Brasell et al. 1986
Tropical Undisturbed forest floor Pohlia nutans + Anabaena &/or Nostoc 3.27 nmol N gdm-1 hr-1 Brasell et al. 1986
Tropical Undisturbed forest floor Tortella calycina + Anabaena &/or Nostoc 2.57 nmol N gdm-1 hr-1 Brasell et al. 1986
Tropical Undisturbed forest floor Pohlia nutans + Anabaena &/or Nostoc 3.27 nmol N gdm-1 hr-1 Brasell et al. 1986
Temperate Grassland Ceratodon purpureus + Nostoc 10.4 nmol N gdm-1 hr-1 Vlassak et al. 1973
Temperate Japan Aquatic
Sphagnum capillaceum + Stigonema, Hapalosiphon, Scytonema, & Nodularia 0.13 nmol N gfm-1 hr-1
Morimoto & Maruyama 1982
Temperate Peatland Sphagnum + Stigonema, Hapalosiphon,
Scytonema, & Nodularia 0.13 nmol N gfm-1 hr-1
Morimoto & Maruyama 1982
Temperate Coniferous forest floor
(Bilberry-spruce forest) Sphagnum girgensohnii + Anabaenopsis
None detected *included only plant apex.
Basilier 1979
Temperate Forest margin Sphagnum papillosum + endophytic Nostoc 0.033 nmol N gdm-1 hr-1
(only plant apex) Basilier 1979
Temperate Fen Sphagnum angustifolium + endophytic Nostoc 43.3 nmol N gdm-1 hr-1
(only plant apex) Basilier 1979
Temperate Fen Drepanocladus aduncus + unidentified epiphytic
Cyanobacteria 25.67 nmol N gdm-1 hr-1 (only plant apex)
Basilier 1979
Temperate Fen Sphagnum riparium + epiphytic Hapalosiphon 26.67 nmol N gdm-1 hr-1 (only plant apex) Basilier 1979
Temperate Lakeside Sphagnum annulatum + Nostoc 15.3 nmol N gdm-1 hr-1
(only plant apex) Basilier 1979
Temperate Desert Grimmia + Azotobacter 0.065 nmol N gdm-1 hr-1 Snyder & Wullstein 1973b
Temperate Desert Syntrichia ruralis + Azotobacter 0.061 nmol N gdm-1 hr-1 Snyder & Wullstein
1973b Boreal Iceland
Iceland Lava field Grimmia + Anabaena & Nostoc 0.13 nmol N/20 cm
plant · hr-1 Englund 1976
Boreal Iceland Lava field Racomitrium + Anabaena & Nostoc 0.1 nmol N/20 cm plant
· hr-1 Englund 1976
Subalpine Forest floor Sphagnum + Cyanobacteria 0.743 nmol N gdm-1 hr-1 Lambert & Reiners 1979
Subalpine Peatland Sphagnum lindbergii + Nostoc & Scytonema 1.3 nmol N gdm-1 hr-1 Granhall & Selander
1973
Subalpine Peatland Sphagnum + Cyanobacteria 0.29 nmol N gdm-1 hr-1 Lambert & Reiners 1979
Subalpine Aquatic Sphagnum + Cyanobacteria 0.13 nmol N gdm-1 hr-1 Lambert & Reiners 1979
Subalpine Forest floor Atrichum + Cyanobacteria 0.053 nmol N gdm-1 hr-1 Lambert & Reiners 1979
Subalpine Forest floor Dicranum + Cyanobacteria 0.023 nmol N gdm-1 hr-1 Lambert & Reiners 1979
Subalpine Forest floor Pleurozium schreberi + Cyanobacteria 0.026 nmol N gdm-1 hr-1 Lambert & Reiners 1979
Subalpine Forest floor Plagiomnium cuspidatum + Cyanobacteria 0.15 nmol N gdm-1 hr-1 Lambert & Reiners 1979

Chapter 8-3: Nutrient Relations: Nitrogen 8-3-17
Subalpine Forest floor Polytrichum + Cyanobacteria 0.011 nmol N gdm-1 hr-1 Lambert & Reiners 1979
Subalpine Forest floor Bazzania trilobata + Cyanobacteria 0.033 nmol N gdm-1 hr-1 Lambert & Reiners 1979
Subalpine Coniferous forest floor Feather mosses 0.23 nmol N gdm-1 hr-1 Granhall & Lindberg
1978
Subalpine Coniferous forest floor Sphagnum 7.47 nmol N gdm-1 hr-1 Granhall & Lindberg
1978 Alpine zone of Mt. Fuji
Mountain summit Aongstroemia fuji-alpina, Ceratodon purpureus,
& Bryum + Nostoc 3.4 nmol N cm-2 hr-1 Nakatsubo & Ohtani
1991
Antarctic East Ongul Island,
Antarctica. Sand near a rocky peak.
Ceratodon purpureus & Bryum pseudotriquetrum + Nostoc
2.37 nmol N cm-2 hr-1 Nakatsubo & Ino 1987
Antarctic Marion Island (highly
minerotrophic receiving nutrient-rich mire runoff)
Brachythecium subplicatum + Anabaena, Calothrix, Hapalosiphon, Nostoc, Sphaerocystis,
Stigonema, & Tolypothrix 103.5 nmol N gdm-1 hr-1 Smith & Russell 1982
Antarctic Marion Island (exposed wind-swept rocky ridges)
Ditrichum strictum (balls) + Anabaena, Calothrix, Hapalosiphon, Nostoc, Sphaerocystis,
Stigonema, & Tolypothrix 0.12 nmol N gdm-1 hr-1 Smith & Russell 1982
Antarctic Marion Island (submerged) Grimmia falcate + Anabaena, Calothrix,
Hapalosiphon, Nostoc, Sphaerocystis, Stigonema, & Tolypothrix
5.15 nmol N gdm-1 hr-1 Smith & Russell 1982
Antarctic Fumaroles near summit of
Mt. Melbourne Campylopus pyriformis & Cephaloziella exiliflora + Mastigocladus laminosus
11 nmol N gdm-1 d-1 Broady et al. 1987
Arctic, Antarctic, and Alpine In bryophyte-Cyanobacteria associations in the
Antarctic (Smith & Russell 1982; Smith 1984; Nakatsubo & Ino 1987; Line 1992; Pandey et al. 1992), Arctic (Alexander et al. 1978), and alpine/subalpine zones (Lambert & Reiners 1979), N fixation may be a very important contribution of this limiting nutrient to the nutrient-poor ecosystems (Smith & Ashton 1981). Although Smith and Ashton failed to show much acetylene reduction to indicate fixation activity in the field on sub-Antarctic Marion Island at ~0°C, they considered that during the warm summer, fixation by Cyanobacterial flora of bryophytes could approach that exhibited in the lab at ~20°C, thus contributing significantly to the available N in the ecosystem. In a 48-hour field incubation with an air temperature of -1.7°C and moss moisture of 300-1500%, only the moss Ditrichum strictum associations had any positive acetylene reduction (1.17 & 1.21 µg g-1 48h-1). The more protected, but nevertheless very cold, Clasmatocolea humilis and Cryptochila grandiflora (=Jamesoniella grandiflora; Figure 54) associations failed to demonstrate any fixation.
Figure 54. Cryptochila grandiflora, an Arctic species that
apparently has no cyanbacterial N fixation. Photo by Juan Larrain, through Creative Commons.
Arctic and Subarctic In the Arctic soils of Svalbard, Norway, N fixation by
both Free-living and bryophyte associations of Cyanobacteria is the only significant source of N input to the soil ecosystem (Solheim et al. 1996). The most important bryophytes for harboring such associations were Calliergon richardsonii (Figure 55) and Sanionia uncinata (Figure 56). An interesting factor in the fixation was grazing by geese (Figure 57). Grazed areas had a 10-fold maximum fixation (693.6±1.5 nmol C2H4 h-1 gdm-1) compared to ungrazed areas (65.3±16.6 nmol C2H4 h-1 gdm-1), perhaps because in these areas the Cyanobacteria also occurred on the grass. The transfer of fixed N to the plants supported high plant productivity. On the other hand, where birds harbored under cliffs, the concentration of bird droppings inhibited N fixation.
Figure 55. Calliergon richardsonii, an important substrate
for Cyanobacteria in the Arctic. Photo by Michael Lüth, with permission.

8-3-18 Chapter 8-3: Nutrient Relations: Nitrogen
Figure 56. Sanionia uncinata, an important substrate for
Cyanobacteria in the Arctic. Photo by Hermann Schachner, through Creative Commons.
Figure 57. Barnacle Goose foraging, creating conditions for
a higher N fixation rate. Photo by Arthur Chapman, through Creative Commons.
Increased levels of UV-B radiation in the sub-Arctic could have an effect on the rate of nitrogen fixation in bryophyte-Cyanobacteria associations (Solheim et al. 2002). These researchers found that it causes a 50% decrease in N-fixation potential in the dominant lichen Peltigera aphthosa (Figure 58), a species with Nostoc as its N-fixing symbiont. Furthermore, the moss Sanionia uncinata (Figure 56) in vegetation exposed to experimentally enhanced levels of UV-B for 3 and 4 years in the high Arctic in Svalbard exhibited a 50% reduction in N-fixation potential compared to controls after 3 years. Hylocomium splendens (Figure 22) failed to show a reduction in N fixation potential after seven years of exposure to increased UV-B. In that same experiment, a 50% increase in precipitation caused a 6-fold increase in N fixation potential.
Nitrogen fixation by Cyanobacteria seems to have been important in the colonization of Surtsey, a subArctic island south of Iceland, formed by volcanic eruptions from 1963-1967 (Henriksson et al. 1987). By 1987 it had extensive colonies of mosses [Bryum argenteum (Figure 59-Figure 60), Ceratodon (Figure 61), Racomitrium spp.
(Figure 62)] that had Cyanobacteria associates capable of N-fixation, primarily Nostoc calcicola. Racomitrium canescens (Figure 62) exhibited an unidentified N-fixing Nostoc species living inside its cells.
Figure 58. Peltigera aphthosa, a species with Cyanobacteria
symbionts. This lichen declines in the presence of elevated UV-B radiation. Photo by Steven K. Sullivan, through Creative Commons.
Figure 59. Bryum argenteum, a pioneer on Surtsey. Photo
by Paul Davison, with permission.
Figure 60. Bryum argenteum capsules – a species that
reproduces mostly by fragments. Photo by Dick Haaksma, with permission.
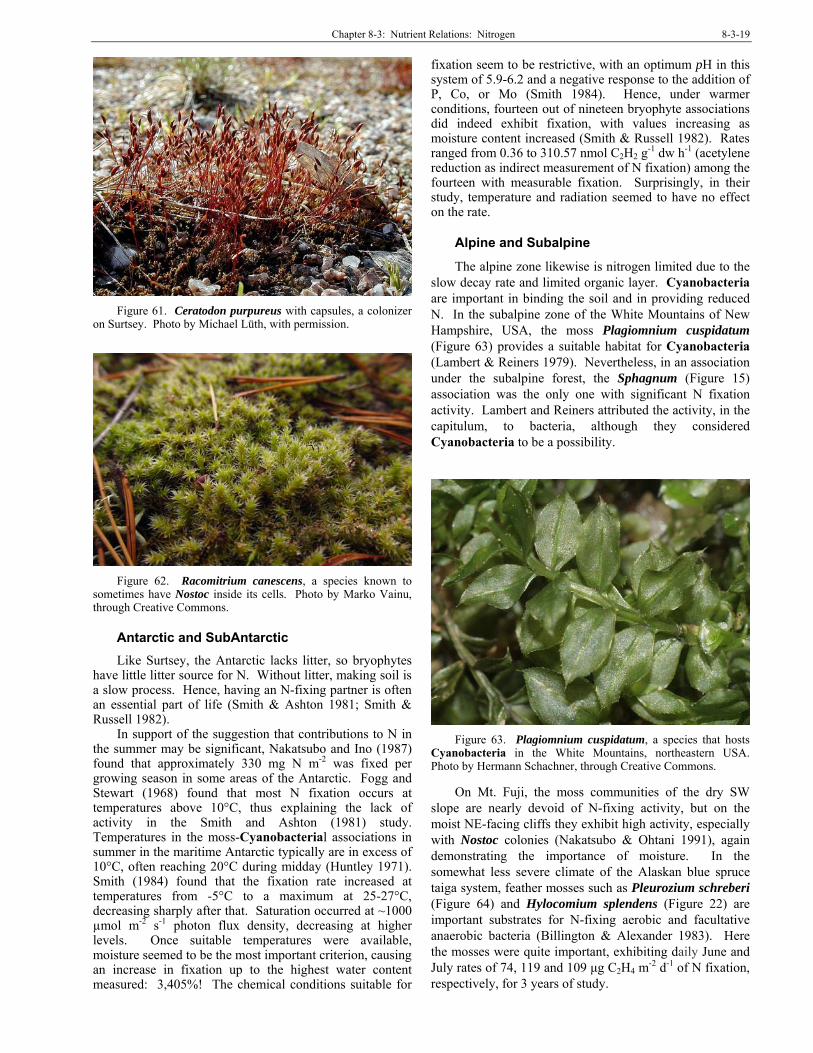
Chapter 8-3: Nutrient Relations: Nitrogen 8-3-19
Figure 61. Ceratodon purpureus with capsules, a colonizer
on Surtsey. Photo by Michael Lüth, with permission.
Figure 62. Racomitrium canescens, a species known to
sometimes have Nostoc inside its cells. Photo by Marko Vainu, through Creative Commons.
Antarctic and SubAntarctic
Like Surtsey, the Antarctic lacks litter, so bryophytes have little litter source for N. Without litter, making soil is a slow process. Hence, having an N-fixing partner is often an essential part of life (Smith & Ashton 1981; Smith & Russell 1982).
In support of the suggestion that contributions to N in the summer may be significant, Nakatsubo and Ino (1987) found that approximately 330 mg N m-2 was fixed per growing season in some areas of the Antarctic. Fogg and Stewart (1968) found that most N fixation occurs at temperatures above 10°C, thus explaining the lack of activity in the Smith and Ashton (1981) study. Temperatures in the moss-Cyanobacterial associations in summer in the maritime Antarctic typically are in excess of 10°C, often reaching 20°C during midday (Huntley 1971). Smith (1984) found that the fixation rate increased at temperatures from -5°C to a maximum at 25-27°C, decreasing sharply after that. Saturation occurred at ~1000 µmol m-2 s-1 photon flux density, decreasing at higher levels. Once suitable temperatures were available, moisture seemed to be the most important criterion, causing an increase in fixation up to the highest water content measured: 3,405%! The chemical conditions suitable for
fixation seem to be restrictive, with an optimum pH in this system of 5.9-6.2 and a negative response to the addition of P, Co, or Mo (Smith 1984). Hence, under warmer conditions, fourteen out of nineteen bryophyte associations did indeed exhibit fixation, with values increasing as moisture content increased (Smith & Russell 1982). Rates ranged from 0.36 to 310.57 nmol C2H2 g
-1 dw h-1 (acetylene reduction as indirect measurement of N fixation) among the fourteen with measurable fixation. Surprisingly, in their study, temperature and radiation seemed to have no effect on the rate.
Alpine and Subalpine
The alpine zone likewise is nitrogen limited due to the slow decay rate and limited organic layer. Cyanobacteria are important in binding the soil and in providing reduced N. In the subalpine zone of the White Mountains of New Hampshire, USA, the moss Plagiomnium cuspidatum (Figure 63) provides a suitable habitat for Cyanobacteria (Lambert & Reiners 1979). Nevertheless, in an association under the subalpine forest, the Sphagnum (Figure 15) association was the only one with significant N fixation activity. Lambert and Reiners attributed the activity, in the capitulum, to bacteria, although they considered Cyanobacteria to be a possibility.
Figure 63. Plagiomnium cuspidatum, a species that hosts
Cyanobacteria in the White Mountains, northeastern USA. Photo by Hermann Schachner, through Creative Commons.
On Mt. Fuji, the moss communities of the dry SW slope are nearly devoid of N-fixing activity, but on the moist NE-facing cliffs they exhibit high activity, especially with Nostoc colonies (Nakatsubo & Ohtani 1991), again demonstrating the importance of moisture. In the somewhat less severe climate of the Alaskan blue spruce taiga system, feather mosses such as Pleurozium schreberi (Figure 64) and Hylocomium splendens (Figure 22) are important substrates for N-fixing aerobic and facultative anaerobic bacteria (Billington & Alexander 1983). Here the mosses were quite important, exhibiting daily June and July rates of 74, 119 and 109 μg C2H4 m
-2 d-1 of N fixation, respectively, for 3 years of study.

8-3-20 Chapter 8-3: Nutrient Relations: Nitrogen
Figure 64. Pleurozium schreberi, a common substrate for
N-fixing Cyanobacteria in the boreal forest. Photo by Janice Glime.
Peatland Associations
Sphagnum (Figure 18, Figure 23, Figure 33) is highly colonized by a variety of Cyanobacteria, both on its surface (Hooper 1982), and in its hyaline cells (Figure 65-Figure 66; Granhall & Hofsten 1976; Granhall & Lindberg 1978), especially by Nostoc (Figure 48) and Hapalosiphon (Figure 67) (Sheridan 1991). In bogs and fens, Cyanobacteria on bryophyte surfaces can contribute considerable usable N to the ecosystem (Alexander et al. 1974; Basilier et al. 1978, Basilier 1979; Lambert & Reiners 1979; Rosswall & Granhall 1980, Hooper 1982). Chapman and Hemond (1982) determined that the contribution was greater than that from the only other known input, bulk precipitation (as NO3
-). Three types of Sphagnum (Figure 18, Figure 23, Figure 33) N-fixing associations fix N: epiphytic Cyanobacteria, intracellular Cyanobacteria, and N-fixing bacteria (Granhall & Selander 1973, Granhall & Hofsten 1976).
Figure 65. Sphagnum cells showing the hyaline cell. Photo
from Botany website, UBC, with permission.
Figure 66. Potential interactions of micro-organisms within
the hyaline cell of Sphagnum. Redrawn from Granhall & Hofsten 1976.
Figure 67. Hapalosiphon, a common member of
Cyanobacteria that occurs on bryophytes. Photo by Jason Oyadomari, with permission.
Basilier (1979) reported N-fixation activity by Cyanobacteria on Sphagnum (Figure 18, Figure 23, Figure 33), Drepanocladus (Figure 68), and Calliergon (Figure 55) in phosphorus-rich environments. Basilier and coworkers (1978), as well as Granhall and Selander (1973), found that the highest N fixation rates in their studies occurred on species of the mosses Sphagnum and Drepanocladus (s.l.), with a mean value of 9.4 g m-2 yr-1. In fact, Cyanobacteria associated with Sphagnum can have higher N fixation per heterocyst than do free-living Cyanobacteria in the same condition (Basilier 1980). Granhall and Lindberg (1978) reported a total rate of 0.8-3.8 g fixed N m-2 yr-1 in wet Sphagnum communities in a mixed pine and spruce forest in central Sweden. Zimicki (1976) and Basilier et al. (1978) have estimated N fixation in various sites for Sphagnum riparium (Figure 69) to be 0.5-6.4 g m-2 yr-1.
Basilier et al. (1978) found that the fixation rate in the Sphagnum riparium (Figure 69) association was strongly light dependent, but that pH in the range of 4.3 to 6.8 had little effect. Maximum fixation occurred around noon with the middle of the growing season exhibiting the highest rates. Interestingly, they found that rates on the apical

Chapter 8-3: Nutrient Relations: Nitrogen 8-3-21
portions and non-green portions of the Sphagnum were lower than other green parts, and that the highest rates occurred on the periphery of the moss community. On the other hand, using 15N as a tracer, Basilier (1980) later found that enrichment of N from Cyanobacteria fixation appeared within two hours in the apex of Sphagnum. It appears that habitat comparisons need to be made to determine where the highest rates might occur – and why.
Figure 68. Drepanocladus cossonii, a species that houses N-
fixing Cyanobacteria in P-rich environments. Photo by Michael Lüth, with permission.
Figure 69. Sphagnum riparium, a substrate for N-fixing
Cyanobacteria. Photo by Michael Lüth, with permission.
Once the Cyanobacteria convert the N to NH4
+ and amino acids, these are available not only for the bryophytes they occupy, but also for the tracheophytes rooted among them. In Thoreau's Bog in Massachusetts, N fixation exceeded atmospheric N deposition (Hemond 1983), and Hemond concluded that microbial N fixation provides sufficient quantity of N that N may never be limiting to primary productivity in a bog (or poor fen) ecosystem.
Boreal Forests
The boreal forest productivity is limited primarily by available soil N. Bryophytes on the forest floor serve as C and N pools. Recently, researchers have realized the role of N-fixation by Cyanobacteria in association with bryophytes in the boreal forest. DeLuca et al. (2002) reported that N-fixation reached only 0.5 kg N ha-1 yr-1. On the other hand, they found that Nostoc (Figure 48) living in association with Pleurozium schreberi (Figure 64) fixes 1.5-2.0 kg N ha-1 yr-1 in Scandinavian and Finnish boreal
forests. They suggest that previous estimates of N-fixation in boreal forests may be too low.
Pleurozium schreberi (Figure 64) is able to modulate its N content based on the amount of N input. With N addition, the N-fixation per unit moss mass and per unit area decreases sharply (Gundale et al. 2011). This causes the N pool in the moss to remain stable except at very high additions. This effect on the bryophytes provides at least part of the explanation for the constancy of N acquisition by woody plants up to 12 kg ha-1 yr-1 additional N. The researchers suggested that bryophytes limit the acquisition of anthropogenic N by woody plants in the boreal forest.
Egorov (2007) found that the nitrogen regime of most of the moss species in the Khibiny Mountains of Eurasia was self-supporting. He attributed this to nitrogen fixation by the epiphytic Cyanobacteria on the mosses, accounting for 28% of the total N in the mosses during the growing period.
Hylocomium splendens (Figure 22) is another important feather moss in the boreal forest. And like Pleurozium schreberi (Figure 64) it is a major contributor to the conversion of N to a usable form by providing a suitable substrate for Cyanobacteria (Zackrisson 2009). It is interesting that both of these feather mosses contribute greater N-fixation rates at northern latitudes (64-69° N) than at the more southern latitudes. This is mostly accomplished by species of Nostoc (Figure 48) and Stigonema (Figure 70) as the Cyanobacteria N fixers. Of further interest is the greater tolerance to N pollution in Hylocomium splendens when compared to P. schreberi. Consistent with its tolerance to N pollution, H. splendens exhibited a somewhat higher N-fixation rate at high fertility sites. But Hylocomium splendens contributed about 50% less to the total N than did P. schreberi. Together, these two species contribute 1.6 kg fixed N ha-1 yr-1.
Figure 70. Stigonema turfacea, member of a genus that is
common on bryophytes as a nitrogen fixer. Photo by Jason Oyadomari, with permission.
Tropics
Although associated Cyanobacteria are best known from bryophytes in northern habitats, they also exist in the tropics. In the cloud forest on a volcano in the French West Indies, Sphagnum erythrocalyx is substrate for the N-fixing Cyanobacterium Hapalosiphon flexuosus (see Figure 67). The mean rate of methane production caused by N reduction was 19.1 nmol C2H4 gdw-1 h-1 with an

8-3-22 Chapter 8-3: Nutrient Relations: Nitrogen
annual contribution of N by N fixation of 4.02 kg N ha-1 yr-1. The production in the uppermost green capitula was 4.5X that in the basal portions.
Epiphylls Epiphylls are those organisms that live on leaves.
These are common in warmer climates where the leaves remain on the plant for more than one year. In rainforests, epiphyllous liverworts provide the moist microhabitat needed for high rates of nitrogen fixation by associated bacteria and Cyanobacteria (Bentley & Carpenter 1980; Bentley 1987; Carpenter 1992), which may be transferred to the host leaves (Bentley & Carpenter 1984).
At least some micro-organisms living in association with epiphyllous liverworts are able to transfer this fixed nitrogen directly to their host plants (Figure 71; Bentley & Carpenter 1984), thus constituting a loose arrangement that benefits the tracheophyte as well as the bryophyte. In the palm Welfia georgii, 10-25% of the N in the leaf was derived from the micro-organisms harbored there among the leafy liverwort cover.
Figure 71. Means and standard errors of 5 hrs of production
of fixed nitrogen in leaves of the palm Welfia georgii incubated alone (with epiphylls removed) and leaves with intact epiphylls, indicating a much greater transfer of new N to the leaf when epiphylls are present. Redrawn from Bentley & Carpenter 1984.
Liverwort Symbiosis Several attempts have been made to explain the high
degree of N fixation in liverwort associations. In an early attempt, Griggs (1937) grew liverworts from Katmai volcanic ash on N-free sand for three years to determine their success compared to that of liverworts on the same
medium, but with the addition of 4 mg L-1 NH4NO3. During that three-year period, the ones with the additive grew no better, but toward the end of the three years, the N-free cultures became pale and unhealthy. When 4 mg L-1 NH4NO3 was added to the N-free cultures, they promptly revived. Griggs took this as evidence that no N fixation had occurred.
Nevertheless, at least the thallus of the liverwort Blasia pusilla (Figure 72) has symbiotic Cyanobacteria that do perform N fixation (Rodgers 1978; Peters 1991). In fact, there are many genetic strains of Nostoc (Figure 48) associated with Blasia (West & Adams 1997; Costa et al. 2001). The presence of Nostoc induces both structural and metabolic changes within the Blasia thallus (Kimura & Nakano 1990; Meeks 1990).
Figure 72. Blasia pusilla. Arrow indicates Nostoc colony.
Photo by Walter Obermayer, with permission.
Nostoc (Figure 48) is only capable of invading the liverwort when the Nostoc is in its mobile stage (Kimura & Nakano 1990). That is, when the segments (called hormogonia) of a filament separate, they are mobile by a gelatinous sol-gel transformation that permits them to slither and glide. In this stage they are able to invade the thallus of Blasia pusilla (Figure 72) and induce the morphological changes that permit the partnership to work. At the same time, the B. pusilla signals the Nostoc by producing two auricles (earlike lobes), each with an enclosed chamber housing a slime papilla that fills the chamber with mucilage (Renzaglia 1982a). The mucilage attracts the Nostoc, which then takes up residence in the chamber (Figure 73). Once the Nostoc arrives, the auricle increases in size and closes its opening. Following the invasion, the surrounding cells of the Blasia thallus have attenuated growth and produce branched filaments from hyaline cells that penetrate the Nostoc colonies (Kimura & Nakano 1990). These filaments form a labyrinth of wall ingrowths into the Nostoc cells, suggesting that they may have the role of transfer cells for exchanging metabolites (Ridgway 1967; Duckett et al. 1977). Once it has settled into its thallus home, the Nostoc produces numerous heterocysts, which are essential for the N fixation.

Chapter 8-3: Nutrient Relations: Nitrogen 8-3-23
Figure 73. Blasia pusilla Nostoc colony, the site of N
fixation. Photo by Dick Haaksma, with permission.
When the Nostoc (Figure 48) grows deeply embedded within the liverwort thallus, it no longer has access to dissolved CO2. Stewart and Rodgers (1977; 1978) determined that the Nostoc obtains its carbon through transfer from the Blasia (Figure 72) thallus to Nostoc, suggesting that this is really a mutualistic relationship (one in which both partners benefit). Within the thallus the Nostoc requires a higher light intensity and higher temperature (above 17ºC) for maximal activity compared to those living alone (max activity above 12ºC) (Rodgers 1978). Hence, the liverwort provides a safe compartment that will remain moist much longer than the external environment, and even provides the needed carbon source for its symbiont.
The ability to colonize rapidly, symbiont intact, is facilitated in Blasia pusilla (Figure 72) by the production of two types of gemmae (Figure 74-Figure 75). These gemmae permit the symbiont to travel with the gemma and easily renew the partnership arrangement upon germination (Renzaglia 1982b; Duckett & Renzaglia 1993). Taxa that depend on spores for their dispersal would not benefit from this convenience.
Figure 74. Blasia pusilla showing gemmae on stalk. Photo
by Des Callaghan, with permission
Figure 75. Blasia pusilla gemmae "star" gemmae. Photo by
Dick Haaksma, with permission.
As already noted, the epiphytic leafy liverwort Porella navicularis (Figure 52-Figure 53) provides a suitable substrate for Nostoc (Figure 48) in western North America (Dalton & Chatfield 1985). This association is present in a broad geographic range. The presence of these Nostoc (Figure 48) symbionts in liverworts seems to be restricted to taxa that are pioneers (Schuster 1992a, b), living in temporary or poorly colonized habitats that are likely to be low in usable N.
Hornwort Associations Hornworts (Anthocerotophyta) are well known for
their symbiotic associations with Cyanobacteria, especially Nostoc (Figure 48) in association with Phaeoceros (Figure 76) and Anthoceros (Figure 77) (Peirce 1906; Ridgway 1967; Enderlin & Meeks 1983; Steinberg & Meeks 1987). A wide diversity of Nostoc strains infect these hornworts (West & Adams 1997), and it appears that Anthoceros harbors a Nostoc that is unique from that of Blasia (Figure 72) (Leizerovich et al. 1990). But Phaeoceros also hosts the filamentous Calothrix (Cyanobacteria; Figure 50) (West & Adams 1997). This multiplicity of symbiotic genera is apparently unusual; Rai et al. (2000) indicate that typically only one genus will infect a particular taxonomic group of plants.
Figure 76. Phaeoceros carolinianus showing bluish green
color typical of plants with Nostoc inhabitants. Photo by Michael Lüth, with permission.
For the association to begin, the Nostoc (Figure 48) must form hormogonia (portions of filament in

8-3-24 Chapter 8-3: Nutrient Relations: Nitrogen
Cyanobacteria that become detached and reproduce by cell division) that can break away and move through the environment to reach the hornwort (Wong & Meeks 2002), just as in Blasia (Figure 72). But it seems that the hornwort makes certain that this occurs, if there is Nostoc in the vicinity. Free-living Nostoc rapidly forms hormogonia when in the presence of Anthoceros punctatus (Figure 77), or even in the presence of agar preconditioned with A. punctatus (Campbell & Meeks 1989), indicating a diffusable substance from A. punctatus that stimulates this response.
Figure 77. Anthoceros punctatus, a species that stimulates
formation of hormogonia in Nostoc. Photo by Jonathan Sleath, with permission.
Both Nostoc (Figure 48) and the hornwort seem to be modified physiologically once joining in symbiosis (Joseph & Meeks 1987; Campbell & Meeks 1992). Before the partnership can work, the Nostoc must form heterocysts (large, transparent, thick-walled cells found in filaments of certain Cyanobacteria; sites of N fixation) (Wong & Meeks 2002). This is where the enzyme nitrogenase, needed for the N fixation, is located in both free-living and symbiotic strains (Rai et al. 1989). When mutants of Nostoc punctiforme (Figure 78), unable to form heterocysts, were introduced to Anthoceros punctatus (Figure 77), the partnership formed, but no N fixation occurred; the mutants did not produce any nitrogenase.
Figure 78. Nostoc punctiforme, a species that does not fix N
when it cannot form heterocysts. Photo by Thibul, through Creative Commons.
As in the Blasia (Figure 72) symbionts, the nitrogenase of the Nostoc (Figure 48) must have an anaerobic environment in which to fix nitrogen. Campbell and Meeks (1992) demonstrated this by showing that the symbiont could produce fixed N only under anaerobic conditions when grown outside its host. However, when it grew in its Anthoceros punctatus (Figure 77) host, it could be grown anaerobically; the special cavities where it grew on the host provided the anaerobic conditions needed.
Perhaps one explanation for the success of N fixation within the host lies in the structure of the symbiont heterocyst, contrasting with that of the free-living Nostoc (Figure 48) strains. When growing inside the host, the Nostoc heterocyst lacks the outer polysaccharide layer typical that in of free-living Nostoc (Campbell & Meeks 1992). Rather, it appears that when the Nostoc grows in the cavities of Anthoceros punctatus (Figure 77), the cavities replace that wall function. Anthoceros also mediates the nitrogenase activity, supressing it in the presence of NO3
- (Campbell & Meeks 1992) and NH4+
(Steinberg & Meeks 1991). The end product of the Nostoc fixation is NH4
+, accounting for 75% of the introduced radioactive N after 0.5 min, but only 14% after 10 minutes of incubation (Meeks et al. 1985), indicating a rapid transformation to something else. Glutamine and glutamate are quickly synthesized via the glutamine synthetase-glutamate synthase pathway, preventing the toxic buildup of NH4
+. Thus one end result of the symbiosis is that the intracellular levels of NH4
+ are low compared to those of symbiont-free Anthoceros.
Only 10% of the NH4+ is assimilated into the Nostoc
(Figure 48); 1% is lost to the medium; Anthoceros (Figure 77) incorporates the remainder (Meeks et al. 1985). Prakasham and Rai (1991) demonstrated that there is a specific methylammonium transport system in the symbiotic Nostoc, which may account for the reduced NH4
+ levels and rapid transfer to the host. In symbiont-free Anthoceros supplied with high levels of NH4
+, the glutamate dehydrogenase system is functional, permitting an NH4
+ buildup (Meeks et al. 1983). Therefore, it appears that the Nostoc partner provides a very effective and safe source of NH4
+ for the Anthoceros host (Meeks et al. 1985).
As in the Blasia (Figure 72) partnership, Nostoc (Figure 48) living within the hornwort gets its carbon primarily from its host plant (Stewart & Rodgers 1977). In fact, Nostoc isolated from Anthoceros punctatus (Figure 77) had only 12% of the Rubisco activity of free-living strains, with an equal reduction in CO2 fixation (Steinberg & Meeks 1989; Rai et al. 1989). However, the distribution and levels of Rubisco were similar in the two strains (Rai et al. 1989), with 4.3% and 5.2% of the protein as Rubisco in symbionts and free-living Nostoc, respectively (Steinberg & Meeks 1989), suggesting that there is regulation of the Rubisco activity and not an alteration at the gene transcription level. This could be related to the fact that the structure of the chlorophyll complex differs somewhat; the Nostoc contains the typical cyanophycean granules, but it lacks phycobilisomes, the cellular organelle located on the surface of the thylakoids of the chlorophyll complex and in which the biliprotein pigments (phycocyanin, phycoerythrin) are present (Honegger 1980).

Chapter 8-3: Nutrient Relations: Nitrogen 8-3-25
Because the Nostoc (Figure 48) has reduced ability to fix its own carbon, this transfer of fixed carbon from Anthoceros punctatus (Figure 77) to Nostoc is necessary for the fixation of N2. When the Nostoc-hornwort association was deprived of light for 28 hours, the rate of acetylene reduction (as a measure of N fixation) declined by 99%, but resumed up to 64% of its illuminated activity when supplied with glucose in the dark (Steinberg & Meeks 1991), indicating the need for light and photosynthetic activity for the partnership to work. These researchers found that photosynthates produced immediately by the Cyanobacterium can supply at least one-third of the reductant needed for nitrogenase activity in the short-term for the symbiosis to work. When gametophytes were deprived of light, but sporophytes were provided with light, nitrogenase activity continued (Stewart & Rodgers 1977), suggesting a transfer of sugar from the sporophyte to the gametophyte, then to the Nostoc. These factors suggest that the Nostoc, living in the reduced light of the interior of the hornwort thallus, may be dependent upon the hornwort for glucose or similar carbohydrate as an energy source in order to continue its N fixation, thus completing a true mutualistic relationship with its host.
The local sites of the host plants act as islands that effectively keep the Nostoc (Figure 48) strains in isolation. Even within a single host plant there may be a great diversity of cyanobacterial strains, and these strains seem to be restricted to one site (Costa et al. 2001). Nevertheless, some host plants shared strains of Nostoc that could be found growing 2000 m away. Furthermore, strains found in Blasia (Figure 72) could also be found in the lichen Peltigera neopolydactyla (Figure 79). Although different cavities can easily host different strains in both Blasia and the Anthocerotophyta, a single cavity seems only to host one strain.
Figure 79. Peltigera neopolydactyla, a lichen with the same
strains of Nostoc as those found in Blasia. Photo by Jason Hollinger, through Creative Commons.
Lunar Rocks
Liverworts were among the few organisms to grow successfully on lunar rocks. But why? The thallose liverwort Marchantia polymorpha (Figure 80) exhibited a tremendous increase in growth following being sprinkled with Apollo 11 or 12 lunar rock material. Hoffman (1974)
followed up on this observation by testing the effects of basalt from Minnesota and C-horizon substrate from the Valley of Ten Thousand Smokes, Alaska. In both cases, the growth of M. polymorpha was significantly increased. But what caused this surge of growth? Nitrogen was absent in any form in both the lunar material and the basalt, and neither P nor K was abundant, so the three typical fertilizer nutrients seem not to be the cause. The macronutrients Ca, Mg, and S were all more abundant in basalt than in the C-horizon soil, but the C-horizon soil caused the greater stimulation. Iron remains a possibility, being abundant in all three substrata. We already know that it stimulates the growth of Funaria hygrometrica (Figure 4) (Hoffman 1966). And it is also known to stimulate N fixation in Cyanobacteria (Mills et al. 2004; Moore et al. 2009). On the other hand, no data were gathered on the pH, which could affect the solubility, and therefore availability, of all the nutrients. Some have speculated that survival of the liverwort was possible due to partnering Cyanobacteria that could trap and convert the atmospheric nitrogen. Perhaps we need to look for soil and rock components that foster the N fixation reaction.
Figure 80. Marchantia polymorpha with gemmae, a species
that can grow on lunar rocks. Here it shows red-violet coloration similar to that which develops on the ventral part of the thallus in response to N and P deficiency. Photo by Dick Haaksma, with permission.
Other Stressful Habitats
In cryptogamic crusts (i.e. soil crusts of algae, lichens, bryophytes, fungi, and micro-organisms; Figure 81) of prairies, deserts, and grasslands, Cyanobacteria are able to maintain an active state longer when water is held by the bryophytes. This increases their contribution to the usable N in the soil (Vlassak et al. 1973; Giddens 1982; Belknap et al. 2001). The crust itself is vital to maintaining both water and nutrients in the soil during and following heavy storms.
In geothermal fields and following fires, bryophytes again provide the moist environment needed to maintain N-fixing micro-organisms (Brasell et al. 1986). Hence, we must ask if the bryophytes are net users of nitrogen, or do they facilitate a net gain to the system. At least in some habitats they definitely facilitate a gain by providing the right habitat for fixation to occur, accompanied by leakage of the new N products.

8-3-26 Chapter 8-3: Nutrient Relations: Nitrogen
Figure 81. Cryptogamic crust with the moss Syntrichia
inermis. Photocourtesy of Lloyd Stark.
Likewise, bryophyte-Cyanobacteria associations are important in the colonization of volcanic lava. Cyanobacteria are common on bryophytes of dry lava fields (Englund 1976) as well as on the moist, warm bryophyte surfaces near steam vents (Broady et al 1987). Both Anabaena variabilis (=Tricormus variabilis; Figure 82) and Nostoc muscorum were associated with Funaria hygrometrica (Figure 4) on the newly formed volcano Surtsey off the Icelandic coast (Rodgers & Henriksson 1976). Although the Funaria did not directly affect the fixation rate, growth of both the Funaria and the Cyanobacteria benefitted by the association, and the N content of Funaria also increased as a result of the cyanobacterial N fixation.
Figure 82. Anabaena variabilis, a species associated with
Funaria hygrometrica. Photo from Cyanosite, through public domain.
Although moss associates are responsible for most N fixation in Arctic and subarctic ecosystems, legume associations are considered the predominant N fixers in temperate ecosystems (Stewart 1967). Nevertheless, in some temperate habitats bryophytes are the only plants able to occupy the habitat. For example, on granite outcrops, bryophytes, especially Grimmia/Schistidium (Figure 83), are well known for their role in accumulating soil and nutrients and holding the moisture needed for tracheophyte establishment. Microbial nitrogen fixation on these bryophytes is part of this successional story (Snyder & Wullstein 1973a; Jones & Wilson 1978).
Figure 83. Schistidium apocarpum with capsules on granite
rock where they accumulate nutrients and prepare the substrate for tracheophytes. Photo by Michael Lüth, with permission.
Nitrogen Translocation We know that N is needed in amino acids, proteins,
nucleic acids, and ribonucleic acids. But where do they go in the plants? Eckstein and Karlsson (1999) compared their locations in the boreal forest moss Hylocomium splendens (Figure 22) and the wet habitat moss Polytrichum commune (Figure 16-Figure 17). They demonstrated that both endohydric (having internal conduction) and ectohydric (using external conduction) species were able to move N compounds from one ramet (attached branch serving like a separate organism) to another. Current-year segments of both species appeared to be strong sinks for nitrogen, as demonstrated by their considerable increase in the labelled N pool during the season. Sinks are locations where something, such as plant nutrients, organic pollutants, or metal ions, is stored and immobilized through natural processes.
In the period of June to September, Polytrichum commune (Figure 16-Figure 17) lost labelled N from all segments (Eckstein & Karlsson 1999). The researchers attributed this to transfer of N to underground structures (sinks). However, in Hylocomium splendens (Figure 22), the one-year-old segments had increased labelled N, whereas the older segments lost 50% of the labelled N they had absorbed. This ability to transfer nutrients from one part to another is especially beneficial in nutrient-poor environments.
N Sequestering Sinks can be seasonal, with actively used nutrients
moving from locations such as leaves to storage locations as winter approaches or simply be storage of excess. Once incorporated into the bryophytes, nutrients, including N compounds, can either be sequestered or recycled. In some cases they are moved to young, growing tissues. In the tropics, epiphytic bryophytes can sequester inorganic nitrogen from atmospheric deposition. Clark et al. (2005) estimated that the epiphytic bryophytes and epiphytic assemblages retained 33-67% of the inorganic N deposition from cloud water and precipitation, retaining 3.4 kg N ha-1 yr-1, accounting for 50% of the inorganic N in atmospheric deposition. This effectively removes 50% of the suitable N sources and sequesters them in the bryophyte tissues.
In the boreal species Hylocomium splendens (Figure 22) in a subarctic birch woodland, retention of labelled N
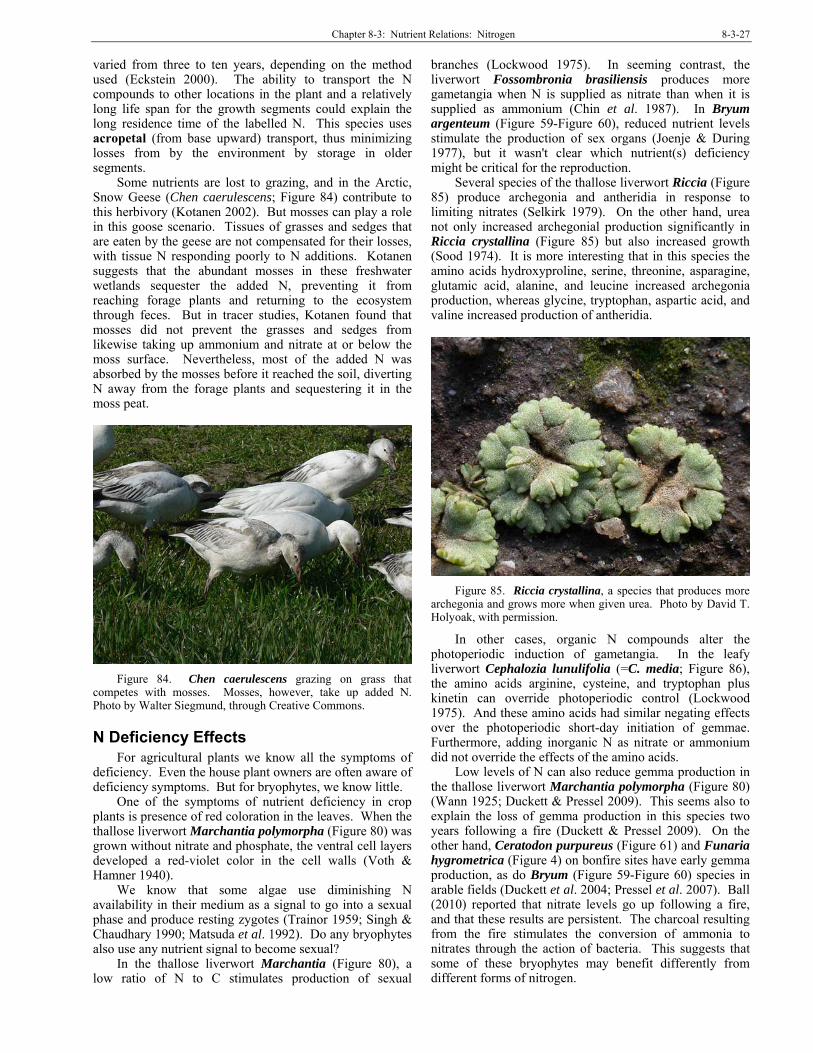
Chapter 8-3: Nutrient Relations: Nitrogen 8-3-27
varied from three to ten years, depending on the method used (Eckstein 2000). The ability to transport the N compounds to other locations in the plant and a relatively long life span for the growth segments could explain the long residence time of the labelled N. This species uses acropetal (from base upward) transport, thus minimizing losses from by the environment by storage in older segments.
Some nutrients are lost to grazing, and in the Arctic, Snow Geese (Chen caerulescens; Figure 84) contribute to this herbivory (Kotanen 2002). But mosses can play a role in this goose scenario. Tissues of grasses and sedges that are eaten by the geese are not compensated for their losses, with tissue N responding poorly to N additions. Kotanen suggests that the abundant mosses in these freshwater wetlands sequester the added N, preventing it from reaching forage plants and returning to the ecosystem through feces. But in tracer studies, Kotanen found that mosses did not prevent the grasses and sedges from likewise taking up ammonium and nitrate at or below the moss surface. Nevertheless, most of the added N was absorbed by the mosses before it reached the soil, diverting N away from the forage plants and sequestering it in the moss peat.
Figure 84. Chen caerulescens grazing on grass that
competes with mosses. Mosses, however, take up added N. Photo by Walter Siegmund, through Creative Commons.
N Deficiency Effects For agricultural plants we know all the symptoms of
deficiency. Even the house plant owners are often aware of deficiency symptoms. But for bryophytes, we know little.
One of the symptoms of nutrient deficiency in crop plants is presence of red coloration in the leaves. When the thallose liverwort Marchantia polymorpha (Figure 80) was grown without nitrate and phosphate, the ventral cell layers developed a red-violet color in the cell walls (Voth & Hamner 1940).
We know that some algae use diminishing N availability in their medium as a signal to go into a sexual phase and produce resting zygotes (Trainor 1959; Singh & Chaudhary 1990; Matsuda et al. 1992). Do any bryophytes also use any nutrient signal to become sexual?
In the thallose liverwort Marchantia (Figure 80), a low ratio of N to C stimulates production of sexual
branches (Lockwood 1975). In seeming contrast, the liverwort Fossombronia brasiliensis produces more gametangia when N is supplied as nitrate than when it is supplied as ammonium (Chin et al. 1987). In Bryum argenteum (Figure 59-Figure 60), reduced nutrient levels stimulate the production of sex organs (Joenje & During 1977), but it wasn't clear which nutrient(s) deficiency might be critical for the reproduction.
Several species of the thallose liverwort Riccia (Figure 85) produce archegonia and antheridia in response to limiting nitrates (Selkirk 1979). On the other hand, urea not only increased archegonial production significantly in Riccia crystallina (Figure 85) but also increased growth (Sood 1974). It is more interesting that in this species the amino acids hydroxyproline, serine, threonine, asparagine, glutamic acid, alanine, and leucine increased archegonia production, whereas glycine, tryptophan, aspartic acid, and valine increased production of antheridia.
Figure 85. Riccia crystallina, a species that produces more
archegonia and grows more when given urea. Photo by David T. Holyoak, with permission.
In other cases, organic N compounds alter the photoperiodic induction of gametangia. In the leafy liverwort Cephalozia lunulifolia (=C. media; Figure 86), the amino acids arginine, cysteine, and tryptophan plus kinetin can override photoperiodic control (Lockwood 1975). And these amino acids had similar negating effects over the photoperiodic short-day initiation of gemmae. Furthermore, adding inorganic N as nitrate or ammonium did not override the effects of the amino acids.
Low levels of N can also reduce gemma production in the thallose liverwort Marchantia polymorpha (Figure 80) (Wann 1925; Duckett & Pressel 2009). This seems also to explain the loss of gemma production in this species two years following a fire (Duckett & Pressel 2009). On the other hand, Ceratodon purpureus (Figure 61) and Funaria hygrometrica (Figure 4) on bonfire sites have early gemma production, as do Bryum (Figure 59-Figure 60) species in arable fields (Duckett et al. 2004; Pressel et al. 2007). Ball (2010) reported that nitrate levels go up following a fire, and that these results are persistent. The charcoal resulting from the fire stimulates the conversion of ammonia to nitrates through the action of bacteria. This suggests that some of these bryophytes may benefit differently from different forms of nitrogen.

8-3-28 Chapter 8-3: Nutrient Relations: Nitrogen
Figure 86. Cephalozia lunulifolia, a liverwort in which the
amino acids arginine, cysteine, and tryptophan plus kinetin can override photoperiodic control of gametangia and gemmae initiation. Photo by Hermann Schachner, through Creative Commons.
N Enrichment
The unusual way in which bryophytes respond to nitrogen addition has interesting effects in the ecosystem. As already noted, increases in nitrogen often result in a reduction of bryophyte cover and diversity or replacement of one species by another. But even though the bryophyte productivity decreases as N deposition increases, the stored N can increase within the bryophyte (Gundale et al. 2011).
This has interesting implications for the ecosystem, because it buffers the N reaching the tree roots, at least in boreal forests (Gundale et al. 2011). Predictably, N fixation by associated Cyanobacteria decreases as N fertilization increases. In the boreal feather moss Pleurozium schreberi (Figure 64), the tissue concentrations of nitrogen increased but the biomass decreased with increasing nitrogen addition. Because feather mosses provide considerable biomass on the boreal forest floor, they can have considerable impact on the nitrogen that is able to reach the trees, trapping nitrogen from precipitation, providing niches for Cyanobacteria, and sequestering nitrogen from airborne dust.
Many studies in peatlands have included enrichment of N to determine effects on bryophyte productivity. In an Arctic heath community, where N and P are colimiting, Gordon et al. (2001) found that applications of N (0, 10, & 50 kg ha-1 yr-1) and P (0 & 5 kg ha-1 yr-1) caused a decrease in lichen cover; applications of 10 kg ha-1 yr-1 resulted in a higher proportion of physiologically active bryophyte shoots. Nevertheless, individual bryophyte species responded differently, suggesting that we cannot draw generalizations from limited fertilization experiments.
Added N can affect different life stages differently. In Wales populations of Racomitrium lanuginosum (Figure 34), growth was stimulated initially with the highest N addition level (60 kg N ha-1 yr-1) (Jones et al. 2002). However, after 6 months, all concentrations (20, 40, & 60 kg N ha-1 yr-1) caused decreased growth compared to the control with no N addition. By contrast, optimum regeneration from fragments occurred at 20-40 kg on bare soil, but under a canopy of the grass Festuca ovina (Figure 87) it was best at 0-20 kg N.
Figure 87. Festuca ovina, a grass that benefits the growth of
Racomitrium lanuginosum fragments on the soil at its base. Photo by J. C. Schou (BioPix), with permission.
Thus we have seen that N enrichment, including that from atmospheric pollution, can be detrimental to bryophytes, especially in some conditions. This has resulted in the disappearance of some species (Strengbom et al. 2001). Strengbom and coworkers found that in a boreal forest after fertilization had been stopped for nine years, there were no signs of bryophyte recovery. Mycorrhizal fungi produced more sporocarps on the formerly fertilized plots than on those still receiving N, but the species composition was very different from that of never-fertilized controls. After 47 years of no fertilization, the mosses Brachythecium reflexum (Figure 88) and Plagiothecium denticulatum (Figure 89) showed enhancement from the previous N fertilization. On the other hand, the common moss Hylocomium splendens (Figure 22) was still less abundant than in the controls that were never treated with N. These changes were in contrast to the constancy of tracheophyte composition during and after cessation of N treatments.
Figure 88. Brachythecium reflexum, a species that showed
enhancement of coverage 47 years after N fertilization ceased. Photo by Michael Lüth, with permission.

Chapter 8-3: Nutrient Relations: Nitrogen 8-3-29
Figure 89. Plagiothecium denticulatum, a species that
showed enhancement of coverage 47 years after N fertilization ceased. Photo by Hermann Schachner, through Creative Commons.
In a boreal forest of northern Sweden, simulated N deposition had no short-term effects on the above- or below-ground biomass of the understory (Nordin et al. 1998). The recovery increased with the N dose. In the plots with 0.5 kg N ha-1 the highest concentrations of labelled N occurred in the bryophytes [Dicranum majus (Figure 90) and Pleurozium schreberi (Figure 64)], whereas in higher applications the grass Deschampsia flexuosa (Figure 91) exhibited the highest levels. The elevated N also resulted in greater herbivory on the blueberry Vaccinium myrtillus (Figure 92). This raises the as-yet unanswered question of how increased N affects herbivory on bryophytes.
Figure 90. Dicranum majus with capsules. This species
exhibits among the highest concentrations of labelled N when given 0.5 kg N ha-1. Photo by Michael Lüth, with permission.
The reduction of bryophyte productivity with increased N deposition is a recurring theme (Koranda et al. 2007). Koranda and coworkers sought an explanation for this reduced productivity. Using fragments of Thuidium tamariscinum (Figure 93) and Hylocomium splendens (Figure 22), they assessed the effects of ammonium nitrate (30 kg ha-1 yr-1) for 80 days. In this experiment, there was no growth change in T. tamariscinum, whereas H. splendens showed growth reduction. The latter also exhibited a significant increase in N concentration, whereas
only T. tamariscinum had a significant increase in amino acid N. Both species exhibited a reduction in lipid concentration, accompanied by strikingly enhanced turnover rates of carbon storage pools in the fertilized plants. Koranda and coworkers interpreted these results to indicate that the depressed growth of H. splendens may be caused by enhanced synthesis of N-containing organic compounds, most probably of cell wall proteins. Disturbance of the cellular carbon metabolism may also contribute.
Figure 91. Deschampsia cespitosa, a species that exhibits
the highest concentrations of labelled N at N applications higher than 0.5 kg N ha-1. Photo by Rasbak, through Creative Commons.
Figure 92. Vaccinium myrtillus, a species that experiences
greater herbivory when treated with elevated N. Photo by Anneli Salo, through Creative Commons.
Figure 93. Thuidium tamariscinum, a species that exhibited
no change in growth rate under elevated ammonium nitrate. Photo by Hermann Schachner, through Creative Commons.

8-3-30 Chapter 8-3: Nutrient Relations: Nitrogen
In a nutrient-deficiency condition, with 10 weeks of watering with distilled water daily, Pseudoscleropodium purum (Figure 94) grew faster than did Brachythecium rutabulum (Figure 95) (Bates 1994). When those populations were subjected to a nutrient pulse of 8 daily additions of KH2PO4 and NH4NO3, followed by 10 weeks of no nutrient additions, growth of P. purum was significantly stimulated, whereas that of B. rutabulum was not. Pseudoscleropodium purum increased its uptake of P, less so of N, and conserved these more effectively in nutrient-deficient conditions than did B. rutabulum. Cation exchange appears to be important in sequestering nutrient cations. These results can explain differences in habitat – P. purum lives where nutrient inputs are unpredictable, coming as wet deposition; B. rutabulum lives in a more continuous nutrient supply, apparently coming from the soil.
Figure 94. Pseudoscleropodium purum, a species that
conserves N and P in nutrient-deficient conditions. Photo by Phil Bendle, with permission.
Figure 95. Brachythecium rutabulum with water droplets, a
species that is not stimulated by N and P additions. Photo by Christophe Quintin, through Creative Commons.
Calliergonella cuspidata (Figure 96) in a calcareous fen in the mountains of Switzerland showed no observable morphological changes due to increased N levels, whereas the same species showed a number of morphological changes in higher light intensities created by cutting of the tracheophyte vegetation (Bergamini & Peintinger 2002).
Figure 96. Calliergonella cuspidata, a species that does not
change morphology in response to increased N levels. Photo by Michael Lüth, with permission.
Sphagnum magellanicum (Figure 12) has a different set of habitat conditions and illustrates differences in ammonium and nitrate enrichment effects. As noted earlier, this species was favored by nitrate concentrations up to 322 μM, whereas ammonium concentrations ≧ 255 μM caused decreases in chlorophyll content and growth (Rudolph & Voigt 1986). At 600 μM of added ammonium there was a 20% reduction in nitrate reductase activity and net photosynthesis.
In a different set of experiments, Heijmans et al. (2001) elevated the nitrogen levels (5 g N m-2 year-1 as ammonium nitrate) in a bog in The Netherlands for three years, added at 3-week intervals during the growing seasons. As one might expect, the tracheophyte biomass increased. But for the Sphagnum (Figure 18, Figure 23, Figure 33), growth was significantly reduced in the third growing season. It is likely that this was the result of encroaching tracheophyte cover.
Can we expect a different response from a submersed species of Sphagnum, such as S. cuspidatum (Figure 9)? In a culture experiment lasting 12 weeks, this species was grown at various levels of ammonium (Paffen & Roelefs 1991). In highly enhanced CO2, this species had increased growth in length and biomass, both with and without ammonium enrichment, but with only ammonium enrichment there was no increase in biomass.
Bryophytes have often been used as monitors. In terrestrial habitats, the moss bag became popular. In aquatic habitats, bryophytes can be used in situ or as transplants. The aquatic moss Fontinalis antipyretica (Figure 97) has been used to assess a variety of pollutants. Mosses such as this have the advantage of accumulating pollutants rather than representing the momentary levels found in chemical assays. For understanding its indications as a biomonitor for NH4
+, it was necessary to understand the pattern of uptake and the way in which high concentrations could alter physiological performance (Vieira et al. 2009). These researchers learned that the concentrations that had significant impact on membrane permeability were the same as those that caused a significant lowering of photosynthetic capacity. As time passes in those higher concentrations, the damage threshold is lowered.

Chapter 8-3: Nutrient Relations: Nitrogen 8-3-31
Figure 97. Fontinalis antipyretica, a species that sequesters
a variety of pollutants. Photo by Štĕpán Koval, with permission.
Habitat Relations Surprisingly, some of our best studies on canopy
bryophytes are from the tropics. Clark et al. (1998) estimated the N accumulation of epiphytic bryophytes in a tropical montane forest in Costa Rica to be 1.8-3.0 g N m-2 yr-1. N release from bryophyte litter in the canopy and on the ground was initially rapid, with ~30% released. Release from green shoots on the forest floor was greater, with ~47% of the initial N released in the first 3 months. The researchers found no evidence for net N immobilization by either litter or green shoots, but the remaining N in the litter, as already seen above in other species, was recalcitrant (substance that degrades at extremely slow rate if at all when released into environment). The epiphytic bryophytes retained 0.8-1.3 g N m-2 yr-1. The ability of these epiphytes to retain inorganic N from atmospheric deposition gives them a major role in converting mobile forms of N to highly recalcitrant forms.
Previous research at this site indicated that epiphytic bryophytes retain inorganic N from atmospheric deposition to the canopy (Clark et al. 1998). Therefore, they play a major role in transforming N from mobile to highly recalcitrant forms in this ecosystem.
In a study of layer differences in a wooded meadow, Kull et al. (1995) found that upper layers have the best access to light and the lower layers have higher N-use efficiency and/or better ability to acquire N. The herbaceous layer has the highest level of foliar nitrogen compared to the tree and moss layers. However, the herbaceous layer is co-limited by light and nitrogen, whereas the moss layer is limited only by light.
On Signy Island in the Antarctic, the dry turf had lower total N concentrations per dry weight (0.79%) than did the wet carpet (2.17%) (Christie 1987). In December, the meltwater and pools of the dry turf had 230 μg N L-1 while 165 μg N L-1 was present in the wet carpet. Nostoc muscorum was present at both sites and exhibited high levels of nitrogen fixation. Biological N fixation accounted for 45.9 mg m-2 yr-1 in the dry turf and 192.4 mg m-2 yr-1 in the wet carpet. Christie attributed additional inputs to penguin activity.
Throughout this chapter we have seen differences both among species and among habitats. We have barely scratched the surface in understanding these differences and why they occur.
Nitrogen Cycling In those habitats where bryophytes form a major
component of the ecosystem, their role in N cycling can be important. This is particularly true in cold biomes and tropical rainforests (Cornelissen et al. 2007). As we have seen, bryophytes host N-fixing bacteria and Cyanobacteria that contribute significant usable N to the soil. They furthermore modify the soil climate through control of hydrology and temperatures. They provide safe sites to soil organisms that contribute to litter breakdown.
Temperature plays an important control on the rate of breakdown in the Alaskan tundra. Warming from 4° to 10° significantly increases the rates of nitrogen mineralization, causing a significant effect on the rate of N cycling in litter and tundra soils (Hobbie 1996). Among the growth forms, graminoid litter had the fast rate, whereas moss and deciduous shrub litter had the slowest decomposition rates. This is largely due to the placement of bryophyte nutrients into recalcitrant forms (Hobbie 1996; Cornelissen et al. 2007). Decomposition will be discussed further in a separate chapter of this volume.
Summary
Nitrogen is available to bryophytes as ammonium (NH4
+), nitrite (NO2-), nitrate (NO3
-), and organic forms such as amino acids and urea. Nitrite, however, is generally toxic. Ammonium can lower internal pH and suppress growth. Nitrite can cause an increase in chlorophyll a, whereas nitrate can cause a decrease in chlorophyll b, both causing an increase in the a/b ratio. But effects on amino acid and protein concentration vary among species and among habitats. In the Arctic, amino acids and urea are utilized by both bryophytes and tracheophytes. Sphagnum species often seem to benefit more from amino acids than from ammonium.
Much of the nitrogen uptake is from precipitation; some is from the soil. But our knowledge of nitrogen uptake mechanisms is meager, and the mechanisms differ among species. These include ion exchange sites and chelation and can be affected by pH, iron and phosphorus concentrations, and temperature.
Some, perhaps many, bryophytes solve the nitrogen problem through symbiotic partners, especially Cyanobacteria, that carry out nitrogen fixation. This process seems to be especially important in the polar and alpine regions under warmer summer conditions up to ~25ºC. But more xeric conditions such as among epiphyllous tropical bryophytes and associated with prairie and grassland cryptogamic crusts also benefit from N fixation. In all of these habitats, bryophytes have an important role in maintaining the moisture necessary for the fixation to occur.
Peatlands have a high N fixation rate, and Cyanobacteria are common in association with Sphagnum. They have a wider pH tolerance range

8-3-32 Chapter 8-3: Nutrient Relations: Nitrogen
(4.3-6.8) than the Cyanobacteria in the cold habitats (5.9-6.2).
The liverwort Blasia pusilla provides a special chamber in each auricle where it is moist with mucilage and the Cyanobacteria enter and grow. It then seals the chamber and produces filaments that penetrate the Nostoc colonies. Finally the Nostoc produces numerous heterocysts. The Nostoc even travels with the gemmae.
Anthoceros punctatus forms a similar partnership, as do most of the hornworts, but it even stimulates the Nostoc to form hormogonia, permitting it to slither toward the hornwort. In both liverwort and hornwort partnerships, the ammonium produced by the cyanobacterial heterocyst is quickly converted to glutamine and glutamate to avoid the buildup of toxic ammonium. The Anthoceros gets almost 90% of the fixed N and provides fixed C to its Cyanobacteria partner.
Moon rock, and rock taken from volcanic areas on Earth, stimulate the growth of bryophytes, but we don't know why. One possibility is the high concentration of iron; another is that symbionts thrived on these rocks, providing N fixation.
It appears that bryophytes play a major role as a substrate for N fixation in many nutrient-poor habitats, making than essential component of those ecosystems.
Nitrogen content varies with species, habitat, season, type of N available, and concentration of N in the ecosystem. It can be sequestered in slowly decaying tissues or translocated to growing regions.
N deficiency, or the wrong form of N (e.g. NH4+),
can cause bryophytes to become long and thin, appearing etiolated. Glycine, serine, arginine, and alanine can induce branching. Methionine not only did not induce branching, but it also inhibited growth. Glycine caused the greatest weight and length gain of these amino acids in Java moss. Even nucleic acids are usable N sources, with good leafy shoot growth in adenine and guanine, but no growth in uracil or thymine in some species and good growth in others. In Sphagnum squarrosum uric acid and cytosine caused the plant to be come thalloid.
N enrichment can have initial stimulating effects followed by long-term negative effects, in some case because of competition from other kinds of plants. These differences vary by species and habitat.
Nitrogen cycling among bryophytes is not well understood. We do know that they can release it when dry tissues are rehydrated, but they can also sequester it, serving as sinks, or expose it in recalcitrant forms as tissues decay.
Acknowledgments I appreciate the contributions of undergraduate Phil
Gaudette and M. S. student Jennifer Jermalowicz Jones for their critical reading of the manuscript from the perspectives of students interested in nutrient relationships of bryophytes. Medora Burke-Scoll prepared the table on N contributions by Cyanobacteria.
Literature Cited Alexander, V. 1975. Nitrogen fixation by blue-green algae in
polar and subpolar regions. In: Stewart, W. D. P. (ed.). Nittrogen Fixation by Free-Living Micro-organisms. Cambridge University Press, Cambridge, pp. 175-188.
Alexander, V., Billington, M., and Schell, D. 1974. The influence of abiotic factors on nitrogen fixation rates in the Barrow Alaska Arctic tundra. Rept. Kevo Subarct. Res. Stat. 11: 3-11.
Alexander, V., Billington, M., and Schell, D. M. 1978. Nitrogen fixation in Arctic and alpine tundra. In: Tieszen, L. L. (ed.). Vegetation and Production Ecology of an Alaskan Arctic Tundra. Springer-Verlag, New York, pp. 539-558.
Alghamdi, A. A. 2003. The Effect of Inorganic and Organic Nitrogen Sources and Their Combination on Growth and Metabolism of Vesicularia dubyana. Ph. D. Dissertation, Michigan Technological University, Houghton, MI, 150 pp.
Ayres, E., Wal, R. van der, Sommerkorn, M., and Bardgett, R. D. 2006. Direct uptake of soil nitrogen by mosses. Biol. Lett. 2: 2862-2888.
Basile, D. V. and Basile, M. R. 1980. Ammonium ion-induced changes in form and hydroxy-proline content of wall protein in the liverwort Gymnocolea inflata. Amer. J. Bot. 67: 500-507.
Basile, D. V., Lin, J.-J., and Varner, J. E. 1988. The metabolism of exogenous hydroxyproline by gametophytes of Plagiochila arctica Bryhn et Kaal. (Hepaticae). Planta 175: 539-545.
Basilier, K. 1979. Moss-associated nitrogen fixation in some mire and coniferous forest environments around Uppsala, Sweden. Lindbergia 5: 84-88.
Basilier, K. 1980. Fixation and uptake of nitrogen in Sphagnum blue-green algal associations. Oikos 34: 239-242.
Basilier, K., Granhall, U., and Stenström, T.-A. 1978. Nitrogen fixation in wet microtrophic moss communities of a subarctic mire. Oikos 31: 236-246.
Bates, J. W. 1994. Responses of the mosses Brachythecium rutabulum and Pseudoscleropodium purum to a mineral nutrient pulse. Funct. Ecol. 8: 686-692.
Baxter, R., Emes, M. J., and Lee, J. A. 1992. Effects of an experimentally applied increase in ammonium on growth and amino-acid metabolism of Sphagnum cuspidatum Ehrh. ex. Hoffm. from differently polluted areas. New Phytol. 120: 265-274.
Belnap, J., Rosentreter, R., Leonard, S., Kaltenecker, J. H., Williams, J., and Eldridge, D. 2001. Biological Soil Crusts: Ecology and Management. U.S. Dept. of the Interior, Bureau of Land Management, 110 pp.
Bentley, B. L. 1987. Nitrogen fixation by epiphylls in a tropical rainforest. Ann. Missouri Bot. Gard. 74: 234-241.
Bentley, B. L. and Carpenter, E. J. 1980. Effects of desiccation and rehydration on nitrogen fixation by epiphylls in a tropical rainforest. Microbial Ecol. 6: 109-113.
Bentley, B. L. and Carpenter, E. J. 1984. Direct transfer of newly-fixed nitrogen from free-living epiphyllous microorganisms to their host plant. Oecologia 63: 52-56.
Bergamini, A. and Peintinger, M. 2002. Effects of light and nitrogen on morphological plasticity of the moss Calliergonella cuspidata. Oikos 96: 355-363.
Bergman, B., Rai, A. N., Johansson, C., and Söderbäck, E. 1993. Cyanobacterial-plant symbioses. In: Galun, M. (ed.). Selected Papers from the International Symbiosis Congress, Balaban Publishers, Rehovot, Israel, 17-22 Nov 1991. Symbiosis 14: 61-81.
Chapter 8-3: Nutrient Relations: Nitrogen 8-3-33
Billington, M. M. and Alexander, V. 1983. Site to site variations in nitrogenase activity in a subarctic black spruce (Picea mariana) forest. Can. J. Forest Res. 13: 782-788.
Brasell, H. M., Davies, S. K., and Mattay, J. P. 1986. Nitrogen fixation associated with bryophytes colonising burnt sites in Southern Tasmania, Australia. J. Bryol. 14: 139-149.
Broady, P., Given, D., Greenfield, L., and Thompson, K. 1987. The biota and environment of fumaroles on Mt. Melbourne, northern Victoria Land. Polar Biol. 7: 97-113.
Brown, D. H. 1982. Mineral nutrition. In: Smith, A. J. E. (ed.). Bryophyte Ecology. Chapman & Hall, London, pp. 383-444.
Burkholder, P. R. 1959. Organic nutrition of some mosses growing in pure culture. Bryologist 62: 6-15.
Campbell, E. L. and Meeks, J. C. 1989. Characteristics of hormogonia formation by symbiotic Nostoc spp. in response to the presence of Anthoceros punctatus or its extracellular products. Appl. Environ. Microbiol. 55: 125-131.
Campbell, E. L. and Meeks, J. C. 1992. Evidence for plant-mediated regulation of nitrogenase expression in the Anthoceros-Nostoc symbiotic association. J. Gen. Microbiol. 138: 473-480.
Carpenter, E. J. 1992. Nitrogen fixation in the epiphyllae and root nodules of trees in the lowland tropical rainforest of Costa Rica. Acta Oecol. 13: 153-160.
Chapman, R. R. and Hemond, H. F. 1982. Dinitrogen fixation by surface peat and Sphagnum in an ombrotrophic bog. Can. J. Bot. 60: 538-543.
Chin, C. M., Maclellan, A. J., and Renzaglia, K. S. 1987. Vegetative growth and reproduction of Fossombronia brasiliensis Steph.: The influence of photoperiod, temperature and inorganic nitrogen source. J. Bryol: 14: 581-591.
Christie, P. 1987. Nitrogen in two contrasting Antarctic bryophyte communities. J. Ecol. 75: 73-94.
Clark, D. L., Nadkarni, N. M., and Gholz, H. L. 1998. Growth, net production, litter decomposition, and net nitrogen accumulation by epiphytic bryophytes in a tropical montane forest. Biotropica 30: 12-23.
Clark, K. L., Nadkarni, N. M., and Gholz, H. L. 2005. Retention of inorganic nitrogen by epiphytic bryophytes in a tropical montane forest. Biotropica 37: 328-336.
Cornelissen, J. H. C., Lang, S. I., Soudzilovskaia, N.A., and During, H. J. 2007. Comparative cryptogam ecology: A review of bryophyte and lichen traits that drive biogeochemistry. Ann. Bot. 99: 987-1001.
Costa, J., Paulsrud, P., Rikkinen, J., and Lindblad, P. 2001. Genetic diversity of Nostoc symbionts endophytically associated with two bryophyte species. Appl. Environ. Microbiol. 67: 4393-4396.
Cullimore, D. R. and McCann, A. E. 1972. Epiphytic algae isolated from moss. Blue Jay 30: 167-168.
Dalton, D. A. and Chatfield, J. M. 1985. A new nitrogen-fixing cyanophyte-hepatic association: Nostoc and Porella. Amer. J. Bot. 72: 781-784.
Deising, H. 1987. In vivo studies on the regulation of nitrate reductase in Sphagnum species. Symp. Biol. Hung. 35: 59-69.
DeLuca, T. H., Zackrisson, O., Nilsson, M.-C., and Sellstedt, A. 2002. Quantifying nitrogen-fixation in feather moss carpets of boreal forests. Nature 419: 917-920.
Duckett, J. G. and Pressel, S. 2009. Extraordinary features of the reproductive biology of Marchantia at Thursley Common. Field Bryol. 97: 3-11.
Duckett, J. G. and Renzaglia, K. S. 1993. The reproductive biology of the liverwort Blasia pusilla L. J. Bryol. 17: 541-552.
Duckett, J. G., Prasad, A. K. S. K., Davies, D. A., and Walker, S. 1977. A cytological analysis of the Nostoc-bryophyte relationship. New Phytol. 79: 349.
Duckett, J. G., Fletcher, P., Francis, R., Matcham, H. W., Russell, A. J., and Pressel, S. 2004. In vitro cultivation of bryophytes; practicalities, progress, problems and promise. J. Bryol. 26: 3-20.
Eckstein, R. L. 2000. Nitrogen retention by Hylocomium splendens in a subarctic birch woodland. J. Ecol. 88: 506-515.
Eckstein, R. L. and Karlsson, P. S. 1999. Recycling of nitrogen among segments of Hylocomium splendens as compared with Polytrichum commune: Implications for clonal integration in an ectohydric bryophyte. Oikos 86: 87-96.
Egorov, V. I. 2007. The nitrogen regime and biological fixation of nitrogen in moss communities (the Khibiny Mountains). Eurasian Soil Sci. 40: 463-467.
Elbert, W., Weber, B., Burrows, S., Steinkamp, J., Büdel, B., Andreae, M. O., and Pöschl, U. 2012. Contribution of cryptogamic covers to the global cycles of carbon and nitrogen. Nat. Geosci. 5: 459-462.
Enderlin, C. S. and Meeks, J. C. 1983. Pure culture and reconstitution of the Anthoceros-Nostoc symbiotic association. Planta 158: 157-165.
Englund, B. 1976. Nitrogen fixation by free-living microorganisms on the lava field of Heimaey, Iceland. Oikos 27: 428-432.
Fogg, E. G. and Stewart, W. D. P. 1968. In situ determinations of biological nitrogen fixation in Antarctica. Brit. Antarct. Surv. Bull. 15: 39-46.
Forsum, Å., Dahlman, L., Näsholm, T., and Nordin, A. 2006. Nitrogen utilization by Hylocomium splendens in a boreal forest fertilization experiment. Funct. Ecol. 20: 421-426.
Frahm, J.-P. 1975. Toxitoleranzversuche an Wassermoosen. Gewass. Abwass. 57/58: 59-66.
Giddens, J. E. 1982. Nitrogen fixation in soil crusts of tall fescue (Festuca arundinacea) sods. Soil Sci. 133(5): 295-297.
Gilbert, D., Francez, A.-J., Amblard, C., and Bourdier, G. 1999. The microbial communities at the surface of the Sphagnum. Ecologie Brunoy 30(1): 45-52.
Given, D. R. 1987. Plants in the Antarctic. Newslett. Spec. Surv. Commiss. 8: 25.
Gordon, C., Wynn, J. M., and Woodin, S. J. 2001. Impacts of increased nitrogen supply on high Arctic heath: The importance of bryophytes and phosphorus availability. New Phytol. 149: 461-471.
Granhall, U. and Hofsten, A. 1976. Nitrogenase activity in relation to intracellular organisms in Sphagnum mosses. Physiol. Plant. 36: 88-94.
Granhall, U. and Lindberg, T. 1978. Nitrogen fixation in some coniferous forest ecosystems. In: Granhall, U. (ed.). Environmental Role of Nitrogen-fixing Blue-green Algae and Asymbiotic Bacteria, Ecol. Bull., Stockholm, pp. 178-192.
Granhall, U. and Selander, H. 1973. Nitrogen fixation in a subarctic mire. Oikos 24: 8-15.
Greenfield, L. G. 1992. Retention of precipitation nitrogen by Antarctic mosses, lichens and fellfield soils. Antarct. Sci. 4: 205-206.
Griggs, R. F. 1937. Growth of liverworts on "nitrogen-free" sand. Amer. J. Bot. 24: 295-298.

8-3-34 Chapter 8-3: Nutrient Relations: Nitrogen
Gundale, M. J., Deluca, T. H., and Nordin, A. 2011. Bryophytes attenuate anthropogenic nitrogen inputs in boreal forests. Global Change Biol. 17: 2743-2753.
Heijmans, M. M. P. D., Berendse, F., Arp, W. J., Maaseliuk, A. K., Klees, H., Visser, W. De, and Breeman, N. van. 2001. Effects of elevated carbon dioxide and increased nitrogen deposition on bog vegetation in The Netherlands. J. Ecol. 89: 269-279.
Hemond, H. F. 1983. The nitrogen budget of Thoreau's bog. Ecology 64: 99-109.
Henriksson, E., Henriksson, L. E., Norrman, J. O., and Nyman, P. O. 1987. Biological dinitrogen fixation (acetylene reduction) exhibited by blue-green algae (Cyanobacteria) in association with mosses gathered on Surtsey, Iceland. Arct. Alp. Res. 19: 432-436.
Hobbie, S. E. 1996. Temperature and plant species control over litter decomposition in Alaskan tundra. Ecol. Monogr. 66: 503-522.
Hoffman, G. R. 1966. Ecological studies of Funaria hygrometrica (L.) Hedw. in eastern Washington and northern Idaho. Ecol. Monogr. 36: 157-180.
Hoffman, G. R. 1974. Growth stimulation of Marchantia polymorpha from ilmenite basalt and volcanic ash. Bryologist 77: 632-636.
Honegger, R. 1980. Zytologie der blaualgen-hornmoos-symbiose bei Anthoceros laevis aus Island. Flora 170: 290-302.
Hooper, C. A. 1982. An experimental study of algal communities on Sphagnum. Unpubl. Ph. D. Dissertation, University of Michigan, 179 pp.
Huntley, B. J. 1971. Vegetation. In: Zindern Bakker, E. M. van, Winterbottom, J. M., and Dyer, R. A. (eds.). Marion and Prince Edward Islands; Report on the South African Biological and Geological Expedition, 1965-1966. A. A. Balkema, Capetown.
Jauhiainen, J., Wallen, B., and Malmer, N. 1998. Potential NH4
+ and NO3- uptake in seven Sphagnum species. New
Phytol. 138: 287-293.
Joenje, W. and During, H. J. 1977. Colonisation of a desalinating Wadden-polder by bryophytes. Plant Ecol. 35: 177-185.
Jones, K. and Wilson, R. E.. 1978. The fate of nitrogen fixed by a free-living blue-green alga. In: Granhall, U. (ed.). Environmental Role of Nitrogen-fixing Blue-green Algae and Asymbiotic Bacteria. Ecol. Bull. (Stockholm) 26: 158-163.
Jones, M. L. M., Oxley, E. R. B., and Ashenden, T. W. 2002. The influence of nitrogen deposition, competition and desiccation on growth and regeneration of Racomitrium lanuginosum (Hedw.) Brid. Environ. Pollut. 120: 371-378.
Joseph, M. and Meeks, J. C. 1987. Regulation of expression of glutamine synthetase in a symbiotic Nostoc strain associated with Anthoceros punctatus. J. Bacteriol. 169: 2471-2475.
Kielland, K. 1997. Role of free amino acids in the nitrogen economy of Arctic cryptogams. Ecoscience 4: 75-79.
Killian, C. 1923. Cultures d'Hepatiques. Soc. Biol. Paris (Compt. Rend.) 88: 746-748.
Kimura, J. and Nakano, T. 1990. Reconstitution of a Blasia-Nostoc symbiotic association under axenic conditions. Nova Hedw. 50: 191-200.
Kopáček, J. and Blažzka, P. 1994. Ammonium uptake in alpine streams in the High Tatra Mountains (Slovakia). Hydrobiologia 294: 157-165.
Koranda, M., Kerschbaum, S., Wanek, W., Zechmeister, H., and Richer, A. 2007. Physiological responses of bryophytes Thuidium tamariscinum and Hylocomium splendens to increased nitrogen deposition. Ann. Bot. 99: 161-169.
Kotanen, P. M. 2002. Fates of added nitrogen in freshwater Arctic wetlands grazed by snow geese: The role of mosses. Arct. Antarct. Alp. Res. 34: 219-225.
Kull, O., Aan, A., and Soelsepp, T. 1995. Light interception, nitrogen and leaf mass-distribution in a multilayer plant community. Funct. Ecol. 9: 589-595.
Lambert, R. L. and Reiners, W. A. 1979. Nitrogen-fixing moss associations in the subalpine zone of the White Mountains, New Hampshire. Arct. Alp. Res. 11: 325-333.
Leizerovich, I., Kardish, N., and Galun, M. 1990. Comparison between eight symbiotic, cultured Nostoc by recombinant DNA. Symbiosis 8: 75-85.
Line, M. A. 1992. Nitrogen fixation in the sub-Antarctic Macquarie Island. Polar Biol. 11: 601-606.
Lockwood, L. G. 1975. The influence of photoperiod and exogenous nitrogen-containing compounds on the reproductive cycles of the liverwort Cephalozia media. Amer. J. Bot. 62: 893-900.
Lovelock, J. 1988. The Ages of Gaia. Bantam Books, New York, 252 pp.
Machlis, L. 1962. The effects of mineral salts, glucose, and light on the growth of the liverwort, Sphaerocarpos donnellii. Physiol. Plant. 15: 354-362.
Madhusoodanan, P. V. and Dominic, T. K. 1996. Epiphytic Cyanobacteria on mosses from Western Ghats of Kerala. J. Econ. Tax. Bot. 20: 355-360.
Matsuda, Y., Shimada, T., and Sakamoto, Y. 1992. Ammonium ions control gametic differentiation and dedifferentiation in Chlamydomonas reinhardtii. Plant Cell Physiol. 33: 909-914.
McKane, R., Johnson, L., Shaver, G., Nadelhoffer, K., Fry, B., Rastetter, E., Giblin, A., and Laundre, J. 1993. Differentiation in uptake of 15N by depth, season, and chemical form in an arctic tussock tundra plant community. 78th Ann. ESA Meeting, 31 July - 4 August 1993. Bull. Ecol. Soc. Amer. Program and Abstracts, Suppl. vol 74(2): 354.
Meeks, J. C. 1990. Cyanobacterial-bryophyte associations. In: Rai, R. N. (ed.). Handbook of Symbiotic Cyanobacteria. CRC Press, Boca Raton, pp. 43-63.
Meeks, J. C., Enderlin, C. S., Wycoff, K. L., Chapman, J. S., and Joseph, C. M. 1983. Assimilation of 13NH4
+ by Anthoceros grown with and without symbiotic Nostoc. Planta 158: 384-391.
Meeks, J. C., Enderlin, C. S., Joseph, C. M., Chapman, J. S., and Lollar, M. W. L. 1985. Fixation of [13N]N2 and transfer of fixed nitrogen in the Anthoceros-Nostoc symbiotic association. Planta 164: 406-414.
Mills, M. M., Ridame, C., Davey, M., La Roche, J., and Geider, R. J. 2004. Iron and phosphorus co-limit nitrogen fixation in the eastern tropical North Atlantic. Nature 429: 292-294.
Miyazaki, T. and Satake, K. 1985. In situ measurements of uptake of inorganic carbon and nitrogen by the aquatic liverworts Jungermannia vulcanicola Steph. and Scapania undulata (L.) Dum. in an acid stream, Kashiranashigawa, Japan. Hydrobiologia 124: 29-34.
Moore, C. M., Mills, M. M., Achterberg, E. P., Geider, R. J., LaRoche, J., Lucas, M. I., McDonagh, E. L., Pan, X., Poulton, A. J., Rijkenberg, M. J. A., Suggett, D. J., Ussher, S. J., and Woodward, E. M. S. 2009. Large-scale distribution of Atlantic nitrogen fixation controlled by iron availability. Nat. Geosci. 2: 867-871.
Morimoto, K. and Maruyama, Y. 1982. Nitrogen fixation by Sphagnum and blue-green algae system in the Ozegahara
Chapter 8-3: Nutrient Relations: Nitrogen 8-3-35
moor. Ozegahara: Scientific Researches of the Highmoor in Central Japan, pp. 231-241.
Nakatsubo, T. and Ino, Y. 1986. Nitrogen cycling in an Antarctic ecosystem 1. Biological nitrogen fixation in the vicinity of Syowa Station Japan. Mem. Natl. Inst. Polar Res. Ser. E Biol. Med. Sci. 37: 1-10.
Nakatsubo, T. and Ino, Y. 1987. Nitrogen cycling in an Antarctic ecosystem 2. Estimation of the amount of nitrogen fixation in a moss community on East Ongul Island. Ecol. Res. 2: 31-40.
Nakatsubo, T. and Ohtani, S. 1991. Nitrogen-fixing (C2H2-reducing) Cyanobacteria epiphytic of moss communities in the alpine zone of Mt. Fuji. Proc. Natl. Inst. Polar Res. Symp. Polar Biol. 4: 75-81.
Nordin, A. and Gunnarsson, U. 2000. Amino acid accumulation and growth of Sphagnum under different levels of N deposition. Ecoscience 7: 474-480.
Nordin, A., Nasholm, T., and Ericson, L. 1998. Effects of simulated N deposition on understorey vegetation of a boreal coniferous forest. Funct. Ecol. 12: 691-699.
Orebamjo, T. O. and Stewart, G. R. 1975. Ammonium repression of nitrate reductase formation in Lemna minor L. Planta 122: 27-36.
Paffen, B. G. P. and Roelefs, J. G. M. 1991. Impact of carbon dioxide and ammonium on the growth of submerged Sphagnum cuspidatum. Aquat. Bot. 40: 61-71.
Pandey, K. D., Kashyap, A. K., and Gupta, R. K. 1992. Nitrogen fixation by Cyanobacteria associated with moss communities in Schirmacher Oasis, Antarctica. Israel J. Bot. 41: 187-198.
Paulissen, M. P., Ven, P. J. Van Der, Dees, A. J., and Bobbink, R. 2004. Differential effects of nitrate and ammonium on three fen bryophyte species in relation to pollutant nitrogen input. New Phytol. 164: 451-458.
Peirce, G. J. 1906. Anthoceros and its Nostoc colonies. Bot. Gaz. 42: 55-59.
Peters, G. A. 1991. Azolla and other plant-Cyanobacteria symbioses: Aspects of form and function. Plant Soil 137: 25-36.
Pressel, S., Matcham, H. W., and Duckett, J. G. 2007. Studies of protonemal morphogenesis in mosses. XI. Bryum and related genera; a plethora of propagules. J. Bryol. 29: 241-258.
Prakasham, R. and Rai, A. N. 1991. Evidence for the occurrence of a specific methylammonium transport system in the cultured cyanobiont of the Anthoceros punctatus-Nostoc association. J. Gen. Microbiol. 137: 1783-1788.
Rai, A. N., Borthakur, M., Singh, S., and Bergman, B. 1989. Anthoceros-Nostoc symbiosis: Immunoelectronmicroscopic localization of nitrogenase, glutamine synthetase, phycoerythrin and ribulose 1,5-biphosphate carboxylase/oxygenase in the cyanobiont and the cultured (free-living) isolate Nostoc 7801. J. Gen. Microbiol. 135: 385-395.
Rai, A. N., Soderback, E., and Bergman, B. 2000. Tansley Review No. 116. Cyanobacterium - Plant symbioses. New Phytol. 147: 449-481.
Renzaglia, K. 1982a. Apical development and the production of Nostoc auricles in Blasia pusilla L. Misc. Publ. Bot. Soc. Amer. 162: 4.
Renzaglia, K. S. 1982b. A comparative developmental investigation of the gametophyte generation in the Metzgeriales (Hepatophyta). Bryophyt. Biblio. 24: 1-253.
Ridgway, J. E. 1967. The biotic relationship of Anthoceros and Phaeoceros to certain Cyanophyta. Ann. Missouri Bot. Gard. 54: 95-102.
Rodgers, G. A. 1978. The effect of some external factors on nitrogenase activity in the free-living and endophytic Nostoc of the liverwort Blasia pusilla. Physiol. Plant. 44: 407-411.
Rodgers, G. A. and Henriksson, E. 1976. Associations between the blue-green algae Anabaena variabilis and Nostoc muscorum and the moss Funaria hygrometrica with reference to the colonization of Surtsey. Acta Bot. Islandica 4: 10-15.
Rosswall, T. and Granhall, U. 1980. Nitrogen cycling in a subarctic ombrotrophic mire. In: Sonesson, M. (ed.). Ecology of a Subarctic Mire. Ecol. Bull. (Stockholm) 30: 209-234.
Rudolph, H. J. and Voigt, J. U. 1986. Effects of NH4+-N and
NO3--N on growth and metabolism of Sphagnum
magellanicum. Physiol. Plant. 66: 339-343.
Rudolph, H., Deising, H., and Voigt, J. U. 1987. The tolerance of raised bog species in respect to inorganic nitrogen. Symp. Biol. Hung. 35: 71-80.
Salisbury, F. B. and Ross, C. W. 1978. Plant Physiology. Wadsworth Publ. Co., Inc., Belmont, Calif. 2nd Edn.
Sanville, W. 1988. Response of an Alaskan wetland to nutrient enrichment. Aquat. Bot. 30: 231-243.
Satake, K. 1980. Limnological studies on inorganic acid lakes in Japan. Jap. J. Limnol. 41: 41-50.
Saxena, D. K. 1981. Role of Anthoceros as a bio-fertilizer. XIII International Botanical Congress Abstracts, Sydney vol. 292.
Schuler, J. F., Diller, V. M., Fulford, M., and Kerstein, H. J. 1955. Plant Physiol. 30: 478-482. Cited in: Brown, D. H. 1982. Mineral nutrition. In: Smith, A. J. E. (ed.). Bryophyte Ecology. Chapman & Hall, London, pp. 383-444.
Schuster, R. M. 1992a. The Hepaticae and Anthocerotae of North America East of the Hundredth Meridian. Vol. V. Field Museum of Natural History, Chicago, Ill.
Schuster, R. M. 1992b. The Hepaticae and Anthocerotae of North America East of the Hundredth Meridian. Vol. VI. Field Museum of Natural History, Chicago, Ill.
Schuurkes, J. A. A. R., Kok, C. J., and Den Hartog, C. 1986. Ammonium and nitrate uptake by aquatic plants from poorly buffered and acidified waters. Aquat. Bot. 24: 131-146.
Schwoerbel, J. and Tillmanns, G. C. 1964. Untersuchungen uber die Stoffwechseldynamik in Fliebgewassern. Arch. Hydrobiol. (Suppl.) 28: 259-267.
Schwoerbel, J. and Tillmanns, G. C. 1972. Adaptation to ammonia in situ by submerged macrophytes. Arch. Hydrobiol. (Suppl.) 42, 1: 139-141.
Schwoerbel, J. and Tillmanns, G. C. 1974. Assimilation of nitrogen from the medium and nitrate reductase activity in submerged macrophytes: Fontinalis antipyretica L. Arch. Hydrobiol. Suppl. 47: 282-294.
Schwoerbel, J. and Tillmanns, G. C. 1977. Uptake of nitrate from the water and activity of nitrate reductase by Fontinalis antipyretica L. under light and dark conditions. Arch. Hydrobiol. (Suppl.) 48: 412-423.
Selkirk, P. M. 1979. Effect of nutritional conditions on sexual reproduction in Riccia. Bryologist 82: 37-46.
Sheridan, R. P. 1991. Nitrogenase activity by Hapalosiphon flexuosus associated with Sphagnum erythrocalyx mats in the cloud forest on the volcano La Soufriere Guadeloupe French West Indies. Biotropica 23: 134-140.
Simola, L. K. 1975. The effect of several protein amino acids and some inorganic nitrogen sources on the growth of Sphagnum nemoreum. Physiol. Plant 35: 194-199.
Simola, L. K. 1979. Dipeptide utilization by Sphagnum fimbriatum. J. Hattori Bot. Lab. 46: 49-54.

8-3-36 Chapter 8-3: Nutrient Relations: Nitrogen
Singh, H. V. and B. R. Chaudhary, B. R. 1990. Nutrient effects on the formation of oogonia in Oedogonium hatei (Chlorophyta). Phycologia 29: 332-337.
Sironval, C. 1947. Expériences sur les stades de développement de la forme filamenteuse en culture de Funaria hygrometrica L. Bull. Soc. Bot. Belg. 29(1-2): 48-78.
Smith, V. R. 1984. Effects of abiotic factors on acetylene reduction by Cyanobacteria epiphytic on moss at a subAntarctic island. Appl. Environ. Microbiol. 48: 594-600.
Smith, V. R. 1993. Effect of nutrients on carbon dioxide assimilation by mosses on a sub-Antarctic island. New Phytol. 123: 693-697.
Smith, V. R. and Ashton, P. J. 1981. Bryophyte-Cyanobacteria associations on sub-Antarctic Marion Island: Are they important in nitrogen fixation? S. Afr. T. Nav. Antarkt., Deel 10/11: 24-26.
Smith, V. R. and Russell, S. 1982. Acetylene reduction by bryophyte-Cyanobacteria associations on a subAntarctic island. Polar Biol. 1: 153-157.
Snyder, J. M. and Wullstein, L. H. 1973a. Nitrogen fixation in granite outcrop pioneer systems. Bryologist 76: 197-199.
Snyder, J. M. and Wullstein, L. H. 1973b. The role of desert cryptogams in nitrogen fixation. Amer. Midl. Nat. 90: 257-265.
Soares, A. and Pearson, J. 1997. Short-term physiological responses of mosses to atmospheric ammonium and nitrate. Water Air Soil Pollut. 93: 225-242.
Solheim, B., Endal, A., and Vigstad, H. 1996. Nitrogen fixation in Arctic vegetation and soils from Svalbard, Norway. Polar Biol. 16: 35-40.
Solheim, B., Johanson, U., Callaghan, T. V., Lee, J. A., Gwynn-Jones, D., and Björn, L. O. 2002. The nitrogen fixation potential of Arctic cryptogam species is influenced by enhanced UV-B radiation. Oecologia 133: 90-93.
Sood, S. 1974. In vitro studies in Marchantiales. II. Effect of mineral nutrients, chelates and organic nitrogenous sources on the growth and sexuality in Riccia crystallina. Phytomorphology 24: 186-197.
Southorn, A. L. D. 1977. Bryophyte recolonization of burnt ground with particular reference to Funaria hygrometrica. II. The nutrient requirements of Funaria hygrometrica. J. Bryol. 9: 361-374.
Steinberg, N. A. and Meeks, J. C. 1987. Phototrophic and heterotrophic nitrogenase activity by the Cyanobacterium Nostoc in symbiosis with the bryophyte Anthoceros. Plant Physiol. (Bethesda) 83 (4 suppl.): 24.
Steinberg, N. A. and Meeks, J. C. 1989. Photosynthetic CO2 fixation and ribulose bisphosphate carboxylase/oxygenase activity of Nostoc strain UCD 7801 in symbiotic association with Anthoceros punctatus. J. Bacteriol. 171: 6227-6233.
Steinberg, N. A. and Meeks, J. C. 1991. Physiological sources of reductant for nitrogen fixation activity in Nostoc strain UCD 7801 in symbiotic association with Anthoceros punctatus. J. Bacteriol. 173: 7324-7329.
Stewart, W. D. P. 1967. Nitrogen fixing plants. Science 158: 1426-1432.
Stewart, W. D. P. and Rodgers, G. A. 1977. The cyanophyte-hepatic symbiosis. II. Nitrogen fixation and the interchange of nitrogen and carbon. New Phytol. 78: 459-471.
Stewart, W. D. P. and Rodgers, G. A. 1978. Studies on the symbiotic blue-green algae of Anthoceros, Blasia and Peltigera. Ecol. Bull. 26: 247-259.
Strengbom, J., Nordin, A., Näsholm, T., and Ericson, L. 2001. Slow recovery of boreal forest ecosystem following decreased nitrogen input. Funct. Ecol. 15: 451-457.
Syrett, P. J. and Morris, I. 1963. The inhibition of nitrate assimilation by ammonium in Chlorella. Biochim. Biophys. Acta – Specialized Section on Enzymological Subjects 67: 566-575.
Touffet, J. 1971. Apercu phytosociologique et écologique syr les tourbières des pentes du Finistère. Bot. Rhedonica 2(2): 77-80.
Trainor, F. R. 1959. A comparative study of sexual reproduction in four species of Chlamydomonas. Amer. J. Bot. 46: 65-70.
Twenhöven, F. L. 1992. Competition between two Sphagnum species under different deposition levels. J. Bryol. 17: 71-80.
Vanderpoorten, A. 2000. Hydrochemical determinism and molecular systematics in the genus Amblystegium (Musci). Application to the biomonitoring of surface waters. Dissertation de docteur en sciences agronomiques et ingénierie biologique, Faculté Universitaire des Sciences Agronomiques de Gembloux, Gembloux, Belgium, 99 pp.
Vieira, A. R., Gonzalez, C., Martins-Loução, M. A., Branquinho, C. 2009. Intracellular and extracellular ammonium (NH4
+) uptake and its toxic effects on the aquatic biomonitor Fontinalis antipyretica. Ecotoxicology 18: 1087-1094.
Vlassak, K., Paul, E. A., and Harris, R. E. 1973. Assessment of biological nitrogen fixation in grassland and associated sites. Plant Soil 38: 637-649.
Voth, P. D. and Hamner, K. C. 1940. Responses in Marchantia polymorpha to nutrient supply and photoperiod. Bot. Gaz. 102: 169-205.
Wanek, W. and Pörtl, K. 2008. Short-term 15 N uptake kinetics and nitrogen nutrition of bryophytes in a lowland rainforest, Costa Rica. Funct. Plant Biol.: 35: 51-62.
Wann, F. B. 1925. Some of the factors involved in sexual reproduction of Marchantia polymorpha. Amer. J. Bot. 12: 307-318.
West, N. J. and Adams, D. G. 1997. Phenotypic and genotypic comparison of symbiotic and free-living Cyanobacteria from a single field site. Appl. Environ. Microbiol. 63: 4479-4484.
Wilson, R. E. 1975. Growth and nitrogen fixation by a species of Nostoc found in association with the moss Gymnostomum recurvirostrum on soil hummocks by Slapstone Sike, Upper Teesdale. M. Sc. Thesis, Univ. Lancaster.
Wong, F. C. Y. and Meeks, J. C. 2002. Establishment of a functional symbiosis between the Cyanobacterium Nostoc punctiforme and the bryophyte Anthoceros punctatus requires genes involved in nitrogen control and initiation of heterocyst differentiation. Microbiology 148(1): 315-323.
Zackrisson, O., DeLuca, T. H., Gentili, F., Sellstedt, A., and Jäderlund, A. 2009. Nitrogen fixation in mixed Hylocomium splendens moss communities. Oecologia 160: 309-319.
Zimicki, J. 1976. The role of Sphagnum moss in the immobilization of nitrogen in montane ecosystems. Unpublished report for the Mellon Foundation, Dartmouth College, Hanover, N.H.
Glime, J. M. 2017. Nutrient Relations: Uptake and Location. Chapt. 8-4. In: Glime, J. M. Bryophyte Ecology. Volume 1. 8-4-1 Physiological Ecology. Ebook sponsored by Michigan Technological University and the International Association of Bryologists. Last updated 11 November 2017 and available at < http://digitalcommons.mtu.edu/bryophyte-ecology/ >.
CHAPTER 8-4 NUTRIENT RELATIONS: UPTAKE
AND LOCATION
TABLE OF CONTENTS Uptake ................................................................................................................................................................. 8-4-2 General Considerations ................................................................................................................................ 8-4-2 Sources.................................................................................................................................................. 8-4-2 Site of Uptake ....................................................................................................................................... 8-4-3 Rhizoids ................................................................................................................................................ 8-4-3 Growth Form......................................................................................................................................... 8-4-3 Age........................................................................................................................................................ 8-4-4 Nutrient Concentration.......................................................................................................................... 8-4-4 Water Source......................................................................................................................................... 8-4-4 Cation Exchange .......................................................................................................................................... 8-4-5 Polyuronic Acids and CEC ................................................................................................................... 8-4-5 The Mechanism..................................................................................................................................... 8-4-6 Cation Competition............................................................................................................................... 8-4-7 Heavy Metal Relationships ................................................................................................................... 8-4-8 Differing Affinities ............................................................................................................................. 8-4-10 Habitat Differences ............................................................................................................................. 8-4-11 Uptake Rate......................................................................................................................................... 8-4-12 Desiccation and Loss ................................................................................................................................. 8-4-13 Anion Uptake ............................................................................................................................................. 8-4-13 Proton Pumps ............................................................................................................................................. 8-4-13 Cotransport................................................................................................................................................. 8-4-13 Pinocytosis ................................................................................................................................................. 8-4-14 Nanoparticles ............................................................................................................................................. 8-4-14 Influence of Cellular Structures ................................................................................................................. 8-4-14 Location Is Important ........................................................................................................................................ 8-4-14 New Growth...................................................................................................................................................... 8-4-14 Specificity ......................................................................................................................................................... 8-4-15 Seasons.............................................................................................................................................................. 8-4-16 Glucose Uptake ................................................................................................................................................. 8-4-17 Fungal Connections – Mycorrhizae?................................................................................................................. 8-4-18 Cryptothallus mirabilis .............................................................................................................................. 8-4-24 Underground and Other Partnerships......................................................................................................... 8-4-26 Arbuscular Mycorrhizae ............................................................................................................................ 8-4-28 Beneficial or Harmful?............................................................................................................................... 8-4-31 Summary ........................................................................................................................................................... 8-4-31 Acknowledgments............................................................................................................................................. 8-4-31 Literature Cited ................................................................................................................................................. 8-4-31
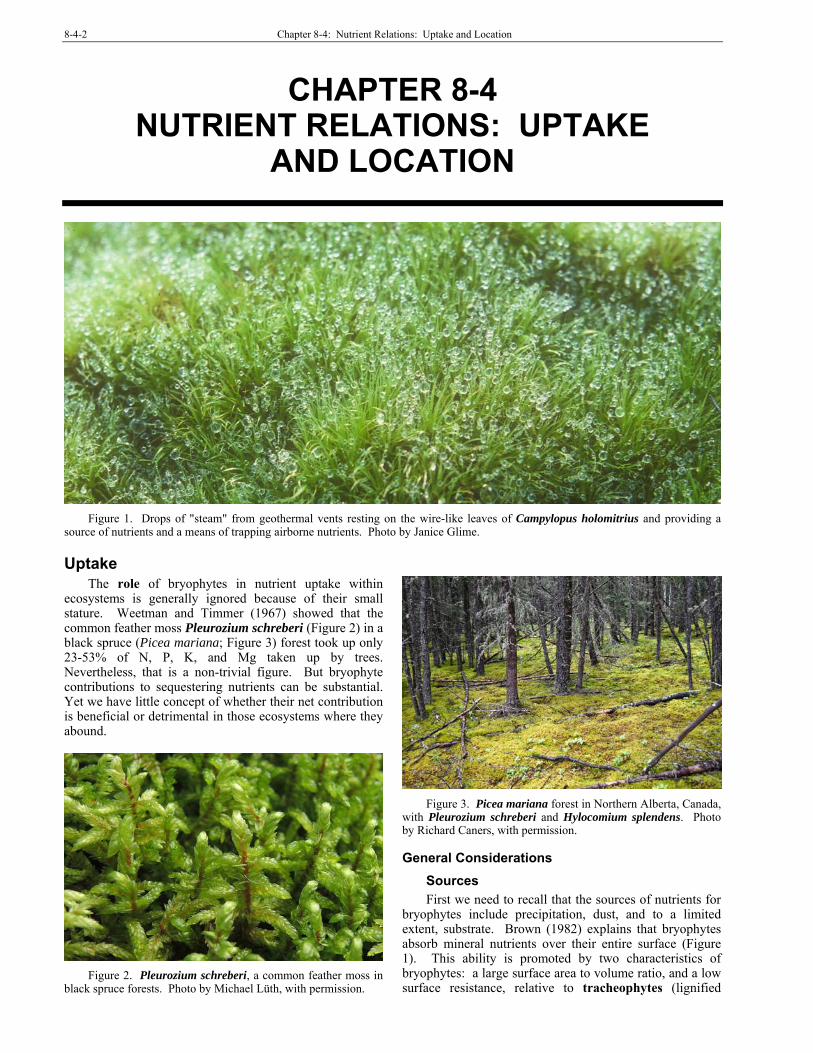
8-4-2 Chapter 8-4: Nutrient Relations: Uptake and Location
CHAPTER 8-4 NUTRIENT RELATIONS: UPTAKE
AND LOCATION
Figure 1. Drops of "steam" from geothermal vents resting on the wire-like leaves of Campylopus holomitrius and providing a
source of nutrients and a means of trapping airborne nutrients. Photo by Janice Glime.
Uptake The role of bryophytes in nutrient uptake within
ecosystems is generally ignored because of their small stature. Weetman and Timmer (1967) showed that the common feather moss Pleurozium schreberi (Figure 2) in a black spruce (Picea mariana; Figure 3) forest took up only 23-53% of N, P, K, and Mg taken up by trees. Nevertheless, that is a non-trivial figure. But bryophyte contributions to sequestering nutrients can be substantial. Yet we have little concept of whether their net contribution is beneficial or detrimental in those ecosystems where they abound.
Figure 3. Picea mariana forest in Northern Alberta, Canada, with Pleurozium schreberi and Hylocomium splendens. Photo by Richard Caners, with permission.
General Considerations
Sources First we need to recall that the sources of nutrients for
bryophytes include precipitation, dust, and to a limited extent, substrate. Brown (1982) explains that bryophytes absorb mineral nutrients over their entire surface (Figure 1). This ability is promoted by two characteristics of bryophytes: a large surface area to volume ratio, and a low surface resistance, relative to tracheophytes (lignified
Figure 2. Pleurozium schreberi, a common feather moss in black spruce forests. Photo by Michael Lüth, with permission.

Chapter 8-4: Nutrient Relations: Uptake and Location 8-4-3
vascular plants), due to the limited development of cuticle. This is further enhanced within the bryophyte by typically having leaves of only one cell layer in thickness, hence exposing every leaf cell directly to the nutrient supply immediately. Based on what we know thus far, actual entry into the cell is most likely similar to that of tracheophytes.
Site of Uptake Their typical differences in site of uptake would
seemingly remove the bryophytes from competition with tracheophytes for soil nutrients. Due to lack of vessels and tracheids, we have assumed that uptake of nutrients by bryophytes is primarily through their leaves. Even in the endohydric Polytrichum (Figure 4), water entry is gained primarily at the tips of the plants by water that has travelled upward through external capillary spaces (Trachtenberg & Zamski 1979). Hence, we can expect that most nutrient entry is not through rhizoids, but through leaves, and at least in some mosses may be greater at the tips than in lower parts of the plant. Brown and Wells (1990) remind us that despite their small size, the bryophytes have intricate surface areas that are effective at trapping both dust and moisture that can subsequently enter the bryophyte (Figure 1). The ratio of surface area to volume in bryophytes is enormous compared to that of trees and other tracheophytes.
Figure 4. Polytrichum commune, a moss with internal
conduction, but that transports nutrients externally through capillary spaces. Photo by Michael Lüth, with permission.
Rhizoids Even if bryophytes were to use their rhizoids to gather
some nutrients, the soil penetration by these structures is generally shallow and well above the zone occupied by most fine roots of tracheophytes, especially trees. Instead, we have assumed that bryophytes typically rely largely on dust on their surfaces and on nutrients dissolved in rainfall. In forests, these arrive primarily through leachates acquired in canopy throughfall. This is a quite different strategy from that of tracheophytes, although in Polytrichum commune (Figure 4) it does appear that some nutrients might enter through the rhizoids (Chapin et al. 1987). On the other hand, P. commune and other forest floor mosses in the black spruce forest (Figure 3) lose nutrients to the black spruce fine roots through mycorrhizae (fungal associates).
Growth Form
Growth form affects nutrient trapping and subsequent uptake. Taylor and Witherspoon ( 1972) found that
Dicranum (Figure 5), which grows in a relatively tight clump, retains more particles than do open lichens such as Cladonia/Cladina (Figure 6), even though these lichens display considerable surface area. Hence, we should expect such tight cushions to be more effective at trapping than more open bryophytes like Brachythecium (Figure 7) or Mnium (Figure 8). On the other hand, Shacklette (1965) found that bryophytes were significantly contaminated with soil particles, including insoluble ones such as Al, Be, Fe, Si, and Zr. But, it would appear that even deeper soil is not immune to moss nutrient scavenging, perhaps through a combination of capillary action and concentration gradient.
Figure 5. Dicranum in its dry state, showing tight growth
form that traps dust particles easily. Photo courtesy of Herschel Horton.
Figure 6. Cladina portentosa, a highly branched lichen.
Photo by Taka, through Creative Commons.
Figure 7. Brachythecium rutabulum, showing open growth
form that traps less dust than the more cushiony forms like Dicranum. Photo by Janice Glime.

8-4-4 Chapter 8-4: Nutrient Relations: Uptake and Location
Figure 8. Mnium hornum, an open bryophyte that may trap
less dust than cushion forms. Photo by Tim Waters, through Creative Commons.
Age Bryophyte uptake can relate to age. In studying the
Alaskan black spruce (Picea mariana) forest (Figure 3), Chapin et al. (1987) found that in three of the moss taxa studied, the phosphate absorption capacity increases with age of green tissue, but decreases with age of brown tissue.
In the aquatic moss Warnstorfia fluitans (Figure 9), an acidophile (preferring acid habitats), iron (Fe) accumulates in the cell wall (Satake 2000). The highest concentrations are in the base, increasing toward the tip. In addition to the biological accumulation within the walls, iron is held on the mosses in crystal form.
Figure 9. Warnstorfia fluitans, a species that can
accumulate iron in its cell walls. Photo by Michael Luth,with permission.
Nutrient Concentration Lou et al. (2013) found that the content of the heavy
metals Pb, Cr, and Cu in the moss Haplocladium microphyllum (Figure 10) correlated with the concentrations in the medium. Iron (Fe), on the other hand, increased in a similar manner until the concentration in the medium reached 400 mg L-1 as Fe++. Below that level the iron facilitated uptake of other nutrient ions. The absorption capacity for these metals follows the order
Fe>Cr>Cu>Pb. Like most things in nutrient relationships, the amount matters. At low concentrations, both lead and copper ions, as with iron, promote the absorptive capacity of other nutrient elements. At high concentrations the same metals decrease uptake of other nutrient elements. Chromium is an exception, inhibiting absorption capacity of the nutrients P, K, Ca, S, Fe, and Cu even when the Cr concentrations are low. Lou and coworkers found that Pb and Cr are stored primarily in the peripheral cortex of the moss stem in Haplocladium microphyllum. It is not clear how this affects uptake of other ions.
Figure 10. Haplocladium microphyllum, a species in which
uptake is dependent on concentration. Photo by Robin Bovey, with permission through Dale Vitt.
Water Source The standing or flowing water habitat of Sphagnum
fen (Figure 11) species contrasts sharply with the rainfall source of many other bryophytes. Although species occupying raised bogs with no ground water input may rely almost entirely on rainfall, those mosses in fen situations undoubtedly get nutrients from the ground water as well. In a study of 21 species of Sphagnum (Figure 21-Figure 29) in Poland, this genus demonstrated its ability to accumulate N, P, and K in the upper parts of the plant through active uptake, whereas Ca, Mg, and Na accumulated through passive cation exchange (Wojtun 1994; see below), suggesting an arrangement of nutrients within the plant similar to that of the tracheophytes.
Figure 11. Rich fen showing marl deposits (Ca++) on plants.
Photo by Janice Glime.

Chapter 8-4: Nutrient Relations: Uptake and Location 8-4-5
A number of researchers have concluded that cryptogamic crusts (soil crusts of algae, Cyanobacteria, fungi, lichens, and bryophytes) that live on the soil in areas with low rainfall increase the availability of essential elements, such as N, Cu, K, Mg, and Zn, thus benefitting seeds, seedlings, and mature tracheophyte plants (Harper & Pendleton 1993; Belnap & Harper 1995; Harper & Belnap 2001). This is most likely due to a combination of trapping airborne nutrients and preventing loss due to erosion and leaching from the soil. We are only beginning to understand the extent and role of bryophytes in nutrient trapping, sequestration, and release in various habitats.
Cation Exchange Once we understand external transport, we must
examine how the nutrients actually enter the moss. Are all nutrients equally capable of entry? Most likely not, but how is that controlled? And can these bryophyte leaves function as well as roots of tracheophytes in the absorption of nutrients?
Brown and Buck (1985) considered the cation exchange capacities (CEC; see below) of bryophyte cell walls to be important in their uptake and sequestering ability. Potassium (K) can be held on exchange sites, then remain in solution once it enters the plant. These researchers warned that it was important to know the locations of minerals within and on the bryophytes because ions such as those of Ca and Pb can remain on exterior exchange sites whereas Mg and Zn can be both internal and external.
Dainty and Richter (1993) identified two classes of weak-acid binding sites. One had a low pK (2-4) and the other a high one (>5). pK is the pH at which equal concentrations of acidic and basic forms of a substance are present; it is the negative log10 of the dissociation constant of the electrolyte. The binding sites are related to the uronic, amino, and phenolic acid contents of the cell walls. Dainty and Richter concluded that "valence-dependent reductions in cation activities in the wall phase are an important contributor to the differences in the pK estimates."
The ability of bryophytes to take up nutrients from weak solutions (Babb & Whitfield 1977) permits them to grow in situations that may be limiting to tracheophytes. We know that many (perhaps all) bryophytes sequester nutrients on exchange sites (Clymo 1964; Craigie & Maass 1966; Wells & Brown 1990; Bates 1997), but that the exchange capacity varies among species (Büscher et al. 1983).
Polyuronic Acids and CEC In bryophytes, cation exchange is the process in
which positively charged ions in the environment are able to replace H+ ions at the surface of the cell walls, particularly those of leaves. Cation exchange capacity (CEC) is due to high concentrations of non-esterified pectates, mostly polyuronic acids, within the cell walls (Clymo, 1963; Craigie & Maass, 1966) and seems to be the first step in uptake of nutrient cations (Koedam & Büscher 1983). Fine roots of tracheophytes use this method as the first step in obtaining cationic nutrients from their surroundings. Koedam and Büscher (1983) demonstrated that CEC in mosses, typically much higher than in tracheophyte roots (Table 1; Knight et al. 1961), was
related to soil preference and carbonate content of the bryophytes.
Table 1. Mean cation exchange capacity of cell walls of tracheophyte roots compared to that of bryophyte gametophores. Tracheophytes from Klein & Horst 2005; bryophytes from Bates 1982b.
µg g-1 dry mass
Calcicolous bryophytes Ctenidium molluscum 15,510 Tortella tortuosa 15,160 Schistidium apocarpum 12,940 Homalothecium sericeum 12,460 Orthotrichum cupulatum 12,250 S
yntrichia ruralis 10,160
Calcifugous bryophytes Ptychomitrium polyphyllum 6,690 Racomitrium fasciculare 3,330 Dicranoweisia cirrata 3,200 Andreaea rothii 2,660 Grimmia donniana 2,610 R
acomitrium lanuginosum 2,330
Tracheophytes 0-5 mm 5-20 mm field bean 491.0 543.7 yellow lupine 422.0 527.4 barley 106.8 59.1 rye 63.1 65.5
The uronic acids are important in creating cation exchange sites. Popper and Fry (2003) have demonstrated that bryophytes (including hornworts, thalloid and leafy liverworts, and basal mosses) have higher concentrations of glucuronic acid in their primary cell walls than any of the other land plants. Basal mosses have higher concentrations than more advanced mosses, and the highest occurs in Sphagnum (Figure 21-Figure 29). Anthoceros (Figure 102-Figure 103) was unique in having a repeat-unit of glucuronic acid‐α(1→3)‐galactose, a substance nearly lacking in other kinds of plants in the study. Galacturonic acid is known as a subunit in some xyloglucans, a group of hemicellulose cell wall compounds (Peña et al. 2012). In particular, Peña et al. (2008) found that mosses and liverworts have xyloglucans that contain galacturonic acid, making them distinctly different from those xyloglucans demonstrated in both hornworts and tracheophytes. Popper and Fry (2003) considered that the cell wall xyloglucans may have been pre-adaptive substances that permitted early colonization of land, permitting rapid acquisition of nutrients during periods of short-lived surface water availability.
The role of cation exchange in nutrient uptake in poor nutrient habitats is further supported by the greater ability of Sphagnum (Figure 21-Figure 29) to exchange Ca++ and Mg++ ions for H+ ions, providing them with a mechanism to obtain the very limited nutrients in their habitats. For example, Temple et al. (1981) reported the exchange capacity of Sphagnum to range 0.9 to 1.5 meq per gram dry biomass, whereas that of other mosses generally ranges 0.6-1.1. Figures in meq on tracheophytes were hard to

8-4-6 Chapter 8-4: Nutrient Relations: Uptake and Location
find; I was able to find that wheat (Triticum vulgare) has a low CEC of 0.02 meq per gram dry biomass of roots, with the highest in that study of 0.2 meq in cress (Lepidium sativum) (Wiersum & Bakuma 1959).
On the other hand, if the Ca++ content of the habitat is too high, Sphagnum will bind so much Ca++ to its leaf surfaces that it will eventually kill the moss (personal observation). Although this cation exchange process is beneficial in obtaining nutrients, it can also result in accumulation of high levels of heavy metal pollutants (Brown 1984) such as Cd because the moss lacks sufficient selectivity in either binding or uptake of these non-nutrients (Brown & Bates 1990).
The Mechanism As early as 1961, Knight et al. found a correlation
between uronic acid contents and cation exchange capacity. Sphagnum (Figure 21-Figure 29), in particular, has extensive binding sites through its use of the polyuronic acid known as galacturonic acid (Clymo 1963). Through this capability, Sphagnum is able to outcompete tracheophytes. By creating an "intense nutrient impoverishment" for other plants, Sphagnum gains a competitive edge (Van Breemen 1995). It can impede growth of peatland shrubs such as leatherleaf (Chamaedaphne calyculata; Figure 12) (Bartsch 1994) by sequestering nutrients the shrubs need for growth.
Figure 12. Chamaedaphne calyculata, a species that must
compete with Sphagnum for nutrients. Photo by Uleli, through Creative Commons.
Polyuronic acids such as galacturonic acid have a carboxyl group (COOH+) protruding on the outer surface of the cell wall. This carboxyl group freely exchanges its H+ for other cations in its surroundings (Figure 13). Hence, when cations such as K+, Mg++, and Ca++ filter through the bryophyte layer, these ions are often bound on these bryophyte cell wall exchange sites.
Seemingly all bryophytes have a large number of exposed exchange sites, compared to those even of roots of tracheophytes (Knight et al. 1961). These exchange sites are essential to the uptake of nutrients in non-Sphagnum bryophyte taxa as well. For example, Pseudoscleropodium purum (Figure 14) ceased absorbing Mg++ and lost intracellular Mg when the exchange sites were saturated with CaCl2, suggesting adherence to exchange sites may be a necessary prerequisite to Mg++ uptake (Bates 1989). Addition of both K+ and Ca++ greatly increased their
concentrations in the exchangeable fraction of the cell but significantly reduced the concentration of Mg++. Malmer et al. (1992) found that the concentrations of Mg++ and Ca++
in Canadian mire species [three Sphagnum species and Tomentypnum nitens (Figure 15), all from hummocks] correlated with the surface water concentrations. It is interesting that when Ca++ is increased, the brown mosses are more competitive than are Sphagnum species. And there is evidence that brown mosses as well as Sphagnum can lower the pH, but that they typically do it at a higher level of pH (Figure 16) (Glime et al. 1982).
Figure 13. View of leaf cross section of Sphagnum (left)
with two enlarged chlorophyllous cells and hyaline cell on right. Enlargement shows carboxyl groups (COOH+) of the polyuronic acid and one Ca++ that will exchange for two H+ ions in cation exchange. Drawing by Janice Glime
Figure 14. Pseudoscleropodium purum. Photo by Michael
Lüth, with permission.
Figure 15. Tomentypnum nitens, a species in which the
Mg++ and Ca++ correlate with surface water concentrations. Photo by Michael Lüth, with permission.

Chapter 8-4: Nutrient Relations: Uptake and Location 8-4-7
Figure 16. Comparison of pH-lowering ability of three
mosses from an alkaline fen, Lawrence Lake, Barry County, Michigan, USA, following 48-hour incubation. Co = control lake water, Dr = Drepanocladus revolvens (=Scorpidium revolvens; Figure 17), Cs = Campylium stellatum (Figure 18), Sr = Sphagnum russowii (Figure 41). 12 hours dark and light indicate last cycle completed. Vertical lines represent 95% confidence intervals. Horizontal lines indicate no significant differences among green (active) (──) and brown (senescent) (• • •) moss species (distribution-free multiple comparisons test, α= 0.05; n = 10). Starting pH = 8.25. From Glime et al. 1982.
Figure 17. Drepanocladus revolvens, an alkaline fen moss
that lowers the pH of its medium. Photo by Michael Lüth, with permission.
Figure 18. Campylium stellatum, alkaline fen moss that
lowers pH of surroundings. Photo by Michael Lüth, with permission.
Cation Competition So how does competition between cations happen?
Divalent cations such as Ca++ and Mg++ require two binding sites. When there are many of these ions in the environment, they compete for binding sites, occupying two of them in paired sites. Other ions that require two sites then have more difficulty finding the pair of sites they need to bind.
Because plants have a finite number of exchange sites, ions must compete with each other for those locations. Thus, if one cation is in excess, it can cause cellular deficiency of other cations that are unable to gain access to these exchange sites. Based on their experiments with Hylocomium splendens (Figure 19) and Sphagnum, using artificial precipitation, Gjengedal and Steinnes (1990) considered that cations such as Na+ and Mg++ in the precipitation may occupy exchange sites and affect the uptake of other ions by this competition. They found that uptake of Zn and Cd were pH dependent and that increasing temperatures increased the uptake for all four of the metals tested (Ca, Cu, Pb, Zn).
Figure 19. Hylocomium splendens, a species in which
cations such as Na+ and Mg++ in the precipitation may occupy exchange sites and affect uptake of nutrient cations. Photo by Michael Lüth, with permission.
Figure 20. Calliergonella cuspidata, a species whose
growth is inhibited at high Ca concentrations. Photo by Michael Lüth, with permission.
Complexing reactions with anions such as Cl- may also interfere with uptake. When Bates and Farmer (1990) applied CaCl2 to three bryophytes, their responses varied by habitat. Pseudoscleropodium purum (Figure 14) and
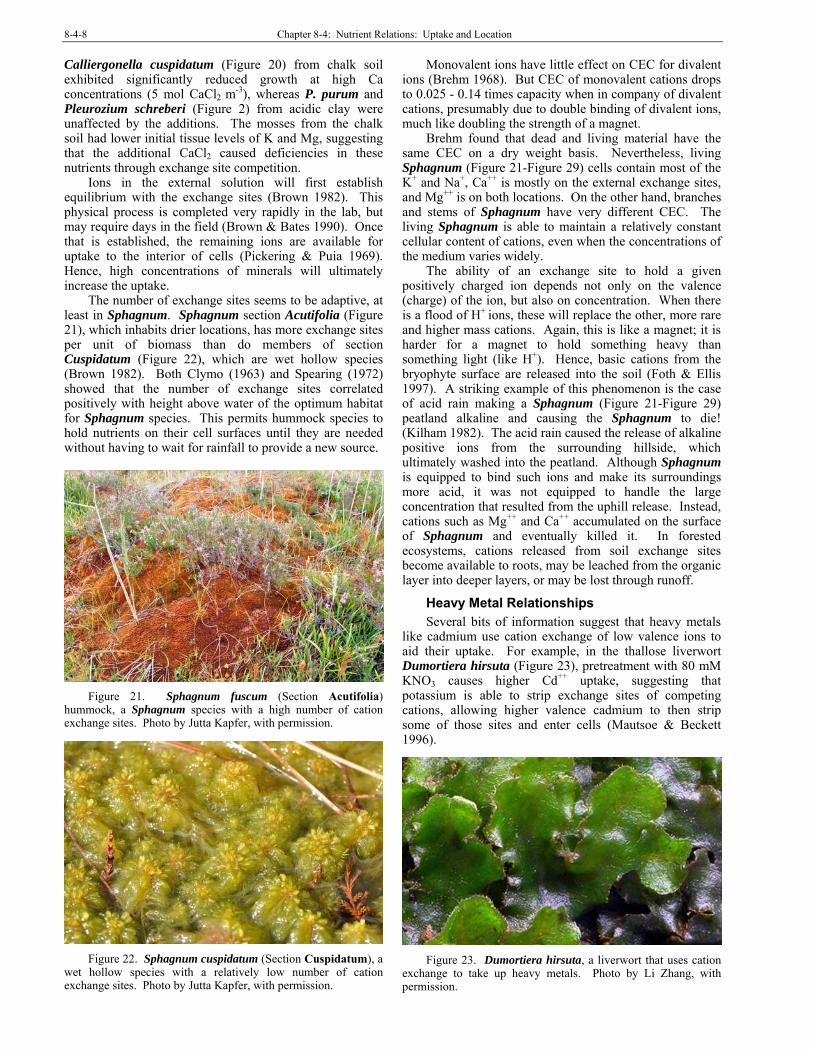
8-4-8 Chapter 8-4: Nutrient Relations: Uptake and Location
Calliergonella cuspidatum (Figure 20) from chalk soil exhibited significantly reduced growth at high Ca concentrations (5 mol CaCl2 m
-3), whereas P. purum and Pleurozium schreberi (Figure 2) from acidic clay were unaffected by the additions. The mosses from the chalk soil had lower initial tissue levels of K and Mg, suggesting that the additional CaCl2 caused deficiencies in these nutrients through exchange site competition.
Ions in the external solution will first establish equilibrium with the exchange sites (Brown 1982). This physical process is completed very rapidly in the lab, but may require days in the field (Brown & Bates 1990). Once that is established, the remaining ions are available for uptake to the interior of cells (Pickering & Puia 1969). Hence, high concentrations of minerals will ultimately increase the uptake.
The number of exchange sites seems to be adaptive, at least in Sphagnum. Sphagnum section Acutifolia (Figure 21), which inhabits drier locations, has more exchange sites per unit of biomass than do members of section Cuspidatum (Figure 22), which are wet hollow species (Brown 1982). Both Clymo (1963) and Spearing (1972) showed that the number of exchange sites correlated positively with height above water of the optimum habitat for Sphagnum species. This permits hummock species to hold nutrients on their cell surfaces until they are needed without having to wait for rainfall to provide a new source.
Figure 21. Sphagnum fuscum (Section Acutifolia)
hummock, a Sphagnum species with a high number of cation exchange sites. Photo by Jutta Kapfer, with permission.
Figure 22. Sphagnum cuspidatum (Section Cuspidatum), a
wet hollow species with a relatively low number of cation exchange sites. Photo by Jutta Kapfer, with permission.
Monovalent ions have little effect on CEC for divalent ions (Brehm 1968). But CEC of monovalent cations drops to 0.025 - 0.14 times capacity when in company of divalent cations, presumably due to double binding of divalent ions, much like doubling the strength of a magnet.
Brehm found that dead and living material have the same CEC on a dry weight basis. Nevertheless, living Sphagnum (Figure 21-Figure 29) cells contain most of the K+ and Na+, Ca++ is mostly on the external exchange sites, and Mg++ is on both locations. On the other hand, branches and stems of Sphagnum have very different CEC. The living Sphagnum is able to maintain a relatively constant cellular content of cations, even when the concentrations of the medium varies widely.
The ability of an exchange site to hold a given positively charged ion depends not only on the valence (charge) of the ion, but also on concentration. When there is a flood of H+ ions, these will replace the other, more rare and higher mass cations. Again, this is like a magnet; it is harder for a magnet to hold something heavy than something light (like H+). Hence, basic cations from the bryophyte surface are released into the soil (Foth & Ellis 1997). A striking example of this phenomenon is the case of acid rain making a Sphagnum (Figure 21-Figure 29) peatland alkaline and causing the Sphagnum to die! (Kilham 1982). The acid rain caused the release of alkaline positive ions from the surrounding hillside, which ultimately washed into the peatland. Although Sphagnum is equipped to bind such ions and make its surroundings more acid, it was not equipped to handle the large concentration that resulted from the uphill release. Instead, cations such as Mg++ and Ca++ accumulated on the surface of Sphagnum and eventually killed it. In forested ecosystems, cations released from soil exchange sites become available to roots, may be leached from the organic layer into deeper layers, or may be lost through runoff.
Heavy Metal Relationships Several bits of information suggest that heavy metals
like cadmium use cation exchange of low valence ions to aid their uptake. For example, in the thallose liverwort Dumortiera hirsuta (Figure 23), pretreatment with 80 mM KNO3 causes higher Cd++ uptake, suggesting that potassium is able to strip exchange sites of competing cations, allowing higher valence cadmium to then strip some of those sites and enter cells (Mautsoe & Beckett 1996).
Figure 23. Dumortiera hirsuta, a liverwort that uses cation
exchange to take up heavy metals. Photo by Li Zhang, with permission.

Chapter 8-4: Nutrient Relations: Uptake and Location 8-4-9
The heavy metals, in turn, influence uptake of potassium and magnesium – two essential nutrients (Carballeira et al. 1999). The researchers suggested that loss of K, a very soluble nutrient, from the cells might be due to the effect of the heavy metals on the cell membranes, changing their permeability. The cation Mg++ was most likely displaced from the cation binding sites by the heavy metals.
In one experiment, three aquatic bryophytes were exposed for 60 minutes to solutions of 0, 1, 10, 50, 100, and 200 ppm each of Cd, Co, Cu, Ni, Pb, and Zn (Carballeira et al. 1999). Locations of these metals plus K and Mg were determined. Most metals remained on extracellular locations, rather than intracellular. On the other hand, only negligible amounts appeared in the particulate fraction. The relationship between water concentration and extracellular concentration could be modelled with a Michaelis-Menten equation:
d[P] V [S] max v = ―― = ――― dt KM +[S] v = reaction rate [S] = concentration of substrate S P = product t = time Vmax = max rate achieved at saturating substrate
concentration KM = substrate concentration at which reaction rate is half
of Vmax
d [P]/dt = change in product per change in time
But the three aquatic species in this study by Carballeira et al. (1999) differed markedly. In Scapania undulata (Figure 24-Figure 25), the extracellular cation-binding sites demonstrated high metal affinity. On the other hand, Fissidens polyphyllus (Figure 26) has relatively low affinity. Nevertheless, F. polyphyllus had the highest internal concentrations of these metals at the end of the experiment. The uptake priorities were the same for all three species.
In these aquatic bryophytes, Fontinalis antipyretica (Figure 27), Scapania undulata (Figure 24-Figure 25), and Fissidens polyphyllus (Figure 26), the extracellular compartment held more metals than did the intracellular compartment (Vázquez Castro et al. 1999). The extracellular cation-binding sites of S. undulata had a high metal affinity, whereas it was relatively low in F. polyphyllus. On the other hand, F. polyphyllus after the incubation in the metal solutions had the highest intracellular metal contents. All three species had the same ranking of metal uptake.
Uptake of heavy metals in these aquatic bryophytes led to considerable losses of intracellular K (probably due to effects on plasma membrane properties) (Carballeira et al. 1999). Similarly, Mg++ cellular contents decreased, but it was apparently due to competition by the metals on the binding sites, limiting uptake. Species differences were again interesting. Scapania undulata (Figure 24-Figure 25) exhibited the highest losses of K from internal cell sites, followed by Fontinalis antipyretica (Figure 27). On the other hand, S. undulata had the lowest losses of Mg from its extracellular exchange sites. These experiments help to explain competition among nutrients and locations in the short term, but long-term effects could be different, as seen in Chapter 8-3 on nitrogen.
Figure 24. Scapania undulata in its stream edge habitat.
Photo by Michael Lüth, with permission.
Figure 25. Scapania undulata, a species with high metal
affinity on its cation exchange sites. Photo by Hermann Schachner, through Creative Commons.
Figure 26. Fissidens polyphyllus, a species with low affinity
for heavy metals. Photo by Janice Glime.

8-4-10 Chapter 8-4: Nutrient Relations: Uptake and Location
Figure 27. Fontinalis antipyretica, a species that loses
potassium and magnesium when exposed to heavy metals. Photo by Bernd Haynold, through Wikimedia Commons.
Much of what we know about uptake of minerals into plants comes from studies on these heavy metal pollutants. Cadmium, a common pollutant in areas with agricultural fertilizers and other human uses, moves from extracellular sites of the bryophytes to intracellular sites. In Rhytidiadelphus squarrosus (Figure 28) cadmium altered photosynthetic rates (Wells & Brown 1987). Its activity at the plasmalemma (cell membrane) may exercise control over other ions, affecting their accumulation within the cell, and vice versa.
Figure 28. Rhytidiadelphus squarrosus, a species that has
an altered photosynthetic rate in the presence of cadmium. Photo by Michael Lüth, with permission.
Differing Affinities
Breuer and Melzer (1990a) contributed to the explanation of ion competition using Sphagnum (Figure 21-Figure 29) from a high moor. They found that when two or more ions are present, there is an order to the binding success: Pb++>Cd++≥Ca++>Mg++>K+>Na+≥NH4
+. Hence, those with higher binding affinities were able to suppress the binding of the lower affinity ions.
Breuer and Melzer (1990b) commented that Sphagnum (Figure 21-Figure 29) "shows behaviour of a relatively ideal ion exchanger." And, while species differ in their capacity, the coefficients of selectivity are independent of species. These bound cations can readily be displaced if another cation is present at a higher concentration, has a larger hydrated atomic radius, or has a higher valency (Bates 2000).
In Sphagnum (Figure 21-Figure 29) Hájek and Adamec (2009) found the exchangeable cation content decreased in the order of Ca++ ≥ K+, Na+, Mg++ > Al+++ > NH4
+, whereas the intracellular element content demonstrated the order of N > K > Na, Mg, P, Ca, Al. While Ca occurred primarily on exchange sites, Mg, Na, and especially K, Al, and N occurred inside the cells. Vertical position in the bog influenced the nutrient uptake and location. Hummock species have a higher cation exchange capacity (CEC) and accumulate more exchangeable Ca++. By contrast, the hollow species have a lower CEC and accumulate more exchangeable Na+, especially among the lower dead shoot segments. Intracellular N and P were consistently lower in the dead portions, indicating their translocation to growing upper portions. Sphagnum magellanicum (Figure 29) has about 40% lower N content in its cells compared to other species, suggesting its inability to compete for N. This can cause it to lose competition to other species (Hájek & Adamec 2009), but its drought tolerance aids it in occupying tops of hummocks (Li et al. 1992). This leaves us wondering why it has such a low N content.
Figure 29. Sphagnum magellanicum, a species with low N
content. Photo by Michael Lüth, with permission.
Rühling and Tyler (1970) demonstrated the order of binding affinity of several heavy metal cations using Hylocomium splendens (Figure 19): Cu Pb > Ni > Co > Zn Mn. In a two-hour experiment, these heavier cations preferentially bound to the exchange sites even when lighter cations of Ca++, K+, Mg++, and Na+ were present in high concentrations. However, this sequence changed when the elements were supplied individually. Other researchers also demonstrated differences from this sequence in Rhytidiadelphus squarrosus (Figure 28) (Brown & Beckett 1985), Brachythecium rutabulum (Figure 7) (Brown & Buck 1978), and Pohlia nutans (Figure 30) (Webster 1985). These differences may relate to damage by some of the elements, such as cell membrane damage by mercury in some of the experiments,
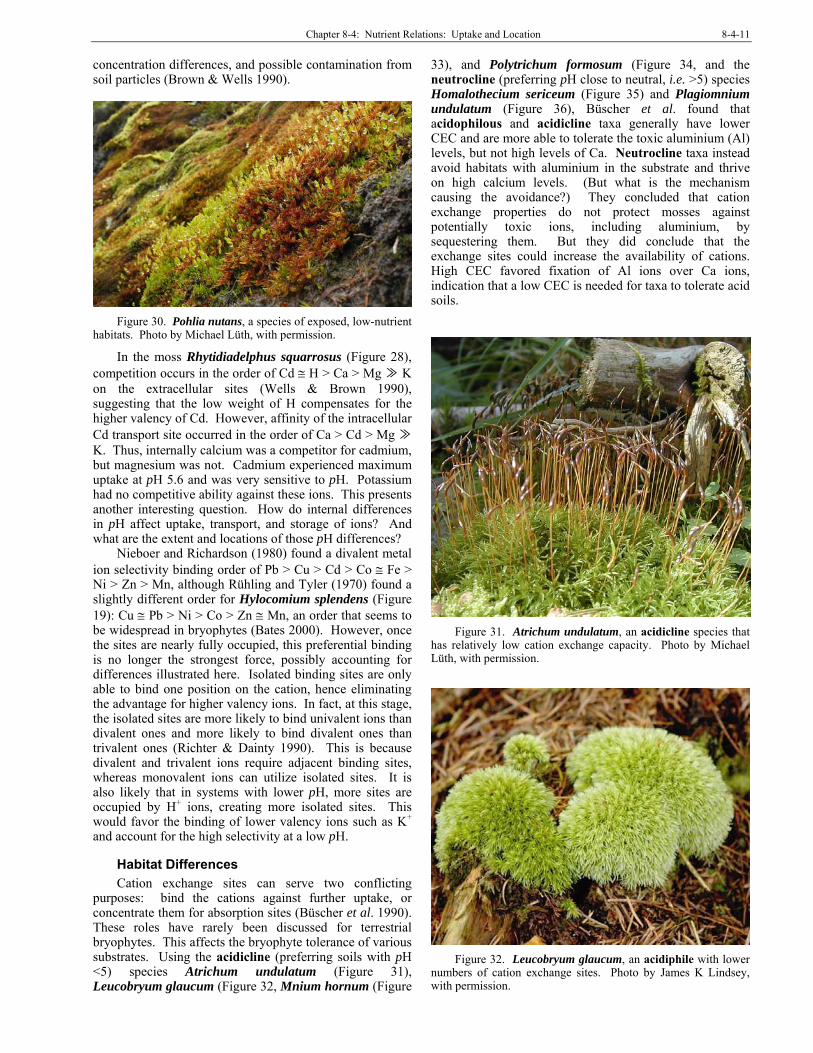
Chapter 8-4: Nutrient Relations: Uptake and Location 8-4-11
concentration differences, and possible contamination from soil particles (Brown & Wells 1990).
Figure 30. Pohlia nutans, a species of exposed, low-nutrient
habitats. Photo by Michael Lüth, with permission.
In the moss Rhytidiadelphus squarrosus (Figure 28), competition occurs in the order of Cd H > Ca > Mg ≫ K on the extracellular sites (Wells & Brown 1990), suggesting that the low weight of H compensates for the higher valency of Cd. However, affinity of the intracellular Cd transport site occurred in the order of Ca > Cd > Mg ≫ K. Thus, internally calcium was a competitor for cadmium, but magnesium was not. Cadmium experienced maximum uptake at pH 5.6 and was very sensitive to pH. Potassium had no competitive ability against these ions. This presents another interesting question. How do internal differences in pH affect uptake, transport, and storage of ions? And what are the extent and locations of those pH differences?
Nieboer and Richardson (1980) found a divalent metal ion selectivity binding order of Pb > Cu > Cd > Co Fe > Ni > Zn > Mn, although Rühling and Tyler (1970) found a slightly different order for Hylocomium splendens (Figure 19): Cu Pb > Ni > Co > Zn Mn, an order that seems to be widespread in bryophytes (Bates 2000). However, once the sites are nearly fully occupied, this preferential binding is no longer the strongest force, possibly accounting for differences illustrated here. Isolated binding sites are only able to bind one position on the cation, hence eliminating the advantage for higher valency ions. In fact, at this stage, the isolated sites are more likely to bind univalent ions than divalent ones and more likely to bind divalent ones than trivalent ones (Richter & Dainty 1990). This is because divalent and trivalent ions require adjacent binding sites, whereas monovalent ions can utilize isolated sites. It is also likely that in systems with lower pH, more sites are occupied by H+ ions, creating more isolated sites. This would favor the binding of lower valency ions such as K+
and account for the high selectivity at a low pH.
Habitat Differences Cation exchange sites can serve two conflicting
purposes: bind the cations against further uptake, or concentrate them for absorption sites (Büscher et al. 1990). These roles have rarely been discussed for terrestrial bryophytes. This affects the bryophyte tolerance of various substrates. Using the acidicline (preferring soils with pH <5) species Atrichum undulatum (Figure 31), Leucobryum glaucum (Figure 32, Mnium hornum (Figure
33), and Polytrichum formosum (Figure 34, and the neutrocline (preferring pH close to neutral, i.e. >5) species Homalothecium sericeum (Figure 35) and Plagiomnium undulatum (Figure 36), Büscher et al. found that acidophilous and acidicline taxa generally have lower CEC and are more able to tolerate the toxic aluminium (Al) levels, but not high levels of Ca. Neutrocline taxa instead avoid habitats with aluminium in the substrate and thrive on high calcium levels. (But what is the mechanism causing the avoidance?) They concluded that cation exchange properties do not protect mosses against potentially toxic ions, including aluminium, by sequestering them. But they did conclude that the exchange sites could increase the availability of cations. High CEC favored fixation of Al ions over Ca ions, indication that a low CEC is needed for taxa to tolerate acid soils.
Figure 31. Atrichum undulatum, an acidicline species that
has relatively low cation exchange capacity. Photo by Michael Lüth, with permission.
Figure 32. Leucobryum glaucum, an acidiphile with lower
numbers of cation exchange sites. Photo by James K Lindsey, with permission.

8-4-12 Chapter 8-4: Nutrient Relations: Uptake and Location
Figure 33. Mnium hornum, an acidiphile with lower
numbers of cation exchange sites. Photo by Tim Waters, through Creative Commons.
Figure 34. Polytrichum formosum, an acidiphile with lower
numbers of cation exchange sites. Photo by Michael Lüth, with permission.
Figure 35. Homalothecium sericeum, a neutricline species
with higher numbers of cation exchange sites. Photo by Michael Lüth, with permission.
Bates (1992) found that in epilithic and woodland soils the cation exchange capacity decreases with decreasing Ca content, and likewise with decreasing pH of the substrate. This change might help to protect the bryophytes against the toxic aluminium that increases in concentration in acidic solutions, e.g. soils polluted by acid rain.
Figure 36. Plagiomnium undulatum, a neutricline species
with higher numbers of cation exchange sites. Photo by Michael Lüth, with permission.
Calcareous rocks, inhabited by calcicoles (Ca-preferring species), typically have Ca++ concentrations 16-17 times that found in species from non-calcareous rocks (calcifuges – species avoiding Ca) (Bates 1982a). The calcicoles exhibit 3-4 times as many cation exchange sites as the calcifuges. Bates suggested that the calcicole mosses may require greater Ca++ concentrations to maintain cell membrane integrity.
Uptake Rate Uptake of these nutrients is very rapid when
concentrations are high. Half the maximum extracellular uptake can be achieved in 4.45+1.03 minutes in 100 μmol L-1 Cd (Brown & Beckett 1985). This rate is concentration dependent and at lower (more natural) concentration levels it can take several days to reach equilibrium (Mouvet 1987). Release of the cations from the exchange sites when the element is removed from the medium takes even longer, as shown in the aquatic liverwort Chiloscyphus polyanthos (Figure 37-Figure 38) (Maurel-Kermarrec et al. 1985). The uptake ability varies between clones that grow within meters of each other (Wells & Brown 1987; Wells 1988). This can result from differences in light/moisture availability in the open vs under shrubs, as demonstrated in Rhytidiadelphus squarrosus (Figure 28) (Wells & Brown 1987). This difference could have been caused by thicker cell walls in the higher light population of R. squarrosus.
Figure 37. Chiloscyphus polyanthos in a typical habitat.
Photo from <www.aphotofauna.com>, with permission.

Chapter 8-4: Nutrient Relations: Uptake and Location 8-4-13
Figure 38. Chiloscyphus polyanthos, a leafy liverwort with
cation exchange. Photo by Michael Lüth, with permission.
In summary, nutrient uptake into the moss is initially dependent on available exchange sites, but then it depends on affinity of a particular nutrient for appropriate transport sites of cell membranes, presence of competing elements, and turnover rate of the uptake site (Brown & Bates 1990), and perhaps cell wall thickness (Wells & Brown 1987).
Desiccation and Loss Brown and Brumelis (1996) found that desiccation and
duration of drought affected cellular location of elements in Hylocomium splendens (Figure 19), a boreal forest floor species. Rehydration partially reversed these effects.
When bryophytes become desiccated, nutrients leave the cells through leaky membranes (Bewley 1979). But Bates (1997) has shown that in Brachythecium rutabulum (Figure 7) and Pseudoscleropodium purum (Figure 14), leaked K+ ions are able to remain on leaf surfaces (Figure 14), held there on exchange sites, and are re-absorbed upon hydration. Like tracheophyte roots, bryophytes utilize cation exchange sites to hold nutrients at their surfaces until those nutrients are moved into the plant.
Anion Uptake Bryophytes also have exchange sites for anions
(negatively charged ions), but these are far less abundant and likewise their role is less well understood (Clymo 1963). Even now, little is known about anion uptake. Wells and Richardson (1985) found that only living shoots of Hylocomium splendens (Figure 19) were able to accumulate arsenate and selenite, both anions. Arsenate uptake is inhibited by phosphate (anion) competition when both are supplied at the same time. On the other hand, if plants were incubated in phosphate before providing arsenate and selenite, it had no effect on their uptake. It appears that arsenate and selenite are accumulated by separate transport systems in this species and that these systems may be the ones responsible for phosphate uptake. pH was important, with arsenate uptake optima occurring between 3 and 5, whereas selenate was optimal at pH 3.
Polytrichum commune (Figure 4) has a well-developed conducting system and was the only bryophyte one study that had more uptake in brown portions than in green ones (Chapin et al. 1987). Sphagnum species were the only ones with significant P uptake in the current growth. But in seeming contradiction, the anionic form of N (nitrate) was preferred by Sphagnum over the cationic
ammonium source of N (Rudolph et al. 1982). This preference likewise contradicts the results of Wanek and Pörtl (2008) who concluded that Sphagnum (Figure 21-Figure 29) prefers ammonium because of its numerous cation exchange sites. But it does coincide with the inhibition of nitrogen reductase by ammonium (Syrett & Morris 1963; Orebamjo & Stewart 1975). Furthermore, Wanek and Pörtl (2008) found that amino acids contributed a significant fraction of the N used by Sphagnum from the lowland rainforest in Puerto Rico
Brown (1982) suggested that anion adsorption is probably especially low in mosses because they have low iron and aluminium content and high cation exchange capacity Clymo 1963; Chapin et al. 1987). Phosphorus, as the phosphate anion, is taken up primarily from the mineral substrate (Bates 1992). Chapin et al. (1987) concluded that accumulation of the phosphate anion, as they observed in mosses of the Alaskan black spruce (Picea mariana, Figure 3) forest, was therefore by active absorption similar to that of higher plants. In these forests, mosses hold 17% of the phosphorus pool, despite accounting for 75% of the annual P accumulation. The mosses have a greater ability to absorb phosphate than do fine roots of the black spruce.
Proton Pumps After ions have reached the surface of the cell, they
require energy to enter the cell. In tracheophytes, the proton pump is well known in such activities as bringing nutrients into root hairs, opening and closing guard cells, closure of the Venus flytrap, and growth, to name only a few. In bryophytes, the proton pump has likewise been demonstrated, and like that of tracheophytes, it uses ATP to "pump" H+ ions out of a cell (Figure 39). This leaves the cell with a negative charge that attracts cations into the cell (Raven et al. 1998). The resulting negative charge provides the force needed to bring in K+, NH4
+, Mg++, Ca++, sugars, and amino acids, and probably other cations that have not yet been confirmed experimentally.
Cotransport
As a positively charged ion enters the cell, it typically brings along an associated anion by cotransport. The pump, at the same time, regulates the pH within the cell to about 7.3-7.6. In bryophytes, the leaf cell surface and interstitial spaces between the cells provide sites where adhering cations are able to enter the cell through the proton pump mechanism.
Figure 39. Known transport processes through the
plasmalemma of a bryophyte cell. Diagram based on Raven et al. 1998.

8-4-14 Chapter 8-4: Nutrient Relations: Uptake and Location
As a result of ion movement through CEC and the proton pump, the bryophyte most likely has an influence on the rhizoidosphere (soil space immediately surrounding rhizoids) similar to that of tracheophytes on the rhizosphere (Raven et al 1998), although in the case of bryophytes, leaves may contribute to the alteration of conditions even more than the rhizoids. The rhizoidosphere is acidified in the process of cation exchange and proton pumping to bring nutrient cations into the cells, creating positive charges within the cells and accumulating organic anions in the cell vacuoles.
Pinocytosis
Pinocytosis results when a cell ingests a liquid by budding small vesicles inward from the cell membrane, thus containing the droplet. The droplet of liquid then is incorporated into the cell cytoplasm. Gullvåg et al. (1974) observed this mechanism in Rhytidiadelphus squarrosus (Figure 28) when it was treated with lead-rich particles in the lab. When they tested mosses that were exposed to lead pollution in the field, they found that the lead was bound within the nucleus. The importance of pinocytosis for incorporating nutrients into the cells of bryophytes seems to lack study.
Nanoparticles
The concept of nanoparticles is a relatively new idea in bryophyte ecology. Canivet et al. (2014) found, for the first time, that nanoparticles of iron in a mineral water suspension could penetrate the leaves of the moss Physcomitrella patens (Figure 40). In follow-up experiments Canivet et al. (2015) further demonstrated the penetration of iron nanoparticles into the moss Physcomitrella patens. Using concentrations of 5 ng, 50 ng, 500 ng, 5 µg, and 50 µg per plant, they found no effect on ATP concentrations, reactive oxygen species, malondialdehyde, or glutathione, suggesting that the plants had not been physiologically harmed at any of these concentrations. The role of nanoparticles in providing essential nutrients or harming the plants seems to thus far lack exploration.
Figure 40. Physcomitrella patens, a moss that can take up
nanoparticles of iron. Photo by Michael Lüth, with permission
Influence of Cellular Structures Many studies have treated cellular influences as if the
cells were homogeneous (Brown & Wells 1990). First, the nutrient must cross the cell membrane But in fact, once inside the cell, the nutrient may be held in solution, like K, or bound into amino acids and proteins, like some of the N and P. The chlorophyll molecule can take Mg out of play. When these binding compounds take the nutrient out of solution, they affect the concentration gradient from outside to inside the cell, affecting the concentration gradient used for the nutrient to cross the cell membrane and enter the cell. Others are bound to intracellular binding sites, again altering uptake rate.
Pickering and Puia (1969) described three phases of element uptake against time, an "unusual" process compared to that in algae and tracheophytes (Brown & Wells 1990). The first phase is the initial rapid uptake as the ions diffuse into interstitial spaces in the tissues (Pickering & Puia 1969). Then the uptake is controlled by equilibration with cell wall exchange sites. The final phase is a slow, linear increase of intracellular uptake. This third phase does not occur in dead material. As demonstrated in Rhytidiadelphus squarrosus (Figure 28), carriers can be used to transport the element across the membrane (Brown & Beckett 1985; Wells & Brown 1987). Specificity of these carriers determines how much inter-element competition there is for the intracellular uptake. This in turn affects the rate of uptake.
Location Is Important As already noted, location of nutrients on and in the
bryophytes is important (Brown and Buck (1985). The method used can present a bias that is misleading regarding normal nutrient concentrations. A nutrient adhering to the cell wall is not immediately available to the cells and may not be representative of the needs of the cells. Others may be held in the spaces within the walls. To fully understand the nutrient physiology, we must understand where these nutrients are located on and in the bryophyte plants (see Table 2).
Table 2. Element locations in bryophytes. Based on Brown 1982.
in particles trapped by leaves in solution on exterior & in matrix of cell wall as ions bound to external exchange or chelating sites
& on plasma membranes in solution in cytoplasm & vacuoles as insoluble substances in cytoplasm & vacuoles in leptome (especially Polytrichaceae)
New Growth When new branches are formed and expand in the
absence of additional nutrients, these nutrients must be obtained from existing tissues. In some cases, this is through acropetal (base to tip) transfer, as seen in Rhytidiadelphus squarrosus (Figure 28) (Wells 1988). Potassium, a very soluble nutrient, declines in lower portions as the apex grows. Calcium, on the other hand, is

Chapter 8-4: Nutrient Relations: Uptake and Location 8-4-15
not soluble and is taken from the initial apical segment, not transported from older tissues. Magnesium exhibited a somewhat similar response, but all segments lost Mg from intracellular sites as the apex grew.
Specificity Some nutrients are taken up more easily than others.
Leblond (2004) examined the uptake of heavy metals in the moss Pseudoscleropodium purum (Figure 14). The nutrient elements manganese and potassium had the highest retention. Non-nutrient ions of sodium, aluminium, and silica had the least retention. Youngest tissues accumulated the most nutrients, but internal redistribution occurred. Leblond found that soluble materials were taken in more easily than those deposited as particulates.
We know that cation exchange sites selectively bind higher valency cations (Richter & Dainty 1990). But at least in Sphagnum russowii (Figure 41-Figure 43) there are two classes of exchange sites. The well-known one is associated with polygalacturonic acids and accounts for more than 50% of the cation exchange capacity (Richter & Dainty 1989). In addition to that, phenolic acids account for about 25%, whereas amino acid, sulfate ester, and silicate deposits in the cell wall contribute to a lesser degree.
Figure 41. Sphagnum russowii, a species with both
polygalacturonic acid and phenolic acid exchange sites. Photo by Ralf Wagner <www.dr-ralf-wagner.de>, with permission.
Figure 42. Sphagnum russowii leaf cells showing the
exposed surface area of the hyaline cells (longer, wider cells with cross bars here). Photo by Ralf Wagner <www.dr-ralf-wagner.de>, with permission.
Figure 43. Sphagnum russowii leaf cells in cross section
showing the exposed surface area of the much larger hyaline cells where cation exchange can occur on both inside and outside of the cell. Photo by Ralf Wagner <www.dr-ralf-wagner.de>, with permission.
When studying aquatic bryophytes, Burton and Peterson (1979) found that 33% of the cell-wall-bound Zn could be removed by the enzyme pronase (mix of enzymes that break down proteins), suggesting that a considerable portion of its binding might be due to protein binding. Richter and Dainty (1989) found a small number of binding sites that are more specific to small valency cations such as potassium. If these sites include phenolic compounds, one can presume that such binding sites might be widespread in bryophytes, wherein phenolic compounds are common (Mues & Zinmeister 1988; Liao 1993; Basile et al. 1999). Is this yet another use for these presumed "secondary" compounds? If so, what does it mean for cycling of potassium if it can be bound to the cell walls? Does this help the plant to retain its valuable potassium when cell membranes, damaged by desiccation, permit potassium to leak from the cell? Such a mechanism could contribute to the survival of bryophytes after desiccation and permit them to become a long-term sink for this and other ions.
We know that cation exchange is a somewhat selective process. Higher valency ions are bound preferentially over lower ones because they occupy more than one exchange site. Cations have binding preferences (Nieboer & Richardson 1980, 1981). Class A includes K, Ca, Mg, and S. These elements prefer oxygen-rich ligands, such as carboxylic groups. Class B elements such as Ag, Cu, H, Hg, Pb, and Au are toxic and prefer ligands that are rich in sulfur and nitrogen. The third group is a borderline class that includes Cu++, Ni++, Pb++, and Zn++. Hence, the quantity of any element bound to the cell wall will depend on concentration in the medium (precipitation, water, soil), its affinity for type of exchange site, and the total number of suitable exchange sites.
Dead cells may actually have more exchange sites than live ones due to shrinkage of cell membranes that cover them on the inside. On the other hand, Wells (1988) found that when the cells are killed by a strong acid, the exchange capacity decreases, a phenomenon he attributed to loss of cytoplasm.
Hence, the quantity of any element bound to the cell wall will depend on concentration in the medium (precipitation, water, soil), its affinity for type of exchange site, and the total number of suitable exchange sites. Dead cells may actually have more exchange sites than live ones due to shrinkage of cell membranes that cover them on the inside. On the other hand, Wells (1988) found that when

8-4-16 Chapter 8-4: Nutrient Relations: Uptake and Location
the cells are killed by a strong acid, the exchange capacity decreases, a phenomenon he attributed to loss of cytoplasm.
Fortunately, bryophytes seem to have uptake specificity for things they need over things they do not. For example, the thallose liverwort Dumortiera hirsuta (Figure 23) preferentially took up Ca, Mg, and Zn over Cd (Mautsoe & Beckett 1996). When KNO3 was used to pretreat the plants, Cd uptake occurred, suggesting that the high concentration of K+ removed the competing ions from the exchange sites and they were subsequently replaced by Cd. Light and increased temperatures also stimulated Cd uptake. Even Sphagnum (Figure 21-Figure 29, Figure 41-Figure 44), the champion of cation exchangers, distinguishes among ions in ways that do not seem to depend strictly on valence. It accumulates Al and Mn, but excludes Cu and Zn, accumulating much less of these than the concentrations in the surrounding fen water (Li & Glime 1990).
Shimwell and Laurie (1972) found that ectohydric and mixohydric mosses differ in their absorption, retention, and excretion of heavy metals. During droughts, ectohydric (having external conduction) mosses excrete such heavy metals as Zn and Pb, forming surface crusts containing up to 6% Pb and 1-5% Zn. In mixohydric (having both external and internal conduction) mosses, on the other hand, the metals generally are located at the base of the moss carpet in the older growth, suggesting their accumulation in older tissues and lack of internal transport.
Seasons Since most bryophytes gain most of their nutrients
from precipitation, we might assume that most nutrient uptake therefore occurs when it rains. Yet the relationship is most likely not so simple. Francez and Loiseau (1999) found that Sphagnum fallax (Figure 44) was more efficient at intercepting applied N (as NH4NO3) in August than in June, even though August had the lowest rainfall. Dust accumulation can benefit bryophytes that are able to absorb nutrients in early morning dew and even on humid nights when there is no benefit for tracheophytes.
Figure 44. Sphagnum fallax, a species that takes up more N
in August than in June. Photo by Michael Lüth, with permission.
Bates (1992) considered that in rapidly growing species such as Brachythecium rutabulum (Figure 7) the
seasonal deposition of tracheophyte litter is especially important. In the slower-growing species such as Pseudoscleropodium purum (Figure 14), wet deposition may be the most important.
Turner and coworkers (2003) found that rates of acid phosphatase activity in moss apices differed markedly among species, but most taxa had the most activity in winter and least in summer. Nevertheless, tissues maintained relatively constant N and P concentrations throughout the year. A negative correlation between phosphatase activity and P concentration in the tissues suggests that the enzyme may become active in response to phosphorus needs and serves to indicate nutrient stress.
Núñez-Olivera et al. (2001) found that seasonal differences in several aquatic bryophytes [Fontinalis antipyretica (Figure 27), F. squamosa (Figure 45, Jungermannia eucordifolia (Figure 46), and Pellia endiviifolia (Figure 47)] did not mimic the seasonal differences in their native streams. Rather, the concentrations depended on the interactions of internal and external factors. The elements that had the most persistent annual cycle were mostly essential nutrients: N, P, and Fe, plus the non-essential Na. The lowest concentrations occurred in spring and the highest in autumn. Concentrations were lowest during periods of growth.
Figure 45. Fontinalis squamosa in alpine water. Photo
from <www.aphotofauna.com>, with permission.
Figure 46. Jungermannia eucordifolia, a species for which
internal nutrient concentrations do not mimic those of its stream habitat. Photo by Jan-Peter Frahm, with permission.

Chapter 8-4: Nutrient Relations: Uptake and Location 8-4-17
Figure 47. Pellia endiviifolia, a species for which internal
nutrient concentrations do not mimic the seasonal changes of its habitat. Photo by Janice Glime.
Glucose Uptake External glucose can enhance growth of at least some
bryophytes (Jennings 1918). Ceratodon purpureus (Figure 48) grew 4-5 times as much when provided with glucose on nutrient agar compared to nutrient agar without glucose. This implies that organic sources of carbon that may be available in the substrate are suitable carbon sources for at least some mosses. Vujičić et al. (2009) found that the best conditions for axenic culture of the moss Dicranum scoparium (Figure 49) was in MS medium enriched with sucrose at 1.5% at 18-20°C.
Figure 48. Ceratodon purpureus, a species that grows faster
when external glucose is supplied. Photo by Michael Lüth, with permission.
Bryophytes can store their carbohydrates as sucrose and fructan, as exhibited in Porella platyphylla (Figure 50) and Sphagnum flexuosum (Figure 51-Figure 52) (Marschall 2010). Galloway and Black (1989) demonstrated that the bryophytes they tested have the necessary enzymes for sucrose to enter cellular metabolism by the sucrose synthase pathway. Adding glucose, fructose, and sucrose to the medium causes these bryophytes to down-regulate photosynthesis when the bryophytes are kept either in the dark or in the light (Marschall 2010). On the other hand, when no
carbohydrates were added, darkness had little influence on total carbohydrates, suggesting that they maintain a well-regulated carbohydrate pool.
Figure 49. Dicranum scoparium on forest floor, a species
that seems to benefit from added sucrose in culture. Photo by Janice Glime.
Figure 50. Porella platyphylla, a species that stores
carbohydrates as sucrose and fructan, growing better when these and other sugars are added to the growth medium. Photo by Janice Glime.
Figure 51. Sphagnum flexuosum in its habitat on the forest
floor. Photo by Michael Lüth, with permission.

8-4-18 Chapter 8-4: Nutrient Relations: Uptake and Location
Figure 52. Sphagnum flexuosum, a species that stores
sucrose and fructan and down-regulates photosynthesis when sugars are available in the medium. Photo by Michael Lüth, with permission.
Sugars differ in their effects on bryophyte development (Sabovljevic et al. 2005). In Bryum argenteum (Figure 53), added sugars have a positive effect on development of the protonema and multiplication of the shoot. On the other hand, all tested sugars had a negative effect on both of these developmental stages in Atrichum undulatum (Figure 31).
Figure 53. Bryum argenteum, a species for which added
sugars have a positive effect on development. Photo from India Biodiversity Images, through Creative Commons.
Not only do bryophytes store sugars, but as we might expect as a consequence, they also release them (Coxson et al. 1992). In the tropical montane rainforest of Guadeloupe, frequent wet-dry cycles cause the epiphytic bryophytes to accumulate 950 kg ha-1 of sugars and polyols. These are released during rewetting, contributing to sugars available to other organisms in the canopy. The canopy leafy liverwort Frullania atrata (Figure 54) stored 17% of its dry biomass as sugar and polyol reserves, whereas the lower canopy species Phyllogonium fulgens (Figure 55) stored less than 6%. On the other hand, it was the lower canopy bryophytes that released the most sugars and polyols (0.9 g m-2) during rewetting, compared to 0.3 g m-2 for the upper canopy. This release yielded an estimated 122 kg ha-1 from the upper canopy. These sugars
contribute significantly to nutrient cycling by providing an energy source for the decomposer organisms.
Figure 54. Frullania atrata, a species that has 17% of its
dry biomass as sugars in the canopy of a tropical cloud forest. Photo by Juan Larrain, with permission.
Figure 55. Phyllogonium fulgens, a Neotropical species that
lives in the lower canopy and stores less than 6% of its dry biomass as sugars. Photo by Michael Lüth, with permission.
Fungal Connections – Mycorrhizae? One mode of uptake by bryophytes has largely been
ignored by ecologists until recently, potentially causing researchers to be looking in the wrong places or not all important places for bryophyte effects on ecosystem nutrient budgets. That mode is by means of mycorrhizae (fungal associations that function in transfer of nutrients to roots or rhizoids) or similar partnerships with fungi.
In 1976, Kottke and coworkers recognized that the ability of mosses to compete was affected by differential growth stimulation of the mosses by fungi. Still, little attention was paid to moss-fungal interactions from an ecosystem perspective, but bryologists began noticing that many mosses seemed to have fungal hyphae associated with their underground parts. Meanwhile, the tree physiologists were recognizing that fungal partners were critical to the nutrient and water uptake of trees. And orchid growers recognized that the native fungi must be kept with the orchids for successful growth. Now, fungi are recognized as essential to the nutrient uptake of tree

Chapter 8-4: Nutrient Relations: Uptake and Location 8-4-19
roots, and stories about their partnerships with roots are replacing the traditional teaching emphasis on root hair mechanisms of uptake.
Ecologists estimate that 95% of all plant species are in genera that form mycorrhizal associations (Sylvia et al. 2004). In temperate and boreal forests, up to 95% of the short roots of trees form ectomycorrhizae [form of symbiotic relationship that occurs between a fungal symbiont and the roots (or rhizoids) of various plant species]. Mycorrhizae are critically important to most forest trees, which depend on them to increase surface area and contact nutrients in a much greater volume of soil than the tree is able to reach. Bryophytes, likewise, are able to take advantage of this partnership to reach sources otherwise unavailable to them. Even in the Antarctic, such fungal relationships can be important, as in the leafy liverwort Cephaloziella exiliflora (Figure 56) (Williams et al. 1994; Chambers et al. 1999). There are also indications that nutrients are transferred from the moss mat to the tree roots through mycorrhizae (Chapin et al. 1987). But we know little of the extent of these relationships.
Figure 56. Cephaloziella exiliflora, a leafy liverwort with
fungal associations in the Antarctic. Photo by Tom Thekathyil, with permission.
Although Boros reported a unique parasitic fungus on mosses in 1926, most botanists considered the bryophytes to be almost immune from fungal attack; even less attention was paid to the possibility of any sort of fungal partnership. In 1970, Kamal and Singh reported on the rhizoidosphere fungal flora of bryophytes. In 1975, Pirozynski and Malloch offered the theory that mycorrhizae were an essential part of the invasion of land by the original bryophyte-like plants, helping them to survive in an environment that was poor in nutrients and sustained frequent periods of desiccation. But actual proof of a mycorrhizal partnership, extant or extinct, was not forthcoming.
Finally, in the 1980's, reports of bryophyte mycorrhizal (shouldn't it be mycorrhizoidal?) associations began to appear in the literature (Parke & Linderman 1980; Rabatin 1980; Pocock & Duckett 1985a; Iqbal et al. 1988a, b; Ligrone 1988). These have included associations with Funaria hygrometrica (Figure 57) (Parke & Linderman 1980; Iqbal et al. 1988a), Sphagnum palustre
(cymbifolium) (Figure 58-Figure 59), Polytrichum commune (Figure 4) (Iqbal et al. 1988a), and in Marchantia emarginata (=M. palmata, Figure 60) both rhizoids and the ventral thallus (Iqbal et al. 1988b).
Figure 57. Funaria hygrometrica protonemata and buds, as
well mature plants with capsules – a mycorrhizal species. Photo by Janice Glime.
Figure 58. Sphagnum palustre habitat. Photo by Michael
Lüth, with permission.
Figure 59. Sphagnum palustre, a species with mycorrhizal
associations. Photo by Michael Lüth, with permission.

8-4-20 Chapter 8-4: Nutrient Relations: Uptake and Location
Figure 60. Marchantia emarginata, a species with
mycorrhizal associations. Photo from Taiwan Mosses, through Creative Commons.
Ligrone and Lopes (1989) demonstrated vesicles and arbuscules ("little trees"; branched structures formed by fungi within plant cells; Figure 61) in both rhizoids and parenchyma cells of the thallose liverwort Conocephalum conicum (Figure 62), suggesting a true mycorrhizal association. The arbuscules are thought to be the site of nutrient exchange (Harrison 1999), at least in roots. Even Phaeoceros laevis (Figure 63), a member of the Anthocerotophyta and host of a Nostoc (Cyanobacteria; Figure 64-Figure 65) symbiont, has a fungal associate that appears to be mycorrhizal (Ligrone 1988). When P. laevis is infected, the plastid forms a networking structure, the vacuole mass decreases, and the organelle density increases, all modifications suggestive of a partnership.
Figure 61. Arbuscules typical of those formed in roots by
VAM fungi, but in this case within the thallus of the liverwort Marchantia foliacea. Photo by Julia Russell, with permission.
Figure 62. Thallus of Conocephalum conicum. Photo by
Janice Glime.
Figure 63. Phaeoceros laevis sporophytes, a species with
both Cyanobacteria (Nostoc) and a fungal associate. Photo by Robert Klips, with permission.
Figure 64. Colonies of Cyanobacteria (Nostoc or
Aphanothece) with mosses. Photo by Janice Glime.
Figure 65. Nostoc colonies from the hornwort Anthoceros
agrestis. Photo by Ralf Wagner <www.dr-ralf-wagner.de>, with permission.
In 1985, Pocock and Duckett (1985b) investigated the rhizoids of 206 of the 284 British liverworts. They found that swollen rhizoids occurred in 33 species of the Jungermanniales and were always associated with fungal hyphae. Swollen and branched rhizoids were particularly well developed in the Lepidoziineae (Figure 66) and Cephaloziineae (Figure 94) and often occurred on flagelliform shoots, but were better developed on the
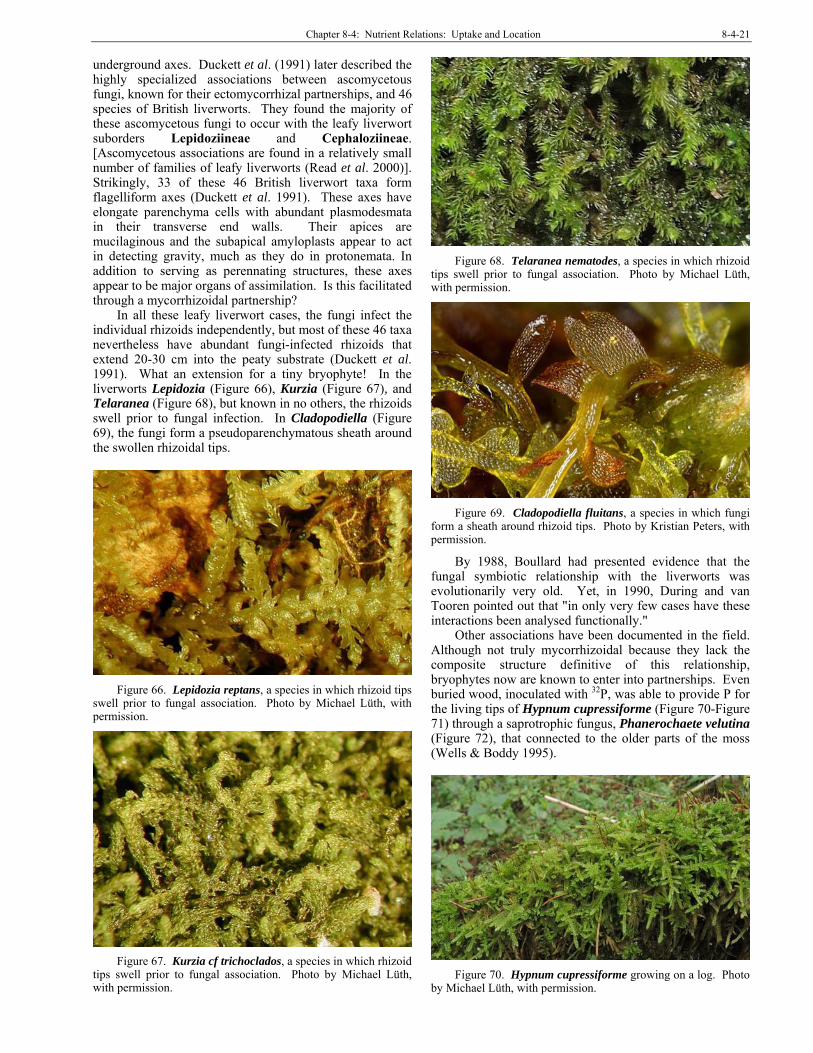
Chapter 8-4: Nutrient Relations: Uptake and Location 8-4-21
underground axes. Duckett et al. (1991) later described the highly specialized associations between ascomycetous fungi, known for their ectomycorrhizal partnerships, and 46 species of British liverworts. They found the majority of these ascomycetous fungi to occur with the leafy liverwort suborders Lepidoziineae and Cephaloziineae. [Ascomycetous associations are found in a relatively small number of families of leafy liverworts (Read et al. 2000)]. Strikingly, 33 of these 46 British liverwort taxa form flagelliform axes (Duckett et al. 1991). These axes have elongate parenchyma cells with abundant plasmodesmata in their transverse end walls. Their apices are mucilaginous and the subapical amyloplasts appear to act in detecting gravity, much as they do in protonemata. In addition to serving as perennating structures, these axes appear to be major organs of assimilation. Is this facilitated through a mycorrhizoidal partnership?
In all these leafy liverwort cases, the fungi infect the individual rhizoids independently, but most of these 46 taxa nevertheless have abundant fungi-infected rhizoids that extend 20-30 cm into the peaty substrate (Duckett et al. 1991). What an extension for a tiny bryophyte! In the liverworts Lepidozia (Figure 66), Kurzia (Figure 67), and Telaranea (Figure 68), but known in no others, the rhizoids swell prior to fungal infection. In Cladopodiella (Figure 69), the fungi form a pseudoparenchymatous sheath around the swollen rhizoidal tips.
Figure 66. Lepidozia reptans, a species in which rhizoid tips
swell prior to fungal association. Photo by Michael Lüth, with permission.
Figure 67. Kurzia cf trichoclados, a species in which rhizoid
tips swell prior to fungal association. Photo by Michael Lüth, with permission.
Figure 68. Telaranea nematodes, a species in which rhizoid
tips swell prior to fungal association. Photo by Michael Lüth, with permission.
Figure 69. Cladopodiella fluitans, a species in which fungi
form a sheath around rhizoid tips. Photo by Kristian Peters, with permission.
By 1988, Boullard had presented evidence that the fungal symbiotic relationship with the liverworts was evolutionarily very old. Yet, in 1990, During and van Tooren pointed out that "in only very few cases have these interactions been analysed functionally."
Other associations have been documented in the field. Although not truly mycorrhizoidal because they lack the composite structure definitive of this relationship, bryophytes now are known to enter into partnerships. Even buried wood, inoculated with 32P, was able to provide P for the living tips of Hypnum cupressiforme (Figure 70-Figure 71) through a saprotrophic fungus, Phanerochaete velutina (Figure 72), that connected to the older parts of the moss (Wells & Boddy 1995).
Figure 70. Hypnum cupressiforme growing on a log. Photo
by Michael Lüth, with permission.
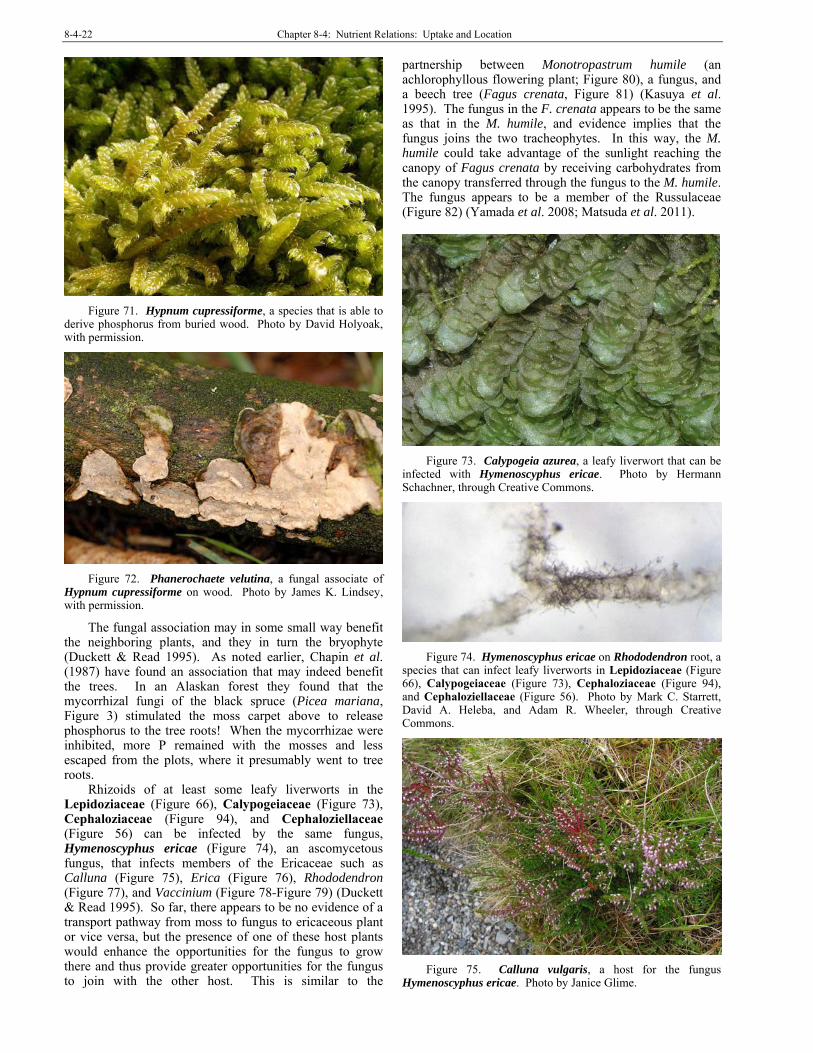
8-4-22 Chapter 8-4: Nutrient Relations: Uptake and Location
Figure 71. Hypnum cupressiforme, a species that is able to
derive phosphorus from buried wood. Photo by David Holyoak, with permission.
Figure 72. Phanerochaete velutina, a fungal associate of
Hypnum cupressiforme on wood. Photo by James K. Lindsey, with permission.
The fungal association may in some small way benefit the neighboring plants, and they in turn the bryophyte (Duckett & Read 1995). As noted earlier, Chapin et al. (1987) have found an association that may indeed benefit the trees. In an Alaskan forest they found that the mycorrhizal fungi of the black spruce (Picea mariana, Figure 3) stimulated the moss carpet above to release phosphorus to the tree roots! When the mycorrhizae were inhibited, more P remained with the mosses and less escaped from the plots, where it presumably went to tree roots.
Rhizoids of at least some leafy liverworts in the Lepidoziaceae (Figure 66), Calypogeiaceae (Figure 73), Cephaloziaceae (Figure 94), and Cephaloziellaceae (Figure 56) can be infected by the same fungus, Hymenoscyphus ericae (Figure 74), an ascomycetous fungus, that infects members of the Ericaceae such as Calluna (Figure 75), Erica (Figure 76), Rhododendron (Figure 77), and Vaccinium (Figure 78-Figure 79) (Duckett & Read 1995). So far, there appears to be no evidence of a transport pathway from moss to fungus to ericaceous plant or vice versa, but the presence of one of these host plants would enhance the opportunities for the fungus to grow there and thus provide greater opportunities for the fungus to join with the other host. This is similar to the
partnership between Monotropastrum humile (an achlorophyllous flowering plant; Figure 80), a fungus, and a beech tree (Fagus crenata, Figure 81) (Kasuya et al. 1995). The fungus in the F. crenata appears to be the same as that in the M. humile, and evidence implies that the fungus joins the two tracheophytes. In this way, the M. humile could take advantage of the sunlight reaching the canopy of Fagus crenata by receiving carbohydrates from the canopy transferred through the fungus to the M. humile. The fungus appears to be a member of the Russulaceae (Figure 82) (Yamada et al. 2008; Matsuda et al. 2011).
Figure 73. Calypogeia azurea, a leafy liverwort that can be
infected with Hymenoscyphus ericae. Photo by Hermann Schachner, through Creative Commons.
Figure 74. Hymenoscyphus ericae on Rhododendron root, a
species that can infect leafy liverworts in Lepidoziaceae (Figure 66), Calypogeiaceae (Figure 73), Cephaloziaceae (Figure 94), and Cephaloziellaceae (Figure 56). Photo by Mark C. Starrett, David A. Heleba, and Adam R. Wheeler, through Creative Commons.
Figure 75. Calluna vulgaris, a host for the fungus
Hymenoscyphus ericae. Photo by Janice Glime.
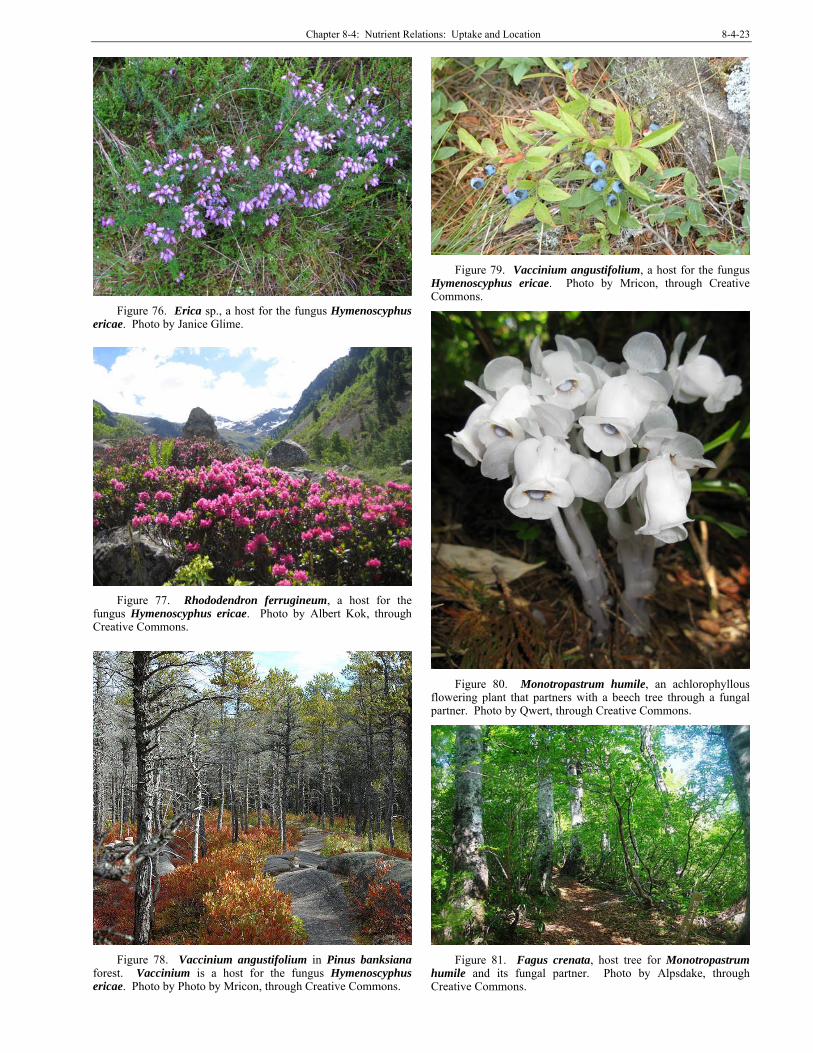
Chapter 8-4: Nutrient Relations: Uptake and Location 8-4-23
Figure 76. Erica sp., a host for the fungus Hymenoscyphus
ericae. Photo by Janice Glime.
Figure 77. Rhododendron ferrugineum, a host for the
fungus Hymenoscyphus ericae. Photo by Albert Kok, through Creative Commons.
Figure 78. Vaccinium angustifolium in Pinus banksiana
forest. Vaccinium is a host for the fungus Hymenoscyphus ericae. Photo by Photo by Mricon, through Creative Commons.
Figure 79. Vaccinium angustifolium, a host for the fungus
Hymenoscyphus ericae. Photo by Mricon, through Creative Commons.
Figure 80. Monotropastrum humile, an achlorophyllous
flowering plant that partners with a beech tree through a fungal partner. Photo by Qwert, through Creative Commons.
Figure 81. Fagus crenata, host tree for Monotropastrum
humile and its fungal partner. Photo by Alpsdake, through Creative Commons.

8-4-24 Chapter 8-4: Nutrient Relations: Uptake and Location
Figure 82. Russula.cavipes with mosses, an ectomycorrhizal
fungus in the family Russulaceae that is associated with Monotropastrum humile and Fagus crenata. Photo by James K. Lindsey, with permission.
Cryptothallus mirabilis
It appears that the fungi may be to some liverworts what the mycorrhizae are to the grape fern Botrychium and to many of the saprophytic forest floor flowering plants – a means of getting sufficient energy when the canopy is blocking an extensive portion of the light. Such a relationship is essential to the thallose liverwort Cryptothallus mirabilis (Figure 83), a European species known as ghostwort. It occurs nestled in mires and lacks chlorophyll. Certainly for it, a partnership is essential. But this liverwort has a Basidiomycota fungus as its ectomycorrhizal partner (Ligrone et al. 1993). They concluded that this liverwort is a parasite! It was thought that its fungal partner joined it to a species of Betula (birch), from which it ultimately obtained its carbohydrate energy source (Wiehle 1988; Pocock & Duckett 1984; Frey & Kürschner 1991; Read et al. 2000), much like the parasitic flowering plant Monotropa uniflora (Figure 84), the Indian pipe. However, Ligrone et al. (1993) disagree. They found that the fungi in Betula roots had a different morphology from those in the associated C. mirabilis. It appears that the association of C. mirabilis is more like that of the goblin fern Botrychium mormo, wherein the fungus derives carbon from decomposing litter and transfers some of it to the fern, permitting it to live in low light (Gundale 2002). But could it also be that the form of the fungus depends on the host, thus differing between that of the C. mirabilis and that of the Betula?
Bidartondo et al. (2003) determined that Cryptothallus mirabilis (Basidiomycota; Figure 83-Figure 86) is an epiparasite, depending on a species of the fungus Tulasnella (Figure 85-Figure 86). This fungus forms ectomycorrhizal (symbiotic relationship between fungal symbiont and roots of plant species) associations with surrounding trees. It is able to transfer labelled 14C from birch (Betula) seedlings in the lab, and presumably from tree roots in the field. Species of this same genus are also associated with Aneura pinguis (Figure 87) (Kottke et al. 2003) and some orchids (Clements & Ellyard 1979; Roche et al. 2010).
Figure 83. Cryptothallus mirabilis, an achlorophyllous
thallose liverwort in the Aneuraceae. This parasitic liverwort depends on a basidiomycete fungus to provide it with nutrients and energy. Photo by Michael Lüth, with permission.
Figure 84. Monotropa uniflora, an achlorophyllous
flowering plant that gets its carbon through its fungal partner. Photo by Magellan, through Creative Commons.
Figure 85. Tulasnella sp. ectomycorrhizae from a Betula
pendula association. Photo courtesy of Martin Bidartondo.

Chapter 8-4: Nutrient Relations: Uptake and Location 8-4-25
Figure 86. Cryptothallus mirabilis and its symbiotic partner
Tulasnella sp. Photo courtesy of Martin Bidartondo.
Figure 87. Aneura pinguis, a species with chlorophyll and
that is closely related to Cryptothallus mirabilis. Photo by Michael Lüth, with permission.
When it develops, the Cryptothallus mirabilis (Figure
83) fungus (Figure 88-Figure 91) forms large, intracellular coils in the liverwort (Ligrone et al 1993). Then the liverwort cytoplasm proliferates and the starch content of its plastids decreases. As the hyphae die back and aggregate into large masses, the liverwort cells senesce. In C. mirabilis, the fungal hyphae contain abundant glycogen and occasionally amyloid deposits. It is interesting that the fungal partner in C. mirabilis is identical to the one in Aneura pinguis (closely related but photosynthetic; Figure 87) from alpine sites but different from the fungus in A. pinguis from a chalk pit and sand dunes. In C. mirabilis, net carbon transfer is to the liverwort, and it is likely that there is transfer from the fungus to the liverwort in A. pinguis as well. In addition to the morphological similarities, further support for this hypothesis in A. pinguis is that spores of both liverwort species fail to develop beyond a few cells in axenic (sterile) culture.
Figure 88. Cryptothallus mirabilis rhizoid with Tulasnella
sp. Photo by Martin Bidartondo, with permission.
Figure 89. Cryptothallus mirabilis rhizoid with its fungal
partner Tulasnella sp. Photo courtesy of Martin Bidartondo.
Figure 90. Cryptothallus mirabilis with Tulasnella sp.
Photo by Martin Bidartondo, with permission.

8-4-26 Chapter 8-4: Nutrient Relations: Uptake and Location
Figure 91. Cryptothallus mirabilis with fungal partner
Tulasnella. Photo courtesy of Martin Bidartondo.
Bidartondo and Duckett (2010) concluded that most of the thalloid liverworts contain Glomeromycota (Figure 92) that form arbuscular mycorrhizae with them. Many leafy liverwort species and members of the thallose Aneuraceae have a relationship with Basidiomycota. Whereas the Aneuraceae associate almost exclusively with species of Tulasnella, eight leafy liverwort genera predominately associate with members of Sebacina vermifera (Basidiomycota; see Figure 93). Sebacina species have a habit of surrounding plants, so some of them may envelop the plants and prevent photosynthesis. It is interesting to note that when multiple species of bryophytes occur together, they rarely share the same fungal species. Furthermore, the bryophyte symbioses are not like those of the tracheophytes.
Figure 92. Claroideoglomus claroideum, a member of
Glomeromycota, common on bryophytes. Photo from Biomesfirst09, through Creative Commons.
Figure 93. Sebacina incrustans, a jelly fungus, on moss,
surrounding it an ultimately able to kill it. Photo © Slavko Serod, with online permission for non-commercial use.
Underground and Other Partnerships It appears that Cryptothallus (Figure 83) is not the
only liverwort capable of living below ground with an Ascomycota fungal partner (Duckett et al. 1989). In bog communities, the leafy liverworts (Jungermanniales) Cephalozia (Figure 94), Cladopodiella (Figure 69), Kurzia (Figure 67), Lepidozia (Figure 95), Odontoschisma (Figure 96), and Telaranea nematodes (Figure 68) can all develop extensive underground stem systems with numerous rhizoids that have swollen, fungus-containing tips. These liverworts can produce new shoots down to 24-30 cm in peat and to 10 cm in rotten logs (Lepidozia reptans, Figure 95).
Figure 94. Cephalozia macrostachya, member of a genus
that houses fungi in swollen rhizoid tips in bogs. Photo by Michael Lüth, with permission.
Figure 95. Lepidozia reptans growing on rotten wood that
its rhizoids can penetrate down to 10 cm. Photo by Michael Lüth, with permission.
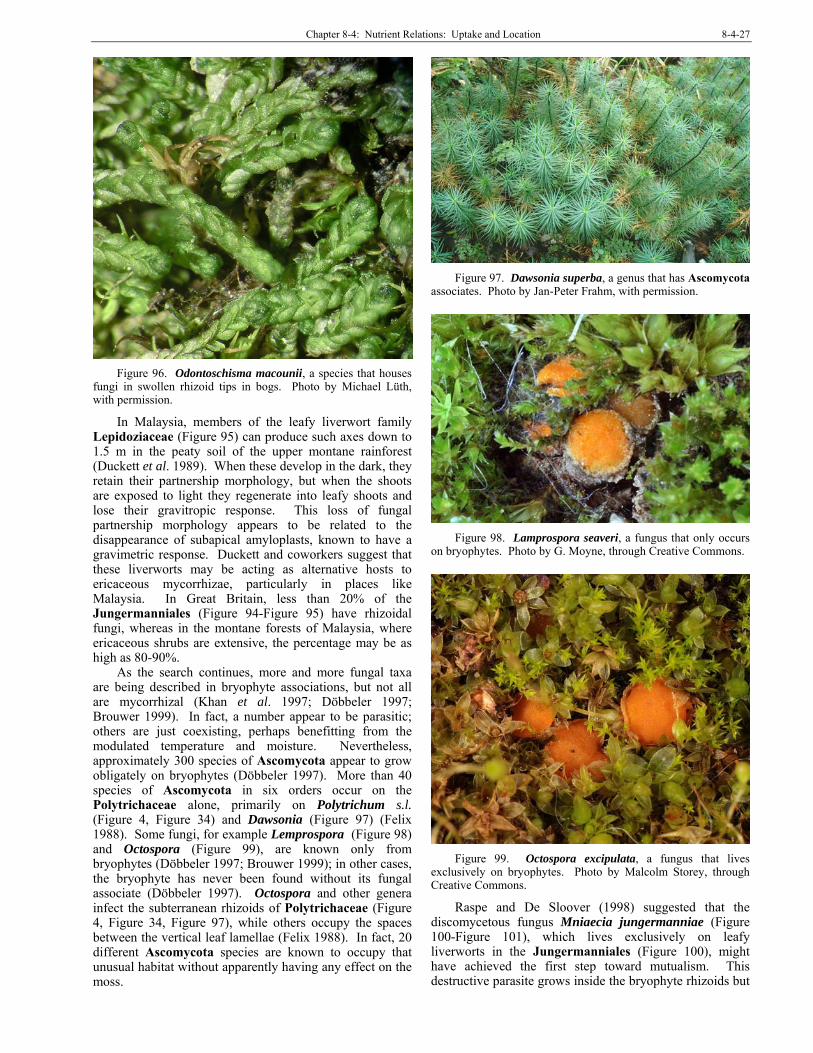
Chapter 8-4: Nutrient Relations: Uptake and Location 8-4-27
Figure 96. Odontoschisma macounii, a species that houses
fungi in swollen rhizoid tips in bogs. Photo by Michael Lüth, with permission.
In Malaysia, members of the leafy liverwort family Lepidoziaceae (Figure 95) can produce such axes down to 1.5 m in the peaty soil of the upper montane rainforest (Duckett et al. 1989). When these develop in the dark, they retain their partnership morphology, but when the shoots are exposed to light they regenerate into leafy shoots and lose their gravitropic response. This loss of fungal partnership morphology appears to be related to the disappearance of subapical amyloplasts, known to have a gravimetric response. Duckett and coworkers suggest that these liverworts may be acting as alternative hosts to ericaceous mycorrhizae, particularly in places like Malaysia. In Great Britain, less than 20% of the Jungermanniales (Figure 94-Figure 95) have rhizoidal fungi, whereas in the montane forests of Malaysia, where ericaceous shrubs are extensive, the percentage may be as high as 80-90%.
As the search continues, more and more fungal taxa are being described in bryophyte associations, but not all are mycorrhizal (Khan et al. 1997; Döbbeler 1997; Brouwer 1999). In fact, a number appear to be parasitic; others are just coexisting, perhaps benefitting from the modulated temperature and moisture. Nevertheless, approximately 300 species of Ascomycota appear to grow obligately on bryophytes (Döbbeler 1997). More than 40 species of Ascomycota in six orders occur on the Polytrichaceae alone, primarily on Polytrichum s.l. (Figure 4, Figure 34) and Dawsonia (Figure 97) (Felix 1988). Some fungi, for example Lemprospora (Figure 98) and Octospora (Figure 99), are known only from bryophytes (Döbbeler 1997; Brouwer 1999); in other cases, the bryophyte has never been found without its fungal associate (Döbbeler 1997). Octospora and other genera infect the subterranean rhizoids of Polytrichaceae (Figure 4, Figure 34, Figure 97), while others occupy the spaces between the vertical leaf lamellae (Felix 1988). In fact, 20 different Ascomycota species are known to occupy that unusual habitat without apparently having any effect on the moss.
Figure 97. Dawsonia superba, a genus that has Ascomycota
associates. Photo by Jan-Peter Frahm, with permission.
Figure 98. Lamprospora seaveri, a fungus that only occurs
on bryophytes. Photo by G. Moyne, through Creative Commons.
Figure 99. Octospora excipulata, a fungus that lives
exclusively on bryophytes. Photo by Malcolm Storey, through Creative Commons.
Raspe and De Sloover (1998) suggested that the discomycetous fungus Mniaecia jungermanniae (Figure 100-Figure 101), which lives exclusively on leafy liverworts in the Jungermanniales (Figure 100), might have achieved the first step toward mutualism. This destructive parasite grows inside the bryophyte rhizoids but

8-4-28 Chapter 8-4: Nutrient Relations: Uptake and Location
does not seem to afford any direct benefit to the liverwort. It appears it has a long way to go to reach mutualism.
Figure 100. Mniaecia jungermanniae (fungus in center) on
leafy liverworts. Photo by Malcolm Storey (DiscoverLife), with online permission.
Figure 101. Mniaecia jungermanniae asci and ascospores.
Photo by Malcolm Storey (DiscoverLife), with online permission.
We have noted several times that bryophytes obtain phosphate, and possibly other nutrients, from the bedrock. It is likely that at least in some cases fungi contribute to this nutrient source. Calling them "rock-eating mycorrhizae," Schöll et al. (2008) demonstrated that tunnels occur in mineral grains. They attributed these to hyphae from ectomycorrhizae that can dissolve mineral grains. Whether these fungi are directly associated with bryophytes, or they use litter or other plants for their carbon source, these fungi permit phosphates and other nutrients to enter nutrient cycling, potentially making some of them available to the bryophytes.
Arbuscular Mycorrhizae Harrison (1999) reported that arbuscular mycorrhizae,
restricted to the fungal order Glomales (Zygomycota, more recently named Glomeromycota; Figure 92), infected some bryophytes. Schüßler (2000) reported that a member of this order, Claroideoglomus claroideum (Figure 92), formed a mycorrhiza-like symbiosis with the hornwort Anthoceros punctatus (Figure 102-Figure 103). Following inoculation with spores, Schüßler found branched hyphae within the thallus within 20 days. This was the first definite experimental establishment of an arbuscular mycorrhiza-like association between a member of the Glomales and a bryophyte, although Felix (1988) had reported mycorrhiza-like associations in a number of taxa (Table 3). In 2003, Jakucs et al. found vesicles of a glomalean fungus in the moss Hypopterygium (Figure 104), suggesting that there might indeed be a mutualistic relationship in which the fungus also benefits, but that hypothesis still awaits verification.
Figure 102. Anthoceros punctatus with young sporophytes;
Claroideoglomus claroideum forms a mycorrhizal association with this species. Photo by Des Callaghan, with permission.
Figure 103. Anthoceros punctatus antheridial pit and
Nostoc colony (dark area). Photo by Des Callaghan, with permission.
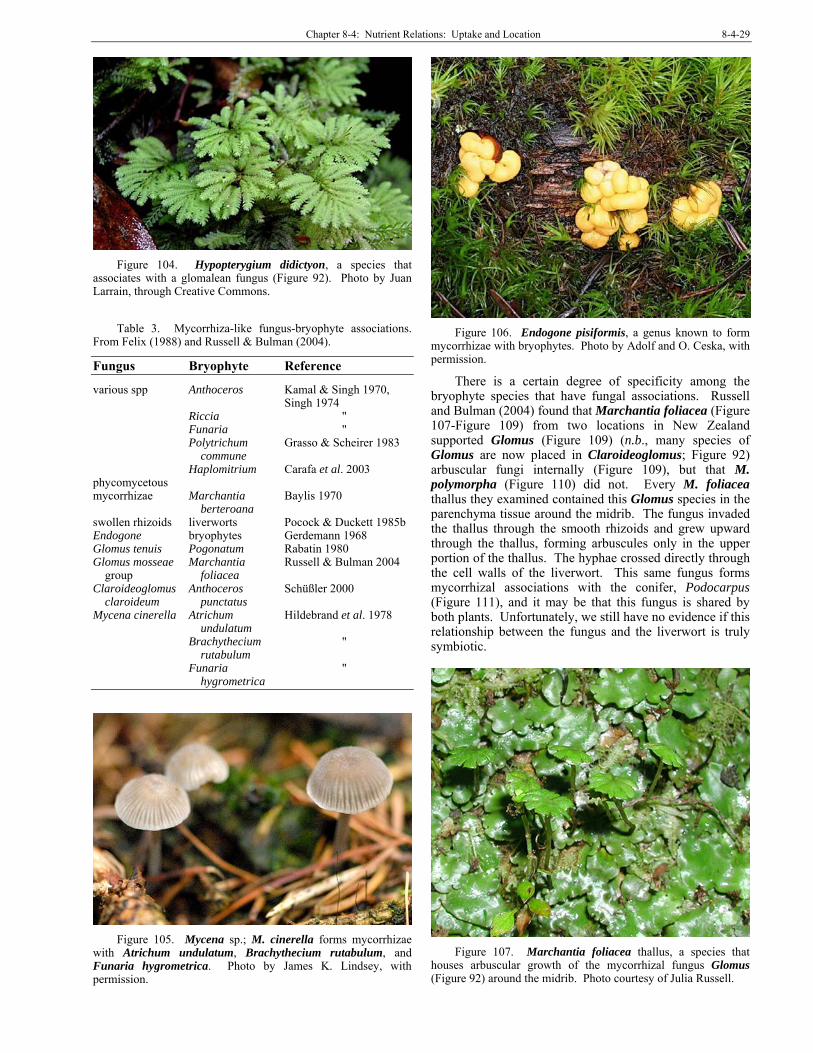
Chapter 8-4: Nutrient Relations: Uptake and Location 8-4-29
Figure 104. Hypopterygium didictyon, a species that
associates with a glomalean fungus (Figure 92). Photo by Juan Larrain, through Creative Commons.
Table 3. Mycorrhiza-like fungus-bryophyte associations. From Felix (1988) and Russell & Bulman (2004).
Fungus Bryophyte Reference various spp Anthoceros Kamal & Singh 1970, Singh 1974 Riccia " Funaria " Polytrichum Grasso & Scheirer 1983 commune Haplomitrium Carafa et al. 2003 phycomycetous mycorrhizae Marchantia Baylis 1970 berteroana swollen rhizoids liverworts Pocock & Duckett 1985b Endogone bryophytes Gerdemann 1968 Glomus tenuis Pogonatum Rabatin 1980 Glomus mosseae Marchantia Russell & Bulman 2004 group foliacea Claroideoglomus Anthoceros Schüßler 2000 claroideum punctatus Mycena cinerella Atrichum Hildebrand et al. 1978 undulatum Brachythecium " rutabulum Funaria " hygrometrica
Figure 105. Mycena sp.; M. cinerella forms mycorrhizae
with Atrichum undulatum, Brachythecium rutabulum, and Funaria hygrometrica. Photo by James K. Lindsey, with permission.
Figure 106. Endogone pisiformis, a genus known to form
mycorrhizae with bryophytes. Photo by Adolf and O. Ceska, with permission.
There is a certain degree of specificity among the bryophyte species that have fungal associations. Russell and Bulman (2004) found that Marchantia foliacea (Figure 107-Figure 109) from two locations in New Zealand supported Glomus (Figure 109) (n.b., many species of Glomus are now placed in Claroideoglomus; Figure 92) arbuscular fungi internally (Figure 109), but that M. polymorpha (Figure 110) did not. Every M. foliacea thallus they examined contained this Glomus species in the parenchyma tissue around the midrib. The fungus invaded the thallus through the smooth rhizoids and grew upward through the thallus, forming arbuscules only in the upper portion of the thallus. The hyphae crossed directly through the cell walls of the liverwort. This same fungus forms mycorrhizal associations with the conifer, Podocarpus (Figure 111), and it may be that this fungus is shared by both plants. Unfortunately, we still have no evidence if this relationship between the fungus and the liverwort is truly symbiotic.
Figure 107. Marchantia foliacea thallus, a species that
houses arbuscular growth of the mycorrhizal fungus Glomus (Figure 92) around the midrib. Photo courtesy of Julia Russell.
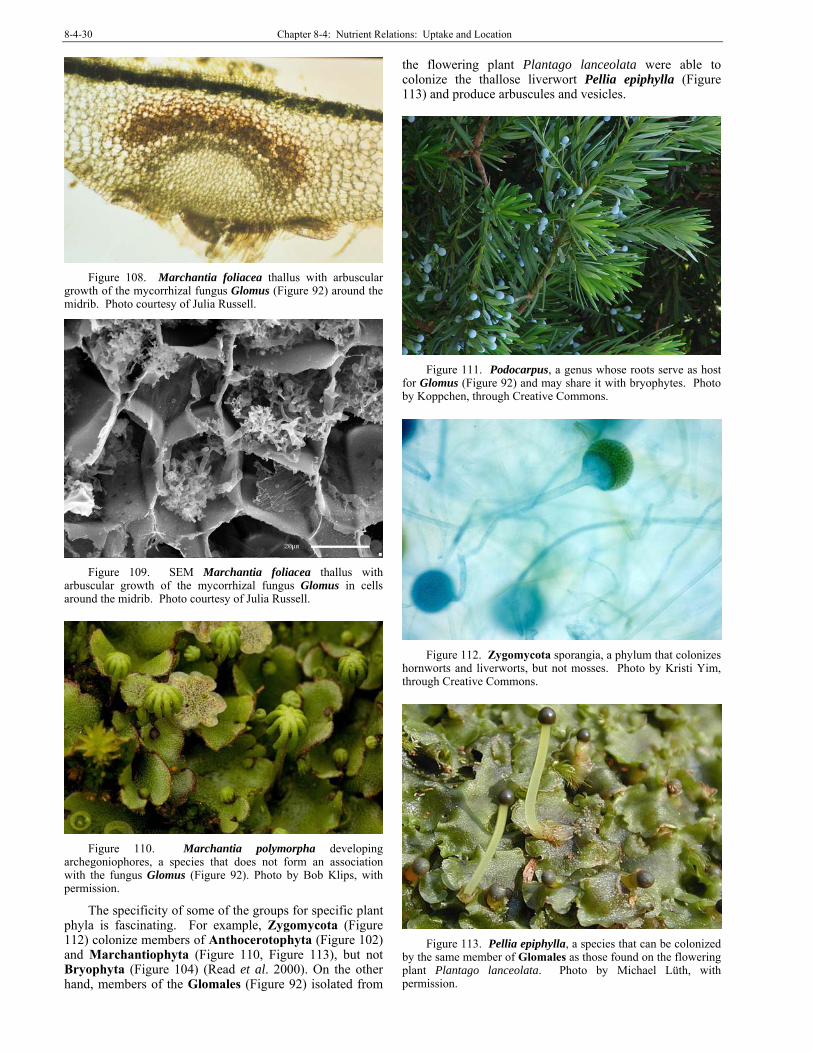
8-4-30 Chapter 8-4: Nutrient Relations: Uptake and Location
Figure 108. Marchantia foliacea thallus with arbuscular
growth of the mycorrhizal fungus Glomus (Figure 92) around the midrib. Photo courtesy of Julia Russell.
Figure 109. SEM Marchantia foliacea thallus with
arbuscular growth of the mycorrhizal fungus Glomus in cells around the midrib. Photo courtesy of Julia Russell.
Figure 110. Marchantia polymorpha developing
archegoniophores, a species that does not form an association with the fungus Glomus (Figure 92). Photo by Bob Klips, with permission.
The specificity of some of the groups for specific plant phyla is fascinating. For example, Zygomycota (Figure 112) colonize members of Anthocerotophyta (Figure 102) and Marchantiophyta (Figure 110, Figure 113), but not Bryophyta (Figure 104) (Read et al. 2000). On the other hand, members of the Glomales (Figure 92) isolated from
the flowering plant Plantago lanceolata were able to colonize the thallose liverwort Pellia epiphylla (Figure 113) and produce arbuscules and vesicles.
Figure 111. Podocarpus, a genus whose roots serve as host
for Glomus (Figure 92) and may share it with bryophytes. Photo by Koppchen, through Creative Commons.
Figure 112. Zygomycota sporangia, a phylum that colonizes
hornworts and liverworts, but not mosses. Photo by Kristi Yim, through Creative Commons.
Figure 113. Pellia epiphylla, a species that can be colonized
by the same member of Glomales as those found on the flowering plant Plantago lanceolata. Photo by Michael Lüth, with permission.

Chapter 8-4: Nutrient Relations: Uptake and Location 8-4-31
Figure 114. Plantago lanceolata, a species that has the same
fungal partner as Pellia epiphylla. Photo by Forest & Kim Starr, through Creative Commons.
These fungal-bryophyte associations form structural associations similar to those of vesicular-arbuscular mycorrhizae of tracheophytes. Despite the large number of associations recognized between bryophytes and fungi, Read and coworkers (2000) still stressed the "need for analysis of the functional attributes of these symbioses." They presented further evidence that these fungal associations were ancient, being important to the first plants to colonize land. This contention is supported by fossil evidence of glomalean fungal structures associated with early bryophytes in Ordovician sediments that are 460 and 400 million years old (Remy et al. 1994; Redecker et al. 2000).
Beneficial or Harmful? The fungal associates are not always beneficial to the
bryophytes. Zobel et al. (1999) treated a sub-Arctic forest community with fungicide and found that the bryophytes and dwarf shrubs increased in biomass relative to the control. Could it be that the fungi are frequently stealing from the bryophytes and making nutrients available to trees?
Summary Unlike tracheophytes, bryophytes take up nutrients
over their entire surface. With leaves only one cell thick in most taxa every leaf cell is thus exposed to environmental sources of nutrients. The three most limiting nutrients (N, P, K) accumulate in the upper parts of the plants through active uptake, whereas Ca, Mg, and Na accumulate through passive cation exchange. Bryophytes have high cation exchange capacity (CEC) due to polyuronic acids in their cell walls. Once ions are bound on exchange sites, a proton pump removes H+ ions from the cell, creating a charge gradient that brings in positive ions. These bring along negative ions by cotransport. It appears that bryophytes have two, perhaps more, types of exchange sites, permitting differential binding of ions. They also seem to have specificity for things they need over things they do not. Anion exchange sites can contribute to phosphate uptake. Abundance of cation sites
compared to anion sites can account for the preference of ammonium (cation) over nitrate (anion).
Further active processes are able to distinguish ions formed by N, P, and K from more exchangeable cations such as those of Ca++ or Mg++, and they are generally able to maintain relatively constant levels of these essential nutrients despite changes in environmental concentrations. Increasing temperatures increase the uptake, which is also pH-dependent. Some uptake occurs through pinocytosis and entry of nanoparticles.
Fungi are often associated with the rhizoids of bryophytes. It may be that a large number of bryophytes are afforded the advantages of fungal partner relationships, providing them with considerably more surface area for acquiring nutrients. The thallose liverwort Cryptothallus mirabilis has a fungal partner (Tulasnella) that provides carbohydrates for this non-chlorophyllous plant.
Many bryophyte-fungal associations have been discovered, but the types of interaction lack our understanding. We know that glomalean fungi are frequently associated with bryophytes, but the association has not been clearly described. This could be a very fruitful area for further research.
Acknowledgments I appreciate the contributions of undergraduate Phil
Gaudette and M. S. student Jennifer Jermalowicz Jones for their critical reading of the manuscript from the perspectives of students interested in nutrient relationships of bryophytes. Dana Richter made many helpful suggestions on the fungal section. Simon Bulman helped me to locate Julia Russell to obtain her mycorrhizae pictures. Jean Faubert made suggestions to improve the chapter. Many photographers have contributed their images through Creative Commons or have given me permission.
Literature Cited Babb, T. A., and Whitfield, D. W. S. 1977. Mineral nutrient
cycling and limitation of plant growth in the Truelove Lowland ecosystem. In: Bliss, L. E. (ed.). Truelove Lowland, Devon Island, Canada: A High Arctic Ecosystem. University of Alberta Press, Edmonton, pp. 589-606.
Bartsch, I. 1994. Effects of fertilization on growth and nutrient use by Chamaedaphne calyculata in a raised bog. Can. J. Bot. 72: 323-329.
Basile, A., Giordano, S., López-Sáez, J. A., and Cobianchi, R. C. 1999. Antibacterial activity of pure flavonoids isolated from mosses. Phytochemistry 52: 1479-1482.
Bates, J. W. 1982a. The role of exchangeable calcium in saxicolous calcicole and calcifuge mosses. New Phytol. 90: 239-252.
Bates, J. W. 1989. Retention of added K, Ca and P by Pseudoscleropodium purum growing under an oak canopy. J. Bryol. 15: 589-605.
Bates, J. W. 1992. Mineral nutrient acquisition and retention by bryophytes. J. Bryol. 17: 223-240.
Bates, J. W. 1997. Effects of intermittent desiccation on nutrient economy and growth of two ecologically contrasted mosses. Ann. Bot. 79: 299-309.

8-4-32 Chapter 8-4: Nutrient Relations: Uptake and Location
Bates, J. W. 2000. Mineral nutrition, substratum ecology, and pollution. In: Shaw, A. J. and Goffinet, B. Bryophyte Biology. Cambridge University Press, Cambridge, UK, pp. 248-311.
Bates, J. W. and Farmer, A. M. 1990. An experimental study of calcium acquisition and its effects on the calcifuge moss Pleurozium schreberi. Ann. Bot. 65: 87-96.
Baylis, G. T. S. 1970. Root hairs and phycomycetous mycorrhizas in phosphorus-deficient soil. Plant Soil 33: 713-716.
Belnap, J. and Harper, K. T. 1995. Influence of cryptobiotic soil crusts on elemental content of tissue of two desert seed plants. Arid Soil Res. Rehab. 9: 107-115.
Bewley, J. D. 1979. Physiological aspects of desiccation tolerance. Ann. Rev. Plant Physiol. 30: 195-238.
Bidartondo, M. I. and Duckett, J. G. 2010. Conservative ecological and evolutionary patterns in liverwort–fungal symbioses. Proc. Royal Bot. Soc. London 277: 485-492.
Bidartondo, M. I., Bruns, T. D., Weiß, M., Sérgio, C., and Read, D. J. 2003. Specialized cheating of the ectomycorrhizal symbiosis by an epiparasitic liverwort. Proc. Royal Soc. London B Biol. Sci. 270: 835-842.
Boros, A. 1926. A new parasitic fungus on mosses. Bryologist 29: 2-3.
Boullard, B. 1988. Observations on the coevolution of fungi with hepatics. In: Pirozynski, K. A. and Hawksworth, D. L. (eds.). Coevolution of Fungi with Plants and Animals. Academic Press, London, pp. 107-124.
Breemen, N. van. 1995. Nutrient cycling strategies. CEC/IUFRO Symposium on Nutrient Uptake and Cycling in Forest Ecosystems, Halmstad, Sweden, 7-10 Jun 1993. Plant Soil 168-169: 321-326.
Brehm, K. 1968. Die Bedeutung des Kationenaustausches fiir den Kationengehalt lebender Sphagnen. Planta 79: 324-345.
Breuer, K. and Melzer, A. 1990a. Heavy metal accumulation (lead and cadmium) and ion exchange in three species of Sphagnaceae. Oecologia 82: 461-467.
Breuer, K. and Melzer, A. 1990b. Heavy metal accumulation (lead and cadmium) and ion exchange in three species of Sphagnaceae. II. Chemical equilibrium of ion exchange and the selectivity of single ions. Oecologia 82: 468-473.
Brouwer, E. 1999. Mosschijfjes (Lamprospora en Octospora): Voorkomen en verspreiding in Nederland. Coolia 42: 2-20.
Brown, D. H. 1982. Mineral nutrition. In: Smith, A. J. E. (ed.). Bryophyte Ecology, Chapman & Hall, London, pp. 383-444.
Brown, D. H. 1984. Uptake of mineral elements and their use in pollution monitoring. In: Dyer, A. F. and Duckett, J. G. (eds.). The Experimental Biology of Bryophytes, Academic Press, New York, London, pp. 229-256.
Brown, D. H. and Bates, J. W. 1990. Bryophytes and nutrient cycling. J. Linn. Soc. Bot. 104: 129-147.
Brown, D. H. and Beckett, R. P. 1985. Intracellular and extracellular uptake of cadmium by the moss Rhytidiadelphus squarrosus. Ann. Bot. 55: 179-188.
Brown, D. H. and Brumelis, G. 1996. A biomonitoring method using the cellular distribution of metals in moss. Sci. Total Environ. 187: 153-161.
Brown, D. H. and Buck, G. W. 1978. Cation contents of acrocarpous and pleurocarpous mosses growing in a strontium rich substratum. J. Bryol. 10: 199-209.
Brown, D. H. and Buck, G. W. 1985. The cellular location of metals in two bryophytes and a lichen. Cryptog. Bryol. Lichénol. 6: 279-286.
Brown, D. H. and Wells, J. M. 1990. The extracellular and intracellular uptake of inorganic chemicals by bryophytes. In: Zinsmeister, H. D. and Mues, R. (eds.). Bryophytes, Their Chemistry and Chemical Taxonomy. Proceedings of the Phytochemical Society of Europe 29, Oxford University Press, Oxford, pp. 299-318.
Burton, M. A. S. and Peterson, P. J. 1979. Metal accumulation by aquatic bryophytes from polluted mine streams. Environ. Pollut. 19(1): 39-46.
Büscher, P., Koedam, N., and Neirinck, L. 1983. Cation-exchange capacity of mosses in relation to soil preference. In: Cran, W. J., Janácek, K., Rybová, R., and Sigler, K. (eds.). Membrane Transport in Plants. Proc. Symp. held in Prague, Czechoslovakia Aug. 15-21, 1983. John Wiley & Sons, New York, pp. 477-478.
Büscher, P., Koedam, N., and Speybroeck, Van D. 1990. Cation-exchange properties and adaptation to soil acidity in bryophytes. New Phytol. 115: 177-186.
Canivet, L., Dubot, P., and Denayer, F.-O. 2014. Uptake of iron nanoparticles by Aphanorrhegma patens (Hedw.) Lindb. J. Bryol. 36: 104-109.
Canivet, L., Dubot, P., Garçon, G., and Denayer, F. O. 2015. Effects of engineered iron nanoparticles on the bryophyte, Physcomitrella patens (Hedw.) Bruch & Schimp, after foliar exposure. Ecotoxicol. Environ. Safety 113: 499-505.
Carafa, A., Duckett, J. G., Ligrone, R. 2003. Subterranean gametophytic axes in the primitive liverwort Haplomitrium harbour a unique type of endophytic association with aseptate fungi. New Phytol. 160: 185–197.
Carballeira, A., López, J., and Vázquez, M. D. 1999. Uptake of heavy metals to the extracellular and intracellular components in three species of aquatic bryophytes. Ecotox. Environ. Safety Environ. Res. 44: 12-24.
Chambers, S. M., Williams, P. G., Seppelt, R. D., and Cairney, J. W. G. 1999. Molecular identification of Hymenoscyphus from rhizoids of the leafy liverwort Cephaloziella exiliflora in Australia and Antarctica. Mycol. Res. 103: 286-288.
Chapin, F. S. III, Oechel, W. C., Cleve, K. van, and Lawrence, W. 1987. The role of mosses in the phosphorus cycling of an Alaskan black spruce forest. Oecologia 74: 310-315.
Clements, M. A. and Ellyard, R. K. 1979. The symbiotic germination of Australian terrestrial orchids [Pterostylis, Diuris, Thelymitra inocultates with mycorrhizal fungi Tulasnella and Ceratobandium]. Amer. Orchid Soc. Bull.
Clymo, R. S. 1963. Ion exchange in Sphagnum and its relation to bog ecology. Ann. Bot. N. S. 27: 309-324.
Clymo, R. S. 1964. The origin of acidity in Sphagnum bogs. Bryologist 67: 427-431.
Coxson, D. S., McIntyre, D. D., and Vogel, H. J. 1992. Pulse release of sugars and polyols from canopy bryophytes in tropical montane rain forest (Guadeloupe, French West Indies). Biotropica, 121-133.
Craigie, J. S. and Maass, W. S. G. 1966. The cation-exchanger in Sphagnum spp. Ann. Bot. 30: 153-154.
Dainty, J. and Richter, C. 1993. Ion behavior in Sphagnum cell walls. Adv. Bryol. 5:107-128.
Döbbeler, P. 1997. Biodiversity of bryophilous Ascomycetes. Symposium on Mycology: Past, Present and Future, at British Mycological Society Symposium Sheffield, UK, Apr 1996. Biodiv. Conserv. 6: 721-738.
Duckett, J. G. and Read, D. J. 1995. Ericoid mycorrhizas and rhizoid-ascomycete associations in liverworts share the same mycobiont: Isolation of the partners and resynthesis of the associations in vitro. New Phytol. 129: 439-447.

Chapter 8-4: Nutrient Relations: Uptake and Location 8-4-33
Duckett, J. G., Renzaglia, K. S., Pell, K., and Russell, A. 1989. The biology of underground organs of Jungermanniales. Bull. Brit. Bryol. Soc. 53: 19-21.
Duckett, J. G., Renzaglia, K. S., and Pell, K. 1991. A light and electron microscope study of rhizoid-Ascomycete associations and flagelliform axes in British hepatics with observations on the effects of the fungi on host morphology. New Phytol. 118: 233-257.
During, H. J. and Tooren, B. F. van. 1990. Bryophyte interactions with other plants. International Symposium on Bryophyte Ecology Edinburgh, UK, 19-22 July 1988. J. Linn. Soc. Bot. 104: 79-98.
Felix, H. 1988. Fungi on bryophytes, a review. Bot. Helv. 98: 239-269.
Foth, H. D. and Ellis, B. G. 1997. Soil Fertility, 2nd Ed. CRC Press, Boca Raton, Florida, 290 pp.
Francez, A. J. and Loiseau, P. 1999. Devenir de l'azote mineral dans une tourbiere a Sphagnum fallax Klinggr. et Carex rostrata Stokes du Massif central (France). [The fate of mineral nitrogen from peat (Sphagnum fallax Klinggr. and Carex rostrata Stokes) of the Massif central (France).]. Can. J. Bot. 77: 1136-1143.
Frey, W. and Kürschner, H. 1991. Das Fossombronio-Gigaspermetum mouretii in der Judäischen Wüste. 2. [The Fossombronio-Gigaspermetum mouretii in the Judean deserts. 2. Ecosociology and life strategy.]. Ökosoziologie und Lebensstrategien. Cryptog. Bot. 1/3: 73-84.
Galloway, C. M. and Black, C. C. 1989. Enzymes of sucrose metabolism in bryophytes. Bryologist 92: 95-97.
Gerdemann, J. W. 1968. Vesicular-arbuscular mycorrhiza and plant growth. Ann. Rev. Phytopathol. 6: 397-418.
Gjengedal, E. and Steinnes, E. 1990. Uptake of metal ions in moss from artificial precipitation. Environ. Monitor. Assess. 14: 77-87.
Glime, J. M., Wetzel, R. G., and Kennedy, B. J. 1982. The effects of bryophytes on succession from alkaline marsh to Sphagnum bog. Amer. Midl. Nat. 108: 209-223.
Grasso, S. M. and Scheirer, D. C. 1981. Scanning electron microscopic observations of a moss-fungus association. Bryologist 84: 348-350.
Gullvåg, B. M., Skaar, H., Ophus, E. M. 1974. An ultrastructural study of lead accumulation within leaves of Rhytidiadelphus squarrosus (Hedw.). Warnst. A comparison between experimental and environmental poisoning. J. Bryol. 8: 117-122.
Gundale, M. J. 2002. Influence of exotic earthworms on the soil organic horizon and the rare fern Botrychium mormo. Conserv. Biol. 16: 1555-1561.
Hájek, T. and Adamec, L. 2009. Mineral nutrient economy in competing species of Sphagnum mosses. Ecol. Res. 24: 291-302.
Harper, K. T. and Belnap, J. 2001. The influence of biological soil crusts on mineral uptake by associated vascular plants. J. Arid Environ. 47: 347-357.
Harper, K. T. and Pendleton, R. L. 1993. Cyanobacteria and cyanolichens: Can they enhance availability of essential minerals for higher plants? Great Basin Nat. 53: 59-72.
Harrison, M. J. 1999. Molecular and cellular aspects of the arbuscular mycorrhizal symbiosis. Ann. Rev. Plant Physiol. Plant Molec. Biol. 50: 361-389.
Hildebrand, R., Kottke, I., and Winkler, S. 1978. Untersuchungen über den Einflu von Pilzen auf die pH-Abhängigkeit von Laubmoosen. Beitr. Biol. Pflanzen 54: 1-12.
Iqbal, S. H., Nasim, G., and Shahjahan. 1988a. Vesicular-arbuscular mycorrhizal fungi associated with three mosses (Sphagnum cymbifolium, Polytrichum commune, and Funaria hygrometrica). Biologia (Lahore) 34: 269-273.
Iqbal, S. H., Nasim, G., and Jahan, S. 1988b. II. Vesicular-arbuscular mycorrhizal fungi associated with a bryophyte: Marchantia palmata. Biologia (Lahore) 34: 275-278.
Jakucs, E., Naár, Z., Szedlay, G., and Orbán, S. 2003. Glomalean and septate endophytic fungi in Hypopterygium mosses (Bryopsida). Cryptog. Mycol. 24(1): 27-37.
Jennings, O. E. 1918. Certain organic substances assimilated by Ceratodon purpureus. Bryologist 21: 86.
Kamal and Singh, C. S. 1970. Rhizosphere mycoflora of some bryophytes. Ann. Inst. Pasteur (Paris) 119: 752-755.
Kasuya, M. C. M., Masaka, K., and Igarashi, T. 1995. Mycorrhizae of Monotropastrum globosum growing in a Fagus crenata forest. Mycoscience 36: 461-464.
Khan, M. R., Imamual Huq, S. M., and Hasanuzzaman, M. 1997. Moss rhizosphere and its microflora. Bangladesh J. Bot. 26(2): 163-168.
Kilham, P. 1982. Acid precipitation: Its role in the alkalization of a lake in Michigan. Limnol. Oceanogr. 27: 856-867.
Klein, M. and Horst, W. J. 2005. Cation specific exchange capacity of cell wall material isolated from roots of plant species differing in Al resistance. Institute of Plant Nutrition, Department of Horticulture, University of Hannover, Germany. Accessed 6 June 2005 at <http://www.ipe.uni-hannover.de/publication/klein_poster1.pdf>.
Knight, A. H., Crooke, W. M., and Inkson, R. H. E. 1961. Cation-exchange capacities of tissues of higher and lower plants and their related uronic acid contents. Nature 192: 142-143.
Koedam, N. and Büscher, P. 1983. Studies on the possible role of cation exchange capacity in the soil preference of mosses. Plant Soil 70: 77-93.
Kottke, J., Krisch, T., and Winkler, S. 1976. Untersuchungen über den Einfluss von Pilzen auf die Konkurrenzfahigkeit von Moosen. Beitr. Biol. Pflanzen 51: 407-415.
Kottke, I., Beiter, A., Weiss, M., Haug, I., Oberwinkler, F., and Nebel, M. 2003. Heterobasidiomycetes form symbiotic associations with hepatics: Jungermanniales have sebacinoid mycobionts while Aneura pinguis (Metzgeriales) is associated with a Tulasnella species. Mycol. Res. 107: 957-968.
Leblond, S. 2004. Étude pluridisciplinaire du transfert des métaux de l’atmosphère vers les mousses (Scleropodium purum (Hedw.) Limpr.): Suivi sur un site rural (Vouzon, France). Thèse de Doctorat, Université Paris 7 – Denis Diderot, Paris, France, 214 pp.
Li, Y. and Glime, J. M. 1990. Growth and nutrient ecology of two Sphagnum species. Hikobia 10: 445-451.
Li, Y., Glime, J. M., and Liao, C.-L.. 1992. Responses of two interacting Sphagnum species to water level. J. Bryol. 17: 59-70.
Liao, C.-L. 1993 Chemical defence in bryophytes with high apparency. Bryol. Times 75: 1-4.
Ligrone, R. 1988. Ultrastructure of a fungal endophyte in Phaeoceros laevis (L.) Prosk. (Anthocerotophyta). Bot. Gaz. (Crawfordsville) 149: 92-100.
Ligrone, R. and Lopes, C. 1989. Cytology and development of a mycorrhiza-like infection in the gametophyte of Conocephalum conicum (L.) Dum., Marchantiales, Hepatophyta. New Phytol. 111: 423-434.

8-4-34 Chapter 8-4: Nutrient Relations: Uptake and Location
Ligrone, R., Pocock, K., and Duckett, J. G. 1993. A comparative ultrastructural study of endophytic Basidiomycetes in the parasitic achlorophyllous hepatic Cryptothallus mirabilis and the closely allied photosynthetic species Aneura pinguis (Metzgeriales). Can. J. Bot. 71: 666-679.
Lou, Y., Cao, T., Zhang, Y., Zeng, Y., Cao, Y. 2013. A study of the characteristics of elements accumulation in tissue culture plants of the moss Haplocladium microphyllum under heavy metal stress by the SRXRF technique. Conference of the International Association of Bryologists, 15-19 July 2013 at Natural History Museum, London, UK.
Malmer, N., Horton, D. G., and Vitt, D. H. 1992. Element concentrations in mosses and surface waters of western Canadian mires relative to precipitation chemistry and hydrology. Ecography 15: 114-128.
Marschall, M. 2010. Photosynthetic responses, carbohydrate composition and invertase activity in fructan accumulating bryophytes (Porella platyphylla and Sphagnum flexuosum) under different environmental conditions (carbohydrate treatments, dark starvation, low temperature, desiccation). Acta Biol. Hung. 61(Supplement 1): 120-129.
Matsuda, Y., Okochi, S., Katayama, T., Yamada, A., and Ito, S. I. 2011. Mycorrhizal fungi associated with Monotropastrum humile (Ericaceae) in central Japan. Mycorrhiza 21: 569-576.
Maurel-Kermarrec, A., Pally, M., Fouiquier, L., and Hébrard, J. P. 1985. Cinétique de la fixation et de la désorption d'un mélange de cobalt 60, de chrome 51, de césium 137, de manganese 54 et de sodium 22 par Chiloscyphus polyanthos (L.) Corda in opiz. Cryptog. Bryol. Lichénol. 6: 359-377.
Mautsoe, P. J. and Beckett, R. P. 1996. A preliminary study of the factors affecting the kinetics of cadmium uptake by the liverwort Dumortiera hirsuta. S. Afr. J. Bot. 62: 332-336.
Mouvet, C. 1987. Accumulation et relargage de plomb, zinc, cadmium, chrome et cuivre par des mousses aquariques en mileu naturel et au laboratoire. Laboratoire d'Ecologie, Université de Metz, Metz.
Mues, R. and Zinsmeister, H. D. 1988. Chemotaxonomy of phenolic compounds in bryophytes. J. Hattori Bot. Lab. 64: 109-141.
Nieboer, E. and Richardson, D. H. S. 1980. The replacement of the nondescript term 'heavy metals' by a biologically and chemically significant classification of metal ions. Environ. Pollut. (Ser. B) 1: 3-26.
Nieboer, E. and Richardson, D. H. S. 1981. Lichens as Monitors of Atmospheric Deposition. Atmospheric Pollutants in Natural Waters, Ann Arbor Science Publishers, Inc., Ann Arbor, MI, pp. 339-388.
Núñez-Olivera, E., García-Álvaro, M., Beaucourt, N., and Martínez-Abaigar, J. 2001. Changes in element concentrations in aquatic bryophytes over an annual cycle. Arch. Hydrobiol. 152: 253-277.
Orebamjo, T. O. and Stewart, G. R. 1975. Ammonium repression of nitrate reductase formation in Lemna minor L. Planta 122: 27-36.
Parke, J. L. and Linderman, R. G. 1980. Association of vesicular-arbuscular mycorrhizal fungi with the moss Funaria hygrometrica. Can. J. Bot. 58: 1898-1904.
Peña, M. J., Darvill, A. G., Eberhard, S., York, W. S., and O’neill, M. A. 2008. Moss and liverwort xyloglucans contain galacturonic acid and are structurally distinct from the xyloglucans synthesized by hornworts and vascular plants. Glycobiology 18: 891-904.
Peña, M. J., Kong, Y., York, W. S., and O’Neill, M. A. 2012. A galacturonic acid-containing xyloglucan is involved in Arabidopsis root hair tip growth. Plant Cell 24: 4511-4524.
Pickering, D. C. and Puia, I. L. 1969. Mechanism for the uptake of zinc by Fontinalis antipyretica. Physiol. Plant. 22: 653-661.
Pirozynski, K. A. and Malloch, D. W. 1975. The origin of land plants: A matter of mycotrophism. Biosystems 6: 153-164.
Pocock, K. and Duckett, J. G. 1984. A comparative ultrastructural analysis of the fungal endophytes in Cryptothallus mirabilis Malm. and other British thalloid hepatics. J. Bryol. 13: 227-233.
Pocock, K. and Duckett, J. G. 1985a. The alternative mycorrhizas: Fungi and hepatics. Bull. Brit. Bryol. Soc. 45: 10-11.
Pocock, K. and Duckett, J. G. 1985b. On the occurrence of branched and swollen rhizoids in British hepatics: Their relationships with the substratum and associations with fungi. New Phytol. 99: 281-304.
Popper, Z. A. and Fry, S. C. 2003. Primary cell wall composition of bryophytes and charophytes. Ann. Bot. 91: 1-12.
Rabatin, S. C. 1980. The occurrence of the vesicular-arbuscular-mycorrhizal fungus Glomus tenuis with moss. Mycologia 72: 191-195.
Raspe, O. and De Sloover, J. R. 1998. Morphology, ecology and chorology of Mniaecia jungermanniae (Ascomycota) in Belgium and the significance of its association to leafy liverworts (Jungermanniales). Belgian J. Bot. 131:251-259.
Raven, J. A., Griffiths, H., Smith, E. C., and Vaughn, K. C. 1998. New perspectives in the biophysics and physiology of bryophytes. In: Bates, J. W., Ashton, N. W., and Duckett, J. G. (eds.). Bryology in the Twenty-first Century. Maney Publishing and the British Bryological Society, UK, pp. 261-275.
Read, D. J., Duckett, J. G., Francis, R., Ligrone, R., Russell, A., Newton, A. E., and Kenrick, P. 2000. Symbiotic fungal associations in 'lower' land plants. Philosoph. Trans. Roy. Soc. London B 355: 815-831.
Redecker, D., Kodner, R., and Graham, L. E. 2000. Glomalean fungi from the Ordovician. Science 289: 1920-1921.
Remy, W., Taylor, T. N., Hass, H., and Kerp, H. 1994. Four hundred-million-year-old vesicular arbuscular mycorrhizae. Proc. Natl. Acad. Sci. USA 91: 11841-11843.
Richter, C. and Dainty, J. 1989. Ion behavior in plant cell walls. I. Characterization of the Sphagnum russowii cell wall ion exchanger. Can. J. Bot. 67: 451-459.
Richter, C. and Dainty, J. 1990. Ion behaviour in plant cell walls. IV. Selective cation binding by Sphagnum russowii cell walls. Can. J. Bot. 68: 773-781.
Roche, S. A., Carter, R. J., Peakall, R., Smith, L. M., Whitehead, M. R., and Linde, C. C. 2010. A narrow group of monophyletic Tulasnella (Tulasnellaceae) symbiont lineages are associated with multiple species of Chiloglottis (Orchidaceae): Implications for orchid diversity. Amer. J. Bot. 97: 1313-1327.
Rühling, A. and Tyler, G. 1970. Sorption and retention of heavy metals in the woodland moss Hylocomium splendens (Hedw.) Br. et Sch. Oikos 21: 92-97.
Russell, J. and Bulman, S. 2004. The liverwort Marchantia foliacea forms a specialized symbiosis with arbuscular mycorrhizal fungi in the genus Glomus. New Phytol. 2004: 1-13.
Sabovljevic, A., Sabovljevic, M., Grubisic, D., and Konjevic, R. 2005. The effect of sugars on development of two moss species (Bryum argenteum and Atrichum undulatum) during in vitro culture. Belgian J. Bot. 138: 79-84.

Chapter 8-4: Nutrient Relations: Uptake and Location 8-4-35
Satake, K. 2000. Iron accumulation on the cell wall of the aquatic moss Drepanocladus fluitans in an acid lake at pH 3.4-3.8. Hydrobiologia 433: 25-30.
Schöll, L. van, Kuyper, T. W., Smits, M. M., Landeweert, R., Hoffland, E., and Breemen, N. Van. 2008. Rock-eating mycorrhizas: Their role in plant nutrition and biogeochemical cycles. Plant Soil 303: 35-47.
Schüßler, A. 2000. Glomus claroideum forms an arbuscular mycorrhiza-like symbiosis with the hornwort Anthoceros punctatus. Mycorrhiza 10(1): 15-21.
Shacklette, H. T. 1965. Element content of bryophytes. Geol. Surv. Bull. 1198-D., U. S. Govt. Print. Off., Washington, D. C.
Shimwell, D. W. and Laurie, A. E. 1972. Lead and zinc contamination of vegetation in the southern Pennines. Environ. Pollut. 3: 291-301.
Singh, H. B. 1974. Rhizosphere fungal flora of bryophytes. Botanique 7: 131-136.
Spearing, A. M. 1972. Cation-exchange capacity and galacturonic acid content of several species of Sphagnum in Sandy Ridge Bog, central New York state. Bryologist 75: 154-158.
Sylvia, D. M., Furhmann, J. J., Hartel, P. G., and Zuberer, D. A. 2004. Principles and Applications of Soil Microbiology, 2nd ed. Prentice Hall, Englewood Cliffs, N. J.
Syrett, P. J. and Morris, I. 1963. The inhibition of nitrate assimilation by ammonium in Chlorella. Biochim. Biophys. Acta – Specialized Section on Enzymological Subjects 67: 566-575.
Taylor, F. G. and Witherspoon, J. P. 1972. Retention of simulated fallout particles by lichens and mosses. Health Phys. 23: 867-869.
Temple, P. J., McLaughlin, D. L., Linzon, S. N., and Wills, R. 1981. Moss bags as monitors of atmospheric deposition. J. Air Pollut. Control Assoc. 31: 668-670.
Trachtenberg, S. and Zamski, E. 1979. The apoplastic conduction of water in Polytrichum juniperinum Willd. gametophytes. New Phytol. 83: 49-52.
Turner, B. L., Baxter, R., Ellwood, N. T. W., and Whitton, B. A. 2003. Seasonal phosphatase activities of mosses from Upper Teesdale, northern England. J. Bryol. 25: 189-200.
Varma, A. and Hock, B. 1999. Mycorrhiza. Springer Verlag, Berlin.
Vázquez Castro, M. D., López, J., and Carballeira, A. 1999. Uptake of heavy metals to the extracellular and intracellular compartments in three species of aquatic bryophytes. Ecotoxicol. Environ. Safety Environ. Res. B 44: 12-24.
Vujičić, M., Sabovljević, A., and Sabovljević, M. 2009. Axenically culturing the bryophytes: a case study of the moss
Dicranum scoparium Hedw. (Dicranaceae, Bryophyta). Bot. Serbica 33: 137-140.
Wanek, W. and Pörtl, K. 2008. Short-term 15N uptake kinetics and nitrogen nutrition of bryophytes in a lowland rainforest, Costa Rica. Funct. Plant Biol.: 35: 51-62.
Webster, H. J. 1985. Elemental analyses of Pohlia nutans growing on coal seeps in Pennsylvania. J. Hattori Bot. Lab. 58: 207-224.
Weetman, G. F. and Timmer, V. 1967. Feather moss growth and nutrient content under upland black spruce. Woodlands Research Index, Pulp and Paper Research Institute of Canada, Pointe Claire, P. Q., Canada 138: 1-38.
Wells, J. M. 1988. The role of the cell wall in metal uptake, redistribution and tolerance in the moss Rhytidiadelphus squarrosus. Ph. D. Thesis, University of Bristol, Bristol.
Wells, J. M. and Boddy, L. 1995. Phosphorus translocation by saprotrophic basidiomycete mycelial cord systems on the floor of a mixed deciduous woodland. Mycol. Res. 99: 977-980.
Wells, J. M. and Brown, D. H. 1987. Factors affecting the kinetics of intra- and extracellular cadmium uptake by the moss Rhytidiadelphus squarrosus. New Phytol. 105: 123-137.
Wells, J. M. and Brown, D. H. 1990. Ionic control of intracellular and extracellular Cd uptake by the moss Rhytidiadelphus squarrosus (Hedw.) Warnst. New Phytol. 116: 541-553.
Wells, J. M. and Richardson, D. H. S. 1985. Anion accumulation by the moss Hylocomium splendens: Uptake and competition studies involving arsenate, selenate, selenite, phosphate, sulphate and sulphite. New Phytol. 101: 571-583.
Wiehle, W. 1988. Cryptothallus mirabilis – ein mykotrophes Lebermoos. Boletus 12: 15-22.
Wiersum, L. K. and Bakema, K. 1959. Competitive adaptation of the cation exchange capacity of roots. Plant Soil 11: 287-292.
Williams, P. G., Roser, D. J., and Seppelt, R. D. 1994. Mycorrhizas of hepatics in continental Antarctica. Mycol. Res. 98: 34-36.
Wojtun, B. 1994. Element contents of Sphagnum mosses of peat bogs of Lower Silesia (Poland). Bryologist 97: 284-295.
Yamada, A., Kitamura, D., Setoguchi, M., Matsuda, Y., Hashimoto, Y., Matsushita, N., and Fukuda, M. 2008. Monotropastrum humile var. humile is associated with diverse ectomycorrhizal Russulaceae fungi in Japanese forests. Ecol. Res. 23: 983-993.
Zobel, M., Pilt, I., Moora, M., Partel, M., and Liira, J. 1999. Small-scale dynamics of plant communities in an experimentally polluted and fungicide-treated subarctic birch-pine forest. Acta Oecol. 20(1): 29-37.

8-4-36 Chapter 8-4: Nutrient Relations: Uptake and Location

Glime, J. M. 2017. Nutrient Relations: Translocation and Transport. Chapt. 8-5. In: Glime, J. M. Bryophyte Ecology. Volume 1. 8-5-1 Physiological Ecology. Ebook sponsored by Michigan Technological University and the International Association of Bryologists. Last updated 9 May 2017 and available at <http://digitalcommons.mtu.edu/bryophyte-ecology/>.
CHAPTER 8-5
NUTRIENT RELATIONS: TRANSLOCATION AND TRANSPORT
TABLE OF CONTENTS Translocation and Transport................................................................................................................................ 8-5-2 Movement from Older to Younger Tissues.................................................................................................. 8-5-6 Directional Differences ................................................................................................................................ 8-5-8 Species Differences...................................................................................................................................... 8-5-8 Mechanisms of Transport.................................................................................................................................... 8-5-9 Source to Sink? ............................................................................................................................................ 8-5-9 Enrichment Effects..................................................................................................................................... 8-5-10 Internal Transport....................................................................................................................................... 8-5-10 Structural Facilitation.......................................................................................................................... 8-5-10 Leptome Transport.............................................................................................................................. 8-5-11 Carbon Transport ................................................................................................................................ 8-5-12 Apoplastic Transport........................................................................................................................... 8-5-13 Desiccation Effects .................................................................................................................................... 8-5-14 External Translocation ............................................................................................................................... 8-5-14 Sporophyte Conduction..................................................................................................................................... 8-5-15 Summary ........................................................................................................................................................... 8-5-18 Acknowledgments............................................................................................................................................. 8-5-18 Literature Cited ................................................................................................................................................. 8-5-18

8-5-2 Chapter 8-5: Nutrient Relations: Translocation and Transport
CHAPTER 8-5
NUTRIENT RELATIONS: TRANSLOCATION AND TRANSPORT
Figure 1. Bazzania trilobata and other bryophytes growing together. Note the dead tissue in the lower right part of the clump,
where nutrient sinks can be mobilized to supply growing apical tissues. Such clumps can play a significant role in the distribution of forest nutrients. Photo by Michael Lüth, with permission.
Translocation and Transport One of the most poorly understood abilities of
bryophytes by "vascular" botanists is the ability of bryophytes to transport nutrients within the plant. Understanding that transport of nutrients occurs through specialized vascular tissue (xylem and phloem), they have sometimes assumed that the "non-vascular" bryophytes are unable to move substances from one part of the plant to another. Hence, the assumption has been that as bryophytes die (Figure 1), decomposition will return the component nutrients. But while bryophytes lack tracheids, vessels, and sieve cells, they do not lack the ability to transport substances from one part of the plant to another, i.e. translocation. In some cases, such as Polytrichum (Figure 17), they actually transport substances through their leptoids (phloem-like cells; Figure 2) and hydroids (xylem-like cells; Figure 2). Those mosses such as
Polytrichum with well-developed leptoids form a leptome, similar to the cylinder of phloem in a tree trunk. The collective hydroids in the center of the stem form the hydrome, also known as the hydrom. But it is clear that lack of even these special conducting cells is no deterrent to transport or to translocation in bryophytes. Hence, we can find nutrient elements in a number of locations within and upon the plant (see subchapter 8-4).
One aid to the transport of substances from cell to cell is the presence of plasmodesmata in the cell walls (Mahmoud 1965; Oliver & Bewley 1984). These connecting threads permit substances to move from cell to cell without traversing cell membranes, although the movement is undoubtedly slower than that of the movement of water in the interstitial capillary spaces of cell walls.

Chapter 8-5: Nutrient Relations: Translocation and Transport 8-5-3
Figure 2. Cross section of Polytrichum juniperinum and longitudinal section of Atrichum undulatum stem to illustrate parts of
central strand (leptoids and hydroids) and stem structures. Drawings by Margaret Minahan, based on Hébant (1977).
Duckett and Ligrone (2003) list several specific
examples in their note "What we couldn't have done if we'd stayed in Europe: Selection and serendipity in the Southern Hemisphere." They demonstrated the presence of "food-conducting cytology" (i.e. food conducting cells) in the widespread groups of Hookeriaceae (Figure 3), Neckeraceae (Figure 4), Orthotrichaceae (Figure 5-Figure 6), and Sphagnum (Figure 7-Figure 11), as well as in most caulonemata and rhizoids. Furthermore, this food conducting organization is present in the axes of the primitive moss Takakia (Figure 12-Figure 13) and the moss-like leafy liverwort Haplomitrium (Figure 14-Figure 15), as well as being widespread in Marchantialian thalli.
Figure 3. Hookeria lucens (Hookeriaceae), a family with
food-conducting parenchyma cells. Photo by Jonathan Sleath, with permission.
Figure 4. Neckera pennata (Neckeraceae) , a family with
parenchyma food-conducting cells. Photo by Michael Lüth, with permission.
Figure 5. Orthotrichum pumilum (Orthotrichaceae), a
family with food-conducting parenchyma cells. Photo by Michael Lüth, with permission.
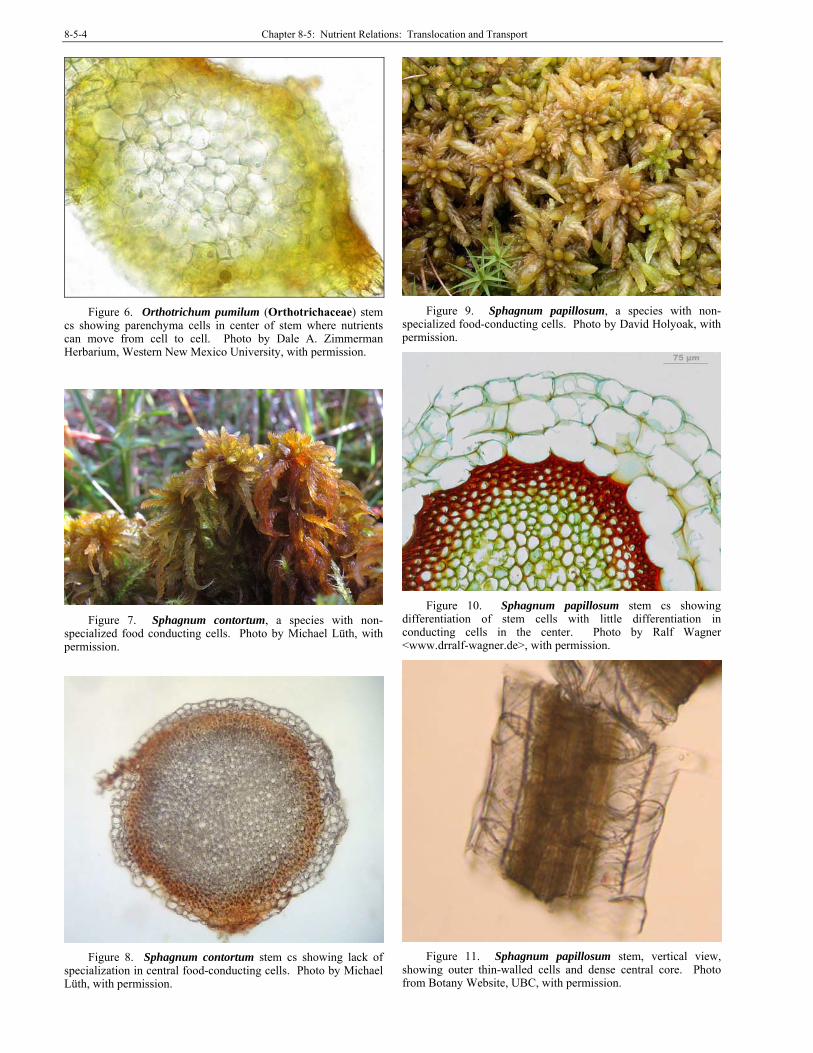
8-5-4 Chapter 8-5: Nutrient Relations: Translocation and Transport
Figure 6. Orthotrichum pumilum (Orthotrichaceae) stem
cs showing parenchyma cells in center of stem where nutrients can move from cell to cell. Photo by Dale A. Zimmerman Herbarium, Western New Mexico University, with permission.
Figure 7. Sphagnum contortum, a species with non-
specialized food conducting cells. Photo by Michael Lüth, with permission.
Figure 8. Sphagnum contortum stem cs showing lack of
specialization in central food-conducting cells. Photo by Michael Lüth, with permission.
Figure 9. Sphagnum papillosum, a species with non-
specialized food-conducting cells. Photo by David Holyoak, with permission.
Figure 10. Sphagnum papillosum stem cs showing
differentiation of stem cells with little differentiation in conducting cells in the center. Photo by Ralf Wagner <www.drralf-wagner.de>, with permission.
Figure 11. Sphagnum papillosum stem, vertical view,
showing outer thin-walled cells and dense central core. Photo from Botany Website, UBC, with permission.

Chapter 8-5: Nutrient Relations: Translocation and Transport 5
Figure 12. Takakia lepidozioides, a primitive moss that
conducts internally through cells that appear to be unspecialized. Photo by Rafael Medina, through Creative Commons.
Figure 13. Takakia lepidozioides stem cs showing
unspecialized conducting cells. Photo from Botany Website, UBC, with permission.
Figure 14. Haplomitrium hookeri, a primitive liverwort that
has some internal conduction. Photo by Des Callaghan, with permission.
Figure 15. Haplomitrium stem cs showing differentiated
cells in the center of the stem. Photo by Rachel Murray and Barbara Crandall-Stotler, with permission.
We have seen that bryophytes move water about internally as well as externally. There is ample evidence that they likewise move nutrients, hormones, and photosynthate within the plant, and of course, nutrients get moved externally with capillary water as well. Within stems, leptoids may serve to enhance nutrient movement; Hébant (1974) demonstrated that "sieve elements" (leptome) of Polytrichum commune (Figure 16-Figure 17) exude liquid. Polytrichaceae have highly specialized leptoids with polarized cytoplasmic organization within the axis. In the endohydric moss Polytrichastrum alpinum (Figure 18), labeled 14C supplied as CO2 travelled at the rate of 7.5 cm h-1 within the stems of a population in Point Barrow, Alaska, whereas in some tracheophytes, the rate may be little more than 1 cm per hour for water movement. In other mosses, including Sphagnum (Figure 7-Figure 11), less specialized parenchyma cells of the stem and seta carry out similar functions.
Figure 16. Polytrichum commune, a moss with extensive
internal conduction. Photo by Michael Lüth, with permission.
It does not require the sophisticated structures of Polytrichum (Figure 16-Figure 17) to move substances within mosses. Alpert (1989) demonstrated that photoassimilate moved from the leaves to the stem bases and even underground stems in Grimmia laevigata (Figure 19), a predominantly ectohydric moss, but he was unable to demonstrate any movement of mineral nutrients in this way (see stem of a related species, Figure 20).
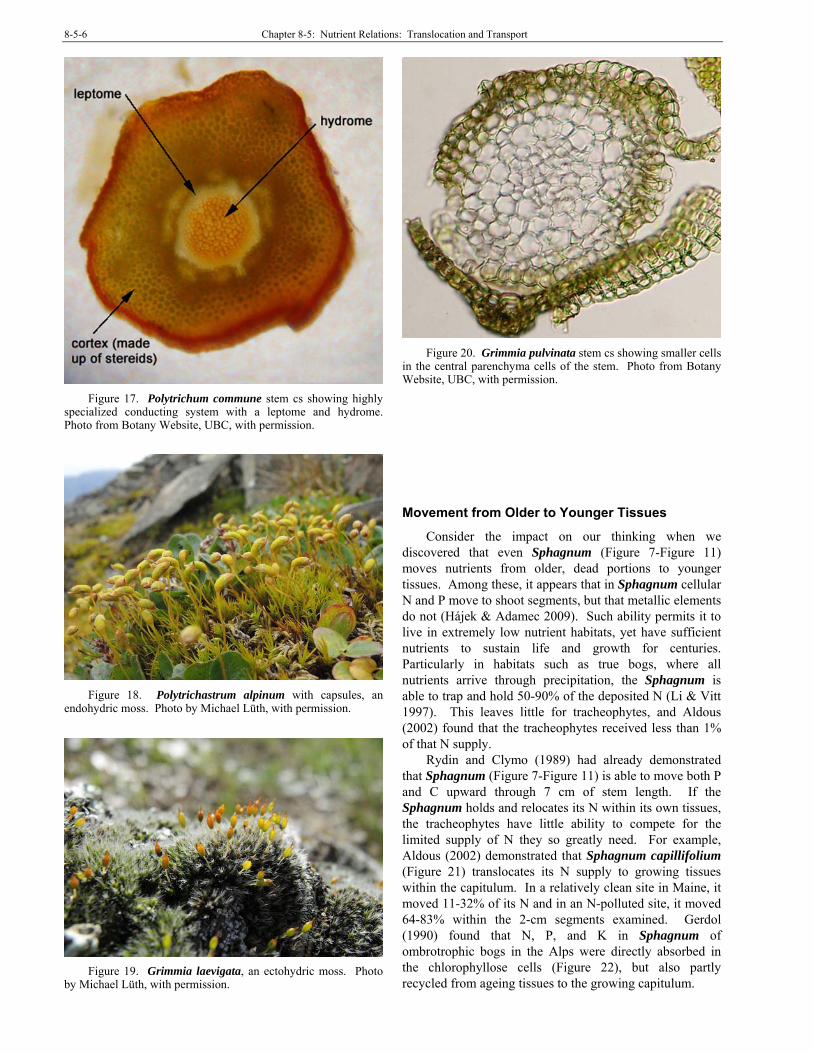
8-5-6 Chapter 8-5: Nutrient Relations: Translocation and Transport
Figure 17. Polytrichum commune stem cs showing highly
specialized conducting system with a leptome and hydrome. Photo from Botany Website, UBC, with permission.
Figure 18. Polytrichastrum alpinum with capsules, an
endohydric moss. Photo by Michael Lüth, with permission.
Figure 19. Grimmia laevigata, an ectohydric moss. Photo
by Michael Lüth, with permission.
Figure 20. Grimmia pulvinata stem cs showing smaller cells
in the central parenchyma cells of the stem. Photo from Botany Website, UBC, with permission.
Movement from Older to Younger Tissues
Consider the impact on our thinking when we discovered that even Sphagnum (Figure 7-Figure 11) moves nutrients from older, dead portions to younger tissues. Among these, it appears that in Sphagnum cellular N and P move to shoot segments, but that metallic elements do not (Hájek & Adamec 2009). Such ability permits it to live in extremely low nutrient habitats, yet have sufficient nutrients to sustain life and growth for centuries. Particularly in habitats such as true bogs, where all nutrients arrive through precipitation, the Sphagnum is able to trap and hold 50-90% of the deposited N (Li & Vitt 1997). This leaves little for tracheophytes, and Aldous (2002) found that the tracheophytes received less than 1% of that N supply.
Rydin and Clymo (1989) had already demonstrated that Sphagnum (Figure 7-Figure 11) is able to move both P and C upward through 7 cm of stem length. If the Sphagnum holds and relocates its N within its own tissues, the tracheophytes have little ability to compete for the limited supply of N they so greatly need. For example, Aldous (2002) demonstrated that Sphagnum capillifolium (Figure 21) translocates its N supply to growing tissues within the capitulum. In a relatively clean site in Maine, it moved 11-32% of its N and in an N-polluted site, it moved 64-83% within the 2-cm segments examined. Gerdol (1990) found that N, P, and K in Sphagnum of ombrotrophic bogs in the Alps were directly absorbed in the chlorophyllose cells (Figure 22), but also partly recycled from ageing tissues to the growing capitulum.

Chapter 8-5: Nutrient Relations: Translocation and Transport 7
Figure 21. Sphagnum capillifolium (nemoreum), a species
that moves its N to growing tissues in the capitulum. Photo by Aimon Niklasson, with permission.
Figure 22. Sphagnum papillosum leaf cells showing
network of green chlorophyllose cells and transparent hyaline cells. Note that the hyaline cells are long with spiral wall thickenings. These cells have pores what expose the inside cation exchange sites. Photo by Ralf Wagner <www.drralf-wagner.de>, with permission.
Potassium is a highly soluble nutrient. Garciadeblas et al. (2007) demonstrated that Physcomitrella patens (Figure 23) expresses the same potassium and sodium transport systems as that found in flowering plants. Hence, we find that potassium is able to move from older to young tissues.
Bakken (1995) suggested that the reason the acrocarpous moss Dicranum majus (Figure 24) has a low N demand and persistence of N in young tissues at sites with high N is that it moves N from older to younger tissues. Pleurozium schreberi (Figure 25), a large, pleurocarpous, feather moss with no central strand or special conducting cells, is even able to move its nutrient supply about. And it is selective about it. It is able to move the soluble K+ and Mg++ from plant base to apex, but, as in tracheophytes, the insoluble Ca++ is non-translocatable (Bates 1979). In fact, the concentration of Ca++ increases with distance from apex, assumedly reflecting its longer
time to accumulate there. As a component of the cell wall, the concentration of Ca++ would increase as the cell sap was lost after death. But that is not the full explanation of its increasing concentration there. Ca++ supplied below the Pleurozium mats moves up the stems externally, taking advantage of the exchange sites and capillary movement of water (Bates & Farmer 1990). If it behaves like Sphagnum (Figure 21-Figure 22), broken cells will expose more exchange sites on the insides of cells, permitting Ca++ to be bound there.
Figure 23. Physcomitrella patens, a species that transports
K in the same manner as flowering plants. Photo by Jan-Peter Frahm, with permission.
Figure 24. Dicranum majus with sporophytes. Photo by
Michael Lüth, with permission.
Figure 25. Pleurozium schreberi. Photo by Michael Lüth,
with permission.

8-5-8 Chapter 8-5: Nutrient Relations: Translocation and Transport
Directional Differences Wells and Brown (1996) demonstrated internal
movement in the moss Rhytidiadelphus squarrosus (Figure 26). By collecting the moss and depriving it of any external nutrient supply, they were able to determine that apical growth continued, facilitated by acropetal (base to tip) transfer of cations (K+, Mg++, and Ca++) from basal segments in proportion to that cation pool. When the mosses were pretreated with these three cations, the status of the shoots did not influence the elements that arrived in the newly grown shoots. Rather, acropetal transfer of externally bound cations occurred.
Figure 26. Rhytidiadelphus squarrosus, a species with
internal nutrient transport that seems to depend on living cells. Photo by Michael Lüth, with permission.
Surprisingly, even the heavy metals travel. Rühling and Tyler (1970) found that in Hylocomium splendens (Figure 27-Figure 28) metals such as Cu, Fe, and Mn are taken in by the young tissues and moved to the older ones. Could this be a means of sequestering them where they are less dangerous to the moss?
Figure 27. Hylocomium splendens on spruce forest floor.
Photo by Janice Glime.
Species Differences It seems that bryophytes differ among species in their
nutrient mobilities, and in which nutrients go where. Eckstein and Karlsson (1999) compared the movement of N in the pleurocarpous moss Hylocomium splendens (Figure 27-Figure 28) and the acrocarpous Polytrichum commune (Figure 16-Figure 17), both common in boreal forests. In both species, the current year of growth served as a sink for N. In P. commune the older segments showed a net loss of N from June to September, a loss the authors interpreted as resorption of N to the subterranean rhizome.
Figure 28. Hylocomium splendens stem cs, showing central
parenchyma cells. Photo by Botany Website, UBC, with permission.
By contrast, in Hylocomium splendens (Figure 27-Figure 28), the one-year-old segments, like the youngest segments, increased in N, whereas the older segments lost 50% of the N initially measured there (Eckstein & Karlsson 1999). All the N lost from the older segments could be identified in the two youngest segments. Thus, as the three-year-old segments of H. splendens died and became brown, N moved upward in the plant to younger segments. It is interesting that one species (P. commune, Figure 16-Figure 17) behaved as trees do in the fall, moving the N downward, whereas the other (H. splendens) behaved as trees or crop plants do in spring, moving it to the new growth.
Even the aquatic mosses behave like tracheophytes in their transfer of nutrients from older to younger segments. The soluble N, P, and K are concentrated in the apical regions of Fontinalis squamosa (Figure 29) and F. antipyretica (Figure 30-Figure 31), whereas the less soluble Ca, Mg, and Fe increase toward the base (Mártínez Abaigar et al. 2002). However, there are two possible explanations for this: N, P, and K are moved from older to younger tissues, just as they are in tracheophytes, or younger, more active tissues actively uptake these three nutrients. Mártínez Abaigar and coworkers considered both factors to be contributing.
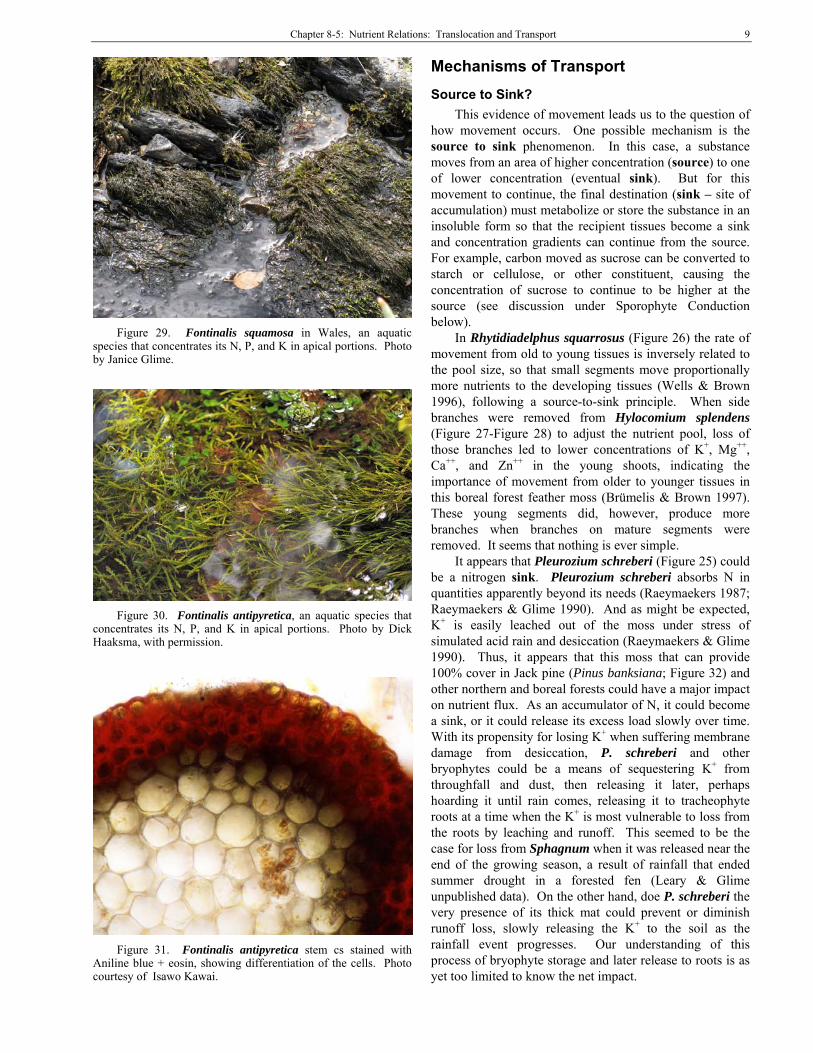
Chapter 8-5: Nutrient Relations: Translocation and Transport 9
Figure 29. Fontinalis squamosa in Wales, an aquatic
species that concentrates its N, P, and K in apical portions. Photo by Janice Glime.
Figure 30. Fontinalis antipyretica, an aquatic species that
concentrates its N, P, and K in apical portions. Photo by Dick Haaksma, with permission.
Figure 31. Fontinalis antipyretica stem cs stained with
Aniline blue + eosin, showing differentiation of the cells. Photo courtesy of Isawo Kawai.
Mechanisms of Transport
Source to Sink?
This evidence of movement leads us to the question of how movement occurs. One possible mechanism is the source to sink phenomenon. In this case, a substance moves from an area of higher concentration (source) to one of lower concentration (eventual sink). But for this movement to continue, the final destination (sink – site of accumulation) must metabolize or store the substance in an insoluble form so that the recipient tissues become a sink and concentration gradients can continue from the source. For example, carbon moved as sucrose can be converted to starch or cellulose, or other constituent, causing the concentration of sucrose to continue to be higher at the source (see discussion under Sporophyte Conduction below).
In Rhytidiadelphus squarrosus (Figure 26) the rate of movement from old to young tissues is inversely related to the pool size, so that small segments move proportionally more nutrients to the developing tissues (Wells & Brown 1996), following a source-to-sink principle. When side branches were removed from Hylocomium splendens (Figure 27-Figure 28) to adjust the nutrient pool, loss of those branches led to lower concentrations of K+, Mg++, Ca++, and Zn++ in the young shoots, indicating the importance of movement from older to younger tissues in this boreal forest feather moss (Brümelis & Brown 1997). These young segments did, however, produce more branches when branches on mature segments were removed. It seems that nothing is ever simple.
It appears that Pleurozium schreberi (Figure 25) could be a nitrogen sink. Pleurozium schreberi absorbs N in quantities apparently beyond its needs (Raeymaekers 1987; Raeymaekers & Glime 1990). And as might be expected, K+ is easily leached out of the moss under stress of simulated acid rain and desiccation (Raeymaekers & Glime 1990). Thus, it appears that this moss that can provide 100% cover in Jack pine (Pinus banksiana; Figure 32) and other northern and boreal forests could have a major impact on nutrient flux. As an accumulator of N, it could become a sink, or it could release its excess load slowly over time. With its propensity for losing K+ when suffering membrane damage from desiccation, P. schreberi and other bryophytes could be a means of sequestering K+ from throughfall and dust, then releasing it later, perhaps hoarding it until rain comes, releasing it to tracheophyte roots at a time when the K+ is most vulnerable to loss from the roots by leaching and runoff. This seemed to be the case for loss from Sphagnum when it was released near the end of the growing season, a result of rainfall that ended summer drought in a forested fen (Leary & Glime unpublished data). On the other hand, doe P. schreberi the very presence of its thick mat could prevent or diminish runoff loss, slowly releasing the K+ to the soil as the rainfall event progresses. Our understanding of this process of bryophyte storage and later release to roots is as yet too limited to know the net impact.

8-5-10 Chapter 8-5: Nutrient Relations: Translocation and Transport
Figure 32. Pinus banksiana forest where Pleurozium
schreberi can form 100% ground cover. Photo from Minnesota Department of Natural Resources, through Creative Commons.
Enrichment Effects When the moss is enriched with a nutrient, the
translocated load can likewise be enriched. When input of N as 15NH4
15NO3 was compared at low and high levels, Sphagnum capillifolium (Figure 21) increased its annual N translocation from 11% to 80% (Aldous 2002). Aldous (2002) estimated that translocation contributes 0.5-11% of the annual N budget of the moss. This observation is consistent with the observation that N translocation is higher in the high N deposition Adirondack sites than in the low deposition Maine sites in the northeastern USA. However, the Maine sites had a low water table and severe drought during the year of measurement and thus we cannot assume that the greater movement in the Adirondacks was due to the greater concentration of N.
Internal Transport Internal conducting cells are present in some members
of both liverworts and mosses, but are unknown in hornworts (Ligrone et al. 2000). In mosses, they can be present in both generations, whereas in liverworts they are present only in the gametophyte. This is predictable in that liverworts form their setae after the capsule matures and is ready for dispersal. Thus, any conducting tissue would be of little value, and furthermore have little time to develop.
Structural Facilitation Mosses also have the ability to conduct nutrients
through symplastic transport in rhizoids and caulonemata, and similarly in the thallus parenchyma of liverworts (Ligrone et al. 2000). The symplast is the living protoplasm of the cells that is interconnected between cells,
and substances can move through it following a concentration gradient.
In Takakia species (mosses), Calobryales (liverworts) and Pallaviciniaceae (liverworts) the water-conducting cells have perforated walls with pores derived from plasmodesmata. In the bryoid mosses, the water conducting cells (hydroids) are imperforate. In the Polytrichaceae (Figure 2, Figure 16- Figure 18) the leptoids (in this family they are highly specialized food-conducting cells) the cytoplasmic organization is polarized and has a distinct axial system of microtubules. In Sphagnum (Figure 7-Figure 11) and other mosses there are less specialized parenchyma cells in the leafy stem and seta.
Rydin and Clymo (1989) considered that the dominant understanding of Sphagnum (Figure 33) was that the lack of any anatomical specialization in the stem (Figure 34-Figure 35) caused those mosses to rely instead on external conduction in the capillary spaces. However, in their experiments they demonstrated that this thinking was wrong. Instead, internal transport is both "rapid and quantitatively important." In fact, when labelled 32P and 14C were supplied below the tips of S. recurvum (Figure 33), both moved to the top of the plant regardless of the direction of external mass flow. High concentrations of the labelled P and C were in the stem. Furthermore, if the stems were steamed above and below the point of application, the labelled P and C failed to move, suggesting that live cells were needed for the transport. Sphagnum recurvum has a central mass of parenchyma that is 20-50 cells across. These cells have end walls with perforations of about 100 nm and a density of 7-13 μm-2, providing a single cell wall with ~1500 perforations.
Figure 33. Sphagnum recurvum, a species that transports P
and C internally. Photo by Malcolm Storey, <www.discoverlife.com>, through Creative Commons.
It is likely that most bryophytes have some sort of conduction specialization within the stem. Sphagnum (Figure 33-Figure 35) has revealed its internal system within the central portion of the stem (Ligrone & Duckett 1998). This system is manifest by the absence of large central vacuoles, presence of a spindle-shaped nucleus with prominent axial system of endoplasmic microtubules, membrane-bound tubules and vesicles, and a high frequency of plasmodesmata in the crosswalls, all characteristics that are common to food-conducting cells. These same characters are also known in the food-
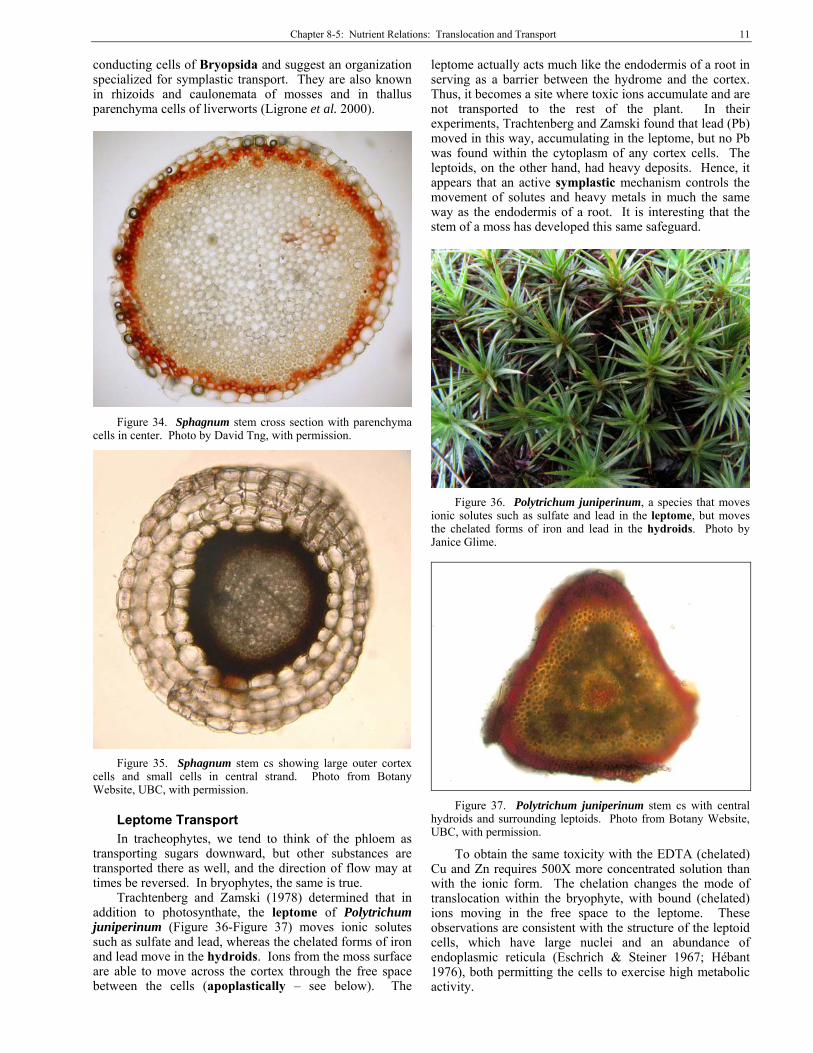
Chapter 8-5: Nutrient Relations: Translocation and Transport 11
conducting cells of Bryopsida and suggest an organization specialized for symplastic transport. They are also known in rhizoids and caulonemata of mosses and in thallus parenchyma cells of liverworts (Ligrone et al. 2000).
Figure 34. Sphagnum stem cross section with parenchyma
cells in center. Photo by David Tng, with permission.
Figure 35. Sphagnum stem cs showing large outer cortex
cells and small cells in central strand. Photo from Botany Website, UBC, with permission.
Leptome Transport
In tracheophytes, we tend to think of the phloem as transporting sugars downward, but other substances are transported there as well, and the direction of flow may at times be reversed. In bryophytes, the same is true.
Trachtenberg and Zamski (1978) determined that in addition to photosynthate, the leptome of Polytrichum juniperinum (Figure 36-Figure 37) moves ionic solutes such as sulfate and lead, whereas the chelated forms of iron and lead move in the hydroids. Ions from the moss surface are able to move across the cortex through the free space between the cells (apoplastically – see below). The
leptome actually acts much like the endodermis of a root in serving as a barrier between the hydrome and the cortex. Thus, it becomes a site where toxic ions accumulate and are not transported to the rest of the plant. In their experiments, Trachtenberg and Zamski found that lead (Pb) moved in this way, accumulating in the leptome, but no Pb was found within the cytoplasm of any cortex cells. The leptoids, on the other hand, had heavy deposits. Hence, it appears that an active symplastic mechanism controls the movement of solutes and heavy metals in much the same way as the endodermis of a root. It is interesting that the stem of a moss has developed this same safeguard.
Figure 36. Polytrichum juniperinum, a species that moves
ionic solutes such as sulfate and lead in the leptome, but moves the chelated forms of iron and lead in the hydroids. Photo by Janice Glime.
Figure 37. Polytrichum juniperinum stem cs with central
hydroids and surrounding leptoids. Photo from Botany Website, UBC, with permission.
To obtain the same toxicity with the EDTA (chelated) Cu and Zn requires 500X more concentrated solution than with the ionic form. The chelation changes the mode of translocation within the bryophyte, with bound (chelated) ions moving in the free space to the leptome. These observations are consistent with the structure of the leptoid cells, which have large nuclei and an abundance of endoplasmic reticula (Eschrich & Steiner 1967; Hébant 1976), both permitting the cells to exercise high metabolic activity.

8-5-12 Chapter 8-5: Nutrient Relations: Translocation and Transport
A similar phenomenon for copper and zinc has been seen in gemmae of Marchantia polymorpha (Figure 38) and protonemata of Funaria hygrometrica (Figure 39-Figure 40) (Coombes & Lepp 1974). Copper was more toxic than zinc to both species at levels above 8 mg L-1. Protonemata did not grow and spores did not germinate in Funaria hygrometrica. Even at 1 mg L-1, few buds formed in Funaria. In zinc, it produced rounded protonemal cells that could be interpreted as brood cells, known to occur as a response to unfavorable conditions (Van Andel 1952). In Marchantia, rhizoid formation on gemmalings was inhibited at 1 ppm copper. Zinc did not cause any noticeable changes. In these bryophytes, there was a delicate line between essential levels and toxic levels of copper, with levels above 0.5 mg L-1 being deleterious to development.
Figure 38. Marchantia polymorpha gemmae cups showing
gemmae. Copper and zinc are toxic to these gemmae. Photo by Walter Obermayer, with permission.
Figure 39. Funaria hygrometrica. Photo by Michael Lüth,
with permission.
Carbon Transport We know that the leptome (that part of the stem of
some mosses composed of leptoids, Figure 41) conducts assimilates, and that sucrose applied to the outside of the plant ends up in the leptoids (Trachtenberg & Zamski 1978). In tracheophytes, many other substances can travel in the phloem, the tracheophyte counterpart of the leptome. But, in a bryophyte, how does one examine what is travelling in a tube so small it cannot be seen without a microscope, for which preparation is likely to disrupt the whole process?
Figure 40. Funaria hygrometrica spore with developing
protonema. Zinc and copper are toxic to both the spore and the protonema. Photo by Janice Glime.
One of the most fascinating techniques (to me at least) in all biology is the use of aphids to determine what travels in conducting tissues. Well, even bryophytes can have aphids! And Thomas and Lombard (1991) have taken advantage of this fascinating tool to determine just what travels in the leptoids of Polytrichum commune (Figure 16-Figure 17). The aphid, Myzodium modestum (Figure 42), a moss aphid and thus quite small, inserts a needlelike stylet into the moss conducting tissue (leptoids) to get nutrients. Thomas and Lombard found that when P. commune leaves are treated with 14C-sucrose, 17-34% of the labelled carbon can be detected in 2-15 aphids within four hours. In fact, these aphids are so efficient at removal that the movement of sucrose to other parts of the plant and to shared underground rhizomes is reduced from its normal 4% to 1% or less.
Figure 41. Cross section of Polytrichum stem. Photo
courtesy of Isawa Kawai.
Figure 42. Myzodium modestum adult, a species that taps
into the "sap" in leptoids of Polytrichum. Photo from CBG Photography Group, through Creative Commons.

Chapter 8-5: Nutrient Relations: Translocation and Transport 13
In Polytrichum commune (Figure 16-Figure 17), labelled 14C from sucrose applied externally quickly appeared in the growing stem apex, young leaves, bud initials, and underground axes, all sinks for this C source (Reinhart & Thomas 1981). It appears that the C is more likely to move acropetally (toward the tip) than basipetally (toward the base). Nevertheless, labelled C travels from the leaves both acropetally (Eschrich & Steiner 1967) to the growing shoot apex and basipetally to underground rhizomes (Collins & Oechel 1974). The movement of externally applied sucrose requires ATP as an energy source for uptake, followed by movement from the apoplastic free space (see below) into the leptome, similar to phloem loading in tracheophytes (Reinhart & Thomas 1981).
The movement of externally applied labelled 14C in Polytrichum commune (Figure 16-Figure 17), and by implication also the plant's own photosynthate, reaches several other leaves within two hours and reaches the rhizome within 72 hours or less (Reinhart & Thomas 1981). Experiments using radioactively labelled 14C demonstrate that C moves in mosses in a source-to-sink fashion, as it does in tracheophytes. Furthermore, movement to the underground axis in this and other mosses allows translocation to neighboring members of a clone (Thomas et al. 1988, 1990), either directly through rhizomatal connections or indirectly through carbohydrates that escape into the soil/moss medium and can be absorbed. The carbon is both used and stored, with labelled carbon appearing in starches and cell wall polysaccharides one week and six weeks later, respectively (Thomas et al. 1988).
As you might expect, the patterns of translocation will vary between species of bryophytes, even in the same ecosystem. For example, near Fairbanks, Alaska, in a Picea mariana forest (Figure 43), Polytrichum commune (Figure 16-Figure 17) retained the most of labelled 14C after 2 hours, while Sphagnum subsecundum (Figure 44) retained the least (Skré et al. 1983). However, after 35 days, it was Sphagnum subsecundum that had the highest fraction of radiolabelled 14C in the brown tissues, with Polytrichum commune coming in second. The two pleurocarpous feather mosses, Hylocomium splendens (Figure 27-Figure 28) and Pleurozium schreberi (Figure 25), had no consistent pattern of translocation after 2 hours or 35 days. All four species exhibited high loss of labelled 14C to respiration (presumably photorespiration) during the first 2 hours, which coincided with the peak of the growth season.
Sphagnum papillosum (Figure 9-Figure 11) translocated 14C in the soluble fraction from older parts of the moss to the apex, with very little transfer into the insoluble fraction, to neighbors, or into the gas phase (Rydin & Clymo 1989). In fact, the transfer of 14C to the capitulum from lower portions of the plant was about equal to that lost from the capitulum through respiration. The capitulum also transferred about twice as much 14C to the insoluble fraction and about half as much to its neighbors. After 22 weeks, about 25% of the remaining labelled carbon was incorporated into new tissues.
Figure 43. Black spruce (Picea mariana) in Alaska taiga,
home of Polytrichum commune, Sphagnum subsecundum, and feather mosses Pleurozium schreberi and Hylocomium splendens. Photo from NOAA, through public domain.
Figure 44. Sphagnum subsecundum, a species that stores
carbon in its lower brown tissues. Photo by Michael Lüth, with permission.
Apoplastic Transport Cell walls and extracellular spaces form the apoplast
of a plant, including any bryophyte. Because the apoplast provides capillary spaces, it facilitates the movement of water and solutes across the plant tissues (Figure 45). Even the cell wall is composed of cellulose fibers that provide minute capillary spaces (Figure 46). But little seems to be published about apoplastic transport in bryophytes. (See above under Leptome Transport and under Carbon Transport; below under Sporophyte Conduction).
Figure 45. Apoplastic and symplastic pathways through
cells. Note that such large vacuoles are not common in healthy bryophytes. Image by Jackacon, through public domain.

8-5-14 Chapter 8-5: Nutrient Relations: Translocation and Transport
Figure 46. Cellulose SEM showing spaces among the fibers.
Photo by Guiotoku et al. 2012, through Creative Commons.
David Hanson (Bryonet) has raised the interesting question about apoplastic movement of sugars in bryophytes. Would this sugar excretion that is beneficial to bacteria and fungi be less favorable in flowing water? I might add, would it instead facilitate the proliferation of the microbial community in the water, providing a nearby source of CO2 for the CO2-limited aquatic species? There is much to learn about nutrient relationships of bryophytes.
Desiccation Effects
Few studies have addressed the effects of desiccation on internal transport in bryophytes. In particular, the specialized food conduction cells (leptoids) of desiccation-tolerant mosses like Polytrichastrum formosum (Figure 47-Figure 48) undergo numerous changes during dehydration (Pressel et al. 2006). The endoplasmic microtubules disappear; the plastids, nucleus, and mitochondria become rounded and lose their longitudinal alignment of organelles. Instead of the typical stacks of endoplasmic reticulum of hydrated tissues, membranous tubules arranged at right angles to the main cellular axis appear. Small vacuoles fill the internal cytoplasm. The plasmalemma forms labyrinthine tubular extensions that outline newly deposited cell wall ingrowths. Leptoids become plugged with electron-opaque material while nearby parenchyma cells are depleted of their starch deposits. However, upon rehydration the leptoids return to their normal cytology within 12-24 hours. When the toxic oryzalin is provided to the plants, it prevents this recovery, indicating the importance of processes of living cells. Pressel and coworkers interpreted this to indicate a key role of the microtubular cytoskeleton in the recovery of the leptoids.
External Translocation
It is well known that water moves externally in mosses (and also internally to varying degrees). Nutrients in the solution move with the water, and nutrients adhering to the leaves can be carried with the water as well. Even soil nutrients can be moved upward this way.
As mosses die, especially those with an upright habit, ions can be moved externally from basal portions to upper portions rather easily (Brehm 1971; Brown 1982). Dead and dying lower tissues release ions that go into solution in the external surface film. Evaporative loss of water (transpiration) from the capitulum of Sphagnum (Figure
7-Figure 11) and from apices of Bryopsida causes water to move upward through the external capillary spaces. As it does, it carries with it the ions leaked from dead and dying cells. These can then be absorbed on the exchange sites of the apex. Brown (1982) considered that the higher concentrations of Ca++, K+, and Mg++ in Mnium hornum (Figure 49) in higher light intensities (Thomas 1970, in Brown 1982) could be the result of increased transpiration. But is it moved internally or externally? It has a well-developed internal conduction system (Figure 50).
Figure 47. Polytrichastrum formosum capsules, a moss
with internal conduction. Photo by Michael Lüth, with permission.
Figure 48. Polytrichastrum formosum stem cs showing
leptoids and hydroids. The leptoids undergo structural changes when dehydrated and regain normal structure when rehydrated. Photo by Botany Website, UBC, with permission.

Chapter 8-5: Nutrient Relations: Translocation and Transport 15
Figure 49. Mnium hornum, a species that may transport
nutrients through a transpiration stream. Photo by Michael Lüth, with permission.
Figure 50. Mnium stem showing central strand where
hydroids occur and leaf traces (arrows) connect to leaf bases. Photo by Janice Glime.
Sporophyte Conduction As we have already seen for water, the sporophyte gets
nutrients, hormones, and an energy supply from the gametophyte through the sporophyte foot (Figure 51-Figure 53) (Courtice et al. 1978). Some of the evidence for this transfer is indirect. For example, in Polytrichastrum formosum (Figure 47-Figure 48), a decrease in the amino acid arginine in the gametophyte is coincidental with an increase in the sporophyte (Whel 1975). Whel suggested that this parallels the tracheophyte movement of N from a mature to young organ.
Figure 51. Marchantia polymorpha (thallose liverwort)
capsule ls showing location of the foot next to gametophyte tissues. Photo from Botany Website, UBC, with permission.
Figure 52. Liverwort (Pellia) young sporophyte. Photo by
Paul Davison, with permission.
Figure 53. Sphagnum capsule ls showing foot imbedded in
pseudopodium (gametophyte) tissue. Photo from Botany Website, UBC, with permission.
The internal structure reveals transfer cells at the gametophyte-sporophyte junction (Figure 54; Lal &

8-5-16 Chapter 8-5: Nutrient Relations: Translocation and Transport
Chauhan 1981). The transfer cells are found in the foot of the sporophyte and in the adjacent gametophyte tissue and are endowed with an extensive and complex wall labyrinth. Ligrone and Renzaglia (1990) demonstrated that the hornwort Dendroceros tubercularis, as in other hornworts, is endowed with dense protein deposits in the vacuoles of both gametophyte transfer cells and the sporophyte foot. The structure of the transfer cells suggests a function in the movement of metabolites from the gametophyte to the sporophyte by their numerous mitochondria and intense enzyme activity, especially of phosphatases and some respiratory enzymes (Lal & Chauhan 1981).
The junction cells are the first to differentiate in the young sporophyte (Kwok & Rushing 1999). The transfer cells on both sides of the junction have plastids and starch content, with numerous small vacuoles and lipid deposits in the junction cells, further supporting the role of this region in transfer of nutrients to the sporophyte.
Caussin et al. (1983) demonstrated that sporophytes of Polytrichastrum formosum (Figure 47-Figure 48) absorb the amino acids glycine, threonine, and α-aminoisobutyric acid through the haustorial (absorptive) foot, using the transfer cells. Removal of the haustorial foot significantly reduced the absorption of these amino acids into the sporophyte.
Figure 54. Transfer cell showing wall labyrinth. Computer-
drawn from photo in Lal and Chauhan (1981).
Chevallier et al. (1977) demonstrated that radioactive orthophosphate moved from the gametophyte to the capsule and eventually to the spores in Funaria hygrometrica (Figure 55). However, once the capsule turned from green to brown, indicating maturity, the original 18% transfer rate turned to zero. But this is not the only potential means for the sporophyte to get its nutrients. It is, at least in Funaria hygrometrica, able to absorb nutrients directly through its capsule, hence opening the possibility that it gets some sporophyte nutrients from dust and rainwater.
It appears that K+ moves into the developing sporophyte rapidly, whereas Ca++, which is generally immobile, moves more slowly (Brown 1982). In Brown's study, as the gametophyte senesced, its K+ diminished and the concentrations of Ca++ and Mg++ increased, presumably due to movement of K+ from the senescing gametophyte to
the young sporophyte, followed by Ca++ and Mg++ occupying the vacated exchange sites on the gametophyte.
Figure 55. Capsules of Funaria hygrometrica. Photo by
Janice Glime.
Marsh and Doyle (1981) demonstrated that sugars are transported actively by the transfer cells. A more startling discovery is that the sporophyte of Anthoceros punctatus (Figure 56) transfers sugars from the photosynthetic sporophyte to the thallose gametophyte, where it is used by its Nostoc (Figure 57) partner (Stewart & Rodgers 1977)!
Figure 56. Thallus of Anthoceros punctatus with young
sporophytes. Photo by Des Callaghan, with permission.
Figure 57. Anthoceros punctatus Nostoc colonies (dark
area). Photo by Des Callaghan, with permission.

Chapter 8-5: Nutrient Relations: Translocation and Transport 17
As nutrients cross the placenta (gametophyte-sporophyte interface) into the sporophyte, there is another opportunity for nutrient discrimination. Basile et al. (2001) found that the gametophyte accumulated much greater quantities of Pb and Zn than did the sporophyte in Funaria hygrometrica (Figure 55). These two elements accumulated in the placental transfer cells on both gametophytic and sporophytic sides. When the two metals were applied in the lab, Basile and coworkers found that the two generations had different accumulation quotients.
The size of the sporophyte seems to play a role in determining the rate of transfer of carbon in the photosynthate from the gametophyte to the sporophyte (Browning & Gunning 1979). In Funaria hygrometrica (Figure 55), labelled gametophyte photosynthetic products were transported to the sporophyte at a linear rate for up to 12 hours after treatment with 14CO2. Movement from the haustorium (nutrient exchange area in foot of sporophyte) to the capsule, through the seta, occurs at the slow rate of 1-3 mm h-1. And larger sporophytes received the photosynthate at a faster rate than did smaller ones. Does this mean that there is a source-sink movement, with larger capsules forming a larger sink? Or is there a transpiration stream involved in which larger capsules lose water faster, hence drawing water up from the gametophyte much like a tracheophyte water stream? Both water stress and lack of light inhibited transport, but if only the sporophyte was darkened, it had no effect. This again suggests the possibility of a source-sink movement, with the source (gametophyte) becoming depleted of photosynthate in the dark. But it is also possible that a transpiration stream could be involved, as suggested by the loss of movement under drought stress. Both could contribute.
In members of Polytrichum s.l. (Figure 58-Figure 59), transport of carbon from the gametophyte to the sporophyte is especially important (Renault et al. 1992). The calyptra completely covers the capsule and is fortified with dense hairs, limiting photosynthesis by the capsule. In Polytrichastrum formosum (Figure 47-Figure 48) sucrose serves as the primary soluble sugar for both the sporophyte and gametophyte. However, in the apoplast (capillary spaces in cell wall) of the vaginula (bottom part of archegonium when calyptra separates; foot of sporophyte is imbedded in vaginula – Figure 60) the sugars are primarily hexoses, with the conversion from sucrose to hexose facilitated by a cell wall invertase at pH of 4.5. The highest concentration (~230 mM) of soluble invertase occurs in both the haustorium and the vaginula, where a soluble invertase has its highest activity (pH 7.0). Glucose uptake is carrier-mediated, with little dependence on external pH. Once glucose is absorbed into the haustorium, it is converted to sucrose. Hence, sucrose is converted at the gametophyte-sporophyte interface to fructose and glucose, then converted back to sucrose after the haustorium cells absorb hexose. These changes may permit the sugar accumulation in the haustorium.
A more detailed anatomy of the gametophyte-sporophyte junction in the moss Acaulon muticum (Figure 61) may clarify some of the nutrient transfer (Rushing & Anderson 1996). This junction has the sporophyte foot imbedded in the gametophyte vaginula, with intervening placental space. The basal cell of the foot develops extensive wall ingrowths. Sporophyte cells that contact
that basal cell likewise develop ingrowths on their outer tangential and radial walls that contact the basal cell. These young sporophyte cells have numerous mitochondria, strands of endoplasmic reticulum, and dictyosomes, especially adjacent to areas of extensive wall development. The plastids contain abundant reserves of starch. The wall ingrowths continue to become more extensive on all walls of the sporophyte foot, but never occur on the upper wall of the basal cell where it contacts the remainder of the sporophyte. As the sporophyte develops, the plastids of the foot contain fewer starch reserves. The gametophyte vaginula does not exhibit wall ingrowths until the sporophyte foot is well developed. Rushing and Anderson suggested that the early development of the wall ingrowths in the sporophyte foot and especially the basal cell may facilitate the rapid movement of both water and nutrients from gametophyte to sporophyte.
Figure 58. Polytrichum juniperinum stem CS showing
conducting hydrome and leptome that continue into the seta. Photo from Botany Website, UBC, with permission.
Figure 59. Polytrichum juniperinum seta cross section
showing cells in the center where conduction occurs. Photo by Dale A. Zimmerman Herbarium, Western New Mexico University, with permission.
8-5-18 Chapter 8-5: Nutrient Relations: Translocation and Transport
Figure 60. Vaginula cross section showing turquoise-
stained cells on left that contact the sporophyte foot. Source unknown.
Figure 61. Acaulon muticum, a species with a very short
seta that helped us understand the structure of the vaginula and foot. Photo by Michael Lüth, with permission.
There has been much recent speculation into the role of the stomata in the sporophyte of bryophytes. Haig (2013) suggests an important function in conduction. Once the calyptra has been "outgrown" by the capsule, leaving the lower part of the capsule exposed, the stomata may provide a transpiration stream that helps to draw resources from the gametophyte up to the sporophyte, much as the open stomata of tree leaves facilitate the transpiration stream of water and nutrients upward in trees. Haig contends that the seta serves to raise the capsule above the boundary layer, facilitating the movement of moisture from the moss to the air and coincidentally moving the nutrients upward from the gametophyte. Haig further suggests that the calyptra serves to protect the gametophyte from excessive transfer to the developing sporophyte.
Summary While most bryophytes obtain their nutrients
primarily from atmospheric dust and precipitation, acrocarpous mosses may also receive considerable input from the substrate through upward movement externally and subsequent internal movement. Cation
exchange sites hold nutrients on leafy surfaces and facilitate uptake and discrimination between ions. Further active processes are able to distinguish ions formed by N, P, and K from more exchangeable cations such as those of Ca++ or Mg++, and they are generally able to maintain relatively constant levels of these essential nutrients despite changes in environmental concentrations. Bryophytes use pathways both through cells (symplastic) and between cells (apoplastic) to move internal substances, just as do the tracheophytes. And they may even have a filter similar to the endodermis, in the form of a leptome, at least in the Polytrichaceae. Leptome cells may become disfigured during desiccation, but they return rapidly to normal configuration following rehydration.
Many bryophytes also behave like tracheophytes in moving essential ions such as those formed by N, P, and K from older to younger parts, whereas less soluble ions like Ca++ remain in older tissues. Their ability to acquire ions from rainwater and hold them in their tissues makes them a sink for forest nutrients, but some, especially K+, may be released in heavy rainfall following a dry period, returning the nutrients to the forest floor as a pulse. Heavy metals may be sequestered in older tissues or on external exchange sites. Movement may additionally occur through source to sink mechanisms or a transpiration stream.
Sucrose is transported in the leptome, as well as through stem parenchyma cells. Radiolabelled carbon quickly appears in the stem apex, young leaves, bud initials, and underground axes. Most of the movement is toward the apex (acropetal), but some also moves to the base (basipetally). Some reaches other stems in the clone. The leptome also moves ionic solutes, whereas the chelated forms move in the hydroids.
Sugars and nutrients move from the gametophyte to the sporophyte through the transfer cells in the sporophyte foot. But members of the Anthocerotophyta may transfer photosynthate from the green sporophyte to the gametophyte to nourish the Nostoc colonies. Stomata at the base of the capsule may create a transpiration stream that helps to move resources from the gametophyte to the sporophyte once the capsule is partially free of the calyptra.
Their ability to move nutrients from old to young tissues and to store them both externally and internally raises serious questions about their role in the nutrient cycling in the habitats where they are abundant. On the other hand, they may release potassium when roots need it the most.
Acknowledgments I appreciate the contributions of undergraduate Phil
Gaudette and M. S. student Jennifer Jermalowicz Jones for their critical reading of the manuscript from the perspectives of students interested in nutrient relationships of bryophytes.
Literature Cited Aldous, A. R. 2002. Nitrogen translocation in Sphagnum
mosses: Effects of atmospheric nitrogen deposition. New Phytol. 156: 241-253.
Chapter 8-5: Nutrient Relations: Translocation and Transport 19
Alpert, P. 1989. Translocation in the nonpolytrichaceous moss Grimmia laevigata. Amer. J. Bot. 76: 1524-1529.
Andel, O. M. Van. 1952. Germination of spores and development of primary and secondary protonema of Funaria hygrometrica. Trans. Brit. Bryol. Soc. 2: 74-81.
Bakken, S. 1995. Effects of nitrogen supply and irradiance on growth and nitrogen status in the moss Dicranum majus from differently polluted areas. J. Bryol. 18: 707-721.
Basile, A., Cogoni, A. E., Bassi, P., Fabrizi, E., Sorbo, S., Giordano, S., and Castaldo Cobianchi, R. 2001. Accumulation of Pb and Zn in gametophytes and sporophytes of the moss Funaria hygrometrica (Funariales). Ann. Bot. 87: 537-543.
Bates, J. W. 1979. The relationship between physiological vitality and age in shoot segments of Pleurozium schreberi (Brid.) Mitt. J. Bryol. 60: 339-351.
Bates, J. W. and Farmer, A. M. 1990. An experimental study of calcium acquisition and its effects on the calcifuge moss Pleurozium schreberi. Ann. Bot. 65: 87-96.
Brehm, K. 1971. Ein Sphagnum-bult als Beispiel einer naturlichen Ionenaustauschersaule. Beitr. Biol. Pflanzen 47: 287-312.
Brown, D. H. 1982. Mineral nutrition. In: Smith, A. J. E. (ed.). Bryophyte Ecology, Chapman & Hall, London, pp. 383-444.
Browning, A. J. and Gunning, B. E. S. 1979. Structure and function of transfer cells in the sporophyte haustorium of Funaria hygrometrica Hedw. III. Translocation of assimilate into the attached sporophyte and along the seta of attached and excised sporophytes. J. Exper. Bot. 30: 1265-1273.
Brümelis, G. and Brown, D. H. 1997. Movement of metals to new growing tissue in the moss Hylocomium splendens (Hedw.) BSG. Ann. Bot. 79: 679-686.
Caussin, C., Fleurat-Lessard, P., and Bonnemain, J. L. 1983. Absorption of some amino acids by sporophytes isolated from Polytrichum formosum and ultrastructural characteristics of the haustorium transfer cells. Ann. Bot. 51: 167-173.
Chevallier, D., Nurit, F. and Pesey, H. 1977. Orthophosphate absorption by the sporophyte of Funaria hygrometrica during maturation. Ann. Bot. 41: 527-531.
Collins, N. J. and Oechel, W. C. 1974. The pattern of growth and translocation of photosynthate in a tundra moss, Polytrichum alpinum. Can. J. Bot. 52: 355-363.
Coombes, A. J. and Lepp, N. W. 1974. The effect of Cu and Zn on the growth of Marchantia polymorpha and Funaria hygrometrica. Bryologist 77: 447-452.
Courtice, G. R. M., Ashton, N. W., and Cove, D. J. 1978. Evidence for the restricted passage of metabolites into the sporophyte of the moss Physcomitrella patens (Hedw.) Br. Eur. J. Bryol. 10: 191-198.
Duckett, J. G. and Ligrone, R. 2003. What we couldn't have done if we'd stayed in Europe: Selection and serendipity in the Southern Hemisphere! Bull. Brit. Bryol. Soc. 80: 19-21.
Eckstein, R. L. and Karlsson, P. S. 1999. Recycling of nitrogen among segments of Hylocomium splendens as compared with Polytrichum commune: Implications for clonal integration in an ectohydric bryophyte. Oikos 86: 87-96.
Eschrich, W. J. and Steiner, M. 1967. Autoradiographische Untersuchungen zum Stofftransport bei Polytrichum commune. Planta 74: 330-349.
Garciadeblas, B., Barrero-Gil, J., Benito, B., and Rodríguez-Navarro, A. 2007. Potassium transport systems in the moss Physcomitrella patens: PpHAK1 plants reveal the complexity of potassium uptake. Plant J. 52: 1080-1093.
Gerdol, R. 1990. Seasonal variations in the element concentrations in mire water and in Sphagnum mosses on an ombrotrophic bog in the southern Alps. Lindbergia 16: 44-50.
Guiotoku, M., Hansel, F. A., Novotny, E. H., and Branco de Freitas Maia, C. M. 2012. Molecular and morphological characterization of hydrochar produced by microwave-assisted hydrothermal carbonization of cellulose. Pesquisa Agropecuária Brasileira 47: 687-692.
Haig, D. 2013. Filial mistletoes: The functional morphology of moss sporophytes. Ann. Bot. 111: 337-345.
Hájek, T. and Adamec, L. 2009. Mineral nutrient economy in competing species of Sphagnum mosses. Ecol. Res. 24: 291-302.
Hébant, C. 1974. The phloem (leptome) of bryophytes. In: Aronoff, S., Dainty, J., Gorham, P. R., Srivastava, L. M., and Swanson, C. A. (eds.). Phloem Transport. Plenum Press, N. Y., pp. 211-215.
Hébant, C. 1976. Studies on the development of the conducting tissue-system in the gametophytes of some Polytrichales. III. Further observations on leptoids, with particular reference to their endoplasmic reticulum. Protoplasma 87: 79-90
Hébant, C. 1977. The Conducting Tissues of Bryophytes. J. Cramer, Lehre, Germany, 157 pp. + 80 Plates.
Kwok, L. Y., and Rushing, A. E. 1999. An ultrastructural and developmental study of the sporophyte-gametophyte junction in Ephemerum cohaerens. Bryologist 102: 179-195.
Lal, M. and Chauhan, E. 1981. Transfer cells in the sporophyte – gametophyte junction of Physcomitrium cyathicarpum Mitt. Protoplasma 107: 79-83.
Li, Y. and Vitt, D. H. 1997. Patterns of retention and utilization of aerially deposited nitrogen in boreal peatlands. Ecoscience 4: 106-116.
Ligrone, R. and Duckett, J. G. 1998. The leafy stems of Sphagnum (Bryophyta) contain highly differentiated polarized cells with axial arrays of endoplasmic microtubules. New Phytol. 140: 567-579.
Ligrone, R. and Renzaglia, K. S. 1990. The sporophyte-gametophyte junction in the hornwort, Dendroceros tubercularis Hatt. (Anthocerotophyta). New Phytol. 114: 497-505.
Ligrone, R., Duckett, J. G., and Renzaglia, K. S. 2000. Conducting tissues and phyletic relationships of bryophytes. Philosoph. Trans. Royal Soc. London B 355: 795-813.
Mahmoud, M. I. 1965. Protoplasmics and drought resistance in mosses. Ph. D. Thesis, Univ. Calif., Davis.
Marsh, B. H. and Doyle, W. T. 1981. Transport in transfer cells of a bryophyte. Plant Physiol. 67 (Suppl. 4): 24.
Mártínez Abaigar, J., García Alvaro, M. A., Beaucourt, N., and Núñez Olivera, E. 2002. Combined seasonal and longitudinal variations of element concentrations in two aquatic mosses (Fontinalis antipyretica and F. squamosa). Nova Hedw. 74: 349-364.
Oliver, M. J. and Bewley, J. D. 1984. Desiccation and ultrastructure in bryophytes. Adv. Bryol. 2: 91-131.
Pressel, S., Ligrone, R., and Duckett, J. G. 2006. Effects of de- and rehydration on food-conducting cells in the moss Polytrichum formosum: A cytological study. Ann. Bot. 98: 67-76.
Raeymaekers, G. 1987. Effects of simulated acidic rain and lead on the biomass, nutrient status, and heavy metal content of Pleurozium schreberi (Brid.) Mitt. J. Hattori Bot. Lab. 63: 219-230.
Raeymaekers, G. and Glime, J. M. 1990. Effect of simulated acidified canopy throughfall on the composition of percolate

8-5-20 Chapter 8-5: Nutrient Relations: Translocation and Transport
and the chlorophyll content from Pleurozium schreberi (Brid.) Mitt. Mém. Soc. Roy. Bot. Belg. 12: 67-76.
Reinhart, D. A. and Thomas, R. J. 1981. Sucrose uptake and transport in conducting cells of Polytrichum commune. Bryologist 84: 59-64.
Renault, S., Bonnemain, J. L., Faye, L., and Gaudillere, J. P. 1992. Physiological aspects of sugar exchange between the gametophyte and the sporophyte of Polytrichum formosum. Plant Physiol. 100: 1815-1822.
Rühling, A. and Tyler, G. 1970. Sorption and retention of heavy metals in the woodland moss Hylocomium splendens (Hedw.) Br. et Sch. Oikos 21: 92-97.
Rushing, A. E. and Anderson, W. B. 1996. The sporophyte-gametophyte junction in the moss Acaulon muticum (Pottiaceae): Early stages of development. Amer. J. Bot. 83: 1274-1281.
Rydin, H. and Clymo, R. S. 1989. Transport of carbon and phosphorus compounds about Sphagnum. Proc. Roy. Soc. London B 237: 63-84.
Skré, O., Oechel, W. C., and Miller, P. M. 1983. Patterns of translocation of carbon in four common moss species in a black spruce (Picea mariana) dominated forest in interior Alaska. Can. J. Forest Res. 13: 869-878.
Stewart, W. D. P. and Rodgers, G. A. 1977. The cyanophyte-hepatic symbiosis. II. Nitrogen fixation and the interchange of nitrogen and carbon. New Phytol. 78: 459-471.
Thomas, H. 1970. Ph. D. Thesis, University of Bristol.
Thomas, R. J. and Lombard, C. S. 1991. Aphid infestation and its effects on translocation in Polytrichum commune. Bryologist 94: 1-4.
Thomas, R. J., Schiele, E. M., and Scheirer, D. C. 1988. Translocation in Polytrichum commune (Bryophyta) I. Conduction and allocation of photoassimilates. Amer. J. Bot. 75: 275-281.
Thomas, R. J., Schiele, E. M., and Damberg, D. T. 1990. Translocation in Polytrichum commune (Bryophyta). II. Clonal integration. Amer. J. Bot. 77: 1569-1573.
Trachtenberg, S. and Zamski, E. 1978. Conduction of ionic solutes and assimilates in the leptom of Polytrichum juniperinum Willd. J. Exper. Bot. 29: 719-727.
Wells, J. M. and Brown, D. H. 1996. Mineral nutrient recycling within shoots of the moss Rhytidiadelphus squarrosus in relation to growth. J. Bryol. 19: 1-17.
Whel, C. 1975. Quantitative changes in free amino acids in Polytrichum formosum during development. Phytochemistry 14: 2337-2340.

Glime, J. M. 2017. Nutrient Relations: Deficiency. Chapt. 8-6. In: Glime, J. M. Bryophyte Ecology. Volume 1. Physiological Ecology. 8-6-1 Ebook sponsored by Michigan Technological University and the International Association of Bryologists. Last updated 6 March 2017 and available at <http://digitalcommons.mtu.edu/bryophyte-ecology/>.
CHAPTER 8-6
NUTRIENT RELATIONS: DEFICIENCY
TABLE OF CONTENTS Nutrient-deficient Habitats.................................................................................................................................. 8-6-2 Nutrient Deficiency Symptoms........................................................................................................................... 8-6-3 N and P Deficiency ...................................................................................................................................... 8-6-5 K Deficiency .............................................................................................................................................. 8-6-10 Ca Deficiency............................................................................................................................................. 8-6-10 Mg Deficiency ........................................................................................................................................... 8-6-12 S Deficiency............................................................................................................................................... 8-6-13 Fe Deficiency ............................................................................................................................................. 8-6-13 Micronutrient Deficiency........................................................................................................................... 8-6-13 Oxygen Deficiency .................................................................................................................................... 8-6-14 Community Effects of Deficiencies .................................................................................................................. 8-6-14 Summary ........................................................................................................................................................... 8-6-15 Acknowledgments............................................................................................................................................. 8-6-16 Literature Cited ................................................................................................................................................. 8-6-16

8-6-2 Chapter 8-6: Nutrient Relations: Deficiency
CHAPTER 8-6
NUTRIENT RELATIONS: DEFICIENCY
Figure 1. Dicranum spadiceum in an alpine habitat where nutrients are typically deficient. Photo by Michael Lüth, with
permission.
Nutrient-deficient Habitats Tracheophytes have well-known adaptations to low
nutrients. Among the herbaceous seed plants adapted for low nutrient habitats, a small growth form with narrow leaves or basal rosettes seems to predominate (Grime 1977). Evergreenness is common in both dry and wet habitats (bogs and fens), presumably affording the plant the opportunity of using their leaves for several years without having to provide the nutrients to grow a new supply. Like the shade plants, these plants possess an inherently slow growth rate.
Bryophytes in general seem to grow best in low-nutrient habitats (Figure 1). It is interesting that their productivity is no greater in extreme rich fens than in bogs and poor fens (Vitt 1990). Furthermore, the addition of nutrients to bryophytes in intermediate fens does not result in an increase in productivity. If we compare the bryophytes to the low-nutrient-adapted plants described by
Grime (1977), the bryophytes are likewise small, have narrow leaves, and are mostly evergreen (but not leathery). As discussed earlier, they are able to move soluble nutrients from older tissues to growing apices. Furthermore, bryophytes are able to survive in low-nutrient habitats despite their small size and slow growth rate. In nutrient-rich habitats, they have no chance of competing with the fast-growing tracheophytes.
In bogs and fens, Sphagnum seems to have its own way of "competing" for the limited supply of nutrients. In experiments where both Sphagnum fuscum (Figure 2) and Drosera rotundifolia (sundew, Figure 2) were fertilized with N, the Sphagnum was able to advance its growth (Svensson 1995), seemingly ready to outcompete the tiny Drosera plants for light. However, the Drosera tapped into the nutrients at a different depth in the system, elongated its vertical stem that connected two successive years of

Chapter 8-6: Nutrient Relations: Deficiency 8-6-3
growth, and hence kept up with the vertical growth of the Sphagnum. Interestingly, the Drosera made more but smaller leaves and increased its leaf thickness, thus not increasing its shading effect on the moss. Svensson concluded that the moss relocates the nutrients within itself, thus preventing their potential spread to tracheophytes.
Figure 2. Sundew (Drosera rotundifolia) (three round
leaves) growing with Sphagnum fuscum. Photo by Michael Lüth, with permission.
Bryophytes can be deprived of nutrients in habitats that are rich in nutrients. This paradox results from nutrient competition for the binding sights. Calcium compounds such as CaCl2 can raise both exchangeable and intracellular Ca++ concentrations and displace other exchangeable essential nutrients such as K+ and Mg++ (Bates & Farmer 1990), both of which are often in limiting supply. But the interesting response to addition of CaCl2 that Bates and Farmer found is that the low-nutrient mosses Pleurozium schreberi (Figure 3) and Pseudoscleropodium purum (Figure 4) from acidic clay were unaffected, whereas Calliergon cuspidatum (Figure 5) and Pseudoscleropodium purum from chalk (CaCO3) soil suffered reduced growth, apparently due to the resulting K+ and Mg++ deficiencies.
Figure 3. Pleurozium schreberi, a low-nutrient species that
was unaffected by CaCl2. Photo by Janice Glime.
Ion concentrations in the substrate or in water can be misleading relative to nutrient availability. A low-nutrient substrate such as a rock in a forest might actually place the bryophyte in a position to obtain considerable nutrients from throughfall that has collected nutrients from the
canopy trees. And bryophytes dwelling in a stream with reasonably fast flow will have a continuous supply of new nutrients that can compensate for low concentrations (Birks & Dransfield 1970).
Figure 4. Pseudoscleropodium purum, a low-nutrient
species that was unaffected by CaCl2 on acidic soil but suffered on chalk soil. Photo by Michael Lüth, with permission.
Figure 5. Calliergonella cuspidata, a species that suffers
from addition of CaCl2 on chalk soil. Photo by Michael Lüth, with permission.
Nutrient Deficiency Symptoms
It takes nerve to title a section Nutrient Deficiency Symptoms when you are writing about bryophytes. This has apparently never been systematically studied for bryophytes in general! A search in Cambridge Abstracts brought one reference, a field study following fire: "Germination of Ceratodon purpureus (Figure 6) on all the burnt surfaces, and of Funaria hygrometrica (Figure 7) on the charred surfaces appeared to be nutrient or pH-limited. Growth of C. purpureus and Dicranella heteromalla (Figure 8) appeared to be nutrient- or pH-limited on some or all of the burnt surfaces." This 1994 study by Thomas et al. appears to be the only field study in recent years even to allude to nutrient deficiency symptoms in any context. And that one is merely a guess.

8-6-4 Chapter 8-6: Nutrient Relations: Deficiency
Figure 6. Healthy Ceratodon purpureus with young
sporophytes. Photo by Jiří Kameníček, with permission.
Figure 7. Funaria hygrometrica growing among charcoal.
Photo by Janice Glime.
Figure 8. Dicranella heteromalla, a species that appears to
be pH- or nutrient-limited when growing on burned substrata.
Culture studies for the purpose of keeping bryophytes alive are the most productive avenue for locating possible clues as to the response of bryophytes to limiting nutrients.
But, since bryophytes tend to have much lower nutrient requirements than do tracheophytes (Griggs & Ready 1934; Voth 1943; Burkholder 1959; Southorn 1977; Dietert 1979), most of the trial and error in culture experiments revolves around getting nutrient concentrations low enough that algae, fungi, and bacteria don't predominate. For whatever reason, the total nutrient content of bryophytes, indicated by what is left in dry matter ash content, is lower than that of any other group of plants, algae, bacteria, or fungi, except for the woody parts of trees and shrubs (Table 1; Larcher 1983, 1995).
Table 1. Comparison of mean dry matter ash content for various groups of organisms. From compilation of Larcher (1983, 1995).
Bacteria 8-10% Fungi 7-8% Planktonic algae without skeletal material ~5% Diatoms up to 50% Seaweed 10-20% Mosses 2-4% Ferns 6-10% Grasses 6-10% Dicotyledonous herbs 6-18% Geophytes 5-10% Succulents 10-20% Halophytes 10-55% Cacti 10-16% Tundra herbs ~5% Swamp plants 5-15% Ericaceous dwarf shrubs Leaves 3-6% Shoots 1-2% Broad-leaved trees Leaves 3-4% Wood ~0.5% Bark 3-8% Conifers Needles ~4% Wood ~0.4% Bark 3-4%
In addition to ions that compete for exchange sites, another problem with nutrient solutions is that they may have higher osmotic values than those internal ones of the bryophytes, causing osmotic shock (Brown 1982). Furthermore, the slow growth of bryophytes permits them to call upon nutrient reserves for a considerable time before deficiency symptoms appear. If multiple nutrients are limiting, the result is likely to be simply retarded growth rate, at least in the short term.
In a study on the epiphyllous leafy liverwort Radula flaccida (Figure 9), Olarinmoye (1975) found that when grown in distilled water, these liverworts became chlorotic and brittle, but still demonstrated considerable growth extension, indicating they most likely were using nutrient reserves. They did best in a nutrient medium diluted to 10-20% of the normal strength bryophyte medium, a solution already dilute compared to that used for most tracheophytes.

Chapter 8-6: Nutrient Relations: Deficiency 8-6-5
Figure 9. Radula flaccida, a species that becomes chlorotic
and brittle when grown in distilled water. Photo by Michaela Sonnleitner, with permission.
N and P Deficiency Nutrient deficiency, especially N and P, can reduce
plant growth by hindering physiological and biochemical processes. Deficiency can reduce protein synthesis and photosynthetic rates, while increasing carbohydrate content. But are bryophytes typically nutrient deficient? There are numerous examples that suggest they typically are not. It appears that they require much lower concentrations of nutrients than do other plants, obtaining most of their nutrients from precipitation. For example, when the nutrients of rainwater near Fairbanks, Alaska, were amplified to 2-5 times their normal concentration, bryophytes showed no growth increase, and some responded negatively (Skré & Oechel 1979). Even the large moss Pseudoscleropodium purum (Figure 4) showed no response to increased nutrients in a field experiment (Bates 1987). Rather, although P. purum may exhibit a temporary increase in internal nutrient concentrations, those relatively quickly return to the concentrations typical under normal rainfall (Bates 1989).
Despite the lack of direct field evidence, Richardson (1981) recognized that inadequate nutrient supply can cause stress and reduce photosynthetic performance of mosses. On the other hand, some bryophytes such as Ceratodon purpureus (Figure 12) may alter their growth form under low nutrient conditions. In this moss, greater shoot initiation occurs on media deficient in N (Seppelt & Hancock 1991). Hmmm... Wouldn't that be maladaptive?
Figure 10. Ceratodon purpureus showing young capsules
and early spring color. Photo by Michael Lüth, with permission
Figure 11. Ceratodon purpureus showing color phase that
can reflect nutrient differences or hydration differences – or age. Photo by Janice Glime.
Figure 12. Ceratodon purpureus with mature capsules,
showing dry color phase of leaves. Photo by Michael Lüth, with permission.
Few visible deficiency symptoms seem to have been documented for bryophytes, contrasting with the symptoms that are highly documented for tracheophytes. In tracheophytes, N deficiency causes plants to be light green with lower leaves yellow due to transport of N to growing tissues; stems are short and slender, and the root-to-shoot ratio is high (Salisbury & Ross 1992). Growth is directly related to N availability in feather mosses (Sveinbjörnsson 2002). P deficiency causes plants to become dark green, often with red-purple on the undersides of leaves. As in N deficiency, the stems are short and slender. For those bryophytes that have been studied, similarities in nitrogen and phosphorus deficiency symptoms exist, but bryophyte responses in general for these two deficiencies seem to be more distinct from each other than in tracheophytes. Development of chlorosis is a typical N deficiency symptom in both tracheophytes and bryophytes. Funaria hygrometrica (Figure 7, Figure 13) responded to absence of either N or P at the protonemal stage by producing few protonemata on the deficient agar, and those soon became chlorotic in the N-free medium (Hoffman 1966), failing to produce gametophores (Dietert 1979). Atrichum undulatum (Figure 14) had a similar response of gametophores becoming yellow (Burkholder 1959). Likewise, no new gametophores were produced in the P-free medium (Hoffman 1966). Weissia (Figure 15) also became chlorotic in the absence of N (Dietert 1979), the gametophore tissue soon became tough and fibrous, and the leaves were scalelike. In P-free media, the entire culture became dark brown.

8-6-6 Chapter 8-6: Nutrient Relations: Deficiency
Figure 13. Funaria hygrometrica protonema with bud;
protonemata development is greatly reduced when P or N is deficient. Photo by Janice Glime.
Figure 14. Atrichum undulatum, a species whose leaves
turn yellow when N or P is deficient. Photo by Janice Glime.
Figure 15. Weissia controversa var. densifolia with
capsules; some members of the genus become chlorotic in the absence of N. Photo by Barry Stewart, with permission.
When mature Fontinalis antipyretica (Figure 16) was cultured in a P-free medium for four weeks, all plants had dark green leaves, as in tracheophytes, although some had scattered chlorotic leaf tips (R. Marr & Glime unpub). In the N-free medium, all had pale green leaves, again being similar to symptoms of tracheophytes. By contrast, in experiments with excess N, Fontinalis dalecarlica (Figure 17) and F. novae-angliae became deep green (Glime unpub., Figure 18-Figure 19).
Figure 16. Fontinalis antipyretica, a species of streams and
lakes. Photo from Proyecto Musgo through Creative Commons.
Figure 17. Fontinalis dalecarlica in its stream habitat.
Photo by Kristoffer Hylander, with permission.
Figure 18. Fontinalis novae-angliae habitat. Streams
typically are N-limited. Photo by Janice Glime.

Chapter 8-6: Nutrient Relations: Deficiency 8-6-7
Figure 19. Fontinalis novae-angliae in control stream water
and 100 ppm NO3, showing much darker green in the high N medium. Photo and research by Janice Glime.
Although roots of tracheophytes are affected by nutrient deficiencies, there seem to be no studies that examine the effects on bryophyte rhizoids.
Phosphorus has been considered a major limiting factor for mire plant growth (Watt 1966; Small 1972; Moore & Bellamy 1974; Li & Glime 1990). On the other hand, mosses may be more competitive against tracheophytes under low P conditions; Richards (1959) reported that mosses can uptake most of the phosphate fertilizer when mosses and grasses are growing together. Apparently the phosphorus can be stored and used later in other locations; Rydin and Clymo (1989) reported the transport of phosphorus in Sphagnum (Figure 20-Figure 29), suggesting that it was being stored for use later.
Figure 20. Sphagnum magellanicum, a species for which
growth is typically limited by inadequate P. Photo by Michael Lüth, with permission.
The greatest number of field studies on nutrient additions have been done on the genus Sphagnum, but
deficiency information is again based primarily on lab studies. Sanville (1988) and Aerts and coworkers (1992) found that Sphagnum production in the field increases in response to nutrient addition, suggesting that it has been growing under deficiency conditions. In support of this, Li and Glime (1990) used lab studies to demonstrate that low nutrient concentration is a major factor causing low productivity or death of parts of Sphagnum. Limiting P can limit the growth of mature Sphagnum magellanicum (Figure 20-Figure 21) and S. papillosum (Figure 22-Figure 23). Boatman and Lark (1971) found that P was likewise limiting for the protonema growth of Sphagnum magellanicum (Figure 21, S. papillosum (Figure 23), and S. cuspidatum (Figure 24).
Figure 21. Sphagnum magellanicum protonema, a stage
harmed by limiting P in the environment. Photo courtesy of Yenhung Li.
Figure 22. Sphagnum papillosum supporting the moisture
needs of the sundew Drosera rotundifolia. Sphagnum papillosum is limited in its growth by inadequate P. Photo by Michael Lüth, with permission.

8-6-8 Chapter 8-6: Nutrient Relations: Deficiency
Figure 23. Sphagnum papillosum protonema buds, a stage
that is limited by low P in its environment. Photo courtesy of Yenhung Li.
Figure 24. Sphagnum cuspidatum, a species of peatland
valleys and pools that has reduced protonema growth in media with low P. Photo by Michael Lüth, with permission.
Li and coworkers (1993) demonstrated that both high and low concentrations of P can cause Sphagnum magellanicum (Figure 25) to produce red pigments, a character common for this moss when it is in strong sunlight in nature (Rudolph 1963, 1964; Rudolph & Vowinkel 1969). What are the implications of this? Does absence of red color mean anything relative to P availability, or only that light is inadequate for pigment development?
Figure 25. Sphagnum magellanicum showing red pigments
that are typical of bright light or low P. Photo by Jan-Peter Frahm, with permission.
Sphagnum (Figure 20-Figure 25) cell structure (Figure 26) and general morphology change in response to nutrient concentrations (Figure 30). Baker and Boatman (1989) found that the stem length between branch fascicles in Sphagnum cuspidatum (Figure 24) was positively related to the N content of the capitula, whereas the capitulum dry biomass was negatively related, suggesting that branches continued to develop somewhat normally, but expansion of the stem between these branches was reduced under N deficiency. Yet, there was no correlation between interfascicular length and capitulum dry biomass. Hintikka (1972) found that Sphagnum fallax (Figure 27) failed to develop hyaline cells in a medium high in NH4
+ or organic N, but low in carbohydrates (Figure 28-Figure 29). Furthermore, Baker and Boatman (1992) found that hyaline cell length of branch leaves in Sphagnum is directly correlated with the CO2 concentration, whereas it is inversely correlated with the N and P concentrations (Figure 30). As might be expected, the lengths of the hyaline and chlorophyllose cells were closely correlated with each other, but also correlated with leaf length. On the other hand, short leaves had few and poorly differentiated hyaline cells.
Figure 26. Sphagnum cells. Photo from Botany Website,
UBC, with permission.
Figure 27. Sphagnum fallax, a species that experiences
morphological when it is nutrient deficient. Photo by Michael Lüth, with permission.

Chapter 8-6: Nutrient Relations: Deficiency 8-6-9
Figure 28. Sphagnum fallax leaf cells showing normal
hyaline cells with fibrils. Photo by Kristian Peters, with permission.
Figure 29. Sphagnum fallax with diminished leaf cells,
suggesting a nutrient imbalance. Photo by Kristian Peters, with permission.
Figure 30. Arrangement of photosynthetic and hyaline cells
in Sphagnum capillifolium leaves grown in high N & P/low CO2 (ambient) treatment (upper) compared to those in low N & P/high CO2 (5%) treatment (lower). Based on Baker & Boatman (1992).
Baker and Boatman (1992) suggested that the presence of well-differentiated hyaline cells in Sphagnum (Figure 26, Figure 28) provided a "scavenging system" for inorganic nutrient ions when they were in low concentration. The additional surface area on the interior of the cells, highly endowed with polyuronic acids, provides a large surface for binding and facilitating uptake. While this suggestion may be true, the notion of cause and effect is questionable. The plant can hardly make a decision that it needs more or longer of these cells in order to get nutrients.
How does this change in hyaline cells affect the desiccation tolerance of the moss? Perhaps one explanation is that bogs and fens are never N limited due to their Cyanobacteria flora, but that if the system is getting dry, little of the N is reaching the new leaves at the top because of the loss of capillary water. This would result in longer leaves and more hyaline cells, providing the hyaline cells needed to hold a water reservoir. But would the timing work? Would these young leaves get the signal soon enough to have the hyaline cells ready when they need them for maintaining hydration?
Liverwort deficiency studies are even more limited than those of mosses. Voth and Hamner (1940) reported that N deficiency caused a reduction in growth of Marchantia polymorpha (Figure 31) and the plants were stunted. Symptoms in Marchantia polymorpha more closely resembled those of tracheophytes. In cultures lacking N, P, or both, the midrib was darker (Figure 32) and scales, rhizoids, and the lower epidermis became red in about 10 days (Voth 1941). After 2 weeks, the N-free plants ceased growing and produced no gemmae cups; they produced few dichotomies and thalli remained narrow. Eventually the upper surface became chlorotic. Those plants lacking P likewise had a very dark midrib (Figure 32) and red underside, but contrasted sharply with the N-free plants in having frequent dichotomies with broad thalli, giving the thalli a rosette appearance, and producing numerous gemmae cups (Figure 33). As in the mosses, Leucolejeunea clypeata (see Figure 34) plants were light yellow to white in the absence of P (Fulford et al. 1947).
Figure 31. Marchantia polymorpha showing normal thallus
and midrib. Photo from Botany Webpage, UBC, with permission.

8-6-10 Chapter 8-6: Nutrient Relations: Deficiency
Figure 32. Marchantia polymorpha showing darkened
midrib typical of severe N or P deficiency. Photo from Dale A. Zimmerman Herbarium, Western New Mexico University, with permission.
Figure 33. Thallus of Marchantia polymorpha with
gemmae cups that are more abundant when P is deficient. Photo by Janice Glime.
Figure 34. Leucolejeunea sp., a species that becomes white
or yellow when it is deprived of P. Photo by Jan-Peter Frahm, with permission.
K Deficiency
Potassium is also a translocatable nutrient, the most easily moved – and lost – of all the nutrients in both tracheophytes and bryophytes due to its high solubility and low ionic mass. When deficient in K+, tracheophytes
exhibit mottled or chlorotic leaves with small spots of dead tissue, usually at the tips and between veins, and especially at the margins; stems are slender. In bryophytes older parts may exhibit leaf margin chlorosis somewhat similar to effects seen on tracheophytes.
When cultured in a liquid medium with no potassium for four weeks, all samples of Fontinalis antipyretica (Figure 16) remained bright grass-green in color, although some were slightly pale (R. Marr & Glime unpub). By contrast, Marchantia polymorpha (Figure 33) (on solid agar) exhibited tan coloration in its older thallus parts, especially along the wing margins near the tip (Voth 1941). In tracheophytes, K+ is important in the regulation of guard cells. No connection has been made between K+ and the cells surrounding Marchantia pores (Figure 35-Figure 36), but it is possible that K+ is likewise involved in their tendency to close under dry conditions.
Figure 35. Marchantia polymorpha gemmae cup with
thallus showing numerous pores. Photo by Bernard de Cuyper, with permission.
Figure 36. Marchantia polymorpha pore cs showing a stack
of cells that can bend to decrease the pore diameter. Photo by Walter Obermayer, with permission.
Ca Deficiency
Calcium is important in maintaining membrane integrity (Brown 1982) and in binding cells together. Brown suggests that Ca++ may be required in greater concentrations by mosses that grow in Ca++-rich sites. These mosses can have 16-17X as much Ca++ as species from Ca++-poor habitats (Bates 1982). Mosses in calcareous habitats have 3-4X as much Ca-exchange

Chapter 8-6: Nutrient Relations: Deficiency 8-6-11
capacity as mosses from Ca++-poor habitats (Bates 1978). Brown (1982) reasons that the Ca++ may be used to maintain membrane integrity. He suggests that these calciphilic (Ca++ loving) bryophytes may have inherently leakier membranes at low Ca++ concentrations and that it is also more difficult for them to uptake ions such as K+. Jefferies (1969) reported that Cephalozia connivens (Figure 37) (a calcifuge – avoiding Ca) had maximal K+ uptake at 0.1 mM Ca++ and pH 4, whereas Mesoptychia turbinata (calcicole – of Ca-rich habitats) did best at 3.0 mM Ca++ and pH 4-8. Nevertheless, K+ efflux was unaffected by the Ca++ concentration in these two liverworts. Patterson (1946) suggested using a K:Ca ratio of 49:1 to maintain membrane integrity when using KCl to test osmotic potential. Osmotic tests that lack Ca++ should be suspect because they do not provide the Ca++ needed to keep the membrane intact.
Figure 37. Cephalozia connivens, a calcifuge. Photo by
Michael Lüth, with permission.
Calcium deficiency is known to interfere with growth because the cell walls cannot cement together properly, lacking the Ca needed for the calcium pectate bonds. In algae, new crosswalls fail to form between newly divided nuclei (Reed 1907). This element has low solubility and is generally not translocatable, so it cannot be taken from older leaves to supply the growing tips. Thus, necrosis of leaf tips and margins and death of the stem apex are common in Ca-deficient tracheophytes, often preceded by chlorosis (Voth 1941). Bryophytes seem to be no exception. In Marchantia polymorpha (Figure 31), the Ca++-deficient plants had less growth and biomass increase than controls (Voth 1941). Nehira (1973) also showed that Ca++ was required for rhizoid differentiation in Marchantia, with Ca++ accumulating at the rhizoid base.
In the leafy liverwort Leucolejeunea clypeata, the response is somewhat unusual, although perhaps only visible because of the one-cell-thick leaves. Growth in a medium with no calcium causes normally flat cells to become swollen (Figure 38; Geldreich 1948a), although it has no effect on already mature cells, suggesting weak or easily extended cell walls, consistent with insufficient Ca
pectate. However, these leaves still test positive for pectic substances, but negative for presence of calcium, indicating that some other element such as Mg or K has been used in place of Ca. Geldreich suggests that the rounding is the result of this substitution because magnesium and potassium do not have the hardening property of calcium pectate, thus permitting elasticity to the cell wall. This is an interesting result because some species of Fissidens [F. cristatus (Figure 39-Figure 40) vs F. adianthoides (Figure 41)] are separated based on this rounded cell character difference. Might this simply be an environmental expression of calcium deficiency? On the other hand, Geldreich did not find the cell difference witnessed by Fulford et al. (1947) on L. clypeata with this same treatment.
Figure 38. Effects of a Ca-deficient environment on leaf
cells of Leucolejeunea clypeata. Upper: leaf grown on normal nutrient agar, showing distinct cell walls and flat surfaces. Lower: leaf grown on Ca-deficient agar, showing bulging cells. Photos retouched from Geldreich 1948a.

8-6-12 Chapter 8-6: Nutrient Relations: Deficiency
Figure 39. Fissidens cristatus, a species that has rounded
leaf cells. Photo by Stuart Dunlop <www.donegal-wildlife.blogspot.com>, with permission.
Figure 40. Fissidens cristatus leaf, showing rounded cells.
Photo by Malcolm Storey (DiscoverLife), with online permission.
Figure 41. Fissidens adiantoides with capsules, a species
with hexagonal leaf cells. Photo by Bob Klips, with permission.
A second symptom of Ca++ deficiency in Leucolejeunea clypeata (Figure 38) is the configuration change in the oil bodies (Geldreich 1948a). In normal cells, the oil bodies are ovoid and typically one per cell. In the Ca++-deficient leaves, the shape varied from globose to ovoid and they numbered up to seven per cell. This is
another trait change that could confound identification in some taxa.
Unlike the response of Leucolejeunea clypeata (Figure 38), wherein the protonema failed to develop on a Ca++-free medium (Geldreich 1948b), Funaria hygrometrica protonemata (Figure 7, Figure 13) grew rapidly on Ca++-free agar, but these were from already established transplanted cultures (Hoffman 1966). The gametophores that developed were small, a response typical of Ca++-deficient tracheophyte sporophytes, with soft tissues that were easily torn; the entire culture turned black. In the chelated form, Ca++ becomes unavailable, at least for Funaria hygrometrica (Iwasa 1965), unlike the chelated form of iron, which is the more usable form, suggesting that on organic substrates this moss might suffer from a Ca++ deficiency. This should be explored as a possible cause of its preference for inorganic soil and ash and its disappearance when other plants arrive.
Marchantia polymorpha (Figure 31-Figure 33) likewise responded to reduced Ca++ supply (12 mg/L) by developing black tips (Voth 1941). The wings of the apical notches became black first, followed by the meristematic region. Then a V-shaped zone developed progressively back from the tip. Many of these blackened tips became watery, but by the end of the 32-day experiment many of the blackened tips were curled upward, dry, and brittle. This is similar to the response of the alga Spirogyra, in which the apical cell eventually contains a dark lecithin-like substance (Reed 1907). Voth (1941) showed that in Marchantia, early symptoms were internal, with maturing cells having larger vacuoles and fewer chloroplasts. One interesting response is that while dorsal cells are breaking down, the ventral cells surrounding the smooth rhizoids are persistent and become a source of regenerated thalli – tenacity to the end!
Mature Fontinalis antipyretica (Figure 16, Figure 43), on the other hand, responded to Ca++ deprivation by becoming pale yellow-green with a hint of brown (R. Marr & Glime, unpub).
Mg Deficiency
Deficiency of magnesium in tracheophytes results in lower leaves becoming mottled or chlorotic due to translocation of the Mg++ to developing apical tissues; leaves often become reddish; tips and margins turn up, causing the leaves to become cupped. Symptoms such as cupped leaves are more difficult to detect, if they exist, in bryophytes. The absence of veins might even make this trait unlikely. In some cases, lacking definitive studies among the bryophytes, deficiency symptoms can be inferred from the symptoms of excess from a competing nutrient. Most mosses need very little calcium, and calcium from limestone rock is more often detrimental than helpful to mosses. Clymo (1973) demonstrated that Ca++ coupled with high pH, at which it is most soluble, actually killed most Sphagnum species, with Sphagnum squarrosum (Figure 42) being the most tolerant in the study. Sphagnum is particularly sensitive to CaCO3, forming crusts on its branch tips and soon losing vigor. Hence, these crusts of CaCO3 are symptomatic that the moss is likely to be deficient in the Mg++ and K+ that must compete for binding sites.

Chapter 8-6: Nutrient Relations: Deficiency 8-6-13
Figure 42. Sphagnum squarrosum, a species tolerant of
high pH and Ca levels. Photo by Janice Glime.
The effects of Mg++ absence seem to be similar to those of Ca++ deficiency for Funaria hygrometrica (Figure 7, Figure 13) (Hoffman 1966). Protonemata grew well and new gametophytes formed, but like the Ca++-deficient plants, these were smaller than those receiving the nutrient. In the culture study, the stems turned brown and eventually many entire gametophores turned brown. But other than the color changes, the leafy plants appeared to be quite healthy. When mature Fontinalis antipyretica (Figure 43) was cultured in a Mg++-free medium for four weeks, all plants seemed to remain normal in appearance (R. Marr & Glime unpub). Marchantia polymorpha (Figure 31-Figure 33) likewise seemed to remain a healthy color, but had less area growth and dry biomass compared to controls (Voth 1941). This differs from tracheophyte symptoms in which the plants become chlorotic. Long-term absence or deficiency of Mg++ would undoubtedly cause chlorosis, and eventually death, because Mg++ is needed to form the chlorophyll molecule.
S Deficiency Sulfur is rarely a limiting nutrient, even for
tracheophytes, but soils in parts of Australia, Scandinavia, southwestern grain-producing parts of Canada, and northwestern U. S. A. can be sulfur deficient. Sulfur is used in the amino acids cysteine and methionine, thus is needed for building proteins. Sulfur is not readily translocated in plants, so deficiencies are exhibited by young tissues. In tracheophytes, the terminal bud remains alive, but young leaves and veins of older leaves become chlorotic (Salisbury & Ross 1992).
As with Ca++ deficiencies, Funaria hygrometrica protonemata (Figure 7, Figure 13) grew on S-free agar, developing gametophores (Hoffman 1966). But these gametophores were likewise small and they later became slightly chlorotic. Depriving mature Fontinalis antipyretica (Figure 43) of S for four weeks seemed to have no effect on its appearance (R. Marr & Glime unpub). Likewise, Marchantia polymorpha (Figure 31-Figure 33) growing on S-free agar showed no visible symptoms (Voth 1941). However, S in the atmosphere during the experiments may be sufficient to provide the needs for these low-nutrient, slow-growing plants.
Fe Deficiency In the soil, high pH contributes to iron deficiency in
plants, and in acidic soils Al can interfere with Fe uptake.
Furthermore, Fe needs to be in a chelated form for cells to absorb it across the membrane. Once delivered to the tissues, Fe is also immobile and cannot be moved easily from older to younger tissues. In tracheophytes its deficiency causes interveinal chlorosis similar to that for Mg++ deficiency, but in the case of Fe it is the younger leaves that become chlorotic. Although it is not required in chlorophyll, it is apparently needed by the enzymes used to synthesize chlorophyll and it is needed especially in the electron transport system.
In bryophytes, symptoms of Fe deficiency are poorly known and vary with species. When transplanted to agar with no iron, Funaria hygrometrica protonemata (Figure 7, Figure 13) grew rapidly, but produced very few new upright gametophores (Hoffman 1966). Those that were produced became chlorotic and the plants eventually turned brown. When mature Fontinalis antipyretica (Figure 43) was cultured without Fe for four weeks, the stems became bright red, especially near the base, and some leaves were likewise red at the base (R. Marr & Glime unpub). When unchelated iron was provided as FeCl3, all F. antipyretica plants had yellow-brown leaves with bright green stems. Normally the stems of this species are brown. One must ask why the symptoms differed when unchelated iron was supplied. Did something in the medium or in the plant chelate it to a limited extent? What could account for the red coloration with no Fe?
Comparisons of the macronutrient deficiency symptoms in the mosses Fontinalis antipyretica (Figure 43) and Funaria hygrometrica (Figure 7, Figure 13) and thallose liverwort Marchantia polymorpha (Figure 31-Figure 33) are presented in Table 2.
Table 2. Deficiency symptoms in Fontinalis antipyretica (Figure 43) based on unpublished data of Robert Marr and Janice Glime, Funaria hygrometrica (Figure 7, Figure 13) based on Hoffman (1966), and Marchantia polymorpha (Figure 31-Figure 33) based on Voth (1941).
Fontinalis Funaria Marchantia N pale green few protonemata, midrib dark, scales chlorotic & rhizoids red
P dark green few protonemata, midrib dark, scales no gametophores & rhizoids red
K no visible effect tan coloration of older parts
S no visible effect small, chlorotic no visible effect
Mg no visible effect small, stems brown less growth many leaves brown
Ca pale yellow-green small, soft tissues less growth black tips
Fe stems bright red few gametophores, chlorotic, brown
Micronutrient Deficiency
It is difficult to deprive plants of micronutrients because the minute quantities needed can occur as contaminants. Any bryophytes brought from the field are likely to have sufficient quantities on their surfaces to last them for a long time. Even when grown on nutrient-

8-6-14 Chapter 8-6: Nutrient Relations: Deficiency
deficient agar (missing B, Cl, Cu, Mn, Mo, and Zn), Funaria hygrometrica (Figure 7, Figure 13) continued to produce protonemata (Hoffman 1966). Although gametophores developed, they remained stunted and their stems turned dark. The tissues were tough and difficult to tear, much like in the N-deficient cultures. When Marr and Glime (unpub) deprived mature Fontinalis antipyretica (Figure 43) of micronutrients for four weeks, most plants exhibited no symptoms, except that 8 apical pieces developed brown tips (in 4/5 replicate containers). On the other hand, when Cu was added to Fontinalis dalecarlica (Figure 44) in Lake Superior water, greener cells resulted.
Figure 43. Fontinalis antipyretica with brown tips (arrow)
such as might be seen with a nutrient deficiency.
Figure 44. Fontinalis dalecarlica showing the greenest leaf
cells at 1.0 mg copper per liter. Photo by Janice Glime.
Biochemical changes that affect the ability of the plant to tolerate stress may also occur. For example, in Marchantia palacea var. diptera (Figure 45) grown in copper-deficient media, the enzyme Cu/Zn-superoxide dismutase was inactivated (Tanaka et al. 1995). This enzyme group is important in maintaining membrane integrity (Dhindsa & Matowe 1981; Dhindsa et al. 1981; Gong et al. 1997). Therefore, its destruction or inactivation may result in greater membrane damage during desiccation, resulting in a loss of nutrients from the cell. Such losses can result in a multiplicity of symptoms because other nutrients have become deficient as well.
Figure 45. Marchantia palacea var. diptera, a species that
disables the enzyme Cu/Zn-superoxide dismutase when grown in a copper-free medium. Photo by Janice Glime.
Oxygen Deficiency
One rarely considers plants in the context of oxygen deficiency, but apparently even some members of this oxygen-producing group can suffer from insufficient oxygen. When the aquatic leafy liverwort Jungermannia exsertifolia subsp. cordifolia (Figure 46) was cultured in a non-aerated solution, it accumulated considerably less phosphorus in the first three days, probably due to blockage of mitochondrial respiration, followed by a net loss of P, indicating probable membrane damage (Mártínez Abaigar 2002).
Figure 46. Jungermannia exsertifolia subsp. cordifolia, a
species that seems to require oxygen to take in P. Photo by Michael Lüth, with permission.
Community Effects of Deficiencies Although nutrient concentration often may not cause
evident deficiency or excess symptoms in bryophytes, it can have a strong effect on community composition. Bryophyte-dominated peatlands provide a good example. Following an extensive literature survey, Bedford et al. (1999) suggest several generalizations regarding peatlands: "(1) plant community type changes across broad nutrient gradients; (2) species richness declines as various indicators of nutrient availability increase beyond some

Chapter 8-6: Nutrient Relations: Deficiency 8-6-15
threshold; and (3) rare and uncommon species are almost always associated with species-rich communities." Perhaps it is safer to agree with Bedford et al. (1999) in their conclusions that our "generalizations do not always hold within community types; for many community types, the threshold beyond which richness declines has not been established, and high or low diversity may occur below that threshold; and (4) the failure of many studies to include bryophytes precludes drawing strong conclusions about nutrient availability and diversity in peatlands."
Brunkman (1936) found that moss cover in other habitats seemed to have little to do with nutrients. Cover on clays and clay loams in Alberta, Canada, ranged from 7 to 92%, on sandy loams from 59 to 92%, and on Jack pine (Pinus banksiana) sand to sandy loams, from 3 to 71%. Brunkman found these data to be “confounding,” and interpreted them to mean that the moss does not correlate with soil type, and by inference, probably does not correlate well with nutrients. He had to conclude that mosses were of little or no value as indicators of possible timber values and volumes because "the moss cover wanders all over the site values without any sequence . . ."
On the other hand, Epstein and Yeatman (2003) found that bryophytes increase when tracheophytes such as Betula nana resorb higher percentages of N, depriving other shrubs of the nutrient and thus favoring bryophytes. Thus, even if the bryophytes do not directly respond to the nutrients, they may respond because of the resulting change in competition from tracheophytes for space and light.
Nevertheless, Marczonek (1984) showed that Conocephalum conicum (Figure 47) population density is dependent on the soil levels of Ca++ and Mg++. Pellia epiphylla (Figure 48) likewise has increased densities with increases of these two elements as well as N and K. Meesia triquetra (Figure 49) occurs where there is both a high pH and high concentration of Ca++ (Montagnes 1990). These are but few examples of the many pH and nutrient relationships that exist among the bryophytes. Many more will be discussed as we examine individual habitats later in this book. This surely is evidence that mosses and liverworts can and do get nutrients from the soil and that bryophytes do have minimal nutrient requirements, which they satisfy with either precipitation or substrate or both. The availability of these nutrients determines their growth and distribution, but not in isolation from other factors such as water availability and competition.
Figure 47. Conocephalum conicum, a species in which
population density is dependent on soil levels of Ca++ and Mg++. Photo by Michael Lüth, with permission.
Figure 48. Pellia epiphylla, a species that has increased
densities with increases of Ca++, Mg++, N, and K. Photo by Robert Klips, with permission.
Figure 49. Meesia triquetra, a species that prefers high pH
and a high concentration of Ca++. Photo by Michael Lüth, with permission.
Summary Bryophytes have low nutrient demands compared
to tracheophytes, and this may permit them to thrive in habitats such as rock surfaces where they collect dust and throughfall, or in streams where a new supply of nutrients constantly flows by.
N and P deficiency can reduce protein synthesis and photosynthetic rates, while increasing carbohydrate content. N deficiency in bryophytes causes chlorosis and may result in tough, fibrous gametophores with scalelike leaves. In liverworts, at least, it causes a reduction in growth and gemmae cups. Liverworts also may develop red pigments in the absence of N, P, or both. In phosphorus-free media, mosses may become dark brown or may be dark green with only the tips exhibiting chlorosis. Low P limits growth. However, in the liverwort Marchantia, absence of P resulted in frequent dichotomies and broad thalli with numerous gemmae cups.

8-6-16 Chapter 8-6: Nutrient Relations: Deficiency
Carbohydrate deficiency, coupled with a high concentration of NH4
+ or organic N can cause Sphagnum to fail to develop hyaline cells. These hyaline cells may provide a "scavenging system" for inorganic nutrient ions when they are in low concentration.
With potassium deficiency, older parts may exhibit leaf margin chlorosis somewhat similar to effects seen on tracheophytes. Marchantia likewise develops pale thallus margins.
Mosses growing in Ca++-rich habitats may develop 3-4X as much Ca-exchange capacity as those from Ca++-poor habitats. The Ca++ may be necessary to maintain membrane integrity and therefore would be important in retaining K+. Ca++ deficiency can result in reduced growth, lack of rhizoid differentiation, failure of protonemata to develop, black thallus tips, change in shape and increase in number of oil bodies in liverwort leaf cells, small gametophores, and soft tissues. If Ca++ is absent during cell development, the cell walls can become more elastic and appear rounded. Internal changes may include larger vacuoles and fewer chloroplasts.
Deficiency of Mg++ can result in smaller gametophytes with stems and leaves turning brown. Otherwise, Mg++-deficient bryophytes seem to be healthy.
Sulfur deficiency symptoms are similar to those of Ca++ and Mg++, with reduced gametophore growth and chlorosis, but few other symptoms. However, there is often sufficient S in the atmosphere to sustain the bryophytes.
Iron deficiency symptoms seem to vary among species. They include reduction in number of upright gametophores, chlorosis, red stems, red leaf bases, and bright green stems (with unchelated iron).
Micronutrient deficiency can result in stunted growth and dark-colored stems with tough tissues. Enzymes needed to maintain membrane integrity may fail, perhaps due to absence of the metal part of the enzyme.
In aquatic habitats, even oxygen can become limiting, resulting in inability to accumulate P.
Nutrient balance affects competition, and bryophytes often gain an advantage when tracheophytes are nutrient-deficient.
Acknowledgments
I appreciate the contributions of undergraduate Phil Gaudette and M. S. student Jennifer Jermalowicz Jones for their critical reading of the manuscript from the perspectives of students interested in nutrient relationships of bryophytes. Thank you to all the photographers who contributed their images through permission of Creative Commons.
Literature Cited Aerts, R., Wallén, B., and Malmer, N. 1992. Growth-limiting
nutrients in Sphagnum-dominated bogs subject to low and high atmospheric nitrogen supply. J. Ecol. 80: 131-140.
Baker, R. G. E. and Boatman, D. J. 1989. The relationship between some morphological and chemical features of Sphagnum cuspidatum Ehrh. and physical characteristics of the environment. New Phytol. 113: 471-480.
Baker, R. G. E. and Boatman, D. J. 1992. The effect of nitrogen, phosphorus and carbon dioxide on cell development in branch leaves of Sphagnum. J. Bryol. 17: 35-46.
Bates, J. W. 1978. The influence of metal availability on the bryophytes and macro-lichen vegetation of four moss communities of a subarctic mire. Oikos 31: 236-246.
Bates, J. W. 1982. Quantitative approaches in bryophyte ecology. In: Smith, A. J. E. (ed.). Bryophyte Ecology. Chapman & Hall, New York, pp. 1-44.
Bates, J. W. 1987. Nutrient retention by Pseudoscleropodium purum and its relation to growth. J. Bryol. 14: 565-580.
Bates, J. W. 1989. Retention of added K, Ca and P by Pseudoscleropodium purum growing under an oak canopy. J. Bryol. 15: 589-605.
Bates, J. W. and Farmer, A. M. 1990. An experimental study of calcium acquisition and its effects on the calcifuge moss Pleurozium schreberi. Ann. Bot. 65: 87-96.
Bedford, B. L., Walbridge, M. R., and Aldous, A. 1999. Patterns in nutrient availability and plant diversity of temperate North American wetlands. Ecology 80: 2151-2169.
Birks, H. J. B. and Dransfield, J. 1970. A note on the habitat of Scorpidium turgescens (T. Jens.) Loeske in Scotland. Trans. Brit. Bryol. Soc. 6: 129-132.
Boatman, D. J., and Lark, P. M. 1971. Inorganic nutrition and the protonemata of Sphagnum papillosum Lindb., S. magellanicum Brid., and S. cuspidatum Ehrh. New Phytol. 70: 1053-1059.
Brown, D. H. 1982. Mineral nutrition. In: Smith, A. J. E. (ed.). Bryophyte Ecology, Chapman & Hall, London, pp. 383-444.
Brunkman, A. H. 1936. Mosses in relation to Cajander theory of forest types. For. Chron. 12: 300-314.
Burkholder, P. R. 1959. Organic nutrition of some mosses growing in pure culture. Bryologist 62: 6-15.
Clymo, R. S. 1973. The growth of Sphagnum: some effects of environment. J. Ecol. 61: 849-869.
Dhindsa, R. S. and Matowe, W. 1981. Drought tolerance in two mosses: Correlated with enzymatic defense against lipid peroxidation. J. Exper. Bot. 32: 79-91.
Dhindsa, R. S., Plumb-Dhindsa, P. and Thorpe, T. A. 1981. Leaf senescence: correlated with increased levels of membrane permeability and lipid peroxidation, and decreased levels of superoxide dismutase and catalase. J. Exper. Bot. 32: 93-101.
Dietert, M. F. 1979. Studies on the gametophyte nutrition of the cosmopolitan species Funaria hygrometrica and Weissia controversa. Bryologist 82: 417-431.
Epstein, H. and Yeatman, W. 2003. Nitrogen resorption from senescing plant tissue in arctic tundra and its effects on ecosystem properties. Abstracts of the 88th meeting of the Ecological Society of America, Savannah, GA, 3-8 August 2003.
Fulford, M., Carrol, G., and Cobbe, T. 1947. The response of Leucolejeunea clypeata to variations in the nutrient solution. Bryologist 50: 113-146.
Geldreich, E. E. Jr. 1948a. Some effects of calcium deficiency on the vegetative plant of Leucolejeunea clypeata. Bryologist 51: 218-229.
Geldreich, E. E. Jr. 1948b. The effects of a calcium-deficient medium on sporelings of Leucolejeunea clypeata. Bryologist 51: 229-235.

Chapter 8-6: Nutrient Relations: Deficiency 8-6-17
Gong, M., Chen, S.-N., Song, Y.-Q., and Li, Z.-G.. 1997. Effect of calcium and calmodulin on intrinsic heat tolerance in relation to antioxidant systems in maize seedlings. Austral. J. Plant Physiol. 23: 371-379.
Griggs, R. F. and Ready, D. 1934. Growth of liverworts from Katmai in nitrogen-free media. Amer. J. Bot. 21: 265-277.
Grime, J. P. 1977. Evidence for the existence of three primary strategies in plants and its relevance to ecological and evolutionary theory. Amer. Nat. 111: 1169-1195.
Hintikka, V. 1972. Variation in gametophyte morphology of Sphagnum fallax in aseptic culture. Ann. Bot. Fennici 9: 91-96.
Hoffman, G. R. 1966. Ecological studies of Funaria hygrometrica (L.) Hedw. in eastern Washington and northern Idaho. Ecol. Monogr. 36: 157-180.
Iwasa, K. 1965. Chemical control of morphogenesis in moss protonema. Plant Cell Physiol. 6: 421-429.
Jefferies, R. L. 1969. Ionic relations of Cephalozia connivens and Leiocolea turbinata. Trans. Brit. Bryol. Soc. 5: 901-902.
Larcher, W. 1983. Physiological Plant Ecology. Trans. by M. A. Biederman-Thorson. Springer-Verlag, Berlin, 303 pp.
Larcher, W. 1995. Physiological Plant Ecology. Ecophysiology and Stress Physiology of Functional Groups, 3rd edition. Berlin.
Li, Y. and Glime, J. M. 1990. Growth and nutrient ecology of two Sphagnum species. Hikobia 10: 445-451.
Li, Y., Glime, J. M., and Drummer, T. D. 1993. Effects of phosphorous on the growth of Sphagnum magellanicum Brid. and S. papillosum Lindb. Lindbergia 18: 25-30.
Marczonek, A. 1984. Ekologia populacji Conocephalum conicum (L.) Lindbg. Acta Universitatis Wratislaviensis, Prace Botaniczne 27: 121-152.
Mártínez Abaigar, J., Núñez Olivera, E., and Beaucourt, N. 2002. Short-term physiological responses of the aquatic liverwort Jungermannia exsertifolia subsp. cordifolia to KH2PO4 and anoxia. Bryologist 105: 86-95.
Montagnes, R. J. S. 1990. The habitat and distribution of Meesia triquetra in North America and Greenland. Bryologist 93: 349-352.
Moore, P. D. and D. J. Bellamy. 1974. Adaptation in mire organisms. In: Moore, P. D. and D. J. Bellamy. (eds.). Peatlands. Springer-Verlag, New York, pp. 118-134.
Nehira, K. 1973. Adsorption of Ca in the differentiation of rhizoids in gemmae of Marchantia polymorpha L. Mem. Fac. Gen. Ed. Hiroshima Univ. 3(7): 1-6.
Olarinmoye, S. O. 1975. Ecological studies on epiphyllous liverworts in western Nigeria. II. Notes on competition and successional changes. Rev. Bryol. Lichénol. 41: 457-463.
Patterson, P. M. 1946. Osmotic values of bryophytes and problems presented by refractory types. Amer. J. Bot. 33: 604-611.
Reed, H. S. 1907. The value of certain nutritive elements to the plant cell. Ann. Bot. 21: 501-543.
Richards, P. W. 1959. Bryophyta. In: Turrill, W. B. Vistas In Botany. Pergamon Press, Oxford, England, pp. 387-420.
Richardson, D. H. S. 1981. The Biology of Mosses. John Wiley & Sons, Inc., N. Y. xii + 220 pp.
Rudolph, H. 1963. Praparative Darsteilung eines roten Wandfarbstoffes von Sphagnum magellanicum. Ber. Deutsch. Bot. Gesell. 76(2): 72-73.
Rudolph, H. 1964. Zur Frage der Membranochromie bei Sphagnen. 1. Welche Faktoren bestimmen den Farbwechsel? Flora 155: 250-293.
Rudolph, H. and Vowinkel, E. 1969. Sphagnorubin, ein kristallines Membranochrom aus Sphagnum magellanicum. Zeits. Naturforsch. 24: 1211-1212.
Rydin, H. and Clymo, R. S. 1989. Transport of carbon and phosphorus compounds about Sphagnum. Proc. Roy. Soc. London B 237: 63-84.
Salisbury, F. B. and Ross, C. W. 1992. Plant Physiology. Wadsworth Publishing Company, Inc., Belmont, CA, pp. 129-135.
Sanville, W. 1988. Response of an Alaskan wetland to nutrient enrichment. Aquat. Bot. 30: 231-243.
Seppelt, R. D. and Hancock, R. J. 1991. Growth responses of Ceratodon purpureus in culture. J. Hattori Bot. Lab. 69: 133-145.
Skré, O. and Oechel, W. C. 1979. Moss production in a black spruce Picea mariana forest with permafrost near Fairbanks, Alaska, as compared with two permafrost-free stands. Holarct. Ecol. 2: 249-254.
Small, E. 1972. Ecological significance of four critical elements in plants of raised Sphagnum peat bogs. Ecology 53: 498-503.
Southorn, A. L. D. 1977. Bryophyte recolonization of burnt ground with particular reference to Funaria hygrometrica. II. The nutrient requirements of Funaria hygrometrica. J. Bryol. 9: 361-374.
Sveinbjörnsson, B. 2002. Growth of feather mosses in white and black spruce stands on the Tanana River floodplain, central Alaska. Abstracts of the 87th Annual Meeting of the Ecological Society of America and the 14th Annual International Conference of the Society for Ecological Restoration, August 4-9, 2002, Tucson, AZ.
Svensson, B. M. 1995. Competition between Sphagnum fuscum and Drosera rotundifolia: A case of ecosystem engineering. Oikos 74: 205-212.
Sylvia, D. M., Furhmann, J. J., Hartel, P. G., and Zuberer, D. A. 2004. Principles and Applications of Soil Microbiology, 2nd ed. Prentice Hall, Englewood Cliffs, N. J.
Tanaka, K., Takio, S., and Satoh, T. 1995. Inactivation of the cytosolic Cu/Zn-superoxide dismutase induced by copper deficiency in suspension-cultured cells of Marchantia paleacea var. diptera. J. Plant Physiol. 146: 361-365.
Thomas, P. A., Proctor, M. C. F., and Maltby, E. 1994. The ecology of severe moorland fire on the North York Moors: Chemical and physical constraints on moss establishment from spores. J. Ecol. 82: 457-474.
Vitt, D. H. 1990. Growth and production dynamics of boreal mosses over climatic chemical and topographic gradients. J. Linn. Soc. Bot. 104: 35-59.
Voth, P. D. 1941. Gemmae-cup production in Marchantia polymorpha and its response to calcium deficiency and supply of other nutrients. Bot. Gaz. 103: 310-325.
Voth, P. D. 1943. Effects of nutrient-solution concentration on the growth of Marchantia polymorpha. Bot. Gaz. 104: 591-601.
Voth, P. D. and Hamner, K. C. 1940. Responses of Marchantia polymorpha to nutrient supply and photoperiod. Bot. Gaz. 102: 169-205.
Watt, R. F. 1966. Growth of black spruce after fertilization treatment based on foliar analyses. Proc. Soc. Amer. Forest, Seattle, Wash., pp. 85-88.

8-6-18 Chapter 8-6: Nutrient Relations: Deficiency
Glime, J. M. 2017. Nutrient relations: Fertilization. Chapt. 8-7. In: Glime, J. M. Bryophyte Ecology. Volume 1. Physiological 8-7-1 Ecology. Ebook sponsored by Michigan Technological University and the International Association of Bryologists. Last updated 7 March 2017 and available at <http://digitalcommons.mtu.edu/bryophyte-ecology/>.
CHAPTER 8-7
NUTRIENT RELATIONS: FERTILIZATION
TABLE OF CONTENTS Fertilization Effects............................................................................................................................................. 8-7-2 N Additions.................................................................................................................................................. 8-7-4 P Additions................................................................................................................................................... 8-7-8 Ca and Mg Additions ................................................................................................................................... 8-7-9 Fe Additions................................................................................................................................................. 8-7-9 CO2 Additions............................................................................................................................................ 8-7-10 Excess Nutrients................................................................................................................................................ 8-7-10 Fertilization and Community Structure............................................................................................................. 8-7-11 Summary ........................................................................................................................................................... 8-7-15 Acknowledgments............................................................................................................................................. 8-7-15 Literature Cited ................................................................................................................................................. 8-7-15

8-7-2 Chapter 8-7: Nutrient Relations: Fertilization
CHAPTER 8-7
NUTRIENT RELATIONS: FERTILIZATION
Figure 1. Gymnostomum aeruginosum growing on calcareous rock. Photo by Michael Lüth, with permission.
Fertilization Effects We often learn about things in science by serendipity.
And when it comes to learning about bryophytes in ecosystems, we often learn by what we do to their neighboring tracheophytes. Hence, when we fertilize our gardens or add fertilizers to restore impoverished land, the bryophytes respond, in their own way, along with the intended tracheophytic plants.
In general, fertilizers are detrimental to bryophytes. This is often because added fertilizers benefit tracheophytes that were unable to grow well in their absence and once being fertilized are able to overgrow the slow-growing bryophytes (Virtanen 2000), depriving them of light. One effect of fertilizers is that they frequently change the pH, often making it more alkaline; this is especially true for lime fertilizers. Few bryophytes are favored by high pH levels (Figure 1), and at the very least, the species composition is likely to change (Miles 1968; Miles 1973). Moreover, lime often has a desiccating effect, like that of chalk dust on your hands. However, some specific nutrients may be limiting and certain fertilizers may actually benefit the bryophytes.
Surprisingly, bryophytes in a polar semi-desert at Svalbard Arctic archipelago increased their cover as a benefit from applications of N, P, and K (with little effect by increased temperature), while there was a significant decrease in the cover of the flowering plants Dryas octopetala (Figure 2) and Saxifraga oppositifolia (Figure 3) (Robinson et al. 1998). A strong winter injury seemed to account for the ultimate decrease in Dryas octopetala. On
the other hand, Hylocomium splendens (Figure 4) and Rhytidium rugosum (Figure 5) exhibited significant reductions in growth in a combined temperature and fertilizer enhancement experiment in a subArctic-alpine community in Sweden (Jägerbrand et al. 2003).
Figure 2. Dryas octopetala, an Arctic species that decreases
cover when fertilized with N, P, and K. Photo by Jörg Hempel, through Creative Commons.

Chapter 8-7: Nutrient Relations: Fertilization 8-7-3
Figure 3. Saxifraga oppositifolia, an Arctic species that
decreases cover when fertilized with N, P, and K. Photo by Smiley.toerist, through Creative Commons.
Figure 4. Hylocomium splendens, a species that
experienced significant reductions in growth in a combined temperature and fertilizer enhancement experiment in a Swedish sub-alpine zone. Photo by Michael Lüth, with permission.
Figure 5. Rhytidium rugosum, a northern species adapted to
low nutrients. Photo by Michael Lüth, with permission.
Changes in nutrient concentrations can affect the lipid content of bryophytes, thus affecting their ability to tolerate cold and desiccation. In the Arctic, growing shoots contain more lipids than carbohydrates (Rastorfer 1972). The lipid content of Sphagnum fuscum (Figure 6-Figure 7) increases
during spring in the actively growing parts while decreasing in the senescent parts (Karunen & Salin 1981). Dicranum elongatum (Figure 8) uses lipids as storage material in its senescent parts (Karunen & Mikola 1980; Karunen & Liljenberg 1981). The conversion to carbohydrates may lower the freezing point, but I have not seen evidence to support this suggestion.
Figure 6. Sphagnum fuscum showing its typical hummock
growth. Photo by Michael Lüth, with permission.
Figure 7. Sphagnum fuscum showing older (lower) parts
where lipids decrease in spring, while increasing in the upper, growing parts. Photo by J. C. Schou, with permission.
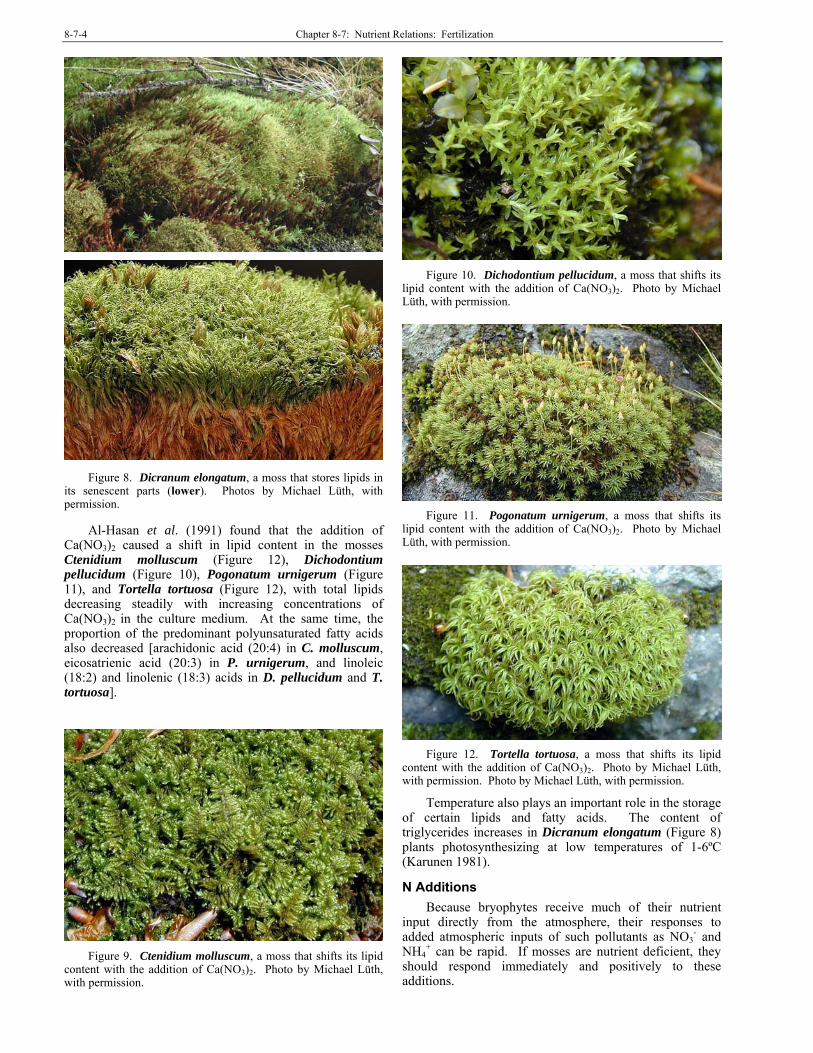
8-7-4 Chapter 8-7: Nutrient Relations: Fertilization
Figure 8. Dicranum elongatum, a moss that stores lipids in its senescent parts (lower). Photos by Michael Lüth, with permission.
Al-Hasan et al. (1991) found that the addition of Ca(NO3)2 caused a shift in lipid content in the mosses Ctenidium molluscum (Figure 12), Dichodontium pellucidum (Figure 10), Pogonatum urnigerum (Figure 11), and Tortella tortuosa (Figure 12), with total lipids decreasing steadily with increasing concentrations of Ca(NO3)2 in the culture medium. At the same time, the proportion of the predominant polyunsaturated fatty acids also decreased [arachidonic acid (20:4) in C. molluscum, eicosatrienic acid (20:3) in P. urnigerum, and linoleic (18:2) and linolenic (18:3) acids in D. pellucidum and T. tortuosa].
Figure 9. Ctenidium molluscum, a moss that shifts its lipid
content with the addition of Ca(NO3)2. Photo by Michael Lüth, with permission.
Figure 10. Dichodontium pellucidum, a moss that shifts its
lipid content with the addition of Ca(NO3)2. Photo by Michael Lüth, with permission.
Figure 11. Pogonatum urnigerum, a moss that shifts its
lipid content with the addition of Ca(NO3)2. Photo by Michael Lüth, with permission.
Figure 12. Tortella tortuosa, a moss that shifts its lipid
content with the addition of Ca(NO3)2. Photo by Michael Lüth, with permission. Photo by Michael Lüth, with permission.
Temperature also plays an important role in the storage of certain lipids and fatty acids. The content of triglycerides increases in Dicranum elongatum (Figure 8) plants photosynthesizing at low temperatures of 1-6ºC (Karunen 1981).
N Additions
Because bryophytes receive much of their nutrient input directly from the atmosphere, their responses to added atmospheric inputs of such pollutants as NO3
- and NH4
+ can be rapid. If mosses are nutrient deficient, they should respond immediately and positively to these additions.

Chapter 8-7: Nutrient Relations: Fertilization 8-7-5
It appears that at least some bryophytes can use more N than they normally get. As noted in Chapter 8-6, Fontinalis novae-angliae (Figure 13) and F. dalecarlica (Figure 14) both became considerably darker green in response to higher N concentrations (Glime, unpubl.); Dicranum majus (Figure 15) likewise had its highest chlorophyll content from the highest N location (Bakken 1995).
Figure 13. Fontinalis novae-angliae, a species that attains a
darker color in N concentrations much higher than their native streams. Photo by Janice Glime.
Figure 14. Fontinalis dalecarlica, a species that attains a
darker color in N concentrations much higher than their native streams. Photo by J. C. Schou, with permission.
Figure 15. Dicranum majus, a species that increases its
chlorophyll content in higher concentrations of N. Photo by Michael Lüth, with permission.
Muller (1997) compared N content of plants from a plot receiving low doses of NH4N03 diluted in rainwater (30 kg N ha-1 year-1) to plants from a control plot that received the same amount of rainwater without added N. The treatment simulated a tripling of the natural N deposition, while the added water represented only 7% of its annual precipitation. Although the N found in tracheophytes (0.7 mg N g-1) in this study provided inconsistent results (Schleppi et al. 1999), the moss Thuidium tamariscinum (Figure 16) had a dry matter increase in N of 1.3 mg g-1
(7%) (Muller 1997). At the same time, treated Hylocomium splendens (Figure 4) tended to become brown (Muller 1997), while Sphagnum nemoreum (= S. capillifolium; Figure 17) seemed to have a reduction in photosynthetic pigments as a result of the added N (Schleppi et al. 1999). It appears that the mosses were harmed by the added N in this form, except for the greater storage of N in Thuidium tamariscinum. On the other hand, Heeschen and coworkers (1996) contended that N is a "critical nutrient" for bryophytes in raised bogs. But the form matters.
Figure 16. Thuidium tamariscinum, a moss that benefits
from increased N input. Photo by Michael Lüth, with permission.
Figure 17. Sphagnum nemoreum (= S. capillifolium), a
species that loses chlorophyll when N is added to its growing medium. Photo by Michael Lüth, with permission.
Li and Vitt (1997) in their experiments on nutrient applications in peatlands in Alberta, Canada, found that the added N increased the productivities of two dominant mosses, Sphagnum fuscum (Figure 6-Figure 7) in a bog and Tomenthypnum nitens (Figure 18) in a rich fen,

8-7-6 Chapter 8-7: Nutrient Relations: Fertilization
whereas the productivity of two dominant shrubs, Rhododendron groenlandicum (=Ledum palustre subsp. groenlandicum; Figure 19) in the bog and Betula pumila (Figure 20) in the rich fen, was unaffected. Furthermore, Nordin and Gunnarsson (2000), working with Sphagnum fuscum, S. magellanicum (Figure 21), and S. rubellum (Figure 22) from two mires in Sweden, found that addition of NH4NO3 actually caused decreased growth, but resulted in higher concentrations of amino acids in the tissues. When tissue amino acid concentrations exceeded 2 mg, growth in length decreased, suggesting the amino acids may have reached a toxicity level or that the feedback mechanism caused a toxic buildup of NH4NO3.
Woodin et al. (1985) found that precipitation high in NO3
- (as often found in acid rain) induces the nitrate reductase in Sphagnum fuscum (Figure 6-Figure 7). Eventually this causes a rise in ammonia, which in turn inhibits the nitrate reductase activity. Nitrate reductase is typically the limiting component in the conversion to amino acids, so it provides a control mechanism that attempts to moderate the concentration of NH4
- and amino acids in the plant:
But it is important to keep in mind several intervening factors. Bryophytes in bogs and poor fens typically have Cyanobacteria associated with them, and ammonium inhibits nitrate reductase, reducing the symbiotic N fixation by the Cyanobacteria. Furthermore, ammonium is more available in acid soils. (See Subchapter 8-3 for further discussion of these intervening factors.)
Figure 18. Tomentypnum nitens, a moss with increased
productivity when N is added. Photo by Michael Lüth, with permission.
Figure 19. Rhododendron groenlandicum, a species that
does not seem to respond to added N in a bog. Photo through Creative Commons.
Figure 20. Betula pumila, a species that does not seem to
respond to added N in a bog. Photo through Creative Commons.
Figure 21. Sphagnum magellanicum, a species in which
addition of NH4NO3 caused decreased growth but increased amino acids. Photo by Michael Lüth, with permission.

Chapter 8-7: Nutrient Relations: Fertilization 8-7-7
Figure 22. Sphagnum rubellum, a species in which addition
of NH4NO3 caused decreased growth but increased amino acids. Photo by Michael Lüth, with permission.
As one might expect, what is good for one bryophyte may destroy another. Dirkse and Martakis (1992) found that in Swedish forests, fertilization with NH4NO3 elicited a positive response from Lophocolea heterophylla (Figure 24) while causing a "distinctly negative" response from Ptilidium ciliare (Figure 24). In another experiment with the aquatic Sphagnum cuspidatum (Figure 37), Paffen and Roelofs (1991) were unable to demonstrate any response to added NH4
+ unless the CO2 concentration was increased simultaneously. This suggests that it is the usable C source (CO2) that is limiting in that habitat, not the N source.
Figure 23. Lophocolea heterophylla, a liverwort that
responds positively to NH4NO3. Photo by Michael Lüth, with permission.
Figure 24. Ptilidium ciliare, a liverwort that responds
negatively to the addition of NH4NO3. Photo courtesy of Eric Schneider.
Nitrate reductase is formed only in the light in Fontinalis antipyretica (Figure 28) (Schwoerbel & Tillmanns 1974). If this is true in other bryophytes, it might explain why Fries (1945) was able to obtain only slight growth of Leptobryum pyriforme (Figure 25) and none in Funaria hygrometrica (Figure 26) when he cultured them on NO3
- in the dark. In the light, on the other hand, Funaria hygrometrica and Weissia controversa (Figure 27) grew best on the NO3
- source (Dietert 1979), but poorly even on a buffered NH4
+ medium. And Fontinalis antipyretica grew best on NH4
+ ions because of the suppression of nitrate reductase by NH4
+ (Schwoerbel & Tillmanns 1974). Many bryophytes can reduce NO3
- to NO2
- in the dark, but light is required to stimulate conversion of NO2
- to NH4+ (Brown 1982).
Figure 25. Leptobryum pyriforme. Photo by Michael Lüth,
with permission.
Figure 26. Funaria hygrometrica with its prolific capsules,
a species that grows best on nitrate and not on ammonium. Photo by Michael Lüth, with permission.

8-7-8 Chapter 8-7: Nutrient Relations: Fertilization
Figure 27. Weissia controversa, a species that grows best on
nitrate and not on ammonium. Photo by Michael Lüth, with permission.
The aquatic moss Fontinalis antipyretica (Figure 28) responded to high levels of KNO3 with a toxicity response that interfered with its physiological gas exchange (Stolz & Weise 1976). Its maximum sensitivity was in late spring, with minimal sensitivity in mid summer. High N levels can cause complete O2 depletion in Fontinalis-colonized waters, interfering with P uptake. Total gas exchange of F. antipyretica increased 10-12 fold when air turbulence in the culture system increased from 25 to 45 L h-1; P uptake increased accordingly.
Figure 28. Fontinalis antipyretica in flowing water with lots
of oxygen. Photo by Michael Lüth, with permission.
P Additions
Phosphorus typically comes from the mineral substrate, animal dung, and decomposition. The presence of Funaria hygrometrica (Figure 26) seems to correlate with the addition of phosphate fertilizer (O'Toole & Synnott 1971). Could this simply be tolerance, or is it a requirement? After all, this moss grows on charcoal, which typically binds ions, providing a low-nutrient habitat. In Polytrichum formosum (Figure 29), there seems to be a clear benefit; Vagts and Kinder (1999) reported an "exceptional stimulatory effect of NPK on this moss in a heathland."
Figure 29. Polytrichum formosum. Photo by Michael Lüth,
with permission.
In an Alaskan study, addition of P in a stream resulted in an increase in cover of the mosses Hygrohypnum alpestre (Figure 30) and H. ochraceum (Figure 31-Figure 32), suggesting that these mosses had been P limited (Figure 33; Bowden et al. 1994). P concentrations are typically low in stream ecosystems and limit algal productivity as well.
Figure 30. Hygrohypnum alpestre, a species that increases
in cover in the Arctic when P is added to the streams. Photo by Michael Lüth, with permission.
Figure 31. Hygrohypnum ochraceum showing its
abundance in the splash of a stream. Photo by Michael Lüth, with permission.
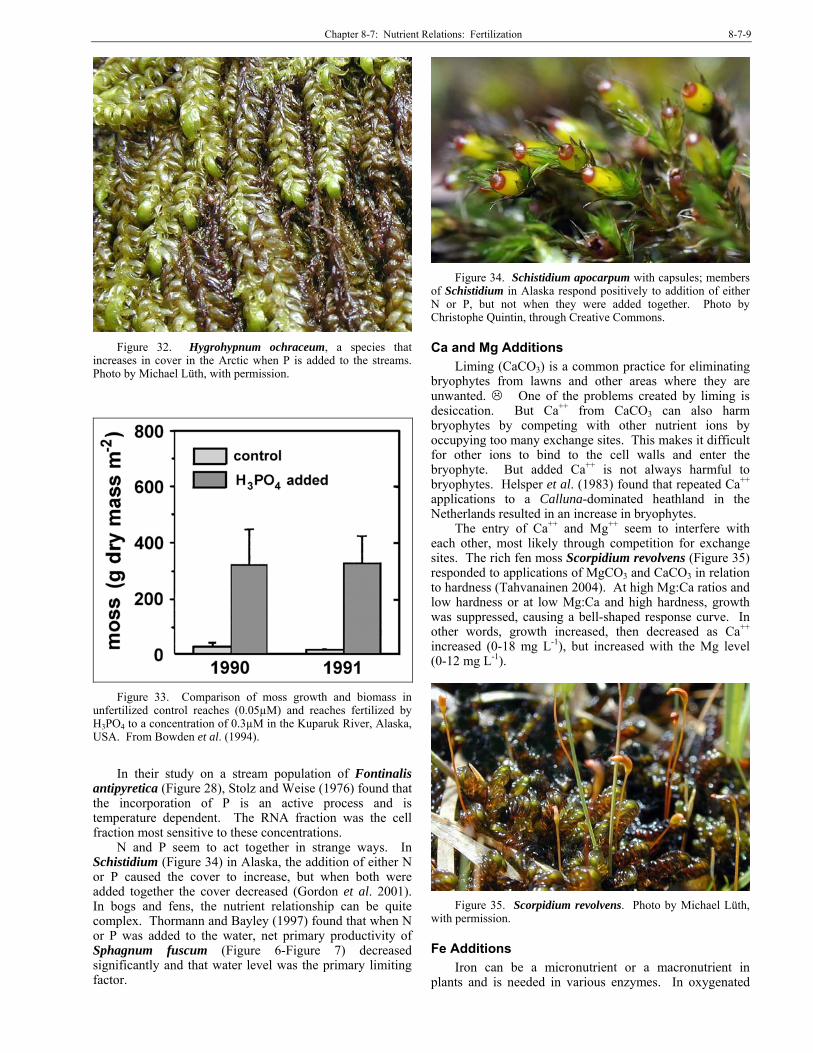
Chapter 8-7: Nutrient Relations: Fertilization 8-7-9
Figure 32. Hygrohypnum ochraceum, a species that
increases in cover in the Arctic when P is added to the streams. Photo by Michael Lüth, with permission.
Figure 33. Comparison of moss growth and biomass in
unfertilized control reaches (0.05µM) and reaches fertilized by H3PO4 to a concentration of 0.3µM in the Kuparuk River, Alaska, USA. From Bowden et al. (1994).
In their study on a stream population of Fontinalis
antipyretica (Figure 28), Stolz and Weise (1976) found that the incorporation of P is an active process and is temperature dependent. The RNA fraction was the cell fraction most sensitive to these concentrations.
N and P seem to act together in strange ways. In Schistidium (Figure 34) in Alaska, the addition of either N or P caused the cover to increase, but when both were added together the cover decreased (Gordon et al. 2001). In bogs and fens, the nutrient relationship can be quite complex. Thormann and Bayley (1997) found that when N or P was added to the water, net primary productivity of Sphagnum fuscum (Figure 6-Figure 7) decreased significantly and that water level was the primary limiting factor.
Figure 34. Schistidium apocarpum with capsules; members
of Schistidium in Alaska respond positively to addition of either N or P, but not when they were added together. Photo by Christophe Quintin, through Creative Commons.
Ca and Mg Additions
Liming (CaCO3) is a common practice for eliminating bryophytes from lawns and other areas where they are unwanted. One of the problems created by liming is desiccation. But Ca++ from CaCO3 can also harm bryophytes by competing with other nutrient ions by occupying too many exchange sites. This makes it difficult for other ions to bind to the cell walls and enter the bryophyte. But added Ca++ is not always harmful to bryophytes. Helsper et al. (1983) found that repeated Ca++ applications to a Calluna-dominated heathland in the Netherlands resulted in an increase in bryophytes.
The entry of Ca++ and Mg++ seem to interfere with each other, most likely through competition for exchange sites. The rich fen moss Scorpidium revolvens (Figure 35) responded to applications of MgCO3 and CaCO3 in relation to hardness (Tahvanainen 2004). At high Mg:Ca ratios and low hardness or at low Mg:Ca and high hardness, growth was suppressed, causing a bell-shaped response curve. In other words, growth increased, then decreased as Ca++ increased (0-18 mg L-1), but increased with the Mg level (0-12 mg L-1).
Figure 35. Scorpidium revolvens. Photo by Michael Lüth,
with permission.
Fe Additions Iron can be a micronutrient or a macronutrient in
plants and is needed in various enzymes. In oxygenated

8-7-10 Chapter 8-7: Nutrient Relations: Fertilization
water, iron forms iron oxides that are insoluble and precipitate out. However, in an aquatic system, deep water becomes anaerobic (lacking oxygen) and the iron then changes to its ferrous state and forms ferrous hydroxide, which is soluble. An interesting consequence of this relationship occurred in our study of a reservoir dam system (Glime & Keen 1984). The dam had the capability of providing outflow from four different depths. When the bottom depth was used, anaerobic water exited the reservoir and joined the shallow river below. The Fontinalis duriaei (Figure 36) in that river soon became covered with iron "pebbles." As the ferrous iron reached the photosynthesizing mosses, it changed to its ferric state and formed iron oxides with the photosynthetic oxygen. These ferric oxides adhered to the mosses as chunks or pebbles.
Figure 36. Fontinalis duriaei, a species that can become
plated with iron when reduced iron meets oxygenated water and plants producing oxygen. Photo by Michael Lüth, with permission.
CO2 Additions
When plants are submersed, CO2 can easily be limiting. This seems to be especially true for Sphagnum as it enjoys the warmer temperatures of summer when CO2 is quickly lost from the warm water. Addition of CO2 to water in which S. cuspidatum (wet kitten moss; Figure 37) was growing caused strong increases in both biomass and length (Paffen & Roelofs 1991). Addition of NH4
+ without additional CO2 had no effect on growth.
Figure 37. Sphagnum cuspidatum growing in water. Photo
by Michael Lüth, with permission.
But once again, relationships are not so simple. When atmospheric CO2 was increased to 700 ppm in combination with low levels of N deposition (6 g m-2 yr-1), Sphagnum recurvum var. mucronatum (Figure 38) responded with increased productivity, exhibiting a 17% increase in dry biomass (Heijden et al. 2000). But when N increased with the CO2, no growth differences occurred. In fact, even at the highest N level coupled with the high CO2 level there was a reduction of total N in the capitulum but not in the stems. This reduction in the capitulum coincided with reduced amino acids, but the soluble protein levels remained the same.
Figure 38. Sphagnum recurvum var. mucronatum, a
species that benefits from added CO2, but not when receiving added N at the same time. Photo by Jan-Peter Frahm, with permission.
Excess Nutrients
Some bryophytes require low nutrient conditions, and many simply cannot survive fertilization or high nutrient situations. The effect of high mineral concentrations has been a source of consternation for many bryologists who have attempted terrariums or culture of bryophytes. Standard nutrient concentrations usually need to be diluted to about 10% that used for tracheophytes and algae (Jeff Duckett, pers. comm. 23 February 2017), but as you will see in this chapter, that varies widely.
This problem of excess came to the attention of Bryonetters. Formation of a white crust on the tips of plants has attracted attention in a number of species. The discussion began when Caitlin Maraist (Bryonet 18 July 2016) cultured Ceratodon purpureus (Figure 39) on Turface (a clay that has been heated to improve absorption) moistened with DI water. The plants developed a white precipitate on their leaf tips. Timea Deakova (Bryonet 19 July 2016) reported having the same problem when culturing Dicranum species (Figure 8, Figure 15).

Chapter 8-7: Nutrient Relations: Fertilization 8-7-11
Figure 39. Ceratodon purpureus with capsules, a species
that accumulates a white precipitate when grown on Turface. Photo by Michael Lüth, with permission.
Lars Hedenäs (Bryonet 19 July 2016) reported Syntrichia ruralis s.l. (Figure 40) as commonly having such a crust when growing in "strongly calcareous and periodically dry habitats... When dry, the upper leaf portions (hair-points and uppermost lamina) become brittle" with what appears to be a precipitated calcium compound.
Figure 40. Syntrichia ruralis, a species that precipitates a
white crust at the leaf tips when it dries in strongly calcareous habitats. Photo by Michael Lüth, with permission.
When Syrrhopodon texanus (Figure 41) grows on mineral-rich sandstones, groups of plants can become white with salts accumulated on leaf tips, but adjoining species do not seem to have these accumulations (David Taylor, Bryonet 18 July 2016). This raises interesting questions about the various abilities of bryophytes to tolerate these salts. Why do some deposit them at their tips and others do not? How does this relate to internal vs external conduction? And what physiological adaptations permit some bryophytes to tolerate these salts without suffering from exosmosis (loss of water through the cell membranes due to the higher salt concentration on the outside of the cell)?
Figure 41. Syrrhopodon texanus, a species of mineral-rich
sandstone where it can accumulate salts on the leaf tips. Photo by Janice Glime.
Fertilization and Community Structure
It is easy to see that, rather than benefit, mosses may suffer from increased fertilization both from acid rain inputs and from airborne farm fertilizers, as shown in many field experiments (Mickiewicz 1976; Brown 1982; Jäppinen & Hotanen 1990; Kellner & Mårshagen 1991). In industrialized areas, heavy metals, needed by the bryophytes in minute quantities, can further result in the decline of bryophytes when the industrial sources greatly increase the quantities of these pollutants. In some cases, this pollution fertilization may be beneficial to the bryophytes, as in the pine-heath system where nutrient levels are especially low. Under such circumstances, mosses including Pohlia (Figure 42-Figure 43) and Pleurozium schreberi (Figure 44) can replace lichens, including Cladonia spp., particularly if irrigation is supplied (Persson 1981). Skré and Oechel (1979) found that Sphagnum nemoreum (= S. capillifolium; Figure 17) also increased its productivity in fertilizer experiments, as did the litter-inhabiting species Brachythecium oedipodium (Figure 45) and Plagiothecium laetum (Figure 46) with higher N, P, or Mg (van Dobben et al. 1992). Increases in productivity and growth of bryophyte species can lead to changes in community structure.
Figure 42. Pohlia nutans, demonstrating its ability to form
extensive mats. Photo by Michael Lüth, with permission.

8-7-12 Chapter 8-7: Nutrient Relations: Fertilization
Figure 43. Pohlia nutans with capsules, a species that can
replace lichens when nutrients are added to nutrient-poor habitats through pollution. Photo by Jan-Peter Frahm, with permission.
Figure 44. Pleurozium schreberi, a species that can replace
lichens in heathlands when fertilized by pollution. Photo by Sture Hermansson, with online permission.
Figure 45. Brachythecium oedipodium increased its
productivity in fertilizer experiments with N, P, and Mg. Photo by Michael Lüth, with permission.
By contrast, Skré and Oechel (1979) found that Hylocomium splendens (Figure 4) and Pleurozium schreberi (Figure 44) in the black spruce (Picea mariana; Figure 47) forest near Fairbanks, Alaska, did not increase in cover with fertilizer additions, suggesting that nutrients were already more available than in the pine-heath system studied by Persson (1981) or that these populations were
adapted to lower nutrient levels. Jäppinen and Hotanen (1990) found that these common boreal species, also including Dicranum (Figure 48) and Sphagnum (Figure 52) species, were killed by fertilizer applications designed to improve timber yield, but that Polytrichum commune (Figure 49) seemed unaffected. The overall effect, then, of the addition of nutrients is that species that are typical of poor sites (lichens, Ericaceae, feather mosses) shift toward associations of species typical of rich sites (Poaceae and litter-inhabiting mosses).
Figure 46. Plagiothecium laetum increased its productivity
in fertilizer experiments with N, P, and Mg. Photo by Kristian Peters, with permission.
Figure 47. Black spruce (Picea mariana) forest. Photo by
Herbert Pöhnl, through Creative Commons.
Figure 48. Dicranum polysetum, a boreal forest species that
is killed by forest fertilization designed to improve timber productions. Photo by Janice Glime.

Chapter 8-7: Nutrient Relations: Fertilization 8-7-13
Figure 49. Polytrichum commune, a boreal forest species
that unaffected by forest fertilization designed to improve timber productions. Photo by Michael Lüth, with permission.
On the other hand, disappearance of Rhytidiadelphus squarrosus (Figure 50) was not coupled with an increase in tracheophyte cover in either acidic or calcareous grassland (Morecroft et al. 1994). Rather, it appears to have responded to additions of NH4NO3 or (NH4)2SO4 (ammonium sulfate) additions through disruption of its N metabolism (Bates 2000).
Figure 50. Rhytidiadelphus squarrosus with competing
vascular plants. Photo by Michael Lüth, with permission.
Peatlands can respond differently in different geographic regions. Aerts and coworkers (1992) attributed the lower productivity of northern Swedish peatlands compared to those in southern Sweden to the 10X greater input of atmospheric N in the southern location. They supported this hypothesis by adding N and P at both sites. At the northern site, added N increased productivity 4-fold, but added P had no effect. Conversely, at the southern site, added N (4 g m-2 y-1) had no effect on productivity, whereas adding P (0.4 g m-2 y-1) increased productivity 3-fold. This trend is likewise supported by comparing a low and high deposition site in the Netherlands. Atmospheric N deposition there has been increasing, causing peatlands to increase in available N (Limpens et al. 2003). This increase in N seems to have coincided with an increase in Sphagnum fallax (Figure 52). However, Limpens et al. could find no evidence that S. fallax outcompeted any of the other five Sphagnum species in the area. Nevertheless, when N was added at a low deposition site, this species did expand its coverage. They determined that at the high deposition site S. fallax was limited by P. They concluded that when the capitulum N concentration is raised to 7 mg
L-1 or higher and the P concentration is 0.7 mg L-1 or higher, this species can increase and dominate.
Li and Vitt (1997) found that while moss productivity increased 4-300% with N enrichment (3 g m-2 yr-1 as NH4Cl), the productivity of the peatland shrubs Betula pumila (Figure 20) and Rhododendron (=Ledum) groenlandicum (Figure 19) did not. In fact, they concluded that the moss layer immediately retained nearly all of the added N. Likewise, Bayley et al. (1987) found that when N was added to a boreal peat system in the form of NO3
-, 90% was taken up by the Sphagnum lawn (Figure 51) within 24 hours, resulting in a growth increase by the Sphagnum. No growth increase occurred in the tracheophytes, even after five years of experimentation (Vitt 1991). Sanville (1988) likewise found that Sphagnum production increased in response to nutrient addition.
Figure 51. Sphagnum lawn. Photo through Creative
Commons.
Figure 52. Sphagnum fallax. Photo by Michael Lüth, with
permission.
In the high Arctic heath, bryophytes are a major ecosystem component. When N and P were added to that system for eight years, there was no change in bryophyte cover, but physiological processes shifted in the bryophyte layer (Gordon et al. 2001). Only 10 kg ha-1 yr-1
of N increased the proportion of physiologically active bryophyte shoots while decreasing their capacity to assimilate NO3
-. Effects of added P were even greater. When both nutrients were added, the species composition changed, with some bryophytes increasing in abundance
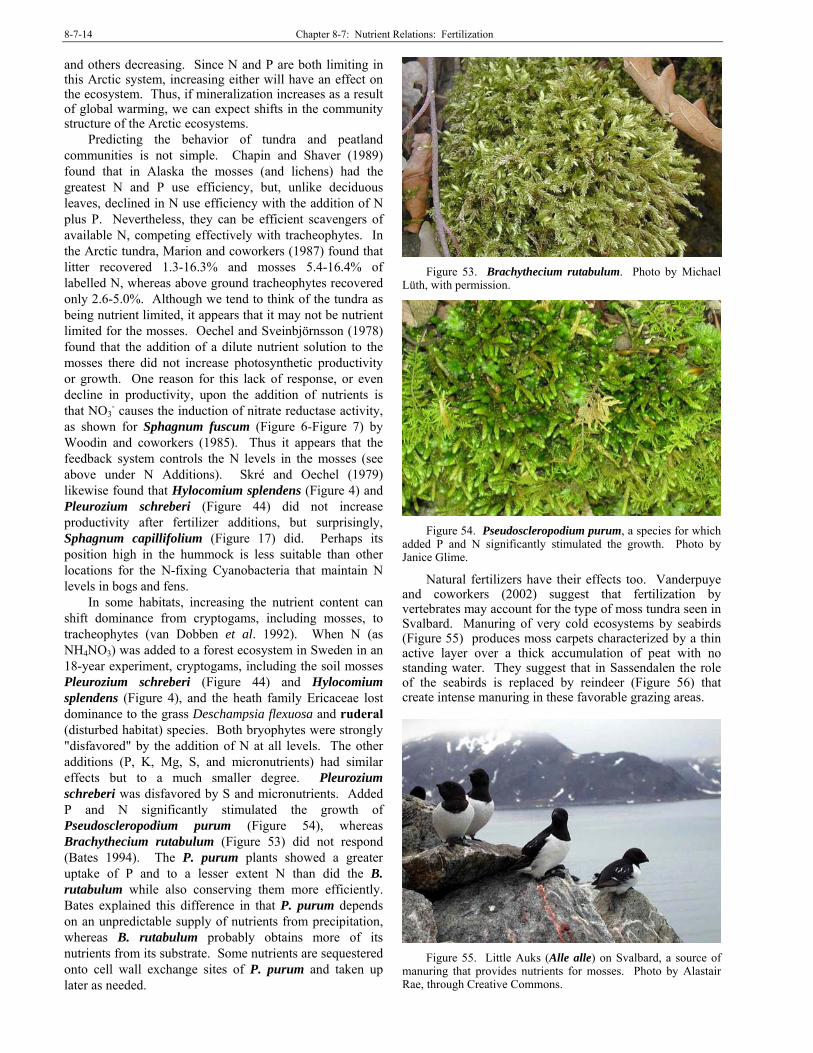
8-7-14 Chapter 8-7: Nutrient Relations: Fertilization
and others decreasing. Since N and P are both limiting in this Arctic system, increasing either will have an effect on the ecosystem. Thus, if mineralization increases as a result of global warming, we can expect shifts in the community structure of the Arctic ecosystems.
Predicting the behavior of tundra and peatland communities is not simple. Chapin and Shaver (1989) found that in Alaska the mosses (and lichens) had the greatest N and P use efficiency, but, unlike deciduous leaves, declined in N use efficiency with the addition of N plus P. Nevertheless, they can be efficient scavengers of available N, competing effectively with tracheophytes. In the Arctic tundra, Marion and coworkers (1987) found that litter recovered 1.3-16.3% and mosses 5.4-16.4% of labelled N, whereas above ground tracheophytes recovered only 2.6-5.0%. Although we tend to think of the tundra as being nutrient limited, it appears that it may not be nutrient limited for the mosses. Oechel and Sveinbjörnsson (1978) found that the addition of a dilute nutrient solution to the mosses there did not increase photosynthetic productivity or growth. One reason for this lack of response, or even decline in productivity, upon the addition of nutrients is that NO3
- causes the induction of nitrate reductase activity, as shown for Sphagnum fuscum (Figure 6-Figure 7) by Woodin and coworkers (1985). Thus it appears that the feedback system controls the N levels in the mosses (see above under N Additions). Skré and Oechel (1979) likewise found that Hylocomium splendens (Figure 4) and Pleurozium schreberi (Figure 44) did not increase productivity after fertilizer additions, but surprisingly, Sphagnum capillifolium (Figure 17) did. Perhaps its position high in the hummock is less suitable than other locations for the N-fixing Cyanobacteria that maintain N levels in bogs and fens.
In some habitats, increasing the nutrient content can shift dominance from cryptogams, including mosses, to tracheophytes (van Dobben et al. 1992). When N (as NH4NO3) was added to a forest ecosystem in Sweden in an 18-year experiment, cryptogams, including the soil mosses Pleurozium schreberi (Figure 44) and Hylocomium splendens (Figure 4), and the heath family Ericaceae lost dominance to the grass Deschampsia flexuosa and ruderal (disturbed habitat) species. Both bryophytes were strongly "disfavored" by the addition of N at all levels. The other additions (P, K, Mg, S, and micronutrients) had similar effects but to a much smaller degree. Pleurozium schreberi was disfavored by S and micronutrients. Added P and N significantly stimulated the growth of Pseudoscleropodium purum (Figure 54), whereas Brachythecium rutabulum (Figure 53) did not respond (Bates 1994). The P. purum plants showed a greater uptake of P and to a lesser extent N than did the B. rutabulum while also conserving them more efficiently. Bates explained this difference in that P. purum depends on an unpredictable supply of nutrients from precipitation, whereas B. rutabulum probably obtains more of its nutrients from its substrate. Some nutrients are sequestered onto cell wall exchange sites of P. purum and taken up later as needed.
Figure 53. Brachythecium rutabulum. Photo by Michael
Lüth, with permission.
Figure 54. Pseudoscleropodium purum, a species for which
added P and N significantly stimulated the growth. Photo by Janice Glime.
Natural fertilizers have their effects too. Vanderpuye and coworkers (2002) suggest that fertilization by vertebrates may account for the type of moss tundra seen in Svalbard. Manuring of very cold ecosystems by seabirds (Figure 55) produces moss carpets characterized by a thin active layer over a thick accumulation of peat with no standing water. They suggest that in Sassendalen the role of the seabirds is replaced by reindeer (Figure 56) that create intense manuring in these favorable grazing areas.
Figure 55. Little Auks (Alle alle) on Svalbard, a source of
manuring that provides nutrients for mosses. Photo by Alastair Rae, through Creative Commons.
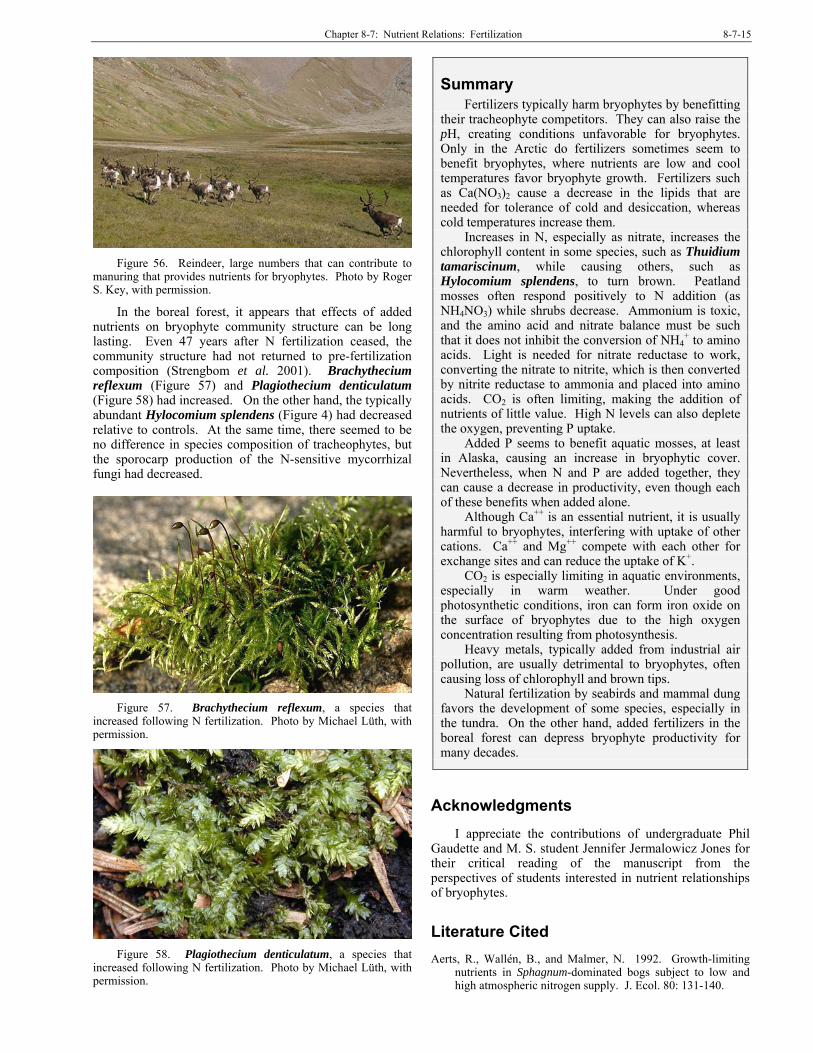
Chapter 8-7: Nutrient Relations: Fertilization 8-7-15
Figure 56. Reindeer, large numbers that can contribute to
manuring that provides nutrients for bryophytes. Photo by Roger S. Key, with permission.
In the boreal forest, it appears that effects of added nutrients on bryophyte community structure can be long lasting. Even 47 years after N fertilization ceased, the community structure had not returned to pre-fertilization composition (Strengbom et al. 2001). Brachythecium reflexum (Figure 57) and Plagiothecium denticulatum (Figure 58) had increased. On the other hand, the typically abundant Hylocomium splendens (Figure 4) had decreased relative to controls. At the same time, there seemed to be no difference in species composition of tracheophytes, but the sporocarp production of the N-sensitive mycorrhizal fungi had decreased.
Figure 57. Brachythecium reflexum, a species that
increased following N fertilization. Photo by Michael Lüth, with permission.
Figure 58. Plagiothecium denticulatum, a species that
increased following N fertilization. Photo by Michael Lüth, with permission.
Summary Fertilizers typically harm bryophytes by benefitting
their tracheophyte competitors. They can also raise the pH, creating conditions unfavorable for bryophytes. Only in the Arctic do fertilizers sometimes seem to benefit bryophytes, where nutrients are low and cool temperatures favor bryophyte growth. Fertilizers such as Ca(NO3)2 cause a decrease in the lipids that are needed for tolerance of cold and desiccation, whereas cold temperatures increase them.
Increases in N, especially as nitrate, increases the chlorophyll content in some species, such as Thuidium tamariscinum, while causing others, such as Hylocomium splendens, to turn brown. Peatland mosses often respond positively to N addition (as NH4NO3) while shrubs decrease. Ammonium is toxic, and the amino acid and nitrate balance must be such that it does not inhibit the conversion of NH4
+ to amino acids. Light is needed for nitrate reductase to work, converting the nitrate to nitrite, which is then converted by nitrite reductase to ammonia and placed into amino acids. CO2 is often limiting, making the addition of nutrients of little value. High N levels can also deplete the oxygen, preventing P uptake.
Added P seems to benefit aquatic mosses, at least in Alaska, causing an increase in bryophytic cover. Nevertheless, when N and P are added together, they can cause a decrease in productivity, even though each of these benefits when added alone.
Although Ca++ is an essential nutrient, it is usually harmful to bryophytes, interfering with uptake of other cations. Ca++ and Mg++ compete with each other for exchange sites and can reduce the uptake of K+.
CO2 is especially limiting in aquatic environments, especially in warm weather. Under good photosynthetic conditions, iron can form iron oxide on the surface of bryophytes due to the high oxygen concentration resulting from photosynthesis.
Heavy metals, typically added from industrial air pollution, are usually detrimental to bryophytes, often causing loss of chlorophyll and brown tips.
Natural fertilization by seabirds and mammal dung favors the development of some species, especially in the tundra. On the other hand, added fertilizers in the boreal forest can depress bryophyte productivity for many decades.
Acknowledgments
I appreciate the contributions of undergraduate Phil Gaudette and M. S. student Jennifer Jermalowicz Jones for their critical reading of the manuscript from the perspectives of students interested in nutrient relationships of bryophytes.
Literature Cited Aerts, R., Wallén, B., and Malmer, N. 1992. Growth-limiting
nutrients in Sphagnum-dominated bogs subject to low and high atmospheric nitrogen supply. J. Ecol. 80: 131-140.

8-7-16 Chapter 8-7: Nutrient Relations: Fertilization
Al-Hasan, R. H., Ka'wash, H. H., and Radwan, S. S. 1991. Enrichment of mosses with lipids and polyunsaturated fatty acids by nitrogen starvation. Bryologist 94: 196-200.
Bakken, S. 1995. Effects of nitrogen supply and irradiance on growth and nitrogen status in the moss Dicranum majus from differently polluted areas. J. Bryol. 18: 707-721.
Bates, J. W. 1994. Responses of the mosses Brachythecium rutabulum and Pseudoscleropodium purum to a mineral nutrient pulse. Funct. Ecol. 8: 686-692.
Bates, J. W. 2000. Mineral nutrition, substratum ecology, and pollution. In: Shaw, A. J. and Goffinet, B. Bryophyte Biology. Cambridge University Press, Cambridge, UK, pp. 248-311.
Bayley, S. E., Vitt, D. H., Newbury, R. W., Beaty, K. G., Behr, R., and Miller, C. 1987. Experimental acidification of a Sphagnum-dominated peatland: First year results. Can. J. Fish. Aquat. Sci. 44, Suppl. 1: 194-205.
Bowden, W. B., Finlay, J. C., and Maloney, P. E. 1994. Long-term effects of PO4 fertilization on the distribution of bryophytes in an Arctic river. Freshwat. Biol. 32: 445-454.
Brown, D. H. 1982. Mineral nutrition. In: Smith, A. J. E. (ed.). Bryophyte Ecology, Chapman & Hall, London, pp. 383-444.
Chapin, F. S. III and Shaver, G. R. 1989. Differences in growth and nutrient use among Arctic plant growth forms. Funct. Ecol. 3: 73-80.
Dietert, M. F. 1979. Studies on the gametophyte nutrition of the cosmopolitan species Funaria hygrometrica and Weissia controversa. Bryologist 82: 417-431.
Dirkse, G. M. and Martakis, G. F. P. 1992. Effects of fertilizer on bryophytes in Swedish experiments on forest fertilization. Biol. Conserv. 59(2/3): 155-161.
Dobben, H. F. van, Dirkse, G. M., Braak, C. J. F. ter, and Tamm, C. O. 1992. Effects of acidification, liming and fertilization on the undergrowth of a pine forest stand in central Sweden. RIN report 92/21. DLO Institute for Forestry and Nature Research, Wageningen, 26 pp.
Fries, N. 1945. Some experiments with mosses cultured in the dark. Bot. Not. 98: 417-424.
Glime, J. M. and Keen, R. E. 1984. The importance of bryophytes in a man-centered world. J. Hattori Bot. Lab. 55: 133-146.
Gordon, C., Wynn, J. M., and Woodin, S. J. 2001. Impacts of increased nitrogen supply on high Arctic heath: The importance of bryophytes and phosphorus availability. New Phytol. 149: 461-471.
Heeschen, V., Matlok, J., Schrader, S., and Rudolph, H. 1996. Asparagine catabolism in bryophytes: Purification and characterization of two L-asparaginase isoforms from Sphagnum fallax. Physiol. Plant. 97: 402-410.
Heijden, E. van der, Verbeek, S. K., and Kuiper, P. J. C. 2000. Elevated atmospheric CO2 and increased nitrogen deposition: effects on C and N metabolism and growth of the peat moss Sphagnum recurvum P. Beauv. var. mucronatum (Russ.) Warnst. Global Change Biol. 6(2): 201-212.
Helsper, H. P. G., Glenn-Lewin, D., and Werger, M. J. A. 1983. Early regeneration of Calluna heathland under various fertilization treatments. Oecologia 58: 208-214.
Jägerbrand, A. K., Molau, U., and Alatalo, J. M. 2003. Responses of bryophytes to simulated environmental change at Latnjajaure, northern Sweden. J. Bryol. 25: 163-168.
Jäppinen, J.-P. and Hotanen, J.-P. 1990. Effect of fertilization on the abundance of bryophytes in two drained peatland forests in eastern Finland. Ann. Bot. Fenn. 27: 93-108.
Karunen, P. 1981. Role of neutral lipids in the physiology and ecology of subarctic Dicranum elongatum. Can. J. Bot. 59: 1902-1909.
Karunen, P. and Liljenberg, C. 1981. Content and fatty acid composition of steryl and wax esters in germinating spores of Polytrichum commune. Physiol. Plant. 53: 48-54.
Karunen, P. and Mikola, H. 1980. Distribution of triglycerides in Dicranum elongatum. Phytochemistry 19: 319-321.
Karunen, P. and Salin, M. 1981. Seasonal variation of lipids in Sphagnum fuscum surface peat. Lindbergia 7: 35-44.
Kellner, O. and Mårshagen, M. 1991. Effects of irrigation and fertilization on the ground vegetation in a 130-year-old stand of Scots pine. Can. J. Forest. Res. 21: 733-738.
Li, Y. and Vitt, D. H. 1997. Patterns of retention and utilization of aerially deposited nitrogen in boreal peatlands. Ecoscience 4(1): 106-116.
Limpens, J., Tomassen, H. B. M., and Berendse, F. 2003. Expansion of Sphagnum fallax in bogs: striking the balance between N and P availability. J. Bryol. 25: 83-90.
Marion, G. M., Miller, P. C., and Black, C. H. 1987. Competition for tracer 15N in tussock tundra ecosystems. Holarct. Ecol. 10: 230-234.
Mickiewicz, J. 1976. Influence of mineral fertilization of moss. Polish Ecol. Studies 2: 57-62.
Miles, J. 1968. Bryological note. Invasion by Bryum bornholmense Winkelm. & Ruthe of heathland treated with calcium carbonate. Trans. Brit. Bryol. Soc. 5: 587.
Miles, J. 1973. Natural recolonization of experimentally bared soil in Callunetum in North-East Scotland. J. Ecol. 61: 399-412.
Morecroft, M. D., Sellers, E. K., and Lee, J. A. 1994. An experimental investigation into the effects of atmospheric nitrogen deposition on two semi-natural grasslands. J. Ecol. 82: 475-483.
Muller, N. 1997. Short-term response of the ground vegetation in a montane forest ecosystem under increased nitrogen deposition - influence of light and competition. Swiss Federal Institute for Forest, Snow and Landscape Research (WSL), CH-8903 Birmensdorf, Switzerland. Thesis 12388, ETH Zurich.
Nordin, A. and Gunnarsson, U. 2000. Amino acid accumulation and growth of Sphagnum under different levels of N deposition. Ecoscience 7: 474-480.
Oechel, W. C. and Sveinbjörnsson, B. 1978. Primary production processes in arctic bryophytes at Barrow, Alaska. In: Tieszen, L. L. (ed.). Vegetation and Production Ecology of an Alaskan Arctic Tundra, Ecological Studies 29, Springer-Verlag New York Inc., New York. Chapt. 11, Pp. 269-298.
O'Toole, M. A. and Synnott, D. M. 1971. The bryophyte succession of blanket peat following calcium carbonate, nitrogen, and potassium fertilizers. J. Ecol. 59: 121-126.
Paffen, B. G. P. and Roelofs, J. G. M. 1991. Impact of carbon dioxide and ammonium on the growth of submerged Sphagnum cuspidatum. Aquat. Bot. 40: 61-71.
Persson, H. 1981. The effect of fertilization and irrigation on the vegetation dynamics of a pine-heath ecosystem. Vegetatio 46: 181-192.
Rastorfer, J. R. 1972. Comparative physiology of four west Antarctic mosses. Antarct. Res. Ser. 20: 143-161.
Robinson, C. H., Wookey, P. A., Lee, J. A., Callaghan, T. V., and Press, M. C. 1998. Plant community responses to simulated environmental change at a high Arctic polar semi-desert. Ecology 79: 856-866.
Chapter 8-7: Nutrient Relations: Fertilization 8-7-17
Sanville, W. 1988. Response of an Alaskan wetland to nutrient enrichment. Aquat. Bot. 30: 231-243.
Schleppi, P., Muller, N., Edwards, P. J., and Bucher, J. B. 1999. Three years of increased nitrogen deposition do not affect the vegetation of a montane forest ecosystem. Phyton 39: 197-204.
Schwoerbel, J. and Tillmanns, G. C. 1974. Assimilation of nitrogen from the medium and nitrate reductase activity in submerged macrophytes: Fontinalis antipyretica L. Arch. Hydrobiol. Suppl. 47: 282-294.
Skré, O. and Oechel, W. C. 1979. Moss production in a black spruce Picea mariana forest with permafrost near Fairbanks, Alaska, as compared with two permafrost-free stands. Holarct. Ecol. 2: 249-254.
Stolz, L. and Weise, G. 1976. Einfluss des Nährstoffgehaltes auf die Stoffproduktion submerser Makrophyten in Fliessgewässern, dargestellt an Fontinalis antipyretica L. [The effect of nutrient content on the productivity of submerged macrophytes in flowing water, with regard to Fontinalis antipyretica L.]. Limnologica 10: 405-417.
Strengbom, J., Nordin, A., Näsholm, T., and Ericson, L. 2001. Slow recovery of boreal forest ecosystem following decreased nitrogen input. Funct. Ecol. 15: 451-457.
Tahvanainen, T. 2004. The growth of Scorpidium revolvens in relation to calcium and magnesium. Lindbergia 29: 123-128.
Thormann, M. N. and Bayley, S. E. 1997. Response of aboveground net primary plant production to nitrogen and phosphorus fertilization in peatlands in southern boreal Alberta, Canada. Wetlands 17: 502-512.
Vagts, I. and Kinder, M. 1999. The response of different Cladonia species after treatment with fertilizer or lime in heathland. Lichenologist 31(1): 75-83.
Vanderpuye, A. W., Elvebakk, A., and Nilsen, L. 2002. Plant communities along environmental gradients of high-Arctic mires in Sassendalen, Svalbard. J. Veg. Sci. 13: 875-884.
Virtanen, R., Johnston, A. E., Crawley, M. J., and Edwards, G. R. 2000. Bryophyte biomass and species richness on the park grass experiment, Rothamsted, UK. Plant Ecol. 151: 129-141.
Vitt, D. H. 1991. Distributional patterns, adaptive strategies, and morphological changes of mosses along elevational and latitudinal gradients on South Pacific Islands. In: Nimis, P. L. and Crovello, T. J. (eds.). Quantitative Approaches to Phytogeography, Kluwer Academic Publishers, The Netherlands, pp. 205-231.
Woodin, S. J., Press, M. C., and Lee, J. A. 1985. Nitrate reductase activity in Sphagnum fuscum in relation to wet deposition of nitrate from the atmosphere. New Phytol. 99: 381-388.

8-7-18 Chapter 8-7: Nutrient Relations: Fertilization

Glime, J. M. 2017. Nutrient relationships: Cycling. Chapt. 8-8. In: Glime, J. M. Bryophyte Ecology. Volume 1. Physiological 8-8-1 Ecology. Ebook sponsored by Michigan Technological University and the International Association of Bryologists. Last updated 28 February 2017 and available at <http://digitalcommons.mtu.edu/bryophyte-ecology/>.
CHAPTER 8-8
NUTRIENT RELATIONSHIPS: CYCLING
TABLE OF CONTENTS Storage and Release ............................................................................................................................................ 8-8-2 Storage Locations................................................................................................................................................ 8-8-4 MethodologyMatters.................................................................................................................................... 8-8-4 Mineral Nutrients ......................................................................................................................................... 8-8-4 What We Learned from Heavy Metals ........................................................................................................ 8-8-5 Oil and Lipid Bodies .................................................................................................................................... 8-8-5 External Storage........................................................................................................................................... 8-8-9 Bryophytes as Nutrient Sinks..................................................................................................................... 8-8-10 Luxury Nutrients................................................................................................................................. 8-8-15 Carbon Sinks....................................................................................................................................... 8-8-16 The Vernal Dam.................................................................................................................................. 8-8-16 Release during Desiccation/Rehydration .......................................................................................................... 8-8-17 Canopy Releases ........................................................................................................................................ 8-8-18 Bogs and Fens ................................................................................................................................................... 8-8-19 pH Effects ......................................................................................................................................................... 8-8-21 Indicator Species ............................................................................................................................................... 8-8-23 Needed Research............................................................................................................................................... 8-8-25 Summary ........................................................................................................................................................... 8-8-26 Acknowledgments............................................................................................................................................. 8-8-26 Literature Cited ................................................................................................................................................. 8-8-26
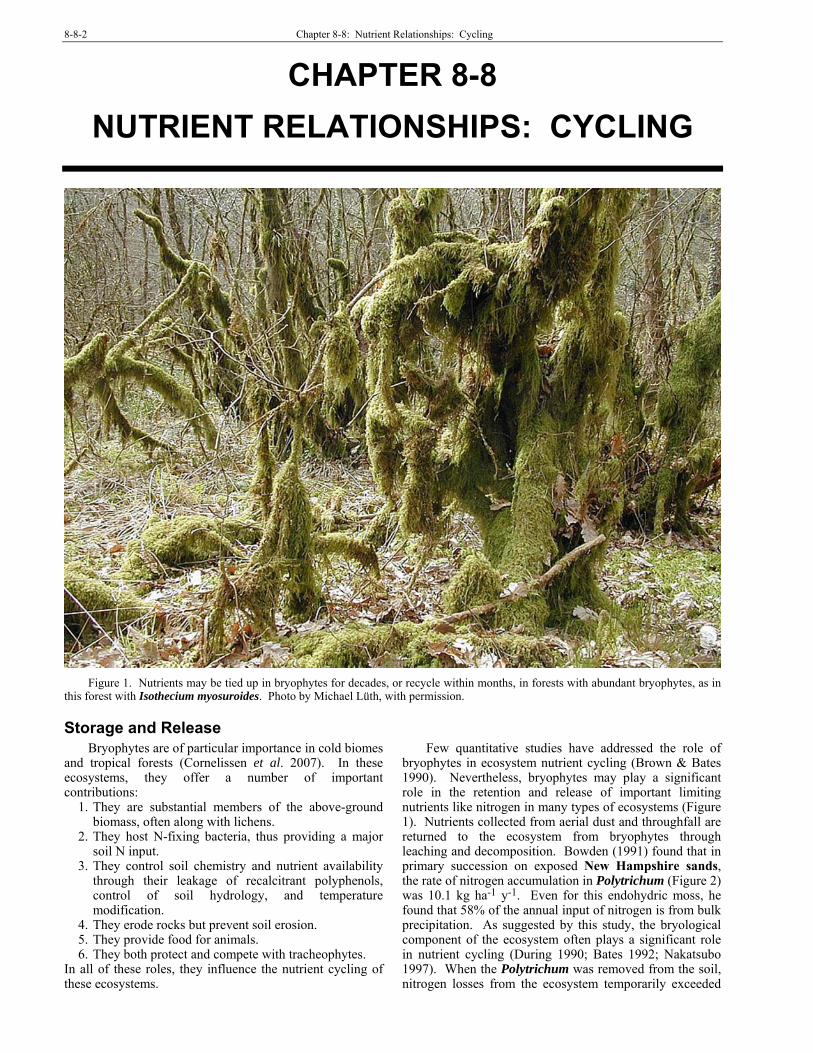
8-8-2 Chapter 8-8: Nutrient Relationships: Cycling
CHAPTER 8-8
NUTRIENT RELATIONSHIPS: CYCLING
Figure 1. Nutrients may be tied up in bryophytes for decades, or recycle within months, in forests with abundant bryophytes, as in
this forest with Isothecium myosuroides. Photo by Michael Lüth, with permission.
Storage and Release Bryophytes are of particular importance in cold biomes
and tropical forests (Cornelissen et al. 2007). In these ecosystems, they offer a number of important contributions:
1. They are substantial members of the above-ground biomass, often along with lichens.
2. They host N-fixing bacteria, thus providing a major soil N input.
3. They control soil chemistry and nutrient availability through their leakage of recalcitrant polyphenols, control of soil hydrology, and temperature modification.
4. They erode rocks but prevent soil erosion. 5. They provide food for animals. 6. They both protect and compete with tracheophytes.
In all of these roles, they influence the nutrient cycling of these ecosystems.
Few quantitative studies have addressed the role of bryophytes in ecosystem nutrient cycling (Brown & Bates 1990). Nevertheless, bryophytes may play a significant role in the retention and release of important limiting nutrients like nitrogen in many types of ecosystems (Figure 1). Nutrients collected from aerial dust and throughfall are returned to the ecosystem from bryophytes through leaching and decomposition. Bowden (1991) found that in primary succession on exposed New Hampshire sands, the rate of nitrogen accumulation in Polytrichum (Figure 2) was 10.1 kg ha-1 y-1. Even for this endohydric moss, he found that 58% of the annual input of nitrogen is from bulk precipitation. As suggested by this study, the bryological component of the ecosystem often plays a significant role in nutrient cycling (During 1990; Bates 1992; Nakatsubo 1997). When the Polytrichum was removed from the soil, nitrogen losses from the ecosystem temporarily exceeded

Chapter 8-8: Nutrient Relationships: Cycling 8-8-3
inputs, underlining the importance of the mosses in sequestering and holding nitrogen at the site. Lamontagne (1998) found that nitrification increased 13-fold under lichen and moss patches. In this case, the lichens did not fix atmospheric nitrogen and thus did not contribute directly to the nitrogen supply. Without the mosses (and lichens), the nitrogen from precipitation and throughfall can be lost to surface water that ultimately ends up in waterways and is carried from the local system. Furthermore, the mosses and lichens can contribute organic acids that leach nitrogen from the underlying bedrock, thus making it available to plants.
Figure 2. Polytrichum commune, a species that accumulates
carbon in growing shoots and brown portions. Photo by Andrew Spink, with permission.
Only in peatlands and the polar latitudes have most ecosystem ecologists traditionally acknowledged the role of the bryophytes in storing or releasing nutrients. Nevertheless, bryophytes play several roles in the nutrient status of their native ecosystems. Whereas tracheophytes obtain nutrients only after mediation by the soil, most bryophytes obtain nutrients before they reach the soil.
The boreal feather moss Hylocomium splendens (Figure 3) in a subarctic birch woodland has a retention time of 3-10 years for N, transporting the N within the plant to the growing tips (Eckstein 2000). Such a retention can have a strong impact on the nutrient dynamics of a forest with 100% bryophyte cover on the forest floor.
Figure 3. Hylocomium splendens, a feather moss. Photo by
Michael Lüth, with permission.
In the Alaskan black spruce forest (Figure 4), the bryophyte layer intercepts and accumulates more of every nutrient element but Ca++ than it receives from throughfall and litter (Oechel & van Cleve 1986), again suggesting that soil nutrients are also contributed. In the boreal forest, bryophytes are limited in biomass, but they nevertheless are major contributors to cover and primary productivity (Oechel & van Cleve 1986). They furthermore act much like a sponge in their ability to take up nutrients rapidly. Their further ability to modify the soil temperature and prevent permafrost makes them major ecosystem engineers for the nutrient regime.
Figure 4. Black spruce (Picea mariana) forest at Arctic
Chalet, Inuvik, NT. Photo through Creative Commons.
Even in tropical forests, where trees can create up to five levels of canopy, the "insignificant" bryophytes can be significant in altering the nutrient regime. The bryophytes serve as filters for nutrients in rainfall, throughfall, and stemflow. This role is a complex one, differing among species of bryophytes, seasons, state of hydration, and types of nutrients (Glime 2001).
Working in chalk grasslands, During (1990) suggested that even when bryophytes are patchy they have a major impact on nutrients and tracheophytes associated with them, particularly during partial dieback and decomposition in the summer months. In chalk grasslands, bryophytes grow and absorb nutrients during autumn and winter, thus not competing with the inactive tracheophytes. They release nutrients by decomposition in spring and summer, hence serving to sequester nutrients in the ecosystem and provide them to the tracheophytes when nutrients are needed most for growth. It is clear that we cannot afford to ignore their potential role in ecosystem-level nutrient cycling.

8-8-4 Chapter 8-8: Nutrient Relationships: Cycling
Storage Locations
Many factors determine where nutrients are stored in bryophytes. External storage on exchange sites provides a ready supply as nutrients are used within the cells. Storage in underground stems can provide nutrients for new growth in spring. And many compounds are stored structurally, making them unavailable until the slow process of decomposition once again releases them.
Methodology Matters
Because of their tremendous surface area, bryophytes are typically "contaminated" with surface dust. This presents serious problems when trying to assess their nutrient content. While it seems obvious that washing would reduce the problem, it brings problems of its own. The success of washing mosses has rarely been quantified. Hence, degree of removal can vary widely between samples and researchers. And some species, with retentive sites such as boat-shaped leaves or clasping bases, will retain more soil particles than others. Furthermore, particulate matter may partially solubilize in the wash and could increase uptake. On the other hand, if the adhering dust contains sulfur or nitrogen oxides, the resulting acids could cause the loss of ions by leaching. The sudden change in ionic balance can have unpredictable influence on the adhering portion (i.e. those on exchange sites), causing a shift in the nutrient component of the bryophyte.
Published studies on the nutrient content of bryophytes have used a variety of methods, and one must assess the method to determine if the values given are appropriate for the interpretation needed. Lack of attention to bound ions on the moss surface can give misleading values.
Studies indicating locations of nutrient concentrations of bryophytes often do not provide a true picture of those constituents within the cells. Rather, they include the numerous ions located on exchange sites on the surfaces of the plant. Hence, in reviewing nutrient concentrations we must pay particular attention to the methods in separating the external from the internal components. Nevertheless, both internal and external storage have an impact on the nutrient cycling of the ecosystem.
Determining the positions of ions on and in bryophytes is largely a chemical process. Two different methods have revealed similar locations. Brehm (1968, 1970) found those located on the extracellular exchange sites by displacing the cations with 0.01N mineral acids. He followed this with formaldehyde to rupture the cells, releasing the internal soluble ions. The remaining cations were displaced with normal acid. Brown and coworkers used 1000 mg L-1 Sr (Bates & Brown 1974) or Ni (Brown & Buck 1978a, b, 1979) to displace the bound extracellular cations, followed by boiling to release soluble ions, and then recovering residual material by a total digestion in concentrated HNO3. Both groups found that Na+ and K+ occurred in the cytosol, while Ca++ remained largely as an extracellular exchangeable form on plant external and intercellular surfaces. This makes sense because a major role of Ca++ is in forming calcium pectate bonds to cement cell walls together. Mg++ and Zn++ showed intermediate patterns of location. Nevertheless, a complete understanding of affinities is necessary to interpret the concentrations. Brown and Bates (1972) used Ni to replace Pb, but later Brown (1982) pointed out that they had failed
to release all the Pb from exchange sites and that a concentration greater than 1000 mg L-1 would be needed to remove elements like Pb that have a very high affinity for exchange sites.
Mineral Nutrients Several studies have identified the locations where
bryophytes store mineral nutrients. Brown (1982) states that in general the monovalent cations, e.g. K+, are concentrated near the apex and the divalent elements toward the base. We also know that in tracheophytes N, P, K, Mg, and Cl move easily due to greater solubility, whereas B, Ca, and Fe are relatively insoluble and immobile. One of the factors contributing to high concentrations of ions of such elements as Al, Ca, Fe, and Mn in older segments is that as cells die or other ions move to the apex, new binding sites are exposed, permitting more of these ions to accumulate there.
Brown and Buck (1985) likewise found that K+ resided in the cytosol of Grimmia donniana (Figure 5) and Calliergonella cuspidata (Figure 6), whereas Ca++ and Pb++ were in extracellular exchangeable forms. Mg++ and Zn++ seemed to be intermediate in behavior, with locations depending on the species and total element concentration.
Figure 5. Grimmia donniana, a species in which K+ resides
in the cytosol and Ca++ and Pb++ in an extracellular locations. Photo by Hermann Schachner, through Creative Commons.
Figure 6. Calliergonella cuspidata, a species in which K+
resides in the cytosol and Ca++ and Pb++ in extracellular locations. Photo by Michael Lüth, with permission.

Chapter 8-8: Nutrient Relationships: Cycling 8-8-5
What We Learned from Heavy Metals Much of our knowledge of ion storage locations is
derived from storage of heavy metal contaminants in the environment. For example, Rhytidiadelphus squarrosus (Figure 7) stores Pb in electron-dense regions of the plasma membrane, in vesicles, vacuoles, chloroplasts, and nuclei, and in the cell wall (Gullvåg et al. 1974; Ophus & Gullvåg 1974; Skaar et al. 1973). But Hylocomium splendens (Figure 3) in the same study only contained electron dense regions in the cell wall (Gullvåg et al. 1974). The researchers reasoned that the thicker cell wall of H. splendens might prevent entry.
Figure 7. Rhytidiadelphus squarrosus, a species that stores
lead in its plasma membranes. Photo by Michael Lüth, with permission.
In the aquatic moss Platyhypnidium riparioides (Figure 8), Cu accumulates in three locations: intercellular in the cell wall free space, exchange sites on the cell wall, and residual within the cell (Mouvet & Claveri 1998). These three locations are those we should expect to hold most of the cations of a bryophyte, suggestion that heavy metals like Cu could compete with nutrients needed in greater quantity.
Figure 8. Platyhypnidium riparioides, a species that is able
to store copper in the cell wall free space, on exchange sites on the cell wall, and residual within the cell. Photo by Michael Lüth, with permission.
Oil and Lipid Bodies Oil bodies (isoprenoid essential oils; Figure 9-Figure
13) are well known in leafy liverworts, providing distinct diagnostic characters and provide distinctive odors, yet their function seems to remain unknown (He et al. 2013). Speculation includes protection from herbivores (Stahl 1888), pathogens, cold temperatures, excessive light (Hieronymus 1892), and UV radiation and desiccation (Gavaudan 1927; Chalaud 1931). These oil bodies are often associated with bryophytes that live in high light, but no physiological studies have demonstrated that they in fact make a difference. Perhaps the best argument for considering them to be food reserves is that most seeds store lipid droplets as a food reserve that is used for germination and subsequent growth (Huang et al. 2009).
Figure 9. Calypogeia peruviana cells with botryoid oil
bodies stained blue. Photo by Paul Davison, with permission.
Figure 10. Nardia scalaris leaf cells with oil bodies. Photo
by Hermann Schachner, through Creative Commons.
Figure 11. Nardia lescurii oil bodies and trigones. Photo by
Blanka Shaw, with permission.

8-8-6 Chapter 8-8: Nutrient Relationships: Cycling
Figure 12. Nardia compressa leaf cells. Photo by Hermann
Schachner, through Creative Commons
Figure 13. Rectolejeunea maxonii oil bodies 1 Blanka
Shaw, with permission.
Figure 14. Frullania fragilifolia ocelli (blue bulges filling
cells) and smaller oil bodies, also stained blue. Photo by Des Callaghan, with permission.
Figure 15. Jungermannia sp. oil bodies. Photo by Blanka
Shaw, with permission.
Figure 16. Frullania pycnantha oil bodies. Photo by Matt
von Konrat, with permission
Figure 17. Frullania squarrosula oil bodies (granular
greenish ovals). Photo by Matt von Konrat, with permission.
Figure 18. Jubulopsis novae-zelandiae oil bodies and cell
wall trigones. Photo by Matt von Konrat, with permission.

Chapter 8-8: Nutrient Relationships: Cycling 8-8-7
Nevertheless, the oil bodies of liverworts seem to have an important function in cell metabolism (He et al. 2013). Understanding it may help us to understand how these plants tolerate their environment. But is that tolerance to light, desiccation, low temperatures, periods of low nutrients, herbivores, or something else?
More recently, Pressel et al. (2009) described the role of liverwort oil bodies in desiccation tolerance. These are well known to "disappear" when the liverworts are dried, thus disappearing in herbarium specimens. However, in their study, Pressel and coworkers found that instead they become unchanged in the dry state, but become flattened upon rewetting. Then, after 48 hours, they regain their normal morphology. Nevertheless, if they are dried too quickly, the oil bodies do indeed vanish upon rewetting and do not reappear. The abilities of these oil bodies to recover as flattened bodies under natural conditions, then regain their shape after 48 hours of recovery suggests that they may shift soluble carbohydrates or other important substances into the cytoplasm, permitting rapid recovery of the cell from drought.
Some mosses may also develop similar structures. Huneck (1984) reported that in mosses these are comprised of lipids, not oil drops. Jönsson and Olin (1898) reported that these lipids occurred only in certain taxonomic groups and exhibited seasonal variation. Among 50 species in Sweden, the contents varied widely, but they generally produced maximum concentrations in spring and autumn during their growth periods. These mosses furthermore lack the distinctive odors exhibited by many liverworts (Lorch 1931).
In mosses, the lipid drops occur in such varied locations as alar cells, basal laminal cells, upper laminal cells, and costa, sometimes occurring in all of these in the same leaf (Frahm 1994). But when present in the Dicranaceae (Figure 19), they consistently occur in basal laminal cells, but may also occur elsewhere. Frahm made one interesting discovery in the herbarium specimens he assessed – the lipid bodies tended to be most frequent in specimens collected in the cold season, at high elevations and Arctic regions. If you want to explore these further, they become more visible with a Fuelgen reaction using wet mosses treated with Schiff's reagent; this gives the lipid bodies a deep violet color.
Figure 19. Dicranum scoparium leaf base cells showing fat
droplets. Photo by Ralf Wagner <www.dr-ralf-wagner.de>, with permission.
Des Callaghan (Bryonet 30 July 2013) reported large oil droplets in the cells of the perichaetial leaf of Diphyscium foliosum (Figure 20-Figure 22). Ida Bruggeman (Bryonet 31 July 2013) reported that members of Fissidens will often produce several small, shiny droplets, a common occurrence in the Fissidens subgenus Aloma (Figure 23-Figure 24). Frahm (1994) reported that oil drops in laminal cells of Dicranaceae (Figure 19) were taxonomically important and considered these to serve as a means of storage in the species that had them. It is likely that all of these apparent "oil droplets" are in reality fat droplets.
Figure 20. Diphyscium foliosum showing perichaetial
leaves around capsule. Photo from Botany 321 Website, UBC, with permission.
Figure 21. Diphyscium foliosum perichaetial leaf with lipid
droplets under polarized light. Photo by Des Callaghan, with permission.
Figure 22. Diphyscium foliosum leaf cs showing fat
droplets. Photo by Hermann Schachner, through Wikimedia Commons.

8-8-8 Chapter 8-8: Nutrient Relationships: Cycling
Figure 23. Fissidens exilis with capsules, a member of the
subgenus Aloma, that exhibits oil/fat droplets. Photo by Malcolm Storey, through Discover Life, with online permission.
Figure 24. Fissidens exilis leaf cells showing fat/oil
droplets. Photo by Malcolm Storey, through Discover Life, with online permission
Silvana B. Vilas Bôas-Bastos (Bryonet 31 July 2013) reported observing oil/fat droplets in the basal cells of the Dicranella hilariana (Figure 25). Rut Caparrós (Bryonet 8 August 2013) reported seeing large oil droplets in the vaginula of Ulota when the sample is crushed under the cover glass. Alison Downing (Bryonet 1 August 2013) saw what appeared to be oil bodies in Chrysoblastella chilensis (Figure 26-Figure 27), but was discouraged by colleagues who said mosses didn't have oil bodies. However, Matteri (1984) reported starch grains and what appeared to be oil drops in C. chilensis in the central tissue of tubers and postulated that they might serve as a means of perennation. She noted that these tubers do not readily separate from the stems and thus considered it unlikely that the tubers served in dispersal. Allan Fife (Bryonet 4 August 2013) described these tubers in New Zealand as common in axils of lower stems in this species.
As the bryophytes remain dry for longer periods of time, these oil/fat droplets gradually become smaller (Frahm 1994), disappearing rapidly in liverworts. In the Dicranaceae (Figure 19, Figure 35), however, they make take 8 years to completely disappear, slowly becoming smaller. In the leafy liverworts, the species that live in dry habitats manage to keep their oil bodies longer, making it possible to see them even in herbarium specimens.
Figure 25. Dicranella hilariana, a species that has oil/fat
droplets. Photo by Piers Majestyk, with online permission.
Figure 26. Chrysoblastella chilensis, a species that produces
oil/fat droplets. Photo by Tom Thekathyil, with permission.
Figure 27. Chrysoblastella chilensis leaf margin cells
showing oil/fat droplets. Photo by Tom Thekathyil, with permission.
Rod Seppelt (Bryonet 31 August 2013) observed that when cutting stems of some species of Bryum (Figure 28), vast quantities of lipids were released – perhaps the same

Chapter 8-8: Nutrient Relationships: Cycling 8-8-9
as those substances being interpreted as oil droplets in moss leaves. It appears that we need help from the biochemists to determine what these substances are. Then we need ecophysiologists to determine their use to the bryophytes and ultimate role in nutrient cycling.
Figure 28. Bryum stem cs, a genus in which lipid droplets
may be released by the stem when it is cut. Photo by Dale A. Zimmerman Herbarium, Western New Mexico University, with permission.
External Storage Bryophytes do not need to store nutrients internally to
have an impact on the ecosystem. Their ability to simply trap dust and retain it within the mat can be useful to some taxa while depriving others. Trapped soil and retained nutrients are apparently essential for some epiphytic taxa, especially in the tropics (Pocs 1982). This role has already been reported for orchids in Madagascar, where the moss Leucoloma (Figure 29) provides both the substrate and the nutrient source for epiphytic orchids (La Farge 2002).
Figure 29. Leucoloma triforme on bark, a moss genus that
helps to support epiphytic orchids. Photo by Michael Lüth, with permission.
Rooting in epiphytic mosses is now known for trees! The koa tree (Acacia koa) in Hawaii produces nodules containing the N-fixing Bradyrhizobium (Figure 30) on adventitious roots (those arising above ground), but much larger and more abundantly, in the mosses growing in lofty places on the same tree (Figure 33-Figure 33; Leary et al.
2004)! These mossy habitats trap organic soils largely derived from decomposing heartwood and leaf litter of the host tree and contain significantly higher concentrations of exchangeable cations, total N, and significantly lower Al than the terrestrial soils. Is it the nutrients, the reduced Al, the moisture-holding capacity of the moss, or some moss exudate that stimulates these large nodules? Most likely it is the combination.
Figure 30. Bradyrhizobium nodule showing bacteria
imbedded in the nodule tissue. Photo by Louisa Howard, through public domain.
Figure 31. Koa tree (Acacia koa) showing location of moss
and nodules (arrow). Photo courtesy of James Leary.
Figure 32. Koa tree (Acacia koa) showing location of
nodules with moss. Photo courtesy of James Leary.

8-8-10 Chapter 8-8: Nutrient Relationships: Cycling
Figure 33. Koa tree (Acacia koa) nodules among mosses.
Photo courtesy of James Leary.
Bryophytes as Nutrient Sinks Storage of nutrients in older parts or placing them in
structural compounds can result in nutrient sinks. These serve as reservoirs that accumulate and store a nutrient; these sinks may result from continually transporting nutrients to new tissues, storing them in older tissues (Figure 34), or binding them in incalcitrant compounds. In any case, the sink makes the nutrient unavailable to other components of the ecosystem.
Figure 34. Dicranum elongatum showing brown senescent
tissues where insoluble nutrients may remain for many years. Photo by Michael Lüth, with permission.
By trapping nutrients from the throughfall before they ever reach the soil, bryophytes serve as nutrient filters. This leads us to ask their role in parcelling out nutrients to the soil. Do bryophytes serve as nutrient sinks, and if so, do they eventually return their nutrient store to the forest soil? It may be too early to make generalizations, but let us consider some examples.
First of all, we know that bryophytes store their nutrients in structural compounds as well as within localized positions within the leaf cells. For example, Bakken (1995) pointed out that in Dicranum majus (Figure 35) N is stored in proteins and in chlorophyll. These organic components may be maintained within the moss for a long time, particularly while it is still alive. We have already seen that bryophytes move nutrients from old to
young tissues, thus depriving the soil of these nutrients through the pathway of decay.
Figure 35. Dicranum majus, a species that stores nitrogen in
proteins and chlorophyll. Photo by Michael Lüth, with permission.
In an old-growth Douglas fir forest (Pseudotsuga menziesii; Figure 36), where bryophytes occupied only 0.13% of the total forest biomass, they contributed 20% to the biomass and 95% to photosynthetic tissue of the forest floor (Binkley & Graham 1981). Their biomass contribution of 1075 kg ha-1 was composed of 92% Eurhynchium oreganum (Figure 37) and 7% Hylocomium splendens (Figure 3). The canopy throughfall contributed 3 kg ha-1 yr-1 N. By adding the moss component, Binkley and Graham added 10% to the estimates of understory N uptake.
Figure 36. Pseudotsuga menziesii forest. photo by Dave
Powell, through Creative Commons.
Figure 37. Eurhynchium oreganum . Photo by Matt Goff
<www.sitkanature.org>, with permission.
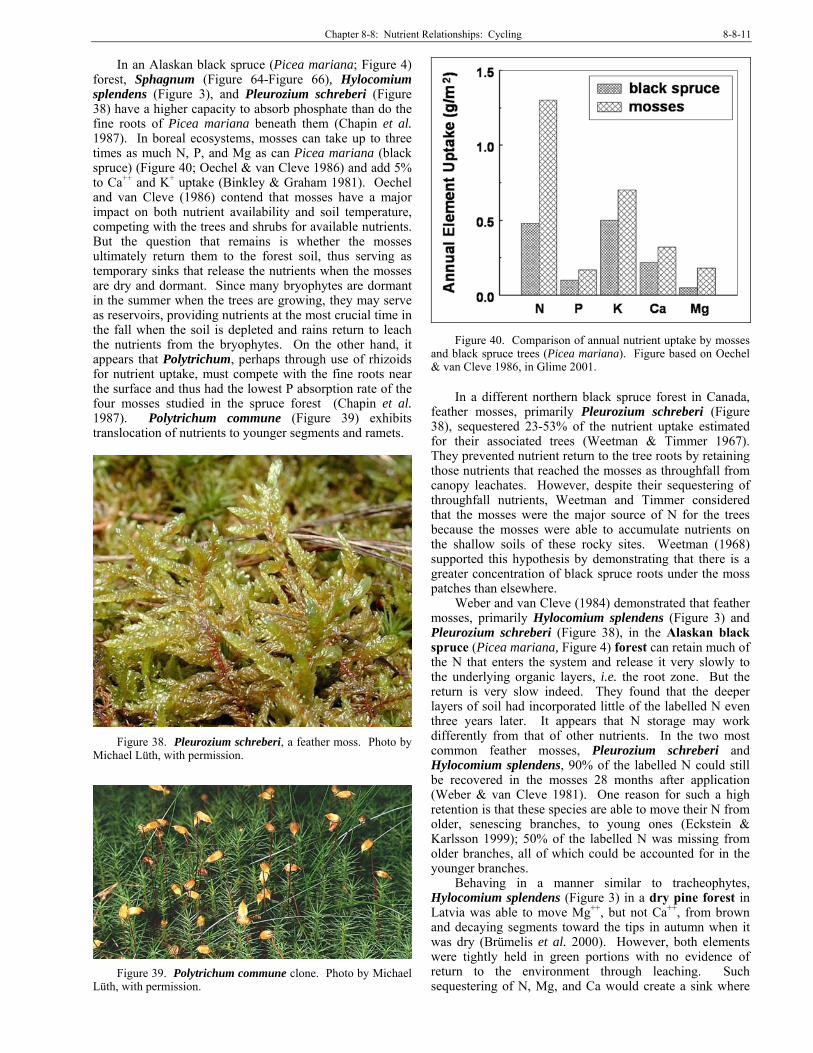
Chapter 8-8: Nutrient Relationships: Cycling 8-8-11
In an Alaskan black spruce (Picea mariana; Figure 4) forest, Sphagnum (Figure 64-Figure 66), Hylocomium splendens (Figure 3), and Pleurozium schreberi (Figure 38) have a higher capacity to absorb phosphate than do the fine roots of Picea mariana beneath them (Chapin et al. 1987). In boreal ecosystems, mosses can take up to three times as much N, P, and Mg as can Picea mariana (black spruce) (Figure 40; Oechel & van Cleve 1986) and add 5% to Ca++ and K+ uptake (Binkley & Graham 1981). Oechel and van Cleve (1986) contend that mosses have a major impact on both nutrient availability and soil temperature, competing with the trees and shrubs for available nutrients. But the question that remains is whether the mosses ultimately return them to the forest soil, thus serving as temporary sinks that release the nutrients when the mosses are dry and dormant. Since many bryophytes are dormant in the summer when the trees are growing, they may serve as reservoirs, providing nutrients at the most crucial time in the fall when the soil is depleted and rains return to leach the nutrients from the bryophytes. On the other hand, it appears that Polytrichum, perhaps through use of rhizoids for nutrient uptake, must compete with the fine roots near the surface and thus had the lowest P absorption rate of the four mosses studied in the spruce forest (Chapin et al. 1987). Polytrichum commune (Figure 39) exhibits translocation of nutrients to younger segments and ramets.
Figure 38. Pleurozium schreberi, a feather moss. Photo by
Michael Lüth, with permission.
Figure 39. Polytrichum commune clone. Photo by Michael
Lüth, with permission.
Figure 40. Comparison of annual nutrient uptake by mosses and black spruce trees (Picea mariana). Figure based on Oechel & van Cleve 1986, in Glime 2001.
In a different northern black spruce forest in Canada, feather mosses, primarily Pleurozium schreberi (Figure 38), sequestered 23-53% of the nutrient uptake estimated for their associated trees (Weetman & Timmer 1967). They prevented nutrient return to the tree roots by retaining those nutrients that reached the mosses as throughfall from canopy leachates. However, despite their sequestering of throughfall nutrients, Weetman and Timmer considered that the mosses were the major source of N for the trees because the mosses were able to accumulate nutrients on the shallow soils of these rocky sites. Weetman (1968) supported this hypothesis by demonstrating that there is a greater concentration of black spruce roots under the moss patches than elsewhere.
Weber and van Cleve (1984) demonstrated that feather mosses, primarily Hylocomium splendens (Figure 3) and Pleurozium schreberi (Figure 38), in the Alaskan black spruce (Picea mariana, Figure 4) forest can retain much of the N that enters the system and release it very slowly to the underlying organic layers, i.e. the root zone. But the return is very slow indeed. They found that the deeper layers of soil had incorporated little of the labelled N even three years later. It appears that N storage may work differently from that of other nutrients. In the two most common feather mosses, Pleurozium schreberi and Hylocomium splendens, 90% of the labelled N could still be recovered in the mosses 28 months after application (Weber & van Cleve 1981). One reason for such a high retention is that these species are able to move their N from older, senescing branches, to young ones (Eckstein & Karlsson 1999); 50% of the labelled N was missing from older branches, all of which could be accounted for in the younger branches.
Behaving in a manner similar to tracheophytes, Hylocomium splendens (Figure 3) in a dry pine forest in Latvia was able to move Mg++, but not Ca++, from brown and decaying segments toward the tips in autumn when it was dry (Brümelis et al. 2000). However, both elements were tightly held in green portions with no evidence of return to the environment through leaching. Such sequestering of N, Mg, and Ca would create a sink where

8-8-12 Chapter 8-8: Nutrient Relationships: Cycling
throughfall nutrients might not reach the forest floor for years or even decades, rather than days or weeks. Oechel and van Cleve (1986) suggest that in Alaska bryophytes have such great ability to immobilize nutrients that they can reduce tracheophyte productivity as succession proceeds from deciduous to coniferous woodland.
After 13 years of primary succession in a New Hampshire, USA, sand pit that had previously been a mature hemlock-maple-yellow birch forest (Tsuga canadensis-Acer saccharum-Betula alleghaniensis), there was a 10.1±1.9 kg ha-1 yr-1 N accumulation in 50-60 cm of soil beneath Polytrichum spp. (Figure 39) (Bowden 1991). The N content in the 50 cm of soil beneath the Polytrichum had increased from 98±7 kg ha-1 in 1969 to 229±26 kg ha-1 in 1982. Bowden reasoned that since the accumulation rate of N was probably much lower during early years in succession, it is likely that the accumulation rate later in succession was even higher than this. Surprisingly, the N content of living biomass of moss below ground was higher than that of above ground portions, with the soil portion accounting for ~55%. Presence of the moss seems to have accounted for a significant trapping and retention of N in the ecosystem, perhaps preparing the environment for success of larger and more N-demanding plants.
In the chalk grassland, bryophytes are able to absorb nutrients from the senescing autumn leaves. These nutrients would probably otherwise be leached from the system while the tracheophytes are inactive for the duration of winter (van Tooren et al. 1988). These leachates, incorporated into the bryophytes, are then released in the spring and summer from the decomposing bryophytes and used by the high-demand tracheophytes. Furthermore, bryophytes can act as sponges for the N in acid rain during winter when tracheophytes are unable to absorb it. We should expect that bryophytes in many temperate forests likewise are able to act as nutrient reservoirs, storing nutrients and releasing them in the hot, dry summer when availability is low due to tracheophyte demands.
In the temperate forest, bryophytes may be rare or abundant. In those forests where they are abundant, they could likewise play the role of a nutrient reservoir. However, the Pseudoscleropodium purum (Figure 41) in European oak forests demonstrates a different dynamic from that of the bryophytes in the boreal forest. Bates (1989b) found that the levels of cations within the moss component under an oak (Quercus; Figure 42) canopy were in dynamic equilibrium with the precipitation and/or throughfall (Bates 1989b; Brown & Bates 1990).
Figure 41. Pseudoscleropodium purum. Photo by Michael
Lüth, with permission.
Figure 42. European oak (Quercus) forest understory
habitat. Photo through Creative Commons.
The dominant and invasive moss Pseudoscleropodium purum (Figure 41) readily absorbed the natural leachates of K+, Ca++, and Mg++, particularly as the tree leaves were senescing in autumn (Bates 1989a, b). When sprayed with dilute solutions containing Ca++, K+, and Mg++, this moss absorbed most of the cations, but those that were not absorbed were released back to the ecosystem through the remaining growing season (Bates 1989a). The bulk of these were released during the next 10-15 days. Bates tracked P and K in P. purum for 74 days after application and found that only 6.3% of the P and 12.1% of the K were recovered in the moss throughfall, reaching the soil. But only 31% and 23%, respectively, remained in the moss tissues. Bates (1989a) suggested that the missing nutrients may have been incorporated by microorganisms or retained in litter. A likely consequence of this is rapid recycling of nutrients within the ecosystem.
Ecologists have theorized that bryophytes may behave like a slow-release fertilizer. They remove nutrients from the precipitation as it passes through them, then slowly release it during the succeeding weeks. This may be facilitated by the damage caused to membranes during drying. In other cases, cations bound to exchange sites may be released back to the ecosystem instead of being absorbed. This slow release mechanism can be beneficial to the ecosystem by reducing loss through leaching and providing a steady supply of nutrients as they are being removed by the roots. But there seem to be no data thus far to support or refute this hypothesis on a broad scale.
Just as in tracheophytes, we cannot generalize about bryophyte nutrient behavior because bryophytes exhibit differences as vast as those of tracheophytes, perhaps even more so. Hylocomium splendens (Figure 3), likewise a large moss, growing on a lime-contaminated site, did not release its excess Ca++ and Mg++ when moved to an uncontaminated site (Brümelis et al. 2000). Hence, bryophytes can serve as sinks, depriving the soil of nutrients returned by throughfall and stemflow. Since bryophytes tend to grow best, at least in deciduous forests, at the bases of trees where stemflow provides a concentrated pool of nutrients from leaves, branches, and atmosphere, this bryophytic filter could have considerable impact on both the nutrients supplied to the trees and on the herbaceous ground cover in the vicinity. Their presence at tree bases seems to be due to the slight rise in topography that reduces leaf litter accumulation, but could it also be due to the added nutrients?

Chapter 8-8: Nutrient Relationships: Cycling 8-8-13
In a North Wales oak (Quercus petraea; Figure 43) woodland, the dominant bryophytes were Dicranum majus (Figure 35), Rhytidiadelphus loreus (Figure 44), Plagiothecium undulatum (Figure 45), Polytrichastrum formosum (Figure 46), and Thuidium tamariscinum (Figure 47), occupying 90% of the ground vegetation standing crop (Rieley et al. 1979). These species were investigated to determine the effects of moss harvesting on the ecosystem. This moss layer readily absorbed the Ca++, K+, and N leached from the canopy (Table 1). It is interesting that Rhytidiadelphus removed NO3
- whereas P. formosum removed NH4
+. However, Mg++ suffered a net loss from the bryophyte layer to the soil. Rhytidiadelphus loreus actually returned more Mg++ to the soil than it intercepted, but removed Ca++ and K+, perhaps exchanging some of these for Mg++ on exchange sites.
Figure 43. Quercus petraea forest. Photo by Rosser,
through Creative Commons.
Figure 44. Rhytidiadelphus loreus, a species that easily
absorbs Ca++, K+, and N leached from the forest canopy leaves. Photo by Michael Lüth, with permission.
Polytrichastrum formosum (Figure 46) seemed to have little effect on nutrient concentrations, with leachates from the moss equalling those in the canopy throughfall for Ca++, K+, Mg++, and Na+ (Rieley et al. 1979). In any case, a large portion of these nutrients were returned to a pathway that would make them available to the root zone. This suggests once more the role of bryophytes as a reservoir for at least some nutrients, providing a slower
release than that of episodic throughfall, a role also supported in the Black Forest (Weetman 1968). Clearly, we need to understand the differences in nutrient retention among species and what causes those differences to be there.
Figure 45. Plagiothecium undulatum, a species that easily
absorbs Ca++, K+, and N leached from the forest canopy leaves. Photo by Michael Lüth, with permission.
Figure 46. Polytrichastrum formosum with capsules, a
species that easily absorbs Ca++, K+, and N leached from the canopy. Photo by Michael Lüth, with permission.
Figure 47. Thuidium tamariscinum, a species that easily
absorbs Ca++, K+, and N leached from the canopy. Photo by Brian Eversham, with permission.

8-8-14 Chapter 8-8: Nutrient Relationships: Cycling
Table 1. Bryophyte-related behavior of essential nutrients in a Welsh oakwood, in mg m-2 yr-1, based on data from Rieley et al. 1979 in Longton 1984.
Ca++ Mg++ K+
Total input to bryophyte layer 3100 1810 2920 Bryophyte accumulation 410 390 1430 Excess input over bryophyte 2690 1420 1490 accumulation
Weetman (1968) suggests that mosses may actually supply tree roots more directly. When he found that roots in a black spruce forest (Figure 4) were concentrated in decomposing mosses, he considered that mosses might serve as a collecting point for elements, especially N, absorbed by mosses from throughfall. Whether N was obtained from throughfall, soil, or airborne dust for Hylocomium splendens (Figure 3), a reservoir that is not easily leached and carried away by rainfall could be an asset to these N-poor forests (Tamm 1953). However, Berg (1984) provides conflicting information that suggests that N may be bound in phenolic compounds in the cell wall and essentially unavailable, even in dead tissue.
Chapin and coworkers (1987) found that mosses account for 75% of the P accumulated annually above ground in an Alaskan Picea mariana (Figure 4) forest, while they account for only 17% of the P pool in aboveground vegetation. In fact, Sphagnum subsecundum (Figure 48-Figure 49), Hylocomium splendens (Figure 3), and Pleurozium schreberi (Figure 38) have a higher capacity to absorb phosphate than do the fine roots of the black spruce beneath them. Again we beg the question, do they serve as a reservoir for slow release of P, or do they keep recycling it within their own tissues, moving it to growing parts, and depriving the roots?
Even those mosses that release some of their nutrients during senescence may hold them for many years. Hylocomium splendens (Figure 3) is an abundant feather moss in the boreal forests and northern taiga. In a subarctic birch woods, this species retained N for 3-10 years, depending on which measure was used (Eckstein 2000). Using 15N labelling, Eckstein found that the mean residence time (MRT) and annual nutrient production (ANP) for N were similar to values found in woody evergreen tracheophytes. These dominant feather mosses may retard the nutrient turnover in these forests first through their acropetal (base to apex) movement of nutrients and second by making unfavorable conditions in the forest floor. Eckstein suggested that such dominant taxa of bryophytes could act as ecosystem engineers to retard the nutrient turnover on the forest floor through production of acidic, nutrient-poor litter and depression of summer soil temperatures. These influences help to maintain a system more favorable for the mosses.
Longton (1992) contends that the humus contributed by moss may maintain soil fertility through chemical associations that retain the mineral ions and prevent loss through drainage. Some of these associations are of extraordinary duration. Dowding et al. (1981) determined that on Devon Island, Northwest Territories, Canada, 50% of the Ca in the mesic tundra meadows was bound in bryophytes with a decomposition time of 22 years.
Figure 48. Sphagnum subsecundum, a species that
accumulates carbon in growing shoots and brown portions. Photo by Michael Lüth, with permission.
Figure 49. Sphagnum subsecundum. Photo by Michael
Lüth, with permission.
One mechanism by which bryophytes can create long-term nutrient sinks is through incorporation into less soluble organic compounds. N can be bound to phenolic compounds in the cell wall or retained in proteins bound by tannic acid compounds in the cell (Berg 1984). Furthermore, cation exchange sites can strongly bind divalent positive ions, rendering these ions unavailable to other ecosystem components, thus making the bryophytes effective competitors, much as they are in bogs and fens.
Soil and rock type also play a role in nutrient retention by bryophytes. For example, Simon and Szerényi (1985) demonstrated that the level of NH4
+ and NO2--N in
soil under mosses increases from xerophytic to mesophytic species. CaCO3 and pH seem to play a role in these differences, but nothing mechanistic can be inferred yet.
Even the epiphytes can make perceptible differences in nutrient cycling by intercepting and absorbing throughfall and stemflow nutrients, as demonstrated for Amazonian epiphytes (Herrera et al. 1978). But it appears they can also acquire nutrients that are in the vascular tissue of the main trunk! When 137Cs was introduced into the stems of Liriodendron, 60% appeared in those bryophytes and lichens on the tree trunk and only 27% in soil bryophytes, with another 9% in bryophytes at the base of the tree (Hoffman 1972).

Chapter 8-8: Nutrient Relationships: Cycling 8-8-15
Luxury Nutrients Most plants have the ability to store nutrients and use
them later, at least to some degree. Tracheophytes transport the soluble nutrients from older, lower leaves to upper, growing ones, often leaving the older leaves chlorotic and eventually dying. Algae store luxury nutrients, using them later as supplies in the ecosystem dwindle, perhaps permitting them to accomplish a sexual phase that permits them to become dormant until better nutrient conditions prevail. Brown and Bates (1990), in investigating the moss Pseudoscleropodium purum (Figure 41), found luxury consumption and accumulation of some nutrient elements (K, Ca, and P) throughout the year, but other nutrients were retained poorly (Bates 1989b). However, they (Bates 1987; Brown & Bates 1990) found that P. purum had poor retention of these luxury nutrients, except for orthophosphate, with rapid transfer of the luxury elements to other parts of the nutrient cycle. Brown and Bates (1990) could find no evidence that these additional nutrient supplies could permanently enhance growth. It would seem that mosses are able to discriminate to a certain extent, maintaining required metabolic levels of N, P, and K, while excluding or excessively storing the ones that normally occur as trace amounts.
Brown (1982) also interpreted the work of Thomas (1970) on light intensity and nutrient concentrations in the moss plant to indicate luxury consumption of N and P. Thomas had found that concentrations of N and P in Mnium hornum (Figure 50) were negatively correlated with light intensity, whereas growth was positively correlated with intensity. This suggested to Brown that the faster-growing mosses in the light had sufficient nutrients and that therefore the higher concentrations in the slower-growing plants in lower light were luxury nutrients. Earlier work by Weetman and Timmer (1967) on Pleurozium schreberi (Figure 38) tends to support Brown's interpretation. They found that as the light intensity under the forest canopy decreased from 38% to 17% of full sunlight the nutrient concentration increased in the moss without any significant changes in total nutrient uptake. But one could also interpret the decreased concentrations in high light intensity to mean that the moss was using up its nutrient supply and moving nutrients from older tissues to actively dividing cells, consequently lowering the overall concentrations.
Figure 50. Mnium hornum, a species in which
concentrations of N and P are negatively correlated with light intensity. Photo by Michael Lüth, with permission.
These additional nutrient supplies are not permanently retained within the new growth, but rather stored throughout the plant, as in tracheophytes. Li and Vitt (1997) reported preliminary results using 15N that indicate mosses may be a major sink for applied N in peatlands, implicating luxury storage.
Mártínez Abaigar and coworkers (2002) found that increased levels of KH2PO4 caused the leafy aquatic liverwort Jungermannia exsertifolia subsp. cordifolia (Figure 51) to accumulate significantly more P and K in its tissues. However, as exposure continued, the K concentrations fluctuated whereas P concentrations continued to increase. Concentrations of 20 mg L-1 PO4
-3 seemed to saturate the liverwort at 0.53% dry biomass (DM). When tissue P concentration exceeded 0.45% DM, the net photosynthesis declined, suggesting toxicity. P enrichment did not affect the chlorophyll concentration, but the chlorophyll a:b ratio did decline, as did the ratio of chlorophyll to phaeopigments (non-photosynthetic pigments which are degradation products of chlorophyll pigments), likewise suggesting P toxicity.
Figure 51. Jungermannia exsertifolia subsp. cordifolia, a
species that accumulates more P and K when treated with KH2PO4. Photo by Des Callaghan, with permission.
Although bryophytes need only minute quantities of heavy metals, the ability to store metals in vesicles or bind them to the cell walls (abilities seemingly missing in tracheophyte leaves) permits bryophytes to store excessive amounts. Under the insult of atmospheric trace metal deposition, Hylocomium splendens (Figure 3) accumulated 14-24% more Cu, Fe, Pb, Ni, and V than did Pleurozium schreberi (Figure 38), but both mosses maintained similar concentrations of Cd, Mn, Zn, and Cr (Ross 1990), showing an inability to regulate those non-limiting ions. Nevertheless, it appears that bryophytes would accumulate most heavy metals, bound in vesicles or other locations, and release them to the cell if needed. At the very least, they could accumulate a heavy load in the cell walls. Burton (1979) found that Fontinalis antipyretica (Figure 52-Figure 53) maintained 80-90% of its accumulated Zn in the cell walls.
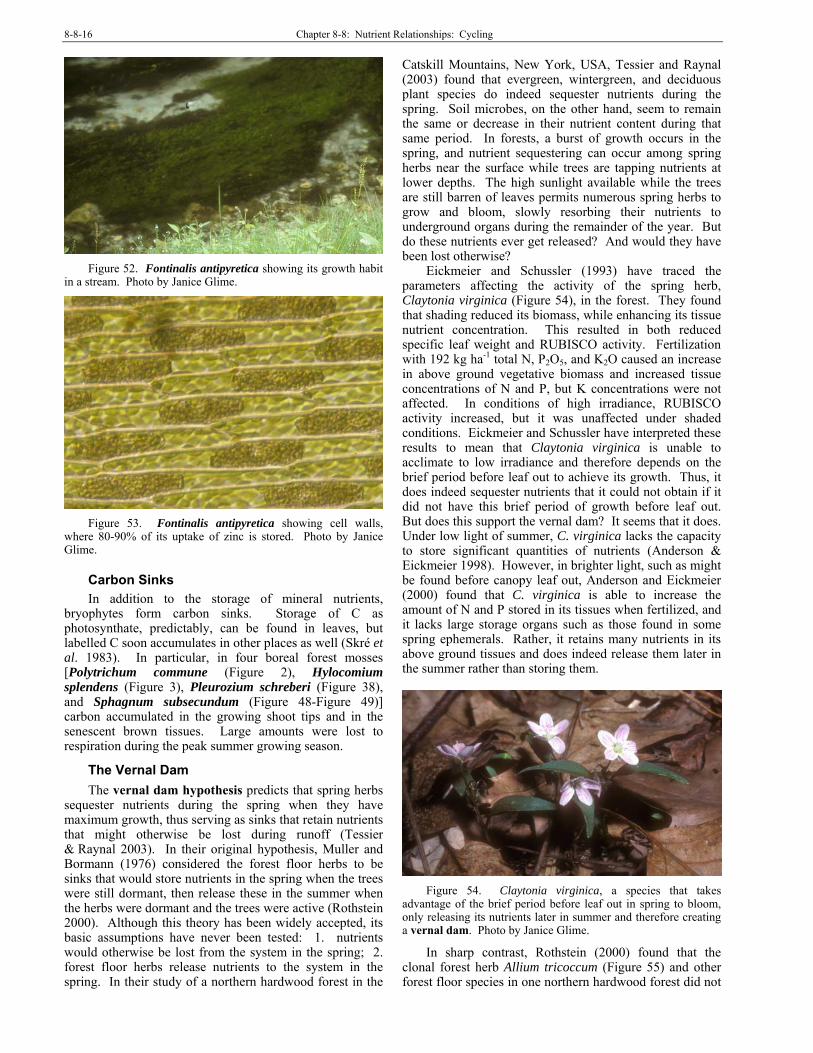
8-8-16 Chapter 8-8: Nutrient Relationships: Cycling
Figure 52. Fontinalis antipyretica showing its growth habit
in a stream. Photo by Janice Glime.
Figure 53. Fontinalis antipyretica showing cell walls,
where 80-90% of its uptake of zinc is stored. Photo by Janice Glime.
Carbon Sinks
In addition to the storage of mineral nutrients, bryophytes form carbon sinks. Storage of C as photosynthate, predictably, can be found in leaves, but labelled C soon accumulates in other places as well (Skré et al. 1983). In particular, in four boreal forest mosses [Polytrichum commune (Figure 2), Hylocomium splendens (Figure 3), Pleurozium schreberi (Figure 38), and Sphagnum subsecundum (Figure 48-Figure 49)] carbon accumulated in the growing shoot tips and in the senescent brown tissues. Large amounts were lost to respiration during the peak summer growing season.
The Vernal Dam
The vernal dam hypothesis predicts that spring herbs sequester nutrients during the spring when they have maximum growth, thus serving as sinks that retain nutrients that might otherwise be lost during runoff (Tessier & Raynal 2003). In their original hypothesis, Muller and Bormann (1976) considered the forest floor herbs to be sinks that would store nutrients in the spring when the trees were still dormant, then release these in the summer when the herbs were dormant and the trees were active (Rothstein 2000). Although this theory has been widely accepted, its basic assumptions have never been tested: 1. nutrients would otherwise be lost from the system in the spring; 2. forest floor herbs release nutrients to the system in the spring. In their study of a northern hardwood forest in the
Catskill Mountains, New York, USA, Tessier and Raynal (2003) found that evergreen, wintergreen, and deciduous plant species do indeed sequester nutrients during the spring. Soil microbes, on the other hand, seem to remain the same or decrease in their nutrient content during that same period. In forests, a burst of growth occurs in the spring, and nutrient sequestering can occur among spring herbs near the surface while trees are tapping nutrients at lower depths. The high sunlight available while the trees are still barren of leaves permits numerous spring herbs to grow and bloom, slowly resorbing their nutrients to underground organs during the remainder of the year. But do these nutrients ever get released? And would they have been lost otherwise?
Eickmeier and Schussler (1993) have traced the parameters affecting the activity of the spring herb, Claytonia virginica (Figure 54), in the forest. They found that shading reduced its biomass, while enhancing its tissue nutrient concentration. This resulted in both reduced specific leaf weight and RUBISCO activity. Fertilization with 192 kg ha-1 total N, P2O5, and K2O caused an increase in above ground vegetative biomass and increased tissue concentrations of N and P, but K concentrations were not affected. In conditions of high irradiance, RUBISCO activity increased, but it was unaffected under shaded conditions. Eickmeier and Schussler have interpreted these results to mean that Claytonia virginica is unable to acclimate to low irradiance and therefore depends on the brief period before leaf out to achieve its growth. Thus, it does indeed sequester nutrients that it could not obtain if it did not have this brief period of growth before leaf out. But does this support the vernal dam? It seems that it does. Under low light of summer, C. virginica lacks the capacity to store significant quantities of nutrients (Anderson & Eickmeier 1998). However, in brighter light, such as might be found before canopy leaf out, Anderson and Eickmeier (2000) found that C. virginica is able to increase the amount of N and P stored in its tissues when fertilized, and it lacks large storage organs such as those found in some spring ephemerals. Rather, it retains many nutrients in its above ground tissues and does indeed release them later in the summer rather than storing them.
Figure 54. Claytonia virginica, a species that takes
advantage of the brief period before leaf out in spring to bloom, only releasing its nutrients later in summer and therefore creating a vernal dam. Photo by Janice Glime.
In sharp contrast, Rothstein (2000) found that the clonal forest herb Allium tricoccum (Figure 55) and other forest floor species in one northern hardwood forest did not

Chapter 8-8: Nutrient Relationships: Cycling 8-8-17
take up significant quantities of NO3- and that removal of
the spring ephemerals did not affect the leaching rate of NO3
-. In fact, many spring ephemerals resorb their nutrients and store them in underground parts (Anderson & Eickmeier 2000). Rather, Rothstein found that microorganisms took up eight times as much N as did the spring herbs. Furthermore, there was no decrease in summertime N mineralization when spring ephemerals had been removed, supporting the earlier study by Zak et al. (1990). Thus, in his study, Rothstein (2000) found that it was the microbes and forest floor litter that dominated the spring sink and created the vernal dam.
Figure 55. Allium tricoccum, a spring ephemeral that does
not take up NO3-. Photo by Hardyplants, through public domain.
But what would occur if this litter were predominantly conifer litter supporting a forest floor that was covered with bryophytes? What is the behavior of bryophytes as the leaves fill the canopy and reduce their light? Certainly in northern ecosystems where the bryophytes are the dominant forest floor vegetation, this question is worthy of consideration. Patterson and Baber (1961) have found that many temperate mosses are dormant in late summer and autumn. Schwabe (1976) found that long days and elevated temperatures often induce dormancy, a phenomenon that can protect them against effects of desiccation during the summer.
Might shade-adapted bryophytes also experience a vernal dam? Light is most available in early spring, and with their C3 photosynthesis, the bryophytes are well adapted to the low temperatures following snow melt. The melting snow has provided a continuous supply of moisture, and at least some light penetrates the thin layer of lingering snow. Spring would also seem to be a season of nutrient pulse for the bryophytes with nutrients provided by the melting snow as well as through aerial cleansing by the spring rains. Summer, with few showers, may be a nutrient-poor period, although the rains that occur will surely bring a good nutrient supply from the leachates and dust accumulations of the forest canopy leaves. Summer light availability, coupled with the high temperatures, would logically seem like a period appropriate for dormancy of most bryophytes. But few studies have considered the role of sunflecks in enhancing bryophyte photosynthesis. With no stomata to open and direct contact with the atmosphere, bryophytes would seem to be even better suited than C3 tracheophytes at taking advantages of these brief pulses of light and processing the captured
energy while awaiting the next pulse. Such activity has been reported for tracheophytes and is discussed in the chapter on light.
This leaves us with the questions of when do the bryophytes need the most nutrients, when do they retain them best, and when might they release them, making them available to the soil below, and hence to the tracheophytes rooted beneath them. We can hypothesize that they would be most likely to release them when they are first wet after a period of drought, losing them before their membranes are repaired. But how long does that last, and how much is lost? Do their numerous exchange sites retain most ions, awaiting the time when the cell can once again bring them in through active transport? Is potassium preferentially lost because other ions compete for the exchange sites, making this very soluble low valence ion the most easily leached away from the plants? It appears that at least in some ecosystems bryophytes might indeed be vernal dams. The role of bryophytes in nutrient cycling is one of which we know very little.
Release during Desiccation/Rehydration Seasonal events are very much the product of the types
of seasons of a given area and what differs among them. Temperature, which folks in the temperate zone seem to consider almost exclusively as a seasonal indicator, may not be the factor most important to the bryophyte nutrient regime. Rather, seasonal differences in precipitation and moisture availability may be the primary controlling factors. This seems to be the case with nutrient release in the feather moss Hylocomium splendens (Figure 3) in a subalpine spruce-fir forest (Wilson & Coxson 1999), a phenomenon known as pulse release because it accumulates (some) nutrients over time, then releases them suddenly. During rehydration, nutrients and C leaked from the desiccated cells is released from the cell surfaces in a pulse release to the throughfall from the mosses. Organic C release to the forest soil can reach up to 1544 mg m-2 under these conditions. Experiments comparing this release to that of an inert mulch layer indicated that 23-75% of that pulse release originated in the moss mats. Release of both C and K is increased when drying is rapid. Wilson and Coxson compared the mosses to capacitors, storing low concentrations of nutrients from dust and minor rainfall events, then releasing them in higher concentrations during high rainfall events. Such a release would put the nutrients into the soil when it was most usable to the tracheophyte plants through uptake of the abundant water.
Buck and Brown (1979) likewise found that seasonal releases were tied to dehydration-rehydration processes in Fontinalis antipyretica (Figure 53) and Plagiomnium undulatum (Figure 45). Both K+ and Mg++ were lost from dry cells, but clung to the extracellular exchange sites. Although K+ in these plants had much higher concentrations in the intercellular spaces than on the exchange sites, the quantities on the extracellular sites also rose during desiccation, accounting for the losses suffered following desiccation and the pulse release to the soil during rehydration. Scafone (unpubl data) found that a pulse of K+ is released from Sphagnum russowii (Figure 56) in the autumn at the time it is most beneficial for the tree roots in preparation for winter. In ecosystems where the bryophyte cover is typically significant it could play a

8-8-18 Chapter 8-8: Nutrient Relationships: Cycling
crucial role in the preparation of forest conifers for winter. This relationship might be of considerable importance for management of these forests to survive the occasional extreme winter.
Figure 56. Sphagnum russowii, a species that releases a
nitrogen pulse in the autumn. Photo by Michael Lüth, with permission.
Bryophytes affect the decomposition rates on the forest floor. Decomposition rates under mosses were more rapid than those under lichens (Sedia & Ehrenfeld 2006), presumably due to higher moisture content.
Canopy Releases
In the montane forest of the tropics, and probably elsewhere, epiphytic bryophytes accumulate considerable N, much of which is fixed from atmospheric N by microbes (Clark et al. 2005). The epiphytic bryophytes, along with the full epiphyte assemblage, retained 33-67% of the nitrogen that was deposited by cloud water and precipitation, with the equivalent of a 50% annual accumulation of the nitrogen in the atmosphere. The bryophytes convert the soluble, highly mobile inorganic forms to organic forms that are retained in the canopy community, potentially being released during dehydration/rehydration cycles.
Even the cloud forest canopy experiences pulse release of nutrients from the canopy bryophytic epiphytes (Coxson 1991). During episodes of drying and rewetting, nutrients are leached from the newly rehydrated bryophytes. This leaching is greatest for the ions that normally reside in the intracellular pools. Coxson found that effluxes from stem segments of bryophytes from the Guadeloupe tropical montane rainforest could reach 80.1 kg ha-1 yr-1 for K, 1.4 kg ha-l yr-1 for P, and 11.8 kg ha-1 yr-
1 for N, although efflux rates from intact bryophyte mats were considerably smaller: 28.7 kg ha-1 yr-1 for K and 0.2 kg ha-1 yr-1 for P. Coxson surmised that the lower rate in the field reflected recycling of the leached nutrients within the moss mat. Nevertheless, the through flow loss provides a significant input to the forest floor below and to epiphylls on the leaves below them.
Coxson et al. (1992) estimated that more than 30% of the days cause these epiphytes to experience severe desiccation. These wet-dry cycles cause the canopy bryophytes to accumulate 950 kg ha-1 of sugars and polyols. These sugars are then released in pulse form during rewetting episodes and subsequently translocated by through flow precipitation within the canopy. But the upper canopy leafy liverwort Frullania atrata accumulates
sugars and polyols equivalent to 17% of its dry weight, whereas the lower canopy moss Phyllogonium fulgens (Figure 57) accumulates less than 6%. Wet-dry cycles cause the release of fructose, mannitol, glucose, erythritol, glycerol, and sucrose into the throughfall. Despite the smaller storage levels of the lower canopy moss, bryophytes at that level released more (0.9 g m-2) compared to the upper canopy bryophytes (0.3 g m-2). Coxson and coworkers concluded that this release of carbon sources has a significant impact on nutrient cycling by providing suitable carbon for the microbes that carry out decomposition and non-symbiotic nitrogen fixation in these forests.
Figure 57. Phyllogonium fulgens, a lower canopy species in
the Neotropics that accumulates less sugars and polyols than bryophytes in the upper canopy. Photo by Michael Lüth, with permission.
Hölscher et al. (2003) compared nutrient fluxes in three successional stages in an upper montane rainforest of Costa Rica. All three sites had Quercus copeyensis (Figure 58) as a dominant species, with various other species mixed in. The epiphyte litterfall of bryophytes and lichens differed greatly, with the highest values in the old-growth forest, which likewise had the greatest epiphyte abundance. Nevertheless, total nutrient throughfall and stemflow differed little among the three successional stages. Potassium in stemflow was only 5% in the old-growth forest, whereas it was 17% in the early successional forest and 26% in the secondary forest. Hence, in old-growth canopies the bryophytes retained the most potassium, releasing it almost entirely in throughfall.
In a montane moist evergreen broad-leaved forest in Yunnan, China, moss litter (including Homaliodendron scalpellifolium (Figure 59), Symphyodon perrottetii, Herberta longifolissa sic (=Herbertus longifolius or H. longifissus?), and Bazzania tridens (Figure 60) had the slowest decay rate (0.22) compared to canopy tree leaf litter and bamboo (Liu et al. 2000). Bryophyte decomposition rates were less correlated with nutrient composition and lignin concentration in their initial mass

Chapter 8-8: Nutrient Relationships: Cycling 8-8-19
than were the tracheophyte rates (trees 0.55, bamboo 0.4). Whereas the turnover time for tree leaves was 1.5-2.50 years, it was 4.55 for the bryophytes.
Figure 58. Quercus copeyensis, where old-growth forests
experience the highest levels of bryophytic epiphyte litterfall. Photo by Helicongus, through Creative Commons.
Figure 59. Homaliodendron scalpellifolium, one of the
species that have the slowest decay rates (0.22) compared to canopy tree leaf litter and bamboo. Photo from Taiwan Liverworts color illustrations, through Creative Commons.
Figure 60. Bazzania tridens, one of the species that have the
slowest decay rates (0.22) compared to canopy tree leaf litter and bamboo. Photo by Li Zhang, with permission.
Bogs and Fens In black spruce (Picea mariana; Figure 4) stands,
bryophytes are the major source of N for the trees (Weetman & Timmer 1967). But the cation exchange ability of Sphagnum (Figure 64-Figure 66) continues even after Sphagnum dies, making nutrient release by dead plants slow, at least in forested peatlands (Brock & Bregman 1989), while competition for nutrients continues by means of exchange on the newly exposed walls of dead cells. Exacerbating this problem is the slow rate of organic mass loss during decomposition, as is known for Sphagnum recurvum (Figure 61), although the release of N, P, and K was larger than that of organic matter (Brock & Bregman 1989). But even after 12 months of decay, a large proportion of the original N and P remained associated with the peat. This slow decomposition process is supported by the poor colonization by organisms and almost total absence of damage to the dead cells.
Figure 61. Sphagnum recurvum, a species with slow
decomposition. Photo from Biopix, through Creative Commons
The same cation exchange ability that permits Sphagnum (Figure 64-Figure 66) to compete with trees for nutrients can also aid competition by facilitating toxicity to the root zone (Klinger 1988). The peat mosses can trap heavy metals in the root zone, making them more toxic due to the acid conditions; they can create anaerobic conditions in the rooting zone; and their chelation of cations can accelerate iron hardpan formation.
Despite our many studies on nutrients in peatlands, Bedford and coworkers, in a 1999 publication, state that the high variances in plant and soil N:P ratios of wetlands suggest it may be necessary to understand nutrient limitations at both the species and the community level before we can predict the effects of nutrient enrichment. If this need still exists for wetlands, it exists a hundred-fold for non-wetland bryophyte systems.
Bogs and fens are rapidly diminishing on our planet as development fills them in and at best puts a water hole somewhere else for wetland replacement. It is unlikely that any new wetland will become a bog or Sphagnum fen, and even if it does, it will be decades to centuries before there is even any evidence it will ever happen. Yet we continue to create conditions unfavorable for these diminishing habitats. Bergamini and Pauli (2001) have shown that fertilization of any sort is likely to destroy these fragile
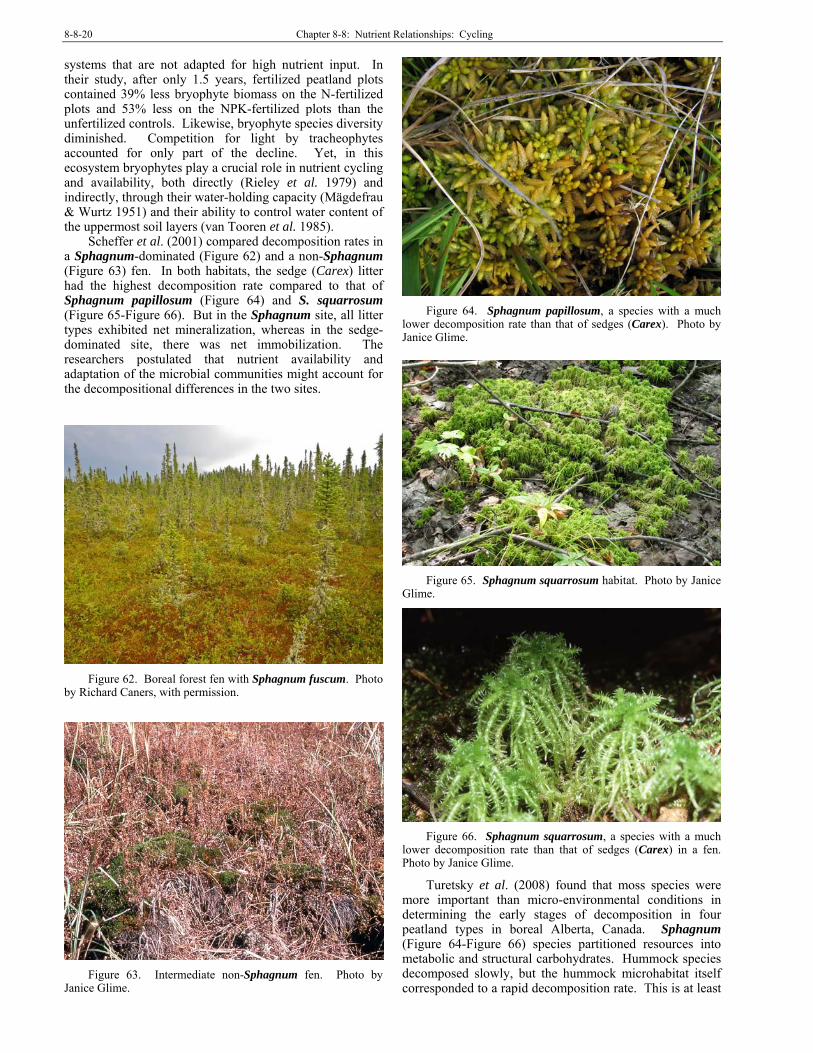
8-8-20 Chapter 8-8: Nutrient Relationships: Cycling
systems that are not adapted for high nutrient input. In their study, after only 1.5 years, fertilized peatland plots contained 39% less bryophyte biomass on the N-fertilized plots and 53% less on the NPK-fertilized plots than the unfertilized controls. Likewise, bryophyte species diversity diminished. Competition for light by tracheophytes accounted for only part of the decline. Yet, in this ecosystem bryophytes play a crucial role in nutrient cycling and availability, both directly (Rieley et al. 1979) and indirectly, through their water-holding capacity (Mägdefrau & Wurtz 1951) and their ability to control water content of the uppermost soil layers (van Tooren et al. 1985).
Scheffer et al. (2001) compared decomposition rates in a Sphagnum-dominated (Figure 62) and a non-Sphagnum (Figure 63) fen. In both habitats, the sedge (Carex) litter had the highest decomposition rate compared to that of Sphagnum papillosum (Figure 64) and S. squarrosum (Figure 65-Figure 66). But in the Sphagnum site, all litter types exhibited net mineralization, whereas in the sedge-dominated site, there was net immobilization. The researchers postulated that nutrient availability and adaptation of the microbial communities might account for the decompositional differences in the two sites.
Figure 62. Boreal forest fen with Sphagnum fuscum. Photo
by Richard Caners, with permission.
Figure 63. Intermediate non-Sphagnum fen. Photo by
Janice Glime.
Figure 64. Sphagnum papillosum, a species with a much
lower decomposition rate than that of sedges (Carex). Photo by Janice Glime.
Figure 65. Sphagnum squarrosum habitat. Photo by Janice
Glime.
Figure 66. Sphagnum squarrosum, a species with a much
lower decomposition rate than that of sedges (Carex) in a fen. Photo by Janice Glime.
Turetsky et al. (2008) found that moss species were more important than micro-environmental conditions in determining the early stages of decomposition in four peatland types in boreal Alberta, Canada. Sphagnum (Figure 64-Figure 66) species partitioned resources into metabolic and structural carbohydrates. Hummock species decomposed slowly, but the hummock microhabitat itself corresponded to a rapid decomposition rate. This is at least
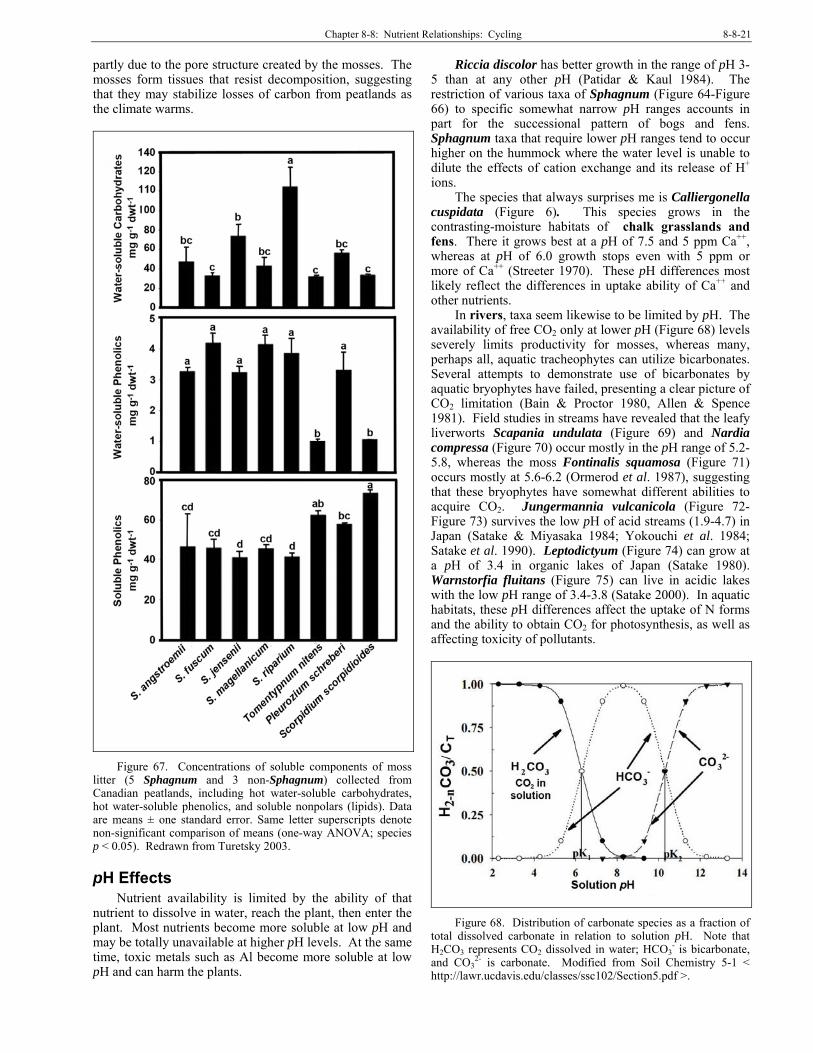
Chapter 8-8: Nutrient Relationships: Cycling 8-8-21
partly due to the pore structure created by the mosses. The mosses form tissues that resist decomposition, suggesting that they may stabilize losses of carbon from peatlands as the climate warms.
Figure 67. Concentrations of soluble components of moss
litter (5 Sphagnum and 3 non-Sphagnum) collected from Canadian peatlands, including hot water-soluble carbohydrates, hot water-soluble phenolics, and soluble nonpolars (lipids). Data are means ± one standard error. Same letter superscripts denote non-significant comparison of means (one-way ANOVA; species p < 0.05). Redrawn from Turetsky 2003.
pH Effects Nutrient availability is limited by the ability of that
nutrient to dissolve in water, reach the plant, then enter the plant. Most nutrients become more soluble at low pH and may be totally unavailable at higher pH levels. At the same time, toxic metals such as Al become more soluble at low pH and can harm the plants.
Riccia discolor has better growth in the range of pH 3-5 than at any other pH (Patidar & Kaul 1984). The restriction of various taxa of Sphagnum (Figure 64-Figure 66) to specific somewhat narrow pH ranges accounts in part for the successional pattern of bogs and fens. Sphagnum taxa that require lower pH ranges tend to occur higher on the hummock where the water level is unable to dilute the effects of cation exchange and its release of H+ ions.
The species that always surprises me is Calliergonella cuspidata (Figure 6). This species grows in the contrasting-moisture habitats of chalk grasslands and fens. There it grows best at a pH of 7.5 and 5 ppm Ca++, whereas at pH of 6.0 growth stops even with 5 ppm or more of Ca++ (Streeter 1970). These pH differences most likely reflect the differences in uptake ability of Ca++ and other nutrients.
In rivers, taxa seem likewise to be limited by pH. The availability of free CO2
only at lower pH (Figure 68) levels severely limits productivity for mosses, whereas many, perhaps all, aquatic tracheophytes can utilize bicarbonates. Several attempts to demonstrate use of bicarbonates by aquatic bryophytes have failed, presenting a clear picture of CO2 limitation (Bain & Proctor 1980, Allen & Spence 1981). Field studies in streams have revealed that the leafy liverworts Scapania undulata (Figure 69) and Nardia compressa (Figure 70) occur mostly in the pH range of 5.2-5.8, whereas the moss Fontinalis squamosa (Figure 71) occurs mostly at 5.6-6.2 (Ormerod et al. 1987), suggesting that these bryophytes have somewhat different abilities to acquire CO2. Jungermannia vulcanicola (Figure 72-Figure 73) survives the low pH of acid streams (1.9-4.7) in Japan (Satake & Miyasaka 1984; Yokouchi et al. 1984; Satake et al. 1990). Leptodictyum (Figure 74) can grow at a pH of 3.4 in organic lakes of Japan (Satake 1980). Warnstorfia fluitans (Figure 75) can live in acidic lakes with the low pH range of 3.4-3.8 (Satake 2000). In aquatic habitats, these pH differences affect the uptake of N forms and the ability to obtain CO2 for photosynthesis, as well as affecting toxicity of pollutants.
Figure 68. Distribution of carbonate species as a fraction of
total dissolved carbonate in relation to solution pH. Note that H2CO3 represents CO2 dissolved in water; HCO3
- is bicarbonate, and CO3
2- is carbonate. Modified from Soil Chemistry 5-1 < http://lawr.ucdavis.edu/classes/ssc102/Section5.pdf >.

8-8-22 Chapter 8-8: Nutrient Relationships: Cycling
Figure 69. Scapania undulata, a species with a preferred pH
range of 5.2-5.8. Photo by Michael Lüth, with permission.
Figure 70. Nardia compressa, a species with a preferred pH
range of 5.2-5.8. Photo byMichael Lüth, with permission.
Figure 71. Fontinalis squamosa, a species with a preferred
pH range of 5.6-6.2. Photo by Michael Lüth, with permission.
Figure 72. Jungermannia vulcanicola acid stream habitat.
Photo courtesy of Angela Ares.
Figure 73. Jungermannia vulcanicola, an acidophile that
prefers a pH range of 1.9-4.7. Photo courtesy of Angela Ares.
Figure 74. Leptodictyum riparium, a species that can grow
at a pH of 3.4 in organic lakes. Photo by Michael Lüth, with permission.

Chapter 8-8: Nutrient Relationships: Cycling 8-8-23
Figure 75. Warnstorfia fluitans, a species of acidic lakes
with the low pH range of 3.4-3.8. Photo by Michael Lüth, with permission.
In an 18-year study of a pine forest stand in central Sweden, van Dobben and coworkers (1992) found that Pohlia nutans (Figure 76) experienced a 10-fold increase when acidified, whereas Pleurozium schreberi (Figure 38) almost disappeared.
Figure 76. Pohlia nutans. Photo by Michael Lüth, with
permission.
In geothermal areas, as we will discuss later, distribution by pH is pronounced, whether by competition leading to more narrow realized niches, or by real limitations imposed by the acidity, and perhaps the accompanying sulfur. The low pH, and in some cases high pH, can affect nutrient solubility and may make certain ions toxic or, in high pH, make them unavailable.
Although many mosses seem to survive at low pH levels, competition from tracheophytes and limited nutrients can severely limit their abundance. In a grassland experiment, Virtanen et al. (2000) found that virtually no mosses were present on plots with a soil pH of 3.3-4.5. Rather, bryophyte biomass and diversity increased with soil pH.
Indicator Species Despite the limited ability of bryophytes to use soil
nutrients, soil characters can still limit their distribution,
making some of them suitable indicators. Some of this may be that they have greater ability to take up soil nutrients than we have imagined, perhaps through mycorrhizae, and some may result from airborne dust derived from the soil. For example, Ceratodon purpureus (Figure 77) is able to tolerate high N content (Dierssen 1973), although this widespread moss seems to be able to tolerate roadside gravel and rock ledges where one would expect N content to be low. On the other hand, Aulacomnium palustre (Figure 78), Pleurozium schreberi (Figure 38), Pogonatum urnigerum (Figure 79), and Polytrichastrum alpinum (Figure 80) indicate low N. Such mosses as Funaria hygrometrica (Figure 81), Pohlia cruda (Figure 82), and Leptobryum pyriforme (Figure 83) indicate good base saturation, whereas poor base saturation is indicated by good growths of Psilopilum laevigatum (Figure 84).
Figure 77. Ceratodon purpureus with capsules, a species
with wide habitat tolerance that can tolerate high N levels. Photo by J. C. Schou, with permission.
Figure 78. Aulacomnium palustre with gemmae, a species
that indicates low N. Photo by Janice Glime.

8-8-24 Chapter 8-8: Nutrient Relationships: Cycling
Figure 79. Pogonatum urnigerum, a species that indicates
low N levels. Photo by Janice Glime.
Figure 80. Polytrichastrum alpinum, a species that indicates
low N levels. Photo by Michael Lüth, with permission.
Figure 81. Funaria hygrometrica, a species that indicates
good base saturation. Photo by Michael Lüth, with permission.
Figure 82. Pohlia cruda with capsules, a species that
indicates good base saturation. Photo by Michael Lüth, with permission.
Figure 83. Leptobryum pyriforme with capsules, a species
that indicates good base saturation. Photo by Michael Lüth, with permission.
Figure 84. Psilopilum laevigatum with capsules, an
indicator of poor base saturation. Photo by Michael Lüth, with permission.
Use of mosses for prospecting was popular for a time during mining exploration, but their short penetration into the soil made them of limited value. Copper mosses – Mielichhoferia (Figure 85-Figure 86), Dryptodon (see Figure 87), Scopelophila (Figure 88-Figure 89) to be discussed in the Habitats volume – seem to be reliable indicators of the presence of copper (Persson 1948; Shacklette 1967), although it may actually be the sulfur

Chapter 8-8: Nutrient Relationships: Cycling 8-8-25
associated with the copper that encourages their growth (Hartman 1969). They are unknown in the copper-rich area of the Keweenaw Peninsula of Michigan, where the copper occurs as pure copper with no associated sulfur (pers. obs.). Nevertheless, their tolerance for the ore is higher than that of other mosses.
Figure 85. Habitat of Mielichhoferia mielichhoferiana, a
copper moss. Photo by Michael Lüth, with permission.
Figure 86. Mielichhoferia mielichhoferi, a copper moss
with calcium deposits on it. Photo by Michael Lüth, with permission.
Figure 87. Dryptodon patens; Dryptodon atrata is a copper
moss. Photo by Michael Lüth, with permission.
Figure 88. Scopelophila ligulata, a copper moss in its
habitat. Photo by Michael Lüth, with permission.
Figure 89. Scopelophila ligulata, a copper moss. Photo by
Michael Lüth, with permission.
Needed Research
In 1992, Bates summarized our needs for understanding the physiology of nutrient uptake, translocation, and loss in bryophytes. We have made considerable progress since that time, but we still are unable to make sweeping generalizations. To understand clearly the ecosystems in which bryophytes form a significant ground cover or a significant epiphytic element, we must understand the role of the bryophytes in nutrient uptake and sequestering. We still have little understanding of what makes the various species differ in their ability to subsist on low nutrients. We likewise lack understanding of the effects nutrient deficiencies or excess may have on the morphology of the species. And we are only beginning to understand how long nutrients might remain within the bryophyte before being returned to the ecosystem. We have learned that, contrary to the perception of tracheophyte ecologists, the bryophytes move essential nutrients from older tissues to younger ones, often being recalcitrant toward returning anything to the soil unless the whole plant dies. But we don't know how widespread this phenomenon is in the many ecosystems where bryophytes form a significant ecosystem component. We have barely realized that bryophytes obtain their nutrients from the soil as well as the rain, but we can add little to the hypothesis

8-8-26 Chapter 8-8: Nutrient Relationships: Cycling
put forth by Bates (1992) that rapidly growing species may depend on the substrate and slower growing species mostly on precipitation. The nutrient role of bryophytes in ecosystems has come of age – we know that it is significant, and now it demands our attention.
Summary Bryophytes can play a significant role in nutrient
cycling in many kinds of ecosystems. Their ability to bind nutrients on their cell walls permits them to take these in when they become hydrated. They intercept atmospheric input and often hold it, preventing it from reaching the forest floor. In some locations, under conditions of wetting and drying, they can release nutrients during the first few minutes of rehydration when adhering inorganic and organic molecules dissolve in the throughfall. However, once their membranes are repaired, they tend to hold the nutrients on their surface exchange sites or within cells, or even between cells.
Nutrient concentration studies must be interpreted with caution due to the ability of bryophytes to hold dust readily on their surfaces. But even so, this is a role in the ecosystem that prevents this dust from reaching other plants or that releases it at some later point in time.
Mosses may have a limited capacity to retain luxury nutrients such as K, Ca, and P, but most of the essential macronutrients seem to be regulated to a relatively constant level. Heavy metals, on the other hand, tend to accumulate to high levels.
In boreal forests, feather mosses retain nutrients and move the soluble ones to young, growing tissues. Hence, nutrients may be bound within the mosses for decades. Nevertheless, spruce roots seem to flourish under the mosses, suggesting that mosses may accumulate nutrients that become available to the roots. Polytrichum seems to compete with the fine roots and therefore has a low absorption rate for P. For some reason, perhaps because the N is moved to underground portions, N is able to accumulate under Polytrichum.
In chalk grasslands, bryophytes trap and retain leachates from the autumn leaves, then release them in the summer when demand is highest for tracheophytes. Other nutrients, such as N, are retained in bryophytes as organic compounds that are bound in cell walls or retained in proteins. And the level of NH4
+-N and of NO2
--N in soil under mosses increases from xerophytic to mesophytic species, but we don't know why.
At least some epiphytic mosses even seem to obtain nutrients from the vascular tissue of tree trunks. Epiphytic mosses in the tropics can provide a suitable habitat for legume nodule formation, for example Bradyrhizobium in the Acacia koa tree in Hawaii, providing a significant contribution to the overall N budget.
Seasonal behavior can, as in the case of Sphagnum russowii, release nutrients such as K+ in the autumn when the trees need it in preparation for winter. But some bryophytes hold to their nutrients tenaciously at exchange sites, again depriving the soil. Sphagnum in bogs and fens can be destroyed by nutrient enrichment,
but even dead plants can retain the nutrients already stored. These mosses can also trap heavy metals and retain them in the soils, making the root zone toxic for trees. Because of their movement of nutrients to young tissues and incorporation into incalcitrant compounds, bryophytes can serve as nutrient sinks.
Low pH makes nutrients more soluble, but some bryophytes cannot survive, in some cases due to competition from tracheophytes, but in others most likely because the pH change disrupts the normal balance of nutrient uptake. High pH levels, especially accompanied by high concentrations of Ca++, can result in competition for exchange sites that are needed for nutrient uptake. In aquatic systems, high pH reduces the available CO2, thus limiting photosynthesis. Some bryophytes serve as indicator species because of their ability to tolerate or not tolerate such conditions as high Ca++ or low pH.
Having learned how mosses gain, use, and lose nutrients, we must ask ourselves how these plants are able to subsist on such low concentrations of nutrients. In addition to their efficient absorption of nutrients in low concentrations, they benefit from their generally slow growth habit, thus greatly reducing their requirements per units of time and space.
Their ability to move nutrients from old to young tissues and to store them both externally and internally raises serious questions about their role in the nutrient cycling in the habitats where they are abundant.
Acknowledgments
I appreciate the contributions of undergraduate Phil Gaudette and M. S. student Jennifer Jermalowicz Jones for their critical reading of the manuscript from the perspectives of students interested in nutrient relationships of bryophytes.
Literature Cited Allen, E. D. and Spence, D. H. N. 1981. The differential ability
of aquatic plants to utilize the inorganic carbon supply in fresh waters. New Phytol. 87: 269-283.
Anderson, W. B. and Eickmeier, W. G. 1998. Physiological and morphological responses to shade and nutrient additions of Claytonia virginica (Portulacaceae): Implications for the "vernal dam" hypothesis. Can. J. Bot. 76: 1340-1349.
Anderson, W. B. and Eickmeier, W. G. 2000. Nutrient resorption in Claytonia virginica L.: Implications for deciduous forest nutrient cycling. Can. J. Bot. 78: 832-839.
Bain, J. T. and Proctor, M. C. F. 1980. The requirement of aquatic bryophytes for free CO2 as an inorganic carbon source: Some experimental evidence. New Phytol. 86: 393-400.
Bakken, S. 1995. Effects of nitrogen supply and irradiance on growth and nitrogen status in the moss Dicranum majus from differently polluted areas. J. Bryol. 18: 707-721.
Bates, J. W. 1987. Nutrient retention by Pseudoscleropodium purum and its relation to growth. J. Bryol. 14: 565-580.
Bates, J. W. 1989a. Interception of nutrients in wet deposition by Pseudoscleropodium purum: An experimental study of

Chapter 8-8: Nutrient Relationships: Cycling 8-8-27
uptake and release of potassium and phosphorus. Lindbergia 15: 93-98.
Bates, J. W. 1989b. Retention of added K, Ca and P by Pseudoscleropodium purum growing under an oak canopy. J. Bryol. 15: 589-605.
Bates, J. W. 1992. Influence of chemical and physical factors on Quercus and Fraxinus epiphytes at Loch Sunart, western Scotland: A multivariate analysis. J. Ecol. 80: 163-179.
Bates, J. W. and Brown, D. H. 1974. The control of cation levels in seashore and inland mosses. New Phytol. 73: 483-495.
Bedford, B. L., Walbridge, M. R., and Aldous, A. 1999. Patterns in nutrient availability and plant diversity of temperate North American wetlands. Ecology 80: 2151-2169.
Berg, B. 1984. Decomposition of moss litter in a mature Scotch pine forest. Pedobiologia 26: 301-308.
Bergamini, A. and Pauli, D. 2001. Effects of increased nutrient supply on bryophytes in montane calcareous fens. J. Bryol. 23: 331-339.
Binkley, D. and Graham, R. L. 1981. Biomass, production, and nutrient cycling of mosses in an old-growth Douglas-fir forest. Ecology 62: 1387-1389.
Bowden, R. D. 1991. Inputs, outputs, and accumulation of nitrogen in an early successional moss (Polytrichum) ecosystem. Ecol. Monogr. 61: 207-223.
Brehm, K. 1968. Die Bedeutung des Kationenaustausches für den Kationengehalt lebender Sphagnen. Planta (Berlin) 79: 324-345.
Brehm, K. 1970. Kationenaustausch bei Hochmoorsphagnen: Die Wirkung von an den Austauscher gebundenen Kationen in Kulturversuchen. Beitr. Biol. Pflanzen 47: 91-116.
Brock, T. C. M. and Bregman, R. 1989. Periodicity in growth, productivity, nutrient content and decomposition of Sphagnum recurvum var. mucronatum in a fen woodland. Oecologia 80: 44-52.
Brown, D. H. 1982. Mineral nutrition. In: Smith, A. J. E. (ed.). Bryophyte Ecology. Chapman & Hall, London, pp. 383-444.
Brown, D. H. and Bates, J. W. 1972. Uptake of lead by two populations of Grimmia donniana. J. Bryol. 7: 187-193.
Brown, D. H. and Bates, J. W. 1990. Bryophytes and nutrient cycling. Bot. J. Linn. Soc. 104: 129-147.
Brown, D. H. and Buck, G. W. 1978a. Cation contents of acrocarpous and pleurocarpous mosses growing on a strontium-rich substratum. J. Bryol. 10: 199-209.
Brown, D. H. and Buck, G. W. 1978b. Distribution of potassium, calcium and magnesium in the gametophyte and sporophyte generations of Funaria hygrometrica Hedw. Ann. Bot. 42: 923-929.
Brown, D. H. and Buck, G. W. 1979. Desiccation effects and cation distribution in bryophytes. New Phytol. 82: 115-125.
Brown, D. H. and Buck, G. W. 1985. The cellular location of metals in two bryophytes and a lichen. Cryptog. Bryol. Lichénol. 6: 279-286.
Brümelis, G., Lapina, L., and Tabors, G. 2000. Uptake of Ca, Mg and K during growth of annual segments of the moss Hylocomium splendens in the field. J. Bryol. 22: 163-174.
Buck, G. W. and Brown, D. H. 1979. The effect of desiccation on cation location in lichens. Ann. Bot. 44: 265-277.
Burton, M. A. S. 1979. Studies on zinc localization in aquatic bryophytes. Bryologist 82: 594-598.
Chalaud, G. 1931. Germination des spores et formation du gametophyte chez Lophocolea cuspidata et Chiloscyphus polyanthus. Ann. Bryol. 4: 49-78.
Chapin, F. S. III, Oechel, W. C., Cleve, K. van, and Lawrence, W. 1987. The role of mosses in the phosphorus cycling of an Alaskan black spruce forest. Oecologia 74: 310-315.
Clark, D. L., Nadkarni, N. M., and Gholz, H. L. 2005. Retention of inorganic nitrogen by epiphytic bryophytes in a montane tropical forest. Biotropica 37: 328-336.
Cornelissen, J. H., Lang, S. I., Soudzilovskaia, N. A., and During, H. J. 2007. Comparative cryptogam ecology: A review of bryophyte and lichen traits that drive biogeochemistry. Ann. Bot. 99: 987-1001.
Coxson, D. 1991. Nutrient release from epiphytic bryophytes in tropical montane rain forest (Guadeloupe). Can. J. Bot. 69: 2122-2129.
Coxson, D., McIntyre, D., and Vogel, J. 1992. Pulse release of sugars and polyols from canopy bryophytes in tropical montane rain forest (Guadeloupe, French West Indies). Biotropica 24: 121-133.
Dierssen, K. 1973. Moosgesellschaften auf Isländischen torfböden und ihre abhängigkeit vom wasser- und nährstoffhaushalt. Ber. aus der Forsc. Nedri As, Hveragerdi, Island 13: 1-29.
Dobben, H. F. van, Dirkse, G. M., Braak, C. J. F. ter, and Tamm, C. O. 1992. Effects of acidification, liming and fertilization on the undergrowth of a pine forest stand in central Sweden. RIN report 92/21. DLO Institute for Forestry and Nature Research, Wageningen, 26 pp.
Dowding, P., Chapin, F. S., Wielgolaski, F. E., and Kilfeather, P. 1981. Nutrients in tundra ecosystems. In: Bliss, L. C., Heal, O. W., and Moore, J. J. (eds.). Tundra Ecosystems: A Comparative Analysis. Cambridge University Press, Cambridge, pp. 647-683.
During, H. J. 1990. The bryophytes of calcareous grasslands. In: Hillier, S. H., Walton, D. W. H., and Wells, D. A. (eds.). Calcareous Grasslands – Ecology and Management. Proceedings of a Joint British Ecological Society/Nature Conservancy Council Symposium, 14-16 September 1987, University of Sheffield, pp. 35-40.
Eckstein, R. L. 2000. Nitrogen retention by Hylocomium splendens in a subarctic birch woodland. J. Ecol. 88: 506-515.
Eckstein, R. L. and Karlsson, P. S. 1999. Recycling of nitrogen among segments of Hylocomium splendens as compared with Polytrichum commune: Implications for clonal integration in an ectohydric bryophyte. Oikos 86: 87-96.
Eickmeier, W. G. and Schussler, E. E. 1993. Responses of the spring ephemeral Claytonia virginica L. to light and nutrient manipulations and the implications for the "vernal dam" hypothesis. Bull. Ecol. Soc. Amer. Program and Abstracts, Suppl. 74(2): 224. 78th Ann. ESA Meeting, 31 July – 4 August 1993.
Frahm, J.-P. 1994. The taxonomic relevance of oil drops in the laminal cells of Dicranaceae. Hikobia 11: 535-538.
Gavaudan, P. 1927. Sur l'origine et les charactères des éléments oléifères des Jungermanniales. C.R. Acad. Sci. 184: 1473-1475.
Glime, J. M. 2001. The role of bryophytes in temperate forest ecosystems. Hikobia 13: 267-289.
Gullvåg, B. M., Skaar, H., and Ophus, E. M. 1974. An ultrastructural study of lead accumulation within leaves of Rhytidiadelphus squarrosus (Hedw.) Warnst. A comparison between experimental and environmental poisoning. J. Bryol. 8: 117-122.
Hartman, E. L. 1969. The Ecology of the "Copper Moss" Mielichhoferia mielichhoferi in Colorado. Bryologist 72: 56-59.

8-8-28 Chapter 8-8: Nutrient Relationships: Cycling
He, X., Sun, Y., and Zhu, R. L. 2013. The oil bodies of liverworts: Unique and important organelles in land plants. Crit. Rev. Plant Sci 32: 293-302.
Herrera, R., Jordan, C. F., Klinge, H., and Medina, E. 1978. Amazon ecosystems. Their structure and functioning with particular emphasis on nutrients. Intercientia 3: 223-232.
Hieronymus, G. 1892. Beitrage zur morphologie und biologie der Algen. Beitr. Biol. Pflanz. 5: 461-495.
Hoffman, G. R. 1972. The accumulation of cesium-137 by cryptogams in a Liriodendron tulipifera forest. Bot. Gaz. 133: 107-119.
Hölscher, D., Köhler, L., Leuschner, C., and Kappelle, M. 2003. Nutrient fluxes in stemflow and throughfall in three successional stages of an upper montane rain forest in Costa Rica. J. Trop. Ecol. 19: 557-565.
Huang, C. Y., Chung, C. I., Lin, Y. C., Hsing, Y. L. C., and Huang, A. H. C. 2009. Oil bodies and oleosins in Physcomitrella possess characteristics representative of early trends in evolution. Plant Physiol. 150: 1192-1203.
Huneck, S. 1984. Chemistry and biochemistry of bryophytes. In: Schuster, R. M. (ed.). New Manual of Bryology, Vol. 1. Hattori Botanical Laboratory, Nichinan, pp. 1-116.
Jönsson, B. and Olin, E. 1898. Der Fettgehalt der Moose. Lunds. Universitets Arkskrift 34: 440-443.
Klinger, L. 1988. Forest declines: Is mighty moss to blame? Sci. News 133: 285.
La Farge, C. 2002. Leucoloma I: A revision of subgenus Leucoloma (Dicranaceae, Bryopsida) in Africa and Madagascar. Bryologist 105: 509-590.
Lamontagne, S. 1998. Nitrogen mineralization in upland Precambrian Shield catchments: Contrasting the role of lichen-covered bedrock and forested areas. Biogeochemistry 41: 53-69.
Leary, J. J. K., Singleton, P. W., and Borthakur, D. 2004. Canopy nodulation of the endemic tree legume Acacia koa in the mesic forests of Hawaii. Ecology 85: 3151-3157.
Li, Y. and Vitt, D. H. 1997. Patterns of retention and utilization of aerially deposited nitrogen in boreal peatlands. Ecoscience 4: 106-116.
Liu, W., Fox, J. E. D., and Xu, Z. 2000. Leaf litter decomposition of canopy trees, bamboo and moss in a montane moist evergreen broad-leaved forest on Ailao Mountain, Yunnan, south-west China. Ecol. Res. 15: 435-447.
Longton, R. E. 1984. The role of bryophytes in terrestrial ecosystems. J. Hattori Bot. Lab. 55: 147-163.
Longton, R. E. 1992. The role of bryophytes and lichens in terrestrial ecosystems. In: Bates, J. W., and Farmer, A. M. (eds.). Bryophytes and Lichens in a Changing Environment. Clarendon Press, Oxford, pp. 32-76.
Lorch, W. 1931. Anatomie der Laubmoose. Handbuch der Pflanzenanatomie Vol. VII/1. Gebrüder Borntraeger, Berlin, 358 pp.
Mägdefrau, K. and Wurtz, A. 1951. Die Wasserkapazitat der Moos- und Flechtendecke des Waldes. Forstwiss. Zentralbl. 70(2): 103-117.
Mártínez Abaigar, J., Núñez Olivera, E., and Beaucourt, N. 2002. Short-term physiological responses of the aquatic liverwort Jungermannia exsertifolia subsp. cordifolia to KH2PO4 and anoxia. Bryologist 105: 86-95.
Matteri, C. M. 1984. Occurrence of tubers and rhizomes in Chrysoblastella chilensis (Mont.) Reim. Lindbergia 10: 165–168.
Mouvet, C. and Claveri, B. 1999. Localization of copper accumulated in Rhynchostegium riparioides using sequential chemical extraction. Aquat. Bot. 63: 1-10.
Muller, R. N. and Bormann, F. H. 1976. Role of Erythronium americanum Ker. in energy flow and nutrient dynamics in the northern hardwood forest. Science 193: 1126-1128.
Nakatsubo, T. 1997. The role of bryophytes in terrestrial ecosystems with special reference to forests and volcanic deserts. Jap. J. Ecol. 47: 43-54.
Oechel, W. C. and Cleve, K. van. 1986. The role of bryophytes in nutrient cycling in the taiga. In: Cleve, K. Van, Chapin, F. S. III, Flanagan, P. W., Viereck, L. A., and Dyrness, C. T. (eds.). Forest Ecosystems in the Alaskan Taiga. Springer-Verlag, New York, pp. 121-137.
Ophus, E. M. and Gullvåg, B. M. 1974. Localization of lead within leaf cells of Rhytidiadelphus squarrosus (Hedw.) Warnst. by means of transmission electron microscopy and X-ray microanalysis. Cytobios 10: 45-58.
Ormerod, S. J., Wade, K. R., and Gee, A. S. 1987. Macro-floral assemblages in upland Welsh streams in relation to acidity, and their importance to invertebrates. Freshwat. Biol. 18: 545-557.
Patidar, K. C. and Kaul, A. 1984. Effect of pH on the growth of Riccia discolor L. et L. Hikobia 9: 61-63.
Patterson, P. M. and Baber, J. S. 1961. Factors breaking vegetative dormancy in certain mosses. Bryologist 64: 336-338.
Persson, H. 1948. On the discovery of Merceya ligulata in the Azores with a discussion of the so-called "copper mosses." Rev. Bryol. Lichenol. 17(1): 75-78.
Pócs, T. 1982. Tropical forest bryophytes. In: Smith, A. J. E. (ed.). Bryophyte Ecology. Chapman & Hall, London, pp. 59-104.
Pressel, S., Duckett, J. G., Ligrone, R., and Proctor, M. C. 2009. Effects of de- and rehydration in desiccation-tolerant liverworts: A cytological and physiological study. Internat. J. Plant Sci. 170: 182-199.
Rieley, J. O., Richards, P. W., and Bebbington, A. D. L. 1979. The ecological role of bryophytes in a North Wales woodland. J. Ecol. 67: 497-527.
Ross, H. B. 1990. On the use of mosses (Hylocomium splendens and Pleurozium schreberi) for estimating atmospheric trace metal deposition. Water Air Soil Pollut. 50: 63-76.
Rothstein, D. E. 2000. Spring ephemeral herbs and nitrogen cycling in a northern hardwood. Oecologia 124: 446-453.
Satake, K. 1980. Limnological studies on inorganic acid lakes in Japan. Jap. J. Limnol. 41: 41-50.
Satake, K. 2000. Iron accumulation on the cell wall of the aquatic moss Drepanocladus fluitans in an acid lake at pH 3.4-3.8. Hydrobiologia 433: 25-30.
Satake, K. and Miyasaka, K. 1984. Discovery of bacteria in the cell wall of the aquatic liverwort Jungermannia vulcanicola Steph. in an acid stream with pH 4.2-4.6. J. Bryol. 13: 277-279.
Satake, K., Shibata, K., and Bando, Y. 1990. Mercury sulphide (HgS) crystals in the cell walls of the aquatic bryophytes, Jungermannia vulcanicola Steph. and Scapania undulata (L.) Dum. Aquat. Bot. 36: 325-341.
Scheffer, R. A., Logtestijn, R. S. P. Van, and Verhoeven, J. T. A. 2001. Decomposition of Carex and Sphagnum litter in two mesotrophic fens differing in dominant plant species. Oikos 92: 44-54.
Schwabe, W. W. 1976. Photoperiodism in liverworts. In: Smith, H. (ed.). Light and Plant Development. Butterworths, Boston, pp. 371-382.

Chapter 8-8: Nutrient Relationships: Cycling 8-8-29
Sedia, E. G. and Ehrenfeld, J. G. 2006. Differential effects of lichens and mosses on soil enzyme activity and litter decomposition. Biol. Fert. Soils 43: 177-189.
Shacklette, H. T. 1967. Copper mosses as indicators of metal concentrations (No. 1198-G). US Govt. Print. Off., Washington, D.C., 18 pp.
Simon, T. and Szerényi, G. 1985. A study of soil characteristics under moss tufts in the acid sand area of Somogy County, Hungary. Abstr. Bot. 9, Suppl. 2: 205-217.
Skaar, H., Ophus, E., and Gullvåg, B. M. 1973. Lead accumulation within nuclei of moss leaf cells. Nature (London) 241: 215-216.
Skré, O., Oechel, W. C., and Miller, P. M. 1983. Patterns of translocation of carbon in four common moss species in a black spruce (Picea mariana) dominated forest in interior Alaska. Can. J. Forest Res. 13: 869-878.
Stahl, E. 1888. Pflanzen und Schnecken. Jena. Z. Med. Naturwiss. 22: 557-584.
Streeter, D. T. 1970. Bryophyte Ecology. Sci. Prog. Oxford 58: 419-434.
Tamm, C. O. 1953. Growth, yield and nutrition in carpets of a forest moss (Hylocomium splendens). Medd. Stat. Skogsforskningsinst. 43: 124 pp.
Tessier, J. T. and Raynal, D. J. 2003. Vernal nitrogen and phosphorus retention by forest understory vegetation and soil microbes. Plant Soil 256: 443-453.
Thomas, H. 1970. Ph. D. Thesis, University of Bristol.
Tooren, B. F. van, During, H. J., and Lensink, M. J. G. 1985. The influence of the bryophyte layer on the microclimate in chalk grasslands. Abstr. Bot. 9(suppl. 2): 219-230.
Tooren, B. F. van, Hertog, J. den, and Verhaar, J. 1988. Cover, biomass and nutrient content of bryophytes in Dutch chalk grasslands. Lindbergia 14: 47-54.
Turetsky, M. R. 2003. The role of bryophytes in carbon and nitrogen cycling. Bryologist 106: 395-409.
Turetsky, M. R., Crow, S. E., Evans, R. J., Vitt, D. H., Wieder, R. K. 2008. Trade-offs in resource allocation among moss species control decomposition in boreal peatlands. J. Ecol. 96: 1297-1305.
Virtanen, R., Johnston, A. E., Crawley, M. J., and Edwards, G. R. 2000. Bryophyte biomass and species richness on the park grass experiment, Rothamsted, UK. Plant Ecol. 151(2): 129-141.
Weber, M. G. and Cleve, K. van. 1981. Nitrogen dynamics in the forest floor of interior Alaska black spruce ecosystems. Can. J. Forest Res. 11: 743-751.
Weber, M. G. and Cleve, K. van. 1984. Nitrogen transformations in feather moss and forest floor layers of anterior Alaska, U.S.A., black spruce (Picea mariana) ecosystems. Can. J. Forest Res. 14: 278-290.
Weetman, G. F. 1968. The relationship between feather moss growth and the nutrition of black spruce. In: Lafleur, C. and Butler, J. (eds.). Proc. 3rd International Peat Congress, Quebec. Natl. Res. Council Canada, Ottawa, pp. 366-370.
Weetman, G. F. and Timmer, V. 1967. Feather moss growth and nutrient content under upland black spruce. Woodlands Research Index, Pulp and Paper Research Institute of Canada, Pointe Claire, P. Q., Canada. 138: 1-38.
Wilson, J. A. and Coxson, D. S. 1999. Carbon flux in a subalpine spruce-fir forest: Pulse release from Hylocomium splendens feather-moss mats. Can. J. Bot. 77: 564-569.
Yokouchi, Y., Satake, K. I., and Ambe, Y. 1984. Monoterpene composition of the essential oil of the aquatic liverwort Jungermannia vulcanicola Steph. Bryologist 87: 323-326.
Zak, D. R., Groffman, P. M., Pregitzer, K. S., Christensen, S., and Tiedje, J. M. 1990. Plant-microbe competition for nitrogen in northern forests. Ecology 71: 651-656.

8-8-30 Chapter 8-8: Nutrient Relationships: Cycling