IPCC WGIII Chapter 8 Transport
117
Working Group III – Mitigation of Climate Change Chapter 8 Transport
Transcript of IPCC WGIII Chapter 8 Transport
Working Group III – Mitigation of Climate Change
Chapter 8
Transport
Note:
This document is the copy‐edited version of the final draft Report, dated 17 December 2013, of the Working Group III contribution to the IPCC 5th Assessment Report "Climate Change 2014: Mitigation of Climate Change" that was accepted but not approved in detail by the 12th Session of Working Group III and the 39th Session of the IPCC on 12 April 2014 in Berlin, Germany. It consists of the full scientific, technical and socio‐economic assessment undertaken by Working Group III.
The Report should be read in conjunction with the document entitled “Climate Change 2014: Mitigation of Climate Change. Working Group III Contribution to the IPCC 5th Assessment Report ‐ Changes to the underlying Scientific/Technical Assessment” to ensure consistency with the approved Summary for Policymakers (WGIII: 12th/Doc. 2a, Rev.2) and presented to the Panel at its 39th Session. This document lists the changes necessary to ensure consistency between the full Report and the Summary for Policymakers, which was approved line‐by‐line by Working Group III and accepted by the Panel at the aforementioned Sessions.
Before publication, the Report (including text, figures and tables) will undergo final quality check as well as any error correction as necessary, consistent with the IPCC Protocol for Addressing Possible Errors. Publication of the Report is foreseen in September/October 2014.
Disclaimer:
The designations employed and the presentation of material on maps do not imply the expression of any opinion whatsoever on the part of the Intergovernmental Panel on Climate Change concerning the legal status of any country, territory, city or area or of its authorities, or concerning the delimitation of its frontiers or boundaries.
A report accepted by Working Group III of the IPCC but not approved in detail.
Final Draft Chapter 8 IPCC WGIII AR5
1 of 115
Chapter: 8
Title: Transport
Author(s): CLAs: Ralph Sims, Roberto Schaeffer
LAs: Felix Creutzig, Xochitl Cruz‐Núñez, Marcio D’Agosto, Delia Dimitriu, Maria Josefina Figueroa Meza, Lew Fulton, Shigeki Kobayashi, Oliver Lah, Alan McKinnon, Peter Newman, Minggao Ouyang, James Jay Schauer, Daniel Sperling, Geetam Tiwari
CAs: Adjo A. Amekudzi, Bruno Soares Moreira Cesar Borba, Helena Chum, Philippe Crist, Han Hao, Jennifer Helfrich, Thomas Longden, André Frossard Pereira de Lucena, Paul Peeters, Richard Plevin, Steve Plotkin, Robert Sausen
REs Elizabeth Deakin, Suzana Kahn Ribeiro
CSA: Bruno Soares Moreira Cesar Borba
Final Draft Chapter 8 IPCC WGIII AR5
2 of 115
Chapter 8: Transport
Contents
Chapter 8: Transport ............................................................................................................................... 2
Executive Summary ............................................................................................................................. 4
8.1 Freight and passenger transport (land, air, sea and water) ......................................................... 7
8.1.1 The context for transport of passengers and freight ............................................................. 9
8.1.2 Energy demands and direct / indirect emissions ................................................................. 11
8.2 New developments in emission trends and drivers .................................................................... 13
8.2.1 Trends .................................................................................................................................. 13
8.2.1.1 Non‐CO2 greenhouse gas emissions, black carbon, and aerosols ................................. 14
8.2.2 Drivers .................................................................................................................................. 15
8.3 Mitigation technology options, practices and behavioural aspects ........................................... 16
8.3.1 Energy intensity reduction – incremental vehicle technologies .......................................... 16
8.3.1.1 Light duty vehicles ......................................................................................................... 17
8.3.1.2 Heavy‐duty vehicles ...................................................................................................... 17
8.3.1.3 Rail, waterborne craft, and aircraft............................................................................... 18
8.3.2 Energy intensity reduction – advanced propulsion systems ............................................... 18
8.3.2.1 Road vehicles ‐ battery and fuel cell electric‐drives ..................................................... 19
8.3.2.2 Rail, waterborne craft, and aircraft............................................................................... 19
8.3.3 Fuel carbon intensity reduction ........................................................................................... 20
8.3.4 Comparative analysis ........................................................................................................... 21
8.3.5 Behavioural aspects ............................................................................................................. 22
8.4 Infrastructure and systemic perspectives ................................................................................... 24
8.4.1 Path dependencies of infrastructure and GHG emission impacts ....................................... 24
8.4.2 Path dependencies of urban form and mobility .................................................................. 25
8.4.2.1 Modal shift opportunities for passengers ..................................................................... 26
8.4.2.2 Modal shift opportunities for freight ............................................................................ 28
8.5 Climate change feedback and interaction with adaptation ........................................................ 30
8.5.1 Accessibility and feasibility of transport routes ................................................................... 30
8.5.2 Relocation of production and reconfiguration of global supply chains ............................... 30
8.5.3 Fuel combustion and technologies ...................................................................................... 31
8.5.4 Transport infrastructure ...................................................................................................... 31
8.6 Costs and potentials .................................................................................................................... 32
8.7 Co‐benefits, risks and spillovers .................................................................................................. 39
8.7.1 Socio‐economic, environmental, and health effects ........................................................... 39
Final Draft Chapter 8 IPCC WGIII AR5
3 of 115
8.7.2 Technical risks and uncertainties ......................................................................................... 42
8.7.3 Technological spillovers ....................................................................................................... 42
8.8 Barriers and opportunities .......................................................................................................... 44
8.8.1 Barriers and opportunities to reduce GHGs by technologies and practices ........................ 44
8.8.2 Financing low‐carbon transport ........................................................................................... 49
8.8.3 Institutional, cultural, and legal barriers and opportunities ................................................ 49
8.9 Sectoral implications of transformation pathways and sustainable development .................... 50
8.9.1 Long term stabilization goals – integrated and sectoral perspectives ................................ 51
8.9.2 Sustainable development .................................................................................................... 55
8.10 Sectoral policies ........................................................................................................................ 57
8.10.1 Road transport ................................................................................................................... 57
8.10.2 Rail transport ..................................................................................................................... 61
8.10.3 Waterborne transport........................................................................................................ 62
8.10.4 Aviation .............................................................................................................................. 62
8.10.5 Infrastructure and urban planning ..................................................................................... 63
8.11 Gaps in knowledge and data ..................................................................................................... 64
8.12 Frequently asked questions ...................................................................................................... 65
References ........................................................................................................................................ 68
Dedication to Lee Schipper. This Transport chapter is dedicated to the memory of Leon Jay (Lee) Schipper. A leading scientist in the field of energy research with emphasis on transport, Lee died on 16 August 2011 at the age of 64. He was a friend and colleague of many of the Chapter authors who were looking forward to working with him in his appointed role as Review Editor. Lee’s passing is a great loss to the research field of transport, energy, and the environment and his expertise and guidance in the course of writing this chapter was sorely missed by the author team, as were his musical talents.
Final Draft Chapter 8 IPCC WGIII AR5
4 of 115
Executive Summary
Reducing global transport greenhouse gas (GHG) emissions will be challenging since the continuing growth in passenger and freight activity could outweigh all mitigation measures unless transport emissions can be strongly decoupled from GDP growth (high confidence).
The transport sector produced 6.7 GtCO2 (7.0 GtCO2eq including non‐CO2 gases) of direct GHG emissions in 2010 and hence was responsible for approximately 23% of total energy‐related CO2 emissions [8.1]. Growth in GHG emissions has continued since the Fourth Assessment Report (AR4) in spite of more efficient vehicles (road, rail, water craft, and aircraft) and policies being adopted. (robust evidence; high agreement)[Section 8.1, 8.3]
Without aggressive and sustained mitigation policies being implemented, transport emissions could increase at a faster rate than emissions from the other energy end‐use sector and reach around 12 Gt CO2eq/yr by 2050. Transport demand per capita in developing and emerging economies is far lower than in Organisation for Economic Co‐operation and Development (OECD) countries but is expected to increase at a much faster rate in the next decades due to rising incomes and development of infrastructure. Analyses of both sectoral and integrated model scenarios suggest a higher emission reduction potential in the transport sector than the levels found possible in AR4 and at lower costs. Since many integrated models do not contain a detailed representation of infrastructural and behavioural changes, their results for transport can possibly be interpreted as conservative. If pricing and other stringent policy options are implemented in all regions, substantial decoupling of transport GHG emissions from gross domestic product (GDP) growth seems possible. A strong slowing of light‐duty vehicle (LDV) travel growth per capita has already been observed in several OECD cities suggesting possible saturation. (medium evidence, medium agreement) [8.6, 8.9, 8.10]
Avoided journeys and modal shifts due to behavioural change, uptake of improved vehicle and engine performance technologies, low‐carbon fuels, investments in related infrastructure, and changes in the built environment, together offer high mitigation potential (high confidence).
Direct (tank‐to‐wheel) GHG emissions from passenger and freight transport can be reduced by:
avoiding journeys where possible – by, for example, densifying urban landscapes, sourcing localized products, internet shopping, restructuring freight logistics systems, and utilizing advanced information and communication technologies (ICT);
modal shift to lower‐carbon transport systems – encouraged by increasing investment in public transport, walking and cycling infrastructure, and modifying roads, airports, ports, and railways to become more attractive for users and minimize travel time and distance;
lowering energy intensity (MJ/passenger km or MJ/tonne km) – by enhancing vehicle and engine performance, using lightweight materials, increasing freight load factors and passenger occupancy rates, deploying new technologies such as electric three‐wheelers;
reducing carbon intensity of fuels (CO2eq/MJ) – by substituting oil‐based products with natural gas, bio‐methane, or biofuels, electricity or hydrogen produced from low GHG sources .
In addition, indirect GHG emissions arise during the construction of infrastructure, manufacture of vehicles, and provision of fuels (well‐to‐tank). (robust evidence; high agreement) [8.3, 8.4, 8.6 and Chapters 10, 11, 12]
Both short‐ and long‐term transport mitigation strategies are essential if deep GHG reduction ambitions are to be achieved (high confidence).
Short‐term mitigation measures could overcome barriers to low‐carbon transport options and help avoid future lock‐in effects resulting, for example, from the slow turnover of vehicle stock and infrastructure and expanding urban sprawl. Changing behaviour of consumers and businesses will likely play an important role but is challenging and the possible outcomes, including modal shift, are
Final Draft Chapter 8 IPCC WGIII AR5
5 of 115
difficult to quantify. Business initiatives to decarbonize freight transport have begun, but need support from policies that encourage shifting to low‐carbon modes such as rail or waterborne options where feasible, and improving logistics. The impact of projected growth in world trade on freight transport emissions may be partly offset in the near term by more efficient vehicles, operational changes, ‘slow steaming’ of ships, eco‐driving and fuel switching. Other short term mitigation strategies include reducing aviation contrails and emissions of particulate matter (including black carbon), tropospheric ozone and aerosol precursors (including NOx) that can have human health and mitigation co‐benefits in the short term. (medium evidence, medium agreement) [8.2, 8.3, 8.6, 8.10]
The mitigation potential of biofuels (particularly advanced ‘drop‐in’ fuels for aircraft and other vehicles) will depend on technology advances and sustainable feedstocks. (medium evidence; medium agreement) [8.3]
The technical potential exists to substantially reduce the current CO2 emissions per passenger or tonne kilometre for all modes by 2030 and beyond. Energy efficiency and vehicle performance improvements range from 30–50% relative to 2010 depending on mode and vehicle type. Realizing this efficiency potential will depend on large investments by vehicle manufacturers, which may require strong incentives and regulatory policies in order to achieve GHG emissions reduction goals. (medium evidence, medium agreement) [8.3, 8.6, 8.10]
Over the medium‐term (up to 2030) to long‐term (to 2050 and beyond), urban (re)development and new infrastructure, linked with land use policies, could evolve to possibly reduce GHG intensity by 20–50% below 2010 baseline by 2050, through more compact and integrated transit, improved cycling infrastructure, and walking‐oriented urban planning. Although high potential improvements for aircraft efficiency are projected, improvement rates are expected to be slow due to long aircraft life, and fuel switching options being limited, apart from biofuels. Widespread construction of high‐speed rail systems could partially reduce short‐to‐medium‐haul air travel demand. For the transport sector, a reduction in total CO2 emissions of 15-40% could be plausible compared to baseline activity growth in 2050. (medium evidence, medium agreement) [8.3, 8.4, 8.6, 8.9, 12.3, 12.5]
Barriers to decarbonizing transport for all modes differ across regions, but can be overcome in part by reducing the marginal mitigation costs (medium evidence, medium agreement).
Financial, institutional, cultural, and legal barriers constrain transport technology uptake and behavioural change. All of these barriers include the high investment costs needed to build low‐emissions transport systems, the slow turnover of stock and infrastructure, and the limited impact of a carbon price on petroleum fuels already heavily taxed. Other barriers can be overcome by communities, cities, and national governments which can implement a mix of behavioural measures, technological advances, and infrastructural changes. Infrastructure investments ($/tCO2 avoided) may appear expensive at the margin, but sustainable urban planning and related policies can gain support when co‐benefits, such as improved health and accessibility, can be shown to offset some or all of the mitigation costs. (medium evidence, medium agreement) [8.4, 8.7, 8.8]
Oil price trends, price instruments on emissions, and other measures such as road pricing and airport charges can provide strong economic incentives for consumers to adopt mitigation measures. Regional differences, however, will likely occur due to cost and policy constraints. Some near term mitigation measures are available at low marginal costs but several longer‐term options may prove more expensive. Full societal mitigation costs (USD/tCO2) of deep reductions by 2030 remain uncertain but range from very low or negative (such as efficiency improvements for LDVs, long‐haul heavy‐duty vehicles (HDVs) and ships) to more than 100 USD/tCO2 for some electric vehicles, aircraft, and possibly high‐speed rail. Such costs may be significantly reduced in the future but the magnitude of mitigation cost reductions is uncertain. (limited evidence, low agreement) [8.6, 8.9]
Final Draft Chapter 8 IPCC WGIII AR5
6 of 115
There are regional differences in transport mitigation pathways with major opportunities to shape transport systems and infrastructure around low‐carbon options, particularly in developing and emerging countries where most future urban growth will occur (robust evidence, high agreement).
Transport can be an agent of sustained urban development that prioritizes goals for equity and emphasizes accessibility, traffic safety, and time‐savings for the poor while reducing emissions, with minimal detriment to the environment and human health. Transformative trajectories vary with region and country due to differences in the dynamics of motorization, age and type of vehicle fleets, existing infrastructure, and urban development processes. In least developed countries, prioritizing access to pedestrians and integrating non‐motorized and public transport services can result in higher levels of economic and social prosperity. In fast growing emerging economies, investments in mass transit and other low‐carbon transport infrastructure can help avoid future lock‐in to carbon intensive modes. Mechanisms to accelerate the transfer and adoption of improved vehicle efficiency and low‐carbon fuels to emerging and developing economies, and reducing the carbon intensity of freight in emerging markets, could offset much of the growth in non‐OECD emissions by 2030. It appears possible for LDV travel per capita in OECD countries to peak around 2035, whereas in non‐OECD countries it will likely continue to increase dramatically from a very low average today. However, growth will eventually need to be slowed in all countries. (limited evidence; medium agreement) [8.7, 8.9]
A range of strong and mutually‐supportive policies will be needed for the transport sector to decarbonize and for the co‐benefits to be exploited (robust evidence, high agreement).
Decarbonizing the transport sector is likely to be more challenging than for other sectors, given the continuing growth in global demand, the rapid increase in demand for faster transport modes in developing and emerging economies, and the lack of progress to date in slowing growth of global transport emissions in many OECD countries. Transport strategies associated with broader non‐climate policies at all government levels can usually target several objectives simultaneously to give lower travel costs, improved mobility, better health, greater energy security, improved safety, and time savings. Realizing the co‐benefits depends on the regional context in terms of economic, social, and political feasibility as well as having access to appropriate and cost‐effective advanced technologies. (medium evidence; high agreement) [8.4, 8.7]
In rapidly growing developing economies, good opportunities exist for both structural and technological change around low‐carbon transport. In OECD countries, advanced vehicle technologies could play a bigger role than structural and behavioural change, since economic growth will be slower than for non‐OECD countries. Policy changes can maximize the mitigation potential by overcoming the barriers to achieving deep carbon reductions and optimizing the synergies. Pricing strategies, when supported by education policies to help create social acceptance, can help reduce travel demand and increase the demand for more efficient vehicles (for example, where fuel economy standards exist) and induce a shift to low‐carbon modes (where good modal choice is available). For freight, a range of fiscal, regulatory, and advisory policies can be used to incentivize businesses to reduce the carbon intensity of their logistical systems. Since rebound effects can reduce the CO2 benefits of efficiency improvements and undermine a particular policy, a balanced package of policies, including pricing initiatives, could help to achieve stable price signals, avoid unintended outcomes, and improve access, mobility, productivity, safety, and health. (medium evidence; medium agreement) [8.7, 8.10]
Knowledge gaps in the transport sector
There is a lack of comprehensive and consistent assessments of the worldwide potential for GHG emission reduction and especially costs of mitigation from the transport sector. Within this context, the potential reduction is much less certain for freight than for passenger modes. For LDVs, the long‐term costs and high energy density potential for on‐board energy storage is not well understood.
Final Draft Chapter 8 IPCC WGIII AR5
7 of 115
Also requiring evaluation is how best to manage the tradeoffs for electric vehicles between performance, driving range and recharging time, and how to create successful business models.
Another area that requires additional research is in the behavioural economic analysis of the implications of norms, biases, and social learning in decision making, and of the relationship between transport and lifestyle. For example, how and when people will choose to use new types of low‐carbon transport and avoid making unnecessary journeys is unknown. Consequently, the outcomes of both positive and negative climate change impacts on transport services and scheduled timetables have not been determined, nor have the cost‐effectiveness of carbon‐reducing measures in the freight sector and their possible rebound effects. Changes in the transport of materials as a result of the decarbonization of other sectors and adaptation of the built environment are unknown. [8.11]
8.1 Freight and passenger transport (land, air, sea and water)
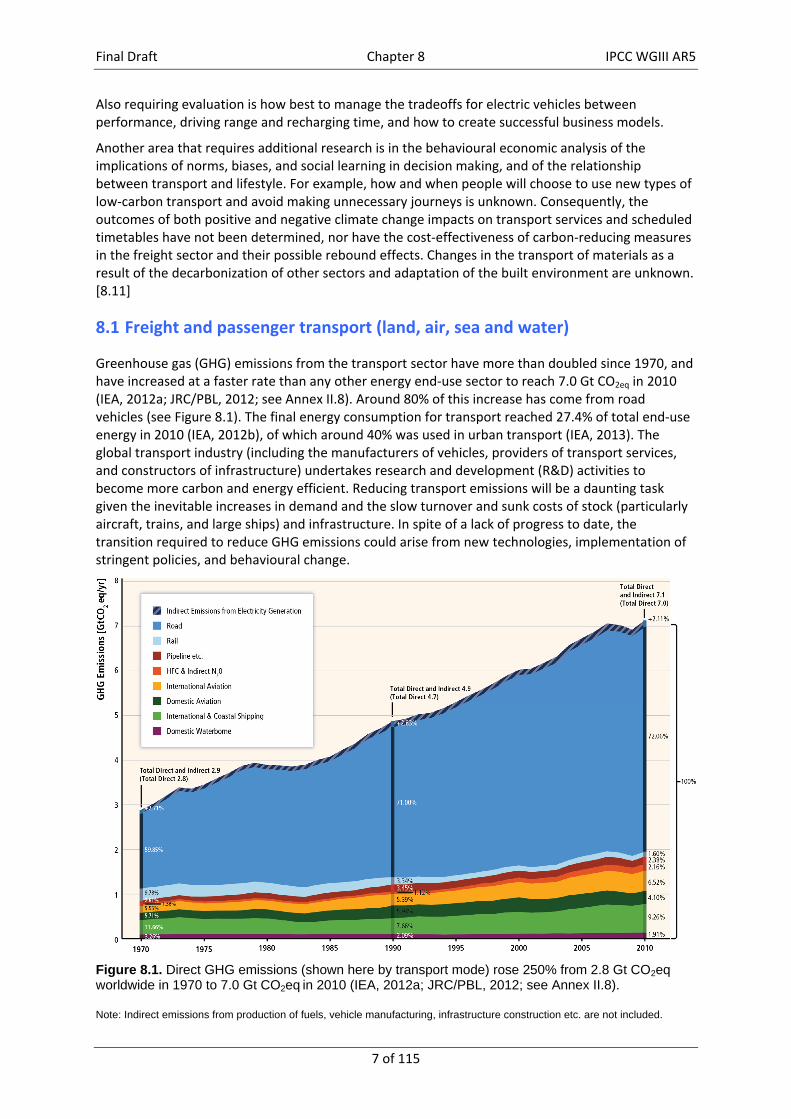
Greenhouse gas (GHG) emissions from the transport sector have more than doubled since 1970, and have increased at a faster rate than any other energy end‐use sector to reach 7.0 Gt CO2eq in 2010 (IEA, 2012a; JRC/PBL, 2012; see Annex II.8). Around 80% of this increase has come from road vehicles (see Figure 8.1). The final energy consumption for transport reached 27.4% of total end‐use energy in 2010 (IEA, 2012b), of which around 40% was used in urban transport (IEA, 2013). The global transport industry (including the manufacturers of vehicles, providers of transport services, and constructors of infrastructure) undertakes research and development (R&D) activities to become more carbon and energy efficient. Reducing transport emissions will be a daunting task given the inevitable increases in demand and the slow turnover and sunk costs of stock (particularly aircraft, trains, and large ships) and infrastructure. In spite of a lack of progress to date, the transition required to reduce GHG emissions could arise from new technologies, implementation of stringent policies, and behavioural change.
Figure 8.1. Direct GHG emissions (shown here by transport mode) rose 250% from 2.8 Gt CO2eq worldwide in 1970 to 7.0 Gt CO2eq in 2010 (IEA, 2012a; JRC/PBL, 2012; see Annex II.8).
Note: Indirect emissions from production of fuels, vehicle manufacturing, infrastructure construction etc. are not included.
Final Draft Chapter 8 IPCC WGIII AR5
8 of 115
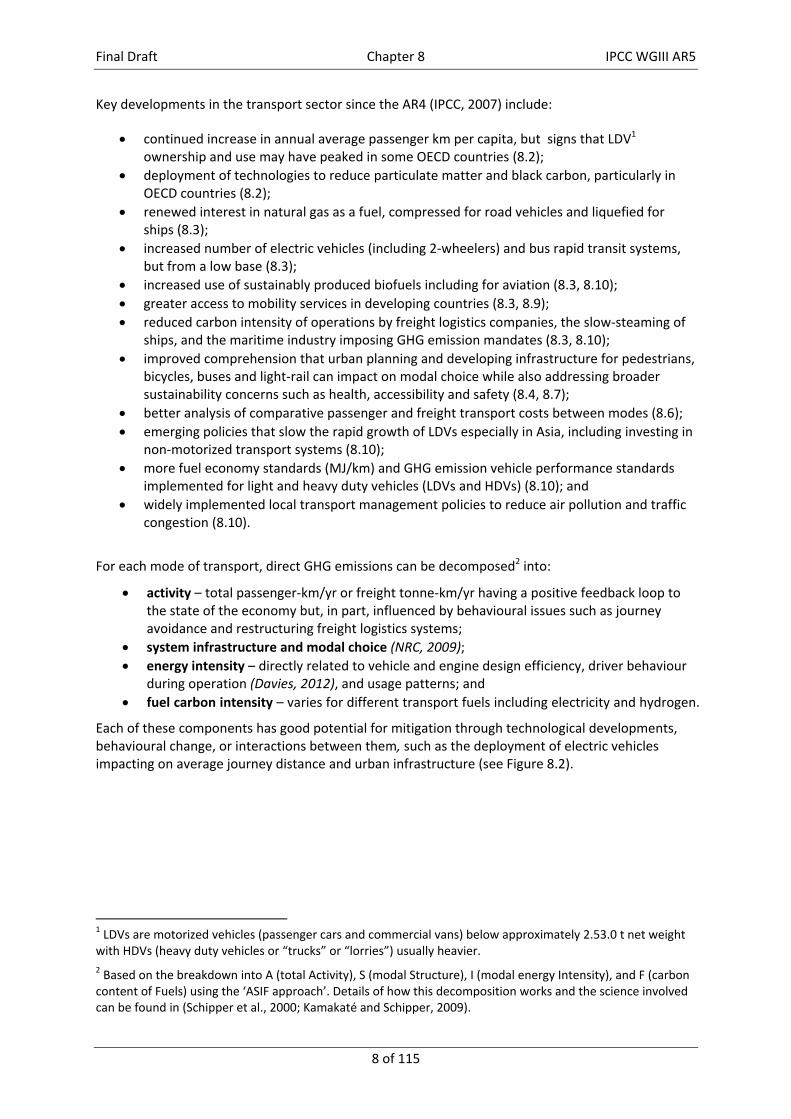
Key developments in the transport sector since the AR4 (IPCC, 2007) include:
continued increase in annual average passenger km per capita, but signs that LDV1 ownership and use may have peaked in some OECD countries (8.2);
deployment of technologies to reduce particulate matter and black carbon, particularly in OECD countries (8.2);
renewed interest in natural gas as a fuel, compressed for road vehicles and liquefied for ships (8.3);
increased number of electric vehicles (including 2‐wheelers) and bus rapid transit systems, but from a low base (8.3);
increased use of sustainably produced biofuels including for aviation (8.3, 8.10);
greater access to mobility services in developing countries (8.3, 8.9);
reduced carbon intensity of operations by freight logistics companies, the slow‐steaming of ships, and the maritime industry imposing GHG emission mandates (8.3, 8.10);
improved comprehension that urban planning and developing infrastructure for pedestrians, bicycles, buses and light‐rail can impact on modal choice while also addressing broader sustainability concerns such as health, accessibility and safety (8.4, 8.7);
better analysis of comparative passenger and freight transport costs between modes (8.6);
emerging policies that slow the rapid growth of LDVs especially in Asia, including investing in non‐motorized transport systems (8.10);
more fuel economy standards (MJ/km) and GHG emission vehicle performance standards implemented for light and heavy duty vehicles (LDVs and HDVs) (8.10); and
widely implemented local transport management policies to reduce air pollution and traffic congestion (8.10).
For each mode of transport, direct GHG emissions can be decomposed2 into:
activity – total passenger‐km/yr or freight tonne‐km/yr having a positive feedback loop to the state of the economy but, in part, influenced by behavioural issues such as journey avoidance and restructuring freight logistics systems;
system infrastructure and modal choice (NRC, 2009);
energy intensity – directly related to vehicle and engine design efficiency, driver behaviour during operation (Davies, 2012), and usage patterns; and
fuel carbon intensity – varies for different transport fuels including electricity and hydrogen.
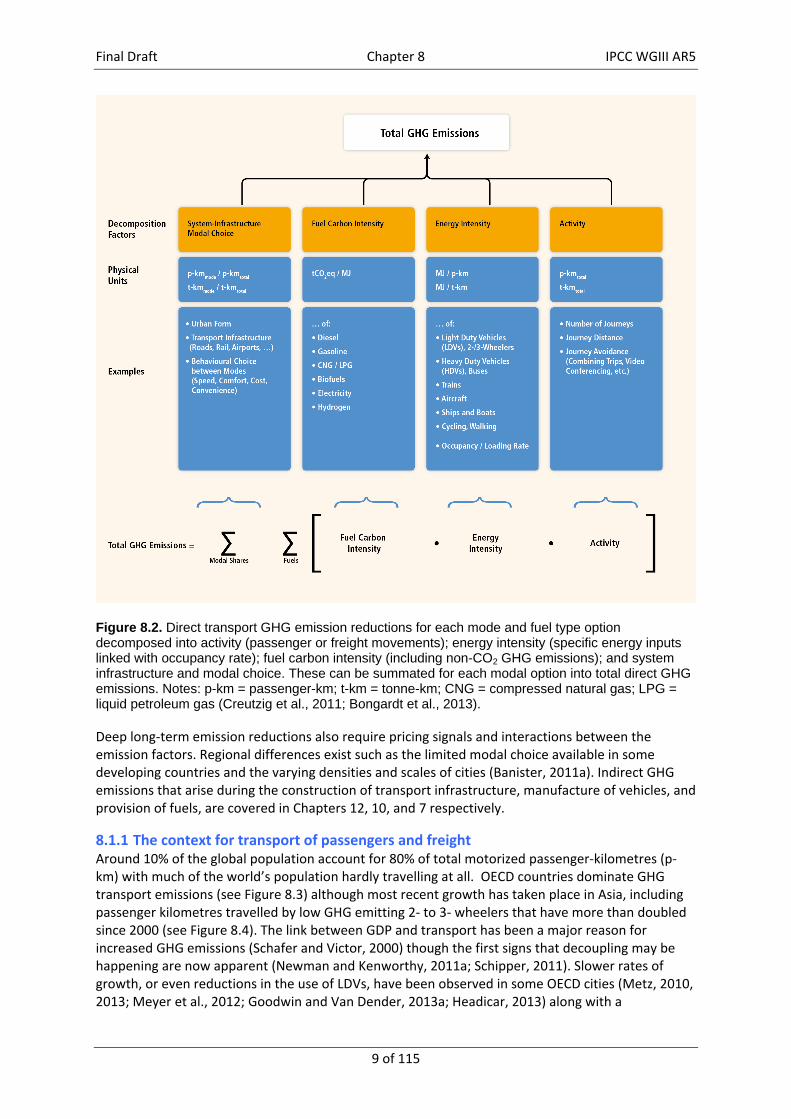
Each of these components has good potential for mitigation through technological developments, behavioural change, or interactions between them, such as the deployment of electric vehicles impacting on average journey distance and urban infrastructure (see Figure 8.2).
1 LDVs are motorized vehicles (passenger cars and commercial vans) below approximately 2.53.0 t net weight with HDVs (heavy duty vehicles or “trucks” or “lorries”) usually heavier.
2 Based on the breakdown into A (total Activity), S (modal Structure), I (modal energy Intensity), and F (carbon content of Fuels) using the ‘ASIF approach’. Details of how this decomposition works and the science involved can be found in (Schipper et al., 2000; Kamakaté and Schipper, 2009).
Final Draft Chapter 8 IPCC WGIII AR5
9 of 115
Figure 8.2. Direct transport GHG emission reductions for each mode and fuel type option decomposed into activity (passenger or freight movements); energy intensity (specific energy inputs linked with occupancy rate); fuel carbon intensity (including non-CO2 GHG emissions); and system infrastructure and modal choice. These can be summated for each modal option into total direct GHG emissions. Notes: p-km = passenger-km; t-km = tonne-km; CNG = compressed natural gas; LPG = liquid petroleum gas (Creutzig et al., 2011; Bongardt et al., 2013).
Deep long‐term emission reductions also require pricing signals and interactions between the emission factors. Regional differences exist such as the limited modal choice available in some developing countries and the varying densities and scales of cities (Banister, 2011a). Indirect GHG emissions that arise during the construction of transport infrastructure, manufacture of vehicles, and provision of fuels, are covered in Chapters 12, 10, and 7 respectively.
8.1.1 The context for transport of passengers and freight Around 10% of the global population account for 80% of total motorized passenger‐kilometres (p‐km) with much of the world’s population hardly travelling at all. OECD countries dominate GHG transport emissions (see Figure 8.3) although most recent growth has taken place in Asia, including passenger kilometres travelled by low GHG emitting 2‐ to 3‐ wheelers that have more than doubled since 2000 (see Figure 8.4). The link between GDP and transport has been a major reason for increased GHG emissions (Schafer and Victor, 2000) though the first signs that decoupling may be happening are now apparent (Newman and Kenworthy, 2011a; Schipper, 2011). Slower rates of growth, or even reductions in the use of LDVs, have been observed in some OECD cities (Metz, 2010, 2013; Meyer et al., 2012; Goodwin and Van Dender, 2013a; Headicar, 2013) along with a
Final Draft Chapter 8 IPCC WGIII AR5
10 of 115
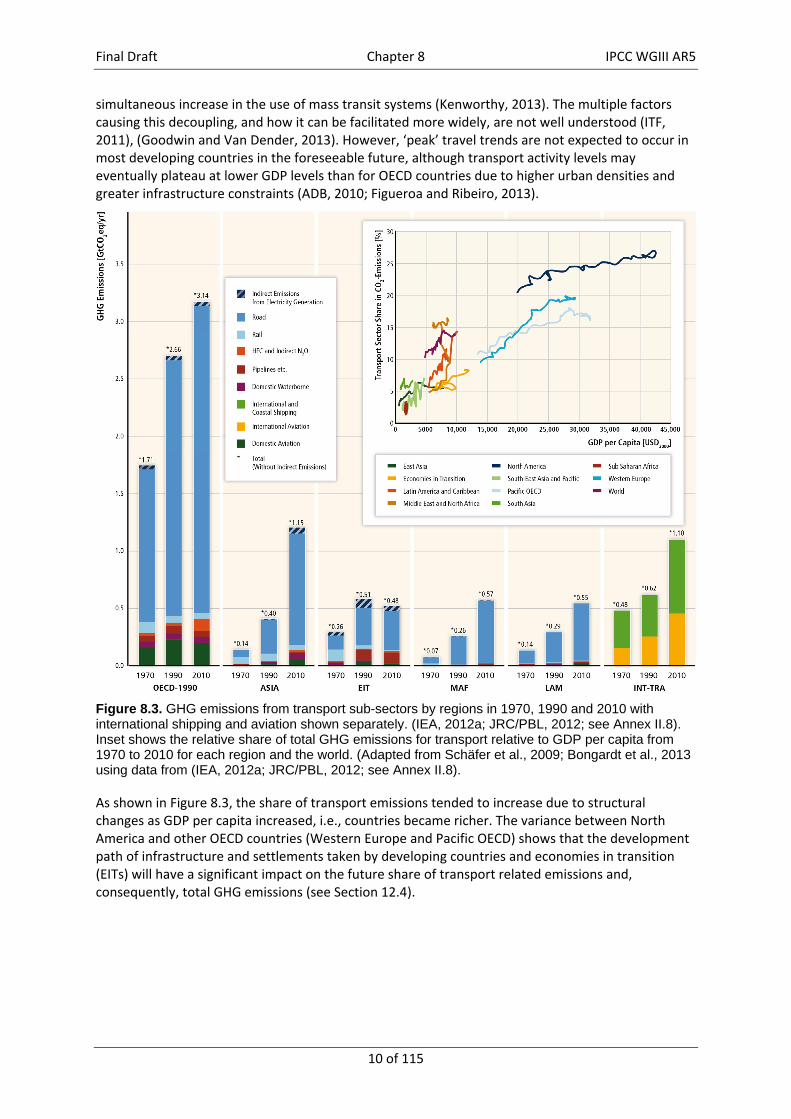
simultaneous increase in the use of mass transit systems (Kenworthy, 2013). The multiple factors causing this decoupling, and how it can be facilitated more widely, are not well understood (ITF, 2011), (Goodwin and Van Dender, 2013). However, ‘peak’ travel trends are not expected to occur in most developing countries in the foreseeable future, although transport activity levels may eventually plateau at lower GDP levels than for OECD countries due to higher urban densities and greater infrastructure constraints (ADB, 2010; Figueroa and Ribeiro, 2013).
Figure 8.3. GHG emissions from transport sub-sectors by regions in 1970, 1990 and 2010 with international shipping and aviation shown separately. (IEA, 2012a; JRC/PBL, 2012; see Annex II.8). Inset shows the relative share of total GHG emissions for transport relative to GDP per capita from 1970 to 2010 for each region and the world. (Adapted from Schäfer et al., 2009; Bongardt et al., 2013 using data from (IEA, 2012a; JRC/PBL, 2012; see Annex II.8).
As shown in Figure 8.3, the share of transport emissions tended to increase due to structural changes as GDP per capita increased, i.e., countries became richer. The variance between North America and other OECD countries (Western Europe and Pacific OECD) shows that the development path of infrastructure and settlements taken by developing countries and economies in transition (EITs) will have a significant impact on the future share of transport related emissions and, consequently, total GHG emissions (see Section 12.4).
Final Draft Chapter 8 IPCC WGIII AR5
11 of 115
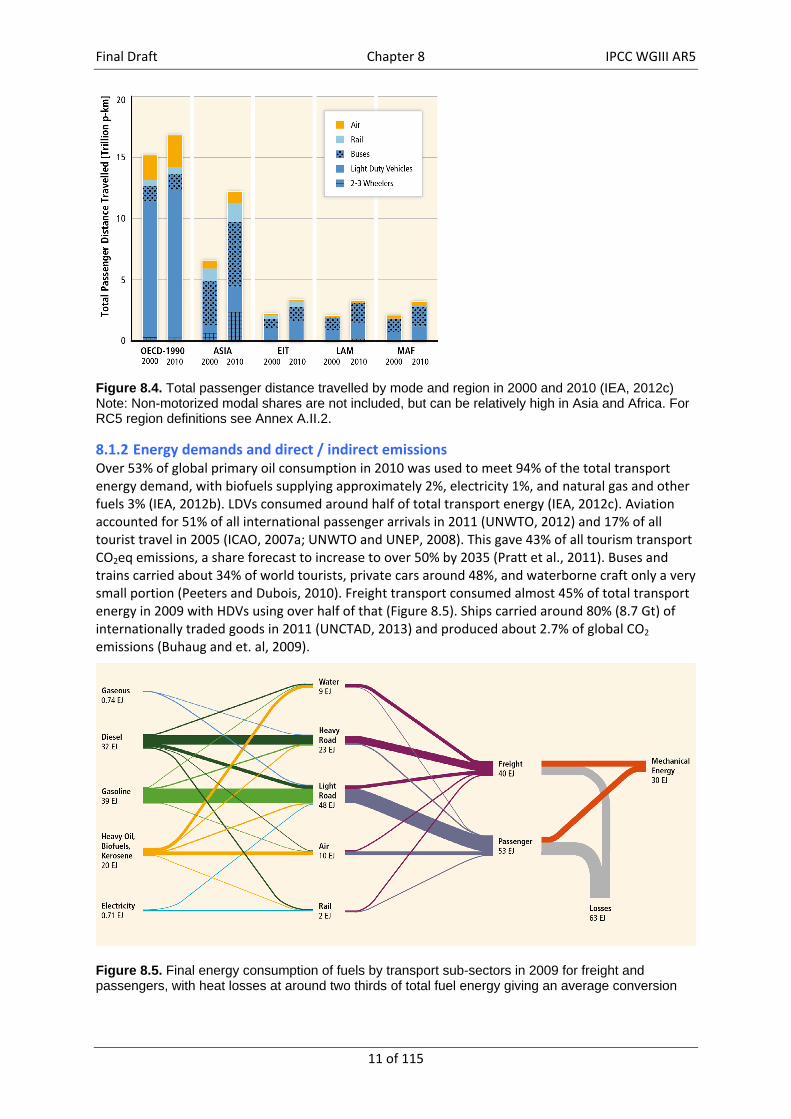
Figure 8.4. Total passenger distance travelled by mode and region in 2000 and 2010 (IEA, 2012c) Note: Non-motorized modal shares are not included, but can be relatively high in Asia and Africa. For RC5 region definitions see Annex A.II.2.
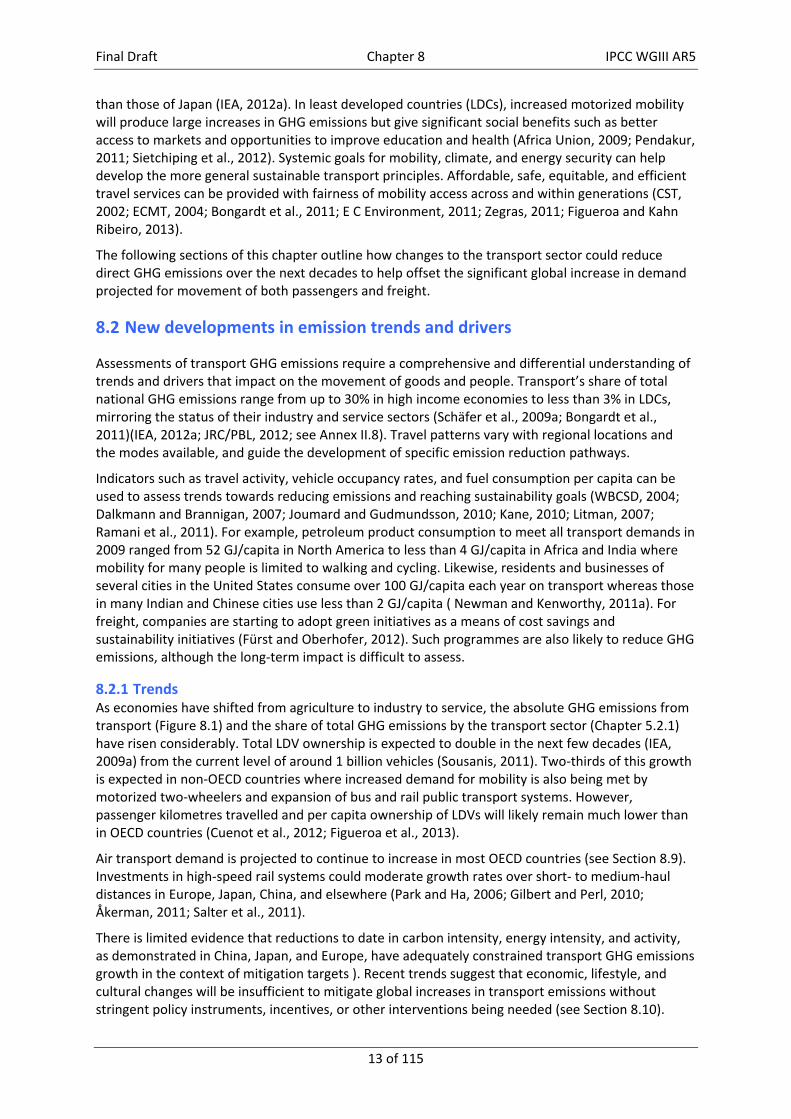
8.1.2 Energy demands and direct / indirect emissions Over 53% of global primary oil consumption in 2010 was used to meet 94% of the total transport energy demand, with biofuels supplying approximately 2%, electricity 1%, and natural gas and other fuels 3% (IEA, 2012b). LDVs consumed around half of total transport energy (IEA, 2012c). Aviation accounted for 51% of all international passenger arrivals in 2011 (UNWTO, 2012) and 17% of all tourist travel in 2005 (ICAO, 2007a; UNWTO and UNEP, 2008). This gave 43% of all tourism transport CO2eq emissions, a share forecast to increase to over 50% by 2035 (Pratt et al., 2011). Buses and trains carried about 34% of world tourists, private cars around 48%, and waterborne craft only a very small portion (Peeters and Dubois, 2010). Freight transport consumed almost 45% of total transport energy in 2009 with HDVs using over half of that (Figure 8.5). Ships carried around 80% (8.7 Gt) of internationally traded goods in 2011 (UNCTAD, 2013) and produced about 2.7% of global CO2 emissions (Buhaug and et. al, 2009).
Figure 8.5. Final energy consumption of fuels by transport sub-sectors in 2009 for freight and passengers, with heat losses at around two thirds of total fuel energy giving an average conversion
Final Draft Chapter 8 IPCC WGIII AR5
12 of 115
efficiency of fuel to kinetic energy of around 32%. Note: Width of lines depicts total energy flows. (IEA, 2012d).
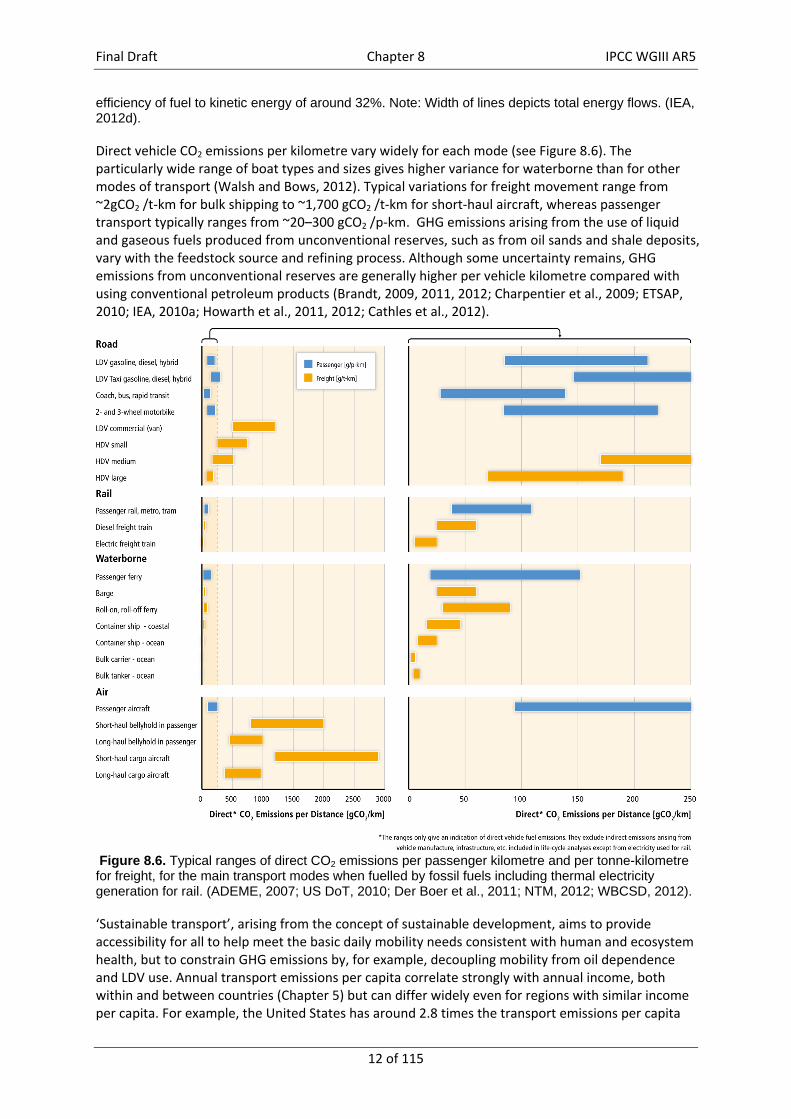
Direct vehicle CO2 emissions per kilometre vary widely for each mode (see Figure 8.6). The particularly wide range of boat types and sizes gives higher variance for waterborne than for other modes of transport (Walsh and Bows, 2012). Typical variations for freight movement range from ~2gCO2 /t‐km for bulk shipping to ~1,700 gCO2 /t‐km for short‐haul aircraft, whereas passenger transport typically ranges from ~20–300 gCO2 /p‐km. GHG emissions arising from the use of liquid and gaseous fuels produced from unconventional reserves, such as from oil sands and shale deposits, vary with the feedstock source and refining process. Although some uncertainty remains, GHG emissions from unconventional reserves are generally higher per vehicle kilometre compared with using conventional petroleum products (Brandt, 2009, 2011, 2012; Charpentier et al., 2009; ETSAP, 2010; IEA, 2010a; Howarth et al., 2011, 2012; Cathles et al., 2012).
Figure 8.6. Typical ranges of direct CO2 emissions per passenger kilometre and per tonne-kilometre for freight, for the main transport modes when fuelled by fossil fuels including thermal electricity generation for rail. (ADEME, 2007; US DoT, 2010; Der Boer et al., 2011; NTM, 2012; WBCSD, 2012).
‘Sustainable transport’, arising from the concept of sustainable development, aims to provide accessibility for all to help meet the basic daily mobility needs consistent with human and ecosystem health, but to constrain GHG emissions by, for example, decoupling mobility from oil dependence and LDV use. Annual transport emissions per capita correlate strongly with annual income, both within and between countries (Chapter 5) but can differ widely even for regions with similar income per capita. For example, the United States has around 2.8 times the transport emissions per capita
Final Draft Chapter 8 IPCC WGIII AR5
13 of 115
than those of Japan (IEA, 2012a). In least developed countries (LDCs), increased motorized mobility will produce large increases in GHG emissions but give significant social benefits such as better access to markets and opportunities to improve education and health (Africa Union, 2009; Pendakur, 2011; Sietchiping et al., 2012). Systemic goals for mobility, climate, and energy security can help develop the more general sustainable transport principles. Affordable, safe, equitable, and efficient travel services can be provided with fairness of mobility access across and within generations (CST, 2002; ECMT, 2004; Bongardt et al., 2011; E C Environment, 2011; Zegras, 2011; Figueroa and Kahn Ribeiro, 2013).
The following sections of this chapter outline how changes to the transport sector could reduce direct GHG emissions over the next decades to help offset the significant global increase in demand projected for movement of both passengers and freight.
8.2 New developments in emission trends and drivers
Assessments of transport GHG emissions require a comprehensive and differential understanding of trends and drivers that impact on the movement of goods and people. Transport’s share of total national GHG emissions range from up to 30% in high income economies to less than 3% in LDCs, mirroring the status of their industry and service sectors (Schäfer et al., 2009a; Bongardt et al., 2011)(IEA, 2012a; JRC/PBL, 2012; see Annex II.8). Travel patterns vary with regional locations and the modes available, and guide the development of specific emission reduction pathways.
Indicators such as travel activity, vehicle occupancy rates, and fuel consumption per capita can be used to assess trends towards reducing emissions and reaching sustainability goals (WBCSD, 2004; Dalkmann and Brannigan, 2007; Joumard and Gudmundsson, 2010; Kane, 2010; Litman, 2007; Ramani et al., 2011). For example, petroleum product consumption to meet all transport demands in 2009 ranged from 52 GJ/capita in North America to less than 4 GJ/capita in Africa and India where mobility for many people is limited to walking and cycling. Likewise, residents and businesses of several cities in the United States consume over 100 GJ/capita each year on transport whereas those in many Indian and Chinese cities use less than 2 GJ/capita ( Newman and Kenworthy, 2011a). For freight, companies are starting to adopt green initiatives as a means of cost savings and sustainability initiatives (Fürst and Oberhofer, 2012). Such programmes are also likely to reduce GHG emissions, although the long‐term impact is difficult to assess.
8.2.1 Trends As economies have shifted from agriculture to industry to service, the absolute GHG emissions from transport (Figure 8.1) and the share of total GHG emissions by the transport sector (Chapter 5.2.1) have risen considerably. Total LDV ownership is expected to double in the next few decades (IEA, 2009a) from the current level of around 1 billion vehicles (Sousanis, 2011). Two‐thirds of this growth is expected in non‐OECD countries where increased demand for mobility is also being met by motorized two‐wheelers and expansion of bus and rail public transport systems. However, passenger kilometres travelled and per capita ownership of LDVs will likely remain much lower than in OECD countries (Cuenot et al., 2012; Figueroa et al., 2013).
Air transport demand is projected to continue to increase in most OECD countries (see Section 8.9). Investments in high‐speed rail systems could moderate growth rates over short‐ to medium‐haul distances in Europe, Japan, China, and elsewhere (Park and Ha, 2006; Gilbert and Perl, 2010; Åkerman, 2011; Salter et al., 2011).
There is limited evidence that reductions to date in carbon intensity, energy intensity, and activity, as demonstrated in China, Japan, and Europe, have adequately constrained transport GHG emissions growth in the context of mitigation targets ). Recent trends suggest that economic, lifestyle, and cultural changes will be insufficient to mitigate global increases in transport emissions without stringent policy instruments, incentives, or other interventions being needed (see Section 8.10).
Final Draft Chapter 8 IPCC WGIII AR5
14 of 115
8.2.1.1 Non‐CO2 greenhouse gas emissions, black carbon, and aerosols The transport sector emits non‐CO2 pollutants that are also climate forcers. These include methane, volatile organic compounds (VOCs), nitrous oxides (NOx), sulphur dioxide (SO2), carbon monoxide (CO), F‐gases, black carbon, and non‐absorbing aerosols (Ubbels, B., Rietveld, P., Peeters, 2002, Chapter 5.2.2, Chapter 6.6.2.1). Methane emissions are largely associated with leakage from the production of natural gas and the filling of compressed natural gas vehicles; VOCs, NOx and CO are emitted by internal combustion engines; and F‐gas emissions generally from air conditioners (including those in vehicles) and refrigerators. Contrails from aircraft and emissions from ships also impact on the troposphere and the marine boundary layer, respectively (Fuglestvedt et al., 2009a; Lee et al., 2010). Aviation emissions can also impact on cloud formation and therefore have an indirect effect on climate forcing (Burkhardt and Kärcher, 2011).
Black carbon and non‐absorbing aerosols, emitted mainly during diesel engine operation, have short lifetimes in the atmosphere of only days to weeks, but can have significant direct and indirect radiative forcing effects and large regional impacts (Boucher et al., 2013). In North and South America and Europe, over half the black carbon emissions result from combusting diesel and other heavy distillate fuels (including marine oil), in vehicle engines (Bond et al., 2013). Black carbon emissions are also significant in parts of Asia, Africa, and elsewhere from biomass and coal combustion, but the relative contribution from transport is expected to grow in the future. There is strong evidence that reducing black carbon emissions from HDVs, off‐road vehicles, and ships could provide an important short term strategy to mitigate atmospheric concentrations of positive radiative forcing pollutants (USEPA, 2012; Shindell et al., 2013; Chapter 6.6; WG I Chapter 7).
Conversely, transport is also a significant emitter of primary aerosols that scatter light and gases that undergo chemical reactions to produce secondary aerosols. Primary and secondary organic aerosols, secondary sulphate aerosols formed from sulphur dioxide emissions, and secondary nitrate aerosols from nitrogen oxide emissions from ships, aircraft, and road vehicles, can have strong, local, and regional cooling impacts (Boucher et al., 2013).
The relative contributions of different short‐term pollutants to radiative forcing in 2020 have been equated by Unger et al. (2010) to having continuous constant GHG emissions since 2000.Although this study did not provide a projection for future emissions scenarios, it did offer a qualitative comparison of short‐ and long‐term impacts of different pollutants. Relative to CO2, major short‐term impacts stem from black carbon, indirect effects of aerosols and ozone from land vehicles, and aerosols and methane emissions associated with ships and aircraft. Their relative impacts due to the longer atmospheric lifetime of CO2 will be greatly reduced when integrated from the present time to 2100.
Although emissions of non‐CO2 GHGs and aerosols can be mitigated by reducing carbon intensity, improving energy intensity, changing to lower‐carbon modes, and reducing transport activity, they can also be significantly reduced by technologies that prevent their formation or lead to their destruction using after‐treatments. Emission control devices such as diesel particulate filters and selective catalytic reduction have fuel efficiency penalties that can lead to an increase in transport CO2 emissions.
Non‐CO2 emissions from road transport and aviation and shipping activities in ports have historically been constrained by local air quality regulations that are directed at near‐surface pollution and seek to protect human health and welfare by reducing ozone, particulate matter, sulphur dioxide, and toxic components or aerosols, including vanadium, nickel, and polycyclic aromatic hydrocarbons (Verma et al. 2011). The importance of regional climate change in the context of mitigation has prompted a growing awareness of the climate impact of these emissions. Policies are already in place for reducing emissions of F‐gases, which are expected to continue to decrease with time (Prinn et al., 2000). More efforts are being directed at potential programmes to accelerate control measures to reduce emissions of black carbon, ozone precursors, aerosols, and aerosol precursors
Final Draft Chapter 8 IPCC WGIII AR5
15 of 115
(Lin and Lin, 2006). Emissions from road vehicles continue to decrease per unit of travel in many regions due to efforts made to protect human health from air pollution. The implementation of these controls could potentially be accelerated as a driver to mitigate climate change (Oxley et al., 2012). Short‐term mitigation strategies that focus on black carbon and contrails from aircraft, together with national and international programmes to reduce aerosol and sulphate emissions from shipping, are being implemented (Buhaug and et. al, 2009; Lack, 2012). However, the human health benefits from GHG emissions reductions and the co‐benefits of climate change mitigation through black carbon reductions need to be better assessed (Woodcock et al., 2009).
8.2.2 Drivers The major drivers that affect transport trends are travel time budgets, costs and prices, increased personal income, and social and cultural factors (Schäfer, 2011). For a detailed discussion of effects of urban form and structure on elasticities of vehicle kilometres travelled see Section 12.4.2.
Travel time budget. Transport helps determine the economy of a city or region based on the time taken to move people and goods around. Travel time budgets are usually fixed and tied to both travel costs and time costs (Noland, 2001; Cervero, 2001; Noland and Lem, 2002). Because cities vary in the proportion of people using different transport modes, urban planners tend to try to adapt land use planning to fit these modes in order to enable speeds of around 5 km/hr for walking, 20–30 km/hr for mass transit, and 40–50 km/hr for LDVs, though subject to great variability. Infrastructure and urban areas are usually planned for walking, mass transit, or LDVs so that destinations can be reached in half an hour on average (Newman and Kenworthy, 1999).
Urban travel time budgets for a typical commute between work and home average around 1.1–1.3 hours per traveller per day in both developed and developing economies (Zahavi and Talvitie, 1980; van Wee et al., 2006). Higher residential density can save fuel for LDVs, but leads to more congested commutes (Small and Verhoef, 2007; Downs, 2004). While new road construction can reduce LDV travel time in the short run, it also encourages increased LDV demand, which typically leads to increases in travel time to a similar level as before (Maat and Arentze, 2012). Moreover, land uses quickly adapt to any new road transport infrastructure so that a similar travel time eventually resumes (Mokhtarian and Chen, 2004).
Regional freight movements do not have the same fixed time demands, but rather are based more on the need to remain competitive by limiting transport costs to a small proportion of the total costs of the goods (Schiller et al. 2010). See also Section 12.4.2.4 on accessibility aspects of urban form.
Costs and prices. The relative decline of transport costs as a share of increasing personal expenditure has been the major driver of increased transport demand in OECD countries throughout the last century and more recently in non‐OECD countries (Mulalic et al., 2013). The price of fuel, together with the development of mass transit systems and non‐motorized transport infrastructure, are major factors in determining the level of LDV use versus choosing public transport, cycling, or walking (Hughes et al., 2006). Transport fuel prices, heavily influenced by taxes, also impact on the competition between road and rail freight. The costs of operating HDVs, aircraft, and boats increase dramatically when fuel costs go up given that fuel costs are a relatively high share of total costs (Dinwoodie, 2006). This has promulgated the designs of more fuel efficient engines and vehicle designs (8.3) (IEA, 2009). Although the average life of aircraft and marine engines is two to three decades and fleet turnover is slower than for road vehicles and small boats, improving their fuel efficiency still makes good economic sense (IEA, 2009).
The high cost of developing new infrastructure requires significant capital investment that, together with urban planning, can be managed and used as a tool to reduce transport demand and also encourage modal shift (Waddell et al., 2007). Changing urban form through planning and development can therefore play a significant role in the mitigation of transport GHG emissions (see Section 8.4) (Kennedy et al., 2009). See also Section 12.5.2 on urban policy instruments.
Final Draft Chapter 8 IPCC WGIII AR5
16 of 115
Social and cultural factors. Population growth and changes in demographics are major drivers for increased transport demand. Economic structural change, particularly in non‐OECD countries, can lead to increased specialization of jobs and a more gender‐diversified workforce, which can result in more and longer commutes (McQuaid and Chen, 2012). At the household level, once a motorized vehicle becomes affordable, even in relatively poor households, then it becomes a major item of expenditure; however, ownership has still proven to be increasingly popular with each new generation (Giuliano and Dargay, 2006; Lescaroux, 2010; Zhu et al., 2012). Thus, there is a high growth rate in ownership of motorized two‐wheel vehicles and LDVs evident in developing countries, resulting in increasing safety risks for pedestrians and non‐motorized modes (Nantulya and Reich 2002; Pendakur, 2011). The development of large shopping centres and malls usually located outside the city centre, allows many products to be purchased by a consumer following a single journey but the travel distance to these large shopping complexes has tended to increase (Weltevreden, 2007). For freight transport, economic globalization has increased the volume and distance of movement of goods and materials (Henstra et al., 2007).
Modal choice can be driven by social factors that are above and beyond the usual time, cost, and price drivers. For example, some urban dwellers avoid using mass transit or walking due to safety and security issues. However, there is evidence that over the past decade younger people in some OECD cities are choosing walking, cycling, and mass transit over LDVs (Parkany et al., 2004; Newman and Kenworthy, 2011b; Delbosc and Currie, 2013; Kuhnimhof et al., 2013) although this trend could change as people age (Goodwin and Van Dender, 2013b). Another example is that in some societies, owning and driving a LDV can provide a symbolic function of status and a basis for sociability and networking through various sign‐values such as speed, safety, success, career achievement, freedom, masculinity, and emancipation of women (Mokhtarian and Salomon, 2001; Steg, 2005; Bamberg et al., 2011; Carrabine and Longhurst, 2002; Miller, 2001; Sheller, 2004; Urry, 2007). In such cases, the feeling of power and superiority associated with owning and using a LDV may influence driver behaviour, for example, speeding without a concern for safety, or without a concern about fuel consumption, noise, or emissions (Brozović and Ando, 2009; Tiwari and Jain, 2012b). The possible effects on travel patterns from declining incomes are unclear.
Lifestyle and behavioural factors are important for any assessment of potential change to low‐carbon transport options and additional research is needed to assess the willingness of people to change (Ashton‐Graham, 2008; Ashton‐Graham and Newman, 2013). Disruptive technologies such as driverless cars and consumer‐based manufacturing (e.g. 3‐D printing) could impact on future transport demands but these are difficult to predict. Likewise, the impact of new information technology (IT) applications and telecommuting could potentially change travel patterns, reduce trips, or facilitate interactions with the mode of choice (ITF, 2011). Conversely, increased demand for tourism is expected to continue to be a driver for all transport modes (8.1; 10.4; Gössling et al., 2009).
8.3 Mitigation technology options, practices and behavioural aspects
Technological improvements and new technology‐related practices can make substantial contributions to climate change mitigation in the transport sector. This section focuses on energy intensity reduction technology options for LDVs, HDVs, ships, trains and aircraft and fuel carbon intensity reduction options related to the use of natural gas, electricity, hydrogen and biofuels. It also addresses some technology‐related behavioural aspects concerning the uptake and use of new technologies, behaviour of firms, and rebound effects. Urban form and modal shift options are discussed in Section 8.4.
8.3.1 Energy intensity reduction – incremental vehicle technologies Recent advances in LDVs in response to strong regulatory efforts in Japan, Europe, and the United States have demonstrated that there is substantial potential for improving internal combustion
Final Draft Chapter 8 IPCC WGIII AR5
17 of 115
engines (ICEs) with both conventional and hybrid drive‐trains. Recent estimates suggest substantial additional, unrealized potentials exist compared to similar‐sized, typical 2007–2010 vehicles, with up to 50% improvements in vehicle fuel economy (in MJ/km or litres/100km units, or equal to 100% when measured as km/MJ, km/l, or miles per gallon) (Bandivadekar et al., 2008; Greene and Plotkin, 2011). Similar or slightly lower potentials exist for HDVs, waterborne craft, and aircraft.
8.3.1.1 Light duty vehicles As of 2011, leading‐edge LDVs had drive‐trains with direct injection gasoline or diesel engines (many with turbochargers), coupled with automated manual or automatic transmissions with six or more gears (SAE International, 2011). Drive‐train redesigns of average vehicles to bring them up to similar levels could yield reductions in fuel consumption and GHG emissions of 25% or more (NRC, 2013). In European Union 27 (EU27), the average tested emissions of 2011 model LDVs was 136 gCO2/km, with some models achieving below 100 gCO2/km (EEA, 2012). In developing countries, vehicle technology levels are typically lower, although average fuel economy can be similar since vehicle size, weight, and power levels are also typically lower (IEA, 2012d).
Hybrid drive‐trains (ICE plus electric motor with battery storage) can provide reductions up to 35% compared to similar non‐hybridized vehicles (IEA, 2012e) and have become mainstream in many countries, but with only a small share of annual sales over the last decade except in Japan, where over two million had been sold by 2012 (IEA, 2012e). There is substantial potential for further advances in drive‐train design and operation, and for incremental technologies (NRC, 2013). There is often a time lag between when new technologies first appear in OECD countries and when they reach developing countries, which import mostly second‐hand vehicles (IEA, 2009b).
Lower fuel consumption can be achieved by reducing the loads that the engine must overcome, such as aerodynamic forces, auxiliary components (including lighting and air conditioners), and rolling resistance. Changes that reduce energy loads include improved aerodynamics, more efficient auxiliaries, lower rolling‐resistance tyres, and weight reduction. With vehicle performance held constant, reducing vehicle weight by 10% gives a fuel economy improvement of about 7% (EEA, 2006). Together, these non‐drive‐train changes offer potential fuel consumption reductions of around 25% (ICCT, 2012a; NRC, 2013). Combined with improved engines and drive‐train systems, overall LDV fuel consumption for new ICE‐powered vehicles could be reduced by at least half by 2035 compared to 2005 (Bandivadekar et al., 2008; NRC, 2013). This predicted reduction is consistent with the Global Fuel Economy Initiative target for new LDVs of a 50% reduction in average fuel use per kilometre in 2030 compared to 2005 (Eads, 2010).
8.3.1.2 Heavy‐duty vehicles Most modern medium and HDVs already have efficient diesel engines (up to 45% thermal efficiency), and long‐haul trucks often have streamlined spoilers on their cabs to reduce drag, particularly in OECD countries. Aerodynamic drag can also be reduced using other modifications offering up to 10% reduction in fuel consumption (TIAX, 2009; NRC, 2010a; AEA, 2011). In non‐OECD countries, many older trucks with relatively inefficient (and highly polluting) engines are common. Truck modernization, along with better engine, tyre, and vehicle maintenance, can significantly improve fuel economy in many cases.
Medium and HDVs in the United States can achieve a reduction in energy intensity of 30–50% by 2020 by using a range of technology and operational improvements (NRC, 2010a). Few similar estimates are available in non‐OECD countries, but most technologies eventually will be applicable for HDVs around the world.
Expanding the carrying capacity of HDVs in terms of both volume and weight can yield significant net reductions in the energy intensity of trucks so long as the additional capacity is well utilized. A comparison of the performance of 18 longer and heavier HDVs in nine countries (ITF/OECD, 2010) concluded that higher capacity vehicles can significantly reduce CO2 emissions per t‐km. The use of
Final Draft Chapter 8 IPCC WGIII AR5
18 of 115
long combination vehicles rather than single trailer vehicles has been shown to cut direct GHG emissions by up to 32% (Woodrooffe and Ash, 2001).
Trucks and buses that operate largely in urban areas with a lot of stop‐and‐go travel can achieve substantial benefits from using electric hybrid or hydraulic hybrid drive‐trains. Typically a 20–30% reduction in fuel consumption can be achieved via hybridization (Chandler et al., 2006; AEA, 2011).
8.3.1.3 Rail, waterborne craft, and aircraft Rail is generally energy efficient, but improvements can be gained from multiple drive‐trains and load‐reduction measures. For example, the high‐speed ‘Shinkansen’ train in Japan gained a 40% reduction of energy consumption by optimizing the length and shape of the lead nose, reducing weight, and by using efficient power electronics (UIC, 2011); Amtrack in the United States employed regenerative braking systems to reduce energy consumption by 8% (UIC, 2011); and in China, electrification and other measures from 1975 to 2007 contributed to a 87% reduction in CO2 emission intensity of the rail system (He et al., 2010).
Shipping is a comparatively efficient mode of freight and passenger transport, although size and load factor are important determinants for specific motorized craft, large and small. Efficiency of new‐built vessels can be improved by 5–30% through changes in engine and transmission technologies, waste heat recovery, auxiliary power systems, propeller and rotor systems, aerodynamics and hydrodynamics of the hull structure, air lubrication systems, electronically controlled engine systems to give fuel efficient speeds, and weight reduction (IMO, 2009; Notteboom and Vernimmen, 2009; (AEA, 2007; IEA, 2009; IMO, 2009; ICCT, 2011). Retrofit and maintenance measures can provide additional efficiency gains of 4–20% (Buhaug and et. al, 2009) and operational changes, such as anti‐fouling coatings to cut water resistance, along with operation at optimal speeds, can provide 5–30% improvement (Pianoforte, 2008; Corbett et al., 2009; WSC, 2011).
Several methods for improving waterborne craft efficiency are already in use. For example, wind propulsion systems such as kites and parafoils can provide lift and propulsion to reduce fuel consumption by up to 30%, though average savings may be much less (Kleiner, 2007). Photovoltaics and small wind turbines can provide on‐board electricity and be part of ‘cold ironing’ electric systems in ports. For international shipping, combined technical and operational measures have been estimated to potentially reduce energy use and CO2 emissions by up to 43% per t‐km between 2007 and 2020 and by up to 60% by 2050 (Crist, 2009; IMO, 2009).
Aircraft designs have received substantial, on‐going technology efficiency improvements over past decades (ITF, 2009) typically offering a 20–30% reduction in energy intensity compared to older aircraft models (IEA, 2009a). Further fuel efficiency gains of 40–50% in the 2030–2050 timeframe (compared to 2005) could come from weight reduction, aerodynamic and engine performance improvements, and aircraft systems design (IEA, 2009a). However, the rate of introduction of major aircraft design concepts could be slow without significant policy incentives, regulations at the regional or global level, or further increases in fuel prices (Lee, 2010). Retrofit opportunities, such as engine replacement and adding ‘winglets’, can also provide significant reductions (Gohardani et al.; 2011, Marks, 2009). Improving air traffic management can reduce CO2 emissions through more direct routings and flying at optimum altitudes and speeds (Dell’Olmo and Lulli, 2003; Pyrialakou et al., 2012). Efficiency improvements of ground service equipment and electric auxiliary power units can provide some additional GHG reductions (Pyrialakou et al., 2012).
8.3.2 Energy intensity reduction – advanced propulsion systems At present, most vehicles and equipment across all transport modes are powered by ICEs, with gasoline and diesel as the main fuels for LDVs; gasoline for 2‐ and 3‐wheelers and small water craft; diesel for HDVs; diesel or heavy fuel oil for ships and trains (other than those using grid electricity); and kerosene for aircraft turbine engines. New propulsion systems include electric motors powered by batteries or fuel cells, turbines (particularly for rail), and various hybridized concepts. All offer
Final Draft Chapter 8 IPCC WGIII AR5
19 of 115
significant potential reductions in GHG, but will require considerable time to penetrate the vehicle fleet due to slow stock turnover rates.
8.3.2.1 Road vehicles ‐ battery and fuel cell electric‐drives Battery electric vehicles (BEVs) emit no tailpipe emissions and have potentially very low fuel‐production emissions (when using low‐carbon electricity generation) (Kromer and Heywood, 2007). BEVs operate at a drive‐train efficiency of around 80% compared with about 20–35% for conventional ICE LDVs. At present, commercially available BEVs typically have a limited driving range of about 100–160km, long recharge times of four hours or more (except with fast‐charging or battery switching systems), and high battery costs that lead to relatively high vehicle retail prices (Greene and Plotkin, 2011). Lithium ion (Li‐ion) batteries will likely improve but new battery technologies (e.g., Li‐air, Li‐metal, Li‐sulphur) and ultra‐capacitors may be required to achieve much higher energy and power densities (IEA, 2009b; NRC, 2013). Compressed air as an energy storage medium for LDVs is thermo‐dynamically inefficient and would require high storage volume (Creutzig et al., 2009).
Plug‐in hybrid electric vehicles (PHEVs) capable of grid recharging typically can operate on battery electricity for 20 to 50 km, but emit CO2 when their ICE is operating. The electric range of PHEVs is heavily dependent on the size of battery, design architectures, and control strategies for the operation of each mode (Plotkin et al., 2001).
For HDVs, the use of BEVs is most applicable to light‐medium duty urban vehicles such as delivery vans or garbage collection trucks whose drive cycles involve frequent stops and starts and do not need a long range (TIAX, 2009; AEA, 2011). Transit buses are also good candidates for electrification either with batteries or more commonly using overhead wire systems (IEA, 2009). Electric two‐wheelers with lower requirements for battery and motor capacities are a mature technology with widespread acceptance, especially in developing countries (Weinert et al., 2008). For example, there were over 120 million electric two‐wheelers in China by the end of 2010 (Wu et al., 2011).
Fuel cell vehicles (FCVs) can be configured with conventional, hybrid, or plug‐in hybrid drive‐trains. The fuel cells generate electricity from hydrogen that may be generated on‐board (by reforming natural gas, methanol, ammonia, or other hydrogen‐containing fuel), or produced externally and stored on‐board after refuelling. FCVs produce no tailpipe emissions except water and can offer a driving range similar to today’s gasoline/diesel LDVs, but with a high cost increment. Fuel cells typically operate with a conversion efficiency of 54–61%, (significantly better than ICEs can achieve), giving an overall fuel‐cycle efficiency of about 35–49% for an LDV (JHFC, 2011).
Although a number of FCV LDVs, HDVs, and buses have been demonstrated and some are expected to become commercially available within five years, overall it could take 10 years or longer for FCVs to achieve commercial success based on current oil and vehicle purchase prices (IEA, 2012e).
8.3.2.2 Rail, waterborne craft, and aircraft Diesel‐hybrid locomotives demonstrated in the UK and advanced types of hybrid drive‐trains under development in the United States and Japan, could save 10–20% of diesel fuel plus around a 60% reduction of NOx and particulate matter compared to conventional locomotives (JR East, 2011). A shift to full electrification may enable many rail systems to reach very low CO2 emissions per kilometre where electricity generation has been deeply decarbonized. Fuel cell systems for rail may be attractive in areas lacking existing electricity infrastructure (IEA, 2012e).
Most ocean‐going ships will probably continue to use marine diesel engines for the foreseeable future, given their high reliability and low cost. However, new propulsion systems are in development. Full electrification appears unlikely given the energy storage requirements for long‐range operations, although on‐board solar power generation systems could be used to provide auxiliary power and is already used for small craft (Crist, 2009). Fuel cell systems (commonly solid‐oxide) with electric motors could be used for propulsion, either with hydrogen fuel directly loaded
Final Draft Chapter 8 IPCC WGIII AR5
20 of 115
and stored on board or with on‐board reforming. However, the cost of such systems appears relatively high, as are nuclear power systems as used in some navy vessels.
For large commercial aircraft, no serious alternative to jet engines for propulsion has been identified, though fuel‐switching options are possible, including ‘drop‐in’ biofuels (that are fungible with petroleum products, can be blended from 0 to 100%, and are compatible with all existing engines) or hydrogen. Hydrogen aircraft are considered only a very long run option due to hydrogen’s low energy density and the difficulty of storing it on board, which requires completely new aircraft designs and likely significant compromises in performance (Cryoplane, 2003). For small, light aircraft, advanced battery electric/motor systems could be deployed but would have limited range (Luongo et al., 2009).
8.3.3 Fuel carbon intensity reduction In principle, low‐carbon fuels from natural gas, electricity, hydrogen, and biofuels (including biomethane) could all enable transport systems to be operated with low direct fuel‐cycle CO2eq emissions, but this would depend heavily on their feedstocks and conversion processes.
Natural gas (primarily methane) can be compressed (CNG) to replace gasoline in Otto‐cycle (spark ignition) vehicle engines after minor modifications to fuel and control systems. CNG can also be used to replace diesel in compression ignition engines but significant modifications are needed. Denser storage can be achieved by liquefaction of natural gas (LNG), which is successfully being used for long‐haul HDVs and ships (Buhaug and et. al, 2009; Arteconi et al., 2010). The energy efficiency of driving on CNG is typically similar to that for gasoline or diesel but with a reduction of up to 25% in tailpipe emissions (CO2/km) because of differences in fuel carbon intensity. Lifecycle GHG analysis suggests lower net reductions, in the range of 10–15% for natural gas fuel systems. They may also provide a bridge to lower carbon biomethane systems from biogas (IEA, 2009).
Electricity can be supplied to BEVs and PHEVS via home or public rechargers. The varying GHG emissions intensity of power grids directly affects lifecycle CO2eq emissions (IEA, 2012e). Since the GHG intensity of a typical coal‐based power plant is about 1000 gCO2eq/kWh at the outlet (Wang, 2012a), for a BEV with efficiency of 200 Wh/km, this would equate to about 200 gCO2eq/km, which is higher than for an efficient ICE or hybrid LDV. Using electricity generated from nuclear or renewable energy power plants, or from fossil fuel plants with carbon dioxide capture and storage (CCS), near‐zero fuel‐cycle emissions could result for BEVs. The numbers of EVs in any country are unlikely to reach levels that significantly affect national electricity demand for at least one to two decades, during which time electricity systems could be at least partially decarbonized and modified to accommodate many EVs (IEA, 2012e).
Hydrogen used in FCVs, or directly in modified ICEs, can be produced by the reforming of biomass, coal or natural gas (steam methane reforming is well‐established in commercial plants); via commercial but relatively expensive electrolysis using electricity from a range of sources including renewable; or from biological processes (IEA, 2009b). The mix of feedstocks largely determines the well‐to‐wheel GHG emissions of FCVs. Advanced, high‐temperature and photo‐electrochemical technologies at the R&D stage could eventually become viable pathways (Arvizu and Balaya, 2011). Deployment of FCVs (8.3.2.1) needs to be accompanied by large, geographically focused, investments into hydrogen production and distribution and vehicle refuelling infrastructure. Costs can be reduced by strategic placement of stations (Ogden and Nicholas, 2011) starting with specific locations (‘lighthouse cities’) and a high degree of coordination between fuel suppliers, vehicle manufacturers and policy makers is needed to overcome ‘chicken‐or‐egg’ vehicle/fuel supply problems (ITS‐UC Davis, 2011).
A variety of liquid and gaseous biofuels can be produced from various biomass feedstocks using a range of conversion pathways (Chapter 11.A.3). The ability to produce and integrate large volumes of biofuels cost‐effectively and sustainably are primary concerns of which policy makers should be
Final Draft Chapter 8 IPCC WGIII AR5
21 of 115
aware (Sims et al., 2011). In contrast to electricity and hydrogen, liquid biofuels are relatively energy‐dense and are, at least in certain forms and blend quantities, compatible with the existing petroleum fuel infrastructure and with all types of ICEs installed in LDVs, HDVs, waterborne craft, and aircraft. Ethanol and biodiesel (fatty‐acid‐methyl‐ester, FAME) can be blended at low levels (10–15%) with petroleum fuels for use in unmodified ICEs. New ICEs can be cheaply modified during manufacture to accommodate much higher blends as exemplified by ‘flex‐fuel’ gasoline engines where ethanol can reach 85% of the fuel blend (ANFAVEA, 2012). However, ethanol has about a 35% lower energy density than gasoline, which reduces vehicle range—particularly at high blend levels— that can be a problem especially for aircraft. Synthetic ‘drop‐in’ biofuels have similar properties to diesel and kerosene fuels. They can be derived from a number of possible feedstocks and conversion processes, such as the hydro‐treatment of vegetable oils or the Fischer‐Tropsch conversion of biomass (Shah, 2013). Bio‐jet fuels suitable for aircraft have been demonstrated to meet the very strict fuel specifications required (Takeshita and Yamaji, 2008; Caldecott and Tooze, 2009). Technologies to produce ligno‐cellulosic, Fisher‐Tropsch, algae‐based, and other advanced biofuels are in development, but may need another decade or more to achieve widespread commercial use (IEA, 2011a). Bio‐methane from suitably purified biogas or landfill gas can also be used in natural gas vehicles (REN21, 2012).
Biofuels have direct, fuel‐cycle GHG emissions that are typically 30–90% lower per kilometre travelled than those for gasoline or diesel fuels. However, since for some biofuels, indirect emissions—including from land use change—can lead to greater total emissions than when using petroleum products, policy support needs to be considered on a case by case basis (see Chapter 11.13 and, for example, Lapola et al., 2010; Plevin et al., 2010; Wang et al., 2011; Creutzig et al., 2012).
8.3.4 Comparative analysis The vehicle and power‐train technologies described above for reducing fuel consumption and related CO2 emissions span a wide range and are not necessarily additive. When combined, and including different propulsion and fuel systems, their overall mitigation potential can be evaluated as an integrated fuel/vehicle system (see Section 8.6). However, to produce an overall mitigation evaluation of the optimal design of a transport system, non‐CO2 emissions, passenger or freight occupancy factors, and indirect GHG emissions from vehicle manufacture and infrastructure should also be integrated to gain a full comparison of the relative GHG emissions across modes (see Section 8.4; Hawkins et al., 2012; Borken‐Kleefeld et al., 2013).
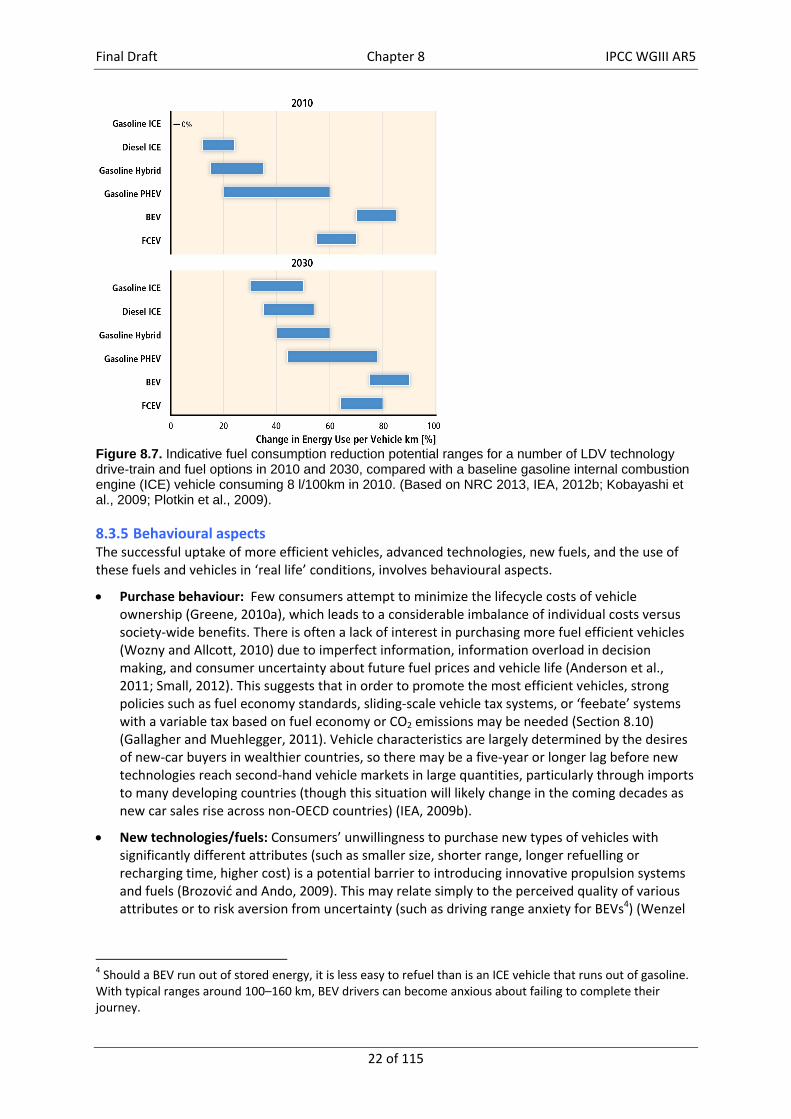
Taking LDVs as an example, a comparative assessment of current and future fuel consumption reduction potentials per kilometre has been made (Figure 8.7), starting from a 2010 baseline gasoline vehicle at about 8 lge3 /100km and 195 g/km CO2. Using a range of technologies, average new LDV fuel economy can be doubled (in units of distance per energy, i.e., energy intensity cut by 50%). Further improvements can be expected for hybrids, PHEVs, BEVs, and FCVs, but several hurdles must be overcome to achieve wide market penetration (see Section 8.8). Vehicle cost increases due to new technologies could affect customers’ willingness to pay, and thus affect market penetration, although cost increases would be at least partly offset by fuel cost savings (see Section 8.6).
3 “Litre per gasoline equivalent” allows for a comparison between fuels with different energy contents.
Final Draft Chapter 8 IPCC WGIII AR5
22 of 115
Figure 8.7. Indicative fuel consumption reduction potential ranges for a number of LDV technology drive-train and fuel options in 2010 and 2030, compared with a baseline gasoline internal combustion engine (ICE) vehicle consuming 8 l/100km in 2010. (Based on NRC 2013, IEA, 2012b; Kobayashi et al., 2009; Plotkin et al., 2009).
8.3.5 Behavioural aspects The successful uptake of more efficient vehicles, advanced technologies, new fuels, and the use of these fuels and vehicles in ‘real life’ conditions, involves behavioural aspects.
Purchase behaviour: Few consumers attempt to minimize the lifecycle costs of vehicle ownership (Greene, 2010a), which leads to a considerable imbalance of individual costs versus society‐wide benefits. There is often a lack of interest in purchasing more fuel efficient vehicles (Wozny and Allcott, 2010) due to imperfect information, information overload in decision making, and consumer uncertainty about future fuel prices and vehicle life (Anderson et al., 2011; Small, 2012). This suggests that in order to promote the most efficient vehicles, strong policies such as fuel economy standards, sliding‐scale vehicle tax systems, or ‘feebate’ systems with a variable tax based on fuel economy or CO2 emissions may be needed (Section 8.10) (Gallagher and Muehlegger, 2011). Vehicle characteristics are largely determined by the desires of new‐car buyers in wealthier countries, so there may be a five‐year or longer lag before new technologies reach second‐hand vehicle markets in large quantities, particularly through imports to many developing countries (though this situation will likely change in the coming decades as new car sales rise across non‐OECD countries) (IEA, 2009b).
New technologies/fuels: Consumers’ unwillingness to purchase new types of vehicles with significantly different attributes (such as smaller size, shorter range, longer refuelling or recharging time, higher cost) is a potential barrier to introducing innovative propulsion systems and fuels (Brozović and Ando, 2009). This may relate simply to the perceived quality of various attributes or to risk aversion from uncertainty (such as driving range anxiety for BEVs4) (Wenzel
4 Should a BEV run out of stored energy, it is less easy to refuel than is an ICE vehicle that runs out of gasoline. With typical ranges around 100–160 km, BEV drivers can become anxious about failing to complete their journey.
Final Draft Chapter 8 IPCC WGIII AR5
23 of 115
and Ross, 2005). The extent to which policies must compensate by providing incentives varies but may be substantial (Gallagher and Muehlegger, 2011).
On‐road fuel economy: The fuel economy of a vehicle as quoted from independent testing can be up to 30% better than that actually achieved by an average driver on the road (IEA, 2009;) TMO, 2010; ICCT, 2012). This gap reflects a combination of factors including inadequacies in the test procedure, real‐world driving conditions (e.g., road surface quality, weather conditions), driver behaviour, and vehicle age and maintenance. Also congested traffic conditions in OECD cities differ from mixed‐mode conditions in some developing countries (Tiwari et al., 2008; Gowri et al., 2009). Some countries have attempted to adjust for these differences in their public vehicle fuel economy information. A significant reduction in the gap may be achievable by an ‘integrated approach’ that includes better traffic management, intelligent transport systems, and improved vehicle and road maintenance (IEA, 2012e).
Eco‐Driving: A 5–10% improvement in on‐road fuel economy can be achieved for LDVs through efforts to promote ‘eco‐driving’ (An et al., 2011; IEA, 2012d). Fuel efficiency improvements from eco‐driving for HDVs are in the 5–20% range (AEA, 2011).
Driving behaviour with new types of vehicles: Taking electric vehicles (EVs) as an example, day/night recharging patterns and the location of public recharging systems could affect how much these vehicles are driven, when and where they are driven, and potentially their GHG emissions impacts (Axsen and Kurani, 2012).
Driving rebound effects: Reactions to lowering the cost of travel (through fuel economy measures or using budget airline operators) can encourage more travel, commonly known as the (direct) rebound effect (Greene et al., 1999; for a general discussion of the rebound effect see Section 5.6.1). In North America, fuel cost elasticity is in the range of a ‐0.05 to ‐0.30 (e.g., a 50% cut in the fuel cost would result in a 2.5% to 15% increase in driving). Several studies show it is declining (Hughes et al., 2006; Small and van Dender, 2007; EPA, 2012). The rebound effect is larger when the marginal cost of driving (mostly gasoline) is a high share of household income. The implication for non‐OECD countries is that the price elasticity of demand for vehicle travel will be a function of household income. The rebound effect may be higher in countries with more modal choice options or where price sensitivity is higher, but research is poor for most countries and regions outside the OECD. Minimizing the rebound can be addressed by fuel taxes or road pricing that offset the lower travel costs created by efficiency improvements or reduced oil prices (see Section 8.10) (Hochman et al., 2010a; Rajagopal et al., 2011a; Chen and Khanna, 2012a).
Vehicle choice‐related rebounds: Other types of rebound effect are apparent, such as shifts to purchasing larger cars concurrent with cheaper fuel or shifts from gasoline to diesel vehicles that give lower driving costs (Schipper and Fulton, 2012). Shifts to larger HDVs and otherwise less expensive systems can divert freight from lower carbon modes, mainly rail, and can also induce additional freight movements (Umweltbundesamt, 2007; TML, 2008; Leduc, 2009; Gillingham et al., 2013).
Company behaviour: Behavioural change also has a business dimension. Company decision making can exert a strong influence on the level of transport emissions, particularly in the freight sector (Rao and Holt, 2005). Freight business operators have a strong incentive to reduce energy intensity, since fuel typically accounts for around one third of operating costs in the road freight sector, 40% in shipping, and 55% in aviation (Bretzke, 2011). The resulting reductions in transport costs can cause a rebound effect and generate some additional freight movement (Matos and Silva, 2011). For company managers to switch freight transport modes often requires a tradeoff of higher logistics costs for lower carbon emissions (Winebrake et al., 2008). Many large logistics service providers have set targets for reducing the carbon intensity of their operations by between 20% and 45% over the period from 2005/2007 to 2020, (McKinnon and
Final Draft Chapter 8 IPCC WGIII AR5
24 of 115
Piecyk, 2012) whereas many smaller freight operators have yet to act (Oberhofer and Fürst, 2012).
8.4 Infrastructure and systemic perspectives
Transport modes, their infrastructures, and their associated urban fabric form a system that has evolved into the cities and regions with which we are most familiar. ‘Walking cities’ existed for 8000 years; some are being reclaimed around their walkability (Gehl, 2011). ‘Transit cities’ were built and developed around trams, trolley buses, and train systems since the mid 19th century (Cervero, 1998; Newman and Kenworthy, 1999). ‘Automobile cities’ evolved from the advent of cheap LDVs (Brueckner, 2000) and have become the dominant paradigm since the 1950s, leading to automobile dependence and auto‐mobility (Urry, 2007). A region can be defined and understood in terms of the transport links to ports and airports regardless of the number and types of cities located there. In all cases, the inter‐linkages between transport infrastructure and the built environment establish path dependencies, which inform long‐term transport‐related mitigation options. For a general discussion of urban form and infrastructure see Chapter 12.4.
8.4.1 Path dependencies of infrastructure and GHG emission impacts Systemic change tends to be slow and needs to address path dependencies embedded in sunk costs, high investment levels, and cultural patterns. Technological and behavioural change can either adapt to existing infrastructures, or develop from newly constructed infrastructures, which could provide an initial template for low carbon technologies and behaviour. Developments designed to improve infrastructure in rapidly urbanizing developing countries will decisively determine the future energy intensity of transport and concomitant emissions (Lefèvre, 2009), and will require policies and actions to avoid lock‐in.
The construction, operation, maintenance, and eventual disposal of transport infrastructure (such as rail tracks, highways, ports, and airports), all result in GHG emissions. These infrastructure‐related emissions are usually accounted for in the industry and building sectors. However, full accounting of life cycle assessment (LCA) emissions from a transport‐perspective requires these infrastructure‐related emissions to be included along with those from vehicles and fuels (see Section 8.3.5). GHG emissions per passenger‐kilometre (p‐km) or per tonne‐kilometre (t‐km) depend, inter alia, on the intensity of use of the infrastructure and the share of tunnels, bridges, runways, etc. (Åkerman, 2011; Chang and Kendall, 2011; UIC, 2012). In the United States, GHG emissions from infrastructure built for LDVs, buses, and air transport amount to 17–45 g/p‐km, 3–17 g/p‐km, and 5–9 g/p‐km respectively (Chester and Horvath, 2009) with rail typically between 3–11 g/p‐km (see Table 8.1). Other than for rail, relevant regional infrastructure‐related GHG emissions research on this topic is very preliminary.
Opportunities exist to substantially reduce these infrastructure related emissions, for instance by up
to 40% in rail (Milford and Allwood, 2010), by the increased deployment of low‐carbon materials and
recycling of rail track materials at their end‐of‐life (Network Rail, 2009; Du and Karoumi, 2012).
When rail systems achieve modal shift from road vehicles, emissions from the rail infrastructure may
be partially offset by reduced emissions from road infrastructures (Åkerman, 2011). To be policy‐
relevant, LCA calculations that include infrastructure need to be contextualized with systemic effects
such as modal shifts (see Sections 8.4.2.3 and 8.4.2.4).
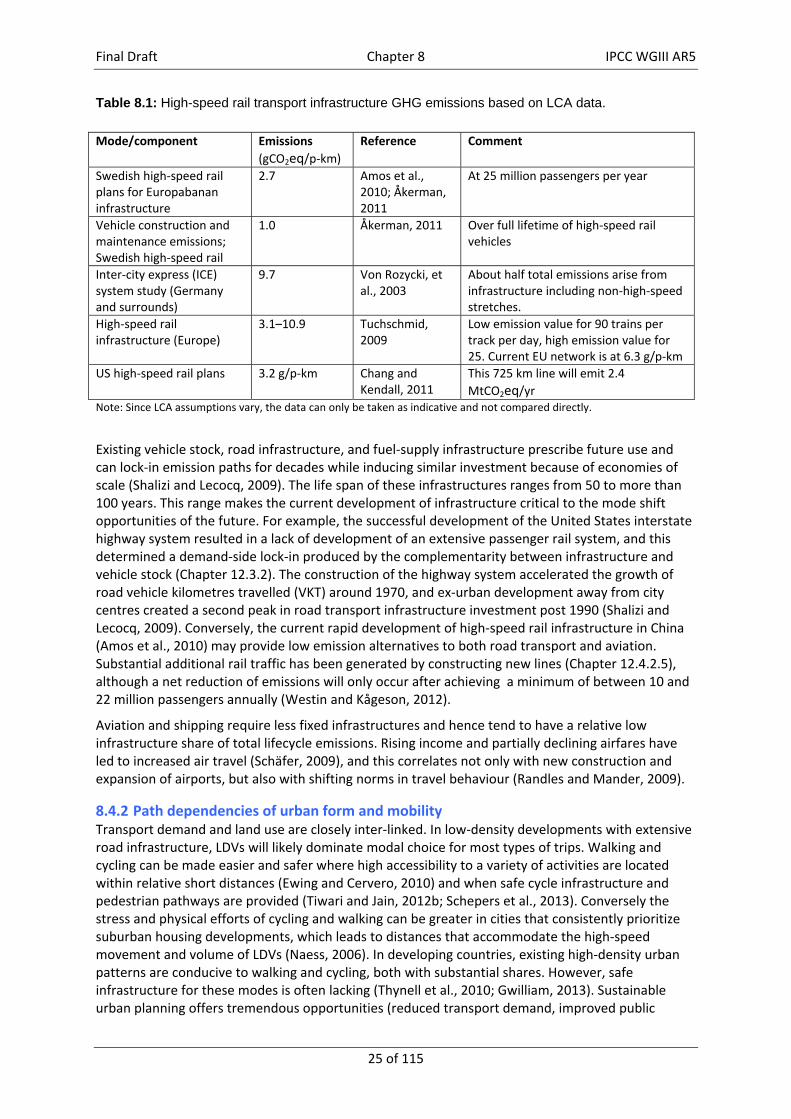
Final Draft Chapter 8 IPCC WGIII AR5
25 of 115
Table 8.1: High-speed rail transport infrastructure GHG emissions based on LCA data.
Mode/component Emissions
(gCO2eq/p‐km)
Reference Comment
Swedish high‐speed rail plans for Europabanan infrastructure
2.7 Amos et al., 2010; Åkerman, 2011
At 25 million passengers per year
Vehicle construction and maintenance emissions; Swedish high‐speed rail
1.0 Åkerman, 2011 Over full lifetime of high‐speed rail vehicles
Inter‐city express (ICE) system study (Germany and surrounds)
9.7 Von Rozycki, et al., 2003
About half total emissions arise from infrastructure including non‐high‐speed stretches.
High‐speed rail infrastructure (Europe)
3.1–10.9 Tuchschmid, 2009
Low emission value for 90 trains per track per day, high emission value for 25. Current EU network is at 6.3 g/p‐km
US high‐speed rail plans 3.2 g/p‐km Chang and Kendall, 2011
This 725 km line will emit 2.4
MtCO2eq/yr Note: Since LCA assumptions vary, the data can only be taken as indicative and not compared directly.
Existing vehicle stock, road infrastructure, and fuel‐supply infrastructure prescribe future use and can lock‐in emission paths for decades while inducing similar investment because of economies of scale (Shalizi and Lecocq, 2009). The life span of these infrastructures ranges from 50 to more than 100 years. This range makes the current development of infrastructure critical to the mode shift opportunities of the future. For example, the successful development of the United States interstate highway system resulted in a lack of development of an extensive passenger rail system, and this determined a demand‐side lock‐in produced by the complementarity between infrastructure and vehicle stock (Chapter 12.3.2). The construction of the highway system accelerated the growth of road vehicle kilometres travelled (VKT) around 1970, and ex‐urban development away from city centres created a second peak in road transport infrastructure investment post 1990 (Shalizi and Lecocq, 2009). Conversely, the current rapid development of high‐speed rail infrastructure in China (Amos et al., 2010) may provide low emission alternatives to both road transport and aviation. Substantial additional rail traffic has been generated by constructing new lines (Chapter 12.4.2.5), although a net reduction of emissions will only occur after achieving a minimum of between 10 and 22 million passengers annually (Westin and Kågeson, 2012).
Aviation and shipping require less fixed infrastructures and hence tend to have a relative low infrastructure share of total lifecycle emissions. Rising income and partially declining airfares have led to increased air travel (Schäfer, 2009), and this correlates not only with new construction and expansion of airports, but also with shifting norms in travel behaviour (Randles and Mander, 2009).
8.4.2 Path dependencies of urban form and mobility Transport demand and land use are closely inter‐linked. In low‐density developments with extensive road infrastructure, LDVs will likely dominate modal choice for most types of trips. Walking and cycling can be made easier and safer where high accessibility to a variety of activities are located within relative short distances (Ewing and Cervero, 2010) and when safe cycle infrastructure and pedestrian pathways are provided (Tiwari and Jain, 2012b; Schepers et al., 2013). Conversely the stress and physical efforts of cycling and walking can be greater in cities that consistently prioritize suburban housing developments, which leads to distances that accommodate the high‐speed movement and volume of LDVs (Naess, 2006). In developing countries, existing high‐density urban patterns are conducive to walking and cycling, both with substantial shares. However, safe infrastructure for these modes is often lacking (Thynell et al., 2010; Gwilliam, 2013). Sustainable urban planning offers tremendous opportunities (reduced transport demand, improved public
Final Draft Chapter 8 IPCC WGIII AR5
26 of 115
health from non‐motorized transport (NMT), less air pollution, and less land use externalities (Banister, 2008; Santos et al., 2010; Bongardt et al., 2013; Creutzig et al., 2012). As an example, an additional 1.1 billion people will live in Asian cities in the next 20 years (ADB, 2012a) and the majority of this growth will take place in small‐medium sized cities that are at an early stage of infrastructure development. This growth provides an opportunity to achieve the long‐term benefits outlined above (Grubler et al., 2012) (see also 8.7 and Chapter 12.4.1).
Urban population density inversely correlates with GHG emissions from land transport (Kennedy et al., 2009; Rickwood et al., 2011) and enables non‐motorized modes to be more viable (Newman and Kenworthy, 2006). Disaggregated studies that analyze individual transport use confirm the relationship between land use and travel (Echenique et al., 2012). Land use, employment density, street design and connectivity, and high transit accessibility also contribute to reducing car dependence and use (Handy et al., 2002; Ewing, 2008; Cervero and Murakami, 2009; Olaru et al., 2011). The built environment has a major impact on travel behaviour (Naess, 2006; Ewing and Cervero, 2010), but residential choice also plays a substantial role that is not easy to quantify (Cao et al., 2009; Ewing and Cervero, 2010). There exists a non‐linear relationship between urban density and modal choice (Chapter 12.4.2.1). For example, suburban residents drive more and walk less than residents living in inner city neighbourhoods (Cao et al., 2009), but that is often true because public transit is more difficult to deploy successfully in suburbs with low densities (Frank and Pivo, 1994). Transport options that can be used in low density areas include para‐transit5 and car‐sharing, both of which can complement individualized motorized transport more efficiently and with greater customer satisfaction than can public transit (Baumgartner and Schofer, 2011). Demand‐responsive, flexible transit, and car sharing services can have lower GHG emissions per passenger kilometre with higher quality service than regional public transport (Diana et al., 2007; Mulley and Nelson, 2009; Velaga et al., 2012; Loose, 2010).
The number of road intersections along the route of an urban journey, the number of destinations within walking distance, and land use diversity issues, have been identified as key variables for determining the modal choice of walking (Ewing and Cervero, 2010). Public transport use in the United States is related to the variables of street network design and proximity to transit. Land use diversity is a secondary factor.
8.4.2.1 Modal shift opportunities for passengers Small but significant modal shifts from LDVs to bus rapid transit (BRT) have been observed where BRT systems have been implemented. Approximately 150 cities worldwide have implemented BRT systems, serving around 25 million passengers daily (Deng and Nelson, 2011; BRT Centre of Excellence, EMBARQ, IEA and SIBRT, 2012). BRT systems can offer similar benefits and capacities as light rail and metro systems at much lower capital costs (Deng and Nelson, 2011), but usually with higher GHG emissions (depending on the local electricity grid GHG emission factor) (Table 8.2). High occupancy rates are an important requirement for the economic and environmental viability of public transport.
5 Para‐transit, also called “community‐transit”, is where flexible passenger transport minibuses (also termed matatus and marshrutkas), shared taxis, and jitneys operate in areas with low population density without following fixed routes or schedules.
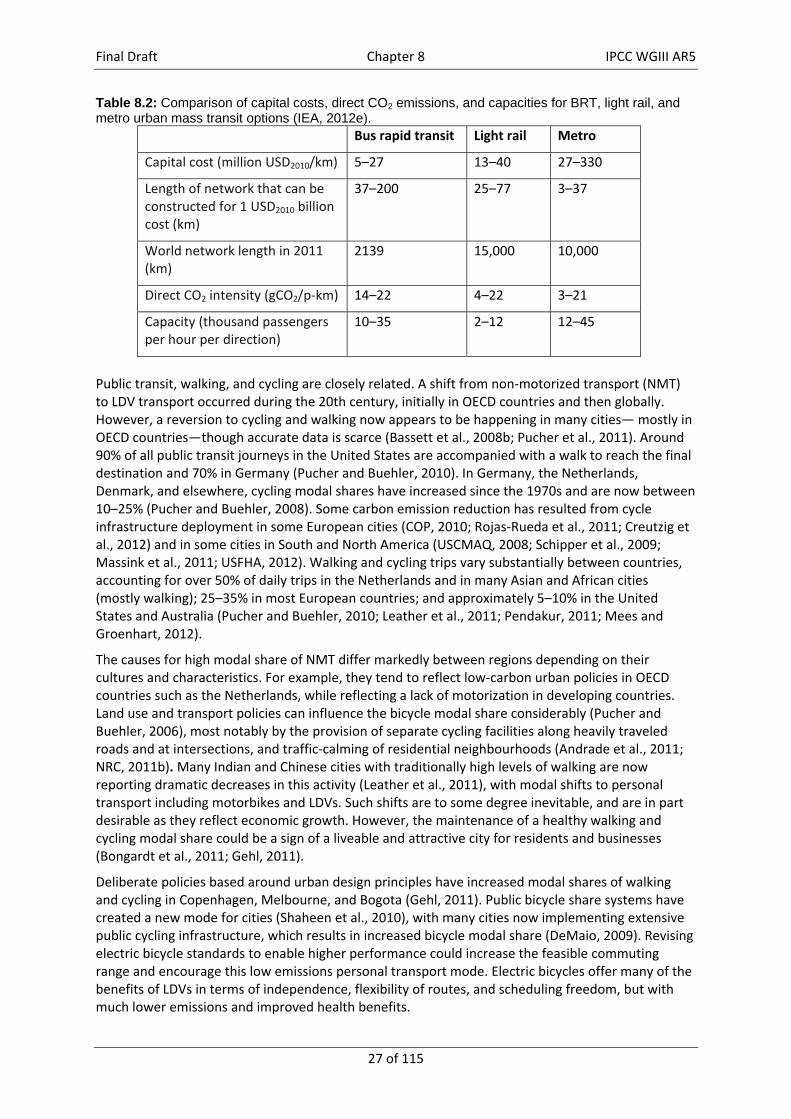
Final Draft Chapter 8 IPCC WGIII AR5
27 of 115
Table 8.2: Comparison of capital costs, direct CO2 emissions, and capacities for BRT, light rail, and metro urban mass transit options (IEA, 2012e).
Bus rapid transit Light rail Metro
Capital cost (million USD2010/km) 5–27 13–40 27–330
Length of network that can be constructed for 1 USD2010 billion cost (km)
37–200 25–77 3–37
World network length in 2011 (km)
2139 15,000 10,000
Direct CO2 intensity (gCO2/p‐km) 14–22 4–22 3–21
Capacity (thousand passengers per hour per direction)
10–35 2–12 12–45
Public transit, walking, and cycling are closely related. A shift from non‐motorized transport (NMT) to LDV transport occurred during the 20th century, initially in OECD countries and then globally. However, a reversion to cycling and walking now appears to be happening in many cities— mostly in OECD countries—though accurate data is scarce (Bassett et al., 2008b; Pucher et al., 2011). Around 90% of all public transit journeys in the United States are accompanied with a walk to reach the final destination and 70% in Germany (Pucher and Buehler, 2010). In Germany, the Netherlands, Denmark, and elsewhere, cycling modal shares have increased since the 1970s and are now between 10–25% (Pucher and Buehler, 2008). Some carbon emission reduction has resulted from cycle infrastructure deployment in some European cities (COP, 2010; Rojas‐Rueda et al., 2011; Creutzig et al., 2012) and in some cities in South and North America (USCMAQ, 2008; Schipper et al., 2009; Massink et al., 2011; USFHA, 2012). Walking and cycling trips vary substantially between countries, accounting for over 50% of daily trips in the Netherlands and in many Asian and African cities (mostly walking); 25–35% in most European countries; and approximately 5–10% in the United States and Australia (Pucher and Buehler, 2010; Leather et al., 2011; Pendakur, 2011; Mees and Groenhart, 2012).
The causes for high modal share of NMT differ markedly between regions depending on their cultures and characteristics. For example, they tend to reflect low‐carbon urban policies in OECD countries such as the Netherlands, while reflecting a lack of motorization in developing countries. Land use and transport policies can influence the bicycle modal share considerably (Pucher and Buehler, 2006), most notably by the provision of separate cycling facilities along heavily traveled roads and at intersections, and traffic‐calming of residential neighbourhoods (Andrade et al., 2011; NRC, 2011b). Many Indian and Chinese cities with traditionally high levels of walking are now reporting dramatic decreases in this activity (Leather et al., 2011), with modal shifts to personal transport including motorbikes and LDVs. Such shifts are to some degree inevitable, and are in part desirable as they reflect economic growth. However, the maintenance of a healthy walking and cycling modal share could be a sign of a liveable and attractive city for residents and businesses (Bongardt et al., 2011; Gehl, 2011).
Deliberate policies based around urban design principles have increased modal shares of walking and cycling in Copenhagen, Melbourne, and Bogota (Gehl, 2011). Public bicycle share systems have created a new mode for cities (Shaheen et al., 2010), with many cities now implementing extensive public cycling infrastructure, which results in increased bicycle modal share (DeMaio, 2009). Revising electric bicycle standards to enable higher performance could increase the feasible commuting range and encourage this low emissions personal transport mode. Electric bicycles offer many of the benefits of LDVs in terms of independence, flexibility of routes, and scheduling freedom, but with much lower emissions and improved health benefits.
Final Draft Chapter 8 IPCC WGIII AR5
28 of 115
With rising income and urbanization, there will likely be a strong pull toward increasing LDV ownership and use in many developing countries. However, public transit mode shares have been preserved at fairly high levels in cities that have achieved high population densities and that have invested heavily in high quality transit systems (Cervero, 2004). Their efficiency is increased by diverse forms of constraints on LDVs, such as reduced number of lanes, parking restrictions, and limited access (La Branche, 2011). Investments in mass rapid transit, timed with income increases and population size/density increases, have been successful in some Asian megacities (Acharya and Morichi, 2007). As traffic congestion grows and freeway infrastructure reaches physical, political, and economic limits, the modal share of public transit has increased in some OECD countries (Newman and Kenworthy, 2011b).
High‐speed rail can substitute for short‐distance passenger air travel (normally up to around 800 km but also for the 1500 km in the case of Beijing to Shanghai), as well as for most road travel over those distances, and hence can mitigate GHG emissions (McCollum et al., 2010; IEA, 2008). With optimized operating speeds and long distances between stops, and high passenger load factors, energy use per passenger‐km could be as much as 65 to 80% less than air travel (IEA, 2008). A notable example is China, which has shown a fast development of its high‐speed rail system. When combined with strong land‐use and urban planning, a high‐speed rail system has the potential to restructure urban development patterns, and may help to alleviate local air pollution, noise, road, and air congestion (McCollum et al., 2010).
8.4.2.2 Modal shift opportunities for freight Over the past few decades, air and road have increased their global share of the freight market at the expense of rail and waterborne transport (European Environment Agency, 2011; Eom et al., 2012). This has been due to economic development and the related change in the industry and commodity mix, often reinforced by differential rates of infrastructure improvement and the deregulation of the freight sector, which typically favours road transport. Inducing a substantial reversal of recent freight modal split trends will be difficult, inter alia because of ‘structural inelasticity’ which confines shorter distance freight movements to the road network because of its much higher network density (Rich et al., 2011). If growth in global truck travel between 2010 and 2050 could be cut by half from the projected 70% and shifted to expanded rail systems, about a 20% reduction in fuel demand and CO2 could be achieved, with only about a fifth of this savings being offset by increased rail energy use (IEA, 2009). The European Commission (EC) set an ambitious target of having all freight movements using rail or waterborne modes over distances greater than 300 km by 2030, leading to major changes in modal shares (Figure 8.8) (Tavasszy and Meijeren, 2011; EC, 2013).
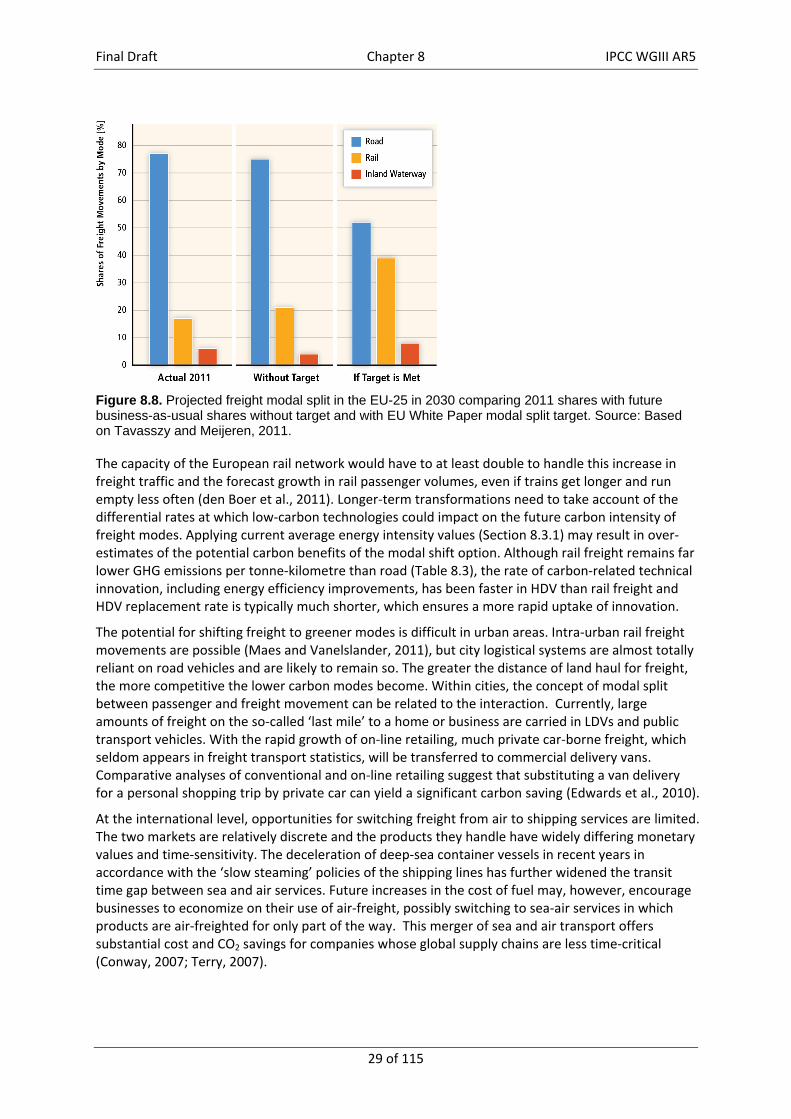
Final Draft Chapter 8 IPCC WGIII AR5
29 of 115
Figure 8.8. Projected freight modal split in the EU-25 in 2030 comparing 2011 shares with future business-as-usual shares without target and with EU White Paper modal split target. Source: Based on Tavasszy and Meijeren, 2011.
The capacity of the European rail network would have to at least double to handle this increase in freight traffic and the forecast growth in rail passenger volumes, even if trains get longer and run empty less often (den Boer et al., 2011). Longer‐term transformations need to take account of the differential rates at which low‐carbon technologies could impact on the future carbon intensity of freight modes. Applying current average energy intensity values (Section 8.3.1) may result in over‐estimates of the potential carbon benefits of the modal shift option. Although rail freight remains far lower GHG emissions per tonne‐kilometre than road (Table 8.3), the rate of carbon‐related technical innovation, including energy efficiency improvements, has been faster in HDV than rail freight and HDV replacement rate is typically much shorter, which ensures a more rapid uptake of innovation.
The potential for shifting freight to greener modes is difficult in urban areas. Intra‐urban rail freight movements are possible (Maes and Vanelslander, 2011), but city logistical systems are almost totally reliant on road vehicles and are likely to remain so. The greater the distance of land haul for freight, the more competitive the lower carbon modes become. Within cities, the concept of modal split between passenger and freight movement can be related to the interaction. Currently, large amounts of freight on the so‐called ‘last mile’ to a home or business are carried in LDVs and public transport vehicles. With the rapid growth of on‐line retailing, much private car‐borne freight, which seldom appears in freight transport statistics, will be transferred to commercial delivery vans. Comparative analyses of conventional and on‐line retailing suggest that substituting a van delivery for a personal shopping trip by private car can yield a significant carbon saving (Edwards et al., 2010).
At the international level, opportunities for switching freight from air to shipping services are limited. The two markets are relatively discrete and the products they handle have widely differing monetary values and time‐sensitivity. The deceleration of deep‐sea container vessels in recent years in accordance with the ‘slow steaming’ policies of the shipping lines has further widened the transit time gap between sea and air services. Future increases in the cost of fuel may, however, encourage businesses to economize on their use of air‐freight, possibly switching to sea‐air services in which products are air‐freighted for only part of the way. This merger of sea and air transport offers substantial cost and CO2 savings for companies whose global supply chains are less time‐critical (Conway, 2007; Terry, 2007).
Final Draft Chapter 8 IPCC WGIII AR5
30 of 115
8.5 Climate change feedback and interaction with adaptation
Transport is impacted by climate change both positively and negatively. These impacts are dependent on regional variations in the nature and degree of climate change and the nature of local transport infrastructure and systems. Adapting transport systems to the effects of climate in some cases complement mitigations efforts while in others they have a counteracting effect. Little research has so far been conducted on the inter‐relationship between adaptation and mitigation strategies in the transport sector.
8.5.1 Accessibility and feasibility of transport routes Decreases in the spatial and temporal extent of ice cover in the Arctic and Great Lakes region of North America regions are opening new and shorter shipping routes over longer periods of the year (Drobot et al., 2009; Stephenson et al., 2011). The expanded use of these routes could reduce GHG emissions due to a reduction in the distance travelled. For example, the Northern Sea Route (NSR) between Shanghai and Rotterdam is approximately 4,600 km shorter (about 40%) than the route via the Suez Canal. The NSR passage takes 18–20 days compared to 28–30 days via the southern route (Verny and Grigentin, 2009). Climate change will not only affect ice coverage, but may also increase the frequency and severity of northern hemisphere blizzards and arctic cyclones, deterring use of these shorter routes (Wassmann, 2011; Liu et al., 2012). It is, nevertheless, estimated that the transport of oil and gas through the NSR could increase from 5.5 Mt in 2010 to 12.8 Mt by 2020 (Ho, 2010). The passage may also become a viable option for other bulk carriers and container shipping in the near future (Verny & Grigentin, 2009; Schøyen & Bråthen, 2011). The economic viability of the NSR is still uncertain without assessments of potentially profitable operation (Liu and Kronbak, 2010) and other more pessimistic prospects for the trans‐Arctic corridors (Econ, 2007). One possible negative impact would be that the increase in shipping through these sensitive ecosystems could lead to an increase in local environmental and climate change impacts unless additional emissions controls are introduced along these shipping routes (Wassmann, 2011). Of specific concern are the precursors of photochemical smog in this polar region that could lead to additional local positive regional climate forcing (Corbett et al., 2010) and emissions of black carbon (see Section 8.2.2.1). Measurement methods of black carbon emissions from ships and additional work to evaluate their impact on the Arctic are needed before possible control measures can be investigated.
Changes in climate are also likely to affect northern inland waterways (Millerd, 2011). In summer, these effects are likely to adversely affect waterborne craft when reductions in water levels impair navigability and cut capacity (Jonkeren et al., 2007; Görgen, K. et al. 2010; Nilson, E. et al. 2012). On the other hand, reduced winter freezing can benefit inland waterway services by extending the season. The net annual effect of climate change on the potential for shifting freight to this low‐carbon mode has yet to be assessed.
8.5.2 Relocation of production and reconfiguration of global supply chains Climate change will induce changes to patterns of agricultural production and distribution (Ericksen et al., 2009; Hanjra and Qureshi, 2010; Tirado et al., 2010; Nielsen and Vigh, 2012; Teixeira et al., 2012). The effect of these changes on freight transport at different geographical scales are uncertain (Vermeulen et al., 2012). In some scenarios, food supply chains become longer, generating more freight movement (Nielsen and Vigh, 2012; Teixeira et al., 2012). These and other long supply lines created by globalization could become increasingly vulnerable to climate change. A desire to reduce climate risk may be one of several factors promoting a return to more localized sourcing in some sectors (World Economic Forum and Accentura, 2009), a trend that would support mitigation. Biofuel production may also be adversely affected by climate change inhibiting the switch to lower carbon fuels (de Lucena et al., 2009).
Final Draft Chapter 8 IPCC WGIII AR5
31 of 115
8.5.3 Fuel combustion and technologies Increased ambient temperatures and humidity levels are likely to affect nitrogen oxide, carbon monoxide, methane, black carbon, and other particulate emissions from internal combustion engines and how these gases interact with the atmosphere (STUMP et al., 1989; Rakopoulos, 1991; Cooper and Ekstrom, 2005; Motallebi et al., 2008) Lin and Jeng, 1996; McCormick et al., 1997; Pidolal. 2012). Higher temperatures also lead to higher evaporative emissions of volatile organic compound emissions (VOCs) (Roustan et al., 2011) and could lead to higher ozone levels (Bell et al., 2007). The overall effects are uncertain and could be positive or negative depending on regional conditions (Ramanathan & Carmichael, 2008).
As global average temperatures increase, the demand for on‐board cooling in both private vehicles and on public transport will increase. The heating of vehicles could also grow as the frequency and severity of cold spells increase. Both reduce average vehicle fuel efficiencies. For example, in a passenger LDV, air‐conditioning can increase fuel consumption by around 3–10% (Farrington and Rugh, 2000; IEA, 2009a). Extremes in temperature (both high and low) negatively impact on the driving range of electric vehicles due to greater use of on‐board heating and air conditioning, and thus will require more frequent recharging. In the freight sector, energy consumption and emissions in the refrigeration of freight flows will also increase as the extent and degree of temperature‐control increases across the supply chains of food and other perishable products (James and James, 2010).
8.5.4 Transport infrastructure Climate proofing and adaptation will require substantial infrastructure investments (see Section 8.4 and IPCC AR5, WG II, Chapter 15). This will generate additional freight transport if implemented outside of the normal infrastructure maintenance and upgrade cycle. Climate proofing of transport infrastructure can take many forms (ADB, 2011a; Highways Agency, 2011) varying in the amount of additional freight movement required. Resurfacing a road with more durable materials to withstand greater temperature extremes may require no additional freight movement, whereas re‐routing a road or rail link, or installing flood protection, are likely to generate additional logistics demands, which have yet to be quantified.
Adaptation efforts are likely to increase transport infrastructure costs (Hamin & Gurran, 2009), and influence the selection of projects for investment. In addition to inflating maintenance costs (Jollands et al., 2007; Larsen et al., 2008), climate proofing would divert resources that could otherwise be invested in extending networks and expanding capacity. This is likely to affect all transport modes to varying degrees. If, for example, climate proofing were to constrain the development of a rail network more than road infrastructure, it might inhibit a modal shift to less carbon‐intensive rail services.
The future choice of freight and passenger traffic between modes may also become more responsive to their relative sensitivity to extreme weather events (Koetse and Rietveld, 2009; Taylor and Philp, 2010). The exposure of modes to climate risks include aviation (Eurocontrol, 2008), shipping (Becker et al., 2012), and land transport (Hunt and Watkiss, 2011). Little attempt has been made to conduct a comparative analysis of their climate risk profiles, to assess the effects on the modal choice behaviour of individual travellers and businesses, or to take account of regional differences in the relative vulnerability of different transport modes to climate change (Koetse and Rietveld, 2009).
Overall, the transport sector will be highly exposed to climate change and will require extensive adaptation of infrastructure, operations, and service provision. It will also be indirectly affected by the adaptation and decarbonization of the other sectors that it serves. Within the transport sector there will be a complex interaction between adaptation and mitigation efforts. Some forms of adaptation, such as infrastructural climate proofing, will be likely to generate more freight and personal movement, while others, such as the NSR, could substantially cut transport distances and related emissions.
Final Draft Chapter 8 IPCC WGIII AR5
32 of 115
8.6 Costs and potentials
For transport, the potential for reducing GHG emissions, as well as the associated costs, varies widely across countries and regions. Appropriate policies and measures that can accomplish such reductions also vary (see Section 8.10) (Kahn Ribeiro et al., 2007; Li, 2011). Mitigation costs and potentials are a function of the stringency of climate goals and their respective GHG concentration stabilization levels (Fischedick et al., 2011; Rogelj et al., 2013). This section presents estimates of mitigation potentials and associated costs from the application of new vehicle and fuel technologies, performance efficiency gains, operational measures, logistical improvements, electrification of modes, and low‐carbon fuels and activity reduction for different transport modes (aviation, rail, road, waterborne and cross‐modal). Potential CO2 emissions reductions from passenger‐km (p‐km) and tonne‐km (t‐km) vary widely by region, technology, and mode according to how rapidly the measures and applications can be developed, manufactured, and sold to buyers replacing existing ones in vehicles an fuels or adding to the total fleet, and on the way they are used given travel behaviour choices (Kok et al., 2011). In general, there is a larger emission reduction potential in the transport sector, and at a lower cost, compared to the findings in AR4 (Kahn Ribeiro et al., 2007).
The efforts undertaken to reduce activity, to influence structure and modal shift, to lower energy intensity, and to increase the use of low‐carbon fuels, will influence future costs and potentials. Ranges of mitigation potentials have an upper boundary based on what is currently understood to be technically achievable, but will most likely require strong policies to be achieved in the next few decades (see Section 8.10). Overall reductions are sensitive to per‐unit transport costs (that could drop with improved vehicle efficiency); resulting rebound effects; and shifts in the type, level, and modal mix of activity. For instance, the deployment of more efficient, narrow‐body jet aircraft could increase the number of commercially‐attractive, direct city‐to‐city connections, which may result in an overall increase in fleet fuel use compared to hub‐based operations.
This assessment follows a bottom‐up approach to maintain consistency in assumptions. Table 8.3 outlines indicative direct mitigation costs using reference conditions as baselines, and illustrative examples of existing vehicles and situations for road, aviation, waterborne, and rail (as well as for some cross‐mode options) available in the literature. The data presented on the cost‐effectiveness of different carbon reduction measures is less detailed than data on the potential CO2 savings due to literature gaps. The number of studies assessing potential future GHG reductions from energy intensity gains and use of low‐carbon fuels is larger than those assessing mitigation potentials and cost from transport activity, structural change and modal shift, since they are highly variable by location and background conditions.
Key assumptions made in this analysis were:
cost estimates are based on societal costs and benefits of technologies, fuels, and other measures, and take into account initial costs as well as operating costs and fuel savings;
existing transport options are compared to current base vehicles and activities, whereas future options are compared to estimates of baseline future technologies and other conditions;
fuel price projections are based on the IEA World Energy Outlook (IEA, 2012b) and exclude taxes and subsidies where possible;
discount rates of 5% are used to bring future estimates back to present (2013) values, though the literature considered has examined these issues mostly in the developed‐world context; and
indirect responses that occur through complex relationships within sectors in the larger socioeconomic system are not included (Stepp et al., 2009).
Results in Table 8.3 indicate that, for LDVs, efficiency improvement potentials of 50% in 2030 are technically possible compared to 2010, with some estimates in the literature even higher (NRC, 2010b). Virtually all of these improvements appear to be available at very low, or even negative,
Final Draft Chapter 8 IPCC WGIII AR5
33 of 115
societal costs. Electric vehicles have a CO2 reduction cost highly correlated with the carbon intensity of electricity generation: using relatively high‐carbon intensity electricity systems (~500600 gCO2/kWh), EVs save little CO2 compared to conventional LDVs and the mitigation cost can be many hundreds of dollars per tonne; for very low‐carbon electricity (below 200 gCO2/kWh) the mitigation cost drops below 200 USD2010/tCO2. In the future, with lower battery costs and low‐carbon electricity, EVs could drop below 100 USD2010/tCO2 and even approach zero net cost.
For long‐haul HDVs, up to a 50% reduction in energy intensity by 2030 appears possible at negative societal cost per tCO2 due to the very large volumes of fuel they use. HDVs used in urban areas where their duty cycle does not require as much annual travel (and fuel use), have a wider range of potentials and costs, reaching above 100 USD2010/t CO2. Similarly, inter‐city buses use more fuel annually than urban buses, and as a result appear to have more low‐cost opportunities for CO2 reduction (IEA, 2009b; NRC, 2010b; TIAX, 2011).
Recent designs of narrow and wide‐body commercial aircraft are significantly more efficient than the models they replace, and provide CO2 reductions at net negative societal cost when accounting for fuel savings over 10–15 years of operation at 5% discount rate. An additional 30–40% CO2 reduction potential is expected from future new aircraft in the 2020–2030 time frame, but the mitigation costs are uncertain and some promising technologies, such as open rotor engines, appear expensive (IEA, 2009a; TOSCA, 2011).
For virtually all types of ocean‐going ships including container vessels, bulk carriers, and oil tankers, the potential reduction in CO2 emissions is estimated to be over 50% taking into account a wide range of technology and operational changes. Due to the large volume of fuel used annually by these ships, the net cost of this reduction is likely to be negative (Buhaug and et. al, 2009; Crist, 2009).
Key factors in the long term decarbonization of rail transport will be the electrification of services and the switch to low‐carbon electricity generation, both of which will vary widely by country. Potential improvements of 35% energy efficiency for United States rail freight, 46% for European Union rail freight and 56% for EU passenger rail services have been forecast for 2050 (Anderson et al., 2011; Vyas et al., 2013) . The EU improvements will yield a 10–12% reduction in operating costs, though no information is available on the required capital investment in infrastructure and equipment.
Regarding fuel substitution in all modes, some biofuels have the potential for large CO2 reduction, although net GHG impact assessments are complex (see Section 8.3 and Chapter 11, Bioenergy Annex). The cost per tonne of CO2 avoided will be highly dependent on the net CO2 reduction and the relative cost of the biofuel compared to the base fuel (e.g., gasoline or diesel), and any technology changes required to the vehicles and fuel distribution network in order to accommodate new fuels and blends. The mitigation cost is so sensitive that, for example, while an energy unit of biofuel that cuts CO2 emissions by 80% compared to gasoline and costs 20% more has a mitigation cost of about 80 USD/t CO2, if the biofuel’s cost drops to parity with gasoline, the mitigation cost drops to 0 USD/t CO2 (IEA, 2009b).
The mitigation potentials from reductions in transport activity consider, for example, that “walking and cycle track networks can provide 20% (5–40% in sensitivity analyses) induced walking and cycle journeys that would not have taken place without the new networks, and around 15% (0–35% in sensitivity analyses) of current journeys less than 5 km made by car or public transport can be replaced by walking or cycling” (Sælensminde, 2004). Urban journeys by car longer than 5km can be replaced by combined use of non‐motorized and intermodal public transport services (Tirachini and Hensher, 2012).
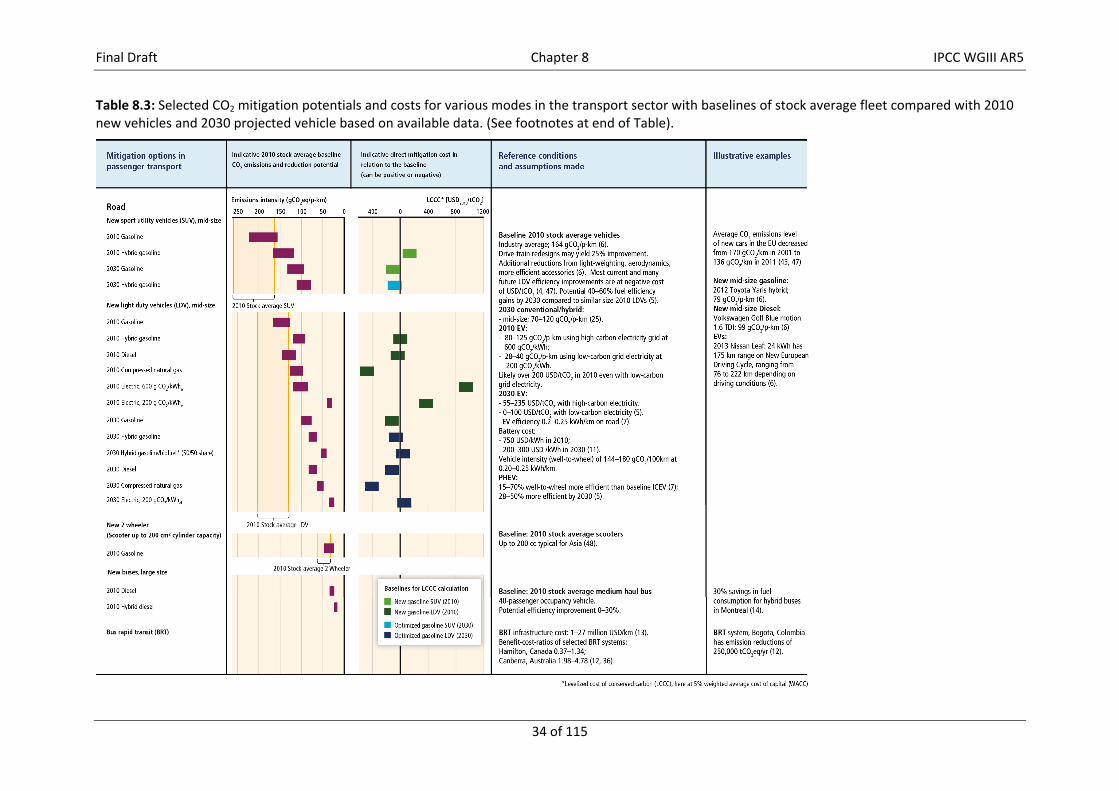
Final Draft Chapter 8 IPCC WGIII AR5
34 of 115
Table 8.3: Selected CO2 mitigation potentials and costs for various modes in the transport sector with baselines of stock average fleet compared with 2010 new vehicles and 2030 projected vehicle based on available data. (See footnotes at end of Table).
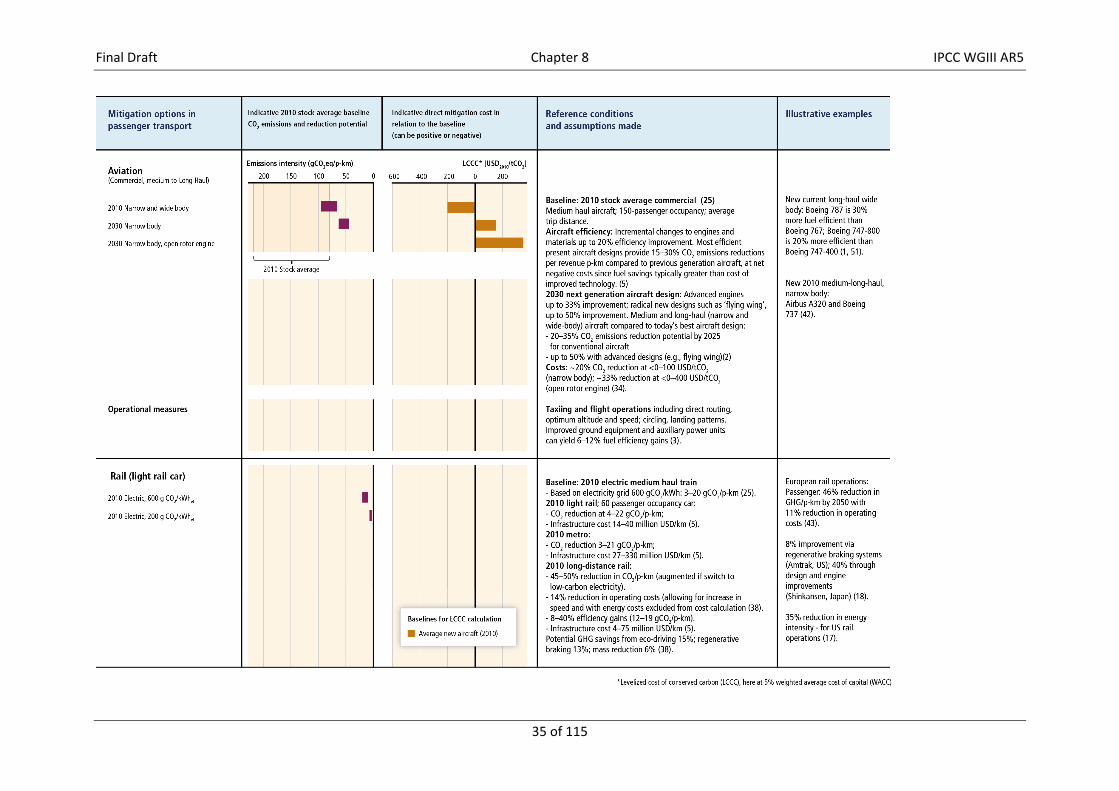
Final Draft Chapter 8 IPCC WGIII AR5
35 of 115
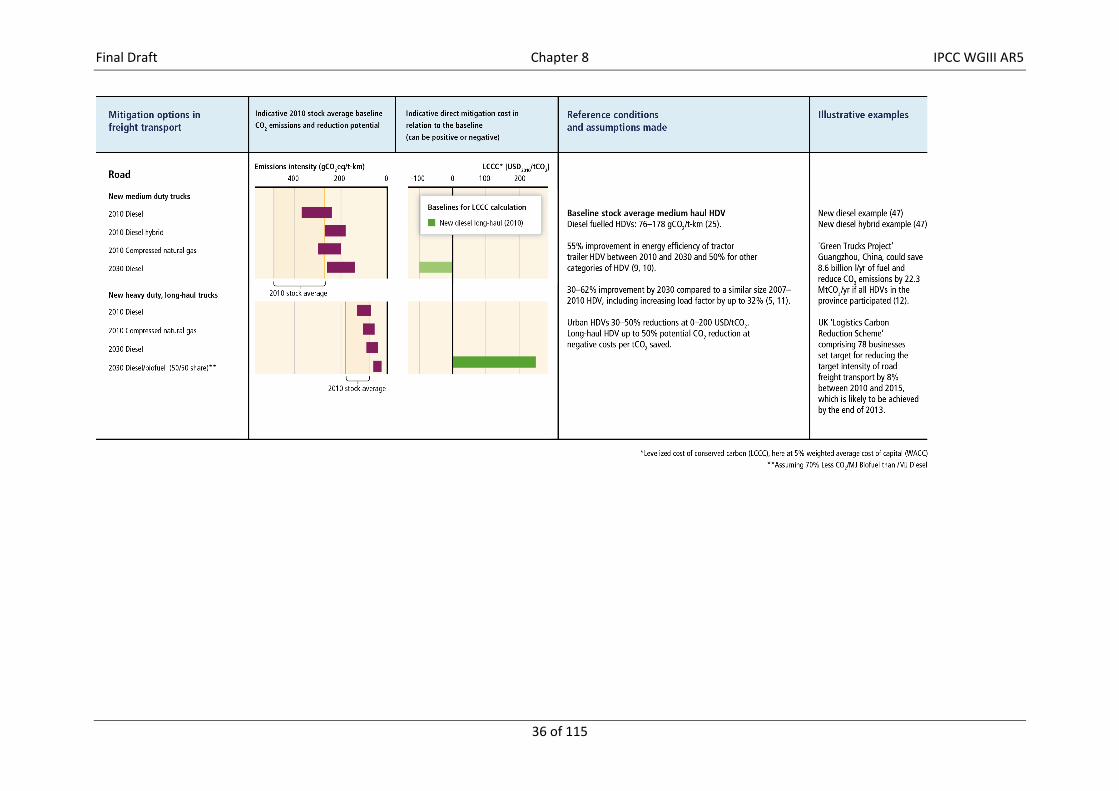
Final Draft Chapter 8 IPCC WGIII AR5
36 of 115
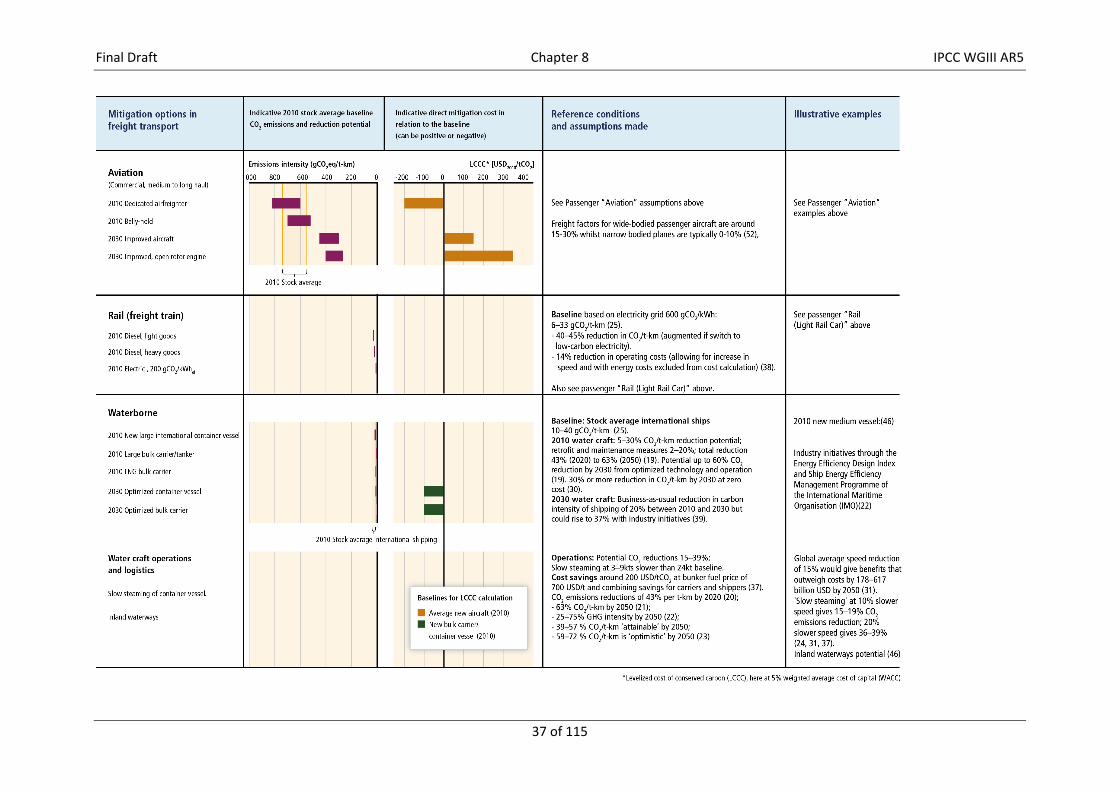
Final Draft Chapter 8 IPCC WGIII AR5
37 of 115
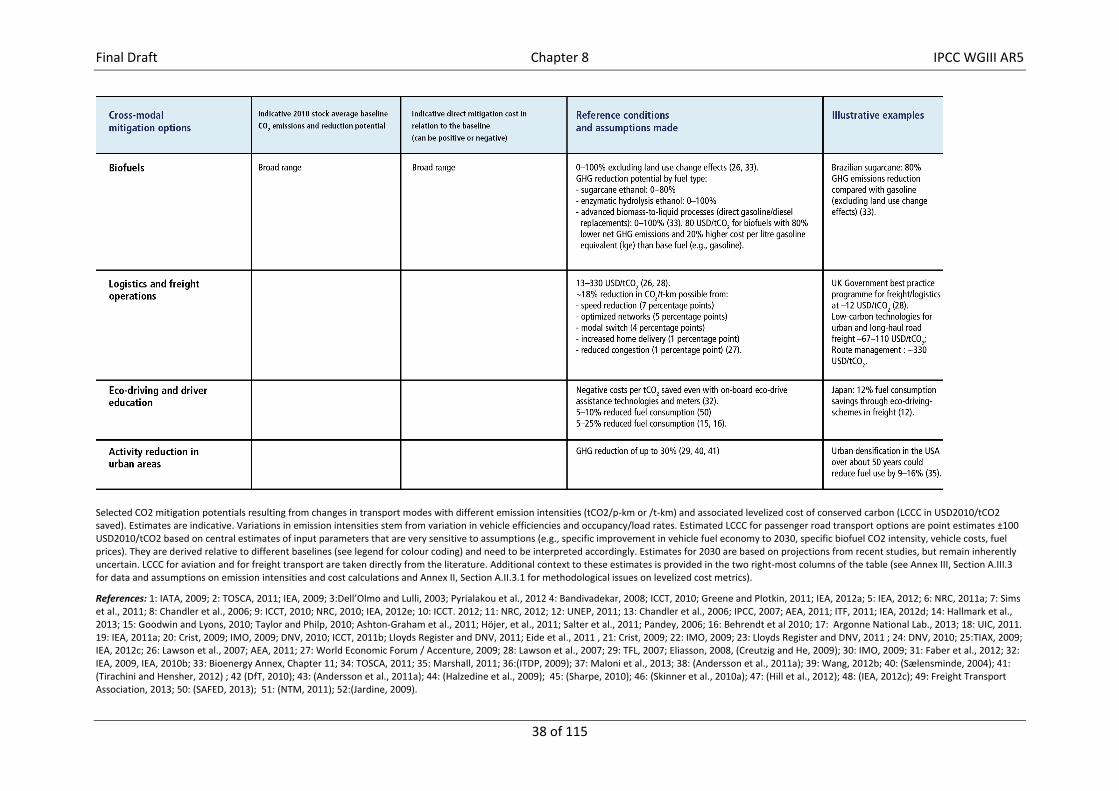
Final Draft Chapter 8 IPCC WGIII AR5
38 of 115
Selected CO2 mitigation potentials resulting from changes in transport modes with different emission intensities (tCO2/p‐km or /t‐km) and associated levelized cost of conserved carbon (LCCC in USD2010/tCO2 saved). Estimates are indicative. Variations in emission intensities stem from variation in vehicle efficiencies and occupancy/load rates. Estimated LCCC for passenger road transport options are point estimates ±100 USD2010/tCO2 based on central estimates of input parameters that are very sensitive to assumptions (e.g., specific improvement in vehicle fuel economy to 2030, specific biofuel CO2 intensity, vehicle costs, fuel prices). They are derived relative to different baselines (see legend for colour coding) and need to be interpreted accordingly. Estimates for 2030 are based on projections from recent studies, but remain inherently uncertain. LCCC for aviation and for freight transport are taken directly from the literature. Additional context to these estimates is provided in the two right‐most columns of the table (see Annex III, Section A.III.3 for data and assumptions on emission intensities and cost calculations and Annex II, Section A.II.3.1 for methodological issues on levelized cost metrics).
References: 1: IATA, 2009; 2: TOSCA, 2011; IEA, 2009; 3:Dell’Olmo and Lulli, 2003; Pyrialakou et al., 2012 4: Bandivadekar, 2008; ICCT, 2010; Greene and Plotkin, 2011; IEA, 2012a; 5: IEA, 2012; 6: NRC, 2011a; 7: Sims et al., 2011; 8: Chandler et al., 2006; 9: ICCT, 2010; NRC, 2010; IEA, 2012e; 10: ICCT. 2012; 11: NRC, 2012; 12: UNEP, 2011; 13: Chandler et al., 2006; IPCC, 2007; AEA, 2011; ITF, 2011; IEA, 2012d; 14: Hallmark et al., 2013; 15: Goodwin and Lyons, 2010; Taylor and Philp, 2010; Ashton‐Graham et al., 2011; Höjer, et al., 2011; Salter et al., 2011; Pandey, 2006; 16: Behrendt et al 2010; 17: Argonne National Lab., 2013; 18: UIC, 2011. 19: IEA, 2011a; 20: Crist, 2009; IMO, 2009; DNV, 2010; ICCT, 2011b; Lloyds Register and DNV, 2011; Eide et al., 2011 , 21: Crist, 2009; 22: IMO, 2009; 23: Lloyds Register and DNV, 2011 ; 24: DNV, 2010; 25:TIAX, 2009; IEA, 2012c; 26: Lawson et al., 2007; AEA, 2011; 27: World Economic Forum / Accenture, 2009; 28: Lawson et al., 2007; 29: TFL, 2007; Eliasson, 2008, (Creutzig and He, 2009); 30: IMO, 2009; 31: Faber et al., 2012; 32: IEA, 2009, IEA, 2010b; 33: Bioenergy Annex, Chapter 11; 34: TOSCA, 2011; 35: Marshall, 2011; 36:(ITDP, 2009); 37: Maloni et al., 2013; 38: (Andersson et al., 2011a); 39: Wang, 2012b; 40: (Sælensminde, 2004); 41: (Tirachini and Hensher, 2012) ; 42 (DfT, 2010); 43: (Andersson et al., 2011a); 44: (Halzedine et al., 2009); 45: (Sharpe, 2010); 46: (Skinner et al., 2010a); 47: (Hill et al., 2012); 48: (IEA, 2012c); 49: Freight Transport Association, 2013; 50: (SAFED, 2013); 51: (NTM, 2011); 52:(Jardine, 2009).
Final Draft Chapter 8 IPCC WGIII AR5
39 of 115
8.7 Co‐benefits, risks and spillovers
Mitigation in the transport sector has the potential to generate synergies and co‐benefits with other economic, social, and environmental objectives. In addition to mitigation costs (see Section 8.6), the deployment of mitigation measures will depend on a variety of other factors that relate to the broader objectives that drive policy choices. The implementation of policies and measures can have positive or negative effects on these other objectives – and vice versa. To the extent these effects are positive, they can be deemed as ‘co‐benefits’; if adverse and uncertain, they imply risks. Potential co‐benefits and adverse side effects of alternative mitigation measures (Section 8.7.1), associated technical risks and uncertainties (Section 8.7.2), and public perceptions (Section 8.7.3) can significantly affect investment decisions and individual behaviour as well as influence the priority‐setting of policymakers. Table 8.7.1 provides an overview of the potential co‐benefits and adverse side‐effects of the mitigation measures that are assessed in this chapter. In accordance with the three sustainable development pillars described in Sections 4.2 and 4.8, the table presents effects on objectives that may be economic, social, environmental, and health related. The extent to which co‐benefits and adverse side effects will materialize in practice, and their net effect on social welfare, differ greatly across regions. Both are strongly dependent on local circumstances and implementation practices as well as on the scale and pace of the deployment of the different mitigation measures (see Section 6.6).
8.7.1 Socio‐economic, environmental, and health effects Transport relies almost entirely on oil with about 94% of transport fuels being petroleum products (IEA, 2011b). This makes it a key area of energy security concern. Oil is also a major source of harmful emissions that affect air quality in urban areas (see Section 8.2) (Sathaye et al., 2011b). In scenario studies of European cities, a combination of public transit and cycling infrastructures, pricing, and land‐use measures is projected to lead to notable co‐benefits. These include improved energy security, reduced fuel spending, less congestion, fewer accidents, and increased public health from more physical activity, less air pollution and less noise‐related stress (Costantini et al., 2007; Greene, 2010b; Rojas‐Rueda et al., 2011; Rojas‐Rueda et al., 2012; Creutzig et al., 2012). However, only a few studies have assessed the associated welfare effects comprehensively and these are hampered by data uncertainties. Even more fundamental is the epistemological uncertainty attributed to different social costs. As a result, the range of plausible social costs and benefits can be large. For example, the social costs of the co‐dimensions congestion, air pollution, accidents, and noise in Beijing were assessed to equate to between 7.5% to 15% of GDP (Creutzig and He, 2009). Improving energy security, mobility access, traffic congestion, public health, and safety are all important policy objectives that can possibly be influenced by mitigation actions (Jacobsen, 2003; Goodwin, 2004; Hultkrantz et al., 2006; Rojas‐Rueda et al., 2011).
Energy security. Transport stands out in comparison to other energy end‐use sectors due to its almost complete dependence on petroleum products (Sorrell and Speirs, 2009) (Cherp et al., 2012). Thus, the sector suffers from both low resilience of energy supply and, in many countries, low sufficiency of domestic resources. (For a broader discussion on these types of concerns see Section 6.6.2.2). The sector is likely to continue to be dominated by oil for one or more decades (Costantini et al., 2009). For oil‐importing countries, the exposure to volatile and unpredictable oil prices affects the terms of trade and their economic stability. Measuring oil independence is possible by measuring the economic impact of energy imports (Greene, 2010b)Mitigation strategies for transport (such as electrifying the sector and switching to biofuels) would decrease the sector’s dependence on oil and diversify the energy supply, thus increasing resilience (Leiby, 2007a; Shakya and Shrestha, 2011) (Jewell et al., 2013). However, a shift away from oil could have implications for energy exporters (see Chapter 14). Additionally, mitigation measures targeted at reducing the overall transport demand—such as more compact urban form with improved transport infrastructure and journey distance reduction and avoidance (see Sections 8.4 and 12.4.2.1)—may
Final Draft Chapter 8 IPCC WGIII AR5
40 of 115
reduce exposure to oil price volatility and shocks (Sovacool and Brown, 2010; Leung, 2011; Cherp et al., 2012).
Access and mobility. Mitigation strategies that foster multi‐modality are likely to foster improved access to transport services particularly for the poorest and most vulnerable members of society. Improved mobility usually helps provide access to jobs, markets, and facilities such as hospitals and schools (Banister, 2011b; Boschmann, 2011; Sietchiping et al., 2012). More efficient transport and modal choice not only increases access and mobility it also positively affects transport costs for businesses and individuals (Banister, 2011b). Transport systems that are affordable and accessible foster productivity and social inclusion (Banister, 2008; Miranda and Rodrigues da Silva, 2012).
Employment impact. In addition to improved access in developing countries, a substantial number of people are employed in the formal and informal public transport sector (UN‐Habitat, 2013). A shift to public transport modes is likely to generate additional employment opportunities in this sector (Santos et al., 2010) . However, the net effect on employment of a shift towards low‐carbon transport remains unclear (UNEP, 2011).
Traffic congestion. Congestion is an important aspect for decision makers, in particular at the local level, as it negatively affects journey times and creates substantial economic cost (Goodwin, 2004; Duranton and Turner, 2011). For example, in the United States in 2000, time lost in traffic amounted to around 0.7% of GDP (Federal Highway Administration, 2000) or approximately 85 billion USD2010. This increased to 101 billion USD2010 in 2010, also being 0.7% of GDP, but with more accurate data covering the cost per kilometre travelled of each major vehicle type for 500 urban centres (Schrank et al., 2011). Time lost was valued at 1.2% of GDP in the UK (Goodwin, 2004); 3.4% in Dakar, Senegal; 4% in Manila, Philippines (Carisma and Lowder, 2007); 3.3% to 5.3% in Beijing, China (Creutzig and He, 2009); 1% to 6% in Bangkok, Thailand (World Bank, 2002) and up to 10% in Lima, Peru where people on average spend around four hours in daily travel (JICA, 2005; Kunieda and Gauthier, 2007).
Modal shifts that reduce traffic congestion can simultaneously reduce GHG emissions and short‐lived climate forcers. These include road congestion pricing, modal shifts from aviation to rail, and shifts from LDVs to public transport, walking, and cycling (Cuenot et al., 2012). However, some actions that seek to reduce congestion can induce additional travel demand, for example, expansions of airport infrastructure or construction of roads to increase capacity (Goodwin, 2004; ECMT, 2007; Small and van Dender, 2007).
Health. Exposure to vehicle exhaust emissions can cause cardiovascular, pulmonary, and respiratory diseases and several other negative health impacts (McCubbin, D.R., Delucchi, 1999; Medley et al., 2002a; Chapters 7.9.2, 8.2, and WG II Chapter 11.9). In Beijing, for example, the social costs of air pollution were estimated to be as high as those for time delays from congestion (Creutzig and He, 2009). Various strategies to reduce fuel carbon intensity have varying implications for the many different air pollutants. For example, many studies indicate lower carbon monoxide and hydrocarbon emissions from the displacement of fossil‐based transport fuels with biofuels, but NOx emissions are often higher. Advanced biofuels are expected to improve performance, such as the low particulate matter emissions from ligno‐cellulosic ethanol (see Hill et al., 2009, Sathaye et al., 2011 and Section 11.13.5). Strategies that target local air pollution, for example switching to electric vehicles, have the potential to also reduce CO2 emissions (Yedla et al., 2005) and black carbon emissions (UNEP and WMO, 2011) provided the electricity is sourced from low‐carbon sources. Strategies to improve energy efficiency in the LDV fleet though fostering diesel‐powered vehicles may affect air quality negatively (Kirchstetter et al., 2008; Schipper and Fulton, 2012) if not accompanied by regulatory measures to ensure emission standards remain stable. The structure and design of these strategies ultimately decides if this potential can be realized (see Section 8.2).
Transport also contributes to noise and vibration issues, which affect human health negatively (WHO, 2009; Oltean‐Dumbrava et al., 2013; Velasco et al., 2013). Transport‐related human inactivity has also been linked to several chronic diseases (WHO, 2008). An increase in walking and cycling
Final Draft Chapter 8 IPCC WGIII AR5
41 of 115
activities could therefore lead to health benefits but conversely, may also lead to an increase in traffic accidents and a larger lung intake of air pollutants (Kahn Ribeiro et al., 2012; Takeshita, 2012). Overall, the benefits of walking and cycling significantly outweigh the risks due to pollution inhalation (Rojas‐Rueda et al., 2011; Rabl and de Nazelle, 2012).
Assessing the social cost of public health is a contested area when presented as disability‐adjusted life years (DALYs). A reduction in CO2 emissions through an increase in active travel and less use of ICE vehicles gave associated health benefits in London (7,332 DALYs per million population per year) and Delhi (12,516 (DALYs/million capita)/yr) – significantly more than from the increased use of lower‐emission vehicles (160 (DALYs/million capita)/yr) in London, and 1,696 in Delhi) (Woodcock et al., 2009). More generally, it has been found consistently across studies and methods that public health benefits (induced by modal shift from LDVs to non‐motorized transport) from physical activity outweighs those from improved air quality (Woodcock et al., 2009; Grabow et al. 2011; Maizlish et al., 2013; Rojas‐Rueda et al., 2011; de Hartog et al., 2010). In a similar trend, reduced car use in Australian cities has been shown to reduce health costs and improve productivity due to an increase in walking (Trubka et al., 2010a).
Safety. The increase in motorized road traffic in most countries places an increasing incidence of accidents with 1.27 million people killed globally each year, of which 91% occur in low and middle‐income countries (WHO, 2011). A further 20 to 50 million people suffer serious injuries (WHO, 2011). By 2030, it is estimated that road traffic injuries will constitute the fifth biggest reason for premature deaths (WHO, 2008). Measures to increase the efficiency of the vehicle fleet can also positively affect the crash‐worthiness of vehicles if more stringent safety standards are adopted along with improved efficiency standards (Santos et al., 2010). Lack of access to safe walking, cycling, and public transport infrastructure remains an important element affecting the success of modal shift strategies, in particular in developing countries (Sonkin et al., 2006; Tiwari and Jain, 2012b).
Fossil fuel displacement. Economists have criticized the assumption that each unit of energy replaces an energy‐equivalent quantity of fossil energy, leaving total fuel use unaffected (Drabik and de Gorter, 2011; Rajagopal et al., 2011b; Thompson et al., 2011). As with other energy sources, increasing energy supply through the production of bioenergy affects energy prices and demand for energy services, and these changes in consumption also affect net global GHG emissions (Hochman et al., 2010b; Rajagopal et al., 2011b; Chen and Khanna, 2012b). The magnitude of the effect of increased biofuel production on global fuel consumption is uncertain (Thompson et al., 2011) and depends on how the world responds in the long term to reduced petroleum demand in regions using increased quantities of biofuels. This in turn depends on the Organization of Petroleum Exporting Countries’ (OPEC) supply response and with China’s and India’s demand response to a given reduction in the demand for petroleum in regions promoting biofuels, and the relative prices of biofuels and fossil fuels including from hydraulic fracturing (fracking) (Gehlhar et al., 2010; Hochman et al., 2010b; Thompson et al., 2011). Notably, if the percentage difference in GHG emissions between an alternative fuel and the incumbent fossil fuel is less than the percentage rebound effect (the fraction not displaced, in terms of GHG emissions), a net increase in GHG emissions will result from promoting the alternative fuel, despite its nominally lower rating (Drabik and de Gorter, 2011). If biofuels displace high carbon‐intensity oil from tar sands or heavy oils, the displacement effect would provide higher GHG emission savings. Estimates of the magnitude of the petroleum rebound effect cover a wide range and depend on modelling assumptions. Two recent modelling studies suggest that biofuels replace about 30–70% of the energy equivalent quantity of petroleum‐based fuel (Drabik and de Gorter, 2011; Chen and Khanna, 2012), while others find replacement can be as low as 12–15% (Hochman et al., 2010b). Under other circumstances, the rebound can be negative. The rebound effect is always subject to the policy context, and can be specifically avoided by global cap and pricing instruments.
Final Draft Chapter 8 IPCC WGIII AR5
42 of 115
8.7.2 Technical risks and uncertainties Different de‐carbonization strategies for transport have a number of technological risks and uncertainties associated with them. Unsustainable mining of resources to supply low‐carbon transport technologies such as batteries and fuel cells may create adverse side effects for the local environment (Massari and Ruberti, 2013); (Eliseeva and Bünzli, 2011). Mitigation options from lower energy‐intensity technologies (e.g., electric buses) and reduced fuel carbon intensity (e.g., biofuels) are particularly uncertain regarding their technological viability, sources of primary energy, and biomass and lifecycle emission reduction potential (see Section 8.3). Biofuels indicators are being developed to ensure a degree of sustainability in their production and use (UNEP/GEF, 2013) Sections 11.13.6 and 11.13.7). For shipping, there is potential for new and shorter routes such as across the Arctic, but these may create risks to vulnerable ecosystems (see Section 8.5).
A focus on improving vehicle fuel efficiency may reduce GHG emissions and potentially improve air quality, but without an increase in modal choice, it may not result in improved access and mobility (Steg and Gifford, 2005). The shift toward more efficient vehicles, for example the increasing use of diesel for the LDV fleet in Europe, has also created tradeoffs such as negatively affecting air quality in cities (Kirchstetter et al., 2008). More generally, mitigation options are also likely to be subject to rebound effects to varying degrees (see Sections 8.3 and 8.10).
8.7.3 Technological spillovers Advancements in technologies developed for the transport sector may have technological spillovers to other sectors. For example advancements in battery technology systems for consumer electronics could facilitate the development of batteries for electric vehicles and vice‐versa (Rao and Wang, 2011). The production of land‐competitive biofuels can also have direct and indirect effects on biodiversity, water, and food availability (see Sections 11.13.6 and 11.13.7). Other areas where technological spillovers may occur include control and navigation systems and other information technology applications.
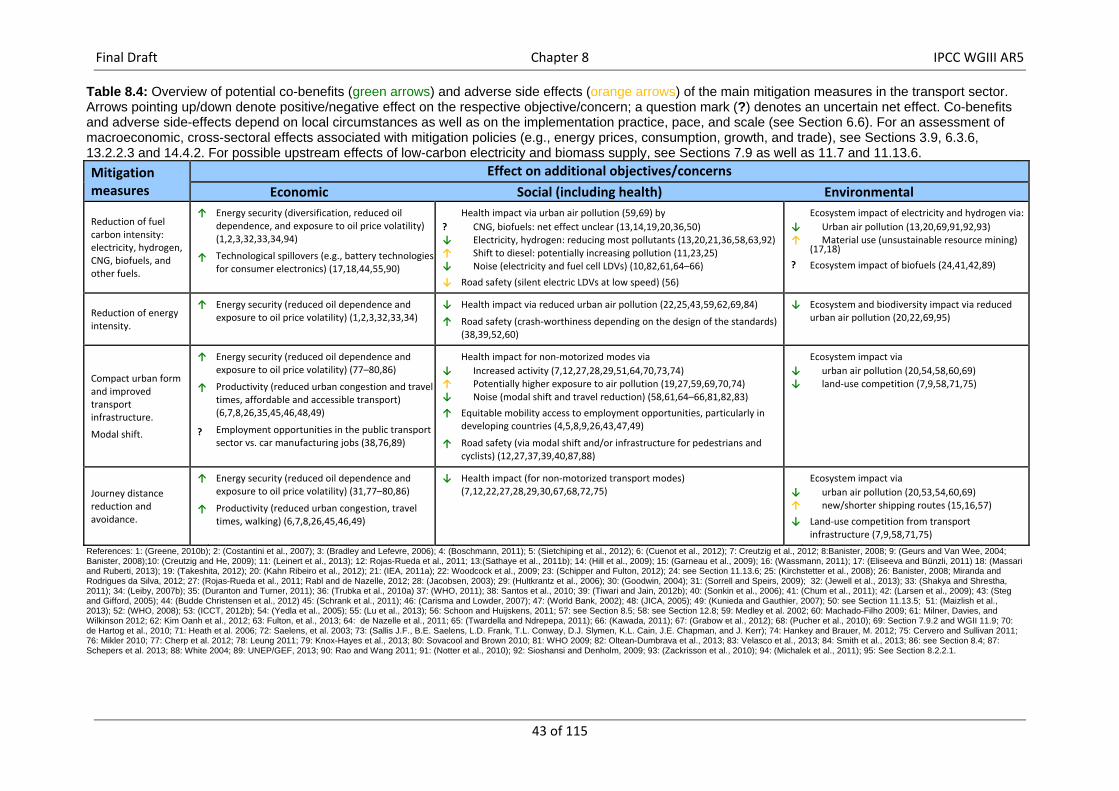
Final Draft Chapter 8 IPCC WGIII AR5
43 of 115
Table 8.4: Overview of potential co-benefits (green arrows) and adverse side effects (orange arrows) of the main mitigation measures in the transport sector. Arrows pointing up/down denote positive/negative effect on the respective objective/concern; a question mark (?) denotes an uncertain net effect. Co-benefits and adverse side-effects depend on local circumstances as well as on the implementation practice, pace, and scale (see Section 6.6). For an assessment of macroeconomic, cross-sectoral effects associated with mitigation policies (e.g., energy prices, consumption, growth, and trade), see Sections 3.9, 6.3.6, 13.2.2.3 and 14.4.2. For possible upstream effects of low-carbon electricity and biomass supply, see Sections 7.9 as well as 11.7 and 11.13.6.
Mitigation measures
Effect on additional objectives/concerns
Economic Social (including health) Environmental
Reduction of fuel carbon intensity: electricity, hydrogen, CNG, biofuels, and other fuels.
↑
↑
Energy security (diversification, reduced oil dependence, and exposure to oil price volatility) (1,2,3,32,33,34,94)
Technological spillovers (e.g., battery technologies for consumer electronics) (17,18,44,55,90)
? ↓↑↓
↓
Health impact via urban air pollution (59,69) by
CNG, biofuels: net effect unclear (13,14,19,20,36,50) Electricity, hydrogen: reducing most pollutants (13,20,21,36,58,63,92) Shift to diesel: potentially increasing pollution (11,23,25) Noise (electricity and fuel cell LDVs) (10,82,61,64–66)
Road safety (silent electric LDVs at low speed) (56)
↓↑
?
Ecosystem impact of electricity and hydrogen via:
Urban air pollution (13,20,69,91,92,93) Material use (unsustainable resource mining) (17,18)
Ecosystem impact of biofuels (24,41,42,89)
Reduction of energy intensity.
↑ Energy security (reduced oil dependence and exposure to oil price volatility) (1,2,3,32,33,34)
↓
↑
Health impact via reduced urban air pollution (22,25,43,59,62,69,84)
Road safety (crash‐worthiness depending on the design of the standards) (38,39,52,60)
↓ Ecosystem and biodiversity impact via reduced urban air pollution (20,22,69,95)
Compact urban form and improved transport infrastructure.
Modal shift.
↑
↑
?
Energy security (reduced oil dependence and exposure to oil price volatility) (77–80,86)
Productivity (reduced urban congestion and travel times, affordable and accessible transport) (6,7,8,26,35,45,46,48,49)
Employment opportunities in the public transport sector vs. car manufacturing jobs (38,76,89)
↓↑↓
↑
↑
Health impact for non‐motorized modes via
Increased activity (7,12,27,28,29,51,64,70,73,74) Potentially higher exposure to air pollution (19,27,59,69,70,74) Noise (modal shift and travel reduction) (58,61,64–66,81,82,83)
Equitable mobility access to employment opportunities, particularly in developing countries (4,5,8,9,26,43,47,49)
Road safety (via modal shift and/or infrastructure for pedestrians and cyclists) (12,27,37,39,40,87,88)
↓↓
Ecosystem impact via
urban air pollution (20,54,58,60,69) land‐use competition (7,9,58,71,75)
Journey distance reduction and avoidance.
↑
↑
Energy security (reduced oil dependence and exposure to oil price volatility) (31,77–80,86)
Productivity (reduced urban congestion, travel times, walking) (6,7,8,26,45,46,49)
↓ Health impact (for non‐motorized transport modes) (7,12,22,27,28,29,30,67,68,72,75)
↓↑
↓
Ecosystem impact via
urban air pollution (20,53,54,60,69) new/shorter shipping routes (15,16,57)
Land‐use competition from transport infrastructure (7,9,58,71,75)
References: 1: (Greene, 2010b); 2: (Costantini et al., 2007); 3: (Bradley and Lefevre, 2006); 4: (Boschmann, 2011); 5: (Sietchiping et al., 2012); 6: (Cuenot et al., 2012); 7: Creutzig et al., 2012; 8:Banister, 2008; 9: (Geurs and Van Wee, 2004; Banister, 2008);10: (Creutzig and He, 2009); 11: (Leinert et al., 2013); 12: Rojas-Rueda et al., 2011; 13:(Sathaye et al., 2011b); 14: (Hill et al., 2009); 15: (Garneau et al., 2009); 16: (Wassmann, 2011); 17: (Eliseeva and Bünzli, 2011) 18: (Massari and Ruberti, 2013); 19: (Takeshita, 2012); 20: (Kahn Ribeiro et al., 2012); 21: (IEA, 2011a); 22: Woodcock et al., 2009; 23: (Schipper and Fulton, 2012); 24: see Section 11.13.6; 25: (Kirchstetter et al., 2008); 26: Banister, 2008; Miranda and Rodrigues da Silva, 2012; 27: (Rojas-Rueda et al., 2011; Rabl and de Nazelle, 2012; 28: (Jacobsen, 2003); 29: (Hultkrantz et al., 2006); 30: (Goodwin, 2004); 31: (Sorrell and Speirs, 2009); 32: (Jewell et al., 2013); 33: (Shakya and Shrestha, 2011); 34: (Leiby, 2007b); 35: (Duranton and Turner, 2011); 36: (Trubka et al., 2010a) 37: (WHO, 2011); 38: Santos et al., 2010; 39: (Tiwari and Jain, 2012b); 40: (Sonkin et al., 2006); 41: (Chum et al., 2011); 42: (Larsen et al., 2009); 43: (Steg and Gifford, 2005); 44: (Budde Christensen et al., 2012) 45: (Schrank et al., 2011); 46: (Carisma and Lowder, 2007); 47: (World Bank, 2002); 48: (JICA, 2005); 49: (Kunieda and Gauthier, 2007); 50: see Section 11.13.5; 51: (Maizlish et al., 2013); 52: (WHO, 2008); 53: (ICCT, 2012b); 54: (Yedla et al., 2005); 55: (Lu et al., 2013); 56: Schoon and Huijskens, 2011; 57: see Section 8.5; 58: see Section 12.8; 59: Medley et al. 2002; 60: Machado-Filho 2009; 61: Milner, Davies, and Wilkinson 2012; 62: Kim Oanh et al., 2012; 63: Fulton, et al., 2013; 64: de Nazelle et al., 2011; 65: (Twardella and Ndrepepa, 2011); 66: (Kawada, 2011); 67: (Grabow et al., 2012); 68: (Pucher et al., 2010); 69: Section 7.9.2 and WGII 11.9; 70: de Hartog et al., 2010; 71: Heath et al. 2006; 72: Saelens, et al. 2003; 73: (Sallis J.F., B.E. Saelens, L.D. Frank, T.L. Conway, D.J. Slymen, K.L. Cain, J.E. Chapman, and J. Kerr); 74: Hankey and Brauer, M. 2012; 75: Cervero and Sullivan 2011; 76: Mikler 2010; 77: Cherp et al. 2012; 78: Leung 2011; 79: Knox-Hayes et al., 2013; 80: Sovacool and Brown 2010; 81: WHO 2009; 82: Oltean-Dumbrava et al., 2013; 83: Velasco et al., 2013; 84: Smith et al., 2013; 86: see Section 8.4; 87: Schepers et al. 2013; 88: White 2004; 89: UNEP/GEF, 2013; 90: Rao and Wang 2011; 91: (Notter et al., 2010); 92: Sioshansi and Denholm, 2009; 93: (Zackrisson et al., 2010); 94: (Michalek et al., 2011); 95: See Section 8.2.2.1.
Final Draft Chapter 8 IPCC WGIII AR5
44 of 115
8.8 Barriers and opportunities
Barriers and opportunities are processes that hinder or facilitate deployment of new transport technologies and practices. Reducing transport GHG emissions is inherently complex as increasing mobility with LDVs, HDVs, and aircraft has been associated with increasing wealth for the past century of industrialization (Meyer et al., 1965; Glaeser, 2011). The first signs of decoupling fossil fuel‐based mobility from wealth generation are appearing in OECD countries (Kenworthy, 2013). To decouple and reduce GHG emissions, a range of technologies and practices have been identified that are likely to be developed in the short‐ and long‐terms (see Section 8.3), but barriers to their deployment exist as do opportunities for those nations, cities, and regions willing to make low‐carbon transport a priority. There are many barriers to implementing a significantly lower carbon transport system, but these can be turned into opportunities if sufficient consideration is given and best‐practice examples are followed.
8.8.1 Barriers and opportunities to reduce GHGs by technologies and practices The key transport‐related technologies and practices garnered from sections above are set out below in terms of their impact on fuel carbon intensity, improved energy intensity of technologies, system infrastructure efficiency, and transport demand reduction. Each has short‐ and long‐term potentials to reduce transport GHG emissions that are then assessed in terms of their barriers and opportunities (Table 8.5). (Details of policies follow in Section 8.10).
Psychological barriers can impede behavioural choices that might otherwise facilitate mitigation as well as adaptation and environmental sustainability. Many individuals are engaged in ameliorative actions to improve their local environment, although many could do more. Gifford (2011) outlined barriers that included “limited cognition about the problem, ideological worldviews that tend to preclude pro‐environmental attitudes and behaviour, comparisons with the responses of other people, sunk costs and behavioural momentum, a dis‐credence toward experts and authorities, perceived risks as a result of making change and positive but inadequate confidence to make behavioural change.”
The range of barriers to the ready adoption of the above technologies and practices have been described in previous sections, but are summarized in Table 8.5 along with the opportunities available. The challenges involved in removing barriers in each of the 16 elements listed depend on the politics of a region. In most places, reducing fuel carbon and energy intensities are likely to be relatively easy as they are technology‐based, though they can meet capital investment barriers in developing regions and may be insufficient in the longer‐term. On the other hand, system infrastructure efficiency and transport demand reduction options would require human interventions and social change as well as public investment. Although these may not require as much capital investment, they would still require public acceptance of any transport policy option (see Section 8.10). As implementation approaches, public acceptance fluctuates, so political support may be required at critical times (Pridmore and Miola, 2011).
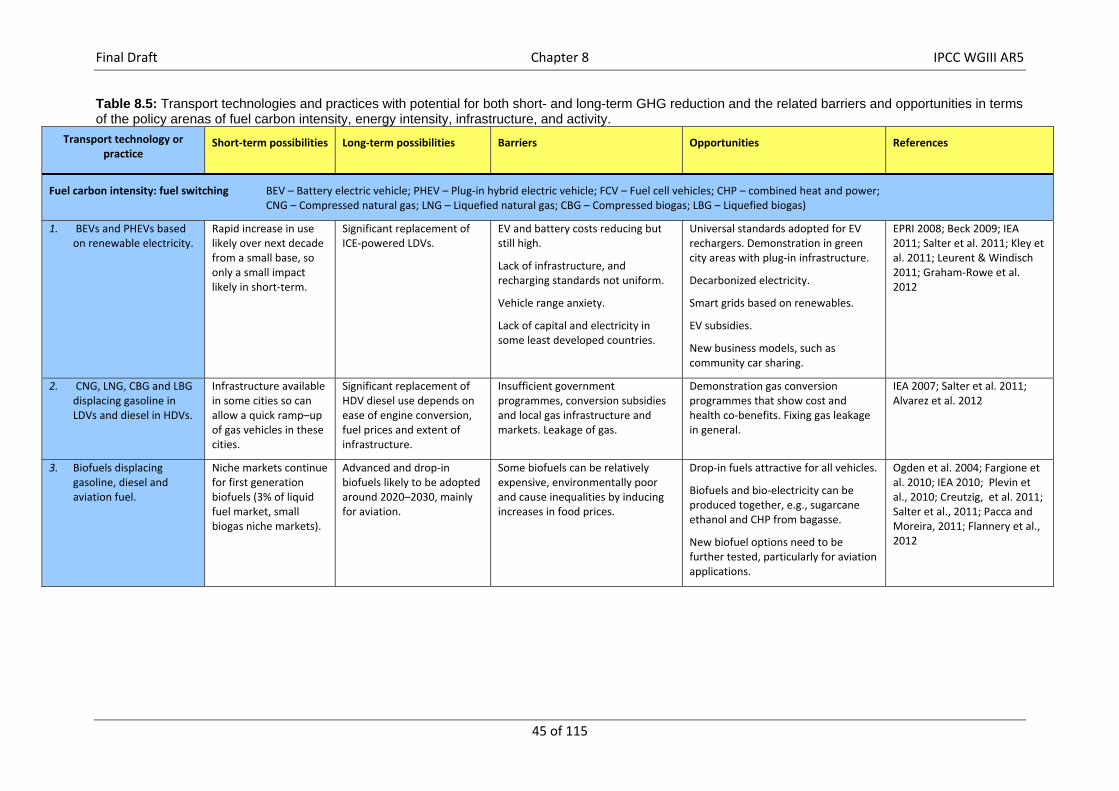
Final Draft Chapter 8 IPCC WGIII AR5
45 of 115
Table 8.5: Transport technologies and practices with potential for both short- and long-term GHG reduction and the related barriers and opportunities in terms of the policy arenas of fuel carbon intensity, energy intensity, infrastructure, and activity.
Transport technology or practice
Short‐term possibilities Long‐term possibilities Barriers Opportunities References
Fuel carbon intensity: fuel switching BEV – Battery electric vehicle; PHEV – Plug‐in hybrid electric vehicle; FCV – Fuel cell vehicles; CHP – combined heat and power; CNG – Compressed natural gas; LNG – Liquefied natural gas; CBG – Compressed biogas; LBG – Liquefied biogas)
1. BEVs and PHEVs based on renewable electricity.
Rapid increase in use likely over next decade from a small base, so only a small impact likely in short‐term.
Significant replacement of ICE‐powered LDVs.
EV and battery costs reducing but still high.
Lack of infrastructure, and recharging standards not uniform.
Vehicle range anxiety.
Lack of capital and electricity in some least developed countries.
Universal standards adopted for EV rechargers. Demonstration in green city areas with plug‐in infrastructure.
Decarbonized electricity.
Smart grids based on renewables.
EV subsidies.
New business models, such as community car sharing.
EPRI 2008; Beck 2009; IEA 2011; Salter et al. 2011; Kley et al. 2011; Leurent & Windisch 2011; Graham‐Rowe et al. 2012
2. CNG, LNG, CBG and LBG displacing gasoline in LDVs and diesel in HDVs.
Infrastructure available in some cities so can allow a quick ramp–up of gas vehicles in these cities.
Significant replacement of HDV diesel use depends on ease of engine conversion, fuel prices and extent of infrastructure.
Insufficient government programmes, conversion subsidies and local gas infrastructure and markets. Leakage of gas.
Demonstration gas conversion programmes that show cost and health co‐benefits. Fixing gas leakage in general.
IEA 2007; Salter et al. 2011; Alvarez et al. 2012
3. Biofuels displacing gasoline, diesel and aviation fuel.
Niche markets continue for first generation biofuels (3% of liquid fuel market, small biogas niche markets).
Advanced and drop‐in biofuels likely to be adopted around 2020–2030, mainly for aviation.
Some biofuels can be relatively expensive, environmentally poor and cause inequalities by inducing increases in food prices.
Drop‐in fuels attractive for all vehicles.
Biofuels and bio‐electricity can be produced together, e.g., sugarcane ethanol and CHP from bagasse.
New biofuel options need to be further tested, particularly for aviation applications.
Ogden et al. 2004; Fargione et al. 2010; IEA 2010; Plevin et al., 2010; Creutzig, et al. 2011; Salter et al., 2011; Pacca and Moreira, 2011; Flannery et al., 2012
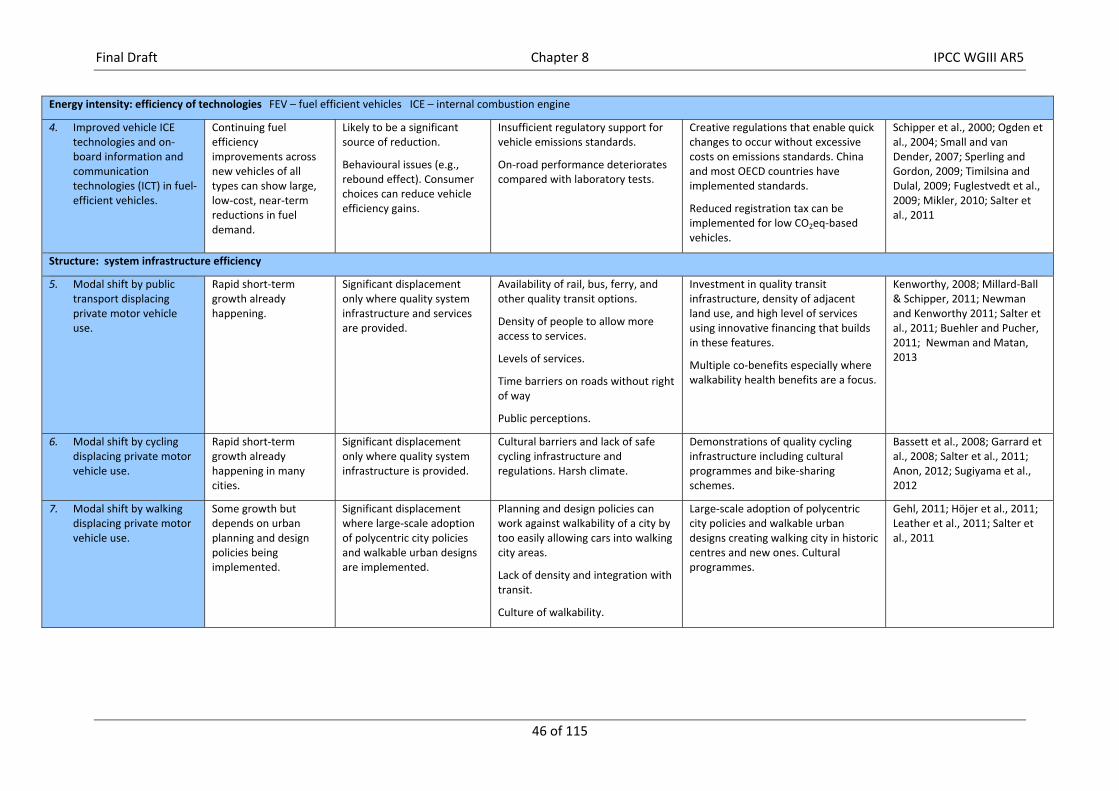
Final Draft Chapter 8 IPCC WGIII AR5
46 of 115
Energy intensity: efficiency of technologies FEV – fuel efficient vehicles ICE – internal combustion engine
4. Improved vehicle ICE technologies and on‐board information and communication technologies (ICT) in fuel‐efficient vehicles.
Continuing fuel efficiency improvements across new vehicles of all types can show large, low‐cost, near‐term reductions in fuel demand.
Likely to be a significant source of reduction.
Behavioural issues (e.g., rebound effect). Consumer choices can reduce vehicle efficiency gains.
Insufficient regulatory support for vehicle emissions standards.
On‐road performance deteriorates compared with laboratory tests.
Creative regulations that enable quick changes to occur without excessive costs on emissions standards. China and most OECD countries have implemented standards.
Reduced registration tax can be implemented for low CO2eq‐based vehicles.
Schipper et al., 2000; Ogden et al., 2004; Small and van Dender, 2007; Sperling and Gordon, 2009; Timilsina and Dulal, 2009; Fuglestvedt et al., 2009; Mikler, 2010; Salter et al., 2011
Structure: system infrastructure efficiency
5. Modal shift by public transport displacing private motor vehicle use.
Rapid short‐term growth already happening.
Significant displacement only where quality system infrastructure and services are provided.
Availability of rail, bus, ferry, and other quality transit options.
Density of people to allow more access to services.
Levels of services.
Time barriers on roads without right of way
Public perceptions.
Investment in quality transit infrastructure, density of adjacent land use, and high level of services using innovative financing that builds in these features.
Multiple co‐benefits especially where walkability health benefits are a focus.
Kenworthy, 2008; Millard‐Ball & Schipper, 2011; Newman and Kenworthy 2011; Salter et al., 2011; Buehler and Pucher, 2011; Newman and Matan, 2013
6. Modal shift by cycling displacing private motor vehicle use.
Rapid short‐term growth already happening in many cities.
Significant displacement only where quality system infrastructure is provided.
Cultural barriers and lack of safe cycling infrastructure and regulations. Harsh climate.
Demonstrations of quality cycling infrastructure including cultural programmes and bike‐sharing schemes.
Bassett et al., 2008; Garrard et al., 2008; Salter et al., 2011; Anon, 2012; Sugiyama et al., 2012
7. Modal shift by walking displacing private motor vehicle use.
Some growth but depends on urban planning and design policies being implemented.
Significant displacement where large‐scale adoption of polycentric city policies and walkable urban designs are implemented.
Planning and design policies can work against walkability of a city by too easily allowing cars into walking city areas.
Lack of density and integration with transit.
Culture of walkability.
Large‐scale adoption of polycentric city policies and walkable urban designs creating walking city in historic centres and new ones. Cultural programmes.
Gehl, 2011; Höjer et al., 2011; Leather et al., 2011; Salter et al., 2011
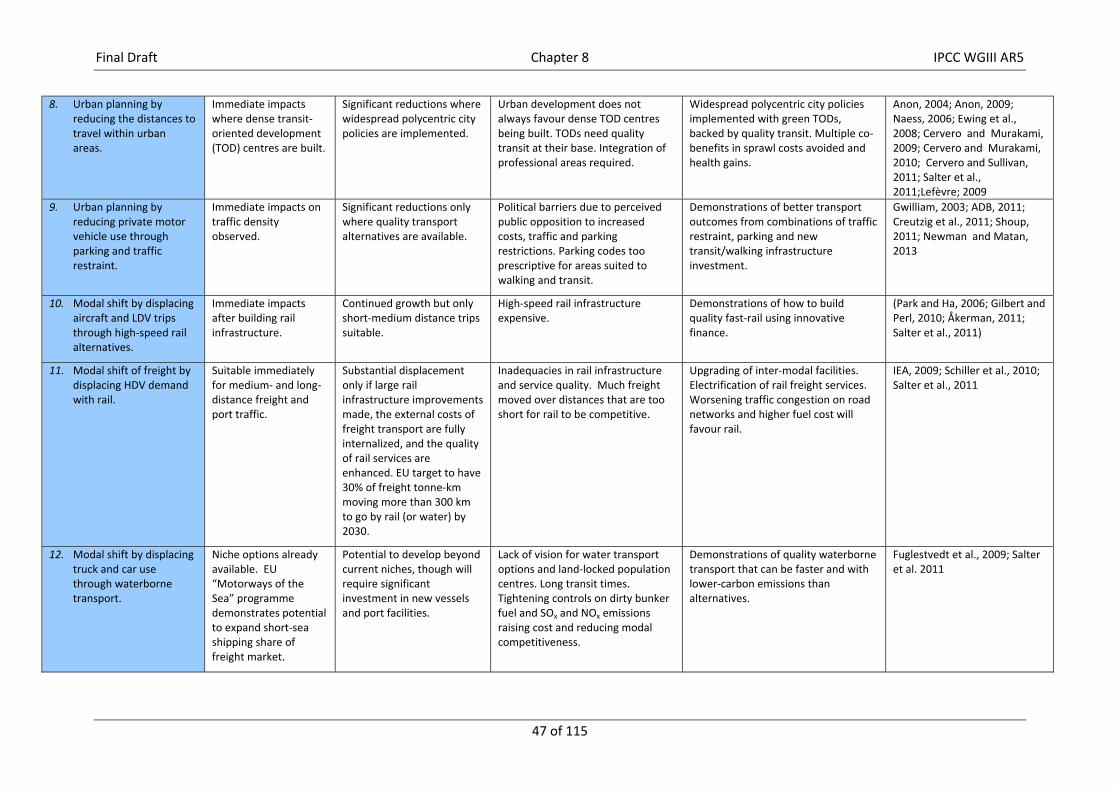
Final Draft Chapter 8 IPCC WGIII AR5
47 of 115
8. Urban planning by reducing the distances to travel within urban areas.
Immediate impacts where dense transit‐oriented development (TOD) centres are built.
Significant reductions where widespread polycentric city policies are implemented.
Urban development does not always favour dense TOD centres being built. TODs need quality transit at their base. Integration of professional areas required.
Widespread polycentric city policies implemented with green TODs, backed by quality transit. Multiple co‐benefits in sprawl costs avoided and health gains.
Anon, 2004; Anon, 2009; Naess, 2006; Ewing et al., 2008; Cervero and Murakami, 2009; Cervero and Murakami, 2010; Cervero and Sullivan, 2011; Salter et al., 2011;Lefèvre; 2009
9. Urban planning by reducing private motor vehicle use through parking and traffic restraint.
Immediate impacts on traffic density observed.
Significant reductions only where quality transport alternatives are available.
Political barriers due to perceived public opposition to increased costs, traffic and parking restrictions. Parking codes too prescriptive for areas suited to walking and transit.
Demonstrations of better transport outcomes from combinations of traffic restraint, parking and new transit/walking infrastructure investment.
Gwilliam, 2003; ADB, 2011; Creutzig et al., 2011; Shoup, 2011; Newman and Matan, 2013
10. Modal shift by displacing aircraft and LDV trips through high‐speed rail alternatives.
Immediate impacts after building rail infrastructure.
Continued growth but only short‐medium distance trips suitable.
High‐speed rail infrastructure expensive.
Demonstrations of how to build quality fast‐rail using innovative finance.
(Park and Ha, 2006; Gilbert and Perl, 2010; Åkerman, 2011; Salter et al., 2011)
11. Modal shift of freight by displacing HDV demand with rail.
Suitable immediately for medium‐ and long‐distance freight and port traffic.
Substantial displacement only if large rail infrastructure improvements made, the external costs of freight transport are fully internalized, and the quality of rail services are enhanced. EU target to have 30% of freight tonne‐km moving more than 300 km to go by rail (or water) by 2030.
Inadequacies in rail infrastructure and service quality. Much freight moved over distances that are too short for rail to be competitive.
Upgrading of inter‐modal facilities. Electrification of rail freight services. Worsening traffic congestion on road networks and higher fuel cost will favour rail.
IEA, 2009; Schiller et al., 2010; Salter et al., 2011
12. Modal shift by displacing truck and car use through waterborne transport.
Niche options already available. EU “Motorways of the Sea” programme demonstrates potential to expand short‐sea shipping share of freight market.
Potential to develop beyond current niches, though will require significant investment in new vessels and port facilities.
Lack of vision for water transport options and land‐locked population centres. Long transit times. Tightening controls on dirty bunker fuel and SOx and NOx emissions raising cost and reducing modal competitiveness.
Demonstrations of quality waterborne transport that can be faster and with lower‐carbon emissions than alternatives.
Fuglestvedt et al., 2009; Salter et al. 2011
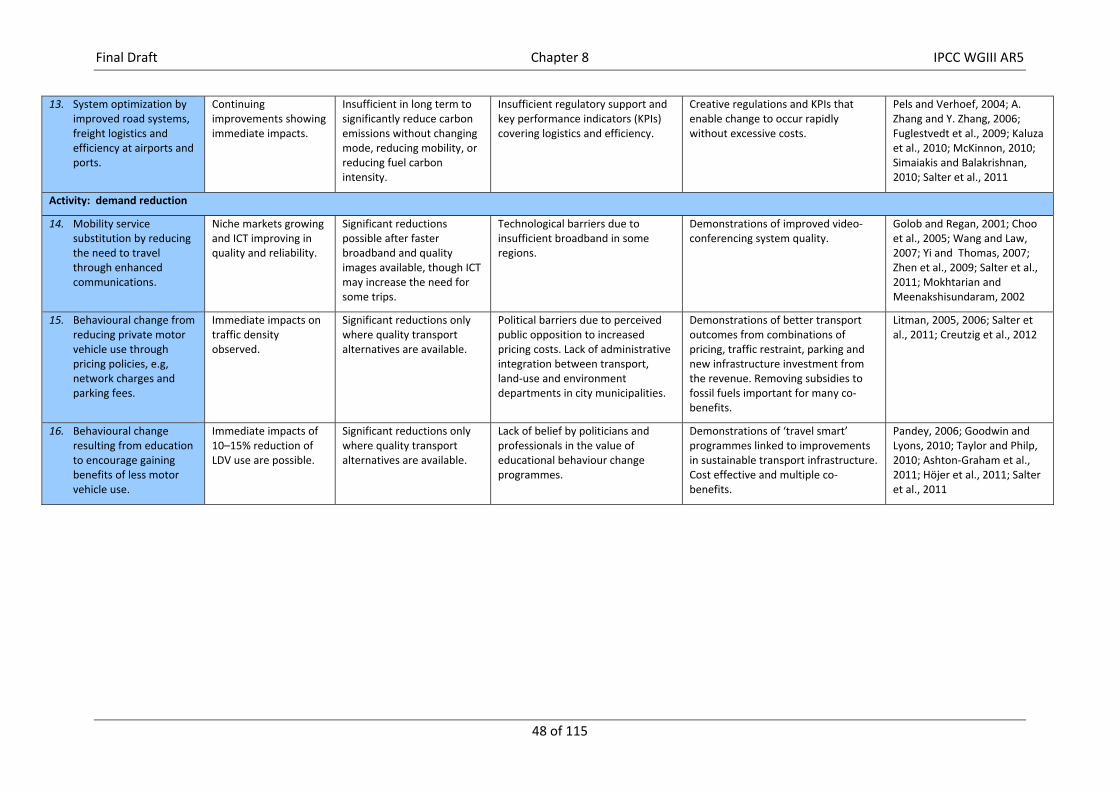
Final Draft Chapter 8 IPCC WGIII AR5
48 of 115
13. System optimization by improved road systems, freight logistics and efficiency at airports and ports.
Continuing improvements showing immediate impacts.
Insufficient in long term to significantly reduce carbon emissions without changing mode, reducing mobility, or reducing fuel carbon intensity.
Insufficient regulatory support and key performance indicators (KPIs) covering logistics and efficiency.
Creative regulations and KPIs that enable change to occur rapidly without excessive costs.
Pels and Verhoef, 2004; A. Zhang and Y. Zhang, 2006; Fuglestvedt et al., 2009; Kaluza et al., 2010; McKinnon, 2010; Simaiakis and Balakrishnan, 2010; Salter et al., 2011
Activity: demand reduction
14. Mobility service substitution by reducing the need to travel through enhanced communications.
Niche markets growing and ICT improving in quality and reliability.
Significant reductions possible after faster broadband and quality images available, though ICT may increase the need for some trips.
Technological barriers due to insufficient broadband in some regions.
Demonstrations of improved video‐conferencing system quality.
Golob and Regan, 2001; Choo et al., 2005; Wang and Law, 2007; Yi and Thomas, 2007; Zhen et al., 2009; Salter et al., 2011; Mokhtarian and Meenakshisundaram, 2002
15. Behavioural change from reducing private motor vehicle use through pricing policies, e.g, network charges and parking fees.
Immediate impacts on traffic density observed.
Significant reductions only where quality transport alternatives are available.
Political barriers due to perceived public opposition to increased pricing costs. Lack of administrative integration between transport, land‐use and environment departments in city municipalities.
Demonstrations of better transport outcomes from combinations of pricing, traffic restraint, parking and new infrastructure investment from the revenue. Removing subsidies to fossil fuels important for many co‐benefits.
Litman, 2005, 2006; Salter et al., 2011; Creutzig et al., 2012
16. Behavioural change resulting from education to encourage gaining benefits of less motor vehicle use.
Immediate impacts of 10–15% reduction of LDV use are possible.
Significant reductions only where quality transport alternatives are available.
Lack of belief by politicians and professionals in the value of educational behaviour change programmes.
Demonstrations of ‘travel smart’ programmes linked to improvements in sustainable transport infrastructure. Cost effective and multiple co‐benefits.
Pandey, 2006; Goodwin and Lyons, 2010; Taylor and Philp, 2010; Ashton‐Graham et al., 2011; Höjer et al., 2011; Salter et al., 2011
Final Draft Chapter 8 IPCC WGIII AR5
49 of 115
8.8.2 Financing low‐carbon transport Transport is a foundation for any economy as it enables people to be linked, goods to be exchanged, and cities to be structured (Glaeser, 2011). Transport is critical for poverty reduction and growth in the plans of most regions, nations, and cities. It therefore is a key area to receive development funding. In past decades the amount of funding going to transport through various low‐carbon mechanisms had been relatively low, but have had a recent increase. The projects registered in the United Nations Environmental Programme (UNEP) pipeline database for the clean development mechanism (CDM) shows only 42 projects out of 6707 were transport‐related (Kopp, 2012). The Global Environment Facility (GEF) has approved only 28 projects in 20 years, and the World Bank’s Clean Technology Fund has funded transport projects for less than 17% of the total. If this international funding does not improve, then transport could move from emitting 22% of energy‐related GHGs in 2009 to reach 80% by 2050 (ADB, 2012a). Conversely, national appropriate mitigation measures (NAMAs) could attract low‐carbon financing in the transport area for the developing world. To support sustainable transport system development, eight multi‐lateral development banks have pledged to invest around 170 billion USD2010 over the next ten years (Marton‐Lefèvre, 2012).
A major part of funding sustainable transport could arise from the redirection of funding from unsustainable transport (Sakamoto et al., 2010; UNEP, 2011; ADB, 2012b). In addition, land‐based taxes or fees can capitalize on the value gains brought by sustainable transport infrastructures (Chapter 12.5.2). For example, in locations close to a new rail system, revenue can be generated from land‐based taxes and rates that are seen to rise by 20–50% compared to areas not adjacent to such an accessible facility (Cervero 1994; Haider and Miller, 2000; Rybeck, 2004). Local municipal financing by land value capture and land taxes could be a primary source of financing for public transit and non‐motorized transport infrastructure, especially in rapidly urbanizing Asia (Chapter 12.5.2; Bongardt et al., 2013). For example, a number of value capture projects are underway as part of the rapid growth in urban rail systems, including Indian cities (Newman et al., 2013). The ability to fully outline the costs and benefits of low‐carbon transport projects will be critical to accessing these new funding opportunities. R&D barriers and opportunities exist for all of these agendas in transport.
8.8.3 Institutional, cultural, and legal barriers and opportunities Institutional barriers to low‐carbon transport include international standards required for new EV infrastructure to enable recharging; low pricing of parking; lack of educational programmes for modal shift; and polycentric planning policies that require the necessary institutional structures (OECD, 2012; Salter et al., 2011). Cultural barriers underlie every aspect of transport, for example, automobile dependence being built into a culture and legal barriers that can exist to prevent the building of dense, mixed‐use community centres that reduce car dependence. Overall, there are political barriers that combine most of the above (Pridmore and Miola, 2011).
Opportunities also exist. Low‐carbon transport elements in green growth programmes (OECD, 2011; Hargroves and Smith, 2008) are likely to be the basis of changing economies because they shape cities and create wealth (Glaeser, 2011; Newman et al., 2009). Those nations, cities, businesses, and communities that grasp the opportunities to demonstrate these changes are likely to be the ones that benefit most in the future (OECD, 2012). The process of decoupling economic growth from fossil fuel dependence could become a major feature of the future economy (ADB, 2012a) with sustainable transport being one of four key approaches. Overcoming the barriers to each technology and practice (Table 8.5) could enable each to contribute to a more sustainable transport system and realize the opportunities from technological and social changes when moving towards a decarbonized economy of the future.
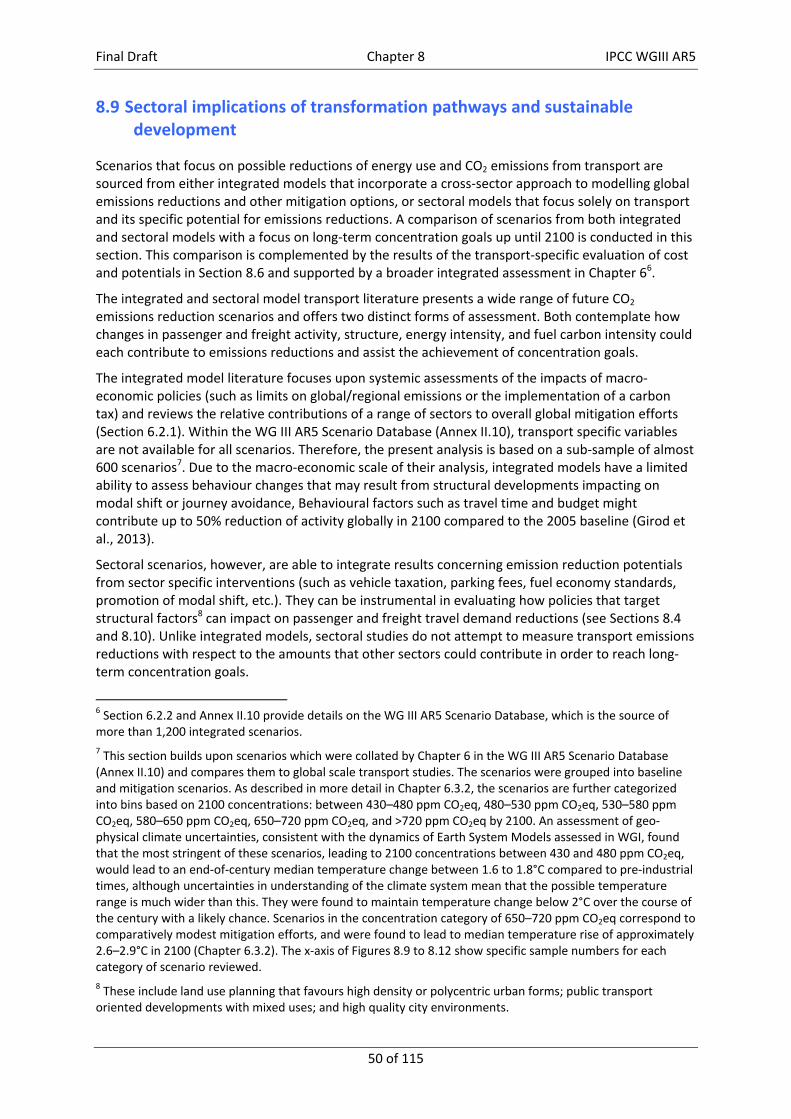
Final Draft Chapter 8 IPCC WGIII AR5
50 of 115
8.9 Sectoral implications of transformation pathways and sustainable development
Scenarios that focus on possible reductions of energy use and CO2 emissions from transport are sourced from either integrated models that incorporate a cross‐sector approach to modelling global emissions reductions and other mitigation options, or sectoral models that focus solely on transport and its specific potential for emissions reductions. A comparison of scenarios from both integrated and sectoral models with a focus on long‐term concentration goals up until 2100 is conducted in this section. This comparison is complemented by the results of the transport‐specific evaluation of cost and potentials in Section 8.6 and supported by a broader integrated assessment in Chapter 66.
The integrated and sectoral model transport literature presents a wide range of future CO2 emissions reduction scenarios and offers two distinct forms of assessment. Both contemplate how changes in passenger and freight activity, structure, energy intensity, and fuel carbon intensity could each contribute to emissions reductions and assist the achievement of concentration goals.
The integrated model literature focuses upon systemic assessments of the impacts of macro‐economic policies (such as limits on global/regional emissions or the implementation of a carbon tax) and reviews the relative contributions of a range of sectors to overall global mitigation efforts (Section 6.2.1). Within the WG III AR5 Scenario Database (Annex II.10), transport specific variables are not available for all scenarios. Therefore, the present analysis is based on a sub‐sample of almost 600 scenarios7. Due to the macro‐economic scale of their analysis, integrated models have a limited ability to assess behaviour changes that may result from structural developments impacting on modal shift or journey avoidance, Behavioural factors such as travel time and budget might contribute up to 50% reduction of activity globally in 2100 compared to the 2005 baseline (Girod et al., 2013).
Sectoral scenarios, however, are able to integrate results concerning emission reduction potentials from sector specific interventions (such as vehicle taxation, parking fees, fuel economy standards, promotion of modal shift, etc.). They can be instrumental in evaluating how policies that target structural factors8 can impact on passenger and freight travel demand reductions (see Sections 8.4 and 8.10). Unlike integrated models, sectoral studies do not attempt to measure transport emissions reductions with respect to the amounts that other sectors could contribute in order to reach long‐term concentration goals.
6 Section 6.2.2 and Annex II.10 provide details on the WG III AR5 Scenario Database, which is the source of more than 1,200 integrated scenarios.
7 This section builds upon scenarios which were collated by Chapter 6 in the WG III AR5 Scenario Database (Annex II.10) and compares them to global scale transport studies. The scenarios were grouped into baseline and mitigation scenarios. As described in more detail in Chapter 6.3.2, the scenarios are further categorized into bins based on 2100 concentrations: between 430–480 ppm CO2eq, 480–530 ppm CO2eq, 530–580 ppm CO2eq, 580–650 ppm CO2eq, 650–720 ppm CO2eq, and >720 ppm CO2eq by 2100. An assessment of geo‐physical climate uncertainties, consistent with the dynamics of Earth System Models assessed in WGI, found that the most stringent of these scenarios, leading to 2100 concentrations between 430 and 480 ppm CO2eq, would lead to an end‐of‐century median temperature change between 1.6 to 1.8°C compared to pre‐industrial times, although uncertainties in understanding of the climate system mean that the possible temperature range is much wider than this. They were found to maintain temperature change below 2°C over the course of the century with a likely chance. Scenarios in the concentration category of 650–720 ppm CO2eq correspond to comparatively modest mitigation efforts, and were found to lead to median temperature rise of approximately 2.6–2.9°C in 2100 (Chapter 6.3.2). The x‐axis of Figures 8.9 to 8.12 show specific sample numbers for each category of scenario reviewed.
8 These include land use planning that favours high density or polycentric urban forms; public transport oriented developments with mixed uses; and high quality city environments.
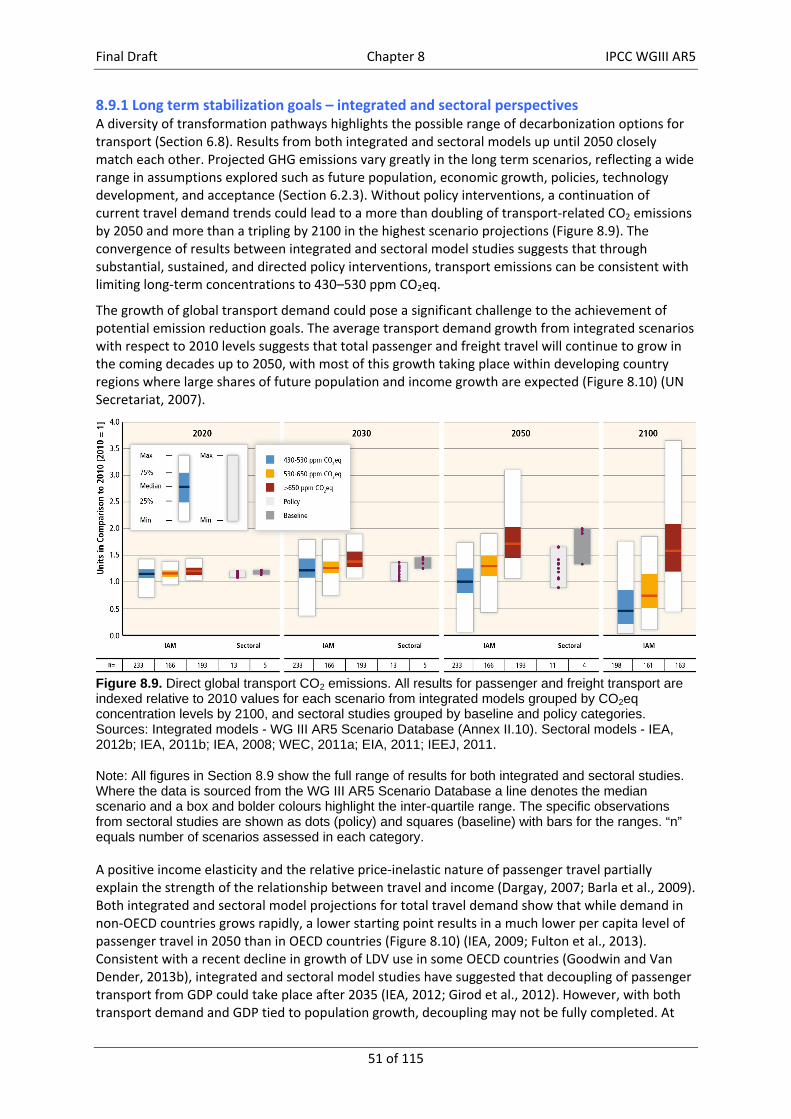
Final Draft Chapter 8 IPCC WGIII AR5
51 of 115
8.9.1 Long term stabilization goals – integrated and sectoral perspectives A diversity of transformation pathways highlights the possible range of decarbonization options for transport (Section 6.8). Results from both integrated and sectoral models up until 2050 closely match each other. Projected GHG emissions vary greatly in the long term scenarios, reflecting a wide range in assumptions explored such as future population, economic growth, policies, technology development, and acceptance (Section 6.2.3). Without policy interventions, a continuation of current travel demand trends could lead to a more than doubling of transport‐related CO2 emissions by 2050 and more than a tripling by 2100 in the highest scenario projections (Figure 8.9). The convergence of results between integrated and sectoral model studies suggests that through substantial, sustained, and directed policy interventions, transport emissions can be consistent with limiting long‐term concentrations to 430–530 ppm CO2eq.
The growth of global transport demand could pose a significant challenge to the achievement of potential emission reduction goals. The average transport demand growth from integrated scenarios with respect to 2010 levels suggests that total passenger and freight travel will continue to grow in the coming decades up to 2050, with most of this growth taking place within developing country regions where large shares of future population and income growth are expected (Figure 8.10) (UN Secretariat, 2007).
Figure 8.9. Direct global transport CO2 emissions. All results for passenger and freight transport are indexed relative to 2010 values for each scenario from integrated models grouped by CO2eq concentration levels by 2100, and sectoral studies grouped by baseline and policy categories. Sources: Integrated models - WG III AR5 Scenario Database (Annex II.10). Sectoral models - IEA, 2012b; IEA, 2011b; IEA, 2008; WEC, 2011a; EIA, 2011; IEEJ, 2011.
Note: All figures in Section 8.9 show the full range of results for both integrated and sectoral studies. Where the data is sourced from the WG III AR5 Scenario Database a line denotes the median scenario and a box and bolder colours highlight the inter-quartile range. The specific observations from sectoral studies are shown as dots (policy) and squares (baseline) with bars for the ranges. “n” equals number of scenarios assessed in each category.
A positive income elasticity and the relative price‐inelastic nature of passenger travel partially explain the strength of the relationship between travel and income (Dargay, 2007; Barla et al., 2009). Both integrated and sectoral model projections for total travel demand show that while demand in non‐OECD countries grows rapidly, a lower starting point results in a much lower per capita level of passenger travel in 2050 than in OECD countries (Figure 8.10) (IEA, 2009; Fulton et al., 2013). Consistent with a recent decline in growth of LDV use in some OECD countries (Goodwin and Van Dender, 2013b), integrated and sectoral model studies have suggested that decoupling of passenger transport from GDP could take place after 2035 (IEA, 2012; Girod et al., 2012). However, with both transport demand and GDP tied to population growth, decoupling may not be fully completed. At
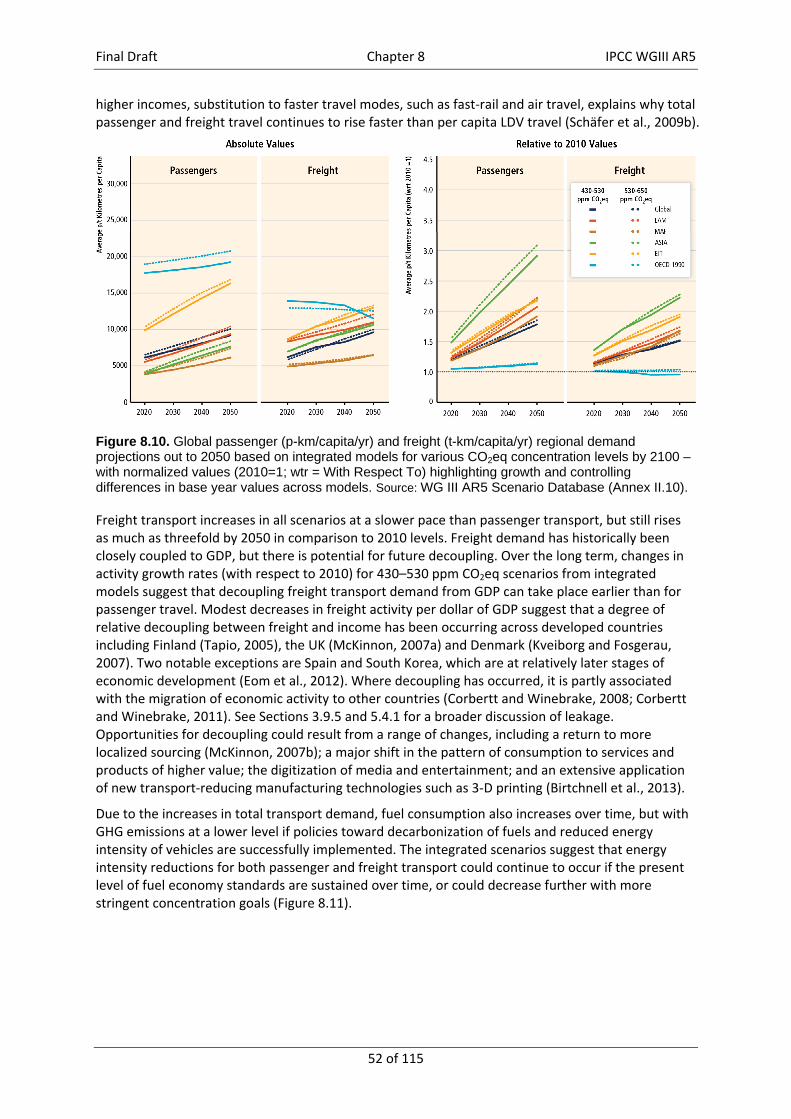
Final Draft Chapter 8 IPCC WGIII AR5
52 of 115
higher incomes, substitution to faster travel modes, such as fast‐rail and air travel, explains why total passenger and freight travel continues to rise faster than per capita LDV travel (Schäfer et al., 2009b).
Figure 8.10. Global passenger (p-km/capita/yr) and freight (t-km/capita/yr) regional demand projections out to 2050 based on integrated models for various CO2eq concentration levels by 2100 – with normalized values (2010=1; wtr = With Respect To) highlighting growth and controlling differences in base year values across models. Source: WG III AR5 Scenario Database (Annex II.10).
Freight transport increases in all scenarios at a slower pace than passenger transport, but still rises as much as threefold by 2050 in comparison to 2010 levels. Freight demand has historically been closely coupled to GDP, but there is potential for future decoupling. Over the long term, changes in activity growth rates (with respect to 2010) for 430–530 ppm CO2eq scenarios from integrated models suggest that decoupling freight transport demand from GDP can take place earlier than for passenger travel. Modest decreases in freight activity per dollar of GDP suggest that a degree of relative decoupling between freight and income has been occurring across developed countries including Finland (Tapio, 2005), the UK (McKinnon, 2007a) and Denmark (Kveiborg and Fosgerau, 2007). Two notable exceptions are Spain and South Korea, which are at relatively later stages of economic development (Eom et al., 2012). Where decoupling has occurred, it is partly associated with the migration of economic activity to other countries (Corbertt and Winebrake, 2008; Corbertt and Winebrake, 2011). See Sections 3.9.5 and 5.4.1 for a broader discussion of leakage. Opportunities for decoupling could result from a range of changes, including a return to more localized sourcing (McKinnon, 2007b); a major shift in the pattern of consumption to services and products of higher value; the digitization of media and entertainment; and an extensive application of new transport‐reducing manufacturing technologies such as 3‐D printing (Birtchnell et al., 2013).
Due to the increases in total transport demand, fuel consumption also increases over time, but with GHG emissions at a lower level if policies toward decarbonization of fuels and reduced energy intensity of vehicles are successfully implemented. The integrated scenarios suggest that energy intensity reductions for both passenger and freight transport could continue to occur if the present level of fuel economy standards are sustained over time, or could decrease further with more stringent concentration goals (Figure 8.11).
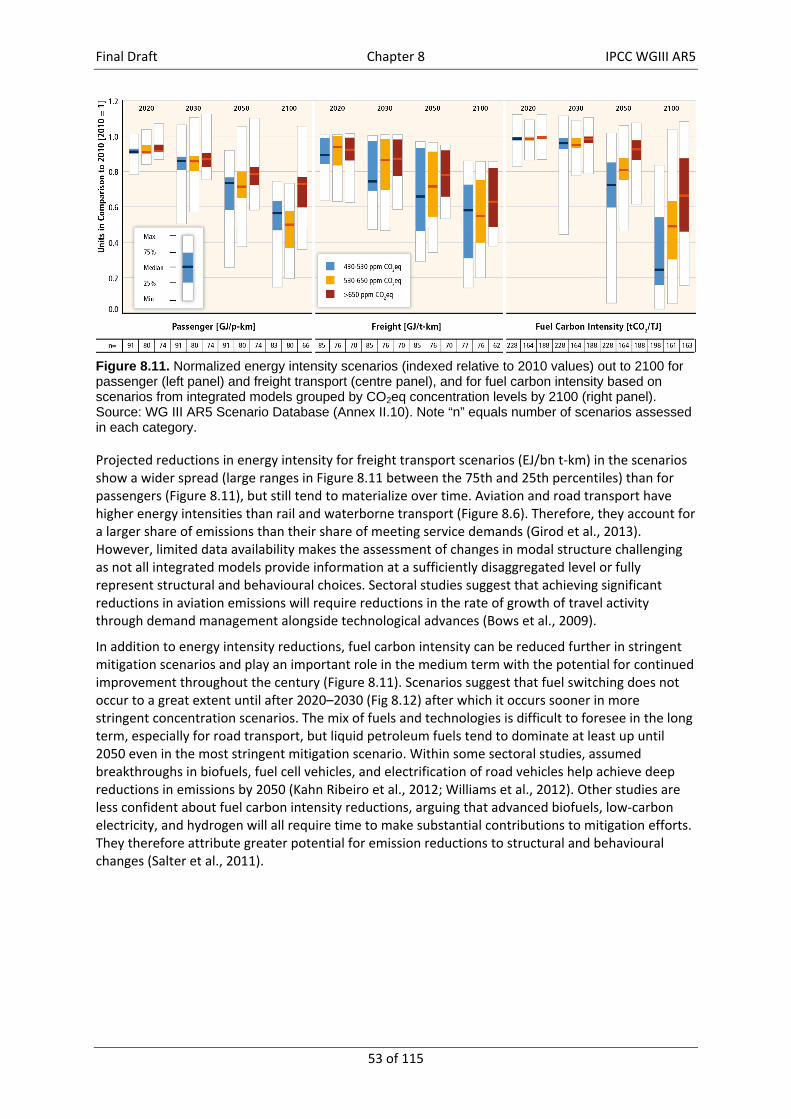
Final Draft Chapter 8 IPCC WGIII AR5
53 of 115
Figure 8.11. Normalized energy intensity scenarios (indexed relative to 2010 values) out to 2100 for passenger (left panel) and freight transport (centre panel), and for fuel carbon intensity based on scenarios from integrated models grouped by CO2eq concentration levels by 2100 (right panel). Source: WG III AR5 Scenario Database (Annex II.10). Note “n” equals number of scenarios assessed in each category.
Projected reductions in energy intensity for freight transport scenarios (EJ/bn t‐km) in the scenarios show a wider spread (large ranges in Figure 8.11 between the 75th and 25th percentiles) than for passengers (Figure 8.11), but still tend to materialize over time. Aviation and road transport have higher energy intensities than rail and waterborne transport (Figure 8.6). Therefore, they account for a larger share of emissions than their share of meeting service demands (Girod et al., 2013). However, limited data availability makes the assessment of changes in modal structure challenging as not all integrated models provide information at a sufficiently disaggregated level or fully represent structural and behavioural choices. Sectoral studies suggest that achieving significant reductions in aviation emissions will require reductions in the rate of growth of travel activity through demand management alongside technological advances (Bows et al., 2009).
In addition to energy intensity reductions, fuel carbon intensity can be reduced further in stringent mitigation scenarios and play an important role in the medium term with the potential for continued improvement throughout the century (Figure 8.11). Scenarios suggest that fuel switching does not occur to a great extent until after 2020–2030 (Fig 8.12) after which it occurs sooner in more stringent concentration scenarios. The mix of fuels and technologies is difficult to foresee in the long term, especially for road transport, but liquid petroleum fuels tend to dominate at least up until 2050 even in the most stringent mitigation scenario. Within some sectoral studies, assumed breakthroughs in biofuels, fuel cell vehicles, and electrification of road vehicles help achieve deep reductions in emissions by 2050 (Kahn Ribeiro et al., 2012; Williams et al., 2012). Other studies are less confident about fuel carbon intensity reductions, arguing that advanced biofuels, low‐carbon electricity, and hydrogen will all require time to make substantial contributions to mitigation efforts. They therefore attribute greater potential for emission reductions to structural and behavioural changes (Salter et al., 2011).
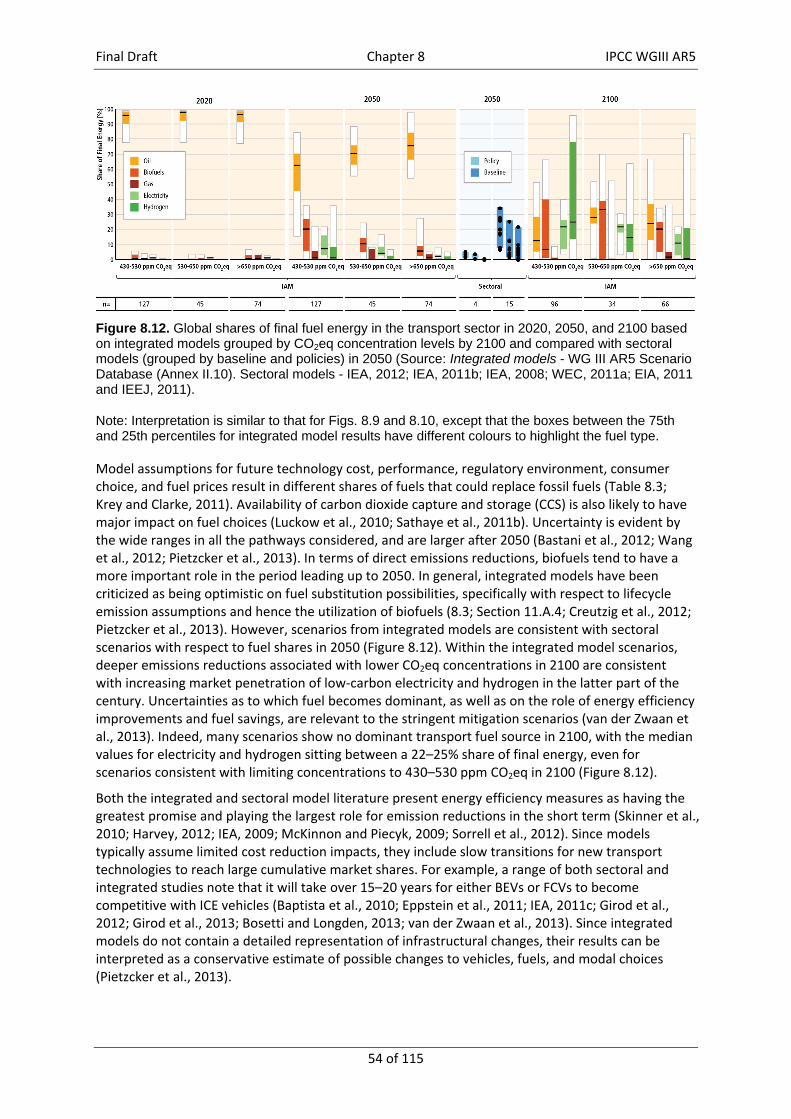
Final Draft Chapter 8 IPCC WGIII AR5
54 of 115
Figure 8.12. Global shares of final fuel energy in the transport sector in 2020, 2050, and 2100 based on integrated models grouped by CO2eq concentration levels by 2100 and compared with sectoral models (grouped by baseline and policies) in 2050 (Source: Integrated models - WG III AR5 Scenario Database (Annex II.10). Sectoral models - IEA, 2012; IEA, 2011b; IEA, 2008; WEC, 2011a; EIA, 2011 and IEEJ, 2011).
Note: Interpretation is similar to that for Figs. 8.9 and 8.10, except that the boxes between the 75th and 25th percentiles for integrated model results have different colours to highlight the fuel type.
Model assumptions for future technology cost, performance, regulatory environment, consumer choice, and fuel prices result in different shares of fuels that could replace fossil fuels (Table 8.3; Krey and Clarke, 2011). Availability of carbon dioxide capture and storage (CCS) is also likely to have major impact on fuel choices (Luckow et al., 2010; Sathaye et al., 2011b). Uncertainty is evident by the wide ranges in all the pathways considered, and are larger after 2050 (Bastani et al., 2012; Wang et al., 2012; Pietzcker et al., 2013). In terms of direct emissions reductions, biofuels tend to have a more important role in the period leading up to 2050. In general, integrated models have been criticized as being optimistic on fuel substitution possibilities, specifically with respect to lifecycle emission assumptions and hence the utilization of biofuels (8.3; Section 11.A.4; Creutzig et al., 2012; Pietzcker et al., 2013). However, scenarios from integrated models are consistent with sectoral scenarios with respect to fuel shares in 2050 (Figure 8.12). Within the integrated model scenarios, deeper emissions reductions associated with lower CO2eq concentrations in 2100 are consistent with increasing market penetration of low‐carbon electricity and hydrogen in the latter part of the century. Uncertainties as to which fuel becomes dominant, as well as on the role of energy efficiency improvements and fuel savings, are relevant to the stringent mitigation scenarios (van der Zwaan et al., 2013). Indeed, many scenarios show no dominant transport fuel source in 2100, with the median values for electricity and hydrogen sitting between a 22–25% share of final energy, even for scenarios consistent with limiting concentrations to 430–530 ppm CO2eq in 2100 (Figure 8.12).
Both the integrated and sectoral model literature present energy efficiency measures as having the greatest promise and playing the largest role for emission reductions in the short term (Skinner et al., 2010; Harvey, 2012; IEA, 2009; McKinnon and Piecyk, 2009; Sorrell et al., 2012). Since models typically assume limited cost reduction impacts, they include slow transitions for new transport technologies to reach large cumulative market shares. For example, a range of both sectoral and integrated studies note that it will take over 15–20 years for either BEVs or FCVs to become competitive with ICE vehicles (Baptista et al., 2010; Eppstein et al., 2011; IEA, 2011c; Girod et al., 2012; Girod et al., 2013; Bosetti and Longden, 2013; van der Zwaan et al., 2013). Since integrated models do not contain a detailed representation of infrastructural changes, their results can be interpreted as a conservative estimate of possible changes to vehicles, fuels, and modal choices (Pietzcker et al., 2013).
Final Draft Chapter 8 IPCC WGIII AR5
55 of 115
The sectoral literature presents a more positive view of transformational opportunities than do the integrated models (IEA, 2008, 2012b; DOE/EIA, 2010; Kahn Ribeiro and Figueroa, 2012). Sectoral studies suggest that up to 20% of travel demand could be reduced by avoided journeys or shifts to low‐carbon modes (McCollum and Yang, 2009; Harvey, 2012; IEA, 2012d; Kahn Ribeiro and Figueroa, 2012; Anable et al., 2012; Huo and Wang, 2012). They also estimate that urban form and infrastructure changes can play decisive roles in mitigation, particularly in urban areas where 70% of the world’s population is projected to live in 2050 (8.4 and Chapter 12.4), although the estimated magnitude varies between 5% and 30% (Ewing, 2007; Creutzig and He, 2009; Echenique et al., 2012). Altogether, for urban transport, 20–50% reduction in GHG emissions is possible between 2010 and 2050 compared to baseline urban development (Ewing, 2007; Eliasson, 2008; Creutzig and He, 2009; Lefèvre, 2009; Woodcock et al., 2009; Ewing and Cervero, 2010; Marshall, 2011; Echenique et al., 2012; Viguié and Hallegatte, 2012; Salon et al., 2012; Creutzig et al., 2012). Since the lead time for infrastructure development is considerable (Short and Kopp, 2005), such changes can only be made on decadal time scales. Conversely, some developing countries with fast growing economies have shown that rapid transformative processes in spatial development and public transport infrastructure are possible. Further advances may be gaining momentum with a number of significant initiatives for reallocating public funding to sustainable and climate‐friendly transport (Bongardt et al., 2011; Wittneben et al., 2009; ADB, 2012; Newman and Matan, 2013).
8.9.2 Sustainable development Within all scenarios, the future contribution of emission reductions from developing countries carries especially large uncertainties. The accelerated pace with which both urbanization and motorization are proceeding in many non‐OECD countries emphasizes serious constraints and potentially damaging developments. These include road and public transport systems that are in dire condition; limited technical and financial resources; the absence of infrastructure governance; poor legal frameworks; and rights to innovate that are needed to act effectively and improve capacity competences (Kamal‐Chaoui and Plouin, 2012; Lefèvre, 2012). The outcome is a widening gap between the growth of detrimental impacts of motorization and effective action (Kane, 2010; Li, 2011; Vasconcellos, 2011). A highly complex and changing context with limited data and information further compromise transport sustainability and mitigation in non‐OECD countries (Dimitriou, 2006; Kane, 2010; Figueroa et al., 2013). The relative marginal socio‐economic costs and benefits of various alternatives can be context sensitive with respect to sustainable development (Amekudzi, 2011). Developing the analytical and data capacity for multi‐objective evaluation and priority setting is an important part of the process of cultivating sustainability and mitigation thinking and culture in
the long‐term.
Potentials for controlling emissions while improving accessibility and achieving functional mobility levels in the urban areas of rapidly growing developing countries can be improved with attention to the manner in which the mobility of the masses progresses in their transition from slower (walking/cycling) to faster motorized modes (Kahn Ribeiro et al., 2012). A major shift towards the use of mass public transport guided by sustainable transport principles, including the maintenance of adequate services and safe infrastructure for non‐motorized transport, presents the greatest mitigation potential (Bongardt et al., 2011; La Branche, 2011). Supporting non‐motorized travel can often provide access and also support development more effectively, more equitably, and with fewer adverse side‐effects, than if providing for motorized travel (Woodcock et al., 2007). Transport can be an agent of sustained urban development that prioritizes goals for equity and emphasizes accessibility, traffic safety, and time savings for the poor with minimal detriment to the environment and human health, all while reducing emissions (Amekudzi et al., 2011; Li, 2011; Kane, 2010; Li, 2011). The choice among alternative mitigation measures in the transport sector can be supported by growing evidence on a large number of co‐benefits, while some adverse side effects exist that need to be addressed or minimized (see Section 8.7) (Figueroa and Kahn Ribeiro, 2013; Creutzig and He, 2009; Creutzig et al., 2012; Zusman et al., 2012).
Final Draft Chapter 8 IPCC WGIII AR5
56 of 115
Box 8.1.Transport and sustainable development in developing countries
Passenger and freight mobility are projected to double in developing countries by 2050 (IEA, 2012e). This increase will improve access to markets, jobs, education, healthcare and other services by providing opportunities to reduce poverty and increase equity (Africa Union, 2009; Vasconcellos, 2011; United Nations Human Settlements Programme, 2012). Well‐designed and well‐managed transport infrastructure can also be vital for supporting trade and competitiveness (United Nations Human Settlements Programme, 2012). Driven by urbanization, a rapid transition from slow non‐motorized transport modes to faster modes using 2‐ or 3‐ wheelers, LDVs, buses, and light rail is expected to continue (Schäfer et al., 2009a; Kumar, 2011). In rural areas of Africa and South Asia, the development of all‐season, high‐quality roads is becoming a high priority (Africa Union, 2009; Arndt et al., 2012). In many megacities, slum area development in peri‐urban fringes confines the urban poor to a choice between low paying jobs near home or long commuting times for marginally higher wages (Burdett and Sudjic, 2010). The poor have limited options to change living locations and can afford few motorized trips, so they predominantly walk, which disproportionally burdens women and children (Anand and Tiwari, 2006; Pendakur, 2011). The urban poor in OECD cities have similar issues (Glaeser, 2011). Reducing vulnerability to climate change requires integrating the mobility needs of the poor into planning that can help realize economic and social development objectives (Amekudzi et al., 2011; Bowen et al., 2012).
Total transport emissions from non‐OECD countries will likely surpass OECD emissions by 2050 due to motorization, increasing population and higher travel demand (Figure 8.10). However, estimated average personal travel per capita in non‐OECD countries at will remain below the average in OECD countries. With countries facing limits to transport infrastructure investment (Arndt et al., 2012), the rapid mobility trends represents a major challenge in terms of traffic congestion, energy demand, and related GHG emissions (IEA, 2012a). Failure to manage the growth of motorized mobility in the near term will inevitably lead to higher environmental cost and greater difficulty to control emissions in the long term (Schäfer et al., 2009a; Pietzcker et al., 2013).
A high modal share of public transport use characterizes developing cities (Estache and GóMez‐Lobo, 2005) and this prevalence is expected to continue (Deng and Nelson, 2011; Cuenot et al., 2012). However, deficient infrastructure and inadequate services leads to the overloading of para‐transit vans, minibuses, jeeps and shared taxis and the use of informal transport services (Cervero and Golub, 2011). By combining technologies, providing new social arrangements, and incorporating a long‐term sustainability and climate perspective to investment decisions, these services can be recast and maintained as mobility resources since they service the poor living in inaccessible areas at affordable prices (Figueroa et al., 2013). A central strategy that can have multiple health, climate, environmental, and social benefits is to invest in the integration of infrastructure systems that connect safe routes for walking and cycling with local public transport, thus giving it priority over infrastructure for LDVs that serve only a small share of the population (Woodcock et al., 2009b; Tiwari and Jain, 2012b). Opportunities for strategic sustainable urban transport development planning exist that can be critical to develop medium sized cities where population increases are expected to be large (Wittneben et al., 2009b; ADB, 2012b; Grubler et al., 2012). Vision, leadership, and a coherent programme for action, adaptation, and consolidation of key institutions that can harness the energy and engagement of all stakeholders in a city will be needed to achieve these goals (Dotson, 2011). Today, more than 150 cities worldwide have implemented bus rapid transit (BRT) systems. Innovative features such as electric transit buses (Gong et al., 2012) and the ambitious high‐speed rail expansion in China provide evidence of a fast process of planning and policy implementation.
Final Draft Chapter 8 IPCC WGIII AR5
57 of 115
8.10 Sectoral policies
Aggressive policy intervention is needed to significantly reduce fuel carbon intensity and energy intensity of modes, encourage travel by the most efficient modes, and cut activity growth where possible and reasonable (see Sections 8.3 and 8.9). In this section, for each major transport mode, policies and strategies are briefly discussed by policy type as regulatory or market‐based, or to a lesser extent as informational, voluntary, or government‐provided. A full evaluation of policies across all sectors is presented in Chapters 14 and 15. Policies to support sustainable transport can simultaneously provide co‐benefits (Table 8.4) such as improving local transport services and enhancing the quality of environment and urban living, while boosting both climate change mitigation and energy security (ECMT, 2004; WBCSD, 2004, 2007; World Bank, 2006; Banister, 2008; IEA, 2009; Bongardt et al., 2011; Ramani et al., 2011; Kahn Ribeiro et al., 2012). The type of policies, their timing, and chance of successful implementation are context dependent (Santos et al., 2010). Diverse attempts have been made by transport agencies in OECD countries to define and measure policy performance (OECD, 2000; CST, 2002; Banister, 2008; Ramani et al., 2011). The mobility needs in non‐OECD countries highlight the importance of placing their climate‐related transport policies in the context of goals for broader sustainable urban development goals (see Section 8.9; Kahn Ribeiro et al., 2007; Bongardt et al., 2011).
Generally speaking, market‐based instruments, such as fuel carbon taxes and carbon cap and trade, are effective at incentivizing all mitigation options simultaneously (Flachsland et al., 2011). However, vehicle and fuel suppliers as well as end‐users, tend to react weakly to fuel price signals especially for passenger travel (Creutzig et al., 2011; Yeh and McCollum, 2011). Market policies are economically more efficient at reducing emissions than fuel carbon intensity standards (Holland et al., 2009; Sperling and Yeh, 2010; Chen and Khanna, 2012a; Holland, 2012). However, financial instruments, such as carbon taxes, must be relatively large to achieve reductions equivalent to those possible with regulatory instruments. As a result, to gain large emissions reductions a suite of policy instruments will be needed (NRC, 2011c; Sperling and Nichols, 2012), including voluntary schemes, which have been successful in some circumstances, such as for the Japanese airline industry (Yamaguchi, 2010).
8.10.1 Road transport A wide array of policies and strategies has been employed in different circumstances to restrain private LDV use, promote mass transit modes, manage traffic congestion and promote new fuels in order to reduce fossil fuel use, air pollution, and GHG emissions. These policies and strategies overlap considerably, often synergistically.
The scale of urban growth and population redistribution from rural to urban areas in emerging and developing countries is expected to continue (see Section 8.2 and Chapter 12.2). This implies a large increase in demand for motorized transport especially in medium‐size cities (Grubler et al., 2012). In regions and countries presently with low levels of LDV ownership, opportunities exist for local and national governments to manage future rising road vehicle demand in ways that support economic growth, provide broad social benefits (Wright and Fulton, 2005; IEA, 2009; Kato et al., 2005) and keep GHG emissions in bounds. Local history and social culture can help shape the specific problem, together with equity implications and policy aspirations that ultimately determine what will become acceptable solutions (Vasconcellos, 2001; Dimitriou, 2006; Kane, 2010; Li, 2011; Verma et al., 2011).
Even if non‐OECD countries pursue strategies and policies that encourage LDV use for a variety of economic, social, and environmental motivations, per capita LDV travel in 2050 could remain far below OECD countries. However, in many OECD countries, passenger LDV travel demand per capita appears to have begun to flatten, partly driven by increasing levels of saturation and polices to manage increased road transport demand (8.2.1; Millard‐Ball and Schipper, 2011; Schipper, 2011; Goodwin, 2012; IEA, 2012c; Meyer et al., 2012). Even if this trend of slowing LDV demand eventually
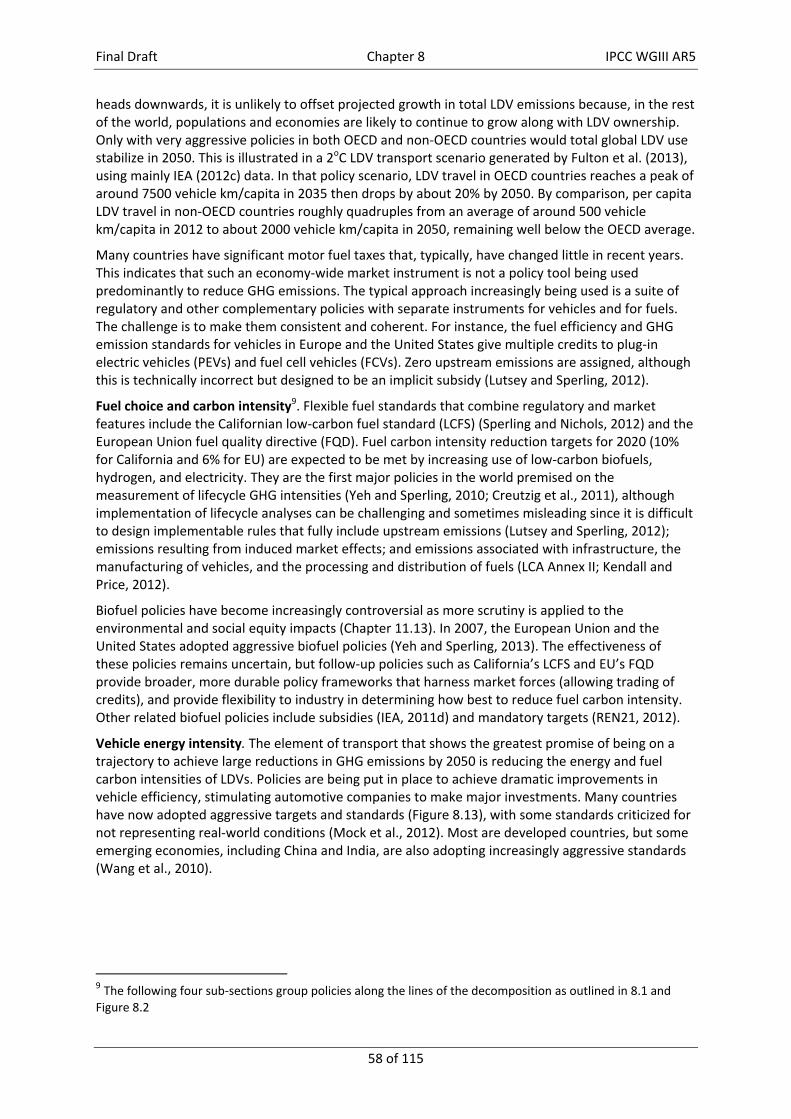
Final Draft Chapter 8 IPCC WGIII AR5
58 of 115
heads downwards, it is unlikely to offset projected growth in total LDV emissions because, in the rest of the world, populations and economies are likely to continue to grow along with LDV ownership. Only with very aggressive policies in both OECD and non‐OECD countries would total global LDV use stabilize in 2050. This is illustrated in a 2oC LDV transport scenario generated by Fulton et al. (2013), using mainly IEA (2012c) data. In that policy scenario, LDV travel in OECD countries reaches a peak of around 7500 vehicle km/capita in 2035 then drops by about 20% by 2050. By comparison, per capita LDV travel in non‐OECD countries roughly quadruples from an average of around 500 vehicle km/capita in 2012 to about 2000 vehicle km/capita in 2050, remaining well below the OECD average.
Many countries have significant motor fuel taxes that, typically, have changed little in recent years. This indicates that such an economy‐wide market instrument is not a policy tool being used predominantly to reduce GHG emissions. The typical approach increasingly being used is a suite of regulatory and other complementary policies with separate instruments for vehicles and for fuels. The challenge is to make them consistent and coherent. For instance, the fuel efficiency and GHG emission standards for vehicles in Europe and the United States give multiple credits to plug‐in electric vehicles (PEVs) and fuel cell vehicles (FCVs). Zero upstream emissions are assigned, although this is technically incorrect but designed to be an implicit subsidy (Lutsey and Sperling, 2012).
Fuel choice and carbon intensity9. Flexible fuel standards that combine regulatory and market features include the Californian low‐carbon fuel standard (LCFS) (Sperling and Nichols, 2012) and the European Union fuel quality directive (FQD). Fuel carbon intensity reduction targets for 2020 (10% for California and 6% for EU) are expected to be met by increasing use of low‐carbon biofuels, hydrogen, and electricity. They are the first major policies in the world premised on the measurement of lifecycle GHG intensities (Yeh and Sperling, 2010; Creutzig et al., 2011), although implementation of lifecycle analyses can be challenging and sometimes misleading since it is difficult to design implementable rules that fully include upstream emissions (Lutsey and Sperling, 2012); emissions resulting from induced market effects; and emissions associated with infrastructure, the manufacturing of vehicles, and the processing and distribution of fuels (LCA Annex II; Kendall and Price, 2012).
Biofuel policies have become increasingly controversial as more scrutiny is applied to the environmental and social equity impacts (Chapter 11.13). In 2007, the European Union and the United States adopted aggressive biofuel policies (Yeh and Sperling, 2013). The effectiveness of these policies remains uncertain, but follow‐up policies such as California’s LCFS and EU’s FQD provide broader, more durable policy frameworks that harness market forces (allowing trading of credits), and provide flexibility to industry in determining how best to reduce fuel carbon intensity. Other related biofuel policies include subsidies (IEA, 2011d) and mandatory targets (REN21, 2012).
Vehicle energy intensity. The element of transport that shows the greatest promise of being on a trajectory to achieve large reductions in GHG emissions by 2050 is reducing the energy and fuel carbon intensities of LDVs. Policies are being put in place to achieve dramatic improvements in vehicle efficiency, stimulating automotive companies to make major investments. Many countries have now adopted aggressive targets and standards (Figure 8.13), with some standards criticized for not representing real‐world conditions (Mock et al., 2012). Most are developed countries, but some emerging economies, including China and India, are also adopting increasingly aggressive standards (Wang et al., 2010).
9 The following four sub‐sections group policies along the lines of the decomposition as outlined in 8.1 and Figure 8.2
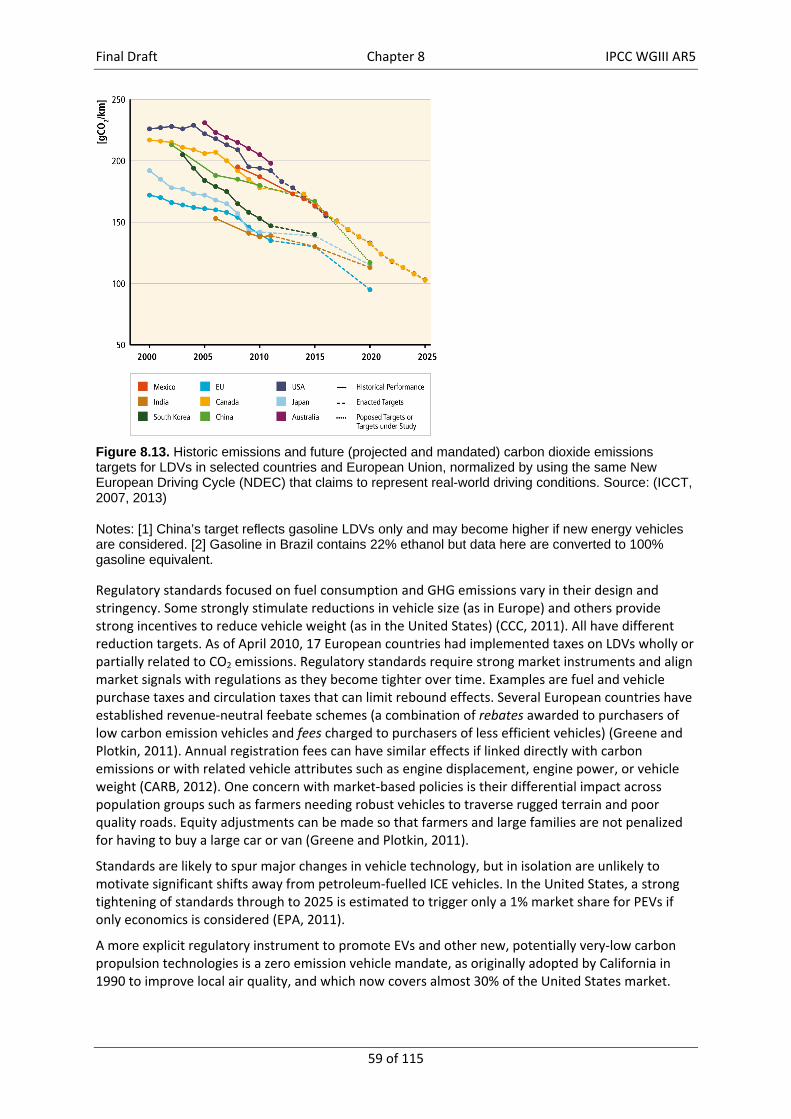
Final Draft Chapter 8 IPCC WGIII AR5
59 of 115
Figure 8.13. Historic emissions and future (projected and mandated) carbon dioxide emissions targets for LDVs in selected countries and European Union, normalized by using the same New European Driving Cycle (NDEC) that claims to represent real-world driving conditions. Source: (ICCT, 2007, 2013)
Notes: [1] China’s target reflects gasoline LDVs only and may become higher if new energy vehicles are considered. [2] Gasoline in Brazil contains 22% ethanol but data here are converted to 100% gasoline equivalent. Regulatory standards focused on fuel consumption and GHG emissions vary in their design and stringency. Some strongly stimulate reductions in vehicle size (as in Europe) and others provide strong incentives to reduce vehicle weight (as in the United States) (CCC, 2011). All have different reduction targets. As of April 2010, 17 European countries had implemented taxes on LDVs wholly or partially related to CO2 emissions. Regulatory standards require strong market instruments and align market signals with regulations as they become tighter over time. Examples are fuel and vehicle purchase taxes and circulation taxes that can limit rebound effects. Several European countries have established revenue‐neutral feebate schemes (a combination of rebates awarded to purchasers of low carbon emission vehicles and fees charged to purchasers of less efficient vehicles) (Greene and Plotkin, 2011). Annual registration fees can have similar effects if linked directly with carbon emissions or with related vehicle attributes such as engine displacement, engine power, or vehicle weight (CARB, 2012). One concern with market‐based policies is their differential impact across population groups such as farmers needing robust vehicles to traverse rugged terrain and poor quality roads. Equity adjustments can be made so that farmers and large families are not penalized for having to buy a large car or van (Greene and Plotkin, 2011).
Standards are likely to spur major changes in vehicle technology, but in isolation are unlikely to motivate significant shifts away from petroleum‐fuelled ICE vehicles. In the United States, a strong tightening of standards through to 2025 is estimated to trigger only a 1% market share for PEVs if only economics is considered (EPA, 2011).
A more explicit regulatory instrument to promote EVs and other new, potentially very‐low carbon propulsion technologies is a zero emission vehicle mandate, as originally adopted by California in 1990 to improve local air quality, and which now covers almost 30% of the United States market.
Final Draft Chapter 8 IPCC WGIII AR5
60 of 115
This policy, now premised on reducing GHGs, requires about 15% of new vehicles in 2025 to be a mix of PEVs and FCVs (CARB, 2012).
There are large potential efficiency improvements possible for medium and heavy‐duty vehicles (HDVs) (see Section 8.3.1.2), but policies to pursue these opportunities have lagged those for LDVs. Truck types, loads, applications, and driving cycles are much more varied than for LDVs and engines are matched with very different designs and loads, thereby complicating policy‐making. However, China implemented fuel consumption limits for HDVs in July 2012 (MIIT, 2011); in 2005 Japan set modest fuel efficiency standards to be met by 2015 (Atabani et al., 2011); California, in 2011, required compulsory retrofits to reduce aerodynamic drag and rolling resistance (Atabani et al., 2011); the United States adopted standards for new HDVs and buses manufactured from 2014 to 2018 (Greene and Plotkin, 2011); and the EU intends to pursue similar actions including performance standards and fuel efficiency labelling by 2014 (Kojima and Ryan, 2010). Aggressive air pollution standards since the 1990s for NOx and particulate matter emissions from HDVs in many OECD countries have resulted in a fuel consumption penalty in the past of 7% to 10% (IEA, 2009; Tourlonias and Koltsakis, 2011). However, emission technology improvements and reductions in black carbon emissions, which strongly impact climate change (see Section 8.2.2.1), will offset some of the negative effect of this increased fuel consumption.
Activity reduction. A vast and diverse mix of policies is used to restrain and reduce the use of LDVs, primarily by focusing on land use patterns, public transport options, and pricing. Other policy strategies to reduce activity include improving traffic management (Barth and Boriboonsomsin, 2008), better truck routing systems (Suzuki, 2011), and smart real‐time information to reduce time searching for a parking space. Greater support for innovative services using information and communication technologies, such as dynamic ride sharing and demand‐responsive para‐transit services (see Section 8.4), creates still further opportunities to shift toward more energy efficient modes of travel.
Policies can be effective at reducing dependence on LDVs as shown by comparing Shanghai with Beijing, which has three times as many LDVs even though the two cities have similar levels of affluence, the same culture, and are of a similar population (Hao et al., 2011). Shanghai limited the ownership of LDVs by establishing an expensive license auction, built fewer new roads, and invested more in public transport, whereas Beijing built an extensive network of high capacity expressways and did little to restrain car ownership or use until recently. The Beijing city administration has curtailed vehicle use by forbidding cars to be used one day per week since 2008, and sharply limited the number of new license plates issued each year since 2011 (Santos et al., 2010) Hao et al., 2011). The main aims to reduce air pollution, traffic congestion, and costs of road infrastructure exemplify how policies to reduce vehicle use are generally, but not always, premised on non‐GHG co‐benefits. European cities have long pursued demand reduction strategies, with extensive public transport supply, strict growth controls, and more recent innovations such as bicycle sharing. California seeks to create more liveable communities by adopting incentives, policies, and rules to reduce vehicle use, land use sprawl, and GHG emissions from passenger travel. The California law calls for 6–8% reduction in GHG emissions from passenger travel per capita (excluding changes in fuel carbon intensity and vehicle energy intensity) in major cities by 2020, and 13–16% per capita by 2035 (Sperling and Nichols, 2012).
The overall effectiveness of initiatives to reduce or restrain road vehicle use varies dramatically depending on local commitment and local circumstances, and the ability to adopt synergistic policies and practices by combining pricing, land use management, and public transport measures. A broad mix of policies successfully used to reduce vehicle use in OECD countries, and to restrain growth in emerging economies, includes pricing to internalize energy, environmental, and health costs; strengthening land use management; and providing more and better public transport. Policies to reduce LDV activity can be national, but mostly they are local, with the details varying from one local administration to another.
Final Draft Chapter 8 IPCC WGIII AR5
61 of 115
Some policies are intrinsically more effective than others. For instance, fuel taxes will reduce travel demand but drivers are known to be relatively inelastic in their response (Hughes et al., 2006; Small and van Dender, 2007). However, drivers are more elastic when price increases are planned and certain (Sterner, 2007). Pricing instruments such as congestion charges, vehicle registration fees, road tolls and parking management can reduce LDV travel by inducing trip chaining, modal shifts, and reduced use of cars (Litman, 2006). Policies and practices of cities in developing countries can be influenced by lending practices of development banks, such as the Rio+20 commitment to spend approximately 170 billion USD2010 on more sustainable transport projects, with a focus on Asia (ADB, 2012c).
System efficiency. Improvements have been far greater in freight transport and aviation than for surface passenger transport (rail and road). Freight transport has seen considerable innovation in containerization and intermodal connections, as has aviation, though the effects on GHG emissions are uncertain (and could be negative because of just‐in‐time inventory management practices). For surface passenger travel, efforts to improve system efficiency and inter‐modality are hindered by conflicting and overlapping jurisdictions of many public and private sector entities and tensions between fiscal, safety, and equity goals. Greater investment in roads than in public transport occurred in most cities of developed countries through the second half of the 20th century (Owens, 1995; Goodwin, 1999). The 21st century, though, has seen increasing government investment in bus rapid transit and rail transit in OECD countries (Yan and Crookes, 2010; Tennøy, 2010) along with increasing support for bicycle use.
Since the 1960s, many cities have instigated supportive policies and infrastructure that have resulted in a stable growth in cycling (Servaas, 2000; Hook, 2003; TFL, 2007; NYC, 2012). Several European cities have had high cycle transport shares for many years, but now even in London, UK, with efficient public transport systems, the 2% cycle share of travel modes is targeted to increase to 5% of journeys in 2026 as a result of a range of new policies (TFL, 2010). However, in less developed cities such as Surabaya, Indonesia, 10% of total trips between 1–3 km are already by cycling (including rickshaws) in spite of unsupportive infrastructure and without policies since there are few affordable alternatives (Hook, 2003). Where cycle lanes have been improved, as in Delhi, greater uptake of cycling is evident (Tiwari and Jain, 2012b).
8.10.2 Rail transport Rail transport serves 28 billion passengers globally, carrying them around 2500 billion p‐km/yr10. Rail also carries 11.4 billion tonne of freight (8845 billion t‐km/yr) (Johansson et al., 2012). Policies to further improve system efficiency may improve competitiveness and opportunities for modal shift to rail (Johansson et al., 2012). Specific energy and carbon intensities of rail transport are relatively small compared to some other modes (see Section 8.3). System efficiency can also be assisted through train driver education and training policies (Camagni et al., 2002).
Fuel intensity. Roughly one third of all rail transport is driven by diesel and two‐thirds by electricity (Johansson et al., 2012). Policies to reduce fuel carbon intensity are therefore linked to a large extent to those for decarbonizing electricity production (Chapter 7; DLR, 2012). For example, Sweden and Switzerland are running their rail systems using very low carbon electricity (Gössling, 2011).
Energy intensity. Driven largely by corporate strategies, the energy intensity of rail transport has been reduced by more than 60% between 1980 and 2001 in the United States (Sagevik, 2006). Overall reduction opportunities of 45–50% are possible for passenger transport in the EU and 40–50% for freight (Andersson et al., 2011b). Recent national policies in the United Kingdom and
10 By way of comparison, aviation moves 2.1 billion passengers globally (some 3900 billion p‐km/yr).
Final Draft Chapter 8 IPCC WGIII AR5
62 of 115
Germany appear to have resulted in 73% rail freight growth over the period 1995–2007, partly shifted from road freight.
System efficiency. China, Europe, Japan, Russia, United States and several Middle‐eastern and Northern African countries continue (or are planning) to invest in high‐speed rail (HSR) (CRC, 2008). It is envisaged that the worldwide track length of about 15,000 km in 2012 will nearly triple by 2025 due to government supporting policies, allowing HSR to better compete with medium haul aviation (UIC, 2012).
8.10.3 Waterborne transport Although waterborne transport is comparatively efficient in terms of gCO2/t‐km compared to other freight transport modes (see Section 8.6), the International Maritime Organization (IMO) has adopted mandatory measures to reduce GHG emissions from international shipping (IMO, 2011). This is the first mandatory GHG reduction regime for an international industry sector and for the standard to be adopted by all countries is a model for future international climate change co‐operation for other sectors (Yamaguchi, 2012). Public policies on emissions from inland waterways are nationally or regionally based and currently focus more on the reduction of NOx and particulate matter than on CO2. However, policy measures are being considered to reduce the carbon intensity of this mode including incentives to promote ‘smart steaming’, upgrade to new, larger vessels, and switch to alternative fuels, mainly LNG (Panteia, 2013). Few if any, policies support the use of biofuels, natural gas or hydrogen for small waterborne craft around coasts or inland waterways and little effort has been made to assess the financial implications of market (and other) policies on developing countries who tend to import and export low value‐to‐weight products, such as food and extractible resources (Faber et al., 2010).
Energy intensity. IMO’s Energy Efficiency Design Index (EEDI) is to be phased in between 2013 and 2025. It aims to improve the energy efficiency of certain categories of new ships and sets technical standards (IMO, 2011). However, the EEDI may not meet the target if shipping demand increases faster than fuel carbon and energy intensities improve. The voluntary Ship Energy Efficiency Management Plan (SEEMP) was implemented in 2013 (IMO, 2011). For different ship types and sizes it provides a minimum energy efficiency level. As much as 70% reduction of emissions from new ships is anticipated with the aim to achieve approximately 25–30% reductions overall by 2030 compared with business‐as‐usual (IISD, 2011). It is estimated that, in combination, EEDI requirements and SEEMP will cut CO2 emissions from shipping by 13% by 2020 and 23% by 2030 compared to a ‘no policy’ baseline (Lloyds Register and DNV, 2011).
8.10.4 Aviation After the Kyoto Protocol directed parties in Annex I to pursue international aviation GHG emission limitation/reduction working through the International Civil Aviation Organization (ICAO) (Petersen, 2008), member states are working together with the industry towards voluntarily improving technologies, increasing the efficient use of airport infrastructure and aircraft, and adopting appropriate economic measures (ICAO, 2007b; ICAO, 2010a). In 2010, ICAO adopted global aspirational goals for the international aviation sector to improve fuel efficiency by an average of 2% per annum until 2050 and to keep its global net carbon emissions from 2020 at the same level (ICAO, 2010b;Committee on Climate Change, 2009). These goals exceed the assumptions made in many scenarios (Mayor and Tol, 2010).
Policy options in place or under consideration include regulatory instruments (fuel efficiency and emission standards at aircraft or system levels); market‐based approaches (emission trading under caps, fuel taxes, emission taxes, subsidies for fuel efficient technologies); and voluntary measures including emission offsets (Daley & Preston, 2009). Environmental capacity constraints on airports also exist and may change both overall volumes of air transport and modal choice (Upham et al., 2004; Evans, 2010). National policies affect mainly domestic aviation, which covers about 30–35% of
Final Draft Chapter 8 IPCC WGIII AR5
63 of 115
total air transport (IATA, 2009; Lee et al., 2009; Wood et al., 2010). A nationwide cap‐and‐trade policy could have the unintended consequence of slowing aircraft fleet turnover and, through diverted revenue, of delaying technological upgrades, which would slow GHG reductions, though to what degree is uncertain (Winchester et al., 2013). In the UK, an industry group including airport companies, aircraft manufacturers and airlines has developed a strategy for reducing GHG emissions across the industry (Sustainable Aviation, 2012).
The inclusion of air transport in the EU emission trading scheme (ETS) is the only binding policy to attempt to mitigate emissions in this sector (Anger, 2010; Petersen, 2008). (Preston et al., 2012) estimated that the EU is currently responsible for 35% of global aviation emissions. The applicability of ETS policy to non‐European routes (for flights to and from destinations outside the EU) (Malina et al., 2012) has been delayed for one year, but the directive continues to apply to flights between destinations in the EU following a proposal by the European Commission in November 2012 in anticipation of new ICAO initiatives towards a global market‐based mechanism for all aviation emissions (ICAO, 2012).
Taxing fuels, tickets, or emissions may reduce air transport volume with elasticities varying between ‐0.3 to ‐1.1 at national and international levels, but with strong regional differences (Europe has 40% stronger elasticities than most other world regions, possibly because of more railway options). Airport congestion adds considerable emissions (Simaiakis and Balakrishnan, 2010) and also tends to moderate air transport demand growth to give a net reduction of emissions at network level (Evans and Schäfer, 2011).
Fuel carbon intensity. Policies do not yet exist to introduce low‐carbon biofuels. However, the projected GHG emission reductions from the possible future use of biofuels, as assumed by the aviation industry, vary between 19% of its adopted total emission reduction goal (Sustainable Aviation, 2008) to over 50% (IATA, 2009a), depending on the assumptions made for the other reduction options that include energy efficiency, improved operation and trading emission permits. Sustainable production issues also apply (see Section 8.3.3).
Energy intensity. The energy efficiency of aircraft has improved historically without any policies in force, but with the rate of fuel consumption reducing over time from an initial 3–6% in the 1950s to between 1% and 2% per year at the beginning of the 21st century (Bows et al., 2006; Fulton and Eads, 2004; Peeters et al., 2009; Peeters and Middel, 2007; Pulles et al., 2002). This slower rate of fuel reduction is possibly due to increasing lead‐times required to develop, certify, and introduce new technology (Kivits et al., 2010).
System efficiency. The interconnectedness of aviation services can be a complicating factor in adopting policies, but also lends itself to global agreements. For example, regional and national air traffic controllers have the ability to influence operational efficiencies. The use of market policies to reduce GHG emissions is compelling because it introduces a price signal that influences mitigation actions across the entire system. But like other aspects of the passenger transport system, a large price signal is needed with aviation fuels to gain significant reductions in energy use and emissions (Tol, 2007, Dubois et al., 2008; Peeters and Dubois, 2010a, OECD & UNEP, 2011). Complementary policies to induce system efficiencies include measures to divert tourists to more efficient modes such as high‐speed rail. However, since short‐ and medium‐haul aircraft now have similar energy efficiencies per passenger km compared to LDVs (Figure 8.6), encouraging people to take shorter journeys (hence by road instead of by air), thereby reducing tourism total travel, has become more important (Peeters & Dubois, 2010b). No country has adopted a low‐carbon tourism strategy (OECD and UNEP, 2011).
8.10.5 Infrastructure and urban planning Urban form has a direct effect on transport activity (see Chapter 12.4). As a consequence, infrastructure policies and urban planning can provide major contributions to mitigation (see
Final Draft Chapter 8 IPCC WGIII AR5
64 of 115
Chapter 12.5). A modal shift from LDVs to other surface transport modes could be partly incentivized by policy measures that impose physical restrictions as well as pricing regimes. For example, LDV parking management is a simple form of cost effective, pricing instrument (Barter et al., 2003; Litman, 2006). Dedicated bus lanes, possibly in combination with a vehicle access charge for LDVs, can be strong instruments to achieving rapid shifts to public transport (Creutzig and He, 2009).
Policies that support the integration of moderate to high density urban property development with transit‐oriented development strategies that mix residential, employment, and shopping facilities can encourage pedestrians and cyclists, thereby giving the dual benefits of reducing car dependence and preventing urban sprawl (Newman and Kenworthy, 1996; Cervero, 2004; Olaru et al., 2011). GHG emissions savings (Trubka et al., 2010a; Trubka et al., 2010b) could result in co‐benefits of health, productivity, and social opportunity (Trubka et al., 2010c; Ewing and Cervero, 2010; Höjer et al., 2011) if LDV trips could be reduced using polycentric city design and comprehensive smart‐growth policies (Dierkers et al., 2008). Policies to support the building of more roads, airports, and other infrastructure can help relieve congestion in the short term, but can also induce travel demand (Duranton and Turner, 2011) and create GHG emissions from construction (Chester and Horvath, 2009).
8.11 Gaps in knowledge and data
The following gaps made assessing the mitigation potential of the transport sector challenging.
Gaps in the basic statistics are still evident on the costs and energy consumption of freight transport, especially in developing countries.
Data and understanding relating to freight logistical systems and their economic implications are poor, as are the future effects on world trade of decarbonization and climate change impacts. Hence, it is difficult to design new low‐carbon freight policies.
Future technological developments and costs of batteries, fuel cells, and vehicle designs are uncertain.
The infrastructure requirement for new low‐carbon transport fuels is poorly understood.
Cost of components for novel vehicle powertrains cannot be determined robustly since rates of learning, cost decreases, and associated impacts are unknown.
Assessments of mitigating transport GHG emissions, the global potential, and costs involved are inconsistent.
Prices of crude oil products fluctuate widely as do those for alternative transport fuels, leading to large variations in scenario modelling assumptions.
A better knowledge of consumer travel behaviour is needed, particularly for aviation.
Limited understanding exists of how and when people will choose to buy and use new types of low‐carbon vehicles or mobility services (such as demand responsive transit or car‐share).
There are few insights of behavioural economics to predict mobility systematically and whether producers will incorporate low‐carbon technologies that may not maximize profit.
How travellers will respond to combinations of low‐carbon strategies (mixes of land use, transit, vehicle options) is especially important for fast‐growing, developing countries where alternative modes to the car‐centric development path could be deployed, is unknown.
Understanding how low‐carbon transport and energy technologies will evolve (via experience
curves and innovation processes) is not well developed. Most vehicles rely on stored energy, so
there is a need to better understand the cost and energy density of non‐hydrocarbon energy
storage mediums, such as batteries, super‐capacitors and pressure vessels.
Decoupling of transport GHG from economic growth needs further elaboration, especially the
policy frameworks that can enable this decoupling to accelerate in both OECD and non‐OECD
nations.
Final Draft Chapter 8 IPCC WGIII AR5
65 of 115
The rate of social acceptance of innovative concepts such as LDV road convoys, induction charging of electric vehicles, and driverless cars (all currently being demonstrated) is difficult to predict, as is the required level of related infrastructure investments. Recent rapid developments in metro systems in several cities illustrate how quickly new transport systems can be implemented when the demand, policies, and investments all come together and public support is strong.
8.12 Frequently asked questions
FAQ 8.1: How much does the transport sector contribute to GHG emissions and how is this changing? The transport sector is a key enabler of economic activity and social connectivity. It supports national and international trade and a large global industry has evolved around it. Its greenhouse gas (GHG) emissions are driven by the ever‐increasing demand for mobility and movement of goods. Together, the road, aviation, waterborne, and rail transport sub‐sectors currently produce almost one quarter of total global energy‐related CO2 emissions [8.1]. Emissions have more than doubled since 1970 to reach 7.0 Gt CO2eq by 2010 with about 80% of this increase coming from road vehicles. Black carbon and other aerosols, also emitted during combustion of diesel and marine oil fuels, are relatively short‐lived radiative forcers compared with carbon dioxide and their reduction is emerging as a key strategy for mitigation [8.2].
Demands for transport of people and goods are expected to continue to increase over the next few decades [8.9]. This will be exacerbated by strong growth of passenger air travel worldwide due to improved affordability; by the projected demand for mobility access in non‐OECD countries that are starting from a very low base; and by projected increases in freight movements. A steady increase of income per capita in developing and emerging economies has already led to a recent rapid growth in ownership and use of 2‐wheelers, 3‐wheelers and light duty vehicles (LDVs), together with the development of new transport infrastructure including roads, rail, airports, and ports.
Reducing transport emissions will be a daunting task given the inevitable increases in demand. Based on continuing current rates of growth for passengers and freight, and if no mitigation options are implemented to overcome the barriers [8.8], the current transport sector’s GHG emissions could increase by up to 50% by 2035 at continued current rates of growth and almost double by 2050 [8.9]. An increase of transport’s share of global energy‐related CO2 emissions would likely result. However, in spite of lack of progress in many countries to date, new vehicle and fuel technologies, appropriate infrastructure developments including for non‐motorized transport in cities, transport policies, and behavioural changes could begin the transition required [8.3, 8.4, 8.9].
FAQ 8.2: What are the main mitigation options and potentials for reducing GHG emissions? Decoupling transport from GDP growth is possible but will require the development and deployment of appropriate measures, advanced technologies, and improved infrastructure. The cost‐effectiveness of these opportunities may vary by region and over time [8.6]. Delivering mitigation actions in the short‐term will avoid future lock‐in effects resulting from the slow turnover of stock (particularly aircraft, trains, and ships) and the long‐life and sunk costs of infrastructure already in place [8.2, 8.4].
When developing low‐carbon transport systems, behavioural change and infrastructure investments are often as important as developing more efficient vehicle technologies and using lower‐carbon fuels [8.1, 8.3].
Final Draft Chapter 8 IPCC WGIII AR5
66 of 115
Avoidance: Reducing transport activity can be achieved by avoiding unnecessary journeys, (for example by tele‐commuting and internet shopping), and by shortening travel distances such as through the densification and mixed‐zoning of cities.
Modal choice: Shifting transport options to more efficient modes is possible, (such as from
private cars to public transport, walking, and cycling), and can be encouraged by urban planning
and the development of a safe and efficient infrastructure.
Energy intensity: Improving the performance efficiency of aircraft, trains, boats, road vehicles,
and engines by manufacturers continues while optimizing operations and logistics (especially for
freight movements) can also result in lower fuel demand.
Fuel carbon intensity: Switching to lower carbon fuels and energy carriers is technically feasible,
such as by using sustainably produced biofuels or electricity and hydrogen when produced using
renewable energy or other low‐carbon technologies.
These four categories of transport mitigation options tend to be interactive, and emission reductions are not always cumulative. For example, an eco‐driven, hybrid LDV, with four occupants, and fuelled by a low‐carbon biofuel would have relatively low emissions per passenger kilometre compared with one driver travelling in a conventional gasoline LDV. But if the LDV became redundant through modal shift to public and non‐motorized transport, the overall emission reductions could only be counted once.
Most mitigation options apply to both freight and passenger transport, and many are available for wide deployment in the short term for land, air, and waterborne transport modes, though not equally and at variable costs [8.6]. Bus rapid transit, rail, and waterborne modes tend to be relatively carbon efficient per passenger or tonne kilometre compared with LDV, HDV, or aviation, but, as for all modes, this varies with the vehicle occupancy rates and load factors involved. Modal shift of freight from short‐ and medium‐haul aircraft and road trucks to high‐speed rail and coastal shipping often offers large mitigation potential [Table. 8.3]. In addition, opportunities exist to reduce the indirect GHG emissions arising during the construction of infrastructure; manufacture of vehicles; and extraction, processing, and delivery of fuels.
The potentials for various mitigation options vary from region to region, being influenced by the stage of economic development, status and age of existing vehicle fleet and infrastructure, and the fuels available in the region. In OECD countries, transport demand reduction may involve changes in lifestyle and the use of new information and communication technologies. In developing and emerging economies, slowing the rate of growth of using conventional transport modes with relatively high‐carbon emissions for passenger and freight transport by providing affordable, low‐carbon options could play an important role in achieving global mitigation targets. Potential GHG emissions reductions from efficiency improvements on new vehicle designs in 2030 compared with today range from 40–70% for LDVs, 30–50% for HDVs, up to 50% for aircraft, and for new ships when combining technology and operational measures, up to 60% [Table 8.3].
Policy options to encourage the uptake of such mitigation options include implementing fiscal incentives such as fuel and vehicle taxes, developing standards on vehicle efficiency and emissions, integrating urban and transport planning, and supporting measures for infrastructure investments to encourage modal shift to public transport, walking, and cycling [8.10]. Pricing strategies can reduce travel demands by individuals and businesses, although successful transition of the sector may also require strong education policies that help to create behavioural change and social acceptance. Fuel and vehicle advances in the short to medium term will largely be driven through research investment by the present energy and manufacturing industries that are endeavouring to meet existing policies as well as to increase their market shares. However, in order to improve upon this business‐as‐usual scenario and significantly reduce GHG emissions across the sector in spite of the rapidly growing demand, more stringent policies will be needed. To achieve an overall transition of
Final Draft Chapter 8 IPCC WGIII AR5
67 of 115
the sector will require rapid deployment of new and advanced technology developments, construction of new infrastructure, and the stimulation of acceptable behavioural changes.
FAQ 8.3: Are there any co‐benefits associated with mitigation actions? Climate change mitigation strategies in the transport sector can result in many co‐benefits [8.7]. However, realizing these benefits through implementing those strategies depends on the regional context in terms of their economic, social, and political feasibility as well as having access to appropriate and cost‐effective advanced technologies. In developing countries where most future urban growth will occur, increasing the uptake, comfort, and safety of mass transit and non‐motorized transport modes can help improve mobility. In least developing countries, this may also improve access to markets and therefore assist in fostering economic and social development. The opportunities to shape urban infrastructure and transport systems to gain greater sustainability in the short‐ to medium‐terms are also likely to be higher in developing and emerging economies than in OECD countries where transport systems are largely locked‐in [8.4].
A reduction in LDV travel and ownership has been observed in several cities in OECD countries, but demand for motorized road transport, including 2‐ and 3‐wheelers, continues to grow in non‐OECD nations where increasing local air pollution often results. Well‐designed policy packages can help lever the opportunities for exploiting welfare, safety, and health co‐benefits [8.10]. Transport strategies associated with broader policies and programmes can usually target several policy objectives simultaneously. The resulting benefits can include lower travel costs, improved mobility, better community health through reduced local air pollution and physical activities resulting from non‐motorized transport, greater energy security, improved safety, and time savings through reduction in traffic congestion.
A number of studies suggest that the direct and indirect benefits of sustainable transport measures often exceed the costs of their implementation [8.6, 8.9]. However, the quantification of co‐benefits and the associated welfare effects still need accurate measurement. In all regions, many barriers to mitigation options exist [8.8], but a wide range of opportunities are available to overcome them and give deep carbon reductions at low marginal costs in the medium‐ to long‐term [8.3, 8.4, 8.6, 8.9]. Decarbonizing the transport sector will be challenging for many countries, but by developing well‐designed policies that incorporate a mix of infrastructural design and modification, technological advances, and behavioural measures, co‐benefits can result and lead to a cost‐effective strategy.

Final Draft Chapter 8 IPCC WGIII AR5
68 of 115
References
Acharya S., and S. Morichi (2007). Motorization and Role of Mass Rapid Transit in East Asian Megacities, IATSS Research 31 6–16 pp. .
ADB (2010). Sustainable Transport Initiative: Operational Plan. Asian Development Bank, Philippines, 36 pp.
ADB (2011a). Guidelines for Climate‐Proofing Investment in the Transport Sector: Road Infrastructure Projects. Asian Development Bank, Mandaluyong City, Philippines. 69 pp.
ADB (2011b). Parking Policy in Asian Cities. Asian Development Bank, Mandaluyong City, Philippines, 112 pp., (ISBN: 978‐92‐9092‐352‐7). .
ADB (2012a). Toward Green Urbanization in Asia and the Pacific. Asian Development Bank, Mandaluyong City, Philippines.
ADB (2012b). Sustainable Transport Initiative. Asian Development Bank, Manila. 36 pp.
ADB (2012c). Billions to Benefit from Rio+20 Transport Commitment, Asian Development Bank . Available at: http://www.adb.org/news/billions‐benefit‐rio20‐transport‐commitment.
ADEME (2007). Emission Factors Guide: Emission Factors Calculation and Bibliographical Sources Used. ADEME, Angers, France. 249 pp.
AEA (2007). Low Carbon Commercial Shipping. AEA Technology, Didcot, UK. 60 pp.
AEA (2011). Reduction and Testing of Greenhouse Gas (GHG) Emissions from Heavy Duty Vehicles – Lot 1: Strategy. European Commission – DG Climate Action. . Available at: http://ec.europa.eu/clima/policies/transport/vehicles/docs/ec_hdv_ghg_strategy_en.pdf.
Africa Union (2009). Transport and the Millennium Development Goals in Africa. UN Economic Commission for Africa.
Åkerman J. (2011). The role of high‐speed rail in mitigating climate change – The Swedish case Europabanan from a life cycle perspective, Transportation Research Part D: Transport and Environment 16 208–217 pp. (DOI: 10.1016/j.trd.2010.12.004), (ISSN: 1361‐9209).
Alvarez R.A., S.W. Pacala, J.J. Winebrake, W.L. Chameides, and S.P. Hamburg (2012). Greater focus needed on methane leakage from natural gas infrastructure, Proceedings of the National Academy of Sciences 1–6 pp. (DOI: 10.1073/pnas.1202407109).
Amekudzi A. (2011). Placing carbon reduction in the context of sustainable development priorities: a global perspective, Carbon Management 2 413–423 pp. (DOI: 10.4155/cmt.11.43), (ISSN: 1758‐3004).
Amekudzi A.A., A. Ramaswami, E. Chan, K. Lam, W. Hon Meng, and D. Zhu (2011). Contextualizing carbon reduction initiatives: how should carbon mitigation be addressed by various cities worldwide?, Carbon Management 2 363–365 pp. (DOI: 10.4155/cmt.11.40), (ISSN: 1758‐3004).
Amos P., D. Bullock, and J. Sondhi (2010). High‐Speed Rail: The Fast Track to Economic Development? World Bank, Beijing. 28 pp.
Final Draft Chapter 8 IPCC WGIII AR5
69 of 115
An F., R. Earley, and L. Green‐Weiskel (2011). Global Overview on Fuel Efficiency and Motor Vehicle Emission Standards: Policy Options and Perspectives for International Co‐Operation. The Innovation Center for Energy and Transportation, Beijing, Los Angeles, New York. 24 pp.
Anable J., C. Brand, M. Tran, and N. Eyre (2012). Modelling transport energy demand: A socio‐technical approach, Energy Policy 41 125–138 pp. (DOI: 10.1016/j.enpol.2010.08.020), (ISSN: 0301‐4215).
Anand A., and G. Tiwari (2006). A Gendered Perspective of the Shelter–Transport–Livelihood Link: The Case of Poor Women in Delhi, Transport Reviews 26 63–80 pp. (DOI: 10.1080/01441640500175615), (ISSN: 0144‐1647).
Anderson S.T., R. Kellogg, and J.M. Sallee (2011). What Do Consumers Believe About Future Gasoline Prices?, National Bureau of Economic Research Working Paper Series No. 16974 . Available at: http://www.nber.org/papers/w16974.
Andersson E., M. Berg, B.‐L. Nelldal, and O. Fröidh (2011a). Rail Passenger Transport. Techno‐Economic Analysis of Energy and Greenhouse Gas Reductions. Royal Institute of Technology (KTH), Stockholm. 43 pp.
Andersson E., M. Berg, B.‐L. Nelldal, and O. Fröidh (2011b). Rail Freight Transport. Techno‐Economic Analysis of Energy and Greenhouse Gas Reductions. Royal Institute of Technology (KTH), Stockholm. 42 pp.
Andrade V., O.B. Jensen, H. Harder, and J.C.O. Madsen (2011). Bike Infrastructures and Design Qualities: Enhancing Cycling, Danish Journal of Geoinformatics and Land Management 46 65–80 pp. . Available at: http://ojs.statsbiblioteket.dk/index.php/tka/article/view/5734.
ANFAVEA (2012). Carta da Anfavea June/2012.
Arndt C., P. Chinowsky, K. Strzepek, and J. Thurlow (2012). Climate Change, Growth and Infrastructure Investment: The Case of Mozambique, Review of Development Economics 16 463–475 pp. (DOI: 10.1111/j.1467‐9361.2012.00674.x), (ISSN: 1467‐9361).
Arteconi A., C. Brandoni, D. Evangelista, and F. Polonara (2010). Life‐cycle greenhouse gas analysis of LNG as a heavy vehicle fuel in Europe, Applied Energy 87 2005–2013 pp. (DOI: 10.1016/j.apenergy.2009.11.012), (ISSN: 0306‐2619).
Arvizu D.E., and P. Balaya (2012). Direct Solar Energy (Chapter 3). In: Renewable Energy Sources and Climate Change Mitigation. Special Report of the Intergovernmental Panel on Climate Change [O. Edenhofer, R. Pichs‐Madruga, Y. Sokona, K. Seyboth, P. Matschoss, S. Kadner, T. Zwickel, P. Eickemeier, G. Hansen, S. Schlömer, C. von Stechow (eds)]. Cambridge University Press, New York, USA pp.333–400.
Ashton‐Graham C. (2008). Behavioural responses to peak oil and carbon pricing: Save 70 cents a litre by driving less. Planning and Transport Research Centre.
Ashton‐Graham C., M. Burgess, O.V.D. Vandersteen, and R. Salter (2011). Influencing Travel Choices. TNA Guidebook Series. In: Technologies for Climate Change Mitigation – Transport. UNEP Riso Centre for Energy, Climate and Sustainable Development, Roskilde, Denmark pp.58–68(ISBN: 978‐87‐550‐3901‐8).
Final Draft Chapter 8 IPCC WGIII AR5
70 of 115
Ashton‐Graham C., and P. Newman (2013). Living Smart in Australian Households: Sustainability Coaching as an Effective Large‐Scale Behaviour Change Strategy. In: The Global Challenge Of Encouraging Sustainable Living: Opportunities, Barriers, Policy and Practice. Edward Elgar, London, UK pp.181–207.
Atabani A.E., I.A. Badruddin, S. Mekhilef, and A.S. Silitonga (2011). A review on global fuel economy standards, labels and technologies in the transportation sector, Renewable and Sustainable Energy Reviews 15 4586–4610 pp. (DOI: 10.1016/j.rser.2011.07.092), (ISSN: 1364‐0321).
Axsen J., and K.S. Kurani (2012). Characterizing Residential Recharge Potential for Plug‐in Electric Vehicles. Transportation Research Board. . Available at: http://trid.trb.org/view.aspx?id=1129899.
Bamberg S., S. Fujii, M. Friman, and T. Gärling (2011). Behaviour theory and soft transport policy measures, Transport Policy 18 228–235 pp. (DOI: 10.1016/j.tranpol.2010.08.006), (ISSN: 0967070X).
Bandivadekar A., K. Bodek, L. Cheah, C. Evans, T. Groode, J. Heywood, E. Kasseris, M. Kromer, and M. Weiss (2008). On the Road in 2035: Reducing Transportation’s Petroleum Consumption and GHG Emissions. MIT Laboratory for Energy and the Environment, Cambridge, Massachusetts. 196 pp.
Banister D. (2008a). The Sustainable Mobility Paradigm, Transport Policy 15 73–80 pp. .
Banister D. (2011a). The trilogy of distance, speed and time, Journal of Transport Geography 19 950–959 pp. (DOI: 10.1016/j.jtrangeo.2010.12.004), (ISSN: 0966‐6923).
Banister D. (2011b). Cities, mobility and climate change, Special section on Alternative Travel futures 19 1538–1546 pp. (DOI: 10.1016/j.jtrangeo.2011.03.009), (ISSN: 0966‐6923).
Baptista P., M. Tomás, and C. Silva (2010). Plug‐in hybrid fuel cell vehicles market penetration scenarios, International Journal of Hydrogen Energy 35 10024–10030 pp. (DOI: 10.1016/j.ijhydene.2010.01.086).
Barla P., B. Lamonde, L.F. Miranda‐Moreno, and N. Boucher (2009). Traveled distance, stock and fuel efficiency of private vehicles in Canada: price elasticities and rebound effect, Transportation 36 389–402 pp. (DOI: 10.1007/s11116‐009‐9211‐2), (ISSN: 0049‐4488, 1572‐9435).
Barter P., J. Kenworthy, and F. Laube (2003). Lessons from Asia on Sustainable Urban Transport. In: Making Urban Transport Sustainable. Palgrave‐ Macmillan, Basingstoke UK pp.252–270.
Barth M., and K. Boriboonsomsin (2008). Real‐World Carbon Dioxide Impacts of Traffic Congestion, Transportation Research Record: Journal of the Transportation Research Board 2058 163–171 pp. (DOI: 10.3141/2058‐20), (ISSN: 0361‐1981).
Bassett D., J. Pucher, R. Buehler, D.L. Thompson, and S.E. Crouter (2008a). Walking, Cycling, and Obesity Rates in Europe, North America, and Australia, Journal of Physical Activity and Health 5 795–814 pp. . Available at: http://policy.rutgers.edu/faculty/pucher/JPAH08.pdf.
Bastani P., J.B. Heywood, and C. Hope (2012). The effect of uncertainty on US transport‐related GHG emissions and fuel consumption out to 2050, Transportation Research Part A: Policy and Practice 46 517–548 pp. (DOI: 10.1016/j.tra.2011.11.011), (ISSN: 0965‐8564).
Baumgartner D.S., and J.L. Schofer (2011). Forecasting Call‐N‐Ride Productivity In Low‐Density Areas. Transportation Research Board, Transportation Research Board 90th Annual Meeting, Washington DC, USA. 14 pp.
Final Draft Chapter 8 IPCC WGIII AR5
71 of 115
Beck L. (2009). V2G ‐ 10: A Text About Vehicle‐to‐Grid, the Technology Which Enables a Future of Clean and Efficient Electric‐Powered Transportation. Self‐Published, Delaware. 331 pp.
Becker A., S. Inoue, M. Fischer, and B. Schwegler (2012). Climate change impacts on international seaports: knowledge, perceptions, and planning efforts among port administrators, Climatic Change 110 5–29 pp. (ISSN: 0165‐0009).
Bell M.L., R. Goldberg, C. Hogrefe, P.L. Kinney, K. Knowlton, B. Lynn, J. Rosenthal, C. Rosenzweig, and J.A. Patz (2007). Climate change, ambient ozone, and health in 50 US cities, Climatic Change 82 61–76 pp. (DOI: 10.1007/s10584‐006‐9166‐7).
Birtchnell T., J. Urry, C. Cook, and A. Curry (2013). Freight Miles: The Impacts of 3D Printing on Transport and Society. University of Lancaster, UK. 40 pp. Available at: http://www.academia.edu/3628536/Freight_Miles_The_Impacts_of_3D_Printing_on_Transport_and_Society.
Den Boer E., H. Van Essen, F. Brouwer, E. Pastori, and A. Moizo (2011). Potential of Modal Shift to Rail Transport. CE Delft, Delft, Netherlands. 119 pp. Available at: http://www.cedelft.eu/publicatie/potential_of_modal_shift_to_rail_transport/1163?PHPSESSID=85969a496d79705462017a60f30353cc.
Der Boer E., M. Otten, and H. Van Essen (2011). STREAM International Freight 2011: Comparison of various transport modes on an EU scale with the STREAM database. STREAM International Freight 2011. . Available at: http://www.shortsea.be/html_nl/publicaties/documents/CEDelft‐STREAMInternationalFreight2011.pdf.
Bongardt D., M. Breithaupt, and F. Creutzig (2010). Beyond the Fossil City: Towards low Carbon Transport and Green Growth, Fifth Regional EST Forum. GTZ Working Paper, Bangkok, Thailand. 2010, .
Bongardt D., F. Creutzig, H. Hüging, K. Sakamoto, S. Bakker, S. Gota, and S. Böhler‐Baedeker (2013). Low‐Carbon Land Transport: Policy Handbook. Routledge, New York, USA, 264 pp., (ISBN: 9781849713771). .
Bongardt D., D. Scmid, C. Huizenga, and T. Litman (2011). Sustainable Transport Evaluation: Developing Practical Tools for Evaluation in the Context of the CSD Process. Partnership on Sustainable Low Carbon Transport, Eschborn, Germany. 44 pp.
Borken‐Kleefeld J., J. Fuglestvedt, and T. Berntsen (2013). Mode, load, and specific climate impact from passenger trips, Environmental Science & Technology 47 7608–7614 pp. .
Boschmann E.E. (2011). Job access, location decision, and the working poor: A qualitative study in the Columbus, Ohio metropolitan area, Geoforum 42 671–682 pp. (DOI: 10.1016/j.geoforum.2011.06.005), (ISSN: 0016‐7185).
Bosetti V., and T. Longden (2013). Light duty vehicle transportation and global climate policy: The importance of electric drive vehicles, Energy Policy 58 209–219 pp. (DOI: 10.1016/j.enpol.2013.03.008), (ISSN: 0301‐4215).
Boucher O., D.R. Artaxo, C.Bretherton, G. Feingold, P. Forster, V.Kerminen, Y. Kondo, H. Liao, U. Lohmann, P. Rasch, S.K. Satheesh, S. Sherwood, B. Stevens, and X. Zhang (2013). Clouds and aerosols ‐ Chapter 7. In: IPCC Fifth Assessment Report Climate Change 2013: The Physical Science Basis [Stocker, T.F., D. Qin, G.‐K. Plattner, M. Tignor, S.K. Allen, J. Boschung, A. Nauels, Y. Xia, V. Bex
Final Draft Chapter 8 IPCC WGIII AR5
72 of 115
and P.M. Midgley (eds.)]. Intergovernmental Panel on Climate Change. Cambridge University Press, New York, USA pp.571–657.
Bowen A., S. Cochrane, and S. Fankhauser (2012). Climate change, adaptation and economic growth, Climatic Change 113 95–106 pp. (DOI: 10.1007/s10584‐011‐0346‐8), (ISSN: 0165‐0009).
Bows A., K. Anderson, and S. Mander (2009). Aviation in turbulent times, Technology Analysis & Strategic Management 21 17–37 pp. (DOI: 10.1080/09537320802557228), (ISSN: 0953‐7325).
Bradley R., and N. Lefevre (2006). Assessing Energy Security and Climate Change Policy Interactions. International Energy Agency, Paris, France.
La Branche S. (2011). La gouvernance climatique face à la mobilité quotidienne. Le cas des Lyonnais, Environnement urbain 5 10 pp. (DOI: 10.7202/1005874ar), (ISSN: 1916‐4645).
Brandt A.R. (2009). Converting Oil Shale to Liquid Fuels with the Alberta Taciuk Processor: Energy Inputs and Greenhouse Gas Emissions, Energy & Fuels 23 6253–6258 pp. (DOI: 10.1021/ef900678d), (ISSN: 0887‐0624, 1520‐5029).
Brandt A.R. (2011). Upstream Greenhouse Gas (GHG) Emissions from Canadian Oil Sands as a Feedstock for European Refineries. Stanford University, Stanford, USA. 51 pp. Available at: https://circabc.europa.eu/d/d/workspace/SpacesStore/db806977‐6418‐44db‐a464‐20267139b34d/Brandt_Oil_Sands_GHGs_Final.pdf.
Brandt A.R. (2012). Variability and Uncertainty in Life Cycle Assessment Models for Greenhouse Gas Emissions from Canadian Oil Sands Production, Environmental Science & Technology 46 1253–1261 pp. (DOI: 10.1021/es202312p), (ISSN: 0013‐936X, 1520‐5851).
Bretzke W.‐R. (2011). Sustainable logistics: in search of solutions for a challenging new problem, Logistics Research 3 179–189 pp. (DOI: 10.1007/s12159‐011‐0059‐4), (ISSN: 1865‐035X).
Brozović N., and A.W. Ando (2009). Defensive purchasing, the safety (dis)advantage of light trucks, and motor‐vehicle policy effectiveness, Transportation Research Part B: Methodological 43 477–493 pp. (DOI: 10.1016/j.trb.2008.09.002), (ISSN: 0191‐2615).
BRT Centre of Excellence, EMBARQ, IEA and SIBRT (2012). Global BRT data. . Available at: http://brtdata.org/.
Brueckner J.K. (2000). Urban Sprawl: Diagnosis and Remedies, International Regional Science Review 23 160–171 pp. . Available at: http://irx.sagepub.com/content/23/2/160.abstract.
Budde Christensen T., P. Wells, and L. Cipcigan (2012). Can innovative business models overcome resistance to electric vehicles? Better Place and battery electric cars in Denmark, Special Section: Frontiers of Sustainability 48 498–505 pp. (DOI: 10.1016/j.enpol.2012.05.054), (ISSN: 0301‐4215).
Buehler R., and J. Pucher (2011). Making public transport financially sustainable, Transport Policy 18 126–138 pp. (DOI: 10.1016/j.tranpol.2010.07.002), (ISSN: 0967‐070X).
Buhaug Ø., and et. al (2009). Second IMO GHG Study 2009. International Maritime Organization, London, UK. 240 pp.
Final Draft Chapter 8 IPCC WGIII AR5
73 of 115
Burdett R., and D. Sudjic (2010). The Endless City: The Urban Age Project by the London School of Economics and Deutsche Bank’s Alfred Herrhausen Sociey. Phaidon, London, 510 pp., (ISBN: 9780714859569). .
Burkhardt U., and B. Kärcher (2011). Global radiative forcing from contrail cirrus, Nature Climate Change 1 54–58 pp. (DOI: 10.1038/nclimate1068), (ISSN: 1758‐678X, 1758‐6798).
Caldecott B., and S. Tooze (2009). Green Skies Thinking: Promoting the Development and Commercialisation of Sustainable Bio‐Jet Fuels. Policy Exchange, London, UK. 27 pp.
Camagni R., M.C. Gibelli, and P. Rigamonti (2002). Urban mobility and urban form: the social and environmental costs of different patterns of urban expansion, Ecological Economics 40 199–216 pp. (DOI: 10.1016/S0921‐8009(01)00254‐3), (ISSN: 0921‐8009).
Cao X., P.L. Mokhtarian, and S. Handy (2009). Examining the impacts of residential self‐selection on travel behaviour: A focus on empirical findings, Transport Reviews 29 359–395 pp. .
CARB (2012). Zero Emission Vehicles 2012. . Available at: http://www.arb.ca.gov/regact/2012/zev2012/zev2012.htm.
Carisma B., and S. Lowder (2007). Estimating the Economic Costs of Traffic Congestion: A Review of Literature on Various Cities & Countries.
Carrabine E., and B. Longhurst (2002). Consuming the car: anticipation, use and meaning in contemporary youth culture, The Sociological Review 50 181–196 pp. (DOI: 10.1111/1467‐954X.00362), (ISSN: 1467‐954X).
Cathles L.M., L. Brown, M. Taam, and A. Hunter (2012). A commentary on ‘The greenhouse‐gas footprint of natural gas in shale formations’ by R.W. Howarth, R. Santoro, and Anthony Ingraffea, Climatic Change 113 525–535 pp. (DOI: 10.1007/s10584‐011‐0333‐0), (ISSN: 0165‐0009, 1573‐1480).
CCC (2011). Meeting Carbon Budgets – 3rd Progress Report to Parliament. Committee on Climate Change. . Available at: http://www.theccc.org.uk/wp‐content/uploads/2011/06/CCC‐Progress‐Report_Interactive_3.pdf.
Cervero R. (1994). Rail Transit and Joint Development: Land Market Impacts in Washington, D.C. and Atlanta, Journal of the American Planning Association 60 83–94 pp. (DOI: 10.1080/01944369408975554), (ISSN: 0194‐4363, 1939‐0130).
Cervero R. (1998). The Transit Metropolis: A Global Inquiry. Island Press, Washington, D.C., 480 pp., (ISBN: 1559635916 9781559635912). .
Cervero R. (2001). Road Expansion, Urban Growth, and Induced Travel: A Path Analysis. University of California Transportation Center, Berkeley, USA. 30 pp. Available at: http://EconPapers.repec.org/RePEc:cdl:uctcwp:qt05x370hr.
Cervero R. (2004). Transit‐Oriented Development in the United States: Experiences, Challenges and Prospects. Transportation Research Board, Washington DC, USA. 534 pp.
Cervero R., and A. Golub (2011). Informal public transport: a global perspective. In: Urban Transport in the Developing World : a Handbook of Policy and Practice. Edward Elgar Publishers, Cheltenham, UK pp.488–547.
Final Draft Chapter 8 IPCC WGIII AR5
74 of 115
Cervero R., and J. Murakami (2009). Rail and Property Development in Hong Kong: Experiences and Extensions, Urban Studies 46 2019 –2043 pp. (DOI: 10.1177/0042098009339431).
Cervero R., and J. Murakami (2010). Effects of built environments on vehicle miles traveled: evidence from 370 US urbanized areas, Environment and Planning A 42 400–418 pp. . Available at: http://www.envplan.com/abstract.cgi?id=a4236.
Cervero R., and C. Sullivan (2011). Green TODs: marrying transit‐oriented development and green urbanism, International Journal of Sustainable Development & World Ecology 18 210–218 pp. .
Chandler K., E. Eberts, and L. Eudy (2006). New York City Transit Hybrid and CNG Transit Buses: Interim Evaluation Results. National Renewable Energy Lab, Golden CO, Washington DC, USA. 64 pp. Available at: http://www.afdc.energy.gov/pdfs/38843.pdf.
Chang B., and A. Kendall (2011). Life cycle greenhouse gas assessment of infrastructure construction for California’s high‐speed rail system, Transportation Research Part D: Transport and Environment 16 429–434 pp. (DOI: 10.1016/j.trd.2011.04.004), (ISSN: 1361‐9209).
Charpentier A.D., J.A. Bergerson, and H.L. MacLean (2009). Understanding the Canadian oil sands industry’s greenhouse gas emissions, Environmental Research Letters 4 014005 pp. (DOI: 10.1088/1748‐9326/4/1/014005), (ISSN: 1748‐9326).
Chen X., and M. Khanna (2012a). The Market‐Mediated Effects of Low Carbon Fuel Policies, AgBioForum 15 89–105 pp. . Available at: http://www.agbioforum.org/v15n1/v15n1a11‐khanna.htm.
Cherp A., A. Adenikinju, A. Goldthau, F. Hernandez, L. Hughes, J. Jansen, J. Jewell, M. Olshanskaya, R. Soares de Oliveira, B. Sovacool, and S. Vakulenko (2012). Chapter 5 ‐ Energy and Security. In: Global Energy Assessment ‐ Toward a Sustainable Future.Cambridge University Press, Cambridge, UK and New York, NY, USA and the International Institute for Applied Systems Analysis, Laxenburg, Austria pp.325–384(ISBN: 9781 10700 5198 hardback 9780 52118 2935 paperback).
Cherp A., and J. Jewell (2011). The three perspectives on energy security: intellectual history, disciplinary roots and the potential for integration, Current Opinion in Environmental Sustainability 3 202–212 pp. (DOI: 10.1016/j.cosust.2011.07.001), (ISSN: 1877‐3435).
Chester M.V., and A. Horvath (2009). Environmental assessment of passenger transportation should include infrastructure and supply chains, Environmental Research Letters 4 024008 pp. . Available at: http://stacks.iop.org/1748‐9326/4/i=2/a=024008.
China aims to ride high‐speed trains into the future (2011). National Public Radio NPR.
Choo S., P.L. Mokhtarian, and I. Salomon (2005). Does telecommuting reduce vehicle‐miles traveled? An aggregate time series analysis for the US, Transportation 32 37–64 pp. . Available at: http://www.escholarship.org/uc/item/74t9663f.
Chum H., A. Faaij, J. Moreira, G. Berndes, P. Dhamija, H. Dong, B. Gabrielle, A. Goss, W. Lucht, M. Mapako, O. Masera Cerutti, T. McIntyre, T. Minowa, and K. Pingoud (2011). Bioenergy. In: IPCC Special Report on Renewable Energy Sources and Climate Change Mitigation [O. Edenhofer, R. Pichs‐Madruga, Y. Sokona, K. Seyboth, P. Matschoss, S. Kadner, T. Zwickel, P. Eickemeier, G. Hansen, S. Schlömer, C. von Stechow (eds)]. Cambridge University Press, New York, USA pp.209–331(ISBN: 978‐1‐107‐60710‐1).
Final Draft Chapter 8 IPCC WGIII AR5
75 of 115
City Cycling (2012). MIT Press, Cambridge, Mass, 393 pp., (ISBN: 9780262517812). .
Conway P. (2007). Sea change: Is air cargo about to reach maturity? Available at: http://www.flightglobal.com/news/articles/sea‐change‐is‐air‐cargo‐about‐to‐reach‐maturity‐218779/.
Cooper D.A., and M. Ekstrom (2005). Applicability of the PEMS technique for simplified NOX monitoring on board ships, Atmospheric Environment 39 127–137 pp. (DOI: 10.1016/j.atmosenv.2004.09.019).
COP (2010). Copenhagen City of Cyclists: Bicycle Account 2010. City of Copenhagen, The Technical and Environmental Administration. . Available at: http://www.cycling‐embassy.dk/wp‐content/uploads/2011/05/Bicycle‐account‐2010‐Copenhagen.pdf.
Corbertt J., and J.J. Winebrake (2008). The impact of globalization on international maritime transport activity: Past trends and future perspectives. In: Globalisation, Transport and the Environment. Organisation for Economic Co‐operation and Development, Paris, France.
Corbertt J., and J.J. Winebrake (2011). Freight Transportation and the Environment. In: Intermodal transportation: moving freight in a global economy. L.A. Hoel, G. Giuliano, M.D. Meyer, (eds.), Eno Transportation Foundation, Washington, DC(ISBN: 9780971817555).
Corbett J.J., D.A. Lack, J.J. Winebrake, S. Harder, J.A. Silberman, and M. Gold (2010). Arctic shipping emissions inventories and future scenarios, Atmospheric Chemistry and Physics 10 9689–9704 pp. (DOI: 10.5194/acp‐10‐9689‐2010), (ISSN: 1680‐7316).
Corbett J.J., H. Wang, and J.J. Winebrake (2009). The effectiveness and costs of speed reductions on emissions from international shipping, Transportation Research Part D: Transport and Environment 14 593–598 pp. (DOI: 10.1016/j.trd.2009.08.005), (ISSN: 1361‐9209).
Costantini V., F. Gracceva, A. Markandya, and G. Vicini (2007). Security of energy supply: Comparing scenarios from a European perspective, Energy Policy 35 210–226 pp. (DOI: 10.1016/j.enpol.2005.11.002), (ISSN: 0301‐4215).
CRC (2008). Environmental regulations pertaining to rail: Developing best practice. Cooperative Research Centre for Rail Innovation. . Available at: http://www.railcrc.net.au/project/r1102.
Creutzig F., and D. He (2009). Climate change mitigation and co‐benefits of feasible transport demand policies in Beijing, Transportation Research Part D: Transport and Environment 14 120–131 pp. (DOI: doi: 10.1016/j.trd.2008.11.007), (ISSN: 1361‐9209).
Creutzig F., E. McGlynn, J. Minx, and O. Edenhofer (2011a). Climate policies for road transport revisited (I): Evaluation of the current framework, Energy Policy 39 2396–2406 pp. . Available at: http://www.sciencedirect.com/science/article/pii/S0301421511000760.
Creutzig F., R. Mühlhoff, and J. Römer (2012a). Decarbonizing urban transport in European cities: four cases show possibly high co‐benefits, Environmental Research Letters 7 044042 pp. (ISSN: 1748‐9326).
Creutzig F., R. Mühlhoff, and J. Römer (2012b). Decarbonizing urban transport in European cities: four cases show possibly high co‐benefits, Environmental Research Letters 7 044042 pp. (DOI: 10.1088/1748‐9326/7/4/044042), (ISSN: 1748‐9326).
Final Draft Chapter 8 IPCC WGIII AR5
76 of 115
Creutzig F., A. Papson, L. Schipper, and D.M. Kammen (2009). Economic and environmental evaluation of compressed‐air cars, Environmental Research Letters 4 044011 pp. (DOI: 10.1088/1748‐9326/4/4/044011), (ISSN: 1748‐9326).
Creutzig F., A. Popp, R.J. Plevin, G. Luderer, J. Minx, and O. Edenhofer (2011b). Reconciling top‐down and bottom‐up modeling on future bioenergy deployment, Nature Climate Change.
Creutzig F., A. Popp, R. Plevin, G. Luderer, J. Minx, and O. Edenhofer (2012c). Reconciling top‐down and bottom‐up modelling on future bioenergy deployment, Nature Climate Change 2 320–327 pp. (DOI: 10.1038/nclimate1416), (ISSN: 1758‐678X).
Creutzig F., A. Thomas, D.M. Kammen, and E. Deakin (2012d). Transport Demand Management in Beijing, China: Progress and Challenges. In: Low Carbon Transport in Asia: Capturing Climate and Development Co‐benefits. Earthscan, London.
Crist P. (2009). Greenhouse Gas Emissions Reduction Potential from International Shipping. JTRC Discussion Paper. Joint Transport Research Centre of the OECD and the International Transport Forum. . Available at: http://www.internationaltransportforum.org/jtrc/discussionpapers/DP200911.pdf.
Cryoplane (2003). Liquid Hydrogen Fuelled Aircraft – System Analysis. Airbus Deutschland GmbH, Hamburg. 80 pp.
CST (2002). Definition and Vision of Sustainable Transport. The Center for Sustainable Transportation, Ontario, Canada. 4 pp.
Cuenot F., L. Fulton, and J. Staub (2012). The prospect for modal shifts in passenger transport worldwide and impacts on energy use and CO2, Energy Policy 41 98–106 pp. (DOI: 10.1016/j.enpol.2010.07.017), (ISSN: 0301‐4215).
Dalkmann H., and C. Brannigan (2007). Transport and climate change. A Sourcebook for Policy‐Makers in Developing Cities: Module 5e. Gesellschaft Für Technische Zusammenarbeit–GTZ Eschborn.
Dargay J. (2007). The effect of prices and income on car travel in the UK, Transportation Research Part A: Policy and Practice 41 949–960 pp. (DOI: 10.1016/j.tra.2007.05.005), (ISSN: 0965‐8564).
Davies N. (2012). What are the ingredients of successful travel behavioural change campaigns?, Transport Policy 24 19–29 pp. (DOI: 10.1016/j.tranpol.2012.06.017), (ISSN: 0967‐070X).
Delbosc A., and G. Currie (2013). Causes of Youth Licensing Decline: A Synthesis of Evidence, Transport Reviews 33 271–290 pp. (DOI: 10.1080/01441647.2013.801929), (ISSN: 0144‐1647).
Dell’Olmo P., and G. Lulli (2003). A new hierarchical architecture for Air Traffic Management: Optimisation of airway capacity in a Free Flight scenario, European Journal of Operational Research 144 179–193 pp. (DOI: 10.1016/S0377‐2217(01)00394‐0), (ISSN: 0377‐2217).
DeMaio P. (2009). Bike‐sharing: History, Impacts, Models of Provision, and Future, Journal of Public Transportation 12 41–56 pp. . Available at: http://www.nctr.usf.edu/jpt/pdf/JPT12‐4DeMaio.pdf.
Deng T., and J.D. Nelson (2011). Recent Developments in Bus Rapid Transit: A Review of the Literature, Transport Reviews 31 69–96 pp. (DOI: 10.1080/01441647.2010.492455), (ISSN: 0144‐1647, 1464‐5327).
Final Draft Chapter 8 IPCC WGIII AR5
77 of 115
DfT (2010). Future Aircraft Fuel Efficiencies—Final Report. Department for Transport, London, UK. 92 pp. Available at: https://www.gov.uk/government/uploads/system/uploads/attachment_data/file/4515/future‐aircraft‐fuel‐efficiency.pdf.
Diana M., L. Quadrifoglio, and C. Pronello (2007). Emissions of demand responsive services as an alternative to conventional transit systems, Transportation Research Part D: Transport and Environment 12 183–188 pp. (DOI: 10.1016/j.trd.2007.01.009), (ISSN: 1361‐9209).
Dierkers G., E. Silsbe, S. Stott, S. Winkelman, and M. Wubben (2008). CCAP Transportation Emissions Guidebook. Part One: Land Use, Transit & Travel Demand Management. Center for Clean Air Policy, Washington DC, USA.
Dimitriou H.T. (2006). Towards a generic sustainable urban transport strategy for middle‐sized cities in Asia: Lessons from Ningbo, Kanpur and Solo, Habitat International 30 1082–1099 pp. (DOI: 10.1016/j.habitatint.2006.02.001), (ISSN: 0197‐3975).
Dinwoodie J. (2006). Rail freight and sustainable urban distribution: Potential and practice, Journal of Transport Geography 14 309–320 pp. (DOI: 10.1016/j.jtrangeo.2005.06.001), (ISSN: 0966‐6923).
DOE/EIA (2010). International Energy Outlook 2011. US Energy Information Administration, Washington DC, USA.
Dotson R. (2011). Institutional and political support for urban transport. In: Urban Transport in the Developing World : a Handbook of Policy and Practice. Edward Elgar Publishers, Cheltenham, UK pp.262–304.
Downs A. (2004). Still Stuck in Traffic. Brookings Institution Press, Washington. . Available at: http://www.brookings.edu/research/books/2004/stillstuckintraffic.
Drabik D., and H. de Gorter (2011). Biofuel policies and carbon leakage, AgBioForum 14 104–110 pp. . Available at: file://localhost/Users/rjp/literature/d/Drabik%20‐%20Biofuel%20policies%20and%20carbon%20leakage%202011.pdf.
Drobot S.D., J.A. Maslanik, and M.R. Anderson (2009). Interannual variations in the opening date of the Prudhoe Bay shipping season: links to atmospheric and surface conditions, International Journal of Climatology 29 197–203 pp. (DOI: 10.1002/joc.1725), (ISSN: 0899‐8418).
Du G., and R. Karoumi (2012). Life cycle assessment of a railway bridge: comparison of two superstructure designs, Structure and Infrastructure Engineering 9 1149–1160 pp. (DOI: 10.1080/15732479.2012.670250), (ISSN: 1573‐2479).
Duranton G., and M.A. Turner (2011). The Fundamental Law of Road Congestion: Evidence from US Cities, The American Economic Review 101 2616–2652 pp. (DOI: 10.1257/aer.101.6.2616).
Eads G. (2010). 50by50 Prospects and Progress Report for Global Fuel Economy Initiative. Global Fuel Economy Initiative. 64 pp. Available at: http://www.globalfueleconomy.org/Documents/Publications/prospects_and_progress_lr.pdf.
EC (2013). EU Transport in Figures. European Commission. 71 pp. Available at: http://ec.europa.eu/transport/facts‐fundings/statistics/doc/2013/pocketbook2013.pdf.
Final Draft Chapter 8 IPCC WGIII AR5
78 of 115
Echenique M.H., A.J. Hargreaves, G. Mitchell, and A. Namdeo (2012). Growing Cities Sustainably, Journal of the American Planning Association 78 121–137 pp. (DOI: 10.1080/01944363.2012.666731), (ISSN: 0194‐4363).
ECMT (2004). Assessment and Decision Making for Sustainable Transport. Organization of Economic Co‐Operation and Development, Paris. 235 pp. Available at: http://internationaltransportforum.org/pub/pdf/04Assessment.pdf.
ECMT (2007). Cutting Transport CO2 Emissions: What Progress? OECD, Paris, 264 pp. Available at: http://www.internationaltransportforum.org/Pub/pdf/07CuttingCO2.pdf.
Econ (2007). Arctic Shipping 2030: From Russia with Oil, Stormy Passage or Arctic Great Game? Commissioned by Norshipping, Oslo. 49 pp.
Edwards J.B., A.C. McKinnon, and S.L. Cullinane (2010). Comparative analysis of the carbon footprints of conventional and online retailing: A ‘last mile’ perspective, International Journal of Physical Distribution & Logistics Management 40 103–123 pp. (DOI: 10.1108/09600031011018055), (ISSN: 0960‐0035).
EEA (2006). Technology to Improve the Fuel Economy of Light Trucks to 2015. Energy and Environmental Analysis Inc.
EEA (2011). Monitoring the CO2 Emissions from New Passenger Cars in the EU: Summary of Data for 2010. European Environment Agency, Copenhagen.
EIA (2011). International Energy Outlook. U.S. Energy Information Administration, Washington D C, USA. 292 pp. Available at: www.eia.gov/ieo/.
Eichhorst U. (2009). Adapting Urban Transport to Climate Change. Module 5f. Sustainable Transport: A Sourcebook for Policy‐Makers in Developing Countries. Deutsche Gesellschaft Fur Technische Zusammenarbeit (GTZ), Eschborn. 70 pp.
Eliasson J. (2008). Lessons from the Stockholm congestion charging trial, Transport Policy 15 395–404 pp. (DOI: 10.1016/j.tranpol.2008.12.004), (ISSN: 0967‐070X).
Eliseeva S.V., and J.‐C.G. Bünzli (2011). Rare earths: jewels for functional materials of the future, New Journal of Chemistry 35 1165 pp. (DOI: 10.1039/c0nj00969e), (ISSN: 1144‐0546, 1369‐9261).
Eom J., L. Schipper, and L. Thompson (2012). We keep on truckin’: Trends in freight energy use and carbon emissions in 11 IEA countries, Energy Policy 45 327–341 pp. (DOI: 10.1016/j.enpol.2012.02.040), (ISSN: 0301‐4215).
EPA (2011). EPA and NHTSA Adopt First‐Ever Program to Reduce Greenhouse Gas Emissions and Improve Fuel Efficiency of Medium‐and Heavy‐Duty Vehicles. Environmetal Protection Agency, Washington DC, USA. 8 pp. Available at: http://www.epa.gov/oms/climate/documents/420f11031.pdf.
EPA (2012). Final Rulemaking for 2017‐2025 Light‐Duty Vehicle Greenhouse Gas Emission Standards and Corporate Average Fuel Economy Standards. Environmetal Protection Agency, Washington DC, USA. 555 pp. Available at: http://www.epa.gov/otaq/climate/documents/420r12016.pdf.
Final Draft Chapter 8 IPCC WGIII AR5
79 of 115
Eppstein M.J., D.K. Grover, J.S. Marshall, and D.M. Rizzo (2011). An agent‐based model to study market penetration of plug‐in hybrid electric vehicles, Energy Policy 39 3789–3802 pp. (DOI: 10.1016/j.enpol.2011.04.007).
EPRI (2008). The Green Grid: Energy Savings and Carbon Emissions Reductions Enabled by a Smart Grid. Electric Power Research Institute, Palo Alto, USA. 64 pp.
Ericksen P.J., J.S.I. Ingram, and D.M. Liverman (2009). Food security and global environmental change: emerging challenges, Environmental Science & Policy 12 373–377 pp. (DOI: 10.1016/j.envsci.2009.04.007), (ISSN: 1462‐9011).
Estache A., and A. GóMez‐Lobo (2005). Limits to competition in urban bus services in developing countries, Transport Reviews 25 139–158 pp. (DOI: 10.1080/0144164042000289654), (ISSN: 0144‐1647, 1464‐5327).
ETSAP (2010). Unconventional oil and gas production, Energy Technology Systems Analysis Programme. Paris, France. 2010, Available at: http://www.iea‐etsap.org/web/E‐TechDS/PDF/P02‐Uncon%20oil&gas‐GS‐gct.pdf.
Eurocontrol (2008). The Challenges of Growth, Air Traffic Statistics and Forecasts, The European Organisation for the Safety of Air Navigation. Eurocontrol, Brussels, Belgium. 40 pp. Available at: http://www.eurocontrol.int/statfor.
European Commission, Transport and Environment (2011). Emissions from maritime transport. . Available at: http://ec.europa.eu/environment/air/transport/ships.htm.
European Environment Agency (2011). Laying the Foundations for Greener Transport : TERM 2011 : Transport Indicators Tracking Progress towards Environmental Targets in Europe. Publications Office of the European Union, Luxembourg, 92 pp., (ISBN: 9789292132309 929213230X). .
Evans A. (2010). Simulating airline operational responses to environmental constraints. Clare College, University of Cambridge, Cambridge, UK, 185 pp. Available at: http://www.dspace.cam.ac.uk/handle/1810/226855.
Evans A., and A. Schäfer (2011). The impact of airport capacity constraints on future growth in the US air transportation system, Journal of Air Transport Management 17 288–295 pp. (DOI: doi: 10.1016/j.jairtraman.2011.03.004), (ISSN: 0969‐6997).
Ewing R. (2007). Growing Cooler:The Evidence on Urban Development and Climate Change. Urban Land Institute, Chicago, 2007.
Ewing R. (2008). Characteristics, Causes, and Effects of Sprawl: A Literature Review. In: Urban Ecology. Springer US, New York, USA pp.519–535(ISBN: 978‐0‐387‐73412‐5).
Ewing R., K. Bartholomew, S. Winkelman, J. Walters, and G. Anderson (2008). Urban development and climate change, Journal of Urbanism: International Research on Placemaking and Urban Sustainability 1 201–216 pp. (DOI: 10.1080/17549170802529316), (ISSN: 1754‐9175).
Ewing R., and R. Cervero (2010). Travel and the Built Environment ‐‐ A Meta‐Analysis, Journal of the American Planning Association 76 265–294 pp. . Available at: http://dx.doi.org/10.1080/01944361003766766.
Final Draft Chapter 8 IPCC WGIII AR5
80 of 115
Faber J., D. Nelissen, G. Hon, H. Wang, and M. Tsimplis (2012). Regulated Slow Steaming in Maritime Transport: An Assessment of Options, Costs and Benefits. International Council on Clean Transportation (ICCT), Delft, Netherlands. 119 pp.
Fargione J.E., R.J. Plevin, and J.D. Hill (2010). The Ecological Impact of Biofuels, Annual Review of Ecology and Systematics 41 351–377 pp. (DOI: 10.1146/annurev‐ecolsys‐102209‐144720), (ISSN: 1543‐592X).
Farrington R., and J. Rugh (2000). Impact of Vehicle Air‐Conditioning on Fuel Economy, Tailpipe Emissionsm and Electric Vehicle Range. National Renewable Energy Laboratory, Golden, Colorado. 12 pp.
Federal Highway Administration (2000). Operations Story. . Available at: http://www.ops.fhwa.dot.gov/aboutus/opstory.htm.
Figueroa M.J., L. Fulton, and G. Tiwari (2013). Avoiding, transforming, transitioning: pathways to sustainable low carbon passenger transport in developing countries, Current Opinion in Environmental Sustainability 5 184–190 pp. (DOI: 10.1016/j.cosust.2013.02.006), (ISSN: 1877‐3435).
Figueroa M.J., and S.K. Kahn Ribeiro (2013). Energy for road passenger transport and sustainable development: assessing policies and goals interactions, Current Opinion in Environmental Sustainability 5 152–162 pp. (DOI: 10.1016/j.cosust.2013.04.004), (ISSN: 1877‐3435).
Fischedick M., R. Schaeffer, A. Adedoyin, M. Akai, T. Bruckner, L. Clarke, V. Krey, S. Savolainen, S. Teske, D. Ürge‐Vorsatz, and R. Wright (2011). Mitigation Potential and Costs. In: IPCC Special Report on Renewable Energy Sources and Climate Change Mitigation [O. Edenhofer, R. Pichs‐Madruga, Y. Sokona, K. Seyboth, P. Matschoss, S. Kadner, T. Zwickel, P. Eickemeier, G. Hansen, S. Schlömer, C. von Stechow (eds)]. Cambridge University Press, Cambridge and New York pp.791–864.
Flachsland C., S. Brunner, O. Edenhofer, and F. Creutzig (2011). Climate policies for road transport revisited (II): Closing the policy gap with cap‐and‐trade, Energy Policy 39 2100–2110 pp. (DOI: 10.1016/j.enpol.2011.01.053), (ISSN: 0301‐4215).
Flannery T., R. Beale, G. Hueston, Climate Commission, and Australia. Dept. of Climate Change and Energy Efficiency (2012). The Critical Decade: International Action on Climate Change. Climate Commission Secretariat (Department of Climate Change and Energy Efficiency), Canberra, Australia, 75 pp., (ISBN: 9781922003676 1922003670). .
Frank L.D., and G. Pivo (1994). Impacts of mixed use and density on utilization of three modes of travel: Single occupant vehicle, transit, and walking, Transportation Research Record: Journal of the Transportation Research Board 1466 44–52 pp. .
Freight Transport Association (2013). Logistics Carbon Review. Tunbridge Wells, UK. 28 pp.
Fuglestvedt J., T. Berntsen, V. Eyring, I. Isaksen, D.S. Lee, and R. Sausen (2009a). Shipping Emissions: From Cooling to Warming of Climate—and Reducing Impacts on Health, Environmental Science & Technology 43 9057–9062 pp. (DOI: 10.1021/es901944r), (ISSN: 0013‐936X, 1520‐5851).
Fuglestvedt J., T. Berntsen, V. Eyring, I. Isaksen, D.S. Lee, and R. Sausen (2009b). Shipping Emissions: From Cooling to Warming of Climate—and Reducing Impacts on Health, Environmental Science & Technology 43 9057–9062 pp. (DOI: 10.1021/es901944r), (ISSN: 0013‐936X, 1520‐5851).
Final Draft Chapter 8 IPCC WGIII AR5
81 of 115
Fulton L., O. Lah, and F. Cuenot (2013). Transport Pathways for Light Duty Vehicles: Towards a 2° Scenario, Sustainability 5 1863–1874 pp. (DOI: 10.3390/su5051863), (ISSN: 2071‐1050).
Fürst E., and P. Oberhofer (2012). Greening road freight transport: evidence from an empirical project in Austria, Journal of Cleaner Production 33 67–73 pp. (DOI: 10.1016/j.jclepro.2012.05.027), (ISSN: 0959‐6526).
Gallagher K.S., and E. Muehlegger (2011). Giving green to get green? Incentives and consumer adoption of hybrid vehicle technology, Journal of Environmental Economics and Management 61 1–15 pp. (DOI: 10.1016/j.jeem.2010.05.004), (ISSN: 0095‐0696).
Garneau M.‐È., W.F. Vincent, R. Terrado, and C. Lovejoy (2009). Importance of particle‐associated bacterial heterotrophy in a coastal Arctic ecosystem, Journal of Marine Systems 75 185–197 pp. (DOI: 10.1016/j.jmarsys.2008.09.002), (ISSN: 0924‐7963).
Garrard J., G. Rose, and S.K. Lo (2008). Promoting transportation cycling for women: the role of bicycle infrastructure, Preventive Medicine 46 55–59 pp. (DOI: 10.1016/j.ypmed.2007.07.010), (ISSN: 0091‐7435).
Gehl J. (2011). Cities for People. Island Press, Washington, D.C., 269 pp.
Gehlhar M., A. Somwaru, P.B. Dixon, M.T. Rimmer, and A.R. Winston (2010). Economywide Implications from US Bioenergy Expansion, American Economic Review 100 172–77 pp. (DOI: 10.1257/aer.100.2.172).
Geurs K.T., and B. van Wee (2004). Accessibility evaluation of land‐use and transport strategies: review and research directions, Journal of Transport Geography 12 127–140 pp. (DOI: 10.1016/j.jtrangeo.2003.10.005), (ISSN: 0966‐6923).
Gifford R. (2011). The Dragons of Inaction: Psychological Barriers That Limit Climate Change Mitigation and Adaptation, American Psychologist 66 290–302 pp. .
Gilbert R., and A. Perl (2010). Transport Revolutions: Moving People and Freight Without Oil. New Society, Philadelphia, Pa., 432 pp., (ISBN: 9781550924534 1550924532). .
Gillingham K., M.J. Kotchen, D.S. Rapson, and G. Wagner (2013). Energy policy: The rebound effect is overplayed, Nature 493 475–476 pp. (DOI: 10.1038/493475a), (ISSN: 0028‐0836, 1476‐4687).
Girod B., D.P. Vuuren, M. Grahn, A. Kitous, S.H. Kim, and P. Kyle (2013). Climate impact of transportation A model comparison, Climatic Change 118 595–608 pp. (DOI: 10.1007/s10584‐012‐0663‐6), (ISSN: 0165‐0009, 1573‐1480).
Girod B., D.P. van Vuuren, and S. Deetman (2012). Global travel within the 2°C climate target, Energy Policy 45 152–166 pp. (DOI: 10.1016/j.enpol.2012.02.008), (ISSN: 0301‐4215).
Giuliano G., and J. Dargay (2006). Car ownership, travel and land use: a comparison of the US and Great Britain, Transportation Research Part A: Policy and Practice 40 106–124 pp. (DOI: 10.1016/j.tra.2005.03.002), (ISSN: 0965‐8564).
Glaeser E. (2011). The Triumph of the City. Pan Macmillan, London, 338 pp., (ISBN: 0230709397 9780230709393 9780230709386 0230709389). .
Final Draft Chapter 8 IPCC WGIII AR5
82 of 115
Gohardani A.S., G. Doulgeris, and R. Singh (2011). Challenges of future aircraft propulsion: A review of distributed propulsion technology and its potential application for the all electric commercial aircraft, Progress in Aerospace Sciences 47 369–391 pp. (DOI: 10.1016/j.paerosci.2010.09.001), (ISSN: 0376‐0421).
Golob T.F., and A.C. Regan (2001). Impacts of information technology on personal travel and commercial vehicle operations: research challenges and opportunities, Implications of New Information Technology 9 87–121 pp. (DOI: 10.1016/S0968‐090X(00)00042‐5), (ISSN: 0968‐090X).
Gong H., M.Q. Wang, and H. Wang (2012). New energy vehicles in China: policies, demonstration, and progress, Mitigation and Adaptation Strategies for Global Change 18 207–228 pp. (DOI: 10.1007/s11027‐012‐9358‐6), (ISSN: 1381‐2386, 1573‐1596).
Goodwin P. (1999). Transformation of transport policy in Great Britain, Transportation Research Part A: Policy and Practice 33 655–669 pp. (DOI: 10.1016/S0965‐8564(99)00011‐7), (ISSN: 09658564).
Goodwin P. (2004). The Economic Costs of Road Traffic Congestion. UCL (University College London), The Rail Freight Group, London, UK.
Goodwin P. (2012). Three Views on Peak Car, World Transport Policy and Practice 17.
Goodwin P., and K. Van Dender (2013a). ‘Peak Car’ — Themes and Issues, Transport Reviews 33 243–254 pp. (DOI: 10.1080/01441647.2013.804133), (ISSN: 0144‐1647, 1464‐5327).
Goodwin P., and G. Lyons (2010). Public attitudes to transport: Interpreting the evidence, Transportation Planning and Technology 33 3–17 pp. (ISSN: 0308‐1060).
Gössling S. (2011). Carbon Management in Tourism: Mitigating the Impacts on Climate Change. Routledge, UK, 350 pp., (ISBN: 0415566320). .
Gössling S., J.P. Ceron, G. Dubois, and C.M. Hall (2009). Hypermobile travellers. In: Climate Change and Aviation. S. Gössling, P. Upham, (eds.), Earthscan, pp.131–149.
Gowri A., K. Venkatesan, and R. Sivanandan (2009). Object‐oriented methodology for intersection simulation model under heterogeneous traffic conditions, Advances in Engineering Software 40 1000–1010 pp. (DOI: 10.1016/j.advengsoft.2009.03.015), (ISSN: 0965‐9978).
Grabow M.L., S.N. Spak, T. Holloway, B. Stone, A.C. Mednick, and J.A. Patz (2012). Air Quality and Exercise‐Related Health Benefits from Reduced Car Travel in the Midwestern United States, Environmental Health Perspectives 120 68–76 pp. (DOI: 10.1289/ehp.1103440), (ISSN: 0091‐6765).
Graham‐Rowe E., B. Gardner, C. Abraham, S. Skippon, H. Dittmar, R. Hutchins, and J. Stannard (2012). Mainstream consumers driving plug‐in battery‐electric and plug‐in hybrid electric cars: A qualitative analysis of responses and evaluations, Transportation Research Part A: Policy and Practice 46 140–153 pp. (DOI: 10.1016/j.tra.2011.09.008), (ISSN: 0965‐8564).
Greene D.L. (2010a). How Consumers Value Fuel Economy: A Literature Review. U.S. Environmental Protection Agency, Washington DC, USA. 79 pp. Available at: http://www.epa.gov/otaq/climate/regulations/420r10008.pdf.
Greene D.L. (2010b). Measuring energy security: Can the United States achieve oil independence?, Energy Policy 38 1614–1621 pp. (DOI: 10.1016/j.enpol.2009.01.041), (ISSN: 0301‐4215).
Final Draft Chapter 8 IPCC WGIII AR5
83 of 115
Greene D.L., J.R. Kahn, and R.C. Gibson (1999). The Energy Journal . Fuel Economy Rebound Effect for U.S. Household Vehicles, The Energy Journal 20 1–31 pp. . Available at: http://ideas.repec.org/a/aen/journl/1999v20‐03‐a01.html.
Greene D.L., and S.E. Plotkin (2011). Reducing greenhouse gas emissions from U.S. transportation,. Pew Center on Global Climate Change.
Grubler A., X. Bai, T. Buettner, S. Dhakal, D. Fisk, T. Ichinose, J. Keristead, G. Sammer, D. Satterthwaite, N. Schulz, N. Shah, J. Steinberger, and H. Weiz (2012). Urban Energy Systems. In: Global Energy Assessment ‐ Toward a Sustainable Future. International Institute for Applied Systems Analysis and Cambridge University Press, Cambridge, United Kingdom and New York, NY, USA pp.1307–1400.
Gwilliam K. (2003). Urban transport in developing countries, Transport Reviews 23 197–216 pp. (DOI: 10.1080/01441640309893), (ISSN: 0144‐1647).
Gwilliam K. (2013). Cities on the move – Ten years after, Urban Transport in Developing Countries: CODATU Special Issue 40 3–18 pp. (DOI: 10.1016/j.retrec.2012.06.032), (ISSN: 0739‐8859).
Haider M., and E.J. Miller (2000). Effects of Transportation Infrastructure and Location on Residential Real Estate Values Application of Spatial Autoregressive Techniques. Transportation Research Board, Washington DC, USA. 1–7 pp.
Hallmark S.L., B. Wang, Y. Qiu, and R. Sperry (2013). Evaluation of In‐Use Fuel Economy for Hybrid and Regular Transit Buses, Journal of Transportation Technologies 03 52–57 pp. (DOI: 10.4236/jtts.2013.31006), (ISSN: 2160‐0473, 2160‐0481).
Halzedine T., A. Primdore, D. Belissen, and J. Hulskotte (2009). EU Transport GHG: Routes to 2050? Technical Options to Reduce GHG for Non‐Road Transport Modes. European Commission Directorate‐General Environment, Brussels, Belgium. 58 pp. Available at: http://www.eutransportghg2050.eu/cms/assets/UPDATED‐EU‐Transport‐GHG‐2050‐Paper‐3‐Technical‐options‐for‐non‐road‐modes‐30‐10‐09.pdf.
Hamin E.M., and N. Gurran (2009). Urban form and climate change: Balancing adaptation and mitigation in the U.S. and Australia, Habitat International 33 238–245 pp. (DOI: 10.1016/j.habitatint.2008.10.005), (ISSN: 0197‐3975).
Handy S., M.G. Boarnet, R. Ewing, and R.E. Killingsworth (2002). How the built environment affects physical activity: Views from urban planning, American Journal of Preventive Medicine 23 64–73 pp. (DOI: doi: 10.1016/S0749‐3797(02)00475‐0), (ISSN: 0749‐3797).
Hanjra M.A., and M.E. Qureshi (2010). Global water crisis and future food security in an era of climate change, Food Policy 35 365–377 pp. (DOI: 10.1016/j.foodpol.2010.05.006), (ISSN: 0306‐9192).
Hankey, J. M. J., and Brauer, M. (2012). Health impacts of the built environment: within‐urban variability in physical inactivity, air pollution, and ischemic heart disease mortality., Environmental Health Perspectives 120(2) 247–252 pp. .
Hao H., H. Wang, and M. Ouyang (2011). Comparison of policies on vehicle ownership and use between Beijing and Shanghai and their impacts on fuel consumption by passenger vehicles, Energy Policy 39 1016–1021 pp. (DOI: 10.1016/j.enpol.2010.11.039), (ISSN: 0301‐4215).
Final Draft Chapter 8 IPCC WGIII AR5
84 of 115
Hargroves C., and M. Smith (2008). The Natural Advantage of Nations. Earthscan, London, UK, 576 pp.
De Hartog J.J., H. Boogaard, H. Nijland, and G. Hoek (2010). Do the Health Benefits of Cycling Outweigh the Risks?, Environmental Health Perspectives 118 1109–1116 pp. (DOI: 10.1289/ehp.0901747), (ISSN: 0091‐6765).
Harvey L.D.D. (2012). Global climate‐oriented transportation scenarios, Energy Policy (DOI: 10.1016/j.enpol.2012.10.053), (ISSN: 0301‐4215).
Hawkins T.R., O.M. Gausen, and A.H. Strømman (2012). Environmental impacts of hybrid and electric vehicles—a review, The International Journal of Life Cycle Assessment 17 997–1014 pp. (DOI: 10.1007/s11367‐012‐0440‐9), (ISSN: 0948‐3349, 1614‐7502).
He J., W. Wu, and Y. Xu (2010). Energy Consumption of Locomotives in China Railways during 1975–2007, Journal of Transportation Systems Engineering and Information Technology 10 22–27 pp. (DOI: 10.1016/S1570‐6672(09)60061‐1), (ISSN: 1570‐6672).
Headicar P. (2013). The Changing Spatial Distribution of the Population in England: Its Nature and Significance for ‘Peak Car’, Transport Reviews 33 310–324 pp. (DOI: 10.1080/01441647.2013.802751), (ISSN: 0144‐1647, 1464‐5327).
Heath G.W., R.C. Brownson, J. Kruger, R. Miles, K.E. Powell, and L.T. Ramsey (2006). The effectiveness of urban design and land use and transport policies and practices to increase physical activity: a systematic review., Journal of Physical Activity & Health 3.
Henstra D., C. Ruijgrok, and L. Tavasszy (2007). Globalized trade, logistics and intermodality: European perspectives, Globalized Freight Transport 135–163 pp. .
Highways Agency (2011). Climate Change Risk Assessment. High Ways Agency Media Services.
Hill N., C. Brannigan, R. Smokers, A. Schroten, H. van Essen, and I. Skinner (2012). Developing a Better Understanding of the Secondary Impacts and Key Sensitivities for the Decarbonisation of the EU’s Transport Sector by 2050. European Commission Directorate ‐ General Climate Action and AEA Technology, Brussels, Belgium. 112 pp. Available at: http://www.eutransportghg2050.eu/cms/assets/Uploads/Reports/EU‐Transport‐GHG‐2050‐II‐Final‐Report‐29Jul12.pdf.
Hill J., S. Polasky, E. Nelson, D. Tilman, H. Huo, L. Ludwig, J. Neumann, H. Zheng, and D. Bonta (2009). Climate change and health costs of air emissions from biofuels and gasoline, Proceedings of the National Academy of Sciences 106 2077–2082 pp. (DOI: 10.1073/pnas.0812835106).
Ho J. (2010). The implications of Arctic sea ice decline on shipping, Marine Policy 34 713–715 pp. (DOI: 10.1016/j.marpol.2009.10.009), (ISSN: 0308‐597X).
Hochman G., D. Rajagopal, and D. Zilberman (2010a). The effect of biofuels on crude oil markets, AgBioForum 13 112–118 pp. . Available at: http://www.agbioforum.org/v13n2/v13n2a03‐hochman.htm.
Höjer M., K.H. Dreborg, R. Engström, U. Gunnarsson‐Östling, and Å. Svenfelt (2011a). Experiences of the development and use of scenarios for evaluating Swedish environmental quality objectives, Futures 43 498–512 pp. (DOI: 10.1016/j.futures.2011.02.003), (ISSN: 0016‐3287).
Final Draft Chapter 8 IPCC WGIII AR5
85 of 115
Höjer M., A. Gullberg, and R. Pettersson (2011b). Images of the Future City: Time and Space for Sustainable Development. Springer, Dordrecht; Heidelberg [u.a.], 457 pp., (ISBN: 9789400706521 9400706529 9789400706538 9400706537). .
Holland S.P. (2012). Emissions taxes versus intensity standards: Second‐best environmental policies with incomplete regulation, Journal of Environmental Economics and Management 63 375–387 pp. (DOI: 10.1016/j.jeem.2011.12.002), (ISSN: 0095‐0696).
Holland S.P., J.E. Hughes, and C.R. Knittel (2009). American Economic Journal: Economic Policy . Greenhouse Gas Reductions under Low Carbon Fuel Standards?, American Economic Journal: Economic Policy 1 106–46 pp. . Available at: http://ideas.repec.org/a/aea/aejpol/v1y2009i1p106‐46.html.
Hook W. (2003). Preserving and Expanding the Role of Non‐Motorised Transport. GTZ Transport and Mobility Group, Eschborn, Germany. 40 pp.
Howarth R.W., R. Santoro, and A. Ingraffea (2011). Methane and the greenhouse‐gas footprint of natural gas from shale formations: A letter, Climatic Change 106 679–690 pp. (DOI: 10.1007/s10584‐011‐0061‐5), (ISSN: 0165‐0009, 1573‐1480).
Howarth R.W., R. Santoro, and A. Ingraffea (2012). Venting and leaking of methane from shale gas development: response to Cathles et al., Climatic Change 113 537–549 pp. (DOI: 10.1007/s10584‐012‐0401‐0), (ISSN: 0165‐0009, 1573‐1480).
Hughes J.E., C.R. Knittel, and D. Sperling (2006). Evidence of a Shift in the Short‐Run Price Elasticity of Gasoline Demand. National Bureau of Economic Research, Cambridge, USA. 33 pp. Available at: http://www.nber.org/papers/w12530.
Hultkrantz L., G. Lindberg, and C. Andersson (2006). The value of improved road safety, Journal of Risk and Uncertainty 32 151–170 pp. . Available at: http://www.scopus.com/inward/record.url?eid=2‐s2.0‐33646696193&partnerID=40&md5=abf898e93f64ebf18026a62628a86d44.
Hunt A., and P. Watkiss (2011). Climate change impacts and adaptation in cities: a review of the literature, Climatic Change 104 13–49 pp. . Available at: http://opus.bath.ac.uk/22301/.
Huo H., and M. Wang (2012). Modeling future vehicle sales and stock in China, Energy Policy 43 17–29 pp. (DOI: 10.1016/j.enpol.2011.09.063), (ISSN: 0301‐4215).
IATA (2009). Aviation and Climate Change Pathway to Carbon‐Neutral Growth in 2020. International Air Transport Association, Geneva. . Available at: http://www.iata.org/SiteCollectionDocuments/AviationClimateChange_PathwayTo2020_email.pdf.
ICAO (2007a). Safety and Operational Issues Stemming from Dramatic Regional Growth and Intensifying Environmental Concerns Have Created Challenging Times for Global Aviation. International Civil Aviation Organisation, Montreal, Canada. 40 pp.
ICAO (2007b). Outlook for Air Transport to the Year 2025. International Civil Aviation Organization, Quebec, Canada. 58 pp.
ICAO (2010a). Annual Report of the Council. International Civil Aviation Organization, Montreal, Canada. 160 pp.
Final Draft Chapter 8 IPCC WGIII AR5
86 of 115
ICAO (2010b). Consolidated Statement of Continuing ICAO Policies and Practices Related to Environmental Protection‐ Climate Change. International Civil Aviation Organization, Montreal, Canada. 20 pp.
ICAO (2012). New ICAO Council High‐Level Group to Focus on Environmental Policy Challenges. International Civil Aviation Organization, Montreal, Canada. 1 pp. Available at: http://www.icao.int/Newsroom/Pages/new‐ICAO‐council‐high‐level‐group‐to‐focus‐on‐environmental‐policy‐challenges.aspx.
ICCT (2007). Passenger Vehicle Greenhouse Gas and Fuel Economy Standards: A Global Update. International Council on Clean Transportation, Washington DC, USA. 36 pp. Available at: http://www.theicct.org/sites/default/files/publications/PV_standards_2007.pdf.
ICCT (2011). Reducing Greenhouse Gas Emissions from Ships: Cost Effectiveness of Available Options. 24 pp.
ICCT (2012a). Discrepancies between Type Approval and ‘real‐World’ Fuel Consumption and CO2 Values. International Council on Clean Transportation, Washington DC, USA. 13 pp. Available at: http://www.theicct.org/sites/default/files/publications/ICCT_EU_fuelconsumption2_workingpaper_2012.pdf.
ICCT (2012b). Estimated Cost of Emission Reduction Technologies for Light‐Duty Vehicles. International Council on Clean Transportation, Washington DC, USA. 136 pp. Available at: http://www.theicct.org/sites/default/files/publications/ICCT_LDVcostsreport_2012.pdf.
ICCT (2013). Global passenger vehicle standards, International Council on Clean Transportation . Available at: http://www.theicct.org/info‐tools/global‐passenger‐vehicle‐standards.
IEA (2007). Energy Technology Essentials: Hydrogen Production & Distribution. International Energy Agency, Paris. 4 pp.
IEA (2008). Energy Technology Perspectives ‐ Scenarios & Strategies to 2050. International Energy Agency, Paris. 650 pp.
IEA (2009a). Transport, Energy and CO2: Moving Toward Sustainability. International Energy Agency, Paris, France. 418 pp.
IEA (2009b). Transport, Energy and CO2: Moving Toward Sustainability. International Energy Agency, Paris, France. 418 pp.
IEA (2010a). World Energy Outlook 2010. International Energy Agency, OECD/IEA, Paris, France, 738 pp. Available at: https://www.iea.org/publications/freepublications/publication/weo2010.pdf.
IEA (2010b). Transport Energy Efficiency ‐ Implementation of IEA Recommendations since 2009 and next Steps. International Energy Agency, Paris, France. 60 pp. Available at: https://www.iea.org/publications/freepublications/publication/transport_energy_efficiency.pdf.
IEA (2010c). Sustainable Production of Second‐Generation Biofuels: Potential and Perspectives in Major Economies and Developing Countries. International Energy Agency, Paris, France. 16 pp. Available at: https://www.iea.org/publications/freepublications/publication/biofuels_exec_summary.pdf.
Final Draft Chapter 8 IPCC WGIII AR5
87 of 115
IEA (2011a). Technology Roadmap. Biofuels for Transport. International Energy Agency, Paris. 56 pp. Available at: http://www.iea.org/publications/freepublications/publication/bioenergy.pdf.
IEA (2011b). World Energy Outlook 2011. International Energy Agency, OECD/IEA, Paris, 659 pp., (ISBN: 978 92 64 12413 4). .
IEA (2011c). Technology Roadmap: Electric and Plug‐in Hybrid Electric Vehicles (EV/PHEV). International Energy Agency, Paris. 52 pp. Available at: http://www.iea.org/publications/freepublications/publication/EV_PHEV_Roadmap.pdf.
IEA (2011d). Renewable Energy: Policy Considerations for Deploying Renewables. International Energy Agency, Paris. 76 pp. Available at: http://www.iea.org/publications/freepublications/publication/Renew_Policies.pdf.
IEA (2012a). CO2 Emissions from Fuel Combustion. Beyond 2020 Online Database. 2012 Edition. Available at: http://data.iea.org.
IEA (2012b). World Energy Outlook 2012. International Energy Agency, OECD/IEA, Paris, France, 690 pp., (ISBN: 978‐92‐64‐18084‐0). .
IEA (2012c). Mobility Model (‘Momo’) database — Input data for the Energy Technology Perspectives 2012 report. International Energy Agency.
IEA (2012d). Technology Roadmap: Fuel Economy of Road Vehicles. International Energy Agency, Paris. 50 pp. Available at: http://www.iea.org/publications/freepublications/publication/name,31269,en.html.
IEA (2012e). Energy Technology Perspectives 2012. International Energy Agency, Paris. 690 pp.
IEA (2013). Policy Pathways: A Tale of Renewed Cities. International Energy Agency, Paris, 98 pp.
IEEJ (2011). Asia/World Energy Outlook 2011. The Institute of Energy Economics, Japan. 68 pp.
IISD (2011). IMO environment committee adopts mandatory GHG emission reduction measures. . Available at: http://climate‐l.iisd.org/news/imo‐environment‐committee‐adopts‐mandatory‐ghg‐reduction‐measures/.
IMO (2011). Mandatory energy efficiency measures for international shipping adopted at IMO Environmental meeting, International Maritime Organization . Available at: http://www.imo.org/MediaCentre/PressBriefings/Pages/42‐mepc‐ghg.aspx.
IPCC (2007). Climate Change 2007‐ Mitigation for Climate Change, 4th Assessment Report. Intergovernmental Panel on Climate Change, Working Group III. Cambridge University Press [B. Metz, O.R. Davidson, P.R. Bosch, R. Dave, L.A. Meyer (eds)], Cambridge and New York, 1076 pp. Available at: http://www.ipcc.ch/publications_and_data/ar4/wg3/en/contents.html.
ITDP (2009). Bus Rapid Transit Planning Guide. Institute for Transportation and Development Policy, New York. 45 pp. Available at: http://www.itdp.org/documents/Bus%20Rapid%20Transit%20Guide%20‐%20Part%28Intro%29%202007%2009.pdf.
ITF (2009). Reducing Transport GHG Emissions: Opportunities and Costs. International Transport Forum. . Available at: http://www.internationaltransportforum.org/Pub/pdf/09GHGsum.pdf.
Final Draft Chapter 8 IPCC WGIII AR5
88 of 115
ITF (2011). Trends in the Transport Sector. Annual Transport Statistics, International Transport Forum, OECD/ITF, Paris. 92 pp. Available at: www.internationaltransportforum.org/statistics/index.html.
ITF/OECD (2010). Moving Freight with Better Trucks. International Transport Forum, Paris, France. 45 pp. Available at: http://www.internationaltransportforum.org/jtrc/infrastructure/heavyveh/TrucksSum.pdf.
Jacobsen P.L. (2003). Safety in numbers: More walkers and bicyclists, safer walking and bicycling, Injury Prevention 9 205–209 pp. . Available at: http://www.scopus.com/inward/record.url?eid=2‐s2.0‐0142139344&partnerID=40&md5=e7b87ddd40a59305865140d0a239d57b.
James S.J., and C. James (2010). The Food Cold Chain and Climate Change, Food Research International 43 1944–1956 pp. .
Jardine C.N. (2009). Calculating the Carbon Dioxide Emissions of Flights. Environmental Change Institute, Oxford, UK. 20 pp.
Jewell J., A. Cherp, and K. Riahi (2013). Energy security under de‐carbonization energy scenarios., Energy Policy 65 743–760 pp. .
JHFC (2011). JHFC Phase 2 Final Report. The Japan Hydrogen & Fuel Cell Demonstration Project. Japan Hydrogen & Fuel Cell Demonstration Project.
JICA (2005). The Master Plan for Lima and Callo Metropolitan Area Urban Transportation in the Republic of Peru; Chapter 6, Traffic Control and Management Conditions. Transport Council of Lima and Callo, Ministry of Transportation and Communications of the Republic of Peru.
Johansson T.B., A. Patwardhan, N. Nakicenovic, L. Gomez‐Echeverri, and International Institute for Applied Systems Analysis (2012). Global Energy Assessment (GEA). Cambridge University Press ; International Institute for Applied Systems Analysis, Cambridge; Laxenburg, Austria, (ISBN: 9781107005198 1107005191 9780521182935 052118293X). .
Jollands N., M. Ruth, C. Bernier, and N. Golubiewski (2007). The climate’s long‐term impact on New Zealand infrastructure (CLINZI) project—A case study of Hamilton City, New Zealand, Journal of Environmental Management 83 460–477 pp. (DOI: 10.1016/j.jenvman.2006.09.022).
Jonkeren O., P. Rietveld, and J. van Ommeren (2007). Climate change and inland waterway transport — Welfare effects of low water levels on the river Rhine, Journal of Transport Economics and Policy 41 387–411 pp. (ISSN: 0022‐5258).
Joumard R., and H. Gudmundsson (2010). Indicators of Environmental Sustainability in Transport: An Interdisciplinary Approach to Methods. Institut National de Recherche Sur Les Transports et Leur Sécurité, Bron, France, 426 pp.
JR East (2011). JR East Group Sustainability Report 2011. East Japanese Railway Company, Tokyo, Japan. 92 pp.
JRC/PBL (2012). EDGAR version 4.2 FT2010, Joint Research Centre of the European Commission/PBL Netherlands Environmental Assessment Agency . Available at: http://edgar.jrc.ec.europa.eu/overview.php?v=42.
Final Draft Chapter 8 IPCC WGIII AR5
89 of 115
Kahn Ribeiro S., and M.J. Figueroa (2012). Energy End‐Use: Transportation. In: Global Energy Assessment ‐ Toward a Sustainable Future. International Institute for Applied Systems Analysis and Cambridge University Press, Vienna, Austria, Cambridge, UK and New York, NY, USA pp.575–648(ISBN: 9780 52118 2935).
Kahn Ribeiro S., and M. Figueroa (2013). Energy Systems . Energy Use in Transport and Sustainable Development, Current Opinion in Environmental Sustainability.
Kahn Ribeiro S., M.J. Figueroa, F. Creutzig, S. Kobayashi, C. Dubeux, and J. Hupe (2012). Energy End‐Use: Transportation. In: The Global Energy Assessment: Toward a more Sustainable Future. IIASA, Laxenburg, Austria and Cambridge University Press, United Kingdom and New York, USA, pp.93(ISBN: 9780 52118 2935).
Kahn Ribeiro S, K.S., G.J. Beuthe M,, L.D.S. Greene D,, N.P.J. Muromachi Y,, S.D. Plotkin S,, and Z.P.J. Wit R, (2007). Transport and its infrastructure. In: Climate Change 2007: Mitigation. Contribution of Working Group III to the Fourth Assessment. Cambridge University Press, Cambridge, United Kingdom and New York, USA pp.324–385.
Kaluza P., A. Kölzsch, M.T. Gastner, and B. Blasius (2010). The complex network of global cargo ship movements, Journal of The Royal Society Interface 7 1093–1103 pp. . Available at: http://rsif.royalsocietypublishing.org/content/7/48/1093.abstract.
Kamakaté F., and L. Schipper (2009). Trends in truck freight energy use and carbon emissions in selected OECD countries from 1973 to 2005, Energy Policy 37 3743–3751 pp. (DOI: 10.1016/j.enpol.2009.07.029), (ISSN: 0301‐4215).
Kamal‐Chaoui L., and M. Plouin (2012). Cities and Green Growth: Case Study of the Paris/Ile‐de‐France Region. OECD Regional Development, Paris. 143 pp. Available at: http://www.oecd‐ilibrary.org/governance/oecd‐regional‐development‐working‐papers_20737009.
Kane L. (2010). Sustainable transport indicators for Cape Town, South Africa: Advocacy, negotiation and partnership in transport planning practice, Natural Resources Forum 34 289–302 pp. .
Kato H., Y. Hayasi, and K. Jimbo (2005). A Framework for Benchmarking Environmental Sustainability in Asian Mega Cities, Journal of the Eastern Asian Society for Transportation Studies 6 3214–3249 pp. .
Kawada T. (2011). Noise and Health — Sleep Disturbance in Adults, Journal of Occupational Health 53 413–416 pp. .
Kendall A., and L. Price (2012). Incorporating Time‐Corrected Life Cycle Greenhouse Gas Emissions in Vehicle Regulations, Environmental Science & Technology 46 2557–2563 pp. (DOI: 10.1021/es203098j), (ISSN: 0013‐936X).
Kennedy C., J. Steinberger, B. Gasson, Y. Hansen, T. Hillman, M. Havránek, D. Pataki, A. Phdungsilp, A. Ramaswami, and G.V. Mendez (2009). Greenhouse Gas Emissions from Global Cities, Environmental Science & Technology 43 7297–7302 pp. (DOI: 10.1021/es900213p), (ISSN: 0013‐936X, 1520‐5851).
Kennedy C., J. Steinberger, B. Gasson, Y. Hansen, T. Hillman, M. Havránek, D. Pataki, A. Phdungsilp, A. Ramaswami, and G.V. Mendez (2011). Greenhouse Gas Emissions from Global Cities, Environ. Sci. Technol. 43 7297–7302 pp. (DOI: doi: 10.1021/es900213p), (ISSN: 0013‐936X).
Final Draft Chapter 8 IPCC WGIII AR5
90 of 115
Kenworthy J.R. (2008). Chapter 9 ‐ Energy Use and CO2 Production in the Urban Passenger Transport Systems of 84 International Cities: Findings and Policy Implications. In: Urban Energy Transition. Elsevier, Amsterdam pp.211–236(ISBN: 978‐0‐08‐045341‐5).
Kenworthy J. (2013). Decoupling Urban Car Use and Metropolitan GDP Growth, World Transport Policy and Practice 19.
Kim Oanh N.T., M.T. Thuy Phuong, and D.A. Permadi (2012). Analysis of motorcycle fleet in Hanoi for estimation of air pollution emission and climate mitigation co‐benefit of technology implementation, Atmospheric Environment 59 438–448 pp. . Available at: http://www.scopus.com/inward/record.url?eid=2‐s2.0‐84863438570&partnerID=40&md5=bf03bb981b19ddeaee96d820448e25f8.
Kirchstetter T.W., J. Aguiar, S. Tonse, D. Fairley, and T. Novakov (2008). Black carbon concentrations and diesel vehicle emission factors derived from coefficient of haze measurements in California: 1967 ‐ 2003, Atmospheric Environment 42 480–491 pp. (DOI: 10.1016/j.atmosenv.2007.09.063).
Kleiner K. (2007). The shipping forecast, Nature 449 272–273 pp. (DOI: 10.1038/449272a), (ISSN: 0028‐0836, 1476‐4687).
Kley F., C. Lerch, and D. Dallinger (2011). New business models for electric cars—A holistic approach, Energy Policy 39 3392–3403 pp. (DOI: 10.1016/j.enpol.2011.03.036), (ISSN: 0301‐4215).
Knox‐Hayes J., M.A. Brown, B.K. Sovacool, and Y. Wang (2013). Understanding attitudes toward energy security: Results of a cross‐national survey, Global Environmental Change 23 609–622 pp. (DOI: 10.1016/j.gloenvcha.2013.02.003), (ISSN: 0959‐3780).
Kobayashi S., S. Plotkin, and S. Kahn Ribeiro (2009). Energy efficiency technologies for road vehicles, Energy Efficiency 2 125–137 pp. .
Koetse M.J., and P. Rietveld (2009). The impact of climate change and weather on transport: An overview of empirical findings, Transportation Research Part D: Transport and Environment 14 205–221 pp. (DOI: 10.1016/j.trd.2008.12.004), (ISSN: 1361‐9209).
Kojima K., and L. Ryan (2010). Transport Energy Efficiency — Implementation of IEA Recommendations since 2009 and next Steps. International Energy Agency, Paris. 60 pp. Available at: http://ideas.repec.org/p/oec/ieaaaa/2010‐9‐en.html.
Kok R., J.A. Annema, and B. van Wee (2011). Cost‐effectiveness of greenhouse gas mitigation in transport: A review of methodological approaches and their impact, Clean Cooking Fuels and Technologies in Developing Economies 39 7776–7793 pp. (DOI: 10.1016/j.enpol.2011.09.023), (ISSN: 0301‐4215).
Kopp A. (2012). Turning the Right Corner: Ensuring Development Through A Low‐Carbon Transport Sector. World Bank, Washington DC. 181 pp.
Krey V., and L. Clarke (2011). Role of renewable energy in climate mitigation: a synthesis of recent scenarios, Climate Policy 11 1131–1158 pp. (DOI: 10.1080/14693062.2011.579308).
Kromer M.A., and J.B. Heywood (2007). Electric Powertrains: Opportunities and Challenges in the U.S. Light‐Duty Vehicle Fleet. Massachusetts Institute of Technology, Cambridge, USA. 157 pp.
Final Draft Chapter 8 IPCC WGIII AR5
91 of 115
Available at: http://web.mit.edu/sloan‐auto‐lab/research/beforeh2/files/kromer_electric_powertrains.pdf.
Kuhnimhof T., D. Zumkeller, and B. Chlond (2013). Who Made Peak Car, and How? A Breakdown of Trends over Four Decades in Four Countries, Transport Reviews 33 325–342 pp. (DOI: 10.1080/01441647.2013.801928), (ISSN: 0144‐1647).
Kumar A. (2011). Understanding the Emerging Role of Motorcycles in African Cities: A Political Economy Perspective. The World Bank.
Kunieda M., and A. Gauthier (2007). Gender and Urban Transport: Smart and Affordable — Module 7a. Sustainable Transport: A Sourcebook for Policy‐Makers in Developing Cities. Deutsche Gesellschaft Fur Technische Zusammenarbeit (GTZ), Eschborn, Germany. 50 pp.
Kveiborg O., and M. Fosgerau (2007). Decomposing the decoupling of Danish road freight traffic growth and economic growth, Transport Policy 14 39–48 pp. (DOI: 10.1016/j.tranpol.2006.07.002), (ISSN: 0967‐070X).
Lack D.A. (2012). Investigation of Appropriate Control Measures (abatement Technologies) to Reduce Black Carbon Emissions from International Shipping. International Maritime Organization. 118 pp.
Lapola D.M., R. Schaldach, J. Alcamo, A. Bondeau, J. Koch, C. Koelking, and J.A. Priess (2010). Indirect land‐use changes can overcome carbon savings from biofuels in Brazil, Proceedings of the National Academy of Sciences 107 3388–3393 pp. (DOI: 10.1073/pnas.0907318107).
Larsen P.H., S. Goldsmith, O. Smith, M.L. Wilson, K. Strzepek, P. Chinowsky, and B. Saylor (2008). Estimating future costs for Alaska public infrastructure at risk from climate change, Global Environmental Change 18 442–457 pp. (DOI: 10.1016/j.gloenvcha.2008.03.005).
Larsen U., T. Johansen, and J. Schramm (2009). Ethanol as a Fuel for Road Transportation. International Energy Agency, Technical University of Denmark,, Denmark. 115 pp.
Leather J., H. Fabian, S. Gota, and A. Mejia (2011). Walkability and Pedestrian Facilities in Asian Cities State and Issues. Asian Development Bank, Manila, Philippines. 78 pp.
Leduc G. (2009). Longer and Heavier Vehicles: An Overview of Technical Aspects. Institute for Prospective Technological Studies, Seville, Spain. 49 pp.
Lee J.J. (2010). Can we accelerate the improvement of energy efficiency in aircraft systems?, Energy Conversion and Management 51 189–196 pp. (DOI: 10.1016/j.enconman.2009.09.011), (ISSN: 0196‐8904).
Lee D.S., D.W. Fahey, P.M. Forster, P.J. Newton, R.C.N. Wit, L.L. Lim, B. Owen, and R. Sausen (2009). Aviation and global climate change in the 21st century, Atmospheric Environment 43 3520–3537 pp. (DOI: 10.1016/j.atmosenv.2009.04.024), (ISSN: 1352‐2310).
Lee D.S., G. Pitari, V. Grewe, K. Gierens, J.E. Penner, A. Petzold, M.J. Prather, U. Schumann, A. Bais, T. Berntsen, D. Iachetti, L.L. Lim, and R. Sausen (2010). Transport impacts on atmosphere and climate: Aviation, Atmospheric Environment 44 4678–4734 pp. (DOI: 10.1016/j.atmosenv.2009.06.005), (ISSN: 1352‐2310).
Final Draft Chapter 8 IPCC WGIII AR5
92 of 115
Lefèvre B. (2009). Long‐term energy consumptions of urban transportation: A prospective simulation of ‘transport–land uses’ policies in Bangalore, Energy Policy 37 940–953 pp. (DOI: 10.1016/j.enpol.2008.10.036), (ISSN: 0301‐4215).
Lefèvre B. (2012). Incorporating cities into the post‐2012 climate change agreements, Environment and Urbanization 24 575–595 pp. (DOI: 10.1177/0956247812456359), (ISSN: 0956‐2478, 1746‐0301).
Leiby P.N. (2007b). Estimating the Energy Security Benefits of Reduced U. S. Oil Imports. Oak Ridge National Laboratory, Oak Ridge, USA. 38 pp.
Leinert S., H. Daly, B. Hyde, and B.Ó. Gallachóir (2013). Co‐benefits? Not always: Quantifying the negative effect of a CO2‐reducing car taxation policy on NOx emissions, Energy Policy 63 1151–1159 pp. (DOI: 10.1016/j.enpol.2013.09.063), (ISSN: 0301‐4215).
Lescaroux F. (2010). Car Ownership in Relation to Income Distribution and Consumers’ Spending Decisions, Journal of Transport Economics and Policy (JTEP) 44 207–230 pp. . Available at: http://www.ingentaconnect.com/content/lse/jtep/2010/00000044/00000002/art00005.
Leung G.C.K. (2011). China’s energy security: Perception and reality, Energy Policy 39 1330–1337 pp. (DOI: 10.1016/j.enpol.2010.12.005), (ISSN: 0301‐4215).
Leurent F., and E. Windisch (2011). Triggering the development of electric mobility: a review of public policies, European Transport Research Review 3 221–235 pp. (DOI: 10.1007/s12544‐011‐0064‐3), (ISSN: 1867‐0717).
Levinson D.M. (1999). Space, money, life‐stage, and the allocation of time, Transportation 26 141–171 pp. .
Li J. (2011). Decoupling urban transport from GHG emissions in Indian cities — A critical review and perspectives, Energy Policy 39 3503–3514 pp. (DOI: 10.1016/j.enpol.2011.03.049), (ISSN: 0301‐4215).
Litman T. (2005). Pay‐As‐You‐Drive Pricing and Insurance Regulatory Objectives, Journal of Insurance Regulation 23 35–53 pp. .
Litman T. (2006). Parking Management: Strategies, Evaluation and Planning. Victoria Transport Policy Institute.
Litman T. (2007). Developing Indicators for Comprehensive and Sustainable Transport Planning, Transportation Research Record: Journal of the Transportation Research Board 2017 10–15 pp. (DOI: 10.3141/2017‐02).
Liu J., J.A. Curry, H. Wang, M. Song, and R.M. Horton (2012). Impact of declining Arctic sea ice on winter snowfall, Proceedings of the National Academy of Sciences of the United States of America 109 4074–4079 pp. . Available at: http://www.pnas.org/content/109/11/4074.
Liu M., and J. Kronbak (2010). The potential economic viability of using the Northern Sea Route (NSR) as an alternative route between Asia and Europe, Journal of Transport Geography 18 434–444 pp. (DOI: 10.1016/j.jtrangeo.2009.08.004), (ISSN: 0966‐6923).
Final Draft Chapter 8 IPCC WGIII AR5
93 of 115
Lloyds Register and DNV (2011). Air pollution and energy efficiency: estimated CO2 emissions reductions from introduction of mandatory technical and operational energy efficiency measures for ships. International Maritime Organisation.
Loose W. (2010). The State of European Car‐Sharing. Bundesverband CarSharing E. V., Berlin, Germany. 129 pp.
Lu L., X. Han, J. Li, J. Hua, and M. Ouyang (2013). A review on the key issues for lithium‐ion battery management in electric vehicles, Journal of Power Sources 226 272–288 pp. (DOI: 10.1016/j.jpowsour.2012.10.060), (ISSN: 0378‐7753).
De Lucena A.F.P., A.S. Szklo, R. Schaeffer, R.R. de Souza, B.S.M.C. Borba, I.V.L. da Costa, A.O.P. Júnior, and S.H.F. da Cunha (2009). The vulnerability of renewable energy to climate change in Brazil, Energy Policy 37 879–889 pp. (DOI: 10.1016/j.enpol.2008.10.029), (ISSN: 0301‐4215).
Luckow P., M.A. Wise, J.J. Dooley, and S.H. Kim (2010). Large‐scale utilization of biomass energy and carbon dioxide capture and storage in the transport and electricity sectors under stringent CO2 concentration limit scenarios, International Journal of Greenhouse Gas Control 4 865–877 pp. (DOI: 10.1016/j.ijggc.2010.06.002), (ISSN: 1750‐5836).
Luongo C.A., P.J. Masson, T. Nam, D. Mavris, H.D. Kim, G.V. Brown, M. Waters, and D. Hall (2009). Next Generation More‐Electric Aircraft: A Potential Application for HTS Superconductors, IEEE Transactions on Applied Superconductivity 19 1055–1068 pp. (DOI: 10.1109/TASC.2009.2019021), (ISSN: 1051‐8223, 1558‐2515).
Lutsey N., and D. Sperling (2012). Regulatory adaptation: Accommodating electric vehicles in a petroleum world, Energy Policy 45 308–316 pp. (DOI: 10.1016/j.enpol.2012.02.038), (ISSN: 0301‐4215).
Maat K., and T. Arentze (2012). Feedback Effects in the Relationship between the Built Environment and Travel, disP ‐ The Planning Review 48 6–15 pp. (DOI: 10.1080/02513625.2012.759341), (ISSN: 0251‐3625, 2166‐8604).
Machado‐Filho H. (2009). Brazilian low‐carbon transportation policies: Opportunities for international support, Climate Policy 9 495–507 pp. . Available at: http://www.scopus.com/inward/record.url?eid=2‐s2.0‐73649106533&partnerID=40&md5=8828f39e1dbdc479a441d3d28dd5de83.
Maes J., and T. Vanelslander (2011). The Use of Rail Transport as Part of the Supply Chain in an Urban Logistics Context. In: City Distribution and Urban Freight Transport: Multiple Perspectives. Edward Elgar Publishers, London pp.217–233.
Maizlish N., J. Woodcock, S. Co, B. Ostro, A. Fanai, and D. Fairley (2013). Health Cobenefits and Transportation‐Related Reductions in Greenhouse Gas Emissions in the San Francisco Bay Area, American Journal of Public Health 103 703–709 pp. (DOI: 10.2105/AJPH.2012.300939), (ISSN: 0090‐0036, 1541‐0048).
Malina R., D. McConnachie, N. Winchester, C. Wollersheim, S. Paltsev, and I.A. Waitz (2012). The impact of the European Union Emissions Trading Scheme on US aviation, Journal of Air Transport Management 19 36–41 pp. (DOI: 10.1016/j.jairtraman.2011.12.004), (ISSN: 09696997).
Final Draft Chapter 8 IPCC WGIII AR5
94 of 115
Maloni M., J.A. Paul, and D.M. Gligor (2013). Slow steaming impacts on ocean carriers and shippers, Maritime Economics & Logistics 15 151–171 pp. (DOI: 10.1057/mel.2013.2), (ISSN: 1479‐2931, 1479‐294X).
Marks P. (2009). ‘Morphing’ winglets to boost aircraft efficiency, The New Scientist 201 22–23 pp. (DOI: 10.1016/S0262‐4079(09)60208‐6), (ISSN: 0262‐4079).
Marshall J.D. (2011). Energy‐Efficient Urban Form, Environmental Science & Technology 42 3133–3137 pp. (DOI: doi: 10.1021/es087047l), (ISSN: 0013‐936X).
Marton‐Lefèvre J. (2012). Rio+20 : Focusing on the solutions. . Available at: http://www.goodplanet.info/eng/Contenu/Points‐de‐vues/Rio‐20‐Focusing‐on‐the‐solutions/(theme)/1518.
Massari S., and M. Ruberti (2013). Rare earth elements as critical raw materials: Focus on international markets and future strategies, Resources Policy 38 36–43 pp. . Available at: http://www.scopus.com/inward/record.url?eid=2‐s2.0‐84873251739&partnerID=40&md5=cc64beb523adfb7f59929151d84cd831.
Massink R., M. Zuidgeest, J. Rijnsburger, O.L. Sarmiento, and M. van Maarseveen (2011). The Climate Value of Cycling, Natural Resources Forum 35 100–111 pp. (DOI: 10.1111/j.1477‐8947.2011.01345.x), (ISSN: 01650203).
Matos F.J.F., and F.J.F. Silva (2011). The rebound effect on road freight transport: Empirical evidence from Portugal, Energy Policy 39 2833–2841 pp. (DOI: 10.1016/j.enpol.2011.02.056), (ISSN: 0301‐4215).
Mayor K., and R.S.J. Tol (2010). The impact of European climate change regulations on international tourist markets, Transportation Research Part D: Transport and Environment 15 26–36 pp. (DOI: 10.1016/j.trd.2009.07.002), (ISSN: 1361‐9209).
McCollum D.L., G. Gould, and D.L. Greene (2010). Greenhouse Gas Emissions from Aviation and Marine Transportation: Mitigation Potential and Policies. . Available at: http://www.escholarship.org/uc/item/5nz642qb.
McCollum D., and C. Yang (2009). Achieving deep reductions in US transport greenhouse gas emissions: Scenario analysis and policy implications, Energy Policy 37 5580–5596 pp. (DOI: 10.1016/j.enpol.2009.08.038), (ISSN: 0301‐4215).
McCubbin, D.R., Delucchi M.A. (1999). The health costs of motor‐vehicle‐related air pollution, Journal of Transport Economics and Policy 33 253–286 pp. . Available at: http://www.scopus.com/inward/record.url?eid=2‐s2.0‐0033453278&partnerID=40&md5=e5a6b3277da328c8f5c065b5f83e003b.
McIntosh J., and P. Newman (2012). Value Capture: Financing the Next Rail Revolution. In: Value Capture: Financing the Next Rail Revolution.
McKinnon A.C. (2007a). Decoupling of Road Freight Transport and Economic Growth Trends in the UK: An Exploratory Analysis, Transport Reviews 27 37–64 pp. (DOI: 10.1080/01441640600825952), (ISSN: 0144‐1647).
Final Draft Chapter 8 IPCC WGIII AR5
95 of 115
McKinnon A.C. (2007b). Decoupling of Road Freight Transport and Economic Growth Trends in the UK: An Exploratory Analysis, Transport Reviews 27 37–64 pp. (DOI: 10.1080/01441640600825952), (ISSN: 0144‐1647, 1464‐5327).
McKinnon A. (2010). Green Logistics: the Carbon Agenda, Electronic Scientific Journal of Logistics 6 1–9 pp. . Available at: http://www.logforum.net/pdf/6_3_1_10.pdf.
McKinnon A.C., and A. Kreie (2010). Adaptive logistics: preparing logistical systems for climate change. In: Proceedings of the Annual Logistics Research Network Conference 2010. Chartered Institute of Logistics and Transport / University of Leeds, Leeds.
McKinnon A.C., and M. Piecyk (2009). Logistics 2050: Moving Goods by Road in a Very Low Carbon World. In: Supply Chain Management in a Volatile World. Sweeney, E., Dublin.
McKinnon A., and M. Piecyk (2012). Setting targets for reducing carbon emissions from logistics: current practice and guiding principles, Carbon Management 3 629–639 pp. (DOI: 10.4155/cmt.12.62), (ISSN: 1758‐3004).
Medley A.J., C.‐M. Wong, T.Q. Thach, S. Ma, T.‐H. Lam, and H.R. Anderson (2002a). Cardiorespiratory and all‐cause mortality after restrictions on sulphur content of fuel in Hong Kong: an intervention study, The Lancet 360 1646–1652 pp. (DOI: 10.1016/S0140‐6736(02)11612‐6), (ISSN: 0140‐6736).
Metz D. (2010). Saturation of Demand for Daily Travel, Transport Reviews 30 659–674 pp. (DOI: 10.1080/01441640903556361), (ISSN: 0144‐1647, 1464‐5327).
Metz D. (2013). Peak Car and Beyond: The Fourth Era of Travel, Transport Reviews 33 255–270 pp. (DOI: 10.1080/01441647.2013.800615), (ISSN: 0144‐1647, 1464‐5327).
Meyer J.R., J.F. Kain, and M. Wohl (1965). The Urban Transportation Problem. Harvard University Press, Cambridge, Mass., 427 pp., (ISBN: 0674931211 9780674931213). .
Meyer I., S. Kaniovski, and J. Scheffran (2012). Scenarios for regional passenger car fleets and their CO2 emissions, Modeling Transport (Energy) Demand and Policies 41 66–74 pp. (DOI: 10.1016/j.enpol.2011.01.043), (ISSN: 0301‐4215).
Michalek J.J., M. Chester, P. Jaramillo, C. Samaras, C.‐S.N. Shiau, and L.B. Lave (2011). Valuation of plug‐in vehicle life‐cycle air emissions and oil displacement benefits, Proceedings of the National Academy of Sciences 108 16554–16558 pp. (DOI: 10.1073/pnas.1104473108), (ISSN: 0027‐8424, 1091‐6490).
MIIT (2011). Fuel Consumption Limits for Heavy Duty Commercial Vehicles. Ministry of Industry and Information Technology (MIIT) of the Government of the People’s Republic of China, Beijing.
Mikler J. (2010). Apocalypse now or business as usual? Reducing the carbon emissions of the global car industry, Cambridge Journal of Regions, Economy and Society 3 407–426 pp. (DOI: 10.1093/cjres/rsq022), (ISSN: 1752‐1378, 1752‐1386).
Milford R.L., and J.M. Allwood (2010). Assessing the CO2 impact of current and future rail track in the UK, Transportation Research Part D: Transport and Environment 15 61–72 pp. (ISSN: 1361‐9209).
Final Draft Chapter 8 IPCC WGIII AR5
96 of 115
Millard‐Ball A., and L. Schipper (2011). Are We Reaching Peak Travel? Trends in Passenger Transport in Eight Industrialized Countries, Transport Reviews 31 357–378 pp. (DOI: 10.1080/01441647.2010.518291), (ISSN: 0144‐1647).
Miller D. (2001). Car cultures. . Available at: http://discovery.ucl.ac.uk/117850/.
Millerd F. (2011). The potential impact of climate change on Great Lakes international shipping, CLIMATIC CHANGE 104 629–652 pp. (DOI: 10.1007/s10584‐010‐9872‐z), (ISSN: 0165‐0009).
Milner J., M. Davies, and P. Wilkinson (2012). Urban energy, carbon management (low carbon cities) and co‐benefits for human health, Current Opinion in Environmental Sustainability 4 338–404 pp. . Available at: http://www.scopus.com/inward/record.url?eid=2‐s2.0‐84867626608&partnerID=40&md5=0b0d86183e33e9aabac3650a84a174b8.
Miranda H. de F., and A.N. Rodrigues da Silva (2012). Benchmarking sustainable urban mobility: The case of Curitiba, Brazil, Transport Policy 21 141–151 pp. (DOI: 10.1016/j.tranpol.2012.03.009), (ISSN: 0967‐070X).
Mock P., J. German, A. Bandivadekar, and I. Riemersma (2012). Discrepancies between type‐approval and ‘real‐world’ fuel‐consumption and CO2 values. International Council on Clean Transportation. . Available at: http://www.theicct.org/sites/default/files/publications/ICCT_EU_fuelconsumption2_workingpaper_2012.pdf.
Mokhtarian P.L., and C. Chen (2004). TTB or not TTB, that is the question: a review and analysis of the empirical literature on travel time (and money) budgets, Transportation Research Part A: Policy and Practice 38 643–675 pp. (DOI: 10.1016/j.tra.2003.12.004), (ISSN: 0965‐8564).
Mokhtarian P.L., and R. Meenakshisundaram (2002). Patterns of Telecommuting Engagement and Frequency: A Cluster Analysis of Telecenter Users, Prometheus 20 21–37 pp. (DOI: 10.1080/08109020110110907), (ISSN: 0810‐9028, 1470‐1030).
Mokhtarian P.L., and I. Salomon (2001). How derived is the demand for travel? Some conceptual and measurement considerations, Transportation Research Part A: Policy and Practice 35 695–719 pp. (DOI: 10.1016/S0965‐8564(00)00013‐6), (ISSN: 0965‐8564).
Motallebi N., M. Sogutlugil, E. McCauley, and J. Taylor (2008). Climate change impact on California on‐road mobile source emissions, Climatic Change 87 S293–S308 pp. (DOI: 10.1007/s10584‐007‐9354‐0).
Mulalic I., J.N. Van Ommeren, and N. Pilegaard (2013). Wages and commuting: quasi‐natural experiments’ evidence from firms that relocate, The Economic Journal n/a–n/a pp. (DOI: 10.1111/ecoj.12074), (ISSN: 00130133).
Mulley C., and J.D. Nelson (2009). Flexible transport services: A new market opportunity for public transport, Symposium on Transport and Particular Populations 25 39–45 pp. (DOI: 10.1016/j.retrec.2009.08.008), (ISSN: 0739‐8859).
Naess P. (2006). Urban Structure Matters: Residential Location, Car Dependence and Travel Behaviour. Routledge, Oxfordshire, UK, 328 pp., (ISBN: 978‐0415375740). .
Nantulya, V.M., Reich M.R. (2002). The neglected epidemic: Road traffic injuries in developing countries, British Medical Journal 324 1139–1141 pp. . Available at:
Final Draft Chapter 8 IPCC WGIII AR5
97 of 115
http://www.scopus.com/inward/record.url?eid=2‐s2.0‐0037062095&partnerID=40&md5=1e876ab09e1717b5b75e30c9c4e96726.
De Nazelle A., M.J. Nieuwenhuijsen, J.M. Antó, M. Brauer, D. Briggs, C. Braun‐Fahrlander, N. Cavill, A.R. Cooper, H. Desqueyroux, S. Fruin, G. Hoek, L.I. Panis, N. Janssen, M. Jerrett, M. Joffe, Z.J. Andersen, E. van Kempen, S. Kingham, N. Kubesch, K.M. Leyden, J.D. Marshall, J. Matamala, G. Mellios, M. Mendez, H. Nassif, D. Ogilvie, R. Peiró, K. Pérez, A. Rabl, M. Ragettli, D. Rodríguez, D. Rojas, P. Ruiz, J.F. Sallis, J. Terwoert, J.‐F. Toussaint, J. Tuomisto, M. Zuurbier, and E. Lebret (2011). Improving health through policies that promote active travel: A review of evidence to support integrated health impact assessment, Environment International 37 766–777 pp. (DOI: 10.1016/j.envint.2011.02.003), (ISSN: 0160‐4120).
Network Rail (2009). Comparing Environmental Impact of Conventional and High Speed Rail. New Lines Rail, London, UK. 68 pp. Available at: http://www.networkrail.co.uk/newlinesprogramme/.
Newman P., T. Beatley, and H. Boyer (2009). Resilient Cities: Responding to Peak Oil and Climate Change. Island Press, Washington, DC, 166 pp.
Newman P., and J. Kenworthy (1996). The land use — transport connection : An overview, Land Use Policy 13 1–22 pp. (DOI: doi: 10.1016/0264‐8377(95)00027‐5), (ISSN: 0264‐8377).
Newman P., and J. Kenworthy (1999). Sustainability and Cities: Overcoming Automobile Dependence. Island Press, Washington, D.C., 464 pp.
Newman P., and J. Kenworthy (2006). Urban Design to Reduce Automobile Dependence, Opolis 2 35–52 pp. .
Newman P., and J. Kenworthy (2011a). Evaluating the Transport Sector’s Contribution to Greenhouse Gas Emissions and Energy Consumption. In: Technologies for Climate Change Mitigation ‐ Transport Sector. UNEP Riso Center, pp.7–23. Available at: http://www.uneprisoe.org/TNA‐Guidebook‐Series.
Newman P., and J. Kenworthy (2011b). Peak car use – understanding the demise of automobile dependence, World Transport Policy and Practice 17 31–42 pp. . Available at: http://www.eco‐logica.co.uk/pdf/wtpp17.2.pdf.
Newman P., and A. Matan (2013a). Green Urbanism in Asia. World Scientific, Singapore.
Newman P., and A. Matan (2013b). Green Urbanism in Asia : The Emerging Green Tigers. World Scientific, Singapore, 243 pp., (ISBN: 9789814425476 9814425478). .
Nielsen J.Ø., and H. Vigh (2012). Adaptive lives. Navigating the global food crisis in a changing climate, Global Environmental Change 22 659–669 pp. (DOI: 10.1016/j.gloenvcha.2012.03.010), (ISSN: 0959‐3780).
Noland R.B. (2001). Relationships between highway capacity and induced vehicle travel, Transportation Research Part A: Policy and Practice 35 47–72 pp. (DOI: 10.1016/S0965‐8564(99)00047‐6), (ISSN: 0965‐8564).
Noland R.B., and L.L. Lem (2002). A review of the evidence for induced travel and changes in transportation and environmental policy in the US and the UK, Transportation Research Part D: Transport and Environment 7 1–26 pp. (DOI: 10.1016/S1361‐9209(01)00009‐8).
Final Draft Chapter 8 IPCC WGIII AR5
98 of 115
Notteboom T.E., and B. Vernimmen (2009). The effect of high fuel costs on liner service configuration in container shipping, Journal of Transport Geography 17 325–337 pp. (DOI: 10.1016/j.jtrangeo.2008.05.003), (ISSN: 0966‐6923).
Notter D.A., M. Gauch, R. Widmer, P. Wäger, A. Stamp, R. Zah, and H.‐J. Althaus (2010). Contribution of Li‐Ion Batteries to the Environmental Impact of Electric Vehicles, Environmental Science & Technology 44 6550–6556 pp. (DOI: 10.1021/es903729a), (ISSN: 0013‐936X).
NRC (2009). Driving and the Built Environment:The Effects of Compact Development on Motorized Travel, Energy Use, and CO2 Emissions. National Academies Press, Washington, DC. . Available at: http://www.nap.edu/openbook.php?record_id=12747.
NRC (2010a). Technologies and Approaches to Reducing the Fuel Consumption of Medium‐ and Heavy‐Duty Vehicles. National Academies Press, Washington, D.C. 250 pp. Available at: http://www.nap.edu/catalog.php?record_id=12845.
NRC (2010b). Technologies and Approaches to Reducing the Fuel Consumption of Medium‐ and Heavy‐Duty Vehicles. National Academies Press, Washington, D.C. 250 pp.
NRC (2011a). Assessment of Fuel Economy Technologies for Light‐Duty Vehicles. US National Research Council, Washington, D.C. 232 pp.
NRC (2011b). Bicycles 2011. Transportation Research Board, Washington, D.C., 125 pp., (ISBN: 9780309167673 0309167671). .
NRC (2011c). Policy Options for Reducing Energy Use and Greenhouse Gas Emissions from U.S. Transportation:Special Report 307. The National Academies Press, Washington, D.C. 224 pp. Available at: http://www.nap.edu/openbook.php?record_id=13194.
NRC (2013). Transitions to Alternative Vehicles and Fuels. National Academies Press, Washington, D.C, 170 pp., (ISBN: 9780309268523). .
NTM (2011). Environmental data for international cargo and passenger air transport: calculation methods, emission factors, mode‐specific issues. Network for Transport and Environment, Stockholm. . Available at: www.ntmcalc.org.
NTM (2012). NTM CALC 4. . Available at: http://www.ntmcalc.org/index.html.
NYC (2012). NYC DOT ‐ Bicyclists ‐ Network and Statistics. . Available at: http://www.nyc.gov/html/dot/html/bicyclists/bikestats.shtml.
Oberhofer P., and E. Fürst (2012). Environmental management in the transport sector: findings of a quantitative survey, EuroMed Journal of Business 7 268–279 pp. (DOI: 10.1108/14502191211265325), (ISSN: 1450‐2194).
OECD (2000). Environmentally Sustainable Transport: Future, Strategies and Best Practice. Organization of Economic Co‐Operation and Development, Paris. 146 pp.
OECD (2011). Green Growth Indicators. OECD Publishing, Paris.
OECD (2012). Compact City Policies: A Comparative Assessment. OECD Publishing, Paris. 284 pp.
Final Draft Chapter 8 IPCC WGIII AR5
99 of 115
OECD, and UNEP (2011). Climate Change and Tourism Policy in OECD Countries. Organisation for Economic Co‐Operation and Development / United Nations Environment Programme, Geneva. 100 pp.
Ogden J., and A. Lorraine (Eds.) (2011). Sustainable Transportation Energy Pathways. A Research Summary for Decision Makers. Institute of Transportation Studies, University of California, Davis, California, 333 pp. Available at: http://steps.ucdavis.edu/files/09‐06‐2013‐STEPS‐Book‐A‐Research‐Summary‐for‐Decision‐Makers‐Sept‐2011.pdf.
Ogden J., and M. Nicholas (2011). Analysis of a ‘cluster’ strategy for introducing hydrogen vehicles in Southern California, Energy Policy 39 1923–1938 pp. (DOI: 10.1016/j.enpol.2011.01.005), (ISSN: 0301‐4215).
Ogden J.M., R.H. Williams, and E.D. Larson (2004). Societal lifecycle costs of cars with alternative fuels/engines, Energy Policy 32 7–27 pp. (DOI: doi: 10.1016/S0301‐4215(02)00246‐X), (ISSN: 0301‐4215).
Olaru D., B. Smith, and J.H.E. Taplin (2011). Residential location and transit‐oriented development in a new rail corridor, Transportation Research Part A: Policy and Practice 45 219–237 pp. (DOI: doi: 10.1016/j.tra.2010.12.007), (ISSN: 0965‐8564).
Oltean‐Dumbrava C., G. Watts, and A. Miah (2013). Transport infrastructure: making more sustainable decisions for noise reduction, Journal of Cleaner Production 42 58–68 pp. (DOI: 10.1016/j.jclepro.2012.10.008), (ISSN: 0959‐6526).
Owens S. (1995). From ‘predict and provide’ to ‘predict and prevent’?: Pricing and planning in transport policy, Transport Policy 2 43–49 pp. (DOI: 10.1016/0967‐070X(95)93245‐T), (ISSN: 0967‐070X).
Oxley T., A. Elshkaki, L. Kwiatkowski, A. Castillo, T. Scarbrough, and H. ApSimon (2012). Pollution abatement from road transport: cross‐sectoral implications, climate co‐benefits and behavioural change, Environmental Science & Policy 19–20 16–32 pp. (DOI: 10.1016/j.envsci.2012.01.004), (ISSN: 1462‐9011).
Pacca S., and J.R. Moreira (2011). A Biorefinery for Mobility?, Environmental Science & Technology 45 9498–9505 pp. (DOI: 10.1021/es2004667), (ISSN: 0013‐936X, 1520‐5851).
Pandey R. (2006). Looking beyond inspection and maintenance in reducing pollution from in‐use vehicles, Environmental Economics and Policy Studies 7 435–457 pp. .
Panteia (2013). Contribution to Impact Assessment: Of Measures for Reducing Emissions of Inland Navigation. European Commission Directorate‐General for Transport. European Commission Directorate‐General for Transport, Zoetermeer, Netherlands. 241 pp.
Park Y., and H.‐K. Ha (2006). Analysis of the impact of high‐speed railroad service on air transport demand, Transportation Research Part E: Logistics and Transportation Review 42 95–104 pp. (DOI: 10.1016/j.tre.2005.09.003), (ISSN: 1366‐5545).
Parkany E., R. Gallagher, and Viveiros (2004). Are attitudes important in travel choice?, Transportation Research Record 1894 127–139 pp. . Available at: http://www.scopus.com/inward/record.url?eid=2‐s2.0‐19944381891&partnerID=40&md5=d7f2e80c556b74b7e95e62227c5092cb.
Final Draft Chapter 8 IPCC WGIII AR5
100 of 115
Peeters P.M., and G. Dubois (2010). Tourism travel under climate change mitigation constraints, Journal of Transport Geography 18 447–457 pp. (DOI: 10.1016/j.jtrangeo.2009.09.003).
Pels E., and E.T. Verhoef (2004). The economics of airport congestion pricing, Journal of Urban Economics 55 257–277 pp. (DOI: doi: 10.1016/j.jue.2003.10.003), (ISSN: 0094‐1190).
Pendakur V. (2011). Non‐motorized urban transport as neglected modes. In: Urban transport in the developing world. H. Dimitriou, R. Gakenheimer, (eds.), Edward Elgar, Cheltenham, UK pp.203–231.
Pianoforte K. (2008). Marine coatings market: Increasing fuel efficiency through the use of innovative antifouling coatings is a key issue for ship owners and operators. Coatings World.
Pidol L., B. Lecointe, L. Starck, and N. Jeuland (2012). Ethanol–biodiesel–Diesel fuel blends: Performances and emissions in conventional Diesel and advanced Low Temperature Combustions, Fuel 93 329–338 pp. (DOI: 10.1016/j.fuel.2011.09.008), (ISSN: 0016‐2361).
Pietzcker R., T. Longden, W. Chen, F. Sha, E. Kriegler, P. Kyle, and G. Luderer (2013). Long‐term transport energy demand and climate policy: Alternative visions on Transport decarbonization in Energy‐Economy Models, Energy 64 95–108 pp. .
Plevin R.J., M. O’Hare, A.D. Jones, M.S. Torn, and H.K. Gibbs (2010). Greenhouse Gas Emissions from Biofuels’ Indirect Land Use Change Are Uncertain but May Be Much Greater than Previously Estimated, Environmental Science & Technology 44 8015–8021 pp. (DOI: 10.1021/es101946t), (ISSN: 0013‐936X).
Plotkin S., D. Santini, A. Vyas, J. Anderson, M. Wang, J. He, and D. Bharathan (2001). Hybrid Electric Vehicle Technology Assessment: Methodology, Analytical Issues, and Interim Results. Argonne National Laboratory. . Available at: http://www.transportation.anl.gov/pdfs/TA/244.pdf.
Plotkin S.E., M.K. Singh, and Ornl (2009). Multi‐Path Transportation Futures Study : Vehicle Characterization and Scenario Analyses. Available at: http://www.osti.gov/servlets/purl/968962‐2I2Sit/.
Pratt L., L. Rivera, and A. Bien (2011). Tourism: investing in energy and resource efficiency. In: Towards a Green Economy. United Nations Environment Programme, Nairobi, Kenya pp.410–446(ISBN: 978‐92‐807‐3143‐9).
Preston H., D.S. Lee, and P.D. Hooper (2012). The inclusion of the aviation sector within the European Union’s Emissions Trading Scheme: What are the prospects for a more sustainable aviation industry?, Environmental Development 2 48–56 pp. (DOI: 10.1016/j.envdev.2012.03.008), (ISSN: 2211‐4645).
Pridmore A., and A. Miola (2011). Public Acceptability of Sustainable Transport Measures: A Review of the Literature Discussion Paper No. 2011‐20. OECD. . Available at: http://www.internationaltransportforum.org/jtrc/DiscussionPapers/DP201120.pdf.
Prinn R., R. Weiss, P. Fraser, P. Simmonds, D. Cunnold, F. Alyea, S. O’Doherty, P. Salameh, B. Miller, J. Huang, R. Wang, D. Hartley, C. Harth, L. Steele, G. Sturrock, P. Midgley, and A. McCulloch (2000). A history of chemically and radiatively important gases in air deduced from ALE/GAGE/AGAGE, Journal of Geophysical Research‐Atmospheres 105 17751–17792 pp. (DOI: 10.1029/2000JD900141), (ISSN: 0747‐7309).
Final Draft Chapter 8 IPCC WGIII AR5
101 of 115
Pucher J., and R. Buehler (2006). Why Canadians cycle more than Americans: A comparative analysis of bicycling trends and policies, Transport Policy 13 265–279 pp. (DOI: 10.1016/j.tranpol.2005.11.001), (ISSN: 0967‐070X).
Pucher J., and R. Buehler (2008). Making Cycling Irresistible: Lessons from The Netherlands, Denmark and Germany, Transport Reviews 28 495–528 pp. (DOI: 10.1080/01441640701806612), (ISSN: 0144‐1647, 1464‐5327).
Pucher J., and R. Buehler (2010). Walking and Cycling for Healthy Cities, Built Environment 36 391–414 pp. (DOI: 10.2148/benv.36.4.391).
Pucher J., R. Buehler, D.R. Bassett, and A.L. Dannenberg (2010). Walking and Cycling to Health: A Comparative Analysis of City, State, and International Data, American Journal of Public Health 100 1986–1992 pp. (DOI: 10.2105/AJPH.2009.189324), (ISSN: 0090‐0036, 1541‐0048).
Pucher J., R. Buehler, and M. Seinen (2011). Bicycling renaissance in North America? An update and re‐appraisal of cycling trends and policies, Transportation Research Part A: Policy and Practice 45 451–475 pp. (DOI: 10.1016/j.tra.2011.03.001), (ISSN: 0965‐8564).
Pyrialakou V.D., M.G. Karlaftis, and P.G. Michaelides (2012). Assessing operational efficiency of airports with high levels of low‐cost carrier traffic, Journal of Air Transport Management 25 33–36 pp. (DOI: 10.1016/j.jairtraman.2012.05.005), (ISSN: 09696997).
Pyrialakou V.D., M.G. Karlaftis, and P.G. Michaelides. Assessing operational efficiency of airports with high levels of low‐cost carrier traffic, Journal of Air Transport Management (DOI: 10.1016/j.jairtraman.2012.05.005).
Rabl A., and A. de Nazelle (2012). Benefits of shift from car to active transport, Transport Policy 19 121–131 pp. (DOI: 10.1016/j.tranpol.2011.09.008).
Rajagopal D., G. Hochman, and D. Zilberman (2011a). Indirect fuel use change (IFUC) and the lifecycle environmental impact of biofuel policies, Energy Policy 39 228–233 pp. (ISSN: 0301‐4215).
Rakopoulos C. (1991). INFLUENCE OF AMBIENT‐TEMPERATURE AND HUMIDITY ON THE PERFORMANCE AND EMISSIONS OF NITRIC‐OXIDE AND SMOKE OF HIGH‐SPEED DIESEL‐ENGINES IN THE ATHENS GREECE REGION, Energy Conversion and Management 31 447–458 pp. (DOI: 10.1016/0196‐8904(91)90026‐F).
Ramanathan V., and G. CaRmiChael (2008). Global and regional climate changes due to black carbon, Nature Geoscience 4 221–227 pp. . Available at: http://www.nature.com/ngeo/journal/v1/n4/abs/ngeo156.html.
Ramani T., J. Zietsman, H. Gudmundsson, R. Hall, and G. Marsden (2011). A Generally Applicable Sustainability Assessment Framework for Transportation Agencies, Transportation Research Record: Journal of the Transportation Research Board 2242 9–18 pp. .
Randles S., and S. Mander (2009). Aviation, consumption and the climate change debate: ‘Are you going to tell me off for flying?’, Technology analysis & strategic management 21 93–113 pp. .
Rao P., and D. Holt (2005). Do green supply chains lead to competitiveness and economic performance?, International Journal of Operations & Production Management 25 898–916 pp. (DOI: 10.1108/01443570510613956), (ISSN: 0144‐3577).
Final Draft Chapter 8 IPCC WGIII AR5
102 of 115
Rao Z., and S. Wang (2011). A review of power battery thermal energy management, Renewable and Sustainable Energy Reviews 15 4554–4571 pp. (DOI: 10.1016/j.rser.2011.07.096), (ISSN: 1364‐0321).
REN21 (2012). Renewables 2012. Global Status Report. Renewable Energy for the 21st Century, Paris. 172 pp. Available at: http://www.ren21.net/REN21Activities/Publications/GlobalStatusReport/tabid/5434/Default.aspx.
Rich J., O. Kveiborg, and C.O. Hansen (2011). On structural inelasticity of modal substitution in freight transport, Journal of Transport Geography 19 134–146 pp. (DOI: 10.1016/j.jtrangeo.2009.09.012), (ISSN: 0966‐6923).
Rickwood P., G. Glazebrook, and G. Searle (2011). Urban Structure and Energy — A Review, Urban Policy and Research 26 57–81 pp. (DOI: doi: 10.1080/08111140701629886), (ISSN: 0811‐1146).
Rogelj J., D.L. McCollum, B.C. O/’Neill, and K. Riahi (2013). 2020 emissions levels required to limit warming to below 2°C, Nature Climate Change 3 405–412 pp. (DOI: 10.1038/nclimate1758), (ISSN: 1758‐6798).
Rojas‐Rueda D., A. de Nazelle, M. Tainio, and M.J. Nieuwenhuijsen (2011a). The health risks and benefits of cycling in urban environments compared with car use: health impact assessment study, British Medical Journal 343 1–8 pp. (DOI: http://dx.doi.org/10.1136/bmj.d4521).
Rojas‐Rueda D., A. de Nazelle, O. Teixidó, and M.J. Nieuwenhuijsen (2012). Replacing car trips by increasing bike and public transport in the greater Barcelona metropolitan area: A health impact assessment study, Environment International 49 100–109 pp. . Available at: http://www.scopus.com/inward/record.url?eid=2‐s2.0‐84866515038&partnerID=40&md5=f902551906abd1a9ebb80403535edcec.
Rojas‐Rueda D., A. de Nazelle, M. Tainio, and M.J. Nieuwenhuijsen (2011b). The health risks and benefits of cycling in urban environments compared with car use: health impact assessment study, British Medical Journal 343 1–8 pp. .
Roustan Y., M. Pausader, and C. Seigneur (2011). Estimating the effect of on‐road vehicle emission controls on future air quality in Paris, France, Atmospheric Environment 45 6828–6836 pp. (DOI: 10.1016/j.atmosenv.2010.10.010).
Von Rozycki C., H. Koeser, and H. Schwarz (2003). Ecology profile of the German high‐speed rail passenger transport system, ICE, International Journal of Life Cycle Analysis 8 83–91 pp. .
Rybeck R. (2004). Using Value Capture to Finance Infrastructure and Encourage Compact Development, Public Works Management & Policy 8 249–260 pp. (DOI: 10.1177/1087724X03262828), (ISSN: 1087724X, 00000000).
SAE International (2011). Automotive Engineering International Online. . Available at: http://www.sae.org/mags/aei/.
Saelens, B.E., Sallis, J.F., Frank L.D. (2003). Environmental correlates of walking and cycling: Findings from the transportation, urban design, and planning literatures, Annals of Behavioral Medicine 25 80–91 pp. . Available at: http://www.scopus.com/inward/record.url?eid=2‐s2.0‐0037877920&partnerID=40&md5=fe4f6b0d4b2054e702e15283aeeeb3ff.
Final Draft Chapter 8 IPCC WGIII AR5
103 of 115
Sælensminde K. (2004). Cost–benefit analyses of walking and cycling track networks taking into account insecurity, health effects and external costs of motorized traffic, Transportation Research Part A: Policy and Practice 38 593–606 pp. (DOI: 10.1016/j.tra.2004.04.003), (ISSN: 0965‐8564).
SAFED (2013). Safe and fuel efficient driving (SAFED) programme. UK‐Road Safety. . Available at: http://www.uk‐roadsafety.co.uk/safed.htm.
Sagevik (2006). Transport and Climate Change. International Union of Railways, London, UK. . Available at: http://www.rtcc.org/2007/html/soc_transport_uic.html.
Sakamoto K., H. Dalkmann, and D. Palmer (2010). A Paradigm Shift towards Sustainable Low‐Carbon Transport. Institute for Transportation & Development Policy, New York, USA. 66 pp.
Sallis J.F., B.E. Saelens, L.D. Frank, T.L. Conway, D.J. Slymen, K.L. Cain, J.E. Chapman, and J. Kerr. Neighborhood built environment and income: Examining multiple health outcomes, Social Science & Medicine 68 1285–1293 pp. (DOI: DOI: 10.1016/j.socscimed.2009.01.017).
Salon D., M.G. Boarnet, S. Handy, S. Spears, and G. Tal (2012). How do local actions affect VMT? A critical review of the empirical evidence, Transportation Research Part D: Transport and Environment 17 495–508 pp. (DOI: 10.1016/j.trd.2012.05.006), (ISSN: 1361‐9209).
Salter R., S. Dhar, and P. Newman (2011). Technologies for Climate Change Mitigation – Transport. United Nations Environment Program Riso Centre for Energy, Climate and Sustainable Development, Denmark. 250 pp.
Santos G., H. Behrendt, L. Maconi, T. Shirvani, and A. Teytelboym (2010a). Part I: Externalities and economic policies in road transport, Research in Transportation Economics 28 2–45 pp. (DOI: 10.1016/j.retrec.2009.11.002), (ISSN: 0739‐8859).
Santos G., H. Behrendt, and A. Teytelboym (2010b). Part II: Policy instruments for sustainable road transport, Research in Transportation Economics 28 46–91 pp. (DOI: 10.1016/j.retrec.2010.03.002), (ISSN: 0739‐8859).
Sathaye J., O. Lucon, A. Rahman, J. Christensen, F. Denton, J. Fujino, G. Heath, S. Kadner, M. Mirza, H. Rudnick, A. Schlaepfer, and A. Shmakin (2011b). Renewable Energy in the Context of Sustainable Development. In: IPCC Special Report on Renewable Energy Sources and Climate Change Mitigation [O. Edenhofer, R. Pichs‐Madruga, Y. Sokona, K. Seyboth, P. Matschoss, S. Kadner, T. Zwickel, P. Eickemeier, G. Hansen, S. Schlömer, C. von Stechow (eds)]. Cambridge University Press, Cambridge, UK and New York, NY, USA pp.707–789.
Schäfer A. (2009). Transportation in a Climate‐Constrained World. MIT Press, Cambridge, Mass., 356 pp., (ISBN: 9780262012676 0262012677 9780262512343 0262512343). .
Schäfer A. (2011). The Future of Energy for Urban Transport. In: Urban Transport in the Developing World: A Handbook of Policy and Practice. Edward Elgar, Northampton, MA pp.113–136(ISBN: 978 0 85793 139 9).
Schäfer A., J.B. Heywood, H.D. Jacoby, and I. Waitz (2009a). Transportation in a Climate‐Constrained World. MIT Press, 356 pp., (ISBN: 978‐0‐262‐51234‐3). .
Schafer A., and D.G. Victor (2000). The future mobility of the world population, Transportation Research Part A: Policy and Practice 34 171–205 pp. . Available at:
Final Draft Chapter 8 IPCC WGIII AR5
104 of 115
http://www.scopus.com/inward/record.url?eid=2‐s2.0‐0034083333&partnerID=40&md5=35370cd2eba8b4c48aef18b8dfc8dc7a.
Schepers P., M. Hagenzieker, R. Methorst, B. van Wee, and F. Wegman (2013). A conceptual framework for road safety and mobility applied to cycling safety, Accident Analysis & Prevention 62 331–340 pp. .
Schiller P.L., E.C. Brun, and J.R. Kenworthy (2010). An Introduction to Sustainable Transport: Policy, Planning and Implementation. Earthscan, London, 342 pp.
Schipper L. (2011). Automobile use, fuel economy and CO(2) emissions in industrialized countries: Encouraging trends through 2008?, TRANSPORT POLICY 18 358–372 pp. (DOI: 10.1016/j.tranpol.2010.10.011), (ISSN: 0967‐070X).
Schipper L., E. Deakin, C. McAndrews, L. Scholl, and K.T. Frick (2009). Considering Climate Change in Latin American and Caribbean Urban Transportation: Concepts, Applications, and Cases. University of California, Berkeley, USA. 112 pp.
Schipper L., and L. Fulton (2012). Dazzled by diesel? The impact on carbon dioxide emissions of the shift to diesels in Europe through 2009, Energy Policy 54 3–10 pp. (DOI: 10.1016/j.enpol.2012.11.013), (ISSN: 0301‐4215).
Schipper L., C. Marie‐Lilliu, and R. Gorham (2000). Flexing the Link Between Tranport and Green House Gas Emissions. International Energy Agency, Paris, France. 86 pp.
Schoon C., and C. Huijskens (2011). Traffic Safety Consequences of Electrically Powered Vehicles. SWOV, Leidschendam, NL. 50 pp. Available at: http://www.swov.nl/rapport/R‐2011‐11.pdf.
Schøyen H., and S. Bråthen (2011). The Northern Sea Route versus the Suez Canal: cases from bulk shipping, Journal of Transport Geography 19 977–983 pp. (DOI: 10.1016/j.jtrangeo.2011.03.003), (ISSN: 0966‐6923).
Schrank D., T. Lomax, and W. Eisele (2011). 2011 URBAN MOBILITY REPORT. Texas Transportation Institute, Texas, USA. 141 pp. Available at: http://www.news‐press.com/assets/pdf/A4179756927.PDF.
Servaas M. (2000). The significance of non‐motorised transport for developing countries. Commissioned by the World Bank.
Shah Y.T. (2013). Biomass to Liquid Fuel via Fischer–Tropsch and Related Syntheses. In: Advanced Biofuels and Bioproducts. J.W. Lee, (ed.), Springer New York, New York, NY pp.185–208(ISBN: 978‐1‐4614‐3347‐7, 978‐1‐4614‐3348‐4).
Shaheen S., S. Guzman, and H. Zhang (2010). Bikesharing in Europe, the Americas, and Asia ‐ Past, Present, and Future, Transportation Research Record: Journal of the Transportation Research Board 2143 159–167 pp. .
Shakya S.R., and R.M. Shrestha (2011). Transport sector electrification in a hydropower resource rich developing country: Energy security, environmental and climate change co‐benefits, Energy for Sustainable Development 15 147–159 pp. (DOI: 10.1016/j.esd.2011.04.003), (ISSN: 0973‐0826).
Final Draft Chapter 8 IPCC WGIII AR5
105 of 115
Shalizi Z., and F. Lecocq (2009). Climate Change and the Economics of Targeted Mitigation in Sectors with Long‐Lived Capital Stock. World Bank, Washington DC, USA. 41 pp. Available at: http://ssrn.com/paper=1478816.
Sharpe R. (2010). Technical GHG Reduction Options for Fossil Fuel Based Road Transport. European Commission Directorate‐General Environment, Brussels, Belgium. 50 pp. Available at: http://www.eutransportghg2050.eu/cms/assets/Paper‐1‐preliminary.pdf.
Sheller M. (2004). Automotive Emotions: Feeling the Car, Theory, Culture & Society 21 221–242 pp. (DOI: 10.1177/0263276404046068), (ISSN: 0263‐2764, 1460‐3616).
Shindell D.T., J.F. Lamarque, M. Schulz, M. Flanner, C. Jiao, M. Chin, P.J. Young, Y.H. Lee, L. Rotstayn, N. Mahowald, G. Milly, G. Faluvegi, Y. Balkanski, W.J. Collins, A.J. Conley, S. Dalsoren, R. Easter, S. Ghan, L. Horowitz, X. Liu, G. Myhre, T. Nagashima, V. Naik, S.T. Rumbold, R. Skeie, K. Sudo, S. Szopa, T. Takemura, A. Voulgarakis, J.H. Yoon, and F. Lo (2013). Radiative forcing in the ACCMIP historical and future climate simulations, Atmospheric Chemistry and Physics 13 2939–2974 pp. (DOI: 10.5194/Acp‐13‐2939‐2013), (ISSN: 1680‐7316).
Short J., and A. Kopp (2005). Transport infrastructure: Investment and planning. Policy and research aspects, Transport Policy 12 360–367 pp. (DOI: 10.1016/j.tranpol.2005.04.003), (ISSN: 0967‐070X).
Shoup D.C. (2011). The High Cost of Free Parking. Planners Press, American Planning Association, Chicago, 765 pp., (ISBN: 9781932364965). .
Sietchiping R., M.J. Permezel, and C. Ngomsi (2012). Transport and mobility in sub‐Saharan African cities: An overview of practices, lessons and options for improvements, Special Section: Urban Planning in Africa (pp. 155‐191) 29 183–189 pp. (DOI: 10.1016/j.cities.2011.11.005), (ISSN: 0264‐2751).
Simaiakis I., and H. Balakrishnan (2010). Impact of Congestion on Taxi Times, Fuel Burn, and Emissions at Major Airports, Transportation Research Record: Journal of the Transportation Research Board 2184 22–30 pp. (DOI: 10.3141/2184‐03).
Sims R., P. Mercado, W. Krewitt, G. Bhuyan, D. Flynn, H. Holttinen, G. Jannuzzi, S. Khennas, Y. Liu, M. O’Malley, L.J. Nilsson, J. Ogden, K. Ogimoto, H. Outhred, Ø. Ullberg, and F. van Hulle (2011). Integration of Renewable Energy into Present and Future Energy Systems. In: IPCC Special Report on Renewable Energy Sources and Climate Change Mitigation [O. Edenhofer, R. Pichs‐Madruga, Y. Sokona, K. Seyboth, P. Matschoss, S. Kadner, T. Zwickel, P. Eickemeier, G. Hansen, S. Schlömer, C. von Stechow (eds)]. IPCC, Cambridge, United Kingdom and New York, NY, USA pp.609–705.
Skinner I., H. van Essen, H. Smokers, and N. Hill (2010a). Towards the Decarbonisation of EU’s Transport Sector by 2050. European Commission Directorate‐General Environment and AEA Technology, Brussels, Belgium. 99 pp. Available at: http://www.eutransportghg2050.eu/cms/assets/EU‐Transport‐GHG‐2050‐Final‐Report‐22‐06‐10.pdf.
Small K.A. (2012). Energy policies for passenger motor vehicles, Transportation Research Part A: Policy and Practice 46 874–889 pp. (DOI: 10.1016/j.tra.2012.02.017), (ISSN: 09658564).
Small K., and K. van Dender (2007). Fuel Efficiency and Motor Vehicle Travel: The Declining Rebound Effect, Energy Journal 28 25–51 pp. .
Final Draft Chapter 8 IPCC WGIII AR5
106 of 115
Small K.A., and E.T. Verhoef (2007). The Economics of Urban Transportation. Routledge, New York, 276 pp., (ISBN: 9780415285155 0415285151 9780415285148 0415285143 9780203642306 0203642309). .
Sonkin B., P. Edwards, I. Roberts, and J. Green (2006). Walking, cycling and transport safety: an analysis of child road deaths, Journal of the Royal Society of Medicine 99 402–405 pp. (DOI: 10.1258/jrsm.99.8.402), (ISSN: 0141‐0768).
Sorrell S., M. Lehtonen, L. Stapleton, J. Pujol, and Toby Champion (2012). Decoupling of road freight energy use from economic growth in the United Kingdom, Modeling Transport (Energy) Demand and Policies 41 84–97 pp. (DOI: 10.1016/j.enpol.2010.07.007), (ISSN: 0301‐4215).
Sorrell S., and J. Speirs (2009). UKERC Review of Evidence on Global Oil Depletion ‐ Technical Report 1: Data Sources and Issues. UK Energy Research Centre, Sussex/ London, UK. 53 pp.
Sousanis J. (2011). World Vehicle Population Tops 1 Billion, WardsAuto . Available at: http://wardsauto.com/ar/world_vehicle_population_110815.
Sovacool B.K., and M.A. Brown (2010). Competing Dimensions of Energy Security: An International Perspective. In: Annual Review of Environment and Resources, Vol 35. A. Gadgil, D.M. Liverman, (eds.), Annual Reviews, Palo Alto, USA pp.77–108(ISBN: 978‐0‐8243‐2335‐6).
Sperling D., and D. Gordon (2009). Two Billion Cars. Oxford University Press, New York, USA, 336 pp.
Sperling D., and M. Nichols (2012). California’s Pioneering Transportation Strategy. Issues in Science and Technology. . Available at: http://www.issues.org/28.2/sperling.html.
Sperling D., and S. Yeh (2010). Toward a global low carbon fuel standard, Transport Policy 17 47–49 pp. (DOI: 10.1016/j.tranpol.2009.08.009), (ISSN: 0967‐070X).
Steg L. (2005). Car use: lust and must. Instrumental, symbolic and affective motives for car use, Transportation Research Part A: Policy and Practice 39 147–162 pp. (DOI: 10.1016/j.tra.2004.07.001), (ISSN: 0965‐8564).
Steg L., and R. Gifford (2005). Sustainable transportation and quality of life, Journal of Transport Geography 13 59–69 pp. .
Stephenson S.R., L.C. Smith, and J.A. Agnew (2011). Divergent long‐term trajectories of human access to the Arctic, NATURE CLIMATE CHANGE 1 156–160 pp. (DOI: 10.1038/NCLIMATE1120), (ISSN: 1758‐678X).
Stepp M.D., J.J. Winebrake, J.S. Hawker, and S.J. Skerlos (2009). Greenhouse gas mitigation policies and the transportation sector: The role of feedback effects on policy effectiveness, Energy Policy 37 2774–2787 pp. (DOI: 10.1016/j.enpol.2009.03.013), (ISSN: 0301‐4215).
Sterner T. (2007). Fuel taxes: An important instrument for climate policy, Energy Policy 35 3194–3202 pp. (DOI: 10.1016/j.enpol.2006.10.025), (ISSN: 0301‐4215).
STUMP F., S. TEJADA, W. RAY, D. DROPKIN, F. BLACK, W. CREWS, R. SNOW, P. SIUDAK, C. DAVIS, L. BAKER, and N. PERRY (1989). THE INFLUENCE OF AMBIENT‐TEMPERATURE ON TAILPIPE EMISSIONS FROM 1984‐1987 MODEL YEAR LIGHT‐DUTY GASOLINE MOTOR VEHICLES, Atmospheric Environment 23 307–320 pp. (DOI: 10.1016/0004‐6981(89)90579‐9).
Final Draft Chapter 8 IPCC WGIII AR5
107 of 115
Sugiyama T., M. Neuhaus, and N. Owen (2012). Active Transport, the Built Environment, and Human Health. In: Sustainable Environmental Design in Architecture. S.T. Rassia, P.M. Pardalos, (eds.), Springer New York, New York, NY pp.43–65(ISBN: 978‐1‐4419‐0744‐8, 978‐1‐4419‐0745‐5).
Sustainable Aviation (2012). Sustainable Aviation CO2 Road Map. Sustainable Aviation, London, UK. 60 pp.
Suzuki Y. (2011). A new truck‐routing approach for reducing fuel consumption and pollutants emission, Transportation Research Part D: Transport and Environment 16 73–77 pp. (DOI: 10.1016/j.trd.2010.08.003), (ISSN: 1361‐9209).
Takeshita T. (2012). Assessing the co‐benefits of CO2 mitigation on air pollutants emissions from road vehicles, Applied Energy 97 225–237 pp. . Available at: http://www.scopus.com/inward/record.url?eid=2‐s2.0‐84862322260&partnerID=40&md5=0d608a0d7d47b00c98629d006a1cfec8.
Takeshita T., and K. Yamaji (2008). Important roles of Fischer–Tropsch synfuels in the global energy future, Energy Policy 36 2773–2784 pp. (DOI: 10.1016/j.enpol.2008.02.044), (ISSN: 0301‐4215).
Tapio P. (2005). Towards a theory of decoupling: degrees of decoupling in the EU and the case of road traffic in Finland between 1970 and 2001, Transport Policy 12 137–151 pp. (DOI: 10.1016/j.tranpol.2005.01.001), (ISSN: 0967‐070X).
Tavasszy L.A., and J. van Meijeren (2011). Modal Shift Target for Freight Transport Above 300km: An Assessment. ACEA. . Available at: http://www.acea.be/images/uploads/files/SAG_17_Modal_Shift_Target_for_Freight_Transport_Above_300km.pdf.
Taylor M.A.P., and M. Philp (2010). Adapting to climate change — implications for transport infrastructure, transport systems and travel behaviour, Road & Transport Research 19 66–79 pp. (ISSN: 1037‐5783).
Teixeira E.I., G. Fischer, H. van Velthuizen, C. Walter, and F. Ewert (2012). Global hot‐spots of heat stress on agricultural crops due to climate change, Agricultural and Forest Meteorology (DOI: 10.1016/j.agrformet.2011.09.002), (ISSN: 0168‐1923).
Tennøy A. (2010). Why we fail to reduce urban road traffic volumes: Does it matter how planners frame the problem?, Transport Policy 17 216–223 pp. (DOI: 10.1016/j.tranpol.2010.01.011), (ISSN: 0967‐070X).
Terry L. (2007). Air Cargo Navigates Uncertain Skies — Inbound Logistics. . Available at: http://www.inboundlogistics.com/cms/article/air‐cargo‐navigates‐uncertain‐skies/.
TFL (2007). Transport for London Annual Report and Statement of Accounts. Transport for London, London, UK. 112 pp. Available at: http://www.tfl.gov.uk/assets/downloads/annual‐report‐and‐statement‐of‐accounts‐06‐07.pdf.
TFL (2010). Analysis of Cycling Potential — Travel for London. Transport for London, London, UK. 53 pp.
The New Transit Town: Best Practices in Transit‐Oriented Development (2004). Island Press, Washington, DC, 253 pp., (ISBN: 1559631171). .
Final Draft Chapter 8 IPCC WGIII AR5
108 of 115
Thompson W., J. Whistance, and S. Meyer (2011). Effects of US biofuel policies on US and world petroleum product markets with consequences for greenhouse gas emissions, Energy Policy 39 5509–5518 pp. (ISSN: 0301‐4215).
Thynell M., D. Mohan, and G. Tiwari (2010). Sustainable transport and the modernisation of urban transport in Delhi and Stockholm, Cities 27 421–429 pp. (DOI: 10.1016/j.cities.2010.04.002), (ISSN: 0264‐2751).
TIAX (2009). Assessment of Fuel Economy Technologies for Medium‐ and Heavy‐Duty Vehicles. National Academy of Sciences, Washington DC, USA.
TIAX (2011). European Union Greenhouse Gas Reduction Potential for Heavy‐Duty Vehicles. International Council on Clean Transportation, San Francisco, California. 69 pp.
Timilsina G.R., and H.B. Dulal (2009). A Review Of Regulatory Instruments To Control Environmental Externalities From The Transport Sector. World Bank Publications, Washington DC, USA, 54 pp. Available at: http://www.worldbank.icebox.ingenta.com/content/wb/wps4301/2009/00000001/00000001/art04867.
Tirachini A., and D.A. Hensher (2012). Multimodal Transport Pricing: First Best, Second Best and Extensions to Non‐motorized Transport, Transport Reviews 32 181–202 pp. (DOI: 10.1080/01441647.2011.635318), (ISSN: 0144‐1647, 1464‐5327).
Tirado M.C., R. Clarke, L.A. Jaykus, A. McQuatters‐Gollop, and J.M. Frank (2010). Climate change and food safety: A review, Climate Change and Food Science 43 1745–1765 pp. (DOI: 10.1016/j.foodres.2010.07.003), (ISSN: 0963‐9969).
Tiwari G. (2002). Urban Transport Priorities: Meeting the Challenge of Socio‐economic Diversity in Cities, a Case Study of Delhi, India, Cities 19 95–103 pp. .
Tiwari G., J. Fazio, S. Gaurav, and N. Chatteerjee (2008). Continuity Equation Validation for Nonhomogeneous Traffic, Journal of Transportation Engineering 134 118–127 pp. (DOI: 10.1061/(ASCE)0733‐947X(2008)134:3(118)), (ISSN: 0733‐947X).
Tiwari G., and D. Jain (2012a). Accessibility and safety indicators for all road users: Case study Delhi BRT, Journal of Transport Geography 22 87–95 pp. (DOI: 10.1016/j.jtrangeo.2011.11.020).
Tiwari G., and D. Jain (2012b). Accessibility and safety indicators for all road users: case study Delhi BRT, Special Section on Rail Transit Systems and High Speed Rail 22 87–95 pp. (DOI: 10.1016/j.jtrangeo.2011.11.020), (ISSN: 0966‐6923).
TML (2008). Effects of Adapting the Rules on Weights and Dimensions of Heavy Commercial Vehicles as Established with Directive 96/53/EC. Transport & Mobility Leuven, Brussels. 315 pp.
TMO (2010). CO2 Uitstoot van Personenwagens in Norm En Praktijk – Analyse van Gegevens van Zakelijke Rijders [CO2 Emissions from Passenger Cars in Standard and Practice – Analysis of Data from Business Drivers].
TOSCA (2011). Techno‐Economic Analysis of Aircraft. Technology Opportunities and Strategies towards Climate Friendly Transport.
Final Draft Chapter 8 IPCC WGIII AR5
109 of 115
Tourlonias P., and G. Koltsakis (2011). Model‐based comparative study of Euro 6 diesel aftertreatment concepts, focusing on fuel consumption, INTERNATIONAL JOURNAL OF ENGINE RESEARCH 12 238–251 pp. (DOI: 10.1177/1468087411405104), (ISSN: 1468‐0874).
Transit Oriented Development: Making It Happen (2009). Ashgate, Farnham, Surrey, England ; Burlington, VT, USA, 291 pp., (ISBN: 9780754673156). .
Trubka R., P. Newman, and D. Bilsborough (2010a). The Costs of Urban Sprawl – Physical Activity Links to Healthcare Costs and Productivity, Environment Design Guide GEN 85 1–13 pp. .
Trubka R., P. Newman, and D. Bilsborough (2010b). The Costs of Urban Sprawl – Infrastructure and Transportation, Environment Design Guide GEN 83 1–6 pp. .
Trubka R., P. Newman, and D. Bilsborough (2010c). The Costs of Urban Sprawl – Greenhouse Gases, Environment Design Guide GEN 84 1–16 pp. .
Tuchschmid M. (2009). Carbon Footprint of High‐Speed Railway Infrastructure (Pre‐Study). Methodology and Application of High Speed Railway Operation of European Railways. The International Union of Railways (UIC), Zürich.
Twardella D., and A. Ndrepepa (2011). Relationship between noise annoyance from road traffic noise and cardiovascular diseases: A meta‐analysis, Noise and Health 13 251 pp. (DOI: 10.4103/1463‐1741.80163), (ISSN: 1463‐1741).
Ubbels, B., Rietveld, P., Peeters P. (2002). Environmental effects of a kilometre charge in road transport: An investigation for the Netherlands, Transportation Research Part D: Transport and Environment 7 255–264 pp. . Available at: http://www.scopus.com/inward/record.url?eid=2‐s2.0‐0036643472&partnerID=40&md5=742008ed759dcebdb6cc7508b35cf3f1.
UIC (2011). World Rail Statistics. International Union of Railways, Paris. 2 pp. Available at: http://www.uic.org/com/IMG/pdf/cp18_uic_stats_2010_en‐2.pdf.
UIC (2012). High Speed Rail Fast Track to Sustainable Mobility. InternatIonal UnIon of Railways (UIC), Paris. 18 pp.
Umweltbundesamt (2007). Longer and Heavier on German Roads: Do Megatrucks Contribute towards Sustainable Transport. Umweltbundesamt, Dessau. 6 pp.
UN Secretariat U. (2007). World population prospects: the 2006 revision, PLACE: the Population Division of the Department of Economic and Social Affairs of the UN Secretariat [http://earthtrends. wri. org/text/population‐health/variable‐379. html].
UNCTAD (2013). Review of Maritime Transport 2012. United Nations Conference on Trade and Development, New York, USA, 194 pp., (ISBN: 9789211128604 : 9211128609). .
UNEP (2011). Towards a Green Economy: Pathways to Sustainable Development and Poverty Eradication. United Nations Environment Programme, Nairobi, Kenya, 630 pp., (ISBN: 9280731432). .
UNEP, and WMO (2011). Integrated assessment of black carbon and tropospheric ozone. United Nations Environment Programme and World Meteorological Organization. . Available at: http://www.unep.org/dewa/Portals/67/pdf/Black_Carbon.pdf.
Final Draft Chapter 8 IPCC WGIII AR5
110 of 115
UNEP/GEF (2013). Global Assessments and Guidelines for Sustainable Liquid Biofuel Production in Developing Countries, United Nations Environment Programme and Global Environment Facility,. . Available at: http://www.unep.org/bioenergy/Portals/48107/publications/Global%20Assessment%20and%20Guidelines%20for%20Biofuels.pdf.
UN‐Habitat (2013). Planning and Design for Sustainable Urban Mobility — Global Report on Human Settlements 2013. UN‐HABITAT, Nairobi, Kenya. 348 pp. Available at: http://www.unhabitat.org/content.asp?catid=555&typeid=19&cid=12336.
United Nations Human Settlements Programme (2012). The State of Latin American and Caribbean Cities 2012: Towards a New Urban Transition. (ISBN: 9789211333978 9211333970 9789211324686 9211324688). .
UNWTO (2012). UNWTO Tourism Highlights 2012. United Nations World Tourism Organization. . Available at: http://mkt.unwto.org/en/publication/unwto‐tourism‐highlights‐2013‐edition.
UNWTO, and UNEP (2008). Climate Change and Tourism: Responding to Global Challenges. World Tourism Organization; United Nations Environment Programme, Madrid; Paris, 269 pp., (ISBN: 9789284412341 928441234X 9789280728866 9280728865). .
Upham P., D. Raper, C. Thomas, M. McLellan, M. Lever, and A. Lieuwen (2004). Environmental capacity and European air transport: stakeholder opinion and implications for modelling, Journal of Air Transport Management 10 199–205 pp. (DOI: 10.1016/j.jairtraman.2003.10.016), (ISSN: 0969‐6997).
Urry J. (2007). Mobilities. John Wiley & Sons, Hoboken, NJ, 336 pp., (ISBN: 978‐0745634197). .
US DoT (2010). Public Transportation’s Role in Responding to Climate Change. US Department of Transportation Federal Transit Authority. . Available at: http://www.fta.dot.gov/documents/PublicTransportationsRoleInRespondingToClimateChange2010.pdf.
USCMAQ (2008). SAFETEA‐LU 1808: CMAQ — Evaluation and Assessment. United States Congestion Mitigation and Air Quality Improvement Program, Washington DC, USA. 158 pp. Available at: http://www.fhwa.dot.gov/environment/air_quality/cmaq/safetealu1808.pdf.
USEPA (2012). Report to Congress on Black Carbon. Environmental Protection Agency, Washington D C, USA. 288 pp.
USFHA (2012). Report to the U.S. Congress on the Outcomes of the Nonmotorized Transportation Pilot Program SAFETEA‐LU Section 1807. US Department of Transportation. 105 pp.
Vasconcellos E. (2001). Urban Transport, Environment and Equity: The Case for Developing Countries. Earthscan, London, 344 pp.
Vasconcellos E.A. (2011). Equity Evaluation of Urban Transport. In: Urban transport in the developing world : a handbook of policy and practice. H.T. Dimitriou, Gakenheimer, (eds.), Edward Elgar, Cheltenham, UK; Northhampton, MA pp.333–359(ISBN: 9781847202055 1847202055).
Velaga N.R., J.D. Nelson, S.D. Wright, and J.H. Farrington (2012). The Potential Role of Flexible Transport Services in Enhancing Rural Public Transport Provision, Journal of Public Transportation 15 111–131 pp. .
Final Draft Chapter 8 IPCC WGIII AR5
111 of 115
Velasco E., K.J.J. Ho, and A.D. Ziegler (2013). Commuter exposure to black carbon, carbon monoxide, and noise in the mass transport khlong boats of Bangkok, Thailand, Transportation Research Part D: Transport and Environment 21 62–65 pp. (DOI: 10.1016/j.trd.2013.02.010), (ISSN: 1361‐9209).
Verma V., P. Pakbin, K.L. Cheung, A.K. Cho, J.J. Schauer, M.M. Shafer, M.T. Kleinman, and C. Sioutas (2011). Physicochemical and oxidative characteristics of semi‐volatile components of quasi‐ultrafine particles in an urban atmosphere, Atmospheric Environment 45 1025–1033 pp. (DOI: 10.1016/j.atmosenv.2010.10.044), (ISSN: 1352‐2310).
Vermeulen S.J., P.K. Aggarwal, A. Ainslie, C. Angelone, B.M. Campbell, A.J. Challinor, J.W. Hansen, J.S.I. Ingram, A. Jarvis, P. Kristjanson, C. Lau, G.C. Nelson, P.K. Thornton, and E. Wollenberg (2012). Options for support to agriculture and food security under climate change, Environmental Science & Policy 15 136–144 pp. (DOI: 10.1016/j.envsci.2011.09.003), (ISSN: 1462‐9011).
Verny J., and C. Grigentin (2009). Container shipping on the Northern Sea Route, International Journal of Production Economics 122 107–117 pp. (DOI: 10.1016/j.ijpe.2009.03.018), (ISSN: 0925‐5273).
Viguié V., and S. Hallegatte (2012). Trade‐offs and synergies in urban climate policies, Nature Climate Change 2 334–337 pp. (DOI: 10.1038/nclimate1434), (ISSN: 1758‐678X).
Vyas A.D., D.M. Patel, and K.M. Bertram (2013). Potential for Energy Efficiency Improvement Beyond the Light‐Duty‐Vehicle Sector. U.S. Department of Energy and Argonne National Laboratory, Oak Ridge, US. 82 pp.
Waddell P., G.F. Ulfarsson, J.P. Franklin, and J. Lobb (2007). Incorporating land use in metropolitan transportation planning, Transportation Research Part A: Policy and Practice 41 382–410 pp. (DOI: 10.1016/j.tra.2006.09.008), (ISSN: 0965‐8564).
Wang M. (2012a). GREET1_2012 model. Argonne National Laboratory.
Wang H. (2012b). Cutting Carbon from Ships, International Council on Clean Transportation . Available at: http://www.theicct.org/blogs/staff/cutting‐carbon‐ships.
Wang M.Q., J. Han, Z. Haq, W.E. Tyner, M. Wu, and A. Elgowainy (2011). Energy and greenhouse gas emission effects of corn and cellulosic ethanol with technology improvements and land use changes, Biomass and Bioenergy 35 1885–1896 pp. (ISSN: 0961‐9534).
Wang Z., Y. Jin, M. Wang, and W. Wei (2010). New fuel consumption standards for Chinese passenger vehicles and their effects on reductions of oil use and CO2 emissions of the Chinese passenger vehicle fleet, Special Section on Carbon Emissions and Carbon Management in Cities with Regular Papers 38 5242–5250 pp. (DOI: 10.1016/j.enpol.2010.05.012), (ISSN: 0301‐4215).
Wang D., and F. Law (2007). Impacts of Information and Communication Technologies (ICT) on time use and travel behavior: a structural equations analysis, Transportation 34 513–527 pp. (DOI: 10.1007/s11116‐007‐9113‐0), (ISSN: 0049‐4488).
Wang M., M. Wang, and S. Wang (2012). Optimal investment and uncertainty on China’s carbon emission abatement, Energy Policy 41 871–877 pp. (DOI: 10.1016/j.enpol.2011.11.077), (ISSN: 0301‐4215).
Final Draft Chapter 8 IPCC WGIII AR5
112 of 115
Wassmann P. (2011). Arctic marine ecosystems in an era of rapid climate change, Progress In Oceanography 90 1–17 pp. (DOI: 10.1016/j.pocean.2011.02.002), (ISSN: 0079‐6611).
WBCSD (2004). Mobility 2030: Meeting the Challenges to Sustainability. World Business Council for Sustainable Development, Geneva. 180 pp. Available at: http://www.wbcsd.org/web/publications/mobility/mobility‐full.pdf.
WBCSD (2007). Mobility for Development Facts & Trends. World Business Council for Sustainable Development, Conches‐Geneva, Switzerland. 20 pp.
WBCSD (2012). GHG Protocol: Emission Factors from Cross‐Sector Tools. . Available at: http://www.ghgprotocol.org/download?file=files/ghgp/tools/Emission‐Factors‐from‐Cross‐Sector‐Tools‐(August‐2012).xlsx.
WEC (2011). Global Transport Scenarios 2050. World Energy Council, London. 71 pp.
Van Wee B., P. Rietveld, and H. Meurs (2006). Is average daily travel time expenditure constant? In search of explanations for an increase in average travel time, Journal of Transport Geography 14 109–122 pp. (DOI: 10.1016/j.jtrangeo.2005.06.003), (ISSN: 0966‐6923).
Weltevreden J.W.J. (2007). Substitution or complementarity? How the Internet changes city centre shopping, Journal of Retailing and Consumer Services 14 192–207 pp. . Available at: http://www.scopus.com/inward/record.url?eid=2‐s2.0‐33846354929&partnerID=40&md5=c37a228bb6aac63469209e5e92ae624a.
Wenzel T.P., and M. Ross (2005). The effects of vehicle model and driver behavior on risk, Accident Analysis & Prevention 37 479–494 pp. (DOI: 10.1016/j.aap.2004.08.002), (ISSN: 0001‐4575).
Westin J., and P. Kågeson (2012). Can high speed rail offset its embedded emissions?, Transportation Research Part D: Transport and Environment 17 1–7 pp. (DOI: 10.1016/j.trd.2011.09.006), (ISSN: 1361‐9209).
White M.J. (2004). The arms race on American roads: The effect of sport utility vehicles and pickup trucks on traffic safety, Journal of Law and Economics 47 333–355 pp. . Available at: http://www.scopus.com/inward/record.url?eid=2‐s2.0‐10244249266&partnerID=40&md5=acc5151c6a3427b4656b63a87da3ad8c.
WHO (2008). Economic Valuation of Transport Related Health Effects Review of Methods and Development of Practical Approaches with a Special Focus on Children. World Health Organization Regional Office for Europe, Copenhagen, DK. 151 pp. Available at: http://www.euro.who.int/__data/assets/pdf_file/0008/53864/E92127.pdf.
WHO (2009). Night Noise Guideline for Europe. World Health Organization Regional Office for Europe, Copenhagen, DK. 184 pp. Available at: http://www.euro.who.int/document/e92845.pdf.
WHO (2011). Global Status Report on Road Safety. World Health Organization.
Williams J.H., A. DeBenedictis, R. Ghanadan, A. Mahone, J. Moore, W.R. Morrow, S. Price, and M.S. Torn (2012). The Technology Path to Deep Greenhouse Gas Emissions Cuts by 2050: The Pivotal Role of Electricity, Science 335 53–59 pp. (DOI: 10.1126/science.1208365), (ISSN: 0036‐8075, 1095‐9203).
Final Draft Chapter 8 IPCC WGIII AR5
113 of 115
Winchester N., C. Wollersheim, R. Clewlow, N.C. Jost, S. Paltsev, J.M. Reilly, and I.A. Waitz (2013). The Impact of Climate Policy on US Aviation, Journal of Transport Economics and Policy (JTEP) 47 1–15 pp. . Available at: http://www.ingentaconnect.com/content/lse/jtep/2013/00000047/00000001/art00001.
Winebrake J.J., J.J. Corbett, A. Falzarano, J.S. Hawker, K. Korfmacher, S. Ketha, and S. Zilora (2008). Assessing Energy, Environmental, and Economic Tradeoffs in Intermodal Freight Transportation, Journal of the Air & Waste Management Association 58 1004–1013 pp. (DOI: 10.3155/1047‐3289.58.8.1004), (ISSN: 1096‐2247).
Wittneben B., D. Bongardt, H. Dalkmann, W. Sterk, and C. Baatz (2009). Integrating Sustainable Transport Measures into the Clean Development Mechanism. Transport Reviews 29, 91–113. (DOI: 10.1080/01441640802133494).
Wittneben B., D. Bongardt, H. Dalkmann, W. Sterk, and C. Baatz (2009b). Integrating Sustainable Transport Measures into the Clean Development Mechanism, Transport Reviews 29 91–113 pp. (DOI: 10.1080/01441640802133494), (ISSN: 0144‐1647).
Wood F.R., A. Bows, and K. Anderson (2010). Apportioning aviation CO2 emissions to regional administrations for monitoring and target setting, Transport Policy 17 206–215 pp. (DOI: 10.1016/j.tranpol.2010.01.010), (ISSN: 0967‐070X).
Woodcock J., P. Edwards, C. Tonne, B.G. Armstrong, O. Ashiru, D. Banister, S. Beevers, Z. Chalabi, Z. Chowdhury, and A. Cohen (2009a). Public health benefits of strategies to reduce greenhouse‐gas emissions: urban land transport, The Lancet 374 1930–1943 pp. (DOI: 10.1016/S0140‐6736(09)61714‐1), (ISSN: 01406736).
Woodcock J., P. Edwards, C. Tonne, B.G. Armstrong, O. Ashiru, D. Banister, S. Beevers, Z. Chalabi, Z. Chowdhury, and A. Cohen (2009b). Public health benefits of strategies to reduce greenhouse‐gas emissions: urban land transport, The Lancet 374 1930–1943 pp. (DOI: 10.1016/S0140‐6736(09)61714‐1), (ISSN: 01406736).
Woodcock J., P. Edwards, C. Tonne, B.G. Armstrong, O. Ashiru, D. Banister, S. Beevers, Z. Chalabi, Z. Chowdhury, A. Cohen, O.H. Franco, A. Haines, R. Hickman, G. Lindsay, I. Mittal, D. Mohan, G. Tiwari, A. Woodward, and I. Roberts (2009c). Public health benefits of strategies to reduce greenhouse‐gas emissions: urban land transport, The Lancet 374 1930–1943 pp. (DOI: doi: 10.1016/S0140‐6736(09)61714‐1), (ISSN: 0140‐6736).
Woodcock, J., Banister, D., Edwards, P., Prentice, A.M., Roberts I. (2007). Energy and transport, Lancet 370 1078–1088 pp. . Available at: http://www.scopus.com/inward/record.url?eid=2‐s2.0‐34548767083&partnerID=40&md5=2453f1fa1d39375abcd22d22475b978e.
Woodrooffe J., and L. Ash (2001). Economic Efficiency of Long Combination Transport Vehicles in Alberta. Woodrooffe and Associates. 31 pp. Available at: http://www.transportation.alberta.ca/Content/docType61/production/LCVEconomicEfficiencyReport.pdf.
World Bank (2002). Cities on the Move : A World Bank Urban Transport Strategy Review. The World Bank, Washington, D.C., 228 pp., (ISBN: 0821351486 9780821351482). .
World Bank (2006). Promoting Global Environmental Priorities in the Urban Transport Sector: Experiences from the World Bank Group‐Global Environmental Facility Projects. The World Bank, Washington, DC. 30 pp.
Final Draft Chapter 8 IPCC WGIII AR5
114 of 115
World Economic Forum, and Accentura (2009). Supply Chain Decarbonisation. Geneva.
Wozny N., and H. Allcott (2010). Gasoline Prices, Fuel Economy, and the Energy Paradox. MIT Center for Energy and Environmental Research Policy, Cambridge, MA. 64 pp. Available at: http://dspace.mit.edu/handle/1721.1/54753.
Wright L., and L. Fulton (2005). Climate Change Mitigation and Transport in Developing Nations, Transport Reviews 25 691–717 pp. (DOI: 10.1080/01441640500360951), (ISSN: 0144‐1647, 1464‐5327).
WSC (2011). Design and Implementation of the Vessel Efficiency Incentive Scheme (EIS). World Shipping Council and Japan’s Ministry of Land, Infrastructure, Transport and Tourism, Tokyo. 16 pp. Available at: http://www.google.de/url?sa=t&rct=j&q=design%20and%20implementation%20of%20the%20vessel%20efficiency%20incentive%20scheme%20(eis)&source=web&cd=1&ved=0CFAQFjAA&url=http%3A%2F%2Fwww.worldshipping.org%2FFinal_Final__EIS_July_2011_for_Letter.pdf&ei=ggXsT4rZCNDP4QTM‐fiVBQ&usg=AFQjCNEvhebfk3O2wBE33eDctA3k9RLL_Q&cad=rja.
Wu C., L. Yao, and K. Zhang (2011). The red‐light running behavior of electric bike riders and cyclists at urban intersections in China: An observational study, Accident Analysis & Prevention 49 186–192 pp. (DOI: 10.1016/j.aap.2011.06.001), (ISSN: 00014575).
Yamaguchi K. (2010). Voluntary CO2 emissions reduction scheme: Analysis of airline voluntary plan in Japan, Air Transport, Global Warming and the Environment Selected Papers from the Air Transport Research Society Meeting, Berkeley 15 46–50 pp. (DOI: 10.1016/j.trd.2009.07.004), (ISSN: 1361‐9209).
Yamaguchi M. (2012). Policy and Measures. In: Climate Change Mitigation, A Balanced Approach to Climate Change. Springer Publishing Company, London, UK pp.129–156.
Yan X., and R.J. Crookes (2010). Energy demand and emissions from road transportation vehicles in China, Progress in Energy and Combustion Science 36 651–676 pp. (DOI: 10.1016/j.pecs.2010.02.003), (ISSN: 0360‐1285).
Yedla S., R. Shrestha, and G. Anandarajah (2005). Environmentally sustainable urban transportation ‐ comparative analysis of local emission mitigation strategies vis‐a‐vis GHG mitigation strategies, Transport Policy 12 245–254 pp. .
Yeh S., and D. McCollum (2011). Optimizing the transportation climate mitigation wedge. In: Sustainable Transport Energy Pathways. Institution of Transportation Studies, University of Davis, California. pp.234–248. Available at: http://creativecommons.org/licences/by‐nc‐nd/3.0/.
Yeh S., and D. Sperling (2010). Low carbon fuel standards: Implementation scenarios and challenges, Energy Policy 38 6955–6965 pp. (DOI: 10.1016/j.enpol.2010.07.012), (ISSN: 0301‐4215).
Yeh S., and D. Sperling (2013). Low carbon fuel policy and analysis, Energy Policy 56 1–4 pp. (DOI: 10.1016/j.enpol.2013.01.008), (ISSN: 0301‐4215).
Yi L., and H.R. Thomas (2007). A review of research on the environmental impact of e‐business and ICT, Environment International 33 841–849 pp. (DOI: 10.1016/j.envint.2007.03.015), (ISSN: 0160‐4120).
Final Draft Chapter 8 IPCC WGIII AR5
115 of 115
Zackrisson M., L. Avellán, and J. Orlenius (2010). Life cycle assessment of lithium‐ion batteries for plug‐in hybrid electric vehicles – Critical issues, Journal of Cleaner Production 18 1519–1529 pp. (DOI: 10.1016/j.jclepro.2010.06.004), (ISSN: 0959‐6526).
Zahavi Y., and A. Talvitie (1980). Regularities in travel time and money expenditures, Transportation Research Record: Journal of the Transportation Research Board 750 13–19 pp. .
Zegras C. (2011). Mainstreaming sustainable urban transport: putting the pieces together. In: Urban transport in the developing world: a handbook of policy and practice. H.T. Dimitriou, R.A. Gakenheimer, (eds.), Edward Elgar, Cheltenham, UK; Northhampton, MA pp.548–588(ISBN: 9781847202055 1847202055).
Zhang A., and Y. Zhang (2006). Airport capacity and congestion when carriers have market power, Journal of Urban Economics 60 229–247 pp. (DOI: doi: 10.1016/j.jue.2006.02.003), (ISSN: 0094‐1190).
Zhen F., Z. Wei, S. Yang, and X. Cao (2009). The impact of information technology on the characteristics of urban resident travel: Case of Nanjing, Geographical Research 28 1307–1317 pp. .
Zhu C., Y. Zhu, R. Lu, R. He, and Z. Xia (2012). Perceptions and aspirations for car ownership among Chinese students attending two universities in the Yangtze Delta, China, Journal of Transport Geography 24 315–323 pp. (DOI: 10.1016/j.jtrangeo.2012.03.011), (ISSN: 0966‐6923).
Zusman E., A. Srinivasan, and S. Dhakal (2012). Low Carbon Transport in Asia: Strategies for Optimizing Co‐Benefits. Earthscan; Institute for Global Environmental Strategies, London; New York; [s.l.], (ISBN: 9781844079148 1844079147 9781844079155 1844079155 9780203153833 0203153839). .
Van der Zwaan B., H. Rösler, T. Kober, T. Aboumahboub, K. Calvin, D. Gernaat, G. Marangoni, and D. McCollum (2013). A Cross‐model Comparison of Global Long‐term Technology Diffusion under a 2˚C Climate Change Control Target., Climate Change Economics.