Summary report on the SBSTA–IPCC special event - UNFCCC
24
SBSTA/IPCC Summary Report on Unpacking the new scientific knowledge and key findings in the Working Group I contribution to the Sixth Assessment report: The Physical Science Basis SBSTA/IPCC Special Event.2021.1 Summary Report 1 of 24 Summary report on the SBSTA–IPCC special event: Unpacking the new scientific knowledge and key findings in the Working Group I contribution to the Sixth Assessment report: The Physical Science Basis Glasgow, United Kingdom, 4 November 2021 Note by the Chairs of the SBSTA and the IPCC 09 May 2021 Contents Page I. Introduction 2 A. Background ............................................................................................................. 2 B. General objective and approach for the special event ............................................. 2 II. Summary of the special event 2 A. Opening ................................................................................................................ 3 B. Presentations by experts to unpack the new scientific knowledge and key findings 3 1. The current state of the climate 3 Summary of the Q&A session for theme 1 10 2. Possible climate futures 10 Summary of the Q&A session for theme 2 13 3. Climate information for risk and adaptation 14 Summary of the Q&A session for theme 3 18 4. Limiting climate change 19 Summary of the Q&A session for theme 4 22 C. Summary of the general discussion and interventions from Parties ........................ 24 D. Closing remarks ...................................................................................................... 24
-
Upload
khangminh22 -
Category
Documents
-
view
1 -
download
0
Transcript of Summary report on the SBSTA–IPCC special event - UNFCCC
SBSTA/IPCC Summary Report on Unpacking the new scientific knowledge and key findings in the Working Group I
contribution to the Sixth Assessment report: The Physical Science Basis
SBSTA/IPCC Special Event.2021.1 Summary Report
1 of 24
Summary report on the SBSTA–IPCC special event: Unpacking the new scientific knowledge and key findings in the Working Group I contribution to the Sixth Assessment report: The Physical Science Basis
Glasgow, United Kingdom, 4 November 2021
Note by the Chairs of the SBSTA and the IPCC
09 May 2021
Contents
Page
I. Introduction 2
A. Background ............................................................................................................. 2
B. General objective and approach for the special event ............................................. 2
II. Summary of the special event 2
A. Opening ................................................................................................................ 3
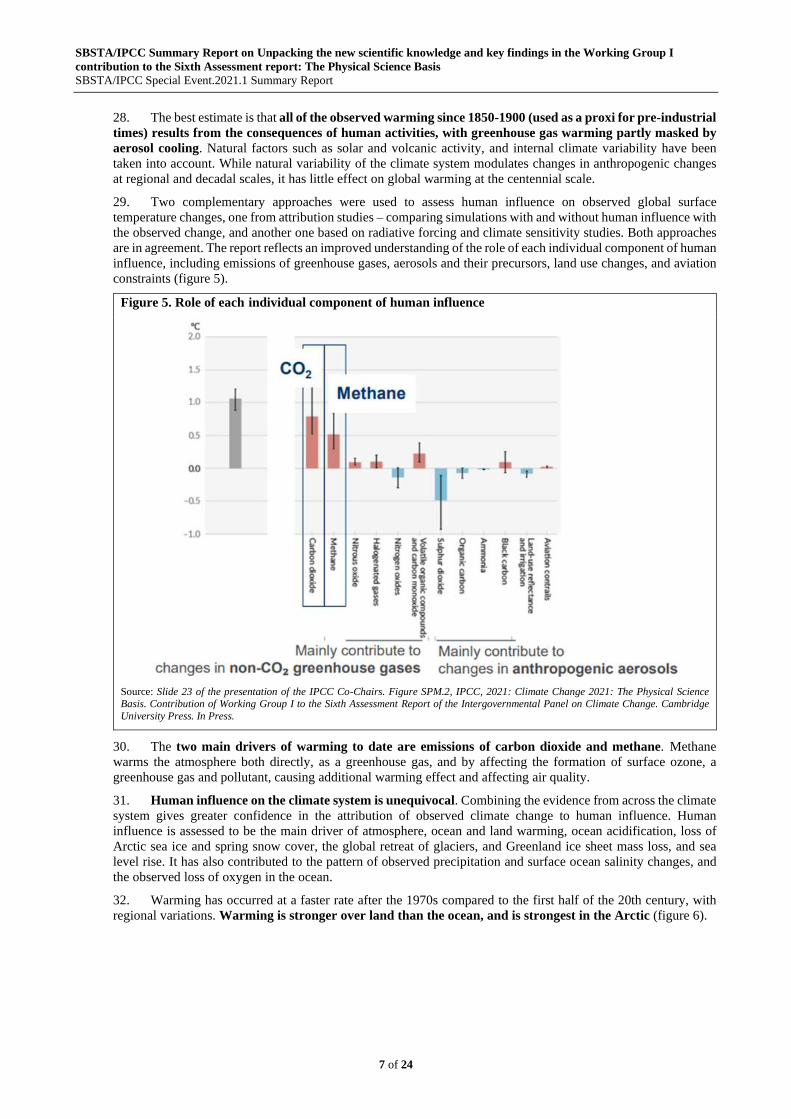
B. Presentations by experts to unpack the new scientific knowledge and key findings 3
1. The current state of the climate 3
Summary of the Q&A session for theme 1 10
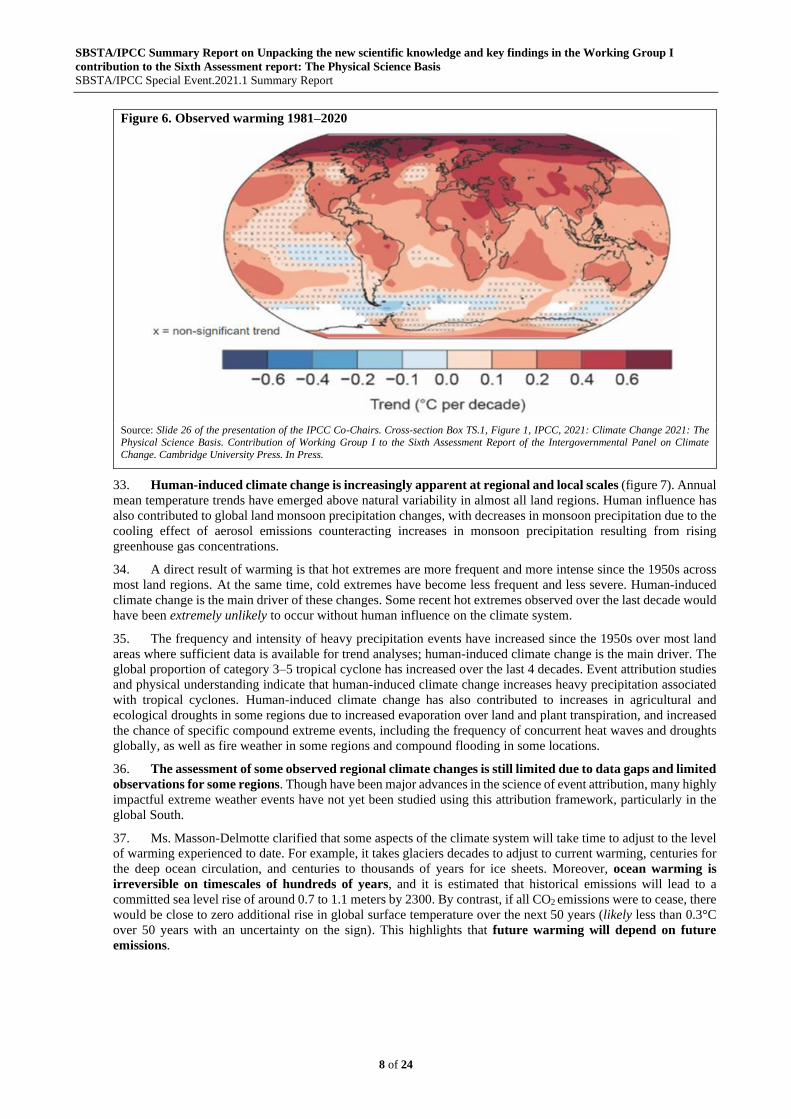
2. Possible climate futures 10
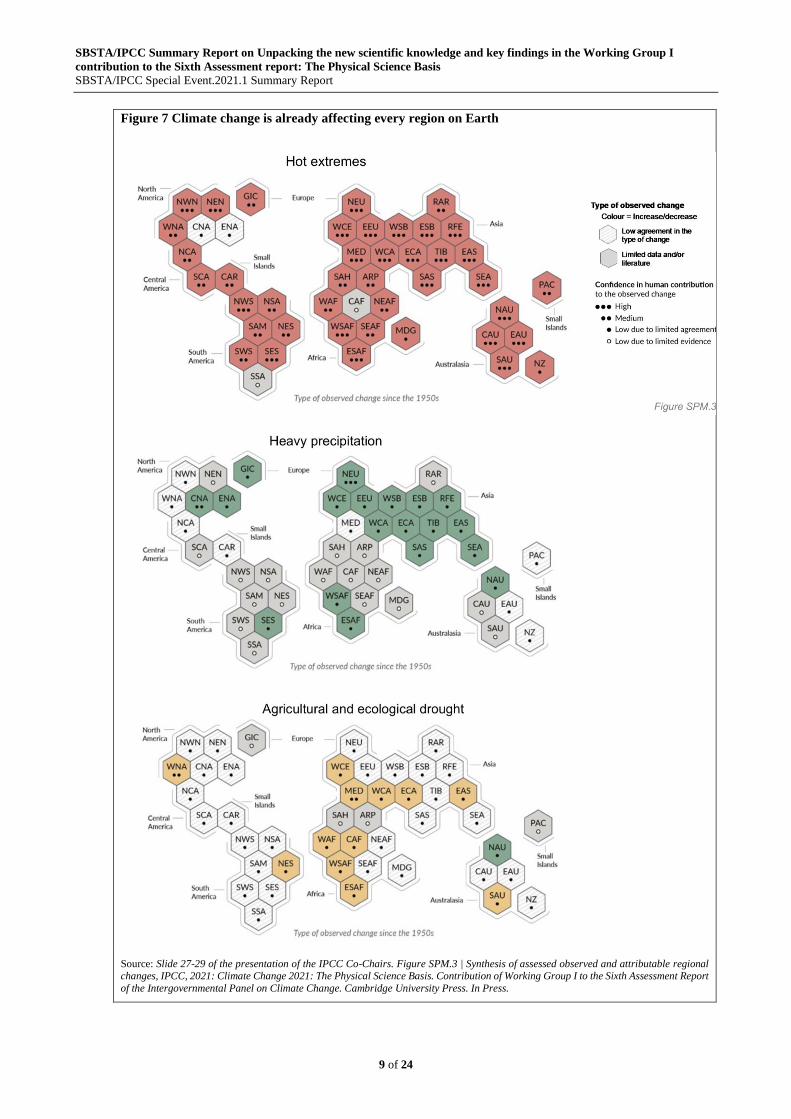
Summary of the Q&A session for theme 2 13
3. Climate information for risk and adaptation 14
Summary of the Q&A session for theme 3 18
4. Limiting climate change 19
Summary of the Q&A session for theme 4 22 C. Summary of the general discussion and interventions from Parties ........................ 24
D. Closing remarks ...................................................................................................... 24
SBSTA/IPCC Summary Report on Unpacking the new scientific knowledge and key findings in the Working Group I
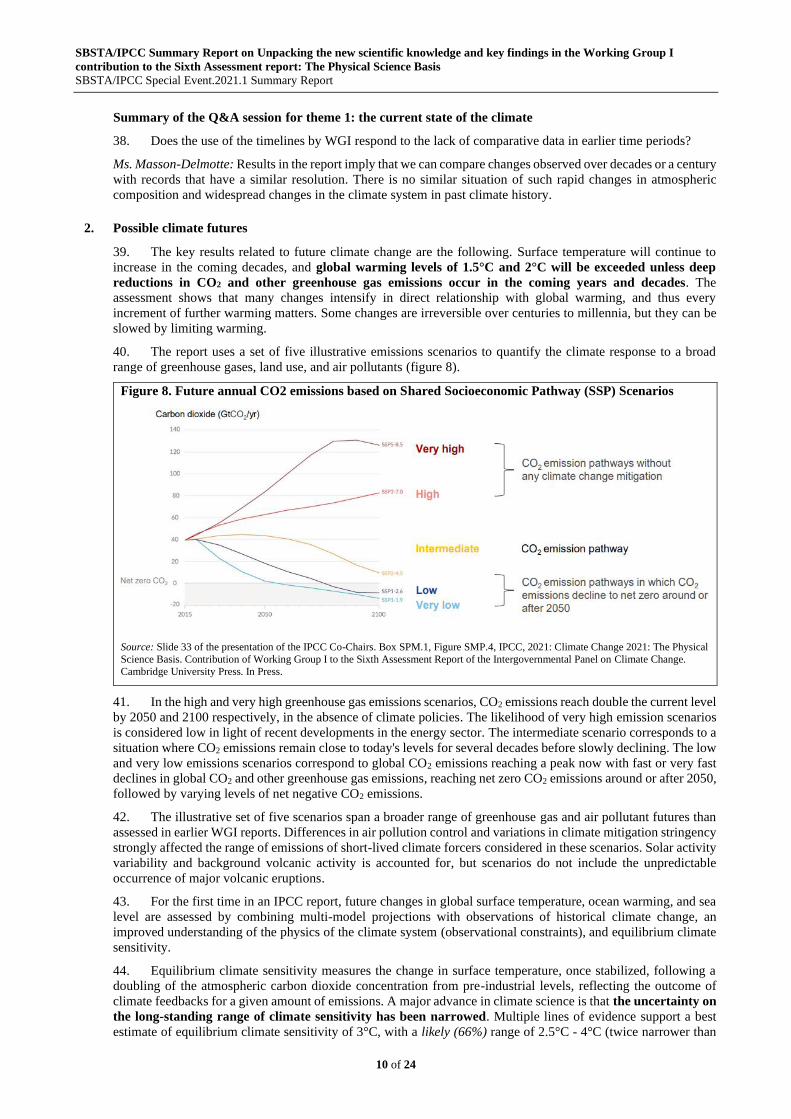
contribution to the Sixth Assessment report: The Physical Science Basis
SBSTA/IPCC Special Event.2021.1 Summary Report
2 of 24
I. Introduction
A. Background
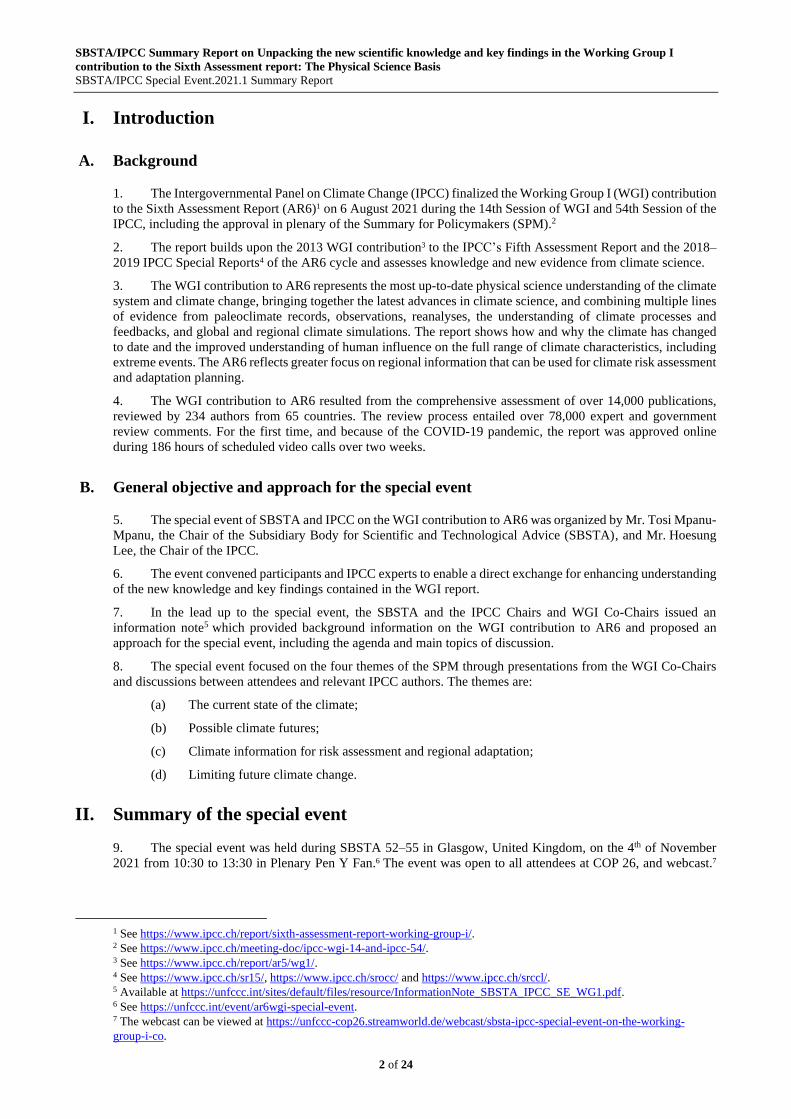
1. The Intergovernmental Panel on Climate Change (IPCC) finalized the Working Group I (WGI) contribution
to the Sixth Assessment Report (AR6)1 on 6 August 2021 during the 14th Session of WGI and 54th Session of the
IPCC, including the approval in plenary of the Summary for Policymakers (SPM).2
2. The report builds upon the 2013 WGI contribution3 to the IPCC’s Fifth Assessment Report and the 2018–
2019 IPCC Special Reports4 of the AR6 cycle and assesses knowledge and new evidence from climate science.
3. The WGI contribution to AR6 represents the most up-to-date physical science understanding of the climate
system and climate change, bringing together the latest advances in climate science, and combining multiple lines
of evidence from paleoclimate records, observations, reanalyses, the understanding of climate processes and
feedbacks, and global and regional climate simulations. The report shows how and why the climate has changed
to date and the improved understanding of human influence on the full range of climate characteristics, including
extreme events. The AR6 reflects greater focus on regional information that can be used for climate risk assessment
and adaptation planning.
4. The WGI contribution to AR6 resulted from the comprehensive assessment of over 14,000 publications,
reviewed by 234 authors from 65 countries. The review process entailed over 78,000 expert and government
review comments. For the first time, and because of the COVID-19 pandemic, the report was approved online
during 186 hours of scheduled video calls over two weeks.
B. General objective and approach for the special event
5. The special event of SBSTA and IPCC on the WGI contribution to AR6 was organized by Mr. Tosi Mpanu-
Mpanu, the Chair of the Subsidiary Body for Scientific and Technological Advice (SBSTA), and Mr. Hoesung
Lee, the Chair of the IPCC.
6. The event convened participants and IPCC experts to enable a direct exchange for enhancing understanding
of the new knowledge and key findings contained in the WGI report.
7. In the lead up to the special event, the SBSTA and the IPCC Chairs and WGI Co-Chairs issued an
information note5 which provided background information on the WGI contribution to AR6 and proposed an
approach for the special event, including the agenda and main topics of discussion.
8. The special event focused on the four themes of the SPM through presentations from the WGI Co-Chairs
and discussions between attendees and relevant IPCC authors. The themes are:
(a) The current state of the climate;
(b) Possible climate futures;
(c) Climate information for risk assessment and regional adaptation;
(d) Limiting future climate change.
II. Summary of the special event
9. The special event was held during SBSTA 52–55 in Glasgow, United Kingdom, on the 4th of November
2021 from 10:30 to 13:30 in Plenary Pen Y Fan.6 The event was open to all attendees at COP 26, and webcast.7
1 See https://www.ipcc.ch/report/sixth-assessment-report-working-group-i/.
2 See https://www.ipcc.ch/meeting-doc/ipcc-wgi-14-and-ipcc-54/.
3 See https://www.ipcc.ch/report/ar5/wg1/.
4 See https://www.ipcc.ch/sr15/, https://www.ipcc.ch/srocc/ and https://www.ipcc.ch/srccl/.
5 Available at https://unfccc.int/sites/default/files/resource/InformationNote_SBSTA_IPCC_SE_WG1.pdf.
6 See https://unfccc.int/event/ar6wgi-special-event.
7 The webcast can be viewed at https://unfccc-cop26.streamworld.de/webcast/sbsta-ipcc-special-event-on-the-working-
group-i-co.

SBSTA/IPCC Summary Report on Unpacking the new scientific knowledge and key findings in the Working Group I
contribution to the Sixth Assessment report: The Physical Science Basis
SBSTA/IPCC Special Event.2021.1 Summary Report
3 of 24
The event was opened by Mr. Mpanu-Mpanu, and Mr. Lee. Mr. Kakhaberi Divani, SBSTA Vice-Chair, and
Mr. Lee jointly chaired the event after the opening.
A. Opening
10. Mr. Mpanu-Mpanu, and Mr. Lee, welcomed all participants to the special event and provided opening
remarks.
11. During his intervention, Mr. Mpanu-Mpanu showed his appreciation to the IPCC WGI Co-Chairs
Ms. Valerie Masson-Delmotte and Mr. Panmao Zhai, as well as to the IPCC authors present on the day.
Mr. Mpanu-Mpanu highlighted the relevance of the WGI contribution to the AR6 in creating awareness of the
urgency of climate action and in providing the best available science to identify and measure the consequences of
climate change. Mr. Mpanu-Mpanu also emphasized that the report signals that limiting global warming to 1.5°C
is still possible if we collectively achieve deep and rapid emission reductions. Finally, Mr. Mpanu-Mpanu stressed
the importance of science in informing the UNFCCC process and, in particular, the negotiations and activities at
COP 26.
12. In his opening remarks, Mr. Lee highlighted that the WGI contribution to the AR6 is the latest of several
important reports, such as the IPCC special reports on Global Warming of 1.5°C, on Climate Change and Land,
and on the Ocean and Cryosphere in a Changing Climate, among others. The WGI report contains the most up-to-
date physical science on the understanding of the climate system and climate change.
13. The WGI contribution to the AR6 report is dedicated to Sir John Houghton, former chair and co-chair of
WGI. Mr. Lee congratulated two eminent climate scientists and IPCC authors, Mr. Syukuro Manabe and Mr. Klaus
Hasselmann, for having been awarded the Nobel Prize in Physics.
14. The second and third instalments of the Sixth Assessment Report by WGII and WGIII respectively will be
released next year and will focus on the latest scientific knowledge on the impacts of climate change, adaptation,
and mitigation. The AR6 Synthesis Report is planned to be released in September of 2022.
15. The WGI contribution to the AR6 reflects the magnitude of the challenge posed by climate change. Mr.
Lee outlined some of the key findings of the report, including the indisputability of the attribution of climate
change to human influence, the fact that climate change is impacting every region on Earth in multiple ways, the
irreversibility of many of these changes, and the need for strong, rapid, and sustained reductions in carbon dioxide
, methane, and other greenhouse gases to limit global warming.
16. Mr. Lee emphasised that there have been major advances in climate science globally since the previous
IPCC Assessment Report, including on observations, the understanding of processes in the climate system, and
global and regional modelling. It is critical that this knowledge is used for mitigation and adaptation strategies
around the world.
17. An introductory video on the WGI contribution to AR6 prepared by IPCC was shown to introduce the main
findings of each section of the report. The video included relevant information and figures, as well as interviews
with the WGI Co-Chairs and various authors.
B. Presentations by experts to unpack the new scientific knowledge and key findings8
1. The current state of the climate
18. Ms. Masson-Delmotte presented all four substantive themes as Mr. Zhai, was unfortunately unable to
connect directly to the meeting and only follow the streaming of the session.
19. The WGI report’s new structure reflects major advances in climate science, as well as the climate
information needs expressed by governments. In particular, it is designed to integrate all relevant lines of
evidence in each chapter and a third of the report is focused on regional climate information.
20. Recent advances in climate science have resulted from progress in the furthering of multiple lines of
evidence and their integration – progress on in-situ and remote observations, insights from natural archives and
past climates, reanalysis products, global and regional climate model advances, and understanding climate drivers’
feedbacks and processes, together with new methods of analysis. This gives us a clearer picture of how the Earth's
climate is changing and how human activities affect it at global and regional scales, and allows us to conclude that
8 See https://unfccc.int/sites/default/files/resource/slides_SBSTA_MASTER.pdf.

SBSTA/IPCC Summary Report on Unpacking the new scientific knowledge and key findings in the Working Group I
contribution to the Sixth Assessment report: The Physical Science Basis
SBSTA/IPCC Special Event.2021.1 Summary Report
4 of 24
recent changes in the climate are widespread, rapid and intensifying, with magnitudes and scales
unprecedented in thousands of years. Human influence on the climate is now unequivocal. Climate change
is already affecting every region on Earth in multiple ways, making extreme climate events including heat
waves, heavy rainfall and droughts more frequent and severe.
21. The average annual emissions of carbon dioxide, methane and nitrous oxide have reached the highest
recorded levels in human history during the last decade (figure 1). Observed increases in well-mixed greenhouse
gas concentrations since around 1750 are unequivocally caused by human activities.
The rise in carbon dioxide is primarily driven by emissions from fossil fuels, as well as land use change. The
uptake by land corresponds to around 31% of annual emissions, and the uptake by the ocean to around 23%. A
direct consequence of carbon dioxide emissions is ocean acidification, which is now evident globally and spreading
deeper into the ocean. The atmospheric methane concentration has risen rapidly over the last decade, largely driven
by emissions from fossil fuels and livestock. The concentration of nitrous oxide has continued to rise due to
emissions from nitrogen fertilizers, manure and fossil fuels.
Figure 1. Atmospheric concentrations of CO2, CH4 and N2O
Source: Slide 14 of the presentation of the IPCC Co-Chairs. Figure 5.4, IPCC, 2021: Climate Change 2021: The Physical Science
Basis. Contribution of Working Group I to the Sixth Assessment Report of the Intergovernmental Panel on Climate Change. Cambridge
University Press. In Press.
22. The rate of increase of the concentration of carbon dioxide in the atmosphere since 1900 is several times
higher than any known past change in Earth's history and is unprecedented in more than two million years, now at
47% above pre-industrial levels, (figure 2). The concentration of methane is now 156% above pre-industrial levels,
and nitrous oxide is 23% above pre-industrial levels. These gases trap heat, causing increased anthropogenic
radiative forcing and creating an imbalance of the Earth’s energy budget, leading to the heating of the climate
system.
23. Human-caused radiative forcing is now around 20% higher than estimated in the previous 2013 WGI report,
reaching 2.7 W/m2. Human-caused radiative forcing has increased faster in the last decade than in previous periods
due to increased greenhouse-gas concentrations and a reduced cooling effect from pollution particles (aerosols)
overall, with contrasting regional patterns. Variations in solar activity have a small effect at the global scale.

SBSTA/IPCC Summary Report on Unpacking the new scientific knowledge and key findings in the Working Group I
contribution to the Sixth Assessment report: The Physical Science Basis
SBSTA/IPCC Special Event.2021.1 Summary Report
5 of 24
Episodic major volcanic eruptions have a temporary cooling effect and it is likely that at least one large volcanic
eruption will occur in this century.
Figure 2. Changes in radiative forcing
Source: Slide 16 of the presentation of the IPCC Co-Chairs. Figure 2.10, IPCC, 2021: Climate Change 2021: The Physical Science Basis. Contribution of Working Group I to the Sixth Assessment Report of the Intergovernmental Panel on Climate Change. Cambridge
University Press. In Press.
24. Our understanding of the changes in the Earth's energy budget has increased since the previous WGI report,
from the radiative forcing driving the change, to where the heat goes. The warming of the atmosphere represents
1% of the excess heat accumulating in the climate system. 3% of that heat results in the loss of ice and 5% in soil
warming. Around 91% corresponds to the ocean heat uptake from the surface into the deep ocean.
25. Recent changes in the climate are widespread, rapid, and intensifying. Major changes in the climate system
highlighted by Ms. Masson-Delmotte are (figure 3):
• The atmosphere is warming and getting wetter, with shifts in large-scale atmospheric circulation , with a
widening and strengthening of the Hadley circulation, in the tropics, and a poleward shift of extratropical
storm tracks.
• In the cryosphere, widespread loss of snow and ice has been observed, including a decrease in Arctic sea
ice area and thickness, permafrost warming and thaw, a global retreat of glaciers, and loss of ice from
Greenland due to increased surface melting and from sectors in Antarctica due to increased melt under
ice shelves.
• The ocean is warming and experiencing more frequent marine heatwaves. It is changing in multiple ways,
including increasing salinity contrasts, increased upper ocean acidification, and loss of oxygen. As a
result, the geographic range of marine organisms has shifted. Sea level is rising at an accelerating rate,
now reaching 3.7 millimetres per year.
• Over land surface air temperatures are rising faster than the global average. Climatic zones are shifting
poleward. The growing season length in much of the Northern Hemisphere extratropics has increased.
• The majority of land area has experienced decreases in available water during dry seasons due to
increased evaporation and plant transpiration in a warmer climate. The spring snow cover has decreased,
affecting streamflows. This has resulted in a shift in the distribution of many land species, as well as
increases in species turnover in many land ecosystems.
26. Ms. Masson-Delmotte emphasised that, taken together, these observed changes provide a coherent picture
of a warming world, and that many of these changes are unprecedented. The surface ocean is warming more
quickly than in the previous 11,000 years. Sea level rise is unprecedented in more than 3,000 years. The uptake
of heat in the ocean is unprecedented since the last glacial period. The observed degree of ocean acidification is
unusual in the last 2 million years. Summer Arctic sea ice area is at its lowest level in at least 1,000 years, and the
retreat of glaciers on a global scale is unprecedented in at least 2000 years.

SBSTA/IPCC Summary Report on Unpacking the new scientific knowledge and key findings in the Working Group I
contribution to the Sixth Assessment report: The Physical Science Basis
SBSTA/IPCC Special Event.2021.1 Summary Report
6 of 24
Figure 3. Global changes
Source: Slide 18 of the presentation of the IPCC Co-Chairs. Figure FAQ2.2, IPCC, 2021: Climate Change 2021: The Physical Science
Basis. Contribution of Working Group I to the Sixth Assessment Report of the Intergovernmental Panel on Climate Change. Cambridge
University Press. In Press.
27. A key indicator of the state of climate, the global surface temperature in the last decade was 1.1°C higher
than in 1850–1900, and this warming rate is unprecedented in the last 2,000 years (figure 4). Each of the last four
decades have been successively warmer than any decade that preceded it since 1850. Our estimate of warming
today is about 0.25°C higher than the reported value in the previous WGI report (in 2013). This difference is due
to new and updated data sets and methods, though is mainly due to further warming recorded from 2003 to 2012
(around +0.2°C).
Figure 4. Changes in global surface temperature relative to 1850–1900
Source: Slide 21 of the presentation of the IPCC Co-Chairs. Figure SPM.1, IPCC, 2021: Climate Change 2021: The Physical Science Basis. Contribution of Working Group I to the Sixth Assessment Report of the Intergovernmental Panel on Climate Change. Cambridge
University Press. In Press.
SBSTA/IPCC Summary Report on Unpacking the new scientific knowledge and key findings in the Working Group I
contribution to the Sixth Assessment report: The Physical Science Basis
SBSTA/IPCC Special Event.2021.1 Summary Report
7 of 24
28. The best estimate is that all of the observed warming since 1850-1900 (used as a proxi for pre-industrial
times) results from the consequences of human activities, with greenhouse gas warming partly masked by
aerosol cooling. Natural factors such as solar and volcanic activity, and internal climate variability have been
taken into account. While natural variability of the climate system modulates changes in anthropogenic changes
at regional and decadal scales, it has little effect on global warming at the centennial scale.
29. Two complementary approaches were used to assess human influence on observed global surface
temperature changes, one from attribution studies – comparing simulations with and without human influence with
the observed change, and another one based on radiative forcing and climate sensitivity studies. Both approaches
are in agreement. The report reflects an improved understanding of the role of each individual component of human
influence, including emissions of greenhouse gases, aerosols and their precursors, land use changes, and aviation
constraints (figure 5).
Figure 5. Role of each individual component of human influence
Source: Slide 23 of the presentation of the IPCC Co-Chairs. Figure SPM.2, IPCC, 2021: Climate Change 2021: The Physical Science Basis. Contribution of Working Group I to the Sixth Assessment Report of the Intergovernmental Panel on Climate Change. Cambridge
University Press. In Press.
30. The two main drivers of warming to date are emissions of carbon dioxide and methane. Methane
warms the atmosphere both directly, as a greenhouse gas, and by affecting the formation of surface ozone, a
greenhouse gas and pollutant, causing additional warming effect and affecting air quality.
31. Human influence on the climate system is unequivocal. Combining the evidence from across the climate
system gives greater confidence in the attribution of observed climate change to human influence. Human
influence is assessed to be the main driver of atmosphere, ocean and land warming, ocean acidification, loss of
Arctic sea ice and spring snow cover, the global retreat of glaciers, and Greenland ice sheet mass loss, and sea
level rise. It has also contributed to the pattern of observed precipitation and surface ocean salinity changes, and
the observed loss of oxygen in the ocean.
32. Warming has occurred at a faster rate after the 1970s compared to the first half of the 20th century, with
regional variations. Warming is stronger over land than the ocean, and is strongest in the Arctic (figure 6).
SBSTA/IPCC Summary Report on Unpacking the new scientific knowledge and key findings in the Working Group I
contribution to the Sixth Assessment report: The Physical Science Basis
SBSTA/IPCC Special Event.2021.1 Summary Report
8 of 24
Figure 6. Observed warming 1981–2020
Source: Slide 26 of the presentation of the IPCC Co-Chairs. Cross-section Box TS.1, Figure 1, IPCC, 2021: Climate Change 2021: The
Physical Science Basis. Contribution of Working Group I to the Sixth Assessment Report of the Intergovernmental Panel on Climate
Change. Cambridge University Press. In Press.
33. Human-induced climate change is increasingly apparent at regional and local scales (figure 7). Annual
mean temperature trends have emerged above natural variability in almost all land regions. Human influence has
also contributed to global land monsoon precipitation changes, with decreases in monsoon precipitation due to the
cooling effect of aerosol emissions counteracting increases in monsoon precipitation resulting from rising
greenhouse gas concentrations.
34. A direct result of warming is that hot extremes are more frequent and more intense since the 1950s across
most land regions. At the same time, cold extremes have become less frequent and less severe. Human-induced
climate change is the main driver of these changes. Some recent hot extremes observed over the last decade would
have been extremely unlikely to occur without human influence on the climate system.
35. The frequency and intensity of heavy precipitation events have increased since the 1950s over most land
areas where sufficient data is available for trend analyses; human-induced climate change is the main driver. The
global proportion of category 3–5 tropical cyclone has increased over the last 4 decades. Event attribution studies
and physical understanding indicate that human-induced climate change increases heavy precipitation associated
with tropical cyclones. Human-induced climate change has also contributed to increases in agricultural and
ecological droughts in some regions due to increased evaporation over land and plant transpiration, and increased
the chance of specific compound extreme events, including the frequency of concurrent heat waves and droughts
globally, as well as fire weather in some regions and compound flooding in some locations.
36. The assessment of some observed regional climate changes is still limited due to data gaps and limited
observations for some regions. Though have been major advances in the science of event attribution, many highly
impactful extreme weather events have not yet been studied using this attribution framework, particularly in the
global South.
37. Ms. Masson-Delmotte clarified that some aspects of the climate system will take time to adjust to the level
of warming experienced to date. For example, it takes glaciers decades to adjust to current warming, centuries for
the deep ocean circulation, and centuries to thousands of years for ice sheets. Moreover, ocean warming is
irreversible on timescales of hundreds of years, and it is estimated that historical emissions will lead to a
committed sea level rise of around 0.7 to 1.1 meters by 2300. By contrast, if all CO2 emissions were to cease, there
would be close to zero additional rise in global surface temperature over the next 50 years (likely less than 0.3°C
over 50 years with an uncertainty on the sign). This highlights that future warming will depend on future
emissions.
SBSTA/IPCC Summary Report on Unpacking the new scientific knowledge and key findings in the Working Group I
contribution to the Sixth Assessment report: The Physical Science Basis
SBSTA/IPCC Special Event.2021.1 Summary Report
9 of 24
Figure 7 Climate change is already affecting every region on Earth
Source: Slide 27-29 of the presentation of the IPCC Co-Chairs. Figure SPM.3 | Synthesis of assessed observed and attributable regional changes, IPCC, 2021: Climate Change 2021: The Physical Science Basis. Contribution of Working Group I to the Sixth Assessment Report
of the Intergovernmental Panel on Climate Change. Cambridge University Press. In Press.
SBSTA/IPCC Summary Report on Unpacking the new scientific knowledge and key findings in the Working Group I
contribution to the Sixth Assessment report: The Physical Science Basis
SBSTA/IPCC Special Event.2021.1 Summary Report
10 of 24
Summary of the Q&A session for theme 1: the current state of the climate
38. Does the use of the timelines by WGI respond to the lack of comparative data in earlier time periods?
Ms. Masson-Delmotte: Results in the report imply that we can compare changes observed over decades or a century
with records that have a similar resolution. There is no similar situation of such rapid changes in atmospheric
composition and widespread changes in the climate system in past climate history.
2. Possible climate futures
39. The key results related to future climate change are the following. Surface temperature will continue to
increase in the coming decades, and global warming levels of 1.5°C and 2°C will be exceeded unless deep
reductions in CO2 and other greenhouse gas emissions occur in the coming years and decades. The
assessment shows that many changes intensify in direct relationship with global warming, and thus every
increment of further warming matters. Some changes are irreversible over centuries to millennia, but they can be
slowed by limiting warming.
40. The report uses a set of five illustrative emissions scenarios to quantify the climate response to a broad
range of greenhouse gases, land use, and air pollutants (figure 8).
Figure 8. Future annual CO2 emissions based on Shared Socioeconomic Pathway (SSP) Scenarios
Source: Slide 33 of the presentation of the IPCC Co-Chairs. Box SPM.1, Figure SMP.4, IPCC, 2021: Climate Change 2021: The Physical
Science Basis. Contribution of Working Group I to the Sixth Assessment Report of the Intergovernmental Panel on Climate Change.
Cambridge University Press. In Press.
41. In the high and very high greenhouse gas emissions scenarios, CO2 emissions reach double the current level
by 2050 and 2100 respectively, in the absence of climate policies. The likelihood of very high emission scenarios
is considered low in light of recent developments in the energy sector. The intermediate scenario corresponds to a
situation where CO2 emissions remain close to today's levels for several decades before slowly declining. The low
and very low emissions scenarios correspond to global CO2 emissions reaching a peak now with fast or very fast
declines in global CO2 and other greenhouse gas emissions, reaching net zero CO2 emissions around or after 2050,
followed by varying levels of net negative CO2 emissions.
42. The illustrative set of five scenarios span a broader range of greenhouse gas and air pollutant futures than
assessed in earlier WGI reports. Differences in air pollution control and variations in climate mitigation stringency
strongly affected the range of emissions of short-lived climate forcers considered in these scenarios. Solar activity
variability and background volcanic activity is accounted for, but scenarios do not include the unpredictable
occurrence of major volcanic eruptions.
43. For the first time in an IPCC report, future changes in global surface temperature, ocean warming, and sea
level are assessed by combining multi-model projections with observations of historical climate change, an
improved understanding of the physics of the climate system (observational constraints), and equilibrium climate
sensitivity.
44. Equilibrium climate sensitivity measures the change in surface temperature, once stabilized, following a
doubling of the atmospheric carbon dioxide concentration from pre-industrial levels, reflecting the outcome of
climate feedbacks for a given amount of emissions. A major advance in climate science is that the uncertainty on
the long-standing range of climate sensitivity has been narrowed. Multiple lines of evidence support a best
estimate of equilibrium climate sensitivity of 3°C, with a likely (66%) range of 2.5°C - 4°C (twice narrower than

SBSTA/IPCC Summary Report on Unpacking the new scientific knowledge and key findings in the Working Group I
contribution to the Sixth Assessment report: The Physical Science Basis
SBSTA/IPCC Special Event.2021.1 Summary Report
11 of 24
the range assessed in 2013) and a very likely (90%) range of 2 to 5°C. This enables an improved estimate of the
projected future range of global warming resulting from a specific scenario and a given level of emissions.
45. Based on the five illustrative scenarios, the current best estimate indicates that the 20-year average of global
surface temperature will reach 1.5°C in the period 2021 to 2040. This implies that by the 2030s, every single
year will have a 50% chance of having an annual global surface temperature above 1.5°C (figure 9).
Figure 9. Global surface temperature change under the SSP Scenarios
Source: Slide 36 of the presentation of the IPCC Co-Chairs. SPM.8, IPCC, 2021: Climate Change 2021: The Physical Science Basis. Contribution of Working Group I to the Sixth Assessment Report of the Intergovernmental Panel on Climate Change. Cambridge
University Press. In Press.
46. Global warming of 1.5°C and 2°C will be exceeded during this century unless deep reductions in CO2 and
other greenhouse gas emissions occur in the coming decades, as reflected in the low and very low emissions
scenarios. The last time global surface temperature was sustained at or above 2.5°C higher than pre-industrial
levels was over 3 million years ago. Global surface temperature is already more likely than not warmer than any
multi-centennial period of the past 100,000 years due to human influence.
47. Every additional increment of global warming matters, because many changes in the climate system such
as regional changes in mean temperature, precipitation and soil moisture increase in direct relation to increasing
global warming. Temperature changes will continue to be amplified over land areas and in the Arctic, compared
to the global average (figure 10)
48. With every increment of global warming, annual mean precipitation is projected to increase over high
latitudes, the equatorial Pacific, and parts of monsoon regions but decrease over parts of the subtropics and some
areas in the tropics. Changes in precipitation lead to changes in annual mean soil moisture, together with the
increased evapotranspiration related to a warmer atmosphere. Soil moisture is therefore projected to decrease with
every increment of global warming in semi-arid, winter rainfall dominated areas. Note that relatively small
absolute changes in regions with dry baseline conditions (eg. the Sahara) appear as large percentage changes in
Figure 9, while the corresponding amount of precipitation increase is small.
49. Continued global warming is projected to further intensify the global water cycle, its variability, global
monsoon precipitation, and the severity of wet and dry events. Precipitation and surface water flows are projected
to become more variable over most land regions, both within seasons and from year to year. The earlier onset of
spring snowmelt will lead to higher peak flows and reduced summer flows in snow-dominated regions. A warmer
climate will both intensify very wet and very dry weather and climate events and seasons, with implications
to flooding or drought, depending on changes in regional atmospheric circulation.
50. Monsoon precipitation is projected to increase in the mid- to long term, particularly over Asia and West
Africa, apart from the far west Sahel. The onset of the monsoon season is projected to be delayed in North and
South America and the monsoon is projected to have a delayed ending over West Africa.
51. There will be further changes in extremes with every additional increment of global warming. Every
additional half a degree of global warming causes clearly discernible increases in the intensity and frequency
of hot extremes, including heat waves, and heavy precipitation, as well as agricultural and ecological droughts in
some regions. Regional changes in meteorological and hydrological droughts are also expected. The frequency of
marine heatwaves will continue to increase, with the largest changes in the tropical and Arctic ocean.

SBSTA/IPCC Summary Report on Unpacking the new scientific knowledge and key findings in the Working Group I
contribution to the Sixth Assessment report: The Physical Science Basis
SBSTA/IPCC Special Event.2021.1 Summary Report
12 of 24
52. Extreme heavy precipitation events will intensify globally by about 7% for each degree of global warming
and will become more frequent. The proportion of tropical cyclones categorized as intense, categories 4–5, are
projected to increase with increasing global warming.
Figure 10. Changes in annual mean temperature, precipitation and soil moisture
Source: Slide 39 and 40 of the presentation of the IPCC Co-Chairs. SPM.5, IPCC, 2021: Climate Change 2021: The Physical Science
Basis. Contribution of Working Group I to the Sixth Assessment Report of the Intergovernmental Panel on Climate Change. Cambridge
University Press. In Press.
53. Ms. Masson-Delmotte emphasized that with further warming, including of and beyond 1.5°C, we will
experience extreme events with larger magnitude, increased frequency, affecting new locations, and occurring
with different timing, and new combinations of extreme events.
54. Many other changes in the climate system become larger in direct relation to increasing warming, in
particular for the fast responding components of the cryosphere. Additional warming is projected to further amplify
permafrost thaw, loss of seasonal snow cover and loss of Arctic sea ice. The Arctic is likely to be practically
sea-ice free in September at least once before 2050 under the five scenarios considered, with more frequent
occurrences for higher warming levels. Upper ocean acidification and loss of oxygen will continue to increase in
the coming decades, at rates dependent on future emissions.
55. The slow components of the climate system (deep ocean, glaciers, ice sheets) will continue to adjust on
timescales of hundreds to thousands of years. Sea level is thus committed to rise for centuries to millennia due to
the continuing deep ocean warming and ice sheet melt and will remain elevated for thousands of years (figure 11). By 2050, sea level is committed to rise by 15 to 30 centimetres above present-day levels (likely range, 66%),
almost independently of future emissions scenarios. Beyond 2050, the rate and magnitude of sea level rise strongly
depend on choices regarding future greenhouse gas emissions.
56. By lowering emissions and limiting the level of future warming, there is an increased chance of avoiding
triggering irreversible instabilities in the ice sheets that could substantially increase sea level rise. The reported
projections only consider processes that are best understood, and the likely (66%) range. There is deep uncertainty
associated with specific processes related to ice sheet instability, in particular for the Antarctic ice sheet. For high
emissions and large warming levels, the possibility of a low likelihood outcome cannot be ruled out that rapid ice
sheet loss could lead to more than 1.5 metre of sea level rise by the end of the century.

SBSTA/IPCC Summary Report on Unpacking the new scientific knowledge and key findings in the Working Group I
contribution to the Sixth Assessment report: The Physical Science Basis
SBSTA/IPCC Special Event.2021.1 Summary Report
13 of 24
57. By 2300, a sea level rise would reach between 50 centimetres to three metres for a low greenhouse gas
emissions scenario, or between two to seven metres under the very high scenario. Ice sheet instability processes
increase potential sea-level rise by many metres more.
58. Over the next 2000 years, if peak warming is limited to 3°C, global mean sea level would rise by around 4
to 10 metres. If peak warming is limited to 2°C, this rise would be around 2 to 6 metres. The estimates of very
long term sea level rise are consistent with reconstructed sea levels during past warm geological periods.
59. Reducing greenhouse gas emissions limits the magnitude and the rate of sea level rise, allowing for more
time for coastal responses, including in situ adaptation and also relocation. For instance, a global mean sea level
of one meter above present day would be reached by the middle of the next century for the intermediate greenhouse
gas emissions scenario, but around 40 years later for a low greenhouse gas emission scenario.
Figure 11. Global mean sea level rise relative to 1900 (m)
Source: Slide 45 of the presentation of the IPCC Co-Chairs. SPM.8, IPCC, 2021: Climate Change 2021: The Physical Science Basis.
Contribution of Working Group I to the Sixth Assessment Report of the Intergovernmental Panel on Climate Change. Cambridge
University Press. In Press.
Summary of the Q&A session for theme 2: possible climate futures
60. The projections in this report align well to those in previous reports and to the subsequent observed changes
in the climate system. What has made consecutive generations of climate models perform so well?
Ms. Maisa Rojas: The IPCC reports uses different sets of models, in many cases based on scenarios elaborated by
the scientific community with calculations of radiative forcing. The results output by these models are compared
with the observed radiative forcing.
Ms. June-Yi Lee: Simulations of the climate from models underpinning this report have improved relative to the
previous generation, based on improved representation of physical, chemical and biological processes, as well as
increased resolution. Simulations are also used to better quantify internal variability of climate system, and these
are also more high-resolution models than previous generations, which better simulate regional features and
interaction between large-scale climate changes and regional climate variability. Only scenario-based climate
model projections were used in previous assessment cycles, but the AR6 considers additional information such as
on climate sensitivity.
61. Is there a risk that rapid and irreversible processes leading to catastrophic sea-level rise may be triggered at
2°C, and can such risk can be ruled out by limiting global warming to 1.5°C?
Helene Hewitt: The risk of widespread ice loss from the West Antarctic Ice Sheet cannot be ruled out, though there
is deep uncertainty associated with the Antarctic region. This is highlighted in the report as a low-likelihood, high-
impact outcome for future sea level rise to inform risk management. It is assessed that, between 1.5°C and 2°C,
there is limited evidence to suggest that the West Antarctic Ice Sheet will be lost almost completely. As 2°C is
approached or exceeded, the probability of the loss of the West Antarctic Ice Sheet increases. Reducing further
warming reduces the risk of the large contribution to sea-level rise that would be made by the loss of the West
Antarctic Ice Sheet.
62. A Party representative underlined that the SSPs were developed to be illustrative and non-exhaustive. The
development of alternative scenarios may be considered.

SBSTA/IPCC Summary Report on Unpacking the new scientific knowledge and key findings in the Working Group I
contribution to the Sixth Assessment report: The Physical Science Basis
SBSTA/IPCC Special Event.2021.1 Summary Report
14 of 24
Ms. Valerie Masson-Delmotte: The climate projections assessed in this report build on the 5 illustrative scenarios,
which can also be used regarding exposure and vulnerability in impact studies assessed in WGII. The assessed
climate sensitivity is also used through emulators (simplified climate models) used across WGI and WGIII to
ensure consistency when assessing hundreds of climate trajectories and pathways available from the literature.
This ensures that the forthcoming Working Group III assessment is consistent with the climate responses assessed
by WGI.
3. Climate information for risk assessment and regional adaptation
63. The WGI report assesses the state of knowledge related to best practices to distil context-specific, robust
and actionable climate information. This includes the methodological process to construct and synthesize climate
information and the co-production required for this information to inform action in an interactive process involving
multiple stakeholders. Knowledge of the climate response to the interplay between human influence and natural
variability, and the range of possible outcomes, including low-likelihood, high impact outcomes, informs climate
services- the assessment of climate-related risks and adaptation planning.
64. Natural variability can temporarily amplify or mask human-caused climate changes, especially on
regional and decadal scales. Every region will increasingly experience a specific combination of multiple
concurrent changes. Low-likelihood outcomes cannot be ruled out and are part of risk assessment. Reducing
greenhouse gas emissions will decrease the frequency, duration and number of regions where extremes reach
critical thresholds for health and agriculture.
65. Natural drivers and internal variability will modulate human caused changes, especially at regional scales
and in the near term, with little effect on centennial global warming. These modulations are important to consider
in planning for the full range of possible changes. For example, natural variability will modulate the rate of
warming by either enhancing or masking underlying human-caused long-term changes (figure 12). These aspects
are important to consider in planning for the full range of possible future changes.
Figure 12. Natural variability can affect near term climate changes
Source: Slide 53 of the presentation of the IPCC Co-Chairs. Figure 1.13, IPCC, 2021: Climate Change 2021: The Physical Science Basis. Contribution of Working Group I to the Sixth Assessment Report of the Intergovernmental Panel on Climate Change. Cambridge
University Press. In Press.
66. The role of internal variability is illustrated by large ensembles of climate simulations. It has little influence
on the Earth's energy budget, and all long-term trends in ocean heat content are very similar. However, despite the
continuing increase in the Earth’s energy imbalance, there can be 10-year periods where the long-term trend of
increasing global surface temperature change is masked or amplified at the global scale, and this effect is even
stronger at seasonal and regional scales. While the direction of future climate change is clear for global warming
in the coming decades, these variations are important to consider in adaptation strategies.
67. Also, based on paleoclimate and historical evidence, it is likely that at least one large explosive volcanic
eruption will occur during the 21st century. Such an eruption would temporarily reduce global surface temperature
and precipitation, especially over land, with a typical timescale of one to three years. It would also alter the global
monsoon circulation and modify extreme precipitation. A sequence of several large explosive volcanic eruptions
within decades have occurred in the past, causing substantial global and regional climate perturbations over

SBSTA/IPCC Summary Report on Unpacking the new scientific knowledge and key findings in the Working Group I
contribution to the Sixth Assessment report: The Physical Science Basis
SBSTA/IPCC Special Event.2021.1 Summary Report
15 of 24
decades. Such events cannot be ruled out in the future. Due to their inherent unpredictability, they are not included
in the illustrative set of scenarios referred to in this report but can be considered as part of low-likelihood, but
potentially high-impact temporary outcomes.
68. Low-likelihood, high-impact outcomes describe events whose probability of occurrence is low or not
well known, as in the context of deep uncertainty, but whose potential impact on society and ecosystems
could be high, and therefore relevant for a comprehensive risk assessment. Such outcomes include high-
warming storylines, if the response of the climate system exceeds the assessed very likely range of climate
sensitivity, leading to greater changes in regional water cycle changes. Another aspect is related to high-end sea
level rise, if ice sheet instabilities are triggered. Other examples are related to the Atlantic Meridional Overturning
Circulation. While there is medium confidence that its projected decline will not involve an abrupt collapse before
2100, such a collapse might be triggered by an unexpected meltwater influx from the Greenland ice sheet. If such
a collapse were to occur, it would result in abrupt shifts in weather patterns and affect tropical precipitation patterns
and monsoons.
69. Regional climate information is the focus of several chapters and a third of the WGI contribution to
AR6.
70. The Interactive Atlas9 is a novel element of the report, enabling users to explore observational products,
climate data and global and regional model data, for different variables, indices, regions, for different scenarios,
time horizons, and global warming levels. It also includes the synthesis of future changes of different climatic
impact drivers across regions.
71. The report uses sub-continental regions, defined by their regional climate features, considering the
representativeness of model results (figure 13). Information is also available for eleven ocean regions and specific
regions for small islands or land monsoon regions, major river basins and mountain regions. On the report’s
webpage, there are two-page summary factsheets at the continental scale for the different continents.
Figure 13. Regions as used in the WGI report
Source: Slide 54 of the presentation of the IPCC Co-Chairs. IPCC, 2021: Climate Change 2021: The Physical Science Basis. Contribution of Working Group I to the Sixth Assessment Report of the Intergovernmental Panel on Climate Change. Cambridge University Press. In
Press.
72. Ms. Masson-Delmotte highlighted that the WGI report uses a novel framework of thirty-three climatic
impact-drivers. These are physical climate system conditions such as means, events, and extremes that affect an
element of society or ecosystems, acting as priority climate information. These climatic impact-drivers and their
changes can be detrimental, beneficial, neutral or a mixture of each. The drivers are categorized into seven broad
types: heat and cold, rain and drought, wind, snow and ice, coastal, open ocean, and other.
73. Climatic impact-drivers can be measured by indices to represent related tolerance threshold. For instance,
an index of daily maximum temperature of 35°C is considered critical for maize production, or an index of humid
heat inducing human health stress is associated with a heat index above 41°C. Human-induced climate change has
already altered the profiles of these climatic impact-drivers and resulted in shifting the magnitude, frequency,
duration, seasonality and spatial extent of associated indices.
9 Available at https://interactive-atlas.ipcc.ch/.

SBSTA/IPCC Summary Report on Unpacking the new scientific knowledge and key findings in the Working Group I
contribution to the Sixth Assessment report: The Physical Science Basis
SBSTA/IPCC Special Event.2021.1 Summary Report
16 of 24
74. With every further increment of warming, every region will increasingly experience a combination
of multiple changes.
75. With further global warming, every region is projected to increasingly experience concurrent and multiple
changes in climatic impact-drivers (Figure 14). Changes in several climatic impact-drivers will be more
widespread at 2°C compared to 1.5°C of global warming, and even more widespread or pronounced for higher
warming levels. All regions are projected to experience changes in at least five of these climatic impact-drivers.
For 96% of regions, it would be at least ten of them. And for half of the of the regions, at least fifteen climatic
impact-drivers would change.
76. Worldwide changes in heat, cold, snow and ice, coastal and oceanic climatic impact-drivers will continue
over the 21st century. Changes related to the water cycle have a more region-specific distribution. The coastal
climatic impact drivers include relative sea level, coastal floods, coastal erosion, marine heatwaves and ocean
acidification. The majority of coastal locations have a medium projection of regional sea level rise within 20% of
the global mean sea level increase. The assessed global mean sea level projections can be visualised alongside tide
gauge observations using the NASA sea-level projection tool,10 that has been developed in collaboration with
WGI. Almost every coastal region will increasingly experience concurrent and multiple changes in coastal climate
impact-drivers, escalating with further greenhouse gas emissions. Marine heat waves will continue to increase in
frequency with further warming. Regional sea level rise contributes to increases in the frequency and intensity
of coastal flooding in low-lying areas and to coastal erosion along most sandy coasts.
77. By 2050, it is estimated that once-per-century extreme sea level events will occur globally 20 to 30
times more frequently. At 20% to 30% of locations with tide gauges extreme events are projected to occur
annually or more frequently. By 2100, and warming limited to well below 2°C, events that occurred once per
century in the past would occur at least 160 times more frequently. They would occur at least annually at 60% of
tide gauge locations (80% in the case of 4°C warming).
78. The probability of compound flooding resulting from storm surges, extreme rainfall, or river flow will
continue to increase due to both sea level rise and increases in heavy precipitation, including changes in
precipitation intensity associated with tropical cyclones in a warming world.
79. All regions are projected to experience further increases in hot climatic impact drivers and decreases
in cold ones, intensifying with any further increment of warming. At 1.5°C of global warming, heavy
precipitation and associated flooding are projected to intensify and be more frequent in most regions in Africa and
Asia, North America and Europe. More frequent and /or severe agricultural, ecological, and meteorological
droughts are projected in a few regions; increases in meteorological droughts in a few regions. At 2°C of global
warming, the magnitude of changes increases for droughts, heavy precipitation and associated flooding events,
and mean precipitation compared to those at 1.5°C. Those are projected to become more intense and frequent in
the Pacific Islands, in some regions in Australia, and Central and South America. Mean precipitation is projected
to increase in all high latitude regions and most Asian regions. Several regions in Africa, South America, Europe,
Australasia, Central and North America, and the Caribbean, are projected to experience an increase in the
frequency and /or severity of agricultural and ecological droughts.
80. Fire weather conditions are projected to further increase with more warming. Regional changes in wind-
related climatic impact drivers include intensification of tropical cyclones and/or in extratropical storms.
81. Widespread permafrost thaw and loss of snow and ice is projected in all concerned regions, increasing with
any increment of warming. There is low confidence in most regions for potential future changes in hail and ice
storms.
82. Open ocean regions are projected to experience widespread warming, increased marine heatwaves, loss of
oxygen and increased contrast in surface salinity due to an intensified water cycle.
83. Strong reductions in greenhouse gas emissions would strongly limit the increase in the frequency of
extreme sea level events, heavy precipitation and pluvial flooding and exceedance of dangerous heat
thresholds are less likely to be exceeded while limiting the number of regions where such exceedances occur
relative to the consequences of increased emissions. would be limited.
10 Available at https://sealevel.nasa.gov/ipcc-ar6-sea-level-projection-tool.

SBSTA/IPCC Summary Report on Unpacking the new scientific knowledge and key findings in the Working Group I
contribution to the Sixth Assessment report: The Physical Science Basis
SBSTA/IPCC Special Event.2021.1 Summary Report
17 of 24
Figure 14. Climatic impact-drivers by 2050 compared to 1960-2014 (2°C global warming)
Source: Slide 59-64 of the presentation of the IPCC Co-Chairs. Figure SPM.9 | Synthesis of the number of AR6 WGI reference regions
where climatic impact-drivers are projected to change, IPCC, 2021: Climate Change 2021: The Physical Science Basis. Contribution of
Working Group I to the Sixth Assessment Report of the Intergovernmental Panel on Climate Change. Cambridge University Press. In Press.
SBSTA/IPCC Summary Report on Unpacking the new scientific knowledge and key findings in the Working Group I
contribution to the Sixth Assessment report: The Physical Science Basis
SBSTA/IPCC Special Event.2021.1 Summary Report
18 of 24
Summary of the Q&A session for theme 3: Climate information for risk and adaptation
84. How could the variability and uncertainty of projections impact current net-zero and climate action
policies? How does the IPCC address uncertainty in projections?
Ms. June-Yi Lee: The IPCC’s projections are probabilistic, and the IPCC uses the calibrated uncertainty language.
By using simulations from multiple models, IPCC tries to better estimate the uncertainty range.
Mr. Joeri Rogelj: Uncertainties are taken into account in the assessments of the requirements for net-zero. The
IPCC assessments include uncertainties, specifying the level of confidence for each finding, and also highlight the
robustustness of findings. Any uncertainties that remain are quantified and can inform how to respond to climate
change from a precautionary principle perspective.
85. Does the report contain long-term climate change projections for phenomena other sea level rise, such as
long-term changes in the cryosphere or long-term ocean circulation changes?
Ms. Helene Hewitt: Chapter Nine of the report looks at the long-term changes in sea level rise up to 2300, taking
into account an assessment of the changes in both the thermal expansion of the ocean and the loss of mass from
glaciers and from ice sheets.
86. The report assesses global mean temperature rise as well as global warming. What is the definition of global
warming used in the report?
Ms. Sonia Seneviratne and Mr. Joeri Rogelj: Global warming is defined as the increase in global surface
temperature compared to pre-industrial times (1850-1900). It is the long-term average with single-year variations
evened out. Global surface air temperature is used in climate model simulations.
87. Does the melting of glaciers in the Himalaya become irreversible under high emissions scenarios, and how
would staying below 1.5°C impact glacier melt?
Ms. Valerie Masson-Delmotte: A short synthesis can be found in the WGI fact sheets on mountains. They reflect
the assessment that greater glacier mass loss is likelier in higher greenhouse gas emissions scenarios. Furthermore,
rising temperature and precipitation in high-mountain Asia regions can increase the occurrence of glacial lake
outburst floods and landslides over dammed lakes.
88. Can more information on tipping points in the climate system at the global and regional levels, for example
in Africa, be provided?
Ms. June-Yi Lee: The WGI report assesses the abrupt responses and tipping points of the climate system, such as
increased Antarctic ice sheet melt. There is medium confidence that there will not be an abrupt collapse of the
Atlantic meridional overturning circulation before 2100. However, if such a collapse were to occur, it would very
likely cause an abrupt shift in regional weather patterns and water cycles, including changes in the African and
Asia monsoon systems.
89. Can the IPCC assist in ensuring that the information in the WGI report reaches the general population,
including areas with different levels of education?
Ms. Valerie Masson-Delmotte: Many authors are involved in higher education and teaching outreach. Education
and training play an important role in ensuring that the latest knowledge is shared as broadly as possible.
Mr. Richard Jones: The interactive Atlas is a valuable tool for educators, as well as in interactions with journalists.
The IPCC is working on easy-to-understand messaging, as spreading the outcomes of the report is a priority.
90. Is information on low-likelihood events in extreme scenarios helpful to the UNFCCC process?
Ms. Valerie Masson-Delmotte: The mandate of the WGI is to assess the available literature in a neutral way.
Governments and sectors have requested information relevant for risk assessment and to inform decisions
associated with, for example, critical infrastructure that may be affected by such events.
91. Does climate change currently align to the very high emission scenario? If emissions continue to rise as
they are, could the global surface temperature rise to 5°C above pre-industrial levels by 2100?
Ms. Valerie Masson-Delmotte: It is not part of the WGI mandate to assess the likelihood of specific scenarios. The
assessment of recent socio-economic trends in the forthcoming WGIII report can provide more information.
However, Chapter 1 of the WGI report flags that scenarios with very high emissions are considered to have a low
likelihood due to recent changes in the energy sector. Additionally, for a given emissions scenario, the WGI
contribution reported on the most likely temperature outcome informed by multiple lines of evidence, but the
climate response assessment – the climate sensitivity, has a range of distributions, and low-probability outcomes

SBSTA/IPCC Summary Report on Unpacking the new scientific knowledge and key findings in the Working Group I
contribution to the Sixth Assessment report: The Physical Science Basis
SBSTA/IPCC Special Event.2021.1 Summary Report
19 of 24
that a given scenario would lead to a higher warming cannot be ruled out. More information is provided in Box
TS.3 in the Technical Summary.
4. Limiting climate change
92. From a physical science perspective, limiting human-induced global warming to a specific level
requires limiting cumulative CO2 emissions, reaching at least net zero CO2 emissions. These are achieved
when anthropogenic CO2 emissions are balanced by anthropogenic CO2 removals.
93. Strong, rapid and sustained reductions in methane emissions would limit the warming effect from declining
aerosol pollution and further improve air quality. The effects of strong emissions reductions emerge within a few
years for air quality, and around 20 years for global surface temperature trends. The climate we experience in the
future depends on our decisions now.
94. The WGI contribution to the AR6 confirms the close relationship between cumulative CO2 emissions
and increasing global surface temperature. The near linear relationship between cumulative CO2 emissions and
global surface temperature increase caused by CO2 (figure 15) implies that stabilizing human-induced global
temperature increase at any level requires net anthropogenic CO2 emissions to be reduced to zero (net zero CO2).
Limiting global temperature increase to a specific level therefore implies that there is a so-called carbon budget
within which cumulative CO2 emissions need to be limited.
Figure 15. Global surface temperature increases since 1850–1900 (°C) as a function of cumulative CO2
emissions (GtCO2)
Source: Slide 72 of the presentation of the IPCC Co-Chairs. SPM.10, IPCC, 2021: Climate Change 2021: The Physical Science Basis.
Contribution of Working Group I to the Sixth Assessment Report of the Intergovernmental Panel on Climate Change. Cambridge
University Press. In Press.
95. Over the period 1850–2019, a total of 2390 GtCO2 was emitted. Estimated remaining carbon budgets are
calculated from the beginning of 2020 and extended until global net zero CO2 emissions are reached. The
methodology used in the WGI report to estimate the remaining carbon budget is the same as that used in the Special
Report on Global Warming of 1.5°C.11 Each factor that determines the estimates of the remaining carbon budget
has been reassessed and updated, including climate system feedbacks. When adjusted for emissions to date,
estimates of remaining budgets are of similar magnitude compared to the Special Report on Global Warming of
1.5°C.
96. The report contains the remaining carbon budget estimates for several global temperature levels and various
levels of probability based on the estimated value of the transient climate response to cumulative emissions, with
the narrower uncertainty range for climate sensitivity. It also includes updated estimates of historical warming,
variations in projected warming from non-CO2 emissions, and the estimate of the net-zero temperature
commitment. It also takes into account climate system feedbacks, such as CO2 emissions from thawing permafrost
(figure 16).
97. Estimates of the remaining carbon budget vary by plus or minus 220 GtCO2, depending on the level of non-
CO2 emissions at the time that global anthropogenic CO2 emissions reach net zero levels. This variation is referred
to as non-CO2 scenario uncertainty and will be further assessed in the WGIII report. The main estimates of
11 Available at https://www.ipcc.ch/sr15//.

SBSTA/IPCC Summary Report on Unpacking the new scientific knowledge and key findings in the Working Group I
contribution to the Sixth Assessment report: The Physical Science Basis
SBSTA/IPCC Special Event.2021.1 Summary Report
20 of 24
remaining carbon budgets take into account deep reductions in other greenhouse gases and air pollutants. If they
non-CO2 greenhouse gas reductions are not achieved, the estimates of remaining carbon budgets would be reduced
by about 220 GtCO2 per additional 0.1°C of warming caused by non-CO2 emissions. Geophysical uncertainties
are covered by the levels of likelihoods provided and each of them is reported separately for transparency.
Figure 16. An updated assessment of the total and remaining carbon budget
Source: Slide 73 of the presentation of the IPCC Co-Chairs. TS.14 and Table SPM.2, IPCC, 2021: Climate Change 2021: The Physical
Science Basis. Contribution of Working Group I to the Sixth Assessment Report of the Intergovernmental Panel on Climate Change.
Cambridge University Press. In Press.
98. The WGI report assesses the climate chance response of natural carbon sinks (figure 17). The report shows
that natural land and ocean carbon sinks are projected to take up a progressively larger amount of CO2 with
increasing emissions in absolute terms, but they will become less effective at slowing the accumulation of CO2 in
the atmosphere. This means that the fraction of emissions taken up by natural sinks decreases with increasing
cumulative CO2 emissions, which results in a higher proportion of emitted CO2 remaining in the
atmosphere.
Figure 17. Total cumulative CO₂ emissions taken up by land and ocean
Source: Slide 74 of the presentation of the IPCC Co-Chairs. TS.14 and Table SPM.7, IPCC, 2021: Climate Change 2021: The Physical
Science Basis. Contribution of Working Group I to the Sixth Assessment Report of the Intergovernmental Panel on Climate Change.
Cambridge University Press. In Press.

SBSTA/IPCC Summary Report on Unpacking the new scientific knowledge and key findings in the Working Group I
contribution to the Sixth Assessment report: The Physical Science Basis
SBSTA/IPCC Special Event.2021.1 Summary Report
21 of 24
99. The magnitude of the feedbacks between climate change and the carbon cycle become larger and
more uncertain in high CO2 emissions scenarios. Additional ecosystem responses to warming that are not yet
fully included in climate models, such as methane and carbon dioxide fluxes from wetlands, permafrost thaw, and
wildfires, would further increase concentrations of these gases in the atmosphere.
100. By contrast, under the very low and low greenhouse gas emissions scenarios where CO2 concentrations
peak and decline during this century, the land and ocean begin to take up less carbon in response to declining
atmospheric CO2 concentrations. In the same way that around 56% of current anthropogenic CO2 emissions are
taken up by land and ocean carbon stores, net CO2 removal will be partially counteracted by CO2 release from
these stores.
101. Strong, rapid and sustained reductions in methane emissions would also limit the warming effect resulting
from declining aerosol pollution and would improve air quality. In the low and very low greenhouse gas emissions
scenarios, assumed reductions in anthropogenic aerosol emissions lead to net warming, while reductions in
methane and other ozone precursor emissions lead to a net cooling. Because of the short lifetime of both methane
and aerosols in the atmosphere, these climate effects partially counterbalance each other, and reductions in methane
emissions also contribute to improved air quality by reducing global surface ozone. In the long term, net warming
is lower in scenarios assuming air pollution controls, combined with strong and sustained methane emission
reductions.
102. For the first time, the WGI report includes a chapter on short-lived climate forces. Strategies integrating
climate and air quality can achieve multiple benefits and limit trade-offs. Scenarios with very low or low
greenhouse gas emissions lead within years to discernible effects on short-lived component concentrations, and
therefore air quality relative to high and very high greenhouse gas emissions scenarios.
103. Differences in 20-year trends of global surface temperature would emerge from natural variability during
the next decades under a very low greenhouse gas emission scenario compared to a high or very high scenario.
The response of many other climatic variables would emerge with different timings later in the 21st century
(figure 18).
Figure 18. Differences in trends in global surface temperature would begin to emerge from natural
variability within around the next 20 years
Source: Slide 76 of the presentation of the IPCC Co-Chairs. FAQ4.2, Figure 1, IPCC, 2021: Climate Change 2021: The Physical Science Basis. Contribution of Working Group I to the Sixth Assessment Report of the Intergovernmental Panel on Climate Change. Cambridge
University Press. In Press.
104. By the end of the century, scenarios with low or very low greenhouse gas emissions would strongly limit
the increase in the frequency of extreme sea level events, heavy precipitation and pluvial flooding, and exceedance
of dangerous heat thresholds. The number of regions where such exceedances occur would be limited relative to
scenarios with intermediate or high emissions, and higher warming levels (figure 19).
105. Ms. Masson-Delmotte emphasized that the climate we experience in the future depends on our decisions
now.

SBSTA/IPCC Summary Report on Unpacking the new scientific knowledge and key findings in the Working Group I
contribution to the Sixth Assessment report: The Physical Science Basis
SBSTA/IPCC Special Event.2021.1 Summary Report
22 of 24
Figure 19. Limiting global warming reduces consequences of climate change that can impact society and
natural systems
Source: Slide 77 of the presentation of the IPCC Co-Chairs. Figure TS.6, IPCC, 2021: Climate Change 2021: The Physical Science Basis. Contribution of Working Group I to the Sixth Assessment Report of the Intergovernmental Panel on Climate Change. Cambridge
University Press. In Press.
Summary of the Q&A session for theme 4: Limiting climate change
106. Regarding the IPCC’s assessment of the literature from the Global South, is room for improvement in the
regional and gender balance of the authors of the assessed literature?
Ms. Maisa Rojas: The IPCC can only rely on published literature and this can underpin an imbalance in the
information that the IPCC assesses. There are several ways that developing countries can be further involved in
the IPCC process, such as by building a diverse team of authors, getting involved in the review process, including
signalling existing research publications that the IPCC authors may not be aware of.
Ms. Erika Coppola: There is a gap of information coming from some parts of the world, but there are also various
coordinated regional projects in Africa and Latin America, as well as increased efforts in data sharing to make
climate simulation data more accessible.
107. Can the IPCC elaborate on the need for negative CO2 emissions following the achievement of net-zero CO2,
and can WGI estimate the total amount of negative CO2 emissions needed?
Mr. Joeri Rogelj: Net negative CO2 emissions occur when CO2 removal or anthropogenic removals exceed
anthropogenic CO2 emissions. The WGI assessment shows that if such a state is achieved, this would lower global
surface temperature, reverse ocean acidification and reduce atmospheric CO2 concentrations. The WGI assessment
also shows that if global CO2 emissions are reduced to net-zero, global warming would be halted. Net negative
emissions that occur in scenarios contribute to the gradual reversal of warming after its peak over the course of the
century.
Carbon dioxide removal methods can have potentially wide-ranging effects on biogeochemical cycles and climate,
and can influence water availability and quality, as well as food production and biodiversity, which will be further
assessed by WGII and III. Despite the various aspects of climate change that can be reversed by net negative CO2
emissions, there are also changes that would continue in their current direction for decades or millennia,
particularly the slow-changing components of the Earth's system in the cryosphere and the oceans.
108. What are the main differences between the findings of the current WGI assessment report and the findings
from previous ones?
Ms. Valerie Masson-Delmotte: The robustness of findings have been highly strengthened in this report. Specific
advances have been summarized in the first pages of the Technical Summary,12 as compared to the three special
reports and the AR5 WGI report.
12 Available at https://www.ipcc.ch/report/ar6/wg1/downloads/report/IPCC_AR6_WGI_TS.pdf.
SBSTA/IPCC Summary Report on Unpacking the new scientific knowledge and key findings in the Working Group I
contribution to the Sixth Assessment report: The Physical Science Basis
SBSTA/IPCC Special Event.2021.1 Summary Report
23 of 24
109. Can the outreach plan of the IPCC be elaborated on with regards to ensuring that key findings and
knowledge are adequately shared in developing countries, particularly in Africa?
Mr. Richard Jones: The IPCC has outreach activities planned to disseminate the results of the report via the
Interactive Atlas through the IPCC Task Group on Data. Additionally, the African scientists involved in the writing
of the report are very keen to disseminate the findings of the report more widely across the continent through the
institutes in their countries.
110. Data from CMIP models are not easily accessible by developing countries. How much of the literature that
used data from CMIP models came from Africa?
Ms. Erika Coppola: There is an increasing number of papers from and regional climate publications on Africa
based on CMIP6, and many of these publications were assessed.
111. Will the WGIII report will include the mitigation efforts captured in NDCs?
Ms. Valerie Masson-Delmotte: The WGIII report is work in progress, but WGI is not in a position to answer the
question on WGIII’s assessed literature. There is a close and highly important collaboration between the Working
Groups on multiple aspects, including consistency in the climate response to future scenarios by WGI and the
assessment of mitigation pathways in WGIII.
112. Interaction between atmospheric methane, air quality, and the aerosol cooling effect was emphasised as
important to developing countries, and messaging was highlighted on the degree of the role of the reduction of
methane emissions in mitigating climate change and affecting air quality through the processes by which
atmospheric methane is involved in the production of and interaction with aerosols.
Mr. Piers Forster: Regarding changes over the next two decades, the aim of the messaging, specifically in headline
D.1 of the Summary for Policymakers13, aims to convey that changing temperature trends over the next 20 years
requires action today..
113. Can more information be provided on the link between the WGI and WGIII reports in regard to the set of
pathways being considered by WGIII to limit warming to 1.5°C, as well as how the illustrative pathways presented
by WGI compare to the wider literature on 1.5°C pathways?
Mr. Joeri Rogelj: The set of illustrative WGI scenarios covers a broad range of scenarios in terms of emissions
and total forcing from the literature. They are representative of scenarios with similar warming, but variations to
the scenarios will be presented in the WGIII report.
114. Can the panel comment on how local governments and NGOs can be encouraged to work more closely
with national governments on climate action? What could these combined efforts achieve?
Ms. Valerie Masson-Delmotte: The WGI report provides much more granular regional information, as well as
information on urban climate science, which shows how climate effects can be exacerbated in urban areas due to
their characteristics. A special report will be focused on cities and climate change in the next cycle of the IPCC
assessment, the AR7.
115. Can the panel comment on the findings of the IEA14 that, even if current mitigation pledges were fulfilled,
the remaining 22 billion tonnes of worldwide CO2 emissions in 2050 would result in a temperature rise of around
2.1°C by 2100.
Ms. Valerie Masson-Delmotte: It is not part of the WGI mandate to assess aspects related to recent pledges,
however, the report includes information on how a specific level of warming affects global and regional climate
characteristics, which is relevant to understand why every increment of warming matters.
116. Since system feedbacks mean that the actual long-term Earth system sensitivity could be higher than the
equilibrium climate sensitivity, should we be using a more conservative carbon budget?
Mr. Joeri Rogelj: The feedbacks that would otherwise not be covered are taken into account in the carbon budget
estimates. These carbon budget estimates apply to the emissions until net zero CO2. The Earth's system sensitivity
would be the response of the Earth system over many centuries, therefore, the response of over four or five
centuries cannot be included into the carbon budget today already.
Ms. Helene Hewitt: The report assessed the impact of possible biogeochemical feedbacks from tropical and boreal
forests and permafrost. The result is that these feedbacks could significantly increase emissions, but they are
unlikely to exceed the anthropogenic emissions in this century.
13 Available at https://www.ipcc.ch/report/ar6/wg1/downloads/report/IPCC_AR6_WGI_SPM_final.pdf.
14 See https://www.iea.org/reports/net-zero-by-2050.
SBSTA/IPCC Summary Report on Unpacking the new scientific knowledge and key findings in the Working Group I
contribution to the Sixth Assessment report: The Physical Science Basis
SBSTA/IPCC Special Event.2021.1 Summary Report
24 of 24
C. Summary of the general discussion and interventions from Parties
112. A total of 19 Parties and three Observers posed questions and/or provided comments. Overall, participants
expressed their gratitude to the IPCC, and particularly WGI, for their continued work and for providing crucial
information regarding the state of the climate. Participants also welcomed the WGI contribution to the AR6 report
and thanked the SBSTA and the IPCC for organising the event, which was deemed a useful opportunity to discuss
the report’s findings.
113. Many Parties and observers used the opportunity to ask the authors and WGI Co-Chair technical and
scientific questions related to the physical science of climate change. The panel provided clarifications and useful
information included in the report, as well as on the literature assessment process that the WGI authors undertook.
114. Different Parties showed interest in the outreach strategies by the IPCC, to ensure that knowledge is spread
among the general population in a way that can be easily understood, especially in developing countries and among
population groups with different levels of education. The IPCC assured Parties that disseminating the information
was a priority, and that several outreach efforts were underway.
115. Some Parties also expressed concern that there is an imbalance in the regional sources of information, with
less data and literature assessed from developing countries. The gender imbalance of authors contributing to the
assessment was also noted. The panel acknowledged this issue as an area for improvement, but also highlighted
that more technical information and scientific literature is being produced in the global South, including from
regional collaboration projects.
116. Participants emphasized the relevance of the information on climate change impacts for risk assessment
and adaptation strategies, particularly for developing countries, coastal communities, small islands and vulnerable
populations and ecosystems. Participants also welcomed the stronger regional focus, which will be helpful for
developing strategies at the national and subnational levels.
117. Participants and authors highlighted the importance of the finding that deep and rapid emission reductions
would allow global warming to be limited to 1.5°C, halting and reversing many of the impacts of climate change.
However, many of the changes are irreversible for centuries to millennia.
118. The discussions touched upon different topics that will be addressed by the WGII and WGIII contributions
to AR6, expected to be published in 2022.
D. Closing remarks
119. In his closing remarks, the IPCC Chair, Mr. Hoesung Lee, thanked the SBSTA for organizing the session.
He expressed his satisfaction with the very productive event. He highlighted the following key policy-relevant
elements included in the report and the presentations by the panel: cause and effect scenarios; low-likelihood high-
impact outcomes; and remaining carbon budgets. He also emphasized the wealth of policy relevant information,
which can be useful for action now. He thanked the WGI authors, the 230 scientists that worked on the report and
the WGI Co-Chairs for their outstanding work.
120. In closing, the SBSTA Vice-Chair, Mr. Kakhaberi Divani, also extended his gratitude to the IPCC Chair,
the WGI Co-Chairs, the IPCC experts joining the session, as well as the authors that made it possible to access the
best available knowledge from the global scientific community. He also thanked the participants for the enriching
discussions and expressed his hope that participants could benefit from this dialogue in the negotiation process,
contributing to a successful and ambitious outcome.