
THE KYRGYZ REPUBLIC'S SECOND NATIONAL ... - UNFCCC
200
THE KYRGYZ REPUBLIC’S SECOND NATIONAL COMMUNICATION TO THE UNITED NATIONS FRAMEWORK CONVENTION ON CLIMATE CHANGE Bishkek-2009
-
Upload
khangminh22 -
Category
Documents
-
view
5 -
download
0
Transcript of THE KYRGYZ REPUBLIC'S SECOND NATIONAL ... - UNFCCC
THE KYRGYZ REPUBLIC’S SECOND NATIONAL COMMUNICATION
TO THE UNITED NATIONS FRAMEWORK CONVENTION
ON CLIMATE CHANGE
Bishkek-2009

УДК 316.3/.4ББК 66.3 (Ku)
В 87 Second National Communication of the Kyrgyz Republic to the UN Frame-work Convention on Climate Change – Bishkek: – “Полиграфоформление“, 2009. 206 с.
ISBN 978-997-25-326-1
The Second National Communication of the Kyrgyz Republic to the UN Frame-work Convention on Climate Change was prepared within framework of the GEF/UNDP "Enabling Activities for Preparation of the Kyrgyz Republic's Second National Commu-nication to the UNFCCC" Project (PIMS 3209 CC EA SNC Kyrgyzstan) in response to Kyr-gyzstan’s commitments to the UNFCCC with the financial support of the Global Envi-ronment Facility and the UNDP assistance.
The Communication was prepared in the format recommended by IPCC for the non-Annex-I countries.
The text of this publication can be used for educational and non-profit uses provided acknowledgement of the source is made.
В 0803010200-09 УДК 316.3/.4 ББК 66.3 (2Ku)ISBN 978-9967-25-326-1 © ПРООН, 2009

3
Person list
CoordinatorsNational Project Director A. Davletkeldiev
Director of the State Agency for the Environment Protection and Forestry under the Government of the Kyrgyz Republic
UNDP Z. TakenovInternational Senior Programme Advisor
Consultative Board J. Kanimetov Kyrgyz Republic Jogorku Kenesh (Parliament)I. Ismailov Kyrgyz Republic Government OfficeS. MukambetovKyrgyz Republic Ministry of Economic Development and TradeK. KasymovKyrgyz Republic Ministry of Agriculture, Water Re-sources and Processing Industry A. TumenbaevKyrgyz Republic Ministry of Industry, Energy and Fuel ResourcesM. BaihodjoevKyrgyz Republic Ministry of Foreign AffairsO.Abdykalykov Kyrgyz Republic National Statistical Committee
Executive Committee Z. Abaihanova, Project Manager S. Iliasov, Candidate of Technical Sciences, Leading Expert E. Urazbaeva, Finance-Administrative Assistant
AuthorsS. Iliasov, Candidate of Technical Sciences V. Yakimov, Candidate of Geology

4
National experts and consultants B. Aksamaev, Candidate of Medicine V. AfanasenkoL. AhmetovaT. BurovaA. VedenevB. Goltsov G. Desyatkov, Doctor of Physics and MathematicsC. Djumadylova, Candidate of GeologyA. Djundubaev, Candidate of Technical Sciences S. DresvyannikovN. KabanovaV. Kasymova, Doctor of Economics O. KatkovaV. Kuzmichenok, Candidate of Technical SciencesN. Kumskova, Doctor of EconomicsE. Lupinin I. MayatskayaA. MeleshkoN. Myrsaliev Y. Nemaltsev, Candidate of Chemical Sciences A. NifadievaO. PavlovaP. Pahomov, Doctor of Technical Sciences V. RomanovskyV. Surappaeva, Candidate of Biology G. ShabaevaA. Shabunin, Candidate of Technical Sciences M. Shamsutdinov, Doctor of Technical ScienceA. Sharshenova, Doctor of Medicine

5
Preface
The specifics of modern development of the Kyrgyz Republic is the desire of our state to integrate into sustainable development process at the global, regional and subregional levels. Active participation of the republic in the international programs and projects, as well as joining the international environmental conventions contribute to the inclusion of our republic in the global environmental processes and stimulate strengthening of its capacity, open up access to modern technology, information networks and financial sources.
One of the major focus areas in environmental security of our country is tackling the global climate change problem. The international community cooperated their efforts through implementing the United Nations Framework Convention on Climate Change and its Kyoto Protocol. Despite the socio-economic problems, the Kyrgyz Republic recognizes special importance and urgency of environmental protection and sustainable use of natural resources and is taking all necessary steps to implement the provisions of the Convention and the Kyoto Protocol. This is largely contributed by the Concept of Environmental Security of the Kyrgyz Republic till 2020, which was adopted and approved in 2007 by the Kyrgyz Republic President, and the fact that successful tackling of global climate change due to its specifics allows our country to solve a set of the most urgent economic, water-energy and environmental problems.
The First National Communication of Kyrgyzstan to the United Nations Framework Convention on Climate Change (2003) was the first step of our country in fulfilling its obligations in this area. Following steps in this direction helped raise the public awareness, establish legal frameworks, as well as to build human and intellectual potential for further addressing of environmental problems.
The Second National Communication of the Kyrgyz Republic (2008) demonstrates sustainability of development priorities and the current relevance of climate change for the country. The Kyrgyz Republic intends to further work in close coordination and cooperation with the world community to continue and expand the activities to tackle the climate change.
It is a pleasant duty for us to express our gratitude to the Global Environment Facility, the United Nations Development Program in Kyrgyzstan, the Secretariat of the United Nations Framework Convention on Climate Change for the financial, technical and organizational support, which made possible the preparation of the Second National Communication of our country on climate change. The document would be incomplete without the assistance and participation of government experts and international organizations, scientific community and civil society.
We are grateful to specialists of Intergovernmental Panel on Climate Change, GEF/UNDP National Communications Support Programme, the Environment Program of UNDP in Kyrgyzstan, the UNDP Regional Bureau in Slovakia and other international organizations for their advice, guidance and logistical support, information materials, software, which no doubt helped to raise the level of this document.
The authors of the Communication are also grateful to all ministries, departments and organizations of the republic, whose expertise and provided information were

6
invaluable. We express our gratitude to the leading specialists of government institutions,
private and non-governmental sectors for the interested discussion of draft versions of the Communication, critical comments and suggestions that upgraded the quality of the Second National Communication of the Kyrgyz Republic to the United Nations Framework Convention on Climate Change.
Our special thanks are to the leaders of expert groups, consultants, national and international experts, all project managers for the responsibility they took in collecting information, their creative approach to processing and analysis of extensive data during preparation of the National Communication.
A. A Davletkeldiev
Director of the State Agency on Environment Protectionand Forestry under the Government of the Kyrgyz Republic

7
AcronymsSummary1. Introduction2. National circumstances
2.1. Country profile2.2. Geography2.3. Demography2.4. Climate2.5. Natural resources
2.5.1. Land resources2.5.2. Forest resources2.5.3. Water resources2.5.4. Hydropower resources2.5.5. Renewable energy sources2.5.6. Renewables
2.6. Economy2.7. Agriculture2.8. Food security2.8. Industry
2.8.1. Power industry2.8.2. Heat supply
2.9. Transportation2.10. Industrial and domestic wastes
2.10.1. Waste dumps2.10.2. Tailings
2.11. Environment2.11.1. Soils: status, impact factors, risks2.11.2. Water resources: status, impact factors, risks 2.11.3. Air: status, impact factors, risks
3. Greenhouse gas inventory3.1. General information
3.1.1. Methodology3.1.2. Legal and institutional background3.1.3. Stakeholders involved in GHG inventory 3.1.4. Timetable3.1.5. Comprehensive coverage3.1.6. Quality assessment and quality control (QA/QC)
3.2. Inventory results3.2.1. Overall emissions
3.2.1.1. Greenhouse gases3.2.1.2. Gases - precursors
3.2.2. Emission per sectors3.2.2.1. Energy
3.2.2.1.1. Energy production
Table of Contents
1011293131323335373737383940404243464747484851515252525354555555555656575858585861656569

8
3.2.2.1.2. Industry and construction3.2.2.1.3. Transport3.2.2.1.4. Other sectors3.2.2.1.5. Fugitive emission from fuel
3.2.2.2. Industrial processes3.2.2.2.1. Mineral substances production3.2.2.2.2. Chemical industry3.2.2.2.3. Metallurgy3.2.2.2.4. Production of food and beverages3.2.2.2.5. Blast works3.2.2.2.6. Consumption of hydrofluorocarbons (refrigerat-ing facilities maintenance)
3.2.2.3. Solvents and other production3.2.2.4. Agriculture
3.2.2.4.1. Enteric fermentation3.2.2.4.2. Manure storage systems3.2.2.4.3. Rice cultivation3.2.2.4.4. Cultivated soils 3.2.2.4.5. Agricultural residues burning
3.2.2.5. Land use, land use change and forestry3.2.2.5.1. Change of wood biomass stock3.2.2.5.2. Change of carbon stock in soils
3.2.2.6. Wastes3.2.2.6.1. Solid waste landfill3.2.2.6.2. Waste water treatment
3.2.3. Emission per regions3.2.3.1. Overall emissions3.2.3.2. Emission per sector
4. Base scenarios4.1. Climatic scenario 4.2. Macroeconomic scenarios4.3. Demographic scenario
5. Vulnerability assessment and adaptation measures5.1. Methodology5.2. Water resources
5.2.1. Vulnerability assessment5.2.1.1. Glaciers5.2.1.2. Surface water-flow5.2.1.3. Lakes
5.2.2. Adaptation measures5.3. Agriculture
5.3.1. Vulnerability assessment5.3.2. Adaptation measures
5.4. Population health5.4.1. Vulnerability assessment
5.4.1.1. Infectious diseases5.4.1.2. Cardiovascular system diseases5.4.1.3. Cancer diseases5.4.1.4. Mortality rate related to blood system diseases
5.5. Climatic emergency situations5.5.1. Vulnerability assessment 5.5.2. Adaptation measures
70717375757880808283
8484858788899090919395969798100100101110110118120122122123123123127131132132132138139140140141142142143144147

9
6. Climate change mitigation6.1. Methodology6.2. National mitigation potential6.3. Basic background for scenarios assessment
6.3.1. All scenarios6.3.2. Scenario with no measures been taken (А)6.3.3. Scenario with taken measures defined in prospective national development plans (В1 и В2)6.3.4. Scenario with taken measures defined in prospective national development plans, and additional long-term measures (С1 и С2)
6.4. Emissions per scenarios6.5. Assessment of emission reduction
7. Other information related to achievement of the convention objectives7.1. Technology transfer7.2. Systematic observation7.3. Capacity strengthening
ReferencesAnnex 1 Global Warming Potential for key greenhouse gases recommended by
the IPCCAnnex 2 General report on national GHG inventory, GgAnnex 3. National emissions in СО-eqAnnex 4. Modeling of glaciation change as per scenario В2
149149150151151153
153
155156160163163165166169
172173189197

10
AMV Auto Motor Vehicles CDS Country Development Strategy CFC chlorfluorocarbon CIS Commonwealth of Independent States GCM Global Climatic modelsGDP Gross Domestic ProductGEF Global Environment Facility Gg Gigagram, 109 gramGHG Greenhouse GasGJ Gigajoule, 109 jouleGWP Global Warming PotentialHCFC HydrochlorofluorocarbonHFC HydrofluorcarbonHPP Heat Power Plant HPS Hydro Power StationsIPCC Intergovernmental Panel on Climate Change KR Kyrgyz RepublickV Kilovolt, 103 voltkW Kilowatt, 103 wattLEAP Long-range Energy Alternatives Planning systemMCB Minimal Consumption Budget mcR/hr Micro-roentgen per hour MJ Megajoule, 106 joulesMM Mass MediamW Miliwatt, 10-3 wattMW Megawatt, 106 wattNMVOC Non-methane volatile organic compoundNSA Kyrgyz Republic National Science Academy NTRES Non-traditional renewable energy resources, including heat and
photoelectrical solar equipments, mini- and micro HPS, wind power equipments, geothermal and biogas technology
OJSC Open Joint Stock Company PCF Perfluorocarbons PJ Petajoule, 1015 jouleRES Renewable Energy ResourcesSAI MIA State Auto Inspection, Kyrgyz Republic Ministry of Internal Affairs SDW Solid Domestic WasteTJ Terrajoule, 1*1012TOE Ton of oil equivalent (7000 kcal/kg)TPS Thermal Power Station UNDP United Nations Development ProgramUNFCCC United Nations Framework Convention on Climate ChangeUTS Urban Type SettlementWHO World Health Organization
Acronyms

11
Summary
National circumstances
According to its Constitution the Kyrgyz Republic is a sovereign, democratic, so-cially oriented, jural state. The government of the Kyrgyz Republic acts on the basis of division of legislative, executive and judicial branches of power.
The Kyrgyz Republic is located at the juncture of two mountain systems (the Tien Shan and the Pamirs). The highest point of the Republic is Victory Peak (7,439 m), the lowest area is a transboundary crossing of the Naryn river at 480 m above sea level. The average elevation of the territory of the Republic is 2,630 m above sea level. About 93 percent of its territory lies at an elevation higher than 1,000 m; 85 percent lies higher that 1,500 m and about 42 percent lies higher that 3,000 m above sea level.
The Kyrgyz Republic has a population of 5,166,400 people as on 1 January 2006. Density of population is extremely uneven, majority of it is concentrated in the valley and foothill climatic zone, which is considered as the area for comfort habitation and covers about 20 percent of the territory of the country. Overwhelming part of popula-tion constantly reside here, their business activity is concentrated here also.
Fig. S.1. Distribution of resident population in administrative units of the Kyrgyz Republic as of 1 January 2006
The alpine type of relief with mountain ridges of different direction determines climate features and creates four climatic regions in the Kyrgyz Republic.
Observed average surface temperatures convey pretty significant link with area altitude above sea level and vary between +10° С for the altitude lower than 1,000 me-ters up to -5° С for areas located at the altitude over 3,000 meters above sea level.
Annual precipitation total differs within broad range in all climatic regions. Av-eraged readings of annual precipitation total in all climatic regions are comparable: North-western region - 456 mm, North-eastern region – 421 mm and South-western region – 521 mm. The higher readings in the South-western climatic region reflect the
c. Osh 5.0%
Batken oblast 8.0%
Jalal-Abad oblast 18.5%
Issyk-Kul oblast 8.4%
Naryn oblast 5.2%
Osh oblast 20.2%
Talas oblast 4.1%
Chui oblast 14.7%
c. Bishkek 15.9%

12
higher moister transfer by western air streams. Low amount of annual precipitation in the Internal Tien-Shan (294 mm) is explained by the region location in the windless region of north-west moisture-laden air.
Total area makes up 187,518 km²; this includes latest amendments related to de-limitation of frontiers with Peoples’ Republic of China.
Disposition of land in the Kyrgyz Republic is shown at Fig.S.2. The percentage of irrigable lands is 67.5 percent of plough-lands total. There are 0.247 ha of plough land per capita in the Republic; 0.167 hectares of this amount are irrigable lands.
Other 36.8%
Tillage 6.9%
Pasture 45.1%
Vegetation 5.6%
Buildings 0.6%
Water objects 5.0%
Fig. S.2. Disposition of land in the Kyrgyz Republic, as of 1 January, 2006.
The quality of soil differs from grey-brown desert type to chernozem-forest type in spruce forests. Foothill valleys and inter-mountain valleys are areas of permanent residence and economical activity; the soil here belongs primarily to various types grey soils and grey-brown desert type soils of mountain-valley classification. The soils here contain from 0.8 percent to 2.5 percent of humus.
According to national forest registry of the Kyrgyz Republic (2003) the area of land under forests (forest reserves) was 8,649 km², area of other forest related lands was 3,089 km² (non-closed forests, nursery forests, plantations, sparse forests and other lands suitable for reforestation).
Vertical stratification and variety of climatic zones caused significant diversity of tree species in the forest reserves, on one hand, and, on the other hand, low percent-age of forest lands in the country (4.6 percent). 30 forest cover species and over 17 types of shrubs could be found in the Kyrgyz Republic. Most widely spread is juniper and spruce forests which have relatively low biomass buildup rate.
Kyrgyz Republic is of special interest for the whole Central Asian region because it turns up to be a zone of forming its water resources. Water resources of the country are concentrated in its glaciers, lakes, rivers and underground reservoirs.
Glacier volume estimated 417.5 km3 in the year 2000. There are 1,923 lakes in the Kyrgyz Republic. The biggest lakes are Issyk-Kul, Son-Kul, Chatyr-Kul. Water reserves contained in the lakes of the Republic estimated as 1,745 km3; 1,731 km3 of the water volume is in Issyk-Kul Lake. Issyk-Kul lake water is salty and cannot by used for water supply.
There are about 5 thousand rivers in the Republic, these rivers relate to 8 hydro-logical basins. The hydrological basins belong to rivers Syr-Darya, Amu-Darya, Chui, Talas, Ili (Kar-Kyra), Tarim and two closed lakes – Issyk-Kul and Chatyr-Kul. All basins ex-cept for last two are transboundary basins. Total averaged annual river flow from the territory of the Republic for many years equaled 48.6 km3 in the year 2000. Potential

13
fresh water underground reserves of the Kyrgyz Republic estimated as 13 km3. These underground reserves are located in intermountain troughs, these territories are the most economically developed. Useful ground water resources under commercial re-covery classification make 16 million m3 a day or more than 5 km3 a year. Total con-sumption ground water withdrawal makes about 5 percent of the resources. In 2000 there was 2,300 m3 potentially available consumption of fresh water per capita.
The total of hydropower potentiality of the Republic is estimated as 28,828 thou-sand kW of power capacity and 249 billion kWh (896.4 PJ) of power output a year of medium water availability.
Probable reserves of coal deposits in the Kyrgyz Republic estimated as more than 2.2 billion tones with reserves 1,316.9 million tones (750.7 TOE) on 1 January 2006. Ex-tent of production descended from maximum of 4,508 thousand tons in 1979 to 314.3 thousand tons in 2006.
Recoverable oil reserves of these deposits estimated as 11.6 million tones and recoverable natural gas reserves – 4.9 billion m3. Between 1991 and 2007 oil produc-tion reduced 2.2 times less and gas production became 6.4 times less. In general the Republic can provide less than 5 percent of its own consumption of oil products and natural gas.
The provision of the country with fuel an energy resources as of 2005 is 77.57 percent.
Kyrgyz Republic has got significant potential of unconventional and renewable energy sources. Use of these sources could increase provision with fuel an energy re-sources and cut dependence on import.
• Solarenergy.Averageannualperiodofsolarilluminationis2,500–2,600hours.1 m² of solar heat collector can produce 500 – 600 kWh (3,700 – 4,600 MJ) of energy in summer and 300 – 400 kWh in winter, i.e. 1,028-1,278 kWh (3,700 – 4,600 MJ) a year. In 2006 there were 60 thousand m² of heat panels installed in 2008, currently 25 thousand m² of them are in operating mode. By the year of 2100 total area of installed thermal collectors could be up to 258.5 thousand m², energy generation is estimated at 265.7 - 330.4 million kWh a year (955 – 1,190 TJ).
• Windpower.Thezoneofpermanentresidencemonthaveragedwindspeedisno more than 2 – 2.5 m/sec. Winter season recurrence of wind with 0 – 1 m/sec is 50 percent and higher. Stable wind of 4 m/sec speed can be detected at the watersheds far from the locations of permanent residence. There were 16 wind-generators with 16 kW power output in 2005. Potential of development of wind power is considered as pretty low.
• Biogas.In2005,therewere24operatingbiogasplantsintheRepublicwithtotalvolume 2,050 m3. 8 biogas plants out of 23 have volume 100 m3 and more. The biogas plants process about 5-7 thousand tonnes of manure in a year. Their to-tal output can be assessed as 1,247 – 1,696 m3 of biogas or 8,050 – 10,900 kWh (29 – 39 GJ) annually. National potential of biogas production in 2100 could be about 200 thousand m3, i.e. approximately 5 TJ.
• Geothermalenergy.Presentdays,thegeothermalenergyofhotwellsandwell-springs is in use only for balneal purposes. Prospects for use of geothermal energy in business activities are possible for North Chui and Bar-Barskaun areas of East Kyrgyz Zone.
Between 1990 and 2006 there were two phases in the social and economic de-velopment of the Kyrgyz Republic. Phase 1 (1991 – 1995): dramatic reduction of GDP up to 50.7 percent was registered, in industry it was up to 33 percent. Phase 2 (1996 – 2006): there was a growth of GDP – up to 80 percent compared to 1990 (in prices of 1990). Simultaneously economic structure of the country had changed significantly;

14
share of service industries had increased owing to other sectors. (Fig. S.3).
Fig. S.3. Tendencies of GDP restructuring
In past five years steady development tendencies in industrial production the country has not been observed. Metallurgy (mostly gold production), energy and natural gas generation, food and beverages industry, tobacco processing industry de-termine 3/4 of total industrial production. High-technology production compiles less than 5 percent of gross industrial production.
After 1990 agriculture went through essential change of ownership from large collective farms to private peasant farms and private plots. Maintaining of volume of production in general, this stipulates satisfactory provision of the country with its own food-stuffs. Deficiency of some resources in the country could be filled in by yield in-crease and diversification of crops.
Most sustainable development tendencies are observed in service industry, its contribution in gross domestic product practically has not changed and even increased almost 1.5 times compared to 1990.
Mountain relief of the country and lack of navigable waterways predetermined predominant role of automobile transport for inland carriage. Negligible volume of inland carriage at the Issyk-Kul lake is carried out by water transport. Leading role in foreign carriers to CIS and European countries belongs to rail transport. Steady growth of cargo and passenger turnover started in 1995. Nevertheless, given sector of econo-my still faces some problems which stand in the way of its further development. Only about 38 percent of general use road network are hard-surface roads, high percentage of these roads including international roads are in a pretty bad condition. As a result we have increased transportation deadlines, higher risk of traffic accidents on these roads and raised greenhouse gas emission.
In general environmental conditions in the Kyrgyz Republic could be considered as satisfactory. Some certain problems, like air pollution, water and soil pollution had been determined. Most serious hazard is being posed by waste placement areas, espe-cially it relates to mining industry wastes and solid consumption wastes.
Inventory of anthropogenic greenhouse gas emissions and removals
The inventory of anthropogenic greenhouse gas emissions and removals had been accomplished between 2001 and 2005. Besides, the recalculation of previously
3500G
DP,
mln
US$
3000
2500
2000
1500
1000
500
industry agriculture other
1990 1991 1992 1993 20001994 20011995 20021996 20031997 20041998 200519990

15
received sector results (from 1990 till 2000) was performed. It was required due to newly received data on national emission coefficients, and because previously used algorithms of calculation had been verified. The recalculation was required in order to accomplish the assessment of emissions and sinks as a cross-section of all administra-tive units of the Republic (oblasts and cities centrally governed).
According to working recommendations the inventory covered the following sec-tions:
• energy;• industrialprocesses;• useofsolventsandotherproduction;• agriculture;• landtenurechangeandforestry;• wastes.Emissions of the following greenhouse gases were taken into account in the
inventory:• carbondioxide(СО₂);• мethane(СН₄);• nitrousoxide(N₂O);• hydrofluorocarbons(HFC);• perfluorocarbons(PFC);• sulfurhexafluoride(SF₆).The emission of perfluorocarbons and sulfur hexafluoride was considered as in-
significant, therefore the final results does not reflect it.Emissions of gases precursors have been included as well:• carbonoxide(CO);• nitrogenoxide(NOx);• none-methanevolatileorganiccompounds(NMVOC);• sulfuroxides(SОx).Inventory has been conducted in the context of all administrative units of the
country:• Batkenoblast(establishedon12October1999,theofficialstatisticsisavailable
since 1999);• Jalal-Abadoblast;• Issyk-Kuloblast;• Narynoblast;• Oshoblast;• Talasoblast;• Chuioblast.• Bishkek;• Osh(after2002,theofficialstatisticsavailablesince2000).Evaluation of greenhouse gas emission as a result of use of bunker oil for inter-
national transportation and emission of carbon dioxide from biomass has been con-ducted.
Procedures for quality assurance and quality control have been observed at all stages of inventory (data collection and analysis, calculations, test analysis).
Fig S.4 demonstrates breakdown of greenhouse gas emission by separate gases, Fig S.5 – by sections. In the section “Use of solvents” there is no emission of greenhouse gases.

16
Fig S.4 Total emission of all greenhouse gases including GWP.
The chart does not include HFC-134а due to its insignificant amount.
35000
Emis
sion
Gg
30000
25000
20000
15000
10000
5000
carbon dioxide nitrous oxidemethan
1990 1991 1992 1993 20001994 20011995 20021996 20031997 20041998 200519990
35000
Emis
sion
, Gg
30000
25000
20000
15000
10000
5000
energy industrial processesagriculture land use change and forestrywastes
1990 1991 1992 1993 20001994 20011995 20021996 20031997 20041998 200519990
Fig P.5 GHG emissions including GWP per section.
Character of tendencies of total emission reflects to some extent status of nation-al economy. Stabilization almost equivalent to 1994 with simultaneous GDP growth is determined by GDP restructuring at the expense of growing share of sectors with in-significant contribution to greenhouse gas emission, for instance services sector. Al-terations in breakdown by gases and by sections in the course of inventory are pretty insignificant. Main contribution belongs to carbon dioxide (76 percent), methane (23 percent) and nitrous oxide (1 percent).
Main emission of carbon dioxide occurs in “Energy” section (about 95 percent). Emission of methane is going on mostly in “Agriculture” section - 62.9 percent, in “Wastes” section – 19.1 percent and in “Energy” section – 17.8 percent. Alterations in methane emission by years are mainly determined by reduction in “Energy” and “Wastes” sections. Contribution of other sections is negligible.
Emission of nitrous oxide occurs in four sections. The highest emission of nitrous oxide in 2005 was observed in the following sections: “Wastes” – 49.4 percent, “En-ergy” – 25.5 percent and “Agriculture” – 24.8 percent.
Evaluation of emission of sulfur oxide, hydrofluorcarbons and perfluorcarbons in the Kyrgyz Republic has been done for the first time as inventory implemented in the course of preparation of the First National Communication did not cover the emis-

17
sion of these substances. The reason for that were assumptions that their quantities are insignificant, as well as lack of official data not only on emission but on volumes of their use in the Kyrgyz Republic. However, taking into account considerable amount of global warming potential of these substances the detailed analysis has been imple-mented. On the basis of its results it was determined that out of all above mentioned substances only HFC, namely HFC-134a is applied in the country. Country has not got its own production of HFC. Main area of HFC application is refrigerating agent in refrig-erators. For determination of HFC volumes there exits special “upwards” methodology. It is based on specific volumes of consumption by service businesses, because official statistics and customs offices register import of the substance not accurately. For sim-plification of the process it was suggested that total consumption volume in a certain year is discharged into the air. Significant quantities of HFC-134а emission have been observed from year 2000, in 2005 emission was 0.0095 Gg in СО² equivalent.
Emission of the following productions was considered in the section “Industrial processes”:
• Cast-ironandsteelproduction(emissionofСО², NOx and СО);• Aluminiumproduction(emissionofСО², NOx and СО);• Stibiumproduction(emissionofСО², NOx, СО and SОx);• Mercuryproduction(emissionofСО², СО and SОx);• Leadproduction(emissionofСО², NOx and СО);• Copperproduction(emissionofСО²);• Blastworks.All the processes of this sector are not covered with IPCC methodical instructions
(remelting was meant under metal production except for stibium and mercury); that is why the national emission coefficients have been used.
Fig.S.6. Total emission of gases-precursors with breakdown by separate gasesFig S.6 shows breakdown of emission of gases-precursors by separate gases, Fig.
S.7 shows breakdown by sections in the course of inventory. In “Wastes” section emis-sion of gases-precursors does not take place, because it is not produced in the coun-try. Character of tendencies in “Energy” and “Solvent” sections depended on status of national economy (i.e. reduction of emission). In other sections changes were deter-mined by destructing of business activity. Growth of emission has been observed.
Abrupt growth of emission of non-methane volatile organic carbons (NMVOC) started in 2001 is determined by activization of activities in roads asphalting.
Fig S.8 demonstrates breakdown of emission of greenhouse gases in СО-eqivalent by regions for the period of 1990 – 2005. Emissions in Bishkek are the high-est in the whole course of inventory, though their relative contribution has slightly
1000
900
800
700
600
500
400
300
200
100
0
Emis
sion
, Gg
nitrous oxides sulphur oxidescarbon oxide NMVOC
1990 1991 1992 1993 20001994 20011995 20021996 20031997 20041998 20051999

18
decreased in 2005. Chui oblast and Bishkek are main industrial centers where during the whole inventory time the bigger part of industrial production had been concen-trated. Considerable part of population of the country lives in this area. It is worth to mention absence of well-defined tendency of growth of greenhouse gas emission for all regions of the country after its significant decrease in 1990 – 1995. It is very likely that decrease was determined by relative stabilization of emission in “Energy” section, which gave main contribution to total emission.
Fig.S.7 Total emission of gases-precursors by sections
35000
30000
25000
20000
15000
10000
5000
0
Emis
sion
, Gg
1990 1991 1992 1993 1994 1995 1996 1997 1998 1999 2000 2001 2002 2003 2004 2005
Batken oblastNaryn oblastChui oblast
Jalal-Abad oblastOsh oblastBishkek
Issyk-Kul oblastTalas oblast
Fig.S.8. Distribution change of the greenhouse gases emission total (including GWP) per regionAlterations of region’s share in the period between 1990 and 2005 are pretty insig-
nificant and reflect direction of alteration to bigger proportionality of GHG emission to amount of population in given area, at the expense of consecutive decrease of indus-trial sector contribution.
Basic scenarios
Three basic scenarios are required for correct assessment of vulnerability, for fore-cast of national emissions and for proved selection of actions aimed at mitigation of impact on the climate:
1000
900
800
700
600
500
400
300
200
100
0
Emis
sion
, Gg
1990 1991 1992 1993 1994 1995 1996 1997 1998 1999 2000 2001 2002 2003 2004 2005
energysolvents land use change and forestry
industrial processesagriculture
19
• climatic;• macroeconomic;• demographic.It is necessary to anticipate, that the developed scenarios will be useful for prepara-
tion of long-term strategic plans, programs and other similar documents able to deter-mine directions of national and industrial development in view of climatic changes.
Out of 48 climatic scenarios MAGICC/SCENGEN programme complex, version 4.1 the following scenarios have been selected:
• A2-ASF-thescenariothatgivesthemaximalvalueofСОconcentrationbyyear 2100 among scenarios of A2 family (among scenarios А2 with more mod-erate economic and demographic parameters);
• В2-MESSAGE-thescenariothatgivestheminimalvalueofСОconcentrationby year 2100 among scenarios of B2 family (among В2 scenarios with more moderate economic and demographic parameters);
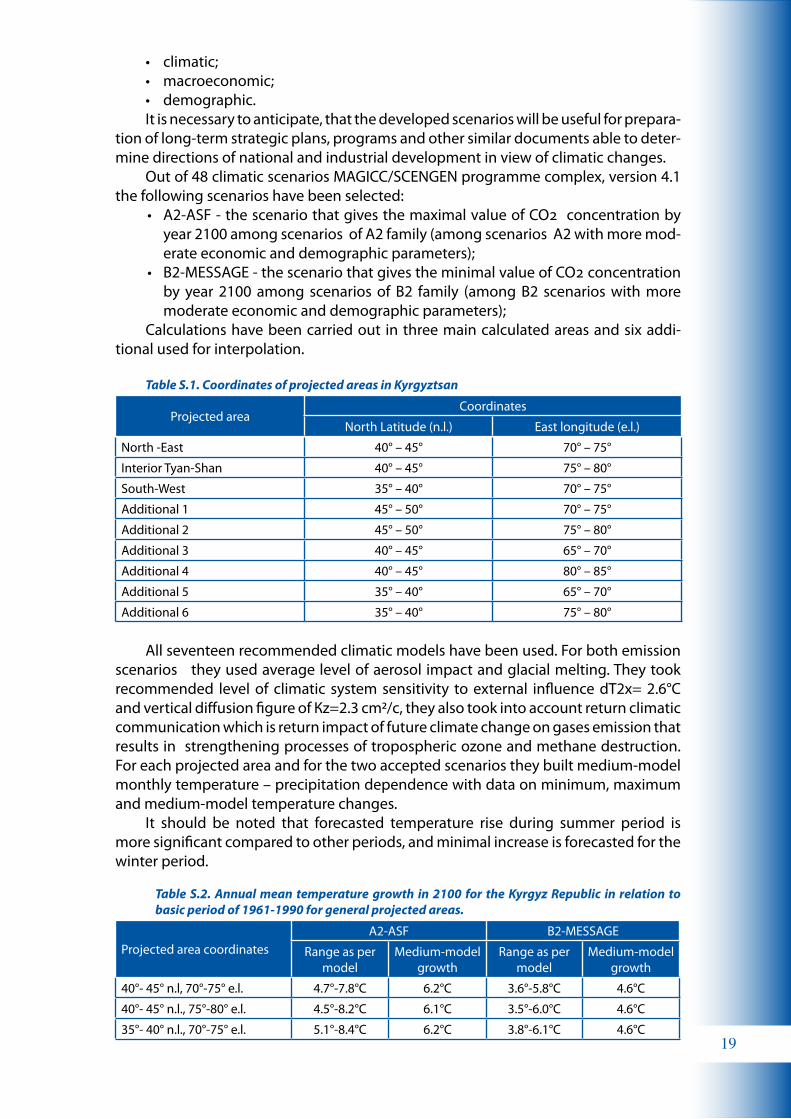
Calculations have been carried out in three main calculated areas and six addi-tional used for interpolation.
Table S.1. Coordinates of projected areas in Kyrgyztsan
Projected areaCoordinates
North Latitude (n.l.) East longitude (e.l.)
North -East 40° – 45° 70° – 75°
Interior Tyan-Shan 40° – 45° 75° – 80°
South-West 35° – 40° 70° – 75°
Additional 1 45° – 50° 70° – 75°
Additional 2 45° – 50° 75° – 80°
Additional 3 40° – 45° 65° – 70°
Additional 4 40° – 45° 80° – 85°
Additional 5 35° – 40° 65° – 70°
Additional 6 35° – 40° 75° – 80°
All seventeen recommended climatic models have been used. For both emission scenarios they used average level of aerosol impact and glacial melting. They took recommended level of climatic system sensitivity to external influence dТ2х= 2.6°С and vertical diffusion figure of Кz=2.3 cm²/с, they also took into account return climatic communication which is return impact of future climate change on gases emission that results in strengthening processes of tropospheric ozone and methane destruction. For each projected area and for the two accepted scenarios they built medium-model monthly temperature – precipitation dependence with data on minimum, maximum and medium-model temperature changes.
It should be noted that forecasted temperature rise during summer period is more significant compared to other periods, and minimal increase is forecasted for the winter period.
Table S.2. Annual mean temperature growth in 2100 for the Kyrgyz Republic in relation to basic period of 1961-1990 for general projected areas.
Projected area coordinatesA2-ASF В2-MESSAGE
Range as per model
Medium-model growth
Range as per model
Medium-model growth
40°- 45° n.l, 70°-75° e.l. 4.7°-7.8°С 6.2°С 3.6°-5.8°С 4.6°С
40°- 45° n.l., 75°-80° e.l. 4.5°-8.2°С 6.1°С 3.5°-6.0°С 4.6°С
35°- 40° n.l., 70°-75° e.l. 5.1°-8.4°С 6.2°С 3.8°-6.1°С 4.6°С

20
Table S.3. Total annual precipitation changes by year 2100 in Kyrgyzstan in relation to basic period of 1961-1990 for general projected areas
Projected area coordinatesA2-ASF В2-MESSAGE
Range as per model
Medium-model growth
Range as per model
Medium-model growth
40°-45° n.l., 70°-75° e.l. (-)41.8 – 48.0% 2.1% (-)27.2 – 24.0 2.1%
40°-45° n.l., 75°-80° e.l. (-)25.9 – 59.9% 1.3% (-)16.7 – 40.9 1.3%
35°-40° n.l., 70°-75° e.l. (-)43.4 – 28.7% (-)2.0% (-)30.9 – 17.5 (-)3.1%
As a whole for both annual and seasonal precipitation changes they forecast in-significant changes of annual total precipitation compared to basic period of years 1961-1990 with probable significant fluctuations of total precipitation both to de-crease and increase for all projected areas in Kyrgyzstan. However, the biggest diver-gence between high and low range data for different models is apparent for the sum-mer period. The most significant precipitation reduction is expected during summer period, and the biggest growth is estimated for the winter period. These estimations are mostly true for all projected areas and emission scenarios.
It should be noted that in Kyrgyzstan with its complex relief, for all climatic sce-narios the low sanction of global climatic models, i.e. outcomes as per 5х5 degrees estimation grid, is a major deficiency of used approach, and requires further usage of regional climatic models in future climatic scenarios assessments.
Country Development Strategy is a basis for climatic scenarios creation. Forecast for a longer period (up to year 2100) was performed on the basis of three scenarios with consideration of probable decrease of economic development rate due to the following main reasons:
• Availableinternationalorganizationsforecastsonexpected,moreconstrainedannual rates of GDP growth for the countries with transitive economies;
• Influenceofgeneral tendencyofenergyprices rise in theworldmarketandits influence on economic development rates fluctuations to positive for the countries – fuel and energy exporters and negative for the countries – fuel and energy importers;
• Influence of corruption being an obstacle for the country’smacroeconomicpolicy implementation and braking investments inflow, i.e. resulting in nega-tive influence on sustainable economic growth.
For all scenarios it is planned to change energy consumption structure due to in-crease of electric power share and simultaneous decrease of gas, coal and oil products share.
For the first scenario mid-annual rate of GDP decrease is supposed up to 104 per-cent by 2020 and up to 103 percent by 2100.
For the second scenario mid-annual rate of GDP decrease is supposed up to 103 percent by 2020 and up to 102 percent by 2100.
For the third scenario mid-annual rate of GDP decrease is supposed up to 102 percent by 2020 and up to 101 percent by 2100.
For demographic scenario it is supposed that maximum population size will be achieved by the year 2050, and then process of absolute population size reduction will lead to the outcome when the country’s population size will decrease a little in 2100, though it will still be bigger than in 2005. It could be explained that conditions and traditions of high birth rate will be still preserved in Kyrgyzstan. And in spite of the fact that processes of industrial development, urbanization, higher educational level will widely involve women into different economic and public activities thus having an impact on national and religious demographic traditions, this influence will definitely have a long term effect. In addition to all the above-mentioned basic estimations/ as-

21
sessment they expect change of population age structure for increase of advanced ages population and life expectancy.
8000Po
pula
tion
thou
peo
ple
7000
6000
5000
4000
3000
2000
1000
urban population rural population
2010 2020 2030 2040 2050 2060 2070 2080 2090 21000
Fig.S.9. Changes of population size in the Kyrgyz Republic
Assessment of vulnerability to climate change and adaptation measures
Based on international experience and national research the following most vul-nerable to climate change sectors were identified:
• Waterresources(vulnerabilityindicators–glaciersparameters,volumeofsu-perficial runoff, lakes parameters);
• Health(indicatorsofvulnerability–morbidityandmortalityrate);• Agriculture(indicatorsofvulnerability–heatavailability,productivityofvari-
ous types of crops and pastures);• Emergency climate situations (indicators of vulnerability - mud-flows, land-
slides, lake breakout, avalanches occurrence,).In order to get true quantitative vulnerability estimations they used physical com-
munications (“Wastes” sector) or statistical methods (“Health”, “Agriculture”, “Emergen-cy climate situations” sectors).
Vulnerability estimations for glaciers and surface water-flow were performed us-ing a complex of digital relief models and land humidification in Kyrgyzstan (DMR и DMHum accordingly). These models have been developed in the Institute of Water problems and Hydro-power Engineering of the National Academy of Sciences of the Kyrgyz Republic. You can see general outcomes of glacier status forecast for the period up to 2100 in Table S.4.
Table S.5 gives result estimations of basic parameters obtained by summing sepa-rate hydrological basins when modeling for the most probable alternatives of fore-casted climatic parameters.
Apparently from forecast results essential decrease of surface water-flow for all most probable climatic scenarios is expected. Thus, the increase surface water-flow during the period from 2020 till 2025 is expected at the expense of increase of glacial component, reduction of flow approximately up to 42.4 – 20.4 km3 further is expected, that makes 43.6 – 88.4 percent from volume of flow in 2000. Consequences of so sig-nificant predicted reduction of the surface water-flow undoubtedly should have an effect on conditions of life and economic activities in the Kyrgyz Republic, and also in neighboring, mainly, flat-country states. Without acceptance of preventive measures inevitably increase risks in the spheres of water use and water-distribution.
For the most probable climate scenarios glacial water yield reduction will have a significant effect on intraannual river runoff distribution, with its significant summer

22
maximum reduction and shifting it for earlier period. Glaciers, accumulating solid pre-cipitation, give out most of water during summertime which is the most important time for agriculture, and increase river flow during hot shallow years. In accordance with modeling outcomes this natural potential of runoff regulation becomes weak, which means that without corresponding adaptation measures it will have an essen-tial influence on basic waste consumers in the Kyrgyz Republic and neighboring coun-tries.
Table S.4. Outcomes of modeling glaciation evolution for the most probable climatic changes op-tions (dТ – mid-year temperature changes in оС, m – ratio of total annual precipitation to basic period)
mdТ (°C) 2.96 3.96 4.96 5.96
Parameter 2050 2100 2050 2100 2050 2100 2050 2100
1.16 Amount 2,803 1,446
Area, km² 3,573.02 2,320.74
Volume, km3 233,487 161,772
Thickness, m 65.35 69.71
1.06 Amount 3,097 1,484 1,958 721 1,276 378 897 227
Area, km² 3,861.63 2,428.06 2,901.73 1,529.93 2,214.80 1,039.11 1,716.25 741.98
Volume, km3 251,056 169,654 197,236 115,389 157,143 83,151 126,872 61,889
Thickness, m 65.01 69.87 67.97 75.42 70.95 80.02 73.92 83.41
0.96 Amount 1442 397 988 238 651 142
Area, km² 2,395.21 1,092.01 1,861.05 783.32 1,453.63 571.54
Volume, km3 168,889 87,522 136,439 65,445 111,234 49,250
Thickness, m 70.51 80.15 73.31 83.55 76.52 86.17
0.86 Amount 1,071 251 741 152 508 87
Area, km² 2,014.70 826.97 1,573.22 609.03 1,258.77 452.33
Volume, km3 146,630 69,183 119,369 52,472 99,064 39,754
Thickness, m 72.78 83.66 75.88 86.16 78.70 87.89
0.76 Amount 402 59
Area, km² 1,104.55 362.41
Volume, km3 89,061 32,207
Thickness, m 80.63 88.87
Table S.5. Outcomes of superficial modeling for Kyrgyzstan as a whole (dТ – mid-annual tem-perature changes in °С, m – annual precipitation - basic period ratio)
dТ (°C) 2.72 3.72 4.72 5.72
m 2050 2100 2050 2100 2050 2100 2050 2100
1.16 43.776 42.421
1.06 43.679 41.311 41.671 38.436 39.860 36.170
0.96 37.739 32.187 36.149 30.453 34.753 29.036
0.86 32.650 25.221 31.449 24.099
0.76 29.357 20.434
Climate change may also significantly affect the state of the lakes. For example, the water surface of the Issyk-Kul Lake is expected to reduce from 232 to 1,049 km², and the water level can fall from 5.1 to 27.5 m compared to 2000. The preliminary as-sessments for another enclosed lake –Chatyr-Kul established that in all most possible climatic scenarios it can exist merely as a small reservoir drying up completely every year.

23
Detailed stages of adaptable process should be concretized for each region, but in any case the general actions are:
• moreeffectiveandcarefulmanagementofirrigationalsystemsinordertopre-serve and reduce water loss;
• regulationofthesurfacewater-flowandcreationofwaterreservesinartificialwater reservoirs;
• implementationmodern,moreeffectivesystemsandmodesofwaterdistribu-tion in order to reduce its losses;
• incentives forwater-userstourgethemtouseefficientlytheavailablewaterresources at the expense of implementation of system of paid water use.
For agriculture the climate change will first of all change the thermal regime (heat supply), which is a major factor for agroclimatic zoning of the territory. Rising tempera-ture will significantly change the options for cultivating of various crops as well:
• Inthenorth-westernregion,undertheA2-ASFscenariofortheyear2100,theclimate at 1,400 meters altitude will range from very hot to moderately hot, while under the B2-MESSAGE scenario such a climate would be at an altitude of 1,200 m. The frost-free period under the A2 –ASF scenario will range between 264 days at an altitude of 600 meters and 120 days at an altitude of 3,000 m. Under the B2-MESSAGE scenario it will last 246 days at 600 m and 103 days at 3,000 m.
• Inthenorth-easternregion,undertheA2-ASFscenariofortheyear2100,theclimate on lake coast at 1,800 meters will be moderately hot while the B2-MES-SAGE scenario projects no such hot climate in the basin. The frost-free period according to the A2-ASF scenario will last from 304 days at an altitude of 1,600 meters to 102 days at an altitude of 3,000 m. Under the B2-MESSAGE scenario it will last 255 days at an altitude of 1,600 meters and 73 days at an altitude of 3,000 meters.
• IntheinternalTien-Shan,undertheA2-ASFscenariofortheyear2100therewill be moderately warm climate at an altitude of 1,800 meters while according to the B2-MESSAGE scenario there will be no such hot climate in internal Tien-Shan.
• Insouth-westernregion,undertheA2-ASFscenariofortheyear2100,thecli-mate at an altitude of 2000 meters will range from very hot to moderately hot while the B2-MESSAGE scenario projects such a climate at altitudes up to 1,600 m. The length of frost-free period under the A2 -ASF scenario will range from 294 days at an altitude of 600 meters to 161 days at 3,000 m. Under the B2-MESSAGE scenario it will last 276 days at 600 m and 144 days at 3,000 meters.
In general, in the Kyrgyz Republic the areas with various thermal regimes will substantially change, so the areas with temperatures > 4,000 °C will rise more than two times by year 2100.
Due to the lower humidity the proportion of arid desert and semi-arid areas can increase from approximately 15.0 percent in 2000 to 23.3-49.7 percent in 2100. The areas and productivity of highland pastures may significantly reduce in the inner Tien-Shan, in the Ak-Say and Alai valleys, etc.
The dependence of the expected yield on indicators of climate change has been estimated for the major crops and various types of pasture plants, which can be a basis in selecting the key areas for adaptation measures.
The main areas of common approaches to adaptation are the following: • technologicalimprovementofexistingagriculturalprocesses;• economicmechanismsthatencouragetheactivitiesofindividualowners;• identificationofthemainwaysofstatesupportforagriculture.On the basis of statistical models the relationship between the climate change

24
and the following health-demographic indicators have been analyzed: 1. morbidity rates of population: • by incidenceof infectiousdiseases, casesof acute intestinal infections in all
regions of the country; • bynon-infectiousdiseases,forexamplediseasesofcirculatorysysteminBish-
kek. 2. mortality rates of population: • bynumberofdeceasedpersonsintermsofKyrgyzstan’sdifferentregions,as
well as a detailed analysis of mortality rates of population in terms of gender and age for Ton and Zhetioguz regions of Issyk-Kul oblast;
• bymortalityratesofpeoplewithdiseasesofcirculationsysteminJalal-Abadand Chui oblasts, and in Bishkek.
The studies show significant dependence of health and demographic indicators on climate change:
• theincidenceofacuteintestinalinfectiousdiseasesisexpectedtoincreaseby year 2100. The indicators of the expected incidence of acute intestinal in-fections under the A2-ASF scenarios can reach 57.0 cases per 100 thousand people by year 2100, however under the B2-MESSAGE scenario these projec-tions are lower - 54.4, i.e the increase will be by 15.9 percent and 10.6 percent respectively, against the basic disease indicators in 2005;
• the incidenceofdiseasesof thecirculatorysystem is to increaseagainst the2005 ( in Chui region - by 69.6 percent and by 45.6 percent for the A2-ASF and B2-MESSAGE scenarios respectively; Issyk-Kul region - by 13.5 percent and - 8.3 percent for the A2-ASF and B2-MESSAGE scenarios respectively; Jalal-Abat region - by 73.2 percent and 37.6 percent for the A2-ASF and B2-MESSAGE sce-narios respectively). Almost the same increase in the incidence is expected in the northern and southern regions of the country. Less increase (even a slight decrease for the scenario B2-MESSAGE) in Issyk-Kul region is explained by a significant difference in climatic conditions of the region due to smoothing impact of the Issyk-Kul lake on extreme temperatures;
• theincidenceofmalignanttumorsinwomenisexpectedtoincrease(approxi-mately by 7 percent compared with 2000) and to decrease in men;
• substantialgrowthofdeathratesfromdiseasesofthecirculatorysystemisex-pected in 2100 against 2005 (in Bishkek - by 50.6 percent and 39.4 percent for the A2-ASF and B2-MESSAGE scenarios respectively; in Chui region– by 54.4 percent and 42.9 percent for the A2-ASF and B2-MESSAGE scenarios respec-tively; Jalal-Abad region - by 75.3 percent and 54.3 percent for the A2-ASF and B2-MESSAGE scenarios respectively).
The main adaptation measures of health care to climate change should include: • expandingresearchassessingtheadverse impactsofclimatechangeonthe
health of the population in the republic; • developingaplanofscientificresearchofthehealthimpactsofclimatechange,
with science-based forecasts of possible exacerbation of public health due to climate change and justification of the prevention and adaptation measures;
• preparationofnationalreportsonaregularbasis toassessthe impactsofclimate change on public health in the republic;
• raisingpublicawarenessthroughthepublicationofspecializedpublicationsand periodicals, on climate change and human health, as well as through the mass media;
• improvementof educationandtrainingsystemfor epidemiologicalcontroland public health specialists;
• developmentofaNationalActionPlantopreventandmitigatethehealthim-

25
pacts of climate change in the Kyrgyz Republic; • consideringthattheterritoryoftheKyrgyzRepublicasamountainouscountry
is largely exposed to dangerous climate and nature processes and phenom-ena, its vulnerability to emergencies of this kind has been assessed based on statistical models, which can be understood as a possible forecast of disasters for the period of up to year 2100;
• theassessmentconsideredthevulnerabilityofthecountrytothefollowingtypes of natural emergencies;
• landslides,thenumberofwhichintheKyrgyzRepublichavenowreachedatleast 5,000;
• mudflows,floodsandhighlandlakesoutbursts,whichthreatalmosttheen-tire territory of the republic as more than 95 percent of settlements are located in close proximity to water sources, mostly along the riverbeds of rivers and more than 90 percent of the lakes are highland lakes, 200 of which are under burst danger every year;
• avalanches,intensityofwhichisduetogeomorphologicstructureofdeeplydissected mountain terrain of the republic, which forms deep unsustainable snow cover in cases of heavy rainfalls.
The assessment of vulnerability was carried out for three major regions (Central, North and South), traditionally selected in the republic for monitoring and analy-sis of emergencies. Mudflows, floods and outbursts of highland lakes fall under the common category, as outbursts of highland lakes happen rarely and it is difficult to model them separately. The expected changes in climatic parameters were estimated in accordance with the obtained climate scenarios. The results of calculations for the period of up to year 2100 led to the following conclusions:
• IntheSouthernregion,theprobabilityoflandslidesundertheA2-ASFsce-nario will not change, while under the B2-MESSAGE scenario it can slightly increase. The likelihood of mudslides, floods and outbursts of highland lakes under the A2-ASF and B2-MESSAGE scenarios is to increase several times. In all scenarios the likelihood of avalanches is to increase in Chatkal region, but significantly decrease in Toktogul region;
• In theCentral region, the likelihoodofmudslides, floods andoutbursts ofhighland lakes under the A2-ASF and B2-MESSAGE scenarios is to significantly reduce. The likelihood of avalanches on both scenarios would increase slight-ly;
• IntheNorthernregion,thelikelihoodofmudslides,floodsandoutbursts ofhighland lakes under the A2-ASF and B2-MESSAGE scenarios is to significantly reduce. The likelihood of avalanches on both scenarios would substantially in-crease.
Adaptation measures actually are the development of the existing set of mea-sures to prevent emergencies (supplemented by reasonable possibility of reallocating resources to prevent emergencies in the most dangerous areas), the main components of which are:
• Spatialplanning for all natural emergencies,which is about identifying thehigh-risk areas and the resulting requirements for the use of these areas based on existing and projected data of possible emergencies with the possible cli-mate change taken into account;
• Engineeringactivitiesaimedateliminatingnotonlyasourceofthreat,butitsprecondition;
• Legislativemeasuresdefiningtherulesandregulationsthatprovidefirstofallthe basis for the spatial planning and engineering activities;
• Awarenessraisingandtrainingonpreventingofemergenciestoexcludeun-reasonable solutions, taking into account the expected climate change.

26
Climate change mitigation measures
Calculation of greenhouse gas emissions for three country development scenar-ios:
A - without adoption of mitigation measures, that is while preserving all existing conditions and proportions at the national level, but considering the trends in the global technology;
B – taking into account the mitigation measures identified in national and sec-toral development plans;
P - taking into account the mitigation measures identified in national and sectoral development plans, as well as additional measures, which are necessary in the longer term.
Additional measures are defined as measures, which are proposed for inclusion in subsequent national development plans, as reviewed by the time interval until year 2100 is certainly longer than the existing development plans.
Estimates were made using the software LEAP (Long-range Energy Alternatives Planning system), version 2006.0015. The calculations were made for the period 2010 - 2100 for 15 different development scenarios (Table S.6), differing by rates of annual economic growth of the republic and the size of implemented measures.
As a result of calculating the following conclusions can be drawn on the possible implementation of the commitments to reduce greenhouse gas emissions:
• TrendsinemissionsfortheB1andB2scenarios,andC1andC2scenariosinany economic growth rates are almost parallel to each other and differ only by the amount of additional greenhouse gas emissions from the start of the Kara-Keche Heating Power Plant, the emissions of which can reach approximately 12.5 Gg per year;
Table S.6. Considered scenarios
Implemented activities Rates of annual economic
growth
3% 2% 1%
Without taking actions 103А 102А 101А
With taking measures identified in national and sectoral develop-ment plans
103В1 102В1 101В1
With taking measures identified in national and sectoral develop-ment plans and commissioning of new generating capacities under favorable conditions
103В2 102В2 101В2
With taking measures identified in national and sectoral develop-ment plans and additional measures
103С1 102С1 101С1
With taking measures identified in national and sectoral develop-ment plans and commissioning of new generating capacities under favorable conditions and additional measures
103С2 102С2 101С2
• Economicgrowthdoesnotleadtoasimilar increaseinemissionsduetotheexpected significant changes in the structure of GDP;
• ImplementationoftheUNFrameworkConventiononClimateChangeanditsKyoto Protocol without taking measures to reduce greenhouse gas emissions (scenario A) is possible only if the annual economic growth does not exceed 1 percent;
• Plannedgovernmentmeasures (theB1andB2scenario) canensurecompli-ance of commitments on annual economic growth of up to 3 percent;
• Additionalmeasures(scenarioC1andC2)canensurecomplianceofcommit-ments for annual economic growth of 3 percent;

27
• Implementation of the commitments to reduce greenhouse gas emissions,with an economic growth rate exceeding 3 percent is possible only given that the list of additional measures expanded.
Using the results of calculation by LEAP one can also estimate self-sufficiency of the republic with its own energy resources. For all scenarios, despite the expected increase in its own production, traditional imports of fossil fuels (coal, natural gas and oil) will remain. In addition, depending on paces of economic development there may arise the shortage of electricity provided by its own production:
• withouttakingmeasures(scenarioA)afteryear2010,therepublicwillhavetoimport electricity, even if the rate of annual economic growth will be 1 per-cent.
• incaseofgeneratingsupplyinputandimplementingthemeasuresundertheB1 and C1 scenario the imports of electricity will be needed after years 2030 - 2050 depending on the paces of economic development;
• withtheintroductionofadditionalgeneratingsupplyandimplementationofthe B2 and C2 scenarios with the rate of economic growth less than 3 percent the republic will fully meet its own power demands. The need to import elec-tricity occurs only after 2060 with the rate of annual economic growth of ≥ 3 percent.
It should be noted that the provided estimates of power energy supply are opti-mistic because they do not take into account possible reduction of electricity at hydro-electric power stations due to the expected decrease of superficial runoff.
For all measures there has been carried out economic assessment. The assess-ment considers both the activities within national and sectoral plans, and additional measures, but only in terms of necessary capital expenditure to reduce greenhouse gas emissions and does not take into account other costs and benefits.
Other information relevant to achievment of the Convention objectives
An analytical assessment carried out in the area of technology transfer helped to implement or initiate implementation of the following concrete actions:
• “Bishkek-CleanAir”-reducingemissionsby15percentthroughinstallationofelectronic ignition device in cars;
• “Improvingtheefficiencyofstovesincombinationwithbiogasequipmentsandwarming of buildings” - the introduction of energy-efficient heating system «Kann» and improving insulation of buildings;
• “IntroductionofsolarenergytechnologiesinruralareasofKyrgyzstan”-replac-ing diesel pumps with solar technology in water supply;
• “Captureandutilizationofbiogasatsanctionedmunicipalsolidwastelandfillsof Bishkek” - reducing emissions of methane;
• “Promotingrenewableenergysources(RES)forthedevelopmentofremotere-gions of Kyrgyzstan” - introduction of micro and small hydropower, solar and biogas equipments;
• CapacityBuildingforImplementationofSustainableWasteManagementPrin-ciples in the Kyrgyz Republic” - development of National Strategy for Production and Consumption Wastes Management, expanding opportunities for private sector in-volvement in waste management;
• “Tien-ShanEcosystemDevelopment”hasthefirstcomponentonrestoringofforest area at 18 hectares and the second component on biodiversity conservation in Tien-Shan.
Systematic climatic observations in the country are carried out by a network of 26 meteorological stations (as of 2005), two of which (Naryn and Bishkek) belong to the
28
Global Climate Observing System. Since the first National Communication on Climate Change has been prepared the Hydrometeorological Service of the Kyrgyz Republic had compiled new meteorological data and transformed the data from previous observations. Taking into account the changes in the baseline data a retrospective analysis of temperature changes over the entire period of instrumental weather ob-servations has been carried out again. According to the assessment for the entire period of instrumental observations from 1883 to 2005 the average temperature trend throughout the Kyrgyz Republic made up 0.7854 °С over 100 years.
The National Communication process, and other relevant activities have signifi-cantly contributed to building of institutional, legal and technical capacities of Kyr-gyzstan in this area. The republic has established a National Committee on Climate Change, which has been authorized with the functions of Designated National Author-ity on Clean Development Mechanism. The Committee is an inter-ministerial coordi-nating body that is made up of representatives of all key partners in the republic. To provide the effective work of the committee the required legal documents identifying the criteria for selection of projects and their approval process have been devel-oped.
In terms of improving the legal framework a law “On the State Regulation and Policy of Greenhouse Gas Emissions and Absorption” has been adopted in the country and “Environmental Security Concept of the Kyrgyz Republic” has been prepared. The amendments were introduced into the laws “On Environment Protection” and “On Pro-tection of Atmospheric Air” that reflect the country’s commitments under the frame-work convention. The Government of the Kyrgyz Republic adopted the regulation on measures for implementation of the UN Framework Convention on Climate Change.
The self-assessment of the national capacity for implementing of global environ-mental conventions helped to identify barriers hampering the capacity development and prepare “Strategy and Action Plan for National Capacity Building to Implement The Global Environmental Conventions”.
To raise public awareness and build capacity, a series of trainings has been conducted for the national experts, along with the national conferences, workshops and round tables covering the developments of the Second national communication on climate change, Clean Development Mechanism potential in the republic. Climate change has regularly been covered in mass media and on specialized internet sites.

29
1. Introduction
The Kyrgyz Republic has ratified the UN Framework Convention on Climate Change in January 2000; the Kyoto Protocol has been ratified in January 2003. In compliance with obligations of the Parties of the Framework Convention, Articles 4 and 12, the Re-public prepared the Second National Communication on climate change, as a logical continuation of the First National Communication. It reflects intention of the Republic to be into solution the global ecological problem of climate change.
The coverage of the Second National Communication is determined in compli-ance with resolution 17/CP.8 ‘National Communication Guidelines for the Parties not included in Annex I to the Convention’ that was ratified on the Conference of the Par-ties of the UN Framework Convention on Climate Change, 8th Session, 2002.
The report contains information on specific features of geographical location of the Republic, its climate, economy and natural resources – those, related to vulner-ability of various sectors to climate change, adaptation potential and ability for actions aimed at mitigation of man’s impact on climate.
The detailed inventory of anthropogenic GHG emission and removals not includ-ed into Montreal Protocol on substances with negative effect on ozone layer has been carried out. The inventory includes information about all years during the period from 1990 to 2005. The inventory has been performed according to recommendations of methodic guidelines and regional analyses. National methods of analyses of green-house gas emissions have been developed for the processes not covered by the me-thodic guidelines. The inventory includes all recommended greenhouse gases (car-bon dioxide, methane, nitrous oxide, hydrofluorocarbon, perfluorocarbon and sulfur hexafluoride) as well as precursors (carbon monoxide, nitric oxide and non-methane volatile organic compounds).
The basic scenarios of possible climatic changes on the territory of the Kyrgyz Republic have been determined by means of global climatic models. These scenarios cover the period till the year 2100; they include the most probable concentration of carbon dioxide in air, as well as demographic and macroeconomic scenarios.
The assessment of vulnerability main sectors (“Water resources”, “Population Health”, “Agriculture” and “Emergency Climate Situations”) regarding expected climate changes have been performed, and adaptation measures suggested. The most de-tailed study was devoted to expected state of water resources of the Republic (gla-ciers, surface water-flow and lakes), because they represent the principle life support-ing sectors in the Kyrgyz Republic and other countries of Central Asia regions.
Be means of program complex LEAP (Long-range Energy Alternatives Planning system) the analyses of expected greenhouse gases emissions till year 2100 have been carried out, the analyses included three supposed scenarios of the Republic’s develop-ment:
• ifnoactionswillbeundertakenandexistingconditionsandcorrelations re-tained at the national level; the influence of world-wide technological tendencies tak-en into account;
• alleviationactionsincompliancewithnationalanddepartmentaldevelopment

30
plans are taken into account;• alleviationactionsincompliancewithnationalanddepartmentaldevelopment
plans are taken into account; additional actions should be undertaken in long-term perspective.
The report contains description of the conditions when concrete actions should be undertaken in order to alleviate emission and provide the Republic with domestic resources of energy correlating to planned rate of economic development.
The report contains results of transfer of required technologies and capacity im-provement in the Kyrgyz Republic. New meteorological data were received and the data acquired during the previous surveys had been confirmed. It gave an opportu-nity to obtain more specific information on averaged annual temperature trend for entire territory of the Kyrgyz Republic. According to verified evaluation it equals to 0.7854°С for 100 years.

31
2.1. Country profile
According to its Constitution the Kyrgyz Republic is a sovereign, democratic, socially oriented, jural state. The Government of the Kyrgyz Republic acts on the basis of division of legislative, executive and judicial branches of power. The Constitution of the Kyrgyz Republic was ratified on 5 May 1993 at the 12th Session of the Supreme
Council of the Republic of Kyrgyzstan. On 19 October 2007 the 6th revision of the Kyrgyz Constitution has been ratified, it is in force now.
The Constitution of the Kyrgyz Republic defines the President as a head of the state. The President is guarantor of the state sovereignty, territorial integrity, civil rights and freedoms. Structure of the state power as of 1 February 2008 is displayed in the chart (Fig. 2.1).
Territorial structure of the Kyrgyz Republic is based on principles of unity and integrity of its national territory, on balance of social and economic development of the regions of the Kyrgyz Republic. The administrative subdivision of the Kyrgyz Republic takes into account historic, economic and environmental features of its regions.
Building of the Kyrgyz Republic Government. Project archive.
2. National circumstances
Presidentof the Kyrgyz Republic
Supreme Council (Jogorku Kenesh)
of the Kyrgyz Republic
Government of the Kyrgyz RepublicPrime-minister
First Vice-prime-ministerVice-prime-ministers (2)
Government administrationMinistries (17)
Stete Committees (4)
State agencies at the Government
Local administrations
Courts and system of justice
Executive power of the Kyrgyz Republic
Administration of the President Advisors and aids of the President Parliament relations group Sub-divisions of the Administration Committees at the President Councils at the President Institutions at the President
Figure 2.1. Chart of state structure of the Kyrgyz Republic (as of 1 February 2008)

32
The Kyrgyz Republic has three-level government for its administrative-territorial subdivisions. On 1 January 2006 the administrative-territorial system of the Kyrgyz Republic had six oblasts (Fig.2.2) as well as Bishkek and Osh cities – two cities governed directly by the central government; 40 rayons (without urban rayons) that include 444 ayil keneshes (rural councils); 1,906 settlements, out of this number there are 25 towns and cities in Kyrgyzstan (including the above-mentioned) and 28 urban-type communities under oblast and rayon governance.
Fig.2.2. Administrative division of the Kyrgyz Republic
2.2. Geography
The Kyrgyz Republic is situated on the north-eastern part of Central Asia and in the center of Eurasia. The total area of the Republic is 187.5 thousand km² (the area of the Republic after boundary delimitation with the People’s Republic of China has been determined according to the map ‘Kyrgyz Republic’ - scale 1:500 000, Bishkek: Goskartografia, 2004). The territory of the Republic is 900 km from West to East and 450 km from North to South. The Kyrgyz Republic is bordered by the Republic of Kazakhstan, the People’s Republic of China, the Republic of Tajikistan and the Uzbek Republic. It has delimited boundaries with the People’s Republic of China and the Republic of Kazakhstan; the boundary delimitation with the Republic of Tajikistan and the Uzbek Republic has not been completed.
The Kyrgyz Republic is located at the juncture of two mountain systems (the Tien Shan and the Pamirs). The highest point of the Republic is Victory Peak (7,439 m), the lowest area is a transboundary crossing of the Naryn river at 480 m above sea level. The average elevation of the territory of the Republic is 2,630 m above sea level. About 93 percent of its territory lies at an elevation higher than 1,000 m; 85 percent lies higher that 1,500 m and about 42 percent lies higher that 3,000 m above sea level.
The variety of climatic and natural conditions and landscapes of mountainous Kyrgyzstan can be classified as four climatic zones.
Valley-submountain zone (from 900 to 1,200 m) is characterized by hot summer, Intermountain trough. Photo R. Slaba

33
snowless and temperate winter with significant lack of precipitation. The total of cumulative positive temperatures for this zone equals to 3,600 – 4,900°C.
Mountain zone (from 900 – 1,200 to 2,000 – 2,200 m) has typical temperate climate with warm and relatively sufficiently damp summer; temperate, cold stable and snowy winter. The total of accumulated positive temperatures for this zone equals to 2,700 – 4,000°C.
High-mountain zone (from 2,000 – 2,200 to 3,000 – 3,500 m) has cool summer and cold winter without much snow. Temperature of July here equals to 11 - 16°C. Extended winter lasts from November to March. January temperature is 8-10°C below zero, other cold months of the year have temperature minus 3-7°C. In the upper part of this zone a frost-free period is reduced to three-four months and even less, the frost-free period can be reduced to zero if we move higher, i.e. there is some frost during the warmest summer days here. The total of accumulated positive temperatures for this zone equals to 600 – 2,600°C.
Nival belt zone (from 3,500 m and higher) has severe and very cold climate. This is a belt of snowfields, rocks and glaciers, a belt of moisture accumulation. Even the lowest parts of this belt the average July temperatures do not exceed 4-7°C, while January temperatures go down to 19-22°C below zero. The total of accumulated positive temperatures for this zone equals to 600-800°C.
Only 20 percent of the territory of the Republic can be classified as an area of comfortable habitation (Table 2.1). The majority of population lives here, its economical activity is located here as well.
About 50 percent of the territory classified as an area of non-compensated discomfort. Only mining enterprises run their activity here on the permanent basis, while other economical activity is only of seasonal type.
Table 2.1. Bioclimatic subdivision of the Kyrgyz Republic territory
Bioclimatic ZonesBiological Indicator of meteorological
severity, points
Territorial coverage of zones,
percentZones according to altitude
Comfortable 10 – 8.0 1.7 Low altitude
Relatively comfortable 7.9 – 7.0 16.7 Low and medium altitude
Relative and compensated discomfort
6.9 – 4.0 35.8 Medium altitude, rendered habitable
Noncompensated discomfort 3.9 and lower 45.8
High mountains rendered habitable, nival areas non-
inhabitable high mountainous areas
Source: Institute of Physiology and Experimental Pathology, Kyrgyz National Academy of Science
2.3. Demography
The Kyrgyz Republic has a population of 5,166.4 thousand people as on 1 January 2006. The population is distributed unevenly (Fig.2.3). The urban population makes 35 percent while 63 percent out of this number are able-aged people (men of age
Khan-Tengri Peak. Pic. By N. Kuznetsov

34
from 16 to 59, women of age from 16 to 54). The rural population makes 65 percent, 55 percent of this number are able-aged people. In 2005, the natural increase of population made 11.7 people per 1,000 people in urban areas, and in rural areas it was 15.5 people. There are more than 90 ethnic groups live in the Kyrgyz Republic. In the beginning of 2006 there were 68.4 percent ethnic Kyrgyz people, 14.3 percent - Uzbeks, 9.5 percent - Russians. The amount of Hui (Doongans, or Chinese Muslims), Uighur and Tajik ethnic groups was about 1 percent each, other ethnic groups was less than 5 percent. Average annual increase of the resident population of the Republic was 0.94 percent during the period 2001 – 2006.
Fig.2.3. Density of resident population in the Kyrgyz Republic
Figure 2.4 shows the age structure of the population in the Kyrgyz Republic at the end of 2005.
Menfolk Womenfolk
Age, ears
300 300200 200100 1000 0
>10095-9990-9485-8980-8475-7970-7465-6960-6455-5950-5445-4940-4435-3930-3425-2920-2415-1910-14
5-90-4
Fig.2.4. Age structure of population in Kyrgyzstan, end of 2005, thousands peopleSource: Kyrgyz Republic National Statistical CommitteeAccording to the first national census (1999) there were 4.43 people in one house,
this indicator has a decreasing trend. 73.5 percent of people lived in the houses with furnace heating.
35
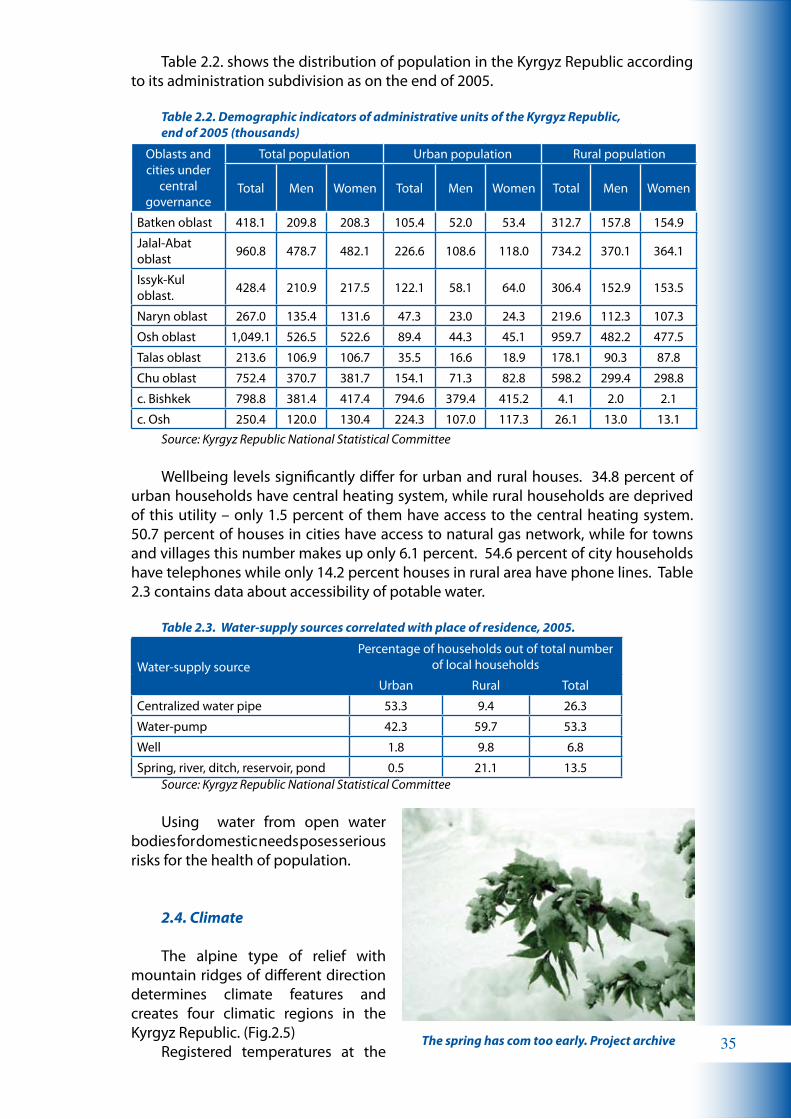
Table 2.2. shows the distribution of population in the Kyrgyz Republic according to its administration subdivision as on the end of 2005.
Table 2.2. Demographic indicators of administrative units of the Kyrgyz Republic, end of 2005 (thousands)
Oblasts and cities under
central governance
Total population Urban population Rural population
Total Men Women Total Men Women Total Men Women
Batken oblast 418.1 209.8 208.3 105.4 52.0 53.4 312.7 157.8 154.9
Jalal-Abat oblast 960.8 478.7 482.1 226.6 108.6 118.0 734.2 370.1 364.1
Issyk-Kul oblast. 428.4 210.9 217.5 122.1 58.1 64.0 306.4 152.9 153.5
Naryn oblast 267.0 135.4 131.6 47.3 23.0 24.3 219.6 112.3 107.3
Osh oblast 1,049.1 526.5 522.6 89.4 44.3 45.1 959.7 482.2 477.5
Talas oblast 213.6 106.9 106.7 35.5 16.6 18.9 178.1 90.3 87.8
Chu oblast 752.4 370.7 381.7 154.1 71.3 82.8 598.2 299.4 298.8
c. Bishkek 798.8 381.4 417.4 794.6 379.4 415.2 4.1 2.0 2.1
c. Osh 250.4 120.0 130.4 224.3 107.0 117.3 26.1 13.0 13.1Source: Kyrgyz Republic National Statistical Committee Wellbeing levels significantly differ for urban and rural houses. 34.8 percent of
urban households have central heating system, while rural households are deprived of this utility – only 1.5 percent of them have access to the central heating system. 50.7 percent of houses in cities have access to natural gas network, while for towns and villages this number makes up only 6.1 percent. 54.6 percent of city households have telephones while only 14.2 percent houses in rural area have phone lines. Table 2.3 contains data about accessibility of potable water.
Table 2.3. Water-supply sources correlated with place of residence, 2005.
Water-supply sourcePercentage of households out of total number
of local households
Urban Rural Total
Centralized water pipe 53.3 9.4 26.3
Water-pump 42.3 59.7 53.3
Well 1.8 9.8 6.8
Spring, river, ditch, reservoir, pond 0.5 21.1 13.5Source: Kyrgyz Republic National Statistical Committee
Using water from open water bodies for domestic needs poses serious risks for the health of population.
2.4. Climate
The alpine type of relief with mountain ridges of different direction determines climate features and creates four climatic regions in the Kyrgyz Republic. (Fig.2.5)
Registered temperatures at the The spring has com too early. Project archive

36
surface layer are correlated with altitude of the location above sea level. (Fig.2.6)According to estimate meaning of elevation of zero averaged annual temperature
and reduced to sea level temperature, the south-western region is the most “warm” one. Higher readings of reduced temperature for north-eastern climatic region are anomalous because Issyk-Kul Lake plays role of temperature buffer for its coastal zone.
Fig.2.5. Climatic zones of the Kyrgyz Republic and localization of weather-stationsSource: Kyrgyzidromet
Tem
pera
ture
(ºС
)
Altitude above sea level (m)
0 500 1000 1500 2000 2500 3000 3500 4000
Fig.2.6. Correlation of averaged annual temperature for several years at surface layer with altitude above sea level for various climatic regions: 1 – North-western, 2 – North-eastern, 3 – South-western, 4 – Central Tien-Shan.Source: Kyrgyzidromet
Annual precipitation total differs within broad range in all climatic regions. Averaged readings of annual precipitation total in all climatic regions are comparable: North-western region - 456 mm, North-eastern region – 421 mm and South-western region – 521 mm. The higher readings in the South-western climatic region reflect the higher moister transfer by western air streams. Low annual precipitation amount in the internal Tien-Shan (294 mm) is explained by location of the region under the wind shadow of north-western moisture-laden air flows.
The annual total of precipitation does not show any stable correlation with the elevation above sea level. The North-western region displays some relation between increase of the precipitation total and elevation.

37
2.5. Natural resources
Land and water resources are the most significant resources for social production in terms of climate dependency.
2.5.1. Land resources
Land distribution in the Kyrgyz Republic is shown in Table 2.3. The percentage of irrigable lands is 67 percent of plough-lands total. There are 0.247 ha of plough land per capita in the Republic; 0.167 ha of this amount are irrigable lands.
Table 2.3: Land resources of the Kyrgyz Republic
Type of lands1990 1995 2000 20051)
thousand ha
thousand ha
thousand ha
thousand ha %
Lands in administrative boundaries 19,995.0 19,995.0 19,995.0 18,751.8 100.00
Lands in agricultural use including plough-lands 10,495.2 10,779.9 10,801.3 10,013.5 53.40
Arable lands 1,363.1 1,408.2 1,367.5 1,284.6 6.85
Including irrigable lands 1,056.9 936.3 931.0 867.1 4.62
Permanent plantations 65.2 69.9 67.9 71.5 0.38
Fallow land 11.9 20.1 21.3 35.5 0.19
Hayfield 207.7 164.4 169.4 172.0 0.92
Pastures 8,847.3 9,117.3 9,175.2 8,449.9 45.06
Lands covered by trees and shrubs 1,123.3 1,043.0 1,054.7 1,056.8 5.64
Including forest reserves 839.0 845.6 855.7 875.6 4.67
Lands under buildings 89.6 107.0 109.1 121.2 0.65
Lands under water reservoirs, including 875.7 875.7 875.7 875.7 4.67
Lakes 677.0 677.0 677.0 677.0 3.61
Mashes 5.6 5.6 5.6 5.6 0.03
Other lands 7,411.2 7,189.4 7,154.2 6,684.6 35.65
Including lands under glaciers 810.7 810.7 810.7 556.2 2.971) Changes of the territory of the Republic due to boundary delimitation with China evaluated according the map of Kyrgyz Republic, scale 1:500 000, Bishkek: Gosrartografia, 2004Source: Kyrgyzgiprozem
The quality of soil differs from grey-brown desert type to chernozem-forest type in spruce forests. Foothill valleys and inter-mountain valleys are areas of permanent residence and economical activity; the soil here belongs primarily to various types grey soils and grey-brown desert type soils of mountain-valley classification. The soils here contain from 0.8 to 2.5 percent of humus, only eastern area of Issyk-Kul valley has mountain-valley type of light-brown soils with humus content form 2.6 to 3.4 percent and dark-brown soils with humus up to 6 percent.
2.5.2. Forest resources
According to national forest registry of the Kyrgyz Republic (2003) the area of land under forests (forest reserves) was 8,649 km², area of other forest related lands was 3,089 km² (non-closed forests, nursery forests, plantations, sparse forests and other lands suitable for reforestation).

38
Vertical stratification and variety of climatic zones caused significant diversity of tree species in the forest reserves, on one hand, and, on the other hand, low percentage of forest lands in the country (4.6 percent). There are 30 species of forest trees common for middle latitudes: conifers, hard-leaved trees, soft-wooded broad leaf trees, chestnut trees, fruit, large fruit trees and more than 17 types of shrubs. Different combination of species creates wide diversity of forest ecosystems: juniper and spruce at high altitude, chestnut ecosystem - at middle altitude and flood-plain type - at foothills. Juniper and spruce forests represent about half of the forests in the country. Nut tree forests cover about 10 percent of the area covered by forests. The prevailing type of tree and shrub vegetation in the Kyrgyz Republic has low ration of biomass growth, therefore the country has relatively low capacity for fixing carbon due to increased forestation.
The long-run objective for the State Forest Service is to increase the forest cover up to 6 percent by 2025 - 2030, which means expanding the forest areas by 289 thousand hectares compared to 2003. If this goal is to be achieved the additional annual carbon sink in forest reservoirs in 2030 was estimated to be 341 Gg in CO² equivalent.
National capacity to increase the forest cover was estimated by experts in a rather wide range. The most realistic is the assessment of increasing the forest area up to 8 percent, which means an increase in the area covered by forests by 664 ha compared to 2003. In achieving this goal the additional annual carbon sink in forest reservoirs was estimated to be 784 Gg CO²
2.5.3. Water resources
Water resources of the Republic are used for irrigation, industrial and residential water supply, for power generation. The water resources are accumulated in glaciers, lakes, rivers and as underground water.
Glacier volume estimated 417.5 km³ in the year 2000. According to data of mathematic-cartographic modeling performed in the middle of 70th by the end of the century the glaciers lost about 15 percent of their volume.
There are 1,923 lakes in the Kyrgyz Republic. The biggest lakes are Issyk-Kul, Son-Kul, Chatyr-Kul. Tien-Shan mountains have ‘syrts’ – wide and leveled intermountain troughs located at 3,000 m above sea level and higher, these troughs have typical glacier-accumulative relief. Permafrost zone starts at this altitude, the relief here has thermokarst features. Tien-Shan mountains have 1,677 high altitude small lakes at the elevation above 3,000 m. Water reserves contained in the lakes of the Republic estimated as 1,745 km³ and 1,731 km³ of the water volume is in Issyk-
Spruce young growth. Photo R. Slaba
Mountain river. Photo R.. Slaba

39
Kul Lake. Issyk-Kul Lake water is salty and cannot by used for water supply.
The mountainous relief of the Republic formed well developed river network. There are about 5,000 rivers in the Republic, these rivers relate to eight hydrogeologic basins. The hydrological basins belong to rivers Syr-Darya, Amu-Darya, Chui, Talas, Ili (Kar-Kyra), Tarim and two closed lakes – Issyk-Kul and Chatyr-Kul. The latter are closed basins and river flow there makes 3.5 percent of river flow from the territory of the Republic, the other basins are transboundary basins. Total averaged annual river flow from the territory of the Republic for many years equaled 48.6 km³ in the year 2000. The average annual river flow became 2.9 km³ bigger or displayed 6.4 percent increase. The percentage of river flow during vegetation period is averaged to 74 percent and 26 percent during fall-winter and early spring seasons. 20 – 25 percent of river flow is used for domestic water consumption while the rest of river flow goes to the territories of neighboring states: Uzbekistan, Kazakhstan, Tajikistan and China.
Potential fresh water underground reserves of the Kyrgyz Republic estimated as 13 km³. These underground reserves are located in intermountain troughs, these territories are the most economically developed. Useful ground water resources under commercial recovery classification make 16 million m³ a day or more than 5 km³ a year. Total consumption ground water withdrawal makes about 5 percent of the resources.
In 2000, there was 2,300 m³ potentially available consumption of fresh water per capita, it is higher that minimum required water consumption threshold according to UN data.
2.5.4. Hydropower resources
In the end of 20th century the total of hydropower potentiality of the Republic’s 268 rivers, 97 biggest channels and 19 water reservoirs was estimated as 28,828 thousand kW of power capacity and 249 billion kWh (896.4 PJ) of power output in a year of medium water availability. Naryn River basin has 44 percent of hydropower resources of the Republic, Ferghana valley - 23 percent, Chui river basin - 8.1 percent, Sary-Jaz river basin - 6.6 percent and the other basins contain 18.3 percent.
Technically available capacity is about 20 percent of the total capacity and by the end of the 20th century according to rough assessment it was estimated at 5,500 – 5,800 MW with established overall generating capacity of 2,950 MW. Due to the change of surface water-flow (see Section 5.2.1.2), short-term increase in capacity by 5 -10 percent can be expected by 2020 - 2025 estimates. During this period, in accordance with state program “The Main Areas for Prospective Development of Power Energy in the Kyrgyz Republic till 2025” it is planned to add from 2,660 to 3,660 MW of generating capacity (Tables 6.3, 6.4). 50 percent of capacity utilization gives manufacture of 11.6 to 16.0 billion kWh (41.8 - 57.6 PJ) of electricity per year. But
Reservoir is full. Electrical Station Ltd archive
40
after the 2020 - 2025 the water-flow may decrease, which will reduce the capacity of hydroelectric power generation.
Under the National Energy Program it is planned to restore 39 small power plants that existed before and to build the new ones. For the beginning of 2008 there are more than 10 micro-hydro power plants in the republic.
2.5.5. Fuel and energy resources
Probable reserves of 70 coal deposits in the Kyrgyz Republic estimated as more than 2.2 billion tones with reserves of 1,316.9 million tones (750.7 TOE) on 1 January 2006. Maximum output of coal mining was reached in 1979 – 4,508 thousand tones. Starting from 1980 gradual decline of coal output took place – down to 3,148 thousand tones in 1991. Coal production slump occurred after 1992, output in 2006 was 314.3 thousand tones. Main cause of the production decline was economical and administrative circumstances. Transition to market economy triggered the growth of power price, related consumables and services. As a result, the coal industry deprived of subsidies found itself incapable to maintain equipment basis of coal mining in operating conditions. The halt of underground mining brought underground workings to unoperational status. The Republic suffers a permanent deficit of coal for its economy, at the same time increased coal delivery prices significantly reduce markets.
There 15 developed oil and gas deposits in the Republic, recoverable oil reserves of these deposits estimated as 11.6 million tones (16.6 million TOE) and recoverable natural gas reserves – 4.9 billion m³ (5.6 million TOE). According to forecast estimate resources of undiscovered oil and gas reserves in the Kyrgyz Republic are about 289 million tones. The oil and gas production is of insignificant volume. Between 1991 and 2007 oil production became 2.2 times less (to 70 thousand tones) and gas production became 6.4 times less. 19.4 million m³ of natural gas was produced in 2006.
The Republic’s self-sufficiency with its own oil products and natural gas is less than 5 percent and it is heavily dependent on external supplies of oil and natural gas.
In general, the Kyrgyz Republic’s self-sufficiency with fuel and energy resources was estimated at 77.57 percent as of 2005. Availability of other energy resources is provided in Table 2.4.
2.5.6. Renewable energy sources
The potential unconventional energy sources of renewable energy, which are available at the current level of technological development is represented by solar and wind, geothermal energy and biogas. Unconventional renewable energy sources include hydropower resources of small watercourses also, as described in Section 2.5.4.
In the Kyrgyz Republic, the direct solar radiation in mid day at an altitude of 2,000 meters above sea level, in permanent residence area of population ranges from 0.3 - 0.4 kVt/m² in winter to 0.6 kVt/m² in summer (from 2.19 - 2.72 kW in winter to 6.53 – 6.75 kW in summer per day). The average annual sunshine is 2,500 – 2,600 hours. 1 m² of solar thermal collector can provide 500 - 600 W/hour in summer and 300 - 400 W/hour in winter and can generate 1,028 – 1,278 kWh (3,700 – 4,600 MJ) of energy per year. There are the examples of successful use of solar thermal collectors in the Republic, particularly in rest houses and resorts of the Issyk-Kul Lake. According to the data of Center on Renewable Energy Use (Kyrgyz Republic National Academy of

41
Science), in 2006 there have been installed about 60 thousand m² of heat panels and about 25 thousand m² of them is now in operation. To assume that in 2100 the rate of supply with residential areas will remain unchanged and the total area of solar thermal collectors will be 0.5 percent of the residential developments, the total area of the reservoirs could amount to 258.5 thousand m² and captured solar energy will be 265.7 - 330.4 million kW per year (955 – 1,190 TJ).
Table 2.4. Availability of energy resources in 2005
Name of fuel-energy resource Unit Mined /
produced Import Export
Availability of own
resources %
Coal thousand tones 335.27 981.26 8.86 26.72
Firewood thousand m³ 3.28 0.00 0.00 100.00
Oil thousand tones 77.89 5.14 0.00 97.05
Natural gas million m³ 25.10 711.10 0.00 4.00
Hydropower million kWh 13,987.55 0.00 2,685.20 100.00
Metallurgical coke thousand tones 0.00 1.63 0.00 0.00
Fuel oil thousand tones 41.70 14.01 10.24 73.73
Heating oil thousand tones 0.03 0.00 0.00 14.15
Diesel fuel thousand tones 31.40 122.94 19.14 25.25
Gasoline thousand tones 13.18 273.58 5.39 4.86
Illuminating oil thousand tones 0.00 0.00 0.00 0.00
Light distillate thousand tones 0.00 2.71 0.00 0.00
Liquefied gas thousand tones 0.00 6.94 0.00 0.00
Aviation kerosene thousand tones 0.00 210.72 84.77 0.00
Bitumen thousand tones 0.00 14.63 0.40 0.00
Lubricating oil thousand tones 0.00 9.05 0.00 0.00
Wind energy potentiality in the Republic is low. The zone of permanent residence month averaged windspeed in no more than 2 – 2.5 m/sec. Winter season recurrence of wind with 0 – 1 m/sec is 50 percent and higher. Only the area around Balykchy weather-station has spring and fall-time monthly averaged windspeed 4.0 – 4.8 m/sec, the number of days with windspeed 8 m/sec and higher is 171. There are 125 days with windspeed 8 m/sec and higher in the area of Karakol weather-station. Stable wind of 4 m/sec speed can be detected at the watersheds far from the locations of permanent residence. There were 16 wind-generators with 16 kW power output in 2005.
The biogas technology development in the Republic is initiated mostly by individual enthusiasts and private firms. In 2005, there were 24 operating biogas plants in the Republic with a total volume of 2,050 m³, 8 reactors of which having a capacity of 100 m³ or more. Reactors process about 5 -7 tons of manure in terms of dry matter per year. Their total capacity is estimated at 1,247 – 1,696 m³ of biogas or 8,050 – 10,900 kW (29 - 39 GJ) per year. National capacity for production of biogas in 2100 was estimated by experts at 1,200 – 1,600 tons of agricultural organic waste (manure and manure stored in solid form in the storage systems or in pens in the farm) in terms of dry matter, in addition crop residues and organic portion of solid waste can also be used for production of biogas. Processing of 1 kg of dry matter gives 0.25 - 0.34 m³ of biogas containing 70 percent of methane (“Biogas Technology in Kyrgyzstan”, Bishkek, 2006). If by 2100 the waste is used at 50 percent, the production of biogas in 2100 may total about 200 thousand m³, which is equivalent to about 5 TJ of energy. Realization of this potential requires a total capacity of reactors at 103 thousand m³.

42
The prospects of geothermal energy utilization are determined by the depth of 100°C geothermal layers. Tien-Shan is an Alpine mountain system with high seismic activity and heterogeneous structure of the earth’s crust. Therefore the geothermal flow alternates its location. Average meaning of geothermal flow in the Republic equals to 55 mW/m² with range of changing from 13 to 134 mW/m². Average gradient meaning at 1 km deep is 25°C/km, while range of changing is from 7 to 40°C/km. In general, there is an increase of geothermal gradients from South to North and from West to East. High geothermal gradients of 30– 40ºС/km and higher were found in Talas-Chatkal-Kuramin and Eastern-Kyrgyz anomalous zones. North-Chui and Bar-Barskoon areas of Eastern-Kyrgyz zone have the closest to the surface isotherm 100ºС occurrence at 2.5 km. This depth is currently accessible. The isotherm 100ºС depth of occurrence in Talas-Chatkal-Kuramin zone is 3 km and more (Fig.2.7).
Present days, the geothermal energy of hot wells and well-springs are in use only for balneal purposes. The projects of economical use of geothermal energy have not been realized.
Fig.2.7. Map of +100°C isotherms, depth of °Ccurrence is given in km. Symbols: NCh – North-Chui, BB – Bar-Barskoon areas of minimum depth of isotherm layers. Source: Institute of Seismology, Kyrgyz National Academy of Science
2.6. Economy
The social and economical development of the Kyrgyz Republic can be broken down into two phases – the first phase covers the years from 1991 to 1995 and the second – from 1996 to 2006. The first phase was a period of significant fall of economic activity, particularly, industrial activity. It led to abrupt decline of GDP in 1995 when GDP made 50.7 percent of the 1990 level (expressed in prices of 1990). That decline included the fall of industrial production down to 33 percent, agriculture – to 45 percent, transport – to 88 percent, services – to 61 percent of 1990 GDP.
The second phase was a period of GDP growth in real estimate (prices of 1990). By 2005 the GDP achieved 80 percent of the respective meaning of 1990 (Fig.2.8). At the same time gross industrial product came to 53.9 percent, construction – to 46 percent, agriculture – to 103.8 percent and transport – to 130.9 percent. The services made 6.5 as much comparing to 1990. The second phase was a period of economical stabilization. The state of economy in 1990 – 2005 can be represented by the dynamic of the index of consumer prices (Table 2.4) and real GDP (prices of 1990). The break down of sectors of national economy shows the stable growth of services sector of GDP structure.

43
Table 2.4. Index of consumer prices in 1990 – 2005
Year Index of consumer prices Year Index of consumer prices
1990 2.100 1999 1.399
1991 2.790 2000 1.096
1992 13.587 2001 1.037
1993 14.660 2002 1.023
1994 1.814 2003 1.056
1995 1.319 2004 1.028
1996 1.350 2005 1.049
1997 1.147 2006 1.051
1998 1.184 2007 1.201 Source: Kyrgyz Republic National Statistical Committee
80
100
70
70
605040302010
industry construction transport & communication
agriculture trade & public catering rest kind of business
1990 1991 1992 1993 1994 1995 1996 1997 1998 1999 2000 2001 2002 2003 2004 20050
Fig. 2.8. Dynamics of real GDP in 1990 – 2005 (prices of 1990)Source: Kyrgyz Republic National Statistical Committee
The key indexes of living standards in the Kyrgyz Republic (at the end of 2005) are given in Table 2.5.
2.7. Agriculture
The agriculture is a factor of food security. Between 1990 and 2005, the share of the agriculture in the GDP was about 30 percent. Plant cultivation took 54.4 percent of the agriculture input into GDP, and cattle-breeding provided 43.9 percent accordingly. Participation of services, forestry and hunting in agriculture input was insignificant.
The agriculture is climate dependant branch of business activity. Its productivity and especially productivity of plant cultivation depends on annual climatic conditions: total of precipitation and humidity, seasonal distribution of precipitation and moisture readings during vegetation period. The agriculture productivity can be negatively affected by draught, hail, strong wind and other weather phenomena. That is why the productivity of some cultures varies from year to year. At the same time the dynamic of gross output indicates the tendency of agriculture growth. Plant cultivation and cattle breeding display stable growth trend (Fig.2.9).
The wheat. Photo S. Korchueva

44
Table 2.5. Living standards indexes in the Kyrgyz Republic (at the end of 2005)
Index Value
GDP nominal, million Kyrgyz Soms 100,899.3
Percentage of GDP:
agriculture 28.6
industry and construction 20.0
services 40.7
GDP per capita, thousand Kyrgyz Soms 19.62
Kyrgyz Som – US$ exchange rate 41.0
Import, million US$ 1,101.3
Export, million US$ 672.0
Actual consumption per capita, thousand Kyrgyz Soms a year 18.3
Cash income per capita, thousand Kyrgyz Soms a year 11.5
Average monthly accounted payment per employee, Kyrgyz Soms 2,612.5
Average monthly accounted pension per pensioner, Kyrgyz Soms 729.0
Minimum Consumer Budget (MCB) per capita, Kyrgyz Soms a month 1,836.6
Cost of MCB Food Basket, Kyrgyz Soms a month 1,336.9
Amount per 100 households: radio sets, units 14
TV-sets, units 102
tape recorders, videorecorders, units 53
photo cameras, units 8
laundry washers, units 50
refrigerators, unites 70
vacuum cleaners, units 15
cars, units 10
Number of employed, thousand people 2,077.1
Employment level of able-bodied citizens, percent 66.8
Income comparison of 10 percent of the most and the least profitable citizens, times 17.5
Distribution of total volume of cash income of 20 percent groups, %:
1st group (the lowest income) 4.9
5th group (the highest income) 48.8
Gini coefficient (consumption) 0.271Source: Kyrgyz Republic National Statistical Committee
170160150140130120110100
9080706050
1990 1991 1992 1993 1994 1995 1996 1997 1998 1999 2000 2001 2002 2003 2004 2005
Plant groving Stock
Fig. 2.9. Production dynamics of agriculture branches as a percentage of 1990 levelSource: Kyrgyz Republic National Statistical Committee
The data on plant cultivation and cattle breeding production in the Republic is presented in Table 2.6 and Table 2.7.

45
Out of the mentioned here cultures only sugar-beet suffered rapid decline. The production of other cultures varies insignificantly.
Table 2.6. Gross production of main crops in 2005, thousand tons
Production Harvested area, thousand hectares
Gross yield, thousand tons
Gross output, million Kyrgyz Soms 1)
Plant cultivation 34,496.3
Grain (weight after processing), including: 1,667.4 10,677.9
Wheat 423.8 950.1
Barley 102.2 213.5
Maize grain 72.6 437.3
Rice 5.9 17.1
Leguminous grain 24.6 45.9
Oats 1.4 3.0
Raw-cotton (registered weight) 45.5 118.1 1552.6
Tobacco (registered weight) 5.6 13.4 286.9
Sugar-beet (refinery) 14.3 288.8 329.7
Potatoes 76.0 1,141.5 5,603.7
Vegetables 40.6 736.6 4,821.4
Melons and gourds 4.5 85.8 609.7
Fruits and berries 146.7 2,383.31) Here and in Table 2.7 the price of gross production is expressed in prices of 2005Source: Kyrgyz Republic National Statistical Committee
Table 2.7. Cattle breeding production, 2005
Production Produced Gross output, million Kyrgyz Soms
Cattle-breeding 27,829.0
Meat (slaughter weight), thousand tons, including: 181.7 16,940.6
Beef and veal 90.8
Mutton and goat meat 46.4
Pork 18.7
Horse-flesh 20.2
Poultry 5.4
Fresh milk, thousand tons, including 1,197.6 8,946.1
Cow’s milk 1,151.4
Mare’s milk 39.0
Goat’s milk 8.2
Eggs, millions, including 317.3 938.7
Hen’s egg 316.0
Wool (actual weight), tons, including: 10,596.0 239.2
Sheep wool 9,980.0
Goat wool 616.0Source: Kyrgyz Republic National Statistical Committee
Private agricultural producers (farms and individual households) make prevailing input into gross agricultural product in amount of 95 – 98 percent. At the same time

46
the share of farms in plant cultivation evidently prevails (70 – 72 percent), while cattle breeding prevail to a certain extent over input of individual agricultural producers (53 – 58 percent).
2.8. Food securityThe data on food consumption in the Kyrgyz Republic in 2005 is given in Table 2.8.
Table 2.9 shows data on food availability.
Table 2.8. Standard and actual food consumption in 2005.
Food itemAverage consumption per capita, kg a month
Minimum standard1) Actual
Bread of all kinds (converted to grain) 7.43 15.9
Potatoes 4.78 11.9
Meat and meet foods 3.26 3.1
Sugar and confectionary 1.81 1.5
Vegetables, melons and gourds 12.53 10.9
Fruits and berries 9.37 2.5
Milk and diary products 15.40 17.5
Eggs, pieces 13.83 4.9
Vegetable fat 0.80 0.4
Nutritive value, Kilo-calories 2.249 2.1251) Minimum standards of food consumption approved by Jogorku Kenesh of the Kyrgyz Republic in 1995.Source: Kyrgyz Republic National Statistical Committee
Table 2.9. Assessment of availability of main food items in 2005.
Food item Consumed, thousand tonnes
Net import, thousand tonnes
Availability of domestic resources, %
Bread of all kinds (converted to grain) 982.8 224.8 77
Potatoes 735.8 -0.5 100
Meat and meet foods 193.9 12.6 94
Sugar and confectionary (converted to sugar) 92.5 30.4 67
Milk and diary products 1,083.0 -28.7 103
Vegetable fats 22.4 12.1 46
Fruits and berries 156.9 29.0 82
Vegetables, melons and gourds 672.2 -28.6 104
The daily nutrition rate accepted in the Republic makes 75 percent of the standard recommended by WHO (3,000 kcal). The actual average daily nutrition consumption in the Republic exceeded the minimum standard daily rate according to WHO (2,100 kcal a day), while south regions displayed lower readings – 1,828 kcal in Jalal-Abad oblast and 1,990 kcal in Batken oblast. On the whole, the availability of food in the Republic should be considered as safe enough. The deficit of domestic grain resources can be replenished by growth of local crop capacity – the crop capacity in the collective farms of the recent past and information about crop capacity development in the development countries prove that. Certain improvements can be reached due to adjustment of crop structure and alternation of consumption.

47
2.8. Industry
The period between 1990 – 1995 displayed not only significant reduction of industry input into GDP of the Republic, but also drastic restructuring of the of industrial production. Before 1990 the main part of the industrial production was represented by machinery construction, production of electrical equipment and electronics, while production of light and processing industry played auxiliary role. The economics of the Republic stabilized after 1995, when to top position in the production of industry products was taken by the light and processing industry. After putting into operation of Kumtor gold-mining processing complex, the input of metallurgical industry into Republic’s economics significantly increased.
13.7%
1.8%
4.8%
1.1%
4.4%
16.0%
19.8%
38.4%
Metullrgy (Au, Sb, Hg)
Energy, natural gas and water production
Toodstuffs, beverage and tobacco
Texstile and clothing manufacture
Oil products production
Electrical and electronic equipment
Mining industry
Other industries
Fig.2.10. Structure of industrial production in the Kyrgyz Republic, 2005.
The current state of industrial production can be described as unstable due to low industry diversification. Three quarters of the industrial production produced by the following branches of industry – metallurgy (mainly gold production), electrical power, natural gas, food items, beverages and tobacco production. At the same time, the only one gold-mining enterprise produces prevailing part of metallurgical industry product. The only enterprise (Kant Cement and Roofing Slate Complex) gives main part of produced mineral products. Advanced technology products of machinery, electrical equipment and electronics make less than 5 percent of gross industry production.
There is no noticeable development trend in the industrial production of the Republic within recent five years. The production volume stays at the level of 37.7 – 40.7 billion Kyrgyz Soms in comparable prices.
2.8.1. Power industry
The position of power industry in the industrial sector has suffered minor alterations. The production basis of the power sector consists of 17 power stations. This number includes 15 hydro-power stations of 2.95 million kW of installed capacity, two heat and power plants of 0.73 million kW and more than 70 thousand km power lines of 0.4÷500 KV. 546 km of this number are power lines of 500 KV capacity; 1,714 km power lines of 220 KV capacity and 4,380 km of 110 KV power lines. There are about 490 transformer substations with voltage of 35÷500 KV each and total capacity of more than 8 million kW.
In 2005, this sector produced 15,346 kWh (55.24 PJ) including 91 percent produced by hydro-power stations, 8.9 percent produced by heat and power stations and 0.1 percent - by renewable energy sources (URES). Power consumption made 1,351 kWh per capita.

48
2.8.2. Heat supply
The heat energy in the Republic is produced by heat-power stations and boiler plants that belong to Joint Stock Company “Electrical Stations” and “Kyrgyzjilkommunsoyuz”. The heat energy is produced by municipal, departmental boiler stations and houses with furnace heating. Currently the centralized heat supply exists only in 4 cities of the Republic: c. Bishkek has heat supply coverage – 85 percent of housing, c. Osh – from 35 percent to 40 percent, c. Kyzyl-
Kiya – 60 percent and c. Karakol 26 percent. 3,523 thousand Gcal (14.76 PJ) of heat energy were produced by heat-power stations, enterprises of Joint Stock Company “Electrical Stations” and “Kyrgyzjilkommunsoyuz” in 2005. 93.8 percent of heat energy was produced by fuel heat generating enterprises; 2,404 Gcal (68.2 percent) was produced by heat-power stations, 900 thousand Gcal (25.6 percent) was produced by boiler plants. The power producing boiler plants produced 219 thousand Gcal (5.2 percent) of heat energy. Information about heat energy produced in the houses with furnace heating, municipal and departmental boiler plants is not available officially.
2.9. Transportation
The state of transportation sector, the dynamics of goods and passenger turnover altogether with macroeconomic indicators are indicators of general state of country’s economy. Mountainous relief of the Republic and lack of navigable waterways predetermined the prevailing role of motor transportation for in-country traffic. Insignificant amount of in-country traffic is carried out by water across Issyk-Kul Lake. External traffic northward (CIS and Europe) is carried out by railway, southward traffic (China) is covered by motor transportation. Air transportation plays insignificant role when it comes to external goods traffic.
Figures 2.11 and 2.12 contain the dynamics of goods and passenger turnover.
Power line. Photo by B. Zhakeev
Fig. 2.11. Goods turnover per type of transportation in the Republic between 1995 and 2000s. Source: Kyrgyz Republic National Statistical Committee
2500
2000
1500
1000
500
0
mill
ion
ton-
kilo
met
ers
1995 1996 1997 1998 1999 2000 2001 2002 2003 2004 2005
RailwayInternal water
AutomobileAir
Pipeline

49
mill
ion
pass
enge
r -ki
lom
eter
s
7000
6000
5000
4000
3000
2000
1000
01995 1996 1997 1998 1999 2000 2001 2002 2003 2004 2005
Railway Bus transport Trolleybus Taxy Air
Fig.2.12. Passenger turnover dynamics per type of transportation (without car transportation) in the Republic in1995-2005.Source: Kyrgyz Republic National Statistical Committee
In 2005, 46 percent of goods turnover was carried out in Chui valley and c. Bishkek (Fig.2.13).
Batken oblast
Jalal-Abad oblast
Issik-Kul oblast
Naryn oblast
Osh oblast
Talas oblast
Chu oblast
city Bishkek
city Osh
Fig. 2.13. Distribution of domestic goods transportation as per administrative units of the Kyrgyz Republic, 2005.Source: Kyrgyz Republic National Statistical Committee
Fig. 2.14 shows availability of means of motor transportation in the Kyrgyz Republic.
400
350
300
250
200
150
100
0
Am
mou
nt o
f aut
omot
or m
eans
, th
ousa
nd u
nits
1990 1991 1992 1993 1994 1995 1996 1997 1998 1999 2000 2001 2002 2003 2004 2005
Motor-transport SpecialPassenger (automobile and buses) Cargo
Fig.2.14. Dynamic of technically available means of motor transport in the Kyrgyz Republic.Source: State Traffic Inspectorate of the Kyrgyz Republic

50
If during recent years the total amount of transportation means has not significantly change, a park of privately owned trucks and buses demonstrate a clear growth trend, while a number of state owned trucks and buses declined (Fig.2.15).
During last ten years the gap between urban and rural living standards deepened, and if the total number of vehicles in the Republic has not changed significantly, the amount of vehicles in cities and towns, and especially in c. Bishkek, significantly increased. There is traffic-jam in the main streets during rush-hours. Due to lack or insufficient amount of parking space at the markets and popular shops the roads turn into narrow lanes and cars hardly can pass one another. Therefore the vehicles move around with often braking and acceleration, increasing this way consumption of motor fuel and, subsequently, emission.
1000.0
100.0
10.0
1.0
0.1
Vahi
cls
num
ber,
thou
sand
uni
ts
Individual automobileState automobile
Individual busesState buses
Individual cargoState cargo
1990 1991 1992 1993 1994 1995 1996 1997 1998 1999 2000 2001 2002 2003 2004 2005
Fig.2.15. Vehicle types dynamics according to ownership classification.Source: State Traffic Inspectorate of the Kyrgyz Republic
Total length of the motor roads of the Kyrgyz Republic is about 340,000 km. The length of public roads is about 18,810 km (Fig.2.16), the others make 15,190 km – these are the roads of cities, towns, villages and roads belong to agricultural and industrial enterprises. The length of international roads is 4,160 km, national roads – 5,680 km, local roads – 8,970 km. The length of paved roads is 7,320 km, gravel surfaced roads – 9,960 km and ground roads – 1,620 km. The mountainous terrain of the Republic complicates road network development of the country.
About 38 percent of the public roads have hard surface, at the same time many of the roads, even the international highways, are in very poor condition. It noticeably increases transportation time, raises traffic accident risks and, finally, leads to rise of transportation cost and reduces business attractiveness of economy.
Reconstruction and rehabilitation of the public roads might allow reduction of transportation cost as well as reduce consumption of motor fuels and, subsequently, reduce greenhouse gas emissions as a result of goods and passenger transportation.
Starting from 2001, the Kyrgyz Republic launched focused actions in order to rehabilitate and develop the network of public roads. At the same time, there was initiated road improvement in the cities, first of all, in the capital of the Republic. National development strategy presupposes rehabilitation and reconstruction of a number of international roads with total length 1,523 km.
City development plans (Bishkek, Osh, Jalal-Abad) include rehabilitation and reconstruction of streets (total length about 1,380 km) and optimization of street

51
traffic. Besides that, the General Development Plan of Bishkek contains plans to build road junctions, flyover crossings and pedestrian subways.
Fig.2.16. Road network of the Krygyz Republic.Source: Topographic map of oblasts. Scale 1:500,000
2.10. Industrial and domestic wastes
2.10.1. Waste dumps
The environmental impact of solid wastes has twofold effect:• thewastedumpsoccupylandsinvicinitywithcities,theselands,asarule,have
been in use or potentially can be used for agricultural purposes;• theindustrialanddomesticwastesdumpedtherecontainharmful,toxicand
poisonous substances, they pose risks of soil contamination, contamination of ground water and air.
The solid domestic wastes are dumped in 31 municipal waste dumps. All waste dumps of the Republic are uncontrolled dumps. There were 1,384 m³ of solid domestic wastes produced in the Republic in 2005. Morphologic content of solid domestic wastes differs in urban and rural areas. Food wastes are feed to animals in the households with domestic animals. Paper scrap, textile and wood wastes are utilized as fuel in the households with furnace heating. The percentage of food waste in urban solid domestic wastes considerably differs depending on the season and usually estimates as 30 – 35 percent; more over, the solid wastes here contain from 25 to 35 percent of paper scrap, textile and wood scrap. Local municipalities are in charge of the dumps of solid domestic wastes.
12 percent of solid domestic wastes in urban areas and 41.3 percent in urban areas are burnt down; correspondingly, 5.8 percent and 30.4 percent are buried.
Three-quarters of solid domestic wastes are wastes with organic components, therefore application of any methods of their utilization leads to reduction of methane emission caused by anaerobic decomposition in the dumps. The most acceptable way of avoiding it, is a selection of garbage components and utilization of those components as secondary raw materials.

52
2.10.2. Tailings
In 2005, the Republic had 44 disposal locations of 81,946.1 toxic industrial wastes. The Republic does not have appropriately facilitated sites for storage and treatment of unusable toxic industrial wastes. Two gold-mining enterprises send cyanide-containing wastes to their tailings facilities. The process of natural decomposition of cyanide produces carbon dioxide. Tailings facilities pose a threat of complex environmental contamination. The risk posed by third tailing dump in the Basin of Maylusuu River (Jalal-Abad oblast) is considered as the highest. The situation worsened because the tailing dump has been used as a storage area for metallurgical uranium ore samples and untreated ores delivered from other countries to Maylusuu uranium processing complex.
2.11. Environment
2.11.1. Soil: status, impact factors , risks
The majority of zones of permanent residence and economic activity have poor soil with low-thickness cross-section and low content of humus, Nitrogen, Phosphorus and Potassium. The soil is very sensible to external impact under arid climate conditions. To maintain crop-producing power of cultivated land require strict implementation of land treatment, agrochemical and irrigation procedures. The system of collective land-utilization collapsed due to change of land ownership type in the agriculture. The development private land ownership brought to life small-plot land utilization, which does not afford practical maintenance of crop rotation procedures and resource-intensive irrigation projects. The maintenance of crop-capacity potential by means of organic and mineral fertilizers is a problem too. There is a noticeable trend of degradation of cultivated lands due to salinization, waterlogging and desertification.
Some of the locations have soil contamination by heavy metals, caused by mining and industrial activities. The most significant locations are
• industrialsiteofHaydarkanMercuryComplexandneighboringareasofBatkenoblast;
• industrialsitesofKyrgyzMiningandMetallurgicalComplexandneighboringareas: town Aktuz (mining and processing complex) and town Orlovka (chemical-metallurgical complex) in Chui oblast.
In the beginning, the Aktuz minining and processing complex produced lead. Starting from 60th of previous century the Kyrgyz Mining-Metallurgical Complex supplied rare-earth metals for needs of USSR industry. There was an accident on the second tailings dump of mining-processing complex – the dam breach and uncontrolled release of hundred thousand m³ of pulp from the processing plant.
The flood of pulp moved along the river bed of Kichikemin river and entered Chui valley, reached Kazakh border, covered fields and orchards of five villages with a layer of slurry. By means of heavy equipment the pulp was collected and returned to the tailing pond. The remains of emergency release were left in the hollows of the surface; these spots have high radioactive readings now – up to 70 mr/hr. The geological and biological survey undertaken in the beginning of 1990th showed that the territory and neighboring areas had been contaminated with lead; the contamination of some spots reached up to three or even ten maximum concentration limits. The medical and biological survey detected high level of iron-deficiency anemia – 80 percent of examined women of childbearing age.
Pesticides belong to the group of persistent organic pollutants. They have never

53
been produced in the Kyrgyz Republic and used to be shipped to Kyrgyzstan under centralized supervision of “Kyrgyzselhimia” (Kyrgyz Agriculture Chemistry) – a former subdivision of “Souzselhimia” (Agriculture Chemistry of the Soviet Union). According to official information no pesticides of the group of persistent organic pollutants have been imported into or re-exported from the Kyrgyz Republic within last 15 years. About 5,000 thousand tons of pesticides were used annually; this number includes the pesticides of the group of persistent organic pollutants – up to 30 percent. The peak utilization of these kind pesticides came to the period 1970 – 1980. In the end of 80th, the chemical substances were utilized to treat about 1 million hectares of crops: cotton, sugar beet, vegetables, tobacco, grain, orchards, vineyards and pastures. The chloride organic pesticides were used for livestock treatment in order to combat ectoparasites.
Dichlorodiphenyltrichlormethylethane was in use for some years after official ban on its application. It was used as a means of pest control and control of plague natural zones in the Republic. From 1971 to 1989 about 1.8 million hectares of plague hot zones were chemically treated.
According to “Kyrgyzgidromet” information, out of 29.9 thousand hectares of test areas 7.6 thousand hectares or 25 percent of examined lands were contaminated by pesticides; it includes contamination higher than maximum concentration limit (0.1 mg/kg). The most contaminated lands are the fields allocated for gardens, cotton and tobacco plantations.
Since 1985 the usage of some types of pesticides has been banned or restricted on the territory of the Kyrgyz Republic. Among those banned were persistent chloride organic pollutants: dichlorodiphenyltrichlormethylethane, hexachlorocyclohexane, dildrin, aldrin, heptachlor and hexachlorobenzene. The most part of those pesticides has been buried in the locations remote from settlements. But the storage facilities, poorly adjusted for storage, decayed or arranged on the former helicopter pads and runways, still have on them banned pesticides and their remains in unlabeled packing. This way, they still pose a threat of pollution to environment and health. The Toxicological Laboratory of the Department of Chemicalixation and Plant Protection of the Ministry of Agriculture, Water Resources and Processing Industry undertook a survey. That survey showed that the level of soil contamination of the territories neighboring or remote to those storage areas exceeded many times the maximum permissible concentration.
In the territory of the republic there have been found more than 1,000 cattle foot-and-mouth disease burial sites. Many of burial grounds are not fenced and have no warning signs. Measures about burial grounds are usually taken by companies after a new incident of infection of cattle disease. Due to lack of regular activities on burial grounds the risk for contact of foot-and-mouth remain high.
2.11.2. Water resources: status, impact factors, risks
An estimated 12 million m³ sewage is produced in the Republic after industrial and domestic use of water. In 2005, only 29 of the 1,906 communities had municipal wastewater treatment facilities and 23.9 percent of the population in the Republic had access to sewer systems (from 80.7 percent in Bishkek to 4.4 percent in Talas region).
At selected sites of groundwater in Bishkek the pollution with nitrogen - decomposed waste of life - has spread to a depth of 100 m and the tendency for distribution of nitrogen pollution to a depth remains high. In Bishkek the supply of drinking water from a number of water wells has been halted because the water in the wells do not meet the quality requirements for the drinking water.

54
There is a high risk of water pollution in the resort area of Issyk-Kul Lake. In recent years, resorts in Issyk-Kul have up to 1 million or more guests annually and this number is constantly growing. Many of these resort houses do not have the treatment facilities.
Water resources in the basins of Naryn, Karadarya, Chu, Talas, Sary-Dzhaz rivers, as well as the rivers in the slopes of the Ferghana Valley and Karkyra river are used by neighbouring countries. Monitoring of water quality at the cross-border river basins did not find pollution that exceeds the maximum allowed norms. Only in Chu (in village Kamyshanovka 6 km above the end of the edge of the river Chu) and Akbura rivers (in cross-border shift), there have been found the pollution exceeding the allowed norms.
The residual quantities of pesticides (from minor to many times exceeding the maximum allowable concentrations) were found in the water of drainage networks, which tend to be released to other water bodies. And this water, especially in southern regions, is used by population for drinking and cooking. The water in drainage networks, usually thrown in the water bodies thus leading up to their pollution.
2.11.3. Air: status, impact factors, risks
The air quality in the Republic is monitored in four settlements: c. Bishkek, c. Osh, cities Karabalta and Tokmok. According to the data of the monitoring, in c. Bishkek, in Eastern Industrial Zone the ambient air during winter time was polluted by suspended matter (primarily ashes); its content very often exceeds permissible concentration limits (the source of emission is Bishkek Heat-Power Station 1). Some of the cross-roads of c. Bishkek display ambient air benzyperene pollution for short period of time during rush-hours, the concentration reaches up 47 permissible limits (source of emission is transport).
The main sources of air pollution in Kyrgyzstan are enterprises of heating and power producing complex including furnace heating of houses and transport. The share of industrial enterprises makes up some few percents of total of all emission.
There are five cities with resident population more than 500,000 people, the area residence with population density higher than 100 people per km² is estimated as 90,000 km² (Fig.2.3.). The existing air quality monitoring network is evidently insufficient.

55
3.1. General information
3.1.1. Methodology
The Inventory has been carried out in compliance with the decisions of the United Nations Framework Convention on Climate Change (17/CP.8 of Guidelines for review of the Parties not included into Annex 1 to the Framework Convention). The method-ological principles of the Inventory are based on the following guidelines:
• Revised1996IPCCGuidelinesforNationalGreenhouseGasInventoriesoftheIntergovernmental Panel on Climate Change;
• GoodPracticeGuidanceandUncertaintyManagementinNationalGreenhouseGas Inventories, IPCC 2000;
• Good Practice Guidance for Land Use, Land-Use Change and Forestry. IPCC2003;
• SoftwaresupportfortheworkingmaterialofIntergovernmentalPanelonCli-mate Change, 1997.
Besides all that, the national regulation and methodological documentation has been used. These documentations include guidelines and regulations on inventory, estimate of specific emissions as well as materials and results of the previous studies gained within the framework of the First National Communication of the Kyrgyz Re-public under the UN Framework Convention on Climate Change.
3.1.2. Legal and institutional background
In 2001, when the law on ratification of the UN Framework Convention on Cli-mate Change (2000) had been issued, the Resolution 369 of the Kyrgyz Republic Gov-ernment on Actions required by the UN Framework Convention on Climate Change (UNFCCC) was ratified. According to Resolution 369 the Kyrgyz Republic Ministry of Ecology and Emergency Situations has been titled as a coordinating body on realiza-tion of international obligations of the Kyrgyz Republic related to the UN Framework Convention on Climate Change. The Kyrgyz Republic Ministry of Ecology and Emer-gency Situations altogether with Kyrgyz Republic National Statistical Committee and all concerned executive governmental bodies got an order to decide on the way how requiredstatisticaldataongreenhousegasesvolumehadtobegathered(СО,СН,NOandhydroflourocarbons(РFС,PFСandSF).ActuallythefirstGHGinventoryforthe period of 1990-2000 has been carried out under the project GEF/UNDP KYR/00/G31/A/1G/99 “Enabling Kyrgyzstan to prepare its Initial National Communication to the UNFCCC” with the financial support of the Global Environment Facility and in co-
3. Greenhouse gas inventory

56
operation with United Nations Development Programme. Similar proceedings were implemented for the second inventory under the project GEF/UNDP PIMS 3209 CC GA “Enabling activities for the preparation of the Kyrgyz Republic’s Second National Com-munication to the UNFCCC”
The establishment of the national institutional structure should be considered as a next development phase. The Resolution of the President of the Kyrgyz Republic 281, dated 18 July 2005, established the National Committee on Climate Change with standing working body – the Climate Change Center. Among other tasks the National Committee on Climate Change is in charge of development, regular update, publica-tion and submission of anthropogenic emissions inventories by sources and sorbents of all greenhouse gases not covered by the Montreal Protocol on substances that de-plete the ozone layer. The Chart of the Climate Change Center includes participation in the coordinations and greenhouse gas emission inventory, development of emis-sion inventory data base. The said data base includes primarily data, national emission coefficients, estimate algorithms and their results.
Legal bases of the inventory are determined by Law 71 “On the State Regulation and Policy of Greenhouse Gas Emission and Absorption” dated 25 May 2007. This law stipulates principles of state policy in this area, as well as the competence of state bod-ies, institutions of local self-governing and public organizations, the order of cadastre maintenance and provisions of information submission.
The efforts undertaken by the Kyrgyz Republic are aimed at maintenance of con-tinuous inventory process registering anthropogenic GHG emissions and removals.
3.1.3. Stakeholders involved into the inventory
The basic inventory work has been carried out by the working group of the proj-ect GEF/UNDP PIMS 3209 CC GA “Enabling activities for the preparation of the Kyrgyz Republic’s Second National Communication to the UNFCCC”
The general project management was carried out by the State Agency on Envi-ronmental Protection and Forestry under the Kyrgyz Republic Government. The main volume of the initial data for calculation had been submitted by Kyrgyz Republic Na-tional Statistical Committee. The active support for the inventory completion has been provided by:
• TrafficPoliceoftheKyrgyzRepublicMinistryofInternalAffairs;• NationalDesigningInstituteofLandUse;• InstituteofWaterProblemsandWater-powerEngineeringoftheKyrgyzRepub-
lic National Academy of Science;• KyrgyzNationalTechnicalUniversitynamedafterI.Razzakov;• Kyrgyz-RussianSlavonicUniversitynamedafterB.Eltsyn;• KyrgyzRepublicNationalStatisticalCommittee;• OzoneCenterundertheKyrgyzRepublicMinistryofEmergencySituations;• PublicSociety‘Powerstations’;• DepartmentofForestryandHuntingManagementoftheStateAgencyonEn-
vironmental Protection and Forestry under Kyrgyz Republic Government.The inventory results had been discussed at workshops with participation of all
interested organizations and NGO representatives.
3.1.4. Timetable
The inventory of anthropogenic GHG emissions and removals has been accom-plished between 2001 and 2005. Besides, the recalculation of previously received sec-

57
tor results (from 1990 till 2000) was performed, it was required due to newly received data on national emission coefficients, and because previously used algorithms of cal-culation had been verified. The recalculation was required in order to accomplish the assessment of emissions and sinks as a cross-section of all administrative units of the Republic (oblasts and cities centrally governed). Therefore the results of inventory for the period 1990 – 2005 received by means of uniform methods, and they are com-pletely comparable.
3.1.5. Comprehensive coverage
According to working recommendations the inventory covered the following sec-tions:
• Energy;• Industrialprocesses;• Useofsolventsandotherproduction;• Agriculture;• Landusechangeandforestry;• Wastes.Emissions of the following greenhouse gases were taken into account in the
inventory:• carbondioxide(СО);• мethane(СН);• nitrousoxide(NO);• hydrofluorocarbons(HFC);• perfluorocarbons(PFC);• sulfurhexafluoride(SF).The emission of perfluorocarbons and sulfur hexafluoride was considered as in-
significant, therefore the final results does not reflect it.GreenhousegasemissionsexpressedinmetrictonesandtonesofСО-equivalent.
ToexpressemissionintonesofСО-equivalenttheunitsofglobalwarmingpotential(GWP) have been used, these units are recommended by the Intergovernmental Panel on Climate Change (IPCC) for 100 year time periods (see Annex 1).
Emissions of gases-precursors have been included as well:• carbonoxide(CO);• nitrogenoxides(NOx);• none-methanevolatileorganiccompounds(NMVOC);• sulfuroxides(SОx).The emission of greenhouse gases and removals as well as anthropogenic emis-
sion of gases- precursors included into the cross-section study of all administrative units of the Republic. The oblasts included are as follows:
• Batkenoblast(afterestablishmenton12October1999,theofficialstatisticsisavailable since 1999);
• Jalal-Abadoblast;• Issyk-Kuloblast;• Narynoblast;• Oshoblast;• Talasoblast;• Chuioblast.Centrally governed cities:• Bishkek;• Osh(thestatusgainedin2002,theofficialstatisticsisavailablesince2000).

58
In compliance with the decision (17/СР.8 Guidelines of Preparation of National Communications by non-Annex I Parties of the UN Framework Convention on Climate Change) the assessment of greenhouse gas emission related to use of bunker fuel for international air transportation (the international sea shipping is not available in the Republic) has been carried out.
3.1.6. Quality assessment and quality control (QA/QC)
QA/QC procedure is carried out according to IPCC Greenhouse Gas Inventory methodologies and Good Practice Guidance on Uncertainty Management, 2000.
At the first stage, the completeness, comparability and consistence of time-series of the initial data from various sources was checked. All sources of the initial informa-tion have been ranged according to their reliability rate in the following order:
• officialpublicationsoftheKyrgyzRepublicNationalStatisticalCommittee;• officialpublicationsoftheKyrgyzRepublicministriesanddepartments;• internalinformationoftheKyrgyzRepublicministriesanddepartments;• informationproducedbynationalexperts;• informationacquiredbymeansofcalculations;• informationfrommassmedia.If data from various sources differs, the information from a source of greater prior-
ity is used.Procedure QA/QC was carried out directly by the expert of inventory working
group for each individual section. Besides activity examination, the examination of emissions coefficients used for estimates.
At the second stage there was an examination of completed estimates and re-ceived results. The ongoing quality control of estimates was carried out by the leader of inventory group. After the inventory process completion, the received results were considered during the final discussion attended by leading experts of the Republic.
3.2. Inventory results
3.2.1. Overall emission
3.2.1.1. Greenhouse gases
Table. 3.1 shows break down of the GHG emission sum for individual gases, and Table. 3.2 shows phases of entire inventory period. In the section ‘Solvents usage’ greenhouse gas emission does not take place, therefore it has not been shown. The tendencies of the total emission reflect somewhat a condition of the national econ-omy. The stabilization after 1994 (practically, at the same level), when correlated with simultaneous growth of GDP is determined by structural alternation of GDP: there was some growth of the sectors of the economy that bring insignificant greenhouse gas emission contribution, for example, services. There are insignificant annual changes of gases distribution and sections distribution (see Tables 3.1 and 3.2). Relatively small growth shown in some sections of the year 2005 in comparison with 1990 is not abso-lute and can be explained by significant emission reduction in the section ‘Energy’. The reduction of carbon dioxide share should be explained by significant reduction of the emission of its basic source - section ‘Energy’.
The emission of carbon dioxide occurs only in three sections (see Fig. 3.3). These are sections: ‘Energy’, ‘Industrial processes’ and ‘Land use change and forestry’. Changes of the emission by years practically are completely determined by reduction in section ‘Energy’ as the contribution of other sections is insignificant, see Table 3.3.

59
Table 3.1. Change of greenhouse gas emission distribution per individual gas, percentage
Section 1990 2005
Carbon dioxide 79.22 73.50
Methane 20.17 24.92
Nitrous oxide 0.61 1.48
HFC-134а 0.00 0.10
Table 3.2. Change of greenhouse gas emission distribution per section, percentage
Section 1990 2005
Energy 82.49 74.03
Industrial processes 2.56 4.21
Agriculture 8.73 16.05
Land use change and forestry 0.09 0.22
Wastes 6.12 5.48
Fig.3.1. Total GHG emission including GWP. The chart does not include HFC-134а due to its insignificant amount.
35000
30000
25000
20000
15000
10000
5000
0
Emis
sion
Gg
1990 1991 1992 1993 1994 1995 1996 1997 1998 1999 2000 2001 2002 2003 2004 2005
Carbon dioxide Methane Nitrous oxide
35000
30000
25000
20000
15000
10000
5000
0
Emis
sion
Gg
1990 1991 1992 1993 1994 1995 1996 1997 1998 1999 2000 2001 2002 2003 2004 2005
Energy Agriculture Wastes
Industrial processes Land use change and forestry
Fig. 3.2. GHG emissions sum including GWP per section

60
The methane emission occurs in four sections (see Table. 3.4.). Annual emission changes basically determined by reduction in sections ‘Energy’ and ‘Wastes’, the con-tribution of other sections is insignificant, see Table 3.4.
Table 3.3. Change of distribution of the carbon dioxide emission, percentage
Section 1990 2005
Energy 96.69 94.05
Industrial processes 3.23 5.72
Land use change and forestry 0.08 0.22
30000
25000
20000
15000
10000
5000
0
Emis
sion
, Gg
1990 1991 1992 1993 1994 1995 1996 1997 1998 1999 2000 2001 2002 2003 2004 2005
Energy Industrial processes Land use change and forestry
Fig. 3.3. Carbon dioxide emission per sections
Table 3.4. Methane emission distribution change, percentage
Section 1990 2005
Energy 27.84 17.85
Agriculture 43.06 62.89
Industrial processes 0.11 0.20
Land use change and forestry 29.00 19.07
Fig. 3.4. Methane emission per sections
350
300
250
200
150
100
50
0
Emis
sion
, Gg
1990 1991 1992 1993 1994 1995 1996 1997 1998 1999 2000 2001 2002 2003 2004 2005
Energy Land use change and forestry
Agriculture Wastes

61
Fig. 3.5. Nitrous oxide emission per section
3.2.1.2. Gases - precursors
Fig. 3.6 shows distribution of total emission of gases-precursors per individual gases. Fig. 3.7 shows the sum per sections for entire inventory period. There is no emis-sion of gases-precursors in the section ‘Wastes’, therefore it is not demonstrated here. The specific trend shown only in sections ‘Energy’ and ‘Solvents’ correlated with the state of national economy (i.e. there was a reduction of the emission), in other sections the changes were determined by changes of economic activities. There was even some growth of emission. Annual changes of distribution of gases-precursors are re-sulted in Table 3.6, and in Fig. 3.7. Apparently, distribution of emissions per gases and sections has essentially changed as a result of change of economic activities. More detailed comments to the changes will be given further in the analysis of emissions per separate section.
Table 3.6. Distribution change of gases-precursors emission per sections, percentage
Section 1990 2005
Nitrogen oxides 39.21 11.35
Carbon oxide 24.60 37.30
NMVOC 9.20 42.16
Sulfur oxides 26.99 9.19
The nitrous oxide emission occurs in four sections (see Fig. 3.5.). The most sig-nificant reduction of nitrous oxide emission took place in the section ‘Energy’; in other sections it did not display significant change. The relative contribution of various sec-tions is resulted in Table 3.5.
Table 3.5. Change of distribution of nitrous oxide in percentage
Section 1990 2005
Energy 46.95 25.48
Agriculture 7.29 24.78
Land use change and forestry 0.34 0.35
Wastes 45.42 49.39
Tendencies of emission HFC are resulted further as they occur only in one section ‘Industrial processes’
0,7
0,6
0,5
0,4
0,3
0,2
0,1
0
Emis
sion
, Gg
1990 1991 1992 1993 1994 1995 1996 1997 1998 1999 2000 2001 2002 2003 2004 2005
Energy Industrial processes
Agriculture Wastes

62
Table 3.7. Change of emission distribution of gases-precursors per sections, percentage
Section 1990 2005
Energy 47.16 14.64
Industrial processes 11.66 46.58
Solvents 2.50 1.04
Agriculture 17.83 30.91
Land use change and forestry 20.85 6.83
Fig. 3.6. Total emission of gases-precursors per individual gas
Fig. 3.8 shows distribution of the emission of nitrogen oxides per section. The basic contribution to the emission of nitrogen oxides is produced by sections ‘Energy’ and ‘Land use change and forestry’ (see Table 3.8), where the emission during inven-tory period considerably reduced.
Fig. 3.7. Total of emissions of gases-precursors per section
Distribution of the carbon oxide emission per section is resulted in Fig. 3.9. The ba-sic contribution to the total emission of carbon oxide the sections ‘Industrial processes’ and ‘Agriculture‘ brought (see Table 3.9).
1000
900
800
700
600
500
400
300
200
100
0
Emis
sion
, Gg
Nitrogen oxides Sulfur oxidesCarbon oxide NMVOC
1990 1991 1992 1993 20001994 20011995 20021996 20031997 20041998 20051999
1000
900
800
700
600
500
400
300
200
100
0
Emis
sion
, Gg
1990 1991 1992 1993 1994 1995 1996 1997 1998 1999 2000 2001 2002 2003 2004 2005
Energy Solvents Land use change and forestry
Industrial processes Agriculture

63
Table 3.8. Change of distribution of nitrogen oxides emission per section, percentage
Section 1990 2005
Energy 49.01 49.94
Industrial processes 0.97 0.03
Agriculture 0.01 0.02
Land use change and forestry 50.00 50.00
Fig.3.8. Emission of nitrogen oxides per section
Table 3.9. Change of distribution of the carbon oxide emission per section, percentage
Section 1990 2005
Energy 6.93 1.22
Industrial processes 15.57 12.81
Agriculture 72.47 82.87
Land use change and forestry 5.03 3.10 Table 3.10. Change of distribution of NMVOC emission per sections, percentage
Section 1990 2005
Energy 4.99 0.28
Industrial processes 67.83 97.24
Solvents 27.18 2.48
Distribution of the emission of none methane volatile organic compounds (NM-VOC) per section is resulted in Fig. 3.10. The basic contribution to the emission brought by section ‘Industrial processes’ (see Table 3.10), especially during recent years due to increased road pavement works.
Emission distribution of sulfur oxides per section is resulted in Fig. 3.11. The basic contribution to the total emission of sulfur oxides is produced by the section ‘Energy’, the total reduction of the emission was a result of reduction of burnt fuel volumes (see Table 3.11).
Table 3.11. Change of distribution of the emission of sulfur oxides per sections, percentage
Section 1990 2005
Energy 95.51 91.31
Industrial processes 4.49 8.69
140
120
100
80
60
40
20
0
Emis
sion
, Gg
1990 1991 1992 1993 1994 1995 1996 1997 1998 1999 2000 2001 2002 2003 2004 2005
Energy Agriculture
Industrial processes

64
Fig. 3.9. Emission of carbon oxide per section
Fig. 3.10. The NMVOC emission per a section
Fig. 3.11. Sulfur oxides emission per section
700
600
500
400
300
200
100
0
Emis
sion
, Gg
1990 1991 1992 1993 1994 1995 1996 1997 1998 1999 2000 2001 2002 2003 2004 2005
Energy Agriculture
Industrial processesLand use change and forestry
100
90
80
70
60
50
40
30
20
10
0
Emis
sion
, Gg
1990 1991 1992 1993 1994 1995 1996 1997 1998 1999 2000 2001 2002 2003 2004 2005
Energy Industrial processes Solvents
40
35
25
20
15
10
5
0
Emis
sion
, Gg
1990 1991 1992 1993 1994 1995 1996 1997 1998 1999 2000 2001 2002 2003 2004 2005
Energy Industrial processes

65
3.2.2. Emission per sections
3.2.2.1. Energy
Under section ‘Energy’ the greenhouse gas emissions caused by burning of fossil fuels(carbondioxide(CO);methane(CH);nitrousoxide(NO),andalsogases-pre-cursors - nitrogen oxides (NOx); carbon oxide (CO); none methane volatile compounds (NMVOC) and sulfur oxides (SОx) are considered. The section includes information about leakage of greenhouse gases not related to burning, at processes of mining, processing, transportation and distribution of fossil fuels (methane). Burning of the vegetativebiomassalsoresultsinemissionsofcarbondioxide(СО),buttheyarenotincluded into the general emission under ‘Energy’ section but classified under ‘Biomass СОemission’sectorinthesection‘Memoitems’.
Fig. 3.12. Distribution of the basic fuel and energy resources consumption in 2005.
The basic source of fuel and energy resources in the Kyrgyz Republic is electricity; oil products and coal (see Fig. 3.12) are following the electrical energy. From 1990 till 2005 the overall energy consumption in the national economy became 1.6 times less. Thus, the consumption of energy received by burning of mineral fuel types decreased 2.7 times, while consumption of electricity, primarily produced by hydroelectric sta-tions increased. Unfortunately, this reduction of consumption of fossil types of fuel was not caused by the policy and actions related to implementation of power-saving modern technologies, it was caused by the economic recession in the country. From the end of 1990th and till 2005 the percentages of the energy generated by hydro-power stations, on one hand, and the energy generated by burning of fossil fuels (see Fig. 3.12), on the other hand, remain practically constant.
Currently, the basic fossil types of fuel are imported, the reduction of their use unites the ecological and economic goals of the state policy: emissions reduction and reduce of import dependency.
The section ‘Energy’ considered the emissions by the following sectors:• useoffuel:• energyproduction;• industrialproductionandconstruction;• transport;• other sectors including sub-sectors‘Municipal, cultural and domestic needs
(including distribution to the population)’ and ‘Agriculture works’;• volatilefuelemissions.Two recommended methods have been used for greenhouse gas emissions as-
Gasoline11%
Black oil2%
Electricity39%
Natural gas19%
Oil products3%
Coal21%
Diesel fuel5%

66
sessment: 1. evaluation of emissions according to carbon content in the various types of
fuel shipped to the country, as a whole, i.e. the basic approach, and2. emission assessment correlated to the activities related to the burning of fuel,
i.e. according to the category of a source, i.e. the method of the first tier range or sectoral approach.
Table 3.12 shows comparative results of the greenhouse gas emissions for esti-mates carried out by means of different approaches. The difference between estimate results gained by both methods displays rather satisfactory concurrence. Maximum divergence of the results makes 119.16 Gg or 1.54 percent. From the resulted table it is possible to draw conclusion about substantial quality improvement of official sta-tistical system achieved by 2005 as main errors were caused by malfunctioning of this system.
Table 3.12. Comparison of base method and source category method of emission estimate under ‘Energy’ section.
Year 1990 1995 1997 1999 2000 2001 2002 2003 2004 2005
Base method,Gg 23,282.21 7,327.58 7,708.13 7,413.44 7,842.56 7,287.85 8,045.43 8,260.36 8,593.58 8,321.16
Sectoral approach, Gg
23,202.53 7,262.01 7,616.30 7,312.01 7,723.40 7,329.66 8,097.87 8,264.81 8,589.22 8,321.12
Deviation, Gg 79.68 65.57 91.83 101.43 119.16 -41.81 -52.43 -4.45 4.36 0.04
Deviation, percent 0.34 0.90 1.21 1.39 1.54 -0.57 -0.65 -0.05 0.05 0.00
For fuel types taken into account in the section ‘Energy’ the estimates were based on lowest combustion heat index, carbon emission coefficients and adjustments ac-cording to incomplete carbon oxidation as it is stipulated by ‘IPCC Guidelines’. The lowest combustion heat indexes for natural gas, imported bitumen and sub-bitumen coals produced domestically were excluded. The lowest combustion heat indexes equal to 21.28 TJ/thousand t and 16.71 TJ/thousand t have been accepted. These in-dexes are used by the Kyrgyz Republic National Statistical Committee for drawing up the fuel and energy balance of the Republic.
Fig. 3.13 shows annual carbon dioxide emissions by fuel type. Greenhouse gas emissions are insignificant and proportional to the carbon dioxide emissions. In gen-eral the proportions were insignificantly changing with some increase of liquid types of fuel.
25000
20000
15000
10000
5000
0
Carb
on d
ioxi
de e
mis
sion
, Gg
1990 1991 1992 1993 1994 1995 1996 1997 1998 1999 2000 2001 2002 2003 2004 2005
Liquid fuel Solid fuel Gas
Fig. 3.13. Carbon dioxide emission by fuel type

67
Emission trends with break-down according the sectors mentioned above shown on Fig. 3.14. The reduction of the total emission during the period between 1990 and 1995 is related to the halt of work of large enterprises – the ones that used imported feedstock and used to export their products, as well as due to general deterioration of economic situation in the Republic. That is why the reduction was more significant in the beginning (1990 - 1995) with some subsequent growth (1996 - 2005) that re-flected its total growth in the main spheres of economic activity. The biggest contribu-tion to the emission total under ‘Energy production’ sector and the sector that com-bines sub-sectors ‘Municipal, cultural and community needs (including distribution for population)’ and ‘Agriculture works’. The lowest emissions were in the sector ‘Volatile emissions from fuel’. Annual distribution of emissions by sector is practically constant except drastic reduction of volatile emissions. The main share of the total emission including GWP is produced by carbon dioxide emission - 97.45 percent, then methane - 2.02 percent and nitrous oxide - 0.53 percent. These percentages practically did not change within entire inventory period.
Fig. 3.14. Total GHG emissions under ‘Energy’ section
Fig. 3.15. shows total emissions of gases-precursors. It is interesting to note, that as against greenhouse gas emissions, the basic contribution of gases-precursors caused by the sector that unites sub-sectors ‘Municipal, cultural and community needs (including distribution for the population)’ and ‘Agriculture works’.
30000
25000
20000
15000
10000
5000
0
Emis
sion
, Gg
1990 1991 1992 1993 1994 1995 1996 1997 1998 1999 2000 2001 2002 2003 2004 2005
Energy production Transport Volatile emissions from fuel
Industry and constructionOther sectors
Fig.3.15. Trends of total gases-precursors emissions under section ‘Energy’ with break-down by the sectors
1000
800
600
400
200
0
Emis
sion
, Gg
1990 1991 1992 1993 1994 1995 1996 1997 1998 1999 2000 2001 2002 2003 2004 2005
Energy production Other sectorsIndustry and construction Transport

68
The main volume of emission comes to carbon oxide with its share of 78 percent in 2005, nitrogen oxides - 13.1 percent, sulfur oxides - 5.4 percent and NMVOC - 3.5 percent (see Fig. 3.16).
Fig.3.16. Emissions dynamic under section ‘Energy’ by gas-precursor
Uncertainty assessment of emission estimate has been carried out according to recommendations of guideline documentation of IPCC, EMEP/CORINAIR and expert evaluations.
Focal sources of the years 1990 and 2005 are shown in Table 3.14. The emis-sions by sector have been determined by summation of all GHG emissions, their global warming potential has been also taken into consideration.
Table 3.13. Uncertainty assessment
Sector GHG Uncertainty, % Basic source of uncertainty
Energy production
CO 5.0 Basic consumption data
CH 30.0 Emission coefficients
NO 50.0 Emission coefficients
Industry and construction
CO 10.0 Basic consumption data
CH 30.0 Emission coefficients
NO 50.0 Emission coefficients
Transport
CO 60.0 Basic consumption data
CH 60.0 Basic consumption data
NO 60.0 Basic consumption data
Other sectors
CO 15.0 Basic consumption data
CH 30.0 Emission coefficients
NO 50.0 Emission coefficients
Fuel volatile emissions CH 50.0 Emission coefficients
Table 3.14. Key sources in 1990 and 2005.
Sector
1990 2005
GHG emis-sion, Gg
Percentage of emission total
of the sector, %
GHG emission, Gg
Percentage of emission total
of the sector, %
Other sectors 8,311.79 33.78 3,172.50 36.16
Transport 5,053.03 20.54 2,487.45 28.35
Energy production 8,445.72 34.33 2,238.85 25.52
Industry and construction 1,768.02 7.19 628.23 7.16
900
800
700
600
500
400
300
200
100
0
Emis
sion
, Gg
1990 1991 1992 1993 1994 1995 1996 1997 1998 1999 2000 2001 2002 2003 2004 2005
Nitrogen oxides Sulfur oxides Carbon oxide NMVOC

69
3.2.2.1.1. Energy production
The initial data have been taken from the article ‘Energy conversion’ of the ‘Na-tional Fuel and Energy Balance’ without classification of sources subcategories.
The carbon dioxide emission creates the main contribution to the greenhouse ef-fect. In 2005 with account the share of carbon dioxide emission including GWP made up 99.56 percent, methane - about 0.03 percent, and nitrous oxide - 0.41 percent. The percentage contributions insignificantly changed annually. Taking into account emis-sion of individual greenhouse gases Fig. 3.15 shows the tendency of the carbon di-oxide emission only. Reduction of dioxide emission during the period between 1990 and 1995 is basically connected to reduction of consumption of thermal energy by industrial sector. The following years (1996 - 2005), at absence of essential structural changes in the economy, the emission was practically stabilized at the level of 2,000 – 3,000 Gg. Similar tendencies were displayed by methane and nitrous oxide.
The dynamics of gases-precursors emission is resulted in Fig. 3.18. The basic per-centage is displayed by nitrogen oxides and sulfur oxides emissions. The dynamics of changes of these gases completely coincides with dynamics of changes of carbon dioxide due to obvious reasons.
Fig. 3.17. Dynamics of carbon dioxide emission under ‘Energy production’ sector
70
60
50
40
30
20
10
0
Emis
sion
, Gg
1990 1991 1992 1993 1994 1995 1996 1997 1998 1999 2000 2001 2002 2003 2004 2005
Nitrogen oxides Sulfur oxidesCarbon oxide NMVOC
Fig. 3.18. Dynamics of gases-precursors emission under ‘Energy’ sector
9000
8000
7000
6000
5000
4000
3000
2000
1000
0
Emis
sion
, Gg
1990 1991 1992 1993 1994 1995 1996 1997 1998 1999 2000 2001 2002 2003 2004 2005

70
3.2.2.1.2. Industry and construction
The initial information has been taken from articles of the ‘National Fuel and Ener-gy Balance’: ‘Industrial production”, ‘Construction and assembling works, drilling’ and ‘Usage for industrial and non- fuel needs’. The article ‘Usage for industrial and non-fuel needs’ includes the following items of consumption:
• coalusedasanadditivetothechargeasapartofglass-massproduction;• coalusedastheadditivetoclayforproductionofporousbrick;• blackoiladdedtoclayforhayditeproduction,etc.It means that actual combustion of fuel takes place in the production processes.Carbon dioxide emission makes the main contribution into greenhouse effect un-
der this sector. In 2005, the carbon dioxide emission including GWP made up to 99.99 percent, methane - about 0.01 percent, and practically zero readings of nitrous oxide. Other years demonstrate the same correlations of inputs. Dynamics of annual carbon dioxide emission of is shown in Fig. 3.19. Reduction of dioxide emission between 1990 and 1995 is connected to the general common decrease of industrial production in the Republic, that is why it was sharper in the beginning (1990 - 1995), and displayed some small growth (1996 - 2005), reflecting growth of the industry and construction activi-ties. Dynamics of methane and nitrous oxide completely coincides with one shown by carbon dioxide.
Fig. 3.19. Dynamics of carbon dioxide emission under the sector ‘Industry and construction’
2000
1800
1600
1400
1200
1000
800
600
400
200
0
Emis
sion
, Gg
1990 1991 1992 1993 1994 1995 1996 1997 1998 1999 2000 2001 2002 2003 2004 2005
12
10
8
6
4
2
0
Emis
sion
, Gg
1990 1991 1992 1993 1994 1995 1996 1997 1998 1999 2000 2001 2002 2003 2004 2005
Nitrogen oxides Sulfur oxidesCarbon oxide NMVOC,
Fig. 3.20. Dynamics of gases-precursors emission under the sector ‘Industry and construction’

71
Dynamics of gases-precursors emission is shown in Fig. 3.20. The main share is created – similar to the previous sub-sector- by emissions of nitrogen oxides and sulfur oxides. Emission dynamics of these gases and its reasons completely coincide with dynamics of carbon dioxide emission (see Fig. 3.19).
3.2.2.1.3. Transport
Initial information is taken from the article of the ‘National Fuel and Energy Bal-ance’: ‘Transport performance (including private vehicles)’. The data on technically sound motor-vehicles have been used too. Carbon dioxide emission produced main contribution to the greenhouse effect under this sub-section.
The sector ‘Transport’ has the following sub-sectors:• ‘Civilaviation’- localandinternationalflightsseparately(inthegivensection
only local flights have been considered, international flights are considered in the section ‘International bunker’);
• Sub-sectors‘Motortransport’,‘Railwaytransportation’and‘Watertransport’areincorporated into one category, because contribution of greenhouse gas emis-sion of railway and water types of transport does not surpass 0.5 percent of the total emission produced by transport and due to similarity of their estimate schemes.
The emission produced by motor transport has been calculated on the basis of ac-tual amount of motor vehicles, estimate of annual run, and fuel consumption volume per each category, taking into account significant volume of not reported imported fuel. This estimate has been performed by experts as a probable bottom evaluation; it means that, possibly, the actual consumption of fuel and, consequently, actual emis-sion is much higher.
Fig. 3.21 shows volumes of consumed fuel, and Fig. 3.22 shows the amount of mo-tor transport in the Republic. The notable inconsistency of these two readings (under normal circumstances they are rigidly correlated) is caused by significant volume of il-legal import of fuel; this inconsistency has not been compensated by the used method of calculation. Significant decrease of volume of consumed fuel in 1993 - 1997 is re-lated also to the essential changes of structure of transport fleet. These years there was significant decrease of trucks and coaches and simultaneous increase of cars amount.
Fig. 3.21. Dynamics of fuel consumed by transport, thousands tons
Civil aviation (internal flights) produces an insignificant part of general emission produced by transport - from 0.4 percent in 2001 (minimum) to 2.6 percent in 2005 (maximum). In 2005 the carbon dioxide emission including GWP made 99.97 percent, methane - about 0.03 percent, and nitrous oxide was practically undetected. The simi-
1200
1000
800
600
400
200
01990 1991 1992 1993 1994 1995 1996 1997 1998 1999 2000 2001 2002 2003 2004 2005

72
lar correlation of contributions by individual gases took place during other years. Aviation fuel consumption dynamics (see Fig. 3.23) according to official data re-
flects the economic recession similar to other sectors of economic activities, but slow-er and longer. The aviation fuel consumption restored its readings to initial volumes by 2005. The consumption of an aviation fuel by international flights, after similar de-crease, has undergone sharp growth connected to refueling of airplanes of the coali-tion forces based in the Republic since 2002. The official statistics does not keep sepa-rate records of aviation fuel consumption produced by international civil and military airplanes.
Fig. 3.22. Motor transport dynamics
Fig. 3.23. Dynamics of aviation fuel consumption in Kyrgyz Republic
Annual emission of carbon dioxide is shown on Fig. 3.24. The dynamics methane and nitrous oxide emission completely coincides with the dynamics of carbon dioxide emission, but their contribution to the general emission of greenhouse gases makes less than 1 percent.
Dynamics of gases-precursors emissions is shown in Fig. 3.25. The main input is similar to the previous sub-section and made by emissions of nitrogen oxides and sul-fur oxides. Dynamics of their emission due to natural reasons completely coincides with dynamics of carbon dioxide emission (see Fig. 3.24).
350
300
250
200
150
100
50
0
Qua
ntity
, tho
usan
ds u
nits
1990 1991 1992 1993 1994 1995 1996 1997 1998 1999 2000 2001 2002 2003 2004 2005
Private State-owned
250
200
150
100
50
0
Avia
ker
osen
e, th
ousa
nds
tons
1990 1991 1992 1993 1994 1995 1996 1997 1998 1999 2000 2001 2002 2003 2004 2005
Bunker Internal consumption

73
Fig. 3.24. Dynamics of carbon dioxide emission under sector ‘Transport’
Fig. 3.25. Dynamics of gases-precursors emission under sector ‘Transport ‘
3.2.2.1.4. Other sectors
Carbon dioxide emission contributes mainly to the greenhouse effect under this sector. The initial data have been taken from the articles of ‘National Fuel and Energy Balance’: ‘For municipal, cultural and community needs (including distribution to pop-ulation)’ and ‘Agriculture works’. Taking into account various emission coefficients for coal, the estimate of consumption under the first article was based on the following assumptions:
• all importedcoal isusedforproductionofelectricpower,heatand industryoutput;
• localcoalisusedforcommercial/non-residentialandresidentialsectors;• thedistributionofpercentagesusedinthe‘Fuelandenergybalance’for1999
is also used for the period till the year 2001: about 47 percent of coal is con-sumed by population; about 40 percent consumed for municipal, cultural and community needs. Since 2001 there have been used the distribution of coal consumption already available in the Balance between residential and com-mercial /non-residential sectors.
6000
5000
4000
3000
2000
1000
0
Emis
sion
, Gg
1990 1991 1992 1993 1994 1995 1996 1997 1998 1999 2000 2001 2002 2003 2004 2005
500
450
400
350
300
250
200
150
100
50
0
Emis
sion
, Gg
1990 1991 1992 1993 1994 1995 1996 1997 1998 1999 2000 2001 2002 2003 2004 2005
Nitrogen oxides Sulfur oxidesCarbon oxide NMVOC

74
Fig. 3.26. Dynamics of the total emission of carbon dioxide, methane and nitrous oxide including GWP in the other sectors
9000
8000
7000
6000
5000
4000
3000
2000
1000
0
Emis
sion
, Gg
1990 1991 1992 1993 1994 1995 1996 1997 1998 1999 2000 2001 2002 2003 2004 2005
Carbon dioxide Methane Nitrous oxide
9000
8000
7000
6000
5000
4000
3000
2000
1000
0
Emis
sion
, Gg
1990 1995 1997 1999 2000 2001 2002 2003 2004 2005
Communal needs Agriculture works
Population needs
350
300
250
200
150
100
50
0
Emis
sion
, Gg
1990 1991 1992 1993 1994 1995 1996 1997 1998 1999 2000 2001 2002 2003 2004 2005
Nitrous oxide Sulphur oxidecarbon oxide NMVOC
Fig. 3.27. Carbon dioxide emission distribution among various sub-sectors in the sector ‘Other sectors’
Fig. 3.28. Dynamics of gases-precursors emission in the sector ‘Other sectors’
In 2005, carbon dioxide emission including GWP made 94.5 percent, methane - about 4.6 percent and nitrous oxide - 0.9 percent. These percentages are similar

75
for other years. Annual dynamics of total inputs of carbon dioxide, methane and ni-trous oxide including GWP is shown in Fig. 3.26. Decrease of the total emission during the period between 1990 and 1995 occurred due to general deterioration of the eco-nomic situation in the Republic, therefore it was sharper in the beginning (1990 - 1995) with the subsequent small growth (1996 - 2005), reflecting some improvement of the economic situation. The methane and nitrous oxide dynamics completely coincides with the dynamics of carbon dioxide.
Carbon dioxide distribution among various sub-sectors is shown in Fig. 3.27. An-nual emission dynamics of gases-precursors is shown in Fig. 3.28. Nitrous oxides made the main input. Dynamics of the total emission of these gases due to natural reasons practically completely coincides with the dynamics of total changes of greenhouse gases emissions (see Fig. 3.26). Distribution of emissions of gases-precursors among sub-sectors coincides with distribution of the emission of greenhouse gases.
3.2.2.1.5. Fugitive emissions from fuel
Volatile emissions were estimated separately from solid fuel (coal), oil and mineral oil. Data on the burning reserves and coal terraces in the Republic for the period of 1990-2005 is not available; therefore the emission from these sources has not been assessed.
Due to absence of the national factors, the assessment of volatile emissions of methane during extraction and subsequent handling of hydrocarbon raw material has been carried out by means of the factors recommended by IPCC – the same way it was done in the first national inventory of greenhouse gases.
Dynamics of emission reduction is shown in Fig. 3.29; it reflects decrease of extrac-tion and consumption of fuel, significant decrease of solid fuel consumption.
Fig. 3.29. Dynamics of fuel volatile emissions
3.2.2.2. Industrial processes
Between 1990 and 2005 the industry of the Republic has undergone significant structural transformations. Big enterprises used to work on imported feedstock and export their production were replaced by significant amount of small enterprises with almost home-made production. It essentially complicates registration of their activ-ity.
60
50
40
30
20
10
0
Emis
sion
, Gg
1990 1991 1992 1993 1994 1995 1996 1997 1998 1999 2000 2001 2002 2003 2004 2005
Solid fuel Oil and mineral oil

76
The section ‘Industrial processes’ includes the following sectors:• mineralsubstancesproduction;• chemicalindustry;• metallurgy;• foodandbeveragesproduction;• blastworks;• hydrofluorocarbonsconsumption(maintenanceofcoolingequipment).Under section ‘Industrial processes’ emissions of the following greenhouse gases
considered:• carbondioxide(СО)-duringproductionofmineralsubstances,inmetallurgy
and blast works;• hydrofluorocarbons(HFC-134а)–maintenanceofcoolingequipment;and gases – precursors:• carbonoxide(CO)–metallurgyandblastworks;• nitrogenoxides(NОх)-metallurgy;• none-methanevolatile compounds (NMVOC)– foodandbeveragesproduc-
tion, production of mineral substances, the chemical industry;• sulfuroxides(SОх)-productionofmineralsubstances,metallurgy.Emission estimates have been carried out according to IPCC methodical recom-
mendations. The use of national coefficients of emission has been stipulated individu-ally. The basic data required for calculation is well registered by statistical state bodies; it facilitated the estimation of emissions in the majority of cases.
The greenhouse gases emission decreased between 1990 and 1995 approximate-ly 4 times as much, then gradually has grown and in 2005 made approximately 67 percent of 1990 level.
Sectoral distribution of emissions is very simple. In 2005, the GHG emission (total, including GWP) falls at the following sectors:
• 94.78percent-‘Productionofmineralsubstances’(СО);• 1.14percent-‘Metallurgy’(СО);• 2.35percent-‘Consumptionofhydrofluorocarbons’(HFC-134а);• 1.70percent-‘Blastworks’(СО).The emission caused by cement production was 98.3 percent in 2005; that was
the percentage of the emission under sector ‘Production of mineral substances’, actu-ally this emission caused by one enterprise - Kant Cement-Slate Complex.
Nitrogen oxides emission is entirely caused by metallurgical sector. Emission dis-tribution of NMVOC, nitrogen oxides and sulfur oxides are shown in Fig. 3.30 - 3.32.
12,0
10,0
8,0
6,0
4,0
2,0
0,0
Emis
sion
, Gg
1990 1991 1992 1993 1994 1995 1996 1997 1998 1999 2000 2001 2002 2003 2004 2005
Metallurgy Blast works
Fig. 3.30. Distribution of carbon oxide emission

77
Fig. 3.31. Distribution of NMVOC emission. Small volume of the emission was registered also under sector ‘Chemical industry’; the maximum readings do not exceed 0.02 Gg.
80
70
60
50
40
30
20
10
0
Emis
sion
, Gg
1990 1991 1992 1993 1994 1995 1996 1997 1998 1999 2000 2001 2002 2003 2004 2005
Production of mineral substances Blast works
Fig. 3.32. Distribution of sulfur oxides emission
Estimation of uncertainty is shown in Table 3.15. For the sectors ‘Chemical indus-try’ and ‘Production of food and beverages’ the uncertainty estimation has not been carried out for these sectors as they do not have emission of greenhouse gases.
Table 3.15. Uncertainty estimate
Sector GHG Uncertainty, percent Basic source of uncertainty
Production of mineral substances CO 15.0 Initial consumption data
Metallurgy CO 30.0 Initial consumption data
Blast works CО2 20.0 Emission ratio
Consumption of hydrofluorocarbons HFC 30.0 Initial consumption data
The key sources of 1990 and 2005 are shown in Table 3.16. Sectoral emissions have been calculated by summation of emissions of all greenhouse gases regarding their global warming potential.
3,0
2,5
2,0
1,5
1,0
0,5
0,0
Emis
sion
, Gg
1990 1991 1992 1993 1994 1995 1996 1997 1998 1999 2000 2001 2002 2003 2004 2005
Metallurgy Production of mineral substances

78
Table 3.16. Key sources of 1990 and 2005.
Sector
1990 2005.
GHG emis-sion, Gg
Percentage of total emission
of the sector, %
GHG emis-sion, Gg
Percentage of total emission
of the sector, %
Production of mineral substances 763.00 98.44 491.4 94.78
Consumption of hydrofluorocarbons 0.00 0.00 12.36 2.38
3.2.2.2.1. Mineral substances production
Emission estimate includes the following enterprises: • cementproduction(СОandSOxemission);• buildinglimeproduction(emissionofСО);• productionanduseofsodaash(COemission);• productionofroofingbitumen(NMVOCemission);• productionofroadasphalt(NMVOCemission);• glassmaking(NMVOCemission).All calculations for this sector have been carried out according to IPCC methodical
instructions.BasicСОemissionsfalltothesub-sectors‘Cementproduction’and‘Limeproduc-
tion’ (see Fig. 3.33). The carbon dioxide emission presents in sector ‘Production and use of soda ash’, however it is insignificant and made 0.028 percent of general emission in the sector in 2005. Temporal changes of the emission relate to changes of production volumes and caused by numerous shifts of owners of the only cement producing en-terprise.
Emission of sulfur oxides (see Fig. 3.34) occurs only in the sub-sector ‘Cement pro-duction’. Temporal changes of the emission and the reasons of changes naturally coin-cide with changes of the carbon dioxide emission.
800
700
600
500
400
300
200
100
0
Emis
sion
, Gg
1990 1991 1992 1993 1994 1995 1996 1997 1998 1999 2000 2001 2002 2003 2004 2005
Cement production Lime production
Fig. 3.33. Carbon dioxide emission in the sector ‘Production of mineral substances’
NMVOC emission occurs in sub-sectors ‘Production of roofing bitumen’, ‘Glass making’ (see Fig. 3.35) and ‘Production of road asphalt’ (see Fig. 3.36). The basic emis-sion falls at the sub-sector ‘Production of road asphalt’. The sharp increase of emission volume starting in 2001 is caused by increase of bitumen consumption of intensified road construction during that period.

79
Fig. 3.34. Sulfur oxides emission in sector ‘Production of mineral substances’
Fig. 3.35. NMVOC emission in sub-sectors ‘Production of roofing bitumen’ and ‘Glass making’
Fig. 3.36. NMVOC emission in a sub-sector ‘Production of road asphalt’
0.45
0.4
0.35
0.3
0.25
0.2
0.15
0.1
0.05
0
Emis
sion
, Gg
1990 1991 1992 1993 1994 1995 1996 1997 1998 1999 2000 2001 2002 2003 2004 2005
0.6
0.5
0.4
0.3
0.2
0.1
0
Emis
sion
, Gg
1990 1991 1992 1993 1994 1995 1996 1997 1998 1999 2000 2001 2002 2003 2004 2005
Production of roofing bitumen Glass making
80
70
60
50
40
30
20
10
0
Emis
sion
, Gg
1990 1991 1992 1993 1994 1995 1996 1997 1998 1999 2000 2001 2002 2003 2004 2005

80
Fig. 3.37. NMVOC emission under ‘Chemical industry’ sector
3.2.2.2.2. Chemical industry
Actually, there is no chemical industry in the Republic. There are small enterpris-es using ready plastic, they perform heating and moulding. That is why only NMVOC emissions occur. NMVOC emission dynamics is shown in Fig. 3.37. Significant decrease of the emission is explained by implementation of modern technologies that practi-cally exclude emissions.
3.2.2.2.3. Metallurgy
Metallurgy in the Republic is represented by enterprises producing stibium, mer-cury and gold. Remelting of steel, cast-iron and nonferrous metal scrap is included into this sector. Gold production employ hydrometallurgical processes – these processes do not cause emission of greenhouse gases and their precursors, therefore they are not consider further on.
The sector includes emissions of the following activities:• cast-ironandsteelproduction(СО,NOxandCOemission);• aluminiumproduction(СО,NOxandCOemission);• stibiumproduction(CO,NOx,COandSОxemission);• mercuryproduction(CO2,COandSОxemission);• leadproduction(СО,NOxandCOemission);• copperproduction(СОemission).The term ‘production’ means remelting when applied to all metals but stibium
and mercury. All the processes of this sector are not covered with IPCC methodical instructions; that is why the national emission coefficients have been used.
NationalemissioncoefficientsforСО,CO,SOХ,NOХhavebeentakenfromex-perimental studies and calculated data for foundry enterprises of the Kyrgyz Repub-lic: electric furnaces for remelting of nonferrous metals, steel, cast-iron and moulding from metal scrap. Stibium and mercury are extracted from ore.
Fig. 3.38 shows dynamics of carbon dioxide emission under ‘Metallurgy’ sector. The basic contribution made by production of stibium and mercury.
Emissions volume fluctuations are caused by unstable work of the enterprises. All stibium and mercury production in the Republic is provided by single, irregularly working enterprises, their productivity completely determines emission volume. De-
0.0250
0.0200
0.0150
0.1000
0.0050
0.00001990 1991 1992 1993 1994 1995 1996 1997 1998 1999 2000 2001 2002 2003 2004 2005
Emis
sion
, Gg

81
crease of emission caused by cast-iron and steel production is explained by reduction of remelting volumes. Emission of carbon dioxide and other industries of the given sector (‘Aluminum production’, ‘Lead production’ and ‘Copper production’) is insignifi-cant if compared with the general emission of the sector, it totals less that 1 percent.
Table 3.17. Emission coefficients of the metallurgical production
Production СО NOx СО SОx
Cast-iron and steel 0.0143 0.0018 0.0091 0.0
Aluminium 0.000035 0.0000216 0.000022 0.
Stibium 0.00024 0.0000216 0.0001531 0.0000631
Mercury 0.0193262 0.0 0.01230968 0.0022213
Lead 0.00035 0.000214 0.000223 0.0
Copper 0.000017 0.0000135 0.0000105 0.0
18.0
16.0
14.0
10.0
8.0
6.0
4.0
2.0
0.0
Emis
sion
, Gg
1990 1991 1992 1993 1994 1995 1996 1997 1998 1999 2000 2001 2002 2003 2004 2005
Cast-iron and steel production Stibium production Mercury production
Fig. 3.38. Carbon dioxide emissions under metallurgical sector
Fig. 3.39 shows emissions of nitrogen oxides. The main contribution is created by production of stibium, cast-iron and steel. The total contribution of other producers does not exceed 0.0009 Gg. The decrease emission is caused by consecutive decrease production volumes.
0.70
0.60
0.50
0.40
0.30
0.20
0.10
0.00
Emis
sion
, Gg
1990 1991 1992 1993 1994 1995 1996 1997 1998 1999 2000 2001 2002 2003 2004 2005
Cast-iron and steel production Stibium production
Fig. 3.39. Nitrogen oxides emission under sector ‘Metallurgy’

82
Carbon oxide emission is shown in Fig. 3.40. The main contribution is created by production of mercury, stibium, cast-iron and steel. The contribution of other produc-ers is less that 1 percent.
Fig. 3.40. Emission of carbon oxide in sector of metallurgy
Emission of sulfur oxides is also caused primarily by production of stibium and mercury (see Fig. 3.41).
12.0
10.0
8.0
6.0
4.0
2.0
0.0
Emis
sion
, Gg
1990 1991 1992 1993 1994 1995 1996 1997 1998 1999 2000 2001 2002 2003 2004 2005
Cast-iron and steel production Stibium production Mercury production
Fig. 3.41. Emission of sulfur oxides in sector of metallurgy
3.2.2.2.4. Production of food and beverages
The food-processing industry includes food production including forages and beverages (alcoholic and nonalcoholic) production. For food production only NMVOC emission is taken into account in compliance with IPCC methodical instructions where fuel consumption is attributed to section ‘Energy’ with typical to factors of the emis-sion. The results of calculations are shown in Fig. 3.42. Irregularity of emission changes is caused by registration problems – since 1990 actually all large enterprises have fallen down into innumerous amount of small ones.
2.5
2.0
1.5
1.0
0.5
0.0
Emis
sion
, Gg
1990 1991 1992 1993 1994 1995 1996 1997 1998 1999 2000 2001 2002 2003 2004 2005
Stibium production Mercury production

83
3.2.2.2.5. Blast works
Large scale blast works are carried out in the Republic for mining purposes and road construction. The IPCC instructions do not contain a method developed for the blast works emission calculation; therefore for the purposes of the Inventory national coefficients have been employed. The main explosive in use is ammonite. The am-moniteconsistsofsaltpeter(NHNO)-79percentandtrotyl(CHHO)-21percent.Calculation of explosive products employed into explosion has been performed ac-cording to the formula. The formula takes into account decomposition of explosive compounds:CO,CO,HO,HandN.Onthebasisofquantityofexplosionproductsemission coefficients have been determined:
• forCO-0.0004286Gg/tonofexplosives;• forCO–0.0000985Gg/tonofexplosives.There is no nitrogen oxides emission after blast because the ammonite has nega-
tive oxygen balance (blasts in closed spaces). It has been proved by air tests. Fig. 3.43 shows the dynamics of carbon dioxide emission resulted from blast works. Carbon oxide emissions are completely similar and, therefore, have not been included.
Fig. 3.42. NMVOC emissions produced by food and beverages production
2.5
2.0
1.5
1.0
0.5
0.0
Emis
sion
, Gg
1990 1991 1992 1993 1994 1995 1996 1997 1998 1999 2000 2001 2002 2003 2004 2005
Stibium production Mercury production
14.0
12.0
10.0
8.0
6.0
4.0
2.0
0.0
Emis
sion
, Gg
1990 1991 1992 1993 1994 1995 1996 1997 1998 1999 2000 2001 2002 2003 2004 2005
Fig. 3.43. Carbon dioxide emission caused by blast works

84
3.2.2.2.6. Consumption of hydrofluorocarbons (refrigerating facilites maintenance)
Estimate of emission of sulfur hexafluoride, hydrofluorocarbons and perfluorocar-bons in the Kyrgyz Republic is carried out for the first time. The inventory under the First National Communication did not include the emission of these substances, be-cause it was assumed that their volume was insignificant, and also because the official data about their usage in the Republic was not available. However, taking into account significant size of global warming potential of sulfur hexafluoride, hydrofluorocarbons (HFC) and perfluorocarbons (10 – 22,000) such work has been carried out. On the basis of the preliminary analysis it is established, that from all listed above substances in the Republic only HFC is in use, namely HFC-134а.
There is no production of HFC in territory of the Republic. Basic application of HFC is its use as a coolant in the equipment for stationary cooling in household refrigerator and conditioners, trading-commercial and industrial refrigerators and in the equip-ment of mobile cooling (refrigerators on transport and mobile conditioners). HFC-134а is a coolant replacing chlorine fluorocarbons, such as CFC-12 and HCFC-22. Application in other spheres is not detected. Earlier at the enterprises of electronic industry CFC-113 and CFC-13 were used as solvents. When the enterprises have been closed the use of any halocarbon in electronic industry of the Republic stopped. Similar situation was about the use of halocarbon as foamers. Foam products in small amounts were made in the Republic in the beginning of 1990s years with use CFC. After drop of production, the imported foam products are consumed only. As filling agent for the equipment of automatic fire-fighting HFC is not used in the Republic, the system of fire-fighting are filled with other substances.
For definition of volumes of HFC the accepted methodology is from below-up-wards, it is based on concrete volumes of consumption of service enterprises, because its import is not registered by official statistics and customs bodies. For simplification it is supposed, that all substances consumed in a singular year are emitted into atmo-sphere. Results of calculation are shown in Fig. 3.44. There were no emissions before year 2000 for the cooling equipment used CFC.
Fig. 3.44. Emission of HFC-134а during the cooling equipment maintenance
3.2.2.3. Use of solvents and other production
Calculation of emissions in this section is carried out for the enterprises produc-ing paints, varnishes, coverings, and also in view of works, proceeding from volume of
0.01
0.009
0.008
0.007
0.006
0.005
0.004
0.003
0.002
0.001
0
Emis
sion
, Gg
2000 2001 2002 2003 2004 2005

85
the imported paint and varnish materials.The basic sources of emissions are:• paintingshops;• construction;• degreasingofdetails;• repairworks,includingworksinresidentialsector;• small-scaleproductionofpaintandvarnishmaterials.In all listed cases the emitted substances are none methane volatile compounds
(NMVOC). The emissions occur both during paint and varnish production, and at their application. Taking into account insignificant volumes of paint and varnish production and small factors of the emission, this section considers only the emissions caused by application of the substances.
For calculation of NMVOC emission the typical factors of emission indicated in ‘CORINAIR Emission Inventory Instructions‘ have been used. Results of calculation are shown in Fig. 3.45. Changes of the emission are related to changes of volumes of pro-duction.
Uncertainty of an estimation of the emission makes about 50 percent due to in-sufficiency of the initial data about conditions of production and usage of paint and varnish production, and also due to inexact initial data on volumes of use and import.
Fig. 3.45. NMVOC emission caused by use of paint and varnish production
3.2.2.4. Agriculture
Agriculture is an economic basis of the economy of the Republic. In 1991 - 1995 agrarian sector though and to a lesser degree, than other industrial branches, suffered the economic crisis replaced further by rise as a result of the carried out agrarian and land reform. The reform has essentially changed the structure of the property in the agriculture – it converted approximately 560 collective farms into hundreds thousand private farms. That had positive influence but also constrains rates of growth, espe-cially when it comes to seed-growing and animal breeding industries.
The section ‘Agriculture’ includes the following sectors:• internalfermentation;• manurestoragesystems(theemissionfromproductsoflivestock-cattleand
poultry);• cultivationofrice(rice-growingontheinundatedricefields);
3,5
3,0
2,5
2,0
1,5
1,0
0,5
0,0
Emis
sion
, Gg
1990 1991 1992 1993 1994 1995 1996 1997 1998 1999 2000 2001 2002 2003 2004 2005

86
• cultivatedsoil(theemissionfromfertilizersandfromcultivationofthecertaincultures);
• burningoftheagriculturalwastes.The section ‘Agriculture’ considers emissions of the following greenhouse gases:• methane(СН) - in sectors ‘Enteric fermentation’, ‘Manure storage systems’,
‘Burning of the agricultural residues’ and ‘Rice cultivation’;• nitrousoxide (NO) - in sectorsof‘Manurestoragesystems’, ‘Burningof the
agricultural wastes’ and ‘Soil cultivation’The emission of gases-precursors (NOx and CO) occurs only in the sector ‘Burn-
ing of the agricultural residues’. Emission of carbon dioxide in this sector is attributed tothesector‘BiomassСОemission’inthesection‘Memoitems’.
The emission of methane is distributed non-uniformly. For 2005: an internal fer-mentation – 88.4 percent, manure storage – 9.5 percent, cultivation of rice – 0.5 percent and burning of the agricultural wastes - 1.6 percent. The general tendency is directed to decrease because of reduction of livestock amount.
Fig. 3.47. Distribution of nitrous oxide emission by sectors of ‘Agriculture’ section
140
120
100
80
60
40
20
0
Emis
sion
, Gg
1990 1991 1992 1993 1994 1995 1996 1997 1998 1999 2000 2001 2002 2003 2004 2005
Enteric fermentation Rice cultivation
Manure storage systemsBurning of agriculture residues
0.08
0.07
0.06
0.05
0.04
0.03
0.02
0.01
0
Emis
sion
, Gg
1990 1991 1992 1993 1994 1995 1996 1997 1998 1999 2000 2001 2002 2003 2004 2005
Manure storage systems Soil cultivation Burning of agricultural residues
Fig. 3.46. Distribution of methane emission by sectors of ‘Agriculture’ section

87
The emission of nitrous oxide (see Fig. 3.47) is distributed in 2005 between sec-tors as follows: ‘Manure storage systems’ - 4.3 percent, ‘ Soil cultivation’ - 6.1 percent and ‘Burning of agricultural residues’ - 89.6 percent. The general tendency also is di-rected to downturn of the emission.
The estimation of uncertainty of emissions calculation was made on the basis of IPCC, ЕМЕP/CORINAIR recommendations and expert estimations.
Table 3.18. Estimation of uncertainty
Sector GHG Uncertainty, % The basic source of uncertainty
Internal fermentation CH 30.0 Factors of the emission
Manure storage systemsCH 25.0 Factors of the emission
NO 30.0 Factors of the emission
Rice cultivation CH 10.0 The initial data on areas under crops
Soil cultivation NO 50.0 Initial data on volumes of fertilizers
Burning of agriculture wastes
CH 50.0 Initial data on volumes of burnt wastes
NO 50.0 Initial data on volumes of burnt wastes
Key sources for 1990 and 2005 are shown in Table 3.19. The emissions in each sec-tor are determined by summation of all greenhouse gases emissions in view of their global warming potential.
Table 3.19. Key sources for 1990 and 2005.
Sector1990 2005
GHG emission, Gg Percentage of emission total, %
GHG Emission,Gg
Percentage of emission total, %
Internal fermentation 2,407.524 91.22 1,693.96 87.47
Manure storage 197.96 7.50 182.67 9.43
3.2.2.4.1. Enteric fermentation
Factors of the emission of methane from the enteric fermentation are accepted according to IPCC instructions. The following categories of agricultural animals were taken into account:
• dairycattle;• meatcattle;• yaks;• sheepandgoats;• pigs;• horses;• camels;• donkeys.Results of calculation of the emission from the enteric fermentation are shown in
Fig. 3.48 (yaks are switched to cattle). In 2005 a correlation of emissions among various categories of livestock was the following: dairy cattle – 38.53 percent, meat cattle – 29.0 percent, sheep and goats – 24.02 percent, horses – 7.70 percent, pigs, camels and donkeys in total – 0.74 percent. During the examined period the livestock of sheep drastically reduced.

88
Fig. 3.48. Methane emission from internal fermentation
3.2.2.4.2. Manure storage systems
Emissions of methane and nitrous oxide from manure storage systems were es-timated for categories of the agricultural animals listed in the previous section and poultry. At the estimation of emissions of methane and nitrous oxide from manure the typical factors of the emission for outrun methods of pasture for each recommended subgroup of the livestock and poultry are used. All produced manure is broken into separate categories:
• dailytakenouttofields;• storedassolidsinpensatfarms;• leftonpastures,fencedpasturesorinpens;• usedasfuel.
Fig. 3.49. The emission of methane from manure storage systems
The relative volume of each category is determined in the First National commu-nication. In this sector for definition of emissions only the manure stored as solids in pens at farms has been considered. Outrun method is used for horses, camels, sheep and goats, therefore the most part of manure remains on pastures or in pens. For vari-
120
100
80
60
40
20
0
Emis
sion
, Gg
1990 1991 1992 1993 1994 1995 1996 1997 1998 1999 2000 2001 2002 2003 2004 2005
Dairy cattle Sheep and goatsMeat cattle Horses
10.0
9.0
8.0
70
6.0
5.0
4.0
3.0
2.0
1.0
0.0
Emis
sion
, Gg
1990 1991 1992 1993 1994 1995 1996 1997 1998 1999 2000 2001 2002 2003 2004 2005
Diary cattle
Horses
Sheep and goats
Camels
Meat cattle
Poultry
Pigs
Donkeys

89
ous animals and poultry, the typical factors of the emission from IPCC Guidelines spe-cific to less developed countries of moderate region are accepted.
Results of calculation of the methane emission from manure storage systems are shown in Fig. 3.49. In 2005 a correlation of emissions from various categories of agri-cultural animals and poultry is the following: dairy cattle - 80.36 percent, meat cattle - 6.14 percent, sheep and goats - 5.82 percent, pigs - 1.03 percent, horses - 5.22 percent, poultry - 0.89 percent, camels - 0.006 percent and donkeys - 0.53 percent.
Results of calculation of the emission of nitrous oxide from manure storage sys-tems are shown in Fig. 3.50. In 2005 the parity ratio of emissions from various sys-tems was the following: the manure left on pastures, fenced pastures or in pens - 80.11 percent; storage as solids and in pens at farms - 19.89 percent.
3.2.2.4.3. Rice cultivation
In the Republic rice is grown with irrigational water supply and repeated aeration. The data on areas under crops in Osh, Jalal-Abad and Batken oblasts and since 1994 - in Chui oblast are used. In southern oblasts soils are sierozems and sierozem-meadow, in Chui oblast – low-carbon- sierozem soils. Mineral fertilizers in small amounts are ap-plied as ammoniac saltpeter to carry out additional fertilizer during vegetation.
Fig. 3.50. The emission of nitrous oxide from manure storage systems
0.006
0.005
0.004
0.003
0.002
0.001
0.000
Emis
sion
, Gg
1990 1991 1992 1993 1994 1995 1996 1997 1998 1999 2000 2001 2002 2003 2004 2005
Manure left on pastures, fenced pastures or in pens Storage as solids and in pens at farms
0.6
0.5
0.4
0.3
0.2
0.1
0.0
Emis
sion
, Gg
1990 1991 1992 1993 1994 1995 1996 1997 1998 1999 2000 2001 2002 2003 2004 2005
Fig. 3.51. Methane emission from rice cultivation

90
For calculations of the methane emission the standard IPCC Guidelines were used. The results of calculations are shown in Fig. 3.51. Growth of the emission is explained by increase of rice plantations.
3.2.2.4.4. Cultivated soil
In the given sector the following categories of emission sources are considered:• directemissionofnitrousoxidefromtheagriculturallands;• directemissionofnitrousoxiderelatedtouseoflivestockandpoultry(manure
and guano) as fertilizers;• indirectemissionofnitrousoxidefromtheagriculturallandswhichcanbecon-
nected to use various nitrogen containing cultures in the agriculture.At an estimation of the emission of nitrous oxide from the agricultural lands the
standard IPCC coefficients were used. The share of nitrogen in nitrogen-binding and non-nitrogen-binding cultures dry biomass is determined as average for the cultures grown in the Republic.
Results of calculation of the emission are shown in Fig. 3.52 which reflects the reduction trend of fertilizers use.
Fig. 3.52. The emission of nitrous oxide at cultivated soils
3.2.2.4.5. Agricultural residues burning
After harvesting a significant mass of agricultural (stubble) residues remains on fields. In the Kyrgyz Republic their burning is usual practice. According to the expert in the field of plant cultivation, the residues of the basic eight cultures are exposed to burning: wheat, oats, rice, rye, barley, sunflower, cotton and safflower. Stubble remains of some cultures (sunflower, cotton, and safflower) residues are completely burnt. Practice of burning of the residues of plant cultivation is also common on personal plots,summerresidencesandprivateindividualgardens.СОemissionfromburningtheagriculturalresiduesareattributedtosector‘СОEmissionfrombiomass’insec-tion ‘Memo items’.
At an estimation of the emission from burning the agricultural residues the standard IPCC Guidelines for section ‘Land use, of land use change and forestry’ were used.
On Fig. 3.53 – 3.54 tendencies of GHG emission changes are similar to the tenden-cies of gases-precursors emissions from burning the agricultural remains are shown.
0.008
0.007
0.006
0.005
0.004
0.003
0.002
0.001
0.000
Emis
sion
, Gg
1990 1991 1992 1993 1994 1995 1996 1997 1998 1999 2000 2001 2002 2003 2004 2005

91
Fig. 3.53. The emission of greenhouse gases from burning the agricultural residues including GWP
3.2.2.5. Land use, land use change and forestry
The sources of GHG emission and/or sinks in the given section are natural: tree-and-bush vegetation and soils. The anthropogenic impact changes only the intensity ofGHGemissionand/orsinks.СОemission/sinksinthissection,besidesanthropo-genic influence, strongly depends on climatic conditions of the country.
Fig. 3.54. The emission of gases - precursors from burning the agricultural remains
As a whole, the emission and sinks in the section are determined by IPCC guide-lines. The GHG emission in sectors ‘Conversion forest and meadow lands’ and ‘Halt of land use’ was not made due to absence of the official initial data.
As a result, the section includes two following sectors:• Changeofstocksofawoodbiomasswhichis,inturn,subdivided:
•forestreserves:•plantgrowinginthesettlements;•protectiveafforestations;•long-termplantings;
• changeofcarboncontentinsoils.
45
40
35
30
25
20
15
10
5
0
Emis
sion
, Gg
1990 1991 1992 1993 1994 1995 1996 1997 1998 1999 2000 2001 2002 2003 2004 2005
Nitrogen oxides Carbon oxide
60
50
40
30
20
10
0
Emis
sion
, Gg
1990 1991 1992 1993 1994 1995 1996 1997 1998 1999 2000 2001 2002 2003 2004 2005
Methan Nitrous oxide

92
All subdivisions of ‘Change of stocks of a wood biomass’ sector include carbon dioxide sinks, formed during accumulation of biomass, as well as the emission of greenhouse gases (methane, nitrous oxide) and gases - precursors (carbon oxide and nitrogen oxides) as a result of biomass burning. The emission of carbon dioxide as a resultofbiomassburningisattributedtothesector‘СОemissionfrombiomass’inthesection ‘Memo Items’.
‘Change of carbon stock in soils’ sector takes into account a change of carbon content in a ground soil which determines what processes occur - the emission or sink of carbon dioxide.
As a whole, the section ‘Land use, land use change and forestry’ sinks essentially exceed the GHG emission (see Fig. 3.55). For example, in 2005 carbon dioxide sinks made 96.1 percent of all influence on atmosphere, whereas the total emission of ni-trous oxide and methane was only 1.2 percent, and the emission of carbon dioxide sinks from soil - 2.7 percent. For other years the correlation did not change essentially.
The estimation of uncertainty on emission calculation was made on the basis of recommendations of the Revised IPCC guidelines and expert estimations.
Key sources are determined for 1990 and 2005. The emissions under sector ‘Change of wood biomass stocks’ were defined by summation of emissions of nitrous oxide and methane in view of their global warming potential. The sinks in the same sector has been accepted as a separate source. Proceeding from these preconditions a key source for 1990 and 2005 is a sink in sector ‘Change of wood biomass stock’, mak-ing more than 96 percent for entire period of inventory.
Fig. 3.55. Sinks and emission in ‘Land use, land use change and forestry’section. Sinks are shown as negative, and emission - as positive.
Table 3.20. Estimation of uncertainty
Sector GHG Uncertainty, % Basic source of uncertainty
Change of stocks of wood biomass (sink) CО 30.0 Factors of biomass growth and
the initial data on forest areas
Change of stocks of wood biomass (emission)
CH 50.0 Amount of immediately burnt wood
NO 50.0 Amount of immediately burnt wood
Change of carbon stock in soils CО 80.0 Initial data on carbon content in soil
100
0
100
200
300
400
500
600
700
800
900
Emis
sion
/sin
k, G
g
1990 1991 1992 1993 1994 1995 1996 1997 1998 1999 2000 2001 2002 2003 2004 2005
Changes in forest biomass Emission from soil
Emission from biomass burning

93
3.2.2.5.1. Change of wood biomass stocks
‘Wood reserves’ are attributed to the category of natural and restored massive of tree-and-bush vegetation - woods, large massive. Criterion of belonging to this source is a growth of natural conditions without irrigational and agrotechnical services. For-mal criteria are the density of crones and height of vegetation (in Kyrgyzstan the ac-cepted density of crones is not below 10 percent, the height is not lower than 2 m).
‘Plantings in settlements’ are attributed to the category of the public gardening, special purpose and limited usage in settlements (parks, gardens, squares, parkways, quays, forest parks, groves, nurseries, green plantings in cemeteries, gardening of wa-ter-intakes, treatment facilities, plantings at houses and in households farms, subur-ban forest parks of the state forest fund, etc.).
‘Protective afforestations’ are attributed to the category of artificial plantings of tree-and-bush vegetation of protective purpose (field-protecting forest belts, water-protective plantings, roadside plantings, etc.).
The vegetation of patterns of ownership concerning agricultural lands is attrib-uted to the category ‘Long-term plantings’, berry-fruit, tree-and-bush.
The state registry of forest fund up to 30 tree and more than ten bush plant spe-cies are classified. All variety of species is grouped into species (coniferous, hard-leaf, soft-leaved, other tree species), all bushes are incorporated into one group, and there is a group ‘Uncertain species’ – there is no full information on it.
On the basis of estimation of annual accumulation of dry organic substance in tons/ha for species and groups of species separately for administrative territories in view of division into districts on high-altitude and climatic zones, and also in view of the growth of underground part, the national factors of biomass growth (see Table 3.21) have been developed.
Table 3.21. National factors of biomass growth at high-altitude and by climatic zones, t/ha
Groups of species Northern Tien-Shan
Internal Tien-Shan
Ferghana valley
High-altitude zone up to 1,500 m
Coniferous 0.8785 - 0.1746
Hard-leaf 1.0010 - 1.0010
Soft-leaf 1.8150 - 1.8150
Other species 0.7865 - 0.4594
Bushes 0.4588 - 0.4588
Uncertain species 0.7902 - 0.6897
High-altitude zone from 1,500 up to 2,500 m
Coniferous 0.8785 0.2059 0.1746
Hard-leaf 0.7293 0.7293 0.7293
Soft-leaf 1.2100 1.4300 1.2100
Other species 0.7385 0.8580 0.7385
Bushes 0.3626 0.3626 0.3626
Uncertain species 0.7708 0.7574 0.6703
High-altitude zone is higher than 2,500 m
Coniferous 0.3324 0.1496 0.0701
Bushes 0.2664 0.2664 0.2664
Uncertain species 0.2994 0.2080 0.1683
Distribution of sinks in time in the subdivisions changed insignificantly. In 2005, the basic contribution to sinks has brought by subdivisions ‘Forest reserves’ – 73.49

94
percent, ‘Plantings in settlements’ – 0.90 percent, ‘Protective afforestations’ – 15.55 percent, ‘Long-term plantings’ – 10.06 percent.
Fig. 3.56. Carbon dioxide in sector ‘Change of wood biomass stocks’
The emission of other greenhouse gases of ‘Change of wood biomass stocks’ sector (nitrous oxide and methane) practically did not change in time that testifies the constant volumes of immediately burnt biomass. Some fluctuations depend on the current changes of volumes of felling which changed in limits from 5.6 percent up to 8.7 percent from annual accumulation of wood biomass in forest reserves, and the share of the wood taken out and burnt down during different years changed within limits from 28 percent up to 45 percent from total amount of felling. The correlation of nitrous oxide and methane on years in the general emission did not change and made approximately 8 and 92 percent accordingly.
900
800
700
600
500
400
300
200
100
0
Sink
s, G
g
1990 1991 1992 1993 1994 1995 1996 1997 1998 1999 2000 2001 2002 2003 2004 2005
Forest reserves Protective forestations
Plantings in settlementsLong-term plantings
8
7
6
5
4
3
2
1
0
Emis
sion
, Gg
1990 1991 1992 1993 1994 1995 1996 1997 1998 1999 2000 2001 2002 2003 2004 2005
Nitrous oxide Methane
Fig. 3.57. GHG emission (except for СО) in sector ‘Change of wood biomass stocks’ at biomass burning (including GWP)
Emissions of gases-precursors - nitrogen oxides and carbon oxide - was deter-mined according to above mentioned volumes of felling and shown in Fig. 3.58 and 3.59. Essential changes of the emission distribution among subdivisions for the period

95
of inventory has not been noted. In 2005 the distribution was as follows:• forestreserves–21.2percent;• plantingsinsettlements–0.4percent;• protectiveafforestations–22.8percent;• long-termplantings-55.6percent.
Fig. 3.58. Emission of nitrogen oxides in sector ‘Change of wood biomass stocks’ at biomass burning
Fig. 3.59. Carbon oxide emission in sector ‘Change of wood biomass stocks’ at biomass burning
3.2.2.5.2. Change of carbon stock in soils
Emission/sinksofСО fromsoilsareestimatedonly for thecultivated lands,aslands under the greatest anthropogenic impact. The cultivated lands include the lands under annual (grain, vegetable oil, vegetables, root and fodder crops) and long-term agricultural crops, and also plough-land (i.e., the land left for one or several years be-fore the subsequent cultivation).
Calculation of the emission was made according to the IPCC Guidelines. Results of calculation are submitted in Fig. 3.60. Sharp fluctuations of the emission reflect dis-crepancies of the amount of carbon in soils which is not available in the official statis-
0.035
0.030
0.020
0.015
0.010
0.005
0.005
0.000
Emis
sion
, Gg
1990 1991 1992 1993 1994 1995 1996 1997 1998 1999 2000 2001 2002 2003 2004 2005
Forest reserves Protective forestations
Plantings in settlements Long-term plantings
1.8
1.6
1.4
1.2
1.0
0.8
0.6
0.4
0.2
0.0
Emis
sion
, Gg
1990 1991 1992 1993 1994 1995 1996 1997 1998 1999 2000 2001 2002 2003 2004 2005
Forest reserves Protective forestations
Plantings in settlements Long-term plantings

96
tics and received by researches. The reduction of carbon stocks in the cultivated soils, i.e. decrease of the land quality, testifies the fact that not a carbon dioxide seqestration but the emission has constantly taken place.
Fig. 3.61. GHG emission by sectors, including GWP
21.5
21.0
20.5
20.0
19.5
19.0
18.5
18.0
Emis
sion
, Gg
1990 1991 1992 1993 1994 1995 1996 1997 1998 1999 2000 2001 2002 2003 2004 2005
2500
2000
1500
1000
500
0
Emis
sion
, Gg
1990 1991 1992 1993 1994 1995 1996 1997 1998 1999 2000 2001 2002 2003 2004 2005
Sewage treatment Burial of solid household wastes
Fig. 3.60. Carbon dioxide emission from change of carbon stock in soils
3.2.2.6. Wastes
Section ‘Wastes’ is divided into two sectors:• burialofsolidhouseholdwastes;• sewagetreatment.Methan emission is assembled for the sector ‘Burial of solid household wastes’,
and of methane and nitrogen protoxide - for the sector "Sewage treathment".Calculation of emissions in the section (see Fig. 3.61 – Fig. 3.62) shows relative
stability of emissions in sector ‘Sewage treatment’ both for nitrous oxide (against the significant reduction in sector ‘Burial of solid domestic wastes’) and for methane. This reduction does not relate to any measures the emissions reduction, and basically is connected to decrease of effectiveness of the solid wastes treatment facilities and fall-ing of industrial production.

97
Fig. 3.62. Division of the emission by gases. At the expense of decrease of methane emission the share of nitrous oxide emission has increased from 4.5 percent in 1990 up to 13.3 percent in 2005.
The estimation of emissions calculation uncertainty was made on the basis of IPCC recommendations and expert estimations.
Table 3.22. Estimation of uncertainty in percentage
Sector GHG Uncertainty, % Basic source of uncertainty
Burial of solid wastes CН4 30.0 Emission ratio and initial data on solid wastes volumes
Sewage treatmentCH 50.0 Initial data on quantity and structure of
sewage
NO 50.0 Initial data on quantity and structure of sewage
3.2.2.5.1. Solid waste landfill
Calculation of methane emission from burial of solid domestic wastes (SDW) is executed according to the IPCC documents with a use of tipical factors of emission. Taking into account that there were research works in the Republic aimed at definition of constants of speed of methane formation (which can differ for concrete bural places by tens), and also taking into account that the quantity of wastes changed annually within small limits, the insufficiency method was used to calculate the methane emis-sion. According to experts estimations, all dumps in the Republic are of an uncon-trolled type. All landfills with a depth of waste disposal more than 5 m are not to be at-tributed to the category of uncontrolled waste disposals. Solid wastes in the Republic are not burnt (except of spontaneous ignition), methane formed in the disposals is not utilised, there is no system of preparatory sorting.
Regular statistical registration of SDW volume disposed at the landfills (the amount is determined by a truck body capacity) is conductedin the Republic, while there is no regular stock taking of SDW density and morphological structure. The irregular control takes place, that is a reason to use special extrapolation (accounting character and amount of the initial data) for the whole period of inventory.
Results of calculation are shown in Fig. 3.63.
2500
2000
1500
1000
500
0
Emis
sion
, Gg
1990 1991 1992 1993 1994 1995 1996 1997 1998 1999 2000 2001 2002 2003 2004 2005
Methan Nitrous oxide

98
Fig. 3.63. Emission of methane from solid household wastes dumps
Essential decrease of the emission is basically connected to decrease of waste col-lection sistem effectiveness, and also with some decrease in population life standards. Some tendencies on partial waste recicling also effect on the emission decrease.
3.2.2.5.2. Waste water treatment
Two main types of waste water, according tothe IPCC Guidelines, are to be esti-mated separately, such as:
• domesticandcommercial(miscellaneousindustrial)wastewaters;• industrialwastewaters.Actually, this division in the Kyrgyz Republic is symbolic, for the existing system of
the sewage drains is essentially are the same (in residential area); it has been taken into account in order to simplify the calculations.
The calculations did not take into account utilized/burnt methane on the treat-ment facilities, because there is no such practice in the Republic.
Due to the fact that no assesment was undertaken in the Republic to define share of degradable organoc matter removed with silt, it was assumed, following the re-comendations of the revised IPCC Guidelines that no organic substance is present in silts.
Only big enterprises in the Republic maintain monitoring on quality and quantity of waste water drawn to the sewage treatment facilities. Even there the monitoring is not regular. So, the calculations have been based on the standards from reference books; the standards were adjusted to sinks totals.
Sector ‘Waste water treatment’ contains information about the following emis-sions:
• methane(CH)–domesticandcommercial(otherindustrial)wastewater,in-dustrial waste water;
• nitrousoxide(NO)-domesticandcommercial(otherindustrial)wastewater.Calculations were based on the typical emission factors - those recommended by
methodical instructions of IPCC. The estimate emissions of methane and nitrous oxide from waste water are shown in Fig. 3.64 and Fig. 3.65.
During inventory period the emission of methane from industrial waste water (percentage of emission in 1990 - 58.1 percent and in 2005 - 11.3 percent) suffered the most essentially decrease. It can be explained by a general industrial recession and a corresponding decrease of industrial waste water volume. Reduction of the methane emission volumes from domestic waste water took place only after year 2000. It can be
100
90
80
70
60
50
40
30
20
10
0
Emis
sion
, Gg
1990 1991 1992 1993 1994 1995 1996 1997 1998 1999 2000 2001 2002 2003 2004 2005

99
somewhat explained by decrease of waste water system efficiency.
Fig. 3.64. Methane emission from waste water
12
10
8
6
4
2
0
Emis
sion
, Gg
1990 1991 1992 1993 1994 1995 1996 1997 1998 1999 2000 2001 2002 2003 2004 2005
Industrial wastes Household wastes
0.3
0.25
0.2
0.15
0.1
0.05
0
Emis
sion
, Gg
1990 1991 1992 1993 1994 1995 1996 1997 1998 1999 2000 2001 2002 2003 2004 2005
Fig. 3.65. Nitrous oxide emission from domestic and commercial waste water
Fig. 3.66. Distribution of the GHG emission change (including GWP) per region
35000
30000
25000
20000
15000
10000
5000
0
Emis
sion
, Gg
1990 1991 1992 1993 1994 1995 1996 1997 1998 1999 2000 2001 2002 2003 2004 2005
Batken oblast Naryn oblastChui oblast
Jalal-Abad oblastOsh oblastBishkek
Issyk-Kul oblastTalas oblast

100
3.2.3. Emission per regions
3.2.3.1. Overall emissions
Only technical restrictions (for example, lack of statistical information in required volume about city Osh) have not allowed to estimate emission and sinks in regions for all sectors in complete compliance with the existing administrative division of the Kyrgyz Republic. Nevertheless, the received results help to determine general contri-bution of the main regions into climate change. Fig. 3.66 shows distribution of the to-tal emission of greenhouse gases (including GWP) per a region, and Table 3.24 shows change of emission total distribution per region between 1990 and 2005. The emis-sion in c. Bishkek is the highest during the entire inventory period, though its relative contribution has decreased by 2005. Chui oblast follows с. Bishkek, it can be easily explained - Bishkek and Chui oblast are the main industrial centers. During the entire period of inventory the most part of all industrial production has been concentrated here; it also the main residential area. It should be noted that there is no clearly ex-pressed dynamics of greenhouse gas emission in almost all regions, after significant reduction during 1990 - 1995 period, which can be explained by relative stabilization of the emission in section ‘Energy’ – a section that brings the main contribution into the total of emission (see Fig. 3.2).
Table 3.23. Change of regions share in GHG emission totals (including GWP), %
Section 1990 2005
Batken oblast 0.00 3.94
Jalal-Abad oblast 12.05 12.53
Issyk-Kul oblast 4.86 5.42
Naryn oblast 2.55 4.85
Osh oblast 9.68 10.18
Talas oblast 1.80 2.53
Chui oblast 24.71 24.69
Bishkek 44.35 35.86
Fig. 3.67. Annual distribution of gases-precursors emission per region
1000
900
800
700
600
500
400
300
200
100
0
Emis
sion
, Gg
1990 1991 1992 1993 1994 1995 1996 1997 1998 1999 2000 2001 2002 2003 2004 2005
Batken oblast Naryn oblastChui oblast
Jalal-Abad oblastOsh oblastBishkek
Issyk-Kul oblastTalas oblast

101
Input change between 1990 and 2005 was insignificant; it reflects general dynam-ics of GHG emission towards higher correlation with the resident population of the region due to consecutive decrease of industrial sector input.
Regional dynamics of gases-precursors emissions is shown in Fig. 3.67, though the decrease of emission was not so significant, and during the period between 1995 and 2005 there was some growth.
Changes of various regions share in the total emission of gases - precursors be-tween 1990 and 2005 (see Table 3.24) practically completely repeat similar changes for greenhouse gases for the same period.
Table 3.24. Regional inputs into the total of gases-precursors emission, %
Section 1990 2005
Batken oblast 0.00 4.52
Jalal-Abad oblast 12.69 13.48
Issyk-Kul oblast 5.00 5.29
Naryn oblast 2.68 4.23
Osh oblast 10.41 12.01
Talas oblast 1.92 2.54
Chui oblast 22.02 23.15
Bishkek 45.28 34.78
3.2.3.2. Emission per sector
Energy
‘Energy’ section is the section producing the main emission of greenhouse gases and gases-precursors in the Republic. It is obvious, that the emissions of this section determine total emissions. That is why it is obvious, that all basic correlations and gen-eral dynamics of greenhouse gases (see Fig. 3.68 and table 3.25), and gases-precursors (see Fig. 3.69 and Table 3.26) essentially comply with correlations and dynamics of emissions total. Bishkek and Chui oblast made the main contribution to the emission total during the period of inventory. Jalal-Abad and Osh oblasts follow Bishkek and Chui oblast. The contribution of other oblasts makes about 15 percent. Emission of gases – precursors displays similar dynamics.
Fig. 3.68. Distribution of GHG emission (including GWP) under ‘Energy’ section per region
30000
25000
20000
15000
10000
5000
0
Emis
sion
, Gg
1990 1991 1992 1993 1994 1995 1996 1997 1998 1999 2000 2001 2002 2003 2004 2005
Batken oblast Naryn oblastChui oblast
Jalal-Abad oblastOsh oblastBishkek
Issyk-Kul oblastTalas oblast

102
Industrial processes
Fig. 3.70 shows distribution of greenhouse gas emission (including GWP) per re-gion, and Table 3.28 - the percentage distribution of greenhouse gas emission per region in 1990 and 2005, under ‘Industrial processes’ section. Apparently the basic contribution brings Chui oblast, to be exact, as the only thing of the enterprise on manufacture of cement - Kant Cement and Roofing Slate Complex (90 percent in 1990 and more than 87 percent in 2005) was already marked above. More or less significant contribution to general emission the Issik-Kul oblast brings (about 9 percent) where also there is a small enterprise on manufacture of cement. The contribution of other regions to general GHG emission is insignificant (less than 5 percent) as the activity of the enterprises on manufacture of stibium and mercury, bringing earlier some con-tribution to general emission (Batken oblast) has practically stopped. Therefore the changes in general GHG emission of ‘Industrial processes‘ section are naturally defined only by fluctuations in volumes of cement manufacture.
Fig. 3.69. Regional dynamics of gases-precursor emission under ‘Energy’ sector
900
800
700
600
500
400
300
200
100
0
Emis
sion
, Gg
1990 1991 1992 1993 1994 1995 1996 1997 1998 1999 2000 2001 2002 2003 2004 2005
Batken oblast Naryn oblastChui oblast
Jalal-Abad oblastOsh oblastBishkek
Issyk-Kul oblastTalas oblast
900
800
700
600
500
400
300
200
100
0
Emis
sion
, Gg
1990 1991 1992 1993 1994 1995 1996 1997 1998 1999 2000 2001 2002 2003 2004 2005
Batken oblast Naryn oblastChui oblast
Jalal-Abad oblastOsh oblastBishkek
Issyk-Kul oblastTalas oblast
Fig. 3.70. Regional dynamics of GHG emission distribution (including GWP) under ‘Industrial processes‘ section

103
Table 3.25. Dynamics of GHG emission (including GWP) under ‘Energy’ section, %
Section 1990 2005
Batken oblast 0.00 3.94
Jalal-Abad oblast 12.05 12.53
Issyk-Kul oblast 4.86 5.42
Naryn oblast 2.55 4.85
Osh oblast 9.68 10.18
Talas oblast 1.80 2.53
Chui oblast 24.71 24.69
Bishkek 44.35 35.86
Table 3.26. Percentage dynamics of gases-precursor emission under ‘Energy’ sector
Section 1990 2005
Batken oblast 0.00 3.98
Jalal-Abad oblast 12.08 12.95
Issyk-kul oblast 5.03 5.59
Naryn oblast 2.67 4.94
Osh oblast 9.32 10.20
Talas oblast 1.88 2.60
Chui oblast 21.90 21.80
Bishkek 47.12 37.95
Table 3.27. Percentage dynamics of GHG emission (including GWP) under ‘Industrial processes’ section
Section 1990 2005
Batken oblast 0.00 1.33
Jalal-Abad oblast 0.84 0.75
Issyk-Kul oblast 8.30 9.44
Naryn oblast 0.02 0.13
Osh oblast 0.57 0.59
Talas oblast 0.02 0.11
Chui oblast 90.18 87.16
Bishkek 0.08 0.48
Distribution of input of gases-precursors into general emission for total gases-precursors emissions under sector ‘Industrial processes’ essentially differs from green-house gas distribution (see Fig. 3.71 and Table 3.28). Significant emission fluctuations that differ from the ones in other sectors are basically determined by fluctuations of NMVOC emission caused by road construction. 2001 – 2005 was the period of intensive road construction, the same period showed highest readings of total gases–precursors emissions (the emissions increased practically three times as much if compared to the previous period). So, for example, in 2005 the basic volume of road construction was carried out in Chui and Osh oblasts, and also in Bishkek. It explains the essential con-tribution of these regions into total of gases-precursors emissions under the section (namely NMVOC) – the total of these emissions made about 87 percent in 2005.
Agriculture
Distribution of greenhouse gas emissions in the regions under ‘Agriculture’ sec-tion is rather uniform, in comparison with other sectors (see Fig. 3.72 and Table 3.29).

104
Other distinctive feature of the section is insignificant decrease during 1990 - 1995, further replaced by consecutive (without sharp changes) growth. Contributions of the regions during GHG inventory changed insignificantly. It should be noted some de-crease of Chui oblast input at the simultaneous increase of Osh oblast contribution. The contribution to the general GHG emission produced by c. Bishkek is rather small (less than 1 percent) due to obvious reasons. Availability of the statistical data has al-lowed to estimate emission in Batken oblast for the entire period of inventory.
100
90
80
70
60
50
40
30
20
10
0
Emis
sion
, Gg
1990 1991 1992 1993 1994 1995 1996 1997 1998 1999 2000 2001 2002 2003 2004 2005
Batken oblast Naryn oblastChui oblast
Jalal-Abad oblastOsh oblastBishkek
Issyk-Kul oblastTalas oblast
Fig. 3.71. Distribution of gases-precursors emission under ‘Industrial processes’ section per regions
Table 3.28. Regional dynamics of gases-precursors emission under ‘Industrial processes’ section, %
Sector 1990 2005
Batken oblast 0.00 8.55
Jalal-Abad oblast 10.88 1.07
Issyk-kul oblast 0.99 3.10
Naryn oblast 0.42 0.15
Osh oblast 39.57 17.68
Talas oblast 0.42 0.19
Chui oblast 24.82 35.11
Bishkek 22.89 34.14
Table 3.29. Dynamics of GHG emission (including GWP) under ‘Agriculture’ section per region, %
Section 1990 2005
Batken oblast 6.32 9.43
Jalal-Abad oblast 15.79 17.18
Issyk-kul oblast 15.86 14.10
Naryn oblast 14.89 13.37
The Osh oblast 18.23 23.17
Talas oblast 7.65 6.21
Chui oblast 20.96 16.38
Bishkek 0.08 0.16

105
Fig. 3.72. Distribution of GHG emission (including GWP) under ‘Agriculture’ section per region
Fig. 3.73 and Table 3.30 show the distribution of inputs into the general emis-sion of gases-precursors under ‘Agriculture’ section. Rather sharp fluctuations of the emission can be explained by the problems related to registration of initial data. The growing emission trend visible in practically all regions can be explained by official-ly not recommended practice of agricultural wastes burning. This practice is widely spread in Jalal-Abad, Osh and Chui oblasts. It determines their greatest contributions to the general emission of gases-precursors during all inventory period. Greenhouse gas contribution of c. Bishkek into general emission is rather insignificant (less than 0.01 percent). Availability of statistical data has allowed to estimate the contribution of c. Osh to the general emission. Its contribution appeared also small (0.29 percent in 2005), though also a bit bigger, than the contribution of c. Bishkek.
Fig. 3.73. Distribution of the gases-precursors emission under ‘Agriculture’ section per region
Land use, land use change and forestry
Change of the regional contributions in carbon dioxide sinks is shown in Fig. 3.74 and Table 3.31. For the obvious reasons the sinks conributions for Bishkek and Osh
3000
2500
200
1500
1000
500
0
Emis
sion
, Gg
1990 1991 1992 1993 1994 1995 1996 1997 1998 1999 2000 2001 2002 2003 2004 2005
Batken oblast Naryn oblastChui oblast
Jalal-Abad oblastOsh oblastBishkek
Issyk-Kul oblastTalas oblast
45
40
35
30
25
15
10
5
0
Emis
sion
, Gg
1990 1991 1992 1993 1994 1995 1996 1997 1998 1999 2000 2001 2002 2003 2004 2005
Batken oblast Naryn oblastChui oblast
Jalal-Abad oblastOsh oblastBishkek
Issyk-Kul oblastTalas oblast

106
cities are not shown. There were no essential changes in contributions of the different regions during the period of inventory. The greatest GNG sinks belond to the Jalal-Abad and Osh oblasts. For all regions, consistent (although small) reduction of sinks is typycal - caused by the forests and wood biomass deterioration. The process stopped only after year 2000. As compared with 1990, the general reduction of sinks in 2005 has made 10.4 percent, including the oblasts:
• Jalal-Abad–4.00percent;• Issyk-Kul–12.58percent;• Naryn–21.08percent;• BatkenandOsh,thesum–7.15percent;• Talas–25.18percent;• Chui–24.61percent.
Table 3.30. Dynamics of regional inputs into emission of gases-precursors under ‘Agriculture’ section, %
Sector 1990 2005
Batken oblast 0 4.42
Jalal-Abad oblast 33.74 36.78
Issyk-kul oblast 5.30 4.04
Naryn oblast 4.48 1.67
Osh oblast 27.93 25.03
Talas oblast 4.03 4.90
Chui oblast 24.50 22.87
Bishkek 0.01 0.00
Osh 0.00 0.29
Fig. 3.74. Regional distribution of carbon dioxide sinks
Fig. 3.75 shows the results of estimation of carbon emission (+)/sinks (-) from soils ofcultivatedlandsinCO-eqivalent.Owingtolackoftheinitialdata,theresultsforBatken and Osh oblasts are incorporated. Due to obvious reasons, the results for Bish-kek and Osh are not shown. On the whole, the emissions exceed over sinks in the Re-public, reasoned by soil fertility decrease. Nevertheless, Jalal-Abad, Issyk-Kul, Osh and Talas oblasts' sinks are higher, it is positive tendency that leads to the increase of car-bon in soil and, hence, of fertility. The greatest volumes of emission are registered in Chui oblast, and the biggest sinks - in Osh oblast.
900
800
700
600
500
400
300
200
100
01990 1991 1992 1993 1994 1995 1996 1997 1998 1999 2000 2001 2002 2003 2004 2005
Batken oblast Naryn oblastChui oblast
Jalal-Abad oblastOsh oblastBishkek
Issyk-Kul oblastTalas oblast

107
Table 3.31. Change of carbon dioxide sinks in the regions, %
Sector 1990 2005
Batken oblast 0.00 17.35
Jalal-Abad oblast 37.65 40.34
Issyk-Kul oblast 7.65 7.46
Naryn oblast 8.28 7.30
Osh oblast 30.24 13.98
Talas oblast 7.34 6.12
Chui oblast 8.84 7.44
Fig. 3.75. Distribution of dynamics of carbon emissions (+)/sinks (-) from the soils of cultivated lands
50
40
30
20
10
0
-10
-20
-30
Emis
sion
, Gg
1990 1991 1992 1993 1994 1995 1996 1997 1998 1999 2000 2001 2002 2003 2004 2005
Naryn oblastChui oblast
Jalal-Abad oblastOsh oblast
Issyk-Kul oblastTalas oblast
2.5
2
1.5
1
0.5
0
Emis
sion
, Gg
1990 1991 1992 1993 1994 1995 1996 1997 1998 1999 2000 2001 2002 2003 2004 2005
Batken oblast Naryn oblastChui oblast
Jalal-Abad oblastOsh oblastBishkek
Issyk-Kul oblastTalas oblast
Fig. 3.76. Change of distribution of gases-precursors emission under sector ‘Land use, land use of land use change and forestry’, regions

108
Fig. 3.76 and Table 3.32. show the distribution of inputs into general emission of gases-precursors under ‘Land use, of land use change and forestry’ . Data on Bishkek and Osh cities have not been shown for it is insignificant. The annual contribution dy-namics of other regions is low insignificant, though it is necessary to note unavailabil-ity and significant uncertainty of the initial data.
Wastes
While considering the emission changes it should be taken into account, that dur-ing the period of inventory there were no technological actions aimed at decrease of emissions. So, other factors are to be taken into account. Volume of produced wastes and consequently the volume of GHG emission, have positive dependence on eco-nomic conditions, and negative - on the amount of secondary processing, as well as a collection and processing system efficiency. The secondary processyng size in the Republic is insignificant with no growth tendencies, but the economic condition has been steadily improving since 1995. So thecorrelations shown in Fig. 3.77 illustrate a continuous decrease of the waste collection system efficiency, characteristic to all regions. The situations in Jalal-Abad oblast and Bishkek can be considered relatively safe: for example, Bishkek displayed relative growth of its contribution into the gen-eral emission from 42.62 percent in 1990 up to 56.35 percent in 2005 at the absolute decrease from 809.29 Gg in 1990 down to 371.75 Gg in 2005. Regional situation com-pared with the Jalal-Abad oblast and c. Bishkek displays a considerable sharp decrease of efficiency (see Table 3.33).
Table 3.32. Emission of gases-precursors under ‘Land use, land use change and forestry’ section per region, %
Section 1990 2005
Batken oblast 0.00 24.74
Jalal-Abad oblast 19.84 10.53
Issyk-kul oblast 20.86 22.36
Naryn oblast 2.77 2.53
The Osh oblast 34.36 18.7
Talas oblast 4.71 7.08
Chui oblast 17.47 14.08
Table 3.33. Dynamics of total GHG emission (including GWP) under ‘Wastes’ section per region, %
Section 1990 2005
Batken oblast 0.00 7.02
Jalal-Abad oblast 8.68 15.02
Issyk-Kul oblast 12.31 3.89
Naryn oblast 3.07 1.33
Osh oblast 15.50 8.58
Talas oblast 2.07 0.97
Chui oblast 14.74 6.85
Bishkek 42.62 56.35

109
Fig. 3.77. Distribution of change of the total GHG emission (including GWP) under ‘Wastes’ regions
2500
2000
1500
1000
500
0
Emis
sion
, Gg
1990 1991 1992 1993 1994 1995 1996 1997 1998 1999 2000 2001 2002 2003 2004 2005
Batken oblast Naryn oblastChui oblast
Jalal-Abad oblastOsh oblastBishkek
Issyk-Kul oblastTalas oblast

110
Three basic scenarios are required for correct assessment of vulnerability, forecast of national emissions and proved selection of measures to mitigate climate change:
• climatic;• macroeconomic;• demographic.Besides the achievement of specific purposes mentioned above, it is necessary to
anticipate, that the developed scenarios will be useful for preparation of long-term strategic plans, programs and other similar documents able to determine directions of national and industrial development in view of climate change. Similar basic scenarios have been already developed in many research works, but a part of them defines only regional assessments, another part is limited by two or three decades and practically all of them do not take into account specific development of individual countries. Therefore the present section is an attempt to specify the previously developed scenarios in compliance with national peculiarities.
4.1. Climatic scenario
Climatic scenarios have been developed by means of MAGICC/SCENGEN program complex (version 4.1), recommended for climate change analysis under the National communications of non-Annex I countries of the UN Framework Convention on Climate Change. The scenarios of GHG emissions included into MAGICC library were considered as the initial data.
The preliminary analysis resulted in selection of the following GHG emission scenarios:
• А1CAI and A1B-AIM-scenariosgivingthemaximalvalueofСОconcentrationby year 2100 (out of all 48 scenarios );
• B1Т-MESSAGE-scenariothatgivestheminimalvalueofСОconcentrationbyyear 2100 (out of all 48 scenarios);
• A2-ASF - scenario that gives the maximal value of СО concentration byyear 2100 among scenarios of A2 family (among scenarios А2 with more moderate economic and demographic parameters);
• В2-MESSAGE -scenariothatgivestheminimalvalueofСОconcentrationbyyear 2100 among scenarios of B2 family (among В2 scenarios with more moderate economic and demographic parameters);
• B1HIMI - scenario that results to average readings of global temperature changesandvaluesofСОconcentrationbyyear2100underall48scenarios.
However, for further work it was decided to accept as working versions scenarios from A2 and В2 families, for they have more moderate social and economic indexes and describe the development conditions with focus on preservation of local originality and local solution of problems of economic, social and ecological sustainability (see. Emission Scenarios, Special IPCC Report, 2000).
The algorithm of scaling program complex MAGICC/SCENGEN (version 4.1) allows to receive target results with the resolution 5° of latitude and 5° of longitude. Oblast-size breakdown of the territory of Kyrgyzstan is given in Table 4.1 and Fig. 4.1.
4. Base scenarios

111
The calculations have been performed for three main oblasts and six additional oblasts for interpolation. The first estimate area covers Talas and Chui oblasts (North-West climatic region of Kyrgyzstan, Fig. 2.2). The second estimate area covers Issyk-Kul (North-East climatic region of Kyrgyzstan) and Naryn oblasts (climatic region - Inner Tien-Shan), and a part of Jalal-Abad oblast. The third area covers the larger part of Batken and Osh oblasts (South-West climatic region of Kyrgyzstan).
Table 4.1. Coordinates of estimate on the territory of Kyrgyzstan
Estimate areaCoordinates
North latitude East longitude
North-East 40° – 45° 70° – 75°
Inner Tien-Shan 40°– 45° 75° – 80°
South-West 35° – 40° 70° – 75°
Additional 1 45° – 50° 70° – 75°
Additional 2 45° – 50° 75° – 80°
Additional 3 40° – 45° 65° – 70°
Additional 4 40° – 45° 80° – 85°
Additional 5 35° – 40° 65° – 70°
Additional 6 35° – 40° 75° – 80°
Fig. 4.1. Location of estimate areas. Red color contours the main estimate areas, and dark blue outlines the additional ones, used for interpolation
The estimate for the chosen areas have been carried out on the basis of chosen scenarios A2-ASF and В2-MESSAGE with the use of all 17 global climatic models (GCM) from the program database. For both emission scenarios the averaged level of influence of aerosols and ice thawing has been used. It was decided to accept the recommended level of climatic system sensitivity to external influences dТ2х = 2.6°С and the value of vertical diffusion Кz=2.3 cm²/s. Under both scenarios the influence of invert climatic correlation has been taken into account. It means that the reverse influence of the

112
future climate change on emission that cause the amplification of tropospheric ozone and methane destruction have been taken into account.
Results of calculations for temperature change are presented in Table 4.2 (emission scenario A2-ASF) and Table 4.3 (emission scenario В2-MESSAGE). For each estimate area and both accepted scenarios there was developed the annual correlation of temperature change with highlighted minimum, maximum and medium model changes of temperature. GCM terminology related to minimum and maximum annual changes of temperature is given. The resulting temperatures values (minimal, maximum and averaged) are drawn out.
Table. 4.2. Averaged annual changes of temperatures in relation to the base period of 1961-1990. А2-ASF emissions scenario
Estimate area Change of temperature
40°-45oN. lat&70°-75°E.long
40°-45°N.lat&75°-80°E. long
35°-40°N.lat&70°-75°E. long

113
Table. 4.3. Averaged-annual changes of temperatures compared to the base period of 1961-1990. Emissions scenario of В2-MESSAGE
Estimate area Change of temperature
40°-45°N.lat&70°-75°E. long
40°-45°N.lat&70°-80°E. long
35°-40°N.lat&70°-75° E.long
As a whole it is possible to sum up, that change of temperature for all three estimate areas is more or less identical, and in any case, the growth of averaged-annual temperatures should be expected. А2-ASF emission scenario determines the greater growth of temperature changes if compared to В2-MESSAGE scenario. For the year 2100 this difference makes approximately 1.6°С. Minimal changes of temperatures are always determined by MRI_96 model for all estimate areas and scenarios, whereas the maximum change of temperatures is determined by BMRC98 model, except for the estimate area with coordinates 35°-40° N. lat and 70°-75° E. long, this area is determined by model ECH498. It should be noted, that under А2-ASF scenario the temperature change display temporal nonlinear changes with increase in time, whereas under В2-MESSAGE scenario it is practically linear in time.
Table 4.4 shows values of seasonal temperature changes by year 2100. It allows to anticipate a greater increase of summer temperature in comparison to other seasons, and the minimum increase is predicted for the winter period.

114
Table 4.4. Changes of seasonal temperatures by year 2100 in territory of Kyrgyzstan (compared to the base period of 1961-1990)
Coordinates of Estimate areaA2-ASF В2-MESSAGE
dT range Medium model dT dT range Medium
model dT
Summer period
40о-45° N.lat, 70°-75° E.long 5.1°-10.5°С 7.0°С 4.0°-7.7°С 5.3°С
40о-45° N.lat, 75°-80° E.long 5.2°-10.7°С 7.0°С 4.0°-7.3°С 5.4°С
35о-40° N.lat, 70°-75° E.long 4.7°-10.8°С 7.0°С 3.7°-7.8°С 5.2°С
Spring period
40о-45° N.lat, 70°-75° E.long 4.0°-8.3°С 6.0°С 2.9°-5.8°С 4.3°С
40о-45° N.lat, 75°-80° E.long 4.0°-7.3°С 5.7°С 2.8°-5.0°С 4.0°С
35о-40° N.lat, 70°-75° E.long 3.8°-8.1°С 6.1°С 3.0°-5.9°С 4.6°С
Winter period
40о-45° N.lat, 70о-75° E.long 3.5°-7.8°С 5.8°С 2.8°-5.6°С 4.2°С
40о-45° N.lat, 75о-80° E.long 4.0°-8.2°С 5.8°С 3.2°-6.0°С 4.3°С
35о-40° N.lat, 70о-75° E.long 3.9°-8.2°С 5.5°С 3.1°-6.0°С 4.3°С
Fall period
40о-45° N.lat, 70о-75° E.long 5.1°-7.8°С 6.2°С 3.6°-5.4°С 4.7°С
40о-45° N.lat, 75о-80° E.long 4.8°-8.7°С 5.8°С 3.2°-6.4°С 4.8°С
35о-40° N.lat, 70о-75° E.long 4.8°-7.8°С 5.6°С 4°-5.8°С 4.8°С
Estimate results of precipitation changes are given in Table 4.5 (A2-ASF emission scenario) and Table 4.6 (В2-MESSAGE emission scenario). Correlations have been drawn out for each estimate area and two accepted emission scenarios. These correlations include a change of precipitation amount (annual percentage) with emphasized minimum, maximum and average-model changes of precipitation amount compared to the base period. The GCM determining minimum and maximum annual changes of precipitation amount is presented. For the year 2100 the resulting values of precipitation changes are shown (minimum, maximum and average-model amounts).

115
Table 4.5. Changes of annual precipitation amounts compared to the base period of 1961-1990. А2-ASF emission scenario
Estimate area Change of precipitation amount
40°-45° N.lat&70-75° E.long
40°-45° N.lat&75-80° E.long
35°-40° N.lat&70-75° E.long
Prec
ipita
tion,
%Pr
ecip
itatio
n, %
Prec
ipita
tion,
%

116
Table 4.6. Changes of annual precipitation amount compared to the base period of 1961-1990. В2-MESSAGE emissions scenario
Estimate area Change of precipitation amount
40°-45° N.lat&70-75° E.long
40°-45° N.lat&70-80° E.long
35°-40° N.lat&70-75° E.long
Averaged-model change of annual precipitation sums for all three estimate areas is insignificant. For the northern part of the Republic some increase of precipitation amount is assumed (1.3 - 2.1 percent compared to the base period irrespective of any scenario), and for the southern part of the Republic some decrease is assumed (from -2.0 to -3.1 percent compared to the base period for scenarios А2 and В2 accordingly). А2-ASF emissions scenario determines the greater scatter of readings between GCM compared to В2-MESSAGE scenario, i.e. bigger maximum and minimum values. Minimum amounts of precipitation are determined by SERF98 model for the first and
Prec
ipita
tion,
%Pr
ecip
itatio
n, %
Prec
ipita
tion,
%

117
second estimate areas and CCSR96 model - for the third estimate area irrespective of scenarios. Maximum amounts of precipitation are determined by РСМ_00 model for the first and second estimate areas, and for the third CSI296 model, irrespective of emission scenarios.
Table 4.7 shows values of seasonal changes of precipitation amount in 2100 compared to the base period. Both for annual and for seasonal changes of precipitation mode, the analysis of results shows that significant fluctuations are possible both decrease-ward, and increase-ward regarding all totals of precipitation for all areas of Kyrgyzstan. However, the greatest divergence between the top and bottom limits has been observed for summer. The most essential decrease of precipitation during the summer season and the greatest increase during winter season is expected. These conclusions, as a whole, are similar for all estimate areas and all emission scenarios.
During the estimate period for the climatic scenario, based on A2-ASF emission scenario for southern region of the Republic, there is a sharp increase of precipitation total till year 2020 with the subsequent sharp decrease after years 2030 - 2040. For the climatic scenario, based on B2-MESSАGE emission scenario all these transitions are smoother.
Table 4.7. Change of seasonal precipitation totals for year 2100 in the territory of Kyrgyzstan (compared to the base period of 1961-1990)
Coordinates of estimate area
A2-ASF В2-MESSAGE
Range of changes, %
Averaged model, %
Range of changes, %
Averaged model, %
Summer
40°-45° N.lat, 70°-75° E.long -100.0 – 40.1 -37.8 -100.0 – 21.0 -31.6
40°-45° N.lat, 75°-80° E.long -100.0 – 47.3 -34.5 -100.0 – 29.8 -25.0
35°-40° N.lat, 70°-75° E.long -100.0 – 32.9 -35.7 -100.0 – 14.3 -31.7
Spring
40°-45° N.lat, 70°-75° E.long -51.3 – 27.8 0.8 -44.1 – 19.6 1.4
40°-45° N.lat, 75°-80° E.long -49.8 – 47.3 5.7 -37.9 – 32.0 4.1
35°-40° N.lat, 70°-75° E.long -83.2 – 31.4 -12.1 -65.5 – 11.4 -17.8
Winter
40°-45° N.lat, 70°-75° E.long -16.0 – 82.0 21.8 -9.9 – 56.8 15.9
40°-45° N.lat, 75°-80° E.long 0.7 – 92.6 26.5 -9.9 – 63.5 19.2
35°-40° N.lat, 70°-75° E.long -25.9 – 61.0 17.5 -27.9 – 42.4 13.2
Fall
40°-45° N.lat, 70°-75° E.long -16.0 – 82.0 6.7 -25.5 – 49.5 5.6
40°-45° N.lat, 75°-80° E.long -30.3 – 72.4 2.7 -20.8 – 48.0 1.2
35°-40° N.lat, 70°-75° E.long -33.0 – 98.9 12.3 -21.1 – 67.6 9.5
All above mentioned results for probable climatic change are based on average model assessments. If required to determine a set of probable climate scenarios the

118
helpful information can be acquired from probabilities of possible scenarios realization, assuming that the set of employed GCM correctly reflects the multitude of probable realizations of climatic changes.
To summarize it is necessary to note, that low GCM resolution (i.e. output results according to estimate grid of 5х5 degrees) is one of the main deficiencies of the used approach, because Kyrgyzstan with its complex relief requires the analysis of alternative models and tools of the further study of climate scenarios.
4.2. Macroeconomic scenarios
The basic document determining directions of development of the Kyrgyz Republic for the period of 2006 – 2010 is the ‘Country Development Strategy (CDS), which defines the basic macroeconomic parameters for the specified period. According to CDS the forecasted averaged annual growth of real GDP is fixed at the level of 6.1 percent. The forecast for longer period (till year 2100) is carried under three more pessimistic scenarios in view of possible decrease of economic development rates due to following principal reasons:
• Th prognosis reports of international organizations consider more discreetannual growth rates of GDP for the countries with transitive economy;
• The general tendency of energy prices growth on the world market andcorrespondent price growth on regional markets. Modern tendencies of world prices on oil, natural gas and, accordingly, tariffs on electrical and heat energy will positively influence the fluctuations of economic development rates for the exporting countries and negatively-for the countries - importers of energy resources;
• High level of corruption. The economic damage caused by corruption isconnected with the fact that the corruption creates obstacles for realization of macroeconomic policy of the state, slows down investments inflow, i.e. has an adverse effect on stability of economic growth.
For all scenarios the change of energy consumption structure is assumed: the structure can be changed due to growth of electric power consumption share and simultaneous decrease of the shares of gas, coal and mineral oil consumption.
First scenario. According to this scenario, it is assumed that there is a decrease of averaged annual rates of GDP growth by year 2020 up to 104 percent and by year 2100 - up to 103 percent (see Fig.4.2).
1600
1400
1200
1000
800
600
400
200
02010 2020 2030 2040 2050 2060 2070 2080 2090 2100
GDP Power Consumption Electricity Consumption
Fig. 4.2. The forecast of macroeconomic parameters under the first scenario

119
Rates of growth of fuel and energy resources consumption are lower in comparison with rates of GDP growth, and rates of growth of the power consumption are higher than rates of GDP growth. The accelerated rates of growth of the power consumption will demand increase in of coal mining, oil and natural gas extracting, production of electrical and heat power in volumes that the Republic is not able to provide due to limited availability of fuel and energy resources and conditions of their development. Even under favorable conditions with inflow of sufficient investments the production of electricity by hydroelectric power stations on the rivers Naryn, Sary-Jazz, Chui, Chatkal, Talas, and by all small hydroelectric power stations their forecast production volumes can not satisfy the electric power demand. In any case, the export of electricity should be stopped and import of fuel should be increased.
Second scenario. It assumed that there is a decrease of averaged annual rates of GDP growth by year 2020 down to 103 percent and down to 102 percent - by year 2100 (see Fig. 4.3).
900
800
700
600
500
400
300
200
100
02010 2020 2030 2040 2050 2060 2070 2080 2090 2100
GDP Power Consumption Electricity Consumption
Fig. 4.3. Forecast of macroeconomic parameters under the second scenario
Rates of growth of fuel and energy resources consumption are lower in comparison with rates of GDP growth, and rates of growth of the power consumption coincide with rates of GDP growth. Moderate rates of growth of the power consumption can meet the demand of the Republic for electric power produced by hydroelectric power stations on the rivers Naryn, Sary-Jazz, Chui, Chatkal, Talas, and also all small hydroelectric power stations without export of the electricity. In order to meet the demand for fuel it is necessary to increase coal mining, extraction of oil and natural gas, and also to maintain the import of fuel from neighboring states at the simultaneous commencing into operation of Kara-Keche coal deposit.
Third scenario. Under this scenario it is assumed that there is a decrease of averaged annual rates of GDP growth by year 2020 down to 102 percent and down to 101percent - by year 2100 (see Fig. 4.4).
Rates of growth of fuel and energy resources consumption are lower in comparison with rates of gross national product growth, and the rates of power consumption growth are higher than rates of GDP growth. Rather low rates of power consumption growth can meet the demand for electricity at the expense of construction of hydroelectric power station on the rivers Naryn and Sary-Jazz, etc., and can also provide export of electricity to neighboring countries for regulation of frequency and maintenance of steady work of regional power supply systems. The demand for fuel can be met at the expense of growth of coal mining, the demand for mineral oil - at the expense of raw oil import for oil refining, and also by means of natural gas import.

120
Fig. 4.4. The forecast of macroeconomic parameters under the third scenario
4.3. Demographic scenario
The population forecast for the Kyrgyz Republic is based on well proved assessment of the Department of Economic and Social Affairs (UN Population Secretariat) prepared in 2003. It includes specific national features of demographic and economic development. Economic and structural reforms of the recent decades have determined substantial growth of population migration inside and outside the Republic. Recently the internal migration from villages into cities has gained a large scale. Practically all oblasts (Batken, Jalal-Abad, Issyk-Kul, Naryn, Osh and Talas including с. Osh) are characterized by outflow of the population into Chui oblast and Bishkek. This process influences percentage of rural and urban parts of population. The lower rates of urban population growth (started in 2000) can be explained by outflow of people of childbearing age from rural areas to cities and abroad due to economic reasons. According to Migration Agency data about 75 percent of the migrants, left the country, represent able-bodied and, therefore, the childbirth population.
Therefore, assuming relative preservation of influencing conditions and according to the worldwide tendencies, the developed demographic scenario is based on dropping rates of growth. And till year 2050 the increase of population with lowered gain rates will occur as relatively high birth rate will be maintained. After the year 2050 there will be a demographic transition to absolute reduction of population of the Republic, it corresponds to the general trend of the demographic development inherent to all world population.
The maximum population of the Republic will be reached in 2050, after that point the process of absolute reduction results in slight decrease of population by year 2100. But comparing with 2005 the readings of 2100 will be higher. It can be explained by the fact that Kyrgyzstan will maintain conditions and traditions of increased child-birth. And though the processes of industrial development, urbanization and raise of educational level will increasingly influence the role of women in various spheres of economic and public activities, as well as national and religious demographic traditions, nevertheless, their impact will affect, undoubtedly, much longer. Results of demographic assessments are given in Fig. 4.5 and Fig. 4.6.
Besides the main assessments there will be some change of age structure of the population toward increase of number of aged people and also increase of life expectancy.
400
350
300
250
150
100
50
02010 2020 2030 2040 2050 2060 2070 2080 2090 2100
GDP Power Consumption Electricity Consumption

121
Fig. 4.5. Changes of male and female population
8000
7000
6000
5000
4000
3000
2000
1000
02010 2020 2030 2040 2050 2060 2070 2080 2090 2100
Men
popu
latio
n, th
ousa
nds
Women
Fig. 4.6. Changes of urban and rural population
For preparation the following recommendations and guidelines materials have been used:
• IPCCgeneral guidelines on the use of scenario data for climate impact andadaptation assessment, TGICA, 2007;
• NCSPguidancedocumentondevelopmentandapplicationofclimatescenarios,2007;
• IPCCGuidelinesontheUseofScenarioDataforClimateImpactandAdaptationAssessment, 1999;
• Guidelines for Use of Climate Scenarios Developed from Regional ClimateModel Experiments, DDC of IPCC TGCIA, 2003;
• IPCC Guidelines for Use of Climate Scenarios Developed from StatisticalDownscaling Methods2004;
• TheDevelopmentofRegionalClimateChangeScenariosforSubSaharanAfrica,2006;
• Climateandsocio-economicscenariosforglobal-scaleclimatechangeimpactsassessments: characterizing the SRES storylines, 2004;
• Guidance Document on Developing Socio-economic Scenarios for Use inVulnerability and Adaptation Assessments, NCSP, 2003.
8000
7000
6000
5000
4000
3000
2000
1000
02010 2020 2030 2040 2050 2060 2070 2080 2090 2100
Urban population
popu
latio
n, th
ousa
nds
Rural population

122
5.1. Methodology
The primary goal of the given section is to get verified quantitative assessments of vulnerability, such assessment is a necessary condition for development of concrete and efficient measures on adaptation. Therefore, an obligatory task to acquire quantitative assessments became a basic principle of vulnerability assessment . An attempt has been undertaken to get correlations of the following type:
v = f (хr), where: v - vulnerability indicator;хr - vector of retrospective climatic parameters.Further on, the acquired correlations allow estimation of quantitative assessment
of vulnerability (the forecast indicator of vulnerability)v = f (хf), where:хf - vector of forecast climatic parameters.The approach to form a correlation can be based on well-known physical
relations (sector ‘Water resources’) or by means of statistical methods (sectors ‘Health’, ‘Agriculture’, ‘Emergency climatic situations’). The choice of the method has been determined by individual characteristics of a sector.
The change of indicator for a concrete time point makes up the assessment of vulnerability, which further on, in many cases, can be rendered into monetary form.
It should be noted that the above mentioned approach to the vulnerability assessment has been carried out within the rigid limitations of time and limitations of financial character; the activity aimed at the development of detailed adaptation strategy requires individual studies in order to get accurate assessment of sectoral and regional vulnerability.
Being based on the international experience and national studies (‘Kyrgyz Republic First National Communication to the UN Framework Convention on Climate Change’, 2003, ‘Capacity Self-Assessment for Preparation of the Kyrgyz Republic Second National Communication to the UN Framework Convention on Climate Change’, 2004 and ‘National Capacity Self-Assessment for Global Environment Management’, 2005) the following sectors have been chosen as the most vulnerable to climate change impact:
• Waterresources(indicatorsofvulnerability-parametersofglaciers,volumeofthe surface water-flow, parameters of lakes);
• Populationhealth(indicatorsofvulnerability-diseaseanddeathrate);• Agriculture(indicatorsofvulnerability–heatavailability,cropproductivityof
various types of crops and pastures);
5. Vulnerability assesment and adaptation measures

123
• Climaticemergencysituations(indicatorsofvulnerability-frequencyofmud-flows, landslides, uncontrolled release of water from high-mountainous lakes, avalanches).
The adaptation process is based on the following actions common to all sectors; the actions are to be implemented step-by-step and regional-wide:
• Improvement of legislation (first of all, development of national adaptationstrategy to climate change including sectoral development plans);
• Improvementofinstitutionalstructure(creationofpermanentstructuresandstrengthening of communication connection of individual departments);
• Increaseofknowledge;• Economicincentivesofadaptationactions.Adaptation actions should be based also on the preventive principle, i.e., the
adequate means are to be allocated today in order to solve the problem of creation of climatically sustainable future.
Values of expected climatic parameters are taken according to the assessments received in section ‘Basic scenarios’.
5.2. Water resources
5.2.1. Vulnerability assessment
Vulnerability assessment of glaciers and volume of surface water-flow have been carried out by means of digital models of relief and conditions of humidifying of the Kyrgyzstan territory (DMR and DMHum accordingly). These models have been developed in the Institute of Water Problems and Hydro-power Engineering of the Kyrgyz Republic National Academy of Sciences.
Each of these digital models describes the territory of the Republic by set of corresponding characteristics in the mesh points of regular (square) grid with a step of 500 m of a locality (770,418 points in total).
The digital model of the relief contains values on each point of the regular grid: heights, tilt angle, exposition, parameter of orientation and average curvature of macro-inclination of a topographical surface. In order to get digital models of humidifying conditions the statistical correlation were employed (Kuzmichenok, 2003), the statistical correlations had been developed for the territory of Kyrgyzstan and neighboring territories.
Basic hydrological basins were selected for estimate. They are shown in Fig. 5.1. For best accuracy modelling results of the biggest hydrological basin of the Republic (Syr-Darya river basin) has been subdivided into four individual sub-basins.
The estimate for assessment of vulnerability indicators (parameters of glaciers, volume of surface water-flow) were carried out separately for hydrological basins, and also for the Republic. Calculations are performed for anticipated climate change under scenario В2-MESSAGE; this scenario predicts more moderate change of climatic parameters.
5.2.1.1. Glaciers
The main sources of information on the conditions of glaciers of Kyrgyzstan are the ‘Catalogue of Glaciers of the USSR’ and the map ‘Modern glaciation’ (scale 1:500000) from the series ‘Natural Resources of the Kyrgyz Soviet Socialist Republic’.
According to the available sources, the number of glaciers in Kyrgyzstan is 8,208; total area of glaciation – 8,076.9 km²; total amount – 494.7 km³. In territory of Kyrgyzstan

124
Fig. 5.1. The basic hydrological basins of Kyrgyzstan. The accepted titles of the basins: I - Issyk-Kul Lake; II - r. Chu; III - r. Talas; IV - r. Syr-Darya; IVa - rivers of northern flanking of Fergana valley (r. Syr-Darya); IVb - r. Naryn (r. Syr-Darya); IVc - r. Kara-Darya (r. Syr-Darya); IVd - rivers of southern flanking of Fergana valley (r. Syr-Darya); V –Chatyr-Kul Lake; VI - r. Amu Darya; VII - р. Tarim; VIII – Balkhash Lake.
It is natural to assume, that by present time parameters of glaciers should change significantly. The research based on extrapolation of results of separate glaciers fragmentary monitoring, has confirmed this assumption and allowed to reveal the general correlation for assessment of change for all glaciers of the Republic. The parameters of glaciers received as a result of interpolation for the year 2000 are used as initial conditions for the further assessment of their condition change.
Results of assessment of climatic parameters probabilities are given in Table 5.2. The estimates are executed for the centers of glaciers and predicted sizes of average summer air temperatures were used.
The approach is applied for modelling the subsequent probable changes of glaciers condition with use of height values of a firn line, as a reliable climatic parameter of glaciers existence conditions. Modelling of glaciating condition was carried out separately for each glacier with the area not less than 0.1 km². The basic results of predicted galciers condition for the period till year 2100 are resulted in Tab. 5.3 and Fig. 5.2 – Fig. 5.3.
Glacier and lake. Photo V.Kuzmichenok
there were approximately 45 percent of all glaciers of Central Asia and they occupied about 4.0 percent of its territory. However, it is necessary to take into account, that these data on glaciers basically reflects the situation in the 1960th of the last century.

125
Table 5.1. Assessment of the basic characteristics of glaciation in year 2000. A change relative to situation of 1960th is given in brackets, (%)
Basin Number of glaciers Area, km² Volume, km³ Average thickness,
m
I 614 (97.3%) 538.11 (84.6%) 24.224 (83.1%) 45.02
II 715 (94.8%) 582.12 (82.3%) 26.377 (80.4%) 45.31
III 177 (88.5%) 112.91 (72.7%) 4.643 (71.5%) 41.13
IV 2965 (95.2%) 1982.34 (84.1%) 100.973 (83.2%) 50.94
V 3 (100.0%) 2.61 (93.4%) 0.099 (92.6%) 37.75
VI 277 (99.6%) 604.36 (94.0%) 42.158 (93.5%) 69.76
VII 1693 (94.6%) 2991.83 (85.3%) 219.055 (84.8%) 73.22
VIII 1 (100.0%) 0.25 (82.3%) 0.008 (80.4%) 33.69
BK 6445 (95.2%) 6814.53 (85.1%) 417.537 (84.6%) 61.27
IVa 107 (89.9%) 39.41 (77.3%) 1.460 (76.1%) 37.04
IVb 1661 (94.2%) 1098.08 (81.2%) 55.657 (79.7%) 50.69
IVc 269 (91.2%) 74.18 (68.4%) 2.735 (67.1%) 36.87
IVd 928 (99.0%) 770.67 (91.0%) 41.122 (90.1%) 53.36
Table 5.2. Probabilities of realization of climatic change variants, where dT - size of absolute increase in mid-annual temperature in year 2100, and m - size of relative change of the annual sum of deposits by the base period of 1961-1990.
m\dT 2°C 3°C 4°C 5°C 6°C 7°C 8°C 9°C 10°C
Scenario A2-ASF
1.6 0.0000 0.0000 0.0000 0.0000 0.0000 0.0000 0.0000 0.0000 0.0000
1.5 0.0000 0.0000 0.0000 0.0000 0.0000 0.0000 0.0000 0.0000 0.0000
1.4 0.0000 0.0000 0.0000 0.0000 0.0000 0.0000 0.0000 0.0000 0.0000
1.3 0.0000 0.0000 0.0001 0.0007 0.0009 0.0002 0.0000 0.0000 0.0000
1.2 0.0000 0.0000 0.0011 0.0066 0.0090 0.0028 0.0002 0.0000 0.0000
1.1 0.0000 0.0001 0.0045 0.0304 0.0467 0.0164 0.0013 0.0000 0.0000
1.0 0.0000 0.0003 0.0091 0.0701 0.1212 0.0481 0.0042 0.0001 0.0000
0.9 0.0000 0.0002 0.0094 0.0813 0.1581 0.0706 0.0070 0.0001 0.0000
0.8 0.0000 0.0001 0.0049 0.0474 0.1038 0.0521 0.0059 0.0001 0.0000
0.7 0.0000 0.0000 0.0013 0.0139 0.0343 0.0194 0.0025 0.0001 0.0000
0.6 0.0000 0.0000 0.0002 0.0020 0.0057 0.0036 0.0005 0.0000 0.0000
0.5 0.0000 0.0000 0.0000 0.0001 0.0005 0.0003 0.0001 0.0000 0.0000
0.4 0.0000 0.0000 0.0000 0.0000 0.0000 0.0000 0.0000 0.0000 0.0000
Scenario В2-MESSAGE
1.6 0.0000 0.0000 0.0000 0.0000 0.0000 0.0000 0.0000 0.0000 0.0000
1.5 0.0000 0.0000 0.0000 0.0000 0.0000 0.0000 0.0000 0.0000 0.0000
1.4 0.0000 0.0000 0.0000 0.0000 0.0000 0.0000 0.0000 0.0000 0.0000
1.3 0.0000 0.0001 0.0004 0.0002 0.0000 0.0000 0.0000 0.0000 0.0000
1.2 0.0000 0.0007 0.0092 0.0071 0.0003 0.0000 0.0000 0.0000 0.0000
1.1 0.0000 0.0030 0.0610 0.0682 0.0043 0.0000 0.0000 0.0000 0.0000
1.0 0.0000 0.0043 0.1323 0.2133 0.0203 0.0001 0.0000 0.0000 0.0000
0.9 0.0000 0.0020 0.0946 0.2204 0.0311 0.0002 0.0000 0.0000 0.0000
0.8 0.0000 0.0003 0.0222 0.0753 0.0156 0.0001 0.0000 0.0000 0.0000
0.7 0.0000 0.0000 0.0017 0.0084 0.0026 0.0000 0.0000 0.0000 0.0000
0.6 0.0000 0.0000 0.0000 0.0003 0.0001 0.0000 0.0000 0.0000 0.0000
0.5 0.0000 0.0000 0.0000 0.0000 0.0000 0.0000 0.0000 0.0000 0.0000
0.4 0.0000 0.0000 0.0000 0.0000 0.0000 0.0000 0.0000 0.0000 0,0000

126
Table 5.3. The generalized results of modelling of glaciation evolution in Kyrgyzstan for the most probable variants of predicted climatic change, dТ - change of mid-annual temperature in оС, m - relation of the annual sum of deposits in relation to the base period
m dТ (°C) 2.96 3.96 4.96 5.96
Parameter 2050 2100 2050 2100 2050 2100 2050 2100
1,16 Amount 2,803 1,446
Area, km² 3,573.02 2,320.74
Volume, km³ 233,487 161,772
Thickness, m 65.35 69.71
1,06 Amount 3,097 1,484 1,958 721 1,276 378 897 227
Area, km² 3,861.63 2,428.06 2,901.73 1,529.93 2,214.80 1,039.11 1,716.25 741.98
Volume, km³ 251,056 169,654 197,236 115,389 157,143 83,151 126,872 61,889
Thickness, m 65.01 69.87 67.97 75.42 70.95 80.02 73.92 83.41
0,96 Amount 1442 397 988 238 651 142
Area, km² 2,395.21 1,092.01 1,861.05 783.32 1,453.63 571.54
Volume, km³ 168,889 87,522 136,439 65,445 111,234 49,250
Thickness, m 70.51 80.15 73.31 83.55 76.52 86.17
0,86 Amount 1,071 251 741 152 508 87
Area, km² 2,014.70 826.97 1,573.22 609.03 1,258.77 452.33
Volume, km³ 146,630 69,183 119,369 52,472 99,064 39,754
Thickness, m 72.78 83.66 75.88 86.16 78.70 87.89
0,76 Amount 402 59
Area, km² 1,104.55 362.41
Volume, km³ 89,061 32,207
Thickness, m 80.63 88.87
Results of modelling of consecutive glaciation change on territory of the Republic in 2000 - 2100 for the most probable variant of climatic change (dТ=4.96°C, m=0.96) are resulted also in Annex 2.
In conditions of predicted essential growth of air temperature (both averaged summer and averaged annual) and small changes of the annual sums of an atmospheric precipitation, results of probable galcier changes modelling specify their significant reduction for all considered most probable variants of climatic scenarios. For the Republic as a whole, the reduction of glaciation area from 64 percent up to 95 percent from year 2000 till year 2100 is predicted, depending on the accepted variant of climatic scenario. It is quite obvious, that such change of glaciation will negatively effect a river flow and its intra-annual distribution, and also ecological assessment of the environment quality.
Fig. 5.3 shows assessment of glaciation basic characteristics change in Kyrgyz Republic for some (most probable) variants of predicted climatic change for the period of 2000-2100.

127
Fig. 5.2. Distributions of quantities correlation of extant and extinct glaciers per decade, received from modelling for the most probable variant of predicted climatic change (dТ=4.96°C, m=0.96). Dark blue color designated for extant glaciers, and red – for extinct ones.
5.2.1.2. Surface water-flow
At assessments and modelling the surface water-flow was defined as difference between the annual sum of atmospheric precipitation and annual layer of evaporation. The value of underground water-flow in the areas of water-flow formation wasn’t taken into account as underground waters which have been filled up by surface water-flow, usually taper out in the same areas.
Table 5.4 shows assessments of key parameters received by summation of separate hydrologic basins at the modelling of the most probable versions of predicted climatic parameters.
Table 5.4. The generalized results of modelling surface water-flow evolution for Kyrgyzstan as a whole (dТ - change of averaged-annual temperature in °С, m - relation of annual sum of precipitation to the base period)
dТ (°C) 2.72 3.72 4.72 5.72
m 2050 2100 2050 2100 2050 2100 2050 2100
1.16 43,776 42,421
1.06 43,679 41,311 41,671 38,436 39,860 36,170
0.96 37,739 32,187 36,149 30,453 34,753 29,036
0.86 32,650 25,221 31,449 24,099
0.76 29,357 20,434
210020001960
0
1000
2000
3000
4000
5000
6000

128
7000
6000
5000
4000
3000
2000
1000
0450
400
350
300
250
200
150
100
50
0
90
85
80
75
70
65
6010
9876543210
Are
a (s
q. k
m)
Volu
me
(kub
. km
)Av
erag
e th
ickn
ess
(m)
Wat
er y
ield
(kub
. km
)
dT=2.96°C; m=1.06 dT=3.96°C; m=1.06 dT=4.96°C; m=0.96 dT=5.96°C; m=0.86
2000 2010 2020 2030 2040 2050 2060 2070 2080 2090 2100
Fig. 5.3. Assessment of glacier key parameters change: dТ- change of averaged annual temperature in °С, m - annual sum of precipitations in relation to the base period

129
Fig. 5.4 shows the glacial component in the general water-flow for all Kyrgyzstan, and Fig. 5.5 shows temporal changes of the basic modelled characteristics under the most probable versions of predicted climatic change.
55
50
45
40
35
30
25
20
2000
2010
2020
2030
2040
2050
2060
2070
2080
2090
2100
Version: dТ = 2.72°C, m = 1.06
55
50
45
40
35
30
25
20
2000
2010
2020
2030
2040
2050
2060
2070
2080
2090
2100
Version: dТ = 3.72°C, m = 0.96
55
50
45
40
35
30
25
20
2000
2010
2020
2030
2040
2050
2060
2070
2080
2090
2100
Version: dТ = 4.72°C, m = 0.96
55
50
45
40
35
30
25
20
2000
2010
2020
2030
2040
2050
2060
2070
2080
2090
2100
Version: dТ = 5.72°C, m = 0.86
-from precipitation -from glaciers
Fig.5.4.Dynamics of surface water-flow structure of all Kyrgyzstan for some versions of predicted climatic changes.
The forecast shows an essential decrease of surface water-flow for all most probable climatic. Thus the increase surface water-flow during the period 2020-2025 is expected at the expense of increase of glacial component, the reduction of flow approximately up to 42.4 – 20.4 km³ further is expected, that makes 43.6 – 88.4 percent from volume of flow in 2000. Reduction of flow after its some increase in the beginning of 21st century is caused by increase of evaporation mainly. Consequences of so significant predicted reduction of the surface flow undoubtedly should have an effect on conditions of life and economic activities in the Kyrgyz Republic, and also in neighbouring, mainly, flat-country states. Ignorance of taking preventive measures increases risks in the field of water use and water-distribution.
For all most probable climatic scenarios the glaciers water-feedback reduction renders to significant influence on intra-annual distribution of the river flow, essentially reducing its summer maximum and shifting it to earlier season. Glaciers, accumulating atmospheric precipitation in solid form practically all year round, give the most part of water during summer season - the most important season for agriculture, and also increase the river flow during hot low-water years. According to predicted climatic

130
scenarios this natural potential of flow regulation is reduced. Ignorance of taking the adaptive measures can effect the basic consumers of water resources in Kyrgyz Republic and neighboring states.
Fig. 5.5. Dynamics of the basic modelled characteristics for all Kyrgyzstan for some versions of climatic change; dT - change of averaged annual temperature, °С, m - annual sum of precipitation compared to the base period.
18000
17000
16000
15000
14000
13000
12000
11000
1000
900
470
460
450
440
430
420
410
400
39055
50
45
40
35
30
25
20
0.80.75
0.70.65
0.60.55
0.50.45
0.40.35
0.3
Pote
ntia
l Eva
pora
tion
(mm
)Ev
apor
atio
n (m
m)
Dra
inag
e (k
ub. k
m)
Wet
ting
dT=2.72°C; m=1.06 dT=3.72°C; m=0.96 dT=4.72°C; m=0.96 dT=5.72°C; m=0.86
2000 2010 2020 2030 2040 2050 2060 2070 2080 2090 2100

131
5.2.1.3. Lakes
Closed lakes are natural reservoirs the most sensitive to climate change. Modelling of probable changes in state of the Issyk-Kul Lake (the largest lake in Kyrgyzstan) specifies probable essential decrease of its level and other parameters (Fig. 5.6).
1610
1605
1600
1595
1590
1585
1580
1575
6300
6100
5900
5700
5500
5300
5100
1750173017101690167016501630161015901570
Wat
er le
vel (
m)
Are
a (s
q. k
m)
Volu
m (k
ub. k
m)
dT=2.72°C; m=1.07 dT=3.72°C; m=0.97 dT=4.72°C; m=0.97 dT=5.72°C; m=0.87
2000 2010 2020 2030 2040 2050 2060 2070 2080 2090 2100
Fig. 5.6. Change of Issyk-Kul Lake key parameters under В2-MESSAGE scenario for different climatic scenarios, where dT- change of averaged annual temperature, °С, m - annual sum of precipitation compared to the base period
By results of modelling after some initial increase of the Issyk-Kul Lake water level in the beginning, there is a possibility of its further reduction from 5.1 up to 27.5 m in relation to 2000, depending on the climatic scenario. Reduction of the lake’s water area from 232 up to 1,049 km² is also expected. The southern coast of the lake can suffer water-line recession, therefore the greater attention at designing and construction of tourism objects and rest-areas should be paid in the future.
For another closed lake, Chatyr-Kul, according to tentative estimations it is established, that at increase of average annual air temperature by 3°С and more and minor alteration of the annual sum of atmospheric precipitation (that is expected under all climatic scenarios), Chatyr-Kul Lake most likely can exist only in a form of small reservoir which completely dries out annually.

132
5.2.2. Adaptation measures
Climate change adaptation activities aimed at water resources basically are determined by particularities of water consumption. The basic sector consuming water resources in Kyrgyzstan is agriculture which uses 92-96 percent of water for the purpose of irrigation during recent years. Selecting adaptation actions, it is necessary to take into account the anticipated reduction of surface water-flow and also emergency climatic situations, that currently cannot be predicted. It amplifies the negative effect caused by reduction of surface water-flow. However, there are good reasons to believe that floods will be stronger and longer while droughts -more frequent and extensive.
Detailed stages of adaptation process should be concretized for each region, but in any case the general actions are:
• more effective and careful management of irrigational systems in order topreserve and reduce water loss;
• regulation of surface water-flow and creation of water reserves in artificialwater reservoirs;
• implementation of modern, more effective systems and modes of waterdistribution in order to reduce its losses;
• incentivesforwater-userstourgethemtouseefficientlytheavailablewaterresources by implementation of paid water use system.
It is usually considered, that global approach to effective utilization of power resources belongs to application of extenuating actions; but for Kyrgyz Republic the water resources are the power resources as well - from 90 percent to 94 percent of the electricity in the Republic is produced by hydroelectric power stations. We think that the prime step in this area should be directed to specification of Kyrgyzstan energy capacity assessment.
The preliminary analysis of the Issyk-Kul basin parameters has shown that climate change impact can be rather significant. As it follows from the data shown in Table 5.5 the full energy potential of the Issyk-Kul basin rivers at the most adverse versions of predicted climatic change can decrease two times by year 2100.
In lack of mineral fuel the problem of power sector development requires urgent additional studies to get verified assessments of the Republic future energy capacity.
Table 5.5. Average ratio of predicted and initial values (the year 2000) of the entire energy capacity for 20 selected main rivers of the Issyk-Kul basin, %
mdТ (°C) 2.72 3.72 4.72 5.72
Parameter 2050 2100 2050 2100 2050 2100 2050 2100
1.07
Capacity, %
90 82 86 76 83 71
0.97 79 64 76 59 72 56
0.87 69 49 65 46
5.3. Agriculture
5.3.1. Vulnerability assessment
The climate change influences firstly the thermal conditions (heat availability). It is one of the major factors for agroclimatic division of the territory. The heat availability in many respects determines opportunities of various crops cultivation (Table 5.6).
For all climatic regions of the Kyrgyz Republic (Northwest, Northeast, Internal Tien-Shan, Southwest) and emissions scenarios A2-ASF and В2-MESSAGE the heat availability of the vegetative period in 2100 has been determined. Sums of active temperatures

133
were calculated with altitude interval of 200 m up to the height of 3,000 m for the periods with daily average temperature above 0.5°, 10°, 15° and 20°С. The frost-free period has been determined on the basis of the received significant correlation of averaged annual temperature and duration of the frost-free period.
Table 5.6. Heat availability requirements for some agricultural crops
Thermal zone Sum of active temperatures higher than 10оС Agricultural crops
Very hot >4,900 Fine-fibered cotton
Hot 4,990 – 4,400 Mid-ripening cotton
Moderately hot 4,400 – 4,000 Early ripening cotton
Very warm 4,000 – 3,500 Mid-ripening grapes
Warm 3,500 – 3,100 Early ripening grapes
Moderately warm 3,100 – 2,800 Very early ripening grapes
Cool
2,800 – 1,950 Apple-tree
2,650 – 2,000 Corn as grain
1,900 – 1,200 Potato
1,900 – 1,050 Corn as silage
1,800 – 1,400 Spring wheat
1,600 – 1,400 Winter wheat and a rye
1,600 – 1,250 Oats
1,600 – 1,200 Buckwheat
1,450 – 1,250 Barley
Cold <1,000 High altitudes
The estimate shows that:• In2100,fortheNorthwestregionunderscenarioA2-ASF,theclimatefromvery
hot up to moderately hot at heights up to 1,400 m will be observed, and the same climate will be observed at heights up to 1,200 m under scenario В2-MESSAGE. Duration of the frost-free period under scenario A2-ASF will make from 264 days at height of 600 m and up to 120 days at height of 3,000 m. Under scenario В2-MESSAGE it - 246 days at height 600 m, and 103 days at height of 3,000 m.
• InNortheastregionin2100underscenarioA2-ASFatlakecoastuptoheightof 1,800 m a moderately hot climate will be registered, and under scenario B2-MESSAGE a hot climate in hollow will not be registered. Duration of the frost-free period under scenario A2-ASF will make from 304 days at height of 1,600 m till 102 days at height of 3,000 m. Under scenario B2-MESSAGE it will make 255 days at height of 1,600 m, and 73 days at height of 3,000 m.
• InInternalTien-Shanin2100underscenarioA2-ASFamoderatelyhotclimatewill be observed at heights up to 1,800 m, and under scenario B2-MESSAGE - a hot climate in Internal Tien-Shan will not be observed.
• InSouthwestregionin2100underscenarioA2-ASFatheightsupto2,000mthe climate will vary from very hot up to moderately hot, and under scenario B2-MESSAGE such climate will be observed at heights up to 1,600 m. Duration of the frost-free period under scenarioA2-ASF will make from 294 days at height of 600 m till 161 days at height of 3,000 m. Under scenario B2-MESSAGE - 276 days at height of 600 m, and 144 days at height of 3,000 m.
Temperature mode of the Northwest and Southwest regions will be favorable for cultivation of cotton and grapes. The grapes can be cultivated on lakeside plain of the Issyk-Kul region and even in Internal Tien-Shan at heights up to 2,400 m.

134
The longest frost-free period (100 and 34 days more than at the same height in Northwest and Southwest regions accordingly) will take place on lakeside plain of Issyk-Kul. Accumulating heat during the warm period and giving it back during the cold period, the lake smoothly influences climate of adjoining territories. Currently, winter air temperature at the lake is 0.5° – 1.0°С higher than at the same height outside Issyk-Kul hollow. In 2100 the difference will make 3° - 4°С.
As a whole, distribution of the areas with various heat availability (Table 5.7) will be essentially changed.
Table 5.7. Shares of heat-availability areas to the entire area of the Republic
Heat availability, °CRelative coverage, % of the territory
Current state Under scenario B2-MESSAGE
≤ 1,000 25.8 14.1
From > 1,000 to ≤ 2,000 36.6 38.1
From > 2,000 to ≤ 3,000 22.8 26.8
From > 3,000 to ≤ 4,000 11.2 11.4
> 4,000 3.6 9.6
Fig. 5.7. Distribution of territories with various heat availability, the base period
Fig. 5.8. Distribution of territories with various heat availability in 2100 under scenario B2-MESSAGE

135
Change of distribution of the areas with different heat-supply in 2100 in comparison with the present distribution, Fig. 5.7 and Fig. 5.8.
While modelling changes of water flow for predicted climate change, the assessment of humidifying (relation of precipitation sum to vaporability) is used as objective landscape-climatic parameter. In Table 5.8 the subdivision of the territory of the Republic according to last accessible data (‘Climate of the Kyrgyz Soviet Socialist Republic’, 1965. Edited by Z.A. Ryazantseva, Frunze, Ilim) is presented. The assessment of humidifying for year 2000 has been used as the initial data for modelling.
Table 5.8. Subdivision of Kyrgyzstan territory by intervals of average humidity values and corresponding landscape-climatic zones for the basic hydrological basins, %
BasinApproximately in 1950 Assessment for year 2000
А B C D E F А B C D E FI 2.87 16.03 30.25 20.90 20.98 8.97 3.49 16.97 31.21 22.89 20.64 4.80II 0.75 14.79 42.04 21.28 15.51 5.63 0.92 20.69 38.79 22.23 14.51 2.86III 0.00 23.13 29.86 21.71 15.13 10.17 0.00 25.43 30.25 22.37 14.69 7.26IV 1.08 12.24 30.25 27.03 17.68 11.73 1.18 13.94 32.26 27.31 17.03 8.28V 0.00 0.00 21.56 46.83 18.75 12.85 0.00 0.00 30.54 44.02 17.06 8.38VI 0.04 10.49 40.46 26.49 15.31 7.21 0.05 13.88 41.46 26.41 14.04 4.15VII 0.00 1.34 7.87 22.85 29.99 37.95 0.00 1.70 9.65 28.68 30.90 29.06VIII 0.00 0.00 0.00 12.83 56.25 30.92 0.00 0.00 0.00 18.17 68.75 13.08BK 0.94 11.91 29.05 25.08 19.13 13.89 1.06 13.96 30.24 26.28 18.70 9.77IVa 0.00 11.08 26.84 30.61 18.94 12.52 0.00 12.06 29.48 31.11 18.22 9.13IVb 0.00 6.52 28.40 29.27 19.74 16.07 0.00 8.36 31.06 29.40 19.47 11.71IVc 0.00 13.16 36.80 28.04 16.37 5.62 0.00 14.78 38.55 28.61 14.78 3.28IVd 6.76 30.27 28.76 16.22 12.11 5.88 7.38 32.06 28.68 16.53 11.60 3.75
Legend: A, < 0.13 - arid zone of deserts;B, 0.13-0.30 – semi-arid zone of semideserts;C, 0.30-0.60 - zone of insufficient humidifying, steppe and dry savannas;D, 0.60-1.0 - zone of moderate humidifying (forest-steppe, savannas);E, 1.0-1.5 - zone of forest sufficient humidity;F, > 1.5.
Basin subdivision is shown in Fig. 5.1. EK – entire territory of the Kyrgyz Republic.Table 5.9 shows probabilities of climatic forecasts under scenario В2-MESSAGE.
The choice of the most probable forecast was made for all points of relief digital model DMR, the predicted readings of averaged annual air temperatures were used.
Table 5.9. Probabilities of climate change forecasts, estimated for all points of the Kyrgyz Republic digital model, where dТ - change of averaged annual temperature, °С, m - annual precipitation sum compared to the base period
mdТ
2.72 3.72 4.72 5.72 6.72
1.46 0.0000 0.0000 0.0000 0.0000 0.0000
1.36 0.0000 0.0002 0.0003 0.0000 0.0000
1.26 0.0001 0.0024 0.0038 0.0005 0.0000
1.16 0.0005 0.0167 0.0329 0.0049 0.0001
1.06 0.0011 0.0560 0.1522 0.0273 0.0003
0.96 0.0009 0.0668 0.2659 0.0668 0.0009
0.86 0.0003 0.0273 0.1522 0.0560 0.0011
0.76 0.0001 0.0049 0.0329 0.0167 0.0005
0.66 0.0000 0.0005 0.0038 0.0024 0.0001
0.56 0.0000 0.0000 0.0003 0.0002 0.0000

136
The comparison of distribution shown in Table 5.5 with results of humidity values modelling for selected landscape-climatic zones (Tab. 5.10) for year 2050 testifies rather essential change of subdivision of the Republic’s territory toward more arid landscapes in 2100. Redistribution of various landscape-climatic zones as well as reduction of average humidified areas are predicted. It is expected, that average value of humidification of the Kyrgyz Republic can decrease from 0.794 in 2000 to 0.602 – 0.343 in 2100, depending on a climatic scenario. The share of areas with humidity lower than 0.30 (arid zone of deserts and semi-arid zone of semideserts) can approximately increase from 15.0 percent in 2000 to 23.3-49.7 percent in 2100. The areas and efficiency of high-mountainous outrun pastures of internal Tien-Shan, Ak-Say and Alay valleys might essentially decrease. Such changes of humidifying can result with necessity of agriculture structure reorganization as well as with essential changes of natural vegetative and animal communities.
Table 5.10. The generalized results of evolution of territory distribution modelled for the areas with various gradation of humidity for the most probable versions of predicted climatic parameters, where dТ - averaged annual temperature (°С), m - annual precipitation sum compared to the base period
mdТ (°C) 2.72 3.72 4.72 5.72
Zone 2050 2100 2050 2100 2050 2100 2050 2100
1.16 A 1.48 1.91
B 20.19 25.04
C 34.20 37.69
D 28.14 27.97
E 13.31 6.78
F 2.67 0.62
1.06 A 1.37 1.66 1.53 2.00 1.71 2.40
B 18.33 21.64 20.25 25.16 22.14 28.82
C 32.52 34.65 33.63 36.75 34.76 38.93
D 27.43 28.08 27.76 27.57 27.95 25.23
E 15.81 11.84 13.76 7.62 11.41 4.30
F 4.53 2.13 3.08 0.90 2.03 0.31
0.96 A 1.78 2.58 1.98 3.15 2.19 3.88
B 22.24 29.24 24.16 33.19 26.19 37.36
C 34.23 38.02 35.39 39.83 36.56 41.36
D 27.57 24.89 27.48 21.27 26.85 16.30
E 11.86 4.81 9.49 2.40 7.30 1.03
F 2.32 0.45 1.51 0.16 0.91 0.07
0.86 A 2.30 4.36 2.55 5.75
B 26.37 38.08 28.38 42.05
C 36.09 40.26 37.34 40.89
D 26.55 16.02 25.43 10.84
E 7.63 1.19 5.69 0.43
F 1.06 0.09 0.62 0.04
0.76 A 2.72 7.20
B 28.63 42.48
C 36.86 39.56
D 25.13 10.23
E 5.94 0.47
F 0.72 0.05

137
The correlation of main agricultural crops productivity and change of climatic parameters has been assessed. Models for assessment were constructed on the basis of retrospective data of crops productivity and climatic parameters for the period of 1990-2005. The choice of the period is based on availability of sufficient correct data on productivity. This information is taken according to comparable methodologies and also according to significant change of climatic parameters for this period. So, for example, the growth of averaged annual temperature in the Republic for this period made 0.0683°С a year; it is essentially higher than readings for all period of instrumental monitoring in the Kyrgyz Republic (0.0079°С a year for the period of monitoring from 1983 till 2005).
Table 5.11. The generalized results of modeled evolution of humidifying characteristicsfor entire Kyrgyzstan: dТ - change of averaged annual temperature (°С),m - annual precipitation sum compared to the base period
dТ (°C) 2.72 3.72 4.72 5.72
m 2050 2100 2050 2100 2050 2100 2050 2100
1.16 0.627 0.529
1.06 0.678 0.602 0.635 0.537 0.595 0.482
0.96 0.601 0.486 0.563 0.436 0.529 0.393
0.86 0.532 0.389 0.499 0.351
0.76 0.500 0.343
Using the constructed models and expected values of climatic parameters till year 2100 the assessment of crops productivity change for all regions of the Republics (Table 5.12) have been received.
Table 5.12. Assessment of productivity change of the main agriculture crops till year 2100.
Oblast
Mel
ons
Gra
pes
Pota
toes
Corn
Vege
tabl
es
Frui
ts
Whe
at
Rice
Suga
r
Toba
cco
Cott
on
Barle
y
Batken – – – – + 0 +
Jalal-Abad + 0 – + + 0 + + 0
Issyk-Kul 0 – 0 0 0
Naryn + + + +
Osh 0 0 0 0 + 0 0 0 0
Talas + + + – –
Chui + – 0 0 0 – – – 0Legend: "+" - growth of productivity, "-" - reduction, "0" - no significant changes
The data of the table should be interpreted as expected change of productivity if all other conditions besides climate are constant, i.e. the methods of cultivation, methods of irrigation, varieties of cultivated plants and use of fertilizers, etc. Though it is obvious, that the received results can change essentially with change of other conditions, but it is necessary to take into account, that introduction of any change in agriculture is a process rather inertial, and in the nearest future the revealed tendencies most likely will maintain.
Table 5.13 shows assessments of pastures productivity change. These assessments have been estimated according to the same scheme.
As it follows from the results shown in Table 5.13, the climate change is generally favorable to the growth of pasture vegetation productivity though some distortion

138
could be brought by decrease of pasture workload. On the basis of vulnerability models the assessment of predicted indicators, i.e. change of productivity for each year for the whole predicted period from 2005 till 2100, has been determined. Nevertheless, in Tables 5.12 and 5.13 the tendencies of indicators change, based on the employed models of incomplete set of factors determining productivity are shown. It influenced the significance of models.
Table 5.13. Assessment of pastures productivity change till year 2100 for various types of pasture vegetation.
Oblast
Echi
nata
Kobo
ezy
Stip
a ty
pe
Gra
min
eous
her
b m
edow
Synd
ow- g
ram
ineo
us
Synd
ow
Blue
gras
s
Sedg
e
Art
emis
ia-h
alop
hytic
Art
emis
ia-g
ram
eneo
us
Art
emis
ia-e
phem
eral
Art
emis
ia
Ptila
gros
tistis
y
Cauc
h-gr
ass-
sedg
y
Cauc
h-gr
ass
Step
pe-a
ndro
pogo
n-rt
emis
ia
Fesc
ue-B
lueg
rass
-Her
bal
Fesc
ue
Barle
y ty
pe
Batken + – + + – +
Jalal-Abad + + + +
Issyk-Kul 0 + + – + +
Naryn + + – + +
Osh + – + + + +
Talas – + + + +
Chu + + 0 – + + Legend: "+" - growth of productivity, "-" - reduction, "0" - no significant changes
5.3.2. Adaptation measures
In general, the actions aimed at climate change adaptation of agriculture are well-known and successfully implemented in many countries. For successful realization of adaptation strategy it’s necessary to prove the choice of concrete measures and to design clear sequence of actions on adaptation on the basis of general approach for each region of the Kyrgyz Republic. The basic directions of general approach are as follows:
Technological improvement:• diversificationofcropandcattlelivestockvarietiestoleranttoexpectedclimate
change;• alternationofplantcultivationandcattlebreedingregionalpriorities;• implementationofalternativeapproach to landcultivation inorder to solve
the problem of water and mineral substances deficit;• changeoflandtopographyinordertosolvetheproblemsofwaterdeficit;• implementationofefficientirrigationpractice;• changeofagricultureworkstimingduetochangeofvegetativeperiodduration
and heat availability;• developmentofnewvarietiesofcultures,includinghybrids,forimprovement
of endurance and suitability to temperature, humidity and other varying agroclimatic conditions;
• innovativestudies inthefieldof irrigation, tosolvetheproblemofmoisturedeficit and increase of droughty periods frequency.

139
Economic mechanisms:• crop insurance in order to reduce a risk of income loss caused by climate
change;• investment into agricultural equities and futures in order to reduce risk of
income loss;• participation in programs on income stabilization in order to reduce risk of
income loss;• diversificationofincomesourcesinordertoreduceriskofincomelosscaused
by climate change. State support:• assistancetodevelopmentofseed-growingandcattlebreeding;• developmentandimplementationofmodernsystemsofearlynotificationand
prevention of natural and temperature anomalies, daily and seasonal weather forecasts;
• changeofcrop insuranceprograms inorder to influencethestrategyof riskmanagement regarding crop losses caused by climate change;
• increaseofinvestmentstostabilizeaprofitablepartinordertoinfluenceriskmanagement strategy related to crop losses caused by climate change;
• development of incentive programs to support peasants and farmers,implementation of agricultural grants to affect the agricultural production;
• developmentofspecialprogramstosupportfarmersandcompensatelosses,as well as dissemination of information about risk of loss due to emergency situations and natural accidents;
• improvementofequipmentandfertilizersavailabilityforpeasantsandfarms;• development and implementationof statepolicy andprograms influencing
the mode of water and land use by peasants and farmers in view of varying climate conditions;
• improvementofwaterresourcesmanagementatlocallevel.
5.4. Population health
It is obvious, that climate change negatively influences human health though current assessments of potential influence of climate change on health contain a degree of uncertainty. Various extreme natural phenomenon: flooding, typhoons, weather situations with plenty of hot or, on the contrary, very cold days are additional impacts of climate change. A person in any unstable situation (social, psychological, ecological or any other) feels discomfort, thus his/her adaptive mechanism stays alert. Continuous stress conducts to occurrence of stress reactions, increase free radicals amount in the body and, as a result, leads to different pathological status.
It is clear, that climate change determines various ways of influence on population health. It can be:
• directinfluenceofhighertemperatures;• influencesrelatedtoextremeclimaticphenomenon;• influenceofhigherairpollution;• influenceonthediseasestransmittedthroughwaterandfoodstuff;• influenceonthediseasestransmittedbyinfectioncarriers,etc.Further in this section the assessment of vulnerability to climate change only in
the context of such indicators as acute intestinal infections, blood circulation diseases and malignant neoplasms, and also general mortality and mortality resulting from cardiovascular system diseases by virtue of fragmentariness of available data necessary for definition of numerical assessments of vulnerability have been considered.

140
5.4.1. Vulnerability assessment
Vulnerability assessment has been made on the basis of statistics taken from the following sources:
• RepublicanMedical-InformationCentre(RMIC);• Department of State Sanitary and Epidemiologic Control, Kyrgyz Republic
Ministry of Health (DSSEC);• CenterofStateSanitaryandEpidemiologicControl(с.Bishkek,TonandJety-
Oguz rayons of Issyk-Kul oblast (CSSEC);• NationalCenterofOncology,KyrgyzRepublicMinistryofHealth(NCO);• Research and ProductionAssociation‘PreventiveMedicine’, Kyrgyz Republic
Ministry of Health (RPAPM);• KyrgyzRepublicNationalStatisticalCommittee(NSC).The analysis on climate change impact has been carried on the basis of the
following medical and demographical parameters:1. Diseases:• infectiouspathology,onexampleofacuteintestinalinfections(sourceofthe
data: CSSEC) and bacterial dysentery (sources of the data: CSSEC and DSSEC) for all regions of the Republic;
• infectious pathology, on example of blood circulation systemdiseases (thedata source: RMIC) for all regions of the Republic and malignant neoplasms (the data source: NCO) for Bishkek city.
2. Population mortality:• thenumberofdeceasedpeopleper region (thedata source:KRNSC),with
detailed gender and age analysis for Ton and Jety-Oguz rayons of Issyk-Kul oblast;
• mortalityresultingfrombloodcirculationsystemdiseasesforJalal-AbadandChui oblasts and Bishkek city (source: KR MH RMIC).
The analysis of given morbidity and mortality parameters has been carried out only partially for some settlements not only because of resource restrictions, but first of all due to unavailability of data.
5.4.1.1. Infectious diseases
Climate warming promotes spread of many infectious and parasitic diseases due to creation of favorable conditions for infectious agent in the environment. The level of intestinal infections also substantially depends on such vulnerable to climate change indicators as quality of water (both in sources of water supply and in water-distributing network) and level of foodstuff infection contamination.
Fig. 5.9 shows the data of expected monthly average morbidity rate (per 100 thousand people) for acute intestinal infections in c. Bishkek till year 2100. The received results prove that by year 2100 the increase of intestinal infections rate is expected. Morbidity rate for acute intestinal infections under scenario A2-ASF can reach 57 cases (per 100 thousand people), and under scenario В2-MESSAGE a little bit lower – 54.4, i.e. the growth will make 15.9 percent and 10.6 percent, accordingly, in relation to
base parameters of disease for year 2005.
Fig.5.9. Expected monthly average morbidity rate for acute intestinal infections in c. Bishkek under two climatic scenarios.
58
565452504846
Mor
bidi
ty
Scenario A2-ASF Scenario B2-MESSAGE
2010 2020 2030 2040 2050 2060 2070 2080 2090 2100

141
Thus the greatest values of morbidity rate should be expected during summer season (about 38 percent of all cases) with its peak in July for both scenarios which coincides with an existing situation. For other regions of the Republic the results are similar.
5.4.1.2. Cardiovascular system diseases
Direct influence of warming results, first of all, in increase of cardiovascular system diseases especially among people of elderly age.
Fig. 5.10 – Fig. 5.12 show expected levels of monthly average morbidity per 100 thousand people till year 2100 for northern (Chui and Issyk-Kul oblasts) and southern (Jalal-Abad oblast) regions of the Republic, as the received statistical correlations for these regions are significant. The results for other regions of the Republic are similar. Vulnerability assessment results show the essential growth of blood circulation system diseases compared to year 2005, with one exception:
Fig. 5.10. Expected averaged annual level of diseases per 100 thousand people. Diseases of cardiovascular system for Chu oblast.
Fig. 5.11. Expected averaged annual level of diseases per 100 thousand people. Diseases of cardiovascular system Issyk-kul oblast.
Fig. 5.12. Expected averaged annual level of diseases per 100 thousand people. Diseases of cardiovascular system Jalal-Abad oblast.
• Chuioblast–69.6percentand45.6percentunderscenariosA2-ASFandВ2-MESSAGE accordingly;
• Issyk-Kuloblast–13.5percentand8.3percentunderscenariosA2-ASFandВ2-MESSAGE accordingly;
• Jalal-Abadoblast–73.2percentand37.6percentunderscenariosA2-ASFandВ2-MESSAGE accordingly.
The almost identical increase of diseases rate in the northern and southern regions of the Republic is expected. Less significant growth (even some reduction under scenario В2-MESSAGE) of morbidity in the Issyk-Kul oblast is caused by essential difference of climatic conditions in the oblast due to smoothing influence of the Issyk-Kul Lake. Differences between climatic scenarios A2-ASF and В2-MESSAGE reflect the
18001600140012001000
800600
Mor
bidi
ty
Scenario A2-ASF Scenario B2-MESSAGE
2010 2020 2030 2040 2050 2060 2070 2080 2090 2100
18001600140012001000
800600
Mor
bidi
ty
Scenario A2-ASF Scenario B2-MESSAGE
2010 2020 2030 2040 2050 2060 2070 2080 2090 2100
1400
1200
1000
800
600
400
Mor
bidi
ty
Scenario A2-ASF Scenario B2-MESSAGE
2010 2020 2030 2040 2050 2060 2070 2080 2090 2100

142
differences of expected temperatures under these scenarios. The highest values of morbidity in all cases should be expected in summer with peak in July (except for Issyk-Kul oblast where the peak of morbidity is shifted to August), which coincides with the existing situation.
5.4.1.3. Cancer diseases
Analysis of the data on acute intestinal infections and blood circulation system diseases did not consider the gender aspect. The forecast of malignant neoplasms diseases separately for men and women in c. Bishkek has revealed opposite tendencies of vulnerability.
Fig. 5.13 shows expected morbidity in c. Bishkek for the most vulnerable age category of 70 year old and older. Small reduction of morbidity for men and, at the same time, small increase of morbidity for women is expected under all climatic scenarios A2-ASF and В2-MESSAGE.
Fig. 5.13. Expected averaged annual morbidity per a 100 thousand people for malignant neoplasm (men and women)
Fig. 5.14. Expected averaged annual morbidity per a 100 thousand people for malignant neoplasm (men and women, c. Bishkek)
The further analysis has revealed the increased morbidity of malignant neoplasm diseases for women in the summer, during the period of the highest temperatures, whereas for men during this period a minimum morbidity is registered (Fig. 5.14) irrespective of climatic scenario. Taking this fact into account, it’s clear, that rise of temperature results in growth of malignant neoplasm among women and decrease - among men.
5.4.1.4. Mortality rate related to blood system diseases
One of the climate change consequences is the increase in number of days with abnormally high temperature. These days assume an increase of fatal outcomes number, mainly among the elderly people suffering of cardiovascular and blood circulation system diseases. Perhaps, the risk factor for population of the Kyrgyz Republic during the nearest decades will grow, taking into account gradual ageing of the population as a result of lifetime increase.
Fig. 5.15 – Fig. 5.17 show the assessment of averaged annual mortality rate of
130
120
110
100
90
80
70
Scenario A2-ASF
Men
Women
Scenario B2-MESSAGE
2010 2020 2030 2040 2050 2060 2070 2080 2090 2100
160
140
120
100
80
60
Mor
bidi
ty
Men
I II III IV V VI VII VIII IX XIX XIImonths
Women

143
population living in northern (Bishkek and Chui oblasts) and southern (Jalal-Abad oblast) regions of the Republic.
The received results of vulnerability assessment lead to conclusion about expected essential growth of mortality rate caused by diseases of blood circulation system in 2100 compared with year 2005:
Fig. 5.15. Expected mortality per 100 thousand people caused by cardiovascular system diseases, c. Bishkek
Fig. 5.16. Expected mortality per 100 thousand people caused by cardiovascular system diseases, Chui oblast
Fig. 5.17. Expected mortality per 100 thousand people caused by cardiovascular system diseases, Jalal-Abad oblast
• c. Bishkek - 50.6 percent and 39.4 percent under scenarios A2-ASF and В2-MESSAGE accordingly;
• Chuioblast -54.4percentand42.9percentunderscenariosA2-ASFandВ2-MESSAGE accordingly;
• Jalal-Abadoblast-75.3percentand54.3percentunderscenariosA2-ASFandВ2-MESSAGE accordingly.
The increase of expected mortality caused by diseases of blood circulation system is a bit higher for southern region of the Republic. The difference between climatic scenarios A2-ASF and В2-MESSAGE (similar for the previous cases) reflects the difference of expected temperature rates under these scenarios. The highest values of mortality in all cases should be expected during summer season with peak in July that coincides with an existing situation.
5.5. Climatic emergency situations
The territory of the Kyrgyz Republic as a high-mountainous landscape is exposed to dangerous processes such as landslips, landslides, rockfalls, mud-flows, high water, avalanches, earthquakes, impounding (of subsoil waters outcrop), glacial lakes breaks and other hazards. The damage caused by these emergency situations is rather great. Its average value for the Kyrgyz Republic (Basics of Emergency Situations Management, Bishkek, 2008) makes:
750700650600550500450400
Mor
talit
y
Scenario A2-ASF Scenario B2-MESSAGE
2010 2020 2030 2040 2050 2060 2070 2080 2090 2100
450
400
350
300
250
200
Mor
talit
y
Scenario A2-ASF Scenario B2-MESSAGE
2010 2020 2030 2040 2050 2060 2070 2080 2090 2100
800750700650600550500450
Mor
talit
y
Scenario A2-ASF Scenario B2-MESSAGE
2010 2020 2030 2040 2050 2060 2070 2080 2090 2100

144
• landslides–57,021US$(2.75);• mud-flowsandhighwater–109,067US$(6.30);• snowavalanches–97,522US$(3.07).The annual average of registered emergency situations (for the period of 1951-
2006) is shown in brackets.In this section the vulnerability assessment interpreted as development forecast
of natural emergency situations till year 2100 on the basis of statistical models have been carried out. For modeling the data on amount of occurred emergency situations in Kyrgyzstan since year 1951 have been employed. The following state agencies submitted a data :
• KyrgyzRepublicMinistryofEmergencySituations;• StateGeologicalAgencyundertheGovernmentoftheKyrgyzRepublic;• Institute ofWater Problems and Hydro-power Engineering, Kyrgyz Republic
National Academy of Sciences;• InstituteofRockPhysicsandMechanics,KyrgyzRepublicNationalAcademyof
Sciences.On the basis of the received vulnerability assessment the adaptation actions have
been developed. These actions could be considered as measures for improvement of state emergency situations monitoring and forecasting system.
5.5.1. Vulnerability assessment
Vulnerability assessment of the following emergency situations has been considered:
Landslides. On the territory of the Kyrgyz Republic no less than 5,000 landslides were registered, basically in low- and middle-mountain stage, they are rare in the high-mountainous zone. The number of landslides grows annually due to activation of interrelating ongoing geodynamic movements, seismicity, rise of subsoil waters, abnormal amount of atmospheric precipitation, and also engineering-economic activities. All those circumstances break the slope stability in the mountain zones. The number of households moved from landslide zones since 1992 has reached the amount of 7,873, i.e. 656 houses annually. Landslides destruct the houses and infrastructure of settlements located nearby, the remote landslides pose a threat of blocking the river-beds and their inflows. It is accompanied with formation of breach-hazardous dams and impounded lakes which, in case of breach, can destruct the buildings located below the river bed by shock hydrodynamical wave carrying a mud-flow. Currently within three southern administrative oblasts of the Republic there are 3,500 landslides of various activity levels. The long-term monitoring of atmospheric precipitation for five months (since 1 October of the last year till 28 February of the current year) shows 20 percent reduction of landslides formation. When precipitation is 40 percent higher than averaged long-term rate, the amount of new landslides is insignificant. When precipitation exceeds 40 percent than averaged long-term rate, the amount of new landslides formation is significant. The long-term monitoring established, that many of landslides took place during water abounding years.
Mud-flows, high waters and breach of high-mountainous lakes. Almost entire territory of the Republic is under the influence mud-flow processes. Practically more than 95 percent of settlements are in the direct vicinity with water sources, mainly along river beds. More than 90 percent of all lakes are high-mountainous lakes; about 200 lakes annually are in breach-hazardous condition. During the period of monitoring started in 1952, there were about 70 sites of mountain lakes breaches with glacial and moraine-glacial dams. Some of them led to emergency situations. Mud-flows turn into

145
catastrophic mode due to mountain lakes and man-made reservoirs breach. Every summer a catastrophic breach of the Mertsbaher lake glacial dam and water release in Sary-Jaz River occurs. Major factors of mud-flows and high-water flows related to the breaches of high-mountainous lakes are related to snow accumulation in the high-mountainous zone and specific snow
thawing mode determined by temperature. More than 300 settlements can be damaged by these processes.
Avalanches. The geomorphological structure of deeply cut mountain relief of the Kyrgyz Republic determines intensive avalanche activity in case of active precipitation and presence of a steady deep snow cover. The highest avalanche activity takes place in the basins of the following rivers: Chandalash (700 avalanches per year), Chychkan (390), Uzun-Аkmат (378), Chatkal (292), Susamyr (218). More than 150 avalanches are registered in the basins of Western Karakol, Kegart, Padysha-Ata, Turgen-Ajsuу, Tar and Chon-Kemin rivers. In these basins under especially favorable conditions snow avalanches take place, their volume exceeds 1 million m³. The avalanches of this volume used to be noted on the 248 km of Bishkek-Osh road, in the gorge Kochko-Bulak. They were the reason of traffic blocks up to 1 month. A huge cone used to block r. Chychkan and formed retained lake with the area of water level up to 30 thousand m² and the maximum depth of 10 m. Talas Alatoo (17.7 percent of total avalanches), Fergana (12.7 percent), Kyrgyz (10 percent), Chatkal (9.8 percent), Terskey Alatoo (8.7 percent) and Susamyr Too (7.6 percent) ridges have the greatest avalanche loading. The linear engineering constructions and communications as well as large forests are often become target for avalanches; the industrial-civil objects are exposed to negative influence of avalanches much less. December-April is a dangerous period. The maximum of avalanche period comes to February and March. Zones with high degrees of avalanche hazard are situated in the high and medium mountainous slopes of watershed Fergana, Trans-Alay, Alay, Chatkal, Kyrgyz, Talas, Kyngey-Teskey and Kokshaal ridges.
Vulnerability assessment has been carried out for three basic regions (Central, Northern and Southern) – the regions traditionally selected in the Republic for monitoring of emergency situations (Fig. 5.18). Mud-flows, high waters and breaches of high-mountainous lakes are incorporated into one category, because the breaches of high-mountainous lakes are rare and their individual modelling is very difficult. Assessment is given for expected change of climatic parameters according to climatic scenarios presented in Section 4 and according to probable growth of climatic emergency situations. Estimated results for the period till year 2100 allow drawing the following conclusions:
Mad –flow. Photo R. Slaba
Avalanche. Photo R.Slaba

146
1. Southern region:
The probability of landslides under scenario A2-ASF practically will not change, and under B2-MESSAGE scenario - will slightly increase. The probability of mud-flows, high waters and breaches of high-mountainous lakes under scenarios A2-ASF and B2-MESSAGE will increase by several times. For all scenarios the probability of avalanches will increase in Chatkal area and considerably decrease in Toktogul area.
2. Central region:
Vulnerability assessment of landslides has not been carried out because due to statistical data shortage. The probability of mud-flows, high waters and high-mountainous lakes breaches under scenarios A2-ASF and B2-MESSAGE will considerably decrease. The probability of avalanches under both scenarios will increase insignificantly.
3. Northern region:
Vulnerability assessment of landslides has not been carried out due to statistical data shortage. The probability of mud-flows, high waters and breaks of high-mountainous lakes breaches under scenarios A2-ASF and B2-MESSAGE will considerably decrease. The probability of avalanches under both scenarios will essentially increase.
Results of assessment are given in Table 5.14. The analysis of avalanches included only the avalanches threatening to existing motorways.
On the basis of vulnerability models the numerical assessments of predicted indicators, i.e. change of averaged annual frequency of emergency situations per year during entire predicted period 2005-2100 have been determined. Nevertheless, considering low importance of statistical models due to incomplete sets of all factors influencing process and random character of concrete climatic parameters for each year, Table 5.14 shows only trends of indicators change.
Fig.5.18. Subdivision of the Kyrgyz Republic territory for monitoring and analysis of emergency situations

147
Table 5.14. Vulnerability assessment per region for various scenarios.
Emergency situationsCentral Northern Southern
А2 В2 А2 В2 А2 В2
Landslides 0 +
Mud-flows, high-water, lake breaches – – – – + +
Avalanches on motorways:
Alabuka – Kanyshkiyz, 62 – 100 km + +
Bishkek – Osh, 216 – 265 km – –
Bishkek – Osh, 133 – 216 km + +
Karakol – Enelchek, 45 – 90 km + +
Aral – Minkush, 10 – 35 km + +Legend: ‘+’ – indicator growth, ‘-’ – indicator decrease, 0 - no significant changes.
5.5.2. Adaptation measures
Adaptation actions should develop the existing set of actions aimed at prevention of emergency situations. The basic components of these actions are:
• Spatialplanningofallemergencysituationsincludingidentificationofdangerzones and sequent requirements for use of these zones. In order to identify danger zones it is necessary to take into account the existing data on probability of emergency situations and also predicted one in view of probable climate change and prospective use of danger zones;
• Engineeringactionsaimedateliminationofhazardsourceandpreconditions.It is obvious that after implementation of engineering actions the additional research to redefine danger zones is needed;
• Thelegislativemeasuresprescribingstandardsandrulestoprovidebasisforcarrying out of all spatial planning and engineering actions;
• Informingandtraininginthefieldofemergencysituationspreventiontoavoidinaccurate decisions. In view of expected climatic change the informing should be directed not only to the existing situation analysis, but also to the probable change in future, as nowadays people in charge of decision making as well as population do not have any experience of adaptation.
Fig. 5.19. Dynamics of emergency situations quantity for expected climate change

148
This implies that analysis of vulnerability and development of adaptation actions is a continuous, dynamic process which should be performed on a regular basis that entails corresponding actions of institutional development.
Alongside with above-stated, actions focused on risk reduction and prevention of mud-flows, high-water, land-slide, avalanche and other emergency situations in the regions of possible emergency activation are as follows:
Landslide preventive actions in the landslide hazardous locations (Osh, Jalal-Abad and Batken oblasts):
• passive type - a choice of optimum location for newly constructed objects,reduction of engineering-economic activity that breaks natural balance of mountain slopes, etc.;
• engineering-active type - drainage of landslide hazardous slopes bymeansof water diverting, water accumulating and drainage facilities and slopes afforestation, construction of protective retaining walls, artificial unloading and levelling of landslide hazardous slopes, etc.
Mud-flow preventive actions in mud-flow hazard locations (Osh, Jalal-Abad and Batken oblasts):
• recalculation of estimated rivers water discharge related to climate changefactors for use of new data in designing protective and water-controlling constructions;
• passive actions to fight with mud-flows in the river beds and river basinsterritories: mud-flow dams, silt detaining facilities for mountain rivers (flow running constructions); the washout protecting dams;
• active or complex actions providing mud-flow protection, i.e. agriculture,afforestation and irrigation actions in a zone of mud-flow formation, river bed levelling for liquidation of possible flow obstructions near protected objects, construction of engineering protective facilities;
• protective actions in places of mud-flows formation – slope afforestation,terracing, trenching and dams.
Besides irrigation, engineering and agriculture, afforestation and irrigation actions, it is necessary to carry out the following organizational actions:
• regulationofstandards,termsofcattlepasturingontheerodedslopes;• schedulingandobservanceofcattledrovelocations;• decreaseindestructionsofthegroundtoplayeratconstructionofbuildings,
roads, open casts etc.;• eliminationofwasterockstockpilingintheriverbeds;Anti-avalanche actions (Naryn, Issyk-Kul, Chui oblasts and Chatkal area
which is climatically similar to central region):• passivepreventiveactionsincludingavalanchedangerassessment,regulation
of economic activities, protection and reproduction of forests, no-access mode for avalanche hazardous locations, forecasting of avalanches;
• activepreventiveactionsconsistingof systematicartificial snowclearingonavalanche hazardous slopes;
• regulationofsnowdriftsdeposingbymeansofsnowaccumulatingandsnowblowing facilities;
• artificial snow-retaining facilities on the avalanche hazardous slopes bymeans of snow retaining shields and fences construction, terracing and slopes afforestation;
• changeofavalanchedirectionbymeansofbreaksnowanddirectingberms;• reducing of avalanche speed and release by means of avalanche stopping
pyramids, posts and others types of avalanche preventive facilities;• passingofavalanchesovertheprotectedobjectsbyconstructionofgalleries,
tunnels and bridges.

149
6.1. Methodology
According to the Kyoto Protocol, the Kyrgyz Republic has no quantitative obliga-tions on greenhouse gases emission reduction. Nevertheless, joining and supporting the objectives of the Protocol, and also considering that mitigation activities mainly coincide with its sustainable development goals, the Republic takes into account the necessity to undertake efforts in this area. These measures in the sphere of mitigation of climate impact have been reflected in the following documents determining the basic development objectives of the Kyrgyz Republic:
• CountryDevelopmentStrategy(2007-2010).ApprovedbytheDecreeoftheKyrgyz Republic President # 249 as of 16 May 2007;
• TheEnvironmentalSecurityConceptoftheKyrgyzRepublic.ApprovedbytheResolution of the Kyrgyz Republic Government # 469 as of 16 October 2007; approved by the Decree of the Kyrgyz Republic President # 506b as of 23 November 2007;
• TheNational Energy Programof theKyrgyz Republic for 2008-2010 and theStrategy of Fuel and Energy Complex Development till year 2025. Approved by the Resolution of the Kyrgyz Republic Government as of 13 February 2008 # 47, and the Resolution of Jogorku Kenesh #346-IV as of 24 April, 2008;
• The National Forestation Program for 2005 – 2015, Action Plan on theImplementation of the National Forestation Program for 2005-2015. Approved by the Resolution of the Kyrgyz Republic Government as of 25 November, 2004, # 858;
• TheStateProgramofIndustrialandDomesticWastesDisposal.ApprovedbytheResolution of the Kyrgyz Republic Government as of 19 August, 2005, #389;
• TheProgramofOil-and-gasIndustryDevelopmentintheKyrgyzRepublictillyear 2010. Approved by the Resolution of the Kyrgyz Republic Government as of 5 December 2001, # 763;
• AgrarianPolicyConceptoftheKyrgyzRepublictillyear2010.ApprovedbytheRegulation of the Kyrgyz Republic Government as of 22 June 2004 #465;
• TheMid-termProgramofIndustryDevelopmentofKyrgyzstan(2002-2004)andfor the period till year 2010. Approved by the Resolution of the Kyrgyz Republic Government as of 16 May 2002, # 309.
This section determines GHG emissions under three scenarios of the Republic’s development:
A with no mitigation actions been undertaken, i.e. with preservation of all existing conditions and correlations at the national level, but in view of worldwide tendencies of technologies development;
В taking into account the mitigation actions defined in the national and sectoral
6. Climate change mitigation

150
development plans;С taking into account the mitigation actions according to the national and sectoral
development plans as well as additional actions to be undertaken within long-term outlook.
While considering mitigation measures, the following should be taken into account:
• The actionsdetermined in thenational and sectoral developmentplans areaimed at their own targets, while emission reduction is a by-effect;
• Theadditionalactionsdonotreflectgapsintheavailabledevelopmentplans.They are more of proposals for future, since the time period till year 2100 is much longer than the periods envisaged in the national and sectoral development plans.
Basic demographic and macroeconomic scenarios are applied for all scenarios (the options with annual rates of the general growth of national economy of 1.2% and 3%), that are presented in Section 4.
The energy and economic analysis of probable development scenarios was made by means of software complex LEAP (Long-range Energy Alternatives Planning system, version 2006.0015).
6.2. National mitigation potential
The international community experience on mitigation of anthropogenic impact on climate change includes a number of the following areas:
• IncreaseoftheenergysharegeneratedbytechnologiesthatdonotemitGHG.First of all, this use of renewable energy sources - hydropower, solar, wind and geothermal energy, development of nuclear power industry with priorities of safety and fuller use of nuclear fuel potentiality. In the long term the opportunities of practical use of thermonuclear power industry are positively assessed;
• FuelswitchtotheenergyresourcesnotcausingGHGemission.Anexampleofsuch replacement is the use of hydrogen in internal combustion engines;
• Replacement of mineral oil with bio-analogs. Burning of biogas, bio-dieseland ethanol produced from vegetable raw material is accompanied with GHG emission similar to that of mineral oil burning. But burning of mineral fuel involves the carbon withdrawn from natural cycle and been preserved in subsoil for millions (oil, coal, natural gas) or hundreds and thousand (peat) years. This leads to increase of carbon oxides concentration in the atmosphere;
• Developmentandwideapplicationofenergy-saving technologies.This areaincludes a very wide spectrum of actions from an application of modern heat-insulating materials and designs in construction to an application of power-saving devices, including automatic control;
• Development and distribution of new devices and technologieswith a lowpower consumption.
All these areas, except for use of renewables, are innovative. Apart from other conditions, their use and distribution to the Kyrgyz Republic will be determined by a level of their development in the advanced countries and the technology transfer opportunities. Regarding renewables the potential of Kyrgyzstan is estimated as 11.7 – 16.1 billion in kWh per year that is equal to 1,433.08 - to 1,979.01 thousand TOE, and reduction of СО2 emission by 3,973.2 – 5,486.8 Gg in coal equivalent. More than 99 % of capacity is accounted to hydropower engineering. In addition to measures in energy sector mitigation steps can be conducted in other spheres:
• Processingofmunicipalwaste,thevegetativeresiduesandoforganicpartof

151
solid domestic waste for biogas and organic fertilizers. The mitigation effect is that methane emission from anaerobic decomposition of carbonaceous waste products is replaced by carbon dioxide emission as a result of methane burning in reactors;
• Development of public transportation, road network rehabilitation anddevelopment, traffic optimization in the cities (by means of "green wave », creation of multi-level road junctions, etc.). The mitigation is obtained by reduction of fuel consumption;
• Enhanced reforestationof the republic, that leads tocarbonconservation inwood and its withdrawal from the current natural cycle.
6.3. Basic background for scenarios assessment
The assessment was made for the period 2010 - 2100 for 15 development scenarios (Table 6.1) with different rates of annual economic growth and scope of implemented of measures.
Table 6.1. The scenarios considered
Implemented measuresRates of annual economic
growth
3% 2% 1%
No measures undertaken 103А 102А 101А
The measures undertaken that are envisaged in the national and sector development plans 103В1 102В1 101В1
The measures undertaken that are envisaged in the national and sector development plans and upon the commissioning of the new generating capacities with favorable conditions
103В2 102В2 101В2
The measures undertaken that are envisaged in the national and sector development plans, and additional measures 103С1 102С1 101С1
The measures undertaken that are envisaged in the national and sector development plans and upon the commissioning of the new generating capacities with favorable conditions, as well as additional measures
103С2 102С2 101С2
6.3.1. All scenarios
Gross domestic product growth rates for the republic and for some sectors (industry, agriculture, services), and the ratio between the sectors according to the macroeconomic scenarios of Section 4 are used, at a natural restriction of obligatoriness of absolute growth of GDP in each sector.
Energy sector
The coal and natural gas mining, oil extraction and refining will increase by 2100 approximately by 1,5 - 3 times as compared to 2005, i.e. will reach maximum level achieved earlier in these sectors.
Out of all types of transport (aviation, automobile, railway and water) only GHG emission from motor transport is taken into account, as a major energy consumer in transport (about 97 %). Energy consumption by motor transport is assumed as proportional to the number of vehicles.

152
Fig. 6.1. Evaluation of the number of vehicles in the Kyrgyz Republic with different rates of economic development
Anticipated number of vehicles (Fig. 6.1) was estimated based on statistical dependence between the number of vehicles per 1,000 people and GDP per capita (for construction of dependence the information on more is used, than to 130 countries).
For the scenario of economic growth by 101 and 102 %, the relationship between the number of vehicles and economic level was adapted to the specific conditions of the national economy, since GDP is not reflected to the full by the official statistics. Actually, the number of vehicles in the country in 2005 four times exceeded the figure that would correspond to the economic development level according to official statistics, for whatever reasons.
It is assumed, that energy consumption in agriculture depends on the size of sector gross national product, while specific energy consumption per GDP unit will decrease by year 2100 by 20 % in comparison with 2005 due to inevitable application of technical progress achievements in the republic.
Energy consumption in commercial sector (services sector) is accepted proportional to the size of the sector gross national product. Energy consumption by urban and rural population is assumed being proportional to the number of a relevant category of the population.
It is accepted that technical losses at distribution of energy to the end user will decrease from the level of 2005 (34,5 % for the electric power and 3,5 % for gas) up to 6 % for the electric power and 1,5 % for gas by 2010 that corresponds to already achieved international indicators.
Other sectors
In the sectors industrial processes and agriculture the volume of GHG mission has been accepted as proportional to the gross national product growth in each sector.
At the analysis of waste products sector only solid domestic wastes were considered, as making the greatest contribution to GHG emission and as the sub-sector for which emission reduction measures are known enough and already been planned in the republic. The specific volume of formation of solid domestic wastes (SDW) is determined based on the constructed dependence of education SDW on the person depending on a level of economy, i.e. GDP per capita. For construction the universal statistical data are used. Forecast volumes of SDW formation in the republic for the period from 2010 to 2100 (Fig. 6.2) were determined based on the data on the population and living standards, according to demographic and macroeconomic scenarios (Section 4). Substantial growth of waste volume after 2005, even despite of the underestimated official assessment of GDP figure till 2005, reflects an existing insufficiency of the waste collection system. The morphological structure of waste products for the whole forecast period is accepted being constant and corresponding to 2005.
1000900800700600500400300200100
0
Vehi
cles
, tho
u pi
eces
2005 2010 2020 2030 2040 2050 2060 2070 2080 2090 2100103 % 102 % 101 %

153
Fig. 6.2. Evaluation of the amount of formed solid domestic waste in the Kyrgyz Republic with different economic growth rates.
The greenhouse gases emission from the insignificant sources with an essential uncertainty of assessment, such as a use of solvents, was not taken into account.
6.3.2. Scenario with no measures been taken (А)
In this hypothetical scenario it is assumed, that till 2100 in the Kyrgyz Republic in all sectors the measures aimed at emission reduction or increased absorption of greenhouse gases will not be implemented, including any measures carried out with other purposes, however resulting in greenhouse gases emission change, excepting natural impact of world technological tendencies. It is supposed for this scenario, that new generation and transformation power capacity will not be commissioned in the republic.
It is supposed, that power consumption of industrial production for 2005 (1,08 toe/1000 dollars. The USA) for the period till 2100 remain constant and equal to a reference value for 2005 under all {scenarios} of growth of gross national product (101, 102 and 103 %) with preservation of structure of consumed energy sources, characteristic for 2005.
Taking into account, that the Kyrgyz Republic does not make, and entirely imports motor transport, it is supposed, that consumption of energy by motor transport will consistently decrease as a result of the general{common} technical progress (estimations{assessments} of similar reduction are resulted, for example, in report World Business Council on Sustainable Development's, 2004). Proceeding from this, it is accepted, that by 2100 consumption of energy by motor transport in republic will decrease for 20 % in comparison with 2005.
Energy consumption per GDP unit in agriculture by 2100 will decrease for 20 % in comparison with a level of 2005 due to adoption of new technologies without change of structure of consumed energy structure, peculiar to 2005.
In commercial sector energy intensity of GDP and structure of consumed energy sources will stay constant and corresponding to the data of 2005.
For urban population it is accepted, that by 2100 specific consumption of energy per person will increase by 1,5 times in comparison with 2005 level, while for rural population it will grow up to the level of energy consumption of urban population by 2100, with invariable structure of consumed energy sources, peculiar for 2005.
Wood species plantations and, accordingly, the level of carbon dioxide sinks, are supposed to stay preserved at the level of 2005.
6.3.3. Scenario with taken measures defined in prospective national development plans (В1 and В2)
In these scenarios it is assumed that till 2100 in the Kyrgyz Republic the national
200018001600140012001000
800600400200
0
Was
tes,
thou
tone
s
2000 2005 2010 2020 2030 2040 2050 2060 2070 2080 2090 2100103 % 102 % 101 %

154
measures will be implemented in all sectors that are stipulated in the national development plans and aimed at GHG emission reduction or increased absorption of greenhouse gases, along with any other measures reflected in plans and sold with the other purposes, but resulting{bringing} to change of issues{emissions} of hotbed{greenhouse} gases, in addition to natural influence of universal technological tendencies (script{scenario} А) will be realized.
{Scenarios} В1 and В2 differ only commissioning of new capacities on manufacture{production} and transformation of energy, the other initial data is identical.
Energy sector
According to the National Energy Program of the Kyrgyz Republic for 2007-2010 and Strategy of development of a fuel and energy complex till 2025, it is supposed that growth of energy production of on existing capacities and commissioning of new capacities on manufacture{production} and transformation of energy under two {scenarios} (В1 and В2), that will provide increase in manufacture{production} of the electric power (table 6.2).
Table 6.2. Forecast of power generation in the Kyrgyz Republic (billion kWh) for scenarios В1 and В2
Title 2010 2015 2020 2025
Scenario В1
Downstream-Naryn HPS cascade 12,291 14,547 14,547 14,547
City HPP 2,350 2.35 2.35 2.35
Small HPS 0.150 0.650 1.0 1.5
RES 0.020 0.025 0.030 0.045
Kambarata HPS 1 - - 1.2 5.6
Kambarata HPS 2 0.7 1.1 1.1 1.1
Upstream-Naryn HPS 1,2 and 3 - - 0.75 0.75
Akbulun HPS - - - 0.75
Total, scenario В1 13,571 18,437 21,075 26,742
Option implemented under favorable conditions
Sary-Jaz HPS - - - 3.6
Kara-Keche coal power plant - 1.1 4.4 4.4
Total, scenario В2 13,571 19,537 25,475 34,742
It is supposed, that current excessively high power intensity of industrial production will be reduced by 2100 to the level achieved now by the advanced countries, i.e. will decrease approximately in 3 times for all {scenarios} of growth of gross national product (101, 102 and 103 %). The structure of consumed energy sources, characteristic for 2005 will be saved till 2100. Reduction of energy intensity of industrial production can be achieved due to of realization of provisions on restriction of the outdated equipment import, reflected in the Concept of Environmental Safety of the Kyrgyz Republic.
For motor transport it is supposed, that apart from obvious reduction of energy consumption due to technical progress, similarly to industrial sector, the measures will be implemented on restriction of outdated transport import, as well as the measure on roads rehabilitation and the public transportation development. These actions envisaged in the Country Development Strategy will give an additional reduction of energy consumption by 2100 by 20 %, i.e. all on 36 % compared to the level of 2005.
In agricultural and commercial sectors, as well as in the sector of energy

155
consumption by the population (urban and rural), no measures are supposed to be accepted, therefore energy consumption under scenarios В1 and В2 is assumed to be equal to that of scenario A (no measures undertaken). The structure of consumption of fuel in these sectors according to universal tendencies will change and by 2100 will be following:
• Agriculture-power(31.15percent)anddieselfuel(68.85percent);• Services (commercial sector) - power (99.82 percent) and diesel fuel (0.18
percent);• Urbanpopulation-power(66.09percent)andheat(33.91percent);• Ruralpopulation-power(100percent).
Other sectors
According to the perspective forestry development programs, the forestation of the republic is supposed to be increased up to 6 % by 2025 – 2030. This means an expansion of the area covered with forest by at 289 thousand ha in comparison with the data of the recent forest inventory along with a corresponding increase of the volume of carbon dioxide absorption.
The state program of production and consumption waste disposal covers a wide enough range of possible measures. However, in view of lack of necessary financing, only the measures on construction of the new modern landfills could be fulfilled on planned timeframes. It is worth to note that these measures are carried out with the main purpose of reduce in negative environment impact, in line with the sanitary norms and rules, but their implementation will lead to some increase of methane emission.
6.3.4. Scenario with taken measures defined in prospective national development plans, and additional long-term measures (С1 and С2)
As these scenarios are based on В1 and В2 scenarios, this case will also consider two scenarios - С1 and С2 - differing only with the commissioning of the new capacities on energy generation and transformation.
Energy sector
For industrial sector scenarios С1 and С2 coincide on all parameters with scenarios В1 and В2.
For motor transport it is assumed, that besides a reduction of energy consumption by 36 % in comparison with a level of 2005 according to scenarios В1 and В2, additional measures will be implemented in terms of effective traffic management providing extra reduction in energy consumption in this sector by 10 %. As a result total decrease of energy consumption by motor transport in 2100, as compared with 2005 level, will make 42.4 % for scenarios С1 and С2.
In agricultural and commercial sectors, as well as sector of consumption of energy the urban population of acceptance of additional measures does not suppose, therefore consumption of energy under {scenarios} С1 and С2 is accepted to equal scenarios В1 and В2. The structure of consumption of fuel in these sectors will coincide also with structure in scenarios В1 and В2.
It is supposed, that the structure of energy consumption by rural population for scenarios С1 and С2 will not change in comparison with scenarios В1 and В2, but the volume of consumption by 2100 will decrease on 5 % in comparison with 2005 due to of use of energy efficiency and renewable energy sources, biogas in particular.

156
Other sectors
Proceeding from expert assessments of national capacity on reforestation of the republic, the figure of 8 % increase by 2100 is assumed to be realistic enough. This means expansion of forest land by 664 thousand ha in comparison with a current situation, pursuant to the recent forest inventory, and corresponding increase in volume of carbon dioxide absorption.
In the sector of solid domestic waste products the employment of combustion plants is presupposed, which would be introduced stage by stage, with gradual increase in volume of solid domestic waste in 2040 by 58 %, in 2060 - by 70 %, in 2090 – by 90 %. At each stage recycling operations will be carried out.
Table 6.3. Volume of waste (%) out of total mass of solid domestic waste subject to sorting and to use as secondary raw material
Fractions subject to secondary processingYear
2040 2060 2090
Paper 55 70 90
Food waste 70 80 90
Wood 60 70 90
Textile 55 70 90
Bones 70 80 90
Ferrous metal 50 80 90
Glass 60 80 90
Plastic 20 60 90
Leather, rubber 70 80 90
Stones - 40 60
Swept waste 70 80 90
Ashes - 50 70
Other - - -
6.4. Emissions per scenarios
Results of calculation of total GHG emissions (all gases and in all sectors) for the Kyrgyz Republic by means of program complex LEAP for various scenarios of economic development and packages of measures aimed at decreasing emissions are resulted on Fig. 6.3 - 6.5.
Emissions trends for scenarios В1 and В2, and also for scenarios С1 and С2 at any rates of economic growth, are practically parallel among themselves and differ only in the volume of additional greenhouse gases emission from commissioning of the Kara-Keche coal power plant, whi emission makes up about 12.5 Gg per year. To simplify the calculations it was supposed, that commissioning of the coal power plant will be made at full capacity straight away after 2020.
It should be noted, that if the republic exceeds economic level of 1990, this will not cause the similar increase of emissions as of 1990, due to essential change of GDP structure. Such a change, according to the current tendencies, is planned for entire period till 2100. In compliance with the macroeconomic development scenarios (Section 4) it is supposed, that the services sector will be developing much faster than the industrial sector, which will lead to reduction of the general power consumption intensity of gross national product, as power inputs for 1,000 US dollars in the industry in 2005 have made 39.0 MJ, and in services sector only 6,68 MJ. Even taking into

157
account reduction in power consumption intensity of GDP assumed{prospective} for industrial sector under scenarios B and C, power inputs in the services sector will be much lower.
Fig. 6.3. Greenhouse gases emission in СО-equivalent on scenarios with economic growth of 1 percent per year
25
20
15
10
5
2010 2020 2030 2040 2050 2060 2070 2080 2090 2100
101А 101В2
Emis
sion
, Gg
101В1 101С1 101С2
Fig. 6.4. Greenhouse gases emission in СО-equivalent on scenarios with economic growth of 2 percent per year
30
25
20
15
102010 2020 2030 2040 2050 2060 2070 2080 2090 2100
101А 101В2
Emis
sion
, Gg
101В1 101С1 101С2
Fig. 6.5. Greenhouse gases emission in СО-equivalent on scenarios with economic growth of 3 percent per year
40
35
30
25
20
15
102010 2020 2030 2040 2050 2060 2070 2080 2090 2100
101А 101В2
Emis
sion
, Gg
101В1 101С1 101С2

158
For the group of scenarios without acceptance of measures (А) and with annual economic growth of 3 %, the essential growth of emissions tripling by 2100 is observed. For annual economic growth of 1 % by 2100, after the period of growth till 2060, some stabilization of emissions connected to the expected demographic decline according to the demographic scenario (Section 4) is shown. Hence, performance of obligations under the UNFCCC and the Kyoto Protocol without any measures aimed at reduction of GHG emissions is possible only in case of annual economic growth of no more than 1 %.
For scenarios В1 and В2 stabilization of GHG emissions growth comes about at rates of annual economic growth less than 3 %, while already at 3 % of growth the emission increase takes place. For scenarios С1 and С2, at annual economic growth of 3 %, some reduction tendency for GHG emission is still observed, but it is obvious, that the greater economic growth rate will lead to the emission growth as well. Hence, the planned governmental measures can stabilize GHG emission only for annual economic growth less than 3 % (i.e. acceptance of these measures is sufficient to meet the requirements of the UN Framework Convention on Climate Change and the Kyoto Protocol). However, performance of the obligations on reduction of greenhouse gases emissions, at the rates of economic growth exceeding 3 %, is possible only at expansion of the list of the measures, planned in scenarios С1 and С2.
Tendencies of emission in all sectors are monotonous and coincide with the general tendencies, except for sector of solid domestic waste products (Fig. 6.6). For this sector implementation of the national measures results in growth of the emissions ( scenarios 103В, 102В and 101В) in comparison with the scenarios without acceptance of measures (103А, 102А and 101А). As the governmental measures are aimed first of all at reduction of negative impacts of waste disposals on environment. Implementation of the additional measures (scenarios 103С, 102С and 101С) is supposed to be carried out in three stages to facilitate the financing process.
4000
3500
3000
2500
1000
500
02010 2020 2030 2040 2050 2060 2070 2080 2090 2100
103А 101А103С 101С
Emis
sion
, Gg
103В 101В102А 102В 102C
Diagram 6.6. Emission in СО-equivalent from solid domestic waste sector. For simplification, distinguishing of scenarios В1, С1 and В2, С2, is excluded, since those are similar.
Namely presence of these stages of implementation of measures on methane emission reduction from places of solid domestic waste products disposals defines absence of monotony of GHG emissions trends for scenarios С1 and С2, shown on Fig. 6.3 - 6.5.
Using results of calculation by means of program complex LEAP it is also possible to estimate the republic’s provision with its energy resources.

159
For all scenarios, despite of prospective increase in own extraction, traditional import of mineral kinds of fuel (coal, natural gas and mineral oil) will be saved. Besides depending on the achieved rates of economic development there can be a deficiency of the electric power, poor own manufacture{production} (table 6.4).
Table 6.4. Years, after which domestic energy production does not cover domestic demand
Implemented measuresRates of annual economic growth
1% 2% 3%
Without the measures А 2010 2010 2010
With the measures undertaken that are envisaged in the national and sector development plans В1 2040 2030 2030
With the measures undertaken that are envisaged in the national and sector development plans and upon the commissioning of the new generating capacities with favorable conditions
В2 >2100 >2100 2060
With the measures undertaken that are envisaged in the national and sector development plans, and additional measures
С1 2050 2030 2030
With the measures undertaken that are envisaged in the national and sector development plans and upon the commissioning of the new generating capacities with favorable conditions, as well as additional measures
С2 >2100 >2100 2060
Provided that measures aimed at GHG emission reduction are not implemented and generating capacities (Table 6.3) will not be commissioned with accordance with the National Energy program of the Kyrgyz Republic for 2007-2010 and the Strategy of Fuel and Energy Complex Development till 2025, then after 2010 the republic will be already compelled to import the electric power, even at rates of annual economic growth of 1 %.
In case of commissioning of generating capacities (scenario В1, table 6.2) implementation of measures according to scenarios В1 and С1 puts off the necessity to import power up to 2030 - 2050 depending on economic development rates. Only for scenarios В2 and С2 with the commissioning of additional generating capacities (scenario В2, Table 6.2) and at the rates of economic growth less than 3 % the republic will completely satisfy domestic power demand. Necessity for power import arises only after 2060 at annual economic growth rates of ≥3 %.
It should be noted, that given assessments of power supply are optimistic as those do not take into account possible decrease of power generation at HPSs provided expected reduction of surface runoff.
With the implementation of mitigation measures, the structure of consumed power resources will considerably change that will impact the share of emission from each resource. Results of calculation of scenario options at annual level of economic growth of 3 percent without measures (Fig. 6.7) and with the measures determined in long-term development plans and commissioning of the new generating capacities under favorable conditions, and also additional measures (Fig. 6.8), show, that in the second scenario in comparison with the first one, absolute value of consumption of all fuel types decreases, except for coal, which consumption in the second scenario also is consistently reduced. The total volume of greenhouse gases emission for the second scenario is much lower, in comparison with the first one and does not even reach the level of 1990 emission.
The sharp increase of coal consumption after 2020 on Fig. 6.8 corresponds with the time of Kara-Keche coal power plant commissioning.

160
Fig. 6.7. Greenhouse gases emission broken down by energy resources type for scenario without measures (А) at annual economic growth rate of 3 percent
35000
30000
25000
20000
15000
10000
5000
02010 2020 2030 2040 2050 2060 2070 2080 2090 2100
Mazut Kerosene
Emis
sion
, Gg
Gas Petrol Diesel fuel Coal
25000
20000
15000
10000
5000
02010 2020 2030 2040 2050 2060 2070 2080 2090 2100
Mazut Kerosene
Emis
sion
, Gg
Gas Petrol Diesel fuel Coal
Fig. 6.8. Greenhouse gases emission broken down by energy resources type for scenario with measures undertaken that are defined in perspective development plans and upon the commissioning of the new generating capacities with favorable conditions, as well as additional measures taken (С2) with annual economic growth rate of 3 percent.
6.5. Assessment of emission reduction
Possible effect of emission reduction in the СО-equivalent from theimplementation of national capacity in terms of mitigation of anthropogenic climate change impact according to national and sector plans, and additional measures, is shown in Table 6.5.
Assessment is made for both the actions stipulated by the national and sector plans, and for additional measures. The latter also cover measures on the use of solar energy and processing of carbonaceous waste products in biogas. These measures are not reflected in available plans and programs, but there is successful practical experience in the republic already, which should be considerably expanded. This experience shows that solar thermal collectors and biogas installations even at the existing cost and energy tariffs at domestic market are economically expedient. Under the conditions of growing demand for energy and increase of its cost, these areas will be developing, especially if the Government creates the conditions stimulating this development

161
Table 6.5. Estimated cost and expected emission reduction in 2100 from the measures stipulated in the national and sector development plans and from additional measures
№ Measure Cost, mln. US$
Emission reduction,СО-
equivalent, t
Cost of 1 t reduction,
US$
1 Construction of Kambarata HPS-2 360.0 374,616.0 961.0
2 Construction of Kambarata HPS-1 1,900.0 1,907,136.0 996.3
3 Construction of Akbulun HPS 200.0 255,420.0 783.0
4 Construction of Upstream-Naryn HPSs 200.0 255,420.0 783.0
5 Construction of Sary-Jaz HPSs 1,200.0 1,226,016.0 978.8
6 Use of solar collectors 16.5 72,399.8 228.3
7 Installation of biogas reactors 9.2 10,263.2 898.0
8 Waste processing 139.7 130,362.0 1,071.8
9 Traffic management 1,093.6 749,261.9 1,459.6
10 Reforestation 14,383.7 783,773.7 18,351.8
It should be noted that the capacity of these two positions is not limited to the values, which have been taken into account during assessment. The accessible capacity is essentially higher. Thus, 0.5 percent of roofs area is taken into account, while roofs of public buildings are not considered during assessment, which are potential platforms for placement of solar collectors. During the assessment of biogas reactors potential 5 percent of manure, which is collected in stalls and shelters and 50 percent of poultry excrements are taken into account. Manure of those animals that graze on pastures (horses, donkeys) is not accounted in the calculations. Vegetative stubble remains, which are good raw material for biogas production, are also not taken into account
Measures given in Table 6.5 are divided into two groups:• Themeasuresaimedatenergyproductionwithoutgreenhousegasesemissions
- construction of HPS and solar collectors;• Themeasures addressing environmental problems for which GHG emission
reduction is not a target, but rather an additional result - biogas installations and processing of waste products (reduction of the waste products volumes demanding accommodation and creating risks for an environment), traffic management (traffic optimization in cities, reduction of exhaust gases emissions), enhancing of reforestation (preservation of a biodiversity and a landscape variety).
In the Table 6.5, the line “Cost of measures” shows only capital investments for resource base creation. Operating costs on any positions, except for «Reforestation» are not considered in calculation. It should be noted that the cost of reduction of 1 t of СО2-equivalent emission is attributed to assessment of emission reduction for 2100 - final year of the assessment period, instead of being attributed to emission reduction for entire period of 2006 - 2100. This parameter can be used only with a view of comparison of measures at mitigation of anthropogenic influence on change of a climate, but not for economic estimations.
The volume of capital investments is determined from the assumption that by the aggregative estimation of 1 kW of installed capacity for the large HPSs in 2005 prices makes up about 1,000 US dollars and the implementation of the state program will demand 2.7 - 3.7 billion US dollars without taking into account expenses for creation of an infrastructure.
Total costs for creation of solar collectors are determined proceeding from cost of a thermal collector of 1 m2 in 70 US dollars (in the prices of local manufacturers).
Depending on volume, specific cost of a biogas reactor of 1 m3 changes from 75 up to 220 dollars. The USA, for reactors in capacity of 50 m3 it makes 90 US dollars. At

162
acceptance of this cost as average total expenses for creations of technical base of biogas technologies will be made approximately with 9 million US dollars in the prices of 2005.
Estimated cost of municipal plans and development strategy on secondary processing waste products makes of about 140 million US dollars.
According to accounting of Department of Forestry and Hunting Management of the State EPA, the whole cycle of reforestation work, from gathering seeds to planting and cultivating of wood species for 1 ha of a restored forest, demands 888.15 thousand Kyrgyz som (21.66 thousand US dollars) in the prices of 2005. Expenses on 1 га at natural лесовосстановлении make 43.96 thousand catfish (1.07 thousand US dollars).
Assessment of their economic characteristics is made for both measures envisaged by the national and sector plans, and for additional measures only from the point of view of necessity of capital investments to reduce greenhouse gases emission per year and does not take into account other costs and benefits.
By preparation of design decisions, after definition of operation time of the capital equipment, and, operational and other costs it will be possible to estimate actual costs for each concrete measure and cumulative volumes of emission reduction.
163
7.1. Technology transfer
In 2004 the analytical process of technology needs assessment performed according to the decision of 4/СР.4 Conferences of the Parties was completed in the Kyrgyz Republic. The following sectors were selected for of technologies transfer in the first turn:
• Energy sector (energyefficiency, smallhydro-powerengineering, renewableand alternative energy sources);
• Transport;• Forestry;• Domesticandagriculturalwasteproducts;• Construction.For each sector the current state analysis was carried out and the development
forecast outlined. The legal aspects have been considered and criteria for necessary technologies selection developed. The most perspective areas, as well as barriers and ways to overcome those were identified. Based on the analysis the technologies required for each sector have been formulated. Many of the developed proposals have already been implemented, or are in the process of realization by means of various funding sources.
The projects funded by GEF/UNDP:
• UNDPProgram“Environmentprotectionforsustainabledevelopment”hasthemain objective to assist the Government in:- enhancing national capacity of environmental management;- performing obligations under the global environmental conventions, including
the UNFCCC and Kyoto Protocol, in the area of sustainable development and environment protection;
- integration of the ideology and sustainable development procedures into the national strategies and programs at the national and local levels.
• UNDPProject“Promotionofrenewableenergysourcesuseforthedevelopmentof the remote regions of Kyrgyzstan”. This project is aimed to reduce poverty and improve living standards of rural population by promoting the use of RES, such as micro and small HPS, solar and biogas installations;
• UNDP Project “Capacity building on introduction of the principles ofsustainable waste management in the Kyrgyz Republic”. The project is intended to facilitate the introduction of sustainable waste management principles through a development of the National Strategy of Industrial and Domestic
7. Other information related to achievement of the convention objectives

164
Waste Management, widening the opportunities to involve private sector into the waste management system, implementation of the pilot projects, and increasing the public incentives for waste management.
• UNDPProject“CleanDevelopmentMechanismcapacitybuildinginKyrgyzstan”,co-financed by the MDG Carbon Facility is aimed at increasing the opportunities for public and private sectors of the republic to access to carbon funding.
• UNDP/GEFProject“Improvementofenergysavinginthebuildings”isaimedatreduction of energy consumption and greenhouse gases emissions cut off in the construction sector in Kyrgyzstan by 30-40% as compared to current state.
• UNDP/GEFProject“Capacitybuildingforimprovednationalfinancingofglobalenvironmental management in Kyrgyzstan” will assist Kyrgyzstan in terms of conservation of its natural resources and prevention of further degradation through initiation of fiscal reform process in the area of environmental protection. At the international level this project will also assist in achieving the global objectives in the spheres of biodiversity preservation, climate change mitigation and adaptation, and reduction of land degradation.
Small grants program of Global Environment Facility (GEF/SGP) was launchedin Kyrgyzstan by the initiative of UNDP in 2001. During the previous period 45
projects aimed at climate change mitigation were implemented.GEF/SGP projects facilitate removal of cultural, institutional, technical and
economic barriers and enable a dissemination of affordable, sustainable and climate friendly technologies. In general, those are aimed at local capacity building, energy efficiency, raising of public awareness with regard to climate change.
The projects in the field of transport sector, energy saving, energy efficiency, introduction of alternative energy sources and etc. may serve as positive examples of addressing the set up tasks:
• “Bishkek–cleanair”.Theprojectisaimedatreductionofemissionsleveldueto installation of ignition electronic device in the vehicles along with informing public on the device benefits to expand the frames of its application. The emissions cutoff is achieved due to reduced fuel consumption (by 15 percent). Under this pilot project, 30 vehicles were re-equipped to demonstrate effectiveness of this device operation;
• “Increasedefficiencyoffurnacesincombinationwithbiogasinstallationsandheat insulation of the buildings”. Advertising and introduction of the energy saving heating system "Kann” along with an improvement of heat insulation of the buildings is the main idea of the project. The given type of the furnace reduces the coal and fire wood consumption by 30-40 percent, thus reducing greenhouse gases emissions;
• “Introduction of solar technologies in rural area of Kyrgyzstan”. The projectis aimed to replace the diesel pumps with photovoltage technologies in the agriculture and in water supply sector. In the rural region the diesel pumps were replaced with the ones operated from solar energy.
Further activities of the Small grants program is planned in the following areas:• increasing the afforestation and reforestation through improved pasture
management, changing of livestock structure, enhancing of collection and processing of non-wood forest products;
• Raising awareness of the population and propaganda of energy savingconstruction standards and heating systems standards;
• Fuelswitchpilotprojectsforthebuildingsownedbythelocalself-governancebodies, to the combined heating with a use of biogas, solar, wind installations, vertical heat-generators along with the change of existing practice of heating

165
cost funding and the introduction of energy efficient building materials;• Supportoftheinnovationsusingrenewableenergysources;• Supporttotheeffortsoflocalself-governancebodiesontheintroductionof
bicycle transport as the element of public transportation.
Projects on Clean Development Mechanism:• TheDepartmentforEnvironmentProtection,Denmark(DEPA),andMayoroffice
of the capital of Kyrgyzstan have developed and are implementing the project “Landfill gas capturing and utilization in Bishkek”.
• The first component of Tien Shan Biodiversity Project is aimed at thereforestation on the area of 18 thousand ha and reduction of greenhouse gases emission with further sale of certified carbon emissions to biocarbon funds and obtaining additional income. The second component - Tien Shan biodiversity conservation - is aimed at capacity building of special protected area, reduction of anthropogenic pressure on natural resources by means of sustainable forestry management and eco-tourism development. The project will be implemented together with the Forestry Committee of the Republic of Kazakhstan.
Portfolio of CDM projects is being prepared on energy efficiency in industry and energy sectors, fuel switch in social sector, and on processing of livestock breeding wastes.
Provided adequate funding, complete implementation of the list of transferred technologies may be anticipated.
7.2. Systematic observations
The main areas in terms of regular climate observations performed by the hydrometeorological service of the Kyrgyz Republic are:
• Maintenanceofregularobservationsbythenetworkofthemonitoringstationsincluded into the Global climate monitoring system;
• Technicalandtechnologicaldevelopmentofhydrometeorologicalobservationsnetwork;
• Dataprocessingandmanagementtechnologiesdevelopment;• Conductingofthesystematicscientificclimateresearchaimedattheassessment
of global climate parameters at the national and regional levels;• Participationinthevulnerabilityassessmentofdifferenteconomicsectorsof
the republic and the environment status;• Participationinthedevelopmentofclimatechangeadaptationmeasures.Two meteorological stations of the Kyrgyz Republic are included into the Global
Climate Monitoring System (Table 7.1).Fig. 7.1 illustrates the total number of observations in time on all meteorological
stations for the entire period of instrumental observations broken down by climatic regions (1883 – 2005). The period of the observations growth was replaced since 1990 by a steady reduction of the number of observations, ended in 1999 by the figures equal to the level of the 1930th of the past century, and caused by a reduced budgetary funding. Further, the number of observations was not changed considerably.
For the period followed by the development of the First national communication on climate change the hydro meteorological service of the Kyrgyz Republic have collected the new meteorological data and re-processed the previous observation data. Considering the changes in the initial data, the retrospective analysis has been re-done for temperature change for the entire period of the instrumental

166
meteorological observations. The method of annual changes analysis was applied. This method is rather simple –a series of differences of the current and previous years, instead of temperatures, is analyzed for each time series. This method allows covering all available data due to, acceptable in this case, summing and averaging of individual series, including the ones with omissions. To minimize the risks of information noise introduction, a restoration of the missed observations was not applied. Fig. 7.2 gives the graph of summarized temperature differences for all series of meteorological observations made in the republic. According to the assessment obtained for the whole period of the instrumental observations from 1883 to 2005, an average temperature trend for the republic as a whole makes up 0.7854°С for 100 years.
Table 7.1. Meteorological stations included into the Global climate monitoring system
Number Station nameCoordinate Altitude above
sea level, m
North latitude East longitude
36974 Naryn 41°26’ 76°00’ 2041
38353 Bishkek 42°51’ 74°32’ 760
70
60
50
40
30
20
10
01883 1893 1903 1913 1923 1933 1943 1953 1963 1973 1983 1993 2003
Inner Tien Shan North-West North-East South
Fig. 7.1. The number of climate observations for all meteorological stations located on the territory of the Kyrgyz Republic broken down by climate regions.
y = 0,007854x - 0,7479012
1,5
1
0,5
0
-0,5
-1
-1,5
-2
-2,5
-3
1885 1895 1905 1915 1925 1935 1945 1955 1965 1975 1985 1995 2005
Fig. 7.2. Global temperature trend on the territory of the Kyrgyz Republic for the entire period of instrumental observations, centigrade.
7.3. Capacity strengthening
The national communications process and the implementation of the project “Technical assistance to Kazakhstan, Kyrgyzstan, Tajikistan, Turkmenistan and

167
Uzbekistan with respect to their global climate change commitments” funded by the European Union, as well as the performance of other relevant activities provided Kyrgyzstan with a considerable assistance in terms of the organizational, legal and technical capacity building in the country on climate change. Trainings for potential developers of CDM projects were conducted under the support of the European Union and the UNDP.
In 2005, the National Committee on Climate Change was established by the Decree of the President of the Kyrgyz Republic empowered with the function of Designated National Authority on Clean Development Mechanism. The above Committee is an interdepartmental coordinating body, which includes the representatives of all key partners in the republic. To enable the effective work of the Committee the relevant legal documents were developed that stipulate the CDM project selection criteria and approval procedures.
The main tasks of the committee are the following:• Creation of the national system to assess the anthropogenic emissions and
absorption by all greenhouse gases sinks;• Establishmentof thenational register toaccount theemittedandabsorbed
anthropogenic greenhouse gases;• Ensuring of regular submission of the national communications on climate
change;• Cross-sectoralcoordinationofactivitiesonpreparationandimplementationof
Clean Development Mechanism projects;• Monitoring over the process of Clean Development Mechanism projects
implementation.The Law “On State Regulation and Policy in the Field of Greenhouse Gases Emission
and Absorption” was adopted and approved by the Presidential Decree as of 25 May 2007, UP#71, which defines the basics of state regulation, procedures, rights, and responsibilities of public bodies, local self-governance bodies, individuals and legal entities in the field of greenhouse gases emission and absorption on the territory of the Kyrgyz Republic.
The “Environment Security Concept of the Kyrgyz Republic”, approved by the Decree of the President of the Kyrgyz Republic UP#506 in 2007, defines the priority of climate change problems for the republic.
The amendments were introduced into the Laws “On Environment Protection” and “On Air Protection” that reflect the obligations of the republic under the convention.
The adopted regulations of the Kyrgyz Republic Government outline the measures to be undertaken to ensure the implementation of UN Framework Convention on Climate Change. The adaptation, mitigation and capacity building related issues have been defined as the priorities in the new version of the Country Development Strategy for 2009-2011.
The self-assessment of the national capacity on the implementation of the global environmental conventions on biodiversity preservation, desertification and climate change was conducted in 2005 under GEF/UNDP support. The cross-sectoral analysis identified the barriers hindering the capacity development:
• Sectoralanddepartmentaldissociation;• Inadequatepublicawareness;• Lackofeffectiveincentivesandmotivations;• Departmentalmonopolismanddissociation;• Latent“fighting”fornaturalresources;• Drawbacksofhumanresourcepolicy.Based on the analysis results the “Strategic Action Plan to enhance the Kyrgyzstan
capacity with respect of the global environmental conventions implementation” has

168
been developed for the following areas:• Nationallegalandnormativeframeworkrelatedtoconventionobligations;• Institutionalcapacityandenhancingofcoordination;• Capacitytodevelopmarketmechanismssystemandeconomicincentives;• Newtechnologiesdevelopmentcapacity;• Capacity in the area of the information, knowledge and education
mobilization;• Capacityinthefieldofmonitoringandreporting.The Strategic Action Plan is aimed at uniting efforts of all current and potential
stakeholders based on synergy, involvement of not only the relevant key agencies, but other partners as well, that have not yet announced themselves as the active participants.
To raise public awareness and build capacity, a series of trainings has been conducted for the national experts, along with the national conferences, workshops and round tables covering the developments of the Second national communication on climate change, Clean Development Mechanism potential in the republic. Vulnerability and adaptation to climate change, mitigation options, carbon financing perspectives, gender aspects impact on sustainable development in view of climate change, as well as the matters of the institutional and legal capacity building have been regularly covered in mass media and on the specialized websites: climatechange.carnet.kg, CARESDNet.

169
I. Guiding and methodological documents
Methods for Human Health Sensitivity Assessment and Adaptation of Public Health Care System to Climate Change. Series “Health and Global Environment Change”, #1, WHO, 2005, p.111;
Revised 1996 IPCC Guiding Principles for National GNG Inventories. IPCC, 1996;
IPCC software and tables developed by the UNFCCC secretariat (decision 17/CP.7). IPCC, 1997;
Good Practices for Land Use, Land Use Change and Forestry. IPCC, 2003;
Good Practice and Uncertainty Management in National Greenhouse Gas Inven-tories, IPCC, 2001;
Adaptation Policy Frameworks for Climate Change: Developing Strategies, Poli-cies and Measures, UNDP, 2004;
Background Paper on Impacts, Vulnerability and Adaptation to Climate Change in Africa for the African Workshop on Adaptation Implementation of Decision 1/CP.10 of the UNFCCC Convention, Accra, Ghana. 2006;
Climate and Socio-Economic Scenarios for Global-Scale Climate Change Impacts Assessment: characterizing the SRES storylines. 2004;
Climate Change and Adaptation Strategies for Human Health. Bettina Menne, Kristiel Ebi. WHO, Regional Office for Europe. 2006, p.449;
Climate Change and Human Health: Preliminary Research Results in Russia. Prof. Boris Revich. Workshop on Climate Change Impact on Health and Variability in Central Asia, Tashkent. May, 2006;
Compendium of Decision Tools to Evaluate Strategies for Adaptation to Climate Change, UNFCCC, 1999;
Disaster Risk Management in a Changing Climate, With an Addendum - The World Conference on Disaster Reduction, Outcomes Relevant to Climate Change Initiatives, 2005;
Guidelines for Use of Climate Scenarios Developed from Regional Climate Model Experiments, DDC of IPCC TGCIA, 2003;
Guidance on Developing Socio-Economic Scenarios for Use in Vulnerability and Adaptation Assessments. NCSP, 2003;
IPCC General Guidelines on the Use of Scenario Data for Climate Impact and Ad-aptation Assessment . TGICA, 2007;
References

170
IPCC Guidelines for Use of Climate Scenarios Developed from Statistical Down-scaling Methods. 2004;
IPCC Guidelines on the Use of Scenario Data for Climate Impact and Adaptation Assessment. 1999;
NCSP Guidance on Development and Application of Climate Scenarios. 2007;
The Development of Regional Climate Change Scenarios for Sub Saharan Africa. 2006;
Vulnerability and Adaptation to Climate Change in Europe. European Environ-ment Agency, Copenhagen, 2006;
II. National plans and programs
Country Development Strategy (2007-2010). Adopted by the Decree of the Presi-dent of the Kyrgyz Republic as of May, 2007, #24916;
Environmental Security Concept of the Kyrgyz Republic. Adopted by the Act of the Government of the Kyrgyz Republic #469 as of October 16, 2007 and by the Presi-dential decree UP#506 as of November 23, 2007;
Industry Development Mid-term Program of Kyrgyzstan (2002-2004) and for the period to 2010. Adopted by the Act of the Government of the Kyrgyz Republic as of May 16, 2002, #309;
Kyrgyz Republic’s Oil-and-Gas Sector Development Program till 2010. Adopted by the Act of the Government of the Kyrgyz Republic as of December 5, 2001, #763;
National Forest Program for 2005 - 2015. Action Plan on Implementation of the National Forest Program. Adopted by the Act of the Government of the Kyrgyz Repub-lic as of November 25, 2004, #858;
National Energy Program of the Kyrgyz Republic for 2008-2010, and Fuel and En-ergy Complex Development Strategy till 2025. Adopted by the Act of the Government of the Kyrgyz Republic as of February, 13, 2008, #47 and by the Act of the Parliament #346-IV as of April 24, 2008;
State Program on Waste Management. Adopted by the Act of the Government of the Kyrgyz Republic as of August 19, 2005, #389.
III. Reference books
Agriculture of the Kyrgyz Republic 2003-2005. The annual publication. Bishkek: National Statistic Committee, 2006. p. 78;
Agriculture of the Kyrgyz Republic 2004-2006. The annual publication. Bishkek: National Statistic Committee, 2007. p. 86;
Basics of Emergency Situations Management. Bishkek, 2008;
Bolshakov M.N., Shpak V.G. Hydro-Energy Resources of the Kyrgyz Republic. Frun-ze: Academy of Sciences Publishing House, 1960, p.252;
Biogas Technologies in the Kyrgyz Republic. Manual. Vedenev A.G., Vedeneva Т.А. Bishkek: "Euro", 2006, p. 90;

171
Catalogue of Glaciers of the USSR. Volume 14. Central Asia. Л.: Hydrometizdat: 1979, p. 78;
Climate Change and Technology Needs Assessment. Bishkek, 2004, p. 166;
Demographic Year-book of the Kyrgyz Republic. The annual publication for 2001 – 2005. Bishkek: National Statistic Committee, 2006, p. 310;
Environment Protection in the Kyrgyz Republic 2000 - 2006. Statistical Collection. Bishkek, 2008. p. 127;
Ermolov A.A, Stavinsky J.S. Lakes Behind Clouds. Frunze: Kyrgyzstan, 1979, p.45;
First National Communication of the Kyrgyz Republic under the UN Framework Convention on Climate Change. Bishkek, 2003;
Food Security and Poverty. Newsletter of the Kyrgyz Republic. Issue 4/2006. Bish-kek: National Statistic Committee, 2007, p. 43;
Fuel and Energy Balance of the Kyrgyz Republic (1999, 2001, 2005). Bishkek: Na-tional Statistic Committee, 2006;
Global Assessment of Forest Resources: the updated version, 2005. The Kyrgyz Re-public. The National Report: the State Forestry of the Kyrgyz Republic. Bishkek, 2004, p. 38;
Human Development Report for 2006. What is covered behind water shortage: power, poverty and global crisis of water resources. M.: « World », 2006,.p. 440;
Industry of the Kyrgyz Republic 2001 - 2005. The annual publication. Bishkek: Na-tional Statistic Committee, 2005. p. 268
Kuzmitchenok V.A. Math-Cartographic Modeling of Probable Changes of Water Resources and Glaciation of Kyrgyzstan under Climate Change. The Kyrgyz-Russian Slavic University Bulletin. Volume 3, N 6, 2003, p.p. 53-64;
Lithosphere of the Tien-Shan. M.: Science, 1986, p.157;
Living Standards of the population of the Kyrgyz Republic 2002-2006. The annual publication. Bishkek: National Statistic Committee, 2007, p. 125;
Mamatkanov D.M., Bazhanova L.V., Romanovsky V.V. Water Resources of Moun-tainous Kyrgyzstan at present. Bishkek: Ilim, 2006. p. 276;
Mamytov A.M. Soil Resources and Land Inventory Issues. Bishkek: Kyrgyzstan, 1996, p.240;
Map of the Kyrgyz Republic. Bishkek: State Cartography, 2004;
Map of Modern Glaciations. “Natural Resources of Kyrgyzstan” Series. M.: State Re-search and Production Center "Nature", 1987;
Map of Soils. “Natural Resources of Kyrgyzstan” Series. M.: State Research and Pro-duction Center "Nature", 1988;
Mountains of Kyrgyzstan. Bishkek: Mig, 2000, p.465;
Scientific - Applied Directory on Climate of the USSR. Series 3 “Long-term data”. Parts 1 -6. Issue 32 - Kyrgyzstan. Leningrad: Hydrometizdat 1989. p. 375.

172
Global warming potential of the main greenhouse gases. Recommended by IPCC for 100 year time period
Substance Chemical formula Global warming potentiality
Carbon dioxide CO 1Methane CH 21Nitrous oxide NO 310
Hydrogene fuorocarbon (HAC)*HFC-23 CHF 11,700HFC-32 CHF 650HFC-41 CHF 150HFC-43-10mee CHF 1,300HFC-125 C2HF5 2,800HFC-134 CHF(CHFCHF) 1,000HFC-134a CHF(CHFCF) 1,300HFC-143 CHF(CHFCHF) 300HFC-143a CHF(CFCH) 3,800HFC-152a CHF(CHCHF) 140HFC-227ea CHF 2,900HFC-236fa CHF 6,300HFC-245ca CHF 560
Hydrogene fluorine ether (HFE)HFE-7100 CFOCH 500HFE-7200 CFOCH 100
Perfluorocarbon (PFС)Perfluoromethane (tetrafluorine methane) CF 6,500
Perfluoroethane (hexafluoroethane) CF 9,200Perfluoropropane CF 7,000Perfluorobutane CF 7,000Perfluorocyclobutane c-CF 8,700Perfluropentane CF 7,500Perfluorohexane CF 7,400Sulfur hexafluoride SF 23,900
Annex 1

173
Annex 2
Summary Report for National Greenhouse Gas Inventory (Gg)
Inventory Year 1990
Greenhouse gas source and sink categories
COemissions
COre-movals CH₄ N₂O HFCs NOx CO NMVOCs SOx
Total national emissions and removals 23997,198 -799,762 290,664 0,595 0,000 117,033 629,021 35,998 98,525
1. Energy 23202,528 81,013 0,275 115,161 600,184 24,974 96,998
A. Fuel combustion (sectoral approach) 23202,528 13,824 0,275 115,161 600,184 24,211 96,993
1. Energy Industries 8419,201 0,181 0,073 24,207 2,148 0,578 32.462
2. Manufacturing industries and construction 1761,160 0,139 0,012 4,995 1,322 0,212 4.861
3. Transport 5015,516 1,149 0,043 47,190 401,185 0,046 7.227
4. Other sectors 8006,651 12,355 0,147 38,769 195,529 23,375 52.443
B. Fugitive emissions from fuels 67,189 0,000 0,000 0,763 0,005
1. Solid fuels 13,924 0,000 0,000 0,000 0.000
2. Oil and natural gas 53,265 0,000 0,000 0,763 0.005
2. Industrial processes 775,110 0,000 0,000 0,000 0,482 4,825 7,876 1,527
A. Mineral products 763,035 – – 5,370 0,416
B. Chemical industry – – – – – 0,020 –
C. Metal production 5,029 – – 0,482 3,205 – 1,111
D. Food and drink production – – – – – 2,486 –
F. Consumption ofhydrofluorinecarbons 0,000
G. Explosive works 7,046 1,620
3. Solvent and other product use 0,000 0,000 3,148
A. Paint application – – 3,148
4. Agriculture 124,947 0,050 1,359 22,454 0,000
A. Enteric fermentation 114,644
B. Manure management 9,352 0,005 –
C. Rice cultivation 0,096 –
D. Agricultural soils – 0,007 –
F. Burning of agricultural residues 0,855 0,038 1,359 22,454 –
5. Land-use change and forestry 19,560 -799,762 0,312 0,002 0,031 1,558
A. Changes in forest and other woody biomass stocks 85,449 -885,211 0,312 0,002 0,031 1,558
D.COemissionsandremovalsfromsoil 19,560 0,000
6. Waste 84,392 0,268 0,000 0,000 0,000
A. Solid waste disposal on land 74,770 – –
B. Waste-water handling 9,622 0,268 – – –
7. Other (please specify) 0,000 0,000 0,000 0,000 0,000 0,000 0,000 0,000
Memo items
International bunkers 363,859 0,003 0,010 1,542 0,514 0,257 0,115
Aviation 363,859 0,003 0,010 1,542 0,514 0,257 0.115
COemissionsfrombiomass 644,754
Note: The section ‘Land use change and forestry’ the column ‘СО-emission’ shows the emission without sector ‘Forestry’, the column ‘СО-sinks’ contains net emission of ‘Forestry’ sector.

174
Inventory Year 1991
Greenhouse gas source and sink categories
COemissions
COremovals CH₄ N₂O HFCs NOx CO NMVOCs SOx
Total national emissions and removals 22818,940 -781,577 301,363 0,576 0,000 118,723 591,505 38,676 92,893
1. Energy 22072,842 80,544 0,272 117,454 571,811 26,155 90,937
A. Fuel combustion (sectoral approach) 22072,842 13,070 0,272 117,454 571,810 25,453 90,934
1. Energy Industries 8112,128 0,167 0,073 23,520 2,065 0,552 33.573
2. Manufacturing industries and construction 1584,473 0,126 0,011 4,479 1,162 0,187 4.401
3. Transport 4489,426 1,043 0,039 41,901 370,713 0,052 6.171
4. Other sectors 7886,815 11,734 0,149 47,554 197,870 24,662 46.789
B. Fugitive emissions from fuels 67,474 0,000 0,000 0,702 0,003
1. Solid fuels 12,309 0,000 0,000 0,000 0.000
2. Oil and natural gas 55,165 0,000 0,000 0,702 0.003
2. Industrial processes 726,515 0,000 0,000 0,000 0,609 5,140 10,093 1,956
A. Mineral products 715,681 – – 5,328 0,416
B. Chemical industry – – – – – 0,018 –
C. Metal production 6,501 – – 0,609 4,144 – 1,540
D. Food and drink production – – – – – 4,747 –
F. Consumption ofhydrofluorinecarbons 0,000
G. Explosive works 4,333 0,996
3. Solvent and other product use 0,000 0,000 2,428
A. Paint application – – 2,428
4. Agriculture 124,569 0,029 0,630 13,064 0,000
A. Enteric fermentation 114,491
B. Manure management 9,440 0,005 –
C. Rice cultivation 0,140 –
D. Agricultural soils – 0,007 –
F. Burning of agricultural residues 0,498 0,017 0,630 13,064 –
5. Land-use change and forestry 19,583 -781,577 0,298 0,002 0,030 1,490
A. Changes in forest and other woody biomass stocks 82,378 -863,955 0,298 0,002 0,030 1,490
D.COemissionsandremovalsfrom soil 19,583 0,000
6. Waste 95,952 0,273 0,000 0,000 0,000
A. Solid waste disposal on land 87,180 – –
B. Waste-water handling 8,772 0,273 – – –
7. Other (please specify) 0,000 0,000 0,000 0,000 0,000 0,000 0,000 0,000
Memo items
International bunkers 338,416 0,002 0,001 1,434 0,478 0,239 0,107
Aviation 338,416 0,002 0,001 1,434 0,478 0,239 0.107
COemissionsfrombiomass 410,461

175
Inventory Year 1992
Greenhouse gas source and sink categories
COemissions
COremovals CH₄ N₂O HFCs NOx CO NMVOCs SOx
Total national emissions and removals 15549,703 -768,019 265,382 0,492 0,000 86,416 405,523 30,870 62,153
1. Energy 14934,422 60,782 0,192 85,280 386,716 19,490 60,461
A. Fuel combustion (sectoral approach) 14934,422 8,766 0,192 85,280 386,716 18,934 60,458
1. Energy Industries 5558,225 0,109 0,052 16,249 1,411 0,374 24,575
2. Manufacturing industries and construction 1010,521 0,081 0,007 2,846 0,723 0,117 2,824
3. Transport 2846,803 0,670 0,025 26,355 242,435 0,040 3,725
4. Other sectors 5518,873 7,906 0,108 39,830 142,147 18,403 29,334
B. Fugitive emissions from fuels 52,016 0,000 0,000 0,556 0,003
1. Solid fuels 8,996 0,000 0,000 0,000 0,000
2. Oil and natural gas 43,020 0,000 0,000 0,556 0,003
2. Industrial processes 596,022 0,000 0,000 0,000 0,515 4,373 10,414 1,692
A. Mineral products 586,866 – – 5,670 0,329
B. Chemical industry – – – – – 0,009 –
C. Metal production 5,564 – – 0,515 3,547 – 1,363
D. Food and drink production – – – – – 4,735 –
F. Consumption ofhydrofluorinecarbons 0,000
G. Explosive works 0,826
3. Solvent and other product use 0,000 0,000 0,966
A. Paint application – – 0,966
4. Agriculture 116,926 0,027 0,591 12,946 0,000
A. Enteric fermentation 107,249
B. Manure management 9,032 0,005 –
C. Rice cultivation 0,152 –
D. Agricultural soils – 0,006 –
F. Burning of agricultural residues 0,493 0,016 0,591 12,946 –
5. Land-use change and forestry 19,259 -768,019 0,298 0,002 0,030 1,488
A. Changes in forest and other woody biomass stocks 82,617 -850,636 0,298 0,002 0,030 1,488
D.COemissionsandremovalsfromsoil 19,259 0,000
6. Waste 87,376 0,271 0,000 0,000 0,000
A. Solid waste disposal on land 80,320 – –
B. Waste-water handling 7,056 0,271 – – –
7. Other (please specify) 0,000 0,000 0,000 0,000 0,000 0,000 0,000 0,000
Memo items
International bunkers 312,974 0,002 0,009 1,326 0,442 0,221 0,099
Aviation 312,974 0,002 0,009 1,326 0,442 0,221 0,099
COemissionsfrombiomass 407,425

176
Inventory Year 1993
Greenhouse gas source and sink categories
COemissions
COremovals CH₄ N₂O HFCs NOx CO NM-
VOCs SOx
Total national emissions and removals 11195,768 -757,660 222,655 0,438 0,000 67,091 302,363 20,687 45,334
1. Energy 10794,202 47,253 0,144 66,177 278,853 15,407 42,809
A. Fuel combustion (sectoral approach) 10794,202 6,265 0,144 66,177 278,853 14,976 42,807
1. Energy Industries 4067,629 0,076 0,040 11,990 1,031 0,271 19.135
2. Manufacturing industries and construction 685,906 0,055 0,004 1,925 0,479 0,078 1.929
3. Transport 1919,739 0,458 0,017 17,628 168,450 0,031 2.384
4. Other sectors 4120,928 5,676 0,083 34,634 108,893 14,596 19.359
B. Fugitive emissions from fuels 40,988 0,000 0,000 0,431 0,002
1. Solid fuels 6,994 0,000 0,000 0,000 0.000
2. Oil and natural gas 33,994 0,000 0,000 0,431 0.002
2. Industrial processes 382,249 0,000 0,000 0,000 0,378 10,186 4,759 2,525
A. Mineral products 365,001 – – 0,393 0,208
B. Chemical industry – – – – – 0,007 –
C. Metal production 15,277 – – 0,378 9,733 – 2,317
D. Food and drink production – – – – – 4,359 –
F. Consumption ofhydrofluorinecarbons 0,000
G. Explosive works 1,971 0,453
3. Solvent and other product use 0,000 0,000 0,521
A. Paint application – – 0,521
4. Agriculture 106,691 0,024 0,505 11,795 0,000
A. Enteric fermentation 97,434
B. Manure management 8,608 0,004 –
C. Rice cultivation 0,200 –
D. Agricultural soils – 0,006 –
F. Burning of agricultural residues 0,449 0,014 0,505 11,795 –
5. Land-use change and forestry 19,317 -757,660 0,306 0,002 0,031 1,529
A. Changes in forest and other woody biomass stocks 85,323 -842,984 0,306 0,002 0,031 1,529
D.COemissionsandremovalsfromsoil 19,317 0,000
6. Waste 68,405 0,268 0,000 0,000 0,000
A. Solid waste disposal on land 63,350 – –
B. Waste-water handling 5,055 0,268 – – –
7. Other (please specify) 0,000 0,000 0,000 0,000 0,000 0,000 0,000 0,000
Memo items
International bunkers 287,532 0,002 0,008 1,219 0,406 0,203 0,091
Aviation 287,532 0,002 0,008 1,219 0,406 0,203 0.091
COemissionsfrombiomass 381,685

177
Inventory Year 1994
Greenhouse gas source and sink categories
COemissions
COremovals CH₄ N₂O HFCs NOx CO NM-
VOCs SOx
Total national emissions and removals 8328,547 -746,705 157,502 0,368 0,000 53,838 224,597 16,403 33,228
1. Energy 8069,263 29,010 0,111 53,116 207,567 12,636 31,250
A. Fuel combustion (sectoral approach) 8069,263 4,619 0,111 53,116 207,567 12,202 31,248
1. Energy Industries 3078,374 0,055 0,031 9,148 0,778 0,203 15.352
2. Manufacturing industries and construction 479,507 0,038 0,003 1,341 0,326 0,053 1.357
3. Transport 1332,058 0,322 0,012 12,131 120,328 0,025 1.566
4. Other sectors 3179,324 4,204 0,065 30,496 86,135 11,921 12.973
B. Fugitive emissions from fuels 24,391 0,000 0,000 0,434 0,002
1. Solid fuels 2,931 0,000 0,000 0,000 0.000
2. Oil and natural gas 21,460 0,000 0,000 0,434 0.002
2. Industrial processes 238,084 0,000 0,000 0,000 0,352 7,615 3,427 1,978
A. Mineral products 224,833 – – 0,232 0,127
B. Chemical industry – – – – – 0,002 –
C. Metal production 11,217 – – 0,352 7,147 – 1,851
D. Food and drink production – – – – – 3,193 –
F. Consumption ofhydrofluorinecarbons 0,000
G. Explosive works 2,034 0,468
3. Solvent and other product use 0,000 0,000 0,340
A. Paint application – – 0,340
4. Agriculture 87,277 0,016 0,339 7,892 0,000
A. Enteric fermentation 79,072
B. Manure management 7,655 0,003 –
C. Rice cultivation 0,249 –
D. Agricultural soils – 0,004 –
F. Burning of agricultural residues 0,301 0,009 0,339 7,892 –
5. Land-use change and forestry 21,200 -746,705 0,305 0,002 0,031 1,523
A. Changes in forest and other woody biomass stocks 85,350 -832,055 0,305 0,002 0,031 1,523
D.COemissionsandremovalsfromsoil 21,200 0,000
6. Waste 40,910 0,239 0,000 0,000 0,000
A. Solid waste disposal on land 37,020 – –
B. Waste-water handling 3,890 0,239 – – –
7. Other (please specify) 0,000 0,000 0,000 0,000 0,000 0,000 0,000 0,000
Memo items
International bunkers 262,089 0,002 0,007 1,111 0,370 0,185 0,083
Aviation 262,089 0,002 0,007 1,111 0,370 0,185 0.083
COemissionsfrombiomass 285,679

178
Inventory Year 1995
Greenhouse gas source and sink categories
COemissions
COremovals CH₄ N₂O HFCs NOx CO NMVOCs SOx
Total national emissions and removals 7457,552 -739,128 151,441 0,401 0,000 52,607 210,633 15,738 29,047
1. Energy 7262,007 26,620 0,103 51,311 185,644 12,383 27,403
A. Fuel combustion (sectoral approach) 7262,007 4,088 0,103 51,309 185,640 11,924 27,365
1. Energy Industries 2804,245 0,047 0,029 8,401 0,707 0,183 14.779
2. Manufacturing industries and construction 401,618 0,032 0,002 1,119 0,266 0,044 1.143
3. Transport 1106,054 0,271 0,010 9,989 102,772 0,023 1.227
4. Other sectors 2950,090 3,738 0,062 31,800 81,895 11,674 10.216
B. Fugitive emissions from fuels 22,532 0,002 0,004 0,459 0,038
1. Solid fuels 1,693 0,000 0,000 0,000 0.000
2. Oil and natural gas 20,839 0,002 0,004 0,459 0.038
2. Industrial processes 174,469 0,000 0,000 0,000 0,262 6,760 3,038 1,644
A. Mineral products 162,518 – – 0,365 0,093
B. Chemical industry – – – – – 0,001 –
C. Metal production 9,852 – – 0,262 6,277 – 1,551
D. Food and drink production – – – – – 2,672 –
F. Consumption ofhydrofluorinecarbons 0,000
G. Explosive works 2,099 0,483
3. Solvent and other product use 0,000 0,000 0,317
A. Paint application – – 0,317
4. Agriculture 80,877 0,035 1,004 16,726 0,000
A. Enteric fermentation 72,496
B. Manure management 7,384 0,003 –
C. Rice cultivation 0,360 –
D. Agricultural soils – 0,004 –
F. Burning of agricultural residues 0,637 0,028 1,004 16,726 –
5. Land-use change and forestry 21,076 -739,128 0,301 0,002 0,030 1,503
A. Changes in forest and other woody biomass stocks 84,226 -823,355 0,301 0,002 0,030 1,503
D.COemissionsandremovalsfromsoil 21,076 0,000
6. Waste 43,643 0,261 0,000 0,000 0,000
A. Solid waste disposal on land 39,960 – –
B. Waste-water handling 3,683 0,261 – – –
7. Other (please specify) 0,000 0,000 0,000 0,000 0,000 0,000 0,000 0,000
Memo items
International bunkers 236,691 0,002 0,007 1,003 0,334 0,167 0,075
Aviation 236,691 0,002 0,007 1,003 0,334 0,167 0.075
COemissionsfrombiomass 500,978

179
Inventory Year 1996
Greenhouse gas source and sink categories
COemissions
COremovals CH₄ N₂O HFCs NOx CO NM-
VOCs SOx
Total national emissions and removals 8332,037 -728,358 145,513 0,421 0,000 60,613 286,510 21,536 29,641
1. Energy 8015,767 31,845 0,126 59,151 254,159 15,509 27,536
A. Fuel combustion (sectoral approach)
8015,767 5,501 0,126 59,145 254,150 15,038 27,447
1. Energy Industries 2988,483 0,052 0,028 8,810 0,792 0,205 13.950
2. Manufacturing industries and construction
462,816 0,035 0,003 1,285 0,293 0,049 1.526
3. Transport 1550,339 0,385 0,014 14,046 147,086 0,022 1.700
4. Other sectors 3014,129 5,029 0,081 35,004 105,979 14,762 10.271
B. Fugitive emissions from fuels 26,344 0,006 0,009 0,471 0,089
1. Solid fuels 1,166 0,000 0,000 0,000 0.000
2. Oil and natural gas 25,178 0,006 0,009 0,471 0.089
2. Industrial processes 295,196 0,000 0,000 0,000 0,226 9,186 5,828 2,105
A. Mineral products 279,634 – – 1,203 0,164
B. Chemical industry – – – – – 0,002 –
C. Metal production 13,790 – – 0,226 8,779 – 1,941
D. Food and drink production – – – – – 4,623 –
F. Consumption ofhydrofluorinecarbons
0,000
G. Explosive works 1,772 0,407
3. Solvent and other product use 0,000 0,000 0,199
A. Paint application – – 0,199
4. Agriculture 76,753 0,038 1,205 21,606 0,000
A. Enteric fermentation 68,361
B. Manure management 7,136 0,002 –
C. Rice cultivation 0,433 –
D. Agricultural soils – 0,003 –
F. Burning of agricultural residues 0,823 0,033 1,205 21,606 –
5. Land-use change and forestry 21,074 -728,358 0,312 0,002 0,031 1,559
A. Changes in forest and other woody biomass stocks
87,711 -816,068 0,312 0,002 0,031 1,559
D.COemissionsandremovalsfromsoil
21,074 0,000
6. Waste 36,603 0,255 0,000 0,000 0,000
A. Solid waste disposal on land 32,810 – –
B. Waste-water handling 3,793 0,255 – – –
7. Other (please specify) 0,000 0,000 0,000 0,000 0,000 0,000 0,000 0,000
Memo items
International bunkers 209,894 0,001 0,006 0,890 0,297 0,148 0,067
Aviation 209,894 0,001 0,006 0,890 0,297 0,148 0.067
COemissionsfrombiomass 624,004

180
Inventory Year 1997
Greenhouse gas source and sink categories
COemissions
COremovals CH₄ N₂O HFCs NOx CO NM-
VOCs SOx
Total national emissions and removals 8002,760 -721,579 150,769 0,404 0,000 59,617 319,476 23,307 25,787
1. Energy 7616,302 31,502 0,127 58,234 286,100 16,145 23,760
A. Fuel combustion (sectoral approach) 7616,302 5,985 0,127 58,225 286,086 15,633 23,616
1. Energy Industries 2738,047 0,049 0,022 7,940 0,760 0,196 11.133
2. Manufacturing industries and construction 458,291 0,033 0,003 1,268 0,277 0,048 1.718
3. Transport 1786,141 0,450 0,016 16,233 172,950 0,013 1.936
4. Other sectors 2633,823 5,453 0,086 32,784 112,099 15,376 8.829
B. Fugitive emissions from fuels 25,517 0,009 0,014 0,512 0,144
1. Solid fuels 1,058 0,000 0,000 0,000 0.000
2. Oil and natural gas 24,459 0,009 0,014 0,512 0.144
2. Industrial processes 365,432 0,000 0,000 0,000 0,168 9,222 6,617 2,027
A. Mineral products 349,497 – – 2,009 0,197
B. Chemical industry – – – – – 0,001 –
C. Metal production 13,652 – – 0,168 8,697 – 1,830
D. Food and drink production – – – – – 4,607 –
F. Consumption ofhydrofluorinecarbons 0,000
G. Explosive works 2,283 0,525
3. Solvent and other product use 0,000 0,000 0,545
A. Paint application – – 0,545
4. Agriculture 79,102 0,040 1,183 22,563 0,000
A. Enteric fermentation 70,396
B. Manure management 7,358 0,003 –
C. Rice cultivation 0,488 –
D. Agricultural soils – 0,004 –
F. Burning of agricultural residues 0,860 0,033 1,183 22,563 –
5. Land-use change and forestry 21,026 -721,579 0,318 0,002 0,032 1,591
A. Changes in forest and other woody biomass stocks 89,528 -811,108 0,318 0,002 0,032 1,591
D.COemissionsandremovalsfromsoil 21,026 0,000
6. Waste 39,847 0,235 0,000 0,000 0,000
A. Solid waste disposal on land 36,250 – –
B. Waste-water handling 3,597 0,235 – – –
7. Other (please specify) 0,000 0,000 0,000 0,000 0,000 0,000 0,000 0,000
Memo items
International bunkers 122,244 0,001 0,003 0,518 0,173 0,086 0,039
Aviation 122,244 0,001 0,003 0,518 0,173 0,086 0.039
COemissionsfrombiomass 649,443

181
Inventory Year 1998
Greenhouse gas source and sink categories
COemissions
COremovals CH₄ N₂O HFCs NOx CO NM-
VOCs SOx
Total national emissions and removals 8416,231 -719,128 142,509 0,419 0,000 60,597 290,123 23,529 29,247
1. Energy 8015,767 30,275 0,126 59,151 254,159 15,509 27,536
A. Fuel combustion (sectoral approach) 8015,767 5,501 0,126 59,145 254,150 15,038 27,447
1. Energy Industries 2988,483 0,052 0,028 8,810 0,792 0,205 13.950
2. Manufacturing industries and construction 462,816 0,035 0,003 1,285 0,293 0,049 1.526
3. Transport 1550,339 0,385 0,014 14,046 147,086 0,022 1.700
4. Other sectors 3014,129 5,029 0,081 35,004 105,979 14,762 10.271
B. Fugitive emissions from fuels 24,774 0,006 0,009 0,471 0,089
1. Solid fuels 0,381 0,000 0,000 0,000 0.000
2. Oil and natural gas 24,393 0,006 0,009 0,471 0.089
2. Industrial processes 379,973 0,000 0,000 0,000 0,031 9,031 7,728 1,711
A. Mineral products 363,096 – – 3,411 0,213
B. Chemical industry – – – – – 0,001 –
C. Metal production 12,655 – – 0,031 8,060 – 1,498
D. Food and drink production – – – – – 4,316 –
F. Consumption ofhydrofluorinecarbons 0,000
G. Explosive works 4,222 0,971
3. Solvent and other product use 0,000 0,000 0,292
A. Paint application – – 0,292
4. Agriculture 80,772 0,045 1,384 25,391 0,000
A. Enteric fermentation 71,740
B. Manure management 7,625 0,003 –
C. Rice cultivation 0,440 –
D. Agricultural soils – 0,004 –
F. Burning of agricultural residues 0,967 0,038 1,384 25,391 –
5. Land-use change and forestry 20,491 -719,128 0,308 0,002 0,031 1,542
A. Changes in forest and other woody biomass stocks 86,461 -805,588 0,308 0,002 0,031 1,542
D.COemissionsandremovalsfromsoil 20,491 0,000
6. Waste 31,154 0,246 0,000 0,000 0,000
A. Solid waste disposal on land 27,920 – –
B. Waste-water handling 3,234 0,246 – – –
7. Other (please specify) 0,000 0,000 0,000 0,000 0,000 0,000 0,000 0,000
Memo items
International bunkers 120,268 0,001 0,003 0,510 0,170 0,085 0,038
Aviation 120,268 0,001 0,003 0,510 0,170 0,085 0.038
COemissionsfrombiomass 715,769

182
Inventory Year 1999
Greenhouse gas source and sink categories
COemissions
COremovals CH₄ N₂O HFCs NOx CO NM-
VOCs SOx
Total national emissions and removals 7550,294 -713,818 137,153 0,445 0,000 59,730 347,729 22,496 25,759
1. Energy 7312,006 21,440 0,133 58,085 308,646 16,913 24,082
A. Fuel combustion (sectoral approach) 7312,006 6,649 0,133 58,077 308,633 16,449 23,952
1. Energy Industries 2103,680 0,036 0,022 6,310 0,525 0,136 9.066
2. Manufacturing industries and construction 478,023 0,033 0,003 1,331 0,276 0,050 1.313
3. Transport 1895,581 0,480 0,017 17,170 187,498 0,012 1.994
4. Other sectors 2834,722 6,100 0,091 33,266 120,334 16,251 11.579
B. Fugitive emissions from fuels 14,791 0,008 0,013 0,464 0,130
1. Solid fuels 0,462 0,000 0,000 0,000 0.000
2. Oil and natural gas 14,329 0,008 0,013 0,464 0.130
2. Industrial processes 218,075 0,000 0,000 0,000 0,047 9,359 5,450 1,677
A. Mineral products 200,359 – – 2,139 0,116
B. Chemical industry – – – – – 0,001 –
C. Metal production 12,985 – – 0,047 8,271 – 1,561
D. Food and drink production – – – – – 3,310 –
F. Consumption ofhydrofluorinecarbons 0,000
G. Explosive works 4,731 1,088
3. Solvent and other product use 0,000 0,000 0,133
A. Paint application – – 0,133
4. Agriculture 82,596 0,050 1,568 28,236 0,000
A. Enteric fermentation 73,142
B. Manure management 7,890 0,003 –
C. Rice cultivation 0,488 –
D. Agricultural soils – 0,004 –
F. Burning of agricultural residues 1,076 0,043 1,568 28,236 –
5. Land-use change and forestry 20,213 -713,818 0,298 0,002 0,030 1,488
A. Changes in forest and other woody biomass stocks 83,358 -797,176 0,298 0,002 0,030 1,488
D.COemissionsandremovalsfromsoil 20,213 0,000
6. Waste 32,819 0,260 0,000 0,000 0,000
A. Solid waste disposal on land 29,580 – –
B. Waste-water handling 3,239 0,260 – – –
7. Other (please specify) 0,000 0,000 0,000 0,000 0,000 0,000 0,000 0,000
Memo items
International bunkers 119,466 0,001 0,003 0,506 0,169 0,084 0,038
Aviation 119,466 0,001 0,003 0,506 0,169 0,084 0.038
COemissionsfrombiomass 782,224

183
Inventory Year 2000
Greenhouse gas source and sink categories
COemissions
COremovals CH₄ N₂O HFCs NOx CO NM-
VOCs SOx
Total national emissions and removals 7993,351 -703,945 138,336 0,444 0,000 60,759 356,473 25,666 27,717
1. Energy 7723,402 23,448 0,135 59,086 317,894 16,615 26,201
A. Fuel combustion (sectoral approach) 7723,402 6,662 0,135 59,080 317,885 16,177 26,111
1. Energy Industries 2376,227 0,038 0,024 7,123 0,611 0,157 9.625
2. Manufacturing industries and construction 493,463 0,034 0,003 1,377 0,289 0,052 1.292
3. Transport 2003,143 0,507 0,018 18,140 198,205 0,010 2.142
4. Other sectors 2850,569 6,083 0,090 32,440 118,780 15,958 13.052
B. Fugitive emissions from fuels 16,786 0,006 0,009 0,438 0,090
1. Solid fuels 0,512 0,000 0,000 0,000 0.000
2. Oil and natural gas 16,274 0,006 0,009 0,438 0.090
2. Industrial processes 249,716 0,000 0,000 0,000 0,054 8,684 9,017 1,516
A. Mineral products 231,946 – – 5,337 0,135
B. Chemical industry – – – – – 0,000 –
C. Metal production 11,295 – – 0,054 7,195 – 1,381
D. Food and drink production – – – – – 3,680 –
F. Consumption ofhydrofluorinecarbons 0,000
G. Explosive works 6,475 1,489
3. Solvent and other product use 0,000 0,000 0,034
A. Paint application – – 0,034
4. Agriculture 83,612 0,051 1,587 28,299 0,000
A. Enteric fermentation 73,974
B. Manure management 8,048 0,003 –
C. Rice cultivation 0,512 –
D. Agricultural soils – 0,004 –
F. Burning of agricultural residues 1,078 0,044 1,587 28,299 –
5. Land-use change and forestry 20,233 -703,945 0,319 0,002 0,032 1,596
A. Changes in forest and other woody biomass stocks 90,092 -794,036 0,319 0,002 0,032 1,596
D.COemissionsandremovalsfromsoil 20,233 0,000
6. Waste 30,957 0,256 0,000 0,000 0,000
A. Solid waste disposal on land 27,360 – –
B. Waste-water handling 3,597 0,256 – – –
7. Other (please specify) 0,000 0,000 0,000 0,000 0,000 0,000 0,000 0,000
Memo items
International bunkers 113,879 0,001 0,003 0,483 0,161 0,080 0,036
Aviation 113,879 0,001 0,003 0,483 0,161 0,080 0.036
COemissionsfrombiomass 790,358

184
Inventory Year 2001
Greenhouse gas source and sink categories
COemissions
COremovals CH₄ N₂O HFCs NOx CO NM-
VOCs SOx
Total national emissions and removals 7609,783 -703,086 142,074 0,463 0,001 58,631 380,560 93,767 28,263
1. Energy 7329,660 24,886 0,140 56,675 336,899 17,614 26,576
A. Fuel combustion (sectoral approach) 7329,660 7,357 0,140 56,670 336,892 17,197 26,506
1. Energy Industries 2250,491 0,036 0,021 6,701 0,604 0,154 10.676
2. Manufacturing industries and construction 452,062 0,030 0,003 1,255 0,244 0,045 1.361
3. Transport 2067,327 0,530 0,018 18,675 207,390 0,007 2.182
4. Other sectors 2559,780 6,761 0,098 30,039 128,654 16,991 12.287
B. Fugitive emissions from fuels 17,529 0,005 0,007 0,417 0,070
1. Solid fuels 0,339 0,000 0,000 0,000 0.000
2. Oil and natural gas 17,190 0,005 0,007 0,417 0.070
2. Industrial processes 259,695 0,000 0,000 0,001 0,085 9,314 76,063 1,687
A. Mineral products 241,051 – – 72,109 0,140
B. Chemical industry – – – – – 0,000 –
C. Metal production 12,350 – – 0,085 7,867 – 1,547
D. Food and drink production – – – – – 3,954 –
F. Consumption ofhydrofluorinecarbons 0,000
G. Explosive works 6,294 1,447
3. Solvent and other product use 0,000 0,000 0,090
A. Paint application – – 0,090
4. Agriculture 84,856 0,058 1,840 32,809 0,000
A. Enteric fermentation 74,969
B. Manure management 8,189 0,003 –
C. Rice cultivation 0,448 –
D. Agricultural soils – 0,004 –
F. Burning of agricultural residues 1,250 0,051 1,840 32,809 –
5. Land-use change and forestry 20,428 -703,086 0,308 0,002 0,031 1,538
A. Changes in forest and other woody biomass stocks 86,574 -789,660 0,308 0,002 0,031 1,538
D.COemissionsandremovalsfromsoil 20,428 0,000
6. Waste 32,024 0,263 0,000 0,000 0,000
A. Solid waste disposal on land 28,480 – –
B. Waste-water handling 3,544 0,263 – – –
7. Other (please specify) 0,000 0,000 0,000 0,000 0,000 0,000 0,000 0,000
Memo items
International bunkers 113,564 0,001 0,003 0,481 0,160 0,080 0,036
Aviation 113,564 0,001 0,003 0,481 0,160 0,080 0.036
COemissionsfrombiomass 897,378

185
Inventory Year 2002
Greenhouse gas source and sink categories
COemissions
COremovals CH₄ N₂O HFCs NOx CO NM-
VOCs SOx
Total national emissions and remov-als 8409,924 -704,229 144,126 0,473 0,003 60,171 380,231 77,194 26,887
1. Energy 8097,869 29,321 0,145 58,199 336,343 17,614 25,348
A. Fuel combustion (sectoral approach) 8097,869 7,487 0,145 58,194 336,335 17,191 25,268
1. Energy Industries 2653,410 0,041 0,026 7,949 0,705 0,179 9.988
2. Manufacturing industries and construction 583,849 0,044 0,003 1,627 0,363 0,062 1.214
3. Transport 2038,400 0,527 0,018 18,336 206,647 0,011 2.089
4. Other sectors 2822,210 6,875 0,098 30,282 128,620 16,939 11.977
B. Fugitive emissions from fuels 21,834 0,005 0,008 0,423 0,080
1. Solid fuels 0,281 0,000 0,000 0,000 0.000
2. Oil and natural gas 21,553 0,005 0,008 0,423 0.080
2. Industrial processes 291,670 0,000 0,000 0,003 0,055 8,866 58,737 1,539
A. Mineral products 273,103 – – 53,626 0,159
B. Chemical industry – – – – – 0,000 –
C. Metal production 11,293 – – 0,055 7,193 – 1,380
D. Food and drink production – – – – – 5,111 –
F. Consumption ofhydrofluorinecarbons 0,003
G. Explosive works 7,274 1,673
3. Solvent and other product use 0,000 0,000 0,843
A. Paint application – – 0,843
4. Agriculture 86,285 0,059 1,887 33,559 0,000
A. Enteric fermentation 76,105
B. Manure management 8,362 0,003 –
C. Rice cultivation 0,540 –
D. Agricultural soils – 0,004 –
F. Burning of agricultural residues 1,278 0,052 1,887 33,559 –
5. Land-use change and forestry 20,385 -704,229 0,293 0,002 0,030 1,463
A. Changes in forest and other woody biomass stocks 82,088 -786,317 0,293 0,002 0,030 1,463
D.COemissionsandremovalsfromsoil
6. Waste 20,385 0,000
A. Solid waste disposal on land 28,227 0,267 0,000 0,000 0,000
B. Waste-water handling 24,870 – –
7. Other (please specify) 3,357 0,267 – – –
Memo items 0,000 0,000 0,000 0,000 0,000 0,000 0,000 0,000
International bunkers
Aviation 396,589 0,003 0,011 1,681 0,560 0,280 0,126
COemissionsfrombiomass 911,218

186
Inventory Year 2003
Greenhouse gas source and sink categories
COemissions
COremovals CH₄ N₂O HFCs NOx CO NM-
VOCs SOx
Total national emissions and remov-als 8689,399 -703,040 137,651 0,455 0,005 61,695 379,845 71,355 29,712
1. Energy 8264,810 25,438 0,147 59,723 336,736 17,249 28,523
A. Fuel combustion (sectoral approach) 8264,810 7,516 0,147 59,719 336,730 16,864 28,456
1. Energy Industries 2671,751 0,040 0,030 8,136 0,671 0,171 11.659
2. Manufacturing industries and construction 589,751 0,047 0,004 1,656 0,403 0,066 1.361
3. Transport 2059,711 0,536 0,018 18,497 210,216 0,010 2.082
4. Other sectors 2943,597 6,893 0,095 31,430 125,440 16,617 13.354
B. Fugitive emissions from fuels 17,922 0,004 0,006 0,385 0,067
1. Solid fuels 0,240 0,000 0,000 0,000 0.000
2. Oil and natural gas 17,682 0,004 0,006 0,385 0.067
2. Industrial processes 404,177 0,000 0,000 0,005 0,032 7,841 52,966 1,189
A. Mineral products 384,759 – – 47,571 0,226
B. Chemical industry – – – – – 0,000 –
C. Metal production 7,479 – – 0,032 5,096 – 0,963
D. Food and drink production – – – – – 5,395 –
F. Consumption ofhydrofluorinecarbons 0,005
G. Explosive works 11,939 2,745
3. Solvent and other product use 0,000 0,000 1,140
A. Paint application – – 1,140
4. Agriculture 85,920 0,060 1,910 33,797 0,000
A. Enteric fermentation 75,933
B. Manure management 8,202 0,003 –
C. Rice cultivation 0,498 –
D. Agricultural soils – 0,004 –
F. Burning of agricultural residues 1,287 0,053 1,910 33,797 –
5. Land-use change and forestry 20,412 -703,040 0,294 0,002 0,030 1,471
A. Changes in forest and other woody biomass stocks 82,632 -785,672 0,294 0,002 0,030 1,471
D.COemissionsandremovalsfrom soil 20,412 0,000
6. Waste 25,999 0,246 0,000 0,000 0,000
A. Solid waste disposal on land 22,950 – –
B. Waste-water handling 3,049 0,246 – – –
7. Other (please specify) 0,000 0,000 0,000 0,000 0,000 0,000 0,000 0,000
Memo items
International bunkers 522,810 0,004 0,015 2,216 0,739 0,369 0,166
Aviation 522,810 0,004 0,015 2,216 0,739 0,369 0.166
COemissionsfrombiomass 917,521

187
Inventory Year 2004
Greenhouse gas source and sink categories
COemissions
COremovals CH₄ N₂O HFCs NOx CO NM-
VOCs SOx
Total national emissions and removals 9072,262 -711,617 148,328 0,494 0,007 65,024 414,364 72,159 29,892
1. Energy 8589,221 27,721 0,151 62,809 366,255 17,835 28,529
A. Fuel combustion (sectoral approach) 8589,221 7,914 0,151 62,804 366,248 17,422 28,454
1. Energy Industries 2587,673 0,037 0,029 7,909 0,648 0,165 11.418
2. Manufacturing industries and construction 649,904 0,054 0,004 1,823 0,459 0,074 1.295
3. Transport 2310,097 0,600 0,020 20,724 235,725 0,015 2.310
4. Other sectors 3041,547 7,223 0,098 32,348 129,416 17,168 13.431
B. Fugitive emissions from fuels 19,807 0,005 0,007 0,413 0,075
1. Solid fuels 0,646 0,000 0,000 0,000 0.000
2. Oil and natural gas 19,161 0,005 0,007 0,413 0.075
2. Industrial processes 462,252 0,000 0,000 0,007 0,013 8,539 52,805 1,363
A. Mineral products 442,013 – – 47,608 0,259
B. Chemical industry – – – – – 0,000 –
C. Metal production 9,547 – – 0,013 6,081 – 1,104
D. Food and drink production – – – – – 5,197 –
F. Consumption ofhydrofluorinecarbons 0,007
G. Explosive works 10,692 2,458
3. Solvent and other product use 0,000 0,000 1,519
A. Paint application – – 1,519
4. Agriculture 88,463 0,067 2,174 38,156 0,000
A. Enteric fermentation 78,094
B. Manure management 8,417 0,003 –
C. Rice cultivation 0,498 –
D. Agricultural soils – 0,004 –
F. Burning of agricultural residues 1,454 0,060 2,174 38,156 –
5. Land-use change and forestry 20,789 -711,617 0,283 0,002 0,028 1,414
A. Changes in forest and other woody biomass stocks 79,222 -790,839 0,283 0,002 0,028 1,414
D.COemissionsandremovalsfrom soil 20,789 0,000
6. Waste 31,861 0,274 0,000 0,000 0,000
A. Solid waste disposal on land 29,010 – –
B. Waste-water handling 2,851 0,274 – – –
7. Other (please specify) 0,000 0,000 0,000 0,000 0,000 0,000 0,000 0,000
Memo items
International bunkers 590,734 0,004 0,017 2,504 0,835 0,417 0,187
Aviation 590,734 0,004 0,017 2,504 0,835 0,417 0.187
COemissionsfrombiomass 1020,940

188
Inventory Year 2005
Greenhouse gas source and sink categories
COemissions
COremovals CH₄ N₂O HFCs NOx CO NM-
VOCs SOx
Total national emissions and removals 8847,295 -714,489 144,246 0,497 0,010 64,922 417,415 68,040 26,902
1. Energy 8321,123 25,491 0,146 62,766 372,885 17,209 25,936
A. Fuel combustion (sectoral approach) 8321,123 7,650 0,146 62,761 372,878 16,778 25,861
1. Energy Industries 2230,163 0,032 0,026 6,852 0,551 0,140 10,148
2. Manufacturing industries and construction 626,047 0,054 0,003 1,756 0,455 0,072 1,136
3. Transport 2467,159 0,632 0,023 21,922 248,125 0,046 2,407
4. Other sectors 2997,754 6,932 0,094 32,231 123,747 16,520 12,170
B. Fugitive emissions from fuels 17,841 0,005 0,007 0,431 0,075
1. Solid fuels 0,291 0,000 0,000 0,000 0,000
2. Oil and natural gas 17,550 0,005 0,007 0,431 0,075
2. Industrial processes 506,267 0,000 0,000 0,010 0,004 5,778 49,568 0,966
A. Mineral products 491,575 – – 43,256 0,290
B. Chemical industry – – – – – 0,000 –
C. Metal production 5,897 – – 0,004 3,756 – 0,676
D. Food and drink production – – – – – 6,312 –
F. Consumption ofhydrofluorinecarbons 0,010
G. Explosive works 8,795 2,022
3. Solvent and other product use 0,000 0,000 1,263
A. Paint application – – 1,263
4. Agriculture 91,243 0,066 2,124 37,357 0,000
A. Enteric fermentation 80,665
B. Manure management 8,657 0,003 –
C. Rice cultivation 0,498 –
D. Agricultural soils – 0,004 –
F. Burning of agricultural residues 1,423 0,059 2,124 37,357 –
5. Land-use change and forestry 19,905 -714,489 0,279 0,002 0,028 1,395
A. Changes in forest and other woody biomass stocks 78,272 -792,761 0,279 0,002 0,028 1,395
D.COemissionsandremovalsfrom soil 19,905 0,000
6. Waste 27,233 0,283 0,000 0,000 0,000
A. Solid waste disposal on land 24,630 – –
B. Waste-water handling 2,603 0,283 – – –
7. Other (please specify) 0,000 0,000 0,000 0,000 0,000 0,000 0,000 0,000
Memo items
International bunkers 617,404 0,004 0,017 2,617 0,872 0,436 0,196
Aviation 617,404 0,004 0,017 2,617 0,872 0,436 0,196
COemissionsfrombiomass 1000,224
Note: – No emissions can be determined
0,000 – The emission less than 0.001 Гг
– – No emissions have been determined

189
Annex 3N
atio
nal e
mis
sion
s of С
О-
equ
ival
ent (
Gg)
1990
19
91
Gre
enho
use
gas
sour
ce c
ateg
orie
sCO
₂CH
₄N₂O
HFC
sTo
tal
CO
₂CH
₄N₂O
HFC
sTo
tal
Tota
l nat
iona
l em
issi
ons
2399
7,19
861
03,9
4418
4,48
10,
000
3028
5,62
322
818,
940
6328
,623
178,
560
0,00
029
326,
410
1. E
nerg
y23
202,
528
1701
,273
85,3
4324
989,
144
2207
2,84
216
91,4
2484
,320
2384
8,58
6
A. F
uel c
ombu
stio
n (s
ecto
ral a
ppro
ach)
2320
2,52
829
0,30
485
,343
2357
8,17
522
072,
842
274,
470
84,3
2022
431,
632
1. E
nerg
y In
dust
ries
8419
,201
3,80
122
,630
8445
,632
8112
,128
3,50
722
,630
8138
.265
2. M
anuf
actu
ring
indu
strie
s a
nd c
onst
ruct
ion
1761
,160
2,91
93,
813
1767
,892
1584
,473
2,64
63,
410
1590
.529
3. T
rans
port
5015
,516
24,1
2913
,330
5052
,975
4489
,426
21,9
0312
,090
4523
.419
4. O
ther
sec
tors
8006
,651
259,
455
45,5
7083
11,6
7678
86,8
1524
6,41
446
,190
8179
.419
B. F
ugiti
ve e
mis
sion
s fr
om fu
els
1410
,969
1410
,969
1416
,954
1416
,954
1. S
olid
fuel
s29
2,40
429
2,40
425
8,48
925
8.48
9
2. O
il an
d na
tura
l gas
1118
,565
1118
,565
1158
,465
1158
.465
2. In
dust
rial p
roce
sses
775,
110
0,00
00,
000
0,00
077
5,11
072
6,51
50,
000
0,00
00,
000
726,
802
A. M
iner
al p
rodu
cts
763,
035
763,
035
715,
681
715,
681
C. M
etal
pro
duct
ion
5,02
9–
–5,
029
6,50
1–
–6,
501
F. Co
nsum
ptio
n of
hyd
roflu
orin
ecar
bons
0,00
00,
000
0,28
70,
287
G. E
xplo
sive
wor
ks7,
046
7,04
64,
333
4,33
3
4. A
gric
ultu
re26
23,8
8715
,438
2639
,325
2615
,949
8,99
026
24,9
39
A. E
nter
ic fe
rmen
tatio
n24
07,5
2424
07,5
2424
04,3
1124
04,3
11
B. M
anur
e m
anag
emen
t19
6,39
21,
550
197,
942
198,
240
1,55
019
9,79
0
C. R
ice
culti
vatio
n2,
016
2,01
62,
940
2,94
0
D. A
gric
ultu
ral s
oils
–2,
170
2,17
0–
2,17
02,
170
F. Bu
rnin
g of
agr
icul
tura
l res
idue
s17
,955
11,7
1829
,673
10,4
585,
270
15,7
28
5. L
and-
use
chan
ge a
nd fo
rest
ry19
,560
6,55
20,
620
26,7
3219
,583
6,25
80,
620
26,4
61
A. C
hang
es in
fore
st a
nd o
ther
woo
dy
biom
ass
stoc
ks0,
000
6,55
20,
620
7,17
20,
000
6,25
80,
620
6,87
8
D.COem
ission
san
dremov
alsfrom
soil
19,5
6019
,560
19,5
8319
,583
6. W
aste
1772
,232
83,0
8018
55,3
120,
000
2014
,992
84,6
3020
99,6
22
A. S
olid
was
te d
ispo
sal o
n la
nd15
70,1
7015
70,1
7018
30,7
8018
30,7
80
B. W
aste
-wat
er h
andl
ing
202,
062
83,0
8028
5,14
218
4,21
284
,630
268,
842

190
1992
1993
Gre
enho
use
gas
sour
ce c
ateg
orie
sCO
₂CH
₄N₂O
HFC
sTo
tal
CO
₂CH
₄N₂O
HFC
sTo
tal
Tota
l nat
iona
l em
issi
ons
1554
9,70
355
73,0
2215
2,52
00,
000
2127
5,24
511
195,
768
4675
,755
135,
780
0,00
016
007,
303
1. E
nerg
y14
934,
422
1276
,422
59,5
2016
270,
364
1079
4,20
299
2,31
344
,640
1183
1,15
5
A. F
uel c
ombu
stio
n (s
ecto
ral a
ppro
ach)
1493
4,42
218
4,08
659
,520
1517
8,02
810
794,
202
131,
565
44,6
4010
970,
407
1. E
nerg
y In
dust
ries
5558
,225
2,28
916
,120
5576
,634
4067
,629
1,59
612
,400
4081
.625
2. M
anuf
actu
ring
indu
strie
s a
nd c
onst
ruc-
tion
1010
,521
1,70
12,
170
1014
,392
685,
906
1,15
51,
240
688.
301
3. T
rans
port
2846
,803
14,0
707,
750
2868
,623
1919
,739
9,61
85,
270
1934
.627
4. O
ther
sec
tors
5518
,873
166,
026
33,4
8057
18,3
7941
20,9
2811
9,19
625
,730
4265
.854
B. F
ugiti
ve e
mis
sion
s fr
om fu
els
1092
,336
1092
,336
860,
748
860,
748
1. S
olid
fuel
s18
8,91
618
8,91
614
6,87
414
6.87
4
2. O
il an
d na
tura
l gas
903,
420
903,
420
713,
874
713.
874
2. In
dust
rial p
roce
sses
596,
022
0,00
00,
000
0,00
059
6,02
238
2,24
90,
000
0,00
00,
000
382,
249
A. M
iner
al p
rodu
cts
586,
866
586,
866
365,
001
365,
001
C. M
etal
pro
duct
ion
5,56
4–
–5,
564
15,2
77–
–15
,277
F. Co
nsum
ptio
n of
hyd
roflu
orin
ecar
bons
0,00
00,
000
0,00
00,
000
G. E
xplo
sive
wor
ks3,
592
3,59
21,
971
1,97
1
4. A
gric
ultu
re24
55,4
468,
370
2463
,816
2240
,511
7,44
022
47,9
51
A. E
nter
ic fe
rmen
tatio
n22
52,2
2922
52,2
2920
46,1
1420
46,1
14
B. M
anur
e m
anag
emen
t18
9,67
21,
550
191,
222
180,
768
1,24
018
2,00
8
C. R
ice
culti
vatio
n3,
192
3,19
24,
200
4,20
0
D. A
gric
ultu
ral s
oils
–1,
860
1,86
0–
1,86
01,
860
F. Bu
rnin
g of
agr
icul
tura
l res
idue
s10
,353
4,96
015
,313
9,42
94,
340
13,7
69
5. L
and-
use
chan
ge a
nd fo
rest
ry19
,259
6,25
80,
620
26,1
3719
,317
6,42
60,
620
26,3
63
A. C
hang
es in
fore
st a
nd o
ther
woo
dy
biom
ass
stoc
ks0,
000
6,25
80,
620
6,87
80,
000
6,42
60,
620
7,04
6
D.COem
ission
san
dremov
alsfrom
soil
19,2
5919
,259
19,3
1719
,317
6. W
aste
1834
,896
84,0
1019
18,9
0614
36,5
0583
,080
1519
,585
A. S
olid
was
te d
ispo
sal o
n la
nd16
86,7
2016
86,7
2013
30,3
5013
30,3
50
B. W
aste
-wat
er h
andl
ing
148,
176
84,0
1023
2,18
610
6,15
583
,080
189,
235

191
1994
1995
Gre
enho
use
gas
sour
ce c
ateg
orie
sCO
₂CH
₄N₂O
HFC
sTo
tal
CO
₂CH
₄N₂O
HFC
sTo
tal
Tota
l nat
iona
l em
issi
ons
8328
,547
3307
,542
114,
080
0,00
011
750,
169
7457
,552
3180
,265
124,
310
0,00
010
762,
127
1. E
nerg
y80
69,2
6360
9,21
034
,410
8712
,883
7262
,007
559,
020
31,9
3078
52,9
57
A. F
uel c
ombu
stio
n (s
ecto
ral a
ppro
ach)
8069
,263
96,9
9934
,410
8200
,672
7262
,007
85,8
4831
,930
7379
,785
1. E
nerg
y In
dust
ries
3078
,374
1,15
59,
610
3089
,139
2804
,245
0,98
78,
990
2814
.222
2. M
anuf
actu
ring
indu
strie
s a
nd c
on-
stru
ctio
n47
9,50
70,
798
0,93
048
1,23
540
1,61
80,
672
0,62
040
2.91
0
3. T
rans
port
1332
,058
6,76
23,
720
1342
,540
1106
,054
5,69
13,
100
1114
.845
4. O
ther
sec
tors
3179
,324
88,2
8420
,150
3287
,758
2950
,090
78,4
9819
,220
3047
.808
B. F
ugiti
ve e
mis
sion
s fr
om fu
els
512,
211
512,
211
473,
172
473,
172
1. S
olid
fuel
s61
,551
61,5
5135
,553
35.5
53
2. O
il an
d na
tura
l gas
450,
660
450,
660
437,
619
437.
619
2. In
dust
rial p
roce
sses
238,
084
0,00
00,
000
0,00
023
8,08
417
4,46
90,
000
0,00
00,
000
174,
469
A. M
iner
al p
rodu
cts
224,
833
224,
833
162,
518
162,
518
C. M
etal
pro
duct
ion
11,2
17–
–11
,217
9,85
2–
–9,
852
F. Co
nsum
ptio
n of
hyd
roflu
orin
ecar
bons
0,00
00,
000
0,00
00,
000
G. E
xplo
sive
wor
ks2,
034
2,03
42,
099
2,09
9
4. A
gric
ultu
re18
32,8
174,
960
1837
,777
1698
,421
10,8
5017
09,2
71
A. E
nter
ic fe
rmen
tatio
n16
60,5
1216
60,5
1215
22,4
2015
22,4
20
B. M
anur
e m
anag
emen
t16
0,75
50,
930
161,
685
155,
064
0,93
015
5,99
4
C. R
ice
culti
vatio
n5,
229
5,22
97,
560
7,56
0
D. A
gric
ultu
ral s
oils
–1,
240
1,24
0–
1,24
01,
240
F. Bu
rnin
g of
agr
icul
tura
l res
idue
s6,
321
2,79
09,
111
13,3
778,
680
22,0
57
5. L
and-
use
chan
ge a
nd fo
rest
ry21
,200
6,40
50,
620
28,2
2521
,076
6,32
10,
620
28,0
17
A. C
hang
es in
fore
st a
nd o
ther
woo
dy
biom
ass
stoc
ks0,
000
6,40
50,
620
7,02
50,
000
6,32
10,
620
6,94
1
D.COem
ission
san
dremov
alsfrom
soil
21,2
0021
,200
21,0
7621
,076
6. W
aste
859,
110
74,0
9093
3,20
091
6,50
380
,910
997,
413
A. S
olid
was
te d
ispo
sal o
n la
nd77
7,42
077
7,42
083
9,16
083
9,16
0
B. W
aste
-wat
er h
andl
ing
81,6
9074
,090
155,
780
77,3
4380
,910
158,
253

192
1996
19
97
Gre
enho
use
gas
sour
ce c
ateg
orie
sCO
₂CH
₄N₂O
HFC
sTo
tal
CO
₂CH
₄N₂O
HFC
sTo
tal
Tota
l nat
iona
l em
issi
ons
8332
,037
3055
,773
130,
510
0,00
011
518,
320
8002
,760
3166
,149
125,
240
0,00
011
294,
149
1. E
nerg
y80
15,7
6766
8,74
539
,060
8723
,572
7616
,302
661,
542
39,3
7083
17,2
14
A. F
uel c
ombu
stio
n (s
ecto
ral a
ppro
ach)
8015
,767
115,
521
39,0
6081
70,3
4876
16,3
0212
5,68
539
,370
7781
,357
1. E
nerg
y In
dust
ries
2988
,483
1,09
28,
680
2998
,255
2738
,047
1,02
96,
820
2745
.896
2. M
anuf
actu
ring
indu
strie
s a
nd c
on-
stru
ctio
n46
2,81
60,
735
0,93
046
4,48
145
8,29
10,
693
0,93
045
9.91
4
3. T
rans
port
1550
,339
8,08
54,
340
1562
,764
1786
,141
9,45
04,
960
1800
.551
4. O
ther
sec
tors
3014
,129
105,
609
25,1
1031
44,8
4826
33,8
2311
4,51
326
,660
2774
.996
B. F
ugiti
ve e
mis
sion
s fr
om fu
els
553,
224
553,
224
535,
857
535,
857
1. S
olid
fuel
s24
,486
24,4
8622
,218
22.2
18
2. O
il an
d na
tura
l gas
528,
738
528,
738
513,
639
513.
639
2. In
dust
rial p
roce
sses
295,
196
0,00
00,
000
0,00
029
5,19
636
5,43
20,
000
0,00
00,
000
365,
432
A. M
iner
al p
rodu
cts
279,
634
279,
634
349,
497
349,
497
C. M
etal
pro
duct
ion
13,7
90–
–13
,790
13,6
52–
–13
,652
F. Co
nsum
ptio
n of
hyd
roflu
orin
ecar
bons
0,00
00,
000
0,00
00,
000
G. E
xplo
sive
wor
ks1,
772
1,77
22,
283
2,28
3
4. A
gric
ultu
re16
11,8
1311
,780
1623
,593
1661
,142
12,4
0016
73,5
42
A. E
nter
ic fe
rmen
tatio
n14
35,5
8114
35,5
8114
78,3
1614
78,3
16
B. M
anur
e m
anag
emen
t14
9,85
60,
620
150,
476
154,
518
0,93
015
5,44
8
C. R
ice
culti
vatio
n9,
093
9,09
310
,248
10,2
48
D. A
gric
ultu
ral s
oils
–0,
930
0,93
0–
1,24
01,
240
F. Bu
rnin
g of
agr
icul
tura
l res
idue
s17
,283
10,2
3027
,513
18,0
6010
,230
28,2
90
5. L
and-
use
chan
ge a
nd fo
rest
ry21
,074
6,55
20,
620
28,2
4621
,026
6,67
80,
620
28,3
24
A. C
hang
es in
fore
st a
nd o
ther
woo
dy
biom
ass
stoc
ks0,
000
6,55
20,
620
7,17
20,
000
6,67
80,
620
7,29
8
D.COem
ission
san
dremov
alsfrom
soil
21,0
7421
,074
21,0
2621
,026
6. W
aste
768,
663
79,0
5084
7,71
383
6,78
772
,850
909,
637
A. S
olid
was
te d
ispo
sal o
n la
nd68
9,01
068
9,01
076
1,25
076
1,25
0
B. W
aste
-wat
er h
andl
ing
79,6
5379
,050
158,
703
75,5
3772
,850
148,
387

193
1998
1999
Gre
enho
use
gas
sour
ce c
ateg
orie
sCO
₂CH
₄N₂O
HFC
sTo
tal
CO
₂CH
₄N₂O
HFC
sTo
tal
Tota
l nat
iona
l em
issi
ons
8416
,231
2992
,689
129,
890
0,00
011
538,
810
7550
,294
2880
,213
137,
950
0,00
010
568,
457
1. E
nerg
y80
15,7
6763
5,77
539
,060
8690
,602
7312
,006
450,
240
41,2
3078
03,4
76
A. F
uel c
ombu
stio
n (s
ecto
ral a
ppro
ach)
8015
,767
115,
521
39,0
6081
70,3
4873
12,0
0613
9,62
941
,230
7492
,865
1. E
nerg
y In
dust
ries
2988
,483
1,09
28,
680
2998
,255
2103
,680
0,75
66,
820
2111
.256
2. M
anuf
actu
ring
indu
strie
s a
nd
cons
truc
tion
462,
816
0,73
50,
930
464,
481
478,
023
0,69
30,
930
479.
646
3. T
rans
port
1550
,339
8,08
54,
340
1562
,764
1895
,581
10,0
805,
270
1910
.931
4. O
ther
sec
tors
3014
,129
105,
609
25,1
1031
44,8
4828
34,7
2212
8,10
028
,210
2991
.032
B. F
ugiti
ve e
mis
sion
s fr
om fu
els
520,
254
520,
254
310,
611
310,
611
1. S
olid
fuel
s8,
001
8,00
19,
702
9.70
2
2. O
il an
d na
tura
l gas
512,
253
512,
253
300,
909
300.
909
2. In
dust
rial p
roce
sses
379,
973
0,00
00,
000
0,00
037
9,97
321
8,07
50,
000
0,00
00,
000
218,
075
A. M
iner
al p
rodu
cts
363,
096
363,
096
200,
359
200,
359
C. M
etal
pro
duct
ion
12,6
55–
–12
,655
12,9
85–
–12
,985
F. Co
nsum
ptio
n of
hyd
roflu
orin
ecar
-bo
ns0,
000
0,00
00,
000
0,00
0
G. E
xplo
sive
wor
ks4,
222
4,22
24,
731
4,73
1
4. A
gric
ultu
re16
96,2
1213
,950
1710
,162
1734
,516
15,5
0017
50,0
16
A. E
nter
ic fe
rmen
tatio
n15
06,5
4015
06,5
4015
35,9
8215
35,9
82
B. M
anur
e m
anag
emen
t16
0,12
50,
930
161,
055
165,
690
0,93
016
6,62
0
C. R
ice
culti
vatio
n9,
240
9,24
010
,248
10,2
48
D. A
gric
ultu
ral s
oils
–1,
240
1,24
0–
1,24
01,
240
F. Bu
rnin
g of
agr
icul
tura
l res
idue
s20
,307
11,7
8032
,087
22,5
9613
,330
35,9
26
5. L
and-
use
chan
ge a
nd fo
rest
ry20
,491
6,46
80,
620
27,5
7920
,213
6,25
80,
620
27,0
91
A. C
hang
es in
fore
st a
nd o
ther
woo
dy
biom
ass
stoc
ks0,
000
6,46
80,
620
7,08
80,
000
6,25
80,
620
6,87
8
D.COem
ission
san
dremov
alsfrom
so
il20
,491
20,4
9120
,213
20,2
13
6. W
aste
654,
234
76,2
6073
0,49
468
9,19
980
,600
769,
799
A. S
olid
was
te d
ispo
sal o
n la
nd58
6,32
058
6,32
062
1,18
062
1,18
0
B. W
aste
-wat
er h
andl
ing
67,9
1476
,260
144,
174
68,0
1980
,600
148,
619

194
2000
20
01
Gre
enho
use
gas
sour
ce c
ateg
orie
sCO
₂CH
₄N₂O
HFC
sTo
tal
CO
₂CH
₄N₂O
HFC
sTo
tal
Tota
l nat
iona
l em
issi
ons
7993
,351
2905
,056
137,
640
0,53
611
036,
583
7609
,783
2983
,554
143,
530
1,66
110
738,
528
1. E
nerg
y77
23,4
0249
2,40
841
,850
8257
,660
7329
,660
522,
606
43,4
0078
95,6
66
A. F
uel c
ombu
stio
n (s
ecto
ral a
ppro
ach)
7723
,402
139,
902
41,8
5079
05,1
5473
29,6
6015
4,49
743
,400
7527
,557
1. E
nerg
y In
dust
ries
2376
,227
0,79
87,
440
2384
,465
2250
,491
0,75
66,
510
2257
.757
2. M
anuf
actu
ring
indu
strie
s a
nd
cons
truc
tion
493,
463
0,71
40,
930
495,
107
452,
062
0,63
00,
930
453.
622
3. T
rans
port
2003
,143
10,6
475,
580
2019
,370
2067
,327
11,1
305,
580
2084
.037
4. O
ther
sec
tors
2850
,569
127,
743
27,9
0030
06,2
1225
59,7
8014
1,98
130
,380
2732
.141
B. F
ugiti
ve e
mis
sion
s fr
om fu
els
352,
506
352,
506
368,
109
368,
109
1. S
olid
fuel
s10
,752
10,7
527,
119
7.11
9
2. O
il an
d na
tura
l gas
341,
754
341,
754
360,
990
360.
990
2. In
dust
rial p
roce
sses
249,
716
0,00
00,
000
0,53
625
0,25
225
9,69
50,
000
0,00
01,
661
261,
356
A. M
iner
al p
rodu
cts
231,
946
231,
946
241,
051
241,
051
C. M
etal
pro
duct
ion
11,2
95–
–11
,295
12,3
50–
–12
,350
F. Co
nsum
ptio
n of
hyd
roflu
orin
ecar
-bo
ns0,
536
0,53
61,
661
1,66
1
G. E
xplo
sive
wor
ks6,
475
6,47
56,
294
6,29
4
4. A
gric
ultu
re17
55,8
5215
,810
1771
,662
1781
,976
17,9
8017
99,9
56
A. E
nter
ic fe
rmen
tatio
n15
53,4
5415
53,4
5415
74,3
4915
74,3
49
B. M
anur
e m
anag
emen
t16
9,00
80,
930
169,
938
171,
969
0,93
017
2,89
9
C. R
ice
culti
vatio
n10
,752
10,7
529,
408
9,40
8
D. A
gric
ultu
ral s
oils
–1,
240
1,24
0–
1,24
01,
240
F. Bu
rnin
g of
agr
icul
tura
l res
idue
s22
,638
13,6
4036
,278
26,2
5015
,810
42,0
60
5. L
and-
use
chan
ge a
nd fo
rest
ry20
,233
6,69
90,
620
27,5
5220
,428
6,46
80,
620
27,5
16
A. C
hang
es in
fore
st a
nd o
ther
woo
dy
biom
ass
stoc
ks0,
000
6,69
90,
620
7,31
90,
000
6,46
80,
620
7,08
8
D.COem
ission
san
dremov
alsfrom
so
il20
,233
20,2
3320
,428
20,4
28
6. W
aste
650,
097
79,3
6072
9,45
767
2,50
481
,530
754,
034
A. S
olid
was
te d
ispo
sal o
n la
nd57
4,56
057
4,56
059
8,08
059
8,08
0
B. W
aste
-wat
er h
andl
ing
75,5
3779
,360
154,
897
74,4
2481
,530
155,
954

195
20
0220
03
Gre
enho
use
gas
sour
ce c
ateg
orie
sCO
₂CH
₄N₂O
HFC
sTo
tal
CO
₂CH
₄N₂O
HFC
sTo
tal
Tota
l nat
iona
l em
issi
ons
8409
,924
3026
,646
146,
630
3,90
011
587,
100
8689
,399
2890
,671
141,
050
6,50
011
727,
620
1. E
nerg
y80
97,8
6961
5,74
144
,950
8758
,560
8264
,810
534,
198
45,5
7088
44,5
78
A. F
uel c
ombu
stio
n (s
ecto
ral a
ppro
ach)
8097
,869
157,
227
44,9
5083
00,0
4682
64,8
1015
7,83
645
,570
8468
,216
1. E
nerg
y In
dust
ries
2653
,410
0,86
18,
060
2662
,331
2671
,751
0,84
09,
300
2681
.891
2. M
anuf
actu
ring
indu
strie
s a
nd
cons
truc
tion
583,
849
0,92
40,
930
585,
703
589,
751
0,98
71,
240
591.
978
3. T
rans
port
2038
,400
11,0
675,
580
2055
,047
2059
,711
11,2
565,
580
2076
.547
4. O
ther
sec
tors
2822
,210
144,
375
30,3
8029
96,9
6529
43,5
9714
4,75
329
,450
3117
.800
B. F
ugiti
ve e
mis
sion
s fr
om fu
els
458,
514
458,
514
376,
362
376,
362
1. S
olid
fuel
s5,
901
5,90
15,
040
5.04
0
2. O
il an
d na
tura
l gas
452,
613
452,
613
371,
322
371.
322
2. In
dust
rial p
roce
sses
291,
670
0,00
00,
000
3,90
029
5,57
040
4,17
70,
000
0,00
06,
500
410,
677
A. M
iner
al p
rodu
cts
273,
103
273,
103
384,
759
384,
759
C. M
etal
pro
duct
ion
11,2
93–
–11
,293
7,47
9–
–7,
479
F. Co
nsum
ptio
n of
hyd
roflu
orin
ecar
-bo
ns3,
900
3,90
06,
500
6,50
0
G. E
xplo
sive
wor
ks7,
274
7,27
411
,939
11,9
39
4. A
gric
ultu
re18
11,9
8518
,290
1830
,275
1804
,320
18,6
0018
22,9
20
A. E
nter
ic fe
rmen
tatio
n15
98,2
0515
98,2
0515
94,5
9315
94,5
93
B. M
anur
e m
anag
emen
t17
5,60
20,
930
176,
532
172,
242
0,93
017
3,17
2
C. R
ice
culti
vatio
n11
,340
11,3
4010
,458
10,4
58
D. A
gric
ultu
ral s
oils
–1,
240
1,24
0–
1,24
01,
240
F. Bu
rnin
g of
agr
icul
tura
l res
idue
s26
,838
16,1
2042
,958
27,0
2716
,430
43,4
57
5. L
and-
use
chan
ge a
nd fo
rest
ry20
,385
6,15
30,
620
27,1
5820
,412
6,17
40,
620
27,2
06
A. C
hang
es in
fore
st a
nd o
ther
woo
dy
biom
ass
stoc
ks0,
000
6,15
30,
620
6,77
30,
000
6,17
40,
620
6,79
4
D.COem
ission
san
dremov
alsfrom
soil
20,3
8520
,385
20,4
1220
,412
6. W
aste
592,
767
82,7
7067
5,53
754
5,97
976
,260
622,
239
A. S
olid
was
te d
ispo
sal o
n la
nd52
2,27
052
2,27
048
1,95
048
1,95
0
B. W
aste
-wat
er h
andl
ing
70,4
9782
,770
153,
267
64,0
2976
,260
140,
289

196
2004
2005
Gre
enho
use
gas
sour
ce c
ateg
orie
sCO
₂CH
₄N₂O
HFC
sTo
tal
CO
₂CH
₄N₂O
HFC
sTo
tal
Tota
l nat
iona
l em
issi
ons
9072
,262
3114
,888
153,
140
9,10
012
349,
390
8847
,295
3029
,166
154,
070
13,0
0012
043,
531
1. E
nerg
y85
89,2
2158
2,14
146
,810
9218
,172
8321
,123
535,
311
45,2
6089
01,6
94
A. F
uel c
ombu
stio
n (s
ecto
ral a
ppro
ach)
8589
,221
166,
194
46,8
1088
02,2
2583
21,1
2316
0,65
045
,260
8527
,033
1. E
nerg
y In
dust
ries
2587
,673
0,77
78,
990
2597
,440
2230
,163
0,67
28,
060
2238
.895
2. M
anuf
actu
ring
indu
strie
s a
nd
cons
truc
tion
649,
904
1,13
41,
240
652,
278
626,
047
1,13
40,
930
628.
111
3. T
rans
port
2310
,097
12,6
006,
200
2328
,897
2467
,159
13,2
727,
130
2487
.561
4. O
ther
sec
tors
3041
,547
151,
683
30,3
8032
23,6
1029
97,7
5414
5,57
229
,140
3172
.466
B. F
ugiti
ve e
mis
sion
s fr
om fu
els
415,
947
415,
947
374,
661
374,
661
1. S
olid
fuel
s13
,566
13,5
666,
111
6.11
1
2. O
il an
d na
tura
l gas
402,
381
402,
381
368,
550
368.
550
2. In
dust
rial p
roce
sses
462,
252
0,00
00,
000
9,10
047
1,35
250
6,26
70,
000
0,00
013
,000
519,
267
A. M
iner
al p
rodu
cts
442,
013
442,
013
491,
575
491,
575
C. M
etal
pro
duct
ion
9,54
7–
–9,
547
5,89
7–
–5,
897
F. Co
nsum
ptio
n of
hyd
roflu
orin
ecar
-bo
ns9,
100
9,10
013
,000
13,0
00
G. E
xplo
sive
wor
ks10
,692
10,6
928,
795
8,79
5
4. A
gric
ultu
re18
57,7
2320
,770
1878
,493
1916
,103
20,4
6019
36,5
63
A. E
nter
ic fe
rmen
tatio
n16
39,9
7416
39,9
7416
93,9
6516
93,9
65
B. M
anur
e m
anag
emen
t17
6,75
70,
930
177,
687
181,
797
0,93
018
2,72
7
C. R
ice
culti
vatio
n10
,458
10,4
5810
,458
10,4
58
D. A
gric
ultu
ral s
oils
–1,
240
1,24
0–
1,24
01,
240
F. Bu
rnin
g of
agr
icul
tura
l res
idue
s30
,534
18,6
0049
,134
29,8
8318
,290
48,1
73
5. L
and-
use
chan
ge a
nd fo
rest
ry20
,789
5,94
30,
620
27,3
5219
,905
5,85
90,
620
26,3
84
A. C
hang
es in
fore
st a
nd o
ther
woo
dy
biom
ass
stoc
ks0,
000
5,94
30,
620
6,56
30,
000
5,85
90,
620
6,47
9
D.COem
ission
san
dremov
alsfrom
soil
20,7
8920
,789
19,9
0519
,905
6. W
aste
669,
081
84,9
4075
4,02
157
1,89
387
,730
659,
623
A. S
olid
was
te d
ispo
sal o
n la
nd60
9,21
060
9,21
051
7,23
051
7,23
0
B. W
aste
-wat
er h
andl
ing
59,8
7184
,940
144,
811
54,6
6387
,730
142,
393
Note: – No emissions can be determined
0,000 – The emission less than 0.001 Gg
– – No emissions have been determined

197
Change of glaciation modelling in Kyrgyzstan according to scenario В2
Annex 4
Fig. A.1. State of glaciation in 2000 compared to the period glacier catalogue drawing up (60s). Extant glaciers marked with dark blue, extinct glaciers marked with red.
Fig. A.2. State of glaciation in 2025 compared to the period glacier catalogue drawing up (60s). Extant glaciers marked with dark blue, extinct glaciers marked with red.

198
Fig. A.3. State of glaciation in 2050 compared to the period glacier catalogue drawing up (60s). Extant glaciers marked with dark blue, extinct glaciers marked with red.
Fig. A.4. State of glaciation in 2075 compared to the period glacier catalogue drawing up (60s). Extant glaciers marked with dark blue, extinct glaciers marked with red.

199
Fig. A.5. State of glaciation in 2075 compared to the period glacier catalogue drawing up (60s). Extant glaciers marked with dark blue, extinct glaciers marked with red.

United Nations Development Programme in Kyrgyz RepublicUN House, 160 Chui AvenueBishkek, 720040Kyrgyz Republicwww.undp.kgwww.caresd.net