Green House Gases (GHG) Inventory in Syria - UNFCCC
32
-
Upload
khangminh22 -
Category
Documents
-
view
2 -
download
0
Transcript of Green House Gases (GHG) Inventory in Syria - UNFCCC


Ministry of state for Environment Affairs (MSEA), in collaboration with United Nation Development Programm (UNDP) in Syria, and Global Environmental Facility (GEF).
Project Title: "Enabling Activities for Preparation of Syria's Initial National Communication to UNFCCC", (Project Nr.00045323).
General Report
Of
Green House Gases (GHG) Inventory in Syria
(INC-SY_GHG_General Inventory-En)
Edited by:
Yousef Meslmani, Ph. D.,
National Project Director [email protected]
Damascus July 2009
Copyright © 2009 _ INC-SY_GHG_General Inventory-En, United Nation Development Programme (UNDP) / MSEA.
GHG inventory of the Syrian's Initial National Communication to UNFCCC
INC-SY_GHG_General Inventory-En www.inc-sy.org
Study Team:
Dr. Yousef Meslmani National Project Director Dr. Sadeen Khorfan GHG General Inventory / Team Leader Dr. Ali Hainoun GHG Inventory for Energy Dr. Nadra Housami GHG Inventory for Industry Dr. Elias Jabbour GHG Inventory for ALULUCF Eng. Riad Al Kabikly GHG Inventory for Waste Steering Committee:
Headed by Dr. Kaoukab Daya Minister of state for Environment Affairs, and membership of:
Mr. Ismail Ould Cheikh Ahmed United Nations Resident Coordinator and UNDP Resident Representative in Syria.
Dr. Taysir Raddawi Head of the Syrian's State Planning Commission.
Eng. Imad Hassoun Deubty Minister / GEF national Focal Point.
Eng. Abir Zeno Energy & Environment Team Leader / UNDP � Syria.
Eng. Haitham Nashawati National Project Coordinator. Dr. Yousef Meslmani National Project Director.
Technical Committee of the Project:
Consisting of General Director of General Commission for Environmental Affairs, Energy & Environment Team Leader / UNDP - Syria, National Project Director, National Project Coordinator, and the representatives of: Ministy of State for Environmental Affairs, State Planning Commission, Ministry of Agriculture and Agrarian Reform, Ministry of Irregation, Ministry of Industry, Ministry of Electrisity/National Center of Energy Researches, Ministry of Housing and Construction, Ministry of Transportation, Ministry of petroleum and Mineral Resources, Meteorological Directorate, Universities and Scientific Researches Centers, NGOs. This report has been approved unanimously by the technical committee, during the Technical Workshop which took place on 23.7.2009, in the Resort of Mount Hermon, Qunitra.
GHG inventory of the Syrian's Initial National Communication to UNFCCC
INC-SY_GHG_General Inventory-En www.inc-sy.org
TABLE OF CONTENTE
FIRST CHAPTER: INTRODUCTION ........................................................................................... 6 1.1. CLIMATE CHANGE AND GHG INVENTORY�����.................................���.�������� 6
1.2. SPECIAL INSTITUTIONAL ARRANGEMENTS CONCERNING GHG INVENTORY�...�........�7
1.3. PREPARATION OF GHG INVENTORY��������...��������....................................�..� 8
1.4. METHODOLOGIES AND SOURCES OF DATA����������������..................................9
1.5. KEY CATEGORIES�����������������������...................................................�.�9
SECOND CHAPTER: TREND OF GHG EMISSIONS .........................................................11 2.1. TOTAL EMISSIONS���������������..................................................��������.�.�11
2.2. TOTAL EMISSIONS ACCORDING TO GAS ���������..................................������.�....11
2.3. TOTAL EMISSIONS ACCORDING TO SECTOR���������................................��.���.�.12
THIRD CHAPTER: OVERVIEW OF EMISSIONS ...............................................................14 3.1. TOTAL EMISSIONS������������������������..................................................�..15
3.2. ENERGY SECTOR�������������������������.......................................................16
3.3. INDUSTRIAL SECTOR���������������������................................................��.�.18
3.4. WASTE SECTORS�������������������������.......................................................20
3.5. AGRICULTURE SECTOR�����������������������...................................................22
3.6. EMISSIONS OF GHG FROM LAND USE AND FORESTRY���������....................................24
3.7. TREND OF EMISSIONS OF GHG PRECURSORS AND SO2 �����������.........................27
FOURTH CHAPTER: GENERAL ISSUES AND SCOPE FOR DEVELOPMENT..29 4.1. QUALITY CONTROL������������������������.....................................................29
4.2. UNCERTAINTY��������������������������...................................................... 29
4.3. USE OF HIGHER METHODOLOGIES�������������������.........................................29
4.4. TRAINING OF GHG INVENTORY GROUP����������������........................................29
SYMBOLS AND NOMENCLATURE ...........................................................................................30
REFERENCES.........................................................................................................................................31

GHG inventory of the Syrian's Initial National Communication to UNFCCC
INC-SY_GHG_General Inventory-En www.inc-sy.org
TABLES
Table 1. Indicators of GHG Emissions in Syria and World ............................................................ 14
Table 2. Total Emissions of GHG According to Gas for 1994........................................................ 15
Table 3. Total Emissions of GHG according to Sector for 1994..................................................... 15
FIGURES
Fig 1. The Organization Chart of GHG Inventory Team Management ............................................. 8
Fig 2. Total Emissions of GHG from 1994 to 2005......................................................................... 11
Fig 3. Share of Each GHG gas from Total Emissions from 1994 to 2005....................................... 12
Fig 4. GHG Emissions by Sector in CO2 eq for the years 1994 and 2005 ...................................... 13
Fig 5. Emissions of GHG According to Sector from 1994 to 2005 ................................................. 13
Fig 6. Overview of TotalEemissions in 2005 according to Gas and Sector..................................... 15
Fig 7. Trend of Total GHG Emissions from the Energy Sector from 1994 to 2005........................ 16
Fig 8. Emissions of GHG by Gas from Energy Sector for the year 1994 and 2005 ........................ 17
Fig 9. Emissions of GHG in Energy Sector according to Sectors in 1994-2005 ............................. 18
Fig 10. General Trend of GHG Emissions from Industry for 1994-2005........................................ 18
Fig 11. Emissions of GHG from Industry according to Gas from 1994-2005................................. 19
Fig 12. Emissions of GHG from Industry according to Sector ........................................................ 20
Fig 13. Total Emissions of GHG from Waste Sector in CO2 eq for 1994-2005 ............................. 20
Fig 14. GHG Emissions from the Waste Sector in CO2 eq by gas................................................... 21
Fig 15. Emission of CH4 from the Waste Sector by Sector for 1994 and 2005 ............................... 22
Fig 16. Total GHG Emissions from Agriculture for the years 1994-2005 ...................................... 22
Fig 17. Total Emissions of GHG from Agriculture by Gas ............................................................. 23
Fig 18. Emissions of GHG from Agriculture by Sector................................................................... 24
Fig 19. Emissions of GHG from LUCEF by Gas ............................................................................ 25
Fig 20. Emissions & Sinks of GHG from LUCEF for 1994............................................................ 25
Fig 21. Emissions and Sinks of GHG from LUCEF for 1994-2005 ................................................ 27
Fig 22. Emissions of NMVOC, SOx and NOx from Industry ......................................................... 27
Fig 23. Emissions of CO from LUCEF............................................................................................ 28
GHG inventory of the Syrian's Initial National Communication to UNFCCC
INC-SY_GHG_General Inventory-En www.inc-sy.org
First Chapter: Introduction
1.1. Climate Change and GHG inventory : The second half of the twentieth century witnessed important changes in the global climate. Scientists registered a rise in the temperature, which resulted in melting of ice caps and rise in sea level. They attributed this to the Greenhouse Gas effect's phenomena which resulted from the increase in the concentration of green house gases GHG especially carbon dioxide CO2. This increase is a result of human activities especially burning of fossil fuels, clearing of forests and others.(1) For this purpose, the World Climate Conference was held in 1979 by the World Meteorological Office WMO and came to the conclusion "The activities of human beings can cause local and global changes to the environment". We should notice here that until that time there was no clear signal about the effect on the global climate. The conference held in Austria in 1985 by WMO and United Nation Environment Program UNEP stated that "CO2 and other gases influence the climate change", and the Intergovernmental Panel for Climate Change IPCC was established. IPCC presented its first report in 1990 which played an important role in establishing the United Nation Framework Convention for Climate Change UNFCCC" in The Earth Summit Conference which was held in Rio de Janiro in 1992. The second IPCC report titled "Climate Chang" led to signing the Koyoto Protocol in 1997. The third assessment report TAR by the title "Climate Change" was presented at the 7th conference of the UNFCCC in the year 2001. The report was recommended to be used by Conference of the Parties COP. The fourth report was presented in 2007.
Decision 17/COP8 of the 8th Conference of Parties which belongs to UNFCCC states that: "Countries are obliged to present National Communications every year about their emissions of GHG and its sinks". Countries from non-Annex 1 parties must deliver estimates of their emissions of CO2, CH4 and N2O gases and its sinks. They are encouraged to present information about HFCs, PFCs and SF6.
National Communications consist of the followings:
• National Circumstances. • Inventory of GHG emissions and sinks. • Policies for adaptation to climate change. • Policies and measures for mitigation. • Other measures for achieving these goals. • Gaps, difficulties and the financial, technical and trained human personnel needed.
The Center for Scientific and Environmental Research which belongs to the Ministry of State for Environment in Syria carried out with the help of GTZ-Germany a study of GHG in Syria for the years 1990 and 1994. The study was presented in 2000. This report is the first concerned with GHG inventory in the First National Communication INC according to project number 00045323 with UNDP.
The First GHG inventory for Syria presents emissions of required GHG according to COP directions. It also gives an idea about emissions of non-direct GHG such as CO and NMVOC. It also gives emissions of SOx for the years studied. This inventory is essential for carrying out mitigation studies and policies and for their evaluations. The GHG inventory also gives information about the main sectors such as energy, agriculture, industry, transport and waste, which helps in dealing with other environmental issues.
GHG inventory of the Syrian's Initial National Communication to UNFCCC
INC-SY_GHG_General Inventory-En www.inc-sy.org
It also provides data on the economic and social development which can help in planning and management.
The GHG inventory considered the year 1994 a base year for calculation as recommended by COP. The calculations were carried out for the years 1994 to 2005 to evaluate the trend of GHG emissions and sinks. This was explained in the context of the economic and social progress taking place in the country. They can provide a sound basis for evaluating mitigation policies and measures. They could also provide a useful tool for developing future scenarios.
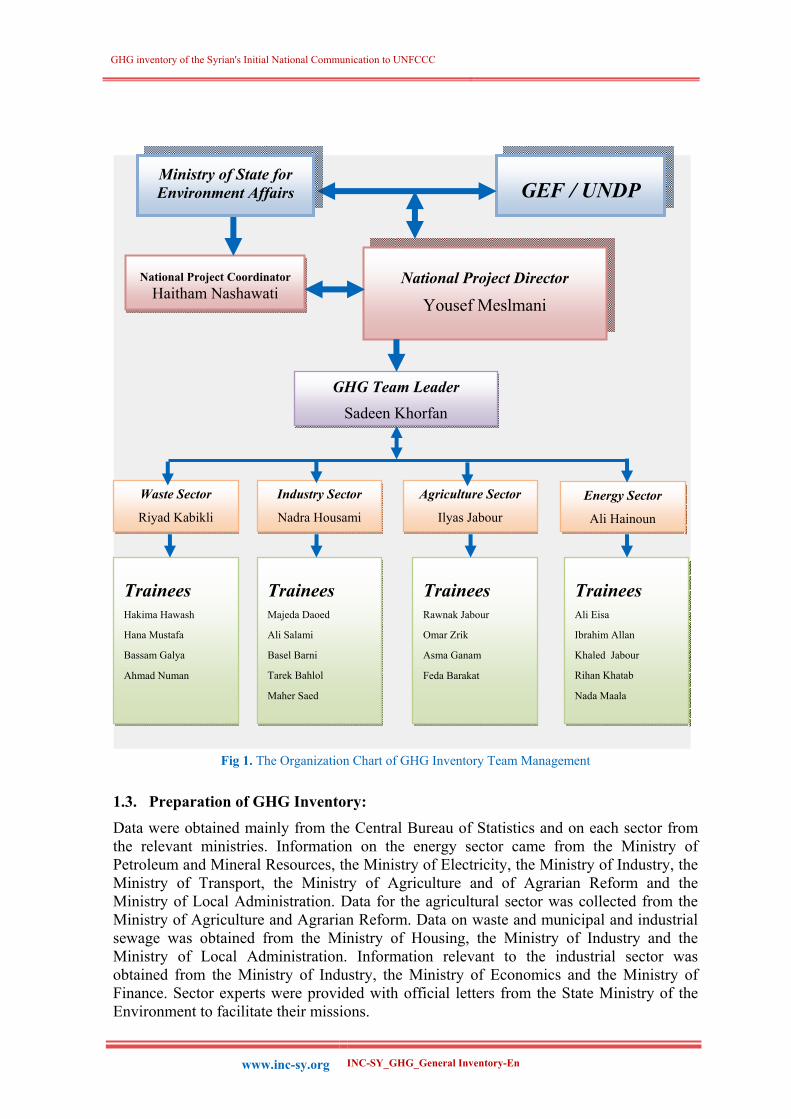
1.2. Special Institutional Arrangements Concerning GHG Inventory: A Team Leader was appointed by contract No 179 / 2008 by 20 July 2008, and was charged with composing Term of Reference TOR for GHG sectoral experts and presents it to Project Manager for announcement. A committee from the Focal Point, Project Leader, UNDP representative and Team Leader was established to interview applicants and choose candidates. The committee held two meetings, reviewed the CV's of applicants and interviewed them decided to contract a group of four GHG experts in the fields of energy, agriculture, industry and wastes. Since there was no previous experience of GHG inventory compilation in Syria, it was essential to train people to carry out the work after completing the First National Communication. A group of personnel from the General Environmental Commission and the Center for Environmental Studies and other public establishments concerned with the project was established to accompany the work performed by GHG experts and to get training on the GHG inventory compilation according to Revised 1996 GHG Guidelines. The team was allocated to the four sectors (energy, agriculture, industry and wastes) according to specializations Table1.
The process of inventory compilation was done through self-learning since the team had no previous experience. The team was provided with the IPCC 1996 Revised Guidelines and Software. A workshop was supposed to be held with external experts to give an introductory course on the subject but the advance of the process by discussions in meetings and workshops given by team leader proved sufficient enough. Four workshops were held for trainees and they were engaged in collecting and preparing data as well as participating in some estimation.
GHG inventory of the Syrian's Initial National Communication to UNFCCC
INC-SY_GHG_General Inventory-En www.inc-sy.org
Fig 1. The Organization Chart of GHG Inventory Team Management
1.3. Preparation of GHG Inventory: Data were obtained mainly from the Central Bureau of Statistics and on each sector from the relevant ministries. Information on the energy sector came from the Ministry of Petroleum and Mineral Resources, the Ministry of Electricity, the Ministry of Industry, the Ministry of Transport, the Ministry of Agriculture and of Agrarian Reform and the Ministry of Local Administration. Data for the agricultural sector was collected from the Ministry of Agriculture and Agrarian Reform. Data on waste and municipal and industrial sewage was obtained from the Ministry of Housing, the Ministry of Industry and the Ministry of Local Administration. Information relevant to the industrial sector was obtained from the Ministry of Industry, the Ministry of Economics and the Ministry of Finance. Sector experts were provided with official letters from the State Ministry of the Environment to facilitate their missions.
National Project Coordinator Haitham Nashawati
National Project Director
Yousef Meslmani
GEF / UNDP
GHG Team Leader Sadeen Khorfan
Waste Sector
Riyad Kabikli
Industry Sector
Nadra Housami
Energy Sector
Ali Hainoun
Agriculture Sector
Ilyas Jabour
Trainees Ali Eisa
Ibrahim Allan
Khaled Jabour
Rihan Khatab
Nada Maala
Trainees Rawnak Jabour
Omar Zrik
Asma Ganam
Feda Barakat
Trainees Majeda Daoed
Ali Salami
Basel Barni
Tarek Bahlol
Maher Saed
Trainees Hakima Hawash
Hana Mustafa
Bassam Galya
Ahmad Numan
Ministry of State for Environment Affairs

GHG inventory of the Syrian's Initial National Communication to UNFCCC
INC-SY_GHG_General Inventory-En www.inc-sy.org
Great difficulties were encountered, however, in obtaining data, especially since climate change was new to officials working in these sectors. There was a paucity of statistics and information in the energy sector since energy balances for the years 2000-2004 were not available. The same was true for data on HFCs, PFCs and SF6 consumption in the industrial sector. Data was converted to the form usable by IPCC Guidelines, and local conversion factors were used in some cases such as the calorific values of fuel products. In other cases, factors were chosen from the 1996 guidelines for countries with similar circumstances. Detailed data are presented in tables in the sectoral reports.
1.4. Methodologies and Sources of Data:
According to decision 17 / COP8 "Non- Annex 1 countries should prepare the first national INC communication of data about climate change". It should include a GHG inventory. This inventory should adhere to the IPCC 1996 Revised Guidelines established by NGGIP. These Guidelines were followed for all sectors. The GHG inventory included CO2, CH4, and N2O gases. The study used Tier 1 methodology, although it was adjusted in certain cases to suit better local or national circumstances i.e. Tier 2. Default emission factors (DEF) from the Guidelines were used in most cases for similar circumstances. Activity data (AD) were taken from the Central Bureau of Statistics.5 Other statistics and data were collected from the relevant sources such as the Ministry of Industry, the Ministry of Agriculture and Agrarian Reform, the Ministry of Petroleum and Mineral Resources, the Ministry of Electricity, the Ministry of Housing, the Ministry of Local Administration, the State Ministry of Environment and the International World Energy Agency (IEA).11 The computer program based on IPCC revised 1996 Guidelines and provided by NGGIP was used for calculations.12 Moreover, worksheets of the 1996 Guidelines were used. Finally, the relevant tables in the Guidelines were used for reporting.
1.5. Key Categories (KC):
Key categories were not analyzed quantitatively because this was the first time in Syria that GHG inventory was carried out. Therefore a qualitative analysis applied to Syria on the key categories in the IPCC 1996 Guidelines. In general most categories in the energy sector were key ones because of the significance of burning fossil fuel and the rapid increase in demand for energy. This also included fumes from the oil industry since Syria is a gas and oil producing and exporting country. Moreover, agricultural enteric fermentation, the fermentation of animal manure and the fertilization of land are key categories. The emissions and sinks from land uses Forests and trees are important key categories in Land Use and Land Use Change and Forest sector (LULUCF).
Solid waste disposal is a key category because of the increase in waste volume caused by large population growth and the lack of suitable waste disposal methods enabling the recovery of methane. Emissions from domestic waste water have increased in quantity because of the construction of waste water treatment units in big cities in Syria over the recent years. Emissions from industrial waste water plants were not significant because of the small scale of industry in Syria compared to industrialized countries and the lack of waste water treatment facilities in industry or their closure for technical reasons. Nevertheless emissions from waste are in general small compared to those of the energy and even the agricultural sector. Cement manufacturing plants and lime production are significant categories contributing to CO2 emissions; so are the chemical and the metal industries.

GHG inventory of the Syrian's Initial National Communication to UNFCCC
INC-SY_GHG_General Inventory-En www.inc-sy.org

GHG inventory of the Syrian's Initial National Communication to UNFCCC
INC-SY_GHG_General Inventory-En www.inc-sy.org
Second Chapter: Trend of GHG Emissions
This chapter describes the results of GHG inventory compilation for the years 1994-2005.
2.1. Total Emissions: Total GHG emissions from Syria (excluding the LUCF sector) increased from 52.66 T g CO2 eq in 1994 to 79.07 T g in the year 2005, as shown by figure 2.1. Total emissions increased steadily from 1994 to 2005 due to: population growth, which averaged 2.5% yearly, steady rise in the standard of living and increased consumption, the growth of economic development (averaging 4 -7 % yearly) and emigration from the countryside to the cities. Nevertheless emissions from energy sources increased more rapidly from 38 T g in 1994 to 58 T g in 2005. This increase was due to a big growth in electricity demand and in transport, which increased rapidly due to the liberalization of the economy and to the reduction of custom duties in 2003-2005. However emissions per unit of energy plummeted due to higher efficiency of industry and its more automatic character, the import of fuel-efficient modern cars and the transfer from fossil fuel oil to natural gas for electricity generation.
Fig 2. Total Emissions of GHG from 1994 to 2005
2.2. Total Emissions According to Gas: Fig (3) shows the share of each GHG gas from total emissions. It is clear that the share of CO2 is the highest and increased from 68% in 1994 to 74% in 2005 due to the increase in use of oil and gas for energy since most CO2 comes from burning fossil fuels in the energy sector. The share of CH4 decreased from 18% in 1994 to 13% in 2005 while the share of

GHG inventory of the Syrian's Initial National Communication to UNFCCC
INC-SY_GHG_General Inventory-En www.inc-sy.org
N2O decreased from 14% in to 13% during the same period. This could be explained by the high increase in the share of GHG released from electricity generation in total emissions.
Fig 3. Share of Each GHG gas from Total Emissions from 1994 to 2005
2.3. Total Emissions According to Sector: The share of GHG emissions in key sectors like energy, agriculture (except LUCF), industry and waste are presented in Figure (4), which shows that the energy sector is the largest contributor with 72% in 1994 and 73% in 2005. The total emissions of GHG from the energy sector increased from 38.23 k ton/year in 1994 to 58.35 k ton/year in 2005 .Emissions of GHG in agriculture sector increased from 9.47 K ton/year in 1994 to 13.93 k ton/year in 2005. Agriculture�s share has remained constant at 18% and likewise that of waste at 5%; industry�s share decreased slightly from 5% in 1994 to 4% in 2005. This means that the energy sector has grown the fastest, followed by agriculture and to a lesser extent waste, while the growth of industry has been less substantial.

GHG inventory of the Syrian's Initial National Communication to UNFCCC
INC-SY_GHG_General Inventory-En www.inc-sy.org
Fig 4. GHG Emissions by Sector in CO2 eq for the years 1994 and 2005
Figure (5) also shows emissions of GHG for the years 1994-2005 according to sector. It is clear that emissions from the energy sector have risen steadily and fast, while agriculture�s share has remained constant; the same can be said of the waste sector, while industry�s contribution has slightly increased from 2.49 k ton/year in 1994 to 2.94 k ton/year in 2005 . This slight increase is translated to a decrease in the share of industry in total GHG emissions from 5% to in 1994 to 4% in 2005 as shown in Fig 4.
Fig 5. Emissions of GHG According to Sector from 1994 to 2005
Table (1) presents a comparison of emissions from different countries. Per capita emissions of equivalent CO2 are around 4.0 ton in Syria for the year 2005 (without taking LUCF into account). It is obvious that emissions per capita in Syria are much less than those of the European Union, 15 or 25 % less than the world average and slightly less than Turkey13.

GHG inventory of the Syrian's Initial National Communication to UNFCCC
INC-SY_GHG_General Inventory-En www.inc-sy.org
Table 1. Indicators of GHG Emissions in Syria and World (13)
Countries Ton CO2/ acpita Without LUCF
Tg Co2 eq Without LUCF Ton CO2/ capita Tg Co2 eq
EU-15 10.9 4.180 9.0 3.447 EU-25 11.0 4.925 9.0 4.064 OECD NA NA 11.1 12.780
Annex 1 14.7 17.288 12.2 14.289 Non Annex 1 16.0 13.855 13.4 11.633
The world NA NA 4.0 24.983 Turkey 4.1 286.3 3.3 231.0
Syria(*) 3.95 79.0 2.85 57.00
(*)In suppose the population of Syria is 20 million.

GHG inventory of the Syrian's Initial National Communication to UNFCCC
INC-SY_GHG_General Inventory-En www.inc-sy.org
Third Chapter: Overview of Emissions
3.1. Total Emissions: In the year 2005 the share of CO2 was the largest of GHG emissions in Syria. It reached 74% while share of CH4 was 13% and N2O 13% CO2 eq. Table (2) gives the total emissions for 1994 according to GHG. Table (3) shows total emissions of GHG in TG CO2 eq in four sectors; energy, agriculture, industry and waste.
Table 2. Total Emissions of GHG According to Gas for 1994
Gas 1994 1995 1996 1997 1998 1999 2000 2001 2002 2003 2004 2005
CO2 36.16 37.18 37.22 38.94 42.96 45.75 51.10 52.12 53.56 54.13 55.34 58.34
CH4 9.33 9.98 9.83 10.22 10.46 10.33 10.06 9.65 9.65 9.76 9.96 10.19
N2O 7.17 7.81 8.06 8.07 8.72 8.33 8.36 7.34 7.74 8.91 9.42 10.54
Table 3. Total Emissions of GHG according to Sector for 1994
Sector 1994 1995 1996 1997 1998 1999 2000 2001 2002 2003 2004 2005
Energy 38.23 39.40 39.06 40.82 44.65 47.40 52.66 52.96 54.13 54.54 55.60 58.35
Agriculture 9.47 10.32 10.70 10.78 11.72 11.04 11.04 9.85 10.38 11.74 12.56 13.93
Industry 2.49 2.71 2.74 2.74 2.81 2.88 2.65 3.04 2.99 2.95 2.86 2.94
Waste 2.47 2.54 2.61 2.88 2.95 3.07 3.16 3.25 3.45 3.57 3.670 3.85
Energy 73.80%
CO273.78%
Agr. 17.62%CH4
12.89%
Industry 3.72%N2O
13.33%
Waste 4.87%
0.00
10.00
20.00
30.00
40.00
50.00
60.00
70.00
80.00
90.00
100.00
by Sector by Gas
%
Total GHG Emissions
Fig 6. Overview of Total Emissions in 2005 according to Gas and Sector
In Syria the majority of GHG gases emitted are CO2 and from the energy sector. This sector emitted 95.137% of all CO2 gases in 2005. Electricity generation is responsible for 39% while transport represented 22% in 2005.

GHG inventory of the Syrian's Initial National Communication to UNFCCC
INC-SY_GHG_General Inventory-En www.inc-sy.org
3.2. Energy Sector
3.2.1. Trend of GHG emissions
Emissions from the energy sector grew steadily from 1994 to 2005 as shown in Fig (7) . Since energy balance for the years 2000-2004 was not available, emissions were calculated for these years by the Reference method only. A comparison was made between the Reference and Sectoral methods for GHG emissions from the energy sector for the year 2005. It was found that total emissions from the energy sector was 58.35 T g by the sectoral method and 58.366 T g by the Reference method ( after taking emissions of CH4 and N2O in the reference method into account). The difference between both methods is 0.03%.
Total emissions of GHG in 1994 were estimated to be 38.24 M ton CO2 eq with CO2 representing 89% of total emissions. GHG emissions reached 58.35 M ton CO2 eq in 2005 with CO2 constituting 95%. So it achieved an annual growth of 3.9% on average. This growth is less than the growth of demand on primary energy which increased from 11.7 M ton oil equivalent to 19.39 M ton during the same period. Therefore, emission per capita from the energy sector only decreased from 3.30 ton CO2 eq /ton equivalent oil to 2.98 during this period.
Fig 7. Trend of Total GHG Emissions from the Energy Sector from 1994 to 2005
3.2.2. Emissions of the Energy Sector by Gas
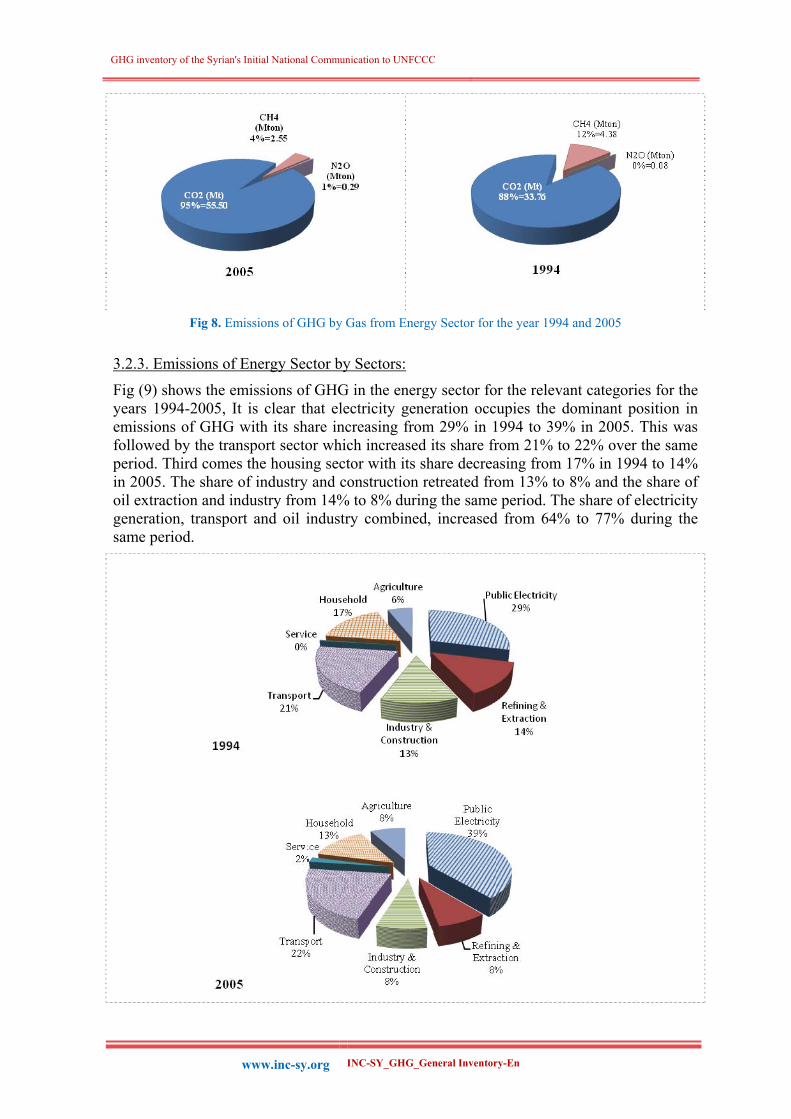
Fig (8) shows emissions of GHG according to gas from the energy sector. It is quite clear that the share of CO2 is the largest by far reaching 89% in 1994 and that CH4 comes second with 11% while that of N2O is negligible. This situation developed due to the increase in consumption of oil and gas in electricity generation and transport and to get energy so share of CO2 reached 95% of GHG emissions in 2005 while that of CH4 4% and N2O 1%.
GHG inventory of the Syrian's Initial National Communication to UNFCCC
INC-SY_GHG_General Inventory-En www.inc-sy.org
Fig 8. Emissions of GHG by Gas from Energy Sector for the year 1994 and 2005
3.2.3. Emissions of Energy Sector by Sectors:
Fig (9) shows the emissions of GHG in the energy sector for the relevant categories for the years 1994-2005, It is clear that electricity generation occupies the dominant position in emissions of GHG with its share increasing from 29% in 1994 to 39% in 2005. This was followed by the transport sector which increased its share from 21% to 22% over the same period. Third comes the housing sector with its share decreasing from 17% in 1994 to 14% in 2005. The share of industry and construction retreated from 13% to 8% and the share of oil extraction and industry from 14% to 8% during the same period. The share of electricity generation, transport and oil industry combined, increased from 64% to 77% during the same period.

GHG inventory of the Syrian's Initial National Communication to UNFCCC
INC-SY_GHG_General Inventory-En www.inc-sy.org
Fig 9. Emissions of GHG in Energy Sector according to Sectors in 1994-2005
3.3. Industrial Sector:
3.3.1. Trend of Total GHG Emissions from Industry:
Fig (10) shows total emissions of GHG in CO2 eq from the industrial sector for the years 1994-2005. The curve shows a slight increase in emissions from 1994 to 1999 which reached a peak in 2001 then dropped slightly till 2005. This is explained by fluctuations in production especially in the cement industry which is responsible for most of the emissions from the industrial emissions.
Fig 10. General Trend of GHG Emissions from Industry for 1994-2005

GHG inventory of the Syrian's Initial National Communication to UNFCCC
INC-SY_GHG_General Inventory-En www.inc-sy.org
3.3.2. Emissions from Industry by GHG Gas
Emissions of the three main GHG gases CO2, CH4 and N2O from industry were presented in Fig (11) . It shows that the highest emission from industry is in the form of CO2 while emission of CH4 from the petroleum coke industry is negligible and so N2O from fertilizer's industry.
Fig 11. Emissions of GHG from Industry according to Gas from 1994-2005
3.3.3. Emissions of GHG from Industry by Sector:
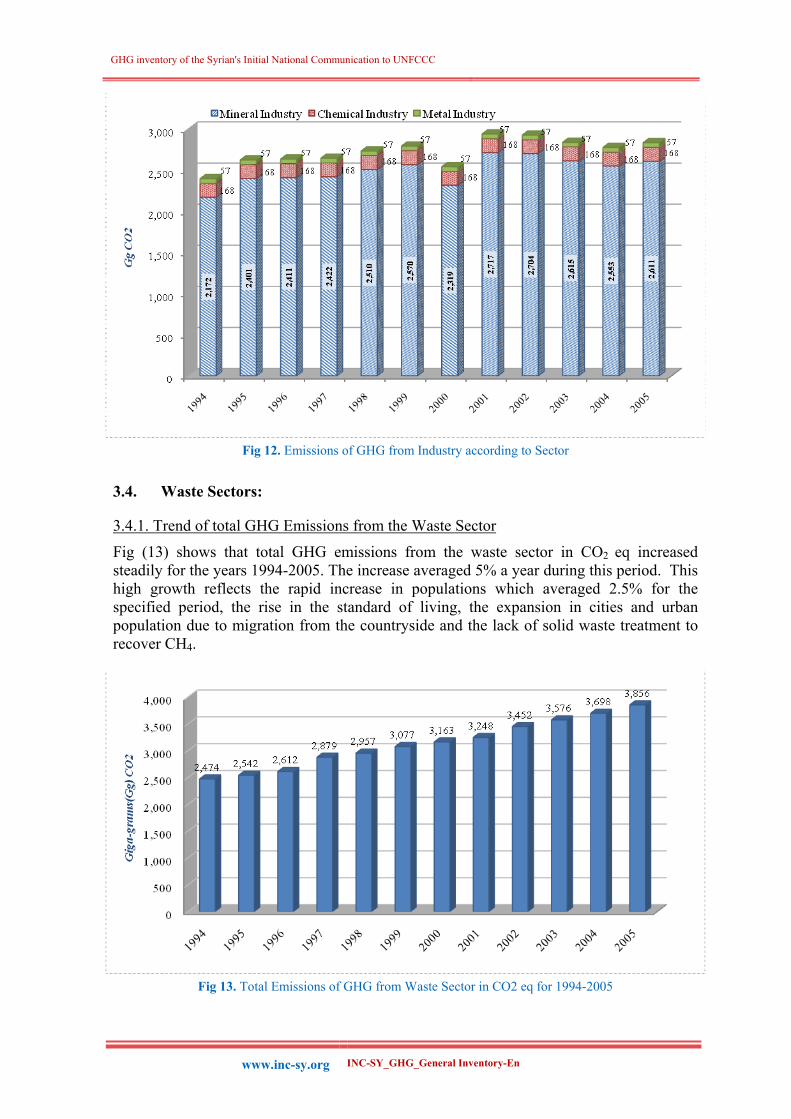
Figure (12) shows industrial emissions of CO2 gas by sector. It is obvious that the largest share comes from the mineral industry which has increased from 91% in 1994 to 92% in 2005. The largest contribution to the mineral sector comes from the cement industry with 89% of total emissions in 1994 and 91% in 2005. The second contributor (7%) is the fertilizer industry and a small percentage (2%) derives from metal and iron industries.
GHG inventory of the Syrian's Initial National Communication to UNFCCC
INC-SY_GHG_General Inventory-En www.inc-sy.org
Fig 12. Emissions of GHG from Industry according to Sector
3.4. Waste Sectors:
3.4.1. Trend of total GHG Emissions from the Waste Sector
Fig (13) shows that total GHG emissions from the waste sector in CO2 eq increased steadily for the years 1994-2005. The increase averaged 5% a year during this period. This high growth reflects the rapid increase in populations which averaged 2.5% for the specified period, the rise in the standard of living, the expansion in cities and urban population due to migration from the countryside and the lack of solid waste treatment to recover CH4.
Fig 13. Total Emissions of GHG from Waste Sector in CO2 eq for 1994-2005

GHG inventory of the Syrian's Initial National Communication to UNFCCC
INC-SY_GHG_General Inventory-En www.inc-sy.org
3.4.2. Emissions of Waste Sector by GHG gas:
Fig (14) shows emissions from the waste sector in terms of GHG gases. It is clear that the main GHG is CH4 produced by the fermentation of organic waste, followed by N2O. The importance of nitrates is due to the fact that most municipal water treatment plants were not operational in 1994.
Fig 14. GHG Emissions from the Waste Sector in CO2 eq by gas
3.4.3. Emission from the Waste (by Sector):
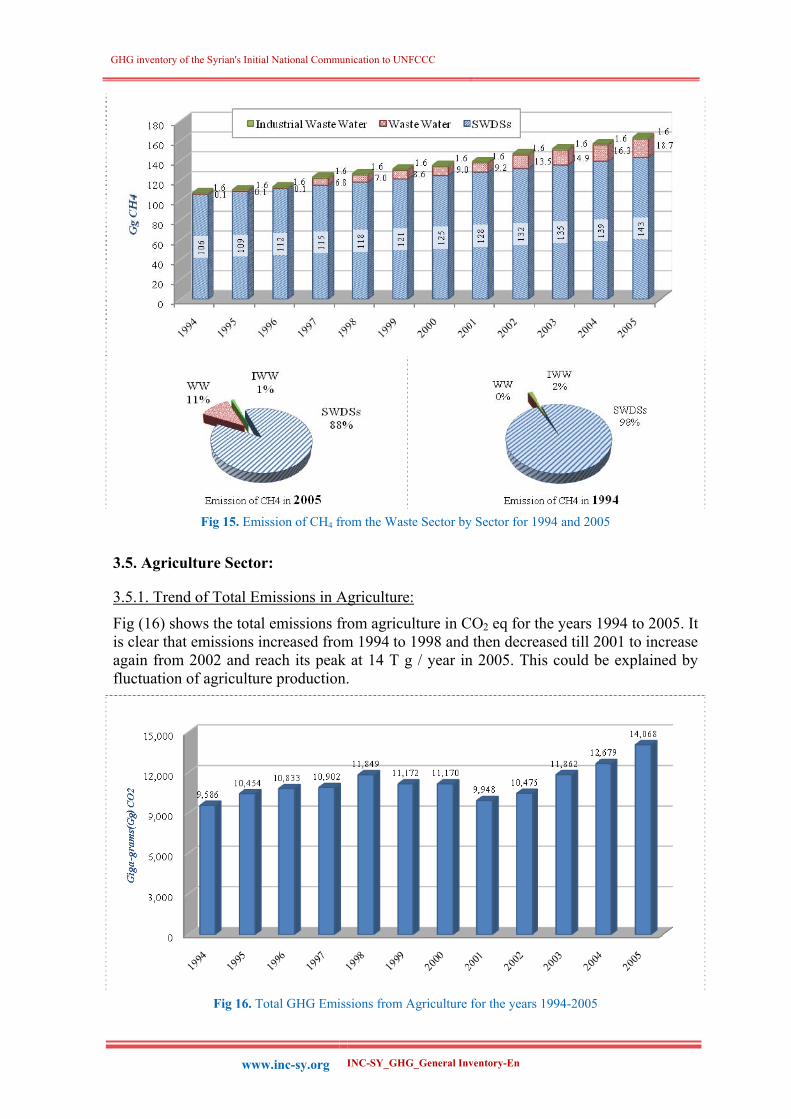
Figure (15) shows emissions from the waste sector by sector for the years 1994 � 2005 (essentially methane � CH4). It is clear that the main producer of GHG is solid waste, followed by municipal sewage water and finally industrial waste water. The figure shows also the distribution of methane emissions in the waste sector for the years 1994 and 2005. It is clear that emissions from solid waste accounted for 88% in 2005, followed by 11% from municipal sewage water and 1% only from industrial waste water. The reason for this is the delay in building municipal water and sewage treatment plants, as well as the lack of water treatment plants in industry or their closure because of technical reasons.
GHG inventory of the Syrian's Initial National Communication to UNFCCC
INC-SY_GHG_General Inventory-En www.inc-sy.org
Fig 15. Emission of CH4 from the Waste Sector by Sector for 1994 and 2005
3.5. Agriculture Sector:
3.5.1. Trend of Total Emissions in Agriculture:
Fig (16) shows the total emissions from agriculture in CO2 eq for the years 1994 to 2005. It is clear that emissions increased from 1994 to 1998 and then decreased till 2001 to increase again from 2002 and reach its peak at 14 T g / year in 2005. This could be explained by fluctuation of agriculture production.
Fig 16. Total GHG Emissions from Agriculture for the years 1994-2005

GHG inventory of the Syrian's Initial National Communication to UNFCCC
INC-SY_GHG_General Inventory-En www.inc-sy.org
3.5.2. Agricultural Emissions (by gas)
Fig (17) shows emissions of GHG from agriculture sector for the year 1994 and 2005 for CH4 and N2O only. It is clear that share of N2O in CO2 eq is higher with 72% to 74%. The major part comes from fertilizing the soil followed by animal waste.
Fig 17. Total Emissions of GHG from Agriculture (by Gas)
3.5.3. Agricultural Emissions (by Sector)
Fig (18) presents emissions by sector from agriculture, in CO2 eq. It is clear that the key category in this sector is N2O from agricultural fertilizer (72 -74% of the total). CH4 from the enteric fermentation of animals (22-24% of the total) is the second source of GHG. The percentage of emissions from burning agriculture crop waste after the harvest accounts for a mere 3%, that of animal waste and manure is 1%, while emissions from burning steppe vegetation is negligible.

GHG inventory of the Syrian's Initial National Communication to UNFCCC
INC-SY_GHG_General Inventory-En www.inc-sy.org
Fig 18. Emissions of GHG from Agriculture by Sector
3.6. Emissions of GHG from Land Use and Forestry
3.6.1. Emissions of GHG (by Gas)
Fig (19) shows emissions by GHG from land use and the forestry sector (LUCF). It is obvious that emissions of CO2 are by far the highest, while those of CH4 and N2O are negligible.

GHG inventory of the Syrian's Initial National Communication to UNFCCC
INC-SY_GHG_General Inventory-En www.inc-sy.org
Fig 19. Emissions of GHG from LUCEF by Gas
3.6.2.Emissions of GHG and sinks (by sector)
Figure (20) shows emissions for the year 1994 by sector of GHG and its sinks (absorption) by the LUCF sector. It is clear that emissions are less than the absorption of GHG by natural factors (sinks). The main factor of absorption (sinks) comes from forests and trees, followed to a much lesser extent by deserted land. Emissions were highest from fires in forests, followed by those from mineral soils and finally emissions from in-field burning.
Fig 20. Emissions & Sinks of GHG from LUCEF for 1994

GHG inventory of the Syrian's Initial National Communication to UNFCCC
INC-SY_GHG_General Inventory-En www.inc-sy.org

GHG inventory of the Syrian's Initial National Communication to UNFCCC
INC-SY_GHG_General Inventory-En www.inc-sy.org
Fig (21) shows results of GHG emissions and sinks in LUCEF from 1994-2005.
Fig 21. Emissions and Sinks of GHG from LUCEF for 1994-2005
3.5. Trend of Emissions of GHG Precursors and SO2 Emissions of NMVOC, CO, SO2 and NOx from the industry sector were calculated according to IPCC 1996 Revised Guidelines. Figure (22) shows the total emissions of these gases. Most emissions are in the form of NMVOC which come from the food and drinks industry, followed by asphalt used on roads and to cover roofs. SOx gases come next (mainly from the cement industry). It is worth mentioning that SOx is not a GHG or a precursor, but a polluting agent.
Fig 22. Emissions of NMVOC, SOx and NOx from Industry
GHG inventory of the Syrian's Initial National Communication to UNFCCC
INC-SY_GHG_General Inventory-En www.inc-sy.org
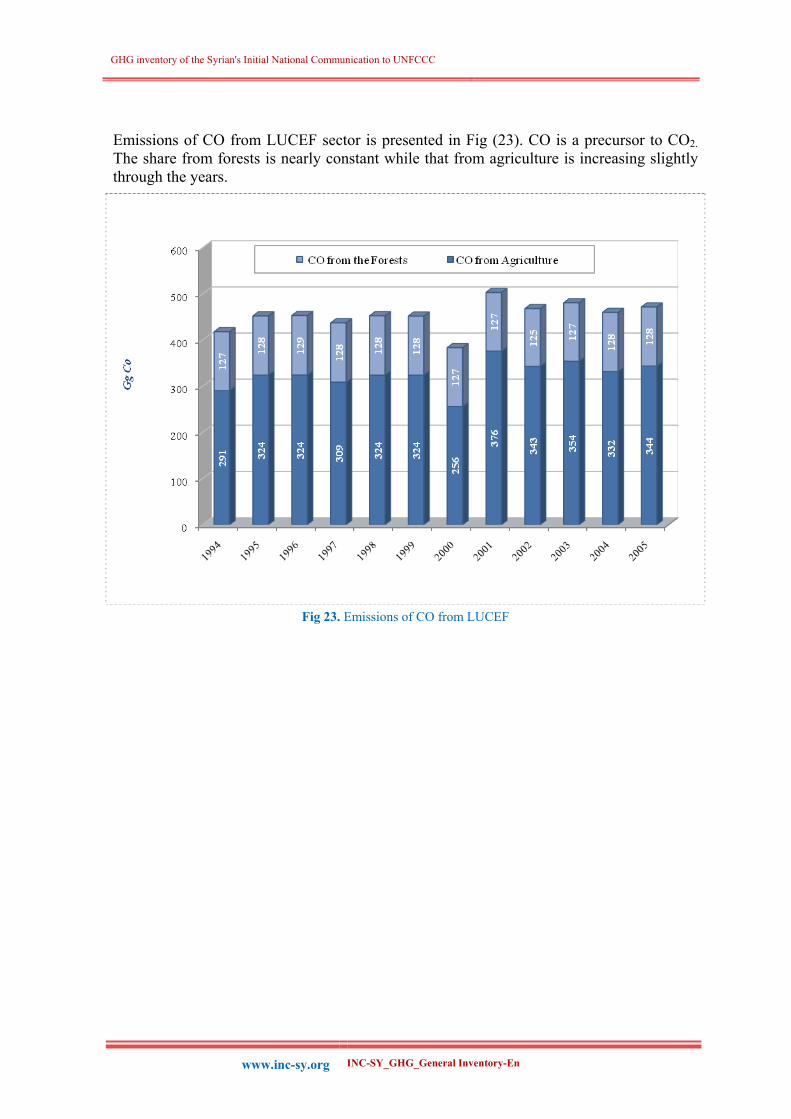
Emissions of CO from LUCEF sector is presented in Fig (23). CO is a precursor to CO2. The share from forests is nearly constant while that from agriculture is increasing slightly through the years.
Fig 23. Emissions of CO from LUCEF

GHG inventory of the Syrian's Initial National Communication to UNFCCC
INC-SY_GHG_General Inventory-En www.inc-sy.org
Fourth Chapter: General Issues and Scope for Development
4.1. Quality Control: Since this report is the first national communication for Syria that followed the methodologies and instructions of the IPCC, and due to the absence of institutions dealing with the GHG inventory, there was in general a lack of data or a deficiency in the quality of data. This was especially true for the energy sector, with the lack of an energy balance for the years 2000-2004. This made it necessary to calculate GHG emissions from the energy sector for these years by using the Reference method only. There was a lack of data from the industrial sector concerning other GHGs such as SF6, HFCs and PFCs. Another problem in industry is related to the lack of data from the private sector: there is for instance a paucity on lime production. In the waste sector there was also a lack of quality data on municipal waste water plants, and more specifically on industrial waste water stations.
4.2. Uncertainty: Uncertainty is inevitable in the GHG inventory compilation, this for many reasons. Data were obtained from the Central Bureau of Statistics and the concerned ministries. There was uncertainty relating to these data due to inaccuracies and their availability from more than one source. There were many instances of lack of data and of conversion and emission factors. This made it necessary to use default emission factors (DEF) from IPCC Guidelines, many of these not local. There was moreover a degree of uncertainty related to them. In several cases, local conversion factors, when available, were used for better estimations (such as the calorific values of oil products used in Syria). Also Tier 1 was used, adding another source of uncertainty.
4.3. Use of higher methodologies: Tier 1 in the IPCC Revised 1996 Guidelines was applied. This was recommended by COP for non-annex 1 countries and for the first national communication (INC). In this work the gaps were recognized. It will be possible in the second national communication to avoid these gaps and to use a mixture of Tier 1 and Tier 2, which depends on more accurate data and local emission factors.
4.4. Training of GHG inventory group:
During the process of the GHG inventory compilation linked to the first national communication, a group of trainees from the State Ministry of Environment met together and gained experience. During the workshops other trainees from the concerned ministries joined in. These trained personnel could later form the basis of a permanent unit in charge of preparing inventories for the following years and for the second national communication. Further training could be needed both locally and externally.

GHG inventory of the Syrian's Initial National Communication to UNFCCC
INC-SY_GHG_General Inventory-En www.inc-sy.org
Symbols and Nomenclature
AD Activity Data
CO2 Carbon Dioxide
CO Carbon Monoxide
COP Conference of Parties
CH4 Methane
DEF Default Emission Factor
EF Emission Factor
GEF Global Energy Forum
Gg Giga gram equal 109 gram
GHG Green House Gases
Guidelines 1996 IPCC Guidelines for GHG calculation 1996
GTZ German association for technical cooperation
GWP Global Warming Potential
HFC's Hydro flouro Carbons
IEA International Energy Agency
IPCC Inter-Governmental Panel for Climate Change
KC Key Categories
LULUCEF Land Use, Land-Use Change and Forestry
NC National Communication
NGGIP National Green House Gases Inventory Program
NMVOC Non Methane Volatile Organic Compounds
N2O Nitrous Oxide
Non-Annex 1 Countries not included in Annex 1 of Koyoto Ptotocol
PFC's Per Flouro Carbons
SF6 Sulfur Hexa Flouride
SO2 Sulfur Dioxide
Tg Tera gram equal 1012 gram
TOR Term of Reference
Tier 1 Methodology 1: lower level for GHG calculation
UNDP United Nation Development Program
UNEP United Nation Environment Program
UNFCCC United Nation Framework Convention for Climate Change
WMO World Meteorological Organization

GHG inventory of the Syrian's Initial National Communication to UNFCCC
INC-SY_GHG_General Inventory-En www.inc-sy.org
References
1. 16th years of scientific assessment in support of the climate change (2004). Jarrud, M. & Topfer, K., IPCC,
Dec., (2004). 2. Climate Change: The Physical Science Basis (2007). Solomon، S.، D. et al., "Summary for Policymakers,
Contribution of Working Group I to the Fourth Assessment Report of IPCC, Cambridge University Press, Cambridge, United Kingdom (2007).
3. Climate-Changes-and-the-Mediterranean-Environmental-and-societal-impacts (2008). Meslmani, Y., and Eido, M., (INC-SY_ Climate Changes and the-Mediterranean); United Nation Development Programme (UNDP) / GCEA Damascus, Syria. June 2008. (Arabic report).
4. Dust full study in the surrounding area of a cement factory and determination of the major elements of the dust fall using Neutron Activation Analysis, NAA (2004). Y. Meslmani, M. Al-Oudat, Seventh Arab Conference on the peaceful uses of Atomic Energy Sanaa 4 � 8 December 2004. Sanaa � Yemen.
5. Effect of using unleaded gasoline on lead concentration in air, soil and plants in Damascus-Syria (2006). Y. Meslmani, M. Al Aoudat, K. Al Kharfan, K. Al Shamali. Eighth Arab Conference on the peaceful uses of Atomic Energy Amman, 3 � 7 December 2006.
6. Final Energy Balance for the year 2005. Ministry for Electricity. 7. First National Communication of Turkey, www.unfccc.int. 8. Gas Movement in Syria. Ministry of Oil and Mineral Wealth (2005). 9. Greenhouse gas (GHG) Emissions Inventory of the industrial sector in Syria (2009). Meslmani, Y., and
Housami, N.; Ministry of State for Environment Affairs (MSEA) / United Nation Development Programme (UNDP), Damascus, Syria. (INC-SY_GHG_ Industrial Inventory) July 2009.
10. Greenhouse gas (GHG) Emissions Inventory of the Energy Sector in Syria (2009). Meslmani, Y., and Hainoun, A.; Ministry of State for Environment Affairs (MSEA) / United Nation Development Programme (UNDP), Damascus, Syria. (INC-SY_GHG_ Energy Inventory). July 2009.
11. Greenhouse gas (GHG) Emissions Inventory of the Waste Sector in Syria (2009). Meslmani, Y., and Kabekli, R.; Ministry of State for Environment Affairs (MSEA) / United Nation Development Programme (UNDP), Damascus, Syria. (INC-SY_GHG_ Waste Inventory), Damascus, Syria. July 2009.
12. Greenhouse gas (GHG) Emissions Inventory of Agriculture, Land use, Land use Change and Forestry (ALULUCF) in Syria (2009). Meslmani, Y., and Jabour, E.; Ministry of State for Environment Affairs (MSEA) / United Nation Development Programme (UNDP), Damascus, Syria. (INC-SY_GHG_ALULUCF Inventory); July 2009.
13. IEA statistics, www.iea.org. 14. Influence of Cement Dust Emission on Olive trees around Tartous cement factory in Syria: A case study
for the eastern Mediterranean region (2007). Y. Meslmani; M. Al-Aoudat; and K. Al-kharfan. 14th International Symposium on Environmental Pollution and its Impact on Life in the Mediterranean Region with focus on Environment and Health. October 10-14, 2007; Seville - Spain.
15. Inception Report of Syria's Initial National Communication (2007). Meslmani, Y., (INC-SY_ Inception Report); United Nation Development Programme (UNDP) / GCEA. Damascus, Syria. December 2007.
16. IPCC Guidelines for National Greenhouse Gas Inventories (2006). Vol. 1-5, NGGIP, IGES, Japan. (http://www.ipcc-nggip.iges. or.jp).
17. Koyoto Protocol, United Nations Framework Convention on Climate Change (UFCCC). Informal 83 UN (2005). www.unfccc.int.
18. Manual for the United Nations Framework Convention on Climate Change (UFCCC) non-Annex I. GHG Inventory Software, Version1.3.2.
GHG inventory of the Syrian's Initial National Communication to UNFCCC
INC-SY_GHG_General Inventory-En www.inc-sy.org
19. National Circumstances of Syria's Initial National Communication (2008). Meslmani, Y., Maya, R., Eido, M., A., Khalil, I., Mawed, K., Saker, and Alwanous, N., (INC-SY_ National Circumstances); United Nation Development Programme (UNDP) / GCEA. Damascus, Syria. June 2008.
20. Properties of nitrate, sulfate and ammonium in typical polluted atmospheric aerosols (PM10) in Beijing (2007). Zhang Kai, Wang Yuesi, Wen Tianxue, Meslmani Yousef and Murray Frank. Atmospheric Research, March 2007. Volume 84, Issue 1, pp. 67-77.
21. PROPOSAL OF AIR QUALITY PROGRAMME FOR DAMASCUS City (2004), Yousef Meslmani, International Conference on Atmospheric Pollution, Dubai International Convention Center, 21 � 24. February 2004. Dubai � UAE.
22. Revised 1996 IPCC Guidelines for National Greenhouse Inventories. Vol. 1-5. NGGIP, IGES, Japan. (http://www.ipcc-nggip.iges. or.jp).
23. Review of Air Quality in Syria: 1999-2006; (2006). Yousef Meslmani; Environmental Protection Division, Atomic Energy Commission of Syria. AECS-PR/Rss 697; September, 2006.
24. SOME TRENDS RELATED TO THE AIR POLLUTION IN DAMASCUS (2002), Y. Meslmani, Management of Environmental Quality: an International Journal, Vol. 15 No. 4, 2004.
25. State-and-Trends of the Environment: 1987�2007; Atmosphere. Lead authors: Mike Ashmore, Duncan Brack, Hans Eerens, Sara Feresu, Kejun Jiang, Héctor Jorquera, Sivan Kartha, Yousef Meslmani, Luisa T. Molina, Frank Murray, Linn Persson, Dieter Schwela, Hans Martin Seip, Ancha Srinivasan, and Bingyan Wang. Fourth Global Environment Outlook report (GEO-4). Division of Early Warning and Assessment (DEWA), United Nation of Environmental Programs (UNEP); P.O.Box: 30552, Nairobi � Kenya. (Copies of this report are available for download on www.unep.org/geo/geo4/).
26. Statistical Agriculture Tables (2004). Ministry of Agriculture and Agrarian Reform, Bureau of Statistics, Syria.
27. Statistical Tables(2006). The 59th. Year, Office of prime minister, Central Bureau of Statistics, Syria 28. Studies on water-soluble salts in PM10 during the heavy pollution process in Beijing (2006). ZHANG Kai,
WANG Yue-si, WEN Tian-xue, HU Bo, LIU Guang-ren and MESLMANI Yousef. CHINA ENVIRONMENTAL SCIENCE. 2006 Vol. 26 No.4, pp.385-389.
29. Technical Statistical Report (2006). Ministry of Electricity, Damascus, Syria. 30. Technical Statistical Report. Ministry of Electricity. Damascus. 2006. 31. The relationship between the vertical distribution of the Boundary Layer Ozone and preexisting NOx
concentrations (2007). MESLMANI Yousef; AN Junlin LI X, WANG Yuesi, HU Fei. 12th International Conference of the Pacific Basin Consortium for Environment & Health Sciences. 26th -29th October 2007; Peking University, Beijing - China.
32. The relationship between the vertical distribution of the Boundary Layer Ozone and preexisting NOx concentrations (2007). MESLMANI Yousef; AN Junlin LI X, WANG Yuesi, HU Fei. Submitted to Journal of Atmospheric Research.
33. The effects of cement dust on olive trees in the area surrounding Tartous cement factory (2005). Yousef Meslmani, Mohammad Al-Aoudat, Kamel Al-kharfan. 3rd International Symposium on Air Quality. Management at Urban, Regional and Global Scales, 26 � 30 September 2005, Istanbul � Turkey.
34. United Nations Framework Convention on Climate Change (UFCCC). UN (1992). 35. View of Air pollution problem in Damascus, Y. Meslmani, Department of Protection and Safety, AECS,
European-Arabian Conference for the Environment, 10 � 14 October 2002, Rostock � Germany.