Eritrea NC3.pdf - UNFCCC
196
THE STATE OF ERITREA MINISTRY OF LAND, WATER AND ENVIRONMENT DEPARTMENT OF ENVIRONMENT Third National Communication Under The United Nations Framework Convention On Climate Change (UNFCCC) December 2021 ASMARA, ERITREA
-
Upload
khangminh22 -
Category
Documents
-
view
6 -
download
0
Transcript of Eritrea NC3.pdf - UNFCCC

THE STATE OF ERITREA
MINISTRY OF LAND, WATER AND ENVIRONMENT
DEPARTMENT OF ENVIRONMENT
Third National Communication Under The United Nations
Framework Convention On Climate Change (UNFCCC)
December 2021
ASMARA, ERITREA

i
Table of Contents
List of Figures ....................................................................................................................................vi
List Table ........................................................................................................................................ viii
List of Acronyms and Abbreviations ................................................................................................ x
Foreword ........................................................................................................................................... xv
Acknowledgment ............................................................................................................................ xvi
Executive Summary ...................................................................................................................... xvii
1 NATIONAL CIRCUMSTANCES ............................................................................................ 1
1.1 Introduction ............................................................................................................................ 1
1.2 Geographical Setting .............................................................................................................. 2
1.3 Climate .................................................................................................................................. 2
1.4 Agro-Ecological Zones ........................................................................................................... 4
1.5 Land Use and Land Cover ...................................................................................................... 5
1.6 Soil ........................................................................................................................................ 6
1.7 Socio- Economic and Development Context ........................................................................... 6
1.7.1 Population and Demographic Profile ........................................................................ 7
1.7.2 The Education Sector ............................................................................................... 7
1.7.3 The Health Sector .................................................................................................... 8
1.8 Economic Sectors ................................................................................................................... 9
1.8.1 Agriculture ............................................................................................................ 10
1.8.2 Fishery, Marine and Coastal Resources .................................................................. 11
1.8.3 Tourism ................................................................................................................. 11
1.8.4 Trade and Industry ................................................................................................. 12
1.8.5 Transport and Communication ............................................................................... 12
1.8.6 Energy and Mines .................................................................................................. 13
1.9 Environmental Context ......................................................................................................... 13
1.9.1 Climate Changes.................................................................................................... 14
1.9.2 Water Resources .................................................................................................... 14
1.10 Waste Management .............................................................................................................. 16
1.11 National and Regional Policies and Strategies ....................................................................... 16
1.12 Institutional Arrangement for National Communication ........................................................ 17
2 NATIONAL INVENTORY OF GREENHOUSE GASES .................................................... 19
2.1 Introduction .......................................................................................................................... 19
2.1.1 Objectives ............................................................................................................. 19

ii
2.1.2 Institutional Arrangement for TNC preparation ...................................................... 19
2.2 Methodologies ...................................................................................................................... 21
2.2.1 Activity Data ......................................................................................................... 21
2.3 Emission of GHG by Source and Removals by sink .............................................................. 22
2.3.1 Aggregated GHG Emissions and Trends ................................................................ 22
2.3.2 Emissions of Indirect Greenhouse Gases by Sources .............................................. 27
2.4 Sectoral GHG Emissions ...................................................................................................... 27
2.4.1 Energy Sector ........................................................................................................ 27
2.4.2 Industrial Processes and Product Use (IPPU) ......................................................... 31
2.4.3 Agriculture, Forestry and Other Land Use (AFOLU).............................................. 31
2.4.4 Waste Sector.......................................................................................................... 34
2.5 Quality Assurance (QA) and Quality Control (QC) ............................................................... 35
2.5.1 Quality Assurance (QA) ........................................................................................ 35
2.6 Uncertainty Analysis ............................................................................................................ 36
2.7 Key Category Analysis ......................................................................................................... 36
2.7.1 Level Assessment .................................................................................................. 36
2.7.2 Trend assessment ................................................................................................... 37
2.8 Consistency .......................................................................................................................... 38
2.9 Completeness of the 2000 to 2015 Inventories ...................................................................... 39
2.10 Comparability and Recalculation of GHG emission .............................................................. 42
2.11 Archiving ............................................................................................................................. 42
2.12 National Inventory Improvement Plan .................................................................................. 42
3 NATIONAL GHG MITIGATION ASSESSMNET AND ANALYSIS ............................................ 49
3.1 Introduction .......................................................................................................................... 49
3.2 Energy Sector Background ................................................................................................... 50
3.2.1 Scope of the Assessment ........................................................................................ 55
3.2.2 Mitigation Assessment Methods and Approaches ................................................... 55
3.2.3 Socio Economic Scenarios ..................................................................................... 57
3.3 Energy Sector Mitigation Assessment and Analysis .............................................................. 58
3.3.1 Business as Usual Scenario .................................................................................... 58
3.3.2 Mitigation Scenarios .............................................................................................. 61
3.3.3 GHG Mitigation Analysis ...................................................................................... 62
3.4 Non-Energy Sectors Mitigation Options ............................................................................... 67
3.4.1 Forest Management (Afforestation and Reforestation)............................................ 67
3.5 Solid Waste Management ..................................................................................................... 68

iii
3.5.1 Mitigation Options for Solid Wastes ...................................................................... 68
3.6 Key Barriers to GHG Mitigation Analysis ............................................................................ 68
3.6.1 Financial Constraints ............................................................................................. 68
3.6.2 Capacity Building .................................................................................................. 68
3.6.3 Lack of Monitoring-Evaluation (M & E) and Reporting Progress ........................... 69
3.7 Key Opportunities for GHG Mitigation................................................................................. 69
3.7.1 Community Participation ....................................................................................... 69
3.7.2 Integration of Climate Change into Education ........................................................ 69
3.7.3 Contribution of the Mass Media ............................................................................. 70
3.8 Institutional Capacity-Building ............................................................................................. 70
3.9 Key Findings ........................................................................................................................ 70
3.9.1 Energy Sub Sector ................................................................................................. 70
3.9.2 Road Transport ...................................................................................................... 71
3.9.3 Household ............................................................................................................. 71
3.9.4 Market-Based Instruments and Regulatory Measures ............................................. 71
3.9.5 Dissemination of Mitigation Technologies ............................................................. 71
4 VULNERABILITY, IMPACTS, AND ADAPTATION ASSESSMENT ........................................... 73
4.1 Introduction .......................................................................................................................... 73
4.2 Methods and Approaches...................................................................................................... 73
4.3 Climate and Climatic variability: Trends and Projection........................................................ 74
4.3.1 Rainfall.................................................................................................................. 74
4.3.2 Temperature .......................................................................................................... 75
4.4 Projected Future Climate ...................................................................................................... 77
4.4.1 Rainfall.................................................................................................................. 77
4.4.2 Temperature .......................................................................................................... 77
4.5 Vulnerability and Impact Assessment ................................................................................... 78
4.6 Indicators for the Components of Vulnerability..................................................................... 78
4.7 Factors Affecting Vulnerability to Climate Change ............................................................... 79
4.8 Vulnerability and Impacts on Sectors .................................................................................... 81
4.8.1 Crop and Livestock production .............................................................................. 81
4.8.2 Water Resources .................................................................................................... 85
4.8.3 Forest Sector.......................................................................................................... 90
4.8.4 Human Health ....................................................................................................... 90
4.8.5 Coastal Areas ........................................................................................................ 93
4.9 Adaptation Assessment, Strategy and Policies ...................................................................... 94

iv
4.10 Coping Mechanism/Strategies .............................................................................................. 94
4.10.1 Crop Production .................................................................................................... 94
4.10.2 Adaptation Options in Natural Resource Management ........................................... 98
4.10.3 Adaptation Activities of Water Resources ............................................................ 100
4.10.4 Health Sector ....................................................................................................... 101
4.10.5 Coastal Areas ...................................................................................................... 103
5 INFORMATION RELEVANT TO ACHIEVEMENT OF UNFCCC ............................................105
5.1 Introduction ........................................................................................................................ 105
5.2 Steps Taken to Integrate Climate Change into Social, Economic and Environmental Policies ....
.......................................................................................................................................... 105
5.2.1 Economic Policies ............................................................................................... 106
5.2.2 Environmental Polices ......................................................................................... 108
5.3 Development and Transfer of Environmentally Sound Technologies (ESTS) ...................... 111
5.3.1 Technology Needs Assessment ............................................................................ 111
5.3.2 Priority Technologies Needs of Eritrea ................................................................. 111
5.4 Climate Change Research and Systematic Observation ....................................................... 114
5.4.1 Climate Change Research .................................................................................... 114
5.4.2 Systematic Observation ....................................................................................... 115
5.5 Education, Training and Public Awareness ......................................................................... 117
5.5.1 Education ............................................................................................................ 117
5.5.2 Capacity Building ................................................................................................ 118
5.5.3 Public Awareness ................................................................................................ 121
5.6 Information and Networking ............................................................................................... 122
5.6.1 Efforts to Promote Sharing Among Within Countries and Regions ....................... 122
5.6.2 Participation In and Contribution to Information Networks .................................. 123
5.6.3 Access and Use of Information Technologies ....................................................... 123
6 CONSTRAINTS AND GAPS, AND RELATED, TECHNICAL AND CAPACITY
NEEDS.....................................................................................................................................124
6.1 General Background ........................................................................................................... 124
6.2 Financial Constraints .......................................................................................................... 124
6.2.1 Financial Constraints to Report National Communications ................................... 124
6.2.2 Identification and Utilization of Support Programmes .......................................... 126
6.2.3 Level of Financial Investment in Climate Change ................................................ 127
6.2.4 General Needs ..................................................................................................... 127
6.3 Technical Needs ................................................................................................................. 128
6.3.1 Technical Assistance ........................................................................................... 128
v
6.3.2 Inadequate Human Capacity ................................................................................ 129
6.3.3 Inadequate Institutional Capacity ......................................................................... 130
6.3.4 Insufficient Climate Data ..................................................................................... 131
6.3.5 Scientific Research and Innovation needs............................................................. 132
6.3.6 Incoherent Climate Change Regulatory Framework ............................................. 133
6.4 Monitoring and Evaluation (M&E) Plan ............................................................................. 133
REFERENCES ...............................................................................................................................135
Annexes-A: TNC Preparation and Coordinating System ............................................................140
Annex-A1: List of Experts responsible for Quality Assurance and Quality Control..................... 140
Annex-A2: List of Experts and Consultants participated in TNC preparation .............................. 141
Annex-B: Implemented Adaption projects ...................................................................................143
Annex B1: Smart Agriculture Practiced by Farming Community................................................ 143
Annex B2: Specific Needs, Options & Priorities in Climate Change and Related Thematic Areas
144
Annex-B3: Climate Change- Specific Projects Implemented Under GEF-SGP, 2009-2019 ......... 146
Annex-B4: National Policies, rules, regulations and guidelines .................................................. 148
Annex-C: National Emissions and Removals...............................................................................150
Annex-C1: Key Summary of GHG Emission (2015) .................................................................. 150
Annex-C2: GHG Emission from Energy Sector (2015) .............................................................. 152
Annex-C3: GHG Emission from IPPU sector (2015) .................................................................. 156
Annex-C4: GHG Emission from AFOLU Sector (2015) ............................................................. 159
Annex-C5: GHG emission from Waste Sector (2015) ................................................................ 163
Annex-C6: Level and Trend Uncertainty (2015) ......................................................................... 164
vi
List of Figures Figure 1.1: Location and administrative regions of Eritrea 2
Figure 1.2: Mean Annual Temperature in oC of Eritrea (Source: SNC, 2012) 3
Figure 1.3: Rainfall Map of Eritrea 3
Figure 1.4: Agro ecological zones of Eritrea 5
Figure 1.5: Soil map of Eritrea – extracted from Harmonized World Soil Database (version 1.2). 6
Figure 1.6: Infant and under-5 mortality rates per 1,000 live births (1970 - 2016) 9
Figure 1.7: Drainage Basin Classifications of Eritrea (Source: MOLWE, 2007) 15
Figure 1.8: Institutional Arrangement 18
Figure 2.1: Institutional arrangements for the GHG inventory preparation 21
Figure 2.2: Trend of total GHG Emission by year CO2 eq (Gg) 23
Figure 2.3: GHG emission contributions by sector 2000-2015 24
Figure 2.4: Share of GHG emission by gas in 2015 25
Figure 2.5: GHGs emissions in Gg of CO2 equivalent by sub-sector in the energy sector, in 2015 30
Figure 2.6: Methane Emission by source category 32
Figure 2.7: Land net CO2 removal in Gg through the inventory years 33
Figure 2.8: Emission from waste sector in Gg 35
Figure 2.9: GHG emission consistency 39
Figure 3.1: Share of the Energy Supply and Primary supply, dissipated in transformation and final
consumption (‘000’toe) in 2018 50
Figure 3.2: Share of Fuel Consumption by Sector in the Energy Balance of Eritrea, 2018 51
Figure 3.3: ICS + SCS) electricity generation GWh, sales and losses 51
Figure 3.4: Wind potential at 10 Meter height in different regions 51
Figure 3.5: Average daily solar irradiance 52
Figure 3.6: Solar PV Diesel Hybrid Mini-grid system (Mai – Dma) 54
Figure 3.7: Solar Home system and solar water pump 54
Figure 3.8: Traditional Improved stove (Adhanet Mogogo) training and demonstration 55
Figure 3.9: Mitigation assessment approaches 56
Figure 3.10: Projected population statistics of Eritrea 57
Figure 3.11: Percentage share of projected population in Eritrea 57
Figure 3.12: Reference Scenario total final fuel demand all fuels (ktoe) 59
Figure 3.13: Reference Scenario, Global warming Potential in CO2-eq (Gg) 60
Figure 3.14: Mitigation Scenario, Global warming potential CO2 eq of the different energy subsectors 62
Figure 3.15: Mitigation and Reference Scenario, Global warming potential CO2 eq in millions kgs 63
Figure 3.16: Mitigation and Reference Scenario, household energy demand in thousand tones oil eq. 64
Figure 3.17: Mitigation scenarios, household GWP in million kgCO2 eq. 64

vii
Figure 3.18: Mitigation and Reference, Services Energy demand in 1000 ton of Oil equivalents CO2 eq
65
Figure 3.19: Mitigation and Reference, Energy demand in 1000 ton of Oil equivalents CO2 eq 66
Figure 4.1: Asmara station long -term annual precipitation (1903-2018) 75
Figure 4.2: Massawa station long term annual precipitations (1940 - 1977 and 1980-2010) 75
Figure 4.3: Maximum Average Air Temperature (C) Variability for Central Highland of Eritrea 76
Figure 4.4: Total Production (tons) from 2007 to 2018 for Sorghum, Barley and Wheat 83
Figure 4.5: Productivity (t/ha) from 2007 to 2018 for Sorghum, Barley and Wheat 83
Figure 4.6: Simulated Annual Stream Flow Series of Mereb-Gash Basin at Tesenay 86
Figure 4.7: Simulated Annual Stream Flow Series of Anseba River System at Halib Mentel 86
Figure 4.8: Annual inflow of Toker Dam 87
Figure 4.9: Annual inflow of Mai Nefhi Dam (Source: AWSD, 2019) 87
Figure 4.10: Water Table Decline from the Surface in Alluvial Formation of Bisha, Area 88
Figure 4.11: Water Table Decline from Surface in the Hard Rock Formation of Adi-Nfas area 88
Figure 4.12: EC Values of Asseb water supply, Harsile Area 89
Figure 4.13: EC Values of Bisha Mining Area Monitoring Wells (Source: BMSC, 2018) 90
Figure 4.14: Vulnerability and Spread of Schistosomiasis in six regions of Eritrea 2015 92
Figure 4.15: High tides inundating the coastal village of Barasole, Southern Red Sea 93
Figure 4.16: Observed Sea Level rise in Red Sea Area at 17° Longitude and 40° Latitude (1992-2012) 94
Figure 4.17: Spate Irrigation Dams that need Periodic Maintenance in Gash Barka 97
Figure 4.18: Drug Administration for Schistosomiasis to community Members and School Children 103

viii
List Table Table 1.1: Description of the Agro Ecological Zones of Eritrea 4
Table 1.2: Land Use Types of Eritrea 5
Table 1.3: Manufacturing Sectors of Eritrea 12
Table 1.4: Major drainage basins of Eritrea and estimated runoff contribution (Mm3/yr) 15
Table 1.5: Ground water sources of Eritrea (million M3) 16
Table 1.6: Roles and Responsibilities of each institution 18
Table 2.1: Members of the NGHGITEWG and their respective mandates 20
Table 2.2: Direct GHG Emissions and removals by year and sector 22
Table 2.3: Direct GHG Emissions by year and Gas 23
Table 2.4: Summary report for national direct GHG emissions (Gg) (2000, 2006, 2010 and 2015) 25
Table 2.5: Emissions of HFCs, PFCs and SF6 27
Table 2.6: Fuel consumption disaggregated by fuel type reference versus sectoral approach for 2015 28
Table 2.7: Emissions from Bunker fuels in absolute unit of Gg, 2000- 2015 30
Table 2.8: GHG Emissions from Industrial Process & percentage share Inventory Year 2000-2015 31
Table 2.9: Data and assumption used for waste sector. 34
Table 2.10: Level Assessment 2015 37
Table 2.11: Trend Assessment 38
Table 2.12: Completeness of the 2015 inventories of Eritrea 40
Table 2.13: Improvement Plan 44
Table 3.1: Reference Scenario, Energy demand all fuels in thousand tons of oil equivalents 58
Table 3.2: Reference Scenario, Global warming Potential in CO2-eq (million kgs) 59
Table 3.3: Reference Scenario, Energy demand in Household in kilo tons of oil equivalents 61
Table 3.4: Mitigation Scenario Energy demand in all sectors in kilo-ton of oil equivalent 62
Table 3.5: Mitigation and Reference Scenario, GHG emission in thousand Metric tons CO2eq 63
Table 3.6: Mitigation Scenario, Transport energy demand kilo ton of oil eq. 63
Table 3.7: Transformation; Electricity generation from all fuels in GWh 66
Table 4.1: Indicators used for the Components of Vulnerability 78
Table 4.2: Factors Affecting Vulnerability to Climate Change in Regions of Eritrea 79
Table 4.3: Crop Vulnerability Exposure and the Risks according to Experts in the Zobas 79
Table 4.4: Vulnerability to Natural Disasters in Zobas during the period 2006 to 2018 80
Table 4.5: Crop Deficits in the Traditional Farming System 80
Table 4.6: Ranking of Vulnerability across Sectors according to Experts in Eritrea 81
Table 4.7: Production and Yield (t/ha) Cereals, Pulses & Oil Seeds averaged (1992 -2018 82
Table 4.8: Food Consumption and Deficit/Surplus in Eritrea 2010 - 2018 84

ix
Table 4.9: Number of Livestock and Products per annum (2006-2018) 85
Table 4.10: General Climate Change and Impacts on Health in Eritrea 91
Table 4.11: Priority Options in Adaptation Programs in Agriculture 96
Table 4.12: Total Land areas Occupied by Various Types of Irrigation Systems 97
Table 4.13: Adaptation Activities in Natural Resources Management 99
Table 4.14: Type of Vegetation of Eritrea 100
Table 4.15: Soil and Water Conservation Structures 100
Table 5.1: GHG mitigation technologies and level of implementation 112
Table 5.2: Climate change adaption technologies and the level of implementation since the SNC 113
Table 5.3: In-Country and out- Country Training Opportunity 119
Table 6.1: Main Constraints and description of the needed capacity 130

x
List of Acronyms and Abbreviations Acronyms Description
AD Activity Data
ADB African Development Bank
AF Adaptation Fund
AFOLU Agriculture, Forestry & Other Land Use
AMSC Asmara Mines Share Company
AOGCMs Atmospheric Oceanic Global Circulation Models
ASARECA Association for Agricultural Research in Eastern and Central Africa
AWSD Annual Water flow Simulation on Dams
BHCP Basic Health Care Package
BMSC Bisha Mining Share Company
BRT Bus Rapid Transit
CDM Clean Development Mechanism
CERs Certified Emission Reductions
CFL Compact Flourcent Lamp
CH4 Methane
CO Carbon monoxide
CO2 Carbon dioxide
CO2-eq Carbon dioxide equivalent
COMESA Common Market for Eastern and Southern Africa
COP Conference of the Parties
DANIDA Danish International Development Agency
DoE Department of Environment
ECMIB Eritrea’s Coastal Marine and Island Biodiversity
EF Emission Factor
ENDA Environment Development Action
EPHS Eritrean Public Health Survey
ET Evapotranspiration
FAO Food Agricultural Organization of the United Nations
FNR Facilitating National Reporting
FReMP Fish Resources Management Program
FSS Food Security Strategy
FWA Forestry and Wildlife Authority
GCCM Global Circulation Climate Models
GCOS Global Climate Observing System
GDI Gender Development Index
GDP Gross Domestic Product
GEF Global Environmental Facility
GER Gross Enrolment Rate
GFRA Global Forest Resources Assessment
Gg Gig gram

xi
Acronyms Description
GHG Greenhouse Gas
GIS Geographical Information System
GoSE Government of the State of Eritrea
GOOS Global Ocean Observing System
GPG Good Practice Guidance
GTOS Global Terrestrial Observing System
GWP Global Warming Potential
ha Hectare
HCS High Climate Sensitivity
HDI Human Development Index
HFCs Hydro fluorocarbons
HSD Horizontal set back dam
HSS Health Sector Strategy
ICAM Integrated Coastal Area Management
ICPAC IGAD Climate Prediction and Applications Centre
IDP Internally Displaced People
IDS Institute of Development Studies
IFAD International Fund for Agricultural Development
IFPRI International Food Program and Research Institute
IGAD Intergovernmental Agency for Development
IHEs Institutions of Higher Education
IMCI Integrated Management of Child Illness
INC Initial National Communication
INDC Intended Nationally Determined Contribution
IPCC Intergovernmental Panel on Climate Change
IPPU Industrial Processes and Product Use
I-PRSP Interim Poverty Reduction Strategy Paper
IWRMP Integrated Water Resources Management Plan
KP Kyoto Protocol
LDCF Least Developed Countries Fund
LDCs Least Developed Countries
LEAP Long Range Energy Alternative Planning
LPG Liquefied Petroleum Gas
LULUCF Land Use Land Use Change & Forestry
M &E Monitoring & Evaluation
MAED Model for Analysis of Energy Demand
MAR Mean Annual Rainfall
MAT Mean Annual Temperature
MDG Millennium Development Goals
MEAs Multilateral Environmental Agreements
MHDG Millennium Health Development Goals

xii
Acronyms Description
MIHAP Minimum Integrated Household Agricultural Package
MoA Ministry of Agriculture
MoEM Ministry of Energy and Mines
MoFND Ministry of Finance and National Development
MoH Ministry of Health
MoI Ministry of Information
MoLG Ministry of Local Government
MoLWE Ministry of Land, Water & Environment
MoMR Ministry of Marine Resources
MOP Montreal Protocol on Substances that Deplete the Ozone Layer
MoPW Ministry of Public Works
MoTC Ministry of Transport & Communication
MoTI Ministry of Trade and Industry
MSW Municipal Solid Waste
MSY Maximum Sustainable Yields
N2O Nitrous Oxide
NAMAs National Appropriate Mitigation Actions
NAP National Agriculture Programme
NAPA National Adaptation Programmes of Action
NAPDD National Action Plan for Drought & Desertification
NARI National Agricultural Research Institute
NBSAP National Biodiversity Strategy & Action Plan
NC National Communication
NCSA National Capacity Needs Self-Assessment
NCSP National Communication Support Programme
NDC Nationally Determined Contribution
NDHS National Demographic and Health Survey
NDIP National Development Indicative Programme
NEIAPG National Environmental Impact Assessment Procedures and Guidelines
NEMP-E National Environmental Management Plan-for Eritrea
NEPFP National Economic Policy Framework and Program
NERTC National Energy Research and Training Centre
NGAP National Gender Action Plan
NGHGI National Greenhouse Gas Inventory
NGHGITEWG National Greenhouse gas Inventory Technical Expert Working Group
NHCP National Health Care Policy
NMHOA National Meteorological, Hydrological and Oceanographic Agency
NMVOC Non-Methane Volatile Organic Compounds
NOx Nitrogen oxides
NUEW National Union of Eritrean Women
NUEYS National Union of Eritrean Youth and Students

xiii
Acronyms Description
ORS Oral Dehydration Solution
PEM Protein-Energy Malnutrition
PFCs Per fluorocarbons
PIF Project Identification Form
POPs Persistent Organic Pollutants
PPs Project Profiles
PRECIS Providing Regional Climate for Impacts Studies
PRRD Post Recovery and Rehabilitation Development
QA Quality Assurance
QC Quality Control
RCM Regional Climate Model
RD Research and Development
SCCF Special Climate Change Fund
SDG Sustainable Development Goals
SEI Stockholm Environment Institute
SF6 sulphur hexafluoride
SGP Small Grant Programme
SimCLIM Simulation of Climate
SNC Second National Communication
SO2 Sulphur dioxide
SoER State of Environment Report
SPA Strategic Priority on Adaptation Fund
SPM Summary for Policy Makers
SRS Southern Red Sea
SSA Sub-Sahara Africa
SST Sea Surface Temperature
SWC Soil and Water Conservation
T Ton
TAR Third Assessment Report of the IPCC
TED Technological and Environmental Data
TNA Technology Needs Assessment
TNC Third National communication
ToRs Terms of References
TVET Technical and Vocational Education Training
UN United Nations
UNCBD United Nations Convention on Biodiversity
UNCCD United Nations Convention on Combating Desertification
UNDAF United Nations Development Assistance Framework
UNDP United Nations Development Programme
UNEP United Nations Environmental Programme
UNFCCC United Nations Framework on Climate Change

xiv
Acronyms Description
VATWG Vulnerability and Adaptation Thematic Working Group
WEAP Water Evaluation and Planning
WG Working Group of the IPCC
WHO World Health Organization
WMO World Meteorological Organization
WRD Water Resources Department

xv
Foreword

xvi
Acknowledgment

xvii
Executive Summary 1. Introduction
Eritrea has taken a number of steps to enhance its resilience against the risk hazards emanating
from climate change and hence ensure sustainable development. In this connection, the country
acceded to the UNFCCC on 24 April 1995 and has been actively participating in the UNFCCC
process to ensure the implementation of the convention. The Third National Communication
(TNC) to the UNFCCC is prepared in accordance with the guidelines on the national
communications from non-Annex I Parties. The report builds up on the Initial National
Communication (INC) and the Second National Communication (SNC) and presents the overall
climate change situations of the country since the last report was submitted. The preparation of
Eritrea‘s TNC has been motivated not only to comply with the reporting commitment to the
Conference of Parties (COP) of UNFCCC, but also to support the rapidly evolving process of
mitigation and adaptation policy making process, which at the moment lacks a clear roadmap.
Virtually, all communities and various sectors in Eritrea have been adversely impacted by the
effects of climate change. As a result, climate change mitigation and adaptation strategies, and
hence reducing vulnerability remain at the centre of the country’s sustainable development
agenda. Nevertheless, a number of traditional climate change coping mechanisms exist, which
need to be considered seriously in knowledge management strategies.
2. The National Circumstances
The National Circumstance is one of the main components of the Third National
Communications and the first Biennial Update Report (BURI, which Eritrea has to report to the
UN Framework Convention on Climate Changes (UNFCCC). The document is prepared in
accordance with the guidelines developed and adopted by the Conference of the Parties (COP).
It is the most effective tool and means of providing country context information to the COP. It
helps Eritrea and other non-Annex I Parties to meet their reporting requirements, and serves as
a medium for the presentation of information in a consistent and transparent manner.
Eritrea possesses a geopolitically significant location covering a total of 124,320km2. Its
climate is most influenced by altitude and topography, which cause variations in temperature.
Based on the climatic parameters, the country is divided into six agro-ecological zones. There
are two rainfall regimes, summer (June-September) in the highlands and western low lands; and
winter rains (Nov-February) in the eastern and coastal areas, and the main feature of rainfall is
the extreme variability within years and variations over short distance. The country is
vulnerable to the adverse effects of climate mainly, due to its geographical location.
The major land-use/land-cover types in the country are categorized as grazing land, woody
vegetation, cropland and barren land. Grazing land and woody vegetation, account for the
largest proportion of the land cover system. Depletion of land productivity, caused by
overgrazing, infertile soils, and poorly established incentive measures for sustainable land
management, is a major problem. In general, soils with the highest agricultural potential are
found in the southern part of the central highlands and south-western lowlands of the country.
However, shallowness, which is the result of continuous cultivation and soil degradation, is the
major constraint to productivity in agriculture.
The immediate development priority of Eritrea is to meet the basic needs of its population
through achieving economic stability, and rehabilitating and expanding infrastructures. The
Government formulated Macro Economic Policy in 1994, which clearly sets out the path for
enhanced national development. In this respect, Eritrea has made significant efforts to provide
educational services to all its citizens. The National Gender Plan of Action which addresses the

xviii
critical constraints of girls’ education and training, and outlines key strategic objectives and
plans of action to address the problems. Similarly, the country has made a remarkable progress
in the health system through improvement in longevity and the general wellbeing for all
citizens. The progress in the health sector is mainly attributed to increased number of medical
personnel and expanded facilities and services. Eritrea is one of the few countries to have
achieved the Millennium Development Goals (MDGs) in health before the given deadline date.
Eritrea is a pre-industrial society where a large proportion of its population is rural, directly
depending on land resources for its livelihood. The country’s economy is based on the
extraction of natural resources such as agriculture, fishery and mining. Agriculture is the main
source of income and food security for the great majority of the population. It plays a
significant role in reducing poverty and supports industrialization at a national level. The
Government is pursuing a policy that aims at increasing farm productivity in recognition of the
significant role agriculture plays in the national development. Eritrea has the potential to
harvest a large amount of fish annually, though the current fish catch is known to be very low.
Moreover, the country has an excellent opportunity for developing tourism industry particularly
along its coastal area. In recent years, the economy has been driven by the mineral resources,
especially with the start-up of commercial mining activities and the export of copper and zinc at
the Bisha mine.
Eritrea is one of the most vulnerable countries of the world to the adverse effects of climate
changes due to its geographic location in the Sahelian Zone. The problem has been further
aggravated by human activities such as over-cultivation and excessive fuel wood collection.
Anthropogenic factors are thus the main driving forces of the changes in climate. Land
degradation is prevalent throughout the country, but is particularly manifested in the central,
northern highlands and southern plateau. The Eritrean Red Sea and coastal beaches remain
relatively clean as there are no serious pressures from industrial and other related activities.
3. National Greenhouse Gas Inventory
The GHG national inventories include anthropogenic emissions by sources and removals by
sinks of all greenhouse gases not controlled by the Montreal Protocol. These inventories have
been produced, to the extent of the countries capabilities, using recommended methodologies of
the IPCC 2006 guidelines. The inventory is prepared for (i) Energy (i) Industrial Processes and
Product Use (IPPU) (iii) Agriculture, Forestry and Other Land Use (AFOLU); and (iv) Waste
sectors. It covers both direct greenhouses: CH4, CO2, and N2O gases (GHG) and indirect
precursor gases, CO, NOx SOx.
Inventory Estimates of Aggregated Emissions: Eritrea’s net total GHG emissions by year;
2000, 2006, 2010 and 2015 of all sectors were respectively 3286.76, 3293.31, 3433.05 and
3866.76 Gg of CO2 eq coming from the four key category sectors. Over the period 2000 –
2015, total GHG emissions have increased by 17.65% from 3286.76 Gg CO2eq in 2000 to
3866.76 Gg CO2 eq in 2015. Although the contribution to the aggregated GHG emission from,
the IPPU and Waste remained low, the % increment observed in the years 2000-2015 was
drastic mainly due to the establishment of new Cement Factory. The emission from the waste
sector is attributed to the increase in urban population growth and change in living habits.
The GHG emission revealed that CH4 has the highest GHG emission contribution for all the
inventory periods followed by CO2. However, the change in CO2 emission of 41.7% increase is
much higher than that of CH4 emission change of 14.34% increase between the year 2000 and
2015. Looking at the GHG emission trend, it shows that Eritrea is a net GHG emitter in which

xix
the change GHG emission between 2000 to and 2010 was gentle, and showed an abrupt
increase from 2010 onwards; and remains to undertake appropriate mitigation actions.
Between 2000-2015, the GHG emissions by year and gas in Gg of CO2-eq show fallowing: i)
CO2 increased by 41.70% i.e. 401.24 to 568.55 ii) CH4 by 14.34% (2759.26 – 3154.89) iii) N2O
increased by 13.51%. Looking at the trends of the various gases emission, in 2015, GHG
inventory year, methane gas followed by CO2 were the highest. Majority of methane emissions
came from enteric fermentation and manure management sub-sector. The second highest direct
gas emission, is CO2 from Energy sector which indicates that the country has not adopted a
full-fledged energy efficient and renewable energy technologies.
Anthropogenic emissions by sources of Per-fluorocarbons (PFCs) and sulphur hexafluoride
(SF6) from production activities were not accounted due to lack of data availability. But for
anthropogenic emissions by sources of hydro fluorocarbons (HFCs) in Gg CO2 eq. for the 2000,
2006, 2010 and 2015 are 0.10, 2.66, 6.41 and 14.23 respectively.
Quality Assurance and Quality Control: Quality Assurance (QA) procedures, as defined in the
IPCC 2006 Guidelines, were implemented. As per the Guide 2006 guidelines, the GHG data
and information were collected and compiled by NGHGITEWG. QC of the GHG inventory
was performed the project coordinator and the lead experts. In case of inconsistencies, and
transcription errors, the responsible institutions were consulted with the aim of instantly solving
the problem. Although capacity is limited. The QA of the GHG i.e., consistency, completeness,
accuracy and transparency and comparability of data was carried out by two independent GHG
experts who had prior training in the IPPCC 2006 guidelines; and who were registered in the
UNFCCC expert group.
Uncertainty analysis: has been performed using the tool available within the IPCC 2006
software model version 2.691. Based on the quality of the survey data and whether the EFs
used were defaults or nationally derived, uncertainty levels were allocated for the two
parameters and the combined uncertainty calculated for the latest inventory year 2015. For the
national inventory, the level and trend assessment uncertainties show 11.29% and 11.75%
respectively. Looking at the categories it is noted that the highest uncertainties was in the 3.A
Livestock followed by biomass consumption in Energy sector.
Key Category Analysis: The level assessment shows that nine categories; These are i) Enteric
Fermentation, ii) Forest land Remaining Forest land, iii) Road Transportation, iv) Cement
production, v) Energy Industries - Liquid Fuels, Other Sectors – vi) Biomass, Other Sectors –
vii) Liquid Fuels, viii) Manure Management (CH4) and ix) Manure Management (N2O) that
account for the cumulative total of 95.1%.
In the trend assessment the following ten categories are the key category of Eritrea based on the
2015 inventory year and GHG emissions. These are: i) Cement production, ii) Enteric
Fermentation, iii) Energy Industries - Solid Fuels, iv) Other Sectors - Liquid Fuels, v)
Manufacturing Industries and Construction - Liquid Fuels, vi) Road Transportation, vii) Solid
Waste Disposal, viii) Forest land Remaining Forest land, ix) Energy Industries - Liquid Fuels
and x) Refrigeration and Air Conditioning.
4. National GHG Mitigation Assessment & Analysis
Eritrea is committed to stabilize and mitigate greenhouse gas concentrations. The mitigation
assessment covers five sectors/subsector : i) Energy, ii) Public and Commercial, iii) Industry

xx
and Road Transportation, iv) Agriculture, Forestry and Other Land Uses (AFOLU) and v) Solid
Waste.
The population size which stood 3.2 million (70% Rural) in 2010 is expected to reach 6.52
million in 2035. In 2035, the proportion of the rural population is expected to decline to about
49.8% which is equivalent to 3.25 million. The energy demand in the energy sector increased
from 767.6 in 2016 to 977.9 thousand tons in 2035. The breakdown of the various sub sectors
was as follows: i) household from 602.9 decreased to 545.5; transport 79.3 increased to 251.4;
public and commercial 72.8 increased to 142.6; and industry 12.7 to 38.9. Corresponding GHG
emission based on BAU scenario increased from 739.8 in 2016 to 17,717 in 2035.
Emission Estimates scenario: In 2016, the household sector, as the main GHGs contributor,
accounted for 40.8% in the reference scenario, its contribution is expected to be reduced to
30.8%. Within the sector, from 2016 data rural households accounted for an average of 60.9%
contribution of the total emissions which is mainly from wood, dung and agricultural residue
consumption. This is followed by emissions from urban households 35.9% mainly from the use
of LPG, kerosene and wood fuel for cooking. The BAU projection shows that the expected
emission contribution from household category by 2035 is 529.13 GgCO2 eq. Therefore, GHGs
emission form household sector shows a decreasing trend throughout the scenario years.
Transportation will be the major CO2 emission contributor in 2035 in which the share of
transport sector GHG emission in GWP CO2-eq was projected to increase from 32.6% in 2016
to more than 44.5% of which emissions from road transport will account for more than 80% of
the sector’s emissions.
Public and Commercial Services, based on BAU scenario analysis, GHGs emission from the
services sector are projected to increase from 167 GgCO2e in 2016 to 335.2 GgCO2e in 2035;
whereas, its share will decrease from 22.6% in 2016 to 19.52% in 2035. Thus, the industrial
sector shows increasing trend from 29.09 GgCO2 eq in 2016 to 87.84 GgCO2 eq in 2035. Its
share in the demand sector also increases from 3.9% in 2016 to 5.11% in 2035.
The fuel derived from the electricity demand of the various scenarios and BAU were fed in the
Long Range Energy Alternatives Planning (LEAP) modelling tool to compute emissions. The
difference in emissions between the BAU and each individual mitigation scenario provides its
abatement potential. The mitigation scenario shows household sector will remain the main
emitter up to 2025; the transport sector will outmanoeuvre the household accounting for 440.54
GgCO2eq. In addition, the mitigation scenario reveals household emission will be reduced from
40.85percent to 32.61percent emission contributor. Transport sector will increase from
30.62percent to 39.92percent GWP CO2 eq emission contributor in Eritrea.
During the scenario period emission from transport sector grows faster and bypasses the
household sector due to the fact that the transport sector depends only on oil. Thus, thus, by
2035 the main emission contributors within the energy demand sector are transport (45%),
household (30%), and services (20%). Although industry is forecasted to grow; it will only
contribute about 5% to the total emission by the same year. Based on the BAU scenario, by
2035 total GHGs emission is expected to rise by 2.32 times.
Key Barriers to GHG Mitigation: GHG mitigation involves the introduction, adoption and
adaptation of appropriate new technologies. In this endeavour, shortage of skilled human and
financial resources still remains a major constraint for installation and maintenance. These
constraints should be alleviated through human capacity building focusing on the various

xxi
emitting sectors; which would require linkage partnership at the national and regional levels. In
this regards, the role of higher Education and Research Institutes, civil societies and
professional associations and beneficiaries is crucial. Harmonization of the existing land uses
practices, policies and legal frameworks is required to yield the desired level of outcome in
mitigating GHGs; the financial constraints must be addressed through domestic and
international financial resource mobilization.
Opportunities GHG mitigation: There are a number of opportunities for GHG Mitigation upon
which the strategy should capitalise. These are, among others, community participation,
Integration of Climate Change in to the Curricula, Continuous Education, and the Contribution
of the Mass Media. Participation of local communities is critical to the success of the proposed
mitigation projects and/or programs. The commitment of the local stakeholders is guaranteed as
these projects/ideas were generated from the various sectors including energy, agriculture,
transport, land water and environment as well as the various municipalities involved in the
management of wastes in the six administrative regions of Eritrea. The emergence and
advancement of the renewable energy sources, such as solar, wind, and geothermal are key
drivers for shifting from fossil fuel energy generation to more clear energy production and
energy efficiency technologies.
Institutional Capacity-Building to Sustain Mitigation Work: To sustain GHG mitigation works,
it is important to strength the national institutions to enable them design and implement
projects. Consistent technical and human capacity building should be designed, implemented
and regularly evaluated and improved. Further retention of trained and experienced expert in
the paramount importance and mechanism need be developed for ensuring effective transfer of
knowledge and skills to younger and junior. To this effect strategy for the transfer of
knowledge needs to be developed.
5. Vulnerability, Impacts, and Adaptation Assessment
Rainfall: Analysis of rainfall data for the years 1900 to 2018 was used for the current scenario
in which there is a decreasing trend in the mean annual precipitation that amounts from 17% to
30%. Overall, the long term precipitation showed that rainfall is decreasing during the past 28
years whereas in some localities (southern red sea) an increasing trend was observed in the mid
red sea region. The rate of decrease of rainfall in south-eastern coastal areas of Eritrea is much
smaller compared to the inland parts. The degree of uncertainty in future projections of rainfall
patterns very high. None of the models showed a reduction in mean annual rainfall patterns,
though the probability for drought occurrence is very high. Drought has long been a significant
natural phenomenon in the past and it will continue in the future, which is a matter of great
concern.
Temperature: Data on temperature for the years from 1961 to 2018 was applied for the current
scenario. Result of the analysis showed a significant increase in the maximum average
temperature of 1.85°C in the Eritrean plateau and a modest increase of minimum average
temperature of about 1.64°C. The result did not significantly differ from the analysis carried out
by IPCC, which mentioned an increase of 1.7°C. However, in the coastal areas of the country, a
significant decrease of maximum average temperature of about 2.5°C was observed from 1960
to 2018.
Vulnerability and impact assessments: Vulnerability is a combination of exposure and
sensitivity in which decrease in vulnerability implies reduction of exposure to hazards,
sensitivity of their effects and build capacity for adaptation action. The agricultural sector is the

xxii
most vulnerable sector to the effects of climate change as it is highly dependent on the natural
system. Drought, epidemic pests, diseases and parasitic weeds are the major threats that hamper
crop and livestock production systems. Subsistence farmers, rural dwellers, pastoralists, urban
poor and fishermen are, in particular, form the most vulnerable groups. Among Eritrea’s
regions, the Northern Red Sea and Southern Red Sea are much more vulnerable compared to
the other parts of the country.
Sectoral vulnerability and Impact assessment: Eritrea is highly vulnerable to drought being the
most important single climate related natural hazard impact. The major adverse impacts of
climate change includes decline of agricultural yield (food insecurity), depletion of water
resources, land degradation, loss of biodiversity outbreak of diseases associated with climate
change, and loss of livestock and property due to wind storm accompanied by heavy rainfall.
Crop subsector: In general crop production is dwindling as the result of climate change. Some
crops have either decreased in diversity or extinct. Sorghum is the most important crop which
occupies 49% of the total cultivated area and accounts for 46.4% of the total production. Barley
stands second to sorghum in total production based on the 1992 to 2018 data. Sorghum, pearl
millet and barley are early maturing and drought tolerant crops grown by majority of farmers.
Productivity for sorghum and barley is 0.55 tons/ha and 0.75 tons/ha, respectively though there
were fluctuations of yield in different years. Based on the impact of climate change scenarios,
although yield loss would be significant for all crops its impact is more pronounced for wheat
in which it is expected to be reduced by more than 25%.
Livestock subsector: Livestock production is mainly affected by drought, which contributes to
poor animal feed, lack of water points and decreased food intake as the result of heat stress.
Livestock are important sources of milk, meat, manure and draught power. Income from the
sales of livestock and their products is also an important means of a coping mechanism in time
of food shortages. Droughts that occurred between 1992 and 2004 have led to massive death of
cattle and camels and such environmental stress in the future might result in similar trends.
Forestry: A century ago, 30percent of Eritrea’s land surface was covered by forest, which
dwindled to less than 1% now. Deforestation for the expansion of agriculture, cutting of trees
for fuel-wood and construction of materials-intensive traditional houses are the main causes.
The overwhelming dependence on biomass (charcoal, firewood, agro-residues etc.) and cow
dung for domestic energy contributes significantly to clearing of forests and woodlands. Land
degradation is one of the most serious environmental concern following inappropriate land
management, unsustainable agricultural practices, overgrazing and deforestation resulting in
clearing of vegetation cover and increased soil erosion. The annual rate of soil loss from
cropland is estimated at 12-20 tons/ha and crop yield is declining at the rate of 0.5% per annum
owing to soil erosion.
Water resources: Climate change reduced surface water and groundwater resources in most dry
regions of the country intensifying competition for water among different sectors. There is a
decreasing order of stream flow series in almost all river basins except in the Anseba River. The
water quality in the Central Highland region and the Western lowlands is good with respect to
chemical quality, while that in the Red Sea coastal area is mostly saline. The bacteriological
analysis indicated that on the average 59.7% were found to be biologically contaminated.
Human Health: In Eritrea, climate change has evident effects on public health. Consequent to
prevailing climate change some areas have been infested with new diseases. This are related
directly or indirectly linked with the expansion of irrigated agriculture or increased temperature

xxiii
due to climate change. Habitually malaria infestation was common in lowlands; with increased
temperature, the disease expanded to highlands where the disease was unknown in the pasts.
Nonetheless, as the result of the effective government intervention, morbidity and mortality due
to malaria have declined by more than 86% and 82% respectively.
Period of drought are usually followed by torrential rains that cause tremendous floods thereby
contaminating water points. Under climate change scenarios associated with flooding, drought,
and rise in temperature, diarrhoea incidence increase and remain to be one of the major killers
of the poor and children under the age of five. In response to droughts, a number of dams,
reservoirs and ponds have been constructed for irrigation and these water bodies are believed to
favour the development of snails, the intermediate host of Schistosomiasis. Consequent to
climate change new diseases emerged during the past few decades some of which included
Chikungunya and dengue fever.
Adaptation Assessment, Strategies and Policies
In order to withstand the impacts of climate change, policies and other related programs should
aim at promoting drought-resistant breeds of livestock so that opportunities for income
diversification are created, and effective rural finance institutions along with extension service
are established. These polices should focus at ecosystem enhancement by promoting soil and
water conservation structure, afforestation and reforestation, drought resistant crop varieties,
integrated pest management and disease control etc. Policies should also be tailored coastal area
management to prevent coastal erosion.
In the crop subsector, the adaptation activities carried out are distribution of inputs, utilizing
smart agriculture practices: choice of crops and varieties, inter tillage cultivation,
intercropping/mixed cropping, minimum tillage, irrigation, soil and water conservation and
water harvesting in crop fields. Similarly in the Livestock subsector, the current adaptation
measures that are implemented are conservation of standing hay and crop residue; building
water harvesting structures and distribution of breeds that are resistant to feed shortages,
diseases and heat. The farming community are utilizing various livestock breeds for production.
Natural Resource management/forestry: The adaptation activities commonly carried out in
some parts of Eritrea are soil and water conservation, afforestation, reforestation, enrichment
using indigenous plants or mixing with selected exotic varieties programs and area closure. In
addition, considerable number of trees has been planted through green campaigns. Moreover,
distribution of energy saving stoves has helped in conserving a large track of forested area.
Water resources: A climate smart water use system is being adopted that includes reducing
flooding through maintaining ground water recharge; sustainable use of river basins;
introducing new technologies in irrigated agriculture and dissemination of knowledge in the
protection of water resources. In addition water conservation activities and techniques such as
terracing, check dams, bunding and water harvesting structures have been constructed.
Health: The key adaptation strategies would be to focus on climate smart health system, which
is integrated in the health service provision.
Malaria: Integrated vector control includes environmental management, larveciding, indoor
residual spray; bed net distribution; malaria case management composed of early diagnosis and
treatment; training community health agents; ensuring availability of drugs for treatment;
operational research such as malaria surveys, drug sensitivity and drug resistance are the
adaptation measures that are undertaken.

xxiv
Malnutrition: The activities include therapeutic feeding and supplementary feeding program. In
addition, appropriate and high quality complementary food for infants accompanied by
appropriate micronutrient intervention have helped to address the problem of malnutrition and
stunting.
Diarrhoea: The adaptation activities are feeding and supply of ORS which helps to reduce
dehydration and minimize the adverse consequences of diarrhoea; the stool disposal has also
prevented the spread of diseases that is if faeces are not properly disposed the disease
(diarrhoea) may spread with direct contact or through animal contact.
Yellow fever: Travellers coming to Eritrea from a country with risk of yellow fever virus
transmission are required to have international vaccination certificate.
Coastal areas and island: Adaptation activities carried out along the Eritrean coast includes
distribution of fishing nets and polyethylene ropes, mangrove reforestation programs in the
mainland and. A major adaptation activity also includes strengthening inland fisheries with a
potential to produce around 100-150 tonnes per year. Fisheries management measures are also
in place to avoid over-exploitation of marine resources and habitat destruction. The
conservation and management efforts include activities such as not allowing fishing any marine
mammals and turtles but if caught accidentally they are released immediately.
Urbanization: The major adaptation strategies for urbanization include building cities and
towns with proper waste management and providing suitable conditions for residents,
investment, tourism and development. Urban development consider public space such as parks,
sport places, road dividers, roadsides and roundabouts, festival areas, and water shed areas and
urban agriculture. Furthermore, woodlots and green belts near cities and compounds need to be
planted with different types of vegetation, fruits and ornamentals so that the cities could
become green at all times.
Review on selected Adaptation Projects: Several climate resilient adaptations activities have
been undertaken throughout the country. Examples of these adaptation projects among others
include: Gash Barka Livestock and Agricultural Development project, Post Recovery and
Rehabilitation Development (PRRD) add on Development Program in Gash Barka and Zoba
Debub 2010-2014; Climate Change adaptation program in water and agriculture in Anseba
region, Eritrea; Semenawi and Debubawi Bahri, Buri-Irrori and Hawakil protected areas, The
Conservation Management of Eritrea’s Coastal, Marine and Island Biodiversity (ECMIB)
Project.
Policy issues related to adaptation: The adaptation activities that are mentioned in various
policies are briefly described in this report. The policies where adaptation programs to climate
change are documented includes the National Economic Policy Framework and Program
(1998-2000), Food Security Strategy, The Interim Poverty Reduction Strategy
Paper,(IPRSP2004), National Adaptation Plan of Action (NAPA, 2007) National Biodiversity
Strategy and Action Plan for Eritrea,(NBSAP-2015) , National Environmental Assessment
Procedures and Guidelines (NEAPG, 1999), National Action Program (NAP) to Combat
Desertification, Environmental Management Plan for Eritrea (NEMP-E,1995), Water Policy
and Proclamations,(2010), Health Policy, Coastal Areas Policy and Marine Protected Areas
(MPA) and Land use policy are fully specified to show that the policy reflects the adaptation
activities to be implemented.
xxv
6. Information Relevant to the Achievement of the UNFCCC
Adaptive measures to tackle climate-related challenges require mobilizing national resources
including economic, social capital, information, technology, education, and wealth. Resources
have to be used effectively so as to realize effective coping mechanisms. In this regard, Eritrea
has mobilized substantial amount of resources to promote development and enhance enabling
environment for achieving goals under UNFCCC.
Formation of technical Expert Groups and committees: In its endeavours to mitigate
climate change and adapt to it Eritrea has involved various stakeholders to take part in the
design and development of climate change projects. As a result, relevant stakeholders have
been organized as technical expert groups; and offered their expertise. Such arrangement helps
to develop sense of belongings on the on-going and planned climate change or related
activities.
Level of integration of climate change into National Development priorities: Eritrea has
issued a number of environmental laws, proclamations, directives and legal notices to address
climate change. Committed to the international endeavours, today, Eritrea is party to a number
of international conventions and protocols including the UNFCCC. To that end, the Ministries
of Agriculture, Health, Land Water and Environment, and Marine Resources have issued
climate change related polices laws and guidelines.
Extent of the development and transfer of environmentally sound technologies: The
UNFCCC has created a platform to promote transfer of technologies for mitigating and/or
adapting impacts of climate change. In this regard, Eritrea is involved in technology transfer
through technology needs assessment, technology development, creating enabling
environments, capacity building and setting mechanisms for technology transfer.
Extent of climate change awareness and systematic observations: There is increased public
awareness about climate variability in Eritrea. However, climatic data is highly constrained
because of lack of modern instruments. Besides, most of the attributes including location,
geographical distribution, and type of instruments used in some stations do not satisfy the
requirements for a national observation network and WMO standards. Thus, there is need for
upgrading and calibrating the weather stations to meet international standards.
Assessment of the Educational Training Programmes and Public Awareness: The
educational policy underlines the need for building human resources as one most important
resources of the country. In recognition of the critical role education plays, structural changes
have been introduced in the educational system. A number of short -term training and
workshops were carried out with the aim of providing knowledge and skills on specific aspects
of climate change mitigation and adaptation.
Public Awareness: The MOLWE is preparing a robust environmental awareness programs
targeting all levels of the public. It prepared several environmental awareness packages such as
video shots on environmental challenges and solutions associated with climate changes. The
mass media is playing crucial role in raising public awareness with regard to mitigation and
adaption programmes. Interviews with experts and dissemination documentary films
highlighting climate change are broadcasted on opportune times.
Gender main streaming: Climate change affects the most vulnerable segment of the
population including women -headed households, children and the old. To increase the copping
capacity of women to climate change, it has increasingly become necessary to stream line
xxvi
climate change issues. In this connection, the distribution of energy saving stoves has been the
right step in the right direction. The improved stoves not only reduce GHG emission but also
improve the health of women and children at household level.
Capacity Building efforts: Climate change is multifaceted challenges; which requires
institutional and human capacities to respond to the needs. Up to now, Eritrea has limited
capacity to cope - up with the requirement for climate change mitigation and adaptation
programmes and projects. It is vital that Eritrea alleviate the constraints related to capacity
building through training, institutional strengthening, awareness raising, technology transfer,
and knowledge management and sharing of experiences. The implementation of capacity
building requires an uninterrupted development and strengthening of the country’s capacities in
various aspects of GHG mitigation activities.
Extent of information sharing and networking: Eritrea has enhanced the level of
involvement of stakeholders in preparing the Intended Nationally Determined contributions
(INDC and Nationally Determined Contributions (NDC). The information acquired from the
UNFCCC regarding capacity building (training workshops and seminars) are disseminated and
shared with stakeholders at the national and sub-regional levels. This would be boosted by the
steady expansion of the telecommunication in the country.
7. Constraints and Gaps Related to Financial, Technical, and Capacity Needs
Eritrea has a number of constraints and gaps that need to be addressed to produce better quality
reports for planning and reporting to the Convention. Climate change study has been
constrained by limited institutional capacity, in most sectors, coupled with limited financial
resources. Further, there is lack of central point for data management, storage and retrieval or
data unavailability and low quality. The main technical and capacity constraints and gaps
identified were low level of knowledge, skills and awareness of the climate change issues
among the national stakeholders. In the greenhouse gases inventory the major problems were i)
Inconsistent data and Information formats ii) Sectoral data unavailability iii) Lack of solid
waste characterization data iv) Lack of country specific emission factor and v) inadequate of
institutional memory.
Constraints and Gaps in Implementing Adaption Projects: In line with the NAPA, Eritrea
has implemented a number of pilot projects in the various regions of the country with the aim
of promoting increased food security through ecologically sustainable and climate-resilient
agricultural production system. These projects also aim at enhancing resilience of communities
and adaptive capacity to climate change through integrated water management and agricultural
development approach. The main beneficiaries were vulnerable small-scale farmers, agro-
pastoralists, pastoralists and a rural woman that is anticipated to up- scale its outcomes of the
project to other regions of Eritrea.
The inadequacy of the financial support can be analysed from two perspectives. First, the
number of climatic change projects is small because climate change is viewed as a global issue
linked with the emission of GHG from the industrial countries. Second, the immediate
environmental problems in the developing countries are related with land degradation that
attracts less financial resources.
Measures taken to alleviate the gaps and constraints: To address gaps and constraints
described above and to strengthen adaption to climate change, Eritrea has prepared National
Action Plan (NAP) with the following objectives: i) Establishment of an innovative and
effective NAP consultative framework at the various levels involving key stakeholders ii)

xxvii
Enhance the national capacity in climate data collection, analysis and modelling of climate
change projections, and risks and vulnerability assessments iii) Streamline climate change
adaptation issues into sector strategies and budgets and monitoring systems iv) Secure and
sustain climate change financing mechanisms for NAP implementation.
The outcome of the NAP is expected to facilitate a consultative process, utilize downscaled
global climate, determine risks and vulnerabilities to climate change, prioritize the best
adaptation approaches, ensure sustainable budget for the implementation and strengthen
monitoring and evaluation systems in the country.

1
CHAPTER ONE
1 NATIONAL CIRCUMSTANCES
1.1 Introduction The preparation of the National Communications in Eritrea has been carried out as part of the
country’s commitment to the United Nations Framework Convention on Climate Change
(UNFCCC). The National Communication is thought to be the most effective tool and means
for evaluating the implementation of the convention as it enables parties gain information on
the overall aggregated effects of the implementation of the convention. That far, Eritrea has
submitted the Initial National Communication (DoE, 2000) and the Second National
Communication (DoE, 2012).
This TNC presents information on the trend of the national GHG emissions, impacts and
vulnerability, mitigation and adaption policies and plans as well to use the information to
develop project addressing climate changes. The preparation and reporting processes of TNC
was prepared under the auspice of the MOLWE which guides and oversees the preparation
process; and facilitates access to additional technical assistance when and if required. The DoE
is the executing body as well as the Focal Point for UNFCCC. The Global Environment Facility
(GEF) through its implementing agencies including UNEP and UNDP plays crucial role a s
source of financial resources.
Eritrea, for most of its history, has been a victim of expansionists as a result of its strategic
location along the sea route between Europe and Asia. The country suffered invasions from the
Bejas and the Turkish beginning from the early to the medieval periods. With the opening of
the Suez Canal in 1869, the European powers showed increased interest in the Red Sea region.
Italians captured the port town of Massawa in 1889 with the aim of establishing a permanent
place of residence for their settlers. They invested heavily in Eritrea, viewing it as a staging
ground for further conquest of East Africa. Italian entrepreneurs confiscated land with high
potential for agriculture from the indigenous population and transformed it into large-scale
commercial farms. After the defeat of the Italians in 1941, the country was put under the British
military administration from 1941 through 1951. This was the time of popular uprising among
the Eritrean people for independence. Despite the call for a free nation, the UN, however,
adopted a resolution in 1952 that brought an end to the autonomous administration, which was
followed by the Ethiopian annexation. The armed struggle for independence began in 1961and
ended in 1991, after years of peaceful protest against Ethiopia’s violation. In 1993, Eritrea
became an independent nation; and was admitted to a full membership in the UN as the 182nd
member state.
By virtue of its geographical location in the Sahelian region of Africa, Eritrea is prone to
drought since time immemorial (MoLWE, 2012). Throughout the country, drought remains one
of the major threats to the rural livelihoods as well as urban dwellers. Since recent past, risks
associated with climatic variability have intensified thus accelerating land degradation. The
mean annual temperature has increased by 1.7°C over the last few decades, which is a clear
manifestation of climate change at the local level (MoLWE, 2018). Adaptaion Plan of Action
(NAPA, 2007) indicated that increased temperature has detrimental effects on crops, livestock
and the marine ecosystems. In most cases, periods of droughts are followed by intensive
torrential rains that trigger flooding particularly in areas adjacent to the seasonal rivers basins.
Moreover, recent studies (Waithaka et al. , 2012) using Global Circulation Model (GCM)

2
projections indicate that in the medium to long-term periods of drought and flooding contribute
to future risk and vulnerability of the rural livelihoods in sub-Saharan Africa.
In view of the complexity of the problems highlighted in the previous paragraphs, the extent to
which Eritrea will effectively mitigate and adapt climate changes depends on the country’s
coping capacity to the adverse effects. Undoubtedly, such endeavours require mobilisation of
local communities, financial support and transfer of knowledge and technology which
necessitates the establishment of a reliable climate change database to generate information
needed for mitigation and adaptation activities in the country.
1.2 Geographical Setting Eritrea is geographically located between 12o22’ and 18o02’ north and 36026’ and 43013’ east.
It is bounded by the Sudan to the north and west, the Red Sea to the east and northeast, Djibouti
to the southeast and Ethiopia to the south (Figure 1.1). It covers an area of 124,320 km2, with
two major physiographic zones identified as highland and lowland. The country has a mainland
and island coastline of approximately 3300 km (ECMIB, 2007). The elevation ranges from
120m below sea level, in the southern arid region, to over 3000m in the central highlands. The
country is divided into six administrative regions (Figure 1.1).
Figure 1.1: Location and administrative regions of Eritrea Source (Measho et. al., 2019)
1.3 Climate Temperature: The temperature in Eritrea is most influenced by altitude and topography.
Average temperature varies considerably in space and time. The average annual temperatures in
the eastern lowlands and western lowlands are 31oC and 25oC respectively. In the highlands,
the annual mean is 21oC (Figure 1.2). Temperature fluctuates with change of altitude; moving

3
westward from the Red Sea towards the highlands, temperature reduces by around 10C for
every 200 m of elevation increase. According to Eritrea Second National Communication under
the United Nations Framework Convention on Climate Change (MoLWE, 2012.); since 1960,
the mean annual temperature has increased by 1.7°C; a clear manifestation of climate change.
Rainfall: there are two major rainfall regimes: the summer and winter rains. The summer rains
occur from June to September; and covers the Highlands and the Western Lowlands with mean
annual rainfall ranging from 400 to 700mm. The Eastern Lowlands receive winter rains, from
October to March, ranging between 50mm and 200mm. The amount of rainfall in the Sub-
humid eastern escarpment, with bimodal rainfall regime, reaches about 1000mm. Precipitation
is constantly changing with unpredictable patterns. In general, rainfall declines both in amount
and intensity from south to north and from the highlands to the lowlands (Figure 1.3).
Figure 1.2: Mean Annual Temperature in oC of Eritrea (Source: SNC, 2012)
Figure 1.3: Rainfall Map of Eritrea

4
1.4 Agro-Ecological Zones Based on combination of parameters such as slope, altitude, rainfall, temperature, Potential
evaporate-transpiration, and length of growing period, Eritrea is divided into six agro-
ecological zones, (MoLWE, 1997). The characteristic features of these zones is summarised in
Table 1.1. The map depicting the six zones is given in (Figure 1.4).
Table 1.1: Description of the Agro Ecological Zones of Eritrea
Agro Ecological Zone
Parameters
Sub-
Humid
Arid
Highland
Moist
Highland
Moist
Lowland
Arid
Lowland
Semi-
Desert
Area (km2) 1006 3143 9302 20363 43115 48772
Total area (%) 1 3 7 16 34 39
Slope (%) 8-100 2-100 2-30 2-30 0-30 0-30
Altitude (m a.s.l.) 600 - 2600 1600 2600 1600 - 3018 500 – 1600 400 - 1600 <100 - 1,355
Rainfall (mm) 700-1100 200-500 500-700 500-800 200-500 <200
temperature (oC) 16-27 15-21 15-21 21-28 21-29 24-32
Potential Evapotranspiration
(mm)
1600 - 2000 1600 - 1800 1600 - 1800 1800 – 2000 1800- 2000 1800 - 2100
Dependable Length of
Growing Period (days)
60-210 0-30 60-110 50-90 0-30 0
Median Length of Growing
Period (days)
90-240 30-60 90-120 60-120 30-60 <30
Source: MoLWE, 1997
From Table 1.1, it becomes evident that the vast majority of the land surface areas of Eritrea are
occupied by the Semi-Desert (39%) and arid lowlands (34%). The dominant farming system in
these areas is spate irrigation supported agro pastoralism and nomadic pastoralist. High
temperatures and irregularity in precipitation characterize the climatic conditions of these
zones. Both the Moist Lowland (16%) and Moist Highland (7%) cover the south-western and
highlands; and both are the most productive agricultural lands suitable for rain-fed and irrigated
agriculture; and account for the majority of annual crop production and cultivable lands.
Contrary, the Arid Highland (3%) is a sparsely populated; and characterized by deficiency in
rainfall and a short growing season. Consequently pastoralism is the basis of the livelihoods of
the population in the area. The Sub-Humid Zone, small stretch of land in the Eastern
Escarpment covering (1%) receives bi-modal rainfall with diversified ecological niches.

5
Figure 1.4: Agro ecological zones of Eritrea
1.5 Land Use and Land Cover To date, there is no comprehensive land use plan covering the whole country. Nevertheless, the
Land Proclamation No.58/1994 (MoLWE, 1998), and Land Use Planning Regulatory
Framework, (MoLWE, 1999) form the basis for the country’s land use policy. Based on these
Proclamations, a pilot project on sustainable land management was carried out in the central
region (Zoba Maekel) using remote sensing data; and discussion with key local informants. The
pilot project has proved to be successful and is expected to expand throughout the country in
order to generate a much extensive land use plan.
The main land uses in Eritrea are crop production (agriculture) and livestock production
(pastoralism). According to the MoA (2002), the major land uses are cropland (3.5%), Grazing
land (56.3%), Grass and Shrub Land (5.4%), Settlement land (0.1%) and Bare and Other land
(34.1%), Forest Land (0.4) and Wetland (0.1). Grazing land and Barren Lands and other land
account for the largest proportion of the land use in the country (Table 1.2).
Table 1.2: Land Use Types of Eritrea Major Land Use Types Sub - category Areas (000ha) %
Cropland
439 3.5
Rainfed 417 3.4
Irrigated 22 0.2
Grazing Land
7000 56.3
Woody Vegetation
737 5.9
Highland Forest 53 0.4
Plantation 10 0.1
Wood land 674 5.4
(Dry) 664 5.3
(Riverine ) 5 0.0
Coastal 5 0.0
Urban land
13 0.1
Barren Land
4243 34.1
Total
12,432 100.0
Source: The National Adaption Plan of Action (MoA, 2002)

6
A large proportion of the population in Eritrea depends on traditional subsistence farming.
Hence, agriculture plays a crucial role in the livelihoods of the population. Nonetheless, it is
highly constrained by decline of land productivity caused by human induced land degradation
including overgrazing, over cultivation, deforestation and overall inadequate land resource
management practices. To mitigate and adapt the adverse effects of climate change; the GoE is
undertaking efforts to create a green economy. Strategies for environmental reclamation are
incorporated into the National Action Programmes (NAP). Despite the positive moves,
however, land and forest degradation still pose a major environmental problem (MoA, 2017a).
1.6 Soil The Harmonized World Soil Database (FAO, 2012) identifies 13 soil types out of which
Leptosols and Arenosols covers most parts of the country (Figure 1.5). Solonchak, soils with
high salinity, are mostly found along the coastal regions. In general, soils with the highest
agricultural potential are found in the southern central highlands and south-western parts of the
country.
Figure 1.5: Soil map of Eritrea – extracted from Harmonized World Soil Database (version 1.2). (Source: FAO, 2012)
1.7 Socio- Economic and Development Context Eritrea’s development objective is to attain rapid, widely shared and regionally balanced
growth with macroeconomic stability and sustainable reduction in poverty. In 1994, the Macro
Economic Policy of Eritrea clearly set out the path for enhanced national development.
Important measures to address development challenges in the country, among others, include
the Interim Poverty Reduction Strategy Paper (I-PRSP, 2004), the Food Security Strategy
(FSS), Education Sector Development Program, the National Water Supply Emergency Action
Plan and the 2003-2008 national Gender Action Plan, and the National Health Policy. For
instance, the I-PRSP aims to promote economic growth and development through the following
measures:
creating favourable conditions to achieve sustainable growth,

7
attracting investment in high potential growth centres mainly in fisheries, tourism,
construction, manufacturing and regional trade,
investing in human resources development with priority to health and education, and
expanding and modernizing the country’s basic infrastructures (UNDAF, 2006).
1.7.1 Population and Demographic Profile
In Eritrea, there are nine ethnic groups namely Tigrigna, Tigre, Afar, Bilen, Bdawet, Kunama,
Saho, Nara, and Rashaida. These groups differ in language, customs, and exhibit diversified
land management practices with noble indigenous knowledge regarding climate change.
According to the Population and Health Survey (NSO, 2010), the total population of Eritrea
was estimated at 3.2 million people. The majority of the population (65%) lived in rural areas.
The population density is approximately 26% per km2. At a national level, the geographic
distribution of the population shows that highlands with mild temperatures are densely
populated than the hot and arid lowlands.
The country’s population is essentially young, with children below age 15 years accounting for
41 %. Dependency ratio, which indicates fertility rates, is high. The rate of population growth is
generally higher in rural areas than in the urban areas. There are strong inclinations among both
men and women, in the countryside, for having as many children as possible, with no
preference of one sex for another. Significant improvements in early childhood mortality rates
have been observed in both rural and urban areas, which as a result, Eritrea’s population is
expected to grow rapidly in the coming decades. The rapid population growth rate, in turn, will
have implication for the country’s development.
1.7.2 The Education Sector
Eritrea made significant stride to ensure equitable access of education across all regions of the
country. Many areas, previously unreached and disadvantaged benefited from investments in
infrastructure. Curriculum improvement and deployment of trained teachers has been improved.
The number of students, teachers and schools increased at all levels (MoE, 2004).
As part of global commitment for gender, special attention has been given to ensure that the
gender gap is closed at different levels of education. Promotional activities have been
conducted in various administrative zones to help females and disadvantaged children attend
school. Children from poorer families received incentives including school feeding, waiving of
registration fees and supply of stationery materials. Besides, increasing enrolment at the formal
primary education system, a complementary primary education program has been developed to
provide catch-up education for children who missed the opportunity for formal education. Thus,
a large number of over-aged children have been given the opportunity to attend school through
non-formal education.
Though Eritrea had made quite a remarkable progress in terms of increasing school enrolment,
the Gender Parity Index is skewed towards male students. The most critical challenges that
limit girls’ education are related to economic and social conditions (MoE, 2004). Community
attitudes towards females’ enrolment in school, early marriages and heavy domestic loads are
among the major factors that contribute to the gender disparity at all levels of education.
Nevertheless, a major strategy to enhance women’s participation in education should, focus on
alleviating these social barriers. The National Gender Plan of Action (2003-2008) identified
critical constraints to girls’ education; and outlined strategic objectives and plan of actions to
address the problems (MoE, 2004). Awareness raising campaign a key approach to tackle the
negative attitudes towards educating females. Female teachers help assure parents regarding

8
safety of girls at schools and hence increase enrolment rate for female students. Besides
expanding education at the primary and secondary levels, the Government recognizes tertiary
education as a key to social and economic development. Accordingly, student enrolment rate in
the Institutes of Higher Education is steadily growing with increased female enrolment in
various colleges.
As part of the country’s basic education system, Eritrea expanded adult literacy. Adult literacy
is equivalent to five years of the elementary education; and is composed of literacy and post
literacy for persons 15 years old and above. As the result of relentless and collaborative efforts,
a total of 700,000 adult learners have been enrolled since 2000 (MoE, 2013). In addition to the
basic education, Information and Communication Technology (ICT) became an important
variable in enhancing quality education. The introduction of ICT into the Eritrean school
system since 2005 laid foundation for improved school system. More importantly, it has created
extensive awareness and common understanding in preparing the young generation of learners
for today’s globalized world of knowledge and information.
1.7.3 The Health Sector
The goal of the health system, in Eritrea, is improvement in the general wellbeing, and
economic productivity of all citizens. The country adopted the National Health Care Policy
(NHCP) and Health Sector Strategy (HSS) to provide basic health services to the wider sections
of the population. The outcome has been an increase in accessibility to the health facilities
within 10km radius from 46 % in 1991 to 80% in 2018. In addition, over 60% of the population
is now living within 5 km from health facilities (MoH, 2017). Health indicators such as longer
life expectancy and reduction in child and maternal mortalities are among the major
achievements in the health sector. In general, the main contributing factors for the progress in
the health sector of the country are increased number of workers and expanded facilities.
Health Facilities and Personnel: Eritrea made extensive progress in terms of building health
infrastructure with the aim of promoting access to health services. At independence in 1991, the
country which had only 16 hospitals, and 106 health stations; today possess 391 facilities of
which 29 are hospitals, 56 centres, 193 stations and 113 clinics. The national care network is
three times bigger than what it had been in 1991. There are 74 laboratories categorized under
five different levels, namely: National Health Laboratory, National Referral Hospital
Laboratory, Regional Hospital Laboratory, Hospital Laboratory and Community Hospital
Laboratory. There National Medicine and Food Administration (NMFA); an agency that
monitors the safety and availability of medical and pharmaceuticals supplies at affordable
prices is established. Besides, the number of health professionals increased over the years.
According to the World Health Organization (WHO), a country needs to have at least 2.5 health
workers per 10,000 inhabitants to achieve the MDG (WHO, 2017). Eritrea has achieved beyond
the WHO requirement by having 15.9, 17.9 and 18.2 workers/ 10,000 for the years 2015, 2016
and 2017, respectively (MoH, 2017).
Trends in Morbidity and Mortality: Eritrea achieved the Millennium Development Goals
(MDGs) for health before the timeline set. Maternal Mortality Rate (MMR) is reduced from
998/100,000 in 1995 to 486/100,000 in 2010. Similarly, Figure (1.6) depicts the infant and
child mortality was reduced from 72/1000 in 1995 to 34/1000 in 2015 (MoH, 2019). Building
on the progress to date, infant immunization showed remarkable success with coverage
standing at 85% at a national level (Tekie, 2019). The reduction in child mortality places
Eritrea among the ten countries in sub Saharan Africa that have achieved the MDG4. A further
improvement in the health sector is the reduction in the prevalence rate of HIV, TB, and

9
Malaria. The rate for HIV infection decreased substantially, while malaria is put under control
as the country moves toward pre-elimination phase. Morbidity and mortality from measles have
gone down to less than 90% of the 1991 level. The country is heading towards achieving the
polio-free status (WHO, 2017). Although, Eritrea is classified as having low potential for
yellow fever virus (YFV), the principal vector that transmits the disease (Aedes aegyptiaca) still
prevails in the country. Moreover, the country shares border with countries that have higher risk
of yellow fever transmission. As part of the progress made in the sector, major preventable
diseases no longer pose significant public health threat. Currently, non-communicable diseases
such as heart and hypertensive diseases and diabetes are among the leading causes of morbidity
and mortality in the country.
Figure 1.6: Infant and under-5 mortality rates per 1,000 live births (1970 - 2016)
Source: MoH, 2017
Safe Water and Sanitation: Eritrea made tremendous effort over the years to increase access
to clean drinking water and improved sanitation (UNDAF, 2006). This effort has reduced the
threat from waterborne diseases; and; enhanced hygienic behaviour of the public. The
improvement has been significant particularly for rural communities; though access to
sanitation facilities still lag behind. In spite of Eritrea’s huge success in the health sector, there
are emerging challenges that adversely influence the availability of clean drinking water. The
challenges, among others, include the effect of climate change and unplanned expansion of
urban areas. The changes in climate pattern have, in particular, resulted in new disease
epidemiology. Lack of Public Health Act has been identified as the main gap in the country’s
health system.
1.8 Economic Sectors Eritrea’s immediate development priorities have been set to meet the basic needs of the
population. To this effect, the Government formulated Macro Economic Policy, which
stipulates the need to enhance national economic development and to monitor the changes in
the natural environment. The Government has also prepared the National Economic Policy
Framework to optimize resource use and sustain human development. Moreover, the country’s
Interim Poverty Reduction Strategy Paper (I-PRSP) has been a milestone in directing
development interventions (MoND, 2004). The long-term objective of the I-PRSP is to attain
rapid and widely shared economic growth with a steady and sustainable reduction in poverty. I-
PRSP is based on the following four pillars. (i) Provide strength to economic growth; (ii) Create
income earning opportunities for the poor; (iii) Enhance access to essential services for human
development; and (iv) Promote economic, social and political participation of the population by

10
creating an enabling environment. The I-PRSP further states that the private sector, non-
governmental and community-based organizations all have vital roles to play in meeting the
challenges of poverty reduction. Immediately after independence in 1993 and up to 1997, the
socio-economic polices and strategies led to notable rise in economic growth averaging 7.4 %
(UNDAF, 2006). There were marked improvements throughout key sectors until the outbreak
of the border war with Ethiopia (1998-2000), which reversed positive post-independence
achievements.
1.8.1 Agriculture
Crop production: Agriculture has been and still remains the cornerstone of the Eritrean
economy food security for the largest proportion of the population. It plays significant role in
reducing poverty and support industrialization. It is critical for achieving export growth,
employment generation, and supply of raw materials for agro-industrial processing.
Agriculture sector contribution to the country’s Gross Domestic Product (GDP) estimated at
20.30 (MoA, 2016).
The farmers produce cereal crops, oil crops, pulses, fruits and vegetables primarily for
subsistence use, but they also sell a small portion of their produce at the local markets. The
farm sizes are small and highly fragmented, particularly in the densely populated Central Zone
of the country. Farming practices remain traditional; and the use of mechanization and modern
agricultural inputs are highly limited. In addition, agriculture suffers from unpredictable
weather conditions and wide seasonal price fluctuations of outputs. Consequently, domestic
food production, even in good years, remains well below the requirements forcing the country
to rely on commercial imports. Other critical challenges impeding the development of
agriculture includes limited availability of water resources, insufficient modern farming inputs,
poor marketing channels, and limited access to credit. Female-headed households represent a
typical group within the vulnerable segment largely because they lack sufficient labour and
own fewer assets.
Livestock Production: Livestock occupy a place of significant importance in the economic and
social lives of rural communities in Eritrea. They are important sources of food in the form of
meat and milk. Livestock also play a crucial role in agriculture as plough animals and as a
means of transport in rural areas. They acquire cultural significance as important indicators of a
person’s social status. Skins and hides provide major raw materials for local industries and
important sources of foreign currency. Besides, the country generates significant revenue
through export of live animals and frozen meat. Since recent times, Eritrea suffered from sharp
fluctuations in livestock production. The causes are linked to human factors and to the changes
in climate. Livestock are kept in traditional grazing systems with low level of productivity.
Shortages of pasture and water points, caused mainly by climate change and deteriorating land
quality also hamper livestock economy of the country. Droughts that occurred between 1992
and 2004, for example, have caused deaths to a large number of small and large ruminants. The
climatic stress is expected to exceed the thresholds that animals can tolerate, leading to reduced
feed intake, lower animal productivity, and increased exposure to pathogens.
The Veterinary Institute of Asmara, though it went through a gradual decline during the
colonial times, is currently playing crucial role in tackling animal health problems. Veterinary
facilities have been expanded and a large number of assistant veterinarians trained during post-
independence period. The outcome has been a substantial reduction in the outbreaks of major
livestock diseases. The veterinary institute at present is engaged in diagnosis services to plant
and animal diseases; and monitoring food safety and quality services. It also provides research

11
support to prospective graduates from the various colleges in the country. At present the
institute is working hard to come up with viable vaccine production.
1.8.2 Fishery, Marine and Coastal Resources
Eritrea has substantial and underexploited marine and fishery resources. With its long coastline,
Eritrea has very high potential to exploit fish and other marine resources. The coastal beaches
are relatively pristine and provide an excellent opportunity for developing tourism industries.
The MoMR has a regulatory mechanism for monitoring fishing activities. The Ministry’s policy
prohibits fishing during the months of July to October to avoid over-exploitation of the marine
resources; and to allow sufficient time for breeding. Presently, Eritrea’s marine ecosystems are
vulnerable to the adverse effects of climate changes, as a result of which, it has experienced
temperature rise causing tremendous losses of biodiversity, sea level rise and coral bleaching
(MoMR, 2020). The MoMR has set a plan for adapting climate smart technologies to
counteract the adverse impacts of climate changes. Relevant intervention strategies including
Integrated Coastal Zone Management, Marine Protected Areas and Mangrove Afforestation
Program have been established.
Extensive continental shelf and the coral reefs along the coastline and islands are rich in marine
biodiversity. There are about 1,000 known species of fish of which 250 are of commercial
importance. Small pelagic fish account for 62% of the total fish catch. The Maximum
Sustainable Yield (MSY) of Eritrea Red Sea fisheries is estimated at about 80,000 tonnes per
year (MoMR, 2018); but presently, the annual domestic fish production is much lower than the
potential.
The Macro-Economic Policy of Eritrea provides wider legal context for the development of the
fishery sector. The policy goal for this sector includes a long-term sustainable utilization of
fishery resources for the benefit of the Eritrean people. The policy, more specifically, aims to
attain the following strategic objectives:
Increase the profitability of artisanal fisheries by strengthening the fishers’ cooperatives;
Enhance food security and the provision of employment opportunities for the coastal
population;
Increase foreign exchange earnings through the export of fish and fish products, and
Encourage domestic fishing market through promoting local fish consumption.
Problems concerning lack of data about the precise fishery stock and inadequate market
linkages are the main challenges that constrain the development of the sector. The MoMR in
collaboration with its partners including IFAD is working to enhance the productivity of the
artisanal fishery.
1.8.3 Tourism
Eritrea’s pristine marine waters, spectacular coasts and islands, diverse marine-life and
colourful coral reefs, numerous historical, archaeological sites, mountain sceneries, and
pleasant climatic zones are the basis for a dynamic tourism industry. The country’s relative
proximity to the major tourist markets in Europe and the Middle East is a key feature to the
development of the sector. The decision by the Government to pursue a strategy for developing
tourism potential is based on the industry’s positive economic impacts, which fall into two
broad categories namely: wealth generation and employment creation. It is widely argued that
success in the tourism industry depends mainly on building infrastructure, and protecting the
natural environment. In this regard, the country has laid the basis for environmental protection
through its National Environmental Management Plan (NEMP-E, 1996) which has outlined

12
specific activities for an integrated coastal zone management. At present, the major bottleneck
for the development of the tourism sector remains to be the inadequate hotel facilities and
transport infrastructure.
1.8.4 Trade and Industry
Manufacturing industries in Eritrea are dominated by light industries shown in Table 1-3. These
industries have great potential to become important contributor to Eritrea’s growth and
development thanks to the country’s strategic location along the world’s busiest shipping route
which offers opportunity for accessing export markets, while there is large potential for import
substitution. The country, in the past, had a well-developed industrial economy in Africa. The
long war for independence and the border conflict that followed, however, had an adverse
effect on the country’s manufacturing sector. Eritrea possesses manufacturing sectors that range
in type from food and textile to chemicals and construction materials. However, the industries
operate below capacity for reasons including lack of raw materials operate below capacity due
to a number of reasons including among others lack of foreign currency, unsustainable power
supply, non-competitive products and shortage of skilled manpower. The country imports a
wide range of agricultural and industrial items from Asian, European, African and the Middle
East countries. The import values for food and, textile and garment account for the largest
amount of expenditures compared to all other items imported. Similarly, the country earns
substantial amount of revenue from its exportable items that mainly include textile, and leather
and shoe. Since recently, the mining sector is increasingly becoming a driving force to the
economic growth of Eritrea.
Table 1.3: Manufacturing Sectors of Eritrea
Sub-sector Number
of establishment
Capacity in %
Food and beverage 83 41
Textile and leather 33 42
Paper and printing 15 29
Chemicals, paints and pharmaceuticals 23 27
Rubber and plastic 11 39
Construction materials 32 48
Metal 17 26
Furniture 32 41 Source: Ministry of Trade and Industry, 2019
1.8.5 Transport and Communication
The modes of transport in Eritrea comprise road, railway, water and air. The road transport, in
particular, is critical as it meets much of the demand for passenger and freight services and
hence it has a significant contribution to the overall development of the country. Road transport
has undergone improvement as a result of the rehabilitation work and the opening up of new
routes and terminals. In addition, proclamations on compulsory third party insurance, road
traffic safety and legal notice on technical specifications and standards of vehicles have been
issued and enforced to ensure public safety. The Eritrean highway system is categorized into
primary, secondary and tertiary levels. The tertiary level is the lowest level in the road category,
and serves mainly the rural areas. It is a dry weather road that makes travel during the rainy
season difficult. The next higher level in the road classification system is secondary, which is
an all-weather gravel road that connects district centres with the regional capital centres.
Primary roads are those that are fully asphalted throughout their entire length. They carry traffic

13
between all the major towns in the country. At present, there are a total of 15,000 km of road in
the country of which 36 % consist of asphalt and paved roads (MoTC, 2016).
The railway transport system of Eritrea began in the 1930s, carrying both passengers and
freight at a limited capacity. In the past, there was a total of 317 kilometres narrow gauge rail
line linking Asmara with towns of Massawa and Akordet. However, it remained non-
operational starting from 1978 until it was reopened in 1994. Some rehabilitation works took
place in recent years, and as result, the line from Massawa all the way through Asmara had
been restored. Currently, there are no railway links with adjacent countries.
1.8.6 Energy and Mines
Eritrea has favourable geology for mineral resources, but largely remained unexplored. The
country is made up of tertiary geological formation. As a result, several high-grade volcanic
massive sulphide (VMS) discoveries were made in the past few years. It is well endowed with
significant precious minerals, base metals and, industrial and construction materials that can
support the development of a viable mining industry. There are rich deposits of gold, copper,
iron ore, lead, magnesium, nickel, potash, silver, zinc and chromium. The country also
possesses reserves of industrial and construction materials that include basalt, cement, clay,
coral, granite, gravel, gypsum, limestone, marble, salt, sand, and silica. Moreover, there is a
potential for large reserves of natural gas and petroleum. Several companies including Nevsun,
Sub-Sahara, Sanu and Sun ridge Corporation took part in the exploration of minerals in the
country, while Bisha, Zara and Asmara mining companies are currently involved in the actual
operational activities. The development of the mining sector is believed to have a good prospect
to the economic development of Eritrea (MoEM, 2018).
Presently, the largest proportion of the total energy consumption of the country is met from
biomass sources followed by oil and electricity. The various biomass sources that account for
83% of the total energy consumption show the following estimates: Fuel wood 76 %, charcoal
(11 %), dung (10%) and agricultural residues (3%) (MoEM, 2018). Excessive dependence on
biomass has significantly contributed to the clearing of forests and woodlands. Such
unsustainable practices have led to the overall reduction of Eritrea‘s terrestrial biodiversity. As
part of a long term development strategy, the GoE together with its partners piloted a wind
energy project in 2010 in the Southern Red Sea region, which consists of a wind farm with a
capacity of 750 kilowatts (MoEM, 2018).
Five small stand-alone decentralized wind turbines were installed in the villages of Rahayta,
Gahro, Barasole, Edi, and Beylul. The Government has also embarked on solar projects that
provide modern, affordable and sustainable energy to the previously off-grid villages and rural
towns. A good example is the solar power project that aims to serve over 40,000 residents in
Areza area in the southern part of the country (MoEM, 2019). This is expected to improve the
livelihoods of the rural population through increased income and access to social services. The
project will contribute to the Sustainable Development Goal 7 (affordable and clean energy)
and will contribute to the reduction of fuel-wood dependence. In addition, the project is
anticipated to reduce carbon emission substantially. Besides wind and solar energy, the country
has huge prospect for the development of geothermal energy.
1.9 Environmental Context Eritrea suffers from intense environmental degradation as a result of a complex set of factors
including long and short-term climate changes, expansion of settlements, agricultural
encroachments and excessive use of fuel wood. Loss of vegetation cover through continued
14
deforestation affected the hydrological conditions making the water supply unreliable. The
problem is further aggravated by the use of animal dung for domestic fuel and absence of input
replacement for the nutrient loss. Land degradation is prevalent throughout the country, but is
particularly manifested in the central, northern highlands and southern plateau. The degraded
area covers 2.4 million hectares, constituting around 19% of the total land area of the country
(MoA, 2017a). The most visible impact of such environmental crisis is reflected in the decline
in crop yield; consequently, the country is incapable of meeting its annual food requirement.
The long term changes in the country’s ecosystem are expected to have serious adverse impacts
on the human health, forestry, and coastal and marine environments.
1.9.1 Climate Changes
Eritrea is one of the most vulnerable countries of the world to the adverse effects of climate
changes due, primarily, to its geographic location in the Sahelian Zone. Human activities have
led to unsustainable land use practices such as clearing of land for farming. Moreover, heavy
dependence on wood for energy needs had adversely impacted the forest cover of the country,
which, in turn, has reduced crop yield and livestock production. There is a widely accepted
proposition that climate change has brought about an increase in the mean annual temperature
of 1.7oC since 1960 (MoLWE, 2018). As a consequence, the country faces recurrent droughts
and associated problems of food insecurity and poverty. Overall, the changes in climate have
seriously impacted livelihoods and socio-economic systems of the country.
1.9.2 Water Resources
Eritrea is not endowed with rich water resources due to its exposure to vulnerable environments
such as drought. The country’s water supply coverage is estimated at 75% and 93% for the
rural and urban areas, respectively (MOLWE, 2007). In order to meet the demand for clean
potable water, the present per capita consumption for the rural population should increase from
15lt/day to 20lt/day. Similarly, clean water supply for the urban population has to increase from
40lt/capita/day to 50lt/capita/day. In 2020, the overall domestic water needs for the rural
population and for the urban population were expected to be 27.0 Mm3/yr and 40.8 Mm3/yr,
respectively (WRD). A survey to determine the future water demand for livestock is based on
the assumption that herd size increases by 1% annually. A large quantity of clean water is also
needed for agriculture sector with a projected amount of 2396.5 Mm3. Nevertheless, the mining
projects that are on the operational phase are expected to demand a considerable amount of
water in the future. The water resource of the country faces major challenges including lack of
regulatory mechanism for proper water use allocation and severe environmental degradation.
Surface Water: There are five major river basins that drain a significant proportion of the
country’s land surface. Table (1-4) presents Major drainage basins of Eritrea and estimated
runoff contribution (Mm3/yr) where the largest share of the total annual runoff flows to the
west, while the remaining flows to the east entering into the Red Sea. The total estimated mean
annual runoff from the five rivers basins is 9967Mm3/year (IWRMP, 2009).
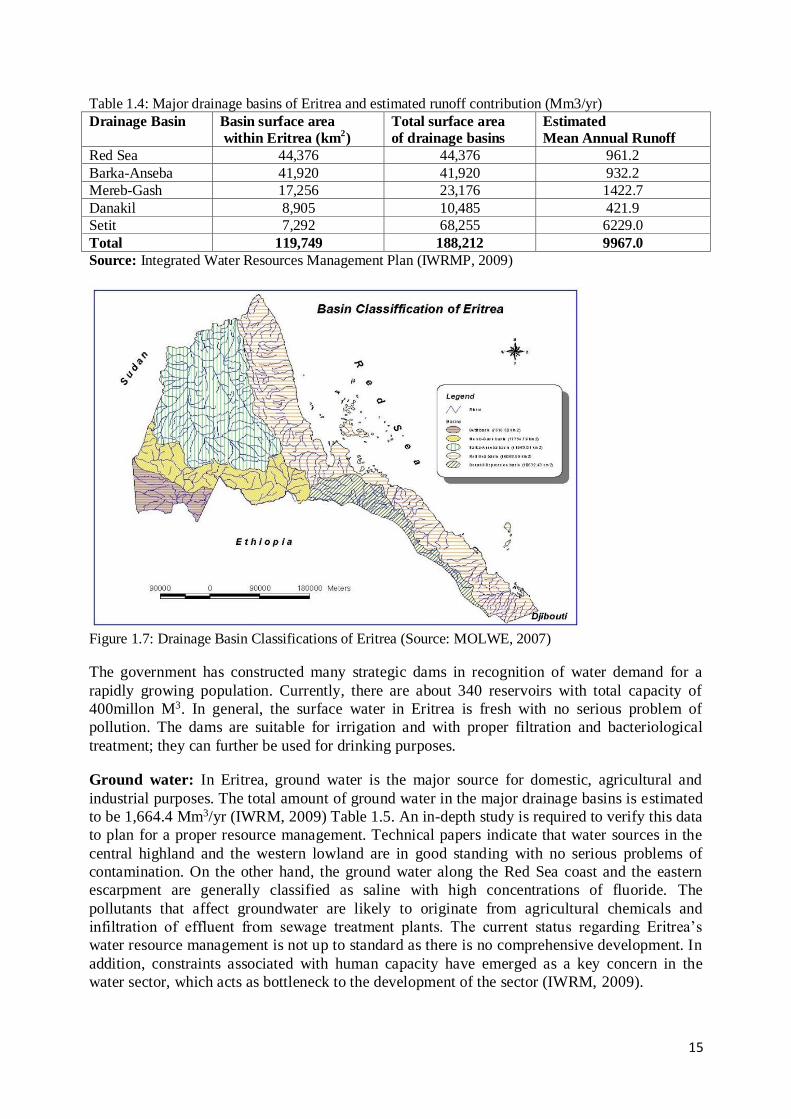
15
Table 1.4: Major drainage basins of Eritrea and estimated runoff contribution (Mm3/yr)
Drainage Basin Basin surface area
within Eritrea (km2)
Total surface area
of drainage basins
Estimated
Mean Annual Runoff
Red Sea 44,376 44,376 961.2
Barka-Anseba 41,920 41,920 932.2
Mereb-Gash 17,256 23,176 1422.7
Danakil 8,905 10,485 421.9
Setit 7,292 68,255 6229.0
Total 119,749 188,212 9967.0
Source: Integrated Water Resources Management Plan (IWRMP, 2009)
Figure 1.7: Drainage Basin Classifications of Eritrea (Source: MOLWE, 2007)
The government has constructed many strategic dams in recognition of water demand for a
rapidly growing population. Currently, there are about 340 reservoirs with total capacity of
400millon M3. In general, the surface water in Eritrea is fresh with no serious problem of
pollution. The dams are suitable for irrigation and with proper filtration and bacteriological
treatment; they can further be used for drinking purposes.
Ground water: In Eritrea, ground water is the major source for domestic, agricultural and
industrial purposes. The total amount of ground water in the major drainage basins is estimated
to be 1,664.4 Mm3/yr (IWRM, 2009) Table 1.5. An in-depth study is required to verify this data
to plan for a proper resource management. Technical papers indicate that water sources in the
central highland and the western lowland are in good standing with no serious problems of
contamination. On the other hand, the ground water along the Red Sea coast and the eastern
escarpment are generally classified as saline with high concentrations of fluoride. The
pollutants that affect groundwater are likely to originate from agricultural chemicals and
infiltration of effluent from sewage treatment plants. The current status regarding Eritrea’s
water resource management is not up to standard as there is no comprehensive development. In
addition, constraints associated with human capacity have emerged as a key concern in the
water sector, which acts as bottleneck to the development of the sector (IWRM, 2009).

16
Table 1.5: Ground water sources of Eritrea (million M3)
Source Quantity %
Barka-Anseba 479.6 28.9 Mereb Gash 261.6 15.7 Red Sea 558 33.6 Danakil Depression 26.2 1.6 Setit 339 20.4 Total 1664.4 100.0 Source: Water Resource Sector Study, 1998
1.10 Waste Management The volume of solid waste produced is increasing as a result of the growth in urban
populations, concentration of industries, and consumption patterns of residents. In the
developing countries, municipal solid wastes constitute a serious health problem to the local
community. Illegal sites for dumping also bring serious threats to environmental sanitation. In
Eritrea, a total of 539.2 tonnes of municipal solid waste are generated from major towns and
cities each day. Out of this, 283.4 tones (52.5 %) (MOLWE, 2007) were collected and disposed
at the dumping sites through municipalities of respective towns and cities. Organic waste
accounts for almost 70 % of the total generated from households, commercial and agricultural
activities. Limitations in finance and technology are the main constraints that force people to
dump wastes using inappropriate means such as burning, burring and throwing in drains or
open places along the streets. Additionally, wastes collected through municipalities are poorly
managed with no proper means of segregation. Accordingly, the economic and environmental
benefits that could have been generated from wastes are not realized. Absence of proper
disposal mechanism also makes the level of methane gas emission difficult to estimate.
1.11 National and Regional Policies and Strategies Eritrea, as a member state of the Intergovernmental Agency for Development (IGAD) shares,
common understanding about the environmental challenges in general and climate change
induced hazards such as drought, rainfall variability, temperature fluctuation, sea level rise,
locust infestation, and human diseases (IGAD-Regional Climate Change Strategy (IRCCS,
2016)). The IGAD platform is also used as hub for exchange of data and information pertinent
to climate change. Eritrea‘s seasonal forecasts for climate information is done through the
IGAD Climate Prediction and Applications Centre (ICPAC).
Besides the aforementioned regional engagement, Eritrea, as member state of COMESA, will
participate in the “Regional capacity building of COMESA member states in Eastern and
Southern Africa for enhanced transparency in Climate Change Monitoring, Reporting and
Verification(MRV) as defined in the Paris Agreement. This has to be specifically oriented
towards addressing towards consistent, transparent and comparable regular reports.
Towards achieving Eritrea‘s environmental goals, the five years Indicative Development Plan
of Eritrea (IFYIDP) stipulates the following measures to be undertaken during the plan period
and beyond: (i) comprehensive national baseline data on the environment shall be prepared; (ii)
legal provisions reviewed to determine their adequacy and supplemented if needed; (iii) land
use classification and land use maps developed to promote sound land use management; (iv)
alternative renewable energy sources, such as wind and solar, shall be harnessed and
developed; (v) non-wood construction materials developed to prevent further depletion of forest

17
resources; (vi) establishment of appropriate vehicle emission standards, inspection procedures,
and enforcement capacities; and (vii) environmental protection, restoration and enhancement
measures shall be mainstreamed in all investments and development programs by requiring
appropriate environmental impact assessments, provision of mitigation measures and effective
enforcement mechanisms for compliance with established national standards. Details about
specific environmental policies and prioroties is summarised in chapter 5 wich specifies about
information relevant to the achievement of UNFCCC.
Eritrea has prepared its NDC in 2018 and thrives to implement the programmes and projects as
well as evaluate the extent of the impacts of its implementation. Indeed, the NDCs presents
measures and steps that need to be taken in the implementation of projects and programs to
address climate change issues in the country; and include, capacity building, technology
transfer, financial support and partnership with regional and international agencies involved in
climate change.
1.12 Institutional Arrangement for National Communication The Technical Committee guides and oversees the technical issues for the preparation of the
Third National Communications (TNC). The Committee comprises sub-technical committees
for the National Communication including sub-technical committees for the preparation of four
major components: i) National Circumstances, ii) National Greenhouse Gas Inventories, iii)
National Greenhouse Gas Mitigation and Analysis, iv) Impacts, Vulnerability and Adaptation
Assessment, and v) Constraints and Gaps and Related Financial Technical and Capacity needs.
The current working institutional arrangement for the preparation of national communications
is shown Figure 1.8. The Ministry of Land, Water and Environment, in consultation with the
relevant institutions has established Technical Expert Working Groups composed of
representatives of the line ministries and academic institutions. Each institution has a clear role
and a set of responsibilities as described in Table 1.6. Nonetheless, these roles and
responsibilities are not mutually exclusive; instead they overlap across components and
activities that will enable the various sub-technical committees to work in complementary
manners to bring integrated and consistent results.

18
Figure 1.8: Institutional Arrangement
Table 1.6: Roles and Responsibilities of each institution Agency/Sector Roles and responsibility
MLWE The MLWE is the representative of the convention that approves the budget allocation of the projects. It also leads the Department of Environment for any designated project coordinator and communication with the line ministries.
DoE (Climate Change Unit)
The Department of Environment is the focal point of the UNFCCC and responsible to manage and supervise the implementation of the project and financial disbursement. It
also contracting for any consultancy when accept and approved implementation of the project by the MLWE and UNFCCC convention. The climate change unit also responsible to coordinate the project and compiled data relevant to GHG emission and modelling and quality control of the project.
Energy Hub The department of Energy and MoTC are the responsible agencies for providing data related to fuel and biomass consumption in power plants, road transport, civil and marine aviation also in commercial and residential consumption. These agencies also have responsibility to assess the status of mitigation action and its effects in the country.
AFOLU Hub MoA is the main responsible sector to provide the overall agriculture information relevant to mitigation and adaptation programmes and GHG relevant data. The crop and livestock corporation and forest and wildlife authority are the two institutions to provide the relevant information on crop, livestock, forest and wildlife of the country. These institutions have also responsibility to assess the status of mitigation and adaptation progress on agriculture.
IPPU Hub MoTI is the responsible sector to provide the industrial information including the production, consumption, and import and export volume of the industrial material. It also has responsibility to assess the status of industrial mitigation action.
Waste Hub MoLG is the lead agency of the Municipalities to provide the waste generation of the country and other relevant information in use and change of wastes.

19
CHAPTER TWO
2 NATIONAL INVENTORY OF GREENHOUSE GASES
2.1 Introduction Since its establishment in 1988, the Intergovernmental Panel on Climate Change (IPCC) has,
provided conclusive evidence that greenhouse gases (GHGs) concentration in the atmosphere
are increasing beyond tolerable levels; and thus, causing global climate change; where these
climate changes are negatively impacting the globe. Eritrea, having appended her signature and
ratified the UNFCCC is required to fulfil its obligations. Accordingly, Eritrea
decided/committed to produce and regularly update national Greenhouse Gas (GHG)
inventories. This will enable the country to work in coordination and close cooperation with the
international community to tackle climate change and associated challenges. Thus, Eritrea, to
comply with the obligation under Article 4, paragraph 1(a), and Article 12, paragraph 1(a) of
the (UNFCCC), takes its responsibility to develop, periodically update and publish national
inventories of anthropogenic emissions by sources and removals by sinks of all its greenhouse
gases not controlled by Montreal Protocol to the extent its capacities permit, using comparable
methodologies and following the provisions of Decision 17/CP.8.
The INC and SNC, the national GHG inventories were carried out for the years 1994 and 2000
respectively and submitted to COP in 2000 and 2012 respectively. In this chapter, GHGs
emissions inventory for the years 2006, 2010 and 2015 are elected as part of TNC. It covers
anthropogenic activities representing the main economic sectors that contribute to the release
and/or capture of greenhouse gases. These sectors are Energy, Industrial Processes and Product
Use (IPPU), Agriculture, Forestry and Other Land Uses (AFOLU) and Waste. The GHGs
emissions are grouped into two categories: direct and indirect GHGs. While the direct GHG
include (carbon dioxide (CO2), methane (CH4) and nitrous oxide (N2O); the indirect GHG
precursor gases are carbon monoxide (CO), oxides of nitrogen (NOX) and non-methane volatile
organic compounds (NMVOC).
2.1.1 Objectives
The main objective of undertaking this inventory is to identify and quantify the major
anthropogenic sources of greenhouse gas emissions and sinks in Eritrea. Among the specific
objectives are to:
Develop of baseline data to understand the relationship between GHG emissions and
climate change;
Develop the capacity of Eritrea to identify, monitor, document update and report the
national inventories of GHG sources and sinks;
Develop baseline information for possible identification of national technological and
policy options that could reduce and/or avoid future national GHG emissions in Eritrea;
and
Build institutional capacity and information sharing on climate change issues.
2.1.2 Institutional Arrangement for TNC preparation
The DOE of the MOLWE, as the focal point of UNFCCC and the executing agency for the
preparation of National Communications in Eritrea, has established a National Greenhouse
Gases Inventory Technical Expert Working Group (NGHGITEWG) in order to facilitate and
institutionalize the national GHG inventory process. This group is composed of more than 15
experts from eleven public institutions and academia. While the ministries of Energy and Mines

20
(MoEM), Agriculture (MoA), Trade and Industry (MoTI), Transport and Communication
(MoTC), Marine Resources (MoMR), Health (MoH) and Local Government (MoLG) and the
Forestry and Wildlife Authority (FWA) represented the public sector; the National Higher
Education Institutions and Research Institute (NHERI) was represented by three higher
education institutions namely Hamelmalo Agricultural College (HAC), College Business and
Social Sciences (CBSS), College of Science -Eritrean Institute of Technology (EIT). The
NGHGITEWG has been entrusted with the mandate of data collection planning and execution,
and preparation of documentation and activities necessary for the completion of national GHG
inventory.
Consultation with Technical Expert Working Group:
The flow chart of the institutional arrangement for NGHGITEWG is given in Figure 2-1. The
working group had specific ToR to enhance the national endeavours aimed at sustaining the
GHG inventory process. In addition to being members of the working group also officially
represented their respective institutions which are custodians of data and information as
specified in Table 2-1. TEWG meet regularly to discuss and exchange experiences regarding
climate change mitigation and adaption to climate change. Data gathered were validated
through regular meeting arranged at the Bureau of Standards and Evaluation of the National
Higher Education and Research Institutes (NEHRI); as well as identify the gaps, constrains
affecting the climate adaption and mitigation projects. The inputs of the expert opinions in
addition to data gathered from the respective institutions are integrated in the document as part
of the national report.
Table 2.1: Members of the NGHGITEWG and their respective mandates
Institution Mandate related to GHG inventory
Ministry of Land, Water and Environment
Formulation of environmental information relevant to policies, rules and regulations
Department of Environment
Overall coordination for the national GHGI,
Monitors adequacy and review of reports/GHGI
Prepare, progress, financial and audit reports
Communicate with UNEP on technical and financial matters,
Data and information archiving
Data source for land use planning,
Hire National Consultant
Ministry of Energy and Mines
Provide data and information of the energy sector (Type and Quantity of Fuel Consumption for energy production, national electrification and energy efficiency including renewable energy at national level)
Ministry of Transport and Communication
Provide data and information of the transport sector (existing and trends of number of vehicles and fuel consumption )
Ministry of Trade
and Industry
Provide data and information of the IPPU sector (Type of industrial
installation, raw material used and fuel consumption, etc.))
Ministry of Agriculture Provide data relevant to AFOLU (Land management practice, Fertilizers used, Crop production and manure management of livestock population)
Forestry and Wild life authority
Data source for forest cover ( Forest cover, afforested/.reforested, Wood and Charcoal, consumption,)
Ministry of Local
Government
Provides data and information on Municipality wastes, Administrative
Structure information pertinent to the GHGI
NHERI Provide technical consultant service by leading the different Technical Expert Working groups and Prepare, Compile and submit the TNC report to the DOE
The institutional arrangement for the preparation of the GHGI is shown in Figure 2.1.

21
Figure 2.1: Institutional arrangements for the GHG inventory preparation
2.2 Methodologies The emissions’ inventory has been conducted in series of steps using a diverse data sources.
They were estimated through the application of methodologies that link emissions to data on
observable economic activities in the country. Eritrea’s GHG emissions inventory report was
prepared according to the UNFCCC convention in compliance with the IPCC, 2006. The use of
the IPCC Guidelines was enhanced by the inventory software (version 2.691 GHG software)
developed for use in calculating and estimating emissions. As there are no site specific
emission factors for Eritrea that can be utilized to establish emissions for the sectors, IPCC Tier
1 methodology was applied to estimate emissions of direct GHGs (CO2, CH4, and N2O) and
indirect GHGs (N2O, CO, NOX and NMVOC) from all sectors.
In the subsections that follow, GHG emissions are reported both in absolute units of carbon
dioxide, methane and nitrous oxide emissions, as well as in units of global warming potential of
CO2 equivalent (i.e., 1 for CO2, 21 for CH4, and 310 for nitrous oxide) as recommended by the
IPCC in its Second Assessment Report. Generic emission factors from the IPCC guidelines
have been used, due to lack of sufficient available source-category and technology-based
inventory. The detailed data and calculations used to estimate these emissions are available
within the IPCC software employed in the inventory.
2.2.1 Activity Data
A. Data Source: The NGHGITEWG identified all data needs and the custodian institutions.
Hence, the GHG inventory was prepared using data from national data sources. Thus, national
activity data were collected through questionnaire and survey for the key category sectors:
Energy, Industrial Processes Product Use (IPPU), AFOLU and Waste. The Ministries of
MoEM and MoTC were the activity data sources for the energy sector. MoTI provided the
activity data source for the IPPU. MOA provided the activity data source for GHG emissions
from the Agriculture. The Municipalities of the cities and towns were data source for GHG
emissions from the waste sector. The last forest resources assessment has been carried out by
MoA in 1997 through support from FAO. Hence, the most recent data on Eritrean AFOLU has
DoE
(GHGI
Coordination)
GEF
Financial
Support
UNEP
Technical
Support
Bureau of Standard and
Evaluation (Consultant)
MoLWE: Approval
& Endorsement
Energy
Sector
IPPU
Sector
Waste
Sector
AFOLU
Sector
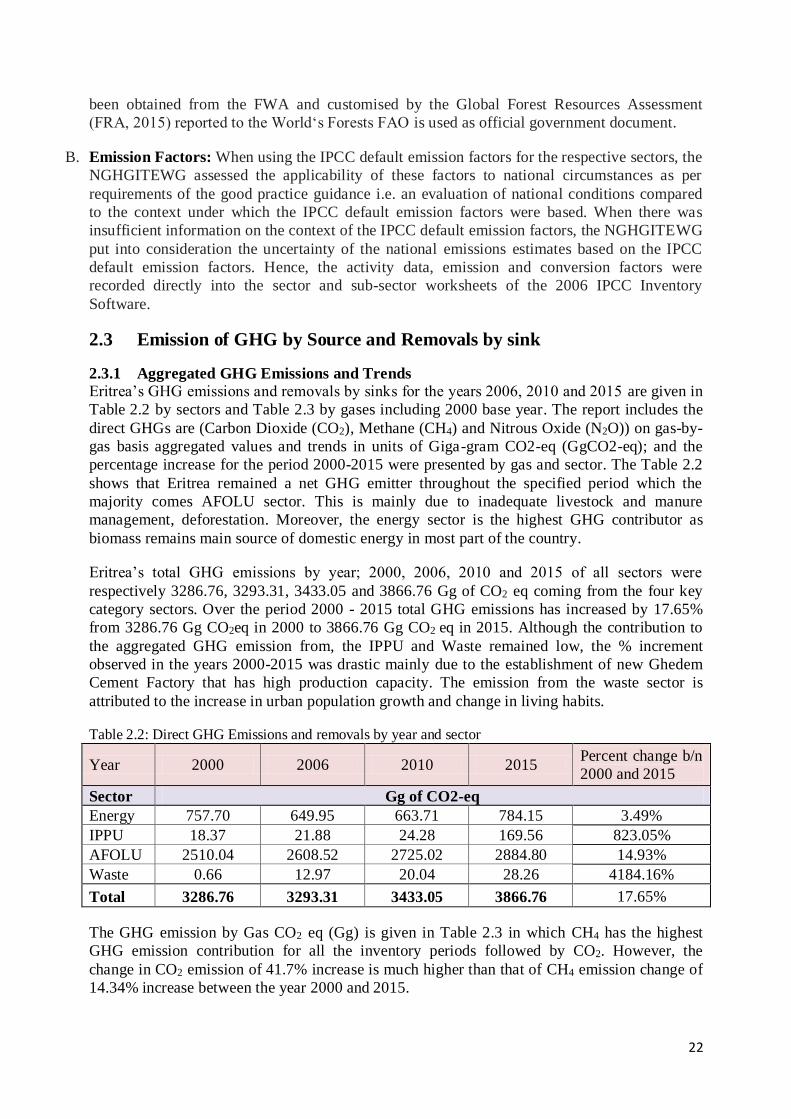
22
been obtained from the FWA and customised by the Global Forest Resources Assessment
(FRA, 2015) reported to the World‘s Forests FAO is used as official government document.
B. Emission Factors: When using the IPCC default emission factors for the respective sectors, the
NGHGITEWG assessed the applicability of these factors to national circumstances as per
requirements of the good practice guidance i.e. an evaluation of national conditions compared
to the context under which the IPCC default emission factors were based. When there was
insufficient information on the context of the IPCC default emission factors, the NGHGITEWG
put into consideration the uncertainty of the national emissions estimates based on the IPCC
default emission factors. Hence, the activity data, emission and conversion factors were
recorded directly into the sector and sub-sector worksheets of the 2006 IPCC Inventory
Software.
2.3 Emission of GHG by Source and Removals by sink
2.3.1 Aggregated GHG Emissions and Trends
Eritrea’s GHG emissions and removals by sinks for the years 2006, 2010 and 2015 are given in
Table 2.2 by sectors and Table 2.3 by gases including 2000 base year. The report includes the
direct GHGs are (Carbon Dioxide (CO2), Methane (CH4) and Nitrous Oxide (N2O)) on gas-by-
gas basis aggregated values and trends in units of Giga-gram CO2-eq (GgCO2-eq); and the
percentage increase for the period 2000-2015 were presented by gas and sector. The Table 2.2
shows that Eritrea remained a net GHG emitter throughout the specified period which the
majority comes AFOLU sector. This is mainly due to inadequate livestock and manure
management, deforestation. Moreover, the energy sector is the highest GHG contributor as
biomass remains main source of domestic energy in most part of the country.
Eritrea’s total GHG emissions by year; 2000, 2006, 2010 and 2015 of all sectors were
respectively 3286.76, 3293.31, 3433.05 and 3866.76 Gg of CO2 eq coming from the four key
category sectors. Over the period 2000 - 2015 total GHG emissions has increased by 17.65%
from 3286.76 Gg CO2eq in 2000 to 3866.76 Gg CO2 eq in 2015. Although the contribution to
the aggregated GHG emission from, the IPPU and Waste remained low, the % increment
observed in the years 2000-2015 was drastic mainly due to the establishment of new Ghedem
Cement Factory that has high production capacity. The emission from the waste sector is
attributed to the increase in urban population growth and change in living habits.
Table 2.2: Direct GHG Emissions and removals by year and sector
Year 2000 2006 2010 2015 Percent change b/n
2000 and 2015
Sector Gg of CO2-eq
Energy 757.70 649.95 663.71 784.15 3.49%
IPPU 18.37 21.88 24.28 169.56 823.05%
AFOLU 2510.04 2608.52 2725.02 2884.80 14.93%
Waste 0.66 12.97 20.04 28.26 4184.16%
Total 3286.76 3293.31 3433.05 3866.76 17.65%
The GHG emission by Gas CO2 eq (Gg) is given in Table 2.3 in which CH4 has the highest
GHG emission contribution for all the inventory periods followed by CO2. However, the
change in CO2 emission of 41.7% increase is much higher than that of CH4 emission change of
14.34% increase between the year 2000 and 2015.

23
Table 2.3: Direct GHG Emissions by year and Gas
Year 2000 2006 2010 2015 Percent change b/n
2000 and 2015
Gas Gg of CO2-eq
CO2 401.24 307.43 313.02 568.55 41.70
CH4 2759.26 2859.14 2986.10 3154.89 14.34
N2O 126.26 126.75 133.93 143.33 13.51
Total 3286.76 3293.31 3433.05 3866.76 17.65
Looking at the GHG emission trend, it shows that Eritrea is a net GHG emitter as indicated in
Figure 2.2 which illustrates that change GHG emission between 2000 to and 2010 was gentle,
and showed a sharp increase from 2010 onwards; and remains to undertake appropriate
mitigation actions.
2000 2006 2010 2015
Total CO2-eq emission 3286.76 3293.31 3433.05 3866.76
2800
3000
3200
3400
3600
3800
4000
GH
G e
mis
sio
n i
n G
g o
f C
O2
-eq
Trend of GHG Emissions
Figure 2.2: Trend of total GHG Emission by year CO2 eq (Gg)

24
Figure 2.3: GHG emission contributions by sector 2000-2015
The figure 2.3 shows that GHG emission in GgCO2e-eq for the direct greenhouse gases; and the
contribution by each sector in the GHG emission through the selected years has changed over
the years. Throughout the selected inventory years, although there is some fluctuation, it is
clear that the AFOUL sector followed by Energy have been the major contributors.
Looking at the share of the various gases emission in 2015, Methane gas followed by CO2 was
the highest (Figure 2.4). Majority of methane emissions came from the livestock (enteric
fermentation) and manure management sub-sector. Methane emission is mainly due to
inadequate manure management; and farmers/herders preference on quantity (more livestock
with less productivity) rather than quality (less but productive) of livestock. The second highest
direct gas emission, in the country, is CO2 from Energy sector which indicates that the country
has not adopted a full-fledged energy efficient and renewable energy technologies.

25
Figure 2.4: Share of GHG emission by gas in 2015
Table 2.4: Summary report for national direct GHG emissions (Gg) (2000, 2006, 2010 and 2015)
GREENHOUSE GAS SOURCE AND SINK CATEGORIES
Year
GgCO2-eq % Contribution CO2 CH4 N2O
Total GHG emission
Total Gas Emissions 401.24 2759.26 126.26 3286.76 100.00
2000 1 Energy 613.08 117.78 26.83 757.70 23.05
2 IPPU 18.37 0.00 0.00 18.37 0.56
4 AFOLU -230.88 2641.48 99.43 2510.04 76.37
6 Waste 0.66 0.00 0.00 0.66 0.02
Total Gas Emissions 307.43 2859.14 126.75 3290.89 100.00
2006
1 Energy 509.93 114.95 25.07 649.95 19.75
2 IPPU 21.88 0.00 0.00 21.88 0.66
4 AFOLU -227.59 2732.00 101.67 2606.09 79.19
6 Waste 0.78 12.19 0.00 12.97 0.39
2010
Total Gas Emissions 304.39 2986.10 133.93 3424.41 100.00
1 Energy 506.46 129.13 28.12 663.71 19.38
2 IPPU 18.37 0.00 0.00 18.37 0.54
4 AFOLU -221.32 2837.81 105.80 2722.30 79.50
6 Waste 0.88 19.16 0.00 20.04 0.59
2015
Total Gas Emissions 565.41 3154.89 143.33 3863.63 100.00
1 Energy 607.16 144.87 32.12 784.15 20.30
2 IPPU 169.56 0.00 0.00 169.56 4.39
4 AFOLU -212.32 2982.78 111.20 2881.66 74.58
6 Waste 1.01 27.25 0.00 28.26 0.73
A. Emission of Carbon Dioxide (CO2)
The total national net CO2 emission in the years 2000, 2006, 2010 and 2015 were 401.2 Gg,
307.43 Gg, 304.39 Gg and 565.41 Gg respectively (Table 2.4). The highest contributor of CO2
emission is Energy sector in all the years. In the energy sector, during the period during the
period 2000 - 2010 the CO2 emission showed a decreasing trend, and later increased in 2015
(Table 2.4) following border conflict with Ethiopia in which there was fuel rationing and low
26
level of economic development. The net CO2 emission in 2000 is higher than the years 2006
and 2010 and this is attributed to the high level of land use change for agriculture, and
resettlement which lead to massive tree clearing. The categories considered in the energy sector
are 1.A.1 energy industry, 1.A.2 manufacturing industry and construction, 1.A.3 transport &
1.A.4 other sector. The net CO2 emission from industrial sector was attributed to the emission
from 2.A.1. Cement and 2.A.2 lime production in the country which was very small prior to the
establishment of the new Ghedem Cement Factory. The AFOLU sector remains net sequester in
all the years. The CO2 emission from waste sector was solely from 4 C incineration & open
burning of waste.
B. Emission of Methane (CH4)
CH4 is primarily removed from the atmosphere through a chemical reaction with hydroxyl
radical (OH) which is ultimately converted to CO2. Increasing emissions of CH4 reduces the
concentration of OH, a feedback that increases the atmospheric lifetime of CH4 (IPCC, 2003).
Incomplete combustion of hydrocarbons in fuels results in methane emissions. The amount of
CH4 emitted is also a function of the methane content of the fuel, the amount of hydrocarbons
un-burnt in the engine, the engine type, and any post-combustion controls (IPCC, 1996). CH4
emissions from fuel combustion are relatively small on a national scale and the uncertainty in
estimating it is high.
The total national methane emission in 2000, 2006, 2010, and 2015 were 2759.26 (83.96%),
2859.14 (86.88%), 2986.10 (87.2%) and 3154.89 (81.65%) Gg CO2-eq respectively. Table 2.4
shows that, in 2015, the AFOLU sector had the lion share (94.54%) of methane emissions
followed by energy sector (4.59%) and waste sector (0.86%). In the AFOLU sector, methane
emission came from enteric fermentation from ruminant animals and manure mismanagement.
In the energy sector, the residential, Energy industry and the road transport were the major
sources and to some extent the solid waste disposal also contributed to the CH4 emission to a
limited extent.
C. Nitrous Oxide (N2O)
Generally, the anthropogenic sources of N2O emissions include agricultural soils, especially
production of nitrogen-fixing crops and forages, the use of commercial fertilisers and farm yard
manure, and manure deposition by livestock; fossil fuel combustion, especially from mobile
combustion; adipic (nylon) and nitric acid production; wastewater treatment and waste
incineration and biomass burning.
Emission of Nitrous Oxide (N2O) in 2000, 2006, 2010 and 2015 was 126.26, 126.75, 133.93
and 143.33 Gg CO2-eq respectively. In most cases, agricultural activities particularly sub
category of manure management has high N2O emission contribution in the country, whereas
the energy sector is the second highest emitter due to fuel combustion and the low engine
efficiency in transport and electricity generation sub-categories Overall, Nitrous Oxide
emission in 2015 was estimated at 143.33 GgCO2-eq coming exclusively from the AFOLU
(Manure management) and Energy (Electricity generation, Transport, Commercial and
Residential ) sectors.
D. Emissions of HFCs, PFCs and SF6
Hydro Fluorocarbons (HFCs), Per-Fluorocarbons (PFCs) and sulphur hexafluoride (SF6) are
direct GHGs. Anthropogenic emissions by sources of Per-fluorocarbons (PFCs) and sulphur
hexafluoride (SF6) from production activities was not accounted due to lack of data
availability. But for anthropogenic emissions by sources of hydro fluorocarbons (HFCs) in Gg

27
CO2 eq. for the 2000, 2006, 2010 and 2015 are 0.10, 2.66, 6.41 and 14.23 respectively (Table
2.5). However, the data from 2000 to 2010 are estimated by the extrapolating the 2012-2015
data from the Eritrean ODS alternative survey report (2017).
In 2015, a comprehensive assessment on the consumption of ODS and use of ODS-related
equipment in the country has been conducted by the DoE. The data was formatted, refined and
used as an input to the National GHG Inventory in these inventory years. The GHG inventory
for the emission incurred by the HFCs and PFCs is shown in Table 2.5. The report covers
mainly emissions from consumption activities, mainly, from the use of refrigerator and air-
conditioning units.
Table 2.5: Emissions of HFCs, PFCs and SF6
Categories CO2 Equivalents(Gg)
HFCs PFCs SF6
2.F - Product Uses as Substitutes for Ozone Depleting Substances 14.234 0 0
2.F.1 - Refrigeration and Air Conditioning 14.234 0 0
2.F.1.a - Refrigeration and Stationary Air Conditioning 13.528
2.F.1.b - Mobile Air Conditioning 0.706
2.3.2 Emissions of Indirect Greenhouse Gases by Sources
The emission of carbon monoxide (CO), Nitrogen oxides (NOx) and NMVOCs in the presence
of sunlight contribute to the formation of the greenhouse gas Ozone (O3) in the troposphere and
are therefore often called Ozone precursors. Furthermore, NOx emission plays an important role
in the earth’s nitrogen cycle. Sulphur Dioxide emissions led to formation of sulphates particles
which also play a role in climate change. All indirect greenhouse gases could be emitted from
all source categories. The methodologies contained in the EMEP/ CORINAIR Emission
Inventory Guidebook is the basis used for the estimation of emission from CO, NOx, NMVOCs
and SO2. However, the 2006 IPCC software version used for this GHG inventory of those gases
are estimated to be negligible or not occurring as shown in Annex-C1 (key Summary of GHG
emission)
2.4 Sectoral GHG Emissions
2.4.1 Energy Sector
Energy industries in Eritrea are mainly based on thermal power plants that utilize fossil fuels
for electricity generation. Consequently, the country is a net importer of refined petroleum
products. The main secondary energy sources are from liquid, gaseous and biomass fuels.
Liquid fuels consist of petroleum products: diesel, gasoline, heavy fuel oil, Jet-kerosene, LPG
and lubricants that were used for combustion and non-energy activities; and the biomass
include wood fuel, charcoal, dung and agricultural-residue. Biomass is the main sources used to
support household, certain commercial and small - scale industries. Emissions arise from these
activities by combustion and as fugitive emissions (e.g. escape without combustion). Carbon
dioxide (CO2), methane (CH4), and nitrous oxide (N2O) are the GHGs emitted from combustion
of fuels. In addition, the GHG precursors: carbon monoxide (CO), nitrogen oxides (NOx), and
non-methane volatile organic compounds (NMVOCs) are released in the process.
The IPCC 2006 guideline provides two ways of estimating CO2 emissions from fuel
combustion. These are the top-down (reference approach), and the bottom-up (sector approach).
In this case, in the GHGs inventory, both top-down and bottom-up analyses were carried out for
comparison. Ideally there should not be much of a difference in the emission calculations using
these methods.

28
A. Reference (Top-Down Approach)
In the reference approach, the primary level of energy supply and distribution is considered. It
enables calculations of CO2 emissions by considering the overall national inventory of fuel
supply. The basic data requirement is an overall inventory of the national fuel supply including
information on fuel qualities for each fuel type utilized in the following activities: i) production
ii) imports iii) exports iv) international bunkers (the amount of fuel used for international
aviation and marine transport) and v) stock change or the variation in the quantity of fuel in
stock. Fuels that are imported and/or used for international bunkers (i.e. aviation) are subtracted
from the overall apparent consumption and hence are not included in the total national net GHG
emissions. CO2 emissions from international bunkers, nonetheless, are still computed as a
separate memo items as recommended by IPCC, 2006 guidelines in section 2.4.1 D.
Calculating the Apparent Fuel Composition
The data for fuel consumption were provided by the MoEM and Petroleum Corporation of
Eritrea. The data on fuel type, production, import, export, transport through international
bunkers and stock change are used in kilotons of oil equivalent or Giga grams (Gg). The
apparent consumption of fuel was estimated using the equation 2.1.
Apparent Consumption = (Production + imports) – (international Bunkers – Stock change) Eq. 2.1
The Reference Approach does not distinguish between different source categories within the
energy sector. It only estimates total the CO2 emissions from Source category 1A, Fuel
Combustion. National total carbon dioxide emission from fuel combustion, based on reference
approach apparent emission of CO2 was estimated disaggregated by fuel type (Table 2.6). The
Table show a difference in energy consumption and carbon dioxide emission of -4.97% and -
4.77 % respectively. The Reference Approach and the Sectoral Approach often have different
results because the Reference Approach is a top-down approach using a country’s energy
supply data and has no detailed information on how the individual fuels are used in each sector.
Table 2.6: Fuel consumption disaggregated by fuel type reference versus sectoral approach for 2015
Fuel
Apparent
Consumption
(TJ)
Excluded
consumption
(TJ)
Apparent Consumption
(excluding non-energy
use and feedstock) (TJ))
CO2
Emissions
(Gg)
Energy
Consumptio
n (TJ)
CO2
Emissions
(Gg)
Energy
Consumption
(%)
CO2
Emissions
(%)
Other Kerosene 0.00 0.00 0.00 0.00 520.78 37.44 -100.00 -100.00
Gas/Diesel Oil 3448.60 0.00 3448.60 255.43 3184.58 235.98 8.29 8.24
Residual Fuel Oil 2103.63 2103.63 162.75 2103.63 162.82 0.00 -0.04
Liquefied
Petroleum Gases237.97 0.00 237.97 15.01 238.87 15.07 -0.38 -0.43
Bitumen 229.14 229.14 0.00 0.00 135.88 10.97 -100.00 -100.00
Lubricants 113.36 0.00 113.36 8.31 111.69 8.19 1.50 1.55
Coking Coal 1068.47 1068.47 101.08 1068.47 101.08 0.00 0.00
Total 7714.87 229.14 7485.73 578.17 7877.85 607.16 -4.97 -4.77
Reference Approach Sectoral Approach Difference
Based on the assessment the difference energy consumption and CO2 emission into the coking
coal sub-sector is zero which indicates that data recording system at the Ghedem Cement
factory, the sole coking coal consumer is efficient. On the contrary for all other type of fuels,
except Gas/Diesel Oil and Lubricants, the difference in energy consumption and CO2 emission
show negative results. This difference may be due to inadequate data management and
recording system of the sectors which could have led to double counting or there be over
estimation of sectoral energy consumption.

29
B. The Sectoral (Bottom-up Approach)
This sectoral approach looks at the actual energy consumption of the specific subsectors. The
subsectors are the energy industry (Power generation or energy production), transportation,
manufacturing industry and service sector (public and commercial), and residential. Being more
detailed in the sense that; it is applied for each specific end-use category. This approach
identifies the specific sector consumers of fuel, including major emitters of energy-related
GHGs, and thus provides a more detailed inventory of the CO2 emissions from fuel
combustion. Compared with the reference approach, nevertheless, requires a much more
detailed disaggregated data and analysis. Correspondingly, the estimated CO2 emissions may be
underestimated since this approach relies heavily on data reported by fuel end-users, which may
not always be complete. Thus, there is a persistent problem of incompleteness of data submitted
by end- users due to recording errors and biases in addition to data collection challenges.
Calculating Apparent Fuel Consumption for Each Fuel Type
In order to calculate the emissions from fuel consumption, the following parameters are
required: the fuel type, its consumption figures for every sub-category, and the carbon emission
factors and conversion factors extracted for the fuel type are subdivided in to CO2 and non-CO2
categories. The Tier 1 approach was used to compute GHG emissions where default emission
factors were used to estimate emissions as there are no country specific emissions factors. The
GHG emissions from the stationary combustion are calculated using equation 2.2, from volume
2 of the IPCC 2006 guidelines.
Emissions (GHG Fuel) = Fuel Consumption Fuel * Emission Factor GHG, Fuel Eq. 2.2
Where:
• Emissions GHG, fuel = emissions of a given GHG by type of fuel (kg GHG)
• Fuel Consumption fuel = amount of fuel combusted (TJ)
• Emission Factor GHG, fuel = default emission factor of a given GHG by type of fuel (kg
gas/TJ).
The CO2 emission factors mainly depend on the carbon content of the fuel in units of kg
CO2/TJ on a net calorific value basis which reflect the carbon content of the fuel and the
assumption that the carbon oxidation factor is 1. Emission factors for CH4 and N2O for different
source categories differ due to differences in combustion technologies applied in the different
source categories. The default factors presented for Tier 1 is applied to technologies without
emission controls.
The contribution GHG emission in Gg of CO2-eq by sub-sectors in the energy sector is shown
in Figure 2.5 which synthesises the major clusters (sub sectors) of the energy sector. In this pie
chart, although the other sectors (include commercial/institutional, Residential and stationary
agricultural activities) account for 39% of the emission, it is clear that the energy industries
particularly electricity generation (33%) followed by the transport (25%) are also in the picture.
The manufacturing industries and construction accounted for only 3% of the total emission. For
more clarification and details of the GHG emissions from energy sector refer (Annex-C2, GHG
emission from Energy Sector).

30
Figure 2.5: GHGs emissions in Gg of CO2 equivalent by sub-sector in the energy sector, in 2015
C. Bunker Fuels
Bunker fuels are categories included international aviation and marine bunker fuels. Emission
estimates from these sources were not included in the national total in accordance with the
Revised 2006 IPCC Guidelines. The CO2 emission from International Aviation Bunker came in
from the use of Jet Kerosene; and the estimated emissions are shown in Table 2.7. Emission
from International Marine Bunker was not estimated as there was no sufficient supporting data
in the country for this purpose. Thus, in order to improve the completeness of the inventory,
Eritrea will include in the improvement plan to estimate those emissions in future inventory
submissions. The total GHG emission from international aviation were estimated around 4.396
Gg of CO2-eq in which 99% is CO2 and the remaining 1% are Methane and Nitrous Oxide.
Table 2-7 shows that there is almost the same GHG emission in 2000 and 2006 where as in
2010 and 2015 substantially reduced. . This is mainly due to the economic sanction imposed of
2008 which continued until 2018 which have affected most of the international flights.
Table 2.7: Emissions from Bunker fuels in absolute unit of Gg, 2000- 2015
GHG 2000 2006 2010 2015
CO2 21.1 21.13 4.04 4.35
CH4 2E-4 1.5E-4 2.8-5 3E-5
N2O 8E-4 6E-4 1E-4 1E-4
D. CO2 Emission from Biomass Combustion for Energy Production
As described in the previous sections, majority of the population of Eritrea, particularly rural
communities, the energy demand mainly rely on biomass combustion for cooking and heating
purposes. The overall CO2 emission from the biomass combustion in 2015; GHG inventory
year is estimated 2553.663 Gg that shows there is still high fuel wood consumption in the
country leading to deforestation and hence land degradation. Thus, there is dire need for an
urgent action to shift to more energy efficient fuel and adoption of renewable energy to reduce
communities’ dependence on biomass energy.

31
E. Fugitive Emissions from Fuels
Fugitive emissions came from all intentional and unintentional emissions from extraction,
processing, storage and transport of fuel to the point of final use. According to the 2006 IPCC
guidelines, in fugitive emissions the following categories should be considered: i) CH 4
emissions from coal mining and handling, ii) CH4 emissions from oil and natural gas activities,
iii) emissions of ozone precursors and SO2 from oil refining (Tier 1 or Tier 2). These emissions
were not applicable in Eritrea in all the inventory years because of the fact that there was no
extraction and/ processing facilities. Nonetheless trace may exist in filling stations and
transportation.
2.4.2 Industrial Processes and Product Use (IPPU)
The IPPU category covers the processes that transform materials, chemically or physically to
make certain desired products. The energy inputs for process heating are covered under the
energy sector section. The IPCC 2006 broadly classifies this sector into seven industrial
processes and others as indicated in Annex-C3 (GHG emission from IPPU sector). These are
A) Mineral Industry B) Chemical industry C) metal industry D) Non-Energy Products from
Fuels and Solvent Use E) Electronics Industry F) Product Uses as Substitutes for Ozone
Depleting Substances G) Other Product Manufacture and Use and, H) others. Of these
categories, only the mineral products (e.g. cement and lime production) and the Product Uses
as Substitutes for Ozone Depleting Substances (Refrigeration and Stationary Air Conditioning
And Mobile Air Conditioning) were relevant to Eritrea. Other subcategories (2B-Chemichal
industry, 2C-Metal production) were not there in the country within the inventory years. Thus,
the whole of CO2 emission by this sector is attributed to cement industry. Share of the CO2-eq
emission from this sector in the years 2000-2015 are shown in Table 2.8 which shows an
increase from 0.56% in 2000 to 4.3% in 2015
Table 2.8: GHG Emissions from Industrial Process & percentage share Inventory Year 2000-2015
Direct GHG 2000 2006 2010 2015
Gg CO2-equ 18.37 21.88 24.28 169.6
Share of CO2-eq (0.56%) (0.66%) (0.54%) (4.39%)
The higher emission value in 2015 is because of the start of a new cement plant in 2013.
However, the low level of the share contributed by industrial sector indicated the low level of
industrial development and limited production activities at this point in time.
2.4.3 Agriculture, Forestry and Other Land Use (AFOLU)
The AFOLU sector comprises activities responsible for emissions and removals linked to
Agriculture, Forestry, and Other Land Uses. Agriculture comprise of emissions from crops and
livestock which generate GHG emissions through decomposition and other biological
processes. In this sector, the main GHG emissions are of methane and nitrous oxide associated
with agricultural practices, enteric fermentation of livestock, manure management etc. Methane
is produced through the processes of enteric fermentation, and manure management. Nitrous
oxide is produced from cultivated soil by direct and indirect mechanisms. Therefore, methane
and nitrous oxide in the country remain the most significant emissions resulting solely from
Livestock rearing resulting in enteric fermentation and manure management as indicate in
(Annex-C4- GHG emission from AFOLU Sector). All domestic livestock have been considered
in this assessment and information from the MOA was used in the estimation of methane and
nitrous oxide gases. Accordingly, the corresponding emissions are described in the following
sections.

32
A. Methane (CH4) Emission from Enteric Fermentation and Manure Management
Methane emission from agriculture categorised by main source is shown in Figure 2.6. The
Figure shows that emissions from the sector shows increasing trend from 2000 mainly as a
result of livestock related activities. The results further, further shows that enteric fermentation
remains the main source of methane emissions while manure management produce both
Methane and Nitrous Oxide emissions in the Agriculture sector. The low level of emission of
methane directly corresponds to the livestock population. Methane and Nitrous Oxide
emissions in the 2015 inventory year were 2982.77GgCO2-eq and 111.205 GgCO2-eq
respectively. While enteric fermentation accounts for 95.91% of the total methane emissions
100% of the N2O emission came from Manure management (livestock sub-sector). Compare to
the 2000 level, Methane and N2O emissions in 2015 increased by 12.9% and 13% respectively.
Figure 2.6: Methane Emission by source category
B. Agricultural Soils - N2O
The following emissions subcategories were assessed under “N2O Emissions from Agricultural
Soils” category: i) Direct N2O Emissions from agricultural fields, excluding cultivation of
Histosols, ii) Direct N2O Emissions from cultivation of Histosols, iii) Nitrous Oxide Soil
emissions from grazing animals, pasture range and Paddock, IV) Indirect Nitrous Oxide
emission from atmospheric deposition of NH3 and NOx and V) Indirect Nitrous Oxide
emissions from Leaching. However, based on the 2006 IPCC Software the value of N2O
emission could not be observed and hence it is considered zero.
Land Use and Land Use change
Land use affects the ability of the natural environment to absorb (sequester) carbon, thus
removing it from the atmosphere. When carbon is sequestered in a given area, the area is
referred to as an “emission sink.” The AFOLU sector differs from the other sectors in that; it
functions as source of atmospheric emissions and a sink of emissions through the removal of
atmospheric CO2. The balance of the two is net emissions or removals in the AFOLU sector.
According to Land Degradation Neutrality report carried out by the MOA (MoA, 2017); it
become evident that 8% of the Eritrean land mass showed declining trend in terms of land
productivity, and 16% showed early signs of land productivity and 12% of the land covers
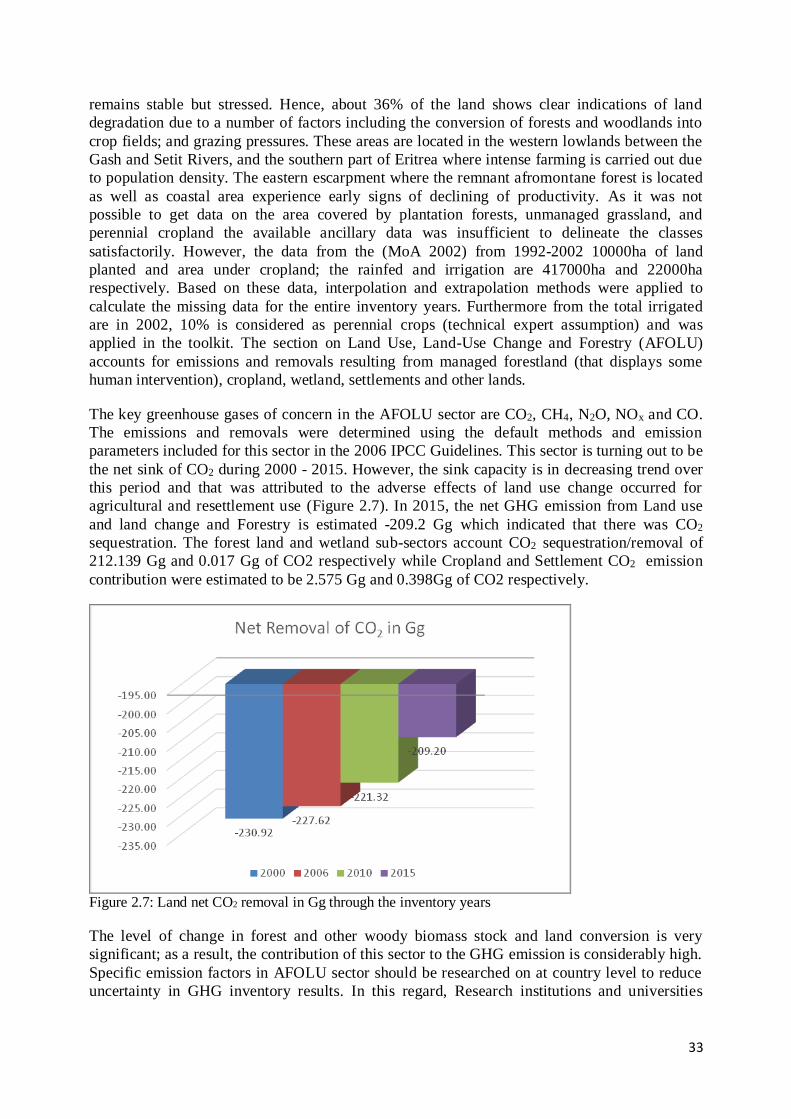
33
remains stable but stressed. Hence, about 36% of the land shows clear indications of land
degradation due to a number of factors including the conversion of forests and woodlands into
crop fields; and grazing pressures. These areas are located in the western lowlands between the
Gash and Setit Rivers, and the southern part of Eritrea where intense farming is carried out due
to population density. The eastern escarpment where the remnant afromontane forest is located
as well as coastal area experience early signs of declining of productivity. As it was not
possible to get data on the area covered by plantation forests, unmanaged grassland, and
perennial cropland the available ancillary data was insufficient to delineate the classes
satisfactorily. However, the data from the (MoA 2002) from 1992-2002 10000ha of land
planted and area under cropland; the rainfed and irrigation are 417000ha and 22000ha
respectively. Based on these data, interpolation and extrapolation methods were applied to
calculate the missing data for the entire inventory years. Furthermore from the total irrigated
are in 2002, 10% is considered as perennial crops (technical expert assumption) and was
applied in the toolkit. The section on Land Use, Land-Use Change and Forestry (AFOLU)
accounts for emissions and removals resulting from managed forestland (that displays some
human intervention), cropland, wetland, settlements and other lands.
The key greenhouse gases of concern in the AFOLU sector are CO2, CH4, N2O, NOx and CO.
The emissions and removals were determined using the default methods and emission
parameters included for this sector in the 2006 IPCC Guidelines. This sector is turning out to be
the net sink of CO2 during 2000 - 2015. However, the sink capacity is in decreasing trend over
this period and that was attributed to the adverse effects of land use change occurred for
agricultural and resettlement use (Figure 2.7). In 2015, the net GHG emission from Land use
and land change and Forestry is estimated -209.2 Gg which indicated that there was CO2
sequestration. The forest land and wetland sub-sectors account CO2 sequestration/removal of
212.139 Gg and 0.017 Gg of CO2 respectively while Cropland and Settlement CO2 emission
contribution were estimated to be 2.575 Gg and 0.398Gg of CO2 respectively.
Figure 2.7: Land net CO2 removal in Gg through the inventory years
The level of change in forest and other woody biomass stock and land conversion is very
significant; as a result, the contribution of this sector to the GHG emission is considerably high.
Specific emission factors in AFOLU sector should be researched on at country level to reduce
uncertainty in GHG inventory results. In this regard, Research institutions and universities

34
should be encouraged to conduct research on the existing gaps to develop local emission factors
to enable Tier 2 computation of GHG emissions.
2.4.4 Waste Sector
The IPCC 2006, guidelines categorise waste sector into five categories: 4A solid waste
disposal, 4B Biological treatment of solid wastes, 4C Incineration and open burning of wastes 4
D wastewater treatment discharge and 4E any other waste that must be specified. In Eritrea, the
solid wastes included three types of waste generated from domestic, clinical, and industrial
wastes. The composition of solid waste in the capital city Asmara and other major towns is
increasing rapidly. There are some medical incinerators installed at the referral hospitals to
incinerate medical waste; but most of these incinerators are not operational due to technical
constraints. Solid waste (domestic, clinical and industrial) is collected and transferred to
municipal disposal sites in the major towns where it is left to decompose or burned in open air.
Each year, about 320,948 tons (MoLG, 2019 archives) of municipal solid waste are generated
from major towns and cities. Approximately 57.7% of the solid waste is collected for dumping
at the landfill and the remaining is managed in various ways including open burning, burying,
or left unattended. Organic waste accounts for nearly 70% of the total solid waste generated
from households, commercial and agricultural activities. Limitations in finance and technology
are the main constraints compelling people to dump wastes using inappropriate means: burning,
burring and throwing in drains or open places along the streets. Solid wastes collected through
municipalities are poorly managed with no proper classification. As a result, the economic and
environmental benefits from solid wastes are not realized. Absence of proper disposal
mechanism also makes the level of carbon dioxide and methane gas emission difficult to
estimate.
In the current inventory the subcategory 6A Solid Waste Disposal; 4C Incineration and open
burning of wastes are considered; and the level of carbon dioxide and methane gas emission are
estimate. All calculation and estimation for waste sector in this inventory is based on the data
based on survey on solid waste management status of the major cities and towns of Eritrea. The
data and expert assumption made for use in the 2006 IPCC software are as indicated in Table-
2.8. All waste in rural communities is discards at farmland or any other open area; and it is
assumed zero open burning for this inventory. The waste generated from the urban area is
estimated based on the given data in Table 2.8 including assumptions by considering the solid
waste management status of the major cities and towns of Eritrea.
Table 2.9: Data and assumption used for waste sector.
Waste generated per capita (kg/can/year) 146
Rural population in % 65
Urban population in % 35
Waste collected in urban areas in % 53.5
Assumption of waste burning from collected waste in % 30
Assumption of waste open burning for unmanaged in % 40
According the above data and assumption, the total GHG emission from waste sector in Eritrea
is estimated to be 28.26 GgCO2-eq in 2015 inventory year and around 96% of the total GHG
emission is methane. The GHG Emission from waste accounted for about 0.02%, 0.39%,
0.58%, and 0.73% relative to overall anthropogenic GHG emissions in CO2-eq during the
inventory years (2000, 2006, 2010, and 2015 respectively) which may be attributed to the
expansion of dumping sites in medium towns. The CO2 and CH4 emissions in Gg from the sub
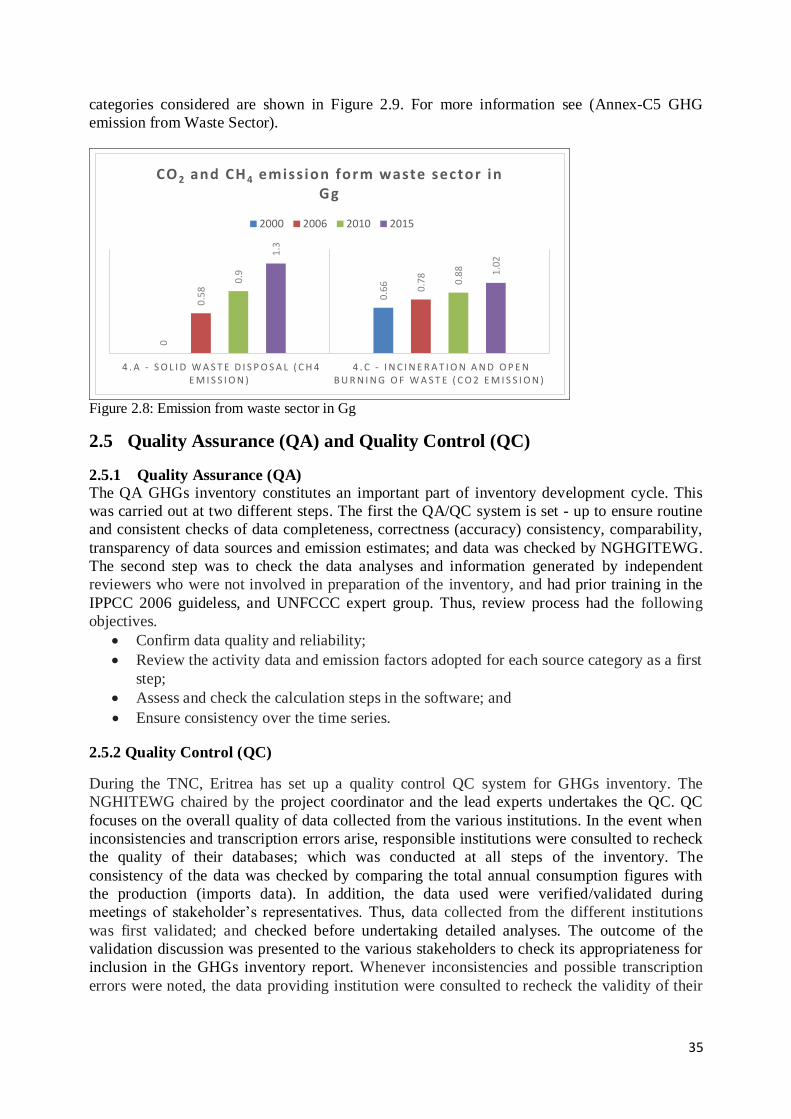
35
categories considered are shown in Figure 2.9. For more information see (Annex-C5 GHG
emission from Waste Sector).
0
0.6
6
0.5
8 0.7
80.9
0.8
8
1.3
1.0
2
4 . A - S O L I D W A S T E D I S P O S A L ( C H 4 E M I S S I O N )
4 . C - I N C I N E R A T I O N A N D O P E N B U R N I N G O F W A S T E ( C O 2 E M I S S I O N )
CO 2 and CH 4 emiss ion form waste sector in Gg
2000 2006 2010 2015
Figure 2.8: Emission from waste sector in Gg
2.5 Quality Assurance (QA) and Quality Control (QC)
2.5.1 Quality Assurance (QA)
The QA GHGs inventory constitutes an important part of inventory development cycle. This
was carried out at two different steps. The first the QA/QC system is set - up to ensure routine
and consistent checks of data completeness, correctness (accuracy) consistency, comparability,
transparency of data sources and emission estimates; and data was checked by NGHGITEWG.
The second step was to check the data analyses and information generated by independent
reviewers who were not involved in preparation of the inventory, and had prior training in the
IPPCC 2006 guideless, and UNFCCC expert group. Thus, review process had the following
objectives.
Confirm data quality and reliability;
Review the activity data and emission factors adopted for each source category as a first
step;
Assess and check the calculation steps in the software; and
Ensure consistency over the time series.
2.5.2 Quality Control (QC)
During the TNC, Eritrea has set up a quality control QC system for GHGs inventory. The
NGHITEWG chaired by the project coordinator and the lead experts undertakes the QC. QC
focuses on the overall quality of data collected from the various institutions. In the event when
inconsistencies and transcription errors arise, responsible institutions were consulted to recheck
the quality of their databases; which was conducted at all steps of the inventory. The
consistency of the data was checked by comparing the total annual consumption figures with
the production (imports data). In addition, the data used were verified/validated during
meetings of stakeholder’s representatives. Thus, data collected from the different institutions
was first validated; and checked before undertaking detailed analyses. The outcome of the
validation discussion was presented to the various stakeholders to check its appropriateness for
inclusion in the GHGs inventory report. Whenever inconsistencies and possible transcription
errors were noted, the data providing institution were consulted to recheck the validity of their

36
data. Accordingly, QC was implemented through combination of the following techniques and
processes:
Routine and consistent checks to ensure data integrity, reliability and completeness; Routine and consistent checks to identify errors and omissions;
Accuracy checks on data acquisition processes and calculations;
Use of approved standardized procedures for emissions calculations; and
Technical and scientific reviews of data used, methods adopted and results obtained.
2.6 Uncertainty Analysis Uncertainty assessment was an essential element of the GHG emission inventory to help
prioritize efforts to improve the accuracy of future inventories. For estimates of GHGs from
different sources, the amount of GHG emitted, in principle is directly proportional to the
amount of activity data and emission factors. For the national inventory the level and trend
assessment uncertainties shows that 11.29% for the 2015 inventory year where as the trend
assessment 11.75% uncertainty between the 2000 and 20015 and is this is considered as being
acceptable given the existing data gaps in the various sectors.
Based on the quality of the data and whether the EFs used were defaults or nationally derived,
uncertainty levels were allocated for the different subsectors and the combined uncertainty
calculated for the latest inventory year 2015. For details for more clarification of the level and
trend uncertainty of all sectors (See annex-6).
2.7 Key Category Analysis In this inventory, key categories and corresponding key gases were identified based on tier 1
methodology of the 2006 IPCC guidelines at both level and trends analyses were conducted.
These deserve special attentions in the national inventory system as their GHG estimate
emissions have significant contribution to the country’s total direct GHG emissions, in terms of
both absolute level and trends in GHG emissions. This is done to enable the government to
prioritize efforts in the reduction of GHG emission and undertaken appropriate
mitigation/adaptation measures for the Key category. The percentages of contributions to both
levels and trends in GHG emissions were calculated and sorted in descending manner using the
2006 IPCC software; and 95% cumulative contribution threshold has been applied as an upper
boundary for key category identification.
2.7.1 Level Assessment
The level assessment for the latest inventory year (2015), Table 2.9, shows that nine categories
namely Enteric Fermentation, Forest land Remaining Forest land, Road Transportation, Cement
production, Energy Industries - Liquid Fuels, Other Sectors – Biomass, Other Sectors - Liquid
Fuels, Manure Management (CH4) and Manure Management (N2O) accounted for 95.1% of the
total cumulative emission.

37
Table 2.10: Level Assessment 2015
2.7.2 Trend assessment
In the trend assessment (Table 2.10) for the inventory years (2000-2015) ten categories
contributed 95.9% of the GHG emission. These are, Cement production, Enteric Fermentation,
Energy Industries - Solid Fuels, Other Sectors - Liquid Fuels, Manufacturing Industries and
Construction - Liquid Fuels, Road Transportation, Solid Waste Disposal, Forest land
Remaining Forest land, Energy Industries - Liquid Fuels and Refrigeration and Air
Conditioning. Most of the sub-category identified in both level and trend assessment are key
category that require specially intervention (Table 2.9 and 2.10).
A B C D E F G
IPCC
Category
code
IPCC Category Greenhouse gas
2015
Ex,t
(Gg CO2 Eq)
|Ex,t|
(Gg CO2 Eq)Lx,t
Cumulative
Total of
Column F
3.A.1 Enteric Fermentation METHANE (CH4) 2860.96 2860.96 0.66 0.66
3.B.1.a Forest land Remaining Forest land CARBON DIOXIDE (CO2) -212.14 212.14 0.05 0.71
1.A.3.b Road Transportation CARBON DIOXIDE (CO2) 196.53 196.53 0.05 0.76
2.A.1 Cement production CARBON DIOXIDE (CO2) 163.02 163.02 0.04 0.80
1.A.1 Energy Industries - Liquid Fuels CARBON DIOXIDE (CO2) 158.21 158.21 0.04 0.83
1.A.4 Other Sectors - Biomass METHANE (CH4) 143.85 143.85 0.03 0.87
1.A.4 Other Sectors - Liquid Fuels CARBON DIOXIDE (CO2) 129.84 129.84 0.03 0.90
3.A.2 Manure Management METHANE (CH4) 121.82 121.82 0.03 0.93
3.A.2 Manure Management NITROUS OXIDE (N2O) 111.20 111.20 0.03 0.95
1.A.1 Energy Industries - Solid Fuels CARBON DIOXIDE (CO2) 101.08 101.08 0.02 0.97
1.A.4 Other Sectors - Biomass NITROUS OXIDE (N2O) 27.81 27.81 0.01 0.98
4.A Solid Waste Disposal METHANE (CH4) 27.25 27.25 0.01 0.99
1.A.2Manufacturing Industries and Construction -
Liquid FuelsCARBON DIOXIDE (CO2) 21.50 21.50 0.00 0.99
2.F.1 Refrigeration and Air Conditioning HFCs, PFCs 14.23 14.23 0.00 1.00
2.A.2 Lime production CARBON DIOXIDE (CO2) 6.54 6.54 0.00 1.00
3.D.1 Harvested Wood Products CARBON DIOXIDE (CO2) -3.14 3.14 0.00 1.00
1.A.3.b Road Transportation NITROUS OXIDE (N2O) 3.08 3.08 0.00 1.00
3.B.2.b Land Converted to Cropland CARBON DIOXIDE (CO2) 2.55 2.55 0.00 1.00
4.C Incineration and Open Burning of Waste CARBON DIOXIDE (CO2) 1.01 1.01 0.00 1.00
1.A.1 Energy Industries - Solid Fuels NITROUS OXIDE (N2O) 0.50 0.50 0.00 1.00
1.A.3.b Road Transportation METHANE (CH4) 0.49 0.49 0.00 1.00
3.B.5.b Land Converted to Settlements CARBON DIOXIDE (CO2) 0.40 0.40 0.00 1.00
1.A.1 Energy Industries - Liquid Fuels NITROUS OXIDE (N2O) 0.38 0.38 0.00 1.00
1.A.4 Other Sectors - Liquid Fuels METHANE (CH4) 0.35 0.35 0.00 1.00
1.A.4 Other Sectors - Liquid Fuels NITROUS OXIDE (N2O) 0.30 0.30 0.00 1.00
1.A.1 Energy Industries - Liquid Fuels METHANE (CH4) 0.13 0.13 0.00 1.00
1.A.2Manufacturing Industries and Construction -
Liquid FuelsNITROUS OXIDE (N2O) 0.05 0.05 0.00 1.00
3.B.2.a Cropland Remaining Cropland CARBON DIOXIDE (CO2) 0.03 0.03 0.00 1.00
1.A.1 Energy Industries - Solid Fuels METHANE (CH4) 0.02 0.02 0.00 1.00
1.A.2Manufacturing Industries and Construction -
Liquid FuelsMETHANE (CH4) 0.02 0.02 0.00 1.00
3.B.4.a.i Peatlands remaining peatlands CARBON DIOXIDE (CO2) -0.02 0.02 0.00 1.00

38
Table 2.11: Trend Assessment A B C D E F G H
IPCC
Category
code
IPCC CategoryGreenhouse
gas
2000 Year
Estimate
Ex0
(Gg CO2 Eq)
2015 Year Estimate
Ext
(Gg CO2 Eq)
Trend
Assessme
nt
(Txt)
%
Contributio
n to Trend
Cumulative Total
of Column G
2.A.1 Cement production CO2 14.92 163.02 0.04 0.21 0.21
3.A.1 Enteric Fermentation CH4 2533.81 2860.96 0.03 0.19 0.40
1.A.1 Energy Industries - Solid Fuels CO2 0.00 101.08 0.03 0.15 0.55
1.A.4 Other Sectors - Liquid Fuels CO2 181.18 129.84 0.02 0.12 0.67
1.A.2Manufacturing Industries and
Construction - Liquid FuelsCO2 82.13 21.50 0.02 0.11 0.78
1.A.3.b Road Transportation CO2 201.41 196.53 0.01 0.06 0.84
4.A Solid Waste Disposal CH4 0.00 27.25 0.01 0.04 0.88
3.B.1.a Forest land Remaining Forest land CO2 -230.89 -212.14 0.01 0.03 0.91
1.A.1 Energy Industries - Liquid Fuels CO2 148.37 158.21 0.00 0.02 0.94
2.F.1 Refrigeration and Air Conditioning HFCs, PFCs 0.10 14.23 0.00 0.02 0.96
1.A.4 Other Sectors - Biomass CH4 116.52 143.85 0.00 0.01 0.97
3.A.2 Manure Management N2O 99.43 111.20 0.00 0.01 0.98
3.A.2 Manure Management CH4 107.67 121.82 0.00 0.01 0.98
3.B.2.b Land Converted to Cropland CO2 0.00 2.55 0.00 0.00 0.99
2.A.2 Lime production CO2 3.45 6.54 0.00 0.00 0.99
3.D.1 Harvested Wood Products CO2 -2.04 -3.14 0.00 0.00 0.99
1.A.4 Other Sectors - Biomass N2O 22.65 27.81 0.00 0.00 1.00
1.A.3.b Road Transportation N2O 3.16 3.08 0.00 0.00 1.00
1.A.1 Energy Industries - Solid Fuels N2O 0.00 0.50 0.00 0.00 1.00
3.B.5.b Land Converted to Settlements CO2 0.00 0.40 0.00 0.00 1.00
1.A.4 Other Sectors - Liquid Fuels CH4 0.51 0.35 0.00 0.00 1.00
4.C Incineration and Open Burning of Waste CO2 0.66 1.01 0.00 0.00 1.00
1.A.4 Other Sectors - Liquid Fuels N2O 0.45 0.30 0.00 0.00 1.00
1.A.2Manufacturing Industries and
Construction - Liquid FuelsN2O 0.20 0.05 0.00 0.00 1.00
1.A.3.b Road Transportation CH4 0.56 0.49 0.00 0.00 1.00
1.A.2Manufacturing Industries and
Construction - Liquid FuelsCH4 0.07 0.02 0.00 0.00 1.00
1.A.1 Energy Industries - Liquid Fuels N2O 0.36 0.38 0.00 0.00 1.00
1.A.1 Energy Industries - Solid Fuels CH4 0.00 0.02 0.00 0.00 1.00
1.A.1 Energy Industries - Liquid Fuels CH4 0.12 0.13 0.00 0.00 1.00
3.B.2.a Cropland Remaining Cropland CO2 0.03 0.03 0.00 0.00 1.00
3.B.4.a.i Peatlands remaining peatlands CO2 -0.02 -0.02 0.00 0.00 1.00
2.8 Consistency The actual activity data for each source category in the inventory year of 2000, 2006, 2010 and
2015 were collected from the relevant sectors. Interpolation method was applied to estimate
missing activity data of the years in between to allow consistent comparison of GHG emission
across time. The same emission factors were also used for all the time series in line with 2006
IPCC Guidelines. The emission trends from 2000 to 2015 were estimated as shown in Figure
2.11 for consistency and that indicates to some extent GHG emission has been increasing.

39
Figure 2.9: GHG emission consistency
2.9 Completeness of the 2000 to 2015 Inventories All the direct and indirect GHG emissions for all the source categories were included. The
sectors are energy, IPPU, Agriculture, AFOLU and waste sectors. Completeness of data for
those categories considered is provided in details in Table 2-12. Despite the efforts made, GHG
emissions from some categories and subcategories like the International water born navigation,
Waste water Treatment, Non-Energy Products from Fuels and Solvent Use were not included
mainly owing to lack of data sources.

40
Table 2.12: Completeness of the 2015 inventories of Eritrea
Emissions (Gg) Emissions CO2
Equivalents (Gg) Emissions (Gg)
Categories Net CO2
(1)(2) CH4 N2O HFCs PFCs SF6
Other
halogenated
gases with
CO2
equivalent
conversion
factors (3)
Other
halogenated
gases
without
CO2
equivalent
conversion
factors (4)
NOx CO NMVOCs SO2
Total National Emissions and Removals 603.894 154.34 0.474 21.236 NO NO NO NO NO NO NO NO
1 - Energy 617.243 6.4870 0.097 NO NO NO NO NO NO NO NO NO
1.A - Fuel Combustion Activities 617.244 6.4870 0.097 NO NO NO NO NO NO NO NO NO
1.A.1 - Energy Industries 330.148 0.0095 0.003 NO NO NO NO
1.A.2 - Manufacturing Industries and Construction 12.881 0.0005 1E-04 NO NO NO NO
1.A.3 - Transport 160.343 0.021 0.008 NO NO NO NO
1.A.4 - Other Sectors 113.871 6.455 0.085 NO NO NO NO
1.B - Fugitive emissions from fuels NA NA NA NA NA NA NA NA NA NA NA NA
1.C - Carbon dioxide Transport and Storage NA NA NA NA NA NA NA NA NA NA NA NA
2 - Industrial Processes and Product Use 190.558 NO NO 21.236 NO NO NO NO NO NO NO NO
2.A - Mineral Industry 190.558 NO NO NO NO NO NO NO NO NO NO NO
2.A.1 - Cement production 185.317 NO NO NO NO
2.A.2 - Lime production 5.241 NO NO NO NO
2.A.3 - Glass Production NA NA NA NA NA
2.B - Chemical Industry NA NA NA NA NA NA NA NA NA NA NA NA
2.C - Metal Industry NA NA NA NA NA NA NA NA NA NA NA NA
2.D - Non-Energy Products from Fuels and Solvent Use NE NE NE NE NE NE NE NE NE NE NE NE
2.E - Electronics Industry NA NA NA NA NA NA NA NA NA NA NA NA
2.F - Product Uses as Substitutes for Ozone Depleting Substances NE NE NE 21.236 NE NE NE NE NE NE NE NE
2.F.1 - Refrigeration and Air Conditioning 21.236 NE NE NE NE NE
2.F.2 - Foam Blowing Agents NE NE NE NE NE NE
2.F.3 - Fire Protection NE NE NE NE NE NE NE
2.F.4 - Aerosols NE NE NE NE NE NE
2.F.5 - Solvents NE NE NE NE NE NE NE
2.G - Other Product Manufacture and Use NE NE NE NE NE NE NE NE NE NE NE NE

41
Categories Net CO2
(1)(2) CH4 N2O HFCs PFCs SF6
Other
halogenated
gases with
CO2
equivalent
conversion
factors (3)
Other
halogenated
gases
without
CO2
equivalent
conversion
factors (4)
NOx CO NMVOCs SO2
3 - Agriculture, Forestry, and Other Land Use -205.011 146.33 0.378 NO NO NO NO NO NO NO NO NO
3.A - Livestock 0 146.33 0.378 NO NO NO NO NO NO NO NO NO
3.A.1 - Enteric Fermentation 140.36 NO NO NO NO
3.A.2 - Manure Management 5.9760 0.378 NO NO NO NO
3.B - Land -205.011 NO NO NO NO NO NO NO NO NO NO NO
3.B.1 - Forest land -207.981 NO NO NO NO
3.B.2 - Cropland 2.590 NO NO NO NO
3.B.3 - Grassland NO NO NO NO NO
3.B.4 - Wetlands -0.017 NO NO NO NO NO
3.B.5 - Settlements 0.398 NO NO NO NO
3.B.6 - Other Land 0 NO NO NO NO
3.C - Aggregate sources and non-CO2 emissions sources on land NE NE NE NE NE NE NE NE NE NE NE NE
3.C.1 - Emissions from biomass burning NE NE NE NE NE NE
3.C.2 - Liming NE NE NE NE NE
3.C.3 - Urea application NE NE NE NE NE
3.C.4 - Direct N2O Emissions from managed soils NE NE NE NE NE
3.C.5 - Indirect N2O Emissions from managed soils NE NE NE NE NE
3.C.6 - Indirect N2O Emissions from manure management NE NE NE NE NE
3.C.7 - Rice cultivation NA NA NA NA NA
4 - Waste 1.104 1.5220 NO NO NO NO NO NO NO NO NO NO
4.A - Solid Waste Disposal NO 1.5220 NO NO NO NO NO NO NO NO NO NO
4.B - Biological Treatment of Solid Waste NE NE NE NE NE NE NE NE NE NE NE NE
4.C - Incineration and Open Burning of Waste 1.104 NO NO NO NO NO NO NO NO NO NO NO
4.D - Wastewater Treatment and Discharge NE NE NE NE NE NE NE NE NE NE NE NE
International Bunkers 13.084 9.1E-05 4E-04 NO NO NO NO NO NO NO NO NO
1.A.3.a.i - International Aviation (International Bunkers) (1) 13.084 9.1E-05 4E-04 NO NO NO NO
1.A.3.d.i - International water-borne navigation (International bunkers) (1) NE NE NE NE NE NE NE
NO = Not Occurring; NE = Not Estimated; NA = Not Available

42
2.10 Comparability and Recalculation of GHG emission The last national GHG inventory submitted to the UNFCCC, as part of the second national
communication, was in February 2012. The methodology used for this inventory was the
revised 1996 IPCC Guidelines for estimating and reporting national GHG inventories except
for the LULUCF which was estimate based on the IPCC guidelines of 2006 Volume 4 and
Good Practice Guidance (GPG) 2003 and the reported GHG emission, excluding the biomass
emission was 7501 Gg CO2-eq. On the other hand, GHG inventory in the TNC report is
estimated/calculated using the 2006 IPCC software version 4.691. To provide consistent data
series, recalculation was performed using the 2006 IPCC guidelines for the 2000 inventory
data. Moreover in the second national communication, it was erroneously indicated that the
country forest cover was 12.7% of the total area. It is now evident that the actual Eritrea’s
forest cover is less 1%; and accordingly round wood and fuel wood removal is prohibited.
Therefore, data on annual round and fuel wood removal as well area forest cover are improved
at this stage. Based on the data improvement and application of revised 2006 IPCC guideline
under, the GHG emission for the 2000 inventory year is 3286.76 Gg CO2-eq and which is
43.8% of the valued reported under the second National communication.
2.11 Archiving All raw data collected for the inventory have been stored in a database; and in the 2006
software database after being processed and formatted for making estimates of emissions and
removals. All documentation on the data processing and formatting have been kept in soft
copies in the excel sheets with the summaries reported. These versions will be managed in
electronic format in copies, at the MoLWE, the Department of Environment as reference for
future use and comparison the dynamics of GHG emissions in Eritrea.
2.12 National Inventory Improvement Plan Based on the constraints and gaps and other challenges encountered during the preparation of
the inventory, a list of improvements has been identified. The following list provides highlights
of the major activities that need to be addressed prior to the preparation of the upcoming 4 th
National Communication. These are outlined in the following bullet points.
Refine data collection norms and procedures: Eritrea is endowed with diversified
breeds of livestock adapted to agro-ecological zones of the country. Determining
country - specific factors is increasingly becoming necessary to establish national norms
i.e. weights for livestock as country - specific data is better than using default IPCC
values.
Improve data collection from the IPPU,
Much remains to be done on the waste sector specially to categorize the various
components of wastes not covered in this inventory;
Introduction of national Quality Control mechanism: Adequate and proper data
collection including QC, validation, and storage and retrieval mechanism to facilitate
the compilation of future inventories is required. There is a need for a shift from an ad-
hoc basis of QC approach to an organized institutional set - up so as to take over the task
and coordination of data sources from various stakeholders involved in GHG
inventories.
Implement fully the QA/QC system: in order to reduce uncertainty and improve the
inventory quality, fully-fledged QA and QC need to be institutionalized at the national
level. International support is needed to adapt an effective, efficient and sustainable
QA/QC mechanisms and procedures.

43
The collection and providing of data are a challenging issue for compiling and estimation of
GHG inventory in Eritrea. The previous and current procedure for collecting of data used were
in aggregated form that inappropriate for the data quality and identify the sectoral key category
of GHG emission in the country. To avoid this problem the next GHG inventory could include
the disaggregate data and national emission factor and clearly defined the roles and
responsibility of the national institution as described in Table-2-14.

44
Table 2.13: Improvement Plan
Category Code
and name
Issue Improvement Option Priori
ty
Responsible
Sector
Implementation
period
National Circumstance
Lack of updated national statistics on (population and population growth rate, Economic contribution and population distribution)
The national statistics office will update the information relevant to population; if necessary take a survey and updated the national statistics documents. The other economic sectors/Institutions will identify and calculate the contribution of their respective sector contribution to the national economy.
High NSO of the MoND, MoA, MoTI, MoH, MoMR, MoEM, MOT etc.
2022
National Meteorological Information
There is no complete national on ground measurements of temperature fluctuation during the day and seasonal variations, rainfall, wind direction
and speed as well as information relevant changes to Ambient air quality (State of air pollution)
Installation of appropriate and representative Meteorological Instruments across the country; and take measurements of the relevant parameters. Data obtained from global sources could be calibrated using ground truth.
High MoLWE, MOLG, MOTC (Aviation)
2023
Institutional Arrangement (IA)
Limited coordination and network of communication among the relevant national institutions.
Develop coordination and network of communication with national institutions and establish Domestic MRV system at national level for accuracy, transparency, consistency and completeness of the GHG inventory; which would be helpful for QA/QC system. In this venture, the national UNFCCC focal point, in collaboration with relevant stakeholders will revitalise
the technical committees to periodically monitor the effectiveness and efficiency of the system on a sustainable manner. Establish a well-equipped and staffed GHG inventory unit within the DOE responsible for GHG inventory compilation and coordination of activities among the various stakeholders.
High DOE (MoLWE) 2022

45
Category Code
and name
Issue Improvement Option Priori
ty
Responsible
Sector
Implementation
period
IA Strengthened existing
institutional framework:
More than ever, there is increasingly becoming necessity
to further build capacity and strengthen the existing institutional framework to improve a coordinated action for reliable data collection and accessibility. Hence, institutionalize the archiving system is imperative.
High DOE (MoLWE) 2021
1.A.4.c-ii Off-road vehicles and other machinery
Activity data not included separately in this inventory
For accuracy, and completeness of the GHG inventory, the activity data should be gathered separately from transportation statistical data; and include it in the
National communication.
High MoA, FWA, MoTC, MOLG, MOH etc.)
2023
1.A.3.d.i - International water-borne navigation (International
bunkers)
The consumption of fuel and technology used were not considered in this inventory
It is understood the international water borne navigation is reported separately from the National GHG inventory; but for meeting the reporting requirement efforts will be made to gather relevant information to fill the gaps.
low Ministry of transport and communication, Eritrean Maritime, MOMR
2024
1.A.3.d.ii-domestic water-borne navigation
The consumption of fuel by the domestic water-borne is important to the
national GHG inventory but due to lack of data; it could not be included in this report.
The consumption of fuel will be included in the next inventory; and the technology used with the domestic water-borne will be assed.
medium
MOTC, MOMR, Eritrean Maritime
2023
2.D.1 lubricant use The consumption and
use of Lubricants are not included in this inventory.
Inclusion of the lubricant consumption and use would
make the nation national GHG inventory complete; and hence efforts will be made to include the information on lubricants in the next inventory.
low MoTI, Custom
office
2023
2.D.2 Paraffin wax
use
The consumption and
use of paraffin wax were not consider in this inventory
Although small, it would important to include the
consumption and use of paraffin in the national GHG inventory.
low MoTI, Custom
office
2024

46
Category Code
and name
Issue Improvement Option Priori
ty
Responsible
Sector
Implementation
period
2.G.1.b-use of
electrical equipment and 2.G.1.c-disposal of electrical equipment
Due to inadequate data
recording and management system, the use and disposal of electrical equipment were not considered in this inventory.
The department of energy responsible for the data
recording especially out of use equipment and disposal. Adequate data recording and management system shall be developed for the out of use and disposal of electrical equipment
low Department of
Energy
2024
3.A.2 - Manure management
The characterizing of national manure management in this inventory was not clearly identified as there are data gaps in
livestock management.
Develop appropriate mechanism to identify and characterize the national manure management system to include in the national GHG inventory.
High MOA, Eritrean Crop and livestock Corporation
2023
3.B.1.a Forest land The national land classification used in the inventory is out dated (MoA, 2002). The
likelihood of land use change over the last 19 years is very high; and this should be captured in FNC inventory.
It is important that updated and current land use classification report is prepared for forest land. This needs the application of spatial and temporal remote sensing data and GIS application tools and expertise to
analyse and detect the change.
High MOLG, MLWE (DOL) MOAFWA, Crop and Livestock Corporation (CLC),
2022
3.B.2.a-Cropland Reclassification required More accurate and transparent GHG inventory. High 2022
3.B.4 Wetlands Up-to-date assessment More accurate and transparent GHG inventory. High 2022
3.B.5-Settlements Land use change More accurate and transparent GHG inventory. Medium
2022

47
Category Code
and name
Issue Improvement Option Priori
ty
Responsible
Sector
Implementation
period
Forest Resources
Inventory:
The last forest cover
map of Eritrea was carried out in collaboration with FOA in 1997; and has not been updated in view of the subsequent changes in the forest cover of the country.
There are evident changes in the forest resources in the
country due to climate change particularly climate change. Hence, there is a need for a comprehensive forest inventories to supplement the available data on the LAND category. Review and correct inconsistencies that exist for the recent land cover maps with additional overlays with previous maps and ground referencing.
High FWA 2022
4.A - Solid Waste Disposal
Due to inadequate activity data on waste compositions; the IPCC default factor is used in
this inventory; and this could have led to some errors in the GHG inventory report. Insufficient data on the type and amount of waste disposed at the landfill is another area
where improvement is required.
Develop national waste data and information recording system especially on the composition and type of waste generated and disposed at the landfills (industrial commercial/domestic). The solid, liquid waste disposal
and management needs to be assessed to generate suitable data.
High Municipality 2022
4.C.1-Waste Incineration
The Ministry of Health uses inclinators to
incinerate medical wastes, however, due to lack of data; this has not been included in this inventory.
Appropriate data and information on the amount of medical waste incinerated at each premise shall be
recorded and documented on a regular basis (daily, weekly monthly and yearly.
High MoH and Municipalities
(MoLG)
2022

48
Category Code
and name
Issue Improvement Option Priori
ty
Responsible
Sector
Implementation
period
4.C.2-Open
Burning of Waste
There is insufficient data
and information about open burning of waste and fraction of population that practice open burning.
Classify and identify the amount of open burning waste
(Clinical, Hazardous and industrial) and estimate fraction of population that use open burning of waste
High Municipality and
MoH
2022
4.D.1 - Domestic Wastewater Treatment and Discharge
Generally there is no waste treatment at national level; but discharges of domestic wastes directly to the sewer system; and were not include in this
inventory due lack of data.
The municipality estimates the daily waste drainage to the sewer and identify the final ends and usage of sewage.
High Municipalities of cities with liquid waste discharges
2023
4.D.2-Industrial Wastewater Treatment and
Discharge
Industrial wastes generated at each facility are discharged to the
sewer system without pre-treatment. However, due to lack sufficient data and information, it has not been included in the inventory
Appropriate data and information recording and management shall be developed to support the estimation of GHG from the sub-sector
High MoTI, MoLWE (DoE and WRD). Relevant
Municipalities
2025

49
CHAPTER THREE
3 NATIONAL GHG MITIGATION ASSESSMNET AND ANALYSIS
3.1 Introduction In order to stabilize greenhouse gas (GHG) concentration in the atmosphere, Article 4.2 (a) of
the convention stipulates that parties shall adopt national policies and take corresponding
measures on mitigation of climate change by limiting their anthropogenic emissions of GHG,
and by protecting and enhancing GHG sinks and removal. Unlike developed country parties,
less developed countries such, as Eritrea, have no specific mandatory targets set for them, but
their participatory role is considered important because these countries are striving for
economic expansion which will eventually lead to higher GHG accumulation in the
atmosphere. Apart from meeting, the UNFCCC requirements, the GHG mitigation process
presents every country with a challenge to achieve economic development in harmony with
environmental protection.
The energy sector is one of the highest emitters of the global CO2 emissions. Hence, many
mitigation studies have justifiably focused on this sector. This chapter presents mitigation
options of the energy sector; despite Eritrea not being expected to be among the major emitters
of GHGs for the reason that both its population and level of economic development are low.
Eritrea is also expected to report on the GHG emission levels and mitigation strategies in
compliance with the UNFCCC to which it is a party. Eritrea’s economic base is expected to
grow resulting in increased emissions. Thus, it is important to incorporate GHG abatement
technologies in the growing economic infrastructure now to benefit from the energy and cost
savings associated with the mitigation measures.
Energy production through fossil fuel heavily contributes to GHG emissions. Thus, GHG
mitigation measures in this sector play an important role in achieving positive environmental,
economic, and social impact through both demand and supply side management and clean
energy production. The implementation of mitigation measures helps in reducing the country’s
GHG emissions by reducing and improving the efficiency of supply and end- use consumption
by various intervention activities in the energy sector. Therefore, Eritrea is committed to
contribute to its maximum capability towards meeting Article 2 of the UNFCCC which states
“the stabilization of greenhouse gas concentrations in the atmosphere at a level that would
prevent dangerous anthropogenic interference with the climate system”. The two major
principles in this mitigation assessment are to meet the ultimate objective of the Convention
and promote socio-economic development as per the policies and strategies in place presently
and mapping the medium term strategic plans and actions of the country.
In view of the above background, this mitigation assessment and analysis provides a description
of Eritrea’s efforts in understanding its options in reducing greenhouse gas emissions within the
context of key sustainable development initiatives. It too provides an overview of the
reductions that could be achieved in critical emitting sectors and a forward-looking set of
recommendations for overcoming current challenges and barriers. This analysis addresses
options which present the highest potential for mitigation for their abatement potential based on
the year 2016 up to the 2035-time horizon.
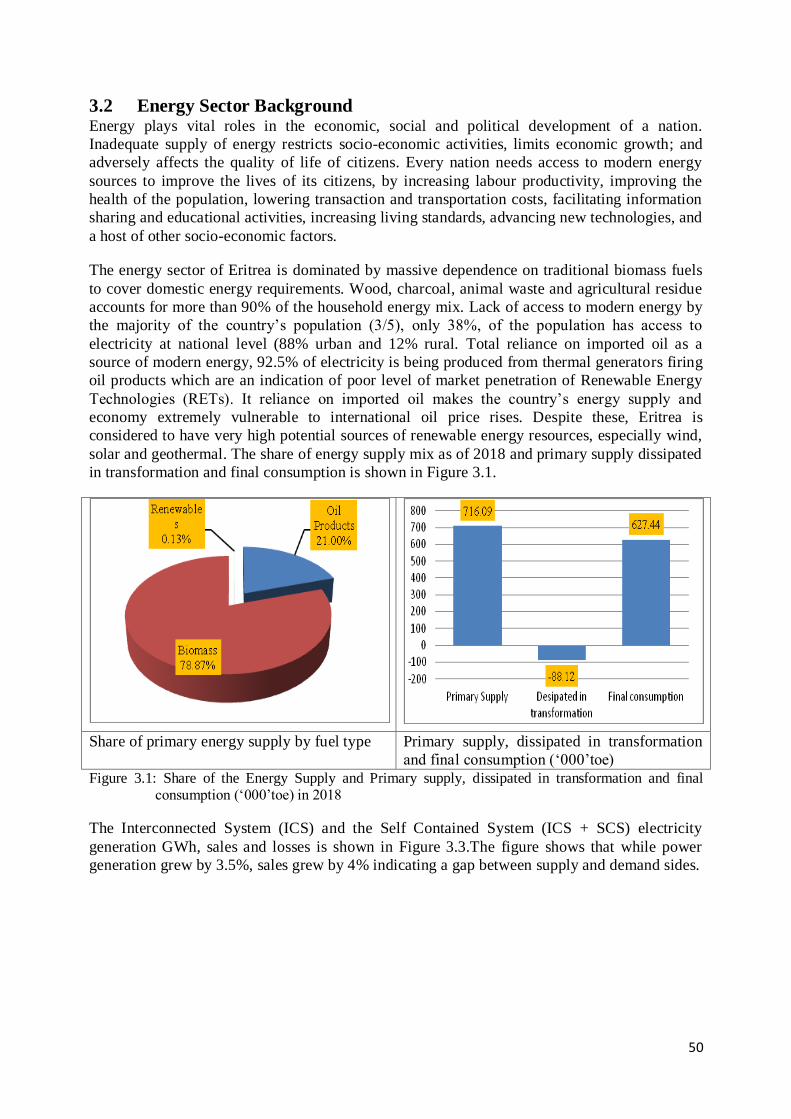
50
3.2 Energy Sector Background Energy plays vital roles in the economic, social and political development of a nation.
Inadequate supply of energy restricts socio-economic activities, limits economic growth; and
adversely affects the quality of life of citizens. Every nation needs access to modern energy
sources to improve the lives of its citizens, by increasing labour productivity, improving the
health of the population, lowering transaction and transportation costs, facilitating information
sharing and educational activities, increasing living standards, advancing new technologies, and
a host of other socio-economic factors.
The energy sector of Eritrea is dominated by massive dependence on traditional biomass fuels
to cover domestic energy requirements. Wood, charcoal, animal waste and agricultural residue
accounts for more than 90% of the household energy mix. Lack of access to modern energy by
the majority of the country’s population (3/5), only 38%, of the population has access to
electricity at national level (88% urban and 12% rural. Total reliance on imported oil as a
source of modern energy, 92.5% of electricity is being produced from thermal generators firing
oil products which are an indication of poor level of market penetration of Renewable Energy
Technologies (RETs). It reliance on imported oil makes the country’s energy supply and
economy extremely vulnerable to international oil price rises. Despite these, Eritrea is
considered to have very high potential sources of renewable energy resources, especially wind,
solar and geothermal. The share of energy supply mix as of 2018 and primary supply dissipated
in transformation and final consumption is shown in Figure 3.1.
Share of primary energy supply by fuel type Primary supply, dissipated in transformation
and final consumption (‘000’toe)
Figure 3.1: Share of the Energy Supply and Primary supply, dissipated in transformation and final consumption (‘000’toe) in 2018
The Interconnected System (ICS) and the Self Contained System (ICS + SCS) electricity
generation GWh, sales and losses is shown in Figure 3.3.The figure shows that while power
generation grew by 3.5%, sales grew by 4% indicating a gap between supply and demand sides.

51
Share of Fuel Consumption by Sector in the Energy Balance of Eritrea, 2018
Share of energy consumption by sector share of energy consumption by fuel
Figure 3.2: Share of Fuel Consumption by Sector in the Energy Balance of Eritrea, 2018
Figure 3.3: ICS + SCS) electricity generation GWh, sales and losses
In Eritrea, there are a number of Potential Renewable energy sources: wind, solar and
geothermal to meet the demands of the population. The wind energy (high potential of wind
electricity generation and wind mechanical water pumping) is given in Figure 3.4.
Figure 3.4: Wind potential at 10 Meter height in different regions
Average losses including own consumption
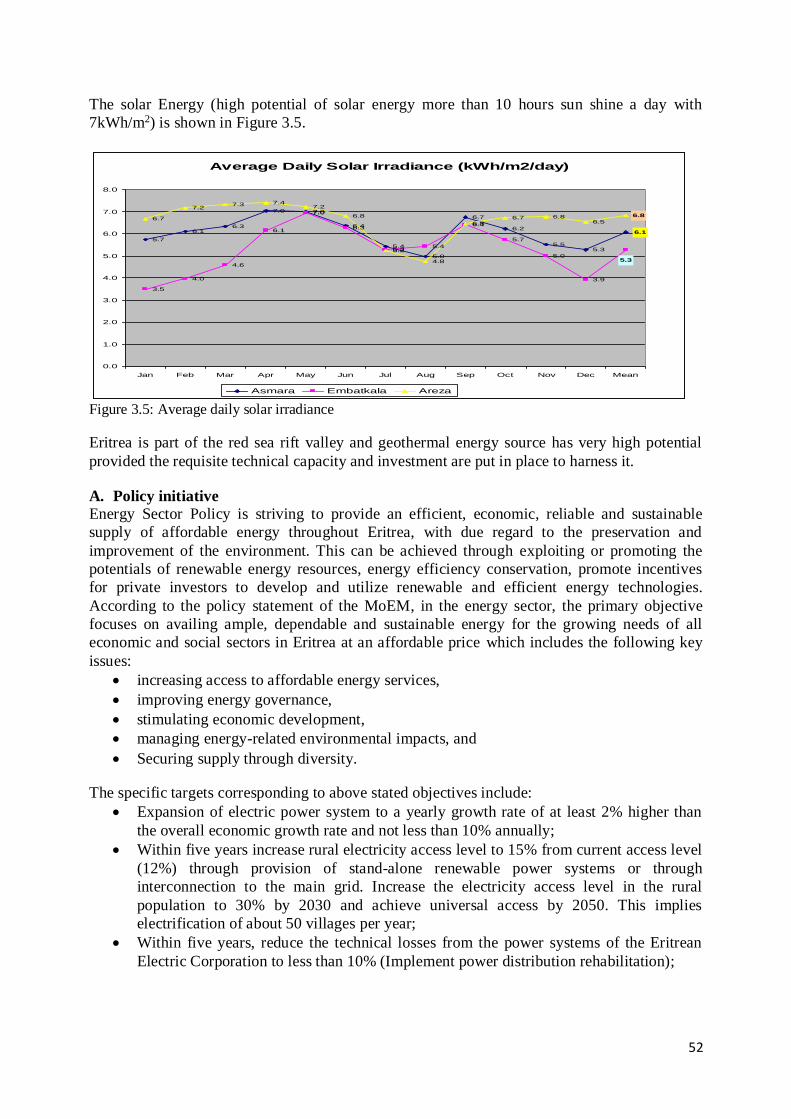
52
The solar Energy (high potential of solar energy more than 10 hours sun shine a day with
7kWh/m2) is shown in Figure 3.5.
Average Daily Solar Irradiance (kWh/m2/day)
5.7
6.16.3
7.0 7.0
6.4
5.4
5.0
6.7
6.2
5.55.3
3.5
4.0
4.6
6.1
7.0
6.3
5.35.4
6.4
5.7
5.0
3.9
6.7
7.27.3 7.4
7.2
6.8
5.2
4.8
6.5
6.7 6.86.5
6.1
5.3
6.8
0.0
1.0
2.0
3.0
4.0
5.0
6.0
7.0
8.0
Jan Feb Mar Apr May Jun Jul Aug Sep Oct Nov Dec Mean
Asmara Embatkala Areza
Figure 3.5: Average daily solar irradiance
Eritrea is part of the red sea rift valley and geothermal energy source has very high potential
provided the requisite technical capacity and investment are put in place to harness it.
A. Policy initiative
Energy Sector Policy is striving to provide an efficient, economic, reliable and sustainable
supply of affordable energy throughout Eritrea, with due regard to the preservation and
improvement of the environment. This can be achieved through exploiting or promoting the
potentials of renewable energy resources, energy efficiency conservation, promote incentives
for private investors to develop and utilize renewable and efficient energy technologies.
According to the policy statement of the MoEM, in the energy sector, the primary objective
focuses on availing ample, dependable and sustainable energy for the growing needs of all
economic and social sectors in Eritrea at an affordable price which includes the following key
issues:
increasing access to affordable energy services,
improving energy governance,
stimulating economic development,
managing energy-related environmental impacts, and
Securing supply through diversity.
The specific targets corresponding to above stated objectives include:
Expansion of electric power system to a yearly growth rate of at least 2% higher than
the overall economic growth rate and not less than 10% annually;
Within five years increase rural electricity access level to 15% from current access level
(12%) through provision of stand-alone renewable power systems or through
interconnection to the main grid. Increase the electricity access level in the rural
population to 30% by 2030 and achieve universal access by 2050. This implies
electrification of about 50 villages per year;
Within five years, reduce the technical losses from the power systems of the Eritrean
Electric Corporation to less than 10% (Implement power distribution rehabilitation);

53
Initiate bilateral or multi-party discussions with neighbouring countries on joint energy
and development and interconnection in the vicinity areas. To achieve the above targets,
the MoEM has prepared following short and medium - term development programs:
Consolidation and expansion of the existing power plants in both the ICS and SCS;
Consolidation, expansion and rehabilitation of transmission and distribution systems
including substation; and
Promotion of renewable energy applications and energy efficiency and conservation
programs.
To this effect, actions in progress to address energy problem in the country are:
refurbish the generators at the national power plant to their normal condition;
install additional modular solar PV systems to back the national grid;
rehabilitate the distribution system to reduce the line losses; and
Expanding access of electricity to rural areas through grid extension and standalone
systems.
Prioritized development programs waiting for financing are the following.
Exploitation of wind and solar resources:
20-30 MW Grid connected wind power (Dekemhare and Asseb area);
10-20 MW Grid Connected solar power (Asmara, Adi Keih Dbaruwa Barentu
area), Kerkebet Wind and Solar or Gerset hybrid system;
Feasibility study and development of geothermal energy;
Reactivating and rehabilitation of Asmara power distribution;
Construction of 220kV transmission line (Hirgigo-Tesenay) including corresponding
substation and distribution lines;
Expansion of rural electrification through solar systems; and
Establishment of assembling plant for RETs and batteries.
Challenges
There is excessive and inefficient consumption of wood fuel for domestic usage, which has
caused the degradation of forest cover and negatively affecting the environment. The ever
escalating oil prices on the international market imposes heavy burden on the economy and
making the country energy insecure. Lack of access to electricity by majority of the population,
especially the rural people on one hand; and limited resources to increase access to affordable,
efficient, reliable, clean and modern energy services for the majority of Eritrean on the other is
a daunting endeavour. As the result of limited skilled personnel and spare parts, power plants
operate for an extended period without regular and timely maintenance. Old energy
infrastructure, including power plants, transmission and distribution systems are with high level
of losses involved in conversion, transmission and distribution of energy (about 22% loss).
There is low level of awareness and information about energy conservation practices and
improved energy technologies among energy users which is aggravated by lack of developed
indigenous or proven energy resources for commercial energy production. Adequate capital
investments are necessary to address the urgent need for energy infrastructure development.
This is compounded by insufficient incentives and financing mechanisms for the private sector
to invest in modern efficient energy technologies. High capital cost of RETs relative to income
of the majority of the population compounded by the absence of financing instruments/
mechanisms for RETs. These limitations are compounded by inadequate institutional capacities
are manifested in the following three bottlenecks.

54
Inadequate energy information management system that is necessary for energy supply
and demand analysis and planning purposes.
There is low level of co-ordination and information sharing between or among various
government institutions, private sector and civil society organizations.
Lack of planning and appropriate research and development (R&D) capacity.
Besides, efforts are also underway to introduce 2.25 MW solar PV- Diesel hybrid systems to
enhance rural electrification. For instance, two of 4MW grid tides PV system to feed the
national grid (Figure 3.6, Figure 3.7) and 16MW to back generators of mining sector.
Figure 3.6: Solar PV Diesel Hybrid Mini-grid system (Mai – Dma)
Figure 3.7: Solar Home system and solar water pump
In order to optimize firewood consumption and minimize smoke emissions traditional stove of
Mogogo has been developed Figure 3.8. Through promotional campaign, as of 2018, it has been
possible to install improved Mogogo in over 250,000 rural households which constitutes about
(30%) of the country.
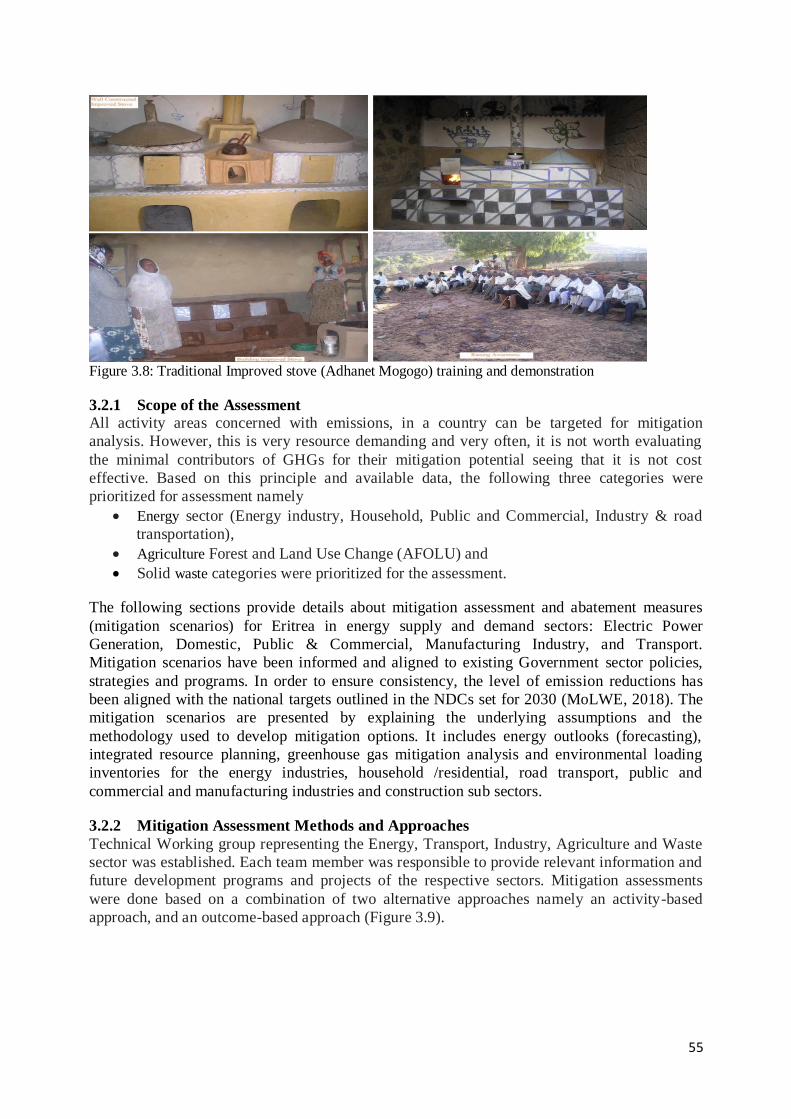
55
Figure 3.8: Traditional Improved stove (Adhanet Mogogo) training and demonstration
3.2.1 Scope of the Assessment
All activity areas concerned with emissions, in a country can be targeted for mitigation
analysis. However, this is very resource demanding and very often, it is not worth evaluating
the minimal contributors of GHGs for their mitigation potential seeing that it is not cost
effective. Based on this principle and available data, the following three categories were
prioritized for assessment namely
Energy sector (Energy industry, Household, Public and Commercial, Industry & road
transportation),
Agriculture Forest and Land Use Change (AFOLU) and
Solid waste categories were prioritized for the assessment.
The following sections provide details about mitigation assessment and abatement measures
(mitigation scenarios) for Eritrea in energy supply and demand sectors: Electric Power
Generation, Domestic, Public & Commercial, Manufacturing Industry, and Transport.
Mitigation scenarios have been informed and aligned to existing Government sector policies,
strategies and programs. In order to ensure consistency, the level of emission reductions has
been aligned with the national targets outlined in the NDCs set for 2030 (MoLWE, 2018). The
mitigation scenarios are presented by explaining the underlying assumptions and the
methodology used to develop mitigation options. It includes energy outlooks (forecasting),
integrated resource planning, greenhouse gas mitigation analysis and environmental loading
inventories for the energy industries, household /residential, road transport, public and
commercial and manufacturing industries and construction sub sectors.
3.2.2 Mitigation Assessment Methods and Approaches
Technical Working group representing the Energy, Transport, Industry, Agriculture and Waste
sector was established. Each team member was responsible to provide relevant information and
future development programs and projects of the respective sectors. Mitigation assessments
were done based on a combination of two alternative approaches namely an activity-based
approach, and an outcome-based approach (Figure 3.9).
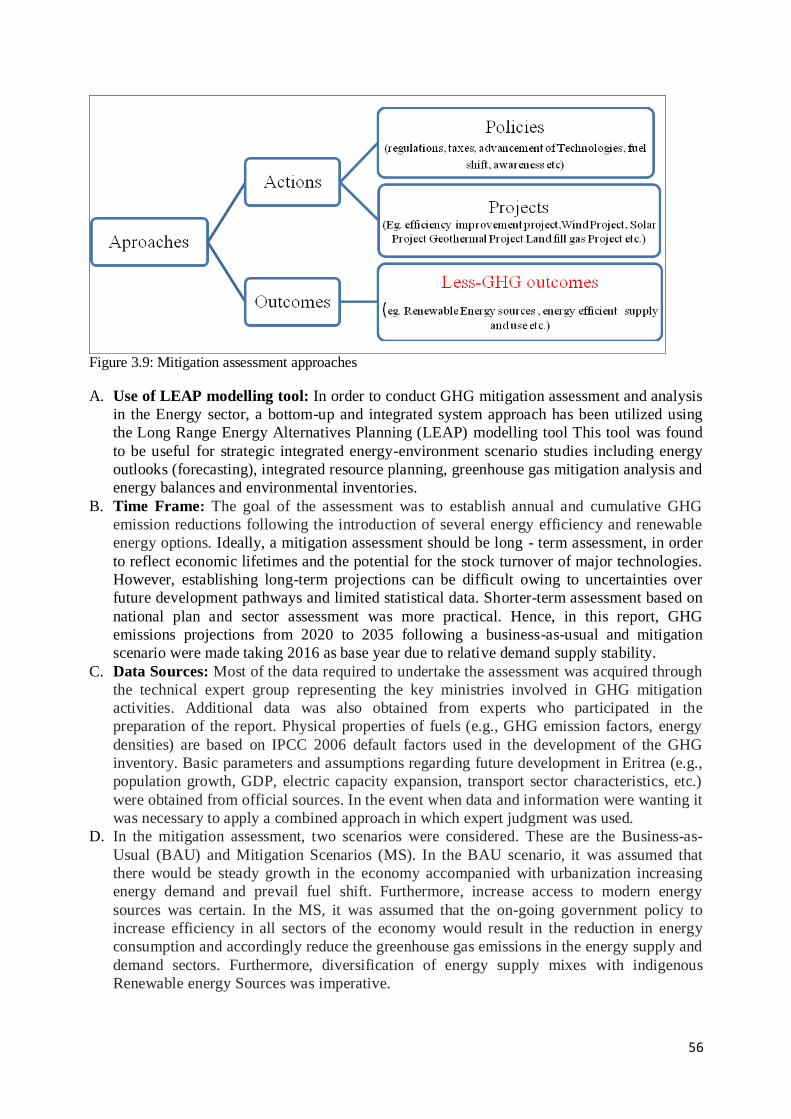
56
Figure 3.9: Mitigation assessment approaches
A. Use of LEAP modelling tool: In order to conduct GHG mitigation assessment and analysis
in the Energy sector, a bottom-up and integrated system approach has been utilized using
the Long Range Energy Alternatives Planning (LEAP) modelling tool This tool was found
to be useful for strategic integrated energy-environment scenario studies including energy
outlooks (forecasting), integrated resource planning, greenhouse gas mitigation analysis and
energy balances and environmental inventories.
B. Time Frame: The goal of the assessment was to establish annual and cumulative GHG
emission reductions following the introduction of several energy efficiency and renewable
energy options. Ideally, a mitigation assessment should be long - term assessment, in order
to reflect economic lifetimes and the potential for the stock turnover of major technologies.
However, establishing long-term projections can be difficult owing to uncertainties over
future development pathways and limited statistical data. Shorter-term assessment based on
national plan and sector assessment was more practical. Hence, in this report, GHG
emissions projections from 2020 to 2035 following a business-as-usual and mitigation
scenario were made taking 2016 as base year due to relative demand supply stability.
C. Data Sources: Most of the data required to undertake the assessment was acquired through
the technical expert group representing the key ministries involved in GHG mitigation
activities. Additional data was also obtained from experts who participated in the
preparation of the report. Physical properties of fuels (e.g., GHG emission factors, energy
densities) are based on IPCC 2006 default factors used in the development of the GHG
inventory. Basic parameters and assumptions regarding future development in Eritrea (e.g.,
population growth, GDP, electric capacity expansion, transport sector characteristics, etc.)
were obtained from official sources. In the event when data and information were wanting it
was necessary to apply a combined approach in which expert judgment was used.
D. In the mitigation assessment, two scenarios were considered. These are the Business-as-
Usual (BAU) and Mitigation Scenarios (MS). In the BAU scenario, it was assumed that
there would be steady growth in the economy accompanied with urbanization increasing
energy demand and prevail fuel shift. Furthermore, increase access to modern energy
sources was certain. In the MS, it was assumed that the on-going government policy to
increase efficiency in all sectors of the economy would result in the reduction in energy
consumption and accordingly reduce the greenhouse gas emissions in the energy supply and
demand sectors. Furthermore, diversification of energy supply mixes with indigenous
Renewable energy Sources was imperative.
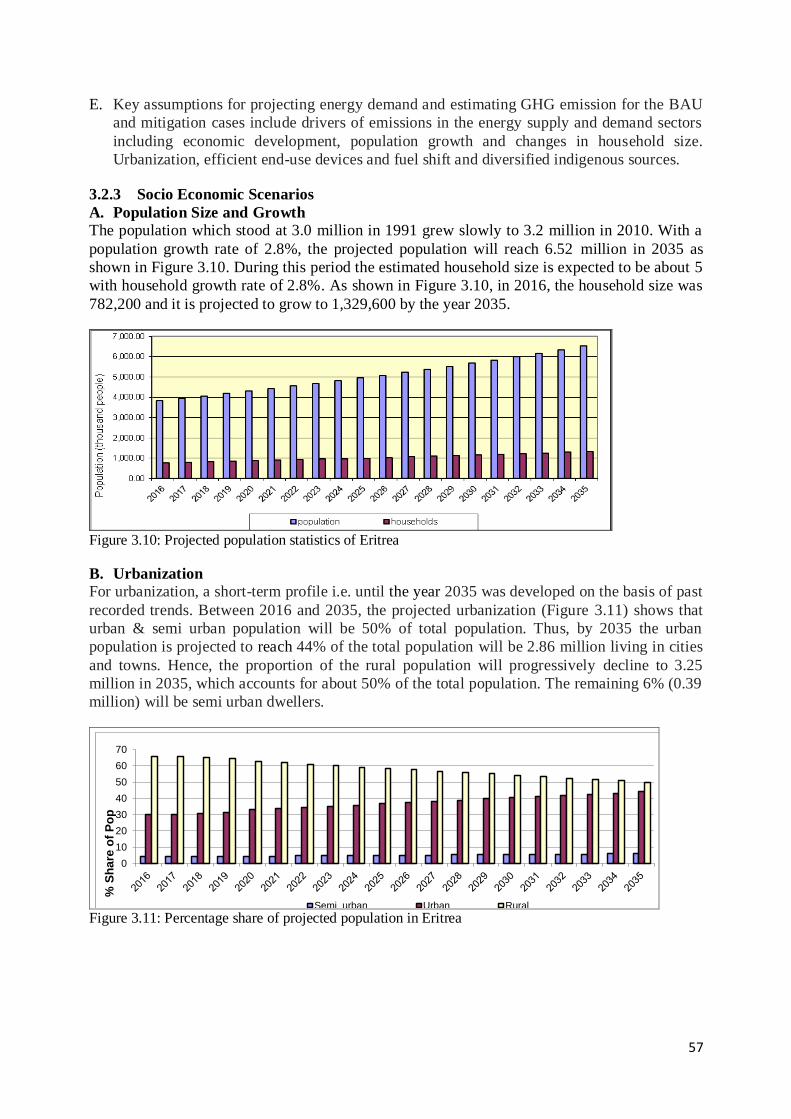
57
E. Key assumptions for projecting energy demand and estimating GHG emission for the BAU
and mitigation cases include drivers of emissions in the energy supply and demand sectors
including economic development, population growth and changes in household size.
Urbanization, efficient end-use devices and fuel shift and diversified indigenous sources.
3.2.3 Socio Economic Scenarios
A. Population Size and Growth
The population which stood at 3.0 million in 1991 grew slowly to 3.2 million in 2010. With a
population growth rate of 2.8%, the projected population will reach 6.52 million in 2035 as
shown in Figure 3.10. During this period the estimated household size is expected to be about 5
with household growth rate of 2.8%. As shown in Figure 3.10, in 2016, the household size was
782,200 and it is projected to grow to 1,329,600 by the year 2035.
Figure 3.10: Projected population statistics of Eritrea
B. Urbanization
For urbanization, a short-term profile i.e. until the year 2035 was developed on the basis of past
recorded trends. Between 2016 and 2035, the projected urbanization (Figure 3.11) shows that
urban & semi urban population will be 50% of total population. Thus, by 2035 the urban
population is projected to reach 44% of the total population will be 2.86 million living in cities
and towns. Hence, the proportion of the rural population will progressively decline to 3.25
million in 2035, which accounts for about 50% of the total population. The remaining 6% (0.39
million) will be semi urban dwellers.
0
10
20
30
40
50
60
70
% S
ha
re o
f P
op
Year
Semi_urban Urban Rural Figure 3.11: Percentage share of projected population in Eritrea

58
C. GDP and GDP per Capital
Between 2000 and 2020, the average estimated annual growth rate for total GDP was 3.5% in
which the contribution of the sectors was i) Agriculture with 20.30%, ii) Industry including
mining 20.90% and iii) Services 58.80%. Given a 2.8% increase in the size of the population,
the increase in demand, GDP per capita which is currently 204 USD is expected to change by
only 3.5%. Considering short term recession and world crisis, a conservative scenario has been
built to portrait the GDP growth until 2035 to remain constant at 3.5% growth rate.
3.3 Energy Sector Mitigation Assessment and Analysis
3.3.1 Business as Usual Scenario
Annual emissions were projected up to 2035 for Business-as-Usual Scenario (BAU) that were
used as the baseline against which to demonstrate the expected abatement potential in the
energy sector. Key assumptions considered for projecting energy demand and estimating GHG
emission for the reference case were the following:
Population grows by 2.8 annually;
Household size decrease but total number of households increases;
Urbanization is assumed to grow to 50 % from present rate of 30 %;
Share of the economic sector industry to GDP is assumed to grow by 20.9 % to 28 %
due to mining sector, share of agriculture is assumed to be 20.3% but production per
hectare and mechanization is expected to increase. Service sector is assumed to
contribute 58.8%;
Improvement of life style (fuel shift from traditional biomass to modern commercial
fuel, and use of new appliances); and
Increased access to modern energy sources (e.g. rural access to electricity) is assumed to
grow from the current status 3 % to 20 % access by the end of the model year and 7 %
increase (from 92 % to 99 %) in urban connection rate.
Based on the above listed assumptions, energy demand projection from end use sectors for the
model years is summarised in Table 3.1. From the table, it can be deduced that the total energy
demand projection grows by about 1.3 times compared with the base year value 767.6 ktoe.
Energy demand projection for the model year in economic and service sectors (Industry,
transport and service) respectively grown by 3.0%, 3.2% and 2% compared to the base year
levels; whereas, demand of household sector shows decreasing trend. The increase of energy
demand in industrial, transport and service sectors were mainly attributed to the demand from
mining sector and improvement in services of the service sector, whereas the decrease in
energy demand from household sector was attributed to fuel shift to more efficient sources and
devices.
Table 3.1: Reference Scenario, Energy demand all fuels in thousand tons of oil equivalents
Year
Sector 2016 2020 2025 2030 2035
Household 602.9 626.4 599.3 571 545.5
Transport 79.3 92.2 127.3 177.9 251.4
Public and Commercial 72.8 77.3 94.1 115.5 142.6
Industry 12.7 14 19.5 27.2 38.3
Total 767.6 809.9 840.2 891.5 977.9

59
As shown in Figure 3.12, the projected demand is growing more in the economic sectors which
attributes to the close relationship between energy and economic development activities.
Figure 3.12: Reference Scenario total final fuel demand all fuels (ktoe)
Based on BAU scenario is shown in Table 3.2 in which it is shown during the scenario period
emission from transport sector grows faster and the corresponding GHG emission bypasses the
level of emission from household sector. These could be due to the fact that the transport sector
depends only on oil products (main source for GHGs emissions) while the Industrial, public
and commercial sectors use diversified sources. Thus, their corresponding emission is less
whereas; in household sector, there is fuel shift to more efficient fuels and devices. Thus, by
2035, the main emission contributors within the energy demand sector are transport (45%),
household (30%), and services (20%). Although industry is forecasted to grow; it will only
contribute about 5% to the total emission by the same year. Based on the BAU scenario, by
2035 total GHGs emission is expected to rise by 2.32 times (Table 3.2, Figure 3.13).
Table 3.2: Reference Scenario, Global warming Potential in CO2-eq (million kgs)
Year 2016 2020 2025 2030 2035
Household 302.2 336.8 388.0 449.8 529.1
Transport 241.3 280.4 387.4 541.2 764.8
Public and Commercial 167.2 181.6 221.2 271.4 335.2
Industry 29.1 32.1 44.6 62.4 87.8
Total 739.8 830.9 1,041.2 1,324.8 1,717.0

60
Figure 3.13: Reference Scenario, Global warming Potential in CO2-eq (Gg)
A. Transportation:-Transportation will be the major CO2 emission contributor in 2035
(Figure 2.13). Share of transport sector GHG emission in GWP CO2-eq was projected to
increase from 32.6% in 2016 to more than 44.5% of which emissions from road transport will
account for more than 80% of the sector’s emissions. The expected rise in road transport
emissions in the reference scenario was attributed to rising motorization and associated traffic
congestions. With more than 44% of Eritreans expected to live in urban areas, and steady
growth in the economy, the demand for individual car ownership will significantly drive future
emissions in the transport category. Similarly, domestic aviation emissions are expected to
increase annually considering future growth trends in the aviation industry in Eritrea.
B. Household: In 2016, the household sector, as the main GHGs contributor, accounted
for 40.8% in the reference scenario its contribution is expected to be reduced to 30.8%. Within
the sector, the 2016 data, the rural households accounted for an average of 60.9% contribution
of the total emissions which is mainly from wood, dung and agricultural residue consumption.
This is followed by emissions from urban households 35.9% mainly from the use of LPG,
kerosene and wood fuel for cooking. The BAU projection shows that the expected emission
contribution from household category by 2035 is 529.13 GgCO2 eq. Urbanization and
diversification of the energy mix in household sector attribute to fuel shift and efficient end use
device. Thus, demand for traditional biomass (dung, agric-residue and wood) will gradually
decrease throughout the period. Nonetheless, for charcoal, the household demand will increase
with increase in population for instance, it customarily used for preparation of coffee. The
demand for LPG, electricity and kerosene is expected to rise as the BAU scenario is based on
the assumption that there will be a shift from biomass consumption to those sources of fuel in
households (Table 3.3). Therefore, GHGs emission form household sector shows a decreasing
trend throughout the scenario years.

61
Table 3.3: Reference Scenario, Energy demand in Household in kilo tons of oil equivalents
Year Agric –
residue
Charcoal Dung Electricity Kerosene LPG Wood Total
2035 4.346 28.197 34.652 30.981 36.581 35.156 375.61 545.52
2030 5.013 27.807 40.363 26.433 36.396 29.277 405.703 570.99
2025 6.644 27.293 48.165 22.116 36.238 23.777 435.064 599.30
2020 8.146 26.657 56.499 18.212 35.941 19.051 461.935 626.44
2016 8.706 24.291 61.291 13.636 35.807 14.194 444.941 602.8
C. Public and Commercial Services: Based on the BAU scenario analysis, GHGs
emission from the services sector are projected to increase from 167 GgCO2e in 2016 to 335.2
GgCO2e in 2035; whereas, its share will decrease from 22.6% in 2016 to 20% in 2035 as a
result of efficiency improvement and fuel shift.
D. Industries: The BAU scenario analysis of GHGs emission from industrial sector shows
increasing trend from 29.09 GgCO2 eq in 2016 to 87.84 GgCO2 eq in 2035. This is attributed to
the future demand for energy use in industry (construction, mining and quarry and manufacturing) with an annual average growth rate of 2.35%. Its share in the demand sector
also increases from 3.9% in 2016 to 5% in 2035.
3.3.2 Mitigation Scenarios
The mitigation scenario implies a reduction relative to what emissions would otherwise have
been in the future in the absence of specific GHG mitigation actions, that is, relative to the
reference scenario. This considers a future scenario where the existing renewable energy
policies that government is committed to adequately implement; and the emission savings
thereof are realized. This scenario is considered as the least ambitious option; and in order to
attain greater emission reductions. The key assumptions that form the mitigation scenario are
the following.
Phase - out the existing energy generation plants to enhance their effectiveness and
improve their efficiency, improve the grid-connected electrification and distribution.
Increase in the share of renewable energy sources i.e. energy diversification in all
sectors.
Shift from biomass to electricity and LPG targeting, in both urban and rural households,
mainly for cooking and enhanced distribution of efficient smoke less cook stoves and
Electric stoves including electric Mogogo.
Complete replacement of existing lamps with efficient LED lamps, gradual replacement
of existing refrigerators with efficient ones
Use of mass transport and introduction of bus rapid transit and rail ways, as well as non-
motorized vehicles.
Based on the above bulleted assumptions, energy demand projection for the model years (Table
3.4), total energy demand will increase by 1.003 times compared with the base year value.
Industrial energy demand would be growing by 2.11 times due to potential demand from the
mining sector followed by 2 times for transport due to increase in population and 1.5 times
grow in service sectors at the end of the model year. However, the model shows a decrease in
household sector by 1.3 times due to introduction of new technology and reduction of biomass
consumption in households.

62
Table 3.4: Mitigation Scenario Energy demand in all sectors in kilo-ton of oil equivalent
Year Household Transport Public and Commercial Industry Total
2016 602.867 79.3 72.75 12.698 767.615
2020 588.729 89.046 75.71 13.505 766.991
2025 549.296 106.189 84.756 16.703 756.945
2030 508.259 128.883 95.96 20.988 754.089
2035 473.725 159.196 109.874 26.792 769.586
Under the Mitigation Scenario assumption, total energy demand would be reduced by 11.9%
compared to the Reference Scenario due to mitigation measures undertaken by the introduction
of new environment friendly technologies, fuel shift, and efficient utilization and conservation
measures.
3.3.3 GHG Mitigation Analysis
The difference in emissions between the BAU and each individual mitigation scenario provides
its abatement potential. The GWP CO2 eq in Gg trends for the four sectors based on energy
demand mitigation scenario is shown in Figure 3.14.
Household
Public and Commercial
Industry
Transport
Environmental Results: Global warming potential CO2 eq
Scenario: Mitgation, Fuel: All Fuels, GWP: All GWPs
2016 2020 2025 2030 2035
Millio
n Kilo
gram
mes
1,100
1,050
1,000
950
900
850
800
750
700
650
600
550
500
450
400
350
300
250
200
150
100
50
0
Figure 3.14: Mitigation Scenario, Global warming potential CO2 eq of the different energy subsectors
The Figure 3.14 shows that household sub-sector will remain as the main emitter up to 2025;
followed by the transport sub-sector that would outmanoeuvre the household and will be the
main emission contributor by 2035 accounting for 440.54 GgCO2 eq. Additionally, while the
mitigation scenario of the share of household emission will be reduced from 40.85% to 32.61%;
the, transport sector will increase its share in the demand sector from 30.62% to 39.92% GWP
CO2 eq. Based on mitigation measures, the global warming potential in CO2 equivalent for the
GHG Mitigation Potential was 16.8 % less compared to the Reference Scenario as shown in
Figure 3.15.
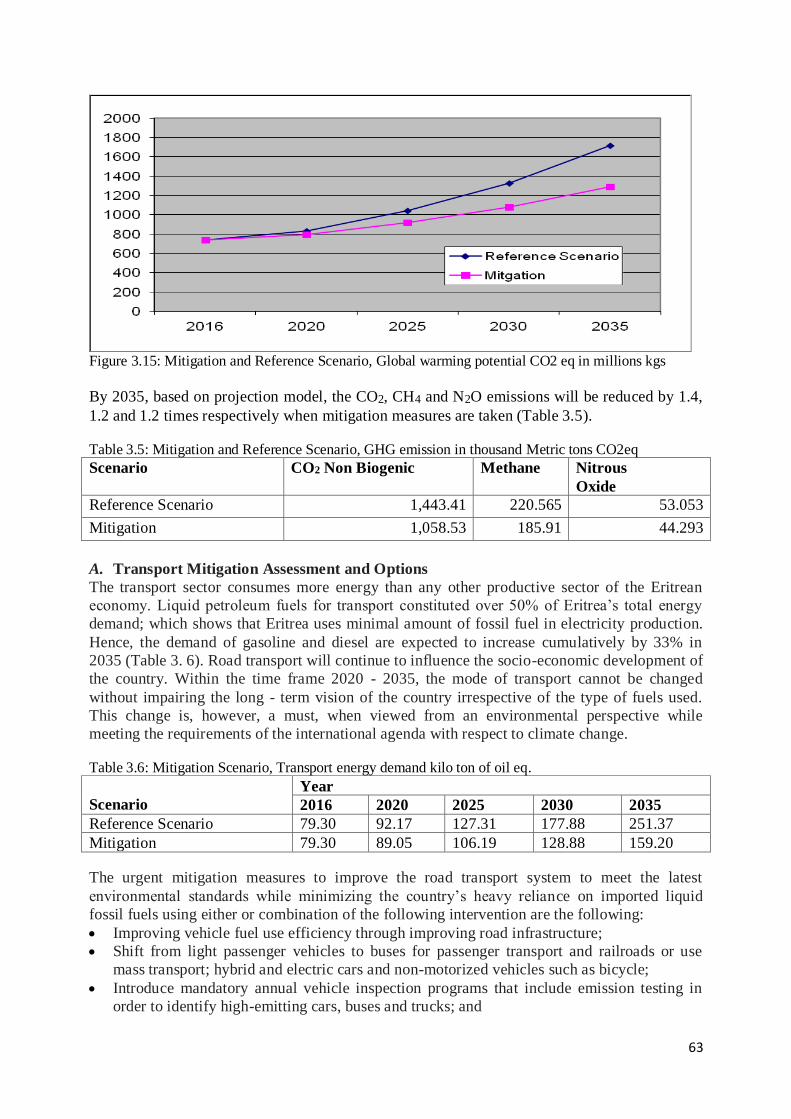
63
Figure 3.15: Mitigation and Reference Scenario, Global warming potential CO2 eq in millions kgs
By 2035, based on projection model, the CO2, CH4 and N2O emissions will be reduced by 1.4,
1.2 and 1.2 times respectively when mitigation measures are taken (Table 3.5).
Table 3.5: Mitigation and Reference Scenario, GHG emission in thousand Metric tons CO2eq
Scenario CO2 Non Biogenic Methane Nitrous
Oxide
Reference Scenario 1,443.41 220.565 53.053
Mitigation 1,058.53 185.91 44.293
A. Transport Mitigation Assessment and Options
The transport sector consumes more energy than any other productive sector of the Eritrean
economy. Liquid petroleum fuels for transport constituted over 50% of Eritrea’s total energy
demand; which shows that Eritrea uses minimal amount of fossil fuel in electricity production.
Hence, the demand of gasoline and diesel are expected to increase cumulatively by 33% in
2035 (Table 3. 6). Road transport will continue to influence the socio-economic development of
the country. Within the time frame 2020 - 2035, the mode of transport cannot be changed
without impairing the long - term vision of the country irrespective of the type of fuels used.
This change is, however, a must, when viewed from an environmental perspective while
meeting the requirements of the international agenda with respect to climate change.
Table 3.6: Mitigation Scenario, Transport energy demand kilo ton of oil eq.
Scenario
Year
2016 2020 2025 2030 2035
Reference Scenario 79.30 92.17 127.31 177.88 251.37
Mitigation 79.30 89.05 106.19 128.88 159.20
The urgent mitigation measures to improve the road transport system to meet the latest
environmental standards while minimizing the country’s heavy reliance on imported liquid
fossil fuels using either or combination of the following intervention are the following:
Improving vehicle fuel use efficiency through improving road infrastructure; Shift from light passenger vehicles to buses for passenger transport and railroads or use
mass transport; hybrid and electric cars and non-motorized vehicles such as bicycle;
Introduce mandatory annual vehicle inspection programs that include emission testing in
order to identify high-emitting cars, buses and trucks; and

64
Additional no cost measures that can easily be implemented include, new legislations to
limit speed and new taxation policies on import duties and licenses.
The positive impact of this measure will reduce traffic congestion, improving local air quality,
reduction in pollution and improve road safety.
B. Household Mitigation Assessment and Options
Mitigation scenario shows 7.04% (71,790 toe) less energy demand in household sector by 2035
compared to the energy demand in BAU scenario by 2035 Figure 3.16.
Figure 3.16: Mitigation and Reference Scenario, household energy demand in thousand tones oil eq.
The assessment on household in the entire sub -category shows that the emission from urban
will take over the contribution from rural area as population in urban dwellers will surpass the
rural by the 2035. The determining factors include introduction of new technologies and shift in
consumption of biomass in rural areas. The overall reduction in emission due to mitigation
measures taken by 2035 will be 35.5 Gg CO2 eq. (Figure 3.17).
0
50
100
150
200
250
2016 2020 2025 2030 2035
Global warming potential CO2 eq in million kilogrammes
Semi_urban Urban Rural Figure 3.17: Mitigation scenarios, household GWP in million kgCO2 eq.
The vital mitigation measures that can reduce the emission from household are the following.
Distribution of efficient wood stoves and shift from biomass use to electricity and LPG
in residential areas mainly for cooking;

65
Introduce new regulations to gradually replace conventional lighting and refrigerators
systems by more energy efficient alternatives;
Reduce cost of LPG cylinders to enable households afford to switch from biomass to
LPG stoves, while introducing awareness programs to educate the public of the benefit
of using LPG stoves to the environment; and
Reduce taxation on LPG cooking equipment and other renewable energy sources.
The above measures will have not only positive impacts in reducing indoor air pollution,
mainly health benefits for women and children, but also lower fuel wood demand &
deforestation and potential cost savings to households (reducing household demand and
expenditure on energy).
C. Public and Commercial Services Mitigation Assessment and Options
Energy demand based on the mitigation scenario from the service sector are 75.71, 84.76,
95.96, & 109.87 thousand tonnes of CO2-eq in the year 2020, 2025, 2030 & 2035 respectively
(Figure 3.18). Comparison of mitigation scenario with reference scenario from service sector
shows that there will be a reduction in total by 13% in comparison to the BAU scenario.
Figure 3.18: Mitigation and Reference, Services Energy demand in 1000 ton of Oil equivalents CO2 eq
The proposed measures focus mainly on the introduction of efficient lighting and other efficient
electrical devices, and fuel switching. For lighting and other electrical devices, the mitigation
measure involves the gradual introduction of high efficiency equipment such that the average
energy intensity improves by 25% of its current value by 2035. For fuel switching, it involves
the gradual replacement of diesel, kerosene, and fuel wood by LPG by 2035 in bakeries and
restaurants.
D. Industry Mitigation Assessment and Options
The mitigation scenario forecast, mining and cement industries will be the main emitting
sectors by 2035. The forecasted emissions based on the energy demand are illustrated in Figure
3.19; which shows a reduction in emission, with mitigation options, of 17.72% in the same
year.

66
Figure 3.19: Mitigation and Reference, Energy demand in 1000 ton of Oil equivalents CO2 eq
The mitigation scenario projection of GWP CO2 eq shows a slight increase in emission from
3.93% (29.1 Gg CO2 eq.) in 2016 to 5.6% (61.4 Gg CO2 eq.) in 2035. This increase is attributed
to the expected increase in demand of the industry sector. Industrial sector mitigation measures
focus on clinker replacement, the introduction of efficient lighting and other efficient electrical
devices, and fuel switching. For lighting and other electrical devices, it includes the gradual
introduction of high efficiency equipment such that average energy intensity improvement by
25% of its current value by 2035 such as in the cement industry. For fuel switching, it involves
the complete replacement of charcoal and fuel wood in the lime industry.
E. Electricity supply and Mitigation Options on power generation sub- sector
Power generation and transmission: Electricity is produced by a thermal power plants using
heavy fuel oil. No power transfers across international boundaries are in place or are projected
during the planning period. Current transmission losses are very high, estimated at 20%. A total
of 100 MW of new capacity is projected. These measures focus on the complete phased
replacement of existing diesel generation by efficient generator, starting in 2025, and a
renewable power generation mix in 2035 that consists of 50% solar PV, 20% wind, and 20%
Geothermal. The mitigation scenario abatement measures show a decrease importation of
primary fuels by 19% in 2035 i.e., when the measures are taken electricity generation from
fuels in Gig watt-hour will increase by 70.3% only in 2035 (Table 3.7).
Table 3.7: Transformation; Electricity generation from all fuels in GWh
Year Mitigation Reference Scenario Total
2035 705.523 856.622 1,562.15
2030 627.379 698.763 1,326.14
2025 547.288 552.768 1,100.06
2020 412.125 424.019 836.144
2016 298.64 298.64 597.28
Mitigation analysis on power generation includes the following four options:
Continue expansion of electrification programs in urban and rural areas.
Gradually replace existing inefficient diesel- and heavy fuel oil electricity generation
with new efficient ones and with renewable energy technologies (solar PVs with large
gird, wind turbines, geothermal power and biogas at big farms).
Reduce distribution losses through rehabilitation of old distribution systems.
Encourage local and external private investment in the generation of electrical power.

67
3.4 Non-Energy Sectors Mitigation Options 3.4.1 Forest Management (Afforestation and Reforestation)
Eritrea’s land sub-sector is a net sink of CO2 based on the latest (2015) GHG inventory which
accounts for -212.14 Gg of CO2 and 4.9% contribution to the total emission due to
deforestation and agricultural activity. In Eritrea, the land categories include the protected
forests, Grass land, Shrub land and sparsely vegetated land, and perennial crops. It should be
noted, however, this mitigation has multiple advantages including greater carbon and water
storage, reduced soil erosion, increased landscape connectivity and conservation of native
biodiversity, provision of food, wood, and shade and income generation for rural communities.
Nonetheless, tree planting is not a simple solution to the problem. It must be carefully planned
and implemented to achieve desired outcome level of mitigation of GHGs emission. Despite the
challenges, the main activities that have a direct impact on Eritrean forests are categorized into
the following three major categories.
Removal of timber (poles) for the construction of houses and fences;
Removal of fuel wood for charcoal and cooking purpose;
Minimization of forest degradation through human induced activities (e.g. deforestation,
overgrazing) and climate variability (e.g. low, and erratic rainfall), as well as extreme
events such as droughts and climate change that lead to loss of vegetation cover.
It is estimated that the younger forest stands and woodlands, that are less than 20 years, are lost
quicker than the older, more than 20 years. Annual growth rates of the younger trees are higher
and the loss of sink capacity is thus further exacerbated when using the gain loss method for
estimating emissions.
Mitigation Options
The BAU scenario emissions include biomass lost on account of deforestation and wood
removals for other purposes including charcoal production and fuel wood. The main
intervention options and the associated constrains are the following:
The main intervention options The key barriers and risks associated with
implementation of the mitigation options
- Rehabilitate degraded landscapes through
reforestation, afforestation, and control run-
off and loss of arable land on downstream
areas through soil erosion. - Create healthy and well managed forest
plantations that withstand the impacts of
climate change;
- Encourage individual households in
communities to plant and own trees and
produce sustainable wood, annual crops
(fruit and fodder),
- Establish new or upgrade existing
government and community forest
nurseries; - Train communities to integrate tree planting
and management in their farming systems
through agroforestry systems (crops with
trees, trees with livestock, trees, crops and
livestock).
A shortage of skilled human resources,
Conflicting land uses: grazing in
competition with tree growing;
agriculture versus reforestations etc.,
Insufficient coordination between/among
different stakeholders with conflicting
interests (urban and rural development,
agriculture, and other land
users/managers),
Financial capacity constraint to support
communities (short-term problems versus
long-term gains) planting stocks and
provision of hand tools, and Limited enforcement for national and
regional action plans and regulatory
instruments pertinent to forest
conservation and development.

68
3.5 Solid Waste Management In the waste sector, management options for solid waste are only considered because it is one of
the contributors to the GHG emissions. The rising trend in the emissions is closely linked to
population growth, urbanization and changes in lifestyle. With a projected national population
of nearly 6.52 million in 2035 and per capita waste generation of 0.5 kg/day, total solid waste is
expected to rise by (1.86 thousand tonnes every year). The management of such volumes of
waste has major logistical and financial challenges especially to city authorities. Similarly,
GHG emissions are likely to be more than triple compared to the 2006 - 2015 average of 125.4
Gg CO2 eq by 2035. Despite this, however, there are opportunities for avoiding such levels of
emissions in the baseline scenario. The challenge is how to convert solid waste threats to
opportunity in using as a renewable resource to gain financial gains in recycling and
manufacturing durable products.
3.5.1 Mitigation Options for Solid Wastes
Presently, there is no activity of recycling solid waste in general and that of plastic and organic
wastes. There exist inadequate incentives for private sector to expand capacity to recycle solid
wastes. Hence, the majority of the waste is dumped on unmanaged landfill sites under
anaerobic conditions that lead to the production of methane. Other parts are disposed of in low
heaps under aerobic conditions, producing mainly carbon dioxide. At the moment, more than
half of the scattered waste is openly burnt producing extreme air pollution in settlements.
The GHG Mitigation assessment focused on options for abatement emissions from solid waste
including improved recycling of plastics and composting of food waste; eliminate scattering of
waste in the landscape; reduce open burning of scattered waste; reduce crude dumping of waste
and tap gas from existing landfill including sanitary landfills and production of biogas. The key
barriers in the intervention of the solid waste options are:
inadequate skilled human resources in the operational management of landfills;
Limited funding arrangements from municipalities and
Uncertainty about the use of solid waste as raw material for the production of biogas.
3.6 Key Barriers to GHG Mitigation Analysis 3.6.1 Financial Constraints
According to the Eritrea’s NDC report of the MoLWE (2018), the implementation of climate
resilient economy strategy of the country requires an estimated expenditure of more than USD
3,548 billion by 2030. This suggests that there is a need for key capital investments in the GHG
emitting sectors namely energy, IPPU, AFOLU and Waste. Thus, the types of contributions
required to implement Eritrea’s NDC are categorized into unsupported (unconditional) and
supported (conditional) contributions. The details of the specific requirements would have to be
determined in collaboration with the key sectors directly involved in mitigation projects. To
that end, there is dire need for preparing a detailed programmes and project with clear goals,
objectives and activities with budget requirements to execute the mitigation activities in Eritrea.
3.6.2 Capacity Building
To alleviate the constraints related with capacity building are related with training, institutional
strengthening, awareness raising (knowledge sharing mechanisms), technology transfer, and
management and sharing of experiences across the diverse administrative regions of Eritrea is
imperative. The implementation of the capacity, in the time horizon, requires an uninterrupted
development and strengthening of Eritrea’s capacities in various aspects of GHG mitigation
activities. Thus, it is important to establish and strengthen platform for the exchange of
information associated with climate mitigation through national, regional and international

69
networks. Higher Education and Research Institutes, civil societies and professional
associations should be involved to expedite implementation process and enhance the sense of
belongingness. It is also indispensable to involve the most vulnerable sectors of the society
including women headed households and the poor to grantee no one is left behind in the
development process.
Geographically, it should also cover the various administrative regions to reduce social and
geographical disparity and eventually narrowing the gaps between various social groups. One
of the most important requirements for capacity building is the need for a firm internal and
external linkage partnership which would not only enable Eritrea to mobilise its internal
resources but also expand and strengthen its international cooperation pertinent with the
UNFCCC. This linkage partnership would also enable the youth to acquire new skills and
knowledge and exchange their experiences with others with same or similar socioeconomic
situation. This would enable them to get enlightened about the climatic variability and get
acquainted with new tools and approaches that are used to mitigate GHGs.
3.6.3 Lack of Monitoring-Evaluation (M & E) and Reporting Progress
Shortage of quantitative climate change data, and accurate monitoring and evaluation of global
environmental benefits is still a bottleneck. Hence, M & E of the mitigation projects should be
harmonised. There is a dire need for harmonising dissimilar data and systems collected from
various agencies and project management offices. Removing this barrier will allow a holistic
perspective of the projects’ status and results as well as outputs. In Eritrea, this is possible
because, country ownership for any project or program is very strong as demonstrated in the
past in explicit effectiveness in enhancing the interest in climate change among various players
including rural communities.
In the long run, M & E should involve local communities, researchers and policy makers to
triangulate the accuracy consistency of data sets and activities. Various community groups have
already shown readiness to make a meaningful contribution in the evaluation of adaption and
mitigation technologies. Whatever happens, the Ministry of Land, Water and Environment has
the full responsibility to monitor and evaluate through regular stakeholder’s consultative
engagement. Fine-tuning, and updating the implementation of GHGs mitigation activities.
3.7 Key Opportunities for GHG Mitigation
3.7.1 Community Participation
Local communities’ participation is critical to the success of the proposed mitigation projects
and programs. The commitment of the local stakeholders is guaranteed as these projects/ideas
were generated from the various sectors including energy, agriculture, transport, land water and
environment as well as the various municipalities involved in the management of wastes in the
six administrative regions of Eritrea. Hence, direct community involvement and participations
in the mitigation projects and programs is anticipated through direct including or co-financing
in the form of labour inputs in the construction and sustenance as well as management of
projects. Local communities are already well acquainted with the risk hazards associated with
climate changes; and there are already community demands to solve day in day out societal
problems through the introduction of renewable energy sources at various scales.
3.7.2 Integration of Climate Change into Education
Inclusion and mainstreaming climate related topics into the educational system is underway.
There is ample opportunity for improving it through extensive and an in-depth curricula review

70
at the basic, secondary and tertiary education systems. Courses are proposed as standalone
courses or part of the syllabus of relevant courses.
There is plenty of space to include climate change topics into the adult education system. The
existing topics would expand the awareness of adults regarding the risks related with climate
change. This step will enhance school children awareness about the issue at hand. The
expansion of environmental education through adult education will have direct bearing while
implementing mitigation projects at the local levels.
3.7.3 Contribution of the Mass Media
The radio, press, television broadcasting are already broadcasting climate change documentary
films and case studies with tremendous impacts on the public awareness. There are ample
opportunities to further expand its scope and in-depth converge of the risks and opportunities
for mitigation of GHGs. Expanding the intranet and internet facilities would also enable
individuals and communities to tap the wealth of data and information out there on the local,
regional and global webs.
3.8 Institutional Capacity-Building To sustain GHG mitigation works, it is important to strength the National institutions to enable
them design and implement projects that are consistent with Eritrea’s objectives and operational
strategies of UNFCCC focal area. For instance, unnecessary duplication between focal areas
namely the UNCBD and UNCCD should be avoided to optimise resources uses and focus on
the main issues.
The MoLWE (2018) has already prepared the Eritrean NDC based on sustainable development
strategies, plans and objectives aligned with national development plans of the country.
Nevertheless, the document should be periodically updated in order to integrate new ideas into
the outlined mitigation actions. This is because of the fact that the NDC was developed based
on series of consultative process held with the various stakeholders involved in the mitigation
activities where the key sectors provided inputs based on their strategic plans and activities
contextualised in the short, medium and long-term perspectives. Hence, it is important to
capitalise on the confidence built during preparation process.
Against the above mentioned background, it can be confidently stated that there is an
institutional set up to enable stakeholder to fully engage themselves and secure their full
commitment of the government (e.g. local, regional and national) levels. This lays a firm
foundation for further implementation of GHGs mitigation in the country. From now, the
implementation of GHGs mitigation activities are well aligned with existing government plans,
strategies, policies, legal frameworks. To enhance the implementation of climate related
national documents such as the fourth communication (FNC) and Appropriate Mitigation
Actions (NAMAs).
3.9 Key Findings
3.9.1 Energy Sub Sector
In 2020, the energy sector will be responsible for large GHG emissions following the AFOLU
sector in Eritrea. The energy sector consists of the supply and demands including energy
transformation mostly electricity generation and charcoal production, electricity transmission
and distribution, fuel storage and distribution and all end-use consumer sub-sectors including
transport, industry, mining, commercial, domestic, agricultural/fishery/agriculture sub sectors.

71
GHGs mitigation options in the energy supply sub-sector should focus on increasing plant
efficiency, reducing losses in the transmission and distribution of electricity and fuels. There is
also a dire need for increasing the use of renewable energy sources including solar, wind, and
geothermal energy sources.
3.9.2 Road Transport
Road transport sub -sector is the highest CO2 emitter (197 Gg) of all energy demands sub-
sectors in (2020). Emission from the road transport is the result of many factors such as the type
of fuel used, fuel efficiency, type of mode of transportation used, quality of road infrastructure
and efficacy of the type of transport.
In view of the aforementioned fact, the mitigation measures in the transport sub-sector should
focus on fuel efficiency improvements. This entails changes in vehicle and engine design (e.g.
hybrids). It is also important to expand public transport infrastructure and enforce the regulation
on age restriction on the importation of vehicles and encourage the importation of unused
vehicles. Further, it would be necessary to raise public awareness about its environmental and
public health aspects of using such means of transportation. The need for introducing public
transport technologies such as big buses and trains is imperative.
3.9.3 Household
At the household level, biomass is the main sources of domestic source of energy including
firewood, charcoal, animal dung and agricultural residue. Biomass provided up to 73.8% of the
total energy household demand. Biomass is still used in both urban and rural areas with
different proportions. Biomass is used for cooking in traditional stoves for which its energy
efficiency is very low (does not exceed 10 %). Further, charcoal is produced in traditional earth
kilns using local wood resources having conversion efficiency not exceeding 30 %.
At the national level, 37.2 % of the households in Eritrea have electricity which has increased
slightly from EDHS 2002 (32 %) but has substantially increased since EDHS 1995 (23 %). On
the other hand, there is a marked increase of households with electricity in rural areas (13 %)
which was only three % in 2002. Regarding urban areas, 81 % of households have electricity in
2020 compared to 78 % in 2012. Mitigation options in the household sub-sector include
electrification of households, replacement of inefficient incandescent lamps with compact
fluorescent lamps (CFLs), lighting emitting diode lamps (LED), upgrading the efficiency of
traditional biomass stove, increase supply of modern fuels to allow fuel substitution which have
synergistic effects on reducing the pressure on forest resources and hence and reducing CO2
emissions from AFOLU.
3.9.4 Market-Based Instruments and Regulatory Measures
Market-based instruments to mitigate GHG emissions should focus on social economic and
environmental regulatory policies and legal frameworks. Special attention need to be paid in the
i) fuel carbon content related taxes and ii) cap-and-trade systems and subsidies for renewable
energy. Regulatory measures consist of specifying the use of low carbon fuels, performance
and emissions standards. Hybrid measures such as tradable emissions permit and renewable
portfolio standards need to be instituted.
3.9.5 Dissemination of Mitigation Technologies
The need for Government funded research, development and demonstration activities emerged
as a necessary tool to develop home based technologies and enhances innovation in the sector.
In this regard for establishing low-carbon energy system and mitigation costs became

72
necessary. In conclusion, in this report, assessments of mitigation costs or the reduction
potential of the identified measures in term of CO2 are not quite comprehensive. In this
connection, given that this is a very important part of the mitigation analysis, the GHG
reductions and costs across all sectors should be done. The AFOLU being the main source of
GHG emissions, there is a need for a much more detailed assessment of technology options for
the different mitigation options vis a vis the land use changes. With time it is increasingly
necessary to investigate the various sectors of the economy for reporting in subsequent GHG
mitigation assessment and analysis study submissions.

73
CHAPTER FOUR
4 VULNERABILITY, IMPACTS, AND ADAPTATION ASSESSMENT
4.1 Introduction As stipulated by the IPCC, climate-change induced hazards are caused mainly by
anthropogenic factors occurring at local and global levels. In dry lands, drought is natural
hazard that affects the social and economic conditions of a country. Drought could be
Hydrological, Meteorological or Agricultural. In the Hydrological drought, the important
variable is availability of water in rivers, lakes, reservoirs and underground water storage.
While meteorological drought refers to the amount of rainfall and its pattern, agricultural
drought discusses the soil moisture content to sustain crop growth. Various assessments show
that agriculture is the most vulnerable sector as it affects the livelihoods of rural communities;
and subsistence farmers and pastoralists are the most vulnerable groups. Vulnerability refers to
the degree in which a system is susceptible to and unable to cope with adverse effects of
climate change i.e. variability and extremes weather condions.
According to Lingaraj et al. (2014), vulnerability is a function of the character, magnitude, and
rate of climate changes and variations to which a system is exposed. Eritrea is vulnerable to
climate change because of its least adaptive capacity and geographical location. Increased
climatic variability, recurrent droughts, flash flooding and sea level rise are the major threats;
and the effects of climate change are evident everywhere. The frequency of prevalence of
droughts and dry spells increased and consequently increased runoff and flooding. Though
most of the arid and semi-arid parts of the country are affected by drought conditions; the Red
Sea coastal areas and the islands of Eritrea are prone to various hazards including sea level rise
(MoA and FAO, 2016). Vulnerability of communities across the country varies depending on
the social, economic, and institutional conditions of the regions. In view of the above briefed
background, this chapter aims to identify the vulnerabilities, impacts and adaptions to climate
change. By focusing on selected sectors in Eritrea; it identifies potential options and measures
to facilitate adequate adaptation to climate change in the country.
4.2 Methods and Approaches Various complementary approaches have been used. The policy-based approach has been used
to investigate the adaptation strategies, while the adaptive capacity approach was applied to
assess actions on increasing capacity and removing barriers to adaptation. The regional climate
model used by ASARECA has been thoroughly reviewed for agriculture in which the changes
in average precipitation between 2000 and 2050 for the four Global Circulation Models
(GCMs) are featured in climate change projection using the A1B scenario. Moreover, the
emissions simulation results of the IAMs were made available to the GCM models as inputs
that alter atmospheric chemistry.
Open-ended and close-ended questionnaire were prepared; and filled at national and regional
levels. Secondary data were reviewed; and discussions were held with key informants and
experts involved in climate change adaptation activities. Qualitative and quantitative methods
were employed to identify linkages and the directions of climate impacts.
In the V&A assessment, a combination of top-down and bottom up approaches were used.
While the readily quantifiable top-down assessments focused on the biophysical effects of
climate change, the bottom-up approach assessment was based on the causes of people’s

74
vulnerability to a specific hazard. In situations where simulation models cannot be applied,
future projection scenarios from credible regional organizations were included in all sectors
(ASARECA) and international organizations (e.g. IPCC, WHO). Finally, adaptation assessment
and their options have been compiled using the existing potential adaptation options, based on
the existing adaptation projects, and their effectiveness in addressing climate risk and
variability. Expert judgment by the V & A Technical Expert Working Groups was used to
prioritize adaptation options. In summary, the methodology used to analyse the impact and
vulnerability to climate change involves the following major steps.
current and historic climate trends in rainfall and temperature for the years 1961 to 2018
was generated;
Assess the extent of the existing vulnerability to climate variability was assessed;
projections on future climate status using climate model outputs and a range was of
scenarios for future rainfall, temperature and other climate variables was made; and
future impacts of climate change and review appropriate adaptation measures and
options were evaluated.
4.3 Climate and Climatic variability: Trends and Projection
4.3.1 Rainfall
About 65% of the Eritrea land surface receives average annual rainfall of less than 350 mm.
The eastern lowlands have an average annual rainfall between 50 and 200 mm; which fall
within the eastern limit of the Sahelian Africa. The south-western parts experience average
annual precipitation of 600 mm; and the central highlands get about 400-500 mm. The eastern
escarpment receives a bimodal rainfall of up to 800 -1000mm per annum. The main features of
rainfall pattern are extreme variability within and between years, and the spatial variations over
a short distance. High rainfall intensity combined with sparse vegetation cover results in
excessive runoff, high evaporation rate and reduced recharge of underground aquifers. The
current scenario of rainfall accumulated over several years are described in the following
paragraphs.
Central
highland
There was modest decrease in mean annual precipitation by 96.5mm (17%) from
1900 to 2018. Rainfall decreased by 30 % from 1920 to 1967. On the other hand,
the rate of decrease of mean annual precipitation decreased during the last 50 years
as indicated for Asmara shown in Figure 4.1. It can be concluded that mean annual
precipitation in Central highlands has decreased in the range of 20 to 50% at
different locations. The rate of decrease of the mean annual precipitation is much
higher in the last 20-30 years compared to early years of the century. The
variability of rainfall between years and locations is very high
Northern
region
A significant decrease of mean annual precipitation was observed between 1905
and 1968 and between 1992 and 2009. The trend reveals that the mean annual
precipitation has improved in the late segment i.e. 20 years of the record period.
Western
region
The mean annual precipitation has decreased significantly by 60% (220mm)
between 1992 and 2018.
Coastal
areas
Mean annual precipitation along the country’s southern coastline, has decreased
significantly by about 47% (27mm) between 1931 and 2017. However, an
opposite trend is observed in the central part of the coastal area where the mean
annual precipitation has increased by 30mm between 1940 and 1977 and by40mm
between 1980 and 2010. Over all, the rate of increase of mean annual precipitation
in the coastal areas was much higher in the last 30 years compared with early
periods of the century as shown in Figure 4.2).
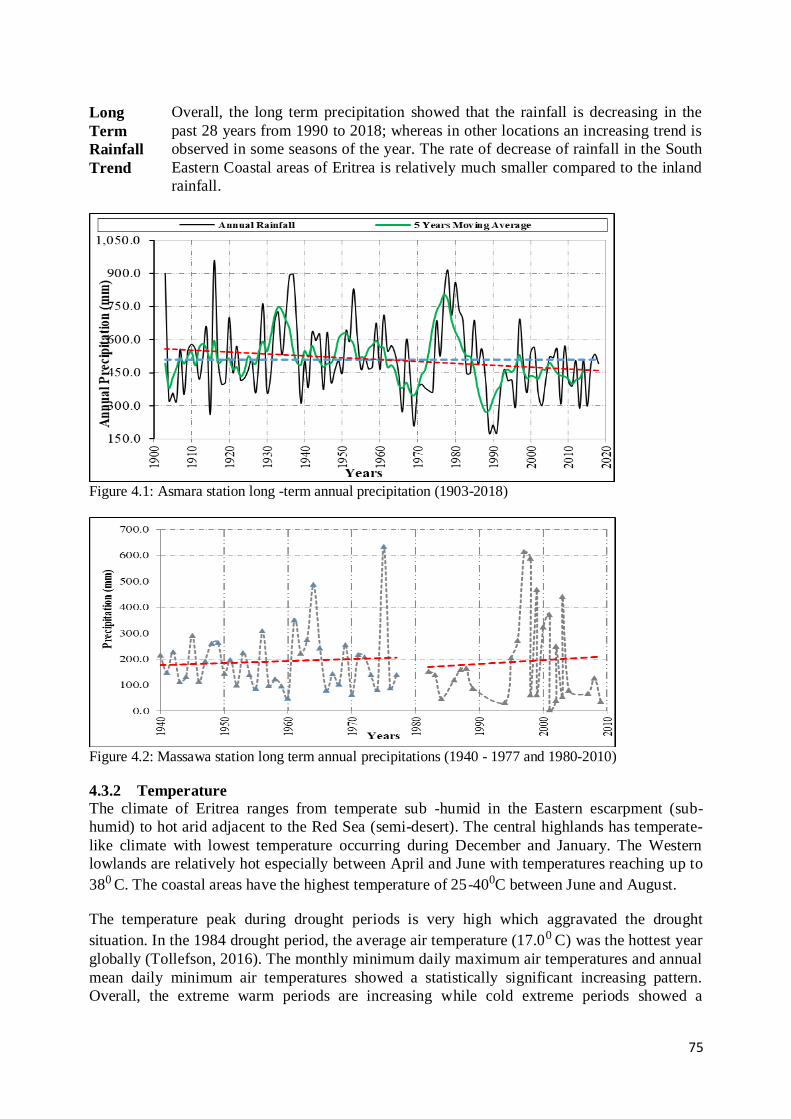
75
Long
Term
Rainfall
Trend
Overall, the long term precipitation showed that the rainfall is decreasing in the
past 28 years from 1990 to 2018; whereas in other locations an increasing trend is
observed in some seasons of the year. The rate of decrease of rainfall in the South
Eastern Coastal areas of Eritrea is relatively much smaller compared to the inland
rainfall.
Figure 4.1: Asmara station long -term annual precipitation (1903-2018)
Figure 4.2: Massawa station long term annual precipitations (1940 - 1977 and 1980-2010)
4.3.2 Temperature
The climate of Eritrea ranges from temperate sub -humid in the Eastern escarpment (sub-
humid) to hot arid adjacent to the Red Sea (semi-desert). The central highlands has temperate-
like climate with lowest temperature occurring during December and January. The Western
lowlands are relatively hot especially between April and June with temperatures reaching up to
380 C. The coastal areas have the highest temperature of 25-400C between June and August.
The temperature peak during drought periods is very high which aggravated the drought
situation. In the 1984 drought period, the average air temperature (17.00 C) was the hottest year
globally (Tollefson, 2016). The monthly minimum daily maximum air temperatures and annual
mean daily minimum air temperatures showed a statistically significant increasing pattern.
Overall, the extreme warm periods are increasing while cold extreme periods showed a

76
decreasing trend. Thus, these trends indicated a marked warming pattern over the last 100 years
in the central highland of Eritrea (Figure 4.3). Frequency of cold days increased since 1960,
despite the significant increases in mean temperature. The frequency of cold nights has,
however, decreased significantly for the months of June, July and August, and October,
November and December. This rate of decrease is most rapid in September, October and
November where the average number of cold nights has decreased by 4.9 nights per month.
(McSweeney and Lizcano, 2010).
Figure 4.3: Maximum Average Air Temperature (C) Variability for Central Highland of Eritrea

77
4.4 Projected Future Climate
4.4.1 Rainfall
The model used by ASARECA-IFPRI for Eritrea, for the years 2000-2050 under the four
downscaled climate models showed that rainfall will increase by 50 to100mm in the Central,
Southern zones and in parts of the Northern Red Sea zone. The model CSIRO Mark 3 showed
minimum change in precipitation throughout the country, while the ECHAM 5 Model showed a
small increase in precipitation of 50-100 mm in South-western part of the country and parts of
the Southern Red Sea zone. Model MIROC 3.2 showed areas of the Red Sea zone gaining 100-
200 millimetres in precipitation (Waithaka, et al. 2012).
There is no consensus among different models as to the direction of change in the mean annual
rainfall. The projected changes range from -13 to +19 mm per month by the year 2090s. The
models indicate that there will be an increase of rainfall during the months of October,
November and December and a decrease during the months of January February, March, April,
and May. The increase in the rainfall for October-December is projected to be the greatest in
the South-eastern parts of Eritrea, whilst the decreases of rainfall during the months of January-
March and April-June will be greatest in the North-west part of Eritrea. On the other hand, the
precipitation showed a decreasing trend of 10 to 20% for the rest of the country (IPCC, 2014).
Similarly, precipitation for the period 2046-2065 showed an increasing trend of 0-10% for the
South east of the coastal areas and the South western part of the country.
According to IPCC (2014) the projected rainfall for the years 2016-2035, during the months of
April-September, showed an increasing trend of 0 to10% for south east coast, South and South
west, north and central parts of the country, while a decreasing trend will be observed for the
northern part of the country. The projected rainfall for the years 2046-2065 for the same months
showed a tendency of 10% decrease in the far North of the coastal areas and an increasing
tendency of 10% for the rest of the country. Precipitation has decreased and varied greatly over
time and location for the last 30-60 years; and the variability is expected to continue in the near
and mid of the century.
4.4.2 Temperature
Most of the General Circulation Models predict increases in the mean annual temperatures,
frequency of droughts, and heat waves in Eritrea. However, predictions from these models have
not been yet refined to be used as support tool for decision making process due to the
coarseness nature of the models. The day to day pattern of temperature change is maintained,
but the average monthly temperature becomes higher than 3.6 0C. Hence, the mean annual
temperature is expected to rise. The coastal plains will experience an increase in monthly
temperature from 29 to 370C. The Western lowlands will also experience an increase in
temperature with monthly mean between 28 and 370C. The temperature rise due GHG
concentration is expected to be 4.10C (MoLWE, 2001).
IPCC (2014), in its regional climate change projections , mentioned that there will be increase
in surface temperature of 0.5-1.0°C in North, East, Central and South east coast, and an
increase of 1.5-2.0°C in the West and South Western part of Eritrea for the period of 2016-
2035. The increase in surface temperatures for 2045-2065 will be in the range of 2.0-3.0°C for
the whole Eritrea. Regardless of the magnitude of climate change, it can be concluded the
surface temperature has increased over the last 50-100 years and this warming trend is very
likely to continue towards the mid of the century.
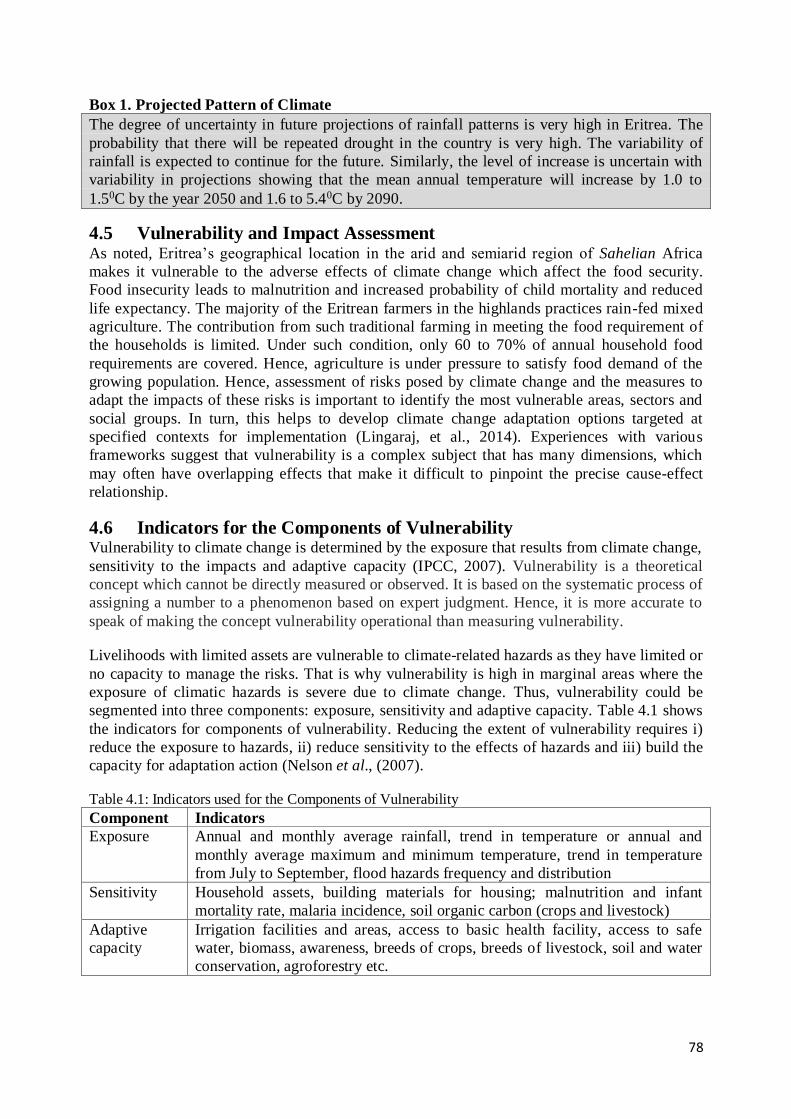
78
Box 1. Projected Pattern of Climate
The degree of uncertainty in future projections of rainfall patterns is very high in Eritrea. The
probability that there will be repeated drought in the country is very high. The variability of
rainfall is expected to continue for the future. Similarly, the level of increase is uncertain with
variability in projections showing that the mean annual temperature will increase by 1.0 to
1.50C by the year 2050 and 1.6 to 5.40C by 2090.
4.5 Vulnerability and Impact Assessment As noted, Eritrea’s geographical location in the arid and semiarid region of Sahelian Africa
makes it vulnerable to the adverse effects of climate change which affect the food security.
Food insecurity leads to malnutrition and increased probability of child mortality and reduced
life expectancy. The majority of the Eritrean farmers in the highlands practices rain-fed mixed
agriculture. The contribution from such traditional farming in meeting the food requirement of
the households is limited. Under such condition, only 60 to 70% of annual household food
requirements are covered. Hence, agriculture is under pressure to satisfy food demand of the
growing population. Hence, assessment of risks posed by climate change and the measures to
adapt the impacts of these risks is important to identify the most vulnerable areas, sectors and
social groups. In turn, this helps to develop climate change adaptation options targeted at
specified contexts for implementation (Lingaraj, et al., 2014). Experiences with various
frameworks suggest that vulnerability is a complex subject that has many dimensions, which
may often have overlapping effects that make it difficult to pinpoint the precise cause-effect
relationship.
4.6 Indicators for the Components of Vulnerability Vulnerability to climate change is determined by the exposure that results from climate change,
sensitivity to the impacts and adaptive capacity (IPCC, 2007). Vulnerability is a theoretical
concept which cannot be directly measured or observed. It is based on the systematic process of
assigning a number to a phenomenon based on expert judgment. Hence, it is more accurate to
speak of making the concept vulnerability operational than measuring vulnerability.
Livelihoods with limited assets are vulnerable to climate-related hazards as they have limited or
no capacity to manage the risks. That is why vulnerability is high in marginal areas where the
exposure of climatic hazards is severe due to climate change. Thus, vulnerability could be
segmented into three components: exposure, sensitivity and adaptive capacity. Table 4.1 shows
the indicators for components of vulnerability. Reducing the extent of vulnerability requires i)
reduce the exposure to hazards, ii) reduce sensitivity to the effects of hazards and iii) build the
capacity for adaptation action (Nelson et al., (2007).
Table 4.1: Indicators used for the Components of Vulnerability
Component Indicators
Exposure Annual and monthly average rainfall, trend in temperature or annual and
monthly average maximum and minimum temperature, trend in temperature
from July to September, flood hazards frequency and distribution
Sensitivity Household assets, building materials for housing; malnutrition and infant
mortality rate, malaria incidence, soil organic carbon (crops and livestock)
Adaptive
capacity
Irrigation facilities and areas, access to basic health facility, access to safe
water, biomass, awareness, breeds of crops, breeds of livestock, soil and water
conservation, agroforestry etc.

79
4.7 Factors Affecting Vulnerability to Climate Change The main environmental problems in Eritrea which make people vulnerable are soil erosion,
deforestation, recurrent drought, desertification, land degradation and loss of biodiversity.
Vulnerability to climate change is closely associated with excessive dependence on rain-fed
agriculture. Other factors are undeveloped health service coverage, low economic status of the
community, poor adaptive capacity, inadequate road infrastructure and lack of awareness. It is
considered that marginal or semi-arid areas respond more to increased temperature compared to
desert ecosystem subjected to similar change. Thus, the Northern Red Sea and Southern Red
Sea parts of Eritrea are much more vulnerable compared to the Central, Southern or Gash Barka
regions of Eritrea. The variation related to the causes of hazard/disasters across regions of
Eritrea is shown in Table 4.2.
Table 4.2: Factors Affecting Vulnerability to Climate Change in Regions of Eritrea
Region Disaster
Central Loss of fertile soil due to erosion, higher waste disposal, crop diseases and insects
and land degradation, deforestation and loses of biodiversity.
Southern Loss of fertile soil due to erosion, land degradation, waste disposal,
desertification, crop and livestock diseases and insects and drought, deforestation
and loses of biodiversity.
Anseba Loss of fertile soil due to erosion, cause pre-harvest losses in various crops, tsese
fly in certain villages, livestock movement, dust storms, torrential rains, high
temperature, flooding and land degradation, deforestation and loses of
biodiversity.
Gash
Barka
Human health (malaria), loss of fertile soil due erosion, crop diseases and insects,
dust storms, torrential storms, flooding, high temperature, land degradation,
deforestation and loses of biodiversity.
Northern
Red Sea
flooding, loss of fertile soil, dust storms, high temperature, livestock and human
movement to higher elevation, land degradation, desertification, crop insects
(locust, army warm), drought.
Southern
Red Sea
Human health (Diarrhoea), loss of fertile soil, dust storms, high temperature,
seismic activities, land degradation and desertification.
The crop vulnerability exposure to risk hazards is shown in Table 4.3
Table 4.3: Crop Vulnerability Exposure and the Risks according to Experts in the Zobas
Crop Risks Sensitivity
Sorghum Parasitic weed Striga, loss of soil fertility and soil erosion,
quelea quelea birds, insects (ants, termites, desert locust, and
army warm).
High
Pearl millet Degradation of land, diseases (downy mildew), insects
(termites, ants, desert locus).
Low
Barley Diseases (rust), loss of soil fertility and soil erosion Low
Wheat Rust diseases, erratic rainfall, loss of soil fertility and soil
erosion.
High
Maize Drying during the rainy season and erratic rainfall, stalk borer. Very High
Banana Post-harvest losses. Very High
Potato Post-harvest losses, blight, shortage of water. High
Beans/chickpea Excessive rainfall, water logging, viral and bacterial diseases,
pod borer.
High

80
Sometimes, diseases cause up to 90% losses in horticultural crops, which is equivalent to an
estimated financial loss of 497,408,000 USD (Table 4.4). Besides, locust invasion especially in
the Northern Red Sea zone prevails every year causing damage to crops and vegetation.
However, the size and characterises of the swarm, and the magnitude of losses it inflicted are
not properly assessed. Further, hazard from flood is so severe that it not only forms big gulley,
but destroys crop fields, livestock and settlements. Incidence of disaster from such natural
hazards is enormous especially in parts of Northern Red Sea (MoLHW, 2018a and Southern
Red Sea MLHW, 2018b and Gash Barka.
Table 4.4: Vulnerability to Natural Disasters in Zobas during the period 2006 to 2018
Disaster/
Type of Hazard # of
events
Estimated # of
households affected
Estimated
damage in US
$ (‘000)
Droughts Rainfall variability 6 1,200,000 495,108
Seismic activity Earthquake, ground
shaking
3 700 1000
Epidemic diseases Bacterial, parasitic
& viral infectious
- 13000-30000 -
Flooding flooding, flash
flooding
5 200-500 700
Wind storm Violent winds with
torrential rainfall 300-500 100
Insect infestation Locust/crop pests 10-12 - 500
Total 497,408
In many parts of the Eritrea, the main causes for crop failure are drought followed by diseases
and pests. The results of the survey show that, 72 to 97% of the respondents mentioned drought
as a major threat to crop production. Land degradation, poor soil fertility and crop management
practices lead to low yield in crop production (Table 4.5).
Table 4.5: Crop Deficits in the Traditional Farming System
Reasons Range
(%)
Mean
(%)
Region
with highest
(%)
1 Shortage of tools and equipment 11.5.-22.0 19.2 Debub
2 Drought (crops, livestock, natural resources) 72.3-97.8 85.5 All regions
3 Poor seed quality 5.2-34.6 16.2 Maekel
4 Poor soil fertility/Land degradation 4.5-33.3 21.6 Anseba
5 Diseases and pests 6.4-69.8 33.2 North Red Sea
6 Poor crop management practices 14.9-36.0 28.5 North Red Sea Source: MoA (2017)
Ranking vulnerability across sectors
All sectors are potentially impacted by climate change. Nonetheless, agriculture (crop and
livestock production) and water resources are the most affected by the spatial and temporal
variability of climate change. Ranking the magnitude of risk shows that while agriculture and
water resources are most vulnerable, marine resources and biodiversity are vulnerable with
varying degree of severity from high to medium. Comparatively, forests are less risky when
compared to the other sectors (Table 4.6).

81
Table 4.6: Ranking of Vulnerability across Sectors according to Experts in Eritrea
Resource/ ranking Severity Importance of Resource
Water Resources 5 5
Agriculture 5 5
Marine, Coastal & Island 3-5 5
Forests 1-5 5
Human Health 3-5 5
Biodiversity 3-5 3-5
Note: High=5, Medium to high= 5-3; Medium to low= 3-1
4.8 Vulnerability and Impacts on Sectors The projected climate change impacts: increased temperatures and drought conditions will have
a detrimental effects on food security and economic development. The current low agricultural
productivity will be exacerbate the situation leading to reduced household incomes, increased
malnutrition, and associated health impacts. Hence, the number of people at risk from drought
events will increase. The most vulnerable groups to climate variability are those who depend
mainly on the natural resources including subsistence farmers, rural dwellers, pastoralists,
urban poor and fishermen. Adverse impacts of climate change in Eritrea are the following:
Food insecurity arising from recurrent drought, crop pests and livestock diseases;
Outbreak of diseases (malaria, dengue fever, etc.)and climate-induced diseases
Land degradation due to deforestation and high intensity of rainfall; and
Loss of livestock and
Loss of biodiversity: agro biodiversity and terrestrial diversity.
4.8.1 Crop and Livestock production
Crop Production: The major crops are cereals, pulses, oil seeds (groundnuts, sesame etc.),
vegetables and fruits; crop production is based on subsistence level farming under rain-fed
conditions which is dominated by traditional farming techniques Table 4.7 presents
comparisons of major crops and vegetables in terms of area, production and productivity.
Among the cereals in Eritrea, sorghum is by far most important, which accounts for 49% of the
total cultivated area, and 46.4% of the total production. Sorghum has the greatest genetic
diversity; and grows in most parts of the country. This crop is adapted to moisture stress and
temperature ranges. Pearl millet which is the second most important crop in the country grows
in the lowlands with total cropped area of 13.1% and production of 7.3%. Barley stands third in
total area, but second in total production next to sorghum.
Land under sorghum is expected to be reduced in size in some parts of Eritrea as the result of
mono-cropping leading to parasitic weed infestation. Striga infestation is compelling farmers to
shift to pearl millet which is resistant to Striga. The major pulses grown are chickpeas, Faba
beans, field peas, lentils, and grass pea out of which chickpea and grass pea are drought tolerant
crops. Among the oil crops, sesame stands first in terms of production and total production
followed by groundnuts.
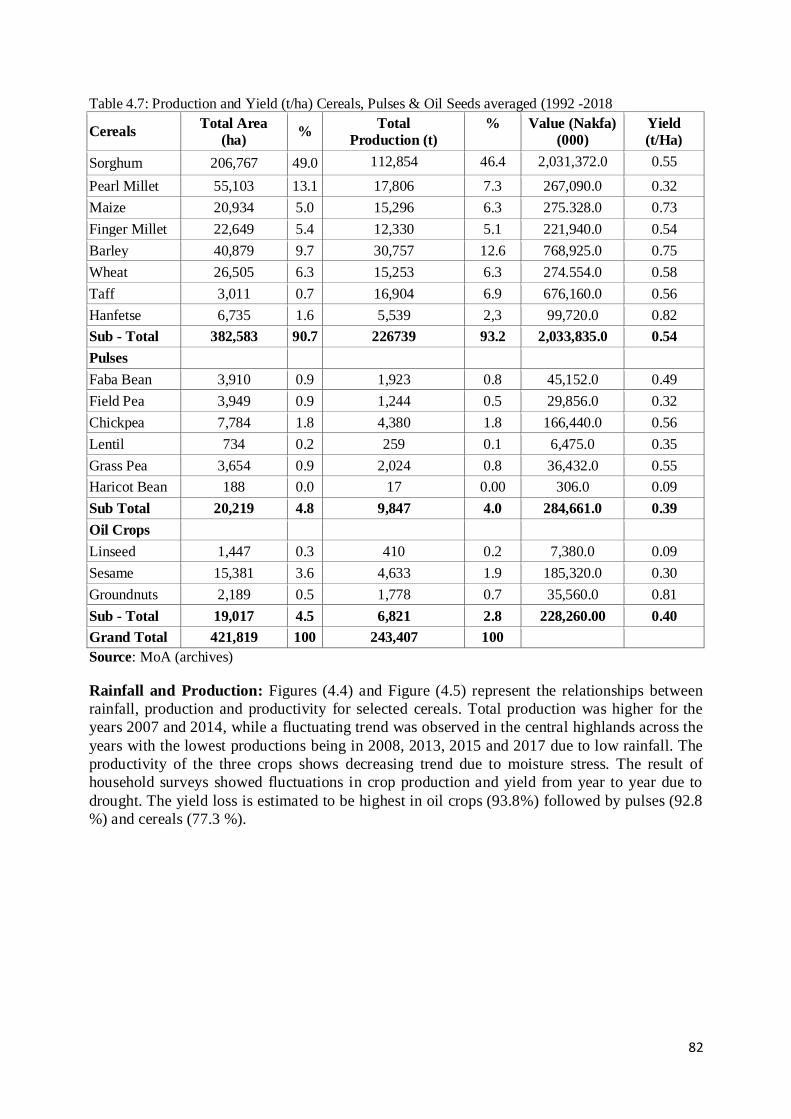
82
Table 4.7: Production and Yield (t/ha) Cereals, Pulses & Oil Seeds averaged (1992 -2018
Cereals Total Area
(ha) %
Total
Production (t)
% Value (Nakfa)
(000)
Yield
(t/Ha)
Sorghum 206,767 49.0 112,854 46.4 2,031,372.0 0.55
Pearl Millet 55,103 13.1 17,806 7.3 267,090.0 0.32
Maize 20,934 5.0 15,296 6.3 275.328.0 0.73
Finger Millet 22,649 5.4 12,330 5.1 221,940.0 0.54
Barley 40,879 9.7 30,757 12.6 768,925.0 0.75
Wheat 26,505 6.3 15,253 6.3 274.554.0 0.58
Taff 3,011 0.7 16,904 6.9 676,160.0 0.56
Hanfetse 6,735 1.6 5,539 2,3 99,720.0 0.82
Sub - Total 382,583 90.7 226739 93.2 2,033,835.0 0.54
Pulses
Faba Bean 3,910 0.9 1,923 0.8 45,152.0 0.49
Field Pea 3,949 0.9 1,244 0.5 29,856.0 0.32
Chickpea 7,784 1.8 4,380 1.8 166,440.0 0.56
Lentil 734 0.2 259 0.1 6,475.0 0.35
Grass Pea 3,654 0.9 2,024 0.8 36,432.0 0.55
Haricot Bean 188 0.0 17 0.00 306.0 0.09
Sub Total 20,219 4.8 9,847 4.0 284,661.0 0.39
Oil Crops
Linseed 1,447 0.3 410 0.2 7,380.0 0.09
Sesame 15,381 3.6 4,633 1.9 185,320.0 0.30
Groundnuts 2,189 0.5 1,778 0.7 35,560.0 0.81
Sub - Total 19,017 4.5 6,821 2.8 228,260.00 0.40
Grand Total 421,819 100 243,407 100
Source: MoA (archives)
Rainfall and Production: Figures (4.4) and Figure (4.5) represent the relationships between
rainfall, production and productivity for selected cereals. Total production was higher for the
years 2007 and 2014, while a fluctuating trend was observed in the central highlands across the
years with the lowest productions being in 2008, 2013, 2015 and 2017 due to low rainfall. The
productivity of the three crops shows decreasing trend due to moisture stress. The result of
household surveys showed fluctuations in crop production and yield from year to year due to
drought. The yield loss is estimated to be highest in oil crops (93.8%) followed by pulses (92.8
%) and cereals (77.3 %).

83
Figure 4.4: Total Production (tons) from 2007 to 2018 for Sorghum, Barley and Wheat
Figure 4.5: Productivity (t/ha) from 2007 to 2018 for Sorghum, Barley and Wheat
Food Consumption: Food production and consumption for the period 2010 -2018 are shown in
Table 4.8 in which it can be shown that the lowest food deficit was recorded in 2010 (16 %).
The leading crops for human consumption are wheat (40.7%), sorghum (14.3%), and roots and
tuber crops (11.0%). As the amount of wheat produced in Eritrea is insufficient; and the
country imports considerable amount grain. Efforts are also required to produce sufficient
maize and barley. Barley is a staple food crop in the highlands as well used in the brewing
industries.
Sorghum is a staple food crop for many people, which is also consumed in various forms. On
the other hand, surplus food was recorded in 2014 with an increase of 19 % from the previous
production year.
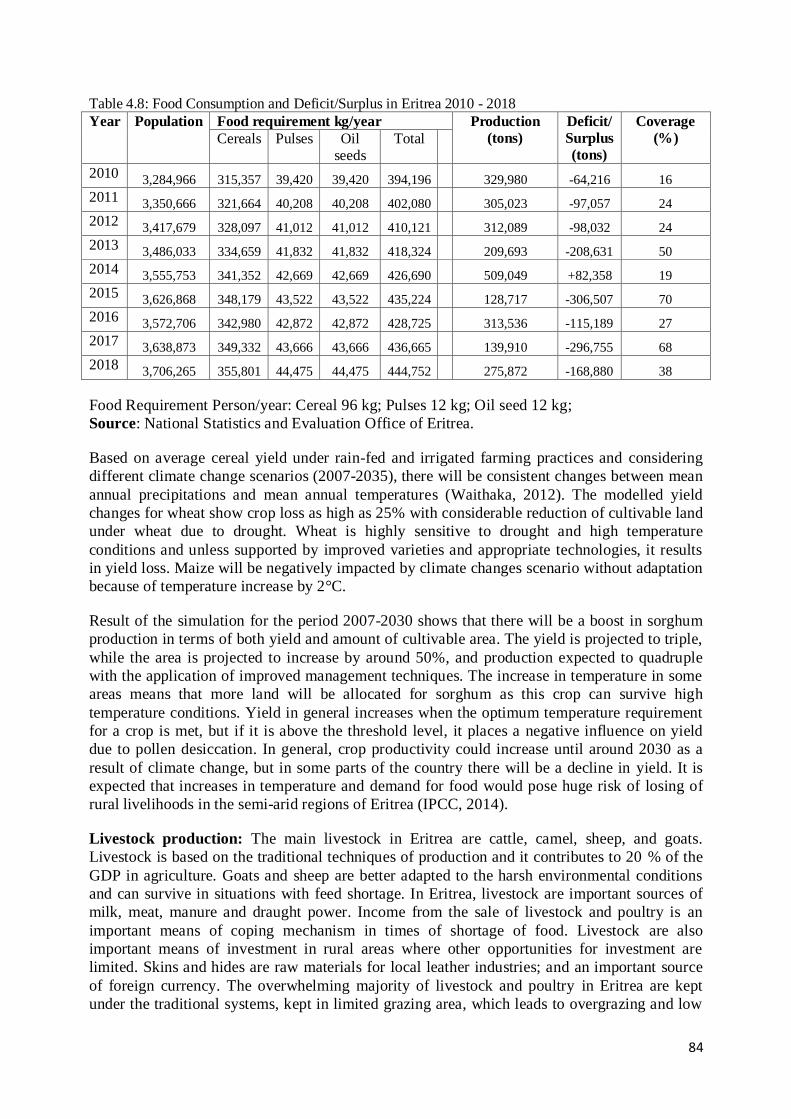
84
Table 4.8: Food Consumption and Deficit/Surplus in Eritrea 2010 - 2018
Year Population Food requirement kg/year Production
(tons)
Deficit/
Surplus
(tons)
Coverage
(%) Cereals Pulses Oil seeds
Total
2010 3,284,966 315,357 39,420 39,420 394,196 329,980 -64,216 16
2011 3,350,666 321,664 40,208 40,208 402,080 305,023 -97,057 24
2012 3,417,679 328,097 41,012 41,012 410,121 312,089 -98,032 24
2013 3,486,033 334,659 41,832 41,832 418,324 209,693 -208,631 50
2014 3,555,753 341,352 42,669 42,669 426,690 509,049 +82,358 19
2015 3,626,868 348,179 43,522 43,522 435,224 128,717 -306,507 70
2016 3,572,706 342,980 42,872 42,872 428,725 313,536 -115,189 27
2017 3,638,873 349,332 43,666 43,666 436,665 139,910 -296,755 68
2018 3,706,265 355,801 44,475 44,475 444,752 275,872 -168,880 38
Food Requirement Person/year: Cereal 96 kg; Pulses 12 kg; Oil seed 12 kg;
Source: National Statistics and Evaluation Office of Eritrea.
Based on average cereal yield under rain-fed and irrigated farming practices and considering
different climate change scenarios (2007-2035), there will be consistent changes between mean
annual precipitations and mean annual temperatures (Waithaka, 2012). The modelled yield
changes for wheat show crop loss as high as 25% with considerable reduction of cultivable land
under wheat due to drought. Wheat is highly sensitive to drought and high temperature
conditions and unless supported by improved varieties and appropriate technologies, it results
in yield loss. Maize will be negatively impacted by climate changes scenario without adaptation
because of temperature increase by 2°C.
Result of the simulation for the period 2007-2030 shows that there will be a boost in sorghum
production in terms of both yield and amount of cultivable area. The yield is projected to triple,
while the area is projected to increase by around 50%, and production expected to quadruple
with the application of improved management techniques. The increase in temperature in some
areas means that more land will be allocated for sorghum as this crop can survive high
temperature conditions. Yield in general increases when the optimum temperature requirement
for a crop is met, but if it is above the threshold level, it places a negative influence on yield
due to pollen desiccation. In general, crop productivity could increase until around 2030 as a
result of climate change, but in some parts of the country there will be a decline in yield. It is
expected that increases in temperature and demand for food would pose huge risk of losing of
rural livelihoods in the semi-arid regions of Eritrea (IPCC, 2014).
Livestock production: The main livestock in Eritrea are cattle, camel, sheep, and goats.
Livestock is based on the traditional techniques of production and it contributes to 20 % of the
GDP in agriculture. Goats and sheep are better adapted to the harsh environmental conditions
and can survive in situations with feed shortage. In Eritrea, livestock are important sources of
milk, meat, manure and draught power. Income from the sale of livestock and poultry is an
important means of coping mechanism in times of shortage of food. Livestock are also
important means of investment in rural areas where other opportunities for investment are
limited. Skins and hides are raw materials for local leather industries; and an important source
of foreign currency. The overwhelming majority of livestock and poultry in Eritrea are kept
under the traditional systems, kept in limited grazing area, which leads to overgrazing and low

85
productivity. The livestock population of the country (Table 4.9) had been affected by recurrent
droughts resulting in animal feed and lack of water points and massive death. During period
1970 to 1986 period, droughts reduced animal resources has been reduced 50 to705 (MoA
2015). Thermal stress as well exceed the threshold that animals tolerate, which in turn lead to
decreased feed intake, interference with animal reproduction functions, and increasing exposure
to pathogens.
Table 4.9: Number of Livestock and Products per annum (2006-2018)
Type Number (000) Products (millions)
Cattle 2,239 Milk (litres/year) 341,038
Sheep 2473 Meat (kg/year) 45,998
Goats 5416 Eggs (No/year 71,877.25
Equines 596 Honey (kg/year) 298
Camels 371 - -
Poultry 1318 - -
Beehives 23.41 - -
Diminishing Biological Diversity: Crop diversity: Land degradation has been the cause of genetic loss in Eritrea where tall, high
yielding and late maturing landraces have disappeared as a result of diminished soil fertility.
Farmers used to cultivate barley landraces known as Quunto over wider geographical areas, but
right now, confined to limited areas due to lack of sufficient water. Durum wheat grown vastly,
in the past, is nowadays limited to certain pockets areas in Weki - Zager due to spatial and
temporal reduction of rainfall. Wheat landraces varieties such as ‘Quaderno and ’, ‘Demhay’
are extinct (MoLWE, 2008; Woldeamlak et al., 1998).
Weeds, Disease and Pest Incidence: Weeds, diseases and pest incidences hamper crop
production. While moisture stress increases Striga infestation, grasshopper infestation occurs
with onset of the rainy season in spring and damages crops in July and August. Aphids become
serious during the drier months in October and November. Shoot fly incidence is higher with
low rainfall. Various flies attack potato, tomato, pepper and cabbage under irrigated agriculture
in dry season. Crop diseases linked with climate change are wheat rust in cereals, chocolate
spot in Faba beans, root rot in chickpea and Faba bean; in vegetables early blight of tomato and
late blight of potato cause yield loss when rainfall is higher (Woldeamlak et al., 1998). Locust
incidence is common almost every year especially in the Red Sea Zone; even though the swarm
is bigger during climate fluctuations.
4.8.2 Water Resources
Climate change is projected to reduce surface and groundwater resources in most dry regions
resulting in intensified competition for water among different users. The mean annual
precipitation has significantly decreased between 20-50%; and the trend changed over the last
30-60 years (IPCC, 2004). Local communities, in the highlands of Eritrea, felt the impact of
climate change on water resources (MOLWE, 2005). The following sections describe the
impact of climate change on surface, ground water resources in Eritrea.
A. Surface Water Resources
Freshwater resources are highly influenced by inter-and intra-annual rainfall variability,
flooding and drought. The demand for water from domestic, livestock and industrial activities
is expected to increase with population growth. With increasing temperatures, climate change
may further reduce its availability with decrease summer stream flow. To study the trends, the

86
annual stream flows in different sites were simulated at three gauged basins namely the Gash,
Mereb and Anseba. The results showed decreasing stream flow in almost all river basins,
though an increasing tendency has been observed for Anseba River at Halib - Mentel site
(Figure 4.7). Similar trend is observed for Mereb-Gash (Figure 4.6). The decline of stream flow
was consistent with decline in precipitation in the last 30 to 60 years. Nonetheless, trends in
stream flow are not always consistent with changes in precipitation owing to data limitations in
precipitation and effect of human interventions (e.g. Reservoir impoundment (Lindstrom and
Bergstrom, 2004). The annual inflow data from Toker Dam (2001-2019) and Mai - Nefhi Dam
(1972-1986) showed a decreasing stream flow ranging from 4.0 - 2.0 MCM (Figure 4.8) at
Toker Dam and 9.0-2.0 MCM at Mai - Nefhi Dam (Figure 4.9) in the last 20 years (Figure 10).
Figure 4.6: Simulated Annual Stream Flow Series of Mereb-Gash Basin at Tesenay (Source: Euro consult, 1998)
Figure 4.7: Simulated Annual Stream Flow Series of Anseba River System at Halib Mentel (Source: Euro consult, 1998)

87
Figure 4.8: Annual inflow of Toker Dam (Source: AWSD, 2019)
Figure 4.9: Annual inflow of Mai Nefhi Dam (Source: AWSD, 2019)
Groundwater Resources: In Eritrea, groundwater is source of water supply for 96% of rural
communities. Inhabitants in the Central and Northern highlands, the Eastern and Western
escarpments depend on groundwater. Due to over pumping and droughts, ground water table in,
many places including, Mogoraeb and Bisha (Figure 4.10) and Adi-Nfas (Figure 4.11) areas
declined by about 5m during the last 10 years. Due to high temperature and low precipitation, a
similar trend was noted in areas of hard rock aquifers around Dbaruwa area (AMSC, 2018).
Such a decline is not only explained by the impact of climate change, equally the level of
groundwater could drop significantly due to excessive pumping surpassing the rate of
recharging. A large portion of the country is underlain by hard rock, and most frequently the
success rate of drilling from such hard rock is very low (Sander, 1996; MOLWE, 2005). Thus,
besides climate change and excessive exploitation, ground water availability is constrained by
the physical and geological nature of the area which makes the groundwater exploitation
expensive and difficult.

88
Figure 4.10: Water Table Decline from the Surface in Alluvial Formation of Bisha, Area (Source: BMSC, 2018)
Figure 4.11: Water Table Decline from Surface in the Hard Rock Formation of Adi-Nfas area Source: AMSC, 2018
Community perception on ground water supply in sub-zoba Dbaruwa: The increase in
mean annual temperature and decrease in rainfall in the last 30-60 years has dropped the water
levels. The yield of wells has been reduced; and springs dried. This has negatively affected the
rural water supply of the sub - zoba which depends on ground water. The village of “Sefea” and
“Guhcha” are examples of the sub-regions regions which suffered due to shortage of water
supply.
Dam Storage and Structures: In Eritrea, over the past 15 years, 340 dams out of which,
twenty five purely for irrigation, eighty three for domestic use and the remaining for both
irrigation and domestic use were constructed. The capacity of these dams ranges from 0.02
Mm3 to over 100Mm3, most of them in the range of 150,000 - 360,000m3. The storage capacity
of most of the dams is low owing to inadequate investment in water management infrastructure
due to the hydrology and hydraulic nature.
Water Quality Status: Water quality assessment, in the Central Highland and the Western
lowlands, carried out by the WRD over a ten-year period (1994-2004) showed good quality

89
with respect to chemical composition. In the Red Sea coastal area, water is generally saline due
to increased temperature and intrusion of sea water in the wells. The quality of many shallow
hand dug wells and surface water sources is generally acceptable. Drinking water source open
hand dug wells springs; dams are prone to bacteriological contamination. Samples taken from
548 water points across the country shows that 59.7percent of the wells are contaminated, 22.7
% are mildly contaminated and 27%are highly contaminated which is aggravated by poor
hygiene practices, low sanitation coverage, poor construction and maintenance of water points.
Regarding chemical quality, 30% of water points in the Southern Red Sea region and 40% in
the Northern Red Sea region were found to be unsuitable for human consumption due to
salinity problem. The high temperature would likely result in water evaporation pushing the salt
upward to the surface affecting the chemical quality of the water (IWRM, 2019). Thus, under
climate change scenarios associated with drought, flooding and rise in temperature; water
quality deteriorates and remains to be one of the major causes of child mortality.
Along the Red Sea coastal areas, the state of water table has been disturbed because of
decreased surface water recharge caused by low precipitation. The decline in ground water
table could lead to water, which is highly vulnerable to salt water intrusion. The electro
conductivity (EC) values in the coastal line have increased from 1400μS/cm-2000μS/cm in the
last 25 years (Figure 4.12). This has been described well by the community living around the
coast line in Sub Zoba Foro. Furthermore, the water quality (EC values) from inland Eritrea, in
Bisha Area showed an increase amount from 800μS/cm-1100μS/cm (Figure 4.13) (MOLWE,
2018).
Figure 4.12: EC Values of Asseb water supply, Harsile Area (Source: MoLWE, 2018)

90
Figure 4.13: EC Values of Bisha Mining Area Monitoring Wells (Source: BMSC, 2018)
Community Perception on Groundwater Quality in sub-zoba Foro: The communities in the
Northern Red Sea coastal areas are from wells, springs, base flows and shallow dug wells
located at foothills of the escarpment. In the last decades, these sources have been declining and
some of them are already dried out due to shortage of precipitation. Moreover, the wells located
closer to the sea shore become more saline due to high evapotranspiration and intrusion of sea
waters into the wells.
4.8.3 Forest Sector
The vegetation cover of Eritrea, which was 30% declined to less than 1% now. Certain plant
species having timber and non-wood products uses have disappeared climate change.
Deforestation due to expansion of agriculture, domestic fuel wood consumption, construction
of traditional houses, the ‘hdmos’ agricultural implements and war had negative impacts on
forest cover. The overwhelming dependence on biomass (charcoal, firewood) clears forests and
woodlands. Thus, deforestation leads land degradation consequently widespread environmental
problem. Over-grazing and incidences of bush fire destroy wildlife habitats. Wildlife species
such as the Oryx are locally extinct; others such as the Nubian ibex and the African wild ass are
critically endangered. It is expected that the trend on biological diversity would diminish for the
future unless conservation are in placed to conserve the biodiversity. Studies indicate that the
annual rate of soil loss from cropland is estimated at 12-20 tons/ha, while the decline in crop
yield is about 0.5 per annum. These unsustainable practices reduced the Eritrea’s terrestrial
biodiversity. Due to low level of economic activities the coastal and marine biodiversity
resources remained relatively stable.
4.8.4 Human Health
Climate changes affect human health through social and environmental determinants of clean
air, safe drinking water, food security and shelter. The adverse health impacts of climate change
are caused by scarcity of water and disasters such as floods and droughts. Malaria, dengue
fever, and yellow fever are the main vector-borne diseases caused due to climate changes in
Eritrea (Table 4.10).

91
Table 4.10: General Climate Change and Impacts on Health in Eritrea
Climate change Health Impact
Extreme weather conditions Cardiovascular diseases, skin cancer
Lack of hygiene Diarrheal diseases
Changing rainfall and
temperature patterns
Malaria, Dengue fever, Schistosomiasis, Chikungunya
Poor crop yield Malnutrition and hunger
Sea rise and flooding Fatal and non-fatal injuries
Air pollution Deaths and ill health associated with air pollution and allergies
Malaria: In Eritrea, with climate change, the prevalence and distribution of malaria disease
gradually diffused from the lowlands to the highlands. Transmission of malaria is seasonal with
September to December being the peak transmission season. This places a significant economic
burden on the farming populations which coincides with harvesting months for major crops.
While Gash Barka had the highest prevalence rate of (69%) Debub with (9%) is the lowest.
The highest mortality rates of 13% and 11% were reported in 2014 and 2016 respectively
(Figure 15). Variations in malaria transmission are associated with changes in temperature,
rainfall, humidity and the level of immunity (IPCC, 2007). As a case, the country faced serious
malaria epidemics following heavy rainfall in 1998 and the El Nino of 1997. Considering the
health, social and economic threat of malaria as a public health problem, the MoH launched a
Roll Back Malaria Strategy in 1999 (Annual Health Service Report, 2018).
As the result of climate change, temperature, rainfall and humidity are increasingly met by the
B2 high 90 percentile 2030s and 2050s scenarios, which will likely increase the prevalence of
the disease in the drainage basins (Waithaka et al, 2012). There is a positive association
between malaria prevalence and monthly temperatures, and rainfall patterns. Future projections
indicate that incidence of malaria, in Eritrea, will increase. However, taking Eritrea's past
record, there is higher chance of controlling the disease without causing risk hazards.
Malnutrition: The poor nutritional status of children and women has been a serious problem in
Eritrea for many years. Malnourished women during pregnancy often have children with
stunted growth during their life time. In rural areas, a considerable proportion of children (50%)
are stunted. A similar situation prevails in all other regions of the country except in Maekel
(Central) where the prevalence of stunting stands at 35%. This is in agreement with the IPCC
(20014) assessment where under-nutrition was found to be linked with extreme climatic events.
The impact of food insecurity and malnutrition is particularly severe in poor households with
limited livelihood assets. Rainfall situation and temperature could partly predict the variations
in child stunting and underweight.
Prediction on malnutrition indicates that acute global malnutrition will range from 19.8 -7.8%.
Under the A2 and B2 high 10 percentile scenarios, malnutrition increase following incidences
drought. Malnutrition increase under the A2 and B2 high 90 percentile scenarios as a result of
potential inundations and subsequent decrease in crop yield (Waithaka, 2012). It is important to
explore possibilities of conducting model based assessment for the future national
communication reports.
Diarrhoea: Diarrhoea is prevalent in areas suffering high under-nutrition and low accessibility
to safe drinking water and poor waste disposal systems. It frequently occurs during peak rainy
months indicating possible contamination of drinking water by flooding. Children aged below
five years are most vulnerable to diarrheal diseases due to poor hygiene, and lack of access to

92
clean drinking water. The problem is more acute in rural areas where there are no proper
excreta disposal systems. The disease is persistently one of the three leading causes of mortality
among children under 5 years of age in Eritrea (MoH, 2016). Pathogens that cause water-borne
diseases are temperature-dependent where rising temperatures leads to increased bacterial
reproduction causing incidence of diarrheal diseases.
Schistosomiasis: Schistosomiasis is prevalent in Gash Barka, Southern Red Sea and the
Northern Red Sea administrative zones with the two regions, Gash Barka and Southern Red
Sea having the highest rate of prevalence (Figure 4.14). The disease diffuses when urine and
faeces contaminate drinking water and the intermediate host the snails are present in the ponds.
With increasing demands for irrigation, in the arid regions, the snail would easily spread the
disease to the population and hence, higher risk of human infection with Schistosomiasis
parasite. Under the B2 high 10 percentile 2030s and 2050s scenarios, the disease will likely
further prevail and infect more people in the various drainage basins of the country (Waithaka
2012, 2013).
Figure 4.14: Vulnerability and Spread of Schistosomiasis in six regions of Eritrea 2015
Chikungunya: In Eritrea, Chikungunya was first detected in 2018 in the town of Tesenay
bordering the Sudan. Later, the disease spread to parts of Gash -Barka, Anseba, Debub, Maekel
and Northern Red Sea regions. Today, the largest number of people affected by Chikungunya
(13,710) was in Gash Barka region followed by Anseba (2,609). In 2018, the MoH (2018)
report 16,904 people infected by Chikungunya. Till now, there is no report indicating the
incidence of the disease in Southern Red Sea.
Dengue Fever: Although Dengue fever is one of the endemic vector-borne diseases in Eritrea;
before 2010, the disease was commonly found in the coastal areas. Today, it has spread to all
parts of the country following increasing in temperature and consequently widely affecting the
population and considered as climate change related disease in Eritrea (MoH, 2018).
Yellow Fever: The distribution of yellow fever shows that the virus (Flavi virus) is transmitted
through mosquitos’ bites. Eritrea is not a high-risk country for yellow fever; but introduction
from the neighbouring countries where the diseased is prevalent pose potential risk. In recent
years, there has been a global change in the epidemiology of yellow fever with outbreaks
occurring in areas not previously assessed as risky. This is due the changes in the pattern of
temperature and precipitation. Thus, the disease could be a potential threat for Eritrea unless
concerted efforts are made by all countries to tackle the problem (MoH, 2018).

93
4.8.5 Coastal Areas
The Eritrean Red Sea coastal areas are susceptible to the adverse effects of climate change. The
following paragraphs describe the impacts of climate change on various aspects of the
ecosystems.
Coral Reefs: Coral reefs are highly vulnerable to climate change as well as human activities.
They could be easily killed unless they are protected by environmental law. Excessive salinity
and an increase in water temperature of more than 1-2 °C (1.8-3.6 °F) can destroy some species
of coral. An increase of 1°C or more above the historical maximum sea surface temperatures
(SSTs) results in “coral bleaches,” The sea surface temperature (SST) across much of the
tropics has increased by 0.4° to 1°C since the mid-1970s. As a result, an increase in the
frequency of coral bleaching and mortality has become a concern that pose a major threat to the
survival of coral reef ecosystem. Climate model simulations of IPCC predicted that if the
current warming trend continues, the coral species could cease growing altogether by 2070
(www.sciencemag.org Science, 2010).
Mangrove: Mangrove patches in the Eritrean coastal areas are, among the most, vulnerable
species to climate change. Some mangrove patches along the coast are observed to lose their
patchiness periodically and unable regenerate. If the current trend continues the mangrove
grown in inter tidal areas could completely submerged and displaced in the future (MOMR,
2019).
Coastal And Island Community: Sea level rise has been observed in many sites along the
coastal areas; and adversely affecting the people living in low lying island villages and coastal
towns. The coastal villages of Gelealo, Tio, Edi and Barasole are located at sea level and
vulnerable climate change. During time of extreme tide such as sea water flashes beyond the
low lying villages like Barasole (Figure 4.15. If the current situation continues unabated, many
islands would be submerged and populations living there would be displaced.
Figure 4.15: High tides inundating the coastal village of Barasole, Southern Red Sea
Observed Sea Level rise in the Red Sea Area at 17° Longitude and 40° Latitude during the
1992-2012 is shown in Figure 4.16.

94
Figure 4.16: Observed Sea Level rise in Red Sea Area at 17° Longitude and 40° Latitude (1992-2012)
4.9 Adaptation Assessment, Strategy and Policies In this section “adaptive capacity’ is taken as system’s ability to modify its characteristics or
behaviour to better cope with changes in external conditions (Füssel & Klein, 2006). Most
often, adaptation does not mean doing new things completely, but rather modifying
development interventions. It is not a development objective but a necessary prerequisite for
safeguarding beneficial outcomes. Adaptation can contribute to the well-being of people, and to
the maintenance of ecosystem goods. It helps to reduce the risks of climate change impacts.
However, there are always limitations to its effectiveness, especially when the climate change
is extreme. Assessment on adaptation activities is linked with priority sectors such as
agriculture and water as both are key issues in achieving food security, economic growth and
poverty reduction.
Drought and climatic variability caused reduction in productivity of crops and livestock. These
results in economic problems particularly when those affected have no capacity to respond, in
any other way. This is particularly evident in the case of extremely poor communities or where
the costs of adaptation measures are considered to be high relative to the risk of expected
damage.
4.10 Coping Mechanism/Strategies In Eritrea, assessment on coping mechanism strategies provided information on the measures
taken towards formulating and implementing national programs relevant to the UNFCCC
Convention. A range of traditional drought coping mechanisms are used at a household level.
The most frequently used drought coping mechanism is selling of livestock, while the least
mechanism used is food (Menghisteab et al, 2019). As a general rule, rich households show
less dependency on selling livestock to cope with extreme weather conditions as they have a
much more diversified livelihood system. The section below presents adaptation activities
related to agriculture in the country.
4.10.1 Crop Production
Use of inputs: As part of adaptive strategy, agricultural inputs such as fertilizers, pesticides,
and seeds were distributed to the farming households. In 2015, the amount of inputs distributed
were 2208qt of fertilizers, 9662 litres of pesticides and 2199kgs pesticides in the form of
powder. A large amount of potato seed (4350qt) was also distributed along with other types of
seeds of cereals, vegetables and forage.

95
The Minimum Integrated Household Agricultural Package (MIHAP): The MoA has
introduced a MIHAP in which a given household acquires an improved cross breed of dairy
cow or 6 goats, 25 chicken, 2 bee hives, a vegetable plot and 20 trees. The package has
improved the living conditions of households and satisfied their food and nutrition requirement.
Eggs provide nutritious food for the family and surplus sold to earn money for purchase of
items needed by the family. Vegetables and fruits also contribute to the bulk of nutritious food.
If up-scaled and implemented properly, the MIHAP would enable farming families become
self-sufficient in food and nutrition and financially secured at household and community levels
(MoA, 2018).
Choice of Crops and Varieties: Eritrea is a centre of diversity for a number of crops and
possess diversified landraces foe given crop species. Farmers use drought resistant varieties
such as sorghum, pearl millet and barley in places with shortage of water. These crops mature
earlier and thus escaping the impacts of drought. There are a number of landraces grown for
generations by adapting the existing climate conditions. By and large, 76% of the households
use landraces from their own source.
Inter-tillage cultivation: Inter tillage cultivation is practiced particularly for sorghum and
pearl millet at knee height stage. This practice helps to conserve moisture, provides proper
aeration in soil; and minimizes weed infestation. About 98% of the farmers in Gash Barka and
94%t in Anseba practice inter-tillage cultivation for sorghum and pearl millet.
Intercropping/Mixed cropping: This is a method where two or more crops are grown in the
same field during the same year. The intercropping/mixed cropping has advantages of making
yield stable and ensures farmers with the second crop in case the first crop fails due to drought.
It also helps to reduce infestation of insects, diseases and weeds.
Minimum tillage: This is ploughing land only once before planting period (0+1) or ploughing
before and after planting (1+1) for covering the seed planted. Minimum tillage creates a coarse
seed bed for better moisture conservation, preventing soil erosion/runoff, maintains the soil
structure and minimizes the loss of soil fertility.
Improved Varieties for Smart Agriculture: The most serious challenges in crop production
are shortage of inputs, lack of high yielding varieties, inadequate multiplication of seeds; and
post harvesting losses due to lack of cold storage facilities. Drought will continue to cause
shortage of food production in the country unless irrigation and high-yield varieties are
introduced in the farming system. An example of improved varieties developed in the face of
smart agriculture in Eritrea is Kona in pearl millet, which easily adapts to conditions of drought
and high temperature. It is early maturing and disease resistant that gives yield ranging from 12
to 21 qt/ha. The same improvement is reported to sorghum with varieties such as Shambucco,
Bushuka and Hamelmalo released recently. Barley varieties such as Shishay and Rahwa have
been also developed, which are early maturing and high yielding. Landraces that are relatively
drought tolerant and early maturing have survived for generations. Various landraces of pearl
millet such as Bariyay and, sorghum- Wedi- Aker and Koden have, for example, survived for
long period of time in the face of climate change.
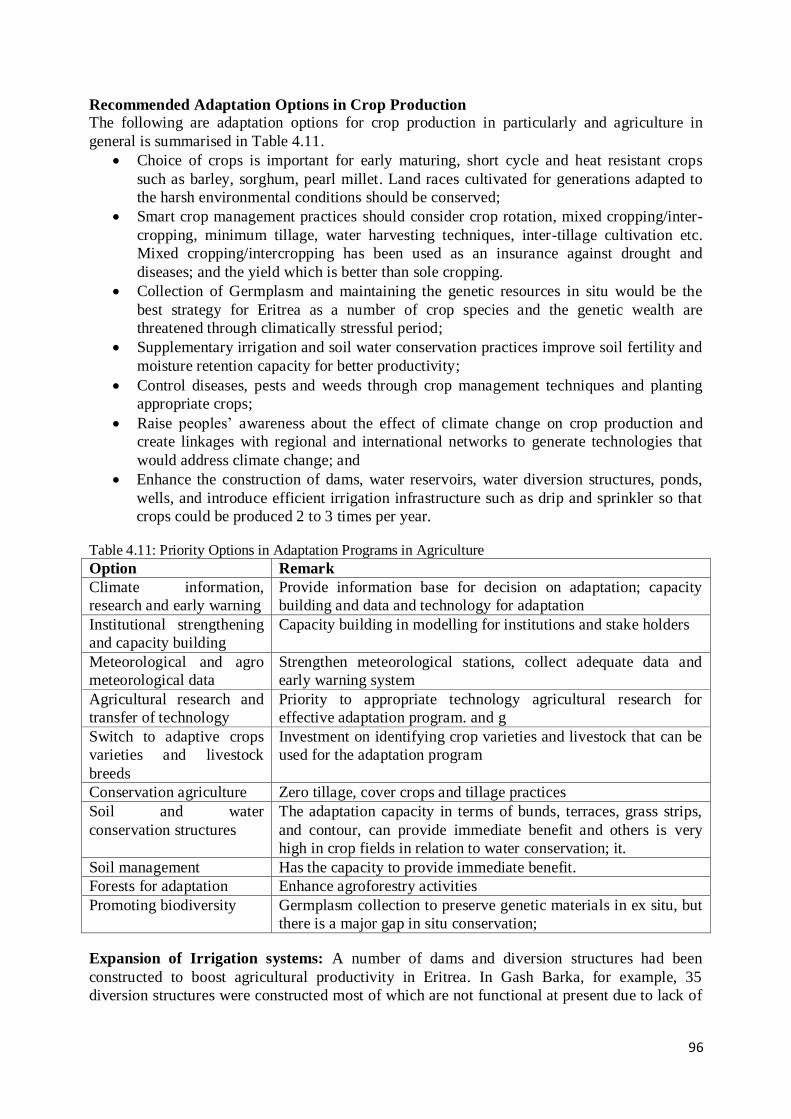
96
Recommended Adaptation Options in Crop Production
The following are adaptation options for crop production in particularly and agriculture in
general is summarised in Table 4.11.
Choice of crops is important for early maturing, short cycle and heat resistant crops
such as barley, sorghum, pearl millet. Land races cultivated for generations adapted to
the harsh environmental conditions should be conserved;
Smart crop management practices should consider crop rotation, mixed cropping/inter-
cropping, minimum tillage, water harvesting techniques, inter-tillage cultivation etc.
Mixed cropping/intercropping has been used as an insurance against drought and
diseases; and the yield which is better than sole cropping.
Collection of Germplasm and maintaining the genetic resources in situ would be the
best strategy for Eritrea as a number of crop species and the genetic wealth are
threatened through climatically stressful period;
Supplementary irrigation and soil water conservation practices improve soil fertility and
moisture retention capacity for better productivity;
Control diseases, pests and weeds through crop management techniques and planting
appropriate crops;
Raise peoples’ awareness about the effect of climate change on crop production and
create linkages with regional and international networks to generate technologies that
would address climate change; and
Enhance the construction of dams, water reservoirs, water diversion structures, ponds,
wells, and introduce efficient irrigation infrastructure such as drip and sprinkler so that
crops could be produced 2 to 3 times per year.
Table 4.11: Priority Options in Adaptation Programs in Agriculture
Option Remark
Climate information,
research and early warning
Provide information base for decision on adaptation; capacity
building and data and technology for adaptation
Institutional strengthening
and capacity building
Capacity building in modelling for institutions and stake holders
Meteorological and agro
meteorological data
Strengthen meteorological stations, collect adequate data and
early warning system
Agricultural research and
transfer of technology
Priority to appropriate technology agricultural research for
effective adaptation program. and g
Switch to adaptive crops
varieties and livestock
breeds
Investment on identifying crop varieties and livestock that can be
used for the adaptation program
Conservation agriculture Zero tillage, cover crops and tillage practices
Soil and water
conservation structures
The adaptation capacity in terms of bunds, terraces, grass strips,
and contour, can provide immediate benefit and others is very
high in crop fields in relation to water conservation; it.
Soil management Has the capacity to provide immediate benefit.
Forests for adaptation Enhance agroforestry activities
Promoting biodiversity Germplasm collection to preserve genetic materials in ex situ, but
there is a major gap in situ conservation;
Expansion of Irrigation systems: A number of dams and diversion structures had been
constructed to boost agricultural productivity in Eritrea. In Gash Barka, for example, 35
diversion structures were constructed most of which are not functional at present due to lack of

97
proper design and maintenance. There are 10 dams in Gash Barka and 7in Anseba with a total
capacity exceeding 300,000 m3. However, much remains to be done to fully operationalize their
usage and increase the number of beneficiaries. There are a total of 121 ponds out of which
93% are functional, while the remaining is non-functional due to sedimentation. In Anseba,
there are 34 dams whose water holding capacity varying greatly. The dam in Habero have a
capacity of 90,000 m3 is the smallest and the one Mesa-Shebah (Hamelmalo) the largest with
a capacity of 600,000 m3. At present these dams are either fully or partially filled with
sedimentation. At a national level, an estimated 35,500 ha of land is under perennial irrigation
using water from dams and wells. Although the spate irrigation potential in Gash Barka is
13,535 hectares, only 12,773 ha of land have been irrigated as some of the structures are
dysfunctional.
The use of modern and affordable irrigation system is a viable option to crop production. In this
respect, installation of drip system is highly recommended as it has very high water efficiency
and could cover up to 25percent more land. Drip system reduces the incidence of fungal
diseases and saves labour, and reduces salinity problems. Initially, properly designed drip
irrigation is more expensive than sprinkler irrigation system. However, the lower operating cost
and higher efficiency of the drip system quickly offsets the extra expenses incurred in sprinkler
irrigation in many horticultural production systems. Although furrow irrigation is very popular
in most regions of the country, salt accumulation, rough field surface with poor levelling, soil
erosion hazards and high labour requirement limits its use on sustainable basis. With regular
maintenance of the infrastructure spate irrigations a viable adaptation option in Eritrea (Figure
4.17).The total land area occupied by various types of irrigation systems is shown in Table
4.12.
Table 4.12: Total Land areas Occupied by Various Types of Irrigation Systems
Irrigation system Hectare %
Spate irrigation 63,000 60.6
Dams 8,600 8.3
Pressurized irrigation 5,400 5.2
Well irrigation 26,900 25.9
Total 103,900 100 Source: MoA-annual reports
Figure 4.17: Spate Irrigation Dams that need Periodic Maintenance in Gash Barka

98
Livestock Production: Livestock production suffers from various types of constraints and as a
result yield is extremely low. Shortages of animal feed and lack of capital and skills are among
the challenges that hinder sufficient production from the sector.
Recommended Adaptation Options in Livestock Production: The following are adaptation
activities are recommended for livestock production to address difficulties of use of appropriate
breeds, feeds and feeding, water supply and livestock diseases.
Selection and use of local breeds of livestock that are resistant to water and feed
shortages, and extreme weather conditions;
Production of feeds and formulation of appropriate feeding ration
Construction of water ponds, area closures including promotion of permanent and
temporary enclosures for cut and carry system;
Enriching the natural pasture by over-sowing grasses and other drought resistant
legumes; and
Improve management of livestock, pasture and health for higher productivity.
4.10.2 Adaptation Options in Natural Resource Management
A key concept linked to maintaining a healthy and productive ecosystem is to look for options
that would enable communities use natural resources on a sustainable manner. In view of
environmental conservation, it is important to identify tree species that survive under adverse
environmental. Selecting species that are capable of acclimatization and possessing a wide
genetic diversity could act as adaptation option to climate change. There are fast growing tree
species adapted to a wide -range of climatic conditions is grown in Eritrea. Species such as
Acacia etbaica and Eucalyptus cladocalyx are well adaptable to a wide range of ecological
conditions in the highlands. Similarly, Acacia polyacantha and other Eucalyptus in the
midlands and E. camaldulensis, Acacia Senegal and Acacia tortilis in the lowlands have
demonstrated wide adaptability.
Soil and water conservation structures using stone and earth bunds are best adaptation practises
in Eritrea. Though measures and achievements in soil and water conservation fluctuate from
year to year; Table 4.13 presents adaptation activities carried out as part of the natural resource
management in the country.

99
Table 4.13: Adaptation Activities in Natural Resources Management
Type Activities
Soil and water conservation (SWC
-Off farm SWC measures: hill side terrace, half moon, micro basin, loose rock check dam, tree planting -On farm SWC activities: terraces, check dams and agronomic measures; -Along rivers and streams: loose rock check dams, gabion check dam, masonry check
dam, micro dams and dams
Afforestation More than 43,257,747 seedlings have been planted in the last 12 years to rehabilitate the degraded lands; different exotic and indigenous species have been used for reforestation degraded landscapes.
Nurseries About 37 nurseries with a total capacity of producing 12.5 million seedlings are established; some regions having 2 to 10 nurseries.
Area closure development and catchment rehabilitation
A total of 371,390 ha (18%) of land have been closed 1991 in order to promote natural vegetation; the plan is to enclose about 18% of the total surface area of the country.
Demarcation and draft mapping
A total of 308,294 ha of the enclosures are demarcated and mapped. A total of 157,866 has of land is protected or put under enclosures. The extent of degraded community catchments that needs rehabilitation is about 2,007,400 ha.
Afforestation
and green clubs
Since 2006, the number of green clubs for afforestation programs have increased by
43.8%; a total of 46,396,360 trees are planted through Green campaign in religious sites, schools, institutions, community, and private people,
Distribution of energy
saving stoves
Improved stove reduces firewood consumption by over 50%; energy saving stoves that far, saved an estimated 28,000 ha of land from deforestation; a total of 12,000 energy
saving stoves have been distributed to households and the number is expected to increase.
The following adaptation options for management of natural resources are recommended.
Integration of multipurpose tree and shrubs in cropping systems (agroforestry) with the
aim of providing fuel wood, improvement of soil fertility and land stabilization. Effort
should be also extended to stabilize farmland through biological or physical measures of
reducing soil erosion;
Re-establishment of habitats in selected areas such as Buri Peninsula and Hawakil Bay
for the conservation of terrestrial wild life.
Introduce comprehensive rehabilitation and protection plans in forested areas to meet
the demand for fuel wood and fodder for rural communities as well as sequester carbon
dioxide and hence reduce the impacts of climate change;
Provide incentives to promote community involvement in forestry conservation
programs. Encourage private reforestation schemes and ensure that trees planted belong
to those individuals who planted and cared them. Plant a mix of drought resistant
indigenous and fast growing exotic species through community forestry initiatives;
Complete demarcation and designation of forest areas that has already started; introduce
proper resource management plan and overall land use map of the country;
Introduce a national reforestation scheme and encourage school wood-lot programs and
traditional energy saving stoves; delineate certain forest areas for the conservation of
forest genetic resources, encouraging natural regeneration through closure etc. It is
important to maintain the diversity of forest species in situ.
Promote energy diversification to substitute wood fuel such as solar, wind, kerosene,
gas, electricity etc. while improving wood consumption efficiently using improved
stoves.

100
Table 4.14: Type of Vegetation of Eritrea
Type Area (Km2) % Coverage
Forest 591 0.48
Trees And Shrubs 410 0.33
Scattered Trees 14094 11.34
Grassland And Bushes 25577 20.57
Bushes 53824 43.29
Riverine Vegetation 1865 1.50
Mangrove 64 0.05
Others 27915 22.45
Source: FAO, 1997
4.10.3 Adaptation Activities of Water Resources
In Eritrea, recurrent droughts, rising temperature and high rate of evaporation have resulted in
reduced water flow, lowered ground water level and deterioration of water quality. In order to
alleviate the problem, development in the water sector should concentrate on climate smart
water resources. To alleviate the problems, dams and check-dams been constructed; and so far,
450 concrete earthen dams and 2000 km long check-dams have been constructed to protect the
dams from siltation. The dams vary in water holding capacities from 0.1 million m3 to 350
million m3. Many of these dams are being used for small-scale vegetable production. The SWC
structures constructed from 2012 up to 2018 is shown in Table 4.15.
Table 4.15: Soil and Water Conservation Structures
Year Hillside
Terracing (ha)
Check Dam
(m3)
Stone Bund
Terrace (km)
Soil Bund
Terrace (km)
2012 3,554 203,681 573 432
2013 1,709 377,276 143 18
2014 3570 44,561 143 18
2015 1914 33,234 2,570 9336
2016 884 76,573 1,209 4,849
2017 762 6,644 7,287 17,076
2018 2441 5120 1,643 15,402
Source: MoA, 2018
Over the past decade, the State of Eritrea has shown interest to incorporate adaptation strategies
to climate change in its comprehensive development plans. However, implementation and
integration of these adaptation strategies and programs remained highly limited, though it is
steadily growing. A major setback was the development plans were not streamlined to reflect
the reality of future climate conditions. Thus, it is recommended to develop and implement
adaptation strategies by focusing on the following intervention areas:
Water Resources Management: This includes water resource assessment, water supply
augmentation and water demand management.
a) Water Resource Assessment
Strengthen studies on the underground water and river basin potential of Eritrea for
water resources development.
Improve the assessment of current and future water needs across sectors
Use climate models to assess the impact of current and future climate change impact

101
b) Water Supply Augmentation
Prioritize options to increase the availability of surface and ground water (e.g.
construction of small and large water harvesting structures, and water treatment
plants).
c) Water Demand Management:
Outline strategies to address anticipated water shortfalls.
Outline strategies of frequent and intense droughts to reduce demand.
Allocate water to more economically, ecologically sound and more efficient uses
(within the water sector and across sectors); and
Improve and prioritize water pollution reducing strategies.
Management of Extreme Events
Outline and improve strategies aimed at increasing water resources development to
cope up with frequent and intense floods arising from climate change.
Categorize and incorporate drought and flood management strategies into short and
long term strategies for prioritization purposes.
Supporting Environment
Review and streamline the existing adaptation strategies and programs outlined by
different sectors towards Climate Change Response strategies.
Develop National Climate Change Response Strategy. In addition, the following
options are recommended for the water resources:
Establish, upgrade and strengthen a national meteorological and hydrological
information system. and upgrade the hydrological information system and
network;
Increase storage capacity of water by building water harvesting structures;
Rehabilitate catchment areas through planting trees, soil water conservation and
rain water harvesting measures to reduce runoff and to enhance recharge the
ground water;
Improve urban water and sanitation infrastructure and utilize and plant crops
with high water use efficiency;
flood protection through construction infrastructure to create barriers against
flooding and water rise; and
Water quality through surveillance of ground water and surface water resources;
improve forecasting of water resources and promulgate national water law.
Some of the climate-change induced hazards of water could be alleviated using the following
adaptive measures
Reducing exposure to flooding by restoring the function of flood plains in combination
with a comprehensive land use planning;
Introducing sustainable use of river basins to expand livelihood assets and to enhance
economic development through use of new technologies such as drip irrigation,
diversification of crops and agroforestry practices; and
Dissemination of knowledge in the protection of water resources to empower the
community in planning and decision making related to adaptation.
4.10.4 Health Sector
Climate variability negatively affects health status of population; and malnutrition reduces
work force capacity. Parasitic and microorganisms caused disease are influenced by climate
change. Thus, in the context of the Eritrean health system, adaptation strategies focus on the

102
provision of integrated health services. According to the Millennium Health Development Goal
Report (MHDG, 2014), the Eritrean health system is based on the following strategies:
Primary level of health services, with coverage of an estimated 2,000 to 3,000 people,
provide basic health care package by empowering communities and mobilizing
resources;
Health Stations offering facility-based primary health care services to a catchment
population of approximately 5,000-10,000; and
Community Hospital is the referral facility for the primary health care level of service
delivery, serving a community of approximately 50,000-100,000 people.
The indicators of the success in the health sector are the provision of clean water and sanitation,
improved housing, ecological sustainability, building of roads and waterways, and enhanced
roles for women. The MoH works in collaboration with various governmental agencies to
improve the health system of the country to address malnutrition, feeding supply of ORs, and
improving stool disposal. These are detailed in the following paragraphs.
Malnutrition: The MoH address malnutrition in different parts of the country including
improving maternal nutrition; early breastfeeding, community based therapeutic feeding and
supplementary feeding program. These approaches are effective in preventing diseases; and
consequently the death rate. In 2018, the death rate was reported to be 0.8% with no case of
deaths in the centres that run supplementary feeding programs.
Feeding and supply of ORS: Mothers are encouraged to supply their children Oral
Dehydration Solution (ORS) as supplement to the normal feeding habit. Moreover, increased
fluid intake of their children to reduce dehydration is promoted. These interventions minimize
the adverse consequences of diarrhoea.
Stool Disposal: The proper disposal of children’s faeces is important in preventing the spread
of diseases; and is of particular importance as faeces are causes for the contamination in the
household environment.
Adaptation Activities in the Health Sector
The following are important measures to control climate related diseases:
Improved sanitation and adequate and safe water supply would reduce the prevalence of
diseases. Adoption of Integrated Management of Child Illness (IMCI), allows a child
visiting a clinic for one particular type of disease to be treated for other possible diseases.
Use of ORS to avoid dehydration and reduce mortality rate in children less than 5 years.
Increase community awareness on the impacts of climate change on health using leaflets
and brochures in languages easily understood by the community.
Equip the health research centres with adequate laboratory facilities and strengthen the
research capacity and the national research collaborations related to climate change and
health.
Update the existing health policies and develop new strategies to meet national and
international standards. There is also an urgent need to mainstream climate change and
health units at various organizations and academic/research institutes.
A multidisciplinary approach among professionals in the fields of health, agriculture,
climate, and water resources need to be strengthened.
Climate change cannot be addressed in a fragmented manner; hence it is important to
create partnership among institutions to address climate change hazards.

103
Figure 4.18: Drug Administration for Schistosomiasis to community Members and School Children
4.10.5 Coastal Areas
Several adaptation activities have been carried out along the Eritrean coastal areas. These
packages include the distribution of fishing gears, strengthening inland fisheries, mangrove
reforestation and aquaculture. Fishery management measures are emplaced to avoid over-
exploitation of marine resources and strengthen conservation and management efforts.
Adaptation activities for the coastal areas of the country are described as follows.
Distribution of fishing gears and tools: The MoMR in collaboration with its partners such as
IFAD has distributed different fishing gears to fishermen in the Northern and Southern Red Sea
Regions. This is project is intended to enhance productivity among the fishing communities. So
far, 5,722 fishing nets, 10,872 Poly ethylene rope, 61, 8750 floats, 2,628 Nylon multifilament
twine and 1,344 Long line and its accessories were distributed.
Mangrove Reforestation Program: About 380 km of the Eritrean mainland and island
coastlines is covered by mangrove forests. Of the seven mangrove species in the Red Sea area,
Avicennia marina, Rhizophora mucronata and Ceriops tagal are found in Eritrea. The
mangrove forest cover 70 km² (7000ha) mainly found in patches along the Eritrean coast and
islands (State of the Coast of Eritrea, 2007). Since mid-1996, ‘Manzanar Project’ took
mangrove reforestation initiative along the Eritrean coast. The project planted inter-tidal zones
with mangrove plants to enhance inshore fisheries and restore the coastal environment. The
project was also involved in an innovative method of growing mangrove trees in places where
they never grew before. To date, the project has piloted a 20 hectare inter-tidal area in Hirgigo,
planting half a million trees to rehabilitate severely overgrazed mangrove forests (State of the
Coast Eritrea, 2006-2007).
Strengthening inland fisheries: To support fish consumption at a national level, the MoMR is
extending its effort toward inland fisheries by stocking dams with species of fishes that mostly
contain tilapia, cat fish and carp. The inland fishery potential is estimated to produce 100-150
tonnes per year. A total of 15 dams with higher potential for fisheries are selected for the
programme to produce at least 74 tons of fish per year (GoE, 2016).
Coastal setback: A coastal setback is a horizontal distance along the coastline defined on the
basis of coastal morphology, exposure and stability of the coastline, and nature of coastal
resources. In Eritrea, the setback distance is meant to protect development investments such as
roads, industries or tourism facilities by absorbing the impact of severe storms, the global sea
level rise and the fluctuation of natural coastal processes. The proposed 100m setback will be
applied from a defined line known as the horizontal setback datum (HSD).

104
Fishery Management
There are measures in place to avoid over-exploitation of marine resources, and habitat
destruction. In this respect, the MoMR has outlined regulations for the proper management of
fisheries such as closed seasons and closed areas, prohibited fishing methods and gear
specification. The characteristics of fish and its size are addressed as part of the scheme for
fisheries management. There are certain type fish species where people are not allowed to
catch. In case these species are caught accidentally, they must be released immediately with the
least injury to the water.
Recommended adaptation options for the coastal areas
In coastal areas, the following adaptation options are recommended to address the adverse
effects of climate change.
Integrated Coastal Zone Management Plan (ICZMP) should be considered taking into
account short- and long-term concerns of climate change. Accommodation and
protection methods should be implemented to protect coastal areas from hurricanes and
sea level rise. The plan must address erosion in coastal areas, pollution, and habitat
destruction.
Coastal area afforestation and reforestation, particularly mangroves, could stabilize
shorelines and prevents wave erosion. Mangroves provide habitat for wildlife and
nursery for many marine species. It is therefore, extremely important that mapping and
evaluation of mangroves and other coastal vegetation is considered in the ICZMP.
The discharge of heated water from the cooling systems of power generation plants
along urban settlements should be properly managed. The water should be cooled
before reaching the marine environment.
The development of appropriate institutional and technical capacities for the
establishment of a comprehensive ecological, oceanographic and metrological
information system is essential for developing an adaptive strategy of coastal areas.
105
CHAPTER FIVE
5 INFORMATION RELEVANT TO ACHIEVEMENT OF UNFCCC
5.1 Introduction Subsequent to the realisation of its d’jure independence in 1993, Eritrea has been actively
engaged in ratifying and signing global conventions and protocols to contribute its part to the
global challenges facing our globe in general and climate change in particular. In this regards,
between 1995 and 2005, it signed and ratified the following global conventions that have direct
bearing on climate change. These are the i) the UNFCCC, ii) UNCBD and iii) UNCCD, iii)
Kyoto Protocol and Doha Amendments, iv) Cartagena Protocol on Biosafety v) Nagoya
Protocol on access and benefit sharing of Biologic Resources iv) Vienna Convention on the
Preservation of the Ozone Layer vi) Stockholm convention on pesticides and organic pollutants
and vii) Montreal Protocol on Substances that Deplete the Ozone Layer.
Its participation implementation of these global endeavours reflects the extent to which Eritrea
views itself vulnerable to the impacts of climate change, and biodiversity depletion, and land
degradation in at the local level and global environmental problems facing the globe. Further,
the international conventions and protocols create a platform for the country to express its
specific climate change challenges at the national level and enable it access to technical,
scientific, and financial resources to support the implementation of climate change mitigation
and adaption programmes and projects. In view of the abovementioned background, this
chapter provides additional information that is relevant to the achievement of the UNFCCC
objectives in Eritrea. It specifically describes
steps taken to integrate climate change into the national polices,
activities related to technology transfer,
climate change research and systematic observations,
information on research programmes,
Information on education training, and public awareness,
Capacity building, and
Information and networking.
To facilitate the formulation and implementation of sustainable development programmes, non-
Annex I Parties are encouraged to provide information on any step untaken to integrate climate
change considerations into relevant social, economic and environmental policies and actions in
accordance with Article 4, paragraph 1 (f), of the Convention. Cognizant those National reports
are continuous; this section referred back to the INC and SNC and other relevant enabling
activities to identify relevant information for the preparation of report.
5.2 Steps Taken to Integrate Climate Change into Social, Economic and
Environmental Policies In order to describe and analyse the steps taken to integrate climate change into the social and
economic policies, the plan and strategy for the implementation of activities relating to
integration of climate change considerations into social, economic and environmental policies
and actions based on previous and on-going interventions were thoroughly analysed. Based on
the activities described below; information on activities relating to integration of climate
change considerations into social, economic and environmental policies and actions are
described. For that, the following activities were carried out or will have to be carried out

106
Reviewed the National Rules of Procedure (Regulations)/mandates/acts/policies/road
maps, in view of effective implementation of the Convention and its Kyoto protocol in
Eritrea;
Identified institutional arrangement/units to deal with climate change issues in key
selected ministries and institutions, as a first step, along with the respective ToRs;
Identified capacity-building needs for the new institutional arrangements/units in key
selected pilot ministries mentioned below, and plans to organize and conduct targeted
training;
Proposes to establish an innovative national climate change fund in consultation with
relevant institutions (Ministry of Finance);
Proposes to Participate in the preparation of the first biennial climate change sectoral
report by key ministries and organizations as input to BURs;
The NCCWG will encourage and coordinate the planning, development and
implementation of climate proofing of on-going and planned development projects and
programmes in Eritrea;
Encourage and coordinate the planning, development and implementation of new
projects/programs for mitigation and adaptation of climate change through initiatives
such as NAP, CDM, NAMAs and CTCN;
Encourage and coordinate plan, the and adoption of national and sectoral policies
supporting effective implementation of NAMAs, CDM, NAPs, GCF and CTCN in
Eritrea;
Encourage and coordinate mainstreaming of international climate policies into national,
regional, sectoral and local polices, as appropriate;
Review regularly the appropriateness and the adequacy of Eritrea’s Nationally
Determined Contributions (NDCs) for full and effective participation of Eritrea in the
global climate change regime; and
Prepared of the chapter on Integration of Climate Change Concerns into Sustainable
Development Plans and Programmes to be included in the communication
5.2.1 Economic Policies
In 1994, the GoE prepared the Macro-Policy document (GoE, 1994) which outlines the
background for Eritrea's national economic growth strategy. It includes the establishment of an
efficient outward-looking market economy in which the government playing a proactive role to
stimulate private initiatives. Being one of the major economic sectors, irrigation-based
agriculture was identified key sectors targeted for development. In view of potential negative
effects of some of the development activities, it specified the need for environmental impact
assessment (EIA); Land use plan while implementation agricultural projects to avoid land
degradation and conserve biodiversity. The policy underlines the importance of early warning
systems in general drought preparedness in particular.
The National Economic Policy Framework and Program (1998 - 2000) provides a framework,
for climate change adaptation strategy including the restoration, enhancement and preservation
of Eritrea’s ecology; prudent utilization of land, air and water resources; establishment of sound
environmental standards; and introduction of sustainable land management practices; all of
which form part of the project design and implementation activities.
Developed by the MoND, the Interim Poverty Reduction Strategy (IPRS) outlines the actions to
be taken to improve crops’ productivity, promotion of high value crops, expanding land under
cultivation, increasing water availability by harnessing seasonal water flows and improving
storage capacity. It list activities such as improving water conservation techniques at farm level,

107
improved pest control, reducing post-harvest losses, developing and disseminating of drought
resistant, faster-maturing varieties, soil conservation measures (terracing, construction of check
dams, planting/afforestation, and closure of areas to allow natural regeneration), improve soil
fertility; protecting and restoring the rural environment and reorienting agricultural extension
and research to respond effectively to farmers’ priority needs and demands; assisting in markets
and marketing, livestock production, developing and rehabilitating hatching centres (poultry)
milk collection centres, technical advice and training, strengthening dairy associations and bee
keeping (IPRSP, 2004).
National Food Security Strategy of Eritrea (FSSP, 2006) focuses on the following key issues. i)
increase the agricultural production and productivity, ii) improving marketing of agricultural
output; iii) improving national capacity to import food, iv) keeping adequate strategic reserve of
food. It emphasises on using international food assistance more efficiently and effectively as a
measure of last resort during emergency. The Household Food Security strategy encompasses
increasing domestic production and farm income, nutrition, ensuring access to food or
enhancing household purchasing power and promoting public assistance program including
food for vulnerable and the poor (FSSP, 2006).
Although social, economic and environmental policies and measures constituted, thus far, in
Eritrea may not have specifically targeted climate change as such, these policies, in one way or
the other, touch upon climate change issues. In this respect, steps taken by the government to
integrate climate change informally into social, economic and environmental policies have been
summarized in the SNC under two headings including the sections of Integrated Social
Services; and Economic and Environmental Policies. Now, Eritrea has realized that it is almost
impossible to prepare the NCs on a continuous basis and to integrate climate change adaptation
and mitigation into national development plans and policies in a formal, planned and
coordinated manner without an official regulation/mandate/act/policy/road map, as appropriate,
approved and implemented by the government. Therefore, there is an urgent need to establish a
“National Climate Change Working Group (NCCWG)”comprised of high-level representatives
from all relevant ministries and organizations. The primary task of the NCCWG should be to
develop the National Rules of Procedure (Regulations) /mandates/acts/policies/road maps, as
appropriate, for effective implementation of the Convention, its Kyoto Protocol, the
implementation of the intended nationally determined contributions for full and effective
implementation. Accordingly, the NCCWG should comprise of high-level representatives from
the following ministries and organizations. Once the NCCWG with detailed ToRs on
permanent basis is established; there is a need for identification of capacity-building needs for
the NCCWG and conduct targeted training. The proposed members of the NCCWG are listed
below.
Ministry of Land, Water & Environment; Ministry of Transport & Communication
Ministry of National Development Ministry of Agriculture
Ministry of Finance Ministry of Foreign Affairs
Ministry of Trade & Industry; Ministry of Energy & Mines
Ministry of Public Works Ministry of Marine Resources
Ministry of Tourism Ministry of Labour& Human Welfare
Representatives of NARI NHERI
The NCCWG can be Co-chaired by the Ministry of Land, Water & Environment and the
Ministry of National Development to harmonize national development and environmental
issues by maintaining their specific roles and responsibilities in policy formulation.
108
5.2.2 Environmental Polices
The National Environmental Management Plan for Eritrea (NEMP-E, 1995) is the most
relevant to the UNFCCC. The document which was prepared using participatory approach
provides policy framework for action in environment. The plan laid out strategies for
conservation and protection of natural resources which are of the strategic importance of the
country. As part of national economic growth and development process, it intends to conserve
the natural resources as well as maintaining the environmental quality.
As follow - up to the NEMP-E, the MoLWE in 2007 developed the NAPA; which is the most
specific plan of action to climate change. In this document, agriculture, water resources,
forestry, coastal environments, and human health were identified as the most vulnerable
sectors. Small-scale farmers, agro-pastoralists and rural women living in the particularly
drought-prone areas were the most vulnerable segments of the society. It identified several
direct and indirect climate hazards driving climate change. In the agricultural sector, recurrent
droughts increased temperature; decreased rainfall, increased hot night and days, change in
rainfall pattern both spatially and temporally, torrential rainfall with heavy runoff and flooding,
increased evapotranspiration due to increased aridity index, desertification and increased
aridity, increased heat stress were the most important hazards for immediate action.
Accordingly, the highest five priority adaptation programmes were the following:
breeding drought and disease resistant crops,
community-based afforestation and agroforestry,
groundwater recharge for irrigation and wells,
improved community-based rangeland management and
Selecting livestock breeds such as sheep and goat adaptable to climate change.
Drought and unsustainable resource exploitation have negative impacts on Forest resources of
Eritrea. To expedite the rehabilitation effort on degraded forest resources of the country, in
2006, the MoA issued the ‘Forestry and Wildlife Conservation and Development Proclamation
(GoE, 2006). Other relevant specific policies, strategies, and legal frameworks that have been
integrated into the national environmental policies are i) the Ozone Depleting Substances
(ODS), ii) Persistent Organic Pollutants, iii) Eritrean Environmental Protection, Management &
Rehabilitation Framework (Proclamation No 179/2017), and iv) Environmental Protection and
Management Regulations (Legal Notice No. 127/2017).
In view of its sensitivity to climate change the MoMR integrated the coastal area policy and
fisheries legislation in the sector. The coastal policy for instance, defines the coastal area as 100
meters setback from a fixed geological feature near the coastal line. Multiple Use Managed
Areas’ is supposed in to favour many of the endangered species, the marine turtle. In addition, a
core of national Marine Protected Areas (MPAs) networks and species conservation
programme has been established with all technical and legal documents to declare two MPAs
for the species and educational purposes (State of the Coast Eritrea, 2006 - 2007). The Fisheries
legislation is promulgated to safeguard the sustainability of marine resource and protects the
country’s marine and coastal biodiversity. Two proclamations and thirteen legal notices are
already adopted. The laws provide comprehensive coverage about the development and
management of the marine sector in Eritrea; and cover a numbers of articles that are relevant to
the protection and conservation of marine resources in the country. It refers to the establishment
of marine protected areas. The Fisheries proclamations provide comprehensive coverage about
the development and management of the marine sector include a number of articles relevant to
the protection and conservation of marine resources, and the need for the establishment of
marine protected areas.

109
Eritrea’s coastal marine are vulnerable to climate change; and the MoMR in collaboration with
GEF), carried out an Integrated Coastal Area Management (ICAM) project from 2004 to 2007
(ICAM, 2007). Accordingly the outcome of the project are as follows i) the establishment of
the Eritrean Coastal Authority, ii) Integrated Coastal Area Management and iii) Mainstreaming
Environmental Protection in the marine sector plan. Today, the MoMR requires appropriate
environmental impact assessments; and effective enforcement mechanisms in compliance with
the national standards.
Climate change has direct bearing on the health and wellbeing of the population in Eritrea.
Accordingly the ministry issued policy guidelines for training, monitoring and management
policy guidelines and environmental health document related to specific climate related
diseases including malaria and Persistent Organic Pollutants (Tekie, 2019). In the health sector,
the MoH issued the Health Policy (HP) (MoH, 2010). The policy, the course of action, is driven
towards strengthening the community - based health services. It targets at gradually
restructuring facility-based health services to make it much more responsive to people closest
to their homes especially in the rural areas through upgrading the health centres to community
hospitals. It strengthens decentralised health governance structures and improves the efficiency
and the quality of care provided by hospitals. Simultaneously, it looks at restructuring of the
existing health financing framework into an acceptable and appropriate financing structure that
minimises catastrophic health-care expenditure; and impoverishment of care-seeking
individuals. The policy provides ample space to strengthen health sector coordination at all
levels to enable better participation of public or private sectors.
The WRD of the MoLWE has developed an Integrated Water Resources Management (IWRM)
policy. The policy elaborates strategies, actions and activities to support an IWRM for
sustainable economic development of the country (WRD, 2009). It recognizes water resource as
a social and economic good; its allocation gives first priority to domestic use. The policy
highlights the key role played by stakeholders in water management and development specific
activities. Water Resources Proclamation emphasise on the need for water resource
development as a base to achieve sustainable socio economic development and ecosystem
stability (MoLWE, 2007).
Land degradation contributes to climate change; and it is one of the major problems affecting
land resources in Eritrea. In response to the UNCCD, the MoA prepared NAP (MOA, 2002) to
addresses environmental problems affecting the agricultural sector in country. The priority
actions include cautionary expansion of agriculture into dry woodlands and pasturelands. It
encourages community forestry with the aim of securing fuel wood and fodder plantations. It
proposes adopting moisture retention, groundwater conservation and water recycling measures
as core activities. Furthermore, its demands expanding fuel substitution programs using energy
saving stoves, creating a national database to monitor, assess and evaluate land degradation and
to use such information as input to early warning system and predict climate anomalies. Land
rehabilitation and restoration of degraded areas is a daunting task and calls upon communities
to participate in the processes. Hence, the action plans specified sensitisation of communities
and hence increase awareness.
In Eritrea, different Land tenure systems co-existed in the past. These systems had varying
degree of negative effects that hamper sustainable land management. In response to the
fundamental effects of these tenure systems, the GoE issued the ‘Land proclamation 58/94’
which states that land is exclusively owned by the state in which all citizens and other legal
body, regardless of their gender, religion or ethnicity have the right to use a piece of land

110
allotted to them for life. This proclamation was intended to develop sense of ownership from
the part of users; and at the same time integration of sustainable land management (SLM)
practices on farm land; and hence increase land productivity. This land law encourages long-
term investment including the establishment of perennial crops, forest plantation, agro-forestry
and building major soil and water conservation structures. The user is required to take good
care of land allotted to him/her; and have the right of having in only one place in his village. As
part of SLM project, it was implemented, as a model, in 5 villages of Zoba Maekel
administrative zone in 2015. Right now, the 6 administrative regions of Eritrea are in the
process of implementing the proclamation but found at varying extent.
In response to the UNCBD convention, the DoE of the MoLWE prepared the NBSAP. The plan
is highly relevant to climate change. It recognizes three core areas on biodiversity: terrestrial,
marine and agricultural biodiversity. In the strategy, Pollution management, Public awareness
& education, sustainable use of natural resource; in-situ conservation (protected areas,
information acquisition & storage, lien invasive species; ex-situ conservation, taxonomic
knowledge and legal & institutional structure and capacity building are identified thematic
areas deserving attention.
In 1999, the MoLWE prepared the National Environmental Assessment Procedures and
Guidelines (NEAPG). The NEAPG requires adequate level of environmental assessment prior
to the development and implementing projects to avoid negative environmental consequences.
All proposed projects must pass through a screening process by relevant government agencies.
The EIA guidelines have proved to be effective mechanism for ensuring an integrated approach
for development. Specific and relevant policies, strategies, and legal frameworks are the
following:
The Ozone Depleting Substances (ODS),
The national Biodiversity Strategy Action Plan (NBSAP),
Persistent Organic Pollutants,
Environmental impact assessment guideline (NEPAGA, 2009) to regulate the
environmental impacts of development projects,
The Water Law promulgated (WRD, 2012),
Eritrean Environmental Protection, Management & Rehabilitation Framework
(Proclamation No. 179/2017), and
Environmental Protection and Management Regulations (Legal Notice No. 127/2017).
Drought and unsustainable resource exploitation negative impacts on Forest resources of
Eritrea. To expedite the rehabilitation effort on degraded forest resources of the country, in
2006, the MoA issued the ‘Forestry and Wildlife Conservation and Development Proclamation
(GoE, 2006). This proclamation is effectively used by the forestry and wildlife authority.
Climate change has direct bearing on health and wellbeing of population in Eritrea. As policy,
the MoH adopted policy of ‘prevention is better than cure’. Accordingly, the ministry issued
policy guidelines for training, monitoring and management policy guidelines and
environmental health document related to specific climate related diseases including malaria
and Persistent Organic Pollutants (Tekie, 2019).
Eritrea’s coastal marine are prone to climate change. The MoMR in collaboration with the
GEF), carried out projects during the period 2004 – 2007 (ICAM, 2007). As an outcome of the
project, an ‘Integrated Coastal Area Management (ICAM)’ was drafted. As an outcome, the
following were achieved: i) the establishment of the Eritrean Coastal Authority, ii) Integrated

111
Coastal Area Management and iii) Mainstreaming Environmental Protection in the sector plan.
The effort from the Ministry also required appropriate environmental impact assessments and
effective enforcement mechanisms for compliance with the national standards. The marine
Proclamation also ensures that exploitation marine aquatic resource is consistent with
sustainable economic, environmental and social conditions.
5.3 Development and Transfer of Environmentally Sound Technologies
(ESTS) Pursuant to decision 4/CP 7, its annex, and the implementation of Article 4, paragraph 5 of the
Convention, non-Annex I; Parties are encouraged to provide information on activities relating
to the transfer of, and access to, environmentally sound technologies and know-how, the
development and enhancement of endogenous capacities, technologies and know-how, and
measures relating to enhancing the enabling environment for development and transfer of
technologies. In this context, Eritrea conducted preliminary GHG mitigation and adaptation
technology needs and needs assessment. This aspect was reported as part of the SNC focusing
on energy and agriculture sectors. The outcomes of the TNA were prioritized technologies for
energy sector mitigation actions; and for agricultural sector adaptation actions. However, there
are constraints for implementing the identified mitigation and adaptation technologies. There
lack of understanding about the enabling frameworks and Technology Action Plan (TAP)
including development of project ideas. Therefore, full-fledged TNA and transfer process needs
to be initiated by initiating phases I, II and III of the TNC as well as elements of
implementation. In this context, Eritrea needs to benefit from Convention’s technology
initiatives such as the Poznan Strategic and Long-Term Programme on Technology Transfer,
CTCN mechanisms, GEF Programming (GEF Trust Fund), GCF, SCCF-B and LDCF. A plan
and strategy for the implementation of activities relating to technology development,
acquisition and transfer based on previous and on-going interventions should be revised and
prepared.
5.3.1 Technology Needs Assessment
The negotiations under the UNFCCC create a framework to promote transfer of technologies.
Technology transfer comprising i) technology needs assessment, ii) technology generation, iii)
creating enabling environment iv) capacity building and v) mechanisms for technology transfer
should be implemented. As a follow- up activity, a project profile has been prepared for
implementation by establishing an institutional framework within the DoE, as central
coordinating body. This institutional arrangement enables key actors and stakeholders to
prepare awareness materials in local languages; and organize periodic sensitization and training
workshops for targeted audiences through the mass media.
Eritrea has conducted GHG mitigation and adaptation technology needs and needs assessment
for priority socio-economic sectors namely energy and agriculture. The objective of Eritrea’s
Technology Needs Assessment
5.3.2 Priority Technologies Needs of Eritrea
Pursuant to the implementation of article 6 of the UNFCCC, the National Capacity Self -
Assessment (NCSA, 1999) identified education, training and public awareness as priority areas
for interventions. According to the NDCs report to the UNFCCC, following technologies were
identified (MoLWE, 2018). The Mitigation technologies and the level of implementation are
enlisted in Figure
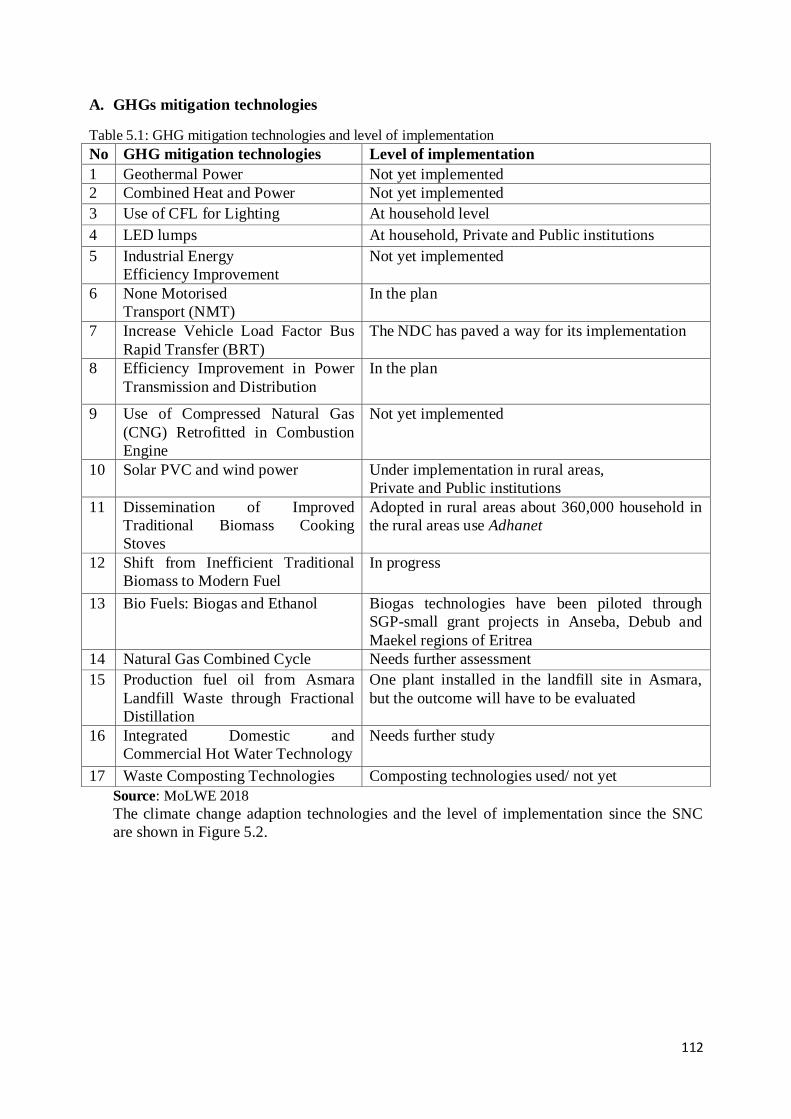
112
A. GHGs mitigation technologies
Table 5.1: GHG mitigation technologies and level of implementation
No GHG mitigation technologies Level of implementation
1 Geothermal Power Not yet implemented
2 Combined Heat and Power Not yet implemented
3 Use of CFL for Lighting At household level
4 LED lumps At household, Private and Public institutions
5 Industrial Energy
Efficiency Improvement
Not yet implemented
6 None Motorised
Transport (NMT)
In the plan
7 Increase Vehicle Load Factor Bus
Rapid Transfer (BRT)
The NDC has paved a way for its implementation
8 Efficiency Improvement in Power
Transmission and Distribution
In the plan
9 Use of Compressed Natural Gas
(CNG) Retrofitted in Combustion
Engine
Not yet implemented
10 Solar PVC and wind power Under implementation in rural areas,
Private and Public institutions
11 Dissemination of Improved
Traditional Biomass Cooking
Stoves
Adopted in rural areas about 360,000 household in
the rural areas use Adhanet
12 Shift from Inefficient Traditional
Biomass to Modern Fuel
In progress
13 Bio Fuels: Biogas and Ethanol Biogas technologies have been piloted through
SGP-small grant projects in Anseba, Debub and
Maekel regions of Eritrea
14 Natural Gas Combined Cycle Needs further assessment
15 Production fuel oil from Asmara
Landfill Waste through Fractional
Distillation
One plant installed in the landfill site in Asmara,
but the outcome will have to be evaluated
16 Integrated Domestic and
Commercial Hot Water Technology
Needs further study
17 Waste Composting Technologies Composting technologies used/ not yet
Source: MoLWE 2018
The climate change adaption technologies and the level of implementation since the SNC
are shown in Figure 5.2.

113
B. Climate Change Adaptation Technologies
Table 5.2: Climate change adaption technologies and the level of implementation since the SNC
no Climate Change Adaption
Technologies
Level of implementation since the
second national communication
1 Climate Resilient Crop
and Livestock Production
Climate and agriculture project in Zoba Anseba, Tslema in
Zoba Debub (Project endorsed)
2 Crop & Animal
Technologies
Crop improvement projects have been piloted. Pearl millet
(Kona), sorghum (Bushuka) has been successful in Anseba,
Gash Barka and Anseba.
3 Modern Irrigation
Technologies e.g. drip
systems
Water saving technologies: drip and sprinklers irrigation are
introduced in the large - scale farms and to some extent at
small and medium farms.
4 Soil and Water
Conservation: Soil Bunds,
Stone Bunds, and Check
Dams Construction
Adopted throughout the country with the aim of conserving
soils and improving land productivity, this technology has
proven to be effective in doubling the yield of crops,
recharge of underground water.
5 Improved Traditional
Farming Practices
Pilot projects on climate and agriculture, sustainable land
Management have been implemented in Zoba Maekel.
6 Research and Development The NARI of the MoA undertakes research on Agriculture
and natural resources management.
To supplement undergraduate and postgraduate studies, the
institutions of Higher education carry out adaptive and
applied research on climate smart agriculture, crop and
livestock production and soil organic carbon assessment.
The research wing of the MoMR carried out a
comprehensive study on ‘integrated coastal areas
management.
The MoEM undertakes adaptive research on renewable
energy and checking the efficiency of the improved stoves.
7 Drought Resistant and
Early Maturing Crop
Varieties & Improved
Seeds/alternative Crop and
hybrid varieties
Some research was carried out addressing these issues. For
instance, HAC release three sorghum varieties
8 Modern Water
Conservation Technologies
(WCT)
The GoE undertook several effective WCT in which
construction of water storage structures was encouraged.
The approximate overall water holding capacity of the
structures reaches 446, 000,000 M3)
9 Conservation Tillage With increase sensitization of the farming communities, the
frequency of tilling the land has been reduced to three.
Although this is inadequate, it in the right tracks.
This section provides information on activities relating to the transfer of, and access to,
environmentally sound technologies and know-how; the development and enhancement of
endogenous capacities, technologies and know-how, and measures relating to enhancing the
enabling environment for development and transfer of technologies. The report specifically
contain information on the technology needs assessment conducted, technology action plan, the
data base on prioritized technologies, project ideas and programme for strengthening the human
and institutional capacities of Eritrea to adopt and develop relevant technologies. This section
114
goes further to develop a project/proposal to develop and integrate environmental technologies
effectively, efficiently and on a suitable manner. To that end, the following priority activities
are proposed to achieve proposed projects.
- Establish National Technology Development and Transfer Technical Expert Group
(NTDTTEG) with detailed ToR on permanent basis;
- Organize and conduct targeted training for NTDTTEG on how effectively and efficiently
address all areas of technology transfer for adaptation and mitigation actions;
- Establish appropriate institutional arrangement for CTCN building on the NTDTTEG for
effective participation of Eritrea in the CTCN process;
- Develop a project proposal to conduct full-fledged TNA and transfer process for adaptation
and mitigation as part of the TNC to benefit from existing funding windows including the
GEF Programming (GEF Trust Fund), the CTCN, the GCF and other GEF funds such as the
SCCF-B and the LDCF;
- Enhance the capacity of the DNE for the CTCN in consultation with the CTCN and the
TEC mechanisms to coordinate effectively the tasks of technology development and
transfer in Eritrea; and
- Prepare report on development and transfer of environmentally sound technologies (ESTs)
for inclusion in national reports.
5.4 Climate Change Research and Systematic Observation
5.4.1 Climate Change Research
Annex I Parties are encouraged to provide information on climate change research and
systematic observation, including their participation in and contribution to activities and
programmes, as appropriate, of national, regional and global research networks and observing
systems such as the Global Climate Observing System (GCOS), Global Terrestrial Observing
System (GTOS) and Global Ocean Observing System (GOOS).
Climate change research has not yet been well developed in Eritrea. To date climate change
research is not fully integrated in the research and academic systems of the country. For
instance, the Division of Renewable Energy Centre of the MoEM works on the development of
renewable energy and technologies, energy efficiency improvement and conservation; The
NARI MoA focuses on plant genetic resources (e.g. high yielding and drought tolerant crops)
and livestock, animal breeding, soil and water conservation and post-harvest loss assessment;
As part of the undergraduate and postgraduates programmes HAC conducts various research
activities on various aspects of crop and livestock production, natural resources management
including land degradation, biodiversity conservation and climate change; Colleges of
Engineering and Sciences focus on various engineering aspects, biodiversity and oceanographic
and earth related researches.
In view of the aforementioned background, much remains to be done in climate change
research and systematic observation that could provide adequate and quality climate data and
information for planning of climate change response measures. Although a number of research
activities were carried out using limited resources and capacity; the research outputs are not
organized in a way that responds to climate change. They are haphazardly found in different
institution representing only very limited information about what is being done in the respective
organizations. Despite the importance of scientific research and innovation, as tools, to address
societal problems, there still exist scientific knowledge gaps in climate change. Thus, human
and institutional capacity of higher education and the various research institutions should be
strengthened to bring about effective, efficient and sustainable responses to climate change.

115
To a certain extent, there exists knowledge and technology, in the country, that can be used to
mitigate climate change and reduce the vulnerability of communities to the impacts of climate
changes. These technologies need to be adapted to local circumstances. For that to happen,
there is a need for continuous innovation to find and test the suitability of technologies that best
fit into Eritrea’ environment and socioeconomic circumstance. Scientific research should meet
certain qualities; and be relevant to the local needs. Quality could be achieved through
engagement of experts as well as the use of valid data to generate the desired level of outcomes.
Besides, research should explore possibilities for integrating exogenous knowledge with the
modern knowledge system. Further, it is important for research and innovation system to be
instituted to ensure that local need and land users are well linked. With regard to
instrumentation, it is necessary to acquire up-to-date equipment and continuously upgrade them
to move along with global or regional systems. Installation and calibration of the instruments
used in the data collection and analyses should be seriously considered. While some
calibrations are done at the local level; there might be cases regional or international assistance
are required.
The limited research activities focusing on agriculture (e.g. climate adaptation related to crop
and livestock), energy (e.g. energy saving stoves), marine resources (e.g. integrated coastal and
island ecosystems) and natural resources management (e.g. soil organic carbon assessment and
impact of smart agriculture) carried out by various institutions should be systematized in a
manner that contributes toward the mitigation and adaptations of climate change.
Eritrea‘s involvement in research activities with bilateral and multilateral institutions is
inadequate. Thus, there is a need for a comprehensive action addressing the gaps that need to be
filled within given timeframe. Specific and relevant aspects of climate change related
information is lacking. In GHG inventory, identification of mitigation activities, sector specific
emission factors and activity data particularly for key source categories were lacking. Thus,
research needs to be carried out to generate such information. Funding sources including the
CDM should be explored to gather data, generate information and knowledge on the extent of
greenhouse emission and reduction of deforestation and desertification.
5.4.2 Systematic Observation
There is no systematic climate observation system in Eritrea. Climate data collection and
documentation is carried out by different institutions for their own purposes. In Eritrea,
Systematic observation is shared among different institutions including MoA, the WRD of the
MoLWE, Asmara International Air Port, etc. The roles and responsibilities of these institutions
are not clearly defined; and a number of overlapping activities exist. Each of them established
meteorological stations at selected sites to generate data needed for the respective institutions.
The attributes such as the location, distribution, and type of instruments used, in each of these
stations, do not satisfy the WMO standards. Hence, the coverage and quality of data is not
complete. There is no adequate upper-air and oceanographic observations and other existing
data need to be improved in terms of standardization and exchange of data. More importantly,
there has been little downscaling of climate change projections for Eritrea and considerable
uncertainties exist.
Besides the above mentioned facts, there is no upper-atmosphere and oceanographic
observations instruments in Eritrea. Most of the climate prediction models are derived from
remote sensing lack ground trothing and they are downscaled to reflect the situation on the
ground. For that reasons, Eritrea‘s seasonal forecasts for agriculture is done with support from
the IGAD Climate Prediction and Applications Centre (ICPAC) which is based in Nairobi.

116
ICPAC in collaboration with international organizations has undertaken human resources
development targeting the climate prediction in the region including Eritrea. Participation in the
global research and observation systems such WMO and Global Climate Observation System
(GCOS) should be strengthened.
Irrespective of the institutional set - up, it is necessary to ensure that relevant climate data is
gathered, processed stored/used on timely bases. There should be smooth flow of data from the
various regions to a centrally managed system. Investment needed to upgrade the
communication and information technology to satisfactory to support systematic observations.
The above mentioned facts clearly demonstrate that extensive data gaps exist with respect to
assessing impacts, and developing adaptation strategies. The Eritrean capacity to analyse
climate change trends is underfunded. Downscaling exercises have only been conducted in the
broadest terms. Asmara International Air Port which is currently considered to be providing
meteorological services does not yet have an adequate database. Observations are not always
systematically conducted and information received from the regions is not computerized, and
may be unreliable. This means that climate risk information, in terms of climate observations
and projections, is scanty and poorly understood by policy makers and civil society. An in-
depth assessment of the potential changes in climate from national to local scale has yet to be
undertaken.
Climate services are increasingly necessary because of the rapidly growing climatic impacts.
Therefore, there is a need to improve systematic observation and the sharing in a coordinated
manner by establishing a National Meteorological, Hydrological and Oceanographic Agency
(NMHOA) to enhance adaptation responses. The relevant activities would include increasing
the number and standard of atmospheric and hydrological observing stations and installing new
oceanographic observing stations, developing downscaled projections for the region and
establishing a National Climate Change Research and Systematic Observation Technical Expert
Group (NCCRSOTEG) for facilitating activities including National Communications.
Besides, Eritrea’s participation in and contribution to activities and programmes of national,
regional and global research networks and observing systems is inexistent. Thus, there is a need
to enhance Eritrea’s participation to benefit from their activities and programmes. Matters
emerging from the 2010 updated Global Climate Observing System (GCOS) implementation
plan and related activities can be consulted for identifying priority areas of participation.
To solve the problem, it is important to undertake a thorough assessment of the status of the
implementation of research and systematic observations in Eritrea. This can be done based on
previous and on-going programmes including action plan for development of national hydro
meteorological and oceanographic services. It is equally important to develop a strategy for
improving climate services in the country. In this regard, it is anticipated to produce a study
report containing information on climate change research and systematic observation, research
relating to programmes containing measures to mitigate climate change and programmes
containing measures to facilitate adequate adaptation to climate change. To that end, the
following are plausible activities.
Establish a National Climate Change Research and Systematic Observation Technical
Expert Group (NCCRSOTEG) with detailed ToR on permanent basis;
Organize and conduct training for the expert group specifically on research
methodology including quantitative approaches;

117
Establish a National Meteorological, Hydrological and Oceanographic Agency
(NMHOA) with clear mandate and responsibility;
Develop the capacity of meteorological, hydrological and oceanographic observations
through iterative training, equipment and institutional development;
Develop National Climate Service Action Plan (NCSAP) by participating in the Global
Framework for Climate Services (GFCS);
Enhance partnership with UN agencies and other international organizations which have
comparative advantage in climate services;
Develop the capacity for regional climate downscaling by partnership with Regional
Climate Centres; and
Write report on Climate Change Research and Systematic Observation as part of the
fourth national communication.
5.5 Education, Training and Public Awareness Human resource is the main asset of Eritrea; and the country needs to promote education,
training and awareness to address climate change and variability at different levels. Today,
there is increased public awareness about climate variability. Many people sense natural
hazards such as droughts and torrential floods; and the damages inflicted on agriculture and
physical infrastructures in many parts of the country. On the other hand, there are people who
do not have a clear distinction between climate change and seasonal climatic variability.
5.5.1 Education
The running school curricula which have been into effect, during the last three decade, require
period revision not only to update its contents but also integrate global issues such as climate
change. The Department of General Education and School Curriculum, MoE works in
collaboration with DoE to prepare environmental topics and integrate them into new school
curriculum. The DoE has assigned the tasks to the Climate Change Unit (CCU) to take the lead
and prepare relevant environment materials into the school curricula. The CCU unit has already
taken concrete steps to introduce relevant climate change topics at various levels of the
educational system in all relevant subjects including geography, biology and agriculture. In this
context, 15 student hand books, at all levels of school have, been prepared.
The MoLWE was actively engaged in reviewing school curriculum to ensure that climate and
environmental issues are mainstreamed in the country’s educational system. This endeavour is
sought to appropriately integrate climate change issues in the training programmes at various
levels of the educational system in the country. Such step encourages training institutions to
integrate climate change topics into their training programmes; and eventually strengthen the
human resources of those institutions involved in the implementation of climate change.
Restructuring of higher education took place in 2004. The higher education facility which was
confined to one University expanded to seven autonomous higher education institutions. The
Colleges of Agriculture, Marine Science and Technology, Eritrean Institute of Technology,
Business and Economics, Medicine, Heath Sciences and Arts and Social Sciences were
strategically located in different administrative regions of the country. Over the last 10 years,
more than 31,000 students graduated at diploma and B.Sc. /BA Degree levels. Some of the
colleges offered postgraduate programs, while more than 584 were sent abroad to pursue their
studies at Masters and PhD levels.
Vulnerable farmers and pastoralist in Eritrea lack systematic advance warning about climate
risks such as dry spells which hampers their ability to build adaptive capacity. Although much

118
has been done in education, training and public awareness, nothing is known about the extent of
implementation of article 6 of the UNFCCC convention that deals with this aspect. Hence, there
is a need for an assessment of the status of the implementation of Article 6 (education, training
and public awareness) based on previous and on-going interventions and development of a plan
and strategy for improving the situation. This would clarify, in a measurable manner the
information on activities relating to climate change education, training and public awareness
conducted or envisaged. Such report would help in availing concrete information for the
national communication. In this connection, the following activities are proposed for
achievement of the desired output and outcome.
Establish National Education, Training and Public Awareness, Information Networking
and Capacity Building Technical Expert Group (NETPAINCBTEG) with clear ToR on
a permanent basis;
Organize and conduct training for the NETPAINCBTEG;
DoE, coordinate, MoE, NHERI and mass media to promote periodic CC awareness and
training in local languages and revise the curricula at elementary, secondary and tertiary
levels;
Promote and facilitate public access to information on CC, and its effects though
various means;
Revitalize and implement a national early warning system to accelerate the provision of
user-orientated climate services: seasonal outlooks, drought and flood advisories to
allow for a more proactive approach to reducing risks; and
Prepare user manuals/ on climate change education, training and public awareness.
5.5.2 Capacity Building
The major synergistic constraints and opportunities for capacity building have been identified
in 1999, during the NCSA process. Specific needs and priorities in the climate change thematic
areas were included. The following are broad categories:
Developing and enhancing technical capacities and skills to carry out and effectively
integrate vulnerability and adaptation assessments into sustainable development
programmes and implement climate response activities;
Strengthening existing national research and training institutions;
Instituting and strengthening the capacity of meteorological, hydrological and
oceanographic services; and
Enhancing public awareness, training and education.
Although these capacity needs were identified years back, the status report on the
implementation of capacity building decisions of the COP under the Convention and its Kyoto
Protocol in Eritrea based on previous and on-going interventions and to develop a plan and
strategy for improving on the situation needs to be revisited. Thus, a comprehensive report
containing information on steps taken to implement capacity building activities at national, sub-
regional and regional levels as contained in the capacity building framework for Non-Annex I
Parties (Decision 2/CP. 7) should be prepared to have up-to-date information. In this regards,
the following priority activities are proposed:
Review all activities conducted on capacity building and assess information contained
in previous national communications, NEMP-E, NAPA, NCSA and the Stocktaking and
Stakeholder Consultations conducted in preparation of the previous NC;
Determine all capacity building gaps and data and information requirements of Eritrea
not only to prepare its national communication on continuous basis but also enable the
country implement other Climate Change Convention and its Kyoto Protocol issues;

119
Develop a programme and strategy for the implementation of capacity building needs
for the implementation of the Convention and its Kyoto protocol in Eritrea;
Develop and strengthen the institutional and human capacity of the Climate Change
Focal Point and Climate Change Unit under the DoE of the MoLWE;
Developing and enhancing technical capacities and skills to carry out and effectively
integrate vulnerability and adaptation assessments into sustainable development
programmes and implement climate response activities;
Strengthening existing national research and training institutions by providing funds to
carry out research on climate change;
Instituting and strengthening the capacity of meteorological, hydrological and
oceanographic services;
Enhancing CC public awareness (press and TVs), training and education; and
Prepare a report on the status of capacity-building to mitigate and adapt to climate
change which would be integrated into the national communication reports.
Capacity building is one of the key strategic elements to build, develop and strengthen the
economic development of Eritrea. Its contribution to the achievement of the objective of the
Convention through preparation and implementation of the provisions of the Kyoto Protocol is
significant.
A. Short-term training: The MoLWE, in collaboration with national and international
stakeholders, carried out short-term training sessions to build human capacity to respond to
the challenges of climate change. On-job training modules focussed on upgrading
competencies and specific tasks related to climate change were offered. Table 5.1 presents
opportunities for in-country and out of country training programs (Table 5.1).
Table 5.3: In-Country and out- Country Training Opportunity
Country Themes/Topic of training
Eritrea Earth Observation Receiving Stations: System Administration and Earth data
Observation Data Application’
Eritrea Environmental Monitoring and Hazards Assessment Using Earth Observation &
GIS”
Eritrea GHGs inventory and mitigation modelling using GCMO models. This short term
training activities helped the technical expert group to successfully prepare the
NDC.
Eritrea Short-term Training carried out on the application models (e.g. WEAP, LEAP)
Algeria Consultative group of Experts (CGE) hands on training workshop for Africa
region on institutionalisation of data management for GHGI held in Algeria;
Tanzania East Africa Regional MRC network first training and peer review held in
Tanzania
Kenya Africa Regional Training Workshop on the Building of Sustainable National
GHGI Management system; and the 2006 IPCC guidelines for national GHGI
Morocco Central and North and west Africa workshop on national CC report, project
management and regional MRV network development’
B. Specific Needs Options and Priorities for Capacity Building: Based on Annex VIII of
the convention, which refers to the specific needs to strengthen climate change, mitigation
and adaption measures; the constraints and opportunities for capacity building have been
identified. The NCSA process (MoLWE, 1999) identified education and capacity needs as a
major setback. Although the level of environmental awareness has improved, over the past

120
years, in all of the administrative regions of the country, their capacities for environmental
management, in general, and climate change response in particular, still remains limited at
various local levels. Hence, the regional governance structures needs institutional capacity
building to address environmental and climate change concern and prevent the impacts of
climate change at the grass root levels.
C. South - South Cooperation: Though the potential for South-South cooperation to enhance
capacity building is essential, its opportunity has not been fully exploited. In view of the
recent positive development between the neighbouring countries in the Horn of Africa,
setting a strategy to enhance cooperation is the first step in the right direction. The
cooperation would guarantee and ensures that climate change matters are well grasped and
understood. It would not only maintain the current north -south partnership but also initiate
and promote south-south partnership among countries in the region.
D. Building of Stakeholders’ Involvement: In the Second national Communication
(MoLWE, 2012), Eritrea has developed guidelines that allow stakeholders to, effectively,
engage in the various climate related activities and projects. The stakeholders participate in
critical climate change issues focussing on measures for mitigation and adaptation. Thus,
the level of involvement of stakeholders is in recognition of the fact that climate change is a
cross-cutting issue across all activities covered in the various sectors. Thus, all stakeholders
involved in climate change mitigation and climate adaptation projects and programmes are
involved; and their involvement is critical to effectively, efficiently respond to the impact of
climate change on a sustainable manner.
The MoLWE invited various stakeholders to participate climate change consultative process.
The initiative was taken to establish Technical Expert Working Group (TEWG) in the
preparation of the TNC and BUR1. Members of the task force forward their strategic plans and
assessed how these plans fit within the framework of UNFCCC. Reprehensive of the key
stakeholders participated in climate change public dialogue. In 2015, the INDC which later
formulated as the NDC were prepared in consultation with taskforce representing the ministries
of agriculture, marine resources, forestry and wildlife authority, energy and mines, trade and
industry and, health and local. The on-going dialogue and negotiation and policy dialogue is
expected to assess the viability of adaptive and mitigation measures. Together, the research
community and stakeholders can develop adaptive and mitigation strategies by combining
scientific or factual information with local knowledge and experience of change and responses
over time too.
Traditional community based climate change adaptation strategies are widely used in Eritrea.
However, the gap between research, extension and communities should be narrowed down to
facilitate smooth flow, and exchange of information between the various stakeholders. There is
an on-going discussion among researchers and stakeholders to generate and develop adaptive
mitigation strategies. This step explores possibilities for integrating indigenous practices with
modern scientific knowledge; as there are increased tendencies to assess and accept merits of
traditional coping mechanisms in the country. Hence, there is a need for increased dialogue to
enhance the involvement of stakeholders.
E. Status of Activities Related to Coordination and Sustainability: Focal points and
national coordinating entities lack capacity to ensure effective coordination at the country
and regional levels of capacity-building activities which compromise the development and
sustainability of capacity-building activities. Hence, capacity-building for national focal
points is imperative. To that end, a number of workshops and seminars were carried out on
climate change and gender main streaming.

121
F. Workshops and Seminars: Ssince Eritrea submitted its SNC in 2012, a number of
workshops were held, varying in duration. These workshops were carried in and outside of
the country to offer training on specific aspects of climate mitigation and adaptation. These
trainings were part of the capacity-building activities conducted under the implementation
of NAPA, the INC and SNC. A number of capacity building activities to implement
projects across all components by engaging relevant stakeholders to enhance national
capacity were held. The GoE in collaboration with international partners prepared a number
of short-term (e.g. full size) projects aimed at tackling challenges of climate change. Among
these include the Water and Agriculture in Anseba, the SLM in Maekel region.
Mainstreaming climate change consideration in Tslema in Debub, and the Rora-Habab and
Nakfa in the Northern Red Sea region are in progress.
G. Gender Mainstreaming: Climate change affects the most vulnerable segment of the
population including women headed households, children and the elderly. The National
Union of Eritrean Woman is engaged in sensitising women on how to cope - up with the
adverse effects of climate variability. In this direction, there are community-based activities
aimed at empowering women. A good example is the distribution of energy saving stoves to
women which reduces the time spent in the collection of fuel wood for domestic of energy
saving stoves to households and reduces the GHG emission improves the energy
consumption.
5.5.3 Public Awareness
Despite progress in general awareness, much remains to be done for improvement in public
education and awareness. Public awareness communication strategies should be prepared to
avail climate change issues accessible to the general public. This would enhance public
awareness and enhance understanding about climate change and reduce vulnerability to the
adverse effects of Climate Change. Adult education, training and public awareness facilitates
capacity building to participate and implement effectively the commitments to the UNFCCC. It
is a means used to drive support for actions about climate change issues nationally, and
eventually encourage support for government policies. It is critical measures that influences
change in habits that have adverse effects on climate change.
Although climate change is a reality, still there exist scepticism about its impacts on the
economic, social and environment. There remains insufficient awareness among people and key
stakeholders concerning the impact of climate change and adaptation options. Hence, besides
awareness building, at the local level, it is equally important to involve high-level policy
makers that will not only open policy dialogues among stakeholders but also facilitate
integration of climate change issues into national development policies. Within the local
administration, ad-hoc environment committees are established to organize and participate in
environmental awareness raising and training of zone and local actors on climate change. Some
of the related issues include Multilateral Environmental Agreements (MEAs), UNCCD and
UNCBD implementation at that level. Specific issues addressed are described in the following
paragraphs.
Greening Day: Since 2006, the Forestry and wildlife authority organises a national greening
day in which all stakeholders including government officials are invited. The aim of such
occasion is to appraise the activities carried out on i) afforestation/reforestation activities,
protected areas establishment to expand forest area and wildlife, iii) establishment of green
clubs, iv) introduction and promotion of energy saving stoves in the country.

122
International Water Day: The MoLWE launches a number of environmental public
awareness campaigns using various means including interviews with experts and reportages.
The packages include video shots on environmental challenges and possible solutions.
Information on global and local climate, in general and information on mitigation and adaption
to climate change in particular, are broadcasted in TV and radio programmes. Besides Climate
change specific documentaries are shared from international platform enhances public
awareness.
Production of Environmental Booklets and Posters: The Biodiversity Report (2019)
indicated that 750 booklets, 25 newsletters, 170 posters, 5 documentary films, 20 TV spots, and
25 radio programs were produced and disseminated in local languages. The national News
letter “Haddas Eritrea”, publishes article entitled ‘The Environment’ on regular basis in which
the threat posed by climate change are covered.
5.6 Information and Networking Nowadays, information and networking should not be taken too lightly for a number of reasons.
Consequently, Eritrea’s participation in and contribution to global and regional information and
networking should be enhanced. As thisis is a cross cutting issue requires multilateral dialogue
among stakeholders at national, regional and global levels. By and large, information and
networking in Eritrea could be improved. This might be understatement of the situation on the
ground; and there is a need for a comprehensive identification, inventory and prioritization of
regional and global centres for information and networking in line with the national needs. In
all cases, access to, and use of, information technologies for information exchange needs
reliable intranet and internet access; and availability of Clearing House Mechanism (CHM).
Thus, the issue at hand is how to provide, as complete as possible, information on Networking,
Knowledge and Information sharing for implementation of the UNFCC Convention. Preparing
a report containing information on the efforts of Eritrea to promote networking and information
sharing with other countries and regions, and how it utilizes and contributes to global and
regional knowledge networks, as input for the national communication is required. To that end,
the following priority activities are proposed for achievement of the desired output.
Assess the information technology needs of the country in the area of climate change
and other environmental areas;
Develop and use a Climate Change Clearing House Mechanism (CHM);
Promote networking with NCSP, UNEP, UNDP, FAO, GCOS, GTOS, GOOS, GFCS,
CTCN, etc.
Conduct comprehensive inventory and prioritization of regional and global CC
information centres; and
Write a report on activities on information and networking as part of the TNC.
While some of these activities have been already done, others require long term and through
investigation on a continuous basis.
5.6.1 Efforts to Promote Sharing Among Within Countries and Regions
The need for information sharing within the country and among other countries has been
emphasised during the SNC. Since then, not much has been achieved in this respect. The
secretariat needs to establish a regional mechanism to share information on a continuous basis.
The strategy must focus on creating a regional platform for countries to share information
created by themselves instead of organizing and conducting business as usual trainings and
workshops. Countries might be invited to present their works in different areas such NAPA,
NCs, FNR -Rio, AF concrete projects and programmes, SCCF project activities, and NCSA as

123
appropriate to the respective countries. Each participating country might be required to present,
at least, one area of work representing country including; how to prepare project documents as
per the eligibility criteria of a particular fund. At national level, focal points should organize
platforms to link regional and sub-regional officers and policy makers at regular interval. In this
area, the secretariat needs to establish regional mechanisms to share information on a
continuous basis.
5.6.2 Participation In and Contribution to Information Networks
Despite the efforts of the UNFCCC secretariat’s effort to establish regional hubs for sharing of
experience and information; such effort is still at its infancy stage. So far, the country
participated in a number of international fora; and contributed to information networks of
regional and international initiatives. These are i) Africa Adapt knowledge sharing platform, ii)
Global Climate Change Adaptation Network. Thus, the regional cooperation should be
strengthened to create regional platforms where countries share timely information on regular
basis. This would enhance south – south cooperation. In as much as possible, workshops and
trainings should be arranged in Africa to create regional hubs to put developing countries on
equal/comparable footing with the developed countries. This would not only enable developing
countries such as Eritrea to present their programs and action plans that facilitates sharing of
information and resource in a more appropriate manner. The DoE, as a national focal point, is
ready to organize platforms linking regional and sub-regional experts and policy makers to
present specific area of activity pertinent to climate change.
5.6.3 Access and Use of Information Technologies
Nowadays, fast, affordable and reliable communication systems are critical for sustainable
economic development. This is because of the fact that technological advancement and human
needs are changing faster than ever before. Hence there is need for updating old knowledge
systems and acquiring new knowledge and skills to respond appropriately to the problems
climate change challenges. Despite Eritrea’s investment in Information technologies, much
remains to be done in this field. Indeed, it has substantially invested in the development of its
telecommunications and postal services. The country is now connected domestically and
internationally by both telecommunications and postal services. All of the major cities can be
accessed through postal and telephone services; and efforts are underway to provide access to
telephone services throughout the country.
Internet services and the installation of GSM - 900 with the capacity of 400,000 users have
improved the access to telecommunication services. Since 2009, the CDMA-WLL fixed
network is operational; and enhanced access and reliability of the telecommunication system in
Eritrea. In spite of these accomplishments, the transmission of large volume text, voice and
video data is still limited by the absence of inadequacy of broadband fibre optic infrastructure
system.

124
CHAPTER SIX
6 CONSTRAINTS AND GAPS, AND RELATED, TECHNICAL
AND CAPACITY NEEDS
6.1 General Background As non-Non-Annex I Parties member, Eritrea is required to describe any constraints and gaps,
and related financial, technical and capacity needs, as well as proposed and/or implemented
activities for overcoming the gaps and constraints, associated with the implementation of
activities, measures and programmes envisaged under the Convention. Eritrea has undertaken a
number of climate change adaptation projects and strengthened policy frameworks in favour of
climate change mitigation and adaptation works. However, there are still gaps; and constraints
that hinder effective implementation of mitigation and adaption projects and programmes.
The preparation of the TNC of Eritrea builds on the INC and SNC. Since the SNC in 2012,
much has been gained during the pasts eight years. The past reports facilitated in described
important climate change problems that deserve immediate attention in various sectors. On the
other hand, there are still a lot of challenges that Eritrea is facing with regards to sustaining the
capacity that has already been built and ensuring sustainable preparation of the national
communications for the future. This section is intended to present the major constraints, gaps
and related financial, technical and capacity needs. It also reviews the support received from
international partners for climate change adaption and mitigation; and the way such support
programmes have met the specific needs and concerns of Eritrea.
6.2 Financial Constraints
6.2.1 Financial Constraints to Report National Communications
Eritrea has faced a number of financial difficulties in the course of implementing its reporting
commitment under the Convention. In this regards, one of the difficulties was the inadequacy of
fund to cover priority areas identified under the components of the INC and SNC national
communication. Therefore, there is a need to enhance the funds if meaningful preparation and
improvement of national communications is to be achieved on a continuous basis.
Preparation of the national communications, in Eritrea, is done on an ad-hoc basis; and most of
the work is contract out to consultants. Yet, the enhancement of the reporting requirements
demands for advanced reporting standards. For that, permanent institutional arrangements need
to be emplaced to enable sustainable reporting while guaranteeing quality. Consequently, there
is a need for Eritrea to establish permanent institutional framework which would be responsible
for the preparation of the future national communications. The national climate change policy
highlights the need for a sustainable institutional framework for the national reporting under the
UNFCCC; and the DoE, the focal point, takes the responsibility to ensure the recruitment of
adequate and skilled personnel with the aim of sustainable reporting. Undoubtedly, such
arrangement will facilitate the capacity building of public institution in general and those
working in the DoE to ensure timely and continuous improvement of the national reports. To
that end, the main challenges of the present set-up are the following:
Inadequate capacity of the coordinating institution ,
Lack of institutional and technical capacity for the different thematic areas of the
national communication i.e. GHG inventory, GHGs inventory, Mitigation assessment
and Vulnerability and adaption.
125
Shortage of national expertise, particularly in GHGs mitigation assessment,
vulnerability and adaptation assessment and GHG inventory;
Unavailability of personnel from collaborating/ stakeholders institutions; and even lack
of technical capacity due to over schedule workloads;
Lack of motivations and derisory incentives to maintain permanent team members to
work continuously to improve reporting of the national communication.
A. Financial Constraints to Implement NAPA
Eritrea has prepared and submitted its NAPA to the COP in 2007. However, most of the urgent
and immediate adaptation needs identified therein have not yet been implemented, partly, due
to financial constraint from the Least Developed Countries Fund (LDCF). Eritrea‘s various
expectations from the climate change negotiation have not yet been materialized hindering the
country‘s progress in complying with its commitment under the Convention. Eritrea has
favourable environmental policy and legal framework at the national level. It has prepared the
National Environment Management Programme- NEMP-E (GoE, 1996), which serves as a
blue-print for a holistic environmental management embracing climate change, land
degradation and dwindling biodiversity. It addresses the major environmental and development
issues confronting Eritrea (Annex IX). These issues are grouped into those with direct bearing
and indirect bearing on human health and wellbeing. Other environmental and development
issues are categorized into natural resources, socioeconomic, institutional and environmental
affairs. Although many of the projects listed in the plan are partially or fully implemented;
some remain pending due to financial constraints or capacity gaps.
In 2007, the NAPA identified six coping strategies and potential adaptation projects through a
consultative work with the stakeholders (MoLWE, 2007). These strategies cover agriculture,
livestock, forestry, water resources, marine and coastal zone; and public health sectors. NAPA
is a platform of action, in this regard, which represented the highest priority interventions as
determined through a structured Multi-Criteria Analysis (MCA) process involving a broad
range of stakeholders.
B. Pilot Project
The ‘Climate Change Adaptation Programme in Water and Agriculture’ was implemented in
Eritrea as a pilot project between 2013 and 2018 with a grant from GEF to the amount of US$
6.5 million (UNDP, 2019). The project aims to promote food security in Eritrea through
ecologically sustainable and climate-resilient improvements in the agricultural sector. It also
aims at increasing community resilience and adaptive capacity to climate change through
integrated water management and agricultural development approaches in various regions of
the country. The main beneficiaries of the programme were small-scale farmers, pastoralists,
agro-pastoralists and rural women, who are vulnerable to the impacts of climate change. The
implementation of the programme, being part of a bigger process under the National Adaptation
Programmes of Action (NAPAs) of the country, represents one of the five prioritized course of
actions in the agriculture, forestry and water sectors. While this programme is funded under the
Adaptation Fund (AF), two other projects will be funded by the Least Developed Country Fund
(LDCF). The pilot project has showed the following satisfactory results.
Increased water availability through groundwater recharge & rainwater harvesting,
irrigation, and soil and water conservation measures;
Enhancement of climate-resilient agricultural and livestock production;
Improvement of climate risk information used to raise awareness of and enhance
community preparedness to climate hazards; and

126
Establishment of knowledge management system; and knowledge management
activities.
The above outcomes came into effect as a result of a successful implementation of the planned
activities including the construction of diversion structures, irrigation technologies, structures
related to micro-dams and soil and water conservation works. Climate-resilient agricultural
technologies, methods and trainings were provided to the farmers in what is now called the
Minimum Integrated Household Agricultural Package (MIHAP). Traditional improved fuel-
efficient stoves and solar panels are part of MIHAP that provided diversified livelihood options
and opportunities to many farming households in the project area. Many farmers have
appreciated the adaptive capacity and production systems that resulted in increased crop and
livestock productivity. As a result, there are possibilities for up scaling lessons learned as a
viable adaption strategy to climate change.
A) Financial Support: Eritrea, in collaboration with the global partners, has exerted
tremendous efforts to tackle climate change impacts by mobilizing its own human and material
resources. The outcome in general is commendable particularly in areas related to soil and
water conservation, area closure and expansion of the renewable energy sources such as the
traditional energy saving stove (Adhanet). Nevertheless, financial constraints still hinder
climate change mitigation and adaptation measures at a national, zoba and sub-zoba levels. In
this connection, fiscal management reforms might be required to improve the overall budget
formulation and reporting mechanisms.
B) Climate Funds: Eritrea made significant strides toward implementing a number of climate
change mitigation and adaptation projects. GEF funded a number of these projects including the
INC, SNCs and now the TNC. It also benefited from the Least Developed Countries Fund
(LDCF) provided USD 200,000 for the preparation of NAPA; the Adaptation Fund (AF) USD
4,000,000.00 for the implementation of an adaptation programme. Although various sources of
funds are allocated from Clean Development mechanism (CDM), Special Climate Change Fund
(SCCF), and Strategic Priority on Adaptation Fund (SPA), they will have to be materialised in
the course of time when and if the requisite capacity are built. Although the contributions of
GEF funds have been evaluated positively, they were inadequate because most community-
based projects required additional follow-up funds to up-scale the technologies to other areas.
6.2.2 Identification and Utilization of Support Programmes
The level of financial support from annex II parties, the Global Climate Fund (GCF) and the
Global Environment Facility (GEF) was inadequate to bring about a significant result in
reversing the impacts of climate change. The shortage of financial support can be analysed
from the perspectives that the number of climate change projects in the country is small
because climate change is viewed as a global issue linked with the emission of GHG from the
industrial countries. In the developing countries, the immediate environmental problems are
related with land degradation that attracts less financial resources. Land degradation like that of
climate changes deserves sufficient attention while preparing projects and allocating funds.
Total budget allocated to the amount of 64,183,600 USD came to Eritrea from two sources.
These are contributions from local communities and from the Global Environment Facility
(GEF). Various agencies including the United Nations Development Program (UNDP), United
Nations Environment Program (UNEP), and International Fund for Agricultural Development
(IFAD) are also involved in these projects. The following list presents projects relevant to
climate in Eritrea:

127
National Biodiversity Strategy, Action Plan and National Reports,
Conservation Management of Eritrea's Coastal, Marine and Island Biodiversity,
Assessment of Capacity Building Needs for Biodiversity, Participation in Clearing
House Mechanism and Preparation of Second National Report,
National Capacity Self - Assessment (NCSA) for Global Environmental Management
Enabling Activities to Facilitate Early Action on the Implementation of the Stockholm
Convention on POPs,
SIP-Sustainable Land Management Pilot Project,
Eritrea: Prevention and Disposal of POPs and Obsolete Pesticides and
Operationalization of Protected Areas Management Systems of Eritrea
Wind Energy Applications,
Development of a National Adaptation Program of Action (NAPA), and
Climate Change Adaptation Programme in Water and Agriculture.
6.2.3 Level of Financial Investment in Climate Change
A total of 22 projects were executed in Eritrea with the support from GEF to the amount US$
433,883 and in-kind contribution from local resources equivalent to US$ 1,522,323. Since
2010, the GEF Small Grants Programme (SGP) received a financial support of US$ 1,034,998
for various projects. A large share of SGP fund was allocated to support Land Degradation
projects (US$ 607,316), while climate specific projects accounted for a small share only
suggesting the need for preparing climate specific projects in the future. Beside Land
Degradation projects, other programs including Climate Change Mitigation (US$ 197,017),
Multifocal Area (US$171,186) and Biodiversity (US$59,479) were also supported. In addition
to the above full-scale projects implemented by government institutions, community based
activities were also carried out during the period 2009-2019. Out of the 28 small-scale projects,
seven were climate-specific implemented in Anseba, Maekel, Keih - Bahri, and Debub regions.
6.2.4 General Needs
Generally, Eritrea‘s capacity needs are related to its specific needs and concerns arising from
the adverse effects of climate change (Article 4. 8). At present, even though the heightened
environmental awareness and the efforts made to adopt better natural resources management
and to protect the environment, Eritrea’s overall environment remains fragile and a matter of
great concern. Nevertheless, specifically what are the general needs of the country that require
immediate attention? To respond to the question posed, this section provide, as complete as
possible, information on constraints and gaps, and related financial, technical and capacity
needs of Eritrea in the implementation of the Convention and its Kyoto protocol. The technical
working group assessed and analysed the status of the following priority activities.
Develop comprehensive national baseline data on the environment (land, water &
atmospheric components) to prepare periodic State of Environment Reports (SoERs) to
monitor environmental sustainability;
Establishing and strengthening the capacity of meteorological, oceanographic and
hydrological services;
Strengthening existing national research and training institutions considering climate
change at the centre;
Develop a project proposal to conduct a full-fledged Technology Needs Assessment
(TNA) and transfer of technology process for adaptation and mitigation included as part
of the TNC to benefit from existing funding windows including the GEF Programming
(GEF Trust Fund), the CTCN, the GCF and other GEF funds such as the SCCF-B and
the LDCF.

128
Provide information on specific barriers and opportunities in implementing the on-going
pilot adaptation projects or programmes (pilot or demonstration) that are being
undertaken through existing and upcoming UNFCCC funding windows;
Identification and utilization of support programmes which provide financial and
technical resources for adaptation and how such support programmes are meeting the
specific adaptation needs and concerns of Eritrea;
Provide information on the level of financial support from Annex II Parties, the GCF
and the GEF; Eritrea’s participation in the CTC and CTN; development and
enhancement of endogenous capacities, technologies and know-how.
6.3 Technical Needs Technical needs cut across all activities spanning from scientific knowledge of climate change
to skills of climate and impact modelling to formulation of GHG mitigation and adaptation
strategies to preparation of project and programme documents, monitoring and evaluation of
concrete projects and programmes to climate change negotiation skills. These technical needs
are hindering Eritrea from maximizing and optimizing the Convention resources. While
preparing the TNC, a number national experts working in various ministries were involved as
members of the different technical working groups and contributed substantially. Nevertheless,
it was also become clear that these experts needed capacity building to fully understand and
contribute to the various thematic areas of the communication. Thus, Eritrea’s commitment to
implement the ToR under UNFCCC partly depends on the extent that developed country
Parties’ willingness not only to extend financial support but also transfer of appropriate
technologies.
6.3.1 Technical Assistance
There are a number of technical needs that constrain climate change projects and programs.
These needs should be properly addressed on a timely basis putting into consideration the
specific needs of a target area. The difficulties related with transfer of technology are related
with inadequacy of fund to cover priority areas identified under the components of the national
communication.
International and/or regional experts were invited to provide assistance to national team
responsible for the preparation of the TNC in specific approaches, tools and methods to be used
for the planned activities under the GHG Inventories, vulnerability and adaptation assessment
and mitigation assessment. However, the Technical assistance from UNEP did not materialise.
In view of that, past NC experiences and lessons learnt from other on-going climate change
enabling activity programs in the region technical assistance were used to train local experts in
the process. Training materials from the past and the on-going activities were partly obtained
from various regional and international sources, such as IPCC, UNFCCC and UNITAR. To
assess the technical assistance provided, the team reviewed the project document and realised
that Due to COVID-19, international/regional technical assistance was not obtained. Instead,
the following activities were carried out.
National expertise who had prior training (consultants) provided technical Assistance)
and trained to the technical working groups involved in GHG Inventory Training;
National expertise (consultants) provided Technical Assistance on the V & A training;
and
National expertise (consultants Technical Assistance) was engaged with Mitigation
Assessment).

129
6.3.2 Inadequate Human Capacity
At present, there is lack of adequate capacity to sustain climate change data collection and
analysis that ultimately generates information and knowledge. Consequently, it is indispensable
to develop and upgrade human resources at various levels and move together with the changing
circumstances. In connection with climate change and mitigation and adaptation activities,
climate and hydrological sciences are dynamic that change at the fastest rate. Emphasis should
be focussed on human capacity that is needed for data collection, data analytical tools and
methodologies. Capacity could get improved either on continuous basis i.e. on the job training
or on a long - term training in higher education institution within country or abroad.
A. Greenhouse Gas Inventory
Even though much progress has been achieved since the submission of the INC to UNFCCC in
2001, Eritrea still faces challenges in undertaking detailed GHG inventories. These processes
are crucial components that inform the development of effective policies, strategies, and
mitigation measures. The following challenges were encountered during the preparation of the
national GHG inventory. First and foremost, there was no continuity in the estimation of the
inventory as there was no data or any information available from the last inventory calculation.
This is mainly because the following reasons:
There is no archiving system put in place; or any inventory manual that was produced in
the last inventory.
Some of the activity data was not available for the past years in some sectors, especially
IPPU and wastes hence, a lot of interpolation and extrapolation was done.
Solid waste generated and characterization data was collected for selected town.
Besides, the waste water generated was not measured in all towns; and it had to be
derived in the future;
The national experts lack technical capacity to estimate the inventory; for this reason
training of national experts on the IPCC 2006 guidelines and inventory software should
be a priority before the next inventory is prepared.
There no climates change institutional arrangement regarding data collection and
provision.
The inventory is done on an ad-hoc manner through consultants; hence there is a need to
put in place sustainable GHG inventory system to help improve inventory estimation
and quality.
B. Mitigation and Adaptation
The effectiveness of mitigation measures and adaptation options is dependent on strong
institutions with technical, financial, and managerial capabilities. Any institutional weakness in
these areas undermines the attempt to implement adaptation and mitigation measures
effectively. Implementation and monitoring of mitigation and adaptation actions since the
second national communication pose some challenge. This is mainly because of other national
urgent priorities and the absence of a national climate change policy to guide the
implementation of this action. Hence, there is a need for mainstream mitigation and adaptation
to national development objectives and enhance the capacity of the MoLWE, a focal institution
for climate change.
Eritrea’s action are further constrained by the fact that climate change concerns are yet to fully
mainstream into national development programmes and integrated into national planning and
budgeting. Therefore, they are not yet reflected significantly in the sectoral development plans
or the overall development agenda for the country at present. In the preparation of national
communication, Eritrea faces the following challenges:

130
Lack of national experts for mitigation assessment and estimation of abatement cost for
mitigation action.
Lack of capacity in doing GHG inventory projections and use of the LEAP/WEAP
model.
Lack of national experts to do climate change scenarios and projections.
Lack of capacity to do socio-economic scenarios for the vulnerability and adaptation
component,
Inadequate climate research experts for vulnerability and adaptation assessments.
Based on this background, the main constraints and corresponding needs are summarised in
table 6.1
Table 6.1: Main Constraints and description of the needed capacity Activity Description of The Needed Capacity
Sustainable GHGs
inventory management
system
Setting of an institutional arrangements; and GHGs data
management,
Development of national GHGs manual, and
Establishment of a national GHGs management system.
GHGs estimation
training on the use of IPCCC, 2006 guidelines and software
Agriculture, Forestry, and Other Land Uses (AFOLU) land
classification
use of satellite remote sensing data and Geographical Information
System (GIS)
Mitigation Training on Developing Mitigation Baseline
Training on use of LEAP/WEAP
Training on marginal abatement cost curve
Adaptation
Climate scenario: training in downscaling of global/regional
meteorological data climate modelling
Climate impacts assessments: training on uses of statistical packages
and dynamic crop and hydrological modelling
Adaptation tools and methods: training on the uses of different
adaptation tools and methods applicable to different sectors including
economic models, biophysical models and cost benefits analyses
Scenario development in different sectors (AFOLU, Energy, Waste,
IPPU)
General Climate Change Programmes and project development
Policy analyses
6.3.3 Inadequate Institutional Capacity
In the short-term, there are institutional gaps including inadequate expertise in climate change
science, analysis of vulnerability and adaptations, and impacts of climate change for key social
and economic sectors. Moreover, there is lack of sufficient knowledge, skills and tools for
integrating climate change into development planning, budgeting, implementation and
monitoring. Further, there are capacity limitations in designing and preparing climate change
projects and programme documents, monitoring progress and impacts, and budgeting and
economic appraisal also hampers timely design of projects. Recent consultations with
stakeholders on the National Adaption Plan (NAP) highlighted the need for specific human
development requirements in the following areas:

131
meteorological sciences, including modelling to plan future climate change and impact
assessments on key geographical areas and economic sectors;
hydrological and water resource assessment and management;
coastal zone and fishery management;
Smart agriculture and
Integrated landscape and ecosystem-based management for climate change adaptation.
Looking at the magnitude of the gaps, it can be concluded that there is a limited pool of climate
change experts in the government, academia and civil societies. There remains a low level of
awareness about climate change and its potential impacts on the economy and livelihoods
across all levels of Eritrea’s society including key decision-makers. In addition, there is dire
shortage of human resource capacity to effectively plan and execute the economic, social and
environmental pillars of sustainable development as called for in Agenda 2030 and the SDGs.
6.3.4 Insufficient Climate Data
Meteorological stations which are established by different organisation in selected sites
generate climate/weather data to meet specific institutional needs. These stations don’t satisfy
the requirements of the World Meteorological Organization (WMO). Consequently, there are
gaps in area coverage and data quality. Recent documentation from the Climate Prediction and
Application Centre for IGAD indicates that the number of climate data collection points in
Eritrea compared to other countries in eastern Africa. The inadequacies in climate data covering
the main geographical areas is a significant barrier for national and sub-national based
modelling of climate change projections over time. Thus, inadequate climate data is an
overriding factor hindering experts to undertake thorough analyses and climate change
projections.
In view of the above background, local experts largely depend on downscaled climate
projections and scenario analysis to undertake risk and vulnerability assessments to simulate
effective climate adaptation activities. Result from the questionnaire survey revealed that there
are weather stations in all administrative regions. However, only those located in Asmara,
Asseb, Massawa, Sawa, Halhale, Hamelmalo and Afdeyu are in good working conditions.
Hence, it can be concluded that Eritrea is far behind the countries in the region with regards to
the availability of climate data (e.g. rainfall, temperature and wind) which poses a major
challenge for long-term climate predictions. This being the case, experts are obliged to use
Global Circulation Models (GCM). The GCM can’t only capture the local atmospheric
dynamics but also has poor grid resolution of data. Hence, this can’t disclose local effects such
as mountains and bays and certain unique coastal landscapes. Further, while down – scaling,
the global data to local levels, there are losses in sight in the course of the analytical process.
Historical trends and recent level of changes in climate become complicated. This is mainly due
to the inadequacy of climate data covering a given project area. Under such circumstances, the
issue of climate data has to be handled with sufficient care and build climate data bases from
reprehensive stations.
Installation of weather stations in strategic locations throughout the country has to meet certain
scientific requirements. Calibration of instruments, which in most cases is underestimated,
needs to be addressed properly. In parallel, curriculum development in meteorology and
atmospheric sciences need to be properly designed and integrated into higher educational
systems of Eritrea to ensure training of young scientists on a sustainable basis. Further, the
existing national research and training institutions should be strengthened to enhance the

132
research and development. This domain entails knowledge management systems right from
data collection up to knowledge generation. Procurement of vital equipment such as Remote
Sensing and Geographic Information Systems (GIS) tools, biomass and carbon stock
assessment for carrying out forest inventory and soil organic carbon are vital for data collection
tasks. Further, research on adaptive technologies especially alternative renewable energy
sources (e.g. wind and solar) should be promoted at various scales. The major issues identified
to strengthen climate change science and adaptation planning re the following:
Investing in meteorological and hydrological data collection stations;
introducing standardized methods for climate and hydrological data collection and
analysis;
Investing in meteorological and climate modelling;
strengthen national institutions’ capacity including academic and research institutes to
better anticipate the country’s range of climate change scenarios and risks;
Researching indigenous adaptation tools and initiatives to identify best practice and
lessons learnt to inform capacity building, assessment and planning processes; and
Consolidating national and sub-national information exchange platforms to more readily
making climate change science and adaptation information available at all levels of
society and government.
Climate database should integrate traditional knowledge in a way that allows for the
management system of adaptation and mitigation efforts. Knowledge management system
should be instituted to allow predictable flow of information targeted towards the above goal.
This type of management also necessitates a comprehensive analyses on the manner in which
data is collected, analysed and knowledge is generated and disseminated. In this regards, much
needs to be done to encourage local communities to be vigilant on climatic variability at the
local level and noticeable climate change should be reported accordingly.
6.3.5 Scientific Research and Innovation needs
Despite the importance of scientific research and innovation to address specific societal
problems; there still exist scientific knowledge gaps in climate change. Higher education and
research institutes in the country need to be strengthened in terms of institutional and human
capacities to contribute to the knowledge and skills of climate change and bring about attitude
changes among people in Eritrea. To date, a number of research activities were carried out
using available resources and capacity, which paved way for further mitigation and adaptation
activities. Nonetheless, the research outputs are not organized in a proper manner; and
haphazardly found in different institution. These topics represent very limited information
about what is being done in specific institutions. Thus, long-term investment in research and
development is required to enhance capacity in research, development and innovation to
address the challenges of climate change across all key vulnerable sectors. A financing strategy
for research and development should be created in partnership with all stakeholders.
Continuous research on vulnerability and adaptation in agriculture, water resources, forestry,
human health, and biodiversity including wildlife is needed in order to establish the level of
vulnerability to climate change and identify the best adaptation options and policies.
To certain extent, there exists knowledge and technology, in the country, that can be used to
mitigate and reduce the vulnerability of communities to the impacts of climate changes. These
technologies invariably should be adapted to local circumstances; and there is a need for
continuous innovation to test suitability of technologies that fit into a given environment and
socioeconomic circumstance of the country. Scientific research should meet certain qualities
and should be relevant to the local needs. Quality could be achieved through engagement of

133
experts as well as the use of valid data to generate the desired level of outcomes. Besides, the
research should also explore possibilities for integrating exogenous knowledge with the modern
knowledge system. Further, it research and innovation system should be instituted to ensure
that local need assessment and land users are well linked. There are also events where the
qualities of outputs generated become questionable with regard to instrumentation. It is
necessary to acquire up-to-date equipment and continuously upgrade to move along with global
or regional systems. Installation and calibration of the instruments used in the data collection
and analyses should be seriously considered. While some calibrations are done at the national
level; there might be cases where regional or international assistance might be required.
6.3.6 Incoherent Climate Change Regulatory Framework
National and sector policies, and associated legal frameworks are required for successful
adaptation to climate change across all climate vulnerable sectors. The link between national,
sub-national and local levels should be mutually supportive and coherent to guarantee smooth
flow of information. It is important to avoid consequences arising from unforeseen policies that
may result in undermining the objectives of other relevant policies. Sector policies needs to
have sufficient consideration about a long-term climate change scenarios and possible impacts
on the sectors (e.g. agriculture, forestry) and that climate change and adaptation should be
directly referenced. In this respect, there is a need for undertaking a stocktaking of existing
sector policies to identify the extent of incorporating climate change information in the
determination of priorities, objectives and main programmes to be implemented.
National development plans, policies, strategies are not static; instead they vary within a certain
period of time such as medium to long-term. Normally, a given plan that covers a period of 5 to
10-year cyclic time should be periodically revised. Nonetheless, revision should be carried out
based on progress and achievements, knowledge gained; and local, regional and global
changing circumstances. There is increasing justification for forthcoming national development
plans and sector plans (e.g. 2019 -2029) to draw on the analysis and recommendations from
climate change scenarios and vulnerability assessments. The technical inputs provided by
MoLWE and key Environment Units in sector ministries needs to be duly incorporated in the
framework.
6.4 Monitoring and Evaluation (M&E) Plan At present, monitoring and reporting activities is inadequate. The progress of adaptation
activities, both the amount of funds and lessons learned by sector ministries and zoba
administrations are not satisfactory. The need for M & R is important as it focus on concrete
climate change projects and programmes. It also develops certain level of negotiation skills as
to how to acquire project funds from the international sources. Further, it is important to focus
on sustainability issues and impacts assessments on the livelihoods with the potential for up-
scaling of specific technologies. For some sectors, such as health, there is a working monitoring
and reporting system in place to track key health sector indicators involving the support of
UNICEF. Besides limitations in human capacity and inadequate training and access to
resources for regular monitoring, there is insufficient policy framework in place to advance
time and resource investments into national adaptation monitoring and reporting.
Irrespective of the circumstance, a detailed schedule of project reviews meetings need to
developed by the project management, in consultation with project implementation partners and
stakeholder representatives and incorporated in the Project Inception Report need to be worked
out including (i) tentative time frames for project oversight meetings and (ii) project related M
& E activities. For that UNEP should provide periodic funding as per the request of the Project

134
Executing Agency (EA), which is the DoE; and in as much as possible UNEP should be in a
position to provide technical assistance.
Day to day monitoring of implementation progress will be the responsibility of the National
Project Coordinator (PC) based on the Annual Work Plan. The PC will inform the UNEP of
any delays or difficulties faced during project execution so that appropriate support or
corrective measures can be adopted in a timely manner.
Periodic monitoring of implementation progress should be undertaken in collaboration with
UNEP using appropriate means of communication including quarterly tele-conferences with the
project proponent, or more frequently as deemed necessary. This will allow parties to take stock
and to troubleshoot any problems pertaining to the project in a timely fashion to ensure smooth
implementation of project activities. The PC will be responsible for the preparation and
submission of the following reports that form part of the monitoring process including
inception report, quarterly progress report, technical report and other.
135
REFERENCES
African Development Bank, 2009. Interim Country Strategy Paper for Eritrea, Tunis, Tunisia.
AMSC 2018. Groundwater monitoring data sheet. Asmara Mining Share Company:
Groundwater monitoring data of Dbaruwa Area. Asmara, Eritrea.
Asgedom T. and Fitsumbrhan G., 2009. Gash-Barka Livestock and Agricultural Development
Project. Consultancy on the Project Completion Report, the State of Eritrea.
BMSC, 2018. Groundwater monitoring data sheet. Bisha Mining Share Company:
Groundwater monitoring data of Bisha Area. Asmara, Eritrea.
ECMIB, 2007. The State of the Coast, 2006-2007. Eritrean Coastal, Marine and Islands
Biodiversity project, Ministry of marine resources, Massawa, Eritrea.
Euro consults 1998. Sector Study on National Water Resources and Irrigation Potential. Stage I
Draft Report, Groundwater Resources, Volumes 1 & 2, Water Resources Department,
Asmara, Eritrea.
FAO, 1997. Forestry and Wildlife Sector: Pre-investment Study. TCP/ERI 6712. Asmara,
Eritrea.
FAO, 2015. Country profiles: Eritrea. Available at http://www.faostat.fao.org/
FAO/IIASA/ISRIC/ISSCAS/JRC, 2012. Harmonized World Soil Database (version 1.2). FAO,
Rome, Italy and IIASA, Luxemburg, Austria.
Fessehaye M, Y. Brugnara, M. J Savage, S. Brönnimann, 2019. A note on air temperature and
precipitation variability and extremes over Asmara: 1914–2015. International Journal
of Climatology 1 (13).
GoE 1994. Macro Policy, Government of the State of Eritrea.
GOE, 1996. National Environmental Management Plan-Eritrea, Frankfurt am Main, The
Eritrean Agency for the Environment.
GoE, 1997. Legal Notice No. 31, 1997, Department of Land, Ministry of Land Water and
environment.
GOE, 2014. Health Millennium Development Goals Report in Eritrea, Ministry of Health,
Asmara
GoE, 2017. Environmental Protection and Management Regulations; Legal Notice No.
127/2017
Haddas Eritrea Newspaper, 2019. Tigrigna version on the control of Bilharzias in Eritrea.
Tigrigna version (local language) of Nov 9, 2019.
Hinkel, J., 2011. Indicators of vulnerability and adaptive capacity: towards clarification of the
science policy interface. Global Environment Change 21: 198-208.
IFPRI, 2012. Strategies for Adapting to Climate Change in Rural Sub-Saharan Africa:
Targeting the Most Vulnerable, Washington, ASARECA.
136
IPCC 2006, 2006. IPCC Guidelines for National Greenhouse Gas Inventories, Prepared by the
National Greenhouse Gas Inventories Programme, Eggleston H.S., Buendia L., Miwa
K., Ngara T., and Tanabe K. (eds); Published by IGES, Japan.
IPCC, 1996. Revised IPCC Guidelines for National Greenhouse Gas Inventories.
IPCC, 2003. Good Practice Guidance and Uncertainty Management in National Greenhouse
Gas Inventories.
IPCC, 2007. Impact, Adaptation and Vulnerability. Geneva. Switzerland.
IPCC, 2014. Climate Change 2014: Synthesis Report. Contribution of Working Groups I, II and
III to the Fifth Assessment Report of the Intergovernmental Panel on Climate Change
IPCC, Geneva, Switzerland.
MoLWE, 2009. Integrated Water Resources Management Plan, Department of Water, Asmara
Lindstrom, G. and S. Bergstrom, 2004. Runoff trends in Sweden 1807–2002. Hydrological
Science Journal 49 (1): 69–83.
Lingaraj, B. J., H. Upadhyay, S. Ghosh, S. Balakishman, A. Mishra, S. Bhadwa and S. Nair.
2014. A Frame work for Climate Change Vulnerability and policy Assessment: Project
on Climate Change Adaptation in Rural Areas of India. New Delhi, India.
McSweeney, M. New and G. Lizcano. 2010. Eritrea UNDP Climate Change Country Profiles.
School of Geography and Environment, University of Oxford and Tyndall Centre for
Climate Change Research.
Menghistab G., Tesfai T. Woldeselassie O., Woldeamlak A., Simon M., Semere A. 2019.
Understanding Drought Coping Mechanisms in Smallholder Farm Households:
Evidence from Dry Lands of Eritrea. Journal of Agricultural Economics and Rural
Development 5 (1): 548-554.
Measho Simon, Chen Baozhang, Trisurat Yongyut, Pellikka Petri, Guo Lifeng, Arunyawat
Sunsanee, Tuankrua Venus , Ogbazghi Woldeselassie and Yemane Tecle, 2019. Spatio-
Temporal Analysis of Vegetation Dynamics as a Response to Climate Variability and
Drought Patterns in the Semiarid Region, Eritrea. Remote Sensing.11: 724 -747;
doi:10.3390/rs11060724.
MHDG, 2014. Millennium Health Development Goals Report: Innovations Driving Health
Millennium Development Goals in Eritrea. Asmara, Eritrea.
MoA and DoE. 2019. Terminal Evaluation on Climate change adaptation program in water
and agriculture in Anseba region, Eritrea. Asmara, Eritrea.
MOA, 2002. the National Action Program for Eritrea to Combat Desertification and Mitigate
the Effects of Drought, Ministry of Agriculture, Asmara, Eritrea.
MoA, 2006. Forest and Wildlife Conservation & Development Proclamation No. 155/2006.
MoA, 2016. Annual Report, Ministry of Agriulture Department of Statistics, Asmara.

137
MoA, 2017a. Base line socio economic survey in support of Agriculture and Food security in
all zobas of Eritrea. Bureau of Standards and Evaluation for the Ministry of
Agriculture, Asmara, Eritrea.
MoA, 2017b. Final Country report of the LDN targets setting programmes in Eritrea, Ministry
of Agriculture.
MoA, 2018. The Minimum Integrated Household Agricultural Package (MIHAP) for Self-
sufficiency in small farm households in Eritrea. Asmara, Eritrea.
MoA, 2019. Land use Land covers Data Collected and Compiled for TNC, Asmara, Eritrea.
MoE, 2004. National Gender Plan of Action (2003-2008), Ministry of Education, the
Government of the State of Eritrea, Asmara
MOE, 2013. Enhancing Equitable Access to Quality Basic Education for Social Justice,
Asmara, Eritrea
MoEM, 2018. Ministry of Energy and Mines Annual Report, Asmara.
MoH, 2016. Situation Analysis of the Health Sector. Asmara, Eritrea.
MoH, 2018. Health Management Information System (HMIS). Ministry of Health Report 2019.
Asmara, Eritrea.
MoLHW, 2018a. Assessment of Hazards and Proposals for Community Based Mitigation and
Management measures of disaster risks for Northern red sea Zone Administration,
Ministry of Labour and Human Welfare, Asmara.
MoLHW, 2018b. Assessment of Hazards and Proposals for Community Based Mitigation and
Management measures of disaster risks for Southern red Sea \adminitrion, Ministry of
Labour and Human Welfare, Asmara.
MoLWE, 2000. Initial National Communications, Department of Environment Asmara.
MoLWE, 2001. National Communication under the United Nations Frame work Convention on
Climate Change (UNFCCC) Asmara, Eritrea.
MoLWE, 2005. Review of Impact of Climate Change on Water Sector Eritrea and Adaptation
Strategies/Measures. Asmara, Eritrea.
MoLWE, 2007. Country Strategy on Integrated Water Resources Management, Water
Resource Department, Asmara, Eritrea.
MoLWE, 2007. National Adaptation Programme of Action (NAPA), the Department of
Environment, Asmara.
MOLWE, 2007. Water Balance Frame Work for Analysis and Planning in Eritrea, Asmara,
Eritrea.
MoLWE, 2009. Integrated Water Resource Management, Asmara, Department of Water
resources Development.
MoLWE, 2010. Water Law, Proclamation No. 162 /2010, 2010, Water Resources Development
Department, Asmara.
138
MoLWE, 2012. Eritrea Second National Communication under the United Nations Framework
Convention on Climate Change (UNFCCC), Ministry of Land Water and Environment,
Deprtment of Environment, Asmara.
MoLWE, 2018. Nationally Determined Contributions (NDCs) Report to UNFCCC, Department
of Environment, the State of Eritrea Asmara.
MoLWE. 1999. Eritrea Biodiversity Stock Taking Assessment Report. Asmara, Eritrea.
MoMR, 2018. Fish Inspection Quality Control Division Report, Asmara, Eritrea
MoND, 2004. Interim- Poverty Reduction Strategy Paper (I-PRSP), Asmara, Eritrea.
MoTC, 2016. Annual report, Ministry of Transport and Communication .
MoTI, 2020. Archieves, Ministry of Trade and Industry, Asmara, Eritrea
MoLWE, 2007. Survey on solid waste management status of the major cities and towns of
Eritrea, Deprtment of Environment, Ministry of Land Water and Environment, Asmara,
Eritrea
NSO, 2010. Eritrea Population and Health Survey (EPHS) National Statistics Office, Asmara
Eritrea.
ODA, 2011. Progress in Health in Eritrea: Cost effective inter-sector interventions, UK.
Sander, P., 1996. Remote Sensing and GIS for Groundwater Assessment in Hard Rocks:
Applications to water well sitting in Ghana and Botswana. PhD dissertations submitted
to Chalmers University of Technology, Sweden.
Solomon, S and F. Quiel. 2006. Groundwater study using remote sensing and geographic
information systems (GIS) in the central highlands of Eritrea. Hydrogeology Journal
(2006), pp. 729–741.
Tekie, A. 2019. National Circumstances for the Health Sector, the State of Eritrea, Ministry of
Health, Asmara, Eritrea.
Tollefson, 2016. 2015 declared the hottest year on record. Nature 29 (7587): 450–451.
https://doi.org/10.1038/nature.2016.19216.
UNDAF, 2006. Eritrea: United Nations Development Assistant Framework. Asmara, Eritrea.
UNDP, 2004. Adaptation Policy Framework for Climate Change: Developing strategies,
policies and measures. United Nations Development Program, New York.
UNDP, 2010. Climate change adaptation programme in water and agriculture in Anseba region,
Eritrea. Project document, Asmara, Eritrea.
Waithaka, Michael, Gerald C. Nelson, Timothy S. Thomas, and Miriam Kyotalimy (ditors)
2012. East African Agriculture and Climate Change A Comprehensive Analysis,
International Food Policy Research Institute Washington, DC.
WHO, 2017. ‘WHO Country Cooperation Strategy 2009–2013.’ Brazzaville: WHO Regional
Office for Africa.

139
Woldeamlak A, Menghisteab G. and Senay G., 2014. Beneficiary Impact Assessment Post
Crisis Rural Recovery Development Program and Post Crisis Rural Recovery
Development Program Add-on in Gash Barka and Zoba Debub. Asmara, Eritrea.
Woldeamlak A., Woldeselassie O. and Bissrat G., 1998. Vulnerability and Adaptation of
Eritrean Agriculture in view of Climate Change. A paper presented in Climatic Change
Workshop from Sept 3-4, 1998. Asmara, Eritrea.
www.sciencemag.org Science. 2010. Coral Growth in the Central Red Sea; American
Association to the Advancement of Science 329.
People’s Front for Democracy and Justice (PFDJ) National Charter. Adopted by the 3rd
Congress of the EPLF/PFDJ Nakfa, February 10-16, 1994
Government of the State of Eritrea. March, 2018. Nationally Determined Contributions
(NDCs) Report to UNFCCC. Asmara, Eritrea.

140
Annexes-A: TNC Preparation and Coordinating System
Annex-A1: List of Experts responsible for Quality Assurance and Quality Control
S. no Full Name Contact information Role Organisation
1 Mr. Kibrom Asmarom [email protected]
Tele:002917154731
Project Supervisor MoLWE
2 Dr. Woldeselassie Ogbazghi [email protected] Lead Consultant Hamelmalo Agricultural College,
department of Land Resources and
Environment, HAC
3 Prof. Woldeamlak Araia
[email protected] Tele: 002917154593
Consultant Hamelmalo Agricultural College,
department of Agronomy, NHERI
4 Dr. Woldetnsae Tewolde
[email protected] Tel:002917195457
Consultant Adi Keih College of Business and Social
Science, department of geography NHERI
5 Mr. Haben Haile
[email protected] Tele:002917131730
consultant College of Science, Department of
Chemistry
6 Mr. Teame Tekleab [email protected]
Tele: 002917266389
Quality Assurance MoLWE
7 Mr. Robel Kibrom [email protected]
Tele:002917338151
Quality Assurance MoLWE

141
Annex-A2: List of Experts and Consultants participated in TNC preparation
Full
Name
Contact
information Role Organisation
Mr. Michael Berhane
Provide activity data and information used to assess the vulnerability of the Agricultural sector to climate change and related to the sector have
been appropriately integrated, to the document GHG emission data, efforts that have been undertaken to adapt to climate change; validate data and information
Ministry of Agriculture, Department of Agricultural Extension
Mr. Solomon Sium [email protected] Tele: 002917131511
Gather information and data related to Industrial greenhouse gases emissions and emitting and all efforts that have been undertaken in the sector to minimize GHGs emissions. Ensure all information related to the sector appropriately captured in the document
Ministry of trade and Industry
Mr. Haile Selassie Tsegai
Tele: 002917463219 [email protected]
Gather/Provide data on water resources and relevant information that are
used to assess the vulnerability of water resources to climate change and ensure that the issues related to the sector have been addresses appropriately.
MoLWE, Department of Water resources
Mr. Tesfamariam Woldegebriel
Tele: 002917126006
Provide (gather) data and information related to the transport sector that
is used in determining the GHGs emissions; and mitigations efforts of the sector. Fuel consumption by sector, number of vehicles by types, models, year of productions and related regulations that contribute to the reduction of GHgs emission. Information related to efforts that have been undertaken in the reduction of greenhouse gases.
Ministry of Transport and Communication
Mr. Tesfai
Gebrehiwet [email protected]
National fuel consumption of the sector, efforts that has been undertaken to improve electricity generation, consumption. On top of this, he was responsible to determine the GHGs emission from the inventory and perform the mitigation assessment and analyses; gave general training on the application of the different models for GHGs inventory and mitigation assessment and analyses. Participated in the preparation of draft reports on these components.
MoEM
Mr. Teklezghi Tekie
Provide information on land use and vulnerability of land resources to climate change. Provided activity data that contribute to GHGs emission and efforts used and efforts undertaken to reduce the vulnerability and GHGs emissions (AFOLU); and ensured that issues related to the sector
are appropriately integrated.
Department of Land MoLWE

142
Mr. Tekie Abraha
Tele: 002917454641
Provided information related to the vulnerability of the health sector and efforts that have been under the sector to mitigate and adapt to climate
change. Prevalence of climate change induced human health problems such as Malaria, Dengue and Chikungunya)
Department of Public
health, Ministry of Health
Mr. Petros Araia [email protected] Tele: 002917433460
Provide data related to Forestry and wildlife that is used the vulnerability of the sector (AFOLU); and the sub-sectors contributing in carbon
sequestration (sinks) and the efforts, so far, carried out to combat climate change (mitigation and adaption) i.e. forest cover by type, reforested and afforested areas in ha, tree number, deforestation rate and other relevant data pertaining to climate change.
Forestry and Wildlife Authority
Mr. Andemicahel Hidru
@gmail.com
Provide data and information on marine resources that is used to assess
the vulnerability of the sector to climate change and ensure that the issues related to this sector have been addressed appropriately. He also availed activity data that is used foe estimating GHGs emissions and efforts that have been carried out so far to reduce vulnerability and emissions.
MoMR
Mr. Mulubrhan
Gebreyohannes [email protected]
Provided /collected data and information on the waste sector that is used to assess the GHG emission from the sector; and availed feedback on the efforts that have been carried out to reduce greenhouse gases emissions. Prepared a concise report on national waste management i.e. (solid waste, liquid, etc.).
Ministry of Local
Government
Mr. Dawit Berhane [email protected] Tele: 002917140670
Having prior training during the second national communication, he undertook training on the vulnerability of the water resources to climate change. He also assisted in identifying relevant water resources data and information; and prepared concise report on the water sector.
Segen Construction pt. Lt.
Mr. Michael Haile Tel: 002917122406
Provided social, economic, data and formation relevant to assessment of climate change vulnerability, adaption, and mitigation components. Previous efforts and future plans of the sector and other relevant sectors that would contribute to the adaption and mitigation to climate change.
Ministry of Local Government
Mr. Mebrahtu Zewde
[email protected] Tel: 002917176393
Logistical arrangements i.e. meetings seminars, and taking care of the management issues.
National Bureau of Standards and Evaluation, NHERI

143
Annex-B: Implemented Adaption projects
Annex B1: Smart Agriculture Practiced by Farming Community
Aspects of smart
agriculture
Description
Choice of Crops
And KYR Varieties
Eritrea is a centre of diversity for a number of crop species and land races. Farmers use drought resistant crops such as sorghum,
pearl millet and barley in locations that have drought problems. These crops mature earlier which is a drought escape mechanism. There are also a number of landraces that have grown for generations and adapting the existing climate situations. A total of 76percent of the households use landraces from their own source.
Inter Tillage
Cultivation
Inter tillage cultivation is practiced for sorghum and pearl millet when the crop reaches knee height stage. Inter tillage cultivation
helps for better moisture conservation or water harvesting in the crop field, provides proper aeration in the soil; minimizes weed infestation and provides better nutrient supply. About 98 % of the farmers in Gash Barka and 94percent in Anseba practice inter-tillage cultivation for sorghum and pearl millet.
Intercropping/ Mixed Cropping
Two or more crops are grown in the same land and in the same year with or without raw arrangements. The intercropping/mixed cropping has advantages such as yield stability, insurance for the farmers during periods of drought because if one crop fails then
farmers could get the harvest of the second crop and reduce the infestation of insects, diseases and weeds.
Minimum Tillage: This is ploughing the land only once during planting (0+1) for covering the seed or it is 1 + 1 ploughing which is one time ploughing before planting and additional ploughing for covering the seed during planting. Minimum tillage creates a coarse seed bed for better moisture conservation, preventing soil erosion/runoff, maintains the soil structure and minimizes the loss of soil
fertility.
Improved Varieties for Smart Agriculture
Examples of improved varieties developed in the face of smart agriculture are Kona in pearl millet which is adaptable to drought and hot areas. The variety is early maturing and disease resistant that gives a yield range from 12 to 21 qt/ha. The same thing can be noted in sorghum with improved varieties released such as Shambucco, Bushuka and Hamelmalo. The varieties are early maturing and drought resistant and relatively high yielding types adapted in the western lowlands and mid altitude areas. There are also barley
varieties developed such as Shishay and Rahwa that are early maturing and high yielding.
Land Races for Smart Agriculture
Eritrea is a centre of diversity for a number of crops such as barley, sorghum and pearl millet. The landraces that needs high water requirement and late maturing that were grown by farmers have disappeared. The landraces that are relatively drought tolerant and early maturing have survived for generations. For example the landraces of barley grown includes Tsada-sgem and in wheat-Italy.
There are various landraces of pearl millet such as Bariyay and sorghum- Wedi Aker, Koden etc. that have survived for generations in the face of climate change.

144
Annex B2: Specific Needs, Options & Priorities in Climate Change and Related Thematic Areas S. no Activities Objectives
1 Establish national climate change secretariat To enable the effective identification of sector- specific climate change related challenges and proposed approaches to tackle them to appropriately responds to the requirements of the UNFCC Convention,
2 Develop an integrated implementation programme to take into account the roles of research and training in capacity building
3 Develop and enhance technical capacities and skills
Carry out and effectively integrate vulnerability and adaptation assessments into sustainable development programmes; and implement national adaptation programmes of action
4 Development of National Climate change strategy and National Mitigation Action Plan
To enable the country appropriately address climate change adaptation and mitigation programmes at various levels.
5 Strengthen existing national research and development programmes
equip research centres e.g. the National Agricultural Research Institutes (NARI), Hamelmalo Agricultural College (HAC), National Energy Research & Training Centre; (Renewable energy training centre) and Marine resources research centre To strength institutional and human capacity to ensure sustainability of climate mitigation and
adaption projects and programmes.
6 Strengthen the capacity of meteorological and & hydrological services
Enhance the human and institutional capacity; Equip the regions with the necessary tools and equipment to collect, analyse, interpret; and disseminate weather and climate information to support implementation of national adaptation
programmes of action, mitigation and adaptation strategies formulated in the national communications
7 Enhance public awareness Increase the level of understanding and human capacity development through various means: media and press, booklets and brochures.
8 Enhance effective participation in the Kyoto protocol meetings to move in tandem with the on-going processes
Tap opportunities in the CDM to enable Eritrea effectively mobilise its resources; Strengthen the technical, institutional and managerial capacity of stakeholders to effectively prepare CDM project Enhance/build capacity CDM project and formulation including monitoring and evaluation
9 Strengthen institutional capacity to integrate traditional knowledge into modern systems to address climate change
Support/enable existing national institutions to incorporate traditional skills, knowledge and practices; Provide appropriate services and facilitate information sharing to the required level mobilize existing national, sub-regional and regional institutions on existing processes and endogenous capacities;

145
S. no Activities Objectives
10 Establish an early warning systems for climate related natural disaster management e.g. drought
Reduce the disaster risk; enhance the coping range of the country as a whole and individuals/communities in the face of climate hazards. Disseminate information on the magnitude of eminent disaster risks such as drought.
11 Rehabilitate degraded lands and combat desertification
Implement the proposed 23 Project Profiles in 2002 indicated in the National Action Plan (NAP) of UNCCD. Enhance the awareness on land degradation as key environmental concerns that compromise Eritrea’ adaptive capacity.
12 Mobilizing financial resources and political will s Mobilise financial resources to implement projects that have been identified in the NAPA, NBSAP, INC, SNC Create enabling environment to fully implement the proposed projects.

146
Annex-B3: Climate Change- Specific Projects Implemented Under GEF-SGP, 2009-2019
Administrative
Region
Focal area Name of projects Year Budgets
(USD)
Anseba Climate specific
Mahabesh Watershed Management 2018 49,990
Adi Berbere Watershed Management 50,000
Gabgabo Watershed Management 50,000
Semenawi Keih Bahri
Harena Community Based Fish Development for improved Livelihood using Fish Aggregating Devices (FAD)
2019 39,020
Debub Demonstration of low carbon solar home systems and afforestation in Qnafna in Zoba Debub 2013 149,998
Bio-Gas as alternative source of energy for Environmental protection and improving livelihood at household level
2010 31,128
Solar powered IT system for the schools of Adibeza and Adi-Gulti in sub- region Areza 47,019
Semenawi Keih
Bahri
Biodiversity Traps in Maedir village to conserve Biodiversity and improve community livelihood 2019 84,528.00
Introduction of Fish Traps in Gelealo village to conserve Biodiversity and improve community livelihood,
2019 248,264
Rehabilitation of Hirgigo Mangrove Forests and Improving Communities' Livelihood 2009 50,000
Maekel Land Degradation
Azien - Quazien Community Based Afforestation Programme Maekel 2013 50,000
Community -based Gulie micro watershed Management in Gala Nefhi Sub region 2013 50,000
Community - based Rehabilitation of Degraded Land through fruit trees 2013 50,000
Rehabilitation of Land Degradation through Afforestation and Introduction of Compost in Serejeka Sub region
2013 50,000;
Weki - Zager Community Based Afforestation Programme 2013 50,000
Rehabilitation of Degraded Catchments in Elaberd sub - region 2012 50,000;
Rehabilitation of Degraded Sub catchments in Gala-Nefhi sub region 2012 50,000
Debub Community based Watershed Management in Dbaruwa Sub region 2013 50,000
Gash-Barka Community Based Watershed Management in Laelai Gash sub region 2013 50,000
Anseba Gerger Integrated Watershed Management in Gelb, Sub region, 2013 50,000
Promotion of Community Based Afforestation and Soil & Water Conservation at Sub Zoba Adi -Tekelezan
2010 33,018;
Promotion of community afforestation and land reclamation in Sub zoba Adi-Tekelezan
Anseba
2010; 25,568;
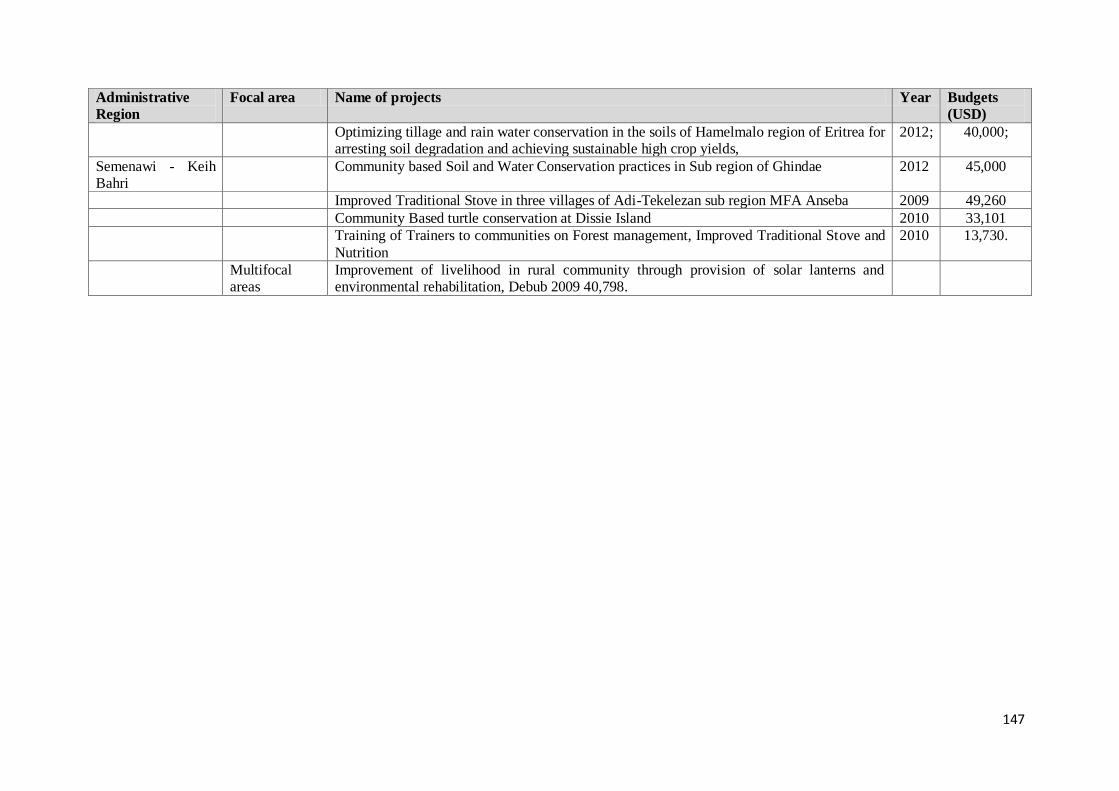
147
Administrative
Region
Focal area Name of projects Year Budgets
(USD)
Optimizing tillage and rain water conservation in the soils of Hamelmalo region of Eritrea for arresting soil degradation and achieving sustainable high crop yields,
2012; 40,000;
Semenawi - Keih Bahri
Community based Soil and Water Conservation practices in Sub region of Ghindae 2012 45,000
Improved Traditional Stove in three villages of Adi-Tekelezan sub region MFA Anseba 2009 49,260
Community Based turtle conservation at Dissie Island 2010 33,101
Training of Trainers to communities on Forest management, Improved Traditional Stove and
Nutrition
2010 13,730.
Multifocal areas
Improvement of livelihood in rural community through provision of solar lanterns and environmental rehabilitation, Debub 2009 40,798.

148
Annex-B4: National Policies, rules, regulations and guidelines No National policies, legal Documents References
1 Macro Policy, 1994 GoE, 1994
2 National Economic Policy Framework and programme (NEPFP), 1998 GoE, 1998-2000
3 Interim-Poverty Reduction Strategy Paper (I-PRSP), 2003 GoE, 2003
4 Five Year Indicative Development Plan (FYIDP), 2009 GoE, 2009
Agriculture
5 National Agricultural Development Strategy and Policy MoA, 2005
6 Plant Quarantine Proclamation, No.156/2006 MOA, 2006
7 Agricultural Sector Policy and Strategy framework MOA, 2006
8 Forest and Wildlife Policy MoA, 2005
9 Agriculture Sector Policy MoA, 2006
10 Forest and Wildlife Conservation & Development Proclamation No. 155 MoA, 2006
11 National Action Program (NAP) for the UNCCD, MoA, 2002
12 ODS Terminal Phase-out Management plan 2008 MoA, 2008
13 Registration for Importation, Handling, Use, Storage and Handling of Pesticides MoA, 2006
Energy
14 Renewable Energy Sub-Sector policy MoEM, 1997
Health
15 Guidelines for indoor residual spraying, 2017 MOH 2017
16 Training manual for indoor residual spraying, 2017 MOH, 2017
17 Insecticide Resistance Monitoring and Management plan, 2015 MOH, 2015
18 Policy and Guidelines For Malaria Control in Eritrea, 2003 MOH, 2003
19 Environmental Health Policy and Guidelines, 1998 MOH, 1998
Land, Water and Environment
20 The Eritrean Environmental Protection, Management & Rehabilitation Framework Proclamation No. 179/2017, 2017 MLWE, 2017
21 Environmental Protection and Management Regulations- Legal Notice No. 127/2017 MLWE, 2017
22 Eritrean National Code of Conduct for Environmental Security MLWE, 1995
23 National Environnemental Management Plan (NEMP), 1995 MoLWE, 1995

149
No National policies, legal Documents References
24 National Environmental Assessment Procedures & Guidelines (NEAPG), 1999 MoLWE, 1999
25 Land Use Policy, 2007 MoLWE, 2007
26 Water Policy , 2010 MoLWE, 2010
27 National Biodiversity Strategy and Action Plan, 1996, 1999, 2015 MoLWE, 1996, 1999, 2015
28 Proclamation on Conservation of Biodiversity, 1998 MoLWE, 1998
29 Bio safety Policy Framework, 2007 MoLWE, 2007
30 National Adaptation Program of Action (NAPA), 2007 MoLWE, 2007
31 Land law Proclamation No.58/1994, 1998 MoLWE, 1994
32 Legal Notice No. 31, 1997 MoLWE, 1997
33 Land Use Planning Regulatory Framework, 1999 MoLWE, 1999
34 Integrated Water Resource Management, 2003 MoLWE, 2009
35 Water Law, Proclamation No. 162 /2010, 2010 MoLWE, 2010
36 Five Year Action Plan for The Great green wall initiative, 2015 MoLWE, 2011-2015
37 Hydro-Chloro-Floro-carbon Phase-out Management Plan (HPMP), 2010 MoLWE, 2010
38 Regulations for the Issuance of Permit for the Importation or exportation of Ozone Depleting Substances (ODS) and ODS Based Equipment or Products, 2010
MoLWE, 2010
39 Initial National Implementation plan (NIP) for the Management of POPs-chemical, 2012 MoLWE,2012
40 Updated NIP for the Management of POPs, 2018 MLWE, 2012
Marine resources
41 Eritrea Integrated Coastal Area Management (ICAM), 2007 MoMR, 2007
42 National Coastal Policy (draft) , 2006 MoMR, 2006
43 Proclamation No. 176/2014 the Fisheries Proclamation: MoMR, 2014

150
Annex-C: National Emissions and Removals
Annex-C1: Key Summary of GHG Emission (2015)
Emissions
(Gg)
Emissions
CO2 Equivalents (Gg)
Emissions
(Gg)
Categories Net CO2
(1)(2) CH4 N2O HFCs PFCs SF6
Other halogenated
gases with CO2
equivalent
conversion factors
(3)
Other halogenated
gases without
CO2 equivalent
conversion factors
(4)
NOx CO NMVOCs SO2
Total National Emissions and Removals 565.411 150.233 0.462 14.234 0.0 0.0 0.0 0.0 0.0 0.0 0.0 0.0
1 - Energy 607.161 6.898 0.104 0.0 0.0 0.0 0.0 0.0 0.0 0.0 0.0 0.0
1.A - Fuel Combustion Activities 607.161 6.898 0.104 0.0 0.0 0.0 0.0
1.B - Fugitive emissions from fuels 0.0 0.0 0.0 0.0 0.0 0.0 0.0
1.C - Carbon dioxide Transport and
Storage 0.0 0.0 0.0 0.0 0.0
2 - Industrial Processes and Product Use 169.556 0.0 0.0 14.234 0.0 0.0 0.0 0.0 0.0 0.0 0.0 0.0
2.A - Mineral Industry 169.556 0.0 0.0 0.0 0.0 0.0 0.0
2.B - Chemical Industry 0.0 0.0 0.0 0.0 0.000 0.0 0.0 0.0 0.0 0.0 0.0 0.0
2.C - Metal Industry 0.0 0.0 0.0 0.0 0.000 0.0 0.0 0.0 0.0 0.0 0.0 0.0
2.D - Non-Energy Products from Fuels and
Solvent Use 0.0 0.0 0.0 0.0 0.0 0.0 0.0
2.E - Electronics Industry 0.0 0.0 0.0 0.0 0.0 0.0 0.0 0.0 0.0 0.0 0.0 0.0
2.F - Product Uses as Substitutes for Ozone
Depleting Substances 14.234 0.0 0.0 0.0 0.0 0.0 0.0
2.G - Other Product Manufacture and Use 0.0 0.0 0.0 0.0 0.0 0.0 0.0 0.0 0.0 0.0 0.0 0.0
2.H - Other 0.0 0.0 0.0 0.0 0.0 0.0 0.0
3 - Agriculture, Forestry, and Other Land
Use -212.319 142.037 0.359 0.0 0.0 0.0 0.0 0.0 0.0 0.0 0.0 0.0
3.A - Livestock 142.037 0.359 0.0 0.0 0.0 0.0
3.B - Land -209.183 0.0 0.0 0.0 0.0 0.0
3.C - Aggregate sources and non-CO2
emissions sources on land 0.000 0.0 0.0 0.0 0.0 0.0 0.0
3.D - Other -3.136 0.0 0.0 0.0 0.0 0.0 0.0
4 - Waste 1.013 1.297 0.0 0.0 0.0 0.0 0.0 0.0 0.0 0.0 0.0 0.0
4.A - Solid Waste Disposal 1.297 0.0 0.0 0.0 0.0
4.B - Biological Treatment of Solid Waste 0.0 0.0 0.0 0.0 0.0 0.0
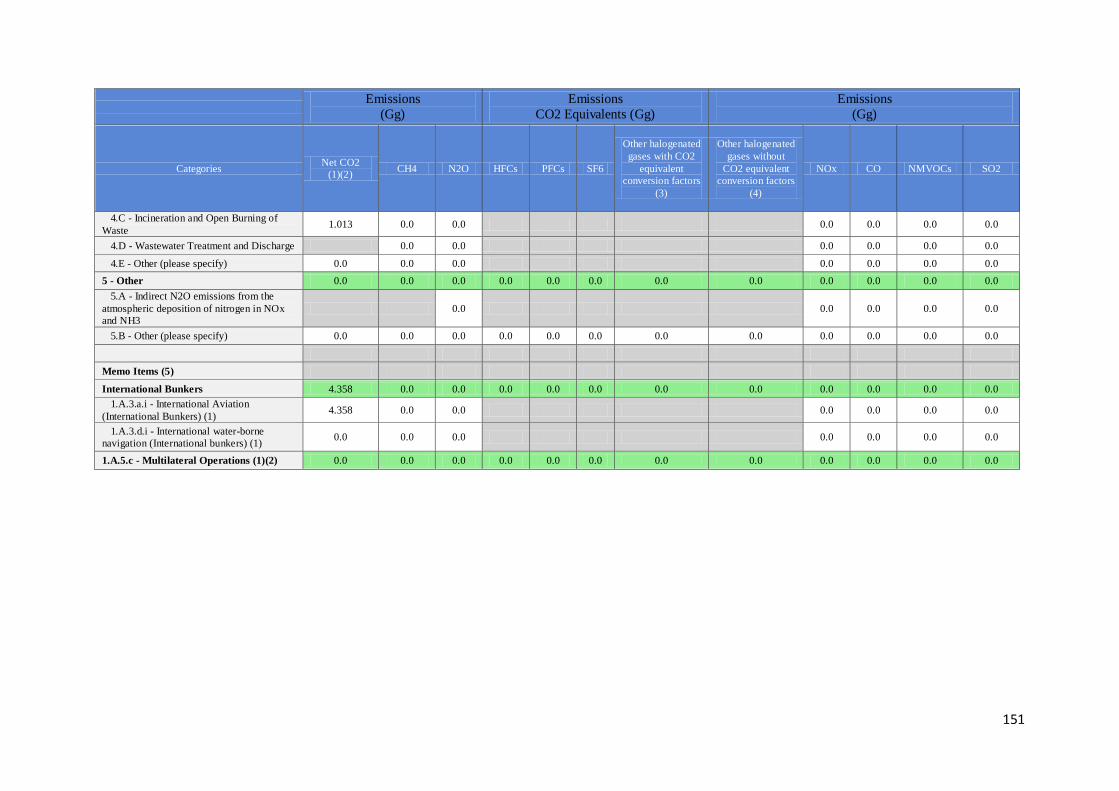
151
Emissions
(Gg)
Emissions
CO2 Equivalents (Gg)
Emissions
(Gg)
Categories Net CO2
(1)(2) CH4 N2O HFCs PFCs SF6
Other halogenated
gases with CO2
equivalent
conversion factors
(3)
Other halogenated
gases without
CO2 equivalent
conversion factors
(4)
NOx CO NMVOCs SO2
4.C - Incineration and Open Burning of
Waste 1.013 0.0 0.0 0.0 0.0 0.0 0.0
4.D - Wastewater Treatment and Discharge 0.0 0.0 0.0 0.0 0.0 0.0
4.E - Other (please specify) 0.0 0.0 0.0 0.0 0.0 0.0 0.0
5 - Other 0.0 0.0 0.0 0.0 0.0 0.0 0.0 0.0 0.0 0.0 0.0 0.0
5.A - Indirect N2O emissions from the
atmospheric deposition of nitrogen in NOx
and NH3
0.0 0.0 0.0 0.0 0.0
5.B - Other (please specify) 0.0 0.0 0.0 0.0 0.0 0.0 0.0 0.0 0.0 0.0 0.0 0.0
Memo Items (5)
International Bunkers 4.358 0.0 0.0 0.0 0.0 0.0 0.0 0.0 0.0 0.0 0.0 0.0
1.A.3.a.i - International Aviation
(International Bunkers) (1) 4.358 0.0 0.0 0.0 0.0 0.0 0.0
1.A.3.d.i - International water-borne
navigation (International bunkers) (1) 0.0 0.0 0.0 0.0 0.0 0.0 0.0
1.A.5.c - Multilateral Operations (1)(2) 0.0 0.0 0.0 0.0 0.0 0.0 0.0 0.0 0.0 0.0 0.0 0.0

152
Annex-C2: GHG Emission from Energy Sector (2015)
Emissions
(Gg)
Categories CO2 CH4 N2O NOx CO NMVOCs SO2
1 - Energy 607.161 6.898 0.104 0.0 0.0 0.0 0.0
1.A - Fuel Combustion Activities 607.161 6.898 0.104 0.0 0.0 0.0 0.0
1.A.1 - Energy Industries 259.290 0.007 0.003 0.0 0.0 0.0 0.0
1.A.1.a - Main Activity Electricity and Heat Production 259.290 0.007 0.003 0.0 0.0 0.0 0.0
1.A.1.a.i - Electricity Generation 158.213 0.006 0.001 0.0 0.0 0.0 0.0
1.A.1.a.ii - Combined Heat and Power Generation (CHP) 0.0 0.0 0.0 0.0
1.A.1.a.iii - Heat Plants 101.077 0.001 0.002 0.0 0.0 0.0 0.0
1.A.1.b - Petroleum Refining 0.0 0.0 0.0 0.0
1.A.1.c - Manufacture of Solid Fuels and Other Energy Industries 0.0 0.0 0.0 0.0 0.0 0.0 0.0
1.A.1.c.i - Manufacture of Solid Fuels 0.0 0.0 0.0 0.0
1.A.1.c.ii - Other Energy Industries 0.0 0.0 0.0 0.0 0.0 0.0 0.0
1.A.2 - Manufacturing Industries and Construction 21.505 0.001 0.0 0.0 0.0 0.0 0.0
1.A.2.a - Iron and Steel 0.0 0.0 0.0 0.0
1.A.2.b - Non-Ferrous Metals 0.0 0.0 0.0 0.0 0.0 0.0 0.0
1.A.2.c - Chemicals 0.0 0.0 0.0 0.0
1.A.2.d - Pulp, Paper and Print 0.0 0.0 0.0 0.0
1.A.2.e - Food Processing, Beverages and Tobacco 0.0 0.0 0.0 0.0
1.A.2.f - Non-Metallic Minerals 0.0 0.0 0.0 0.0
1.A.2.g - Transport Equipment 0.0 0.0 0.0 0.0
1.A.2.h - Machinery 0.0 0.0 0.0 0.0
1.A.2.i - Mining (excluding fuels) and Quarrying 0.0 0.0 0.0 0.0
1.A.2.j - Wood and wood products 0.0 0.0 0.0 0.0
1.A.2.k - Construction 0.0 0.0 0.0 0.0
1.A.2.l - Textile and Leather 0.0 0.0 0.0 0.0
1.A.2.m - Non-specified Industry 21.505 0.001 0.0 0.0 0.0 0.0 0.0
1.A.3 - Transport 196.529 0.023 0.010 0.0 0.0 0.0 0.0
1.A.3.a - Civil Aviation 0.0 0.0 0.0 0.0 0.0 0.0 0.0
1.A.3.a.i - International Aviation (International Bunkers) (1)
1.A.3.a.ii - Domestic Aviation 0.0 0.0 0.0 0.0 0.0 0.0 0.0

153
Emissions
(Gg)
Categories CO2 CH4 N2O NOx CO NMVOCs SO2
1.A.3.b - Road Transportation 196.529 0.023 0.010 0.0 0.0 0.0 0.0
1.A.3.b.i - Cars 0.0 0.0 0.0 0.0
1.A.3.b.i.1 - Passenger cars with 3-way catalysts 0.0 0.0 0.0 0.0
1.A.3.b.i.2 - Passenger cars without 3-way catalysts 0.0 0.0 0.0 0.0
1.A.3.b.ii - Light-duty trucks 0.0 0.0 0.0 0.0
1.A.3.b.ii.1 - Light-duty trucks with 3-way catalysts 0.0 0.0 0.0 0.0
1.A.3.b.ii.2 - Light-duty trucks without 3-way catalysts 0.0 0.0 0.0 0.0
1.A.3.b.iii - Heavy-duty trucks and buses 0.0 0.0 0.0 0.0
1.A.3.b.iv - Motorcycles 0.0 0.0 0.0 0.0
1.A.3.b.v - Evaporative emissions from vehicles 0.0 0.0 0.0 0.0
1.A.3.b.vi - Urea-based catalysts 0.0 0.0 0.0 0.0 0.0
1.A.3.c - Railways 0.0 0.0 0.0 0.0
1.A.3.d - Water-borne Navigation 0.0 0.0 0.0 0.0
1.A.3.d.i - International water-borne navigation (International bunkers) (1)
1.A.3.d.ii - Domestic Water-borne Navigation 0.0 0.0 0.0 0.0
1.A.3.e - Other Transportation 0.0 0.0 0.0 0.0
1.A.3.e.i - Pipeline Transport 0.0 0.0 0.0 0.0
1.A.3.e.ii - Off-road 0.0 0.0 0.0 0.0
1.A.4 - Other Sectors 129.838 6.867 0.091 0.0 0.0 0.0 0.0
1.A.4.a - Commercial/Institutional 56.210 0.232 0.003 0.0 0.0 0.0 0.0
1.A.4.b - Residential 48.160 6.631 0.087 0.0 0.0 0.0 0.0
1.A.4.c - Agriculture/Forestry/Fishing/Fish Farms 25.467 0.003 0.0 0.0 0.0 0.0 0.0
1.A.4.c.i - Stationary 25.467 0.003 0.0 0.0 0.0 0.0 0.0
1.A.4.c.ii - Off-road Vehicles and Other Machinery 0.0 0.0 0.0 0.0
1.A.4.c.iii - Fishing (mobile combustion) 0.0 0.0 0.0 0.0
1.A.5 - Non-Specified 0.0 0.0 0.0 0.0
1.A.5.a - Stationary 0.0 0.0 0.0 0.0
1.A.5.b - Mobile 0.0 0.0 0.0 0.0
1.A.5.b.i - Mobile (aviation component) 0.0 0.0 0.0 0.0
1.A.5.b.ii - Mobile (water-borne component) 0.0 0.0 0.0 0.0
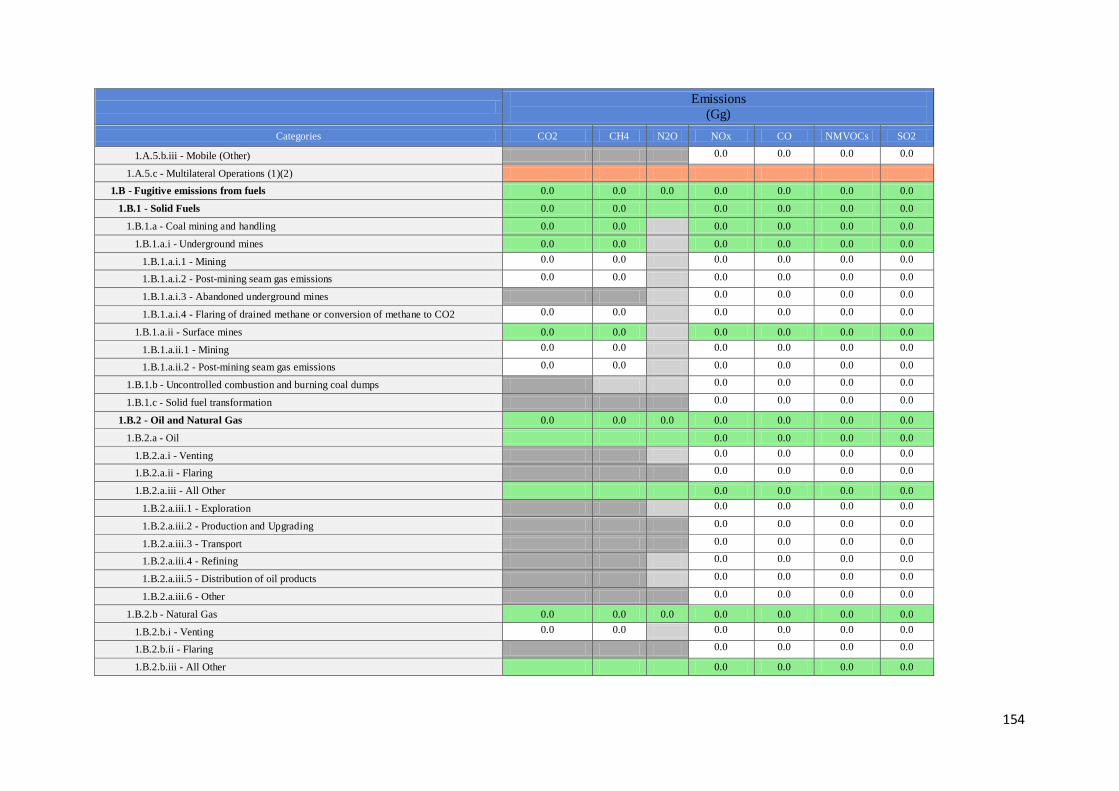
154
Emissions
(Gg)
Categories CO2 CH4 N2O NOx CO NMVOCs SO2
1.A.5.b.iii - Mobile (Other) 0.0 0.0 0.0 0.0
1.A.5.c - Multilateral Operations (1)(2)
1.B - Fugitive emissions from fuels 0.0 0.0 0.0 0.0 0.0 0.0 0.0
1.B.1 - Solid Fuels 0.0 0.0 0.0 0.0 0.0 0.0
1.B.1.a - Coal mining and handling 0.0 0.0 0.0 0.0 0.0 0.0
1.B.1.a.i - Underground mines 0.0 0.0 0.0 0.0 0.0 0.0
1.B.1.a.i.1 - Mining 0.0 0.0 0.0 0.0 0.0 0.0
1.B.1.a.i.2 - Post-mining seam gas emissions 0.0 0.0 0.0 0.0 0.0 0.0
1.B.1.a.i.3 - Abandoned underground mines 0.0 0.0 0.0 0.0
1.B.1.a.i.4 - Flaring of drained methane or conversion of methane to CO2 0.0 0.0 0.0 0.0 0.0 0.0
1.B.1.a.ii - Surface mines 0.0 0.0 0.0 0.0 0.0 0.0
1.B.1.a.ii.1 - Mining 0.0 0.0 0.0 0.0 0.0 0.0
1.B.1.a.ii.2 - Post-mining seam gas emissions 0.0 0.0 0.0 0.0 0.0 0.0
1.B.1.b - Uncontrolled combustion and burning coal dumps 0.0 0.0 0.0 0.0
1.B.1.c - Solid fuel transformation 0.0 0.0 0.0 0.0
1.B.2 - Oil and Natural Gas 0.0 0.0 0.0 0.0 0.0 0.0 0.0
1.B.2.a - Oil 0.0 0.0 0.0 0.0
1.B.2.a.i - Venting 0.0 0.0 0.0 0.0
1.B.2.a.ii - Flaring 0.0 0.0 0.0 0.0
1.B.2.a.iii - All Other 0.0 0.0 0.0 0.0
1.B.2.a.iii.1 - Exploration 0.0 0.0 0.0 0.0
1.B.2.a.iii.2 - Production and Upgrading 0.0 0.0 0.0 0.0
1.B.2.a.iii.3 - Transport 0.0 0.0 0.0 0.0
1.B.2.a.iii.4 - Refining 0.0 0.0 0.0 0.0
1.B.2.a.iii.5 - Distribution of oil products 0.0 0.0 0.0 0.0
1.B.2.a.iii.6 - Other 0.0 0.0 0.0 0.0
1.B.2.b - Natural Gas 0.0 0.0 0.0 0.0 0.0 0.0 0.0
1.B.2.b.i - Venting 0.0 0.0 0.0 0.0 0.0 0.0
1.B.2.b.ii - Flaring 0.0 0.0 0.0 0.0
1.B.2.b.iii - All Other 0.0 0.0 0.0 0.0
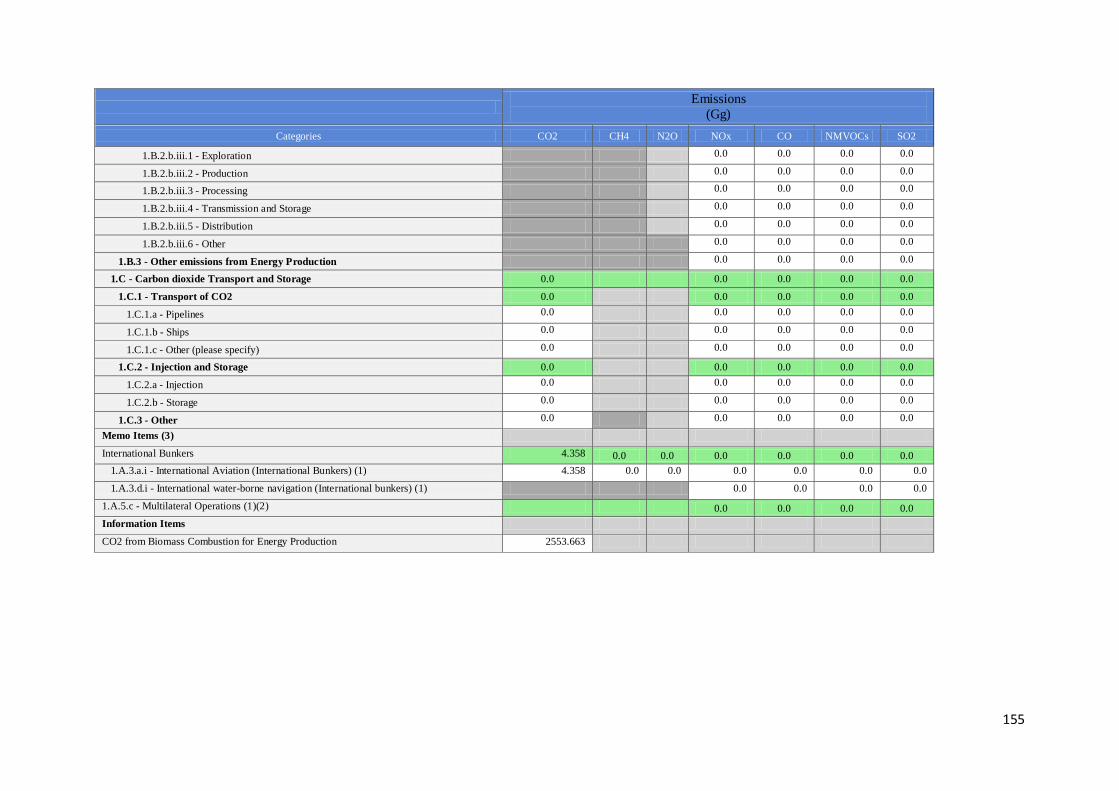
155
Emissions
(Gg)
Categories CO2 CH4 N2O NOx CO NMVOCs SO2
1.B.2.b.iii.1 - Exploration 0.0 0.0 0.0 0.0
1.B.2.b.iii.2 - Production 0.0 0.0 0.0 0.0
1.B.2.b.iii.3 - Processing 0.0 0.0 0.0 0.0
1.B.2.b.iii.4 - Transmission and Storage 0.0 0.0 0.0 0.0
1.B.2.b.iii.5 - Distribution 0.0 0.0 0.0 0.0
1.B.2.b.iii.6 - Other 0.0 0.0 0.0 0.0
1.B.3 - Other emissions from Energy Production 0.0 0.0 0.0 0.0
1.C - Carbon dioxide Transport and Storage 0.0 0.0 0.0 0.0 0.0
1.C.1 - Transport of CO2 0.0 0.0 0.0 0.0 0.0
1.C.1.a - Pipelines 0.0 0.0 0.0 0.0 0.0
1.C.1.b - Ships 0.0 0.0 0.0 0.0 0.0
1.C.1.c - Other (please specify) 0.0 0.0 0.0 0.0 0.0
1.C.2 - Injection and Storage 0.0 0.0 0.0 0.0 0.0
1.C.2.a - Injection 0.0 0.0 0.0 0.0 0.0
1.C.2.b - Storage 0.0 0.0 0.0 0.0 0.0
1.C.3 - Other 0.0 0.0 0.0 0.0 0.0
Memo Items (3)
International Bunkers 4.358 0.0 0.0 0.0 0.0 0.0 0.0
1.A.3.a.i - International Aviation (International Bunkers) (1) 4.358 0.0 0.0 0.0 0.0 0.0 0.0
1.A.3.d.i - International water-borne navigation (International bunkers) (1) 0.0 0.0 0.0 0.0
1.A.5.c - Multilateral Operations (1)(2) 0.0 0.0 0.0 0.0
Information Items
CO2 from Biomass Combustion for Energy Production 2553.663

156
Annex-C3: GHG Emission from IPPU sector (2015)
Categories
(Gg) CO2 Equivalents(Gg) (Gg)
CO2 CH4 N2O HFCs PFCs SF6
Other
halogenated
gases with
CO2
equivalent
conversion
factors (1)
Other
halogenated
gases
without CO2
equivalent
conversion
factors (2)
NO
x CO
NMVOC
s SO2
2 - Industrial Processes and Product Use 169.556 0 0 14.234 0 0 0 0 0 0 0 0
2.A - Mineral Industry 169.556 0 0 0 0 0 0 0 0 0 0 0
2.A.1 - Cement production 163.02 0 0 0 0
2.A.2 - Lime production 6.536 0 0 0 0
2.A.3 - Glass Production 0 0 0 0 0
2.A.4 - Other Process Uses of Carbonates 0 0 0 0 0 0 0 0 0 0 0 0
2.A.4.a - Ceramics 0 0 0 0 0
2.A.4.b - Other Uses of Soda Ash 0 0 0 0 0
2.A.4.c - Non Metallurgical Magnesia Production 0 0 0 0 0
2.A.4.d - Other (please specify) (3) 0 0 0 0 0
2.A.5 - Other (please specify) (3) 0 0 0 0
2.B - Chemical Industry 0 0 0 0 0 0 0 0 0 0 0 0
2.B.1 - Ammonia Production 0 0 0 0 0
2.B.2 - Nitric Acid Production 0 0 0 0 0
2.B.3 - Adipic Acid Production 0 0 0 0 0
2.B.4 - Caprolactam, Glyoxal and Glyoxylic Acid
Production 0 0 0 0 0
2.B.5 - Carbide Production 0 0 0 0 0 0
2.B.6 - Titanium Dioxide Production 0 0 0 0 0
2.B.7 - Soda Ash Production 0 0 0 0 0
2.B.8 - Petrochemical and Carbon Black Production 0 0 0 0 0 0 0 0 0 0 0 0
2.B.8.a - Methanol 0 0 0 0 0 0
2.B.8.b - Ethylene 0 0 0 0 0 0
2.B.8.c - Ethylene Dichloride and Vinyl Chloride
Monomer 0 0 0 0 0 0
2.B.8.d - Ethylene Oxide 0 0 0 0 0 0
2.B.8.e - Acrylonitrile 0 0 0 0 0 0

157
Categories
(Gg) CO2 Equivalents(Gg) (Gg)
CO2 CH4 N2O HFCs PFCs SF6
Other
halogenated
gases with
CO2
equivalent
conversion
factors (1)
Other
halogenated
gases
without CO2
equivalent
conversion
factors (2)
NO
x CO
NMVOC
s SO2
2.B.8.f - Carbon Black 0 0 0 0 0 0
2.B.9 - Fluorochemical Production 0 0 0 0 0 0 0 0 0 0 0 0
2.B.9.a - By-product emissions (4) 0 0 0 0 0
2.B.9.b - Fugitive Emissions (4) 0 0 0 0
2.B.10 - Other (Please specify) (3) 0 0 0 0
2.C - Metal Industry 0 0 0 0 0 0 0 0 0 0 0 0
2.C.1 - Iron and Steel Production 0 0 0 0 0 0
2.C.2 - Ferroalloys Production 0 0 0 0 0 0
2.C.3 - Aluminium production 0 0 0 0 0 0
2.C.4 - Magnesium production (5) 0 0 0 0 0 0
2.C.5 - Lead Production 0 0 0 0 0
2.C.6 - Zinc Production 0 0 0 0 0
2.C.7 - Other (please specify) (3) 0 0 0 0
2.D - Non-Energy Products from Fuels and Solvent
Use (6) 0 0 0 0 0 0 0 0 0 0 0 0
2.D.1 - Lubricant Use 0 0 0 0 0
2.D.2 - Paraffin Wax Use 0 0 0 0 0
2.D.3 - Solvent Use (7) 0 0 0 0
2.D.4 - Other (please specify) (3), (8) 0 0 0 0
2.E - Electronics Industry 0 0 0 0 0 0 0 0 0 0 0 0
2.E.1 - Integrated Circuit or Semiconductor (9) 0 0 0 0 0 0 0 0
2.E.2 - TFT Flat Panel Display (9) 0 0 0 0 0 0 0
2.E.3 - Photovoltaics (9) 0 0 0 0 0
2.E.4 - Heat Transfer Fluid (10) 0 0 0 0 0
2.E.5 - Other (please specify) (3) 0 0 0 0
2.F - Product Uses as Substitutes for Ozone Depleting
Substances 0 0 0 14.234 0 0 0 0 0 0 0 0
2.F.1 - Refrigeration and Air Conditioning 0 0 0 14.234 0 0 0 0 0 0 0 0

158
Categories
(Gg) CO2 Equivalents(Gg) (Gg)
CO2 CH4 N2O HFCs PFCs SF6
Other
halogenated
gases with
CO2
equivalent
conversion
factors (1)
Other
halogenated
gases
without CO2
equivalent
conversion
factors (2)
NO
x CO
NMVOC
s SO2
2.F.1.a - Refrigeration and Stationary Air
Conditioning 13.528 0 0 0 0
2.F.1.b - Mobile Air Conditioning 0.706 0 0 0 0
2.F.2 - Foam Blowing Agents 0 0 0 0 0 0
2.F.3 - Fire Protection 0 0 0 0 0 0
2.F.4 - Aerosols 0 0 0 0 0 0
2.F.5 - Solvents 0 0 0 0 0 0 0
2.F.6 - Other Applications (please specify) (3) 0 0 0 0 0 0 0
2.G - Other Product Manufacture and Use 0 0 0 0 0 0 0 0 0 0 0 0
2.G.1 - Electrical Equipment 0 0 0 0 0 0 0 0 0 0 0 0
2.G.1.a - Manufacture of Electrical Equipment 0 0 0 0 0 0
2.G.1.b - Use of Electrical Equipment 0 0 0 0 0 0
2.G.1.c - Disposal of Electrical Equipment 0 0 0 0 0 0
2.G.2 - SF6 and PFCs from Other Product Uses 0 0 0 0 0 0 0 0 0 0 0 0
2.G.2.a - Military Applications 0 0 0 0 0 0
2.G.2.b - Accelerators 0 0 0 0 0 0
2.G.2.c - Other (please specify) (3) 0 0 0 0 0 0
2.G.3 - N2O from Product Uses 0 0 0 0 0 0 0 0 0 0 0 0
2.G.3.a - Medical Applications 0 0 0 0 0
2.G.3.b - Propellant for pressure and aerosol products 0 0 0 0 0
2.G.3.c - Other (Please specify) (3) 0 0 0 0 0
2.G.4 - Other (Please specify) (3) 0 0 0 0
2.H - Other 0 0 0 0 0 0 0 0 0 0 0 0
2.H.1 - Pulp and Paper Industry 0 0 0 0
2.H.2 - Food and Beverages Industry 0 0 0 0
2.H.3 - Other (please specify) (3) 0 0 0 0

159
Annex-C4: GHG Emission from AFOLU Sector (2015)
Categories
(Gg)
Net CO2
emissions /
removals
Emissions
CH4 N2O NOx CO NMVOCs 3 - Agriculture, Forestry, and Other Land Use -209.183 142.037 0.359 0.0 0.0 0.0
3.A - Livestock 0.0 142.037 0.359 0.0 0.0 0.0
3.A.1 - Enteric Fermentation 0.0 136.236 0.0 0.0 0.0 0.0
3.A.1.a - Cattle 0.0 71.816 0.0 0.0 0.0 0.0
3.A.1.a.i - Dairy Cows 1.061 0.0 0.0 0.0
3.A.1.a.ii - Other Cattle 70.756 0.0 0.0 0.0
3.A.1.b - Buffalo 0.002 0.0 0.0 0.0
3.A.1.c - Sheep 12.733 0.0 0.0 0.0
3.A.1.d - Goats 27.881 0.0 0.0 0.0
3.A.1.e - Camels 17.549 0.0 0.0 0.0
3.A.1.f - Horses 0.110 0.0 0.0 0.0
3.A.1.g - Mules and Asses 6.141 0.0 0.0 0.0
3.A.1.h - Swine 0.005 0.0 0.0 0.0
3.A.1.j - Other (please specify) 0.0 0.0 0.0 0.0
3.A.2 - Manure Management (1) 0.0 5.801 0.359 0.0 0.0 0.0
3.A.2.a - Cattle 0.0 2.306 0.0 0.0 0.0 0.0
3.A.2.a.i - Dairy cows 0.023 0.0 0.0 0.0 0.0
3.A.2.a.ii - Other cattle 2.282 0.0 0.0 0.0 0.0
3.A.2.b - Buffalo 0.000 0.0 0.0 0.0 0.0
3.A.2.c - Sheep 0.509 0.096 0.0 0.0 0.0
3.A.2.d - Goats 1.227 0.263 0.0 0.0 0.0
3.A.2.e - Camels 0.977 0.0 0.0 0.0 0.0
3.A.2.f - Horses 0.013 0.0 0.0 0.0 0.0
3.A.2.g - Mules and Asses 0.737 0.0 0.0 0.0 0.0
3.A.2.h - Swine 0.005 0.0 0.0 0.0 0.0
3.A.2.i - Poultry 0.027 0.0 0.0 0.0 0.0
3.A.2.j - Other (please specify)
0.0 0.0 0.0 0.0 0.0

160
Categories
(Gg)
Net CO2
emissions /
removals
Emissions
CH4 N2O NOx CO NMVOCs
3.B - Land -209.183 0.0 0.0 0.0 0.0 0.0
3.B.1 - Forest land -212.139 0.0 0.0 0.0 0.0 0.0
3.B.1.a - Forest land Remaining Forest land -212.139 0.0 0.0 0.0
3.B.1.b - Land Converted to Forest land 0.0 0.0 0.0 0.0 0.0 0.0
3.B.1.b.i - Cropland converted to Forest Land 0.0 0.0 0.0 0.0
3.B.1.b.ii - Grassland converted to Forest Land 0.0 0.0 0.0 0.0
3.B.1.b.iii - Wetlands converted to Forest Land 0.0 0.0 0.0 0.0
3.B.1.b.iv - Settlements converted to Forest Land 0.0 0.0 0.0 0.0
3.B.1.b.v - Other Land converted to Forest Land 0.0 0.0 0.0 0.0
3.B.2 - Cropland 2.576 0.0 0.0 0.0 0.0 0.0
3.B.2.a - Cropland Remaining Cropland 0.026 0.0 0.0 0.0
3.B.2.b - Land Converted to Cropland 2.549 0.0 0.0 0.0 0.0 0.0
3.B.2.b.i - Forest Land converted to Cropland 0.0 0.0 0.0 0.0
3.B.2.b.ii - Grassland converted to Cropland 0.0 0.0 0.0 0.0
3.B.2.b.iii - Wetlands converted to Cropland 0.0 0.0 0.0 0.0
3.B.2.b.iv - Settlements converted to Cropland 0.0 0.0 0.0 0.0
3.B.2.b.v - Other Land converted to Cropland 2.549 0.0 0.0 0.0
3.B.3 - Grassland 0.0 0.0 0.0 0.0 0.0 0.0
3.B.3.a - Grassland Remaining Grassland 0.0 0.000 0.000 0.000
3.B.3.b - Land Converted to Grassland 0.0 0.0 0.0 0.0 0.0 0.0
3.B.3.b.i - Forest Land converted to Grassland 0.0 0.0 0.0 0.0
3.B.3.b.ii - Cropland converted to Grassland 0.0 0.0 0.0 0.0
3.B.3.b.iii - Wetlands converted to Grassland 0.0 0.0 0.0 0.0
3.B.3.b.iv - Settlements converted to Grassland 0.0 0.0 0.0 0.0
3.B.3.b.v - Other Land converted to Grassland 0.0 0.0 0.0 0.0
3.B.4 - Wetlands -0.017 0.0 0.0 0.0 0.0 0.0
3.B.4.a - Wetlands Remaining Wetlands -0.017 0.0 0.0 0.0 0.0 0.0
3.B.4.a.i - Peatlands remaining peatlands -0.017 0.0 0.0 0.0 0.0

161
Categories
(Gg)
Net CO2
emissions /
removals
Emissions
CH4 N2O NOx CO NMVOCs 3.B.4.a.ii - Flooded land remaining flooded land 0.0 0.0 0.0
3.B.4.b - Land Converted to Wetlands 0.0 0.0 0.0 0.0 0.0 0.0
3.B.4.b.i - Land converted for peat extraction 0.000 0.0 0.0 0.0
3.B.4.b.ii - Land converted to flooded land 0.000 0.0 0.0 0.0
3.B.4.b.iii - Land converted to other wetlands 0.0 0.0 0.0
3.B.5 - Settlements 0.398 0.0 0.0 0.0 0.0 0.0
3.B.5.a - Settlements Remaining Settlements 0.0 0.0 0.0 0.0
3.B.5.b - Land Converted to Settlements 0.398 0.0 0.0 0.0 0.0 0.0
3.B.5.b.i - Forest Land converted to Settlements 0.0 0.0 0.0 0.0
3.B.5.b.ii - Cropland converted to Settlements 0.0 0.0 0.0 0.0
3.B.5.b.iii - Grassland converted to Settlements 0.0 0.0 0.0 0.0
3.B.5.b.iv - Wetlands converted to Settlements 0.0 0.0 0.0 0.0
3.B.5.b.v - Other Land converted to Settlements 0.398 0.0 0.0 0.0
3.B.6 - Other Land 0.0 0.0 0.0 0.0 0.0 0.0
3.B.6.a - Other land Remaining Other land 0.0 0.0 0.0
3.B.6.b - Land Converted to Other land 0.0 0.0 0.0 0.0 0.0 0.0
3.B.6.b.i - Forest Land converted to Other Land 0.0 0.0 0.0 0.0
3.B.6.b.ii - Cropland converted to Other Land 0.0 0.0 0.0 0.0
3.B.6.b.iii - Grassland converted to Other Land 0.0 0.0 0.0 0.0
3.B.6.b.iv - Wetlands converted to Other Land 0.0 0.0 0.0 0.0
3.B.6.b.v - Settlements converted to Other Land 0.0 0.0 0.0 0.0
3.C - Aggregate sources and non-CO2 emissions sources on land
(2) 0.0 0.0 0.0 0.0 0.0 0.0
3.C.1 - Emissions from biomass burning 0.0 0.0 0.0 0.0 0.0 0.0
3.C.1.a - Biomass burning in forest lands 0.0 0.0 0.0 0.0 0.0
3.C.1.b - Biomass burning in croplands 0.0 0.0 0.0 0.0 0.0
3.C.1.c - Biomass burning in grasslands 0.0 0.0 0.0 0.0 0.0
3.C.1.d - Biomass burning in all other land 0.0 0.0 0.0 0.0 0.0
3.C.2 - Liming 0.0 0.0 0.0 0.0

162
Categories
(Gg)
Net CO2
emissions /
removals
Emissions
CH4 N2O NOx CO NMVOCs 3.C.3 - Urea application 0.0 0.0 0.0 0.0
3.C.4 - Direct N2O Emissions from managed soils (3) 0.0 0.0 0.0 0.0
3.C.5 - Indirect N2O Emissions from managed soils 0.0 0.0 0.0 0.0
3.C.6 - Indirect N2O Emissions from manure management 0.0 0.0 0.0 0.0
3.C.7 - Rice cultivation 0.0 0.0 0.0 0.0
3.C.8 - Other (please specify) 0.0 0.0 0.0
3.D - Other 0.0 0.0 0.0 0.0 0.0 0.0
3.D.1 - Harvested Wood Products 0.0 0.0 0.0 0.0
3.D.2 - Other (please specify) 0.0 0.0 0.0
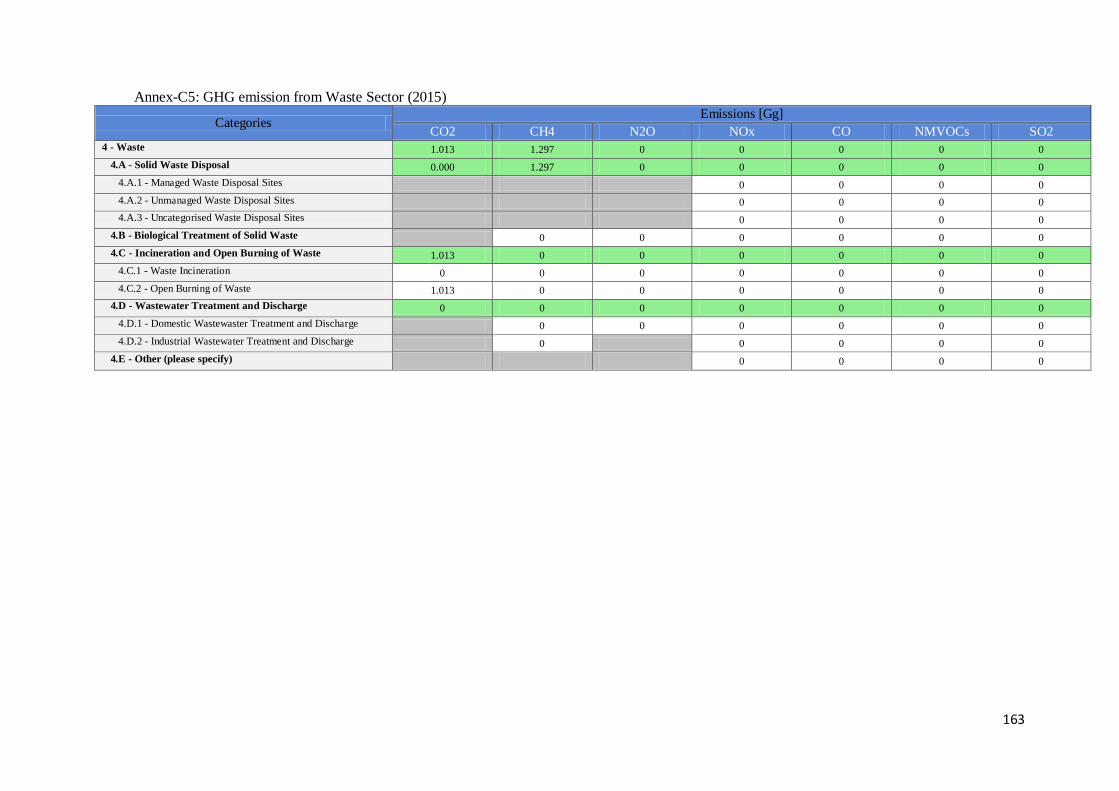
163
Annex-C5: GHG emission from Waste Sector (2015)
Categories Emissions [Gg]
CO2 CH4 N2O NOx CO NMVOCs SO2 4 - Waste 1.013 1.297 0 0 0 0 0
4.A - Solid Waste Disposal 0.000 1.297 0 0 0 0 0
4.A.1 - Managed Waste Disposal Sites 0 0 0 0
4.A.2 - Unmanaged Waste Disposal Sites 0 0 0 0
4.A.3 - Uncategorised Waste Disposal Sites 0 0 0 0
4.B - Biological Treatment of Solid Waste 0 0 0 0 0 0
4.C - Incineration and Open Burning of Waste 1.013 0 0 0 0 0 0
4.C.1 - Waste Incineration 0 0 0 0 0 0 0
4.C.2 - Open Burning of Waste 1.013 0 0 0 0 0 0
4.D - Wastewater Treatment and Discharge 0 0 0 0 0 0 0
4.D.1 - Domestic Wastewaster Treatment and Discharge 0 0 0 0 0 0
4.D.2 - Industrial Wastewater Treatment and Discharge 0 0 0 0 0
4.E - Other (please specify) 0 0 0 0
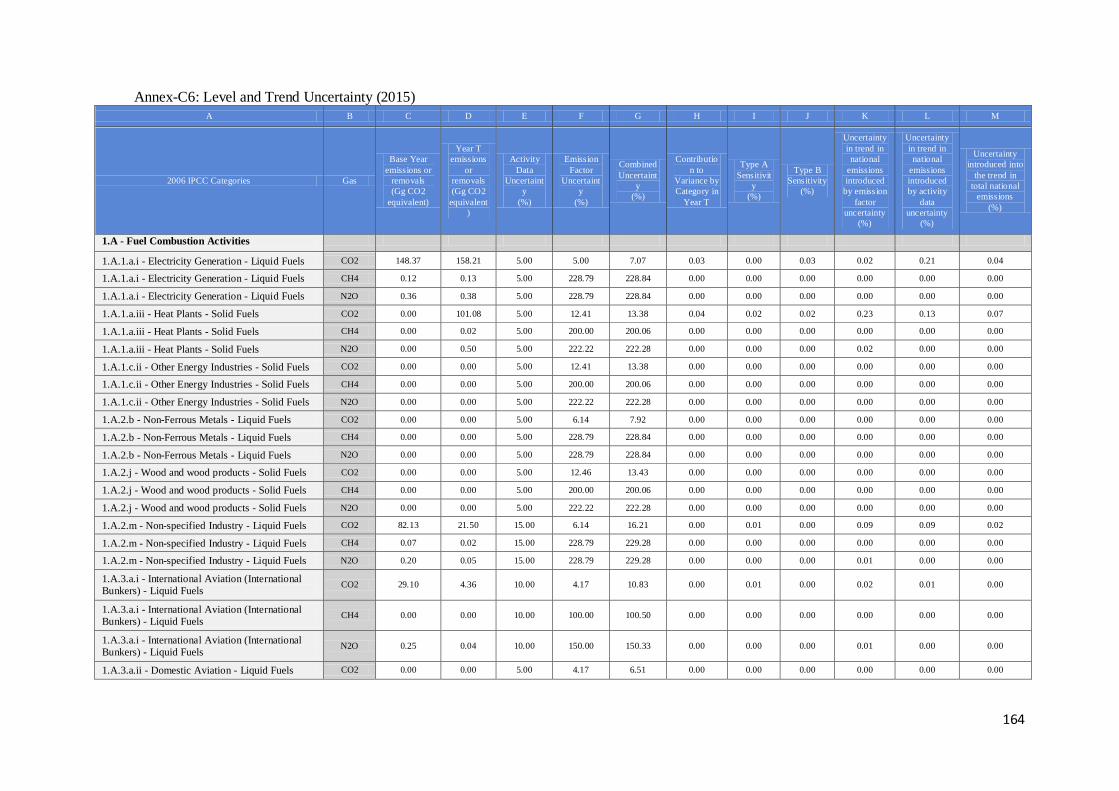
164
Annex-C6: Level and Trend Uncertainty (2015)
A B C D E F G H I J K L M
2006 IPCC Categories Gas
Base Year
emissions or
removals
(Gg CO2
equivalent)
Year T
emissions
or
removals
(Gg CO2
equivalent
)
Activity
Data
Uncertaint
y
(%)
Emission
Factor
Uncertaint
y
(%)
Combined
Uncertaint
y
(%)
Contributio
n to
Variance by
Category in
Year T
Type A
Sensitivit
y
(%)
Type B
Sensitivity
(%)
Uncertainty
in trend in
national
emissions
introduced
by emission
factor
uncertainty
(%)
Uncertainty
in trend in
national
emissions
introduced
by activity
data
uncertainty
(%)
Uncertainty
introduced into
the trend in
total national
emissions
(%)
1.A - Fuel Combustion Activities
1.A.1.a.i - Electricity Generation - Liquid Fuels CO2 148.37 158.21 5.00 5.00 7.07 0.03 0.00 0.03 0.02 0.21 0.04
1.A.1.a.i - Electricity Generation - Liquid Fuels CH4 0.12 0.13 5.00 228.79 228.84 0.00 0.00 0.00 0.00 0.00 0.00
1.A.1.a.i - Electricity Generation - Liquid Fuels N2O 0.36 0.38 5.00 228.79 228.84 0.00 0.00 0.00 0.00 0.00 0.00
1.A.1.a.iii - Heat Plants - Solid Fuels CO2 0.00 101.08 5.00 12.41 13.38 0.04 0.02 0.02 0.23 0.13 0.07
1.A.1.a.iii - Heat Plants - Solid Fuels CH4 0.00 0.02 5.00 200.00 200.06 0.00 0.00 0.00 0.00 0.00 0.00
1.A.1.a.iii - Heat Plants - Solid Fuels N2O 0.00 0.50 5.00 222.22 222.28 0.00 0.00 0.00 0.02 0.00 0.00
1.A.1.c.ii - Other Energy Industries - Solid Fuels CO2 0.00 0.00 5.00 12.41 13.38 0.00 0.00 0.00 0.00 0.00 0.00
1.A.1.c.ii - Other Energy Industries - Solid Fuels CH4 0.00 0.00 5.00 200.00 200.06 0.00 0.00 0.00 0.00 0.00 0.00
1.A.1.c.ii - Other Energy Industries - Solid Fuels N2O 0.00 0.00 5.00 222.22 222.28 0.00 0.00 0.00 0.00 0.00 0.00
1.A.2.b - Non-Ferrous Metals - Liquid Fuels CO2 0.00 0.00 5.00 6.14 7.92 0.00 0.00 0.00 0.00 0.00 0.00
1.A.2.b - Non-Ferrous Metals - Liquid Fuels CH4 0.00 0.00 5.00 228.79 228.84 0.00 0.00 0.00 0.00 0.00 0.00
1.A.2.b - Non-Ferrous Metals - Liquid Fuels N2O 0.00 0.00 5.00 228.79 228.84 0.00 0.00 0.00 0.00 0.00 0.00
1.A.2.j - Wood and wood products - Solid Fuels CO2 0.00 0.00 5.00 12.46 13.43 0.00 0.00 0.00 0.00 0.00 0.00
1.A.2.j - Wood and wood products - Solid Fuels CH4 0.00 0.00 5.00 200.00 200.06 0.00 0.00 0.00 0.00 0.00 0.00
1.A.2.j - Wood and wood products - Solid Fuels N2O 0.00 0.00 5.00 222.22 222.28 0.00 0.00 0.00 0.00 0.00 0.00
1.A.2.m - Non-specified Industry - Liquid Fuels CO2 82.13 21.50 15.00 6.14 16.21 0.00 0.01 0.00 0.09 0.09 0.02
1.A.2.m - Non-specified Industry - Liquid Fuels CH4 0.07 0.02 15.00 228.79 229.28 0.00 0.00 0.00 0.00 0.00 0.00
1.A.2.m - Non-specified Industry - Liquid Fuels N2O 0.20 0.05 15.00 228.79 229.28 0.00 0.00 0.00 0.01 0.00 0.00
1.A.3.a.i - International Aviation (International
Bunkers) - Liquid Fuels CO2 29.10 4.36 10.00 4.17 10.83 0.00 0.01 0.00 0.02 0.01 0.00
1.A.3.a.i - International Aviation (International
Bunkers) - Liquid Fuels CH4 0.00 0.00 10.00 100.00 100.50 0.00 0.00 0.00 0.00 0.00 0.00
1.A.3.a.i - International Aviation (International
Bunkers) - Liquid Fuels N2O 0.25 0.04 10.00 150.00 150.33 0.00 0.00 0.00 0.01 0.00 0.00
1.A.3.a.ii - Domestic Aviation - Liquid Fuels CO2 0.00 0.00 5.00 4.17 6.51 0.00 0.00 0.00 0.00 0.00 0.00

165
A B C D E F G H I J K L M
2006 IPCC Categories Gas
Base Year
emissions or
removals
(Gg CO2
equivalent)
Year T
emissions
or
removals
(Gg CO2
equivalent
)
Activity
Data
Uncertaint
y
(%)
Emission
Factor
Uncertaint
y
(%)
Combined
Uncertaint
y
(%)
Contributio
n to
Variance by
Category in
Year T
Type A
Sensitivit
y
(%)
Type B
Sensitivity
(%)
Uncertainty
in trend in
national
emissions
introduced
by emission
factor
uncertainty
(%)
Uncertainty
in trend in
national
emissions
introduced
by activity
data
uncertainty
(%)
Uncertainty
introduced into
the trend in
total national
emissions
(%)
1.A.3.a.ii - Domestic Aviation - Liquid Fuels CH4 0.00 0.00 5.00 100.00 100.12 0.00 0.00 0.00 0.00 0.00 0.00
1.A.3.a.ii - Domestic Aviation - Liquid Fuels N2O 0.00 0.00 5.00 150.00 150.08 0.00 0.00 0.00 0.00 0.00 0.00
1.A.3.b - Road Transportation - Liquid Fuels CO2 201.41 196.53 20.00 3.07 20.23 0.38 0.01 0.04 0.03 1.04 1.08
1.A.3.b - Road Transportation - Liquid Fuels CH4 0.56 0.49 20.00 244.69 245.51 0.00 0.00 0.00 0.01 0.00 0.00
1.A.3.b - Road Transportation - Liquid Fuels N2O 3.16 3.08 20.00 209.94 210.89 0.01 0.00 0.00 0.03 0.02 0.00
1.A.4.a - Commercial/Institutional - Liquid Fuels CO2 106.51 56.21 25.00 6.14 25.74 0.05 0.01 0.01 0.08 0.37 0.14
1.A.4.a - Commercial/Institutional - Liquid Fuels CH4 0.30 0.16 25.00 200.00 201.56 0.00 0.00 0.00 0.01 0.00 0.00
1.A.4.a - Commercial/Institutional - Liquid Fuels N2O 0.26 0.14 25.00 228.79 230.15 0.00 0.00 0.00 0.01 0.00 0.00
1.A.4.a - Commercial/Institutional - Biomass CO2 74.20 87.69 5.00 18.69 19.35 0.07 0.00 0.02 0.01 0.12 0.01
1.A.4.a - Commercial/Institutional - Biomass CH4 4.06 4.73 5.00 227.27 227.33 0.03 0.00 0.00 0.01 0.01 0.00
1.A.4.a - Commercial/Institutional - Biomass N2O 0.76 0.88 5.00 297.73 297.77 0.00 0.00 0.00 0.00 0.00 0.00
1.A.4.b - Residential - Liquid Fuels CO2 66.48 48.16 25.00 6.14 25.74 0.04 0.01 0.01 0.04 0.32 0.10
1.A.4.b - Residential - Liquid Fuels CH4 0.19 0.12 25.00 200.00 201.56 0.00 0.00 0.00 0.00 0.00 0.00
1.A.4.b - Residential - Liquid Fuels N2O 0.16 0.10 25.00 236.36 237.68 0.00 0.00 0.00 0.00 0.00 0.00
1.A.4.b - Residential - Biomass CO2 1964.91 2465.97 5.00 18.69 19.35 54.98 0.02 0.46 0.36 3.26 10.74
1.A.4.b - Residential - Biomass CH4 112.46 139.13 5.00 227.27 227.33 24.15 0.00 0.03 0.17 0.18 0.06
1.A.4.b - Residential - Biomass N2O 21.90 26.93 5.00 297.73 297.77 1.55 0.00 0.01 0.03 0.04 0.00
1.A.4.c.i - Stationary - Liquid Fuels CO2 8.19 25.47 25.00 6.14 25.74 0.01 0.00 0.00 0.02 0.17 0.03
1.A.4.c.i - Stationary - Liquid Fuels CH4 0.02 0.07 25.00 200.00 201.56 0.00 0.00 0.00 0.00 0.00 0.00
1.A.4.c.i - Stationary - Liquid Fuels N2O 0.02 0.06 25.00 236.36 237.68 0.00 0.00 0.00 0.00 0.00 0.00
1.A.5.b.i - Mobile (aviation component) - Liquid
Fuels CO2 0.00 0.00 5.00 4.17 6.51 0.00 0.00 0.00 0.00 0.00 0.00
1.A.5.b.i - Mobile (aviation component) - Liquid
Fuels CH4 0.00 0.00 5.00 100.00 100.12 0.00 0.00 0.00 0.00 0.00 0.00
1.A.5.b.i - Mobile (aviation component) - Liquid
Fuels N2O 0.00 0.00 5.00 150.00 150.08 0.00 0.00 0.00 0.00 0.00 0.00
1.A.3.b.vi - Urea-based catalysts CO2 0.00 0.00 0.00 0.00 0.00 0.00 0.00 0.00 0.00 0.00 0.00
2.A - Mineral Industry
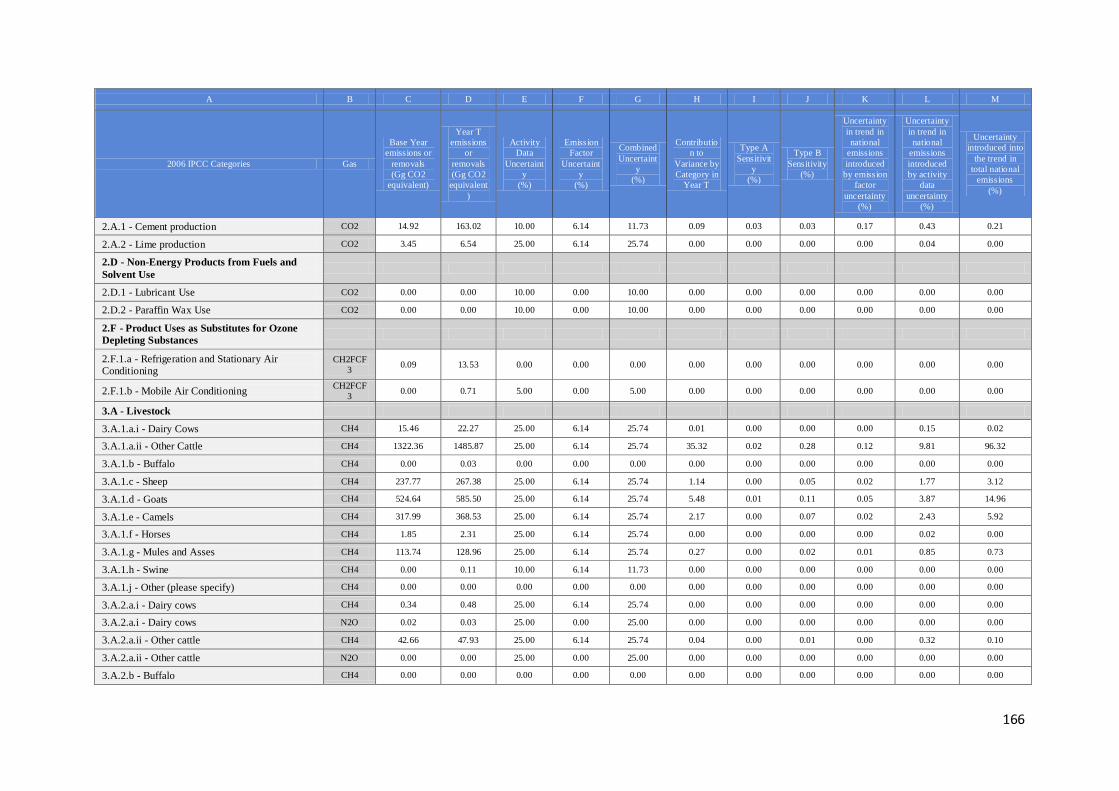
166
A B C D E F G H I J K L M
2006 IPCC Categories Gas
Base Year
emissions or
removals
(Gg CO2
equivalent)
Year T
emissions
or
removals
(Gg CO2
equivalent
)
Activity
Data
Uncertaint
y
(%)
Emission
Factor
Uncertaint
y
(%)
Combined
Uncertaint
y
(%)
Contributio
n to
Variance by
Category in
Year T
Type A
Sensitivit
y
(%)
Type B
Sensitivity
(%)
Uncertainty
in trend in
national
emissions
introduced
by emission
factor
uncertainty
(%)
Uncertainty
in trend in
national
emissions
introduced
by activity
data
uncertainty
(%)
Uncertainty
introduced into
the trend in
total national
emissions
(%)
2.A.1 - Cement production CO2 14.92 163.02 10.00 6.14 11.73 0.09 0.03 0.03 0.17 0.43 0.21
2.A.2 - Lime production CO2 3.45 6.54 25.00 6.14 25.74 0.00 0.00 0.00 0.00 0.04 0.00
2.D - Non-Energy Products from Fuels and
Solvent Use
2.D.1 - Lubricant Use CO2 0.00 0.00 10.00 0.00 10.00 0.00 0.00 0.00 0.00 0.00 0.00
2.D.2 - Paraffin Wax Use CO2 0.00 0.00 10.00 0.00 10.00 0.00 0.00 0.00 0.00 0.00 0.00
2.F - Product Uses as Substitutes for Ozone
Depleting Substances
2.F.1.a - Refrigeration and Stationary Air
Conditioning
CH2FCF
3 0.09 13.53 0.00 0.00 0.00 0.00 0.00 0.00 0.00 0.00 0.00
2.F.1.b - Mobile Air Conditioning CH2FCF
3 0.00 0.71 5.00 0.00 5.00 0.00 0.00 0.00 0.00 0.00 0.00
3.A - Livestock
3.A.1.a.i - Dairy Cows CH4 15.46 22.27 25.00 6.14 25.74 0.01 0.00 0.00 0.00 0.15 0.02
3.A.1.a.ii - Other Cattle CH4 1322.36 1485.87 25.00 6.14 25.74 35.32 0.02 0.28 0.12 9.81 96.32
3.A.1.b - Buffalo CH4 0.00 0.03 0.00 0.00 0.00 0.00 0.00 0.00 0.00 0.00 0.00
3.A.1.c - Sheep CH4 237.77 267.38 25.00 6.14 25.74 1.14 0.00 0.05 0.02 1.77 3.12
3.A.1.d - Goats CH4 524.64 585.50 25.00 6.14 25.74 5.48 0.01 0.11 0.05 3.87 14.96
3.A.1.e - Camels CH4 317.99 368.53 25.00 6.14 25.74 2.17 0.00 0.07 0.02 2.43 5.92
3.A.1.f - Horses CH4 1.85 2.31 25.00 6.14 25.74 0.00 0.00 0.00 0.00 0.02 0.00
3.A.1.g - Mules and Asses CH4 113.74 128.96 25.00 6.14 25.74 0.27 0.00 0.02 0.01 0.85 0.73
3.A.1.h - Swine CH4 0.00 0.11 10.00 6.14 11.73 0.00 0.00 0.00 0.00 0.00 0.00
3.A.1.j - Other (please specify) CH4 0.00 0.00 0.00 0.00 0.00 0.00 0.00 0.00 0.00 0.00 0.00
3.A.2.a.i - Dairy cows CH4 0.34 0.48 25.00 6.14 25.74 0.00 0.00 0.00 0.00 0.00 0.00
3.A.2.a.i - Dairy cows N2O 0.02 0.03 25.00 0.00 25.00 0.00 0.00 0.00 0.00 0.00 0.00
3.A.2.a.ii - Other cattle CH4 42.66 47.93 25.00 6.14 25.74 0.04 0.00 0.01 0.00 0.32 0.10
3.A.2.a.ii - Other cattle N2O 0.00 0.00 25.00 0.00 25.00 0.00 0.00 0.00 0.00 0.00 0.00
3.A.2.b - Buffalo CH4 0.00 0.00 0.00 0.00 0.00 0.00 0.00 0.00 0.00 0.00 0.00

167
A B C D E F G H I J K L M
2006 IPCC Categories Gas
Base Year
emissions or
removals
(Gg CO2
equivalent)
Year T
emissions
or
removals
(Gg CO2
equivalent
)
Activity
Data
Uncertaint
y
(%)
Emission
Factor
Uncertaint
y
(%)
Combined
Uncertaint
y
(%)
Contributio
n to
Variance by
Category in
Year T
Type A
Sensitivit
y
(%)
Type B
Sensitivity
(%)
Uncertainty
in trend in
national
emissions
introduced
by emission
factor
uncertainty
(%)
Uncertainty
in trend in
national
emissions
introduced
by activity
data
uncertainty
(%)
Uncertainty
introduced into
the trend in
total national
emissions
(%)
3.A.2.b - Buffalo N2O 0.00 0.00 0.00 0.00 0.00 0.00 0.00 0.00 0.00 0.00 0.00
3.A.2.c - Sheep CH4 9.51 10.70 25.00 6.14 25.74 0.00 0.00 0.00 0.00 0.07 0.00
3.A.2.c - Sheep N2O 26.38 29.67 25.00 0.00 25.00 0.01 0.00 0.01 0.00 0.20 0.04
3.A.2.d - Goats CH4 23.08 25.76 25.00 6.14 25.74 0.01 0.00 0.00 0.00 0.17 0.03
3.A.2.d - Goats N2O 73.03 81.50 25.00 0.00 25.00 0.10 0.00 0.02 0.00 0.54 0.29
3.A.2.e - Camels CH4 17.70 20.51 25.00 6.14 25.74 0.01 0.00 0.00 0.00 0.14 0.02
3.A.2.e - Camels N2O 0.00 0.00 25.00 0.00 25.00 0.00 0.00 0.00 0.00 0.00 0.00
3.A.2.f - Horses CH4 0.23 0.28 25.00 6.14 25.74 0.00 0.00 0.00 0.00 0.00 0.00
3.A.2.f - Horses N2O 0.00 0.00 25.00 0.00 25.00 0.00 0.00 0.00 0.00 0.00 0.00
3.A.2.g - Mules and Asses CH4 13.65 15.48 25.00 6.14 25.74 0.00 0.00 0.00 0.00 0.10 0.01
3.A.2.g - Mules and Asses N2O 0.00 0.00 25.00 0.00 25.00 0.00 0.00 0.00 0.00 0.00 0.00
3.A.2.h - Swine CH4 0.00 0.11 10.00 0.00 10.00 0.00 0.00 0.00 0.00 0.00 0.00
3.A.2.h - Swine N2O 0.00 0.00 10.00 0.00 10.00 0.00 0.00 0.00 0.00 0.00 0.00
3.A.2.i - Poultry CH4 0.51 0.57 25.00 6.14 25.74 0.00 0.00 0.00 0.00 0.00 0.00
3.A.2.i - Poultry N2O 0.00 0.00 25.00 0.00 25.00 0.00 0.00 0.00 0.00 0.00 0.00
3.B - Land
3.B.1.a - Forest land Remaining Forest land CO2 -230.89 -212.14 35.00 6.14 35.53 1.37 0.01 0.04 0.08 1.96 3.85
3.B.1.b.v - Other Land converted to Forest Land CO2 0.00 0.00 0.00 0.00 0.00 0.00 0.00 0.00 0.00 0.00 0.00
3.B.2.a - Cropland Remaining Cropland CO2 0.03 0.03 35.00 6.14 35.53 0.00 0.00 0.00 0.00 0.00 0.00
3.B.2.b.v - Other Land converted to Cropland CO2 0.00 2.55 35.00 6.14 35.53 0.00 0.00 0.00 0.00 0.02 0.00
3.B.3.a - Grassland Remaining Grassland CO2 0.00 0.00 35.00 6.14 35.53 0.00 0.00 0.00 0.00 0.00 0.00
3.B.4.a.i - Peatlands remaining peatlands CO2 -0.02 -0.02 25.00 6.14 25.74 0.00 0.00 0.00 0.00 0.00 0.00
3.B.4.a.i - Peatlands remaining peatlands N2O 0.00 0.00 25.00 0.00 25.00 0.00 0.00 0.00 0.00 0.00 0.00
3.B.5.a - Settlements Remaining Settlements CO2 0.00 0.00 35.00 6.14 35.53 0.00 0.00 0.00 0.00 0.00 0.00
3.B.5.b.v - Other Land converted to Settlements CO2 0.00 0.40 35.00 6.14 35.53 0.00 0.00 0.00 0.00 0.00 0.00
3.D.1 - Harvested Wood Products CO2 -2.04 -3.14 0.00 0.00 0.00 0.00 0.00 0.00 0.00 0.00 0.00

168
A B C D E F G H I J K L M
2006 IPCC Categories Gas
Base Year
emissions or
removals
(Gg CO2
equivalent)
Year T
emissions
or
removals
(Gg CO2
equivalent
)
Activity
Data
Uncertaint
y
(%)
Emission
Factor
Uncertaint
y
(%)
Combined
Uncertaint
y
(%)
Contributio
n to
Variance by
Category in
Year T
Type A
Sensitivit
y
(%)
Type B
Sensitivity
(%)
Uncertainty
in trend in
national
emissions
introduced
by emission
factor
uncertainty
(%)
Uncertainty
in trend in
national
emissions
introduced
by activity
data
uncertainty
(%)
Uncertainty
introduced into
the trend in
total national
emissions
(%)
4.A - Solid Waste Disposal
4.A - Solid Waste Disposal CH4 0.00 27.25 25.00 6.14 25.74 0.01 0.01 0.01 0.03 0.18 0.03
4.C - Incineration and Open Burning of Waste
4.C.1 - Waste Incineration CO2 0.00 0.00 0.00 0.00 0.00 0.00 0.00 0.00 0.00 0.00 0.00
4.C.1 - Waste Incineration CH4 0.00 0.00 0.00 0.00 0.00 0.00 0.00 0.00 0.00 0.00 0.00
4.C.1 - Waste Incineration N2O 0.00 0.00 0.00 0.00 0.00 0.00 0.00 0.00 0.00 0.00 0.00
4.C.2 - Open Burning of Waste CO2 0.66 1.01 25.00 6.14 25.74 0.00 0.00 0.00 0.00 0.01 0.00
4.C.2 - Open Burning of Waste CH4 0.00 0.00 25.00 0.00 25.00 0.00 0.00 0.00 0.00 0.00 0.00
4.C.2 - Open Burning of Waste N2O 0.00 0.00 25.00 0.00 25.00 0.00 0.00 0.00 0.00 0.00 0.00
Total
Sum(C): 5353.291 Sum(D): 6435.920 Sum(H): 127.390 Sum(M): 137.961
Uncertainty in total inventory: 11.287 Trend uncertainty:
11.746