US CLIMATE ACTION REPORT—2006 - UNFCCC
145
U.S. CLIMATE ACTION REPORT—2006 Fourth National Communication of the United States of America Under the United Nations Framework Convention on Climate Change U.S. CLIMATE ACTION REPORT—2006
-
Upload
khangminh22 -
Category
Documents
-
view
5 -
download
0
Transcript of US CLIMATE ACTION REPORT—2006 - UNFCCC

U.S. CLIMATE ACTION REPORT—2006Fourth National Communication of the United States of America
Under the United Nations Framework Convention on Climate Change
U.S
.CLIM
AT
EA
CT
ION
RE
PO
RT
—2006

The United States is pursuing a comprehensive strategy to address global climatechange that is science-based, fosters breakthroughs in clean energy technologies,and encourages coordinated global action in support of the United Nations Frame-
work Convention on Climate Change (UNFCCC).The U.S. strategy integrates measures to address climate change into a broader agenda
that promotes energy security, pollution reduction, and sustainable economic develop-ment. This integrated approach recognizes that actions to address climate change, includ-ing actions to mitigate greenhouse gas (GHG) emissions, will be more sustainable andsuccessful if they produce multiple economic and environmental benefits.
The United States is committed to continued leadership on climate change. Promotingbiofuels, advanced fossil fuel technologies, renewable sources of energy, and advanced nu-clear technologies is a key component of U.S. climate-related efforts. Since 2001, the Na-tion has dedicated nearly $29 billion to advance climate-related science, technology,international assistance, and incentive programs.
In 2002, President Bush announced plans to cut GHG intensity—emissions per unitof economic activity—by 18 percent by 2012. The Nation is on track to meet this goal.Dozens of federal programs, including partnerships, consumer information campaigns,incentives, and mandatory regulations, combined with state and local efforts, contributeto the ultimate objective of the UNFCCC: stabilizing atmospheric GHG concentrationsat a level that would prevent dangerous human interference with the climate system.Thesecoordinated actions are advancing the development and market uptake of cleaner, moreefficient energy technologies, conservation, biological and geological sequestration, andadaptation to climate risks.
Recognizing the serious, long-term challenges of global climate change, the UnitedStates continues to work with nations around the world. Active bilateral and multilateralclimate change initiatives, including the recently established Asia-Pacific Partnership onClean Development and Climate, are promoting collaboration among key countries andwith the private sector.
In thisU.S. Climate Action Report (2006 CAR), the United States provides its fourth for-mal national communication under the UNFCCC, as specified under Articles 4 and 12 ofthe Convention. The 2006 CAR documents the climate change actions the Nation is takingto help achieve the UNFCCC’s ultimate objective. This review was undertaken to accountfor activities up to and including 2006. It explains how U.S. social, economic, and geo-graphic circumstances affect U.S.GHG emissions; summarizes U.S.GHG emission trendsfrom 1990 through 2004; identifies existing and planned U.S. policies andmeasures to re-duce GHGs; indicates future trends for U.S. GHG emissions; outlines impacts and adap-tation measures; provides information on financial resources and technology transfer;details U.S. research and systematic observation efforts; and describes U.S. climate edu-cation, training, and outreach initiatives.
1ExecutiveSummaryExecutiveSummary

CHAPTER 1—EXECUTIVE SUMMARY 3CHAPTER 1—EXECUTIVE SUMMARY 3
tronics, such as computers and recharge-able tools.
These and other factors contribute tothe United States being the world’s largestproducer and consumer of energy. Manyof the long-term trends identified in the2002 CAR continue today, but recentevents have significantly affected U.S. na-tional circumstances. In particular, theeconomic slowdown in 2001 and early2002 had a major impact on energy useand, correspondingly, GHG emissions. Aseconomic recovery took hold in 2002, en-ergy demand also picked up, topping 100quadrillion British thermal units in 2004.However, technological change, energy ef-ficiency improvements in transportation,buildings, and other sectors, and a shift toless energy-intensive economic activityhave continued to slow the growth of en-ergy demand. As a result, while absoluteenergy use rose from 2000 to 2005, theamount of energy used per dollar of eco-nomic output—the energy intensity of theeconomy—fell by 11 percent.
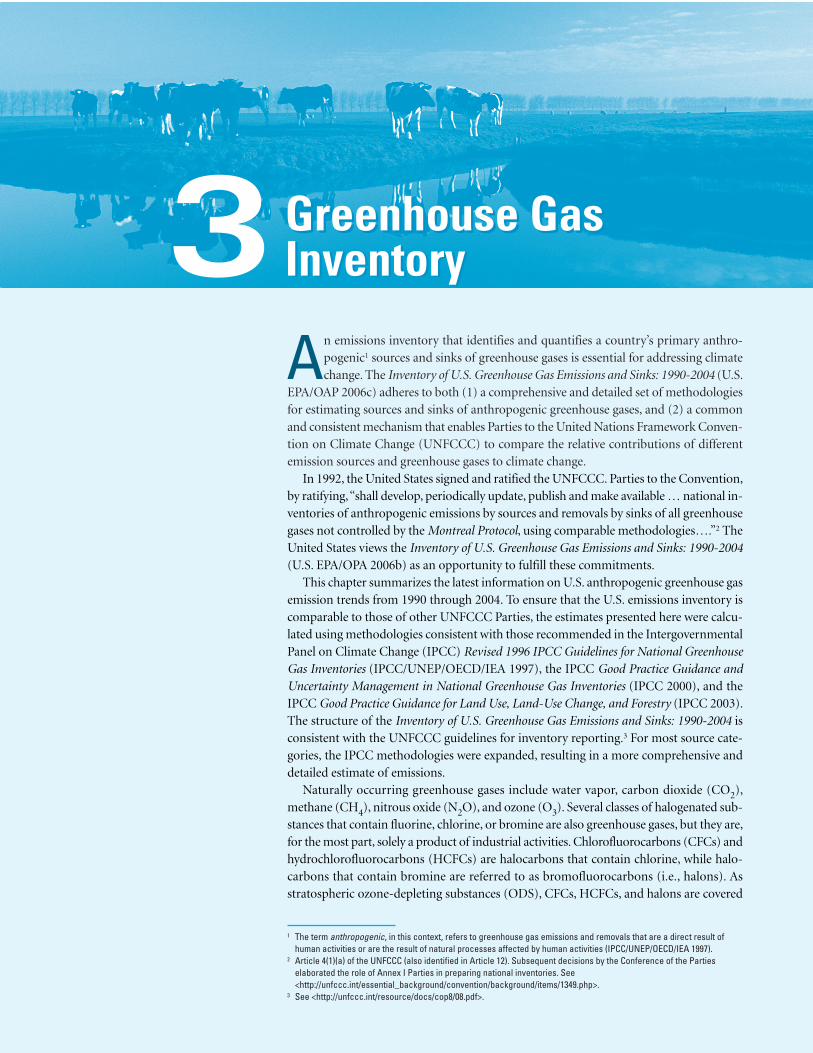
GREENHOUSE GAS INVENTORYChapter 3 summarizes U.S. anthro-
pogenic GHG emission trends from 1990through 2004 (themost recent submissionto the UNFCCC). The estimates presentedin the report were calculated usingmethodologies consistent with those rec-ommended by the IntergovernmentalPanel on Climate Change (IPCC).
Although the direct GHGs—carbondioxide, methane, and nitrous oxide—occur naturally in the atmosphere, humanactivities have changed their atmosphericconcentrations. In 2004, total U.S. GHGemissions were 7,074.4 teragrams of car-bon dioxide equivalent (Tg CO2 Eq.).Overall, total U.S. emissions rose by 15.8percent from 1990 through 2004. Overthat same time period,U.S.GDP increasedby 51 percent (U.S. DOC/BEA 2006a).
Carbon dioxide (CO2) accounted forapproximately 85 percent of total U.S.GHG emissions in 2004. As the largestsource of U.S. GHG emissions, CO2 fromfossil fuel combustion has accounted for
approximately 80 percent of global warm-ing potential-weighted emissions since1990. Emissions of CO2 from fossil fuelcombustion increased at an average annualrate of 1.3 percent from 1990 through2004. The fundamental factors influencingthis trend include (1) general domesticeconomic growth over the last 14 years,and (2) significant growth in emissionsfrom transportation activities and electric-ity generation. Between 1990 and 2004,CO2 emissions from fossil fuel combus-tion increased from 4,696.6 Tg CO2 Eq. to5,656.6 Tg CO2 Eq., a 20 percent total in-crease over the 14-year period.Historically,changes in emissions from fossil fuel com-bustion have been the dominant factor af-fecting U.S. emission trends.
Methane (CH4) accounted for 8 per-cent of total U.S. GHG emissions in 2004,with landfills being the largest anthro-pogenic source of CH4 emissions.Overall,U.S. emissions of CH4 declined by 10 per-cent from 1990 through 2004.
Nitrous oxide (N2O) accounted for ap-proximately 5 percent of total U.S. GHGemissions in 2004. The main U.S. anthro-pogenic activities producing N2O are agri-cultural soil management and fuelcombustion in motor vehicles. Overall,U.S. emissions of N2O declined by 2 per-cent from 1990 to 2004.
Halogenated substances—hydrofluoro-carbons, perfluorocarbons, and sulfurhexafluoride—accounted for 2 percent oftotal U.S. GHG emissions in 2004. The in-creasing use of these compounds since1995 as substitutes for ozone-depletingsubstances has been largely responsible fortheir upward emission trends.
POLICIES AND MEASURESThe U.S. approach to climate change
combines near-termGHGmitigation pro-grams with substantial investments in thetransformational technologies needed foreven greater emission reductions in the fu-ture. Chapter 4 of this report outlinesnear-term policies and measures under-taken by the U.S. government to mitigateGHG emissions.
NATIONAL CIRCUMSTANCESChapter 2 of this report outlines the na-
tional circumstances of the United Statesand how those circumstances affect U.S.GHG emissions. The United States is a vastand prosperous country with diverse to-pography, biota, climates, and land uses.The U.S. economy is large and vibrant,driven by a growing and geographicallydispersed population. The United Stateshas the highest real gross domestic prod-uct (GDP) in the world. U.S. GDP has ex-perienced significant growth since 2000;by 2005 it increased by 13.4 percent toslightly over $11.1 trillion (in constant2000 dollars). The United States is thethirdmost populous country in the world;from 2000 to 2005, the U.S. populationgrew by about 1 percent per year. In 2005,the U.S. population was an estimated296.4 million people, an increase of about15 million people since 2000, of whom 42percent are immigrants.
The diversity of climate zones foundthroughout the United States results inboth regional differences in energy use andimpacts associated with climate changeand variability. The United States possessesa broad mix of energy resources to pro-duce power and meet other energy re-quirements. Petroleum remains the largestsingle source of energy consumed in theUnited States, accounting for 40 percent oftotal energy demand in 2005.Other majorenergy sources include natural gas at 23percent, coal at 22 percent, nuclear at 8percent, and renewables at 6 percent.
The United States has a highly devel-oped transportation system that isdesigned to meet the needs of a mobileand dispersed population. This demandfor mobility and the desire for larger andmore affordable homes—along with othersocioeconomic factors—are associatedwith the decentralizing trend observed inU.S. metropolitan areas. The sustainedgrowth in new housing in the South andWest, where most new homes have airconditioning, has increased residentialelectricity demand, as has the increase inhousing size and the use of consumer elec-

4 U.S. CLIMATE ACTION REPORT—20064 U.S. CLIMATE ACTION REPORT—2006
Meeting President Bush’s commitmentto reduce the GHG intensity of the U.S.economy by 18 percent by 20121 will pre-vent the release of more than 1,833 TgCO2 Eq. to the atmosphere, adding to the255 Tg CO2 Eq. avoided in 2002. The Pres-ident’s emissions intensity approach en-sures a focus on policies andmeasures thatreduce emissions while fostering a grow-ing, prosperous economy. Over the sameperiod from 2002 to 2012, while GHG in-tensity is declining, total gross GHG emis-sions are expected to rise by 11 percent tomore than 7,709 Tg CO2 Eq.
The United States has implemented arange of programs that are contributing tothe achievement of this 18 percent inten-sity goal—including regulatory mandates,tax and other incentives, consumer andeducation campaigns, and voluntary ac-tions. This report details near-term federalclimate programs and policies that spanthe major sectors of the U.S. economy en-compassing generation and use of energyin the commercial, residential, industrial,and transportation sectors, and manage-ment of agriculture, forestry, wastestreams, and industrial by-products. Anumber of new initiatives have been intro-duced since 2002, and many are alreadyachieving significant emission reductions.
Additionally, several fiscal and incen-tive-based policies are mitigating emis-sions. The Energy Policy Act of 2005contains new tax rules that are helping tounleash substantial new capital invest-ment, including purchases of cleaner,more efficient equipment and facilities.The Act also grants the U.S. Department ofEnergy (DOE) the authority to issue loanguarantees for a variety of early commercialprojects that use advanced technologies thatavoid, reduce,or sequesterGHGs.Further, itauthorizes DOE to indemnify against cer-tain regulatory and litigation delays for thefirst six new nuclear plants, and offers pro-duction tax credits for 6,000 megawatts ofnew nuclear capacity.
A number of U.S. states and cities areimplementing a range of voluntary, incen-
tive-based, and locally relevant mandatorymeasures. Many of these build on or part-ner with related federal programs and con-tribute to meeting the President’s GHGintensity goal.
PROJECTED GREENHOUSE GASEMISSIONS
Chapter 5 of the 2006 CAR provides es-timates of projected national GHG emis-sions. These projections are used tomeasure the effectiveness of the emissionreduction programs and progress towardachieving the targets established under theGlobal Climate Change policy announcedby President Bush in February 2002. Basedon the latest forecasts of CO2 and non-CO2GHG emissions,which reflect currenteconomic conditions and include the ef-fects of federal climate programs, theUnited States is projected to exceed thePresident’s goal of reducing GHG intensityby 18 percent from 2002 to 2012. In ab-solute terms, the intensity goal corre-sponds to a reduction in GHG emissionsof 367 Tg CO2 Eq. in 2012 and more than1,833 Tg CO2 Eq. in cumulative GHG re-ductions between 2002 and 2012, relativeto projected emissions under Business AsUsual conditions. From 2002 through2012, GHG emissions are expected to riseby 11 percent to 7,709 Tg CO2 Eq.
This chapter also contains inventorydata for 2000 and emission projections to2020 for the United States. These projec-tions reflect national estimates of GHGemissions, considering population growth,long-term economic growth potential, his-torical rates of technology improvement,normal weather patterns, and reductionsdue to implemented policies andmeasures.
IMPACTS AND ADAPTATIONChapter 6 of this report highlights ac-
tions taken in the United States to betterunderstand and respond to vulnerabilitiesand impacts associated with climatechange. The U.S. government has madeconsiderable scientific progress in under-
standing the nature of climate change andits potential effects. It is involved in a widearray of climate assessments, research, andother activities to understand the potentialimpacts of climate change and climatevariability on the environment and theeconomy, and to develop methods andtools to enhance adaptation options. At-tention is also being focused at the localand state levels as well.
Chapter 6 also presents a selection ofsector- and region-specific adaptationprojects that illustrate the variety and scaleof approaches used within the UnitedStates. These activities inform decision-making processes at all levels—local, na-tional, and international—and help toincrease societal resilience to climatechanges.
Since 2002,U.S. research has led to newinsights into the impacts of climate changeand variability on key physical processes(e.g., snowpack, streamflow, extremeevents) that have implications for a rangeof socioeconomic sectors. In addition toparticipation in national and internationalassessment processes, the United States isengaged in national efforts to reduce un-certainty regarding climate change im-pacts. The U.S. government is providingpractical scientific information and toolsto help decision makers plan for potentialchanges in climate. These activities addressthe Nation’s needs for sound scientific in-formation that decision makers can use todevelop a better understanding of climatechange impacts and vulnerabilities, as wellas to improve the design and implementa-tion of adaptation measures.
FINANCIAL RESOURCES ANDTRANSFER OF TECHNOLOGY
Cooperation with other countries toaddress climate change continues to be ahigh priority for the United States. Chap-ter 7 outlines U.S. agency roles in interna-tional assistance and technology transfer.U.S. financial flows to developing and
1 At the time this commitment was made in February 2002, U.S. GHG emissions intensity was expected to improve by 14percent from 2002 to 2012 under a Business As Usual reference case. The President’s goal, therefore, was expected toimprove GHG intensity by 4 percentage points over the expected 14 percent.

CHAPTER 1—EXECUTIVE SUMMARY 5CHAPTER 1—EXECUTIVE SUMMARY 5
international partnerships to contribute tothe ultimate objective of the UNFCCCand promote sustainable development.These include the Asia-Pacific Partnershipon Clean Development and Climate, theMethane toMarkets Partnership, the Car-bon Sequestration Leadership Forum, theInternational Partnership for a HydrogenEconomy, the Generation IV InternationalForum, the President’s Initiative AgainstIllegal Logging, and the Group on EarthObservations. The United States also par-ticipates in the Renewable Energy and En-ergy Efficiency Partnership, the GlobalBioenergy Partnership, and the RenewableEnergy Policy Network for the 21st Cen-tury. Private-sector involvement is a keyaspect of these partnerships, and each ofthe partnerships includes countries fromall regions of the world, contributing tothe development, deployment, and trans-fer of technology across the globe. Addi-tionally, the United States has establishedbilateral climate partnerships, encompass-ing more than 450 individual activities,with 15 countries and regional organiza-tions.
RESEARCH AND SYSTEMATICOBSERVATION
Chapter 8 outlines how the UnitedStates is laying a strong scientific and tech-nological foundation to reduce uncertain-ties, clarify risks and benefits, and developeffective mitigation options for climatechange that complements U.S. efforts toslow the pace of growth of GHG emis-sions. In 2002, President Bush establisheda cabinet-level Committee on ClimateChange Science and Technology Integra-tion (CCCSTI), to provide guidance forinvestments in climate change science andtechnology,with funding of approximately$4.5 billion annually. CCCSTI coordinatestwomulti-agency programs—the ClimateChange Science Program (CCSP), led bythe U.S. Department of Commerce, andthe Climate Change Technology Program(CCTP), led by DOE. These two coordi-nated programs address issues at the inter-section of science and technology, such as
the evaluation of approaches to sequestra-tion, anthropogenic GHG emissionsmonitoring, global Earth observations,and energy technology development andmarket penetration scenarios.
The United States funds a significantportion of the world’s climate change re-search. Climate change and climate vari-ability play important roles in shaping theenvironment, infrastructure, economy,and other aspects of life in all countries,and decisionmakers must be able tomakeinformed decisions regarding thesechanges. U.S. global change research andglobal observations are facilitating deci-sion makers’ access to better and more re-liable information.
CCSP facilitates the creation and appli-cation of knowledge of the Earth's globalenvironment through research, observa-tions, decision support, and communica-tion. The program has developed astrategic plan in consultation with thou-sands of individuals in the research com-munity, and its efforts provide a soundscientific basis for national and interna-tional decisionmaking.CCSP is organizedaround five goals: (1) improving knowl-edge of climate history and variability, (2)improving the ability to quantify factorsthat affect climate, (3) reducing uncer-tainty in climate projections, (4) improv-ing understanding of the sensitivity andadaptability of ecosystems and human sys-tems to climate change, and (5) exploringoptions to manage risks.
The United States conducts technologyresearch, development, demonstration,and deployment through the multi-agency CCTP. The program provides aninteragency coordinating mechanism forclimate technology research and develop-ment funding. This effort will lead tomorecost-effective methods of reducing emis-sions and will facilitate more rapid devel-opment and commercialization ofadvanced technologies and best practicesto helpmeet the long-termU.S. goal of re-ducing, and eventually reversing, GHGemissions. CCTP’s strategic vision has six
transition economies that support the dif-fusion of climate-related technologies in-clude official development assistance andofficial aid, government-based project fi-nancing, foundation grants, nongovern-mental organization (NGO) resources,private-sector commercial sales, commer-cial lending, foreign direct investment, andprivate equity investment.
Adaptation to climate variability andchange is an important component of U.S.financial and technical cooperation to ad-dress climate change. U.S. governmentagencies are involved in collaborative ef-forts to develop and support themany dif-ferent scientific and technical activitiesneeded to promote adaptation, includingEarth observations, research and model-ing, and pilot projects. A number of U.S.government agencies also provide finan-cial resources and transfer of technologyto address development and climatechange. These programs apply a variety ofapproaches in locations around the globe.Capacity building and institution buildingare fundamental to the success and sus-tainability of these development efforts.
The United States provides substantialassistance resources through bilateral andmultilateral avenues. Between 2001 and2006, U.S. funding for climate change indeveloping countries totaled approxi-mately $1.4 billion, including $209millionto the Global Environment Facility (GEF)in support of climate change projects (outof a total GEF contribution of approxi-mately $680 million). The United States isthe largest contributor to both theUNFCCC and multilateral developmentbanks, the latter of which undertake arange of international energy investmentand adaptation activities. Though these re-sources are a relatively small share of over-all climate-related investment flows, theyare important in promoting the policy andinstitutional environment necessary togenerate recipient countries’ investmentsin cleaner andmore efficient technologies.
Since 2002, the United States has estab-lished and participated in a range of new

complementary goals: (1) reducing emis-sions from energy use and infrastructure,(2) reducing emissions from energy sup-ply, (3) capturing and sequestering CO2,(4) reducing emissions of other GHGs, (5)measuring andmonitoring emissions, and(6) bolstering the contributions of basicscience.
Long-term, high-quality observationsof the global environmental system are es-sential for understanding and evaluatingEarth system processes and for providingsound information to decision makers.The United States contributes to the devel-opment and operation of global observingsystems that combine data streams fromboth research and operational observingplatforms to provide a comprehensivemeasure of climate system variability andclimate change. The United States sup-ports multiple oceanic, atmospheric, ter-restrial, and space-based systems, workingwith international partners to enhance ob-servations and improve data quality andavailability.
In developing the CCSP roadmap, theUnited States recognized the need for en-hanced observations and the importance
of international cooperation in this area.To address key environmental data needs,the United States hosted the first EarthObservation Summit, in July 2003. At thethird Earth Observation Summit, in Brus-sels in 2005, nearly 60 countries adopted a10-year plan for implementing a GlobalEarth Observation System of Systems(GEOSS), which addresses multiple envi-ronmental data needs, including climate,weather, biodiversity, natural disasters, andwater and energy resource management(GEO 2005).
EDUCATION, TRAINING, ANDOUTREACH
Chapter 9 outlines how U.S. climatechange education, training, and outreachefforts have continued to evolve. U.S. fed-eral agencies—including the Agencyfor International Development; theDepartments of Agriculture, Energy, theInterior, and Transportation; the Environ-mental Protection Agency; the NationalAeronautics and Space Administration;the National Oceanic and AtmosphericAdministration; and the National ScienceFoundation—work on a wide range of ed-
ucation, training, and outreach programson the issues of U.S. climate change sci-ence, impacts, and mitigation. Each ofthese programs helps build the foundationfor understanding and taking broad actionto reduce the risks of climate change. TheCCSP includes a communications work-ing group that serves to provide policy-makers and the public with informationon the issue of global climate change andCCSP’s efforts and accomplishments inthis area.
Capacity building and training form anintegral part of many federal agencies’ in-ternational efforts on climate change. Ef-forts by industry, states, local governments,universities, schools, and NGOs are essen-tial complements to federal programs thateducate industry and the public regardingclimate change. The combined efforts ofthe U.S. federal, state, and local govern-ments and private entities are ensuringthat the American public is better in-formed about climate change and moreaware of the impact the Nation’s choicesmay have on the sustainability of theplanet.
6 U.S. CLIMATE ACTION REPORT—20066 U.S. CLIMATE ACTION REPORT—2006

Anumber of factors influence the Nation’s greenhouse gas (GHG) emissions, in-cluding government structure, climatic conditions, population growth, geography,economic growth, energy consumption, technology development, resource base,
and land use. This chapter focuses on current circumstances and departures from histor-ical trends since the third U.S. Climate Action Report1(CAR) was submitted to the UnitedNations Framework Convention on Climate Change (UNFCCC) in 2002, and the impactof these changes on emissions and removals (U.S. DOS 2002).
GOVERNMENT STRUCTUREThe United States is the world’s oldest federal republic. Governmental responsibilities
affecting economic development, energy, natural resources, and many other issues areshared among local, state, and federal governments. Those interested in learning moreabout the U.S. government’s structure should consult the 2002 CAR, Chapter 2.
POPULATION PROFILEPopulation growth can have a significant impact on energy consumption, land-use
patterns, housing density, and transportation. Recent data from the U.S. Census Bureauindicate that the U.S. population trends highlighted in the 2002 CAR remain unchanged.As of 2005, the United States was the third most populous country in the world, with anestimated 296.4 million people. From 2000 to 2005, the U.S. population grew by about 15million, at an annual rate of about 1 percent. This growth was essentially unchanged fromthe annual rate during the 1990s and is relatively high compared to the growth rates ofother industrialized countries (U.S. DOC/Census 2006a). Net immigration continues tohave a significant and increasing effect onU.S. population growth.About 42 percent of thegrowth between 2000 and 2005 was due to immigration, and about 58 percent from nat-ural increase (U.S. DOC/Census 2006b).
The warm“Sunbelt”—i.e., the U.S. South and Southwest—continues to show the great-est population growth. California, Texas, Florida, andArizona experienced the largest ab-solute increase in population from 2000 to 2005 (U.S. DOC/Census 2006b). Thispreference for warmer climates has amixed impact on energy use. In general, while homesin these areas use less energy for heating, they use more energy for cooling.
In addition to these regional trends, the U.S. population has shifted from rural to met-ropolitan areas.About 54 percent of the population lives inmetropolitan areas of 1millionpeople or more (U.S.DOC/Census 2006c).Much of the growth inmetropolitan areas hasnot been in city centers; instead, it has occurred in the surrounding suburbs and newlyemerging“exurbs.”Between 1997 and 2003, the number of houses in suburbanmetropol-itan areas increased by 15.3 percent. The comparable figure for central cities was just 3.4
2 NationalCircumstancesNationalCircumstances
1 See <http://unfccc.int/resource/docs/natc3.pdf>.

8 U.S. CLIMATE ACTION REPORT—20068 U.S. CLIMATE ACTION REPORT—2006
southern California and Arizona, wherethe annual average temperature exceeds21°C (70°F), to much cooler conditions inthe northern parts of the country alongthe Canadian border.
Similarly, precipitation shows a stronggradient, measuring more than 127 cen-timeters (cm) (50 inches (in)) a year alongthe Gulf of Mexico, and decreasing todesert regions of the intermountainWest.A similar but steeper gradient occurs in thePacific Northwest, ranging from very highannual precipitation in the Cascades andSierra Nevada, which can exceed 254 cm(100 in), to the rain shadows east of thesemountain ranges, where annual precipita-tion can be less than 30 cm (12 in).
Seasonal variability in temperature alsoshows a very wide range with distancefrom the oceans. The difference betweensummer and winter temperatures isgreater than 50°C (90°F) in areas like thenorthern Great Plains, whereas this differ-ence is less than 8°C (14.4°F) in areas likesouth Florida. Seasonal variability in pre-cipitation, however, shows a much differ-ent pattern. Areas in the eastern third ofthe country receive rainfall fairly consis-tently throughout the year.However, partsof the Great Basin (e.g., Arizona) experi-ence two peaks in rainfall—one during thePacific winter storms, and one in the midto late summer during the peak of theNorth American monsoon. Along theWest Coast, wet conditions prevail duringthe winter, and very dry conditions prevailduring the summer.
The United States is subject to almostevery kind of weather extreme, includingcountless severe thunderstorms during thewarmer months of the year, and almost1,500 tornadoes a year, most occurringduring the spring and early summer. Thehurricane season, which runs from Junethrough November, produces an averageof seven hurricanes, three of which makelandfall. At any given time, approximately20 percent of the country experiencesdrought conditions; however, during thelargest droughts, almost 80 percent of the
continental United States has been inmoderate to severe drought. Blizzards, icestorms, and high wind events occur acrossthe country during the winter, and coldwaves often produce freezing temperaturesin regions that rarely see these kinds ofconditions.
Differing U.S. climate conditions areseen in the number of annual heating andcooling degree-days. From 2000 to 2004,the number of heating degree-days aver-aged 4,330, which was 4.3 percent belowthe 30-year normal average.Over the sameperiod, the annual number of coolingdegree-days averaged 1,283, which was 5.6percent above normal (U.S. DOE/EIA2006b). Figure 2-1 shows the U.S. geo-graphic distribution of heating and cool-ing degree-days.
ECONOMIC PROFILEThe U.S. economy is the largest in the
world. In 2005, the U.S. economy contin-ued a robust expansion, with strong out-put growth and steady improvement in thelabor market. Looking to the future, theU.S. economy is poised for sustainedgrowth for years to come.
From 2000 to 2005, the U.S. economygrew by more than $1.3 trillion (in con-stant 2000 dollars), or 13.4 percent. In2005, real gross domestic product (GDP)was just over $11.1 trillion (in constant2000 dollars). Nonfarm payroll employ-ment increased by 2.0million during 2005,leading to an average unemployment rateof 5.1 percent. Since the business-cyclepeak in the first quarter of 2001 (a periodthat included a recession and a recovery),labor productivity grew at an average 3.6-percent annual rate, notably higher thanduring any comparable period since 1948.
The performance of the U.S. economyin 2005 was a marked turnaround fromthe economic situation the Nation facedfour years earlier. The bursting of the high-tech bubble of the late 1990s, slow growthamong major U.S. trading partners, andthe terrorist attacks of September 11, 2001,combined to dampen growth. Business in-vestment slowed sharply in late 2000 and
percent, and the number of homes outsideof metropolitan areas declined by 2.2 per-cent (U.S.DOC/Census 1999, 2004). Cou-pled with the Nation’s generally lowpopulation density, this decentralizingtrend in metropolitan areas has implica-tions for energy use. In the past, commut-ing patterns were largely between thecentral city and surrounding suburbs,whereas today there is a much greateramount of suburb-to-suburb commuting,increasing reliance on the automobile fortransportation.
GEOGRAPHIC PROFILEThe United States is one of the largest
countries in the world, with a total areaof 9,192,000 square kilometers (3,548,112square miles) stretching over seven timezones. The U.S. topography is diverse, fea-turing deserts, lakes, mountains, plains,and forests. More than 60 percent of theU.S. land area is privately owned. The U.S.government owns and manages the natu-ral resources on about 28 percent of theland, most of which is managed as part ofthe national systems of parks, forests,wilderness areas, wildlife refuges, andother public lands. States and local govern-ments own about 9 percent, and the re-maining 2 percent is held in trust by theBureau of Indian Affairs (Lubowski et al.2006). While the private sector plays amajor role in developing and managingU.S. natural resources, federal, state, andlocal governments regulate activities onprivately owned lands and provide educa-tional support to ensure the protectionand sustainable management of the natu-ral resources on these lands.
CLIMATE PROFILEThe climate of the United States varies
greatly, ranging from tropical conditionsin south Florida and Hawaii to arctic andalpine conditions in Alaska and the highelevations of the Rocky Mountains andSierra Nevada. Temperatures for the con-tinental United States show a strong gra-dient, from very high temperatures insouth Florida, south Texas, and parts of

CHAPTER 2—NATIONAL CIRCUMSTANCES 9CHAPTER 2—NATIONAL CIRCUMSTANCES 9
remained soft for more than two years.The economy lost more than 900,000 jobsfrom December 2000 to September 2001,and nearly 900,000 more in the threemonths immediately following the Sep-tember 11 attacks. This slowdown in eco-nomic growth contributed to an absolutedrop in GHG emissions in 2001.
Substantial tax relief andmonetary pol-icy provided stimulus to aggregate de-mand that softened the recession andhelped put the economy on the path to re-covery. Pro-growth tax policies not onlyprovided timely stimulus, but improvedincentives for work and capital accumula-tion, fostering an environment favorableto long-term economic growth.
However, high energy prices, whichweaken both the supply and the demandsides of the economy, restrained growthsomewhat in 2004 and 2005. Strong globaldemand, especially in Asia, and supply dis-ruptions combined to push the price ofcrude oil to about $50 per barrel. Severalhurricanes also harmed the productive ca-pacity of the economy, damaging GulfCoast oil and gas platforms and refining
installations. Despite these factors and along series of interest rate hikes by the Fed-eral Reserve, the economy grew a healthy3.5 percent in 2005 (CEA 2006).Althoughworld oil production capacity is expectedto increase, so is world demand, and theUnited States is likely to face tight crude oilmarkets for a number of years, whichcould constrain GDP growth and GHGemissions.
Long-term trends in the relative contri-butions of industrial sectors to GDP havechanged little since the 2002 CAR. As ashare of GDP, the service sector continuesto grow, while the manufacturing sectorcontinues to decline (CEA 2006). Thisshift has been a factor in improving U.S.GHG emissions intensity.
ENERGY RESERVES, PRODUCTION,AND CONSUMPTION
The considerable size of the UnitedStates and its variable and often severe cli-matic conditions, large and growing pop-ulation, dynamic economy and industries,and rich endowment of energy resourcesare all factors that contribute to makingthe Nation the world’s largest producer
and consumer of energy. Figure 2-2 pro-vides an overview of energy flows throughthe U.S. economy in 2005. This section fo-cuses on changes in U.S. energy supplyand demand since the 2002 CAR, whichcovered energy through 2000.
Reserves and ProductionThe United States has vast reserves
of energy, especially fossil fuels, whichhave been instrumental in the country’seconomic development. Uranium ore,renewable biomass, and hydropower arethree other major sources of energy.Otherrenewable energy sources contribute a rel-atively small but growing portion of theU.S. energy portfolio.
Fossil FuelsFossil fuels accounted for about four-
fifths of U.S. domestic energy productionin 2005, slightly less than in 2000.
Coal, which has the highest emissionsof carbon dioxide (CO2) per unit of en-ergy, is particularly plentiful, and is thelargest source of energy produced domes-tically. Coal remains the preferred fuel forpower generation, supplying about half ofthe energy used to generate electricity in
Geographic cooling and heating patterns have a significant impact on the type and amount of energy consumed. Areas of the country withgreater-than-average cooling degree-days typically use more energy for space cooling, while areas with greater-than-average heating degree-days typically use more energy for space heating.
FIGURE 2-1 Cooling and Heating Degree-Days for the Continental United States (30-Year Normals, 1971-2000)
EastSouth
Central
Notes:• Cooling and heating degree-days represent the number of degrees that the
daily average temperature—the mean of the maximum and minimumtemperatures for a 24-hour period—is below (heating) or above (cooling) 65°F(18.3°C). For example, a weather station recording a mean daily temperature of40°F (11.3°C) would report 25 heating degree-days.
• Data for the Pacific region exclude Alaska and Hawaii.
Source: U.S. DOE/EIA 2006a.

10 U.S. CLIMATE ACTION REPORT—200610 U.S. CLIMATE ACTION REPORT—2006
The trends in oil reserves and produc-tion identified in the 2002 CAR havechanged very little. Both peaked in 1970,when Alaskan North Slope fields came online, and generally have declined sincethen. Proved domestic reserves of oil standat about 3.4 trillion liters (21.9 billion bar-rels). At the 2005 production rate of about912 billion liters (5.7 million barrels) perday, these reserves would be recovered in
slightly less than 12 years (absent addi-tions) (U.S. DOE/EIA 2006g).
U.S. refining capacity, while well off its1981 peak, has increased since 1994, evenas the number of refineries declines. Al-though the number of operable refineriesfell from 158 to 148 from 2000 to 2005, re-fining capacity over the period actuallyrose from 26.3 billion to 27.2 billion liters(16.5 to 17.1 million barrels) per day (U.S.
the United States. Moreover, from 2000 to2005, coal’s competitive position vis-à-visoil and natural gas improved because of therising cost of the latter fuels. Coal reservesare estimated at about 449 billion metrictons (495 billion tons), enough to last forabout 440 years at current recovery rates.Annual coal production from 2000 to 2005averaged about 1.0 billion metric tons (1.1billion tons) (U.S. DOE/EIA 2006f).
FIGURE 2-2 Energy Flow Through the U.S. Economy: 2005 (Quadrillion Btus)
The U.S. energy system is the world’s largest, and it uses a diverse array of fuels from many different sources. The United States is largely self-sufficient in most fuels, except for petroleum. In 2005, net imports of crude oil and refined products accounted for about 65 percent of U.S.petroleum consumption on a Btu basis.
a Includes lease condensate.b Natural gas plant liquids.C Conventional hydroelectric power, wood, waste, ethanol blended into motor gasoline, geothermal, solar, and wind.d Crude oil and petroleum products. Includes imports into the Strategic Petroleum Reserve.e Natural gas, coal, coal coke, and electricity.f Stock changes, losses, gains, miscellaneous blending components, and unaccounted-for supply.g Coal, natural gas, coal coke, and electricity.h Includes supplemental gaseous fuels.i Petroleum products, including natural gas plant liquids.j Includes 0.04 quadrillion Btus of coal coke net imports.k Includes, in quadrillion Btus: (1) 0.34 ethanol blended into motor gasoline, which is accounted for in both fossil fuels and renewable energy, but is counted only once in total
consumption; and (2) 0.08 electricity net imports.l Primary consumption, electricity retail sales, and electrical system energy losses, which are allocated to the end-use sectors in proportion to each sector’s share of total electricity
retail sales. Electrical system energy loss is the amount of energy lost during the generation, transmission, and distribution of electricity.
Notes:• Data are preliminary.• Values are derived from source data prior to rounding for publication.• Totals may not equal sum of components due to independent rounding.Source: U.S. DOE/EIA 2006b.

CHAPTER 2—NATIONAL CIRCUMSTANCES 11CHAPTER 2—NATIONAL CIRCUMSTANCES 11
DOE/EIA 2005e). However, this capacity isstill well below the demand for petroleumproducts, which in 2005 averaged 32.8 bil-lion liters (20.7 million barrels) per day.
In 2005, net imports of crude oil andrefined products accounted for 60 percentof U.S. petroleum (volumetric) consump-tion, about 7 percentage points above thelevel for 2000.2 In addition to strong globaldemand, the active hurricane season in2005 temporarily affected Gulf Coastcrude oil production and refining, whichcontributed to the rising cost of crude oiland petroleum products in 2005.
Natural gas is the fossil fuel with thelowest emissions of CO2 per unit of en-ergy. The 2002 CAR pointed to the intro-duction of market pricing and regulatorychanges in the 1980s as factors that led toa recovery in natural gas production anddemand. The addition of natural gas-firedelectricity-generating capacity also hasboosted demand. Estimated dry naturalgas reserves of about 5.5 trillion cubic me-ters (192.5 trillion cubic feet) at the begin-ning of 2005 were 8.5 percent higher thanreserves at the beginning of 2000. Naturalgas production also increased since the2002 CAR, but onlymodestly, rising 1 per-cent between 2000 and 2005 to 1.5 millioncubic meters (53.2 million cubic feet) perday.As a result, the reserves-to-productionratio increased from 9.2 to 10.6 years (U.S.DOE/EIA 2006g).
Nuclear EnergyThe United States has about 120 mil-
lion kilograms (kg) (265 million pounds(lb)) of uranium oxide reserves recover-able at $66 per kg ($30 per lb) (U.S.DOE/EIA 2004b).AlthoughU.S. uraniumproduction has been trending downwardfor many years, production saw a turn-around in 2004, as U.S. uranium drilling,mining, production, and employment ac-tivities increased for the first time since1998. Total U.S. uranium concentrate pro-duction in 2005 was about 1.2 million kg(2.7 million lb). Although well below its1980 peak, it was 35 percent above the2003 level (U.S. DOE/EIA 2005a).
Production from nuclear energy facili-ties in 2005 contributed 20 percent of totalelectricity generation3 and 12 percent oftotal domestic energy production.
Renewable EnergyRenewable energy production in 2005
was 6.1 quadrillion Btus, accounting for8.8 percent of total U.S. energy produc-tion. Of this amount, biomass accountedfor 46 percent; hydropower, 45 percent; ge-othermal, 5.8 percent; wind, 2.5 percent;and solar, 1.1 percent. Owing largely tohigher than normal hydropower output,renewable energy production reached itshighest point in 1996 at 7.1 quadrillionBtus, or just below 10 percent of total U.S.energy production,
After peaking in 1997, hydropower pro-duction declined for four consecutiveyears, and has been at normal or below-normal levels since 2000.Geothermal out-put in 2005 reached its highest level since1993. Wind expanded rapidly in recentyears, but its share of the total was notenough to significantly affect the overallrenewable industry trend (U.S. DOE/EIA2006e).
ElectricityTheUnited States relies on electricity to
meet a significant portion of its energydemands, especially for lighting, electricmotors, heating, and air-conditioning. Theelectricity generation sector, the largestU.S. economic sector, is composed oftraditional electric utilities as well as otherentities, such as power markets and non-utility power producers.
Coal-fired capacity in 2005maintainedthe largest share of U.S. electric generatingcapacity, at 32 percent. Natural gas capac-ity accounted for 23 percent of the totalgenerating capacity; dual-fired (naturalgas and petroleum), 18 percent; nuclear, 10percent; hydroelectric, 8 percent; and otherrenewables (wood products, solar, wind,etc.), 2 percent.
While coal-fired capacity remains thelargest, its share of total capacity fell rela-tive to other fuels, particularly natural gas.In 2004, 72 percent of the new unit capac-ity was natural gas-fired, and at 15.3 gi-gawatts was well ahead of natural gas plantretirements. Also notable was the growthin renewable capacity, which added about9 megawatts for every megawatt retired.Additionally, re-powering of large coal-fired plants into more efficient natural gascombined-cycle plants, as well as the re-tirement of older coal-fired units, hasslightly reduced coal-fired capacity.How-ever, new orders for natural gas-fired unitscould slow because of high fuel costs.
In 2005, net generation of electricitywas 4.06 trillion kilowatt-hours, 6.7 per-cent above the 2000 level. Regulated elec-tric utilities’ share of total generationcontinues to decline as independent powerproducers’ share continues to increase(U.S. DOE/EIA 2005c). Although coal-fired capacity represents roughly one-thirdof total generating capacity, it accounts forabout half of the electricity generated. Thisis because coal-fired plants are for themost part run constantly to meet base-load capacity, rather than sporadically tomeet peak-load demand.
ConsumptionSince 2000, the overall trend in U.S. en-
ergy demand has been driven largely byeconomic activity. From 2000 to 2001,total U.S. energy consumption fell 2.5 per-cent, primarily in response to weakness inthe U.S. economy and the effects of in-creased oil prices. As the economy beganto recover in 2002, energy consumptionalso picked up. By 2004, U.S. energy con-sumption topped 100 quadrillion Btus, be-fore dipping slightly in 2005, owing in partto hurricane-related damage along theGulf Coast and Florida. Figure 2-3 pres-ents U.S. energy use by sector.
While absolute U.S. energy use hasrisen since 2000, the amount of energy
2 On a Btu basis, net petroleum imports accounted for 65 percent of U.S. petroleum consumption in 2005, about 7percentage points higher than in 2000.
3 For the electric power sector; excludes electricity production in the commercial and industrial sectors.

12 U.S. CLIMATE ACTION REPORT—200612 U.S. CLIMATE ACTION REPORT—2006
24 percent; coal, at 23 percent; nuclear, at8 percent; and renewables, at 6 percent(U.S. DOE/EIA 2006e).
Emissions of CO2 from energy reflectthe changing economic conditions andadoption of more energy-efficient tech-nologies over the period since the 2002CAR. While CO2 emissions from fossilfuel combustion tracked economicgrowth, the intensity of CO2 emissionsfrom fossil fuel combustion—measured asthe ratio of metric tons of CO2 emitted per$1,000 of real gross domestic product—declined steadily over the period, from0.59 in 2000 to 0.54 in 2004, the latest yearfor which data are available (U.S.DOE/EIA 2006d).
Residential SectorThe residential sector is made up of liv-
ing quarters for private households. Com-mon uses of energy associated with thissector include space heating—the largest
single source of residential energy con-sumption—water heating, air conditioning,lighting, refrigeration, cooking, and run-ning a variety of other appliances.4 In 2005,energy consumption in this sector,including electricity losses, totaled 21.9quadrillion Btus, or 22 percent of U.S.consumption. About one-fifth of GHGemissions from burning fossil fuels isattributable to residential buildings.
Between 2000 and 2005, total energyconsumption in the residential sector rose6.6 percent. As more people move towarmer climates, and as plug load fromconsumer electronics continues to grow,electricity is expected to comprise a grow-ing share of energy consumption in thissector, a trend that is reflected in the con-sumption data. From 2000 to 2005,electricity consumption, including systemlosses, increased every year, regardless ofweather or economic conditions; in 2005it accounted for 68 percent of totalresidential energy consumption5 (U.S.DOE/EIA 2006e).
Compared to electricity, demand forpetroleum (primarily fuel oil) and naturalgas is much more variable and fluctuatesseasonally, regionally, and annually basedon winter temperatures. Consumption ofnatural gas during 2000–2005 peaked in2003, largely because of high demand fornatural gas brought on by a relatively coldwinter heating season throughoutmuch ofthe country. Demand also was affected bychanges in relative prices between naturalgas and its substitutes.
Commercial SectorService-providing facilities and equip-
ment of businesses, governments, and pri-vate and public organizations, institutionalliving quarters, and sewage treatmentplants are themain components that makeup the commercial sector. The most com-mon uses of energy in this sector includespace ventilation and air conditioning,water heating, lighting, refrigeration,cooking, and running a wide variety of of-fice and other equipment. A relativelysmall portion is used for transportation. In
used per dollar of economic output—theenergy intensity of the U.S. economy—hasdeclined on average by 1.9 percent a year.From 10,100 Btus per dollar in 2000, U.S.energy intensity dropped by 11 percent to9,000 Btus (per 2000 dollar) in 2005. Thesedata reflect a continuing trend driven byadvances in energy technology and effi-ciency, and by the growing importance ofservice industries and the declining con-tribution of energy-intensive industries tothe GDP. Between 1992 and 2004, theenergy-intensive industries’ share of totalindustrial production fell by 1.3 percent ayear on average (U.S. DOE/EIA 2006a).
Petroleum remains the largest singlesource of U.S. energy consumption; in2005 it accounted for 41 percent of totalU.S. energy demand. Other major energysources consumed include natural gas, at
FIGURE 2-3 U.S. Energy Consumption by Sector: 1973-2005
Between 2000 and 2005, energy consumption in the residential, commercial, and transportationsectors rose by 6.6, 4.4, and 5.0 percent, respectively, while energy demand in the industrialsector fell by 7.6 percent. Since 1973, the industrial sector has accounted for a graduallyshrinking portion of total energy consumed in the United States, falling from 43 percent to lessthan one-third in 2005.
Source: U.S. DOE/EIA 2006e.
4 For data on the energy-consuming characteristics ofU.S. households, see Figure 2-8 of the 2002 CAR.
5 Total electricity, including retail sales and energy losses.

CHAPTER 2—NATIONAL CIRCUMSTANCES 13CHAPTER 2—NATIONAL CIRCUMSTANCES 13
2005, total energy in the commercial sectorwas 4.4 percent higher than in 2000. Atnearly 18 quadrillion Btus, it represented 18percent of total U.S. energy demand andapproximately 18 percent of GHG emis-sions from fossil fuel consumption.
Electricity, including system losses,6sup-plies a little over three-quarters of energyused by the sector, and natural gas, about 18percent.Demand for these fuels respondedlargely to a combination of prices andweather, although normally the impact ofweather is less marked than in the residen-tial sector.Demand for electricity increasedevery year except 2003. In 2005, electricityretail sales were about 9.1 percent higherthan in 2000, while natural gas demand,which is more variable, fluctuated over theperiod (U.S. DOE/EIA 2006e).
Industrial SectorThe industrial sector consists of all fa-
cilities and equipment used for producing,processing, or assembling goods, includingmanufacturing, mining, agriculture, andconstruction. Since 1973, the industrialsector has accounted for a graduallyshrinking portion of total energy con-sumed in the United States, falling from 43percent to about one-third in 2005. Fossilfuel-related CO2 emissions from the in-dustrial sector also have fallen by about 33percent since 1990, and account for about28 percent of total U.S. CO2 emissions.
Overall energy use in the industrial sec-tor is largely for process heating and cool-ing and powering machinery, with lesseramounts used for facility heating, air con-ditioning, and lighting. Fossil fuels are alsoused as raw material inputs to manufac-tured products. Approximately four-fifthsof the total energy used in the industrialsector is for manufacturing, with chemi-cals and allied products, petroleum andcoal products, paper and nonmetallic min-erals, and primary metals accounting formost of this share.
Electricity use, including system losses,represents a little more than one-third ofall energy consumed in the industrial sec-tor, while petroleum and natural gas ac-count for 30 percent and 25 percent,respectively.
Since the 2002 CAR, economic condi-tions and high energy costs affected indus-trial and manufacturing outputs, whichwere declining or flat until 2004, whenboth increased significantly. Nevertheless,compared to 2000, energy demand in thissector was 7.6 percent lower in 2005.At 7.9quadrillion Btus in 2005, natural gas de-mand was at its lowest level in this sectorsince 1988. Coal and electricity consump-tion also has not returned to 2000 levels,but by 2005 petroleum consumption was5.7 percent higher than in 2000 (U.S.DOE/EIA 2006e).
Transportation SectorEnergy consumption in the transporta-
tion sector includes all energy used tomove people and goods: automobiles,trucks, buses, andmotorcycles; trains, sub-ways, and other rail vehicles; aircraft; andships, barges, and other waterborne vehi-cles.7 Total energy demand in this sectoraccounts for nearly 28 percent of total U.S.energy demand and approximately one-third of GHG emissions from fossil fuels.
In 2005, petroleum supplied 98 percentof the energy used in the transportationsector. Transportation is responsible forabout two-thirds of all the petroleum used,and personal transportation accounts for60 percent of this consumption.
Slower economic growth and the ter-rorist attacks of September 11, 2001, werethemajor factors affecting energy demandin this sector since the 2002 CAR.Overall,transportation-related energy demanddropped 1.6 percent between 2000 and2001, which was confined largely to avia-tion jet fuel (especially in the two yearsafter the September 11 attacks) and resid-
ual fuel oil (e.g., bunker fuels). However,demand rose in each subsequent year,reaching a historic high of 28 quadrillionBtus in 2005, which was 5 percent abovethe 2000 level (U.S.DOE/EIA 2006e). Thebasic factors affecting energy demand inthis sector that were identified in the 2002CAR—increasingly decentralized land-usepatterns, population growth, and eco-nomic expansion—continue to drivemuch of the increase in the sector’s energyconsumption.
Concerns about methyl tertiary butylether (MTBE) contamination of ground-water from leaking storage tanks have ledseveral states to institute bans on MTBE.As a result, ethanol use has grown signifi-cantly as a transportation fuel over the pastfew years, jumping from 139 trillion Btusin 2000 to 340 trillion Btus in 2005 (U.S.DOE/EIA 2006c). As CO2 emissions fromethanol consumption are not net addi-tions to the atmosphere (as long as no newland is put into production), this trend hastended to mitigate the growth of trans-portation-related emissions.
Federal GovernmentThe U.S. government remains the Na-
tion’s largest single user of energy. Underthe Federal EnergyManagement Program,federal agencies have invested in energy ef-ficiency over the past two decades. TheU.S. government’s total primary energyconsumption—including energy con-sumed to produce, process, and transportenergy—was 1.65 quadrillion Btus duringfiscal year 2004, about 1.7 percent of totalU.S. energy consumption.8 Combined,federal agencies reported a 22 percent de-crease in total primary energy consump-tion, compared to consumption duringfiscal year 1990 (U.S. DOE 2006a).
Executive Order 13123 establishes anumber of goals that go beyond what is re-quired under the National Energy Conser-vation Act. These include goals related toimproved energy efficiency and GHGreduction in federal buildings, renewable6 Electrical system energy loss is the amount of energy lost during generation, transmission, and distribution of electricity.
7 Transportation does not include such vehicles as construction cranes, bulldozers, farming vehicles, warehouse tractors,and forklifts, whose primary purpose is not transportation.
8 Just over 1.1 quadrillion Btus for site-delivered energy consumption.

14 U.S. CLIMATE ACTION REPORT—200614 U.S. CLIMATE ACTION REPORT—2006
vehicles for every licensed driver. This highdegree of vehicle ownership, which reflectsa strong desire for personal mobility, af-fects and is affected by population distri-bution, land-use patterns, location ofwork and shopping, energy use, and GHGemissions. It also contributes to decreaseduse of carpooling and public transport.
Passenger cars account for more thanhalf of highway vehicles and over one-third of all the energy consumed in thetransportation sector (Figure 2-4). How-ever, between 1997 and 2004, the numberof registered light trucks, sport utility vehi-cles, and vans increased by a combined 31percent. In 2004, they made up nearly 38percent of the highway vehicle fleet andused almost 28 percent of all the energy inthe transportation sector. Though thesetypes of vehicles are generally less energyefficient, consumers often choose them onthe basis of other concerns, such as safety,affordability, capacity, and aesthetics.Morerecent data suggest that sales of light trucksas a percent of total vehicle sales have de-clined.
The number of miles driven is anothermajor factor affecting energy use in thehighway sector. From 1997 to 2003, the av-erage number of kilometers driven per ve-hicle each year increased by 1 percent, andthe total number of vehicle kilometerstraveled increased by 16 percent.
Despite the large increase in the totalnumber of vehicle kilometers traveled, as-sociated increases in energy consumptionhave been more moderate, due to en-hanced fuel efficiencies driven in part bythe corporate average fuel economy(CAFE) standards for cars (11.7 kilome-ters per liter (kpl), or 27.5 miles per gallon(mpg)) and light trucks (8.8 kpl, or 20.7mpg). In 2004, new passenger cars enter-ing the U.S. fleet averaged 12.4 kpl (29.3mpg), and new trucks averaged 9.1 kpl(21.5 mpg), compared to 12.2 and 8.8 kpl(28.7 and 20.7 mpg), respectively, in 1997.However, the growing portion of less fuel-efficient light trucks in the vehicle fleet hasoffset these efficiency gains somewhat. In2006, fuel economy standards were raised
for model years 2008–11, using an inno-vative vehicle, size-based approach, reach-ing 10.2 kpl (24.0 mpg) for model year2011. This reform is expected to save 40.5billion liters (10.7 billion gallons) of fuel.
Air CarriersThe terrorist attacks of September 11,
2001, the slowdown in economic activityin 2001, and industry restructuring had asignificant impact on the airline industrysince the 2002 CAR. In 2001, U.S. domes-tic passenger kilometers dropped sharplyby 5.7 percent from the previous year, anddipped another 0.9 percent in 2002.How-ever, a recovering economy helped pushdomestic airline passenger distance trav-eled to 896 billion kilometers (558 billionmiles) in 2003, 8.1 percent above the 2000level.
Increased competitive pressures andthe higher cost of aviation fuel wereamong the factors contributing to a 19percent improvement in the energy effi-ciency of domestic industry operationsbetween 1997 and 2004, based on energyused per passenger kilometer.
FreightFrom 1997 to 2003 (the latest year for
which data for allmodes are available),U.S.freight transportation grew by 5.3 percentto 6.36 trillion metric ton kilometers (4.36
energy, reduction of petroleum use, reduc-tion of primary energy use, and water con-servation.
The GHG reduction goal for federalgovernment facilities—which includesstandard buildings and industrial, labora-tory, and other energy-intensive facili-ties—was set at 30 percent below 1990levels by 2010. Recent data show emissionsfrom these facilities have decreased by 19.4percent since fiscal year 1990, from 54.7teragrams of CO2 equivalent (Tg CO2 Eq.)in fiscal year 1990 to 44.1 Tg CO2 Eq. infiscal year 2004 (U.S. DOE 2006b).
TRANSPORTATIONThe U.S. transportation system has
evolved to meet the needs of a highly mo-bile, dispersed population and a large, dy-namic economy. Over the years, theUnited States has developed an extensivemultimodal system that includes water-borne, highway, mass transit, air, rail, andpipeline transport capable of moving largevolumes of people and goods long dis-tances. For-hire transport services accountfor 2.8 percent of GDP (U.S. DOC/BEA2006b).
Economic circumstances, increased oilprices, and the terrorist attacks of Septem-ber 11, 2001, interrupted some of the long-term trends noted in the 2002 CAR.Automobiles and light trucks still domi-nate the passenger transportation system,and the highway share of passenger kilo-meters traveled in 2003 was about 90 per-cent of the total, relatively unchanged fromthe 2002 CAR. Air travel accounted for alittle less than 10 percent, andmass transitand rail travel combined accounted foronly about 1 percent of passenger kilome-ters traveled. The following sections focuson changes in transportation since the2002 CAR.
Highway VehiclesThe trends in highway vehicles de-
scribed in the 2002 CAR have not changedappreciably. Vehicle ownership continuesto increase. Between 1997 and 2004, thenumber of passenger vehicles rose nearly15 percent to 243.0 million, about 1.2
FIGURE 2-4 Share of TransportationEnergy Consumption by Mode: 2003
In 2003, cars and light-duty vehiclesaccounted for just over two-thirds of theenergy consumed in the transportationsector.
Source: U.S. DOT 2006.

CHAPTER 2—NATIONAL CIRCUMSTANCES 15CHAPTER 2—NATIONAL CIRCUMSTANCES 15
trillion tonmiles). The predominantmodeof freight transportation was rail (37 per-cent), followed by trucks (29 percent),pipelines (20 percent), waterways (14 per-cent), and air (less than 1 percent).
Revenue per metric ton kilometer forrailroads grew by nearly 15 percent be-tween 1997 and 2003. While the numberof railroad cars in use also rose, it did so ata much slower pace (less than 1 percent).With comparatively fewer cars being calledon to carry more freight greater distances,the energy intensity of Class 1 railroadfreight services,measured as Btus permet-ric ton kilometer of freight, improved by 7percent.
Freight trucks are the second largestconsumers of energy in the transport sec-tor, behind a category of vehicles compris-ing passenger cars and light-duty vehicles.Between 1997 and 2003, their share of en-ergy use rose from 11 to 14 percent. Thetotal amount of energy consumed byfreight trucks increased by about one-thirdover the period. The number of registeredcombination trucks increased by about 12percent, and the number of metric tonkilometers of freight increased by 13 per-cent.
Metric ton kilometers shipped by airgrew steadily from 1997 to 2000, beforedropping sharply (16 percent) in 2001.While air freight recovered over the nexttwo years, its 2003 level was still below its2000 peak. The metric ton kilometersshipped by domestic water transport de-clined from 1997 to 2003, a continuationof a long-term trend.Water transport met-ric ton kilometers fell by 14 percent overthe period, led largely by declines in coast-wise and lakewise shipping (U.S. DOT2006a).
INDUSTRYThe U.S. industrial sector boasts a wide
array of light and heavy industries inman-ufacturing and nonmanufacturing subsec-
tors, the latter of which include mining,agriculture, and construction. Together,the value added of manufacturing andnonmanufacturing activities accounts forabout 20 percent of total GDP, with utili-ties adding another 2 percent.
Relative to the economy as a whole, theindustrial sector overall has shown sloweroutput growth in recent decades, and im-ports havemet a growing share of demandfor industrial goods. From 1990 to 2005,the value added by manufacturing fellfrom 16.3 percent to 12.1 percent of totalGDP, with declines in both durable andnondurable goods.9 The shares attributedto agriculture and utilities also fell.
In contrast, mining rose from 1.5 per-cent to 1.9 percent of GDP, owing to a re-covery in oil and gas extraction that beganaround 2000. After falling in the early1990s, construction’s share also rose,boosted by rapid growth in the housingsector (U.S. DOC/BEA 2006b).
The energy intensity of the industrialsector has improved appreciably.Deliveredenergy consumption is roughly the sametoday as it was in 1980, despite amore thandoubling of GDP and a 50 percent in-crease in the value of shipments. Withinthe industrial sector,manufacturing activ-ities are more energy-intensive than non-manufacturing activities, using about 50percent more energy per dollar of output.Since the mid-1980s, energy intensity de-clinedmore rapidly for nonmanufacturingthan for manufacturing industries, prima-rily because most of the historical reduc-tion in energy intensity in manufacturinghad already occurred in response to thehigh energy prices of the late 1970s andearly 1980s.Much of the decline in energyintensity in nonmanufacturing activitiesresulted from a compositional shift, withthe relatively low-intensity constructionindustry growing more rapidly than therelatively high-intensity mining sector,
particularly in the late 1990s and early2000s (U.S. DOE/EIA 2006a).
WASTEThe 2002 CAR reported waste data
through 1999. This section updates thesedata to 2004, the most recent reportingyear available. In 2004, the United Statesgenerated approximately 247millionmet-ric tons (272 million tons) of municipalsolid waste (MSW), about 17millionmet-ric tons (nearly 19million tons)more thanin 1999. Paper and paperboard productsmade up the largest component of MSWgenerated by weight (35 percent), and yardtrimmings comprised the second largestmaterial component (more than 13 per-cent). Glass, metals, plastics, wood, andfood each constituted between 5 and 12percent of the total MSW generated. Rub-ber, leather, and textiles combined madeup about 7 percent of the MSW, whileother miscellaneous wastes comprised ap-proximately 3 percent of the MSW gener-ated in 2004. These shares have not changeappreciably since the 2002 CAR.
Recycling has resulted in a change inwaste management from a GHG perspec-tive (U.S. EPA 2006b). From 1990 to 2004,the recycling rate increased from just over16 percent to about 32 percent. Of the re-mainingMSWgenerated, about 14 percentis combusted and 55 percent is disposed ofin landfills. The number of operatingMSWlandfills in the United States has decreasedsubstantially over the past 20 years, fromabout 8,000 in 1988 to about 1,654 in 2004,while the average landfill size has increased.
Landfills are the largest U.S. source ofanthropogenic methane emissions, ac-counting for 25 percent of the total. Pres-ent data suggest a marked increase in theamount of methane recovered for eithergas-to-energy or flaring purposes in recentyears (U.S. EPA/OAP 2006c).
9 Durable goods include wood products; nonmetallic mineral products; primary metals; fabricated metal products; machinery; computer and electronic products; electrical equipment,appliances, and components; motor vehicles, bodies and trailers, and parts; other transportation equipment; furniture and related products; and miscellaneous manufacturing.Nondurable goods include food and beverage and tobacco products; textile mills and textile product mills; apparel and leather and allied products; paper products; printing and relatedsupport activities; petroleum and coal products; chemical products; and plastics and rubber products.

16 U.S. CLIMATE ACTION REPORT—200616 U.S. CLIMATE ACTION REPORT—2006
erage about 13 percent larger than thestock of existing homes, and thus havegreater requirements for heating, cooling,and lighting. Nevertheless, under currentbuilding codes and appliance standardsfor heat pumps, air conditioners, furnaces,refrigerators, and water heaters, the energyrequirement per square foot of a newhome is typically lower than of an existinghome (U.S. DOE/EIA 2005b).
Commercial BuildingsBetween 2000 and 2003, commercial
floor space rose an estimated 1.8 percenta year. By 2003 there were nearly 4.9 mil-lion commercial buildings and more than6.7 billion square meters (71.7 billionsquare feet) of floor space. Much of thisgrowth has been related to the rapidly ex-panding information, financial, and healthservices sectors.
More than half of commercial build-ings are 465 square meters (5,000 squarefeet) or smaller, and nearly three-fourthsare 929 square meters (10,000 square feet)or smaller. Just 2 percent of buildings arelarger than 9,290 square meters (100,000square feet), but these large buildings ac-count for more than one-third of com-mercial floor space (U.S.DOE/EIA 2003).
Electricity and natural gas are the twolargest sources of energy used in commer-cial buildings. Over 85 percent of com-mercial buildings are heated, and morethan 75 percent are cooled. The use ofcomputers and other office electronicequipment continues to grow and willhave an impact on the demand for elec-tricity (U.S. DOE/EIA 2006a).
AGRICULTURE AND GRAZINGAgriculture in the United States is
highly productive.U.S. croplands producea wide variety of food and fiber crops, feedgrains, oil seeds, fruits and vegetables, andother agricultural commodities for bothdomestic and international markets. In2002, U.S. cropland was 137.6 millionhectares (ha) (399.9 million acres (ac)) ,about 2.6 percent lower than in 1997(Lubowski et al. 2006).
Conservation is an important objectiveof U.S. farm policy. The U.S. Departmentof Agriculture administers a set of conser-vation programs that have been highlysuccessful at removing environmentallysensitive lands from commodity produc-tion and encouraging farmers to adoptconservation practices on working agri-cultural lands. The largest of these pro-grams, the Conservation Reserve Program(CRP), seeks to reduce soil erosion, im-prove water quality, and enhance wildlifehabitat by retiring environmentally sensi-tive lands from crop production.About 16million ha (39.5 million ac) of land is en-rolled in CRP.
Improved tillage practices also havehelped reduce soil erosion and conserveand build soil carbon levels. From 1998 to2004, the amount of cropland managedwith no-till systems increased by 31 per-cent to 25.4 ha (62.7 ac), in part becauseof the widespread adoption of herbicide-tolerant crops developed using biotech-nology. Land managed using allconservation tillage systems has fluctuatedbetween about 40 and 46 million ha (98.8and 113.6 million ac) (CTIC 2004).
Sources of GHG emissions from U.S.croplands include nitrous oxide from ni-trogen fertilizer use and residue burningand methane from rice cultivation andresidue burning. Nitrous oxide related tofertilizer use is by far the largest source,representing more than 97 percent ofemissions from croplands (U.S. EPA/OAP2006c).
Grasslands account for slightly morethan one-third of themajor U.S. land uses.Pasture and range ecosystems can includea variety of different flora and fauna com-munities, and are generally managed byvarying grazing pressure, by using fire toshift species abundance, and by occasion-ally disturbing the soil surface to improvewater infiltration. In 2002, grasslands to-taled about 316 million ha (780.5 millionac), about the same as in 1997. Since 1949,grassland acreage has declined by about 8percent, reflecting improved productivity
BUILDING STOCK AND URBANSTRUCTURE
Buildings are large users of energy.Their number, size, and distribution andthe appliances and heating and coolingsystems that go into them influence energyconsumption and GHG emissions. About37 percent of total U.S. energy consump-tion and about 70 percent of total electric-ity consumption are in buildings.
Residential BuildingsThe economic slowdown had little ef-
fect on the housing market, which has re-mained relatively strong since the 2002CAR.Between 1997 and 2003, the numberof residences in the United States grew by8.3 percent to approximately 121 millionhouseholds, 62 percent of which were sin-gle, detached dwellings.
Most of the recent growth in housinghas occurred in the U.S. South and West.Combined, between 1997 and 2003 thesetwo regions added nearly three times asmany homes to the U.S. building stock asthe Northeast andMidwest. The sustainedgrowth in new housing in the Sunbelt,where almost all new homes have air con-ditioning, and the increasing market pen-etration of consumer electronics willcontinue to fuel the demand for residentialelectricity.
The desire for larger lots and more af-fordable housing has helped drive the de-centralizing trend observed inmetropolitan areas, and has created greaterdemand for more and larger homes. Be-tween 1997 and 2003, the share of housingunits of four or fewer rooms fell, while theshares of units with five to seven roomsand with eight to ten or more rooms rose(U.S. DOC/Census 1999, 2004).
While new homes are larger and moreplentiful, their energy efficiency has in-creased greatly. In 2004, 8 percent of allnew single-family homes were certified asENERGY STAR compliant, implying atleast a 30 percent energy savings for heat-ing and cooling relative to comparablehomes built to current code (U.S.DOE/EIA 2006a). New homes are on av-

CHAPTER 2—NATIONAL CIRCUMSTANCES 17CHAPTER 2—NATIONAL CIRCUMSTANCES 17
of grazing lands, land-use changes, and adecline in the number of domestic animalsraised on grazing lands (Lubowski et al.2006).
FORESTSU.S. forests are predominately natural
stands of native species, and vary from thecomplex hardwood forests in the East tothe highly productive conifer forests of thePacific Coast. Planted forest land is mostcommon in the East, and planted stands ofnative pines are common in the South. In1630, forest land comprised an estimated46 percent of the total U.S land area,whereas in 2002, forests covered aboutone-third of the total area. Historically,
most of the forest land loss was due toagricultural conversions, but today mostlosses are due to such intensive uses asurban development.
Of the 303million ha (748.4million ac)of U.S. forest land, nearly 204 million ha(503.9 million ac) are timberland, most ofwhich is privately owned in the contermi-nous United States. However, a significantarea of forest land is reserved forests, whichin 2002 accounted for about one-third offorest land, about 99million ha (244.5mil-lion ac) (Lubowski et al. 2006).
Since the 1950s, timber growth for bothsoftwoods and hardwoods in the UnitedStates has consistently exceeded harvests. In2001, net growth exceeded removals by 33
percent (i.e., U.S. forest inventory accruedmore volume than it lost by mortality andharvest by nearly one-third). Recent de-clines in harvesting on public lands in theWest have significantly deviated from his-toric growth and removal patterns, andhave placed more pressure on easternforests that are predominantly in privateownership (Smith et al. 2004).
Existing U.S. forests are an importantnet sink for atmospheric carbon. Improvedforestmanagement practices, the regenera-tion of previously cleared forest areas, aswell as timber harvesting and use have re-sulted in net sequestration of CO2 everyyear since 1990 (U.S. EPA/OAP 2006c).
An emissions inventory that identifies and quantifies a country’s primary anthro-pogenic1 sources and sinks of greenhouse gases is essential for addressing climatechange. The Inventory of U.S. Greenhouse Gas Emissions and Sinks: 1990-2004 (U.S.
EPA/OAP 2006c) adheres to both (1) a comprehensive and detailed set of methodologiesfor estimating sources and sinks of anthropogenic greenhouse gases, and (2) a commonand consistent mechanism that enables Parties to the United Nations Framework Conven-tion on Climate Change (UNFCCC) to compare the relative contributions of differentemission sources and greenhouse gases to climate change.In 1992, the United States signed and ratified the UNFCCC. Parties to the Convention,
by ratifying,“shall develop, periodically update, publish andmake available…national in-ventories of anthropogenic emissions by sources and removals by sinks of all greenhousegases not controlled by theMontreal Protocol, using comparable methodologies….”2 TheUnited States views the Inventory of U.S. Greenhouse Gas Emissions and Sinks: 1990-2004(U.S. EPA/OPA 2006b) as an opportunity to fulfill these commitments.This chapter summarizes the latest information onU.S. anthropogenic greenhouse gas
emission trends from 1990 through 2004. To ensure that the U.S. emissions inventory iscomparable to those of other UNFCCC Parties, the estimates presented here were calcu-lated usingmethodologies consistent with those recommended in the IntergovernmentalPanel on Climate Change (IPCC) Revised 1996 IPCC Guidelines for National GreenhouseGas Inventories (IPCC/UNEP/OECD/IEA 1997), the IPCC Good Practice Guidance andUncertainty Management in National Greenhouse Gas Inventories (IPCC 2000), and theIPCC Good Practice Guidance for Land Use, Land-Use Change, and Forestry (IPCC 2003).The structure of the Inventory of U.S. Greenhouse Gas Emissions and Sinks: 1990-2004 isconsistent with the UNFCCC guidelines for inventory reporting.3 For most source cate-gories, the IPCC methodologies were expanded, resulting in a more comprehensive anddetailed estimate of emissions.Naturally occurring greenhouse gases include water vapor, carbon dioxide (CO2),
methane (CH4), nitrous oxide (N2O), and ozone (O3). Several classes of halogenated sub-stances that contain fluorine, chlorine, or bromine are also greenhouse gases, but they are,for themost part, solely a product of industrial activities. Chlorofluorocarbons (CFCs) andhydrochlorofluorocarbons (HCFCs) are halocarbons that contain chlorine, while halo-carbons that contain bromine are referred to as bromofluorocarbons (i.e., halons). Asstratospheric ozone-depleting substances (ODS), CFCs, HCFCs, and halons are covered
3
1 The term anthropogenic, in this context, refers to greenhouse gas emissions and removals that are a direct result ofhuman activities or are the result of natural processes affected by human activities (IPCC/UNEP/OECD/IEA 1997).
2 Article 4(1)(a) of the UNFCCC (also identified in Article 12). Subsequent decisions by the Conference of the Partieselaborated the role of Annex I Parties in preparing national inventories. See<http://unfccc.int/essential_background/convention/background/items/1349.php>.
3 See <http://unfccc.int/resource/docs/cop8/08.pdf>.
Greenhouse GasInventoryGreenhouse GasInventory

CHAPTER 3—GREENHOUSE GAS INVENTORY 19CHAPTER 3—GREENHOUSE GAS INVENTORY 19
under theMontreal Protocol on SubstancesThat Deplete the Ozone Layer. TheUNFCCC defers to this earlier interna-tional treaty. Consequently, Parties to theUNFCCC are not required to includethese gases in their national greenhousegas emission inventories.4 Some otherfluorine-containing halogenated sub-stances—hydrofluorocarbons (HFCs),perfluorocarbons (PFCs), and sulfur hexa-fluoride (SF6)—do not deplete stratos-pheric ozone, but are potent greenhousegases. These latter substances are ad-dressed by the UNFCCC and accountedfor in national greenhouse gas emissioninventories.There are also several gases that do not
have a direct global warming effect but in-directly affect terrestrial and/or solarradiation absorption by influencing theformation or destruction of greenhousegases, including tropospheric and stratos-pheric ozone. These gases include carbonmonoxide (CO), oxides of nitrogen(NOx), and nonmethane volatile organiccompounds (NMVOCs). Aerosols, whichare extremely small particles or liquiddroplets, such as those produced by sulfurdioxide (SO2) or elemental carbon emis-sions, can also affect the absorptive charac-teristics of the atmosphere.Although the direct greenhouse gases
CO2, CH4, and N2O occur naturally in theatmosphere, human activities havechanged their atmospheric concentra-tions. From the pre-industrial era (i.e.,ending about 1750) to 2004, concentra-tions of these greenhouse gases have in-creased globally by 35, 143, and 18 percent,respectively (IPCC 2001; Hofmann 2004).Beginning in the 1950s, the use of CFCs
and other stratospheric ODSs increased bynearly 10 percent per year until the mid-1980s, when international concern aboutozone depletion led to the entry into forceof the Montreal Protocol. Since then, theproduction of ODSs is being phased out.
Emissions Reporting Nomenclature
The global warming potential (GWP)-weighted emissions of all direct greenhousegases throughout this chapter are presented in terms of equivalent emissions of car-bon dioxide (CO2), using units of teragrams of CO2 equivalent (Tg CO2 Eq.). The GWPof a greenhouse gas is defined as the ratio of the time-integrated radiative forcingfrom the instantaneous release of 1 kilogram (kg) (2.2 pounds (lb)) of a trace sub-stance relative to that of 1 kg of a reference gas (IPCC 2001a). The relationship be-tween gigagrams (Gg) of a gas and Tg CO2 Eq. can be expressed as follows:
Tg CO2 Eq. = (Gg of gas) x (GWP) x ( )The UNFCCC reporting guidelines for national inventories were updated in 2002,5 butcontinue to require the use of GWPs from the IPCC Second Assessment Report(IPCC 1996b). The GWP values used in this report are listed below in Table 3-1, andare explained in more detail in Chapter 1 of the Inventory of U.S. Greenhouse GasEmissions and Sinks: 1990-2004 (U.S. EPA/OAP 2006c).
The concept of a global warming potential(GWP) has been developed to comparethe ability of each greenhouse gas to trapheat in the atmosphere relative to anothergas. Carbon dioxide was chosen as thereference gas to be consistent with IPCCguidelines.
Gas GWP
CO2 .................................................................1CH4*..............................................................21N2O.............................................................310HFC-23 ..................................................11,700HFC-32 .......................................................650HFC-125 ..................................................2,800HFC-134a................................................1,300HFC-143a................................................3,800HFC-152a...................................................140HFC-227ea..............................................2,900HFC-236fa...............................................6,300HFC-4310mee ........................................1,300CF4...........................................................6,500C2F6 .........................................................9,200C4F10........................................................7,000C6F14........................................................7,400SF6.........................................................23,900
* The methane GWP includes the direct and indirecteffects due to the production of troposphericozone and stratospheric water vapor. The indirecteffect due to the production of CO2 is not included.Source: IPCC 1996b.
Tg________1,000 Gg)
TABLE 3-1 Global WarmingPotentials (100 Year Time Horizon)Used in This Report
4 Emission estimates of CFCs, HCFCs, halons, and otherODS are included in the annexes of the Inventory reportfor informational purposes.
5 See <http://unfccc.int/resource/docs/cop8/08.pdf>.

20 U.S. CLIMATE ACTION REPORT—200620 U.S. CLIMATE ACTION REPORT—2006
In recent years, use of ODS substitutes,such as HFCs and PFCs, has grown as theybegin to be phased in as replacements forCFCs and HCFCs. Accordingly, atmos-pheric concentrations of these substituteshave been growing (IPCC 2001a).
RECENT TRENDS IN U.S.GREENHOUSE GAS EMISSIONSAND SINKSIn 2004, total U.S. greenhouse gas emis-
sions were 7,074.4 Tg CO2 Eq. Overall,total U.S. emissions rose by 15.8 percentfrom 1990 through 2004, while the U.S.gross domestic product increased by 51percent over the same period (U.S.DOC/BEA 2006a). Emissions rose from2003 through 2004, increasing by 1.7 per-cent (115.3 Tg CO2 Eq.). The followingfactors were primary contributors to thisincrease: (1) robust economic growth in2004, leading to increased demand forelectricity and fossil fuels; (2) expandingindustrial production in energy-intensiveindustries, also increasing demand forelectricity and fossil fuels; and (3) in-creased travel, leading to higher rates ofconsumption of petroleum fuels.Figures 3-1 through 3-3 illustrate the
overall trends in total U.S. emissions bygas, annual changes, and absolute changesince 1990. Table 3-2 provides a detailedsummary of U.S. greenhouse gas emis-sions and sinks from 1990 through 2004.Figure 3-4 illustrates the relative contri-
bution of the direct greenhouse gases tototal U.S. emissions in 2004. The primarygreenhouse gas emitted by human activi-ties in the United States was CO2, repre-senting approximately 85 percent of totalgreenhouse gas emissions. The largestsource of CO2, and of overall greenhousegas emissions, was fossil fuel combustion.CH4 emissions, which have steadily de-clined since 1990, resulted primarily fromdecomposition of wastes in landfills, natu-ral gas systems, and enteric fermentationassociated with domestic livestock. Agri-cultural soil management and mobilesource fossil fuel combustion were themajor sources of N2O emissions. Theemissions of ODS substitutes and
FIGURE 3-1 Growth in U.S. Greenhouse Gas Emissions by Gas
In 2004, total U.S. greenhouse gas emissions rose to 7,074.4 teragrams of carbon dioxideequivalent (Tg CO2 Eq.), which was 15.8 percent above 1990 emissions. The U.S. grossdomestic product increased by 51 percent over the same period.
FIGURE 3-2 Annual Percent Change in U.S. Greenhouse Gas Emissions
Between 2003 and 2004, U.S. greenhouse gas emissions rose by 1.7 percent; the averageannual rate increase from 1990 through 2004 was also 1.1 percent.

CHAPTER 3—GREENHOUSE GAS INVENTORY 21CHAPTER 3—GREENHOUSE GAS INVENTORY 21
emissions of HFC-23 during the produc-tion of HCFC-22 were the primary con-tributors to aggregate HFC emissions.Electrical transmission and distributionsystems accounted formost SF6 emissions,while PFC emissions resulted from semi-conductor manufacturing and as a by-product of primary aluminumproduction.Overall, from 1990 through 2004, total
emissions of CO2 increased by 982.7 TgCO2 Eq. (20 percent), while CH4 andN2Oemissions decreased by 61.3 Tg CO2 Eq.(10 percent) and 8.2 Tg CO2 Eq.(2 percent), respectively. During the sameperiod, aggregate weighted emissions ofHFCs, PFCs, and SF6 rose by 52.2 Tg CO2Eq. (58 percent). Despite being emitted insmaller quantities relative to the otherprincipal greenhouse gases, emissions ofHFCs, PFCs, and SF6 are significant be-cause many of them have extremely highGWPs and, in the cases of PFCs and SF6,long atmospheric lifetimes. Conversely,U.S. greenhouse gas emissions were partlyoffset by carbon sequestration in forests,
trees in urban areas, agricultural soils, andlandfilled yard trimmings and food scraps,which, in aggregate, offset 11 percent oftotal emissions in 2004. The following sec-tions describe each gas’s contribution tototal U.S. greenhouse gas emissions inmore detail.
Carbon Dioxide EmissionsThe global carbon cycle is made up of
large carbon flows and reservoirs. Billionsof tons of carbon in the form of CO2 areabsorbed by oceans and living biomass(i.e., sinks) and are emitted to the atmos-phere annually through natural processes(i.e., sources). When in equilibrium, car-bon fluxes among these various reservoirsare roughly balanced. Since the IndustrialRevolution (i.e., about 1750), global at-mospheric concentrations of CO2 haverisen about 35 percent (IPCC 2001a; Hof-mann 2004), principally due to the com-bustion of fossil fuels. Within the UnitedStates, fuel combustion accounted for 94percent of CO2 emissions in 2004 (Figure3-5 and Table 3-3). Globally, approxi-mately 25,575 Tg of CO2 were added tothe atmosphere through the combustionof fossil fuels in 2002, of which the UnitedStates accounted for about 23 percent.6
Changes in land use and forestry practicescan also emit CO2 (e.g., through conver-sion of forest land to agricultural or urbanuse) or can act as a sink for CO2 (e.g.,through net additions to forest biomass)As the largest source of U.S. greenhouse
gas emissions, CO2 from fossil fuel com-bustion has accounted for approximately80 percent of GWP-weighted emissionssince 1990, growing slowly from 77 per-cent of total GWP-weighted emissions in1990 to 80 percent in 2004. Emissions ofCO2 from fossil fuel combustion increasedat an average annual rate of 1.3 percentfrom 1990 through 2004. The fundamen-tal factors influencing this trend include agenerally growing domestic economy overthe last 14 years, and significant growth inemissions from transportation activitiesand electricity generation. Between 1990and 2004, CO2 emissions from fossil fuelcombustion increased from 4,696.6 Tg
6 Global CO2 emissions from fossil fuel combustion weretaken from Marland et al. 2005 <http://cdiac.esd.ornl.gov/trends/emis/tre_glob.htm>.
FIGURE 3-3 Cumulative Change in U.S. Greenhouse Gas Emissions Relative to 1990
From 1990 to 2004, total U.S. greenhouse gas emissions rose by 965.4 Tg CO2 Eq., an increaseof 15.8 percent.
FIGURE 3-4 2004 U.S. GreenhouseGas Emissions by Gas
The principal greenhouse gas emitted byhuman activities in 2004 was CO2, drivenprimarily by emissions from fossil fuelcombustion.
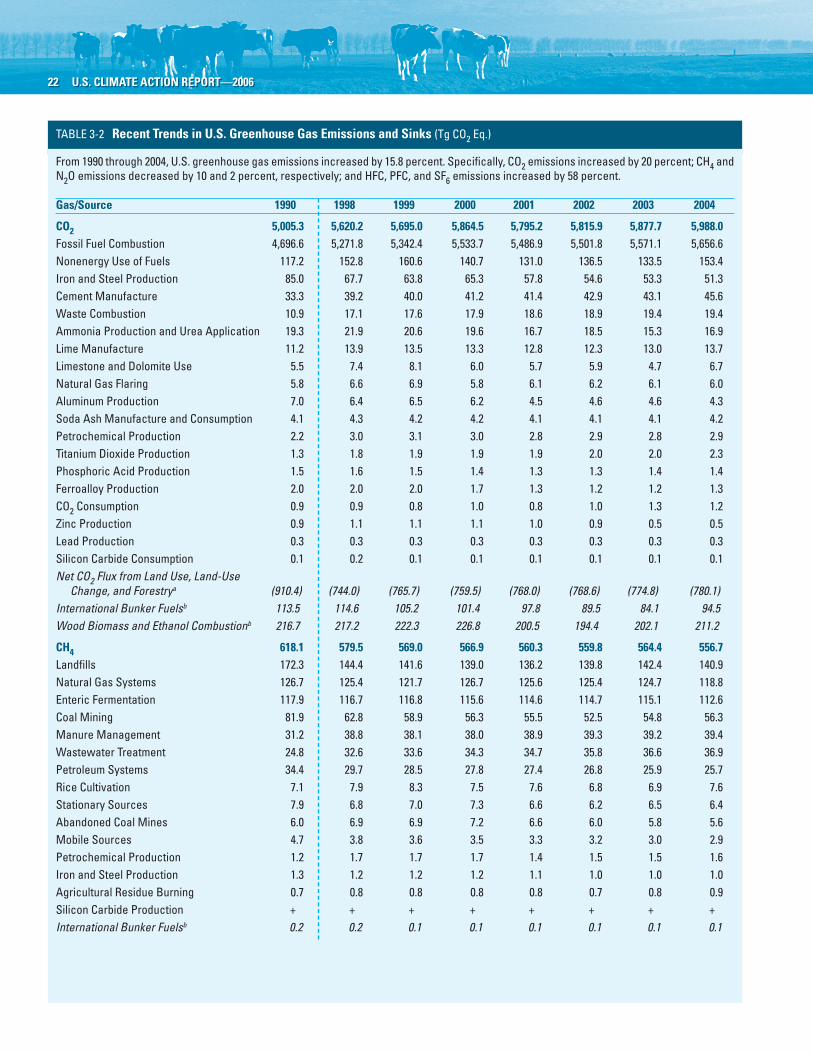
22 U.S. CLIMATE ACTION REPORT—200622 U.S. CLIMATE ACTION REPORT—2006
TABLE 3-2 Recent Trends in U.S. Greenhouse Gas Emissions and Sinks (Tg CO2 Eq.)
From 1990 through 2004, U.S. greenhouse gas emissions increased by 15.8 percent. Specifically, CO2 emissions increased by 20 percent; CH4 andN2O emissions decreased by 10 and 2 percent, respectively; and HFC, PFC, and SF6 emissions increased by 58 percent.
Gas/Source 1990 1998 1999 2000 2001 2002 2003 2004
CO2 5,005.3 5,620.2 5,695.0 5,864.5 5,795.2 5,815.9 5,877.7 5,988.0Fossil Fuel Combustion 4,696.6 5,271.8 5,342.4 5,533.7 5,486.9 5,501.8 5,571.1 5,656.6Nonenergy Use of Fuels 117.2 152.8 160.6 140.7 131.0 136.5 133.5 153.4Iron and Steel Production 85.0 67.7 63.8 65.3 57.8 54.6 53.3 51.3Cement Manufacture 33.3 39.2 40.0 41.2 41.4 42.9 43.1 45.6Waste Combustion 10.9 17.1 17.6 17.9 18.6 18.9 19.4 19.4Ammonia Production and Urea Application 19.3 21.9 20.6 19.6 16.7 18.5 15.3 16.9Lime Manufacture 11.2 13.9 13.5 13.3 12.8 12.3 13.0 13.7Limestone and Dolomite Use 5.5 7.4 8.1 6.0 5.7 5.9 4.7 6.7Natural Gas Flaring 5.8 6.6 6.9 5.8 6.1 6.2 6.1 6.0Aluminum Production 7.0 6.4 6.5 6.2 4.5 4.6 4.6 4.3Soda Ash Manufacture and Consumption 4.1 4.3 4.2 4.2 4.1 4.1 4.1 4.2Petrochemical Production 2.2 3.0 3.1 3.0 2.8 2.9 2.8 2.9Titanium Dioxide Production 1.3 1.8 1.9 1.9 1.9 2.0 2.0 2.3Phosphoric Acid Production 1.5 1.6 1.5 1.4 1.3 1.3 1.4 1.4Ferroalloy Production 2.0 2.0 2.0 1.7 1.3 1.2 1.2 1.3CO2 Consumption 0.9 0.9 0.8 1.0 0.8 1.0 1.3 1.2Zinc Production 0.9 1.1 1.1 1.1 1.0 0.9 0.5 0.5Lead Production 0.3 0.3 0.3 0.3 0.3 0.3 0.3 0.3Silicon Carbide Consumption 0.1 0.2 0.1 0.1 0.1 0.1 0.1 0.1Net CO2 Flux from Land Use, Land-Use
Change, and Forestrya (910.4) (744.0) (765.7) (759.5) (768.0) (768.6) (774.8) (780.1)International Bunker Fuelsb 113.5 114.6 105.2 101.4 97.8 89.5 84.1 94.5Wood Biomass and Ethanol Combustionb 216.7 217.2 222.3 226.8 200.5 194.4 202.1 211.2
CH4 618.1 579.5 569.0 566.9 560.3 559.8 564.4 556.7Landfills 172.3 144.4 141.6 139.0 136.2 139.8 142.4 140.9Natural Gas Systems 126.7 125.4 121.7 126.7 125.6 125.4 124.7 118.8Enteric Fermentation 117.9 116.7 116.8 115.6 114.6 114.7 115.1 112.6Coal Mining 81.9 62.8 58.9 56.3 55.5 52.5 54.8 56.3Manure Management 31.2 38.8 38.1 38.0 38.9 39.3 39.2 39.4Wastewater Treatment 24.8 32.6 33.6 34.3 34.7 35.8 36.6 36.9Petroleum Systems 34.4 29.7 28.5 27.8 27.4 26.8 25.9 25.7Rice Cultivation 7.1 7.9 8.3 7.5 7.6 6.8 6.9 7.6Stationary Sources 7.9 6.8 7.0 7.3 6.6 6.2 6.5 6.4Abandoned Coal Mines 6.0 6.9 6.9 7.2 6.6 6.0 5.8 5.6Mobile Sources 4.7 3.8 3.6 3.5 3.3 3.2 3.0 2.9Petrochemical Production 1.2 1.7 1.7 1.7 1.4 1.5 1.5 1.6Iron and Steel Production 1.3 1.2 1.2 1.2 1.1 1.0 1.0 1.0Agricultural Residue Burning 0.7 0.8 0.8 0.8 0.8 0.7 0.8 0.9Silicon Carbide Production + + + + + + + +International Bunker Fuelsb 0.2 0.2 0.1 0.1 0.1 0.1 0.1 0.1

CHAPTER 3—GREENHOUSE GAS INVENTORY 23CHAPTER 3—GREENHOUSE GAS INVENTORY 23
tions led to decreases in demand for heat-ing fuels in the residential and commercialsectors. Moreover, much of the increasedelectricity demanded was generated bynatural gas consumption and nuclearpower, rather than by morecarbon-intensive coal, moderating the in-crease in CO2 emissions from electricitygeneration. Use of renewable fuels rosevery slightly, due to increases in the use ofbiofuels. Figures 3-6 and 3-7 summarizeCO2 emissions from fossil fuel combus-tion by sector and fuel type and by end-use sector.Other significant CO2 trends included
the following:• CO2 emissions from iron and steel pro-
CO2 Eq. to 5,656.6 Tg CO2 Eq.—a 20 per-cent total increase over the 14-year period.Historically, changes in emissions fromfossil fuel combustion have been the dom-inant factor affecting U.S. emission trends.From 2003 through 2004, emissions
from fossil fuel combustion increased by85.5 Tg CO2 Eq. (1.5 percent). A numberof factors played a major role in the mag-nitude of this increase. Strong growth inthe U.S. economy and industrial produc-tion, particularly in energy-intensive in-dustries, caused an increase in the demandfor electricity and fossil fuels. Demand fortravel was also higher, causing an increasein petroleum consumed for transporta-tion. In contrast, the warmer winter condi-
TABLE 3-2 (Continued) Recent Trends in U.S. Greenhouse Gas Emissions and Sinks (Tg CO2 Eq.)
Gas/Source 1990 1998 1999 2000 2001 2002 2003 2004
N2O 394.9 440.6 419.4 416.2 412.8 407.4 386.1 386.7Agricultural Soil Management 266.1 301.1 281.2 278.2 282.9 277.8 259.2 261.5Mobile Sources 43.5 54.8 54.1 53.1 50.0 47.5 44.8 42.8Manure Management 16.3 17.4 17.4 17.8 18.1 18.0 17.5 17.7Nitric Acid Production 17.8 20.9 20.1 19.6 15.9 17.2 16.7 16.6Human Sewage 12.9 14.9 15.4 15.5 15.6 15.6 15.8 16.0Stationary Sources 12.3 13.4 13.4 13.9 13.5 13.2 13.6 13.7Settlements Remaining Settlements 5.6 6.2 6.2 6.0 5.8 6.0 6.2 6.4Adipic Acid Production 15.2 6.0 5.5 6.0 4.9 5.9 6.2 5.7N2O Product Usage 4.3 4.8 4.8 4.8 4.8 4.8 4.8 4.8Waste Combustion 0.5 0.4 0.4 0.4 0.5 0.5 0.5 0.5Agricultural Residue Burning 0.4 0.5 0.4 0.5 0.5 0.4 0.4 0.5Forest Land Remaining Forest Land 0.1 0.4 0.5 0.4 0.4 0.4 0.4 0.4International Bunker Fuelsb 1.0 1.0 0.9 0.9 0.9 0.8 0.8 0.9
HFCs, PFCs, and SF6 90.8 133.4 131.5 134.7 124.9 132.7 131.0 143.0Substitution of Ozone-Depleting Substances 0.4 54.5 62.8 71.2 78.6 86.2 93.5 103.3HCFC-22 Production 35.0 40.1 30.4 29.8 19.8 19.8 12.3 15.6Electrical Transmission and Distribution 28.6 16.7 16.1 15.3 15.3 14.5 14.0 13.8Semiconductor Manufacture 2.9 7.1 7.2 6.3 4.5 4.4 4.3 4.7Aluminum Production 18.4 9.1 9.0 9.0 4.0 5.3 3.8 2.8Magnesium Production and Processing 5.4 5.8 6.0 3.2 2.6 2.6 3.0 2.7
Total 6,109.0 6,773.7 6,814.9 6,982.3 6,893.1 6,915.8 6,959.1 7,074.4
Net Emissions (Sources and Sinks) 5,198.6 6,029.6 6,049.2 6,222.8 6,125.1 6,147.2 6,184.3 6,294.3
+ Does not exceed 0.05 Tg CO2 Eq.a Parentheses indicate negative values or sequestration. The net CO2 flux total includes both emissions and sequestration, and constitutes a sink in the United States. Sinks are onlyincluded in the net emissions total.
b Emissions from international bunker fuels and from wood biomass and ethanol combustion are not included in the totals.Note: Totals may not sum due to independent rounding.
duction decreased to 51.3 Tg CO2 Eq.in 2004, and declined by 33.7 Tg CO2Eq. (40 percent) from 1990 through2004, due to reduced domestic produc-tion of pig iron, sinter, and coal coke.
• CO2 emissions from cement produc-tion increased to 45.6 Tg CO2 Eq. in2004, a 37 percent increase in emissionssince 1990. Emissionsmirror growth inthe construction industry. In contrastto many other manufacturing sectors,demand for domestic cement remainsstrong, because it is not cost-effectiveto transport cement far from its pointof manufacture.
• CO2 emissions fromwaste combustion(19.4 Tg CO2 Eq. in 2004) increased by

24 U.S. CLIMATE ACTION REPORT—200624 U.S. CLIMATE ACTION REPORT—2006
TABLE 3-3 AND FIGURE 3-5 2004 U.S. Sources of CO2 (Tg CO2 Eq.)
In 2004, CO2 accounted for 84.6 percent of U.S. greenhouse gas emissions. Between 1990 and 2004, CO2 emissions from fossil fuel combutionincreased at an average annual rate of 1.3 percent and grew by 20.4 percent over the 14-year period.
Sources 1990 1998 1999 2000 2001 2002 2003 2004Fossil Fuel Combustion 4,696.6 5,271.8 5,342.4 5,533.7 5,486.9 5,501.8 5,571.1 5,656.6Nonenergy Use of Fuels 117.2 152.8 160.6 140.7 131.0 136.5 133.5 153.4Iron and Steel Production 85.0 67.7 63.8 65.3 57.8 54.6 53.3 51.3Cement Manufacture 33.3 39.2 40.0 41.2 41.4 42.9 43.1 45.6Waste Combustion 10.9 17.1 17.6 17.9 18.6 18.9 19.4 19.4Ammonia Production and Urea Application 19.3 21.9 20.6 19.6 16.7 18.5 15.3 16.9Lime Manufacture 11.2 13.9 13.5 13.3 12.8 12.3 13.0 13.7Limestone and Dolomite Use 5.5 7.4 8.1 6.0 5.7 5.9 4.7 6.7Natural Gas Flaring 5.8 6.6 6.9 5.8 6.1 6.2 6.1 6.0Aluminum Production 7.0 6.4 6.5 6.2 4.5 4.6 4.6 4.3Soda Ash Manufacture and Consumption 4.1 4.3 4.2 4.2 4.1 4.1 4.1 4.2Petrochemical Production 2.2 3.0 3.1 3.0 2.8 2.9 2.8 2.9Titanium Dioxide Production 1.3 1.8 1.9 1.9 1.9 2.0 2.0 2.3Phosphoric Acid Production 1.5 1.6 1.5 1.4 1.3 1.3 1.4 1.4Ferroalloy Production 2.0 2.0 2.0 1.7 1.3 1.2 1.2 1.3CO2 Consumption 0.9 0.9 0.8 1.0 0.8 1.0 1.3 1.2Zinc Production 0.9 1.1 1.1 1.1 1.0 0.9 0.5 0.5Lead Production 0.3 0.3 0.3 0.3 0.3 0.3 0.3 0.3Silicon Carbide Consumption 0.1 0.2 0.1 0.1 0.1 0.1 0.1 0.1Net CO2 Flux from Land Use, Land-Use
Change, and Forestrya (910.4) (744.0) (765.7) (759.5) (768.0) (768.6) (774.8) (780.1)International Bunker Fuelsb 113.5 114.6 105.2 101.4 97.8 89.5 84.1 94.5Wood Biomass and Ethanol Combustionb 216.7 217.2 222.3 226.8 200.5 194.4 202.1 211.2
Total 5,005.3 5,620.2 5,695.0 5,864.5 5,795.2 5,815.9 5,877.7 5,988.0a Parentheses indicate negative values or sequestration. The net CO2 flux total includes both emissions and sequestration, and constitutes a sink in the United States. Sinks are onlyincluded in separate net emissions totals.
b Emissions from international bunker fuels and from wood biomass and ethanol combustion are not included in the totals.Note: Totals may not sum due to independent rounding.

CHAPTER 3—GREENHOUSE GAS INVENTORY 25CHAPTER 3—GREENHOUSE GAS INVENTORY 25
8.4 Tg CO2 Eq. (77 percent) from 1990through 2004, as the volume of plasticsand other fossil carbon-containingma-terials in municipal solid waste grew.
• Net CO2 sequestration from land use,land-use change, and forestry decreasedby 130.3 Tg CO2 Eq. (14 percent) from1990 through 2004. This decline wasprimarily due to a decline in the rate ofnet carbon accumulation in forest car-bon stocks. Annual carbon accumula-tion in landfilled yard trimmings andfood scraps also slowed over this pe-riod, while the rate of carbon accumu-lation in agricultural soils and urbantrees increased.
FIGURE 3-6 2004 U.S. CO2 Emissions From Fossil Fuel Combustion by Sector andFuel Type
Of the emissions from fossil fuel combustion in 2004, transportation sector emissions wereprimarily from petroleum consumption, while electricity generation emissions were primarilyfrom coal consumption.
Note: Electricity generation also includes emissions of less than 1 Tg CO2 Eq. from geothermal-basedelectricity generation.
Methane EmissionsAccording to the IPCC, CH4 is more
than 20 times as effective as CO2 at trap-ping heat in the atmosphere. Over the last250 years, the concentration of CH4 in theatmosphere increased by 143 percent(IPCC 2001a; Hofmann 2004). Anthro-pogenic emission sources of CH4 includelandfills, natural gas and petroleum sys-tems, agricultural activities, coal mining,wastewater treatment, stationary and mo-bile combustion, and certain industrialprocesses (Figure 3-8 and Table 3-4).Some significant trends in U.S. emis-
sions of CH4 include the following:• Landfills are the largest anthropogenicsource of CH4 emissions in the United
States. In 2004, landfill CH4 emissionswere 140.9 Tg CO2 Eq. (approximately25 percent of total CH4 emissions),which represents a decline of 31.4 TgCO2 Eq., or 18 percent, since 1990. Al-though the amount of solid waste land-filled each year continues to climb, theamount of CH4 captured and burnedat landfills has increased dramatically,countering this trend.
• CH4 emissions fromnatural gas systemswere 118.8 Tg CO2 Eq. in 2004; emis-sions have declined by 7.9 TgCO2 Eq. (6percent) since 1990. This decline hasbeen due to improvements in technol-ogy and management practices, as wellas some replacement of old equipment.
• Enteric fermentation was also a signif-icant source of CH4, accounting for112.6 Tg CO2 Eq. in 2004. This amounthas declined by 5.3 Tg CO2 Eq. (4 per-cent) since 1990, and by 10.4 Tg CO2Eq. (8 percent) from a high in 1995.Generally, emissions have been decreas-ing since 1995, mainly due to decreas-ing populations of both beef and dairycattle and improved feed quality forfeedlot cattle.
Nitrous Oxide EmissionsNitrous oxide is produced by biological
processes that occur in soil andwater and bya variety of anthropogenic activities in theagricultural, energy-related, industrial, andwaste management fields. While total N2Oemissions are much lower than CO2 emis-sions,N2O is approximately 300 timesmorepowerful than CO2 at trapping heat in theatmosphere. Since 1750, the global atmos-pheric concentration of N2O has risen byapproximately 18 percent (IPCC 2001a;Hofmann 2004). The main anthropogenicactivities producing N2O in the UnitedStates are agricultural soilmanagement, fuelcombustion in motor vehicles, manuremanagement, nitric acid production,human sewage, and stationary fuel combus-tion (Figure 3-9 and Table 3-5).Some significant trends in U.S. emis-
sions of N2O include the following:• Agricultural soil management activities,such as fertilizer application and other

26 U.S. CLIMATE ACTION REPORT—200626 U.S. CLIMATE ACTION REPORT—2006
cropping practices, were the largestsource of U.S.N2O emissions, account-ing for 68 percent (261.5 Tg CO2 Eq.)of 2004 emissions.N2O emissions fromthis source have not shown any signifi-cant long-term trend, as they are highlysensitive to such factors as temperatureand precipitation, which have generallyoutweighed changes in the amount ofnitrogen applied to soils.
• In 2004, N2O emissions from mobilecombustion were 42.8 Tg CO2 Eq. (ap-proximately 11 percent of U.S. N2Oemissions). From 1990 through 2004,N2O emissions from mobile combus-tion decreased by 1 percent. However,from 1990 through 1998, emissions in-creased by 26 percent, due to controltechnologies that reduced NOx emis-sions while increasing N2O emissions.Since 1998, newer control technologies
have led to a steady decline in N2Oemissions from this source.
HFC, PFC, and SF6 EmissionsHFCs and PFCs are families of syn-
thetic chemicals that are being used as al-ternatives to ODSs, which are beingphased out under the Montreal Protocoland Clean Air Act Amendments of 1990.HFCs and PFCs do not deplete the stratos-pheric ozone layer, and are therefore ac-ceptable alternatives under the MontrealProtocol.These compounds, however, along with
SF6, are potent greenhouse gases. In addi-tion to having high GWPs, SF6 and PFCshave extremely long atmospheric lifetimes,resulting in their essentially irreversible ac-cumulation in the atmosphere once emit-ted. SF6 is the most potent greenhouse gasthe IPCC has evaluated.
Other emissive sources of these gases in-clude HCFC-22 production, electricaltransmission and distribution systems,semiconductormanufacturing, aluminumproduction, and magnesium productionand processing (Figure 3-10 andTable 3-6).Some significant trends in U.S. HFC,
PFC, and SF6 emissions include the fol-lowing:• Emissions resulting from the substitu-tion of ODSs (e.g., CFCs) have been in-creasing from small amounts in 1990 to103.3 Tg CO2 Eq. in 2004. Emissionsfrom ODS substitutes are both thelargest and the fastest growing source ofHFC, PFC, and SF6 emissions. Theseemissions have been increasing asphase-outs required under the Mon-treal Protocol come into effect, espe-cially after 1994, when full marketpenetration was made for the first gen-eration of new technologies featuringODS substitutes.
• The increase in ODS substitute emis-sions is offset substantially by decreasesin emissions of HFCs, PFCs, and SF6from other sources. Emissions fromaluminum production decreased by 85percent (15.6 Tg CO2 Eq.) from 1990through 2004, due to both industryemission reduction efforts and lowerdomestic aluminum production.
• Emissions from the production ofHCFC-22 decreased by 55 percent(19.4 Tg CO2 Eq.) from 1990 through2004, due to a steady decline in theemission rate of HFC-23 (i.e., theamount of HFC-23 emitted per kilo-gram of HCFC-22 manufactured) andthe use of thermal oxidation at someplants to reduce HFC-23 emissions.
• Emissions from electric power trans-mission and distribution systems de-creased by 52 percent (14.8 Tg CO2Eq.) from 1990 through 2004, primarilybecause of higher purchase prices forSF6 and efforts by industry to reduceemissions.
FIGURE 3-7 2004 U.S. End-Use Sector Emissions of CO2 From Fossil Fuel Combustion
In 2004, most commercial and residential emissions were from these sectors’ use of electricity.The transportation sector has small emissions associated with electricity use.

CHAPTER 3—GREENHOUSE GAS INVENTORY 27CHAPTER 3—GREENHOUSE GAS INVENTORY 27
TABLE 3-4 AND FIGURE 3-8 2004 U.S. Sources of CH4 (Tg CO2 Eq.)
Methane accounted for 7.9 percent of U.S. greenhouse gas emissions in 2004. Landfills were the largest anthropogenic source of CH4,representing 25 percent of total U.S. CH4 emissions.
Gas/Source 1990 1998 1999 2000 2001 2002 2003 2004Landfills 172.3 144.4 141.6 139.0 136.2 139.8 142.4 140.9Natural Gas Systems 126.7 125.4 121.7 126.7 125.6 125.4 124.7 118.8Enteric Fermentation 117.9 116.7 116.8 115.6 114.6 114.7 115.1 112.6Coal Mining 81.9 62.8 58.9 56.3 55.5 52.5 54.8 56.3Manure Management 31.2 38.8 38.1 38.0 38.9 39.3 39.2 39.4Wastewater Treatment 24.8 32.6 33.6 34.3 34.7 35.8 36.6 36.9Petroleum Systems 34.4 29.7 28.5 27.8 27.4 26.8 25.9 25.7Rice Cultivation 7.1 7.9 8.3 7.5 7.6 6.8 6.9 7.6Stationary Sources 7.9 6.8 7.0 7.3 6.6 6.2 6.5 6.4Abandoned Coal Mines 6.0 6.9 6.9 7.2 6.6 6.0 5.8 5.6Mobile Sources 4.7 3.8 3.6 3.5 3.3 3.2 3.0 2.9Petrochemical Production 1.2 1.7 1.7 1.7 1.4 1.5 1.5 1.6Iron and Steel Production 1.3 1.2 1.2 1.2 1.1 1.0 1.0 1.0Agricultural Residue Burning 0.7 0.8 0.8 0.8 0.8 0.7 0.8 0.9Silicon Carbide Production + + + + + + + +International Bunker Fuels* 0.2 0.2 0.1 0.1 0.1 0.1 0.1 0.1
TOTAL 618.1 579.5 569.0 566.9 560.3 559.8 564.4 556.7
+ Does not exceed 0.05 Tg CO2 Eq.* Emissions from international bunker fuels are not included in the totals.

28 U.S. CLIMATE ACTION REPORT—200628 U.S. CLIMATE ACTION REPORT—2006
TABLE 3-5 AND FIGURE 3-9 2004 U.S. Sources of N2O (Tg CO2 Eq.)
Nitrous oxide accounted for 5.5 percent of U.S. greenhouse gas emissions in 2004. Agricultural soil management was the largest source of N2O,representing approximately 60 percent of total N2O emissions in 2004.
Gas/Source 1990 1998 1999 2000 2001 2002 2003 2004Agricultural Soil Management 266.1 301.1 281.2 278.2 282.9 277.8 259.2 261.5Mobile Sources 43.5 54.8 54.1 53.1 50.0 47.5 44.8 42.8Manure Management 16.3 17.4 17.4 17.8 18.1 18.0 17.5 17.7Nitric Acid Production 17.8 20.9 20.1 19.6 15.9 17.2 16.7 16.6Human Sewage 12.9 14.9 15.4 15.5 15.6 15.6 15.8 16.0Stationary Sources 12.3 13.4 13.4 13.9 13.5 13.2 13.6 13.7Settlements Remaining Settlements 5.6 6.2 6.2 6.0 5.8 6.0 6.2 6.4Adipic Acid Production 15.2 6.0 5.5 6.0 4.9 5.9 6.2 5.7N2O Product Usage 4.3 4.8 4.8 4.8 4.8 4.8 4.8 4.8Waste Combustion 0.5 0.4 0.4 0.4 0.5 0.5 0.5 0.5Agricultural Residue Burning 0.4 0.5 0.4 0.5 0.5 0.4 0.4 0.5Forest Land Remaining Forest Land 0.1 0.4 0.5 0.4 0.4 0.4 0.4 0.4International Bunker Fuels* 1.0 1.0 0.9 0.9 0.9 0.8 0.8 0.9
Total 394.9 440.6 419.4 416.2 412.8 407.4 386.1 386.7* Emissions from international bunker fuels are not included in the totals.Note: Totals may not sum due to independent rounding.
OVERVIEW OF SECTOR EMISSIONSAND TRENDSIn accordance with the Revised 1996
IPCC Guidelines for National GreenhouseGas Inventories (IPCC/UNEP/OECD/IEA1997) and the 2003 UNFCCC Guidelineson Reporting and Review (UNFCCC2003), the Inventory of U.S. GreenhouseGas Emissions and Sinks: 1990-2004 (U.S.EPA/OAP 2006a) is segregated into sixsector-specific chapters. Figure 3-11 andTable 3-7 aggregate emissions and sinksby these chapters.
EnergyThe Energy sector contains emissions
of all greenhouse gases resulting from sta-tionary and mobile energy activities, in-cluding fuel combustion and fugitive fuelemissions. Energy-related activities, pri-marily fossil fuel combustion, accountedfor the vast majority of U.S. CO2 emis-sions from 1990 through 2004. In 2004,approximately 86 percent of the energyconsumed in the United States was pro-duced through the combustion of fossil
fuels. The remaining 14 percent camefrom other energy sources, such as hy-dropower, biomass, nuclear, wind, andsolar energy (Figure 3-12). Energy-relatedactivities are also responsible for CH4 andN2O emissions (39 percent and 15 percentof total U.S. emissions of each gas, respec-tively). Overall, emission sources in theEnergy sector accounted for a combined86 percent of total U.S. greenhouse gasemissions in 2004.

CHAPTER 3—GREENHOUSE GAS INVENTORY 29CHAPTER 3—GREENHOUSE GAS INVENTORY 29
trial processes release HFCs, PFCs, andSF6. Overall, emission sources in the In-dustrial Process sector accounted for 4.5percent of U.S. greenhouse gas emissionsin 2004.
Solvent and Other Product UseThe Solvent and Other Product Use
sector contains greenhouse gas emissionsthat are produced as a by-product of var-ious solvent and other product uses. In2004, U.S. emissions from N2O ProductUsage, the only source of greenhouse gasemissions from this sector, accounted forless than 0.1 percent of total U.S. anthro-pogenic greenhouse gas emissions on acarbon equivalent basis.
AgricultureThe Agriculture sector contains an-
thropogenic emissions from agriculturalactivities (except fuel combustion, whichis addressed in the Energy sector). Agri-
cultural activities contribute directly toemissions of greenhouse gases through avariety of processes, including the follow-ing source categories: enteric fermentationin domestic livestock, livestock manuremanagement, rice cultivation, agriculturalsoil management, and field burning ofagricultural residues. CH4 and N2O werethe primary greenhouse gases emitted byagricultural activities. In 2004, CH4 emis-sions from enteric fermentation and ma-nure management represented about 20percent and 7 percent of total CH4 emis-sions from anthropogenic activities, re-spectively. Agricultural soil managementactivities, such as fertilizer application andother cropping practices, were the largestsource of U.S. N2O emissions in 2004, ac-counting for 68 percent. In 2004, emissionsources accounted for in the Agriculturesector were responsible for 6.2 percent oftotal U.S. greenhouse gas emissions.
Industrial ProcessesThe Industrial Processes sector contains
by-product or fugitive emissions of green-house gases from industrial processes notdirectly related to energy activities, such asfossil fuel combustion. For example, indus-trial processes can chemically transformraw materials, which often release wastegases, such as CO2, CH4, and N2O. Theprocesses include iron and steel production,lead and zinc production, cementmanufac-ture, ammonia manufacture and urea ap-plication, limemanufacture, limestone anddolomite use (e.g., flux stone, flue gas desul-furization, and glass manufacturing), sodaashmanufacture and use, titanium dioxideproduction, phosphoric acid production,ferroalloy production, CO2 consumption,aluminumproduction, petrochemical pro-duction, silicon carbide production, nitricacid production, and adipic acid produc-tion. Additionally, emissions from indus-
TABLE 3-6 AND FIGURE 3-10 2004 U.S. Sources of HFCs, PFCs, SF6 (Tg CO2 Eq.)
Because HFCs and PFCs do not deplete the stratospheric ozone layer, they are acceptable alternatives under theMontreal Protocol. However,these compounds, along with SF6, have high global warming potentials, and SF6 and PFCs have extremely long atmospheric lifetimes.
Gas/Source 1990 1998 1999 2000 2001 2002 2003 2004Substitution of Ozone-Depleting Substances 0.4 54.5 62.8 71.2 78.6 86.2 93.5 103.3HCFC-22 Production 35.0 40.1 30.4 29.8 19.8 19.8 12.3 15.6Electrical Transmission and Distribution 28.6 16.7 16.1 15.3 15.3 14.5 14.0 13.8Semiconductor Manufacture 2.9 7.1 7.2 6.3 4.5 4.4 4.3 4.7Aluminum Production 18.4 9.1 9.0 9.0 4.0 5.3 3.8 2.8Magnesium Production and Processing 5.4 5.8 6.0 3.2 2.6 2.6 3.0 2.7
Net Emissions (Sources and Sinks) 90.8 133.4 131.5 134.7 124.9 132.7 131.0 143.0
Note: Totals may not sum due to independent rounding.

30 U.S. CLIMATE ACTION REPORT—200630 U.S. CLIMATE ACTION REPORT—2006
Land Use, Land-Use Change, andForestryThe Land Use, Land-Use Change, and
Forestry sector contains emissions and re-movals of CO2 from forest management,other land-use activities, and land-usechange. Forest management practices, treeplanting in urban areas, the managementof agricultural soils, and the landfilling ofyard trimmings and food scraps have re-sulted in a net uptake (sequestration) of
carbon in the United States. Forests (in-cluding vegetation, soils, and harvestedwood) accounted for approximately82 percent of total 2004 sequestration;urban trees accounted for 11 percent; agri-cultural soils (including mineral and or-ganic soils and the application of lime)accounted for 6 percent; and landfilledyard trimmings and food scraps accountedfor 1 percent of the total sequestration in2004. The net forest sequestration is a re-
sult of net forest growth and increasingforest area, as well as a net accumulationof carbon stocks in harvested wood pools.The net sequestration in urban forests is aresult of net tree growth in these areas. Inagricultural soils,mineral soils account fora net carbon sink that is almost two timeslarger than the sum of emissions fromorganic soils and liming. The mineral soilcarbon sequestration is largely due to theconversion of cropland to permanent
TABLE 3-7 AND FIGURE 3-11 Recent Trends in U.S. Greenhouse Gas Emissions and Sinks by IPCC Sector (Tg CO2 Eq.)
In accordance with the IPCC Guidelines, the U.S. greenhouse gas inventory is segregated into six sector-specific chapters.
IPCC Sector 1990 1998 1999 2000 2001 2002 2003 2004Energy 5,148.3 5,752.3 5,822.3 5,994.3 5,931.6 5,944.6 6,009.8 6,108.2Industrial Processes 301.1 335.1 327.5 329.6 300.7 310.9 304.1 320.7Solvent and Other Product Use 4.3 4.8 4.8 4.8 4.8 4.8 4.8 4.8Agriculture 439.6 483.2 463.1 458.4 463.4 457.8 439.1 440.1Land Use, Land-Use Change, andForestry (Emissions) 5.7 6.5 6.7 6.4 6.2 6.4 6.6 6.8
Waste 210.0 191.8 190.7 188.8 186.4 191.3 194.8 193.8
Total 6,109.0 6,773.7 6,814.9 6,982.3 6,893.1 6,915.8 6,959.1 7,074.4
Net CO2 Flux from Land Use, Land-UseChange, and Forestry* (910.4) (744.0) (765.7) (759.5) (768.0) (768.6) (774.8) (780.1)
Net Emissions (Sources and Sinks) 5,198.6 6,029.6 6,049.2 6,222.8 6,125.1 6,147.2 6,184.3 6,294.3
* Parentheses indicate negative values or sequestration. The net CO2 flux total includes both emissions and sequestration, and constitutes a sink in the United States. Sinks are onlyincluded in the net emissions total.Note: Totals may not sum due to independent rounding.
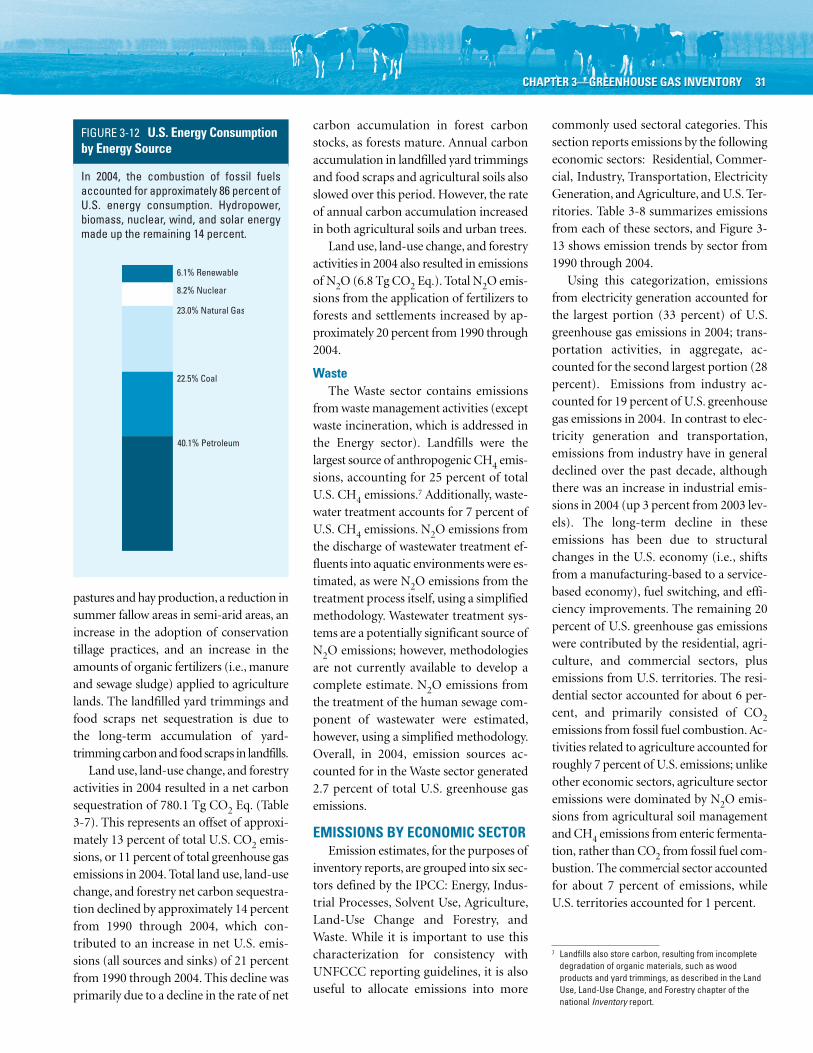
CHAPTER 3—GREENHOUSE GAS INVENTORY 31CHAPTER 3—GREENHOUSE GAS INVENTORY 31
carbon accumulation in forest carbonstocks, as forests mature. Annual carbonaccumulation in landfilled yard trimmingsand food scraps and agricultural soils alsoslowed over this period. However, the rateof annual carbon accumulation increasedin both agricultural soils and urban trees.Land use, land-use change, and forestry
activities in 2004 also resulted in emissionsof N2O (6.8 Tg CO2 Eq.). Total N2O emis-sions from the application of fertilizers toforests and settlements increased by ap-proximately 20 percent from 1990 through2004.
WasteThe Waste sector contains emissions
fromwaste management activities (exceptwaste incineration, which is addressed inthe Energy sector). Landfills were thelargest source of anthropogenic CH4 emis-sions, accounting for 25 percent of totalU.S. CH4 emissions.
7 Additionally, waste-water treatment accounts for 7 percent ofU.S. CH4 emissions. N2O emissions fromthe discharge of wastewater treatment ef-fluents into aquatic environments were es-timated, as were N2O emissions from thetreatment process itself, using a simplifiedmethodology. Wastewater treatment sys-tems are a potentially significant source ofN2O emissions; however, methodologiesare not currently available to develop acomplete estimate. N2O emissions fromthe treatment of the human sewage com-ponent of wastewater were estimated,however, using a simplified methodology.Overall, in 2004, emission sources ac-counted for in the Waste sector generated2.7 percent of total U.S. greenhouse gasemissions.
EMISSIONS BY ECONOMIC SECTOREmission estimates, for the purposes of
inventory reports, are grouped into six sec-tors defined by the IPCC: Energy, Indus-trial Processes, Solvent Use, Agriculture,Land-Use Change and Forestry, andWaste. While it is important to use thischaracterization for consistency withUNFCCC reporting guidelines, it is alsouseful to allocate emissions into more
commonly used sectoral categories. Thissection reports emissions by the followingeconomic sectors: Residential, Commer-cial, Industry, Transportation, ElectricityGeneration, andAgriculture, andU.S. Ter-ritories. Table 3-8 summarizes emissionsfrom each of these sectors, and Figure 3-13 shows emission trends by sector from1990 through 2004.Using this categorization, emissions
from electricity generation accounted forthe largest portion (33 percent) of U.S.greenhouse gas emissions in 2004; trans-portation activities, in aggregate, ac-counted for the second largest portion (28percent). Emissions from industry ac-counted for 19 percent of U.S. greenhousegas emissions in 2004. In contrast to elec-tricity generation and transportation,emissions from industry have in generaldeclined over the past decade, althoughthere was an increase in industrial emis-sions in 2004 (up 3 percent from 2003 lev-els). The long-term decline in theseemissions has been due to structuralchanges in the U.S. economy (i.e., shiftsfrom a manufacturing-based to a service-based economy), fuel switching, and effi-ciency improvements. The remaining 20percent of U.S. greenhouse gas emissionswere contributed by the residential, agri-culture, and commercial sectors, plusemissions from U.S. territories. The resi-dential sector accounted for about 6 per-cent, and primarily consisted of CO2emissions from fossil fuel combustion.Ac-tivities related to agriculture accounted forroughly 7 percent of U.S. emissions; unlikeother economic sectors, agriculture sectoremissions were dominated by N2O emis-sions from agricultural soil managementand CH4 emissions from enteric fermenta-tion, rather than CO2 from fossil fuel com-bustion. The commercial sector accountedfor about 7 percent of emissions, whileU.S. territories accounted for 1 percent.
pastures and hay production, a reduction insummer fallow areas in semi-arid areas, anincrease in the adoption of conservationtillage practices, and an increase in theamounts of organic fertilizers (i.e.,manureand sewage sludge) applied to agriculturelands. The landfilled yard trimmings andfood scraps net sequestration is due tothe long-term accumulation of yard-trimmingcarbonand food scraps in landfills.Land use, land-use change, and forestry
activities in 2004 resulted in a net carbonsequestration of 780.1 Tg CO2 Eq. (Table3-7). This represents an offset of approxi-mately 13 percent of total U.S. CO2 emis-sions, or 11 percent of total greenhouse gasemissions in 2004. Total land use, land-usechange, and forestry net carbon sequestra-tion declined by approximately 14 percentfrom 1990 through 2004, which con-tributed to an increase in net U.S. emis-sions (all sources and sinks) of 21 percentfrom 1990 through 2004. This decline wasprimarily due to a decline in the rate of net
FIGURE 3-12 U.S. Energy Consumptionby Energy Source
In 2004, the combustion of fossil fuelsaccounted for approximately 86 percent ofU.S. energy consumption. Hydropower,biomass, nuclear, wind, and solar energymade up the remaining 14 percent.
7 Landfills also store carbon, resulting from incompletedegradation of organic materials, such as woodproducts and yard trimmings, as described in the LandUse, Land-Use Change, and Forestry chapter of thenational Inventory report.

32 U.S. CLIMATE ACTION REPORT—200632 U.S. CLIMATE ACTION REPORT—2006
TABLE 3-8 AND FIGURE 3-13 U.S. Greenhouse Gas Emissions Allocated to Economic Sectors (Tg CO2 Eq.)
In 2004, U.S. greenhouse gas emissions from electricity generation accounted for one-third of total greenhouse gas emissions, and thetransportation sector accounted for almost 28 percent.
Economic Sector 1990 1998 1999 2000 2001 2002 2003 2004Electricity Generation 1,846.4 2,202.4 2,213.3 2,315.9 2,284.4 2,280.1 2,308.5 2,337.8Transportation 1,520.3 1,753.4 1,819.3 1,866.9 1,852.7 1,898.0 1,898.9 1,955.1Industry 1,438.9 1,452.4 1,411.0 1,409.7 1,366.6 1,346.7 1,342.7 1,377.3Agriculture 486.3 541.6 523.9 509.5 514.4 511.0 484.2 491.3Commercial 433.6 428.0 430.6 443.0 439.5 447.5 466.5 459.9Residential 349.4 353.3 372.6 390.4 381.6 380.1 399.8 391.1U.S. Territories 33.8 42.7 44.2 46.9 54.0 52.4 58.6 61.9
Total 6,109.0 6,773.7 6,814.9 6,982.3 6,893.1 6,915.8 6,959.1 7,074.4
Land Use, Land-Use Change, andForestry (910.4) (744.0) (765.7) (759.5) (768.0) (768.6) (774.8) (780.1)
Net Emissions (Sources and Sinks) 5,198.6 6,029.6 6,049.2 6,222.8 6,125.1 6,147.2 6,184.3 6,294.3
Notes:Parentheses indicate negative values or sequestration. The net CO2 flux total includes both emissions and sequestration, and constitutes a sink in the United States. Sinks are onlyincluded in the net emissions total.Totals may not sum due to independent rounding. Emissions include CO2, CH4, N2O, HFCs, PFCs, and SF6.
Note: Does not include U.S. territories.

CHAPTER 3—GREENHOUSE GAS INVENTORY 33CHAPTER 3—GREENHOUSE GAS INVENTORY 33
CO2 was also emitted and sequesteredby a variety of activities related to forestmanagement practices, tree planting inurban areas, the management of agricul-tural soils, and landfilling of yard trim-mings.Electricity is ultimately consumed in
the economic sectors described above.Table 3-9 presents greenhouse gas emis-sions from economic sectors with emis-sions related to electricity generationdistributed into end-use categories (i.e.,emissions from electricity generation areallocated to the economic sectors in whichthe electricity is consumed). To distributeelectricity emissions among end-use sec-tors, emissions from the source categoriesassigned to electricity generation were al-located to the residential, commercial, in-dustry, transportation, and agricultureeconomic sectors according to retail salesof electricity.8 These source categories in-clude CO2 from fossil fuel combustion andthe use of limestone and dolomite for fluegas desulfurization, CO2 and N2O fromwaste combustion, CH4 and N2O fromstationary sources, and SF6 from electricaltransmission and distribution systems.When emissions from electricity are
distributed among these sectors, industryaccounts for the largest share of U.S.greenhouse gas emissions (30 percent) in2004. Emissions from the residential andcommercial sectors also increase substan-tially when emissions from electricity areincluded, due to their relatively large shareof electricity consumption (lighting, ap-pliances, etc.). Transportation activities re-main the second largest contributor tototal U.S. emissions (28 percent). In all sec-tors except agriculture, CO2 accounts formore than 80 percent of greenhouse gas
Each year, emission and sink estimates are recalculated and revised for all years inthe Inventory of U.S. Greenhouse Gas Emissions and Sinks, as attempts are made toimprove both the analyses themselves, through the use of better methods or data,and the overall usefulness of the report. In this effort, the United States follows theIPCC Good Practice Guidance (IPCC 2000), which states, regarding recalculations ofthe time series, “It is good practice to recalculate historic emissions when methodsare changed or refined, when new source categories are included in the national in-ventory, or when errors in the estimates are identified and corrected.” In general, re-calculations are made to the U.S. greenhouse gas emission estimates either toincorporate newmethodologies or, most commonly, to update recent historical data.
In each Inventory report, the results of all methodology changes and historical dataupdates are presented in the “Recalculations and Improvements” chapter; detaileddescriptions of each recalculation are contained within each source’s descriptioncontained in the report, if applicable. In general, whenmethodological changes havebeen implemented, the entire time series (in the case of the most recent Inventoryreport, 1990 through 2003) has been recalculated to reflect the change, per IPCCGood Practice Guidance. Changes in historical data are generally the result ofchanges in statistical data supplied by other agencies. References for the data areprovided for additional information. More information on the most recent changes isprovided in the “Recalculations and Improvements” chapter of the Inventory of U.S.Greenhouse Gas Emissions and Sinks: 1990-2004 (U.S. EPA/OAP 2006c), and previousInventory reports can further describe the changes in calculation methods and datasince the previous Climate Action Report.
Recalculations of Inventory Estimates
8 Emissions were not distributed to U.S. territories, sincethe electricity generation sector only includesemissions related to the generation of electricity in the50 states and the District of Columbia.
9 See <http://unfccc.int/resource/docs/cop8/08.pdf>.10 NOx and CO emission estimates from field burning ofagricultural residues were estimated separately, andtherefore were not taken from U.S. EPA 2005.
emissions, primarily from the combustionof fossil fuels. Figure 3-14 shows the trendin these emissions by sector from 1990through 2004.
INDIRECT GREENHOUSE GASESThe reporting requirements of the
UNFCCC9 request that information beprovided on indirect greenhouse gases,which include CO, NOx, NMVOCs, andSO2. These gases do not have a directglobal warming effect, but indirectly affectterrestrial radiation absorption by influ-encing the formation and destruction oftropospheric and stratospheric ozone, or,in the case of SO2, by affecting the absorp-tive characteristics of the atmosphere.Ad-
ditionally, some of these gases may reactwith other chemical compounds in the at-mosphere to form compounds that aregreenhouse gases.Since 1970, the United States has pub-
lished estimates of annual emissions ofCO, NOx, NMVOCs, and SO2 (U.S. EPA2005),10 which are regulated under theClean Air Act. Table 3-10 shows that fuelcombustion accounts for the majority ofemissions of these indirect greenhousegases. Industrial processes—such as themanufacture of chemical and allied prod-ucts, metals processing, and industrialuses of solvents—are also significantsources of CO, NOx, and NMVOCs.

34 U.S. CLIMATE ACTION REPORT—200634 U.S. CLIMATE ACTION REPORT—2006
TABLE 3-9 AND FIGURE 3-14 U.S Electricity-Related Greenhouse Gas Emissions Distributed Among Economic Sectors(Tg CO2 Eq.)
When 2004 U.S. greenhouse gas emissions from electricity generation were distributed among the economic sectors, industry accounted for thelargest share (30 percent) and transportation, the second largest (28 percent).
Economic Sector 1990 1998 1999 2000 2001 2002 2003 2004Industry 2,074.6 2,210.3 2,174.4 2,186.1 2,073.6 2,042.0 2,066.0 2,103.0Transportation 1,523.4 1,756.5 1,822.5 1,870.3 1,856.2 1,901.4 1,903.2 1,959.8Commercial 979.2 1,102.0 1,115.8 1,171.8 1,190.8 1,191.4 1,204.3 1,211.0Residential 950.8 1,060.0 1,083.2 1,140.0 1,136.2 1,154.1 1,182.9 1,181.9Agriculture 547.2 602.4 575.0 567.2 582.6 574.5 544.3 556.9U.S. Territories 33.8 42.7 44.2 46.9 54.0 52.4 58.6 61.9
Total 6,109.0 6,773.7 6,814.9 6,982.3 6,893.1 6,915.8 6,959.1 7,074.4
Land Use, Land-Use Change, andForestry (910.4) (744.0) (765.7) (759.5) (768.0) (768.6) (774.8) (780.1)
Net Emissions (Sources and Sinks) 5,198.6 6,029.6 6,049.2 6,222.8 6,125.1 6,147.2 6,184.3 6,294.3
Note: Parentheses indicate negative values or sequestration. The net CO2 flux total includes both emissions and sequestration, and constitutes a sink in the United States. Sinks areonly included in the net emissions total.
Note: Does not include U.S. territories.

CHAPTER 3—GREENHOUSE GAS INVENTORY 35CHAPTER 3—GREENHOUSE GAS INVENTORY 35
TABLE 3-10 Emissions of Indirect Greenhouse Gases (Gg)
Fuel combustion accounts for the majority of emissions of indirect greenhouse gases. Industrial processes—such as the manufacture of chemicaland allied products, metals processing, and industrial uses of solvents—are also significant sources of CO, NOx, and NMVOCs.
Gas/Activity 1990 1998 1999 2000 2001 2002 2003 2004
NOx 22,860 21,964 20,530 20,288 19,414 18,850 17,995 17,076Stationary Fossil Fuel Combustion 9,884 9,419 8,344 8,002 7,667 7,522 7,138 6,662Mobile Fossil Fuel Combustion 12,134 11,592 11,300 11,395 10,823 10,389 9,916 9,465Oil and Gas Activities 139 130 109 111 113 135 135 135Waste Combustion 82 145 143 114 114 134 134 134Industrial Processes 591 637 595 626 656 630 631 632Solvent Use 1 3 3 3 3 6 6 6Agricultural Burning 28 35 34 35 35 33 34 39Waste 0 3 3 2 2 2 2 2
CO 130,580 98,984 94,361 92,895 89,329 87,428 87,518 87,599Stationary Fossil Fuel Combustion 4,999 3,927 5,024 4,340 4,377 4,020 4,020 4,020Mobile Fossil Fuel Combustion 119,482 87,940 83,484 83,680 79,972 78,574 78,574 78,574Oil and Gas Activities 302 332 145 146 147 116 116 116Waste Combustion 978 2,826 2,725 1,670 1,672 1,672 1,672 1,672Industrial Processes 4,124 3,163 2,156 2,217 2,339 2,286 2,286 2,286Solvent Use 4 1 46 46 45 46 46 46Agricultural Burning 689 789 767 790 770 706 796 877Waste 1 5 13 8 8 8 8 8
NMVOCs 20,937 16,403 15,869 15,228 15,048 14,217 13,877 13,556Stationary Fossil Fuel Combustion 912 1,016 1,045 1,077 1,080 923 922 922Mobile Fossil Fuel Combustion 10,933 7,742 7,586 7,230 6,872 6,560 6,212 5,882Oil and Gas Activities 555 440 414 389 400 340 341 341Waste Combustion 222 326 302 257 258 281 282 282Industrial Processes 2,426 2,047 1,813 1,773 1,769 1,723 1,725 1,727Solvent Use 5,217 4,671 4,569 4,384 4,547 4,256 4,262 4,267Agricultural Burning NA NA NA NA NA NA NA NAWaste 673 161 140 119 122 133 134 134
SO2 20,936 17,189 15,917 14,829 14,452 13,928 14,208 13,910Stationary Fossil Fuel Combustion 18,407 15,191 13,915 12,848 12,461 11,946 12,220 11,916Mobile Fossil Fuel Combustion 793 665 704 632 624 631 637 644Oil and Gas Activities 390 310 283 286 289 315 315 315Waste Combustion 39 30 30 29 30 24 24 24Industrial Processes 1,306 991 984 1,031 1,047 1,009 1,009 1,009Solvent Use 0 1 1 1 1 1 1 1Agricultural Burning NA NA NA NA NA NA NA NAWaste 0 1 1 1 1 1 1 1
NA = Not Available.Note: Totals may not sum due to independent rounding.Source: U.S. EPA 2005, except for estimates from field burning of agricultural residues.
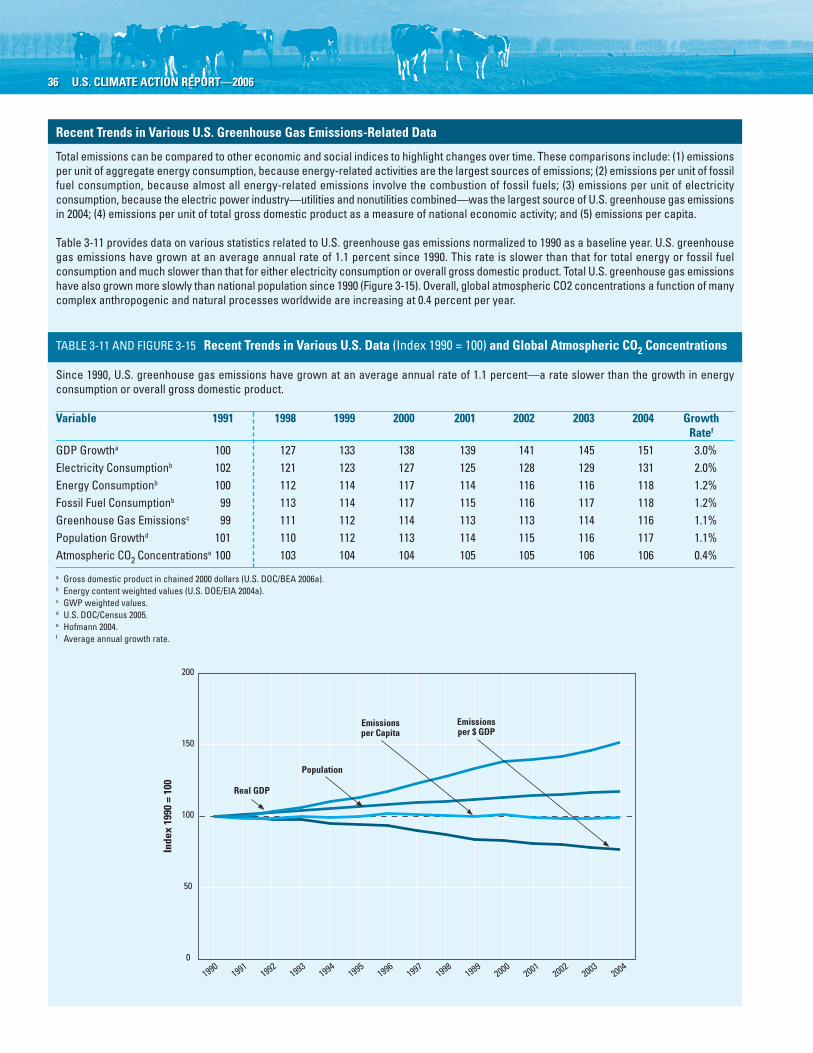
36 U.S. CLIMATE ACTION REPORT—200636 U.S. CLIMATE ACTION REPORT—2006
TABLE 3-11 AND FIGURE 3-15 Recent Trends in Various U.S. Data (Index 1990 = 100) and Global Atmospheric CO2 Concentrations
Since 1990, U.S. greenhouse gas emissions have grown at an average annual rate of 1.1 percent—a rate slower than the growth in energyconsumption or overall gross domestic product.
Variable 1991 1998 1999 2000 2001 2002 2003 2004 GrowthRatef
GDP Growtha 100 127 133 138 139 141 145 151 3.0%Electricity Consumptionb 102 121 123 127 125 128 129 131 2.0%Energy Consumptionb 100 112 114 117 114 116 116 118 1.2%Fossil Fuel Consumptionb 99 113 114 117 115 116 117 118 1.2%Greenhouse Gas Emissionsc 99 111 112 114 113 113 114 116 1.1%Population Growthd 101 110 112 113 114 115 116 117 1.1%Atmospheric CO2 Concentrations
e 100 103 104 104 105 105 106 106 0.4%
a Gross domestic product in chained 2000 dollars (U.S. DOC/BEA 2006a).b Energy content weighted values (U.S. DOE/EIA 2004a).c GWP weighted values.d U.S. DOC/Census 2005.e Hofmann 2004.f Average annual growth rate.
Recent Trends in Various U.S. Greenhouse Gas Emissions-Related Data
Total emissions can be compared to other economic and social indices to highlight changes over time. These comparisons include: (1) emissionsper unit of aggregate energy consumption, because energy-related activities are the largest sources of emissions; (2) emissions per unit of fossilfuel consumption, because almost all energy-related emissions involve the combustion of fossil fuels; (3) emissions per unit of electricityconsumption, because the electric power industry—utilities and nonutilities combined—was the largest source of U.S. greenhouse gas emissionsin 2004; (4) emissions per unit of total gross domestic product as a measure of national economic activity; and (5) emissions per capita.
Table 3-11 provides data on various statistics related to U.S. greenhouse gas emissions normalized to 1990 as a baseline year. U.S. greenhousegas emissions have grown at an average annual rate of 1.1 percent since 1990. This rate is slower than that for total energy or fossil fuelconsumption andmuch slower than that for either electricity consumption or overall gross domestic product. Total U.S. greenhouse gas emissionshave also grownmore slowly than national population since 1990 (Figure 3-15). Overall, global atmospheric CO2 concentrations a function of manycomplex anthropogenic and natural processes worldwide are increasing at 0.4 percent per year.
In February 2002, President Bush set a national goal to reduce the greenhouse gas(GHG) intensity1 of the American economy by 18 percent by 2012.2 Meeting this com-mitment will prevent the release of more than 1,833 teragrams of carbon dioxide equiv-
alent (Tg CO2 Eq.) to the atmosphere, adding to the 255 Tg CO2 Eq. avoided in 2002. Tohelp achieve this goal, President Bush has taken the following actions:• created an interagency, cabinet-level committee to coordinate and prioritize federal re-
search on global climate science and advanced energy technologies;• increased the federal budget for climate change activities; and• proposed tax incentives that help spur GHG reductions by spurring cleaner, renewable
energy and more energy-efficient technologies.The Administration is pursuing a broad range of policy measures, financial incentives,
voluntary programs, and other federal programs that can help to slow the growth in GHGemissions and reduce GHG intensity. The Administration’s approach balances near-termopportunities with long-term investments in breakthrough technologies needed forgreater emission reductions in the future. These federal efforts span the major sectors ofthe U.S. economy encompassing generation and use of energy in the commercial, resi-dential, industrial, and transportation sectors; management of agriculture and forestry;and management of waste streams and industrial byproducts. In addition, businesses,state and local governments, and nongovernmental organizations (NGOs) are addressingglobal climate change in numerous ways.
NATIONAL POLICYMAKING PROCESSIn 2001, the President created the National Climate Change Technology Initiative
(NCCTI), charging the Secretaries of Commerce and Energy, working with other federalagencies, to:• evaluate the state of U.S. climate change technology research and development (R&D)
and make recommendations for improvement;• provide guidance on strengthening basic research at universities and national labora-
tories, including the development of advanced mitigation technologies that offer thegreatest promise for low-cost reductions of GHG emissions;
• develop opportunities to enhance private–public partnerships in applied R&D to ex-pedite innovative and cost-effective approaches to reducing GHG emissions;
• make recommendations for funding demonstration projects for cutting-edge tech-nologies; and
4 Policies andMeasuresPolicies andMeasures
1 Defined as the amount of CO2 equivalents emitted per unit of gross domestic product (GDP).2 The national commitment to improve U.S. GHG intensity by 18 percent by 2012 is based on projections of U.S. GHG
emissions and GDP as estimated in 2002. The commitment is to improve GHG intensity by 4 percentage points over aBusiness As Usual case, which is expected to avoid GHG emissions of about 100 million metric tons of carbonequivalents (MMTCE) (367 Tg CO2 Eq.) in 2012 and 500 MMTCE (1,833 Tg CO2 Eq.) cumulatively by 2012.

38 U.S. CLIMATE ACTION REPORT—200638 U.S. CLIMATE ACTION REPORT—2006
3 See <http://www.climatetechnology.gov/vision2005/cctp-vision2005.pdf>.
4 See <http://www.climatescience.gov/>.5 For example, the Landfill Rule and the Significant New
Alternatives Program, discussed later in this chapter.6 The reported impacts of individual policies and
measures in this chapter are based on specificassumptions of the impacts and adoption of eachmeasure, but recognize fewer interactions andcompetitive effects within and between economicsectors than the aggregate estimates used in Chapter5. For a more detailed explanation, see Chapter 5.
7 See <http://www.climatevision.gov/>,<http://www.pi.energy.gov/enhancingGHGregistry/>,and <http://www.eia.doe.gov/oiaf/1605/aboutcurrent.html>.
• evaluate improved technologies formeasuring and monitoring gross andnet terrestrial GHG emissions.In February 2002, the President reor-
ganized federal oversight, management,and administrative control of climatechange activities. He established thecabinet-level Committee on ClimateChange Science and Technology Integra-tion (CCCSTI), thereby directly engagingthe heads of all relevant departments andagencies in guiding and directing climatechange activities, and charged the CCCSTIwith developing innovative approaches inaccord with a number of basic principles:• Be consistent with the long-term goal
of stabilizing GHG concentrations inthe atmosphere.
• Be measured, and continually build onnew scientific data.
• Be flexible to adjust to new informationand take advantage of new technology.
• Ensure continued economic growthand prosperity.
• Pursue market-based incentives andspur technological innovation.
• Base efforts on global participation, in-cluding developing countries.3
The CCCSTI makes recommendationsto the President on matters concerning cli-mate change science and technology plans,investment, and progress. Under the aus-pices of the CCCSTI, two multi-agencyprograms were established to coordinatefederal activities in this area: the U.S. Cli-mate Change Science Program (CCSP),4
led by the U.S. Department of Commerce(DOC), and the U.S. Climate Change
Technology Program (CCTP), led by theU.S.Department of Energy (DOE). CCSPand CCTP are discussed in greater detailin Chapter 8.
The U.S global climate change strategyand the progress being made are routinelyreviewed by the relevant committees andworking groups. This fourth nationalcommunication demonstrates U.S. pro-gress toward implementing the provisionsof the United Nations Framework Con-vention on Climate Change in accordancewith current knowledge of the science andU.S. efforts to develop longer-term solu-tions.
Federal Policies and MeasuresFederal policies and measures play a
central role in achieving the President’sGHG intensity goal and longer-term cli-mate change objectives. Policies consist ofa balanced mix of near- and long-term,voluntary and regulatory,5 research and de-velopment, CO2 and other potent GHGs,and commercial, residential, industrial, andtransportation sector initiatives. Federalprograms and initiatives provide a com-prehensive approach for the near term, anda foundation for climate science and tech-nologies that will reduce uncertainties anddeliver even greater emission reductions inthe future. The United States will continueto pursue lowering GHG intensity in par-allel with reducing the uncertainties in cli-mate science and technology.The domesticpolicies and programs promoted by thePresident allow consumers and businessesto make flexible decisions about emissionreductions, rather than only mandatingparticular control options or rigid targets.The President’s policies challenge and pro-vide incentives to businesses to reduce theirGHG emissions by joining federal partner-ship programs promoting improved en-ergy efficiency and increased use ofrenewable energy technologies.Going for-ward, future initiatives will build on thesesuccesses.
With sustained efforts, emission reduc-tions accompanied by economic growthare expected to achieve the President’s
goal. Established programs have demon-strated the accomplishments that well-designed policies can achieve.However, theprogram projections in this chapter shouldnot be compared to the information pre-sented in Chapter 5 and should not beused directly to calculate the national pro-jections.6 In addition, several programs arenot included in the Chapter 5 projectionsfor a number of reasons, including doublecounting of benefits and stage of imple-mentation. However, these unscored pro-grams are still expected to contribute to theoverall emission reductions and reachingthe 2012 target. Representative federaldomestic climate programs and their esti-mated GHG reduction goals are listed inTable 4-2 at the end of this chapter.
NEW INITIATIVES SINCETHE 2002 CAR
Since the last Climate Action Report(CAR) was published in 2002, new initia-tives have been introduced to augment ex-isting climate change activities at thefederal level. They target additionalsources of emissions and provide oppor-tunities for significant reductions. Someexamples of these new initiatives follow.
Climate VISIONClimate VISION7 assists industry ef-
forts to accelerate the transition to prac-tices, improved processes, and energytechnologies that are cost-effective,cleaner, more efficient, and more capableof reducing, capturing, or sequesteringGHGs.Already, business associations rep-resenting 14 industry sectors and TheBusiness Roundtable have become pro-gram partners with the federal govern-ment and have issued letters of intent tomeet specific targets for reducing GHGemissions intensity. These partners repre-sent a broad range of industry sectors: oiland gas production, transportation, andrefining; electricity generation; coal andmineral production and mining; manufac-turing; railroads; and forestry products.Partnering sectors account for about 40–45 percent of total U.S. emissions.

CHAPTER 4—POLICIES AND MEASURES 39CHAPTER 4—POLICIES AND MEASURES 39
Revised Guidelines for Voluntary GHGEmissions Reporting
RevisedGuidelines forVoluntaryGreen-house Gas Emissions Reporting under sec-tion 1605(b) of the Energy Policy Act of1992 are intended to encourage utilities, in-dustries, farmers, landowners, and otherparticipants to submit to an on-line registrycomprehensive reports on their emissionsand emission reductions, including seques-tration. The enhanced registry is intendedto boost measurement accuracy, reliability,and verifiability, working with and takinginto account emerging domestic and inter-national approaches. For the most recentreporting year (2004), 226 U.S. companiesand other organizations filedGHG reports.
Climate LeadersClimate Leaders8 was launched in early
2002 to encourage individual companies todevelop long-term, comprehensive climatechange strategies. Under this program,partners set corporate-wide GHG reduc-tion goals and inventory their emissions tomeasure progress.The partnership now in-cludes more than 100 partners, half ofwhom have already set GHG emission re-duction goals. The U.S. GHG emissions ofthese partners are equal to nearly 10 percentof the U.S. total.
Green Power PartnershipAs part of the U.S. Environmental Pro-
tection Agency’s (EPA’s) Clean Energy Ini-tiative, theGreen Power Partnership9 assistsorganizations in demonstrating environ-mental leadership by choosing electricityproducts generated from renewable energysources. The partnership now has morethan 600 partners committed to purchasingmore than 4 million megawatt-hours(MWh) of green power (U.S. EPA/OAR2006).
8 See <http://www.epa.gov/climateleaders/>.9 See <http://www.epa.gov/greenpower/>.10 See <http://www.epa.gov/otaq/smartway/index.htm>.11 See <http://www.energystar.gov/>.12 See <http://www.epa.gov/cleanenergy/stateandlocal/
partnership.htm>.13 See <http://www.epa.gov/cppd/mac/>.14 See Title XVII of the Energy Policy Act of 2005.
SmartWay Transport PartnershipSmartWay Transport Partnership10
works to increase U.S. energy efficiencyand energy security, while significantly re-ducing air pollution and GHGs. It createsstrong market-based incentives for corpo-rations and the maritime, trucking, andrail companies that deliver their productsto improve the environmental perform-ance of freight operations.
New ENERGY STAR ProductsThe ENERGY STAR11 program has ex-
panded substantially to include new prod-ucts and building types, such as schools,grocery stores, hotels, hospitals and med-ical office buildings, and warehouses. Anational campaign challenges buildingowners and managers to improve energyefficiency by 10 percent or more. NewENERGY STAR-labeled products forhomes and businesses have been intro-duced into the marketplace, including ex-ternal power supplies, battery chargers,and vending machines. To date, con-sumers have purchased 2 billion ENERGYSTAR-qualified products.
Clean Energy–Environment StatePartnership Program
The Clean Energy–Environment StatePartnership Program12 encourages statesto develop and implement cost-effectiveclean energy and environmental strategiesthat help further both environmental andclean energy goals and achieve publichealth and economic benefits.
Mobile Air Conditioning ClimateProtection Partnership
Launched in 2004, the Mobile Air Con-ditioning Climate Protection Partnership13
strives to reduce GHG emissions fromvehicle air conditioning systems throughvoluntary approaches. The program pro-motes cost-effective designs and improvedservice procedures that minimize emis-sions from mobile air conditioning sys-tems.
Energy Policy Act of 2005In August 2005, President Bush signed
into law the Energy Policy Act of 2005(EPAct), a bill with far-reaching impacts
on the U.S. energy economy. In additionto R&D programs, EPAct has a number ofprovisions designed to accelerate marketpenetration of advanced, clean-energytechnologies. The provisions include taxbreaks for production from advanced nu-clear power; clean coal facilities; integratedgasification-combined cycle; energy-effi-cient commercial buildings, homes, andappliances (i.e., ENERGY STAR); residen-tial energy-efficient property; business in-stallation of fuel cells and stationarymicroturbine power plants; business solarinvestment tax credit; alternative motorvehicle credit; and nuclear power.
EPAct authorizes DOE to enter intoloan guarantees for a variety of early com-mercial projects that use advanced tech-nologies that avoid, reduce, or sequesterair pollutants or anthropogenic sources ofGHGs, and have a reasonable prospect ofthe borrower’s repayment of the principaland interest on the obligation.14 Eligibleprojects include renewable energy systems;advanced fossil fuel technology; hydrogenfuel cell technology; advanced nuclear en-ergy facilities; carbon capture and seques-tration practices and technology; efficientend-use energy technologies; efficient en-ergy generation, transmission, and distri-bution; production facilities forfuel-efficient vehicles; pollution controlequipment; and refineries. EPAct also pro-vides standby default coverage for certainregulatory and litigation delays for the firstsix nuclear power plants.Under this provi-sion, DOE is authorized to indemnify cer-tain covered costs up to $500 million foreach of the first two and $250 million foreach of the next four nuclear power plantsif full power operation is delayed becauseof an unmet regulatory schedule or theinitiation of litigation. The provision alsooffers production tax credits for 6,000megawatts of new nuclear capacity.
In addition, EPAct mandates an in-crease in the renewable content of gasolinefrom 4 billion gallons (15.1 billion liters)in 2006 to 7.5 billion gallons (28.4 billionliters) in 2012, establishes 16 new effi-ciency mandates covering a variety of

appliances, and requires federal agenciesto improve the efficiency of their build-ings. EPAct also provides for U.S. agenciesto undertake a range of cooperative activi-ties designed to reduce the greenhouse gasintensity of large developing countryeconomies.
NEAR-TERMMEASURESThe programs discussed in this section
are representative of the U.S. government’sefforts to curb the growth of GHG emis-sions. The near-term measures in this Cli-mate Action Report are defined by theirimplementing federal agencies as measurescontributing directly to the achievement ofthe President’s 2012 GHG intensity goal.Estimates of mitigation impacts of pro-grams are provided by the agency responsi-ble for each individual program, based onthe agency’s experience and assumptionsrelated to the implementation of voluntaryprograms. These estimates may includeassumptions about the continued orincreased participation of partners, devel-opment and deployment goals, and/orwhether the necessary commercializationor significant market penetration isachieved. Estimates of mitigation impactsfor individual policies or measures shouldnot be aggregated to the sectoral level, dueto possible synergies and interactionsamong policies andmeasures thatmight re-sult in double counting.
Energy: Residential and CommercialSectors
Representing approximately 35 percentof U.S.GHG emissions, the residential andcommercial sectors15 remain an importantfocus of U.S. climate change policies andmeasures. The use of electricity for suchservices as lighting, heating, cooling, andrunning electronic equipment and appli-ances accounts for the majority of CO2emissions in these sectors. These sectorscontinue to have potential for significant
reductions that can be realized throughboth regulatory and voluntary programsthat set standards, provide information,develop measurement tools, and buildpartnerships. By using commercially avail-able, energy-efficient products, technolo-gies, and best practices,many commercialbuildings and homes could save up to 30percent on energy bills and substantiallyreduce GHG emissions. Following are de-scriptions of key policies and measuresaimed at saving energy and avoiding GHGemissions in the residential and commer-cial sectors.
ENERGY STAR for the CommercialMarket
The ENERGY STAR program has ex-panded in the commercial market, as itcontinues to offer thousands of organiza-tions a strategy for superior energymanagement and standardized tools formeasuring their energy efficiency. Since2002, the U.S. Environmental ProtectionAgency (EPA) has expanded a key effortfirst introduced in 1999—a nationalenergy performance rating system thatallows interested parties to rate the energyefficiency of a building on a scale fromzero to 100 and to recognize top-perform-ing ENERGY STAR buildings. This systemhas been valuable in identifying cost-effective opportunities for improvementsfor a wide range of building types, includ-ing hospitals, schools, grocery stores, officebuildings, warehouses, and hotels.
The ENERGY STAR program is help-ing the commercial marketplace respondto the President’s challenge to business tovoluntarily take actions that reduce GHGemissions. In 2005, EPA joined more than20 trade associations, businesses, andstate-based institutions to challenge busi-nesses and institutions across the countryto take the necessary steps to identify themany buildings where financially attrac-tive improvements can reduce energy useby 10 percent or more, and to make theimprovements. EPA has also announced itwill recognize organizations, businesses,and institutions demonstrating energy
savings across their building portfolios by10, 20, or 30 points, as ENERGY STARLeaders. EPA estimates that in 2002,ENERGY STAR in the commercial build-ing market helped businesses reduce GHGemissions by 35 Tg CO2 Eq. and save $3billion in energy costs. EPA projects thatpursuing this effort could result in reduc-tions of 64 Tg CO2 Eq. in 2012.
Commercial Building IntegrationThe Commercial Building Integration16
(CBI) program works to realize energy-saving opportunities provided by advanc-ing a whole-building approach forcommercial construction and major ren-ovation. CBI is increasing its industry part-nerships in design, construction, operationandmaintenance, indoor environment, andcontrol and diagnostics of heating, ventila-tion, air conditioning, lighting, and otherbuilding systems. Through these efforts,DOE helps transfer the most energy-efficient building techniques and practicesinto commercial buildings through regula-tory activities, such as supporting the up-grade of voluntary (model) building energycodes and promulgating upgraded federalcommercial building energy codes.
Since 2002, CBI has facilitated a 10percent increase in commercial buildingdesigns that incorporate energy efficiencydesign tools. In 2005, the program assessedcontrol technologies, optimization meth-ods, and market opportunities to establisha framework for developing programmaticpathways to improve energy efficiency inbuildings by 50 percent or better, enablingthe development of energy-efficient designand technology packages for new com-mercial buildings. DOE estimates thatCBI, in conjunction with Rebuild Amer-ica, could reduce GHG emissions by 0.5Tg CO2 Eq. in 2012.
Rebuild AmericaRebuild America17 is being redesigned
to be better integrated with DOE’s Com-mercial Building Integration program,described above. This program works witha network of hundreds of community-based partnerships across the Nation that
40 U.S. CLIMATE ACTION REPORT—200640 U.S. CLIMATE ACTION REPORT—2006
15 See <http://www.eere.energy.gov/buildings/>.16 See <http://www.eere.energy.gov/buildings/high
performance/>.17 See <http://www.eere.energy.gov/buildings/program_
areas/rebuild.html>.

are saving energy, improving buildingperformance, decreasing air pollutionthrough reduced energy demand, and en-hancing the quality of life through energyefficiency and renewable energy technolo-gies. In 2005, the program helped RebuildAmerica community partnerships to up-grade 5.6 million square meters (60 mil-lion square feet) of floor space in K-12schools, colleges, public housing, and stateand local governments, reducing the aver-age energy used in these buildings by 18percent.
Residential Building Integration:Building America
The objective of Building America18 isto design, build, and evaluate energy-efficient homes that use 30–40 percent lesstotal energy than comparable traditionalhomes with little or no increase in con-struction costs, and for industry to adoptthese practices for new home construc-tion. The program optimizes building en-ergy performance and savings through theintegration of new technologies with in-novative residential building practices.Ongoing research also focuses on integrat-ing on-site power systems, including re-newable energy technologies.
The Building America approach hasbuilt more than 32,000 homes in 36 states.Through the program, DOE and its morethan 470 industry partners are conductingresearch to develop advanced building en-ergy systems to make homes and commu-nities much more energy-efficient. Theenergy technologies and solutions beingadvanced by the program will contributeto a 70 percent reduction in energy useof new prototype residential buildingsthat, when combined with on-site energytechnologies, will result in “zero-energyhomes”by 2020 and a 20 percent reductionin energy use of existing homes. DOE esti-mates these efforts could generate 3.8 TgCO2 Eq. of emission reductions in 2012.
ENERGY STAR for the ResidentialMarket
The ENERGY STAR programs in theresidential sector have been expanded since
CHAPTER 4—POLICIES AND MEASURES 41CHAPTER 4—POLICIES AND MEASURES 41
2002. In addition to ongoing efforts in thenew construction marketplace, this pro-gram is developing several programmodelsfor the existing homes stock that focus onenergy efficiency opportunities with thehome envelope (e.g.,windows) and heatingand cooling systems. With new construc-tion, close to 10 percent of the new homeswere built to ENERGY STAR specificationsin 2005, meaning they were 30 percentmore efficient than model energy code (or15 percent more efficient than state energycode, whichever is stricter).
In the existing homes market, ENERGYSTAR has expanded to a whole-houseretrofit program, Home Performance withENERGYSTAR.Trained and certified con-tractors conduct whole-house energy auditsand implement the requisite cost-effectiveefficiency improvements, backed by astrong quality assurance program. EPA es-timates that homeowners could save 20–30percent on their total energy bills under thisprogram.
ENERGY STAR has also expanded intothe affordable housing market in partner-ship with the U.S. Department of Housingand Urban Development. EPA estimatesthat these programs may provide about 7TgCO2 Eq. in emission reductions in 2012.
Residential Appliance StandardsThis DOE-managed program develops,
promulgates, and enforces test proceduresand energy conservation standards for res-idential appliances and certain commercialequipment. Federal residential energy ef-ficiency standards19 that have been in effectsince 1988 or that will take effect by theend of 2007 could save an estimated totalof 34 quadrillion Btus of energy by 2020.In 2012 alone, DOE estimates a reductionof 5 Tg CO2 Eq.
Emerging Buildings Technologies20
This DOE program develops cost-effective, energy-efficient, advanced tech-nologies for residential and commercialbuildings, including lighting, building en-velope, and space heating and coolingtechnologies. Technologies developed bythis program could penetrate the market
and avoid an estimated 4.4 Tg CO2 Eq. in2012 and 25.4 Tg CO2 Eq. in 2020.
ENERGY STAR-Labeled ProductsENERGY STAR continues to grow in its
coverage of efficient products for the homeand business and partnerships with majorretailers, energy utilities, states, and others.The label is now available on models inmore than 40 product categories.Awarenessof the ENERGY STAR label has grown tomore than 60 percent, andmany consumersreport using the ENERGY STAR label aspart of their purchasing decisions.The pro-gram is currently focused on maintainingthe integrity of the ENERGY STAR brand,identifying new product categories for EN-ERGYSTAR, as well as increasing the strin-gency of performance requirements forexisting product categories, where appro-priate. About 2 billion ENERGY STAR-qualified products were purchased through2005. Due to the increased penetration ofthese products, EPA estimates that 39 TgCO2 Eq. of emissions were avoided in 2002and projects that 102 Tg CO2 Eq. may beavoided in 2012.
Weatherization Assistance ProgramDuring the last 30 years,DOE’sWeather-
ization Assistance Program21 has providedcost-effective energy efficiency improve-ments tomore than 5.5million low-incomehouseholds through the weatherization ofhomes. The program gives priority to theelderly, people with disabilities, familieswith children, and households that spend adisproportionate amount of their incomeon energy bills. (Low-income familiesspend 15–20 percent of household expenseson utility bills, compared to 5 percent or lessfor all other Americans.) On average, DOEestimates that weatherization reduces heat-ing bills by 31 percent and overall energybills by $358 per year at current prices,
18 See <http://www.eere.energy.gov/buildings/building_america/>.
19 See <http://www.eere.energy.gov/buildings/appliance_standards/>.
20 See <http://www.eere.energy.gov/buildings/tech/emerging.html>.
21 See <http://www.eere.energy.gov/weatherization/>.

and water and wastewater industries. EN-ERGY STAR has provided strategies andguidance to help these businesses volun-tarily improve the energy efficiency oftheir operations, and at the same timecontribute to the President’s overall GHGintensity improvement goal. EPA esti-mates that in 2002, ENERGY STAR in theindustrial sector prevented 14 Tg CO2 Eq.and could avoid 21 Tg CO2 Eq. in 2012.
Industrial Technologies ProgramITP: Research and Development—The
Industrial Technologies Program23 (ITP)works in partnership with the Nation’sindustrial sector to improve its energyintensity, enhance its long-term competi-tiveness, and accelerate research, develop-ment, and commercialization of tech-nologies that increase energy and resourceefficiency. ITP develops, manages, and im-plements a balanced portfolio of technologyinvestments to address industry require-ments throughout the technology develop-ment cycle. R&D—particularly high-risk,high-return R&D—is conducted to targetefficiency opportunities in manufacturingprocesses and crosscutting energy systems.Validation and verification of technologybenefits through intermediate-term pilotand demonstration phases help emergingtechnologies gain commercialization andnear-term adoption.
ITP has contributed to the develop-ment of hundreds of commercializedindustrial technologies, perhaps accelerat-ing energy savings that might not havehappened without DOE assistance. DOEestimates this program could reduceapproximately 18 Tg CO2 Eq. in 2012.ITP: Best Practices and Save Energy Now
—This program works with industry toidentify plant-wide opportunities for en-ergy savings and process efficiency. By im-plementing new technologies and systemimprovements, many companies are real-izing the benefits of applying a Best Prac-tices24 approach. In 2006, the programintroduced a new campaign called SaveEnergy Now25 to address high U.S. naturalgas prices. Also in 2006, DOE continuedenergy savings assessments of 200 energy-
intensive facilities, and will offer an addi-tional 250 assessments in 2007. The facil-ities received a targeted, three-day steam-or process-heating assessment by a DOEenergy efficiency expert using the DOEsoftware analysis tools. The 200 assess-ments identified $475 million per year inpotential energy cost savings, that couldreduce natural gas consumption by morethan 50 trillion Btus per year, equivalent tothe natural gas consumed by more than725,000 typical homes. The annual carbonreduction from these energy savings is es-timated at 17 Tg CO2 Eq.ITP: Industrial Assessment Cen-
ters26—These centers provide eligiblesmall- and medium-sized manufacturersno-cost energy assessments, serve as atraining ground for engineers who con-duct energy audits or industrial assess-ments, and provide recommendations tomanufacturers to help them identify op-portunities to improve productivity, re-duce waste, and save energy. Thecontinuing efforts of this program may re-duce an estimated 18 Tg CO2 Eq. in 2012.ITP: Process Technologies27—This activ-
ity addresses the critical technology chal-lenges partners face for developingmaterials and production processes.An ex-ample is the isothermal melting (ITM)technology,which reduces energy use by 50percent and emissions by 80 percent. Thefirst ITMhas been installed at theAleris In-ternational Rolled Products plant inUhrichsville, Ohio. This technology couldsave theU.S. aluminum industry 18 trillionBtus per year and reduce carbon emissionsby 1 Tg CO2 Eq. per year by 2020.ITP: Crosscutting Technologies28—This
activity addresses technologies that affect all
thereby assisting low-income families inmeeting their energy needs, while alsoreducing GHG emissions. DOE estimatesthat the homes being weatherized throughthis program could displace 4 Tg CO2 Eq.in 2012.
Additional Policies and MeasuresState Energy Program22—This federal
program strengthens and supports the ca-pabilities of states to promote energy effi-ciency and to adopt renewable energytechnologies.DOE estimates that this pro-gram will displace 3 Tg CO2 Eq. in 2012.
Energy: Industrial SectorAt about 30 percent, the industrial sec-
tor has the greatest GHG emissions, largelyfrom fossil fuel combustion on site orat the power generation source. Thenumerous energy-intensive U.S. industriesprovide ample opportunities for efficiencyimprovements and emission reductions.Policies and measures included in thissection target the industrial sector bypromoting cost-effective investments intechnologies and practices to improve in-dustrial productivity, lower energy costs,and reduce waste.
ENERGY STAR for IndustryThe ENERGY STAR program also
works with manufacturing industries toenable them to enhance their corporateenergy management systems. EPA is work-ing with specific industries to identify bar-riers to energy performance, definestrategies for minimizing these barriers,and design management tools that will as-sist the industries with improvements.These efforts include the development ofplant energy performance indicators thatenable the industries to assess the effi-ciency of particular manufacturing plants,building upon the successful energy per-formance and benchmarking work in thecommercial sector.
Since 2002, the program has workedwith hundreds of industrial companiesacross energy-intensive and nonintensivesectors, including the automobile manu-facturing, cement, corn refining, food pro-cessing, glass, petroleum, pharmaceutical,
42 U.S. CLIMATE ACTION REPORT—200642 U.S. CLIMATE ACTION REPORT—2006
22 See <http://www.eere.energy.gov/state_energy_program/>.
23 See <http://www.eere.energy.gov/industry/bestpractices/>.
24 See < http://www.eere.energy.gov/industry/25 See <http://www.eere.energy.gov/industry/best
practices/index.html>.26 See <http://www.eere.energy.gov/industry/program_
areas/industries.html>.27 See <http://www.eere.energy.gov/industry/best
practices/iacs.html>.28 See < http://www.eere.energy.gov/industry/program_
areas/crosscutting_technologies.html>.

CHAPTER 4—POLICIES AND MEASURES 43CHAPTER 4—POLICIES AND MEASURES 43
manufacturing sector energy systems. Anexample is the Super Boiler technology,which can achieve 94 percent boiler steamefficiencywithNOx emissions below 5 partsper million volume. DOE estiamtes thistechnology could save theU.S. industry 180trillion Btus per year and reduce carbonemissions by an estimated 10 Tg CO2 Eq.per year by 2020.
Energy: SupplyElectricity generation from fossil fuels is
a major contributor to U.S.CO2 emissions.Federal policies and measures aimed at en-ergy supply promote CO2 reductionsthrough the development of more energy-efficient technologies for power generationand transmission, cleaner fuels, andthe use of more nuclear power and renew-able resources. Solar energy, wind power,biopower, and hydrogen are some of the re-newable resources supported by theUnitedStates. Tax credits have helped increase do-mestic investments in renewable energy andcontinue to accelerate the cost-competitive-ness of these emerging technologies.
Nuclear Energy Plant OptimizationProgram
TheNuclear Energy PlantOptimizationProgram supports the use of nuclear energyin theUnited States by conducting researchand development focused on improving theoperations and reliability of currently oper-ating nuclear power plants,whilemaintain-ing a high level of safety and security. Theprogram made significant progress towardaddressing many of the aging material andgeneration optimization issues,which havebeen identified as the key long-term issuesfacing current operating plants. This pro-gramhas helped extend the life of the exist-ing fleet of nuclear power plants withoutcompromising safety, thus reducing theneed for additional fossil fuel-fired genera-tion capacity.
Nuclear Power 2010 ProgramNuclear Power 2010,29 funded at $66
million in fiscal year 2006, supports de-ployment of new U.S. nuclear powerplants. Activities include completing thecost-shared Early Site Permit demonstra-
tion projects, with issuance of three EarlySite Permits at three utility sites by the U.S.Nuclear Regulatory Commission (NRC).In addition, the program supports the de-velopment of advanced nuclear plant tech-nologies, evaluates the business case forbuilding new nuclear power plants, anddemonstrates the NRC’s new Construc-tion and Operating License process.
Renewable Energy CommercializationWind Energy30—Wind energy is the
world’s fastest-growing energy-supplytechnology. Today, the United States hasmore than 10,000 MW of wind-generatingcapacity. DOE’s wind program has suc-cessfully graduated its high-speed wind ef-fort, meeting its cost-of-energy goal of 3cents/kilowatt-hour (kWh) in Class 6winds in 2004. Electricity generated fromwind power in America displaced approx-imately 11,000 short tons of CO2 emis-sions in 2004. (Note that this figureassumes that wind displaces new coalgeneration.) Since 2002, the program hasfocused most of its efforts on low-wind-speed technologies and, through itspublic–private partnerships, has improvedthe cost of energy for large systems in Class4 onshore winds from 5.5 cents/kWh in2002 to 4.3 cents/kWh in 2005. Based onthe recent emergence of U.S. offshore windpower development prospects and assess-ments of potential national benefits, theprogram is also supporting activities ad-dressing barriers and opportunities for thisU.S. energy market segment. DOE esti-mates that realizing the program’s R&Dgoals could result in wind energy displac-ing 5 Tg CO2 Eq. in 2012.Solar Energy31—This program is im-
proving the performance of solar energysystems and reducing development, pro-duction, and installation costs to compet-itive levels, thereby accelerating large-scaleusage across the Nation. When federalsolar energy research began in the 1970s,the cost of electricity from solar resourceswas about $2.00/kWh. Technological ad-vances over the last two decades have sig-nificantly reduced solar electricity costs.Today, the cost of solar electricity ranges
from as low as $0.12/kWh for concentrat-ing solar power to $0.18/kWh for certainphotovoltaic applications. DOE estimatesthat realizing the program’s R&D goalscould result in solar energy displacing 0.2Tg CO2 Eq. in 2012.Geothermal Energy32—This program
works in partnership with industry to es-tablish geothermal energy as an economi-cally competitive contributor to the U.S.energy supply.Geothermal energy produc-tion generates electricity or provides heatfor direct applications, including aquacul-ture, crop drying, and district heating, orfor use in heat pumps to heat and coolbuildings. The technologies developed bythis program will provide the Nation withnew sources of electricity that are highlyreliable and cost-competitive and do notadd to America’s air pollution or GHGemissions. In 2004, U.S. electricity gener-ated from geothermal power displacedabout 11,000 short tons of CO2 emissions.Biofuels33—DOE has contributed to the
advancement of biomass technology bytesting and demonstrating biomassco-firing with coal, developing advancedtechnologies for biomass gasification,developing and demonstrating small mod-ular systems, and developing and testinghigh-yield, low-cost biomass feedstocks.This research has helped biomass become aproven commercial electricity-generationoption in the United States. With about9,700 MW of installed capacity in 2004(wood and waste), it is estimated that bio-mass displaced approximately 50,000 tonsof CO2 emissions in 2004.
Distributed EnergyThe Distributed Energy Program34
supports cost-effective R&D aimed atlowering costs, reducing emissions, andimproving reliability and performance to
29 See <http://np2010.ne.doe.gov/> and<http://www.ne.doe.gov/infosheets/np2010.pdf>.
30 See <http://www.eere.energy.gov/windandhydro/wind_research.html>.
31 See <http://www.energy.gov/energysources/solar.htm>.
32 See <http://www.eere.energy.gov/geothermal/>.33 See <http://www.eere.energy.gov/biomass/>.34 See <http://www.eere.energy.gov/de/>.

fossil fuel process treatment.The program’sgoal is to research and develop a portfolioof safe, cost-effectiveGHGcapture, storage,and mitigation technologies by 2012, lead-ing to substantial market penetration be-yond 2012. DOE estimates the impacts ofresultant technologies to be 30.3 Tg CO2Eq. in 2012 and 34.0 Tg CO2 Eq. in 2020.
Additional Policies and MeasuresWoody Biomass—The Secretaries of
Agriculture, Energy, and the Interiorsigned an agreement in June 2003 to en-courage the use of woody biomass fromforest, rangeland, and woodland landmanagement treatments wherever ecolog-ically sustainable. Such use can reducesmoke and GHG emissions by up to 97percent, compared to open burning. Useof woody biomass as a bio-based product(timber, engineered lumber, paper andpulp, furniture, plastics, etc.) may also se-quester carbon by an unspecified amount.
In May 2005, the Department of the In-terior (DOI) issued a regulation authoriz-ing the removal and use of woody biomassfrom all land management projects, wher-ever ecologically appropriate and in accor-dance with the law, from the 500 millionacres managed by DOI.
Transportation
Corporate Average Fuel EconomyProgram
The Corporate Average Fuel Economy38
(CAFE) program requires automobilemanufacturers to meet average fuel econ-omy standards for the light-duty vehiclefleet sold in the United States. The passen-ger car standard has been set by statute at11.7 kilometers per liter(kpl) (27.5 milesper gallon (mpg)), but can be amendedthrough rulemaking. In 2003, the NationalHighway Traffic Safety Administration(NHTSA) raised the standard for mini-vans, pickup trucks, sport utility vehicles(SUVs), and other light trucks from 8.8kpl (20.7 mpg) to 8.9 kpl (21.0 mpg) for2005, 9.2 kpl (21.6 mpg) for 2006, and 9.4kpl (22.2 mpg) for 2007. The action morethan doubles the increase in the standardthat occurred between 1986 and 2001, a
period of more than 15 years. It is pre-dicted that this activity might save approx-imately 412 trillion Btus (3.6 billiongallons) of gasoline over the life of modelyear 2005–07 light-truck fleets and is pro-jected to result in emission reductions of42 Tg of CO2 Eq. in 2012 for all lighttrucks after model year 2005.
In March 2006, NHTSA issued a newrule for light trucks covering model years2008–11. The new rule raises requiredlight-truck fuel economy to 24 mpg bymodel year 2011 and will save nearly 1,259trillion Btus (11 billion gallons) of gasoline(73 Tg of CO2 Eq.) over the life of the af-fected vehicles. The new rule includes aninnovative reform that varies fuel econ-omy standards according to the size of thevehicle. The regulation has also been ex-tended for the first time to large passengervans and SUVs.
SmartWay Transport PartnershipThis voluntary partnership39 between
EPA and the transportation industry aimsto increase energy efficiency while signifi-cantly reducing GHGs and air pollution.EPA provides tools and models to helpSmartWay Transport partners adopt cost-effective strategies to save fuel and reduceemissions.
To date, more than 500 companies andorganizations have joined the partnership.Freight shippers meet their goals by usingparticipating carriers, while trucking andrail companies meet their goals by improv-ing freight transport efficiency.
The SmartWay National Transporta-tion Idle Free Corridor Program has estab-lished 86 projects to reduce long-durationtruck and locomotive idling, convertingmore than 5,000 parking spaces to no-idlezones. To help states improve idle-reduction policies and programs, EPApublished a model idle-reduction law.
expand opportunities for the current andfuture installation of distributed energyequipment. The program is working to de-velop and commercialize by 2015 a diversearray of high-efficiency, integrated, distrib-uted-generation, and thermal-energy tech-nologies at market-competitive prices, sothat homes, businesses, industry, commu-nities, and electricity companies choose touse them.Along with reducing GHG emis-sions, these technologieswill increase the re-liability of America’s electricity system.DOEanticipates that the efforts of this programcould avoid almost 24 Tg CO2 Eq. in 2012.
Clean Energy InitiativeEPA’s Clean Energy Initiative consists
of two partnership programs that promotecost-effective technologies that offer im-proved efficiencies and lower emissionsthan traditional energy supply options.EPA projects the continued efforts of thesetwo programs will spur new clean energyinvestments that could avoid 29 Tg CO2Eq. of GHG emissions in 2012.Green Power Partnership35—This pro-
gram facilitates the purchase of environ-mentally friendly electricity fromrenewable energy sources by addressingthe market barriers that stifle demand.Since its launch in 2001, the Green PowerPartnership has grown to more than 600partners who have committed to purchas-ing 4 billion kWh of green power.Combined Heat and Power (CHP) Part-
nership36—Also launched in 2001, CHPprovides technical assistance toorganizations across multiple sectors thatinvested in CHP projects and assisted stategovernments in designing regulations thatencourage investment in CHP.As a result,the program now includes 170 partnerswho have installed 3,460 MW of opera-tional CHP.
Carbon Sequestration ProgramDOE’s Carbon Sequestration Program37
will focus primarily on developing captureand separation technologies that dramati-cally lower the costs and energy require-ments of reducing CO2 emissions from
44 U.S. CLIMATE ACTION REPORT—200644 U.S. CLIMATE ACTION REPORT—2006
35 See <http://www.epa.gov/greenpower/index.htm>.36 See <http://www.epa.gov/chp/index.htm>.37 See <http://www.fe.doe.gov/programs/sequestration/
index.html>.38 See <http://www.nhtsa.dot.gov/portal/site/nhtsa/
menuitem.d0b5a45b55bfbe582f57529cdba046a0/>.39 See <http://www.epa.gov/smartway/>.

CHAPTER 4—POLICIES AND MEASURES 45
SmartWay Upgrade Kits, availablethrough truck dealerships and parts deal-ers, can save companies up to 15 percentin fuel and CO2 emissions per year. EPApartnered with the Small Business Admin-istration to offer SmartWay Upgrade Kitloans, and will publish guidance for statesto initiate these projects.
Other SmartWay initiatives includeEPA’s recent announcement of a Smart-Way designation for new, clean, and effi-cient tractor-trailer combination trucks,which can save 10–20 percent annually infuel and CO2 emissions. SmartWay’ssupply-chain initiative is developing newstrategies to provide a more efficient inte-gration of marine transport, port opera-tions, and logistics. And to encourage theuse of low-carbon renewable fuels, EPA re-cently introduced SmartWay Grow andGo, which aims for 25 percent of Smart-Way partners to use biofuels by 2012.
EPA estimates the SmartWay Transportpartnership could reduce emissions by 33Tg CO2 Eq. in 2012.
Renewable Fuel StandardUnder the Energy Policy Act of 2005,
EPA is responsible for promulgating regu-lations to ensure that gasoline sold in theUnited States contains a specific volume ofrenewable fuel. This national RenewableFuel Standard will increase the volume ofrenewable fuel that is blended into gaso-line, starting with calendar year 2006. Thestandard is intended to double the amountof renewable fuel usage by 2012.
FreedomCAR and Fuel Partnership andVehicle Technologies Program
This public–private partnership40 withtheNation’s automobilemanufacturers andpetroleum companies promotes the devel-opment of hydrogen as a primary fuel forcars and trucks. Its focus is on researchneeded to develop hydrogen fromdomesticrenewable sources and technologies that uti-lize hydrogen, such as fuel cells. The pro-gram41 works jointly with DOE’s hydrogen,fuel cell, and infrastructure R&Defforts andthe efforts to develop improved technologyfor hybrid electric vehicles. These advanced
technologies —which include the hybridelectric components (such as batteries andelectric motors), advanced materials toreduce the weight of vehicles, advancedhigh-efficiency combustion engines, andadvanced fuels—could result in dramaticreductions of criteria pollutants and GHGemissions from the transportation sector.42
DOE estimates that achieving its vehicletechnologyR&Dgoals could reduce carbonemissions by about 11.5 Tg CO2 Eq. by2012.
Clean CitiesThe benefits of Clean Cities43 are now
included in the FreedomCAR and FuelPartnership and in the Vehicle Technolo-gies Program. This DOE program sup-ports efforts to deploy alternative fuelvehicles (AFVs) and develop the necessarysupporting infrastructure. Clean Citiesworks through a network of more than 85volunteer, community-based coalitions topromote the use of alternative fuels andpetroleum-displacement technologies,and to advance the use of alternative fuelblends, idle-reduction technologies, hy-brid electric vehicles, and fuel economypractices. Clean Cities stakeholders haveadded approximately 200,000 AFVs totheir fleets, which have displaced morethan 109 trillion Btus (950 million gallons)of petroleum since 1994.
Congestion Mitigation and Air QualityImprovement Program
Administered by DOT in consultationwith EPA, the Congestion Mitigation andAir Quality (CMAQ) Improvement Pro-gram,44 provides states with funds to reducecongestion and to improve air qualitythrough transportation control measuresand other strategies. The amount of fund-ing given to a state is based on the severityof the air quality problem and the popula-tion of the area that does not meet air qual-ity standards. State and local governmentsselect the projects to fund and coordinatethem through metropolitan planning or-ganizations. The projects vary by region,but typically include transit improvements,alternative fuel programs, shared-ride serv-
ices, traffic flow improvements, demandmanagement strategies, pedestrian andbicycle programs, and inspection andmaintenance programs. Other activities,such as idle-reduction, diesel engine retro-fits, and education and outreach programs,may also be eligible for CMAQ funds.Transportation control measures in airquality plans—strategies to reduce pollu-tion by reducing vehicle use or improvingtraffic flow—receive priority funding underCMAQ. Nearly 16,000 air quality projectshave received CMAQ funding since 1992,resulting in significant reductions in vehicleemissions, including GHG emissions.
Aircraft Fuel EfficiencyAviation yields GHG emissions that
have the potential to influence global cli-mate. In the United States, aviation makesup about 3 percent of the national GHGinventory and about 12 percent of trans-portation emissions. Currently,measuringand tracking fuel efficiency from aircraftoperations provide the data for assessingthe improvements in aircraft and enginetechnology, operational procedures, andthe airspace transportation system that re-duce aviation’s contribution to CO2 emis-sions. DOT has a goal to improve aviationfuel efficiency per revenue plane-mile by 1percent per year through 2009. In the nearterm, new technologies to improve air traf-fic management will help reduce fuel burnand, thus, emissions. In the long term, newengines and aircraft will feature more effi-cient components and aircraft aerodynam-ics, enhanced engine cycles, and reducedweight, thereby improving fuel efficiency.
Biomass and Biorefinery SystemsProgram45
DOE and the U.S.Department of Agri-culture (USDA) partner with industry tofoster R&D of advanced technologies that
CHAPTER 4—POLICIES AND MEASURES 45
40 See <http://www.eere.energy.gov/vehiclesandfuels/about/partnerships/freedomcar/index.html>.
41 See <http://www.eere.energy.gov/vehiclesandfuels/>.42 The U.S. government uses six “criteria pollutants” as
indicators of air quality: ozone, carbon monoxide, sulfurdioxide, nitrogen dioxides, particulate matter, and lead.
43 See <http://www.eere.energy.gov/cleancities/>.44 See <http://www.fhwa.dot.gov/environment/cmaqpgs/>.45 See <http://www.eere.energy.gov/biomass/>.

Natural Gas STAR47—Through thispartnership program, EPA works withcompanies that produce, process, trans-mit, and distribute natural gas to identifyand promote the implementation of cost-effective technologies and practices to re-ducemethane emissions. Since its launch in1993, Natural Gas STAR has been success-ful in reducing methane emissions andbringing more energy to markets. As of2004,Natural Gas STARpartner companiesrepresented almost 60 percent of the U.S.natural gas industry. EPA estimates the pro-gram reduced methane emissions by 20 TgCO2 Eq. in 2002. Because of the program’sexpanded reach, EPA estimates the reduc-tion for 2012 may be 28 Tg CO2 Eq.Coalbed Methane Outreach
Program48—The fraction of coal minemethane from degasification systems cap-tured and used grew from 25 percent in1990 to more than 70 percent in 2002. Ini-tiated in 1994, the Coalbed Methane Out-reach Program (CMOP) is working todemonstrate technologies that can elimi-nate the remaining emissions from degasi-fication systems, and is addressingmethane emissions in mine ventilation air.EPA estimates that CMOP reduced 6 TgCO2 Eq. in 2002.Due to enhanced marketopportunities for natural gas and power,EPA anticipates further refinement oftechnical options for the capture and uti-lization of mine methane, a growing re-liance on methane degasification in thewestern United States, and CMOP’s con-tinued success in reducing ventilation airmethane over the next few years. EPA proj-ects CMOP could reduce emissions by 10Tg CO2 Eq. in 2012.
High-GWP ProgramsThe United States is one of the first na-
tions to develop and implement a nationalstrategy to control emissions of high-GWP gases. The strategy is a combinationof industry partnerships and regulatorymechanisms to minimize atmosphericreleases of hydrofluorocarbons (HFCs),perfluorocarbons (PFCs), and sulfur hexa-fluoride (SF6)—which are potent GHGs
that contribute to global warming—whileensuring a safe, rapid, and cost-effectivetransition away from chlorofluorocarbons(CFCs),hydrochlorofluorocarbons (HCFCs),halons,andotherozone-depleting substancesacrossmultiple industry sectors.Environmental Stewardship—The objec-
tive of this initiative is to limit emissions ofHFCs,PFCs, and SF6 in three industrial ap-plications: semiconductor production,49
electric power distribution,50 and magne-sium production.51 Since 2002, the SF6emission reduction partnership formagne-sium set a goal to eliminate emissions of SF6by the end of 2010. Additional sectors arebeing assessed for the availability of cost-ef-fective emission reduction opportunitiesand are being added to this initiative.
EPA estimates that EnvironmentalStewardship partners reduced emissionsby 5 Tg CO2 Eq. in 2002, and projects theymay reduce emissions by 35 Tg CO2 Eq. in2012. Because of a significant decline inthe growth rates of domestic production,particularly in the magnesium and semi-conductor industries, EPA’s estimate of thetotal 2012 reduction is more than 50 per-cent less than had been expected in 2002.Nonetheless, significant reductions perunit of activity in these sectors are attrib-utable to this initiative’s voluntary partner-ships.HFC-23—This partnership continued
to encourage companies to develop and im-plement technically feasible, cost-effectiveprocessing practices or technologies toreduce HFC-23 emissions from the manu-facture of the ozone-depleting substanceHCFC-22. Despite a 4 percent increase inproduction compared to 1990, EPA esti-mates that total emissions in 2002 weresignificantly below 1990 levels. Comparedto the Business As Usual case in 2002, therewas a reduction of 17 Tg CO2 Eq. EPA
will convert U.S. biomass resources into af-fordable industrial products (includingenergy and higher-valued chemicals andmaterials) through the development ofbiorefineries. An analogy to this approachis the petroleum refinery that refines crudeoil into a broad range of industrial prod-ucts. In the future, biorefineries will useadvanced technology—such as hydrolysisof cellulosic biomass to sugars and ligninand thermochemical conversion of bio-mass to synthesis gas for fermentation andcatalysis of these platform chemicals—toproduce slates of biopolymers and fuels.Today, America’s environment is reapingthe benefits of the public–private R&Dpartnerships that have formed over thepast two decades and that, in combinationwith government energy policies, have re-sulted in such alternative fuels as gasohol(a combination of gasoline and ethanol),accounting for approximately 10 percentof the fuel used on U.S. highways. By 2012these efforts could yield an estimated 0.6Tg CO2 Eq. in avoided emissions.
Industry: Non-CO2
Methane ProgramsU.S. industries, along with state and
local governments, collaborate with EPAto implement several voluntary programsthat promote profitable opportunities forreducing emissions of methane, an impor-tant GHG.46 These programs are designedto overcome a wide range of informa-tional, technical, and institutional barriersto reducing methane emissions, while cre-ating profitable activities for the coal, nat-ural gas, and petroleum industries. Thecollective results of EPA’s voluntarymethane partnership programs have beensubstantial. Total U.S. methane emissionsin 2004 were 10 percent lower than emis-sions in 1990, despite robust economicgrowth over that period. EPA projectsthese programs may maintain emissionsbelow 1990 levels beyond 2012, due to ex-panded industry participation and thecontinuing commitment of the participat-ing companies to identify and implementcost-effective technologies and practices.
46 U.S. CLIMATE ACTION REPORT—200646 U.S. CLIMATE ACTION REPORT—2006
46 See <http://www.epa.gov/methane/index.html>.47 See <http://www.epa.gov/gasstar/index.htm>.48 See <http://www.epa.gov/cmop/index.html>.49 See <http://www.epa.gov/semiconductor-pfc/>.50 See <http://www.epa.gov/highgwp/electricpower-
sf6/index.html>.51 See <http://www.epa.gov/magnesium-sf6/>.

CHAPTER 4—POLICIES AND MEASURES 47
estimates a reduction of 16 Tg CO2 Eq. for2012, which is lower than EPA anticipatedin 2002.One major U.S. producer stoppedmanufacturing HCFC-22 in 2002; thus,the reduction potential has declined dueto lower total production.Voluntary Aluminum Industry Partner-
ship52—This partnership has continued toreduce CF4 and C2F6 where cost-effectivetechnologies and practices are technicallyfeasible. Since 2002, the partnership ex-panded its reduction goal to reduce directcarbon emissions from anode consump-tion as well as PFCs. EPA estimates that thepartnership reduced PFC emissions by 7Tg CO2 Eq. in 2002 and projects reduc-tions of 10 Tg CO2 Eq. in 2012.Significant New Alternatives
Program53—Since the 2002 CAR, the Sig-nificant New Alternatives Program(SNAP) has continued its progress inphasing down the use of ozone-depletingsubstances (ODSs), such as CFCs andHCFCs. SNAP has worked closely with in-dustry to research, identify, and imple-ment climate- and ozone-friendlyalternatives, supporting a smooth transi-tion to these new technologies. In addi-tion, SNAP has initiated programs withdifferent industry sectors to monitor andminimize emissions of global-warminggases, such as HFCs and PFCs used assubstitutes for ozone-depleting chemi-cals. By limiting use of these gases in spe-cific applications where safe alternativesare available, SNAP reduced emissions byan estimated 26 Tg CO2 Eq. in 2002 and isprojected to reduce emissions by 150 TgCO2 Eq. in 2012.Mobile Air Conditioning Climate Protec-
tion Partnership54—Announced in 2004,the Mobile Air Conditioning Climate Pro-tection Partnership is striving to reduceGHG emissions from vehicle air condi-tioning systems through voluntary ap-proaches. The program will identifynear-term opportunities to improve theenvironmental performance of mobile airconditioners and to promote cost-effectivedesigns and improved service procedures
that minimize emissions from mobile airconditioning systems. Partnership mem-bers are pursuing two goals: reduce fuelconsumption from the operation of vehi-cle air conditioning by at least 30 percent,and reduce direct refrigerant emissions by50 percent, thereby avoiding emissions ofHFC-134a, a very potent GHG. Driverswill save money by using less fuel, and willbenefit from improved air conditioning re-liability due to improved technology. EPAestimates that this effort will avoid morethan 5 Tg CO2 Eq. in 2012.
Additional Policies and MeasuresVoluntary Code of Practice for the Reduc-
tion of Emissions of HFC & PFC Fire Pro-tection Agents—In 2002, EPA and severalhundred equipment and chemical manu-facturers and distributors representing theU.S. fire protection industry launched theVoluntary Code of Practice for theReduction of Emissions of HFC & PFCFire Protection Agents (VCOP). Success-ful implementation of VCOP achieves thedual goals of minimizing nonfire emis-sions of HFCs and PFCs, used as fire-sup-pression alternatives to ozone-depletinghalons, and continuing to protect peopleand property from the threat of firethrough the use of proven, effective prod-ucts and systems.Green Grocer—EPA is working with su-
permarket companies and equipmentmanufacturers to promote the deploymentof new, energy-efficient technologies thatreduce emissions of fluorocarbon refriger-ants (including HFCs). The first stage ofthis program is underway and includesEPA and industry evaluations of the per-formance, feasibility, costs, and benefits ofalternative systems in stores.
AgricultureUSDA is providing incentives and sup-
porting voluntary actions by privatelandowners to conserve and protect natu-ral resources on agricultural lands. USDAconservation programs were established toprovide broad conservation goals, such ascleaner water and reduced soil erosion.Many of the actions and activities sup-
ported by these programs also reduceGHG emissions and increase carbon se-questration. To bolster these benefits, in2003, USDA announced that, for the firsttime, it would give consideration to GHGbenefits in implementing the Nation’s for-est and agriculture conservation pro-grams. Major elements of the USDAactions to reduce GHGs are described inthe following sections.
Environmental Quality IncentivesProgram
The Environmental Quality IncentivesProgram55 (EQIP) provides financial assis-tance for conservation practices on work-ing farm and ranch lands. The NaturalResources Conservation Service (NRCS)provided guidance to its state offices thatnoted that conservation technologies andsystems for reducing emissions, increasingcarbon sequestration, and achieving otherenvironmental benefits can be compatiblewith production agriculture, and encour-aged recognition for these extra effortswithin the local EQIP ranking systems. Awide array of conservation practices canreduce GHG emissions, including residuemanagement, irrigation water manage-ment, nutrient management, crop rota-tions, cover crops, wetland restoration,and grazing land management.
For two practices, NRCS has estimatedEQIP’s contribution to mitigating GHGemissions. In 2005, EQIP provided assis-tance to farmers to adopt residue manage-ment on about 1 million hectares (ha)(2.47 million acres (ac)), which is esti-mated to sequester about 2 Tg CO2 Eq. peryear. In addition, reduced use of diesel fuelon these same lands could lower CO2emissions by as much as 0.1 Tg CO2 Eq.per year. Also in 2005, EQIP provided as-sistance to ranchers to undertake pre-scribed grazing on 1.8 million ha (4.5million ac), which is estimated to sequesterabout 0.3 Tg CO2 Eq. per year.
CHAPTER 4—POLICIES AND MEASURES 47
52 See <http://www.epa.gov/highgwp/aluminum-pfc/index.html>.
53 See <http://www.epa.gov/ozone/snap/index.html>.54 See <http://www.epa.gov/cppd/mac/>.55 See <http://www.nrcs.usda.gov/programs/eqip/>.

vides financial and technical assistance topromote conservation on working crop-land, pasture, and range land, as well asforested land that is an incidental part ofan agriculture operation.NRCS is provid-ing enhancement payments under theCSP to promote energy conservation andthe production and use of renewable fuelsand electricity.
AgSTARJointly sponsored by EPA, USDA, and
DOE,AgSTAR58 encourages the voluntaryuse of methane-recovery (biogas) tech-nologies at the confined animal feedingoperations that manage manure as liquidsor slurries. These technologies reducemethane emissions while achieving otherenvironmental benefits. Although theoverall impact of AgSTAR on GHG emis-sions has been comparatively small on anational scale, livestock producers in thedairy and swine sector have demonstratedthat AgSTAR practices can reduce GHGemissions and achieve other pollutioncontrol benefits while increasing farmprofitability. These practices have been in-corporated into USDA’s broader technical,conservation, and cost-share programs.
Renewable Energy Systems and EnergyEfficiency Improvements Program
Under this program, USDA providesloan guarantees and grants to agriculturalproducers and rural small businesses topurchase renewable energy systems andimprove energy efficiency. Between 2002and 2006, the program helped finance 272renewable energy systems (including 11biodiesel and 7 ethanol refineries, 82anaerobic digesters, 121 wind projects, 17solar projects, and 4 geothermal projects)and 165 energy efficiency improvements.USDA estimates that these projects mayachieve energy savings amounting to 755billion Btus (6.6 million barrels) of oil andan estimated reduction in GHG emissionsof approximately 1 Tg CO2 Eq.
ForestryThe U.S. government supports efforts
to sequester carbon in both forests and
harvested wood products to minimize un-intended carbon emissions from forests byreducing the catastrophic risk of wildfires.
Healthy Forest InitiativeToday, between 40.5 and 81 million ha
(100 and 200 million ac) of federal landsare at risk of catastrophic wildfires, in largepart due to significant changes in forestand woodland structure that have oc-curred in the last century. Innovative,large-scale management is needed to re-store at-risk ecosystems to healthy, resilientconditions. This threat to forestsprompted the development of the Presi-dent’s Healthy Forest Initiative, which nowincludes the National Fire Plan59 and thejoint federal–state 10-year ComprehensiveStrategy Implementation Plan.60 The goalof these efforts is to increase biomass andwood fiber utilization as an integral com-ponent of restoring the Nation’s preciousforests, woodlands, and rangelands. Coor-dination among DOI, USDA, and DOE isimportant to the success of these initia-tives, as is working cooperatively withstates, tribes, private landowners, non-governmental organizations, and other in-terested parties and potential partners.These efforts are expected to lead to sub-stantial co-benefits in terms of reduced airpollution and better air quality, particu-larly with respect to smoke, particulatematter, and nitrogen oxides.
Forest Land Enhancement ProgramUSDA’s Forest Service administers the
Forest Land Enhancement Program61
(FLEP). Created as part of the Farm Secu-rity and Rural Investment Act of 2002, theprogram provides assistance to nonindus-trial private forest landowners for foreststewardship. Through FLEP, the ForestService, working with states, can promotecarbon sequestration with tree planting,forest stand improvements, and agro-forestry practices. Program enrollment infiscal year 2005 was just over 456,000 ha(1.1 million ac), and program-related car-bon sequestration is estimated at 0.2 TgCO2 Eq.
Under EQIP, NRCS also offers innova-tion grants to accelerate the development,transfer, and adoption of innovative tech-nologies and approaches, including thosewith GHG benefits. USDA awarded 37percent of its fiscal year 2005 ConservationInnovation Grants funding to energy-related proposals that addressed energyconservation or the production of renew-able fuels. USDA estimates that effortsunder EQIP could avoid 26.1 Tg CO2 Eq.by 2012.
Conservation Reserve ProgramThe Conservation Reserve Program56
(CRP) encourages farmers to convert envi-ronmentally sensitive acreage to nativegrasses, wildlife plantings, trees, restoredwetlands, filter strips, or riparian buffers.USDA’s Farm Service Agency (FSA) hasissued a new rule that explicitly allows theprivate sale of carbon credits for lands en-rolled in theCRP.FSAhas alsomodified theEnvironmental Benefits Index used to scoreand rank offers to enroll land in the CRP togive more points for installing vegetativecover that sequesters more carbon. Finally,FSA has announced it will target 500,000acres of continuous signup enrollment to-ward hardwood tree planting. In fiscal year2005, 50 Tg CO2 Eq. were sequestered onland enrolled in the CRP—an increase of 2Tg CO2 Eq. relative to 2001. Of this in-crease, 5 percent can be attributed to thepolicies and initiatives FSA adopted to in-crease sequestration. USDA estimates thesequestration attributable to these newpoli-cies and initiatives will offset U.S. GHGemissions by 3.1 Tg CO2 Eq. in 2012.
Conservation Security ProgramThe Conservation Security Program57
(CSP) is a voluntary program that pro-
48 U.S. CLIMATE ACTION REPORT—200648 U.S. CLIMATE ACTION REPORT—2006
56 See <http://www.fsa.usda.gov/dafp/cepd/crp.htm>.57 See <http://www.nrcs.usda.gov/Programs/csp/>.58 See <http://www.epa.gov/agstar/> and <http://www.
rurdev.usda.gov/rbs/farmbill/index.html>.59 See <http://www.fireplan.gov/reports/10-
YearStrategyFinal_Dec2006.pdf>.60 See <http://www.fireplan.gov/reports/11-23-en.pdf>.61 See <http://www.fs.fed.us/spf/coop/programs/ loa/flep.
shtml>.

CHAPTER 4—POLICIES AND MEASURES 49
Waste ManagementThe U.S. government’s waste manage-
ment programs reduce municipal solidwaste and GHG emissions through energysavings, increased carbon sequestration,and avoided methane emissions fromlandfill gas––the largest contributor toU.S. anthropogenic methane emissions.
Landfill Methane Outreach ProgramThe Landfill Methane Outreach Pro-
gram62 (LMOP) reducesGHG emissions atlandfills by supporting the recovery and useof landfill gas for energy. Capturing andusing landfill gas reduces methane emis-sions directly and reduces CO2 emissionsby displacing the use of fossil fuels throughthe use of landfill gas as a source of energy.Since the 2002 CAR, LMOP continues topartner with landfill owners and operators,state energy and environmental agencies,utilities and other energy suppliers, corpo-rations, industry, and other stakeholders tolower the barriers to promote cost-effectivelandfill gas energy projects. LMOP focusesits efforts on smaller landfills not requiredto collect and combust their landfill gas, aswell as larger, regulated operations that arecombusting their gas but not using it as aclean energy source.
LMOP has developed a range of tech-nical resources and tools to help the land-fill gas industry overcome barriers toenergy project development, including fea-sibility analyses, project evaluation soft-ware, a database of more than 1,300candidate landfills across the country, aproject development handbook, commer-cial and industrial sector analyses, and eco-nomic analyses. Due to these efforts, thenumber of landfill gas energy projects hasgrown from fewer than 100 in the early1990s to more than 400 projects today.EPA estimates that LMOP reduced GHGemissions from landfills by about 14 TgCO2 Eq. in 2002, and projects reductionsof 24 Tg CO2 Eq. in 2012.
Stringent Landfill RulePromulgated under the Clean Air Act
in March 1996, the New Source Perform-ance Standards and Emissions Guidelines
(“Landfill Rule”) require large landfills tocapture and combust their landfill gasemissions. The implementation of the rulebegan at the state level in 1998. Recent dataon the rule’s impact indicate that increas-ing its stringency has significantly in-creased the number of landfills that mustcollect and combust their landfill gas. EPAestimates that methane reductions in 2002were 9 Tg CO2 Eq., and reductions for2012 may remain about the same.
WasteWiseWasteWise63 continues to encourage re-
cycling and source reduction. EPA is im-plementing a number of targeted effortswithin this program and is working withorganizations to reduce solid wastethrough voluntary waste reduction activi-ties. New efforts since the 2002 CARinclude a Coal Combustion Products Part-nership64 and a GreenScapes65 program,which promotes sustainable landscapingtechniques, such as increased use of com-post and recycled-content materials. EPAcontinues to promote product stewardship(promoting further waste reduction effortsthrough voluntary or negotiated agreementswith product manufacturers) and its Pay-As-You-Throw Initiative to provide informa-tion and education on community-based programs that provide cost incen-tives for residential waste reduction. In ad-dition to program implementation, EPA’sClimate andWaste program supports out-reach, technical assistance, and research ef-forts on the linkages between climatechange and waste management to comple-ment these activities. EPA estimated GHGemission reductions in 2002 were 10 TgCO2 Eq. EPA projects reductions could in-crease to 21 Tg CO2 Eq. in 2012.
Federal Woody Biomass Working GroupChartered under the Biomass R&D
Board, the Federal Woody Biomass Work-ing Group is working on alternative dis-posal options for woody biomass resultingfrom catastrophic events (hurricanes,floods, fire, tornadoes, volcanic eruption,etc).Hurricane Katrina, for example, dam-aged an estimated 19 billion board feet of
timber, much of which will be burned ordisposed of in a landfill. The WorkingGroup seeks to use much of this disastermaterial for bio-based products andbioenergy applications, thus reducingGHG emissions. As bioenergy and woodproduct markets develop, this effort mayserve as an alternative to green waste dis-posal in landfills.
Cross-SectoralPublic–private partnerships are an im-
portant component of efforts to meet thePresident’s goal of reducingGHG intensity.Several of these cross-sectoral partnershipprograms are described below, withestimates of expected reductions thatwould be reported by participants. Theestimated reductions for some of these pro-grams have not been included in the scor-ing of mitigation impacts in this chapter,due to the potential for double counting.
Climate VISIONClimate VISION66—Voluntary Innova-
tive Sector Initiatives: OpportunitiesNow—is a new public–private partnershipinitiative launched by the federal govern-ment in 2003 for the industrial sector toboost its contribution to the President’sgoal of reducing GHG intensity. Businessassociations representing 14 energy-intensive industry sectors and The Busi-ness Roundtable have become programpartners with the federal government andhave issued letters of intent to meet spe-cific targets for reducing GHG emissionsintensity. These Climate VISION partnersinclude some of the largest companies inAmerica and represent a broad range ofindustry sectors: oil and gas refining,electricity generation, coal and mineralproduction and mining, automobilemanufacturing, cement, iron and steel,magnesium, aluminum, chemicals, semi-conductors, railroads, and forestry prod-ucts. Climate VISION works with its
CHAPTER 4—POLICIES AND MEASURES 49
62 See <http://www.epa.gov/lmop/>.63 See <http://www.epa.gov/wastewise/>.64 See <http://www.epa.gov/epaoswer/osw/conserve/
c2p2/>.65 See <http://www.epa.gov/greenscapes/>.66 See <http://www.climatevision.gov/>.

2006 reporting year.The new guidelines areintended to strengthen the program by en-couraging comprehensive, entity-wide re-porting of emissions and emissionreductions, including sequestration, andby increasing the measurement accuracy,reliability, and verifiability of reports.
Climate LeadersEPA launched the Climate Leaders pro-
gram69 in 2002 as part of the President’s cli-mate change strategy to challenge individualcompanies to demonstrate leadership bysetting aggressive GHG reduction goals fortheir sectors. Companies that join the part-nership receive a number of benefits, suchas understanding andmanaging their emis-sions, increased identification of cost-effec-tive reduction opportunities, and strategicpreparation for the future as the climatechange policy discussion evolves. ClimateLeader partners set corporate-wide GHGreduction goals and conduct annual inven-tories of their emissions to measureprogress. The program has expanded fromits original 12Charter Partners tomore than100 partners across a number of industrialsectors fromheavymanufacturing to bank-ing and retail.The totalU.S.GHGemissionsof these partners equal nearly 10 percent oftotal U.S. emissions.
Clean Energy-Environment StatePartnership Program
EPA’s Clean Energy-Environment StatePartnership Program70 motivates GHGemission reductions as one of several ben-efits states derive from implementing acomprehensive suite of cost-effective cleanenergy policies and programs.(U.S. EPA2006a). (See the following NonfederalPolicies and Measures section for morespecific information on a variety of stateprograms.)
Under the Partnership Program, the 15member states work across their relevantagencies to develop and implement state-specific action plans, applying existing andnew policies and programs to promote en-ergy efficiency, clean distributed genera-tion, renewable energy, and other cleanenergy strategies that can provide benefits
involving GHGs, air quality, public health,energy diversity, and economic growth. Tocommunicate these benefits to other inter-ested state governments, EPA providestechnical support and actively shares withthem effective strategies and lessonslearned. EPA projects that in 2012, thisprogram could contribute 7.3 Tg CO2 Eq.in GHG reductions.
Federal Energy Management ProgramThe federal government is the largest
single user of energy in the Nation. TheFederal Energy Management Program71
(FEMP) reduces energy use in federalbuildings, facilities, and operations by ad-vancing energy efficiency andwater conser-vation, promoting the use of renewableenergy, and managing the utility choices offederal agencies. The program accom-plishes its mission by leveraging both fed-eral and private resources to provide federalagencies the technical and financial assis-tance they need to achieve their goals.As of2005, FEMPhad assisted federal agencies inreducing the energy intensity of their build-ings by 30 percent using 1985 as a baseline.DOE estimates that realizing FEMP’s goalof providing financing and technical assis-tance to federal agencies to further the useof cost-effective energy efficiency and re-newable energy could result in energy sav-ings of nearly 2.2 Tg CO2 Eq. in 2012.
NONFEDERAL POLICIES ANDMEASURES
In addition to the national effort, stateand local governments and private andnonprofit organizations are taking a varietyof steps that contribute to the overallGHG intensity reduction goal. These non-federal climate change activities can be an
partners to standardize measuring andmonitoring; find cost-effective solutions toreduce energy use and GHG emissions;accelerate R&D; and explore cross-sectorefficiency gains to reduce emissions. Basedsolely on the specific numeric targets intheir letters of commitment, ClimateVISION partners are estimated conserva-tively to reduce emissions by about 90 TgCO2 Eq. in 2012, including the reductionsfrom the non-CO2 industry programs dis-cussed previously.67 This estimate indicatesthe scale of GHG reductions from thisprogram; however, there may be an over-lap with other programs and a potentialfor double counting.
Voluntary Reporting of GreenhouseGases Under 1605(b)
Authorized under Section 1605(b) ofthe Energy Policy Act of 1992, this volun-tary program68 provides a means for utili-ties, industries, and other entities toestablish a public record of their emissionsand the results of voluntary measures toreduce, avoid, or sequester GHG emis-sions. Currently, about 230 U.S. compa-nies and other organizations file reports.The information collected through theprogram is made available through a pub-lic use database that supports educationalexchanges, informs public policy develop-ment, and encourages public recognitionof initiatives to reduce GHGs.
Each year, a report is published high-lighting the results of reported activities toreduce emissions. For the 2004 reportingyear, 226 U.S. companies and other organ-izations reported that they had undertaken2,154 projects to reduce or sequesterGHGs.The reportedGHGemission reductions forthe projects reported included 277 Tg CO2Eq. of direct reductions, 92 Tg CO2 Eq. ofindirect reductions, 7 Tg CO2 Eq. of reduc-tions from carbon sequestration, and 14 TgCO2 Eq. of unspecified reductions. Theseestimates of reductions may overlap withother programs and may result in a poten-tial for double counting.
New general and technical guidelines forreporting will be effective in 2007 for the
50 U.S. CLIMATE ACTION REPORT—200650 U.S. CLIMATE ACTION REPORT—2006
67 Projections for partnerships in the aluminum,semiconductor, and magnesium sectors are provided inthe Industry: Non-CO2 section of this chapter underVoluntary Aluminum Industry Partnership andEnvironmental Stewardship, and are not doublecounted in the overall projections.
68 See <http://www.eia.doe.gov/oiaf/1605/frntvrgg.html>.69 See <http://www.epa.gov/climateleaders/>.70 See <http://www.epa.gov/cleanenergy/stateandlocal/
partnership.htm>.71 See <http://www1.eere.energy.gov/femp/>.

CHAPTER 4—POLICIES AND MEASURES 51CHAPTER 4—POLICIES AND MEASURES 51
important factor in the success of emissionreduction policies.
State InitiativesMany state governments have made
clean energy, energy efficiency, and climatechange initiatives high priorities, recogniz-ing their significant economic and envi-ronmental benefits and widespread publicsupport. These states are implementing awide range of policies and measuresto achieve the multiple benefits of mini-mizing their GHG emissions, encouragingthe development of cleaner energysources, and achieving air quality goals.Appreciating the value of collaboration,states are working across agencies,regionally, and with public- and private-sector stakeholders to develop the mostcost-effective mitigation and clean energystrategies. Table 4-1 illustrates the range ofactions that states are taking on climatechange, as of 2006.
Regional InitiativesAppreciating the economic value of in-
tegrating their strategies,many states havejoined to launch regional initiatives to re-duce GHG emissions and promote cleanenergy. Current examples include:West Coast Governors’ Global Warming
Initiative72—Created by the governors ofCalifornia,Oregon, andWashington to re-duce GHG emissions.Regional Greenhouse Gas Initiative73—
Made up of mid-Atlantic and northeasternstates to establish a regional CO2 emissionscap-and-trade program for electric powergenerators.Western Governors’ Association Clean
and Diversified Energy Initiative74—Eigh-teen states working together to meet thegoal of clean and diversified energy by de-veloping 30,000 MW of clean electricity by2015 and increasing energy efficiency by20 percent by 2020.
Powering the Plains75—Five states col-laborating on energy and agriculture initia-tives that address climate change whilepromoting regional economic develop-ment.
Carbon Sequestration Regional Partner-ships76—Seven partnerships that represent40 states, 300 organizations, four Canadianprovinces, and three Indian nations thatwork to determine the most suitable tech-nologies, regulations, and infrastructureneeds for carbon capture and storage tech-nology across the United States.U.S. Mayors Climate Protection Agree-
ment77—Agreement by 376 U.S.mayors toreduce GHGs by 7 percent below 1990 lev-els by 2012.
Climate Action PlansSome states have developed compre-
hensive climate change action plansthrough stakeholder processes that lay outcost-effective strategies for reducing theirGHG emissions. Following are somerecent examples.California: Issued April 2006—Devel-
oped by the Governor’s Climate ActionTeam, the report identifies 46 specificstrategies California can use to meet thegovernor’s near-term target of 1990 levelsby 2020 (i.e., a 30 percent reduction of theBusiness As Usual baseline). The reportalso includes nine key policy recommen-dations to help ensure the targets are met,along with a preliminary macroeconomicanalysis of the recommended strategiesthat suggests net economic and employ-ment benefits to the state.Connecticut: Issued February 2005—
Developed through theGovernor’s SteeringCommittee on Climate Change, the actionplan is comprised of 55 measures that areestimated to reduce GHG emissions by 9Tg CO2 Eq. in 2010 and 19 Tg CO2 Eq. in2020. The plan is designed to help achievethe regional goals set out by the New Eng-land Governors/Eastern Canadian Pre-miers 2001 Climate Change Action Plan(NEG/ECP 2001).Massachusetts: IssuedMay 2004—Moti-
vated by the joint goals of reducing GHGemissions and improving energy efficiency,the plan is a comprehensive set of near- andmid-term actions that help the environ-ment, energy system, and economy of theCommonwealth. Consistent with the
NEG/ECP 2001 Climate Change ActionPlan, Massachusetts’ goals are to reduceGHG emissions to 1990 levels by 2010, re-duce emissions to 10 percent below 1990levels in 2020, and eliminate any dangerousthreat to climate in the long run.New Mexico: Issued December 2006—
Developed by the Governor’s ClimateChange Advisory Group, the report in-cludes policy recommendations for reduc-ing New Mexico’s total GHG emissions to2000 levels by 2012, to 10 percent below2000 levels by 2020, and to 75 percent by2050. The report lays out 69 policy recom-mendations that address energy supply anddemand, transportation and land use, agri-culture and forestry, and emissions report-ing.Oregon: IssuedDecember 2004—Recom-
mendedby theGovernor’sAdvisoryGroup,the Oregon plan put primary emphasis onreal,measurable,meaningful reductions thatalso were cost-effective and created invest-ment and entrepreneurial opportunities. Itsgoals are to stop growth of GHG emissionsin 2010, reduce GHG emissions to 10 per-cent below 1990 levels by 2020, and stabilizeemissions to at least 75 percent below 1990levels by 2050. This action plan comple-ments the agenda of the West Coast Gover-nors’ GlobalWarming Initiative.
Lead by Example ProgramsMany state governments are implement-
ing programs and policies that are loweringGHGswithin their own facilities and oper-ations. States are leveraging their purchas-ing power, their ability to control significantenergy-using resources to test programs,and the often highly visible profile of publicfacilities to demonstrate clean energy tech-nologies and approaches that save energy
72 See <http://www.climatechange.ca.gov/westcoast/index.html>.
73 See <http://www.rggi.org/>.74 See <http://www.westgov.org/wga/initiatives/cdeac/
index.htm>.75 See <http://www.gpisd.net/resource.html?Id=61>.76 See <http://www.fe.doe.gov/programs/sequestration/
partnerships/index.html>.77 See <http://www.ci.seattle.wa.us/mayor/climate/
default.htm#what>.
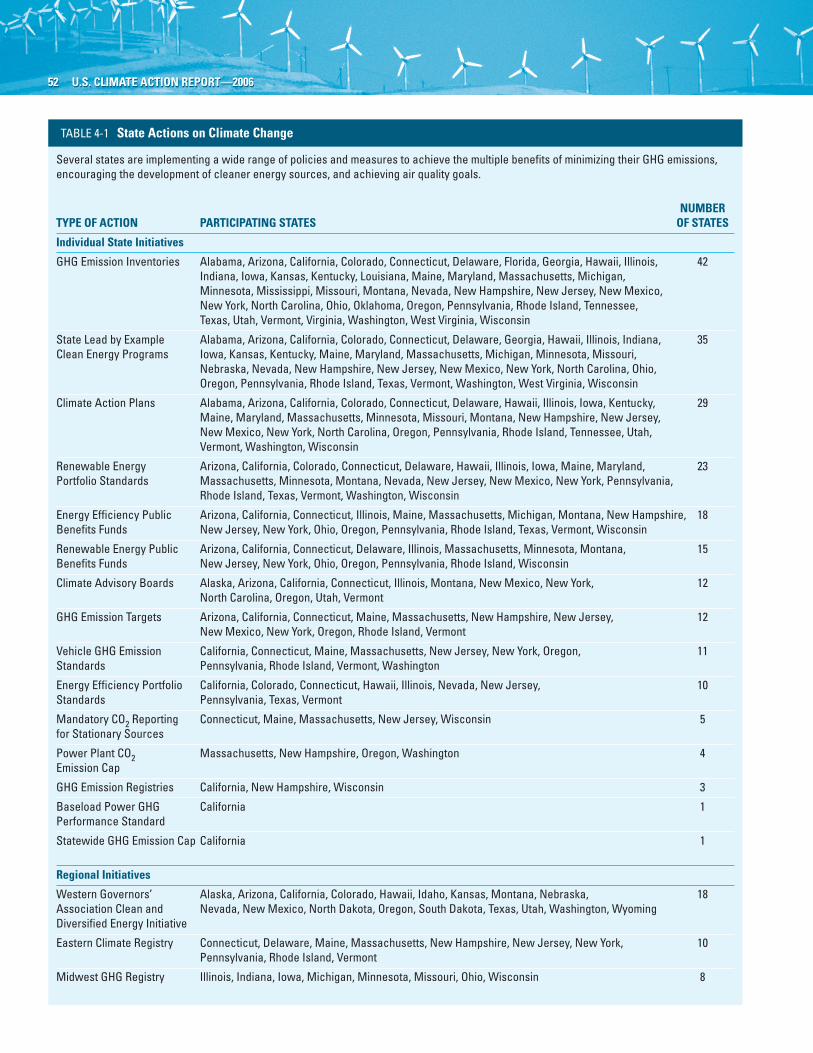
52 U.S. CLIMATE ACTION REPORT—200652 U.S. CLIMATE ACTION REPORT—2006
TABLE 4-1 State Actions on Climate Change
Several states are implementing a wide range of policies and measures to achieve the multiple benefits of minimizing their GHG emissions,encouraging the development of cleaner energy sources, and achieving air quality goals.
NUMBERTYPE OF ACTION PARTICIPATING STATES OF STATES
Individual State Initiatives
GHG Emission Inventories Alabama, Arizona, California, Colorado, Connecticut, Delaware, Florida, Georgia, Hawaii, Illinois, 42Indiana, Iowa, Kansas, Kentucky, Louisiana, Maine, Maryland, Massachusetts, Michigan,Minnesota, Mississippi, Missouri, Montana, Nevada, New Hampshire, New Jersey, New Mexico,New York, North Carolina, Ohio, Oklahoma, Oregon, Pennsylvania, Rhode Island, Tennessee,Texas, Utah, Vermont, Virginia, Washington, West Virginia, Wisconsin
State Lead by Example Alabama, Arizona, California, Colorado, Connecticut, Delaware, Georgia, Hawaii, Illinois, Indiana, 35Clean Energy Programs Iowa, Kansas, Kentucky, Maine, Maryland, Massachusetts, Michigan, Minnesota, Missouri,
Nebraska, Nevada, New Hampshire, New Jersey, New Mexico, New York, North Carolina, Ohio,Oregon, Pennsylvania, Rhode Island, Texas, Vermont, Washington, West Virginia, Wisconsin
Climate Action Plans Alabama, Arizona, California, Colorado, Connecticut, Delaware, Hawaii, Illinois, Iowa, Kentucky, 29Maine, Maryland, Massachusetts, Minnesota, Missouri, Montana, New Hampshire, New Jersey,New Mexico, New York, North Carolina, Oregon, Pennsylvania, Rhode Island, Tennessee, Utah,Vermont, Washington, Wisconsin
Renewable Energy Arizona, California, Colorado, Connecticut, Delaware, Hawaii, Illinois, Iowa, Maine, Maryland, 23Portfolio Standards Massachusetts, Minnesota, Montana, Nevada, New Jersey, New Mexico, New York, Pennsylvania,
Rhode Island, Texas, Vermont, Washington, Wisconsin
Energy Efficiency Public Arizona, California, Connecticut, Illinois, Maine, Massachusetts, Michigan, Montana, New Hampshire, 18Benefits Funds New Jersey, New York, Ohio, Oregon, Pennsylvania, Rhode Island, Texas, Vermont, Wisconsin
Renewable Energy Public Arizona, California, Connecticut, Delaware, Illinois, Massachusetts, Minnesota, Montana, 15Benefits Funds New Jersey, New York, Ohio, Oregon, Pennsylvania, Rhode Island, Wisconsin
Climate Advisory Boards Alaska, Arizona, California, Connecticut, Illinois, Montana, New Mexico, New York, 12North Carolina, Oregon, Utah, Vermont
GHG Emission Targets Arizona, California, Connecticut, Maine, Massachusetts, New Hampshire, New Jersey, 12New Mexico, New York, Oregon, Rhode Island, Vermont
Vehicle GHG Emission California, Connecticut, Maine, Massachusetts, New Jersey, New York, Oregon, 11Standards Pennsylvania, Rhode Island, Vermont, Washington
Energy Efficiency Portfolio California, Colorado, Connecticut, Hawaii, Illinois, Nevada, New Jersey, 10Standards Pennsylvania, Texas, Vermont
Mandatory CO2 Reporting Connecticut, Maine, Massachusetts, New Jersey, Wisconsin 5for Stationary Sources
Power Plant CO2 Massachusetts, New Hampshire, Oregon, Washington 4Emission Cap
GHG Emission Registries California, New Hampshire, Wisconsin 3
Baseload Power GHG California 1Performance Standard
Statewide GHG Emission Cap California 1
Regional Initiatives
Western Governors’ Alaska, Arizona, California, Colorado, Hawaii, Idaho, Kansas, Montana, Nebraska, 18Association Clean and Nevada, New Mexico, North Dakota, Oregon, South Dakota, Texas, Utah, Washington, WyomingDiversified Energy Initiative
Eastern Climate Registry Connecticut, Delaware, Maine, Massachusetts, New Hampshire, New Jersey, New York, 10Pennsylvania, Rhode Island, Vermont
Midwest GHG Registry Illinois, Indiana, Iowa, Michigan, Minnesota, Missouri, Ohio, Wisconsin 8

CHAPTER 4—POLICIES AND MEASURES 53CHAPTER 4—POLICIES AND MEASURES 53
equivalent to removing 32,500 cars fromthe road for one year.
Local Initiatives
Cities for Climate Protection CampaignIn addition to contributing to their state
GHG initiatives, more than 150 U.S. citiesand counties representing more than 50million people are participating in the Inter-national Council for Local EnvironmentalInitiatives’ Cities for Climate ProtectionCampaign.80 The program offers trainingand technical assistance to cities, towns, andcounties for projects focused on reducingGHG emissions. Actions implemented byparticipating cities are reducing emissionsby 20 Tg CO2 Eq. annually.
Heat Island Reduction InitiativeThrough its Heat Island Reduction Ini-
tiative (HIRI),81 EPAhas beenworkingwithstate and local officials, researchers, and in-dustry and nonprofit groups to reducesummertime temperatures by promotinguse of ENERGY STAR cool-roof productsand increasing vegetative cover. HIRI hasbeen hosting quarterly forums on heat is-land research and implementation activi-ties, as well as supporting heat island policyworkshops involving eight U.S. cities.
Private-Sector and NGO InitiativesSeveral innovative efforts of private-
sector and nonprofit initiatives demon-strate the impact that organizations can
have on climate change by making a com-mitment to a healthier environment.
Climate SaversClimate Savers82 is an initiative organ-
ized by the World Wildlife Fund in 2000 tomobilize companies to cut CO2 emissions.Collins, Sagawa and Lafarge have joinedJohnson & Johnson, IBM, Nike, and Po-laroid in participating. Each company haspledged to reduce its worldwide GHGemissions by 7 percent below 1990 levels by2010. The program includes an independ-ent verification process.
Ceres’ Investor Network on Climate RiskIn 2002, Ceres launched the Sustainable
Governance Project to raise global climatechange as a significant risk to the long-termvalue of corporations and the viability offinancial assets. In November 2003, Ceresorganized the Institutional Investor SummitonClimateRisk and established the InvestorNetwork on Climate Risk (INCR).83
Through INCR, Ceres has mobilized someof theNation’s largest institutional investorsto focus on companies’ climate risk. INCR
and reduce GHGs. This can take manyforms: adopting energy efficiency savingsgoals for buildings; procuring energy-efficient equipment and green power forpublic facilities; implementing“green fleets”programs, purchasing alternative fuel vehi-cles, and reducing vehicle trips; and estab-lishing financing mechanisms, providingtechnical assistance, and training staff tohelp ensure energy-saving goals areachieved. Currently, 35 states have someform of Lead by Example program. Somesuccesses of these state efforts follow.New Hampshire’s Building Energy Con-
servation Initiative78—Reducing energycosts in 10 state buildings through energyretrofits and building upgrades. Uses a“paid from savings”procedure, also knownas Performance Contracting, in which en-ergy savings pay for building retrofits andupgrades.Overall avoided energy costs nowexceed $200,000 annually.New Jersey’s Green Power Purchasing Pro-
gram79—Helping support the state goal ofreducing GHGs to 3.5 percent below 1990levels by 2005, in part, through an innova-tive aggregated green power purchasingprogram that supplies 500 million kWh ofgreen power to more than 200 facilitiesstatewide. The program has expandedgreen energy markets in the state and hasincreased private-sector green power pur-chases. The reduced CO2 emissions are
78 See <http://www.nh.gov/oep/programs/energy/beci.htm>.
79 See <http://www.state.nj.us/dep/dsr/bscit/GreenPower.pdf>.
80 See <http://www.iclei.org/index.php?id=800>.81 See <http://www.epa.gov/heatisland/index.html>.82 See <http://www.worldwildlife.org/climate/projects/
climateSavers.cfm>.83 See <http://www.ceres.org/>.
NUMBERTYPE OF ACTION PARTICIPATING STATES OF STATES
Regional Initiatives (Continued)
Regional Greenhouse Connecticut, Delaware, Maine, Maryland, Massachusetts, New Hampshire, New Jersey, 8Gas Initiative New York, Vermont (Pennsylvania and Rhode Island are observers)
New England Governors: Connecticut, Maine, Massachusetts, New Hampshire, Rhode Island, Vermont 6Climate Change Action Plan
Powering the Plains Iowa, Minnesota, North Dakota, South Dakota, Wisconsin 5
West Coast Governor’s California, Oregon, Washington 3Global Warming Initiative
Southwest Climate Change Arizona, New Mexico 2Initiative
Note: This table includes completed actions. Other states may have initiatives in progress or being considered.
TABLE 4-1 (Continued) State Actions on Climate Change

change. Membership has grown to include38 corporations,27 of whomhave set publicGHG reduction targets.
PowerSwitch!In February 2004,Austin Energy (Texas),
BurlingtonElectricDepartment (Vermont),Florida Power and Light (Florida), Sacra-mento Municipal Utility District (Califor-nia), and Waverley Light and Power (Iowa)joined the World Wildlife Fund’s Power-Switch! campaign.87 Each of the companiesagreed to call for binding limits on CO2emissions from the power sector. In addi-tion, these companies are voluntarily reduc-ing GHG emissions by committing toachieve at least one of three PowerSwitch!goals by 2020: (1) using renewable energyto generate 20 percent of power sold, (2) in-creasing energy efficiency by 15 percent, or(3) phasing out the least efficient half of en-ergy generation (or production) from coal.
Climate RESOLVESponsored by The Business Roundtable,
Climate RESOLVE88 seeks to encourage100 percent of theRoundtablemembershipto undertake voluntary actions to controlGHG emissions.Roundtable CEOs believethat motivated, forward-looking compa-nies working in partnership with govern-ment can findmany practical, cost-effectiveopportunities to improve energy efficiencyand reduce, avoid, offset, or sequester GHGemissions—without the serious economicdisruption caused by mandatory GHGcontrols. Approximately 70 percent ofRoundtable companies from every sectorof the economy have signed up for ClimateRESOLVE.
LONG-TERMMEASURESIn addition to implementing policies
and measures that reduce emissions inten-sity in the near term, the U.S. governmentis committed to investing in relevant R&Dover the long term. These R&D efforts arethe key to discovering breakthrough tech-nologies that are needed for emission reduc-tions beyond what is achievable at present.The long-term component of U.S. climatechange strategy—discussed in detail inChapter 8, Research and Systematic Obser-
vation—includes the following programs:CarbonSequestrationRegionalPartnerships,89
GenerationIVNuclearEnergySystemsInitia-tive,90NuclearHydrogenInitiative,91AdvancedFuel Cycle Initiative,92 Global Nuclear EnergyPartnership,93CleanAutomotiveTechnology,94
Hydrogen Technology,95 and High-Tempera-ture Superconductivity.96
INTERNATIONALMEASURESIn addition to implementing a broad
portfolio of domestic programs, the UnitedStates has committed to working globallywith developed anddeveloping countries onclimate change issues. Because climatechange is a global concern, international co-operation is necessary to make discernibleprogress. The United States has signed anumber of bilateral agreements and partic-ipates in numerous multilateral efforts, in-cluding theAsia-Pacific Partnership and theMethane to Markets Partnership. Severalfederal agencies, including DOE, EPA, theU.S.Agency for InternationalDevelopment,and USDA, are engaged in technologytransfer programs with developing andtransitional countries to provide assistancein limiting GHG emissions. The interna-tional technology development collabora-tions are described inmore detail inChapter8, Research and Systematic Observation,and those on technology transfer inChapter7,Financial Resources andTransfer of Tech-nology.
collaborates with investors and the financialcommunity through briefings, meetings,and publication and distribution of reports.Ceres also convenes high-emitting compa-nies in dialogueswith investors and environ-mental groups, and coordinates the globalwarming shareholder campaign.
Green Power Market Development GroupThe Green Power Market Development
Group84 is a collaboration between theWorldResources Institute and 13 participat-ing companies. NatureWorks, LLC, Star-bucks, and Staples recently joined originalmembers Alcoa, Delphi, Dow, DuPont,FedEx,Kinko’s,GeneralMotors, IBM, Inter-face, Johnson& Johnson, andPitneyBowes.The group’s goal is to develop corporatemarkets for 1,000 MW of new, cost-com-petitive green power by 2010.The groupde-velops and publishes an ongoing series ofwhite papers that focus on market develop-ment issues, including the design of innova-tive green power purchasing vehicles.
Chicago Climate ExchangeTheChicagoClimate Exchange (CCX)85
includes more than 25 member companiesthat agreed to reduce their GHG emissionsby 1 percent per year from 2003 through2006. Companies achieve this reductiontarget through internal reductions, emis-sions tradingwith othermembers, purchas-ing GHG offsets from qualifying projects,or a combination of these approaches.Con-tinuous electronic trading of GHG emis-sion allowances and offsets began onDecember 12, 2003. The tradable CarbonFinancial Instruments employed in CCXare Exchange Allowances and ExchangeOffsets. ExchangeAllowances are issued onthe basis of forest carbon sequestration andreductions in electricity use. Exchange Off-sets are generated by qualifying mitigationprojects and are registeredwithCCXby Ex-change Participant Members.
Business Environmental LeadershipCouncil
ThePewCenter’s Business Environmen-tal Leadership Council86 is a group ofleading companies worldwide that are re-sponding to the challenges posed by climate
54 U.S. CLIMATE ACTION REPORT—200654 U.S. CLIMATE ACTION REPORT—2006
84 See <http://www.thegreenpowergroup.org/us.cfm>.85 See <http://www.chicagoclimatex.com/>.86 See <http://pewclimate.org/companies_leading_the_
way_belc/>.87 See <http://powerswitch.panda.org/news_publications/
news_detail.cfm?uxNewsID=13042>.88 See <http://www.businessroundtable.org/TaskForces/
TaskForce/issue.aspx?qs=6EC5BF159FF49514481138A6DF6185 1159169FEB56A3FB0AE>.
89 See <http://www.fe.doe.gov/programs/sequestration/partnerships/index.html>.
90 See <http://gen-iv.ne.doe.gov/ andhttp://www.ne.doe.gov/infosheets/genIV.pdf>.
91 See <http://www.ne.doe.gov/infosheets/hydrogen.pdf>.92 See <http://www.ne.doe.gov/infosheets/afci.pdf>.93 See <http://www.gnep.energy.gov/>.94 See <http://www.epa.gov/otaq/technology/>.95 See <http://www.eere.energy.gov/hydrogenand
fuelcells/>.96 See <http://www.oe.energy.gov/randd/supercon.htm>.

CHAPTER 4—POLICIES AND MEASURES 55CHAPTER 4—POLICIES AND MEASURES 55
TABLE 4-2 Summary of U.S. Actions to Reduce Greenhouse Gas Emissions (Tg CO2 Eq.)1
Policy or Objective and/or Activity Affected GHG Type of Status Implementing Estimated MitigationMeasure Affected Instrument Entities Impact for1
2002 2012 2020
Energy: Commercial and Residential2
Commercial Building Realizes energy-saving opportunities CO2 Research; Implemented DOE NA 0.5 3.1Integration (includes provided by whole-building-system- RegulatoryRebuild America) design approach during new
construction and major renovationof existing commercial buildings.
Emerging Buildings Conducts R&D on building components CO2 Information; Implemented DOE 0.0 4.4 25.4Technologies* and design tools, and issues standards Research
and test procedures for a variety ofappliances and equipment.
ENERGY STAR for the Promotes the improvement of energy CO2 Voluntary Implemented EPA 35.2 64.2 93.5Commercial Market performance in commercial buildings. Agreement
ENERGY STAR for the Promotes the improvement of energy CO2 Voluntary; Implemented EPA 0.2 7.3 44.0Residential Market performance in residential buildings Outreach
beyond the labeling of products.
ENERGY STAR- Provides labels to distinguish energy- CO2 Voluntary; Implemented EPA/DOE 38.1 102.7 148.5Labeled Products efficient products in the marketplace. Outreach
Residential Conducts analyses of and develops, CO2 Regulatory Implemented DOE NA 5.1 17.3Appliance Standards reviews, and updates efficiency
standards for most major householdappliances and major commercialbuilding technologies and equipment.
Residential Building Enables industry to adopt systems CO2 Voluntary; Implemented DOE NA 3.8 9.5Integration engineering approaches to the design Research;
and construction of new housing by Educationfunding, developing, demonstrating,and deploying housing that integratesenergy efficiency technologies andpractices.
State Energy Strengthens and supports the CO2 Economic; Implemented DOE 0.0 2.5 2.6Programs capabilities of states to promote energy Information
efficiency and to adopt renewableenergy technologies, helping the Nationachieve a stronger economy, a cleanerenvironment, and greater energy security.
Weatherization Enables low-income families to CO2 Economic; Implemented DOE 1.1 3.9 6.0Assistance permanently reduce their energy bills Deployment
by making their homes more energyefficient.
1 Estimates of mitigation impacts of programs are provided by the agency responsible for each individual program, based on the agency’s experience andassumptions related to the implementation of voluntary programs. These estimates may include assumptions about the continued or increased participationof partners, development and deployment goals, and/or whether the necessary commercialization or significant market penetration is achieved.
2 Estimates of mitigation impacts for individual policies or measures should not be aggregated to the sectoral level, due to possible synergies and interactionsamong policies and measures that might result in double counting.
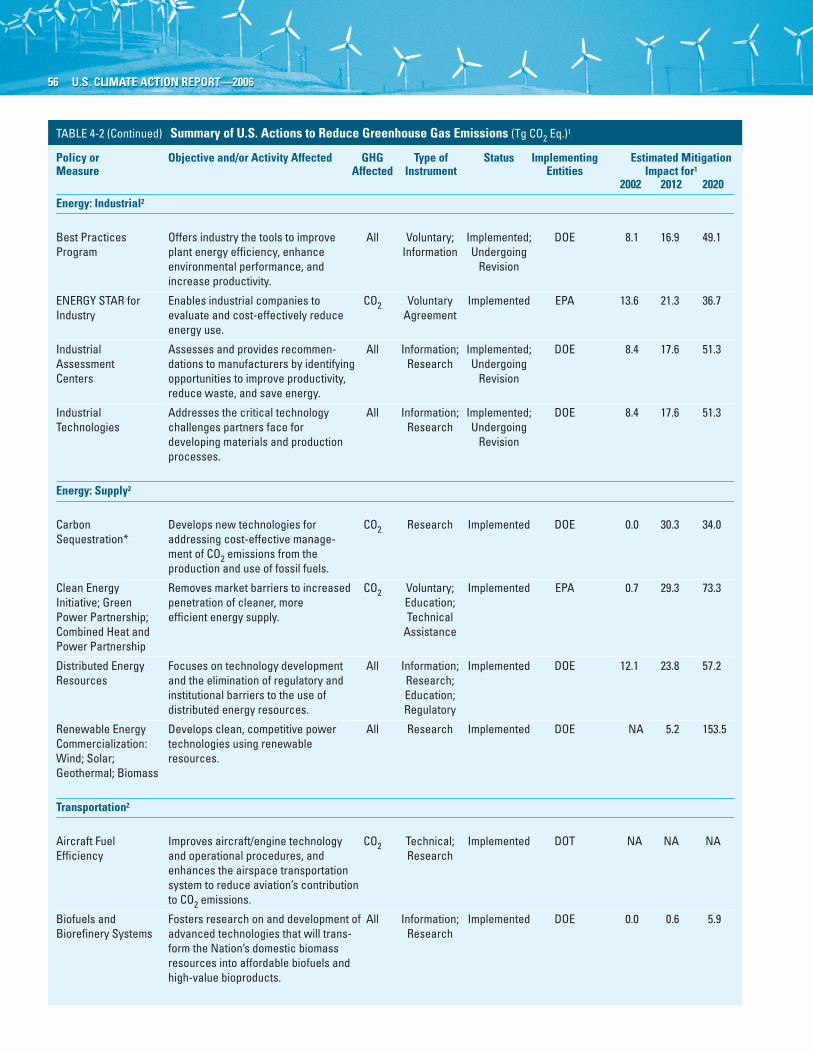
TABLE 4-2 (Continued) Summary of U.S. Actions to Reduce Greenhouse Gas Emissions (Tg CO2 Eq.)1
Policy or Objective and/or Activity Affected GHG Type of Status Implementing Estimated MitigationMeasure Affected Instrument Entities Impact for1
2002 2012 2020
Energy: Industrial2
Best Practices Offers industry the tools to improve All Voluntary; Implemented; DOE 8.1 16.9 49.1Program plant energy efficiency, enhance Information Undergoing
environmental performance, and Revisionincrease productivity.
ENERGY STAR for Enables industrial companies to CO2 Voluntary Implemented EPA 13.6 21.3 36.7Industry evaluate and cost-effectively reduce Agreement
energy use.
Industrial Assesses and provides recommen- All Information; Implemented; DOE 8.4 17.6 51.3Assessment dations to manufacturers by identifying Research UndergoingCenters opportunities to improve productivity, Revision
reduce waste, and save energy.
Industrial Addresses the critical technology All Information; Implemented; DOE 8.4 17.6 51.3Technologies challenges partners face for Research Undergoing
developing materials and production Revisionprocesses.
Energy: Supply2
Carbon Develops new technologies for CO2 Research Implemented DOE 0.0 30.3 34.0Sequestration* addressing cost-effective manage-
ment of CO2 emissions from theproduction and use of fossil fuels.
Clean Energy Removes market barriers to increased CO2 Voluntary; Implemented EPA 0.7 29.3 73.3Initiative; Green penetration of cleaner, more Education;Power Partnership; efficient energy supply. TechnicalCombined Heat and AssistancePower Partnership
Distributed Energy Focuses on technology development All Information; Implemented DOE 12.1 23.8 57.2Resources and the elimination of regulatory and Research;
institutional barriers to the use of Education;distributed energy resources. Regulatory
Renewable Energy Develops clean, competitive power All Research Implemented DOE NA 5.2 153.5Commercialization: technologies using renewableWind; Solar; resources.Geothermal; Biomass
Transportation2
Aircraft Fuel Improves aircraft/engine technology CO2 Technical; Implemented DOT NA NA NAEfficiency and operational procedures, and Research
enhances the airspace transportationsystem to reduce aviation’s contributionto CO2 emissions.
Biofuels and Fosters research on and development of All Information; Implemented DOE 0.0 0.6 5.9Biorefinery Systems advanced technologies that will trans- Research
form the Nation’s domestic biomassresources into affordable biofuels andhigh-value bioproducts.
56 U.S. CLIMATE ACTION REPORT—200656 U.S. CLIMATE ACTION REPORT—2006

TABLE 4-2 (Continued) Summary of U.S. Actions to Reduce Greenhouse Gas Emissions (Tg CO2 Eq.)1
Policy or Objective and/or Activity Affected GHG Type of Status Implementing Estimated MitigationMeasure Affected Instrument Entities Impact for1
2002 2012 2020
Congestion Mitigation Provides states with funds to reduce CO2 Voluntary Implemented DOT NA NA NAand Air Quality congestion and improve air quality AgreementImprovement Program through transportation control
measures and other strategies.
Corporate Average Raises the fuel economy standard CO2 Regulatory Implemented DOT 0.0 41.8 76.7Fuel Economy for minivans, pickup trucks, SUVs, and
other light trucks from the current 8.8 kpl(20.7 mpg) to 9.4 kpl (22.2 mpg) by 2007.
FreedomCAR and Advances high-risk research needed CO2 Research Implemented DOE 0.0 11.5 72.0Fuel Partnership to develop the necessary technologies,and Vehicle such as fuel cells and advanced hybridTechnologies propulsion systems, to provide a fullProgram (includes range of affordable cars and lightClean Cities) trucks that are free of foreign oil and
harmful emissions—and that do notsacrifice freedom of mobility andfreedom of vehicle choice.
Renewable Fuel Implements the Energy Policy Act 2005 CO2 Regulatory New; Being EPA NA NA NAStandard requirement to increase the amount of Implemented
renewable fuel used in transportationto 7.5 billion gallons by 2012.
SmartWay Transport Accelerates development of fuel- CO2 Voluntary Implemented EPA 7.7 33.0 43.0Partnership savingtechnology and practices in Agreement;
transport and freight operations. TechnicalAssistance;Information;Education;Outreach
Industry (Non-CO2)2
Coalbed Methane Reduces methane emissions from U.S. CH4 Information; Implemented EPA 6.2 10.6 12.1Outreach Program coal mining operations through cost- Education;
effective means. Outreach
Environmental Limits emissions of HFCs, PFCs, High Voluntary Implemented EPA 4.8 35.6 54.3Stewardship Initiative and SF6 in industrial applications. GWP Agreement
HFC-23 Partnership Encourages reduction of HFC-23 HFC-23 Voluntary Implemented EPA 16.5 16.5 15.4emissions through cost-effective Agreementpractices and technologies.
Mobile Air Identifies near-term opportunities to CO2, Voluntary; Implemented EPA 0.0 5.5 24.5Conditioning Climate improve the environmental perfor- HFC-134a ResearchProtection mance of mobile air conditioners, andPartnership promotes cost-effective designs and
improved service procedures tominimize emissions from mobile airconditioning systems.
Natural Gas Reduces methane emissions from CH4 Voluntary Implemented EPA 20.2 30.8 46.9STAR Program U.S. natural gas systems through the Agreement
widespread adoption of industry bestmanagement practices.
CHAPTER 4—POLICIES AND MEASURES 57CHAPTER 4—POLICIES AND MEASURES 57

TABLE 4-2 (Continued) Summary of U.S. Actions to Reduce Greenhouse Gas Emissions (Tg CO2 Eq.)1
Policy or Objective and/or Activity Affected GHG Type of Status Implementing Estimated MitigationMeasure Affected Instrument Entities Impact for1
2002 2012 2020
58 U.S. CLIMATE ACTION REPORT—200658 U.S. CLIMATE ACTION REPORT—2006
Significant New Facilitates smooth transition away from High Regulatory; Implemented EPA 26.0 149.6 222.9Alternatives Program ozone-depleting chemicals in industrial GWP Information
and consumer sectors.
Voluntary Aluminum Encourages reduction of CF4 and PFCs Voluntary Implemented EPA 6.6 10.3 10.3Industry Partnership C2F6 where technically feasible and Agreement
cost-effective.
Voluntary Code of Minimizes nonfire emissions of HFCs HFCs, Voluntary Implemented EPA NA NA NAPractice for HFC & and PFCs used as fire-suppression PFCs AgreementPFC Fire Protection alternatives, and protects people andAgents property from the threat of fire through
the use of proven, effective productsand systems.
Agriculture2, 3
AgSTAR Promotes practices to reduce GHG CH4 Information; Implemented EPA/USDA NA NA NAemissions at U.S. farms. Education;
Outreach
Environmental Quality Under EQIP, NRCS offers innovation All Partnerships/ Implemented USDA 0.0 26.1 26.1Incentives Program; grants to livestock producers and FinancialConservation owners of working farmlands to AssistanceInnovation Grants accelerate the development, transfer,
and adoption of innovative technologiesand approaches, including those thatdeliver GHG benefits and improve thequality of nutrient management systems.
Conservation Encourages farmers to convert highly CO2 Technical/ Implemented USDA 0.0 3.1 7.8Reserve Program erodible cropland or other environment- Financial
ally sensitive acreage to native grasses, Assistancewildlife plantings, trees, filter strips, andriparian buffers.
Conservation Provides financial and technical CO2, Technical/ Implemented USDA NA NA NASecurity Program assistance to promote conservation CH4 Financial
on working cropland, pasture, and Assistancerange land, as well as forested landthat is an incidental part of an agricultureoperation.
Commodity Encourages bioenergy production CO2 Economic Implemented USDA NA NA NACredit Corporation through economic incentives toBioenergy Program** commodity producers.
Rural Development Provides economic incentives to CO2 Economic Implemented USDA 0.0 1.2 1.2Renewable Energy commodity producers to installPrograms*** renewable energy systems.
Forestry2
Forest Land Provides assistance to nonindustrial CO2 Technical/ Implemented USDA 0.0 0.2 0.2Enhancement private forest landowners for FinancialProgram forest stewardship, with explicit Assistance
carbon sequestration goals.

CHAPTER 4—POLICIES AND MEASURES 59CHAPTER 4—POLICIES AND MEASURES 59
TABLE 4-2 (Continued) Summary of U.S. Actions to Reduce Greenhouse Gas Emissions (Tg CO2 Eq.)1
Policy or Objective and/or Activity Affected GHG Type of Status Implementing Estimated MitigationMeasure Affected Instrument Entities Impact for1
2002 2012 2020
Waste Management2
Landfill Methane Reduces methane emissions from CH4 Voluntary Implemented EPA 14.3 24.6 30.8Outreach Program U.S. landfills through cost-effective Agreements;
means. Information;Education;Outreach
Stringent Landfill Reduces methane/landfill gas CH4 Regulatory Implemented EPA 8.7 9.5 9.9Rule emissions from U.S. landfills.
WasteWise Encourages recycling, source All Voluntary Implemented EPA 10.3 20.9 33.0reduction, and other progressive Agreements;integrated waste management Technicalactivities for the purpose of Assistance;reducing GHG emissions. Information;
Research
Cross-Sectoral2
Clean Energy- Motivates GHG emission reductions All Information; Implemented EPA 7.3 7.3 7.3Environment State as one of several benefits states Education;Partnership Program derive from implementing a compre- Research
hensive suite of cost-effective clean-energy policies and programs.
Climate Leaders Assists companies with developing All Voluntary Implemented EPA NA NA NAlong-term, comprehensive climate Agreementchange strategies.
Climate VISION Works with partners to measure and All Voluntary Implemented DOE/EPA/ NA NA NAmonitor emissions, find cost-effective USDA/DOTsolutions to reduce energy use andGHG emissions, accelerate R&D, andexplore cross-sector efficiency gainsto reduce emissions.
Federal Energy Promotes energy efficiency and All Economic; Implemented DOE 0.0 2.2 3.7Management renewable energy use in federal Information;Program buildings, facilities, and operations. Education
Voluntary Reporting Provides a means for organizations All Voluntary Implemented DOE/ NA NA NAof Greenhouse and individuals to record the results Agreement EPA/Gases (1605(b)) of voluntary measures to reduce, avoid, USDA
or sequester GHG emissions.
1 Estimates of mitigation impacts of programs are provided by the agency responsible for each individual program, based on the agency’s experience and assumptions related to theimplementation of voluntary programs. These estimates may include assumptions about the continued or increased participation of partners, development and deployment goals,and/or whether the necessary commercialization or significant market penetration is achieved.
2 Estimates of mitigation impacts for individual policies or measures should not be aggregated to the sectoral level, due to possible synergies and interactions among policies andmeasures that might result in double counting.
3 Estimates presented here reflect mitigation impacts due to GHG measures and policies implemented since 2002 in USDA’s conservation and renewable energy programs.NA: Not applicable for long-term, R&D, and umbrella programs.* These are long-term research efforts discussed in Chapter 8. To allow for a conservative estimate of overlap between Chapters 4 and 5, estimated impacts from technologies
expected to penetrate the market by 2012 are included in this table.** This program ended in 2006.***Although no additional renewable energy projects are planned under this program after 2006, renewable energy systems implemented under this program are expected to have
GHG benefits through 2020. The estimates shown here reflect only wind energy projects implemented between 2002 and 2006.

On February 14, 2002, President Bush announced his Global Climate Change policy,committing to reduce the greenhouse gas (GHG) intensity of the U.S. economy by18 percent by 2012. GHG intensity measures the ratio of GHG emissions to eco-
nomic output. This approach focuses on reducing the growth of GHG emissions, whilesustaining the economic growth needed to finance investment in new, clean energy tech-nologies. It sets the United States on a path to slow the growth of GHG emissions, and—as the science justifies—to stop and then reverse that growth. This chapter providesprojections for national emissions under the Global Climate Change policy.
MEETING THE PRESIDENT’S TARGET FOR REDUCING U.S. GHG INTENSITYThe President’s commitment to reducing GHG intensity represented a 4 percentage
point improvement in absolute terms over the projected U.S. Business As Usual GHG in-tensity improvement.1 This corresponded to a reduction in GHG emissions of 367 tera-grams of carbon dioxide equivalent (Tg CO2 Eq.) by 2012 relative to Business As Usualprojections, and more than 1,833 Tg CO2 Eq. in cumulative GHG reductions between2002 and 2012.2 The President’s Global Climate Change policy focuses on reducing emis-sions through technology improvements and dissemination, demand-side efficiency gains,voluntary programs with industry, and shifts to cleaner fuels.The President’s GHG intensity improvement target was developed using the best avail-
able data, including GHG projections from the U.S. Environmental Protection Agency(EPA), and GHG and economic projections from the Energy InformationAdministration(EIA), an independent statistical and analytical agency within the U.S.Department of En-ergy (DOE). These data have been updated in the present report to reflect actual GHGemissions and gross domestic product (GDP) data for the years 2002 through 2004 andprojections of both emissions and economic growth based on the latest available U.S. gov-ernment analyses from EIA and EPA.Themost recent projections published in theAnnualEnergy Outlook 2006 (AEO) (U.S. DOE/EIA 2006a) incorporate the effects of many poli-cies enacted through October 2005 and also use much higher oil prices than in previousanalyses. These updates result in lower projected energy consumption and lower CO2emission projections, as compared to previous editions of the AEO.
5 Projected GreenhouseGas EmissionsProjected GreenhouseGas Emissions
1 At the time of President Bush’s announcement in 2002, the estimated GHG intensity of the U.S. economy was 671 metrictons of carbon dioxide equivalent (t CO2 Eq.) emissions per million dollars of gross domestic product (GDP). The GHGintensity was projected to decrease to 578 t CO2 Eq. emissions per million dollars of GDP in 2012 under a Business AsUsual scenario based on existing polices and efforts—a decline of 14 percent. See <www.whitehouse.gov/news/releases/2002/02/addendum.pdf>.
2 In the metric used at the time of the President’s announcement, million metric tons of carbon equivalents (MMTCE), thiscorresponded to a reduction of more than 100 MMTCE in 2012 and more than 500 MMTCE from 2002 through 2012, overand above the Business As Usual projection. (One teragram (Tg) equals one million metric tons (Mt). Carbon dioxideequivalents can be converted to carbon equivalents by multiplying by the ratio of their atomic masses (12/44): 367 Tg CO2Eq. = 367 Mt CO2 Eq. = 100 MMTCE.)

CHAPTER 5—PROJECTED GREENHOUSE GAS EMISSIONS 61CHAPTER 5—PROJECTED GREENHOUSE GAS EMISSIONS 61
U.S. greenhouse gas intensity under Full Implementation of Climate Programs andMeasuresis projected to meet the President’s target for 2012. The GHG emission reduction in 2012 isprojected to be 407 Tg CO2 Eq. (111MMTCE), and the cumulative GHG emission reduction from2002 through 2012 is projected to be 2,225 Tg CO2 Eq. (607 MMTCE), relative to projectedemissions under Business As Usual conditions. From 2002 through 2012, GHG emissions areexpected to rise by 11 percent to 7,709 Tg CO2 Eq.
Note: One teragram (Tg) equals one million metric tons.
dustry and tax incentives on renewablesand cogeneration, are expected to furtherreduce GHG intensity by 2012. Using thelatest available data, these additional meas-ures—as outlined in Chapter 4 of this re-port—are accounted for in the FullImplementation of Climate Programs andMeasures baseline. The calculation of over-all reductions in GHG emissions due tothe federal climate programs is based onthe methodology originally presented inthe 2002 Climate Action Report (CAR)(U.S. DOS 2002).Based on actual data from 2002
through 2004 (U.S. EPA/OAP 2006c), Fig-ure 5-1 contains two projections: the GHGintensity associated with the Business AsUsual projection and the additional GHGintensity improvement resulting from theFull Implementation of Climate Programsand Measures.3 The influence of U.S. poli-
cies and measures in encouraging the de-velopment and use of cleaner, more effi-cient technologies can be seen in thereduction of GHG intensity over the pe-riod examined. Other important factorsimproving U.S.GHG intensity include thesubstitution of fuels that emit lower vol-umes of GHGs and changes in the com-position of GDP to goods and serviceswith fewer fuel inputs.
ASSUMPTIONS USED TO ESTIMATEFUTURE GREENHOUSE GASEMISSIONSEIA’s AEO 2006 provided the baseline
projection of energy-related CO2 emis-sions (U.S.DOE/EIA 2006a). This baselinepartially reflects the impact of the energy-related policies and measures discussed inChapter 4. Federal agencies with direct re-sponsibility for implementing polices andmeasures adjusted theAEO 2006 referencecase to reflect their own estimates of theexpected impacts of their programs. EPAprepared the emission projections forsource categories other than CO2 emis-sions resulting from fossil fuel consump-tion (U.S. EPA/OAP 2006b), and the U.S.Department of Agriculture (USDA) pre-pared the estimates of carbon sequestra-tion rates based on the carbonsequestration models developed for theU.S. inventory (U.S. EPA/OAP 2002). Theprojections reflect long-run trends and donot attempt to mirror short-run depar-tures from those trends.The AEO 2006 presents medium-term
scenarios of energy supply, demand, andprices through 2030 (U.S. DOE/EIA2006a), based on results from EIA’s Na-tional EnergyModeling System (NEMS), apublicly shared and well-documentedmodel. The AEO 2006 cases reflect an in-tegrated analysis of CO2 emissions, ac-counting for interaction and feedbackeffects in energymarkets and the economy.
Given Full Implementation of ClimatePrograms and Measures, and based on re-cent U.S. government forecasts that reflectcurrent economic conditions, the UnitedStates is projected to exceed the President’s18 percent goal by 2012. The gross 686 tCO2 Eq. emissions per million dollars ofGDP emitted in 2002 are projected to belowered to 559 t CO2 Eq. per million dol-lars GDP in 2012—an 18.6 percent reduc-tion in GHG intensity. Over the sameperiod from 2002 to 2012, while GHG in-tensity is declining, total gross GHG emis-sions are expected to rise by 11 percent to7,709 Tg CO2 Eq.Since 2002, the President has expanded
existing measures and has implementednew short- and long-termmeasures to re-duce GHG intensity. The short-termmeasures, such as voluntary reductions ofmethane and fluorinated gases from in-
FIGURE 5-1 Historical and Projected U.S. Greenhouse Gas Intensity
3 Some of the impact of existing national policies andprograms is already being captured in the Business AsUsual projection, as described in the following sectionof this chapter.

62 U.S. CLIMATE ACTION REPORT—200662 U.S. CLIMATE ACTION REPORT—2006
In some cases, however, the AEO uses as-sumptions about technology diffusion andadoption rates that differ from the as-sumptions used for the independent poli-cies and measures estimates in Chapter 4of this report.The reported effects of the individual
policies and measures in Chapter 4 arebased on assumptions regarding the adop-tion and impacts of eachmeasure. Becausethis approach differs from the approachimplicit in NEMS, a precise mapping tothe emission reductions from individualpolicies and measures against the aggre-gate estimates developed in the AEO casesis not possible. There are two distinct chal-lenges. First, the energy-related measuresdescribed in Chapter 4 are already partiallyreflected in the AEO results (for example,the 2003 corporate average fuel economy(CAFE) increase for light trucks). Second,the impacts reported in Chapter 4, whichare typically estimated on a stand-alonebasis, recognize fewer interactions andcompetitive effects within and among theeconomic sectors in which the individualmeasures are applied. In contrast to theNEMSmodel, which addresses interactioneffects between a comprehensive set of eco-nomic variables and policies, the modelsused in projecting the direct impacts ofChapter 4 policies andmeasures are partialequilibrium models that do not representthe economy as a whole. The Chapter 4programs and measures effects do notreflect interactions between competitive al-ternatives, which could include overlap-ping, double counting, or synergistic effects.To address these challenges, the mitigationimpacts of all policies and measures as re-ported in Chapter 4 were adjusted down-ward by 25 percent or greater4 and thensubtracted from the appropriate baseline togenerate the projections in this chapter.This adjustment was necessary to addressthe possible interactions between the poli-cies and measures as well as uncertainty inmarket responses, and the potential forsome portion of the mitigation impact ofthe policies andmeasures to already be cap-tured in the Business As Usual baseline.
The AEO 2006 projects a decliningratio of emissions to GDP by incorporat-ing the enacted regulatory and fiscal poli-cies as well as the impacts—includingcosts—of technology dissemination.5 Thedegree of technology improvement re-flected in the projections is internally gen-erated in the modeling process based onEIA’s judgment about the availability, cost,and performance of technologies, theirrates of adoption, and their potential forefficiency improvement. The assumptionsunder which the AEO 2006 estimates wereprepared include real GDP growth of 3.0percent annually from 2004 through 2030,without specific regard to interim businesscycles. Based on the AEO 2006 referencecase estimates, the average U.S. cost of im-ported crude oil in real 2000 dollars is pro-jected to be just over $41 per barrel by2020.6 To support projections of increased
demand, natural gas supplies are supple-mented with growing imports—in partic-ular, liquefied natural gas—and domesticunconventional production. The naturalgas wellhead price is projected to be $4.49per thousand cubic feet in 2020 in real2000 dollars. EIA’s projection assumes thatcurrent laws and regulations will continuein force, but it does not anticipate meas-ures not yet enacted or implemented.Table 5-1 presents several measures of theU.S. economy that generate estimates ofenergy consumption and related carbonemissions for 2020, and compares the val-ues used in the 2002 CAR to those reliedupon for this report (2006 CAR). In thisreport, 2020 real GDP is somewhat lower,energy intensity per dollar of GDP is no-tably lower, and the prices of natural gasand crude oil are higher than the levels as-sumed in the 2002 CAR.
TABLE 5-1 Comparison of the 2002 CAR and the 2006 CAR Assumptions and ModelResults for the Year 2020
Several measures of the U.S. economy generate energy consumption and related carbonemission estimates. This table compares the values used in the 2002 CAR to those relied uponfor this report.
Factors Assumptions for 2020
2002 CAR 2006 CARReal GDP (billions of 2000 dollars) 18,136 17,541Population (millions) 325 337Energy Intensity (Btus per 2000 dollar GDP) 8,712 6,877Light-Duty Vehicle Miles Traveled (billions) 3,631 3,474Energy Commodity Price/Imported Crude Oil Price
(2000 dollars/barrel) 24.68 41.24Wellhead Natural Gas (2000 dollars/1,000 cubic feet) 3.26 4.49Minemouth Coal (2000 dollars/ton) 12.79 18.52Average Price Electricity (2000 cents/kWh) 6.50 6.64Average Price Gasoline (2000 dollars/gallon) 1.40 1.90
Source: U.S. DOE/EIA 2006a.
4 The effects of the non-CO2 policies and measures in reducing emissions as presented in Chapter 4 were adjusteddownward by 25 percent to generate the projections for 2012 and 2020 presented in this chapter. The effects of the CO2policies and measures were adjusted downward by 25 percent in 2012 and by 50 percent in 2020 to reflect an increasingamount of energy efficiency reductions included in the AEO 2006 reference case.
5 A description of the policies and measures and technology assumptions embodied in the AEO projections can be foundat <www.eia.doe.gov>.
6 While current oil prices are higher, the AEO 2006 reference case does not project the recent growth trend to continue.Alternatively, the AEO 2006 high-price case projects the imported crude oil price to be $73 per barrel in 2020. If this 2007CAR analysis were to use the AEO 2006 high-price case, energy consumption would likely be lower, resulting in lowerU.S. GHG emissions than the projections presented in this chapter.

CHAPTER 5—PROJECTED GREENHOUSE GAS EMISSIONS 63CHAPTER 5—PROJECTED GREENHOUSE GAS EMISSIONS 63
on the latest edition of the AEO producedby EIA’s NEMSmodel.Using the referencecase scenario provided by EIA as a startingpoint, agencies with policy responsibilitythen adjust it to reflect their assessmentsof the additional impact of the policiesand measures, as described above. Fornon-CO2 GHGs and estimates of carbonsequestration, the inventory models de-scribed in Chapter 3 are used to projectemissions based on economic activityfrom the AEO 2006 report.
U.S. GREENHOUSE GAS EMISSIONESTIMATES: 2000–2020Projections for both the Business As
Usual baseline and the Full Implementa-tion of Climate Programs and Measures
scenario are presented in Table 5-2 for theyears 2012 and 2020, along with historicalinventory data for the years 2000, 2002,and 2004. The projections of U.S. GHGemissions described here reflect estimatesof GHG emissions considering nationaltrends in population growth, long-termeconomic growth potential, historical ratesof technology improvement, normalweather patterns, and reductions due toimplemented policies and measures.The total projected levels of U.S. green-
house gas emissions are tallied by combin-ing the CO2 contributions of energy andnonenergy activities with the non-CO2greenhouse gases (which includemethane(CH4), nitrous oxide (N2O), hydrofluoro-carbons (HFCs), perfluorocarbons
Emission projections in this report areconverted to Tg CO2 Eq., in keeping withthe reporting guidelines of the United Na-tions Framework Convention on ClimateChange (UNFCCC). To analyze the non-CO2 gases in the same framework as CO2,this report uses the 100-year global warm-ing potential (GWP) listed in the Intergov-ernmental Panel on Climate Change’sSecondAssessment Report (IPCC 1996b),to determine the relative heat-trappingability of each gas.The 2002 CAR—the analysis used by
the Bush Administration in setting its in-tensity goal—and the analysis presented inthis 2006 CAR use consistent analyticaltechniques. Baseline projections of energy-related CO2 emissions are developed based
U.S. GHG emissions from energy consumption and other anthropogenic sources are projected to grow from historic levels, although emissionsprojected with the Full Implementation of Climate Programs and Measures are lower than under the Business As Usual baseline.
HISTORICAL GHG EMISSIONS PROJECTED GHG EMISSIONSFull Implementation ofClimate Programs
GREENHOUSE GASES Business As Usual Business As Usual and Measures7
20001 20021 20041 20122 2020 20122 2020Energy-Related CO2
3 5,534 5,502 5,657 6,318 6,931 6,060 6,447Nonenergy CO2
4 331 314 331 361 396 361 396Methane 567 560 557 621 667 599 621Nitrous Oxide 416 407 387 383 399 380 397High GWP Gases 135 133 143 434 622 312 417Adjustments5 0 0 0 -3 52 -3 52
Total Gross Emissions 6,982 6,916 7,074 8,115 9,067 7,709 8,330
Sinks6 -760 -769 -780 -776 -675 -806 -709
Total Net Emissions 6,223 6,147 6,294 7,340 8,392 6,903 7,621
GROSS GHG INTENSITY
GDP (billions of 2000 dollars) $10,075 $13,793 $13,793
Gross GHG Intensity 686 588 559
2002–12 Gross GHG Intensity Reduction -14.3% -18.6%
Notes:1 Historical emissions and sinks data are from U.S. EPA/OAP 2006c. Bunker fuels and biomass combustion are not included in inventory calculations.2 2012 data are interpolated when specific data are unavailable.3 Energy-related CO2 projections are calculated from U.S. DOE/EIA 2006a CO2, with any CO2 from nonenergy sources removed.4 Nonenergy CO2 includes emissions from nonenergy fuel use and other industrial emission sources.5 Adjustments include international bunker fuels and emissions in U.S. territories.6 Sinks projections are extrapolated from U.S. EPA/OAP 2006c, with programs and measures projections from the U.S. Department of Agriculture.7 Programs and measures reductions for 2002 are presented in Chapter 4, but are not shown in this table because historical data are used to calculate the GHG intensity in 2002.Programs and measures reductions shown in this table are net of 2002 reductions for the purpose of calculating the reduction in emissions intensity from the initial implementationof the President’s policy in 2002.
TABLE 5-2 Historical and Projected U.S. Greenhouse Gas Emissions From All Sources (Tg CO2 Eq.)

64 U.S. CLIMATE ACTION REPORT—200664 U.S. CLIMATE ACTION REPORT—2006
(PFCs), and sulfur hexafluoride (SF6)),and then aggregating these using equiva-lence factors. Because some types of GHGemissions cannot be attributed to a partic-ular economic sector, the totals are re-ported in aggregate.U.S. GHG emissions from energy con-
sumption, industrial and agricultural ac-tivities, and other anthropogenic sourcescontinue to grow from 2002 levels asshown in Table 5-2. Gross emissions areprojected to rise under the impetus ofpopulation and economic growth. Underthe Business As Usual path, total gross U.S.GHG emissions would be expected to rise30 percent between 2000 and 2020. How-ever, in the Full Implementation of ClimatePrograms andMeasures case, emissions areprojected to rise from 6,982 Tg CO2 Eq. in2000 to 8,330 Tg CO2 Eq. in 2020, agrowth of 19 percent. Increased efforts touse cleaner fuels, more efficient technolo-gies, and better management methods foragriculture, forestry, mines, and landfillsare projected to keep the growth of GHGemissions below the concurrent growth ofthe U.S. economy.Moreover, emissions ofsome non-CO2 greenhouse gases—e.g.,methane and industrial gases associatedwith the production of aluminum andHCFC-22—have declined from 1990 lev-els and are projected to remain below 1990levels out through 2020.The projected emission levels with full
programs and measures for the year 2020are lower than the levels projected for thesame year in the 2002CAR.Conversely, theactual level of net emissions reported for2000 is higher than the projected value inthe 2002 CAR, mainly due to a revision ofthe available sinks. The sections that followpresent more detailed projections of spe-cific categories of total U.S.GHGemissions.
CO2 Emissions
Energy CO2 EmissionsFrom 2000 to 2020, total CO2 emis-
sions—as calculated with Full Implementa-tion of Climate Programs and Measures—are projected to increase by 17 percent to an
absolute level of 6,843 Tg CO2. The esti-mated level of U.S. CO2 emissions fromfossil fuel combustion for the year 2020 is6,447 Tg CO2. These rising absolute levelsof CO2 emissions occur against a back-ground of growing population and GDP.
Nonenergy CO2 EmissionsNonenergy sources of CO2 emissions
include natural gas production and pro-cessing, cement production, and wastehandling and combustion. These CO2emissions are subject to increasing volun-tary control, as U.S. firms use recapturetechnologies to reduce their emission lev-els. Because the underlying sources are sovaried, there is no clear projectionmethodavailable other than historical extrapola-tion. These nonenergy CO2 emissions areprojected to grow by 1 percent annually,from 331 Tg CO2 in 2000 to 396 Tg CO2in 2020. The total nonenergy CO2 emis-sion estimates in this 2006 CAR are ap-proximately two and a half times higherthan in the 2002 CAR. This is due to theinclusion of significantly more nonenergysources of CO2 emissions.
7
Non-CO2 Greenhouse Gas EmissionsEmissions other than CO2 include
(1) CH4 emissions from natural gas pro-duction and transmission, coal mine op-eration, landfills, and livestock operations;(2) N2O emissions from agriculture and,to a lesser degree, transportation; and (3)HFC, PFC, and SF6 gases from industrialactivities and, in some cases, the life cyclesof the resulting products.
MethaneWith full programs andmeasures, total
CH4 emissions are estimated to increasefrom 567 Tg CO2 Eq. in 2000 to 621 TgCO2 Eq. in 2020 (U.S. EPA/OAP 2006a),primarily due to increases in natural gasusage. The projection of total CH4 emis-sions presented in this report is lower thanthat reported in the 2002 CAR in absolute
terms. This is primarily due to an im-proved inventory accounting model forthe landfill sector, which substantially low-ered projected emissions from the sector.
Nitrous OxideN2O emissions are expected to decline
from 416 Tg CO2 Eq. in 2000 to 397 TgCO2 Eq. in 2020. The largest single sourceof these emissions is agricultural soils.Emissions of N2O from transportation arealso expected to decrease over this period(U.S. EPA/OAP 2006b).
HFCs, PFCs, and SF6Emissions of HFCs, PFCs, and SF6 are
projected to rise from 135 Tg CO2 Eq. in2000 to 417 Tg CO2 Eq. in 2020 (U.S.EPA/OAP 2006b). This increase stemslargely from the use of HFCs as replace-ments for ozone-depleting substances.Growth in the use of HFCs will allow rapidphase-out of chlorofluorocarbons (CFCs),hydrochlorofluorocarbons (HCFCs), andhalons in a number of important applica-tions where other alternatives are notavailable.HFCs are expected to be selected for
applications where they provide superiortechnical reliability or safety (low toxicityand flammability) performance. In manycases,HFCs provide equal or better energyefficiency compared to other available al-ternatives. Moreover, their acceptance inthe market will reduce long-term net en-vironmental impacts, because HFCs areexpected to replace a significant portion ofpast and current demand for CFCs andHCFCs in insulating foams, refrigerationand air-conditioning, propellants used inmetered dose inhalers, and other applica-tions. Emissions of HFCs, PFCs, and SF6from all other industrial sources are ex-pected to be reduced significantly below1990 levels, despite high growth rates ofmanufacturing in some sectors.
7 Since the 2002 CAR, the following CO2 sources have been added to the U.S. inventory: nonenergy use of fuels, iron andsteel production, ammonia production and urea application, petrochemical production, titanium dioxide production,phosphoric acid production, and ferroalloys.

CHAPTER 5—PROJECTED GREENHOUSE GAS EMISSIONS 65CHAPTER 5—PROJECTED GREENHOUSE GAS EMISSIONS 65
jected to increase by 2020, according toUSDA estimates.
KEY UNCERTAINTIES AFFECTINGPROJECTED GREENHOUSE GASEMISSIONSAny projection of future emissions is
subject to considerable uncertainty. In theshort term (less than 5 years), the key fac-tors that can increase or decrease esti-mated net emissions include unexpectedchanges in retail energy prices, shifts in thecompetitive relationship between naturalgas and coal in electricity generationmar-kets, changes in economic growth, abnor-mal winter or summer temperatures, andimperfect forecastingmethods.Additionalfactors may influence emission rates overthe longer term, notably technology devel-opments, shifts in the composition of eco-nomic activity, and changes ingovernment policies.
Technology DevelopmentForecasts of net U.S. emissions of
GHGs take into consideration likely im-provements in technology over time. Forexample, technology-based energy-efficiency gains, which have contributed toreductions in U.S. energy intensity formore than 30 years, are expected to con-tinue. However, while long-term trends intechnology are often predictable, the spe-cific areas in which significant technologyimprovements will occur and the specificnew technologies that will become domi-nant in commercial markets are highlyuncertain, especially over the long term.Unexpected scientific and technical
breakthroughs can cause changes in eco-nomic activities, with dramatic effects onpatterns of energy production and use.Such breakthroughs could enable theUnited States to considerably reduce fu-ture GHG emissions. While U.S. govern-ment and private support of research anddevelopment efforts can accelerate the rate
of technology change, the effect of suchsupport on specific technology develop-ments is unpredictable.The AEO 2006 Business As Usual
baseline referenced in this report assumescontinuing improvement of energy-consuming and -producing technologies,consistent with historical trends. In theAEO 2006 high technology growth case,energy use in 2020 is projected to be 5 per-cent lower than in the reference case, whileCO2 emissions are projected to be 5 per-cent (or 385 Tg) lower than in the refer-ence case.
Regulatory or Statutory ChangesThe current forecast of U.S.GHG emis-
sions does not include the effects of anylegislative or regulatory action that was notfinalized before October 31, 2005. Conse-quently, the forecast does not include anyincrease in the stringency of equipmentefficiency standards, even though exist-ing law requires DOE to periodicallystrengthen its existing standards and issuenew standards for other products. Simi-larly, the forecast does not assume any fu-ture increase in new building or auto fueleconomy standards, even though such in-creases are either required by law or underconsideration in various states. For exam-ple, while the AEO 2006 includes theCAFE standards for light trucks covering2005–07 and finalized in 2003, the morerecent standards covering 2008–11 werenot finalized in time to be incorporated.
Energy PricesThe relationship between energy prices
and emissions is complex. Lower energyprices generally reduce the incentive forenergy conservation and tend to encour-age increased energy use and related emis-sions. However, a reduction in the price ofnatural gas relative to other fuels could en-courage fuel switching that could, in turn,reduce carbon emissions. Alternatively,
Carbon SequestrationU.S. forests and agricultural soils ac-
count for a significant removal of CO2from the atmosphere, representing 11 per-cent of total gross U.S. CO2 emissions in2000. This net removal—or sequestra-tion—is related to a continuation of trendsin land use and land management ob-served throughout the 1990s in theforestry and agriculture sectors, includingthe reforestation and regeneration of pre-viously cleared forests and expanded useof no-till and reduced-tillage systems inagriculture.While significant in quantity, the car-
bon sequestration that occurred in U.S.forests and agricultural soils prior to 2000occurred in the absence of government in-centives to sequester carbon. Since 2000,the U.S. government has implemented anumber of innovations in its farm sectorconservation programs to encourage pri-vate landowners to voluntarily adopt landuses and management practices that se-quester additional carbon in forest systemsand agricultural soils. Examples include aprogram to plant 203,250 hectares(500,000 acres) of bottomland hardwoodforest (primarily in the Mississippi RiverValley) and revised ranking criteria for pri-oritizing lands offered for enrollment inUSDA’s Environmental Quality IncentivesProgram and Conservation Reserve Pro-gram. These revised criteria allow federalprogram managers to give additionalweight to bids that include the implemen-tation of activities and/or practices that se-quester carbon.Table 5-2 shows both recent historical
data and projections for 2012 and 2020 forannual carbon sequestration (i.e., sinks) inU.S. forests and agricultural soils.8 Seques-tration associated with forests includescarbon stored in the forest ecosystem,wood products in use, and wood productsin landfills. Annual carbon sequestrationdue to innovative farm conservation pro-grams (e.g., encouraging landowners toadopt carbon-sequestering land usesand/or management practices) is pro-
8 The projections for carbon sequestration are lower than the corresponding projections in the 2002 CAR due to revisedinventory methods. An explanation of the revision has been provided to the UNFCCC in the 2002 edition of the Inventoryof U.S. Greenhouse Gas Emissions and Sinks (U.S. EPA/OAP 2002), available at <http://yosemite.epa.gov/oar/globalwarming.nsf/content/ResourceCenterPublicationsGHGEmissionsUSEmissionsInventory2002.html>.

66 U.S. CLIMATE ACTION REPORT—200666 U.S. CLIMATE ACTION REPORT—2006
coal could become more competitive vis-à-vis natural gas, which could increaseemissions from the power sector.TheAEO 2006 projections reflect a shift
in oil market assumptions, with projectedoil prices substantially higher than in pre-vious editions (U.S. DOE/EIA 2006a).However energy and oil price projectionsare subject to significant uncertainty. De-creases in delivered energy prices could re-sult from increased competition in theelectric utility sector or improved technol-ogy. On the other hand, energy price in-creases could result from the faster thanexpected depletion of oil and gas re-sources, or from political or other disrup-tions in oil-producing countries.
Economic GrowthEconomic growth increases the future
demand for energy services, such as vehiclemiles traveled, amount of lighted and ven-tilated space, and process heat used in in-
dustrial production.However, growth alsostimulates capital investment and reducesthe average age of the capital stock, in-creasing its average energy efficiency. Theenergy-service demand and energy-efficiency effects of economic growth workin opposing directions.However, the effecton service demand is the stronger of thetwo, so that levels of primary energy useare positively correlated with the size of theeconomy.In addition to the reference case cited
previously, the AEO 2006 provides highand low economic growth cases. The high-growth case raises the GDP growth rate by0.5 percentage points to 3.5 percent, whilethe low-growth case reduces the GDPgrowth rate by 0.6 percentage points to 2.4percent.• In the high-growth case, 2020 energyuse is 5 percent higher than in the refer-ence case. By 2020, carbon emissions
from energy use are 423 Tg CO2 (6.1percent) greater than in the referencecase.• In the low-growth case, 2020 energy useis 6 percent lower than in the referencecase.By 2020, carbon emissions from en-ergy use are 399 Tg CO2 (5.8 percent)lower than in the reference case.
WeatherEnergy use for heating and cooling is di-
rectly responsive to weather variation. TheAEO forecast of CO2 emissions assumes30-year average values for population-weighted heating and cooling degree-days.Unlike other sources of uncertainty, forwhich deviations between assumed and ac-tual trends may follow a persistent courseover time, the effect of weather on energyuse and emissions in any particular year islargely independent from year to year.

The United States is involved in a wide array of climate assessments, research, andother activities at the local, regional, national, and international levels to increaseunderstanding of impacts and vulnerability needed to initiate effective adaptation
measures. These activities range from assessments of adaptation options for a specific sec-toral impact in one locale to the modeling of potential impacts worldwide. They informdecision-making processes at all levels and help to increase societal resilience to climatechanges. Many of the most successful U.S. programs are demand-driven—they generateresearch or spur activities in response to the needs and priorities identified by decisionmakers to address current and near-term risks and opportunities.
The 2002 U.S. Climate Action Report (2002 CAR) highlighted findings from the Na-tional Assessment of climate change impacts on the United States (NAST 2000), and thoseof the Intergovernmental Panel on Climate Change (IPCC 2001a, b). The United Statescontinues to use a range of peer-reviewed scientific outputs to inform decision makingwith regard to climate impacts, spanning domestic scientific articles and assessments tointernational assessments, such as those of the IPCC.
Since the release of the 2002 CAR, and as described in the Strategic Plan of the U.S. Cli-mate Change Science Program (CCSP and SGCR 2003a), the U.S. government has under-taken an ambitious suite of focused assessments addressing high-priority researchquestions. This open, transparent approach communicates scientific analyses to the publicvia a set of 21 synthesis and assessment products developed by the U.S. Climate ChangeScience Program (CCSP). These products consider, evaluate, and summarize the currentstate of understanding in critical areas related to climate change, its ongoing and potentialimpacts, and options for responding to these changes. This material is intended for use bya diverse group of decision makers, stakeholders, communicators (e.g., the media), andscientists. The material addresses the Nation’s need for sound scientific information thatcan lead to a better understanding of climate change impacts and vulnerabilities, as wellimproved design and implementation of adaptation measures. As with previous CCSPoutputs, the synthesis and assessment products are reviewed by government and non-government scientists, U.S. government officials, stakeholders, and the general public.These products build on and integrate cutting-edge research and application activities,advanced over the years by the interagency research efforts in climate and global change.1
The synthesis and assessment products highlighted in this chapter will provide analysesof ongoing and potential impacts of climate variability and change, adaptability of keysystems, andmeasures that may be taken to reduce vulnerability. Althoughmany of theseproducts are currently under development, the United States also has participated in anumber of international climate change assessments that include consideration of
6VulnerabilityAssessment, ClimateChange Impacts, andAdaptation Measures
VulnerabilityAssessment, ClimateChange Impacts, andAdaptation Measures
1 More information about CCSP and the synthesis and assessment products may be found in Chapter 8 and at<www.climatescience.gov>.

68 U.S. CLIMATE ACTION REPORT—200668 U.S. CLIMATE ACTION REPORT—2006
Many of these activities are leading todemonstrable reductions in socioeco-nomic and environmental vulnerability toclimate variability and change.
DEVELOPING RESILIENT SOCIETIESAND ECONOMIES
The ultimate goal of adaptation is todevelop resilient societies and economiesthat have the knowledge and capacity toaddress both the challenges and the op-portunities presented by changing climaticconditions. Climate change will alter pat-terns of climate variability in unknownways. Resilience is a matter of reducingpresent vulnerability as well as minimizingthe risk of future vulnerability to climateevents. Efforts to help sensitive popula-tions adapt to current climate variabilityhave shown that socioeconomic, environ-mental, and climatic stresses are all con-nected. Future changes in these conditionscould substantially alter the environmentin which adaptation must take place. Thefull range of likely future stresses must beconsidered. To be sustainable, adaptationefforts must consider options that buildresilience to these stresses (Goklany 1995,2007).
Decision makers and planners in suchclimate-dependent sectors as agricultureand water generally consider historicalpatterns of climate variability and extremeevents, particularly those that have oc-curred relatively recently. These includeconsiderations of variations at short timescales (e.g., seasonal and annual varia-tions). Relatively few decision makers,however, consider variations in climatethat occur on longer time scales (e.g.,decades to a century). Moreover, decisionmakers do not typically consider how po-tential climate change could cause patternsof climate variability to differ from histor-ical trends. Although scenario-based as-sessments regarding the future do notalways agree on the type or direction ofchange that might occur, and these dis-agreements often increase at smaller geo-graphical scales, global and regionalclimate models provide a range of projec-tions that can be helpful in communicat-ing climate risks to regional decisionmakers.
A key component in building resilienceinto human and natural systems is to ex-pand scientific understanding of the na-ture and implications of climate variabilityand change across sectors, often within aplace-specific framework that considersthe socioeconomic and institutional ca-pacities and decision-making practices.Lessons from early research investmentsintended to increase understanding of thehuman and natural sources of vulnerabil-ity to climate variability and change haveprofoundly influenced the approach of thecurrent U.S. research program. As calledfor in the CCSP strategic plan, researchpartnerships have been initiated and sus-tained in some regions to involve decisionmakers in the process of identifyingknowledge gaps of the highest relevance totheir decision processes (CCSP and SGCR2003a). These partnerships have also ex-ploredmechanisms for improving the util-ity and flow of knowledge from theresearch community to those who can useand benefit from it.
projected impacts and adaptation of rele-vance to the Nation (see Box 6-1).In addi-tion, this chapter focuses on activities theUnited States is undertaking to assess andrespond to specific types of impacts andvulnerability, in accordance withArticle 12of the U.N. Framework Convention onClimate Change. It also highlights ongoingU.S. efforts that are generating new in-sights into the potential impacts of climatechange on key physical and biologicalprocesses (e.g., snowpack changes, stream-flow, drought, extreme events, biodiver-sity) and changing resilience andvulnerability in a range of socioeconomicsectors (e.g., energy, forestry, agriculture,coastal systems, human health, and trans-portation). It provides an overview of thecurrent U.S. government approach towardcharacterizing and reducing uncertaintyassociated with specific climate-related is-sues and providing practical scientific in-formation and tools to decisionmakers viaCCSP and other mechanisms.Often theseactivities take place within broader activi-ties to improve sectoral risk managementwithin the context of many changing so-cial, economic, and environmental factors.
BOX 6-1 U.S. Participation in International Impact Assessments
Since the 2002 CAR, the United States has participated in two significant internationalassessments that address projected impacts of climate change on the United States—although within the larger context of the North American and Arctic regions. In the ArcticClimate Impact Assessment (AC and IASC 2004), the authors found that:• Arctic climate is now warming rapidly, and much larger changes are projected.• Arctic warming and its consequences have worldwide implications.• Arctic vegetation zones are very likely to shift, causing wide-ranging impacts.• Animal species' diversity, ranges, and distribution will change.• Many coastal communities and facilities face increasing exposure to storms.• Reduced sea ice is very likely to increase marine transport and access to resources.• Thawing ground will disrupt transportation, buildings, and other infrastructure.• Indigenous communities are facing major economic and cultural impacts.• Elevated ultraviolet radiation levels will affect people, plants, and animals.• Multiple influences interact to cause impacts to people and ecosystems.
Current information on impacts on polar regions and on the North American region can alsobe found in the Working Group II Contribution to the Intergovernmental Panel on ClimateChange (IPCC) Fourth Assessment Report: Climate Change Impacts, Adaptation andVulnerability. The United States is an active participant in the creation of this report, which willbe completed in November 2007. The most recent findings of the IPCC are available at<http://www.ipcc.ch/>.

CHAPTER 6—VULNERABILITY ASSESSMENT, CLIMATE CHANGE IMPACTS, AND ADAPTATION MEASURES 69CHAPTER 6—VULNERABILITY ASSESSMENT, CLIMATE CHANGE IMPACTS, AND ADAPTATION MEASURES 69
BOX 6-2 Sample U.S. Climate Vulnerability and Change ResearchPrograms and Activities
The U.S. government supports several programs and activities that are working to assess theimpacts of climate change and reduce vulnerability across sectors. Following is a samplecross-section of the types of programs being carried out at all levels to build resilience intohuman and natural systems.
International Programs and Activities
NASA and USAID Regional HubsThe National Aeronautics and Space Administration (NASA) and the U.S. Agency forInternational Development (USAID) are developing regional hubs around the world to applyremotely sensed information to development assistance. Based on the successful SERVIRhub in Central America, this activity will link available data streams to new applications,develop tools, and build local human and institutional capacity to use this information. Thesesystems will support decision making in a number of areas, including climate change, landmanagement, urban planning, food security, agriculture, and disaster mitigation.
USAID Climate Change ProgramOften in partnership with other agencies, USAID leads a number of activities to help builddeveloping country capacity to understand climate change and adapt to its impacts. ItsClimate Change Program conducts projects to test methodologies to insert climate informationin mainstream development project planning. The projects emphasize stakeholderparticipation. For example, USAID:• worked with farmers in Mali, planting crop varieties that are better suited to a hotter
climate;• helped local stakeholders in South Africa identify water demand management and
infrastructure requirements as climate changes;• addressed flooding concerns with coastal residents, businesses, and planning officials in
Honduras; and• helped fishermen and farmers in Thailand determine how to build resilience to warming
temperatures and more variable rains.
Lessons learned from these projects informed the development of an adaptation guidancemanual, which is being applied in additional projects in cooperation with USAID missionsaround the world. The manual will be disseminated to USAIDmissions and other developmentpartners to ensure the methods and tools are used broadly.
Local to National Programs and Activities
NASA Applied Sciences ProgramThis program benchmarks practical uses of NASA-sponsored observations from Earthobservation systems and predictions from Earth science models. NASA implements projectsthat carry forth this mission through partnerships with public, private, and academicorganizations developing innovative approaches for using Earth system science informationto provide decision support that can be adapted in applications worldwide. The programfocuses on applications of national priority to expand and accelerate the use of knowledge,science, and technologies resulting from the NASA goal of improving predictions in the areasof weather, climate, and natural hazards.2
EPA Global Change Research ProgramThe primary emphasis of this U.S. Environmental Protection Agency (EPA) assessment-orientedprogram is understanding the potential consequences of climate variability and change onhuman health, ecosystems, and socioeconomic systems in the United States. This work entails(1) improving the scientific basis for evaluating the effects of global change in the context ofother stressors and human dimensions (as humans are catalysts of and respond to globalchange), (2) conducting assessments of the risks and opportunities presented by global change,and (3) assessing adaptation options to improve society’s ability to effectively respond to thoserisks and opportunities as they emerge. EPA’s intramural assessment program has four areasof emphasis: (1) human health, (2) air quality, (3) water quality, and (4) ecosystem health. In anattempt to capitalize on expertise in the academic community, a significant portion of theprogram’s resources are dedicated to extramural research grants administered through EPA’sSTAR (Science to Achieve Results) grants program, which supports science related toassessments of consequences of global change and human dimensions research. 3
Box 6-2 presents a cross-section of thetypes of programs being carried out by theUnited States at the international, federal,state, and local levels to assess impacts ofclimate change and reduce vulnerability.This list is not comprehensive; rather it isa small sample of the relevant activitiesbeing carried out on a variety of scales inthe United States. A continuing goal is acoherent program that allows synergiesamong these many and varied programs.
SECTOR-SPECIFIC U.S.ADAPTATION ACTIVITIES
The sector- and region-specific projectsin this section illustrate the variety andscale of adaptation methods utilizedwithin the United States. They representonly a small sample of key areas of inves-tigation the United States has undertakenin its extensive portfolio of past and cur-rent adaptation activities.
Water ResourcesChanges in atmospheric, surface, and
subsurface water storage and flow havebeen observed over the past severaldecades in the United States (Groisman etal. 2004). Whether due to anthropogenicor natural causes, these changes have sig-nificant implications for the provision ofadequate water supply for human con-sumption, agriculture, energy production,industrial uses, and other needs. Whilepopulation growth, pollution, and indus-trial development add stresses to the watersupply (U.S.DOI 2003), climate variationsand change may significantly exacerbatewater supply issues.
For example, despite increases in winterprecipitation, in many places a large per-centage of the traditionally snow-coveredareas of the northwestern United Stateshas experienced a decline in spring snow-pack, especially since the middle of the20th century (Mote et al. 2005). Thelargest decreases have occurred at lowerelevations where snowpack is most sensi-tive to temperature and in regions where
2 See <http://science.hq.nasa.gov/earth-sun/aplications/index.html>.
3 See <http://cfpub.epa.gov/gcrp/about_ov.cfm>.

in spring snow cover over the region dur-ing the last half century (Groisman et al.2004), and about a one-week advancesince the mid-1960s in the timing of peaksnowmelt in northern Alaska (Stone et al.2002). The peak of streamflow in the Pa-
winter temperatures are mild, especially inthe CascadeMountains and northern Cal-ifornia. Substantial declines in snow-waterequivalent have been observed in lower el-evations of the Pacific Northwest (Mote2003), along with a significant reduction
70 U.S. CLIMATE ACTION REPORT—200670 U.S. CLIMATE ACTION REPORT—2006
cific Northwest and New England, inbasins dominated by snowmelt, has typi-cally advanced by 1–2 weeks (Groisman etal. 2004; Hodgkins et al. 2003), therebyproviding less river runoff during the latespring and summer.
Another example of potential changesis the severe and extreme drought that is arecurring feature across much of theUnited States. Research suggests that abroad array of physical mechanisms con-tributes to droughts, from internal atmos-pheric variability on the shortest timescales, to interactions with oceans andland surface at seasonal-to-decadal andlonger time scales.Among recent scientificstudies is one suggesting that drought con-ditions in the 1998–2002 time frame overNorth America, parts of southern Europe,and southwest Asia were linked to partic-ular ocean conditions (Hoerling andKumar 2003). Cold sea-surface tempera-tures in the eastern tropical Pacific and un-precedented warm sea-surface conditionsin the western tropical Pacific and IndianOceans worked synergistically to causewidespread drying in the mid-latitudes.This synergy suggests an increased risk forsevere and synchronized drying of North-ern Hemisphere mid-latitudes if similaroceanic conditions occur in the future.The warmer temperatures projected withrising concentrations of greenhouse gasesare expected to exacerbate present risks ofdrought in the United States by increasingthe rate of evaporation (Gleick 2000).However, the effects of drought and low soilmoisture on vegetation, including crops,may be offset by higher CO2 levels—or atleast partly offset for a period of time (e.g.,Triggs et al. 2004; Nelson et al. 2004).
Regional Integrated Sciences andAssessments
Federally funded researchers are work-ing with water and ecosystemmanagers as
BOX 6-2 (Continued) Sample U.S. Climate Vulnerability and ChangeResearch Programs and Activities
NSF Decision Making Under Uncertainty CentersThese National Science Foundation (NSF) centers are comprised of five interdisciplinaryresearch teams studying important aspects of problems associated with understandingclimate-related decisions under uncertainty. The increased knowledge generated by recentscientific research on the causes and consequences of climate change and variability has ledto a growing need to better understand how decision makers choose among alternativecourses of action. These teams are expected to produce new insights of interest to theacademic community, generate significant educational benefits, and develop new tools thatwill benefit decision makers and a range of stakeholders. Research centers are located atArizona State, Carnegie-Mellon, and Columbia universities. Other interdisciplinary teams areconducting research at the University of Colorado at Boulder and Rand Corporation in SantaMonica, California.
National Water and Climate CenterAdministered by the U.S. Department of Agriculture’s Natural Resources Conservation Service,the National Water and Climate Center (NWCC) focuses on providing leadership in apartnership effort to help people conserve, improve, and sustain their natural resources andenvironment. NWCC’s mission is to lead the development and transfer of water and climateinformation and technology that support natural resource conservation through naturalresource planning support, data acquisition and management, technology innovation andtransfer, and partnerships and joint ventures.4
Regional Program
Regional Integrated Sciences and Assessments (RISA) ProgramThe National Oceanic and Atmospheric Administration’s (NOAA’s) RISA program supportsresearch that addresses complex climate-sensitive regional issues of concern to decisionmakers and policy planners. RISA research teammembers are primarily based at universities,though some are based at government research facilities, nonprofit organizations, and private-sector entities. Research areas include the fisheries, water, wildfire, and agriculture sectors,coastal restoration, and climate-sensitive public health issues.5
State Program
California Climate Change CenterThe center investigates the range of possible changes to California’s climate and the likelihoodand rate of progression of such changes. Using the results of this work, the center is assessingthe potential future economic and ecological consequences of climate change for California,and is examining a range of impacts and adaptation options concerning, e.g., agriculture andwater resources, as well as mitigation strategies. The center manages a robust researchprogram with a dynamic community of California researchers from various scientificdisciplines and a worldwide network of peers collaborating on climate change issues ofinterest to California.6
Local Program
King County Global Warming InitiativeWashington State’s King County is pursuing aggressive strategies to reduce and adapt toglobal warming in each of the following areas: land use, public transportation, innovativeenvironmental management, and development of clean energy technologies. The county isone of several jurisdictions that are accounting for climate change in their short- and long-term infrastructural planning. Specific actions being taken by King County that accountexplicitly for climate change include developing a flood plan and proposed major upgrades inits 119 miles of levees on local rivers, as well as constructing a $28 million reclaimed watersystem to help address expected water shortages.7
4 See <http://www.wcc.nrcs.usda.gov/>.5 See <http://www.climate.noaa.gov/cpo_pa/risa/>.6 See <http://www.climatechange.ca.gov/research/index. html>.
7 See <http://www.metrokc.gov/globalwarming/default.sapx>.

CHAPTER 6—VULNERABILITY ASSESSMENT, CLIMATE CHANGE IMPACTS, AND ADAPTATION MEASURES 71CHAPTER 6—VULNERABILITY ASSESSMENT, CLIMATE CHANGE IMPACTS, AND ADAPTATION MEASURES 71
new insights and techniques become avail-able, allowing incorporation of scientificdata and information into near- and long-term planning. NOAA’s Climate ProgramOffice funds eight programs designed toprovide the Nation with experience-basedknowledge about how to provide climateservices (see Box 6-1).8 Called Regional In-tegrated Sciences and Assessments(RISAs), these programs are an importantelement of CCSP’s efforts to support deci-sionmaking on climate-related issues. Fol-lowing are some sample RISA programs.
Climate Impacts Group—The Univer-sity of Washington’s Climate ImpactsGroup (CIG) is using emerging know-ledge to help inform decision makingrelated to changing hydroclimatic condi-tions in the Pacific Northwest. CIG isutilizing its hydrologic modeling and pre-diction capabilities to evaluate water re-source issues, including the consequencesof alternative water and hydroelectricpower management strategies for salmonrestoration efforts, and the consequencesof changing water demands and changesin land cover for regional water resources.9
Western Water Assessment—The Wes-ternWater Assessment (WWA) is examin-ing the interplay between changinghydrologic and climatic conditions, andthe complex array of intrastate, interstate,and international water agreements in theColorado River Basin. Recent analyses in-dicate that current “assumptions aboutplanning in the Colorado basin [are not]borne out by the climate record [of naturalvariability] and by projections of change”(Pulwarty et al. 2005).Working with watermanagers, WWA researchers have ana-lyzed how interannual-to-multidecadalclimate variability affects critical water is-sues and what climate information can beused in the resourcemanagement decisionprocess to meet multiple and expandingwater uses in the basin.10 Usingmultidisci-plinary teams of experts in climate, water,law, and economics,WWAprovides infor-mation (usually in the form of climateforecasts and regional vulnerability assess-ments) designed to assist water-resource
decisionmakers, such as those responsiblefor managing Denver’s water supply.
Climate Assessment for the South-west—A RISA based at the University ofArizona, titled the Climate Assessment forthe Southwest,11 is developing and usingnew information on drought to increasesocietal resilience to this recurrent phe-nomenon. The impacts of U.S. droughtduring the last 5–7 years have includedsustained and extensive economic losses,significantly reduced reservoir levels, wateremergencies, and widespread and severewildfires.
Creating amore drought-resilient soci-ety requires a fundamental shift from crisismanagement to risk management. Inves-tigators studying the impacts of droughtare researching the historical record, evolv-ing demographics and population growth,water law, and ecosystem management.For example, they are working to developmethods to utilize seasonal climate andstreamflow forecasts more effectively tomitigate the impact of drought on watersupplies. This type of knowledge is ex-pected to become even more valuable inthe coming decades, if climate model pro-jections of increasing aridity in continentalinteriors prove accurate.
National Integrated DroughtInformation System
The sustained drought in parts of theU.S.West has exposed critical vulnerabili-ties and has revealed the effects of multiplestresses on institutions designed under dif-ferent climatological circumstances. Thisexperience has prompted advances in pre-paredness and a national-scale responsethrough the development of a National In-tegrated Drought Information System(NIDIS) (WGA 2004). NIDIS is de-signed as a user-based drought informa-tion system that assesses potential droughtindicators and impacts to provide toolsfor anticipating, preparing for, and miti-gating the effects of drought. U.S. govern-ment services and research aim to providethe scientific knowledge needed for U.S.public and private sectors to anticipate,
track, assess, and respond to droughtthreats at regional and local levels.12
New York City Task Force onClimate Change
As in the U.S. West, water issues are ofconcern in the eastern half of the countryas well. The NewYork City Department ofEnvironmental Protection,which provideswater for 9million people in the NewYorkmetropolitan region, has created a TaskForce on Climate Change that is compre-hensively addressing climate variabilityand change (Rosenzweig et al. 2007). Thetask force has developed a robust, dy-namic, scenario framework for the region;built a set of adaptation assessment stepsthat characterizes potential adaptations asoperations/management, infrastructure,or policy; and identified key vulnerabili-ties, such as sea level rise for sewer andwastewater treatment systems and theneed for integrated modeling of upstateregions of water supply and reservoirs.
EcosystemsClimate is an important factor influ-
encing the distribution, structure, func-tion, and services of ecosystems. Ongoingclimate changes are interacting with otherenvironmental changes to affect biodiver-sity and the future condition of ecosystems(e.g., IPCC 2001b; McCarty 2001;Parmesan and Yohe 2003). Significant cli-mate change would affect many U.S.ecosystems, including wetlands, forests,grasslands, rivers, and lakes (NRC 2001).The extent to which ecosystem conditionswill be affected will depend on the magni-tude of climate change, the degree of sensi-tivity of the ecosystem and nonclimatepressures on biodiversity to that change, theavailability of adaptation options for effec-tive ecosystem management, and the will-ingness to deploy those options.
8 See <http://www.climate.noaa.gov/cpo_pa/risa/>.9 See <http://www.cses.washington.edu/cig/res/hwr/hwr.shtml>.
10 See <http://wwa.colorado.edu/about/>.11 See <http://www.ispe.arizona.edu/climas>.12 For example, see <http://www.drought.noaa.gov/>.

72 U.S. CLIMATE ACTION REPORT—200672 U.S. CLIMATE ACTION REPORT—2006
tion or resources may impede successfulimplementation. In some cases, managersmay not have the knowledge or informa-tion they need to address climate changeimpacts. In other instances, managers mayunderstand the issues and have the relevantinformation but lack resources to imple-ment adaptation options. Furthermore,even with improvement in the knowledgeand communication of available andemerging adaptation strategies, the feasibil-ity and effectiveness of adaptation will de-pend on the adaptive capacity of theecological system or social entity.
Thus, increasing adaptive capacity willrequire information and tools that aid in(1) understanding the combined effects onecosystems of climate changes and noncli-mate stressors, and consequent implica-tions for achieving specific managementgoals; (2) applying existing managementoptions or developing new adaptation ap-proaches that reduce the risk of negativeoutcomes; and (3) understanding the op-portunities and barriers that affect success-ful implementation of managementstrategies to address climate change im-pacts.
CCSP’s Ecosystem Adaptation WorkOne example of work by CCSP in im-
proving the adaptive capacity of ecosystemsrelates to understanding climate and wild-fire interactions on a regional scale for thewestern United States (Roads et al. 2005;Reinbold et al. 2004), development of long-lead forecasts for use by wildfire managers(Brown et al. 2003), and compilation of acomprehensive new western U.S. 21-yearfire history to facilitate climate-based pre-dictions of the potential severity of the fireseason several months in advance (Wester-ling et al. 2003).TheUnited States supportsyearly regional meetings to prepare fireforecasts that integrate the complex patternof fire potential anomalies, current andevolving climate conditions, fuel types, ex-tended climate predictions, and disturbancefactors, such as drought- or insect-inducedforest mortality.13
Another example of CCSP’s adaptationwork related to managed ecosystems in-
volves the agricultural sector. Building onassessments of the impacts of El Niño onparticular crops, and interactions withfarmers and extension agents,U.S. researchscientists are contributing information andclimate predictions tailored to the specificneeds of farmers, enabling them to plan inadvance seasons, or longer, to increase pro-ductivity and decrease exposure.14Methodsare also currently being developed for lim-iting potential damages from global warm-ing in irrigated and rain-fed croppingsystems,while sustaining agricultural yields.
The polar and subpolar regions, anotherCCSP priority, have exhibited more rapidchanges than the lower latitudes (AC andIASC 2004). The U.S. Army Cold RegionsResearch and Engineering Laboratory(CRREL) is the leadU.S. government labo-ratory for polar and subpolar expertise.CRREL research has examined the impactsof climate change on retreating Arctic seaice to assist in defining the requirements forU.S.Coast Guard ice-breaking ships for thenext 30 years. Satellite data show that the ex-tent of Arctic sea ice has decreased by about10 percent, and the upward-looking sonardata from U.S. Navy submarines between1957 and 2000 show the average ice thick-ness has decreased by 33–42 percent.
State-of-the-art knowledge on ecosys-tem impacts, adaptation, and vulnerabilitywill be addressed in three different CCSPsynthesis and assessment products: S&AProduct 4.2, State-of-Knowledge of Thresh-olds of Change That Could Lead toDiscontinuities in Some Ecosystems andClimate-Sensitive Resources; S&A Product4.3, The Effects of Climate Change on Agri-culture, Biodiversity, Land, and Water Re-sources; and S&A Product 4.4, PreliminaryReview of Adaptation Options for Climate-Sensitive Ecosystems and Resources.
International Ecosystem AdaptationActivities
Internationally, theUnited States collab-orates with developing country partners ina broad range of activities designed to betterunderstand climate and its implications fordevelopment and to build resilience to cli-mate variability and change.These activities
Adaptation Strategies and OptionsCCSP addresses management strategies
for facilitating ecosystem adaptation to cli-mate variability and change. The goal ofthese adaptation strategies is to reduce therisk of adverse outcomes through activitiesthat increase the resilience of ecological sys-tems to climate change, and to take advan-tage of positive outcomes (Turner et al.2003; Tompkins and Adger 2004; Schefferet al. 2001). Because changes in the climatesystem are likely to persist into the futureregardless of emissions mitigation, adapta-tion is an essential response for future pro-tection of climate-sensitive ecosystems.
Adaptation options for enhancingecosystem resilience include changes inprocesses, practices, or structures to reduceanticipated damages or enhance beneficialresponses associatedwith climate variabilityand change. In some cases, opportunitiesfor adaptation offer stakeholders multiplebenefit outcomes, such as the addition of ri-parian buffer strips that, for example,man-age pollution loadings from agriculturalland into rivers or provide a protective bar-rier to increases in both pollution and sed-iment loadings that may be associated withfuture climate or other environmentalchange. Adaptation options also includemeasures that would reduce current vulner-abilities to ecosystems—e.g., loss of habitatand migratory corridors—by enhancingthe productivity of current food and agri-cultural practices (Goklany 1995, 1998,2007). Such options could reduce what isfrequently considered to be an importantthreat to biodiversity, as well as conservecarbon stocks and sinks, but the potentialfor those systems to be affected by a chang-ing climate needs to be taken into accountas adaptation and mitigation options areevaluated.
A range of adaptation options is possibleformany ecosystems, but a lack of informa-
13 For example, see <http://www.iawfonline.org/conferences.shtml>, <http://www.sftrforest.org>,<http://www.wildfirecolorado.org>, <http://www.stateforesters.org>.
14 For example, see <http://www.agclimate.org/Development/apps/agClimate/controller/perl/agClimate.pl>.
include analyzing data fromEarth observa-tions, developing decision-support tools,and integrating climate information intodevelopment projects. For example,USAIDand NOAA collaborate with developingcountry partners to operate the FamineEarly Warning System Network (FEWSNET), which combines data from satelliteobservations with local meteorological,crop, and livelihood information to providedecision makers with early warnings offood security risks. FEWS NET operates in21 countries and has been providing earlywarnings for 20 years. Similar programs arebeing developed towarn of risks of malaria,meningitis, and pests.
Public HealthThroughout theworld, the prevalence of
some diseases and other threats to humanhealth depends largely on local climate.Given the complexity of the factors that in-fluence human health, assessing health im-pacts related to climate change poses adifficult challenge (NRC 2001). The extentand nature of climate change impacts onhuman health vary by region, by relativesensitivity of population groups, by the ex-tent and duration of exposure to climatechange itself, and by society’s ability toadapt to or cope with the change (Rose etal. 2001). The U.S. government has under-taken several initiatives to better understandand to develop and implement responses tothese potential changes.
Centers for Disease Control andPrevention Research
A variety of efforts are underway in theUnited States to reduce negative healthoutcomes related to climate variability andchange. For example, the Division of Envi-ronmental Hazards and Health Effectswithin the U.S.Department of Health andHuman Services’Centers for Disease Con-trol and Prevention (CDC) conducts in-tramural research to investigate morbidityand mortality associated with exposure toexcessive heat. Also, renewed concernabout emerging and re-emerging infec-tious diseases has prompted increased at-tention to a variety of diseases whoseincidence would be affected by environ-
mental change. CDC’s Division of Vector-Borne Infectious Diseases is currently col-laborating on studies to outline adaptationmeasures for vector-borne infectious dis-eases that may be affected by climatechange. Its Guatemala field station isstudying the impact that adverse climato-logical events, such as El Niño andHurricane Gilbert, have had on the trans-mission dynamics of malaria and otherdiseases. These catastrophic events resultin tremendous changes that can simulta-neously create new vector habitat, reducethe levels of sanitation, and overwhelm theability of public health systems to respond.
Global Change Research ProgramAssessments
EPA’s Global Change Research Programis undertaking important work assessingthe relationships between climate changeand human health. This assessment workgoes beyond basic epidemiological re-search to develop integrated health assess-ment frameworks that consider the effectsof multiple stresses, their interactions, andhuman adaptive responses. Along withhealth sector assessments, conducted inconjunction with the U.S. Global ChangeResearch Program’s National Assessmentprocess, the work includes research andassessment activities focused on the con-sequences of global change on weather-related morbidity and vector- and water-borne diseases. In addition, the resultsfrom the Global Change Research Pro-gram's air quality assessments will be usedto evaluate health consequences.15
Decision-Support ToolsOne example of a decision-support
tool that has been developed to help re-duce the negative effects of climate vari-ability and change on human health iswork on encephalitis viruses. The risk ofinfection from these viruses depends inpart on temperature-related factors.Activ-ities are underway that use climate fore-casting at various spatial scales to alertlocal and state public health officials tochanging risks of encephalitis infection. Arisk model has been developed that char-acterizes climate factors related to en-
cephalitis outbreaks (e.g., indicators forrainfall, runoff, and temperature) in Cali-fornia. Themodel demonstrates that mos-quito abundance patterns and associatedpatterns of encephalitis risk vary spatiallyacross the different biomes of Californiaand show strong links to climate variations(Barker et al. 2003).
Another example of a decision-supporttool is the Excessive Heat Events Guidebook,developed by EPA and other federalagencies responsible for addressing“exces-sive heat events” (EHEs) (U.S. EPA/OAP2006a). The guidebook provides interestedpublic health officials with information onrisks and impacts from EHEs, includingguidance on EHE forecasting and identi-fication. It also provides a menu of notifi-cation and response actions to considerwhen developing or enhancing a localEHE program based in part upon a reviewof various EHE response programs.16
CCSP S&A Product 4.6,Analyses of theEffects of Global Change on Human Healthand Welfare and Human Systems, will pro-vide a timely update to the 2000 HealthSector Assessment (Patz et al. 2000). Thisproduct will, in part, report on the poten-tial human health effects of globalenvironmental change, and the climate, so-cioeconomic, and environmental informa-tion that is needed to assess the cumulativerisk to health in the United States fromthese effects. It will also inform adaptationsin the provision of public health and healthcare interventions.
CoastsSea level is rising 2–3 millimeters
(0.08–0.12 inches) per year along most oftheU.S. coast (Zervas 2001).Accounting forlocal subsidence, coastal scientists areconsidering the possible impacts of a 1–3-foot rise in sea level over the next century(IPCC 2001a). Key concerns associatedwith these changes include land loss, in-creased flooding of low-lying coastal com-munities, coastal erosion, barrier island
CHAPTER 6—VULNERABILITY ASSESSMENT, CLIMATE CHANGE IMPACTS, AND ADAPTATION MEASURES 73CHAPTER 6—VULNERABILITY ASSESSMENT, CLIMATE CHANGE IMPACTS, AND ADAPTATION MEASURES 73
15 See <http://cfpub.epa.gov/gcrp/>.16 See <http://www.epa.gov/heatisland/about/heatguidebook.html>.

74 U.S. CLIMATE ACTION REPORT—200674 U.S. CLIMATE ACTION REPORT—2006
property by erecting shore protection struc-tures such as bulkheads, which eliminatethe intertidal wetlands and beaches thatwould otherwise be found between thewater and the dry land. Several states haveadopted policies to ensure that beaches,dunes, or wetlands are able to migrate in-land as sea level rises. Some states prohibitnew houses in areas likely to be eroded inthe next 30–60 years (e.g. North CarolinaCoastal Resources Commission). Con-cerned about the need to protect propertyrights, Maine, Rhode Island, South Car-olina, and Texas have implemented someversion of “rolling easements,” in whichpeople are allowed to build, but only on thecondition that they will remove the struc-ture if and when it is threatened by an ad-vancing shoreline (IPCC 2001b).
Developing Data for Addressing SeaLevel Rise
Many agencies and individuals are de-veloping data that can provide insightsregarding the implications of sea level rise.Following are some examples of these ef-forts:• NASA, with its partner the French space
agency, continues to provide climate-quality global sea level data every 10 days.
• The Federal Emergency ManagementAgency (FEMA), the U.S. Army Corpsof Engineers, and several states are de-veloping elevation data for floodplainmanagement.
• NOAA and the U.S. Geological Survey(USGS) are developingDigital ElevationModels that use a common vertical ref-erence frame for both topographic andbathymetric maps (Hess et al. 2004).
• Local governments and major coastalland conservancies are developing geo-graphic information system land-usedata for managing ecosystems and eco-nomic growth.
• TheU.S. Fish andWildlife Service is de-veloping relevant wetlands data.
• NOAA’s Coastal Change Analysis Pro-gram periodically provides a compre-hensive assessment of land coverchanges in the U.S. coastal zone.
• USGS collects high-resolution LIDAR
elevation data for producing assess-ments of shoreline erosion and othercoastal processes through its NationalAssessment of Coastal ChangeHazards.FEMA has conducted similar analyses.
• USGS also evaluates the ability of wet-lands to keep pacewith rising relative sealevel.
• EPA has been working with local gov-ernments to create county-scale mapsthat identify the areas likely to requireshore protection as sea level rises.
• TheNewYorkCityDepartment of Envi-ronmental Protection is analyzing the ef-fects of current and future sea level riseon its coastal infrastructure (Rosenzweiget al. 2007).
• CCSP S&A Product 4.1, Coastal Eleva-tions and Sensitivity to Sea Level Rise,willsynthesize information from the ongo-ingmapping efforts by federal and non-federal researchers related to theimplications of rising sea level.
TransportationTransportation accounts for approxi-
mately one-quarter of total U.S. greenhousegas emissions. Climate change will mostlikely have significant impacts on trans-portation infrastructure and operations(U.S. DOT 2006b). The safety and securityof the national transportation infrastruc-ture, as well as emergency and routinetransportation operations, could also be af-fected (U.S.DOT 2006b). Examples of spe-cific types of impacts include softening ofasphalt roads, warping of railroad rails, de-creased airplane “lift” in extremely hot air,and damage to roads and opening of ship-ping routes in polar regions (IPCC 2001b).
The United States is working to providebetter information to decision makersacross the transportation sector about whatfuture climate variability and change couldmean for existing and planned infrastruc-ture and about the set of potential responsestrategies that might be implemented toadapt to future climate.
DOT Programs, Initiatives, and StudiesTheCenter for Climate Change and En-
vironmental Forecasting is an initiative ofthe U.S. Department of Transportation
migration, vertical accretion of wetlands,and increased salinity of aquifers and estu-aries, especially during droughts.
Approximately half the U.S. popula-tion—153 million people—lives in one ofthe 673 coastal counties; this number is ex-pected to grow by 7 million by 2008 (U.S.DOC/NOAA 2004). Increases in coastalvulnerability are strongly affected by in-creasing coastal populations (Höppe andPielke 2006), as well by as the effects of sealevel rise and changes in the intensity andfrequency of coastal storms. After a periodof relatively light activity, the Atlantic basinhas recently experienced an increase in hur-ricane activity, the cause of which is the sub-ject of ongoing scientific debate (e.g.,Webster et al. 2005; Hoyos et al. 2006;Kossin et al. 2007; Landsea et al. 2006).Concern over this increasing societal vul-nerability is leading some insurance com-panies to increase rates or deny propertycoverage to communities along the GulfandAtlantic coasts (Mills 2005).Due largelyto improved warning systems, death anddeath rates from extreme weather eventshave generally declined since the beginningof the 20th century.
Reducing Vulnerability to Sea Level RiseIn recognition of significant potential
impacts from climate change, the FederalCoastal ZoneManagement Act states: “Be-cause global warming may result in a sub-stantial sea-level rise with serious adverseeffects in the coastal zone, coastal statesmust anticipate and plan for such an occur-rence (16USCode § 1451).”Property own-ers and federal, state, and local governmentsare already starting to takemeasures to pre-pare for the consequences of rising sea level.Most coastal states are working with theU.S.ArmyCorps of Engineers to place sandonto their beaches to offset shore erosion.Property owners are elevating existingstructures in many low-lying areas, whichprovide resilience to episodic storms as wellas long-term change.
Shoreline erosion along estuaries has ledmany property owners to defend their
17 See <www.dot.gov/climate>.

(DOT) dedicated to fostering awareness ofthe potential links between transportationand global climate change, and to formu-lating policy options to deal with the chal-lenges posed by climate change andvariability.17 Several DOT programs arehelping to curb greenhouse gas emissionsand pollution from transportation, includ-ing the Automotive Fuel Economy Pro-gram, the Congestion Mitigation and AirQuality Improvement Program, and theVoluntaryAirport LowEmissions Program.DOT research projects are investigating thepotential impacts of climate variability andchange on transportation infrastructureand its operation, and are providing guid-ance as to how transportation planners anddecisionmakersmay incorporate this infor-mation into transportation planning deci-sions to ensure a reliable and robust futuretransportation network.
DOT has partnered with the NationalAcademies of Science/Transportation Re-search Board (TRB) to study strategies forthe transportation system to adapt to po-tential impacts of climate change. TheDOT/TRB study will reexamine the role ofdesign standards for transportation infra-structure considering potential impactsfrom climate change, develop operationalresponses to potential climate change im-pacts, and review approaches to decisionmaking under uncertainty.
A related DOT study is focusing on thecentral U.S. Gulf Coast. The region’sunique transport modes and commercialsignificance add texture and interest to itstransportation sector, while its unusual to-pography and geographic locationmake itparticularly vulnerable to sea level rise andthe threat of severe weather events. Resultsfrom this research will be reported inCCSP S&A Product 4.7, Impacts of ClimateChange and Variability on TransportationSystems and Infrastructure.
EnergyEnergy production and use are sensitive
to changes in climate. For example, in-creasing temperatures will reduce con-sumption of energy for heating but willincrease energy used for cooling buildings.
The net effects of these changes on energyproduction, use, and utility bills will varyby region and by season (Hadley et al.2006; Scott et al. 2005). There may bechanges in energy consumed for otherclimate-sensitive processes, such as pump-ing water for irrigation in agriculture(Peart et al. 1995; IPCC 2001b). Depend-ing on themagnitude of these possible en-ergy consumption changes, it may benecessary to consider changes in energysupply or conservation practices to bal-ance demand (Franco and Sanstad 2006;CEPA 2006).
HydropowerTo date, less research has been under-
taken on how climate change may affectenergy production. Hydropower genera-tion is the energy source that is likely to bemost directly affected by climate changebecause it is sensitive to the amount, tim-ing, and geographic pattern of precipita-tion and temperature (IPCC 2001b).However, changes in precipitation are dif-ficult to project at the regional scale, whichmeans that climate change will affect hy-dropower either positively or negatively,depending on the region.
Renewable EnergySome renewable sources of energy
could be affected by climate change, al-though these changes are very difficult topredict. If climate change leads to in-creased cloudiness, solar energy produc-tion could be reduced. Wind energyproduction would be reduced if windspeeds rise above or fall below the accept-able operating range of the technology.Changes in growing conditions could af-fect biomass production—a transporta-tion and power plant fuel source that isstarting to receive more attention (IPCC2001b). Climate change may also havecomplex effects on U.S. energy conditionsthrough effects on global and hemisphericenergy markets and policies.
Energy InfrastructureInfrastructure for energy production,
transmission, and distribution could be af-fected by climate change as well. For exam-
ple, changes in the frequency and magni-tudes of more extreme weather events,such as windstorms, ice storms, floods,tornadoes, and hail, and associated dam-ages to the transmission systems of electricutilities may affect the rate of failure withattendant costs (IPCC 2001b). Power plantoperations can be affected by the fre-quency and magnitude of extreme heatand cold waves. For example, intake waterthat is normally used to cool power plantsmay become warm enough during ex-treme heat events to compromise powerplant operations, or ice storms may bringdown transmission lines.
Energy Supply and DemandClimate change effects on energy sup-
ply and demand will depend not only onclimatic factors, but also on patterns ofeconomic growth, land use, populationgrowth and distribution, technologicalchange, and social and cultural trends thatshape individual and institutional actions(IPCC 2001b).
Prospects for AdaptationBecause of the lack of research to date,
prospects for adaptation to climate changeeffects by energy providers, energy users,and society at large are speculative, al-though the potentials are considerable.Perhaps the greatest challenges could be inconnection with possible increases in theintensity of extreme weather events andpossible significant changes in regionalwater supply regimes. But adaptationprospects depend considerably on theavailability of information about possibleclimate change effects to inform decisionsabout adaptive management, along withtechnological change in the longer term.Given that the current knowledge base isso limited, CCSP S&A Product 4.5, Effectsof Global Change on Energy Production andUse, will summarize what is currentlyknown about effects of climate change onenergy production and use in the UnitedStates and will address needs for expandedresearch, through broad-based collabora-tion among federal and state governments,industry, nongovernmental institutions,and academia.
CHAPTER 6—VULNERABILITY ASSESSMENT, CLIMATE CHANGE IMPACTS, AND ADAPTATION MEASURES 75CHAPTER 6—VULNERABILITY ASSESSMENT, CLIMATE CHANGE IMPACTS, AND ADAPTATION MEASURES 75

The international commercialization of technologies that mitigate greenhouse gasemissions, reduce air pollution, and enhance energy security in a context of eco-nomic growth is a central objective of U.S. climate and development policies.
A successful global response to climate change requires the participation of countriesfrom all regions of the world.At the same time the United States is working to address cli-mate change at home, we are working closely with and supporting partners around theworld. U.S. policies are seeking to help developing countries to slow emissions growth inthe near term and build capacity for longer-term efforts to ensure cleaner, sustainable de-velopment and progress toward a low-emissions economy.
The U.S. approach recognizes that progress will be best achieved by embedding climategoals in a broader agenda for developing countries—including the promotion of eco-nomic growth, reduction of poverty, access to modern sanitation and clean water, en-hanced energy security, and reduced air pollution. Cleaner energy technologies can helpachieve all of these development objectives.
The United States is cooperating with countries around the world to promote effectiveclimate approaches in the context of broader development strategies. Many developingcountries have rapidly advancing industries and considerable technical capabilities. TheUnited States regards these countries as crucial partners in our efforts to address climatechange and promote sustainable development.
Technology transfer is a key component of the U.S. development assistance strategy.Elements of this strategy include establishing partnerships with developing and transitioncountries and creating incentives for investment in environmentally soundtechnologies. In turn, these climate-related activities complement core U.S. developmentassistance priorities that include (1) supporting economic growth and social developmentthat protect the resources of the host country, (2) supporting design and implementationof policy and institutional frameworks for sustainable development, and (3) strengtheningin-country institutions and capacity that involve and empower the citizens. The intendedoutcome of such assistance with a technology component is the development of resilient,robust societies, economies, and ecosystems that have the capacity to address the chal-lenges and opportunities of both current and potential climate change conditions.
U.S. federal agencies promote the transfer of climate-friendly technologies through arange of tools and services. These include export credits, project financing, risk guarantees,and insurance to U.S. companies, as well as credit enhancements for host-country financialinstitutions. U.S. official development assistance and official assistance provide grants fora variety of technology transfer programs. Investments in physical capital, such as plantsand equipment, involve U.S. government-supported project financing and credit enhance-ments, commercial sales, commercial lending, foreign private equity investment, and for-eign direct investment. As a major shareholder in international financial institutions, the
7 Financial Resources andTransfer of TechnologyFinancial Resources andTransfer of Technology

CHAPTER 7—FINANCIAL RESOURCES AND TRANSFER OF TECHNOLOGY 77CHAPTER 7—FINANCIAL RESOURCES AND TRANSFER OF TECHNOLOGY 77
nerability and adaptation, financial andtechnical assistance by U.S. agencies, tradeand development financing, and private-sector involvement. It also explains howthe United States is helping to meet thechallenge of expected future growth inglobal energy demand while addressingclimate change, by promoting approachesthat effectively integrate both the near-and long-term environmental and eco-nomic goals. Table 7-3 presents more in-formation on several of these efforts.
MAJOR U.S. INITIATIVES:TECHNOLOGY TRANSFER ANDFINANCIAL ASSISTANCE
USAID Climate Change ProgramSince 1991,USAID has included global
climate change in its development fund-ing, spending approximately $2.6 billionon climate-related development projectsand programs. Though the approach hasgone through several iterations, its mainthrust has been to incorporate climatechange considerations into developmentprojects, whether their focus is energy,land management, or vulnerability andadaptation. USAID works in developingand transition countries to implement“win-win” solutions that provide climate-related benefits, while also meeting devel-opment objectives in the energy and watersectors, urban areas, forest conservation,agriculture, and disaster assistance. Thesesolutions include activities that (1) pro-mote the transfer of clean energy tech-nologies, (2) measure reductions ingreenhouse gas (GHG) emissions, (3)promote carbon management throughimproved land use, (4) support countriesto participate more effectively in theUnited Nations Framework Conventionon Climate Change (UNFCCC), and (5)assess vulnerability to the impacts of cli-mate change and increase adaptive capac-ity.2
Group on Earth ObservationsEarth observations provide critical
input for understanding the Earth sys-tem—its weather, climate, oceans, land,
geology, natural resources, ecosystems,and natural and human-induced hazards.This input is crucial to achieving sustain-able development. The United Stateshosted the first Earth Observation Sum-mit in Washington,D.C., on July 31, 2003,attended by 33 nations and the EuropeanCommission. The intergovernmental adhoc Group on Earth Observations (GEO)formed at that meeting committed to de-veloping a 10-year plan for implementingan integrated Earth Observation System.At the second Earth Observation Summitin Tokyo in April 2004, the GEO, repre-senting 43 nations, adopted a frameworkfor the system of systems, focusing on ninesocietal benefit areas. In February 2005, atthe third Earth Observation Summit inBrussels, the nearly 60 nations of the GEObrought the first phase of the process to aclose by adopting The Global Earth Obser-vation System of Systems (GEOSS) 10-YearImplementation Plan (GEO 2005), and es-tablishing the new GEO.
The U.S.Group on Earth Observations(U.S. GEO) recently released a strategicplan for implementing the U.S. compo-nents of a comprehensive, coordinated,and sustained Earth Observation System(IWGEO and NSTC/CENR 2005). TheU.S. contribution to GEOSS is the Inte-grated Earth Observation System (IEOS).GEOSS and IEOS will facilitate the shar-ing and applied use of global, regional, andlocal data from satellites, ocean buoys,weather stations, and other surface andairborne Earth-observing instruments.The end result will be access to an un-precedented amount of environmental in-formation, integrated into new dataproducts and services benefiting societiesand economies worldwide.Application ofthese data through decision-support tools,outreach, and capacity building will bothhelp efforts to mitigate and increase re-silience to climate change.3
United States has supported efforts to pro-mote investments that will lead to cleanerdevelopment, especially in the energy area.
U.S. policies also contribute to both theefficient operation of private equity mar-kets and policy and institutional frame-works to support private investments thatpromote cleaner and more efficient tech-nology deployment and transfer. As high-lighted in the 2002 U.S. Climate ActionReport (CAR), private equity investmentsin clean energy and other projects relevantto climate change are considerably largerthan official development assistance (U.S.DOS 2002). Technology transfer is furtherstrengthened by official activities that sup-port policy and institutional environmentsin recipient countries and globally.
Since the 2002 CAR, the United Stateshas actively promoted international sci-ence and technology partnerships that in-tegrate the efforts of partner governmentsand private-sector wherewithal to addresstargeted objectives that can contribute toclimate goals. Between 2001 and 2006,U.S.funding for climate change in developingcountries totaled approximately $1.4 bil-lion, including $209 million to the GlobalEnvironment Facility (GEF) in support ofclimate change projects (out of a total GEFcontribution of approximately $680 mil-lion) (Tables 7-1 and 7-2).
The United States has also played aleadership role in establishing a number ofinternational partnerships focused on thedevelopment and commercialization ofclimate-friendly technologies and prac-tices, and new mechanisms to transferfunding to and assist development in de-veloping and transition countries. TheMillennium Challenge Corporation1 andthe U.S. Agency for International Devel-opment’s (USAID’s) Global DevelopmentAlliance are changing how the UnitedStates promotes technology transfer andprovides development assistance.
This chapter highlights U.S. interna-tional efforts. It outlines U.S. initiatives onclimate change and clean development,U.S.-sponsored activities addressing vul-
1 See <http://www.mca.gov/>.2 See <http://www.usaid.gov/our_work/environment/
climate/index.html>.3 See <http://iwgeo.ssc.nasa.gov/>.

78 U.S. CLIMATE ACTION REPORT—200678 U.S. CLIMATE ACTION REPORT—2006
From 2001 through 2006, the United States contributed $679.44 million to the Global Environment Facility, which has a number of focal areas,including climate change.
Institution 2001 2002 2003 2004 2005 2006 TotalGlobal Environment Facility 107.80 100.50 146.90 138.40 106.64 79.20 679.44
Source: U.S. Department of the Treasury.
TABLE 7-1 U.S. Financial Contributions to the Global Environment Facility: 2001–2006 (Millions of U.S. Dollars)
The U.S. government provides direct funding to multilateral institutions and programs in support of sustainable economic development andpoverty alleviation. In many cases, a portion of this funding supports climate change activities.
2001 2002 2003 2004World Bank Group 783.273 797.400 846.095 908.929International Bank for Reconstruction and Development 0.000 0.000 0.000 0.000International Development Association 773.295 792.400 844.475 907.812Multilateral Investment Guarantee Agency 9.978 5.000 1.620 1.117International Finance Corporation 0.000 0.000 0.000 0.000
Other Multilateral Institutions, Funds, and ProgramsInter-American Investment Corporation 24.945 18.000 18.232 0.000Inter-American Development Bank - Multilateral Investment Fund 9.978 0.000 24.431 24.853Asian Development Bank 0.000 0.000 0.000 0.000Asian Development Fund 71.842 98.017 97.250 143.569African Development Bank 6.087 5.100 5.071 5.075African Development Fund 99.780 100.000 107.371 112.060European Bank for Reconstruction and Development 35.700 35.779 35.572 35.222International Fund for Agricultural Development 4.989 20.000 14.906 14.916NADBank 0.000 0.000 0.000 0.000
United Nations Development Programme 87.091 97.100 100.000 101.398United Nations Environment Programme 10.000 10.750 10.500 10.935UNFCCC Supplementary Fund 0.000 0.000 0.000 0.000
Multilateral Scientific, Technological, and Training Programs1. OAS Development Assistance Programs 5.500 5.500 5.500 5.4682. World Food Program 5.000 6.000 0.000 0.0003. U.N. Development Fund for Women 1.000 1.000 1.000 0.9944. World Trade Organization 1.000 1.000 2.000 0.9945. International Civil Aviation Organization 0.300 0.300 0.300 0.9946. Montreal Protocol Multilateral Fund 26.000 25.000 23.000 20.8767. International Conservation Programs 5.450 7.700 6.225 6.3628. Intergovernmental Panel on Climate Change/UNFCCC 6.500 7.400 6.000 5.5679. International Contributions for Scientific, Educational, and Cultural Activities 1.750 1.750 1.750 1.889
10. World Meteorological Organization 2.000 2.000 2.000 1.98811. Center for Human Settlements 0.000 0.000 0.250 0.746
Sources: Congressional Budget Justification, World Bank, International Finance Corporation, and Asian Development Bank annual reports.
TABLE 7-2 Annual U.S. Financial Contributions to Multilateral Institutions (Millions of U.S. Dollars)

CHAPTER 7—FINANCIAL RESOURCES AND TRANSFER OF TECHNOLOGY 79CHAPTER 7—FINANCIAL RESOURCES AND TRANSFER OF TECHNOLOGY 79
Since 2001, the United States has established several partnerships with developing and transition countries, with the primary goal ofpromoting the development and deployment of climate-friendly technologies and practices. Some examples of those partnerships arepresented in this table.
Purpose Description Recipient Sector Funding Years in Factors Enabling Technologies Impact on GHGCountries or Operation Project’s Success Transferred Emissions/SinksPartners
U.S./China Energy and Environmental Technology Center (EETC)Promote the Focused on Implemented Energy $1,000,000 Created U.S. cleanefficient, responsible emission-reducing jointly by the in fiscal in 1997. energy andproduction and and clean coal U.S. and years 2004 environmentalutilization of clean technologies, Chinese and 2005; technologiesfossil energy; EETC is working governments, $994,000 in and expertise.encourage environ- with Chinese and Tulane fiscal yearmental performance, organizations to and Tsinghua 2004.while improving create U.S. universities.China’s quality of life. business oppor-
tunities inChina'senergy sector.
Famine Early Warning System Network (FEWS NET)Establish more FEWS NET Afghanistan, Adaptation $13 million FEWS: The combined Information Noteffective, assesses short- Burkina Faso, per year. 1985-2000; U.S. environ- networks: applicable.sustainable, to long-term Chad, Djibouti, FEWS NET: mental monitor- remote-host country-led vulnerability Eritrea, Ethiopia, 2000- ing expertise sensingnetworks that to food insecurity Guatemala, Haiti, current. of NASA, datareduce with environmental Honduras, NOAA, and acquisition,vulnerability to information from Kenya, Malawi, USGS; processing,food insecurity. satellites and Mali, Mauritania, implementation and analysis;
agricultural and Nicaragua, by host geographicsocioeconomic Niger, country field informationinformation from Mozambique, staff. system (GIS)field representa- Rwanda, analyticaltives; conducts Somalia, skills.vulnerability Sudan, Uganda, Equipmentassessments, Zambia, to facilitatecontingency and Zimbabwe adaptation:response planning, GISaimed at hardwarestrengthening host and software.country foodsecurity networks.
TABLE 7-3 Sample U.S. Government Efforts Promoting the Transfer of Climate-Friendly Technologies and Practices
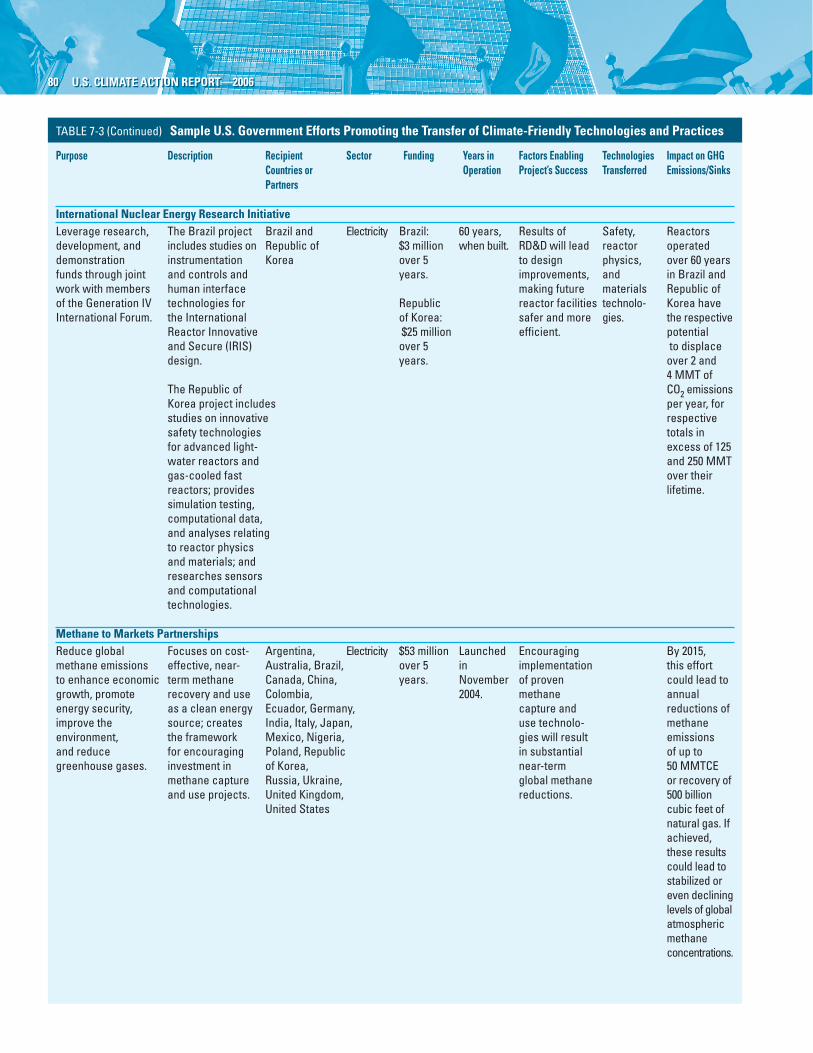
80 U.S. CLIMATE ACTION REPORT—200680 U.S. CLIMATE ACTION REPORT—2006
TABLE 7-3 (Continued) Sample U.S. Government Efforts Promoting the Transfer of Climate-Friendly Technologies and Practices
Purpose Description Recipient Sector Funding Years in Factors Enabling Technologies Impact on GHGCountries or Operation Project’s Success Transferred Emissions/SinksPartners
International Nuclear Energy Research InitiativeLeverage research, The Brazil project Brazil and Electricity Brazil: 60 years, Results of Safety, Reactorsdevelopment, and includes studies on Republic of $3 million when built. RD&D will lead reactor operateddemonstration instrumentation Korea over 5 to design physics, over 60 yearsfunds through joint and controls and years. improvements, and in Brazil andwork with members human interface making future materials Republic ofof the Generation IV technologies for Republic reactor facilities technolo- Korea haveInternational Forum. the International of Korea: safer and more gies. the respective
Reactor Innovative $25 million efficient. potentialand Secure (IRIS) over 5 to displacedesign. years. over 2 and
4 MMT ofThe Republic of CO2 emissionsKorea project includes per year, forstudies on innovative respectivesafety technologies totals infor advanced light- excess of 125water reactors and and 250 MMTgas-cooled fast over theirreactors; provides lifetime.simulation testing,computational data,and analyses relatingto reactor physicsand materials; andresearches sensorsand computationaltechnologies.
Methane to Markets PartnershipsReduce global Focuses on cost- Argentina, Electricity $53 million Launched Encouraging By 2015,methane emissions effective, near- Australia, Brazil, over 5 in implementation this effortto enhance economic term methane Canada, China, years. November of proven could lead togrowth, promote recovery and use Colombia, 2004. methane annualenergy security, as a clean energy Ecuador, Germany, capture and reductions ofimprove the source; creates India, Italy, Japan, use technolo- methaneenvironment, the framework Mexico, Nigeria, gies will result emissionsand reduce for encouraging Poland, Republic in substantial of up togreenhouse gases. investment in of Korea, near-term 50 MMTCE
methane capture Russia, Ukraine, global methane or recovery ofand use projects. United Kingdom, reductions. 500 billion
United States cubic feet ofnatural gas. Ifachieved,these resultscould lead tostabilized oreven declininglevels of globalatmosphericmethaneconcentrations.

CHAPTER 7—FINANCIAL RESOURCES AND TRANSFER OF TECHNOLOGY 81CHAPTER 7—FINANCIAL RESOURCES AND TRANSFER OF TECHNOLOGY 81
laborative activities among partner coun-tries in these sectors. The internationalroll-out of these action plans took place onOctober 31, 2006, and included theendorsement of 96 projects.4 The Asia-Pacific Partnership is a key means of imple-menting Title XVI of the Energy Policy Actof 2005,which provides for U.S. agencies toundertake a range of activities designed toimprove the greenhouse gas intensity levelsof large developing countries.
Methane to Markets PartnershipThe goal of this action-oriented inter-
national initiative is to reduce globalmethane emissions to enhance economicgrowth, promote energy security, improvethe environment, and reduce greenhousegases. The partnership initially targets fourmajor methane sources: landfills, under-ground coal mines, natural gas and oil sys-tems, and livestock waste management. Itfocuses on the development of strategiesand markets for the recovery and use ofmethane through technology develop-ment, demonstration, deployment, anddiffusion; implementation of effective pol-icy frameworks; identification of ways and
means to support investment; and re-moval of barriers to collaborative projectdevelopment and implementation. Mem-ber countries work in collaboration withthe private sector, multilateral develop-ment banks, and other governmental andnongovernmental organizations (NGOs)to achieve these objectives. The partner-ship has the potential to deliver by 2015annual reductions in methane emissionsof up to 50 million metric tons of carbonequivalent (MMTCE) or recovery of 500billion cubic feet of natural gas.5
International Partnership for theHydrogen Economy
The International Partnership for theHydrogen Economy (IPHE) is committedto accelerating the development of hydro-gen and fuel cell technologies to improvetheir energy, environmental, and eco-nomic security. IPHE was established in2003 as an international institution toaccelerate the transition to a hydrogen
Asia-Pacific Partnership on CleanDevelopment and Climate
The Asia-Pacific Partnership on CleanDevelopment and Climate is an innovativeeffort among Australia, China, India,Japan, the Republic of Korea, and theUnited States to accelerate the develop-ment and commercialization of clean en-ergy technologies and practices. Partnercountries work together and with theirprivate sectors to meet energy security, na-tional air pollution reduction, and climatechange goals in ways that promote sustain-able economic growth and poverty reduc-tion. The partnership’s inauguralministerial meeting took place in January2006 in Sydney, Australia, and resulted inthe issuance of a Charter, Communiqué,and Work Plan that guide the work of thepartnership. Subsequently, the partnershipestablished eight public/private-sector taskforces on (1) cleaner fossil energy, (2) re-newable energy and distributed genera-tion, (3) power generation andtransmission, (4) steel, (5) aluminum, (6)cement, (7) coal mining, and (8) buildingsand appliances. These task forces havedrafted action plans that underpin the col-
TABLE 7-3 (Continued) Sample U.S. Government Efforts Promoting the Transfer of Climate-Friendly Technologies and Practices
Purpose Description Recipient Sector Funding Years in Factors Enabling Technologies Impact on GHGCountries or Operation Project’s Success Transferred Emissions/SinksPartners
International Partnership for the Hydrogen Economy (IPHE) Hydrogen Energy Technology Roadmap Development AssistanceProvide technical Both Brazil and China, India, Alternative $250,000 Established Compiling Expertise inassistance to key China have and Brazil Energy in 2003. roadmap developmentIPHE partners to completed their Technology and strategy of hydrogenaccelerate the hydrogen energy information energydevelopment of technology from IPHE technologyhydrogen and fuel roadmaps. partners will roadmapping.cell technologies facilitateand improve effective andtheir energy, efficientenvironmental, collaborationand economic on hydrogensecurity. and fuel cell
RD&Dactivities.
4 See <http://www.asiapacificpartnership.org/>.5 See <www.methanetomarkets.org> and
<www.epa.gov/methanetomarkets>.6 See <www.iphe.net>.

82 U.S. CLIMATE ACTION REPORT—200682 U.S. CLIMATE ACTION REPORT—2006
increased support for R&D projects car-ried out in support of GIF’s goals.9
Global Nuclear Energy PartnershipThe Global Nuclear Energy Partnership
(GNEP), led in the United States by theU.S. Department of Energy (DOE), is onecomponent of the Advanced Energy Ini-tiative, announced by President Bush inhis 2006 State of the Union Address.GNEP has two major goals: (1) expandcarbon-free nuclear energy to meet grow-ing electricity demand worldwide, and (2)promote nonproliferation objectivesthrough the leasing of nuclear fuel tocountries that agree to forgo enrichmentand reprocessing.GNEP partner countrieswould consist of both fuel supplier nationsand reactor nations. Fuel supplier nationswould provide reliable nuclear fuel serv-ices to reactor nations through an inde-pendent nuclear fuel broker, such as theInternational Atomic Energy Agency.10
U.S./China Energy and EnvironmentalTechnology Center
Located at Beijing’s Tsinghua Univer-sity, the U.S./China Energy and Environ-mental Technology Center (EETC) wasestablished in 1997 by DOE, the U.S. En-vironmental Protection Agency (EPA),and China’s Ministry of Science and Tech-nology. Jointly operated by Tsinghua Uni-versity and Tulane University, EETC willassist China with environmental and en-ergy policy development and provide in-formation on technologies and expertisefrom American industry. EETC projectsare meant to be broadly applicable toChina's power production infrastructure,focused primarily on clean-coal technolo-gies and technologies for emission reduc-tion, while improving the quality of life inChina.11
Clean Energy Technology ExportInitiative
Led by DOE, the Clean Energy Tech-nology Export Initiative seeks to increasemarket access for U.S. exports of cleanerenergy technologies, and to improveinteragency collaboration and build part-nerships with the private sector. The pro-
gram builds on and moves beyond priorR&D and capacity-building efforts to ad-dress the market needs of a wide spectrumof U.S. private-sector stakeholders, includ-ing relatively sophisticated market partic-ipants and new market entrants. Theprogram is focused on activities expectedto yield results in the near to mid-term (6months to 4 years).
U.S. Climate Technology CooperationGateway
The U.S. Climate Technology Cooper-ation (US-CTC) Gateway provides theframework for a range of programs, proj-ects, resources, and actions supported bythe U.S. government to promote interna-tional technology cooperation to addressglobal climate change. The US-CTC Gate-way enables climate technology coopera-tion stakeholders to work together andhighlights U.S.-sponsored activities thathave resulted in clear, measurable bene-fits. The US-CTC Gateway is designed toserve as an on-line resource on specific ac-tivities and to provide useful informationand resources that can allow users to im-plement climate-friendly technologies andpractices throughout the world.12
U.S. Clean Energy InitiativeAt the August 2002 World Summit on
Sustainable Development (WSSD) inJohannesburg, the United States launcheda Clean Energy Initiative consisting ofthree market-oriented, performance-based partnerships: Efficient Energy forSustainable Development, led by DOE; theGlobal Village Energy Partnership, led byUSAID; and Partnership for Clean IndoorAir, led by EPA. The Clean EnergyInitiative’s mission is to bring togethergovernments, international organizations,industry, and civil society in partnerships
economy.Developing and emerging econ-omy country partners include India, theRepublic of Korea, Brazil, and China. Hy-drogen technology roadmaps have beendeveloped in India and Brazil.6
Carbon Sequestration LeadershipForum
An international climate change initia-tive that includes both developed and de-veloping countries, the CarbonSequestration Leadership Forum (CSLF)is focused on developing improved andcost-effective technologies for the separa-tion and capture of carbon dioxide and itstransport and long-term safe storage.CSLF works to make these technologiesbroadly available internationally and toidentify and address more comprehensiveissues, such as regulation, relating to car-bon capture and storage. Currently 17CSLF-endorsed projects are underway toevaluate and demonstrate carbon seques-tration technologies.7
ITERITER is a proposed multilateral collab-
orative project among the United States,China, the European Union, Japan, Russia,India, and the Republic of Korea to designand demonstrate a fusion energy produc-tion system with a goal of commercializa-tion by 2050. The United States isparticipating in negotiations on the siting,construction, operation, deactivation, anddecommissioning of ITER.8
Generation IV International ForumThe Generation IV International
Forum (GIF) is a multilateral partnershipof 10 countries and the European Com-mission that is fostering international co-operation in research and development(R&D) for the next generation of safer,more affordable, and more proliferation-resistant nuclear energy systems. This newgeneration of nuclear power plants couldproduce electricity and hydrogen withsubstantially less waste and without emit-ting any air pollutants or GHG emissions.Since GIF’s formal establishment in July2001, the United States has led the devel-opment of a technology roadmap and has
7 See <www.cslforum.org>.8 See <www.iter.org>.9 See <http://gen-iv.ne.doe.gov/GENIVintl-gif.asp>.10 See <http://www.gnep.energy.gov/default.html/>.11 See <http://www.tulane.edu/~uschina/intro.html>.12 See <http://www.usaid.gov/our_work/environment/
climate/policies_prog/ghg.html>.

CHAPTER 7—FINANCIAL RESOURCES AND TRANSFER OF TECHNOLOGY 83CHAPTER 7—FINANCIAL RESOURCES AND TRANSFER OF TECHNOLOGY 83
ing countries, with women and childrenbeing most significantly affected. ThePartnership for Clean Indoor Air was cre-ated in response to this challenge. Its morethan 120 public and private organizationsare contributing their resources and ex-pertise to improve health, livelihoods, andquality of life in Asia, Africa, and LatinAmerica by reducing exposure to indoorair pollution from household energy use.The partnership is focusing on four prior-ity areas: meeting social and culturalneeds, developing local markets, improv-ing technology design and performance,and monitoring impacts.16
EPA Programs for Energy EfficiencyEPA supports several programs that
promote energy efficiency in products andbuildings.
Energy Efficiency EndorsementLabeling Programs
Drawing on the lessons, experience, in-formation, and tools available from itssuccessful ENERGY STAR program, EPAis working with developing countries (pri-marily China and India) to enhance theircapacity to design and implement theirown effective, voluntary energy efficiencyendorsement labeling programs. For ex-ample, with technical assistance from EPAand other international organizations, theChina Standard Certification Center hasestablished a China-specific endorsementlabel that is now applied to 21 products.17
It is estimated that by 2014, product label-ing will reduce GHG emissions in Chinaby up to 27 MMTCE.
eeBuildingsA second program, eeBuildings, helps
building owners, managers, and tenantsimprove the energy efficiency of theirbuildings worldwide. eeBuildings formspartnerships with multinational corpora-tions, local businesses and NGOs, govern-ment agencies, and other organizationsthat share eeBuildings' goal of improvingenergy efficiency to save energy andmoney. Key elements of eeBuildings aretechnical resources and training, links toother programs with related goals, and
recognition for implementing or promot-ing energy efficiency in commercial build-ings.18
Collaborative Labeling and ApplianceStandards Program
The Collaborative Labeling and Appli-ance Standards Program (CLASP) wasformed in 1999 as a partnership devotedto promoting best practices in energy effi-ciency standards and labeling programs indeveloping and transition countries.CLASP includes the design, implementa-tion, and enforcement of energy efficiencystandards and labels for appliances, equip-ment, and lighting products. Supported byUSAID, DOE, and EPA, the partnershipincludes governments, intergovernmentalorganizations, industry, NGOs, and tech-nical institutions. CLASP has providedtechnical support to Argentina, Bahrain,Brazil, Chile, China, Colombia, the Do-minican Republic, Ecuador, Egypt,Ghana,India, Mexico, Nepal, Poland, Sri Lanka,Thailand, Tunisia, and Uruguay. It has alsosupported regional standards and labelingprojects in 30 countries. The overall resultof energy efficiency standards and labels isto reduce both required investments inpower plants and fuel consumption fortheir operation, with powerful economicgains (e.g., freeing up capital for invest-ments in nonenergy social infrastructure,such as schools, roads, or hospitals) andenvironmental benefits (e.g., avoiding car-bon emissions).19
Integrated Environmental StrategiesProgram
EPA’s Integrated Environmental Strate-gies program engages developing coun-tries to build support for integratedplanning to address both local environ-mental concerns and global GHG emis-sions. The program promotes the analysis
to alleviate poverty and spur economicgrowth in the developing world by mod-ernizing energy services.13
Efficient Energy for SustainableDevelopment
Efficient Energy for Sustainable Devel-opment (EESD) aims to improve the pro-ductivity and efficiency of energy systems,while reducing pollution and waste, savingmoney, and improving reliability throughless energy-intensive products, moreenergy-efficient processes, and productionmodernization. EESD is helping develop-ing economies get ahead of their develop-ment curves by focusing on promotingpublic leadership in the efficient use ofclean energy technologies in public facili-ties, facilitating locally managed financialprograms to attract long-term financingfor energy efficiency and renewable energyprojects, and building capacity in the localprivate sector to adopt cleaner and moreefficient technologies.14
Global Village Energy PartnershipThe Global Village Energy Partnership
brings together developing and industrial-ized country governments, public andprivate organizations,multilateral institu-tions, consumers, and others in an effortto ensure low-income families have accessto modern energy services. The partner-ship aims to reduce poverty and enhanceeconomic and social development for mil-lions around the world. Its work will becarried out under a 10-year implementa-tion-based program. The partnership’sobjectives are to catalyze country commit-ments to village energy programs; bridgethe gap among investors, entrepreneurs,and energy users; facilitate policy and mar-ket regulatory frameworks; serve as a mar-ketplace for information and bestpractices; and create and maintain an ef-fective coordination mechanism.15
Partnership for Clean Indoor AirSome three billion people worldwide
burn traditional biomass and coal indoorsfor home cooking and heating. Indoor airpollution from household energy ranks asthe fourth leading health risk in develop-
13 See <www.sdp.gov>.14 See <http://www.sdp.gov/sdp/initiative/c17707.htm>.15 See <http://www.gvep.org//>.16 See <http://www.epa.gov/iaq/pcia.html and
www.PCIAonline.org>.17 See <http://www.cecp.org.cn/englishhtml/index.asp>.18 See <www.epa.gov/eeBuildings>.19 See <http://www.clasponline>.
84 U.S. CLIMATE ACTION REPORT—200684 U.S. CLIMATE ACTION REPORT—2006
of and local support for implementationof clean energy technology policies andmeasures, with multiple public health,economic, and environmental benefits. Todate, government agencies, research insti-tutions, businesses, and NGOs in Ar-gentina, Brazil, Chile, China, India,Mexico, the Philippines, and the Republicof Korea have participated in the pro-gram.20
Central America Greenhouse GasInventory Improvement Project
In partnership with the seven nationsof Central America, USAID and EPA arecarrying out an extensive three-year proj-ect to improve the quality and sustainabil-ity of national GHG inventories in theregion. The project focuses on developinglong-term national inventory manage-ment systems, improving the methods anddata used in the agriculture and the land-use change and forestry sectors, and train-ing regional experts. The project includesexperts from the United States, Belize,Costa Rica, El Salvador, Guatemala, Hon-duras, Nicaragua, and Panama.21
International Renewable EnergyProgram
The mission of the International Re-newable Energy Program (IREP) is to pro-mote international capacity building insupport of market-focused transfer ofclean energy technology. Application ofDOE’s world-class technical expertise con-tributes to U.S. goals for sustainable devel-opment and improved trade, security,climate, and environment. IREP activitiesare focused on capacity building in sup-port of optimal use of energy efficiencyand renewable energy technologies, andmarket and trade development to enhancecommercialization of these technologies.To address these needs, IREP providestechnical assistance, disseminates informa-tion, and conducts trade missions and re-verse trade missions.22
United States–Asia EnvironmentalPartnership
Since 1992, the United States–Asia En-vironmental Partnership (US–AEP) has
been USAID’s primary program in Asiasupporting efforts to improve environ-mental conditions in selected Asian coun-tries. US–AEP has developed valuablepartnerships, strengthened the capacitiesof Asian environmental institutions, ad-dressed the challenges of urbanization andindustrialization, and promoted sustain-able economic growth to improve the en-vironment and quality of life for thepeople of Asia. After more than a decadeof accomplishments, US–AEP formallyconcluded on September 30, 2005.
A new USAID regional environmentalprogram was launched in October 2005.This new program continues and extendsUS–AEP’s support of a number of activi-ties promoting regional environmentalinitiatives, such as the Asian Environmen-tal Compliance and Enforcement Net-work, ASEAN Sustainable Cities Initiative,and Southeast Asia Water Utilities Net-work.23
Climate Technology InitiativeThe Climate Technology Initiative
(CTI) is a multilateral cooperative activitythat supports implementation of theUNFCCC by fostering international coop-eration for accelerated development anddiffusion of climate-friendly technologiesand practices. CTI was originally estab-lished at the first Conference of the Partiesto the UNFCCC in 1995. Since July 2003,CTI has been operating under an imple-menting agreement of the InternationalEnergy Agency that includes the UnitedStates, Austria, Canada, Denmark, Fin-land, Germany, Japan, Norway, and theUnited Kingdom. Through a variety ofcapacity-building activities, CTI has pro-moted meaningful technology transfer toand among developing and transitioncountries. In addition to their current andfuture environmental benefits, these ef-forts are promoting near- and long-termglobal economic and social stability.24
Renewable Energy and EnergyEfficiency Partnership
Formed at the WSSD in Johannesburg,the United Kingdom-led Renewable En-
ergy and Energy Efficiency Partnership(REEEP) seeks to accelerate and expandthe global market for renewable energyand energy efficiency technologies. As theworld’s largest producer and consumer ofrenewable energy, and with more renew-able energy generation capacity than Ger-many, Denmark, Sweden, France, Italy,and the United Kingdom combined, theUnited States is one of 17 partners inREEEP. The United States also activelyparticipated in Germany’s Renewables2004 conference in June 2004, and submit-ted five action items intended to providespecific technology plans and cost targetsfor renewable energy technologies usingsolar, biomass, wind, and geothermal re-sources.25
FOREST CONSERVATIONPARTNERSHIPS
Tropical Forest Conservation ActThe Tropical Forest Conservation Act
(TFCA) was enacted in 1998 to offer eligi-ble developing countries options to relievecertain official debt owed to the UnitedStates, while at the same time to generatefunds to support local tropical forest con-servation activities.As of June 2006, TFCAprograms are being implemented inBangladesh, Belize, Colombia, El Salvador,Jamaica, Panama (two agreements),Paraguay, Peru, and the Philippines, andagreements for two additional countriesare being negotiated. The 12 agreementscompleted to date will directly generatemore than $135 million for tropical forestconservation in these countries over thelife of the agreements, and additional re-sources will be created through returns oninvestments and matching funds.
20 See <www.epa.gov/IES>.21 See <http://www.usaid.gov/our_work/environment/
climate/country_nar/gcap_profile.html>.22 See <www.eere.energy.gov/wip/program/
international.html>.23 See <http://www.usaep.org/transition.html> and
<http://www.usaid.gov/locations/asia_near_east/countries/rdma/>.
24 See <http://www.climatetech.net/>.25 See <www.reeep.org>.

CHAPTER 7—FINANCIAL RESOURCES AND TRANSFER OF TECHNOLOGY 85CHAPTER 7—FINANCIAL RESOURCES AND TRANSFER OF TECHNOLOGY 85
able natural resource management withinthe Congo Basin.Announced by SecretaryPowell at the WSSD in Johannesburg in2002, CBFP builds on USAID’s CentralAfrican Regional Program for the Envi-ronment. The U.S. goal in this partnershipis to promote economic development,poverty alleviation, improved governance,and natural resource conservation throughsupport for a network of nationalparks and protected areas, well-managedforestry concessions, and assistance tocommunities that depend upon the con-servation of the outstanding forest andwildlife resources of 11 key landscapes in 6Central African countries. The climatechange impacts of the CBFP include in-creased carbon sequestration and reducedGHG emissions through preservation ofthe forest biomass.28
Amazon Basin Conservation InitiativeThe Amazon Basin Conservation Ini-
tiative (ABCI) is a new regional conserva-tion program to support the nationalgovernments and civil societies of theAmazon in their efforts to conserve theAmazon Basin’s unique and globally im-portant resources. ABCI is the second in aseries of initiatives designed to address theshared responsibility of the United Statesfor the stewardship of globally importantbiodiversity. Over the next five years,USAID plans to make an initial invest-ment of $50 million to support commu-nity groups, governments, and public andprivate organizations in their efforts toconserve the Amazon’s globally importantbiodiversity. This investment will be in ad-dition to the current portfolio of conser-vation efforts supported by USAID in theregion.29
U.S.-SPONSORED ACTIVITIESADDRESSING VULNERABILITY ANDADAPTATION
The United States has undertaken abroad range of activities to assist countriesto develop flexible and resilient societiesand economies that have the capacity toaddress both the challenges and the op-portunities presented by changing climatic
conditions. The United States was one ofthe first nations to assist developing coun-tries to build core capacity to undertakevulnerability assessments through itsCountry Studies Program (CSP).30 Be-tween 1994 and 2001, the CSP helped 56countries build the human and institu-tional capacities necessary to assess theirvulnerability to climate change. Subse-quent activities have built off those efforts,with the goal of furthering knowledgegained through the assessments andmobilizing adaptation actions.This sectiondescribes some of thewide-ranging adapta-tion activities the United States is pursuing.
Building Resilience ThroughDevelopment Assistance
USAID has broadened its climatechange portfolio to include activitiesaimed at strengthening the capabilities ofdeveloping and transition countries to re-spond to the challenges posed by climate-related impacts and risks. These activitiesinclude sustainable forestry and supportfor agricultural research for stress-resistantcrops. USAID seeks to strengthen thecapabilities of program managers, host-country institutions, project imple-menters, and sectoral experts to assessrelative vulnerabilities and to evaluate andimplement adaptation options for agricul-ture, water, and coastal zone managementprojects within USAID’s development as-sistance portfolio. Pilot projects to identifyadaptation options are underway in SouthAfrica,Honduras,Mali, and Thailand. Les-sons learned from the pilot projects will beincorporated into a guidance manual onadaptation activities for developmentprojects.31
Regional Climate Outlook ForumsThe National Oceanic and Atmos-
pheric Administration (NOAA) andUSAID jointly fund Regional ClimateOutlook Forums. These forums have be-come a principal vehicle for providing ad-vance information about the likelycharacter of seasonal climate in severaldeveloping regions. They bring togetherclimate forecasters and forecast users
A number of other countries have qual-ified for or expressed interest in the TFCAprogram, and agreements beyond thosementioned here are anticipated as the pro-gram continues to expand. In addition toforest conservation and debt relief, TFCAis intended to strengthen civil society bycreating local foundations to supportsmall grants to NGOs and communities.The program also offers a unique oppor-tunity for public–private partnerships. Sixof the agreements to date have includedmore than $7 million in cash raised byU.S.-based NGOs, in addition to the ap-proximately $60 million in appropriateddebt-reduction funds contributed by theU.S. government.26
President’s Initiative Against IllegalLogging
On July 28, 2003, Secretary of StatePowell launched the President's InitiativeAgainst Illegal Logging to assist developingcountries in combating illegal logging, in-cluding the sale and export of illegally har-vested timber, and in fighting corruptionin the forest sector. The initiative repre-sents the most comprehensive strategy un-dertaken by any nation to address thiscritical sustainable development challenge,and reinforces the U.S. leadership role intaking action to counter the problem andpreserve forest resources that store carbon.The initiative focuses on three critical re-gions—the Congo Basin, the AmazonBasin and Central America, and South andSoutheast Asia—and four key strategies:good governance, community-based ac-tions, technology transfer, and harnessingmarket forces.27
Congo Basin Forest PartnershipThe Congo Basin Forest Partnership
(CBFP) studies and implements sustain-
26 See <http://www.usaid.gov/our_work/environment/forestry/tfca.html>.
27 See <http://www.state.gov/r/pa/prs/ps/2003/22843.htm>.
28 See <http://www.usaid.gov/locations/ sub-saharan_africa/initiatives/cbfp.html>.
29 See <http://www.usaid.gov/locations/latin_america_caribbean/environment/abci.html>.
30 See <www.gcrio.org/CSP/webpage.html>.31 See <http://www.usaid.gov/our_work/environment/
climate/index.html>.

86 U.S. CLIMATE ACTION REPORT—200686 U.S. CLIMATE ACTION REPORT—2006
to develop a consensus forecast frommultiple predictions and to discussmethods of dissemination and applicationof information. They provide a unique op-portunity for stakeholders to meet, shareinformation and concerns, and forge aninformal network to address commonproblems.
The Hermosillo Project: Vulnerabilityand Adaptation Support for Mexico
EPA and Mexico’s National Institute ofEcology initiated the Hermosillo Project tointegrate consideration of climatic risksinto the city’s policy formation process,with support from USAID. The overarch-ing goals of the project were to identifyand evaluate options for adapting to cli-mate stresses on water resources in north-ern Mexico, work with stakeholders toprioritize these options, and begin aprocess for evaluating such options forother cities in Mexico and the Americas.Stakeholder involvement in design andimplementation, close institutional collab-oration at various levels, and coordinationof adaptation proposals with local policypriorities were important features of theproject.
Famine Early Warning System NetworkUSAID, the National Aeronautics and
Space Administration (NASA), the U.S.Geological Survey (USGS), the U.S. De-partment of Agriculture (USDA), andNOAA are collaborating with local, re-gional, and international partners to pro-vide early-warning and vulnerabilityinformation on emerging or evolving foodsecurity issues, including information re-lating to variability and changes in re-gional climate conditions. A primary goalof the Famine Early Warning System Net-work (FEWS NET) program is to producehigh-quality information for disaster andcrisis prediction. FEWS NET providesdemand-driven information products thatpinpoint and assess emerging or evolvingfood security problems. Program profes-sionals in the United States and Africamonitor data and information—includingremotely sensed as well as ground-based
data on meteorological, crop, and range-land conditions—for early indications ofpotential threats to food security. The pro-gram also works to strengthen Africanearly-warning and response networks byincreasing local technical capacity, build-ing and strengthening networks, develop-ing policy-relevant information, andforming consensus about food securityproblems and solutions.32
RANET ProgramUSAID and NOAA are working with a
range of humanitarian and meteorologicalorganizations to provide useful weatherand climate information to rural commu-nities. The RANET program (Radio andInternet for the Communication ofHydro-Meteorological and Climate-Related Information for Development)uses reserve capacity on the WorldSpacedigital satellite system to transmit fore-casts, bulletins, imagery, seasonal assess-ments, and data to remote areas. The goalof the program is to provide environmen-tal information that assists governmentsand populations in coping with hydro-meteorological hazards and environmen-tal fluctuations. RANET also supports theformation of community groups and as-sociations that are instrumental in dissem-inating information and extending thenetwork to new communities. The pro-gram operates in Africa, South and South-east Asia, and the Western Pacific.33
U.S. FINANCIAL AND TECHNICALASSISTANCE
U.S. government agencies provide tradeand development financing to developingand transition countries. They facilitatethe transfer of climate-friendly technolo-gies by providing official assistance, exportcredits, project financing, risk guarantees,and insurance to U.S. companies, as wellas credit enhancements for host-countryfinancial institutions. Trade and develop-ment financing leverages foreign directinvestment, foreign private equity invest-ment, and host-country and non-U.S. pri-vate capital by decreasing the risk involved
in long-term capital-intensive projects andprojects in nontraditional sectors.
U.S. Agency for InternationalDevelopment
The Bush Administration’s climatechange policy states that USAID“serves asa primary vehicle for transferring Ameri-can energy and sequestration technologiesto developing countries to promote sus-tainable development and minimize theirgreenhouse gas emissions growth.”USAID’s foreign assistance and develop-ment role is key to the involvement of de-veloping countries in resolving climatechange issues, as climate change is a globalproblem that requires action by all. Meet-ing the future economic and energy needsof developing countries will require devel-oping and transferring the technologiesand expertise necessary to reduce theGHG emissions and natural resource de-mands of current technologies.34
U.S. Environmental Protection AgencyA global leader in methane mitigation
and energy efficiency promotion, EPAspearheaded the Methane to Markets Part-nership, which focuses on cost-effective,near-term methane recovery and use as aclean energy source. EPA supports the in-ternational Collaborative Labeling andAppliance Standards Program, as well asseveral bilateral programs that encourageenergy efficiency. EPA designs and imple-ments innovative programs on a variety ofglobal environmental challenges, includ-ing efforts to make transportation cleaner,reduce GHG emissions, and improve localair quality. EPA also works with develop-ing countries on 14 climate change bilat-erals.35
U.S. Department of EnergyIn addition to providing funding sup-
port for such interagency activities as theClimate Change Technology Program and
32 See <www.fews.net>.33 See <http://www.ranetproject.net/>.34 See <www.usaid.gov>.35 See <http://www.epa.gov/>.

CHAPTER 7—FINANCIAL RESOURCES AND TRANSFER OF TECHNOLOGY 87CHAPTER 7—FINANCIAL RESOURCES AND TRANSFER OF TECHNOLOGY 87
systems, designing and implementingagriculture- and forest-sector componentsof national GHG inventories, reducingGHG emissions through improved agri-cultural practices, increasing carbon se-questration through improved forestmanagement (including forest conserva-tion, sustainable forestry, and agro-forestry), and encouraging sustainable andrenewable bioenergy technology and use.38
National Oceanic and AtmosphericAdministration
NOAA provides weather, water, and cli-mate services; manages and protects fish-eries and sensitive marine ecosystems;conducts atmospheric, climate, andecosystem research; promotes efficientand environmentally safe commerce andtransportation; supports emergency re-sponse; and provides vital information insupport of homeland security.NOAA’s cli-mate mission is to: “Understand and de-scribe climate variability and change toenhance society’s ability to plan and re-spond.” NOAA’s long-term climate effortsare designed to develop a predictive un-derstanding of variability and change inthe global climate system, and to advancethe application of this information inclimate-sensitive sectors through a suite ofprocess research, observations and mod-eling, and application and assessment ac-tivities.39
National Aeronautics and SpaceAdministration
NASA advances scientific knowledgeby observing the Earth system from space;assimilating new observations into cli-mate, weather, and other Earth systemmodels; and developing new technologies,systems, and capabilities for its observa-tions, including those with the potential toimprove future operational systems man-aged by NOAA and others. NASA is amajor participant in the U.S. ClimateChange Science Program and in U.S. ac-tivities to support the GEO. NASA’s Earthobservation data are openly available to allnations, organizations, and individuals,and the Agency has many active partner-
ships with U.S. and international agenciesto facilitate the use of its data in researchand operational applications.40
U.S. Department of CommerceThe U.S. Department of Commerce
recently established an International CleanEnergy Initiative that links U.S. companieswith foreign markets to facilitate dissemi-nation of clean energy technologies, prod-ucts, and services. The initiative seeks torealize a vision for enhanced exports ofclean energy technology.41
TRADE AND DEVELOPMENTFINANCING
U.S. government agencies provide tradeand development financing to developingand transition countries. These agenciesfacilitate the transfer of technologies byproviding official assistance, export credits,project financing, risk and loan guaran-tees, and investment insurance to U.S.companies, as well as credit enhancementsfor host-country financial institutions.These activities help leverage direct invest-ment by decreasing risks associated withlong-term, capital-intensive projects orprojects in nontraditional sectors. Severalagencies engage in this type of financing,including activities that promote climatechange objectives.
Overseas Private InvestmentCorporation
The Overseas Private Investment Cor-poration’s (OPIC's) core mission is to sup-port economic development by promotingU.S. private investment in developingcountries and transition economies.OPICprovides project financing, political riskinsurance, and investment guarantees forU.S. company projects covering a range ofinvestments, including many independentpower projects in developing countries.
the Climate Change Science Program,DOE works directly with foreign govern-ments and institutions to promote dissem-ination of energy efficiency, renewableenergy, and clean energy technologies andpractices. Since the 2002 CAR, DOE haslaunched major international initiatives inkey technology areas, including hydrogen,carbon sequestration, and next-generationnuclear power, that involve industrialized,emerging, and developing economies.DOE’s International Renewable EnergyProgram works with foreign governments,industry, and NGOs to help them imple-ment viable activities that address climatechange, transportation needs, local airquality, and related health risks. DOE alsoworks with developing countries through14 climate change bilateral collaborationsand participates in market developmentefforts for clean energy technologiesthrough the Energy Efficiency for Sustain-able Development program and theUnited Kingdom-led Renewable Energyand Energy Efficiency Partnership, both ofwhich are WSSD partnerships.36
U.S. Department of StateThe U.S. Department of State (DOS)
serves as a coordinating agency for trans-ferring technology and providing financialresources to developing countries. DOShas implemented bilateral climate changepartnerships with a number of developingcountries, which enable DOS to coordi-nate, monitor, and facilitate both jointprojects and assistance to U.S. partners.37
U.S. Department of AgricultureThrough its participation in a variety of
bilateral agreements, multilateral agree-ments, and international partnerships,USDA provides technical and financial as-sistance to help countries carry out a wideset of agriculture- and forest-sector activ-ities that support their efforts to mitigateor adapt to the impacts of climate change.These activities include developing meth-ods and protocols for measuring GHGemissions from agricultural sources, devel-oping methods and protocols to estimatecarbon fluxes from forest and agricultural
36 See <www.energy.gov> and <www.iisd.ca/wssd/partnerships.html>.
37 See <www.state.gov>.38 See <www.usda.gov>.39 See <www.noaa.gov>.40 See <www.nasa.gov>.41 See <www.commerce.gov>.

88 U.S. CLIMATE ACTION REPORT—200688 U.S. CLIMATE ACTION REPORT—2006
OPIC also supports a variety of funds thatmake direct equity and equity-related in-vestments in new, expanding, and priva-tizing companies in emerging marketeconomies. OPIC evaluates all project ap-plications on the basis of their contribu-tion to economic development to ensurethe successful implementation of the or-ganization's core developmental mission,and prioritizes the allocation of scarce re-sources to projects on the basis of their de-velopmental benefits.42
Export-Import BankThe Export-Import Bank (Ex-Im), the
export credit agency of the United States,provides financial support to exporters ofU.S. equipment and services through itsinsurance, working capital, and loan guar-antee programs. Ex-Im also features anEnvironmental Exports Program (EEP)that provides enhanced financial supportfor renewable energy and other environ-mentally beneficial exports. Under theEEP, Ex-Im provides special support forexports of air, water, and soil pollutioncleanup; ecological and forestry manage-ment; renewable and alternative energyprojects, including photovoltaic, wind,biomass, fuel cells, waste to energy, hydro-electric, clean coal, and geothermal proj-ects; products to measure or monitor airor water quality; equipment to reduceemissions or effluents; environmental im-pact assessments and ecological studies;environmental training services; andproducts designed to improve energy effi-ciency.
Ex-Im also offers foreign buyers ex-tended repayment terms of up to 15 yearsto cover the purchase of U.S. goods andservices for renewable energy projects.This special support is available for exportsto wind energy, geothermal energy, tidal,wave power, solar photovoltaic, solar ther-mal, ocean thermal, sustainable biomass,and certain bioenergy projects. In fiscalyear 2006, Ex-Im authorized approxi-mately $9.8 million in loan guarantees, in-surance, and working capital guarantees tosupport U.S. renewable energy exports tovarious foreign countries.43
USAID Development Credit AuthorityThe Development Credit Authority
(DCA) is a broad financing authority thatallows USAID to use credit to pursue anyof the development purposes specifiedunder the Foreign Assistance Act of 1961,as amended.DCA seeks to provide USAIDthe flexibility to make more rationalchoices about appropriate financing toolsused in project development, including in-dividual or combined loans, guarantees,and grants. DCA activities are designedand managed by USAID’s overseas mis-sions. Credit projects offer several distinctand attractive advantages over other formsof assistance, and leverage and maximizeUSAID resources by providing access tolocal private capital, sharing risk to en-courage lending, mobilizing local privatecapital, and enhancing“the demonstrationeffect.”44 For example,USAID is providingan Indian bank a 10-year, $20 million loanportfolio guarantee to facilitate financingof small-scale renewable energy, energy ef-ficiency, and water conservation projectsby small and medium enterprises. This as-sistance will increase energy access and re-duce GHG intensity.
USAID Global Development AllianceUSAID’s Global Development Alliance
(GDA) business model links U.S. foreignassistance with the resources, expertise,and creativity of governments, business,and civil society. Through public–privatepartnerships, USAID and its partnerscombine their assets to address pressingdevelopment problems, achieving a solu-tion that would not be possible for any in-dividual partner alone. Through fiscal year2005, USAID funded 400 alliances, with$1.4 billion of USAID funding leveraging$4.6 billion from partners. To provide analternative to traditional grants andcontracts for nontraditional partners,45
USAID created a new obligating instru-ment—the collaborative agreement—thatbecame operational in fiscal year 2005.46
For example, USAID and General Electrichave launched a GDA to pilot commer-cially viable rural electrification in Indiausing renewable energy systems, thus in-
creasing energy access and economicgrowth while reducing the growth of GHGemissions.
U.S. Trade and Development AgencyThe U.S. Trade and Development
Agency (USTDA) is a foreign assistanceagency that delivers its program commit-ments through overseas grants, contractswith U.S. firms, and the use of trust fundsat several multilateral development bankgroups. The projects supported byUSTDA activities represent strong andmeasurable development priorities in hostcountries and offer opportunities forcommercial participation by U.S. firms.Public- and private-sector project spon-sors in developing and middle-incomecountries request USTDA support to assistthem in implementing their developmentpriorities. USTDA’s program is designedto help countries establish a favorabletrading environment and a modern infra-structure that promotes sustainable eco-nomic development. To this end, theagency funds overseas project sponsor ac-cess to U.S. private-sector expertise in theareas of (1) trade capacity building andsector development, and (2) project defini-tion and investment analysis.As a priority,USTDA facilitates development in emerg-ing markets by promoting U.S. partner-ships in high-priority overseas projects.USTDA has promoted the transfer ofclimate-friendly technology in the energy,environment, and water resources sec-tors.47
42 See <www.opic.gov>.43 See <www.exim.gov>.44 Demonstration effects are effects on the behavior of
individuals caused by observation of the actions ofothers and their consequences. The term is particularlyused in political science and sociology to describe thefact that developments in one place will often act as acatalyst in another place. See<http://www.usaid.gov/our_work/economic_growth_and_trade/development_credit/index.html>.
45 Nontraditional partners include private industry, localpartners, and faith-based organizations that are outsidethe typical set of contractors and NGOs.
46 See <http://www.usaid.gov/our_work/global_partnerships/gda/>.
47 See <http://www.tda.gov/>.

CHAPTER 7—FINANCIAL RESOURCES AND TRANSFER OF TECHNOLOGY 89CHAPTER 7—FINANCIAL RESOURCES AND TRANSFER OF TECHNOLOGY 89
cies, foundations, NGOs, and businesseseach have a different role to play in pro-moting climate technology transfer to de-veloping and transition countries.
Foreign direct investment (FDI) andcommercial lending together represent theprimary investment vehicle for long-term,private-sector technology transfer. Alongwith financial capital, these vehicles alsobring other assets vital to production, in-
PRIVATE-SECTOR ASSISTANCEPrivate-sector participation is critical to
the successful transfer of much-neededtechnical know-how and technologies tomost regions of the world. Because the pri-vate sector finances, produces, and sup-plies most climate-friendly technologies, itcan provide much of the human and fi-nancial capital for effective deployment ofthese technologies.U.S. government agen-
cluding technology, knowledge, and skills.It is estimated that U.S. FDI comprises thevast majority of funding going to climatechange and related activities in developingand transition countries. However, be-cause most information relating to financ-ing and implementation of private-sectorprojects is proprietary, very little FDI is re-ported in Table 7-4.

90 U.S. CLIMATE ACTION REPORT—200690 U.S. CLIMATE ACTION REPORT—2006
TAB
LE7-
42001and2004U.S.DirectFinancialContributionsRelatedtoImplementationoftheUNFCCC
(Mill
ions
ofU
.S.D
olla
rs)
MITIGATION
ADAPTATION
Other
RECIPIENT
Waste
Capacity
CoastalZoneVulnerability
COUNTRY/
Energy
Transport
Forestry
Agriculture
Management
Industry
Building
Management
Studies
TOTALS
REGION
2001
2004
2001
2004
2001
2004
2001
2004
2001
2004
2001
2004
2001
2004
2001
2004
20012004
2001
2004
WORLD
13,816.3715,878.7638,711.7839,020.63
65.73142.787,439.718,538.75
0.038,538.75
71,752.5772,778.24
0.000.14
0.00
0.02
0.65
5.98131,786.85136,365.30
Africa
205.40
233.16
1,931.55
1,722.01
20.91
48.84
994.461,506.44
0.001,506.44
891.831,090.23
0.000.00
0.00
0.00
0.00
1.00
4,044.15
4,601.68
Afric
aRe
gion
al0.9
30.1
30.0
00.0
03.9
50.0
021
.263.5
70.0
03.5
70.0
00.0
00.0
00.0
00.0
00.0
00.0
00.0
026
.143.7
0
Ango
la8.0
97.4
919
.6225
.850.0
00.0
015
3.26
352.0
30.0
035
2.03
21.79
43.40
0.00
0.00
0.00
0.00
0.00
0.00
202.7
642
8.77
Beni
n2.3
40.0
81.4
724
.480.0
00.0
00.8
22.0
70.0
02.0
76.6
91.7
30.0
00.0
00.0
00.0
00.0
00.0
011
.3128
.36
Bots
wan
a0.7
20.6
216
.815.7
00.0
00.0
00.0
50.0
10.0
00.0
12.6
515
.710.0
00.0
00.0
00.0
00.0
00.0
020
.2322
.04
Burk
ina
Faso
0.32
0.08
0.17
1.66
0.00
0.00
0.16
9.96
0.00
9.96
0.50
1.79
0.00
0.00
0.00
0.00
0.00
0.00
1.14
13.49
Buru
ndi
0.01
0.00
0.91
4.11
0.00
0.00
0.03
1.74
0.00
1.74
0.49
2.62
0.00
0.00
0.00
0.00
0.00
0.00
1.43
8.48
Cam
eroo
n1.6
61.6
311
1.04
3.90
0.00
0.00
32.27
39.96
0.00
39.96
13.81
7.62
0.00
0.00
0.00
0.00
0.00
0.00
158.7
853
.11
Cape
Verd
e0.1
80.0
95.5
546
.500.0
00.0
00.0
00.0
50.0
00.0
50.2
10.1
80.0
00.0
00.0
00.0
00.0
00.0
05.9
446
.82
Cent
ral
Afric
anRe
p.0.1
20.0
90.2
85.7
20.0
017
.030.4
98.5
50.0
08.5
51.6
00.8
00.0
00.0
00.0
00.0
00.0
00.0
02.4
932
.17
Chad
2.44
0.22
9.87
0.90
0.00
0.00
61.63
30.58
0.00
30.58
16.67
1.85
0.00
0.00
0.00
0.00
0.00
0.00
90.61
33.56
Com
oros
0.00
0.00
0.03
0.04
0.00
0.00
0.16
0.53
0.00
0.53
0.95
0.04
0.00
0.00
0.00
0.00
0.00
0.00
1.13
0.62
Cong
o(DR
OC)
0.30
2.56
0.22
1.25
0.00
1.52
3.42
3.20
0.00
3.20
1.99
7.27
0.00
0.00
0.00
0.00
0.00
0.00
5.94
15.80
Cong
o(R
OC)
6.63
1.25
0.88
4.61
0.00
0.00
31.67
28.43
0.00
28.43
8.08
4.27
0.00
0.00
0.00
0.00
0.00
0.00
47.26
38.57
Cote
d'Iv
oire
3.30
2.18
3.09
9.22
0.00
0.00
18.01
12.42
0.00
12.42
12.69
17.53
0.00
0.00
0.00
0.00
0.00
0.00
37.10
41.35
Djib
outi
0.16
0.39
0.30
1.09
0.00
0.00
4.47
5.13
0.00
5.13
0.81
2.15
0.00
0.00
0.00
0.00
0.00
0.00
5.73
8.77
East
Afric
aRe
gion
al0.0
00.0
00.0
00.0
00.0
00.0
00.0
00.0
00.0
00.0
00.0
00.0
00.0
00.0
00.0
00.0
00.0
00.0
00.0
00.0
0
Equa
toria
lGu
inea
0.00
0.00
0.00
0.00
0.00
0.00
0.00
0.00
0.00
0.00
0.00
0.00
0.00
0.00
0.00
0.00
0.00
0.00
0.00
0.00
Eritr
ea0.0
60.0
70.8
10.8
30.0
00.0
04.0
60.7
30.0
00.7
31.6
41.4
50.0
00.0
00.0
00.0
00.0
00.0
06.5
63.0
8
Ethi
opia
0.22
0.96
4.36
305.9
90.0
50.0
09.1
323
.790.0
023
.793.9
49.5
60.0
00.0
00.0
00.0
00.0
00.0
017
.7034
0.30
Gabo
n0.8
22.1
52.4
62.8
00.0
00.0
044
.9330
.780.0
030
.785.8
932
.190.0
00.0
00.0
00.0
00.0
00.0
054
.1067
.92
Gam
bia
0.08
0.17
0.64
2.24
0.00
0.00
0.01
0.10
0.00
0.10
1.54
1.44
0.00
0.00
0.00
0.00
0.00
0.00
2.26
3.95
Ghan
a4.3
68.3
925
.1926
.710.0
00.9
025
.0560
.970.0
060
.9722
.9337
.490.0
00.0
00.0
00.0
00.0
00.0
077
.5313
4.46
Guin
ea0.5
40.6
84.8
25.0
30.0
03.7
713
.7810
.840.0
010
.846.4
84.8
20.0
00.0
00.0
00.0
00.0
00.0
025
.6325
.14

CHAPTER 7—FINANCIAL RESOURCES AND TRANSFER OF TECHNOLOGY 91CHAPTER 7—FINANCIAL RESOURCES AND TRANSFER OF TECHNOLOGY 91TA
BLE
7-4
(Con
tinue
d)2001and2004U.S.DirectFinancialContributionsRelatedtoImplementationoftheUNFCCC
(Mill
ions
ofU
.S.D
olla
rs)
MITIGATION
ADAPTATION
Other
RECIPIENT
Waste
Capacity
CoastalZoneVulnerability
COUNTRY/
Energy
Transport
Forestry
Agriculture
Management
Industry
Building
Management
Studies
TOTALS
REGION
2001
2004
2001
2004
2001
2004
2001
2004
2001
2004
2001
2004
2001
2004
2001
2004
20012004
2001
2004
Guin
ea-
Biss
au0.0
00.0
70.0
20.4
10.0
00.0
00.0
00.0
00.0
00.0
00.3
30.4
10.0
00.0
00.0
00.0
00.0
00.0
00.3
50.8
8
Keny
a3.4
42.9
844
1.84
216.5
12.2
02.7
210
.659.8
10.0
09.8
127
.1131
.990.0
00.0
00.0
00.0
00.0
00.0
048
5.23
264.0
1
Leso
tho
0.02
1.25
0.35
0.10
0.00
0.00
0.00
0.03
0.00
0.03
0.35
0.07
0.00
0.00
0.00
0.00
0.00
0.00
0.72
1.44
Liber
ia0.2
80.5
82.2
38.0
00.0
00.0
04.3
82.2
20.0
02.2
22.1
69.1
10.0
00.0
00.0
00.0
00.0
00.0
09.0
519
.91
Mad
agas
car
0.21
0.45
5.20
4.64
8.68
8.23
0.50
3.04
0.00
3.04
4.81
2.60
0.00
0.00
0.00
0.00
0.00
0.00
19.41
18.95
Mal
awi
2.08
0.20
2.19
0.35
0.00
2.90
4.49
4.38
0.00
4.38
1.16
3.06
0.00
0.00
0.00
0.00
0.00
0.00
9.92
10.89
Mal
i1.0
80.5
01.5
94.2
20.0
00.1
08.0
013
.490.0
013
.497.2
76.8
40.0
00.0
00.0
00.0
00.0
00.0
017
.9426
.15
Mau
ritan
ia1.6
31.4
80.2
345
.190.0
00.0
015
.3115
.530.0
015
.533.4
02.9
50.0
00.0
00.0
00.0
00.0
00.0
020
.5765
.15
Mau
ritiu
s1.0
10.9
27.0
52.8
10.0
00.0
01.3
31.6
30.0
01.6
34.0
65.4
40.0
00.0
00.0
00.0
00.0
00.0
013
.4510
.81
Moz
ambi
que
0.39
2.07
1.18
3.44
0.00
0.10
12.70
21.01
0.00
21.01
1.60
3.67
0.00
0.00
0.00
0.00
0.00
0.00
15.87
30.28
Nam
ibia
0.97
0.73
175.9
23.8
40.0
01.9
21.6
31.4
40.0
01.4
410
.873.2
20.0
00.0
00.0
00.0
00.0
00.0
018
9.39
11.16
Nige
r5.8
10.3
85.7
34.2
20.0
00.0
020
7.92
391.9
50.0
039
1.95
15.40
7.25
0.00
0.00
0.00
0.00
0.00
0.00
234.8
640
3.79
Nige
ria59
.6977
.6577
.3614
0.36
0.00
0.90
7.17
4.07
0.00
4.07
162.3
421
5.13
0.00
0.00
0.00
0.00
0.00
0.00
306.5
543
8.11
Rwan
da0.1
50.0
00.4
60.0
00.0
00.0
03.8
82.0
60.0
02.0
66.5
02.1
30.0
00.0
00.0
00.0
00.0
00.0
010
.994.1
8
Sahe
l0.0
00.0
00.0
00.0
00.0
00.0
00.0
00.0
00.0
00.0
00.0
00.0
00.0
00.0
00.0
00.0
00.0
00.0
00.0
00.0
0
Sene
gal
2.49
1.57
6.38
9.45
0.00
1.00
16.10
9.28
0.00
9.28
11.52
10.91
0.00
0.00
0.00
0.00
0.00
0.00
36.50
32.21
Sier
raLe
one
0.31
0.95
0.64
3.30
0.00
0.00
1.63
1.40
0.00
1.40
3.57
8.24
0.00
0.00
0.00
0.00
0.00
0.00
6.15
13.90
Som
alia
0.03
0.02
0.64
0.07
0.00
0.00
0.00
0.62
0.00
0.62
0.66
0.32
0.00
0.00
0.00
0.00
0.00
0.00
1.33
1.03
Sout
hAf
rica
89.45
96.66
976.3
372
7.72
0.00
0.00
241.8
333
4.15
0.00
334.1
546
5.97
558.5
80.0
00.0
00.0
00.0
00.0
00.0
01,7
73.59
1,717
.11
Sout
hern
Afric
aRe
gion
al0.0
00.0
00.0
00.0
00.0
00.0
00.0
00.0
00.0
00.0
00.0
00.0
00.0
00.0
00.0
00.0
00.0
00.0
00.0
00.0
0
Suda
n0.0
00.0
00.0
11.5
80.0
00.0
00.0
024
.300.0
024
.300.1
50.0
80.0
00.0
00.0
00.0
00.0
00.0
00.1
625
.96
Swaz
iland
0.14
0.12
1.02
1.22
0.00
0.00
0.03
0.23
0.00
0.23
2.37
1.55
0.00
0.00
0.00
0.00
0.00
0.00
3.56
3.12
Tanz
ania
0.57
13.82
4.33
55.13
1.55
2.50
14.67
8.27
0.00
8.27
7.85
10.58
0.00
0.00
0.00
0.00
0.00
0.00
28.97
90.30
Ugan
da0.5
50.7
32.3
22.9
84.3
84.4
06.4
514
.350.0
014
.359.7
16.5
90.0
00.0
00.0
00.0
00.0
00.0
023
.4029
.05
Wes
tAfri
caRe
gion
al0.0
00.0
00.0
00.0
00.0
00.0
02.5
65.8
50.0
05.8
50.0
00.0
00.0
00.0
00.0
00.0
00.0
00.0
02.5
65.8
5
Zam
bia
1.06
0.18
1.91
1.84
0.10
0.86
6.25
10.06
0.00
10.06
3.92
5.59
0.00
0.00
0.00
0.00
0.00
0.00
13.25
18.54

92 U.S. CLIMATE ACTION REPORT—200692 U.S. CLIMATE ACTION REPORT—2006
TAB
LE7-
4(C
ontin
ued)2001and2004U.S.DirectFinancialContributionsRelatedtoImplementationoftheUNFCCC
(Mill
ions
ofU
.S.D
olla
rs)
MITIGATION
ADAPTATION
Other
RECIPIENT
Waste
Capacity
CoastalZoneVulnerability
COUNTRY/
Energy
Transport
Forestry
Agriculture
Management
Industry
Building
Management
Studies
TOTALS
REGION
2001
2004
2001
2004
2001
2004
2001
2004
2001
2004
2001
2004
2001
2004
2001
2004
20012004
2001
2004
Zim
babw
e0.7
80.6
38.1
06.0
20.0
00.0
00.0
01.8
20.0
01.8
27.4
00.0
00.0
00.0
00.0
00.0
00.0
00.0
018
.648.4
7
Asia/Near
East
3,285.36
4,477.77
13,958.9414,680.32
6.4826.67
2,036.642,073.39
0.012,073.39
35,179.9341,285.41
0.000.13
0.00
0.00
0.20
0.13
54,467.5662,543.81
Afgh
anist
an0.0
080
.780.0
023
.700.0
04.0
00.0
050
.390.0
050
.390.5
146
.160.0
00.0
00.0
00.0
00.0
00.0
00.5
120
5.03
Alge
ria25
.0095
.5839
7.21
168.1
60.0
00.0
011
5.02
132.6
10.0
013
2.61
170.3
415
9.04
0.00
0.00
0.00
0.00
0.00
0.00
707.5
755
5.39
Asia
/Nea
rEa
stRe
giona
l1.3
00.1
50.0
00.0
50.0
02.1
41.7
00.3
50.0
00.3
50.0
00.0
00.0
00.0
00.0
00.0
00.0
00.0
03.0
02.6
9
Bahr
ain
0.00
0.00
0.00
0.00
0.00
0.00
0.00
0.00
0.00
0.00
0.00
0.00
0.00
0.00
0.00
0.00
0.00
0.00
0.00
0.00
Bang
lade
sh22
.3343
.7416
.0120
.330.6
02.5
06.2
911
.460.0
011
.4643
.3735
.280.0
00.0
00.0
00.0
00.0
00.0
088
.6011
3.30
Bhut
an0.1
20.2
00.0
40.1
00.0
00.0
00.0
10.5
10.0
00.5
10.0
90.1
50.0
00.0
00.0
00.0
00.0
00.0
00.2
60.9
5
Brun
ei13
.748.7
710
.2414
.690.0
00.0
04.9
67.3
00.0
07.3
046
.287.9
20.0
00.0
00.0
00.0
00.0
00.0
075
.2238
.69
Burm
a(M
yanm
ar)
0.39
2.23
0.65
0.72
0.00
0.00
1.71
2.60
0.00
2.60
3.50
0.51
0.00
0.00
0.00
0.00
0.00
0.00
6.25
6.05
Cam
bodi
a26
.6428
.498.8
829
.420.0
00.0
00.0
21.3
60.0
01.3
62.9
32.7
50.0
00.0
00.0
00.0
00.0
00.0
038
.4862
.02
Chin
a70
7.62
1,385
.083,6
56.58
4,527
.540.0
10.1
332
3.87
638.8
80.0
163
8.88
5,704
.128,8
87.15
0.00
0.13
0.00
0.00
0.00
0.03
10,39
2.20
15,43
8.94
East
Timor
0.00
0.00
0.00
0.00
0.00
0.00
8.07
0.00
0.00
0.00
0.00
0.00
0.00
0.00
0.00
0.00
0.00
0.00
8.07
0.00
Egyp
t12
0.57
98.35
1,195
.4662
6.56
0.00
0.00
200.6
922
0.39
0.00
220.3
946
3.89
525.6
80.0
00.0
00.0
00.0
00.0
00.0
01,9
80.60
1,470
.98
Fede
rate
dSt
ates
ofM
icro
nesia
0.00
0.00
0.00
0.00
0.00
0.00
0.00
0.00
0.00
0.00
0.00
0.00
0.00
0.00
0.00
0.00
0.00
0.00
0.00
0.00
Fiji
0.00
0.00
0.00
0.00
0.00
0.00
0.00
0.00
0.00
0.00
0.00
0.00
0.00
0.00
0.00
0.00
0.00
0.00
0.00
0.00
Fren
chPo
lynes
ia0.0
00.0
00.0
00.0
00.0
00.0
00.0
00.0
00.0
00.0
00.0
00.0
00.0
00.0
00.0
00.0
00.0
00.0
00.0
00.0
0
Hong
Kong
490.1
859
6.03
988.5
991
6.89
0.00
0.00
78.52
103.5
40.0
010
3.54
4,713
.604,8
22.01
0.00
0.00
0.00
0.00
0.00
0.00
6,270
.906,4
38.46
Indi
a17
9.40
297.8
670
6.27
799.3
30.0
00.0
884
.7715
6.05
0.00
156.0
587
0.49
1,374
.610.0
00.0
00.0
00.0
00.2
00.0
41,8
41.13
2,627
.98
Indo
nesia
59.86
70.80
176.2
617
0.12
4.00
8.50
190.4
521
7.43
0.00
217.4
334
9.91
328.2
20.0
00.0
00.0
00.0
00.0
00.0
078
0.48
795.0
8
Iraq
0.00
0.00
0.00
0.00
0.00
0.00
0.00
11.35
0.00
11.35
0.00
0.00
0.00
0.00
0.00
0.00
0.00
0.00
0.00
11.35
Jord
an0.0
90.0
00.0
00.0
00.0
00.0
014
.4713
.230.0
013
.230.0
00.0
00.0
00.0
00.0
00.0
00.0
00.0
014
.5613
.23
Kirib
ati
0.00
0.00
0.00
0.00
0.00
0.00
0.00
0.00
0.00
0.00
0.00
0.00
0.00
0.00
0.00
0.00
0.00
0.00
0.00
0.00
Kore
a(R
OK)
874.0
21,0
57.41
4,082
.593,7
61.65
0.01
0.00
111.5
619
3.37
0.01
193.3
79,0
64.26
10,40
7.80
0.00
0.00
0.00
0.00
0.00
0.00
14,13
2.44
15,42
0.23
Laos
73.25
68.67
0.00
0.67
0.00
0.00
0.30
0.05
0.00
0.05
210.6
730
9.81
0.00
0.00
0.00
0.00
0.00
0.00
284.2
237
9.20

CHAPTER 7—FINANCIAL RESOURCES AND TRANSFER OF TECHNOLOGY 93CHAPTER 7—FINANCIAL RESOURCES AND TRANSFER OF TECHNOLOGY 93TA
BLE
7-4
(Con
tinue
d)2001and2004U.S.DirectFinancialContributionsRelatedtoImplementationoftheUNFCCC
(Mill
ions
ofU
.S.D
olla
rs)
MITIGATION
ADAPTATION
Other
RECIPIENT
Waste
Capacity
CoastalZoneVulnerability
COUNTRY/
Energy
Transport
Forestry
Agriculture
Management
Industry
Building
Management
Studies
TOTALS
REGION
2001
2004
2001
2004
2001
2004
2001
2004
2001
2004
2001
2004
2001
2004
2001
2004
20012004
2001
2004
Leba
non
0.00
0.00
0.00
0.00
0.00
0.00
0.00
5.49
0.00
5.49
0.00
0.00
0.00
0.00
0.00
0.00
0.00
0.00
0.00
5.49
Mac
ao2.3
04.9
07.0
023
.200.0
00.0
00.0
80.1
10.0
00.1
143
.3435
.470.0
00.0
00.0
00.0
00.0
00.0
052
.7263
.67
Mal
aysia
195.7
424
8.96
1,114
.421,2
19.12
0.00
0.00
47.54
64.17
0.00
64.17
5,468
.946,6
85.00
0.00
0.00
0.00
0.00
0.00
0.00
6,826
.638,2
17.24
Mal
dive
Isla
nds
15.93
12.49
3.77
4.28
0.00
0.00
0.12
0.03
0.00
0.03
38.34
46.75
0.00
0.00
0.00
0.00
0.00
0.00
58.16
63.56
Mar
shal
lIs
land
s0.0
00.0
00.0
00.0
00.0
00.0
00.4
40.0
00.0
00.0
00.0
00.0
00.0
00.0
00.0
00.0
00.0
00.0
00.0
00.0
0
Mon
golia
1.28
1.13
0.99
2.25
0.00
0.00
1.04
4.65
0.00
4.65
3.66
5.17
0.00
0.00
0.00
0.00
0.00
0.00
6.37
13.19
Mor
occo
6.88
0.00
34.36
0.00
0.00
0.00
1.04
0.61
0.00
0.61
38.53
42.56
0.00
0.00
0.00
0.00
0.00
0.00
80.82
43.16
Naur
u0.0
00.0
00.0
00.0
00.0
00.0
00.0
00.0
00.0
00.0
00.0
00.0
00.0
00.0
00.0
00.0
00.0
00.0
00.0
00.0
0
Nepa
l0.0
00.7
53.0
91.7
80.5
01.4
20.5
81.4
20.0
01.4
23.7
811
.080.0
00.0
00.0
00.0
00.0
00.0
07.9
416
.46
New
Cale
doni
a0.0
00.0
00.0
00.0
00.0
00.0
00.0
00.0
00.0
00.0
00.0
00.0
00.0
00.0
00.0
00.0
00.0
00.0
00.0
00.0
0
North
Kore
a0.0
00.0
00.0
80.0
00.0
00.0
00.0
00.0
00.0
00.0
00.0
80.0
00.0
00.0
00.0
00.0
00.0
00.0
00.1
50.0
0
Oman
0.00
0.00
0.00
0.00
0.00
0.00
0.00
0.00
0.00
0.00
0.00
0.00
0.00
0.00
0.00
0.00
0.00
0.00
0.00
0.00
Pakis
tan
38.07
46.88
64.49
800.4
80.0
00.0
021
.2648
.890.0
048
.8975
.5819
3.95
0.00
0.00
0.00
0.00
0.00
0.00
199.4
01,0
90.20
Pala
u0.0
00.0
00.0
00.0
00.0
00.0
00.0
00.0
00.0
00.0
00.0
00.0
00.0
00.0
00.0
00.0
00.0
00.0
00.0
00.0
0
Papu
aNe
wGu
inea
0.00
0.00
0.00
0.00
0.00
0.00
0.00
0.00
0.00
0.00
0.00
0.00
0.00
0.00
0.00
0.00
0.00
0.00
0.00
0.00
Philip
pine
s20
2.71
87.73
373.3
454
4.71
1.37
7.90
44.97
26.17
0.00
26.17
5,102
.034,6
19.47
0.00
0.00
0.00
0.00
0.00
0.06
5,724
.425,2
86.04
Qata
r0.0
00.0
00.0
00.0
00.0
00.0
00.0
00.0
00.0
00.0
00.0
00.0
00.0
00.0
00.0
00.0
00.0
00.0
00.0
00.0
0
Reun
ion
0.36
0.00
0.80
0.00
0.00
0.00
0.00
0.00
0.00
0.00
0.51
0.85
0.00
0.00
0.00
0.00
0.00
0.00
1.67
0.85
Sam
oa0.0
00.0
00.0
00.0
00.0
00.0
00.0
00.0
00.0
00.0
00.0
00.0
00.0
00.0
00.0
00.0
00.0
00.0
00.0
00.0
0
Saud
iAra
bia
0.00
0.00
0.00
0.00
0.00
0.00
0.00
0.00
0.00
0.00
0.00
0.00
0.00
0.00
0.00
0.00
0.00
0.00
0.00
0.00
Seyc
helle
s0.6
60.0
015
6.21
0.00
0.00
0.00
0.00
0.00
0.00
0.00
15.71
3.08
0.00
0.00
0.00
0.00
0.00
0.00
172.5
83.0
8
Sing
apor
e0.0
00.0
00.0
00.0
00.0
00.0
068
3.76
0.00
0.00
0.00
0.00
0.00
0.00
0.00
0.00
0.00
0.00
0.00
683.7
60.0
0
Sout
heas
tAs
iaRe
gion
al0.0
00.0
00.0
00.0
00.0
00.0
00.0
00.0
00.0
00.0
00.0
00.0
00.0
00.0
00.0
00.0
00.0
00.0
00.0
00.0
0
SriL
anka
3.70
30.81
9.29
20.69
0.00
0.00
0.80
2.35
0.00
2.35
37.57
28.71
0.00
0.00
0.00
0.00
0.00
0.00
51.36
82.57
Syria
0.00
0.00
0.00
0.00
0.00
0.00
0.00
0.00
0.00
0.00
0.00
0.00
0.00
0.00
0.00
0.00
0.00
0.00
0.00
0.00
Taiw
an0.0
00.0
00.0
00.0
00.0
00.0
00.0
00.0
00.0
00.0
00.0
00.0
00.0
00.0
00.0
00.0
00.0
00.0
00.0
00.0
0
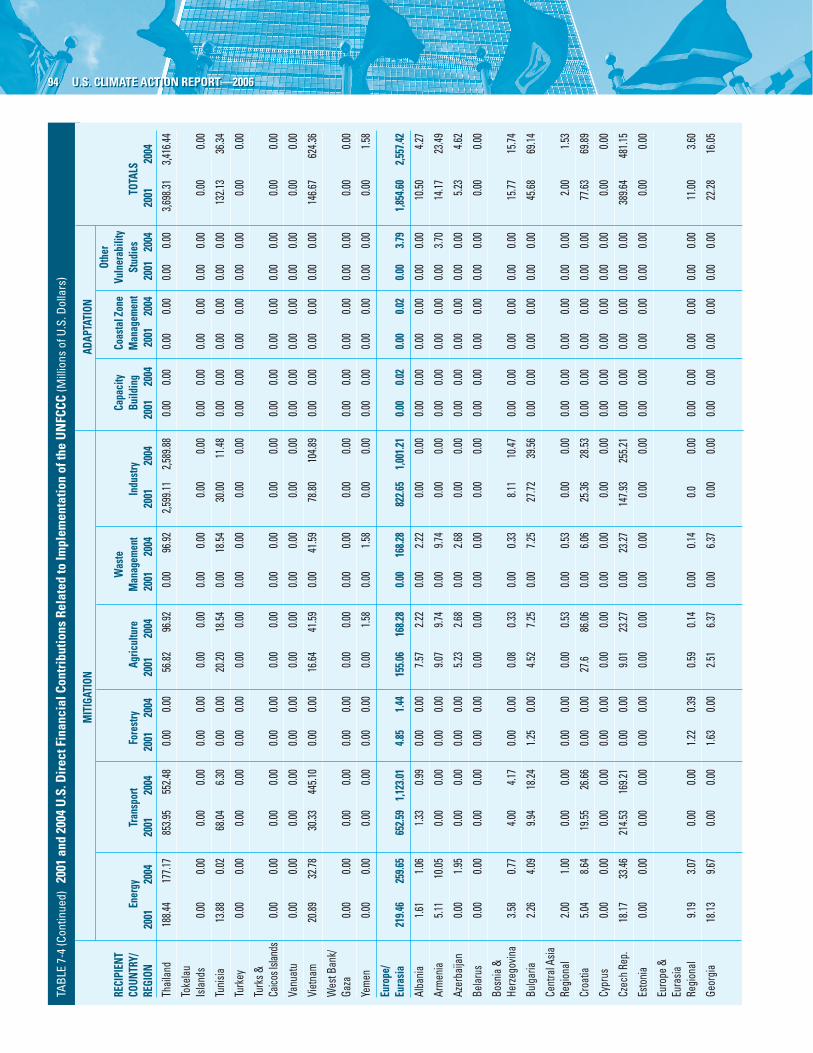
94 U.S. CLIMATE ACTION REPORT—200694 U.S. CLIMATE ACTION REPORT—2006
TAB
LE7-
4(C
ontin
ued)2001and2004U.S.DirectFinancialContributionsRelatedtoImplementationoftheUNFCCC
(Mill
ions
ofU
.S.D
olla
rs)
MITIGATION
ADAPTATION
Other
RECIPIENT
Waste
Capacity
CoastalZoneVulnerability
COUNTRY/
Energy
Transport
Forestry
Agriculture
Management
Industry
Building
Management
Studies
TOTALS
REGION
2001
2004
2001
2004
2001
2004
2001
2004
2001
2004
2001
2004
2001
2004
2001
2004
20012004
2001
2004
Thai
land
188.4
417
7.17
853.9
555
2.48
0.00
0.00
56.82
96.92
0.00
96.92
2,599
.112,5
89.88
0.00
0.00
0.00
0.00
0.00
0.00
3,698
.313,4
16.44
Toke
lau
Isla
nds
0.00
0.00
0.00
0.00
0.00
0.00
0.00
0.00
0.00
0.00
0.00
0.00
0.00
0.00
0.00
0.00
0.00
0.00
0.00
0.00
Tuni
sia13
.880.0
268
.046.3
00.0
00.0
020
.2018
.540.0
018
.5430
.0011
.480.0
00.0
00.0
00.0
00.0
00.0
013
2.13
36.34
Turk
ey0.0
00.0
00.0
00.0
00.0
00.0
00.0
00.0
00.0
00.0
00.0
00.0
00.0
00.0
00.0
00.0
00.0
00.0
00.0
00.0
0
Turk
s&Ca
icosI
sland
s0.0
00.0
00.0
00.0
00.0
00.0
00.0
00.0
00.0
00.0
00.0
00.0
00.0
00.0
00.0
00.0
00.0
00.0
00.0
00.0
0
Vanu
atu
0.00
0.00
0.00
0.00
0.00
0.00
0.00
0.00
0.00
0.00
0.00
0.00
0.00
0.00
0.00
0.00
0.00
0.00
0.00
0.00
Viet
nam
20.89
32.78
30.33
445.1
00.0
00.0
016
.6441
.590.0
041
.5978
.8010
4.89
0.00
0.00
0.00
0.00
0.00
0.00
146.6
762
4.36
Wes
tBan
k/Ga
za0.0
00.0
00.0
00.0
00.0
00.0
00.0
00.0
00.0
00.0
00.0
00.0
00.0
00.0
00.0
00.0
00.0
00.0
00.0
00.0
0
Yem
en0.0
00.0
00.0
00.0
00.0
00.0
00.0
01.5
80.0
01.5
80.0
00.0
00.0
00.0
00.0
00.0
00.0
00.0
00.0
01.5
8
Europe/
Eurasia
219.46
259.65
652.591,123.01
4.85
1.44
155.06168.28
0.00168.28
822.651,001.21
0.000.02
0.00
0.02
0.00
3.79
1,854.60
2,557.42
Alba
nia
1.61
1.06
1.33
0.99
0.00
0.00
7.57
2.22
0.00
2.22
0.00
0.00
0.00
0.00
0.00
0.00
0.00
0.00
10.50
4.27
Arm
enia
5.11
10.05
0.00
0.00
0.00
0.00
9.07
9.74
0.00
9.74
0.00
0.00
0.00
0.00
0.00
0.00
0.00
3.70
14.17
23.49
Azer
baija
n0.0
01.9
50.0
00.0
00.0
00.0
05.2
32.6
80.0
02.6
80.0
00.0
00.0
00.0
00.0
00.0
00.0
00.0
05.2
34.6
2
Bela
rus
0.00
0.00
0.00
0.00
0.00
0.00
0.00
0.00
0.00
0.00
0.00
0.00
0.00
0.00
0.00
0.00
0.00
0.00
0.00
0.00
Bosn
ia&
Herz
egov
ina
3.58
0.77
4.00
4.17
0.00
0.00
0.08
0.33
0.00
0.33
8.11
10.47
0.00
0.00
0.00
0.00
0.00
0.00
15.77
15.74
Bulg
aria
2.26
4.09
9.94
18.24
1.25
0.00
4.52
7.25
0.00
7.25
27.72
39.56
0.00
0.00
0.00
0.00
0.00
0.00
45.68
69.14
Cent
ralA
siaRe
gion
al2.0
01.0
00.0
00.0
00.0
00.0
00.0
00.5
30.0
00.5
30.0
00.0
00.0
00.0
00.0
00.0
00.0
00.0
02.0
01.5
3
Croa
tia5.0
48.6
419
.5526
.660.0
00.0
027
.686
.060.0
06.0
625
.3628
.530.0
00.0
00.0
00.0
00.0
00.0
077
.6369
.89
Cypr
us0.0
00.0
00.0
00.0
00.0
00.0
00.0
00.0
00.0
00.0
00.0
00.0
00.0
00.0
00.0
00.0
00.0
00.0
00.0
00.0
0
Czec
hRe
p.18
.1733
.4621
4.53
169.2
10.0
00.0
09.0
123
.270.0
023
.2714
7.93
255.2
10.0
00.0
00.0
00.0
00.0
00.0
038
9.64
481.1
5
Esto
nia
0.00
0.00
0.00
0.00
0.00
0.00
0.00
0.00
0.00
0.00
0.00
0.00
0.00
0.00
0.00
0.00
0.00
0.00
0.00
0.00
Euro
pe&
Eura
siaRe
gion
al9.1
93.0
70.0
00.0
01.2
20.3
90.5
90.1
40.0
00.1
40.0
0.00
0.00
0.00
0.00
0.00
0.00
0.00
11.00
3.60
Geor
gia
18.13
9.67
0.00
0.00
1.63
0.00
2.51
6.37
0.00
6.37
0.00
0.00
0.00
0.00
0.00
0.00
0.00
0.00
22.28
16.05

CHAPTER 7—FINANCIAL RESOURCES AND TRANSFER OF TECHNOLOGY 95CHAPTER 7—FINANCIAL RESOURCES AND TRANSFER OF TECHNOLOGY 95TA
BLE
7-4
(Con
tinue
d)2001and2004U.S.DirectFinancialContributionsRelatedtoImplementationoftheUNFCCC
(Mill
ions
ofU
.S.D
olla
rs)
MITIGATION
ADAPTATION
Other
RECIPIENT
Waste
Capacity
CoastalZoneVulnerability
COUNTRY/
Energy
Transport
Forestry
Agriculture
Management
Industry
Building
Management
Studies
TOTALS
REGION
2001
2004
2001
2004
2001
2004
2001
2004
2001
2004
2001
2004
2001
2004
2001
2004
20012004
2001
2004
Hung
ary
43.64
80.18
94.38
552.1
40.0
00.0
025
.7332
.720.0
032
.7216
4.51
175.9
20.0
00.0
00.0
00.0
00.0
00.0
032
8.27
840.9
7
Kaza
khst
an5.2
81.7
50.0
00.0
00.0
00.0
00.8
40.4
10.0
00.4
10.0
00.0
00.0
00.0
10.0
00.0
10.0
00.0
86.1
12.2
6
Koso
vo0.0
00.9
20.0
00.0
00.0
00.0
02.3
42.0
00.0
02.0
00.0
00.0
00.0
00.0
00.0
00.0
00.0
00.0
02.3
42.9
2
Kyrg
yzst
an0.7
50.8
00.0
00.0
00.0
00.0
01.1
60.6
20.0
00.6
20.0
00.0
00.0
00.0
00.0
00.0
00.0
00.0
01.9
11.4
2
Latv
ia0.0
00.0
00.0
00.0
00.0
00.0
00.0
00.0
00.0
00.0
00.0
00.0
00.0
00.0
00.0
00.0
00.0
00.0
00.0
00.0
0
Lithu
ania
0.00
0.00
0.00
0.00
0.00
0.00
0.00
0.00
0.00
0.00
0.00
0.00
0.00
0.00
0.00
0.00
0.00
0.00
0.00
0.00
Mac
edon
ia2.6
40.7
43.6
21.0
60.0
00.0
02.7
80.6
80.0
00.6
811
.198.1
00.0
00.0
00.0
00.0
00.0
00.0
020
.2210
.58
Mol
dova
4.58
0.00
0.00
0.00
0.00
0.00
1.95
10.53
0.00
10.53
0.00
0.00
0.00
0.00
0.00
0.00
0.00
0.00
6.53
10.53
Mon
tene
gro
0.00
0.00
0.00
0.00
0.00
0.00
0.00
0.22
0.00
0.22
0.00
0.00
0.00
0.00
0.00
0.00
0.00
0.00
0.00
0.22
Pola
nd22
.4130
.9196
.3315
0.00
0.00
0.00
26.18
30.00
0.00
30.00
261.7
624
4.51
0.00
0.00
0.00
0.00
0.00
0.00
406.6
845
5.41
Rom
ania
12.20
36.20
178.9
967
.880.0
00.0
08.9
710
.600.0
010
.6010
3.79
126.2
80.0
00.0
00.0
00.0
00.0
00.0
030
3.94
240.9
6
Russ
ia1.3
03.0
00.0
00.0
00.7
51.0
50.7
00.4
00.0
00.4
00.0
00.0
00.0
00.0
00.0
00.0
00.0
00.0
02.7
54.4
5
Serb
ia0.0
00.0
00.0
00.0
00.0
00.0
01.0
02.3
00.0
02.3
00.0
00.0
00.0
00.0
00.0
00.0
00.0
00.0
01.0
02.3
0
Slov
akRe
p.2.9
13.1
46.2
232
.330.0
00.0
02.9
13.0
20.0
03.0
225
.4544
.150.0
00.0
00.0
00.0
00.0
00.0
037
.4982
.66
Slov
enia
9.28
8.17
17.87
39.76
0.00
0.00
2.86
2.26
0.00
2.26
39.52
43.35
0.00
0.00
0.00
0.00
0.00
0.00
69.53
93.53
Tajik
istan
0.10
0.50
0.00
0.00
0.00
0.00
0.57
0.38
0.00
0.38
0.00
0.00
0.00
0.00
0.00
0.00
0.00
0.00
0.67
0.88
Turk
men
istan
0.35
0.02
0.00
0.00
0.00
0.00
0.10
0.10
0.00
0.10
0.00
0.00
0.00
0.00
0.00
0.00
0.00
0.00
0.45
0.12
Ukra
ine
47.65
16.76
0.00
0.00
0.00
0.00
8.64
8.25
0.00
8.25
0.00
0.00
0.00
0.01
0.00
0.01
0.00
0.01
56.29
25.03
Uzbe
kista
n0.2
50.0
00.0
00.0
00.0
00.0
00.6
40.9
30.0
00.9
30.0
00.0
00.0
00.0
00.0
00.0
00.0
00.0
00.8
90.9
3
Yugo
slavia
1.05
2.80
5.84
60.56
0.00
0.00
1.44
4.31
0.00
4.31
7.32
25.12
0.00
0.00
0.00
0.00
0.00
0.00
15.65
92.79
LatinAmerica/
Caribbean
10,090.1110,905.0422,168.6521,495.12
29.47
44.28
4,242.764,708.00
0.004,708.00
34,858.1429,401.39
0.000.00
0.00
0.00
0.00
0.71
71,389.1366,554.53
Angu
illa0.6
60.5
61.8
71.6
40.0
00.0
00.5
61.5
50.0
01.5
52.7
32.9
60.0
00.0
00.0
00.0
00.0
00.0
05.8
26.7
0
Antig
ua&
Barb
uda
3.28
4.01
14.54
11.73
0.00
0.00
1.05
1.99
0.00
1.99
14.04
12.35
0.00
0.00
0.00
0.00
0.00
0.00
32.91
30.09
Arge
ntin
a17
7.16
144.3
839
9.72
378.9
60.0
00.0
022
7.06
249.5
10.0
024
9.51
1,005
.1354
7.44
0.00
0.00
0.00
0.00
0.00
0.00
1,809
.071,3
20.29
Arub
a9.1
110
.4217
.8815
.910.0
00.0
02.3
712
.810.0
012
.8178
.6338
.320.0
00.0
00.0
00.0
00.0
00.0
010
7.99
77.46
Baha
mas
32.72
40.85
96.15
92.89
0.00
0.00
38.90
19.84
0.00
19.84
96.82
102.2
00.0
00.0
00.0
00.0
00.0
00.0
026
4.59
255.7
7
Barb
ados
12.53
13.44
15.08
20.84
0.00
0.00
5.56
10.02
0.00
10.02
63.09
65.89
0.00
0.00
0.00
0.00
0.00
0.00
96.26
110.2
0

96 U.S. CLIMATE ACTION REPORT—200696 U.S. CLIMATE ACTION REPORT—2006
TAB
LE7-
4(C
ontin
ued)2001and2004U.S.DirectFinancialContributionsRelatedtoImplementationoftheUNFCCC
(Mill
ions
ofU
.S.D
olla
rs)
MITIGATION
ADAPTATION
Other
RECIPIENT
Waste
Capacity
CoastalZoneVulnerability
COUNTRY/
Energy
Transport
Forestry
Agriculture
Management
Industry
Building
Management
Studies
TOTALS
REGION
2001
2004
2001
2004
2001
2004
2001
2004
2001
2004
2001
2004
2001
2004
2001
2004
20012004
2001
2004
Beliz
e8.1
37.2
820
.5815
.500.0
00.0
05.3
13.0
30.0
03.0
325
.5220
.190.0
00.0
00.0
00.0
00.0
00.0
059
.5546
.00
Berm
uda
13.85
12.10
53.35
110.7
70.0
00.0
02.4
94.8
40.0
04.8
461
.9670
.570.0
00.0
00.0
00.0
00.0
00.0
013
1.65
198.2
8
Boliv
ia7.1
312
.9719
.1616
.734.9
51.8
052
.4838
.380.0
038
.3865
.0647
.150.0
00.0
00.0
00.0
00.0
00.0
014
8.77
117.0
4
Braz
il1,4
00.64
406.6
23,4
31.13
3,099
.632.5
03.5
671
9.59
761.1
40.0
076
1.14
1,797
.031,2
20.55
0.00
0.00
0.00
0.00
0.00
0.00
7,350
.895,4
91.51
Briti
shVi
rgin
Isla
nds
3.27
2.97
62.03
346.2
40.0
00.0
01.6
71.9
60.0
01.9
62,1
48.70
1,158
.580.0
00.0
00.0
00.0
00.0
00.0
02,2
15.66
1,509
.74
Carib
bean
Regi
onal
0.55
0.00
0.00
0.00
0.00
0.98
0.00
1.74
0.00
1.74
0.00
0.00
0.00
0.00
0.00
0.00
0.00
0.00
0.55
2.72
Caym
anIs
land
s6.7
618
.0024
.0449
.390.0
00.0
02.4
44.0
80.0
04.0
823
.2053
.920.0
00.0
00.0
00.0
00.0
00.0
056
.4312
5.38
Cent
ral
Amer
ica
Regi
onal
0.00
0.00
0.00
0.00
4.56
5.60
0.00
1.72
0.00
1.72
0.00
0.00
0.00
0.00
0.00
0.00
0.00
0.00
4.56
7.32
Chile
144.4
618
3.04
449.3
935
9.47
0.00
0.00
337.2
244
3.61
0.00
443.6
178
0.83
710.1
80.0
00.0
00.0
00.0
00.0
00.0
01,7
11.89
1,696
.29
Colo
mbi
a17
8.47
199.1
427
6.10
294.0
60.0
00.0
030
3.55
345.9
30.0
034
5.93
740.1
779
1.36
0.00
0.00
0.00
0.00
0.00
0.00
1,498
.291,6
30.49
Cost
aRi
ca10
9.62
110.6
521
5.90
207.6
30.0
00.0
036
.9935
.770.0
035
.7759
6.16
1,063
.730.0
00.0
00.0
00.0
00.0
00.0
095
8.67
1,417
.78
Dom
inic
aIs
land
s0.5
91.0
61.5
51.6
00.0
00.0
00.6
70.6
10.0
00.6
15.6
56.9
40.0
00.0
00.0
00.0
00.0
00.0
08.4
510
.21
Dom
inic
anRe
publ
ic20
4.69
341.2
920
6.85
147.6
90.0
00.1
962
.9028
.940.0
028
.9475
0.99
444.3
40.0
00.0
00.0
00.0
00.0
00.0
01,2
25.44
962.4
5
Ecua
dor
71.17
68.09
117.4
392
.725.3
05.6
617
7.22
171.1
60.0
017
1.16
246.8
631
0.46
0.00
0.00
0.00
0.00
0.00
0.00
617.9
964
8.09
ElSa
lvado
r23
.1224
.8737
.2714
6.56
0.00
0.00
12.94
17.15
0.00
17.15
177.8
122
8.62
0.00
0.00
0.00
0.00
0.00
0.00
251.1
441
7.20
Fren
chGu
iana
0.71
0.53
7.72
2.60
0.00
0.00
0.81
1.06
0.00
1.06
5.17
3.48
0.00
0.00
0.00
0.00
0.00
0.00
14.42
7.66
Gren
ada
Isla
nds
4.42
5.80
2.81
3.05
0.00
0.00
2.10
0.60
0.00
0.60
115.0
822
0.63
0.00
0.00
0.00
0.00
0.00
0.00
124.4
023
0.09
Guad
elou
pe2.3
01.3
63.5
03.3
50.0
00.0
01.6
40.5
80.0
00.5
87.9
98.1
00.0
00.0
00.0
00.0
00.0
00.0
015
.4213
.40
Guat
emal
a59
.4551
.7286
.7611
8.93
0.00
1.88
45.90
61.19
0.00
61.19
115.5
815
3.48
0.00
0.00
0.00
0.00
0.00
0.00
307.6
938
7.20
Guya
na12
.516.4
73.6
06.1
20.0
00.0
010
.574.3
50.0
04.3
513
5.44
204.5
00.0
00.0
00.0
00.0
00.0
00.0
016
2.12
221.4
5
Haiti
25.66
33.62
23.91
23.73
0.00
0.00
9.23
5.48
0.00
5.48
24.20
28.11
0.00
0.00
0.00
0.00
0.00
0.00
83.00
90.95
Hond
uras
54.96
68.08
52.25
124.1
52.8
90.7
518
.2224
.290.0
024
.2913
1.78
151.1
40.0
00.0
00.0
00.0
00.0
00.0
026
0.10
368.4
1

CHAPTER 7—FINANCIAL RESOURCES AND TRANSFER OF TECHNOLOGY 97CHAPTER 7—FINANCIAL RESOURCES AND TRANSFER OF TECHNOLOGY 97TA
BLE
7-4
(Con
tinue
d)2001and2004U.S.DirectFinancialContributionsRelatedtoImplementationoftheUNFCCC
(Mill
ions
ofU
.S.D
olla
rs)
MITIGATION
ADAPTATION
Other
RECIPIENT
Waste
Capacity
CoastalZoneVulnerability
COUNTRY/
Energy
Transport
Forestry
Agriculture
Management
Industry
Building
Management
Studies
TOTALS
REGION
2001
2004
2001
2004
2001
2004
2001
2004
2001
2004
2001
2004
2001
2004
2001
2004
20012004
2001
2004
Jam
aica
45.56
40.06
99.56
73.26
1.94
1.38
28.87
23.59
0.00
23.59
161.5
114
3.64
0.00
0.00
0.00
0.00
0.00
0.00
337.4
428
1.93
Latin
Amer
ica
Regi
onal
1.70
1.99
0.00
0.00
2.03
10.60
0.60
2.64
0.00
2.64
0.00
0.00
0.00
0.00
0.00
0.00
0.00
0.00
4.33
15.23
Mar
tiniq
ue0.8
00.6
54.7
76.2
40.0
00.0
01.0
20.8
60.0
00.8
611
2.64
76.49
0.00
0.00
0.00
0.00
0.00
0.00
119.2
484
.24
Mex
ico
6,908
.878,5
94.34
15,25
8.10
14,66
2.68
3.20
3.81
1,007
.861,3
35.41
0.00
1,335
.4118
,636.3
515
,859.7
80.0
00.0
00.0
00.0
00.0
00.7
141
,814.3
840
,456.7
4
Mon
tser
rat
Isla
nds
0.50
0.12
0.26
0.28
0.00
0.00
0.00
0.48
0.00
0.48
4,779
.123,6
64.99
0.00
0.00
0.00
0.00
0.00
0.00
4,779
.883,6
65.88
Nica
ragu
a19
.9125
.2623
.8429
.980.4
90.5
022
.6522
.450.0
022
.4525
.6639
.510.0
00.0
00.0
00.0
00.0
00.0
092
.5511
7.70
Pana
ma
57.96
43.59
101.5
827
8.71
0.00
5.12
23.92
30.92
0.00
30.92
165.1
012
8.32
0.00
0.00
0.00
0.00
0.00
0.00
348.5
548
6.65
Para
guay
3.47
7.38
6.51
8.66
0.00
0.93
2.27
1.45
0.00
1.45
69.38
88.50
0.00
0.00
0.00
0.00
0.00
0.00
81.63
106.9
2
Peru
56.08
64.75
83.45
87.09
1.62
1.51
207.6
921
9.59
0.00
219.5
924
1.68
264.8
20.0
00.0
00.0
00.0
00.0
00.0
059
0.52
637.7
6
Sain
tKi
tts-
Nevis
9.39
15.43
6.07
4.05
0.00
0.00
0.65
1.29
0.00
1.29
233.2
236
5.87
0.00
0.00
0.00
0.00
0.00
0.00
249.3
338
6.64
Sain
tLu
cia
Isla
nds
3.30
2.11
3.50
4.38
0.00
0.00
1.04
1.17
0.00
1.17
173.1
116
5.90
0.00
0.00
0.00
0.00
0.00
0.00
180.9
417
3.55
Sain
tPie
rre&
Miq
uelo
n0.0
10.0
00.0
20.0
00.0
00.0
00.0
00.0
00.0
00.0
01.7
33.7
10.0
00.0
00.0
00.0
00.0
00.0
01.7
63.7
1
Sain
tVin
cent
&Gr
enad
ines
1.24
2.27
2.01
3.10
0.00
0.00
1.14
0.45
0.00
0.45
6.70
9.00
0.00
0.00
0.00
0.00
0.00
0.00
11.09
14.82
Surin
ame
4.68
6.10
9.02
13.02
0.00
0.00
9.91
13.41
0.00
13.41
16.45
22.29
0.00
0.00
0.00
0.00
0.00
0.00
40.05
54.81
Trin
idad
&To
bago
52.39
64.26
60.01
62.85
0.00
0.00
199.6
516
9.96
0.00
169.9
619
4.79
178.4
00.0
00.0
00.0
00.0
00.0
00.0
050
6.83
475.4
8
Urug
uay
13.24
8.61
21.42
28.79
0.00
0.00
7.54
7.22
0.00
7.22
65.59
44.38
0.00
0.00
0.00
0.00
0.00
0.00
107.7
989
.00
Vene
zuel
a34
3.09
258.7
784
7.96
540.1
60.0
00.0
064
8.52
623.7
60.0
062
3.76
759.5
268
0.62
0.00
0.00
0.00
0.00
0.00
0.00
2,599
.082,1
03.31
Other
Global
Programs
16.06
3.15
0.05
0.18
4.0221.55
10.79
82.64
0.02
82.64
0.02
0.00
0.000.00
0.00
0.00
0.45
0.35
31.41
107.86

Climate change and climate variability play important roles in shaping the environ-ment, infrastructure, economy, and other aspects of life worldwide. The UnitedStates continues to lead the world in research on climate and other global environ-
mental changes, funding a significant portion of the world’s climate change research toprovide a sound scientific basis for national and international decisions regarding thesechanges.
With the goal of improving understanding of the science behind climate change, Pres-ident Bush launched the interagency Climate Change Science Program (CCSP) in Febru-ary 2002, building on strong U.S. commitment to research on global change. With its$1.5 billion annual investment in monitoring and predicting global change, CCSP isimproving understanding of the natural and human-induced changes in the Earth’s globalenvironmental system.
The United States also conducts a robust technology research, development, demon-stration, and commercialization effort coordinated through the multi-agency ClimateChange Technology Program (CCTP). Since 2003, the United States has invested nearly$3 billion annually to facilitate more rapid development and commercialization of ad-vanced and cost-competitive technologies to help meet the Nation’s long-term goal of re-ducing, and eventually reversing, greenhouse gas (GHG) emissions. CCSP and CCTPcollaborate to address issues at the intersection of science and technology, such as the eval-uation of approaches to sequestration, anthropogenic GHG emissions monitoring, andenergy technology development and market penetration scenarios.
Long-term, high-quality observations of the global environmental system are essentialfor understanding and evaluating Earth system processes. The United States contributesto the development and operation of global observing systems that combine data streamsfrom both research and operational observing platforms to provide a comprehensivemeasure of climate system variability and climate change. The United States supportsmultiple oceanic, atmospheric, terrestrial, and space-based systems, working with inter-national partners to enhance observations and improve data quality and availability.
In developing the roadmap for CCSP, the United States recognized the need for en-hanced observations and the importance of international cooperation in this area. To ad-dress these issues, the United States initiated the first intergovernmental,ministerial-levelEarth Observation Summit, which was held in July 2003. At the third Earth ObservationSummit, in Brussels in 2005, nearly 60 countries adopted a 10-year plan for implementinga Global Earth Observation System of Systems (GEOSS), that addresses multiple environ-mental data needs, including climate, weather, biodiversity, natural disasters, and waterand energy resource management (GEO 2005).With its focus on climate science, technol-ogy, and Earth observations, the United States is at the forefront of finding long-term an-swers to the complicated issue of global climate change.
8 Research andSystematic ObservationResearch andSystematic Observation

CHAPTER 8—RESEARCH AND SYSTEMATIC OBSERVATION 99CHAPTER 8—RESEARCH AND SYSTEMATIC OBSERVATION 99
2003a), along with its shorter companiondocument, The U.S. Climate Change Sci-ence Program—Vision for the Program andHighlights of the Scientific Strategic Plan(CCSP and SGCR 2003b). The StrategicPlan is the first comprehensive update ofa U.S. national plan for climate and globalchange research since the originalUSGCRP strategy was issued at the pro-gram’s inception in 1990.
In February 2004, theNRC review com-mittee issued its second public report on theplan, Implementing Climate and GlobalChange Research: A Review of the Final U.S.Climate Change Science Program StrategicPlan (NRC2004).This report expressed thecommittee’s conclusions on the content,objectivity, quality, and comprehensivenessof the final Strategic Plan, on the processused to produce it, and on the proposedprocess for developing subsequent findingsto be reported by CCSP. The NRC reviewmade a number of recommendations onimplementing the plan, concluding:The Strategic Plan for the U.S. Climate
Change Science Program articulates a guiding vi-sion, is appropriately ambitious, and is broad inscope. It encompasses activities related to areas oflong-standing importance, together with new orenhanced cross-disciplinary efforts. It appropri-ately plans for close integration with the comple-mentary Climate Change Technology Program.The CCSP has responded constructively to theNational Academies review and other commu-nity input in revising the strategic plan. In fact,the approaches taken by the CCSP to receive andrespond to comments from a large and broadgroup of scientists and stakeholders, including atwo-stage independent review of the plan, set ahigh standard for government research programs.As a result, the revised strategic plan is much im-proved over its November 2002 draft, and nowincludes the elements of a strategic managementframework that could permit it to effectively guideresearch on climate and associated global changesover the next decades. Advancing science on allfronts identified by the program will be of vitalimportance to the nation.
CCSP VisionOver the past 15 years, the United States
has invested heavily in scientific research,monitoring, data management, and assess-
THE U.S. CLIMATE CHANGESCIENCE PROGRAM
CCSP1 is a collaborative interagencyprogram that integrates the U.S. GlobalChange Research Program (USGCRP)with the Administration’s Climate ChangeResearch Initiative (CCRI). CCSP addsvalue to the individual Earth and climatescience missions of its 13 participating fed-eral agencies and their national and inter-national partners by coordinating researchand information to achieve results that nosingle agency, or small group of agencies,could attain. In addition to integrating re-search and observational approachesacross disciplinary boundaries, CCSP isworking to create a more seamless ap-proach among the theory, modeling, ob-servations, and applications that arerequired to address the multiple scientificchallenges posed by climate change andvariability.
Development of the CCSPStrategic Plan
In July 2002, CCSP began a process tocreate a 10-year strategic plan, solicitingand comprehensively examining the re-search and observation needs of nationaland international climate change scientistsand stakeholders. In November 2002, theBush Administration released a “discus-sion” draft of the CCSP strategic plan forpublic review (CCSP 2002). Guided by thepriority information needs identified byscientists and stakeholders, the discussiondraft outlined a comprehensive, collabo-rative approach for developing a more ac-curate understanding of climate changeand its potential impacts.
External comments, obtained throughwell-attended workshops, public reviewperiods, and multiple reviews by the Na-tional Academies’ National ResearchCouncil (NRC), played an important rolein revising the draft plan. After considera-tion of all of the external input and exten-sive comments from the internal U.S.government review process, the Bush Ad-ministration released the final StrategicPlan for the U.S. Climate Change ScienceProgram in July 2003 (CCSP and SGCR
ment for climate change analyses to builda foundation of knowledge for decisionmaking. The seriousness of the issues andthe unique role that science can play inhelping to inform society’s course give riseto CCSP’s guiding vision: A nation and theglobal community empowered with the science-
based knowledge to manage the risks and oppor-
tunities of change in the climate and related
environmental systems.
CCSP MissionThe core precept thatmotivates CCSP is
that the best possible scientific knowledgeshould be the foundation for the informa-tion required to manage climate variabilityand change, and related aspects of globalchange. Thus, CCSP’s mission is to: Facili-tate the creation and application of knowledge of
the Earth’s global environment through research,
observations, decision support, and communica-
tion.
CCSP Core ApproachesCCSP employs the following core ap-
proaches in working toward its goals:2
Scientific Research: Plan, Sponsor, andConduct Research on Changes in Climateand Related Systems—The greatest per-centage of the CCSP budget is devoted tocontinuing the essential ongoing invest-ment in scientific knowledge, facilitatingthe discovery of the unexpected, and ad-vancing the frontiers of science. CCSPagencies coordinate their work throughseven interdisciplinary research elementsand four cross-cutting elements, which to-gether support scientific research across awide range of interconnected issues of cli-mate and global change. The CCSP re-search elements are: (1) AtmosphericComposition, (2) Climate Variability andChange (including Climate Modeling), (3)Global Water Cycle, (4) Land-Use/Land-Cover Change, (5) Global Carbon Cycle,(6) Ecosystems, and (7) Human Contribu-tions and Responses/Decision Support.The four cross-cutting elements are: (1)Observations, (2) Modeling, (3) Commu-nications, and (4) International Research
1 See <http://www.climatescience.gov>.2 For greater detail, see <http://www.climatescience.gov/Library/stratplan2003/final/default.htm>.

100 U.S. CLIMATE ACTION REPORT—2006100 U.S. CLIMATE ACTION REPORT—2006
and Cooperation. CCSP encourages evo-lution of the research elements over thecoming decade in response to new knowl-edge and societal needs.Observations: Enhance Observations
and DataManagement Systems to Generatea Comprehensive Set of Variables Needed forClimate-Related Research—Prior and cur-rent investments in new Earth observa-tions will significantly enhance knowledgeof environmental variables in the comingyears. But enhanced global and regionalintegration of observation and data man-agement systems, especially to help gener-ate new and improved decision-supportproducts, will also be needed. CCSP isworking to increase the capacity to prior-itize, ensure the quality of, archive, anddisseminate (in useful format) the largequantity of available observations.
The intergovernmental Group on EarthObservations (GEO) is committed tocontinuing progress toward the develop-ment of a comprehensive, coordinated,and sustained GEOSS. In February 2005,the GEO released a 10-year implementa-tion plan summarizing the essential stepsto be taken by a global community of na-tions and intergovernmental, interna-tional, and regional organizations (GEO2005). The U.S. contribution to GEOSS isthe Integrated Earth Observation System(IEOS). In March 2005, the National Sci-ence and Technology Council’s Commit-tee on Environment and NaturalResources (CENR) released the StrategicPlan for the U.S. Integrated Earth Observa-tion System (IWGEO and NSTC/CENR2005). The plan addresses the policy, tech-nical, fiscal, and societal benefit compo-nents of this integrated system, and createdthe U.S. Group on Earth Observations(USGEO) as a standing subcommittee ofCENR. CCSP is coordinating its observa-tion priorities with USGEO as IEOS is de-veloped.Decision Support: Develop Improved Sci-
ence-Based Resources to Aid DecisionMak-ing—CCSP is encouraging improvedinteractions with stakeholders and is de-veloping resources to support public dis-
cussion and planning, adaptive manage-ment, and policymaking. The program isalso encouraging development of newmethods,models, and other resources thatfacilitate economic analysis, decision mak-ing under conditions of uncertainty, andintegration and interpretation of informa-tion from the natural and social sciencesin particular decision contexts.Communications: Communicate Results
to Domestic and International Scientific andUser Communities, Stressing Openness andTransparency—CCSP has a responsibilityto communicate with interested partnersin the United States and throughout theworld, and to learn from these partners ona continuing basis. CCSP aims to improvedialogue withpublic- and private-sector constituenciesand to provide users of climate change in-formation with adequate opportunities tohelp frame important scientific researchactivities. This dialogue is an essentialcomponent of the development ofdecision-support tools.
CCSP Scientific GoalsIn its Strategic Plan, CCSP adopted five
overarching scientific goals (CCSP andSGCR 2003a). By developing informationresponsive to these goals, the program en-sures that it addresses the most importantclimate-related issues. The following fivegoals frame what might be termed an“end-to-end” approach to climate andglobal change research, including observa-tions, understanding processes, projec-tions of future change, understandingpotential consequences of change, and ap-plications of knowledge to managementdecisions.• Goal 1—Improve knowledge of the
Earth’s past and present climate and en-vironment, including its natural vari-ability, and improve understanding ofthe causes of observed variability andchange.
• Goal 2—Improve quantification of theforces bringing about changes in theEarth’s climate and related systems.
• Goal 3—Reduce uncertainty in projec-tions of how the Earth’s climate and re-
lated systems may change in the future.• Goal 4—Understand the sensitivity and
adaptability of different natural andmanaged ecosystems and human sys-tems to climate and related globalchanges.
• Goal 5—Explore the uses and identifythe limits of evolving knowledge tomanage risks and opportunities relatedto climate variability and change.
Synthesis and Assessment ProductsCCSP is producing synthesis and as-
sessment products to support informeddiscussion and decision making onclimate variability and change by policy-makers, resource managers, stakeholders,the media, and the general public. Theseproducts provide current evaluations ofthe identified science foundation that canbe used for informing public debate, pol-icy development, and adaptive manage-ment decisions, and for defining andsetting the program’s future direction andpriorities.
U.S. government and nongovernmentalresearchers are producing 21 synthesis andassessment (S&A) products. Each productwill undergo a rigorous peer review by sci-entists, stakeholders, and the general pub-lic, as well as final approval by the U.S.government. These products constitute animportant new form of topic-driven inte-gration of U.S. global change assessmentefforts and will be disseminated by the U.S.government at various dates between 2006and 2008. Box 8-1 presents the list of prod-ucts associated with the five CCSP goals.
The first of these products, S&A Prod-uct 1.1—Temperature Trends in the LowerAtmosphere: Steps for Understanding andReconciling Differences—was released onMay 9, 2006 (CCSP and SGCR 2006b).S&A Product 1.1 addresses some of thelong-standing difficulties that have im-peded understanding changes in atmos-pheric temperatures and the basic causesof these changes. It is an important contri-bution toward improving understandingof climate change and human influenceson temperature trends. S&A Product 1.1and other S&A products to follow will

CHAPTER 8—RESEARCH AND SYSTEMATIC OBSERVATION 101CHAPTER 8—RESEARCH AND SYSTEMATIC OBSERVATION 101
on a timely and effective basis amongall interested scientists and end users.
• Support development of scientific ca-pabilities and the application of resultsin developing countries to promote thefullest possible participation by scien-tists and scientific institutions in thesecountries.On behalf of the U.S. government
and the scientific community,CCSPpartic-ipates in and provides input to, majorinternational scientific and related organi-zations. In addition, CCSP provides sup-port to maintain the central coordinating
BOX 8-1 Summary of the 21 Climate Change Science Program Synthesis and Assessment Products
Goal 1: Improve knowledge of the Earth’s past and present climate and environment, including its natural variability, and improve understandingof the causes of observed variability and change.
1.1 Temperature trends in the lower atmosphere: Steps for understanding and reconciling differences. (Released on May 9, 2006).
1.2 Past climate variability and change in the Arctic and at high latitudes.
1.3 Re-analyses of historical climate data for key atmospheric features. Implications for attribution of causes of observed change.
Goal 2: Improve quantification of the forces bringing about changes in the Earth’s climate and related systems.
2.1 (A) Scenarios of greenhouse gas emissions and atmospheric concentrations, and (B) global change scenarios: their development and use.
2.2 North American carbon budget and implications for the global carbon cycle.
2.3 Aerosol properties and their impacts on climate.
2.4 Trends in emissions of ozone-depleting substances, ozone layer recovery, and implications for ultraviolet exposure and climate change.
Goal 3: Reduce uncertainty in projections of how the Earth’s climate and related systems may change in the future.
3.1 Climate models: an assessment of strengths and limitations for user applications.
3.2 Climate projections based on emission scenarios for long-lived radiatively active trace gases and future climate impacts of short-livedradiatively active gases and aerosols.
3.3 Weather and climate extremes in a changing climate.
3.4 Abrupt climate change.
Goal 4: Understand the sensitivity and adaptability of different natural and managed ecosystems and human systems to climate and relatedglobal changes.
4.1 Coastal elevations and sensitivity to sea level rise.
4.2 State-of-knowledge of thresholds of change that could lead to discontinuities in some ecosystems and climate-sensitive resources.
4.3 The effects of climate change on agriculture, land resources, water resources, and biodiversity.
4.4 Preliminary Review of Adaptation Options for Climate-Sensitive Ecosystems and Resources.
4.5 Effects of climate change on energy production and use in the United States.
4.6 Analyses of the effects of global change on human health and welfare and human systems.
4.7 Impacts of climate variability and change on transportation systems and infrastructure: Gulf Coast study.
Goal 5: Explore the uses and identify the limits of evolving knowledge to manage risks and opportunities related to climate variability andchange.
5.1 Uses and limitations of observations, data, forecasts, and other projections in decision support for selected sectors and regions.
5.2 Best-practice approaches for characterizing, communicating, and incorporating scientific uncertainty in climate decision making.
5.3 Decision-support experiments and evaluations using seasonal-to-interannual forecasts and observational data.
constitute a valuable source of informationfor policymakers, researchers, and other in-terested parties.
International Research and CooperationInternational coordination and cooper-
ation are essential to improve understand-ing of climate variability and change. Asdescribed in theCCSP Strategic Plan, an in-ternational approach to research is requiredbecause of the global scope of the climatesystem, as well as limitations to the scientificcapacity and financial resources of any onenation (CCSP and SGCR 2003a).
The goals of the U.S. efforts to promote
international cooperation in support ofCCSP are:• Actively promote and encourage coop-
eration between U.S. scientists and sci-entific institutions and agencies andtheir counterparts around the globe.
• Expand observing systems to provideglobal observational coverage of vari-ability and change in the atmosphereand oceans and on land.
• Ensure that the data collected are of thehighest quality possible, suitable forboth research and forecasting, and thatthese data are exchanged and archived

102 U.S. CLIMATE ACTION REPORT—2006102 U.S. CLIMATE ACTION REPORT—2006
infrastructure of major international re-search programs and activities that com-plement CCSP and U.S. government goalsand objectives for climate science.
The U.S. government also supports theenvironmental programs of other coun-tries that have reduced GHG emissions,while promoting energy efficiency, forestprotection, biodiversity conservation, andother development goals. This “multiplebenefits" approach to climate change helpsdeveloping and transition countries ex-pand economically without sacrificing en-vironmental protection.
CCSP has provided scientific resourcesand/or direct funding support for interna-tional projects and programs, includingthe Arctic Climate Impact Assessment, theInternational Geosphere-Biosphere Pro-gramme, Diversitas, the InternationalHuman Dimensions Programme, theWorld Climate Research Programme, SyS-Tem for Analysis Research and Training,the Intergovernmental Panel on ClimateChange, and the Northern Eurasia EarthScience Partnership Initiative. The UnitedStates has also established bilateral(climate-related) partnerships with Aus-tralia, Brazil, Canada, China, CentralAmerica (Belize, Costa Rica, El Salvador,Guatemala, Honduras, Nicaragua, andPanama), the European Union, Germany,India, Italy, Japan, Mexico, New Zealand,the Republic of Korea, the Russian Feder-ation, and South Africa.
CCSP Workshop: Climate Science inSupport of Decision Making
CCSP has committed to support publicdiscussion and planning, adaptive man-agement, and policymaking. In November2005, the program reported on its progressand future plans regarding these threedecision-support goals at a CCSP-spon-sored public workshop,Climate Science inSupport of Decision Making (CCSP 2005).The more than 700 participants includedan international audience of climate scien-tists, decision makers, and users of infor-mation on climate variability and change,and more than 260 abstracts were submit-ted. A variety of sessions addressed recent
has six complementary goals: (1) reducingemissions from energy use and infrastruc-ture; (2) reducing emissions from energysupply; (3) capturing and sequesteringCO2; (4) reducing emissions of otherGHGs; (5) measuring and monitoringemissions; and (6) bolstering the contri-butions of basic science. Figure 8-1 pro-vides a schematic roadmap for thetechnologies being pursued under thesegoals. A fuller explanation of these tech-nologies is available in CCTP’s Researchand Current Activities (CCTP 2003) andTechnology Options for the Near and LongTerm (CCTP 2005a) reports.
Energy Use and InfrastructureImproving energy efficiency and reduc-
ingGHGemissions intensity in transporta-tion, buildings, and industrial processes cansignificantly reduce overall GHGemissions.In addition, improving the infrastructure ofthe electricity transmission and distributiongrid can reduce GHG emissions by makingpower generation more efficient and byproviding greater grid access for wind andsolar power.
Key research activities include the U.S.Department of Energy’s (DOE’s) FreedomCAR (Cooperative Automotive Research)4
program, a cost-shared, government–industry partnership that is pursuing re-search and development in technologiesneeded to enable themass production of af-fordable, practical hybrid vehicles, such ashydrogen-powered fuel-cell vehicles. TheU.S. Environmental Protection Agency’sClean Automotive Technology5 program isworking on cost-effective automotive tech-nologies that increase fuel efficiency andproduce ultra-low pollution and GHGemissions. Advanced heavy-duty-vehicletechnologies, zero-energy homes and com-mercial buildings, solid-state lighting, andhigh-temperature superconducting wiresthat virtually eliminate electricity transmis-sion losses are other areas of research thatcould yield significant emission reductions.
and ongoing global change assessments,the application of climate science to adap-tive management (e.g., water, ecosystems,energy systems, coastal and air qualitymanagement), and the use of climate in-formation in analyses of policy options.
Participants provided positive feedbackon the opportunity to learn about CCSP’sactivities and exchange information withother scientists and decision makers.CCSP will use insights from the workshopto guide current and future CCSP pro-grams, and intends to provide additionalforums for future communication aboutthis aspect of the program.
CLIMATE CHANGE TECHNOLOGYPROGRAM
In addition to laying a strong founda-tion in climate science, the United States ismoving ahead on realistic technology op-tions to meet the United Nations Frame-work Convention on Climate Change’s(UNFCCC’s) ultimate objective of stabi-lizing GHG atmospheric concentrations ata level that avoids dangerous human inter-ference with the climate system.
The United States is leading the devel-opment of advanced technologies thathave the potential to reduce, avoid, orsequester GHG emissions. CCTP3 wascreated to coordinate and prioritize theU.S. government’s investment in climate-related technology research, development,demonstration, and commercialization—which was about $3 billion in fiscal year2006—and to further the President’s Na-tional Climate Change Technology Initia-tive, a suite of discrete activities that, ifsuccessful, could advance technologies toavoid, reduce, or capture and store GHGemissions on a large scale.
CCTP developed its August 2005Visionand Framework for Strategy and Planning(CCTP 2005b) and September 2006Strategic Plan (CCTP 2006) to guide andprioritize the federal government’s climatetechnology efforts. CCTP’s strategic vision
3 See <http://www.climatetechnology.gov>.4 See <http://www1.eere.energy.gov/vehiclesandfuels/about/partnerships/freedomcar/index.html>.5 See <http://www.epa.gov/otaq/technology/>.

CHAPTER 8—RESEARCH AND SYSTEMATIC OBSERVATION 103CHAPTER 8—RESEARCH AND SYSTEMATIC OBSERVATION 103
biomass technologies. In fiscal year 2006,DOE and the U.S.Department of Agricul-ture (USDA) spent a combined $247.5million on wind, solar, and biomass pro-grams. Although the price competitivenessof many of these technologies has im-proved significantly, there still is a need toreduce their manufacturing, operating,and maintenance costs.
There will be a continuing need forportable, storable energy carriers for heat,power, and transportation.Hydrogen is anexcellent energy carrier, generates no emis-sions when used in a fuel cell, and can beproduced from diverse sources, includingrenewable, nuclear, and fossil fuel power
(the last of which could be combined withcarbon capture). President Bush’s $1.2 bil-lion Hydrogen Fuel Initiative6 is exploringthese production options, as well as the in-frastructure needed to store and deliverhydrogen economically and safely. CurrentCCTP research is expected to make possi-ble an industry decision to commercializehydrogen fuel-cell vehicles in 2015, andpossibly bring them to market by 2020.
Advanced fossil-based power and fuelsis an area of special interest for the UnitedStates, because about half of the Nation’s
Energy SupplyFossil fuels, which emit CO2 when
burned, remain the world’s energy supplyof choice. Therefore, a transition to a low-carbon energy future would require theavailability of cost-competitive low- orzero-carbon energy supply options.Whencombined with improved energy carriers,such as electricity and hydrogen, these op-tions could offer the prospect of consider-able reductions in GHG emissions.
Renewable energy includes a range ofdifferent technologies that can play an im-portant role in reducing GHG emissions.The United States invests considerable re-sources in wind, solar photovoltaics, and
FIGURE 8-1 Roadmap for Climate Change Technology Development
LONG-TERM GOALS• Widespread Use of EngineeredUrban Designs & Regional Planning
• Energy-Managed Communities• Integration of Industrial Heat, Power,Processes, & Techniques
• Superconducting Transmission &Equipment
• Zero-Emission Fossil Energy• H2 & Electric Economy• Widespread Renewable Energy• Bio-Inspired Energy & Fuels• Widespread Nuclear Power• Fusion Power Plants
• Track Record of Successful CO2Storage Experience
• Large-Scale Sequestration• Carbon- & CO2-Based Products &Materials
• Safe, Long-Term Ocean Storage
• Integrated Waste ManagementSystem With Automated Sorting,Processing, & Recycling
• Zero-Emission Agriculture• Solid-State Refrigeration/AC Systems
• Fully Operational Integrated MMSystems Architecture (Sensors,Indicators, Data Visualization &Storage, Models)
NEAR-TERM GOALS• Hybrid & Plug-In Hybrid ElectricVehicles
• Engineered Urban Designs• High-Performance Integrated Homes• High-Efficiency Appliances• High-Efficiency Boilers &Combustion Systems
• High-Temperature SuperconductivityDemonstrations
• IGCC Commercialization• Stationary H2 Fuel Cells• Cost-Competitive Solar PV• Demonstrations of Cellulosic Ethanol• Distributed Electric Generation• Advanced Fission Reactor & FuelCycle Technology
• CSLF & CSRP• Post-Combustion Capture• Oxy-Fuel Combustion• Enhanced Hydrocarbon Recovery• Geologic Reservoir Characterization• Soils Conservation• Dilution of Direct-Injected CO2
• Methane to Markets• Precision Agriculture• Advanced RefrigerationTechnologies
• PM Control Technologies forVehicles
• Low-Cost Sensors andCommunications
MID-TERM GOALS• Fuel Cell Vehicles and H2 Fuels• Low-Emission Aircraft• Solid-State Lighting• Ultra-Efficient HVACR• “Smart” Buildings• Transformational Technologies forEnergy-Intensive Industries
• Energy Storage for Load Leveling
• FutureGen Scale-Up• H2 Co-Production From Coal/Biomass• Low-Wind-Speed Turbines• Advanced Biorefineries• Community-Scale Solar• Gen IV Nuclear Plants• Fusion Pilot Plant Demonstration
• Geologic Storage Proven Safe• CO2 Transport Infrastructure• Soils Uptake & Land Use• Ocean CO2 Biological ImpactsAddressed
• Advanced Landfill Gas Utilization• Soil Microbial Processes• Substitutes for SF6• Catalysts That Reduce N2O to ElementalNitrogen in Diesel Engines
• Large-Scale, Secure Data StorageSystem
• Direct Measurement to Replace Proxies& Estimators
GOAL 1Energy End Use andInfrastructure
GOAL 2Energy Supply
GOAL 3Capture, Storage, &Sequestration
GOAL 4Other Gases
GOAL 5Measure & Monitor
6 See <http://www.eere.energy.gov/hydrogenandfuelcells/presidents_initiative.html>.

104 U.S. CLIMATE ACTION REPORT—2006104 U.S. CLIMATE ACTION REPORT—2006
electricity demand is generated from itsvast coal reserves. FutureGen7 is a 10-year,$1 billion government–industry collabo-ration to build the world’s first emission-free, coal-fired power plant. This project,which includes India and the Republic ofKorea, will incorporate the latest technolo-gies in carbon sequestration, oxygen andhydrogen separation membranes, tur-bines, fuel cells, and coal-to-hydrogengasification. Through this research, cleancoal can remain part of a diverse, secureenergy portfolio well into the future.
Concerns about resource availability,energy security, and air quality as well asclimate change suggest a larger role for nu-clear power as an energy supply choice.The Generation IV Nuclear Energy Sys-tems Initiative8 is investigating the next-generation reactor and fuel-cycle systems,which represent a significant leap in eco-nomic performance, safety, and prolifera-tion resistance. One promising systembeing developed under the Nuclear Hy-drogen Initiative9 would pair very-high-temperature reactor technology withadvanced hydrogen production capabili-ties that could produce both electricity andhydrogen on a scale to meet transportationneeds. Complementing these programs isthe Advanced Fuel Cycle Initiative—Ad-vanced Burner Reactor,10 which is devel-oping advanced, proliferation-resistantnuclear fuel technologies that can improvethe fuel cycle, reduce costs, and increasethe safety of handling nuclear wastes.
Fusion energy11 is a potential majornew source of energy that, if successfullydeveloped, could be used to produce elec-tricity and possibly hydrogen. Fusion hasfeatures that make it an attractive optionfrom both environmental and safety per-
spectives. However, the technical hurdlesof fusion energy are very high, and with acommercialization objective of 2050, itsimpact will not be felt until the second halfof the century.
Recent InitiativesIn his 2006 State of the Union Address,
President Bush outlined plans for an Ad-vanced Energy Initiative (AEI).12 AEI aimsto accelerate the development of advancedtechnologies that could change the wayAmerican homes, businesses, and auto-mobiles are powered. AEI is designed totake advantage of technologies that with alittle push could play a big role in helpingto reduce both the Nation’s use of foreignsources of energy and its pollution andGHG emissions. AEI includes greater in-vestments in zero-emission coal-firedplants, solar and wind power, nuclear en-ergy, better battery and fuel cell technolo-gies for pollution-free cars, and cellulosicbiorefining technologies for biofuels pro-duction. One component of AEI is theGlobal Nuclear Energy Partnership, agroundbreaking effort to develop a world-wide consensus on enabling expanded useof economical, carbon-free nuclear energyto meet growing electricity demand. Thisinitiative is discussed in greater detail laterin the Multilateral Research section, whichbegins on the following page.
Carbon Capture and SequestrationCarbon capture and sequestration is a
central element of CCTP’s strategy, be-cause for the foreseeable future, fossil fuelswill continue to be the world’s most reli-able and lowest-cost form of energy. Thus,a realistic approach is to find ways to “se-quester” the CO2 produced when thesefuels—especially coal—are used. The term
carbon sequestration describes a number oftechnologies and methods to capture,transport, and store CO2 or remove itfrom the atmosphere.
Advanced techniques to capturegaseous CO2 from energy and industrialfacilities and store it permanently in geo-logic formations are under development.DOE’s core Carbon Sequestration Pro-gram13 emphasizes technologies that cap-ture CO2 from large point sources andstore the emissions in geologic formationscapable of holding vast amounts of CO2.In 2003, DOE launched a nationwide net-work of seven Regional Carbon Sequestra-tion Partnerships14 that include 40 states,four Canadian provinces, three Indian na-tions, and over 300 organizations. Thepartnerships’ main focus is on determin-ing the best approaches for sequestrationin their regions. They are also examiningregulatory and infrastructure needs.Small-scale validation testing of 35 sites in-volving terrestrial and geologic sequestra-tion technologies began in 2005, and willcontinue until 2009.
Terrestrial sequestration—removingCO2 from the atmosphere and sequester-ing it in trees, soils, or other organic mate-rials—has proven to be a low-cost meansfor long-term carbon storage. The DOE-supported Carbon Sequestration in Ter-restrial Ecosystems consortium providesresearch on mechanisms that can enhanceterrestrial sequestration.15 In addition,USDA operates the Greenhouse Gas Re-duction ThroughAgricultural Carbon En-hancement Network at 30 locationsaround the country to measure and pre-dict carbon sequestration and GHG emis-sions across a range of agriculturalsystems, soils, and climate zones.
Other Greenhouse GasesA main component of the U.S. strategy
is to reduce other GHGs, such as methane(CH4), nitrous oxides (N2O), sulfur hexa-fluoride (SF6), and fluorocarbons.
Improvements in methods and tech-nologies to detect and either collect orprevent CH4 emissions from varioussources—such as landfills, coal mines,
7 See <http://fossil.energy.gov/programs/powersystems/futuregen/index.html>.8 See <http://gen-iv.ne.doe.gov>.9 See <http://nuclear.gov/hydrogen/hydrogenOV.html>.10 See <http://www.gnep.energy.gov/gnepAdvancedBurnerReactors.html>.11 See <http://www.sc.doe.gov/Program_Offices/fes.htm>.12 See <http://www.whitehouse.gov/stateoftheunion/2006/energy/index.html>.13 See <http://fossil.energy.gov/programs/sequestration/index.html>.14 See <http://fossil.energy.gov/programs/sequestration/partnerships/index.html>.15 Another option being explored is using biotechnology to enhance the ability of plants to take up CO2, and thus sequesteradditional carbon.

CHAPTER 8—RESEARCH AND SYSTEMATIC OBSERVATION 105CHAPTER 8—RESEARCH AND SYSTEMATIC OBSERVATION 105
Basic ScienceBasic scientific research is a fundamen-
tal element of CCTP. Tackling the dualchallenges of addressing climate changeand meeting growing world energy de-mand is likely to require discoveries andinnovations that can shape the future inoften unexpected ways. The CCTP frame-work aims to strengthen the basic researchenterprise through strategic research thatsupports ongoing or projected researchactivities and exploratory research involv-ing innovative concepts.
Multilateral ResearchThe United States believes that well-
designed multilateral collaborations fo-cused on achieving practical results canaccelerate development and commercial-ization of new technologies. The UnitedStates has initiated or joined a number ofmultilateral technology collaborations inhydrogen, carbon sequestration, nuclearenergy, and fusion that address manyenergy-related concerns (e.g., energy secu-rity, climate change, and environmentalprotection).
International Partnership for theHydrogen Economy16
InNovember 2003, representatives from16 governments gathered in Washington,D.C., to launch the International Partner-ship for the Hydrogen Economy (IPHE), avehicle to coordinate and leveragemultina-tional hydrogen research programs. IPHEwill develop common recommendationsfor internationally recognized standardsand safety protocols to speed market pene-tration of hydrogen technologies. An im-portant aspect of IPHE is maintainingcommunications with the private sectorand other stakeholders to foster public–private collaboration and address the
technological, financial, and institutionalbarriers to hydrogen.
Carbon SequestrationLeadership Forum17
The Carbon Sequestration LeadershipForum (CSLF) is a multilateral U.S. initia-tive that provides a framework for inter-national collaboration on sequestrationtechnologies. Established at a June 2003ministerial meeting held in Washington,D.C., CSLF consists of members from 22governments representing both developedand developing countries.
The CSLF’s main focus is assisting thedevelopment of technologies to separate,capture, transport, and store CO2 safelyover the long term; making carbon seques-tration technologies broadly available in-ternationally; and addressing broaderissues relating to carbon capture and stor-age, such as regulation and policy. To date,CSLF has endorsed 17 international re-search projects, five of which involve theUnited States.
Generation IV International Forum18
In July 2001, under U.S. leadership,nine other countries and Euratom char-tered the Generation IV InternationalForum (GIF), to fulfill the objective of theGeneration IV Nuclear Energy SystemsInitiative. GIF’s goal is to develop a fourthgeneration of advanced, economical, safe,and proliferation-resistant nuclear systemsthat can be adopted commercially by 2030.Six technologies have been selected as themost promising candidates for future de-signs, some of which could be commer-cially ready by 2015. GIF countries arejointly preparing a collaborative researchprogram to develop and demonstrate theprojects.
ITER19
In January 2003, President Bush an-nounced that the United States was joiningthe negotiations for the construction andoperation of the international fusion ex-periment ITER. The goal of this proposedmultilateral $5 billion collaborative projectis to design and demonstrate a fusion en-ergy production system. If successful, ITER
natural gas pipelines, and oil and gas ex-ploration operations—can prevent thisGHG from escaping to the atmosphere.Reducing CH4 emissions may also have apositive benefit in reducing local ozoneproblems, as CH4 is a long-lived ozoneprecursor. In agriculture, improved man-agement practices for fertilizer applica-tions and livestock waste can reduce CH4and N2O emissions appreciably.
Hydrofluorocarbons (HFCs), perfluo-rocarbons (PFCs), and SF6 are all highglobal warming potential (GWP) gases.HFCs and PFCs are used as substitutes forozone-depleting chlorofluorocarbons andare used in or emitted during complexmanufacturing processes.Advanced meth-ods to reduce the leakage of, reuse, and re-cycle these chemicals and to use lowerGWP alternatives are being explored.
Programs aimed at reducing particulatematter have led to significant advances infuel combustion and emission controltechnologies to reduce U.S. black carbonaerosol emissions. Reducing emissions ofblack carbon, soot, and other chemicalaerosols can have multiple benefits, in-cluding better air quality and public healthand reduced radiative forcing.
Measuring and MonitoringTo meet future GHG emission meas-
urement requirements, a wide array ofsensors,measuring platforms,monitoringand inventorying systems, and inferencemethods are being developed.Many of thebaseline measurement, observation, andsensing systems used to advance climatechange science are being developed as partof CCSP. CCTP’s efforts focus primarilyon validating the performance of variousclimate change technologies, such as interrestrial and geologic sequestration.
16 See <http://www.iphe.net>. IPHE members include the United States, Australia, Brazil, Canada, China, EuropeanCommission, France, Germany, Iceland, India, Italy, Japan, New Zealand, Norway, Republic of Korea, RussianFederation, and United Kingdom.
17 See <http://www.cslforum.org>. CSLF members include the United States, Australia, Brazil, Canada, China, Colombia,Denmark, European Commission, France, Germany, Greece, India, Italy, Japan, Republic of Korea, Mexico, Netherlands,Norway, Russian Federation, Saudi Arabia, South Africa, and United Kingdom.
18 See <http://www.ne.doe.gov/genIV/neGenIV2.html>. GIF member countries include the United States, Argentina, Brazil,Canada, France, Japan, Republic of Korea, South Africa, Switzerland, and United Kingdom.
19 See <http://www.iter.org>. ITER members include the United States, China, European Union, India, Japan, Republic ofKorea, and Russian Federation.

106 U.S. CLIMATE ACTION REPORT—2006106 U.S. CLIMATE ACTION REPORT—2006
will advance progress toward producingclean, abundant, commercially available fu-sion energy by the middle of the century.In November 2006, the seven ITER part-ners signed an agreement to construct theproject.20
Global Nuclear Energy Partnership21
The Global Nuclear Energy Partnership(GNEP), a component of AEI, has twomajor goals: (1) expand carbon-free nuclearenergy to meet growing electricity demandworldwide, and (2) promote nonprolifera-tion objectives through the leasing of nu-clear fuel to countries that agree to forgoenrichment and reprocessing. GNEP part-ner countries would consist of both fuel-supplier nations and reactor nations.Fuel-supplier nations would provide reli-able nuclear fuel services to reactor nationsthrough an independent nuclear fuel bro-ker, such as the International Atomic En-ergy Agency.
SYSTEMATIC OBSERVATIONSLong-term,high-quality observations of
the global environmental system are essen-tial for defining the current state of theEarth’s system, its history, and its variability.This task requires both space- and surface-based observation systems. The term cli-mate observations can encompass a broadrange of environmental observations, in-cluding (1) routine weather observations,which, when collected consistently over along period of time, can be used to help de-scribe a region’s climatology; (2) observa-tions collected as part of researchinvestigations to elucidate chemical, dy-namic, biological, or radiative processesthat contribute to maintaining climatepatterns or to their variability; (3) highlyprecise, continuous observations of climatesystem variables collected for the expresspurpose of documenting long-term(decadal-to-centennial) change; and (4)observations of climate proxies, collectedto extend the instrumental climate recordto remote regions and back in time to pro-vide information on climate change formillennial and longer time scales.
Satellite observations provide a unique
prespective of the global integrated Earthsystem and are necessary for good globalclimate coverage. In situ observations are re-quired for the measurement of parametersthat cannot be estimated from space plat-forms (e.g., biodiversity, groundwater, car-bon sequestration at the root zone, andsubsurface ocean parameters). In situ ob-servations also provide long time series ofobservations required for the detection anddiagnosis of global change, such as surfacetemperature, precipitation and water re-sources, weather and other natural hazards,the emission or discharge of pollutants, andthe impacts of multiple stresses on the en-vironment due to human and naturalcauses.
One critical challenge to the Earth ob-servation field is tomaintain existing obser-vation capabilities in a variety of areas. Forexample, maintaining the observationalrecord of stratospheric ozone is essential indiscerning the effects of climate change onthe nature and timing of ozone recovery.Other key areas include radiative energyfluxes of the Sun and Earth, atmosphericcarbon dioxide, and global surface temper-ature. Efforts to create a long-term recordof global land cover, started by Landsat inthe 1970s, are currently being prepared forthe transition to a Landsat Data ContinuityMission (LDCM) being planned by theNa-tional Aeronautics and Space Administra-tion (NASA) and the U.S. GeologicalSurvey.22 The LDCM is expected to have a5-yearmission life with 10-year expendableprovisions.
Planning continues on deploying theNational Polar-orbiting Operational Envi-ronmental Satellite System (NPOESS).Thissatellite system is designed to monitorglobal environmental conditions, and tocollect and disseminate data related toweather, atmosphere, oceans, land, andnear-space environment. NPOESS willmaintain a continuous global climaterecord for a subset of the environmentalparameters measured on current U.S. re-search and operational satellites. TheUnited States is currently evaluating the im-pacts of the current configuration, and is
addressing options that could enhance fu-tureU.S. satellite-based climatemonitoring.AnNPOESS Preparatory Reportmission isscheduled for launch in 2009, and the firstNPOESS spacecraft is scheduled for launchin 2013.
To meet the long-term needs for thedocumentation of global changes, theUnited States integrates observations fromboth research and operational systems.TheUnited States supports the need to improveglobal observing systems for climate, and toexchange information on national plansand programs that contribute to the globalcapacity in this area.
Providing for wide access to informationfrom the Global Earth Observation Systemof Systems (GEOSS) for applications thatbenefit society has been a focus of effortscoordinated by the intergovernmentalGroup on Earth Observations (GEO) andthe U.S. Group on Earth Observation(USGEO).An international framework foropen access toGEOSS data was established,and aU.S. strategic planwas drafted to pro-vide a basis for international cooperation.At the third Earth Observation Summit inFebruary 2005, the United States joinednearly 60 countries and the EuropeanCommission in endorsing to a plan that,over the next 10 years,will revolutionize theunderstanding of Earth systemprocesses. 23
A key regional effort of GEOSS in theWestern Hemisphere is known as GEOSSin the Americas. The vision of this effort isto build partnershipswith countries and or-ganizations in the Americas and theCaribbean to strengthen the ability to utilizeeach other’s research and operational Earthobservations. The first significant GEOSSin theAmericas project involved the shiftingof the GOES-10 satellite in 2006 to a neworbit, to greatly improve environmentalsatellite coverage of the Western Hemi-sphere, especially over South America. By
20 The seven ITER partners are the European Union, India,Japan, People’s Republic of China, Republic of Korea,Russian Federation, and United States.
21 See <http://www.gnep.energy.gov>.22 See <http://landsat.gsfc.nasa.gov/>.23 For more details, see <http://earthobservations.org>.

CHAPTER 8—RESEARCH AND SYSTEMATIC OBSERVATION 107CHAPTER 8—RESEARCH AND SYSTEMATIC OBSERVATION 107
as a large number of remote-sensing satel-lite platforms that are essential to climatemonitoring.
In Situ Atmospheric ObservationsThe United States supports 75 stations
in the Global Climate Observing System(GCOS) Surface Network (GSN), 21 sta-tions in the GCOS Upper Air Network(GUAN), and 4 stations in the Global At-mospheric Watch (GAW). These stationsare distributed geographically as pre-scribed in the GCOS and GAW networkdesigns. The data (metadata and observa-tions) from these stations are shared ac-cording to GCOS and GAW protocols.
Since publishing its last report to theUNFCCC, the United States has begunfielding and commissioning a systemknown as the Climate Reference Network(CRN). The CRN is designed to answerthe question: How has the U.S. climatechanged over the past 50 years at national,regional, and local levels? Since 2002, 74CRN stations have been commissionedout of a planned 110 stations.25
The U.S. GCOS program supports anumber of climate observing systems andprojects in developing nations. In 2002,there were 20 nontransmitting GUAN sta-tions around the globe. Through focusedprojects, the number of nontransmittingstations has dropped to 6. The GCOS pro-gram continues to ensure the long-termsustainability of all stations through theestablishment of regional technical andmaintenance support centers for southernand eastern Africa, the Caribbean, and thePacific Islands. Related to this capacity-building activity, the program will be sup-porting an intensive upper-air campaignas part of the African Monsoon Multidis-ciplinary Analysis, with the installation ofa new hydrogen generator at the upper-airsite in Dakar, Senegal.
While it is difficult to list all observingcampaigns and systems, several othersshould be noted for their global climatesignificance. The Southern HemisphereADditional OZonesondes (SHADOZ)provides a consistent dataset fromballoon-borne ozonesondes for ground
verification of satellite tropospheric ozonemeasurements at 12 sites across the tropi-cal and subtropical regions of the southernhemisphere.26 Another key system alongthese lines is the Aerosol Robotic NET-work (AERONET), which is a federationof ground-based, remote-sensing aerosolnetworks established in part by NASA andFrance’s Centre Nationale de RechercheScientifique (CNRS).27 AERONET pro-vides a long-term, continuous, and readilyaccessible public domain database ofaerosol optical properties for research andcharacterization of aerosols and for vali-dation of satellite retrievals. AERONETprovides synergy with other databases,along with a series of globally distributedobservations of spectral aerosol opticaldepth, inversion products, and precip-itable water in diverse aerosol regimes.
The collaborative effort betweenNASA’s Advanced Global AtmosphericGases Experiment (AGAGE) and NOAA’sFlask Monitoring Network has been in-strumental in measuring the compositionof the global atmosphere continuouslysince 1978. The AGAGE is distinguishedby its capability to measure globally and athigh frequency most of the importantgases in the Montreal Protocol to protectthe ozone layer and almost all of the sig-nificant non-CO2 gases in the Kyoto Pro-tocol to mitigate climate change. This keyclimate monitoring activity demonstratesNASA’s and NOAA’s significant collabora-tive research efforts.28
The primary goal of the AtmosphericRadiation Measurement (ARM) ClimateResearch Facility (ACRF) is to provide theinfrastructure needed for studies investi-gating atmospheric processes in severalclimatic regimes and for climate model de-velopment and evaluation. The ACRFconsists of three stationary facilities, anARM Mobile Facility (AMF), and theARM Aerial Vehicles Program (AAVP).The stationary sites provide scientific testbeds in three climatically significant re-gions (mid-latitude, polar, and tropical),and the AMF provides a capability to ad-dress high-priority scientific questions in
significantly enhancing satellite detection ofsuch natural hazards as severe storms,floods, drought, landslides, and wildfires,the shift will help protect lives and propertyin both South America and the UnitedStates, and will allow for improved predic-tion, response, and follow-up and ex-panded understanding of Earth systemprocesses.24
Potential benefits of Earth observationswere detailed in the IEOS 10-year strategicplan that covered climate and eightother related areas—agriculture, disasters,ecology, energy, health, integration, oceanresources, water resources, and weather(IWGEO and NSTC/CENR 2005). Simi-larly, the CCSP Strategic Plan (CCSP andSGCR 2003a) has identified several over-arching questions for observing and mon-itoring the climate system, such as: Howcan we provide stewardship for open accessto integrated data and products with suffi-cient accuracy and precision to address cli-mate and associated global changes?
Documentation of U.S. ClimateObservations
As part of its continuing contributionsto systematic observations in support ofclimate monitoring, the United States sub-mitted The United States Detailed NationalReport on Systematic Observations for Cli-mate to the UNFCCC Secretariat on Sep-tember 6, 2001 (U.S. DOC/NOAA 2001).The report documents the U.S. systematicclimate observing program and includesinformation on in situ atmospheric obser-vations, in situ oceanographic observa-tions, in situ terrestrial observations, andsatellite-based observations. The report at-tempted to cover all relevant observationsystems and is representative of the largerU.S. effort to collect environmental data.The United States supports a broad net-work of in situ global atmospheric, ocean,and terrestrial observation systems, as well
24 See <http://www.strategies.org/EOPA.html>.25 See <http://www.ncdc.noaa.gov/oa/climate/uscrn>.26 See <http://croc.gsfc.nasa.gov/shadoz/>.27 See <http://aeronet.gsfc.nasa.gov/data_frame.html>.28 See <http://agage.eas.gatech.edu/> and<http://www.esrl.noaa.gov/>.
108 U.S. CLIMATE ACTION REPORT—2006108 U.S. CLIMATE ACTION REPORT—2006
regions other than the stationary sites. TheAAVP provides a capability to obtain insitu cloud and radiation measurementsthat complement the ground measure-ments. Data streams produced by theACRF will be available to the atmosphericcommunity for use in testing and improv-ing parameterizations in global climatemodels. The AMF was deployed inNiamey, Niger, in 2006 measuring radia-tion, cloud, and aerosol properties duringthe monsoon and dry seasons.
In Situ Ocean ObservationsThe climate requirements of the Global
Ocean Observing System (GOOS) are thesame as those for GCOS. Also like GCOS,GOOS is based on a number of in situ andspace-based observing components. TheUnited States supports the IntegratedOcean Observing System’s surface andmarine observations through a variety ofcomponents, including fixed and surface-drifting buoys, subsurface floats, and vol-unteer observing ships. It also supports theGlobal Sea Level Observing Systemthrough a network of sea level tidal gauges.
The United States currently providessatellite coverage of the global oceans forsea-surface temperatures, surface elevation,ocean-surface vector winds, sea ice, oceancolor, and other climate variables. The firstelement of the climate portion of GOOS,completed in September 2005, is the globaldrifting buoy array, which is a network of1,250 drifting buoys measuring sea-surfacetemperature and other variables as theyflow in the ocean currents.
Continued upgrading of the Global SeaLevel Observing System (GLOSS) tidalgauge network from 43 to 170 stations isplanned for 2006–10. Ocean carbon in-ventory surveys in a 10-year repeat surveycycle help determine the anthropogenicintake of carbon into the oceans. Plans foradvancement of the global Tropical–Atmosphere–Ocean (TAO) network ofocean buoys include an expansion of thenetwork into the Indian Ocean (the PacificOcean has a current array of 70 TAObuoys).During 2005-07, 8 new TAO buoyswere installed in the Indian Ocean in col-
laboration with partners from India, In-donesia, and France. Plans call for a totalof 39 TAO buoys in the Indian Ocean by2013. These moorings will enhance thetropical networks currently monitoringabove-surface, surface, and subsurfaceconditions in the Pacific and AtlanticOceans. As of the end of 2006,57 percent of the GOOS suite of oceanclimate observing platforms had beenfielded; the full system of ocean climatesensors is scheduled for completionby 2010.
The Integrated Ocean Observing Sys-tem (IOOS) is the U.S. coastal observingcomponent of GOOS. IOOS is envisionedas a coordinated national and interna-tional network of observations, data man-agement, and analyses that systematicallyacquires and disseminates data and infor-mation on past, present, and future statesof the oceans. A coordinated IOOS effortis being established by NOAA via a na-tional IOOS Program Office co-locatedwith the Ocean.US consortium of officesconsisting of NASA, NOAA, the NationalScience Foundation, and the U.S. Navy.29
The IOOS observing subsystem employsboth remote and in situ sensing. Remotesensing includes satellite-, aircraft-, andland-based sensors; power sources; andtransmitters. In situ sensing includes plat-forms (ships, buoys, gliders, etc.); in situsensors; power sources; sampling devices;laboratory-based measurements; andtransmitters.
In Situ Terrestrial ObservationsFor terrestrial observations, GCOS and
the Global Terrestrial Observing System(GTOS) have identified permafrost thermalstate and permafrost active layer as key vari-ables for monitoring the state of the cryo-sphere. The United States operates a long-term “benchmark” glacier program to in-tensively monitor climate, glacier motion,glacier mass balance, glacier geometry, andstream runoff at a few select sites. The datacollected are used to understand glacier-related hydrologic processes and improvethe quantitative prediction of water re-sources, glacier-related hazards, and the
consequences of climate change. Long-term, mass-balance monitoring programshave been established at threewidely spacedU.S. glacier basins that clearly sample dif-ferent climate-glacier-runoff regimes.SNOTEL and SCAN Networks—The
SNOTEL (SNOpack TELemetry) andSCAN (Soil Climate Analysis Network)monitoring networks provide automatedcomprehensive snowpack, soil moisture,and related climate information designedto support natural resource assessments.SNOTEL operates more than 660 remotesites in mountain snowpack zones of thewestern United States. SCAN,which beganas a pilot program, now consists of morethan 120 sites. These networks collect anddisseminate continuous, standardized soilmoisture and other climate data in publiclyavailable databases and climate reports.Uses for these data include inputs to globalcirculation models, verifying and groundtruthing satellite data, monitoring droughtdevelopment, forecasting water supply, andpredicting sustainability for cropping sys-tems.Polar Climate Observations—Polar cli-
mate observations will continue to be afocus of U.S. activities as preparations aremade for the International Polar Year be-ginning in 2007. Currently, the UnitedStates maintains soil-moisture climate sta-tions in both Alaska and Antarctica, andplans to increase efforts on observations ofthe Arctic atmosphere, sea ice, and ocean.Working with a number of Arctic nationsvia the InternationalArctic Systems forOb-serving the Atmosphere (IASOA), theUnited States will deploy and/or participatein a number of observing activities to pro-duce a higher-resolution characterization ofclouds and aerosols and of both incomingand outgoing radiation, to provide thehigh-quality records needed to detect cli-mate change and to improve calibration ofbroad-scale satellite observations in theArctic. For example, through the IASOAprocess, the United States will be working
29 See <http://www.ocean.us/>.

CHAPTER 8—RESEARCH AND SYSTEMATIC OBSERVATION 109CHAPTER 8—RESEARCH AND SYSTEMATIC OBSERVATION 109
clude instruments on the GeostationaryOperational Environmental Satellites(GOES) and Polar Operational Environ-mental Satellites (POES), the series of EarthObserving Satellites (EOS), the Landsats 5and 7, the TotalOzoneMapping Spectrom-eter satellite, and the Jason satellitemeasur-ing sea-surface height, winds, and waves.Additional satellite missions in support ofGCOS include (1) the Active Cavity Ra-diometer Irradiance Monitor for measur-ing solar irradiance; (2) the EOS-Terra,Aqua, andAura series; (3) QuickSCAT; (4)the Sea-viewingWide Field-of-view Sensor(SeaWiFS) for studying ocean and produc-tivity, as well as aerosols; (5) the ShuttleRadar Topography Mission; and (6) theTropical Rainfall Measuring Mission formeasuring rainfall, clouds, sea-surface tem-perature, radiation, and lightning.A majorupgrade to the GOES system, known asGOES-R, is under development,with a firstlaunch scheduled for late 2012.
Also, several new missions will belaunched during the next few years: (1) theOrbiting Carbon Observatorymission willmeasure CO2 (2008 launch); (2) Glorymissionwillmeasure black carbon soot andother aerosols, as well as total solar irradi-ance (2008 launch); (3) the altimetryOcean Surface Topography mission willprovide sea-surface heights for determiningocean circulation, climate change, and sealevel rise (2008 launch); (4) Aquarius willmeasure global sea surface salinity (2009launch); and (5) the Global PrecipitationMeasurement mission will monitor world-wide precipitation (2012 launch).
Some recent missions since the last re-port to the UNFCCC include:• The Ice, Cloud, and Land Elevation
Satellite (ICESat), launched in 2003, hasbeenmeasuring surface elevations of iceand land, vertical distributions of cloudsand aerosols, vegetation-canopy heights,and other features with unprecedentedaccuracy and sensitivity. The primarypurpose of ICESat has been to acquiretime series of ice-sheet elevationchanges for determining the present-daymass balance of the ice sheets, to study
associations between observed icechanges and polar climate, and to im-prove estimates of the present and futurecontributions to global sea level rise.
• The Solar Radiation andClimate Exper-iment (SORCE) satellite, launched in2003, is equippedwith four instrumentsthat measure variations in solar radia-tion much more accurately than previ-ous measurements and observe some ofthe spectral properties of solar radiationfor the first time.
• The Cloud-Aerosol Lidar and InfraredPathfinder Satellite Observation(CALIPSO) andCloudSat satellites weresuccessfully launched in April 2006.CALIPSO andCloudSat are highly com-plementary and together will providenew, three-dimensional perspectives ofhow clouds and aerosols form, evolve,and affect weather and climate. BothCalipso and CloudSat fly in formationas part of the NASA A-Train constella-tion (e.g., along with Aqua, Aura, andthe French PARASOL spacecraft), pro-viding the benefits of near simultaneityand, thus, the opportunity for synergisticmeasurements made with complemen-tary techniques.NASA’s Gravity Recovery and Climate
Experiment (GRACE) twin satellites cele-brated their fifth anniversary on orbit inMarch 2007, completing a successful pri-mary mission that has provided improvedestimates of the Earth’s gravity field on anongoing basis. In conjunction with otherdata andmodels,GRACEhas provided ob-servations of terrestrial water storagechanges, ice-mass variations, ocean bottompressure changes, and sea level variations.
Data ManagementData management is an important as-
pect of any systematic observing effort.U.S.agencies have separate and unique man-dates for climate-focused and -related sys-tematic observations, and for the attendantdata processing, archiving, and use of theimportant information from these observ-ing systems.
Cooperative efforts by CCSP andUSGEO agencies are moving toward
with its international partners in establish-ing a super-site climate observatory in theRussian Arctic in Tiksi, north of the ArcticCircle at latitude 71.50º North.The AmeriFLUXNetwork—TheAmeri-
FLUXnetwork endeavors to establish an in-frastructure for guiding, collecting,synthesizing, and disseminating long-termmeasurements of CO2, water, and energyexchange from a variety of ecosystems. Itsobjectives are to collect critical new infor-mation to help define the current globalCO2 budget, enable improved projectionsof future concentrations of atmosphericCO2, and enhance the understanding ofcarbon fluxes, net ecosystem production,and carbon sequestration in the terrestrialbiosphere.North American Carbon Program—A
major focus of the U.S. CCSP, the NorthAmerican Carbon Program measures andstudies the sources and sinks of CO2,CH4,and CO in North America and in adjacentocean regions.
Space-Based ObservationsSpace-based, remote-sensing observa-
tions of the atmosphere–ocean–land sys-tem have evolved substantially since theearly 1970s, when the first operationalweather satellite systems were launched.Over the last decade satellites have proventheir observational capability to accuratelymonitor nearly all aspects of the total Earthsystem on a global basis. Currently, satellitesystemsmonitor the evolution and impactsof El Niño and La Niña, weather phenom-ena, natural hazards, and vegetation cycles;the ozone hole; solar fluctuations; changesin snow cover, sea ice and ice sheets, oceansurface temperatures, and biologicalactivity; coastal zones and algal blooms;deforestation and forest fires; urban devel-opment; volcanic activity; tectonic platemotions; aerosol and three-dimensionalcloud distributions; water distribution; andother climate-related information.
A number of U.S. satellite operationaland research missions form the basis of arobust national remote-sensing programthat fully supports the requirements ofGCOS (U.S.DOC/NOAA 2001).These in-

110 U.S. CLIMATE ACTION REPORT—2006110 U.S. CLIMATE ACTION REPORT—2006
providing integrated andmore easily acces-sible Earth observations. Currently operat-ing CCSP systems for data managementand distribution highlighted in the 2007OurChanging Planet report includeNASA’sGlobal ChangeMasterDirectory and EarthObserving System Data and InformationSystem, and DOE’s Carbon Dioxide Infor-mation Analysis Center (CCSP and SGCR2006a). NOAA’s National Climatic DataCenter’s (NCDC’s) Climate Data Onlinesite provides climate data frommultiple sta-tions around the world. Plans for 2007 and2008 include the International Polar Year(IPY) participation through a focus onpolar climate observations via NCDC’sWorld Data Center for Meteorology.30 Datamanagement for IPY is coordinated amongmultiple U.S. agencies and throughout theworld.
U.S. agencies and participants in CCSPand USGEO are working with their part-ners in Earth observation for climate actionon local, state, regional, and national levelsand in government, academia, and the pri-vate sector.
Finally, efforts are being explored to im-prove climate data integration in the PacificIslands region and produce more useful,end-user-driven climate products. The Pa-cific Region Integrated Data Enterprise(PRIDE), currently underway in Hawaii, isefficiently using existing resources via anewly created NOAA Integrated Data andEnvironmental Applications (IDEA) Cen-ter, which is developing more customer-focused, integrated environmental prod-ucts. Operating under the auspices of
NOAA’s NCDC, the IDEA Center is part-neringwith academic institutions and otherfederal and local agencies in the region toprovide information on (1) issues related toPacific islands, including past, current, andfuture trends in patterns of climate- andweather-related extreme events (e.g., tropi-cal cyclones, flooding, drought, and oceantemperature extremes); (2) their implica-tions for key sectors of the economy, suchas agriculture, tourism, and fisheries; and(3) options for coastal communities andmarine ecosystemmanagers to adapt to andmanage the effects of variable and changingenvironmental conditions.31
International and Regional Support andCooperation for Sustained ClimateObservations
The Regional Implementation Work-shop, initiated byGCOS in response toDe-cision 6/CP.5 of the UNFCCC, expandedon the Secretariat of the Pacific RegionalEnvironment Program’s needs analysis.Held in Apia, Samoa, in August 2000 withthe support and active participation of Aus-tralian and U.S. experts, the workshop pro-vided the basis for development of a PacificIsland-GCOS (PI-GCOS) program32 to im-plement high-priority actions required torestore and improve observing systems inthe region, to effectivelymonitor and detecttrends and changes in the region’s climate.The U.S.GCOS Program Office at NOAA’sNCDC supports and contributes resourcesto the PI-GCOS effort.
Since 2002, theUnited States has enteredinto a number of important bilateral cli-mate agreements, funding projects with
Australia, China, New Zealand, and SouthAfrica. These wide-ranging projects dealwith climate prediction, ocean observation,stratospheric detection, water vapor meas-urements, capacity building and training,and communication of information, andfocus the attention and resources of thesecountries on developing amore sustainableand robust GCOS program.
Finally, the transition of the GlobalObserving System Information Center(GOSIC)33 from a developmental activity atthe University of Delaware to an opera-tional global data facility at NOAA’sNCDCwas completed on behalf of and with theconcurrence of the global observing com-munity in October 2006. GOSIC providesinformation, and facilitates easier access todata and information produced by GCOS,GOOS, and GTOS and their partner pro-grams. The distributed nature of this vastsystem of global and regional data and in-formation systems is best served by this sin-gle entry point for users. GOSIC providesexplanations of the various global data sys-tems, as well as an integrated overview ofthe myriad global observing programs,which includes on-line access to their data,information, and services. GOSIC offers asearch capability across international datacenters, to enhance access to a worldwideset of observations and derived products.
30 See <http://www.ncdc.noaa.gov/oa/wdc/>.31 See <http://www.apdrc.soest.hawaii.edu/PRIDE>.32 See <http://pi-gcos.org>.33 For more details, see <http://gosic.org>.

Climate change education, training, and outreach have continued to expand since thelastU.S. Climate Action Reportwas released in 2002. Federal programs support formaleducational initiatives ranging from K-12 classroom curriculum to undergraduate,
graduate, and postdoctoral research, and informal education conducted inmuseums, parks,nature centers, zoos, and aquariums across the country. Educators can also access extensiveon-line educational global change resources, such as the sample federal websites highlightedin Table 9-1 at the end of this chapter.
Efforts by state and local governments,universities, schools, and nongovernmental organ-izations (NGOs) are essential complements to federal programs that educate industry and thepublic regarding climate change. State environment and energy agencies provide teachertraining workshops, often in cooperation with universities and local utility companies; localschool systems institute climate change curricula and activities at themiddle and high schoollevels; universities are joining forces with NGOs to educate staff and students about the im-portance of energy efficiency and are instituting new, sustainable practices on campuses acrossthe country. From wildlife conservation groups (e.g., National Wildlife Federation, WorldWildlife Fund, IzaakWalton League, and Federation of Fly Fishers), to science-based organ-izations (e.g., American Meteorological Society, Union of Concerned Scientists), to energy-oriented groups (e.g., Alliance to Save Energy), a variety of NGOs conduct workshops andsurveys, produce brochures and kits, andwritemedia articles to alert the public to the scienceunderlying, impacts of, and possible solutions to climate change.
Industry is also beginning to play a role in education, training, and outreach. Several cor-porations have contributed to the National Park Service’s efforts to communicate energy ef-ficiency messages; various electric utilities conduct education forums to educate the publicabout the sources and choices of electrical power in this country and the need for energy ef-ficiency in today’s world; oil companies advertise and sponsor conferences to make peopleaware of alternative energy sources and the possible impacts of the choices wemake.
Because of these efforts, theAmerican public is better informed about climate change andbetter equipped to adjust their lifestyles to enhance the sustainability of planet Earth.
FEDERAL AGENCY EDUCATION AND OUTREACH ACTIVITIESSeveral federal agencies provide state and local governments, industry, NGOs, and the
public with information about national and global climate change research and risk assess-ments studies, U.S. mitigation activities, and policy developments. They work both inde-pendently and in partnership with other agencies,NGOs, and industry toward the commongoal of increasing awareness about the potential environmental and societal challenges posedby climate change.
9 Education, Training,and OutreachEducation, Training,and Outreach

112 U.S. CLIMATE ACTION REPORT—2006112 U.S. CLIMATE ACTION REPORT—2006
the feasibility and potential benefits of col-lecting and using landfill gas for energy re-covery. This effort resulted in thedevelopment of the Mexico Landfill GasModel, a trainingworkshop, and a guidancemanual.
Global PartnershipsSince its inception, USAID has worked
in cooperation with U.S. and internationalpartners to improve conditions for peoplearound the world.While these partnershipshave long been key to USAID’s success, thisstrategy has never been more importantthan now. USAID is committed to an ap-proach that recognizes and incorporates theefforts of partnership and private giving, fo-cusing on grassroots support, local owner-ship, sustainability, and accountability.
U.S. Department of AgricultureAs theU.S. Department of Agriculture’s
(USDA’s) chief intramural scientific researchbody, the Agricultural Research Service(ARS) is responsible for research on the im-pacts of agricultural practices on potentialclimate change or disruptions and viceversa. Although ARS has no formal educa-tional mechanism to disseminate researchinformation to the general public, it employsa number of less formal means to commu-nicate andmake use of research advances.
All scientific research publications aresubmitted with an Interpretive Summarythat is used for timely news releases. In ad-dition, through collaboration with univer-sity scientists, climate change researchinformation is provided to state and countycooperative extension agencies for release toidentified producers. Also, all agency fieldlocations publish informative brochures thatdescribe theirwork and the impact of the re-search findings on stakeholders’ interests.
Table 9-1 lists websites that provide ad-ditional information about ARS’s GlobalChange Program and research magazine,the Global Change ProgramOffice’s activi-ties, and the Natural Resources Conserva-tion Service’s work on managing carbonsequestration and reducing greenhouse gasemissions.
U.S. Department of EnergyThe U.S. Department of Energy (DOE)
supports numerous education andoutreachinitiatives focused on increasing energy ef-ficiency and reducing greenhouse gas emis-sions. Some of these initiatives are outlinedbelow and in Table 9-1.
Energy Efficiency InitiativesEnergy Savers—This programandpublic
awareness campaign educates consumers,homeowners, and businesses on smart en-ergy use and how to cut energy bills.Energy Hog—This national public serv-
ice advertising campaign helps children andtheir parents learn about energy-efficientbehavior.Building Technologies Program—This
programoffers a wide range of informationon reducing energy consumption in homesand other buildings, which account forroughly 40 percent of energy use.Building Toolbox—This comprehensive
guide to designing, constructing, or reno-vating more efficient, affordable buildingsincludes software tools to help researchers,designers, architects, engineers, builders,code officials, and others evaluate and rankpotential energy efficiency technologies andrenewable energy strategies.Home Energy Saver—Part of the joint
DOE/EPA ENERGY STAR program, thisinitiative is designed to help consumersidentify the best ways to save energy in theirhomes and find the resources to realize thosesavings.
Carbon Dioxide InformationAnalysis Center
This center, which includes the WorldData Center for Atmospheric Trace Gases,is DOE’s primary center for global changedata and information analysis.
National Institute for GlobalEnvironmental Change
This DOE-funded institute conducts re-search on global climate change in six U.S.regions—theGreat Plains,Midwest,North-east, SouthCentral, Southeast, andWest; in-tegrates and synthesizes information to helpdecisionmakers and communities better re-spond to regional-scale or ecosystem-scale
U.S. Agency for InternationalDevelopment
TheU.S.Agency for InternationalDevel-opment’s (USAID’s) Global ClimateChange Program incorporates climatechange considerations into developmentprojects. A significant part of this programinvolves building the capacity of local part-ners to understand how climate change is-sues affect their ability to achieve theirdevelopment goals.
Global Climate Change ProgramThe Global Climate Change Program
provides a resource for learningmore aboutUSAID’s climate change activities in morethan 40 developing and transition countries.The program’s Publications and Outreachsection includes sector overviews, such asClean Energy Technology, Land Use andForestry, Adapting to Climate Variabilityand Change, Capacity Building, and Cli-mate Science forDecisionMaking.The pro-gramalso provides publications focusing onclimate change and individual regions, andhighlights the climate change activities un-dertaken in various countrieswhereUSAIDmaintains climate change portfolios, includ-ing training, education, andoutreach efforts.
Climate PartnershipsUSAID places particular emphasis on
partnerships with the private sector and onworking with other U.S. government agen-cies, local and national authorities, commu-nities, and NGOs to create alliances thatbuild on each other’s relative strengths.Bringing together a diverse range of stake-holders helps avoid unnecessary duplicationand lays the foundation for a sustained, in-tegrated approach. Through training, tools,and other means of capacity building,USAID helps developing countries andcountries with economies in transition ad-dress climate-related concerns as a part oftheir development goals.Mexico Landfill GasModel—Anexample
of these climate partnerships isUSAID’s col-laboration with the U.S. EnvironmentalProtectionAgency (EPA) and severalMexi-can government agencies to help landfillowners and operators in Mexico evaluate

CHAPTER 9—EDUCATION, TRAINING, AND OUTREACH 113CHAPTER 9—EDUCATION, TRAINING, AND OUTREACH 113
effects of climate change; and educates thepublic on climate change and energy-relatedenvironmental risks.
Office of Fossil Energy, National EnergyTechnology Lab, Keystone Center
DOE’s Office of Fossil Energy and theNational Energy Technology Lab are work-ing with the Keystone Center of Keystone,Colorado, to conduct outreach, risk com-munication, stakeholder efforts, and focusgroups to better understand communityconcerns related to carbon sequestration.The Keystone Center hosts a teacher train-ing institute focusing on a climate changecurriculum developed under a grant fromDOE. Its staff attend regional and nationalmeetings to present overviews of the cur-riculum to teachers across the country.
Global Change Education ProgramDOE’s Global Change Education Pro-
gram continues to support three coordi-nated components aimed at providing bothresearch and educational support to post-doctoral scientists, graduate students, fac-ulty, and undergraduates at minoritycolleges and universities, through the Sum-mer Undergraduate Research Experience(SURE),Graduate Research EnvironmentalFellowships (GREF), and the SignificantOpportunities inAtmosphericResearch andScience (SOARS) program.
U.S. Department of the Interior
National Park ServiceAs the steward of the world’s foremost
system of national parks, the National ParkService (NPS) is responsible for preservingand protecting the significant resourceswithin the parks for the enjoyment of futuregenerations. Recognizing its role as themodel for national park systems around theworld,NPS has increased its support of ed-ucation on climate change and environ-mental stewardship through severalinnovative programs.Sustainability Initiative—Through a
combination of interpretive talks, signage,brochures, fact sheets, and other informa-tional materials and programs,NPS is edu-cating visitors about its efforts to ensure thesustainability of the national park system.
Greening of the National Park Service—NPS conserves energy and incorporates re-newable energy resources into the parksystem to save money, to protect the parks’natural resources, and to educate the publicabout creating environmentally friendly fa-cilities. Park visitors learn about NPS’s“greening" activities through fact sheets,brochures, and on-site signage.Climate Friendly Parks—NPS and EPA
have joined forces to conduct the ClimateFriendly Parks program.NPS is “leading byexample” in mitigating climate change andair quality impacts in the parks by imple-menting action plans to reduce greenhousegas emissions in the parks and providing amodel to visitors on how to reduce energyconsumption and emissions in their com-munities. The action plans are based ongreenhouse gas emission inventories thatquantify their baseline activities inseveral areas, including facilitymanagement,fleet management, visitor transportation,and waste management. The parks committo educating park visitors and the commu-nity on the importance of reducing emis-sions and saving energy, and how theseactionsmayhelp reduce harmful impacts onthe parks. NPS communicates success sto-ries from its parks’mitigationwork throughits creative labeling of energy-efficient proj-ects in the parks, interpretive programs inthe parks and in the communities, educa-tional programs in schools, andwayside ex-hibits.
U.S. Geological SurveyAs the Nation’s largest water, Earth, and
biological science and civilian mappingagency, the U.S. Geological Survey (USGS)collects, monitors, analyzes, and providesscientific understanding about natural re-source conditions, issues, andproblems.Theagency’s diversity of scientific expertise en-ables it to carry out large-scale, multidisci-plinary investigations and provide impartialscientific information to resourcemanagers,planners, and other customers.The USGS and Science Education—
USGS provides scientific information toeducate the public about natural resources,
natural hazards, geospatial data, andquality-of-life issues. Educational resourcesinclude lesson plans and maps to assistteachers in communicating the concepts ofglobal change.Earth Surface Dynamics Program—
USGSglobal change research activities striveto achieve awhole-systemunderstanding ofthe interrelationships among Earth surfaceprocesses, ecological systems, and humanactivities. USGS work in the Earth SurfaceDynamics Program focuses on understand-ing the likely consequences of climatechange, especially by studying how climatehas changed in the past.
U.S. Department of TransportationTransportation is the fastest-growing
U.S. source of greenhouse gases. Addition-ally, climate change may affect U.S. trans-portation systems through more frequentweather disruptions, changes in infrastruc-ture life, rising sea levels, and other impacts.The U.S. Department of Transportation(DOT) has developed programs to addressthese issues.
Center for Climate Change andEnvironmental Forecasting
The center is the focal point of DOTtechnical expertise on transportation andclimate change. Through strategic research,policy analysis, partnerships, and outreach,the center focuses on activities designed toreduce transportation-related greenhousegases and tomitigate the effects of global cli-mate change on the transportationnetwork.
It All Adds Up to Cleaner AirDeveloped and guided by the Federal
Highway Administration, the FederalTransit Administration, and EPA, this ini-tiative is a multilevel public education andpartnership-building program to informthe public about the connections betweentheir transportation choices, traffic con-gestion, and air pollution through televi-sion, radio, and print public serviceannouncements. The program encouragespeople to take simple, convenient actionsthat can make a difference in traffic con-gestion and air quality when practiced ona wide scale, such as trip chaining

114 U.S. CLIMATE ACTION REPORT—2006114 U.S. CLIMATE ACTION REPORT—2006
the environment by presenting accurate, ac-cessible, understandable information on cli-mate change and global warming tocommunities, individuals, businesses, pub-lic officials, governments, and other inter-ested parties. The site features climatescience, emissions data, impact assessmentsummaries, U.S. policy information, andsuggested actions that individuals and otherinterested parties can take to reduce green-house gas emissions.
Resources for Educators and StudentsClimate Change, Wildlife and Wildlands
Toolkit for Teachers and Interpreters—EPAled a partnership effort with NPS and theU.S. Fish and Wildlife Service to develop aclimate change educational toolkit for class-room teachers and natural resource inter-preters. The kit contains fact sheets, a shortvideo, and other presentationmaterials thatinvestigate the links between climate changeand changes to habitat, ecosystems,wildlife,and public lands, including national parksand wildlife refuges.Global Warming Wheel Card Classroom
Activity Kit—This tool helps teachers edu-cate students in grades 6 through 8 aboutthe causes and potential impacts of globalwarming.Centered on the hand-heldwheelcard that students use to estimate householdcarbon dioxide emissions, the kit encour-ages students to think about ways to reducetheir personal, family, school, and commu-nity contributions to the greenhouse effect.Students’ Energy Manual—EPA worked
with Harvard University to develop an on-line manual designed to help members ofother campus communities initiate studentinternship programs aimed at improvingenergy efficiency, reducing greenhouse gasemissions, and producing economic andeducational benefits as well.Topic-Specific Brochures—EPA has pro-
duced several brochures to educate specificaudiences about particular topics relevantto possible climate change impacts in theUnited States.Those brochures includeCli-mateChange andBirds,ClimateChange andCold-Water Fish,ClimateChange andPublicLands, andClimate Change andCoral Reefs.
EPA is currently revising all of the brochuresto reflect the latest scientific research.
Training of Select Leaders, Educators,and Technicians
EPA responds to many requests to traineducators to more effectively use EPA-produced kits in their classrooms, to helpother government agencies educate theirstaff to interact with the public on climatechange issues, and to teach students howthey can help reduce greenhouse gas emis-sions. EPA also shares information with in-ternational parties on technical issues,including greenhouse gas inventorymethodologies and practices, economicmodeling, analysis of the co-benefits of si-multaneous reductions in greenhouse gasesand conventional air pollutants, technologyassessments, and preparation of NationalCommunications for the United NationsFramework Convention on ClimateChange.
Sea Level Rise OutreachEPA supports a number of projects to
provide information to stakeholders whowish to take timelymeasures in anticipationof sea level rise. Planning scenariomappingprojects inform coastal planners about sealevel rise. Informational brochures about therisk of sea level rise, includingmaps of stateswith coastal land, illustrate which areas arelikely to be protected against rising seas andwhich are likely to flood. These efforts in-form dialogue within communities abouthow to prepare for sea level rise.
State and Local Technical AssistanceTo enable state and local governments to
quantify and reduce greenhouse gas emis-sions, EPA has developed tools in coopera-tion with its partners, and offers technicalassistance to help determine the emissionsimplications of a range of policy options.These quantification tools include theCleanAir andClimate Protection Software and theState Greenhouse Gas Inventory Tool.
States havemade great progress in imple-menting innovative and cost-effective en-ergy efficiency and renewable energyprograms and policies that achievemultiple
(combining trips), car maintenance, andalternative modes of transportation.
The campaign’s messages were designedto increase public awareness of the connec-tion between travel behavior and air quality,with a focus on reducing criteria air pollu-tants frommotor vehicles. Improved trans-portation choices also produce animportant ancillary benefit of reducinggreenhouse gas emissions.
U.S. Environmental Protection AgencyEPA supports numerous climate change
outreach and education initiatives for vari-ous audiences, helping them better under-stand climate change, its implications, andprograms led or supported by the Agency.EPA also provides useful tools to help indi-viduals and organizations identifymeasuresthey can take to reduce greenhouse gasemissions. Following are EPA education,training, and outreach efforts targeted tobusiness and industry, the general public,and educators and students, and informa-tion about EPA training for select leaders,educators, and technicians, sea level rise out-reach, and technical assistance to state andlocal governments.
Business and Industry OutreachEPA has actively engaged business and
industry on climate change-related issues,with a goal of working together to reducegreenhouse gas emissions and improve cor-porate operational efficiency. ENERGYSTAR, the Green Power Partnership Pro-gram, Climate Leaders, the SmartWayTransport Partnership, the LandfillMethaneOutreach Program, and the internationalMethane to Markets Partnership are all ex-amples of themanyhallmark public–privatepartnership programs that EPA leads.Thesepartnerships and programs, among others,provide businesses and consumers withtools, technical assistance, information andcost-effective ways to save energy, foster theuse of clean energy, reduce greenhouse gasemissions, and promote energy security andefficiency at home and abroad.
General Public OutreachThe Climate Change website supports
EPA’s mission to protect human health and

CHAPTER 9—EDUCATION, TRAINING, AND OUTREACH 115CHAPTER 9—EDUCATION, TRAINING, AND OUTREACH 115
benefits, including reducing greenhousegases. EPA technical assistance and guid-ance help states and municipalities adoptclean energy strategies and then share thesesuccesses with their peers through EPA-sponsored technical forums for state policy-makers and other information-exchangeopportunities.
National Aeronautics and SpaceAdministration
TheNationalAeronautics and SpaceAd-ministration (NASA) conducts education,training, and public awareness on climatechange, using NASA’s observational, re-search, andmodeling assets.
Primary, Secondary, and HigherEducation
NASA’s Earth Explorers Series supportseducator enhancement and systemic im-provement in elementary, secondary,higher,and informal education by encouraging theuse of NASA-unique resources in Earth sys-tem and climate research.
Training ProgramsEarth System Science Fellowship Pro-
gram—This program supports individualspursuingmaster’s or Ph.D. degrees in Earthsystem science, climate change, and relatedresearch.New Investigator Program in Earth Sci-
ence—This program encourages integratedenvironments for research and educationfor scientists and engineers in Earth–Sunsystems and climate research at the earlystages of their professional careers.
On-line Resource or Information CentersEarth System Science Learning
Resources—NASAproduces and sponsors awide-ranging suite of Earth system scienceeducation products for elementary throughpostsecondary instruction and informal ed-ucation.Earth Observatory Newsroom—NASA’s
on-line newsroom for journalists featuresthe latest news on Earth science research re-leased fromallNASA centers andmore than80universities participating inNASA’s Earthprograms through sponsored research.NASA’s Earth Observing System also pro-
vides journalists with a ready source of in-ternational expertise on global climatechange science and policy.
Climate Change Outreach and EducationPress Releases—NASA’s press releases on
climate change science often result in featurearticles in the media.Visuals—NASA also produces visuals to
help explain climate change science con-cepts to the media and prepares “ScienceWritersGuides”forNASA’s climate change-related missions, which are distributed atpress briefings and available on-line throughthe Earth Observatory Newsroom.NASATelevision—NASATelevisionpro-
gramming is made available to televisionoutlets and reformatted for formal and in-formal educational settings. It is also pre-sented to tens of thousands of people in alive theater format at various education, sci-ence, and public events.Science for the Public—In addition,
NASA funds thousands of scientists atNASA centers and in academia who givepublic talks and interviews explaining thescience of climate change.Video Library—NASA Television main-
tains a library of video news releases and ed-ucational videos for distribution to themedia, educational institutions, and thepublic. These videos include data visualiza-tions, conceptual animations, and inter-viewswith expert scientists on the subject ofclimate change.NASA Publications—NASA also pub-
lishes brochures, fact sheets, and lithographsexplaining climate change science. TheGlobal Change Master Directory brochureand website point users to where they canobtain data on Earth science and climatechange.Competitive Solicitations—NASA funds
universities, museums, professional soci-eties, andNGOs to provide climate change-related education through competitivesolicitations for education and outreachprograms.
PartnershipsGLOBE Program—Through a consor-
tiumof scientists, institutional partners, and
schools in 107 countries, the Global Learn-ing and Observations to Benefit the Envi-ronment (GLOBE) Program, jointlysponsored by NASA, the National ScienceFoundation (NSF), and the Department ofState, aims to improve student achievementin science andmathematics, increase scien-tific understanding of the Earth system andclimate, and enhance the environmentalawareness of individuals worldwide.Television Productions—NASAoften col-
laborates on its television productions withpartners like USGS, the National Snow andIceData Center, theU.S. Forest Service, andEPA.Research Support—NASA’s Socioeco-
nomic Data and Applications Center part-nered with the SysTem for Analysis,Research and Training, USAID, the UnitedNations Environment Programme, theThird World Academy of Sciences, and theNASA Goddard Institute for Space Studiesin supporting the Data,Methods, and Syn-thesisActivity of theAssessments of ImpactsandAdaptations toClimateChange inMul-tiple Regions and Sectors, including supportfor researchers in developing countries.
U.S. Department of Commerce/NationalOceanic and Atmospheric Administration
Climate EducationWorking GroupThis group develops education and out-
reach products, activities, and lesson plansfor K-16 teachers and the general public toenhance their understanding of climatechange and other important climate topics.
Climate and Global Change PostdoctoralFellowship Program
This program is helping to create thenext generation of climate researchers whowill predict and assess global climate changeon seasonal-to-centennial time scales.Morethan 100 programparticipants haveworkedat agencies, laboratories, and institutions ofhigher education.
National Climatic Data CenterThe National Climatic Data Center
maintains the world’s largest archive ofweather-related data used by specialists inmeteorology, insurance, and agriculture,
116 U.S. CLIMATE ACTION REPORT—2006116 U.S. CLIMATE ACTION REPORT—2006
• broadening participation of underrepre-sented groups, geographic regions, andtypes of institutions in all S&E fields.Because NSF provides awards—princi-
pally to academic institutions—to accom-plish these objectives, it does not directlydisseminate climate information. Theagency provides support to the principal in-vestigators to develop results, databases, andeducational practices that the scientific com-munity uses for research and education pur-poses. In addition to funded educationprojects, investigators at academic institu-tions who conduct research related to cli-mate change contribute to the education ofundergraduate, graduate, and postdoctoralstudents who work on those research proj-ects.
NSFpartnerswith other agencies to sup-port specific programs related to education,training, and outreach. Examples includethe GLOBE Program and the SysTem forAnalysis, Research and Training (START).(See Chapter 8 for more activities.)
NSF’sOffice of Legislative andPublicAf-fairs workswith themedia, federal and stategovernment representatives, industry repre-sentatives, and NSF grantees to facilitate abroader understanding of science and globalclimate change. Outreach activities includenews releases, in-depth special reports, andspecial events open to the public.
OTHER FEDERAL ACTIVITIES
Climate Change Science ProgramThe Climate Change Science Program
(CCSP) is responsible for communicatingwith a variety of stakeholders nationally andglobally on issues related to climate variabil-ity and climate change science. The Com-munications Interagency Working GroupleadsCCSP’s coordinated interagency com-munications efforts by:• assisting in developing communications
strategies andmaterials for synthesis andassessment products issued by CCSPworking groups and affiliated agencies;
• developing and advancing a strategy forimproving, integrating, and promotingthe content of websites operated or sup-
ported by CCSP and its participatingagencies, recognizing that the sites are es-sential communication and outreachtools; and
• identifying opportunities for outreach tospecific audiences through constituentbriefings, exhibits at science conferences,and placement of CCSP speakers onpanels.
Highlights of Recent CCSP InteragencyCommunications Activity
Following are highlights of recent CCSPcommunications activities coordinated atthe interagency level:• Published and distributedOurChangingPlanet: The U.S. Climate Change ScienceProgram for Fiscal Year 2007 (CCSP andSGCR 2006a).
• Published Ecosystems and ClimateChange: Research Priorities for theUSCCSP in 2006 (Lucier et al. 2006).
• Managed and improved CCSP websites,which receive an average of 5,000 hits aday.
• Assumed responsibility for the GlobalChange Research Information Office,which disseminates U.S. scientific re-search information that would be usefulin preventing,mitigating, or adapting tothe effects of global change.
Highlights of CCSP InteragencyCommunications Plans Through FY 2007
Some of the communications activitiescoordinated at the interagency level andplanned through FY 2007 include the fol-lowing:• Prepare,publish, and disseminate the fis-
cal year 2007 and 2008 editions of OurChanging Planet.
• Disseminate new synthesis and assess-ment products, effectively communicat-ing important conclusions to the relevantstakeholder communities.
• Facilitate stakeholder participation in theU.S. government review of draft docu-ments from the Intergovernmental Panelon Climate Change.
• Maintain and enhance the content andservices of the CCSP website.
and indirectly inmost business sectors. Thecenter includes a section on paleoclimatedata, which was developed to help educate,inform, and highlight the importance ofpaleoclimate research in helping scientistsand others better understand global warm-ing, climate variability, and climate change.
Climate Prediction CenterThe Climate Prediction Center develops
climate outlook products to help farmers,businesses, and the public better plan forextreme weather events related to climatevariations. It issues drought, hurricane,and winter outlooks, along with El Niño-SouthernOscillation advisories, and threatsassessments.
National Science FoundationConsistent with its mission to support
research and education across a broad rangeof science and engineering disciplines, NSFfunds research in numerous areas related toglobal climate change. NSF’s Directoratesfor Geosciences; Biological Sciences; Social,Behavioral, and Economic Sciences; Educa-tion and Human Resources; MathematicsandPhysical Sciences;Computer and Infor-mation Science and Engineering; and theOffice of Polar Programs participate in theClimate Change Science Program and pro-vide access to climate-related results fromprincipal investigators.
NSF is the principal federal agencycharged with promoting science and engi-neering (S&E) education. To this end, NSFsupports the development of a diverse andwell-prepared scientific and technical work-force, and a scientifically literate citizenry.NSF programs support:• the development of instructional mate-
rials, curricula, andmethods for kinder-garten through graduate school;
• programs that increase public interest,understanding, engagement and life-long learning in S&E, including informaleducation, such asmuseum exhibits andIMAX films;
• robust research and development ofeffective S&E education practices; and

Smithsonian InstitutionEvery year millions of U.S. and foreign
visitors view Smithsonian exhibits inWash-ington,D.C.,NewYorkCity, and other citieshosting Smithsonian traveling exhibits. Infulfilling its mission to promote the "in-crease and diffusion of knowledge," theSmithsonian educates the public aboutmany areas of science, including globalwarming.
Deltas-Global Change ProgramInitiated at the Smithsonian’s National
Museum of Natural History in 1995, thismultidisciplinary, multinational research
program assesses geological and environ-mental changes that seriously affect selecteddeltas in different climatic regions aroundthe world.
Forces of ChangeThrough exhibits, publications, com-
puter projects, and a variety of public pro-grams, the National Museum of NaturalHistory’sForces of Change examines the con-nections among the physical, biological, andcultural forces that shape the world. Theprogram helps people see connections be-tween seemingly remote forces, such as gasbubbles within the Antarctic ice cap and
famines in tropical Africa. The museum’sGlobal Links andAntarctica exhibits are ex-amples of how Forces of Change communi-cates these connections.
Arctic Studies CenterThe Arctic Studies Center invites the
public to explore the history of northernpopulations, cultures, and environmentsand the issues that matter to northern resi-dents today, including climate change.Visi-tors can excavate arctic sites, supportindigenous efforts to preserve cultural her-itage, and work with communities andscholars to share the treasures preserved inmuseum collections and archives.
CHAPTER 9—EDUCATION, TRAINING, AND OUTREACH 117CHAPTER 9—EDUCATION, TRAINING, AND OUTREACH 117
Resource Description Website
U.S. AGENCY FOR INTERNATIONAL DEVELOPMENT
Global Climate Change Program Provides an overview of the program and its efforts http://www.usaid.gov/our_work/in more than 40 countries. environment/climate/pub_outreach/index.html
Mexico Landfill Gas Partnership Helps evaluate the feasibility and potential benefits of http://www.epa.gov/lmop/international.htmcollecting and using landfill gas for energy recoveryin Mexico.
Global Partnerships Describes the programs that support USAID’s efforts to http://www.usaid.gov/our_work/globalimprove conditions for people around the world. _partnerships/
U.S. DEPARTMENT OF AGRICULTURE
Agricultural Research Service
ARS Global Change Programs Discusses the program’s background, goals, and http://www.ars.usda.gov/research/programs/research components. programs.htm?NP_CODE=204
Agriculture Research Provides on-line access to USDA’s monthly science http://www.ars.usda.gov/is/AR/magazine.
Global Change Program Office Coordinates climate change activities across USDA http://www.usda.gov/oce/global_agencies, and interacts with other federal agencies, change/index.htmthe legislative branch, and international partners onclimate change issues affecting agriculture and forestry.
Natural Resources ConservationService
NRCS Fact Sheet Presents opportunities for managing carbon http://www.nrcs.usda.gov/feature/outlook/sequestration and reducing GHGs using conservation Carbon.pdfincentive programs.
Voluntary Reporting On-line Provides an on-line tool for estimating and voluntarily http://cometvr.colostate.edu/Carbon Management Tool reporting carbon sequestration and GHG emissions.
TABLE 9-1 Governmental On-line Climate Change Educational Resources

118 U.S. CLIMATE ACTION REPORT—2006118 U.S. CLIMATE ACTION REPORT—2006
TABLE 9-1 (Continued) Governmental On-line Climate Change Educational Resources
Resource Description Website
U.S. DEPARTMENT OF ENERGY
Carbon Dioxide Information Responds to information requests from users http://cdiac.esd.ornl.gov/Analysis Center concerned about the greenhouse effect and
climate change.
Climate Change Technology Provides a wealth of information and reports on www.climatetechnology.gov/Program technologies being developed to mitigate
climate change.
Climate VISION Program Provides information on activities being pursued under http://www.climatevision.gov/this voluntary public–private partnership program toreduce greenhouse gas emissions.
Enhancing DOE’s 1605(b) Voluntary Serves as a source of information on revisions to http://www.pi.energy.gov/enhancingGreenhouse Gas Registry Program the “1605(b)” voluntary GHG registry. GHGregistry/index.html
Energy Information Provides all manner of current and historical http://www.eia.doe.gov/Administration energy data.
National Institute for Global Helps decision makers and communities better http://nigec.ucdavis.edu/Environmental Change respond to regional-scale or ecosystem-scale effects
of climate change, and educates the public on climatechange and energy-related environmental risks.
Energy Efficiency and Renewable Energy
Office of Energy Efficiency and Describes DOE’s work toward enhancing U.S. energy http://www.eere.energy.gov/Renewable Energy efficiency and expanding sources of renewable energy.
Building Technologies Program Offers information on reducing energy consumption in http://www.eere.energy.gov/buildings/homes and other buildings.
Building Toolbox Presents a comprehensive guide and software tools http://www.eere.energy.gov/buildingsfor designing, constructing, or renovating more /info/toolboxdirectory.htmlefficient, affordable buildings.
ENERGY STAR Offers businesses and consumers energy-efficient http://www.energystar.gov/solutions that save money and reduce GHG emissions(joint program with EPA).
FreedomCAR and Vehicle Provides information on the program’s goal of http://www1.eere.energy.gov/vehiclesTechnologies Program examining the research needed to improve vehicle andfuels/about/partnerships/freedomcar
fuel efficiency. /index.html
Energy Hog Campaign Site Presents information about improving energy http://www.energyhog.org/efficiency in the home.
Energy Savers Provides homeowners with tips on saving energy http://www.eere.energy.gov/consumer/tips/and money.
Home Energy Saver Offers the first web-based do-it-yourself energy http://hes.lbl.gov/audit tool.
Hydrogen Fuel
Hydrogen Fuel Initiative Provides information on this Presidential initiative to http://www.eere.energy.gov/hydrogenreduce America’s dependence on foreign oil. andfuelcells/presidents_initiative.html
International Partnership for the Describes the partnership’s work to accelerate the http://www.iphe.net/Hydrogen Economy development of hydrogen and fuel cell technologies.
FutureGen Project Presents an initiative to build the world's first http://www.fe.doe.gov/programs/integrated sequestration and hydrogen production powersystems/futuregen/research power plant.

CHAPTER 9—EDUCATION, TRAINING, AND OUTREACH 119CHAPTER 9—EDUCATION, TRAINING, AND OUTREACH 119
TABLE 9-1 (Continued) Governmental On-line Climate Change Educational Resources
Resource Description Website
Fossil Energy and Carbon Sequestration
Office of Fossil Energy Describes DOE programs in fossil energy research http://fossil.energy.gov/and development.
DOE Carbon Sequestration Examines DOE’s research and development http://fossil.energy.gov/programs/Programs programs in carbon capture and storage. sequestration/
Carbon Sequestration Regional Discusses the public- and private-sector partnership http://fossil.energy.gov/programs/Partnerships efforts to determine the most suitable technologies, sequestration/partnerships/index.html
regulations, and infrastructure needs for carboncapture, storage, and sequestration.
Carbon Sequestration Leadership Reviews CSLF activities toward developing cost- http://www.cslforum.org/Forum (CSLF) effective technologies for capturing and storing CO2.
Nuclear Energy
Office of Nuclear Energy Describes DOE programs in nuclear fission research http://www.ne.doe.gov/and development.
Generation IV Nuclear Energy Discusses DOE’s research into the next generation http://nuclear.energy.gov/Systems Initiative of nuclear systems.
Global Nuclear Energy Partnership Provides information on the partnership, grants, http://www.gnep.energy.gov/default.htmland job opportunities.
Fusion Energy
Fusion Energy Sciences Describes DOE programs in the fusion energy sciences. http://www.sc.doe.gov/feature/fes.htm
ITER Project Describes the work of an international partnership http://www.iter.org/toward demonstrating the feasibility of using fusionpower to produce electricity.
Resources for Educators and Students
For Students and Kids Offers on-line energy, engineering, and science http://www.energy.gov/forstudentseducation for kids. andkids.htm
For Educators Provides details on educational resources, http://www.energy.gov/foreducators.htmscholarships and internships, contests andcompetitions, and support for schools and universities.
EERE Kids—Dr. E’s Energy Lab Provides an on-line resource for kids on all types of http://www.eere.energy.gov/kids/index.htmlenergy efficiency and renewable energy.
Ask a Scientist Serves as an archive of answers to science questions http://www.newton.dep.anl.gov/aas.htmfrom K-12 students and teachers, and an opportunityto ask new questions.
Resources for Researchers
Research and Grant Programs Provides information on support for research and http://www.energy.gov/forresearchers.htmdevelopment programs, educational institutions, andcareers at DOE.
Office of Science Describes DOE’s fundamental research programs. http://www.sc.doe.gov/

120 U.S. CLIMATE ACTION REPORT—2006120 U.S. CLIMATE ACTION REPORT—2006
TABLE 9-1 (Continued) Governmental On-line Climate Change Educational Resources
Resource Description Website
U.S. DEPARTMENT OF THE INTERIOR
National Park Service
Greening of the National Park Promotes the use of sustainable energy and practice http://www.nps.gov/renew/Service of environmental leadership in national parks.
Climate Friendly Parks Initiative Provides an overview of this joint NPS/EPA energy http://www.nps.gov/climatefriendlyparks/efficiency initiative.
Sustainability News Published biannually, asks important questions about http://www.nature.nps.gov/Sustainabilityand offers appropriate responses to reducing GHG News/index.htmemissions and mitigating the effects of climate change.
U.S. Geological Survey
The USGS and Science Education Provides public information about natural resources, http://education.usgs.gov/natural hazards, geospatial data, and quality-of-lifeissues.
Earth Surface Dynamics Program Presents USGS global change research activities, http://geochange.er.usgs.gov/data sets, fact sheets, frequently asked questions,and information about the U.S. Climate ChangeScience Program.
U.S. DEPARTMENT OF TRANSPORTATION
Center for Climate Change and Provides data on national and global transportation- http://www.volpe.dot.gov/Environmental Forecasting related emissions, and information about related
research projects, reports, partnerships, and events.
It All Adds Up to Cleaner Air Educates the public about the connections between http://climate.volpe.dot.gov/addsup.htmltheir transportation choices, traffic congestion, andair pollution.
U.S. ENVIRONMENTAL PROTECTION AGENCY
Partnership Programs
EPA’s State and Local Clean Provides information about EPA’s support of http://epa.gov/cleanenergy/stateandlocal/Energy Programs the clean energy efforts of state and local
governments.
Business/Industry Outreach Presents key sources for partnership programs http://www.epa.gov/air/ccd.htmlfor reducing GHG emissions. http://www.epa.gov/cppd/
http://www.epa.gov/otaq/
ENERGY STAR Helps businesses and homes save money http://energystar.gov/and protect the environment through energy-efficient products and practices (joint programwith DOE).
Climate Leaders Describes EPA’s work with companies to develop http://www.epa.gov/climateleaders/long-term, comprehensive climate change strategies.
SmartWay Transport Partnership Establishes incentives between various freight http://www.epa.gov/SmartwayLogistics/industry sectors and EPA to improve fuel efficiency swplan.htmand reduce GHG emissions.
Green Power Partnership Discusses EPA’s support of organizations that are http://www.epa.gov/greenpower/buying or planning to buy electricity generated fromrenewable energy sources.

CHAPTER 9—EDUCATION, TRAINING, AND OUTREACH 121CHAPTER 9—EDUCATION, TRAINING, AND OUTREACH 121
TABLE 9-1 (Continued) Governmental On-line Climate Change Educational Resources
Resource Description Website
Methane Reduction and Recovery Partnerships
Methane to Markets Partnership Describes an international initiative that promotes http://www.epa.gov/methanetomarkets/cost-effective methane recovery and use inagriculture, coal mines, landfills, and oil andgas systems.
AgSTAR Program Encourages the use of methane recovery (biogas) http://epa.gov/agstar/technologies at confined animal feeding operationsthat manage manure as liquids or slurries. (Sponsoredwith USDA and DOE.)
Coalbed Methane Outreach Discusses EPA’s work with coal companies and http://epa.gov/cmop/Program related industries to reduce methane emissions.
Landfill Methane Outreach Program Promotes the use of landfill gas as a renewable, http://epa.gov/lmop/green energy source.
Natural Gas STAR Program Identifies and promotes the implementation of cost- http://epa.gov/gasstar/effective technologies and practices to reducemethane emissions from the oil and naturalgas industry.
Climate Change Outreach and Education
Climate Change Educates general audiences about climate change http://www.epa.gov/climatechange/science and impacts, GHG emissions, and mitigationactions.
Climate Change, Wildlife, and Contains materials for educating the public about how http://epa.gov/climatechange/wycd/ORWWildlands Toolkit for Teachers climate change is affecting U.S. wildlife and public Kit.htmland Interpretors lands. Produced in partnership with NPS and the U.S.
Fish and Wildlife Service.
Sea Level Rise Reports Provides an extended abstract on which EPA sea level http://epa.gov/climatechange/effects/coastal/rise reports produced over the past 25 years contain slrreports.htmlrelevant information on particular issues and what toread first.
Harvard Green Campus Initiative Presents an on-line manual designed to help colleges http://www.greencampus.harvard.edu/and universities initiate student internship programs greenteamsaimed at improving energy efficiency and reducingGHG emissions.
Climate Change Kids Site Explains global warming and climate science and http://epa.gov/climatechange/kids/index.htmlincludes interactive games about climate change.
Global Warming Wheel Card Helps students link their own energy use to http://epa.gov/climatechange/downloads/Classroom Activity Kit global warming. ActivityKit.pdf
NATIONAL AERONAUTICS AND SPACE ADMINISTRATION
Climate Change Outreach and Education
NASA Education Links and Offers brochures, fact sheets, and lithographs http://disc.gsfc.nasa.gov/education_Publications explaining climate change science. links.shtml
http://eospso.gsfc.nasa.gov/eos_homepage/for_educators/educational_publications.php
Students’ Cloud Observations Provides information on climate change in http://asd-www.larc.nasa.gov/SCOOL/On-line Project the context of the effects of clouds on climate.
The GLOBE Program Offers participants in the GLOBE Program, grades http://www.globe.gov/K-12, an interactive science and educationlearning experience.

122 U.S. CLIMATE ACTION REPORT—2006122 U.S. CLIMATE ACTION REPORT—2006
Resource Description Website
Climate Change Outreach and Education (continued)
Earth Science Frequently Provides answers to frequently asked questions http://gcmd.nasa.gov/Resources/FAQs/Asked Questions about global environmental change. faqpage.html
State of the Cryosphere Provides educational material on the status of snow http://nsidc.org/sotc/and ice as indicators of climate change.
Earth Explorers Series Encourages educators to use NASA-unique resources http://science.hq.nasa.gov/education/earth_in Earth system and climate research. explorers/index.html
Earth System Science Fellowship Supports individuals pursuing master's or Ph.D. http://research.hq.nasa.gov/code_y/nra/Program degrees in Earth system science, climate change, current/Fellowship-ESS01/
and related research.
Earth Science Education Plan Characterizes the overriding principles, objectives, http://science.hq.nasa.gov/research/epo.htmand plan for ensuring the successful results of Earthscience communication efforts.
Resource and Information Centers
Earth System Science Learning Lists on-line resources for a wide-ranging suite http://science.hq.nasa.gov/education/catalog/Resources of Earth system science education products. resources/resources_index.html
Global Change Master Directory Contains data and information about global http://gcmd.nasa.gov/Resources/Learning/Learning Center environmental change.
Goddard Institute for Space Offers information about the scientific results of http://www.giss.nasa.gov/Studies climate modeling, as well as educational opportunities.
Earth Observatory Publishes satellite imagery and scientific information http://www.earthobservatory.nasa.gov/focusing on the Earth’s climate and environmentalchange.
Earth Observatory Newsroom Features the latest news on Earth science research http://www.earthobservatory.nasa.gov/released from all NASA centers and more than 80 Newsroomuniversities participating in NASA's Earth programs.
New Investigator Program in Earth Encourages climate research at the early stages of http://www.nasa.gov/audience/foreducators/Science the professional careers of scientists and engineers. postsecondary/features/F_New_Investigator_
Program.html
Climate Change Products
Scientific Visualization Studio Presents numerous data visualizations relating to http://svs.gsfc.nasa.gov/changes in the Earth’s climate, including theConceptual Imaging Lab’s animations of Earth’scomplex processes.
Global Change Master Directory Points users to information about climate change http://gcmd.nasa.gov/data and services.
Daily Earth Temperatures from Contains information on global atmospheric http://pm-esip.nsstc.nasa.gov/amsutemps/Satellites temperature trends.
Goddard TV Presents video news releases and educational videos http://www.gsfc.nasa.gov/gtv.htmlthat include data visualizations, conceptual animations,and interviews with expert scientists on the subject ofclimate change.
Assessments of Impacts and Facilitates access to extensive data, software, and http://sedac.ciesin.columbia.edu/aiacc/Adaptations to Climate Change bibliographic resources related to climate impacts,
adaptation, and vulnerability across multiple sectors.
TABLE 9-1 (Continued) Governmental On-line Climate Change Educational Resources

CHAPTER 9—EDUCATION, TRAINING, AND OUTREACH 123CHAPTER 9—EDUCATION, TRAINING, AND OUTREACH 123
Resource Description Website
U.S. DEPARTMENT OF COMMERCE/NATIONAL OCEANIC AND ATMOSPHERIC ADMINISTRATION
Resources for Educators and Students
NOAA’s Education Resources Helps students, teachers, librarians and the general http://www.education.noaa.gov/public access the NOAA’s educational activities,publications, and booklets.
Climate Change and Our Planet: Lists NOAA’s sites related to climate change tailored http://www.education.noaa.gov/sSpecially for Kids for kids in grades K-5. climate.html
Climate Change and Our Planet: Lists NOAA’s sites related to climate change http://www.education.noaa.gov/tclimate.htmlSpecially for Teachers tailored for educators.
OGP Video Library Offers links to numerous videos on climate change. http://www.ogp.noaa.gov/streams/index.html
Resources for Researchers
A Paleo Perspective on Explains the importance of paleoclimate research http://www.ngdc.noaa.gov/paleo/globalGlobal Warming and its relation to global warming. warming/home.html
Climate Program Office Contains a variety of climate change topics, articles, http://www.climate.noaa.gov/and funding opportunities.
Climate and Global Change Provides information and application instructions for http://www.vsp.ucar.edu/cgc.htmlPostdoctoral Fellowship Program postdoctoral researchers seeking to be paired with
host scientists at U.S. institutions working on climatestudies.
Climate-Related Products and Services
Climate Portal Provides access to a variety of NOAA’s climate-related http://www.noaa.gov/climate.htmlproducts, services, and organizations.
National Climatic Data Center Provides access to an extensive database of http://www.ncdc.noaa.gov/weather-related information.
Climate Prediction Center Offers educational materials to help farmers, http://www.cpc.ncep.noaa.gov/products/Educational Materials businesses, and the public understand the role of the outreach/education.shtml
climate system and to better plan for extreme weatherevents related to climate variations. http://www.cpc.ncep.noaa.gov/products/
expert_assessment
NATIONAL SCIENCE FOUNDATION
NSF Special Reports
Arctic Climate Change Explores the complex factors that influence climate http://www.nsf.gov/news/special_reportschange, which require a multifaceted approach—from /arctic/index.jspships at sea to snowmobiles in Alaska—to studythe process.
Ecology of Infectious Diseases Discusses efforts to understand the underlying http://www.nsf.gov/news/special_reportsecological and biological mechanisms behind human- /ecoinf/index.jspinduced environmental changes and the emergenceand transmission of infectious diseases.
Autumn Weather Predicts Explores the major role of large-scale weather patterns http://www.nsf.gov/news/special_reportsWinter Snows in controlling seasonal weather, along with the /autumnwinter/index.jsp
conditions of these atmospheric oscillations, tosignificantly improve long-range weather predictions.
The (Environmental) Sensor Introduces the Sensor Revolution—the world's http://www.nsf.gov/news/special_reportsRevolution first electronic nervous system. /sensor/index.jsp
Seafloor Science Uncovers the mysteries of the ocean's most extreme http://www.nsf.gov/news/special_reportsenvironment—the seafloor. /sfs/index.jsp
TABLE 9-1 (Continued) Governmental On-line Climate Change Educational Resources

124 U.S. CLIMATE ACTION REPORT—2006124 U.S. CLIMATE ACTION REPORT—2006
TABLE 9-1 (Continued) Governmental On-line Climate Change Educational Resources
Resource Description Website
CLIMATE CHANGE SCIENCE PROGRAM
CCSP Provides information about the program and CCSP http://www.climatescience.gov/products and resources.
U.S. Global Change Research As mandated in the Global Change Research Act, http://www.gcrio.org/Information Office (GCRIO) GCRIO is responsible for the physical and electronic
dissemination of information resulting from the U.S.climate program.
SMITHSONIAN INSTITUTION
Climate-Related Outreach and Education
Global Warming: Focus on This web version of an exhibit that toured the U.S. http://globalwarming.enviroweb.org/the Future encourages visitors to learn about the history of global
warming, examines why it is a problem, and empowersthem to help solve the problem.
Forces of Change Examines the connections among the physical, http://forces.si.edu/biological, and cultural forces that shape the world.
Arctic Studies Center Explores the history of northern peoples, cultures, http://www.mnh2.si.edu/arctic/and environments and such critical issues asclimate change.
Resources for Researchers
Deltas-Global Change Program Describes the research that drives this http://www.nmnh.si.edu/paleo/deltas/multidisciplinary, multinational program.
Migratory Bird Center Explores how climate change affects birds’ http://nationalzoo.si.edu/ConservationAndmigratory patterns. Science/MigratoryBirds/research/climate
_change/default.cfm#ContentArea

Appendix AEmission TrendsAppendix AEmission Trends

126 U.S. CLIMATE ACTION REPORT—126 U.S. CLIMATE ACTION REPORT—2006

APPENDIX A — EMISSION TRENDS 127APPENDIX A — EMISSION TRENDS 127

128 U.S. CLIMATE ACTION REPORT—128 U.S. CLIMATE ACTION REPORT—2006

APPENDIX A — EMISSION TRENDS 129APPENDIX A — EMISSION TRENDS 129

130 U.S. CLIMATE ACTION REPORT—130 U.S. CLIMATE ACTION REPORT—2006

APPENDIX A — EMISSION TRENDS 131APPENDIX A — EMISSION TRENDS 131

132 U.S. CLIMATE ACTION REPORT—132 U.S. CLIMATE ACTION REPORT—2006

APPENDIX A — EMISSION TRENDS 133APPENDIX A — EMISSION TRENDS 133

134 U.S. CLIMATE ACTION REPORT—134 U.S. CLIMATE ACTION REPORT—2006

APPENDIX A — EMISSION TRENDS 135APPENDIX A — EMISSION TRENDS 135

136 U.S. CLIMATE ACTION REPORT—136 U.S. CLIMATE ACTION REPORT—2006

Appendix B
BibliographyAppendix B
Bibliography
AC and IASC 2004—Arctic Council and the International Arctic Science Committee.Impacts of a Warming Arctic: Arctic Climate Impact Assessment. ACIA Overview Report.New York, NY: Cambridge University Press, 2004. <http://www.acia.uaf.edu/>
Barker et al. 2003—Barker, C.M.,W.K. Reisen, and V.L. Kramer. “California State Mos-quito-Borne Virus Surveillance and Response Plan: A Retrospective Evaluation UsingConditional Simulations.”American Journal of Tropical Medicine and Hygiene68(5):508-18. <http://www.ajtmh.org/cgi/content/abstract/68/5/508>
Brown et al. 2003—Brown, T.J., A. Barnston, J.O. Roads, R. Martin, and K.E.Wolter.“2003 Seasonal Consensus Climate Forecasts for Wildland Fire Management.”Experi-mental Long-Lead Forecasts Bulletin 12(1). <www.cefa.dri.edu/Publications/cefare-port03-01.pdf>
CCSP 2002—U.S. Climate Change Science Program. Strategic Plan for the ClimateChange Science Program: Review Draft.Washington, DC: CCSP, November 2002. Up-dated October 11, 2003.<http://www.climatescience.gov/Library/stratplan2003/draft/toc.htm>
CCSP 2005—U.S. Climate Change Science Program.Climate Science in Support of De-cision Making: Workshop Report. November 14-16, 2005, Arlington, VA. Updated June20, 2006. <http://www.climatescience.gov/workshop2005/default.htm>
CCSP and SGCR 2003a—U.S. Climate Change Science Program and Subcommittee onGlobal Change Research. Strategic Plan for the U.S. Climate Change Science Program: AReport by the Climate Change Science Program and the Subcommittee on Global ChangeResearch.Washington, DC: July 2003. Updated May 19, 2004. < http://www.climate-science.gov/Library/stratplan2003/final/default.htm>
CCSP and SGCR 2003b—U.S. Climate Change Science Program and Subcommittee onGlobal Change Research. The U.S. Climate Change Science Program: Vision for the Pro-gram and Highlights of the Scientific Strategic Plan.Washington, DC: July 24, 2003.Updated April 20, 2004. <http://www.climatescience.gov/Library/stratplan2003/vision/default.htm>
CCSP and SGCR 2006a—U.S. Climate Change Science Program and Subcommittee onGlobal Change Research.Our Changing Planet: The U.S. Climate Change Science Pro-gram for Fiscal Year 2007. A Supplement to the President’s Budget for Fiscal Year 2007.Posted December 15, 2006. <http://www.climatescience.gov/>

138 U.S. CLIMATE ACTION REPORT—138 U.S. CLIMATE ACTION REPORT—2006
CCSP and SGCR 2006b—U.S. Climate Change Science Program and Subcommittee on Global Change Research. Temperature Trendsin the Lower Atmosphere: Steps for Understanding and Reconciling Differences. Synthesis and Assessment Product 1.1. Ed. T.R. Karl, S.J.Hassol, C.D.Miller, andW.L. Murray.Washington, DC: April 2006. <http://www.climatescience.gov/Library/sap/sap1-1/finalreport/default.htm>
CCTP 2003—U.S. Climate Change Technology Program. Research and Current Activities. DOE/PI-0001.Washington, DC: U.S. De-partment of Energy, November 2003. <http://www.climatetechnology.gov/library/2003/currentactivities/index.htm>
CCTP 2005a—U.S. Climate Change Technology Program. Technology Options for the Near and Long Term. August 2005.<http://www.climatetechnology.gov/library/2005/tech-options/tor2005-51-56.pdf>
CCTP 2005b—U.S. Climate Change Technology Program.Vision and Framework for Strategy and Planning. DOE/PI-0003.Washing-ton, DC: U.S. Department of Energy, August 2005. <http://www.climatetechnology.gov/vision2005/index.htm>
CCTP 2006—U.S. Climate Change Technology Program.U.S. Climate Change Technology Program: Strategic Plan. DOE/PI-0005.Washington, DC: September 2006. <http://www.climatetechnology.gov/stratplan/final/index.htm>
CEA 2006—Council of Economic Advisors. Economic Report of the President.Washington, DC: U.S. Government Printing Office.<http://www.whitehouse.gov/cea/erp06.pdf>
CEPA 2006—California Environmental Protection Agency.Climate Action Team Report to Governor Swarzenegger and the Legislature.Sacramento, CA: March 2006. <http://www.climatechange.ca.gov/climate_action_team/reports/index.html>
CTIC 2004—Conservation Technology Information Center.National Crop Residue Management Survey 2004. “Conservation Tillageand Other Tillage Types in the United States: 1990–2004.” <http://www.conservationinformation.org/index.asp?site=1&action=crm_results>
Franco and Sanstad 2006—Franco, G., and A. Sanstad.Climate Change and Electricity Demand in California. Final white paper. CEC-500-2005-201-SF. Berkeley, CA: California Climate Change Center, February 2006. <www.energy.ca.gov/2005publications/CEC-500-2005-201/CEC-500-2005-201-SF.PDF>
GEO 2005—Group on Earth Observations. The Global Earth Observation System of Systems (GEOSS) 10-Year Implementation Plan.February 2005. <earthobservations.org/docs/ 10-Year%20Implementation%20Plan.pdf>
Goklany 1995—Goklany, I.M. “Strategies to Enhance Adaptability: Technological Change, Sustainable Growth and Free Trade.”Cli-matic Change 30(4):427-49. <www.springerlink.com/index/XXU1188X5KK852U6.pdf>
Goklany 1998—Goklany, I.M. “Saving Habitat and Conserving Biodiversity on a Crowded Planet.” BioScience 48:941-53.<http://members.cox.net/igoklany/Golany%201995%20Climatic%20Change.pdf>
Goklany 2007—Goklany, I.M. “Integrated Strategies to Reduce Vulnerability and Advance Adaptation, Mitigation, and SustainableDevelopment.”Mitigation and Adaptation Strategies for Global Change (in press). <www.hm-treasury.gov.uk/media/26C/23/Goklany-Integrating_A&M_preprint.pdf>
Groisman et al. 2004—Groisman, P.Y., R.W. Knight, T.R. Karl, D.R. Easterling, B. Sun, and J.H. Lawrimore. “Contemporary Changesof the Hydrological Cycle over the Contiguous United States: Trends Derived from In Situ Observations.” Journal of Hydrometeorology5(1):64-85. <http://ams.allenpress.com/perlserv/?request=get-archive&issn=1525-7541&volume=5>
Hadley et al. 2006—Hadley, S.W., D.J. Erickson III, J.L. Hernandez, C.T. Broniak, and T.J. Blasing. “Responses of Energy Use toClimate Change: A Climate Modeling Study.”Geophysical Research Letters 33, L17703, doi:10.1029/2006GL026652.<http://www.agu.org/pubs/crossref/2006/2006GL026652.shtml>

Hess et al. 2004—Hess, K.W., S.A.White, J. Sellars, E.A. Spargo, A.Wong, S.K. Gill, and C. Zervas.North Carolina Sea Level Rise Proj-ect: Interim Technical Report. NOAA Technical Memorandum NOS CS 5. Silver Spring, MD: National Oceanic and Atmospheric Ad-ministration, National Ocean Service, Coast Survey Development Laboratory, September 2004.
Hodgkins et al. 2003—Hodgkins, G.A., R.W. Dudley, and T.G. Huntington. “Changes in the Timing of High River Flows in New Eng-land over the 20th Century. Journal of Hydrology 278(1-4):244-52. <water.usgs.gov/osw/Hodgkins.et.al.Q-Timing.pdf>
Hoerling and Kumar 2003—Hoerling, M., and A. Kumar. “The Perfect Ocean for Drought.” Science 299(5607):691-94. <www.sciencemag.org/cgi/content/full/299/5607/691>
Hofmann 2004—Hofmann, David. Long-lived Greenhouse Gas Annual Averages for 1979–2004. Boulder, CO: National Oceanic andAtmospheric Administration, Earth Systems Research Laboratory, Global Monitoring Division. <http://www.blackwellsynergy.com/doi/ abs/10.1111/j.1600-0889.2006.00201.x>
Höppe and Pielke 2006—Höppe, P., and R. Pielke, Jr., eds.Workshop on Climate Change and Disaster Losses: Understanding and At-tributing Trends and Projections. Hohenkammer, Germany: May 25-26, 2006. <http://sciencepolicy.colorado.edu/sparc/research/projects/extreme_events/munich_workshop/index.htm>
Hoyos et al. 2006—Hoyos, C.D., P. Agudelo, P.Webster, and J. Curry. “Deconvolution of the Factors Leading to the Increase in GlobalHurricane Intensity.” Science 312(94). <www.sciencemag.org/cgi/content/abstract/1123560v1>
IPCC 1996a—Intergovernmental Panel on Climate Change.Climate Change 1995: The Science of Climate Change. Contribution ofWorking Group I to the Second Assessment of the Intergovernmental Panel on Climate Change. Ed. J.T. Houghton, L.G. Meira Filho, B.A.Callender, N. Harris, A. Kattenberg, and K.Maskell. Cambridge, UK: Cambridge University Press. <www.ipcc.ch/pub/reports.htm>
IPCC 1996b—Intergovernmental Panel on Climate Change. IPCC Second Assessment—Climate Change 1995. A Report of the Inter-governmental Panel on Climate Change. Geneva, Switzerland: United Nations Environment Programme,World Meteorological Or-ganization, IPCC. <http://www.ipcc.ch/pub/sa(E).pdf>
IPCC 2000—Intergovernmental Panel on Climate Change.Good Practice Guidance and Uncertainty Management in National Green-house Gas Inventories. IPCCXVI/Doc. 10 (1.IV.2000). Montreal, Canada: IPCC, National Greenhouse Gas Inventories Programme,May 2000. <www.ipcc-nggip.iges.or.jp/public/gp/english/>
IPCC 2001a—Intergovernmental Panel on Climate Change.Climate Change 2001: The Scientific Basis. Contribution of WorkingGroup I to the Third Assessment Report of the Intergovernmental Panel on Climate Change. Ed. J.T. Houghton, Y. Ding, D.J. Griggs,M. Noguer, P.J. van der Linden, X. Dai, K. Maskell, and C.A. Johnson. Cambridge, England, and New York, NY: Cambridge UniversityPress. <http://www.grida.no/climate/ipcc_tar/>
IPCC 2001b—Intergovernmental Panel on Climate Change.Climate Change 2001: Impacts, Adaptation, and Vulnerability. Contribu-tion of Working Group II to the Third Assessment Report of the Intergovernmental Panel on Climate Change. Ed. J.J. McCarthy, O.F.Canziani, N.A. Leary, D.J. Dokken, and K.S.White. Cambridge, England, and New York, NY: Cambridge University Press.<www.grida.no/climate/ipcc_tar/wg2/index.htm>
IPCC 2003—Intergovernmental Panel on Climate Change, National Greenhouse Gas Inventories Programme.Good Practice Guidancefor Land Use, Land-Use Change, and Forestry. Ed. J. Penman et al. Kanagawa, Japan: Institute for Global Environmental Strategies,2003. Accessed August 13, 2004. <http://www.ipcc-nggip.iges.or.jp/public/gpglulucf/gpglulucf.htm>
IPCC/UNEP/OECD/IEA 1997—Intergovernmental Panel on Climate Change, United Nations Environment Programme, Organisa-tion for Economic Co-operation and Development, International Energy Agency. Revised 1996 IPCC Guidelines for National Green-house Gas Inventories. Paris, France. <http://www.ipcc-nggip.iges.or.jp/public/gl/invs1.htm>
APPENDIX B — BIBLIOGRAPHY 139APPENDIX B — BIBLIOGRAPHY 139

IWGEO and NSTC/CENR 2005—InteragencyWorking Group on Earth Observations and National Science and Technology Council,Committee on Environment and Natural Resources. Strategic Plan for the U.S. Integrated Earth Observation System.Washington, DC.<usgeo.gov/docs/EOCStrategic_Plan.pdf>
Kossin et al. 2007—Kossin, J.P., K.R. Knapp, D.J. Vimont, R.J. Murnane, and B.A. Harper. “A Globally Consistent Reanalysis of Hurri-cane Variability and Trends.”Geophysical Research Letters 34, L04815, doi:10.1029/2006GL028836. <http://www.agu.org/pubs/cross-ref/2007/2006GL028836.shtml>
Landsea et al. 2006—Landsea, C.W., B.A. Harper, K. Hoarau, and J.A. Knaff. “CanWe Detect Trends in Extreme Tropical Cyclones?”Science 313(5786):452-54. <www.sciencemag.org/cgi/content/full/313/5786/452>
Lubowski et al. 2006—Lubowski, R.N,M.Vesterby, S. Bucholtz, A. Baez, and M.J. Roberts.Major Uses of Land in the United States,2002. Economic Information Bulletin No. EIB-14.Washington, DC: U.S. Department of Agriculture, Economic Research Service, May2006. <http://www.ers.usda.gov/publications/EIB14/>
Lucier et al. 2006—A. Lucier,M. Palmer, H.Mooney, K. Nadelhoffer, D. Ojima, and F. Chavez. Ecosystems and Climate Change: ResearchPriorities for the U.S. Climate Change Science Program. Recommendations from the Scientific Community. Report on an EcosystemsWork-shop, prepared for the Ecosystems InteragencyWorking Group. Special Series No. SS-92-06. Solomons Island,MD: University of Mary-land Center for Environmental Science, Chesapeake Biological Laboratory. <http://www.usgcrp.gov/usgcrp/Library/ecosystems/>
Marland et al. 2005—Marland, G., T.A. Boden, and R.J. Andres. “Global, Regional, and National CO2 Emissions.” In Trends: ACompendium of Data on Global Change. Oak Ridge, TN: U.S. Department of Energy, Oak Ridge National Laboratory, Carbon DioxideInformation Analysis Center. <http://cdiac.ornl.gov/trends/emis/em_cont.htm>
McCarty 2001—McCarty, J.P. “Ecological Consequences of Recent Climate Change.”Conservation Biology 15(2): 320-31.<http://oaspub.epa.gov/eims/xmlreport.display?deid=20426&z_chk=829&format=print>
Mills 2005—Mills, E. “Insurance in a Climate of Change.” Science 309(5737):1040-44, doi:10.1126/science.1112121, LBNL-57943.<http://www.sciencemag.org/cgi/content/full/309/5737/1040>
Mote 2003—Mote, P.W. “Trends in SnowWater Equivalent in the Pacific Northwest and Their Climatic Causes.”Geophysical ResearchLetters 30(12):1601, doi:10.1029/2003GL017258. <http:// www.agu.org/pubs/crossref/2003/2003GL017258.shtml>
Mote et al. 2005—Mote, P.W., A.F. Hamlet, M.P. Clark, and D.P. Lettenmaier. “Declining Mountain Snowpack inWestern NorthAmerica.”Bulletin of the American Meteorological Society 86(1):39-49. <http://ams.allenpress.com/perlserv/?request=get-abstract&doi=10.1175%2FBAMS-86-1-39>
NAST 2000—National Assessment Synthesis Team.Climate Change Impacts on the United States: The Potential Consequences of Cli-mate Variability and Change. Report for the U.S. Global Change Research Program. Cambridge, England: Cambridge University Press.<http://www.usgcrp.gov/usgcrp/Library/nationalassessment/overview.htm>
NEG/ECP 2001—Conference of New England Governors and Eastern Canadian Premiers.Climate Change Action Plan 2001. Pre-pared by the Committee on the Environment and the Northeast International Committee on Energy of the Conference of New Eng-land Governors and Eastern Canadian Premiers. August 28, 2001. <www.negc.org/documents/NEG-ECP%20CCAP.PDF>
NRC 2001—National Research Council.Climate Change Science: An Analysis of Some Key Questions.Washington, DC: National Acad-emy Press. <http://books.nap.edu/openbook.php?isbn=0309075742>
NRC 2004—National Research Council. Implementing Climate and Global Change Research: A Review of the Final U.S. ClimateChange Science Program Strategic Plan.Washington, DC: The National Academies Press. <http://www.nap.edu>
140 U.S. CLIMATE ACTION REPORT—140 U.S. CLIMATE ACTION REPORT—2006

OMB 2006—Office of Management and Budget. Fiscal Year 2007 Report to Congress on Federal Climate Change Expenditures.Wash-ington, DC: April 2006. <http://www.whitehouse.gov/omb/legislative/fy07_climate_change.pdf>
Parmesan and Yohe 2003—Parmesan, C., and G. Yohe. “A Globally Coherent Fingerprint of Climate Impacts Across Natural Systems.”Nature 421:37-42, doi:1038/nature01286. <http://www.nature.com/nature/journal/v421/n6918/abs/nature01286.html>
Patz et al. 2000—Patz, J.A., M.A. McGeehin, S.M. Bernard, K.L. Ebi, P.R. Epstein, A. Grambsch, D.J. Gubler, P. Reiter, I. Romieu, J.B.Rose, J.M. Samet, and J. Trtanj. “Potential Consequences of Climate Variability and Change for Human Health in the United States.” InClimate Change Impacts on the United States: The Potential Consequences of Climate Variability and Change. Report for the U.S. GlobalChange Research Program. Ed. National Assessment Synthesis Team. Cambridge, England: Cambridge University Press, pp. 437–58.<http://www.usgcrp.gov/usgcrp/Library/nationalassessment/overview.htm>
Peart et al. 1995—Peart, R.M., R.B. Curry, C. Rosenzweig, J.W. Jones, K.J. Boote, and L.H. Allen, Jr. “Energy and Irrigation in SouthEastern U.S. Agriculture Under Climate Change.” Journal of Biogeography 22(4/5):635-42, doi:10.2307/2845964.<http://links.jstor.org/sici?sici=0305-0270(199507%2F09)22%3A4%2F5%3C635%3AEAIISE%3E2.0.CO%3B2-9>
Pulwarty et al. 2005—Pulwarty, R.S., K.L. Jacobs, and R.M. Dole. “The Hardest Working River: Drought and Critical Water Problemsin the Colorado River Basin.” In Drought and Water Crises: Science, Technology, and Management Issues. Ed. D.A.Wilhite. CRC Press.<http://www.cdc.noaa.gov/pubs/2005/>
Reinbold et al. 2004—Reinbold, H.J., J.O. Roads, and T.J. Brown. “Evaluation of ECPC's Fire Danger Forecasts Using RAWS Observa-tions.” International Journal of Wildland Fire 14:19-36. <www.publish.csiro.au/?act=view_file&file_id=WF03052.pdf>
Roads et al. 2005—Roads, J., F. Fujioka, S. Chen, and R. Burgan. “Seasonal Fire Danger Forecasts for the US.” International Journal ofWildland Fire 14(1). <ecpc.ucsd.edu/ncepfd/roadsetal2005.pdf>
Rose et al. 2001—Rose, J.B., P.R. Epstein, E.K. Lipp, B.H. Sherman, S.M. Bernard, and J.A. Patz. “Climate Variability and Change in theUnited States: Potential Impacts onWater- and Foodborne Diseases Caused by Microbiologic Agents.”Environmental Health Perspec-tives 109(suppl 2):211–21. <www.pubmedcentral.nih.gov/articlerender.fcgi?artid=1240668>
Rosenzweig et al. 2007—Rosenzweig, C., D.C. Major, K. Demong, R. Horton, C. Stanton, and M. Stults. “Managing Climate ChangeRisks in New York City’s Water System: Assessment and Adaptation Planning.”Mitigation and Adaptation Strategies for Global Change.In press.
Scheffer et al. 2001—Scheffer, M., S. Carpenter, J.A. Foley, C. Folke, and B.Walker. “Catastrophic Shifts in Ecosystems.”Nature413:591-96, doi:10.1038/35098000. <http://www.nature.com/nature/journal/v413/n6856/abs/413591a0.html>
Scott et al. 2005—Scott, M.J., J.A. Dirks, and K.A. Cort. “The Adaptive Value of Energy Efficiency Programs in aWarmerWorld:Building Energy Efficiency Offsets Effects of Climate Change.” In Reducing Uncertainty Through Evaluation: Proceedings of the 2005International Energy Program Evaluation Conference. PNNL-SA-45118. Brooklyn, NY: August 17-19, 2005.<http://www.iepec.org/IEPECHome.htm?programsabstracts.htm>
Smith et al. 2004—Smith,W.B., P.D. Miles, J.S. Vissage, and S.A. Pugh. Forest Resources of the United States, 2002. Gen. Tech. Rep. NC-241. St. Paul, MN: U.S. Department of Agriculture, Forest Service, North Central Research Station, April 2004.<http://ncrs2.fs.fed.us/4801/fiadb/rpa_tabler/gtr_nc241.pdf>
Stone et al. 2002—Stone, R.S., E.G. Dutton, J.M. Harris, and D. Longnecker. “Earlier Spring Snowmelt in Northern Alaska as an Indi-cator of Climate Change.” Journal of Geophysical Research 107(D10):4089, doi:10.1029/2000JD000286.<http://www.agu.org/pubs/crossref/2002/2000JD000286.shtml>
APPENDIX B — BIBLIOGRAPHY 141APPENDIX B — BIBLIOGRAPHY 141

Tompkins and Adger 2004—Tompkins, E.L., andW.N. Adger. “Does Adaptive Management of Natural Resources Enhance Resilienceto Climate Change?”Ecology and Society 9 (2):10. <http://www.ecologyandsociety.org/vol9/iss2/art10/>
Triggs et al. 2004—Triggs, J.M., B.A. Kimball, P.J. Pinter, Jr., G.W.Wall, M.M. Conley, T.J. Brooks, R.L. LaMorte, N.R. Adam,M.J.Ottman, A.D.Matthias, S.W. Leavitt, and R.S. Cerveny. “Free-Air CO2 Enrichment Effects on the Energy Balance and Evapotranspira-tion of Sorghum.”Agricultural and Forest Meteorology 124(2):63-79.
Turner et al. 2003—Turner, B.L.I., R.E. Kasperson, P.A. Matson, J.J. McCarthy, R.W. Corell, L. Christensen, N. Eckley, J.X. Kasperson,A. Luers, M.L. Martello, C. Polsky, A. Pulsipher, and A. Schiller. “A Framework for Vulnerability Analysis in Sustainability Science.”Proceedings of the National Academy of Sciences 100(14):8074-79. <yaquivalley.stanford.edu/pdf/turner_matson_2003.pdf>
UNFCCC 2003—United Nations Framework Convention on Climate Change.National Communications: Greenhouse Gas Inventoriesfrom Parties Included in Annex I to the Convention, UNFCCC Guidelines on Reporting and Review. Conference of the Parties, EighthSession. FCCC/CP/2002/8. New Delhi, India: March 28, 2003. <http://unfccc.int/resource/docs/cop8/08.pdf>
U.S. DOC/BEA 2006a—U.S. Department of Commerce, Bureau of Economic Analysis.Current-Dollar and "Real" Gross DomesticProduct.Washington, DC. Updated June 29, 2006. Accessed June 30, 2006. <http://www.bea.gov/bea/dn/gdplev.xls>
U.S. DOC/BEA 2006b—U.S. Department of Commerce, Bureau of Economic Analysis. Industry Economic Accounts, Gross-Domestic-Product-by-Industry Accounts, “Value Added by Industry as a Percentage of Gross Domestic Product.” <http://www.bea.gov/bea/industry/gpotables/gpo_action.cfm>
U.S. DOC/Census 1999—U.S. Department of Commerce, Bureau of the Census, Housing and Household Economic StatisticsDivision. American Housing Survey for the United States: 1997. Current Housing Reports, Series H-150-97.<http://www.census.gov/hhes/www/housing/ahs/nationaldata.html>
U.S. DOC/Census 2004—U.S. Department of Commerce, Bureau of the Census, Housing and Household Economic Statistics Divi-sion. American Housing Survey for the United States: 2003. Current Housing Reports, Series H-150-03. <http://www.census.gov/hhes/www/housing/ahs/nationaldata.html>
U.S. DOC/Census 2005—U.S. Department of Commerce, Bureau of the Census. U.S. Census Bureau International Database (IDB).Updated April 26, 2005. Accessed August 15, 2005. <http://www.census.gov/ipc/www/idbnew.html>
U.S. DOC/Census 2006a—U.S. Department of Commerce, Bureau of the Census, Population Division. Population Estimates.Table 1: Annual Estimates of the Population for the United States and States, and for Puerto Rico: April 1, 2000, to July 1, 2005.<http://www.census.gov/popest/states/tables/NST-EST2005-01.xls>
U.S. DOC/Census 2006b—U.S. Department of Commerce, Bureau of the Census, Population Division. Population Estimates. Table 4:Cumulative Estimates of the Components of Population Change for the United States and States: April 1, 2000, to July 1, 2005.<http://www.census.gov/popest/states/tables/NST-EST2005-04.xls>
U.S. DOC/Census 2006c—U.S. Department of Commerce, Bureau of the Census. Statistical Abstract of the United States: 2006. 125thedition. Tables No. 17 and 26.Washington, DC: U.S. Government Printing Office. <http://www.census.gov/prod/2005pubs/06statab/pop.pdf>
U.S. DOC/NOAA 2001—U.S. Department of Commerce, National Oceanic and Atmospheric Administration. The United States De-tailed National Report on Systematic Observations for Climate: United States Global Climate Observing System Program. Submitted tothe Conference of the Parties to the United Nations Framework Convention on Climate Change. Silver Spring, MD: 2001.<http://www.ncdc.noaa.gov/oa/usgcos/documents/soc_long.pdf>
142 U.S. CLIMATE ACTION REPORT—142 U.S. CLIMATE ACTION REPORT—2006

U.S. DOC/NOAA 2004—U.S. Department of Commerce, National Oceanic and Atmospheric Administration. Population TrendsAlong the Coastal United States: 1980-2008. Silver Spring, MD: September 2004. <http://www.oceanservice.noaa.gov/programs/mb/supp_cstl_population.html>
U.S. DOE 2006a—U.S. Department of Energy, Energy Efficiency and Renewable Energy, Federal Energy Management Program. An-nual Report to Congress on Federal Government Energy Management and Conservation Programs: Fiscal Year 2004.Washington, DC.<http://www1.eere.energy.gov/femp/pdfs/annrep04.pdf>
U.S. DOE 2006b—U.S. Department of Energy. Report on Federal Agency Activities Under Executive Order 13123, Efficient Energy Man-agement: Fiscal Year 2004.Washington, DC.
U.S.DOE/EIA 2003—U.S. Department of Energy, Energy Information Administration. 2003 Commercial Buildings Energy Consump-tion Survey—Overview of Commercial Buildings Characteristics. <http://www.eia.doe.gov/emeu/cbecs/cbecs2003/introduction.html>
U.S. DOE/EIA 2004a—U.S. Department of Energy, Energy Information Administration.Monthly Energy Review July 2004 and un-published Supplemental Tables on Petroleum Product detail. DOE/EIA-0035(2004/07).Washington, DC. <http://tonto.eia.doe.gov/FTPROOT/monthlyhistory.htm>
U.S. DOE/EIA 2004b—U.S. Department of Energy, Energy Information Administration.U.S. Forward-Cost Uranium Reserves byState, December 31, 2003. <http://www.eia.doe.gov/cneaf/nuclear/page/reserves/ures.html>
U.S. DOE/EIA 2005a—U.S. Department of Energy, Energy Information Administration. 2005 Domestic Uranium Production Report.<http://www.eia.doe.gov/fuelnuclear.html>
U.S. DOE/EIA 2005b—U.S. Department of Energy, Energy Information Administration. Annual Energy Outlook 2005.Washington,DC: February 2005. <http://www.eia.doe.gov/oiaf/archive/aeo05/pdf/0383(2005).pdf>
U.S. DOE/EIA 2005c—U.S. Department of Energy, Energy Information Administration. Electric Power Annual.Washington, DC.<http://www.eia.doe.gov/cneaf/electricity/epa/epates.html>
U.S.DOE/EIA 2005d—U.S. Department of Energy, Energy Information Administration. Emissions of Greenhouse Gases in the UnitedStates 2004. DOE/EIA-0573(2004).Washington, DC: U.S. DOE, December 2005. <http://www.eia.doe.gov/oiaf/1605/gg05rpt/index.html>
U.S. DOE/EIA 2005e—U.S. Department of Energy, Energy Information Administration. Petroleum Supply Annual 2004, Volume 1.Washington, DC. <http://www.eia.doe.gov/pub/oil_gas/petroleum/data_publications/petroleum_supply_annual/ psa_volume1/historical/2004/psa_volume1_2004.html>
U.S. DOE/EIA 2006a—U.S. Department of Energy, Energy Information Administration. Annual Energy Outlook 2006 With Projectionsto 2036. DOE/EIA-0383(2006).Washington, DC: February 2006. <http://www.eia.doe.gov/oiaf/aeo/pdf/0383(2006).pdf>
U.S. DOE/EIA 2006b—U.S. Department of Energy, Energy Information Administration. Annual Energy Review 2005.Washington,DC. <http://www.eia.doe.gov/emeu/aer/contents.html>
U.S. DOE/EIA 2006c—U.S. Department of Energy, Energy Information Administration. EIA-819 Monthly Oxygenate Report, Histori-cal. Various reports. <http://www.eia.doe.gov/oil_gas/petroleum/data_publications/monthly_oxygenate_telephone_report/motr_historical.html>
U.S. DOE/EIA 2006d—U.S. Department of Energy, Energy Information Administration. International Energy Annual 2004. TableH.1gco2. Posted July 21, 2006. <http://www.eia.doe.gov/pub/international/iealf/tableh1gco2.xls>
APPENDIX B — BIBLIOGRAPHY 143APPENDIX B — BIBLIOGRAPHY 143
U.S. DOE/EIA 2006e—U.S. Department of Energy, Energy Information Administration.Monthly Energy Review.Washington, DC:July 2006. <http://www.eia.doe.gov/emeu/mer/contents.html>
U.S. DOE/EIA 2006f—U.S. Department of Energy, Energy Information Administration.Quarterly Coal Report: October–December2005. <http://www.eia.doe.gov/cneaf/coal/quarterly/qcr_sum.html>
U.S. DOE/EIA 2006g—U.S. Department of Energy, Energy Information Administration.U.S. Crude Oil, Natural Gas, and NaturalGas Liquids Reserves 2005 Annual Report. DOE/EIA-0216(2005).Washington, DC: November 2006. <http://www.eia.doe.gov/pub/oil_gas/natural_gas/data_publications/crude_oil_natural_gas_reserves/current/pdf/arr.pdf>
U.S. DOE/NERAC and GIF 2003—U.S. Department of Energy, Nuclear Energy Research Advisory Committee, and Generation IVInternational Forum. A Technology Roadmap for the Generation IV Nuclear Energy Systems. CD-ROMDecember 2002. Washington,DC. <http://gif.inel.gov/roadmap/>
U.S. DOS 2002—U.S. Department of State.U.S. Climate Action Report 2002: Third National Communication of the United States ofAmerica Under the United Nations Framework Convention on Climate Change.Washington, DC: May 2002. <http://www.gcrio.org/CAR2002/>
U.S. DOT 2006a—U.S. Department of Transportation, Bureau of Transportation Statistics.National Transportation Statistics 2006.<http://www.bts.gov/publications/national_transportation_statistics/>
U.S. DOT 2006b—U.S. Department of Transportation, Center for Climate Change and Environmental Forecasting. Strategic Plan2006-2010.Washington, DC. <http://climate.volpe.dot.gov/plan/splan_2006.pdf>
U.S. EPA 2005—U.S. Environmental Protection Agency. Air Emissions Trends—Continued Progress Through 2004. Accessed August 18,2005. <http://www.epa.gov/ttn/chief/net/index.html>
U.S. EPA 2006a—U.S. Environmental Protection Agency.Clean Energy-Environment Guide to Action: Policies, Best Practices, and ActionSteps for States. EPA 430-F-06-006.Washington,DC: February 2006. <http://epa.gov/cleanenergy/pdf/gta/guide_action_full.pdf>
U.S. EPA 2006b—U.S. Environmental Protection Agency. SolidWaste Management and Greenhouse Gases: A Life-Cycle Assessment of Emis-sions and Sinks. EPA530-R-06-004.Washington,DC. <www.epa.gov/climatechange/wycd/waste/SWMGHGreport.html>
U.S. EPA/OAP 2002—U.S. Environmental Protection Agency, Office of Atmospheric Programs. Inventory of U.S. Greenhouse GasEmissions and Sinks: 1990-2000. EPA 430-R-02-003.Washington, DC: April 2002. <http://yosemite.epa.gov/OAR/globalwarming.nsf/content/ ResourceCenterPublicationsGHGEmissionsUSEmissionsInventory2002.html>
U.S. EPA/OAP 2006a—U.S. Environmental Protection Agency, Office of Atmospheric Programs. Excessive Heat Events Guidebook.EPA 430-B-06-005.Washington, DC: June 2006. <www.epa.gov/heatisland/about/pdf/EHEguide_final.pdf>
U.S. EPA/OAP 2006b—U.S. Environmental Protection Agency, Office of Atmospheric Programs.Global Anthropogenic Emissions ofNon-CO2 Greenhouse Gases 1990-2020.Washington, DC: June 2006. <http://www.epa.gov/nonco2/econ-inv/international.html>
U.S. EPA/OAP 2006c—U.S. Environmental Protection Agency, Office of Atmospheric Programs. Inventory of U.S. Greenhouse GasEmissions and Sinks: 1990–2004. EPA 430-R-06-002.Washington, DC: April 15, 2006. <http://www.epa.gov/climatechange/emissions/usinventoryreport.html>
U.S. EPA/OAR 2006—U.S. Environmental Protection Agency, Office of Air and Radiation. ENERGY STAR® and Other Climate Pro-tection Partnerships: 2005 Annual Report. EPA 430-R-06-014.Washington, DC: October 2006. <http://www.epa.gov/appdstar/pdf/CPPD2005complete.pdf>
144 U.S. CLIMATE ACTION REPORT—144 U.S. CLIMATE ACTION REPORT—2006

U.S. GAO 2005—U.S. Government Accountability Office.Climate Change: Federal Reports on Climate Change Funding Should BeClearer and More Complete. GAO-05-461.Washington, DC: August 25, 2005. <http://www.gao.gov/new.items/d05461.pdf>
WGA 2004—Western Governors’ Association.Creating a Drought Early Warning System for the 21st Century: The National IntegratedDrought Information System. Denver, CO:WGA, June 2004. <http:// www.westgov.org/wga/publicat/nidis.pdf>
Webster et al. 2005—Webster, P.J., G.J. Holland, J.A. Curry, and H.-R. Chang. “Changes in Tropical Cyclone Number, Duration, andIntensity in aWarming Environment.” Science 309(5742):1844-46. <http://www.sciencemag.org/cgi/content/full/sci;309/5742/1844>
Westerling et al. 2003—Westerling, A.L., T.J. Brown, A. Gershunov, D.R. Cayan, and M.D. Dettinger. “Climate andWildfire in theWestern United States.”Bulletin of the American Meteorological Society 84(5):595-604. <http://ams.allenpress.com/perlserv/?request=get-abstract&issn=1520-0477&volume=084&issue=05&page=0595>
Zervas 2001—Zervas, C.E. Sea Level Variations of the United States 1854-1999. NOAA Technical Report NOS CO-OPS 36. SilverSpring, MD: National Oceanic and Atmospheric Administration, National Ocean Service.
APPENDIX B — BIBLIOGRAPHY 145APPENDIX B — BIBLIOGRAPHY 145