ACCEPTED VERSION SUBJECT TO FINAL EDITS - IPCC ...
225
FINAL DRAFT Chapter 9 IPCC WGII Sixth Assessment Report Do Not Cite, Quote or Distribute 9-1 Total pages: 225 1 Chapter 9: Africa 2 3 Coordinating Lead Authors: Christopher H. Trisos (South Africa), Ibidun O. Adelekan (Nigeria), Edmond 4 Totin (Benin). 5 6 Lead Authors: Ayansina Ayanlade (Nigeria), Jackson Efitre (Uganda), Adugna Gemeda (Ethiopia), 7 Kanungwe Kalaba (Zambia), Christopher Lennard (South Africa), Catherine Masao (Tanzania), Yunus 8 Mgaya (Tanzania), Grace Ngaruiya (Kenya), Daniel Olago (Kenya), Nicholas P. Simpson (Zimbabwe/South 9 Africa), Sumaya Zakieldeen (Sudan). 10 11 Contributing Authors: Philip Antwi-Agyei (Ghana), Aaron Atteridge (Sweden/Australia), Rachel Bezner 12 Kerr (Canada/USA), Max Callaghan (United Kingdom/Germany), Tamma Carleton (USA), Colin Carlson 13 (USA), Hayley Clements (South Africa), Declan Conway (United Kingdom), Sean Cooke (South Africa), 14 Matthew Chersich (South Africa), David Chiawo (Kenya), Joanne Clarke (Australian/United Kingdom), 15 Marlies Craig (South Africa), Olivier Crespo (South Africa), James Cullis (South Africa), Jampel 16 Dell’Angelo (Italy/USA), Luleka Dlamini (South Africa) Hussen Seid Endris (Kenya), Christien Engelbreht 17 (South Africa), Aidan Farrell (Trinidad and Tobago/Ireland), James Franke (USA), Thian Yew Gan 18 (Malaysia/Canada), Christopher Golden (USA), Kerry Grey (South Africa), Toshihiro Hasegawa (Japan), 19 Ryan Hogarth (Canada/United Kingdom), Nadia, Hassan O. Kaya (South Africa), Khalaf (United Kingdom), 20 Mercy Kinyua (Kenya), Scott Kulp (USA), William F. Lamb (United Kingdom/Germany), Charne Lavery 21 (South Africa), Johan Maritz (South Africa), Guy Midgley (South Africa), Danielle Millar (South Africa), 22 Jan Minx (Germany), Glenn Moncrieff (South Africa), Rachid Moussadek (Morocco), Mzime Ndebele- 23 Murisa (Zimbabwe), Emily Nicklin (South Africa), Michelle North (South Africa), Mary Nyasimi (Kenya), 24 Elizabeth Nyboer (Canada), Romaric Odoulami (Benin/South Africa), Andrew Okem (South 25 Africa/Nigeria), Gladys Okemwa (Kenya), Kulthoum Omari (Botswana/South Africa), Esther Onyango 26 (Kenya/Australia), Birgitt Ouweneel (Netherlands/South Africa), Indra Øverland (Norway), Lorena, 27 Pasquini (South Africa), Belynda Petrie (South Africa), Alex Pigot (United Kingdom), Wilfried Pokam 28 (Cameroon), Bronwen Powell (Canada/USA), Jeff Price (United Kingdom), Heather Randell (USA), Maren 29 Radeny (Kenya), Jonathan Rawlins (South Africa), Kanta Kumari Rigaud (Malaysia/USA), Carla Roncoli 30 (USA), Olivia Rumble (South Africa), Elisa Sainz de Murieta (Spain), Georgia Savvidou (Sweden/Cyprus), 31 Lucia Schlemmer (South Africa), Laura Schmitt Olabisi (USA), Chandni Singh (India), Thomas Smucker 32 (USA), Nicola Stevens (South Africa), Anna Steynor (South Africa), Bamba Sylla (Rwanda/Senegal), 33 Arame Tall (Senegal/USA), Richard Taylor (Canada/United Kingdom), Meryem Tenarhte 34 (Morocco/Germany), Mia Thom (South Africa), Jessica Thorn (Namibia/South Africa), Katharina Waha 35 (Germany/Australia), Hitomi Wakatsuki (Japan), Edna Wangui (Kenya/USA), Portia Adade Williams 36 (Ghana), Kevin Winter (South Africa), Caradee Wright (South Africa), Luckson Zvobgo (Zimbabwe/South 37 Africa). 38 39 Review Editors: Stuart Mark Howden (Australia), Robert (Bob) J. Scholes (South Africa), Pius Yanda 40 (Tanzania). 41 42 Chapter Scientists: Michelle North (South Africa), Luckson Zvobgo (Zimbabwe/South Africa). 43 44 Date of Draft: 1 October 2021 45 46 Notes: TSU Compiled Version 47 48 49 Table of Contents 50 51 Executive Summary .......................................................................................................................................... 4 52 9.1 Introduction ............................................................................................................................................ 11 53 9.1.1 Point of Departure ........................................................................................................................ 11 54 9.1.2 Major Conclusions from Previous Assessments ........................................................................... 12 55 9.1.3 What’s New on Africa in AR6? ..................................................................................................... 13 56 9.1.4 Extent of Climate Change Impacts Across Africa......................................................................... 13 57 ACCEPTED VERSION SUBJECT TO FINAL EDITS
-
Upload
khangminh22 -
Category
Documents
-
view
2 -
download
0
Transcript of ACCEPTED VERSION SUBJECT TO FINAL EDITS - IPCC ...
FINAL DRAFT Chapter 9 IPCC WGII Sixth Assessment Report
Do Not Cite, Quote or Distribute 9-1 Total pages: 225
1
Chapter 9: Africa 2 3 Coordinating Lead Authors: Christopher H. Trisos (South Africa), Ibidun O. Adelekan (Nigeria), Edmond 4 Totin (Benin). 5 6 Lead Authors: Ayansina Ayanlade (Nigeria), Jackson Efitre (Uganda), Adugna Gemeda (Ethiopia), 7 Kanungwe Kalaba (Zambia), Christopher Lennard (South Africa), Catherine Masao (Tanzania), Yunus 8 Mgaya (Tanzania), Grace Ngaruiya (Kenya), Daniel Olago (Kenya), Nicholas P. Simpson (Zimbabwe/South 9 Africa), Sumaya Zakieldeen (Sudan). 10 11 Contributing Authors: Philip Antwi-Agyei (Ghana), Aaron Atteridge (Sweden/Australia), Rachel Bezner 12 Kerr (Canada/USA), Max Callaghan (United Kingdom/Germany), Tamma Carleton (USA), Colin Carlson 13 (USA), Hayley Clements (South Africa), Declan Conway (United Kingdom), Sean Cooke (South Africa), 14 Matthew Chersich (South Africa), David Chiawo (Kenya), Joanne Clarke (Australian/United Kingdom), 15 Marlies Craig (South Africa), Olivier Crespo (South Africa), James Cullis (South Africa), Jampel 16 Dell’Angelo (Italy/USA), Luleka Dlamini (South Africa) Hussen Seid Endris (Kenya), Christien Engelbreht 17 (South Africa), Aidan Farrell (Trinidad and Tobago/Ireland), James Franke (USA), Thian Yew Gan 18 (Malaysia/Canada), Christopher Golden (USA), Kerry Grey (South Africa), Toshihiro Hasegawa (Japan), 19 Ryan Hogarth (Canada/United Kingdom), Nadia, Hassan O. Kaya (South Africa), Khalaf (United Kingdom), 20 Mercy Kinyua (Kenya), Scott Kulp (USA), William F. Lamb (United Kingdom/Germany), Charne Lavery 21 (South Africa), Johan Maritz (South Africa), Guy Midgley (South Africa), Danielle Millar (South Africa), 22 Jan Minx (Germany), Glenn Moncrieff (South Africa), Rachid Moussadek (Morocco), Mzime Ndebele-23 Murisa (Zimbabwe), Emily Nicklin (South Africa), Michelle North (South Africa), Mary Nyasimi (Kenya), 24 Elizabeth Nyboer (Canada), Romaric Odoulami (Benin/South Africa), Andrew Okem (South 25 Africa/Nigeria), Gladys Okemwa (Kenya), Kulthoum Omari (Botswana/South Africa), Esther Onyango 26 (Kenya/Australia), Birgitt Ouweneel (Netherlands/South Africa), Indra Øverland (Norway), Lorena, 27 Pasquini (South Africa), Belynda Petrie (South Africa), Alex Pigot (United Kingdom), Wilfried Pokam 28 (Cameroon), Bronwen Powell (Canada/USA), Jeff Price (United Kingdom), Heather Randell (USA), Maren 29 Radeny (Kenya), Jonathan Rawlins (South Africa), Kanta Kumari Rigaud (Malaysia/USA), Carla Roncoli 30 (USA), Olivia Rumble (South Africa), Elisa Sainz de Murieta (Spain), Georgia Savvidou (Sweden/Cyprus), 31 Lucia Schlemmer (South Africa), Laura Schmitt Olabisi (USA), Chandni Singh (India), Thomas Smucker 32 (USA), Nicola Stevens (South Africa), Anna Steynor (South Africa), Bamba Sylla (Rwanda/Senegal), 33 Arame Tall (Senegal/USA), Richard Taylor (Canada/United Kingdom), Meryem Tenarhte 34 (Morocco/Germany), Mia Thom (South Africa), Jessica Thorn (Namibia/South Africa), Katharina Waha 35 (Germany/Australia), Hitomi Wakatsuki (Japan), Edna Wangui (Kenya/USA), Portia Adade Williams 36 (Ghana), Kevin Winter (South Africa), Caradee Wright (South Africa), Luckson Zvobgo (Zimbabwe/South 37 Africa). 38 39 Review Editors: Stuart Mark Howden (Australia), Robert (Bob) J. Scholes (South Africa), Pius Yanda 40 (Tanzania). 41 42 Chapter Scientists: Michelle North (South Africa), Luckson Zvobgo (Zimbabwe/South Africa). 43 44 Date of Draft: 1 October 2021 45 46 Notes: TSU Compiled Version 47 48
49 Table of Contents 50 51 Executive Summary .......................................................................................................................................... 4 52 9.1 Introduction ............................................................................................................................................ 11 53
9.1.1 Point of Departure ........................................................................................................................ 11 54 9.1.2 Major Conclusions from Previous Assessments ........................................................................... 12 55 9.1.3 What’s New on Africa in AR6? ..................................................................................................... 13 56 9.1.4 Extent of Climate Change Impacts Across Africa ......................................................................... 13 57
ACCEPTED VERSIO
N
SUBJECT TO FIN
AL EDITS

FINAL DRAFT Chapter 9 IPCC WGII Sixth Assessment Report
Do Not Cite, Quote or Distribute 9-2 Total pages: 225
9.1.5 Extent of Climate Change Data and Research Gaps Across Africa ............................................. 14 1 9.1.6 Loss and Damage from Climate Change ...................................................................................... 17 2
9.2 Key Risks for Africa ............................................................................................................................... 18 3 9.3 Climate Adaptation Options .................................................................................................................. 22 4
9.3.1 Adaptation Feasibility and Effectiveness ...................................................................................... 22 5 9.3.2 Adaptation Co-Benefits and Trade-Offs with Mitigation and SDGs ............................................ 25 6
9.4 Climate Resilient Development ............................................................................................................. 26 7 9.4.1 Climate Finance ............................................................................................................................ 26 8 9.4.2 Governance ................................................................................................................................... 31 9 9.4.3 Cross-Sectoral and Transboundary Solutions .............................................................................. 33 10 9.4.4 Climate Change Adaptation Law in Africa ................................................................................... 35 11 9.4.5 Climate Services, Perception and Literacy. .................................................................................. 38 12
Box 9.1: Vulnerability Synthesis ................................................................................................................... 43 13 9.5 Observed and Projected Climate Change ............................................................................................ 46 14
9.5.1 Climate Hazards in Africa ............................................................................................................ 46 15 9.5.2 North Africa .................................................................................................................................. 51 16 9.5.3 West Africa .................................................................................................................................... 52 17 9.5.4 Central Africa ............................................................................................................................... 53 18 9.5.5 East Africa ..................................................................................................................................... 54 19 9.5.6 Southern Africa ............................................................................................................................. 56 20 9.5.7 Tropical cyclones .......................................................................................................................... 57 21 9.5.8 Glaciers ......................................................................................................................................... 57 22 9.5.9 Teleconnections and Large-Scale Drivers of African Climate Variability ................................... 57 23 9.5.10 African Marine Heatwaves ........................................................................................................... 58 24
Box 9.2: Indigenous Knowledge and Local Knowledge .............................................................................. 58 25 9.6 Ecosystems ............................................................................................................................................... 61 26
9.6.1 Observed Impacts of Climate Change on African Biodiversity and Ecosystem Services ............. 61 27 9.6.2 Projected Risks of Climate Change for African Biodiversity and Ecosystem Services ................ 64 28 9.6.3 Nature-Based Tourism in Africa ................................................................................................... 69 29 9.6.4 Ecosystem-Based Adaptation in Africa ......................................................................................... 70 30
Box 9.3: Tree Planting in Africa .................................................................................................................... 72 31 9.7 Water ....................................................................................................................................................... 74 32
9.7.1 Observed Impacts from Climate Variability and Climate Change ............................................... 74 33 Box 9.4: African Cities Facing Water Scarcity ............................................................................................ 75 34
9.7.2 Projected Risks and Vulnerability ................................................................................................. 76 35 9.7.3 Water Adaptation Options and their Feasibility ........................................................................... 79 36
Box 9.5: Water-Energy-Food Nexus ............................................................................................................. 79 37 9.8 Food Systems ........................................................................................................................................... 83 38
9.8.1 Vulnerability to Observed and Projected Impacts from Climate Change .................................... 83 39 9.8.2 Observed Impacts and Projected Risks to Crops and Livestock ................................................... 85 40 9.8.3 Adapting to Climate Variability and Change ............................................................................... 91 41 9.8.4 Climate Information Services and Insurance for Agriculture Adaptation .................................... 93 42 9.8.5 Marine and Inland Fisheries ......................................................................................................... 94 43
9.9 Human Settlements and Infrastructure ............................................................................................... 97 44 9.9.1 Urbanisation, Population and Development Trends .................................................................... 97 45 9.9.2 Observed Impacts on Human Settlements and Infrastructure ...................................................... 98 46 9.9.3 Observed Vulnerabilities of Human Settlements to Climate Risks ............................................. 101 47 9.9.4 Projected Risks for Human Settlements and Infrastructure ........................................................ 101 48 9.9.5 Adaptation in Human Settlements and for Infrastructure ........................................................... 109 49
9.10 Health ..................................................................................................................................................... 112 50 9.10.1 The Influence of Social Determinants of Health on the Impacts of Climate Change ................. 112 51 9.10.2 Observed Impacts and Projected Risks ....................................................................................... 113 52
Box 9.6: Pandemic Risk in Africa: COVID-19 and Future Threats ........................................................ 116 53 Box 9.7: The Health-Climate Change Nexus in Africa ............................................................................. 123 54
9.10.3 Adaptation for Health and Well-Being in Africa ........................................................................ 124 55 9.11 Economy, Poverty and Livelihoods ..................................................................................................... 130 56
9.11.1 Observed Impacts of Climate Change on African Economies and Livelihoods ......................... 130 57
ACCEPTED VERSIO
N
SUBJECT TO FIN
AL EDITS
FINAL DRAFT Chapter 9 IPCC WGII Sixth Assessment Report
Do Not Cite, Quote or Distribute 9-3 Total pages: 225
9.11.2 Projected Risks of Climate Change for African economies and livelihoods .............................. 132 1 9.11.3 Informality ................................................................................................................................... 132 2 9.11.4 Climate Change Adaptation to Reduce Vulnerability, Poverty and Inequality .......................... 133 3
Box 9.8: Climate Change, Migration and Displacement in Africa .......................................................... 136 4 9.11.5 COVID-19 Recovery Stimulus Packages for Climate Action ..................................................... 140 5
Box 9.9: Climate Change and Security: Interpersonal Violence and Large-scale Civil Conflict ......... 141 6 9.12 Heritage ................................................................................................................................................. 142 7
9.12.1 Observed Impacts on Cultural Heritage. .................................................................................... 142 8 9.12.2 Projected Risks ............................................................................................................................ 143 9 9.12.3 Adaptation ................................................................................................................................... 144 10
FAQ 9.1: Which climate hazards impact African livelihoods, economies, health and well-being the 11 most? ...................................................................................................................................................... 147 12
FAQ9.2: What are the limits and benefits of climate change adaptation in Africa? ............................. 148 13 FAQ 9.3: How can African countries secure enough food in changing climate conditions for their 14
growing populations? ........................................................................................................................... 149 15 FAQ9.4: How can African local knowledge serve climate adaptation planning more effectively? ...... 150 16 References ...................................................................................................................................................... 151 17 18 19
ACCEPTED VERSIO
N
SUBJECT TO FIN
AL EDITS
FINAL DRAFT Chapter 9 IPCC WGII Sixth Assessment Report
Do Not Cite, Quote or Distribute 9-4 Total pages: 225
Executive Summary 1 2 Overall Key Messages 3 4 Africa has contributed among the least to greenhouse gas emissions, yet key development sectors have 5 already experienced widespread loss and damage attributable to anthropogenic climate change, 6 including biodiversity loss, water shortages, reduced food production, loss of lives and reduced 7 economic growth (high confidence1). {9.1.1, 9.2, 9.6.1, 9.8.2, 9.10.2, 9.11.1; Box 9.4} 8 9 Between 1.5°C and 2°C global warming—assuming localised and incremental adaptation—impacts 10 are projected to become widespread and severe for reduced food production, reduced economic 11 growth, increased inequality and poverty, biodiversity loss, increased human morbidity and mortality 12 (high confidence). Limiting global warming to 1.5°C is expected to substantially reduce damages to 13 African economies and ecosystems (high confidence). {9.2, 9.6.2, 9.8.2, 9.8.5, 9.10.2, 9.11.2} 14 15 Exposure and vulnerability to climate change in Africa are multi-dimensional with socioeconomic, 16 political and environmental factors intersecting (very high confidence). Africans are disproportionately 17 employed in climate-exposed sectors: 55–62% of the sub-Saharan workforce employed is in agriculture and 18 95% of cropland rainfed. In rural Africa, poor and female-headed households face greater livelihood risks 19 from climate hazards. In urban areas, growing informal settlements without basic services increases the 20 vulnerability of large populations to climate hazards, especially women, children and the elderly. {9.8.2, 21 9.9.1, 9.9.3, 9.11.4; Box 9.1} 22 23 Adaptation in Africa has multiple benefits, and most assessed adaptation options have medium 24 effectiveness at reducing risks for present-day global warming, but their efficacy at future warming 25 levels is largely unknown (high confidence). {9.3, 9.6.4, 9.8.3, 9.11.4} 26 27 Enabling Climate-Resilient Development 28 29 Climate-related research in Africa faces severe data constraints, as well as inequities in funding and 30 research leadership that reduce adaptive capacity (very high confidence). Many countries lack regularly 31 reporting weather stations, and data access is often limited. From 1990–2019 research on Africa received just 32 3.8% of climate-related research funding globally: 78% of this funding went to EU and North American 33 institutions and only 14.5% to African institutions. The number of climate research publications with locally-34 based authors are among the lowest globally and research led by external researchers may focus less on local 35 priorities. Increased funding for African partners, and direct control of research design and resources can 36 provide more actionable insights on climate risks and adaptation options in Africa. {9.1, 9.4.5, 9.5.2} 37 38 Adaptation generally is cost effective, but annual finance flows targeting adaptation for Africa are 39 billions of USD less than the lowest adaptation cost estimates for near-term climate change (high 40 confidence). Finance has not targeted more vulnerable countries. From 2014–2018 more finance 41 commitments were debt than grants and—excluding multilateral development banks—only 46% of 42 commitments were disbursed (compared to 96% for other development projects). {9.4.1} 43 44 Adaptation costs will rise rapidly with global warming (very high confidence). Increasing public and 45 private finance flows by billions of dollars per year, increasing direct access to multilateral funds, 46 strengthening project pipeline development, and shifting finance from readiness activities to project 47 implementation would help realise transformative adaptation in Africa (high confidence). Concessional 48 finance will be required for adaptation in low-income settings. Aligning sovereign debt relief with climate 49 goals could increase finance by redirecting debt-servicing payments to climate resilience. {9.4.1} 50 51
1 In this Report, the following summary terms are used to describe the available evidence: limited, medium, or robust;
and for the degree of agreement: low, medium, or high. A level of confidence is expressed using five qualifiers: very
low, low, medium, high, and very high, and typeset in italics, e.g., medium confidence. For a given evidence and
agreement statement, different confidence levels can be assigned, but increasing levels of evidence and degrees of
agreement are correlated with increasing confidence.
ACCEPTED VERSIO
N
SUBJECT TO FIN
AL EDITS
FINAL DRAFT Chapter 9 IPCC WGII Sixth Assessment Report
Do Not Cite, Quote or Distribute 9-5 Total pages: 225
Governance for climate resilient development includes: long-term planning, all-of-government 1 approaches, transboundary cooperation and benefit-sharing, development pathways that increase 2 adaptation and mitigation and reduce inequality, and NDC implementation (high confidence). {9.3.2, 3 9.4.2, 9.4.3} 4 5 Cross-sectoral ‘nexus’ approaches provide significant opportunities for large co-benefits and/or 6 avoided damages (very high confidence). For example, climate change adaptation benefits pandemic 7 preparedness; ‘One Health’ approaches benefit human and ecosystem health; and Ecosystem-based 8 Adaptation can deliver adaptation and emissions mitigation (high confidence). {9.4.3, 9.6.4, 9.11.5; Box 9.6} 9 10 Without cross-sectoral, transboundary and long-term planning, response options in one sector can 11 become response risks, exacerbating impacts in other sectors and causing maladaptation (very high 12 confidence). For example, maintaining indigenous forest benefits biodiversity and emissions mitigation, but 13 afforestation—or wrongly targeting ancient grasslands and savannas for reforestation—harms water security 14 and biodiversity, and can increase carbon loss to fire and drought. Planned hydropower projects may 15 increase risk as rainfall changes impact water, energy and food security exacerbating trade-offs between 16 users, including across countries. {9.4.3; Boxes 9.3, 9.5} 17 18 Robust legislative frameworks that develop or amend laws to mainstream climate change into their 19 empowerment and planning provisions will facilitate effective design and implementation of climate 20 change responses (high confidence). {9.4.4} 21 22 Climate information services that are demand-driven and context-specific (e.g., for agriculture or 23 health) combined with climate change literacy can affect the difference between coping and informed, 24 adaptation responses (high confidence). Across 33 African countries, 23–66% of people are aware of 25 anthropogenic climate change—with larger variation at subnational scales (e.g., 5–71% among states in 26 Nigeria). Climate change literacy increases with education level but is undermined by poverty, and rates 27 average 12.8% lower for women than men. 71% of Africans aware of climate change agree it should be 28 stopped. Production of salient climate information in Africa is hindered by limited availability of and access 29 to weather and climate data. {9.4.5, 9.5.1, 9.8.4, 9.10.3} 30 31 Ecosystem-based adaptation can reduce climate risk while providing social, economic and 32 environmental benefits (high confidence). Direct human dependence on ecosystem services in Africa is 33 high. Ecosystem protection and restoration, conservation agriculture practices, sustainable land management, 34 and integrated catchment management can support climate resilience. Ecosystem-based adaptation can cost 35 less than grey infrastructure in human settlements (e.g., using wetlands and mangroves as coastal protection). 36 {9.6.4, 9.7.3, 9.8.3, 9.9.5, 9.12.3; Box 9.7} 37 38 Observed Impacts and Projected Risks 39 40 Climate 41 Increasing mean and extreme temperature trends across Africa are attributable to human-induced 42 climate change (high confidence). {9.5.1, 9.5.2} 43 44 Climate change has increased heat waves (high confidence) and drought (medium confidence) on land, 45 and doubled the probability of marine heatwaves around most of Africa (high confidence). Multi-year 46 droughts have become more frequent in West Africa, and the 2015–2017 Cape Town drought was three 47 times more likely2 due to human-induced climate change. {9.5.3–7, 9.5.10} 48 49
2 In this Report, the following terms have been used to indicate the assessed likelihood of an outcome or a result:
Virtually certain 99–100% probability, Very likely 90–100%, Likely 66–100%, About as likely as not 33–66%,
Unlikely 0–33%, Very unlikely 0–10%, and Exceptionally unlikely 0–1%. Additional terms (Extremely likely: 95–
100%, More likely than not >50–100%, and Extremely unlikely 0–5%) may also be used when appropriate. Assessed
likelihood is typeset in italics, e.g., very likely). This Report also uses the term ‘likely range’ to indicate that the assessed
likelihood of an outcome lies within the 17-83% probability range.
ACCEPTED VERSIO
N
SUBJECT TO FIN
AL EDITS
FINAL DRAFT Chapter 9 IPCC WGII Sixth Assessment Report
Do Not Cite, Quote or Distribute 9-6 Total pages: 225
Above 2°C global warming, meteorological drought frequency will increase and duration will double 1 from 2 to 4 months over North Africa, the western Sahel and southern Africa (medium confidence). 2 {9.5.2, 9.5.3, 9.5.6.} 3 4 Frequency and intensity of heavy rainfall events will increase at all levels of global warming (except in 5 North and southwestern Africa), increasing exposure to pluvial and riverine flooding (high confidence). 6 {9.5.3–7, 9.7} 7 8 Glaciers on the Rwenzoris and Mt. Kenya are projected to disappear by 2030, and by 2040 on 9 Kilimanjaro (medium confidence). {9.5.8} 10 11 In East and southern Africa, tropical cyclones making landfall are projected to become less frequent 12 but have more intense rainfall and higher wind speeds at increasing global warming (medium 13 confidence). {9.5.7} 14 15 Heat waves on land, in lakes, and in the ocean will increase considerably in magnitude and duration 16 with increasing global warming (very high confidence). Under a 1.5°C-compatible scenario, children born 17 in Africa in 2020 are likely to be exposed to 4–8 times more heat waves compared to people born in 1960, 18 increasing to 5–10 times for 2.4°C global warming. The annual number of days above potentially lethal heat 19 thresholds reaches 50–150 in west Africa at 1.6°C global warming, 100–150 in Central Africa at 2.5°C, and 20 200–300 over tropical Africa for >4°C. {9.5.2, 9.5.3, 9.5.4, 9.5.5, 9.5.6, 9.7.2.1} 21 22 Most African countries will enter unprecedented high temperature climates earlier in this century 23 than generally wealthier, higher latitude countries, emphasising the urgency of adaptation measures in 24 Africa (high confidence). {9.5.1} 25 26 Compound risks 27 Multiple African countries are projected to face compounding risks from: reduced food production 28 across crops, livestock and fisheries; increasing heat-related mortality; heat-related loss of labour 29 productivity; and flooding from sea level rise, especially in West Africa (high confidence). {9.8.2, 9.8.5, 30 9.9.4, 9.10.2, 9.11.2} 31 32 Water 33 Recent extreme variability in rainfall and river discharge (c. -50% to +50% relative to long-term 34 historical means) across Africa have had largely negative and multi-sector impacts across water-35 dependent sectors (high confidence) {9.7.2, 9.10.2}. Hydrological variability and water scarcity have 36 induced cascading impacts from water-supply provision and/or hydro-electric power production to health, 37 economies, tourism, food, disaster risk response capacity and increased inequality of water access. {Box 9.4} 38 39 Extreme hydrological variability is projected to progressively amplify under all climate scenarios 40 relative to the current baseline, depending on region (high confidence). Projections of numbers of people 41 exposed to water stress by the 2050s vary widely—decreases/increases by hundreds of millions, with higher 42 numbers for increases—with disagreement among global climate models the major factor driving these large 43 ranges. Populations in drylands are projected to more than double. Projected changes present heightened 44 cross-cutting risks to water-dependent sectors, and require planning under deep uncertainty for the wide 45 range of extremes expected in future. {9.7.1, 9.7.2} 46 47 Economy and Livelihoods 48 Climate change has reduced economic growth across Africa, increasing income inequality between 49 African countries and those in temperate, Northern Hemisphere climates (high confidence). One 50 estimate suggests GDP per capita for 1991–2010 in Africa was on average 13.6% lower compared to if 51 climate change had not occurred. Impacts manifest largely through losses in agriculture, as well as tourism, 52 manufacturing, and infrastructure. {9.6.3, 9.11.1} 53 54 Climate variability and change undermine educational attainment (high agreement, medium evidence). 55 High temperatures, low rainfall, and flooding, especially in the growing season, may mean children are 56
ACCEPTED VERSIO
N
SUBJECT TO FIN
AL EDITS
FINAL DRAFT Chapter 9 IPCC WGII Sixth Assessment Report
Do Not Cite, Quote or Distribute 9-7 Total pages: 225
removed from school to assist income generation. Early life undernutrition associated with low harvests can 1 impair cognitive development. {9.11.1.2} 2 3 Limiting global warming to 1.5°C is very likely to positively impact GDP per capita across Africa. 4 Increasing economic damage forecasts under high-emissions diverge from low-emissions pathways by 2030. 5 Inequalities between African countries are projected to widen with increased warming. Across nearly all 6 African countries, GDP per capita is projected to be at least 5% higher by 2050 and 10–20% higher by 2100 7 if global warming is held to 1.5°C versus 2°C. {9.11.2} 8 9 Food systems 10 In Africa, climate change is reducing crop yields and productivity (medium confidence). Agricultural 11 productivity growth has been reduced by 34% since 1961 due to climate change, more than any other region. 12 Maize and wheat yields decreased on average 5.8% and 2.3%, respectively in sub-Saharan Africa due to 13 climate change in the period 1974–2008. Farmers and pastoralists perceive the climate to have changed and 14 over two thirds of Africans perceive climate conditions for agricultural production have worsened over the 15 past ten years. Woody plant encroachment has reduced fodder availability. {9.4.5, 9.6.1, 9.8.2} 16 17 Future warming will negatively affect food systems in Africa by shortening growing seasons and 18 increasing water stress (high confidence). By 1.5°C global warming, yields are projected to decline for 19 olives (North Africa) and Sorghum (West Africa) with a decline in suitable areas for coffee and tea (East 20 Africa). Although yield declines for some crops may be partially compensated by increasing atmospheric 21 CO2 concentrations, global warming above 2°C will result in yield reductions for staple crops across most of 22 Africa compared to 2005 yields (e.g., 20–40% decline in West African maize yields), even when considering 23 adaptation options and increasing CO2 (medium confidence). Relative to 1986–2005, global warming of 3°C 24 is projected to reduce labour capacity in agriculture by 30–50% in sub-Saharan Africa. {9.8.2} 25 26 Climate change threatens livestock production across Africa (high agreement, low evidence). Rangeland 27 net primary productivity is projected to decline 42% for west Africa by 2050 at 2oC global warming. Vector-28 borne livestock diseases and the duration of severe heat stress are both projected to become more prevalent 29 under warming. {9.8.2} 30 31 Climate change poses a significant threat to African marine and freshwater fisheries (high confidence). 32 Fisheries provide the main source of protein for ~30% of Africa’s population and support the livelihoods of 33 12.3 million people. At 1.5°C global warming, marine fish catch potential (MFCP) decreases 3–41% by 34 2081–2100 relative to 1986–2005, increasing to 12–69% at 4.3°C, with the highest declines for tropical 35 countries. Under 1.7°C global warming, reduced fish harvests could leave 1.2–70 million people vulnerable 36 to iron deficiencies, up to 188 million for vitamin A deficiencies, and 285 million for vitamin B12 and 37 omega-3 fatty acids by mid-century. For inland fisheries, 55–68% of commercially harvested fish species are 38 vulnerable to extinction under 2.5°C global warming by 2071–2100. {9.8.5} 39 40 Health 41 Climate variability and change already impacts the health of tens of millions of Africans through 42 exposure to non-optimal temperatures and extreme weather, and increased range and transmission of 43 infectious diseases (high confidence). {9.10.1} 44 45 Mortality and morbidity will escalate with further global warming, placing additional strain on health 46 and economic systems (high confidence). At 1.5°C of global warming, distribution and seasonal 47 transmission of vector-borne diseases is expected to increase, exposing tens of millions more people, mostly 48 in East and Southern Africa (high confidence). Above 1.5°C risk of heat-related deaths rises sharply (high 49 confidence), with at least 15 additional deaths per 100,000 annually across large parts of Africa. At 2.1°C 50 degrees, thousands to tens of thousands of additional cases of diarrhoeal disease are projected, mainly in 51 Central and East Africa (medium confidence). These changes risk undermining improvements in health from 52 future socio-economic development (high agreement, medium evidence).{9.10.2} 53 54 Human Settlements 55 Exposure of people, assets and infrastructure to climate hazards is increasing in Africa with rapid 56 urbanisation, infrastructure deficit, and growing population in informal settlements (high confidence). 57
ACCEPTED VERSIO
N
SUBJECT TO FIN
AL EDITS
FINAL DRAFT Chapter 9 IPCC WGII Sixth Assessment Report
Do Not Cite, Quote or Distribute 9-8 Total pages: 225
About one-third of African cities with populations over 300,000 are located in areas that are at high risk from 1 climate hazards. Sub-Saharan Africa is the only region that has recorded increasing rates of flood mortality 2 since the 1990s. {9.9.1, 9.9.2} 3 4 High population growth and urbanisation in low-elevation coastal zones will be a major driver of 5 exposure to sea level rise in the next 50 years (high confidence). By 2030, 108–116 million people in 6 Africa will be exposed to sea level rise in Africa (compared to 54 million in 2000), increasing to 190–245 7 million by 2060. {9.9.1, 9.9.4} 8 9 Africa’s rapidly growing cities will be hotspots of risks from climate change and climate-induced in-10 migration, which could amplify pre-existing stresses related to poverty, informality, exclusion and 11 governance (high confidence). Urban population exposure to extreme heat is projected to increase from 2 12 billion person-days per year in 1985–2005 to 45 billion person-days by the 2060s (1.7℃ global warming 13 with low population growth) and to 95 billion person-days (2.8℃ global warming with medium-high 14 population growth), with greatest exposure in West Africa. Sensitive populations under 5 and over 64 years 15 old in African cities exposed to heat waves are projected to increase from around 27 million in 2010 to 360 16 million (SSP1) and 440 million (SSP5) by 2100, for global warming of 1.8℃ and >4℃, respectively. 17 Compared to 2000, urbanization is projected to increase urban land extent exposed to arid conditions by 18 around 700% and exposure to high-frequency flooding by 2,600% across West, Central and East Africa by 19 2030. {9.9.1, 9.9.2, 9.9.4; Box 9.8} 20 21 Migration 22 Most climate-related migration observed currently is within countries or between neighbouring 23 countries, rather than to distant high-income countries (high confidence). Urbanisation has increased 24 when rural livelihoods were negatively impacted by low rainfall. Over 2.6 million and 3.4 million new 25 weather-related displacements occurred in sub-Saharan Africa in 2018 and 2019. {Box 9.8} 26 27 Climate change is projected to increase migration, especially internal and rural-to-urban migration 28 (high agreement, medium evidence). With 1.7°C global warming by 2050, 17–40 million people could 29 migrate internally in sub-Saharan Africa, increasing to 56–86 million for 2.5°C (>60% in West Africa) due 30 to water stress, reduced crop productivity, and sea level rise. This is a lower-bound estimate excluding rapid-31 onset hazards such as floods and tropical cyclones. {Box 9.8} 32 33 Infrastructure 34 Climate-related infrastructure damage and repairs will be a financially significant burden to countries 35 (high confidence). Without adaptation, aggregate damages from sea level rise and coastal extremes to 12 36 major African coastal cities in 2050 under medium and high emissions scenarios will be USD 65 billion and 37 USD 86.5 billion, respectively. Potential costs of up to USD 183.6 billion may be incurred through 2100 to 38 maintain existing road networks damaged from temperature and precipitation changes due to climate change. 39 Increased rainfall variability is expected to affect electricity prices in countries highly dependent on 40 hydropower. {9.9.4; Boxes 9.4, 9.5} 41 42 Ecosystems 43 Increasing CO2 levels and climate change are destroying marine biodiversity, reducing lake 44 productivity, and changing animal and vegetation distributions (high confidence). Impacts include 45 repeated mass coral bleaching events in east Africa, and uphill (birds) or poleward (marine species) shifts in 46 geographic distributions. For vegetation, the overall observed trend is woody plant expansion, particularly 47 into grasslands and savannas, reducing grazing land and water supplies. {9.6.1} 48 49 The outcome of interacting drivers operating in opposing directions on future biome distributions is 50 highly uncertain. Further increasing CO2 concentrations could increase woody plant cover, but increasing 51 aridity could counteract this, destabilising forest and peatland carbon stores in central Africa (low 52 confidence). {9.6.2.1} 53 54 African biodiversity loss is projected to be widespread and escalating with every 0.5ºC increase above 55 present-day global warming (high confidence). Above 1.5°C, half of assessed species are projected to lose 56 over 30% of their population or area of suitable habitat. At 2°C, 36% of freshwater fish species are 57
ACCEPTED VERSIO
N
SUBJECT TO FIN
AL EDITS
FINAL DRAFT Chapter 9 IPCC WGII Sixth Assessment Report
Do Not Cite, Quote or Distribute 9-9 Total pages: 225
vulnerable to local extinction, 7–18% of species assessed are at risk of extinction, and over 90% of East 1 African coral reefs could be destroyed by bleaching. Above 2°C, risk of sudden and severe biodiversity 2 losses becomes widespread in West, Central and East Africa. Climate change is also projected to change 3 patterns of invasive species spread. {9.6.2} 4 5 Climate security 6 There is increasing evidence linking increased temperatures and drought to conflict risk in Africa 7 (high confidence). Agriculturally dependent and politically excluded groups are especially vulnerable to 8 drought-associated conflict risk. However, climate is one of many interacting risk factors, and may explain a 9 small share of total variation in conflict incidence. Ameliorating ethnic tensions, strengthening political 10 institutions, and investing in economic diversification could mitigate future impacts of climate change on 11 conflict. {Box 9.9} 12 13 Heritage 14 African cultural heritage is already at risk from climate hazards, including sea level rise and coastal 15 erosion. Most African heritage sites are neither prepared for, nor adapted to, future climate change 16 (high confidence). {9.12} 17 18 Adaptation 19 20 With global warming increasing above present-day levels the ability of adaptation responses to offset 21 risk is substantially reduced (high confidence). Crop yield losses, even after adaptation, are projected to 22 rise rapidly above 2°C global warming. Limits to adaptation are already being reached in coral reef 23 ecosystems. Immigration of species from elsewhere may partly compensate for local extinctions and/or lead 24 to local biodiversity gains in some regions. However, more African regions face net losses than net gains. At 25 1.5°C global warming, over 46% of localities face net losses in terrestrial vertebrate species richness with net 26 increases projected for under 15% of localities. {9.6.1.4, 9.6.2.2, 9.8.2.1, 9.8.2.2, 9.8.4} 27 28 Technological, institutional, and financing factors are major barriers to climate adaptation feasibility 29 in Africa (high confidence). {9.3, 9.4.1} 30 31 There is limited evidence for economic growth alone reducing climate damages, but under scenarios of 32 inclusive and sustainable development, millions fewer people in Africa will be pushed into extreme 33 poverty by climate change and negative impacts to health and livelihoods can be reduced by 2030 34 (medium confidence). {9.10.3, 9.11.4} 35 36 Gender-sensitive and equity-based adaptation approaches reduce vulnerability for marginalised 37 groups across multiple sectors in Africa, including water, health, food systems and livelihoods (high 38 confidence). {9.7.3, 9.8.3, 9.9.5, 9.10.3, 9.11.4; Boxes 9.1, 9.2} 39 40 Integrating climate adaptation into social protection programs, such as cash transfers, public works 41 programmes and healthcare access, can increase resilience to climate change (high confidence). 42 Nevertheless, social protection programs may increase resilience to climate-related shocks, even if they do 43 not specifically address climate risks. {9.4.2, 9.10.3, 9.11.4} 44 45 The diversity of African indigenous knowledge and local knowledge systems provide a rich foundation 46 for adaptation actions at local scales (high confidence). African indigenous knowledge systems are 47 exceptionally rich in ecosystem-specific knowledge used for management of climate variability. Integration 48 of indigenous knowledge systems within legal frameworks, and promotion of indigenous land tenure rights 49 can reduce vulnerability. {9.4.4; Box 9.1, Box 9.2} 50 51 Early warning systems based on targeted climate services can be effective for disaster risk reduction, 52 social protection programmes, and managing risks to health and food systems (e.g., vector-borne 53 disease and crops) (high confidence). {9.4.5, 9.5.1, Box 9.2, 9.8.4, 9.8.5, 9.10.3, 9.11.4} 54 55 Risk-sensitive infrastructure delivery and equitable provision of basic services can reduce climate 56 risks and provide net financial savings (high confidence). However, there is limited evidence of pro-active 57
ACCEPTED VERSIO
N
SUBJECT TO FIN
AL EDITS
FINAL DRAFT Chapter 9 IPCC WGII Sixth Assessment Report
Do Not Cite, Quote or Distribute 9-10 Total pages: 225
climate adaptation in African cities. Proactive adaptation policy could reduce road repair and maintenance 1 costs by 74% compared to a reactive policy. Adapting roads for increased temperatures and investment in 2 public transport are assessed as ‘no regret’ options. In contrast, hydropower development carries risk of 3 regrets due to damages when a different climate than was expected materializes. Energy costs for cooling 4 demands are projected to accumulate to USD 51.3 billion in 2035 at 2℃ global warming and to USD 486.5 5 billion in 2076 at 4℃. {9.8.5} 6 7 Reduced drought and flood risk, and improved water and sanitation access, can be delivered by: 8 water-sensitive and climate scenario planning, monitored groundwater use, waterless on-site 9 sanitation, rainwater harvesting and water reuse, reducing risk to human settlements, food systems, 10 economies, and human health (high confidence). {9.8, 9.9, 9.10, 9.11} 11 12 Water sector adaptation measures show medium social and economic feasibility but low feasibility for 13 most African cities due to technical and institutional restrictions, particularly for large supply dams 14 and centralised distribution systems (medium confidence). {9.3.1, 9.7.3} Use of integrated water 15 management, water supply augmentation, and establishment of decentralised water management systems can 16 reduce risk. Integrated water management measures including sub-national financing, demand management 17 through subsidies, rates and taxes, and sustainable water technologies can reduce water insecurity caused by 18 either drought or floods (medium confidence). {9.7.3; Box 9.4} 19 20 Agricultural and livelihood diversification, agroecological and conservation agriculture practices, 21 aquaculture, on-farm engineering, and agroforestry can increase resilience and sustainability of food 22 systems in Africa under climate change (medium confidence). However, smallholder farmers tend to 23 address short-term shocks or stresses by deploying coping responses rather than transformative adaptations. 24 Climate information services, institutional capacity building, and strategic financial investment can help 25 overcome these barriers to adaptation (medium confidence). {9.4.5, 9.8.3, 9.8.5} 26 27 African countries and communities are inadequately insured against climate risk, but innovative 28 index-based insurance schemes can help transfer risk and aid recovery, including in food systems 29 (medium confidence). Despite their potential, uptake of climate insurance products remains constrained by 30 lack of affordability, awareness and product diversity. {9.4.5, 9.8.4, 9.11.4.1} 31 32 Human migration is a potentially effective adaptation strategy across food systems, water, livelihoods 33 and in climate-induced conflict areas, but can also be maladaptive if vulnerability is increased, 34 particularly for health and human settlements (high confidence). Migration of men from rural areas can 35 aggravate the work burden faced by women. The more agency migrants have (that is, degree of voluntarity 36 and freedom of movement) the greater the potential benefits for sending and receiving areas (high 37 agreement, medium evidence).{9.3, 9.8.3, 9.9.1–3, 9.10.2.2.2; Boxes 9.8, 9.9; Cross-Chapter Box MIGRATE 38 in Chapter 7} 39 40
ACCEPTED VERSIO
N
SUBJECT TO FIN
AL EDITS

FINAL DRAFT Chapter 9 IPCC WGII Sixth Assessment Report
Do Not Cite, Quote or Distribute 9-11 Total pages: 225
9.1 Introduction 1 2 9.1.1 Point of Departure 3 4 This chapter assesses the scientific evidence on observed and projected climate change impacts, vulnerability 5 and adaptation options in Africa. The assessment refers to five African sub-regions – North, West, Central, 6 East and southern – closely following the African Union (AU), but including Mauritania in West Africa and 7 Sudan in North Africa because much of the literature assessed places these countries in these regions (Figure 8 9.1). Madagascar and other island states are addressed in Chapter 15. 9 10 Africa has contributed among the least to historical greenhouse gas emissions (GHG) responsible for 11 anthropogenic climate change and has the lowest per capita GHG emissions of all regions currently (high 12 confidence) (Figure 9.2). Yet Africa has already experienced widespread impacts from anthropogenic 13 climate change (high confidence) (Table 9.1; Figure 9.2). 14 15 16
17 Figure 9.1: The 5 Regions of Africa used in this chapter, also showing estimated population density in 2019. The 18 population of Africa was estimated at 1.312 billion for 2020, which is about 17% of the world population but this is 19 projected to grow to around 40% of world population by 2100 (UNDESA, 2019a). Although 57% of the African 20 population currently live in rural areas (43% urban), Africa is the most rapidly urbanising region globally and is 21 projected to transition to a majority urban population in the 2030s with a 60% urban population by 2050 (UNDESA, 22 2019b). The 2019 Gross Domestic Product (GDP) per capita in constant 2010 averaged USD 2,250 across 43 countries 23 reporting data, ranging from USD 202 (Burundi) to USD 8,840 (Gabon), with 40% of the population of sub-Saharan 24 Africa living below the international poverty line of USD 1,90 per day in 2018 (World Bank, 2018). The highest life 25 expectancy at birth is 67 (Botswana and Senegal) and the lowest is 52 (Central African Republic) (World Bank, 2018). 26 Grid-cell population density data for mapping are from (Tatem, 2017; WorldPop, 2021). 27 28 29
ACCEPTED VERSIO
N
SUBJECT TO FIN
AL EDITS
FINAL DRAFT Chapter 9 IPCC WGII Sixth Assessment Report
Do Not Cite, Quote or Distribute 9-12 Total pages: 225
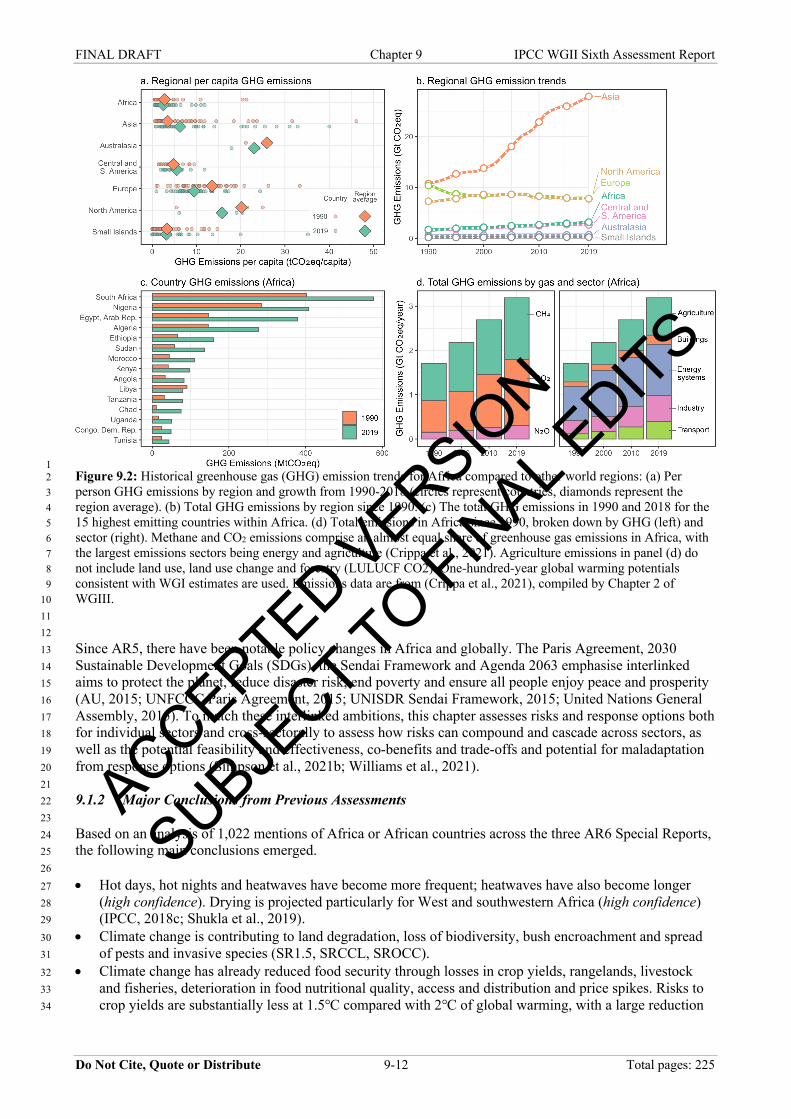
1 Figure 9.2: Historical greenhouse gas (GHG) emission trends for Africa compared to other world regions: (a) Per 2 person GHG emissions by region and growth from 1990-2018 (circles represent countries, diamonds represent the 3 region average). (b) Total GHG emissions by region since 1990. (c) The total GHG emissions in 1990 and 2018 for the 4 15 highest emitting countries within Africa. (d) Total emissions in Africa since 1990, broken down by GHG (left) and 5 sector (right). Methane and CO2 emissions comprise an almost equal share of greenhouse gas emissions in Africa, with 6 the largest emissions sectors being energy and agriculture (Crippa et al., 2021). Agriculture emissions in panel (d) do 7 not include land use, land use change and forestry (LULUCF CO2). One-hundred-year global warming potentials 8 consistent with WGI estimates are used. Emissions data are from (Crippa et al., 2021), compiled by Chapter 2 of 9 WGIII. 10 11 12 Since AR5, there have been notable policy changes in Africa and globally. The Paris Agreement, 2030 13 Sustainable Development Goals (SDGs), the Sendai Framework and Agenda 2063 emphasise interlinked 14 aims to protect the planet, reduce disaster risk, end poverty and ensure all people enjoy peace and prosperity 15 (AU, 2015; UNFCCC Paris Agreement, 2015; UNISDR Sendai Framework, 2015; United Nations General 16 Assembly, 2015). To match these interlinked ambitions, this chapter assesses risks and response options both 17 for individual sectors and cross-sectorally to assess how risks can compound and cascade across sectors, as 18 well as the potential feasibility and effectiveness, co-benefits and trade-offs and potential for maladaptation 19 from response options (Simpson et al., 2021b; Williams et al., 2021). 20 21 9.1.2 Major Conclusions from Previous Assessments 22 23 Based on an analysis of 1,022 mentions of Africa or African countries across the three AR6 Special Reports, 24 the following main conclusions emerged. 25 26
• Hot days, hot nights and heatwaves have become more frequent; heatwaves have also become longer 27 (high confidence). Drying is projected particularly for West and southwestern Africa (high confidence) 28 (IPCC, 2018c; Shukla et al., 2019). 29
• Climate change is contributing to land degradation, loss of biodiversity, bush encroachment and spread 30 of pests and invasive species (SR1.5, SRCCL, SROCC). 31
• Climate change has already reduced food security through losses in crop yields, rangelands, livestock 32 and fisheries, deterioration in food nutritional quality, access and distribution and price spikes. Risks to 33 crop yields are substantially less at 1.5℃ compared with 2℃ of global warming, with a large reduction 34
ACCEPTED VERSIO
N
SUBJECT TO FIN
AL EDITS

FINAL DRAFT Chapter 9 IPCC WGII Sixth Assessment Report
Do Not Cite, Quote or Distribute 9-13 Total pages: 225
in maize cropping areas projected even for 1.5℃, as well as reduced fisheries catch potential (SR1.5, 1 SRCCL, SROCC). 2
• Increased deaths from undernutrition, malaria, diarrhoea, heat stress and diseases related to exposure to 3 dust, fire smoke and other air pollutants are projected from further warming (IPCC, 2018c; Shukla et al., 4 2019). 5
• The largest reductions in economic growth for an increase from 1.5℃ to 2℃ of global warming are 6 projected for low- and middle-income countries, including in Africa (IPCC, 2018c). 7
• Climate change interacts with multidimensional poverty, among other vulnerabilities. Africa is projected 8 to bear an increasing proportion of the global exposed and vulnerable population at 2℃ and 3℃ of 9 global warming (IPCC, 2018c). 10
• Poverty and limited financing continue to undermine adaptive capacity, particularly in rapidly growing 11 African cities (Shukla et al., 2019). 12
• Large-scale afforestation and bioenergy can reduce food availability and ecosystem health (IPCC, 13 2018c) (SRCCL 2019). 14
• Transitioning to renewable energy would reduce reliance on wood fuel and charcoal, especially in urban 15 areas, with co-benefits including reduced deforestation, desertification, fire risk and improved indoor air 16 quality, local development and agricultural yield (Shukla et al., 2019). 17
• Sustainable use of biodiversity, conservation agriculture, reduced deforestation, land and watershed 18 restoration, rainwater harvesting and well-planned reforestation can have multiple benefits for adaptation 19 and mitigation, including water security, food security, biodiversity, soil conservation and local surface 20 cooling (IPBES, 2018; Shukla et al., 2019). 21
• Climate resilience can be enhanced through improvements to early warning systems, insurance, 22 investment in safety nets, secure land tenure, transport infrastructure, communication, access to 23 information and investments in education and strengthened local governance (Shukla et al., 2019). 24
• Scenarios of socio-environmental change are underused in decision-making in Africa (IPBES, 2018). 25
• Africa’s rich biodiversity together with a wealth of indigenous knowledge and local knowledge is a key 26 strategic asset for sustainable development (IPBES, 2018). 27
28 9.1.3 What’s New on Africa in AR6? 29 30
1. Increased confidence in observed and projected changes in climate hazards, including heat and 31 precipitation. 32
2. Increased regional, national and sub-national observed impacts and projected risks. 33 3. Loss and damage assessment. 34 4. Increased quantification of projected risks at 1.5℃, 2℃, 3℃ and 4℃ of global warming (Section 35
9.2; Figure 9.6). 36 5. Improved assessment of sea level rise risk (Sections 9.9 and 9.12). 37 6. Increased quantification of risk across all sectors assessed. 38 7. Expanded assessment of adaptation feasibility and effectiveness and limits to adaptation (Figure 39
9.7). 40 8. Assessment of adaptation finance (Section 9.4.1). 41 9. Increased assessment of how climate risk and adaptation and mitigation response options are 42
interlinked across multiple key development sectors (Section 9.4.3; Boxes 9.4 and 9.5). 43 44 9.1.4 Extent of Climate Change Impacts Across Africa 45 46 In many parts of southern, East and West Africa, temperature or precipitation trends since the 1950s are 47 attributable to anthropogenic climate change and several studies document the impacts of these climate 48 trends on human and natural systems (high confidence) (Figure 9.3; Sections 9.5.6 and 9.5.7). Nevertheless, 49 research into attribution of trends to anthropogenic climate change or climate impacts remains scarce for 50 multiple regions, especially in North and Central Africa. This illustrates an ‘attribution gap’ where robust 51 evidence for attributable impacts is twice as prevalent in high compared to low-income countries globally 52 (Callaghan et al., 2021). Most studies on climate impacts in Africa have focused on terrestrial ecosystems or 53 water, with fewer on marine ecosystems, agriculture, migration and health and well-being (Callaghan et al., 54 2021). Specific factors driving these knowledge gaps include limited data collection, data access and 55 research funding for African researchers (see next section). 56
ACCEPTED VERSIO
N
SUBJECT TO FIN
AL EDITS
FINAL DRAFT Chapter 9 IPCC WGII Sixth Assessment Report
Do Not Cite, Quote or Distribute 9-14 Total pages: 225
1 2
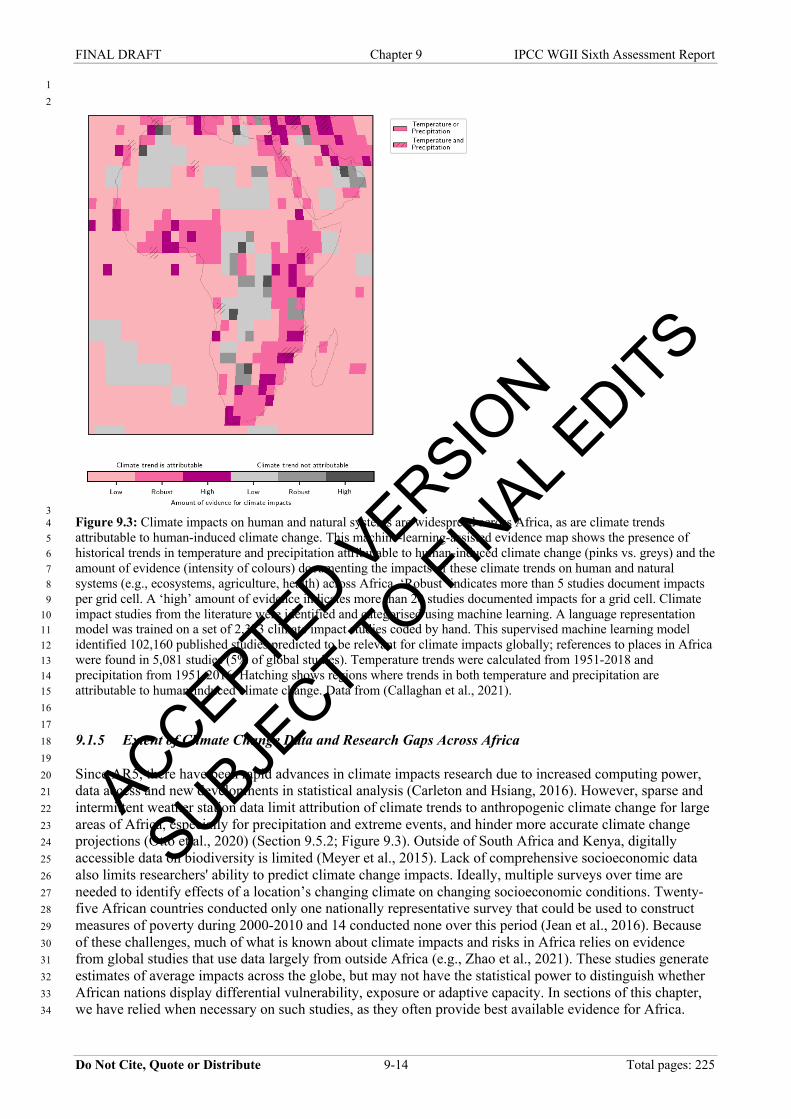
3 Figure 9.3: Climate impacts on human and natural systems are widespread across Africa, as are climate trends 4 attributable to human-induced climate change. This machine-learning-assisted evidence map shows the presence of 5 historical trends in temperature and precipitation attributable to human-induced climate change (pinks vs. greys) and the 6 amount of evidence (intensity of colours) documenting the impacts of these climate trends on human and natural 7 systems (e.g., ecosystems, agriculture, health) across Africa. ‘Robust’ indicates more than 5 studies document impacts 8 per grid cell. A ‘high’ amount of evidence indicates more than 20 studies documented impacts for a grid cell. Climate 9 impact studies from the literature were identified and categorised using machine learning. A language representation 10 model was trained on a set of 2,373 climate impact studies coded by hand. This supervised machine learning model 11 identified 102,160 published studies predicted to be relevant for climate impacts globally; references to places in Africa 12 were found in 5,081 studies (5% of global studies). Temperature trends were calculated from 1951-2018 and 13 precipitation from 1951-2016. Hatching shows regions where trends in both temperature and precipitation are 14 attributable to human-induced climate change. Data from (Callaghan et al., 2021). 15 16 17 9.1.5 Extent of Climate Change Data and Research Gaps Across Africa 18 19 Since AR5, there have been rapid advances in climate impacts research due to increased computing power, 20 data access and new developments in statistical analysis (Carleton and Hsiang, 2016). However, sparse and 21 intermittent weather station data limit attribution of climate trends to anthropogenic climate change for large 22 areas of Africa, especially for precipitation and extreme events, and hinder more accurate climate change 23 projections (Otto et al., 2020) (Section 9.5.2; Figure 9.3). Outside of South Africa and Kenya, digitally 24 accessible data on biodiversity is limited (Meyer et al., 2015). Lack of comprehensive socioeconomic data 25 also limits researchers' ability to predict climate change impacts. Ideally, multiple surveys over time are 26 needed to identify effects of a location’s changing climate on changing socioeconomic conditions. Twenty-27 five African countries conducted only one nationally representative survey that could be used to construct 28 measures of poverty during 2000-2010 and 14 conducted none over this period (Jean et al., 2016). Because 29 of these challenges, much of what is known about climate impacts and risks in Africa relies on evidence 30 from global studies that use data largely from outside Africa (e.g., Zhao et al., 2021). These studies generate 31 estimates of average impacts across the globe, but may not have the statistical power to distinguish whether 32 African nations display differential vulnerability, exposure or adaptive capacity. In sections of this chapter, 33 we have relied when necessary on such studies, as they often provide best available evidence for Africa. 34
ACCEPTED VERSIO
N
SUBJECT TO FIN
AL EDITS
FINAL DRAFT Chapter 9 IPCC WGII Sixth Assessment Report
Do Not Cite, Quote or Distribute 9-15 Total pages: 225
Increasing data coverage and availability would increase the ability to discern important differences in risk 1 both among and within African countries. 2 3 Climate-related research in Africa faces severe funding constraints with unequal funding relationships 4 between countries and with research partners in Europe and North America (high confidence). Based on 5 analysis of over 4 million research grants from 521 funding organisations globally, it is estimated from 1990-6 2020 USD 1,26 billion funded Africa-related research on climate impacts, mitigation and adaptation. This 7 represents only 3.8% of global funding for climate-related research – a figure incommensurate with Africa’s 8 high vulnerability to climate change (Overland et al., 2021) (Box 9.1; Chapter 8). Almost all funding for 9 Africa-related climate research originates outside Africa and goes to research institutions outside Africa 10 (Blicharska et al., 2017; Bendana, 2019; Siders, 2019; Overland et al., 2021). From 1990–2020, 78% of 11 funding for Africa-related climate research flowed to institutions in Europe and the United States – only 12 14.5% flowed to institutions in Africa (Overland et al., 2021) (Figure 9.4). Kenya (2.3% of total funding) 13 and South Africa (2.2%) are the only African countries among the top 10 countries in the world in terms of 14 hosting institutions receiving funding for climate-related research on Africa (Overland et al., 2021). 15 16 These unequal funding relations influence inequalities in climate-related research design, participation, and 17 dissemination between African researchers and researchers from high-income countries outside Africa, in 18 ways that can reduce adaptive capacity in Africa (very high confidence). Those empowered to shape research 19 agendas can shape research answers: climate research agendas, skills gaps and eligible researchers are 20 frequently defined by funding agencies, often from a Global North perspective (Vincent et al., 2020a). 21 Larger funding allocations for research focused on Ghana, South Africa, Kenya, Tanzania and Ethiopia are 22 reflected in higher concentrations of empirical research on impacts and adaptation options in these countries, 23 and there is a general lack of adaptation research for multiple of the most vulnerable countries in Africa 24 (Figure 9.5) (Callaghan et al., 2021; Overland et al., 2021; Sietsma et al., 2021; Vincent and Cundill, 2021). 25 The combination of Northern-led identification of both knowledge and skills gaps can result in projects 26 where African partners are positioned primarily as recipients engaged to support research and/or have their 27 ‘capacity built’ rather than also leading research projects on an equal basis (Vincent et al., 2020a; Trisos et 28 al., 2021). Analysis of >15,000 climate change publications found for over 75% of African countries 60–29 100% of climate change publications on these countries did not include a single local author, with authorship 30 dominated by researchers from richer countries outside Africa (Pasgaard et al., 2015). This can reduce 31 adaptive capacity in Africa as researchers at Global North institutions may shape research questions and 32 outputs for a Northern audience rather than providing actionable insights on priority issues for African 33 partners (Pasgaard et al., 2015; Nago and Krott, 2020). Moreover, in order to access research publications in 34 a timely manner, many researchers in Africa are forced to use shadow websites bypassing journal paywalls 35 (Bohannon, 2016). Ways to enhance research partnerships to produce actionable insights on climate impacts 36 and solutions in Africa include increased funding from African and non-African sources, projects funded by 37 non-African agencies, increasing direct control of resources for African partners and having African research 38 and user priorities set research questions, identify skills gaps and lead research, open access policies for 39 research outputs (ESPA Directorate, 2018; Vogel et al., 2019; Vincent et al., 2020a; IDRC, 2021; Trisos et 40 al., 2021). 41 42 43 ACCEPTED V
ERSION
SUBJECT TO FIN
AL EDITS
FINAL DRAFT Chapter 9 IPCC WGII Sixth Assessment Report
Do Not Cite, Quote or Distribute 9-16 Total pages: 225
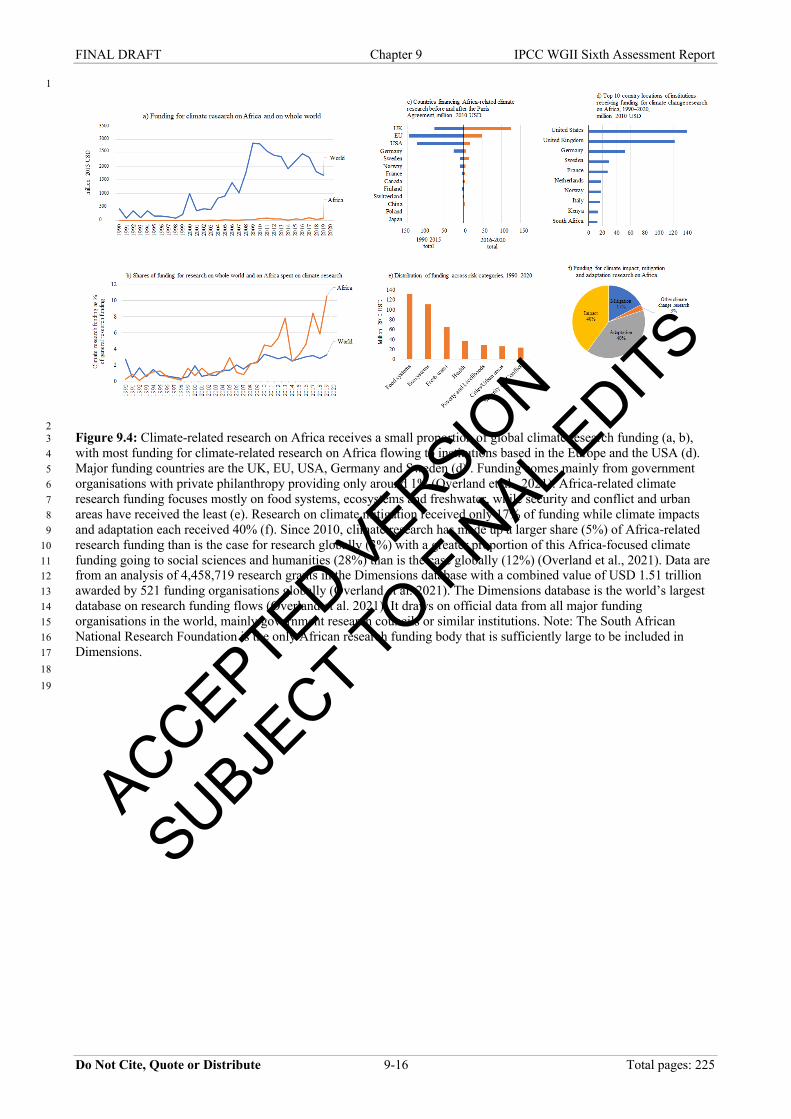
1
2 Figure 9.4: Climate-related research on Africa receives a small proportion of global climate research funding (a, b), 3 with most funding for climate-related research on Africa flowing to institutions based in the Europe and the USA (d). 4 Major funding countries are the UK, EU, USA, Germany and Sweden (d) . Funding comes mainly from government 5 organisations with private philanthropy providing only around 1% (Overland et al., 2021). Africa-related climate 6 research funding focuses mostly on food systems, ecosystems and freshwater, while security and conflict and urban 7 areas have received the least (e). Research on climate mitigation received only 17% of funding while climate impacts 8 and adaptation each received 40% (f). Since 2010, climate research has made up a larger share (5%) of Africa-related 9 research funding than is the case for research globally (3%) with a greater proportion of this Africa-focused climate 10 funding going to social sciences and humanities (28%) than is the case globally (12%) (Overland et al., 2021). Data are 11 from an analysis of 4,458,719 research grants in the Dimensions database with a combined value of USD 1.51 trillion 12 awarded by 521 funding organisations globally (Overland et al. 2021). The Dimensions database is the world’s largest 13 database on research funding flows (Overland et al. 2021). It draws on official data from all major funding 14 organisations in the world, mainly government research councils or similar institutions. Note: The South African 15 National Research Foundation is the only African research funding body that is sufficiently large to be included in 16 Dimensions. 17 18 19
ACCEPTED VERSIO
N
SUBJECT TO FIN
AL EDITS
FINAL DRAFT Chapter 9 IPCC WGII Sixth Assessment Report
Do Not Cite, Quote or Distribute 9-17 Total pages: 225
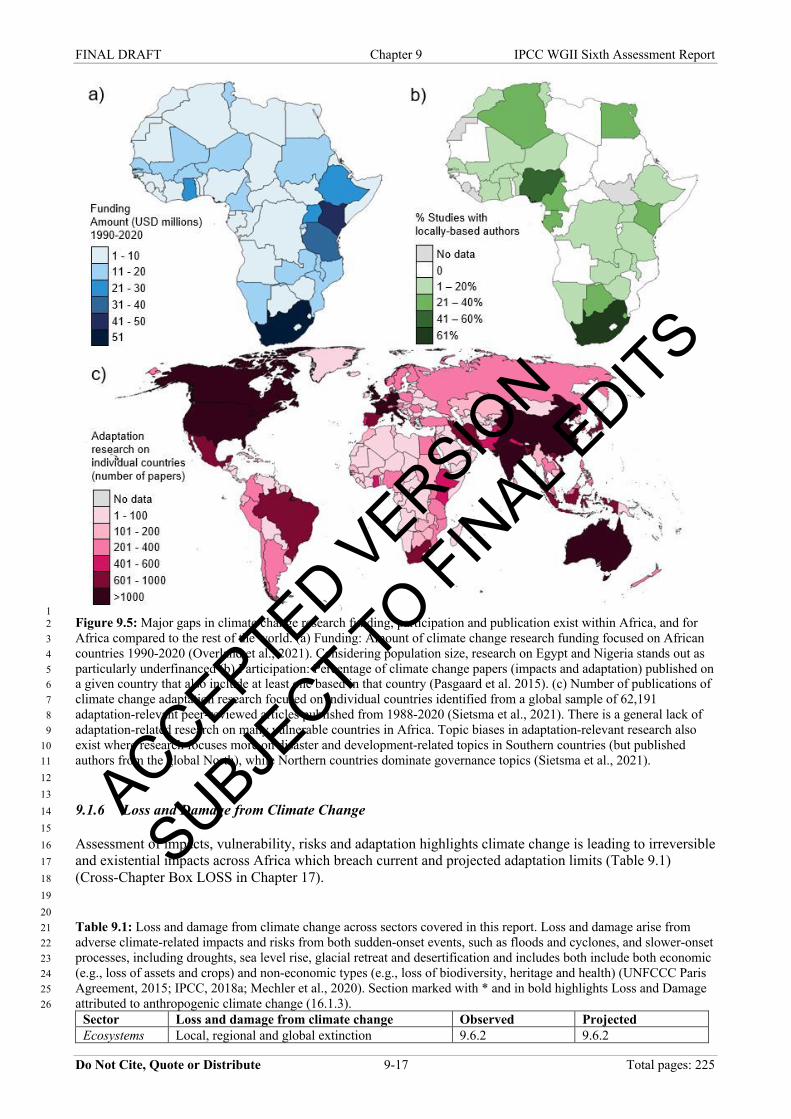
1 Figure 9.5: Major gaps in climate change research funding, participation and publication exist within Africa, and for 2 Africa compared to the rest of the world. (a) Funding: Amount of climate change research funding focused on African 3 countries 1990-2020 (Overland et al., 2021). Considering population size, research on Egypt and Nigeria stands out as 4 particularly underfinanced (b) Participation: Percentage of climate change papers (impacts and adaptation) published on 5 a given country that also include at least one based in that country (Pasgaard et al. 2015). (c) Number of publications of 6 climate change adaptation research focused on individual countries identified from a global sample of 62,191 7 adaptation-relevant peer-reviewed articles published from 1988-2020 (Sietsma et al., 2021). There is a general lack of 8 adaptation-related research on many vulnerable countries in Africa. Topic biases in adaptation-relevant research also 9 exist where research focuses more on disaster and development-related topics in Southern countries (but published 10 authors from the global North), while Northern countries dominate governance topics (Sietsma et al., 2021). 11 12 13 9.1.6 Loss and Damage from Climate Change 14 15 Assessment of impacts, vulnerability, risks and adaptation highlights climate change is leading to irreversible 16 and existential impacts across Africa which breach current and projected adaptation limits (Table 9.1) 17 (Cross-Chapter Box LOSS in Chapter 17). 18 19 20 Table 9.1: Loss and damage from climate change across sectors covered in this report. Loss and damage arise from 21 adverse climate-related impacts and risks from both sudden-onset events, such as floods and cyclones, and slower-onset 22 processes, including droughts, sea level rise, glacial retreat and desertification and includes both include both economic 23 (e.g., loss of assets and crops) and non-economic types (e.g., loss of biodiversity, heritage and health) (UNFCCC Paris 24 Agreement, 2015; IPCC, 2018a; Mechler et al., 2020). Section marked with * and in bold highlights Loss and Damage 25 attributed to anthropogenic climate change (16.1.3). 26
Sector Loss and damage from climate change Observed Projected Ecosystems Local, regional and global extinction 9.6.2 9.6.2
ACCEPTED VERSIO
N
SUBJECT TO FIN
AL EDITS

FINAL DRAFT Chapter 9 IPCC WGII Sixth Assessment Report
Do Not Cite, Quote or Distribute 9-18 Total pages: 225
Reduced ecosystem goods and services
Declining natural coastal protection and habitats
Altered ecosystem structure and declining
ecosystem functioning
Nature–based tourism
Biodiversity loss
9.6.1; 9.6.2
9.6.1; 9.6.2
9.6.1
9.6.3
9.6.2*
9.6.2
9.6.2
9.6.2
9.6.3
Water Declining lake and river resources
Reduced hydro-electricity and irrigation
Disappearing glaciers
Reduced groundwater recharge and salinization
Drought
9.7.1
9.7.2; 9.9.1
-
9.5.9*; 9.7.1
-
Box 9.4*
9.7.2
9.7.2; 9.9.3; Box 9.5
9.5.9
9.7.2
Food systems Reduced crop productivity and revenues
Increased livestock mortality and price shocks
Decreased fodder and pasture availability
Reduced fisheries catch and fisher livelihoods
9.7.2*, 9.8.1; 9.8.2;
9.11.1; Box 9.5
9.8.2
9.8.2
9.6.1; 9.8.5
9.8.2; 9.8.3; Box 9.5
9.8.2
9.8.2
9.8.5
Human settlements and Infrastructure
Loss or damage to formal and informal dwellings
Damage to transport systems
Damage to energy systems
Water supply, sanitation, education and health
infrastructure
Migration
9.9.2
9.9.2
9.9.2
9.9.2; 9.10; 9.11.1
9.9.1; Box 9.8
9.9.4
9.9.4
9.7.2; 9.9.4
9.7.3; 9.9.4; 9.10;
9.11.1
9.9.4; Box 9.8
Health Loss of life
Loss of productivity
Reduced nutrition
9.9.2*; 9.10.2; Box
9.9
9.10.3; 9.11.1
9.8.1; 9.10.2
9.9.4; 9.10.2
9.10.2; 9.11.2
9.10.2
Economy, poverty and Livelihoods
Loss of livelihoods, jobs and income
Reduced productive land
Reduced economic growth and increased
inequality
Community and involuntary displacement
Reduced labour productivity and earning potential
Delayed and poorer education progress
Reduced tourism
Increased urban in-migration
9.9.2; 9.10.2; 9.11.1
9.8.2
9.11.1*; Box 9.5
9.9.3; Box 9.8
9.11.1
9.11.1
9.6.3
9.8.1; 9.9.1; Table
Box 9.8
9.10.2; 9.11.2
9.8.2
9.11.2
9.9.4; Box 9.8
9.11.2
9.11.1
9.5.9, 9.6.3, 9.12.2
9.9.4; Table Box 9.8
Heritage Loss of traditional cultures and ways of life
Loss of language and knowledge systems
Damage to heritage sites
Box 9.2; 9.12.1
-
9.12.1
9.12.2
9.12.1
9.12.2
1 2 9.2 Key Risks for Africa 3 4 A key risk is defined as a potentially severe risk. In line with AR5, ‘severity’ relates to dangerous 5 anthropogenic interference with the climate system, the prevention of which is the ultimate objective of the 6 UNFCCC as stated in its Article 2 (Oppenheimer et al., 2014). The process for identifying key risks for 7 Africa included reviewing risks from the Africa chapter of AR5, and assessing new evidence on observed 8 impacts and projected risks in this chapter. 9 10 Several key risks were identified for both ecosystems and people including species extinction and ecosystem 11 disruption, loss of food production, reduced economic output and increased poverty, increased disease and 12 loss of human life, increased water and energy insecurity, loss of natural and cultural heritage, and 13 compound extreme events harming human settlements and critical infrastructure (Table 9.2). In order to 14 provide a sector and continent-level perspective, the key risks aggregate across different regions and 15 combine multiple risks within sectors. For detailed assessments of observed impacts and future risks within 16 each sector and each sub-region of Africa, see the sector-specific sections of this chapter (Sections 9.6.1 and 17 9.12.1). 18 19
ACCEPTED VERSIO
N
SUBJECT TO FIN
AL EDITS

FINAL DRAFT Chapter 9 IPCC WGII Sixth Assessment Report
Do Not Cite, Quote or Distribute 9-19 Total pages: 225
Several expert elicitation workshops of lead and contributing authors were held to develop ‘burning embers’ 1 assessing how risk increases with further global warming for a subset of key risks, specifically risk of food 2 production losses, risk of biodiversity loss and risk of mortality and morbidity from heat and infectious 3 disease (Figure 9.6). These key risks were selected in part because of underlying assessment work in the 4 chapter to connect multiple studies to observed impacts and/or risk at increasing global warming levels 5 (Sections 9.6.2, 9.8.2, 9.8.5.2 and 9.10.2). 6 7 All three of these key risks are assessed to have already transitioned completely into moderate risk—that is, 8 negative impacts have been detected and attributed to climate change—before the 2010–2020 level of global 9 warming (1.09°C) (IPCC, 2021), with medium confidence for increased mortality and morbidity and high 10 confidence for losses of food productivity and biodiversity (Figure 9.6). For biodiversity, these impacts 11 include repeated mass die-offs of coral reefs due to marine heat (Section 9.6.1.4), reductions in lake 12 productivity due to warming (Section 9.6.1.3), and woody encroachment of grasslands and savannas due to 13 increased atmospheric CO2 concentrations (Section 9.6.1.1), with negative impacts on livelihoods (Section 14 9.6.1). For food production, climate change impacts include up to 5.8% mean reduction in maize 15 productivity due to increased temperatures in sub-Saharan Africa (Section 9.8.2.1 and 9.8.2.2) and reduced 16 fisheries catches due to increased temperatures, especially in tropical regions (Section 9.8.2). For health, 17 climate change impacts include increased mortality and morbidity from changes in the distribution and 18 incidence of malaria and cholera and the direct effects of increasing temperatures (Section 9.10.2). 19 20 In scenarios with low adaptation (that is largely localised and incremental), the transition to high risk—21 widespread and severe impacts—has already begun at the current level of global warming for biodiversity 22 loss (high confidence), and begins below 1.5°C global warming for both food production (medium 23 confidence) and mortality and morbidity from heat and infectious disease (high confidence). Across all risks, 24 the best estimate for the transition to high risk is at 1.5°C of global warming, with transition to high risk 25 completing before 2°C (Figure 9.6). Projected impacts considered high risk around 1.5°C include: across 26 more than 90% of Africa, more than 10% of species are at risk of local extinction (Figure 9.6; Table 9.1); the 27 further expansion of woody plants into grass-dominated biomes (Section 9.6.2.1); 9% declines in maize yield 28 for West Africa and 20–60% decline in wheat yield for southern and northern Africa, as well as declines in 29 coffee and tea in East Africa and sorghum in West Africa (Figures 9.22 and 9.23; Section 9.8.2.1 and 30 9.8.2.2), and >12% decline in marine fisheries catch potential for multiple West African countries, 31 potentially leaving millions at risk of nutritional deficiencies (Figure 9.25; Section 9.8.5); tens of millions 32 more people exposed to vector-borne diseases in East and southern Africa (malaria), and North, East and 33 southern Africa (dengue, zika), increased risk of malnutrition in Central, East and West Africa, and more 34 than 15 additional deaths per 100,000 annually due to heat in parts of West, East and North Africa (Figures 35 9.32 and 9.35; Sections 9.10.2 and 9.9.4.1). 36 37 The transition from high to very high risk—that is severe and widespread impacts with limited ability to 38 adapt—begins either at or just below 2°C for all three risks (Figure 9.6). The assessed temperature range for 39 the transition to very high risk is wider for food production than for biodiversity and health. Projected 40 impacts for food include: 10–30% decline in marine fisheries catch potential for the Horn of Africa region 41 and southern Africa and more than 30% decline for West Africa at 2°C global warming, with greater 42 declines at higher levels of warming (Section 9.8.2). Beyond 2°C global warming, over 50% of 43 commercially important freshwater fish species across Africa are projected to be vulnerable to extinction 44 (Figure 9.26). Between 2℃ and 4℃, wheat, maize and rice yields are projected, on average, to be lower than 45 2005 yields across all regions of Africa. From 2℃ global warming, over 40% losses in rangeland 46 productivity are projected for western Africa. By 3.75°C, severe heat stress may be near year-round for cattle 47 across tropical Africa (Figure 9.24). Multiple countries in West, Central and East Africa are projected to be 48 at risk from simultaneous negative impacts on crops, fisheries and livestock (Thiault et al., 2019) (9.8.2; 49 9.8.5). 50 51 The best estimate for the onset of very high risk for biodiversity and health is at 2.1°C. Projected impacts 52 considered very high risk for biodiversity include potential destabilisation of the African tropical forest 53 carbon sink, risk of local extinction of more than 50% of plants, vertebrate and insect species across one-fifth 54 of Africa, 7–18% of African species at risk of total extinction including, a third of freshwater fish, and more 55 than 90% warm-water coral reefs lost (Section 9.6.2). For health, projected impacts considered high risk 56 include potentially lethal heat exposure for more than 100 days per year in West, Central and East Africa, 57
ACCEPTED VERSIO
N
SUBJECT TO FIN
AL EDITS

FINAL DRAFT Chapter 9 IPCC WGII Sixth Assessment Report
Do Not Cite, Quote or Distribute 9-20 Total pages: 225
with more than 50 additional heat-related deaths per 100,000 annually across large parts of Africa, and 1 hundreds of millions more people exposed to extreme heat in cities (Section 9.5, 9.10.2 and 9.9.4.1; Figure 2 9.35), tens to hundreds of thousands of additional cases of diarrhoeal disease in East, Central and West 3 Africa, and tens of millions more people exposed to mosquito-borne arboviruses like dengue or zika in 4 North, East and southern Africa (Section 9.10.2). 5 6 The feasibility and effectiveness of existing adaptation options under current levels of warming are assessed 7 in Section 9.10.2 and adaptation options considering future levels of warming are assessed in the chapter 8 section for each sector. 9 10 11
12 Figure 9.6: Burning Embers showing increasing risk due to climate change for selected key risks in Africa. Projected 13 increase is assessed for global warming increasing above pre-industrial levels (1850–1900). All three risks are assessed 14 to have already transitioned to moderate risk by the recent level of global warming 2010–2020 (1.09°C). Risks are 15 characterized as undetectable, moderate, high, or very high, and the transition between risk levels as a function of global 16 warming is represented by the colour change of each bar (IPCC, 2021). For range of global warming levels for each risk 17 transition used to make this figure see Supplementary Material Table SM 9.1. 18 19 20 Table 9.2: Key risks from climate change in Africa 21
Key climate change risk Climate impact driver Vulnerability Chapter section
Local or global extinction
of species and reduction
or irreversible loss of
ecosyste§ms and their
services, including
freshwater, land and
ocean ecosystems
Increasing temperatures of
freshwaters, ocean and on
land; heatwaves;
precipitation changes
(both increases and
decreases); increased
atmospheric CO2
Vulnerability highest
among poorly dispersing
organisms (plants) and
species with narrow and
disappearing niches (e.g.
mountain endemics), and
is exacerbated by non-
9.6
ACCEPTED VERSIO
N
SUBJECT TO FIN
AL EDITS

FINAL DRAFT Chapter 9 IPCC WGII Sixth Assessment Report
Do Not Cite, Quote or Distribute 9-21 Total pages: 225
concentrations; sea level
rise; ocean acidification
climate hazards (e.g.
habitat loss for agriculture
or afforestation projects);
Vulnerability is high for
Protected Areas
surrounded by
transformed land
preventing species'
dispersal and areas with
limited elevational
gradients that reduce their
potential to act as climate
refugia
Loss of food production
from crops, livestock and
fisheries
Increasing temperatures
and heat waves for
freshwaters, ocean and on
land; precipitation
changes; drought;
increased atmospheric
CO2 concentrations
High for low-income
coastal and riparian
communities whose
livelihood depends on
healthy ocean and
freshwater ecosystems,
and for populations reliant
on fish for protein and
micronutrients.
Vulnerability is high for
many food producers
dependent on rainfall and
temperature conditions,
including subsistence
farmers, the rural poor,
and pastoralists. Lack of
access to climate
information and services
increases vulnerability.
9.8
Mortality and morbidity
from heat and infectious
diseases
Increasing temperatures;
heatwaves; precipitation
change (both increases
and decreases)
Vulnerability is highest
for the elderly, pregnant
women, individuals with
underlying conditions,
immune-compromised
individuals (e.g., from
HIV), and young children.
Regions without vector
control programmes in
place or without detection
and treatment regimens.
Inadequate insulation in
housing in informal
settlements in urban heat
islands. Inadequate
improvements in public
health systems.
Inadequate water and
sanitation infrastructure,
especially in rapidly
expanding urban areas and
informal settlements.
9.10
ACCEPTED VERSIO
N
SUBJECT TO FIN
AL EDITS

FINAL DRAFT Chapter 9 IPCC WGII Sixth Assessment Report
Do Not Cite, Quote or Distribute 9-22 Total pages: 225
Reduced economic output
and growth, and increased
inequality and poverty
rates
Increased temperatures;
reduced rainfall; extreme
weather events
Conditions underlying
severe risk are lower
income growth, higher
population levels, low
rates of structural
economic change with
more of the labour force
engaged in agriculture and
other more climate-
exposed sectors due in
part to physical labour
outdoors.
9.11
Water and energy
insecurity due to shortage
of irrigation and
hydropower.
Heat and drought High reliance on
hydropower for national
electricity generation,
especially East and
Southern African
countries. Planned for
high reliance on irrigated
food production.
Concentrations of
hydropower plants within
river basins experiencing
similar rainfall and run-off
patterns. Limited
electricity trade between
major river basins.
9.7, 9.9, Box 9.5
Cascading and
compounding risks of loss
of life, livelihoods and
infrastructure in human
settlements.
Extreme heat; floods;
drought; sea level rise and
associated coastal
hazards; compound
climate hazards (e.g.,
coinciding heat and
drought)
Coastal and low-lying
urban areas and those in
dryland regions with
rapidly growing
populations. People living
in informal settlements.
Increased magnitude of
heat waves due to urban
heat island effects.
Climate-shocks to
municipal revenues (e.g.,
from water). Unaffordable
maintenance of transport
and protective
infrastructure with
increasing climate
impacts. Greater water
resource demand from
urban and non-urban
populations and key
economic sectors
9.9
1 2 9.3 Climate Adaptation Options 3 4 9.3.1 Adaptation Feasibility and Effectiveness 5 6 Based on a systematic assessment of observed climate adaptation responses in the scientific literature 7 covering 827 adaptation response types in 553 studies (2013–2021), and expert elicitation process, 24 8 categories of adaptation responses in Africa were identified (Williams et al., 2021). This assessment 9 excluded autonomous adaptation in ecosystems, such as migration and evolution of animal and plant species. 10 11
ACCEPTED VERSIO
N
SUBJECT TO FIN
AL EDITS

FINAL DRAFT Chapter 9 IPCC WGII Sixth Assessment Report
Do Not Cite, Quote or Distribute 9-23 Total pages: 225
1
2 Figure 9.7: Assessment of feasibility of observed climate adaptation responses under current climate conditions for 24 3 categories of adaptation responses across regions of Africa. The assessment comprised evaluation of each adaptation 4 category along six feasibility dimensions: economic viability, environmental sustainability, social validity, institutional 5 relevance, technological availability, and potential for risk reduction (considering current climate conditions) (Williams 6 et al., 2021). Fifty-six experts on the African region were consulted using a structured, expert-driven elicitation process 7 to increase the coverage and robustness of the continent-wide adaptation feasibility and effectiveness assessment in 8 Williams et al. (2021). Assessment included both peer-reviewed articles and grey literature. 9 10 11 At the current global warming level, 83% of adaptation response categories assessed showed medium 12 potential for risk reduction (that is, mixed evidence of effectiveness). Bulk water infrastructure (including 13 managed aquifer recharge, dams, pipelines, pump stations, water treatment plants and distribution networks), 14 human migration, financial investment for agricultural intensification, and social infrastructure (including 15 decentralised management, strong community structures and informal support networks) show high potential 16 for risk reduction (high evidence of option’s effectiveness) (Sections 9.6.4 and 9.7.3; Boxes 9.8, 9.9, 9.10 17 and 9.11). However, there was limited evidence to assess the continued effectiveness of these options at 18 higher global warming levels (Williams et al., 2021) with some options, such as bulk water infrastructure 19 (particularly large dams), expected to face increasing risk with continued warming with damages cascading 20 to other sectors (see Box 9.5), while others, such as crop irrigation and adjusting planting times, may 21 increasingly reach adaptation limits above 1.5°C and 2°C global warming (Sections 9.8.3 and 9.8.4) 22 23 The majority of adaptation studies were in West and East Africa (Ghana, Ethiopia, Kenya and Tanzania), 24 followed by southern Africa, with the least coming from Central and North Africa (Figure 9.7) (Williams et 25 al., 2021). Most studies were on adaptation actions in the food sector, with the least on health (Figure 9.7). 26 The five adaptation response categories with the highest number of reported actions were sustainable water 27
ACCEPTED VERSIO
N
SUBJECT TO FIN
AL EDITS

FINAL DRAFT Chapter 9 IPCC WGII Sixth Assessment Report
Do Not Cite, Quote or Distribute 9-24 Total pages: 225
management (food sector), resilient infrastructure and technologies (health sector), agricultural 1 intensification (food sector), human migration (poverty and livelihoods) and crop management (food sector). 2 3 No adaptation response categories were assessed to have high feasibility of implementation. Technological 4 barriers dominate factors limiting implementation (92% of adaptation categories have low technological 5 feasibility) followed by institutional barriers (71% of adaptation categories have low institutional feasibility). 6 This assessment matches review studies finding institutional responses to be least common in Africa and 7 highlight inadequate institutional capacities as key limits to human adaptation (Berrang-Ford et al., 2021; 8 Thomas et al., 2021) (Cross-Chapter Box FEASIB in Chapter 18). Feasibility is higher for the social 9 dimension of adaptation responses (with moderate feasibility for 88% of categories). The largest evidence 10 gap is for environmental feasibility for which 67% could not be assessed due to insufficient evidence (Figure 11 9.7). 12 13 Sustainable Water Management (SWM) includes rainwater harvesting for irrigation, watershed restoration, 14 water conservation practices (e.g., efficient irrigation) and less water-intensive cropping (also see Section 15 9.8.3), and was the most reported adaptation response in the food sector. SWM was assessed with medium 16 economic and social feasibility and low environmental, institutional and technological feasibility. The 17 feasibility of this adaptation category may depend largely on socioeconomic conditions (Amamou et al., 18 2018; Harmanny and Malek, 2019; Schilling et al., 2020), as many African farmers cannot afford the cost of 19 sustainable water management facilities (Section 9.8.4). 20 21 Resilient Infrastructure and Technologies (RIT) for health include improved housing to limit exposure to 22 climate hazards (Stringer et al., 2020), and improved water quality, sanitation and hygiene infrastructure 23 (e.g., technology across all sectors to prevent contamination and pollution of water, improved water, 24 sanitation and hygiene (WASH) approaches such as promotion of diverse water sources for water supply, 25 improving health infrastructure) (Section 9.10.3). Overall, RIT had medium social feasibility and low 26 institutional and technological feasibility. Bulk water infrastructure was assessed to have high effectiveness, 27 but low institutional and technological feasibility. Increasing variability in climate and environmental 28 challenges has made sustainable and resilient infrastructure design a key priority (Minsker et al., 2015). RIT 29 is, however, generally new in the African context (Cumming et al., 2017) and that may be why there is 30 limited evidence to assess some of its dimensions (economic and environmental feasibility). Construction of 31 resilient public water infrastructures that include safeguards for sanitation and hygiene are expensive and, 32 across national and local levels, planning for its construction poses multiple challenges (Choko et al., 2019). 33 34 Agricultural intensification (including mixed cropping, mixed farming, no soil disturbance, mulching) in 35 many smallholder farming systems remains a key response option to secure food for the growing African 36 population (Nziguheba et al., 2015; Ritzema et al., 2017). Yet this option faces low environmental, 37 institutional and technological feasibility (Figure 9.7). Social and economic feasibility is higher, but barriers 38 include high cost of farm inputs (land, capital and labour), lack of access to timely weather information and 39 lack of water resources can make this option quite challenging for African smallholder farmers (Kihila, 40 2017; Williams et al., 2019b) (Sections 9.8.1 and 9.11.4). 41 42 Crop management includes adjusting crop choices, planting times, or the size, type and location of planted 43 areas (Altieri et al., 2015; Nyagumbo et al., 2017; Dayamba et al., 2018). This option faces environmental, 44 institutional and technological barriers to feasibility. Social and economic barriers to implementation are 45 fewer. Factors such as tenure and ownership rights, labour requirements, high investment costs and lack of 46 skills and knowledge on how to use the practices are reported to hinder implementation of crop management 47 options by smallholder farmers (Muller and Shackleton, 2013; Nyasimi et al., 2017). For instance, when 48 improved seed varieties are available, high price limits access for rural households (Amare et al., 2018) (see 49 Sections 9.8.3 and 9.8.4). 50 51 Human migration was assessed to have high potential for risk reduction (Rao et al., 2019; Sitati et al., 2021) 52 (Cross-Chapter Box MIGRATE in Chapter 7, Box 9.8). However, it had low feasibility for economic, 53 institutional and technological dimensions, with limited evidence on environmental feasibility. Institutional 54 factors such as the implementation of top-down policies have been reported as limiting options for coping 55 locally, resulting in migration (Brockhaus et al., 2013). Limited financial and technical support for migration 56 limits the extent to which it can make meaningful contributions to climate resilience (Djalante et al., 2013; 57
ACCEPTED VERSIO
N
SUBJECT TO FIN
AL EDITS
FINAL DRAFT Chapter 9 IPCC WGII Sixth Assessment Report
Do Not Cite, Quote or Distribute 9-25 Total pages: 225
Trabacchi and Mazza, 2015). International and domestic remittances are an important resource that can help 1 aid recovery from climate shocks, but inadequate finance and banking infrastructure can limit cash transfers 2 (Box 9.8). Male migration can increase burdens of household and agricultural work, especially for women 3 (Poudel et al., 2020; Rao et al., 2020; Zhou et al., 2020). The more agency migrants have (that is, degree of 4 voluntarity and freedom of movement), the greater the potential benefits for sending and receiving areas 5 (high agreement, medium evidence) (Cross-Chapter Box MIGRATE in Chapter 7, Box 9.8) 6 7 Adaptation options within a number of categories, including sustainable agriculture practices, agricultural 8 intensification, fisheries management, health advisory services and education, social infrastructure, 9 infrastructure and built environment and livelihood diversification were observed to reduce socioeconomic 10 inequalities (Williams et al., 2021). Whether adaptation options reduce inequality can be a key consideration 11 enhancing acceptability of policies and adaptation implementation (Islam and Winkel, 2017) (Box 9.1; 12 Section 9.11.4). 13 14 9.3.2 Adaptation Co-Benefits and Trade-Offs with Mitigation and SDGs 15 16 Synergies between the adaptation and progress towards the Sustainable Development Goals (SDGs) present 17 potential co-benefits for realising multiple objectives towards Climate Resilient Development in Africa, 18 increasing the efficiency and cost-effectiveness of climate actions (Cohen et al., 2021). However, designing 19 adaptation policy under conditions of scarcity, common to many African countries, can inadvertently lead to 20 trade-offs between adaptation options, as well as between adaptation and mitigation options, can reinforce 21 inequality, and fail to address underlying social vulnerabilities (Kuhl, 2021). 22 23 Adaptation options such as access to climate information, provision of climate information services, growing 24 of early maturing varieties, agroforestry systems, agricultural diversification and growing of drought-25 resistant varieties of crops may deliver co-benefits, providing synergies that result in positive outcomes. For 26 instance, in SSA drylands including northern Ghana and Burkina Faso and large parts of the Sahel, migration 27 as a result of unfavourable environmental conditions closely linked to climate change has often provided 28 opportunities for farmers to earn income (SDG 1) and mitigate the effects of climate-related fluctuations in 29 crop and livestock productivity (SDG 2) (Zampaligré et al., 2014; Antwi-Agyei et al., 2018; Wiederkehr et 30 al., 2018). Renewable energy can mitigate climate effects (SDG 13), improve air quality (SDG 3), wealth 31 and development (SDGs 1, 2). 32 33 Different types of irrigation including drip and small-scale irrigation can contribute towards increased 34 agricultural productivity (SDG 2), improved income (SDG 1) and food security (SDG 2) and increase 35 resilience to long-term changes in precipitation (SDG 13) (Bjornlund et al., 2020). In Kenya and Tanzania, 36 small-scale irrigation provides employment opportunities and income to both farmers and private businesses 37 (SDGs 8 and 9) (Lefore et al., 2021; Simpson et al., 2021c). Land management practices including the use of 38 fertilizers and mulching have also been highlighted as adaptation options improving soil fertility for better 39 yields (SDG 2) and delivering opportunities to reduce the climate change effects (SDG 13) (Muchuru and 40 Nhamo, 2019). 41 42 Climate smart agriculture (CSA) offers opportunities for smallholder farmers to increase productivity (SDG 43 2), build adaptive capacity whilst reducing the emission of greenhouse gases (SDG 13) from agricultural 44 systems (Lipper et al., 2014; Mutenje et al., 2019). CSA practices including conservation agriculture, access 45 to climate information, agroforestry systems, drip irrigation, planting pits and erosion control techniques 46 (Partey et al., 2018; Antwi-Agyei et al., 2021) can improve soil fertility, increase yield and household food 47 security (Zougmoré et al., 2016; Zougmoré et al., 2018), thereby contributing to the realisation of SDG 2 in 48 Africa (Mbow et al., 2014). 49 50 On the contrary, adaptation actions may induce trade-offs with mitigation objectives, as well as other 51 adaptation and developmental outcomes, delivering negative impacts and compromising the attainment of 52 the SDGs. For example, increased deployment of renewable energy technologies can drive future land use 53 changes (Frank et al., 2021) and threaten important biodiversity areas if poorly deployed (Rehbein et al., 54 2020). The use of early-maturing or drought-tolerant crop varieties may increase resilience (SDGs 1, 2), but 55 adoption by smallholder farmers can also be hindered by affordability of seed. Cultivation of biodiesel crops 56 also can hinder food security (SDG 2) at local and national levels (Tankari, 2017; Brinkman et al., 2020). 57
ACCEPTED VERSIO
N
SUBJECT TO FIN
AL EDITS
FINAL DRAFT Chapter 9 IPCC WGII Sixth Assessment Report
Do Not Cite, Quote or Distribute 9-26 Total pages: 225
Additionally, the use of fertilizers in intense systems can result in increased environmental degradation 1 (Akinyi et al., 2021). When farmers migrate, it puts pressure on inadequate social services provision and 2 facilities at their destination (SDG 8) and leads to reduced farm labour and a deterioration of the workforce 3 and assets (SDG 2) (Gemenne and Blocher, 2017a), which negatively affects farm operations and non-4 migrants, particularly women, elderly and children, at the point of origin (Nyantakyi-Frimpong and Bezner-5 Kerr, 2015; Ahmed et al., 2016; Otto et al., 2017; Eastin, 2018). Farmers may also miss critical periods 6 during the farming season that eventually makes them food insecure (SDG 2) and vulnerable to climate 7 change (SDG 13) (Antwi-Agyei et al., 2018). Migrants should be supported to reduce their overall shocks to 8 climate vulnerability at the points of origin and destination. Small-scale irrigation infrastructure if not 9 managed properly, may lead to negative environmental effects and compromise the integrity of riparian 10 ecosystems (SDG 15) (Loucks and van Beek, 2017) and serve as breeding grounds for malaria-causing 11 mosquitoes (SDG 3) (Attu and Adjei, 2018). 12 13 14 9.4 Climate Resilient Development 15 16 Climate resilient development (CRD) is a process of implementing greenhouse gas mitigation and adaptation 17 measures to support sustainable development for all (Denton et al., 2014; Andrijevic et al., 2020; Owen, 18 2020; Cornforth et al., 2021). It emphasises equity as a core element of sustainable development as well as 19 conditions for inclusive and sustained economic growth, shared prosperity and decent work for all, taking 20 into account different levels of national development and capacities as encoded in the SDGs (Section 9.3.2; 21 Chapter 18, Section 18.1). This chapter section identifies five key dimensions of CRD for Africa: climate 22 finance, governance, cross-sectoral and transboundary solutions, adaptation law and climate services and 23 literacy. 24 25 9.4.1 Climate Finance 26 27 Access to adequate financial resources is crucial for climate change adaptation (Cross-Chapter Box 28 FINANCE in Chapter 17). Since the Copenhagen Accord (UNFCCC, 2009), and then extended by the Paris 29 Agreement (UNFCCC Paris Agreement, 2015 see Article 4.4, and also 4.8, 4.9), developed countries are 30 expected to scale up climate finance for developing countries toward a collective goal of USD 100 billion 31 per year by 2020, with a balanced allocation between adaptation and mitigation. 32 33 9.4.1.1 How Much Adaptation Finance is Needed? 34 35 There is limited research providing quantitative estimates of adaptation costs across Africa. Adaptation costs 36 in Africa have been estimated at USD 7–15 billion per year by 2020 (Schaeffer et al., 2013), corresponding 37 to USD 5–11 per capita per year. The African Development Bank estimates costs of near-term adaptation 38 needs identified in the Intended NDCs (INDCS) of African countries as USD 7.4 billion per year from 2020, 39 recognising INDCs describes only a limited subset of adaptation needs (AfDB, 2019). Many African 40 countries, particularly Least Developed Countries (LDCs), express a stronger demand for adaptation finance 41 – a study of financial demands in INDCs for 16 African countries suggests a ratio around 2:1 for adaptation 42 to mitigation finance with demand for Eritrea and Uganda approximately 80% for adaptation (Zhang and 43 Pan, 2016). 44 45 Adaptation costs in Africa are expected to rise rapidly as global warming increases (high confidence). A 46 meta-analysis of adaptation costs identified in 44 NDCs and NAPs from developing countries estimated a 47 median adaptation cost around USD 17 per capita per year for 2020–2030 (Chapagain et al., 2020). 48 Adaptation cost estimates for Africa increase from USD 20–50 billion per year for RCP2.6 in 2050 (around 49 1.5°C of warming), to USD18–60 billion per year for just over 2°C, to USD 100–437 billion per year for 4°C 50 of global warming above pre-industrial levels (Schaeffer et al., 2013; UNEP, 2015; Chapagain et al., 2020). 51 Focusing on individual sectors, the average country-level cost is projected to be USD 0.8 billion per year for 52 adapting to temperature-related mortality under 4°C global warming (Carleton et al., 2018), with cumulative 53 energy costs for cooling demand projected to reach USD 51 billion by 2°C and USD 486 billion by 4°C 54 global warming (Parkes et al., 2019). Transport infrastructure repair costs are also projected to be substantial 55 (Section 9.8.2) More precise estimates are limited by methodological difficulties and data gaps for costing 56 adaptation, uncertainties about future levels of global warming and associated climate hazards, and ethical 57
ACCEPTED VERSIO
N
SUBJECT TO FIN
AL EDITS
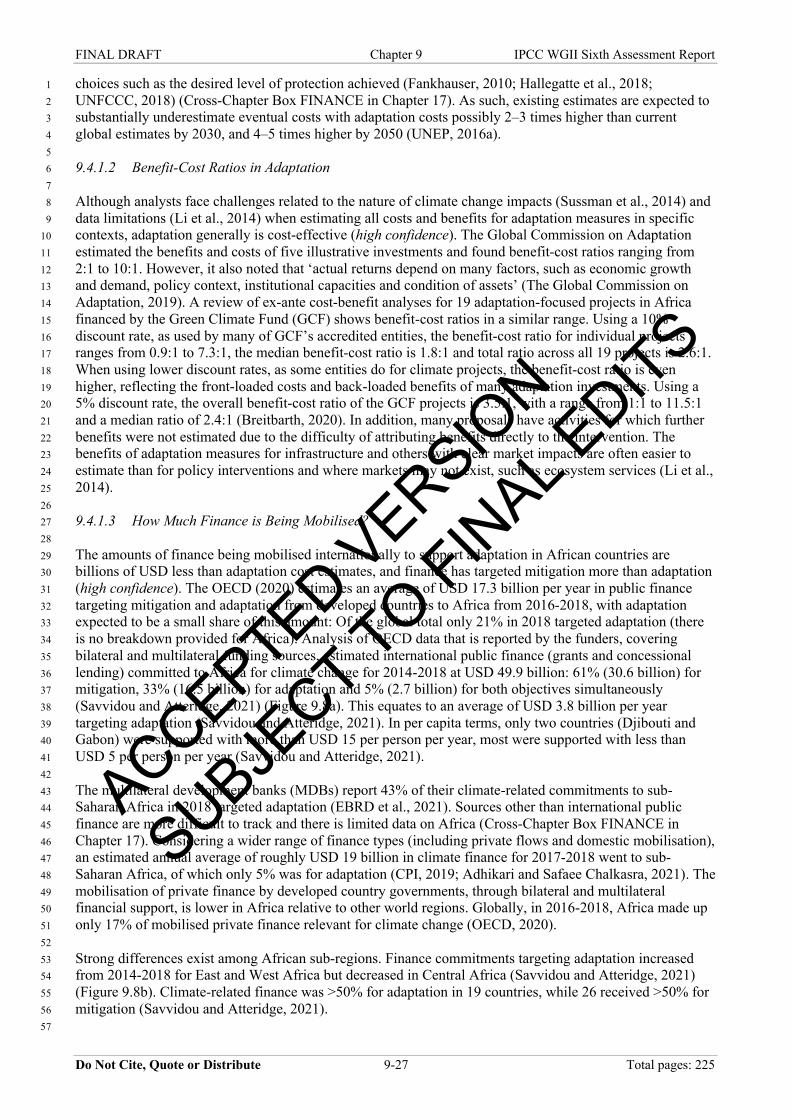
FINAL DRAFT Chapter 9 IPCC WGII Sixth Assessment Report
Do Not Cite, Quote or Distribute 9-27 Total pages: 225
choices such as the desired level of protection achieved (Fankhauser, 2010; Hallegatte et al., 2018; 1 UNFCCC, 2018) (Cross-Chapter Box FINANCE in Chapter 17). As such, existing estimates are expected to 2 substantially underestimate eventual costs with adaptation costs possibly 2–3 times higher than current 3 global estimates by 2030, and 4–5 times higher by 2050 (UNEP, 2016a). 4 5 9.4.1.2 Benefit-Cost Ratios in Adaptation 6 7 Although analysts face challenges related to the nature of climate change impacts (Sussman et al., 2014) and 8 data limitations (Li et al., 2014) when estimating all costs and benefits for adaptation measures in specific 9 contexts, adaptation generally is cost-effective (high confidence). The Global Commission on Adaptation 10 estimated the benefits and costs of five illustrative investments and found benefit-cost ratios ranging from 11 2:1 to 10:1. However, it also noted that ‘actual returns depend on many factors, such as economic growth 12 and demand, policy context, institutional capacities and condition of assets’ (The Global Commission on 13 Adaptation, 2019). A review of ex-ante cost-benefit analyses for 19 adaptation-focused projects in Africa 14 financed by the Green Climate Fund (GCF) shows benefit-cost ratios in a similar range. Using a 10% 15 discount rate, as used by many of GCF’s accredited entities, the benefit-cost ratio for individual projects 16 ranges from 0.9:1 to 7.3:1, the median benefit-cost ratio is 1.8:1 and total ratio across all 19 projects is 2.6:1. 17 When using lower discount rates, as some entities do for climate projects, the benefit-cost ratio is even 18 higher, reflecting the front-loaded costs and back-loaded benefits of many adaptation investments. Using a 19 5% discount rate, the overall benefit-cost ratio of the GCF projects is 3.5:1, with a range from 1:1 to 11.5:1 20 and a median ratio of 2.4:1 (Breitbarth, 2020). In addition, many proposals have activities for which further 21 benefits were not estimated due to the difficulty of attributing benefits directly to the intervention. The 22 benefits of adaptation measures for infrastructure and others with clear market impacts are often easier to 23 estimate than for policy interventions and where markets may not exist, such as ecosystem services (Li et al., 24 2014). 25 26 9.4.1.3 How Much Finance is Being Mobilised? 27 28 The amounts of finance being mobilised internationally to support adaptation in African countries are 29 billions of USD less than adaptation cost estimates, and finance has targeted mitigation more than adaptation 30 (high confidence). The OECD (2020) estimates an average of USD 17.3 billion per year in public finance 31 targeting mitigation and adaptation from developed countries to Africa from 2016-2018, with adaptation 32 expected to be a small share of this amount: Of the global total only 21% in 2018 targeted adaptation (there 33 is no breakdown provided for Africa). Analysis of OECD data that is reported by the funders, covering 34 bilateral and multilateral funding sources, estimated international public finance (grants and concessional 35 lending) committed to Africa for climate change for 2014-2018 at USD 49.9 billion: 61% (30.6 billion) for 36 mitigation, 33% (16.5 billion) for adaptation and 5% (2.7 billion) for both objectives simultaneously 37 (Savvidou and Atteridge, 2021) (Figure 9.8a). This equates to an average of USD 3.8 billion per year 38 targeting adaptation (Savvidou and Atteridge, 2021). In per capita terms, only two countries (Djibouti and 39 Gabon) were supported with more than USD 15 per person per year, most were supported with less than 40 USD 5 per person per year (Savvidou and Atteridge, 2021). 41 42 The multilateral development banks (MDBs) report 43% of their climate-related commitments to sub-43 Saharan Africa in 2018 targeted adaptation (EBRD et al., 2021). Sources other than international public 44 finance are more difficult to track and there is limited data on Africa (Cross-Chapter Box FINANCE in 45 Chapter 17). Considering a wider range of finance types (including private flows and domestic mobilisation), 46 an estimated annual average of roughly USD 19 billion in climate finance for 2017-2018 went to sub-47 Saharan Africa, of which only 5% was for adaptation (CPI, 2019; Adhikari and Safaee Chalkasra, 2021). The 48 mobilisation of private finance by developed country governments, through bilateral and multilateral 49 financial support, is lower in Africa relative to other world regions. Globally, in 2016-2018, Africa made up 50 only 17% of mobilised private finance relevant for climate change (OECD, 2020). 51 52 Strong differences exist among African sub-regions. Finance commitments targeting adaptation increased 53 from 2014-2018 for East and West Africa but decreased in Central Africa (Savvidou and Atteridge, 2021) 54 (Figure 9.8b). Climate-related finance was >50% for adaptation in 19 countries, while 26 received >50% for 55 mitigation (Savvidou and Atteridge, 2021). 56 57
ACCEPTED VERSIO
N
SUBJECT TO FIN
AL EDITS

FINAL DRAFT Chapter 9 IPCC WGII Sixth Assessment Report
Do Not Cite, Quote or Distribute 9-28 Total pages: 225
African countries expect grants to play a crucial role in supporting adaptation efforts because loans add to 1 already high debt levels that exacerbate fiscal challenges, especially in light of high sovereign debt levels 2 from the COVID-19 pandemic (Bulow et al., 2020; Estevão, 2020). From 2014-2018, more finance 3 commitments targeting adaptation in Africa were debt instruments (57%) than grants (42%) (Savvidou and 4 Atteridge, 2021) (Figure 9.8c). 5 6 7
8 Figure 9.8: Finance targeting climate adaptation by sector and percentages of climate finance commitments that have 9 been disbursed in Africa (2014-2018) as reported to OECD. (a) Flows of committed finance targeting adaptation, (b) 10 trend over time in international development finance commitments targeting adaptation in Africa, and (c) country-level 11 shares of total climate finance that targeted adaptation or mitigation or both simultaneously. Source: (Savvidou and 12 Atteridge, 2021). 13 14 15 For Africa combined, the sectors targeted with most support for adaptation are Agriculture and Water Supply 16 and Sanitation, which account for half of total adaptation finance from 2014-2018 (Figure 9.9a). The sectoral 17 distribution has changed little over these years, suggesting adaptation planners and funders are maintaining a 18 relatively narrow view of where support is needed and how to build climate resilience (Savvidou and 19 Atteridge, 2021). 20 21 However, to understand actual expenditure on adaptation, it is necessary to look at disbursements (that is, the 22 amounts paid out versus committed amounts). Low ratios of disbursements to commitments suggest 23 difficulties in project implementation. Disbursement ratios for climate-related finance from all funders other 24 than MDBs (for which data is not published) in Africa are very low (Savvidou and Atteridge, 2021) (Figure 25 9.9b). Only 46% of 2014–2018 commitments targeting adaptation were dispersed (Savvidou and Atteridge, 26 2021). Regions faring worst are North Africa (15%), Central Africa (33%) and West Africa (33%) (Figure 27 9.9c). These disbursement ratios for adaptation and mitigation finance in Africa are lower than the global 28 average (Savvidou and Atteridge, 2021), which suggests greater capacity problems in implementing climate-29 related projects and, in turn, means lost opportunities to build resilience and adaptive capacity and a wider 30 gap in adaptation finance for Africa (Omari-Motsumi et al., 2019). 31 32 33
ACCEPTED VERSIO
N
SUBJECT TO FIN
AL EDITS
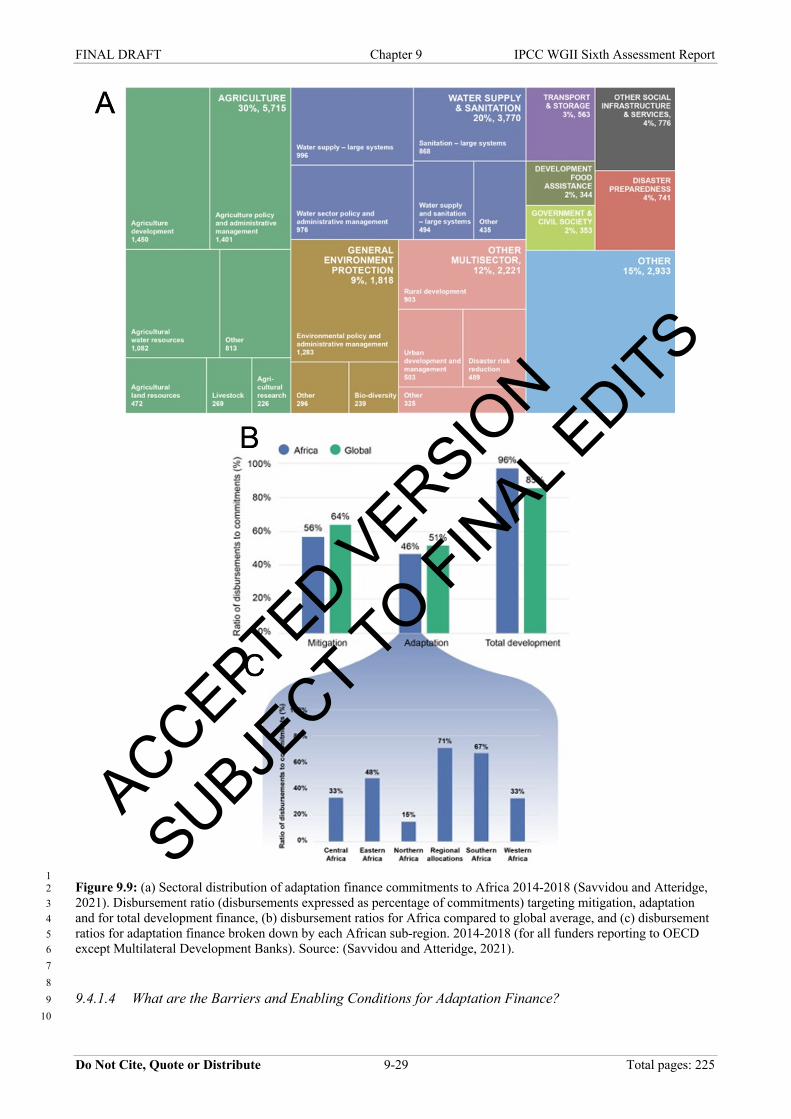
FINAL DRAFT Chapter 9 IPCC WGII Sixth Assessment Report
Do Not Cite, Quote or Distribute 9-29 Total pages: 225
1 Figure 9.9: (a) Sectoral distribution of adaptation finance commitments to Africa 2014-2018 (Savvidou and Atteridge, 2 2021). Disbursement ratio (disbursements expressed as percentage of commitments) targeting mitigation, adaptation 3 and for total development finance, (b) disbursement ratios for Africa compared to global average, and (c) disbursement 4 ratios for adaptation finance broken down by each African sub-region. 2014-2018 (for all funders reporting to OECD 5 except Multilateral Development Banks). Source: (Savvidou and Atteridge, 2021). 6 7 8 9.4.1.4 What are the Barriers and Enabling Conditions for Adaptation Finance? 9 10
ACCEPTED VERSIO
N
SUBJECT TO FIN
AL EDITS
FINAL DRAFT Chapter 9 IPCC WGII Sixth Assessment Report
Do Not Cite, Quote or Distribute 9-30 Total pages: 225
The present situation reflects not only an insufficient level of finance being mobilised to support African 1 adaptation needs (Section 9.4.1) but also problems in accessing and using funding that is available. The 2 direct access modality introduced by the Adaptation Fund and GCF, whereby national and regional entities 3 from developing countries can be accredited to access funds directly, is aimed at reducing transaction costs 4 for recipient countries, increasing national ownership and agency for adaptation actions, and enhancing 5 decision-making responsibilities by national actors, thereby contributing to strengthening local capacity for 6 sustained and transformational adaptation (CDKN, 2013; Masullo et al., 2015). Indeed, direct-access projects 7 from the Adaptation Fund tend to be more community focussed than indirect-access projects (Manuamorn 8 and Biesbroek, 2020). Country institutions in Africa, however, are struggling to be accredited for direct 9 access because of the complicated, lengthy and bureaucratic processes of accreditation, which requires, for 10 example, strong institutional and fiduciary standards and capacity to be in place (Brown et al., 2013; Omari-11 Motsumi et al., 2019). As of December 2019, over 80% of all developing countries had no national Direct 12 Access Entities (DAEs) (Asfaw et al., 2019). Capacity to develop fundable projects in Africa is also 13 inadequate. An analysis of proposals submitted to the GCF up to 2017 revealed that, while African countries 14 were able to submit proposals to the GCF, they had the lowest percentage of approvals (39%) compared to 15 all other regions (Fonta et al., 2018). This suggests the quality of proposals and therefore the capacity to 16 develop fundable proposals remains inadequate in the region. 17 18 Even when accredited, some countries experience significant institutional and financial challenges in 19 programming and implementing activities to support concrete adaptation measures (Omari-Motsumi et al., 20 2019). Low disbursement ratios suggest inadequate capacity to implement projects once they are approved 21 (Savvidou and Atteridge, 2021). Systemic barriers have been highlighted in relation to the multilateral 22 climate funds, including funds not providing full-cost adaptation funding, capacity barriers in the design and 23 implementation of adaptation actions (including the development of fundable project proposals) and barriers 24 in recognising and enabling the involvement of sub-national actors in the delivery and implementation of 25 adaptation action (Omari-Motsumi et al., 2019). As of 2017, most GCF disbursements to Africa (61.9%) 26 were directed to support national stakeholders’ engagement with regards to readiness activities, with only 27 11% directed to support DAEs in implementation of concrete projects/pipeline development (Fonta et al., 28 2018). While supporting readiness activities is important for strengthening country ownership and 29 institutional development, research suggests adaptation finance needs to shift towards implementation of 30 concrete projects and more pipeline development if the goal of transformative and sustained adaptation in 31 Africa is to be realised (Fonta et al., 2018; Omari-Motsumi et al., 2019). The source of these problems needs 32 to be better understood so that the prospects for future climate-related investments can be improved and 33 institutional strengthening and targeted project preparation can be supported (Omari-Motsumi et al., 2019; 34 Doshi and Garschagen, 2020; Savvidou and Atteridge, 2021). 35 36 Some progress has been made in supporting developing countries to enhance their adaptation actions. The 37 process to formulate and implement NAPs was established by parties under the UNFCCC to support 38 developing countries identify their vulnerabilities, and determine their medium- and long-term adaptation 39 needs (UNFCCC Paris Agreement, 2015). NAPs provide a means of developing and implementing strategies 40 and programmes to address those needs. In 2016, the parties agreed for the GCF to fund up to USD 3 million 41 per country for adaptation planning instruments, including NAPs. However, accessing funding through the 42 GCF for NAP formulation is challenging (Fonta et al., 2018) and, as of October 2020, four years after the 43 decision to fund NAPs, only six African countries had completed their NAPs (UNFCCC NAP Central). The 44 next step is to convert adaptation planning documents into programming pipeline projects that are fundable 45 and implementable, which presents a significant barrier to enhanced adaptation action (Omari-Motsumi et 46 al., 2019). 47 48 Adaptation finance has not been targeted more towards more vulnerable countries (Barrett, 2014; Weiler and 49 Sanubi, 2019; Doshi and Garschagen, 2020; Savvidou and Atteridge, 2021). Reasons for this include fast-50 growing middle-income countries offering larger gains in emission reductions, so finance has favoured 51 mitigation in these economies, even within sub-Saharan Africa, and as more climate finance uses debt 52 instruments, mitigation projects are further preferred because returns are perceived to be more certain (Rai et 53 al., 2016; Lee and Hong, 2018; Carty et al., 2020; Simpson et al., 2021c). 54 55 Many adaptation interventions for most vulnerable countries and communities provide no adequate financial 56 return on investments and can therefore only be funded with concessional public finance (Cross-Chapter Box 57
ACCEPTED VERSIO
N
SUBJECT TO FIN
AL EDITS
FINAL DRAFT Chapter 9 IPCC WGII Sixth Assessment Report
Do Not Cite, Quote or Distribute 9-31 Total pages: 225
FINANCE in Chapter 17). Yet, public funds alone are insufficient to meet rapidly growing adaptation needs. 1 Public mechanisms can help leverage private sector finance for adaptation by reducing regulatory, cost and 2 market barriers through blended finance approaches, public-private partnerships, or innovative financial 3 instruments and structuring in support of private sector requirements for risk and investment returns, such as 4 green bonds (Cross-Chapter Box FINANCE in Chapter 17). Subnational actors can be core agents to 5 conceptualize, drive, and deliver adaptation responses and unlock domestic resources in the implementation 6 of adaptation action (CoM SSA, 2019; Omari-Motsumi et al., 2019), provided they are sufficiently resourced 7 and their participation and agency are supported. 8 9 Many African countries are at high risk of debt distress, especially due to the COVID-19 pandemic, and will 10 need to decrease their debt levels to have the fiscal space to invest in climate resilience (Estevão, 2020; 11 Dibley et al., 2021). As of mid-2021, the G20’s Debt Service Suspension Initiative is providing temporary 12 relief for repayment of bilateral credit, but this has largely not been taken up by private lenders (Dibley et al., 13 2021; World Bank, 2021). The total external debt servicing payments combined for 44 African countries in 14 2019 were USD 75 billion (World Bank, 2018), far exceeding discussed levels of near-term climate finance. 15 Aligning debt relief with Paris Agreement goals could provide an important channel for increased financing 16 for climate action, for example, by allowing African countries to use their debt-servicing payments to 17 finance climate change mitigation and adaptation (Fenton et al., 2014). Governments can disclose climate 18 risks when taking on sovereign debt, and debt-for-climate resilience swaps could be used to reduce debt 19 burdens for low-income countries while supporting adaptation and mitigation (Dibley et al., 2021). 20 21 9.4.2 Governance 22 23 9.4.2.1 Governance Barriers 24 25 Overcoming governance barriers is a precondition to ensure successful adaptation and climate-resilient 26 development (Pasquini et al., 2015; Owen, 2020). Despite the ambitious climate targets across African 27 countries and renewed commitments in recent years (Zheng et al., 2019; Ozor and Nyambane, 2020), 28 governance barriers include, among others, slow policy implementation progress (Shackleton et al., 2015; 29 Taylor, 2016), incoherent and fragmented approaches (Zinngrebe et al., 2020; Nemakonde et al., 2021), 30 inadequate governance systems to manage climate finance (Granoff et al., 2016; Banga, 2019), poor 31 stakeholder participation (Sherman and Ford, 2014), gender inequalities (Andrijevic et al., 2020), unaligned 32 development and climate agendas (Musah-Surugu et al., 2019; Robinson, 2020), elite capture of climate 33 governance systems (Kita, 2019), hierarchical and complex state bureaucracy (Meissner and Jacobs, 2016; 34 Biesbroek et al., 2018) and weak, non-existent or fragmented subnational institutions (Paterson et al., 2017; 35 Musah-Surugu et al., 2019). Further, adaptation planning involves cross-cutting themes, multiple actors and 36 institutions with different objectives, jurisdictional authority and levels of power and resources, yet there is 37 often a lack of coordination, clear leadership or governance mandates (Shackleton et al., 2015; Leck and 38 Simon, 2018) and unequal power relations between African countries and developed countries can hinder 39 progress on governance of financial markets, budget allocations and technology transfer to address 40 addressing climate technology gaps in Africa (Rennkamp and Boyd, 2015; Olawuyi, 2018). 41 42 Policy implementation can be slow due to the absence of support mechanisms and dependency on funding by 43 international partners (Leck and Roberts, 2015; Ozor and Nyambane, 2020). In many countries, commitment 44 to climate policy objectives is low (Naess et al., 2015), particularly in light of competing development 45 imperatives and post-COVID-19 recovery efforts (Caetano et al., 2020), although COVID-19 recovery 46 efforts offer significant opportunities for health, economic and climate resilience co-benefits (Sections 9.4.3 47 and 9.11.5; Cross-Chapter Box COVID in Chapter 7). Another challenge relates to long-term planning and 48 decision-making which is hampered by uncertainty related to future socio-economic and GHG emissions 49 scenarios (Coen, 2021), political cycles and short-term political appointment terms (Pasquini et al., 2015). 50 51 Lack of community agency in climate governance affects ability for citizen-led climate interventions in 52 Africa (Antwi-Agyei et al., 2015; Mersha and Van Laerhoven, 2016). This is attributed partly to low civic 53 education, limited participation power of citizens and tokenism due to perceived lack of immediate benefits 54 (Odei Erdiaw-Kwasie et al., 2020), as well as low rates of climate change literacy in many regions (Simpson 55 et al., 2021a) (Section 9.4.3). Participation in climate policy also extends to the private sector, which has 56 been relatively uninvolved in adaptation discussions to date (Crick et al., 2018). 57
ACCEPTED VERSIO
N
SUBJECT TO FIN
AL EDITS

FINAL DRAFT Chapter 9 IPCC WGII Sixth Assessment Report
Do Not Cite, Quote or Distribute 9-32 Total pages: 225
1 Africa requires substantial resources and support to adapt to the unavoidable consequences of climate 2 change, a pertinent climate justice concern for governments. However, the mechanisms needed to redress 3 current power imbalances, structural and systemic inequality are often absent (Saraswat and Kumar, 2016) 4 (see Section 9.11.4) and policies that underpin environmental justice concerns, including distributive justice, 5 participation, recognition and capability (Shi et al., 2016; Chu et al., 2017) are also needed. 6 7 9.4.2.2 Good Governance 8 9 Good governance can contribute to positive climate outcomes and climate-resilient development in Africa 10 through long-term planning, development-focused policy environments, the development of robust and 11 transformational policy architecture, inclusive participation and timely implementation of NDCs (Bataille et 12 al., 2016; Werners et al., 2021) (see Table 9.3 for examples). 13 14 15 Table 9.3: Characteristics and examples of governance that contribute towards climate-resilient development in Africa 16
Governance characteristic
Example
Long-term development planning
Countries are mainstreaming adaptation into their long-term development cycles
(UNFCCC Adaptation Committee, 2019). For example, Burkina Faso’s National
Adaptation Plan elaborates its perspective to 2050 and links to its development pathways
(Government of Burkina Faso, 2015). Many African countries are also enhancing the
adaptation components of their long-term low emissions strategies.
Climate justice and inequality-focused policies
Climate policies can be designed to include specific policy mechanisms (e.g., carbon taxes,
renewable energy subsidies) to maximise developmental gains while reducing inequality
(Andrijevic et al., 2020). For example, revenues from a carbon tax can be used to increase
social assistance programs that benefit poor people and reduce their vulnerability to
climate change (Hallegatte et al., 2016). Climate risk management can be integrated into
social protection and assistance programs, such as public works programs that increase
climate resilience (9.11)
Interlinkages between adaptation and development pathways
Cross-sectoral and multi-level governance approaches can harness synergies with the
SDGs, Paris Agreement and Agenda 2063 aspirations, helping to counter the adaptation
deficit, promote sustainable resource use and contribute to poverty reduction (Niang et al.,
2014; IPBES, 2018; Roy et al., 2018b). Ghana, Namibia, Rwanda and Uganda all link
adaptation with disaster risk reduction in their NDCs (UNFCCC Adaptation Committee,
2019).
High-level engagement
Climate policies, traditionally overseen by environment ministries, are increasingly
receiving priority from finance and planning ministries. Zambia’s Climate Change
Secretariat is currently led by the Ministry of Finance (Government of the Republic of
Zambia, 2010), while Tanzania’s environmental division sits in the office of the Vice-
President (Governmet of the United Republic of Tanzania, 2011).
All-of-government approach
In Kenya, the Climate Change Directorate is the secretariat for the National Climate
Change Commission, serving as an overarching mechanism to coordinate sectoral and
county level action (Government of the Republic of Kenya, 2018). In South Africa, the
National Committee on Climate Change, the Intergovernmental Committee on Climate
Change and the Presidential Climate Change Commission have been established to
enhance intergovernmental and multisectoral coordination on climate action (Climate
Action Tracker, 2021).
Participatory engagement
Polycentric, bottom-up and locally implemented approaches are more able to include the
emergence of new actors (e.g., city networks, multinational companies and sub-state
entities), new instruments and levels (soft law instruments or transnational dynamics) and
new guiding principles and values (fairness, transparency and co-participation) (Leal Filho
et al., 2018; Sapiains et al., 2021). Case studies include the community-based,
participatory scenario planning approach used in Malawi to generate information for
farmers from seasonal forecasts, as well as the integration of climate risk into Lusaka’s
Strategic Plan through engagement with city planners (Conway and Vincent, 2021;
Vincent and Conway, 2021). Many innovative solutions have been designed to promote
participation, such as Pamoja Voices toolkits in pastoralist communities in Northern
Tanzania (Greene et al., 2020).
ACCEPTED VERSIO
N
SUBJECT TO FIN
AL EDITS

FINAL DRAFT Chapter 9 IPCC WGII Sixth Assessment Report
Do Not Cite, Quote or Distribute 9-33 Total pages: 225
Inclusive and diverse stakeholders
Kenya’s Climate Change Directorate has a designated team to integrate gender into its
national climate policies (Murray, 2019), while Seychelles’ National Climate Change
Council has allocated a seat exclusively for a youth candidate (Government of The
Seychelles, 2020). Tanzanian Climate-Smart Agriculture Alliance supports the integration
of farmers and builds strategic alliances to support climate processes (Nyasimi et al.,
2017).
Partnerships Ghana, Kenya, Uganda and Zambia are developing anticipatory scenarios for low-carbon
climate-resilient development pathways for the agricultural sector, aimed at informing
input into national climate policy (Balié et al., 2019). This science to policy to practice
interface is bridged through the inclusion of policymakers, practitioners and academics
(Dinesh et al., 2018). In Lusaka, Durban and other African cities, processes of engagement
and learning have built the trust and capacities needed to inform city-scale, climate-
resilient decisions and associated actions (Taylor et al., 2021a; Taylor et al., 2021b).
NDC implementation
Rwanda has developed an indicator-based Monitoring, Reporting and Verification (MRV)
framework for tracking its NDC implementation and associated financial flows
(Government of Republic of Rwanda, 2020). Zambia has also integrated gender indicators
into its NDC implementation plan and is incorporating gender considerations into its MRV
framework (Murray, 2019).
1 2 African governments are developing and revising ambitious adaptation policies that are enforceable and 3 aligned with wider societal development goals, including an enabling environment for finance and 4 investment in the jobs and skills development necessary to support a just transition (ILO, 2019) (Section 5 9.4.5). If appropriately designed, such institutions offer the opportunity to foster adaptive governance which 6 is collaborative, multi-level and decentralised, offering integration of policy domains, flexibility and an 7 emphasis on non-coerciveness and adaptation (Ruhl, 2010). 8 9 Coordination across multiple sectors, supported with leadership from the highest levels of government, has 10 shown to improve implementation effectiveness and anticipated scaling up (Rigaud et al., 2018). This high-11 level engagement promotes the inclusion of climate resilience and adaptation targets in national planning and 12 budgeting. Financial and capacity support is essential (Adenle et al., 2017; UNEP, 2021), as is the tracking 13 of national progress towards development goals (Box 9.6). 14 15 In Africa, climate governance occurs in a context of deep inequality and asymmetric power relations – both 16 within countries and between countries – making adequate mechanisms for multi-stakeholder participation 17 essential (Sapiains et al., 2021). This requires creation of avenues for the voices of marginalised groups in 18 policy processes and enabling policy environments that can catalyse inclusive action and transformational 19 responses to climate change (Totin et al., 2018; Revi et al., 2020; Ziervogel et al., 2021), safeguarding 20 protection against the climate harms of the most vulnerable in society, particularly of women and children 21 (see also Box 9.1). Community-based natural resource management in pastoral communities was observed to 22 improve institutional governance outcomes through involving community members in decision-making, 23 increasing the capacity of these communities to respond to climate change (Reid, 2014). 24 25 Specific indicators can be included in the performance metrics and monitoring frameworks for each sector, 26 policy intervention and budget planning cycle (Wojewska et al., 2021). Many countries in Africa are also 27 revamping their institutional coordination mechanisms to reflect an all-of-government approach and 28 partnership with non-State stakeholders with diverse capabilities and expertise (see examples from Rwanda 29 and Zambia in Table 9.3). This includes Cape Town’s drought response in 2017/2018 where non-State actors 30 actively partnered with the state response around water management/savings practices (Simpson et al., 31 2020a; Simpson et al., 2020b; Cole et al., 2021b). 32 33 9.4.3 Cross-Sectoral and Transboundary Solutions 34 35 Climate change does not present its problems and opportunities conveniently aligned with traditional sectors, 36 so mechanisms are needed to facilitate interactions and collaborations between people working in widely 37 different sectors (Simpson et al., 2021b). Traditional risk assessments typically only consider one climate 38 hazard and one sector at a time, but this can lead to substantial misestimation of risk because multiple climate 39 risks can interact to cause extreme impacts (Zscheischler et al., 2018; Simpson et al., 2021b). 40 41
ACCEPTED VERSIO
N
SUBJECT TO FIN
AL EDITS
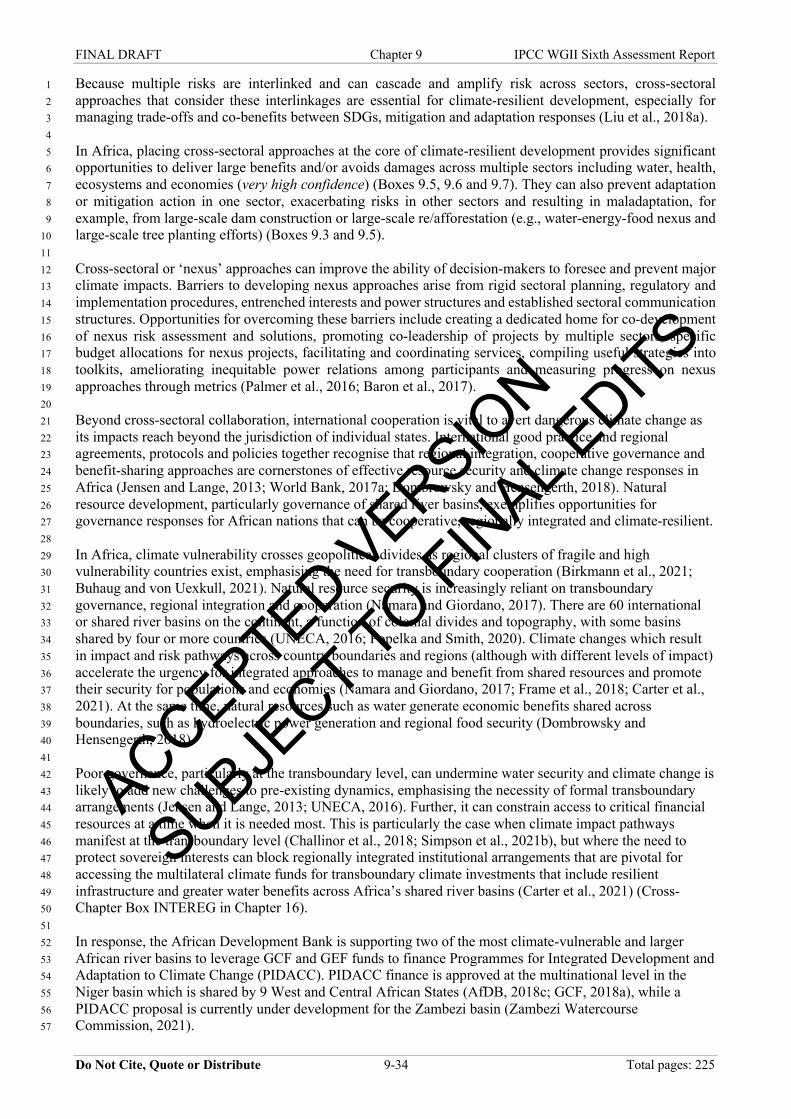
FINAL DRAFT Chapter 9 IPCC WGII Sixth Assessment Report
Do Not Cite, Quote or Distribute 9-34 Total pages: 225
Because multiple risks are interlinked and can cascade and amplify risk across sectors, cross-sectoral 1 approaches that consider these interlinkages are essential for climate-resilient development, especially for 2 managing trade-offs and co-benefits between SDGs, mitigation and adaptation responses (Liu et al., 2018a). 3 4 In Africa, placing cross-sectoral approaches at the core of climate-resilient development provides significant 5 opportunities to deliver large benefits and/or avoids damages across multiple sectors including water, health, 6 ecosystems and economies (very high confidence) (Boxes 9.5, 9.6 and 9.7). They can also prevent adaptation 7 or mitigation action in one sector, exacerbating risks in other sectors and resulting in maladaptation, for 8 example, from large-scale dam construction or large-scale re/afforestation (e.g., water-energy-food nexus and 9 large-scale tree planting efforts) (Boxes 9.3 and 9.5). 10 11 Cross-sectoral or ‘nexus’ approaches can improve the ability of decision-makers to foresee and prevent major 12 climate impacts. Barriers to developing nexus approaches arise from rigid sectoral planning, regulatory and 13 implementation procedures, entrenched interests and power structures and established sectoral communication 14 structures. Opportunities for overcoming these barriers include creating a dedicated home for co-development 15 of nexus risk assessment and solutions, promoting co-leadership of projects by multiple sectors, specific 16 budget allocations for nexus projects, facilitating and coordinating services, compiling useful strategies into 17 toolkits, ameliorating inequitable power relations among participants and measuring progress on nexus 18 approaches through metrics (Palmer et al., 2016; Baron et al., 2017). 19 20 Beyond cross-sectoral collaboration, international cooperation is vital to avert dangerous climate change as 21 its impacts reach beyond the jurisdiction of individual states. International good practice and regional 22 agreements, protocols and policies together recognise that regional integration, cooperative governance and 23 benefit-sharing approaches are cornerstones of effective resource security and climate change responses in 24 Africa (Jensen and Lange, 2013; World Bank, 2017a; Dombrowsky and Hensengerth, 2018). Natural 25 resource development, particularly governance of shared river basins, exemplifies opportunities for 26 governance responses for African nations that can be cooperative, regionally integrated and climate-resilient. 27 28 In Africa, climate vulnerability crosses geopolitical divides as regional clusters of fragile and high 29 vulnerability countries exist, emphasising the need for transboundary cooperation (Birkmann et al., 2021; 30 Buhaug and von Uexkull, 2021). Natural resource security is increasingly reliant on transboundary 31 governance, regional integration and cooperation (Namara and Giordano, 2017). There are 60 international 32 or shared river basins on the continent, a function of colonial divides and topography, with some basins 33 shared by four or more countries (UNECA, 2016; Popelka and Smith, 2020). Climate changes which result 34 in impact and risk pathways across country boundaries and regions (although with different levels of impact) 35 accelerate the urgency for integrated approaches to manage and benefit from shared resources and promote 36 their security for populations and economies (Namara and Giordano, 2017; Frame et al., 2018; Carter et al., 37 2021). At the same time, natural resources such as water generate economic benefits shared across 38 boundaries, such as hydroelectric power generation and regional food security (Dombrowsky and 39 Hensengerth, 2018). 40 41 Poor governance, particularly at the transboundary level, can undermine water security and climate change is 42 likely to add new challenges to pre-existing dynamics, emphasising the necessity of formal transboundary 43 arrangements (Jensen and Lange, 2013; UNECA, 2016). Further, it can constrain access to critical financial 44 resources at a time when it is needed most. This is particularly the case when climate impact pathways 45 manifest at the transboundary level (Challinor et al., 2018; Simpson et al., 2021b), but where the need to 46 protect sovereign interests can block regionally integrated institutional arrangements that are pivotal for 47 accessing the multilateral climate funds for transboundary climate investments that include resilient 48 infrastructure and greater water benefits across Africa’s shared river basins (Carter et al., 2021) (Cross-49 Chapter Box INTEREG in Chapter 16). 50 51 In response, the African Development Bank is supporting two of the most climate-vulnerable and larger 52 African river basins to leverage GCF and GEF funds to finance Programmes for Integrated Development and 53 Adaptation to Climate Change (PIDACC). PIDACC finance is approved at the multinational level in the 54 Niger basin which is shared by 9 West and Central African States (AfDB, 2018c; GCF, 2018a), while a 55 PIDACC proposal is currently under development for the Zambezi basin (Zambezi Watercourse 56 Commission, 2021). 57
ACCEPTED VERSIO
N
SUBJECT TO FIN
AL EDITS

FINAL DRAFT Chapter 9 IPCC WGII Sixth Assessment Report
Do Not Cite, Quote or Distribute 9-35 Total pages: 225
1 Stakeholders across Africa are recognising the scale and severity of transboundary risks to water. Such risks 2 are twofold in nature, arising both from potential impacts due to climate change and from responses to 3 climate change (Simpson et al., 2021b). This awareness amongst stakeholders is leading to increasingly 4 progressive approaches to natural resource development which can also reduce risk across boundaries within 5 regions. For example, river basin organisations (RBOs) in southern Africa such as the Orange-Senqu and the 6 Okavango River Basin Commissions are revising treaties considered to predate the interrelated issues of 7 climate change, growing populations and water scarcity (OKACOM, 2020). In parts of West Africa, where 8 climate change is characterised by reduction of precipitation (Barry et al., 2018), regionally integrated and 9 climate-resilient economic investments for water resource development are enabled by the Senegal River 10 Basin Organisation (OMVS) which emphasises programme and project development, financing and 11 implementation in ensuing work plans (World Bank, 2020e), as does the Nile Basin Initiative (NBI) in North 12 and East Africa (Schmeier, 2017; Blumstein and Petersen-Perlman, 2021). 13 14 Enhanced transboundary governance arrangements suggest that countries are joining forces to coherently 15 manage and protect natural resources (Spalding-Fecher et al., 2014; AfDB, 2021). Underlying governance 16 issues and political economy interests block or advance such transitions to regionally integrated resource 17 management and benefit-sharing, the market drivers of water security (AMCOW, 2012; Soliev et al., 2015). 18 Angola, for example, outlines regional adaptation as a priority and one of its unconditional adaptation 19 strategies (which is already funded) is enhancing resilience in the Benguela fisheries system, a project shared 20 with Namibia and South Africa (GEF and FAO, 2021). Another example is The Great Green Wall for the 21 Sahara and Sahel Initiative which was launched in 2007, with the aim of tackling land degradation in Africa 22 (UNCCD, 2020). This transboundary project, led by the African Union Commission, is being implemented 23 in more than 20 countries across Africa’s Sahel region, in cooperation with international partners including 24 UNCCD, GEF and the World Bank among others. Approximately USD 10 billion have been mobilised 25 and/or promised for this initiative (UNCCD, 2020). Such statements demonstrate the increasing 26 identification of transboundary risks and approaches to manage and adapt to them as areas of ‘common 27 concern’ that require cooperative adaptation actions. Accelerating strengthened transboundary water and 28 climate governance needs to integrate these climate drivers of compromised water security. The role of 29 institutions such as OVMS and the NBI have demonstrated they can be played in influencing economic 30 behaviour among riparian countries of shared river basins highlighting that institutions are an integral part of 31 climate governance in evolving economic systems (Hodgson, 2000). 32 33 9.4.4 Climate Change Adaptation Law in Africa 34 35 9.4.4.1 The Rise of Climate Change Adaptation Law 36 37 Robust legislative frameworks, both climate change specific and non-specific, can foster adaptive responses 38 to climate change, particularly in Least Developed Countries (LDCs) (Nachmany et al., 2017). As discussed 39 in Chapter 17, there are multiple reasons for this. The successful implementation of policy objectives across 40 the continent is often contingent upon or at least supported by an underlying legislative framework 41 (Averchenkova and Matikainen, 2017; Scotford et al., 2017). There are also wider systemic and structural 42 reasons for developing climate change legislation, including the promotion of coordination within 43 government, its policy entrenching role, its symbolic value and its potential to support climate finance flows 44 (Nachmany et al., 2017; Scotford and Minas, 2019). 45 46 Legal systems, however, also have the potential to be maladaptive. Laws may be brittle, often assuming and 47 reinforcing a static state, and the boundary of the law may not align to the relevant location, scale or impact 48 (Craig, 2010; Arnold and Gunderson, 2013; Wenta et al., 2019). This necessitates the review and revision of 49 existing laws to remove such barriers and foster adaptive management (Craig, 2010; Ruhl, 2010; Cosens et 50 al., 2017) and, where necessary, the promulgation of new laws. 51 52 53
ACCEPTED VERSIO
N
SUBJECT TO FIN
AL EDITS

FINAL DRAFT Chapter 9 IPCC WGII Sixth Assessment Report
Do Not Cite, Quote or Distribute 9-36 Total pages: 225
1 Figure 9.10: Progress in development of climate change framework law in Africa derived from an analysis of public 2 databases of African laws (author’s own map), data drawn from (Government of Niger, 1998; Government of Liberia, 3 2002; Government of Algeria, 2004; Government of Tanzania, 2004; Government of Central African Republic, 2008; 4 Government of Lesotho, 2008; Government of Togo, 2008; Government of Guinea Bissau, 2011; Government of Ivory 5 Coast, 2012; Government of Rwanda, 2012; Government of Sierra Leone, 2012; Government of Cape Verde, 2014; 6 Government of Morocco, 2014; Government of Mozambique, 2014; Government of Madagascar, 2015; Government of 7 the Seychelles, 2015; Government of Gabon, 2016; Government of Kenya, 2016; Government of Mali, 2016; 8 Government of Zambia, 2016; Government of Malawi, 2017; Government of Nigeria, 2017; Government of Benin, 9 2018; Government of Ghana, 2018; Government of South Africa, 2018; Government of Uganda, 2018; Government of 10 Zimbabwe, 2019 sources quoted as of September 2019). 11 12 13 There has been a rise in framework and sectoral climate change laws across Africa, as illustrated in Figure 14 9.10 above. The map illustrates the two framework statutes which have been promulgated in Benin and 15 Kenya, as well as the three framework Bills which have been drafted in Nigeria, South Africa and Uganda. 16 There are also discussions taking place in Zimbabwe and Ghana regarding the potential development of a 17 draft framework Climate Change Bill. A review of the climate change framework laws indicates evidence of 18 cross-pollination in design across African jurisdictions, creating the potential for a unique and regionally 19 appropriate body of law with a strong focus on adaptation responses (Rumble, 2019). As discussed in 20 Chapter 17, however, there remains the need for in-country expert input on how the domestic legal landscape 21 may influence their operation, and for each jurisdiction to independently interrogate its adaptation needs and 22 objectives (Scotford et al., 2017). 23 24
ACCEPTED VERSIO
N
SUBJECT TO FIN
AL EDITS
FINAL DRAFT Chapter 9 IPCC WGII Sixth Assessment Report
Do Not Cite, Quote or Distribute 9-37 Total pages: 225
Numerous African states have also included dedicated climate change-related provisions within various 1 existing statutes which regulate the environment or disaster management. For example, Tanzania’s 2 Environmental Management Act 20 of 2004 contains dedicated provisions to address climate change. 3 Rwanda’s Law on Environment 48/2018 also contains detailed provisions on mainstreaming climate change 4 into development planning processes, education on climate change, vulnerability assessments and the 5 promotion of measures to enhance adaptive capacity. Some countries have also developed laws dedicated to 6 a specific aspect of adaptation. For example, the Conservation and Climate Adaptation Trust of Seychelles 7 Act 18 of 2015 establishes a trust fund to finance climate change adaptation responses in Seychelles. 8 Similarly, many countries including Algeria, Burkina Faso, Djibouti, Ghana, Namibia, Malawi, Mauritius, 9 Madagascar, Mozambique, Tanzania and South Africa have dedicated disaster management laws. At this 10 stage, it is still too early to determine whether these laws are having any substantive influence in 11 strengthening resilience and reducing vulnerability and, as discussed in Chapter 17, this is identified as a 12 knowledge gap requiring further research. 13 14 9.4.4.2 Common Themes in Framework Laws 15 16 Laws are now being developed to formalise and entrench institutional structures, specifying their mandate, 17 function, membership and related procedures. A useful example of such an approach can be found in the 18 Nigerian Climate Change Bill which establishes the National Climate Council on Climate Change headed 19 and chaired by the Vice-President, with a wide membership of Ministers, the Chairmen of the Governors’ 20 Forum and Association of Local Governments, as well as the private sector and non-governmental 21 organisation (NGO) representatives. 22 23 Climate change framework laws can play an instrumental role in achieving mainstreaming by directing 24 relevant actors to integrate adaptation considerations into existing mandates, operations and planning 25 instruments (Rumble, 2019). By way of example, the South African Draft Climate Change Bill contains a 26 general duty to ‘coordinate and harmonise the policies, plans, programmes and decisions of the national, 27 provincial and local spheres of government’ to achieve, among other things, the climate change objectives of 28 the Bill and national adaptation objectives. 29 30 Another common theme is the requirement to develop national climate change adaptation strategies and 31 plans. Many laws further entrench their longevity by requiring them to be subject to strong community 32 participation and consultation, as demonstrated by the Kenyan Climate Change Act and the Nigerian Climate 33 Change Bill. 34 35 9.4.4.3 Local Climate Change Laws and Indigenous Knowledge Systems 36 37 The Paris Agreement acknowledges, in Article 7.5, that adaptation should be based on and guided by, among 38 other things, ‘traditional knowledge, knowledge of indigenous peoples and local knowledge systems’. The 39 accumulated knowledge within indigenous knowledge systems is particularly important as it can assist 40 governments in determining how the climate is changing, how to characterise these impacts and provide 41 lessons for adaptation (Salick and Ross, 2009). In this context, indigenous knowledge systems can play an 42 important role in the effective design of local laws (Mwanga, 2019) as well as national laws. Doing so can 43 contribute to the success of climate change response strategies, including enhancing local participation and 44 the implementation of community-based and ecosystem-based adaptations (Chanza and de Wit, 2016; 45 Mwanga, 2019). For example, the Makorongo Village Forest Management By-Law in Tanzania codifies 46 local customary practices relating to forest management and sustainable harvesting with associated dual 47 adaptation and mitigation benefits and includes all villagers in the decision-making processes relating to 48 forest management (Mwanga, 2019). The inclusion of beneficial indigenous knowledge systems within local 49 by-laws is contingent on the active involvement of members of the indigenous community and awareness of 50 climate change considerations within the local sphere of government, and a willingness to foster such 51 practices (Mwanga, 2019). 52 53 In addition to the advancement of indigenous knowledge in adaptive responses, it has been suggested that the 54 protection of the rights of indigenous peoples can have adaptive benefits, in particular through the protection 55 of land tenure rights (Ayanlade and Jegede, 2016). It has been argued that doing so will protect indigenous 56 peoples’ lands and resources from overconsumption, secure the recognition of their cultural stewardship over 57
ACCEPTED VERSIO
N
SUBJECT TO FIN
AL EDITS

FINAL DRAFT Chapter 9 IPCC WGII Sixth Assessment Report
Do Not Cite, Quote or Distribute 9-38 Total pages: 225
the environment, provide the financial incentive for land stewardship and promote the application of their 1 unique knowledge on the sustainable development of that land and its preservation (Jaksa, 2006; Ayanlade 2 and Jegede, 2016). Not only can a lack of protection of indigenous legal tenure undermine these objectives, 3 but a number of African laws may actively work against them. For example, a review of Tanzanian and 4 Zambian laws highlighted existing provisions that empowered the state to terminate or criminalise the 5 occupation of vacant, undeveloped or fallow lands, which undermined the occupation by indigenous peoples 6 of forests and other uncultivated lands (Ayanlade and Jegede, 2016). 7 8 9.4.5 Climate Services, Perception and Literacy. 9 10 Policy actors across Africa perceive that anthropogenic climate change is already impacting their locales 11 through a range of negative socioeconomic and environmental effects (Pasquini, 2020; Steynor and Pasquini, 12 2020). They are highly concerned about and motivated to address these impacts (Hambira and Saarinen, 13 2015; Pasquini, 2020). Transformative responses to the impacts of climate change facilitate climate-resilient 14 development and are informed by perceptions of climate variability and change and climate change literacy 15 (Figure 9.11). 16 17 18
19 Figure 9.11: The importance of climate services and climate change literacy for more transformative responses to 20 climate change in Africa (adapted from Simpson et al., 2021a). Climate services promote Climate Resilient 21 Development by providing climate information for adaptation decision-making (Street, 2016; Vaughan et al., 2018). 22 However, scalable uptake of climate services relies on climate risk perception of users which is largely driven in Africa 23 by experience and perception of local climate changes (Jacobs and Street, 2020; Steynor et al., 2020b; Steynor and 24 Pasquini, 2020). Perception of climate change in Africa can occur without the knowledge of its anthropogenic causes 25 and its effect on risk, as awareness of the concept of climate change is generally low across Africa (Lee et al., 2015; 26 Alemayehu and Bewket, 2017; Andrews and Smirnov, 2020). This can lead to coping responses to climate change 27 which fall short of adaptation. Climate change literacy can fill this knowledge gap and, together with climate services, 28
ACCEPTED VERSIO
N
SUBJECT TO FIN
AL EDITS

FINAL DRAFT Chapter 9 IPCC WGII Sixth Assessment Report
Do Not Cite, Quote or Distribute 9-39 Total pages: 225
extend responses to climate change to include consideration of future risk through awareness of the anthropogenic cause 1 of climate change and its effect on risk (IPCC, 2019b; Simpson et al., 2021a). Maps a-c: (a) Percentage of times 2 scholarship on Africa record that perception of temperature changes (left), (b) precipitation changes (centre), aligned 3 with available meteorological or climate records for 144 country studies across 33 African countries (Size of bubble 4 indicates number of studies per country for both Panels a and b; Panel b, alignment with temperature changes is 5 indicated for all studies within a country in red, and articles indicating no alignment in orange; while in panel c, 6 alignment with precipitation changes is indicated per country in dark blue and articles indicating no alignment in light 7 blue). Panel c) country-level rates of climate change literacy for 33 African countries (that is, percentage of the 8 population that have heard about climate change and think that human activity is wholly or partly the cause of climate 9 change) (adapted from Simpson et al., 2021a). 10 11 12 9.4.5.1 Climate Information and Services 13 14 Climate services (CS) broadly include the generation, tailoring and provision of climate information for use 15 in decision-making at all levels of society (Street, 2016; Vaughan et al., 2018). There is a range of climate 16 service providers in Africa, including primarily National Meteorological and Hydrological Services (NMHS) 17 and partner institutions, complemented by NGOs, the private sector and research institutions (Snow et al., 18 2016; Harvey et al., 2019), which offer the potential for public-private partnerships (Winrock, 2018; Harvey 19 et al., 2019). 20 21 International development funding has progressed the provision of climate services and, together with 22 technological advances and capacity-building initiatives, has increased the reliability of climate services 23 across Africa (Vogel et al., 2019). Most CS investments have been towards the agricultural sector, with other 24 focal sectors including pastoralism, health, water, energy and disaster risk reduction having only small CS 25 initiatives directed towards them (Nkiaka et al., 2019; Carr et al., 2020). Despite this focus and investment, 26 however, there remains a mismatch between the supply and uptake of CS in Africa as information is often 27 inaccessible, unaffordable, not relevant to context or scale and is poorly communicated (Singh et al., 2018; 28 Antwi-Agyei et al., 2021) (Table 9.4; Sections 9.4.1.5.1 and 9.13.4.1). Observational data required for 29 effective regional climate services, including trend analyses, seasonal climate assessment, modelling and 30 model evaluation, is sparse and often of poor quality (Figure 9.11) and usually requires payment which 31 renders it unaffordable (Winrock, 2018). 32 33 A number of these challenges may be addressed through the transdisciplinary co-production of climate 34 services (Alexander and Dessai, 2019; Vogel et al., 2019; Carter et al., 2020). Co-production of climate 35 services involves climate information producers, practitioners and stakeholders, and other knowledge holders 36 participating in equitable partnerships and dialogues to collaboratively identify climate-based risk and 37 develop scale-relevant climate information to address this risk (Table 9.4) (Vincent et al., 2018; Carter et al., 38 2020). 39 40 41 Table 9.4: Challenges and opportunities for Climate Services in Africa for the supply and uptake of climate services. 42
Challenges Opportunities/Solutions References Examples of Programmes that address these challenges. Reproduced from (Carter et al., 2020) with permission.
Supply of climate services
Poor infrastructure (e.g.,
non-functioning
observational networks;
limited Internet
bandwidth; lack of
climate modelling
capacity; keeping pace
with changing
technology).
• International
funding for
observation
networks, data
rescue and data
sharing
• Regular NMHS
budgets from
governments
• Public-private
partnerships
(Winrock,
2018; Harvey et
al., 2019)
(Snow et al.,
2016; World
Bank Group,
2016; Winrock,
2018; Cullmann
et al., 2020;
Meque et al.,
2021)
East Africa and the West African Sahel (ENACTS programme). Work with NMHS to provide
enhanced services by overcoming
the challenges of data quality,
availability and access.
Creation of reliable climate
information suitable for national
and local decision-making using
station observations and satellite
data to provide greater accuracy in
smaller space and time scales.
ACCEPTED VERSIO
N
SUBJECT TO FIN
AL EDITS

FINAL DRAFT Chapter 9 IPCC WGII Sixth Assessment Report
Do Not Cite, Quote or Distribute 9-40 Total pages: 225
Fragmented delivery of
climate services.
• Greater
collaboration
between the NMHS
and sector-specific
specialists to create
a central database of
sector-based climate
services
(Winrock,
2018; Hansen et
al., 2019a)
Rwanda (RCSA programme). improving climate services and
agricultural risk management at
local and national government
levels in the face of a variable and
changing climate
Mismatch in timescales:
short-term information
more desirable, e.g.,
seasonal predictions as
opposed to decadal or
end of century
projections.
• Co-production of CS
climate service
products
(Jones et al.,
2015; Vincent
et al., 2018;
Hansen et al.,
2019a; Carr et
al., 2020;
Sultan et al.,
2020)
Burkina Faso (BRACED project). Strengthening technical and
communication capacities of
national meteorological services to
enable partners to jointly develop
forecasts tailored to support agro-
pastoralists.
Development funding
interventions operate on
timescales that inhibit or
restrict effective
adaptation and neglect
to build in
considerations for
sustainability post the
funded intervention.
• Co-production of
climate service CS
products
• Endogenously
driven climate
services (services
that are developed
by regional actors,
not by remote,
usually developed
nation actors)
(Vincent et al.,
2018; Vogel et
al., 2019)
(Vincent et al.,
2020a)
Burkina Faso (BRACED project). Actors recognised the need to
ensure continuation of climate
services post-project. Burkina Faso
NMHS (ANAM) and National
Council for Emergency Assistance
and Rehabilitation (CONASUR)
budgeted for the continued
communication of climate services
and training of focal weather
intermediaries. Local radio stations
agreed to continue transmitting
climate services.
Use of climate services
Insufficient access to
usable data, including
station data, and
information suited to the
decision context
(including accessibility
limitations based on
gender and social
inequalities)
• Capacity
development
initiatives for CS
providers,
intermediaries
(including extension
agents, NGO
workers and others)
and users
• User needs
assessments
• Consistent
monitoring and
evaluation of
climate services
interventions
(Jones et al.,
2015; Winrock,
2018; Hansen et
al., 2019a;
Hansen et al.,
2019c; Mercy
Corps, 2019;
Nkiaka et al.,
2019; Carr et
al., 2020;
Cullmann et al.,
2020; Gumucio
et al., 2020;
Sultan et al.,
2020)
(Figure 9.11)
Kenya, Ethiopia, Ghana, Niger and Malawi (ALP Programme). Co-production of relevant
information for decision-making
and planning at seasonal time
scales. The methods and media for
communication and messages
differ between different users.
Strong emphasis on participation
by women.
Limited capacity of
users to understand or
request appropriate CS
products
• Co-production of
climate service
products
• Capacity
development
(Snow et al.,
2016; Singh et
al., 2018;
Vincent et al.,
2018; Nkiaka et
al., 2019;
Daniels et al.,
2020)
Cities in Zambia, Namibia, Mozambique, Zimbabwe, Botswana, Malawi and South Africa (FRACTAL programme). Repeated interactions between
each represented sector to learn
and more completely understand
the different contexts of each
represented party and build
understanding through an ethic of
collaboration for solving climate-
related problems in each unique
city.
ACCEPTED VERSIO
N
SUBJECT TO FIN
AL EDITS
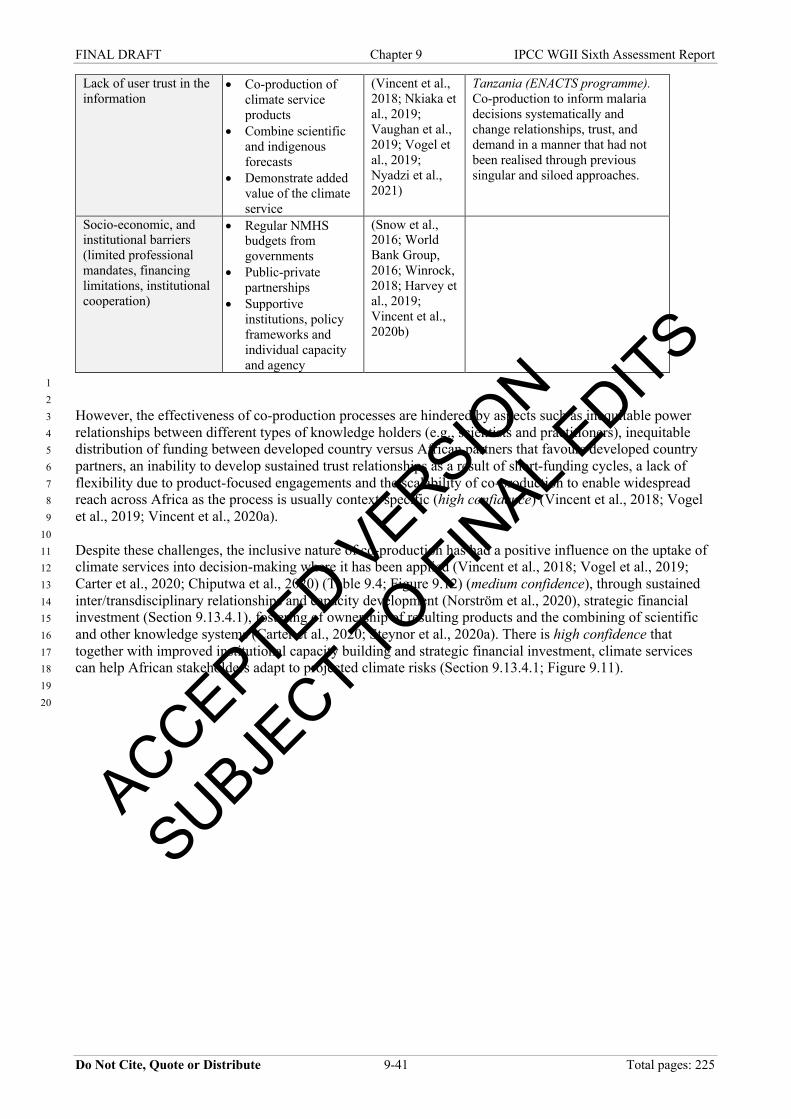
FINAL DRAFT Chapter 9 IPCC WGII Sixth Assessment Report
Do Not Cite, Quote or Distribute 9-41 Total pages: 225
Lack of user trust in the
information
• Co-production of
climate service
products
• Combine scientific
and indigenous
forecasts
• Demonstrate added
value of the climate
service
(Vincent et al.,
2018; Nkiaka et
al., 2019;
Vaughan et al.,
2019; Vogel et
al., 2019;
Nyadzi et al.,
2021)
Tanzania (ENACTS programme). Co-production to inform malaria
decisions systematically and
change relationships, trust, and
demand in a manner that had not
been realised through previous
singular and siloed approaches.
Socio-economic, and
institutional barriers
(limited professional
mandates, financing
limitations, institutional
cooperation)
• Regular NMHS
budgets from
governments
• Public-private
partnerships
• Supportive
institutions, policy
frameworks and
individual capacity
and agency
(Snow et al.,
2016; World
Bank Group,
2016; Winrock,
2018; Harvey et
al., 2019;
Vincent et al.,
2020b)
1 2 However, the effectiveness of co-production processes are hindered by aspects such as inequitable power 3 relationships between different types of knowledge holders (e.g., scientists and practitioners), inequitable 4 distribution of funding between developed country versus African partners that favours developed country 5 partners, an inability to develop sustained trust relationships as a result of short-funding cycles, a lack of 6 flexibility due to product-focused engagements and the scalability of co-production to enable widespread 7 reach across Africa as the process is usually context-specific (high confidence) (Vincent et al., 2018; Vogel 8 et al., 2019; Vincent et al., 2020a). 9 10 Despite these challenges, the inclusive nature of co-production has had a positive influence on the uptake of 11 climate services into decision-making where it has been applied (Vincent et al., 2018; Vogel et al., 2019; 12 Carter et al., 2020; Chiputwa et al., 2020) (Table 9.4; Figure 9.12) (medium confidence), through sustained 13 inter/transdisciplinary relationships and capacity development (Norström et al., 2020), strategic financial 14 investment (Section 9.13.4.1), fostering of ownership of resulting products and the combining of scientific 15 and other knowledge systems (Carter et al., 2020; Steynor et al., 2020a). There is high confidence that 16 together with improved institutional capacity building and strategic financial investment, climate services 17 can help African stakeholders adapt to projected climate risks (Section 9.13.4.1; Figure 9.11). 18 19 20
ACCEPTED VERSIO
N
SUBJECT TO FIN
AL EDITS
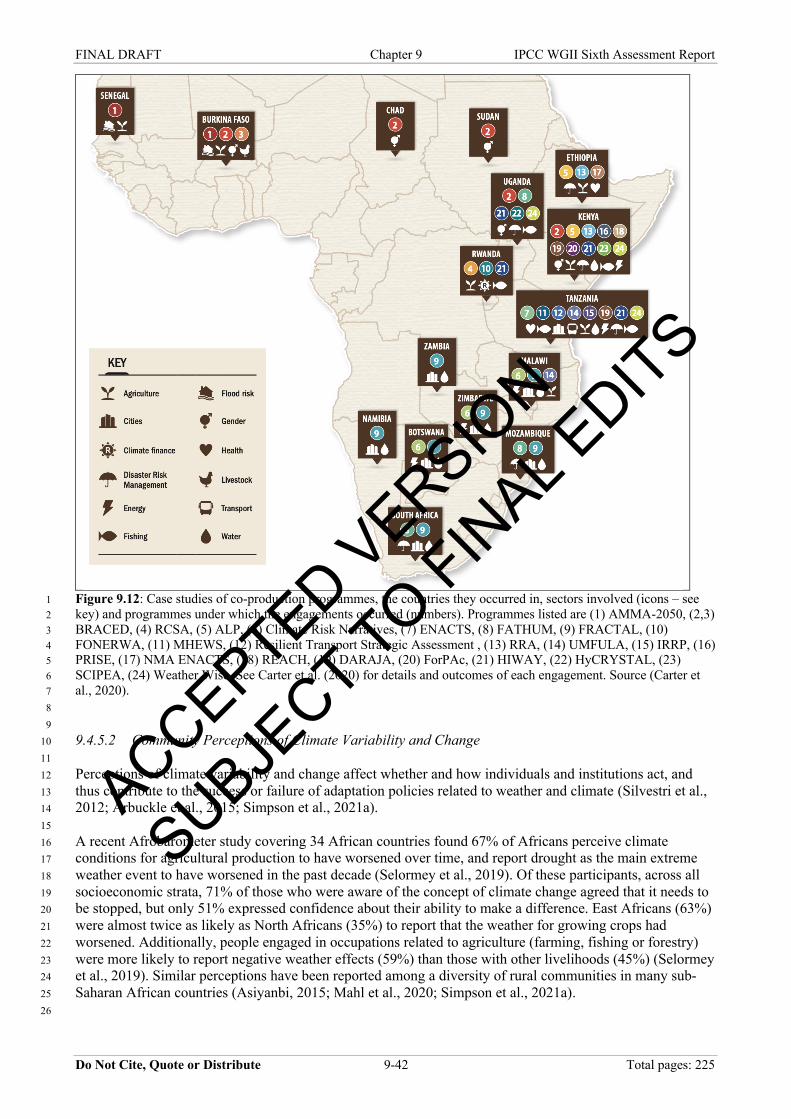
FINAL DRAFT Chapter 9 IPCC WGII Sixth Assessment Report
Do Not Cite, Quote or Distribute 9-42 Total pages: 225
Figure 9.12: Case studies of co-production programmes, the countries they occurred in, sectors involved (icons – see 1 key) and programmes under which the engagements occurred (numbers). Programmes listed are (1) AMMA-2050, (2,3) 2 BRACED, (4) RCSA, (5) ALP, (6) Climate Risk Narratives, (7) ENACTS, (8) FATHUM, (9) FRACTAL, (10) 3 FONERWA, (11) MHEWS, (12) Resilient Transport Strategic Assessment , (13) RRA, (14) UMFULA, (15) IRRP, (16) 4 PRISE, (17) NMA ENACTS, (18) REACH, (19) DARAJA, (20) ForPAc, (21) HIWAY, (22) HyCRYSTAL, (23) 5 SCIPEA, (24) Weather Wise. See Carter et al. (2020) for details and outcomes of each engagement. Source (Carter et 6 al., 2020). 7 8 9 9.4.5.2 Community Perceptions of Climate Variability and Change 10 11 Perceptions of climate variability and change affect whether and how individuals and institutions act, and 12 thus contribute to the success or failure of adaptation policies related to weather and climate (Silvestri et al., 13 2012; Arbuckle et al., 2015; Simpson et al., 2021a). 14 15 A recent Afrobarometer study covering 34 African countries found 67% of Africans perceive climate 16 conditions for agricultural production to have worsened over time, and report drought as the main extreme 17 weather event to have worsened in the past decade (Selormey et al., 2019). Of these participants, across all 18 socioeconomic strata, 71% of those who were aware of the concept of climate change agreed that it needs to 19 be stopped, but only 51% expressed confidence about their ability to make a difference. East Africans (63%) 20 were almost twice as likely as North Africans (35%) to report that the weather for growing crops had 21 worsened. Additionally, people engaged in occupations related to agriculture (farming, fishing or forestry) 22 were more likely to report negative weather effects (59%) than those with other livelihoods (45%) (Selormey 23 et al., 2019). Similar perceptions have been reported among a diversity of rural communities in many sub-24 Saharan African countries (Asiyanbi, 2015; Mahl et al., 2020; Simpson et al., 2021a). 25 26
ACCEPTED VERSIO
N
SUBJECT TO FIN
AL EDITS
FINAL DRAFT Chapter 9 IPCC WGII Sixth Assessment Report
Do Not Cite, Quote or Distribute 9-43 Total pages: 225
Rural communities, particularly farmers, have been the most studied groups for climate change perception. 1 They perceive the climate to be changing, most often reporting changes in rainfall variability, increased dry 2 spells, decreases in rainfall and increased temperatures or temperature extremes, and perceive these changes 3 to bring a range of negative socioeconomic and environmental effects (Alemayehu and Bewket, 2017; 4 Liverpool-Tasie et al., 2020; Simpson et al., 2021a). In some cases, farmers’ perceptions of changes in 5 weather and climate frequently match climate records for decreased precipitation totals, increased drought 6 frequency, shorter rainy season and rainy season delay and increased temperatures (Rurinda et al., 2014; 7 Boansi et al., 2017; Ayanlade et al., 2018) (Figure 9.11), but not in all cases or not for all perceived changes, 8 with common discrepancies in perceived lower rainfall totals (Alemayehu and Bewket, 2017; Ayal and Leal 9 Filho, 2017; Simpson et al., 2021a). 10 11 Farming experience, access to extension services and increasing age are the most frequently cited factors 12 positively influencing the perceptions of climate changes (Alemayehu and Bewket, 2017; Oduniyi and 13 Tekana, 2019). Personal experience of climate-related changes and their impacts appears to be an important 14 factor influencing perceptions through shaping negative associations, for example, experience of flash floods 15 (Elshirbiny and Abrahamse, 2020) or direct effect on economic activity, indicating that perception is not 16 restricted to crop farmers (Liverpool-Tasie et al., 2020). However, perception commonly has misconceptions 17 about the causes of climate change which has implications for climate action (Elshirbiny and Abrahamse, 18 2020), highlighting the importance of climate change literacy. 19 20 9.4.5.3 Climate Change Literacy 21 22 Understanding the human cause of climate change has been shown to be a strong predictor of climate change 23 risk perception (Lee et al., 2015) and a critical knowledge foundation that can affect the difference between 24 coping responses and more informed and transformative adaptation (Oladipo, 2015; Mutandwa et al., 2019) 25 (Figure 9.11). At a minimum, climate change literacy includes both having heard of climate change and 26 understanding it is, at least in part, caused by people (Simpson et al., 2021a). However, large inequalities in 27 climate change literacy exist between and within countries and communities across Africa. 28 29 The average national climate change literacy rate in Africa is only 39% (country rates range from 23-66%) 30 (Figure 9.11). Of 394 sub-national regions surveyed by Afrobarometer, 8% (37 regions in 16 countries) have 31 a climate change literacy rate lower than 20%, while only 2% (8 regions) score higher than 80% which is 32 common across European countries (Simpson et al., 2021a). Striking differences exist when comparing sub-33 national units within countries. Climate change literacy rates in Nigeria range from 71% in Kwara to 5% in 34 Kano, and within Botswana from 69% in Lobatse to only 6% in Kweneng West (Simpson et al., 2021a). 35 Education is the strongest positive predictor of climate change literacy, particularly tertiary education, but 36 poverty decreases climate change literacy and climate change literacy rates average 12.8% lower for women 37 than men (Simpson et al., 2021a). 38 39 As the identified drivers of climate change literacy overlap with broader developmental challenges on the 40 continent, policies targeting these predictors can potentially yield co-benefits for both climate change 41 adaptation as well as progress towards SDGs, particularly education and gender equality (Simpson et al., 42 2021a). Progress towards greater climate change literacy affords a concrete opportunity to mainstream 43 climate change within core national and sub-national developmental agendas in Africa towards more 44 climate-resilient development pathways. Synergies with climate services can also overcome gendered 45 deficits, for example, although women are generally less climate change aware and more vulnerable to 46 climate change than men in Africa, they are generally more likely to adopt climate-resilient crops when they 47 are climate change aware and have exposure to extension services (Acevedo et al., 2020; Simpson et al., 48 2021a). 49 50 51 [START BOX 9.1 HERE] 52 53 Box 9.1: Vulnerability Synthesis 54 55 Vulnerability in Africa is socially, culturally and geographically differentiated among climatic regions, 56 countries and local communities, with climate change impacting the health, livelihoods and food security of 57
ACCEPTED VERSIO
N
SUBJECT TO FIN
AL EDITS
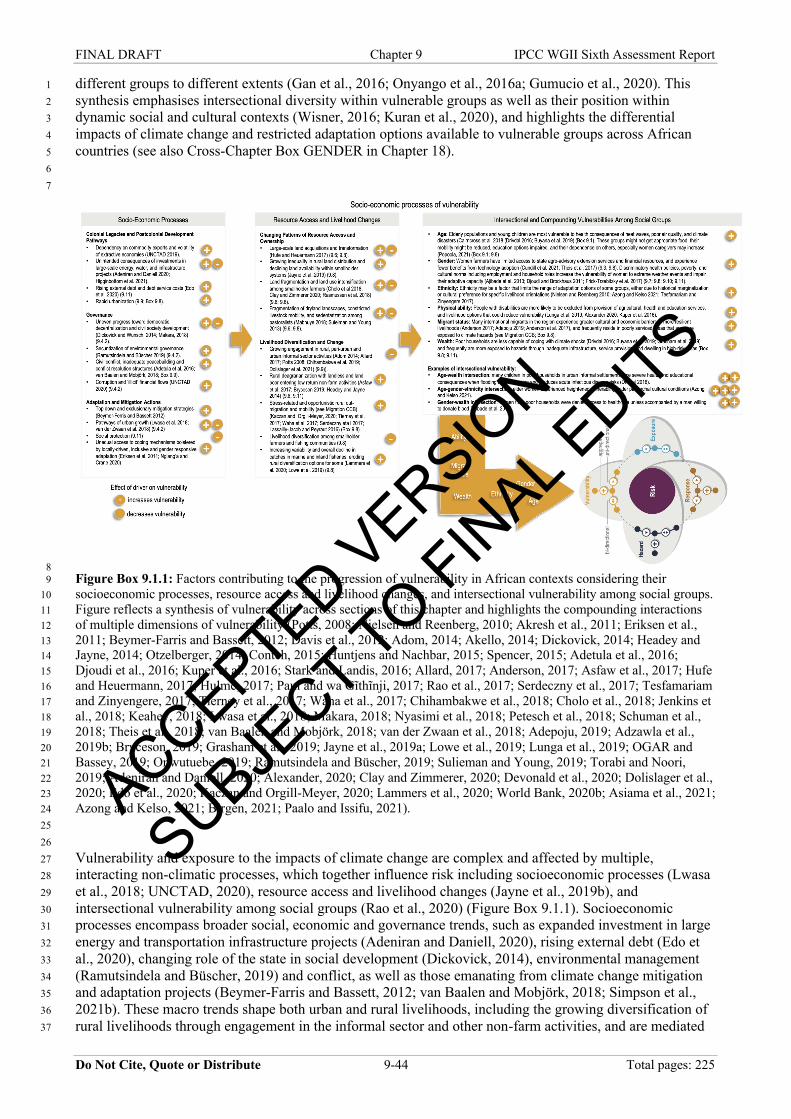
FINAL DRAFT Chapter 9 IPCC WGII Sixth Assessment Report
Do Not Cite, Quote or Distribute 9-44 Total pages: 225
different groups to different extents (Gan et al., 2016; Onyango et al., 2016a; Gumucio et al., 2020). This 1 synthesis emphasises intersectional diversity within vulnerable groups as well as their position within 2 dynamic social and cultural contexts (Wisner, 2016; Kuran et al., 2020), and highlights the differential 3 impacts of climate change and restricted adaptation options available to vulnerable groups across African 4 countries (see also Cross-Chapter Box GENDER in Chapter 18). 5 6 7
8 Figure Box 9.1.1: Factors contributing to the progression of vulnerability in African contexts considering their 9 socioeconomic processes, resource access and livelihood changes, and intersectional vulnerability among social groups. 10 Figure reflects a synthesis of vulnerability across sections of this chapter and highlights the compounding interactions 11 of multiple dimensions of vulnerability (Potts, 2008; Nielsen and Reenberg, 2010; Akresh et al., 2011; Eriksen et al., 12 2011; Beymer-Farris and Bassett, 2012; Davis et al., 2012; Adom, 2014; Akello, 2014; Dickovick, 2014; Headey and 13 Jayne, 2014; Otzelberger, 2014; Conteh, 2015; Huntjens and Nachbar, 2015; Spencer, 2015; Adetula et al., 2016; 14 Djoudi et al., 2016; Kuper et al., 2016; Stark and Landis, 2016; Allard, 2017; Anderson, 2017; Asfaw et al., 2017; Hufe 15 and Heuermann, 2017; Hulme, 2017; Paul and wa Gĩthĩnji, 2017; Rao et al., 2017; Serdeczny et al., 2017; Tesfamariam 16 and Zinyengere, 2017; Tierney et al., 2017; Waha et al., 2017; Chihambakwe et al., 2018; Cholo et al., 2018; Jenkins et 17 al., 2018; Keahey, 2018; Lwasa et al., 2018; Makara, 2018; Nyasimi et al., 2018; Petesch et al., 2018; Schuman et al., 18 2018; Theis et al., 2018; van Baalen and Mobjörk, 2018; van der Zwaan et al., 2018; Adepoju, 2019; Adzawla et al., 19 2019b; Bryceson, 2019; Grasham et al., 2019; Jayne et al., 2019a; Lowe et al., 2019; Lunga et al., 2019; OGAR and 20 Bassey, 2019; Onwutuebe, 2019; Ramutsindela and Büscher, 2019; Sulieman and Young, 2019; Torabi and Noori, 21 2019; Adeniran and Daniell, 2020; Alexander, 2020; Clay and Zimmerer, 2020; Devonald et al., 2020; Dolislager et al., 22 2020; Edo et al., 2020; Kaczan and Orgill-Meyer, 2020; Lammers et al., 2020; World Bank, 2020b; Asiama et al., 2021; 23 Azong and Kelso, 2021; Birgen, 2021; Paalo and Issifu, 2021). 24 25 26 Vulnerability and exposure to the impacts of climate change are complex and affected by multiple, 27 interacting non-climatic processes, which together influence risk including socioeconomic processes (Lwasa 28 et al., 2018; UNCTAD, 2020), resource access and livelihood changes (Jayne et al., 2019b), and 29 intersectional vulnerability among social groups (Rao et al., 2020) (Figure Box 9.1.1). Socioeconomic 30 processes encompass broader social, economic and governance trends, such as expanded investment in large 31 energy and transportation infrastructure projects (Adeniran and Daniell, 2020), rising external debt (Edo et 32 al., 2020), changing role of the state in social development (Dickovick, 2014), environmental management 33 (Ramutsindela and Büscher, 2019) and conflict, as well as those emanating from climate change mitigation 34 and adaptation projects (Beymer-Farris and Bassett, 2012; van Baalen and Mobjörk, 2018; Simpson et al., 35 2021b). These macro trends shape both urban and rural livelihoods, including the growing diversification of 36 rural livelihoods through engagement in the informal sector and other non-farm activities, and are mediated 37
ACCEPTED VERSIO
N
SUBJECT TO FIN
AL EDITS

FINAL DRAFT Chapter 9 IPCC WGII Sixth Assessment Report
Do Not Cite, Quote or Distribute 9-45 Total pages: 225
by complex and intersecting factors like gender, ethnicity, class, age, disability and other dimensions of 1 social status that influence access to resources (Luo et al., 2019). Research increasingly highlights the 2 intersectionality of multiple dimensions of social identity and status that are associated with greater 3 susceptibility to loss and harm (Caparoci Nogueira et al., 2018; Li et al., 2018). 4 5 Arid and semi-arid countries in the Sahelian belt and the greater Horn of Africa are often identified as the 6 most vulnerable regions on the continent (Closset et al., 2017; Serdeczny et al., 2017). Particularly 7 vulnerable groups include pastoralists (Wangui, 2018; Ayanlade and Ojebisi, 2019), fishing communities 8 (Belhabib et al., 2016; Muringai et al., 2019a), small-scale farmers (Ayanlade et al., 2017; Mogomotsi et al., 9 2020) (see Section 9.8.1) and residents of formal and informal urban settlements (see Section 9.9.2). 10 Research has identified key macro drivers as well as the multiple dimensions of social status that mediate 11 differential vulnerability in different African contexts. For example, the contemporary vulnerability of small-12 scale rural producers in semi-arid northern Ghana has been shaped by colonial economic transformations 13 (Ahmed et al., 2016), more recent neoliberal reforms reducing state support (Fieldman, 2011) and the 14 disruption of local food systems due to increasing grain imports (Nyantakyi-Frimpong and Bezner-Kerr, 15 2015). Age interacts with other dimensions of social status, shaping differential vulnerability in several 16 ways. Projected increases in mean temperatures and longer and more intense heat waves (Figure Box 9.1.1) 17 may increase health risks for children and elderly populations by increasing risks associated with heat stress 18 (Bangira et al., 2015; Cairncross et al., 2018). Temperature extremes are associated with increased risk of 19 mortality in Ghana, Burkina Faso, Kenya and South Africa, with greatest increases among children and the 20 elderly (Bangira et al., 2015; Amegah et al., 2016; Omonijo, 2017; Wiru et al., 2019) (see Section 21 9.10.2.3.1). 22 23 Rural African women are often disadvantaged by traditional, patriarchal decision-making processes and lack 24 of access to land – issues compounded by kinship systems (that, is matrilineal or patrilineal), migrant status, 25 age, type of household, livelihood orientation and disability in determining their adaptive options (Ahmed et 26 al., 2016) (sees Section 9.8.1 and 9.11.1.2; Box 9.8). Differential agricultural productivity between men and 27 women is about 20–30% or more in dryland regions of Ethiopia and Nigeria (Ghanem, 2011) and challenges 28 women’s ability to adapt to climate change. Limited access to agricultural resources and limited benefits 29 from agricultural policies, compounded by other social and cultural factors, make women more vulnerable to 30 climatic risks (Shukla et al., 2021). Kinship systems can contribute to their vulnerability and capacity to 31 adapt. Women in matrilineal systems have greater bargaining power and have access to more resources than 32 those in patrilineal systems (Chigbu, 2019; Robinson and Gottlieb, 2021) (see Sections 9.8.1 and 9.11.1.2). 33 34 Knowledge Gaps and Recommendations 35 36 The differential impacts of climate change on and adaptation options available to vulnerable groups in Africa 37 are a critical knowledge gap. More research is needed to examine the intersection of different dimensions of 38 social status on climate change vulnerability in Africa (Thompson-Hall et al., 2016; Oluwatimilehin and 39 Ayanlade, 2021). More analysis of vulnerability based on gender and other social and cultural factors is 40 needed to fully understand the impacts of climate change, the interaction of divergent adaptive strategies, as 41 well as the development of targeted adaptation and mitigation strategies, for example, for women in 42 patrilineal kinship systems, people living with disabilities, youth, girls and the elderly. Finally, there is an 43 urgent need to build capacity among those conducting vulnerability assessments, so that they are familiar 44 with this intersectionality lens. 45 46 Additional information and capacity development through education and early warning systems could 47 enhance vulnerable groups’ ability to cope and adapt their livelihoods (Jaka and Shava, 2018). However, 48 some groups of people may struggle to translate information into actual changes (Makate et al., 2019; 49 McOmber et al., 2019). Lack of access to assets and social networks, for example, among older populations, 50 are critical limitations to locally-driven or autonomous adaptation and limit potential benefits from planned 51 adaptation actions (e.g., adoption of agricultural technologies or effective use of early warning systems). 52 There is an urgent need for societal and political change to realise potential benefits for these vulnerable 53 groups in the long term (Nyasimi et al., 2018). There is a need for gender-sensitive climate change policies 54 in many African countries and gender-responsive policies, implementation plans and budgets for all local-55 level initiatives (Wrigley-Asante et al., 2019). 56 57
ACCEPTED VERSIO
N
SUBJECT TO FIN
AL EDITS
FINAL DRAFT Chapter 9 IPCC WGII Sixth Assessment Report
Do Not Cite, Quote or Distribute 9-46 Total pages: 225
[END BOX 9.1 HERE] 1 2 3 9.5 Observed and Projected Climate Change 4 5 This section assesses observed and projected climate change over Africa. In Working Group I of the IPCC 6 AR6 (WGI), four chapters make regional assessments of observed and projected climate change (Doblas-7 Reyes et al., 2021; Gutiérrez et al., 2021; Ranasinghe et al., 2021; Seneviratne et al., 2021), which facilitates 8 a more nuanced assessment in this section of climate and ocean phenomena that impact African systems. 9 10 9.5.1 Climate Hazards in Africa 11 12 Human-caused temperature increases are detected across Africa and many regions have warmed more 13 rapidly than the global average (Figure 9.13a) (Ranasinghe et al., 2021) and a signal of increased annual 14 heatwave frequency has already emerged from the background natural variability over the whole continent 15 (Engdaw et al., 2021) (Figure 9.14). However, detection of statistically significant rainfall trends is evident 16 in only a few regions (Figure 9.13b), and in some regions different observed precipitation datasets disagree 17 on the direction of rainfall trends (Panitz et al., 2013; Sylla et al., 2013; Contractor et al., 2020). The 18 uncertainty of observed rainfall trends results from a number of sources, including high interannual and 19 decadal rainfall variability, different methodologies used in developing rainfall products and a lack of and 20 poor quality of rainfall station data (Figure 9.15) (Gutiérrez et al., 2021). 21 22 With increased greenhouse gas emissions, mean temperature is projected to increase over the whole 23 continent, as are temperature extremes over most of the continent (Figure 9.16a,b). Increased mean annual 24 rainfall is projected over the eastern Sahel, eastern East Africa and Central Africa (Figures 9.16c and 9.14). 25 In contrast, reduced mean annual rainfall and increased drought (meteorological and agricultural) are 26 projected over southwestern Southern Africa and coastal North Africa, with drought in part as a result of 27 increasing atmospheric evaporative demand due to higher temperatures (Figure 9.16e) (Ukkola et al., 2020; 28 Ranasinghe et al., 2021; Seneviratne et al., 2021). The frequency and intensity of heavy precipitation are 29 projected to increase across most of Africa, except northern and southwestern Africa (Figures 9.16d and 30 9.14). 31 32 Most African countries are expected to experience high temperatures unprecedented in their recent history 33 earlier in this century than generally wealthier, higher latitude countries (high confidence). As low latitudes 34 have lower internal climate variability (e.g. low seasonality), low-latitude African countries are projected to 35 have their populations exposed to large increases in frequency of daily temperature extremes (hotter than 36 99.9% of their historical records) earlier in the 21st century compared to generally wealthier nations at 37 higher latitudes (Harrington et al., 2016; Chen et al., 2021; Doblas-Reyes et al., 2021; Gutiérrez et al., 2021). 38 Although higher warming rates are projected over high latitudes during the first half of this century, societies 39 and environments in low-latitude, low-income countries are projected to become exposed to unprecedented 40 climates before those in high latitude, developed countries (Frame et al., 2017; Harrington et al., 2017; 41 Gutiérrez et al., 2021). For example, beyond 2050, in Central Africa and coastal West Africa 10 months of 42 every year will be hotter than any month in the period 1950–2000 under a high emissions scenario (RCP8.5) 43 (Harrington et al., 2017; Gutiérrez et al., 2021). Ambitious, near-term mitigation will provide the largest 44 reductions in exposure to unprecedented high temperatures for populations in low-latitude regions, such as 45 across tropical Africa (Harrington et al., 2016; Frame et al., 2017). 46 47 48
ACCEPTED VERSIO
N
SUBJECT TO FIN
AL EDITS

FINAL DRAFT Chapter 9 IPCC WGII Sixth Assessment Report
Do Not Cite, Quote or Distribute 9-47 Total pages: 225
Figure 9.13: Mean observed trends calculated for the common 1980-2015 period in (a) 2-meter temperature in degrees 1 Celsius per decade and (b) precipitation in millimetres per decade with respect to the climatological mean over this 2 period. The Climate Research Unit Time Series data (CRU TS) are used to compute temperature trends and the Global 3 Precipitation Climatology Centre data (GPCC) precipitation trends. Regions with no ‘x’ hatching indicate statistically 4 significant trends over this period. The figures are derived from (Gutiérrez et al., 2021). 5 6 7 9.5.1.1 Station Data Limitations 8 9 Sustained station observation networks (Figure 9.15) are essential for the long-term analysis of local and 10 regional climate trends, including for temperature and rainfall, the calibration of satellite-derived climate 11 products, development of gridded climate datasets using interpolated and blended station-satellite products 12 that form the baseline from which climate change departures are measured, development and running of 13 early warning systems, climate projection and impact studies and extreme event attribution studies (Harrison 14 et al., 2019; Otto et al., 2020). However, production of salient climate information in Africa is hindered by 15 limited availability of and access to weather and climate data, especially in Central and North Africa (Figure 16 9.15) (Coulibaly et al., 2017; Hansen et al., 2019a). Existing weather infrastructure remains suboptimal for 17 development of reliable early warning systems (Africa Adaptation Initiative, 2018; Krell et al., 2021). For 18 example, it is estimated only 10% of ground-based observation networks are in Africa, and that 54% of 19 Africa’s surface weather stations cannot capture data accurately (Africa Adaptation Initiative, 2018; World 20 Bank, 2020d). Some programmes are trying to address this issue, including the trans‐African hydro‐21 meteorological observatory (van de Giesen et al., 2014), the West African Science Service Centre on Climate 22 Change and Adaptive Land Management (WASCAL) (Salack et al., 2019), the Southern African Science 23 Service Centre for Climate Change, Adaptive Land Management (SASSCAL) (Kaspar et al., 2015) and 24 AMMA-CATCH (Galle et al., 2018). However, the sustainability of observation networks beyond the life of 25 these programmes is uncertain as many African National Meteorological and Hydrology Services experience 26 structural, financial and technical barriers to maintaining these systems (Section 9.4.5). 27 28 29
ACCEPTED VERSIO
N
SUBJECT TO FIN
AL EDITS
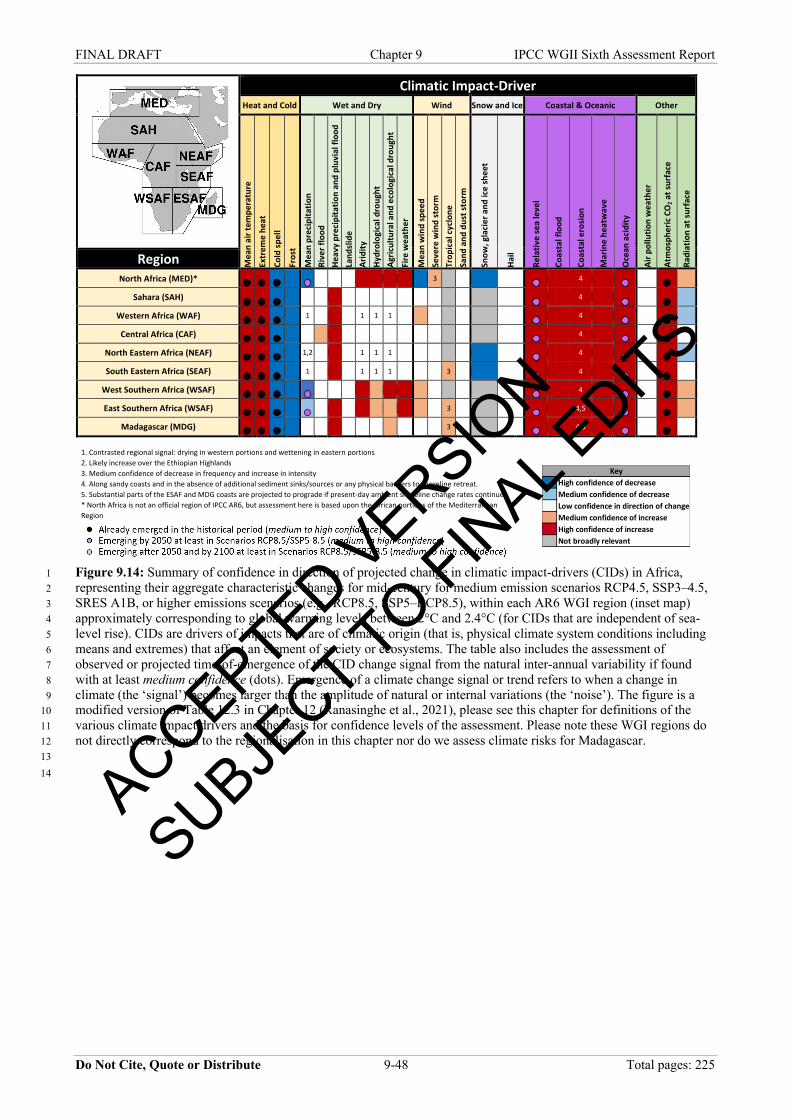
FINAL DRAFT Chapter 9 IPCC WGII Sixth Assessment Report
Do Not Cite, Quote or Distribute 9-48 Total pages: 225
Climatic Impact-Driver Heat and Cold Wet and Dry Wind Snow and Ice Coastal & Oceanic Other
Mea
n ai
r tem
pera
ture
Ex
trem
e he
at
Cold
spel
l Fr
ost
Mea
n pr
ecip
itatio
n Ri
ver f
lood
He
avy
prec
ipita
tion
and
pluv
ial f
lood
La
ndsli
de
Arid
ity
Hydr
olog
ical
dro
ught
Ag
ricul
tura
l and
eco
logi
cal d
roug
ht
Fire
wea
ther
Mea
n w
ind
spee
d Se
vere
win
d st
orm
Tr
opic
al cy
clon
e Sa
nd a
nd d
ust s
torm
Snow
, gla
cier
and
ice
shee
t
Hail
Rela
tive
sea
leve
l
Coas
tal f
lood
Coas
tal e
rosio
n
Mar
ine
heat
wav
e
Oce
an a
cidi
ty
Air p
ollu
tion
wea
ther
Atm
osph
eric
CO
2 at s
urfa
ce
Radi
atio
n at
surf
ace
Region North Africa (MED)*
3
4
Sahara (SAH)
4
Western Africa (WAF)
1 1 1 1
4
Central Africa (CAF)
4
North Eastern Africa (NEAF)
1,2 1 1 1
4
South Eastern Africa (SEAF)
1 1 1 1 3
4
West Southern Africa (WSAF)
4
East Southern Africa (WSAF)
3
4,5
Madagascar (MDG)
3
4,5
1. Contrasted regional signal: drying in western portions and wettening in eastern portions 2. Likely increase over the Ethiopian Highlands 3. Medium confidence of decrease in frequency and increase in intensity 4. Along sandy coasts and in the absence of additional sediment sinks/sources or any physical barriers to shoreline retreat. 5. Substantial parts of the ESAF and MDG coasts are projected to prograde if present-day ambient shoreline change rates continue * North Africa is not an official region of IPCC AR6, but assessment here is based upon the African portions of the Mediterranean Region
Figure 9.14: Summary of confidence in direction of projected change in climatic impact-drivers (CIDs) in Africa, 1 representing their aggregate characteristic changes for mid-century for medium emission scenarios RCP4.5, SSP3–4.5, 2 SRES A1B, or higher emissions scenarios (e.g., RCP8.5, SSP5–RCP8.5), within each AR6 WGI region (inset map) 3 approximately corresponding to global warming levels between 2°C and 2.4°C (for CIDs that are independent of sea-4 level rise). CIDs are drivers of impacts that are of climatic origin (that is, physical climate system conditions including 5 means and extremes) that affect an element of society or ecosystems. The table also includes the assessment of 6 observed or projected time-of-emergence of the CID change signal from the natural inter-annual variability if found 7 with at least medium confidence (dots). Emergence of a climate change signal or trend refers to when a change in 8 climate (the ‘signal’) becomes larger than the amplitude of natural or internal variations (the ‘noise’). The figure is a 9 modified version of Table 12.3 in Chapter 12 (Ranasinghe et al., 2021), please see this chapter for definitions of the 10 various climate impact drivers and the basis for confidence levels of the assessment. Please note these WGI regions do 11 not directly correspond to the regionalisation in this chapter nor do we assess climate risks for Madagascar. 12 13 14
High confidence of decreaseMedium confidence of decreaseLow confidence in direction of changeMedium confidence of increaseHigh confidence of increaseNot broadly relevant
Key
ACCEPTED VERSIO
N
SUBJECT TO FIN
AL EDITS
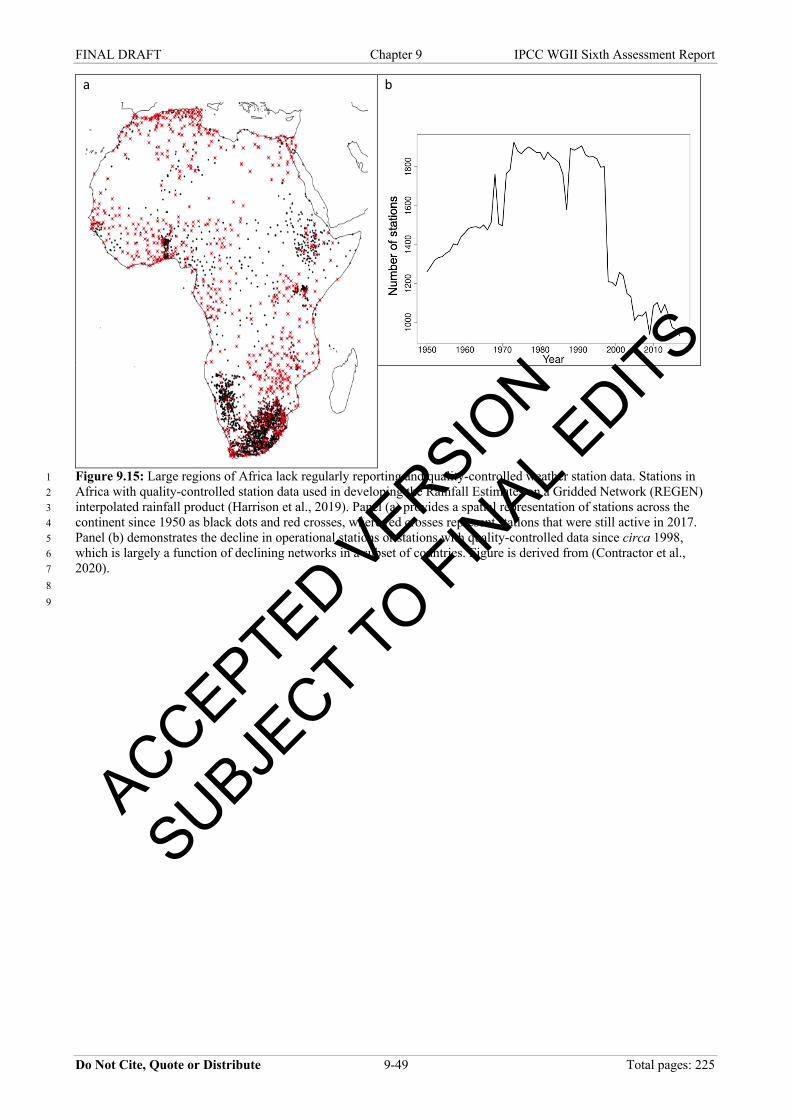
FINAL DRAFT Chapter 9 IPCC WGII Sixth Assessment Report
Do Not Cite, Quote or Distribute 9-49 Total pages: 225
a b
Figure 9.15: Large regions of Africa lack regularly reporting and quality-controlled weather station data. Stations in 1 Africa with quality-controlled station data used in developing the Rainfall Estimates on a Gridded Network (REGEN) 2 interpolated rainfall product (Harrison et al., 2019). Panel (a) provides a spatial representation of stations across the 3 continent since 1950 as black dots and red crosses, where red crosses represent stations that were still active in 2017. 4 Panel (b) demonstrates the decline in operational stations or stations with quality-controlled data since circa 1998, 5 which is largely a function of declining networks in a subset of countries. Figure is derived from (Contractor et al., 6 2020). 7 8 9
ACCEPTED VERSIO
N
SUBJECT TO FIN
AL EDITS

FINAL DRAFT Chapter 9 IPCC WGII Sixth Assessment Report
Do Not Cite, Quote or Distribute 9-50 Total pages: 225
1 Figure 9.16: Projected changes of climate variables and hazards (relative to 1995–2014 average) at 1.5℃, 2℃ and 3℃ 2 of global warming above pre-industrial (1850–1900). Rows are (a) Increase in mean annual temperature; (b) Increase in 3 number of days per year above 35 °C; (c) Change in average annual rainfall (%); (d) Change in heavy precipitation 4 represented by maximum 5-day precipitation (%); (e) Change in drought represented as the six-month standardized 5 precipitation index (%). Negative changes indicate areas where drought frequency, intensity and/or duration is projected 6 to increase. Positive changes show the opposite; (f) Increase in mean annual sea surface temperature (°C). All figures 7 are derived from the WGI Interactive Atlas and show results from between 26 to 33 CMIP6 global climate models, 8 depending on the climate variable. CMIP6 models include improved representations of physical, biological and 9 chemical processes as well as higher spatial resolutions compared to previous CMIP5 models (WGI CH3). Three 10
ACCEPTED VERSIO
N
SUBJECT TO FIN
AL EDITS
FINAL DRAFT Chapter 9 IPCC WGII Sixth Assessment Report
Do Not Cite, Quote or Distribute 9-51 Total pages: 225
categories of trend robustness are shown in the projection figures: (1) No hatching indicates a projected change is robust 1 and likely greater than natural climate variability (that is, ≥66% of models show change greater than natural variability, 2 and ≥80% of all models agree on sign of change); (2) Diagonal lines (\) indicate no robust change (<66% of models 3 show change greater than natural variability); (3) Crossed lines (X) indicate conflicting signals where at least 66% of 4 the models show change greater than natural variability, but <80% of all models agree on direction of change (Gutiérrez 5 et al., 2021). 6 7 8 9.5.2 North Africa 9 10 9.5.2.1 Temperature 11 12 Observations 13 Mean and seasonal temperatures have increased at twice the global rate over most regions in North Africa 14 due to anthropogenic climate change (Ranasinghe et al., 2021) (Figures 9.13a and 9.14) (high confidence). 15 Increasing temperature trends are particularly strong since the 1970s (between 0.2°C/decade and 16 0.4°C/decade), especially in the summer (Tanarhte et al., 2012; Donat et al., 2014a; Lelieveld et al., 2016). 17 Similar warming signals have been observed since the mid‐1960s over the Sahara and the Sahel (Fontaine et 18 al., 2013; Moron et al., 2016). Trends in mean maximum (TX) and minimum (TN) temperatures range 19 between +2°C and +3°C per century over North Africa, and the frequencies of hot days (TX >90th percentile, 20 TX90p) and tropical nights (TN >20°C), as well as the frequencies of warm days and nights, roughly follow 21 these mean TX and TN trends (Fontaine et al., 2013; Moron et al., 2016; Ranasinghe et al., 2021; 22 Seneviratne et al., 2021). Warm spell duration has increased in many North African countries (Donat et al., 23 2014a; Filahi et al., 2016; Lelieveld et al., 2016; Nashwan et al., 2018) and heatwave magnitude and spatial 24 extent have increased across North Africa since 1980, with an increase in the number of events since 2000 25 that is beyond the level of natural climate variability (Russo et al., 2016; Ceccherini et al., 2017; Engdaw et 26 al., 2021). 27 28 Projections 29 At 1.5°C, 2°C and 3°C of global warming above pre-industrial levels, mean annual temperatures in North 30 Africa are projected to be on average, 0.9°C, 1.5°C and 2.6°C warmer than the 1994–2005 average 31 respectively (Figure 9.16a). Warming is projected to be stronger in summer than winter (Lelieveld et al., 32 2016; Dosio, 2017). The number of hot days is likely to increase by up to 90% by the end of the century 33 under RCP8.5 (global warming level [GWL] 4.4°C) (Gutiérrez et al., 2021; Ranasinghe et al., 2021) and hot 34 nights and the duration of warm spells to increase in the first half of the 21st century in both intermediate and 35 high emission scenarios (Patricola and Cook, 2010; Vizy and Cook, 2012; Lelieveld et al., 2016; Dosio, 36
2017; Filahi et al., 2017). Heatwaves are projected to become more frequent and intense even at 1.5°C of 37
global warming (Gutiérrez et al., 2021; Ranasinghe et al., 2021). Children born in 2020, under a 1.5°C-38 compatible scenario will be exposed to 4–6 times more heatwaves in their lifetimes compared to people born 39 in 1960; this exposure increases to 9–10 times more heatwaves for emission reduction pledges, limiting 40
global warming to 2.4°C (Thiery et al., 2021). 41 42 9.5.2.2 Precipitation 43 44 Observations 45 Mean annual precipitation decreased over most of North Africa between 1971–2000 (Donat et al., 2014a; 46 Hertig et al., 2014; Nicholson et al., 2018; Zittis, 2018), with a gradual recovery to normal or wetter 47 conditions in Algeria and Tunisia since 2000 and over Morocco since 2008 (Nouaceur and Murărescu, 48 2016). Since the 1960s days with more than 10 mm of rainfall have decreased and the number of consecutive 49 dry days have increased in the eastern parts of North Africa, while in the western parts of North Africa heavy 50 rainfall and flooding has increased (Donat et al., 2014a). Aridity, the ratio of potential evaporation to 51 precipitation, has increased over the Mediterranean and North Africa due to significant decreases in 52 precipitation (Greve et al., 2019). 53 54 Projections 55 Mean annual precipitation is projected to decrease in North Africa at warming levels of 2°C and higher (high 56 confidence) with the most pronounced decreases in the northwestern parts (Schilling et al., 2012; Filahi et al., 57
ACCEPTED VERSIO
N
SUBJECT TO FIN
AL EDITS
FINAL DRAFT Chapter 9 IPCC WGII Sixth Assessment Report
Do Not Cite, Quote or Distribute 9-52 Total pages: 225
2017; Barcikowska et al., 2018; Ranasinghe et al., 2021) (Figures 9.14 and 9.16c). Meteorological drought 1 over Mediterranean North Africa in CMIP5 and CMIP6 models are projected to increase in duration from 2 approximately 2 months during 1950–2014 to approximately 4 months in the period 2050–2100 under 3 RCP8.5 and SSP5-85 (Ukkola et al., 2020). Extreme rainfall (monthly maximum 1-day rainfall – RX1day) in 4 the region is projected to decrease (Donat et al., 2019). 5 6 During 1984–2012, North Africa experienced a decreasing dust trend with North African dust explaining 7 more than 60% of global dust variations (Shao et al., 2013). Dust loadings and related air pollution hazards 8 (from fine particles that affect health) are projected to decrease in many regions of the Sahara as a result of 9 decreased wind speeds (Evan et al., 2016; Ranasinghe et al., 2021). 10 11 9.5.3 West Africa 12 13 9.5.3.1 Temperature 14 15 Observations 16 Observed mean annual and seasonal temperatures have increased 1–3°C since the mid-1970s with the 17 highest increases in the Sahara and Sahel (Cook and Vizy, 2015; Lelieveld et al., 2016; Dosio, 2017; 18 Nikiema et al., 2017; Gutiérrez et al., 2021; Ranasinghe et al., 2021) (Figure 9.13a) and positive trends in 19 mean annual maximum (TX) and minimum (TN) of 0.16°C and 0.28°C per decade, respectively (Mouhamed 20 et al., 2013; Moron et al., 2016; Russo et al., 2016; Barry et al., 2018). The frequency of very hot days 21 (TX >35°C) and tropical nights has increased by 1–9 days and 4–13 nights per decade between 1961–2014 22 (Moron et al 2016), and cold nights have become less frequent (Fontaine et al., 2013; Mouhamed et al., 23 2013; Barry et al., 2018). In the 21st century, heatwaves have become hotter, longer and more extended 24 compared to the last two decades of the 20th century (Mouhamed et al., 2013; Moron et al., 2016; Russo et 25 al., 2016; Barbier et al., 2018). 26 27 Projections 28 At 1.5°C, 2°C and 3°C of global warming above pre-industrial levels, mean annual temperatures in West 29 Africa are projected to be on average, 0.6°C, 1.1°C and 2.1°C warmer than the 1994–2005 average 30 respectively (Figure 9.16a). Under mid- and high-emission scenarios end of century summer temperatures 31 are projected to increase by 2°C and 5°C, respectively (Sylla et al., 2015a; Russo et al., 2016; Dosio, 2017). 32 The annual number of hot days is projected to increase at all global warming levels with larger increases at 33 higher warming levels (Figure 9.16b). By 2060 the frequency of hot nights is projected to be almost double 34 the 1981–2010 average at GWL 2°C (Dosio, 2017; Bathiany et al., 2018; Gutiérrez et al., 2021; Ranasinghe 35 et al., 2021). Heatwave frequency and intensity are projected to increase under all scenarios, but limiting 36 global warming to 1.5°C leads to a decreased heatwave magnitude (–35%) and frequency (–37%) compared 37 to 2°C global warming (Dosio, 2017; Weber et al., 2018; Nangombe et al., 2019). Children born in 2020, 38
under a 1.5°C-compatible scenario will be exposed to 4–6 times more heatwaves in their lifetimes compared 39
to people born in 1960; this exposure increases to 7–9 times more heatwaves at GWL 2.4°C (Thiery et al., 40 2021). 41 42 The number of dangerous heat days (TX >40.6℃) is projected to increase from approximately 60 per year in 43 1985–2005 to approximately 110, 130 and 140 under RCPs 2.6, 4.5 and 8.5, respectively, in the 2060s and to 44 105, 145 and 196 in the 2090s (Rohat et al., 2019). Over tropical West Africa, heat-related mortality risk 45 through increased heat and humidity is 6–9 times higher than the 1950–2005 average at GWL 2℃, 8–15 46 times at GWL 2.65℃ and 15–30 times at GWL 4.12℃ (Ahmadalipour and Moradkhani, 2018) (Coffel et al., 47 2018). The number of potentially lethal heat days per year is projected to increase from <50 during 1995–48 2005 to 50–150 at GWL 1.6℃, 100–250 at GWL 2.5℃ and 250–350 at GWL 4.4℃, with highest increases 49 in coastal regions (Mora et al., 2017). Increasing urbanization concentrates this exposure in cities, such as 50 Lagos, Niamey, Kano and Dakar (Coffel et al., 2018; Rohat et al., 2019) (Section 9.9.3.1). 51 52 9.5.3.2 Precipitation 53 54 Observations 55 Negative trends in rainfall accompanied by increased rainfall variability were observed between 1960s–56 1980s over West Africa (Nicholson et al., 2018; Thomas and Nigam, 2018), caused by a combination of 57
ACCEPTED VERSIO
N
SUBJECT TO FIN
AL EDITS

FINAL DRAFT Chapter 9 IPCC WGII Sixth Assessment Report
Do Not Cite, Quote or Distribute 9-53 Total pages: 225
anthropogenic aerosols and greenhouse gases emitted between 1950s–1980s (Booth et al., 2012; Wang et al., 1 2016; Giannini and Kaplan, 2019; Douville et al., 2021). Declining rainfall trends ended by 1990 due to the 2 growing influence of greenhouse gasses and reduced cooling effect of aerosol emissions, with a trend to 3 wetter conditions emerging in the mid-1990s accompanied by more intense, but fewer precipitation events 4 (Sanogo et al., 2015; Sylla et al., 2016; Kennedy et al., 2017; Barry et al., 2018; Bichet and Diedhiou, 2018a; 5 Bichet and Diedhiou, 2018b; Thomas and Nigam, 2018). A shift to a later onset and end of the West African 6 monsoon is also reported in West Africa and Sahel (low confidence) (Chen et al., 2021; Ranasinghe et al., 7 2021). Between 1981–2014 the Gulf of Guinea and the Sahel have experienced more intense precipitation 8 events (Panthou et al., 2014; Bichet and Diedhiou, 2018a; Panthou et al., 2018) and the frequency of 9 mesoscale storms has tripled (Taylor et al., 2017; Callo-Concha, 2018). Extreme heavy precipitation indices 10 show increasing trends from 1981–2010 (Barry et al., 2018), increasing high flow events in large Sahelian 11 rivers as well as small to mesoscale catchments leading to pluvial and riverine flooding (Douville et al., 12 2021). Meteorological, agricultural and hydrological drought in the region has increased in frequency since 13 the 1950s (medium confidence) (Seneviratne et al., 2021). 14 15 Projections 16 West African rainfall projections show a gradient of precipitation decrease in the west and increase in the 17 east (medium confidence) (Dosio et al., 2021; Gutiérrez et al., 2021; Ranasinghe et al., 2021) (Figure 9.14). 18 This pattern is evident at 1.5℃ of global warming and the magnitude of change increases at higher warming 19 levels (Schleussner et al., 2016b; Kumi and Abiodun, 2018; Sylla et al., 2018) (Figure 9.16c). A reduction in 20 length of the rainy season is projected over the western Sahel through delayed rainfall onset by 4 to 6 days at 21 global warming levels of 1.5°C and 2°C (Kumi and Abiodun, 2018; Douville et al., 2021; Gutiérrez et al., 22 2021). Although there are uncertainties in rainfall projections over the Sahel (Klutse et al., 2018; Gutiérrez et 23 al., 2021), CMIP6 models project monsoon rainfall amounts to increase by approximately 2.9% per degree 24 of warming (Jin et al., 2020; Wang et al., 2020a), therefore, at higher levels of warming and towards the end 25 of the century, a wetter monsoon is projected in the eastern Sahel (medium confidence). 26 27 The frequency and intensity of extremely heavy precipitation are projected to increase under mid- and high-28 emission scenarios (Sylla et al., 2015b; Diallo et al., 2016; Akinsanola and Zhou, 2019; Giorgi et al., 2019; 29 Dosio et al., 2021; Li et al., 2021; Seneviratne et al., 2021) (Figure 9.16d). However, heavy rainfall statistics 30 from global and regional climate models may be conservative as very-high-resolution, convection-permitting 31 climate models simulate more intense rainfall than these models (Stratton et al., 2018; Berthou et al., 2019; 32 Han et al., 2019; Kendon et al., 2019). 33 34 At 2°C global warming, West Africa is projected to experience a drier, more drought-prone and arid climate, 35 especially in the last decades of the 21st century (Sylla et al., 2016; Zhao and Dai, 2016; Klutse et al., 2018). 36 The duration of meteorological drought duration is projected to increase from approximately 2 months 37 during 1950–2014 to approximately 4 months in the period 2050–2100 under RCP8.5 and SSP5–8.5 (Ukkola 38 et al., 2020). Increased intensity of heavy precipitation events combined with increasing drought occurrences 39 will substantially increase the cumulative hydroclimatic stress on populations in West Africa during the late 40 21st century (Giorgi et al., 2019). 41 42 9.5.4 Central Africa 43 44 9.5.4.1 Temperature 45 46 Observations 47 Mean annual temperature across Central Africa has increased by 0.75℃–1.2°C since 1960 (Aloysius et al., 48 2016; Gutiérrez et al., 2021). The number of hot days, heatwaves and heatwave days increased between 49 1979–2016 (Hu et al., 2019) and cold extremes have decreased (Aguilar et al., 2009; Seneviratne et al., 50 2021) (Figure 9.14). Uncertainties associated with the poor ground-based observation networks in the region 51 and associated observational uncertainties (Section 9.5.1.1) result in an assessment of medium confidence in 52 an increase in the number of heat extremes over the region. 53 54 Projections 55 At 1.5°C, 2°C and 3°C of global warming above pre-industrial levels, mean annual temperatures in Central 56 Africa are projected to be on average, 0.6°C, 1.1°C and 2.1°C warmer than the 1994–2005 average, 57
ACCEPTED VERSIO
N
SUBJECT TO FIN
AL EDITS

FINAL DRAFT Chapter 9 IPCC WGII Sixth Assessment Report
Do Not Cite, Quote or Distribute 9-54 Total pages: 225
respectively (Figure 9.16a). By the end of the century (2070–2099), warming of 2°C (RCP4.5 ) to 4°C 1 (RCP8.5) is projected over the region (Aloysius et al., 2016; Fotso-Nguemo et al., 2017; Diedhiou et al., 2 2018; Mba et al., 2018; Tamoffo et al., 2019) and the number of days with maximum temperature exceeding 3 35°C is projected to increase by 150 days or more at GWL 4.4°C (Gutiérrez et al., 2021; Ranasinghe et al., 4 2021). According to CMIP6 and CORDEX models, the annual average number of days with maximum 5 temperature exceeding 35°C will increase between 14–27 days at GWL 2°C and 33–59 days at GWL 3°C 6 above the 61–63 days for 1995–2014 (Gutiérrez et al., 2021; Ranasinghe et al., 2021) (high confidence). The 7 number of heatwave days is projected to increase and extreme heatwave events may last longer than 180 8 days at GWL 4.1°C (Dosio, 2017; Weber et al., 2018; Spinoni et al., 2019). Children born in 2020, under a 9
1.5°C-compatible scenario will be exposed to 6–8 times more heatwaves in their lifetimes compared to 10
people born in 1960; this exposure increases to 7–9 times more heatwaves at GWL 2.4°C (Thiery et al., 11 2021). The number of potentially lethal heat days per year is projected to increase from <50 during 1995–12 2005 to 50–75 at GWL 1.6℃, 100–150 at GWL 2.5℃ and 200–350 at GWL 4.4℃ (Mora et al., 2017). 13 14 9.5.4.2 Precipitation 15 16 Observations 17 The severe lack of station data over the region leads to large uncertainty in the estimation of observed 18 rainfall trends and low confidence in changes in extreme rainfall (Figure 9.13b) (Creese and Washington, 19 2018; Gutiérrez et al., 2021; Ranasinghe et al., 2021). There is some evidence of drying since the mid-20th 20 century through decreased mean rainfall and increased precipitation deficits (Gutiérrez et al., 2021), as well 21 as increases in meteorological, agricultural and ecological drought (medium confidence) (Seneviratne et al., 22 2021). However, there is spatial heterogeneity in annual rainfall trends between 1983–2010 ranging from –23 10 to +39 mm per year (Maidment et al., 2015), with a decline in mean seasonal April–June precipitation of 24 –69 mm per year in most regions except in the northwest (Zhou et al., 2014; Hua et al., 2016; Klotter et al., 25 2018; Hu et al., 2019). Southern and eastern Central Africa were identified as drought hotspots between 26 1991–2010 (Spinoni et al., 2014). 27 28 Projections 29 Under low emission scenarios and at GWL 1.5 and GWL 2°C there is low confidence in projected mean 30 rainfall change over the region (Figure 9.16c). At GWL 3°C and GWL 4.4°C an increased mean annual 31 rainfall of 10–25% is projected by regional climate models (Coppola et al., 2014; Pinto et al., 2015) and the 32 intensity of extreme precipitation will increase (high confidence) (Sylla et al., 2015a; Diallo et al., 2016; 33 Dosio et al., 2019; Gutiérrez et al., 2021; Ranasinghe et al., 2021; Seneviratne et al., 2021) (Figure 9.16c,d). 34 This is projected to increase the likelihood of widespread flood occurrences before, during and after the 35 mature monsoon season (Figure 9.14). 36 37 Convection permitting simulations (4.5 km spatial resolution) simulate increased dry spell length not 38 apparent at coarser resolutions, suggesting drying in addition to more intense extreme rainfall (Stratton et al., 39 2018). Although reduced drought frequency is indicated in Figure 9.16e, the SPI metric does not account for 40 the effect of increased temperature on drought (increased moisture deficit), and metrics that account for this 41 indicate slightly increased drought frequency or no change (Spinoni et al., 2020). Therefore, there is low 42 confidence in projected changes of drought frequency over the region (Figure 9.14). 43 44 9.5.5 East Africa 45 46 9.5.5.1 Temperature 47 48 Observations 49 Mean temperatures over the region have increased by 0.7℃–1°C from 1973 to 2013, depending on the 50 season (Ayugi and Tan, 2018; Camberlin, 2018). Increases in TX and TN are evident across the region 51 accompanied by significantly increasing trends of warm nights, warm days and warm spells (Russo et al., 52 2016; Gebrechorkos et al., 2019; Nashwan and Shahid, 2019). The greatest increases are found in northern 53 and central regions. 54 55 Projections 56
ACCEPTED VERSIO
N
SUBJECT TO FIN
AL EDITS
FINAL DRAFT Chapter 9 IPCC WGII Sixth Assessment Report
Do Not Cite, Quote or Distribute 9-55 Total pages: 225
At 1.5°C, 2°C and 3°C of global warming above pre-industrial levels, mean annual temperatures in East 1 Africa are projected to be on average, 0.6°C, 1.1°C and 2.1°C warmer than the 1994–2005 average 2 respectively (Figure 9.16a). Highest increases are projected over the northern and central parts of the region 3 and the lowest increase over the coastal regions (Otieno and Anyah, 2013; Dosio, 2017). The magnitude and 4 frequency of hot days are projected to increase from GWL 2°C and above with larger increases at higher 5 GWLs (Dosio, 2017; Bathiany et al., 2018; Dosio et al., 2018; Kharin et al., 2018) (Figure 9.16a,b). At GWL 6 4.6°C a number of East African cities are projected to have an up to 2000‐fold increase in exposure to 7 dangerous heat (days >40.6 ℃) compared to 1985–2005 including Blantyre‐Limbe, Lusaka and Kampala, 8
(Mora et al., 2017; Rohat et al., 2019). Children born in 2020, under a 1.5°C-compatible scenario will be 9 exposed to 3–5 times more heatwaves in their lifetimes compared to people born in 1960; this exposure 10
increases to 4–9 times more heatwaves at GWL 2.4°C (Thiery et al., 2021). The number of potentially lethal 11 heat days per year is projected to increase from <50 during 1995–2005 to <50 at GWL 1.6℃, 50–120 at 12 GWL 2.5℃ and 150–350 at GWL 4.4℃ with largest increases at the coast (Mora et al., 2017), highlighting 13 the new emergence of dangerous heat conditions in these areas. 14 15 9.5.5.2 Precipitation 16 17 Observations 18 Over Equatorial East Africa the short rains (October–November–December) have shown a long-term wetting 19 trend from the 1960s until present (Manatsa and Behera, 2013; Nicholson, 2015; Nicholson, 2017), which is 20 linked with western Indian Ocean warming and a steady intensification of Indian Ocean Walker Cell 21 (Liebmann et al., 2014; Nicholson, 2015). 22 23 In contrast, the long rainfall season (March-April-May) has experienced a long-term drying trend between 24 1986 and 2007, with rainfall declines in each of these months and a shortening of the wet season (Rowell et 25 al., 2015; Wainwright et al., 2019). Unlike previous decades, since around 2000 the long rains have exhibited 26 a significant relationship with the El Niño-Southern Oscillation (Park et al., 2020), as multiple droughts have 27 occurred during recent La Niña events and when the western to central Pacific SST gradient was La Niña-28 like (Funk et al., 2015; Funk et al., 2018a). Wetter-than-average rainfall years within this long-term drying 29 trend are often associated with a stronger amplitude of the Madden-Julian Oscillation (Vellinga and Milton, 30 2018). 31 32 In the northern, summer rainfall region (June–September), a decline in rainfall occurred in the 1960s and 33 rainfall has remained relatively low, while interannual variability has increased since the late 1980s 34 (Nicholson, 2017); the cause of this drying trend is uncertain. 35 36 Since 2005, drought frequency has doubled from once every six to once every three years and has become 37 more severe during the long and summer rainfall seasons than during the short rainfall season (Ayana et al., 38 2016; Gebremeskel Haile et al., 2019). Several prolonged droughts have occurred predominantly within the 39 arid and semi-arid parts of the region over the past three decades (Nicholson, 2017). 40 41 Projections 42 Higher mean annual rainfall, particularly in the eastern parts of east Africa are projected at GWL 1.5℃ and 43 2°C by 25 CORDEX models (Nikulin et al., 2018; Osima et al., 2018). The additional 0.5°C of warming 44 from 1.5°C increases average dry spell duration by between two and four days, except over southern Somalia 45 where this is reduced by between two to three days (Hoegh-Guldberg et al., 2018; Nikulin et al., 2018; 46 Osima et al., 2018; Weber et al., 2018). 47 48 During the short rainy season, a longer rainfall season (Gudoshava et al., 2020) and increased rainfall of up 49 to over 100 mm on average is projected over the eastern horn of Africa and regions of high/complex 50
topography at GWL 4.5°C (Dunning et al., 2018; Endris et al., 2019; Ogega et al., 2020). 51
52 During the long rainy season, there is low confidence in projected mean rainfall change (Gutiérrez et al., 53 2021). Although some studies report projected increased end of century rainfall (Otieno and Anyah, 2013; 54 Kent et al., 2015), the mechanisms responsible for this are not well-understood and a recent regional model 55 study has detected no significant change (Cook et al., 2020b). Projected wetting is opposite to the observed 56 drying trends, giving rise to the ‘East African rainfall paradox’ (Rowell et al., 2015; Wainwright et al., 57
ACCEPTED VERSIO
N
SUBJECT TO FIN
AL EDITS
FINAL DRAFT Chapter 9 IPCC WGII Sixth Assessment Report
Do Not Cite, Quote or Distribute 9-56 Total pages: 225
2019). In other parts of East Africa, no significant trend is evident (Ogega et al., 2020), agreement on the 1 sign of change is low, and in some regions, CMIP5 and CORDEX data show opposite signs of change (Lyon 2 et al., 2017; Lyon and Vigaud, 2017; Osima et al., 2018; Kendon et al., 2019; Ogega et al., 2020). 3 4 Heavy rainfall events are projected to increase over the region at global warming of 2°C and higher (high 5 confidence) (Nikulin et al., 2018; Finney et al., 2020; Ogega et al., 2020; Li et al., 2021). Drought frequency, 6 duration and intensity are projected to increase in Sudan, South Sudan, Somalia and Tanzania but decrease or 7 not change over Kenya, Uganda and Ethiopian highlands (Liu et al., 2018c; Nguvava et al., 2019; Haile et 8 al., 2020; Spinoni et al., 2020). 9 10 9.5.6 Southern Africa 11 12 9.5.6.1 Temperature 13 14 Observations 15 Mean annual temperatures over the region have increased by between 1.04°C and 1.44°C over the period 16 1961–2015 depending on the observational dataset (Gutiérrez et al., 2021) and in northern Botswana and 17 Zimbabwe increasing 1.6°C–1.8°C between 1961–2010 (Engelbrecht et al 2015). The annual number of hot 18 days have increased in southern Africa over the last four decades (Ceccherini et al., 2017; Kruger and 19 Nxumalo, 2017b; Kruger and Nxumalo, 2017a) and there is increasing evidence of increased heat stress 20 impacting agriculture and human health (Section 9.10.2). The occurrence of cold extremes, including frost 21 days, have decreased (Kruger and Nxumalo, 2017b) (Figure 9.14). 22 23 Projections 24 At 1.5℃, 2℃ and 3°C of global warming above pre-industrial levels, mean annual temperatures in southern 25 Africa are projected to be on average, 1.2℃, 2.3℃ and 3.3°C warmer than the 1994–2005 average 26 respectively (Figure 9.16a). The annual number of heatwaves is projected to increase by between 2–4 (GWL 27 1.5°C), 4–8 (GWL 2°C) and 8–12 (GWL 3°C) and hot and very hot days are virtually certain to increase 28 under 1.5°C and 2°C of global warming (Engelbrecht et al., 2015; Russo et al., 2016; Dosio, 2017; Weber et 29 al., 2018; Seneviratne et al., 2021). Cold days and cold extremes are projected to decrease under all emission 30 scenarios with the strongest decreases associated with low mitigation (Iyakaremye et al., 2021). Children 31
born in 2020, under a 1.5°C-compatible scenario will be exposed to 3–4 times more heatwaves in their 32
lifetimes compared to people born in 1960, although in Angola this is 7–8 times; at GWL 2.4°C this 33 exposure increases to 5–9 times more heatwaves (>10 times in Angola) (Thiery et al., 2021). 34 35 9.5.6.2 Precipitation 36 37 Observations 38 Mean annual rainfall has increased over parts of Namibia, Botswana and southern Angola during 1980–2015 39 by between 128 and 256 mm (Figure 9.13b). Since the 1960s decreasing precipitation trends have been 40 detected over the South African winter rainfall region (high confidence) and the far eastern parts of South 41 Africa (low confidence) (Engelbrecht et al., 2009; Kruger and Nxumalo, 2017b; Burls et al., 2019; Lakhraj-42 Govender and Grab, 2019; Gutiérrez et al., 2021; Ranasinghe et al., 2021). The frequency of dry spells and 43 agricultural drought in the region has increased over the period 1961–2016 (Yuan et al., 2018; Seneviratne et 44 al., 2021), the frequency of meteorological drought increased by between 2.5–3 events per decade since 1961 45 (Spinoni et al 2019) and the probability of the multi-year drought over the southwestern cape of South Africa 46 increased by a factor of three in response to global warming (Otto et al., 2018). The number and intensity of 47 extreme precipitation events have increased over the last century (Kruger and Nxumalo, 2017b; Ranasinghe 48 et al., 2021; Sun et al., 2021), and in the Karoo region of southern South Africa, long-term station data show 49 an increasing trend in annual rainfall of greater than 5 mm per decade over the period 1921–2015 (Kruger 50 and Nxumalo, 2017b). 51 52 Projections 53 Mean annual rainfall in the summer rainfall region is projected to decrease by 10–20%, accompanied by an 54 increase in the number of consecutive dry days during the rainy season under RCP8.5 (Kusangaya et al., 55 2014; Engelbrecht et al., 2015; Lazenby et al., 2018; Maúre et al., 2018; Spinoni et al., 2019). The western 56 parts of the region are projected to become drier, with increasing drought frequency, intensity and duration 57
ACCEPTED VERSIO
N
SUBJECT TO FIN
AL EDITS
FINAL DRAFT Chapter 9 IPCC WGII Sixth Assessment Report
Do Not Cite, Quote or Distribute 9-57 Total pages: 225
likely under RCP8.5 (high confidence) (Engelbrecht et al., 2015; Liu et al., 2018b; Liu et al., 2018c; Ukkola 1 et al., 2020) (Figures 9.16c,e and 9.14), including multi-year droughts (Zhao and Dai, 2016; Dosio, 2017). 2 3 Dryness in the summer rainfall region is expected to increase at 1.5°C and higher levels of global warming 4 (Hoegh-Guldberg et al., 2018) and together with higher temperatures will enhance evaporation from the 5 region’s mega-dams and reduce soil-moisture content (Engelbrecht et al., 2015) (Section 9.7.1). Increases in 6 drought frequency and duration are projected over large parts of southern Africa at GWL 1.5°C (Liu et al., 7 2018b; Liu et al., 2018c; Seneviratne et al., 2021) and unprecedented extreme droughts (compared to the 8 1981–2010 period) emerge at GWL 2°C (Spinoni et al., 2021). Meteorological drought duration is projected 9 to increase from approximately 2 months during 1950–2014 to approximately 4 months in the mid-to-late-10 21st century future under RCP8.5 (Ukkola et al., 2020). Heavy precipitation in the southwestern region is 11 projected to decrease (Donat et al., 2019) and increase in the eastern parts of southern Africa at all warming 12 levels (Li et al., 2021; Seneviratne et al., 2021). 13 14 9.5.7 Tropical cyclones 15 16 There is limited evidence of an increased frequency of Category 5 tropical cyclones in the southwestern 17 Indian Ocean (Fitchett et al., 2016; Ranasinghe et al., 2021; Seneviratne et al., 2021) and more frequent 18 landfall of tropical cyclones over central to northern Mozambique (Malherbe et al., 2013; Muthige et al., 19 2018). There is a projected decrease in the number of tropical cyclones making landfall in the region at 1℃, 20 2℃ and 3℃ of global warming, however, they are projected to become more intense with higher wind 21 speeds so when they do make landfall the impacts are expected to be high (medium confidence) (Malherbe et 22 al., 2013; Muthige et al., 2018; Ranasinghe et al., 2021). 23 24 9.5.8 Glaciers 25 26 Total glacial area on Mount Kenya decreased by 121×103 m2 (44%) during 2004–2016 (Prinz et al., 2016), 27 Kilimanjaro from 4.8 km2 in 1984 to 1.7 km2 in 2011 (Cullen et al., 2013) and, in the Rwenzori Mountains, 28 from ~2 km2 in 1987 to ~1 km2 in 2003 (Taylor et al., 2006). Declining glacial areas in East Africa are linked 29 to rising air temperatures (Taylor et al., 2006; Hastenrath, 2010; Veettil and Kamp, 2019), and in the case of 30 Kilimanjaro and Mount Kenya, declining precipitation and atmospheric moisture (Mölg et al., 2009a; Mölg 31 et al., 2009b; Prinz et al., 2016; Veettil and Kamp, 2019). 32 33 Glacial ice cover is projected to disappear before 2030 on the Rwenzori Mountains (Taylor et al., 2006) and 34 Mount Kenya (Prinz et al., 2018) and by 2040 on Kilimanjaro (Cullen et al., 2013). The loss of glaciers is 35 expected to result in a loss in tourism revenues, especially in mountain tourism (Wang and Zhou, 2019). 36 37 9.5.9 Teleconnections and Large-Scale Drivers of African Climate Variability 38 39 The El Niño-Southern Oscillation (ENSO), Indian Ocean dipole (IOD) and southern annular mode (SAM) 40 are the primary large-scale drivers of African seasonal and interannual climate variability. The diurnal 41 temperature range tends to be greater during La Niña than El Niño in northeastern Africa (Hurrell et al., 42 2003; Donat et al., 2014a), and in southern Africa, the El Niño warming effect has been stronger for more 43 recent times (1979–2016) compared to earlier period (1940–1978) (Lakhraj‐Govender and Grab, 2019). In 44 East Africa, ENSO and IOD exert an interannual control on particularly October–November–December 45 (short rains) and June–July–August–September seasons. In southern Africa, El Niño is associated with 46 negative rainfall and positive temperature anomalies with the opposite true for La Niña. The SAM exerts 47 control on rainfall in the southwestern parts of the region and a positive SAM mode is often associated with 48 lower seasonal rainfall in the region (Reason and Rouault, 2005). The SAM shows a systematic positive 49 trend over the last five decades (Niang et al., 2014). 50 51 There is no clear indication that climate change will impact the frequencies of ENSO and IOD (Stevenson et 52 al., 2012; Endris et al., 2019), although there is some indication that extreme ENSO events and extreme 53 phases of the IOD, particularly the positive phase, may become more frequent with implications for extreme 54 events associated with these features, such as drought (Collins et al., 2019; Cai et al., 2021; Seneviratne et 55 al., 2021). Under high emission scenarios, a positive trend in SAM is projected to continue through the 21st 56
ACCEPTED VERSIO
N
SUBJECT TO FIN
AL EDITS

FINAL DRAFT Chapter 9 IPCC WGII Sixth Assessment Report
Do Not Cite, Quote or Distribute 9-58 Total pages: 225
century, however, under low emission scenarios, this trend is projected to be weak or even negative given the 1 potential for ozone hole recovery (Arblaster et al., 2011). 2 3 9.5.10 African Marine Heatwaves 4 5 Marine heatwaves are periods of extreme warm sea surface temperature that persist for days to months and 6 can extend up to thousands of kilometres (Hobday et al., 2016; Scannell et al., 2016), negatively impacting 7 marine ecosystems (Section 9.6.1.4). 8 9 The number of marine heatwaves doubled in Mediterranean North Africa and along the Somalian and 10 southern African coastlines from 1982–2016 (Frölicher et al., 2018; Laufkötter et al., 2020) (Oliver et al., 11 2018), very likely as a result of human-induced climate change (Seneviratne et al., 2021). Marine heatwave 12 intensity has increased along the southern African coastline (Oliver et al., 2018). In the ecologically sensitive 13 region west of southern Madagascar, the longest and most intense marine heatwave in the past 35 years was 14 recorded during the austral summer of 2017 in the region, it lasted 48 days and reached a maximum intensity 15 of 3.44°C above climatology (Mawren et al., 2021). Satellite-derived measurements of coastal marine 16 heatwaves may under-report their intensity as measured against coastal in situ measurements (Schlegel et al., 17 2017). 18 19 Sea surface temperatures around Africa are projected to increase 0.5℃–1.3°C under GWL1.5 and 1.3℃–20 2.0°C under GWL3 (Figure 9.16f). Globally, 87% of observed MHWs have been attributed to anthropogenic 21 forcing, and at GWL2.0, nearly all MHWs would be attributable to anthropogenic heating (Frölicher et al., 22 2018; Laufkötter et al., 2020). Increases in frequency, intensity, spatial extent and duration of marine 23 heatwaves are projected for all coastal zones of Africa. At 1°C and 3.5°C of global warming, the probability 24 of MHW days is between 4–15 times and 30–60 times higher compared to the preindustrial (1861–1880) 99th 25 percentile probability, with highest increases over equatorial and sub-tropical coastal regions (Frölicher et 26 al., 2018) (Figure 9.16). These events are expected to overwhelm the ability of marine organisms and 27 ecosystems to adapt to these changes (Frölicher et al., 2018) (Sections 9.6.1). Reducing emissions and 28 limiting warming to lower levels reduces risk to these systems (high confidence) (Hoegh-Guldberg et al., 29 2018). 30 31 32 [START BOX 9.2 HERE] 33 34 Box 9.2: Indigenous Knowledge and Local Knowledge 35 36 This box aims at mapping the diversity of indigenous and local knowledge systems in Africa and highlights 37 the potential of this knowledge to enable sustainability and effective climate adaptation. This box builds on 38 the framing of the IPCC system for which ‘indigenous knowledge (IK) refers to the understandings, skills 39 and philosophies developed by societies with long histories of interaction with their natural surroundings’ 40 (IPCC, 2019b), while ‘local knowledge (LK) refers to the understandings and skills developed by individuals 41 and populations, specific to the place where they live’ (IPCC, 2019b) (Cross-Chapter Box INDIG in Chapter 42 18). 43 44 Early warning systems and indicators of climate variability 45 46 In most African indigenous agrarian systems, local communities integrate IK to anticipate or respond to 47 climate variability (Mafongoya et al., 2017). This holds potential for a more holistic response to climate 48 change, as IK and LK approaches seek solutions that increase resilience to a wide range of shocks and 49 community stresses (IPCC, 2019b). In Africa, IK and LK are exceptionally rich in ecosystem-specific 50 knowledge, with the potential to enhance the management of natural hazards and climate variability (high 51 confidence), but there is uncertainty about IK and LK for adaptation under future climate conditions. 52 53 Common indicators for the quality of the rain season for local communities in Africa include flower and fruit 54 production of local trees (Nkomwa et al., 2014; Jiri et al., 2015; Kagunyu et al., 2016), insect, bird and 55 animal behaviour and occurrence (Jiri et al., 2016; Mwaniki and Stevenson, 2017; Ebhuoma, 2020) and dry 56 season temperatures (Kolawole et al., 2016; Okonya et al., 2017). Fulani herders in West Africa believe that 57
ACCEPTED VERSIO
N
SUBJECT TO FIN
AL EDITS

FINAL DRAFT Chapter 9 IPCC WGII Sixth Assessment Report
Do Not Cite, Quote or Distribute 9-59 Total pages: 225
when ‘nests hang high on trees, then rains will be heavy; when nests hang low, rains will be scarce’ (Roncoli 1 et al., 2002). In South Africa, LK on weather forecasting is based on the hatching of insects, locust swarm 2 movements and the arrival of migratory birds, which has enabled farmers to make adjustments to cropping 3 practices (Muyambo et al., 2017; Tume et al., 2019). Most of these IK indicators apply to specific 4 communities, and are used for short-term forecasting (e.g., event-specific predictions, such as a violent 5 storm, and onset rain predictions) (Zuma-Netshiukhwi et al., 2013; Mutula et al., 2014). There is evidence of 6 communities that rely heavily on IK and LK indicators to forecast seasonal variability across the continent 7 (Kagunyu et al., 2016; Mwaniki and Stevenson, 2017; Tume et al., 2019). However, their accuracy is 8 debatable, with evidence of both accuracy and inaccuracies due to age-old knowledge losing accuracy 9 because of recent changes in weather conditions (Shaffer, 2014; Adjei and Kyerematen, 2018). There are 10 also some limitations in the transferability of IK across geographical scales, as its understanding is framed by 11 traditional beliefs and cultural practices, historical and social conditions of each community, which vary 12 significantly across communities. This has direct implications for the adoption of IK and LK in national 13 policy and planned adaptation by governments. However, in some parts of Africa, evidence of the integration 14 of IK and LK and scientific-based weather forecasting is increasing (Jiri et al., 2016; Mapfumo et al., 2017; 15 Williams et al., 2020). 16 17 IK and LK and climate adaptation 18 19 Communities across Africa have long histories of using IK and LK to cope with climate variability, reduce 20 vulnerability and improve the capacity to cope with climate variability (Iloka Nnamdi, 2016; Mapfumo et al., 21 2017). The adaptation is mostly incremental, such as customary rainwater harvesting practices and planting 22 ahead of rains (Ajibade and Eche, 2017; Makate, 2019), which are used to address the late-onset rains and 23 rainfall variability. Although IK and LK adaptation practices implemented by African communities are 24 incremental, such practices record higher evidence of climate risk reduction compared to practices 25 influenced by other knowledge types (Williams et al., 2020). African communities have used IK and LK to 26 cope, adapt to and manage climate hazards, mainly floods, wildfires, rainfall variability and droughts (see 27 Table Box 9.2.1) (IPCC, 2018b; IPCC, 2019b). 28 29 30 Table Box 9.2.1: Selected studies where IK and LK have been used to cope with climate variability and climate change 31 impacts in Africa. 32
Climate
Hazard
Adaptation/Coping Strategy Indigenous Group,
Community, Country
Evidence
Floods Use IK to predict floods (village elders acted as meteorologists) and use LK to prepare coping mechanisms (social capital); place valuable goods on higher ground, raise the floor level; leave the field uncultivated when facing flood/drought; indigenous earthen walls to protect homesteads from flooding; planting of culturally flood-immunising indigenous plants.
Coastal communities in Nigeria; Oshiwambo communities in the northern region of Namibia; Matabeleland and Mashonaland provinces in Zimbabwe; communities in Nyamwamba watershed, Uganda; subsistent farmers in Mount Oku and Mbaw, Cameroon; Akobo in South Sudan.
(Fabiyi and Oloukoi, 2013; Hooli, 2016; Lunga and Musarurwa, 2016; Bwambale et al., 2018; Tume et al., 2019)
Wildfires Early burning to prevent the intensity of the late-season fires
Smallholders in Mutoko, Zimbabwe; Khwe and Mbukushu communities in Namibia
(Mugambiwa, 2018; Humphrey et al., 2021)
Rainfall variability
Change crop type (from maize to traditional millet and sorghum); no weeding; forecasting, rainwater harvesting; women perform rituals rainmaking, seed dressing and crop maintenance as adaptation measures; mulching
Communities in Accra, Ghana; small-scale farmers in Ngamiland in Botswana; Malawi; Zimbabwe; Women in Dikgale, South Africa, agropastoral smallholders in Ntungamo, Kamuli and Sembabule in Uganda.
(Codjoe et al., 2014; Nkomwa et al., 2014; Lunga and Musarurwa, 2016; Rankoana, 2016b; Mugambiwa, 2018; Mfitumukiza et al., 2020; Mogomotsi et al., 2020)
Droughts Traditional drying of food for preservation (to consume during short
Communities in Accra, Ghana; Malawi; South Africa, Uganda; Smallholder
(Egeru, 2012; Gebresenbet and Kefale, 2012; Codjoe et al., 2014; Kamwendo and
ACCEPTED VERSIO
N
SUBJECT TO FIN
AL EDITS

FINAL DRAFT Chapter 9 IPCC WGII Sixth Assessment Report
Do Not Cite, Quote or Distribute 9-60 Total pages: 225
term droughts); harvesting wild fruits and vegetables; herd splitting by pastorals
farmers in Mutoko, Zimbabwe; Agro-pastoralists in Makueni, Kenya; Pastoralists in South Omo, Ethiopia
Kamwendo, 2014; Okoye and Oni, 2017; Mugambiwa, 2018)
Drought related water scarcity
Traditional rainwater harvesting to supplement both irrigation and domestic water; indigenous water bottle technology for irrigation.
Smallholder farmers in Beaufort, South Africa
(Ncube, 2018)
1 2 IK and LK and coping strategies in Table Box 9.2.1 are supportive measures that communities cannot solely 3 rely upon, but which can be used to complement other adaptation options to increase community resilience. 4 5 African indigenous language and climate change adaptation 6 7 The diversity of African languages is crucial for climate adaptation. Africa has over 30% of the world’s 8 indigenous languages (Seti et al., 2016) which are exceptionally rich in ecosystem-specific knowledge on 9 biodiversity, soil systems and water (Oyero, 2007; Mugambiwa, 2018). Taking into consideration the low 10 level of literacy in Africa, especially among women and girls, indigenous languages hold great potential for 11 more effective climate change communication and services that enable climate adaptation (Brooks et al., 12 2005; Ologeh et al., 2018; IPCC, 2019b). African traditional beliefs and cultural practices place great value 13 on the natural environment, especially land as the dwelling place of the ancestors and source of livelihoods 14 (Tarusarira, 2017) (see Section 9.12). 15 16 Limitations of African IK and LK in climate adaptation 17 18 Studies on IK and LK and climate change adaptation conducted in various African countries and across 19 ecosystems indicate that indigenous environmental knowledge is negatively affected by several factors. 20 Local farmers who depend on this knowledge system for their livelihoods hold the view that African 21 governments do not support and promote it in policy development. Most government agricultural extension 22 workers still consider IK as unscientific and unreliable (Seaman et al., 2014; Mafongoya et al., 2017). At the 23 national level, there is a lack of recognition and inclusion of IK and LK in adaptation planning by African 24 governments, partly because most of the IK and LK in African local communities remains undocumented, 25 but also because IK and LK are inadequately captured in the literature (Ford et al., 2016; IPCC, 2019b). It is 26 predominantly preserved in the memories of the elderly and is handed down orally or by demonstration from 27 generation to generation. It gradually disappears due to memory gaps, and when those holding the 28 knowledge die or refuse to pass it to another generation, the knowledge becomes extinct (Rankoana, 2016a). 29 The way in which IK is transmitted, accessed and shared in most African societies is not smooth (IIED, 30 2015). IK is also threatened by urbanisation, which attracts rural migrants to urban areas where IK and LK 31 use is limited (Fernández-Llamazares et al., 2015). Further, most African societies that use IK were once 32 colonised, whereby the African indigenous ways of knowing were devalued and marginalised (Bolden et al., 33 2018). There are concerns about the effectiveness of both IK indicators and related adaptation responses by 34 communities to predict and adapt to weather events under future climate conditions (Speranza et al., 2009; 35 Shaffer, 2014; Hooli, 2016). 36 37 38
ACCEPTED VERSIO
N
SUBJECT TO FIN
AL EDITS
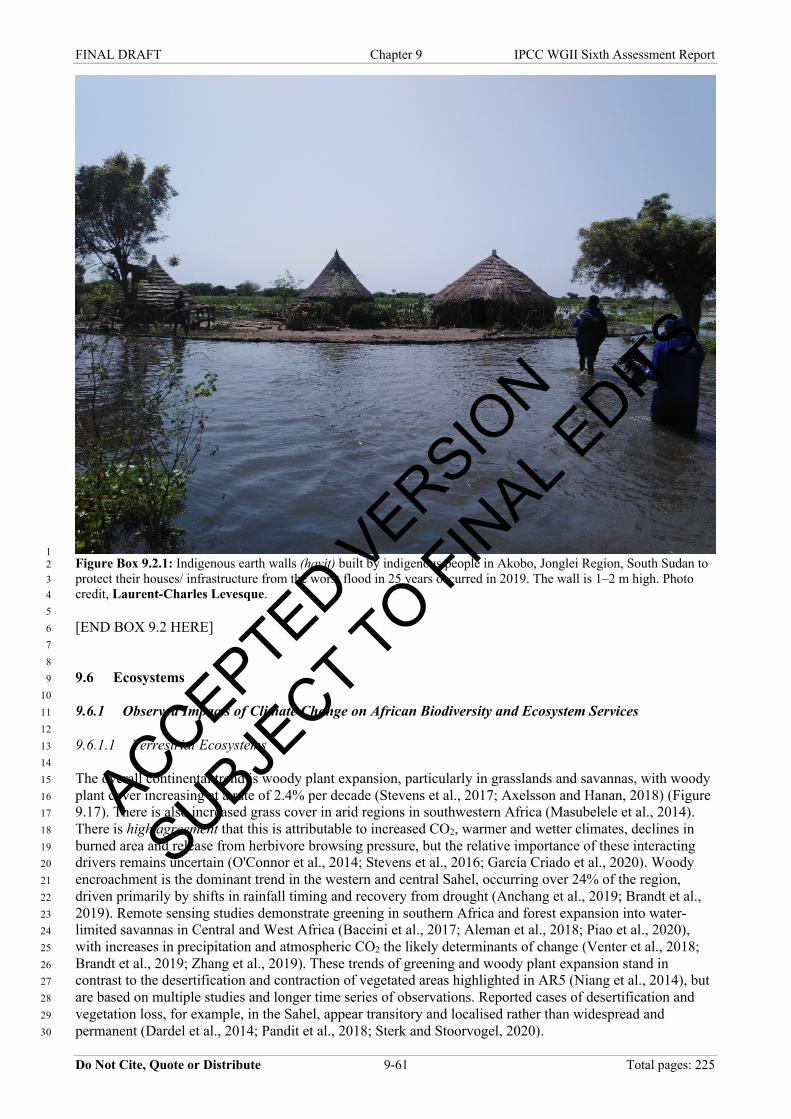
FINAL DRAFT Chapter 9 IPCC WGII Sixth Assessment Report
Do Not Cite, Quote or Distribute 9-61 Total pages: 225
1 Figure Box 9.2.1: Indigenous earth walls (hayit) built by indigenous people in Akobo, Jonglei Region, South Sudan to 2 protect their houses/ infrastructure from the worst flood in 25 years occurred in 2019. The wall is 1–2 m high. Photo 3 credit, Laurent-Charles Levesque. 4 5 [END BOX 9.2 HERE] 6 7 8 9.6 Ecosystems 9 10 9.6.1 Observed Impacts of Climate Change on African Biodiversity and Ecosystem Services 11 12 9.6.1.1 Terrestrial Ecosystems 13 14 The overall continental trend is woody plant expansion, particularly in grasslands and savannas, with woody 15 plant cover increasing at a rate of 2.4% per decade (Stevens et al., 2017; Axelsson and Hanan, 2018) (Figure 16 9.17). There is also increased grass cover in arid regions in southwestern Africa (Masubelele et al., 2014). 17 There is high agreement that this is attributable to increased CO2, warmer and wetter climates, declines in 18 burned area and release from herbivore browsing pressure, but the relative importance of these interacting 19 drivers remains uncertain (O'Connor et al., 2014; Stevens et al., 2016; García Criado et al., 2020). Woody 20 encroachment is the dominant trend in the western and central Sahel, occurring over 24% of the region, 21 driven primarily by shifts in rainfall timing and recovery from drought (Anchang et al., 2019; Brandt et al., 22 2019). Remote sensing studies demonstrate greening in southern Africa and forest expansion into water-23 limited savannas in Central and West Africa (Baccini et al., 2017; Aleman et al., 2018; Piao et al., 2020), 24 with increases in precipitation and atmospheric CO2 the likely determinants of change (Venter et al., 2018; 25 Brandt et al., 2019; Zhang et al., 2019). These trends of greening and woody plant expansion stand in 26 contrast to the desertification and contraction of vegetated areas highlighted in AR5 (Niang et al., 2014), but 27 are based on multiple studies and longer time series of observations. Reported cases of desertification and 28 vegetation loss, for example, in the Sahel, appear transitory and localised rather than widespread and 29 permanent (Dardel et al., 2014; Pandit et al., 2018; Sterk and Stoorvogel, 2020). 30
ACCEPTED VERSIO
N
SUBJECT TO FIN
AL EDITS

FINAL DRAFT Chapter 9 IPCC WGII Sixth Assessment Report
Do Not Cite, Quote or Distribute 9-62 Total pages: 225
1 Shifts in demography, geographic ranges and abundance of plants and animals consistent with expected 2 impacts of climate change are evident across Africa. These include uphill contractions of elevational range 3 limits of birds (Neate-Clegg et al., 2021), changes in species distributions previously reported in AR5 (Niang 4 et al., 2014) and the death of many of the oldest and largest African Baobabs (Patrut et al., 2018). An 5 increase in frequency and intensity of hot, dry weather after wildfires led to a long-term decline in plant 6 biodiversity in Fynbos since the 1960s (Slingsby et al., 2017). Increasing temperatures may have contributed 7 to the declining abundance and range size of South African birds (Milne et al., 2015), including Cape Rock-8 jumper (Chaetops frenatus) and Protea Canary (Serinus leucopterus), from increased risk of reproductive 9 failure (Lee and Barnard, 2016; Oswald et al., 2020). For hot and dry regions (e.g., Kalahari), there is strong 10 evidence increased temperatures are having chronic sublethal impacts, including reduced foraging efficiency 11 and loss of body mass (du Plessis et al., 2012; Conradie et al., 2019), and are approaching species 12 physiological limits, with heat extremes driving mass mortality events in birds and bats (McKechnie et al., 13 2021). Vegetation change linked to climate change and increasing atmospheric CO2 has had an indirect 14 impact on animals. Increased woody cover has decreased the occurrence of bird, reptile and mammal species 15 that require grassy habitats (Péron and Altwegg, 2015; McCleery et al., 2018). Decreased fruit production 16 linked to rising temperatures has decreased the body condition of fruit-dependent forest elephants by 11% 17 from 2008–2018 (Bush et al., 2020). 18 19 There is high agreement that land use activities counteract or exacerbate climate-driven vegetation change 20 (Aleman et al., 2017; Timm Hoffman et al., 2019). Decreased woody plant biomass in 11% of sub-Saharan 21 Africa was attributed to land clearing for agriculture (Brandt et al., 2017; Ordway et al., 2017). Localised 22 loss of tree cover in Miombo woodlands and 16.6±0.5 Mha of forest loss in the Congo basin between 2000-23 2014 was driven largely by forest clearing and drought mortality (McNicol et al., 2018; Tyukavina et al., 24 2018). 25 26 Vegetation changes interacting with climate and land use change have impacted fire regimes across Africa. 27 The frequency of weather conducive for fire has increased in southern and West Africa and is expected to 28 continue increasing in the 21st century under both RCP2.6 and RCP8.5 (Betts et al., 2015; Abatzoglou et al., 29 2019). Increased grass cover in arid regions introduced fire into regions where fuel was previously 30 insufficient to allow fire spread, such as the arid Karoo in South Africa (du Toit et al., 2015; Strydom and 31 Savage, 2016). In contrast, shrub encroachment, increased precipitation (Zubkova et al., 2019), vegetation 32 fragmentation and cropland expansion have reduced fire activity in many African grasslands and savannas 33 (Andela and van der Werf, 2014; Probert et al., 2019). These drivers are expected to negate the effect of 34 increasing fire weather and ultimately lead to a reduction in the total burned area under RCP4.5 and RCP8.5 35 (Knorr et al., 2016; Moncrieff et al., 2016; Wu et al., 2016). 36 37 9.6.1.2 Vegetation Resilience 38 39 African ecosystems have a long evolutionary association with fire, large mammal herbivory and drought 40 (Maurin et al., 2014; Charles-Dominique et al., 2016). The maintenance of biodiversity depends on natural 41 disturbance regimes. Natural regrowth of savanna plant biomass in southern Africa compensated for biomass 42 removal through human activities (McNicol et al., 2018), and rapid recovery occurred after the 2014-2016 43 extreme drought (Abbas et al., 2019). During the same drought event, browsing and mixed feeder herbivores 44 were resilient, but grazers declined by approximately 60% and were highly dependent on drought refugia 45 (Abraham et al., 2019). African tropical forests remained a carbon sink through the record drought and 46 temperature experienced in the 2015–2016 El Niño, indicating resilience in the face of extreme 47 environmental conditions (Bennett et al., 2021). This is likely due to the presence of drought-tolerant species 48 and floristic and functional shifts in tree species assemblages (Fauset et al., 2012; Aguirre-Gutiérrez et al., 49 2019). This resilience indicates that there is the capacity to recover from disturbances and short-term change. 50 But resilience has limits and beyond certain points, change can lead to irreversible shifts to different states 51 (Figure 9.18). 52 53 54
ACCEPTED VERSIO
N
SUBJECT TO FIN
AL EDITS

FINAL DRAFT Chapter 9 IPCC WGII Sixth Assessment Report
Do Not Cite, Quote or Distribute 9-63 Total pages: 225
1 Figure 9.17: Widespread changes to African vegetation have been reported, especially increasing woody plant cover in 2 many savannas and grasslands, with 37% of these changes proposed to be driven by anthropogenic climate change and 3 increased CO2. The warming of lakes and rivers has been detected across Africa and is attributed to climate change. 4 Data on vegetation change was gathered from 156 studies published between 1989 and 2021. Climatic changes, mostly 5 associated with changes in rainfall, are enhancing grass production in arid grasslands and savannas, and causing grass 6 expansion into semi-desert regions with notable increases in the Sahel and southern Africa. Tropical forest expansion 7 into mesic savannas is occurring on the fringes of the central African tropical forest. Interactions between land use, 8 climate change and increasing atmospheric CO2 concentrations are causing a widespread increase in woody plant cover 9 encroachment in tropical savannas and grasslands. Some tree death and woody cover decline associated with climate 10 and land use change have also been recorded across biomes. Of the reported changes to terrestrial vegetation, 24% were 11 explicitly linked to climate change and a further 13% were proposed to be driven by climate change. In 48% of studies, 12 no climate driver was mentioned and in 15% climate change was ruled out as the driver of change. Annual surface 13 water temperatures in African lakes have warmed at a rate of 0.05℃–0.76℃ per decade. Both satellite-based measures 14 spanning 1985-2011 and in situ measurements spanning 1927-2014 agree on this warming trend. Other surface waters 15 across Africa warmed from 1979-2018 at a rate of between 0.05℃ and 0.5℃ per decade (Woolway and Maberly, 16 2020). Vegetation change data were taken from a larger, global literature survey of existing databases supplemented 17 with newer studies documenting changes in tree, shrub and grass cover linked to climate and land use change in natural 18 and semi-natural areas (for further details 2.4.3.5 and Table 2.S.1 in Chapter 2, and see Supplementary Material Table 19 SM 9.2 for Africa vegetation change data and Table SM 9.3 for studies reporting lake warming data). 20 21 22 9.6.1.3 Freshwater Ecosystems 23 24 Small climatic variations have large impacts on ecosystem function in Africa’s freshwaters (Ndebele-Murisa, 25 2014; Ogutu-Ohwayo et al., 2016). Warming of water temperatures from 0.2℃ to 3.2℃ occurred in several 26 lakes over 1927–2014 and has been attributed to anthropogenic climate change (Ogutu-Ohwayo et al., 2016); 27 Figure 9.17). Increased temperature, changes in rainfall, and reduced wind speed altered the physical and 28 chemical properties of inland water bodies, affecting water quality and productivity of algae, invertebrates 29 and fish (high confidence). In deeper lakes, warmer surface waters and decreasing wind speeds reduced 30 shallow waters mixing with nutrient-rich deeper waters, reducing biological productivity in the upper sunlit 31 zone (Ndebele-Murisa, 2014; Saulnier-Talbot et al., 2014). In several lakes, climate change was identified as 32 causing changes in insect emergence time (Dallas and Rivers-Moore, 2014) and in loss of fish habitats 33 (Natugonza et al., 2015; Gownaris et al., 2016). This set of changes can harm human livelihoods, for 34 example, from reduced fisheries productivity (Ndebele-Murisa, 2014; Ogutu-Ohwayo et al., 2016) (9.8.5) 35 and reduced water supply and quality (Section 9.7.1). 36 37
ACCEPTED VERSIO
N
SUBJECT TO FIN
AL EDITS

FINAL DRAFT Chapter 9 IPCC WGII Sixth Assessment Report
Do Not Cite, Quote or Distribute 9-64 Total pages: 225
9.6.1.4 Marine Ecosystems 1 2 Anthropogenic climate change is already negatively impacting Africa’s marine biodiversity, ecosystem 3 functioning and services by changing physical and chemical properties of seawater (increased temperature, 4 salinity and acidification, and changes in oxygen concentration, ocean currents and vertical stratification) 5 (high confidence) (Hoegh-Guldberg et al., 2014; Hoegh-Guldberg et al., 2018). Coastal ecosystems in West 6 Africa are among the most vulnerable because of extensive low-lying deltas exposed to sea level rise, 7 erosion, saltwater intrusion and flooding (Belhabib et al., 2016; UNEP, 2016b; Kifani et al., 2018). In 8 southern Africa, shifting distributions of anchovy, sardine, hake, rock lobster and seabirds have been partly 9 attributed to climate change (Crawford et al., 2015; van der Lingen and Hampton, 2018; Vizy et al., 2018), 10 including southern shifts of 30 estuarine and marine fish species attributed to increased temperature and 11 changes in water circulation from decreased river inflow (Augustyn et al., 2018). Warming sea surface 12 temperatures inhibiting nutrient mixing reduced phytoplankton biomass in the western Indian Ocean by 20% 13 since the 1960s, potentially reducing tuna catches (Roxy et al., 2016). 14 15 Mangroves, seagrasses and coral reefs support nursery habitats for fish, sequester carbon, trap sediment and 16 provide shoreline protection (Ghermandi et al., 2019). Climate change is compromising these ecosystem 17 services (medium confidence). Marine heatwaves associated with El Niño-Southern Oscillation (ENSO) 18 events triggered massive coral bleaching and mortality over the past 20 years (Oliver et al., 2018). Mass 19 coral bleaching in the western Indian Ocean occurred in 1998, 2005, 2010 and 2015/2016 with coral cover 20 just 30–40% of 1998 levels by 2016 (Obura et al., 2017; Moustahfid et al., 2018). The northern Mozambique 21 Channel has served as a refuge from climate change and biological reservoir for the entire coastal East 22 African region (McClanahan et al., 2014; Hoegh-Guldberg et al., 2018). A southern shift of mangrove 23 species has been observed in South Africa (Peer et al., 2018) with loss in total suitable coastal habitats for 24 mangroves and shifts in the distribution of some species of mangroves and a gain for others (Record et al., 25 2013). Mangrove cover was reduced 48% in Mozambique in 2000 from tropical cyclone Eline, with 100% 26 mortality of seaward mangroves dominated by Rhizophora mucronata (Macamo et al., 2016). Recovery of 27 mangrove species was observed 14 years later in sheltered sites. There is low confidence these cyclone-28 induced impacts are attributable to climate change owing, in part, to a lack of reliable long-term data sets 29 (Macamo et al., 2016). In West Africa, oil and gas extraction, deforestation, canalisation and de-silting of 30 waterways have been the largest factors in mangrove destruction (Numbere, 2019). 31 32 9.6.2 Projected Risks of Climate Change for African Biodiversity and Ecosystem Services 33 34 9.6.2.1 Projected Biome Distribution 35 36 African biomes are projected to shift due to changes in atmospheric CO2 concentrations and aridity (Figure 37 9.18). Grassland expansion into the desert, woody expansion into grasslands and forest expansion into 38 savannas are projected for areas of reduced aridity, caused by reduced moisture stress from CO2 fertilisation 39 under medium (RCP4.5) and high (SRES A2) emissions scenarios (Heubes et al., 2011; Moncrieff et al., 40 2016). This greening trend may slow or reverse with continued temperature increase and/or in areas of 41 increased aridity (Berdugo et al., 2020). The net impact of these effects on vegetation is highly uncertain 42 (Trugman et al., 2018; Cook et al., 2020a; Martens et al., 2021). The maintenance or re-establishment of 43 natural fire and large mammal herbivory processes can mitigate projected CO2 and climate-driven changes 44 (Scheiter and Savadogo, 2016; Stevens et al., 2016). Expansion of croplands and pastures will reduce 45 ecosystem carbon storage in Africa, potentially reversing climate- and CO2-driven greening in savannas 46 (Aleman et al., 2018; Quesada et al., 2018). 47 48 Vegetation growth simulated by dynamic vegetation models is often highly sensitive to CO2 fertilisation. 49 These models project the African tropical forest carbon sink to be stable or strengthened under scenarios of 50 future climate change (Huntingford et al., 2013; Martens et al., 2021). In contrast, statistical modelling 51 suggests it has begun to decline and will weaken further, decreasing from current estimates of 0.66 tonnes of 52 carbon removed from the atmosphere per hectare per year to 0.55 tonnes of carbon (Hubau et al., 2020). 53 Increasing rainfall seasonality and aridity over central Africa (Haensler et al., 2013) threatens the massive 54 carbon store in the Congo Basin’s Cuvette Centrale peatlands, estimated at 30.6 billion tonnes (Dargie et al., 55 2019). 56 57
ACCEPTED VERSIO
N
SUBJECT TO FIN
AL EDITS

FINAL DRAFT Chapter 9 IPCC WGII Sixth Assessment Report
Do Not Cite, Quote or Distribute 9-65 Total pages: 225
1
2 Figure 9.18: Increases in atmospheric CO2 and changes in aridity are projected to shift the geographic distribution of 3 major biomes across Africa (high confidence). Arrows in the diagram indicate possible pathways of biome change from 4 current conditions resulting from changes in CO2 and aridity. Changes need not be gradual or linear and may occur 5 rapidly if tipping points are crossed. Currently, widespread greening observed in Africa has been at least partially 6 attributed to increasing atmospheric CO2 concentrations. Future projected increases in aridity are expected to cause 7 desertification in many regions, but it is highly uncertain how this will interact with the greening effect of CO2. Inset 8 maps show the projected geographical extent of changes in CO2 concentrations and aridity. CO2 is projected to increase 9 globally under all future emission scenarios. Aridity index maps show projected change in aridity (calculated as annual 10 precipitation/annual potential evapotranspiration) at around 4℃ global warming relative to 1850–1900 (RCP8.5 in 11 2070–2099) from 34 CMIP5 models (Scheff et al., 2017). Shaded areas indicate regions where >75 % of models agree 12 on the direction of change. 13 14 15 9.6.2.2 Terrestrial Biodiversity 16 17 Local extinction is when a species is extirpated from a local site. The magnitude and extent of local 18 extinctions predicted across Africa increase substantially under all future global warming levels (high 19 confidence) (Table 9.5; Figure 9.19). Above 2℃ the risk of sudden disruption or loss of local biodiversity, 20 increases and becomes more widespread, especially in Central, West and East Africa (Trisos et al., 2020). 21 22 Global extinction is when a species is extirpated from all areas. At 2℃ global warming, 11.6% of African 23 species (mean 11.6%, 95% CI 6.8–18.2%) assessed are at risk of global extinction, placing Africa second 24 only to South America in the magnitude of projected biodiversity losses (Urban, 2015). At >2℃, 20% of 25 North African mammals may lose all suitable climates (Soultan et al., 2019), and over half of the dwarf 26 succulents in South African Karoo may lose >90% of their suitable habitat (Young et al., 2016). Among the 27 thousands of species at risk, many are species of ecological, cultural and economic importance such as 28 African wild dogs (Woodroffe et al., 2017) and Arabica Coffee (Moat et al., 2019). 29 30 With increasing warming, there is a lower likelihood species can migrate rapidly enough to track shifting 31 climates, increasing global extinction risk and biodiversity loss across more of Africa (high confidence). 32 Immigration of species from elsewhere may partly compensate for local extinctions and lead to local 33 biodiversity gains in some regions (Newbold, 2018; Warren et al., 2018). However, more regions face net 34 losses than net gains. At 1.5℃ global warming, >46% of localities face net declines in vertebrate species 35 richness of >10%, with net increases projected for less than 15% of localities (Barbet-Massin and Jetz, 2015; 36 Newbold, 2018). At >2°C, 9% of species face complete range loss by 2100, regardless of their dispersal 37 ability (Urban, 2015). With >4°C global warming, a net loss of >10% of vertebrate species richness is 38
ACCEPTED VERSIO
N
SUBJECT TO FIN
AL EDITS
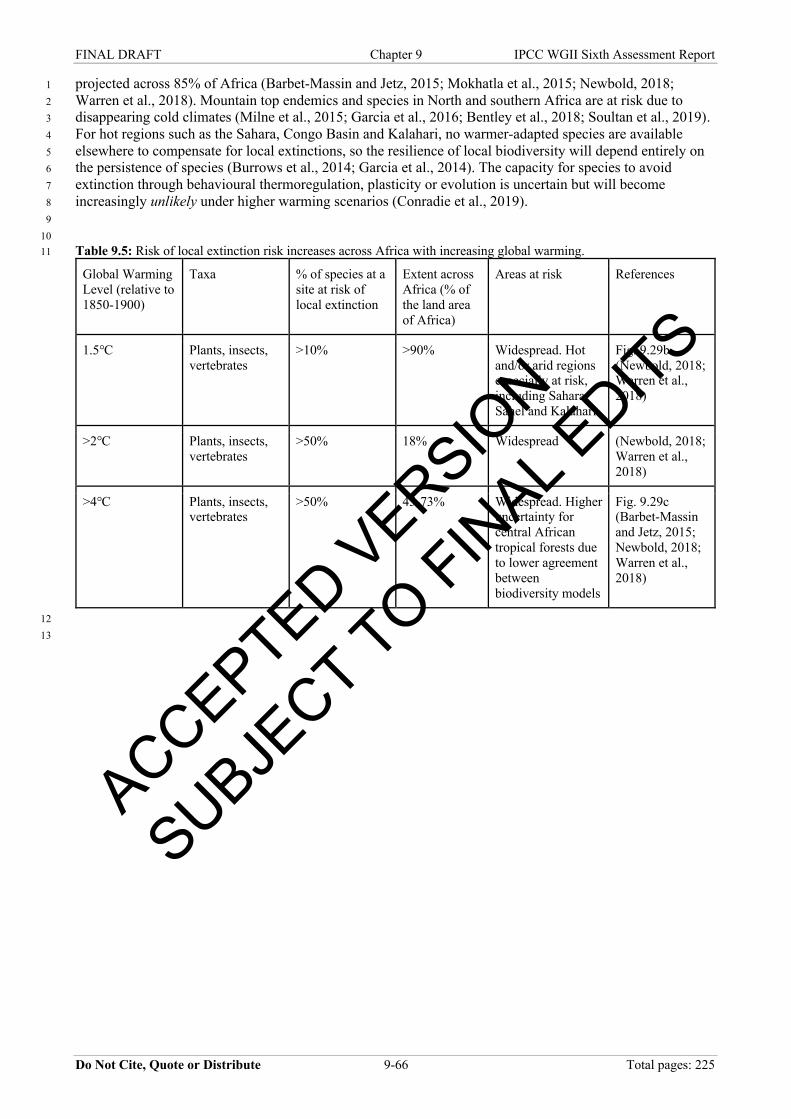
FINAL DRAFT Chapter 9 IPCC WGII Sixth Assessment Report
Do Not Cite, Quote or Distribute 9-66 Total pages: 225
projected across 85% of Africa (Barbet-Massin and Jetz, 2015; Mokhatla et al., 2015; Newbold, 2018; 1 Warren et al., 2018). Mountain top endemics and species in North and southern Africa are at risk due to 2 disappearing cold climates (Milne et al., 2015; Garcia et al., 2016; Bentley et al., 2018; Soultan et al., 2019). 3 For hot regions such as the Sahara, Congo Basin and Kalahari, no warmer-adapted species are available 4 elsewhere to compensate for local extinctions, so the resilience of local biodiversity will depend entirely on 5 the persistence of species (Burrows et al., 2014; Garcia et al., 2014). The capacity for species to avoid 6 extinction through behavioural thermoregulation, plasticity or evolution is uncertain but will become 7 increasingly unlikely under higher warming scenarios (Conradie et al., 2019). 8 9 10 Table 9.5: Risk of local extinction risk increases across Africa with increasing global warming. 11
Global Warming
Level (relative to
1850-1900)
Taxa % of species at a
site at risk of
local extinction
Extent across
Africa (% of
the land area
of Africa)
Areas at risk References
1.5℃ Plants, insects,
vertebrates
>10% >90% Widespread. Hot
and/or arid regions
especially at risk,
including Sahara,
Sahel and Kalahari
Fig. 9.29b
(Newbold, 2018;
Warren et al.,
2018)
>2℃ Plants, insects,
vertebrates
>50% 18% Widespread (Newbold, 2018;
Warren et al.,
2018)
>4℃ Plants, insects,
vertebrates
>50% 45-73% Widespread. Higher
uncertainty for
central African
tropical forests due
to lower agreement
between
biodiversity models
Fig. 9.29c
(Barbet-Massin
and Jetz, 2015;
Newbold, 2018;
Warren et al.,
2018)
12 13
ACCEPTED VERSIO
N
SUBJECT TO FIN
AL EDITS
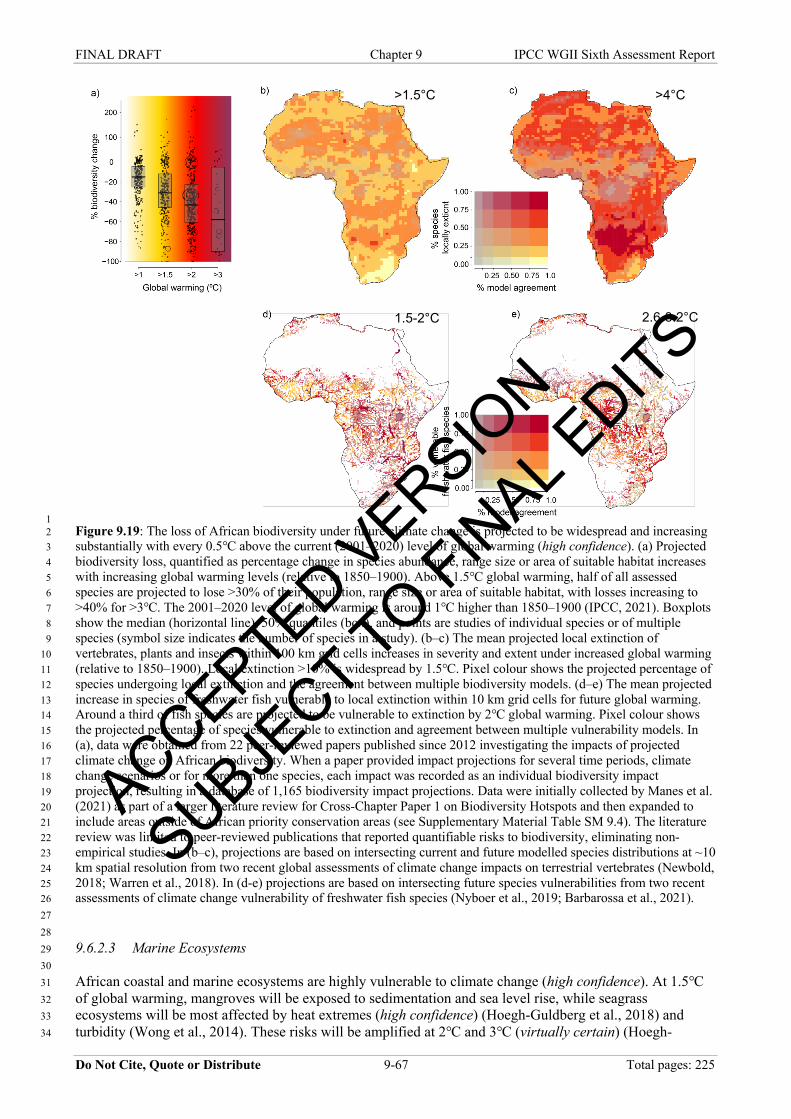
FINAL DRAFT Chapter 9 IPCC WGII Sixth Assessment Report
Do Not Cite, Quote or Distribute 9-67 Total pages: 225
1 Figure 9.19: The loss of African biodiversity under future climate change is projected to be widespread and increasing 2 substantially with every 0.5℃ above the current (2001–2020) level of global warming (high confidence). (a) Projected 3 biodiversity loss, quantified as percentage change in species abundance, range size or area of suitable habitat increases 4 with increasing global warming levels (relative to 1850–1900). Above 1.5℃ global warming, half of all assessed 5 species are projected to lose >30% of their population, range size or area of suitable habitat, with losses increasing to 6 >40% for >3℃. The 2001–2020 level of global warming is around 1℃ higher than 1850–1900 (IPCC, 2021). Boxplots 7 show the median (horizontal line), 50% quantiles (box), and points are studies of individual species or of multiple 8 species (symbol size indicates the number of species in a study). (b–c) The mean projected local extinction of 9 vertebrates, plants and insects within 100 km grid cells increases in severity and extent under increased global warming 10 (relative to 1850–1900). Local extinction >10% is widespread by 1.5℃. Pixel colour shows the projected percentage of 11 species undergoing local extinction and the agreement between multiple biodiversity models. (d–e) The mean projected 12 increase in species of freshwater fish vulnerable to local extinction within 10 km grid cells for future global warming. 13 Around a third of fish species are projected to be vulnerable to extinction by 2℃ global warming. Pixel colour shows 14 the projected percentage of species vulnerable to extinction and agreement between multiple vulnerability models. In 15 (a), data were obtained from 22 peer-reviewed papers published since 2012 investigating the impacts of projected 16 climate change on African biodiversity. When a paper provided impact projections for several time periods, climate 17 change scenarios or for more than one species, each impact was recorded as an individual biodiversity impact 18 projection, resulting in a database of 1,165 biodiversity impact projections. Data were initially collected by Manes et al. 19 (2021) as part of a larger literature review for Cross-Chapter Paper 1 on Biodiversity Hotspots and then expanded to 20 include areas outside of African priority conservation areas (see Supplementary Material Table SM 9.4). The literature 21 review was limited to peer-reviewed publications that reported quantifiable risks to biodiversity, eliminating non-22 empirical studies. In (b–c), projections are based on intersecting current and future modelled species distributions at ~10 23 km spatial resolution from two recent global assessments of climate change impacts on terrestrial vertebrates (Newbold, 24 2018; Warren et al., 2018). In (d-e) projections are based on intersecting future species vulnerabilities from two recent 25 assessments of climate change vulnerability of freshwater fish species (Nyboer et al., 2019; Barbarossa et al., 2021). 26 27 28 9.6.2.3 Marine Ecosystems 29 30 African coastal and marine ecosystems are highly vulnerable to climate change (high confidence). At 1.5℃ 31 of global warming, mangroves will be exposed to sedimentation and sea level rise, while seagrass 32 ecosystems will be most affected by heat extremes (high confidence) (Hoegh-Guldberg et al., 2018) and 33 turbidity (Wong et al., 2014). These risks will be amplified at 2℃ and 3℃ (virtually certain) (Hoegh-34
>1.5°C >4°C
1.5-2°C 2.6-3.2°C
ACCEPTED VERSIO
N
SUBJECT TO FIN
AL EDITS

FINAL DRAFT Chapter 9 IPCC WGII Sixth Assessment Report
Do Not Cite, Quote or Distribute 9-68 Total pages: 225
Guldberg et al., 2018). Over 90% of East African coral reefs are projected to be destroyed by bleaching at 1 2℃ of global warming (very high confidence) (Hoegh-Guldberg et al., 2018). At around 2.5℃ global 2 warming, an important reef-building coral (Diploastrea heliopora) in the central Red Sea is projected to stop 3 growing altogether (Cantin et al., 2010). By 2.5℃, suitable habitat of >50% of species are projected to 4 decline for coastal lobster in East and North Africa, with large declines for commercially important J. 5 lalandii in southern Africa (Boavida-Portugal et al., 2018). More generally, tropical regions, especially 6 exclusive economic zones in West Africa, are projected to lose large numbers of marine species and may 7 experience sudden declines with extratropical regions having potential net increases as species track shifting 8 temperatures poleward (García Molinos et al., 2016; Trisos et al., 2020). 9 10 9.6.2.4 Freshwater Ecosystems 11 12 Above 2℃ global warming, the proportion of freshwater fish species vulnerable to climate change increases 13 substantially (high confidence) (Figure 9.19). At 2℃, 36.4% of fish species are projected to be vulnerable to 14 local or global extinction by 2100, increasing to 56.4% under 4℃ warming (average of values from (Nyboer 15 et al., 2019; Barbarossa et al., 2021) (Figure 9.19). Global warming reduces available habitat for freshwater 16 species due to reduced precipitation and increased drought leading to increasing water temperatures above 17 optimal physiological limits in floodplains, estuaries, wetlands, ephemeral pools, rivers and lakes (Dalu et 18 al., 2017; Kalacska et al., 2017; Nyboer and Chapman, 2018). Along the Zambezi River, projected flow 19 reductions could cause a 22% reduction in annual spawning habitat and depletion of food resources for fry 20 and juvenile fish that could impede fish migration and reduce stocks (Kangalawe, 2017; Martínez-Capel et 21 al., 2017; Tamatamah and Mwedzi, 2020). More aquatic species will have the capacity to cope with 2℃ 22 compared to 4℃ global warming, with more negative effects on physiological performance at 4℃ (Dallas, 23 2016; Pinceel et al., 2016; Zougmoré et al., 2016; Nyboer and Chapman, 2017; Ross-Gillespie et al., 2018). 24 Endemic, specialised fish species will have a lower capacity to adjust to elevated water temperatures 25 compared to hardier generalist fishes (McDonnell and Chapman, 2015; Nyboer and Chapman, 2017; 26 Lapointe et al., 2018; Reizenberg et al., 2019). More work is needed to understand the risk for invertebrates 27 (Dallas and Rivers-Moore, 2014; Cohen et al., 2016), and to understand the potential effects of reduced 28 mixing of water and other climate risks on freshwater biodiversity. 29 30 9.6.2.5 Climate Change & Ecosystem Services 31 32 Direct human dependence on provisioning ecosystem services in Africa is high (Egoh et al., 2012; IPBES, 33 2018). For example, natural forests provided 21% of rural household income across 11 African countries 34 (Angelsen et al., 2014) and wild-harvested foods (including fisheries) provide important nutrition to millions 35 of Africans, including through important micronutrients and increased dietary diversity (Powell et al., 2013; 36 Baudron et al., 2019a) (Sections 9.8.2.3 and 9.8.5) 37 38 Climate change has affected ecosystem services in Africa by reducing fish stocks, crop and livestock 39 productivity and water provisioning due to heat and drought (see Sections 9.8.2.1, 9.8.2.2, 9.8.2.4 and 40 9.8.5.1). Woody encroachment is decreasing cattle production and water supply (Smit and Prins, 2015; 41 Stafford et al., 2017), but can also provide forage for goat production, as well as resins, fuelwood and 42 charcoal (Reed et al., 2015; Stafford et al., 2017; Charis et al., 2019). Local communities perceive climate 43 change to have decreased crop and livestock productivity, reduced wild food availability and reduced forest 44 resources across Africa (Onyekuru and Marchant, 2014) (see Sections 9.8.2.1, 9.8.2.2, 9.8.2.4 and 9.8.2.3). 45 46 With global warming >3℃, and with high population growth and agricultural expansion (SSP3, 2081–2100), 47 1.2 billion Africans are projected to be negatively affected by pollution of drinking water from reduced water 48 quality regulation by ecosystems and 27 million people affected by reduced coastal protection by ecosystems 49 (Chaplin-Kramer et al., 2019). The number of people affected reduces to 0.4 billion and 22 million under a 50 sustainable development scenario with global warming below 2℃ (SSP1, 2081–2100). The African tropical 51 forest carbon sink has been more resilient than Amazonia to recent warming but may already have peaked, 52 and this service is predicted to decline with further warming, reducing 14% by the 2030s (Hubau et al., 2020; 53 Sullivan et al., 2020). This declining carbon storage may be offset by CO2 fertilisation (low confidence) 54 (Martens et al., 2021). Climate change is projected to shift the geographic distribution of important human 55 and livestock disease vectors (see Section 9.8.2.4 and 9.10.2). Changes in rainfall seasonality compounded 56
ACCEPTED VERSIO
N
SUBJECT TO FIN
AL EDITS
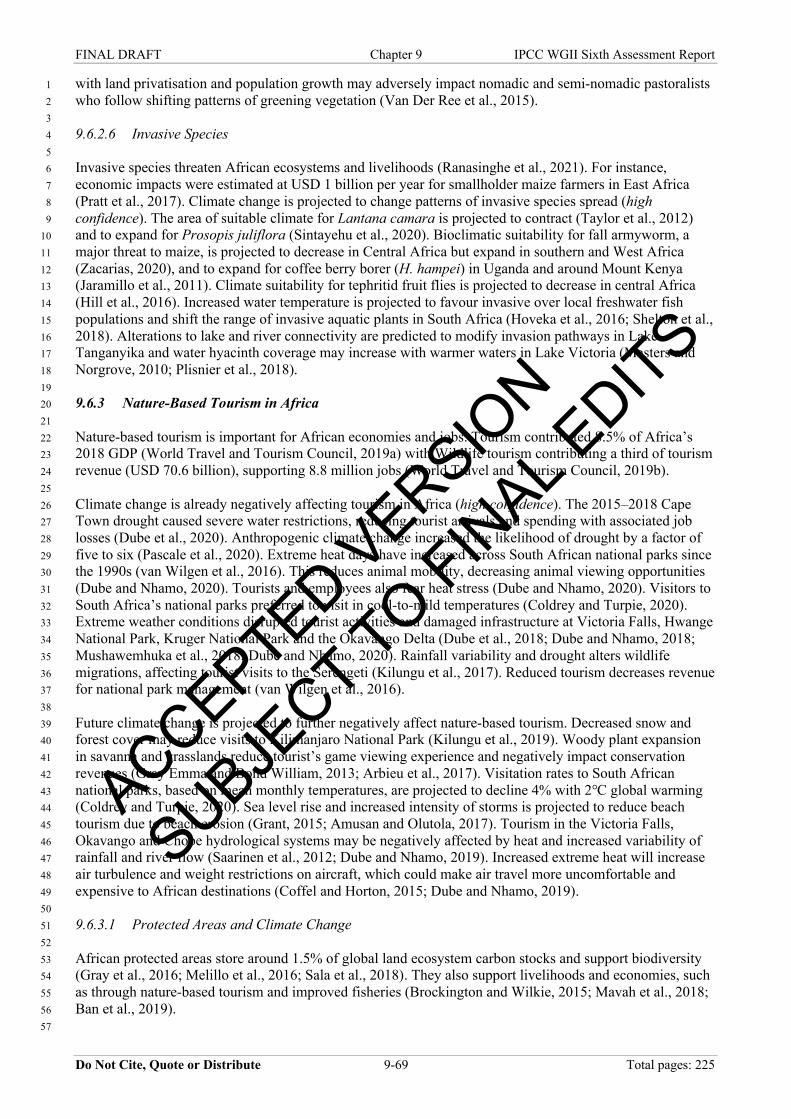
FINAL DRAFT Chapter 9 IPCC WGII Sixth Assessment Report
Do Not Cite, Quote or Distribute 9-69 Total pages: 225
with land privatisation and population growth may adversely impact nomadic and semi-nomadic pastoralists 1 who follow shifting patterns of greening vegetation (Van Der Ree et al., 2015). 2 3 9.6.2.6 Invasive Species 4 5 Invasive species threaten African ecosystems and livelihoods (Ranasinghe et al., 2021). For instance, 6 economic impacts were estimated at USD 1 billion per year for smallholder maize farmers in East Africa 7 (Pratt et al., 2017). Climate change is projected to change patterns of invasive species spread (high 8 confidence). The area of suitable climate for Lantana camara is projected to contract (Taylor et al., 2012) 9 and to expand for Prosopis juliflora (Sintayehu et al., 2020). Bioclimatic suitability for fall armyworm, a 10 major threat to maize, is projected to decrease in Central Africa but expand in southern and West Africa 11 (Zacarias, 2020), and to expand for coffee berry borer (H. hampei) in Uganda and around Mount Kenya 12 (Jaramillo et al., 2011). Climate suitability for tephritid fruit flies is projected to decrease in central Africa 13 (Hill et al., 2016). Increased water temperature is projected to favour invasive over local freshwater fish 14 populations and shift the range of invasive aquatic plants in South Africa (Hoveka et al., 2016; Shelton et al., 15 2018). Alterations to lake and river connectivity are predicted to modify invasion pathways in Lake 16 Tanganyika and water hyacinth coverage may increase with warmer waters in Lake Victoria (Masters and 17 Norgrove, 2010; Plisnier et al., 2018). 18 19 9.6.3 Nature-Based Tourism in Africa 20 21 Nature-based tourism is important for African economies and jobs. Tourism contributed 8.5% of Africa’s 22 2018 GDP (World Travel and Tourism Council, 2019a) with Wildlife tourism contributing a third of tourism 23 revenue (USD 70.6 billion), supporting 8.8 million jobs (World Travel and Tourism Council, 2019b). 24 25 Climate change is already negatively affecting tourism in Africa (high confidence). The 2015–2018 Cape 26 Town drought caused severe water restrictions, reducing tourist arrivals and spending with associated job 27 losses (Dube et al., 2020). Anthropogenic climate change increased the likelihood of drought by a factor of 28 five to six (Pascale et al., 2020). Extreme heat days have increased across South African national parks since 29 the 1990s (van Wilgen et al., 2016). This reduces animal mobility, decreasing animal viewing opportunities 30 (Dube and Nhamo, 2020). Tourists and employees also fear heat stress (Dube and Nhamo, 2020). Visitors to 31 South Africa’s national parks preferred to visit in cool-to-mild temperatures (Coldrey and Turpie, 2020). 32 Extreme weather conditions disrupted tourist activities and damaged infrastructure at Victoria Falls, Hwange 33 National Park, Kruger National Park and the Okavango Delta (Dube et al., 2018; Dube and Nhamo, 2018; 34 Mushawemhuka et al., 2018; Dube and Nhamo, 2020). Rainfall variability and drought alters wildlife 35 migrations, affecting tourist visits to the Serengeti (Kilungu et al., 2017). Reduced tourism decreases revenue 36 for national park management (van Wilgen et al., 2016). 37 38 Future climate change is projected to further negatively affect nature-based tourism. Decreased snow and 39 forest cover may reduce visits to Kilimanjaro National Park (Kilungu et al., 2019). Woody plant expansion 40 in savanna and grasslands reduce tourist’s game viewing experience and negatively impact conservation 41 revenues (Gray Emma and Bond William, 2013; Arbieu et al., 2017). Visitation rates to South African 42 national parks, based on mean monthly temperatures, are projected to decline 4% with 2℃ global warming 43 (Coldrey and Turpie, 2020). Sea level rise and increased intensity of storms is projected to reduce beach 44 tourism due to beach erosion (Grant, 2015; Amusan and Olutola, 2017). Tourism in the Victoria Falls, 45 Okavango and Chobe hydrological systems may be negatively affected by heat and increased variability of 46 rainfall and river flow (Saarinen et al., 2012; Dube and Nhamo, 2019). Increased extreme heat will increase 47 air turbulence and weight restrictions on aircraft, which could make air travel more uncomfortable and 48 expensive to African destinations (Coffel and Horton, 2015; Dube and Nhamo, 2019). 49 50 9.6.3.1 Protected Areas and Climate Change 51 52 African protected areas store around 1.5% of global land ecosystem carbon stocks and support biodiversity 53 (Gray et al., 2016; Melillo et al., 2016; Sala et al., 2018). They also support livelihoods and economies, such 54 as through nature-based tourism and improved fisheries (Brockington and Wilkie, 2015; Mavah et al., 2018; 55 Ban et al., 2019). 56 57
ACCEPTED VERSIO
N
SUBJECT TO FIN
AL EDITS

FINAL DRAFT Chapter 9 IPCC WGII Sixth Assessment Report
Do Not Cite, Quote or Distribute 9-70 Total pages: 225
Climate change and land use change will interact to influence the effectiveness of African protected areas 1 (high confidence). Species representation in the existing African protected area network is projected to 2 decrease due to species range shifts for mammals, bats, birds and amphibians (Hole et al., 2009; Baker et al., 3 2015; Payne and Bro-Jørgensen, 2016; Smith et al., 2016; Phipps et al., 2017). Species ability to disperse 4 between areas to track shifting climates is increasingly impaired by land transformation and fencing, which 5 also impact seasonal wildlife migrations (Lovschal et al., 2017; Sloan et al., 2017). On land, only 0.5% of the 6 African protected area network is connected through low-impact landscapes (Ward et al., 2020). Linear 7 transport infrastructure (e.g., roads, railways, pipelines) and fencing from proposed ‘development corridors’ 8 are projected to bisect over 400 protected areas and degrade around 1,800 more (Laurance et al., 2015). 9 Climate change could increase human-wildlife conflict as resultant resource shortages cause communities to 10 move into protected areas for harvesting or livestock grazing, or wildlife to move out of protected areas and 11 into contact with people (Mukeka et al., 2018; Kupika et al., 2019; Hambira et al., 2020). See Section 9.1.4 12 for the role of land and ocean protected areas in climate change adaptation. 13 14 9.6.4 Ecosystem-Based Adaptation in Africa 15 16 Ecosystem-based adaptation (EbA) uses biodiversity and ecosystem services to assist people to adapt to 17 climate change (Swanepoel and Sauka, 2019). Africa’s Nationally Determined Contributions (NDCs) show 18 36% of adaptation actions identified by 52 countries are considered to be EbA (Figure 9.20). 19 20 EbA can reduce climate impacts and there is high agreement EbA can be more cost-effective than traditional 21 grey infrastructure when a range of economic, social and environmental benefits are also accounted for 22 (Table 9.6) (Baig et al., 2016; Emerton, 2017; Chausson et al., 2020). This is particularly relevant in Africa 23 where climate vulnerabilities are strongly linked to natural resource-based livelihood practices and existing 24 grey infrastructure levels are low in many regions (Dube et al., 2016; Reid et al., 2019). However, financial 25 constraints limit EbA project implementation (Mumba et al., 2016; Swanepoel and Sauka, 2019). 26 27 Evidence for EbA in Africa is largely case study based and often anecdotal (Reid et al., 2018). There is high 28 agreement that costs, challenges and negative outcomes of EbA interventions are still poorly understood 29 (Reid, 2016; Chaplin-Kramer et al., 2019), despite limited evidence for the efficacy of context-specific 30 applications at different scales (Doswald et al., 2014). 31 32 33
34 Figure 9.20: Over a third (36%) of all adaptation actions identified in the NDCs of 52 African countries are Ecosystem-35 based Adaptations (EbA). Of these actions ± 83% fall within the Agriculture, Land Use/Forestry, Environment and 36 Water sectors. The EbA actions identified from the NDCs span 12 primary sectors and 29 sub-sectors. 37 38
ACCEPTED VERSIO
N
SUBJECT TO FIN
AL EDITS
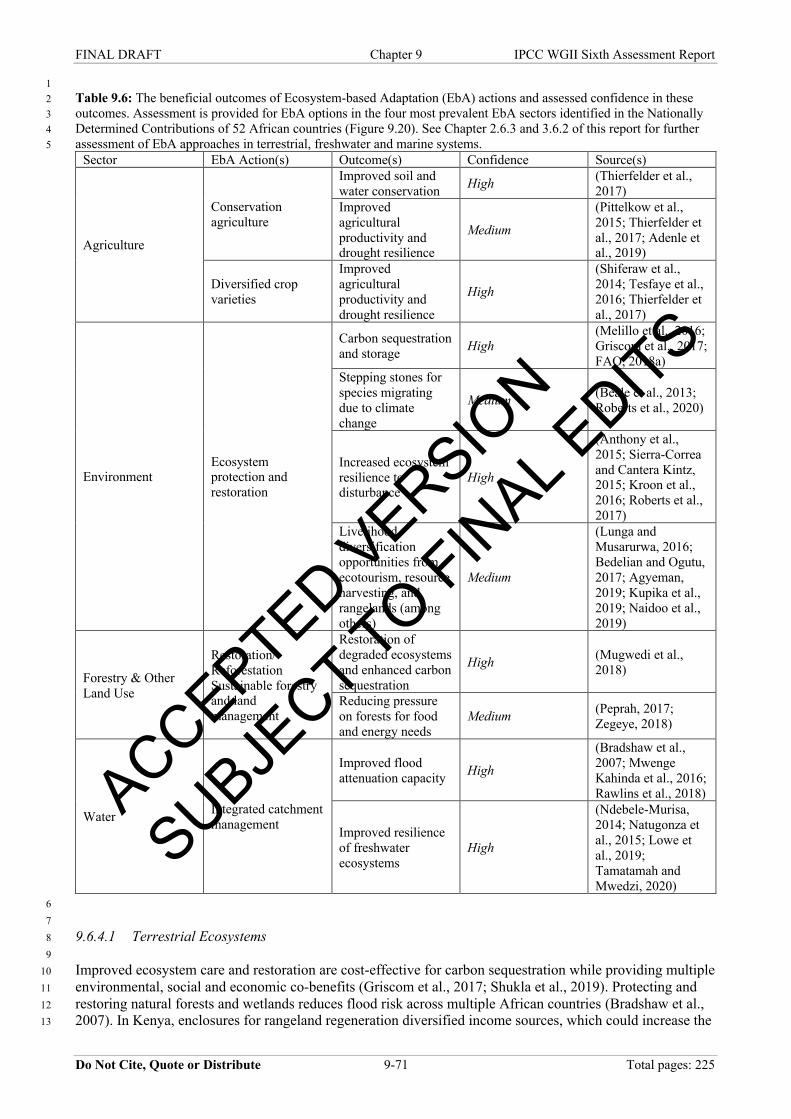
FINAL DRAFT Chapter 9 IPCC WGII Sixth Assessment Report
Do Not Cite, Quote or Distribute 9-71 Total pages: 225
1 Table 9.6: The beneficial outcomes of Ecosystem-based Adaptation (EbA) actions and assessed confidence in these 2 outcomes. Assessment is provided for EbA options in the four most prevalent EbA sectors identified in the Nationally 3 Determined Contributions of 52 African countries (Figure 9.20). See Chapter 2.6.3 and 3.6.2 of this report for further 4 assessment of EbA approaches in terrestrial, freshwater and marine systems. 5
Sector EbA Action(s) Outcome(s) Confidence Source(s)
Agriculture
Conservation
agriculture
Improved soil and
water conservation High (Thierfelder et al.,
2017)
Improved
agricultural
productivity and
drought resilience
Medium
(Pittelkow et al.,
2015; Thierfelder et
al., 2017; Adenle et
al., 2019)
Diversified crop
varieties
Improved
agricultural
productivity and
drought resilience
High
(Shiferaw et al.,
2014; Tesfaye et al.,
2016; Thierfelder et
al., 2017)
Environment
Ecosystem
protection and
restoration
Carbon sequestration
and storage High
(Melillo et al., 2016;
Griscom et al., 2017;
FAO, 2018a)
Stepping stones for
species migrating
due to climate
change
Medium (Beale et al., 2013;
Roberts et al., 2020)
Increased ecosystem
resilience to
disturbance
High
(Anthony et al.,
2015; Sierra-Correa
and Cantera Kintz,
2015; Kroon et al.,
2016; Roberts et al.,
2017)
Livelihood
diversification
opportunities from
ecotourism, resource
harvesting, and
rangelands (among
others)
Medium
(Lunga and
Musarurwa, 2016;
Bedelian and Ogutu,
2017; Agyeman,
2019; Kupika et al.,
2019; Naidoo et al.,
2019)
Forestry & Other
Land Use
Restoration/
Reforestation
Sustainable forestry
and land
management
Restoration of
degraded ecosystems
and enhanced carbon
sequestration
High (Mugwedi et al.,
2018)
Reducing pressure
on forests for food
and energy needs
Medium (Peprah, 2017;
Zegeye, 2018)
Water Integrated catchment
management
Improved flood
attenuation capacity High
(Bradshaw et al.,
2007; Mwenge
Kahinda et al., 2016;
Rawlins et al., 2018)
Improved resilience
of freshwater
ecosystems
High
(Ndebele-Murisa,
2014; Natugonza et
al., 2015; Lowe et
al., 2019;
Tamatamah and
Mwedzi, 2020)
6 7 9.6.4.1 Terrestrial Ecosystems 8 9 Improved ecosystem care and restoration are cost-effective for carbon sequestration while providing multiple 10 environmental, social and economic co-benefits (Griscom et al., 2017; Shukla et al., 2019). Protecting and 11 restoring natural forests and wetlands reduces flood risk across multiple African countries (Bradshaw et al., 12 2007). In Kenya, enclosures for rangeland regeneration diversified income sources, which could increase the 13
ACCEPTED VERSIO
N
SUBJECT TO FIN
AL EDITS

FINAL DRAFT Chapter 9 IPCC WGII Sixth Assessment Report
Do Not Cite, Quote or Distribute 9-72 Total pages: 225
adaptive capacity of local people (Mureithi et al., 2016; Wairore et al., 2016). Sustainable agroforestry in 1 semi-arid regions provides income sources from fuelwood, fruit and timber and reduces exposure to drought, 2 floods and erosion (Quandt et al., 2017). Forest protection in Zimbabwe maintains honey production during 3 droughts, providing food supply options if crops fail (Lunga and Musarurwa, 2016). Community-based 4 natural resource management in pastoral communities improved institutional governance outcomes through 5 involving community members in decision-making, increasing the capacity of these communities to respond 6 to climate change (Reid, 2014). 7 8 EbA can also increase ecological resilience. Re-introduction of fire and large mammals can restore 9 ecosystem services, enhance adaptive capacity and benefit people by combatting woody encroachment, 10 restoring grazing and increasing streamflow (Asner et al., 2016; Stafford et al., 2017; Cromsigt et al., 2018). 11 Herbivores can also reduce fuel loads in areas facing increased fire risk (Hempson et al., 2017). 12 13 Protected areas can be ‘stepping stones’ that facilitate climate-induced species range shifts (Roberts et al., 14 2020), preserve medicinal plant diversity despite climate change (Kaky and Gilbert, 2017) and provide 15 livelihood diversification opportunities (Table 9.6). Protecting 30% of sub-Saharan Africa’s land area could 16 reduce the proportion of species at risk of extinction by around 60% in both low and high warming scenarios 17 (Hannah et al., 2020). The role of protected areas in EbA can be strengthened by: (i) increasing coverage of 18 diverse environments and high carbon storage ecosystems, (ii) habitat restoration, (iii) maintaining intact 19 habitat, (iv) participatory, equitable conservation and adaptation strategies; (v) cooperation across borders 20 and (vi) adequate monitoring (Gillson et al., 2013; Rannow et al., 2014; Midgley and Bond, 2015; Pecl et al., 21 2017; Dinerstein et al., 2019; Roberts et al., 2020). 22 23 24 [START BOX 9.3 HERE] 25 26 Box 9.3: Tree Planting in Africa 27 28 Due to widespread deforestation and forest degradation (Malhi et al., 2014), future scenarios to limit global 29 warming include large-scale reforestation and afforestation (Griscom et al., 2017; Bastin et al., 2019). Africa 30 has been targeted through the AFR100 (https://afr100.org) to plant ~1 million km2 of trees by 2030 (Bond et 31 al 2019). Maintaining existing indigenous forest and indigenous forest restoration is a win-win, maximising 32 benefits to biodiversity, adaptation and mitigation (Griscom et al., 2017; Watson et al., 2018; Lewis et al., 33 2019) (high confidence). 34 35 Yet many areas targeted by AFR100 erroneously mark Africa’s open ecosystems (grasslands, savannas, 36 shrublands) as degraded and suitable for afforestation (Figure Box 9.3.1) (Veldman et al., 2015; Bond et al., 37 2019) (high confidence). These ecosystems are not degraded, they are ancient ecosystems that evolved in the 38 presence of disturbances (fire/herbivory) (Maurin et al., 2014; Bond and Zaloumis, 2016; Charles-39 Dominique et al., 2016). Afforestation prioritises carbon sequestration at the cost of biodiversity and other 40 ecosystem services (Veldman et al., 2015; Bond et al., 2019). Furthermore, it remains uncertain how much 41 carbon can be sequestered as, compared to grassy ecosystems, afforestation can reduce belowground carbon 42 stores and increase aboveground carbon loss to fire and drought (Yang et al., 2019; Wigley et al., 2020b; 43 Nuñez et al., 2021). Thus, afforested areas may store less carbon than ecosystems they replace (Dass et al., 44 2018; Heilmayr et al., 2020). Afforestation would reduce livestock forage, eco-tourism potential and water 45 availability (Gray Emma and Bond William, 2013; Anadón et al., 2014; Cao et al., 2016; Stafford et al., 46 2017; Du et al., 2021), and may reduce albedo thereby increasing warming (Baldocchi and Penuelas, 2019; 47 Bright et al., 2015). 48 49 Exotic tree species are often selected for planting (e.g., Pinus spp or Eucalyptus spp), but in parts of Africa, 50 they have become invasive (Zengeya, 2017; Witt et al., 2018), increasing fire hazards and decreasing 51 biodiversity and water resources (Nuñez et al., 2021) (high confidence). Negative impacts of afforestation on 52 ecosystems are not restricted to plantations of exotic species; they extend to inappropriate planting of native 53 forest species (Slingsby et al., 2020). 54 55 56
ACCEPTED VERSIO
N
SUBJECT TO FIN
AL EDITS
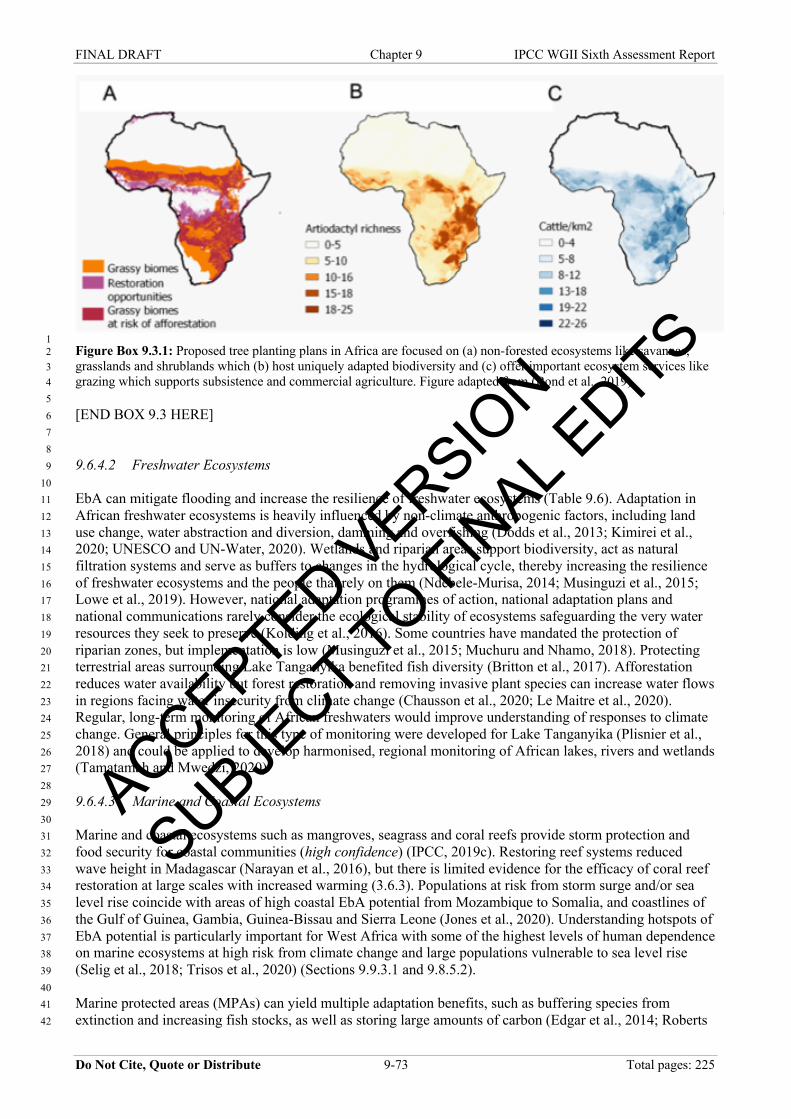
FINAL DRAFT Chapter 9 IPCC WGII Sixth Assessment Report
Do Not Cite, Quote or Distribute 9-73 Total pages: 225
1 Figure Box 9.3.1: Proposed tree planting plans in Africa are focused on (a) non-forested ecosystems like savannas, 2 grasslands and shrublands which (b) host uniquely adapted biodiversity and (c) offer important ecosystem services like 3 grazing which supports subsistence and commercial agriculture. Figure adapted from (Bond et al., 2019). 4 5 [END BOX 9.3 HERE] 6 7 8 9.6.4.2 Freshwater Ecosystems 9 10 EbA can mitigate flooding and increase the resilience of freshwater ecosystems (Table 9.6). Adaptation in 11 African freshwater ecosystems is heavily influenced by non-climate anthropogenic factors, including land 12 use change, water abstraction and diversion, damming and overfishing (Dodds et al., 2013; Kimirei et al., 13 2020; UNESCO and UN-Water, 2020). Wetlands and riparian areas support biodiversity, act as natural 14 filtration systems and serve as buffers to changes in the hydrological cycle, thereby increasing the resilience 15 of freshwater ecosystems and the people that rely on them (Ndebele-Murisa, 2014; Musinguzi et al., 2015; 16 Lowe et al., 2019). However, national adaptation programmes of action, national adaptation plans and 17 national communications rarely consider the ecological stability of ecosystems safeguarding the very water 18 resources they seek to preserve (Kolding et al., 2016). Some countries have mandated the protection of 19 riparian zones, but implementation is low (Musinguzi et al., 2015; Muchuru and Nhamo, 2018). Protecting 20 terrestrial areas surrounding Lake Tanganyika benefited fish diversity (Britton et al., 2017). Afforestation 21 reduces water availability but forest restoration and removing invasive plant species can increase water flows 22 in regions facing water insecurity from climate change (Chausson et al., 2020; Le Maitre et al., 2020). 23 Regular, long-term monitoring of African freshwaters would improve understanding of responses to climate 24 change. General principles for this type of monitoring were developed for Lake Tanganyika (Plisnier et al., 25 2018) and could be applied to develop harmonised, regional monitoring of African lakes, rivers and wetlands 26 (Tamatamah and Mwedzi, 2020) 27 28 9.6.4.3 Marine and Coastal Ecosystems 29 30 Marine and coastal ecosystems such as mangroves, seagrass and coral reefs provide storm protection and 31 food security for coastal communities (high confidence) (IPCC, 2019c). Restoring reef systems reduced 32 wave height in Madagascar (Narayan et al., 2016), but there is limited evidence for the efficacy of coral reef 33 restoration at large scales with increased warming (3.6.3). Populations at risk from storm surge and/or sea 34 level rise coincide with areas of high coastal EbA potential from Mozambique to Somalia, and coastlines of 35 the Gulf of Guinea, Gambia, Guinea-Bissau and Sierra Leone (Jones et al., 2020). Understanding hotspots of 36 EbA potential is particularly important for West Africa with some of the highest levels of human dependence 37 on marine ecosystems at high risk from climate change and large populations vulnerable to sea level rise 38 (Selig et al., 2018; Trisos et al., 2020) (Sections 9.9.3.1 and 9.8.5.2). 39 40 Marine protected areas (MPAs) can yield multiple adaptation benefits, such as buffering species from 41 extinction and increasing fish stocks, as well as storing large amounts of carbon (Edgar et al., 2014; Roberts 42
ACCEPTED VERSIO
N
SUBJECT TO FIN
AL EDITS
FINAL DRAFT Chapter 9 IPCC WGII Sixth Assessment Report
Do Not Cite, Quote or Distribute 9-74 Total pages: 225
et al., 2017; Lovelock and Duarte, 2019). However, this potential of MPAs will reach limits with increased 1 warming (Roberts et al., 2017). For example, MPAs cannot prevent coral bleaching at scale and mass die-2 offs are well-described from MPAs following climate shocks (Bates et al., 2019; Bruno et al., 2019). 3 Although prioritising MPA coverage of climate refugia, such as the northern Mozambique channel, may 4 offer some increased resilience (McClanahan et al., 2014). 5 6 7 9.7 Water 8 9 Much of Africa experiences very high hydrological variability in all components of the water cycle, with 10 important implications for people and ecosystems. Most of the continent’s water is stored in groundwater 11 (660,000 km3), which is 20 times more than the water stored in the lakes and 100 times more than the annual 12 renewable water resources (MacDonald et al., 2012). The accessible volume of groundwater via wells and 13 springs is smaller than these estimates (Xu et al., 2019). Africa has 63 transboundary river basins (UNEP, 14 2010), 72 mapped transboundary aquifers (Nijsten et al., 2018) and 33 transboundary lakes (ILEC and 15 UNEP, 2016), reflecting a highly water-connected and interdependent socio-ecological system across 16 countries, extending also to the coastal areas of the continent (see Section 4.1, Figure 4.1). 17 18 9.7.1 Observed Impacts from Climate Variability and Climate Change 19 20 Climate impacts on water are occurring against a backdrop of increasing temperatures and changes in 21 rainfall, with increased seasonal and interannual variability, droughts in some regions, and increased 22 frequency of heavy rainfall events (see Section 9.5). In West Africa, declines in river flows have been 23 attributed to declining rainfall and increasing temperature, drought frequency and water demand (Biao, 2017; 24 Thompson et al., 2017; Descroix et al., 2018). In Central Africa, the Congo river demonstrates inter-decadal 25 shifts but no long-term trend (Mahe et al., 2013; Alsdorf et al., 2016), however, recently observed falling 26 water levels in its upper and middle reaches are attributed to climate change (von Lossow, 2017). 27 28 A review of river flow and lake level changes in 82 basins in eastern and southern Africa regions for 1970–29 2010 showed mixed trends: 51% had decreasing trends ranging from 10–49% and 11% increasing trends 30 ranging from 7–60% (Schäfer et al., 2015). However, in southern Africa as a whole, river flows have mostly 31 decreased (high confidence) (Dallas and Rivers-Moore, 2014). In East Africa, large rivers such as the Tana 32 show increasing flow (1941–2016) related to increased rainfall in the highlands, with little influence of flow 33 regulation by a series of dams (Langat et al., 2017). The Nile river basin has been experiencing a mainly 34 increasing rainfall trend upstream and decreasing trend downstream (Onyutha et al., 2016). The observed 35 changes are driven by a complex coupling of changes in climate, land use and water demand. 36 37 Observed climate changes in Africa (see Section 9.5) have led to changes in river flow and runoff (Dallas 38 and Rivers-Moore, 2014; Wolski et al., 2014) and high fluctuations in lake levels (high confidence) 39 (Natugonza et al., 2016; Ogutu-Ohwayo et al., 2016; Gownaris et al., 2018). Shallow lakes respond 40 dramatically to hydrological changes, for example, Lake Chilwa has dried up completely nine times in the 41 last century (Wilson, 2014), while Lake Chad shrunk by 90% between 1963 and 2000 (Gao et al., 2011). 42 However, recent analyses indicate that Lake Chad’s water levels have been stable since 2000 due to infilling 43 from groundwater resources (Buma et al., 2018; Pham-Duc et al., 2020). Other factors such as deforestation 44 and increased water use in upstream tributaries also contribute to lake shrinking (Mvula et al., 2014). Water 45 levels in Kenya’s mostly shallow rift lakes have been rising since 2010, with some exceeding historical 46 record high levels (Schagerl and Renaut, 2016; Olago et al., 2021). The recent 10-year rising trend is partly 47 attributed to increased rainfall and changing land uses (Onywere and John M. Mironga, 2012; Olago et al., 48 2021). Changes in water level fluctuations of 13 African lakes have been positively correlated with primary 49 and overall production (Gownaris et al., 2018), and will have important consequences for freshwater 50 ecosystems and related ecosystem goods and services (see Sections 9.6.1.3 and 9.8.5). Other effects of 51 observed climate changes in Africa include higher episodic groundwater recharge, particularly in drylands, 52 from heavy rainfall events that are in some cases related to El Niño-Southern Oscillation and the Indian 53 Ocean Dipole (Taylor et al., 2013; Fischer and Knutti, 2016; Cuthbert et al., 2019; Kotchoni et al., 2019; 54 Myhre et al., 2019), reduced soil moisture, more frequent and intense floods, more persistent and frequent 55 droughts (Douville et al., 2021) and the steady decline and projected disappearance by 2040 of African 56 tropical glaciers (see Section 9.5.9). 57
ACCEPTED VERSIO
N
SUBJECT TO FIN
AL EDITS

FINAL DRAFT Chapter 9 IPCC WGII Sixth Assessment Report
Do Not Cite, Quote or Distribute 9-75 Total pages: 225
1 The mixed-signal in river flow trends (increase/decrease/no-change) across Africa mirrors the results seen 2 globally for runoff and streamflow (see Section 4.2.3 in Chapter 4). Hydrological extremes are, however, of 3 increasing concern. There has been an increase in drought frequency, severity and spatial extent in recent 4 decades. From 1900–2013, Africa suffered the largest number of drought events globally and registered the 5 second largest number of people affected after Asia (Masih et al., 2014). The likelihood of recent severe 6 climate conditions such as the multi-year Cape Town Drought has increased to due to human-induced 7 climate change (Otto et al., 2018; Pascale et al., 2020) (see Box 9.4), and regional and urban floods (Yuan et 8 al., 2018; Tiitmamer, 2020) and droughts (Funk et al., 2018b; Siderius et al., 2018; Uhe et al., 2018) are 9 expected to increase. 10 11 However, between 2010–2020 more people across Africa have been impacted by floods (e.g., related to 12 Cyclone Idai in March 2019) compared to droughts (Lumbroso, 2020). Coastal cities are vulnerable to floods 13 related to rainfall and sea level rise (Musa et al., 2014), as exemplified by the flood disasters experienced in 14 the Niger delta in 2012 which displaced more than 3 million people and destroyed schools, clinics, markets 15 and electricity installations (Amadi and Ogonor, 2015). From 2000–2015, the proportion of people exposed 16 to floods grew by 20–24%, mostly in Africa and Asia, and these numbers will increase under climate change 17 (Tellman et al., 2021). Sectoral impacts from flooding within Africa and globally are further elaborated on in 18 Sections 9.8.2 and 9.8.5.1, Table 9.3 and Section 4.3 in Chapter 4. 19 20 21 [START BOX 9.4 HERE] 22 23 Box 9.4: African Cities Facing Water Scarcity 24 25 Many African cities will face increasing water scarcity under climate change (Grasham et al., 2019). The 26 Cape Town and Dodoma cases illustrate challenges for both surface and groundwater supply and what 27 adaptation responses have been employed. 28 29 The Cape Town Drought (2015-2018) 30 31 The Cape Town drought illustrates how a highly diverse African city and its citizens responded to protracted 32 and unanticipated water scarcity. Anthropogenic climate change made the drought five to six times more 33 likely (Pascale et al., 2020; Doblas-Reyes et al., 2021). After three consecutive years of low precipitation, 34 Cape Town braced for a ‘Day Zero’ where large portions of the city would lose water supply (Cole et al., 35 2021a). The risk of day zero was anticipated to cascade to affect risks to health, economic output and 36 security (Simpson et al., 2021b). The case study highlights the importance of communication, budgetary 37 flexibility, robust financial buffers and insurance mechanisms, disaster planning, intergovernmental 38 cooperation, nature-based solutions, infrastructure transformations and equitable access for climate 39 adaptation in African cities facing water scarcity. 40 41 A substantial media campaign was launched to inform residents about the severity of the drought and urge 42 water conservation (Booysen et al., 2019; Hellberg, 2019; Ouweneel et al., 2020). Together with stringent 43 demand management through higher water tariffs, this communication campaign played an important role in 44 reducing consumption from 540 to 280 litres per household per day (Booysen et al., 2019; Simpson et al., 45 2019a). Revenue from water sales contributes 14% of Cape Town’s total revenue, making it the third-largest 46 source of ‘own’ revenue for the city (Simpson et al., 2019b). However, with an unprecedented reduction in 47 water use, the municipal budget was undermined (Simpson et al., 2020b). Collecting less revenue created a 48 financial shock as the city struggled to recover operating finance, even while new capital requirements were 49 needed for the development of expensive new water supply projects (Simpson et al., 2019b). This financial 50 shock was compounded by the economic stress of poor agricultural and tourism performance brought about 51 by the drought (Shepherd, 2019; Simpson et al., 2021b). As wealthy residents invested in private, off-grid 52 water supplies, the risk of reduced municipal revenue collections from newly off-grid households aggregated 53 with the risk of reduced tourism, increasing the risk to the reputation of the incumbent administration 54 (Simpson et al., 2021b). This demonstrates how a population cohort with a high response capability to water 55 scarcity can reduce risk while simultaneously increasing risks to the municipality and its capacity to provide 56 water to vulnerable residents (Simpson et al., 2020b). Given that city populations in Africa pay 5–7 times 57
ACCEPTED VERSIO
N
SUBJECT TO FIN
AL EDITS
FINAL DRAFT Chapter 9 IPCC WGII Sixth Assessment Report
Do Not Cite, Quote or Distribute 9-76 Total pages: 225
more for water than the average price paid in the United States or Europe (Adamu and Ndi, 2017; Lwasa et 1 al., 2018), municipal finance needs to delink operating revenue from potential climate shocks (see Box 8.6 in 2 Chapter 8). 3 4 The drought led the municipality to consider a broader diversity of water supply options, including 5 groundwater (CoCT, 2019), developing city-scale slow-onset disaster planning (Cole et al., 2021a) and 6 building an enhanced ‘relationship with water’ (CoCT, 2019; Madonsela et al., 2019). This shift in approach 7 is displayed in the recognition of nature-based solutions as a priority in water resilience-building efforts 8 (Rodina, 2019) and is signalled in Cape Town’s Water Strategy which aims to become a ‘water sensitive 9 city’ that makes ‘optimal use of stormwater and urban waterways for flood control, aquifer recharge, water 10 reuse and recreation’ (CoCT, 2019). 11 12 The drought required cooperation between multiple spheres of government, and the management of a broad 13 range of stakeholders and political entities (Nhamo and Agyepong Adelaide, 2019; Cole et al., 2021a). The 14 case highlights how a lack of coordination between essential organs of state and political entities can reduce 15 response efficacy (Rodina, 2019). Despite significant investments in water security by public and private 16 entities, one-quarter of Cape Town’s population remains in persistent conditions of water stress, emphasising 17 the challenge and importance of inclusive solutions that address the persistent social and economic stressors 18 which affect vulnerability to water scarcity (Enqvist and Ziervogel, 2019). 19 20 Sustaining intensive groundwater use in a dryland city under climate change: Dodoma, Tanzania 21 22 Since 1954, the Makutapora wellfield in semi-arid, central Tanzania has supplied safe water to the city of 23 Dodoma. Substantial rises in wellfield pumping and population growth have increased freshwater demand in 24 Dodoma and dependence upon the Makutapora Wellfield, currently the sole perennial source of piped water 25 to the city. Yet, there is high uncertainty of groundwater recharge rates (Nkotagu, 1996; Taylor et al., 2013) 26 which rely on intense seasonal rainfall associated with the El Niño-Southern Oscillation (ENSO) and the 27 Indian Ocean Dipole (IOD) modes of climate variability (e.g., 2 to 7 years) to contribute disproportionately 28 to recharge (Taylor et al., 2013; Kolusu et al., 2019). 29 30 Defining a sustainable pumping rate for the Makutapora wellfield is complicated by the variable and 31 episodic nature of groundwater replenishment in this dryland environment. For example, groundwater 32 recharge during the 1997/1998 El Niño event, the strongest El Niño event of the 20th century, accounted for 33 nearly 20% of all of the recharge received from 1955–2010 (Taylor et al., 2013), highlighting the vital role 34 interannual groundwater storage plays in enabling adaptation to climate variability and change in drylands. 35 The disproportionate contribution of intense seasonal rainfalls to the replenishment of the Makutapora 36 wellfield, consistent with observations from across sub-Saharan Africa (Cuthbert et al., 2019), suggests that 37 groundwater in drylands are currently naturally resilient to climate change. However, it remains unclear 38 whether climate change will strengthen or weaken the influence of ENSO and IOD on rainfall (Brown et al., 39 2020) and thereby affect the predictability of groundwater recharge. 40 41 As freshwater demand in Tanzania’s rapidly growing capital is projected to increase substantially in the 42 coming decades, questions remain as to whether the capacity of the Makutapora wellfield can meet some or 43 all of this demand. Nature-based solutions to improve the resilience of wellfield abstraction to increased 44 pumpage and climate change include Managed Aquifer Recharge (MAR). The sharing of general lessons 45 learned from other cities in dryland Africa employing MAR, such as Windhoek in Namibia (Murray et al., 46 2018), could prove invaluable. 47 48 [END BOX 9.4 HERE] 49 50 51 9.7.2 Projected Risks and Vulnerability 52 53 9.7.2.1 Projected Risks 54 55 By 2050, up to 921 million additional people in Africa could be exposed to climate change-related water 56 stress, while up to 459 million could experience reduced exposure (Dickerson et al., 2021). This large 57
ACCEPTED VERSIO
N
SUBJECT TO FIN
AL EDITS
FINAL DRAFT Chapter 9 IPCC WGII Sixth Assessment Report
Do Not Cite, Quote or Distribute 9-77 Total pages: 225
variance in numbers and direction of change is related to uncertainties in climate models and non-climate 1 factors like population growth and water withdrawals (Dickerson et al., 2021). The baseline for most of the 2 projected risks presented here is 1971–2000. 3 4 In West Africa, significant spatial variability in river flow is projected in the upper reaches of several rivers, 5 with no clear pattern overall (Roudier et al., 2014) and large uncertainties in estimations of change in runoff 6 (Roudier et al., 2014; Bodian et al., 2018). In some higher altitude regions, like the Niger Inland Delta in 7 West Africa, river flows and water levels are expected to increase (medium confidence) (Aich et al., 2014; 8 Thompson et al., 2017). In the Lower Niger Basin, combined average annual rainfall and erosivity for all the 9 climatic models in all scenario shows increasing rainfall amounts are projected to result in an increasing 10 average change in rainfall-runoff erosivity of about 14%, 19% and 24% for the 2030s, 2050s and 2070s, with 11 concomitant increase in soil loss of 12%, 19% and 21% (Amanambu et al., 2019). In the Volta River system, 12 increasing wet season river flows (+36% by 2090s) and Volta lake outflow (+5% by 2090s) are anticipated 13 under RCP8.5 (medium confidence) (Awotwi A et al., 2015; Jin et al., 2018). In the Volta River basin, 14 compared to 1976–2005, drought events are projected to increase by 1.2 events per decade at around 2℃ to 15 1.6 events per decade at around 2.5℃ global warming, and drought area extent is projected to increase by 16 24% to 34% (Oguntunde et al., 2017). In Central Africa, runoff in the Congo River system may increase by 17 up to 50% (RCP8.5), especially in the wet season, enhancing flood risks in the entire Congo basin, 18 particularly in the central and western parts (CSC, 2013). Average river flows are expected to increase in 19 most parts of Central Africa, with expected increases in total potential hydropower production (Ludwig et 20 al., 2013). 21 22 In North Africa, in the upper White Nile basin, Olaka et al. (2019) project a 25% and 5 to 10% (RCP4.5) 23 increase in the intensification of future annual rainfall in the eastern and western parts of the Lake Victoria 24 Basin, respectively, with corresponding variability in future river discharge ranging from 5 to 26%. In the 25 upper Blue Nile basin, models also indicate up to 15% increase in runoffs in wet-season and up to −24% 26 decreasing in dry-season 2021–2040 (RCP8.5) (Ayele et al., 2016; Siam and Eltahir, 2017; Meresa and 27 Gatachew, 2018). The increase of precipitation in wet-season indicates a higher possibility of flash floods 28 while decreased runoffs in dry-season further intensify existing shortage of irrigation water demand (Ayele 29 et al., 2016; Siam and Eltahir, 2017; Meresa and Gatachew, 2018). The annual flow and revenues from 30 hydropower production and irrigated agriculture of the Blue Nile River at Khartoum are projected to increase 31 under maximum but are expected to decrease under minimum and median projected changes in streamflow 32 for 2041–2070 and 2071–2100, respectively (Tariku et al., 2021). The Middle Draa valley in Morocco is 33 expected to experience more severe droughts and the estimation of the water balance suggests a lack of 34 supply in the future (Karmaoui et al., 2016). 35 36 In East Africa, Liwenga et al. (2015) show that it will likely be warmer and wetter in the Great Ruaha River 37 region and with increasing seasonal variation and extremes towards the end of the century. A similar 38 observation is made for the River Pangani, with mean river flow being about 10% higher in the 2050s 39 relative to the 1980–1999 period, associated with a 16–18% increase in rainfall in its upper catchment 40 (Kishiwa et al., 2018). However, at more local scales, the projections cover a range of slight declines to 41 significant increases in mean annual rainfall amounts (Gulacha and Mulungu, 2017). In the Tana River basin 42 in Kenya, water yield is projected to increase progressively under RCP4.5 and RCP8.5 relative to the 43 baseline period 1983–2011 but is characterised by distinct spatial heterogeneity (Muthuwatta et al., 2018). 44 45 In southern Africa, reductions in rainfall over the Limpopo and Zambezi river basins under 1.5℃ and 2℃ 46 global warming could have adverse impacts on hydropower generation, irrigation, tourism, agriculture and 47 ecosystems (Figure Box 9.5.1) (Maúre et al., 2018), although model projections of strong early summer 48 drying trends remain uncertain (Munday and Washington, 2019). 49 50 Changes in the amplitude, timing and frequency of extreme events such as droughts and floods will continue 51 to affect lake levels, rates of river discharge and runoff and groundwater recharge (high confidence) 52 (Gownaris et al., 2016; Darko et al., 2019), but with disparate effects at regional, basin and sub-basin scales, 53 and at seasonal, annual and longer timescales. The increased frequency of extreme rainfall events under 54 climate change (Myhre et al., 2019) is projected to amplify groundwater recharge in drylands (Jasechko and 55 Taylor, 2015; Cuthbert et al., 2019). However, declining trends in rainfall and snowfall in some areas of 56 North Africa (Donat et al., 2014b) are projected to continue in a warming world (Seif-Ennasr et al., 2016), 57
ACCEPTED VERSIO
N
SUBJECT TO FIN
AL EDITS
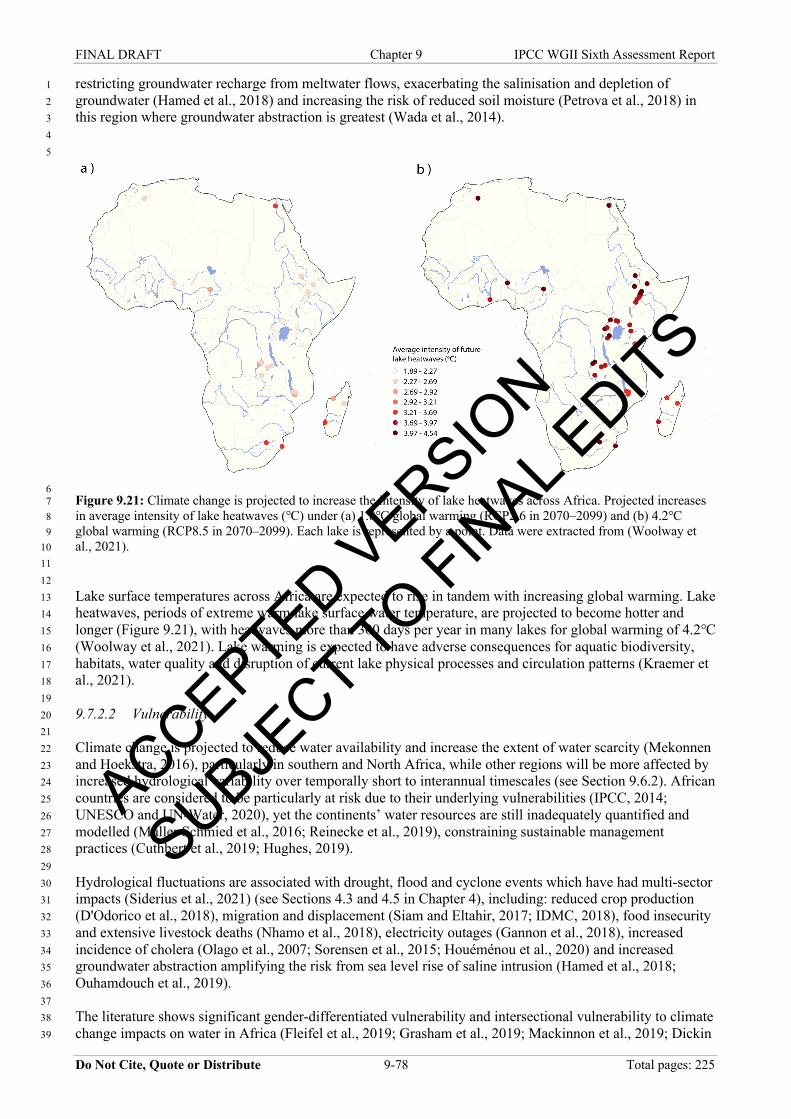
FINAL DRAFT Chapter 9 IPCC WGII Sixth Assessment Report
Do Not Cite, Quote or Distribute 9-78 Total pages: 225
restricting groundwater recharge from meltwater flows, exacerbating the salinisation and depletion of 1 groundwater (Hamed et al., 2018) and increasing the risk of reduced soil moisture (Petrova et al., 2018) in 2 this region where groundwater abstraction is greatest (Wada et al., 2014). 3 4 5
6 Figure 9.21: Climate change is projected to increase the intensity of lake heatwaves across Africa. Projected increases 7 in average intensity of lake heatwaves (℃) under (a) 1.8℃ global warming (RCP2.6 in 2070–2099) and (b) 4.2℃ 8 global warming (RCP8.5 in 2070–2099). Each lake is represented by a point. Data were extracted from (Woolway et 9 al., 2021). 10 11 12 Lake surface temperatures across Africa are expected to rise in tandem with increasing global warming. Lake 13 heatwaves, periods of extreme warm lake surface water temperature, are projected to become hotter and 14 longer (Figure 9.21), with heatwaves more than 300 days per year in many lakes for global warming of 4.2℃ 15 (Woolway et al., 2021). Lake warming is expected to have adverse consequences for aquatic biodiversity, 16 habitats, water quality and disruption of current lake physical processes and circulation patterns (Kraemer et 17 al., 2021). 18 19 9.7.2.2 Vulnerability 20 21 Climate change is projected to reduce water availability and increase the extent of water scarcity (Mekonnen 22 and Hoekstra, 2016), particularly in southern and North Africa, while other regions will be more affected by 23 increased hydrological variability over temporally short to interannual timescales (see Section 9.6.2). African 24 countries are considered to be particularly at risk due to their underlying vulnerabilities (IPCC, 2014; 25 UNESCO and UN-Water, 2020), yet the continents’ water resources are still inadequately quantified and 26 modelled (Müller Schmied et al., 2016; Reinecke et al., 2019), constraining sustainable management 27 practices (Cuthbert et al., 2019; Hughes, 2019). 28 29 Hydrological fluctuations are associated with drought, flood and cyclone events which have had multi-sector 30 impacts (Siderius et al., 2021) (see Sections 4.3 and 4.5 in Chapter 4), including: reduced crop production 31 (D'Odorico et al., 2018), migration and displacement (Siam and Eltahir, 2017; IDMC, 2018), food insecurity 32 and extensive livestock deaths (Nhamo et al., 2018), electricity outages (Gannon et al., 2018), increased 33 incidence of cholera (Olago et al., 2007; Sorensen et al., 2015; Houéménou et al., 2020) and increased 34 groundwater abstraction amplifying the risk from sea level rise of saline intrusion (Hamed et al., 2018; 35 Ouhamdouch et al., 2019). 36 37 The literature shows significant gender-differentiated vulnerability and intersectional vulnerability to climate 38 change impacts on water in Africa (Fleifel et al., 2019; Grasham et al., 2019; Mackinnon et al., 2019; Dickin 39
ACCEPTED VERSIO
N
SUBJECT TO FIN
AL EDITS

FINAL DRAFT Chapter 9 IPCC WGII Sixth Assessment Report
Do Not Cite, Quote or Distribute 9-79 Total pages: 225
et al., 2020; Lund Schlamovitz and Becker, 2020), although studies are generally lacking in northern Africa 1 (Daoud, 2021). Women and girls are in most cases more impacted than men/boys by customary water 2 practices as adult females are the primary water collectors (46% in Liberia to 90% in Cote d’Ivoire), while 3 more female than male children are associated with water collection (62% compared with 38%, respectively) 4 (Graham et al., 2016). Women and girls face barriers toward accessing basic sanitation and hygiene 5 resources, and 71% of studies reported a negative health outcome, reflecting a water-gender-health nexus 6 (Pouramin et al., 2020). These differential vulnerabilities are crucial for informing adaptation, but are still 7 relatively under-researched, more so for the urban poor than rural communities (Grasham et al., 2019; 8 Mackinnon et al., 2019; Lund Schlamovitz and Becker, 2020). 9 10 9.7.3 Water Adaptation Options and their Feasibility 11 12 9.7.3.1 Reducing Risk through a Systems Approach to Water Resources Planning and Management 13 14 An integrated systems and risk-based approach to the design and management of water resources at scale is 15 generally accepted as a practical and viable way of underpinning the resilience of water systems to climate 16 change and human pressures (Duffy, 2012; García et al., 2014). Such approaches confer multiple benefits to 17 nature and society at scale and enhance efficiency gains through technology and management improvements, 18 but their full implementation has not yet been realised (Weinzierl and Schilling, 2013; McDonald et al., 19 2014; UN Environment, 2019). Drylands are particularly singled out as ignored areas that require Integrated 20 Water Resource Management approaches (Stringer et al., 2021) (Section 9.3.1). Appropriate nature-based 21 solutions that are applicable at scale should be identified and strongly embedded in these approaches to 22 deliver multiple benefits while maintaining the integrity of ecosystems and biodiversity (UN Environment, 23 2019) (see Sections 9.6.4, 9.8.5, and Box 4.6). Furthermore, adaptation options are often influenced or 24 constrained by institutions, regulation, availability, distribution, price and technologies (McCarl et al., 2016). 25 Thus, institutional capacity to manage complex water supply systems under rapidly increasing demand and 26 climate change stress is critical in achieving water security for African cities, particularly as cities become 27 more dependent on alternative and distant water sources (Padowski et al., 2016). 28 29 9.7.3.2 Adopting Nexus Lenses 30 31 The water-energy-food (WEF) nexus explicitly recognises the strong interdependencies of these three sectors 32 and their high levels of exposure to climate change (Zografos et al., 2014; Dottori et al., 2018) (see Box 9.5). 33 With increasing societal demands on more variable water resources under climate change, an intensification 34 of WEF competition and trade-offs are projected (D'Odorico et al., 2018; Dottori et al., 2018). Other 35 interacting factors, for example, the increasing number of transnational investments in land resources can 36 lead to localised increased competition for water resources (Messerli et al., 2014; Breu et al., 2016; Chiarelli 37 et al., 2016). Understanding such nexus inter-linkages can help characterise risks to water resource security, 38 identify co-benefits and clarify the range of multi-sectoral actors involved in and affected by development 39 decisions (Kyriakarakos et al., 2020). Major barriers and entry points for greater integration include 40 coordination of horizontal policy and integration of climate change adaptation actions (England et al., 2018), 41 capturing the scarcity values of water and energy embedded in food/energy products (Allan et al., 2015), and 42 inclusion of community-based organisations such as water resource user associations (Villamayor-Tomas et 43 al., 2015) and agricultural cooperatives (Kyriakarakos et al., 2020). 44 45 46 [START BOX 9.5 HERE] 47 48 Box 9.5: Water-Energy-Food Nexus 49 50 The water-energy-food (WEF) nexus explicitly recognises the strong interdependencies of these three sectors 51 and their high levels of exposure to climate change. Risks can be transmitted from one WEF sector to the 52 other two with cascading risks to human health, cities and infrastructure (Conway et al., 2015; Mpandeli et 53 al., 2018; Nhamo et al., 2018; Yang and Wi, 2018; Ding et al., 2019; Simpson et al., 2021b). For example, 54 increasing demand for water for agricultural and energy production is driving an increasing competition over 55 water resources between food and energy industries which, among other effects, compromises the nutritional 56 needs of local populations (Zografos et al., 2014; Dottori et al., 2018). Drought events, such as in southern 57
ACCEPTED VERSIO
N
SUBJECT TO FIN
AL EDITS

FINAL DRAFT Chapter 9 IPCC WGII Sixth Assessment Report
Do Not Cite, Quote or Distribute 9-80 Total pages: 225
Africa during the 2015/16 El Niño, have been associated with major multi-sector impacts on food security 1 (over 40 million food-insecure people and extensive livestock deaths) and reduced energy security through 2 disruption to hydropower generation (associated in Zambia with the lowest rate of real economic growth in 3 over 15 years)(Nhamo et al., 2018). The WEF nexus of the Nile and Zambezi river basins, which include 4 many of Africa’s largest existing hydropower dams, have received the most attention. In these two regions 5 where socioeconomic development is already driving up demand, projections indicate that water scarcity 6 may be exacerbated by drying (Munday and Washington, 2019) and increased flow variability (Siam and 7 Eltahir, 2017). However, for Africa more widely, very few studies fully integrate all three WEF nexus 8 sectors and rarely include an explicit focus on climate change. 9 10 In Africa, the climate risks that the water, energy and food sectors will face in the future are heavily 11 influenced by the infrastructure decisions that governments make in the near term. The African Union’s 12 Programme for Infrastructure Development (PIDA), along with other national energy plans (jointly referred 13 to as PIDA+), aim to increase hydropower capacity nearly six-fold, irrigation capacity by over 60% and 14 hydropower storage capacity by over 80% in major African river basins (Cervigni et al., 2015). The vast 15 majority of hydropower additions would occur in the Congo, Nile, Zambezi and Niger river basins, and the 16 majority of the irrigation capacity additions would occur in the Niger, Nile and Zambezi River basins 17 (Huber-Lee et al., 2015) (Figure Box 9.5.1). 18 19 Climate change risk to the productivity of this rapidly expanding hydropower and irrigation infrastructure 20 compound the overall WEF nexus risk. Future levels of rainfall, evaporation and runoff will have a 21 substantial impact on hydropower and irrigation production. Climate models disagree on whether climates 22 will become wetter or dryer in each river basin. Cervigni et al. (2015) modelled revenues from the sale of 23 hydroelectricity and irrigated crops in major African river basins under different climate scenarios between 24 2015 and 2050 (Figure Box 9.5.1). The study found that hydropower revenues in the driest climate scenarios 25 could be 58% lower in the Zambezi River basin, 30% lower in the Orange basin and 7% lower in the Congo 26 basin relative to a scenario with current climate conditions. Hydropower revenues in the wettest climate 27 scenario could be more than 20% higher in the Zambezi River basin and 50% higher in the Orange basin. 28 The biggest risk to the production of irrigated crops is in the eastern Nile where irrigation revenue could be 29 34% lower in the driest scenario and 11% higher in the wettest than in a scenario without climate change 30 (Cervigni et al., 2015). 31 32 33
ACCEPTED VERSIO
N
SUBJECT TO FIN
AL EDITS

FINAL DRAFT Chapter 9 IPCC WGII Sixth Assessment Report
Do Not Cite, Quote or Distribute 9-81 Total pages: 225
1 Figure Box 9.5.1: Climate risks to hydropower and irrigation in Africa. The map shows the location and size of 2 existing (blue) and planned (red) hydropower plants in African governments’ infrastructure expansion plans, 2015–3 2050. The bar graphs show the forecast revenues for hydropower and irrigation infrastructure from 2015-2050 in each 4 river basin. Hydropower revenues refer to net present value of hydroelectricity produced in each river basin over the 5 period, and irrigation revenues refer to the crop revenues per hectare for each crop multiplied by the number of hectares 6 of each crop across the basin. Dark blue dots show forecasted revenues from 2015–2050 of existing irrigation and 7 hydropower in major African river basins in a scenario without further climate change (i.e., based on historical data). 8 Red dots show how hydropower and irrigation revenues are expected to increase as new hydropower and irrigation 9 infrastructure is added in a scenario without climate change. Blue and green bars illustrate the range of forecasted 10 revenue from 2015–2050 from new and existing hydropower and irrigation under 121 different climate futures. In river 11 basins with a wide range of potential outcomes, such as the eastern Nile and Zambezi River, there is significant 12 uncertainty around revenue forecasts based on historical trends. All figures are estimates of the net present value of 13 revenues, using a discount rate of 3%, and are in 2012 USD billions. The 121 potential climate futures were derived 14 using different General Circulation Models (GCMs), Representative Concentration Pathways (RCPs), and downscaling 15
ACCEPTED VERSIO
N
SUBJECT TO FIN
AL EDITS

FINAL DRAFT Chapter 9 IPCC WGII Sixth Assessment Report
Do Not Cite, Quote or Distribute 9-82 Total pages: 225
methods. IPCC AR4 and AR5 provided data from 22 and 23 GCMs, respectively. These were evaluated across two or 1 three emissions pathways, including RCP4.5 and RCP8.5. The Bias Corrected Spatial Disaggregation (BCSD) method 2 of downscaling was then used to derive 99 potential climate futures. An additional 22 climate futures (11 GCMs driven 3 by the RCP4.5 and RCP8.5 emissions pathways) were produced using the Empirical Statistical Downscaling Methods 4 developed at the Climate Systems Analysis Group at the University of Cape Town.. Data sourced from (Cervigni et al., 5 2015). 6 7 8 Studies have used the river basin as a unit of analysis and adopted sophisticated techniques to assess and 9 present trade-offs between competing uses. For example, Yang and Wi (2018) consider the WEF nexus in 10 the Great Ruaha tributary of the Rufiji River in Tanzania motivated by an observed decrease in streamflow 11 during the dry season in the 1990s, but without an explicit focus on climate. Yang and Wi (2018) show 12 sensitivity of water availability for irrigated crop production to warming, and sensitivity of hydropower 13 generation and ecosystem health to changes in precipitation and dam development. Understanding of WEF 14 nexus interlinkages can help characterise risks and identify entry points and the relevant institutional levels 15 for cross-sectoral climate change adaptation actions (England et al., 2018). An integrated response can be 16 enhanced through the inclusion of community-based organisations, such as water resource user associations 17 and the wide range of other multi-sectoral actors involved in and affected by development decisions. 18 Capturing the scarcity values of water and energy embedded in food and other products can help identify the 19 co-benefits and costs of integrated adaptation (Allan et al., 2015). 20 21 [END BOX 9.5 HERE] 22 23 24 9.7.3.3 Climate-Proofing Water Infrastructure 25 26 While natural variability in the hydrological cycle has always been considered by water resources planners 27 and engineers (Müller Schmied et al., 2016; Muller, 2018), many countries will have to take into 28 consideration the range of historically unprecedented extremes expected in the future. Increasingly, the 29 provision of urban water security is dependent on the functioning of complex bulk water infrastructure 30 systems consisting of dams, inter-basin transfers, pipelines, pump stations, water treatment plants and 31 distribution networks (McDonald et al., 2014). Risk-based studies on the potential climate change risks for 32 water security show that there are benefits when risks are reduced at the tails of the distribution - floods and 33 droughts—even if there is little benefit in terms of changes in the mean (Arndt et al., 2019). When risk is 34 taken into account in an integrated (national) bulk water infrastructure supply system, the overall impact of 35 climate change on the average availability of water to meet current and future demands is significantly 36 reduced (Cullis et al., 2015). Further, stemming leakages and enhancing efficiency through technology and 37 management improvements is important in building climate-resilient water conveyance systems (UN 38 Environment, 2019). African cities could leap-frog through the development phases to achieve a water 39 sensitive city ideal, reaping benefits such as improved liveability, reduced flooding impacts, safe water and 40 overall lower net energy requirements and avoid making the mistakes developed countries’ cities have made 41 (Fisher-Jeffes et al., 2017) (Brodnik et al., 2018). However, the challenge of large proportions of the 42 population lacking access to even basic water supply and sanitation infrastructure (Armitage et al., 2014) 43 must be simultaneously and effectively addressed, particularly in light of other major exacerbating factors 44 like the COVID-19 pandemic (Section 9.11.5). 45 46 9.7.3.4 Decision Support Tools for Managing Complex Water Systems 47 48 Many studies in Africa use the river basin as a unit of analysis at scale and adopt sophisticated model-based 49 techniques to assess climate change impacts on hydrology under different climate and development 50 scenarios, thereby presenting trade-offs between competing uses such as hydropower generation, irrigation 51 and ecosystem requirements (Yang and Wi, 2018; Ahmed, 2020) (Section 9.12.1). However, longer (multi-52 decadal) hydrological datasets and model improvements are required (Taye et al., 2015), and models should 53 incorporate the quantification of the wider benefits, risks and political opportunities arising from reservoir 54 development to better inform decision-makers to achieve a higher level of (transboundary) cooperation 55 (Digna et al., 2016; Nijsten et al., 2018). Collaboration between scientists and policy-makers to address the 56 complexity of decision-making under uncertainty (Steynor et al., 2016) (Pienaar and Hughes, 2017), coupled 57 with community involvement in participatory scenario development and participatory GIS to aid in 58
ACCEPTED VERSIO
N
SUBJECT TO FIN
AL EDITS
FINAL DRAFT Chapter 9 IPCC WGII Sixth Assessment Report
Do Not Cite, Quote or Distribute 9-83 Total pages: 225
collaborative planning that is context-specific (Muhati et al., 2018; Álvarez Larrain and McCall, 2019) are 1 powerful tools for more beneficial adaptive and resilience building actions. 2 3 9.7.3.5 Other Adaptation Options 4 5 Climate change is projected to increase dependence upon groundwater withdrawals in most parts of Africa as 6 an adaptive strategy to amplified variability in precipitation and surface water resources, highlighting the 7 need for conjunctive surface-groundwater management and rainwater harvesting (Cobbing and Hiller, 2019; 8 Taylor et al., 2019). Alternative water supply options such as desalination, managed aquifer recharge, 9 stormwater harvesting and re-use (direct and indirect, potable and non-potable), all require significant 10 amounts of energy and are complex to operate and maintain. A failure to provide a source of reliable energy 11 and the capacity to implement, maintain, and operate these systems is a significant contributor to water 12 scarcity risks in Africa (Muller and Wright, 2016). Soft adaptation options include increasing water use 13 efficiency, chaning agricultural practices, more appropriate water pricing (Olmstead, 2014) and enhancing 14 capacity to tackle groundwater overexploitation (Kuper et al., 2016), among others (see Section 9.10.2.4; 15 Sections 4.6 and 4.7 in Chapter 4). 16 17 9.7.3.6 Mainstreaming Gender Across all Adaptation Options 18 19 Gender is important in building resilience and adaptation pathways to global environmental change (Ravera 20 et al., 2016). It is well-established that women, in most societies, have accumulated considerable knowledge 21 about water resources, including location, quality and storage methods because they are primarily 22 responsible for the management of water for household water supply, sanitation and health, and for 23 productive uses in subsistence agriculture (UN-Water, 2006). As gender-differentiated relationships are 24 complex, adaptation should take into account intersectional differences such as homeownership, employment 25 and age (Harris et al., 2016), educational, infrastructural and programmatic interventions (Pouramin et al., 26 2020), aspects of protection and safety (Mackinnon et al., 2019), barriers to adaptation and gendered 27 differences in the choice of adaptation measures (Mersha and Van Laerhoven, 2016), the complex power 28 dynamics of existing social and political relations (Djoudi et al., 2016; Rao et al., 2017) and inclusion and 29 empowerment of women in the management of environmental resources (Makina and Moyo, 2016). 30 Incorporation of gender and water inequities into climate change adaptation would have a significant impact 31 on achieving the SDGs (particularly 1,3,4, 5 and 6), while failure to incorporate gender will undermine 32 adaptation efforts (Bunce and Ford, 2015; Fleifel et al., 2019; Pouramin et al., 2020). 33 34 35 9.8 Food Systems 36 37 Ideally, a systems approach (Ericksen, 2008; Rosenzweig et al., 2020) could be used to assess how global 38 environmental changes affect the food sector in Africa, emphasising the complex interactions that exist 39 within the components of the food supply system, including its enabling socioeconomic and biophysical 40 environment (Ingram, 2011; Foran et al., 2014; Tendall et al., 2015), and how food is connected to other 41 critical systems such as energy, water and transportation (Albrecht et al., 2018) (see Box 9.5). Production 42 will not be the only aspect of food security that is impacted by climate change. Processing, storage, 43 distribution and consumption will also be affected. Access to healthy and adequate food in the face of 44 climate change requires resilience across these components of the food system (Adenle et al., 2017). 45 However, most studies on climate change impacts on food in Africa are heavily focused on production only. 46 A significant knowledge gap, therefore, exists around the complex ways in which climate change will 47 interact with broader components of African food systems, and strategies for making these systems more 48 resilient, particularly in a context of rapid population growth and urbanisation across the continent (Adenle et 49 al., 2017; Schmitt Olabisi et al., 2018). 50 51 9.8.1 Vulnerability to Observed and Projected Impacts from Climate Change 52 53 Agricultural activities are mainly rainfed and subsistence across Africa. The dominant farming system is 54 mixed cereal-livestock (Thornton and Herrero, 2015; Nematchoua et al., 2019), with pastoral systems in East 55 Africa, and commercial livestock and crop systems also representing a significant proportion of the food 56 system in southern Africa (Thornton and Herrero, 2015). Many African regions are vulnerable to food 57
ACCEPTED VERSIO
N
SUBJECT TO FIN
AL EDITS
FINAL DRAFT Chapter 9 IPCC WGII Sixth Assessment Report
Do Not Cite, Quote or Distribute 9-84 Total pages: 225
insecurity, facing dwindling food production, food access, stocks and income due to low adaptive capacity 1 (Evariste et al., 2018; Fuller et al., 2018; Bang et al., 2019; Gebre and Rahut, 2021). 2 3 Across regions with food systems highly vulnerable to climate change, female farmers, cocoa farmers, 4 pastoralists, plantain farmers, coastal zone communities, rural households and forest communities in central 5 Africa indicate higher vulnerability (Chia et al., 2016; Schut et al., 2016; Nematchoua et al., 2019). Their 6 vulnerability is multidimensional and affected by low adaptive capacity, location, livelihood system, 7 socioeconomic status, gender, age and ethnicity (Perez et al., 2015; Weston et al., 2015; Gebre and Rahut, 8 2021) (see also Box 9.1). 9 10 Across Africa, including West Africa, adverse climate conditions for agricultural and pastoral livelihoods 11 have contributed to rural-to-urban migration patterns and migration among African regions (see Box 9.8) 12 (Baudoin et al., 2014; Abbas, 2017; Gemenne and Blocher, 2017b). Rural to urban migration may increase 13 vulnerability of migrants through exposure to additional risks, including food insecurity (Amadi and Ogonor, 14 2015; Abbas, 2017). In general, West African countries are characterised by the poor adaptive capacity of 15 rural households (Douxchamps et al., 2015; Dumenu and Obeng, 2016). 16 17 In North Africa, livelihoods and economies are strongly dependent on agriculture. Pressure on water demand 18 due to climate change and variability is threatening income, development processes and food security in the 19 region (high confidence) (Mohmmed et al., 2018; Khedr, 2019). Increased temperatures and droughts have 20 enhanced the vulnerability of the irrigation sector (Verner et al., 2018; İlseven et al., 2019), and the 21 combined effect of these hazards negatively affects crop and animal production (Mohmmed et al., 2018; 22 Verner et al., 2018). For example, dairy farms in Tunisia are experiencing warmer temperatures above the 23 thermoneutral zone of cows for more than 5 months each year, reducing production efficiency and resulting 24 in significant economic losses (Amamou et al., 2018). 25 26 Non-climatic stressors aggravate food insecurity in many parts of the continent, including lack of access to 27 production inputs and land, lack of education and limited income sources, with adverse climate impacts on 28 agriculture reducing education attainment for children (Evariste et al., 2018; Fuller et al., 2018) (Section 29 9.11.1.2). Geographic and social isolation is another type of social vulnerability, especially for pastoralist 30 communities in East and southern Africa (Sonwa et al., 2017; Basupi et al., 2019). Rural communities often 31 have poor transport networks, limited access to markets or information and fewer livelihood alternatives, and 32 are less able to be informed of risks or be assisted in the event of extreme climate events (Sonwa et al., 2017; 33 Basupi et al., 2019). 34 35 Extreme climate events have been key drivers in rising acute food insecurity and malnutrition of millions of 36 people requiring humanitarian assistance in Africa (high confidence). Between 2015 and 2019, an estimated 37 45.1 million people in the Horn of Africa and 62 million people in eastern and southern Africa required 38 humanitarian assistance due to climate-related food emergencies. Children and pregnant women experience 39 disproportionately greater adverse health and nutrition impacts (very high confidence) (Gebremeskel Haile et 40 al., 2019) (see Chapter 7, Section 7.2.4). 41 42 Future climate warming will likely have a substantial impact on food security in Africa and is anticipated to 43 coincide with low adaptive capacity as climate change intensifies anthropogenic stressors, as 85% of Africa's 44 poor live in rural areas and mostly depend on agriculture for their livelihoods (Adams, 2018; Mahmood et 45 al., 2019). This highlights the need to prioritise innovative measures for reducing vulnerabilities in Africa 46 food systems (Fuller et al., 2018; Mahmood et al., 2019). 47 48 Climate change impacts could increase the global number of people at risk of hunger in 2050 by 8 million 49 people under a scenario of sustainable development (SSP1) and 80 million people under a scenario of 50 reduced international cooperation and low environmental protection (SSP3), with populations concentrated 51 in sub-Saharan Africa, South Asia and Central America (see Chapter 5, Sections 5.2.2, 5.4.2 and 5.4.3). 52 Global climate impacts on food availability are expected to lead to higher food prices, increasing the risk of 53 hunger for people in African countries, and slow progress towards eradicating child undernutrition and 54 malnutrition in all its forms (see Chapter 7, Section 7.4). 55 56
ACCEPTED VERSIO
N
SUBJECT TO FIN
AL EDITS
FINAL DRAFT Chapter 9 IPCC WGII Sixth Assessment Report
Do Not Cite, Quote or Distribute 9-85 Total pages: 225
9.8.2 Observed Impacts and Projected Risks to Crops and Livestock 1 2 9.8.2.1 Observed Impacts and Projected Risks for Staple Crops 3 4 Climate change is already negatively impacting crop production and slowing productivity growth in Africa 5 (high confidence) (Iizumi et al., 2018; Ray et al., 2019; Sultan et al., 2019; Ortiz-Bobea et al., 2021). Climate 6 change has reduced total agricultural productivity growth in Africa by 34% since 1961, more than in any 7 other region (Ortiz-Bobea et al., 2021), more than in any other region. Maize yields have decreased 5.8% and 8 wheat yields 2.3%, on average, in sub-Saharan Africa due to climate change in the period 1974–2008 (Ray 9 et al., 2019). Overall, climate change has decreased food total calories across all crops in sub-Saharan Africa 10 by 1.4% on average compared to a no climate change counterfactual since 1970, with up to 10% reductions 11 in Ghana and Zimbabwe (Ray et al., 2019). 12 13 Farmers perceive a wide variety of climate threats to crop production including droughts, precipitation 14 variability, a delayed onset and overall reductions in early growing season rainfall and excess heat 15 (Rankoana, 2016a; Elum et al., 2017; Kichamu et al., 2017; Alvar-Beltrán et al., 2020). Farmers attribute 16 these perceived changes as a major driver of yield losses (Ayanlade and Jegede, 2016) (see Section 9.4.5). 17 Over half of surveyed farmers in West Africa perceive increases in crop pests and diseases as due to climate 18 change as the range and seasonality of many pests and diseases change under warming (Callo-Concha, 19 2018),. Pests and diseases contribute between 10–35% yield losses for wheat, rice, maize, potato and 20 soybean in sub-Saharan Africa (Savary et al., 2019). Recent locust outbreaks in 2019 in East Africa have 21 been linked to climate conditions caused in part by ocean warming (Wang et al., 2020b) (see Box 5.8 in 22 Chapter 5). 23 24 Future climate change may increase insect pest-driven losses in Africa for maize, rice and wheat: Compared 25 to 1950–2000, losses may increase by up to 50% at 2°C of global warming (Deutsch et al., 2018). However, 26 many challenges remain in modelling pest and disease under climate change with additional research needed 27 expanding the range of crops and diseases studied (Newbery et al., 2016). 28 29 Agriculture in Africa is especially vulnerable to future climate change in part because 90–95% of African 30 food production is rainfed (Adams, 2018). Maize, rice, wheat and soybean yields in tropical regions (20S-31 20N) are projected to decrease approximately 5% per °C of global warming in a multi-model ensemble 32 (Rosenzweig et al., 2014; Franke et al., 2020). Dryland agricultural areas are especially sensitive to changes 33 in rainfall. For example, without adaptation, substantial yield declines are projected for staple crops in North 34 Africa (Figure 9.3). A recent meta-analysis of 56 studies indicates that, compared to 1995–2005, economic 35 welfare in the agriculture sector in North Africa is projected to decline 5% for 2℃ global warming and 20% 36 for 3℃ global warming, and in sub-Saharan Africa by 5% (2℃) and 10% (3℃) (Moore et al., 2017a), both 37 more pessimistic than previous economic estimates. 38 39 A synthesis of projected staple crop impacts across 35 studies for nearly 1040 locations and cases shows on 40 average decreases in crop yields with increasing global warming across staple crops in Africa, including 41 when accounting for CO2 increases and adaptation measures. For example for maize in West Africa, 42 compared to 2005 yield levels, median projected yields decrease 9% at 1.5℃ global warming and 41% at 43 4℃, without adaptation (Figure 9.22). However, uncertainties in projected impacts across crops and regions 44 are driven by uncertainties in crop responses to increasing CO2 and adaptation response, especially for maize 45 in East Africa and wheat in North Africa and East Africa (Figure 9.22) (Hasegawa et al., 2021). 46 47 There is also growing evidence that climate change is likely beginning to outpace adaptation in agricultural 48 systems in parts of Africa (Rippke et al., 2016). For example, despite the use of adjusted sowing dates and 49 existing heat-tolerant varieties, Sudan’s domestic production share of wheat may decrease from 16.0% to 50 4.5–12.2% by 2050 under RCP8.5 (2.4℃ global warming) (Iizumi et al., 2021). 51 52 53
ACCEPTED VERSIO
N
SUBJECT TO FIN
AL EDITS

FINAL DRAFT Chapter 9 IPCC WGII Sixth Assessment Report
Do Not Cite, Quote or Distribute 9-86 Total pages: 225
1 Figure 9.22: Projected yield changes for major crops in Africa due to climate change (compared to 2005 yield levels). 2 Impacts are binned into global warming levels above pre-industrial global mean temperature (1850–1900). Boxplots 3 show a synthesis of projected staple crop impacts, with and without adaptation measures (e.g. planting date, cultivar, 4 tillage or irrigation). On average crop yields are projected to decrease with increasing global warming across staple 5 crops in Africa. The overall adaptation potential to offset yield losses across Africa for rice, maize and wheat reduces 6 with increasing global warming. On average, in projections including adaptation options and yield losses, in the median 7 case, are reduced from –33% to –10% of 2005 levels at 2℃ of global warming and from –46% to –23% at 4℃. Data 8 are a synthesis across 35 studies for nearly 1040 locations and cases of projected impacts for regions of Africa for 9 maize, rice and wheat (Hasegawa et al., 2021) (Supplementary Material Table SM 9.5). 10 11 12 Elevated CO2 concentrations in the atmosphere might mitigate some or all climate-driven losses (Swann et 13 al., 2016; Durand et al., 2018), but there is considerable uncertainty around the CO2 response (Deryng et al., 14 2016; Toreti et al., 2020), especially when nutrients such as nitrogen and phosphorus are limiting crop 15 growth. Additional Free-Air Carbon dioxide Enrichment (FACE) experiments are needed in the tropics, 16 particularly on the African continent, to better understand the impacts of increased CO2 concentrations on the 17 productivity of crops and cultivars grown in Africa under additional temperature impacts and water and 18 nutrient limitations (Ainsworth and Long, 2021). Warming and elevated CO2 may also change the nutritional 19 content of some crops. By 2050 under RCP8.5 (2.4℃ global warming), overall wheat yields and grain 20 protein content may decrease by 10% and 15%, respectively, in North and East Africa, and by over 15% in 21 southern Africa (Asseng et al., 2019). See Chapter 5 for more details on CO2 impacts and uncertainties. 22 23 9.8.2.2 Observed Impacts and Projected Risks on Regional Cash Crops and Food Crops 24 25
>1.5oC >2oC >3oC >4oC
Yiel
d im
pact
(%)
MAIZE RICE WHEAT
Without adaptation With adaptation
NO
RTH
AFR
ICA
SOU
THER
N A
FRIC
AW
EST
AFR
ICA
EAST
AFR
ICA
Yiel
d im
pact
(%)
Yiel
d im
pact
(%)
Yiel
d im
pact
(%)
>1.5oC >2oC >3oC >4oC >1.5oC >2oC >3oC >4oC
ACCEPTED VERSIO
N
SUBJECT TO FIN
AL EDITS

FINAL DRAFT Chapter 9 IPCC WGII Sixth Assessment Report
Do Not Cite, Quote or Distribute 9-87 Total pages: 225
Few studies have attributed changes in yields of cash crops and other regionally important food crops in 1 Africa to anthropogenic climate change, but recent research suggests yields of cash crops in Africa have 2 already been impacted by climate change, in both a negative and positive manner (Falco et al., 2012; Traore 3 et al., 2013; Ray et al., 2019). For example, between the period 1974–2008, sugarcane yields decreased on 4 average by 3.9% and 5.1% in sub-Saharan Africa and North Africa, respectively, due to climate change, 5 while sorghum yields increased 0.7%, and cassava yield increased 1.7% in sub-Saharan Africa and 18% in 6 North Africa (Ray et al., 2019). 7 8 There are also limited studies for assessing projected climate change impacts on important cash crops and 9 food crops other than maize, rice and wheat (Jarvis et al., 2012; Schroth et al., 2016; Awoye et al., 2017). 10 These studies often represent changes at specific sites in a country or assess changes in the yield and/or 11 suitability for cultivating a specific crop across a larger geographic area. Climate change is projected to have 12 overall positive impacts on sugarcane and Bambara nuts in southern Africa, oil palm in Nigeria and chickpea 13 in Ethiopia (low confidence) (Figure 9.23). 14 15 Climate change is projected to reduce sorghum yields in West Africa (Figure 9.23). For example, across the 16 West African Sahel savanna sorghum yields are projected to decline on average 2% at 1.5℃ and 5% at 2℃ 17 global warming (Faye et al., 2018). For coffee and tea in eastern Africa, olives in Algeria and sunflower in 18 Botswana and Morocco, we find studies indicating mostly negative impacts on production systems. For 19 example, in Kenya, compared to 2000, optimal habitat for tea production is projected to decrease in area by 20 27% with yields declining 10% for global warming of 1.8–1.9℃, although yield declines may be reduced at 21 higher levels of warming (Beringer et al., 2020; Jayasinghe and Kumar, 2020; Rigden et al., 2020). Suitable 22 area for tea production may reduce by half in Uganda (Eitzinger et al., 2011; Läderach et al., 2013). In East 23 Africa, the coffee-growing area is projected to shift up in elevation with suitability decreasing 10–30% 24 between 1.5–2℃ of global warming (Bunn et al., 2015; Ovalle-Rivera et al., 2015). 25 26 For all other crops, there is at least one study that finds low to highly negative impacts for one or several 27 warming levels (Figure 9.23). Mixed results on the direction of change often occur when several contrasting 28 sites with varying baseline climates are studied, and when a study considers the full range of climate 29 scenarios. For example, there are mixed results on the direction of change for impacts of 1.5℃ global 30 warming on cassava, cotton, cocoa and millet in West Africa (low confidence) (Figure 9.23). In general, 31 there is limited evidence in the direction of change, due to single studies being available for most crop-32 country combinations (Knox et al., 2010; Chemura et al., 2013; Asaminew et al., 2017; Bouregaa, 2019). 33 Occasionally, two studies agree on the direction and magnitude of change, for example, for potatoes in East 34 Africa, yields are projected to decrease by 11–17% with 3℃ of warming (Fleisher et al., 2010; Tatsumi et 35 al., 2011). 36 37 38
ACCEPTED VERSIO
N
SUBJECT TO FIN
AL EDITS

FINAL DRAFT Chapter 9 IPCC WGII Sixth Assessment Report
Do Not Cite, Quote or Distribute 9-88 Total pages: 225
1
2 Figure 9.23: Projected risks at increasing global warming levels for regionally important cash and food crops in Africa. 3 Insufficient data (ID) indicates there were limited to no published studies that have quantified projected climate change 4 impacts or adaptation options for specific crops under different warming levels (see Supplementary Material Table SM 5 9.6). 6 7 8 9.8.2.3 Observed Impacts and Projected Risks for Wild-Harvested Food 9 10 Wild-harvested foods (e.g., fruits, vegetables and insects) provide dietary diversification and for many 11 people in Africa, wild-harvested food plants may provide a livelihood and/or nutritional safety net when 12
ACCEPTED VERSIO
N
SUBJECT TO FIN
AL EDITS
FINAL DRAFT Chapter 9 IPCC WGII Sixth Assessment Report
Do Not Cite, Quote or Distribute 9-89 Total pages: 225
other sources of food fail, such as during drought(Sunderland et al., 2013; Shumsky et al., 2014; Wunder et 1 al., 2014; Baudron et al., 2019b). In Zimbabwe, during lean times, consumption of wild fruits increases, as 2 does their sale to generate income for additional food expenses in poor, rural households (Mithöfer and 3 Waibel, 2004).In Zambia, Mali and Tanzania, household surveys indicate that forest products including wild 4 foods can play an important role in reducing household vulnerability to climate shocks by providing 5 alternative sources of food and income during droughts and floods (Robledo et al., 2012).In the Parklands of 6 West Africa, wild trees are a significant source of wild foods and are thus a place where one might expect 7 wild plant foods to make an important contribution to diets and nutrition (Boedecker et al., 2014; Leßmeister 8 et al., 2015). Non-timber forest products are consumed by an estimated 43% of all households in Burkina 9 Faso (FAO, 2019), and wild vegetables accounted for about 50% of total vegetable consumption in 10 southeastern Burkina Faso (Mertz et al., 2001). 11 12 The focus of projected climate change impacts has been almost exclusively on agricultural production, yet 13 climate change could have substantial impacts on the distribution and availability of wild-harvested food 14 plants in Africa (Wessels et al., 2021). Non-cultivated species in Africa are vulnerable to current and future 15 climate changes, with widespread changes in woody plant cover already observed (see Section 9.6.1.1). 16 Evidence about the impacts of climate change on individual wild food species is less consistent. 17 Communities in the Kalahari (Crate and Nuttall, 2016) and Zimbabwe (Sango and Godwell, 2015) report 18 growing scarcity of wild foods (such as wild meat and fruit) perceived to be, at least in part, due to drought 19 and climate change. Shea tree (Vitellaria paradoxa) nuts provide fats and oils for the diets of many rural 20 populations in West Africa. In Burkina Faso, global warming of 3℃ is projected to reduce area of suitable 21 habitat for the Shea tree by 14% (Dimobe et al., 2020). In southern Africa, 40% of native, wild-harvested 22
food plant species are projected to decrease in geographic range extent at 1.7℃ global warming with range 23
reductions for 66% of species projected for 3.5℃ (Wessels et al., 2021). 24
25 9.8.2.4 Observed Impacts and Projected Risks on Livestock 26 27 Livestock systems in Africa are already being affected by changes in climate through increased precipitation 28 variability decreasing fodder availability (Sloat et al., 2018; Stanimirova et al., 2019). More than twice as 29 many countries in Africa have experienced increases in precipitation variability in the last century than 30 decreases (Sloat et al., 2018). Fodder availability is also being impacted by Woody Plant Encroachment—the 31 increase in shrub and tree cover—which has increased by 10% on subsistence grazing lands and 20% on 32 economically important grazing lands in South Africa in the last 60 years (Stevens et al., 2016), and is driven 33 in part by climatic factors (see Section 9.6.1.1). Increased temperature and precipitation have contributed to 34 the expanding range, especially in East and southern Africa, of several ixodid tick species which carry 35 economically important livestock diseases (Nyangiwe et al., 2018). 36 37 Pastoralists in Africa perceive the climate as already changing and report more erratic and reduced rainfall, 38 prolonged and more frequent droughts and a rise in temperature (Sanogo et al., 2017; Kimaro et al., 2018). 39 They also report reduced milk production, increased deaths and disease outbreaks in their herds due to 40 malnutrition and starvation resulting from the shortages in forage and water (Kimaro et al., 2018). Additional 41 research is required to attribute precipitation variability to anthropogenic forcing (see Section 9.3), and to 42 evaluate the relative contributions of climate change and management to disease vector extent. 43 44 Future climate change will have compounding impacts on livestock, including negative impacts on fodder 45 availability and quality, availability of drinking water, direct heat stress and the prevalence of livestock 46 diseases (Nardone et al., 2010; Rojas-Downing et al., 2017; Godde et al., 2021). Climate change is projected 47 to negatively affect fodder availability (Briske, 2017) because overall rangeland net primary productivity 48 (NPP) by 2050 is projected to decrease 42% under RCP4.5 (2℃ global warming) and 46% under RCP8.5 49 (2.4℃ global warming) for western sub-Saharan Africa, compared to a 2000 baseline (Boone et al., 2018). 50 NPP is also projected to decline by 37% in southern Africa, 32% in North Africa and 5% in both East Africa 51 and Central Africa by 2050 under RCP8.5 (2.4℃ global warming) (Boone et al., 2018). For example, in 52 Zimbabwe by 2040–2070, net revenues from livestock production, compared to a 2011 survey, are projected 53 to decline by 8–32% under RCP4.5 for 2℃ and 11–43% under RCP8.5 for 2.7℃ global warming due to a 54 decline in fodder availability (Descheemaeker et al., 2018). The available literature does not 55 comprehensively capture the economic implications of climate-related impacts on livestock production 56 across Africa. 57
ACCEPTED VERSIO
N
SUBJECT TO FIN
AL EDITS
FINAL DRAFT Chapter 9 IPCC WGII Sixth Assessment Report
Do Not Cite, Quote or Distribute 9-90 Total pages: 225
1 Fodder quality, critical for animal health and weight gain, is at risk from climate change as increases in 2 temperature, elevated CO2 and water stress have been shown to reduce dry matter digestibility and nitrogen 3 content for C3 grasses (Augustine et al., 2018), tropical C4 grasses (Habermann et al., 2019) and fodder crops 4 such as Lucerne/Alfalfa (Polley et al., 2013; Thivierge et al., 2016). 5 6 Climate change is projected to threaten water availability for livestock. Droughts in Africa have become 7 more intense, frequent and widespread in the last 50 years (Masih et al., 2014), and progressive increase in 8 droughts between three- and twenty-fold under climate change up to 3℃ of warming are projected for most 9 of Africa (9.5). In the Klela basin in Mali by 2050, groundwater recharge is projected to decline by 49% and 10 groundwater storage by 24% under RCP8.5 (2.4℃ global warming) compared to the 2006 baseline (Toure et 11 al., 2017). Water availability for livestock during drought is a major concern for many African pastoralists 12 including but not limited to those in Zimbabwe (Dzavo et al., 2019) and Nigeria (Ayanlade and Ojebisi, 13 2019). Increased livestock mortality and livestock price shocks have been associated with droughts in Africa, 14 as well as being a potential pathway for climate-related conflict (Catley et al., 2014; Maystadt and Ecker, 15 2014) (see Box 9.9). 16 17 Heat stress may already be the largest factor impacting livestock production in many regions in Africa (El-18 Tarabany et al., 2017; Pragna et al., 2018), as the combination of high temperatures and high relative 19 humidity can be dangerous for livestock and has already decreased dairy production in Tunisia (Amamou et 20 al., 2018). Climate change is projected to increase heat stress for all types of livestock, especially in the 21 tropics (Lallo et al., 2018) (Figure 9.24). More studies quantifying the impact of heat stress on other types of 22 livestock production loss are needed in Africa (Rahimi et al., 2021). 23 24 25
ACCEPTED VERSIO
N
SUBJECT TO FIN
AL EDITS
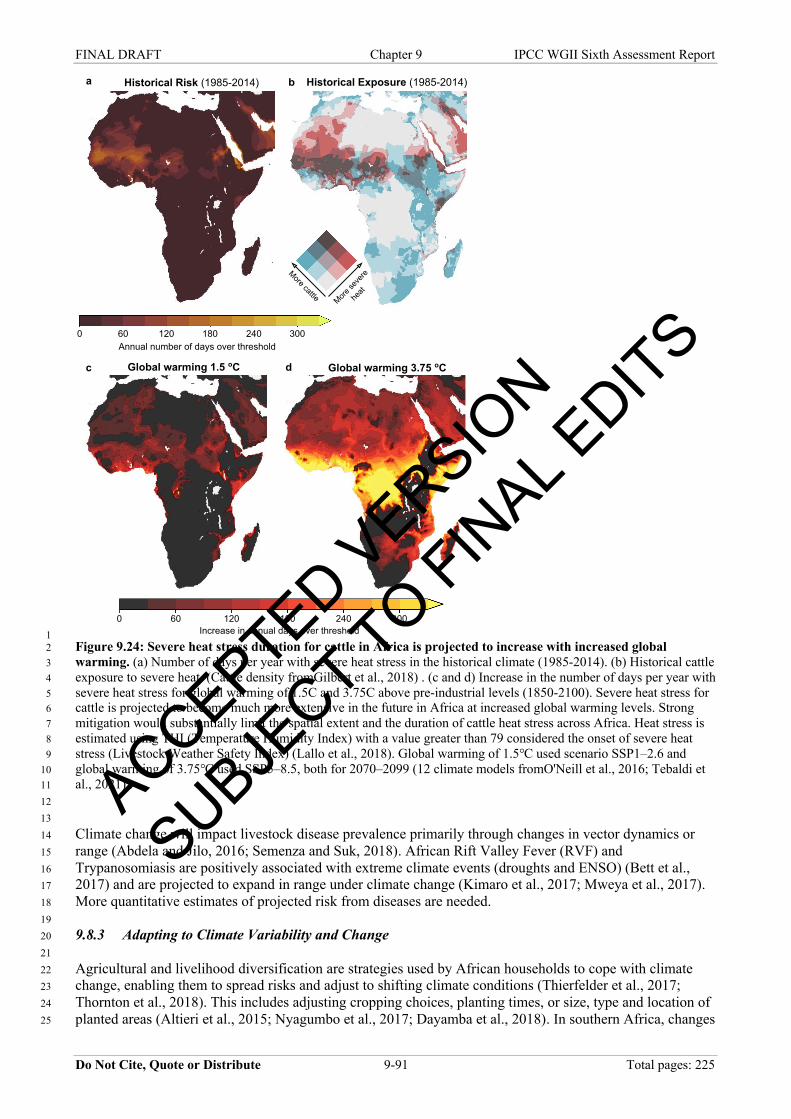
FINAL DRAFT Chapter 9 IPCC WGII Sixth Assessment Report
Do Not Cite, Quote or Distribute 9-91 Total pages: 225
1 Figure 9.24: Severe heat stress duration for cattle in Africa is projected to increase with increased global 2 warming. (a) Number of days per year with severe heat stress in the historical climate (1985-2014). (b) Historical cattle 3 exposure to severe heat. (Cattle density fromGilbert et al., 2018) . (c and d) Increase in the number of days per year with 4 severe heat stress for global warming of 1.5C and 3.75C above pre-industrial levels (1850-2100). Severe heat stress for 5 cattle is projected to become much more extensive in the future in Africa at increased global warming levels. Strong 6 mitigation would substantially limit the spatial extent and the duration of cattle heat stress across Africa. Heat stress is 7 estimated using THI (Temperature Humidity Index) with a value greater than 79 considered the onset of severe heat 8 stress (Livestock Weather Safety Index) (Lallo et al., 2018). Global warming of 1.5℃ used scenario SSP1–2.6 and 9 global warming of 3.75℃ used SSP5–8.5, both for 2070–2099 (12 climate models fromO'Neill et al., 2016; Tebaldi et 10 al., 2021) . 11 12 13 Climate change will impact livestock disease prevalence primarily through changes in vector dynamics or 14 range (Abdela and Jilo, 2016; Semenza and Suk, 2018). African Rift Valley Fever (RVF) and 15 Trypanosomiasis are positively associated with extreme climate events (droughts and ENSO) (Bett et al., 16 2017) and are projected to expand in range under climate change (Kimaro et al., 2017; Mweya et al., 2017). 17 More quantitative estimates of projected risk from diseases are needed. 18 19 9.8.3 Adapting to Climate Variability and Change 20 21 Agricultural and livelihood diversification are strategies used by African households to cope with climate 22 change, enabling them to spread risks and adjust to shifting climate conditions (Thierfelder et al., 2017; 23 Thornton et al., 2018). This includes adjusting cropping choices, planting times, or size, type and location of 24 planted areas (Altieri et al., 2015; Nyagumbo et al., 2017; Dayamba et al., 2018). In southern Africa, changes 25
Historical Risk (1985-2014)
Global warming 1.5 oC
a
c d Global warming 3.75 oC
Annual number of days over threshold
Increase in annual days over threshold0 60 120 180 240 300
0 60 120 180 240 300
Historical Exposure (1985-2014)b
More se
vere
heat
More cattle
ACCEPTED VERSIO
N
SUBJECT TO FIN
AL EDITS

FINAL DRAFT Chapter 9 IPCC WGII Sixth Assessment Report
Do Not Cite, Quote or Distribute 9-92 Total pages: 225
in planting dates provide farmers with greater yield stability in uncertain climate conditions (Nyagumbo et 1 al., 2017). In Ghana, farmers are changing planting schedules and using early maturing varieties to cope with 2 late-onset and early cessation of the rainy season (Antwi-Agyei et al., 2014; Bawakyillenuo et al., 2016). 3 4 The use of drought-tolerant crop varieties is another adaptation available to African farmers (Hove and 5 Gweme, 2018; Choko et al., 2019). Adoption, however, is hindered by lack of information and training, 6 availability or affordability of seed, inadequate labelling and packaging size for seed supplies and financial 7 constraints (Fisher et al., 2015). Moreover, drought-tolerant varieties do not address changing temperature 8 regimes (Guan et al., 2017). 9 10 Crop diversification enhances crop productivity and resilience and reduces vulnerability in smallholder 11 farming systems (McCord et al., 2015; Mulwa and Visser, 2020). In Tanzania, diversified crop portfolios are 12 associated with greater food security and dietary quality (Brüssow et al., 2017). In Kenya, levels of crop 13 diversity are higher in villages affected by frequent droughts, which are the main cause of crop failure 14 (Bozzola and Smale, 2020). They also help control pest outbreaks, which may become more frequent and 15 severe under increased climate variability and extreme events (Schroth and Ruf, 2014). High farming 16 diversity enables households to better meet food needs, but only up to a certain level of diversity (Waha et 17 al., 2018), and the viability of and benefits from mixed-farming are highly context-dependent (Thornton and 18 Herrero, 2015; Weindl et al., 2015). 19 20 Agroecological and conservation agriculture practices, such as intercropping, integration of legumes, 21 mulching and incorporation of crop residues, are associated with household food security and improved 22 health status (Nyantakyi-Frimpong et al., 2017; Shikuku et al., 2017). These practices can enhance the 23 benefits of other adaptations, such as planting drought- and heat-tolerant or improved varieties, although 24 effects vary across soil types, geographical zones and social groups (Makate et al., 2019; Mutenje et al., 25 2019). Non-climatic variables, such as financial resources, access to information and technology, level of 26 education, land security and gender dynamics affect feasibility and adoption (Makate et al., 2019; Mutenje et 27 al., 2019). 28 29 To mitigate growing water stress, countries like Tanzania, Uganda, Rwanda and Ethiopia are striving to 30 improve irrigation efficiency (McCarl et al., 2015; Connolly-Boutin and Smit, 2016; Herrero et al., 2016). 31 The feasibility and effectiveness of this adaptation depend on biophysical and socioeconomic conditions 32 (Amamou et al., 2018; Harmanny and Malek, 2019; Schilling et al., 2020). Irrigation is unaffordable for 33 many smallholder farmers and only covers a negligible proportion of the total cultivated area. Nonetheless, 34 in some regions of West Africa, small-scale irrigation, including the digging of ditches, holes and 35 depressions to collect rainwater (Makondo and Thomas, 2018), is widely adopted and promoted to support 36 national food security (Dowd-Uribe et al., 2018). 37 38 African farmers are also diversifying their income sources to offset reduced yields or crop losses by shifting 39 labour resources to off-farm work, or by migrating seasonally or longer-term (Kangalawe et al., 2017; Hove 40 and Gweme, 2018). Off-farm activities provide financial resources that rural households need to cope with 41 extreme climate variability (Hamed et al., 2018; Rouabhi et al., 2019). However, in some cases, these off-42 farm activities can be maladaptive at larger scales, such as when households turn to charcoal production 43 which contributes to deforestation (Egeru, 2016). Whether off-farm activities constitute maladaptation 44 depends on whether resources are available to upgrade skills or support investments that make a new 45 business more lucrative. Without such resources, this option may lead to impoverishment (see Box 5.8 on 46 AFOLU in Chapter 5). 47 48 Smallholder farmers’ responses tend to address short-term shocks or stresses by deploying coping responses 49 (e.g., selling labour, reducing consumption and temporary migration), rather than longer-term sustainable 50 adaptations (Ziervogel and Parnell, 2014; Jiri et al., 2017). This is partly due to institutional barriers (e.g., 51 markets, credit, infrastructure and information) and resource requirements that are unaffordable to 52 smallholder farmers (Pauline et al., 2017). There is a need for policies that strengthen natural, financial, 53 human and social capitals, the latter being key to household and community resilience, especially where 54 government services may be limited (Mutabazi et al., 2015; Alemayehu and Bewket, 2017). There is 55 evidence that collective action, local organizations and climate information are associated with higher food 56
ACCEPTED VERSIO
N
SUBJECT TO FIN
AL EDITS
FINAL DRAFT Chapter 9 IPCC WGII Sixth Assessment Report
Do Not Cite, Quote or Distribute 9-93 Total pages: 225
security, and that institutional interventions are needed to ensure scaling up of adaptations (Thornton et al., 1 2018). 2 3 A range of options is considered potentially effective in reducing future climate change risk, including plant 4 breeding, crop diversification alongside livestock, mixed planting, intercrops, crop rotation and integrated 5 crop-livestock systems (Thornton and Herrero, 2014; Cunningham et al., 2015; Himanen et al., 2016; Farrell 6 et al., 2018; Snowdon et al., 2021) (Chapter 5, Sections 5.4.4 and 5.14.1). However, adaptation limits for 7 crops in Africa are increasingly reached for global warming above 2℃ (high confidence), and in tropical 8 Africa may already be reached at current levels of global warming (low confidence). 9 10 Global warming beyond 2℃ will place nearly all of sub-Saharan Africa cropland substantially outside of its 11 historical Safe Climate Zone (Kummu et al., 2021) and may exponentially increase the cost of adaptation and 12 residual damage for major crops (Iizumi et al., 2020). Without accounting for CO2 increases, global-scale 13 studies employing ensembles of gridded crop models for 2℃ of global warming find that for adaptation 14 using genetic cultivar change in most of Africa net losses are projected, even with adaptation up to 2℃ of 15 global warming for rice, maize, soybean, and wheat (Minoli et al., 2019; Zabel et al., 2021), although model 16 uncertainty is still high (Müller et al., 2021). In contrast, when accounting for CO2 increases, applying new 17 genetics for rice under warming is projected to fully counteract all climate change-induced losses in Africa 18 up to 3.5℃ of global warming, except in West Africa (van Oort and Zwart, 2018). 19 20 However, compared to temperate regions, risks of adaptation shortfalls – that is climate change impacts even 21 after adaptation – are generally greater for current agricultural conditions across much of Africa (tropical, 22 arid and semi-arid) (Sun et al., 2019). The overall adaptation potential to offset yield losses across Africa for 23 rice, maize, and wheat wheat reduces with increasing global warming. On average, in projections including 24 adaptation options, yield losses, in the median case, are reduced from –33% to –10% of 2005 levels at 2℃ of 25 global warming and from –46% to –23% at 4℃, but estimates vary widely (Hasegawa et al., 2021) (Figure 26 9.22). Across Africa, the risks of no available genetic varieties of maize for growing season adaptation are 27 higher for East Africa and southern Africa than for Central or West Africa (Zabel et al., 2021). To keep pace 28 with expected rates of climate change, crop breeding, development and adoption must accelerate to meet the 29 challenge (Challinor et al., 2016). Regional modelling has shown very little efficacy for late sowing, 30 intensification of seeding density and fertilizers, water harvesting and other measures for cereals in West 31 Africa at 2℃ of global warming (Sultan and Gaetani, 2016; Guan et al., 2017). Historical climate change 32 adaptation by crop migration has been shown in some cases (Sloat et al., 2020) but poses risks to biodiversity 33 and water resources and this option may be limited for maize in Africa by suitable climate shifting 34 completely across national borders and available land at the edges of the continent (Franke et al., 2021). 35 More research is required to evaluate the potential effectiveness and limits of adaptation options in African 36 agriculture under future climate change (see Chapter 5, Section 5.4.4 for more details) 37 38 9.8.4 Climate Information Services and Insurance for Agriculture Adaptation 39 40 In addition to adaptation in crop, soil and water management, the combination of (i) Climate Information 41 Services (CIS), (ii) institutional capacity building and (iii) strategic financial investment can help African 42 food producers adapt to projected climate risks (Carter et al., 2015; Surminski et al., 2016; Scott et al., 2017; 43 Cinner et al., 2018; Diouf et al., 2019; Hansen et al., 2019a). There is growing evidence of farmers’ use of 44 weather and climate information, especially at the short- and medium-time horizon (Carr et al., 2016; Singh 45 et al., 2018). Digital services can contribute to the sustainable intensification of food production globally 46 (Duncombe, 2018; Klerkx et al., 2019). This points to the need for the scientific and development 47 communities to better understand the conditions that enable widespread adoption in Africa. 48 49 Although climate services have the potential to strengthen farmers' resilience, barriers to accessibility, 50 affordability and utilisation remain (Krell et al., 2021). Often the information offered is not consistent with 51 what farmers need to know and how they access and process information (Meadow et al., 2015; Singh et al., 52 2018). Production of salient and credible climate information is hindered by the limited availability of and 53 access to weather and climate data (Coulibaly et al., 2017; Hansen et al., 2019a). The existing weather 54 infrastructure remains suboptimal to enable the development of reliable early warning systems (Africa 55 Adaptation Initiative, 2018; Krell et al., 2021). Of the 1,017 land-based observational networks in the world, 56
ACCEPTED VERSIO
N
SUBJECT TO FIN
AL EDITS

FINAL DRAFT Chapter 9 IPCC WGII Sixth Assessment Report
Do Not Cite, Quote or Distribute 9-94 Total pages: 225
only 10% are in Africa, and 54% of Africa’s surface weather stations cannot capture data accurately (Africa 1 Adaptation Initiative, 2018; World Bank, 2020d). 2 3 Advances in remote sensing and climate analysis tools have allowed the development of weather index 4 insurance products as a potential adaptation option, with Malawi and Ethiopia being early testbeds (Tadesse 5 et al., 2015). These pilot projects were initially sponsored by NGOs, but in the last decade, the private sector 6 has become more active in this sector. The Ghana Agricultural Insurance Pool (GAIP) and Agriculture and 7 Climate Risk Enterprise (ACRE) in Kenya, Tanzania and Rwanda are examples. Despite the potential for 8 weather index insurance, uptake by smallholder farmers in Africa remains constrained by several factors. 9 These include the failure to capture actual crop loss as in traditional crop insurance products, as well as the 10 inability of poor farmers to pay premiums (Elum et al., 2017; Weber, 2019). Weather index insurance could 11 be part of a wider portfolio of risk mitigation services offered to farmers (Tadesse et al., 2015; Weber, 2019). 12 Strategic partnerships between key players (e.g., credit institutions, policymakers, meteorologists, farmer 13 associations, extension services, NGOs) are needed to develop better products and build capacity among 14 smallholder farmers to engage more beneficially with weather index insurance (Singh et al., 2018; Tesfaye et 15 al., 2019). 16 17 9.8.5 Marine and Inland Fisheries 18 19 9.8.5.1 Observed Impacts of Climate Variability and Change on Marine and Inland Fisheries 20 21 Marine and freshwater fisheries provide 19.3% of animal protein intake (Chan et al., 2019) and support the 22 livelihoods of 12.3 million people (de Graaf and Garibaldi, 2015) across Africa. Estimates suggest that fish 23 provides ~30% of the continent’s population (approximately 200 million people) with their main source of 24 animal protein and key micronutrients (Obiero et al., 2019). Although marine fisheries account for >50 % of 25 total capture fishery production (Obiero et al., 2019), 2.9 million tonnes of fish are harvested annually from 26 inland water bodies constituting the highest per-capita inland fishery production of any continent (2.56 kg / 27 year / person) (Harrod et al., 2018a; Funge-Smith and Bennett, 2019). 28 29 Climate change poses a significant threat to marine and freshwater fisheries and aquaculture in Africa 30 (Blasiak et al., 2017; Harrod et al., 2018a). Severe (>30%) coral bleaching has impacted ~80% of major reef 31 areas in the western Indian Ocean and Red Sea along Africa’s eastern coast (Hughes et al., 2018). Biological 32 effects (e.g., changes in primary production, fish distribution) have also occurred (Hidalgo et al., 2018). 33 Range shifts in marine fish species can exacerbate boundary conflicts among fisher communities (Penney et 34 al., 2017; Belhabib et al., 2019). Changes in fish distribution and reductions in catch across inland fisheries 35 are associated with climatic variability by fishing communities (Okpara et al., 2017b; Lowe et al., 2019; 36 Muringai et al., 2019b). Floods and reduced river flow reduces fish catches (Kolding et al., 2019), which 37 scale positively with discharge rates in rivers across Africa (McIntyre et al., 2016). Warming air and water 38 temperatures have altered water stratification patterns in African lakes causing reductions in or 39 redistirbutions of primary productivity and leading to reduced fish biomass (Section 9.6.1.3). Such changes, 40 partially explain reduced fish catches in Lake Tanganyika (Cohen et al., 2016). In some regions, water 41 scarcity has resulted in conflict within and among food production sectors (pastoralists, fishers and farmers) 42 in this region (Okpara et al., 2017b). Small-scale and artisanal fisher communities are ill-equipped to adapt 43 to climate impacts because there are few financially-accessible alternative livelihoods (Belhabib et al., 2016; 44 Ndhlovu and Saito, 2017). 45 46 9.8.5.2 Projected Risks of Climate Change to Fisheries 47 48 At 4.3°C global warming, maximum catch potential (MCP) from marine fisheries in African Exclusive 49 Economic Zones (EEZs) would decrease by 12–69% by the end of the 21st century relative to recent decades 50 (1986–2005) whereas maintaining warming levels below 1.6°C would decrease MCP by 3–41% (Cheung 51 William et al., 2016) (Figure 9.25). However, by mid-century under 2°C global warming, MCP would 52 decrease by 10 to >30% on the western coast of South Africa, the Horn of Africa and West Africa, indicating 53 these regions could be at risk to declines in MCP earlier in the century than other parts of Africa (Cheung et 54 al., 2016) (Figure 9.25). Declining fish harvests due to sea temperature rise could leave 1.2–70 (median 11.1) 55 million people in Africa vulnerable to deficiencies in iron, and up to 188 million to vitamin A and 285 56 million to vitamin B12 and omega-3 fatty acids by mid-century under 1.7°C global warming (Golden et al., 57
ACCEPTED VERSIO
N
SUBJECT TO FIN
AL EDITS
FINAL DRAFT Chapter 9 IPCC WGII Sixth Assessment Report
Do Not Cite, Quote or Distribute 9-95 Total pages: 225
2016). Maire et al. (2021) assessed the nutritional vulnerabilities of African countries to climate change and 1 overfishing, and found that the four most vulnerable countries ranked on a scale from 0 (low vulnerability) to 2 100 (high vulnerability) were Mozambique (87), Madagascar (76), Tanzania (61) and Sierra Leone (58). 3 Coral reef habitat in East Africa is projected to decrease, resulting in negative impacts on demersal fish 4 stocks and invertebrates (Hoegh-Guldberg et al., 2018). Central, West and East Africa appear to be at the 5 greatest nutritional risk from sea temperature rise, leading to reduced catch in coastal waters (Golden et al., 6 2016) (Figure 9.25). In North Africa, a rise in water temperatures is expected to impact the phenology and 7 migratory patterns of large pelagic species (e.g., bluefin tuna, Thunnus thynnus) (Hidalgo et al., 2018). 8 Increased sea surface temperatures have been associated with increases in spring and summer upwelling 9 intensity reducing the abundance and larval survival of small pelagic fishes and shellfish in West Africa 10 (Bakun et al., 2015; Tiedemann et al., 2017; Atindana et al., 2020). Ocean warming, acidification and 11 hypoxia are predicted to affect the early life history stages of several marine food species, including fish and 12 crustaceans (Kifani et al., 2018). Climate warming is projected to impact water temperature and horizontal 13 and vertical mixing on the southern Benguela ecosystem, with marked negative effects on the biomass of 14 several important fishery resources by 2050 amplified under 2.5°C compared to 1.7°C global warming 15 (Ortega-Cisneros et al., 2018). 16 17 For inland fisheries, 55–68% of commercially harvested fish species will be vulnerable to extinction under 18 2.5°C global warming by the end of the 21st century (2071–2100) compared to 77–97% under 4.4°C global 19 warming (Figure 9.26). This will increase the number of countries that are at food security risk due to 20 fishery species declines from 10 to 13 (Figure 9.26). Other recent analyses suggest that African countries 21 with the highest inland fisheries production have low- to mid-range projected climate risk (2.4℃–2.6°C local 22 temperature increase compared to other regions with 2.7℃–3.3°C increase by end of centruy) based on a 23 3.9°C global warming scenario (Harrod et al., 2018b). In regions where inland fishery production is derived 24 primarily from lakes, there is a lower likelihood of reduced catch, especially where precipitation is projected 25 to increase (e.g., African Great Lakes region) (Harrod et al., 2018b). Regions reliant on rivers and 26 floodplains (e.g., Zambezi and Niger basins) are more likely to experience downturns in catch, as 27 hydrological dynamics may be altered (Harrod et al., 2018b). Projections suggest that opportunistic species 28 that do well in modified systems (Escalera-vázquez et al., 2017) and small pelagic fishes will remain 29 important components to inland fishery food systems (Kolding et al., 2016; Gownaris et al., 2018; Kolding et 30 al., 2019). Climate adaptation responses that rely on freshwater resources (e.g., hydroelectric power 31 generation, agricultural irrigation) represent threats to inland fisheries (Cowx et al., 2018; Harrod et al., 32 2018c), by changing flow regimes, reducing water levels, and increasing runoff of pesticides and nutrients 33 (Harrod et al., 2018c). 34 35 For both marine and freshwater fisheries, climate-related extreme weather events and flooding may drive the 36 loss of fishing days, cause damage and loss to fishing gear, endanger the lives of fishers and block 37 transportation from damaged roads (Muringai et al., 2021). Fish processing via weather-dependent 38 techniques such as sun drying may be hampered, causing post-harvest losses (Akintola and Fakoya, 2017; 39 Chan et al., 2019). 40 41 9.8.5.3 Current and Future Adaptation Responses for Fisheries 42 43 Patterns of vulnerability and adaptive capacity are highly context-dependent and vary within and among 44 fishing communities in coastal and riparian areas (Ndhlovu and Saito, 2017; Lowe et al., 2019; D’agata et 45 al., 2020). Interventions that integrate scientific knowledge and fishers’ local knowledge while focusing on 46 vulnerable groups are more likely to be more successful (Musinguzi et al., 2018; Muringai et al., 2019b). 47 Infrastructure improvements (e.g., storage facilities, processing technologies, transport systems) could 48 reduce post-harvest losses and improve food safety (Chan et al., 2019). Fisher safety can be aided by early 49 warning of severe weather conditions (Thiery et al., 2017), enhanced through communication via mass 50 media and mobile phones (Thiery et al., 2017; Kiwanuka-Tondo et al., 2019). Although changing fishing 51 gears and shifting target species are important adaptation options for artisanal fishers, many have instead 52 expanded their fishing range or increased effort (Musinguzi et al., 2015; Belhabib et al., 2016). Adapting to 53 the impacts of climate change on marine fisheries productivity requires management reforms accounting for 54 shifting productivity and species distributions, such as increasing marine protected areas, strengthening 55 regional trade networks, and increasing the investment and innovation in climate-resilient aquaculture 56 production (Golden et al., 2021). This could yield higher catch and profits in the future relative to today in 57
ACCEPTED VERSIO
N
SUBJECT TO FIN
AL EDITS
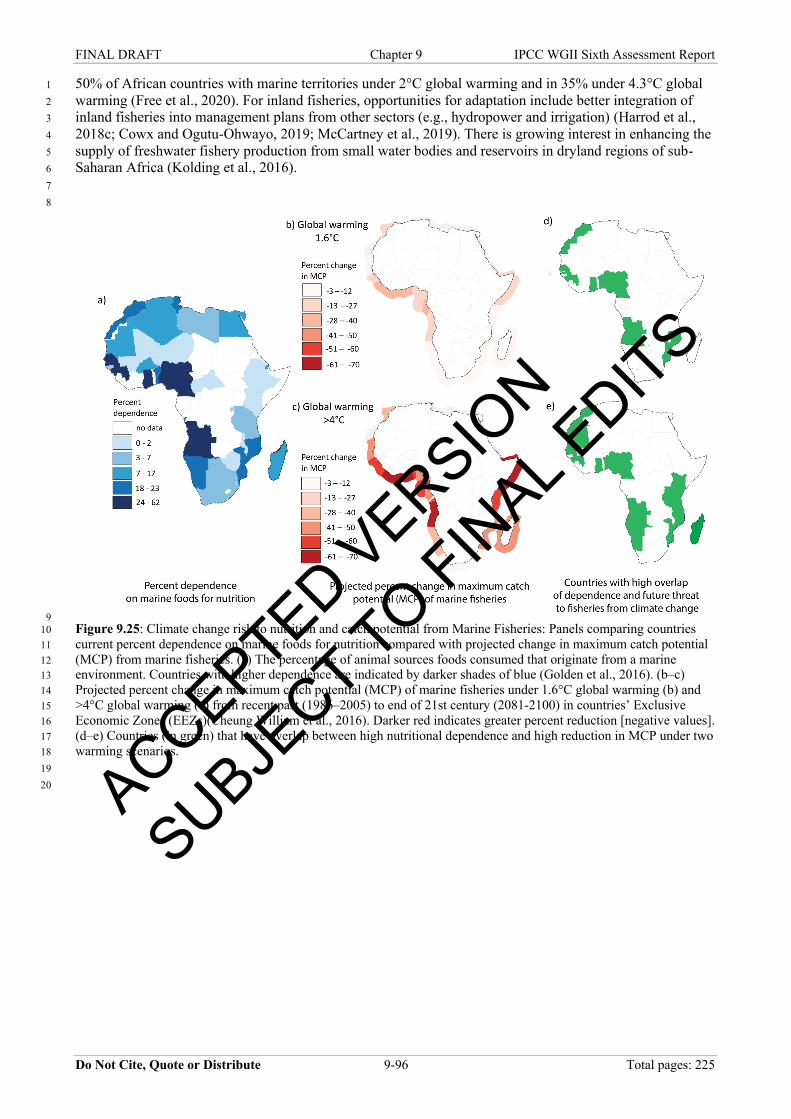
FINAL DRAFT Chapter 9 IPCC WGII Sixth Assessment Report
Do Not Cite, Quote or Distribute 9-96 Total pages: 225
50% of African countries with marine territories under 2°C global warming and in 35% under 4.3°C global 1 warming (Free et al., 2020). For inland fisheries, opportunities for adaptation include better integration of 2 inland fisheries into management plans from other sectors (e.g., hydropower and irrigation) (Harrod et al., 3 2018c; Cowx and Ogutu-Ohwayo, 2019; McCartney et al., 2019). There is growing interest in enhancing the 4 supply of freshwater fishery production from small water bodies and reservoirs in dryland regions of sub-5 Saharan Africa (Kolding et al., 2016). 6 7 8
9 Figure 9.25: Climate change risk to nutrition and catch potential from Marine Fisheries: Panels comparing countries 10 current percent dependence on marine foods for nutrition compared with projected change in maximum catch potential 11 (MCP) from marine fisheries. (a) The percentage of animal sources foods consumed that originate from a marine 12 environment. Countries with higher dependence are indicated by darker shades of blue (Golden et al., 2016). (b–c) 13 Projected percent change in maximum catch potential (MCP) of marine fisheries under 1.6°C global warming (b) and 14 >4°C global warming (c) from recent past (1986–2005) to end of 21st century (2081-2100) in countries’ Exclusive 15 Economic Zones (EEZs)(Cheung William et al., 2016). Darker red indicates greater percent reduction [negative values]. 16 (d–e) Countries (in green) that have overlap between high nutritional dependence and high reduction in MCP under two 17 warming scenarios. 18 19 20 ACCEPTED V
ERSION
SUBJECT TO FIN
AL EDITS
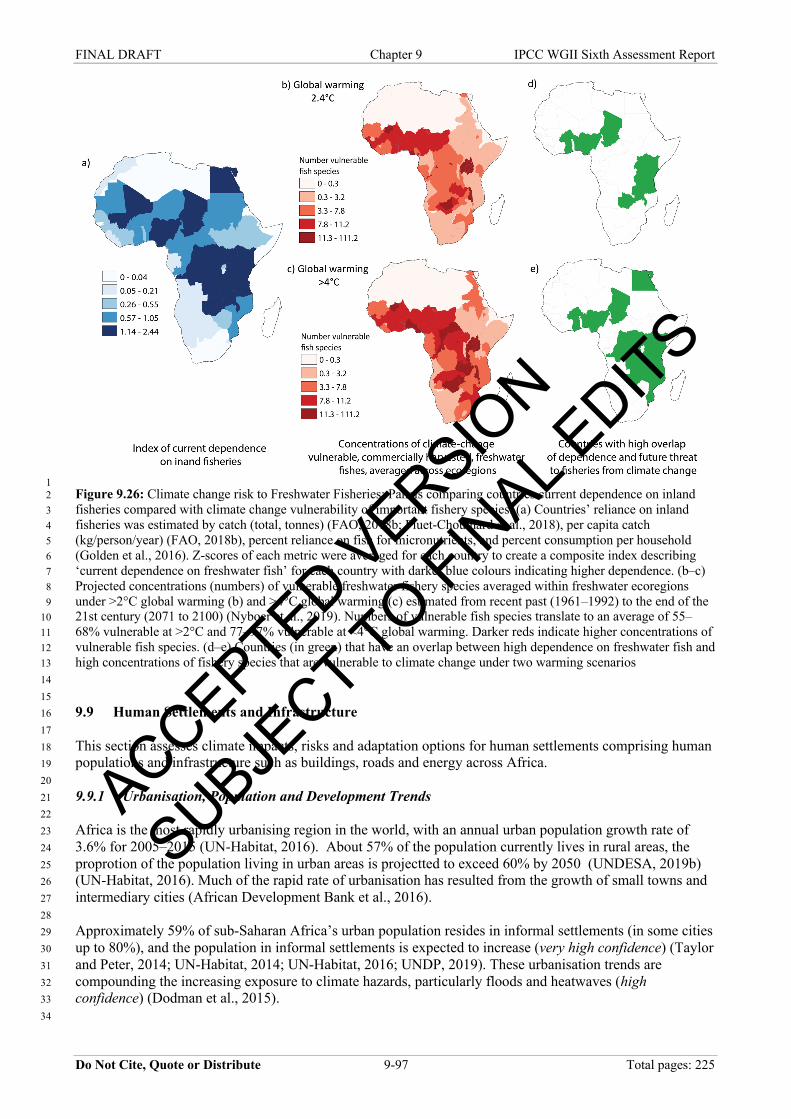
FINAL DRAFT Chapter 9 IPCC WGII Sixth Assessment Report
Do Not Cite, Quote or Distribute 9-97 Total pages: 225
1 Figure 9.26: Climate change risk to Freshwater Fisheries: Panels comparing countries current dependence on inland 2 fisheries compared with climate change vulnerability of important fishery species. (a) Countries’ reliance on inland 3 fisheries was estimated by catch (total, tonnes) (FAO, 2018b; Fluet-Chouinard et al., 2018), per capita catch 4 (kg/person/year) (FAO, 2018b), percent reliance on fish for micronutrients, and percent consumption per household 5 (Golden et al., 2016). Z-scores of each metric were averaged for each country to create a composite index describing 6 ‘current dependence on freshwater fish’ for each country with darker blue colours indicating higher dependence. (b–c) 7 Projected concentrations (numbers) of vulnerable freshwater fishery species averaged within freshwater ecoregions 8 under >2°C global warming (b) and >4°C global warming (c) estimated from recent past (1961–1992) to the end of the 9 21st century (2071 to 2100) (Nyboer et al., 2019). Numbers of vulnerable fish species translate to an average of 55–10 68% vulnerable at >2°C and 77–97% vulnerable at <4°C global warming. Darker reds indicate higher concentrations of 11 vulnerable fish species. (d–e) Countries (in green) that have an overlap between high dependence on freshwater fish and 12 high concentrations of fishery species that are vulnerable to climate change under two warming scenarios 13 14 15 9.9 Human Settlements and Infrastructure 16 17 This section assesses climate impacts, risks and adaptation options for human settlements comprising human 18 populations and infrastructure such as buildings, roads and energy across Africa. 19 20 9.9.1 Urbanisation, Population and Development Trends 21 22 Africa is the most rapidly urbanising region in the world, with an annual urban population growth rate of 23 3.6% for 2005–2015 (UN-Habitat, 2016). About 57% of the population currently lives in rural areas, the 24 proprotion of the population living in urban areas is projectted to exceed 60% by 2050 (UNDESA, 2019b) 25 (UN-Habitat, 2016). Much of the rapid rate of urbanisation has resulted from the growth of small towns and 26 intermediary cities (African Development Bank et al., 2016). 27 28 Approximately 59% of sub-Saharan Africa’s urban population resides in informal settlements (in some cities 29 up to 80%), and the population in informal settlements is expected to increase (very high confidence) (Taylor 30 and Peter, 2014; UN-Habitat, 2014; UN-Habitat, 2016; UNDP, 2019). These urbanisation trends are 31 compounding the increasing exposure to climate hazards, particularly floods and heatwaves (high 32 confidence) (Dodman et al., 2015). 33 34
ACCEPTED VERSIO
N
SUBJECT TO FIN
AL EDITS

FINAL DRAFT Chapter 9 IPCC WGII Sixth Assessment Report
Do Not Cite, Quote or Distribute 9-98 Total pages: 225
Globally, the highest rates of population growth and urbanisation are taking place in Africa’s coastal zones 1 (high confidence) (Merkens et al., 2016). Coastal urban populations account for 25–29% of the total 2 population in West, North and southern Africa (OECD/SWAC, 2020). Accounting for a continuing young 3 population, stagnant economies and migration to regional growth centres, projections indicate that the low-4 lying coastal zone population of sub-Saharan Africa could increase by 175% (2030) and 625% (2060) 5 relative to 24 million in 2000 (Neumann et al., 2015). 6 7 Climate-related displacement is widespread in Africa, with increased migration to urban areas in sub-8 Saharan Africa linked to decreased rainfall in rural areas, increasing urbanisation and affecting household 9 vulnerability (see Box 9.9). Much of this growth can occur in informal settlements which are growing due to 10 both climatic and non-climatic drivers, and which often house temporary migrants, including internally 11 displaced people. Such informal settlements are located in areas exposed to climate change and variability 12 and are exposed to floods, landslides, sea level rise and storm surges in low-lying coastal areas, or alongside 13 rivers that frequently overflow, thereby exacerbating existing vulnerabilities (Satterthwaite et al., 2020). 14 15 Sub-Saharan Africa’s large infrastructure deficit (quantity, quality and access) with respect to road transport, 16 electricity, water supply and sanitation places the region at the lowest of all developing regions (AfDB, 17 2018a; Calderon et al., 2018). Adequate infrastructure to support Africa’s rapidly growing population is 18 important to raise living standards and productivity in informal settlements (AfDB, 2018b; UN Environment, 19 2019). Yet planned infrastructure developments, including those related to African Union’s Programme for 20 Infrastructure Development (PIDA), along with other energy plans, and China’s Belt and Road Initiative 21 (BRI), may increase or decrease both climate change mitigation and adaptation depending on whether 22 infrastructure planning integrates current and future climate change risks (Cervigni et al., 2015; Addaney, 23 2020) (see Box 9.5). 24 25 9.9.2 Observed Impacts on Human Settlements and Infrastructure 26 27 African human settlements are particularly exposed to floods (pluvial and fluvial), droughts and heat waves. 28 Other climate hazards are sea level rise and storm surges in coastal areas, tropical cyclones and convective 29 storms. This sub-section provides an assessment of observed impacts and risks from climate hazards in 30 different sub-regions to underscore the relevance of climate-sensitive planning and actions to advance social 31 and economic development, and reduce the loss and damage of property, assets and critical infrastructure. 32 33 9.9.2.1 Observed Impacts on Human Settlements 34 35 The spatial distribution of climate hazards and observed impacts in terms of total people affected (displaced 36 persons and deaths) during 2010–2020 is shown in Figure 9.27. From 2000–2019 , floods and droughts 37 accounted for 80% and 16%, respectively, of the 337 million affected persons, and a further 32% and 46%, 38 respectively, of 46,078 deaths from natural disasters in Africa (CRED, 2019). Flooding is a major hazard 39 across Africa (Kundzewicz et al., 2014; Douglas, 2017) and is increasing (Zevenbergen et al., 2016; Elboshy 40 et al., 2019). An increase in extreme poverty and up to a 35% decrease in consumption has been associated 41 with exposure to flood shocks (Azzarri and Signorelli, 2020). Globally, only sub-Saharan Africa has 42 recorded increasing rates of flood mortality since the 1990s (Tellman et al., 2021). Economic opportunities, 43 transportation of goods and services, and mobility and access to essential services, including health and 44 education, are greatly hindered by flooding (Gannon et al., 2018). Severe impacts from tropical cyclone 45 landfalls have been recorded in East and southeastern Africa (Rapolaki and Reason, 2018; Cambaza et al., 46 2019; Chatiza, 2019; Hope, 2019). Cyclones Idai and Kenneth in early 2019 caused flooding of districts in 47 Mozambique, Zimbabwe and Malawi, with substantial loss and damage to infrastructure in the energy, 48 transport, water supply, communication services, housing, health and education sectors, particularly in 49 Mozambique (Figure 9.27; see also Cross-Chapter Box DISASTER in Chapter 4) (Warren, 2019; Dube et 50 al., 2021; Phiri et al., 2021). 51 52 53
ACCEPTED VERSIO
N
SUBJECT TO FIN
AL EDITS
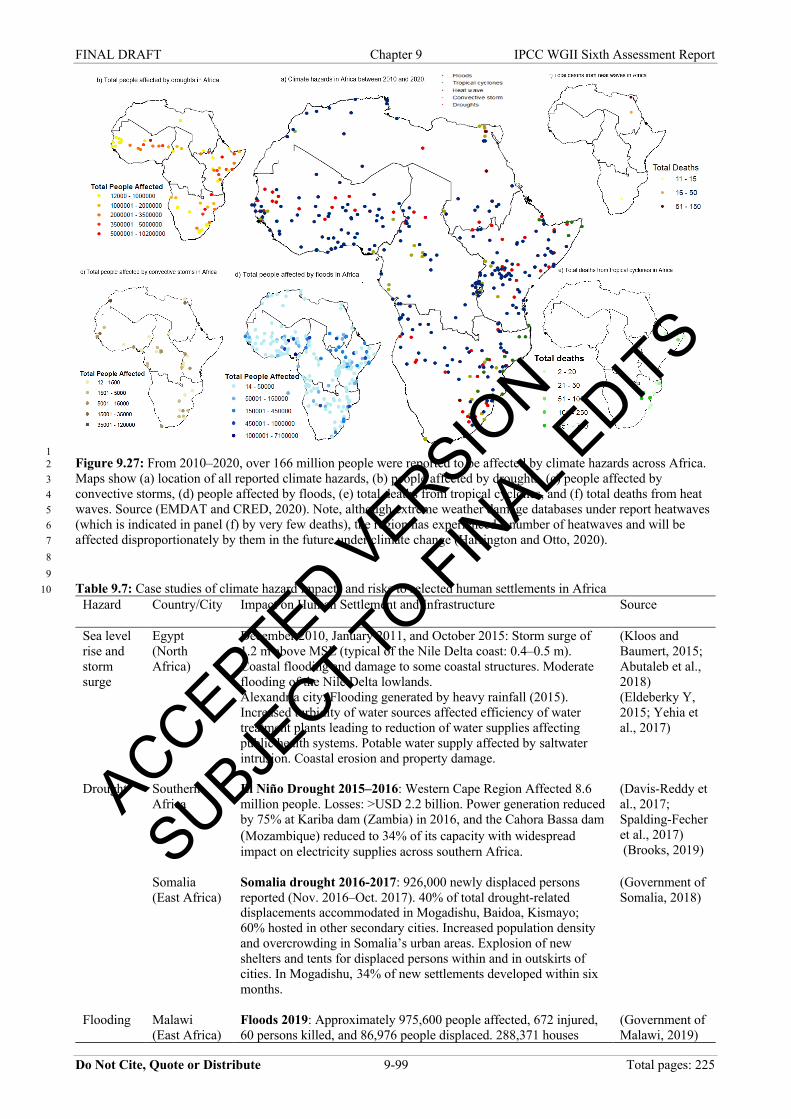
FINAL DRAFT Chapter 9 IPCC WGII Sixth Assessment Report
Do Not Cite, Quote or Distribute 9-99 Total pages: 225
1 Figure 9.27: From 2010–2020, over 166 million people were reported to be affected by climate hazards across Africa. 2 Maps show (a) location of all reported climate hazards, (b) people affected by droughts, (c) people affected by 3 convective storms, (d) people affected by floods, (e) total deaths from tropical cyclones, and (f) total deaths from heat 4 waves. Source (EMDAT and CRED, 2020). Note, although extreme weather damage databases under report heatwaves 5 (which is indicated in panel (f) by very few deaths), the region has experienced a number of heatwaves and will be 6 affected disproportionately by them in the future under climate change (Harrington and Otto, 2020). 7 8 9 Table 9.7: Case studies of climate hazard impacts and risks to selected human settlements in Africa 10
Hazard Country/City Impact on Human Settlement and Infrastructure
Source
Sea level
rise and
storm
surge
Egypt
(North
Africa)
December 2010, January 2011, and October 2015: Storm surge of
1.2 m above MSL (typical of the Nile Delta coast: 0.4–0.5 m).
Coastal flooding and damage to some coastal structures. Moderate
flooding of the Nile Delta lowlands.
Alexandria city: Flooding generated by heavy rainfall (2015).
Increased turbidity of water sources affected efficiency of water
treatment plants leading to reduction of water supplies affecting
public health systems. Potable water supply affected by saltwater
intrusion. Coastal erosion and property damage.
(Kloos and
Baumert, 2015;
Abutaleb et al.,
2018)
(Eldeberky Y,
2015; Yehia et
al., 2017)
Drought Southern
Africa
El Niño Drought 2015–2016: Western Cape Region Affected 8.6
million people. Losses: >USD 2.2 billion. Power generation reduced
by 75% at Kariba dam (Zambia) in 2016, and the Cahora Bassa dam (Mozambique) reduced to 34% of its capacity with widespread
impact on electricity supplies across southern Africa.
(Davis-Reddy et
al., 2017;
Spalding-Fecher
et al., 2017)
(Brooks, 2019)
Somalia
(East Africa)
Somalia drought 2016-2017: 926,000 newly displaced persons
reported (Nov. 2016–Oct. 2017). 40% of total drought-related
displacements accommodated in Mogadishu, Baidoa, Kismayo;
60% hosted in other secondary cities. Increased population density
and overcrowding in Somalia’s urban areas. Explosion of new
shelters and tents for displaced persons within and in outskirts of
cities. In Mogadishu, 34% of new settlements developed within six
months.
(Government of
Somalia, 2018)
Flooding Malawi
(East Africa)
Floods 2019: Approximately 975,600 people affected, 672 injured,
60 persons killed, and 86,976 people displaced. 288,371 houses
(Government of
Malawi, 2019)
ACCEPTED VERSIO
N
SUBJECT TO FIN
AL EDITS
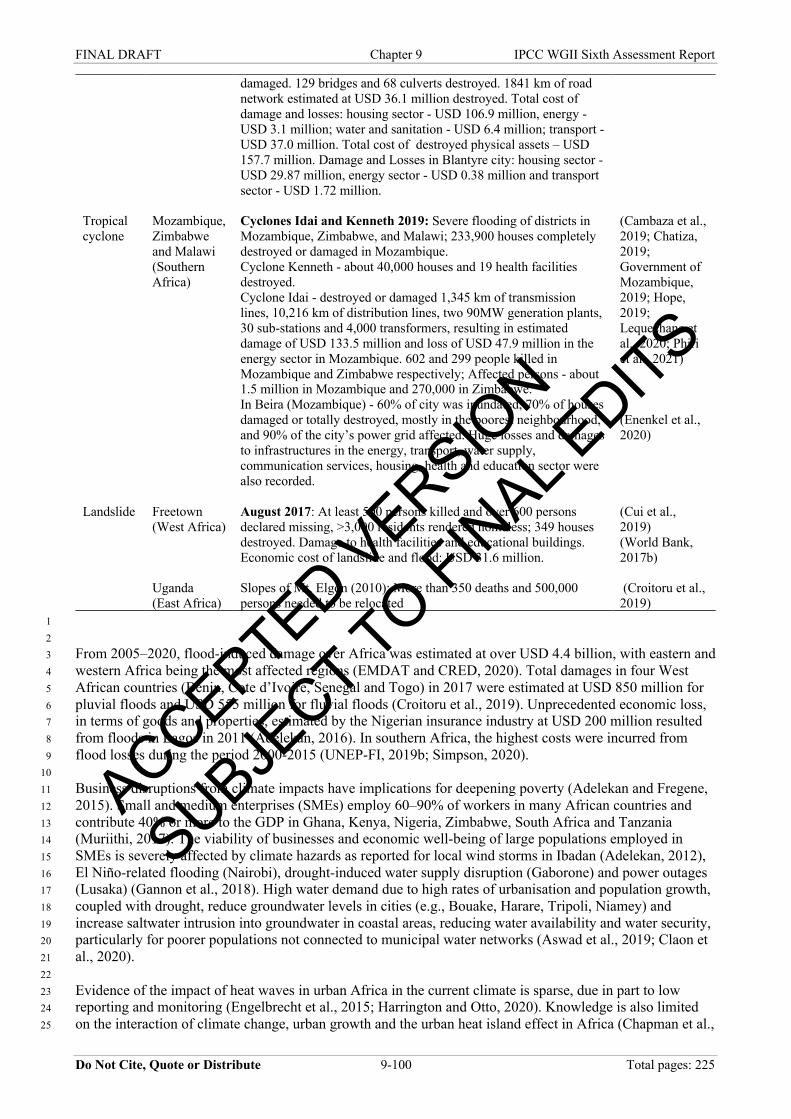
FINAL DRAFT Chapter 9 IPCC WGII Sixth Assessment Report
Do Not Cite, Quote or Distribute 9-100 Total pages: 225
damaged. 129 bridges and 68 culverts destroyed. 1841 km of road
network estimated at USD 36.1 million destroyed. Total cost of
damage and losses: housing sector - USD 106.9 million, energy -
USD 3.1 million; water and sanitation - USD 6.4 million; transport -
USD 37.0 million. Total cost of destroyed physical assets – USD
157.7 million. Damage and Losses in Blantyre city: housing sector -
USD 29.87 million, energy sector - USD 0.38 million and transport
sector - USD 1.72 million.
Tropical
cyclone
Mozambique,
Zimbabwe
and Malawi
(Southern
Africa)
Cyclones Idai and Kenneth 2019: Severe flooding of districts in
Mozambique, Zimbabwe, and Malawi; 233,900 houses completely
destroyed or damaged in Mozambique.
Cyclone Kenneth - about 40,000 houses and 19 health facilities
destroyed.
Cyclone Idai - destroyed or damaged 1,345 km of transmission
lines, 10,216 km of distribution lines, two 90MW generation plants,
30 sub-stations and 4,000 transformers, resulting in estimated
damage of USD 133.5 million and loss of USD 47.9 million in the
energy sector in Mozambique. 602 and 299 people killed in
Mozambique and Zimbabwe respectively; Affected persons - about
1.5 million in Mozambique and 270,000 in Zimbabwe.
In Beira (Mozambique) - 60% of city was inundated, 70% of houses
damaged or totally destroyed, mostly in the poorest neighbourhood,
and 90% of the city’s power grid affected. Huge losses and damages
to infrastructures in the energy, transport, water supply,
communication services, housing, health and education sector were
also recorded.
(Cambaza et al.,
2019; Chatiza,
2019;
Government of
Mozambique,
2019; Hope,
2019;
Lequechane et
al., 2020; Phiri
et al., 2021)
(Enenkel et al.,
2020)
Landslide Freetown
(West Africa)
August 2017: At least 500 persons killed and over 600 persons
declared missing, >3,000 residents rendered homeless; 349 houses
destroyed. Damage to health facilities and educational buildings.
Economic cost of landslide and flood: USD 31.6 million.
(Cui et al.,
2019)
(World Bank,
2017b)
Uganda
(East Africa)
Slopes of Mt. Elgon (2010): More than 350 deaths and 500,000
persons needed to be relocated
(Croitoru et al.,
2019)
1 2 From 2005–2020, flood-induced damage over Africa was estimated at over USD 4.4 billion, with eastern and 3 western Africa being the most affected regions (EMDAT and CRED, 2020). Total damages in four West 4 African countries (Benin, Cote d’Ivoire, Senegal and Togo) in 2017 were estimated at USD 850 million for 5 pluvial floods and USD 555 million for fluvial floods (Croitoru et al., 2019). Unprecedented economic loss, 6 in terms of goods and properties, estimated by the Nigerian insurance industry at USD 200 million resulted 7 from floods in Lagos in 2011 (Adelekan, 2016). In southern Africa, the highest costs were incurred from 8 flood losses during the period 2000-2015 (UNEP-FI, 2019b; Simpson, 2020). 9 10 Business disruptions from climate impacts have implications for deepening poverty (Adelekan and Fregene, 11 2015). Small and medium enterprises (SMEs) employ 60–90% of workers in many African countries and 12 contribute 40% or more to the GDP in Ghana, Kenya, Nigeria, Zimbabwe, South Africa and Tanzania 13 (Muriithi, 2017). The viability of businesses and economic well-being of large populations employed in 14 SMEs is severely affected by climate hazards as reported for local wind storms in Ibadan (Adelekan, 2012), 15 El Niño-related flooding (Nairobi), drought-induced water supply disruption (Gaborone) and power outages 16 (Lusaka) (Gannon et al., 2018). High water demand due to high rates of urbanisation and population growth, 17 coupled with drought, reduce groundwater levels in cities (e.g., Bouake, Harare, Tripoli, Niamey) and 18 increase saltwater intrusion into groundwater in coastal areas, reducing water availability and water security, 19 particularly for poorer populations not connected to municipal water networks (Aswad et al., 2019; Claon et 20 al., 2020). 21 22 Evidence of the impact of heat waves in urban Africa in the current climate is sparse, due in part to low 23 reporting and monitoring (Engelbrecht et al., 2015; Harrington and Otto, 2020). Knowledge is also limited 24 on the interaction of climate change, urban growth and the urban heat island effect in Africa (Chapman et al., 25
ACCEPTED VERSIO
N
SUBJECT TO FIN
AL EDITS
FINAL DRAFT Chapter 9 IPCC WGII Sixth Assessment Report
Do Not Cite, Quote or Distribute 9-101 Total pages: 225
2017). In North Africa, the present day number of high heat-stress nights is around 10 times larger in urban 1 than rural areas (Fischer et al., 2012). 2 3 9.9.2.2 Observed Impacts to Road and Energy Infrastructure 4 5 The highest transport infrastructure exposures are from floods (Koks et al., 2019), with potentially severe 6 consequences for food security (Fanzo et al., 2018), communication and the economy of affected regions 7 (high confidence) (Koks et al., 2019). Eight of the twenty countries with the highest expected annual 8 damages to road and rail assets, relative to the country’s GDP, are located in East, West and Central Africa 9 (Koks et al., 2019). Transport impacts compound climate impacts, such as heat stress and air pollution linked 10 to vehicle emissions in Dar es Salaam (Ndetto and Matzarakis, 2014). 11 12 African economies that rely primarily on hydropower for electricity generation are particularly sensitive to 13 climate variability (Brooks, 2019). This sensitivity was already felt during the 2015/16 El Niño, in which 14 Malawi, Tanzania, Zambia and Zimbabwe all experienced widespread and prolonged load shedding due to 15 low rainfall. The impact was felt throughout the economy and reflected in reduced GDP growth in Zambia 16 (Conway et al., 2017). 17 18 9.9.3 Observed Vulnerabilities of Human Settlements to Climate Risks 19 20 Urban vulnerabilities and exposure to climate change are increasing (medium to high confidence) and are 21 influenced by patterns of urban settlement and housing characteristics (Satterthwaite, 2017; Godsmark et al., 22 2019; Williams et al., 2019a). About 70% of African cities are highly vulnerable to climate shocks of which 23 small- and medium-sized towns and cities are more at risk (Verisk Maplecroft, 2018). Flooding was 24 perceived as the most prominent water risk in 75% of 36 sampled cities across African sub-regions, while 25 drought-related water scarcity was indicated as very important/important in 66.7% of cities (OECD, 2021). 26 Almost one-third of African cities with populations of 300,000 or more are located in areas of high exposure 27 to at least one natural hazard, including floods (12%) and droughts (20–25%) (Gu et al., 2015). The coastal 28 cities of East, West and North Africa are particularly vulnerable to the effects of rising sea levels (Abutaleb 29 et al., 2018; IPCC, 2019a). 30 31 Globally, sub-Saharan Africa has the largest population living in extreme poverty that are exposed to high 32 flood risk (~71 million people or 55% of global total) (Rentschler and Salhab, 2020). Poverty is a significant 33 factor of flood-induced displacement in Africa, where even small flood exposure can lead to high numbers of 34 displacement (Kakinuma et al., 2020). Africa’s large population of urban poor and marginalised groups and 35 informal sector workers, further contribute to high vulnerability to extreme weather and climate change in 36 many settlements (high confidence) (Adelekan and Fregene, 2015; IPCC, 2019a; UNDP, 2019). 37 38 Other non-climatic stressors which exacerbate vulnerabilities, especially in urban areas, include poor 39 socioeconomic development, weak municipal governance, poor resource and institutional capacities, 40 together with multi-dimensional, location-specific inequalities (high confidence) (Dodman et al., 2017; 41 Satterthwaite, 2017). 42 43 9.9.4 Projected Risks for Human Settlements and Infrastructure 44 45 9.9.4.1 Projected Risks for Human Settlements 46 47 The extent of urban areas in Africa exposed to climate hazards will increase considerably and cities will be 48 hotspots of climate risks, which could amplify pre-existing stresses related to poverty, exclusion and 49 governance (high confidence) (IPCC, 2018b). 50 51 Flooding 52 Continuing current population and GDP growth trends, the extent of urban land exposed to high-frequency 53 flooding is projected to increase around 270% in North Africa, 800% in southern Africa, and 2600% in mid-54 latitude Africa by 2030 when compared to 2000, without considering climate change (Güneralp et al., 2015). 55 In addition, global warming is projected to increase frequency and magnitude of river floods in East, Central 56 and West Africa (Alfieri et al., 2017; Gu et al., 2020; Kam et al., 2021). On average across large African 57
ACCEPTED VERSIO
N
SUBJECT TO FIN
AL EDITS
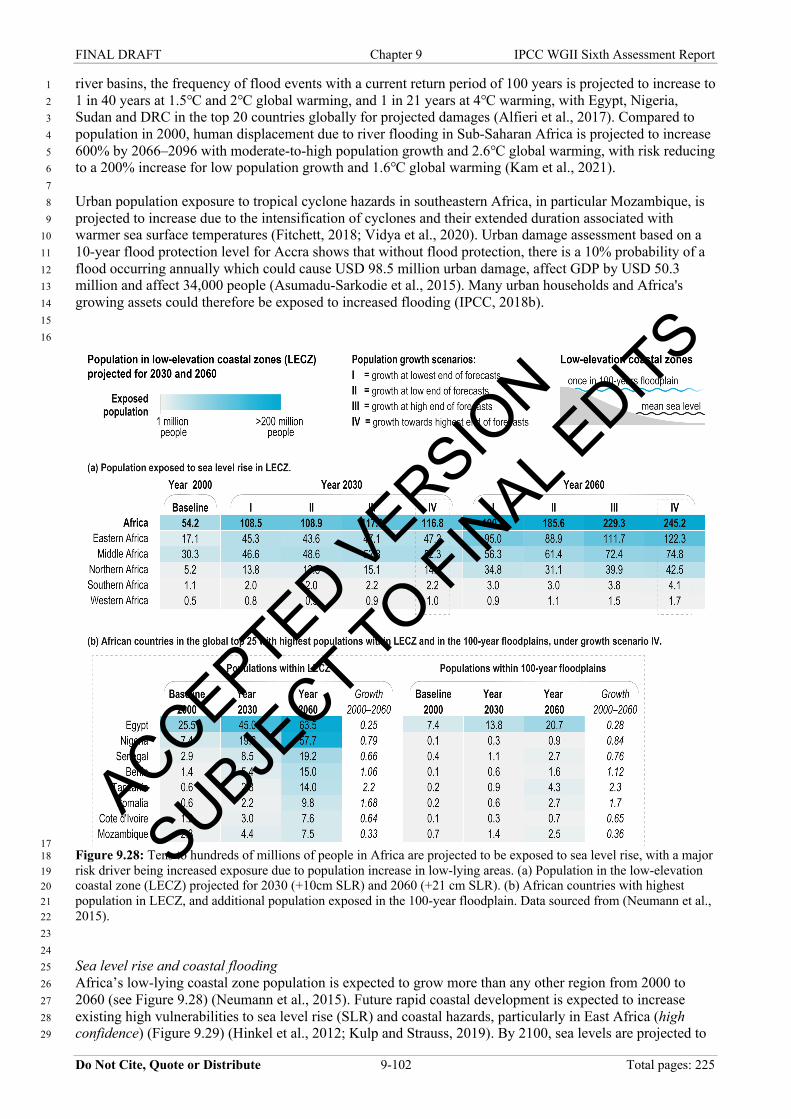
FINAL DRAFT Chapter 9 IPCC WGII Sixth Assessment Report
Do Not Cite, Quote or Distribute 9-102 Total pages: 225
river basins, the frequency of flood events with a current return period of 100 years is projected to increase to 1 1 in 40 years at 1.5℃ and 2℃ global warming, and 1 in 21 years at 4℃ warming, with Egypt, Nigeria, 2 Sudan and DRC in the top 20 countries globally for projected damages (Alfieri et al., 2017). Compared to 3 population in 2000, human displacement due to river flooding in Sub-Saharan Africa is projected to increase 4 600% by 2066–2096 with moderate-to-high population growth and 2.6℃ global warming, with risk reducing 5 to a 200% increase for low population growth and 1.6℃ global warming (Kam et al., 2021). 6 7 Urban population exposure to tropical cyclone hazards in southeastern Africa, in particular Mozambique, is 8 projected to increase due to the intensification of cyclones and their extended duration associated with 9 warmer sea surface temperatures (Fitchett, 2018; Vidya et al., 2020). Urban damage assessment based on a 10 10-year flood protection level for Accra shows that without flood protection, there is a 10% probability of a 11 flood occurring annually which could cause USD 98.5 million urban damage, affect GDP by USD 50.3 12 million and affect 34,000 people (Asumadu-Sarkodie et al., 2015). Many urban households and Africa's 13 growing assets could therefore be exposed to increased flooding (IPCC, 2018b). 14 15 16
17 Figure 9.28: Tens to hundreds of millions of people in Africa are projected to be exposed to sea level rise, with a major 18 risk driver being increased exposure due to population increase in low-lying areas. (a) Population in the low-elevation 19 coastal zone (LECZ) projected for 2030 (+10cm SLR) and 2060 (+21 cm SLR). (b) African countries with highest 20 population in LECZ, and additional population exposed in the 100-year floodplain. Data sourced from (Neumann et al., 21 2015). 22 23 24 Sea level rise and coastal flooding 25 Africa’s low-lying coastal zone population is expected to grow more than any other region from 2000 to 26 2060 (see Figure 9.28) (Neumann et al., 2015). Future rapid coastal development is expected to increase 27 existing high vulnerabilities to sea level rise (SLR) and coastal hazards, particularly in East Africa (high 28 confidence) (Figure 9.29) (Hinkel et al., 2012; Kulp and Strauss, 2019). By 2100, sea levels are projected to 29
ACCEPTED VERSIO
N
SUBJECT TO FIN
AL EDITS

FINAL DRAFT Chapter 9 IPCC WGII Sixth Assessment Report
Do Not Cite, Quote or Distribute 9-103 Total pages: 225
rise at least 40 cm above those in 2000 in a below 2℃ scenario, and possibly up to 1 m by the end of the 1 century under a 4℃ warming scenario (Serdeczny et al., 2017) (see also Cross-Chapter Box SLR in Chapter 2 3). 3 4 5
6 Figure 9.29: Selected African cities exposed to sea level rise include (a) Dar es Salaam, Bagamoyo, and Stone Town in 7 Tanzania (East Africa), (b) Lagos in Nigeria, and Cotonou and Porto-Novo in Benin (West Africa), and (c) Cairo and 8 Alexandria in Egypt (North Africa). Orange shows built-up area in 2014. Shades of blue show permanent flooding due 9 to sea level rise by 2050 and 2100 under low (RCP2.6), medium (RCP4.5) and high (RCP8.5) greenhouse gas 10 emissions scenarios. Darker colours for higher emissions scenarios show areas projected to be flooded in addition to 11 those for lower emissions scenarios. The figure assumes failure of coastal defences in 2050 and 2100. Some areas are 12 already below current sea level rise and coastal defences need to be upgraded as sea level rises (e.g., in Egypt), others 13 are just above mean sea levels and they do not necessarily have high protection levels, so these defences need to be built 14 (e.g., Dar Es Salam and Lagos). Blue shading shows permanent inundation surfaces predicted by Coastal DEM and 15 SRTM given the 95th percentile K14/RCP2.6, RCP4.5, and RCP8.5, for present day, 2050, and 2100 sea level 16 projection for permanent inundation (inundation without a storm surge event), and RL10 (10-year return level storm) 17 (Kulp and Strauss, 2019). Low-lying areas isolated from the ocean are removed from the inundation surface using 18
(a) Dar es Salaam, Bagamoyo and Stonetown (Tanzania)
(b) Lagos (Nigeria) and Cotonou and Porto-Novo (Benin) (c) Cairo and Alexandria (Egypt)
RCP 2.6
RCP 4.5
RCP 8.5
Built-up area (2014)
Present Day 2050 2100
Present Day Present Day
2050 2050
2100 2100
50 km
ACCEPTED VERSIO
N
SUBJECT TO FIN
AL EDITS
FINAL DRAFT Chapter 9 IPCC WGII Sixth Assessment Report
Do Not Cite, Quote or Distribute 9-104 Total pages: 225
connected components analysis. Current water bodies are derived from the SRTM Water Body Dataset. Orange areas 1 represent the extent of coastal human settlements in 2014 (Corbane et al., 2018). See Figure CCP4.7 for projections 2 including subsidence and worst-case scenario projections for 2100. 3 4 5 In the absence of any adaptation, Egypt, Mozambique, and Nigeria are projected to be worst affected by SLR 6 in terms of the number of people at risk of flooding annually in a 4℃ warming scenario (Hinkel et al., 2012). 7 Recent estimates have explored the potential damages due to SLR and coastal extreme events in 12 major 8 African cities using a stochastic approach to account for uncertainty (Abadie et al., 2020). Expected 9 aggregate damages to these cities in 2050 are USD 65 billion for RCP4.5 and USD 86.5 billion for RCP8.5, 10 and USD 137.5 billion under a high-end scenario that incorporates expert opinion on additional ice sheet 11 melting (Table 9.8). When considering low-probability, high-damage events, aggregate damage risks can be 12 more than twice as high, reaching USD 187 billion and USD 206 billion under RCP4.5 and RCP8.5 13 scenarios, respectively, and USD 397 billion under the high-end scenario. City characteristics and exposure 14 play a larger role in expected damages and risk than changes in sea level. The city of Alexandria in North 15 Africa leads the ranking, with aggregate expected damage of USD 36 billion and USD 50 billion under 16 RCP4.5 and RCP8.5 scenarios, respectively, and USD 79.4 billion under the high-end scenario. 17 18 19
ACCEPTED VERSIO
N
SUBJECT TO FIN
AL EDITS

FINAL DRAFT Chapter 9 IPCC WGII Sixth Assessment Report
Do Not Cite, Quote or Distribute 9-105 Total pages: 225
Table 9.8: Regional relative sea level rise and associated damage risks in 12 major African coastal cities under four SLR scenarios. Panel (a) Regional relative sea level rise by 2050 1 and 2100. For SLR, median and 95th percentiles are presented, in centimetres. Panel (b) Probabilistic damage estimations by 2050 include expected average damages (EAD), 2 damages at the 95th percentile (VaR) and the Expected Shortfall (ES), which represents the average damages of the 5% worst cases. Four relative sea level projections were 3 considered under no adaptation: the RCP2.6, 4.5 and 8.5 scenarios from the IPCC AR5, and a high-end RCP8.5 scenario that incorporates expert opinion on additional ice sheet 4 melting. Note that figures are provided in undiscounted millions of US dollars (2005) and have been rounded off to avoid a false sense of precision (Abadie et al., 2020; Abadie et 5 al., 2021). 6 7
a) Regional relative sea level rise (cm)
City Year RCP2.6 RCP4.5 RCP8.5 High end
Median P95 Median P95 Median P95 Median P95
Abidjan 2050 21 30 22 32 24 34 28 48
2100 44 69 53 86 75 114 86 206
Alexandria 2050 18 26 18 28 21 30 25 43
2100 36 58 46 73 67 102 78 186
Algiers 2050 19 27 19 29 22 31 25 45
2100 39 62 47 76 66 98 78 192
Cape Town 2050 20 30 21 31 23 33 27 48
2100 44 69 53 87 75 117 86 199
Casablanca 2050 19 27 20 29 22 31 26 46
2100 39 63 47 78 65 99 77 198
Dakar 2050 21 31 21 31 23 33 27 48
2100 43 69 53 86 73 111 85 209
Dar-es-Salam 2050 20 29 21 31 24 33 27 47
2100 45 70 54 86 76 117 87 206
Durban 2050 20 30 22 32 25 34 28 49
2100 46 72 55 90 78 119 89 207
Lagos 2050 21 30 22 32 24 34 28 48
2100 44 69 54 86 75 113 86 205
Lome 2050 21 30 22 32 24 34 28 48
2100 44 69 53 86 76 115 87 205
Luanda 2050 21 30 23 32 25 35 29 49
2100 45 70 55 88 78 119 90 205
Maputo 2050 21 31 22 32 24 34 28 49
2100 45 71 55 89 78 120 89 209
ACCEPTED VERSIO
N
SUBJECT TO FIN
AL EDITS

FINAL DRAFT Chapter 9 IPCC WGII Sixth Assessment Report
Do Not Cite, Quote or Distribute 9-106 Total pages: 225
b) Expected damages and risk measures (USD millions)
City RCP2.6 RCP4.5 RCP8.5 High-end scenario
EAD VaR(95%) ES(95%) EAD VaR(95%) ES(95%) EAD VaR(95%) ES(95%) EAD VaR(95%) ES(95%)
Abidjan 14,290 33,910 41,690 16,730 38,230 46,390 20,910 42,140 49,550 32,670 77,750 96,570
Alexandria 32,840 74,100 92,470 36,220 83,700 104,270 49,990 99,500 117,580 79,360 180,090 221,390
Algiers 270 620 760 300 700 870 390 810 960 640 1,540 1,920
Cape Town 110 310 400 130 360 450 170 410 490 300 800 1,010
Casablanca 350 1,150 1,520 420 1,340 1,740 610 1,570 1,930 1,230 3,590 4,630
Dakar 590 1,310 1,590 620 1,390 1,690 760 1,530 1,800 1,180 2,880 3,610
Dar-es-Salam 880 2,100 2,600 1,050 2,440 2,970 1,360 2,760 3,250 2,140 5,120 6,360
Durban 110 370 470 150 420 530 210 490 590 370 970 1,230
Lagos 3,680 6,790 7,950 4,200 7,660 8,930 4,920 8,270 9,420 6,750 13,820 16,730
Lome 3,230 10,480 13,460 4,280 12,580 15,780 5,980 14,430 17,380 10,720 28,580 36,010
Luanda 160 380 470 200 440 530 260 510 600 400 910 1,130
Maputo 650 1,990 2,530 700 2,080 2,620 980 2,410 2,910 1,790 4,830 6,110 Aggregate damage and risk
57,160 133,510 165,910 65,000 151,340 186,770 86,540 174,830 206,460 137,550 320,880 396,700
1 2
ACCEPTED VERSIO
N
SUBJECT TO FIN
AL EDITS

FINAL DRAFT Chapter 9 IPCC WGII Sixth Assessment Report
Do Not Cite, Quote or Distribute 9-107 Total pages: 225
Sea level rise and associated episodic flooding are identified as key drivers of projected net migration of 1 750,000 people out of the East African coastal zone between 2020 and 2050 (IPCC, 2019a). These trends, 2 alongside the emergence of ‘hotspots’ of climate in and out-migration (Box 9.8), will have major 3 implications for climate-sensitive sectors and the adequacy of human settlements, including urban 4 infrastructure and social support systems. Actions which could help reduce the number of people being 5 forced to move in distress, include adoption of inclusive and climate-resilient development policies, together 6 with targeted investments to manage the reality of climate migration; and mainstreaming climate migration 7 in development planning (Box 9.8). 8 9 Drought 10 Although an increase in drought hazard is projected for North and southwest southern Africa with increased 11 global warming (Figure 9.15), Central African countries may have the highest drought risk because of high 12 vulnerability and high population growth (Ahmadalipour et al., 2019). Among continents, Africa contains 13 the second largest population of people living in drylands, which is expected to double by 2050 (IPCC, 14 2019a). Continuing current population and GDP growth trends, the extent of urban land in arid zones is 15 projected to increase around 180% in Southern Africa, 300% in North Africa, and 700% in mid-latitude 16 Africa by 2030 when compared to 2000, without considering climate change (Güneralp et al., 2015). At 17 1.5℃ warming, urban populations exposed to severe droughts in West Africa are projected to increase 18 (65±34 million) and increase further at 2℃ (IPCC, 2018b; Liu et al., 2018b). Risks associated with increases 19 in drought frequency and magnitudes are projected to be substantially larger at 2℃ than at 1.5℃ for North 20 Africa and Southern Africa (IPCC, 2018b; Oppenheimer et al., 2019). Dryland populations exposed 21 (vulnerable) to water stress, heat stress, and desertification are projected to reach 951 (178) million at 1.5℃, 22 1,152 (220) million at 2℃, and 1,285 (277) million at 3℃ of global warming (IPCC, 2019a). At global 23 warming of 2℃ under a scenario of low populaton growth and sustainable development (SSP1), the exposed 24 (vulnerable) dryland population is 974 (35) million and for higher population growth and low environmental 25 protections (SSP3) it is 1.27 billion (522 million), a majority of which is in West Africa (IPCC, 2019a). 26 27 Extreme heat 28 Projections for 173 African cities show that around 25 cities will have over 150 days per year with an 29 apparent temperature above 40.6℃ for 1.7℃ global warming, increasing to 35 cities for 2.1℃ and 65 cities 30 for 4.4℃ warming, with West African cities most affected (Rohat et al., 2019). Across Africa, urban 31 population exposure to extreme heat is expected to increase from 2 billion person-days per year for 1985–32 2005 to 45 billion person-days for 1.7℃ global warming with low population growth (SSP1) and to 95 33 billion person-days for 2.8℃ and medium-high population growth (SSP4) by the 2060s, with increases of 34 20–52 times 1985–2005 levels by 2080–2100, depending on the scenario (Rohat et al., 2019). West Africa 35 (especially Nigeria) has the highest absolute exposure and Southern Africa the least. Considering the urban 36 heat island effect, the more vulnerable populations under 5 and over 64 exposed to heat waves of >15 days 37 over 42℃ are projected to increase from 27 million in 2010 to 360 million by 2100 for 1.8℃ global 38 warming, increasing to 440 million for >4℃ global warming, with West Africa most affected (Marcotullio et 39 al., 2021). This portends increased vulnerability to risk of heat stress in big cities of Central, East and West 40 Africa (very high confidence) (Gasparrini et al., 2015; Liu et al., 2017; Rohat et al., 2019). Shifting to a low 41 urban population growth pathway is projected to achieve a greater reduction in aggregate exposure to 42 extreme heat for most cities in West Africa whereas limiting warming through lower emissions pathways 43 achieves greater reductions in exposure in Central and East Africa (Rohat et al., 2019). 44 45 The African population exposed to compound climate extremes, such as coincident heat waves and droughts 46 or drought followed immediately by extreme rainfall, is projected to increase 47‐fold by 2070–2099 47 compared to 1981–2010 for a scenario with high population growth and 4℃ global warming (SSP3/RCP8.5) 48 and only 12-fold for low population growth and 1.6℃ global warming (SSP1/RCP2.6), with West, Central-49 East, northeastern and southeastern Africa especially exposed (Weber et al., 2020). Coincident heat waves 50 and drought is the compound event to which the most people are projected to be exposed: ~1.9 billion 51 person‐events (a 14-fold increase) for SSP1/RCP2.6 and ~7.3 billion person-events (52‐fold increase) for 52 SSP3/RCP8.5 (Weber et al., 2020). 53 54 9.9.4.2 Projected Risks to Electricity Generation and Transmission 55 56
ACCEPTED VERSIO
N
SUBJECT TO FIN
AL EDITS

FINAL DRAFT Chapter 9 IPCC WGII Sixth Assessment Report
Do Not Cite, Quote or Distribute 9-108 Total pages: 225
Climate change poses an increased risk to energy security for human settlements in Africa (high confidence). 1 With burgeoning urban populations and growing economies, sub-Saharan Africa’s electricity needs are 2 growing. The IEA projects total generation capacity in Africa must grow 2.5 times from 244 GW in 2018 to 3 614 GW by 2040 (IEA, 2019). African nations plan to add significant generation capacity from natural gas, 4 hydropower, wind and solar power. Each of these technologies is associated to a varying degree with climate 5 risk. 6 7 The long lifespan of hydropower dams exposes them to decades of climatic variability. There is a wide range 8 of uncertainty around the future climate of Africa’s major river basins, but in several basins, there is the 9 likelihood of increased rainfall variability and a drier climate (see Box 9.5). In countries that rely primarily 10 on hydropower, climate change could have considerable impacts on electricity prices and as a result, 11 consumers’ expenditure (Sridharan et al., 2019). With increasing societal demands on limited water 12 resources and future climate change, it is expected that there will be an intensification of water-energy-food 13 competition and trade-offs (high confidence) (Section 9.7; Box 9.5). 14 15 9.9.4.3 Projected Risks to Road Infrastructure 16 17 Climate change and sea level rise will result in high economic costs for road infrastructure in sub-Saharan 18 Africa (medium confidence) (Chinowsky et al., 2015). Across Africa as a whole, potential cumulative costs 19 estimates through 2100 range from USD 183.6 billion (with adaptation) to USD 248.3 billion (no adaptation) 20 to repair and maintain existing roads damaged by temperature and precipitation changes directly related to 21 projected climate change (see Figure 9.30) (Chinowsky et al., 2013). Climate-related road damage and 22 associated repairs will be a significant financial burden to countries, but to varying degrees according to 23 flood risk, existing road asset liability, topography and rural connectivity, among other factors (Chinowsky 24 et al., 2015; Cervigni et al., 2017; Koks et al., 2019). For example, Mozambique is projected to face 25 estimated annual average costs of USD 123 million for maintaining and repairing roads damaged directly by 26 precipitation and temperature changes from climate change through 2050 in a median climate change 27 scenario for a policy that does not consider climate impacts during road design and construction (Chinowsky 28 et al., 2015). Risk of river flooding to bridges in Mozambique under current conditions is estimated to be 29 USD 200 million, equal to 1.5% of its GDP per year, and could rise to USD 400 million per year in the 30 worst-case climate change scenario by 2050 (Schweikert et al., 2015). 31 32 33
34 Figure 9.30: Projected costs for repair and maintenance of pre-2011 road infrastructure in selected African countries as 35 a result of projected climate-change-related damages due directly to precipitation and temperature changes through to 36 2100 (Data sources: (Chinowsky et al., 2013). The analysis was run for 22 SRES climate scenarios and the median, and 37 maximum results of the analyses are represented as proportions of the 2011 GDP of each country. 38
ACCEPTED VERSIO
N
SUBJECT TO FIN
AL EDITS

FINAL DRAFT Chapter 9 IPCC WGII Sixth Assessment Report
Do Not Cite, Quote or Distribute 9-109 Total pages: 225
1 2 9.9.5 Adaptation in Human Settlements and for Infrastructure 3 4 9.9.5.1 Solutions and Residual Risk Observed in Human Settlements 5 6 Autonomous responses to climate impacts in 40 African cities show that excess rainfall is the primary 7 climate driver of adaptation, followed by multi-hazard impacts, with 72% of responses focused on excess 8 rainfall (Hunter et al., 2020). Innovation for adaptation in areas such as home design, social networks, 9 organisations and infrastructure, is evident (Swanepoel and Sauka, 2019). Social learning platforms also 10 increase communities’ adaptive capacities and resilience to risk (Thorn et al., 2015). 11 12 There is limited evidence of successful, proactively planned climate change adaptation in African cities 13 (Simon and Leck, 2015), particularly for those countries highly vulnerable to climate change (Ford et al., 14 2014). Planned adaptation initiatives in African cities since 2006 have been predominantly determined at the 15 national level with negligible participation of lower levels of government (Ford et al., 2014). Adaptation 16 action directed at vulnerable populations is also rare (Ford et al., 2014). There are emerging examples of 17 cities planned climate adaptation measures, such as those advanced by Durban (Roberts, 2010), Cape Town 18 (Taylor et al., 2016) and Lagos (Adelekan, 2016). There are also examples of community-led projects such 19 as those in Maputo (Broto et al., 2015), which have seen meaningful help from a range of policy networks, 20 dialogue forums and urban learning labs (Pasquini and Cowling, 2014; Shackleton et al., 2015). These 21 researched cities can be lighthouses for wider exchange and the basis for a deeper synthesis of evidence 22 (Lindley et al., 2019). However, planned adaptation progress is slow, especially in West and Central Africa 23 (Tiepolo, 2014). 24 25 Nature-based solutions are also being deployed in mitigating and adapting to climate change, with 26 demonstrated long-term health, ecological and social co-benefits (Swanepoel and Sauka, 2019) (Section 27 9.6.4). The cost-benefit analysis of nature-based solutions, compared to purely grey infrastructure initiatives, 28 is discussed in Chapter 6 (Section 6.3.3). Nature-based solutions can also lengthen the life of existing built 29 infrastructure (du Toit et al., 2018). Since 2014, an increasing number of ecosystem-based adaptation 30 projects involving the restoration of mangrove, wetland and riparian ecosystems have been initiated across 31 Africa, a majority of which address water-related climate risks (Table 9.9). 32 33 34 Table 9.9: Examples of ecosystem-based solutions to climate impacts in African cities. 35
Project City Solution Reference
Green Urban
Infrastructure (GUI)
Beira
(Mozambique)
Mitigating against increased flood
risks through restoration of
mangrove and other natural habitats
along the Chiveve river and the
development of urban green spaces.
(IPCC, 2019a; CES
Consulting Engineers
Salzgitter GmbH and Inros
Lackner SE, 2020) .
The Msimbazi
Opportunity Plan
(MOP) 2019-2024
Dar es Salaam,
Tanzania
Enhancing urban resilience to flood
risk by reducing flood hazard, and
reducing people, properties and
critical infrastructure exposed to
flood hazard.
(Croitoru et al., 2019)
Tanzania Ecosystem
Based Adaptation
Dar es Salaam
and five coastal
districts, Tanzania
Rehabilitation of over 3,000
hectares of climate-resilient
mangrove species.
(UNEP, 2019)
Building Resilience
in the Coastal Zone
through Ecosystem–
based approaches to
adaptation
Maputo,
Mozambique
Restoration of mangrove and
riparian ecosystems for flood
control and protection from coastal
flooding enhanced water supply.
(GEF, 2019)
Addressing Urgent
Coastal Adaptation
Needs and Capacity
Gaps in Angola
Five coastal
communities in
Angola
Restoration of 561 hectares of
wetland, mangroves and other
ecological habitats to promote flood
defence and mitigate the threat of
drought.
(UNEP, 2020)
ACCEPTED VERSIO
N
SUBJECT TO FIN
AL EDITS

FINAL DRAFT Chapter 9 IPCC WGII Sixth Assessment Report
Do Not Cite, Quote or Distribute 9-110 Total pages: 225
Green City Kigali
2016-
Kigali (Rwanda) 600 hectares planned
neighbourhood which integrates
green building and design, efficient
and renewable energy, recycling
and inclusive living.
(SWECO, 2019)
Urban Natural Assets
for Africa - Rivers for
Life
Kampala
(Uganda)
Preservation of natural buffers to
enhance the protective functions
offered by natural ecosystems that
support disaster resilience benefit.
(World Bank, 2015)
1 2 For green infrastructure to be successful, however, sustainable landscapes and regions require both 3 stewardship and management at multiple levels of governance and social scales (Brink et al., 2016). 4 5 Currently planned climate change adaptation to coastal hazards in Africa’s large coastal cities has mainly 6 been achieved through expensive coastal engineering efforts such as sea walls, revetments, breakwaters, 7 spillways, dikes and groynes. Examples are found in West Africa (Adelekan, 2016; Alves et al., 2020). 8 Beach nourishment efforts have also been undertaken in Egypt, Banjul and Lagos (Frihy et al., 2016; Alves 9 et al., 2020). However, the use of vegetated coastal ecosystems presents greater opportunities for African 10 cities because of the lower costs (Duarte et al., 2013). 11 12 Most (>80%) of Africa’s large coastal cities have no adaptation policies and, where available, these are 13 mostly, except for South Africa, dominated by national plans (Olazabal et al., 2019). Coastal adaptation 14 actions minimally consider socioeconomic projections and are not at all aligned with future climate scenarios 15 and risks, which is highly limiting for adaptation planning (Olazabal et al., 2019). 16 17 9.9.5.2 Anticipated Adaptation and Residual Risk for Human Settlements 18 19 Africa’s smaller towns and cities have received far less scholarly and policy development attention for 20 adaptation (Clapp and Pillay, 2017; White and Wahba, 2019). Smaller towns also have less ability to partner 21 effectively with private entities for adaptation initiatives (Wisner et al., 2015). Political will to address 22 climate change and information flows between key stakeholders, professional and political decision-makers 23 may be easier to establish in smaller cities than in the megacity context (Wisner et al., 2015). 24 25 Exposure and vulnerability are particularly acute in informal areas, making coordinated adaptation 26 challenging. Yet, there is growing recognition of the potential for bottom-up adaptation that embraces 27 informality in order to more effectively reduce risk (Taylor et al., 2021a) (Figure 9.31). This can provide an 28 opportunity for change towards more risk-sensitive urban development and transformative climate 29 adaptation (Leck et al., 2018). Addressing social vulnerability is particularly important for ensuring the 30 resilience of populations at risk. Improved monitoring, modelling and communication of climate risks is 31 needed to reduce the impacts of climate hazards (Tramblay et al., 2020; Cole et al., 2021a). 32 33 34 ACCEPTED V
ERSION
SUBJECT TO FIN
AL EDITS
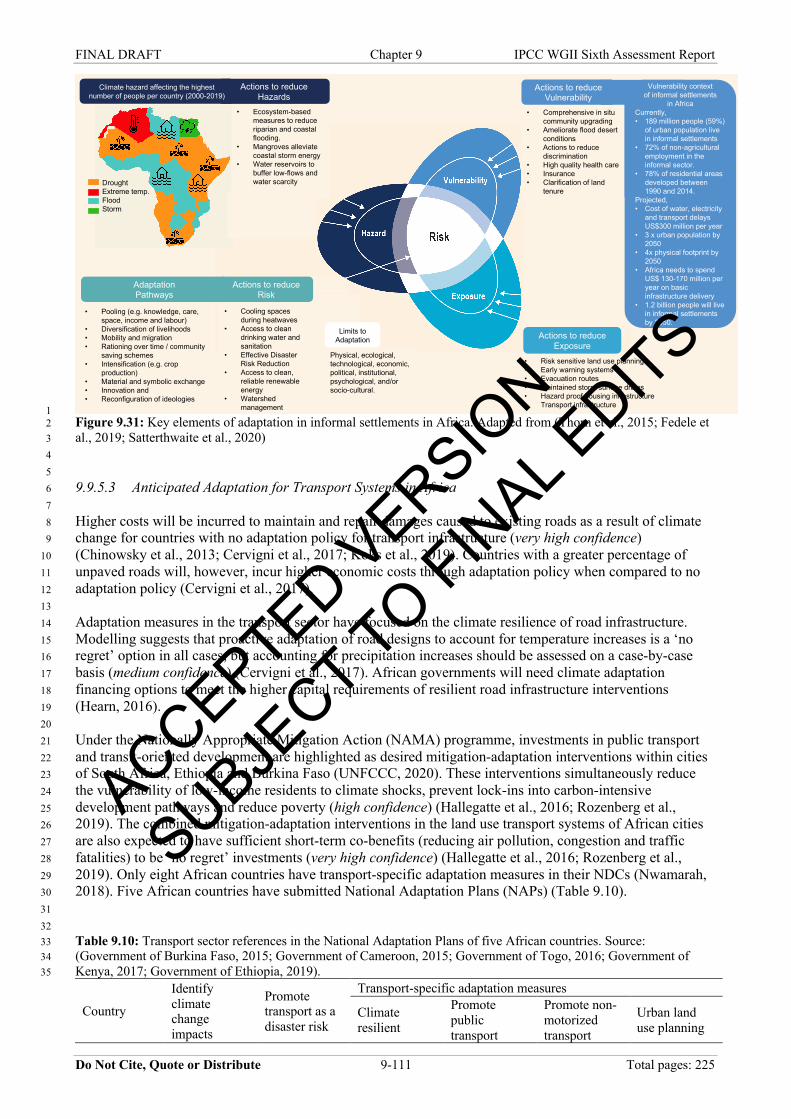
FINAL DRAFT Chapter 9 IPCC WGII Sixth Assessment Report
Do Not Cite, Quote or Distribute 9-111 Total pages: 225
1 Figure 9.31: Key elements of adaptation in informal settlements in Africa. Adapted from (Thorn et al., 2015; Fedele et 2 al., 2019; Satterthwaite et al., 2020) 3 4 5 9.9.5.3 Anticipated Adaptation for Transport Systems in Africa 6 7 Higher costs will be incurred to maintain and repair damages caused to existing roads as a result of climate 8 change for countries with no adaptation policy for transport infrastructure (very high confidence) 9 (Chinowsky et al., 2013; Cervigni et al., 2017; Koks et al., 2019). Countries with a greater percentage of 10 unpaved roads will, however, incur higher economic costs through adaptation policy when compared to no 11 adaptation policy (Cervigni et al., 2017). 12 13 Adaptation measures in the transport sector have focused on the climate resilience of road infrastructure. 14 Modelling suggests that proactive adaptation of road designs to account for temperature increases is a ‘no 15 regret’ option in all cases, but accounting for precipitation increases should be assessed on a case-by-case 16 basis (medium confidence) (Cervigni et al., 2017). African governments will need climate adaptation 17 financing options to meet the higher capital requirements of resilient road infrastructure interventions 18 (Hearn, 2016). 19 20 Under the Nationally Appropriate Mitigation Action (NAMA) programme, investments in public transport 21 and transit-oriented development are highlighted as desired mitigation-adaptation interventions within cities 22 of South Africa, Ethiopia and Burkina Faso (UNFCCC, 2020). These interventions simultaneously reduce 23 the vulnerability of low-income residents to climate shocks, prevent lock-ins into carbon-intensive 24 development pathways and reduce poverty (high confidence) (Hallegatte et al., 2016; Rozenberg et al., 25 2019). The combined mitigation-adaptation interventions in the land use transport systems of African cities 26 are also expected to have sufficient short-term co-benefits (reducing air pollution, congestion and traffic 27 fatalities) to be ‘no regret’ investments (very high confidence) (Hallegatte et al., 2016; Rozenberg et al., 28 2019). Only eight African countries have transport-specific adaptation measures in their NDCs (Nwamarah, 29 2018). Five African countries have submitted National Adaptation Plans (NAPs) (Table 9.10). 30 31 32 Table 9.10: Transport sector references in the National Adaptation Plans of five African countries. Source: 33 (Government of Burkina Faso, 2015; Government of Cameroon, 2015; Government of Togo, 2016; Government of 34 Kenya, 2017; Government of Ethiopia, 2019). 35
Country
Identify
climate
change
impacts
Promote
transport as a
disaster risk
Transport-specific adaptation measures
Climate
resilient
Promote
public
transport
Promote non-
motorized
transport
Urban land
use planning
• Risk sensitive land use planning• Early warning systems• Evacuation routes• Maintained storm surface drains• Hazard proof housing infrastructure• Transport infrastructure
Limits to Adaptation
Physical, ecological, technological, economic, political, institutional, psychological, and/or socio-cultural.
• Comprehensive in situ community upgrading
• Ameliorate flood desert conditions
• Actions to reduce discrimination
• High quality health care• Insurance• Clarification of land
tenure
• Pooling (e.g. knowledge, care, space, income and labour)
• Diversification of livelihoods• Mobility and migration• Rationing over time / community
saving schemes• Intensification (e.g. crop
production)• Material and symbolic exchange• Innovation and • Reconfiguration of ideologies
Actions to reduce Vulnerability
Vulnerability context of informal settlements
in AfricaCurrently, • 189 million people (59%)
of urban population live in informal settlements
• 72% of non-agricultural employment in the informal sector.
• 78% of residential areas developed between 1990 and 2014.
Projected,• Cost of water, electricity
and transport delays US$300 million per year
• 3 x urban population by 2050
• 4x physical footprint by 2050
• Africa needs to spend US$ 130-170 million per year on basic infrastructure delivery
• 1.2 billion people will live in informal settlements by 2050.
DroughtExtreme temp.FloodStorm
• Ecosystem-based measures to reduce riparian and coastal flooding.
• Mangroves alleviate coastal storm energy
• Water reservoirs to buffer low-flows and water scarcity
Actions to reduce Exposure
Actions to reduce Risk
• Cooling spaces during heatwaves
• Access to clean drinking water and sanitation
• Effective Disaster Risk Reduction
• Access to clean, reliable renewable energy
• Watershed management
Actions to reduce Hazards
Adaptation Pathways
Climate hazard affecting the highest number of people per country (2000-2019)
ACCEPTED VERSIO
N
SUBJECT TO FIN
AL EDITS
FINAL DRAFT Chapter 9 IPCC WGII Sixth Assessment Report
Do Not Cite, Quote or Distribute 9-112 Total pages: 225
reduction
measure
design
standards
Burkina Faso X X X X
Cameroon X X
Ethiopia X X X X
Kenya X
Togo X X
1 2 9.9.5.4 Projected Adaptation for Electricity Generation and Transmission in Africa 3 4 Most electricity infrastructure in Africa has been designed to account for historical climatic patterns. Failure 5 to take into account future climate scenarios in power system planning increases the climate risk facing 6 infrastructure and supplies. Yet, energy demand for cooling over Africa, for example, is expected to increase, 7 with a potential increase in heat stress, population growth and rapid urbanisation to 1.2% of total final energy 8 demand by 2100 compared to 0.4% in 2005 (Parkes et al., 2019). Integrated energy system costs from 9 increased demand for cooling to mitigate heat stress are projected to accumulate from 2005 to USD 51.3 10 billion by 2035 at 2℃ and to USD 486.5 billion by 2076 at 4℃ global warming (Parkes et al., 2019). 11 12 For hydropower, adaptations to different climate conditions can be made at the level of the power plant, 13 turbine size and reservoir storage capacities, and can be adjusted to projected hydrological patterns (Lempert 14 et al., 2015). At the river basin level, integrated water resource management practices can be implemented 15 across sectors that compete for the same water resources (Howells et al., 2013). At the power system level, 16 the energy mix and the protocol through which different power plants are dispatched can be adapted to 17 different climate scenarios (Spalding-Fecher et al., 2017; Sridharan et al., 2019). 18 19 Given the uncertainty around future hydroclimate conditions, hydropower development decisions carry risk 20 of ‘regrets’ (that is, damages or missed opportunities) when a different climate than was expected 21 materialises. ‘Robust adaptation’ refers to an adaptation strategy that balances risks across different climate 22 scenarios (Cervigni et al., 2015) (Cross-Chapter Box DEEP in Chapter 17). Development bank lending 23 principles require consideration of the regional picture and interactions with other developments along a 24 river when they determine the social and environmental impacts of the proposed hydropower project. 25 However, these principles often do not explicitly consider climate change, so the risk of reoccurring drought-26 induced hydropower shortages could be missed (Box 9.5). 27 28 Lastly, given the degree to which hydropower competes with other sectors and ecosystems for the same 29 water resources, it is critical that hydropower planning and adaptation does not occur in isolation. As 30 discussed in Section 9.7, it must be part of an integrated water management system that balances the needs of 31 different water-reliant sectors with other societal and ecological demands under increasingly variable climate 32 and hydrological conditions (Section 9.7.3). 33 34 35 9.10 Health 36 37 The health section is organised by disease or health outcome, with observed impacts and projected risks 38 described for each condition. All adaptation options are presented at the end of the section, highlighting 39 prevention and preparedness, community engagement and disease-specific adaptation options. 40 41 9.10.1 The Influence of Social Determinants of Health on the Impacts of Climate Change 42 43 The social determinants of health are ‘the conditions in which people are born, grow, live, work and age’ as 44 well as the drivers of these, including the social circumstances which profoundly affect health and drive 45 health disparities (Commission of Social Determinants of Health, 2008; Gurewich et al., 2020). Social 46 features (e.g., health-related behaviours), socioeconomic factors (e.g., income, wealth and education) and 47 environmental determinants (e.g., air or water quality) are critical for shaping health outcomes. These factors 48 are inextricably linked (Schulz and Northridge, 2004; Moore and Diaz, 2015) and are largely outside the 49 domain of the health sector. Climate change is already challenging the health and well-being of African 50
ACCEPTED VERSIO
N
SUBJECT TO FIN
AL EDITS
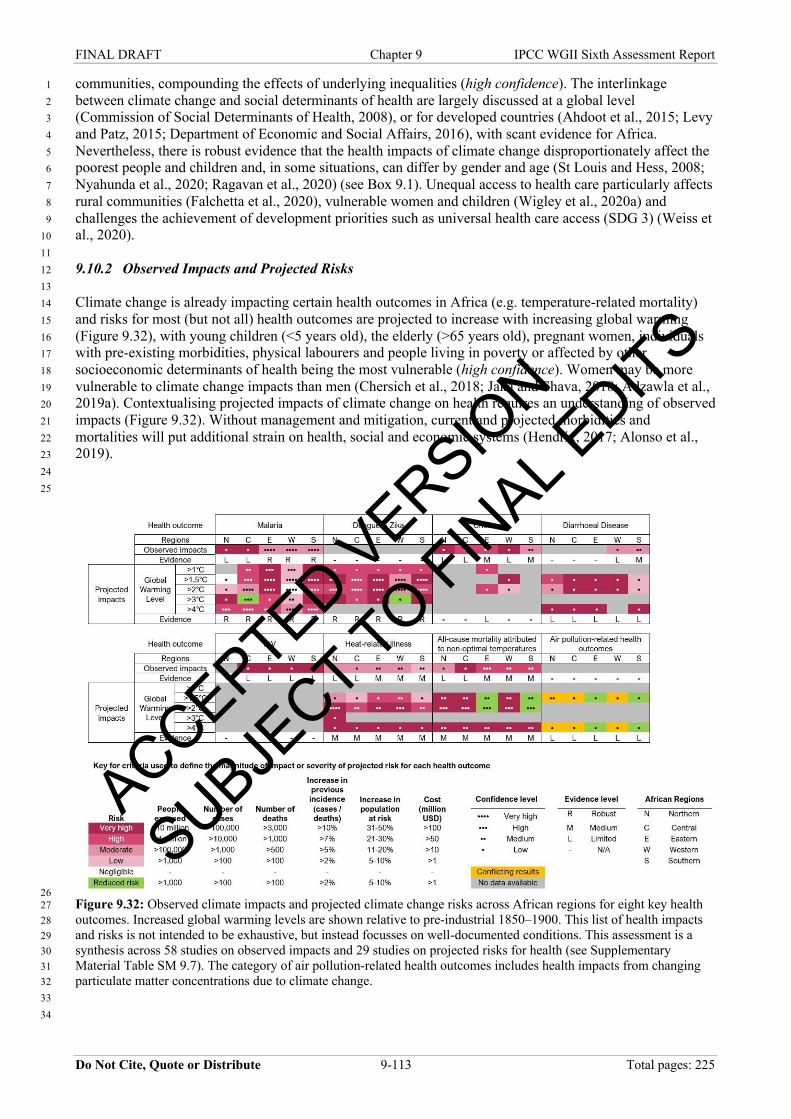
FINAL DRAFT Chapter 9 IPCC WGII Sixth Assessment Report
Do Not Cite, Quote or Distribute 9-113 Total pages: 225
communities, compounding the effects of underlying inequalities (high confidence). The interlinkage 1 between climate change and social determinants of health are largely discussed at a global level 2 (Commission of Social Determinants of Health, 2008), or for developed countries (Ahdoot et al., 2015; Levy 3 and Patz, 2015; Department of Economic and Social Affairs, 2016), with scant evidence for Africa. 4 Nevertheless, there is robust evidence that the health impacts of climate change disproportionately affect the 5 poorest people and children and, in some situations, can differ by gender and age (St Louis and Hess, 2008; 6 Nyahunda et al., 2020; Ragavan et al., 2020) (see Box 9.1). Unequal access to health care particularly affects 7 rural communities (Falchetta et al., 2020), vulnerable women and children (Wigley et al., 2020a) and 8 challenges the achievement of development priorities such as universal health care access (SDG 3) (Weiss et 9 al., 2020). 10 11 9.10.2 Observed Impacts and Projected Risks 12 13 Climate change is already impacting certain health outcomes in Africa (e.g. temperature-related mortality) 14 and risks for most (but not all) health outcomes are projected to increase with increasing global warming 15 (Figure 9.32), with young children (<5 years old), the elderly (>65 years old), pregnant women, individuals 16 with pre-existing morbidities, physical labourers and people living in poverty or affected by other 17 socioeconomic determinants of health being the most vulnerable (high confidence). Women may be more 18 vulnerable to climate change impacts than men (Chersich et al., 2018; Jaka and Shava, 2018; Adzawla et al., 19 2019a). Contextualising projected impacts of climate change on health requires an understanding of observed 20 impacts (Figure 9.32). Without management and mitigation, current and projected morbidities and 21 mortalities will put additional strain on health, social and economic systems (Hendrix, 2017; Alonso et al., 22 2019). 23 24 25
26 Figure 9.32: Observed climate impacts and projected climate change risks across African regions for eight key health 27 outcomes. Increased global warming levels are shown relative to pre-industrial 1850–1900. This list of health impacts 28 and risks is not intended to be exhaustive, but instead focusses on well-documented conditions. This assessment is a 29 synthesis across 58 studies on observed impacts and 29 studies on projected risks for health (see Supplementary 30 Material Table SM 9.7). The category of air pollution-related health outcomes includes health impacts from changing 31 particulate matter concentrations due to climate change. 32 33 34
ACCEPTED VERSIO
N
SUBJECT TO FIN
AL EDITS

FINAL DRAFT Chapter 9 IPCC WGII Sixth Assessment Report
Do Not Cite, Quote or Distribute 9-114 Total pages: 225
9.10.2.1 Vector-Borne Diseases 1 2 9.10.2.1.1 Malaria 3 4 Observed impacts 5 Higher temperatures and shifting patterns of rainfall influence the distribution and incidence of malaria in 6 sub-Saharan Africa (high confidence) (Agusto et al., 2015; Beck-Johnson et al., 2017). Up to 10.9 million 7 km2 of sub-Saharan Africa is optimally suitable for year-round malaria transmission (Mordecai et al., 2013; 8 Ryan et al., 2015). Current climate suitability for endemic malaria transmission is concentrated in the central 9 African region, some areas along the Southern coast of West Africa and the East African coast (Ryan et al., 10 2020). 11 12 In East Africa, there has been an expansion of the Anopheles vector into higher altitudes (Gone et al., 2014; 13 Carlson et al., 2019) and increasing incidence of infection with P. falciparum with higher temperatures (high 14 confidence) (Alemu et al., 2014; Lyon et al., 2017). Over Southern Africa, changes in temperature and 15 rainfall are increasing malaria transmission (Abiodun et al., 2018). In West Africa, studies show both 16 positive (Adu-Prah and Kofi Tetteh, 2015; Darkoh et al., 2017) and negative (M’Bra et al., 2018) 17 correlations of malaria incidence with increases in mean monthly temperatures, and an abundance of 18 Anopheles gambiae s.s. associated with mean diurnal temperature (Akpan et al., 2018). 19 20 Malaria incidence and outbreaks in East Africa were linked with both moderate monthly rainfall and extreme 21 flooding (Boyce et al., 2016; Amadi et al., 2018; Simple et al., 2018), and increase one to two months after 22 periods of rainfall in Southern and West Africa (Diouf et al., 2017; Ferrão et al., 2017; Adeola et al., 2019). 23 The years following La Niña events (Southern Africa) (Adeola et al., 2017)) and high relative humidity 24 (West Africa) (Adu-Prah and Kofi Tetteh, 2015; Darkoh et al., 2017) have been positively linked with 25 malaria incidence. 26 27 Projected risks 28 Since AR5, significant progress has been made in understanding how changes in climate influence the 29 seasonal and geographical range of malaria vectors, transmission intensity and burden of disease of malaria 30 across Africa. Yet projecting changes remains challenging given the range of factors that influence 31 transmission and disease patterns, and model outputs contain high degrees of uncertainty (Zermoglio et al., 32 2019; Giesen et al., 2020). Models have limited ability to account for population changes and development 33 trends (Kibret et al., 2015; Kibret et al., 2017), investments in health sectors and interventions (McCord, 34 2016; Colborn et al., 2018; Caminade et al., 2019), and confounders such as age, socioeconomic status, 35 employment and labour migration and climate variability (Bennett et al., 2016; Karuri and Snow, 2016; 36 Byass et al., 2017; Chuang et al., 2017; Colborn et al., 2018). Nevertheless, available models do allow for 37 projections of malaria transmission under different climate change scenarios to be made with high levels of 38 certainty. 39 40 In East and southern Africa and the Sahel, malaria vector hotspots and prevalence are projected to increase 41 under RCP4.5 and RCP8.5 by 2030 (1.5℃–1.7°C global warming) (high confidence) (Leedale et al., 2016; 42 Semakula et al., 2017b; Zermoglio et al., 2019), becoming more pronounced later in the century (2.4℃–43 3.9°C global warming) (Ryan et al., 2020). Under RCP4.5, 50.6–62.1 million people in East and Southern 44 Africa will be at risk of malaria by the 2030s (1.5°C global warming), and 196–198 million by the 2080s 45 (2.4°C global warming) (Ryan et al., 2020). Northern Angola, Southern DRC, western Tanzania and central 46 Uganda are predicted to be worst impacted in 2030, extending to western Angola, upper Zambezi River 47 Basin, northeastern Zambia and the East African highlands by 2080 (Ryan et al., 2020). Under rising 48 temperatures, by the 2050s, the greatest shifts in suitability for malaria transmission will be seen in East, 49 Southern and Central Africa (2°C global warming) (Tonnang et al., 2014; Zermoglio et al., 2019; Ryan et al., 50 2020). 51 52 Conversely, in some regions, changing climatic conditions are projected to reduce malaria hotspots and 53 prevalence. With continued greenhouse gas emissions, these include: West Africa by 2030 (1.7°C global 54 warming) (high confidence) (Yamana et al., 2016; Semakula et al., 2017b; Ryan et al., 2020), parts of 55 Southern Central Africa and dryland regions in East Africa by 2050 (2.5°C global warming) (high 56 confidence) (Semakula et al., 2017b; Ryan et al., 2020), and large areas of southern Central Africa and the 57
ACCEPTED VERSIO
N
SUBJECT TO FIN
AL EDITS
FINAL DRAFT Chapter 9 IPCC WGII Sixth Assessment Report
Do Not Cite, Quote or Distribute 9-115 Total pages: 225
western Sahel by 2100 (>4°C global warming) (Yu et al., 2015; Tourre et al., 2019). These reductions in 1 transmission correspond with decreasing environmental suitability for the malaria vector and parasite in 2 these regions (Ryan et al., 2015; Mordecai et al., 2020). Most areas in Burkina Faso, Cameroon, Ivory Coast, 3 Ghana, Sierra Leone, Niger, Nigeria, Zambia and Zimbabwe will have almost zero malaria transmission 4 under RCP8.5 (Semakula et al., 2017b; Tourre et al., 2019). 5 6 The El Niño-Southern Oscillation (ENSO) cycle currently contributes to seasonal epidemic malaria in 7 epidemic-prone areas (high confidence), and is projected to shift the malaria epidemic fringe southward and 8 into higher altitudes by mid- to end-century (high confidence) (Bouma et al., 2016; Semakula et al., 2017b; 9 Caminade et al., 2019). More evidence is needed, however, of climate variability impacts through ENSO 10 cycles in future risk projections, as well as a deeper understanding of how climate change will impact the 11 length of transmission season for mosquitoes, particularly in areas where increases in spring and autumn 12 temperatures may increase suitability for the reproduction of malaria vectors (Ryan et al., 2020). Other gaps 13 in knowledge include a better understanding of mosquito thermal biology and thermal limits for a variety of 14 species, potential adaptations to extreme temperatures and how landscape changes contribute to malaria 15 transmission (Tompkins and Caporaso, 2016). 16 17 9.10.2.1.2 Mosquito-borne viruses 18 19 Observed impacts 20 Climate variability has driven a global intensification of mosquito-borne viruses (e.g., dengue, Zika and Rift 21 Valley Fever), including expansion into areas with higher altitudes (Leedale et al., 2016; Mweya et al., 2016; 22 Messina et al., 2019). Concerns centre on diseases vectored by the yellow fever mosquito (Aedes aegypti), 23 common throughout most of sub-Saharan Africa, and the tiger mosquito (Aedes albopictus), currently largely 24 confined to western Central Africa (Kraemer et al., 2019; Mordecai et al., 2020). 25 26 Although warming temperatures are largely responsible for increasing environmental suitability for mosquito 27 vectors (Mordecai et al., 2019), droughts can augment transmission when open water storage provides 28 breeding sites near human settlements, and when flooding enables mosquitoes to proliferate and spread 29 viruses further (Mweya et al., 2017; Bashir and Hassan, 2019). Within Africa’s rapidly growing cities, 30 diseases vectored by urban-adapted Aedes mosquitoes pose a major threat, especially in West Africa 31 (Zahouli et al., 2017; Weetman et al., 2018; Messina et al., 2019). Dengue virus expansion may cause 32 explosive outbreaks but the burden of dengue haemorrhagic fever and associated mortality is higher in areas 33 where transmission is already endemic (Murray et al., 2013). 34 35 Projected risks 36 Populations of Aedes aegypti and Aedes albopictus mosquitoes and epidemics of dengue and yellow fever 37 and other Aedes-borne viruses are expected to increase, including at high altitudes (Weetman et al., 2018; 38 Messina et al., 2019; Ryan et al., 2019; Gaythorpe et al., 2020; Mordecai et al., 2020). Aedes albopictus may 39 expand beyond western Central Africa into Chad, Mali and Burkina Faso by mid-century at >2°C global 40 warming (Kraemer et al., 2019). Shifts projected in Aedes range due to changing environmental suitability, 41 combined with rapid urbanisation and population growth, suggest that by 2050 populations exposed to these 42 vectors in Africa may double, and by 2080 nearly triple at >2°C global warming (Kraemer et al., 2019). 43 Southern limits of dengue transmission in Namibia and Botswana, and the western Sahel, may show the 44 greatest expansions in environmental suitability under 1.8℃–2.6°C global warming (Messina et al., 2019). 45 In the warmest scenarios (RCP8.5), however, some parts of Central Africa may become too hot for 46 mosquitoes to transmit dengue, and thus at-risk populations may peak at intermediate warming levels (Ryan 47 et al., 2019). Climatic conditions favourable for mosquitoes, combined with the increase of animal trade, 48 may result in the expansion of the geographic range of zoonotic diseases like Rift Valley fever (Martin et al., 49 2008), a threat for human and animal health with strong socioeconomic impacts (Peyre, 2015). 50 51 9.10.2.2 Diarrhoeal Diseases, HIV and Other Infectious Diseases 52 53 9.10.2.2.1 Diarrhoeal diseases 54 Observed impacts 55 Africa has the highest rates of death due to diarrhoeal diseases in the world (Havelaar et al., 2015; Troeger et 56 al., 2018) and many children have repeated diarrhoeal episodes with impaired growth, stunting, immune 57
ACCEPTED VERSIO
N
SUBJECT TO FIN
AL EDITS
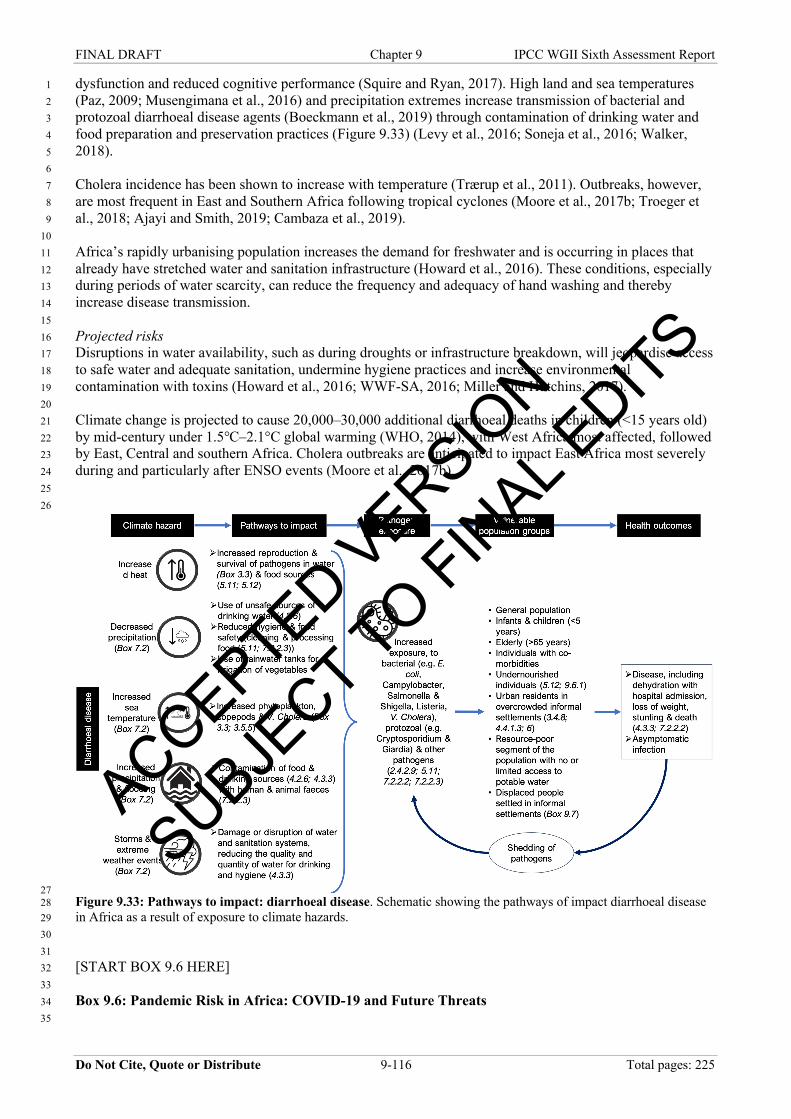
FINAL DRAFT Chapter 9 IPCC WGII Sixth Assessment Report
Do Not Cite, Quote or Distribute 9-116 Total pages: 225
dysfunction and reduced cognitive performance (Squire and Ryan, 2017). High land and sea temperatures 1 (Paz, 2009; Musengimana et al., 2016) and precipitation extremes increase transmission of bacterial and 2 protozoal diarrhoeal disease agents (Boeckmann et al., 2019) through contamination of drinking water and 3 food preparation and preservation practices (Figure 9.33) (Levy et al., 2016; Soneja et al., 2016; Walker, 4 2018). 5 6 Cholera incidence has been shown to increase with temperature (Trærup et al., 2011). Outbreaks, however, 7 are most frequent in East and Southern Africa following tropical cyclones (Moore et al., 2017b; Troeger et 8 al., 2018; Ajayi and Smith, 2019; Cambaza et al., 2019). 9 10 Africa’s rapidly urbanising population increases the demand for freshwater and is occurring in places that 11 already have stretched water and sanitation infrastructure (Howard et al., 2016). These conditions, especially 12 during periods of water scarcity, can reduce the frequency and adequacy of hand washing and thereby 13 increase disease transmission. 14 15 Projected risks 16 Disruptions in water availability, such as during droughts or infrastructure breakdown, will jeopardise access 17 to safe water and adequate sanitation, undermine hygiene practices and increase environmental 18 contamination with toxins (Howard et al., 2016; WWF-SA, 2016; Miller and Hutchins, 2017). 19 20 Climate change is projected to cause 20,000–30,000 additional diarrhoeal deaths in children (<15 years old) 21 by mid-century under 1.5℃–2.1°C global warming (WHO, 2014), with West Africa most affected, followed 22 by East, Central and southern Africa. Cholera outbreaks are anticipated to impact East Africa most severely 23 during and particularly after ENSO events (Moore et al., 2017b). 24 25 26
27 Figure 9.33: Pathways to impact: diarrhoeal disease. Schematic showing the pathways of impact diarrhoeal disease 28 in Africa as a result of exposure to climate hazards. 29 30 31 [START BOX 9.6 HERE] 32 33 Box 9.6: Pandemic Risk in Africa: COVID-19 and Future Threats 34 35
ACCEPTED VERSIO
N
SUBJECT TO FIN
AL EDITS

FINAL DRAFT Chapter 9 IPCC WGII Sixth Assessment Report
Do Not Cite, Quote or Distribute 9-117 Total pages: 225
Rapid advances in vaccination and other control measures in high-income countries means that the burden of 1 COVID-19 is increasingly concentrated in low- and middle-income countries, including those in Africa. The 2 extent to which the COVID-19 pandemic is influenced by weather or by future changes in climate remains 3 contested (WMO, 2021). In time, COVID-19 may develop seasonal dynamics (Baker et al., 2020; Kissler et 4 al., 2020) similar to other respiratory infections (Carlson et al., 2020b). 5 6 Early work interpreted low-reported cases of COVID-19 in Africa as suggesting evidence of a protective 7 climatic effect, but increasing evidence indicates the role of climate is secondary to the timing of disease 8 introduction, the pace of implementation of non-pharmaceutical interventions, and surveillance gaps (Evans 9 et al., 2020; WMO, 2021). Going forward, testing coverage, reporting, governance, non-pharmaceutical 10 interventions and vaccine distribution and uptake are likely to be far more significant for Africa’s COVID-19 11 trajectory than climate change. Compounding risks, where climate hazards and natural disasters impair 12 outbreak responses, may disrupt interventions or cause additional deaths (Phillips et al., 2020; Salas et al., 13 2020). 14 15 Emerging and future pandemic threats 16 Future influenza pandemics are highly likely, as are regional epidemics and pandemics of novel zoonotic 17 viruses (including coronaviruses and flaviviruses) (high confidence). In the next decades, climate change will 18 reshape the risk landscape for emerging zoonotic threats as wildlife-livestock-human interfaces shift, 19 facilitating the emergence of novel zoonotic threats and spillover of known zoonoses into novel geographies 20 (Carlson et al., 2020a; Mordecai et al., 2020). Characteristics of urban development and level of service 21 provision, for example, crowded living spaces and transport facilities, and access to water and sanitation will 22 influence the transmission of COVID-19 and future disease outbreaks (Wilkinson, 2020). Historically, West 23 and Central Africa were considered especially at risk of outbreaks given their high biodiversity, high 24 intensity of human-wildlife contact including wild meat trade, vulnerable health systems and history of 25 Ebola virus disease outbreaks (Paige et al., 2014; Allen et al., 2017; Pigott et al., 2017). However, as the 26 Middle East respiratory syndrome coronavirus (MERS-CoV) and COVID-19 pandemics have shown, there 27 are multiple hotspots of viruses with pandemic potential globally, many of which are not in Africa. Thus, 28 labelling African rainforests as unique ‘hotspots’ undermines global health work and pandemic 29 preparedness. 30 31 [END BOX 9.6 HERE] 32 33 34 9.10.2.2.2 HIV 35 Observed impacts 36 Although levels of new HIV infections declined sharply during the last decade, still more than a million 37 adults and children become infected each year (UNAIDS, 2020). Climate influences on HIV are 38 predominately indirect such as through heightened migration due to climate variability, or extreme weather 39 events leading to increased transactional sex to replace lost sources of income. Changes in climate affect 40 each of the main drivers of HIV transmission in women, including poverty, inequity and gender-based 41 violence (Burke et al., 2015a; Loevinsohn, 2015; Fiorella et al., 2019). 42 43 Projected risks 44 ‘Oscillating’ or ‘circular’ migration for migrant workers in urban and mining centres drove HIV transmission 45 in the 1990s and 2000s (Lurie, 2006), and climate-related displacement may have similar effects (see Box 46 9.7) (Gray and Mueller, 2012; Loevinsohn, 2015; Low et al., 2019). Food insecurity and nutritional 47 deficiencies, projected to increase with increasingly variable climates, has been shown to increase sexual 48 risk-taking and migration, as well as increase susceptibility to other infections (Lieber et al., 2021). Projected 49 increases in exposure to infectious diseases pose considerable threats to HIV-infected people who may 50 already have compromised immune function. Additionally, reduced lung function in people with HIV from 51 previous tuberculosis infection may put them at high risk for morbidity and death during extreme heat 52 (Abayomi and Cowan, 2014). Moreover, extreme weather events accompanied by damage to health system 53 infrastructure could compromise the continuity of antiretroviral treatment (Weiser et al., 2010; Pozniak et al., 54 2020). 55 56
ACCEPTED VERSIO
N
SUBJECT TO FIN
AL EDITS
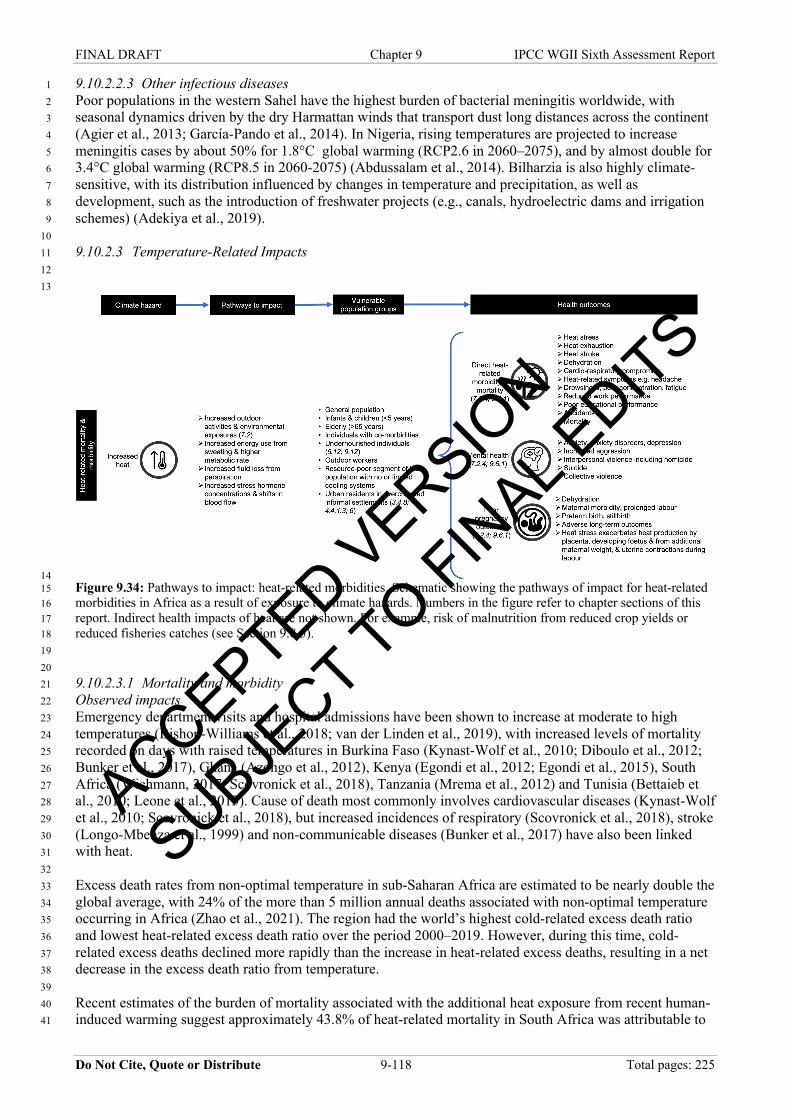
FINAL DRAFT Chapter 9 IPCC WGII Sixth Assessment Report
Do Not Cite, Quote or Distribute 9-118 Total pages: 225
9.10.2.2.3 Other infectious diseases 1 Poor populations in the western Sahel have the highest burden of bacterial meningitis worldwide, with 2 seasonal dynamics driven by the dry Harmattan winds that transport dust long distances across the continent 3 (Agier et al., 2013; García-Pando et al., 2014). In Nigeria, rising temperatures are projected to increase 4 meningitis cases by about 50% for 1.8°C global warming (RCP2.6 in 2060–2075), and by almost double for 5 3.4°C global warming (RCP8.5 in 2060-2075) (Abdussalam et al., 2014). Bilharzia is also highly climate-6 sensitive, with its distribution influenced by changes in temperature and precipitation, as well as 7 development, such as the introduction of freshwater projects (e.g., canals, hydroelectric dams and irrigation 8 schemes) (Adekiya et al., 2019). 9 10 9.10.2.3 Temperature-Related Impacts 11 12 13
14 Figure 9.34: Pathways to impact: heat-related morbidities. Schematic showing the pathways of impact for heat-related 15 morbidities in Africa as a result of exposure to climate hazards. Numbers in the figure refer to chapter sections of this 16 report. Indirect health impacts of heat are not shown. For example, risk of malnutrition from reduced crop yields or 17 reduced fisheries catches (see Section 9.8.5). 18 19 20 9.10.2.3.1 Mortality and morbidity 21 Observed impacts 22 Emergency department visits and hospital admissions have been shown to increase at moderate to high 23 temperatures (Bishop-Williams et al., 2018; van der Linden et al., 2019), with increased levels of mortality 24 recorded on days with raised temperatures in Burkina Faso (Kynast-Wolf et al., 2010; Diboulo et al., 2012; 25 Bunker et al., 2017), Ghana (Azongo et al., 2012), Kenya (Egondi et al., 2012; Egondi et al., 2015), South 26 Africa (Wichmann, 2017; Scovronick et al., 2018), Tanzania (Mrema et al., 2012) and Tunisia (Bettaieb et 27 al., 2010; Leone et al., 2013). Cause of death most commonly involves cardiovascular diseases (Kynast-Wolf 28 et al., 2010; Scovronick et al., 2018), but increased incidences of respiratory (Scovronick et al., 2018), stroke 29 (Longo-Mbenza et al., 1999) and non-communicable diseases (Bunker et al., 2017) have also been linked 30 with heat. 31 32 Excess death rates from non-optimal temperature in sub-Saharan Africa are estimated to be nearly double the 33 global average, with 24% of the more than 5 million annual deaths associated with non-optimal temperature 34 occurring in Africa (Zhao et al., 2021). The region had the world’s highest cold-related excess death ratio 35 and lowest heat-related excess death ratio over the period 2000–2019. However, during this time, cold-36 related excess deaths declined more rapidly than the increase in heat-related excess deaths, resulting in a net 37 decrease in the excess death ratio from temperature. 38 39 Recent estimates of the burden of mortality associated with the additional heat exposure from recent human-40 induced warming suggest approximately 43.8% of heat-related mortality in South Africa was attributable to 41
ACCEPTED VERSIO
N
SUBJECT TO FIN
AL EDITS

FINAL DRAFT Chapter 9 IPCC WGII Sixth Assessment Report
Do Not Cite, Quote or Distribute 9-119 Total pages: 225
anthropogenic climate change from 1991–2018 (Vicedo-Cabrera et al., 2021). In many of South Africa’s 52 1 districts, this equates to dozens of deaths per year. The elderly and children under five years are most 2 vulnerable to heat exposure (Sewe et al., 2015; Scovronick et al., 2018). 3 4 Projected risks 5 Globally, Africa is predicted to suffer disproportionately higher all-cause mortality risk from higher 6 temperature-related all-cause mortality from global warming, compared to temperate, Northern Hemisphere 7 countries (Carleton et al., 2018). The number of days projected to exceed potentially lethal heat thresholds 8 per year reaches 50–150 days in West Africa at 1.6°C global warming, up to 200 days in West Africa and 9 100–150 days in Central Africa and parts of coastal East Africa at 2.5°C, and over 200 days for parts of 10 West, Central and East Africa for >4°C global warming (Mora et al., 2017) (see Sections 9.5.3–7; Figure 11 9.15). Projected rates of heat-related mortality among people in the Middle East and North Africa who are 12 older than 65 years increase by 8–20 fold in 2070–2099, compared with 1951–2005, based on RCP4.5 and 13 RCP8.5 (both at >2°C global warming) (Ahmadalipour and Moradkhani, 2018). 14 15 Temperature-related mortality across Africa is projected to escalate with global warming, reaching 50–180 16 additional deaths per 100,000 people annually in regions of North, West, and East Africa for 2.5°C global 17 warming, and increasing to 200-600 per 100,000 people annually for 4.4°C global warming (Carleton et al., 18 2018) (Figure 9.35). However, some regions that currently experience cold-related mortality (e.g., Lesotho 19 and Ethiopian highlands) are projected to have reduced temperature-related mortality risk from warming. 20 Greenhouse gas mitigation is projected to save tens of thousands of lives: limiting warming to RCP4.5 21 (2.5°C) rather than RCP8.5 (4.4°C) at the end of the century is projected to avoid on average 71 deaths per 22 100,000 people annually across Africa with larger reductions in risk in North, West, Central and parts of East 23 Africa (Figure 9.35). The cost of mitigating heat stress using energy-intensive cooling methods is expected 24 to be to be unachievable for many African countries (Parkes et al., 2019) (see Section 9.9.4). 25 26 27
ACCEPTED VERSIO
N
SUBJECT TO FIN
AL EDITS
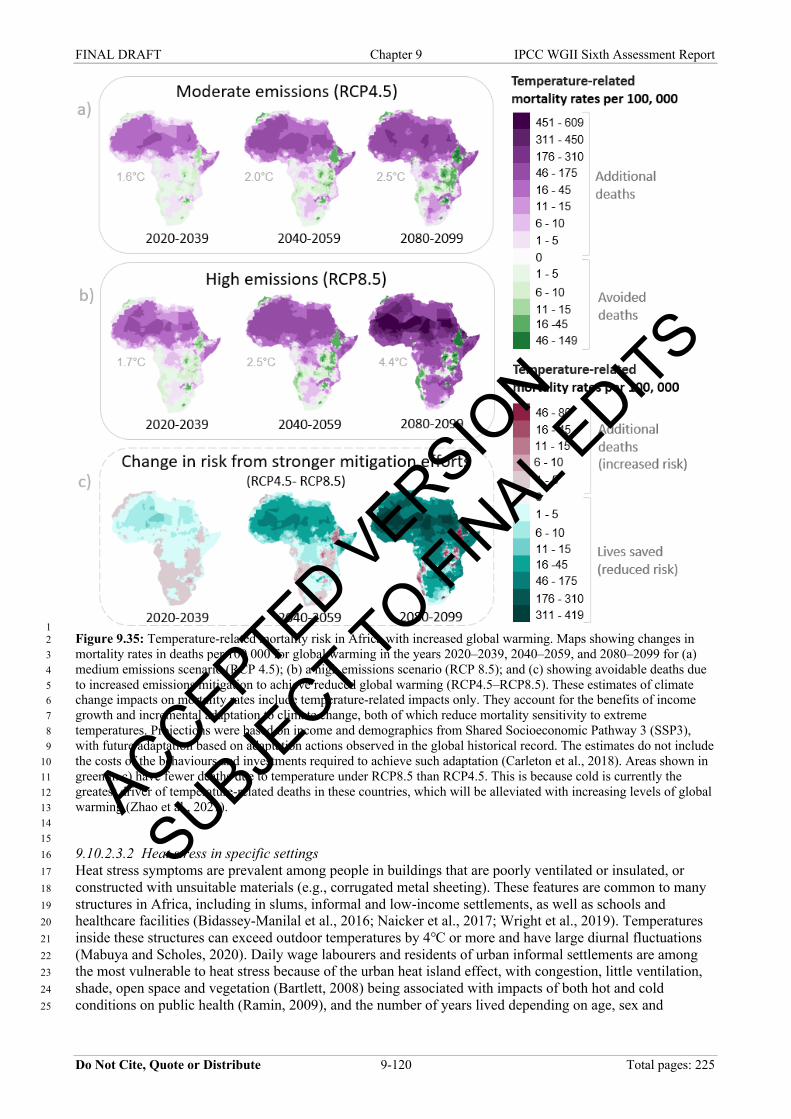
FINAL DRAFT Chapter 9 IPCC WGII Sixth Assessment Report
Do Not Cite, Quote or Distribute 9-120 Total pages: 225
1 Figure 9.35: Temperature-related mortality risk in Africa with increased global warming. Maps showing changes in 2 mortality rates in deaths per 100 000 for global warming in the years 2020–2039, 2040–2059, and 2080–2099 for (a) 3 medium emissions scenario (RCP 4.5); (b) a high emissions scenario (RCP 8.5); and (c) showing avoidable deaths due 4 to increased emissions mitigation to achieve reduced global warming (RCP4.5–RCP8.5). These estimates of climate 5 change impacts on mortality rates include temperature-related impacts only. They account for the benefits of income 6 growth and incremental adaptation to climate change, both of which reduce mortality sensitivity to extreme 7 temperatures. Projections were based on income and demographics from Shared Socioeconomic Pathway 3 (SSP3), 8 with future adaptation based on adaptation actions observed in the global historical record. The estimates do not include 9 the costs of the behaviours and investments required to achieve such adaptation (Carleton et al., 2018). Areas shown in 10 green in c) have fewer deaths due to temperature under RCP8.5 than RCP4.5. This is because cold is currently the 11 greatest driver of temperature-related deaths in these countries, which will be alleviated with increasing levels of global 12 warming (Zhao et al., 2021). 13 14 15 9.10.2.3.2 Heat stress in specific settings 16 Heat stress symptoms are prevalent among people in buildings that are poorly ventilated or insulated, or 17 constructed with unsuitable materials (e.g., corrugated metal sheeting). These features are common to many 18 structures in Africa, including in slums, informal and low-income settlements, as well as schools and 19 healthcare facilities (Bidassey-Manilal et al., 2016; Naicker et al., 2017; Wright et al., 2019). Temperatures 20 inside these structures can exceed outdoor temperatures by 4℃ or more and have large diurnal fluctuations 21 (Mabuya and Scholes, 2020). Daily wage labourers and residents of urban informal settlements are among 22 the most vulnerable to heat stress because of the urban heat island effect, with congestion, little ventilation, 23 shade, open space and vegetation (Bartlett, 2008) being associated with impacts of both hot and cold 24 conditions on public health (Ramin, 2009), and the number of years lived depending on age, sex and 25
ACCEPTED VERSIO
N
SUBJECT TO FIN
AL EDITS

FINAL DRAFT Chapter 9 IPCC WGII Sixth Assessment Report
Do Not Cite, Quote or Distribute 9-121 Total pages: 225
comorbidities (Egondi et al., 2015). Temperature extremes are likely to result in relatively more deaths in 1 informal settlements than in other settlement types (Scovronick and Armstrong, 2012). 2 3 The urban heat island effect exacerbates current and projected heat stress in Africa’s rapidly growing cities 4 (Mitchell, 2016) and is discussed in more detail in Section 9.9.3. 5 6 Escalating temperatures and longer-duration heatwaves are likely to heavily affect workers already exposed 7 to extreme temperatures, e.g., outdoor workers (Kjellstrom et al., 2018) and miners (El-Shafei et al., 2018; 8 Nunfam et al., 2019a; Nunfam et al., 2019b). Vulnerability may also be high for women who cook food for a 9 living, and children who accompany them, due to prolonged exposure to high temperatures (Parmar et al., 10 2019). Prisons, commonly poorly ventilated and overcrowded, are also high-risk settings (Van Hout and 11 Mhlanga-Gunda, 2019). 12 13 9.10.2.3.3 Maternal and child health 14 15 Exposure to high temperatures during pregnancy has been linked with adverse birth outcomes, including 16 stillbirths or miscarriages (Asamoah et al., 2018) and long-term behavioural and developmental deficiencies 17 (Duchoslav, 2017; MacVicar et al., 2017). 18 19 9.10.2.4 Impacts of Extreme Weather 20 21 During extreme conditions, for example, Cyclone Kenneth (Codjoe et al., 2020) and El Niño 2015-2016 22 (WHO, 2016; Pozniak et al., 2020), direct physical injury, loss of life, destruction of property and population 23 displacement can occur. Flooding and landslides are common after extreme rainfall and are the most 24 frequently described impact of climate variability in Africa’s cities currently, with residents of poorly 25 serviced or informal settlements most vulnerable (Hunter et al., 2020). Post-traumatic stress disorders in 26 affected individuals are common, including in children (Rother, 2020). In rural areas, the resulting damage to 27 health facilities, access routes and transport services can severely compromise health service delivery 28 (WHO, 2016). The effects of extreme weather on urban health infrastructure depends on the characteristics, 29 location and adaptive capacity of cities (see Section 9.9.4). 30 31 9.10.2.5 Malnutrition 32 33 Observed impacts 34 Africa has experienced the greatest impacts of climate change on acute food insecurity and malnutrition 35 (FAO and ECA, 2018). Adverse climatic conditions exacerbate the impacts of an unstable global economy, 36 conflict and pandemics on food insecurity (AfDB, 2018b; Food Security Information Network (FSIN), 2019; 37 Fore et al., 2020) (see Chapter 5, Section 5.12.4). 38 39 More than 250 million Africans are undernourished, mostly in Central and East Africa (FAO et al., 2020), 40 which increases childhood stunting, affects cognition and has trans-generational sequelae (IFPRI, 2016; 41 UNICEF et al., 2019). Undernutrition is strongly linked with hot climates (Hagos et al., 2014; Tusting et al., 42 2020). In Burkina Faso, low crop yields resulted in around 110 deaths per 10,000 children under five, with 43 72% of this impact attributable to adverse climate conditions in the growing season (Belesova et al., 2019). 44 45 Increasing incidence and expanded distributions of vector-borne livestock diseases (e.g., bluetongue, 46 trypanosomiasis and Rift Valley Fever) in response to changes in rainfall and increasing temperatures, 47 undermine food security, especially among subsistence farmers (Samy and Peterson, 2016; Caminade et al., 48 2019). Locust infestations linked with changes in climate (Salih et al., 2020) are a major risk for food 49 security in Africa. 50 51 Projected risks 52 Projected risks for malnutrition in Africa are high (FAO, 2016) (see Section 9.8.1): 433 million people in 53 Africa are anticipated to be undernourished by 2030 (FAO et al., 2020) and, compared to 1961–1990, 1.4 54 million additional African children will suffer from severe stunting by 2050 under 2.1°C global warming 55 (WHO, 2014). In Burkina Faso, the mortality burden due to low crop yields could double by 2100 with 56 1.5°C of global warming (Belesova et al., 2019). Drought risks will include crop and livestock failures 57
ACCEPTED VERSIO
N
SUBJECT TO FIN
AL EDITS
FINAL DRAFT Chapter 9 IPCC WGII Sixth Assessment Report
Do Not Cite, Quote or Distribute 9-122 Total pages: 225
(Ahmadalipour et al., 2019). Additionally, increasing concentrations of atmospheric CO2 will affect the 1 nutritional quality of C3 plant staples, lowering levels of protein and minerals like zinc and iron (Myers et al., 2 2014; Weyant et al., 2018). Declining fish catches due to ocean warming, illegal fishing and poor stock 3 management are projected to increase deficiencies of zinc, iron and vitamin A for millions of people across 4 Mozambique, Angola and multiple West African countries (Golden et al., 2016) (see Section 9.8.5). 5 6 9.10.2.6 Non-Communicable Diseases and Mental Health 7 8 Links between climate change and the environmental risk factors for non-communicable diseases (NCDs) 9 may be direct (e.g., extreme heat exposure in people with cardiovascular disease) or indirect, such as via the 10 global agriculture and food industry (Landrigan et al., 2018). These effects are largely unreported for Africa 11 (Amegah et al., 2016), where the burden of many NCDs is growing rapidly with increasing urbanisation and 12 pollution (Rother, 2020). 13 14 Many urban poor populations have unhealthy dietary practices, which present major risks for obesity, type II 15 diabetes and hypertension. Paradoxically, despite growing levels of undernutrition, the incidence of 16 overweight and obesity continues to rise in Africa, particularly in children under five from the northern and 17 southern parts of the continent (FAO and ECA, 2018). Diabetes is increasingly prevalent and outcomes may 18 worsen if climate change undermines health infrastructure and the range of available foods (Keeling et al., 19 2012; Kula et al., 2013; Chersich and Wright, 2019). 20 21 The relationship between cancer and climate change is complex and indirect. Changing temperature and 22 humidity may alter the distribution of Aflatoxin-producing fungi, contaminating food (grains, maize) and 23 causing cancer (see Box 5.9 in Chapter 5) (Sserumaga et al., 2020; Valencia-Quintana et al., 2020). Severe 24 storms and flooding may disrupt wastewater treatment or disposal, potentially contaminating drinking water 25 with carcinogenic substances. 26 27 Areas with low service provision (e.g., informal settlements in Africa) suffer from increased infestations of 28 pests such as flies, cockroaches, rats, bedbugs and lice, which may be controlled by chemical pesticides 29 (Rother et al., 2020) and may become more prevalent with a changing climate (Mafongoya et al., 2019). 30 Inappropriate pesticide use and disposal cause endocrine disruption and increased incidences of some 31 cancers (Rother et al., 2020). 32 33 9.10.2.6.1 Mental health and well-being 34 Mental health and well-being are affected by local climate conditions and are therefore sensitive to climate 35 change (Burke et al., 2018b; Obradovich et al., 2018). High temperatures are strongly associated with poor 36 mental health and suicide in South Africa (Kim et al., 2019). Exposure to extreme heat directly influences 37 emotional control, aggression and violent behaviour, escalating rates of interpersonal violence, with 38 homicides rising by as much as 18% in South Africa when temperatures are above 30℃ compared with 39 temperatures below 20℃ (Burke et al., 2015a; Chersich et al., 2019b; Gates et al., 2019). 40 41 Extreme weather events are often severely detrimental to mental health (Scheerens et al., 2020), with 42 elevated rates of anxiety, post-traumatic stress disorder and depression in impacted individuals (Schlenker 43 and Lobell, 2010; Nuvey et al., 2020). Youth may be at especially high risk (Barkin et al., 2021). 44 45 Loss of livestock from disease or lack of pastures is strongly linked with poor mental health among farmers 46 (Nuvey et al., 2020). Climate change impacts on mental health among refugees is concerning but remains 47 under-researched (Matlin et al., 2018). 48 49 9.10.2.7 Air Quality-Related Health Impacts 50 51 Links between air quality and climate change are complex (Smith et al., 2014; Szopa et al., 2021). Increases 52 in particulate matter concentrations are driven more by vehicle emissions, solid waste, biomass burning and 53 development (Abera et al., 2021) than by climate change, and these factors vary widely across regions of the 54 continent (West et al., 2013). Women and children who are exposed to high particulate matter concentrations 55 when cooking indoors and HIV-infected people are more vulnerable to the health impacts of air pollution 56 (Abera et al., 2021). Information on the direction of change of air quality in different African regions 57
ACCEPTED VERSIO
N
SUBJECT TO FIN
AL EDITS
FINAL DRAFT Chapter 9 IPCC WGII Sixth Assessment Report
Do Not Cite, Quote or Distribute 9-123 Total pages: 225
attributable to climate change are contradictory (Westervelt et al., 2016; Silva et al., 2017). Additionally, 1 much uncertainty remains about interactions between air quality and climate change and relative impacts of 2 different modes of development and climate change on pollutants. However, increasing temperatures 3 combined with a reduction in rainfall are likely to increase particulate matter concentrations (Abera et al., 4 2021), particularly in North Africa (Westervelt et al., 2016; Silva et al., 2017). 5 6 Nevertheless, continued dependence on fossil-fuelled power plants will result in tens of thousands of 7 avoidable deaths due to air pollution by 2030 (Marais and Wiedinmyer, 2016), and accelerate climate 8 change. Actions to reduce air pollution can both mitigate climate change and have major co-benefits for 9 health (West et al., 2013; Rao et al., 2016; Markandya et al., 2018; Rauner et al., 2020a; Rauner et al., 10 2020b) (see also AR6 WGIII, Chapters 3, 4, 8 and 10). Investing in renewable energy resources rather than 11 reliance on the combustion of fossil fuels would mark an important step forward for African population 12 health (Marais et al., 2019). This is especially important in South Africa which emits approximately half the 13 total carbon emissions for Africa, ranking 12th in the world for carbon emissions (Mohsin et al., 2019). 14 15 Dust events in West Africa have severe health impacts (cardiorespiratory and infectious diseases, including 16 meningitis) (Ayanlade et al., 2020) given the proximity of the Sahara, which produces about half of the 17 yearly global mineral dust (de Longueville et al., 2013). Wildfires are projected to become the main source 18 of particulate matter in West, Central and southern Africa under both the lowest and highest future emissions 19 scenarios, whereas, under intermediate scenarios (i.e., SSP3/RCP4.5), anthropogenic sources of particulate 20 matter are projected to exceed that produced by wildfires (Knorr et al., 2017). 21 22 23 [START BOX 9.7 HERE] 24 25 Box 9.7: The Health-Climate Change Nexus in Africa 26 27 The intersections between climate change and human health are involve interactions of numerous systems 28 and sectors (Lindley et al., 2019; Yokohata et al., 2019). This complexity means that holistic, 29 transdisciplinary and cross-sectoral (systems) approaches like One Health, EcoHealth and Planetary Health 30 can improve the long-term effectiveness of responses to health risks (Zinsstag, 2012; Whitmee et al., 2015; 31 Nantima et al., 2019). More research is needed to identify sustainable solutions (Rother et al., 2020), as 32 recently re-emphasised by the Intergovernmental Panel on Biodiversity in its report on the COVID-19 33 pandemic (IPBES, 2020). The close dependency of many Africans on their livestock and surrounding 34 ecosystems forms a context where integrated health approaches are especially critical for addressing climate 35 change risks to health (Figure Box 9.7.1) (Watts et al., 2015; Cissé, 2019). 36 37 38
ACCEPTED VERSIO
N
SUBJECT TO FIN
AL EDITS

FINAL DRAFT Chapter 9 IPCC WGII Sixth Assessment Report
Do Not Cite, Quote or Distribute 9-124 Total pages: 225
1 Figure Box 9.7.1: Human, ecosystem and animal health are intimately interlinked, and require transdisciplinary 2 approaches such as One Health, EcoHealth and Planetary Health for effective, sustainable, long-term management. This 3 schematic shows some examples of these interlinkages, and how they impact human health, highlighting the complex 4 interactions and the importance of holistic, systems approaches to health interventions, including for climate change 5 adaptation. Supporting literature: 1 (Egoh et al., 2012); 2 (Wangai et al., 2016); 3 (Failler et al., 2018); 4 (Ifejika 6 Speranza, 2010); 5 (Brancalion et al., 2020); 6 (Bloomfield et al., 2020); 7 (Rojas-Downing et al., 2017). 7 8 9 Integrated approaches to health in Africa can deliver multiple benefits for humans and ecosystems For 10 example, rather than addressing micronutrient deficiencies with supplements, which may not be accepted 11 culturally and can be disrupted by stockouts or similar, addressing nutrient deficiencies in staple crops by 12 selecting or breeding more nutritious varieties (e.g., orange-fleshed sweet potatoes or ‘golden rice’ for 13 vitamin A deficiency) may prove to be more sustainable options (Datta et al., 2003; Nair et al., 2016; Laurie 14 et al., 2018; Oduor et al., 2019; Stokstad, 2019). Additionally, some micro- or macronutrient deficiencies and 15 food insecurities may be improved by addressing the depletion of soils through better management, 16 including the incorporation of holistic, sustainable principles, such as those promoted by agroforestry or 17 regenerative agriculture (Rhodes, 2017; Elevitch et al., 2018; LaCanne and Lundgren, 2018) (5.12.4). 18 19 [END BOX 9.7 HERE] 20 21 22 9.10.3 Adaptation for Health and Well-Being in Africa 23 24 In this section, we focus on adaptation actions that are well-documented or shown to have the potential for 25 substantially improving health or well-being. These adaptation options are assessed in Figure 9.36 and Table 26 9.11. 27 28 In Africa, adaptive responses have begun to be implemented by local, national and international entities (Ebi 29 and Otmani Del Barrio, 2017). With strong leadership, these initiatives can be used as an opportunity for 30 comprehensive, transformative change rather than incremental improvements to existing systems. Adaptation 31 responses are necessarily context-specific and can focus on providing services for vulnerable and high-risk 32 populations (Dumenu and Obeng, 2016; Herslund et al., 2016). 33 34
ACCEPTED VERSIO
N
SUBJECT TO FIN
AL EDITS
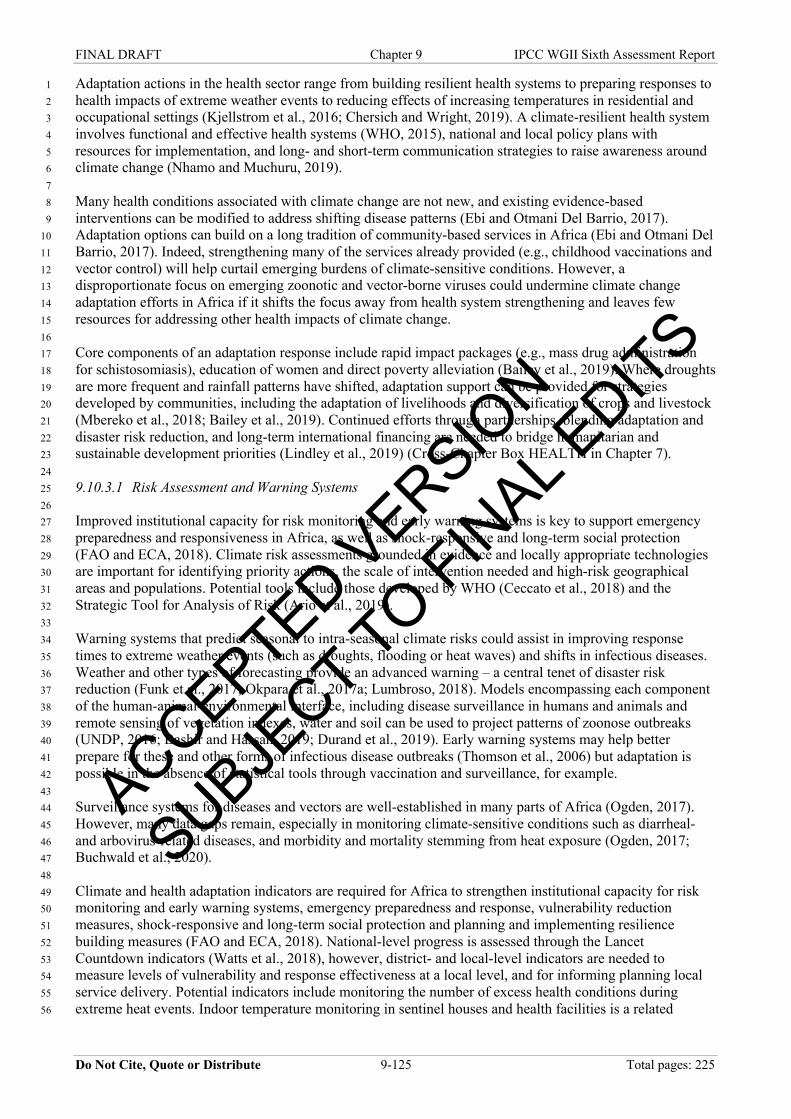
FINAL DRAFT Chapter 9 IPCC WGII Sixth Assessment Report
Do Not Cite, Quote or Distribute 9-125 Total pages: 225
Adaptation actions in the health sector range from building resilient health systems to preparing responses to 1 health impacts of extreme weather events to reducing effects of increasing temperatures in residential and 2 occupational settings (Kjellstrom et al., 2016; Chersich and Wright, 2019). A climate-resilient health system 3 involves functional and effective health systems (WHO, 2015), national and local policy plans with 4 resources for implementation, and long- and short-term communication strategies to raise awareness around 5 climate change (Nhamo and Muchuru, 2019). 6 7 Many health conditions associated with climate change are not new, and existing evidence-based 8 interventions can be modified to address shifting disease patterns (Ebi and Otmani Del Barrio, 2017). 9 Adaptation options can build on a long tradition of community-based services in Africa (Ebi and Otmani Del 10 Barrio, 2017). Indeed, strengthening many of the services already provided (e.g., childhood vaccinations and 11 vector control) will help curtail emerging burdens of climate-sensitive conditions. However, a 12 disproportionate focus on emerging zoonotic and vector-borne viruses could undermine climate change 13 adaptation efforts in Africa if it shifts the focus away from health system strengthening and leaves few 14 resources for addressing other health impacts of climate change. 15 16 Core components of an adaptation response include rapid impact packages (e.g., mass drug administration 17 for schistosomiasis), education of women and direct poverty alleviation (Bailey et al., 2019). Where droughts 18 are more frequent and rainfall patterns have shifted, adaptation support can be provided for strategies 19 developed by communities, including the adaptation of livelihoods and diversification of crops and livestock 20 (Mbereko et al., 2018; Bailey et al., 2019). Continued efforts through partnerships, blending adaptation and 21 disaster risk reduction, and long-term international financing are needed to bridge humanitarian and 22 sustainable development priorities (Lindley et al., 2019) (Cross-Chapter Box HEALTH in Chapter 7). 23 24 9.10.3.1 Risk Assessment and Warning Systems 25 26 Improved institutional capacity for risk monitoring and early warning systems is key to support emergency 27 preparedness and responsiveness in Africa, as well as shock-responsive and long-term social protection 28 (FAO and ECA, 2018). Climate risk assessments grounded in evidence and locally appropriate technologies 29 are important for identifying priority actions, the scale of intervention needed and high-risk geographical 30 areas and populations. Potential tools include those developed by WHO (Ceccato et al., 2018) and the 31 Strategic Tool for Analysis of Risk (Ario et al., 2019). 32 33 Warning systems that predict seasonal to intra-seasonal climate risks could assist in improving response 34 times to extreme weather events (such as droughts, flooding or heat waves) and shifts in infectious diseases. 35 Weather and other types of forecasting provide an advanced warning – a central tenet of disaster risk 36 reduction (Funk et al., 2017; Okpara et al., 2017a; Lumbroso, 2018). Models encompassing each component 37 of the human-animal-environmental interface, including disease surveillance in humans and animals and 38 remote sensing of vegetation indexes, water and soil can be used to project patterns of zoonose outbreaks 39 (UNDP, 2016; Bashir and Hassan, 2019; Durand et al., 2019). Early warning systems may help better 40 prepare for these and other forms of infectious disease outbreaks (Thomson et al., 2006) but adaptation is 41 possible in the absence of statistical tools through vaccination and surveillance, for example. 42 43 Surveillance systems for diseases and vectors are well-established in many parts of Africa (Ogden, 2017). 44 However, many data gaps remain, especially in monitoring climate-sensitive conditions such as diarrheal- 45 and arbovirus-related diseases, and morbidity and mortality stemming from heat exposure (Ogden, 2017; 46 Buchwald et al., 2020). 47 48 Climate and health adaptation indicators are required for Africa to strengthen institutional capacity for risk 49 monitoring and early warning systems, emergency preparedness and response, vulnerability reduction 50 measures, shock-responsive and long-term social protection and planning and implementing resilience 51 building measures (FAO and ECA, 2018). National-level progress is assessed through the Lancet 52 Countdown indicators (Watts et al., 2018), however, district- and local-level indicators are needed to 53 measure levels of vulnerability and response effectiveness at a local level, and for informing planning local 54 service delivery. Potential indicators include monitoring the number of excess health conditions during 55 extreme heat events. Indoor temperature monitoring in sentinel houses and health facilities is a related 56
ACCEPTED VERSIO
N
SUBJECT TO FIN
AL EDITS

FINAL DRAFT Chapter 9 IPCC WGII Sixth Assessment Report
Do Not Cite, Quote or Distribute 9-126 Total pages: 225
indicator (Ebi and Otmani Del Barrio, 2017), linked with threshold temperature levels at which health 1 impacts occur, and the ability of the built environment to protect against these impacts (e.g., for heatwaves). 2 3 Measuring climate-health linkages is challenging due to the considerable diversity of the exposures, impacts 4 and outcomes, as well as constraints in key technical areas. Increasing our understanding of this diversity and 5 how this is influenced by adaptative changes is a major knowledge gap. This could be facilitated through a 6 pan-African database of climate and other environmental exposures, together with real-time statistical 7 support for analyses of climate and health associations. 8 9 9.10.3.2 Community Engagement 10 11 Increased awareness can facilitate community engagement and action (see Section 9.4.3). In Ghana, for 12 example, local communities understand the climate hazards that drive outbreaks of meningitis and adapt 13 accordingly by improving housing to limit heat and exposure, changing funeral practices during outbreaks, 14 increased vaccination uptake and afforestation (Codjoe and Nabie, 2014). Similarly, participation in 15 community organisations improved child nutrition in vulnerable rural households in Eswatini (Anchang et 16 al., 2019). Interventions specifically targeting women are beneficial for food security, although they may be 17 undermined by harmful gender norms in communities that are patriarchal, led by chiefs or have high rates of 18 gender-based violence (Jaka and Shava, 2018; Kita, 2019; Masson et al., 2019). The BRACED project in 19 Burkina Faso and Ethiopia specifically adopted a gender-transformative approach as an integral part of 20 resilience-building (McOmber et al., 2019). Improving ‘climate literacy’ could empower youth, women and 21 men to be active citizens in promoting adherence of governments to international agreements in climate 22 change (Mudombi et al., 2017; Chersich et al., 2019a). 23 24 9.10.3.3 9.10.3.1Health Financing 25 26 Poor and low-income households often are not able to afford high out-of-pocket costs for medical care, or it 27 consumes a large portion of their income. As a result, without financial aid, peoples’ health needs may not be 28 met after a climate shock (Hallegatte and Rozenberg, 2017). Microfinance (the provision of small-scale 29 financial products to low income and otherwise disadvantaged groups by financial institutions) and disaster 30 contingency funds can serve to reduce health risks of climate change for low-income communities 31 (Agrawala and Carraro, 2010; Ozaki, 2016), as can different forms of insurance and disaster relief (Fenton et 32 al., 2015; Dowla, 2018). Unconditional cash transfers in Kenya, Uganda and Zambia assisted vulnerable 33 groups to absorb the negative impacts of climate-related shocks or stress and to prepare for these (Lawlor et 34 al., 2019; Ulrichs et al., 2019). Based on several case studies in Africa, the Food and Agriculture 35 Organization recommends a ‘Cash+’ approach which combines cash transfers with productive assets, inputs 36 or technical training to address the needs of vulnerable households in emergency situations, and enhance 37 livelihoods potential, income generation and food security (FAO, 2017). New economic models have been 38 implemented in North Africa, focused on poor households, youth and women that enable access to credit and 39 support the implementation of policies that balance cash and food crops, social safety nets and social 40 protection (Mumtaz and Whiteford, 2017; Narayanan and Gerber, 2017) (see also Sections 9.4, 9.8 and 41 9.11). 42 43 9.10.3.4 Disease-Specific Adaptations 44 45 Adaptation to prevent malaria 46 Increasing distribution and coverage of long-lasting insecticide-treated bed nets, improved diagnostic tests 47 and increasing health service access could mitigate the impacts of climate change on malaria if aligned with 48 the predicted or actual burden of malaria (medium confidence) (Kienberger and Hagenlocher, 2014; Thwing 49 et al., 2017). Understanding seasonal shifts in malaria transmission suitability as a result of climate change 50 can guide more targeted seasonal public health responses and better planning for different types of 51 management and control interventions based on the impact. For example, an increase in the number of 52 months where climate conditions are suitable for mosquito survival will require public health responses for 53 an extended period of time (Ryan et al., 2020). 54 55 In malaria-endemic areas, repeated malaria infections can provide temporary immunity, which reduces new 56 clinical cases (Laneri et al., 2015; Yamana et al., 2016). Conversely, where people have little or no 57
ACCEPTED VERSIO
N
SUBJECT TO FIN
AL EDITS
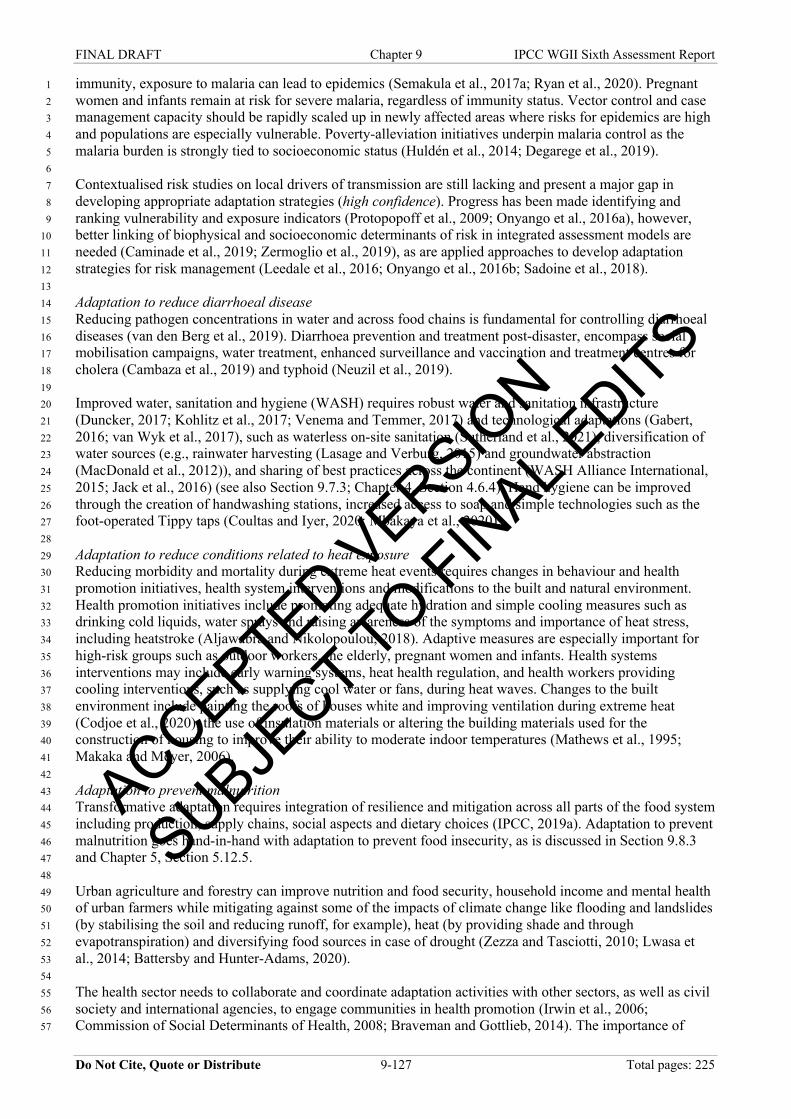
FINAL DRAFT Chapter 9 IPCC WGII Sixth Assessment Report
Do Not Cite, Quote or Distribute 9-127 Total pages: 225
immunity, exposure to malaria can lead to epidemics (Semakula et al., 2017a; Ryan et al., 2020). Pregnant 1 women and infants remain at risk for severe malaria, regardless of immunity status. Vector control and case 2 management capacity should be rapidly scaled up in newly affected areas where risks for epidemics are high 3 and populations are especially vulnerable. Poverty-alleviation initiatives underpin malaria control as the 4 malaria burden is strongly tied to socioeconomic status (Huldén et al., 2014; Degarege et al., 2019). 5 6 Contextualised risk studies on local drivers of transmission are still lacking and present a major gap in 7 developing appropriate adaptation strategies (high confidence). Progress has been made identifying and 8 ranking vulnerability and exposure indicators (Protopopoff et al., 2009; Onyango et al., 2016a), however, 9 better linking of biophysical and socioeconomic determinants of risk in integrated assessment models are 10 needed (Caminade et al., 2019; Zermoglio et al., 2019), as are applied approaches to develop adaptation 11 strategies for risk management (Leedale et al., 2016; Onyango et al., 2016b; Sadoine et al., 2018). 12 13 Adaptation to reduce diarrhoeal disease 14 Reducing pathogen concentrations in water and across food chains is fundamental for controlling diarrhoeal 15 diseases (van den Berg et al., 2019). Diarrhoea prevention and treatment post-disaster, encompass social 16 mobilisation campaigns, water treatment, enhanced surveillance and vaccination and treatment centres for 17 cholera (Cambaza et al., 2019) and typhoid (Neuzil et al., 2019). 18 19 Improved water, sanitation and hygiene (WASH) requires robust water and sanitation infrastructure 20 (Duncker, 2017; Kohlitz et al., 2017; Venema and Temmer, 2017) and technological adaptations (Gabert, 21 2016; van Wyk et al., 2017), such as waterless on-site sanitation (Sutherland et al., 2021), diversification of 22 water sources (e.g., rainwater harvesting (Lasage and Verburg, 2015) and groundwater abstraction 23 (MacDonald et al., 2012)), and sharing of best practices across the continent (WASH Alliance International, 24 2015; Jack et al., 2016) (see also Section 9.7.3; Chapter 4, Section 4.6.4). Hand hygiene can be improved 25 through the creation of handwashing stations, increased access to soap and simple technologies such as the 26 foot-operated Tippy taps (Coultas and Iyer, 2020; Mbakaya et al., 2020). 27 28 Adaptation to reduce conditions related to heat exposure 29 Reducing morbidity and mortality during extreme heat events requires changes in behaviour and health 30 promotion initiatives, health system interventions and modifications to the built and natural environment. 31 Health promotion initiatives include promoting adequate hydration and simple cooling measures such as 32 drinking cold liquids, water sprays and raising awareness of the symptoms and importance of heat stress, 33 including heatstroke (Aljawabra and Nikolopoulou, 2018). Adaptive measures are especially important for 34 high-risk groups such as outdoor workers, the elderly, pregnant women and infants. Health systems 35 interventions may include early warning systems, heat health regulation, and health workers providing 36 cooling interventions, such as supplying cool water or fans, during heat waves. Changes to the built 37 environment include painting the roofs of houses white and improving ventilation during extreme heat 38 (Codjoe et al., 2020), the use of insulation materials or altering the building materials used for the 39 construction of housing to improve their ability to moderate indoor temperatures (Mathews et al., 1995; 40 Makaka and Meyer, 2006). 41 42 Adaptation to prevent malnutrition 43 Transformative adaptation requires integration of resilience and mitigation across all parts of the food system 44 including production, supply chains, social aspects and dietary choices (IPCC, 2019a). Adaptation to prevent 45 malnutrition goes hand-in-hand with adaptation to prevent food insecurity, as is discussed in Section 9.8.3 46 and Chapter 5, Section 5.12.5. 47 48 Urban agriculture and forestry can improve nutrition and food security, household income and mental health 49 of urban farmers while mitigating against some of the impacts of climate change like flooding and landslides 50 (by stabilising the soil and reducing runoff, for example), heat (by providing shade and through 51 evapotranspiration) and diversifying food sources in case of drought (Zezza and Tasciotti, 2010; Lwasa et 52 al., 2014; Battersby and Hunter-Adams, 2020). 53 54 The health sector needs to collaborate and coordinate adaptation activities with other sectors, as well as civil 55 society and international agencies, to engage communities in health promotion (Irwin et al., 2006; 56 Commission of Social Determinants of Health, 2008; Braveman and Gottlieb, 2014). The importance of 57
ACCEPTED VERSIO
N
SUBJECT TO FIN
AL EDITS
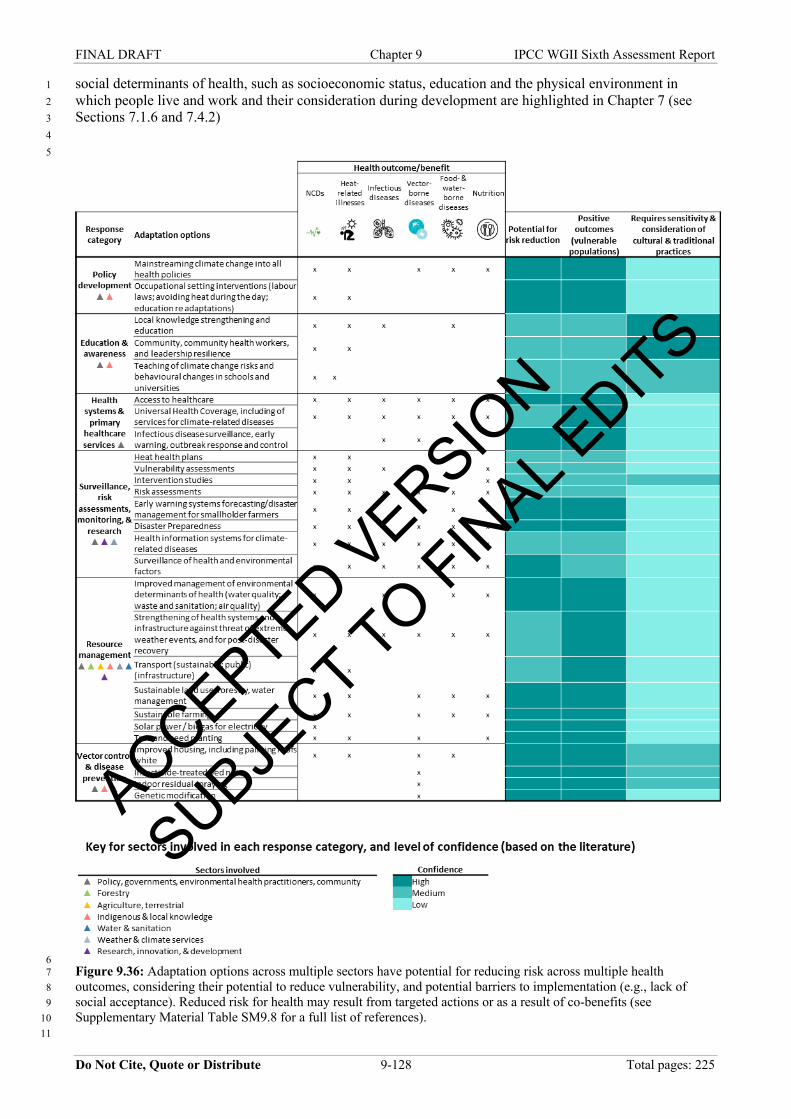
FINAL DRAFT Chapter 9 IPCC WGII Sixth Assessment Report
Do Not Cite, Quote or Distribute 9-128 Total pages: 225
social determinants of health, such as socioeconomic status, education and the physical environment in 1 which people live and work and their consideration during development are highlighted in Chapter 7 (see 2 Sections 7.1.6 and 7.4.2) 3 4 5
6 Figure 9.36: Adaptation options across multiple sectors have potential for reducing risk across multiple health 7 outcomes, considering their potential to reduce vulnerability, and potential barriers to implementation (e.g., lack of 8 social acceptance). Reduced risk for health may result from targeted actions or as a result of co-benefits (see 9 Supplementary Material Table SM9.8 for a full list of references). 10 11
ACCEPTED VERSIO
N
SUBJECT TO FIN
AL EDITS
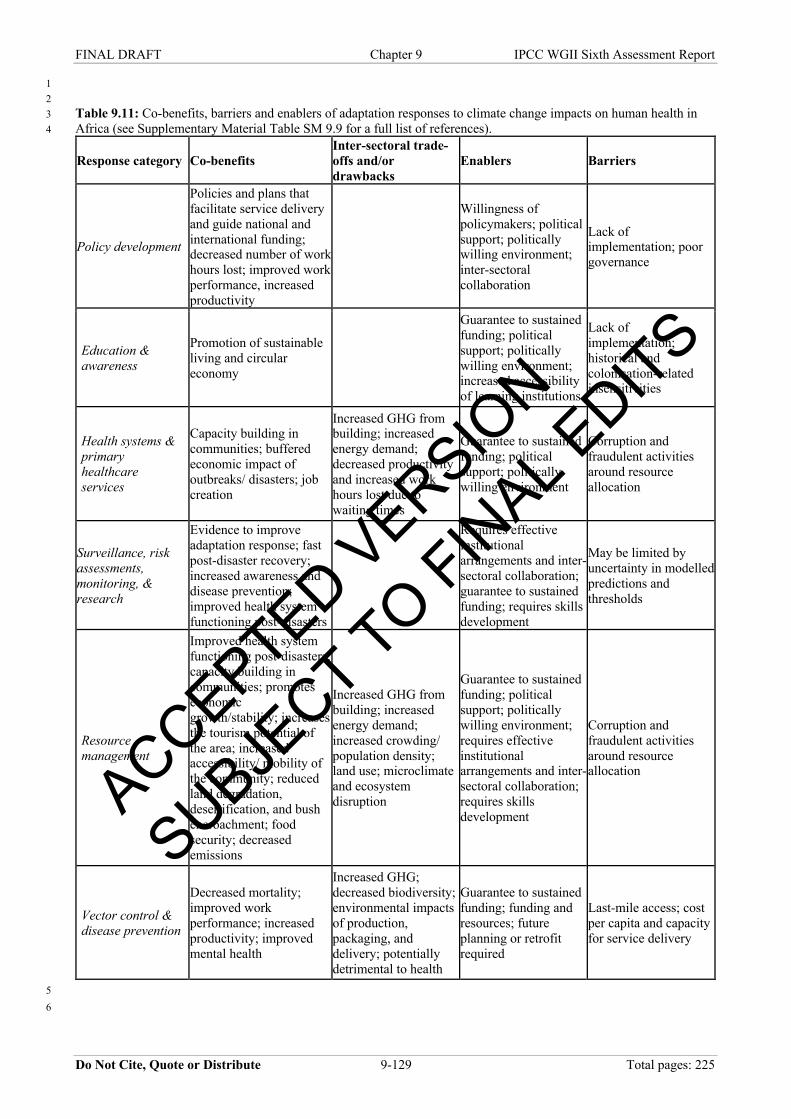
FINAL DRAFT Chapter 9 IPCC WGII Sixth Assessment Report
Do Not Cite, Quote or Distribute 9-129 Total pages: 225
1 2 Table 9.11: Co-benefits, barriers and enablers of adaptation responses to climate change impacts on human health in 3 Africa (see Supplementary Material Table SM 9.9 for a full list of references). 4
Response category Co-benefits Inter-sectoral trade-offs and/or drawbacks
Enablers Barriers
Policy development
Policies and plans that
facilitate service delivery
and guide national and
international funding;
decreased number of work
hours lost; improved work
performance, increased
productivity
Willingness of
policymakers; political
support; politically
willing environment;
inter-sectoral
collaboration
Lack of
implementation; poor
governance
Education & awareness
Promotion of sustainable
living and circular
economy
Guarantee to sustained
funding; political
support; politically
willing environment;
increased accessibility
of learning institutions
Lack of
implementation;
historical and
colonisation-related
insensitivities
Health systems & primary healthcare services
Capacity building in
communities; buffered
economic impact of
outbreaks/ disasters; job
creation
Increased GHG from
building; increased
energy demand;
decreased productivity
and increased work
hours lost due to
waiting times
Guarantee to sustained
funding; political
support; politically
willing environment
Corruption and
fraudulent activities
around resource
allocation
Surveillance, risk assessments, monitoring, & research
Evidence to improve
adaptation response; fast
post-disaster recovery;
increased awareness and
disease prevention;
improved health system
functioning post-disasters
Requires effective
institutional
arrangements and inter-
sectoral collaboration;
guarantee to sustained
funding; requires skills
development
May be limited by
uncertainty in modelled
predictions and
thresholds
Resource management
Improved health system
functioning post-disasters;
capacity building in
communities; promotes
economic
growth/stability; increases
the tourism potential of
the area; increased
accessibility/ mobility of
the community; reduced
land degradation,
desertification, and bush
encroachment; food
security; decreased
emissions
Increased GHG from
building; increased
energy demand;
increased crowding/
population density;
land use; microclimate
and ecosystem
disruption
Guarantee to sustained
funding; political
support; politically
willing environment;
requires effective
institutional
arrangements and inter-
sectoral collaboration;
requires skills
development
Corruption and
fraudulent activities
around resource
allocation
Vector control & disease prevention
Decreased mortality;
improved work
performance; increased
productivity; improved
mental health
Increased GHG;
decreased biodiversity;
environmental impacts
of production,
packaging, and
delivery; potentially
detrimental to health
Guarantee to sustained
funding; funding and
resources; future
planning or retrofit
required
Last-mile access; cost
per capita and capacity
for service delivery
5 6
ACCEPTED VERSIO
N
SUBJECT TO FIN
AL EDITS

FINAL DRAFT Chapter 9 IPCC WGII Sixth Assessment Report
Do Not Cite, Quote or Distribute 9-130 Total pages: 225
9.11 Economy, Poverty and Livelihoods 1 2 9.11.1 Observed Impacts of Climate Change on African Economies and Livelihoods 3 4 9.11.1.1 Economic Output and Growth 5 6 Increased average temperatures and lower rainfall have reduced economic output and growth in Africa, with 7 larger negative impacts than other regions of the world (Abidoye and Odusola, 2015; Burke et al., 2015a; 8 Acevedo et al., 2017; Kalkuhl and Wenz, 2020). In one estimate, GDP per capita is on average 13.6% lower 9 for African countries than it would be if anthropogenic warming since 1991 had not occurred (Diffenbaugh 10 and Burke, 2019), although impacts vary substantially across countries (see Figure 9.37). As such, global 11 warming has increased economic inequality between temperate, Northern Hemisphere countries and those in 12 Africa (Diffenbaugh and Burke, 2019). Warming also leads to differential economic damages within Africa 13 (Baarsch et al., 2020). One estimate found a 1℃ increase in 20-year average temperature reduced GDP 14 growth by 0.67 percentage points, with the greatest impacts in Central African Republic, Democratic 15 Republic of Congo and Zimbabwe (Abidoye and Odusola, 2015). Changes in rainfall patterns also influence 16 individual and national incomes. Had total rainfall not declined between 1960 and 2000, the gap between 17 African GDP and that of the rest of the developing world would be 15–40% smaller than today, with the 18 largest impacts in countries heavily dependent on agriculture and hydropower (Barrios et al., 2010). 19 20 Aggregate macroeconomic impacts manifest through many channels (Carleton et al., 2016). Macroeconomic 21 evidence suggests aggregate impacts occurred largely through losses in agriculture with a smaller role for 22 manufacturing (Barrios et al., 2010; Burke et al., 2015b; Acevedo et al., 2017). Sector-specific analyses 23 confirm that declines in productivity of food crops, commodity crops and overall land productivity 24 contribute to lower macroeconomic performance under rising temperatures (Schlenker and Lobell, 2010; 25 Bezabih et al., 2011; Jaramillo et al., 2011; Lobell et al., 2011; Adhikari et al., 2015). Labour supply and 26 productivity declines in manufacturing, industry, services and daily wage labour have been observed in other 27 regions (Graff Zivin and Neidell, 2014; Somanathan et al., 2015; Day et al., 2019; Nath, 2020) and 28 contribute to aggregate economic declines, countering aggregate poverty reduction strategies and other 29 sustainable development goals (Satterthwaite and Bartlett, 2017; Day et al., 2019). In a case study of a rural 30 town in South Africa, over 80% of businesses (both formal and informal) lost over 50% of employees and 31 revenue due to agricultural drought (Hlalele et al., 2016). Drought and extreme heat events have also reduced 32 tourism revenues in Africa (Section 9.6.3). Infrastructure damage and transport disruptions from adverse 33 climate events reduce access to services and growth opportunities (Chinowsky et al., 2014). In global 34 datasets including Africa, tropical cyclones have been shown to have large and long-lasting negative impacts 35 on GDP growth (Hsiang and Jina, 2014). 36 37 38
ACCEPTED VERSIO
N
SUBJECT TO FIN
AL EDITS

FINAL DRAFT Chapter 9 IPCC WGII Sixth Assessment Report
Do Not Cite, Quote or Distribute 9-131 Total pages: 225
1 Figure 9.37: Observed aggregate economic impacts and projected risks from climate change in Africa. (A) Estimated 2 effect of anthropogenic climate change on GDP per capita for 48 African countries between 1991 and 2010. (B, C) 3 Projected effect on GDP per capita of global warming of ~4°C by 2100 compared to no global warming after 2010 at 4 country level (B) and averaged across sub-Saharan Africa (C). (D) Benefits to GDP per capita of holding warming to 5 1.5℃ versus 2°C above pre-industrial. (E) Probability of realising any economic benefits by holding warming to 1.5°C 6 versus 2°C. Data sources: (Burke et al., 2015b; Burke et al., 2018a; Diffenbaugh and Burke, 2019). 7 8 9 9.11.1.2 Human Capital Development and Education 10 11 Investments in human capital, particularly education, are critical for socioeconomic development and 12 poverty reduction by providing valuable skills and expanding labour market opportunities. Much progress 13 has been made in improving education access, however, in sub-Saharan Africa, 32% of children, adolescents 14 and youth (~97 million people) remain out of school (UNESCO Institute of Statistics, 2018). Climate 15 variability and change can undermine educational attainment with negative impacts on later life earning 16 potential and adaptive capacity to future climate change (Lutz et al., 2014) (Figure 9.11). 17 18 Several studies indicate experiencing low rainfall, warming temperatures or extreme events reduce education 19 attainment and that future climate change may reduce children’s school participation, particularly for 20 agriculturally-dependent and poor urban households. In West and Central Africa, experiencing lower-than-21 average rainfall during early life is associated with up to 1.8 fewer years of completed schooling in 22 adolescence while more rainfall and milder temperatures during the main agricultural season were positively 23 associated with educational attainment for boys and girls in rural Ethiopia (Randell and Gray, 2016; Randell 24 and Gray, 2019). In Uganda, low rainfall reduced primary school enrolment by 5% for girls (Björkman-25 Nyqvist, 2013), and in Malawi, in utero drought exposure was associated with delayed school entry among 26 boys (Abiona, 2017). In rural Zimbabwe, experiencing drought conditions during the first few years of life 27 was associated with fewer grades of completed schooling in adolescence, which translates into a 14% 28 reduction in lifetime earnings (Alderman et al., 2006). In Cameroon, warming temperatures have negatively 29 affected plantain yields, which in turn is linked to lower educational attainment (Fuller et al., 2018). One 30 suggested mechanism underlying the relationship between climate and schooling is that adverse climatic 31 conditions can reduce income among farming households, leading them to pull children out of school 32 (Randell and Gray, 2016; Marchetta et al., 2019). Other potential mechanisms are poor harvests from 33 droughts or supply interruptions from extreme weather events leading to undernutrition among young 34 children, negatively affecting cognitive development and schooling potential (Alderman et al., 2006; Bartlett, 35 2008). 36 37
ACCEPTED VERSIO
N
SUBJECT TO FIN
AL EDITS
FINAL DRAFT Chapter 9 IPCC WGII Sixth Assessment Report
Do Not Cite, Quote or Distribute 9-132 Total pages: 225
More research is needed on climate change impacts on education in Africa. This information can help ensure 1 families keep children in school amidst climate-related income shocks. For example, in Mexico, a 2 conditional cash transfer program mitigated the negative effect of natural disasters on school attendance (de 3 Janvry et al., 2006). 4 5 9.11.2 Projected Risks of Climate Change for African economies and livelihoods 6 7 Future warming will have negative consequences for economic growth in Africa, relative to a future without 8 additional climate change and assuming current levels of adaptation (high confidence) (Dell et al., 2012; 9 Burke et al., 2015a; Burke et al., 2015b; Acevedo et al., 2017; Baarsch et al., 2020). Statistically-based 10 empirical analyses project that global warming of 2.3°C by 2050 could lower GDP per capita across sub-11 Saharan Africa by 12% (SSP2) (Baarsch et al., 2020) and 80% for warming >4°C by 2100 (SSP5, 75% for 12 MENA) (Burke et al., 2015b). Depending on the future socioeconomic scenario, this could increase global 13 inequality and leave some African countries poorer than at present (Burke et al., 2015b). Inequalities 14 between African countries are projected to widen under climate change, with negative impacts estimated to 15 be largest in West and East Africa (Baarsch et al., 2020). While negative impacts across African economies 16 are highly likely under climate change, precise magnitudes are debated in the literature. Alternative statistical 17 analyses suggest a 12% reduction of GDP per capita by 2100 under RCP8.5 across African countries relative 18 to a future without climate change (Kahn et al., 2019), while computable general equilibrium models 19 generate smaller damages as well, ranging from 3.8% reduction across sub-Saharan Africa in 2060 under 20 warming of 2.5°C (Dellink et al., 2019) to 12% across all of Africa in 2100 under warming of 5°C (SSP4) 21 (Takakura et al., 2019). 22 23 Substantial avoided economic damages to African countries are projected from ambitious, near-term global 24 mitigation limiting global warming well below 2°C above pre-industrial levels (high confidence). Increased 25 economic damage forecasts for Africa under high emissions scenarios start diverging rapidly from low 26 emissions scenarios by the 2030s (Baarsch et al., 2020). Across nearly all African countries, GDP per capita 27 is projected to be at least 5% higher by 2050 and 10–20% higher by 2100 if global warming is held to 1.5°C 28 versus 2°C (Burke et al., 2018a; Baarsch et al., 2020) (Figure 9.37). The probability of this positive gain to 29 GDP per capita from achieving 1.5°C versus 2°C is reported as close to 100% (Burke et al., 2018a). While 30 these estimates rely on temperature and rainfall-driven damages, sea level rise also poses a risk for Africa. 31 By 2050, damages from sea level rise across sub-Saharan Africa could reach 2–4% of GDP, depending on 32 the socioeconomic, adaptation and emissions scenario (Parrado et al., 2020). 33 34 Heat stress is projected to reduce working hours and work capacity under climate change, with among the 35 largest declines in sub-Saharan Africa and for workers in vulnerable occupation groups, such as those 36 working outdoors (Kjellstrom et al., 2014; Kjellstrom et al., 2016; de Lima et al., 2021) (AR6 WGII, Chapter 37 5). Global warming of 3°C is projected to reduce labour capacity in agriculture by 30–50% in sub-Saharan 38 Africa (relative to the baseline in 1986–2005) (de Lima et al., 2021). These effects lead to substantial 39 aggregate losses, for example, in West Africa, labour productivity impacts under a 3°C temperature increase 40 are estimated to cost up to 8% of GDP (Roson and Sartori, 2016). Manufacturing productivity across Africa 41 is projected to decline under RCP8.5 by 0–15% by 2080–2099, with the largest effects in the Democratic 42 Republic of Congo, Ethiopia, Somalia, Mozambique and Malawi (Nath, 2020). 43 44 Large risks to road, rail and water infrastructure are projected from climate change with substantial economic 45 cost implications (see Section 9.9.3; Box 9.5). 46 47 9.11.3 Informality 48 49 Aggregate GDP data capture formal economic activity but informal employment is the main source of 50 employment in Africa, accounting for 85.8% of all employment (71.9%, excluding agriculture), which is 51 21.4% higher than the global average (ILO, 2018b). Estimates of national levels of informal employment 52 range from 30% in South Africa, to 94.6% in Burkina Faso (ILO, 2018b), with high variability within 53 countries such as South Africa and Nigeria (Etim and Daramola, 2020). Informal employment is a greater 54 source of employment for women than for men in sub-Saharan Africa and young and old have especially 55 high rates of informal employment: 94.9% of persons between ages 15 and 24 in employment and 96% of 56 persons aged 65 and older (ILO, 2018b). 57
ACCEPTED VERSIO
N
SUBJECT TO FIN
AL EDITS

FINAL DRAFT Chapter 9 IPCC WGII Sixth Assessment Report
Do Not Cite, Quote or Distribute 9-133 Total pages: 225
1 Informal sector impacts are omitted from GDP-based impacts projections. Yet informal sector activity and 2 small to medium-sized enterprises can be highly exposed to climate extremes, as they are often located in 3 low-lying areas, coastal areas, sloped or other hazardous zones (Thorn et al., 2015; Satterthwaite et al., 4 2020). Businesses and individuals in the informal sector, including construction workers, domestic workers, 5 street vendors and transport workers, often cannot operate during climate shocks due to interruptions in 6 transportation and commodity flows and, without the ability to insure against risk, struggle to recover assets 7 from extreme events such as flooding, landslides and waterlogging (Chen, 2014; Thorn et al., 2015; Roy et 8 al., 2018a). Women are overrepresented in the more poorly remunerated sections of the informal economy 9 (Satterthwaite et al., 2020). 10 11 There is scope for governments to better harness the role of the informal sector in mitigation and adaptation 12 (Douxchamps et al., 2015; Satterthwaite et al., 2020). Multi-level governance that includes informal service 13 providers, such as informal water and sanitation networks, into planned adaptation programmes can increase 14 climate resilience, in part because these networks can respond with more flexibility than hard infrastructure 15 projects (Satterthwaite et al., 2020; Peirson and Ziervogel, 2021). Climate risk is often concentrated in urban 16 informal settlements (Section 9.9.4). Here, informal land markets influence development patterns and can 17 help ensure adherence to building codes to ensure safety of informally built structures at high risks of 18 landslides and floods and enforce compliance with regulations relating to planning and land use (Thorn et al., 19 2015; Satterthwaite et al., 2020). Improving land management practices of charcoal producers and artisanal 20 gold miners, combined with appropriate alternative livelihood and energy sources, can reduce emissions and 21 increase resilience (e.g., reduce erosion and sedimentation, increase water infiltration) and benefit health 22 (Atteridge, 2013; Paz et al., 2015; Macháček, 2019; Barenblitt et al., 2021; Eniola, 2021). Providing 23 concessional loans, commercial financing or equity investment to informal brick makers can boost delivery 24 of low emission social housing while the use of crop residues or renewable energy for brick making can 25 replace wood biomass and reduce pressure on forests (Alam, 2006; Paz et al., 2015). 26 27 9.11.4 Climate Change Adaptation to Reduce Vulnerability, Poverty and Inequality 28 29 High temperature-related income losses have been observed in low- and high-income countries, suggesting 30 optimistic economic development trajectories may not substantially reduce climate change impacts on 31 aggregate economic performance in Africa (low confidence) (Burke et al., 2015b; Deryugina and Hsiang, 32 2017; Henseler and Schumacher, 2019). Nevertheless, climate change impacts on poverty in Africa will 33 depend on how socioeconomic development unfolds over the coming decades (medium confidence) 34 (Rozenberg and Hallegatte, 2015; Hallegatte and Rozenberg, 2017; Henseler and Schumacher, 2019). 35 Climate change by 2030 is projected to push 39.7 million Africans into extreme poverty3 under a baseline 36 scenario of delayed and non-inclusive growth, with food prices acting as the dominant channel of impact, but 37 this number is cut roughly in half under an inclusive economic growth scenario (Rozenberg and Hallegatte, 38 2015; Hallegatte and Rozenberg, 2017; Jafino et al., 2020). 39 40 People in Africa are disproportionately employed in highly climate-sensitive sectors: 55–62% of the sub-41 Saharan African workforce is employed in agriculture and while between 90–95% of cropland is rainfed 42 (Woodhouse et al., 2017; ILO, 2018a; International Institute of Water Management, 2019; World Bank, 43 2020c), there has been an expansion of small-scale ‘farmer-led irrigation’ (Woodhouse et al., 2017). 44 Agricultural GDP also appears more strongly affected by increasing temperatures than non-agricultural 45 GDP, implying livelihood diversification out of agriculture may help minimise future economic damage 46 (Bezabih et al., 2011; Burke et al., 2015b; Acevedo et al., 2017; Deryugina and Hsiang, 2017), although such 47 workforce reallocation requires careful management and planning depending on the overall livelihood 48 portfolios, type of farmer and profitability (Stringer et al., 2020). De-agrarianisation can feed urbanisation, 49 which may exacerbate inequality within and between countries (Stringer et al., 2020). 50 51 Changes in trade patterns may help mitigate projected aggregate economic losses by reallocating agricultural 52 production abroad and encouraging economic diversification toward less affected sectors. Temperature 53 increases have been shown to lower agriculture and manufacturing exports with especially large declines in 54
3 Extreme poverty is defined using a consumption poverty line at US$1.25 per day, using 2005 purchasing power parity exchange rates.
ACCEPTED VERSIO
N
SUBJECT TO FIN
AL EDITS

FINAL DRAFT Chapter 9 IPCC WGII Sixth Assessment Report
Do Not Cite, Quote or Distribute 9-134 Total pages: 225
poor countries (Jones and Olken, 2010; Roberts and Schlenker, 2013). Further, imports of agricultural 1 products are projected to rise across most of Africa by 2080-2099 under a high emissions scenario (RCP8.5), 2 with increases ranging from ~30% of GDP in the Central African Republic to ~5% of GDP in South Africa 3 and Nigeria, although some countries will experience increases in net agricultural exports (Nath, 2020). 4 While these reallocation effects may be large, current evidence is mixed regarding whether such adjustment 5 of production will dampen or amplify overall social costs of climate change in Africa (Costinot et al., 2012; 6 Bren d’Amour et al., 2016; Wenz and Levermann, 2016; Nath, 2020), as food prices are projected to rise by 7 2080-2099 across all African countries under a scenario with high challenges to mitigation and adaptation 8 (SSP3 and RCP8.5), with the largest price effects (up to 120%) experienced in Niger, Chad and Sudan (Nath, 9 2020). Moreover, reallocating production of agriculture abroad could be maladaptive if it leads to decline or 10 replacement of traditional sectors by industrial and service sectors which could lead to land abandonment, 11 food insecurity and loss of traditional practices and cultural heritage (Thorn et al., 2020; Gebre and Rahut, 12 2021; Nyiwul, 2021). 13 14 African countries have high inequality: the average within-country share of income accruing to the top 10% 15 of households was estimated at 50% for 2019 (Robilliard, 2020). However, analysis of INDCs across 54 16 African countries suggests current climate policies do not, on average, target social inequality in energy, 17 water and food security; proposed mitigation and adaptation actions fell about 23% for every 1% rise in 18 social inequality across these sectors (Nyiwul, 2021). In contrast, adaptation actions can be designed in ways 19 that actively work towards reducing inequality, whether gender, income, employment, education or 20 otherwise (Andrijevic et al., 2020). 21 22 In rural Africa, poor and female-headed households face greater livelihood risks from climate hazards (high 23 confidence). Women often constitute a high proportion of the informal workforce and are also more likely to 24 be unemployed than men (ILO, 2018a). These factors leave women, and particularly female-headed 25 households, at greater risk of poverty and food insecurity from climate hazards. Controlling for multiple 26 factors, income of female-headed households in agricultural districts in South Africa is more vulnerable to 27 precipitation variability than those headed by men (Davidson, 2016; Flatø et al., 2017). Across nine countries 28 in East and West Africa women tend to control smaller plots of land that is often of poorer quality, have less 29 access to inputs such as fertilizer, tools and improved seeds, have lower educational attainment and benefit 30 less from extension services, government agencies and non-governmental organisations (Perez et al., 2015). 31 Gender assessments prior to adaptation programmes can identify disparities in division of labour and income 32 and socio-cultural norms, hindering women from holding leadership positions or determining livelihood and 33 resource-use activities, thereby helping ensure equitable benefits from livelihood diversification and 34 improving women’s working conditions (ILO, 2018a). Gender-responsive policy instruments can measure 35 success using sex-disaggregated data to monitor impact and meaningful participation in decision-making 36 (GCF, 2018b). 37 38 Exposure to climate hazards can trap poorer households in a cycle of poverty (Dercon and Christiaensen, 39 2011; Sesmero et al., 2018) and poor people in Africa are often more exposed to climate hazards than non-40 poor people. For example, poor people live in hotter areas in Nigeria and in multiple African countries, poor 41 households are more exposed to flooding (Hallegatte et al., 2016) (Section 9.9.2). Daily wage labourers and 42 residents of urban informal settlements are vulnerable to heat stress because of the urban heat-island effect 43 combined with congestion, little shade and ventilation (Bartlett, 2008). Climate change can negatively affect 44 household poverty through price spikes, destroying assets or ability to invest in new assets and reducing 45 productivity (Hallegatte et al., 2016) with important impact pathways operating through agriculture, 46 ecosystem functioning and health (Sections 9.6, 9.8, 9.10; Chapters 5, 7, 8). Non-poor people can lose more 47 in absolute terms from climate shocks because of having more assets and higher incomes, but in relative 48 terms, poor people often lose more than the non-poor. These relative losses matter most for livelihoods and 49 welfare (Hallegatte et al., 2016). 50 51 In Malawi, wealthier households were able to maintain more diversified livelihoods, buffering them from 52 extreme weather-related income losses (Sesmero et al., 2018). Poorer households have limited access to 53 resources such as savings, credit, irrigation technologies and insurance, which can lead to larger crop and 54 other income losses from climate hazards, preventing investments to improve resilience to future climate 55 shocks (Castells-Quintana et al., 2018). Poor households may reduce risk or aid recovery by cooperating 56 with other households in their community to adapt collectively to climate change, for example, through 57
ACCEPTED VERSIO
N
SUBJECT TO FIN
AL EDITS

FINAL DRAFT Chapter 9 IPCC WGII Sixth Assessment Report
Do Not Cite, Quote or Distribute 9-135 Total pages: 225
informal insurance networks (Paul et al., 2016; Wuepper et al., 2018). Prioritising poor households for 1 interventions including social protection, ecosystem-based adaptation, universal healthcare, climate-smart 2 buildings and agriculture, flexible work hours under extreme heat and early warning systems will increase 3 adaptation to climate shocks (Angula and Menjono, 2014; Moosa and Tuana, 2014; Hallegatte et al., 2016; 4 Day et al., 2019) (Section 9.6.4; Chapter 6). Pro-poor policies that link mitigation and adaptation, such as 5 using renewable energy to increase rural electrification or using revenues from a carbon tax, combined with 6 international financial support to increase social assistance, could support sustainable eradication of poverty 7 under near-term climate change (Hallegatte et al., 2016; Aklin et al., 2018; Simpson et al., 2021c). 8 Integrating urban green infrastructure into adaptation planning in informal settlements can simultaneously 9 unlock pathways for inclusivity and social justice (Tozer et al., 2020; Wijesinghe and Thorn, 2021) (Section 10 9.9.5). 11 12 Social protection has been used for decades, particularly in eastern and southern Africa, to safeguard poor 13 and vulnerable populations from poverty and food insecurity (Niño-Zarazúa et al., 2012). Instruments of 14 social protection include public works programs, cash transfers, in-kind transfers, social insurance and 15 microinsurance schemes that assist individuals and households to cope during times of crisis and minimise 16 social inequality. Evidence from Kenya, Ethiopia and Uganda indicates national social protection 17 programmes are effective in improving individual and household resilience to climate-related shocks, 18 regardless of whether they aim specifically to address climate risks (Ulrichs et al., 2019). Strengthening 19 social protection and better integrating climate risk management into design of social protection programs 20 can help build long-term resilience to climate change (Hallegatte et al., 2016; Agrawal et al., 2019). For 21 example, Public Works programs can build climate resilience by targeting soil, water and ecosystem 22 conservation and carbon sequestration, such as South Africa’s Working for Water Programme that restores 23 river catchments to reduce fire risk and increase water supplies (Turpie et al., 2008; Norton et al., 2020). 24 25 9.11.4.1 Climate Insurance 26 27 African countries and communities are inadequately insured against climate risk. Insurance penetration is 28 less than 2% of GDP (Swis Re, 2019) and 90% of natural catastrophe losses were uninsured in Africa in 29 2018 (Swis Re, 2019) leaving a large risk protection gap. The cost of reinsurance in Africa’s most mature 30 insurance market – South Africa – has increased since 2017 due to climate-related payouts (SAIA, 2018; 31 Simpson, 2020), likely to further reduce the extent of insurance coverage. Emerging trends that seek to 32 address this gap include innovative weather and drought index-based insurance schemes to transfer risk, 33 forward-looking climate data and models to manage risk and insurers transitioning from risk transfer 34 providers to proactive risk managers. 35 36 The most significant area of climate risk insurance innovation has occurred in weather and drought index-37 based insurance schemes that pay out fixed amounts based on the occurrence of an event instead of full 38 indemnification against assessed losses (Table 9.12). However, despite the relatively low cost, uptake 39 remains low due to affordability constraints, lack of awareness, access to and trust in products, distribution 40 challenges, basis risk, poor transparency, challenges regarding the integration of complementary 41 interventions (e.g., access to improved inputs or informal savings/credit) and poor perceptions/norms of 42 insurance and risk transfer. Lack of data and models further hinders insurers’ ability to price risk correctly, 43 which reduces value to clients (Greatrex et al., 2015; Di Marcantonio and Kayitakire, 2017; WEF, 2021). 44 Impact assessments point to potential but remain context-specific (Awondo, 2019; Hansen et al., 2019b; 45 Noritomo and Takahashi, 2020). In addition, there is no comprehensive overview of the number of people 46 covered by such schemes, nor of the value they provide in terms of actual claims payouts. Lastly, donor 47 and/or public funds still play an outsized role in launching and/or sustaining these schemes and schemes 48 beyond weather and drought remain limited (Table 9.12). 49 50 Insurers and their clients are often unaware of their risk exposure, partly due to data and modelling gaps. 51 Climate information services and related collaborations are increasingly helping to address this problem (see 52 Section 9.4.5). Climate change attribution methods to estimate the contribution of anthropogenic climate 53 change to the cost of parametric insurance offers possibilities for a sharing of the premium between the 54 impacted African country and a global climate fund, such as the Green Climate Fund (New et al., 2020). 55 Technology companies and start-ups (including fintechs) are also emerging as solutions to fill risk gaps, 56 leveraging new approaches to data and technology through the use of sensors, drones and satellite imaging to 57
ACCEPTED VERSIO
N
SUBJECT TO FIN
AL EDITS
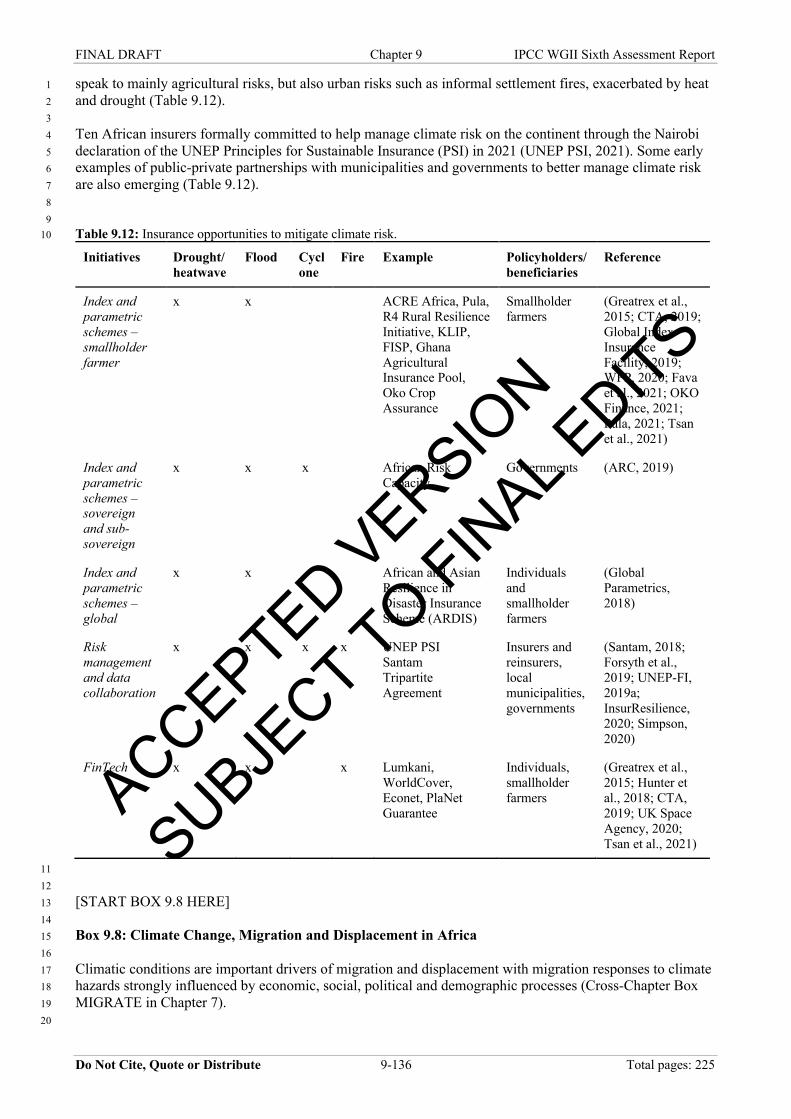
FINAL DRAFT Chapter 9 IPCC WGII Sixth Assessment Report
Do Not Cite, Quote or Distribute 9-136 Total pages: 225
speak to mainly agricultural risks, but also urban risks such as informal settlement fires, exacerbated by heat 1 and drought (Table 9.12). 2 3 Ten African insurers formally committed to help manage climate risk on the continent through the Nairobi 4 declaration of the UNEP Principles for Sustainable Insurance (PSI) in 2021 (UNEP PSI, 2021). Some early 5 examples of public-private partnerships with municipalities and governments to better manage climate risk 6 are also emerging (Table 9.12). 7 8 9 Table 9.12: Insurance opportunities to mitigate climate risk. 10
Initiatives Drought/ heatwave
Flood Cyclone
Fire Example Policyholders/ beneficiaries
Reference
Index and parametric schemes – smallholder farmer
x x ACRE Africa, Pula,
R4 Rural Resilience
Initiative, KLIP,
FISP, Ghana
Agricultural
Insurance Pool,
Oko Crop
Assurance
Smallholder
farmers
(Greatrex et al.,
2015; CTA, 2019;
Global Index
Insurance
Facility, 2019;
WFP, 2020; Fava
et al., 2021; OKO
Finance, 2021;
Pula, 2021; Tsan
et al., 2021)
Index and parametric schemes – sovereign and sub-sovereign
x x x African Risk
Capacity
Governments (ARC, 2019)
Index and parametric schemes – global
x x African and Asian
Resilience in
Disaster Insurance
Scheme (ARDIS)
Individuals
and
smallholder
farmers
(Global
Parametrics,
2018)
Risk management and data collaboration
x x x x UNEP PSI
Santam
Tripartite
Agreement
Insurers and
reinsurers,
local
municipalities,
governments
(Santam, 2018;
Forsyth et al.,
2019; UNEP-FI,
2019a;
InsurResilience,
2020; Simpson,
2020)
FinTech x x x Lumkani,
WorldCover,
Econet, PlaNet
Guarantee
Individuals,
smallholder
farmers
(Greatrex et al.,
2015; Hunter et
al., 2018; CTA,
2019; UK Space
Agency, 2020;
Tsan et al., 2021)
11 12 [START BOX 9.8 HERE] 13 14 Box 9.8: Climate Change, Migration and Displacement in Africa 15 16 Climatic conditions are important drivers of migration and displacement with migration responses to climate 17 hazards strongly influenced by economic, social, political and demographic processes (Cross-Chapter Box 18 MIGRATE in Chapter 7). 19 20
ACCEPTED VERSIO
N
SUBJECT TO FIN
AL EDITS
FINAL DRAFT Chapter 9 IPCC WGII Sixth Assessment Report
Do Not Cite, Quote or Distribute 9-137 Total pages: 225
Most climate-related migration and displacement observed currently is within countries or between 1 neighbouring countries, rather than to more geographically distant high-income countries (Hoffmann et al., 2 2020; Kaczan and Orgill-Meyer, 2020). Natural-related disaster displacements in sub-Saharan Africa were 3 over 2.6 million in 2018 and 3.4 million in 2019 (13.9% of the global total and one of the highest historical 4 figures for the region), with East (1,437,7000) and West Africa (798,000) being hotspots in 2018 5 (Mastrorillo et al., 2016; IDMC, 2019; IDMC, 2020) (Table Box 9.8.1). Estimates indicate future climate 6 change effects on internal migration in Africa will be considerable (Rigaud et al., 2018) (Table Box 9.8.2). 7 8 Internal migration, displacement and urbanisation 9 10 Climate change can have opposing influences on migration flows. Deteriorating economic conditions caused 11 by climate hazards can encourage out-migration (Wiederkehr et al., 2018). However, these same economic 12 losses undermine household resources needed to migrate (Cattaneo and Peri, 2016). The net effect of these 13 two forces leads to mixed results across study methodologies and contexts (Carleton and Hsiang, 2016; 14 Borderon et al., 2019; Cattaneo et al., 2019; Hoffmann et al., 2020). 15 16 Urbanisation in Africa is affected by climate conditions in rural agricultural areas (high confidence). 17 Urbanisation can increase when reduced moisture availability depresses farm incomes or pastoral livelihoods 18 become unviable (Marchiori et al., 2012; Henderson et al., 2014; Mastrorillo et al., 2016). The influence of 19 rainfall on rural-urban migration increased since decolonisation, possibly due to more lenient legislation on 20 internal mobility, with each 1% reduction in precipitation below a long-term average associated with a 21 0.45% increase in urbanisation (Barrios et al., 2006). Rate of rural-urban migration is anticipated to increase 22 (Neumann et al., 2015) as a result of increasing vulnerability of agricultural livelihoods to climate change 23 (Serdeczny et al., 2017). Nevertheless, rural-urban migration is not a simple one-way process. Peri-urban and 24 rural areas provide developmental feedback loops, helping create a ‘regional agglomeration’ effect, for 25 instance, through growing food demand, family and social connections, and flows back to rural areas of 26 goods and services and financial investments (UN-Habitat, 2016; Dodman et al., 2017). 27 28 Migration is an important and potentially effective climate change adaptation strategy in Africa and must be 29 considered in adaptation planning (high confidence) (Williams et al., 2021). The more agency migrants have 30 (that is, degree of voluntarity and freedom of movement), the greater the potential benefits for sending and 31 receiving areas (high agreement, medium evidence) (Cross-Chapter Box MIGRATE in Chapter 7). In a 32 synthesis of 63 studies covering over 9,700 rural households in dryland sub-Saharan Africa, 23% of 33 households employed migration (primarily temporary economic) to adapt to changes in rainfed agriculture 34 (Wiederkehr et al., 2018). Migration responses to climate change tend to be stronger among wealthier 35 households, as poorer households often lack financial resources necessary to migrate (Kaczan and Orgill-36 Meyer, 2020). 37 38 International migration 39 40 Studies on propensity to emigrate have uncovered conflicting results. Some findings suggest in low-income 41 countries high temperatures ‘trap’ people at home and lower migration rates abroad, but in middle-income 42 countries, these same high temperatures encourage emigration (Cattaneo and Peri, 2016). However, other 43 research finds in poor and agriculturally-dependent countries, high temperatures encourage international out-44 migration, particularly to the OECD (Cai et al., 2016). Some evidence indicates people who leave tend to be 45 more educated, possibly leading to ‘brain drain’ (Mbaye, 2017). Recent evidence suggests hotter-than-46 normal temperatures across 103 countries, including many in Africa, increased asylum applications to the 47 European Union (Missirian and Schlenker, 2017). Assuming no change in present-day vulnerability, asylum 48 applications are projected to increase 34% across Africa (relative to 2000–2014) at 2.2°C global warming 49 (Missirian and Schlenker, 2017), although this finding has been challenged in the literature (Abel et al., 50 2019; Boas et al., 2019). 51 52 International remittances are a vital resource for developing countries that can help aid recovery from 53 climate shocks (Hallegatte et al. 2016). Estimated at USD 48 billion in 2019 their importance is expected to 54 grow further due to foreign direct investment declines during the COVID-19 pandemic (World Bank, 55 2020a). Furthermore, domestic remittances from rural-urban migration can help rural households respond to 56 climate risks (KNOMAD, 2016). However, adequate finance and banking infrastructure are essential for 57
ACCEPTED VERSIO
N
SUBJECT TO FIN
AL EDITS
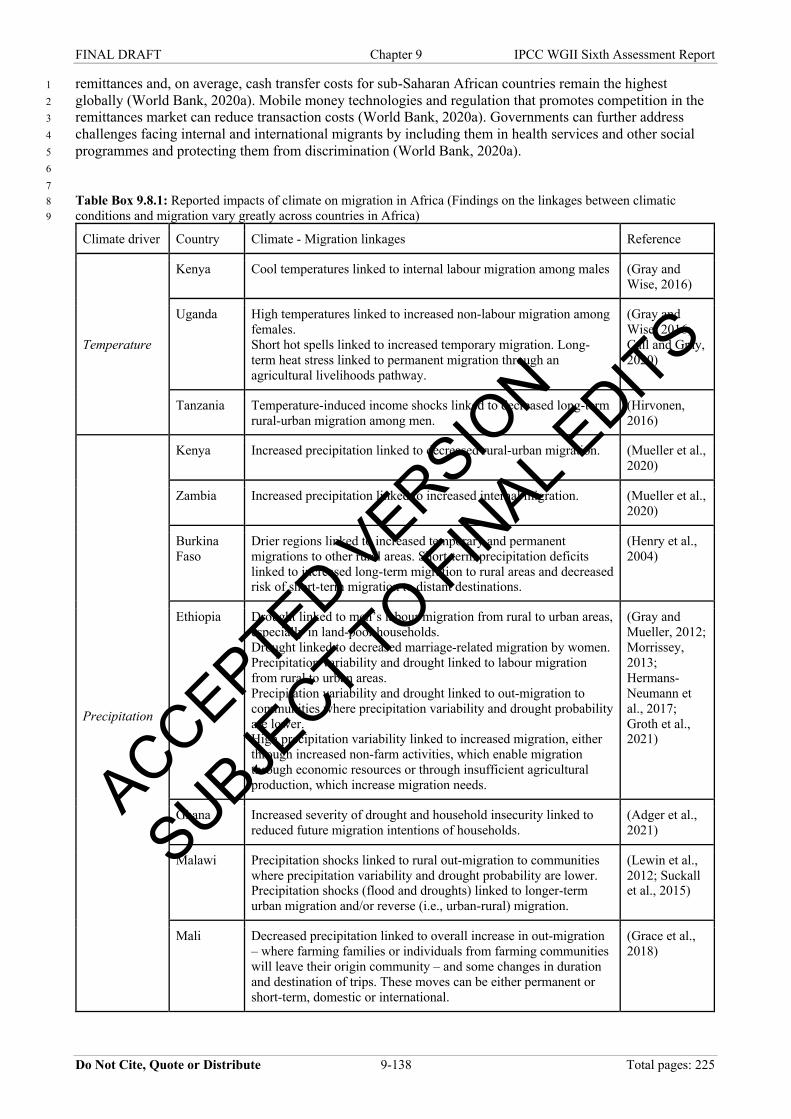
FINAL DRAFT Chapter 9 IPCC WGII Sixth Assessment Report
Do Not Cite, Quote or Distribute 9-138 Total pages: 225
remittances and, on average, cash transfer costs for sub-Saharan African countries remain the highest 1 globally (World Bank, 2020a). Mobile money technologies and regulation that promotes competition in the 2 remittances market can reduce transaction costs (World Bank, 2020a). Governments can further address 3 challenges facing internal and international migrants by including them in health services and other social 4 programmes and protecting them from discrimination (World Bank, 2020a). 5 6 7 Table Box 9.8.1: Reported impacts of climate on migration in Africa (Findings on the linkages between climatic 8 conditions and migration vary greatly across countries in Africa) 9
Climate driver Country Climate - Migration linkages Reference
Temperature
Kenya Cool temperatures linked to internal labour migration among males (Gray and
Wise, 2016)
Uganda High temperatures linked to increased non-labour migration among
females.
Short hot spells linked to increased temporary migration. Long-
term heat stress linked to permanent migration through an
agricultural livelihoods pathway.
(Gray and
Wise, 2016;
Call and Gray,
2020)
Tanzania Temperature-induced income shocks linked to decreased long-term
rural-urban migration among men.
(Hirvonen,
2016)
Precipitation
Kenya Increased precipitation linked to decreased rural-urban migration. (Mueller et al.,
2020)
Zambia Increased precipitation linked to increased internal migration. (Mueller et al.,
2020)
Burkina
Faso
Drier regions linked to increased temporary and permanent
migrations to other rural areas. Short-term precipitation deficits
linked to increased long-term migration to rural areas and decreased
risk of short-term migration to distant destinations.
(Henry et al.,
2004)
Ethiopia Drought linked to men’s labour migration from rural to urban areas,
especially in land-poor households.
Drought linked to decreased marriage-related migration by women.
Precipitation variability and drought linked to labour migration
from rural to urban areas.
Precipitation variability and drought linked to out-migration to
communities where precipitation variability and drought probability
are lower.
High precipitation variability linked to increased migration, either
through increased non-farm activities, which enable migration
through economic resources or through insufficient agricultural
production, which increase migration needs.
(Gray and
Mueller, 2012;
Morrissey,
2013;
Hermans-
Neumann et
al., 2017;
Groth et al.,
2021)
Ghana Increased severity of drought and household insecurity linked to
reduced future migration intentions of households.
(Adger et al.,
2021)
Malawi Precipitation shocks linked to rural out-migration to communities
where precipitation variability and drought probability are lower.
Precipitation shocks (flood and droughts) linked to longer-term
urban migration and/or reverse (i.e., urban-rural) migration.
(Lewin et al.,
2012; Suckall
et al., 2015)
Mali Decreased precipitation linked to overall increase in out-migration
– where farming families or individuals from farming communities
will leave their origin community – and some changes in duration
and destination of trips. These moves can be either permanent or
short-term, domestic or international.
(Grace et al.,
2018)
ACCEPTED VERSIO
N
SUBJECT TO FIN
AL EDITS
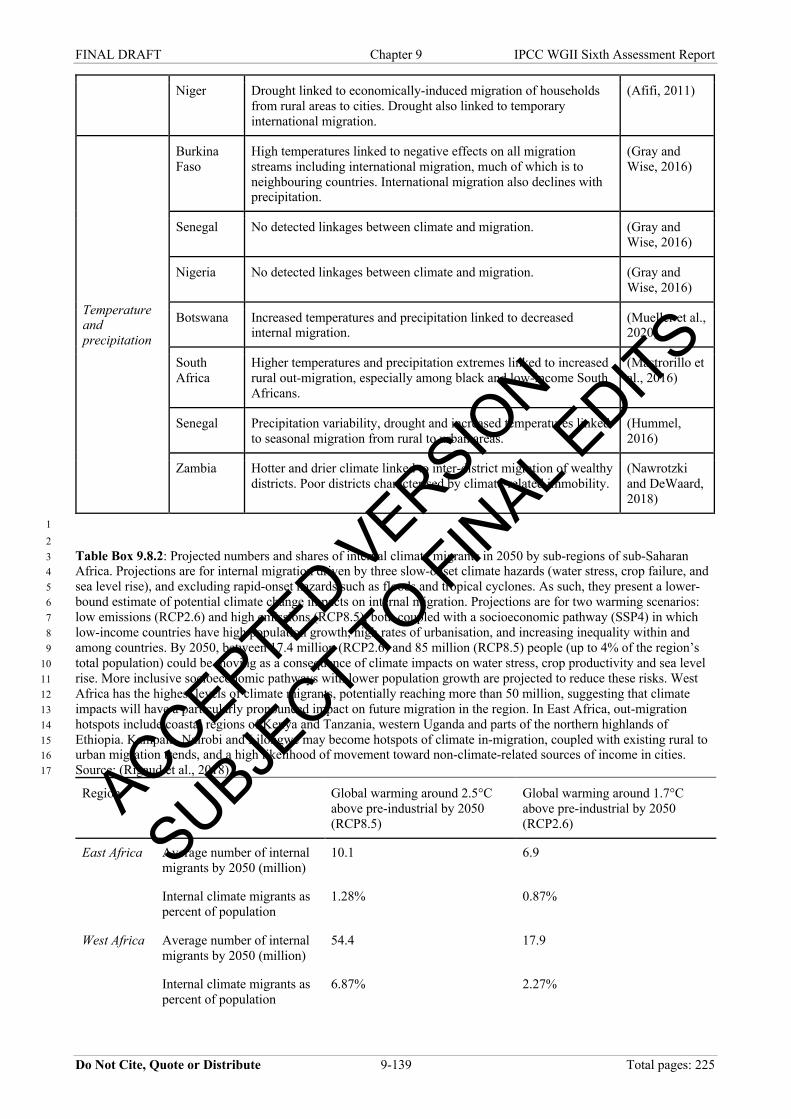
FINAL DRAFT Chapter 9 IPCC WGII Sixth Assessment Report
Do Not Cite, Quote or Distribute 9-139 Total pages: 225
Niger Drought linked to economically-induced migration of households
from rural areas to cities. Drought also linked to temporary
international migration.
(Afifi, 2011)
Temperature and precipitation
Burkina
Faso
High temperatures linked to negative effects on all migration
streams including international migration, much of which is to
neighbouring countries. International migration also declines with
precipitation.
(Gray and
Wise, 2016)
Senegal No detected linkages between climate and migration. (Gray and
Wise, 2016)
Nigeria No detected linkages between climate and migration. (Gray and
Wise, 2016)
Botswana Increased temperatures and precipitation linked to decreased
internal migration.
(Mueller et al.,
2020)
South
Africa
Higher temperatures and precipitation extremes linked to increased
rural out-migration, especially among black and low-income South
Africans.
(Mastrorillo et
al., 2016)
Senegal Precipitation variability, drought and increased temperatures linked
to seasonal migration from rural to urban areas.
(Hummel,
2016)
Zambia Hotter and drier climate linked to inter-district migration of wealthy
districts. Poor districts characterised by climate-related immobility.
(Nawrotzki
and DeWaard,
2018)
1 2 Table Box 9.8.2: Projected numbers and shares of internal climate migrants in 2050 by sub-regions of sub-Saharan 3 Africa. Projections are for internal migration driven by three slow-onset climate hazards (water stress, crop failure, and 4 sea level rise), and excluding rapid-onset hazards such as floods and tropical cyclones. As such, they present a lower-5 bound estimate of potential climate change impacts on internal migration. Projections are for two warming scenarios: 6 low emissions (RCP2.6) and high emissions (RCP8.5), both coupled with a socioeconomic pathway (SSP4) in which 7 low-income countries have high population growth, high rates of urbanisation, and increasing inequality within and 8 among countries. By 2050, between 17.4 million (RCP2.6) and 85 million (RCP8.5) people (up to 4% of the region’s 9 total population) could be moving as a consequence of climate impacts on water stress, crop productivity and sea level 10 rise. More inclusive socioeconomic pathways with lower population growth are projected to reduce these risks. West 11 Africa has the highest levels of climate migrants, potentially reaching more than 50 million, suggesting that climate 12 impacts will have a particularly pronounced impact on future migration in the region. In East Africa, out-migration 13 hotspots include coastal regions of Kenya and Tanzania, western Uganda and parts of the northern highlands of 14 Ethiopia. Kampala, Nairobi and Lilongwe may become hotspots of climate in-migration, coupled with existing rural to 15 urban migration trends, and a high likelihood of movement toward non-climate-related sources of income in cities. 16 Source: (Rigaud et al., 2018). 17
Region Global warming around 2.5°C
above pre-industrial by 2050
(RCP8.5)
Global warming around 1.7°C
above pre-industrial by 2050
(RCP2.6)
East Africa Average number of internal
migrants by 2050 (million)
10.1 6.9
Internal climate migrants as
percent of population
1.28% 0.87%
West Africa Average number of internal
migrants by 2050 (million)
54.4 17.9
Internal climate migrants as
percent of population
6.87% 2.27%
ACCEPTED VERSIO
N
SUBJECT TO FIN
AL EDITS
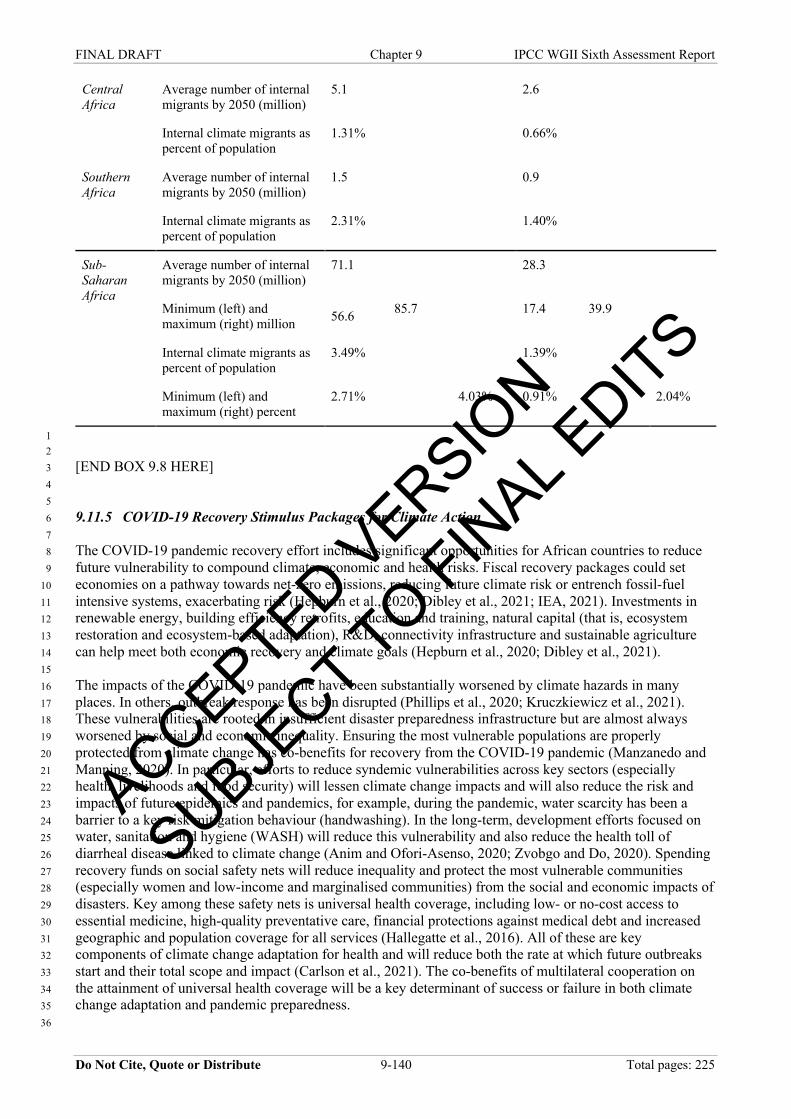
FINAL DRAFT Chapter 9 IPCC WGII Sixth Assessment Report
Do Not Cite, Quote or Distribute 9-140 Total pages: 225
Central Africa
Average number of internal
migrants by 2050 (million)
5.1 2.6
Internal climate migrants as
percent of population
1.31% 0.66%
Southern Africa
Average number of internal
migrants by 2050 (million)
1.5 0.9
Internal climate migrants as
percent of population
2.31% 1.40%
Sub-Saharan Africa
Average number of internal
migrants by 2050 (million)
71.1 28.3
Minimum (left) and
maximum (right) million 56.6
85.7 17.4 39.9
Internal climate migrants as
percent of population
3.49% 1.39%
Minimum (left) and
maximum (right) percent
2.71% 4.03% 0.91% 2.04%
1 2 [END BOX 9.8 HERE] 3 4 5 9.11.5 COVID-19 Recovery Stimulus Packages for Climate Action 6 7 The COVID-19 pandemic recovery effort includes significant opportunities for African countries to reduce 8 future vulnerability to compound climate, economic and health risks. Fiscal recovery packages could set 9 economies on a pathway towards net-zero emissions, reducing future climate risk or entrench fossil-fuel 10 intensive systems, exacerbating risk (Hepburn et al., 2020; Dibley et al., 2021; IEA, 2021). Investments in 11 renewable energy, building efficiency retrofits, education and training, natural capital (that is, ecosystem 12 restoration and ecosystem-based adaptation), R&D, connectivity infrastructure and sustainable agriculture 13 can help meet both economic recovery and climate goals (Hepburn et al., 2020; Dibley et al., 2021). 14 15 The impacts of the COVID-19 pandemic have been substantially worsened by climate hazards in many 16 places. In others, outbreak response has been disrupted (Phillips et al., 2020; Kruczkiewicz et al., 2021). 17 These vulnerabilities are rooted in insufficient disaster preparedness infrastructure but are almost always 18 worsened by social and economic inequality. Ensuring the most vulnerable populations are properly 19 protected from climate change has co-benefits for recovery from the COVID-19 pandemic (Manzanedo and 20 Manning, 2020). In particular, efforts to reduce syndemic vulnerabilities across key sectors (especially 21 health, livelihoods and food security) will lessen climate change impacts and will also reduce the risk and 22 impacts of future epidemics and pandemics, for example, during the pandemic, water scarcity has been a 23 barrier to a key risk mitigation behaviour (handwashing). In the long-term, development efforts focused on 24 water, sanitation and hygiene (WASH) will reduce this vulnerability and also reduce the health toll of 25 diarrheal disease linked to climate change (Anim and Ofori-Asenso, 2020; Zvobgo and Do, 2020). Spending 26 recovery funds on social safety nets will reduce inequality and protect the most vulnerable communities 27 (especially women and low-income and marginalised communities) from the social and economic impacts of 28 disasters. Key among these safety nets is universal health coverage, including low- or no-cost access to 29 essential medicine, high-quality preventative care, financial protections against medical debt and increased 30 geographic and population coverage for all services (Hallegatte et al., 2016). All of these are key 31 components of climate change adaptation for health and will reduce both the rate at which future outbreaks 32 start and their total scope and impact (Carlson et al., 2021). The co-benefits of multilateral cooperation on 33 the attainment of universal health coverage will be a key determinant of success or failure in both climate 34 change adaptation and pandemic preparedness. 35 36
ACCEPTED VERSIO
N
SUBJECT TO FIN
AL EDITS

FINAL DRAFT Chapter 9 IPCC WGII Sixth Assessment Report
Do Not Cite, Quote or Distribute 9-141 Total pages: 225
1 [START BOX 9.9 HERE] 2 3 Box 9.9: Climate Change and Security: Interpersonal Violence and Large-scale Civil Conflict 4 5 There is substantial evidence that climate variability influences human security across Africa (see Chapter 7 6 WGII Section 7.2.7 and 7.3.3 7). However, the strength and nature of this link depend on socioeconomic and 7 institutional conditions, and climate is just one of many factors influencing violence and civil conflict 8 (Schleussner et al., 2016a; von Uexkull et al., 2016; Linke et al., 2018; Mach et al., 2019; van Weezel, 2019; 9 Ide et al., 2020). 10 11 Projections of security implications of long-run climate change in Africa are uncertain, as they rely on 12 extrapolating observed effects of short-run climate variability (Burke et al., 2014). Lack of detection and 13 attribution studies limit assessment of the impacts of observed anthropogenic climate change on security. 14 15 Interpersonal violent crime 16 17 Evidence from across the globe finds that interpersonal violence, ranging from use of profanity to violent 18 crime, increases with temperature and sometimes low rainfall (Hsiang et al., 2013a; Burke et al., 2014; Gates 19 et al., 2019). The effect of temperature may be driven by a physiological mechanism (Morrison et al., 2008; 20 Seo et al., 2008; Ray et al., 2011), while effects of rainfall may operate through an agricultural yield impacts 21 channel (Burke et al., 2014). While few studies link interpersonal violence to climate in Africa, Gates et al. 22 (2019) documents homicide risks increasing under high temperatures in South Africa, and similarity across 23 diverse study settings suggests temperature-induced violent crime likely generalizes to Africa (Burke et al., 24 2014). 25 26 Large-scale intergroup conflict 27 28 Climatic conditions also change the risk of large-scale conflicts such as riots, ethnic conflicts and civil war 29 (Burke et al., 2014; Koubi, 2019). The effects of temperature are particularly well-studied in Africa. Risk of 30 violent conflict rises with temperature in Sudan and South Sudan (Maystadt and Ecker, 2014; Maystadt et 31 al., 2014; Scheffran et al., 2014), Kenya (Hsiang et al., 2013b; Scheffran et al., 2014), the East African 32 region (O'Loughlin et al., 2012) and across sub-Saharan Africa (Burke et al., 2009; O'Loughlin et al., 2014; 33 Witmer et al., 2017). Estimates indicate that warming trends since 1980 have elevated conflict risk across 34 sub-Saharan Africa by 11% (Burke et al., 2009; Carleton et al., 2016). 35 36 Periods of low rainfall or flooding also contribute to social instability and upheaval across Africa (Miguel et 37 al., 2004; Ralston, 2015; von Uexkull et al., 2016; Harari and Ferrara, 2018; van Weezel, 2019; Ide et al., 38 2020). The link between rainfall and conflict appears likely due to crop losses and declines in economic 39 opportunity. One study finds that dry growing seasons increase conflict incidence across 36 African nations, 40 with spillover effects from the location of climate shock to neighbouring communities (Harari and Ferrara, 41 2018). Conflict-inducing impacts of drought have also been uncovered in Somalia (Maystadt and Ecker, 42 2014), Uganda, Sudan, Ethiopia and Kenya (Fjelde and von Uexkull, 2012; Hendrix and Salehyan, 2012; 43 Couttenier and Soubeyran, 2014; Ralston, 2015; Linke et al., 2018; van Weezel, 2019), the Democratic 44 Republic of Congo (von Uexkull et al., 2020) and in a pooled sample of African and Asian countries (von 45 Uexkull et al., 2016). Extremely high rainfall may also incite conflict risk, although results are mixed 46 (Hendrix and Salehyan, 2012; Raleigh and Kniveton, 2012). This uncertainty, combined with large 47 uncertainties in rainfall projections under climate change, render future impacts of anthropogenic emissions 48 on rainfall-induced conflict in Africa highly uncertain. 49 50 While conflict-climate links have been repeatedly identified in Africa, climate is one of many interacting 51 conflict risk factors and appears to explain only a small share of total variation in conflict incidence (von 52 Uexkull et al., 2016; Mach et al., 2019; van Weezel, 2019). 53 54 Opportunities for adaptation 55 56
ACCEPTED VERSIO
N
SUBJECT TO FIN
AL EDITS
FINAL DRAFT Chapter 9 IPCC WGII Sixth Assessment Report
Do Not Cite, Quote or Distribute 9-142 Total pages: 225
Adaptive capacity with respect to climate and conflict remains low in Africa (Sitati et al., 2021). For 1 example, one study finds that relative to each country’s optimal annual temperature, realized temperatures 2 across sub-Saharan Africa increase the annual incidence of war by 29.3% on average (Carleton et al., 2016). 3 Another finds that rising temperatures due to climate change may lead to higher levels of violence in sub-4 Saharan Africa if political rights do not improve from current conditions (Witmer et al., 2017). Available 5 studies on adaptation in conflict-affected areas tend to have a narrow focus, particularly on agriculture-6 related adaptation in rural contexts and adaptation by low-income actors, with little known beyond these 7 contexts (Sitati et al., 2021). Literature on the gender dimension of climate adaptation in conflict-affected 8 countries is also limited (Sitati et al., 2021). 9 10 Migration is a common response (Sitati et al., 2021) and may be an effective adaptive response to climate-11 induced conflict. Bosetti et al. (2018) find that countries with high emigration propensity display lower 12 sensitivity of conflict to temperature, with no evidence of detrimental impacts on the destination countries. 13 Indigenous knowledge has also been applied to enable adaptation amidst conflict, for example, in Libya, to 14 deal with erratic rainfall (Biagetti, 2017). 15 16 Other socioeconomic factors have been identified as adaptive opportunities. Rising incomes may mitigate 17 conflict-climate relationships (Carleton et al., 2016), while weak institutions, lack of political freedom, 18 agricultural dependence and exclusion of ethnic groups increase their strength (Schleussner et al., 2016a; von 19 Uexkull et al., 2016; Witmer et al., 2017; Ide et al., 2020). In particular, agriculturally dependent and 20 politically excluded groups in Africa are especially vulnerable to the impact of drought on conflict (von 21 Uexkull et al., 2016; Koubi, 2019). Household-level resilience to economic shocks has been shown to lower 22 support for violence after drought (von Uexkull et al., 2020). Local-level institutions have also been shown 23 to support non-violence under adverse climate conditions (Bogale and Korf, 2007). 24 25 These findings suggest that ameliorating ethnic tensions, improving political institutions, and investing in 26 economic diversification and household resilience could mitigate future impacts of climate change on 27 conflict. 28 29 [END BOX 9.9 HERE] 30 31 32 9.12 Heritage 33 34 Africa is a rich reservoir of heritage resources and indigenous knowledge, showcased by about 96 sites 35 inscribed by UNESCO as World Heritage Sites (UNESCO, 2018b). These include 53 sites specifically 36 denoted as having great cultural importance and 5 sites with mixed heritage values. Unfortunately, valuable 37 cultural heritage in forms of tangible evidence of past human endeavour, and the intangible heritage 38 encapsulated by diverse cultural practices of many communities (Feary et al., 2016), is under great threat 39 from climate change. 40 41 9.12.1 Observed Impacts on Cultural Heritage. 42 43 For more than 10,000 years, Africans recorded over 8,000 painted and engraved images on rock shelters and 44 rock outcroppings across 800 exceptional rock art sites of incalculable value (Hall et al., 2007; di Lernia and 45 Gallinaro, 2011; di Lernia, 2017; Clarke and Brooks, 2018; Barnett, 2019), but which are exceptionally 46 fragile to the elements. Unfortunately, there has been a poor study of direct climate change impacts on rock 47 art across Africa. 48 49 Underwater heritage includes shipwrecks and artefacts lost at sea and extends to prehistoric sites, sunken 50 towns and ancient ports that are now submerged due to climatic or geological changes (Spalding, 2011). Off 51 the shores of Africa, about 111 shipwrecks have been documented, with South Africa having a major share 52 of about 41 sites. The sunken Egyptian city of Thonis-Heracleion and its associated 60+ shipwrecks reflect 53 the richness of Africa’s waters. Unfortunately, increased storm surges and violent weather currently threaten 54 the integrity of shipwrecks by accelerating the destruction of wooden parts and other features (Harkin et al., 55 2020). However, climate change impacts on underwater cultural heritage sites are poorly studied, as it 56
ACCEPTED VERSIO
N
SUBJECT TO FIN
AL EDITS

FINAL DRAFT Chapter 9 IPCC WGII Sixth Assessment Report
Do Not Cite, Quote or Distribute 9-143 Total pages: 225
requires specialist assessment techniques (Feary et al., 2016), and marine archaeology studies are not well-1 established in Africa. 2 3 Intangible heritage includes instruments, objects, artefacts and cultural spaces associated with communities, 4 and are almost always held orally (UNESCO, 2003). Loss of heritage assets may be a direct consequence of 5 climate change/variability (Markham et al., 2016), or a consequence of indirect factors resulting from 6 climate change, for example, economic instability and poor decision-making in areas of governance. In 7 northern Nigeria, climate change exacerbates the impact of poor land use decisions, reducing the flow of the 8 Yobe River and negatively impacting the Bade fishing festival because the available fish species continue to 9 decline (Oruonye, 2010). Similarly, Lake Sanké in Mali has been degraded by a combination of urban 10 development and poor rainfall, threatening the Sanké mon collective fishing rite (UNESCO, 2018b). 11 12 Migration related to climate change and climatic events could offer openings to women and young people to 13 become de facto family heads (Kaag et al., 2019). However, such societal changes also increase community 14 vulnerability to the loss of cultural knowledge held by village elders. For example, in Mauritius, the Sega 15 tambour Chagos music is at risk, as elders familiar with the landscape pass on (Boswell, 2008). 16 17 Case study: Traditional earthen ‘green energy’ buildings 18 Historically, Africa has had a unique and sustainable architecture (Diop, 2018) characterised by area-19 specific, traditional earthen materials and associated indigenous technology. Key examples include Tiébélé 20 in Burkina Faso, Walata in Mauritania, Akan in Ghana, Ghadames in Libya, Old Towns of Djenné in Mali 21 (World Heritage Site) and other diverse earthen architecture across sub-Saharan Africa. Adegun and Adedeji 22 (2017) indicate that earthen materials provide advantages in thermal conductivity, resistivity and diffusivity, 23 indoor and outdoor temperature, as well as cooling and heating capacities. Moreover, earthen materials are 24 recyclable and environmentally ‘cleaner’ (Sanya, 2012) because of the absence or small quantity of cement 25 in production, thus reducing carbon emissions. Despite these advantages, the expertise and socio-cultural 26 ceremonies that accompany building and renewal of earthen architecture are disappearing fast (Adegun and 27 Adedeji, 2017). Further, earthen construction is being threatened by extreme climatic variability and 28 changing climate that exacerbates decay (Brimblecombe et al., 2011; Bosman and Van der Westhuizen, 29 2014; Brooks et al., 2020). 30 31 9.12.2 Projected Risks 32 33 Sea level rise and its associated hazards will present increasing climate risk to African heritage in the coming 34 decades (Marzeion and Levermann, 2014; Reimann et al., 2018; Brito and Naia, 2020) (Figure 9.38). 35 Although no continental assessment has quantified climate risk to African heritage and little is known of near 36 term exposure to hazards such as sea level rise and erosion, for a handful of coastal heritage sites included in 37 global or Mediterranean studies, 10 cultural sites are identified to be physically exposed to sea level rise by 38 2100 at high emissions scenarios (RCP8.5) (Marzeion and Levermann, 2014; Reimann et al., 2018), of 39 which, 7 World Heritage Sites in the Mediterranean are also projected to face medium or high risk of erosion 40 (Reimann et al., 2018) (Figure 9.38). Further, Brito and Naia (2020) identify natural heritage sites across 27 41 African countries that will be affected by sea level rise by 2100 (RCP8.5), of which 15 sites covering eight 42 countries demonstrated a high need for proactive management actions because of high levels of biodiversity, 43 international conservation relevance and exposure to sea level rise (Figure 9.38). These nascent studies 44 highlight the potential severity of risk and loss and damage from climate change to African heritage, as well 45 as gaps in knowledge of climate risk to African cultural and natural, particularly concerning bio-cultural 46 heritage. 47 48 49
ACCEPTED VERSIO
N
SUBJECT TO FIN
AL EDITS
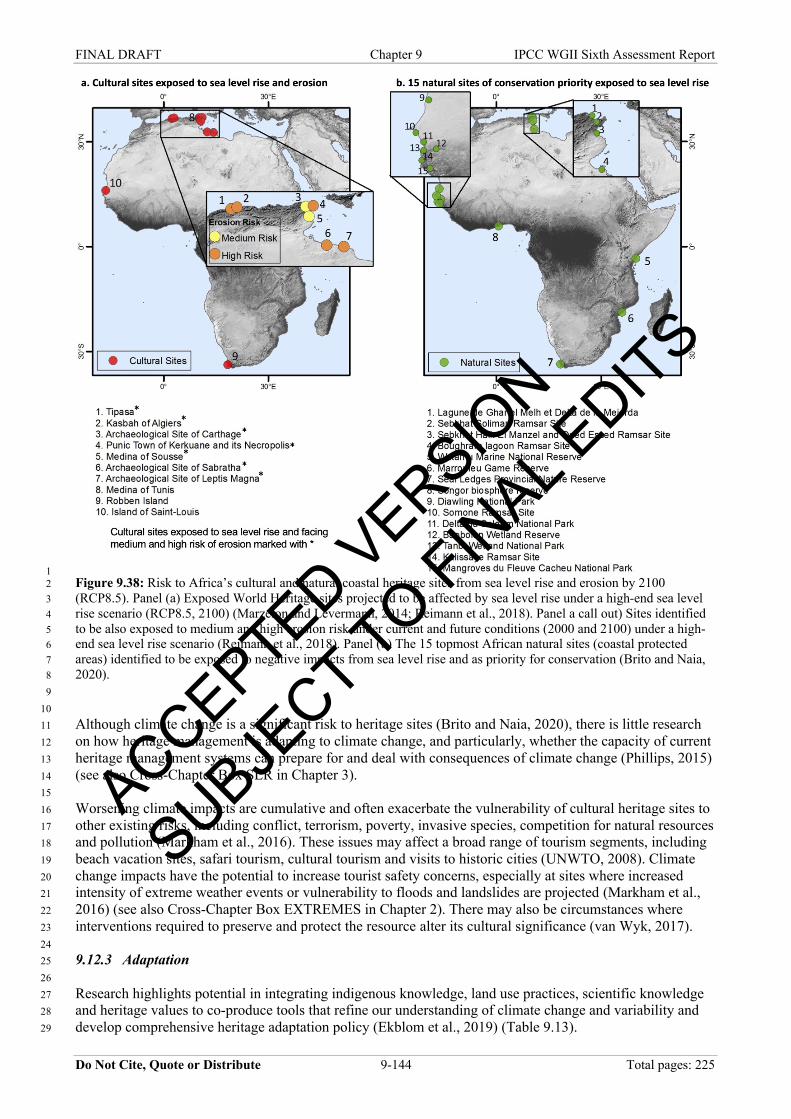
FINAL DRAFT Chapter 9 IPCC WGII Sixth Assessment Report
Do Not Cite, Quote or Distribute 9-144 Total pages: 225
1 Figure 9.38: Risk to Africa’s cultural and natural coastal heritage sites from sea level rise and erosion by 2100 2 (RCP8.5). Panel (a) Exposed World Heritage sites projected to be affected by sea level rise under a high-end sea level 3 rise scenario (RCP8.5, 2100) (Marzeion and Levermann, 2014; Reimann et al., 2018). Panel a call out) Sites identified 4 to be also exposed to medium and high erosion risk under current and future conditions (2000 and 2100) under a high-5 end sea level rise scenario (Reimann et al., 2018). Panel (b) The 15 topmost African natural sites (coastal protected 6 areas) identified to be exposed to negative impacts from sea level rise and as priority for conservation (Brito and Naia, 7 2020). 8 9 10 Although climate change is a significant risk to heritage sites (Brito and Naia, 2020), there is little research 11 on how heritage management is adapting to climate change, and particularly, whether the capacity of current 12 heritage management systems can prepare for and deal with consequences of climate change (Phillips, 2015) 13 (see also Cross-Chapter Box SLR in Chapter 3). 14 15 Worsening climate impacts are cumulative and often exacerbate the vulnerability of cultural heritage sites to 16 other existing risks, including conflict, terrorism, poverty, invasive species, competition for natural resources 17 and pollution (Markham et al., 2016). These issues may affect a broad range of tourism segments, including 18 beach vacation sites, safari tourism, cultural tourism and visits to historic cities (UNWTO, 2008). Climate 19 change impacts have the potential to increase tourist safety concerns, especially at sites where increased 20 intensity of extreme weather events or vulnerability to floods and landslides are projected (Markham et al., 21 2016) (see also Cross-Chapter Box EXTREMES in Chapter 2). There may also be circumstances where 22 interventions required to preserve and protect the resource alter its cultural significance (van Wyk, 2017). 23 24 9.12.3 Adaptation 25 26 Research highlights potential in integrating indigenous knowledge, land use practices, scientific knowledge 27 and heritage values to co-produce tools that refine our understanding of climate change and variability and 28 develop comprehensive heritage adaptation policy (Ekblom et al., 2019) (Table 9.13).29
ACCEPTED VERSIO
N
SUBJECT TO FIN
AL EDITS

FINAL DRAFT Chapter 9 IPCC WGII Sixth Assessment Report
Do Not Cite, Quote or Distribute 9-145 Total pages: 225
Table 9.13: Examples of responses to climate change impacts to heritage sites. 1 Heritage Type Example Type of
Climate Impact
Intervention Focus or Activity
Main Intervention Activity
State of Materials Final State of Heritage
Literature
Tangible
Ancient Historic buildings
Ounga Byzantine Fort and associated archaeological remains, Tunisia
Coastal erosion
Archaeological conservation of fort
Building repairs to outer walls of fort but other archaeological areas no intervention
Mixed. Fort is in good condition, but other parts of the site are under threat of coastal erosion, particularly lesser archaeological remains of other periods
Some aspects of site well preserved, other parts damaged
(Slim et al., 2004)
Archaeological sites
Sabratha, Roman City, Libyan coast
Sea level rise, local flooding and coastal erosion
Monitoring of condition
None Loss of archaeological remains into the sea
Some aspects of site well preserved, other parts damaged
(Abdalahh, 2011)
Living Cities / towns
Lamu Old Town and archipelago, Kenya
Sea Level Rise impacting low lying areas and climate variability impacting protective mangroves
Lamu Old Town managed by National Museums of Kenya the mangrove forests by Community Forest Associations and Forest Conservation and Management Act of 2016. Changes in biodiversity and cultural resilience to climate shocks.
Draft for National Policy for Disaster Management in Kenya
Mangrove forests provide protection from storm surges and coastal erosion. Changing biodiversity of mangroves is threatening mangroves which threaten Lamu Old Town
Continuing deterioration
(Wanderi, 2019)
Mud buildings
Tiébélé, Burkina Faso
Climate variability causing flooding, erosion.
Local community conservation
Improvements to drainage and land security, development of conservation and management plans.
Current and ongoing conservation
Stable (Birabi and Nawangwe, 2011)
Bio-cultural
Rock art Golden Gate Highlands, South Africa
Precipitation and atmospheric changes
Monitoring of condition
No known intervention
Biodeterioration of condition of rock surface
Increasing loss of rock surfaces
(Viles and Cutler, 2012)
ACCEPTED VERSIO
N
SUBJECT TO FIN
AL EDITS

FINAL DRAFT Chapter 9 IPCC WGII Sixth Assessment Report
Do Not Cite, Quote or Distribute 9-146 Total pages: 225
causing luxuriant lichen growth
and images on the rock surfaces
Intangible (indigenous)
Language !Xun and Khwe Indigenous Youth of South Africa
Climate variability causing drought and loss of plants
Groups (youth) Documentation Non-formal, local Enhancement, promotion
(Bodunrin, 2019)
Indigenous Language Use in Agricultural Radio Programming in Nigeria
Climate variability increasing frequency of drought
Farmer groups, communities
Research, documentation
Formal, local Promotion, transmission
(Adeyeye et al., 2020)
Rituals Enkipaata, Eunoto and Olng’esherr Maasai male rites of passage
Climate variability causing drought
Maasai community groups
Identification, documentation, research
Formal, non-formal, local, foreign
promotion (UNESCO, 2018a)
Customs & beliefs
Sanké mon fishing festival in Mali
Climate variability reducing rainfall
Malinkés, Bambara and Buwa communities
Identification, documentation, preservation
Formal, non-formal, local
promotion (UNESCO, 2009)
Indigenous engineering systems
Water measurers of the Foggara irrigation system in Algeria
Increased siltation and sandstorms Climate variability causing flooding
Touat and Tidikelt communities
Research, identification, documentation
Formal, local transmission
(Mokadem et al., 2018)
Arts and crafts
Traditional crafts made from various parts of the Date Palm in Egypt, Mauritania, Morocco, Sudan, Tunisia and other countries outside Africa
Climate variability causing shift in plant habitats
Residents of oases, groups, communities, agricultural cooperative societies
Research, identification, documentation, preservation, protection
Formal, non-formal, local, foreign
Transmission, promotion, enhancement, revitalization
(UNESCO, 2003)
(Shabani et al., 2012)
1
ACCEPTED VERSIO
N
SUBJECT TO FIN
AL EDITS

FINAL DRAFT Chapter 9 IPCC WGII Sixth Assessment Report
Do Not Cite, Quote or Distribute 9-147 Total pages: 225
Conservation of heritage may require offsetting the impact of loss through partial or total excavation under 1 certain circumstances, like environment instability, or where in situ heritage preservation is exorbitant in cost 2 (Maarleveld and Guérin, 2013). 3 4 Although many underwater shipwrecks and ruins of cities are currently preserved better in situ than similar 5 sites on land (Feary et al., 2016), preserving such heritage is often financially prohibitive with many physical 6 and technical challenges. Further, skill capacities of heritage agencies are limited to a few qualified 7 archaeologists in Africa (Maarleveld and Guérin, 2013). 8 9 For centuries, Africans have drawn on intangible heritage to enhance their resilience to climatic variability 10 and support adaptation practices. For example, pastoralist communities have historically translated their 11 experiences into memories that can be ‘translated’ into diverse adaptive practices (Oba, 2014). In coastal 12 Kenya, Mijikenda communities rely on indigenous knowledge and practices used in the management of the 13 sacred Kaya Forests to adapt their farming to a changing climate (Wekesa et al., 2015). 14 15 Hence, preservation measures for transforming oral information into written records should ensure viability 16 of intangible cultural heritage by giving due consideration to the confidentiality of culturally sensitive 17 information and intellectual property rights (Feary et al., 2016). 18 19 Inclusion of cultural landscapes and intangible heritage in the landscape approach at the regional scale 20 development planning processes may have significant impacts on protected area management (Feary et al., 21 2016). For example, at the Domboshava rock art site in Zimbabwe, all management decisions are taken in 22 direct consultation with traditional leaders and other stakeholders from surrounding communities (Chirikure 23 et al., 2010). Such adaptation strategies promote a more open-minded approach to heritage by leveraging 24 local development (UNESCO, 2018b). 25 26 Lack of expertise and resources, together with legislation that privileges certain typologies of heritage, seem 27 to limit implementation of approved policies (Ndoro, 2015). Additionally, cultural heritage has least priority 28 in terms of budgetary allocation, capacity building and inclusion into school curricula. Failure to consider the 29 views of people who attach spiritual significance to places is detrimental to the conservation of heritage 30 places (Bwasiri, 2011). In particular, documented cases of local people having to pay an entrance fee, like 31 tourists, to access burial grounds and places of pilgrimage negate local participation in cultural site 32 management (Ndoro, 2015). 33 34 In the long term, heritage managers and local authorities could shift from planning primarily for disaster 35 response and recovery to strategies that focus on disaster preparedness, reducing the vulnerability of sites 36 and strengthening resilience of local communities (UNFCCC, 2007; Domke and Pretzsch, 2016). This could 37 evolve into innovative approaches that integrate community, government and the research sector in 38 productive cultural heritage management partnerships. 39 40 There is a need for institutions to establish, maintain and update a comprehensive inventory of underwater 41 cultural heritage. This can be done using non-intrusive, detailed mapping of the wreck site and a 3D model 42 from which scientists can reconstruct the site in detail (Maarleveld and Guérin, 2013). 43 44 45 [START FAQ9.1 HERE] 46 47 FAQ 9.1: Which climate hazards impact African livelihoods, economies, health and well-being the 48
most? 49 50 Climate extremes, particularly extreme heat, drought, and heavy rainfall events, impact the livelihoods, 51 health, and well-being of millions of Africans. They will also continue to impact African economies, limiting 52 adaptation capacity. Interventions based on resilient infrastructure and technologies can achieve numerous 53 developmental and adaptation co-benefits. 54 55 Rainfall impacts African livelihoods and well-being primarily through drought and heavy rainfall events. 56 Drought frequency, duration and intensity is projected to increase in most parts of Africa, but particularly in 57
ACCEPTED VERSIO
N
SUBJECT TO FIN
AL EDITS

FINAL DRAFT Chapter 9 IPCC WGII Sixth Assessment Report
Do Not Cite, Quote or Distribute 9-148 Total pages: 225
West Africa and the Sahel. By 2030, about 250 million people may experience high water stress in Africa, 1 with up to 700 million people displaced as a result. In sub-Saharan Africa, floods are expected to displace an 2 average of 2.7 million people in any given year in the future. Changing rainfall distributions together with 3 warming temperatures will alter the distributions of disease vectors like mosquitoes and midges. Malaria 4 vector hotspots and prevalence are projected to increase in East and southern Africa and the Sahel under 5 RCP4.5 by the 2030s, exposing an additional 50.6–62.1 million people to malaria risk. 6 7 Increases in the number of hot days and nights, as well as in heatwave intensity and duration, have had 8 negative impacts on agriculture, human health, water availability, energy demand and livelihoods. By some 9 estimates, African countries’ GDP per capita is on average 13.6% lower since 1991 than if anthropogenic 10 warming had not occurred. In the future, high temperatures combined with high humidity exceed the 11 threshold for human and livestock tolerance over larger parts of Africa and with greater frequency. Increased 12 average temperatures and lower rainfall will further reduce economic output and growth in Africa, with 13 larger negative impacts than on other regions of the world. 14 15 Resilient infrastructure and technologies are required to cope with the increasing climate variability and 16 change (Figure FAQ 9.1). These include improving housing to limit heat and exposure, along with 17 improving water and sanitation infrastructure. Such interventions to ensure that the most vulnerable are 18 properly protected from climate change have many co-benefits, including for pandemic recovery and 19 prevention. 20 21 22
23 Figure FAQ9.1.1: A schematic illustration of the interconnectedness of different sectors and impacts that spillover to 24 affect the health and well-being of African people. 25 26 [END FAQ9.1 HERE] 27 28 29 [START FAQ9.2 HERE] 30 31 FAQ9.2: What are the limits and benefits of climate change adaptation in Africa? 32 33
ACCEPTED VERSIO
N
SUBJECT TO FIN
AL EDITS
FINAL DRAFT Chapter 9 IPCC WGII Sixth Assessment Report
Do Not Cite, Quote or Distribute 9-149 Total pages: 225
The capacity for African ecosystems to adapt to changing environmental conditions is limited by a range of 1 factors, from heat tolerance to land availability. Adaptation across human settlements and food systems are 2 further constrained by insufficient planning and affordability. Integrated development planning and 3 increasing finance flows can improve African climate change adaptation. 4 5 Many species will lose all suitable habitats due to increases in temperature by 2100. Coupled with projected 6 losses of Africa’s protected areas, higher temperatures will also reduce carbon sinks and other ecosystem 7 services. Many nature-based adaptation measures (e.g., for coral reefs, mangroves, marshes) are no longer 8 effective at 1.5ºC of global warming. Human-based adaptation strategies for ecosystems reach their limits as 9 availability and affordability of land decreases, resulting in migration, displacement and relocation. 10 11 The limits to adaptation for human settlements arise largely from developmental challenges associated with 12 Africa’s rapid urbanisation, poor development planning, and increasing numbers of urban poor residing in 13 informal settlements. Further limits arise from insufficient consideration of climate change in adaptation 14 planning and infrastructure investment and insufficient financial resources. There are also limits to 15 adaptation for food production strategies. Increasing climate events – droughts and floods – impose specific 16 adaptation responses which poorer households cannot afford. For instance, the use of early-maturing or 17 drought-tolerant crop varieties may increase resilience, but adoption by smallholder farmers is hindered by 18 the unavailability or unaffordability of seed. 19 20 Adaptation in Africa can reduce risks at current levels of global warming. However, there is very limited 21 evidence for the effectiveness of current adaptation at increased global warming levels. Ambitious, near-term 22 mitigation would yield the largest single contribution to successful adaptation in Africa. 23 24 Current adaptation finance flows are billions of USD less than the needs of African countries and around half 25 of finance commitments to Africa reported by developed countries remain undisbursed. Increasing 26 adaptation finance flows by billions of dollars (including public and private sources), removing barriers to 27 accessing finance and providing targeted country support can improve climate change adaptation across 28 Africa. 29 30 [END FAQ9.2 HERE] 31 32 33 [START FAQ9.3 HERE] 34 35 FAQ 9.3: How can African countries secure enough food in changing climate conditions for their 36
growing populations? 37 38 Climate change is already impacting African food systems and will worsen food insecurity in sub-Saharan 39 Africa in the future. An integrated approach to adaptation planning can serve as a flexible and cost-effective 40 solution for addressing African food security challenges. 41 42 Maize and wheat yields have decreased on average 5.8% and 2.3%, respectively, in Sub-Saharan Africa due 43 to climate change. Among the 135 million acutely food-insecure people in crisis globally, more than half (73 44 million) are in Africa. This is partly due to the growing severity of drought. Adding to these challenges, 45 Africa has the fastest-growing population in the world. Its population is expected to increase by roughly 50% 46 over the next fifteen years, growing from 1.2 billion people to over 1.8 billion by 2035. 47 48 Sustainable agricultural development combined with enabling institutional conditions, such as supportive 49 governance systems and policy, can provide farmers with greater yield stability in uncertain climate 50 conditions. It is also widely acknowledged that an integrated approach for adaptation planning that combines 51 (i) emerging Climate Information Services, (ii) capacity building, (iii) local and indigenous knowledge 52 systems and (iv) strategic financial investment can serve as a flexible and cost-effective solution for 53 addressing African food security challenges (Section 9.4.1.2; Box 9.2). 54 55 [END FAQ9.3 HERE] 56 57
ACCEPTED VERSIO
N
SUBJECT TO FIN
AL EDITS
FINAL DRAFT Chapter 9 IPCC WGII Sixth Assessment Report
Do Not Cite, Quote or Distribute 9-150 Total pages: 225
1 [START FAQ9.4 HERE] 2 3 FAQ9.4: How can African local knowledge serve climate adaptation planning more effectively? 4 5 A strong relationship between scientific knowledge and local knowledge is desirable, especially in 6 developing contexts where technology for prediction and modelling is least accessible. 7 8 In many African settings, farmers use the local knowledge gained over time – through experience and passed 9 on orally from generation to generation – to cope with climate challenges. Indigenous knowledge systems of 10 weather and climate patterns include early warning systems, agroecological farming systems and observation 11 of natural or non-natural climate indicators. For instance, biodiversity and crop diversification are used as a 12 buffer against environmental challenges: if one crop fails, another will survive. Local knowledge of seasons, 13 storms, and wind patterns is used to guide and plan farming and other activities. 14 15 Collaborative partnerships between research, agricultural extension services and local communities would 16 create new avenues for the co-production of knowledge in climate change adaptation to better inform 17 adaptation policies and practices across Africa (Section 9.4.3; Box 9.2). 18 19 [END FAQ9.4 HERE] 20 21 22
ACCEPTED VERSIO
N
SUBJECT TO FIN
AL EDITS

FINAL DRAFT Chapter 9 IPCC WGII Sixth Assessment Report
Do Not Cite, Quote or Distribute 9-151 Total pages: 225
References 1 2 Abadie, L. M. et al., 2020: Comparing urban coastal flood risk in 136 cities under two alternative sea-level projections: 3
RCP 8.5 and an expert opinion-based high-end scenario. Ocean & Coastal Management, 193, 105249, 4 doi:https://doi.org/10.1016/j.ocecoaman.2020.105249. 5
Abadie, L. M. et al., 2021: Additional dataset to "Comparing urban coastal flood risk in 136 cities under two alternative 6 sea-level projections: RCP 8.5 and an expert opinion-based high-end scenario", Zenodo. Available at: 7 https://doi.org/10.5281/zenodo.4733499. 8
Abatzoglou, J. T., A. P. Williams and R. Barbero, 2019: Global Emergence of Anthropogenic Climate Change in Fire 9 Weather Indices. Geophysical Research Letters, 46(1), 326-336, doi:10.1029/2018GL080959. 10
Abayomi, A. and M. N. Cowan, 2014: The HIV/AIDS epidemic in South Africa: Convergence with tuberculosis, 11 socioecological vulnerability, and climate change patterns. S Afr Med J, 104(8), 583, doi:10.7196/samj.8645. 12
Abbas, A. M. (ed.), Climate Change and Forced Migration from Ngala and Kala-Balge LGAs, N.E. Borno State, 13 Nigeria. Global Changes and Natural Disaster Management: Geo-information Technologies, 2017, Cham, 14 Springer International Publishing, 141-151 pp. ISBN 978-3-319-51844-2. 15
Abbas, H. A., W. J. Bond and J. J. Midgley, 2019: The worst drought in 50 years in a South African savannah: Limited 16 impact on vegetation. African Journal of Ecology, 57(4), 490-499, doi:10.1111/aje.12640. 17
Abdalahh, M., 2011: Impact of coastal environmental conditions on building materials of The Roman Theater at the 18 archaeological site of Sabratha, Libya. Yearbook of the General Union of Archaeologists, 14(14), 288-323, 19 doi:10.21608/cguaa.2011.35625. 20
Abdela, N. and K. Jilo, 2016: Impact of Climate Change on Livestock Health: A Review. Global Veterinaria, 16(5), 21 419-424, doi:http://dx.doi.org/10.5829/idosi.gv.2016.16.05.10370. 22
Abdussalam, A. F. et al., 2014: The impact of climate change on meningitis in Northwest Nigeria: An assessment using 23 CMIP5 climate model simulations. Weather, Climate, and Society, 6(3), 371–379, 24 doi:https://doi.org/10.1175/WCAS-D-13-00068.1. 25
Abel, G. J., M. Brottrager, J. Crespo Cuaresma and R. Muttarak, 2019: Climate, conflict and forced migration. Global 26 Environmental Change, 54, 239-249, doi:https://doi.org/10.1016/j.gloenvcha.2018.12.003. 27
Abera, A. et al., 2021: Air Quality in Africa: Public Health Implications. Annual Review of Public Health, 42(1), 193-28 210, doi:10.1146/annurev-publhealth-100119-113802. 29
Abidoye, B. O. and A. F. Odusola, 2015: Climate Change and Economic Growth in Africa: An Econometric Analysis. 30 Journal of African Economies, 24(2), 277-301, doi:10.1093/jae/eju033. 31
Abiodun, G. J. et al., 2018: Exploring the Influence of Daily Climate Variables on Malaria Transmission and 32 Abundance of Anopheles arabiensis over Nkomazi Local Municipality, Mpumalanga Province, South Africa. 33 Journal of Environmental and Public Health, 2018, 3143950, doi:10.1155/2018/3143950. 34
Abiona, O., 2017: Adverse effects of early life extreme precipitation shocks on short-term health and adulthood welfare 35 outcomes. Review of Development Economics, 21, 1229-1254, doi:10.1111/rode.12310. 36
Abraham, J. O., G. P. Hempson and A. C. Staver, 2019: Drought-response strategies of savanna herbivores. Ecol Evol, 37 9(12), 7047-7056, doi:10.1002/ece3.5270. 38
Abutaleb, K. A. A., A. H. E. Mohammed and M. H. M. Ahmed, 2018: Climate Change Impacts, Vulnerabilities and 39 Adaption Measures for Egypt’s Nile Delta. Earth Systems and Environment, 2(2), 183-192, doi:10.1007/s41748-40 018-0047-9. 41
Acevedo, M. et al., 2020: A scoping review of adoption of climate-resilient crops by small-scale producers in low- and 42 middle-income countries. Nat Plants, 6(10), 1231-1241, doi:10.1038/s41477-020-00783-z. 43
Acevedo, S. et al., 2017: The effects of weather shocks on economic activity: How can low-income countries cope? In: 44 World Economic Outlook, October 2017 : Seeking Sustainable Growth: Short-Term Recovery, Long-Term 45 Challenges [IMF (ed.)]. International Monetary Fund. Research Dept., New York, pp. 117-183. 46
Adams, L., 2018: Unlocking the potential of enhanced rainfed agriculture. SIWI, Stockholm. Available at: 47 https://www.siwi.org/wp-content/uploads/2018/12/Unlocking-the-potential-of-rainfed-agriculture-2018-48 FINAL.pdf 49
Adamu, B. and H. N. Ndi, 2017: Changing trends in water sources and related pathologies in small to medium size 50 African cities. GeoJournal, 83(4), 885-896, doi:10.1007/s10708-017-9808-5. 51
Addaney, M., 2020: Strengthening Africa’s Adaptive Capacity to Climate Change: African Union Law and 52 Implications of China’s Belt and Road Policy. In: Climate Change, Hazards and Adaptation Options [Filho, W. 53 L., G. J. Nagy, M. Borga, P. D. C. Muñoz and A. Magnuszewski (eds.)]. Springer Nature Switzerland AG, pp. 54 481-503. 55
Adegun, O. B. and Y. M. D. Adedeji, 2017: Review of economic and environmental benefits of earthen materials for 56 housing in Africa. Frontiers of Architectural Research, 6(4), 519-528, 57 doi:https://doi.org/10.1016/j.foar.2017.08.003. 58
Adekiya, T. A. et al., 2019: The Effect of Climate Change and the Snail-Schistosome Cycle in Transmission and Bio-59 Control of Schistosomiasis in Sub-Saharan Africa. International journal of environmental research and public 60 health, 17(1), 181, doi:10.3390/ijerph17010181. 61
Adelekan, I. and T. Fregene, 2015: Vulnerability of artisanal fishing communities to flood risks in coastal southwest 62 Nigeria. Climate and Development, 7(4), 322-338, doi:10.1080/17565529.2014.951011. 63
ACCEPTED VERSIO
N
SUBJECT TO FIN
AL EDITS
FINAL DRAFT Chapter 9 IPCC WGII Sixth Assessment Report
Do Not Cite, Quote or Distribute 9-152 Total pages: 225
Adelekan, I. O., 2012: Vulnerability to wind hazards in the traditional city of Ibadan, Nigeria. Environment and 1 Urbanization, 24(2), 597-617, doi:10.1177/0956247812454247. 2
Adelekan, I. O., 2016: Flood risk management in the coastal city of Lagos, Nigeria. Journal of Flood Risk Management, 3 9(3), 255-264, doi:10.1111/jfr3.12179. 4
Adeniran, A. B. and K. A. Daniell, 2020: Transaqua: power, political change and the transnational politics of a water 5 megaproject. International Journal of Water Resources Development, 37(2), 234-255, 6 doi:10.1080/07900627.2020.1747408. 7
Adenle, A. A. et al., 2017: Managing Climate Change Risks in Africa - A Global Perspective. Ecological Economics, 8 141, 190-201, doi:https://doi.org/10.1016/j.ecolecon.2017.06.004. 9
Adenle, A. A., K. Wedig and H. Azadi, 2019: Sustainable agriculture and food security in Africa: The role of 10 innovative technologies and international organizations. Technology in Society, 58, 101143, 11 doi:https://doi.org/10.1016/j.techsoc.2019.05.007. 12
Adeola, A. M. et al., 2019: Predicting malaria cases using remotely sensed environmental variables in Nkomazi, South 13 Africa. Geospatial Health, 14(1), doi:10.4081/gh.2019.676. 14
Adeola, A. M. et al., 2017: Climatic Variables and Malaria Morbidity in Mutale Local Municipality, South Africa: A 15 19-Year Data Analysis. International journal of environmental research and public health, 14(11), 1360, 16 doi:10.3390/ijerph14111360. 17
Adepoju, A., 2019: Migrants and Refugees in Africa. In: Oxford Research Encyclopedia of Politics. ISBN 18 9780190228637. 19
Adetula, V. A. O., R. Bereketeab and O. Jaiyebo, 2016: Regional economic communities and peacebuilding in Africa : 20 the experiences of ECOWAS and IGAD. NAI Policy Dialogue, Nordiska Afrikainstitutet, Uppsala, 50 pp. 21 Available at: http://urn.kb.se/resolve?urn=urn:nbn:se:nai:diva-2103 (accessed 2017-01-25t16:44:07.290+01:00). 22
Adeyeye, B. et al., 2020: A SWOT analysis of indigenous language use in agricultural radio programming in Nigeria. 23 In: Emerging Trends in Indigenous Language Media, Communication, Gender, and Health [Adesina, E., O. 24 Afolabi, N. C. Asogwa, F. Falobi, A. C. Ifeanyichukwu, K. Kadiri, P. Mpofu, O. Ogunyombo, K. Onyenankeya, 25 O. Oredola, T. Owolabi and O. Oyero (eds.)]. IGI Global, pp. 188-209. ISBN 9781799820918. 26
Adger, W. N. et al., 2021: Perceived environmental risks and insecurity reduce future migration intentions in hazardous 27 migration source areas. One Earth, 4(1), 146-157, doi:10.1016/j.oneear.2020.12.009. 28
Adhikari, B. and L. S. Safaee Chalkasra, 2021: Mobilizing private sector investment for climate action: enhancing 29 ambition and scaling up implementation. Journal of Sustainable Finance & Investment, 1-18, 30 doi:10.1080/20430795.2021.1917929. 31
Adhikari, U., A. P. Nejadhashemi and S. A. Woznicki, 2015: Climate change and eastern Africa: a review of impact on 32 major crops. Food and Energy Security, 4(2), 110-132, doi:https://doi.org/10.1002/fes3.61. 33
Adjei, V. and R. Kyerematen, 2018: Impacts of Changing Climate on Maize Production in the Transitional Zone of 34 Ghana. American Journal of Climate Change, 7(3), 14, doi:10.4236/ajcc.2018.73028. 35
Adom, K., 2014: Beyond the Marginalization Thesis: An Examination of the Motivations of Informal Entrepreneurs in 36 Sub-Saharan Africa. The International Journal of Entrepreneurship and Innovation, 15(2), 113-125, 37 doi:10.5367/ijei.2014.0144. 38
Adu-Prah, S. and E. Kofi Tetteh, 2015: Spatiotemporal analysis of climate variability impacts on malaria prevalence in 39 Ghana. Applied Geography, 60, 266-273, doi:10.1016/j.apgeog.2014.10.010. 40
Adzawla, W., S. B. Azumah, P. Y. Anani and S. A. Donkoh, 2019a: Gender perspectives of climate change adaptation 41 in two selected districts of Ghana. Heliyon, 5(11), e02854, doi:10.1016/j.heliyon.2019.e02854. 42
Adzawla, W., H. Baumüller, S. A. Donkoh and R. Serra, 2019b: Effects of climate change and livelihood diversification 43 on the gendered productivity gap in Northern Ghana. Climate and Development, 12(8), 743-755, 44 doi:10.1080/17565529.2019.1689093. 45
AfDB, 2018a: The Africa Infrastructure Develoment Index 2018. Available at: 46 https://www.afdb.org/fileadmin/uploads/afdb/Documents/Publications/Economic_Brief_-47 _The_Africa_Infrastructure_Development_Index.pdf. 48
AfDB, 2018b: African Economic Outlook 2018. 200 pp. Available at: 49 https://www.afdb.org/en/documents/document/african-economic-outlook-aoe-2018-99877. 50
AfDB, 2018c: Multinational Appraisal Report for Programme for Integrated Development and Adaptation to Climate 51 Change (PIDACC). African Development Bank (AfDB), AfDB, Abidjan, Côte d’Ivoire, 56 pp. Available at: 52 https://www.afdb.org/en/documents/document/multinational-programme-for-integrated-development-and-53 adaptation-to-climate-change-in-the-niger-basin-pidacc-appraisal-report-109273. 54
AfDB, 2019: Analysis of adaptation components of Africa's Nationally Determined Contributions (NDCs). African 55 Development Bank, Abijan. Available at: https://www.afdb.org/fileadmin/uploads/afdb/Documents/Generic-56 Documents/Analysis_of_Adaptation_Components_in_African_NDCs_2019.pdf. 57
AfDB, 2021: African Development Report 2015 - Growth, Poverty and Inequality Nexus: Overcoming Barriers to 58 Sustainable Development. African Development Bank, Bank, A. D., Abidjan, Côte d’Ivoire, 270 pp. Available at: 59 https://www.afdb.org/en/documents/document/african-development-report-2015-growth-poverty-and-inequality-60 nexus-overcoming-barriers-to-sustainable-development-89715. 61
Afifi, T., 2011: Economic or Environmental Migration? The Push Factors in Niger. International Migration, 49(s1), 62 e95-e124, doi:https://doi.org/10.1111/j.1468-2435.2010.00644.x. 63
ACCEPTED VERSIO
N
SUBJECT TO FIN
AL EDITS

FINAL DRAFT Chapter 9 IPCC WGII Sixth Assessment Report
Do Not Cite, Quote or Distribute 9-153 Total pages: 225
Africa Adaptation Initiative, 2018: Africa State of Adaptation Report. Africa Adaptation Initiative (AAI), New York, 1 USA., 32 pp. 2
African Development Bank, OECD and United Nations Development Programme, 2016: African Economic Outlook 3 2016. Sustainable Cities and Structural Transformation, 400 pp. ISBN 9789264256477. 4
Agier, L. et al., 2013: Seasonality of meningitis in Africa and climate forcing: aerosols stand out. Journal of the Royal 5 Society Interface, 10(79), 20120814, doi:https://doi.org/10.1098/rsif.2012.0814. 6
Agrawal, A. et al., 2019: Climate resilience through social protection. Background paper to the 2019 report of the 7 Global Commission on Adaptation. Rotterdam and Washington, DC. Available at: www.gca.org. 8
Agrawala, S. and M. Carraro, 2010: Assessing the Role of Microfinance in Fostering Adaptation to Climate Change. 9 Fondazione Eni Enrico Mattei, Working Papers, doi:10.2139/ssrn.1646883. 10
Aguilar, E. et al., 2009: Changes in temperature and precipitation extremes in western central Africa, Guinea Conakry, 11 and Zimbabwe, 1955–2006. J Geophys Res-Atmos, 114(D2), doi:https://doi.org/10.1029/2008JD011010. 12
Aguirre-Gutiérrez, J. et al., 2019: Drier tropical forests are susceptible to functional changes in response to a long-term 13 drought. Ecology Letters, 22(5), 855-865, doi:https://doi.org/10.1111/ele.13243. 14
Agusto, F. B., A. B. Gumel and P. E. Parham, 2015: Qualitative assessment of the role of temperature variations on 15 malaria transmission dynamics. J. Biol. Syst., 23(04), 1550030, doi:10.1142/S0218339015500308. 16
Agyeman, Y. B., 2019: Ecotourism as an Adaptation Strategy for Mitigating Climate Change Impacts on Local 17 Communities Around Protected Areas in Ghana. In: Handbook of Climate Change Resilience [Filho, W. L. (ed.)]. 18 Springer, Cham, Switzerland, pp. 537-555. ISBN 978-3-319-93336-8 19
Ahdoot, S., S. E. Pacheco and T. C. O. E. HEALTH, 2015: Global Climate Change and Children’s Health. Pediatrics, 20 peds.2015-3233, doi:10.1542/peds.2015-3233. 21
Ahmadalipour, A. and H. Moradkhani, 2018: Escalating heat-stress mortality risk due to global warming in the Middle 22 East and North Africa (MENA). Environment International, 117, 215-225, 23 doi:https://doi.org/10.1016/j.envint.2018.05.014. 24
Ahmadalipour, A., H. Moradkhani, A. Castelletti and N. Magliocca, 2019: Future drought risk in Africa: Integrating 25 vulnerability, climate change, and population growth. Sci Total Environ, 662, 672-686, 26 doi:10.1016/j.scitotenv.2019.01.278. 27
Ahmed, A. et al., 2016: Adaptation to climate change or non-climatic stressors in semi-arid regions? Evidence of 28 gender differentiation in three agrarian districts of Ghana. Environmental Development, 20, 45-58, 29 doi:https://doi.org/10.1016/j.envdev.2016.08.002. 30
Ahmed, S. M., 2020: Impacts of drought, food security policy and climate change on performance of irrigation schemes 31 in Sub-saharan Africa: The case of Sudan. Agricultural Water Management, 232, 32 doi:10.1016/j.agwat.2020.106064. 33
Aich, V. et al., 2014: Comparing impacts of climate change on streamflow in four large African river basins. Hydrology 34 and Earth System Sciences, 18(4), 1305-1321, doi:10.5194/hess-18-1305-2014. 35
Ainsworth, E. A. and S. P. Long, 2021: 30 years of free-air carbon dioxide enrichment (FACE): What have we learned 36 about future crop productivity and its potential for adaptation? Global Change Biology, 27(1), 27-49, 37 doi:10.1111/gcb.15375. 38
Ajayi, A. and S. I. Smith, 2019: Recurrent cholera epidemics in Africa: which way forward? A literature review. 39 Infection, 47(3), 341-349, doi:https://doi.org/10.1007/s15010-018-1186-5. 40
Ajibade, L. T. and J. O. Eche, 2017: Indigenous knowledge for climate change adaptation in Nigeria. In: Indigenous 41 knowledge systems and climate change management in Africa [Mafongoya, P. L. and O. C. Ajayi (eds.)]. CTA, 42 Wageningen, The Netherlands, pp. 316. 43
Akello, S., 2014: Effects of floods on students access to secondary education in Nyando district, Kisumu county, 44 Kenya. University of Nairobi, Nairobi, 84 pp. 45
Akinsanola, A. A. and W. Zhou, 2019: Projections of West African summer monsoon rainfall extremes from two 46 CORDEX models. Clim Dyn, 52(3), 2017-2028, doi:10.1007/s00382-018-4238-8. 47
Akintola, S. L. and K. A. Fakoya, 2017: Small ‑ scale fisheries in the context of traditional post ‑ harvest practice and 48 the quest for food and nutritional security in Nigeria. Agriculture & Food Security, 6(34), 1-17, 49 doi:10.1186/s40066-017-0110-z. 50
Akinyi, D. P., S. K. Ng’ang’a and E. H. Girvetz, 2021: Trade-offs and synergies of climate change adaptation strategies 51 among smallholder farmers in sub-Saharan Africa: A systematic review. Regional Sustainability, 2(2), 130-143, 52 doi:https://doi.org/10.1016/j.regsus.2021.05.002. 53
Aklin, M., P. Bayer, S. P. Harish and J. Urpelainen, 2018: Escaping the Energy Poverty Trap When and How 54 Governments Power the Lives of the Poor. MIT Press, Cambridge, MA ISBN 9780262535861. 55
Akpan, G. E., K. A. Adepoju, O. R. Oladosu and S. A. Adelabu, 2018: Dominant malaria vector species in Nigeria: 56 Modelling potential distribution of Anopheles gambiae sensu lato and its siblings with MaxEnt. PLOS ONE, 57 13(10), e0204233, doi:10.1371/journal.pone.0204233. 58
Akresh, R., P. Verwimp and T. Bundervoet, 2011: Civil War, Crop Failure, and Child Stunting in Rwanda. Economic 59 Development and Cultural Change, 59(4), 778-810, 60 doi:https://www.journals.uchicago.edu/doi/full/10.1086/660003. 61
Alam, S. A., 2006: Use of biomass fuels in the brick-making industries of Sudan: Implications for deforestation and 62 greenhouse gas emission. University of Helsinki, Finland, Helsinki, Finland, 87 pp. 63
ACCEPTED VERSIO
N
SUBJECT TO FIN
AL EDITS

FINAL DRAFT Chapter 9 IPCC WGII Sixth Assessment Report
Do Not Cite, Quote or Distribute 9-154 Total pages: 225
Albrecht, T. R., A. Crootof and C. A. Scott, 2018: The Water-Energy-Food Nexus: A systematic review of methods for 1 nexus assessment. Environmental Research Letters, 13(4), 043002, doi:10.1088/1748-9326/aaa9c6. 2
Alderman, H., J. Hoddinott and B. Kinsey, 2006: Long term consequences of early childhood malnutrition. Oxford 3 Economic Papers, 58(3), 450-474, doi:10.1093/oep/gpl008. 4
Aleman, J. C. et al., 2017: Tree cover in Central Africa: determinants and sensitivity under contrasted scenarios of 5 global change. Scientific Reports, 7(1), 1-12, doi:10.1038/srep41393. 6
Aleman, J. C., M. A. Jarzyna and A. C. Staver, 2018: Forest extent and deforestation in tropical Africa since 1990. 7 Nature Ecology and Evolution, 2(1), 26-33, doi:10.1038/s41559-017-0406-1. 8
Alemayehu, A. and W. Bewket, 2017: Smallholder farmers’ coping and adaptation strategies to climate change and 9 variability in the central highlands of Ethiopia. Local Environment, 22(7), 825-839, 10 doi:10.1080/13549839.2017.1290058. 11
Alemu, K., A. Worku, Y. Berhane and A. Kumie, 2014: Spatiotemporal clusters of malaria cases at village level, 12 northwest Ethiopia. Malar. J., 13, 223, doi:10.1186/1475-2875-13-223. 13
Alexander, M., 2020: Pandemics, climate change, and disability related to SCI. Spinal Cord Ser Cases, 6(1), 36, 14 doi:10.1038/s41394-020-0285-6. 15
Alexander, M. and S. Dessai, 2019: What can climate services learn from the broader services literature? Climatic 16 Change, 157(1), 133-149, doi:10.1007/s10584-019-02388-8. 17
Alfieri, L. et al., 2017: Global projections of river flood risk in a warmer world. Earth's Future, 5(2), 171-182, 18 doi:https://doi.org/10.1002/2016EF000485. 19
Aljawabra, F. and M. Nikolopoulou, 2018: Thermal comfort in urban spaces: a cross-cultural study in the hot arid 20 climate. Int J Biometeorol, 62(10), 1901-1909, doi:10.1007/s00484-018-1592-5. 21
Allan, T., M. Keulertz and E. Woertz, 2015: The water–food–energy nexus: an introduction to nexus concepts and some 22 conceptual and operational problems. International Journal of Water Resources Development, 31(3), 301-311, 23 doi:10.1080/07900627.2015.1029118. 24
Allard, C., 2017: The Informal Economy in Sub-Saharan Africa. In: Regional Economic Outlook [Robinson, D. (ed.)], 25 pp. 122. ISBN 9781475574463. 26
Allen, T. et al., 2017: Global hotspots and correlates of emerging zoonotic diseases. Nat Commun, 8(1), 1124, 27 doi:10.1038/s41467-017-00923-8. 28
Alonso, S. et al., 2019: The economic burden of malaria on households and the health system in a high transmission 29 district of Mozambique. Malaria Journal, 18(1), 360, doi:10.1186/s12936-019-2995-4. 30
Aloysius, N. R. et al., 2016: Evaluation of historical and future simulations of precipitation and temperature in central 31 Africa from CMIP5 climate models. J Geophys Res-Atmos, 121(1), 130-152, doi:10.1002/2015JD023656. 32
Alsdorf, D. et al., 2016: Opportunities for hydrologic research in the Congo Basin. Reviews of Geophysics, 54(2), 378-33 409, doi:10.1002/2016rg000517. 34
Altieri, M. A., C. I. Nicholls, A. Henao and M. A. Lana, 2015: Agroecology and the design of climate change-resilient 35 farming systems. Agronomy for Sustainable Development, 35(3), 869-890, doi:10.1007/s13593-015-0285-2. 36
Alvar-Beltrán, J. et al., 2020: Farmers’ Perceptions of Climate Change and Agricultural Adaptation in Burkina Faso. 37 Atmosphere, 11(8), 827, doi:10.3390/atmos11080827. 38
Álvarez Larrain, A. and M. K. McCall, 2019: Participatory mapping and participatory GIS for historical and 39 archaeological landscape studies: a critical review. Journal of Archaeological Method and Theory, 26(2), 643-40 678, doi:10.1007/s10816-018-9385-z. 41
Alves, B., D. B. Angnuureng, P. Morand and R. Almar, 2020: A review on coastal erosion and flooding risks and best 42 management practices in West Africa: what has been done and should be done. Journal of Coastal Conservation, 43 24(3), doi:10.1007/s11852-020-00755-7. 44
Amadi, J. A. et al., 2018: Sensitivity of vegetation to climate variability and its implications for malaria risk in Baringo, 45 Kenya. PLOS ONE, 13(7), e0199357, doi:10.1371/journal.pone.0199357. 46
Amadi, L. and U. M. Ogonor, 2015: Climate change, environmental security and displacement in Nigeria: Experience 47 from the Niger Delta Flood Disaster, 2012. African Journal of Environmental Science and Technology, 9(1), 53-48 64, doi:https://doi.org/10.5897/AJEST2014.1749. 49
Amamou, H. et al., 2018: Climate change-related risks and adaptation strategies as perceived in dairy cattle farming 50 systems in Tunisia. Climate Risk Management, 20, 38-49, doi:10.1016/j.crm.2018.03.004. 51
Amanambu, A. C. et al., 2019: Spatio-temporal variation in rainfall-runoff erosivity due to climate change in the Lower 52 Niger Basin, West Africa. CATENA, 172, 324-334, doi:https://doi.org/10.1016/j.catena.2018.09.003. 53
Amare, Z. Y., J. O. Ayoade, I. O. Adelekan and M. T. Zeleke, 2018: Barriers to and determinants of the choice of crop 54 management strategies to combat climate change in Dejen District, Nile Basin of Ethiopia. Agriculture & Food 55 Security, 7(1), 37, doi:10.1186/s40066-018-0188-y. 56
AMCOW, 2012: Water Security and Climate Resilient Development: Strategic Framework. Water Climate 57 Development Programme, The African Ministers’ Council on Water (AMCOW), AMCOW, Abuja Nigeria, 52 pp. 58 Available at: https://www.preventionweb.net/files/43470_watersecurityandclimateresilientdev.pdf. 59
Amegah, A. K., G. Rezza and J. J. K. Jaakkola, 2016: Temperature-related morbidity and mortality in Sub-Saharan 60 Africa: A systematic review of the empirical evidence. Environment International, 91, 133-149, 61 doi:https://doi.org/10.1016/j.envint.2016.02.027. 62
ACCEPTED VERSIO
N
SUBJECT TO FIN
AL EDITS

FINAL DRAFT Chapter 9 IPCC WGII Sixth Assessment Report
Do Not Cite, Quote or Distribute 9-155 Total pages: 225
Amusan, L. and O. Olutola, 2017: Climate change and sustainable tourism: South Africa caught in-between. African 1 Journal of Hospitality, Tourism and Leisure, 6(4). 2
Anadón, J. D., O. E. Sala, B. L. Turner and E. M. Bennett, 2014: Effect of woody-plant encroachment on livestock 3 production in North and South America. Proceedings of the National Academy of Sciences, 111(35), 12948, 4 doi:10.1073/pnas.1320585111. 5
Anchang, J. Y. et al., 2019: Trends in Woody and Herbaceous Vegetation in the Savannas of West Africa. Remote 6 Sensing, 11(5), 576, doi:10.3390/rs11050576. 7
Andela, N. and G. R. van der Werf, 2014: Recent trends in African fires driven by cropland expansion and El Niño to 8 La Niña transition. Nature Climate Change, 4(9), 791-795, doi:10.1038/nclimate2313. 9
Anderson, A., 2017: Mean streets: migration, xenophobia and informality in South Africa. Ethnic and Racial Studies, 10 40(8), 1343-1345, doi:10.1080/01419870.2016.1243252. 11
Andrews, T. M. and O. Smirnov, 2020: Who feels the impacts of climate change? Global Environmental Change, 65, 12 102164, doi:https://doi.org/10.1016/j.gloenvcha.2020.102164. 13
Andrijevic, M. et al., 2020: Overcoming gender inequality for climate resilient development. Nature Communications, 14 11(1), 6261, doi:10.1038/s41467-020-19856-w. 15
Angelsen, A. et al., 2014: Environmental Income and Rural Livelihoods: A Global-Comparative Analysis. World 16 Development, 64, S12-S28, doi:https://doi.org/10.1016/j.worlddev.2014.03.006. 17
Angula, M. N. and E. Menjono, 2014: Gender, culture and climate change in Namibia. 225-238 pp. Available at: 18 http://journals.unam.edu.na/index.php/JSHSS/article/view/980. 19
Anim, D. O. and R. Ofori-Asenso, 2020: Water scarcity and COVID-19 in sub-Saharan Africa. J Infect, 81(2), e108-20 e109, doi:10.1016/j.jinf.2020.05.032. 21
Anthony, K. R. N. et al., 2015: Operationalizing resilience for adaptive coral reef management under global 22 environmental change. Global Change Biology, 21(1), 48-61, doi:10.1111/gcb.12700. 23
Antwi-Agyei, P., A. J. Dougill, J. Doku-Marfo and R. C. Abaidoo, 2021: Understanding climate services for enhancing 24 resilient agricultural systems in Anglophone West Africa: The case of Ghana. Climate Services, 22, 100218, 25 doi:10.1016/j.cliser.2021.100218. 26
Antwi-Agyei, P., A. J. Dougill and L. C. Stringer, 2015: Barriers to climate change adaptation: evidence from northeast 27 Ghana in the context of a systematic literature review. Climate and Development, 7(4), 297-309, 28 doi:10.1080/17565529.2014.951013. 29
Antwi-Agyei, P., A. J. Dougill, L. C. Stringer and S. N. A. Codjoe, 2018: Adaptation opportunities and maladaptive 30 outcomes in climate vulnerability hotspots of northern Ghana. Climate Risk Management, 19, 83-93, 31 doi:https://doi.org/10.1016/j.crm.2017.11.003. 32
Antwi-Agyei, P., L. C. Stringer and A. J. Dougill, 2014: Livelihood adaptations to climate variability: insights from 33 farming households in Ghana. Regional Environmental Change, 14(4), 1615-1626, doi:10.1007/s10113-014-34 0597-9. 35
Arbieu, U., C. Grünewald, M. Schleuning and K. Böhning-Gaese, 2017: The importance of vegetation density for 36 tourists’ wildlife viewing experience and satisfaction in African savannah ecosystems. PLoS ONE, 12(9), 37 doi:10.1371/journal.pone.0185793. 38
Arblaster, J. M., G. A. Meehl and D. J. Karoly, 2011: Future climate change in the Southern Hemisphere: Competing 39 effects of ozone and greenhouse gases. Geophysical Research Letters, 38(2), 40 doi:https://doi.org/10.1029/2010GL045384. 41
Arbuckle, J. G., Jr., L. W. Morton and J. Hobbs, 2015: Understanding Farmer Perspectives on Climate Change 42 Adaptation and Mitigation: The Roles of Trust in Sources of Climate Information, Climate Change Beliefs, and 43 Perceived Risk. Environ Behav, 47(2), 205-234, doi:10.1177/0013916513503832. 44
ARC, 2021: ARC Risk Pools, African Risk Capacity. Available at: https://www.africanriskcapacity.org/countries/arc-45 risk-pools/. 46
Ario, A. R. et al., 2019: The logic model for Uganda's health sector preparedness for public health threats and 47 emergencies. Glob Health Action, 12(1), 1664103, doi:10.1080/16549716.2019.1664103. 48
Armitage, N. et al., 2014: Water Sensitive Urban Design (WSUD) for South Africa: Framework and Guidelines. 49 University of Cape Town. 50
Arndt, C. et al., 2019: Climate change and developing country growth: the cases of Malawi, Mozambique, and Zambia. 51 Climatic Change, 154(3-4), 335-349, doi:10.1007/s10584-019-02428-3. 52
Arnold, C. A. and L. H. Gunderson, 2013: Adaptive law and resilience. Envtl. L. Rep. News & Analysis, 43, 10426-53 10443. 54
Asaminew, T. G., A. Araya, G. Atkilt and H. Solomon, 2017: Modeling the Potential Impact of Climate Change on 55 Cotton (Gossypium hirsutum) Production in Northeastern Semi-Arid Afar and Western Tigray 56
Regions of Ethiopia. J Earth Sci Clim Change, 8(3), doi:10.4172/2157-7617.1000390. 57 Asamoah, B., T. Kjellstrom and P. O. Ostergren, 2018: Is ambient heat exposure levels associated with miscarriage or 58
stillbirths in hot regions? A cross-sectional study using survey data from the Ghana Maternal Health Survey 2007. 59 Int J Biometeorol, 62(3), 319-330, doi:10.1007/s00484-017-1402-5. 60
Asfaw, A., B. Simane, A. Hassen and A. Bantider, 2017: Determinants of non-farm livelihood diversification: evidence 61 from rainfed-dependent smallholder farmers in northcentral Ethiopia (Woleka sub-basin). Development Studies 62 Research, 4(1), 22-36, doi:10.1080/21665095.2017.1413411. 63
ACCEPTED VERSIO
N
SUBJECT TO FIN
AL EDITS
FINAL DRAFT Chapter 9 IPCC WGII Sixth Assessment Report
Do Not Cite, Quote or Distribute 9-156 Total pages: 225
Asfaw, S. et al., 2019: Independent Evaluation of the Green Climate Fund’s Country Ownership Approach. 21, 1 Independent Evaluation Unit, Green Climate Fund, GCF, Songdo, South Korea. 2
Asiama, K. O., W. Voss, R. Bennett and I. Rubanje, 2021: Land consolidation activities in Sub-Saharan Africa towards 3 the agenda 2030: A tale of three countries. Land Use Policy, 101, doi:10.1016/j.landusepol.2020.105140. 4
Asiyanbi, A. P., 2015: 'I don't get this climate stuff!' Making sense of climate change among the corporate middle class 5 in Lagos. Public Underst Sci, 24(8), 1007-1024, doi:10.1177/0963662514565332. 6
Asner, G. P., N. Vaughn, I. P. Smit and S. Levick, 2016: Ecosystem‐scale effects of megafauna in African savannas. 7 Ecography, 39(2), 240-252, doi:http://dx.doi.org/10.1111/ecog.01640. 8
Asseng, S. et al., 2019: Climate change impact and adaptation for wheat protein. Global Change Biology, 25(1), 155-9 173, doi:10.1111/gcb.14481. 10
Asumadu-Sarkodie, S., P. A. Owusu and P. Rufangura, 2015: Impact analysis of flood in Accra, Ghana. Advances in 11 Applied Science Research, 6(9), 53-78. 12
Aswad, N. A. E., T. A. Mohammad, A. H. Ghazali and Z. M. Yusoff, 2019: Modelling of Groundwater Pumping 13 Scenarios and their Impact on Saline Water Intrusion in a Tripoli Coastal Aquifer, Libya. Pertanika J. Sci. & 14 Technol. , 27(3), 1407-1427. 15
Atindana, S. A., P. K. Ofori-danson and S. Brucet, 2020: Modelling the effects of climate change on shellfish 16 production in marine artisanal fisheries of Ghana. AAS Open Research, 2(16), 1-13, 17 doi:https://doi.org/10.12688/aasopenres.12956.1. 18
Atteridge, A., 2013: Transforming household energy practices to reduce climate risks: Charcoal use in Lusaka, Zambia. 19 Climate Change: Adaptation, Resilience and Energy Security, 61, 5-7. 20
Attu, H. and J. K. Adjei, 2018: Local knowledge and practices towards malaria in an irrigated farming community in 21 Ghana. Malar J, 17(1), 150, doi:10.1186/s12936-018-2291-8. 22
AU, 2015: Agenda 2063. The African Union Commission, Addis Ababa, Ethiopia. Available at: 23 https://au.int/sites/default/files/documents/36204-doc-agenda2063_popular_version_en.pdf. 24
Augustine, D. J. et al., 2018: Elevated CO2 induces substantial and persistent declines in forage quality irrespective of 25 warming in mixedgrass prairie. Ecological Applications, 28(3), 721-735, doi:10.1002/eap.1680. 26
Augustyn, J. et al., 2018: South Africa. In: Climate change impacts on fisheries and aquaculture: a global analysis 27 [Phillips, B. and M. Perez-Ramirez (eds.)]. John Wiley and Sons Inc, pp. 479-522. ISBN 978-1-119-15404-4. 28
Averchenkova, A. and S. Matikainen, 2017: Climate legislation and international commitments. In: Trends in Climate 29 Change Legislation [Averchenkova, A., Fankhauser, S., Nachmany, M (ed.)]. Edward Elgar, London, pp. 193-30 208. ISBN 978 1 78643 577 4. 31
Awondo, S. N., 2019: Efficiency of region-wide catastrophic weather risk pools: Implications for African Risk Capacity 32 insurance program. Journal of Development Economics, 136, 111-118, 33 doi:https://doi.org/10.1016/j.jdeveco.2018.10.004. 34
Awotwi A et al., 2015: Predicting Hydrological Response to Climate Change in the White Volta Catchment, West 35 Africa. Journal of Earth Science & Climatic Change, 06(01), doi:10.4172/2157-7617.1000249. 36
Awoye, O. H. R., F. Pollinger, E. K. Agbossou and H. Paeth, 2017: Dynamical-statistical projections of the climate 37 change impact on agricultural production in Benin by means of a cross-validated linear model combined with 38 Bayesian statistics. Agricultural and Forest Meteorology, 234-235, 80-94, 39 doi:https://doi.org/10.1016/j.agrformet.2016.12.010. 40
Axelsson, C. R. and N. P. Hanan, 2018: Rates of woody encroachment in African savannas reflect water constraints and 41 fire disturbance. Journal of Biogeography, 45(6), 1209-1218, doi:https://doi.org/10.1111/jbi.13221. 42
Ayal, D. Y. and W. Leal Filho, 2017: Farmers' perceptions of climate variability and its adverse impacts on crop and 43 livestock production in Ethiopia. Journal of Arid Environments, 140, 20-28, doi:10.1016/j.jaridenv.2017.01.007. 44
Ayana, E. K., P. Ceccato, J. R. B. Fisher and R. DeFries, 2016: Examining the relationship between environmental 45 factors and conflict in pastoralist areas of East Africa. Science of The Total Environment, 557-558, 601-611, 46 doi:https://doi.org/10.1016/j.scitotenv.2016.03.102. 47
Ayanlade, A. and M. O. Jegede, 2016: Climate Change Education and Knowledge among Nigerian University 48 Graduates. Weather, Climate, and Society, 8(4), 465-473, doi:10.1175/wcas-d-15-0071.1. 49
Ayanlade, A. et al., 2020: Early warning climate indices for malaria and meningitis in tropical ecological zones. 50 Scientific Reports, 10(1), 14303, doi:10.1038/s41598-020-71094-8. 51
Ayanlade, A. and S. M. Ojebisi, 2019: Climate change impacts on cattle production: analysis of cattle herders’ climate 52 variability/change adaptation strategies in Nigeria. Change and Adaptation in Socio-Ecological Systems, 5(1), 12-53 23, doi:doi:10.1515/cass-2019-0002. 54
Ayanlade, A., M. Radeny and A. I. Akin-Onigbinde, 2018: Climate variability/change and attitude to adaptation 55 technologies: a pilot study among selected rural farmers’ communities in Nigeria. GeoJournal, 83(2), 319-331, 56 doi:10.1007/s10708-017-9771-1. 57
Ayanlade, A., M. Radeny and J. F. Morton, 2017: Comparing smallholder farmers’ perception of climate change with 58 meteorological data: A case study from southwestern Nigeria. Weather and Climate Extremes, 15, 24-33, 59 doi:https://doi.org/10.1016/j.wace.2016.12.001. 60
Ayele, H., M.-H. Li, C.-P. Tung and T.-M. Liu, 2016: Impact of climate change on runoff in the Gilgel Abbay 61 watershed, the Upper Blue Nile Basin, Ethiopia. Water, 8(9), doi:10.3390/w8090380. 62
ACCEPTED VERSIO
N
SUBJECT TO FIN
AL EDITS

FINAL DRAFT Chapter 9 IPCC WGII Sixth Assessment Report
Do Not Cite, Quote or Distribute 9-157 Total pages: 225
Ayugi, B. O. and G. Tan, 2018: Recent trends of surface air temperatures over Kenya from 1971 to 2010. Meteorology 1 and Atmospheric Physics, 131(5), 1401-1413, doi:10.1007/s00703-018-0644-z. 2
Azong, M. N. and C. J. Kelso, 2021: Gender, ethnicity and vulnerability to climate change: The case of matrilineal and 3 patrilineal societies in Bamenda Highlands Region, Cameroon. Global Environmental Change, 67, 4 doi:10.1016/j.gloenvcha.2021.102241. 5
Azongo, D. K. et al., 2012: A time series analysis of weather variables and all-cause mortality in the Kasena-Nankana 6 Districts of Northern Ghana, 1995–2010. Global Health Action, 5(1), 19073, doi:10.3402/gha.v5i0.19073. 7
Azzarri, C. and S. Signorelli, 2020: Climate and poverty in Africa South of the Sahara. World Development, 125, 8 104691, doi:https://doi.org/10.1016/j.worlddev.2019.104691. 9
Baarsch, F. et al., 2020: The impact of climate change on incomes and convergence in Africa. World Development, 126, 10 104699, doi:https://doi.org/10.1016/j.worlddev.2019.104699. 11
Baccini, A. et al., 2017: Tropical forests are a net carbon source based on aboveground measurements of gain and loss. 12 Science (New York, N.Y.), 358(6360), 230, doi:10.1126/science.aam5962. 13
Baig, S., M. J. Pangilinan, A. R. Rizvi and R. P. Tan, 2016: Cost and benefits of ecosystem based adaptation. IUCN, 14 Gland, Switzerland. Available at: https://portals.iucn.org/library/node/45925 (accessed 2019/09/18/13:26:33). 15
Bailey, K. M., R. A. McCleery, G. Barnes and S. L. McKune, 2019: Climate-Driven Adaptation, Household Capital, 16 and Nutritional Outcomes among Farmers in Eswatini. Int J Environ Res Public Health, 16(21), 17 doi:10.3390/ijerph16214063. 18
Baker, D. J. et al., 2015: Assessing climate change impacts for vertebrate fauna across the West African protected area 19 network using regionally appropriate climate projections. Diversity and Distributions, 21(9), 991-1003, 20 doi:https://doi.org/10.1111/ddi.12337. 21
Baker, R. E. et al., 2020: Susceptible supply limits the role of climate in the early SARS-CoV-2 pandemic. Science 22 (New York, N.Y.), 369(6501), 315-319, doi:10.1126/science.abc2535. 23
Bakun, A. et al., 2015: Anticipated Effects of Climate Change on Coastal Upwelling Ecosystems. Current Climate 24 Change Reports, 1(2), 85-93, doi:10.1007/s40641-015-0008-4. 25
Balié, J. et al., 2019: Exploring opportunities around climate-smart breeding for future food and nutrition security, 26 Wageningen, Netherlands: CGIAR Research Program on Climate Change, Agriculture and Food Security 27 (CCAFS). 28
Ban, N. C. et al., 2019: Well-being outcomes of marine protected areas. Nature Sustainability, 2(6), 524-532, 29 doi:10.1038/s41893-019-0306-2. 30
Bang, H., L. Miles and R. Gordon, 2019: Evaluating local vulnerability and organisational resilience to frequent 31 flooding in Africa: the case of Northern Cameroon. Foresight, 21(2), 266-284, doi:https://doi.org/10.1108/FS-06-32 2018-0068. 33
Banga, J., 2019: The green bond market: a potential source of climate finance for developing countries. Journal of 34 Sustainable Finance & Investment, 9(1), 17-32, doi:10.1080/20430795.2018.1498617. 35
Bangira, T., B. H. P. Maathuis, T. Dube and T. W. Gara, 2015: Investigating flash floods potential areas using ASCAT 36 and TRMM satellites in the Western Cape Province, South Africa. Geocarto International, 30(7), 737-754, 37 doi:10.1080/10106049.2014.997302. 38
Barbarossa, V. et al., 2021: Threats of global warming to the world’s freshwater fishes. Nature Communications, 12(1), 39 1701, doi:10.1038/s41467-021-21655-w. 40
Barbet-Massin, M. and W. Jetz, 2015: The effect of range changes on the functional turnover, structure and diversity of 41 bird assemblages under future climate scenarios. Glob Chang Biol, 21(8), 2917-2928, doi:10.1111/gcb.12905. 42
Barbier, J. et al., 2018: Detection of Intraseasonal Large-Scale Heat Waves: Characteristics and Historical Trends 43 during the Sahelian Spring. Journal of Climate, 31(1), 61-80, doi:10.1175/JCLI-D-17-0244.1. 44
Barcikowska, M. J., S. B. Kapnick and F. Feser, 2018: Impact of large-scale circulation changes in the North Atlantic 45 sector on the current and future Mediterranean winter hydroclimate. Clim Dyn, 50(5), 2039-2059, 46 doi:10.1007/s00382-017-3735-5. 47
Barenblitt, A. et al., 2021: The large footprint of small-scale artisanal gold mining in Ghana. Science of The Total 48 Environment, 781, 146644, doi:https://doi.org/10.1016/j.scitotenv.2021.146644. 49
Barkin, J. L. et al., 2021: Effects of extreme weather events on child mood and behavior. Developmental Medicine & 50 Child Neurology, 63(7), 785-790, doi:https://doi.org/10.1111/dmcn.14856. 51
Barnett, T., 2019: An Engraved Landscape. Rock Carvings in the Wadi al-Ajal, Libya. vol. 1, Society of Libyan Studies, 52 London. ISBN 978-1-900971-51-5. 53
Baron, J. S. et al., 2017: Synthesis Centers as Critical Research Infrastructure. BioScience, 67(8), 750-759, 54 doi:10.1093/biosci/bix053. 55
Barrett, S., 2014: Subnational Climate Justice? Adaptation Finance Distribution and Climate Vulnerability. World 56 Development, 58, 130-142, doi:https://doi.org/10.1016/j.worlddev.2014.01.014. 57
Barrios, S., L. Bertinelli and E. Strobl, 2006: Climatic change and rural–urban migration: The case of sub-Saharan 58 Africa. Journal of Urban Economics, 60(3), 357-371, doi:10.1016/j.jue.2006.04.005. 59
Barrios, S., L. Bertinelli and E. Strobl, 2010: Trends in rainfall and economic growth in Africa: A neglected cause of 60 the African growth tragedy. The Review of Economics and Statistics, 92(2), 350-366, 61 doi:https://doi.org/10.1162/rest.2010.11212. 62
ACCEPTED VERSIO
N
SUBJECT TO FIN
AL EDITS

FINAL DRAFT Chapter 9 IPCC WGII Sixth Assessment Report
Do Not Cite, Quote or Distribute 9-158 Total pages: 225
Barry, A. A. et al., 2018: West Africa climate extremes and climate change indices. International Journal of 1 Climatology, 38(S1), e921-e938, doi:10.1002/joc.5420. 2
Bartlett, S., 2008: Climate change and urban children: impacts and implications for adaptation in low- and middle-3 income countries. Environment and Urbanization, 20(2), 501-519, doi:10.1177/0956247808096125. 4
Bashir, R. S. E. and O. A. Hassan, 2019: A One Health perspective to identify environmental factors that affect Rift 5 Valley fever transmission in Gezira state, Central Sudan. Tropical Medicine and Health, 47(1), 54, 6 doi:10.1186/s41182-019-0178-1. 7
Bastin, J.-F. et al., 2019: The global tree restoration potential. Science (New York, N.Y.), 365(6448), 76, 8 doi:10.1126/science.aax0848. 9
Basupi, L. V., C. H. Quinn and A. J. Dougill, 2019: Adaptation strategies to environmental and policy change in semi-10 arid pastoral landscapes: Evidence from Ngamiland, Botswana. Journal of Arid Environments, 166, 17-27, 11 doi:https://doi.org/10.1016/j.jaridenv.2019.01.011. 12
Bataille, C. et al., 2016: The need for national deep decarbonization pathways for effective climate policy. Climate 13 Policy, 16(sup1), S7-S26, doi:10.1080/14693062.2016.1173005. 14
Bates, A. E. et al., 2019: Climate resilience in marine protected areas and the ‘Protection Paradox’. Biological 15 Conservation, 236, 305-314, doi:https://doi.org/10.1016/j.biocon.2019.05.005. 16
Bathiany, S., V. Dakos, M. Scheffer and T. M. Lenton, 2018: Climate models predict increasing temperature variability 17 in poor countries. Science Advances, 4, eaar5809, doi:10.1126/sciadv.aar5809. 18
Battersby, J. and J. Hunter-Adams, 2020: No Looking Back: [Food]ways Forward for Healthy African Cities in Light of 19 Climate Change. Journal of urban health : bulletin of the New York Academy of Medicine, 97(2), 226-229, 20 doi:10.1007/s11524-020-00429-7. 21
Baudoin, M.-A., A. C. Sanchez and B. Fandohan, 2014: Small scale farmers’ vulnerability to climatic changes in 22 southern Benin: the importance of farmers’ perceptions of existing institutions. Mitigation and Adaptation 23 Strategies for Global Change, 19(8), 1195-1207, doi:10.1007/s11027-013-9468-9. 24
Baudron, F. et al., 2019a: Testing the Various Pathways Linking Forest Cover to Dietary Diversity in Tropical 25 Landscapes. Frontiers in Sustainable Food Systems, 3, 97, doi:10.3389/fsufs.2019.00097. 26
Baudron, F. et al., 2019b: Understanding the factors influencing fall armyworm (Spodoptera frugiperda J.E. Smith) 27 damage in African smallholder maize fields and quantifying its impact on yield. A case study in Eastern 28 Zimbabwe. Crop Protection, 120, 141-150, doi:https://doi.org/10.1016/j.cropro.2019.01.028. 29
Bawakyillenuo, S., J. A. Yaro and J. Teye, 2016: Exploring the autonomous adaptation strategies to climate change and 30 climate variability in selected villages in the rural northern savannah zone of Ghana. Local Environment, 21(3), 31 361-382, doi:10.1080/13549839.2014.965671. 32
Beale, C. M., N. E. Baker, M. J. Brewer and J. J. Lennon, 2013: Protected area networks and savannah bird biodiversity 33 in the face of climate change and land degradation. Ecol Lett, 16(8), 1061-1068, doi:10.1111/ele.12139. 34
Beck-Johnson, L. M. et al., 2017: The importance of temperature fluctuations in understanding mosquito population 35 dynamics and malaria risk. Royal Society Open Science, 4(3), 160969-160969, doi:10.1098/rsos.160969. 36
Bedelian, C. and J. O. Ogutu, 2017: Trade-offs for climate-resilient pastoral livelihoods in wildlife conservancies in the 37 Mara ecosystem, Kenya. Pastoralism, 7(1), 10, doi:10.1186/s13570-017-0085-1. 38
Belesova, K. et al., 2019: Mortality impact of low annual crop yields in a subsistence farming population of Burkina 39 Faso under the current and a 1.5°C warmer climate in 2100. Sci Total Environ, 691, 538-548, 40 doi:10.1016/j.scitotenv.2019.07.027. 41
Belhabib, D., V. W. Y. Lam and W. W. L. Cheung, 2016: Overview of West African fisheries under climate change: 42 Impacts, vulnerabilities and adaptive responses of the artisanal and industrial sectors. Marine Policy, 71, 15-28, 43 doi:https://doi.org/10.1016/j.marpol.2016.05.009. 44
Belhabib, D., U. R. Sumaila and P. Le Billon, 2019: The fisheries of Africa: Exploitation, policy, and maritime security 45 trends. Marine Policy, 101, 80-92, doi:https://doi.org/10.1016/j.marpol.2018.12.021. 46
Bendana, C., 2019: African research projects are failing because funding agencies can’t match donor money. Science 47 (New York, N.Y.), doi:https://doi:10.1126/science.aax6796. 48
Bennett, A. et al., 2016: The relative contribution of climate variability and vector control coverage to changes in 49 malaria parasite prevalence in Zambia 2006–2012. Parasites & Vectors, 9(1), 431-431, doi:10.1186/s13071-016-50 1693-0. 51
Bennett, A. C. et al., 2021: Resistance of African tropical forests to an extreme climate anomaly. Proceedings of the 52 National Academy of Sciences, 118(21), e2003169118, doi:10.1073/pnas.2003169118. 53
Bentley, L. K., M. P. Robertson and N. P. Barker, 2018: Range contraction to a higher elevation: the likely future of the 54 montane vegetation in South Africa and Lesotho. Biodiversity and Conservation, 28(1), 131-153, 55 doi:10.1007/s10531-018-1643-6. 56
Berdugo, M. et al., 2020: Global ecosystem thresholds driven by aridity. Science (New York, N.Y.), 367(6479), 787-790, 57 doi:10.1126/science.aay5958. 58
Beringer, T. et al., 2020: First process-based simulations of climate change impacts on global tea production indicate 59 large effects in the World’s major producer countries. Environmental Research Letters, 15(3), 034023, 60 doi:10.1088/1748-9326/ab649b. 61
Berrang-Ford, L. et al., 2021: A systematic global stocktake of evidence on human adaptation to climate change. Nature 62 Climate Change, doi:https://doi.org/10.21203/rs.3.rs-100873/v1. 63
ACCEPTED VERSIO
N
SUBJECT TO FIN
AL EDITS
FINAL DRAFT Chapter 9 IPCC WGII Sixth Assessment Report
Do Not Cite, Quote or Distribute 9-159 Total pages: 225
Berthou, S. et al., 2019: Larger Future Intensification of Rainfall in the West African Sahel in a Convection-Permitting 1 Model. Geophysical Research Letters, 46(22), 13299-13307, doi:https://doi.org/10.1029/2019GL083544. 2
Bett, B. et al., 2017: Effects of climate change on the occurrence and distribution of livestock diseases. Preventive 3 Veterinary Medicine, 137(Pt B), 119-129, doi:10.1016/j.prevetmed.2016.11.019. 4
Bettaieb, J. et al., 2010: [Relationship between temperature and mortality in the city of Tunis: 2005-2007]. Archives de 5 l'Institut Pasteur de Tunis, 87(1-2), 25-33. 6
Betts, R. A. et al., 2015: Climate and land use change impacts on global terrestrial ecosystems and river flows in the 7 HadGEM2-ES Earth system model using the representative concentration pathways. Biogeosciences, 12(5), 1317-8 1338, doi:10.5194/bg-12-1317-2015. 9
Beymer-Farris, B. A. and T. J. Bassett, 2012: The REDD menace: Resurgent protectionism in Tanzania's mangrove 10 forests. Global Environmental Change, 22(2), 332-341, doi:10.1016/j.gloenvcha.2011.11.006. 11
Bezabih, M., M. Chambwera and J. Stage, 2011: Climate change and total factor productivity in the Tanzanian 12 economy. Climate Policy, 11(6), 1289-1302, doi:10.1080/14693062.2011.579300. 13
Biagetti, S., 2017: Resilience in a Mountain Range: The Case of the Tadrart Acacus (Southwest Libya). Nomadic 14 Peoples, 21(2), 268-285, doi:https://doi.org/10.3197/np.2017.210205. 15
Biao, E., 2017: Assessing the impacts of climate change on river discharge dynamics in Oueme River Basin (Benin, 16 West Africa). Hydrology, 4(4), doi:10.3390/hydrology4040047. 17
Bichet, A. and A. Diedhiou, 2018a: Less frequent and more intense rainfall along the coast of the Gulf of Guinea in 18 West and Central Africa (1981-2014). Climate Research, 76(3), 191-201, doi:10.3354/cr01537. 19
Bichet, A. and A. Diedhiou, 2018b: West African Sahel has become wetter during the last 30 years, but dry spells are 20 shorter and more frequent. Climate Research, 75(2), 155-162, doi:https://doi.org/10.3354/cr01515. 21
Bidassey-Manilal, S. et al., 2016: Students' Perceived Heat-Health Symptoms Increased with Warmer Classroom 22 Temperatures. Int J Environ Res Public Health, 13(6), doi:10.3390/ijerph13060566. 23
Biesbroek, R., B. G. Peters and J. Tosun, 2018: Public Bureaucracy and Climate Change Adaptation. Review of Policy 24 Research, 35(6), 776-791, doi:https://doi.org/10.1111/ropr.12316. 25
Birabi, A. K. and B. Nawangwe (eds.), Mitigating threats to local knowledge embedded in earthen architecture: the case 26 of preserving African architectural semiotics. 2011, Getty Publications, 104 pp. ISBN 1606060430. 27
Birgen, M. K., 2021: A Christian Ecological Theology from an African Christian Perspective. ShahidiHub International 28 Journal of Theology & Religious Studies, 1(1), 1-14. 29
Birkmann, J. et al., 2021: Regional clusters of vulnerability show the need for transboundary cooperation. 30 Environmental Research Letters, 16(9), 094052, doi:10.1088/1748-9326/ac1f43. 31
Bishop-Williams, K. E. et al., 2018: Understanding Weather and Hospital Admissions Patterns to Inform Climate 32 Change Adaptation Strategies in the Healthcare Sector in Uganda. Int J Environ Res Public Health, 15(11), 33 doi:10.3390/ijerph15112402. 34
Björkman-Nyqvist, M., 2013: Income shocks and gender gaps in education: Evidence from Uganda. Journal of 35 Development Economics, 105, 237-253, doi:https://doi.org/10.1016/j.jdeveco.2013.07.013. 36
Bjornlund, H. et al., 2020: Institutional innovation and smart water management technologies in small-scale irrigation 37 schemes in southern Africa. Water International, 45(6), 621-650, doi:10.1080/02508060.2020.1804715. 38
Blasiak, R. et al., 2017: Climate change and marine fisheries: Least developed countries top global index of 39 vulnerability. PLOS ONE, 12(6), e0179632, doi:10.1371/journal.pone.0179632. 40
Blicharska, M. et al., 2017: Steps to overcome the North–South divide in research relevant to climate change policy and 41 practice. Nature Climate Change, 7(1), 21-27, doi:10.1038/nclimate3163. 42
Bloomfield, L. S. P., T. L. McIntosh and E. F. Lambin, 2020: Habitat fragmentation, livelihood behaviors, and contact 43 between people and nonhuman primates in Africa. Landscape Ecology, 35(4), 985-1000, doi:10.1007/s10980-44 020-00995-w. 45
Blumstein, S. and J. D. Petersen-Perlman, 2021: When the water runs dry: supporting adaptive governance in 46 transboundary river basins. Water International, 46(3), 306-324, doi:10.1080/02508060.2021.1877984. 47
Boansi, D., J. A. Tambo and M. Müller, 2017: Analysis of farmers’ adaptation to weather extremes in West African 48 Sudan Savanna. Weather and Climate Extremes, 16(March), 1-13, doi:10.1016/j.wace.2017.03.001. 49
Boas, I. et al., 2019: Climate migration myths. 9, 901-903, doi:10.1038/s41558-019-0633-3. 50 Boavida-Portugal, J. et al., 2018: Climate change impacts on the distribution of coastal lobsters. Marine Biology, 51
165(12), 186, doi:10.1007/s00227-018-3441-9. 52 Bodian, A. et al., 2018: Future Climate Change Impacts on Streamflows of Two Main West Africa River Basins: 53
Senegal and Gambia. Hydrology, 5(1), doi:10.3390/hydrology5010021. 54 Bodunrin, I. A., 2019: Hip-hop and Decolonized Practices of Language Digitization among the Contemporary !Xun and 55
Khwe Indigenous Youth of South Africa. Critical Arts, 33(4-5), 174-190, doi:10.1080/02560046.2019.1702070. 56 Boeckmann, M. et al., 2019: Climate change and control of diarrhoeal diseases in South Africa: Priorities for action. 57
South African Medical Journal, 109, 359, doi:10.7196/SAMJ.2019.v109i6.14075. 58 Boedecker, J. et al., 2014: Dietary contribution of Wild Edible Plants to women’s diets in the buffer zone around the 59
Lama forest, Benin – an underutilized potential. Food Security, 6(6), 833-849, doi:10.1007/s12571-014-0396-7. 60 Bogale, A. and B. Korf, 2007: To share or not to share? (non-)violence, scarcity and resource access in Somali Region, 61
Ethiopia. The Journal of Development Studies, 43(4), 743-765, doi:10.1080/00220380701260093. 62
ACCEPTED VERSIO
N
SUBJECT TO FIN
AL EDITS
FINAL DRAFT Chapter 9 IPCC WGII Sixth Assessment Report
Do Not Cite, Quote or Distribute 9-160 Total pages: 225
Bohannon, J., 2016: Who's downloading pirated papers? Everyone. Science (New York, N.Y.), 352(6285), 508-512, 1 doi:10.1126/science.352.6285.508. 2
Bolden, I. W. et al., 2018: Climate-related community knowledge networks as a tool to increase learning in the context 3 of environmental change. Climate Risk Management, 21, 1-6, doi:https://doi.org/10.1016/j.crm.2018.04.004. 4
Bond, W. and N. P. Zaloumis, 2016: The deforestation story: testing for anthropogenic origins of Africa's flammable 5 grassy biomes. Philosophical Transactions of the Royal Society B: Biological Sciences, 371(1696), 20150170, 6 doi:10.1098/rstb.2015.0170. 7
Bond, W. J., N. Stevens, G. F. Midgley and C. E. R. Lehmann, 2019: The Trouble with Trees: Afforestation Plans for 8 Africa. Trends in Ecology & Evolution, 34(11), 963-965, doi:https://doi.org/10.1016/j.tree.2019.08.003. 9
Boone, R. B. et al., 2018: Climate change impacts on selected global rangeland ecosystem services. Global Change 10 Biology, 24(3), 1382-1393, doi:10.1111/gcb.13995. 11
Booth, B. B. B. et al., 2012: Aerosols implicated as a prime driver of twentieth-century North Atlantic climate 12 variability. Nature, 484(7393), 228-232, doi:10.1038/nature10946. 13
Booysen, M. J., M. Visser and R. Burger, 2019: Temporal case study of household behavioural response to Cape 14 Town's “Day Zero” using smart meter data. Water Research, 149, 414-420, 15 doi:https://doi.org/10.1016/j.watres.2018.11.035. 16
Borderon, M. et al., 2019: Migration influenced by environmental change in Africa: A systematic review of empirical 17 evidence. Demographic Research, 41, 491-544, doi:10.4054/DemRes.2019.41.18. 18
Bosetti, V., C. Cattaneo and G. Peri, 2018: Should they stay or should they go? Climate Migrants and Local Conflicts. 19 National Bureau of Economic Research Working Paper Series No. 24447, doi:10.3386/w24447. 20
Bosman, G. and D. Van der Westhuizen, 2014: The effects of climatic conditions on attitudinal changes towards earth 21 construction in South Africa: review article. Acta Structilia : Journal for the Physical and Development Sciences, 22 21(1), 117-141, doi:10.10520/EJC160907. 23
Boswell, R., 2008: Challenges to identifying and managing intangible cultural heritage in Mauritius, Zanzibar and 24 Seychelles. CODESRIA Monograph Series, CODESRIA, Dakar, Senegal. ISBN 978-2-86978-215-0. 25
Bouma, M. J., A. S. Siraj, X. Rodo and M. Pascual, 2016: El Niño-based malaria epidemic warning for Oromia, 26 Ethiopia, from August 2016 to July 2017. Tropical Medicine & International Health, 21(11), 1481-1488, 27 doi:10.1111/tmi.12776. 28
Bouregaa, T., 2019: Impact of climate change on yield and water requirement of rainfed crops in the Setif region. 29 Management of Environmental Quality: An International Journal, 30(4), 851-863, doi:10.1108/MEQ-06-2018-30 0110. 31
Boyce, R. et al., 2016: Severe Flooding and Malaria Transmission in the Western Ugandan Highlands: Implications for 32 Disease Control in an Era of Global Climate Change. Journal of Infectious Diseases, 214(9), 1403-1410, 33 doi:10.1093/infdis/jiw363. 34
Bozzola, M. and M. Smale, 2020: The welfare effects of crop biodiversity as an adaptation to climate shocks in Kenya. 35 World Development, 135, 105065, doi:https://doi.org/10.1016/j.worlddev.2020.105065. 36
Bradshaw, C. J. A., N. S. Sodhi, K. S. H. Peh and B. W. Brook, 2007: Global evidence that deforestation amplifies 37 flood risk and severity in the developing world. Global Change Biology, 13(11), 2379-2395, 38 doi:https://doi.org/10.1111/j.1365-2486.2007.01446.x. 39
Brancalion, P. H. S. et al., 2020: Emerging threats linking tropical deforestation and the COVID-19 pandemic. 40 Perspectives in Ecology and Conservation, 18(4), 243-246, doi:https://doi.org/10.1016/j.pecon.2020.09.006. 41
Brandt, M. et al., 2019: Changes in rainfall distribution promote woody foliage production in the Sahel. 42 Communications Biology, 2(1), 133, doi:10.1038/s42003-019-0383-9. 43
Brandt, M. et al., 2017: Human population growth offsets climate-driven increase in woody vegetation in sub-Saharan 44 Africa. Nature Ecology & Evolution, 1(4), 1-6, doi:10.1038/s41559-017-0081. 45
Braveman, P. and L. Gottlieb, 2014: The Social Determinants of Health: It's Time to Consider the Causes of the Causes. 46 Public Health Reports, 129(1_suppl2), 19-31, doi:10.1177/00333549141291S206. 47
Breitbarth, T., 2020: Analysis of ex-ante economic models for Green Climate Fund adaptation projects in Africa. Green 48 Climate Fund, Incheon, Republic of Korea. 49
Bren d’Amour, C. et al., 2016: Teleconnected food supply shocks. Environmental Research Letters, 11(3), 035007, 50 doi:10.1088/1748-9326/11/3/035007. 51
Breu, T. et al., 2016: Large-scale land acquisition and its effects on the water balance in investor and host countries. 52 PLoS One, 11(3), e0150901, doi:10.1371/journal.pone.0150901. 53
Brimblecombe, P. et al., 2011: Impact of Climate Change on Earthen Buildings. In: Terra 2008: The 10th International 54 Conference on the Study and Conservation of Earthen Architectural Heritage " [Rainer, L. H., A. B. Rivera and 55 D. Gandreau (eds.)]. Getty Conservation Institute, Getty Publications, Los Angeles, pp. 278-282. 56
Brink, E. et al., 2016: Cascades of green: A review of ecosystem-based adaptation in urban areas. Global 57 Environmental Change, 36, 111-123, doi:10.1016/j.gloenvcha.2015.11.003. 58
Brinkman, M. et al., 2020: The distribution of food security impacts of biofuels, a Ghana case study. Biomass and 59 Bioenergy, 141, 105695, doi:https://doi.org/10.1016/j.biombioe.2020.105695. 60
Briske, D. D., 2017: Rangeland Systems: Processes, Management and Challenges [Briske, D. D. (ed.)]. Springer Series 61 on Environmental Management, Springer International Publishing, Cham. ISBN 978-3-319-46707-8 978-3-319-62 46709-2. 63
ACCEPTED VERSIO
N
SUBJECT TO FIN
AL EDITS
FINAL DRAFT Chapter 9 IPCC WGII Sixth Assessment Report
Do Not Cite, Quote or Distribute 9-161 Total pages: 225
Brito, J. C. and M. Naia, 2020: Coping with Sea-Level Rise in African Protected Areas: Priorities for Action and 1 Adaptation Measures. BioScience, 70(10), 924-932, doi:10.1093/biosci/biaa087. 2
Britton, A. W. et al., 2017: Terrestrial-focused protected areas are effective for conservation of freshwater fish diversity 3 in Lake Tanganyika. Biological Conservation, 212, 120-129, doi:10.1016/j.biocon.2017.06.001. 4
Brockhaus, M., H. Djoudi and B. Locatelli, 2013: Envisioning the future and learning from the past: Adapting to a 5 changing environment in northern Mali. Environmental Science & Policy, 25, 94-106, 6 doi:https://doi.org/10.1016/j.envsci.2012.08.008. 7
Brockington, D. and D. Wilkie, 2015: Protected areas and poverty. Philos Trans R Soc Lond B Biol Sci, 370(1681), 8 doi:10.1098/rstb.2014.0271. 9
Brodnik, C. et al., 2018: Jumping to the top: catalysts for leapfrogging to a water sensitive city. IOP Conference Series: 10 Earth and Environmental Science, 179, 012034, doi:10.1088/1755-1315/179/1/012034. 11
Brooks, C., 2019: Will climate change undermine the potential for hydropower in Africa?, Oxford Management Policy. 12 Available at: https://www.opml.co.uk/blog/the-impact-of-climate-change-on-hydropower-in-africa. 13
Brooks, N., J. Clarke, G. W. Ngaruiya and E. E. Wangui, 2020: African heritage in a changing climate. Azania: 14 Archaeological Research in Africa, 55(3), 297-328, doi:10.1080/0067270x.2020.1792177. 15
Brooks, N., W. Neil Adger and P. Mick Kelly, 2005: The determinants of vulnerability and adaptive capacity at the 16 national level and the implications for adaptation. Global Environmental Change, 15(2), 151-163, 17 doi:https://doi.org/10.1016/j.gloenvcha.2004.12.006. 18
Broto, V. C., E. Boyd and J. Ensor, 2015: Participatory urban planning for climate change adaptation in coastal cities: 19 lessons from a pilot experience in Maputo, Mozambique. Current Opinion in Environmental Sustainability, 13, 20 11-18, doi:10.1016/j.cosust.2014.12.005. 21
Brown, J. R. et al., 2020: Comparison of past and future simulations of ENSO in CMIP5/PMIP3 and CMIP6/PMIP4 22 models. Climate of the Past Discussions, doi:https://doi.org/10.5194/cp-2019-155. 23
Brown, L., C. Polycarp and M. Spearman, 2013: Within Reach. Strengthening Country Ownership and Accountability 24 in Accessing Climate Finance. Working Paper, World Resources Institute, Washington, DC. Available at: 25 wri.org/publication/ownership-andaccountability-in-climate-finance. 26
Bruno, J. F., I. M. Côté and L. T. Toth, 2019: Climate Change, Coral Loss, and the Curious Case of the Parrotfish 27 Paradigm: Why Don't Marine Protected Areas Improve Reef Resilience? Annual Review of Marine Science, 11(1), 28 307-334, doi:10.1146/annurev-marine-010318-095300. 29
Brüssow, K., A. Faße and U. Grote, 2017: Implications of climate-smart strategy adoption by farm households for food 30 security in Tanzania. Food Security, 9(6), 1203-1218, doi:10.1007/s12571-017-0694-y. 31
Bryceson, D. F., 2019: Gender and generational patterns of African deagrarianization: Evolving labour and land 32 allocation in smallholder peasant household farming, 1980–2015. World Development, 113, 60-72, 33 doi:10.1016/j.worlddev.2018.08.021. 34
Buchwald, A. G. et al., 2020: Aedes-borne disease outbreaks in West Africa: A call for enhanced surveillance. Acta 35 tropica, 209, 105468, doi:10.1016/j.actatropica.2020.105468. 36
Buhaug, H. and N. von Uexkull, 2021: Vicious Circles: Violence, Vulnerability, and Climate Change. Annual Review of 37 Environment and Resources, 46(1), doi:10.1146/annurev-environ-012220-014708. 38
Bulow, J., C. Reinhart, K. Rogoff and C. Trebesch, 2020: The Debt Pandemic. Finance & Development, 0057(003), 39 A004, doi:10.5089/9781513544595.022.A004. 40
Buma, W. G., S.-I. Lee and J. Y. Seo, 2018: Recent Surface Water Extent of Lake Chad from Multispectral Sensors and 41 GRACE. Sensors, 18(7), doi:10.3390/s18072082. 42
Bunce, A. and J. Ford, 2015: How is adaptation, resilience, and vulnerability research engaging with gender? 43 Environmental Research Letters, 10(12), doi:10.1088/1748-9326/10/12/123003. 44
Bunker, A. et al., 2017: Excess burden of non-communicable disease years of life lost from heat in rural Burkina Faso: 45 a time series analysis of the years 2000-2010. BMJ open, 7(11), e018068, doi:10.1136/bmjopen-2017-018068. 46
Bunn, C., P. Läderach, O. Ovalle Rivera and D. Kirschke, 2015: A bitter cup: climate change profile of global 47 production of Arabica and Robusta coffee. Climatic Change, 129(1), 89-101, doi:10.1007/s10584-014-1306-x. 48
Burke, M., W. M. Davis and N. S. Diffenbaugh, 2018a: Large potential reduction in economic damages under UN 49 mitigation targets. Nature, 557(7706), 549-553, doi:10.1038/s41586-018-0071-9. 50
Burke, M., E. Gong and K. Jones, 2015a: Income Shocks and HIV in Africa. The Economic Journal, 125(585), 1157-51 1189, doi:10.1111/ecoj.12149. 52
Burke, M. et al., 2018b: Higher temperatures increase suicide rates in the United States and Mexico. Nature Climate 53 Change, 8(8), 723-729, doi:10.1038/s41558-018-0222-x. 54
Burke, M., S. Hsiang and E. Miguel, 2014: Climate and Conflict. Annual Review of Economics, 7(1), 577-617, 55 doi:10.3386/w20598. 56
Burke, M., S. M. Hsiang and E. Miguel, 2015b: Global non-linear effect of temperature on economic production. 57 Nature, 527(7577), 235-239, doi:10.1038/nature15725. 58
Burke, M. B. et al., 2009: Warming increases the risk of civil war in Africa. Proceedings of the National Academy of 59 Sciences, 106(49), 20670, doi:10.1073/pnas.0907998106. 60
Burls, N. J. et al., 2019: The Cape Town “Day Zero” drought and Hadley cell expansion. npj Climate and Atmospheric 61 Science, 2(1), 27, doi:10.1038/s41612-019-0084-6. 62
ACCEPTED VERSIO
N
SUBJECT TO FIN
AL EDITS

FINAL DRAFT Chapter 9 IPCC WGII Sixth Assessment Report
Do Not Cite, Quote or Distribute 9-162 Total pages: 225
Burrows, M. T. et al., 2014: Geographical limits to species-range shifts are suggested by climate velocity. Nature, 1 507(7493), 492-495, doi:10.1038/nature12976. 2
Bush, E. R. et al., 2020: Long-term collapse in fruit availability threatens Central African forest megafauna. Science 3 (New York, N.Y.), 370(6521), 1219, doi:10.1126/science.abc7791. 4
Bwambale, B., M. Muhumuza and M. Nyeko, 2018: Traditional ecological knowledge and flood risk management: A 5 preliminary case study of the Rwenzori. Jamba, 10(1), 536, doi:10.4102/jamba.v10i1.536. 6
Bwasiri, E. J., 2011: The challenge of managing intangible heritage: Problems in Tanzanian legislation and 7 administration. vol. 66, South African Archaeological Society, 129–135 pp. ISBN 0038-1969. 8
Byass, P. et al., 2017: The long road to elimination: malaria mortality in a South African population cohort over 21 9 years. Global Health, Epidemiology and Genomics, 2, e11-e11, doi:10.1017/gheg.2017.7. 10
Caetano, T., H. Winker and J. Depledge, 2020: Towards zero carbon and zero poverty: integrating national climate 11 change mitigation and sustainable development goals. Climate Policy, 20(7), 773-778, 12 doi:10.1080/14693062.2020.1791404. 13
Cai, R., S. Feng, M. Oppenheimer and M. Pytlikova, 2016: Climate variability and international migration: The 14 importance of the agricultural linkage. Journal of Environmental Economics and Management, 79, 135-151, 15 doi:https://doi.org/10.1016/j.jeem.2016.06.005. 16
Cai, W. et al., 2021: Opposite response of strong and moderate positive Indian Ocean Dipole to global warming. Nature 17 Climate Change, 11(1), 27-32, doi:10.1038/s41558-020-00943-1. 18
Cairncross, E. et al., 2018: Climate Change, Air Pollution and Health in South Africa. In: Climate Change and Air 19 Pollution [Akhtar R. and C. Palagiano (eds.)]. Springer Climate, pp. 327-347. ISBN 978-3-319-61345-1. 20
Calderon, C., C. Cantu and P. Chuhan-Pole, 2018: Infrastructure Development in Sub-Saharan Africa : A Scorecard. 21 Policy Research Working Papers, World Bank, Washington, DC. Available at: 22 https://openknowledge.worldbank.org/handle/10986/29770. 23
Call, M. and C. Gray, 2020: Climate anomalies, land degradation, and rural out-migration in Uganda. Population and 24 Environment, 41(4), 507-528, doi:10.1007/s11111-020-00349-3. 25
Callaghan, M. et al., 2021: AI based evidence and attribution mapping of 100,000 climate impact studies. Nature 26 Climate Change. 27
Callo-Concha, D., 2018: Farmer Perceptions and Climate Change Adaptation in the West Africa Sudan Savannah: 28 Reality Check in Dassari, Benin, and Dano, Burkina Faso. Climate, 6(2), doi:10.3390/cli6020044. 29
Cambaza, E. et al., 2019: Outbreak of Cholera Due to Cyclone Kenneth in Northern Mozambique, 2019. International 30 Journal of Environmental Research and Public Health, 16(16), doi:10.3390/ijerph16162925. 31
Camberlin, P., 2018: Climate of Eastern Africa. Oxford University Press. 32 Caminade, C., K. M. McIntyre and A. E. Jones, 2019: Impact of recent and future climate change on vector-borne 33
diseases. Annals of the New York Academy of Sciences, 1436(1), 157-173, doi:10.1111/nyas.13950. 34 Cantin, N. E. et al., 2010: Ocean warming slows coral growth in the central Red Sea. Science (New York, N.Y.), 35
329(5989), 322-325, doi:10.1126/science.1190182. 36 Cao, S., J. Zhang, L. Chen and T. Zhao, 2016: Ecosystem water imbalances created during ecological restoration by 37
afforestation in China, and lessons for other developing countries. Journal of Environmental Management, 183, 38 843-849, doi:https://doi.org/10.1016/j.jenvman.2016.07.096. 39
Caparoci Nogueira, S. M., M. A. Moreira and M. M. Lordelo Volpato, 2018: Evaluating Precipitation Estimates from 40 Eta, TRMM and CHRIPS Data in the South-Southeast Region of Minas Gerais State—Brazil. Remote Sensing, 41 10(2), doi:10.3390/rs10020313. 42
Carleton, T. et al., 2018: Valuing the Global Mortality Consequences of Climate Change Accounting for Adaptation 43 Costs and Benefits. University of Chicago, Becker Friedman Institute for Economics Working Paper No. 2018-44 51., doi:10.2139/ssrn.3224365. 45
Carleton, T., S. M. Hsiang and M. Burke, 2016: Conflict in a changing climate. The European Physical Journal Special 46 Topics, 225(3), 489-511, doi:10.1140/epjst/e2015-50100-5. 47
Carleton, T. A. and S. M. Hsiang, 2016: Social and economic impacts of climate. Science (New York, N.Y.), 353(6304), 48 doi:10.1126/science.aad9837. 49
Carlson, C. J. et al., 2020a: Climate change will drive novel cross-species viral transmission. bioRxiv, 50 2020.2001.2024.918755, doi:10.1101/2020.01.24.918755. 51
Carlson, C. J., G. F. Albery and A. Phelan, 2021: Preparing international cooperation on pandemic prevention for the 52 Anthropocene. BMJ Global Health, 6(3), e004254, doi:10.1136/bmjgh-2020-004254. 53
Carlson, C. J. et al., 2019: Rapid range shifts in African Anopheles mosquitoes over the last century. 54 doi:10.1101/673913. 55
Carlson, C. J., A. C. R. Gomez, S. Bansal and S. J. Ryan, 2020b: Misconceptions about weather and seasonality must 56 not misguide COVID-19 response. Nature Communications, 11(1), 4312, doi:10.1038/s41467-020-18150-z. 57
Carr, E. R., G. Fleming and T. Kalala, 2016: Understanding women’s needs for weather and climate information in 58 agrarian settings: The case of Ngetou Maleck, Senegal. Weather, Climate, and Society, 8(3), 247-264, 59 doi:https://doi.org/10.1175/WCAS-D-15-0075.1. 60
Carr, E. R. et al., 2020: Identifying climate information services users and their needs in Sub-Saharan Africa: a review 61 and learning agenda. Climate and Development, 12(1), 23-41, doi:10.1080/17565529.2019.1596061. 62
ACCEPTED VERSIO
N
SUBJECT TO FIN
AL EDITS

FINAL DRAFT Chapter 9 IPCC WGII Sixth Assessment Report
Do Not Cite, Quote or Distribute 9-163 Total pages: 225
Carter, J. G. et al., 2015: Climate change and the city: Building capacity for urban adaptation. Progress in Planning, 95, 1 1-66, doi:https://doi.org/10.1016/j.progress.2013.08.001. 2
Carter, S. et al., 2020: Co-production of African weather and climate services. Future Climate for Africa and Weather 3 and Climate Information Services for Africa 2ed., Cape Town, 160 pp. Available at: 4 https://futureclimateafrica.org/coproduction-manual/downloads/WISER-FCFA-coproduction-manual.pdf. 5
Carter, T. R. et al., 2021: A conceptual framework for cross-border impacts of climate change. Global Environmental 6 Change, 69, 102307, doi:https://doi.org/10.1016/j.gloenvcha.2021.102307. 7
Carty, T., J. Kowalzig and B. Zagema, 2020: Climate Finance Shadow Report 2020: Assessing progress towards the 8 $100 billion commitment. Oxfam International, Oxford, UK, 32 pp. Available at: 9 https://oxfamilibrary.openrepository.com/bitstream/handle/10546/621066/bp-climate-finance-shadow-report-10 2020-201020-en.pdf. 11
Castells-Quintana, D., M. d. P. Lopez-Uribe and T. K. J. McDermott, 2018: Adaptation to climate change: A review 12 through a development economics lens. World Development, 104, 183-196, 13 doi:https://doi.org/10.1016/j.worlddev.2017.11.016. 14
Catley, A., B. Admassu, G. Bekele and D. Abebe, 2014: Livestock mortality in pastoralist herds in Ethiopia and 15 implications for drought response. Disasters, 38(3), 500-516, doi:10.1111/disa.12060. 16
Cattaneo, C. et al., 2019: Human migration in the era of climate change. Review of Environmental Economics and 17 Policy, 13(2), 189-206, doi:https://dx.doi.org/10.1093/reep/rez008. 18
Cattaneo, C. and G. Peri, 2016: The migration response to increasing temperatures. Journal of Development Economics, 19 122, 127-146, doi:https://doi.org/10.1016/j.jdeveco.2016.05.004. 20
CDKN, 2013: Enhancing direct access to the Green Climate Fund. Climate and Devleopment Knowledge Network. 21 Available at: https://cdkn.org/wp-content/uploads/2013/06/CDKN_GCFPolicyBrief_Pr2_21-06-13_WEB.pdf. 22
Ceccato, P. et al., 2018: Data and tools to integrate climate and environmental information into public health. Infectious 23 diseases of poverty, 7(1), 126, doi:10.1186/s40249-018-0501-9. 24
Ceccherini, G. et al., 2017: Heat waves in Africa 1981-2015, observations and reanalysis. Natural Hazards and Earth 25 System Sciences, 17, 115-125, doi:10.5194/nhess-17-115-2017. 26
Cervigni, R., R. Liden, J. E. Neumann and K. M. Strzepek, 2015: Enhancing the Climate Resilience of Africa's 27 Infrastructure: The Power and Water Sectors. Africa Development Forum, The World Bank, Washington, DC, 28 216 pp. ISBN 978-1-4648-0466-3. 29
Cervigni, R., A. Losos, P. Chinowsky and J. E. Neumann, 2017: Enhancing the Climate Resilience of Africa’s 30 Infrastructure: The Roads and Bridges Sector. 1, World Bank Group, Washinton, DC. Available at: 31 http://documents.worldbank.org/curated/en/270671478809724744/Enhancing-the-climate-resilience-of-Africa-s-32 Infrastructure-the-roads-and-bridges-sector. 33
CES Consulting Engineers Salzgitter GmbH and Inros Lackner SE, 2020: Upscaling Nature-Based Flood Protection in 34 Mozambique’s Cities [Zangerling, B. M., B. Jongman, M. Matera, L. Carrera, X. A. Chavana, S. A. Carrion, A. 35 Midgley, A. E. Erman, B. T. V. Zanten and M. V. Ledden (eds.)]. World Bank Group,, Washington, DC, 45 pp. 36 Available at: http://documents.worldbank.org/curated/en/401611585291379085/Upscaling-Nature-Based-Flood-37 Protection-in-Mozambique-s-Cities-Knowledge-Note. 38
Challinor, A. J. et al., 2018: Transmission of climate risks across sectors and borders. Phil. Trans. R. Soc. A, 376(2121), 39 20170301, doi:10.1098/rsta.2017.0301. 40
Challinor, A. J. et al., 2016: Current warming will reduce yields unless maize breeding and seed systems adapt 41 immediately. Nature Climate Change, 6(10), 954-958, doi:10.1038/nclimate3061. 42
Chan, C. Y. et al., 2019: Prospects and challenges of fish for food security in Africa. Global Food Security, 20(May 43 2018), 17-25, doi:10.1016/j.gfs.2018.12.002. 44
Chanza, N. and A. de Wit, 2016: Enhancing climate governance through indigenous knowledge: Case in sustainability 45 science. South African Journal of Science, 112, 1-7, doi:http://dx.doi.org/10.17159/sajs.2016/20140286. 46
Chapagain, D., F. Baarsch, M. Schaeffer and S. D'Haen, 2020: Climate change adaptation costs in developing countries: 47 insights from existing estimates. Climate and Development, 12(10), 934-942, 48 doi:10.1080/17565529.2020.1711698. 49
Chaplin-Kramer, R. et al., 2019: Global modeling of nature’s contributions to people. Science (New York, N.Y.), 50 366(6462), 255, doi:10.1126/science.aaw3372. 51
Chapman, D., B. V. Purse, H. E. Roy and J. M. Bullock, 2017: Global trade networks determine the distribution of 52 invasive non-native species. Global Ecology and Biogeography, 26, 907-917, doi:10.1111/geb.12599. 53
Charis, G., G. Danha and E. Muzenda, 2019: Waste valorisation opportunities for bush encroacher biomass in savannah 54 ecosystems: A comparative case analysis of Botswana and Namibia. Procedia Manufacturing, 35, 974-979, 55 doi:https://doi.org/10.1016/j.promfg.2019.06.044. 56
Charles-Dominique, T. et al., 2016: Spiny plants, mammal browsers, and the origin of African savannas. Proceedings of 57 the National Academy of Sciences, 113(38), E5572, doi:10.1073/pnas.1607493113. 58
Chatiza, K., 2019: Cyclone Idai in Zimbabwe: An analysis of policy implications for post-disaster institutional 59 development. Oxfam, 30 pp. 60
Chausson, A. et al., 2020: Mapping the effectiveness of nature-based solutions for climate change adaptation. Global 61 Change Biology, 26(11), 6134-6155, doi:https://doi.org/10.1111/gcb.15310. 62
ACCEPTED VERSIO
N
SUBJECT TO FIN
AL EDITS

FINAL DRAFT Chapter 9 IPCC WGII Sixth Assessment Report
Do Not Cite, Quote or Distribute 9-164 Total pages: 225
Chemura, A. et al., 2013: Assessing the impact of climate change on the suitability of rainfed flu-cured tobacco 1 (Nicotiana tobacum) production in Zimbabwe. In: 1st Climate Science Symposium of Zimbabwe., Harare, 1, pp. 1-2 14. 3
Chen, D. et al., 2021: Framing, Context, and Methods [Masson-Delmotte, V., P. Zhai, A. Pirani, S.L. Connors, C. Péan, 4 S. Berger, N. Caud, Y. Chen, L. Goldfarb, M.I. Gomis, M. Huang, K. Leitzell, E. Lonnoy, J.B.R. Matthews, T.K. 5 Maycock, T. Waterfield, O. Yelekçi, R. Yu, and B. Zhou (ed.)]. Climate Change 2021: The Physical Science 6 Basis. Contribution of Working Group I to the Sixth Assessment Report of the Intergovernmental Panel on 7 Climate Change, In Press, Cambridge University Press. Available at: 8 https://www.ipcc.ch/report/ar6/wg1/downloads/report/IPCC_AR6_WGI_Chapter_01.pdf. 9
Chen, M., 2014: Informal Employment and Development: Patterns of Inclusion and Exclusion. The European Journal 10 of Development Research, 26(4), 397-418, doi:10.1057/ejdr.2014.31. 11
Chersich, M. F. et al., 2019a: Climate change and adolescents in South Africa: The role of youth activism and the health 12 sector in safeguarding adolescents' health and education. S Afr Med J, 109(9), 615-619, 13 doi:10.7196/SAMJ.2019.v109i9.14327. 14
Chersich, M. F. et al., 2019b: Violence in hot weather: Will climate change exacerbate rates of violence in South 15 Africa? 2019, vol. 109. ISBN 2078-5135. 16
Chersich, M. F. and C. Y. Wright, 2019: Climate change adaptation in South Africa: a case study on the role of the 17 health sector. Global Health, 15(1), 22, doi:10.1186/s12992-019-0466-x. 18
Chersich, M. F. et al., 2018: Impacts of Climate Change on Health and Wellbeing in South Africa. International 19 Journal of Environmental Research and Public Health, 15(9), 14, doi:10.3390/ijerph15091884. 20
Cheung William, W. L., G. Reygondeau and L. Frölicher Thomas, 2016: Large benefits to marine fisheries of meeting 21 the 1.5°C global warming target. Science (New York, N.Y.), 354(6319), 1591-1594, doi:10.1126/science.aag2331. 22
Cheung, W. W. L. et al., 2016: Structural uncertainty in projecting global fisheries catches under climate change. 23 Ecological Modelling, 325, 57-66, doi:10.1016/j.ecolmodel.2015.12.018. 24
Chia, E. L. et al., 2016: Securing well-being with the advent of climate hazards. International Journal of Climate 25 Change Strategies and Management, 8(2), 175-193, doi:10.1108/IJCCSM-04-2014-0048. 26
Chiarelli, D. D., K. F. Davis, M. C. Rulli and P. D'Odorico, 2016: Climate change and large-scale land acquisitions in 27 Africa: Quantifying the future impact on acquired water resources. Advances in Water Resources, 94, 231-237, 28 doi:https://doi.org/10.1016/j.advwatres.2016.05.016. 29
Chigbu, U. E., 2019: Anatomy of women’s landlessness in the patrilineal customary land tenure systems of sub-Saharan 30 Africa and a policy pathway. Land Use Policy, 86, 126-135, doi:https://doi.org/10.1016/j.landusepol.2019.04.041. 31
Chihambakwe, M., P. Mafongoya and O. Jiri, 2018: Urban and Peri-Urban Agriculture as A Pathway to Food Security: 32 A Review Mapping the Use of Food Sovereignty. Challenges, 10(1), doi:10.3390/challe10010006. 33
Chinowsky, P. et al., 2013: Climate change adaptation advantage for African road infrastructure. Climatic Change, 34 117(1), 345-361, doi:10.1007/s10584-012-0536-z. 35
Chinowsky, P. S., A. E. Schweikert, N. L. Strzepek and K. Strzepek, 2014: Infrastructure and climate change: a study 36 of impacts and adaptations in Malawi, Mozambique, and Zambia. Climatic Change, 130(1), 49-62, 37 doi:10.1007/s10584-014-1219-8. 38
Chinowsky, P. S., A. E. Schweikert, N. L. Strzepek and K. Strzepek, 2015: Infrastructure and climate change: a study 39 of impacts and adaptations in Malawi, Mozambique, and Zambia. Climatic Change, 130(1), 49-62, 40 doi:10.1007/s10584-014-1219-8. 41
Chiputwa, B. et al., 2020: Transforming climate science into usable services: The effectiveness of co-production in 42 promoting uptake of climate information by smallholder farmers in Senegal. Climate Services, 20, 100203, 43 doi:https://doi.org/10.1016/j.cliser.2020.100203. 44
Chirikure, S., M. Manyanga, W. Ndoro and G. Pwiti, 2010: Unfulfilled promises? Heritage management and 45 community participation at some of Africa's cultural heritage sites. International Journal of Heritage Studies, 46 16(1-2), 30-44, doi:10.1080/13527250903441739. 47
Choko, O. P. et al., 2019: A Resilience Approach to Community-Scale Climate Adaptation. Sustainability, 11(11), 48 doi:10.3390/su11113100. 49
Cholo, T., L. Fleskens, D. Sietz and J. Peerlings, 2018: Is Land Fragmentation Facilitating or Obstructing Adoption of 50 Climate Adaptation Measures in Ethiopia? Sustainability, 10(7), doi:10.3390/su10072120. 51
Chu, E., I. Anguelovski and D. Roberts, 2017: Climate adaptation as strategic urbanism: assessing opportunities and 52 uncertainties for equity and inclusive development in cities. Cities, 60, 378-387, 53 doi:https://doi.org/10.1016/j.cities.2016.10.016. 54
Chuang, T.-W. et al., 2017: Assessment of climate-driven variations in malaria incidence in Swaziland: toward malaria 55 elimination. Malaria Journal, 16(1), 232, doi:10.1186/s12936-017-1874-0. 56
Cinner, J. E. et al., 2018: Building adaptive capacity to climate change in tropical coastal communities. Nature Climate 57 Change, 8(2), 117-123, doi:10.1038/s41558-017-0065-x. 58
Cissé, G., 2019: Food-borne and water-borne diseases under climate change in low- and middle-income countries: 59 Further efforts needed for reducing environmental health exposure risks. Acta tropica, 194, 181-188, 60 doi:10.1016/j.actatropica.2019.03.012. 61
Claon, J. S. et al., 2020: Water scarcity in African cities: anthropic factors or climate change? Case of Bouake (Côte 62 d’Ivoire). In: Second International Conference. Water, Megacities and Global Change, 7-11 December 2020. 63
ACCEPTED VERSIO
N
SUBJECT TO FIN
AL EDITS

FINAL DRAFT Chapter 9 IPCC WGII Sixth Assessment Report
Do Not Cite, Quote or Distribute 9-165 Total pages: 225
Clapp, C. and K. Pillay, 2017: Green Bonds and Climate Finance. In: Climate Finance. World Scientific, pp. 79-105. 1 ISBN 978-981-4641-80-7. 2
Clarke, J. and N. Brooks, 2018: The Archaeology of Western Sahara. A Synthesis of Fieldwork, 2002 to 2009, Oxbow 3 Books, Oxford. 4
Clay, N. and K. S. Zimmerer, 2020: Who is resilient in Africa's Green Revolution? Sustainable intensification and 5 Climate Smart Agriculture in Rwanda. Land use policy, 97, 104558, doi:10.1016/j.landusepol.2020.104558. 6
Climate Action Tracker, 2021: Climate governance assessment of the government’s ability and readiness to transform 7 South Africa into a zero emissions society. Climate Action Tracker,, Cologne, Germany, 23 pp. Available at: 8 https://climateactiontracker.org/documents/837/2020_12_CAT_Governance_Report_South_Africa.pdf. 9
Closset, M., S. FEINDOUNO, P. Guillaumont and C. Simonet, 2017: A Physical Vulnerability to Climate Change 10 Index: Which are the most vulnerable developing countries? 11
Cobbing, J. and B. Hiller, 2019: Waking a sleeping giant: Realizing the potential of groundwater in Sub-Saharan 12 Africa. World Development, 122, 597-613, doi:https://doi.org/10.1016/j.worlddev.2019.06.024. 13
CoCT, 2019: Cape Town Water Strategy (2019): Our shared water future. City of Cape Town,, Cape Town. Available 14 at: 15 https://resource.capetown.gov.za/documentcentre/Documents/City%20strategies,%20plans%20and%20framewor16 ks/Cape%20Town%20Water%20Strategy.pdf. 17
Codjoe, S. and V. Nabie, 2014: Climate change and cerebrospinal meningitis in the Ghanaian meningitis belt. 18 International journal of environmental research and public health, 11(7), 6923–6939, 19 doi:https://doi.org/10.3390/ijerph110706923. 20
Codjoe, S. N. A. et al., 2020: Impact of extreme weather conditions on healthcare provision in urban Ghana. Social 21 Science & Medicine, 258, 113072, doi:https://doi.org/10.1016/j.socscimed.2020.113072. 22
Codjoe, S. N. A., G. Owusu and V. Burkett, 2014: Perception, experience, and indigenous knowledge of climate change 23 and variability: The case of Accra, a sub-Saharan African city. Regional Environmental Change, 14(1), 369-383, 24 doi:http://dx.doi.org/10.1007/s10113-013-0500-0. 25
Coen, D. R., 2021: A brief history of usable climate science. Climatic Change, 167(3), 51, doi:10.1007/s10584-021-26 03181-2. 27
Coffel, E. and R. Horton, 2015: Climate Change and the Impact of Extreme Temperatures on Aviation. Weather, 28 Climate, and Society, 7(1), 94-102, doi:10.1175/WCAS-D-14-00026.1. 29
Coffel, E. D., R. M. Horton and A. de Sherbinin, 2018: Temperature and humidity based projections of a rapid rise in 30 global heat stress exposure during the 21(st) century. Environ Res Lett, 13(1), 014001, doi:10.1088/1748-31 9326/aaa00e. 32
Cohen, A. S. et al., 2016: Climate warming reduces fish production and benthic habitat in Lake Tanganyika, one of the 33 most biodiverse freshwater ecosystems. Proceedings of the National Academy of Sciences, 113(34), 9563-9568, 34 doi:10.1073/pnas.1603237113. 35
Cohen, B. et al., 2021: Co-benefits and trade-offs of climate change mitigation actions and the Sustainable 36 Development Goals. Sustainable Production and Consumption, 26, 805-813, doi:10.1016/j.spc.2020.12.034. 37
Colborn, K. L. et al., 2018: Spatio-temporal modelling of weekly malaria incidence in children under 5 for early 38 epidemic detection in Mozambique. Sci. Rep., 8(1), 9238, doi:10.1038/s41598-018-27537-4. 39
Coldrey, K. M. and J. K. Turpie, 2020: Potential impacts of changing climate on nature-based tourism: A case study of 40 South Africa’s national parks. Koedoe, 62(1), doi:https://doi.org/10.4102/koedoe.v62i1.1629 41
Cole, H. D. et al., 2021a: Managing city-scale slow-onset disasters: Learning from Cape Town's 2015–2018 drought 42 disaster planning. International Journal of Disaster Risk Reduction, 63, doi:10.1016/j.ijdrr.2021.102459. 43
Cole, H. D. et al., 2021b: Managing city-scale slow-onset disasters: Learning from Cape Town’s 2015-2018 drought 44 disaster planning. International Journal of Disaster Risk Reduction, 63(September 2021), 45 doi:10.1016/j.ijdrr.2021.102459. 46
Collins, M. et al., 2019: Extremes, Abrupt Changes and Managing Risk. In: IPCC Special Report on the Ocean and 47 Cryosphere in a Changing Climate [H.-O. Pörtner, D. C. R., V. Masson-Delmotte, P. Zhai, M. Tignor, E. 48 Poloczanska, K. Mintenbeck, A. Alegría, M. Nicolai, A. Okem, J. Petzold, B. Rama, N.M. Weyer (ed.)]. In press. 49 Available at: https://www.ipcc.ch/site/assets/uploads/sites/3/2019/11/10_SROCC_Ch06_FINAL.pdf. 50
CoM SSA, 2019: Climate Finance Landscape for sub-Saharan Cities. Covenant of Mayors for Sub-Saharan Africa 51 (CoM SSA),, Covenant of Mayors for Sub-Saharan Africa (CoM SSA), Cape Town, South Africa. Available at: 52 https://africa.iclei.org/wp-content/uploads/2020/06/2020_Publication_Financing-SEACAPs-Mapping-Report-53 English.pdf. 54
Commission of Social Determinants of Health, 2008: Closing the gap in a generation: health equity through action on 55 the social determinants of health. Final Report of the Commission on Social Determinants of Health. World 56 Health Organization, Geneva, Switzerland, 256 pp. Available at: 57 http://apps.who.int/iris/bitstream/handle/10665/43943/9789241563703_eng.pdf;jsessionid=4A55149E474B1A3C58 8BD54A190F5F5891?sequence=1. 59
Connolly-Boutin, L. and B. Smit, 2016: Climate change, food security, and livelihoods in sub-Saharan Africa. Regional 60 Environmental Change, 16(2), 385-399, doi:http://dx.doi.org/10.1007/s10113-015-0761-x. 61
ACCEPTED VERSIO
N
SUBJECT TO FIN
AL EDITS
FINAL DRAFT Chapter 9 IPCC WGII Sixth Assessment Report
Do Not Cite, Quote or Distribute 9-166 Total pages: 225
Conradie, S. R., S. M. Woodborne, S. J. Cunningham and A. E. McKechnie, 2019: Chronic, sublethal effects of high 1 temperatures will cause severe declines in southern African arid-zone birds during the 21st century. Proceedings 2 of the National Academy of Sciences, 116(28), 14065, doi:10.1073/pnas.1821312116. 3
Conteh, I. K., 2015: Natural Hazards and Education. The Impact of Floods on Primary School Education in Zambia. 4 Maastricht University, Boekenplan. 5
Contractor, S. et al., 2020: Rainfall Estimates on a Gridded Network (REGEN)–a global land-based gridded dataset of 6 daily precipitation from 1950 to 2016. Hydrology and Earth System Sciences (HESS), 24(2), 919-943, 7 doi:https://doi.org/10.5194/hess-24-919-2020. 8
Conway, D., C. Dalin, W. A. Landman and T. J. Osborn, 2017: Hydropower plans in eastern and southern Africa 9 increase risk of concurrent climate-related electricity supply disruption. Nature Energy, 2(12), 946-953, 10 doi:10.1038/s41560-017-0037-4. 11
Conway, D. et al., 2015: Climate and southern Africa's water–energy–food nexus. Nature Climate Change, 5(9), 837-12 846, doi:10.1038/nclimate2735. 13
Conway, D. and K. Vincent, 2021: Climate Risk in Africa: Adaptation and Resilience, 1 ed., Palgrave Macmillan, 14 Cham, Switzerland. ISBN 978-3-030-61160-6. 15
Cook, B. I. et al., 2020a: Twenty-First Century Drought Projections in the CMIP6 Forcing Scenarios. Earth's Future, 16 8(6), e2019EF001461, doi:https://doi.org/10.1029/2019EF001461. 17
Cook, K. H., R. G. J. Fitzpatrick, W. Liu and E. K. Vizy, 2020b: Seasonal asymmetry of equatorial East African rainfall 18 projections: understanding differences between the response of the long rains and the short rains to increased 19 greenhouse gases. Clim Dyn, 55(7), 1759-1777, doi:10.1007/s00382-020-05350-y. 20
Cook, K. H. and E. K. Vizy, 2015: Detection and Analysis of an Amplified Warming of the Sahara Desert. Journal of 21 Climate, 28(16), 6560-6580, doi:10.1175/JCLI-D-14-00230.1. 22
Coppola, E. et al., 2014: Present and future climatologies in the phase I CREMA experiment. Climatic Change, 125(1), 23 23-38, doi:10.1007/s10584-014-1137-9. 24
Corbane, C. et al., 2018: GHS built-up grid, derived from Landsat, multitemporal (1975-1990-2000-2014), R2018A, 25 European Commission, Joint Research Centre (JRC), Brussels. 26
Cornforth, R. J., C. Petty and G. Walker, 2021: Supporting Climate-Resilient Planning at National and District Levels: 27 A Pathway to Multi-stakeholder Decision-Making in Uganda. In: Climate Risk in Africa: Adaptation and 28 Resilience [Conway, D. and K. Vincent (eds.)]. Springer International Publishing, Cham, pp. 131-145. ISBN 978-29 3-030-61160-6. 30
Cosens, B. A. et al., 2017: The role of law in adaptive governance. Ecol Soc, 22(1), 1-30, doi:10.5751/ES-08731-31 220130. 32
Costinot, A., D. Donaldson and C. Smith, 2012: Evolving Comparative Advantage and the Impact of Climate Change in 33 Agricultural Markets: Evidence from a 9 Million-Field Partition of the Earth. Journal of Political Economy. 34
Coulibaly, J. Y., B. Chiputwa, T. Nakelse and G. Kundhlande, 2017: Adoption of agroforestry and the impact on 35 household food security among farmers in Malawi. Agricultural Systems, 155, 52-69, 36 doi:https://doi.org/10.1016/j.agsy.2017.03.017. 37
Coultas, M. and R. Iyer, 2020: Handwashing Compendium for Low Resource Settings: A Living Document. The 38 Sanitation Learning Hub. 39
Couttenier, M. and R. Soubeyran, 2014: Drought and Civil War in Sub‐Saharan Africa. The Economic Journal, 40 124(575), 201-244, doi:10.1111/ecoj.12042. 41
Cowx, I. G., A. Lungu and M. Kalonga, 2018: Optimising hydropower development and ecosystem services in the 42 Kafue River, Zambia. Marine and Freshwater Research, 69(12), 1974-1982, 43 doi:https://doi.org/10.1071/MF18132. 44
Cowx, I. G. and R. Ogutu-Ohwayo, 2019: Towards sustainable fisheries and aquaculture management in the African 45 Great Lakes. Fisheries Management and Ecology, 26(August), 397-405, doi:10.1111/fme.12391. 46
CPI, 2019: Global Landscape of Climate Finance 2019 [Buchner, B., A. Clark, A. Falconer, R. Macquarie, C. Meattle, 47 R. Tolentino and C. Wetherbee (eds.)]. Climate Policy Initiative (CPI), London, UK, 38 pp. Available at: 48 https://www.climatepolicyinitiative.org/wp-content/uploads/2019/11/2019-Global-Landscape-of-Climate-49 Finance.pdf. 50
Craig, R. K., 2010: Stationarity is Dead - Long Live Transformation: Five Principles for Climate Change Adaptation 51 Law. Harvard Environmental Law Review, 34(1), 9-74. 52
Crate, S. A. and M. Nuttall, 2016: From local to global: perceptions and realities of environmental change among 53 Kalahari San. In: Anthropology and Climate Change. Routledge, pp. 250-262. 54
Crawford, R. J. M. et al., 2015: A changing distribution of seabirds in South Africa—the possible impact of climate and 55 its consequences. Frontiers in Ecology and Evolution, 3(10), doi:10.3389/fevo.2015.00010. 56
CRED, 2019: Disasters in Africa: 20 year review (2000–2019). CRED Crunch Newsletter,(56), 2. Available at: 57 https://www.emdat.be/cred-crunch-56-disasters-africa-20-year-review-2000-2019. 58
Creese, A. and R. Washington, 2018: A Process-Based Assessment of CMIP5 Rainfall in the Congo Basin: The 59 September–November Rainy Season. Journal of Climate, 31(18), 7417-7439, doi:10.1175/jcli-d-17-0818.1. 60
Crick, F., K. E. Gannon, M. Diop and M. Sow, 2018: Enabling private sector adaptation to climate change in sub-61 Saharan Africa. WIREs Climate Change, 9(2), e505, doi:https://doi.org/10.1002/wcc.505. 62
ACCEPTED VERSIO
N
SUBJECT TO FIN
AL EDITS
FINAL DRAFT Chapter 9 IPCC WGII Sixth Assessment Report
Do Not Cite, Quote or Distribute 9-167 Total pages: 225
Crippa, M. et al., 2021: EDGAR v6.0 Greenhouse Gas Emissions. European Commission Joint Research Centre (JRC), 1 Ispra, Italy. Available at: http://data.europa.eu/89h/97a67d67-c62e-4826-b873-9d972c4f670b. 2
Croitoru, L., J. J. Miranda and M. Sarraf, 2019: The Cost of Coastal Zone Degradation In West Africa: Benin, Côte 3 D’ivoire, Senegal And Togo. Economic and Sector Work (ESW) Studies, World Bank, Washington, DC. 4 Available at: https://openknowledge.worldbank.org/handle/10986/31428. 5
Cromsigt, J. et al., 2018: Trophic rewilding as a climate change mitigation strategy? Philos Trans R Soc Lond B Biol 6 Sci, 373(1761), doi:10.1098/rstb.2017.0440. 7
CSC, 2013: Climate Change Scenarios for the Congo Basin [Haensler, A., D. Jacob, P. Kabat and F. Ludwig (eds.)]. 8 Climate Service Centre, Hamburg, Germany. 9
CTA, 2019: The digitalisation of African agriculture report 2018-2019. The Technical Centre for Agricultural and 10 Rural Cooperation (CTA), Wageningen, The Netherlands, 241 pp. Available at: 11 https://cgspace.cgiar.org/bitstream/handle/10568/101498/CTA-Digitalisation-report.pdf. 12
Cui, Y. et al., 2019: The cost of rapid and haphazard urbanization: lessons learned from the Freetown landslide disaster. 13 Landslides, 16(6), 1167-1176, doi:10.1007/s10346-019-01167-x. 14
Cullen, N. J. et al., 2013: A century of ice retreat on Kilimanjaro: the mapping reloaded. The Cryosphere, 7(2), 419-15 431, doi:10.5194/tc-7-419-2013. 16
Cullis, J. et al., 2015: An Uncertainty Approach to Modelling Climate Change Risk in South Africa. UNU-WIDER, 17 Helsinki, Finland. 18
Cullmann, J. et al., 2020: State of Climate Services: Risk Information and Early Warning Systems. World 19 Meteorological Organisation, Geneva, Switzerland, 25 pp. Available at: 20 https://library.wmo.int/doc_num.php?explnum_id=10385. 21
Cumming, T. L. et al., 2017: Achieving the national development agenda and the Sustainable Development Goals 22 (SDGs) through investment in ecological infrastructure: A case study of South Africa. Ecosystem Services, 27, 23 253-260, doi:https://doi.org/10.1016/j.ecoser.2017.05.005. 24
Cunningham, S. C. et al., 2015: Reforestation with native mixed-species plantings in a temperate continental climate 25 effectively sequesters and stabilizes carbon within decades. Global Change Biology, 21(4), 1552-1566, 26 doi:https://doi.org/10.1111/gcb.12746. 27
Cuthbert, M. O. et al., 2019: Observed controls on resilience of groundwater to climate variability in sub-Saharan 28 Africa. Nature, 572(7768), 230-234, doi:10.1038/s41586-019-1441-7. 29
D'Odorico, P. et al., 2018: The global food-energy-water nexus. Reviews of Geophysics, 56(3), 456-531, 30 doi:10.1029/2017rg000591. 31
D’agata, S. et al., 2020: Multiscale determinants of social adaptive capacity in small-scale fishing communities. 32 Environmental Science & Policy, 108, 56-66, doi:https://doi.org/10.1016/j.envsci.2020.03.006. 33
Dallas, H. F., 2016: The influence of thermal history on upper thermal limits of two species of riverine insects: the 34 stonefly, Aphanicerca capensis, and the mayfly, Lestagella penicillata. Hydrobiologia, 781(1), 95-108, 35 doi:10.1007/s10750-016-2826-3. 36
Dallas, H. F. and N. Rivers-Moore, 2014: Ecological consequences of global climate change for freshwater ecosystems 37 in South Africa. South African Journal of Science, 110(5/6), doi:10.1590/sajs.2014/20130274. 38
Dalu, T., R. J. Wasserman and M. T. B. Dalu, 2017: Agricultural intensification and drought frequency increases may 39 have landscape-level consequences for ephemeral ecosystems. Global Change Biology, 23(3), 983-985, 40 doi:https://doi.org/10.1111/gcb.13549. 41
Daniels, E. et al., 2020: Refocusing the climate services lens: Introducing a framework for co-designing 42 “transdisciplinary knowledge integration processes” to build climate resilience. Climate Services, 19, 43 doi:10.1016/j.cliser.2020.100181. 44
Daoud, M., 2021: Is vulnerability to climate change gendered? And how? Insights from Egypt. Regional Environmental 45 Change, 21(2), doi:10.1007/s10113-021-01785-z. 46
Dardel, C. et al., 2014: Re-greening Sahel: 30years of remote sensing data and field observations (Mali, Niger). Remote 47 Sensing of Environment, 140, 350-364, doi:https://doi.org/10.1016/j.rse.2013.09.011. 48
Dargie, G. C. et al., 2019: Congo Basin peatlands: threats and conservation priorities. Mitigation and Adaptation 49 Strategies for Global Change, 24(4), 669-686, doi:10.1007/s11027-017-9774-8. 50
Darko, D. et al., 2019: The context and politics of decision making on large dams in Ghana: an overview, Manchester. 51 Darkoh, E. L., J. A. Larbi and E. A. Lawer, 2017: A Weather-Based Prediction Model of Malaria Prevalence in Amenfi 52
West District, Ghana. Malar. Res. Treat., 2017, 7820454, doi:10.1155/2017/7820454. 53 Dass, P., B. Z. Houlton, Y. Wang and D. Warlind, 2018: Grasslands may be more reliable carbon sinks than forests in 54
California. Environmental Research Letters, 13(7), 074027, doi:10.1088/1748-9326/aacb39. 55 Datta, K. et al., 2003: Bioengineered 'golden' indica rice cultivars with beta-carotene metabolism in the endosperm with 56
hygromycin and mannose selection systems. Plant Biotechnol J, 1(2), 81-90, doi:10.1046/j.1467-57 7652.2003.00015.x. 58
Davidson, D., 2016: Gaps in agricultural climate adaptation research. Nature Climate Change, 6(5), 433-435, 59 doi:10.1038/nclimate3007. 60
Davis-Reddy, C. L., K. Vincent and J. Mambo, 2017: Socio-economic impacts of extreme weather events in Southern 61 Africa. In: Climate Risk and Vulnerability: A Handbook for Southern Africa. CSIR, Pretoria, South Africa, pp. 30-62 47. 63
ACCEPTED VERSIO
N
SUBJECT TO FIN
AL EDITS
FINAL DRAFT Chapter 9 IPCC WGII Sixth Assessment Report
Do Not Cite, Quote or Distribute 9-168 Total pages: 225
Davis, J., B. Crow and J. Miles (eds.), Measuring water collection times in Kenyan informal settlements. Fifth 1 International Conference on Information and Communication Technologies and Development, Atlanta, GA, USA, 2 114–121 pp. 3
Day, E. et al., 2019: Upholding labour productivity under climate change: an assessment of adaptation options. Climate 4 Policy, 19(3), 367-385, doi:10.1080/14693062.2018.1517640. 5
Dayamba, D. S. et al., 2018: Assessment of the use of Participatory Integrated Climate Services for Agriculture 6 (PICSA) approach by farmers to manage climate risk in Mali and Senegal. Climate Services, 12, 27-35, 7 doi:https://doi.org/10.1016/j.cliser.2018.07.003. 8
de Graaf, G. and L. Garibaldi, 2015: THE VALUE OF AFRICAN FISHERIES. FAO Fisheries and Aquaculture Circular, 9 Food and Agriculture Organization of the United Nations, Rome, 76 pp. Available at: 10 https://www.proquest.com/scholarly-journals/value-african-fisheries/docview/1703270253/se-2?accountid=14500. 11
de Janvry, A., F. Finan, E. Sadoulet and R. Vakis, 2006: Can conditional cash transfer programs serve as safety nets in 12 keeping children at school and from working when exposed to shocks? Journal of Development Economics, 79(2), 13 349-373, doi:10.1016/j.jdeveco.2006.01.013. 14
de Lima, C. Z. et al., 2021: Heat stress on agricultural workers exacerbates crop impacts of climate change. 15 Environmental Research Letters, 16(4), 044020, doi:10.1088/1748-9326/abeb9f. 16
de Longueville, F., P. Ozer, S. Doumbia and S. Henry, 2013: Desert dust impacts on human health: an alarming 17 worldwide reality and a need for studies in West Africa. Int J Biometeorol, 57(1), 1-19, doi:10.1007/s00484-012-18 0541-y. 19
Degarege, A. et al., 2019: Improving socioeconomic status may reduce the burden of malaria in sub Saharan Africa: A 20 systematic review and meta-analysis. PLoS One, 14(1), e0211205, doi:10.1371/journal.pone.0211205. 21
Dell, M., B. F. Jones and B. A. Olken, 2012: Temperature Shocks and Economic Growth: Evidence from the Last Half 22 Century. American Economic Journal: Macroeconomics, 4(3), 66-95, doi:10.1257/mac.4.3.66. 23
Dellink, R., E. Lanzi and J. Chateau, 2019: The Sectoral and Regional Economic Consequences of Climate Change to 24 2060. Environmental and Resource Economics, 72(2), 309-363, doi:10.1007/s10640-017-0197-5. 25
Denton, F. et al., 2014: Climate-Resilient Pathways: Adaptation, Mitigation, and Sustainable Development. In: Climate 26 Change 2014: Impacts, Adaptation, and Vulnerability. Part A: Global and Sectoral Aspects. Contribution of 27 Working Group II to the Fifth Assessment Report of the Intergovernmental Panel on Climate Change [Field, C. 28 B., V. R. Barros, D. J. Dokken, K. J. Mach, M. D. Mastrandrea, T. E. Bilir, M. Chatterjee, K. L. Ebi, Y. O. 29 Estrada, R. C. Genova, B. Girma, E. S. Kissel, A. N. Levy, S. MacCracken, P. R. Mastrandrea and L. L. White 30 (eds.)]. Cambridge University Press, Cambridge, United Kingdom and New York, NY, USA, pp. 1101-1131. 31 ISBN 9781107058071. 32
Department of Economic and Social Affairs, 2016: World Economic and Social Survey 2016: Climate Change 33 Resilience: An Opportunity for Reducing Inequalities. United Nations, 1 ed., New York. Available at: 34 https://www.un.org/development/desa/dpad/wp-content/uploads/sites/45/publication/WESS_2016_Report.pdf. 35
Dercon, S. and L. Christiaensen, 2011: Consumption risk, technology adoption and poverty traps: Evidence from 36 Ethiopia. Journal of Development Economics, 96(2), 159-173, doi:10.1016/j.jdeveco.2010.08.003. 37
Deryng, D. et al., 2016: Regional disparities in the beneficial effects of rising CO2 concentrations on crop 38 water productivity. Nature Climate Change, 6(8), 786-790, doi:10.1038/nclimate2995. 39
Deryugina, T. and S. Hsiang, 2017: The marginal product of climate. Nber Working Paper Series, National Bureau of 40 Economic Research, Inc., Cambridge, MA. Available at: https://www.nber.org/papers/w24072.pdf. 41
Descheemaeker, K. et al., 2018: Effects of climate change and adaptation on the livestock component of mixed farming 42 systems: A modelling study from semi-arid Zimbabwe. Agricultural Systems, 159, 282-295, 43 doi:10.1016/j.agsy.2017.05.004. 44
Descroix, L. et al., 2018: Evolution of surface hydrology in the Sahelo-Sudanian strip: An updated review. Water, 45 10(6), doi:10.3390/w10060748. 46
Deutsch, C. A. et al., 2018: Increase in crop losses to insect pests in a warming climate. Science (New York, N.Y.), 47 361(6405), 916-919, doi:10.1126/science.aat3466. 48
Devonald, M., N. Jones and W. Yadete, 2020: ‘The first thing that I fear for my future is lack of rain and drought’: 49 climate change and its impacts on adolescent capabilities in low-and middle-income countries. London. Available 50 at: https://www.gage.odi.org/wp-content/uploads/2020/12/Climate-change-report-for-web-1.pdf. 51
di Lernia, S., 2017: The Archaeology of Rock Art in Northern Africa. In: The Oxford Handbook of the Archaeology and 52 Anthropology of Rock Art [David, B. and I. J. McNiven (eds.)]. Oxford University Press, Oxford. 53
di Lernia, S. and M. Gallinaro, 2011: Working in a UNESCO WH Site. Problems and Practices on the Rock Art of 54 Tadrart Akakus (SW Libya, Central Sahara). Journal of African Archaeology, 9(2), 159-175, 55 doi:https://doi.org/10.3213/2191-5784-10198. 56
Di Marcantonio, F. and F. Kayitakire, 2017: Review of Pilot Projects on Index-Based Insurance in Africa: Insights and 57 Lessons Learned. In: Renewing Local Planning to Face Climate Change in the Tropics [Tiepolo, M., A. Pezzoli 58 and V. Tarchiani (eds.)]. Springer, Cham, pp. 323-341. ISBN 978-3-319-59095-0. 59
Diallo, I. et al., 2016: Projected changes of summer monsoon extremes and hydroclimatic regimes over West Africa for 60 the twenty-first century. Clim Dyn, 47(12), 3931-3954, doi:10.1007/s00382-016-3052-4. 61
Dibley, A., T. Wetzer and C. Hepburn, 2021: National COVID debts: climate change imperils countries’ ability to 62 repay. Nature, 596(August 2021), 184-187, doi:https://doi.org/10.1038/d41586-021-00871-w. 63
ACCEPTED VERSIO
N
SUBJECT TO FIN
AL EDITS
FINAL DRAFT Chapter 9 IPCC WGII Sixth Assessment Report
Do Not Cite, Quote or Distribute 9-169 Total pages: 225
Diboulo, E. et al., 2012: Weather and mortality: a 10 year retrospective analysis of the Nouna Health and Demographic 1 Surveillance System, Burkina Faso. Global Health Action, 5(1), 19078, doi:10.3402/gha.v5i0.19078. 2
Dickerson, S., M. Cannon and B. O’Neill, 2021: Climate change risks to human development in sub-Saharan Africa: a 3 review of the literature. Climate and Development, 1-19, doi:10.1080/17565529.2021.1951644. 4
Dickin, S., L. Segnestam and M. Sou Dakouré, 2020: Women’s vulnerability to climate-related risks to household water 5 security in Centre-East, Burkina Faso. Climate and Development, 13(5), 443-453, 6 doi:10.1080/17565529.2020.1790335. 7
Dickovick, T. J. W., James S. , 2014: Decentralization: Theoretical, Conceptual, and Analytical Issues. In: 8 Decentralization in Africa: The Paradox of State Strength [Dickovick, T. J. and J. S. Wunsch (eds.)]. Lynne 9 Rienner Publishers. ISBN 978-1-62637-053-1. 10
Diedhiou, A. et al., 2018: Changes in climate extremes over West and Central Africa at 1.5 °C and 2 °C global 11 warming. Environmental Research Letters, 13(6), 065020, doi:10.1088/1748-9326/aac3e5. 12
Diffenbaugh, N. S. and M. Burke, 2019: Global warming has increased global economic inequality. Proceedings of the 13 National Academy of Sciences, 116(20), 9808-9813, doi:10.1073/pnas.1816020116. 14
Digna, R. F. et al., 2016: Nile River Basin modelling for water resources management – a literature review. 15 International Journal of River Basin Management, 15(1), 39-52, doi:10.1080/15715124.2016.1228656. 16
Dimobe, K. et al., 2020: Climate change reduces the distribution area of the shea tree (Vitellaria paradoxa C.F. Gaertn.) 17 in Burkina Faso. Journal of Arid Environments, 181, 104237, doi:https://doi.org/10.1016/j.jaridenv.2020.104237. 18
Dinerstein, E. et al., 2019: A Global Deal For Nature: Guiding principles, milestones, and targets. Science Advances, 19 5(4), eaaw2869, doi:10.1126/sciadv.aaw2869. 20
Dinesh, D. et al., 2018: Facilitating Change for Climate-Smart Agriculture through Science-Policy Engagement. 21 Sustainability, 10(8), 2616, doi:https://doi.org/10.3390/su10082616. 22
Ding, K., J. M. Gilligan and G. M. Hornberger, 2019: "Avoiding "day-zero": A Testbed for Evaluating Integrated Food-23 energy-water Management in Cape Town, South Africa. IEEE, 866-877, doi:10.1109/WSC40007.2019.9004889. 24
Diop, A., 2018: Tombouctou: l’avenir des maçons traditionnels. In: World Heritage for Sustainable Development in 25 Africa. United Nations Educational, Scientific and Cultural Organization. UNESCO, Paris, pp. 99-103. 26
Diouf, I. et al., 2017: Comparison of Malaria Simulations Driven by Meteorological Observations and Reanalysis 27 Products in Senegal. International journal of environmental research and public health, 14(10), 1119, 28 doi:10.3390/ijerph14101119. 29
Diouf, N. S. et al., 2019: Factors influencing gendered access to climate information services for farming in Senegal. 30 Gender, Technology and Development, 23(2), 93-110, doi:10.1080/09718524.2019.1649790. 31
Djalante, R., C. Holley, F. Thomalla and M. Carnegie, 2013: Pathways for adaptive and integrated disaster resilience. 32 Natural Hazards, 69, 2105-2135, doi:10.1007/s11069-013-0797-5. 33
Djoudi, H. et al., 2016: Beyond dichotomies: Gender and intersecting inequalities in climate change studies. Ambio, 34 45(3), 248-262, doi:10.1007/s13280-016-0825-2. 35
Doblas-Reyes, F. J. et al., 2021: Linking Global to Regional Climate Change [Masson-Delmotte, V., P. Zhai, A. Pirani, 36 S. L. Connors, C. Péan, S. Berger, N. Caud, Y. Chen, L. Goldfarb, M. I. Gomis, M. Huang, K. Leitzell, E. 37 Lonnoy, J.B.R. Matthews, T. K. Maycock, T. Waterfield, O. Yelekçi, R. Yu and B. Zhou (ed.)]. Climate Change 38 2021: The Physical Science Basis. Contribution of Working Group I to the Sixth Assessment Report of the 39 Intergovernmental Panel on Climate Change, In Press, Cambridge University Press. Available at: 40 https://www.ipcc.ch/report/ar6/wg1/downloads/report/IPCC_AR6_WGI_Chapter_10.pdf. 41
Dodds, W. K., J. S. Perkin and J. E. Gerken, 2013: Human Impact on Freshwater Ecosystem Services: A Global 42 Perspective. Environmental Science & Technology, 47(16), 9061-9068, doi:10.1021/es4021052. 43
Dodman, D., H. Leck, M. Rusca and S. Colenbrander, 2017: African Urbanisation and Urbanism: Implications for risk 44 accumulation and reduction. International Journal of Disaster Risk Reduction, 26, 7-15, 45 doi:10.1016/j.ijdrr.2017.06.029. 46
Dodman, D. et al., 2015: Understanding the assessment and reduction of vulnerability to climate change in African 47 cities: A focus on low-income and informal settlements. Environment and Urbanization, 24, International Institute 48 for Environment and Development (IIED), 77-97 pp. Available at: https://www.afd.fr/en/understanding-49 assessment-and-reduction-vulnerability-climate-change-african-cities-focus-low-income-and-informal-50 settlements. 51
Dolislager, M. et al., 2020: Youth and Adult Agrifood System Employment in Developing Regions: Rural (Peri-urban 52 to Hinterland) vs. Urban. The Journal of Development Studies, 57(4), 571-593, 53 doi:10.1080/00220388.2020.1808198. 54
Dombrowsky, I. and O. Hensengerth, 2018: Governing the Water-Energy-Food Nexus Related to Hydropower on 55 Shared Rivers—The Role of Regional Organizations. Frontiers in Environmental Science, 6(153), 56 doi:10.3389/fenvs.2018.00153. 57
Domke, M. and J. Pretzsch, 2016: Knowledge Management on Climate Change Adaptation. Analysis of Information 58 Exchange Processes and Collaboration Networks in Rural Ethiopia. In: Climatic and Environmental Challenges: 59 Learning from the Horn of Africa. Centre français des études éthiopiennes, Addis-Abeba. ISBN 9782821873001. 60
Donat, M. G., O. Angélil and A. M. Ukkola, 2019: Intensification of precipitation extremes in the world’s humid and 61 water-limited regions. Environmental Research Letters, 14(6), 065003, doi:10.1088/1748-9326/ab1c8e. 62
ACCEPTED VERSIO
N
SUBJECT TO FIN
AL EDITS
FINAL DRAFT Chapter 9 IPCC WGII Sixth Assessment Report
Do Not Cite, Quote or Distribute 9-170 Total pages: 225
Donat, M. G. et al., 2014a: Changes in extreme temperature and precipitation in the Arab region: long-term trends and 1 variability related to ENSO and NAO. International Journal of Climatology, 34(3), 581-592, 2 doi:10.1002/joc.3707. 3
Donat, M. G. et al., 2014b: Consistency of temperature and precipitation extremes across various global gridded in situ 4 and reanalysis datasets. Journal of Climate, 27(13), 5019-5035, doi:10.1175/jcli-d-13-00405.1. 5
Doshi, D. and M. Garschagen, 2020: Understanding Adaptation Finance Allocation: Which Factors Enable or Constrain 6 Vulnerable Countries to Access Funding? Sustainability, 12(10), 4308, doi:10.3390/su12104308. 7
Dosio, A., 2017: Projection of temperature and heat waves for Africa with an ensemble of CORDEX Regional Climate 8 Models. Clim Dyn, 49, 493-519, doi:10.1007/s00382-016-3355-5. 9
Dosio, A. et al., 2019: What can we know about future precipitation in Africa? Robustness, significance and added 10 value of projections from a large ensemble of regional climate models. Clim Dyn, doi:10.1007/s00382-019-04900-11 3. 12
Dosio, A. et al., 2021: Projected future daily characteristics of African precipitation based on global (CMIP5, CMIP6) 13 and regional (CORDEX, CORDEX-CORE) climate models. Clim Dyn, doi:10.1007/s00382-021-05859-w. 14
Dosio, A., L. Mentaschi, E. M. Fischer and K. Wyser, 2018: Extreme heat waves under 1.5 °C and 2 °C global 15 warming. Environmental Research Letters, 13(5), 054006, doi:10.1088/1748-9326/aab827. 16
Doswald, N. et al., 2014: Effectiveness of ecosystem-based approaches for adaptation: review of the evidence-base. 17 Climate and Development, 6(2), 185-201, doi:10.1080/17565529.2013.867247. 18
Dottori, F. et al., 2018: Increased human and economic losses from river flooding with anthropogenic warming. Nature 19 Climate Change, 8(9), 781-786, doi:10.1038/s41558-018-0257-z. 20
Douglas, I., 2017: Flooding in African cities, scales of causes, teleconnections, risks, vulnerability and impacts. 21 International Journal of Disaster Risk Reduction, 26, 34-42, doi:10.1016/j.ijdrr.2017.09.024. 22
Douville, H. et al., 2021: Water Cycle Changes [Masson-Delmotte, V., P. Zhai, A. Pirani, S. L. Connors, C. Péan, S. 23 Berger, N. Caud, Y. Chen, L. Goldfarb, M. I. Gomis, M. Huang, K. Leitzell, E. Lonnoy, J.B.R. Matthews, T. K. 24 Maycock, T. Waterfield, O. Yelekçi, R. Yu and B. Zhou (ed.)]. Climate Change 2021: The Physical Science 25 Basis. Contribution of Working Group I to the Sixth Assessment Report of the Intergovernmental Panel on 26 Climate Change In Press, Cambridge University Press. Available at: 27 https://www.ipcc.ch/report/ar6/wg1/downloads/report/IPCC_AR6_WGI_Chapter_08.pdf. 28
Douxchamps, S. et al., 2015: Linking agricultural adaptation strategies, food security and vulnerability: evidence from 29 West Africa. Regional Environmental Change, 16(5), 1305-1317, doi:10.1007/s10113-015-0838-6. 30
Dowd-Uribe, B., M. Sanon, C. Roncoli and B. Orlove, 2018: Grounding the Nexus: Examining the Integration of 31 Small-Scale Irrigators into a National Food Security Programme in Burkina Faso. Water Alternatives, 11(2). 32
Dowla, A., 2018: Climate change and microfinance. BUSINESS STRATEGY & DEVELOPMENT, 1(2), 78-87, 33 doi:10.1002/bsd2.13. 34
Du, L. et al., 2021: Effects of anthropogenic revegetation on the water and carbon cycles of a desert steppe ecosystem. 35 Agricultural and Forest Meteorology, 300, 108339, doi:https://doi.org/10.1016/j.agrformet.2021.108339. 36
du Plessis, K. L. et al., 2012: The costs of keeping cool in a warming world: implications of high temperatures for 37 foraging, thermoregulation and body condition of an arid-zone bird. Global Change Biology, 18(10), 3063-3070, 38 doi:https://doi.org/10.1111/j.1365-2486.2012.02778.x. 39
du Toit, J. C. O., L. van den Berg and T. G. O'Connor, 2015: Fire effects on vegetation in a grassy dwarf shrubland at a 40 site in the eastern Karoo, South Africa. African Journal of Range & Forage Science, 32(1), 13-20, 41 doi:10.2989/10220119.2014.913077. 42
du Toit, M. J. et al., 2018: Urban green infrastructure and ecosystem services in sub-Saharan Africa. Landscape and 43 Urban Planning, 180, 249-261, doi:10.1016/j.landurbplan.2018.06.001. 44
Duarte, C. M. et al., 2013: The role of coastal plant communities for climate change mitigation and adaptation. Nature 45 Climate Change, 3(11), 961-968, doi:10.1038/nclimate1970. 46
Dube, K., L. Chapungu and J. M. Fitchett, 2021: Meteorological and Climatic Aspects of Cyclone Idai and Kenneth. In: 47 Cyclones in Southern Africa: Volume 2: Foundational and Fundamental Topics [Nhamo, G. and K. Dube (eds.)]. 48 Springer International Publishing, Cham, pp. 19-36. ISBN 978-3-030-74262-1. 49
Dube, K., K. Mearns, S. Mini and L. Chapungu, 2018: Tourists’ knowledge and perceptions on the impact of climate 50 change on tourism in Okavango Delta, Botswana’. African Journal of Hospitality, Tourism and Leisure, 7(4), 1-51 18. 52
Dube, K. and G. Nhamo, 2018: Climate variability, change and potential impacts on tourism: Evidence from the 53 Zambian side of the Victoria Falls. Environmental Science & Policy, 84, 113-123, 54 doi:https://doi.org/10.1016/j.envsci.2018.03.009. 55
Dube, K. and G. Nhamo, 2019: Climate change and potential impacts on tourism: evidence from the Zimbabwean side 56 of the Victoria Falls. Environment, Development and Sustainability, 21(4), 2025-2041, doi:10.1007/s10668-018-57 0118-y. 58
Dube, K. and G. Nhamo, 2020: Evidence and impact of climate change on South African national parks. Potential 59 implications for tourism in the Kruger National Park. Environmental Development, 33, 100485, 60 doi:https://doi.org/10.1016/j.envdev.2019.100485. 61
ACCEPTED VERSIO
N
SUBJECT TO FIN
AL EDITS
FINAL DRAFT Chapter 9 IPCC WGII Sixth Assessment Report
Do Not Cite, Quote or Distribute 9-171 Total pages: 225
Dube, K., G. Nhamo and D. Chikodzi, 2020: Climate change-induced droughts and tourism: Impacts and responses of 1 Western Cape province, South Africa. Journal of Outdoor Recreation and Tourism, 100319, 2 doi:https://doi.org/10.1016/j.jort.2020.100319. 3
Dube, T., P. Moyo, M. Ncube and D. Nyathi, 2016: The Impact of Climate Change on Agro-Ecological Based 4 Livelihoods in Africa: A Review. Journal of Sustainable Development, 9(1), doi:10.5539/jsd.v9n1p256. 5
Duchoslav, J., 2017: Prenatal Temperature Shocks Reduce Cooperation: Evidence from Public Goods Games in 6 Uganda. Frontiers in behavioral neuroscience, 11, 249, doi:10.3389/fnbeh.2017.00249. 7
Duffy, M., 2012: The “One Water” Approach. 8 Dumenu, W. K. and E. A. Obeng, 2016: Climate change and rural communities in Ghana: Social vulnerability, impacts, 9
adaptations and policy implications. Environmental Science & Policy, 55, 208-217, 10 doi:https://doi.org/10.1016/j.envsci.2015.10.010. 11
Duncker, L. C., 2017: The Effect of Consumer Expectations and Perceptions Regarding Sanitation on Access to Clean 12 Water. Journal of Ethical Urban Living, 1(1), 19-36. 13
Duncombe, R., 2018: Digital Technologies for Agricultural and Rural Development in the Global South. CAB 14 International, , UK, 160 pp. 15
Dunning, C. M., E. Black and R. P. Allan, 2018: Later wet seasons with more intense rainfall over Africa under future 16 climate change. Journal of Climate, 31(23), 9719-9738, doi:https://doi.org/10.1175/JCLI-D-18-0102.1. 17
Durand, B. et al., 2019: Rift Valley fever in northern Senegal : a modelling approach to analyse the processes 18 underlying virus circulation recurrence. bioRxiv, 2019.2012.2023.886978, doi:10.1101/2019.12.23.886978. 19
Durand, J.-L. et al., 2018: How accurately do maize crop models simulate the interactions of atmospheric CO2 20 concentration levels with limited water supply on water use and yield? European Journal of Agronomy, 100, 67-21 75, doi:10.1016/j.eja.2017.01.002. 22
Dzavo, T., T. J. Zindove, M. Dhliwayo and M. Chimonyo, 2019: Effects of drought on cattle production in sub-tropical 23 environments. Trop Anim Health Prod, 51(3), 669-675, doi:10.1007/s11250-018-1741-1. 24
Eastin, J., 2018: Climate change and gender equality in developing states. World Development, 107, 289-305, 25 doi:10.1016/j.worlddev.2018.02.021. 26
Ebhuoma, E. E., 2020: A framework for integrating scientific forecasts with indigenous systems of weather forecasting 27 in southern Nigeria. Development in Practice, 30(4), 472-484, 28 doi:https://doi.org/10.1080/09614524.2020.1723494. 29
Ebi, K. L. and M. Otmani Del Barrio, 2017: Lessons Learned on Health Adaptation to Climate Variability and Change: 30 Experiences Across Low- and Middle-Income Countries. Environ Health Perspect, 125(6), 065001, 31 doi:10.1289/EHP405. 32
EBRD et al., 2021: Joint report on multilateral development banks’ climate finance. World Bank Group, Washington 33 DC, USA, 64 pp. Available at: https://thedocs.worldbank.org/en/doc/9234bfc633439d0172f6a6eb8df1b881-34 0020012021/original/2020-Joint-MDB-report-on-climate-finance-Report-final-web.pdf. 35
Edgar, G. J. et al., 2014: Global conservation outcomes depend on marine protected areas with five key features. 36 Nature, 506(7487), 216-220, doi:10.1038/nature13022. 37
Edo, S., N. E. Osadolor and I. F. Dading, 2020: Growing external debt and declining export: The concurrent 38 impediments in economic growth of Sub-Saharan African countries. International Economics, 161, 173-187, 39 doi:10.1016/j.inteco.2019.11.013. 40
Egeru, A., 2012: Role of indigenous knowledge in climate change adaptation: A case study of the Teso Sub-Region, 41 Eastern Uganda. Indian J. Tradit. Knowl., 11(2), 217-224. 42
Egeru, A., 2016: Climate risk management information, sources and responses in a pastoral region in East Africa. 43 Climate Risk Management, 11, 1-14, doi:10.1016/j.crm.2015.12.001. 44
Egoh, B. N. et al., 2012: An African account of ecosystem service provision: Use, threats and policy options for 45 sustainable livelihoods. Ecosystem Services, 2, 71-81, doi:10.1016/j.ecoser.2012.09.004. 46
Egondi, T. et al., 2012: Time-series analysis of weather and mortality patterns in Nairobi's informal settlements. Global 47 Health Action, 5(1), 19065, doi:10.3402/gha.v5i0.19065. 48
Egondi, T., C. Kyobutungi and J. Rocklov, 2015: Temperature variation and heat wave and cold spell impacts on years 49 of life lost among the urban poor population of Nairobi, Kenya. Int J Environ Res Public Health, 12(3), 2735-50 2748, doi:10.3390/ijerph120302735. 51
Eitzinger, A. et al., 2011: Future climate scenarios for Uganda's tea growing areas. International Center for Tropical 52 Agriculture, Cali, Columbia. 53
Ekblom, A. et al., 2019: Conservation through Biocultural Heritage—Examples from Sub-Saharan Africa. Land, 8(1), 54 doi:10.3390/land8010005. 55
El-Shafei, D. A., S. A. Bolbol, M. B. Awad Allah and A. E. Abdelsalam, 2018: Exertional heat illness: knowledge and 56 behavior among construction workers. Environ Sci Pollut Res Int, 25(32), 32269-32276, doi:10.1007/s11356-018-57 3211-8. 58
El-Tarabany, M. S., A. A. El-Tarabany and M. A. Atta, 2017: Physiological and lactation responses of Egyptian dairy 59 Baladi goats to natural thermal stress under subtropical environmental conditions. Int J Biometeorol, 61(1), 61-68, 60 doi:10.1007/s00484-016-1191-2. 61
Elboshy, B. et al., 2019: A framework for pluvial flood risk assessment in Alexandria considering the coping capacity. 62 Environment Systems and Decisions, 39(1), 77-94, doi:10.1007/s10669-018-9684-7. 63
ACCEPTED VERSIO
N
SUBJECT TO FIN
AL EDITS

FINAL DRAFT Chapter 9 IPCC WGII Sixth Assessment Report
Do Not Cite, Quote or Distribute 9-172 Total pages: 225
Eldeberky Y, H. B. (ed.), Vulnerability of the Nile delta to recent and future climate change. . 36th IAHR WORLD 1 CONGRESS, The Hague, Netherlands, International Association for Hydro-Environment Engineering & 2 Research (IAHR). 3
Elevitch, C. R., D. N. Mazaroli and D. Ragone, 2018: Agroforestry Standards for Regenerative Agriculture. 4 Sustainability, 10(9), 3337, doi:https://doi.org/10.3390/su10093337. 5
Elshirbiny, H. and W. Abrahamse, 2020: Public risk perception of climate change in Egypt: a mixed methods study of 6 predictors and implications. Journal of Environmental Studies and Sciences, 10, 242–254, doi:10.1007/s13412-7 020-00617-6. 8
Elum, Z. A., D. M. Modise and A. Marr, 2017: Farmer’s perception of climate change and responsive strategies in three 9 selected provinces of South Africa. Climate Risk Management, 16, 246-257, doi:10.1016/j.crm.2016.11.001. 10
EMDAT and CRED, 2020: EM-DAT Drought Disaster Occurances: Africa query [UCLouvain (ed.)], UCLouvain, 11 Brussels, Belgium. Available at: www.emdat.be. 12
Emerton, L., 2017: Valuing the Benefits, Costs and Impacts of Ecosystem-based Adaptation Measures: A sourcebook of 13 methods for decision-making. Deutsche Gesellschaft für Internationale Zusammenarbeit (GIZ) GmbH, Bonn and 14 Eschborn, Germany. 15
Endris, H. S. et al., 2019: Future changes in rainfall associated with ENSO, IOD and changes in the mean state over 16 Eastern Africa. Clim Dyn, 52(3), 2029-2053, doi:10.1007/s00382-018-4239-7. 17
Enenkel, M. et al., 2020: Emergencies do not stop at night: Advanced analysis of displacement based on satellite-18 derived nighttime light observations. IBM Journal of Research and Development, 64(1/2), 8:1-8:12, 19 doi:10.1147/JRD.2019.2954404. 20
Engdaw, M. M., A. P. Ballinger, G. C. Hegerl and A. K. Steiner, 2021: Changes in temperature and heat waves over 21 Africa using observational and reanalysis data sets. International Journal of Climatology, n/a(n/a), 22 doi:https://doi.org/10.1002/joc.7295. 23
Engelbrecht, F. et al., 2015: Projections of rapidly rising surface temperatures over Africa under low mitigation. 24 Environmental Research Letters, 10(8), 085004, doi:10.1088/1748-9326/10/8/085004. 25
Engelbrecht, F. A., J. L. McGregor and C. J. Engelbrecht, 2009: Dynamics of the Conformal-Cubic Atmospheric Model 26 projected climate-change signal over southern Africa. International Journal of Climatology, 29(7), 1013-1033, 27 doi:https://doi.org/10.1002/joc.1742. 28
England, M. I. et al., 2018: Climate change adaptation and cross-sectoral policy coherence in southern Africa. Regional 29 Environmental Change, 18(7), 2059-2071, doi:10.1007/s10113-018-1283-0. 30
Eniola, P. O., 2021: Menace and Mitigation of Health and Environmental Hazards of Charcoal Production in Nigeria. 31 In: African Handbook of Climate Change Adaptation [Oguge, N., D. Ayal, L. Adeleke and I. da Silva (eds.)]. 32 Springer International Publishing, Cham, pp. 2293-2310. ISBN 978-3-030-45106-6. 33
Enqvist, J. P. and G. Ziervogel, 2019: Water governance and justice in Cape Town: An overview. WIREs Water, 6(4), 34 e1354, doi:https://doi.org/10.1002/wat2.1354. 35
Ericksen, P. J., 2008: Conceptualizing food systems for global environmental change research. Global Environmental 36 Change, 18(1), 234-245, doi:https://doi.org/10.1016/j.gloenvcha.2007.09.002. 37
Eriksen, S. et al., 2011: When not every response to climate change is a good one: Identifying principles for sustainable 38 adaptation. Climate and Development, 3(1), 7-20, doi:10.3763/cdev.2010.0060. 39
Escalera-vázquez, L. H., N. Calderón-cortés and L. Zambrano-gonzález, 2017: Fish population responses to 40 hydrological variation in a seasonal wetland in southeast México. Neotropical Ichthyology, 15(June), 1-10, 41 doi:10.1590/1982-0224-20160129. 42
ESPA Directorate, 2018: Research into Results for the ESPA Directorate. Ecosystem Services for Poverty Alleviation 43 Programme Highlights 2009–2018. ESPA Directorate,, Edinburgh, UK. Available at: 44 https://www.espa.ac.uk/files/espa/ESPA%20Programme%20Highlights%20Report%202009_2018.pdf. 45
Estevão, M., 2020: Climate-Smart Fiscal Policy Can Foster a Lasting Economic Recovery. One Earth, 3(3), 273-276, 46 doi:https://doi.org/10.1016/j.oneear.2020.08.017. 47
Etim, E. and O. Daramola, 2020: The Informal Sector and Economic Growth of South Africa and Nigeria: A 48 Comparative Systematic Review. Journal of Open Innovation: Technology, Market, and Complexity, 6(4), 49 doi:10.3390/joitmc6040134. 50
Evan, A. T., C. Flamant, M. Gaetani and F. Guichard, 2016: The past, present and future of African dust. Nature, 51 531(7595), 493-495, doi:10.1038/nature17149. 52
Evans, M. et al., 2020: Reconciling model predictions with low reported cases of COVID-19 in Sub-Saharan Africa: 53 Insights from Madagascar. 54
Evariste, F. F., S. Denis Jean, K. Victor and M. Claudia, 2018: Assessing climate change vulnerability and local 55 adaptation strategies in adjacent communities of the Kribi-Campo coastal ecosystems, South Cameroon. Urban 56 Climate, 24, 1037-1051, doi:10.1016/j.uclim.2017.12.007. 57
Fabiyi, O. O. and J. Oloukoi, 2013: Indigenous knowledge system and local adaptation strategies to flooding in coastal 58 rural communities of Nigeria. Journal of Indigenous Social Development, 2(1). 59
Failler, P. et al., 2018: The IPBES regional assessment report on biodiversity and ecosystem services for Africa 60 [Archer, E., L. Dziba, K. J. Mulongoy, M. A. Maoela and M. Walters (eds.)]. Secretariat of the Intergovernmental 61 Science-Policy Platform on Biodiversity and Ecosystem Services, Bonn, Germany, 77–130 pp. 62
ACCEPTED VERSIO
N
SUBJECT TO FIN
AL EDITS

FINAL DRAFT Chapter 9 IPCC WGII Sixth Assessment Report
Do Not Cite, Quote or Distribute 9-173 Total pages: 225
Falchetta, G., A. T. Hammad and S. Shayegh, 2020: Planning universal accessibility to public health care in sub-1 Saharan Africa. Proc Natl Acad Sci U S A, 117(50), 31760-31769, doi:10.1073/pnas.2009172117. 2
Falco, S. D. et al., 2012: Estimating the Impact of Climate Change on Agriculture in Low-Income Countries: 3 Household Level Evidence from the Nile Basin, Ethiopia. Environmental and Resource Economics, 52(4), 457-4 478, doi:10.1007/s10640-011-9538-y. 5
Fankhauser, S., 2010: The costs of adaptation. Wiley Interdisciplinary Reviews: Climate Change, 1(1), 23-30, 6 doi:10.1002/wcc.14. 7
Fanzo, J., C. Davis, R. McLaren and J. Choufani, 2018: The effect of climate change across food systems: Implications 8 for nutrition outcomes. Global Food Security, 18, 12-19, doi:10.1016/j.gfs.2018.06.001. 9
FAO, 2016: The State of Food and Agriculture: Climate Change, Agriculture and Food Security. Food and Agriculture 10 Organization of the United Nations, Rome, 173 pp. Available at: www.fao.org/3/a-i6030e.pdf. 11
FAO, 2017: Cash+: FAO’s Approach Food and Agriculture Organization of the United Nations (FAO), Rome, 20 pp. 12 Available at: http://www.fao.org/3/a-i7864e.pdf. 13
FAO, 2018a: Climate change and its impacts on the work and activities of FAO forestry. FAO, Rome. 14 FAO, 2018b: The State of World Fisheries and Aquaculture: Meeting the sustainable development goals [Barange, M., 15
J. Alder, U. Barg, S. Funge-Smith, P. Mannini, M. Taconet and J. Plummer (eds.)]. The State of World Fisheries 16 and Aquaculture (SOFIA), FAO, Rome, Italy, 277 pp. Available at: http://www.fao.org/3/i9540en/i9540en.pdf. 17
FAO, 2019: The State of the World’s Biodiversity for Food and Agriculture [Bélanger, J. and D. Pilling (eds.)]. FAO 18 Commission on Genetic Resources for Food and Agriculture Assessments, FAO Rome, 575 pp. Available at: 19 http://www.fao.org/3/CA3129EN/CA3129EN.pdf. 20
FAO and ECA, 2018: Africa: Regional Overview of Food Security and Nutrition. Addressing the threat from climate 21 variability and extremes for food security and nutrition. Food and Agriculture Organization of the United Nations, 22 Accra, 116 pp. Available at: http://www.fao.org/3/CA2710EN/ca2710en.pdf. 23
FAO et al., 2020: The State of Food Security and Nutrition in the World 2020. Transforming food systems for 24 affordable healthy diets. The State of Food Security and Nutrition in the World (SOFI), FAO, Rome, Italy, 320 25 pp. Available at: https://doi.org/10.4060/ca9692en. 26
Farrell, A. D., K. Rhiney, A. Eitzinger and P. Umaharan, 2018: Climate adaptation in a minor crop species: is the cocoa 27 breeding network prepared for climate change? Agroecology and Sustainable Food Systems, 42(7), 812-833, 28 doi:10.1080/21683565.2018.1448924. 29
Fauset, S. et al., 2012: Drought-induced shifts in the floristic and functional composition of tropical forests in Ghana. 30 Ecology Letters, 15(10), 1120-1129, doi:https://doi.org/10.1111/j.1461-0248.2012.01834.x. 31
Fava, F. et al., 2021: Building Financial Resilience in Pastoral Communities in Africa. The Financial Protection Forum 32 and Disaster Risk Financing and Insurance Program (DRFIP) and World Bank Group Global Facility for Disaster 33 Reduction and Recovery, Washington, DC. Available at: 34 https://www.financialprotectionforum.org/publication/building-financial-resilience-in-pastoral-communities-in-35 africa. 36
Faye, B. et al., 2018: Impacts of 1.5 versus 2.0 °C on cereal yields in the West African Sudan Savanna. Environmental 37 Research Letters, 13(3), 034014, doi:10.1088/1748-9326/aaab40. 38
Feary, S. et al., 2016: Earth’s cultural heritage. Protected Area Governance and Management, ANU Press, Canberra, 39 Australia ISBN 9781925021691. 40
Fedele, G. et al., 2019: Transformative adaptation to climate change for sustainable social-ecological systems. 41 Environmental Science & Policy, 101, 116-125, doi:https://doi.org/10.1016/j.envsci.2019.07.001. 42
Fenton, A., J. Paavola and A. Tallontire, 2015: Microfinance and climate change adaptation: An overview of the current 43 literature. Enterprise Development and Microfinance, 26, 262-273, doi:10.3362/1755-1986.2015.023. 44
Fenton, A. et al., 2014: Debt relief and financing climate change action. Nature Climate Change, 4(8), 650-653, 45 doi:10.1038/nclimate2303. 46
Fernández-Llamazares, Á. et al., 2015: Rapid ecosystem change challenges the adaptive capacity of Local 47 Environmental Knowledge. Global Environmental Change, 31, 272-284, 48 doi:https://doi.org/10.1016/j.gloenvcha.2015.02.001. 49
Ferrão, J. L., J. M. Mendes, M. Painho and S. Zacarias, 2017: Malaria mortality characterization and the relationship 50 between malaria mortality and climate in Chimoio, Mozambique. Malaria Journal, 16(1), 212, 51 doi:10.1186/s12936-017-1866-0. 52
Fieldman, G., 2011: Neoliberalism, the production of vulnerability and the hobbled state: Systemic barriers to climate 53 adaptation. Climate and Development, 3(2), 159-174, doi:10.1080/17565529.2011.582278. 54
Filahi, S. et al., 2016: Trends in indices of daily temperature and precipitations extremes in Morocco. Theoretical and 55 Applied Climatology, 124(3-4), 959-972, doi:https://doi.org/10.1007/s00704-015-1472-4. 56
Filahi, S., Y. Tramblay, L. Mouhir and E. P. Diaconescu, 2017: Projected changes in temperature and precipitation 57 indices in Morocco from high-resolution regional climate models. International Journal of Climatology, 37(14), 58 4846-4863, doi:https://doi.org/10.1002/joc.5127. 59
Finney, D. L. et al., 2020: Effects of Explicit Convection on Future Projections of Mesoscale Circulations, Rainfall, and 60 Rainfall Extremes over Eastern Africa. Journal of Climate, 33(7), 2701-2718, doi:10.1175/JCLI-D-19-0328.1. 61
Fiorella, K. J. et al., 2019: A review of transactional sex for natural resources: Under-researched, overstated, or unique 62 to fishing economies? Global public health, 14(12), 1803-1814, doi:10.1080/17441692.2019.1625941. 63
ACCEPTED VERSIO
N
SUBJECT TO FIN
AL EDITS
FINAL DRAFT Chapter 9 IPCC WGII Sixth Assessment Report
Do Not Cite, Quote or Distribute 9-174 Total pages: 225
Fischer, E. M. and R. Knutti, 2016: Observed heavy precipitation increase confirms theory and early models. Nature 1 Climate Change, 6(11), 986-991, doi:10.1038/nclimate3110. 2
Fischer, E. M., K. W. Oleson and D. M. Lawrence, 2012: Contrasting urban and rural heat stress responses to climate 3 change. Geophysical Research Letters, 39(3), doi:https://doi.org/10.1029/2011GL050576. 4
Fisher-Jeffes, L., K. Carden and N. Armitage, 2017: A water sensitive urban design framework for South Africa. Town 5 and Regional Planning, 71, 1-10, doi:https://doi.org/10.18820/2415-0495/trp71i1.1. 6
Fisher, M. et al., 2015: Drought tolerant maize for farmer adaptation to drought in sub-Saharan Africa: Determinants of 7 adoption in eastern and southern Africa. Climatic Change, 133(2), 283-299, doi:10.1007/s10584-015-1459-2. 8
Fitchett, J. M., 2018: Recent emergence of CAT5 tropical cyclones in the South Indian Ocean. South African Journal of 9 Science, 114(11-12), 1-6, doi:http://dx.doi.org/10.17159/sajs.2018/4426. 10
Fitchett, J. M., B. Grant and G. Hoogendoorn, 2016: Climate change threats to two low-lying South African coastal 11 towns: Risks and perceptions. South African Journal of Science, 112(n.5-6), 1-9, 12 doi:http://dx.doi.org/10.17159/sajs.2016/20150262 13
Fjelde, H. and N. von Uexkull, 2012: Climate triggers: Rainfall anomalies, vulnerability and communal conflict in Sub-14 Saharan Africa. Political Geography, 31(7), 444-453, doi:10.1016/j.polgeo.2012.08.004. 15
Flatø, M., R. Muttarak and A. Pelser, 2017: Women, Weather, and Woes: The Triangular Dynamics of Female-Headed 16 Households, Economic Vulnerability, and Climate Variability in South Africa. World Development, 90, 41-62, 17 doi:https://doi.org/10.1016/j.worlddev.2016.08.015. 18
Fleifel, E., J. Martin and A. Khalid, 2019: Gender Specific Vulnerabilities to Water Insecurity. Available at: https://ic-19 sd.org/wp-content/uploads/2019/11/eliana-fleifel.pdf. 20
Fleisher, D. et al., 2010: Effects of CO2 and temperature on crops: Lessons from SPAR growth chambers. In: 21 Handbook of Climate Change and Agroecosystems: Impacts, Adaptation, And Mitigation [Hillel, D. and C. 22 Rosenzweig (eds.)]. Imperial College Press, Singapore, pp. 55-86. 23
Fluet-Chouinard, E., S. Funge-Smith and P. B. McIntyre, 2018: Global hidden harvest of freshwater fish revealed by 24 household surveys. Proceedings of the National Academy of Sciences, 115(29), 7623, 25 doi:10.1073/pnas.1721097115. 26
Fonta, W. M., E. T. Ayuk and T. van Huysen, 2018: Africa and the Green Climate Fund: current challenges and future 27 opportunities. Climate Policy, 18(9), 1210-1225, doi:10.1080/14693062.2018.1459447. 28
Fontaine, B., S. Janicot and P.-A. Monerie, 2013: Recent changes in air temperature, heat waves occurrences, and 29 atmospheric circulation in Northern Africa. J Geophys Res-Atmos, 118(15), 8536-8552, doi:10.1002/jgrd.50667. 30
Food Security Information Network (FSIN), 2019: Global Report on Food Crises. World Food Programme, Rome, 31 Italy. Available at: https://ec.europa.eu/knowledge4policy/publication/global-report-food-crises-2019_en. 32
Foran, T. et al., 2014: Taking Complexity in Food Systems Seriously: An Interdisciplinary Analysis. World 33 Development, 61, 85-101, doi:https://doi.org/10.1016/j.worlddev.2014.03.023. 34
Ford, J. D. et al., 2014: The status of climate change adaptation in Africa and Asia. Regional Environmental Change, 35 15(5), 801-814, doi:10.1007/s10113-014-0648-2. 36
Ford, J. D. et al., 2016: Including indigenous knowledge and experience in IPCC assessment reports. Nature Climate 37 Change, 6(4), 349-353, doi:https://doi.org/10.1038/nclimate2954. 38
Fore, H. H., Q. Dongyu, D. M. Beasley and T. A. Ghebreyesus, 2020: Child malnutrition and COVID-19: the time to 39 act is now. The Lancet, 396(10250), 517-518, doi:10.1016/S0140-6736(20)31648-2. 40
Forsyth, G. et al., 2019: The Knysna fires of 2017: learning from this disaster. CSIR, Stellenbosch University & Santam 41 Insurance, Stellenbosch, South Africa. Available at: 42 https://cisp.cachefly.net/assets/articles/attachments/78574_the_knysna_fires_of_2017_learnings_from_the_disaste43 r.pdf. 44
Fotso-Nguemo, T. C. et al., 2017: On the added value of the regional climate model REMO in the assessment of climate 45 change signal over Central Africa. Clim Dyn, 49(11-12), 3813-3838, doi:10.1007/s00382-017-3547-7. 46
Frame, B. et al., 2018: Adapting global shared socio-economic pathways for national and local scenarios. Climate Risk 47 Management, 21, 39-51, doi:https://doi.org/10.1016/j.crm.2018.05.001. 48
Frame, D. et al., 2017: Population-based emergence of unfamiliar climates. Nature Climate Change, 7(6), 407-411, 49 doi:10.1038/nclimate3297. 50
Frank, S. et al., 2021: Land-based climate change mitigation potentials within the agenda for sustainable development. 51 Environmental Research Letters, 16(2), 024006, doi:10.1088/1748-9326/abc58a. 52
Franke, J. A. et al., 2020: The GGCMI Phase 2 experiment: global gridded crop model simulations under uniform 53 changes in CO2, temperature, water, and nitrogen levels (protocol version 1.0). Geosci. Model Dev., 13(5), 2315-54 2336, doi:10.5194/gmd-13-2315-2020. 55
Franke, J. A. et al., 2021: Agricultural breadbaskets shift poleward given adaptive farmer behavior under climate 56 change. Global Change Biology, doi:https://doi.org/10.1111/gcb.15868. 57
Free, C. M. et al., 2020: Realistic fisheries management reforms could mitigate the impacts of climate change in most 58 countries. PLOS ONE, 15(3), e0224347, doi:10.1371/journal.pone.0224347. 59
Frihy, O., W. Moufaddal, E. Deabes and E. E. D. Helmy, 2016: Economic evaluation of using marine dredged material 60 for erosion control along the northeast coast of the Nile Delta, Egypt. Arabian Journal of Geosciences, 9(14), 637, 61 doi:10.1007/s12517-016-2660-y. 62
ACCEPTED VERSIO
N
SUBJECT TO FIN
AL EDITS

FINAL DRAFT Chapter 9 IPCC WGII Sixth Assessment Report
Do Not Cite, Quote or Distribute 9-175 Total pages: 225
Frölicher, T. L., E. M. Fischer and N. Gruber, 2018: Marine heatwaves under global warming. Nature, 560(7718), 360-1 364, doi:10.1038/s41586-018-0383-9. 2
Fuller, T. L. et al., 2018: Climate warming causes declines in crop yields and lowers school attendance rates in Central 3 Africa. Science of The Total Environment, 610-611, 503-510, doi:https://doi.org/10.1016/j.scitotenv.2017.08.041. 4
Funge-Smith, S. and A. Bennett, 2019: A fresh look at inland fisheries and their role in food security and livelihoods. 5 Fish and Fisheries, 20(6), 1176-1195, doi:https://doi.org/10.1111/faf.12403. 6
Funk, C. et al., 2018a: 18. Anthropogenic enhancement of moderate-to-strong El Niño events likely contributed to 7 drought and poor harvests in southern Africa during 2016. Bull. Am. Meteorol. Soc, 99, S91-S96, 8 doi:10.1175/bams-d-17-0112.1. 9
Funk, C. et al., 2017: Climate Change Vulnerability, Impacts and Adaptation Assessment for East Africa: Summary for 10 Policy Makers. USAID, Burlington, Vermont, 31 pp. Available at: 11 https://www.climatelinks.org/sites/default/files/asset/document/2017_USAID-PREPARED-12 TetraTech_Vulnerability-Impacts-Adaptation-Assessment-East-Africa-Water.pdf. 13
Funk, C. et al., 2018b: Examining the role of unusually warm Indo-Pacific sea-surface temperatures in recent African 14 droughts. Quarterly Journal of the Royal Meteorological Society, 144(S1), 360-383, 15 doi:https://doi.org/10.1002/qj.3266. 16
Funk, C., S. Shukla, A. Hoell and B. Livneh, 2015: 16. ASSESSING THE CONTRIBUTIONS OF EAST AFRICAN 17 AND WEST PACIFIC WARMING TO THE 2014 BOREAL SPRING EAST AFRICAN DROUGHT. Bulletin of 18 the American Meteorological Society, 96(12), S77-S82. 19
Gabert, J. (ed.), How to make urban and sanitation planning work? Lessons learnt from West Africa, South East Asia, 20 Madagascar, and Haiti. BORDA Symposium - Integrated Management of Used Water and Sanitation, 10 and 11 21 November 2015, Bremen, Germany, Bremen Overseas Research & Development Association (BORDA), 50-53 22 pp. 23
Galle, S. et al., 2018: AMMA-CATCH, a Critical Zone Observatory in West Africa Monitoring a Region in Transition. 24 Vadose Zone Journal, 17(1), 180062, doi:https://doi.org/10.2136/vzj2018.03.0062. 25
Gan, T. Y. et al., 2016: Possible climate change/variability and human impacts, vulnerability of drought-prone regions, 26 water resources and capacity building for Africa. Hydrological Sciences Journal, 61(7), 1209-1226, 27 doi:10.1080/02626667.2015.1057143. 28
Gannon, K. E. et al., 2018: Business experience of floods and drought-related water and electricity supply disruption in 29 three cities in sub-Saharan Africa during the 2015/2016 El Niño. Global Sustainability, 1(e14), 1–15, 30 doi:10.1017/sus.2018.14. 31
Gao, H. et al., 2011: On the causes of the shrinking of Lake Chad. Environmental Research Letters, 6(3), 32 doi:10.1088/1748-9326/6/3/034021. 33
García-Pando, C. P. et al., 2014: Soil dust aerosols and wind as predictors of seasonal meningitis incidence in Niger. 34 Environmental health perspectives, 122(7), 679–686, doi:https://doi.org/10.1289/ehp.1306640. 35
García Criado, M. et al., 2020: Woody plant encroachment intensifies under climate change across tundra and savanna 36 biomes. Global Ecology and Biogeography, 29(5), 925-943, doi:https://doi.org/10.1111/geb.13072. 37
García, L. E. et al., 2014: Beyond Downscaling: A Bottom-Up Approach to Climate Adaptation for Water Resources 38 Management. World Bank Group, Washington DC. 39
Garcia, R. A., M. Cabeza, R. Altwegg and M. B. Araújo, 2016: Do projections from bioclimatic envelope models and 40 climate change metrics match? Global Ecology and Biogeography, 25(1), 65-74, 41 doi:https://doi.org/10.1111/geb.12386. 42
Garcia, R. A., M. Cabeza, C. Rahbek and M. B. Araújo, 2014: Multiple Dimensions of Climate Change and Their 43 Implications for Biodiversity. Science (New York, N.Y.), 344(6183), 1247579, doi:10.1126/science.1247579. 44
García Molinos, J. et al., 2016: Climate velocity and the future global redistribution of marine biodiversity. Nature 45 Climate Change, 6(1), 83-88, doi:10.1038/nclimate2769. 46
Gasparrini, A. et al., 2015: Mortality risk attributable to high and low ambient temperature: a multicountry 47 observational study. Lancet, 386(9991), 369-375, doi:10.1016/S0140-6736(14)62114-0. 48
Gates, A. et al., 2019: Short-term association between ambient temperature and homicide in South Africa: a case-49 crossover study. Environmental Health, 18:109, doi:10.1186/s12940-019-0549-4. 50
Gaythorpe, K. A. M. et al., 2020: The effect of climate change on yellow fever disease burden in Africa. eLife, 9, 51 e55619, doi:10.7554/eLife.55619. 52
GCF, 2018a: Programme for integrated development and adaptation to climate change in the Niger Basin 53 (PIDACC/NB). Green Climate Fund (GCF), Incheon, Republic of Korea, 3 pp. Available at: 54 https://www.greenclimate.fund/project/fp092. 55
GCF, 2018b: Updated Gender Policy and Action Plan 2018–2020. Green Climate Fund, Manama, Bahrain, 24 pp. 56 Available at: https://www.greenclimate.fund/sites/default/files/document/gcf-b21-02.pdf. 57
Gebre, G. G. and D. B. Rahut, 2021: Prevalence of household food insecurity in East Africa: Linking food access with 58 climate vulnerability. Climate Risk Management, 33, 100333, doi:https://doi.org/10.1016/j.crm.2021.100333. 59
Gebrechorkos, S. H., S. Hülsmann and C. Bernhofer, 2019: Changes in temperature and precipitation extremes in 60 Ethiopia, Kenya, and Tanzania. International Journal of Climatology, 39(1), 18-30, doi:10.1002/joc.5777. 61
Gebremeskel Haile, G. et al., 2019: Droughts in East Africa: Causes, impacts and resilience. Earth-Science Reviews, 62 193, 146-161, doi:https://doi.org/10.1016/j.earscirev.2019.04.015. 63
ACCEPTED VERSIO
N
SUBJECT TO FIN
AL EDITS

FINAL DRAFT Chapter 9 IPCC WGII Sixth Assessment Report
Do Not Cite, Quote or Distribute 9-176 Total pages: 225
Gebresenbet, F. and A. Kefale, 2012: Traditional coping mechanisms for climate change of pastoralists in South Omo, 1 Ethiopia. Indian J. Tradit. Knowl., 11(4), 573-579. 2
GEF, 2019: Mozambique: Building Resilience in the Coastal Zone through Ecosystem Based Approaches to Adaptation 3 (EbA). Global Environment Facility, Washington, DC, 2 pp. Available at: 4 https://www.thegef.org/project/mozambique-building-resilience-coastal-zone-through-ecosystem-based-5 approaches-adaptation. 6
GEF and FAO, 2021: Enhancing Climate Change Resilience in the Benguela Current Fisheries System. FAO and the 7 GEF Partnering for Sustainable Agriculture and the Environment, 2021, FAO and the GEF, FAO, Rome, Italy, 2 8 pp. Available at: http://www.fao.org/gef/projects/detail/en/c/1056798/. 9
Gemenne, F. and J. Blocher, 2017a: How can migration serve adaptation to climate change? Challenges to fleshing out 10 a policy ideal. The Geographical Journal, 183(4), 336-347, doi:10.1111/geoj.12205. 11
Gemenne, F. and J. a. Blocher, 2017b: Climate change, natural disasters and population displacements in West Africa. 12 Geo-Eco-Trop, 41(3), 317-337. 13
Ghanem, H., 2011: The State of Food and Agriculture: Women in Agriculture–Closing the Gender Gap for 14 Development. Rome: Food and agricultural organization of the United Nations (FAO). 15
Ghermandi, A., D. Obura, C. Knudsen and P. A. L. D. Nunes, 2019: Marine ecosystem services in the Northern 16 Mozambique Channel: A geospatial and socio-economic analysis for policy support. Ecosystem Services, 35, 1-17 12, doi:10.1016/j.ecoser.2018.10.009. 18
Giannini, A. and A. Kaplan, 2019: The role of aerosols and greenhouse gases in Sahel drought and recovery. Climatic 19 Change, 152(3), 449-466, doi:10.1007/s10584-018-2341-9. 20
Giesen, C. et al., 2020: The impact of climate change on mosquito-borne diseases in Africa. Pathogens and Global 21 Health, 114(6), 287-301, doi:10.1080/20477724.2020.1783865. 22
Gilbert, M. et al., 2018: Global distribution data for cattle, buffaloes, horses, sheep, goats, pigs, chickens and ducks in 23 2010. Scientific Data, 5(1), 180227, doi:10.1038/sdata.2018.227. 24
Gillson, L., T. P. Dawson, S. Jack and M. A. McGeoch, 2013: Accommodating climate change contingencies in 25 conservation strategy. Trends Ecol Evol, 28(3), 135-142, doi:10.1016/j.tree.2012.10.008. 26
Giorgi, F., F. Raffaele and E. Coppola, 2019: The response of precipitation characteristics to global warming from 27 climate projections. Earth System Dynamics, 10(1), 73-89, doi:10.5194/esd-10-73-2019. 28
Global Index Insurance Facility, 2019: Zambia. Global Index Insurance Facility, Washington, DC, 2 pp. Available at: 29 https://www.indexinsuranceforum.org/sites/default/files/29947_CountryProfile_Zambia_March30.pdf. 30
Global Parametrics, 2021: Global Parametrics Natural Disaster Fund launched with Vision Fund initiative, Global 31 Parametrics, London, UK. Available at: https://www.globalparametrics.com/news/global-parametrics-natural-32 disaster-fund-launched-with-vision-fund-initiative/. 33
Godde, C. M. et al., 2021: Impacts of climate change on the livestock food supply chain; a review of the evidence. 34 Global Food Security, 28, 100488, doi:https://doi.org/10.1016/j.gfs.2020.100488. 35
Godsmark, C. N. et al., 2019: Priority focus areas for a sub-national response to climate change and health: A South 36 African provincial case study. Environment International, 122, 31-51, 37 doi:https://doi.org/10.1016/j.envint.2018.11.035. 38
Golden, C. D. et al., 2016: Nutrition: Fall in fish catch threatens human health. Nature, 534(7607), 317-320, 39 doi:10.1038/534317a. 40
Golden, C. D. et al., 2021: Aquatic foods to nourish nations. Nature, doi:https://doi.org/10.1038/s41586-021-03917-1. 41 Gone, T., M. Balkew and T. Gebre-Michael, 2014: Comparative entomological study on ecology and behaviour of 42
Anopheles mosquitoes in highland and lowland localities of Derashe District, southern Ethiopia. Parasites & 43 Vectors, 7(1), doi:10.1186/s13071-014-0483-9. 44
Government of Algeria, 2004: Law No. 04-20 relative to the Prevention of Major Risks and the Management of 45 Catastrophes in the Framework of Sustainable Development, Algeria. 46
Government of Benin, 2018: Regulating Climate Change, Benin. 47 Government of Burkina Faso, 2015: Burkina Faso National Climate Change Adaptation Plan (NAP), Burkina Faso 48
Ministry of Environment and Fishery Resources, UNFCCC, Ouagadougou. Available at: 49 https://www4.unfccc.int/sites/NAPC/Documents/Parties/PNA_Version_version%20finale%5BTransmission%5D.50 pdf. 51
Government of Cameroon, 2015: Plan National d’Adaptation aux Changements Climatiques du Cameroun, Cameroun 52 Ministere de l’Environnement de Laprotection de la Nature et du Developpement Durable, Government of 53 Cameroon,, Yaounde. Available at: 54 https://www4.unfccc.int/sites/NAPC/Documents/Parties/PNACC_Cameroun_VF_Validée_24062015%20-55 %20FINAL.pdf. 56
Government of Cape Verde, 2014: Resolution no. 87/2014 (creating the Steering Committee of the project 57 'Strengthening Capacity of Adaptation and Resilience to Climate Change in the Water Sector in Cape Verde'), 58 Cape Verde. 59
Government of Central African Republic, 2008: Law no. 08.222 (on the forestry code), Central African Republic. 60 Government of Ethiopia, 2019: Ethiopia’s Climate Resilient Green Economy: National Adaptation Plan, Commission, 61
E. E. F. a. C. C., Federal Democratic Republic of Ethiopia, Addis Ababa. Available at: 62 https://www.google.com/url?sa=t&rct=j&q=&esrc=s&source=web&cd=10&cad=rja&uact=8&ved=2ahUKEwi_r63
ACCEPTED VERSIO
N
SUBJECT TO FIN
AL EDITS
FINAL DRAFT Chapter 9 IPCC WGII Sixth Assessment Report
Do Not Cite, Quote or Distribute 9-177 Total pages: 225
9-1 UnIDlAhWgSRUIHYosAQYQFjAJegQIARAC&url=https%3A%2F%2Fwww4.unfccc.int%2Fsites%2FNAPC%2 2FDocuments%2FParties%2FFinal%2520Ethiopia-national-adaptation-3 plan%2520%25281%2529.pdf&usg=AOvVaw1u-dBNOG1S-N1MuQObwZ7o. 4
Government of Gabon, 2016: Decree No. 0122 setting the responsibilities, organization and functioning of the National 5 Council on Climate Change, Gabon. 6
Government of Ghana, 2018: Public statement that a climate change law is under consideration, Ghana. 7 Government of Guinea Bissau, 2011: Law No. 1/2011 approving the Basic Legislation on Environment, Guinea Bissau. 8 Government of Ivory Coast, 2012: Decree No. 2012-1049 of 24 October 2012 establishing the organization and 9
functioning of the National Commission for the reduction of greenhouse gas emissions from deforestation and 10 forest degradation, Ivory Coast. 11
Government of Kenya, 2016: Climate Change Act No 11 of 2016, Kenya. 12 Government of Kenya, 2017: National Climate Change Action Plan 2013-2017, Resources, M. o. E. a. N., Government 13
Printer, Nairobi. Available at: 14 http://www.environment.go.ke/wpcontent/uploads/2018/08/nationalclimatechangeactionplan2013-2017.pdf 15
Government of Lesotho, 2008: Lesotho: Environment Act 2008 (No. 10 of 2008), Lesotho. 16 Government of Liberia, 2002: Environmental Protection and Management Law of the Republic of Liberia, Liberia. 17 Government of Madagascar, 2015: Law no. 2015-031 on the National Policy of Risk Management and Catastrophes, 18
Madagascar. 19 Government of Malawi, 2017: Environment Management Act, 2017 (No. 19 of 2017), Malawi. 20 Government of Malawi, 2019: Malawi 2019 Floods Post Disaster Needs Assessment (PDNA), 106 pp. Available at: 21
https://reliefweb.int/sites/reliefweb.int/files/resources/Malawi%202019%20Floods%20Post%20Disaster%20Need22 s%20Assessment%20Report.pdf. 23
Government of Mali, 2016: Ordinance No. 2016-007 P-RM of 25 February 2016 establishing the Project to Strengthen 24 Resilience to Food Insecurity and Decree No. 2011-107-PM-RM of March 11, 2011 establishing the National 25 Climate Change Committee Mali, Mali. 26
Government of Morocco, 2014: Framework Law 99-12 on the National Charter for the Environment and Sustainable 27 Development, Morocco. 28
Government of Mozambique, 2014: Law No. 15/2014 establishing the legal framework for disaster management, 29 Mozambique. 30
Government of Mozambique, 2019: Mozambique Cyclone Idai: Post Disaster Needs Assessment. Government of 31 Mozambique, Maputo. Available at: 32 https://www.undp.org/content/dam/undp/library/Climate%20and%20Disaster%20Resilience/PDNA/PDNA%20M33 ozambique%20Cyclone%20Idai%20-%20Post-Disaster%20Needs%20Assessment_Executive%20Summary.pdf. 34
Government of Niger, 1998: Law no. 98-56 (Framework Law on Environmental Management), Niger. 35 Government of Nigeria, 2017: Climate Change Bill 2017, Nigeria. 36 Government of Republic of Rwanda, 2020: Updated Nationally Determined Contribution Minister of Environment 37
Republic of Rwanda, Rwanda, M. o. E. R. o., 96 pp. Available at: 38 https://www4.unfccc.int/sites/ndcstaging/PublishedDocuments/Rwanda%20First/Rwanda_Updated_NDC_May_239 020.pdf. 40
Government of Rwanda, 2012: Law No. 16 of 22 May 2012, determining the Organisation, Functioning and Mission of 41 the National Fund for Environment, Rwanda. 42
Government of Sierra Leone, 2012: The National Protected Area Authority and Conservation Trust Fund Act, 2012 43 (No. 11 of 2012), Sierra Leone. 44
Government of Somalia, 2018: Somalia Drought Impact and Needs Assessment (DINA) Vol. 2, 2, 180 pp. Available at: 45 https://www.undp.org/content/undp/en/home/librarypage/climate-and-disaster-resilience-/somalia-drought-46 impact-and-needs-assessment.html. 47
Government of South Africa, 2018: Climate Change Bill, South Africa. 48 Government of Tanzania, 2004: Environmental Management Act 20 of 2004, Tanzania. 49 Government of the Republic of Kenya, 2018: National Climate Change Action Plan (Kenya): 2018-2022. Ministry of 50
Environment and Forestry, Forestry, M. o. E. a., Nairobi, Kenya, 110 pp. Available at: 51 https://www.lse.ac.uk/GranthamInstitute/wp-content/uploads/2018/10/8737.pdf. 52
Government of the Republic of Zambia, 2010: National Climate Change Response Strategy (NCCRS) Zambia. Ministry 53 of Tourism, Environment and Natural Resources, Ministry of Tourism, E. a. N. R., Lusaka, Zambia, 135 pp. 54 Available at: https://www.adaptation-undp.org/sites/default/files/downloads/zambia-55 climate_change_response_strategy.pdf. 56
Government of the Seychelles, 2015: Conservation and Climate Adaptation Trust of Seychelles Act 18 of 2015, 57 Seychelles. 58
Government of The Seychelles, 2020: Seychelles National Climate Change Strategy. Seychelles Ministry of 59 Environment, Energy and Climate Change, Seychelles, G. o. T., 32 pp. Available at: 60 http://www.meecc.gov.sc/wp-content/uploads/2019/10/seychelles-national-climate-change-policy-may-2020.pdf. 61
Government of Togo, 2008: Law 2008-005 - Framework Law on the Environment, Togo. 62
ACCEPTED VERSIO
N
SUBJECT TO FIN
AL EDITS
FINAL DRAFT Chapter 9 IPCC WGII Sixth Assessment Report
Do Not Cite, Quote or Distribute 9-178 Total pages: 225
Government of Togo, 2016: Plan National d’Adaption aux Changements Climatiques du Togo (PNACC), Forestieres, 1 M. d. l. E. e. d. R., Ministere de l’Environment et des Ressources Forestieres, Lome. Available at: 2 https://www.preventionweb.net/files/12232_TogoNAPA.pdf. 3
Government of Uganda, 2018: Climate Change Bill 2018, Uganda. 4 Government of Zambia, 2016: Constitution of Zambia (Amendment) Act No. 2 of 2016, Zambia. 5 Government of Zimbabwe, 2019: Draft Climate Change Bill, 2019, Zimbabwe. 6 Governmet of the United Republic of Tanzania, 2011: National Climate Change Strategy and Action Plan, President, 7
O. o. t. V., Dar es Salaam, Tanzania, 100 pp. Available at: 8 http://www.tzdpg.or.tz/fileadmin/_migrated/content_uploads/TZ_CC_strategy_draft_Jan_2012_01.pdf. 9
Gownaris, N. J. et al., 2016: Fisheries and water level fluctuations in the world's largest desert lake. Ecohydrology, 10 10(1), e1769, doi:10.1002/eco.1769. 11
Gownaris, N. J. et al., 2018: Water level fluctuations and the ecosystem functioning of lakes. Journal of Great Lakes 12 Research, 44(6), 1154-1163, doi:10.1016/j.jglr.2018.08.005. 13
Grace, K., V. Hertrich, D. Singare and G. Husak, 2018: Examining rural Sahelian out-migration in the context of 14 climate change: An analysis of the linkages between rainfall and out-migration in two Malian villages from 1981 15 to 2009. World Development, 109, 187-196, doi:https://doi.org/10.1016/j.worlddev.2018.04.009. 16
Graff Zivin, J. and M. Neidell, 2014: Temperature and the Allocation of Time: Implications for Climate Change. 17 Journal of Labor Economics, 32(1), 1-26, doi:10.1086/671766. 18
Graham, J. P., M. Hirai and S. S. Kim, 2016: An Analysis of Water Collection Labor among Women and Children in 24 19 Sub-Saharan African Countries. PLoS One, 11(6), e0155981, doi:10.1371/journal.pone.0155981. 20
Granoff, I., J. R. Hogarth and A. Miller, 2016: Nested barriers to low-carbon infrastructure investment. Nature Climate 21 Change, 6(12), 1065-1071, doi:10.1038/nclimate3142. 22
Grant, B. C., 2015: Investigating tourism and climate change: the case of St Francis Bay and Cape St Francis. 23 University of the Witwatersrand, Johannesburg. 24
Grasham, C. F., M. Korzenevica and K. J. Charles, 2019: On considering climate resilience in urban water security: A 25 review of the vulnerability of the urban poor in sub‐Saharan Africa. Wiley Interdisciplinary Reviews: Water, 6(3), 26 doi:10.1002/wat2.1344. 27
Gray, C. and V. Mueller, 2012: Drought and population mobility in rural Ethiopia. World Dev, 40(1), 134-145, 28 doi:10.1016/j.worlddev.2011.05.023. 29
Gray, C. and E. Wise, 2016: Country-specific effects of climate variability on human migration. Climatic Change, 30 135((3–4)), 555–568, doi:10.1007/s10584-015-1592-y. 31
Gray, C. L. et al., 2016: Local biodiversity is higher inside than outside terrestrial protected areas worldwide. Nature 32 Communications, 7(1), 12306, doi:10.1038/ncomms12306. 33
Gray Emma, F. and J. Bond William, 2013: Will woody plant encroachment impact the visitor experience and economy 34 of conservation areas? : original research. Koedoe : African Protected Area Conservation and Science, 55(1), 1-9, 35 doi:10.4102/koedoe.v55i1.1106. 36
Greatrex, H. et al., 2015: Scaling up index insurance for smallholder farmers: Recent evidence and insights. CGIAR 37 Research Program on Climate Change, Agriculture and Food Security (CCAFS), CCAFS, Copenhagen, Denmark, 38 32 pp. Available at: https://cgspace.cgiar.org/bitstream/handle/10568/53101/CCAFS_Report14.pdf. 39
Greene, S. et al., 2020: Understanding local climate priorities. Applying a gender and generation focused planning tool 40 in mainland Tanzania and Zanzibar. International Institute for Environment and Development (IIED). Available 41 at: http://www.jstor.org/stable/resrep29063 (accessed 2021/08/30/). 42
Greve, P., M. L. Roderick, A. M. Ukkola and Y. Wada, 2019: The aridity Index under global warming. Environmental 43 Research Letters, 14(12), 124006, doi:10.1088/1748-9326/ab5046. 44
Griscom, B. W. et al., 2017: Natural climate solutions. Proceedings of the National Academy of Sciences, 114(44), 45 11645, doi:10.1073/pnas.1710465114. 46
Groth, J. et al., 2021: Investigating environment-related migration processes in Ethiopia – A participatory Bayesian 47 network. Ecosystems and People, 17(1), 128-147, doi:10.1080/26395916.2021.1895888. 48
Gu, D., P. Gerland, Pelletier and B. Cohen, 2015: Risks of Exposure and Vulnerability to Natural Disasters at the City 49 Level: A Global Overview. Nations, U., 48 pp. Available at: 50 https://population.un.org/wup/Publications/Files/WUP2014-TechnicalPaper-NaturalDisaster.pdf. 51
Gu, X. et al., 2020: Impacts of anthropogenic warming and uneven regional socio-economic development on global 52 river flood risk. Journal of Hydrology, 590, 125262, doi:https://doi.org/10.1016/j.jhydrol.2020.125262. 53
Guan, K. et al., 2017: Assessing climate adaptation options and uncertainties for cereal systems in West Africa. 54 Agricultural and Forest Meteorology, 232, 291-305, doi:10.1016/j.agrformet.2016.07.021. 55
Gudoshava, M. et al., 2020: Projected effects of 1.5 C and 2 C global warming levels on the intra-seasonal rainfall 56 characteristics over the Greater Horn of Africa. Environmental Research Letters, 15(3), 034037, 57 doi:https://doi.org/10.1088/1748-9326/ab6b33. 58
Gulacha, M. M. and D. M. M. Mulungu, 2017: Generation of climate change scenarios for precipitation and 59 temperature at local scales using SDSM in Wami-Ruvu River Basin Tanzania. Physics and Chemistry of the 60 Earth, Parts A/B/C, 100, 62-72, doi:https://doi.org/10.1016/j.pce.2016.10.003. 61
Gumucio, T., J. Hansen, S. Huyer and T. van Huysen, 2020: Gender-responsive rural climate services: a review of the 62 literature. Climate and Development, 12(3), 241-254, doi:10.1080/17565529.2019.1613216. 63
ACCEPTED VERSIO
N
SUBJECT TO FIN
AL EDITS
FINAL DRAFT Chapter 9 IPCC WGII Sixth Assessment Report
Do Not Cite, Quote or Distribute 9-179 Total pages: 225
Güneralp, B., İ. Güneralp and Y. Liu, 2015: Changing global patterns of urban exposure to flood and drought hazards. 1 Global Environmental Change, 31, 217-225, doi:10.1016/j.gloenvcha.2015.01.002. 2
Gurewich, D., A. Garg and N. R. Kressin, 2020: Addressing Social Determinants of Health Within Healthcare Delivery 3 Systems: a Framework to Ground and Inform Health Outcomes. Journal of General Internal Medicine, 35(5), 4 1571-1575, doi:10.1007/s11606-020-05720-6. 5
Gutiérrez, J. M. et al., 2021: Atlas [Masson-Delmotte, V., P. Zhai, A. Pirani, S. L. Connors, C. Péan, S. Berger, N. 6 Caud, Y. Chen, L. Goldfarb, M. I. Gomis, M. Huang, K. Leitzell, E. Lonnoy, J. B. R. Matthews, T. K. Maycock, 7 T. Waterfield, O. Yelekçi, R. Yu and B. Zhou (ed.)]. Climate Change 2021: The Physical Science Basis. 8 Contribution of Working Group I to the Sixth Assessment Report of the Intergovernmental Panel on Climate 9 Change In Press, Cambridge University Press. Available at: 10 https://www.ipcc.ch/report/ar6/wg1/downloads/report/IPCC_AR6_WGI_Atlas.pdf. 11
Habermann, E. et al., 2019: Warming and water deficit impact leaf photosynthesis and decrease forage quality and 12 digestibility of a C4 tropical grass. Physiologia Plantarum, 165(2), 383-402, doi:10.1111/ppl.12891. 13
Haensler, A., F. Saeed and D. Jacob, 2013: Assessing the robustness of projected precipitation changes over central 14 Africa on the basis of a multitude of global and regional climate projections. Climatic Change, 121(2), 349-363, 15 doi:10.1007/s10584-013-0863-8. 16
Hagos, S. et al., 2014: Climate change, crop production and child under nutrition in Ethiopia; a longitudinal panel 17 study. BMC public health, 14, 884, doi:10.1186/1471-2458-14-884. 18
Haile, G. G. et al., 2020: Projected Impacts of Climate Change on Drought Patterns Over East Africa. Earth's Future, 19 8(7), e2020EF001502, doi:https://doi.org/10.1029/2020EF001502. 20
Hall, K., I. Meiklejohn and J. Arocena, 2007: The thermal responses of rock art pigments: Implications for rock art 21 weathering in southern Africa. Geomorphology, 91(1), 132-145, 22 doi:https://doi.org/10.1016/j.geomorph.2007.02.002. 23
Hallegatte, S. et al., 2016: "Shock Waves" Managing the Impacts of Climate Change on Poverty. Climate Change and 24 Development Series, The World Bank,, Washington, DC, 227 pp. ISBN 978-1-4648-0674-2. 25
Hallegatte, S. et al., 2018: The Economics of (and Obstacles to) Aligning Development and Climate Change 26 Adaptation: A World Bank Group Contribution to the Global Commission on Adaptation. Global Commission on 27 Adaptation, Rotterdam and Washington, DC, 22 pp. Available at: https://gca.org/wp-28 content/uploads/2018/10/18_WP_GCA_Economics_1001_final.pdf. 29
Hallegatte, S. and J. Rozenberg, 2017: Climate change through a poverty lens. Nature Climate Change, 7(4), 250-256, 30 doi:10.1038/nclimate3253. 31
Hambira, W. L. and J. Saarinen, 2015: Policy-makers’ perceptions of the tourism–climate change nexus: Policy needs 32 and constraints in Botswana. Development Southern Africa, 32(3), 350-362, 33 doi:10.1080/0376835X.2015.1010716. 34
Hambira, W. L., J. Saarinen and O. Moses, 2020: Climate change policy in a world of uncertainty: changing 35 environment, knowledge, and tourism in Botswana. African Geographical Review, 39(3), 252-266, 36 doi:10.1080/19376812.2020.1719366. 37
Hamed, Y. et al., 2018: Climate impact on surface and groundwater in North Africa: a global synthesis of findings and 38 recommendations. Euro-Mediterranean Journal for Environmental Integration, 3(1), doi:10.1007/s41207-018-39 0067-8. 40
Han, F., K. H. Cook and E. K. Vizy, 2019: Changes in intense rainfall events and dry periods across Africa in the 41 twenty-first century. Clim Dyn, 53(5), 2757-2777, doi:10.1007/s00382-019-04653-z. 42
Hannah, L. et al., 2020: 30% land conservation and climate action reduces tropical extinction risk by more than 50%. 43 Ecography, 43(7), 943-953, doi:https://doi.org/10.1111/ecog.05166. 44
Hansen, J. et al., 2019a: Scaling Climate Services to Enable Effective Adaptation Action. Adaptation, G. C. o., 45 Rotterdam, the Netherlands & Washington, DC, United States. Available at: https://hdl.handle.net/10568/105763. 46
Hansen, J. et al., 2019b: Climate risk management and rural poverty reduction. Agricultural Systems, 172, 28-46, 47 doi:https://doi.org/10.1016/j.agsy.2018.01.019. 48
Hansen, J. W. et al., 2019c: Climate Services Can Support African Farmers' Context-Specific Adaptation Needs at 49 Scale. Frontiers in Sustainable Food Systems, 3(21), 1-16, doi:10.3389/fsufs.2019.00021. 50
Harari, M. and E. L. Ferrara, 2018: Conflict, Climate, and Cells: A Disaggregated Analysis. The Review of Economics 51 and Statistics, 100(4), 594-608, doi:10.1162/rest_a_00730. 52
Harkin, K. et al., 2020: Impacts of climate change on cultural heritage. MCCIP Sci. Rev, 16, 24-39, 53 doi:10.14465/2020.arc26.che. 54
Harmanny, K. S. and Ž. Malek, 2019: Adaptations in irrigated agriculture in the Mediterranean region: an overview and 55 spatial analysis of implemented strategies. Regional Environmental Change, 19(5), 1401-1416, 56 doi:10.1007/s10113-019-01494-8. 57
Harrington, L. J. et al., 2016: Poorest countries experience earlier anthropogenic emergence of daily temperature 58 extremes. Environmental Research Letters, 11(5), 055007, doi:10.1088/1748-9326/11/5/055007. 59
Harrington, L. J., D. J. Frame, E. Hawkins and M. Joshi, 2017: Seasonal cycles enhance disparities between low- and 60 high-income countries in exposure to monthly temperature emergence with future warming. Environmental 61 Research Letters, 12(11), 114039, doi:10.1088/1748-9326/aa95ae. 62
ACCEPTED VERSIO
N
SUBJECT TO FIN
AL EDITS
FINAL DRAFT Chapter 9 IPCC WGII Sixth Assessment Report
Do Not Cite, Quote or Distribute 9-180 Total pages: 225
Harrington, L. J. and F. E. L. Otto, 2020: Reconciling theory with the reality of African heatwaves. Nature Climate 1 Change, 10(9), 796-798, doi:10.1038/s41558-020-0851-8. 2
Harris, L. et al., 2016: Intersections of gender and water: comparative approaches to everyday gendered negotiations of 3 water access in underserved areas of Accra, Ghana and Cape Town, South Africa. Journal of Gender Studies, 4 26(5), 561-582, doi:10.1080/09589236.2016.1150819. 5
Harrison, L., C. Funk and P. Peterson, 2019: Identifying changing precipitation extremes in Sub-Saharan Africa with 6 gauge and satellite products. Environmental Research Letters, 14(8), 085007, doi:10.1088/1748-9326/ab2cae. 7
Harrod, C., A. Ramirez, J. Valbo-Jorgensen and S. Funge-Smith, 2018a: How climate change impacts inland fisheries. 8 In: Impacts of climate change on fisheries and aquaculture: synthesis of current knowledge, adaptation and 9 mitigation options [Barange, M., T. Bahri, M. Beveridge, K. Cochrane, S. Funge-Smith and F. Poulain (eds.)]. 10 FAO, Rome, pp. 375-391. ISBN 9789251306079. 11
Harrod, C., A. Ramirez, J. Valbo-Jorgensen and S. F. Smith, 2018b: Current anthropogenic stress and projected effect 12 of climate change on global inland fisheries. [Barange, M., T. Bahri, M. Beveridge, K. Cochrane and S. Funge-13 Smith (eds.)]. Food and Agriculture organization of the United Nations, Rome, pp. 393-448. ISBN 14 9789251306079. 15
Harrod, C., F. Simmance, S. Funge-Smith and J. Valbo-Jorgensen, 2018c: Options and opportunities for supporting 16 inland fisheries to cope with climate change adaptation in other sectors. [Barange, M., T. Bahri, M. Beveridge, K. 17 Cochrane and S. Funge-Smith (eds.)]. FAO, Rome, pp. 567-584. ISBN 9789251306079. 18
Harvey, B., L. Jones, L. Cochrane and R. Singh, 2019: The evolving landscape of climate services in sub-Saharan 19 Africa: What roles have NGOs played. Climatic Change, 157, 81–98, doi:10.1007/s10584-019-02410-z. 20
Hasegawa, T. et al., 2021: A global dataset for the projected impacts of climate change on four major crops. bioRxiv, 21 2021.2005.2027.444762, doi:10.1101/2021.05.27.444762. 22
Hastenrath, S., 2010: Climatic forcing of glacier thinning on the mountains of equatorial East Africa. International 23 Journal of Climatology, 30(1), 146-152, doi:https://doi.org/10.1002/joc.1866. 24
Havelaar, A. H. et al., 2015: World Health Organization global estimates and regional comparisons of the burden of 25 foodborne disease in 2010. PLoS medicine, 12(12), e1001923. 26
Headey, D. D. and T. S. Jayne, 2014: Adaptation to land constraints: Is Africa different? Food Policy, 48, 18-33, 27 doi:10.1016/j.foodpol.2014.05.005. 28
Hearn, G., 2016: Managing road transport in a world of changing climate and land use. Proceedings of the Institution of 29 Civil Engineers - Municipal Engineer, 169(3), 146-159, doi:10.1680/muen.15.00009. 30
Heilmayr, R., C. Echeverría and E. F. Lambin, 2020: Impacts of Chilean forest subsidies on forest cover, carbon and 31 biodiversity. Nature Sustainability, 3(9), 701-709, doi:10.1038/s41893-020-0547-0. 32
Hellberg, S., 2019: Scarcity as a means of governing: Challenging neoliberal hydromentality in the context of the South 33 African drought. Environment and Planning E: Nature and Space, 3(1), 186-206, 34 doi:10.1177/2514848619853551. 35
Hempson, G. P., S. Archibald and W. J. Bond, 2017: The consequences of replacing wildlife with livestock in Africa. 36 Scientific Reports, 7(1), 17196, doi:10.1038/s41598-017-17348-4. 37
Henderson, J., A. Storeygard and U. Deichmann, 2014: 50 years of urbanization in Africa : examining the role of 38 climate change. World Bank Policy Research Working Paper,(6925), doi:10.1596/1813-9450-6925. 39
Hendrix, C. S., 2017: The streetlight effect in climate change research on Africa. Global Environmental Change, 43, 40 137-147, doi:10.1016/j.gloenvcha.2017.01.009. 41
Hendrix, C. S. and I. Salehyan, 2012: Climate change, rainfall, and social conflict in Africa. Journal of Peace Research, 42 49(1), 35-50, doi:10.1177/0022343311426165. 43
Henry, S., B. Schoumaker and C. Beauchemin, 2004: The Impact of Rainfall on the First Out-Migration: A Multi-level 44 Event-History Analysis in Burkina Faso. Population and Environment, 25(5), 423-460, 45 doi:10.1023/B:POEN.0000036928.17696.e8. 46
Henseler, M. and I. Schumacher, 2019: The impact of weather on economic growth and its production factors. Climatic 47 Change, 154(3), 417-433, doi:10.1007/s10584-019-02441-6. 48
Hepburn, C. et al., 2020: Will COVID-19 fiscal recovery packages accelerate or retard progress on climate change? 49 Oxford Review of Economic Policy, 36(Supplement_1), S359-S381, doi:10.1093/oxrep/graa015. 50
Hermans-Neumann, K., J. Priess and M. Herold, 2017: Human migration, climate variability, and land degradation: 51 hotspots of socio-ecological pressure in Ethiopia. Regional Environmental Change, 17(5), 1479-1492, 52 doi:10.1007/s10113-017-1108-6. 53
Herrero, M. et al., 2016: Climate change and pastoralism: impacts, consequences and adaptation. Rev Sci Tech, 35(2), 54 417-433, doi:10.20506/rst.35.2.2533. 55
Herslund, L. B. et al., 2016: A multi-dimensional assessment of urban vulnerability to climate change in Sub-Saharan 56 Africa. Natural Hazards, 82(2), 149-172, doi:10.1007/s11069-015-1856-x. 57
Hertig, E. et al., 2014: Statistical modelling of extreme precipitation indices for the Mediterranean area under future 58 climate change. International Journal of Climatology, 34(4), 1132-1156, doi:10.1002/joc.3751. 59
Heubes, J. et al., 2011: Modelling biome shifts and tree cover change for 2050 in West Africa. Journal of 60 Biogeography, 38(12), 2248-2258, doi:10.1111/j.1365-2699.2011.02560.x. 61
Hidalgo, M., V. Mihneva, M. Vasconcellos and M. Bernal, 2018: Climate change impacts, vulnerabilities and 62 adaptations: Mediterranean Sea and the Black Sea marine fisheries [Barange, M., T. Bahri, M. C. M. Beveridge, 63
ACCEPTED VERSIO
N
SUBJECT TO FIN
AL EDITS

FINAL DRAFT Chapter 9 IPCC WGII Sixth Assessment Report
Do Not Cite, Quote or Distribute 9-181 Total pages: 225
K. L. Cochrane, S. Funge-Smith and F. Poulain (eds.)]. Impacts of climate change on fisheries and aquaculture: 1 synthesis of current knowledge, adaptation and mitigation options, FAO, Rome. Available at: 2 http://www.fao.org/3/i9705en/I9705EN.pdf. 3
Hill, M. P. et al., 2016: Predicted decrease in global climate suitability masks regional complexity of invasive fruit fly 4 species response to climate change. Biological Invasions, 18(4), 1105-1119, doi:10.1007/s10530-016-1078-5. 5
Himanen, S. J., H. Mäkinen, K. Rimhanen and R. Savikko, 2016: Engaging Farmers in Climate Change Adaptation 6 Planning: Assessing Intercropping as a Means to Support Farm Adaptive Capacity. Agriculture, 6(3), 7 doi:10.3390/agriculture6030034. 8
Hinkel, J. et al., 2012: Sea-level rise impacts on Africa and the effects of mitigation and adaptation: an application of 9 DIVA. Regional Environmental Change, 12(1), 207-224, doi:10.1007/s10113-011-0249-2. 10
Hirvonen, K., 2016: Temperature Changes, Household Consumption, and Internal Migration: Evidence from Tanzania. 11 American Journal of Agricultural Economics, 98(4), 1230-1249, doi:https://doi.org/10.1093/ajae/aaw042. 12
Hlalele, B., I. Mokhatle and R. Motlogeloa, 2016: Assessing Economic Impacts of Agricultural Drought: A Case of 13 Thaba Nchu, South Africa. Journal of Earth Science and Climate Change, 7(1), 327, doi:10.4172/2157-14 7617.1000327. 15
Hobday, A. J. et al., 2016: A hierarchical approach to defining marine heatwaves. Progress in Oceanography, 141, 227-16 238, doi:https://doi.org/10.1016/j.pocean.2015.12.014. 17
Hodgson, G. M., 2000: What Is the Essence of Institutional Economics? Journal of Economic Issues, 34(2), 317-329, 18 doi:10.1080/00213624.2000.11506269. 19
Hoegh-Guldberg, O. et al., 2014: The Ocean [Barros, V. R., C.B. Field, D.J. Dokken, M.D. Mastrandrea, K.J. Mach, 20 T.E. Bilir, M. Chatterjee, K.L. Ebi, Y.O. Estrada, R.C. Genova, B. Girma, E.S. Kissel, A.N. Levy, S. 21 MacCracken, P.R. Mastrandrea and L. L. White (eds.)]. Climate Change 2014: Impacts, Adaptation, and 22 Vulnerability Part B: Regional Aspects Contribution of Working Group II to the Fifth Assessment Report of the 23 Intergovernmental Panel of Climate Change, USA: Cambridge University Press, Cambridge University Press, 24 Cambridge, United Kingdom and New York, NY, 1655-1731 pp. Available at: 25 https://www.ipcc.ch/site/assets/uploads/2018/02/WGIIAR5-Chap30_FINAL.pdf. 26
Hoegh-Guldberg, O. et al., 2018: Impacts of 1.5ºC global warming on natural and human systems [Masson-Delmotte, 27 V., P. Zhai, H.-O. Pörtner, D. Roberts, J. Skea, P. R. Shukla, A. Pirani, W. Moufouma-Okia, C. Péan, R. Pidcock, 28 S. Connors, J. B. R. Matthews, Y. Chen, X. Zhou, M. I. Gomis, E. Lonnoy, T. Maycock, M. Tignor and T. 29 Waterfield (eds.)]. Global Warming of 1.5°C. An IPCC Special Report on the impacts of global warming of 1.5°C 30 above pre-industrial levels and related global greenhouse gas emission pathways, in the context of strengthening 31 the global response to the threat of climate change, sustainable development, and efforts to eradicate poverty. 32 Available at: https://www.ipcc.ch/site/assets/uploads/sites/2/2019/02/SR15_Chapter3_Low_Res.pdf. 33
Hoffmann, R. et al., 2020: A meta-analysis of country-level studies on environmental change and migration. Nature 34 Climate Change, 10(10), 904-912, doi:10.1038/s41558-020-0898-6. 35
Hole, D. G. et al., 2009: Projected impacts of climate change on a continent-wide protected area network. Ecol Lett, 36 12(5), 420-431, doi:10.1111/j.1461-0248.2009.01297.x. 37
Hooli, L. J., 2016: Resilience of the poorest: coping strategies and indigenous knowledge of living with the floods in 38 Northern Namibia. Regional Environmental Change, 16(3), 695-707, doi:10.1007/s10113-015-0782-5. 39
Hope, M., 2019: Cyclones in Mozambique may reveal humanitarian challenges of responding to a new climate reality. 40 The Lancet Planetary Health, 3(8), e338-e339, doi:https://doi.org/10.1016/S2542-5196(19)30131-7. 41
Houéménou, H. et al., 2020: Degradation of groundwater quality in expanding cities in West Africa. A case study of the 42 unregulated shallow aquifer in Cotonou. Journal of Hydrology, 582, 124438, 43 doi:https://doi.org/10.1016/j.jhydrol.2019.124438. 44
Hove, M. and T. Gweme, 2018: Women's food security and conservation farming in Zaka District-Zimbabwe. Journal 45 of Arid Environments, 149, 18-29, doi:https://doi.org/10.1016/j.jaridenv.2017.10.010. 46
Hoveka, L. N. et al., 2016: Effects of climate change on the future distributions of the top five freshwater invasive 47 plants in South Africa. South African Journal of Botany, 102, 33-38, doi:10.1016/j.sajb.2015.07.017. 48
Howard, G., R. Calow, A. Macdonald and J. Bartram, 2016: Climate Change and Water and Sanitation: Likely Impacts 49 and Emerging Trends for Action. Annual Review of Environment and Resources, 41(1), 253-276, 50 doi:10.1146/annurev-environ-110615-085856. 51
Howells, M. et al., 2013: Integrated analysis of climate change, land-use, energy and water strategies. Nature Climate 52 Change, 3(7), 621-626, doi:10.1038/nclimate1789. 53
Hsiang, S. M., M. Burke and E. Miguel, 2013a: Quantifying the influence of climate on human conflict. Science (New 54 York, N.Y.), 341(6151), 1235367, doi:10.1126/science.1235367. 55
Hsiang, S. M., M. Burke and E. Miguel, 2013b: Reconciling Temperature-conflict Results in Kenya. UC Berkeley, 56 Berkeley, CA. Available at: http://www.escholarship.org/uc/item/9ct8g2zr. 57
Hsiang, S. M. and A. S. Jina, 2014: The causal effect of environmental catastrophe on long-run economic growth: 58 Evidence from 6,700 cyclones. National Bureau of Economic Research, Cambridge, MA. Available at: 59 https://www.nber.org/system/files/working_papers/w20352/w20352.pdf. 60
Hu, L., J.-J. Luo, G. Huang and M. C. Wheeler, 2019: Synoptic Features Responsible for Heat Waves in Central Africa, 61 a Region with Strong Multidecadal Trends. Journal of Climate, 32(22), 7951-7970, 62 doi:https://doi.org/10.1175/JCLI-D-18-0807.1. 63
ACCEPTED VERSIO
N
SUBJECT TO FIN
AL EDITS

FINAL DRAFT Chapter 9 IPCC WGII Sixth Assessment Report
Do Not Cite, Quote or Distribute 9-182 Total pages: 225
Hua, W. et al., 2016: Possible causes of the Central Equatorial African long-term drought. Environmental Research 1 Letters, 11(12), 124002, doi:10.1088/1748-9326/11/12/124002. 2
Hubau, W. et al., 2020: Asynchronous carbon sink saturation in African and Amazonian tropical forests. Nature, 3 579(7797), 80-87, doi:10.1038/s41586-020-2035-0. 4
Huber-Lee, A. et al., 2015: Reference Investment Scenario. In: Enhancing the Climate Resilience of Africa's 5 Infrastructure: The Power and Water Sectors [Cervigni, R., R. Liden, J. E. Neumann and K. M. Strzepek (eds.)]. 6 The World Bank, Washington, DC, pp. 77-83. ISBN 978-1-4648-0466-3. 7
Hufe, P. and D. F. Heuermann, 2017: The local impacts of large-scale land acquisitions: a review of case study 8 evidence from Sub-Saharan Africa. Journal of Contemporary African Studies, 35(2), 168-189, 9 doi:10.1080/02589001.2017.1307505. 10
Hughes, D. A., 2019: Facing a future water resources management crisis in sub-Saharan Africa. Journal of Hydrology: 11 Regional Studies, 23, doi:10.1016/j.ejrh.2019.100600. 12
Hughes, T. P. et al., 2018: Spatial and temporal patterns of mass bleaching of corals in the Anthropocene. Science (New 13 York, N.Y.), 359(6371), 80, doi:10.1126/science.aan8048. 14
Huldén, L., R. McKitrick and L. Huldén, 2014: Average household size and the eradication of malaria. J. R. Stat. Soc. 15 Ser. A Stat. Soc., 177(3), 725-742. 16
Hulme, M., 2017: Climate Change and the Significance of Religion. Economic and Political Weekly, 52(28), 14-17. 17 Hummel, D., 2016: Climate change, land degradation and migration in Mali and Senegal – some policy implications. 18
Migration and Development, 5(2), 211-233, doi:10.1080/21632324.2015.1022972. 19 Humphrey, G. J., L. Gillson and G. Ziervogel, 2021: How changing fire management policies affect fire seasonality and 20
livelihoods. Ambio, 50(2), 475-491, doi:10.1007/s13280-020-01351-7. 21 Hunter, N. B., M. A. North, D. C. Roberts and R. Slotow, 2020: A systematic map of responses to climate impacts in 22
urban Africa. Environmental Research Letters, 15(10), 103005, doi:10.1088/1748-9326/ab9d00. 23 Hunter, R. e., K. Nordin and M. Thom, 2018: Inclusive insurance enhanced through the use of client data; typologies, 24
use cases and adoption challenges. insight2impact, Nairobi, Kenya. Available at: https://cenfri.org/wp-25 content/uploads/2018/10/Inclusive-insurance-enhanced-through-the-use-of-client-data_i2i-FSDA_October-26 2018_SINGLE.pdf. 27
Huntingford, C. et al., 2013: Simulated resilience of tropical rainforests to CO2-induced climate change. Nature 28 Geoscience, 6(4), 268-273, doi:10.1038/ngeo1741. 29
Huntjens, P. and K. Nachbar, 2015: Climate Change as a Threat Multiplier for Human Disaster and Conflict. The 30 Hague Institute for Global Justice. Working Paper 9. Available at: 31 http://www.thehagueinstituteforglobaljustice.org/working-paper-9. 32
Hurrell, J. W., Y. Kushnir, G. Ottersen and M. Visbeck, 2003: An Overview of the North Atlantic Oscillation. The 33 North Atlantic Oscillation: Climatic Significance and Environmental Impact, vol. 134, American Geophysical 34 Union, Washington, D.C. 35
Ide, T., M. Brzoska, J. F. Donges and C.-F. Schleussner, 2020: Multi-method evidence for when and how climate-36 related disasters contribute to armed conflict risk. Global Environmental Change, 62, 102063, 37 doi:https://doi.org/10.1016/j.gloenvcha.2020.102063. 38
IDMC, 2018: Global Report on Internal Displacement - GRID 2018. Internal Displacment Monitoring Centre, 39 Norwegian Refugee Council, Geneva, Switzerland. 40
IDMC, 2019: Global Report on Internal Displacement GRID 2019. Internal Displacement Monitoring Center, Geneva, 41 Switzerland, 159 pp. Available at: https://www.internal-displacement.org/global-report/grid2019/. 42
IDMC, 2020: Global Report on Internal Displacement GRID 2020. . Internal Displacement Monitoring Centre,, 43 Geneva, Switzerland,, 136 pp. Available at: https://www.internal-44 displacement.org/sites/default/files/publications/documents/grid2021_idmc.pdf. 45
IDRC, 2021: Open Access Policy for IDRC-Funded Project Outputs. Available at: https://www.idrc.ca/en/open-access-46 policy-idrc-funded-project-outputs. 47
IEA, 2019: Africa Energy Outlook 2019. World Energy Outlook Special Report, International Energy Agency, Paris. 48 Available at: https://www.iea.org/reports/africa-energy-outlook-2019. 49
IEA, 2021: Sustainable Recovery Tracker. IEA, Paris, 25 pp. Available at: https://www.iea.org/reports/sustainable-50 recovery-tracker. 51
Ifejika Speranza, C., 2010: Drought Coping and Adaptation Strategies: Understanding Adaptations to Climate Change 52 in Agro-pastoral Livestock Production in Makueni District, Kenya. The European Journal of Development 53 Research, 22(5), 623-642, doi:10.1057/ejdr.2010.39. 54
IFPRI, 2016: 2016 Global Nutrition Report. From Promise to Impact: Ending Malnutrition by 2030. International Food 55 Policy Research Institute (IFPRI), Washington, DC. Available at: 56 http://ebrary.ifpri.org/utils/getfile/collection/p15738coll2/id/130354/filename/130565.pdf. 57
IIED, 2015: Vulnerable Communities: Getting their Needs and Knowledge into Climate Policy. IIED Briefing, 58 International Institute for Environment and Development (IIED), London, UK. Available at: 59 https://pubs.iied.org/pdfs/17328IIED.pdf. 60
Iizumi, T. et al., 2021: Rising temperatures and increasing demand challenge wheat supply in Sudan. Nature Food, 61 2(1), 19-27, doi:10.1038/s43016-020-00214-4. 62
ACCEPTED VERSIO
N
SUBJECT TO FIN
AL EDITS

FINAL DRAFT Chapter 9 IPCC WGII Sixth Assessment Report
Do Not Cite, Quote or Distribute 9-183 Total pages: 225
Iizumi, T. et al., 2020: Climate change adaptation cost and residual damage to global crop production. Climate 1 Research, 80(3), 203-218. 2
Iizumi, T. et al., 2018: Crop production losses associated with anthropogenic climate change for 1981–2010 compared 3 with preindustrial levels. International Journal of Climatology, 38(14), 5405-5417, 4 doi:https://doi.org/10.1002/joc.5818. 5
ILEC and UNEP, 2016: Transboundary Lakes and Reservoirs: Status and Trends, Summary for Policy Makers., United 6 Nations Environment Programme (UNEP), Nairobi. Available at: 7 https://www.unep.org/resources/report/transboundary-lakes-and-reservoirs-status-and-future-trends-volume-2-8 lake-basins. 9
ILO, 2018a: The employment Impact of climate change adaptation. International Labour Organisation, Geneva, 10 Switzerland. Available at: https://www.ilo.org/wcmsp5/groups/public/---11 ed_emp/documents/publication/wcms_645572.pdf. 12
ILO, 2018b: Women and men in the informal economy: a statistical picture. 3, International Labour Office, Geneva, 13 Switzerland, 164 pp. Available at: https://www.ilo.org/wcmsp5/groups/public/---dgreports/---14 dcomm/documents/publication/wcms_626831.pdf. 15
ILO, 2019: Skills for a greener future: a global view. International Labout Office, Geneva, Switzerland. Available at: 16 https://www.ilo.org/wcmsp5/groups/public/---ed_emp/documents/publication/wcms_732214.pdf. 17
Iloka Nnamdi, G., 2016: Indigenous knowledge for disaster risk reduction : an African perspective : original research. 18 Jamba : Journal of Disaster Risk Studies, 8(1), 1-7, doi:10.4102/jamba.v8i1.272. 19
İlseven, S. et al., 2019: Attitude and risk perception of climate change in farming communities in Tripoli, Libya. 20 Chimica Oggi/Chemistry Today, 91-96. 21
Ingram, J., 2011: A food systems approach to researching food security and its interactions with global environmental 22 change. Food Security, 3(4), 417-431, doi:10.1007/s12571-011-0149-9. 23
InsurResilience, 2021: Tripartite Agreement: A public-private partnership between BMZ, UNDP and IDF leveraging 24 financing, expertise and risk capital for the fulfilment of Vision 2025, InsurResilience Global Partnership, Bonn, 25 Germany. Available at: https://annualreport.insuresilience.org/tripartite-agreement/. 26
International Institute of Water Management, Rainfed Agriculture Summary. Available at: 27 https://www.iwmi.cgiar.org/issues/rainfed-agriculture/summary/. 28
IPBES, 2018: Summary for policymakers of the regional assessment report on biodiversity and ecosystem services for 29 Africa of the Intergovernmental Science-Policy Platform on Biodiversity and Ecosystem Services. [E. Archer, L. 30 E. D., K. J. Mulongoy, M. A. Maoela, M. Walters, R. Biggs, M-C. Cormier-Salem, F. DeClerck, M. C. Diaw, A. 31 E. Dunham, P. Failler, C. Gordon, K. A. Harhash, R. Kasisi, F. Kizito, W. D. Nyingi, N. Oguge, B. Osman-32 Elasha, L. C. Stringer, L. Tito de Morais, A. Assogbadjo, B. N. Egoh, M. W. Halmy, K. Heubach, A. Mensah, L. 33 Pereira and N. Sitas (ed.)]. IPBES secretariat, Bonn, Germany, 49 pp. Available at: 34 https://ipbes.net/sites/default/files/spm_africa_2018_digital.pdf. 35
IPBES, 2020: IPBES workshop on biodiversity and pandemics: Executive summary. Intergovernmental SciencePolicy 36 Platform on Biodiversity and Ecosystem Services (IPBES), Bonn, Germany. Available at: 37 https://ipbes.net/sites/default/files/2020-38 10/IPBES%20Pandemics%20Workshop%20Report%20Executive%20Summary%20Final.pdf. 39
IPCC, 2014: Climate Change 2014: Synthesis Report. Contribution of Working Groups I, II and III to the Fifth 40 Assessment Report of the Intergovernmental Panel on Climate Change [Pachauri, R. K. and L. A. Meyer (eds.)]. 41 IPCC, Geneva, Switzerland, 151 pp. Available at: https://www.ipcc.ch/report/ar5/syr/. 42
IPCC, 2018a: Annex I: Glossary [Matthews, J.B.R. (ed.)]. In: Global Warming of 1.5°C. An IPCC Special Report on 43 the impacts of global warming of 1.5°C above pre-industrial levels and related global greenhouse gas emission 44 pathways, in the context of strengthening the global response to the threat of climate change, sustainable 45 development, and efforts to eradicate poverty [Masson-Delmotte, V., P. Zhai, H. O. Pörtner, D. Roberts, J. Skea, 46 P. R. Shukla, A. Pirani, W. Moufouma-Okia, C. Péan, R. Pidcock, S. Connors, J. B. R. Matthews, Y. Chen, X. 47 Zhou, M. I. Gomis, E. Lonnoy, T. Maycock, M. Tignor and T. Waterfield (eds.)], pp. In press. ISBN 48 9789291691517. 49
IPCC, 2018b: Global Warming of 1.5°C. An IPCC Special Report on the impacts of global warming of 1.5°C above 50 pre-industrial levels and related global greenhouse gas emission pathways, in the context of strengthening the 51 global response to the threat of climate change, sustainable development, and efforts to eradicate poverty 52 [Masson-Delmotte, V., P. Zhai, H.-O. Pörtner, D. Roberts, J. Skea, P.R. Shukla, A. Pirani, W. Moufouma-Okia, 53 C. Péan, R. Pidcock, S. Connors, J.B.R. Matthews, Y. Chen, X. Zhou, M.I. Gomis, E. Lonnoy, T. Maycock, M. 54 Tignor, and T. Waterfield (ed.)]. In Press pp. Available at: https://www.ipcc.ch/sr15/download/. 55
IPCC, 2018c: Summary for Policymakers [Masson-Delmotte, V., P. Zhai, H. O. Pörtner, D. Roberts, J. Skea, P. R. 56 Shukla, A. Pirani, W. Moufouma-Okia, C. Péan, R. Pidcock, S. Connors, J. B. R. Matthews, Y. Chen, X. Zhou, 57 M. I. Gomis, E. Lonnoy, T. Maycock, M. Tignor and T. Waterfield (eds.)]. Global Warming of 1.5°C. An IPCC 58 Special Report on the impacts of global warming of 1.5°C above pre-industrial levels and related global 59 greenhouse gas emission pathways, in the context of strengthening the global response to the threat of climate 60 change, sustainable development, and efforts to eradicate poverty, In press pp. Available at: 61 https://www.ipcc.ch/site/assets/uploads/sites/2/2019/06/SR15_Full_Report_High_Res.pdf. 62
ACCEPTED VERSIO
N
SUBJECT TO FIN
AL EDITS
FINAL DRAFT Chapter 9 IPCC WGII Sixth Assessment Report
Do Not Cite, Quote or Distribute 9-184 Total pages: 225
IPCC, 2019a: Climate Change and Land: an IPCC special report on climate change, desertification, land degradation, 1 sustainable land management, food security, and greenhouse gas fluxes in terrestrial ecosystems [Skea, J., E. 2 Calvo Buendia, V. Masson-Delmotte, H. O. Pörtner, D. C. Roberts, P. Zhai, R. Slade, S. Connors, R. van Diemen, 3 M. Ferrat, E. Haughey, S. Luz, S. Neogi, M. Pathak, J. Petzold, J. Portugal Pereira, P. Vyas, E. Huntley, K. 4 Kissick, M. Belkacemi and J. Malley (eds.)]. Shukla, P. R., In press pp. Available at: https://www.ipcc.ch/srccl-5 report-download-page/. 6
IPCC, 2019b: IPCC Special Report on the Ocean and Cryosphere in a Changing Climate [Pörtner, H.-O., D. C. 7 Roberts, V. Masson-Delmotte, P. Zhai, M. Tignor, E. Poloczanska, K. Mintenbeck, A. Alegría, M. Nicolai, A. 8 Okem, J. Petzold, B. Rama and N. M. Weyer (eds.)]. In press pp. Available at: 9 https://www.ipcc.ch/srocc/download/. 10
IPCC, 2019c: Technical Summary [H.-O. Pörtner, D. C. R., V. Masson-Delmotte, P. Zhai, E. Poloczanska, K. 11 Mintenbeck, M. Tignor, A. Alegría, M. Nicolai, A. Okem, J. Petzold, B. Rama, N.M. Weyer (ed.)]. IPCC Special 12 Report on the Ocean and Cryosphere in a Changing Climate In press, 39-69 pp. Available at: 13 https://www.ipcc.ch/site/assets/uploads/sites/3/2019/11/04_SROCC_TS_FINAL.pdf 14
IPCC, 2021: Summary for Policymakers [MassonDelmotte, V., P. Zhai, A. Pirani, S. L. Connors, C. Péan, S. Berger, N. 15 Caud, Y. Chen, L. Goldfarb, M. I. Gomis, M. Huang, K. Leitzell, E. Lonnoy, J. B. R. Matthews, T. K. Maycock, 16 T. Waterfield, O. Yelekçi, R. Yu and B. Zhou (ed.)]. Climate Change 2021: The Physical Science Basis. 17 Contribution of Working Group I to the Sixth Assessment Report of the Intergovernmental Panel on Climate 18 Change, In press, Cambridge University Press. Available at: 19 https://www.ipcc.ch/report/ar6/wg1/downloads/report/IPCC_AR6_WGI_SPM.pdf. 20
Irwin, A. et al., 2006: The commission on social determinants of health: tackling the social roots of health inequities. 21 PLoS Med, 3(6), e106, doi:10.1371/journal.pmed.0030106. 22
Islam, N. S. and J. Winkel, 2017: Climate Change and Social Inequality. Building Resilience to Climate Change – An 23 Opportunity to Reduce Inequalities, UNITED NATIONS, New York, USA, 32 pp. Available at: 24 https://www.un.org/esa/desa/papers/2017/wp152_2017.pdf. 25
Iyakaremye, V., G. Zeng and G. Zhang, 2021: Changes in extreme temperature events over Africa under 1.5 and 2.0°C 26 global warming scenarios. International Journal of Climatology, 41(2), 1506-1524, 27 doi:https://doi.org/10.1002/joc.6868. 28
Jack, C., P. Wolski, I. Pinto and V. Indasi, 2016: Southern Africa: Tools for observing and modelling climate. In: 29 Africa’s climate: Helping decision-makers make sense of climate information. Future Climate for Africa, Cape 30 Town, South Africa, pp. 23-30. 31
Jacobs, K. L. and R. B. Street, 2020: The next generation of climate services. Climate Services, 20, 100199, 32 doi:10.1016/j.cliser.2020.100199. 33
Jafino, B. A., B. Walsh, J. Rozenberg and S. Hallegatte, 2020: Revised Estimates of the Impact of Climate Change on 34 Extreme Poverty by 2030. Poverty and Shared Prosperity 2020, World Bank Group, Group, W. B., Washington 35 DC, USA, 17 pp. Available at: https://documents1.worldbank.org/curated/en/706751601388457990/pdf/Revised-36 Estimates-of-the-Impact-of-Climate-Change-on-Extreme-Poverty-by-2030.pdf. 37
Jaka, H. and E. Shava, 2018: Resilient rural women's livelihoods for poverty alleviation and economic empowerment in 38 semi-arid regions of Zimbabwe. Jamba, 10(1), 524, doi:10.4102/jamba.v10i1.524. 39
Jaksa, M. F., 2006: Putting the Sustainable Back in Sustainable Development: Recognizing and Enforcing Indigenous 40 Property Rights as a Pathway to Global Environmental Sustainability Notes & Comments. Journal of 41 Environmental Law and Litigation, 21(1), 157-206. 42
Jaramillo, J. et al., 2011: Some Like It Hot: The Influence and Implications of Climate Change on Coffee Berry Borer 43 (Hypothenemus hampei) and Coffee Production in East Africa. PLoS ONE, 6(9), e24528-e24528, 44 doi:10.1371/journal.pone.0024528. 45
Jarvis, A., J. Ramirez-Villegas, B. V. H. Campo and C. Navarro-Racines, 2012: Is Cassava the Answer to African 46 Climate Change Adaptation? Tropical Plant Biology, 5(1), 9-29, doi:10.1007/s12042-012-9096-7. 47
Jasechko, S. and R. G. Taylor, 2015: Intensive rainfall recharges tropical groundwaters. Environmental Research 48 Letters, 10(12), doi:10.1088/1748-9326/10/12/124015. 49
Jayasinghe, S. L. and L. Kumar, 2020: Climate Change May Imperil Tea Production in the Four Major Tea Producers 50 According to Climate Prediction Models. Agronomy, 10(10), doi:10.3390/agronomy10101536. 51
Jayne, T. S. et al., 2019a: Are medium‐scale farms driving agricultural transformation in sub‐Saharan Africa? 52 Agricultural Economics, 50(S1), 75-95, doi:10.1111/agec.12535. 53
Jayne, T. S., S. Snapp, F. Place and N. Sitko, 2019b: Sustainable agricultural intensification in an era of rural 54 transformation in Africa. Global Food Security, 20, 105-113, doi:https://doi.org/10.1016/j.gfs.2019.01.008. 55
Jean, N. et al., 2016: Combining satellite imagery and machine learning to predict poverty. Science (New York, N.Y.), 56 353(6301), 790-794, doi:10.1126/science.aaf7894. 57
Jenkins, W., E. Berry and L. B. Kreider, 2018: Religion and Climate Change. Annual Review of Environment and 58 Resources, 43(1), 85-108, doi:10.1146/annurev-environ-102017-025855. 59
Jensen, K. M. and R. B. Lange, 2013: Transboundary Water Governance in a Shifting Development Context New 60 Development Finance, Development Spaces and Commitment to Cooperation: A Comparative Study of the 61 Mekong And the Zambezi River Basins. 20, Danish Institute for International Studies (DIIS), DIIS, Copenhagen, 62 134 pp. Available at: http://www.jstor.org/stable/resrep13303 (accessed 2021/09/01/). 63
ACCEPTED VERSIO
N
SUBJECT TO FIN
AL EDITS

FINAL DRAFT Chapter 9 IPCC WGII Sixth Assessment Report
Do Not Cite, Quote or Distribute 9-185 Total pages: 225
Jin, C., B. Wang and J. Liu, 2020: Future Changes and Controlling Factors of the Eight Regional Monsoons Projected 1 by CMIP6 Models. Journal of Climate, 33(21), 9307-9326, doi:10.1175/JCLI-D-20-0236.1. 2
Jin, L. et al., 2018: Modeling future flows of the Volta River system: Impacts of climate change and socio-economic 3 changes. Sci Total Environ, 637-638, 1069-1080, doi:10.1016/j.scitotenv.2018.04.350. 4
Jiri, O., P. Mafongoya and P. Chivenge, 2015: Indigenous knowledge systems, seasonal ‘quality’and climate change 5 adaptation in Zimbabwe. Climate Research, 66(2), 103-111, doi:https://doi.org/10.3354/cr01334. 6
Jiri, O., P. L. Mafongoya and P. Chivenge, 2017: Building climate change resilience through adaptation in smallholder 7 farming systems in semi-arid Zimbabwe. International Journal of Climate Change Strategies and Management, 8 9(2), 151-165, doi:10.1108/IJCCSM-07-2016-0092. 9
Jiri, O., P. L. Mafongoya, C. Mubaya and O. Mafongoya, 2016: Seasonal climate prediction and adaptation using 10 indigenous knowledge systems in agriculture systems in Southern Africa: a review. Journal of Agricultural 11 Science, 8(5), 156. 12
Jones, B. F. and B. A. Olken, 2010: Climate Shocks and Exports. American Economic Review, 100(2), 454-459, 13 doi:10.1257/aer.100.2.454. 14
Jones, H. P. et al., 2020: Global hotspots for coastal ecosystem-based adaptation. PLoS One, 15(5), e0233005, 15 doi:10.1371/journal.pone.0233005. 16
Jones, L. et al., 2015: Ensuring climate information guides long-term development. Nature Climate Change, 5(9), 812-17 814, doi:10.1038/nclimate2701. 18
Kaag, M., G. Baltissen, G. Steel and A. Lodder, 2019: Migration, Youth, and Land in West Africa: Making the 19 Connections Work for Inclusive Development. Land, 8(4), 60, doi:10.3390/land8040060. 20
Kaczan, D. J. and J. Orgill-Meyer, 2020: The impact of climate change on migration: a synthesis of recent empirical 21 insights. Climatic Change, 158(3), 281-300, doi:10.1007/s10584-019-02560-0. 22
Kagunyu, A., S. Wandibba and J. G. Wanjohi, 2016: The use of indigenous climate forecasting methods by the 23 pastoralists of Northern Kenya. Pastoralism, 6(1), doi:10.1186/s13570-016-0054-0. 24
Kahn, M. E. et al., 2019: Long-term macroeconomic effects of climate change: A cross-country analysis [Catherine, P. 25 (ed.)]. International Monetary Fund,, IMF. Available at: 26 https://www.imf.org/en/Publications/WP/Issues/2019/10/11/Long-Term-Macroeconomic-Effects-of-Climate-27 Change-A-Cross-Country-Analysis-48691. 28
Kakinuma, K. et al., 2020: Flood-induced population displacements in the world. Environmental Research Letters, 29 15(12), 124029, doi:10.1088/1748-9326/abc586. 30
Kaky, E. and F. Gilbert, 2017: Predicting the distributions of Egypt's medicinal plants and their potential shifts under 31 future climate change. PLOS ONE, 12(11), e0187714, doi:10.1371/journal.pone.0187714. 32
Kalacska, M., J. Arroyo-Mora, O. Lucanus and M. Kishe-Machumu, 2017: Land Cover, Land Use, and Climate Change 33 Impacts on Endemic Cichlid Habitats in Northern Tanzania. Remote Sensing, 9(6), doi:10.3390/rs9060623. 34
Kalkuhl, M. and L. Wenz, 2020: The impact of climate conditions on economic production. Evidence from a global 35 panel of regions. Journal of Environmental Economics and Management, 103, 102360, 36 doi:https://doi.org/10.1016/j.jeem.2020.102360. 37
Kam, P. M. et al., 2021: Global warming and population change both heighten future risk of human displacement due to 38 river floods. Environmental Research Letters, 16(4), 044026, doi:10.1088/1748-9326/abd26c. 39
Kamwendo, G. and J. Kamwendo, 2014: Indigenous Knowledge-Systems and Food Security: Some Examples from 40 Malawi. Journal of Human Ecology, 48(1), 97-101, doi:10.1080/09709274.2014.11906778. 41
Kangalawe, R. Y. M., 2017: Climate change impacts on water resource management and community livelihoods in the 42 southern highlands of Tanzania. Climate and Development, 9(3), 191-201, doi:10.1080/17565529.2016.1139487. 43
Kangalawe, R. Y. M. et al., 2017: Climate change and variability impacts on agricultural production and livelihood 44 systems in Western Tanzania. Climate and Development, 9(3), 202-216, doi:10.1080/17565529.2016.1146119. 45
Karmaoui, A. et al., 2016: Analysis of the Water Supply-demand Relationship in the Middle Draa Valley, Morocco, 46 under Climate Change and Socio-economic Scenarios. Journal of Scientific Research and Reports, 9(4), 1-10, 47 doi:10.9734/jsrr/2016/21536. 48
Karuri, S. W. and R. W. Snow, 2016: Forecasting paediatric malaria admissions on the Kenya Coast using rainfall. 49 Glob Health Action, 9, 29876, doi:10.3402/gha.v9.29876. 50
Kaspar, F. et al., 2015: The SASSCAL contribution to climate observation, climate data management and data rescue in 51 Southern Africa. Advances in science and research, 12, 171-177, doi:https://doi.org/10.5194/asr-12-171-2015. 52
Keahey, J., 2018: Gendered livelihoods and social change in post-apartheid South Africa. Gender, Place & Culture, 53 25(4), 525-546, doi:10.1080/0966369x.2018.1460328. 54
Keeling, A., K. Dain and L. Hadley, 2012: Diabetes and Climate Change Report. International Diabetes Foundation 55 (IDF), (IDF), I. D. F. Available at: https://www.idf.org/our-activities/advocacy-awareness/resources-and-56 tools/144:diabetes-and-climate-change-report.html. 57
Kendon, E. J. et al., 2019: Enhanced future changes in wet and dry extremes over Africa at convection-permitting scale. 58 Nature communications, 10(1794), 1-14, doi:https://doi.org/10.1038/s41467-019-09776-9. 59
Kennedy, J. et al., 2017: Global and regional climate in 2016. Weather, 72(8), 219-225, doi:10.1002/wea.3042. 60 Kent, C., R. Chadwick and D. P. Rowell, 2015: Understanding Uncertainties in Future Projections of Seasonal Tropical 61
Precipitation. Journal of Climate, 28(11), 4390-4413, doi:10.1175/JCLI-D-14-00613.1. 62
ACCEPTED VERSIO
N
SUBJECT TO FIN
AL EDITS

FINAL DRAFT Chapter 9 IPCC WGII Sixth Assessment Report
Do Not Cite, Quote or Distribute 9-186 Total pages: 225
Kharin, V. V. et al., 2018: Risks from Climate Extremes Change Differently from 1.5°C to 2.0°C Depending on Rarity. 1 Earth's Future, 6(5), 704-715, doi:10.1002/2018ef000813. 2
Khedr, M., 2019: Challenges and Issues in Water, Climate Change, and Food Security in Egypt. In: Conventional Water 3 Resources and Agriculture in Egypt [Negm, A. M. (ed.)]. Springer International Publishing, Cham, pp. 229-243. 4 ISBN 978-3-319-95065-5. 5
Kibret, S. et al., 2015: Malaria impact of large dams in sub-Saharan Africa: maps, estimates and predictions. Malaria 6 Journal, 14(1), 339-339, doi:10.1186/s12936-015-0873-2. 7
Kibret, S. et al., 2017: The Influence of Dams on Malaria Transmission in Sub-Saharan Africa. EcoHealth, 14(2), 408-8 419, doi:10.1007/s10393-015-1029-0. 9
Kichamu, E. A., J. S. Ziro, G. Palaniappan and H. Ross, 2017: Climate change perceptions and adaptations of 10 smallholder farmers in Eastern Kenya. Environment, Development and Sustainability, 20(6), 2663-2680, 11 doi:10.1007/s10668-017-0010-1. 12
Kienberger, S. and M. Hagenlocher, 2014: Spatial-explicit modeling of social vulnerability to malaria in East Africa. 13 Int. J. Health Geogr., 13, 29, doi:10.1186/1476-072X-13-29. 14
Kifani, S. et al., 2018: Chapter 8: Climate change impacts, vulnerabilities and adaptations: Eastern Central Atlantic 15 marine fisheries [Barange, M., T. Bahri, M. Beveridge, K. Cochrane, S. Funge-Smith and F. Poulain (eds.)]. 16 Impacts of Climate Change on Fisheries and Aquaculture: Synthesis of Current Knowledge, Adaptation and 17 Mitigation Options, FAO Fisheries and Aquaculture, Italy, 159-183 pp. Available at: 18 http://www.fao.org/3/i9705en/I9705EN.pdf. 19
Kihila, J. M., 2017: Indigenous coping and adaptation strategies to climate change of local communities in Tanzania: a 20 review. Climate and Development, 10(5), 406-416, doi:10.1080/17565529.2017.1318739. 21
Kilungu, H., R. Leemans, P. K. Munishi and B. Amelung, 2017: Climate change threatens major tourist attractions and 22 tourism in Serengeti National Park, Tanzania. In: Climate Change Adaptation in Africa [Leal Filho, W., S. Belay, 23 J. Kalangu, W. Menas, P. Munishi and K. Musiyiwa (eds.)]. Springer, Cham, pp. 375-392. ISBN 978-3-319-24 49520-0. 25
Kilungu, H. et al., 2019: Forty Years of Climate and Land-Cover Change and its Effects on Tourism Resources in 26 Kilimanjaro National Park. Tourism Planning & Development, 16(2), 235-253, 27 doi:10.1080/21568316.2019.1569121. 28
Kim, Y. et al., 2019: Suicide and Ambient Temperature: A Multi-Country Multi-City Study. Environ Health Perspect, 29 127(11), 117007, doi:10.1289/ehp4898. 30
Kimaro, E. G., S. M. Mor and J.-A. L. M. L. Toribio, 2018: Climate change perception and impacts on cattle production 31 in pastoral communities of northern Tanzania. Pastoralism, 8(1), 19, doi:10.1186/s13570-018-0125-5. 32
Kimaro, E. G., J.-A. L. M. L. Toribio and S. M. Mor, 2017: Climate change and cattle vector-borne diseases: Use of 33 participatory epidemiology to investigate experiences in pastoral communities in Northern Tanzania. Preventive 34 Veterinary Medicine, 147, 79-89, doi:10.1016/j.prevetmed.2017.08.010. 35
Kimirei, I. A. et al., 2020: Trends in Ecological Changes: Implications for East and Southern Africa. In: Ecological 36 Changes in the Zambezi River Basin [Ndebele-Murisa, M., I. A. Kimirei, C. P. Mubaya and T. Bere (eds.)]. 37 CODESRIA, Dakar, pp. 49-82. ISBN 978-2-86978-713-1. 38
Kishiwa, P., J. Nobert, V. Kongo and P. Ndomba, 2018: Assessment of impacts of climate change on surface water 39 availability using coupled SWAT and WEAP models: case of upper Pangani River Basin, Tanzania. Proceedings 40 of the International Association of Hydrological Sciences, 378, 23-27, doi:10.5194/piahs-378-23-2018. 41
Kissler, S. M. et al., 2020: Projecting the transmission dynamics of SARS-CoV-2 through the post-pandemic period. 42 medRxiv, 2020.2003.2004.20031112, doi:10.1101/2020.03.04.20031112. 43
Kita, S. M., 2019: Barriers or enablers? Chiefs, elite capture, disasters, and resettlement in rural Malawi. Disasters, 44 43(1), 135-156, doi:10.1111/disa.12295. 45
Kiwanuka-Tondo, J., F. Semazzi and K. Pettiway, 2019: Climate risk communication of navigation safety and climate 46 conditions over Lake Victoria basin: Exploring perceptions and knowledge of indigenous communities. Cogent 47 Social Sciences, 5(1), 1588485, doi:10.1080/23311886.2019.1588485. 48
Kjellstrom, T. et al., 2016: Heat, Human Performance, and Occupational Health: A Key Issue for the Assessment of 49 Global Climate Change Impacts. Annual Review of Public Health, 37(1), 97-112, doi:10.1146/annurev-50 publhealth-032315-021740. 51
Kjellstrom, T. et al., 2018: Estimating population heat exposure and impacts on working people in conjunction with 52 climate change. Int J Biometeorol, 62(3), 291-306, doi:10.1007/s00484-017-1407-0. 53
Kjellstrom, T. et al., 2014: Occupational Heat Stress Contribution to WHO project on "Global assessment of the health 54 impacts of climate change", which started in 2009. ClimateChip Technical Report, Ruby Coast Research Centre, 55 Mapua, Nelson, New Zealand, 52 pp. Available at: 56 http://climatechip.org/sites/default/files/publications/TP2014_4_Occupational_Heat_Stress_WHO.pdf. 57
Klerkx, L., E. Jakku and P. Labarthe, 2019: A review of social science on digital agriculture, smart farming and 58 agriculture 4.0: New contributions and a future research agenda. NJAS - Wageningen Journal of Life Sciences, 90-59 91, 100315, doi:https://doi.org/10.1016/j.njas.2019.100315. 60
Kloos, J. and N. Baumert, 2015: Preventive resettlement in anticipation of sea level rise: a choice experiment from 61 Alexandria, Egypt. Natural Hazards, 76(1), 99-121, doi:10.1007/s11069-014-1475-y. 62
ACCEPTED VERSIO
N
SUBJECT TO FIN
AL EDITS

FINAL DRAFT Chapter 9 IPCC WGII Sixth Assessment Report
Do Not Cite, Quote or Distribute 9-187 Total pages: 225
Klotter, D., S. E. Nicholson, A. K. Dezfuli and L. Zhou, 2018: New Rainfall Datasets for the Congo Basin and 1 Surrounding Regions. Journal of Hydrometeorology, 19(8), 1379-1396, doi:10.1175/jhm-d-18-0015.1. 2
Klutse, N. A. B. et al., 2018: Potential impact of 1.5 °C and 2 °C global warming on consecutive dry and wet days over 3 West Africa. Environmental Research Letters, 13(5), 055013, doi:10.1088/1748-9326/aab37b. 4
KNOMAD, 2016: Migration and Development Brief 26: Migration and Remittances Recent Developments and 5 Outlook. World Bank, The Global Knowledge Partnership on Migration and Development (KNOMAD), 6 Washington, DC, 48 pp. Available at: 7 http://pubdocs.worldbank.org/en/661301460400427908/MigrationandDevelopmentBrief26.pdf. 8
Knorr, W., A. Arneth and L. Jiang, 2016: Demographic controls of future global fire risk. Nature Climate Change, 6(8), 9 781-785, doi:10.1038/nclimate2999. 10
Knorr, W. et al., 2017: Wildfire air pollution hazard during the 21st century. Atmos. Chem. Phys., 17(14), 9223-9236, 11 doi:10.5194/acp-17-9223-2017. 12
Knox, J. W., J. A. Rodríguez Díaz, D. J. Nixon and M. Mkhwanazi, 2010: A preliminary assessment of climate change 13 impacts on sugarcane in Swaziland. Agricultural Systems, 103(2), 63-72, 14 doi:https://doi.org/10.1016/j.agsy.2009.09.002. 15
Kohlitz, J., J. Chong and J. Willetts, 2017: Climate change vulnerability and resilience of water, sanitation, and hygiene 16 services: A theoretical perspective. Journal of Water Sanitation and Hygiene for Development, 7, 17 washdev2017134, doi:10.2166/washdev.2017.134. 18
Koks, E. E. et al., 2019: A global multi-hazard risk analysis of road and railway infrastructure assets. Nat Commun, 19 10(1), 2677, doi:10.1038/s41467-019-10442-3. 20
Kolawole, O. D. et al., 2016: Climate Variability and Rural Livelihoods: How Households Perceive and Adapt to 21 Climatic Shocks in the Okavango Delta, Botswana. Weather, Climate, and Society, 8(2), 131-145, 22 doi:10.1175/WCAS-D-15-0019.1. 23
Kolding, J., P. van Zwieten, F. Marttin and F. Poulain, 2016: Fisheries in the Drylands of sub-Saharan Africa: "fish 24 come with the rains" - Building resilience for sheries-dependent livelihoods to enhance food security and 25 nutrition in the drylands. FAO Fisheries and Aquaculture Circular Food and Agricultural Organization of the 26 United Nations, Rome, 64 pp. Available at: http://www.fao.org/3/a-i5616e.pdf. 27
Kolding, J. et al., 2019: Freshwater small pelagic fish and their fisheries in major African lakes and reservoirs in 28 relation to food security and nutrition. FAO Fisheries and Aquaculture Technical Paper, FAO, Rome, Italy, 122 29 pp. Available at: http://www.fao.org/documents/card/en/c/CA0843EN/. 30
Kolusu, S. R. et al., 2019: The El Niño event of 2015–2016: climate anomalies and their impact on groundwater 31 resources in East and Southern Africa. Hydrology and Earth System Sciences, 23(3), 1751-1762, 32 doi:10.5194/hess-23-1751-2019. 33
Kotchoni, D. O. V. et al., 2019: Relationships between rainfall and groundwater recharge in seasonally humid Benin: a 34 comparative analysis of long-term hydrographs in sedimentary and crystalline aquifers. Hydrogeology Journal, 35 27(2), 447-457, doi:10.1007/s10040-018-1806-2. 36
Koubi, V., 2019: Climate Change and Conflict. Annual Review of Political Science, 22(1), 343-360, 37 doi:10.1146/annurev-polisci-050317-070830. 38
Kraemer, B. M. et al., 2021: Climate change drives widespread shifts in lake thermal habitat. Nature Climate Change, 39 11(6), 521-529, doi:10.1038/s41558-021-01060-3. 40
Kraemer, M. U. G. et al., 2019: Past and future spread of the arbovirus vectors Aedes aegypti and Aedes albopictus. 41 Nature Microbiology, 4(5), 854-863, doi:10.1038/s41564-019-0376-y. 42
Krell, N. T. et al., 2021: Smallholder farmers' use of mobile phone services in central Kenya. Climate and Development, 43 13(3), 215-227, doi:10.1080/17565529.2020.1748847. 44
Kroon, F. J., P. Thorburn, B. Schaffelke and S. Whitten, 2016: Towards protecting the Great Barrier Reef from land-45 based pollution. Global Change Biology, 22(6), 1985-2002, doi:10.1111/gcb.13262. 46
Kruczkiewicz, A. et al., 2021: Opinion: Compound risks and complex emergencies require new approaches to 47 preparedness. Proceedings of the National Academy of Sciences, 118(19), e2106795118, 48 doi:10.1073/pnas.2106795118. 49
Kruger, A. C. and M. Nxumalo, 2017a: Historical rainfall trends in South Africa: 1921–2015. Water SA, 43(2), 285-50 297, doi:https://doi.org/10.4314/wsa.v43i2.12. 51
Kruger, A. C. and M. Nxumalo, 2017b: Surface temperature trends from homogenized time series in South Africa: 52 1931-2015. International Journal of Climatology, 37(5), 2364-2377, doi:10.1002/joc.4851. 53
Kuhl, L., 2021: Policy making under scarcity: reflections for designing socially just climate adaptation policy. One 54 Earth, 4(2), 202-212, doi:https://doi.org/10.1016/j.oneear.2021.01.008. 55
Kula, N., A. Haines and R. Fryatt, 2013: Reducing Vulnerability to Climate Change in Sub-Saharan Africa: The Need 56 for Better Evidence. PLoS medicine, 10(1), 5, doi:10.1371/journal.pmed.1001374. 57
Kulp, S. A. and B. H. Strauss, 2019: New elevation data triple estimates of global vulnerability to sea-level rise and 58 coastal flooding. Nature Communications, 10(1), 4844, doi:10.1038/s41467-019-12808-z. 59
Kumi, N. and B. J. Abiodun, 2018: Potential impacts of 1.5 °C and 2 °C global warming on rainfall onset, cessation and 60 length of rainy season in West Africa. Environmental Research Letters, 13(5), 055009, doi:10.1088/1748-61 9326/aab89e. 62
ACCEPTED VERSIO
N
SUBJECT TO FIN
AL EDITS

FINAL DRAFT Chapter 9 IPCC WGII Sixth Assessment Report
Do Not Cite, Quote or Distribute 9-188 Total pages: 225
Kummu, M. et al., 2021: Climate change risks pushing one-third of global food production outside the safe climatic 1 space. One Earth, 4(5), 720-729, doi:https://doi.org/10.1016/j.oneear.2021.04.017. 2
Kundzewicz, Z. W. et al., 2014: Flood risk and climate change: global and regional perspectives. Hydrological Sciences 3 Journal, 59(1), 1-28, doi:10.1080/02626667.2013.857411. 4
Kuper, H. et al., 2016: Social protection for people with disabilities in Tanzania: a mixed methods study. Oxford 5 Development Studies, 44(4), 441-457, doi:10.1080/13600818.2016.1213228. 6
Kupika, O. L., E. Gandiwa, G. Nhamo and S. Kativu, 2019: Local Ecological Knowledge on Climate Change and 7 Ecosystem-Based Adaptation Strategies Promote Resilience in the Middle Zambezi Biosphere Reserve, 8 Zimbabwe. Scientifica, 2019, 3069254, doi:10.1155/2019/3069254. 9
Kuran, C. H. A. et al., 2020: Vulnerability and vulnerable groups from an intersectionality perspective. International 10 Journal of Disaster Risk Reduction, 50, 101826, doi:https://doi.org/10.1016/j.ijdrr.2020.101826. 11
Kusangaya, S., M. L. Warburton, E. Archer van Garderen and G. P. W. Jewitt, 2014: Impacts of climate change on 12 water resources in southern Africa: A review. Physics and Chemistry of the Earth, Parts A/B/C, 67-69, 47-54, 13 doi:https://doi.org/10.1016/j.pce.2013.09.014. 14
Kynast-Wolf, G. et al., 2010: Seasonal patterns of cardiovascular disease mortality of adults in Burkina Faso, West 15 Africa. Trop Med Int Health, 15(9), 1082-1089, doi:10.1111/j.1365-3156.2010.02586.x. 16
Kyriakarakos, G., A. T. Balafoutis and D. Bochtis, 2020: Proposing a Paradigm Shift in Rural Electrification 17 Investments in Sub-Saharan Africa through Agriculture. Sustainability, 12(8), doi:10.3390/su12083096. 18
LaCanne, C. E. and J. G. Lundgren, 2018: Regenerative agriculture: merging farming and natural resource conservation 19 profitably. PeerJ, 6(e4428), doi:10.7717/peerj.4428. 20
Läderach, P., A. Martinez-Valle, G. Schroth and N. Castro, 2013: Predicting the future climatic suitability for cocoa 21 farming of the world’s leading producer countries, Ghana and Côte d’Ivoire. Climatic Change, 119(3-4), 841-854, 22 doi:10.1007/s10584-013-0774-8. 23
Lakhraj-Govender, R. and S. W. Grab, 2019: Rainfall and river flow trends for the Western Cape Province, South 24 Africa. South African Journal of Science, 115(9/10), 1-6, doi:http://dx.doi.org/10.17159/sajs.2019/6028 25
Lakhraj‐Govender, R. and S. W. Grab, 2019: Assessing the impact of El Niño–Southern Oscillation on South African 26 temperatures during austral summer. International Journal of Climatology, 39(1), 143-156, 27 doi:https://doi.org/10.1002/joc.5791. 28
Lallo, C. H. O. et al., 2018: Characterizing heat stress on livestock using the temperature humidity index (THI)—29 prospects for a warmer Caribbean. Regional Environmental Change, 18(8), 2329-2340, doi:10.1007/s10113-018-30 1359-x. 31
Lammers, P. L., T. Richter and J. Mantilla-Contreras, 2020: From Safety Net to Point of No Return—Are Small-Scale 32 Inland Fisheries Reaching Their Limits? Sustainability, 12(18), doi:10.3390/su12187299. 33
Landrigan, P. J. et al., 2018: The Lancet Commission on pollution and health. The Lancet, 391(10119), 462-512, 34 doi:10.1016/S0140-6736(17)32345-0. 35
Laneri, K. et al., 2015: Dynamical malaria models reveal how immunity buffers effect of climate variability. 36 Proceedings of the National Academy of Sciences of the United States of America, 112(28), 8786-8791, 37 doi:10.1073/pnas.1419047112. 38
Langat, P., L. Kumar and R. Koech, 2017: Temporal Variability and Trends of Rainfall and Streamflow in Tana River 39 Basin, Kenya. Sustainability, 9(11), doi:10.3390/su9111963. 40
Lapointe, D. et al., 2018: Predicted impacts of climate warming on aerobic performance and upper thermal tolerance of 41 six tropical freshwater fishes spanning three continents. Conserv Physiol, 6(1), coy056, 42 doi:10.1093/conphys/coy056. 43
Lasage, R. and P. H. Verburg, 2015: Evaluation of small scale water harvesting techniques for semi-arid environments. 44 Journal of Arid Environments, 118, 48-57, doi:https://doi.org/10.1016/j.jaridenv.2015.02.019. 45
Laufkötter, C., J. Zscheischler and T. L. Frölicher, 2020: High-impact marine heatwaves attributable to human-induced 46 global warming. Science (New York, N.Y.), 369(6511), 1621-1625, doi:https://doi.org/10.1126/science.aba0690. 47
Laurance, W. F., S. Sloan, L. Weng and J. A. Sayer, 2015: Estimating the Environmental Costs of Africa’s Massive 48 “Development Corridors”. Current Biology, 25(24), 3202-3208, doi:https://doi.org/10.1016/j.cub.2015.10.046. 49
Laurie, S. M., M. Faber and N. Claasen, 2018: Incorporating orange-fleshed sweet potato into the food system as a 50 strategy for improved nutrition: The context of South Africa. Food Research International, 104, 77-85, 51 doi:https://doi.org/10.1016/j.foodres.2017.09.016. 52
Lawlor, K., S. Handa and D. Seidenfeld, 2019: Cash Transfers Enable Households to Cope with Agricultural 53 Production and Price Shocks: Evidence from Zambia. The Journal of Development Studies, 55(2), 209-226, 54 doi:10.1080/00220388.2017.1393519. 55
Lazenby, M. J., M. C. Todd, R. Chadwick and Y. Wang, 2018: Future Precipitation Projections over Central and 56 Southern Africa and the Adjacent Indian Ocean: What Causes the Changes and the Uncertainty? Journal of 57 Climate, 31(12), 4807-4826, doi:10.1175/JCLI-D-17-0311.1. 58
Le Maitre, D. C. et al., 2020: Impacts of Plant Invasions on Terrestrial Water Flows in South Africa. In: Biological 59 Invasions in South Africa [van Wilgen, B. W., J. Measey, D. M. Richardson, J. R. Wilson and T. A. Zengeya 60 (eds.)]. Springer International Publishing, Cham, pp. 431-457. ISBN 978-3-030-32394-3. 61
ACCEPTED VERSIO
N
SUBJECT TO FIN
AL EDITS
FINAL DRAFT Chapter 9 IPCC WGII Sixth Assessment Report
Do Not Cite, Quote or Distribute 9-189 Total pages: 225
Leal Filho, W. et al., 2018: Strengthening climate change adaptation capacity in Africa-case studies from six major 1 African cities and policy implications. Environmental Science & Policy, 86, 29-37, 2 doi:https://doi.org/10.1016/j.envsci.2018.05.004. 3
Leck, H. et al., 2018: Towards Risk-Sensitive and Transformative Urban Development in Sub Saharan Africa. 4 Sustainability, 10(8), doi:10.3390/su10082645. 5
Leck, H. and D. Roberts, 2015: What lies beneath: understanding the invisible aspects of municipal climate change 6 governance. Current Opinion in Environmental Sustainability, 13, 61-67, 7 doi:https://doi.org/10.1016/j.cosust.2015.02.004. 8
Leck, H. and D. Simon, 2018: Local Authority Responses to Climate Change in South Africa: The Challenges of 9 Transboundary Governance. Sustainability, 10(7), 2542, doi:10.3390/su10072542. 10
Lee, A. T. K. and P. Barnard, 2016: Endemic birds of the Fynbos biome: a conservation assessment and impacts of 11 climate change. Bird Conservation International, 26(1), 52-68, doi:10.1017/S0959270914000537. 12
Lee, K. W. and M. Hong, 2018: Relative Effectiveness of Various Development Finance Flows: A Comparative Study. 13 KD Journal of Economic Policy, 40(3), 91-115, doi:10.23895/KDIJEP.2018.40.3.91. 14
Lee, T. M. et al., 2015: Predictors of public climate change awareness and risk perception around the world. Nature 15 Climate Change, 5(11), 1014-1020, doi:10.1038/nclimate2728. 16
Leedale, J., A. Jones, C. Caminade and A. Morse, 2016: A dynamic, climate-driven model of Rift Valley fever. 17 Geospatial health, 11, 394, doi:10.4081/gh.2016.394. 18
Lefore, N., A. Closas and P. Schmitter, 2021: Solar for all: A framework to deliver inclusive and environmentally 19 sustainable solar irrigation for smallholder agriculture. Energy Policy, 154, 112313, 20 doi:https://doi.org/10.1016/j.enpol.2021.112313. 21
Lelieveld, J. et al., 2016: Strongly increasing heat extremes in the Middle East and North Africa (MENA) in the 21st 22 century. Climatic Change, 137(1-2), 245–260, doi:https://doi.org/10.1007/s10584-016-1665-6. 23
Lempert, R. et al., 2015: Adaptation to Climate Change in Infrastructure Planning. In: Enhancing the Climate 24 Resilience of Africa's Infrastructure: The Power and Water Sectors [Cervigni, R., R. Liden, J. E. Neumann and K. 25 M. Strzepek (eds.)]. The World Bank, Washington, DC, pp. 103-130. ISBN 978-1-4648-0466-3. 26
Leone, M. et al., 2013: A time series study on the effects of heat on mortality and evaluation of heterogeneity into 27 European and Eastern-Southern Mediterranean cities: results of EU CIRCE project. Environmental health : a 28 global access science source, 12, 55, doi:10.1186/1476-069x-12-55. 29
Lequechane, J. D. et al., 2020: Mozambique’s response to cyclone Idai: how collaboration and surveillance with water, 30 sanitation and hygiene (WASH) interventions were used to control a cholera epidemic. Infectious Diseases of 31 Poverty, 9(1), 68, doi:10.1186/s40249-020-00692-5. 32
Leßmeister, A. et al., 2015: Substitution of the most important and declining wild food species in southeast Burkina 33 Faso. Flora et Vegetatio Sudano-Sambesica, 18, 11-20, doi:https://doi.org/10.21248/fvss.18.29. 34
Levy, B. S. and J. A. Patz, 2015: Climate Change, Human Rights, and Social Justice. Ann Glob Health, 81(3), 310-322, 35 doi:10.1016/j.aogh.2015.08.008. 36
Levy, K., A. P. Woster, R. S. Goldstein and E. J. Carlton, 2016: Untangling the impacts of climate change on 37 waterborne diseases: a systematic review of relationships between diarrheal diseases and temperature, rainfall, 38 flooding, and drought. Environmental science & technology, 50(10), 4905-4922, 39 doi:https://doi.org/10.1021/acs.est.5b06186. 40
Lewin, P. A., M. Fisher and B. Weber, 2012: Do rainfall conditions push or pull rural migrants: evidence from Malawi. 41 Agricultural Economics, 43(2), 191-204, doi:https://doi.org/10.1111/j.1574-0862.2011.00576.x. 42
Lewis, S. L., C. E. Wheeler, E. T. Mitchard and A. Koch, 2019: Restoring natural forests is the best way to remove 43 atmospheric carbon. Nature, 568, 25-28, doi:https://doi.org/10.1038/d41586-019-01026-8. 44
Li, C. et al., 2021: Changes in Annual Extremes of Daily Temperature and Precipitation in CMIP6 Models. Journal of 45 Climate, 34(9), 3441-3460, doi:10.1175/JCLI-D-19-1013.1. 46
Li, D., G. Christakos, X. Ding and J. Wu, 2018: Adequacy of TRMM satellite rainfall data in driving the SWAT 47 modeling of Tiaoxi catchment (Taihu lake basin, China). Journal of Hydrology, 556, 1139-1152, 48 doi:https://doi.org/10.1016/j.jhydrol.2017.01.006. 49
Li, J., M. Mullan and J. Helgeson, 2014: Improving the practice of economic analysis of climate change adaptation. 50 Journal of Benefit-Cost Analysis, 5(3), 445, doi:https://doi.org/10.1515/jbca-2014-9004. 51
Lieber, M. et al., 2021: The Synergistic Relationship Between Climate Change and the HIV/AIDS Epidemic: A 52 Conceptual Framework. AIDS and Behavior, 25(7), 2266-2277, doi:10.1007/s10461-020-03155-y. 53
Liebmann, B. et al., 2014: Understanding Recent Eastern Horn of Africa Rainfall Variability and Change. Journal of 54 Climate, 27(23), 8630-8645, doi:10.1175/jcli-d-13-00714.1. 55
Lindley, S. J., P. A. Cook, M. Dennis and A. Gilchrist, 2019: Biodiversity, Physical Health and Climate Change: A 56 Synthesis of Recent Evidence. In: Biodiversity and Health in the Face of Climate Change [Marselle, M. R., J. 57 Stadler, H. Korn, K. N. Irvine and A. Bonn (eds.)]. Springer International Publishing, Cham, pp. 17-46. ISBN 58 978-3-030-02317-1. 59
Linke, A. M. et al., 2018: Drought, Local Institutional Contexts, and Support for Violence in Kenya. Journal of Conflict 60 Resolution, 62(7), 1544-1578, doi:10.1177/0022002717698018. 61
Lipper, L. et al., 2014: Climate-smart agriculture for food security. Nature Climate Change, 4(12), 1068-1072, 62 doi:10.1038/nclimate2437. 63
ACCEPTED VERSIO
N
SUBJECT TO FIN
AL EDITS
FINAL DRAFT Chapter 9 IPCC WGII Sixth Assessment Report
Do Not Cite, Quote or Distribute 9-190 Total pages: 225
Liu, B., Y. L. Siu and G. Mitchell, 2017: A quantitative model for estimating risk from multiple interacting natural 1 hazards: an application to northeast Zhejiang, China. Stochastic Environmental Research and Risk Assessment, 31, 2 1319-1340, doi:10.1007/s00477-016-1250-6. 3
Liu, J. et al., 2018a: Nexus approaches to global sustainable development. Nature Sustainability, 1(9), 466-476, 4 doi:10.1038/s41893-018-0135-8. 5
Liu, W. et al., 2018b: Global Freshwater Availability Below Normal Conditions and Population Impact Under 1.5 and 6 2 °C Stabilization Scenarios. Geophysical Research Letters, 45(18), 9803-9813, 7 doi:https://doi.org/10.1029/2018GL078789. 8
Liu, W. et al., 2018c: Global drought and severe drought-affected populations in 1.5 and 2 C warmer worlds. Earth 9 System Dynamics, 9(1), 267-283, doi:https://doi.org/10.5194/esd-9-267-2018. 10
Liverpool-Tasie, L. S. O. et al., 2020: Perceptions and exposure to climate events along agricultural value chains: 11 Evidence from Nigeria. Journal of Environmental Management, 264(January), 12 doi:10.1016/j.jenvman.2020.110430. 13
Liwenga, E. et al., 2015: Climate related projections on future water resources and human adaptation in the Great Ruaha 14 River Basin in Tanzania. 15
Lobell, D. B., M. Bänziger, C. Magorokosho and B. Vivek, 2011: Nonlinear heat effects on African maize as evidenced 16 by historical yield trials. Nature Climate Change, 1(1), 42-45, doi:10.1038/nclimate1043. 17
Loevinsohn, M., 2015: The 2001-03 Famine and the Dynamics of HIV in Malawi: A Natural Experiment. PLoS One, 18 10(9), e0135108, doi:10.1371/journal.pone.0135108. 19
Longo-Mbenza, B. et al., 1999: Hematocrit and stroke in black Africans under tropical climate and meteorological 20 influence. Ann Med Interne (Paris), 150(3), 171-177. 21
Loucks, D. P. and E. van Beek, 2017: Water Resource Systems Modeling: Its Role in Planning and Management. In: 22 Water Resource Systems Planning and Management: An Introduction to Methods, Models, and Applications. 23 Springer International Publishing, Cham, pp. 51-72. ISBN 978-3-319-44234-1. 24
Lovelock, C. E. and C. M. Duarte, 2019: Dimensions of Blue Carbon and emerging perspectives. Biology Letters, 25 15(3), 20180781, doi:10.1098/rsbl.2018.0781. 26
Lovschal, M. et al., 2017: Fencing bodes a rapid collapse of the unique Greater Mara ecosystem. Sci Rep, 7, 41450, 27 doi:10.1038/srep41450. 28
Low, A. J. et al., 2019: Association between severe drought and HIV prevention and care behaviors in Lesotho: A 29 population-based survey 2016–2017. PLoS medicine, 16(1), e1002727, doi:10.1371/journal.pmed.1002727. 30
Lowe, B. S. et al., 2019: Adapting to change in inland fisheries: analysis from Lake Tanganyika, East Africa. Regional 31 Environmental Change, 19(6), 1765-1776, doi:10.1007/s10113-019-01516-5. 32
Ludwig, F. et al., 2013: Climate change impacts on the Congo Basin region [Haensler, A., D. Jacob, P. Kabat and F. 33 Ludwig (eds.)]. Climate Change Scenarios for the Congo Basin, Climate Service Centre, Hamburg, Germany. 34
Lumbroso, D., 2018: How can policy makers in sub-Saharan Africa make early warning systems more effective? The 35 case of Uganda. International Journal of Disaster Risk Reduction, 27, 530-540, 36 doi:https://doi.org/10.1016/j.ijdrr.2017.11.017. 37
Lumbroso, D., 2020: Flood risk management in Africa. Journal of Flood Risk Management, 13(3), 38 doi:10.1111/jfr3.12612. 39
Lund Schlamovitz, J. and P. Becker, 2020: Differentiated vulnerabilities and capacities for adaptation to water shortage 40 in Gaborone, Botswana. International Journal of Water Resources Development, 37(2), 278-299, 41 doi:10.1080/07900627.2020.1756752. 42
Lunga, W. and C. Musarurwa, 2016: Exploiting indigenous knowledge commonwealth to mitigate disasters: from the 43 archives of vulnerable communities in Zimbabwe. Indian J. Tradit. Knowl., 15(1), 22-29. 44
Lunga, W., P. Pathias Bongo, D. van Niekerk and C. Musarurwa, 2019: Disability and disaster risk reduction as an 45 incongruent matrix: Lessons from rural Zimbabwe. Jamba, 11(1), 648, doi:10.4102/jamba.v11i1.648. 46
Luo, X. et al., 2019: Hydrological Simulation Using TRMM and CHIRPS Precipitation Estimates in the Lower 47 Lancang-Mekong River Basin. Chinese geographical science, 29(1), 13-25, doi:https://doi.org/10.1007/s11769-48 019-1014-6. 49
Lurie, M. N., 2006: The Epidemiology of Migration and HIV/AIDS in South Africa. Journal of Ethnic and Migration 50 Studies, 32(4), 649-666. 51
Lutz, W., R. Muttarak and E. Striessnig, 2014: Universal education is key to enhanced climate adaptation. Science (New 52 York, N.Y.), 346(6213), 1061-1062, doi:10.1126/science.1257975. 53
Lwasa, S., K. Buyana, P. Kasaija and J. Mutyaba, 2018: Scenarios for adaptation and mitigation in urban Africa under 54 1.5 °C global warming. Current Opinion in Environmental Sustainability, 30, 52-58, 55 doi:10.1016/j.cosust.2018.02.012. 56
Lwasa, S. et al., 2014: Urban and peri-urban agriculture and forestry: Transcending poverty alleviation to climate 57 change mitigation and adaptation. Urban Climate, 7, 92-106, doi:10.1016/j.uclim.2013.10.007. 58
Lyon, B., T. Dinku, A. Raman and M. C. Thomson, 2017: Temperature suitability for malaria climbing the Ethiopian 59 Highlands. Environmental Research Letters, 12(6), 064015, doi:10.1088/1748-9326/aa64e6. 60
Lyon, B. and N. Vigaud, 2017: Unraveling East Africa's Climate Paradox. In: Climate Extremes [Wang, S. S., J. Yoon, 61 C. C. Funk and R. R. Gillies (eds.)]. John Wiley & Sons, Inc, pp. 265-281. ISBN 9781119068020. 62
ACCEPTED VERSIO
N
SUBJECT TO FIN
AL EDITS

FINAL DRAFT Chapter 9 IPCC WGII Sixth Assessment Report
Do Not Cite, Quote or Distribute 9-191 Total pages: 225
M’Bra, R. K. et al., 2018: Impact of climate variability on the transmission risk of malaria in northern Côte d'Ivoire. 1 PLOS ONE, 13(6), e0182304, doi:10.1371/journal.pone.0182304. 2
Maarleveld, T. J. and U. Guérin, 2013: Manual for Activities directed at Underwater Cultural Heritage [Egger, B. 3 (ed.)]. UNESCO, France, 351 pp. Available at: http://www.unesco.org/culture/en/underwater/pdf/UCH-4 Manual.pdf (accessed 2019/03/22/08:30:46). 5
Mabuya, B. and M. Scholes, 2020: The Three Little Houses: A Comparative Study of Indoor and Ambient 6 Temperatures in Three Low-Cost Housing Types in Gauteng and Mpumalanga, South Africa. International 7 journal of environmental research and public health, 17(10), 3524, doi:10.3390/ijerph17103524. 8
Macamo, C. C. F. et al., 2016: Mangrove’s response to cyclone Eline (2000): What is happening 14 years later. Aquatic 9 Botany, 134, 10-17, doi:10.1016/j.aquabot.2016.05.004. 10
MacDonald, A. M., H. C. Bonsor, B. É. Ó. Dochartaigh and R. G. Taylor, 2012: Quantitative maps of groundwater 11 resources in Africa. Environmental Research Letters, 7(2), doi:10.1088/1748-9326/7/2/024009. 12
Mach, K. J. et al., 2019: Climate as a risk factor for armed conflict. Nature, 571, 193-197, doi:10.1038/s41586-019-13 1300-6. 14
Macháček, J., 2019: Typology of Environmental Impacts of Artisanal and Small-Scale Mining in African Great Lakes 15 Region. Sustainability, 11(11), doi:10.3390/su11113027. 16
Mackinnon, E. et al., 2019: 21st century research in urban WASH and health in sub-Saharan Africa: methods and 17 outcomes in transition. Int J Environ Health Res, 29(4), 457-478, doi:10.1080/09603123.2018.1550193. 18
MacVicar, S. et al., 2017: Whether weather matters: Evidence of association between in utero meteorological exposures 19 and foetal growth among Indigenous and non-Indigenous mothers in rural Uganda. PLoS One, 12(6), e0179010, 20 doi:10.1371/journal.pone.0179010. 21
Madonsela, B., S. Koop, K. Van Leeuwen and K. Carden, 2019: Evaluation of Water Governance Processes Required 22 to Transition towards Water Sensitive Urban Design—An Indicator Assessment Approach for the City of Cape 23 Town. Water, 11(2), 14, doi:10.3390/w11020292. 24
Mafongoya, P. et al., 2019: Climate Change and Rapidly Evolving Pests and Diseases in Southern Africa. pp. 41-57. 25 Mafongoya, P. L., O. Jiri, C. P. Mubaya and O. Mafongoya, 2017: Using indigenous knowledge for seasonal quality 26
prediction in managing climate risk in sub-Saharan Africa. In: Indigenous knowledge systems and climate change 27 management in Africa [Mafongoya, P. L. and O. C. Ajayi (eds.)]. The Technical Centre for Agricultural and Rural 28 Cooperation (CTA), Wageningen, The Netherlands, pp. 43. 29
Mahe, G. et al., 2013: The rivers of Africa: witness of climate change and human impact on the environment. 30 Hydrological Processes, 27(15), 2105-2114, doi:10.1002/hyp.9813. 31
Mahl, D. et al., 2020: “We are a Bit Blind About it”: A Qualitative Analysis of Climate Change-Related Perceptions 32 and Communication Across South African Communities. Environmental Communication, 14(6), 802-815, 33 doi:10.1080/17524032.2020.1736116. 34
Mahmood, R., S. Jia and W. Zhu, 2019: Analysis of climate variability, trends, and prediction in the most active parts 35 of the Lake Chad basin, Africa. Scientific Reports, 9(1), 6317, doi:10.1038/s41598-019-42811-9. 36
Maidment, R. I., R. P. Allan and E. Black, 2015: Recent observed and simulated changes in precipitation over Africa. 37 Geophysical Research Letters, 42(19), 8155-8164, doi:10.1002/2015gl065765. 38
Maire, E. et al., 2021: Micronutrient supply from global marine fisheries under climate change and overfishing. Current 39 Biology, doi:https://doi.org/10.1016/j.cub.2021.06.067. 40
Makaka, G. and E. Meyer, 2006: Temperature Stability of Traditional and Low-cost Modern Housing in the Eastern 41 Cape, South Africa. Journal of Building Physics, 30(1), 71-86, doi:10.1177/1744259106065674. 42
Makara, S., 2018: Decentralisation and good governance in Africa: A critical review. African Journal of Political 43 Science and International Relations, 12(2), 22-32, doi:https://doi.org/10.5897/AJPSIR2016.0973. 44
Makate, C., 2019: Local institutions and indigenous knowledge in adoption and scaling of climate-smart agricultural 45 innovations among sub-Saharan smallholder farmers. International Journal of Climate Change Strategies and 46 Management, 12(2), 270-287, doi:10.1108/IJCCSM-07-2018-0055. 47
Makate, C., M. Makate, N. Mango and S. Siziba, 2019: Increasing resilience of smallholder farmers to climate change 48 through multiple adoption of proven climate-smart agriculture innovations. Lessons from Southern Africa. 49 Journal of Environmental Management, 231, 858-868, doi:https://doi.org/10.1016/j.jenvman.2018.10.069. 50
Makina, A. and T. Moyo, 2016: Mind the gap: institutional considerations for gender-inclusive climate change policy in 51 Sub-Saharan Africa. Local Environment, 21(10), 1185-1197, doi:10.1080/13549839.2016.1189407. 52
Makondo, C. C. and D. S. G. Thomas, 2018: Climate change adaptation: Linking indigenous knowledge with western 53 science for effective adaptation. Environmental Science & Policy, 88, 83-91, 54 doi:https://doi.org/10.1016/j.envsci.2018.06.014. 55
Malherbe, J., F. A. Engelbrecht and W. A. Landman, 2013: Projected changes in tropical cyclone climatology and 56 landfall in the Southwest Indian Ocean region under enhanced anthropogenic forcing. Clim Dyn, 40(11), 2867-57 2886, doi:https://doi.org/10.1007/s00382-012-1635-2. 58
Malhi, Y. et al., 2014: Tropical Forests in the Anthropocene. Annual Review of Environment and Resources, 39(1), 125-59 159, doi:10.1146/annurev-environ-030713-155141. 60
Manatsa, D. and S. K. Behera, 2013: On the Epochal Strengthening in the Relationship between Rainfall of East Africa 61 and IOD. Journal of Climate, 26(15), 5655-5673, doi:10.1175/jcli-d-12-00568.1. 62
ACCEPTED VERSIO
N
SUBJECT TO FIN
AL EDITS
FINAL DRAFT Chapter 9 IPCC WGII Sixth Assessment Report
Do Not Cite, Quote or Distribute 9-192 Total pages: 225
Manes, S. et al., 2021: Endemism increases species' climate change risk in areas of global biodiversity importance. 1 Biological Conservation, 257, 109070, doi:https://doi.org/10.1016/j.biocon.2021.109070. 2
Manuamorn, O. P. and R. Biesbroek, 2020: Do direct-access and indirect-access adaptation projects differ in their focus 3 on local communities? A systematic analysis of 63 Adaptation Fund projects. Regional Environmental Change, 4 20(4), 139, doi:10.1007/s10113-020-01716-4. 5
Manzanedo, R. D. and P. Manning, 2020: COVID-19: Lessons for the climate change emergency. Science of the Total 6 Environment, 742, 140563-140563, doi:10.1016/j.scitotenv.2020.140563. 7
Mapfumo, P. et al., 2017: Pathways to transformational change in the face of climate impacts: an analytical framework. 8 Climate and Development, 9(5), 439-451, doi:https://doi.org/10.1080/17565529.2015.1040365. 9
Marais, E. A. et al., 2019: Air Quality and Health Impact of Future Fossil Fuel Use for Electricity Generation and 10 Transport in Africa. Environmental Science & Technology, 53(22), 13524-13534, doi:10.1021/acs.est.9b04958. 11
Marais, E. A. and C. Wiedinmyer, 2016: Air Quality Impact of Diffuse and Inefficient Combustion Emissions in Africa 12 (DICE-Africa). Environmental Science & Technology, 50(19), 10739-10745, doi:10.1021/acs.est.6b02602. 13
Marchetta, F., D. E. Sahn and L. Tiberti, 2019: The Role of Weather on Schooling and Work of Young Adults in 14 Madagascar. American Journal of Agricultural Economics, 101(4), 1203-1227, doi:10.1093/ajae/aaz015. 15
Marchiori, L., J.-F. Maystadt and I. Schumacher, 2012: The impact of weather anomalies on migration in sub-Saharan 16 Africa. Journal of Environmental Economics and Management, 63(3), 355-374, 17 doi:https://doi.org/10.1016/j.jeem.2012.02.001. 18
Marcotullio, P. J., C. Keßler and B. M. Fekete, 2021: The future urban heat-wave challenge in Africa: Exploratory 19 analysis. Global Environmental Change, 66, 102190, doi:https://doi.org/10.1016/j.gloenvcha.2020.102190. 20
Markandya, A. et al., 2018: Health co-benefits from air pollution and mitigation costs of the Paris Agreement: a 21 modelling study. The Lancet Planetary Health, 2(3), e126-e133, doi:10.1016/S2542-5196(18)30029-9. 22
Markham, A., E. Osipova, K. Lafrenz Samuels and A. Caldas, 2016: World Heritage and Tourism in a Changing 23 Climate., United Nations Environment Programme, Nairobi, Kenya. 24
Martens, C. et al., 2021: Large uncertainties in future biome changes in Africa call for flexible climate adaptation 25 strategies. Global Change Biology, 27(2), 340-358, doi:https://doi.org/10.1111/gcb.15390. 26
Martin, V. et al., 2008: The impact of climate change on the epidemiology and control of Rift Valley fever. Rev Sci 27 Tech, 27(2), 413-426. 28
Martínez-Capel, F., L. García-López and M. Beyer, 2017: Integrating Hydrological Modelling and Ecosystem 29 Functioning for Environmental Flows in Climate Change Scenarios in the Zambezi River (Zambezi Region, 30 Namibia). River Research and Applications, 33(2), 258-275, doi:https://doi.org/10.1002/rra.3058. 31
Marzeion, B. and A. Levermann, 2014: Loss of cultural world heritage and currently inhabited places to sea-level rise. 32 Environmental Research Letters, 9(3), doi:10.1088/1748-9326/9/3/034001. 33
Masih, I., S. Maskey, F. E. F. Mussá and P. Trambauer, 2014: A review of droughts on the African continent: a 34 geospatial and long-term perspective. Hydrology and Earth System Sciences, 18(9), 3635-3649, doi:10.5194/hess-35 18-3635-2014. 36
Masson, V. L., C. Benoudji, S. S. Reyes and G. Bernard, 2019: How violence against women and girls undermines 37 resilience to climate risks in Chad. Disasters, 43 Suppl 3(Suppl 3), S245-s270, doi:10.1111/disa.12343. 38
Masters, G. and L. Norgrove, 2010: Climate change and invasive alien species. 1, CABI, Switzerland, 30 pp. Available 39 at: https://www.cabi.org/Uploads/CABI/expertise/invasive-alien-species-working-paper.pdf. 40
Mastrorillo, M. et al., 2016: The influence of climate variability on internal migration flows in South Africa. Global 41 Environmental Change, 39, 155-169, doi:https://doi.org/10.1016/j.gloenvcha.2016.04.014. 42
Masubelele, M. L., M. T. Hoffman, W. J. Bond and J. Gambiza, 2014: A 50 year study shows grass cover has increased 43 in shrublands of semi-arid South Africa. Journal of Arid Environments, 104, 43-51, 44 doi:https://doi.org/10.1016/j.jaridenv.2014.01.011. 45
Masullo, I., G. Larsen, L. Brown and L. Dougherty-Choux, 2015: “Direct Access” To Climate Finance: Lessons 46 Learned By National Institutions. World Resources Institute, 1-32 pp. Available at: 47 https://wriorg.s3.amazonaws.com/s3fs-48 public/22DIRECT_ACCESS_TO_CLIMATE_FINANCE_LESSONS_LEARNED_BY_NATIONAL_INSTITUT49 IONS.pdf. 50
Mathews, E. H., P. G. Richards, S. L. Van Wyk and P. G. Rousseau, 1995: Energy efficiency of ultra-low-cost housing. 51 Building and Environment, 30(3), 427-432, doi:10.1016/0360-1323(94)00061-V. 52
Matlin, S. A. et al., 2018: Migrants’ and refugees’ health: towards an agenda of solutions. Public Health Rev., 39(1), 55, 53 doi:10.1186/s40985-018-0104-9. 54
Maúre, G. et al., 2018: The southern African climate under 1.5 °C and 2 °C of global warming as simulated by 55 CORDEX regional climate models. Environmental Research Letters, 13(6), 065002, doi:10.1088/1748-56 9326/aab190. 57
Maurin, O. et al., 2014: Savanna fire and the origins of the ‘underground forests’ of Africa. New Phytologist, 204(1), 58 201-214, doi:https://doi.org/10.1111/nph.12936. 59
Mavah, G. A. et al., 2018: Food and livelihoods in park-adjacent communities: The case of the Odzala Kokoua National 60 Park. Biological Conservation, 222, 44-51, doi:10.1016/j.biocon.2018.03.036. 61
Mawren, D., J. Hermes and C. J. C. Reason, 2021: Marine heatwaves in the Mozambique Channel. Clim Dyn, 62 doi:10.1007/s00382-021-05909-3. 63
ACCEPTED VERSIO
N
SUBJECT TO FIN
AL EDITS

FINAL DRAFT Chapter 9 IPCC WGII Sixth Assessment Report
Do Not Cite, Quote or Distribute 9-193 Total pages: 225
Maystadt, J.-F. and O. Ecker, 2014: Extreme Weather and Civil War: Does Drought Fuel Conflict in Somalia through 1 Livestock Price Shocks? American Journal of Agricultural Economics, 96(4), 1157-1182, 2 doi:10.1093/ajae/aau010. 3
Maystadt, J. F., M. Calderone and L. You, 2014: Local warming and violent conflict in North and South Sudan. Journal 4 of Economic Geography, 15(3), 649-671, doi:10.1093/jeg/lbu033. 5
Mba, W. P. et al., 2018: Consequences of 1.5 °C and 2 °C global warming levels for temperature and precipitation 6 changes over Central Africa. Environmental Research Letters, 13(5), 055011, doi:10.1088/1748-9326/aab048. 7
Mbakaya, B. C., F. W. Kalembo and M. Zgambo, 2020: Use, adoption, and effectiveness of tippy-tap handwashing 8 station in promoting hand hygiene practices in resource-limited settings: a systematic review. BMC public health, 9 20(1), 1005, doi:10.1186/s12889-020-09101-w. 10
Mbaye, L. M., 2017: Climate change, natural disasters, and migration. African Development Bank, Côte d’Ivoire. 11 Mbereko, A., M. J. Chimbari and S. Mukaratirwa, 2018: The political ecology of stakeholder-driven climate change 12
adaptation: Case study from Ntalale ward, Gwanda district, in Zimbabwe. Jamba, 10(1), 419, 13 doi:10.4102/jamba.v10i1.419. 14
Mbow, C. et al., 2014: Achieving mitigation and adaptation to climate change through sustainable agroforestry 15 practices in africa. Current Opinion in Environmental Sustainability, 6, 8-14, doi:10.1016/j.cosust.2013.09.002. 16
McCarl, B. A. et al., 2015: Climate change vulnerability and adaptation strategies in Egypt’s agricultural sector. 17 Mitigation and Adaptation Strategies for Global Change, 20(7), 1097-1109, doi:10.1007/s11027-013-9520-9. 18
McCarl, B. A., A. W. Thayer and J. P. H. Jones, 2016: The challenge of climate change adaptation for agriculture: An 19 economically oriented review. Journal of Agricultural and Applied Economics, 48(4), 321-344, 20 doi:10.1017/aae.2016.27. 21
McCartney, M. P. et al., 2019: Rethinking irrigation modernisation: realising multiple objectives through the integration 22 of fisheries. Marine and Freshwater Research, 70(9), 1201-1210, doi:https://doi.org/10.1071/MF19161. 23
McClanahan, T. R. et al., 2014: Biogeography and change among regional coral communities across the Western Indian 24 Ocean. PLoS One, 9(4), e93385, doi:10.1371/journal.pone.0093385. 25
McCleery, R. et al., 2018: Animal diversity declines with broad-scale homogenization of canopy cover in African 26 savannas. Biological Conservation, 226, 54-62, doi:10.1016/j.biocon.2018.07.020. 27
McCord, G. C., 2016: Malaria ecology and climate change. Eur. Phys. J. Spec. Top., 225(3), 459-470, 28 doi:10.1140/epjst/e2015-50097-1. 29
McCord, P. F., M. Cox, M. Schmitt-Harsh and T. Evans, 2015: Crop diversification as a smallholder livelihood strategy 30 within semi-arid agricultural systems near Mount Kenya. Land Use Policy, 42, 738-750, 31 doi:https://doi.org/10.1016/j.landusepol.2014.10.012. 32
McDonald, R. I. et al., 2014: Water on an urban planet: Urbanization and the reach of urban water infrastructure. 33 Global Environmental Change, 27, 96-105, doi:10.1016/j.gloenvcha.2014.04.022. 34
McDonnell, L. H. and L. J. Chapman, 2015: At the edge of the thermal window: effects of elevated temperature on the 35 resting metabolism, hypoxia tolerance and upper critical thermal limit of a widespread African cichlid. Conserv 36 Physiol, 3(1), cov050, doi:10.1093/conphys/cov050. 37
McIntyre, P. B., C. A. Reidy and C. Revenga, 2016: Linking freshwater fishery management to global food security and 38 biodiversity conservation. Proceedings of the National Academy of Sciences, 113(45), 39 doi:10.1073/pnas.1521540113. 40
McKechnie, A. E., I. A. Rushworth, F. Myburgh and S. J. Cunningham, 2021: Mortality among birds and bats during 41 an extreme heat event in eastern South Africa. Austral Ecology, 46(4), 687-691, 42 doi:https://doi.org/10.1111/aec.13025. 43
McNicol, I. M., C. M. Ryan and E. T. A. Mitchard, 2018: Carbon losses from deforestation and widespread degradation 44 offset by extensive growth in African woodlands. Nature Communications, 9(1), 3045, doi:10.1038/s41467-018-45 05386-z. 46
McOmber, C., C. Audia and F. Crowley, 2019: Building resilience by challenging social norms: integrating a 47 transformative approach within the BRACED consortia. Disasters, 43 Suppl 3, S271-s294, 48 doi:10.1111/disa.12341. 49
Meadow, A. M. et al., 2015: Moving toward the deliberate coproduction of climate science knowledge. Climate, and 50 Society, 7(2), 179-191, doi:https://doi.org/10.1175/WCAS-D-14-00050.1. 51
Mechler, R. et al., 2020: Loss and Damage and limits to adaptation: recent IPCC insights and implications for climate 52 science and policy. Sustainability Science, doi:10.1007/s11625-020-00807-9. 53
Meissner, R. and I. Jacobs, 2016: Theorising complex water governance in Africa: the case of the proposed Epupa Dam 54 on the Kunene River. International Environmental Agreements: Politics, Law and Economics, 16(1), 21-48, 55 doi:10.1007/s10784-014-9250-9. 56
Mekonnen, M. M. and A. Y. Hoekstra, 2016: Four billion people facing severe water scarcity. Science Advances, 2(2), 57 e1500323, doi:10.1126/sciadv.1500323. 58
Melillo, J. M. et al., 2016: Protected areas' role in climate-change mitigation. Ambio, 45(2), 133-145, 59 doi:10.1007/s13280-015-0693-1. 60
Meque, A. et al., 2021: Numerical weather prediction and climate modelling: Challenges and opportunities for 61 improving climate services delivery in Southern Africa. Climate Services, 23, 100243, 62 doi:https://doi.org/10.1016/j.cliser.2021.100243. 63
ACCEPTED VERSIO
N
SUBJECT TO FIN
AL EDITS

FINAL DRAFT Chapter 9 IPCC WGII Sixth Assessment Report
Do Not Cite, Quote or Distribute 9-194 Total pages: 225
Mercy Corps, 2019: Climate Information Services Research Initiative: Final Report. A Learning Agenda for Climate 1 Information Services in Sub-Saharan Africa (USAID). Mercy Corps, Washington DC, USA. Available at: 2 https://www.climatelinks.org/sites/default/files/asset/document/2020_USAID_Mercy-CorpsC-CISRI.pdf. 3
Meresa, H. K. and M. T. Gatachew, 2018: Climate change impact on river flow extremes in the Upper Blue Nile River 4 basin. Journal of Water and Climate Change, 10(4), 759-781, doi:10.2166/wcc.2018.154. 5
Merkens, J.-L., L. Reimann, J. Hinkel and A. T. Vafeidis, 2016: Gridded population projections for the coastal zone 6 under the Shared Socioeconomic Pathways. Global and Planetary Change, 145, 57-66, 7 doi:https://doi.org/10.1016/j.gloplacha.2016.08.009. 8
Mersha, A. A. and F. Van Laerhoven, 2016: A gender approach to understanding the differentiated impact of barriers to 9 adaptation: responses to climate change in rural Ethiopia. Regional Environmental Change, 16(6), 1701-1713, 10 doi:10.1007/s10113-015-0921-z. 11
Mertz, O., A. Lykke and A. Reenberg, 2001: Importance and seasonality of vegetable consumption and marketing in 12 Burkina Faso. Economic Botany, 55(2), 276-289, doi:10.1007/BF02864565. 13
Messerli, P. et al., 2014: The geography of large-scale land acquisitions: Analysing socio-ecological patterns of target 14 contexts in the global South. Applied Geography, 53, 449-459, doi:10.1016/j.apgeog.2014.07.005. 15
Messina, J. P. et al., 2019: The current and future global distribution and population at risk of dengue. Nature 16 Microbiology, 4(9), 1508-1515, doi:10.1038/s41564-019-0476-8. 17
Meyer, C., H. Kreft, R. Guralnick and W. Jetz, 2015: Global priorities for an effective information basis of biodiversity 18 distributions. Nature Communications, 6, doi:10.1038/ncomms9221. 19
Mfitumukiza, D. et al., 2020: The role of indigenous knowledge (IK) in adaptation to drought by agropastoral 20 smallholder farmers in Uganda. Indian J. Tradit. Knowl., 19(1), 44-52. 21
Midgley, G. F. and W. J. Bond, 2015: Future of African terrestrial biodiversity and ecosystems under anthropogenic 22 climate change. Nature Climate Change, 5(9), 823-829, doi:10.1038/nclimate2753. 23
Miguel, E., S. Satyanath and E. Sergenti, 2004: Economic Shocks and Civil Conflict: An Instrumental Variables 24 Approach. Journal of Political Economy, 112(4), 725-753, doi:10.1086/421174. 25
Miller, J. D. and M. Hutchins, 2017: The impacts of urbanisation and climate change on urban flooding and urban water 26 quality: A review of the evidence concerning the United Kingdom. Journal of Hydrology: Regional Studies, 12, 27 345-362, doi:10.1016/j.ejrh.2017.06.006. 28
Milne, R., S. J. Cunningham, A. T. K. Lee and B. Smit, 2015: The role of thermal physiology in recent declines of birds 29 in a biodiversity hotspot. Conservation Physiology, 3(1), doi:10.1093/conphys/cov048. 30
Minoli, S. et al., 2019: Global Response Patterns of Major Rainfed Crops to Adaptation by Maintaining Current 31 Growing Periods and Irrigation. Earth's Future, 7(12), 1464-1480, doi:https://doi.org/10.1029/2018EF001130. 32
Minsker, B. et al., 2015: Progress and Recommendations for Advancing Performance-Based Sustainable and Resilient 33 Infrastructure Design. Journal of Water Resources Planning and Management, 141(12), A4015006, 34 doi:10.1061/(ASCE)WR.1943-5452.0000521. 35
Missirian, A. and W. Schlenker, 2017: Asylum applications respond to temperature fluctuations. Science (New York, 36 N.Y.), 358(6370), 1610-1614, doi:10.1126/science.aao0432. 37
Mitchell, D., 2016: Human Influences on Heat-Related Health Indicators During the 2015 Egyptian Heat Wave. 38 Bulletin of the American Meteorological Society, 97, S70-S74, doi:10.1175/BAMS-D-16-0132.1. 39
Mithöfer, D. and H. Waibel (eds.), Seasonal vulnerability to poverty and indigenous fruit use in Zimbabwe. Rural 40 poverty reduction through research for development and transformation, Berlin, Germany, University of 41 Hannover, 5-7 pp. 42
Moat, J., T. W. Gole and A. P. Davis, 2019: Least concern to endangered: Applying climate change projections 43 profoundly influences the extinction risk assessment for wild Arabica coffee. Glob Chang Biol, 25(2), 390-403, 44 doi:10.1111/gcb.14341. 45
Mogomotsi, P. K., A. Sekelemani and G. E. Mogomotsi, 2020: Climate change adaptation strategies of small-scale 46 farmers in Ngamiland East, Botswana. Climatic Change, 159, 441–460, doi:https://doi.org/10.1007/s10584-019-47 02645-w. 48
Mohmmed, A. et al., 2018: Assessing drought vulnerability and adaptation among farmers in Gadaref region, Eastern 49 Sudan. Land Use Policy, 70, 402-413, doi:https://doi.org/10.1016/j.landusepol.2017.11.027. 50
Mohsin, M. et al., 2019: Developing low carbon economies: An aggregated composite index based on carbon 51 emissions. Sustainable Energy Technologies and Assessments, 35, 365-374, 52 doi:https://doi.org/10.1016/j.seta.2019.08.003. 53
Mokadem, N. et al., 2018: Impact of climate change on groundwater and the extinction of ancient “Foggara” and 54 springs systems in arid lands in North Africa: a case study in Gafsa basin (Central of Tunisia). Euro-55 Mediterranean Journal for Environmental Integration, 3(1), 28, doi:10.1007/s41207-018-0070-0. 56
Mokhatla, M. M., D. Rödder and G. J. Measey, 2015: Assessing the effects of climate change on distributions of Cape 57 Floristic Region amphibians. South African Journal of Science, 111(11), 1-7, 58 doi:http://dx.doi.org/10.17159/sajs.2015/20140389. 59
Mölg, T., J. C. H. Chiang, A. Gohm and N. J. Cullen, 2009a: Temporal precipitation variability versus altitude on a 60 tropical high mountain: Observations and mesoscale atmospheric modelling. Quarterly Journal of the Royal 61 Meteorological Society, 135(643), 1439-1455, doi:https://doi.org/10.1002/qj.461. 62
ACCEPTED VERSIO
N
SUBJECT TO FIN
AL EDITS
FINAL DRAFT Chapter 9 IPCC WGII Sixth Assessment Report
Do Not Cite, Quote or Distribute 9-195 Total pages: 225
Mölg, T. et al., 2009b: Quantifying Climate Change in the Tropical Midtroposphere over East Africa from Glacier 1 Shrinkage on Kilimanjaro. Journal of Climate, 22(15), 4162-4181, doi:10.1175/2009JCLI2954.1. 2
Moncrieff, G. R. et al., 2016: The future distribution of the savannah biome: model-based and biogeographic 3 contingency. Philosophical Transactions of the Royal Society B: Biological Sciences, 371(1703), 20150311, 4 doi:10.1098/rstb.2015.0311. 5
Moore, F. and D. Diaz, 2015: Temperature Impacts on Economic Growth Warrant Stringent Mitigation Policy. Nature 6 Climate Change, 5, doi:10.1038/nclimate2481. 7
Moore, F. C., U. Baldos, T. Hertel and D. Diaz, 2017a: New science of climate change impacts on agriculture implies 8 higher social cost of carbon. Nature Communications, 8(1), doi:10.1038/s41467-017-01792-x. 9
Moore, S. M. et al., 2017b: El Niño and the shifting geography of cholera in Africa. Proceedings of the National 10 Academy of Sciences, 114(17), 4436-4441, doi:10.1073/pnas.1617218114. 11
Moosa, C. S. and N. Tuana, 2014: Mapping a Research Agenda Concerning Gender and Climate Change: A Review of 12 the Literature. Hypatia, 29(3), 677-694, doi:10.1111/hypa.12085. 13
Mora, C. et al., 2017: Global risk of deadly heat. Nature Climate Change, 7(7), 501-506, doi:10.1038/nclimate3322. 14 Mordecai, E. A. et al., 2019: Thermal biology of mosquito-borne disease. Ecology Letters, 22(10), 1690-1708, 15
doi:10.1111/ele.13335. 16 Mordecai, E. A. et al., 2013: Optimal temperature for malaria transmission is dramatically lower than previously 17
predicted. Ecol. Lett., 16(1), 22-30, doi:10.1111/ele.12015. 18 Mordecai, E. A. et al., 2020: Climate change could shift disease burden from malaria to arboviruses in Africa. The 19
Lancet Planetary Health, 4(9), e416-e423, doi:10.1016/S2542-5196(20)30178-9. 20 Moron, V. et al., 2016: Trends of mean temperatures and warm extremes in northern tropical Africa (1961-2014) from 21
observed and PPCA-reconstructed time series. J Geophys Res-Atmos, 121(10), 5298-5319, 22 doi:10.1002/2015jd024303. 23
Morrison, S. F., K. Nakamura and C. J. Madden, 2008: Central control of thermogenesis in mammals. Exp Physiol, 24 93(7), 773-797, doi:10.1113/expphysiol.2007.041848. 25
Morrissey, J. W., 2013: Understanding the relationship between environmental change and migration: The development 26 of an effects framework based on the case of northern Ethiopia. Global Environmental Change, 23(6), 1501-1510, 27 doi:https://doi.org/10.1016/j.gloenvcha.2013.07.021. 28
Mouhamed, L., S. B. Traore, A. Alhassane and B. Sarr, 2013: Evolution of some observed climate extremes in the West 29 African Sahel. Weather and Climate Extremes, 1, 19-25, doi:10.1016/j.wace.2013.07.005. 30
Moustahfid, H., F. Marsac and A. Gangopadhyay, 2018: Climate change impacts, vulnerabilities and adaptations: 31 Western Indian Ocean marine fisheries [Barange, M., T. Bahri, M. Beveridge, K. Cochrane, S. Funge-Smith and 32 F. Poulain (eds.)]. Impacts of Climate Change on Fisheries and Aquaculture: Synthesis of Current Knowledge, 33 Adaptation and Mitigation Options, FAO, Rome, Italy, 251-259 pp. Available at: 34 http://www.fao.org/3/i9705en/I9705EN.pdf. 35
Mpandeli, S. et al., 2018: Climate Change Adaptation through the Water-Energy-Food Nexus in Southern Africa. Int J 36 Environ Res Public Health, 15(10), doi:10.3390/ijerph15102306. 37
Mrema, S., A. Shamte, M. Selemani and H. Masanja, 2012: The influence of weather on mortality in rural Tanzania: a 38 time-series analysis 1999-2010. Glob Health Action, 5, 33-43, doi:10.3402/gha.v5i0.19068. 39
Muchuru, S. and G. Nhamo, 2018: Climate change adaptation and the African fisheries: evidence from the UNFCCC 40 National Communications. Environment, Development and Sustainability, 20(4), 1687-1705, doi:10.1007/s10668-41 017-9960-6. 42
Muchuru, S. and G. Nhamo, 2019: A review of climate change adaptation measures in the African crop sector. Climate 43 and Development, 11(10), 873-885, doi:10.1080/17565529.2019.1585319. 44
Mudombi, S., C. Fabricius, V. van Zyl-Bulitta and A. Patt, 2017: The use of and obstacles to social learning in climate 45 change adaptation initiatives in South Africa. Jamba (Potchefstroom, South Africa), 9(1), 292-292, 46 doi:10.4102/jamba.v9i1.292. 47
Mueller, V., C. Gray and D. Hopping, 2020: Climate-Induced migration and unemployment in middle-income Africa. 48 Global Environmental Change, 65, 102183, doi:https://doi.org/10.1016/j.gloenvcha.2020.102183. 49
Mugambiwa, S. S., 2018: Adaptation measures to sustain indigenous practices and the use of indigenous knowledge 50 systems to adapt to climate change in Mutoko rural district of Zimbabwe. Jamba-J. Disaster Risk Stud., 10(1), 1-51 9, doi:10.4102/jamba.v10i1.388. 52
Mugwedi, L. F. et al., 2018: Restoration planning for climate change mitigation and adaptation in the city of Durban, 53 South Africa. International Journal of Biodiversity Science, Ecosystem Services & Management, 14(1), 132-144, 54 doi:10.1080/21513732.2018.1483967. 55
Muhati, G. L., D. Olago and L. Olaka, 2018: Participatory scenario development process in addressing potential 56 impacts of anthropogenic activities on the ecosystem services of Mt. Marsabit forest, Kenya. Global Ecology and 57 Conservation, 14, doi:10.1016/j.gecco.2018.e00402. 58
Mukeka, J. M., J. O. Ogutu, E. Kanga and E. Roskaft, 2018: Characteristics of Human-Wildlife Conflicts in Kenya: 59 Examples of Tsavo and Maasai Mara Regions. Environment and Natural Resources Research, 8(3), 60 doi:10.5539/enrr.v8n3p148. 61
Muller, A. M. and A. Wright, 2016: Unlocking Africa’s Transboundary Water Potential Bank, A. D., Abidjan. 62 Available at: https://ssrn.com/abstract=2856605. 63
ACCEPTED VERSIO
N
SUBJECT TO FIN
AL EDITS

FINAL DRAFT Chapter 9 IPCC WGII Sixth Assessment Report
Do Not Cite, Quote or Distribute 9-196 Total pages: 225
Müller, C. et al., 2021: Exploring uncertainties in global crop yield projections in a large ensemble of crop models and 1 CMIP5 and CMIP6 climate scenarios. Environmental Research Letters, 16(3), 034040, doi:10.1088/1748-2 9326/abd8fc. 3
Muller, C. and S. E. Shackleton, 2013: Perceptions of climate change and barriers to adaptation amongst commonage 4 and commercial livestock farmers in the semi-arid Eastern Cape Karoo. African Journal of Range & Forage 5 Science, 31(1), 1-12, doi:10.2989/10220119.2013.845606. 6
Muller, M., 2018: Cape Town's drought: don't blame climate change. Nature, 559(7713), 174-176, doi:10.1038/d41586-7 018-05649-1. 8
Müller Schmied, H. et al., 2016: Variations of global and continental water balance components as impacted by climate 9 forcing uncertainty and human water use. Hydrology and Earth System Sciences, 20(7), 2877-2898, 10 doi:10.5194/hess-20-2877-2016. 11
Mulwa, C. K. and M. Visser, 2020: Farm diversification as an adaptation strategy to climatic shocks and implications 12 for food security in northern Namibia. World Development, 129, 104906, 13 doi:https://doi.org/10.1016/j.worlddev.2020.104906. 14
Mumba, M. et al., 2016: Ecosystem-based Adaptation (EbA) of African Mountain Ecosystems: Experiences from 15 Mount Elgon, Uganda. In: Climate Change Adaptation Strategies – An Upstream-downstream Perspective 16 [Salzmann, N., C. Huggel, S. U. Nussbaumer and G. Ziervogel (eds.)]. Springer, Cham, pp. 121-140. ISBN 978-3-17 319-40773-9. 18
Mumtaz, Z. and P. Whiteford, 2017: Social safety nets in the development of a welfare system in Pakistan: an analysis 19 of the Benazir Income Support Programme. Asia Pacific Journal of Public Administration, 39(1), 16-38, 20 doi:10.1080/23276665.2017.1290902. 21
Munday, C. and R. Washington, 2019: Controls on the diversity in climate model projections of early summer drying 22 over Southern Africa. Journal of Climate, 32(12), 3707-3725, doi:10.1175/JCLI-D-18-0463.1. 23
Mureithi, S. M. et al., 2016: Benefits Derived from Rehabilitating a Degraded Semi-Arid Rangeland in Communal 24 Enclosures, Kenya. Land Degradation & Development, 27(8), 1853-1862, doi:https://doi.org/10.1002/ldr.2341. 25
Muriithi, S. M., 2017: African small and medium enterprises (SMEs) contributions, challenges and solutions. European 26 Journal of Research and Reflection in Management Sciences, 5(1), 36-48. 27
Muringai, R. T., P. L. Mafongoya and R. Lottering, 2021: Climate Change and Variability Impacts on Sub-Saharan 28 African Fisheries: A Review. Reviews in Fisheries Science & Aquaculture, 1-21, 29 doi:10.1080/23308249.2020.1867057. 30
Muringai, R. T., D. Naidoo, P. Mafongoya and S. Lottering, 2019a: The Impacts of Climate Change on the Livelihood 31 and Food Security of Small-Scale Fishers in Lake Kariba, Zimbabwe. Journal of Asian and African Studies, 55(2), 32 298-313, doi:10.1177/0021909619875769. 33
Muringai, R. T., D. Naidoo, P. Mafongoya and M. Sibanda, 2019b: Small-scale fishers’ perceptions of climate change 34 and its consequences on fisheries: the case of Sanyathi fishing basin, Lake Kariba, Zimbabwe. Transactions of the 35 Royal Society of South Africa, 74(3), 248-257, doi:10.1080/0035919x.2019.1639564. 36
Murray, N. E., M. B. Quam and A. Wilder-Smith, 2013: Epidemiology of dengue: past, present and future prospects. 37 Clin Epidemiol, 5, 299-309, doi:10.2147/clep.s34440. 38
Murray, R., D. Louw, B. van der Merwe and I. Peters, 2018: Windhoek, Namibia: from conceptualising to operating 39 and expanding a MAR scheme in a fractured quartzite aquifer for the city’s water security. Sustainable Water 40 Resources Management, 4(2), 217-223, doi:10.1007/s40899-018-0213-0. 41
Murray, U., 2019: Gender and NDCs: Country Progress and Key Findings. UNDP, Nairobi, Kenya. Available at: 42 https://www.international-climate-initiative.com/fileadmin/Dokumente/2020/200302_undp-ndcsp-gender-ndc-43 country-progress-key-findings.pdf. 44
Musa, Z. N., I. Popescu and A. Mynett, 2014: The Niger Delta's vulnerability to river floods due to sea level rise. 45 Natural Hazards and Earth System Sciences, 14(12), 3317-3329, doi:10.5194/nhess-14-3317-2014. 46
Musah-Surugu, I. J., A. Ahenkan and J. N. Bawole, 2019: Too weak to lead: motivation, agenda setting and constraints 47 of local government to implement decentralized climate change adaptation policy in Ghana. Environment, 48 Development and Sustainability, 21(2), 587-607, doi:10.1007/s10668-017-0049-z. 49
Musengimana, G., F. K. Mukinda, R. Machekano and H. Mahomed, 2016: Temperature Variability and Occurrence of 50 Diarrhoea in Children under Five-Years-Old in Cape Town Metropolitan Sub-Districts. Int J Environ Res Public 51 Health, 13(9), doi:10.3390/ijerph13090859. 52
Mushawemhuka, W., J. M. Rogerson and J. Saarinen, 2018: Nature-based tourism operators’ perceptions and 53 adaptation to climate change in Hwange National Park, Zimbabwe. Bulletin of Geography. Socio-economic 54 Series,(42), 115-127, doi:http://dx.doi.org/10.1515/bog-2018-0034. 55
Musinguzi, L. et al., 2015: Fishers’ perceptions of climate change, impacts on their livelihoods and adaptation strategies 56 in environmental change hotspots: a case of Lake Wamala, Uganda. Environment, Development and 57 Sustainability, 18(4), 1255-1273, doi:10.1007/s10668-015-9690-6. 58
Musinguzi, L., V. Natugonza, J. Efitre and R. Ogutu-Ohwayo, 2018: The role of gender in improving adaptation to 59 climate change among small-scale fishers. Climate and Development, 10(6), 556-576, 60 doi:10.1080/17565529.2017.1372262. 61
ACCEPTED VERSIO
N
SUBJECT TO FIN
AL EDITS

FINAL DRAFT Chapter 9 IPCC WGII Sixth Assessment Report
Do Not Cite, Quote or Distribute 9-197 Total pages: 225
Mutabazi, K. D., T. S. Amjath-Babu and S. Sieber, 2015: Influence of livelihood resources on adaptive strategies to 1 enhance climatic resilience of farm households in Morogoro, Tanzania: an indicator-based analysis. Regional 2 Environmental Change, 15(7), 1259-1268, doi:10.1007/s10113-015-0800-7. 3
Mutandwa, E., B. Hanyani-Mlambo and J. Manzvera, 2019: Exploring the link between climate change perceptions and 4 adaptation strategies among smallholder farmers in Chimanimani district of Zimbabwe. International Journal of 5 Social Economics, 46(7), 850-860, doi:10.1108/ijse-12-2018-0654. 6
Mutenje, M. J. et al., 2019: A cost-benefit analysis of climate-smart agriculture options in Southern Africa: Balancing 7 gender and technology. Ecological Economics, 163, 126-137, doi:https://doi.org/10.1016/j.ecolecon.2019.05.013. 8
Muthige, M. S. et al., 2018: Projected changes in tropical cyclones over the South West Indian Ocean under different 9 extents of global warming. Environmental Research Letters, 13(6), 065019, doi:10.1088/1748-9326/aabc60. 10
Muthuwatta, L. et al., 2018: Understanding the impacts of climate change in the Tana River Basin, Kenya. Proceedings 11 of the International Association of Hydrological Sciences, 379, 37-42, doi:10.5194/piahs-379-37-2018. 12
Mutula, S., C. Stilwell and E. F. Elia, 2014: Indigenous Knowledge use in seasonal weather forecasting in Tanzania: the 13 case of semi-arid central Tanzania. South African Journal of Libraries and Information Science, 80(1), 18-27. 14
Muyambo, F., Y. T. Bahta and A. J. Jordaan, 2017: The role of indigenous knowledge in drought risk reduction: A case 15 of communal farmers in South Africa. Jamba, 9(1), 420, doi:10.4102/jamba.v9i1.420. 16
Mvula, P. et al., 2014: Towards Defragmenting the Management System of Lake Chilwa Basin, Malawi. Defragmenting 17 African Resource Management, LIT Verlag. ISBN 978-3643903983. 18
Mwanga, E., 2019: The Role of By-Laws in Enhancing the Integration of Indigenous Knowledge. Carbon & Climate 19 Law Review, 13(1), 19-30, doi:10.21552/cclr/2019/1/5. 20
Mwaniki, F. and R. B. Stevenson, 2017: Farmers’ uses of indigenous knowledge and practices to cope with climate 21 change in Kilifi County, Kenya. International Journal of Climate Change: impacts and responses, 9(4), 53-65, 22 doi:http://dx.doi.org/10.18848/1835-7156/CGP/v09i04/53-65. 23
Mwenge Kahinda, J., R. Meissner and F. A. Engelbrecht, 2016: Implementing Integrated Catchment Management in the 24 upper Limpopo River basin: A situational assessment. Physics and Chemistry of the Earth, Parts A/B/C, 93, 104-25 118, doi:https://doi.org/10.1016/j.pce.2015.10.003. 26
Mweya, C. N. et al., 2016: Climate Change Influences Potential Distribution of Infected Aedes aegypti Co-Occurrence 27 with Dengue Epidemics Risk Areas in Tanzania. PLOS ONE, 11(9), e0162649, 28 doi:10.1371/journal.pone.0162649. 29
Mweya, C. N., L. E. G. Mboera and S. I. Kimera, 2017: Climate Influence on Emerging Risk Areas for Rift Valley 30 Fever Epidemics in Tanzania. Am J Trop Med Hyg, 97(1), 109-114, doi:10.4269/ajtmh.16-0444. 31
Myers, S. S. et al., 2014: Increasing CO2 threatens human nutrition. Nature, 510, 139, doi:10.1038/nature13179. 32 Myhre, G. et al., 2019: Frequency of extreme precipitation increases extensively with event rareness under global 33
warming. Sci Rep, 9(1), 16063, doi:10.1038/s41598-019-52277-4. 34 Nachmany, M., A. Abeysinghe and S. Barakat, 2017: Climate change legislation in the least developing countries. In: 35
Trends in Climate Change Legislation [Averchenkova, A. F., Sam and M. Nachmany (eds.)]. Edward Elgar 36 Publishing, Cheltenham, UK, pp. 59–82. ISBN 9781786435774. 37
Naess, L. O. et al., 2015: Climate policy meets national development contexts: Insights from Kenya and Mozambique. 38 Global Environmental Change, 35, 534-544, doi:https://doi.org/10.1016/j.gloenvcha.2015.08.015. 39
Nago, M. and M. Krott, 2020: Systemic failures in north–south climate change knowledge transfer: a case study of the 40 Congo Basin. Climate Policy, 1-14, doi:10.1080/14693062.2020.1820850. 41
Naicker, N. et al., 2017: Indoor Temperatures in Low Cost Housing in Johannesburg, South Africa. Int J Environ Res 42 Public Health, 14(11), doi:10.3390/ijerph14111410. 43
Naidoo, R. et al., 2019: Evaluating the impacts of protected areas on human well-being across the developing world. 44 Science Advances, 5(4), eaav3006, doi:10.1126/sciadv.aav3006. 45
Nair, M. K., L. F. Augustine and A. Konapur, 2016: Food-Based Interventions to Modify Diet Quality and Diversity to 46 Address Multiple Micronutrient Deficiency. Frontiers in Public Health, 3(277), doi:10.3389/fpubh.2015.00277. 47
Namara, R. E. and M. Giordano, 2017: Economic Rationale for Cooperation on International Waters in Africa. World 48 Bank Group, Washington DC. 49
Nangombe, S. S. et al., 2019: High‐Temperature Extreme Events Over Africa Under 1.5 and 2 °C of Global Warming. J 50 Geophys Res-Atmos, 124(8), 4413-4428, doi:10.1029/2018jd029747. 51
Nantima, N. et al., 2019: The importance of a One Health approach for prioritising zoonotic diseases to focus on 52 capacity-building efforts in Uganda. Rev Sci Tech, 38(1), 315-325, doi:10.20506/rst.38.1.2963. 53
Narayan, S. et al., 2016: The Effectiveness, Costs and Coastal Protection Benefits of Natural and Nature-Based 54 Defences. PLoS One, 11(5), e0154735, doi:10.1371/journal.pone.0154735. 55
Narayanan, S. and N. Gerber, 2017: Social safety nets for food and nutrition security in India. Global Food Security, 15, 56 65-76, doi:https://doi.org/10.1016/j.gfs.2017.05.001. 57
Nardone, A. et al., 2010: Effects of climate changes on animal production and sustainability of livestock systems. 58 Livestock Science, 130(1-3), 57-69, doi:10.1016/j.livsci.2010.02.011. 59
Nashwan, M. S. and S. Shahid, 2019: Spatial distribution of unidirectional trends in climate and weather extremes in 60 Nile river basin. Theoretical and Applied Climatology, 137(1-2), 1181-1199, doi:https://doi.org/10.1007/s00704-61 018-2664-5. 62
ACCEPTED VERSIO
N
SUBJECT TO FIN
AL EDITS

FINAL DRAFT Chapter 9 IPCC WGII Sixth Assessment Report
Do Not Cite, Quote or Distribute 9-198 Total pages: 225
Nashwan, M. S., S. Shahid and N. Abd Rahim, 2018: Unidirectional trends in annual and seasonal climate and extremes 1 in Egypt. Theoretical and Applied Climatology, 136(1-2), 457-473, doi:10.1007/s00704-018-2498-1. 2
Nath, I. B., 2020: The food problem and the aggregate productivity consequences of climate change. Cambridge 3 University Press, Cambridge, MA. ISBN 9788578110796. 4
Natugonza, V. et al., 2016: Implications of climate warming for hydrology and water balance of small shallow lakes: A 5 case of Wamala and Kawi, Uganda. Aquatic Ecosystem Health & Management, 19(4), 327-335, 6 doi:10.1080/14634988.2016.1142167. 7
Natugonza, V. et al., 2015: The responses of Nile tilapia Oreochromis niloticus (Linnaeus, 1758) in Lake Wamala 8 (Uganda) to changing climatic conditions. Lakes Reserv Res Manage, 20(2), 101-119, doi:10.1111/lre.12091. 9
Nawrotzki, R. J. and J. DeWaard, 2018: Putting trapped populations into place: climate change and inter-district 10 migration flows in Zambia. Regional Environmental Change, 18(2), 533-546, doi:10.1007/s10113-017-1224-3. 11
Ncube, B., 2018: Insights into indigenous knowledge strategies for coping and adapting to drought in agriculture: A 12 Karoo scenario, South Africa. Indilinga African Journal of Indigenous Knowledge Systems, 17(1), 92-108. 13
Ndebele-Murisa, M. R., 2014: Associations between Climate, Water Environment and Phytoplankton Production in 14 African Lakes. In: Phytoplankton: Biology, Classification and Environmental Impacts [Teresa, M. S. (ed.)]. Nova 15 Science Publishers, Inc. , NewYork, pp. 37-64. ISBN 978-1-62948-655-0. 16
Ndetto, E. L. and A. Matzarakis, 2014: Urban atmospheric environment and human biometeorological studies in Dar es 17 Salaam, Tanzania. Air Quality, Atmosphere & Health, 8(2), 175-191, doi:10.1007/s11869-014-0261-z. 18
Ndhlovu, N. and O. Saito, 2017: Assessing the Sensitivity of Small-Scale Fishery Groups to Climate Change in Lake 19 Kariba , Zimbabwe. Sustainability, 9(2209), 1-18, doi:10.3390/su9122209. 20
Ndoro, W., 2015: Heritage laws: Whose heritage are we protecting? In: South African Archaeological Bulletin. South 21 African Archaeological Society, pp. 136–137. ISBN 0038-1969. 22
Neate-Clegg, M. H. C. et al., 2021: Afrotropical montane birds experience upslope shifts and range contractions along a 23 fragmented elevational gradient in response to global warming. PLOS ONE, 16(3), e0248712, 24 doi:10.1371/journal.pone.0248712. 25
Nemakonde, L. D., D. Van Niekerk, P. Becker and S. Khoza, 2021: Perceived Adverse Effects of Separating 26 Government Institutions for Disaster Risk Reduction and Climate Change Adaptation Within the Southern African 27 Development Community Member States. International Journal of Disaster Risk Science, 12(1), 1-12, 28 doi:10.1007/s13753-020-00303-9. 29
Nematchoua, M. K., J. A. Orosa and S. Reiter, 2019: Climate change: Variabilities, vulnerabilities and adaptation 30 analysis - A case of seven cities located in seven countries of Central Africa. Urban Climate, 29, 100486, 31 doi:https://doi.org/10.1016/j.uclim.2019.100486. 32
Neumann, B., A. T. Vafeidis, J. Zimmermann and R. J. Nicholls, 2015: Future coastal population growth and exposure 33 to sea-level rise and coastal flooding-a global assessment. PLoS One, 10(3), e0118571, 34 doi:10.1371/journal.pone.0118571. 35
Neuzil, K. M., A. J. Pollard and A. A. Marfin, 2019: Introduction of Typhoid Conjugate Vaccines in Africa and Asia. 36 Clin Infect Dis, 68(Suppl 1), S27-s30, doi:10.1093/cid/ciy878. 37
New, M., S. Dorbor, R. C. Odoulami and D. Maslo, 2020: Towards attribution-based climate insurance: Redefining 38 who should pay for weather-related insurance. In: Criminology and Climate: Insurance, Finance and the 39 Regulation of Harmscapes, 1st ed. [Holley, C., L. Phelan and C. Shearing (eds.)]. Routledge, London, pp. 15. 40 ISBN 9780429201172. 41
Newbery, F., A. Qi and B. D. L. Fitt, 2016: Modelling impacts of climate change on arable crop diseases: progress, 42 challenges and applications. Current Opinion in Plant Biology, 32, 101-109, doi:10.1016/j.pbi.2016.07.002. 43
Newbold, T., 2018: Future effects of climate and land-use change on terrestrial vertebrate community diversity under 44 different scenarios. Proceedings of the Royal Society B: Biological Sciences, 285(1881), 20180792, 45 doi:10.1098/rspb.2018.0792. 46
Nguvava, M., B. J. Abiodun and F. Otieno, 2019: Projecting drought characteristics over East African basins at specific 47 global warming levels. Atmospheric Research, 228, 41-54, doi:https://doi.org/10.1016/j.atmosres.2019.05.008. 48
Nhamo, G. and O. Agyepong Adelaide, 2019: Climate change adaptation and local government : institutional 49 complexities surrounding Cape Town’s Day Zero. Jamba : Journal of Disaster Risk Studies, 11(3), 1-9, 50 doi:10.4102/jamba.v11i3.717. 51
Nhamo, G. and S. Muchuru, 2019: Climate adaptation in the public health sector in Africa: Evidence from United 52 Nations Framework Convention on Climate Change National Communications. Jamba, 11(1), 644, 53 doi:10.4102/jamba.v11i1.644. 54
Nhamo, L. et al., 2018: The water-energy-food nexus: Climate risks and opportunities in Southern Africa. Water, 10(5), 55 doi:10.3390/w10050567. 56
Niang, I. et al., 2014: Africa. In: Climate Change 2014: Impacts, Adaptation, and Vulnerability. Part B: Regional 57 Aspects. Contribution of Working Group II to the Fifth Assessment Report of the Intergovernmental Panel on 58 Climate Change [Barros, V. R., C.B. Field, D.J. Dokken, M.D. Mastrandrea, K.J. Mach, T.E. Bilir, M. Chatterjee, 59 K.L. Ebi, Y.O. Estrada, R.C. Genova, B. Girma, E.S. Kissel, A.N. Levy, S. MacCracken, P.R. Mastrandrea, and 60 L.L. White (ed.)]. Cambridge University Press, Cambridge, United Kingdom and New York, NY, USA, 1199-61 1266 pp. Available at: https://www.ipcc.ch/site/assets/uploads/2018/02/WGIIAR5-Chap22_FINAL.pdf. 62
ACCEPTED VERSIO
N
SUBJECT TO FIN
AL EDITS

FINAL DRAFT Chapter 9 IPCC WGII Sixth Assessment Report
Do Not Cite, Quote or Distribute 9-199 Total pages: 225
Nicholson, S. E., 2015: Long-term variability of the East African ‘short rains’ and its links to large-scale factors. 1 International Journal of Climatology, 35(13), 3979-3990, doi:10.1002/joc.4259. 2
Nicholson, S. E., 2017: Climate and climatic variability of rainfall over eastern Africa. Reviews of Geophysics, 55(3), 3 590-635, doi:10.1002/2016rg000544. 4
Nicholson, S. E., C. Funk and A. H. Fink, 2018: Rainfall over the African continent from the 19th through the 21st 5 century. Global and Planetary Change, 165, 114-127, doi:https://doi.org/10.1016/j.gloplacha.2017.12.014. 6
Nielsen, J. Ø. and A. Reenberg, 2010: Cultural barriers to climate change adaptation: A case study from Northern 7 Burkina Faso. Global Environmental Change, 20(1), 142-152, doi:10.1016/j.gloenvcha.2009.10.002. 8
Nijsten, G.-J. et al., 2018: Transboundary aquifers of Africa: Review of the current state of knowledge and progress 9 towards sustainable development and management. Journal of Hydrology: Regional Studies, 20, 21-34, 10 doi:10.1016/j.ejrh.2018.03.004. 11
Nikiema, P. M. et al., 2017: Multi-model CMIP5 and CORDEX simulations of historical summer temperature and 12 precipitation variabilities over West Africa. International Journal of Climatology, 37(5), 2438-2450, 13 doi:10.1002/joc.4856. 14
Nikulin, G. et al., 2018: The effects of 1.5 and 2 degrees of global warming on Africa in the CORDEX ensemble. 15 Environmental Research Letters, 13(6), 065003, doi:10.1088/1748-9326/aab1b1. 16
Niño-Zarazúa, M., A. Barrientos, S. Hickey and D. Hulme, 2012: Social Protection in Sub-Saharan Africa: Getting the 17 Politics Right. World Development, 40(1), 163-176, doi:10.1016/j.worlddev.2011.04.004. 18
Nkiaka, E. et al., 2019: Identifying user needs for weather and climate services to enhance resilience to climate shocks 19 in sub-Saharan Africa. Environmental Research Letters, 14(12), 123003, doi:10.1088/1748-9326/ab4dfe. 20
Nkomwa, E. C. et al., 2014: Assessing indigenous knowledge systems and climate change adaptation strategies in 21 agriculture: A case study of Chagaka Village, Chikhwawa, Southern Malawi. Physics and Chemistry of the Earth, 22 67-69, 164-172, doi:https://doi.org/10.1016/j.pce.2013.10.002. 23
Nkotagu, H., 1996: Application of environmental isotopes to groundwater recharge studies in a semi-arid fractured 24 crystalline basement area of Dodoma, Tanzania. Journal of African Earth Sciences, 22(4), 443-457, 25 doi:https://doi.org/10.1016/0899-5362(96)00022-X. 26
Noritomo, Y. and K. Takahashi, 2020: Can Insurance Payouts Prevent a Poverty Trap? Evidence from Randomised 27 Experiments in Northern Kenya. The Journal of Development Studies, 56(11), 2079-2096, 28 doi:10.1080/00220388.2020.1736281. 29
Norström, V. A. et al., 2020: Principles for knowledge co-production in sustainability research. Nature Sustainability, 30 3(3), 182-190, doi:10.1038/s41893-019-0448-2. 31
Norton, A. et al., 2020: Harnessing employment-based social assistance programmes to scale up nature-based climate 32 action. Philosophical Transactions of the Royal Society B: Biological Sciences, 375(1794), 20190127, 33 doi:doi:10.1098/rstb.2019.0127. 34
Nouaceur, Z. and O. Murărescu, 2016: Rainfall Variability and Trend Analysis of Annual Rainfall in North Africa. 35 International Journal of Atmospheric Sciences, 2016, 1-12, doi:10.1155/2016/7230450. 36
Numbere, A. O., 2019: Mangrove Habitat Loss and the Need for the Establishment of Conservation and Protected 37 Areas in the Niger Delta, Nigeria. In: Habitats of the World-Biodiversity and Threats [Musarella, C. M., A. C. 38 Ortiz and R. Q. Canas (eds.)]. IntechOpen, pp. 49-63. ISBN 978-1-78984-487-0. 39
Nuñez, M. A. et al., 2021: Should tree invasions be used in treeless ecosystems to mitigate climate change? Frontiers in 40 Ecology and the Environment, 19(6), 334-341, doi:https://doi.org/10.1002/fee.2346. 41
Nunfam, V. F. et al., 2019a: Perceptions of climate change and occupational heat stress risks and adaptation strategies 42 of mining workers in Ghana. Sci Total Environ, 657, 365-378, doi:10.1016/j.scitotenv.2018.11.480. 43
Nunfam, V. F. et al., 2019b: Climate change and occupational heat stress risks and adaptation strategies of mining 44 workers: Perspectives of supervisors and other stakeholders in Ghana. Environ Res, 169, 147-155, 45 doi:10.1016/j.envres.2018.11.004. 46
Nuvey, F. S. et al., 2020: Poor mental health of livestock farmers in Africa: a mixed methods case study from Ghana. 47 BMC public health, 20(1), 825, doi:10.1186/s12889-020-08949-2. 48
Nwamarah, U., 2018: Gap analysis report: African Nationally Determined Contributions (NDCs) [Dorsouma, A.-H., G. 49 Phillips, S. Wade, G. Jeal, S. Bruton, S. Borrini and G. Esambe (eds.)]. African Development Bank, Abidjan, Côte 50 d’Ivoire, 66 pp. Available at: 51 https://www.afdb.org/fileadmin/uploads/afdb/Documents/Events/Cop24/african_ndcs_gap_analysis_report.pdf. 52
Nyadzi, E., S. E. Werners, R. Biesbroek and F. Ludwig, 2021: Techniques and skills of indigenous weather and 53 seasonal climate forecast in Northern Ghana. Climate and Development, 13(6), 551-562, 54 doi:10.1080/17565529.2020.1831429. 55
Nyagumbo, I., S. Mkuhlani, W. Mupangwa and D. Rodriguez, 2017: Planting date and yield benefits from conservation 56 agriculture practices across Southern Africa. Agricultural Systems, 150, 21-33, 57 doi:https://doi.org/10.1016/j.agsy.2016.09.016. 58
Nyahunda, L., J. C. Makhubele, V. Mabvurira and F. K. Matlakala, 2020: Vulnerabilities and Inequalities Experienced 59 by Women in the Climate Change Discourse in South Africa’s Rural Communities: Implications for Social Work. 60 The British Journal of Social Work, doi:10.1093/bjsw/bcaa118. 61
Nyangiwe, N., M. Yawa and V. Muchenje, 2018: Driving forces for changes in geographic range of cattle ticks (Acari: 62 Ixodidae) in Africa: A review. SA J. An. Sci., 48(5), 829, doi:10.4314/sajas.v48i5.4. 63
ACCEPTED VERSIO
N
SUBJECT TO FIN
AL EDITS
FINAL DRAFT Chapter 9 IPCC WGII Sixth Assessment Report
Do Not Cite, Quote or Distribute 9-200 Total pages: 225
Nyantakyi-Frimpong, H. and R. Bezner-Kerr, 2015: The relative importance of climate change in the context of 1 multiple stressors in semi-arid Ghana. Global Environmental Change, 32, 40-56, 2 doi:10.1016/j.gloenvcha.2015.03.003. 3
Nyantakyi-Frimpong, H. et al., 2017: Agroecology and healthy food systems in semi-humid tropical Africa: 4 Participatory research with vulnerable farming households in Malawi. Acta tropica, 175, 42-49, 5 doi:https://doi.org/10.1016/j.actatropica.2016.10.022. 6
Nyasimi, M. et al., 2018: Inclusion of Gender in Africa’s Climate Change Policies and Strategies. In: Handbook of 7 Climate Change Communication [Leal Filho W., M. E., Azul A., Azeiteiro U., McGhie H. (ed.)]. Springer, Cham, 8 pp. 171-185. ISBN 978-3-319-69837-3. 9
Nyasimi, M. et al., 2017: Adoption and Dissemination Pathways for Climate-Smart Agriculture Technologies and 10 Practices for Climate-Resilient Livelihoods in Lushoto, Northeast Tanzania. Climate, 5(3), 11 doi:10.3390/cli5030063. 12
Nyboer, E. A. and L. J. Chapman, 2017: Elevated temperature and acclimation time affect metabolic performance in the 13 heavily exploited Nile perch of Lake Victoria. The Journal of Experimental Biology, 220(20), 3782-3793, 14 doi:10.1242/jeb.163022. 15
Nyboer, E. A. and L. J. Chapman, 2018: Cardiac plasticity influences aerobic performance and thermal tolerance in a 16 tropical, freshwater fish at elevated temperatures. J Exp Biol, 221(Pt 15), jeb178087, doi:10.1242/jeb.178087. 17
Nyboer, E. A., C. Liang and L. J. Chapman, 2019: Assessing the vulnerability of Africa's freshwater fishes to climate 18 change: A continent-wide trait-based analysis. Biological Conservation, 236, 505-520, 19 doi:https://doi.org/10.1016/j.biocon.2019.05.003. 20
Nyiwul, L., 2021: Climate change adaptation and inequality in Africa: Case of water, energy and food insecurity. 21 Journal of Cleaner Production, 278, 123393, doi:https://doi.org/10.1016/j.jclepro.2020.123393. 22
Nziguheba, G. et al., 2015: Phosphorus in smallholder farming systems of sub-Saharan Africa: implications for 23 agricultural intensification. Nutrient Cycling in Agroecosystems, 104(3), 321-340, doi:10.1007/s10705-015-9729-24 y. 25
O'Connor, T. G., J. R. Puttick and M. T. Hoffman, 2014: Bush encroachment in southern Africa: changes and causes. 26 African Journal of Range & Forage Science, 31(2), 67-88, doi:10.2989/10220119.2014.939996. 27
O'Loughlin, J., A. M. Linke and F. D. Witmer, 2014: Effects of temperature and precipitation variability on the risk of 28 violence in sub-Saharan Africa, 1980-2012. Proceedings of the National Academy of Sciences, 111(47), 16712-29 16717, doi:10.1073/pnas.1411899111. 30
O'Loughlin, J. et al., 2012: Climate variability and conflict risk in East Africa, 1990-2009. Proceedings of the National 31 Academy of Sciences 109(45), 18344-18349, doi:10.1073/pnas.1205130109. 32
O'Neill, B. C. et al., 2016: The Scenario Model Intercomparison Project (ScenarioMIP) for CMIP6. Geosci. Model 33 Dev., 9(9), 3461-3482, doi:10.5194/gmd-9-3461-2016. 34
Oba, G., 2014: Climate change adaptation in Africa: an historical ecology. Routledge, London. ISBN 9781315794907. 35 Obiero, K. et al., 2019: The Contribution of Fish to Food and Nutrition Security in Eastern Africa: Emerging Trends 36
and Future Outlooks. Sustainability, 11(6), doi:10.3390/su11061636. 37 Obradovich, N., R. Migliorini, M. P. Paulus and I. Rahwan, 2018: Empirical evidence of mental health risks posed by 38
climate change. Proceedings of the National Academy of Sciences, 115(43), 10953-10958, 39 doi:10.1073/pnas.1801528115. 40
Obura, D. et al., 2017: Coral reef status report for the Western Indian Ocean. Global Coral Reef Monitoring Network 41 (GCRMN)/International Coral Reef Initiative (ICRI). 144 pp. Available at: 42 https://nairobiconvention.org/clearinghouse/sites/default/files/Coral%20reef%20status%20report%20for%20the%43 20Western%20Indian%20Ocean%20%282017%29.pdf. 44
Odei Erdiaw-Kwasie, M., M. Abunyewah, J. Edusei and E. Buernor Alimo, 2020: Citizen participation dilemmas in 45 water governance: An empirical case of Kumasi, Ghana. World Development Perspectives, 20, 100242, 46 doi:https://doi.org/10.1016/j.wdp.2020.100242. 47
Oduniyi, O. S. and S. S. Tekana, 2019: Adoption of agroforestry practices and climate change mitigation strategies in 48 North West province of South Africa. International Journal of Climate Change Strategies and Management, 49 11(5), 716-729, doi:10.1108/IJCCSM-02-2019-0009. 50
Oduor, F. O., J. Boedecker, G. Kennedy and C. Termote, 2019: Exploring agrobiodiversity for nutrition: Household on-51 farm agrobiodiversity is associated with improved quality of diet of young children in Vihiga, Kenya. PLOS ONE, 52 14(8), e0219680, doi:10.1371/journal.pone.0219680. 53
OECD, 2020: Climate Finance Provided and Mobilised by Developed Countries in 2013-18. Climate Finance and the 54 USD 100 Billion Goal, OECD Publishing, Paris. ISBN 978-92-64-68312-9. 55
OECD, 2021: Water Governance in African Cities. OECD Studies on Water, OECD Publishing, Paris, 110 pp. ISBN 56 9789264715431. 57
OECD/SWAC, 2020: Africa's Urbanisation Dynamics 2020: Africapolis, Mapping a New Urban Geography. West 58 African Studies, OECD Publishing, Paris. ISBN 9789264314306. 59
OGAR, J. N. and S. A. Bassey, 2019: African Environmental Ethics. RAIS Journal for Social Sciences, 3(1), 60 doi:10.5281/zenodo.3066462. 61
Ogden, N. H., 2017: Climate change and vector-borne diseases of public health significance. FEMS Microbiol Lett, 62 364(19), doi:10.1093/femsle/fnx186. 63
ACCEPTED VERSIO
N
SUBJECT TO FIN
AL EDITS
FINAL DRAFT Chapter 9 IPCC WGII Sixth Assessment Report
Do Not Cite, Quote or Distribute 9-201 Total pages: 225
Ogega, O. M. et al., 2020: Heavy precipitation events over East Africa in a changing climate: results from CORDEX 1 RCMs. Clim Dyn, 55(3), 993-1009, doi:10.1007/s00382-020-05309-z. 2
Oguntunde, P. G., B. J. Abiodun and G. Lischeid, 2017: Impacts of climate change on hydro-meteorological drought 3 over the Volta Basin, West Africa. Global and Planetary Change, 155, 121-132, 4 doi:https://doi.org/10.1016/j.gloplacha.2017.07.003. 5
Ogutu-Ohwayo, R. et al., 2016: Implications of climate variability and change for African lake ecosystems, fisheries 6 productivity, and livelihoods. Journal of Great Lakes Research, 42(3), 498-510, 7 doi:https://doi.org/10.1016/j.jglr.2016.03.004. 8
OKACOM, 2020: Realising the Benefits of Transboundary Water Cooperation in the Cubango-Okavango River Basin. 9 The Permanent Okavango River Basin Water Commission (OKACOM), Gaborone, Botswana, 24 pp. Available 10 at: 11 https://unece.org/fileadmin/DAM/env/water/activities/Benefits_cooperation/OKACOM_Policy_Document_June_12 2020.pdf. 13
OKO Finance, 2021: OKO raises $1.2 million to bring innovative insurance to smallholder farmers across Africa, OKO 14 Finance, Uganda. Available at: https://www.oko.finance/post/oko-raises-1-2-million-to-bring-innovative-15 insurance-to-smallholder-farmers-across-africa. 16
Okonya, J. S., O. C. Ajayi and P. L. Mafongoya, 2017: The role of indigenous knowledge in seasonal weather 17 forecasting and planning of farm activities by rural crop farmers in Uganda. In: Indigenous knowledge systems 18 and climate change management in Africa [Mafongoya, P. L. and O. C. Ajayi (eds.)]. The Technical Centre for 19 Agricultural and Rural Cooperation (CTA), Wageningen, The Netherlands, pp. 239. 20
Okoye, J. and K. Oni, 2017: Promotion of indigenous food preservation and processing knowledge and the challenge of 21 food security in Africa. Journal of Food Security, 5(3), 75-87, doi:https://doi.org/10.12691/jfs-5-3-3. 22
Okpara, J. N. et al., 2017a: The applicability of Standardized Precipitation Index: drought characterization for early 23 warning system and weather index insurance in West Africa. Natural Hazards, 89(2), 555-583, 24 doi:10.1007/s11069-017-2980-6. 25
Okpara, U. T., L. C. Stringer and A. J. Dougill, 2017b: Using a novel climate-water conflict vulnerability index to 26 capture double exposures in Lake Chad. Reg Environ Change, 17(2), 351-366, doi:10.1007/s10113-016-1003-6. 27
Oladipo, J. A., 2015: Seeing through the opaque glass, darkly: farmers' perception of climate change. Climate and 28 Development, 8(2), 122-132, doi:10.1080/17565529.2015.1034227. 29
Olago, D. et al., 2007: Climatic, socio-economic, and health factors affecting human vulnerability to cholera in the Lake 30 Victoria Basin, East Africa. AMBIO: A Journal of the Human Environment, 36(4), 350-358, doi:10.1579/0044-31 7447(2007)36[350:CSAHFA]2.0.CO;2. 32
Olago, D. O. et al., 2021: Lentic-Lotic Water System Response to Anthropogenic and Climatic Factors in Kenya and 33 Their Sustainable Management. In: Climate Change and Water Resources in Africa, pp. 193-218. ISBN 978-3-34 030-61224-5 35
978-3-030-61225-2. 36 Olaka, L. A., J. O. Ogutu, M. Y. Said and C. Oludhe, 2019: Projected Climatic and Hydrologic Changes to Lake 37
Victoria Basin Rivers under Three RCP Emission Scenarios for 2015–2100 and Impacts on the Water Sector. 38 Water, 11(7), 1449, doi:10.3390/w11071449. 39
Olawuyi, D. S., 2018: From technology transfer to technology absorption: addressing climate technology gaps in 40 Africa. Journal of Energy & Natural Resources Law, 36(1), 61-84, doi:10.1080/02646811.2017.1379667. 41
Olazabal, M. et al., 2019: A cross-scale worldwide analysis of coastal adaptation planning. Environmental Research 42 Letters, 14(12), 124056, doi:10.1088/1748-9326/ab5532. 43
Oliver, E. C. J. et al., 2018: Longer and more frequent marine heatwaves over the past century. Nature 44 Communications, 9(1), 1324, doi:10.1038/s41467-018-03732-9. 45
Olmstead, S. M., 2014: Climate change adaptation and water resource management: A review of the literature. Energy 46 Economics, 46, 500-509, doi:10.1016/j.eneco.2013.09.005. 47
Ologeh, I. O., J. B. Akarakiri and F. A. Adesina, 2018: Constraints and Limits to Climate Change Adaptation Efforts in 48 Nigeria. In: Limits to Climate Change Adaptation [Leal Filho, W. and J. Nalau (eds.)]. Springer International 49 Publishing, Cham, pp. 159-174. ISBN 978-3-319-64599-5. 50
Oluwatimilehin, I. A. and A. Ayanlade, 2021: Agricultural community-based impact assessment and farmers’ 51 perception of climate change in selected Ecological Zones in Nigeria. Agriculture & Food Security, 10(1), 3, 52 doi:10.1186/s40066-020-00275-5. 53
Omari-Motsumi, K., M. Barnett and L. Schalatek, 2019: Broken Connections and Systemic Barriers: Overcoming the 54 Challenge of the ‘Missing Middle’ in Adaptation Finance. Global Commission on Adaptation, Africa Adaptation 55 Initiative, Cape Town, 1-58 pp. Available at: https://gca.org/wp-56 content/uploads/2020/12/Missing_Middle_Adaptation_Finance_Background_Paper.pdf. 57
Omonijo, A. G., 2017: Assessing seasonal variations in urban thermal comfort and potential health risks using 58 Physiologically Equivalent Temperature: A case of Ibadan, Nigeria. Urban Climate, 21, 87-105, 59 doi:https://doi.org/10.1016/j.uclim.2017.05.006. 60
Onwutuebe, C. J., 2019: Patriarchy and Women Vulnerability to Adverse Climate Change in Nigeria. SAGE Open, 9(1), 61 doi:10.1177/2158244019825914. 62
ACCEPTED VERSIO
N
SUBJECT TO FIN
AL EDITS

FINAL DRAFT Chapter 9 IPCC WGII Sixth Assessment Report
Do Not Cite, Quote or Distribute 9-202 Total pages: 225
Onyango, E., O. Sahin, C. Chu and B. Mackey, 2016a: An Integrated Modelling Approach to Climate Change and 1 Malaria Vulnerability Assessments. International Congress on Environmental Modelling and Software. 2
Onyango, E. A. et al., 2016b: An integrated risk and vulnerability assessment framework for climate change and 3 malaria transmission in East Africa. Malaria Journal, 15(1), 551, doi:10.1186/s12936-016-1600-3. 4
Onyekuru, A. N. and R. Marchant, 2014: Climate change impact and adaptation pathways for forest dependent 5 livelihood systems in Nigeria. 9(24), 1819-1832, doi:https://doi.org/DOI:10.5897/AJAR2013.8315. 6
Onyutha, C. et al., 2016: Analyses of rainfall trends in the Nile River Basin. Journal of Hydro-environment Research, 7 13, 36-51, doi:10.1016/j.jher.2015.09.002. 8
Onywere, S. M. and I. S. John M. Mironga, 2012: Use of Remote Sensing Data in Evaluating the Extent of 9 Anthropogenic 10
Activities and their Impact on Lake Naivasha, Kenya. The Open Environmental Engineering Journal, 5, 9-18. 11 Oppenheimer, M. et al., 2019: Sea Level Rise and Implications for Low-Lying Islands, Coasts and Communities 12
[Pörtner, H. O., D. C. Roberts, V. Masson-Delmotte, P. Zhai, M. Tignor, E. Poloczanska, K. Mintenbeck, A. 13 Alegría, M. Nicolai, A. Okem, J. Petzold, B. Rama and N. M. Weyer (eds.)]. IPCC Special Report on the Ocean 14 and Cryosphere in a Changing Climate, In press pp. Available at: 15 https://www.ipcc.ch/site/assets/uploads/sites/3/2019/12/SROCC_FullReport_FINAL.pdf. 16
Oppenheimer, M. et al., 2014: Emergent risks and key vulnerabilities [Field, C. B., V.R. Barros, D.J. Dokken, K.J. 17 Mach, M.D. Mastrandrea, T.E. Bilir, M. Chatterjee, K.L. Ebi, Y.O. Estrada, R.C. Genova, B. Girma, E.S. Kissel, 18 A.N. Levy, S. MacCracken, P.R. Mastrandrea, and L.L.White (ed.)]. Climate Change 2014: Impacts, Adaptation, 19 and Vulnerability. Part A: Global and Sectoral Aspects. Contribution of Working Group II to the Fifth Assessment 20 Report of the Intergovernmental Panel on Climate Change, Cambridge University Press, Cambridge, United 21 Kingdom and New York, NY, USA, 1039-1099 pp. Available at: 22 https://www.ipcc.ch/site/assets/uploads/2018/02/WGIIAR5-Chap19_FINAL.pdf. 23
Ordway, E. M., G. P. Asner and E. F. Lambin, 2017: Deforestation risk due to commodity crop expansion in sub-24 Saharan Africa. Environmental Research Letters, 12(4), 044015, doi:10.1088/1748-9326/aa6509. 25
Ortega-Cisneros, K. et al., 2018: Evaluating the effects of climate change in the southern Benguela upwelling system 26 using the Atlantis modelling framework. Fisheries Oceanography, 27(5), 489-503, doi:10.1111/fog.12268. 27
Ortiz-Bobea, A. et al., 2021: Anthropogenic climate change has slowed global agricultural productivity growth. Nature 28 Climate Change, 11(4), 306-312, doi:10.1038/s41558-021-01000-1. 29
Oruonye, D. E., 2010: The impact of climate change on the Bade fishing festival of Yobe State, Nigeria. International 30 Journal of Sustainable Development, 3(3), 29-32. 31
Osima, S. et al., 2018: Projected climate over the Greater Horn of Africa under 1.5 °C and 2 °C global warming. 32 Environmental Research Letters, 13(6), 065004, doi:10.1088/1748-9326/aaba1b. 33
Oswald, K. N. et al., 2020: Increasing temperatures increase the risk of reproductive failure in a near threatened alpine 34 ground-nesting bird, the Cape Rockjumper Chaetops frenatus. Ibis, 162(4), 1363-1369, 35 doi:https://doi.org/10.1111/ibi.12846. 36
Otieno, V. O. and R. O. Anyah, 2013: CMIP5 simulated climate conditions of the Greater Horn of Africa (GHA). Part 37 II: projected climate. Clim Dyn, 41(7-8), 2099-2113, doi:10.1007/s00382-013-1694-z. 38
Otto, F. E. et al., 2018: Anthropogenic influence on the drivers of the Western Cape drought 2015–2017. Environmental 39 Research Letters, 13(12), 124010, doi:https://doi.org/10.1088/1748-9326/aae9f9. 40
Otto, F. E. L. et al., 2020: Challenges to Understanding Extreme Weather Changes in Lower Income Countries. Bulletin 41 of the American Meteorological Society, 101(10), E1851-E1860, doi:10.1175/bams-d-19-0317.1. 42
Otto, I. M. et al., 2017: Social vulnerability to climate change: a review of concepts and evidence. Regional 43 Environmental Change, 17(6), 1651-1662, doi:10.1007/s10113-017-1105-9. 44
Otzelberger, A., 2014: Tackling the Double Injustice of Climate Change and Gender Inequality. CARE Climate 45 Change, CARE International. Available at: 46 https://www.carefrance.org/ressources/themas/1/4442,CARE_COP20_Tackling-double-injustic.pdf. 47
Ouhamdouch, S. et al., 2019: Evaluation of climate change impact on groundwater from semi-arid environment 48 (Essaouira Basin, Morocco) using integrated approaches. Environmental Earth Sciences, 78(15), 49 doi:10.1007/s12665-019-8470-2. 50
Ouweneel, B., K. Winter and K. Carden, 2020: How different Cape Town residential suburbs helped avert Day Zero. 51 H2Open Journal, 3(1), 118-134, doi:10.2166/h2oj.2020.018. 52
Ovalle-Rivera, O. et al., 2015: Projected shifts in Coffea arabica suitability among major global producing regions due 53 to climate change. PLoS One, 10(4), e0124155, doi:10.1371/journal.pone.0124155. 54
Overland, I. et al., 2021: Financing for Research on Climate Change in Africa: A Review. Climate and Development, 55 doi:https://doi.org/10.1080/17565529.2021.1976609. 56
Owen, G., 2020: What makes climate change adaptation effective? A systematic review of the literature. Global 57 Environmental Change, 62, 102071, doi:https://doi.org/10.1016/j.gloenvcha.2020.102071. 58
Oyero, O., 2007: Dynamics of indigenous language in environmental communication. Lagos Papers in English Studies, 59 1(1), 228-235. 60
Ozaki, M., 2016: Disaster Risk Financing in Bangladesh. ADB South Asia Working Paper Series, 46, Asian 61 Development Bank. Available at: https://www.adb.org/sites/default/files/publication/198561/sawp-046.pdf. 62
ACCEPTED VERSIO
N
SUBJECT TO FIN
AL EDITS

FINAL DRAFT Chapter 9 IPCC WGII Sixth Assessment Report
Do Not Cite, Quote or Distribute 9-203 Total pages: 225
Ozor, N. and A. Nyambane, 2020: Nationally Determined Contributions Implementation Index and Tracking Tools for 1 Africa. The Pan Africa Climate Justice Alliance (PACJA). Available at: 2 https://www.pacja.org/docs/publications/NDC%20Implementation%20Report%20-final.pdf. 3
Paalo, S. A. and A. K. Issifu, 2021: De-internationalizing Hybrid Peace: State-Traditional Authority Collaboration and 4 Conflict Resolution in Northern Ghana. Journal of Intervention and Statebuilding, 15(3), 406-424, 5 doi:10.1080/17502977.2020.1856551. 6
Padowski, J. C., L. Carrera and J. W. Jawitz, 2016: Overcoming urban water insecurity with infrastructure and 7 institutions. Water Resources Management, 30(13), 4913-4926, doi:10.1007/s11269-016-1461-0. 8
Paige, S. B. et al., 2014: Beyond bushmeat: animal contact, injury, and zoonotic disease risk in Western Uganda. 9 Ecohealth, 11(4), 534-543, doi:10.1007/s10393-014-0942-y. 10
Palmer, M. A., J. G. Kramer, J. Boyd and D. Hawthorne, 2016: Practices for facilitating interdisciplinary synthetic 11 research: the National Socio-Environmental Synthesis Center (SESYNC). Current Opinion in Environmental 12 Sustainability, 19, 111-122, doi:https://doi.org/10.1016/j.cosust.2016.01.002. 13
Pandit, R. et al., 2018: Summary for policymakers of the assessment report on land degradation and restoration of the 14 Intergovernmental Science-Policy Platform on Biodiversity and Ecosystem Services. The Intergovernmental 15 Platform on Biodiversity and Ecosystem Services, Bonn, Germany. Available at: 16 https://www.ipbes.net/system/tdf/spm_3bi_ldr_digital.pdf?file=1&type=node&id=28335. 17
Panitz, H.-J. et al., 2013: COSMO-CLM (CCLM) climate simulations over CORDEX-Africa domain: analysis of the 18 ERA-Interim driven simulations at 0.44° and 0.22° resolution. Clim Dyn, 42(11-12), 3015-3038, 19 doi:10.1007/s00382-013-1834-5. 20
Panthou, G. et al., 2018: Rainfall intensification in tropical semi-arid regions: the Sahelian case. Environmental 21 Research Letters, 13(6), 064013, doi:10.1088/1748-9326/aac334. 22
Panthou, G., T. Vischel and T. Lebel, 2014: Recent trends in the regime of extreme rainfall in the Central Sahel. 23 International Journal of Climatology, 34(15), 3998-4006, doi:https://doi.org/10.1002/joc.3984. 24
Park, S. et al., 2020: Recent ENSO influence on East African drought during rainy seasons through the synergistic use 25 of satellite and reanalysis data. ISPRS Journal of Photogrammetry and Remote Sensing, 162, 17-26, 26 doi:https://doi.org/10.1016/j.isprsjprs.2020.02.003. 27
Parkes, B., J. Cronin, O. Dessens and B. Sultan, 2019: Climate change in Africa: costs of mitigating heat stress. 28 Climatic Change, 154(3), 461-476, doi:10.1007/s10584-019-02405-w. 29
Parmar, A. et al., 2019: Exposure to air pollutants and heat stress among resource-poor women entrepreneurs in small-30 scale cassava processing. Environmental Monitoring and Assessment, doi:10.1007/s10661-019-7811-7. 31
Parrado, R. et al., 2020: Fiscal effects and the potential implications on economic growth of sea-level rise impacts and 32 coastal zone protection. Climatic Change, 160(2), 283-302, doi:10.1007/s10584-020-02664-y. 33
Partey, S. T., R. B. Zougmoré, M. Ouédraogo and B. M. Campbell, 2018: Developing climate-smart agriculture to face 34 climate variability in West Africa: Challenges and lessons learnt. Journal of Cleaner Production, 187, 285-295, 35 doi:10.1016/j.jclepro.2018.03.199. 36
Pascale, S., S. B. Kapnick, T. L. Delworth and W. F. Cooke, 2020: Increasing risk of another Cape Town “Day Zero” 37 drought in the 21st century. Proceedings of the National Academy of Sciences, 117(47), 29495, 38 doi:10.1073/pnas.2009144117. 39
Pasgaard, M. et al., 2015: Geographical imbalances and divides in the scientific production of climate change 40 knowledge. Global Environmental Change, 35, 279-288, doi:https://doi.org/10.1016/j.gloenvcha.2015.09.018. 41
Pasquini, L., 2020: The urban governance of climate change adaptation in least-developed African countries and in 42 small cities: the engagement of local decision-makers in Dar es Salaam, Tanzania, and Karonga, Malawi. Climate 43 and Development, 12(5), 408-419, doi:10.1080/17565529.2019.1632166. 44
Pasquini, L. and R. M. Cowling, 2014: Opportunities and challenges for mainstreaming ecosystem-based adaptation in 45 local government: evidence from the Western Cape, South Africa. Environment, Development and Sustainability, 46 17(5), 1121-1140, doi:10.1007/s10668-014-9594-x. 47
Pasquini, L., G. Ziervogel, R. M. Cowling and C. Shearing, 2015: What enables local governments to mainstream 48 climate change adaptation? Lessons learned from two municipal case studies in the Western Cape, South Africa. 49 Climate and Development, 7, 60-70, doi:10.1080/17565529.2014.886994. 50
Paterson, S. K. et al., 2017: Size does matter: City scale and the asymmetries of climate change adaptation in three 51 coastal towns. Geoforum, 81, 109-119, doi:https://doi.org/10.1016/j.geoforum.2017.02.014. 52
Patricola, C. M. and K. H. Cook, 2010: Northern African climate at the end of the twenty-first century: An integrated 53 application of regional and global climate models. Clim Dyn, 35, 193-212, doi:10.1007/s00382-009-0623-7. 54
Patrut, A. et al., 2018: The demise of the largest and oldest African baobabs. Nature Plants, 4(7), 423-426, 55 doi:10.1038/s41477-018-0170-5. 56
Paul, C. J., E. S. Weinthal, M. F. Bellemare and M. A. Jeuland, 2016: Social capital, trust, and adaptation to climate 57 change: Evidence from rural Ethiopia. Global Environmental Change, 36, 124-138, 58 doi:https://doi.org/10.1016/j.gloenvcha.2015.12.003. 59
Paul, M. and M. wa Gĩthĩnji, 2017: Small farms, smaller plots: land size, fragmentation, and productivity in Ethiopia. 60 The Journal of Peasant Studies, 45(4), 757-775, doi:10.1080/03066150.2016.1278365. 61
ACCEPTED VERSIO
N
SUBJECT TO FIN
AL EDITS

FINAL DRAFT Chapter 9 IPCC WGII Sixth Assessment Report
Do Not Cite, Quote or Distribute 9-204 Total pages: 225
Pauline, N. M., C. Vogel, S. Grab and E. T. Liwenga, 2017: Smallholder farmers in the Great Ruaha River sub-Basin of 1 Tanzania: coping or adapting to rainfall variability? Climate and Development, 9(3), 217-230, 2 doi:10.1080/17565529.2016.1184607. 3
Payne, Benjamin L. and J. Bro-Jørgensen, 2016: Disproportionate Climate-Induced Range Loss Forecast for the Most 4 Threatened African Antelopes. Current Biology, 26(9), 1200-1205, doi:https://doi.org/10.1016/j.cub.2016.02.067. 5
Paz, M., A. Avendaño, A. Caballero and V. Gozalo, 2015: Joining the dots of Informality and Climate Change: A 6 Discussion Paper for Practitioners [Konrad Adenauer Foundation (ed.)]. 40 pp. Available at: 7 https://www.kas.de/c/document_library/get_file?uuid=6139364e-b294-8198-153f-8 1cdf2f91f034&groupId=252038. 9
Paz, S., 2009: Impact of temperature variability on cholera incidence in southeastern Africa, 1971-2006. Ecohealth, 10 6(3), 340-345, doi:10.1007/s10393-009-0264-7. 11
Pecl, G. T. et al., 2017: Biodiversity redistribution under climate change: Impacts on ecosystems and human well-being. 12 Science (New York, N.Y.), 355(6332), doi:10.1126/science.aai9214. 13
Peer, N. et al., 2018: Latitudinal gradients and poleward expansion of mangrove ecosystems in South Africa: 50 years 14 after Macnae’s first assessment. African Journal of Marine Science, 40(2), 101-120, 15 doi:10.2989/1814232X.2018.1466728. 16
Peirson, A. E. and G. Ziervogel, 2021: Sanitation Upgrading as Climate Action: Lessons for Local Government from a 17 Community Informal Settlement Project in Cape Town. Sustainability, 13(15), doi:10.3390/su13158598. 18
Penney, R., G. Wilson and L. Rodwell, 2017: Managing sino-ghanaian fi shery relations : A political ecology approach. 19 Marine Policy, 79(December 2016), 46-53, doi:10.1016/j.marpol.2017.02.008. 20
Peprah, K., 2017: Sustainable production of afforestation and reforestation to salvage land degradation in Asunafo 21 District, Ghana. J. Degrade. Min. Land Manage., 5(1), 955-964, 22 doi:https://doi.org/10.15243/jdmlm.2017.051.955. 23
Perez, C. et al., 2015: How resilient are farming households and communities to a changing climate in Africa? A 24 gender-based perspective. Global Environmental Change, 34, 95-107, doi:10.1016/j.gloenvcha.2015.06.003. 25
Péron, G. and R. Altwegg, 2015: Twenty-five years of change in southern African passerine diversity: nonclimatic 26 factors of change. Global Change Biology, 21(9), 3347-3355, doi:https://doi.org/10.1111/gcb.12909. 27
Petesch, P. et al., 2018: Local normative climate shaping agency and agricultural livelihoods in sub-Saharan Africa. 28 Journal of Gender, Agriculture and Food Security, 3(1), 108-130, doi:https://doi.org/10.19268/JGAFS.312018.5. 29
Petrova, I. Y., C. C. van Heerwaarden, C. Hohenegger and F. Guichard, 2018: Regional co-variability of spatial and 30 temporal soil moisture–precipitation coupling in North Africa: an observational perspective. Hydrol. Earth Syst. 31 Sci., 22(6), 3275-3294, doi:10.5194/hess-22-3275-2018. 32
Peyre, M. a. C. V. a. A.-S. S. a. V. A. a. A.-M. N. a. T. E. a. R. F., 2015: A Systematic Scoping Study of the Socio-33 Economic Impact of Rift Valley Fever: Research Gaps and Needs. Zoonoses and Public Health, 62(5), 309-325, 34 doi:10.1111/zph.12153. 35
Pham-Duc, B. et al., 2020: The Lake Chad hydrology under current climate change. Sci Rep, 10(1), 5498, 36 doi:10.1038/s41598-020-62417-w. 37
Phillips, C. A. et al., 2020: Compound climate risks in the COVID-19 pandemic. Nature Climate Change, 10(7), 586-38 588, doi:10.1038/s41558-020-0804-2. 39
Phillips, H., 2015: The capacity to adapt to climate change at heritage sites—The development of a conceptual 40 framework. Environmental Science & Policy, 47, 118-125, doi:https://doi.org/10.1016/j.envsci.2014.11.003. 41
Phipps, W. L. et al., 2017: Due South: A first assessment of the potential impacts of climate change on Cape vulture 42 occurrence. Biological Conservation, 210, 16-25, doi:10.1016/j.biocon.2017.03.028. 43
Phiri, D., M. Simwanda and V. Nyirenda, 2021: Mapping the impacts of cyclone Idai in Mozambique using Sentinel-2 44 and OBIA approach. South African Geographical Journal, 103(2), 237-258, 45 doi:10.1080/03736245.2020.1740104. 46
Piao, S. et al., 2020: Characteristics, drivers and feedbacks of global greening. Nature Reviews Earth & Environment, 47 1(1), 14-27, doi:10.1038/s43017-019-0001-x. 48
Pienaar, G. W. and D. A. Hughes, 2017: Linking hydrological uncertainty with equitable allocation for water resources 49 decision-making. Water Resources Management, 31(1), 269-282, doi:10.1007/s11269-016-1523-3. 50
Pigott, D. M. et al., 2017: Local, national, and regional viral haemorrhagic fever pandemic potential in Africa: a 51 multistage analysis. Lancet, 390(10113), 2662-2672, doi:10.1016/S0140-6736(17)32092-5. 52
Pinceel, T., B. Vanschoenwinkel, L. Brendonck and F. Buschke, 2016: Modelling the sensitivity of life history traits to 53 climate change in a temporary pool crustacean. Scientific Reports, 6(1), 29451, doi:10.1038/srep29451. 54
Pinto, I. et al., 2015: Evaluation and projections of extreme precipitation over southern Africa from two CORDEX 55 models. Climatic Change, 135(3-4), 655-668, doi:10.1007/s10584-015-1573-1. 56
Pittelkow, C. M. et al., 2015: Productivity limits and potentials of the principles of conservation agriculture. Nature, 57 517(7534), 365-368, doi:10.1038/nature13809. 58
Plisnier, P.-D., M. Nshombo, H. Mgana and G. Ntakimazi, 2018: Monitoring climate change and anthropogenic 59 pressure at Lake Tanganyika. Journal of Great Lakes Research, 44(6), 1194-1208, doi:10.1016/j.jglr.2018.05.019. 60
Polley, H. W. et al., 2013: Climate Change and North American Rangelands: Trends, Projections, and Implications. 61 Rangeland Ecology & Management, 66(5), 493-511, doi:10.2111/REM-D-12-00068.1. 62
ACCEPTED VERSIO
N
SUBJECT TO FIN
AL EDITS
FINAL DRAFT Chapter 9 IPCC WGII Sixth Assessment Report
Do Not Cite, Quote or Distribute 9-205 Total pages: 225
Popelka, S. J. and L. C. Smith, 2020: Rivers as political borders: a new subnational geospatial dataset. Water Policy, 1 22(3), 293-312, doi:10.2166/wp.2020.041. 2
Potts, D., 2008: The urban informal sector in sub-Saharan Africa: from bad to good (and back again?). Development 3 Southern Africa, 25(2), 151-167, doi:10.1080/03768350802090527. 4
Poudel, S., S. Funakawa, H. Shinjo and B. Mishra, 2020: Understanding households’ livelihood vulnerability to climate 5 change in the Lamjung district of Nepal. Environment, Development and Sustainability, doi:10.1007/s10668-019-6 00566-3. 7
Pouramin, P., N. Nagabhatla and M. Miletto, 2020: A Systematic Review of Water and Gender Interlinkages: Assessing 8 the Intersection With Health. Frontiers in Water, 2, doi:10.3389/frwa.2020.00006. 9
Powell, B., P. Maundu, H. V. Kuhnlein and T. Johns, 2013: Wild Foods from Farm and Forest in the East Usambara 10 Mountains, Tanzania. Ecology of Food and Nutrition, 52(6), 451-478, doi:10.1080/03670244.2013.768122. 11
Pozniak, A. et al., 2020: HIV continuity of care after Cyclone Idai in Mozambique. The Lancet HIV, 7(3), e159-e160, 12 doi:10.1016/S2352-3018(20)30045-X. 13
Pragna, P. et al., 2018: Summer season induced rhythmic alterations in metabolic activities to adapt to heat stress in 14 three indigenous (Osmanabadi, Malabari and Salem Black) goat breeds. Biological Rhythm Research, 49(4), 551-15 565, doi:10.1080/09291016.2017.1386891. 16
Pratt, C. F., K. L. Constantine and S. T. Murphy, 2017: Economic impacts of invasive alien species on African 17 smallholder livelihoods. Global Food Security, 14, 31-37, doi:10.1016/j.gfs.2017.01.011. 18
Prinz, R. et al., 2018: Mapping the loss of Mt. Kenya’s Glaciers: An example of the challenges of satellite monitoring 19 of very small glaciers. Geosciences, 8(5), doi:10.3390/geosciences8050174. 20
Prinz, R. et al., 2016: Climatic controls and climate proxy potential of Lewis Glacier, Mt. Kenya. The Cryosphere, 21 10(1), 133-148, doi:10.5194/tc-10-133-2016. 22
Probert, J. R. et al., 2019: Anthropogenic modifications to fire regimes in the wider Serengeti-Mara ecosystem. Global 23 Change Biology, 25(10), 3406-3423, doi:10.1111/gcb.14711. 24
Protopopoff, N. et al., 2009: Ranking malaria risk factors to guide malaria control efforts in African highlands. PLoS 25 One, 4(11), e8022, doi:10.1371/journal.pone.0008022. 26
Pula, 2021: Pula Global Insuretech, Pula Global Insuretech, Nairobi, Kenya. Available at: https://www.pula-27 advisors.com/. 28
Quandt, A., H. Neufeldt and J. T. McCabe, 2017: The role of agroforestry in building livelihood resilience to floods and 29 drought in semiarid Kenya. Ecology and Society, 22(3), doi:10.5751/es-09461-220310. 30
Quesada, B., A. Arneth, E. Robertson and N. d. Noblet-Ducoudré, 2018: Potential strong contribution of future 31 anthropogenic land-use and land-cover change to the terrestrial carbon cycle. Environmental Research Letters, 32 13(6), 064023, doi:10.1088/1748-9326/aac4c3. 33
Ragavan, M. I., L. E. Marcil and A. Garg, 2020: Climate Change as a Social Determinant of Health. Pediatrics, 145(5), 34 e20193169, doi:10.1542/peds.2019-3169. 35
Rahimi, J. et al., 2021: Heat stress will detrimentally impact future livestock production in East Africa. Nature Food, 36 2(2), 88-96, doi:10.1038/s43016-021-00226-8. 37
Rai, N., S. Best and M. Soanes, 2016: Unlocking climate finance for decentralised energy access. Working Paper, 38 International Institute for Environment and Development (IIED), IIED, London, 48 pp. Available at: 39 https://pubs.iied.org/sites/default/files/pdfs/migrate/16621IIED.pdf? 40
Raleigh, C. and D. Kniveton, 2012: Come rain or shine: An analysis of conflict and climate variability in East Africa. 41 Journal of Peace Research, 49(1), 51-64, doi:10.1177/0022343311427754. 42
Ralston, L., 2015: Conflict and Climate: a Micro-level Analysis. CEGA Working Paper. 43 Ramin, B., 2009: Slums, climate change and human health in sub-Saharan Africa. Bulletin of the World Health 44
Organization, 86, World Health Organization, 886 pp. 45 Ramutsindela, M. and B. Büscher, 2019: Environmental Governance and the (Re-)Making of the African State. In: 46
Oxford Research Encyclopedia of Politics. ISBN 9780190228637. 47 Ranasinghe, R. et al., 2021: Climate Change Information for Regional Impact and for Risk Assessment [Masson-48
Delmotte, V., P. Zhai, A. Pirani, S. L. Connors, C. Péan, S. Berger, N. Caud, Y. Chen, L. Goldfarb, M. I. Gomis, 49 M. Huang, K. Leitzell, E. Lonnoy, J. B. R. Matthews, T. K. Maycock, T. Waterfield, O. Yelekçi, R. Yu and B. 50 Zhou (ed.)]. Climate Change 2021: The Physical Science Basis. Contribution of Working Group I to the Sixth 51 Assessment Report of the Intergovernmental Panel on Climate Change In Press, Cambridge University Press. 52 Available at: https://www.ipcc.ch/report/ar6/wg1/downloads/report/IPCC_AR6_WGI_Chapter_12.pdf. 53
Randell, H. and C. Gray, 2016: Climate variability and educational attainment: Evidence from rural Ethiopia. Glob 54 Environ Change, 41, 111-123, doi:10.1016/j.gloenvcha.2016.09.006. 55
Randell, H. and C. Gray, 2019: Climate change and educational attainment in the global tropics. Proc Natl Acad Sci U S 56 A, 116(18), 8840-8845, doi:10.1073/pnas.1817480116. 57
Rankoana, S., 2016a: Perceptions of Climate Change and the Potential for Adaptation in a Rural Community in 58 Limpopo Province, South Africa. Sustainability, 8(8), 672, doi:https://doi.org/10.3390/su8080672. 59
Rankoana, S. A., 2016b: Rainfall scarcity and its impacts on subsistence farming: the role of gender and religious 60 rituals in adaptation to change. Agenda, 30(3), 124-131, doi:https://doi.org/10.1080/10130950.2016.1259867. 61
Rannow, S. et al., 2014: Managing protected areas under climate change: challenges and priorities. Environ Manage, 62 54(4), 732-743, doi:10.1007/s00267-014-0271-5. 63
ACCEPTED VERSIO
N
SUBJECT TO FIN
AL EDITS
FINAL DRAFT Chapter 9 IPCC WGII Sixth Assessment Report
Do Not Cite, Quote or Distribute 9-206 Total pages: 225
Rao, N. et al., 2017: Gendered vulnerabilities to climate change: insights from the semi-arid regions of Africa and Asia. 1 Climate and Development, 11(1), 14-26, doi:10.1080/17565529.2017.1372266. 2
Rao, N. et al., 2019: A qualitative comparative analysis of women’s agency and adaptive capacity in climate change 3 hotspots in Asia and Africa. Nature Climate Change, 9(12), 964-971, doi:10.1038/s41558-019-0638-y. 4
Rao, N. et al., 2020: Managing risk, changing aspirations and household dynamics: Implications for wellbeing and 5 adaptation in semi-arid Africa and India. World Development, 125, 104667, 6 doi:https://doi.org/10.1016/j.worlddev.2019.104667. 7
Rao, S. et al., 2016: A multi-model assessment of the co-benefits of climate mitigation for global air quality. 8 Environmental Research Letters, 11(12), 124013, doi:10.1088/1748-9326/11/12/124013. 9
Rapolaki, R. S. and C. J. C. Reason, 2018: Tropical storm Chedza and associated floods over south-eastern Africa. 10 Natural Hazards, 93(1), 189-217, doi:10.1007/s11069-018-3295-y. 11
Rauner, S. et al., 2020a: Coal-exit health and environmental damage reductions outweigh economic impacts. Nature 12 Climate Change, doi:10.1038/s41558-020-0728-x. 13
Rauner, S. et al., 2020b: Air quality co-benefits of ratcheting up the NDCs. Climatic Change, doi:10.1007/s10584-020-14 02699-1. 15
Ravera, F. et al., 2016: Gender perspectives in resilience, vulnerability and adaptation to global environmental change. 16 Ambio, 45(Suppl 3), 235-247, doi:10.1007/s13280-016-0842-1. 17
Rawlins, J. M., W. J. De Lange and G. C. G. Fraser, 2018: An Ecosystem Service Value Chain Analysis Framework: A 18 Conceptual Paper. Ecological Economics, 147, 84-95, doi:https://doi.org/10.1016/j.ecolecon.2017.12.023. 19
Ray, D. K. et al., 2019: Climate change has likely already affected global food production. PLoS One, 14(5), e0217148, 20 doi:10.1371/journal.pone.0217148. 21
Ray, R. S. et al., 2011: Impaired respiratory and body temperature control upon acute serotonergic neuron inhibition. 22 Science (New York, N.Y.), 333(6042), 637-642, doi:10.1126/science.1205295. 23
Reason, C. J. C. and M. Rouault, 2005: Links between the Antarctic Oscillation and winter rainfall over western South 24 Africa. Geophysical Research Letters, 32(7), doi:https://doi.org/10.1029/2005GL022419. 25
Record, S., N. D. Charney, R. M. Zakaria and A. M. Ellison, 2013: Projecting global mangrove species and community 26 distributions under climate change. Ecosphere, 4(3), art34, doi:https://doi.org/10.1890/ES12-00296.1. 27
Reed, M. S. et al., 2015: Reorienting land degradation towards sustainable land management: Linking sustainable 28 livelihoods with ecosystem services in rangeland systems. Journal of Environmental Management, 151, 472-485, 29 doi:https://doi.org/10.1016/j.jenvman.2014.11.010. 30
Rehbein, J. A. et al., 2020: Renewable energy development threatens many globally important biodiversity areas. 31 Global Change Biology, 26(5), 3040-3051, doi:10.1111/gcb.15067. 32
Reid, H., 2014: Ecosystem-and community-based adaptation: learning from natural resource management. IIED 33 Briefing Paper-International Institute for Environment and Development, 4 pp. Available at: 34 http://pubs.iied.org/17243IIED. 35
Reid, H., 2016: Ecosystem- and community-based adaptation: learning from community-based natural resource 36 management. Climate and Development, 8(1), 4-9, doi:10.1080/17565529.2015.1034233. 37
Reid, H. et al., 2018: Chapter 16 - A Framework for Assessing the Effectiveness of Ecosystem-Based Approaches to 38 Adaptation. In: Resilience [Zommers, Z. and K. Alverson (eds.)]. Elsevier, pp. 207-216. ISBN 978-0-12-811891-39 7. 40
Reid, H. et al., 2019: Is ecosystem-based adaptation effective? Perceptions and lessons learned from 13 project sites. 41 IIED Research 42
Report, IIED, London. Available at: https://pubs.iied.org/17651IIED/ (accessed 2019/09/18/13:35:40). 43 Reimann, L. et al., 2018: Mediterranean UNESCO World Heritage at risk from coastal flooding and erosion due to sea-44
level rise. Nature Communications, 9(1), doi:10.1038/s41467-018-06645-9. 45 Reinecke, R. et al., 2019: Spatially distributed sensitivity of simulated global groundwater heads and flows to hydraulic 46
conductivity, groundwater recharge, and surface water body parameterization. Hydrology and Earth System 47 Sciences, 23(11), 4561-4582, doi:10.5194/hess-23-4561-2019. 48
Reizenberg, J.-L. et al., 2019: Variation in thermal tolerances of native freshwater fishes in South Africa's Cape Fold 49 Ecoregion: examining the east-west gradient in species' sensitivity to climate warming. J Fish Biol, 94(1), 103-50 112, doi:10.1111/jfb.13866. 51
Rennkamp, B. and A. Boyd, 2015: Technological capability and transfer for achieving South Africa's development 52 goals. Climate Policy, 15(1), 12-29, doi:10.1080/14693062.2013.831299. 53
Rentschler, J. and M. Salhab, 2020: People in Harm's Way : Flood Exposure and Poverty in 189 Countries. Policy 54 Research Working Papers, World Bank, Washington, DC. Available at: 55 https://openknowledge.worldbank.org/handle/10986/34655. 56
Revi, A. et al., 2020: Transformative Adaptation in Cities. One Earth, 3(4), 384-387, doi:10.1016/j.oneear.2020.10.002. 57 Rhodes, C. J., 2017: The Imperative for Regenerative Agriculture. Science Progress, 100(1), 80-129, 58
doi:10.3184/003685017x14876775256165. 59 Rigaud, K. K. et al., 2018: Groundswell: Preparing for Internal Climate Migration. The World Bank, Washington, DC. 60
Available at: https://openknowledge.worldbank.org/handle/10986/29461. 61 Rigden, A. J., V. Ongoma and P. Huybers, 2020: Kenyan tea is made with heat and water: how will climate change 62
influence its yield? Environmental Research Letters, 15(4), 044003, doi:10.1088/1748-9326/ab70be. 63
ACCEPTED VERSIO
N
SUBJECT TO FIN
AL EDITS
FINAL DRAFT Chapter 9 IPCC WGII Sixth Assessment Report
Do Not Cite, Quote or Distribute 9-207 Total pages: 225
Rippke, U. et al., 2016: Timescales of transformational climate change adaptation in sub-Saharan African agriculture. 1 Nature Climate Change, 6(6), 605-609, doi:10.1038/nclimate2947. 2
Ritzema, R. S. et al., 2017: Is production intensification likely to make farm households food-adequate? A simple food 3 availability analysis across smallholder farming systems from East and West Africa. Food Security, 9(1), 115-131, 4 doi:10.1007/s12571-016-0638-y. 5
Roberts, C. M., B. C. O'Leary and J. P. Hawkins, 2020: Climate change mitigation and nature conservation both require 6 higher protected area targets. Philosophical Transactions of the Royal Society B: Biological Sciences, 375(1794), 7 20190121, doi:10.1098/rstb.2019.0121. 8
Roberts, C. M. et al., 2017: Marine reserves can mitigate and promote adaptation to climate change. Proceedings of the 9 National Academy of Sciences, 114(24), 6167-6175, doi:10.1073/pnas.1701262114. 10
Roberts, D., 2010: Prioritizing climate change adaptation and local level resilience in Durban, South Africa. 11 Environment and Urbanization, 22(2), 397-413, doi:10.1177/0956247810379948. 12
Roberts, M. J. and W. Schlenker, 2013: Identifying Supply and Demand Elasticities of Agricultural Commodities: 13 Implications for the US Ethanol Mandate. American Economic Review, 103(6), 2265-2295, 14 doi:10.1257/aer.103.6.2265. 15
Robilliard, A.-S., 2020: What’s New About Income Inequality in Africa? Issue Brief, World Inequality Lab, Lab, W. I., 16 9 pp. Available at: https://wid.world/document/whats-new-about-income-inequality-in-africa/. 17
Robinson, A. L. and J. Gottlieb, 2021: How to Close the Gender Gap in Political Participation: Lessons from 18 Matrilineal Societies in Africa. British Journal of Political Science, 51(1), 68-92, 19 doi:10.1017/S0007123418000650. 20
Robinson, S.-a., 2020: Climate change adaptation in SIDS: A systematic review of the literature pre and post the IPCC 21 Fifth Assessment Report. WIREs Climate Change, 11(4), e653, doi:https://doi.org/10.1002/wcc.653. 22
Robledo, C., N. Clot, A. Hammill and B. Riché, 2012: The role of forest ecosystems in community-based coping 23 strategies to climate hazards: Three examples from rural areas in Africa. Forest Policy and Economics, 24, 20-28, 24 doi:https://doi.org/10.1016/j.forpol.2011.04.006. 25
Rodina, L., 2019: Planning for water resilience: Competing agendas among Cape Town’s planners and water managers. 26 Environmental Science & Policy, 99, 10-16, doi:10.1016/j.envsci.2019.05.016. 27
Rohat, G. et al., 2019: Projections of Human Exposure to Dangerous Heat in African Cities Under Multiple 28 Socioeconomic and Climate Scenarios. Earth's Future, 7(5), 528-546, doi:https://doi.org/10.1029/2018EF001020. 29
Rojas-Downing, M. M., A. P. Nejadhashemi, T. Harrigan and S. A. Woznicki, 2017: Climate change and livestock: 30 Impacts, adaptation, and mitigation. Climate Risk Management, 16, 145-163, 31 doi:https://doi.org/10.1016/j.crm.2017.02.001. 32
Roncoli, C., K. Ingram and P. Kirshen, 2002: Reading the Rains: Local Knowledge and Rainfall Forecasting in Burkina 33 Faso. Society & Natural Resources, 15(5), 409-427, doi:https://doi.org/10.1080/08941920252866774. 34
Rosenzweig, C. et al., 2014: Assessing agricultural risks of climate change in the 21st century in a global gridded crop 35 model intercomparison. Proceedings of the National Academy of Sciences, 111(9), 3268, 36 doi:10.1073/pnas.1222463110. 37
Rosenzweig, C. et al., 2020: Climate change responses benefit from a global food system approach. Nature Food, 1(2), 38 94-97, doi:10.1038/s43016-020-0031-z. 39
Roson, R. and M. Sartori, 2016: Estimation of Climate Change Damage Functions for 140 Regions in the GTAP9 40 Database. Policy Research Working Paper, World Bank, Washington, DC. Available at: 41 https://openknowledge.worldbank.org/handle/10986/24643. 42
Ross-Gillespie, V., M. D. Picker, H. F. Dallas and J. A. Day, 2018: The role of temperature in egg development of three 43 aquatic insects Lestagella penicillata (Ephemeroptera), Aphanicercella scutata (Plecoptera), Chimarra ambulans 44 (Trichoptera) from South Africa. Journal of Thermal Biology, 71, 158-170, doi:10.1016/j.jtherbio.2017.11.008. 45
Rother, H.-A., 2020: Controlling and preventing climate-sensitive noncommunicable diseases in urban sub-Saharan 46 Africa. Science of The Total Environment, 722, 137772, doi:10.1016/j.scitotenv.2020.137772. 47
Rother, H.-A., C. E. Sabel and S. Vardoulakis, 2020: A Collaborative Framework Highlighting Climate-Sensitive Non-48 communicable Diseases in Urban Sub-Saharan Africa. In: Africa and the Sustainable Development Goals 49 [Ramutsindela, M. and D. Mickler (eds.)]. Springer International Publishing, Cham, pp. 267-278. 50
Rouabhi, A., M. Hafsi and P. Monneveux, 2019: Climate change and farming systems in the region of Setif (Algeria). 51 Journal of Agriculture and Environment for International Development (JAEID), 113(1), 79-95, 52 doi:http://dx.doi.org/10.12895/jaeid.20191.928. 53
Roudier, P., A. Ducharne and L. Feyen, 2014: Climate change impacts on runoff in West Africa: a review. Hydrology 54 and Earth System Sciences, 18(7), 2789-2801, doi:10.5194/hess-18-2789-2014. 55
Rowell, D. P., B. B. B. Booth, S. E. Nicholson and P. Good, 2015: Reconciling Past and Future Rainfall Trends over 56 East Africa. Journal of Climate, 28(24), 9768-9788, doi:10.1175/jcli-d-15-0140.1. 57
Roxy, M. K. et al., 2016: A reduction in marine primary productivity driven by rapid warming over the tropical Indian 58 Ocean. Geophysical Research Letters, 43(2), 826-833, doi:10.1002/2015gl066979. 59
Roy, J. et al., 2018a: Sustainable development, poverty eradication and reducing inequalities [Masson-Delmotte, V., P. 60 Zhai, H.-O. Pörtner, D. Roberts, J. Skea, P. R. Shukla, A. Pirani, W. Moufouma-Okia, C. Péan, R. Pidcock, S. 61 Connors, J. B. R. Matthews, Y. Chen, X. Zhou, M. I. Gomis, E. Lonnoy, T. Maycock, M. Tignor and T. 62 Waterfield (eds.)]. Global Warming of 1.5°C. An IPCC Special Report on the impacts of global warming of 1.5°C 63
ACCEPTED VERSIO
N
SUBJECT TO FIN
AL EDITS

FINAL DRAFT Chapter 9 IPCC WGII Sixth Assessment Report
Do Not Cite, Quote or Distribute 9-208 Total pages: 225
above pre-industrial levels and related global greenhouse gas emission pathways, in the context of strengthening 1 the global response to the threat of climate change, sustainable development, and efforts to eradicate poverty, In 2 Press. Available at: https://www.ipcc.ch/site/assets/uploads/sites/2/2019/05/SR15_Chapter5_Low_Res.pdf. 3
Roy, M. et al., 2018b: Climate change and declining levels of green structures: Life in informal settlements of Dar es 4 Salaam, Tanzania. Landscape and Urban Planning, 180, 282-293, doi:10.1016/j.landurbplan.2017.11.011. 5
Rozenberg, J. et al., 2019: From A Rocky Road to Smooth Sailing: Building Transport Resilience to Natural Disasters. 6 The World Bank, The World Bank, Washington, DC, 44 pp. Available at: 7 https://openknowledge.worldbank.org/handle/10986/31913. 8
Rozenberg, J. and S. Hallegatte, 2015: The impacts of climate change on poverty in 2030 and the potential from rapid, 9 inclusive, and climate-informed development. The World Bank, Washington DC. Available at: 10 https://www.google.com/url?sa=t&rct=j&q=&esrc=s&source=web&cd=2&cad=rja&uact=8&ved=2ahUKEwib1s11 a_oYDlAhVimVwKHfwzDMgQFjABegQIAxAB&url=https%3A%2F%2Fwww.semanticscholar.org%2Fpaper%12 2FThe-impacts-of-climate-change-on-poverty-in-2030-Rozenberg-13 Hallegatte%2F9e9cbc9e3cf040fd749ce9d58c0b8c31fdae47be&usg=AOvVaw3SaJdptXEfBdMKTZj9-Xj1. 14
Ruhl, J. B., 2010: Climate Change Adaptation and the Structural Transformation of Environmental Law. Environmental 15 Law, 40(2), 363-436. 16
Rumble, O., 2019: Facilitating African Climate Change Adaptation through Framework Laws. Carbon & Climate Law 17 Review (CCLR), 2019(4), 237-245. 18
Rurinda, J. et al., 2014: Sources of vulnerability to a variable and changing climate among smallholder households in 19 Zimbabwe: A participatory analysis. Climate Risk Management, 3, 65-78, doi:10.1016/j.crm.2014.05.004. 20
Russo, S., A. F. Marchese, J. Sillmann and G. Immé, 2016: When will unusual heat waves become normal in a warming 21 Africa? Environmental Research Letters, 11(5), 054016, doi:10.1088/1748-9326/11/5/054016. 22
Ryan, S. J., C. J. Carlson, E. A. Mordecai and L. R. Johnson, 2019: Global expansion and redistribution of Aedes-borne 23 virus transmission risk with climate change. PLOS Neglected Tropical Diseases, 13(3), e0007213, 24 doi:10.1371/journal.pntd.0007213. 25
Ryan, S. J., C. A. Lippi and F. Zermoglio, 2020: Shifting transmission risk for malaria in Africa with climate change: a 26 framework for planning and intervention. Malaria Journal, 19(1), 170, doi:10.1186/s12936-020-03224-6. 27
Ryan, S. J. et al., 2015: Mapping Physiological Suitability Limits for Malaria in Africa Under Climate Change. Vector-28 Borne and Zoonotic Diseases, 15(12), 718-725, doi:10.1089/vbz.2015.1822. 29
Saarinen, J., W. L. Hambira, J. Atlhopheng and H. Manwa, 2012: Tourism industry reaction to climate change in 30 Kgalagadi South District, Botswana. Development Southern Africa, 29(2), 273-285, 31 doi:10.1080/0376835x.2012.675697. 32
Sadoine, M. L. et al., 2018: The associations between malaria, interventions, and the environment: a systematic review 33 and meta-analysis. Malar J, 17(1), 73, doi:10.1186/s12936-018-2220-x. 34
SAIA, 2018: Accelerating our journey to Future-proofing our industry. South African Insurance Association (SAIA), 35 Pretoria, 68 pp. Available at: https://www.saia.co.za/index.php?id=2030. 36
Sala, E., S. Giakoumi and P. Linwood, 2018: No-take marine reserves are the most effective protected areas in the 37 ocean. ICES Journal of Marine Science, 75(3), 1166-1168, doi:10.1093/icesjms/fsx059. 38
Salack, S. et al., 2019: Designing Transnational Hydroclimatological Observation Networks and Data Sharing Policies 39 in West Africa. Data Science Journal (DSJ), 18(1), doi:http://doi.org/10.5334/dsj-2019-033. 40
Salas, R. N., J. M. Shultz and C. G. Solomon, 2020: The Climate Crisis and Covid-19 — A Major Threat to the 41 Pandemic Response. New England Journal of Medicine, 383(11), e70, doi:10.1056/NEJMp2022011. 42
Salick, J. and N. Ross, 2009: Traditional peoples and climate change. Global Environmental Change, 19(2), 137-190, 43 doi:10.1016/j.gloenvcha.2009.01.004. 44
Salih, A. A. M., M. Baraibar, K. K. Mwangi and G. Artan, 2020: Climate change and locust outbreak in East Africa. 45 Nature Climate Change, 10(7), 584-585, doi:10.1038/s41558-020-0835-8. 46
Samy, A. M. and A. T. Peterson, 2016: Climate Change Influences on the Global Potential Distribution of Bluetongue 47 Virus. PLOS ONE, 11(3), e0150489, doi:10.1371/journal.pone.0150489. 48
Sango, I. and N. Godwell, 2015: Climate change trends and environmental impacts in the Makonde Communal Lands, 49 Zimbabwe. South African Journal of Science, 111(7/8), 1-6, doi:10.17159/sajs.2015/20140266. 50
Sanogo, K. et al., 2017: Farmers’ perceptions of climate change impacts on ecosystem services delivery of parklands in 51 southern Mali. Agroforestry Systems, 91(2), 345-361, doi:10.1007/s10457-016-9933-z. 52
Sanogo, S. et al., 2015: Spatio‐temporal characteristics of the recent rainfall recovery in West Africa. International 53 Journal of Climatology, 35(15), 4589-4605, doi:https://doi.org/10.1002/joc.4309. 54
Santam, 2018: Santam integrated report 2018. Santam Group, Cape Town. Available at: 55 https://www.santam.co.za/media/2684712/santam_ir_-2018.pdf. 56
Sanya, T., 2012: Sustainable architecture evaluation method in an African context: transgressing discipline boundaries 57 with a systems approach. Sustainability Science, 7(1), 55-65, doi:10.1007/s11625-011-0137-1. 58
Sapiains, R. et al., 2021: Exploring the contours of climate governance: An interdisciplinary systematic literature 59 review from a southern perspective. Environmental Policy and Governance, 31(1), 46-59, doi:10.1002/eet.1912. 60
Saraswat, C. and P. Kumar, 2016: Climate justice in lieu of climate change: a sustainable approach to respond to the 61 climate change injustice and an awakening of the environmental movement. Energy, Ecology and Environment, 62 1(2), 67-74, doi:10.1007/s40974-015-0001-8. 63
ACCEPTED VERSIO
N
SUBJECT TO FIN
AL EDITS

FINAL DRAFT Chapter 9 IPCC WGII Sixth Assessment Report
Do Not Cite, Quote or Distribute 9-209 Total pages: 225
Satterthwaite, D., 2017: The impact of urban development on risk in sub-Saharan Africa's cities with a focus on small 1 and intermediate urban centres. International Journal of Disaster Risk Reduction, 26, 16-23, 2 doi:https://doi.org/10.1016/j.ijdrr.2017.09.025. 3
Satterthwaite, D. et al., 2020: Building Resilience to Climate Change in Informal Settlements. One Earth, 2(2), 143-4 156, doi:https://doi.org/10.1016/j.oneear.2020.02.002. 5
Satterthwaite, D. and S. Bartlett, 2017: Editorial: The full spectrum of risk in urban centres: changing perceptions, 6 changing priorities. Environment and Urbanization, 29(1), 3-14, doi:10.1177/0956247817691921. 7
Saulnier-Talbot, E. et al., 2014: Small changes in climate can profoundly alter the dynamics and ecosystem services of 8 tropical crater lakes. PLoS One, 9(1), e86561, doi:10.1371/journal.pone.0086561. 9
Savary, S. et al., 2019: The global burden of pathogens and pests on major food crops. Nature Ecology & Evolution, 10 3(3), 430-439, doi:10.1038/s41559-018-0793-y. 11
Savvidou, G. and A. Atteridge, 2021: Tracking adaptation finance in Africa. Climate Policy. 12 Scannell, H. A. et al., 2016: Frequency of marine heatwaves in the North Atlantic and North Pacific since 1950. 13
Geophysical Research Letters, 43(5), 2069-2076, doi:https://doi.org/10.1002/2015GL067308. 14 Schaeffer, M. et al., 2013: Africa's Adaptation Gap Technical Report: Climate-change impacts, adaptation challenges 15
and costs for Africa [Schaeffer, M., R. Munang, J. Andrews, S. Adams and C. Baxter (eds.)]. UNEP, 58 pp. 16 Available at: 17 https://climateanalytics.org/media/schaeffer_et_al__2013__africao__s_a_daptation_gap_technical_report.pdf. 18
Schäfer, M. P., O. Dietrich and B. Mbilinyi, 2015: Streamflow and lake water level changes and their attributed causes 19 in Eastern and Southern Africa: state of the art review. International Journal of Water Resources Development, 20 32(6), 853-880, doi:10.1080/07900627.2015.1091289. 21
Schagerl, M. and R. W. Renaut, 2016: Dipping into the Soda Lakes of East Africa. In: Soda Lakes of East Africa 22 [Schagerl, M. (ed.)]. Springer International Publishing, Switzerland, pp. 3-24. ISBN 978-3-319-28620-4. 23
Scheerens, C. et al., 2020: Tackling adverse health effects of climate change and migration through intersectoral 24 capacity building in Sub-Saharan Africa. BJGP Open, 4(2), bjgpopen20X101065, 25 doi:10.3399/bjgpopen20X101065. 26
Scheff, J., R. Seager, H. Liu and S. Coats, 2017: Are Glacials Dry? Consequences for Paleoclimatology and for 27 Greenhouse Warming. Journal of Climate, 30(17), 6593-6609, doi:10.1175/JCLI-D-16-0854.1. 28
Scheffran, J., T. Ide and J. Schilling, 2014: Violent climate or climate of violence? Concepts and relations with focus on 29 Kenya and Sudan. The International Journal of Human Rights, 18(3), 369-390, 30 doi:10.1080/13642987.2014.914722. 31
Scheiter, S. and P. Savadogo, 2016: Ecosystem management can mitigate vegetation shifts induced by climate change 32 in West Africa. Ecological Modelling, 332, 19-27, doi:https://doi.org/10.1016/j.ecolmodel.2016.03.022. 33
Schilling, J., K. P. Freier, E. Hertig and J. Scheffran, 2012: Climate change, vulnerability and adaptation in North 34 Africa with focus on Morocco. Agriculture, Ecosystems and Environment, 156, 12-26, 35 doi:10.1016/j.agee.2012.04.021. 36
Schilling, J., E. Hertig, Y. Tramblay and J. Scheffran, 2020: Climate change vulnerability, water resources and social 37 implications in North Africa. Regional Environmental Change, 20(1), 15, doi:10.1007/s10113-020-01597-7. 38
Schlegel, R. W., E. C. J. Oliver, T. Wernberg and A. J. Smit, 2017: Nearshore and offshore co-occurrence of marine 39 heatwaves and cold-spells. Progress in Oceanography, 151, 189-205, 40 doi:https://doi.org/10.1016/j.pocean.2017.01.004. 41
Schlenker, W. and D. B. Lobell, 2010: Robust negative impacts of climate change on African agriculture. 42 Environmental Research Letters, 5(1), 014010, doi:10.1088/1748-9326/5/1/014010. 43
Schleussner, C. F., J. F. Donges, R. V. Donner and H. J. Schellnhuber, 2016a: Armed-conflict risks enhanced by 44 climate-related disasters in ethnically fractionalized countries. Proc Natl Acad Sci U S A, 113(33), 9216-9221, 45 doi:10.1073/pnas.1601611113. 46
Schleussner, C. F. et al., 2016b: Science and policy characteristics of the Paris Agreement temperature goal. Nature 47 Climate Change, 6, 827-835, doi:10.1038/nclimate3096. 48
Schmeier, S., 2017: Joint institutional arrangements for governing shared water resources: A comparative analysis of 49 state practice. In: Routledge Handbook of Water Law and Policy [Rieu-Clarke, A., A. Allan and S. Hendry (eds.)]. 50 Routledge, London, pp. 260-274. ISBN 1315651130. 51
Schmitt Olabisi, L. et al., 2018: Using participatory modeling processes to identify sources of climate risk in West 52 Africa. Environment Systems and Decisions, 38(1), 23-32, doi:10.1007/s10669-017-9653-6. 53
Schroth, G. et al., 2016: Vulnerability to climate change of cocoa in West Africa: Patterns, opportunities and limits to 54 adaptation. Science of the Total Environment, 556, 231-241, doi:10.1016/j.scitotenv.2016.03.024. 55
Schroth, G. and F. Ruf, 2014: Farmer strategies for tree crop diversification in the humid tropics. A review. Agronomy 56 for Sustainable Development, 34(1), 139-154, doi:10.1007/s13593-013-0175-4. 57
Schulz, A. and M. Northridge, 2004: Social Determinants of Health: Implications for Environmental Health Promotion. 58 Health Education & Behavior, 31(4), 455 - 471, doi:https://doi.org/10.1177%2F1090198104265598. 59
Schuman, S., J. V. Dokken, D. van Niekerk and R. A. Loubser, 2018: Religious beliefs and climate change adaptation: 60 A study of three rural South African communities. Jamba, 10(1), 509, doi:10.4102/jamba.v10i1.509. 61
Schut, M. et al., 2016: Sustainable intensification of agricultural systems in the Central African Highlands: The need for 62 institutional innovation. Agricultural Systems, 145, 165-176, doi:https://doi.org/10.1016/j.agsy.2016.03.005. 63
ACCEPTED VERSIO
N
SUBJECT TO FIN
AL EDITS
FINAL DRAFT Chapter 9 IPCC WGII Sixth Assessment Report
Do Not Cite, Quote or Distribute 9-210 Total pages: 225
Schweikert, A. et al., 2015: Road Infrastructure and Climate Change: Impacts and Adaptations for South Africa. 1 Journal of Infrastructure Systems, 21(3), 04014046, doi:10.1061/(ASCE)IS.1943-555X.0000235. 2
Scotford, E. and S. Minas, 2019: Probing the hidden depths of climate law: Analysing national climate change 3 legislation. Review of European, Comparative & International Environmental Law, 28(1), 67-81, 4 doi:10.1111/reel.12259. 5
Scotford, E., S. Minas and A. Macintosh, 2017: Climate change and national laws across Commonwealth countries. 6 Commonwealth Law Bulletin, 43(3-4), 318-361, doi:10.1080/03050718.2017.1439361. 7
Scott, A. A. et al., 2017: Temperature and heat in informal settlements in Nairobi. PLoS One, 12(11), e0187300, 8 doi:10.1371/journal.pone.0187300. 9
Scovronick, N. and B. Armstrong, 2012: The impact of housing type on temperature-related mortality in South Africa, 10 1996-2015. Environ Res, 113, 46-51, doi:10.1016/j.envres.2012.01.004. 11
Scovronick, N. et al., 2018: The association between ambient temperature and mortality in South Africa: A time-series 12 analysis. Environmental Research, 161, 229-235, doi:10.1016/j.envres.2017.11.001. 13
Seaman, J. A., G. E. Sawdon, J. Acidri and C. Petty, 2014: The Household Economy Approach. Managing the impact 14 of climate change on poverty and food security in developing countries. Climate Risk Management, 4-5, 59-68, 15 doi:https://doi.org/10.1016/j.crm.2014.10.001. 16
Seif-Ennasr, M. et al., 2016: Climate change and adaptive water management measures in Chtouka Ait Baha region 17 (Morocco). Sci Total Environ, 573, 862-875, doi:10.1016/j.scitotenv.2016.08.170. 18
Selig, E. R. et al., 2018: Mapping global human dependence on marine ecosystems. Conservation Letters, 12(2), 19 doi:10.1111/conl.12617. 20
Selormey, E. E., M. Z. Dome, L. Osse and C. Logan, 2019: Change ahead: Experience and awareness of climate 21 change in Africa. Pan African Profiles: Afrobarometer Policy Paper, 60, Afrobarometer, Accra, Ghana, 1-30 pp. 22 Available at: 23 https://afrobarometer.org/sites/default/files/publications/Policy%20papers/ab_r7_policypaperno60_experience_an24 d_awareness_of_climate_change_in_africa.pdf. 25
Semakula, H. M. et al., 2017a: Prediction of future malaria hotspots under climate change in sub-Saharan Africa. Clim. 26 Change, 143(3-4), 415-428. 27
Semakula, H. M. et al., 2017b: Prediction of future malaria hotspots under climate change in sub-Saharan Africa. 28 Climatic Change, 143(3-4), 415-428, doi:10.1007/s10584-017-1996-y. 29
Semenza, J. C. and J. E. Suk, 2018: Vector-borne diseases and climate change: a European perspective. FEMS 30 Microbiology Letters, 365(2), doi:10.1093/femsle/fnx244. 31
Seneviratne, S. I. et al., 2021: Weather and Climate Extreme Events in a Changing Climate [Masson-Delmotte, V., P. 32 Zhai, A. Pirani, S. L. Connors, C. Péan, S. Berger, N. Caud, Y. Chen, L. Goldfarb, M. I. Gomis, M. Huang, K. 33 Leitzell, E. Lonnoy, J. B. R. Matthews, T. K. Maycock, T. Waterfield, O. Yelekçi, R. Yu and B. Zhou (ed.)]. 34 Climate Change 2021: The Physical Science Basis. Contribution of Working Group I to the Sixth Assessment 35 Report of the Intergovernmental Panel on Climate Change In Press, Cambridge University Press. Available at: 36 https://www.ipcc.ch/report/ar6/wg1/downloads/report/IPCC_AR6_WGI_Chapter_11.pdf. 37
Seo, D., C. J. Patrick and P. J. Kennealy, 2008: Role of Serotonin and Dopamine System Interactions in the 38 Neurobiology of Impulsive Aggression and its Comorbidity with other Clinical Disorders. Aggression and violent 39 behavior, 13(5), 383-395, doi:10.1016/j.avb.2008.06.003. 40
Serdeczny, O. et al., 2017: Climate change impacts in Sub-Saharan Africa: from physical changes to their social 41 repercussions. Regional Environmental Change, 17(6), 1585-1600, doi:10.1007/s10113-015-0910-2. 42
Sesmero, J., J. Ricker-Gilbert and A. Cook, 2018: How Do African Farm Households Respond to Changes in Current 43 and Past Weather Patterns? A Structural Panel Data Analysis from Malawi. American Journal of Agricultural 44 Economics, 100(1), 115-144, doi:10.1093/ajae/aax068. 45
Seti, V., E. Bornman and P. Alvarez-Mosquera, 2016: Opinions on indigenous languages as languages of learning and 46 teaching in Africa. International Journal of Communication and Linguistic Studies, 14(1), 17-31. 47
Sewe, M. et al., 2015: The association of weather variability and under five malaria mortality in KEMRI/CDC HDSS in 48 Western Kenya 2003 to 2008: a time series analysis. Int J Environ Res Public Health, 12(2), 1983-1997, 49 doi:10.3390/ijerph120201983. 50
Shabani, F., L. Kumar and S. Taylor, 2012: Climate Change Impacts on the Future Distribution of Date Palms: A 51 Modeling Exercise Using CLIMEX. PLOS ONE, 7(10), e48021, doi:10.1371/journal.pone.0048021. 52
Shackleton, S. et al., 2015: Why is socially‐just climate change adaptation in sub‐Saharan Africa so challenging? A 53 review of barriers identified from empirical cases. Wiley Interdisciplinary Reviews: Climate Change, 6(3), 321-54 344, doi:https://doi.org/10.1002/wcc.335. 55
Shaffer, L. J., 2014: Making sense of local climate change in rural Tanzania through knowledge co-production. Journal 56 of Ethnobiology, 34(3), 315-334, doi:http://dx.doi.org/10.2993/0278-0771-34.3.315. 57
Shao, Y., M. Klose and K.-H. Wyrwoll, 2013: Recent global dust trend and connections to climate forcing. J Geophys 58 Res-Atmos, 118(19), 11,107-111,118, doi:https://doi.org/10.1002/jgrd.50836. 59
Shelton, J. M. et al., 2018: Vulnerability of Cape Fold Ecoregion freshwater fishes to climate change and other human 60 impacts. Aquatic Conserv: Mar Freshw Ecosyst, 28(1), 68-77, doi:10.1002/aqc.2849. 61
Shepherd, 2019: Making Sense of “Day Zero”: Slow Catastrophes, Anthropocene Futures, and the Story of Cape 62 Town’s Water Crisis. Water, 11(9), 1744, doi:10.3390/w11091744. 63
ACCEPTED VERSIO
N
SUBJECT TO FIN
AL EDITS

FINAL DRAFT Chapter 9 IPCC WGII Sixth Assessment Report
Do Not Cite, Quote or Distribute 9-211 Total pages: 225
Sherman, M. H. and J. Ford, 2014: Stakeholder engagement in adaptation interventions: an evaluation of projects in 1 developing nations. Climate Policy, 14(3), 417-441, doi:10.1080/14693062.2014.859501. 2
Shi, L. et al., 2016: Roadmap towards justice in urban climate adaptation research. Nature Climate Change, 6(2), 131-3 137, doi:10.1038/nclimate2841. 4
Shiferaw, B. et al., 2014: Managing vulnerability to drought and enhancing livelihood resilience in sub-Saharan Africa: 5 Technological, institutional and policy options. Weather and Climate Extremes, 3, 67-79, 6 doi:https://doi.org/10.1016/j.wace.2014.04.004. 7
Shikuku, K. M. et al., 2017: Smallholder farmers’ attitudes and determinants of adaptation to climate risks in East 8 Africa. Climate Risk Management, 16, 234-245, doi:https://doi.org/10.1016/j.crm.2017.03.001. 9
Shukla, P. R. et al., 2019: Technical Summary [P.R. Shukla, J. S., E. Calvo Buendia, V. Masson-Delmotte, H.-O. 10 Pörtner, D. C. Roberts, P. Zhai, R. Slade,, R. v. D. S. Connors, M. Ferrat, E. Haughey, S. Luz, S. Neogi, M. 11 Pathak, J. Petzold, J. Portugal Pereira, P. Vyas, and K. K. E. Huntley, M, Belkacemi, J. Malley, (eds.)]. Climate 12 Change and Land: an IPCC special report on climate change, desertification, land degradation, sustainable land 13 management, food security, and greenhouse gas fluxes in terrestrial ecosystems, In Press pp. Available at: 14 https://www.ipcc.ch/site/assets/uploads/sites/4/2020/07/03_Technical-Summary-TS_V2.pdf. 15
Shukla, R. et al., 2021: Dynamic vulnerability of smallholder agricultural systems in the face of climate change for 16 Ethiopia. Environmental Research Letters, 16(4), 044007, doi:10.1088/1748-9326/abdb5c. 17
Shumsky, S. A., G. M. Hickey, B. Pelletier and T. Johns, 2014: Understanding the contribution of wild edible plants to 18 rural social-ecological resilience in semi-arid Kenya. Ecology and Society, 19(4), 19 doi:http://dx.doi.org/10.5751/ES-06924-190434. 20
Siam, M. S. and E. A. B. Eltahir, 2017: Climate change enhances interannual variability of the Nile river flow. Nature 21 Climate Change, 7(5), 350-354, doi:10.1038/nclimate3273. 22
Siderius, C. et al., 2018: Hydrological response and complex impact pathways of the 2015/2016 El Niño in Eastern and 23 Southern Africa. Earth's Future, 6(1), 2-22, doi:10.1002/2017ef000680. 24
Siderius, C. et al., 2021: High Stakes Decisions Under Uncertainty: Dams, Development and Climate Change in the 25 Rufji River Basin. In: Climate Risk in Africa: Adaptation and Resilience [D. Conway, K. V. (ed.)]. Springer 26 International Publishing. 27
Siders, A. R., 2019: Adaptive capacity to climate change: A synthesis of concepts, methods, and findings in a 28 fragmented field. WIREs Climate Change, 10(3), e573, doi:https://doi.org/10.1002/wcc.573. 29
Sierra-Correa, P. C. and J. R. Cantera Kintz, 2015: Ecosystem-based adaptation for improving coastal planning for sea-30 level rise: A systematic review for mangrove coasts. Marine Policy, 51, 385-393, 31 doi:10.1016/j.marpol.2014.09.013. 32
Sietsma, A. J., J. D. Ford, M. W. Callaghan and J. C. Minx, 2021: Progress in climate change adaptation research. 33 Environmental Research Letters, 16(5), 054038, doi:10.1088/1748-9326/abf7f3. 34
Silva, R. A. et al., 2017: Future global mortality from changes in air pollution attributable to climate change. Nature 35 Climate Change, 7, 647, doi:10.1038/nclimate3354. 36
Silvestri, S. et al., 2012: Climate change perception and adaptation of agro-pastoral communities in Kenya. Regional 37 Environmental Change, 12(4), 791-802, doi:10.1007/s10113-012-0293-6. 38
Simon, D. and H. Leck, 2015: Editorial overview: Sustainability challenges: Assessing climate change adaptation in 39 Africa. Current Opinion in Environmental Sustainability, 13, iv-viii, doi:10.1016/j.cosust.2015.03.002. 40
Simple, O. et al., 2018: Influence of Climatic Factors on Malaria Epidemic in Gulu District, Northern Uganda: A 10-41 Year Retrospective Study. Malar. Res. Treat., 2018, 5482136, doi:10.1155/2018/5482136. 42
Simpson, N. P., 2020: Insurance in the Anthropocene: Exposure, Solvency and Manoeuvrability. In: Criminology and 43 Climate: Insurance, Finance and the Regulation of Harmscapes, 1 ed. [Holley, C., L. Phelan and C. D. Shearing 44 (eds.)]. Routledge, London, UK, pp. 135-152. ISBN 9780429201172. 45
Simpson, N. P. et al., 2021a: Climate Change Literacy in Africa. Nature Climate Change, doi:10.1038/s41558-021-46 01171-x. 47
Simpson, N. P. et al., 2021b: A framework for complex climate change risk assessment. One Earth, 4(4), 489-501, 48 doi:https://doi.org/10.1016/j.oneear.2021.03.005. 49
Simpson, N. P., C. Rabenold, M. Sowman and C. D. Shearing, 2021c: Adoption rationales and effects of off-grid 50 renewable energy access for African youth: A case study from Tanzania. Renewable and Sustainable Energy 51 Reviews, 141(110793), 17, doi:https://doi.org/10.1016/j.rser.2021.110793. 52
Simpson, N. P., C. D. Shearing and B. Dupont, 2019a: Climate gating: A case study of emerging responses to 53 Anthropocene Risks. Climate Risk Management, 26, 100196, doi:10.1016/j.crm.2019.100196. 54
Simpson, N. P., C. D. Shearing and B. Dupont, 2020a: Gated Adaptation during the Cape Town Drought: Mentalities, 55 Transitions and Pathways to Partial Nodes of Water Security. Society & Natural Resources, 33(8), 1041-1049, 56 doi:10.1080/08941920.2020.1712756. 57
Simpson, N. P., C. D. Shearing and B. Dupont, 2020b: ‘Partial functional redundancy’: An expression of household 58 level resilience in response to climate risk. Climate Risk Management, 28, 100216, 59 doi:10.1016/j.crm.2020.100216. 60
Simpson, N. P., K. J. Simpson, C. D. Shearing and L. R. Cirolia, 2019b: Municipal finance and resilience lessons for 61 urban infrastructure management: a case study from the Cape Town drought. International Journal of Urban 62 Sustainable Development, 11(3), 257-276, doi:10.1080/19463138.2019.1642203. 63
ACCEPTED VERSIO
N
SUBJECT TO FIN
AL EDITS
FINAL DRAFT Chapter 9 IPCC WGII Sixth Assessment Report
Do Not Cite, Quote or Distribute 9-212 Total pages: 225
Singh, C. et al., 2018: The utility of weather and climate information for adaptation decision-making: current uses and 1 future prospects in Africa and India. Climate and Development, 10(5), 389-405, 2 doi:10.1080/17565529.2017.1318744. 3
Sintayehu, D. W., A. Egeru, W. T. Ng and E. Cherenet, 2020: Regional dynamics in distribution of Prosopis juliflora 4 under predicted climate change in Africa. Tropical Ecology, 61(4), 437-445, doi:10.1007/s42965-020-00101-w. 5
Sitati, A. et al., 2021: Climate change adaptation in conflict-affected countries: A systematic assessment of evidence. 6 Discover Sustainability. 7
Slim, H. et al., 2004: Le littoral de la Tunisie. Étude géoarchéologique et historique. vol. 1, Persée-Portail des revues 8 scientifiques en SHS. 9
Slingsby, J. A. et al., 2017: Intensifying postfire weather and biological invasion drive species loss in a Mediterranean-10 type biodiversity hotspot. Proceedings of the National Academy of Sciences, 114(18), 4697, 11 doi:10.1073/pnas.1619014114. 12
Slingsby, J. A., G. R. Moncrieff, A. J. Rogers and E. C. February, 2020: Altered ignition catchments threaten a 13 hyperdiverse fire-dependent ecosystem. Global Change Biology, 26(2), 616-628, 14 doi:https://doi.org/10.1111/gcb.14861. 15
Sloan, S., B. Bertzky and W. F. Laurance, 2017: African development corridors intersect key protected areas. African 16 Journal of Ecology, 55. 17
Sloat, L. L. et al., 2020: Climate adaptation by crop migration. Nature Communications, 11(1), 1243, 18 doi:10.1038/s41467-020-15076-4. 19
Sloat, L. L. et al., 2018: Increasing importance of precipitation variability on global livestock grazing lands. Nature 20 Climate Change, 8(3), 214-218, doi:10.1038/s41558-018-0081-5. 21
Smit, I. P. J. and H. H. T. Prins, 2015: Predicting the Effects of Woody Encroachment on Mammal Communities, 22 Grazing Biomass and Fire Frequency in African Savannas. PLOS ONE, 10(9), e0137857, 23 doi:10.1371/journal.pone.0137857. 24
Smith, A. et al., 2016: Synergistic effects of climate and land-use change on representation of African bats in priority 25 conservation areas. Ecological Indicators, 69, 276-283, doi:10.1016/j.ecolind.2016.04.039. 26
Smith, K. R. et al., 2014: Human health: impacts, adaptation, and co-benefits. In: Climate Change 2014: Impacts, 27 Adaptation, and Vulnerability. Part A: Global and Sectoral Aspects. Contribution of Working Group II to the 28 Fifth Assessment Report of the Intergovernmental Panel of Climate Change [Field, C. B., V. R. Barros, D. J. 29 Dokken, K. J. Mach, M. D. Mastrandrea, T. E. Bilir, M. Chatterjee, K. L. Ebi, Y. O. Estrada, R. C. Genova, B. 30 Girma, E. S. Kissel, A. N. Levy, S. MacCracken, P. R. Mastrandrea and L. L. White (eds.)]. Cambridge 31 University Press, Cambridge, United Kingdom and New York, NY, USA, pp. 709-754. 32
Snow, J. T. et al., 2016: A New Vision for Weather and Climate Services in Africa. UNDP, New York, USA. Available 33 at: https://www.undp.org/sites/g/files/zskgke326/files/publications/WeatherAndClimateServicesAfrica.pdf. 34
Snowdon, R. J., B. Wittkop, T.-W. Chen and A. Stahl, 2021: Crop adaptation to climate change as a consequence of 35 long-term breeding. Theoretical and Applied Genetics, 134(6), 1613-1623, doi:10.1007/s00122-020-03729-3. 36
Soliev, I., K. Wegerich and J. Kazbekov, 2015: The Costs of Benefit Sharing: Historical and Institutional Analysis of 37 Shared Water Development in the Ferghana Valley, the Syr Darya Basin. Water, 7(6), 2728-2752, 38 doi:https://doi.org/10.3390/w7062728. 39
Somanathan, E., R. Somanathan, A. Sudarshan and M. Tewari, 2015: The Impact of Temperature on Productivity and 40 Labor Supply: Evidence from Indian Manufacturing. Indian Statistics Institute, Deli. Available at: 41 https://www.isid.ac.in/~pu/dispapers/dp14-10.pdf. 42
Soneja, S. et al., 2016: Extreme precipitation events and increased risk of campylobacteriosis in Maryland, USA. 43 Environmental research, 149, 216-221. 44
Sonwa, D. J. et al., 2017: Drivers of climate risk in African agriculture. Climate and Development, 9(5), 383-398, 45 doi:10.1080/17565529.2016.1167659. 46
Sorensen, J. P. et al., 2015: Emerging contaminants in urban groundwater sources in Africa. Water Res, 72, 51-63, 47 doi:10.1016/j.watres.2014.08.002. 48
Soultan, A., M. Wikelski and K. Safi, 2019: Risk of biodiversity collapse under climate change in the Afro-Arabian 49 region. Sci Rep, 9(1), 955, doi:10.1038/s41598-018-37851-6. 50
Spalding-Fecher, R., B. Joyce and H. Winkler, 2017: Climate change and hydropower in the Southern African Power 51 Pool and Zambezi River Basin: System-wide impacts and policy implications. Energy Policy, 103, 84-97, 52 doi:10.1016/j.enpol.2016.12.009. 53
Spalding-Fecher, R. et al., 2014: Water Supply and Demand Scenarios for the Zambezi River Basin. Climate Change 54 and Upstream Development Impacts on New Hydropower Projects in the Zambezi Project. Climate & 55 Development Knowledge Network (CDKN), University of Cape Town, Cape Town, 92 pp. Available at: 56 http://www.au.uct.ac.za/sites/default/files/image_tool/images/119/Hydro-Zambezi/HZ-57 Water_Supply_and_Demand_Scenarios_Report.pdf. 58
Spencer, D., 2015: “TO PROTECT HER HONOUR” Child marriage in emergencies – the fatal confusion between 59 protecting girls and sexual violence. Gender and Protection in Humanitarian Contexts: Critical Issues Series, 60 CARE International UK, United Kingdom. Available at: 61 https://insights.careinternational.org.uk/media/k2/attachments/CARE_Child-marriage-in-emergencies_2015.pdf. 62
ACCEPTED VERSIO
N
SUBJECT TO FIN
AL EDITS
FINAL DRAFT Chapter 9 IPCC WGII Sixth Assessment Report
Do Not Cite, Quote or Distribute 9-213 Total pages: 225
Speranza, I. C. et al., 2009: Indigenous knowledge related to climate variability and change: insights from droughts in 1 semi-arid areas of former Makueni District, Kenya. Climatic Change, 100(2), 295-315, 2 doi:https://doi.org/10.1007/s10584-009-9713-0. 3
Spinoni, J. et al., 2021: Global exposure of population and land-use to meteorological droughts under different 4 Warming Levels and Shared Socioeconomic Pathways: A Coordinated Regional Climate Downscaling 5 Experiment-based study. International Journal of Climatology, doi:https://doi.org/10.1002/joc.7302. 6
Spinoni, J. et al., 2020: Future Global Meteorological Drought Hot Spots: A Study Based on CORDEX Data. Journal of 7 Climate, 33(9), 3635-3661, doi:10.1175/JCLI-D-19-0084.1. 8
Spinoni, J. et al., 2019: A new global database of meteorological drought events from 1951 to 2016. Journal of 9 Hydrology: Regional Studies, 22, 100593, doi:10.1016/j.ejrh.2019.100593. 10
Spinoni, J. et al., 2014: World drought frequency, duration, and severity for 1951–2010. International Journal of 11 Climatology, 34(8), 2792-2804, doi:https://doi.org/10.1002/joc.3875. 12
Squire, S. A. and U. Ryan, 2017: Cryptosporidium and Giardia in Africa: current and future challenges. Parasites & 13 vectors, 10(1), 195-195, doi:10.1186/s13071-017-2111-y. 14
Sridharan, V. et al., 2019: Resilience of the Eastern African electricity sector to climate driven changes in hydropower 15 generation. Nat Commun, 10(1), 302, doi:10.1038/s41467-018-08275-7. 16
Sserumaga, J. P. et al., 2020: Aflatoxin-producing fungi associated with pre-harvest maize contamination in Uganda. 17 International Journal of Food Microbiology, 313, 108376, doi:https://doi.org/10.1016/j.ijfoodmicro.2019.108376. 18
St Louis, M. E. and J. J. Hess, 2008: Climate change: impacts on and implications for global health. Am J Prev Med, 19 35(5), 527-538, doi:10.1016/j.amepre.2008.08.023. 20
Stafford, W. et al., 2017: The economics of landscape restoration: Benefits of controlling bush encroachment and 21 invasive plant species in South Africa and Namibia. Ecosystem Services, 27, 193-202, 22 doi:https://doi.org/10.1016/j.ecoser.2016.11.021. 23
Stanimirova, R. et al., 2019: Sensitivity of Global Pasturelands to Climate Variation. Earth's Future, 7(12), 1353-1366, 24 doi:10.1029/2019EF001316. 25
Stark, L. and D. Landis, 2016: Violence against children in humanitarian settings: A literature review of population-26 based approaches. Soc Sci Med, 152, 125-137, doi:10.1016/j.socscimed.2016.01.052. 27
Sterk, G. and J. J. Stoorvogel, 2020: Desertification–Scientific Versus Political Realities. Land, 9(5), 28 doi:10.3390/land9050156. 29
Stevens, N., B. F. N. Erasmus, S. Archibald and W. J. Bond, 2016: Woody encroachment over 70 years in South 30 African savannahs: overgrazing, global change or extinction aftershock? Philosophical Transactions of the Royal 31 Society B: Biological Sciences, 371(1703), 20150437, doi:10.1098/rstb.2015.0437. 32
Stevens, N., C. E. R. Lehmann, B. P. Murphy and G. Durigan, 2017: Savanna woody encroachment is widespread 33 across three continents. Global Change Biology, 23(1), 235-244, doi:https://doi.org/10.1111/gcb.13409. 34
Stevenson, J. et al., 2012: Novel vectors of malaria parasites in the western highlands of Kenya. Emerg. Infect. Dis., 35 18(9), 1547-1549, doi:10.3201/eid1809.120283. 36
Steynor, A., J. Lee and A. Davison, 2020a: Transdisciplinary co-production of climate services: a focus on process. 37 Social Dynamics, 46(3), 414-433, doi:10.1080/02533952.2020.1853961. 38
Steynor, A. et al., 2020b: Learning from climate change perceptions in southern African cities. Climate Risk 39 Management, 27, 100202, doi:10.1016/j.crm.2019.100202. 40
Steynor, A. et al., 2016: Co-exploratory climate risk workshops: Experiences from urban Africa. Climate Risk 41 Management, 13, 95-102, doi:10.1016/j.crm.2016.03.001. 42
Steynor, A. and L. Pasquini, 2020: Using environmental psychology to increase the use of climate information. 43 Stokstad, E., 2019: After 20 years, Golden Rice nears approval. Science (New York, N.Y.), 366(6468), 934-934, 44
doi:10.1126/science.366.6468.934. 45 Stratton, R. A. et al., 2018: A Pan-African convection-permitting regional climate simulation with the met office unified 46
model: CP4-Africa. Journal of Climate, 31(9), 3485-3508, doi:https://doi.org/10.1175/JCLI-D-17-0503.1. 47 Street, R. B., 2016: Towards a leading role on climate services in Europe: A research and innovation roadmap. Climate 48
Services, 1, 2-5, doi:10.1016/j.cliser.2015.12.001. 49 Stringer, L. C. et al., 2020: Adaptation and development pathways for different types of farmers. Environmental Science 50
and Policy, 104, 174-189, doi:10.1016/j.envsci.2019.10.007. 51 Stringer, L. C. et al., 2021: Climate change impacts on water security in global drylands. One Earth, 4(6), 851-864, 52
doi:10.1016/j.oneear.2021.05.010. 53 Strydom, S. and M. J. Savage, 2016: A spatio-temporal analysis of fires in South Africa. South African Journal of 54
Science, 112(11-12), 1-8, doi:10.17159/sajs.2016/20150489. 55 Suckall, N., E. Fraser, P. Forster and D. Mkwambisi, 2015: Using a migration systems approach to understand the link 56
between climate change and urbanisation in Malawi. Applied Geography, 63, 244-252, 57 doi:https://doi.org/10.1016/j.apgeog.2015.07.004. 58
Sulieman, H. and H. Young, 2019: Transforming pastoralist mobility in West Darfur: Understanding continuity and 59 change. Feinstein 60
International Center, University, T., Boston, 66 pp. 61 Sullivan, M. J. P. et al., 2020: Long-term thermal sensitivity of Earth’s tropical forests. Science (New York, N.Y.), 62
368(6493), 869, doi:10.1126/science.aaw7578. 63
ACCEPTED VERSIO
N
SUBJECT TO FIN
AL EDITS

FINAL DRAFT Chapter 9 IPCC WGII Sixth Assessment Report
Do Not Cite, Quote or Distribute 9-214 Total pages: 225
Sultan, B., D. Defrance and T. Iizumi, 2019: Evidence of crop production losses in West Africa due to historical global 1 warming in two crop models. Scientific Reports, 9(1), 12834, doi:10.1038/s41598-019-49167-0. 2
Sultan, B. and M. Gaetani, 2016: Agriculture in West Africa in the Twenty-First Century: Climate Change and Impacts 3 Scenarios, and Potential for Adaptation. Frontiers in Plant Science, 7, 1262. 4
Sultan, B. et al., 2020: Current needs for climate services in West Africa: Results from two stakeholder surveys. 5 Climate Services, 18, 100166, doi:https://doi.org/10.1016/j.cliser.2020.100166. 6
Sun, Q. et al., 2019: Global heat stress on health, wildfires, and agricultural crops under different levels of climate 7 warming. Environment International, 128, 125-136, doi:https://doi.org/10.1016/j.envint.2019.04.025. 8
Sun, Q. et al., 2021: A Global, Continental, and Regional Analysis of Changes in Extreme Precipitation. Journal of 9 Climate, 34(1), 243-258, doi:10.1175/JCLI-D-19-0892.1. 10
Sunderland, T. et al., 2013: Food security and nutrition. Center for International Forestry Research,, Bogor, Indonesia. 11 Surminski, S., L. M. Bouwer and J. Linnerooth-Bayer, 2016: How insurance can support climate resilience. Nature 12
Climate Change, 6(4), 333-334, doi:10.1038/nclimate2979. 13 Sussman, F., A. Grambsch, J. Li and C. P. Weaver, 2014: Introduction to a special issue entitled Perspectives on 14
Implementing Benefit-Cost Analysis in Climate Assessment. Journal of Benefit-Cost Analysis, 5(3), 333-346, 15 doi:10.1515/jbca-2014-9000. 16
Sutherland, C. et al., 2021: Socio-technical analysis of a sanitation innovation in a peri-urban household in Durban, 17 South Africa. Science of The Total Environment, 755, 143284, 18 doi:https://doi.org/10.1016/j.scitotenv.2020.143284. 19
Swanepoel, E. and S. Sauka, 2019: Ecosystem-based Adaptation in South African Coastal Cities: Challenges and 20 Opportunities. SAIIA Policy Briefing No 186, South African Institute of International Affairs (SAIIA), Cape 21 Town, South Africa. Available at: https://saiia.org.za/research/ecosystem-based-adaptation-in-south-african-22 coastal-cities-challenges-and-opportunities/. 23
Swann, A. L. S., F. M. Hoffman, C. D. Koven and J. T. Randerson, 2016: Plant responses to increasing CO2 reduce 24 estimates of climate impacts on drought severity. Proceedings of the National Academy of Sciences, 113(36), 25 10019-10024, doi:10.1073/pnas.1604581113. 26
SWECO, 2019: Rwanda’s pilot towards green urbanisation: mid term feasibility study. SWECO GmbH, Frankfurt, 27 Germany, 157 pp. Available at: https://greencitykigali.org/wp-content/uploads/Mid-Term-Feasibility-Study.pdf. 28
Swis Re, 2019: Natural Catastrophes: Tracking the protection gap, Swis Re, Online. Available at: 29 http://files.swissre.com/natcat-protection-gap-map/index.html. 30
Sylla, M. B., N. Elguindi, F. Giorgi and D. Wisser, 2015a: Projected robust shift of climate zones over West Africa in 31 response to anthropogenic climate change for the late 21st century. Climatic Change, 134(1-2), 241-253, 32 doi:10.1007/s10584-015-1522-z. 33
Sylla, M. B. et al., 2018: Projected Heat Stress Under 1.5 °C and 2 °C Global Warming Scenarios Creates 34 Unprecedented Discomfort for Humans in West Africa. Earth's Future, 6(7), 1029-1044, 35 doi:10.1029/2018ef000873. 36
Sylla, M. B., F. Giorgi, E. Coppola and L. Mariotti, 2013: Uncertainties in daily rainfall over Africa: assessment of 37 gridded observation products and evaluation of a regional climate model simulation. International Journal of 38 Climatology, 33(7), 1805-1817, doi:https://doi.org/10.1002/joc.3551. 39
Sylla, M. B. et al., 2015b: Projected Changes in the Annual Cycle of High-Intensity Precipitation Events over West 40 Africa for the Late Twenty-First Century. Journal of Climate, 28(16), 6475-6488, doi:10.1175/jcli-d-14-00854.1. 41
Sylla, M. B. et al., 2016: Climate Change over West Africa: Recent Trends and Future Projections. In: Adaptation to 42 Climate Change and Variability in Rural West Africa [Yaro, J. A. and J. Hesselberg (eds.)]. Springer International 43 Publishing, Cham, pp. 25-40. ISBN 978-3-319-31497-6. 44
Szopa, S. et al., 2021: Short-Lived Climate Forcers [Masson-Delmotte, V., P. Zhai, A. Pirani, S.L. Connors, C. Péan, S. 45 Berger, N. Caud, Y. Chen, L. Goldfarb, M.I. Gomis, M. Huang, K. Leitzell, E. Lonnoy, J.B.R. Matthews, T.K. 46 Maycock, T. Waterfield, O. Yelekçi, R. Yu, and B. Zhou (ed.)]. Climate Change 2021: The Physical Science 47 Basis. Contribution of Working Group I to the Sixth Assessment Report of the Intergovernmental Panel on 48 Climate Change Cambridge University Press, In Press pp. Available at: 49 https://www.ipcc.ch/report/ar6/wg1/downloads/report/IPCC_AR6_WGI_Chapter_06.pdf. 50
Tadesse, M. A., B. A. Shiferaw and O. Erenstein, 2015: Weather index insurance for managing drought risk in 51 smallholder agriculture: lessons and policy implications for sub-Saharan Africa. Agricultural and Food 52 Economics, 3(1), 26, doi:10.1186/s40100-015-0044-3. 53
Takakura, J. y. et al., 2019: Dependence of economic impacts of climate change on anthropogenically directed 54 pathways. Nature Climate Change, 9(10), 737-741, doi:10.1038/s41558-019-0578-6. 55
Tamatamah, R. and T. Mwedzi, 2020: Environmental Flow Analysis of the Zambezi River Basin. In: Ecological 56 Changes in the Zambezi River Basin [Ndebele-Murisa, M., I. A. Kimirei, C. P. Mubaya and T. Bere (eds.)]. 57 CODESRIA, Dakar, pp. 183-210. ISBN 978-2-86978-713-1. 58
Tamoffo, A. T. et al., 2019: Daily characteristics of Central African rainfall in the REMO model. Theoretical and 59 Applied Climatology, 137(3-4), 2351-2368, doi:10.1007/s00704-018-2745-5. 60
Tanarhte, M., P. Hadjinicolaou and J. Lelieveld, 2012: Intercomparison of temperature and precipitation data sets based 61 on observations in the Mediterranean and the Middle East. J Geophys Res-Atmos, 117(D12), 62 doi:10.1029/2011jd017293. 63
ACCEPTED VERSIO
N
SUBJECT TO FIN
AL EDITS

FINAL DRAFT Chapter 9 IPCC WGII Sixth Assessment Report
Do Not Cite, Quote or Distribute 9-215 Total pages: 225
Tankari, M. R., 2017: Cash crops reduce the welfare of farm households in Senegal. Food Security, 9(5), 1105-1115, 1 doi:10.1007/s12571-017-0727-6. 2
Tariku, T. B. et al., 2021: Global warming impact to River Basin of Blue Nile and the optimum operation of its multi-3 reservoir system for hydropower production and irrigation. Sci Total Environ, 767, 144863, 4 doi:10.1016/j.scitotenv.2020.144863. 5
Tarusarira, J., 2017: African Religion, Climate Change, and Knowledge Systems. The Ecumenical Review, 69(3), 398-6 410, doi:10.1111/erev.12302. 7
Tatem, A. J., 2017: WorldPop, open data for spatial demography. Scientific Data, 4(1), 170004, 8 doi:10.1038/sdata.2017.4. 9
Tatsumi, K. et al., 2011: Estimation of potential changes in cereals production under climate change scenarios. 10 Hydrological Processes, 25(17), 2715-2725, doi:https://doi.org/10.1002/hyp.8012. 11
Taye, M. T., P. Willems and P. Block, 2015: Implications of climate change on hydrological extremes in the Blue Nile 12 basin: A review. Journal of Hydrology: Regional Studies, 4, 280-293, doi:10.1016/j.ejrh.2015.07.001. 13
Taylor, A., 2016: Institutional inertia in a changing climate. International Journal of Climate Change Strategies and 14 Management, 8(2), 194-211, doi:10.1108/IJCCSM-03-2014-0033. 15
Taylor, A., H. Davies, G. Oelofse and S. Roux, 2016: Urban Adaptation. Climate Change: Law and Governance in 16 South Africa, Juta, Cape Town, South Africa, 1-38 pp. 17
Taylor, A. et al., 2021a: Understanding and supporting climate-sensitive decision processes in southern African cities. 18 Current Opinion in Environmental Sustainability, 51, 77-84, doi:https://doi.org/10.1016/j.cosust.2021.03.006. 19
Taylor, A. and C. Peter, 2014: Strengthening climate resilience in African cities: A framework for working with 20 informality. Available at: https://media.africaportal.org/documents/CDKN_ACC_WP_final_web-res.pdf. 21
Taylor, A., G. Siame and B. Mwalukanga, 2021b: Integrating Climate Risks into Strategic Urban Planning in Lusaka, 22 Zambia. In: Climate Risk in Africa: Adaptation and Resilience [Conway, D. and K. Vincent (eds.)]. Springer 23 International Publishing, Cham, pp. 115-129. ISBN 978-3-030-61160-6. 24
Taylor, C. M. et al., 2017: Frequency of extreme Sahelian storms tripled since 1982 in satellite observations. Nature, 25 544(7651), 475-478, doi:10.1038/nature22069. 26
Taylor, R. G., G. Favreau, B. R. Scanlon and K. G. Villholth, 2019: Topical Collection: Determining groundwater 27 sustainability from long-term piezometry in Sub-Saharan Africa. Hydrogeology Journal, 27(2), 443-446, 28 doi:10.1007/s10040-019-01946-9. 29
Taylor, R. G. et al., 2006: Recent glacial recession in the Rwenzori Mountains of East Africa due to rising air 30 temperature. Geophysical Research Letters, 33(10), n/a-n/a, doi:10.1029/2006gl025962. 31
Taylor, R. G. et al., 2013: Ground water and climate change. Nature Climate Change, 3(4), 322-329, 32 doi:10.1038/nclimate1744. 33
Taylor, S., L. Kumar, N. Reid and D. J. Kriticos, 2012: Climate Change and the Potential Distribution of an Invasive 34 Shrub, Lantana camara L. PLOS ONE, 7(4), e35565, doi:10.1371/journal.pone.0035565. 35
Tebaldi, C. et al., 2021: Climate model projections from the Scenario Model Intercomparison Project (ScenarioMIP) of 36 CMIP6. Earth Syst. Dynam., 12(1), 253-293, doi:10.5194/esd-12-253-2021. 37
Tellman, B. et al., 2021: Satellite imaging reveals increased proportion of population exposed to floods. Nature, 38 596(7870), 80-86, doi:10.1038/s41586-021-03695-w. 39
Tendall, D. M. et al., 2015: Food system resilience: Defining the concept. Global Food Security, 6, 17-23, 40 doi:https://doi.org/10.1016/j.gfs.2015.08.001. 41
Tesfamariam, Y. and N. Zinyengere, 2017: Climate, Gender, and Ethnicity. In: Beyond Agricultural Impacts, pp. 169-42 191. ISBN 9780128126240. 43
Tesfaye, A. et al., 2019: Estimating the economic value of climate services for strengthening resilience of smallholder 44 farmers to climate risks in Ethiopia: A choice experiment approach. Ecological Economics, 162, 157-168, 45 doi:https://doi.org/10.1016/j.ecolecon.2019.04.019. 46
Tesfaye, K. et al., 2016: Targeting drought-tolerant maize varieties in southern Africa: a geospatial crop modeling 47 approach using big data. International Food and Agribusiness Management Review, 19(A), 75-92. 48
The Global Commission on Adaptation, 2019: Adapt Now: A Global Call for Leadership on Climate Resilience. The 49 Global Commission on Adaptation, Washington, DC. Available at: https://cdn.gca.org/assets/2019-50 09/GlobalCommission_Report_FINAL.pdf. 51
Theis, S., N. Lefore, R. Meinzen-Dick and E. Bryan, 2018: What happens after technology adoption? Gendered aspects 52 of small-scale irrigation technologies in Ethiopia, Ghana, and Tanzania. Agriculture and Human Values, 35(3), 53 671-684, doi:10.1007/s10460-018-9862-8. 54
Thiault, L. et al., 2019: Escaping the perfect storm of simultaneous climate change impacts on agriculture and marine 55 fisheries. Science Advances, 5(11), eaaw9976, doi:10.1126/sciadv.aaw9976. 56
Thierfelder, C. et al., 2017: How climate-smart is conservation agriculture (CA)? – its potential to deliver on adaptation, 57 mitigation and productivity on smallholder farms in southern Africa. Food Security, 9(3), 537-560, 58 doi:10.1007/s12571-017-0665-3. 59
Thiery, W. et al., 2017: Early warnings of hazardous thunderstorms over Lake Victoria. Environmental Research 60 Letters, 12(7), 074012, doi:10.1088/1748-9326/aa7521. 61
Thiery, W. et al., 2021: Age-dependent extreme event exposure. Science (New York, N.Y.). 62
ACCEPTED VERSIO
N
SUBJECT TO FIN
AL EDITS

FINAL DRAFT Chapter 9 IPCC WGII Sixth Assessment Report
Do Not Cite, Quote or Distribute 9-216 Total pages: 225
Thivierge, M.-N. et al., 2016: Predicted Yield and Nutritive Value of an Alfalfa–Timothy Mixture under Climate 1 Change and Elevated Atmospheric Carbon Dioxide. Agronomy Journal, 108(2), 585-603, 2 doi:10.2134/agronj2015.0484. 3
Thomas, A. et al., 2021: Global evidence of constraints and limits to human adaptation. Regional Environmental 4 Change, 21(3), 85, doi:10.1007/s10113-021-01808-9. 5
Thomas, N. and S. Nigam, 2018: Twentieth-Century Climate Change over Africa: Seasonal Hydroclimate Trends and 6 Sahara Desert Expansion. Journal of Climate, 31(9), 3349-3370, doi:10.1175/jcli-d-17-0187.1. 7
Thompson-Hall, M., E. R. Carr and U. Pascual, 2016: Enhancing and expanding intersectional research for climate 8 change adaptation in agrarian settings. Ambio, 45(3), 373-382, doi:10.1007/s13280-016-0827-0. 9
Thompson, J. R., A. Crawley and D. G. Kingston, 2017: Future river flows and flood extent in the Upper Niger and 10 Inner Niger Delta: GCM-related uncertainty using the CMIP5 ensemble. Hydrological Sciences Journal, 62(14), 11 2239-2265, doi:10.1080/02626667.2017.1383608. 12
Thomson, M. C. et al., 2006: Potential of environmental models to predict meningitis epidemics in Africa. Tropical 13 Medicine & International Health, 11(6), 781–788, doi:https://doi.org/10.1111/j.1365-3156.2006.01630.x. 14
Thorn, J., T. F. Thornton and A. Helfgott, 2015: Autonomous adaptation to global environmental change in peri-urban 15 settlements: Evidence of a growing culture of innovation and revitalisation in Mathare Valley Slums, Nairobi. 16 Global Environmental Change, 31, 121-131, doi:10.1016/j.gloenvcha.2014.12.009. 17
Thorn, J. P. R. et al., 2020: A systematic review of participatory scenario planning to envision mountain social-18 ecological systems futures. Ecology and Society, 25(3), 1-55, doi:10.5751/ES-11608-250306. 19
Thornton, P. K. and M. Herrero, 2014: Climate change adaptation in mixed crop–livestock systems in developing 20 countries. Global Food Security, 3(2), 99-107, doi:https://doi.org/10.1016/j.gfs.2014.02.002. 21
Thornton, P. K. and M. Herrero, 2015: Adapting to climate change in the mixed crop and livestock farming systems in 22 sub-Saharan Africa. Nature Climate Change, 5(9), 830-836, doi:10.1038/nclimate2754. 23
Thornton, P. K. et al., 2018: A qualitative evaluation of CSA options in mixed crop-livestock systems in developing 24 countries. In: Climate Smart Agriculture [Lipper, L., N. McCarthy, D. Zilberman, S. Asfaw and G. Branca (eds.)]. 25 Springer, Cham, pp. 385-423. 26
Thwing, J. et al., 2017: Declines in Malaria Burden and All-Cause Child Mortality following Increases in Control 27 Interventions in Senegal, 2005-2010. Am J Trop Med Hyg, 97(3_Suppl), 89-98, doi:10.4269/ajtmh.16-0953. 28
Tiedemann, M. et al., 2017: Does upwelling intensity determine larval fish habitats in upwelling ecosystems? The case 29 of Senegal and Mauritania. Fisheries Oceanography, 26(6), 655-667, doi:https://doi.org/10.1111/fog.12224. 30
Tiepolo, M., 2014: Flood risk reduction and climate change in large cities south of the Sahara. In: Climate change 31 vulnerability in southern African cities [Macchi, S. and M. Tiepolo (eds.)]. Springer, Cham, Switzerland, pp. 19-32 36. 33
Tierney, J. E., P. B. deMenocal and P. D. Zander, 2017: A climatic context for the out-of-Africa migration. Geology, 34 45(11), 1023-1026, doi:10.1130/g39457.1. 35
Tiitmamer, N., 2020: South Sudan’s devastating floods: why there is a need for urgent resilience measures. The Sudd 36 Institute, Juba, South Sudan. 37
Timm Hoffman, M., R. F. Rohde and L. Gillson, 2019: Rethinking catastrophe? Historical trajectories and modelled 38 future vegetation change in southern Africa. Anthropocene, 25, 100189, doi:10.1016/j.ancene.2018.12.003. 39
Tompkins, A. M. and L. Caporaso, 2016: Assessment of malaria transmission changes in Africa, due to the climate 40 impact of land use change using Coupled Model Intercomparison Project Phase 5 earth system models. Geospat. 41 Health, 11(1 Suppl), 380, doi:10.4081/gh.2016.380. 42
Tonnang, H. E. Z. et al., 2014: Zoom in at African country level: potential climate induced changes in areas of 43 suitability for survival of malaria vectors. Int. J. Health Geogr., 13, 12, doi:10.1186/1476-072X-13-12. 44
Torabi, M. and S. M. Noori, 2019: Religious Leaders and the Environmental Crisis. The Ecumenical Review, 71(3), 45 344-355, doi:10.1111/erev.12434. 46
Toreti, A. et al., 2020: Narrowing uncertainties in the effects of elevated CO2 on crops. Nature Food, 1(12), 775-782, 47 doi:10.1038/s43016-020-00195-4. 48
Totin, E. et al., 2018: Can scenario planning catalyse transformational change? Evaluating a climate change policy case 49 study in Mali. Futures, 96, 44-56, doi:https://doi.org/10.1016/j.futures.2017.11.005. 50
Toure, A., B. Diekkrüger, A. Mariko and A. Cissé, 2017: Assessment of Groundwater Resources in the Context of 51 Climate Change and Population Growth: Case of the Klela Basin in Southern Mali. Climate, 5(3), 45, 52 doi:10.3390/cli5030045. 53
Tourre, Y. M. et al., 2019: Malaria in Burkina Faso (West Africa) during the twenty-first century. Environmental 54 Monitoring and Assessment, 191(2), 273, doi:10.1007/s10661-019-7410-7. 55
Tozer, L. et al., 2020: Whose city? Whose nature? Towards inclusive nature-based solution governance. Cities, 107, 56 102892, doi:https://doi.org/10.1016/j.cities.2020.102892. 57
Trabacchi, C. and F. Mazza, 2015: Emerging solutions to drive private investment in climate resilience. Climate Policy 58 Initiative, Australia. Available at: https://www.climatepolicyinitiative.org/wp-content/uploads/2015/06/Finance-59 for-Climate-Resilience.pdf. 60
Trærup, S. L. M., R. A. Ortiz and A. Markandya, 2011: The costs of climate change: a study of cholera in Tanzania. 61 International journal of environmental research and public health, 8(12), 4386-4405, doi:10.3390/ijerph8124386. 62
ACCEPTED VERSIO
N
SUBJECT TO FIN
AL EDITS

FINAL DRAFT Chapter 9 IPCC WGII Sixth Assessment Report
Do Not Cite, Quote or Distribute 9-217 Total pages: 225
Tramblay, Y., G. Villarini and W. Zhang, 2020: Observed changes in flood hazard in Africa. Environmental Research 1 Letters, 15(10), 1040b1045, doi:10.1088/1748-9326/abb90b. 2
Traore, B. et al., 2013: Effects of climate variability and climate change on crop production in southern Mali. European 3 Journal of Agronomy, 49, 115-125, doi:10.1016/j.eja.2013.04.004. 4
Trisos, C. H., J. Auerbach and M. Katti, 2021: Decoloniality and anti-oppressive practices for a more ethical ecology. 5 Nature Ecology & Evolution, 5(9), 1205-1212, doi:10.1038/s41559-021-01460-w. 6
Trisos, C. H., C. Merow and A. L. Pigot, 2020: The projected timing of abrupt ecological disruption from climate 7 change. Nature, 580(7804), 496-501, doi:10.1038/s41586-020-2189-9. 8
Troeger, C. et al., 2018: Rotavirus Vaccination and the Global Burden of Rotavirus Diarrhea Among Children Younger 9 Than 5 Years. JAMA Pediatr, 172(10), 958-965, doi:10.1001/jamapediatrics.2018.1960. 10
Trugman, A. T., D. Medvigy, J. S. Mankin and W. R. L. Anderegg, 2018: Soil Moisture Stress as a Major Driver of 11 Carbon Cycle Uncertainty. Geophysical Research Letters, 45(13), 6495-6503, doi:10.1029/2018GL078131. 12
Tsan, M., S. Totapally, M. Hailu and B. Addom, 2021: The Digitalisation of African Agriculture Report, 2018-2019. 13 CTA, CTA, Wageningen, The Netherlands. Available at: 14 https://cgspace.cgiar.org/bitstream/handle/10568/101498/CTA-Digitalisation-report.pdf. 15
Tume, S. J. P., J. N. Kimengsi and Z. N. Fogwe, 2019: Indigenous Knowledge and Farmer Perceptions of Climate and 16 Ecological Changes in the Bamenda Highlands of Cameroon: Insights from the Bui Plateau. Climate, 7(12), 138, 17 doi:https://doi.org/10.3390/cli7120138. 18
Turpie, J. K., C. Marais and J. N. Blignaut, 2008: The working for water programme: Evolution of a payments for 19 ecosystem services mechanism that addresses both poverty and ecosystem service delivery in South Africa. 20 Ecological Economics, 65(4), 788-798, doi:https://doi.org/10.1016/j.ecolecon.2007.12.024. 21
Tusting, L. et al., 2020: Environmental temperature and growth faltering in African children: a cross-sectional study. 22 The Lancet Planetary Health, 4, e116-e123, doi:10.1016/S2542-5196(20)30037-1. 23
Tyukavina, A. et al., 2018: Congo Basin forest loss dominated by increasing smallholder clearing. Science Advances, 24 4(11), eaat2993, doi:10.1126/sciadv.aat2993. 25
Uhe, P. et al., 2018: Attributing drivers of the 2016 Kenyan drought. International Journal of Climatology, 38, e554-26 e568, doi:10.1002/joc.5389. 27
UK Space Agency, 2020: Space for Finance in Developing Countries. UK Space Agency International Partnership 28 Programme UK Space Agency, Swindon, United Kingdom, 64 pp. Available at: 29 https://www.spacefordevelopment.org/wp-content/uploads/2020/01/118601_UKSA_Finance-Report-30 2019_EL_v9.pdf. 31
Ukkola, A. M. et al., 2020: Robust Future Changes in Meteorological Drought in CMIP6 Projections Despite 32 Uncertainty in Precipitation. Geophysical Research Letters, 47(11), e2020GL087820, 33 doi:https://doi.org/10.1029/2020GL087820. 34
Ulrichs, M., R. Slater and C. Costella, 2019: Building resilience to climate risks through social protection: from 35 individualised models to systemic transformation. Disasters, 43(Suppl 3), S368-s387, doi:10.1111/disa.12339. 36
UN-Habitat, 2014: The State of African Cities 2014: Reimagining Sustainable Urban Transitions. UN-Habitat, Nairobi, 37 Kenya, 200 pp. Available at: https://unhabitat.org/state-of-african-cities-2014-re-imagining-sustainable-urban-38 transitions. 39
UN-Habitat, 2016: World Cities Report 2016. Urbanization and Development: Emerging Futures, UN-Habitat, Nairobi, 40 Kenya, 49 pp. Available at: http://wcr.unhabitat.org/wp-content/uploads/2017/02/WCR-2016_-Abridged-version-41 1.pdf. 42
UN-Water, 2006: Gender, Water and Sanitation: A Policy Brief. Available at: 43 https://www.unwater.org/publications/gender-water-sanitation-policy-brief/. 44
UN Environment, 2019: Global Environment Outlook – GEO-6: Healthy Planet, Healthy People [Ekins, P., J. Gupta 45 and P. Boileau (eds.)]. UNEP, Cambridge University Press, Nairobi, 745 pp. Available at: 46 https://wedocs.unep.org/bitstream/handle/20.500.11822/27539/GEO6_2019.pdf?sequence=1&isAllowed=y. 47
UNAIDS, 2020: UNAIDS data 2020. Joint United Nations Programme on HIV/AIDS (UNAIDS), 436 pp. Available at: 48 https://www.unaids.org/sites/default/files/media_asset/2020_aids-data-book_en.pdf. 49
UNCCD, 2020: Great Green Wall receives over $10b to regreen The Sahel - France, World Bank Listed Among 50 Donors. United Nations Convention to Combat Desertification (UNCCD), Bonn, Germany, 13 pp. 51
UNCTAD, 2020: Climate Change Impacts and Adaptation for Coastal Transport Infrastructure: A Compilation of 52 Policies and Practices. Transport and Trade Facilitation Series, 12, United Nations, New York, USA. Available 53 at: https://unctad.org/system/files/official-document/dtltlb2019d1_en.pdf. 54
UNDESA, 2019a: Revision of World Urbanization Prospects. United Nations Department of Economic and Social 55 Affairs Population Dynamics, New York. Available at: 56 https://population.un.org/wpp/Download/Standard/Population/. 57
UNDESA, 2019b: World Urbanization Prospects: The 2018 Revision. UN, New York. Available at: 58 https://population.un.org/wup/Publications/Files/WUP2018-Report.pdf. 59
UNDP, 2016: Climate Information & Early Warning Systems Communications Toolkit. UNDP Programme on Climate 60 Information for Resilient Development in Africa, UNDP. Available at: https://www.adaptation-61 undp.org/sites/default/files/resources/communications-toolkit-v3.docx. 62
UNDP, The 2019 Global Multidimensional Poverty Index (MPI). Available at: http://hdr.undp.org/en/2018-MPI. 63
ACCEPTED VERSIO
N
SUBJECT TO FIN
AL EDITS
FINAL DRAFT Chapter 9 IPCC WGII Sixth Assessment Report
Do Not Cite, Quote or Distribute 9-218 Total pages: 225
UNECA, 2016: Economic Report on Africa 2016: Greening Africa’s Industrialization. United Nations Economic 1 Commission for Africa (UNECA), UNECA, Addis Ababa, Ethiopia, 254 pp. Available at: 2 https://hdl.handle.net/10855/23017. 3
UNEP-FI, 2019a: African insurance and UN leaders meet in Lagos to drive collaborative action for sustainable 4 development. UN Environment’s Principles for Sustainable Insurance Initiative, Geneva, Switzerland, 4 pp. 5 Available at: https://www.unepfi.org/psi/wp-content/uploads/2019/05/2nd-PSI-African-market-event-outcome-6 document.pdf. 7
UNEP-FI, 2019b: African insurance industry leaders and UN Environment agree on key collaborative initiatives for 8 sustainable development. UNEP-FI, Nairobi, Kenya. Available at: https://www.unepfi.org/psi/wp-9 content/uploads/2019/05/2nd-PSI-African-market-event-outcome-document.pdf. 10
UNEP, 2010: Africa Water Atlas. UNEP, Nairobi, Kenya. 11 UNEP, 2015: Africa’s Adaptation Gap 2: Bridiging the gap – mobilising resources - technical report [Schaeffer, M., F. 12
Baarsch and R. Munang (eds.)]. United Nations Environment Programme, 67 pp. Available at: 13 http://wedocs.unep.org/handle/20.500.11822/9092. 14
UNEP, 2016a: The Adaptation Finance Gap Report [Olhoff, A., B. Dickson, D. Puig, K. Alverson and S. Bee (eds.)]. 15 United Nations Environment Programme (UNEP), Nairobi, Kenya. Available at: 16 https://unepdtu.org/publications/the-adaptation-finance-gap-report/ 17
UNEP, 2016b: Options for Ecosystem-based Adaptation (EBA) in Coastal Environments: A Guide for Environmental 18 Managers and Planners. UNEP, Nairobi, Kenya, 103 pp. Available at: https://www.unep-19 wcmc.org/system/dataset_file_fields/files/000/000/380/original/Options_for_Ecosystem_based_Adaptation_in_C20 oastal_Environments_low-res.pdf?1462462607. 21
UNEP, 2019: Tanzania: Ecosystem-based adaptation. UNEP, Dodoma, Tanzania, 2 pp. Available at: 22 https://wedocs.unep.org/bitstream/handle/20.500.11822/28427/EbA_Tanzania.pdf?sequence=1&isAllowed=y. 23
UNEP, 2020: Angola: Ecosystem-based Adaptation 2016-2020. UNEP, Nairobi, Kenya, 2 pp. Available at: 24 https://wedocs.unep.org/bitstream/handle/20.500.11822/32051/AngolaEBA.pdf?sequence=1&isAllowed=y. 25
UNEP, 2021: Adaptation Gap Report 2020. United Nations Environment Programme, Nairobi, 120 pp. Available at: 26 https://www.unep.org/adaptation-gap-report-2020. 27
UNEP PSI, 2021: The Nairobi Declaration on Sustainable Insurance. UN Environment Programme’s Principles for 28 Sustainable Insurance Initiative (PSI), Nairobi, Kenya, 1 pp. 29
UNESCO, 2003: Convention for the safeguarding of the intangible cultural heritage. UNESCO, Paris, 15 pp. Available 30 at: https://ich.unesco.org/doc/src/15164-EN.pdf. 31
UNESCO, 2021: Sanké mon, collective fishing rite of the Sanké. Available at: https://ich.unesco.org/en/USL/sank-32 mon-collective-fishing-rite-of-the-sank-00289. 33
UNESCO, 2021: Enkipaata, Eunoto and Olng'esherr, three male rites of passage of the Maasai community. Available 34 at: https://ich.unesco.org/en/USL/enkipaata-eunoto-and-olng-esherr-three-male-rites-of-passage-of-the-maasai-35 community-01390. 36
UNESCO, 2018b: World Heritage for Sustainable Development in Africa [Edmond, M. and O. Ishanlosen (eds.)]. 37 United Nations Educational, Scientific and Cultural Organization, France, 274 pp. 38
UNESCO and UN-Water, 2020: United Nations World Water Development Report 2020: Water and Climate Change. 39 UNESCO, Paris 219 pp. ISBN 978-92-3-100371-4. 40
UNESCO Institute of Statistics, 2018: One in five children, adolescents and youth is out of school. The United Nations 41 Educational, Scientific and Cultural Organization, Montreal, 13 pp. Available at: 42 http://uis.unesco.org/sites/default/files/documents/fs48-one-five-children-adolescents-youth-out-school-2018-43 en.pdf. 44
UNFCCC, 2007: Climate change: Impacts, vulnerabilities and adaptation in developing countries. United Nations 45 Climate Change Secretariat (UNFCCC), Bonn, Germany. Available at: 46 http://unfccc.int/resource/docs/publications/impacts.pdf (accessed 2014/02/24/15:53:19). 47
UNFCCC, 2009: Copenhagen Accord. United Nations Framework Convention on Climate Change (UNFCCC), 48 Copenhagen, Denmark, 43 pp. Available at: https://unfccc.int/resource/docs/2009/cop15/eng/11a01.pdf. 49
UNFCCC, 2018: 2018 Biennial Assessment and Overview of Climate Finance Flows. United Nations Framework 50 Convention on Climate Change Standing Committee on Finance, Benn, Germany, 172 pp. Available at: 51 https://unfccc.int/sites/default/files/resource/2018%20BA%20Technical%20Report%20Final%20Feb%202019.pd52 f. 53
UNFCCC, Warsaw International Mechanism for Loss and Damage associated with Climate Change Impacts (WIM), 54 United Nations Framework Convention on Climate Change (UNFCCC), Bonn, Germany. Available at: 55 https://unfccc.int/topics/adaptation-and-resilience/workstreams/loss-and-damage-ld/warsaw-international-56 mechanism-for-loss-and-damage-associated-with-climate-change-impacts-wim. 57
UNFCCC Adaptation Committee, 2019: Various approaches to long-term adaptation planning. United Nations Climate 58 Change Secretariat, Bonn, Germany, 11 pp. Available at: 59 https://unfccc.int/sites/default/files/resource/variousapproaches%20.pdf. 60
UNFCCC Paris Agreement, 2015: Adoption of the Paris Agreement. United Nations Climate Change Secretariat 61 (UNFCCC), Bonn, Germany. Available at: http://unfccc.int/resource/docs/2015/cop21/eng/l09r01.pdf. 62
ACCEPTED VERSIO
N
SUBJECT TO FIN
AL EDITS
FINAL DRAFT Chapter 9 IPCC WGII Sixth Assessment Report
Do Not Cite, Quote or Distribute 9-219 Total pages: 225
UNICEF, WHO and WBG, 2019: Levels and trends in child malnutrition: Key findings of the 2019 Edition Joint Child 1 Malnutrition Estimates [United Nations Children's Fund, World Health Organization and World Bank Group 2 (eds.)]. World Health Organization, Geneva, 15 pp. Available at: 3 https://apps.who.int/iris/rest/bitstreams/1269729/retrieve. 4
UNISDR Sendai Framework, 2015: Sendai Framework for Disaster Risk Reduction 2015–2030. United Nations Office 5 for Disaster Risk Reduction, 24 pp. 6
United Nations General Assembly, 2015: Transforming our world: the 2030 Agenda for Sustainable Development, New 7 York, USA. Available at: https://sustainabledevelopment.un.org/post2015/transformingourworld. 8
UNWTO, 2008: Climate change and tourism: Resoponding to Global Challenges. World Tourism Organization 9 (UNWTO), Madrid, Spain. 10
Urban, M. C., 2015: Accelerating extinction risk from climate change. Science (New York, N.Y.), 348(6234), 571, 11 doi:10.1126/science.aaa4984. 12
Valencia-Quintana, R. et al., 2020: Environment Changes, Aflatoxins, and Health Issues, a Review. International 13 Journal of Environmental Research and Public Health, 17(21), 7850, doi:10.3390/ijerph17217850. 14
van Baalen, S. and M. Mobjörk, 2018: Climate Change and Violent Conflict in East Africa: Integrating Qualitative and 15 Quantitative Research to Probe the Mechanisms. International Studies Review, 20(4), 547-575, 16 doi:10.1093/isr/vix043. 17
van de Giesen, N., R. Hut and J. Selker, 2014: The trans‐African hydro‐meteorological observatory (TAHMO). Wiley 18 Interdisciplinary Reviews: Water, 1(4), 341-348, doi:https://doi.org/10.1002/wat2.1034. 19
van den Berg, H. et al., 2019: Linking water quality monitoring and climate-resilient water safety planning in two urban 20 drinking water utilities in Ethiopia. J Water Health, 17(6), 989-1001, doi:10.2166/wh.2019.059. 21
van der Linden, N. et al., 2019: The use of an 'acclimatisation' heatwave measure to compare temperature-related 22 demand for emergency services in Australia, Botswana, Netherlands, Pakistan, and USA. PLoS One, 14(3), 23 e0214242, doi:10.1371/journal.pone.0214242. 24
van der Lingen, C. D. and I. Hampton, 2018: Climate change impacts, vulnerabilities and adaptations: Southeast 25 Atlantic and Southwest Indian Ocean marine fisheries [Barange, M., T. Bahri, M. Beveridge, K. Cochrane, S. 26 Funge-Smith and F. Poulain (eds.)]. Impacts of Climate Change on Fisheries and Aquaculture: Synthesis of 27 Current Knowledge, Adaptation and Mitigation Options, FAO Fisheries and Aquaculture, Rome, Italy, 219-250 28 pp. Available at: http://www.fao.org/3/i9705en/I9705EN.pdf. 29
Van Der Ree, R., D. J. Smith and C. Grilo, 2015: Handbook of road ecology. John Wiley & Sons. ISBN 1118568168. 30 van der Zwaan, B. et al., 2018: An integrated assessment of pathways for low-carbon development in Africa. Energy 31
Policy, 117, 387-395, doi:10.1016/j.enpol.2018.03.017. 32 Van Hout, M. C. and R. Mhlanga-Gunda, 2019: Prison health situation and health rights of young people incarcerated 33
in sub-Saharan African prisons and detention centres: a scoping review of extant literature. BMC international 34 health and human rights, 19(1), 17, doi:10.1186/s12914-019-0200-z. 35
van Oort, P. A. J. and S. J. Zwart, 2018: Impacts of climate change on rice production in Africa and causes of simulated 36 yield changes. Global Change Biology, 24(3), 1029-1045, doi:https://doi.org/10.1111/gcb.13967. 37
van Weezel, S., 2019: On climate and conflict: Precipitation decline and communal conflict in Ethiopia and Kenya. 38 Journal of Peace Research, 56(4), 514-528, doi:10.1177/0022343319826409. 39
van Wilgen, N. J. et al., 2016: Rising temperatures and changing rainfall patterns in South Africa's national parks. 40 International Journal of Climatology, 36(2), 706-721, doi:10.1002/joc.4377. 41
van Wyk, L., 2017: Cultural and heritage sensitive adaptation measures and principles in climate change adaptation 42 plans for South African metropolitan cities. Council for Scientific and Industrial Research, South Africa, 43 Stellenbosch, 9 pp. Available at: 44 https://www.researchgate.net/publication/319136126_CULTURAL_AND_HERITAGE_SENSITIVE_ADAPTA45 TION_MEASURES_AND_PRINCIPLES_IN_CLIMATE_CHANGE_ADAPTATION_PLANS_FOR_SOUTH_46 AFRICAN_METROPOLITAN_CITIES (accessed 2019/01/31/03:57:32). 47
van Wyk, L., L. C. Duncker and P. du Plessis, 2017: Harvesting Renewable Water: Part 1: Rainwater. In: The Green 48 Bulding Handbook South Africa: The Essential Guide [Van Wyk, L. V. (ed.)]. Alive2green, Cape Town, South 49 Africa, pp. 52-65. 50
Vaughan, C., S. Dessai and C. Hewitt, 2018: Surveying Climate Services: What Can We Learn from a Bird’s-Eye 51 View? Weather, Climate, and Society, 10(2), 373-395, doi:10.1175/WCAS-D-17-0030.1. 52
Vaughan, C. et al., 2019: Evaluating agricultural weather and climate services in Africa: Evidence, methods, and a 53 learning agenda. Wiley Interdisciplinary Reviews: Climate Change, 10(4), e586, doi:10.1002/wcc.586. 54
Veettil and Kamp, 2019: Global Disappearance of Tropical Mountain Glaciers: Observations, Causes, and Challenges. 55 Geosciences, 9(5), doi:10.3390/geosciences9050196. 56
Veldman, J. W. et al., 2015: Where Tree Planting and Forest Expansion are Bad for Biodiversity and Ecosystem 57 Services. BioScience, 65(10), 1011-1018, doi:10.1093/biosci/biv118. 58
Vellinga, M. and S. F. Milton, 2018: Drivers of interannual variability of the East African “Long Rains”. Quarterly 59 Journal of the Royal Meteorological Society, 144(712), 861-876, doi:https://doi.org/10.1002/qj.3263. 60
Venema, H. D. and J. Temmer, 2017: Water supply and sanitation systems. Building a Climate-Resilient City, Prairie 61 Climate Centre, International Institute for Sustainable Development (IISD) and the University of Winnipeg, 10 pp. 62 Available at: https://www.iisd.org/library/building-climate-resilient-city-water-supply-and-sanitation-systems. 63
ACCEPTED VERSIO
N
SUBJECT TO FIN
AL EDITS
FINAL DRAFT Chapter 9 IPCC WGII Sixth Assessment Report
Do Not Cite, Quote or Distribute 9-220 Total pages: 225
Venter, Z. S., M. D. Cramer and H. J. Hawkins, 2018: Drivers of woody plant encroachment over Africa. Nature 1 Communications, 9(1), 2272, doi:10.1038/s41467-018-04616-8. 2
Verisk Maplecroft, Urbanisation and Climate Change Risk. Available at: 3 https://www.maplecroft.com/insights/analysis/84-of-worlds-fastest-growing-cities-face-extreme-climate-change-4 risks/. 5
Verner, D. et al., 2018: Climate Variability, Drought, and Drought Management in Tunisia's Agricultural Sector. World 6 Bank, Washington, DC. Available at: https://openknowledge.worldbank.org/handle/10986/30603. 7
Vicedo-Cabrera, A. M. et al., 2021: The burden of heat-related mortality attributable to recent human-induced climate 8 change. Nature Climate Change, 11(6), 492-500, doi:10.1038/s41558-021-01058-x. 9
Vidya, P. J. et al., 2020: Increased cyclone destruction potential in the Southern Indian Ocean. Environmental Research 10 Letters, 16(1), 014027, doi:10.1088/1748-9326/abceed. 11
Viles, H. A. and N. A. Cutler, 2012: Global environmental change and the biology of heritage structures. Global 12 Change Biology, 18(8), 2406-2418, doi:https://doi.org/10.1111/j.1365-2486.2012.02713.x. 13
Villamayor-Tomas, S. et al., 2015: The water-energy-food security nexus through the lenses of the value chain and the 14 institutional analysis and development frameworks. Water Alternatives, 8(1), 735-755. 15
Vincent, K. et al., 2020a: Addressing power imbalances in co-production. Nature Climate Change, 10(10), 877-878, 16 doi:10.1038/s41558-020-00910-w. 17
Vincent, K. and D. Conway, 2021: Key Issues and Progress in Understanding Climate Risk in Africa. In: Climate Risk 18 in Africa: Adaptation and Resilience [Conway, D. and K. Vincent (eds.)]. Springer International Publishing, 19 Cham, pp. 1-16. ISBN 978-3-030-61160-6. 20
Vincent, K. et al., 2020b: Re-balancing climate services to inform climate-resilient planning – A conceptual framework 21 and illustrations from sub-Saharan Africa. Climate Risk Management, 29, 100242, 22 doi:https://doi.org/10.1016/j.crm.2020.100242. 23
Vincent, K. and G. Cundill, 2021: The evolution of empirical adaptation research in the global South from 2010 to 24 2020. Climate and Development, 1-14, doi:10.1080/17565529.2021.1877104. 25
Vincent, K., M. Daly, C. Scannell and B. Leathes, 2018: What can climate services learn from theory and practice of 26 co-production? Climate Services, 12, 48-58, doi:10.1016/j.cliser.2018.11.001. 27
Vizy, E. K. and K. H. Cook, 2012: Mid-twenty-first-century changes in extreme events over northern and tropical 28 Africa. Journal of Climate, 25, 5748-5767, doi:10.1175/JCLI-D-11-00693.1. 29
Vizy, E. K., K. H. Cook and X. Sun, 2018: Decadal change of the south Atlantic ocean Angola–Benguela frontal zone 30 since 1980. Clim Dyn, 51(9), 3251-3273, doi:10.1007/s00382-018-4077-7. 31
Vogel, C., A. Steynor and A. Manyuchi, 2019: Climate services in Africa: Re-imagining an inclusive, robust and 32 sustainable service. Climate Services, 15, 100107, doi:10.1016/j.cliser.2019.100107. 33
von Lossow, T., 2017: The River Congo - Africa's sleeping giant: regional integration and intersectoral conflicts in the 34 Congo Basin. Stiftung Wissenschaft und Politik -SWP- Deutsches Institut für Internationale Politik und 35 Sicherheit, Berlin. Available at: https://nbn-resolving.org/urn:nbn:de:0168-ssoar-55100-9. 36
von Uexkull, N., M. Croicu, H. Fjelde and H. Buhaug, 2016: Civil conflict sensitivity to growing-season drought. 37 Proceedings of the National Academy of Sciences, 113(44), 12391-12396, doi:10.1073/pnas.1607542113. 38
von Uexkull, N., M. d’Errico and J. Jackson, 2020: Drought, Resilience, and Support for Violence: Household Survey 39 Evidence from DR Congo. Journal of Conflict Resolution, 64(10), 1994-2021, doi:10.1177/0022002720923400. 40
Wada, Y., D. Wisser and M. F. P. Bierkens, 2014: Global modeling of withdrawal, allocation and consumptive use of 41 surface water and groundwater resources. Earth System Dynamics, 5(1), 15-40, doi:10.5194/esd-5-15-2014. 42
Waha, K. et al., 2017: Climate change impacts in the Middle East and Northern Africa (MENA) region and their 43 implications for vulnerable population groups. Regional Environmental Change, 17(6), 1623-1638, 44 doi:10.1007/s10113-017-1144-2. 45
Waha, K. et al., 2018: Agricultural diversification as an important strategy for achieving food security in Africa. Global 46 Change Biology, 24(8), 3390-3400, doi:https://doi.org/10.1111/gcb.14158. 47
Wainwright, C. M. et al., 2019: ‘Eastern African Paradox’rainfall decline due to shorter not less intense Long Rains. npj 48 Climate and Atmospheric Science, 2(34), 1-9, doi:https://doi.org/10.1038/s41612-019-0091-7. 49
Wairore, J. N., S. M. Mureithi, O. V. Wasonga and G. Nyberg, 2016: Benefits Derived from Rehabilitating a Degraded 50 Semi-Arid Rangeland in Private Enclosures in West Pokot County, Kenya. Land Degradation & Development, 51 27(3), 532-541, doi:https://doi.org/10.1002/ldr.2420. 52
Walker, J. T., 2018: The influence of climate change on waterborne disease and Legionella: a review. Perspectives in 53 Public Health, 138(5), 282-286, doi:10.1177/1757913918791198. 54
Wanderi, H., 2019: Lamu Old Town: Balancing Economic Development with Heritage Conservation. JOURNAL OF 55 WORLD HERITAGE STUDIES, Special issue 2019, 16-22, doi:http://doi.org/10.15068/00157681. 56
Wang, B., C. Jin and J. Liu, 2020a: Understanding Future Change of Global Monsoons Projected by CMIP6 Models. 57 Journal of Climate, 33(15), 6471-6489, doi:10.1175/JCLI-D-19-0993.1. 58
Wang, G. et al., 2020b: A Unique Feature of the 2019 Extreme Positive Indian Ocean Dipole Event. Geophysical 59 Research Letters, 47(18), e2020GL088615, doi:https://doi.org/10.1029/2020GL088615. 60
Wang, H. et al., 2016: Detecting cross-equatorial wind change as a fingerprint of climate response to anthropogenic 61 aerosol forcing. Geophysical Research Letters, 43(7), 3444-3450, doi:https://doi.org/10.1002/2016GL068521. 62
ACCEPTED VERSIO
N
SUBJECT TO FIN
AL EDITS
FINAL DRAFT Chapter 9 IPCC WGII Sixth Assessment Report
Do Not Cite, Quote or Distribute 9-221 Total pages: 225
Wang, S.-J. and L.-Y. Zhou, 2019: Integrated impacts of climate change on glacier tourism. Advances in Climate 1 Change Research, 10(2), 71-79, doi:https://doi.org/10.1016/j.accre.2019.06.006. 2
Wangai, P. W., B. Burkhard and F. Müller, 2016: A review of studies on ecosystem services in Africa. International 3 Journal of Sustainable Built Environment, 5(2), 225-245, doi:https://doi.org/10.1016/j.ijsbe.2016.08.005. 4
Wangui, E., 2018: Adaptation to Current and Future Climate in Pastoral Communities Across Africa. Oxford University 5 Press. 6
Ward, M. et al., 2020: Just ten percent of the global terrestrial protected area network is structurally connected via intact 7 land. Nature Communications, 11(1), 4563, doi:10.1038/s41467-020-18457-x. 8
Warren, M., 2019: Why Cyclone Idai is one of the Southern Hemisphere's most devastating storms. Nature, 9 doi:10.1038/d41586-019-00981-6. 10
Warren, R. et al., 2018: The projected effect on insects, vertebrates, and plants of limiting global warming to 1.5°C 11 rather than 2°C. Science (New York, N.Y.), 360(6390), 791, doi:10.1126/science.aar3646. 12
WASH Alliance International, 2015: Accelerating WASH in Ethiopia: Best practices from the 2011-2015 WASH 13 Programme. Available at: https://wash-alliance.org/wp-content/uploads/sites/36/2016/08/Best-Practice-14 Etiopia.pdf. 15
Watson, J. E. M. et al., 2018: The exceptional value of intact forest ecosystems. Nature Ecology & Evolution, 2(4), 599-16 610, doi:10.1038/s41559-018-0490-x. 17
Watts, N. et al., 2015: Health and climate change: policy responses to protect public health. Lancet, 386(10006), 1861-18 1914, doi:10.1016/S0140-6736(15)60854-6. 19
Watts, N. et al., 2018: The Lancet Countdown on health and climate change: from 25 years of inaction to a global 20 transformation for public health. Lancet, 391(10120), 581-630, doi:10.1016/S0140-6736(17)32464-9. 21
Weber, E. J., 2019: Weather Index Insurance in Sub-Saharan Africa. SSRN 3396489, 1-11, 22 doi:https://dx.doi.org/10.2139/ssrn.3396489. 23
Weber, T. et al., 2020: Analysis of Compound Climate Extremes and Exposed Population in Africa Under Two 24 Different Emission Scenarios. Earth's Future, 8(9), e2019EF001473, doi:https://doi.org/10.1029/2019EF001473. 25
Weber, T. et al., 2018: Analyzing Regional Climate Change in Africa in a 1.5, 2, and 3°C Global Warming World. 26 Earth's Future, 6(4), 643-655, doi:10.1002/2017ef000714. 27
Weetman, D. et al., 2018: Aedes Mosquitoes and Aedes-Borne Arboviruses in Africa: Current and Future Threats. Int J 28 Environ Res Public Health, 15(2), doi:10.3390/ijerph15020220. 29
WEF, 2021: Unlocking the potential of Earth Observation to address Africa’s critical challenges. World Economic 30 Forum, Geneva, Switzerland, 31 pp. Available at: 31 http://www3.weforum.org/docs/WEF_Digital_Earth_Africa_Unlocking_the_potential_of_Earth_Observation_to_32 address_Africa_2021.pdf. 33
Weiler, F. and F. A. Sanubi, 2019: Development and Climate Aid to Africa: Comparing Aid Allocation Models for 34 Different Aid Flows. Africa Spectrum, 54(3), 244-267, doi:10.1177/0002039720905598. 35
Weindl, I. et al., 2015: Livestock in a changing climate: production system transitions as an adaptation strategy for 36 agriculture. Environmental Research Letters, 10(9), 094021, doi:10.1088/1748-9326/10/9/094021. 37
Weinzierl, T. and J. Schilling, 2013: On demand, development and dependence: A review of current and future 38 implications of socioeconomic changes for Integrated Water Resource Management in the Okavango Catchment 39 of Southern Africa. Land, 2(1), 60-80, doi:10.3390/land2010060. 40
Weiser, S. D. et al., 2010: Food insecurity as a barrier to sustained antiretroviral therapy adherence in Uganda. PLoS 41 One, 5(4), e10340, doi:10.1371/journal.pone.0010340. 42
Weiss, D. J. et al., 2020: Global maps of travel time to healthcare facilities. Nature Medicine, 26(12), 1835-1838, 43 doi:10.1038/s41591-020-1059-1. 44
Wekesa, C. et al. (eds.), Traditional knowledge-based innovations for adaptation and resilience to climate change: the 45 case of coastal Kenya. XIV World Forestry Congress, Durban, South Africa, 7-11 September 2015. 46
Wenta, J., J. McDonald and J. S. McGee, 2019: Enhancing resilience and justice in climate adaptation laws. 47 Transnational Environmental Law, 8(1), 89-118, doi:10.1017/S2047102518000286. 48
Wenz, L. and A. Levermann, 2016: Enhanced economic connectivity to foster heat stress-related losses. Sci Adv, 2(6), 49 e1501026, doi:10.1126/sciadv.1501026. 50
Werners, S. E. et al., 2021: Adaptation pathways: A review of approaches and a learning framework. Environmental 51 Science & Policy, 116, 266-275, doi:https://doi.org/10.1016/j.envsci.2020.11.003. 52
Wessels, C., C. Merow and C. H. Trisos, 2021: Climate change risk to southern African wild food plants. Regional 53 Environmental Change, 21(2), 29, doi:10.1007/s10113-021-01755-5. 54
West, J. J. et al., 2013: Co-benefits of mitigating global greenhouse gas emissions for future air quality and human 55 health. Nature Climate Change, 3(10), 885-889, doi:https://doi.org/10.1038/nclimate2009. 56
Westervelt, D. M. et al., 2016: Quantifying PM2.5-meteorology sensitivities in a global climate model. Atmospheric 57 Environment, 142, 43-56, doi:10.1016/j.atmosenv.2016.07.040. 58
Weston, P., R. Hong and Kabor, 2015: Farmer-Managed Natural Regeneration Enhances Rural Livelihoods in Dryland 59 West Africa. Environmental Management, 55(6), 1402-1417, doi:10.1007/s00267-015-0469-1. 60
Weyant, C. et al., 2018: Anticipated burden and mitigation of carbon-dioxide-induced nutritional deficiencies and 61 related diseases: A simulation modeling study. PLoS Med, 15(7), e1002586, doi:10.1371/journal.pmed.1002586. 62
ACCEPTED VERSIO
N
SUBJECT TO FIN
AL EDITS
FINAL DRAFT Chapter 9 IPCC WGII Sixth Assessment Report
Do Not Cite, Quote or Distribute 9-222 Total pages: 225
WFP, 2020: R4 Rural Resilience Initiative Annual Report. World Food Programme, Rome, Italy, 124 pp. Available at: 1 https://docs.wfp.org/api/documents/WFP-0000128425/download/?_ga=2.70893520.1511863330.1626445093-2 1538420741.1626445093. 3
White, R. and S. Wahba, 2019: Addressing constraints to private financing of urban (climate) infrastructure in 4 developing countries. International Journal of Urban Sustainable Development, 11(3), 245-256, 5 doi:10.1080/19463138.2018.1559970. 6
Whitmee, S. et al., 2015: Safeguarding human health in the Anthropocene epoch: report of The Rockefeller 7 Foundation–Lancet Commission on planetary health. The Lancet, 386(10007), 1973-2028, 8 doi:https://doi.org/10.1016/S0140-6736(15)60901-1. 9
WHO, 2014: Quantitative risk assessment of the effects of climate change on selected causes of death, 2030s and 2050s 10 [Hales, S., S. Kovats, S. Lloyd and D. Campbell-Lendrum (eds.)]. World Health Organization, Geneva, 11 Switzerland. Available at: https://apps.who.int/iris/bitstream/handle/10665/134014/9789241507691_eng.pdf. 12
WHO, 2015: Operational framework for building climate resilient health systems [World Health Organization (ed.)]. 13 World Health Organisation, 54 pp. Available at: 14 https://apps.who.int/iris/bitstream/handle/10665/189951/9789241565073_eng.pdf. 15
WHO, 2016: El Niño and health. Global Report. World Health Organisation (WHO). Available at: 16 https://www.who.int/hac/crises/el-nino/who_el_nino_and_health_global_report_21jan2016.pdf. 17
Wichmann, J., 2017: Heat effects of ambient apparent temperature on all-cause mortality in Cape Town, Durban and 18 Johannesburg, South Africa: 2006-2010. Sci Total Environ, 587-588, 266-272, 19 doi:10.1016/j.scitotenv.2017.02.135. 20
Wiederkehr, C., M. Beckmann and K. Hermans, 2018: Environmental change, adaptation strategies and the relevance of 21 migration in Sub-Saharan drylands. Environmental Research Letters, 13(11), 113003, 22 doi:https://doi.org/10.1088/1748-9326/aae6de. 23
Wigley, A. S. et al., 2020a: Measuring the availability and geographical accessibility of maternal health services across 24 sub-Saharan Africa. BMC Medicine, 18(1), 237, doi:10.1186/s12916-020-01707-6. 25
Wigley, B. J. et al., 2020b: Grasses continue to trump trees at soil carbon sequestration following herbivore exclusion in 26 a semiarid African savanna. Ecology, 101(5), e03008, doi:https://doi.org/10.1002/ecy.3008. 27
Wijesinghe, A. and J. P. R. Thorn, 2021: Governance of Urban Green Infrastructure in Informal Settlements of 28 Windhoek, Namibia. Sustainability, 13(16), doi:10.3390/su13168937. 29
Wilkinson, A., 2020: Local response in health emergencies: key considerations for addressing the COVID-19 pandemic 30 in informal urban settlements. Environment and Urbanization, 32(2), 503-522, doi:10.1177/0956247820922843. 31
Williams, D. S. et al., 2019a: Vulnerability of informal settlements in the context of rapid urbanization and climate 32 change. Environment and Urbanization, 31(1), 157-176, doi:10.1177/0956247818819694. 33
Williams, P. A., O. Crespo and M. Abu, 2019b: Adapting to changing climate through improving adaptive capacity at 34 the local level – The case of smallholder horticultural producers in Ghana. Climate Risk Management, 23, 124-35 135, doi:https://doi.org/10.1016/j.crm.2018.12.004. 36
Williams, P. A., L. Sikutshwa and S. Shackleton, 2020: Acknowledging Indigenous and Local Knowledge to Facilitate 37 Collaboration in Landscape Approaches—Lessons from a Systematic Review. Land, 9(9), 38 doi:10.3390/land9090331. 39
Williams, P. A. et al., 2021: Feasibility assessment of climate change adaptation options across Africa: an evidence-40 based review. Environmental Research Letters, 16(7), doi:10.1088/1748-9326/ac092d. 41
Wilson, J., 2014: The History of the Level of Lake Chilwa. The Society of Malawi Journal, 67(2), 41-45. 42 Winrock, 2018: Assessing Sustainability and Effectiveness of Climate Information Services in Africa Final Report. 43
Washington, DC, USA. Available at: https://www.climatelinks.org/resources/assessing-sustainability-and-44 effectiveness-climate-information-services-africa-final (accessed 21 June 2020). 45
Wiru, K. et al., 2019: The influence of apparent temperature on mortality in the middle belt of Ghana. Environmental 46 Epidemiology, 3(p 295 ), doi:10.1097/01.EE9.0000609192.22657.a7. 47
Wisner, B., 2016: Vulnerability as Concept, Model, Metric, and Tool. Oxford University Press. 48 Wisner, B. et al., 2015: Small Cities and Towns in Africa: Insights into Adaptation Challenges and Potentials. In: 49
Urban Vulnerability and Climate Change in Africa: A Multidisciplinary Approach [Pauleit, S., A. Coly, S. 50 Fohlmeister, P. Gasparini, G. Jørgensen, S. Kabisch, W. J. Kombe, S. Lindley, I. Simonis and K. Yeshitela (eds.)]. 51 Springer International Publishing, pp. 153-196. ISBN 978-3-319-03982-4. 52
Witmer, F. D. et al., 2017: Subnational violent conflict forecasts for sub-Saharan Africa, 2015–65, using climate-53 sensitive models. Journal of Peace Research, 54(2), 175-192, doi:10.1177/0022343316682064. 54
Witt, A., T. Beale and W. Van Wilgen Brian, 2018: An assessment of the distribution and potential ecological impacts 55 of invasive alien plant species in eastern Africa. Transactions of the Royal Society of South Africa, 73(3), 217-236, 56 doi:10.1080/0035919X.2018.1529003. 57
WMO, 2021: First Report of the WMO COVID-19 Task Team: Review on Meteorological and Air Quality Factors 58 Affecting the COVID-19 Pandemic. World Meteorological Organization (WMO), Geneva. Available at: 59 https://library.wmo.int/index.php?lvl=notice_display&id=21857#.YNHse-gzaHs. 60
Wojewska, A. N., C. Singh and C. P. Hansen, 2021: A policy tool for monitoring and evaluation of participation in 61 adaptation projects. Climate Risk Management, 33, 100326, doi:https://doi.org/10.1016/j.crm.2021.100326. 62
ACCEPTED VERSIO
N
SUBJECT TO FIN
AL EDITS

FINAL DRAFT Chapter 9 IPCC WGII Sixth Assessment Report
Do Not Cite, Quote or Distribute 9-223 Total pages: 225
Wolski, P. et al., 2014: Attribution of floods in the Okavango basin, Southern Africa. Journal of Hydrology, 511, 350-1 358, doi:https://doi.org/10.1016/j.jhydrol.2014.01.055. 2
Wong, P. P. et al., 2014: Coastal Systems and Low-Lying Areas. In: Climate Change 2014: Impacts, Adaptation, and 3 Vulnerability. Part A: Global and Sectoral Aspects. Contribution of Working Group II to the Fifth Assessment 4 Report of the Intergovernmental Panel on Climate Change [Field, C. B., V.R. Barros, D.J. Dokken, K.J. Mach, 5 M.D. Mastrandrea, T.E. Bilir, M. Chatterjee, K.L. Ebi, Y.O. Estrada, R.C. Genova, B. Girma, E.S. Kissel, A.N. 6 Levy, S. MacCracken, P.R. Mastrandrea and L. L. White (eds.)]. Cambridge University Press, United Kingdom 7 and New York, NY, USA, pp. 361-409. 8
Woodhouse, P. et al., 2017: African farmer-led irrigation development: re-framing agricultural policy and investment? 9 The Journal of Peasant Studies, 44(1), 213-233, doi:10.1080/03066150.2016.1219719. 10
Woodroffe, R., R. Groom and J. W. McNutt, 2017: Hot dogs: High ambient temperatures impact reproductive success 11 in a tropical carnivore. Journal of Animal Ecology, 86(6), 1329-1338, doi:https://doi.org/10.1111/1365-12 2656.12719. 13
Woolway, R. I. et al., 2021: Lake heatwaves under climate change. Nature, 589(7842), 402-407, doi:10.1038/s41586-14 020-03119-1. 15
Woolway, R. I. and S. C. Maberly, 2020: Climate velocity in inland standing waters. Nature Climate Change, 10(12), 16 1124-1129, doi:10.1038/s41558-020-0889-7. 17
World Bank, 2015: Promoting Green Urban Development in African Cities: Kampala, Uganda. Urban Environmental 18 Profile, International Bank for Reconstruction and Development / The World Bank, Bank, W., Washington, DC. 19 Available at: 20 https://openknowledge.worldbank.org/bitstream/handle/10986/22941/Promoting0gree0nvironmental0profile.pdf?s21 equence=5&isAllowed=y. 22
World Bank, 2017a: Kariba Dam Rehabilitation Project (RI): Overview. World Bank Group, Bank, W., Washington 23 DC, 3 pp. Available at: https://projects.worldbank.org/en/projects-operations/project-24 detail/P146515?lang=en&tab=overview. 25
World Bank, 2017b: Sierra Leone Rapid Damage and Loss Assessment of August 14th, 2017 Landslides and Floods in 26 the Western Area. Economic and Sector Work (ESW) Studies World Bank, Washington, DC, 118 pp. Available 27 at: https://openknowledge.worldbank.org/handle/10986/28836. 28
World Bank, 2018: World Bank Open Data. World Bank Group, Washington, DC, USA. Available at: 29 https://data.worldbank.org/. 30
World Bank, 2020a: Covid-19 Crisis Through a Migration Lens. World Bank, Washington, DC, 1-50 pp. Available at: 31 https://www.knomad.org/publication/migration-and-development-brief-32-covid-19-crisis-through-migration-32 lens. 33
World Bank, 2020b: Disability Inclusion in Nigeria: A Rapid Assessment. Social Analysis, World Bank. 34 World Bank, 2020c: Global Economic Prospects, June 2020. World Bank Group, Washington DC, USA. 35 World Bank, 2020d: The Next Generation Africa Climate Business Plan : Ramping Up Development-Centered Climate 36
Action. World Bank, Washington, DC. Available at: https://openknowledge.worldbank.org/handle/10986/34098. 37 World Bank, 2020e: Senegal River Basin Climate Change Resilience Development Project. World Bank Group, World 38
Bank, Washington DC, 8 pp. Available at: 39 https://documents1.worldbank.org/curated/en/501211607382827776/pdf/Disclosable-Version-of-the-ISR-40 Senegal-River-Basin-Climate-Change-Resilience-Development-Project-P131323-Sequence-No-14.pdf. 41
World Bank, 2021: Debt Service Suspension and COVID-19, World Bank Group, Washington DC. Available at: 42 https://www.worldbank.org/en/news/factsheet/2020/05/11/debt-relief-and-covid-19-coronavirus. 43
World Bank Group, 2016: Climate information services providers in Kenya. Agriculture global practice technical 44 assistance paper, World Bank, Washington, DC, 1-46 pp. Available at: 45 https://openknowledge.worldbank.org/handle/10986/23768. 46
World Travel and Tourism Council, Africa 2019 Annual Research: Key Highlights. Available at: 47 https://www.wttc.org/economic-impact/country-analysis/country-data/. 48
World Travel and Tourism Council, 2019b: The Economic Impact of Global Wildlife Tourism. Available at: 49 https://travesiasdigital.com/wp-content/uploads/2019/08/The-Economic-Impact-of-Global-Wildlife-Tourism-50 Final-19.pdf. 51
WorldPop, 2021: Population density, University of Southampton. Available at: 52 https://www.worldpop.org/project/categories?id=18. 53
Wright, C. Y. et al., 2019: Socio-economic, infrastructural and health-related risk factors associated with adverse heat-54 health effects reportedly experienced during hot weather in South Africa. Pan Afr Med J, 34, 40-40, 55 doi:10.11604/pamj.2019.34.40.17569. 56
Wrigley-Asante, C., K. Owusu, I. S. Egyir and T. M. Owiyo, 2019: Gender dimensions of climate change adaptation 57 practices: the experiences of smallholder crop farmers in the transition zone of Ghana. African Geographical 58 Review, 38(2), 126-139, doi:10.1080/19376812.2017.1340168. 59
Wu, M. et al., 2016: Vegetation–climate feedbacks modulate rainfall patterns in Africa under future climate change. 60 Earth System Dynamics, 7(3), 627-647, doi:10.5194/esd-7-627-2016. 61
ACCEPTED VERSIO
N
SUBJECT TO FIN
AL EDITS
FINAL DRAFT Chapter 9 IPCC WGII Sixth Assessment Report
Do Not Cite, Quote or Distribute 9-224 Total pages: 225
Wuepper, D., H. Yesigat Ayenew and J. Sauer, 2018: Social Capital, Income Diversification and Climate Change 1 Adaptation: Panel Data Evidence from Rural Ethiopia. Journal of Agricultural Economics, 69(2), 458-475, 2 doi:https://doi.org/10.1111/1477-9552.12237. 3
Wunder, S., J. Börner, G. Shively and M. Wyman, 2014: Safety Nets, Gap Filling and Forests: A Global-Comparative 4 Perspective. World Development, 64, S29-S42, doi:https://doi.org/10.1016/j.worlddev.2014.03.005. 5
WWF-SA, 2016: Water: Facts & Futures Rethinking South Africa’s Water Future. WWF-SA, Cape Town, South 6 Africa. Available at: https://www.wwf.org.za/our_research/publications/?25181/Water-Facts-and-Futures. 7
Xu, Y. et al., 2019: Preface: Groundwater in Sub-Saharan Africa. Hydrogeology Journal, 27(3), 815-822, 8 doi:10.1007/s10040-019-01977-2. 9
Yamana, T. K., A. Bomblies and E. A. B. Eltahir, 2016: Climate change unlikely to increase malaria burden in West 10 Africa. Nature Climate Change, 6(11), 1009-1013, doi:10.1038/nclimate3085. 11
Yang, Y., D. Tilman, G. Furey and C. Lehman, 2019: Soil carbon sequestration accelerated by restoration of grassland 12 biodiversity. Nature Communications, 10(1), 718, doi:10.1038/s41467-019-08636-w. 13
Yang, Y. C. E. and S. Wi, 2018: Informing regional water-energy-food nexus with system analysis and interactive 14 visualization – A case study in the Great Ruaha River of Tanzania. Agricultural Water Management, 196, 75-86, 15 doi:10.1016/j.agwat.2017.10.022. 16
Yehia, A. G., K. M. Fahmy, M. A. S. Mehany and G. G. Mohamed, 2017: Impact of extreme climate events on water 17 supply sustainability in Egypt: case studies in Alexandria region and Upper Egypt. Journal of Water and Climate 18 Change, 8(3), 484-494, doi:10.2166/wcc.2017.111. 19
Yokohata, T. et al., 2019: Visualizing the Interconnections Among Climate Risks. Earth's Future, 7, 85-100, 20 doi:10.1029/2018EF000945. 21
Young, A. J., D. Guo, P. G. Desmet and G. F. Midgley, 2016: Biodiversity and climate change: Risks to dwarf 22 succulents in Southern Africa. Journal of Arid Environments, 129, 16-24, 23 doi:https://doi.org/10.1016/j.jaridenv.2016.02.005. 24
Yu, W. et al., 2015: Projecting Future Transmission of Malaria Under Climate Change Scenarios: Challenges and 25 Research Needs. Critical Reviews in Environmental Science and Technology, 45(7), 777-811, 26 doi:10.1080/10643389.2013.852392. 27
Yuan, X., L. Wang and E. F. Wood, 2018: Anthropogenic intensification of southern African flash droughts as 28 exemplified by the 2015/16 season. Bulletin of the American Meteorological Society, 99(1), S86-S90, 29 doi:10.1175/BAMS-D-17-0077.1. 30
Zabel, F. et al., 2021: Large potential for crop production adaptation depends on available future varieties. Global 31 Change Biology, 27(16), 3870-3882, doi:https://doi.org/10.1111/gcb.15649. 32
Zacarias, D. A., 2020: Global bioclimatic suitability for the fall armyworm, Spodoptera frugiperda (Lepidoptera: 33 Noctuidae), and potential co-occurrence with major host crops under climate change scenarios. Climatic Change, 34 161(4), 555-566, doi:10.1007/s10584-020-02722-5. 35
Zahouli, J. B. Z. et al., 2017: Urbanization is a main driver for the larval ecology of Aedes mosquitoes in arbovirus-36 endemic settings in south-eastern Cote d'Ivoire. PLoS Negl Trop Dis, 11(7), e0005751, 37 doi:10.1371/journal.pntd.0005751. 38
Zambezi Watercourse Commission, 2021: Pre-Feasibility Study for the Programme for Integrated Development and 39 Adaptation to Climate Change in the Zambezi Watercourse (PIDACC Zambezi). United Nations Convention to 40 Combat Desertification Secretariat, UNCCD, Bonn, Germany, 9 pp. 41
Zampaligré, N., L. H. Dossa and E. Schlecht, 2014: Climate change and variability: perception and adaptation strategies 42 of pastoralists and agro-pastoralists across different zones of Burkina Faso. Regional Environmental Change, 43 14(2), 769-783, doi:https://doi.org/10.1007/s10113-013-0532-5. 44
Zegeye, H., 2018: Climate change in Ethiopia: impacts, mitigation and adaptation. International Journal of Research in 45 Environmental Studies, 5(1), 18-35 46
Zengeya, T., 2017: South Africa should sort out the bad from the really bad on its invasive species list. Water Wheel, 47 16(5), 38-39. 48
Zermoglio, F., S. J. Ryan and M. Swaim, 2019: Shifting burdens: malaria risk in a hotter Africa. Technical Report, 49 United States Agency for International Development (USAID) and Adaptation Thought Leadership and 50 Assessments (ATLAS). Available at: 51 https://www.climatelinks.org/sites/default/files/asset/document/2019_USAID_ATLAS_Shifting%20Burdens.pdf. 52
Zevenbergen, C. et al., 2016: In the aftermath of the October 2015 Alexandria Flood Challenges of an Arab city to deal 53 with extreme rainfall storms. Natural Hazards, 86(2), 901-917, doi:10.1007/s11069-016-2724-z. 54
Zezza, A. and L. Tasciotti, 2010: Urban agriculture, poverty, and food security: Empirical evidence from a sample of 55 developing countries. Food Policy, 35(4), 265-273, doi:https://doi.org/10.1016/j.foodpol.2010.04.007. 56
Zhang, W. et al., 2019: From woody cover to woody canopies: How Sentinel-1 and Sentinel-2 data advance the 57 mapping of woody plants in savannas. Remote Sensing of Environment, 234, 111465, 58 doi:https://doi.org/10.1016/j.rse.2019.111465. 59
Zhang, W. and X. Pan, 2016: Study on the demand of climate finance for developing countries based on submitted 60 INDC. Advances in Climate Change Research, 7(1-2), 99-104, doi:10.1016/j.accre.2016.05.002. 61
ACCEPTED VERSIO
N
SUBJECT TO FIN
AL EDITS

FINAL DRAFT Chapter 9 IPCC WGII Sixth Assessment Report
Do Not Cite, Quote or Distribute 9-225 Total pages: 225
Zhao, Q. et al., 2021: Global, regional, and national burden of mortality associated with non-optimal ambient 1 temperatures from 2000 to 2019: a three-stage modelling study. The Lancet Planetary Health, 5(7), e415-e425, 2 doi:10.1016/S2542-5196(21)00081-4. 3
Zhao, T. and A. Dai, 2016: Uncertainties in historical changes and future projections of drought. Part II: model-4 simulated historical and future drought changes. Climatic Change, 144(3), 535-548, doi:10.1007/s10584-016-5 1742-x. 6
Zheng, X. et al., 2019: A review of greenhouse gas emission profiles, dynamics, and climate change mitigation efforts 7 across the key climate change players. Journal of Cleaner Production, 234, 1113-1133, 8 doi:https://doi.org/10.1016/j.jclepro.2019.06.140. 9
Zhou, L. et al., 2014: Widespread decline of Congo rainforest greenness in the past decade. Nature, 509(7498), 86-90, 10 doi:10.1038/nature13265. 11
Zhou, X., W. Ma, A. Renwick and G. Li, 2020: Off-farm work decisions of farm couples and land transfer choices in 12 rural China. Applied Economics, 52(57), 6229-6247, doi:10.1080/00036846.2020.1788709. 13
Ziervogel, G., J. Enqvist, L. Metelerkamp and J. van Breda, 2021: Supporting transformative climate adaptation: 14 community-level capacity building and knowledge co-creation in South Africa. Climate Policy, 1-16, 15 doi:10.1080/14693062.2020.1863180. 16
Ziervogel, G. and S. Parnell, 2014: Tackling barriers to climate change adaptation in South African coastal cities. In: 17 Adapting to Climate Change [Glavovic, B. C. and G. P. Smith (eds.)]. Springer, Dordrecht, pp. 57-73. ISBN 978-18 94-017-8630-0. 19
Zinngrebe, Y. et al., 2020: Agroforestry governance for operationalising the landscape approach: connecting 20 conservation and farming actors. Sustainability Science, 15(5), 1417-1434, doi:10.1007/s11625-020-00840-8. 21
Zinsstag, J., 2012: Convergence of EcoHealth and One Health. Ecohealth, 9(4), 371-373, doi:10.1007/s10393-013-22 0812-z. 23
Zittis, G., 2018: Observed rainfall trends and precipitation uncertainty in the vicinity of the Mediterranean, Middle East 24 and North Africa. Theoretical and Applied Climatology, 134(3), 1207-1230, doi:10.1007/s00704-017-2333-0. 25
Zografos, C., M. C. Goulden and G. Kallis, 2014: Sources of human insecurity in the face of hydro-climatic change. 26 Global Environmental Change, 29, 327-336, doi:https://doi.org/10.1016/j.gloenvcha.2013.11.002. 27
Zougmoré, R. et al., 2016: Toward climate-smart agriculture in West Africa: a review of climate change impacts, 28 adaptation strategies and policy developments for the livestock, fishery and crop production sectors. Agriculture 29 & Food Security, 5(1), 26, doi:10.1186/s40066-016-0075-3. 30
Zougmoré, R. B. et al., 2018: Facing climate variability in sub-Saharan Africa: analysis of climate-smart agriculture 31 opportunities to manage climate-related risks. Cahiers Agricultures (TSI), 27(3), 1-9, 32 doi:http://dx.doi.org/10.1051/cagri/2018019. 33
Zscheischler, J. et al., 2018: Future climate risk from compound events. Nature Climate Change, 8(6), 469-477, 34 doi:10.1038/s41558-018-0156-3. 35
Zubkova, M., L. Boschetti, J. T. Abatzoglou and L. Giglio, 2019: Changes in Fire Activity in Africa from 2002 to 2016 36 and Their Potential Drivers. Geophysical Research Letters, 46(13), 7643-7653, doi:10.1029/2019GL083469. 37
Zuma-Netshiukhwi, G., K. Stigter and S. Walker, 2013: Use of traditional weather/climate knowledge by farmers in the 38 South-western Free State of South Africa: Agrometeorological learning by scientists. Atmosphere, 4(4), 383-410, 39 doi:https://doi.org/10.3390/atmos4040383. 40
Zvobgo, L. and P. Do, 2020: COVID-19 and the call for ‘Safe Hands’: Challenges facing the under-resourced 41 municipalities that lack potable water access - A case study of Chitungwiza municipality, Zimbabwe. Water 42 Research X, 9, 100074, doi:https://doi.org/10.1016/j.wroa.2020.100074. 43
44 45
ACCEPTED VERSIO
N
SUBJECT TO FIN
AL EDITS