
10 Dellwig GCA accepted
41
Accepted Manuscript A new particulate Mn-Fe-P-shuttle at the redoxcline of anoxic basins Olaf Dellwig, Thomas Leipe, Christian März, Michael Glockzin, Falk Pollehne, Bernhard Schnetger, Evgeniy V. Yakushev, Michael E. Böttcher, Hans-Jürgen Brumsack PII: S0016-7037(10)00530-2 DOI: 10.1016/j.gca.2010.09.017 Reference: GCA 6929 To appear in: Geochimica et Cosmochimica Acta Received Date: 8 March 2010 Accepted Date: 13 September 2010 Please cite this article as: Dellwig, O., Leipe, T., März, C., Glockzin, M., Pollehne, F., Schnetger, B., Yakushev, E.V., Böttcher, M.E., Brumsack, H-J., A new particulate Mn-Fe-P-shuttle at the redoxcline of anoxic basins, Geochimica et Cosmochimica Acta (2010), doi: 10.1016/j.gca.2010.09.017 This is a PDF file of an unedited manuscript that has been accepted for publication. As a service to our customers we are providing this early version of the manuscript. The manuscript will undergo copyediting, typesetting, and review of the resulting proof before it is published in its final form. Please note that during the production process errors may be discovered which could affect the content, and all legal disclaimers that apply to the journal pertain.
-
Upload
independent -
Category
Documents
-
view
2 -
download
0
Transcript of 10 Dellwig GCA accepted
Accepted Manuscript
A new particulate Mn-Fe-P-shuttle at the redoxcline of anoxic basins
Olaf Dellwig, Thomas Leipe, Christian März, Michael Glockzin, Falk Pollehne,
Bernhard Schnetger, Evgeniy V. Yakushev, Michael E. Böttcher, Hans-Jürgen
Brumsack
PII: S0016-7037(10)00530-2
DOI: 10.1016/j.gca.2010.09.017
Reference: GCA 6929
To appear in: Geochimica et Cosmochimica Acta
Received Date: 8 March 2010
Accepted Date: 13 September 2010
Please cite this article as: Dellwig, O., Leipe, T., März, C., Glockzin, M., Pollehne, F., Schnetger, B., Yakushev,
E.V., Böttcher, M.E., Brumsack, H-J., A new particulate Mn-Fe-P-shuttle at the redoxcline of anoxic basins,
Geochimica et Cosmochimica Acta (2010), doi: 10.1016/j.gca.2010.09.017
This is a PDF file of an unedited manuscript that has been accepted for publication. As a service to our customers
we are providing this early version of the manuscript. The manuscript will undergo copyediting, typesetting, and
review of the resulting proof before it is published in its final form. Please note that during the production process
errors may be discovered which could affect the content, and all legal disclaimers that apply to the journal pertain.

1
A new particulate Mn-Fe-P-shuttle at the redoxcline of anoxic basins 1
2
Revised manuscript (September 4th 2010) for publication 3
in “Geochimica et Cosmochimica Acta” by 4
5
Olaf Dellwiga,*, Thomas Leipea, Christian Märzb, Michael Glockzina, Falk Pollehnea, 6
Bernhard Schnetgerb, Evgeniy V. Yakushevc, Michael E. Böttchera, Hans-Jürgen Brumsackb 7
8
a Leibniz Institute for Baltic Sea Research, IOW, 18119 Rostock, Germany 9
b Institute for Chemistry and Biology of the Marine Environment, ICBM, University of 10
Oldenburg, 26111 Oldenburg, Germany 11
c Norwegian Institute for Water Research, NIVA, 0349 Oslo, Norway 12
13
14
15
Abstract 16
Pelagic redoxclines of anoxic basins and deeps form the suboxic transition between 17
oxygenated surface and anoxic or even sulfidic bottom waters. Intense element cycling, 18
favoured by elevated microbial activity, causes steep gradients of physico-chemical 19
parameters, nutrients and redox-sensitive trace metals. This study presents a conceptual model 20
for authigenic particle formation at pelagic redoxclines, which is based on the tight coupling 21
of Mn, Fe, and P cycles. Besides the well-known occurrence of Mn-oxides, textural (SEM-22
EDX) and geochemical (ICP-OES, ICP-MS) analyses of particles from the redoxclines of the 23
* Corresponding author. Tel.: +49(0)381-5197-437. E-mail address: [email protected]

2
Black Sea and the Baltic Sea (Gotland Basin, Landsort Deep) evidence the existence of earlier 24
postulated Fe-oxyhydroxo-phosphates and emphasize mixed phases consisting of Mn-oxides 25
and Fe-oxyhydroxo-phosphates as a new solid species. Most of the analyzed particles are star-26
shaped, of about 5 µm in size, and occur as single particles or aggregates without any 27
morphological differences between Mn-oxides, Fe-oxyhydroxo-phosphates, and mixed 28
phases. Throughout the redoxcline, these minerals show a general succession with maximum 29
abundance of Mn-oxides above the redoxcline followed by mixed phases and almost pure Fe-30
phosphates within and below the redoxcline, respectively. Molar Fe/P ratios of single particles 31
argue against the formation of known pure Fe-phosphates like vivianite or strengite at the 32
lower end of the redox transition zone, but are consistent with recent experimental findings 33
for colloidal P-bearing hydrous ferric oxides. Moreover, morphological similarities suggest 34
the formation of irregular Fe-oxyhydroxo coatings due to oxidation of upward diffusing Fe2+ 35
by oxygen and stepwise replacement of Mn(IV) by Fe(III) on sinking MnOx particles 36
followed by immediate adsorption or even co-precipitation of phosphate. Batch-type 37
experiments using biogenic MnOx particles demonstrate the efficient potential of Fe2+ 38
oxidation by sinking MnOx particles. When entering sulfidic waters MnOx particles are 39
progressively reduced leading to an increasing relative abundance of Fe- and P-rich particles. 40
In deeper parts of the water column these particles are also reductively dissolved, thereby 41
releasing Fe2+ and phosphate to the water column. This Mn-Fe-P-shuttle likely affects 42
phosphate transport throughout the water column and thus impacts primary production at least 43
over longer time scales. Furthermore, the particulate Mn-Fe-P-shuttle must have played an 44
important role for the cycling of P and certain trace metals in ancient ocean basins, e.g., 45
during certain periods of Cretaceous black shale formation and should be considered in future 46
mass balances and modelling approaches dealing with oxic/anoxic interfaces of aquatic 47
ecosystems. 48
49

3
1. INTRODUCTION 50
Phosphorus is an essential macronutrient and limits phytoplankton growth in the ocean at 51
least over longer time scales, thereby regulating modern and ancient atmospheric CO2-O2 52
equilibria (e.g. Van Cappellen and Ingall, 1996; Tyrrell, 1999). More intensive oceanic 53
phosphorus recycling and sedimentary reflux under anoxic conditions supposedly plays a key 54
role in this system, as riverine input of phosphorus alone is insufficient to sustain 55
phytoplankton demands (Ingall et al., 2005). Therefore, vertical transport of released 56
phosphate towards surface waters is an important driver of primary production. 57
A typical property of stratified water columns in anoxic basins are redoxclines, i.e., 58
suboxic transition zones separating oxygenated surface waters from anoxic or even sulfidic 59
(euxinic) deep waters. Such redoxclines are characterized by steep gradients of physico-60
chemical properties, nutrients, metabolites, and redox-sensitive trace metals caused by intense 61
element cycling and elevated microbial activity (e.g. Dyrssen and Kremling, 1991; Neretin et 62
al., 2003; Tebo et al., 2004; Taylor et al., 2001; Yakushev et al., 2007). Hence, transfer 63
processes between the dissolved and particulate phase are of particular interest to understand 64
transport modes within elemental cycles. A well known example is the so-called “Manganese-65
pump”, which is driven by bacterial oxidation of upward diffusing Mn2+ and re-dissolution of 66
MnOx particles in sulfidic waters (e.g. Burdige and Nealson, 1986; de Lange et al, 1990; 67
Huckriede and Meischner, 1996; Neretin et al., 2003). A similar cycle is also valid for Fe, 68
albeit with dissolved oxygen as oxidant, and has been intensively studied in the field and 69
laboratory (e.g. Davison et al., 1982; Millero et al., 1987; Buffle et al., 1989). Using birnessite 70
suspensions in solutions with different pH values, Postma (1985) demonstrated 71
experimentally that Mn-oxides can be important and fast oxidants for dissolved Fe2+, as well. 72
At pelagic redoxclines of anoxic basins dissolved phosphate reveals a vertical distribution 73
contrasting to a simple diffusion-like pattern and release from decomposition of organic 74
matter, respectively. Moreover, phosphate shows distinct intervals of depletion and 75

4
enrichment called the “phosphate dipole” (Yakushev et al., 2007). In a previous model, 76
Shaffer (1986) explained these anomalies for the Black Sea by postulating Fe-oxyhydroxo 77
and Mn-oxyhydroxo particles, which adsorb phosphate at the redoxcline. Since the early work 78
of Einsele (1938) the relation between Fe and phosphate was investigated by many scientists 79
and the formation of Fe-oxyhydroxo-phosphates due to adsorption and even co-precipitation 80
of phosphate was evidenced in many laboratory experiments and field studies of limnic and 81
marine sediments, hydrothermal systems, anoxic brines, stratified lakes and rivers (e.g. 82
Berner, 1973; Tessenow, 1974; Trefry et al., 1984; Buffle et al., 1989; Fox, 1993; Slomp et 83
al., 1996; Gunnars et al., 2002; Hyacinthe and Van Cappellen, 2004; Poulton and Canfield, 84
2006). However, field studies dealing with the formation of Fe-oxyhydroxo-phosphates in the 85
water column of anoxic basins are comparatively rare and often restricted to sporadic findings 86
(Bernard et al., 1989; Ingri et al., 1991; Leipe et al, 1996). 87
This communication focuses on the formation of Fe- and P-rich particles and their 88
potential relation to the Mn-cycle within the water column of anoxic deeps from the Baltic 89
and Black Seas. Geochemical analyses of the particulate phases and measurements of 90
dissolved elements (Fe, Mn, and phosphate) are complemented by SEM-EDX inspection of 91
solid particles. Our data reveal additional new insights into the formation of ‘Fe-oxyhydroxo-92
phosphates’ and emphasise a tight coupling of the Mn, Fe, and P cycles resulting in a new 93
conceptual model for authigenic particle formation at pelagic redoxclines. Recently, model 94
calculations by Tsandev and Slomp (2009) underlined the importance of P availability for 95
triggering past Oceanic Anoxic Events. In line with these results, the conceptual model 96
presented in this study is further applied to processes in ancient anoxic systems. 97
98
2. MATERIAL AND METHODS 99
2.1. Study area 100

5
This work is based on data from the following cruises: R/V “Professor Albrecht Penck” 101
(40PE/06/16, July 2006; 07PE/07/08, April 2007) in the Baltic Sea and R/V “Meteor” (M72-102
5, June 2007) in the Black Sea (Fig 1). 103
In the Baltic Sea, which represents one of the largest brackish water bodies in the world, 104
sampling was done in the Gotland Basin (57°35´N, 20°03´E; water depth 241 m) and in the 105
Landsort Deep (58°35´N, 18°14´E; water depth 456 m) during both cruises. The Gotland 106
Deep (max. depth 249 m) forms the deepest part of the eastern Gotland Basin, which 107
represents the basin with the largest average water depth in the Baltic. In contrast, the 108
Landsort Deep, which is the deepest site of the Baltic Proper (max. water depth 459 m), is 109
characterized by a comparatively small spatial extent. Currently, the water bodies of both 110
deeps are well stratified with a permanent pycnocline between 60 and 80 m depth. Water 111
samples were obtained using a CTD-bottle-rosette during the cruises in the Baltic Sea in 2006 112
and 2007 whereas a PUMP-CTD (Strady et al., 2008) was used in the Black Sea 2007. The 113
PUMP-CTD system is a modification of a previously developed system by Friedrich et al. 114
(1988). It enables profiling CTD measurement, besides O2, pH, fluorescence, and turbidity in 115
combination with continuous water sampling throughout the water column down to 350 m 116
water depth. Water is pumped through nylon tubing at a rate of about 2 L min-1 directly into 117
the ship-board laboratory. From the Black Sea cruise two PUMP-CTD casts were chosen for 118
this communication: 21-PCTD5, 42°45´N, 37°30´E, 2132 m and 27-PCTD4, 42°24´N, 119
36°16´E, 1920 m. These stations are located in the SE part of the Black Sea, an area without 120
any significant riverine input. 121
122
2.2. Particle microanalyses using SEM-EDX 123
On average 1 to 2 L of seawater were filtered through pre-weighed Millipore Isopore 124
membrane filters (0.4 µm polycarbonate PC) for SEM-EDX investigations and multi-element 125

6
analyses, respectively. Possible oxidation artefacts were excluded by parallel filtration of 126
selected samples under oxic and anoxic (inert atmosphere) conditions. 127
Scanning electron microscopy (SEM) and energy dispersive X-ray micro-analyses (EDX) 128
were performed on a FEI Quanta 400 microscope connected to an EDAX-Genesis system. 129
About 1 cm2 of PC filters was glued on Al stubs and covered by pure carbon (vacuum 130
sputtered) to assure electric conductivity. Measurement parameters of the microscope system 131
during analyses were: high vacuum; 15 kV electron beam; working distance: 10 mm; SE and 132
BSE detector; variable enlargement. The x-ray microanalyses were done by spot analyses on 133
selected particles taking EDX-spectra (EDAX-Econ 4 detector), identification and 134
quantification of the elements after ZAF-correction. Peak overlapping (e.g. Mn kβ and Fe kα 135
lines at 6.4 to 6.5 keV) was solved by holographic peak deconvolution (HPD). 136
Besides manual single particle analyses the system provides the opportunity of automated 137
particle analyses. The method is based on image processing, particle recognition and element 138
analyses of the particles on a series of different fields of the sample. On average 2000 single 139
particles of each sample were analyzed by this method. The resulting data set was processed 140
for mineral (or particle group) identification and quantification (counting). Minerals and 141
particle groups are defined by “border values” of the proven elements and calculated element 142
concentrations (or ratios). Analyses of standard mineral samples were used to verify this 143
method (Leipe et al., 1999). 144
145
2.3. Geochemical analyses 146
Samples for analysis of dissolved metals in seawater were taken with pre-cleaned PE-147
syringes and 0.45 µm SFCA syringe filters directly from CTD-bottle-rosette and PUMP-CTD 148
(Strady et al., 2008) and acidified to 1 vol.% HNO3 in pre-cleaned PE-bottles. 149
For analysis of suspended matter, PC filters were decomposed with 1 mL HClO4 in open 150
PTFE autoclaves. Residues were digested in the same closed vessels at 180°C after adding 2 151

7
mL concentrated HF. After digestion acids were evaporated at 180°C, residues were re-152
dissolved and fumed off three times with 1 mL semi-concentrated HCl and diluted with 2 153
vol.% HNO3 to a final volume of 5 mL. All acids used were of suprapure quality. 154
Particulate major elements (Fe, P, Mn), trace metals (As, Mo, V) and dissolved P were 155
analyzed by ICP-OES (Perkin Elmer Optima 3000XL; Thermo Scientific iCAP 6300Duo). 156
Particulate Cd, Sb, and U as well as dissolved Fe and Mn were measured by ICP-MS (Thermo 157
Scientific ELEMENT II). Parallel measurements of selected samples by spectrophotometry 158
(Grasshoff et al., 1983) revealed almost similar results (r2=0.97; standard deviation 0.06 µM) 159
indicating the reliability of ICP-OES for analyses of phosphate. Precision (1σ) and accuracy 160
of all measurements were checked by parallel analysis of international and in-house reference 161
materials (precision and accuracy were ≤7.4% and ≤4.3% for major elements and ≤6.8% and 162
≤10.7% for trace metals). During the cruises in the Baltic Sea, O2 and H2S were determined 163
onboard ship (Grasshoff et al., 1983). In the Black Sea, 2 mL seawater were fixed with 50 µL 164
of a 5 vol.% Zn-acetate solution for the subsequent spectrophotometric analysis of H2S 165
(Cline, 1969) using a Spekol 1100 (Analytik Jena) spectrophotometer. O2 data originate from 166
PUMP-CTD casts. 167
168
2.4. Laboratory experiments 169
Three batch-type experiments as well as one control run were carried out in a dark cold 170
room (8-10 °C) in order to investigate the importance of MnOx particles as a potential fast 171
oxidant for dissolved Fe2+. A gas tight reaction vessel was filled with 300 mL of Atlantic 172
seawater (OSIL) diluted to a salinity of 12 with deionised water, thus reflecting the salinity at 173
the redoxcline of the Gotland Basin. The vessel was equipped with four ports enabling the 174
inlet of Ar gas via a tube, the measurement of oxygen, temperature, and pH (Oxi 330I, pH 175
330I; WTW), and sampling of solution aliquots. The solution was permanently stirred to 176
prevent agglomeration of suspended particles. 177

8
In the control run, 2.5 mg iron(II) sulphate was directly transferred into the anoxic reaction 178
cell and the solution was stirred for 150 min under continuous Ar gas flow through the 179
solution. During the experiment six samples were taken every 30 min which showed no loss 180
of dissolved Fe. Therefore, anoxic conditions are assured and possible oxidation artefacts can 181
be excluded, respectively. 182
In experiment A the oxygen concentration was kept at around 25 µM (range 23.1-26.3 µM] 183
by adjusting the bubbling rate with Ar gas. Fe(II) sulphate (7 mg) was added directly and the 184
solution was stirred for 195 min. Experiments B (duration 260 min) and C (duration 220 min) 185
were carried out under oxygen-free conditions and biogenic MnOx particles were used (run B 186
ca 0.4 mg; run C ca 0.2 mg; synthezised by reaction of spores of Bacillus sp. strain SG-1 with 187
100 µM Mn2+; Tebo et al., 2004). The number of MnOx particles was determined by using a 188
Beckman Coulter Multisizer TA II (Beckham Coulter GmbH; Sheldon, 1967) revealed about 189
6x10⁴ particles mL-1 for run B and 2.3x10⁴ particles mL-1 for run C. The average grain sizes 190
of particles were 3.2 µm (run B) and 3.7 µm (run C) ranging between 2 and 9 µm in both 191
runs. While run B was carried out only with Fe(II) sulphate (6 mg), run C (4 mg Fe(II) 192
sulphate) also contained potassium-dihydrogenphosphate (4 mg) as phosphate source. 193
Temperatures showed only minor variations during all experiments (8.9-10.5°C), and pH 194
values varied between 7.4 and 8.4. Such pH range is slightly above the natural level, however 195
is in fair agreement with the typical pH ranges across the redoxcline of the Gotland Basin 196
(pH: 7.1-7.8). Water samples (1 mL) for analysis of dissolved Mn, Fe, and P by ICP-OES 197
were taken every few minutes in the initial phase and every 30 to 45 min in the later stages of 198
the experiments. Samples (5 ml) for SEM-EDX were taken during run B at the beginning, 199
after 60 min and at the end of the run while for run C samples were retrieved after 30 min, 60 200
min, and the end of the run. 201
202
3. RESULTS AND DISCUSSION 203

9
3.1. Formation and fate of the Mn-Fe-P-shuttle 204
In two anoxic deeps of the central Baltic Sea (Gotland Basin GB, Landsort Deep LD) and 205
in the SE Black Sea we detected a new solid phase around the pelagic redoxclines, i.e. the 206
suboxic zone separating oxygenated waters from anoxic or even sulfidic conditions. Besides 207
well known Mn-oxides (Fig. 2 a) and iron-oxyhydroxo-phosphates (Figs. 2 e, f), which were 208
earlier postulated by Shaffer (1986), the occurrence of a transitional phase with variable 209
contents of Mn, Fe, and P (Figs. 2 b-d) was evidenced by SEM-EDX. These types of particles 210
will in the following be referred to as “MnOx”, “FeOOH-PO4”, and “MnOx-FeOOH-PO4” 211
phases. The results of SEM-EDX analyses of individual particles are summarised in Table 1. 212
SEM photographs shown in Figure 2 provide a representative overview about the 213
morphologies of Mn-, Fe-, and P-rich particles from the investigated sites in the Baltic and 214
Black Seas. The chosen depths represent samples above, within, and below the redoxcline. 215
Most of these particles reveal a branching vermicular morphology similar in structure to those 216
MnOx particles reported by Bernard et al. (1989) and Neretin et al. (2003), which will be 217
referred to as star-shaped structure in this work. Additionally, more globular structures were 218
observed especially in the samples from the Black Sea (Figs. 2b and d), which were also 219
reported by Schippers et al. (2005). Surprisingly, all three types of particles (MnOx, MnOx-220
FeOOH-PO4, FeOOH-PO4) exhibit the same star-shaped or globular texture, thus indicating a 221
tightly coupled mode of formation. 222
The star-shaped particles occur as single particles of about 5 µm in size (e.g. Fig. 2 a) but 223
also form larger aggregates (Fig. 2 b). Particles from deeper parts of the water column are 224
highly subjected to dissolution as seen in the almost pure FeOOH-PO4 particles from the 225
Gotland Basin (Fig. 2 f). In addition to the star-shaped structure, the occurrence of more 226
globular minerals was observed especially in samples from the Black Sea (Figs. 2 b, d). This 227
globular structure also consists of more or less pure MnOx and mixed MnOx-“FeOOH-PO4” 228
phases. In accordance with Neretin et al. (2003) no differences in the major chemical 229

10
composition of globular and star-shaped particles were found. Generally, the concentration of 230
detrital elements like Al, Ca, Mg, and Si is comparatively low for the investigated particles 231
(Table 1). Again, the different mineral phases and structures reveal no systematic differences 232
in these constituents. A few exceptions are observed in the centre of star-shaped MnOx 233
particles which partly contain elevated amounts of Si (max. 7.6%), probably reflecting 234
frustule fragments or detrital material which may have acted as a nucleus (Buffle et al., 1989). 235
Additionally, Si contents may also result from adsorption and /or co-precipitation of silica as 236
reported by Hartmann (1985) for anoxic brines of the Red Sea. These data from the water 237
column of the Atlantis-II Deep revealed a strong relation between Mn, Fe, and Si likely 238
initiated by extremely high silica levels (max. ca. 1 mM) exceeding the levels of this study by 239
factors of 50 to 100. Thus, Si contents of particles from the Black and Baltic Seas range only 240
between 1.1% and 1.8% with a higher affinity of phosphate towards solid Fe phases as seen in 241
increasing P/Si ratios (Table 1). 242
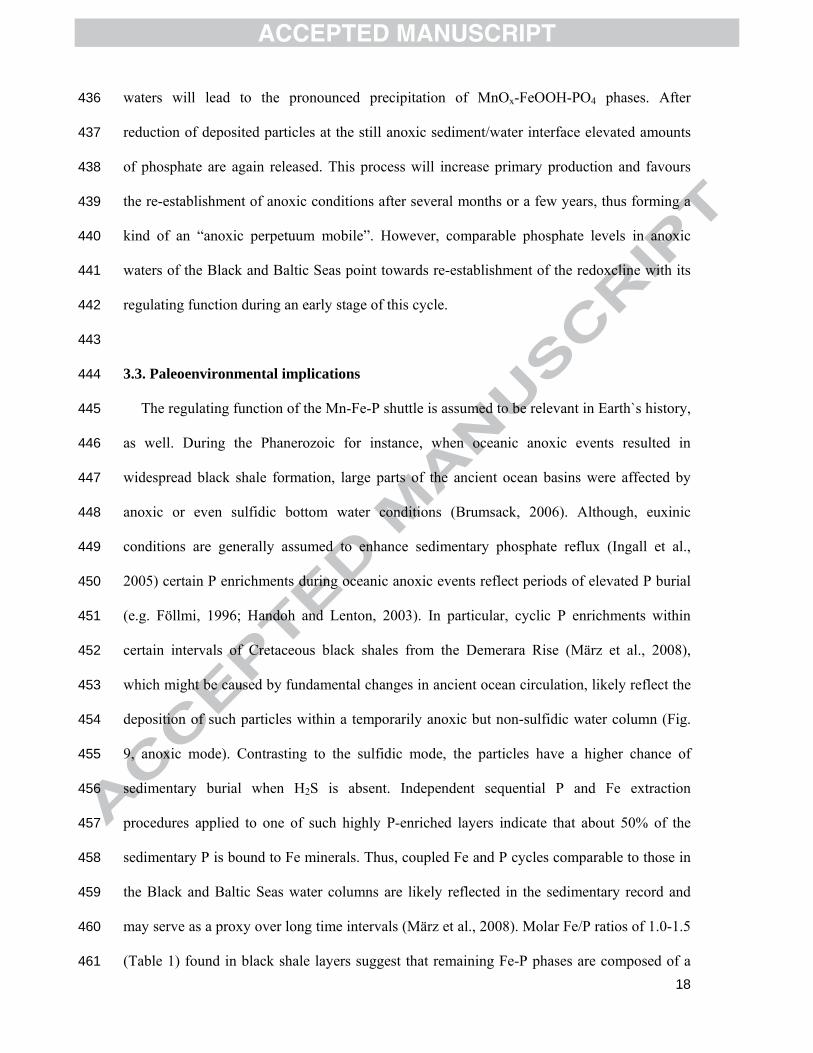
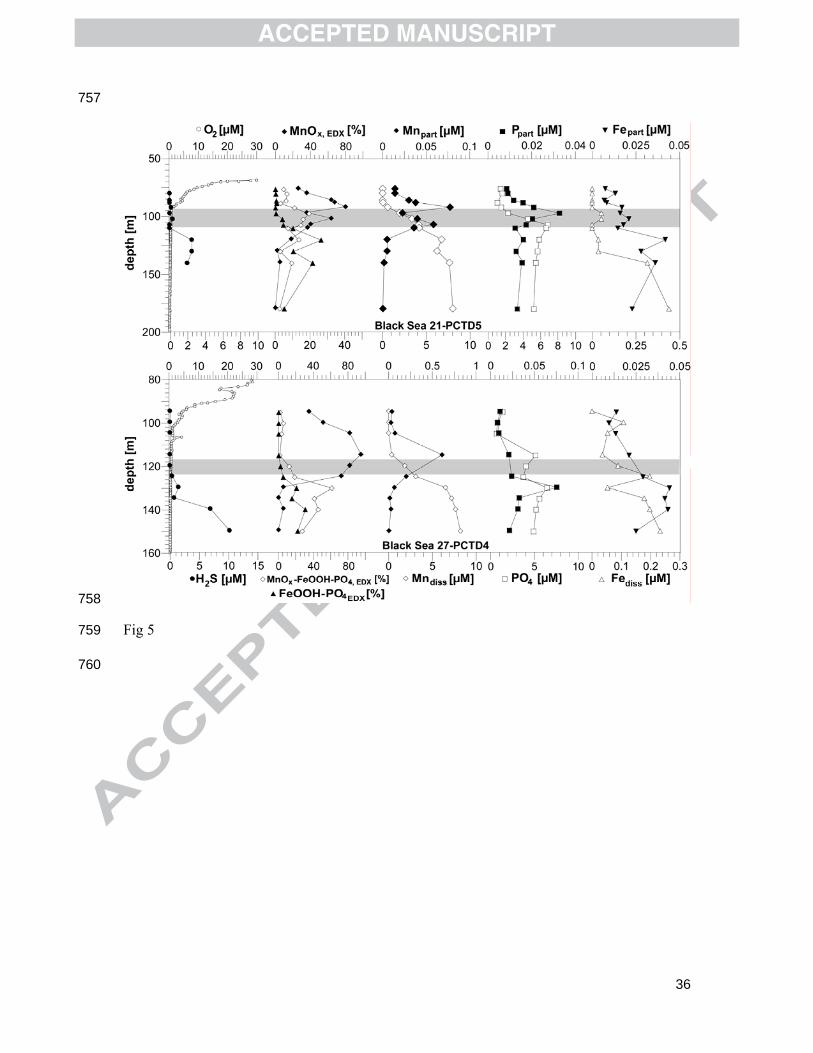
The vertical distribution of relative particle abundances along with selected geochemical 243
parameters from the Baltic and Black Seas are shown in Figs. 3-5. The profiles of SEM-EDX 244
analyses reflect the relative abundance of MnOx and FeOOH-PO4 particles as well as mixed 245
MnOx-FeOOH-PO4 phases normalised to the total amount of particles. The redoxcline, i.e. the 246
zone where O2 and H2S fall below the detection limit of our methods, is indicated by gray 247
bars. The extent of this zone is variable and ranges from about 4 m in the Landsort Deep in 248
2006 to app. 15 m in the Black Sea at site 21. The profiles show a pronounced variability, 249
however, a general succession of the aforementioned particles can be inferred. Thus, maxima 250
of MnOx are generally observed above and in the upper part of the redoxcline where oxygen 251
is still present followed by an increasing abundance of MnOx-FeOOH-PO4. These mixed 252
phases show their highest abundance slightly below the maximum occurrence of MnOx. 253
Almost pure FeOOH-PO4 phases increase below the maxima of the aforementioned solids and 254
reach values of almost 60% in the Gotland Deep in 2007 distinctly below the redoxcline. This 255
11
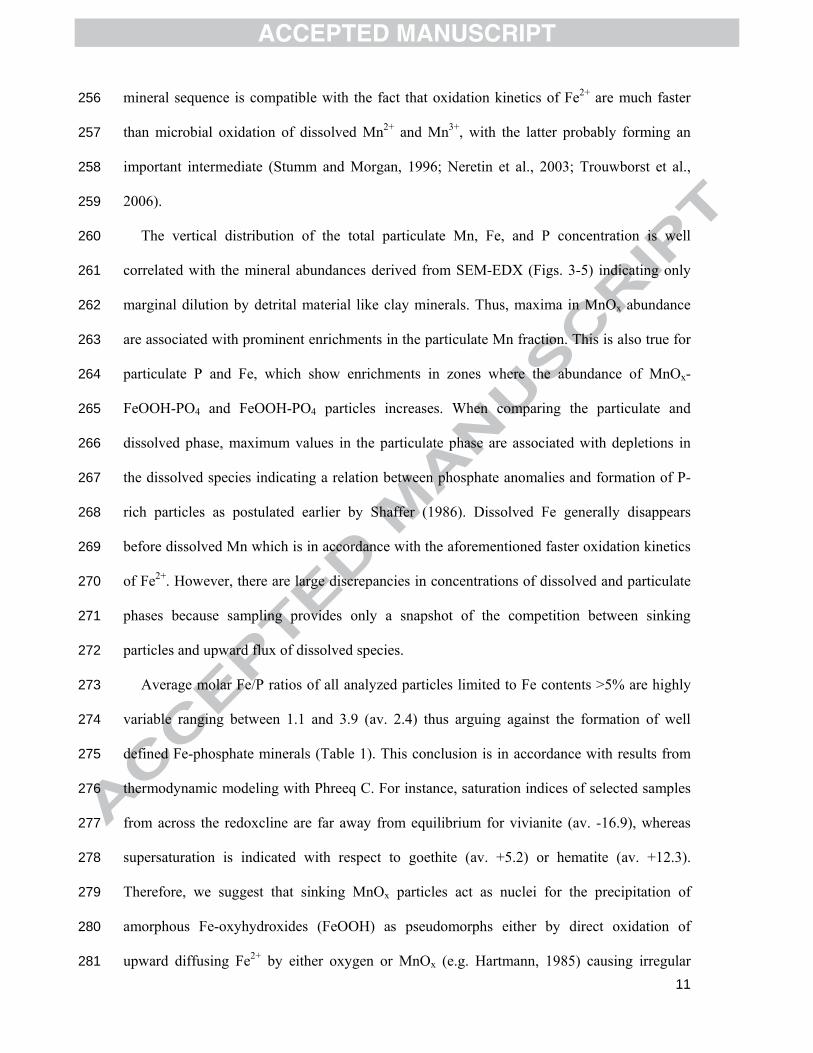
mineral sequence is compatible with the fact that oxidation kinetics of Fe2+ are much faster 256
than microbial oxidation of dissolved Mn2+ and Mn3+, with the latter probably forming an 257
important intermediate (Stumm and Morgan, 1996; Neretin et al., 2003; Trouwborst et al., 258
2006). 259
The vertical distribution of the total particulate Mn, Fe, and P concentration is well 260
correlated with the mineral abundances derived from SEM-EDX (Figs. 3-5) indicating only 261
marginal dilution by detrital material like clay minerals. Thus, maxima in MnOx abundance 262
are associated with prominent enrichments in the particulate Mn fraction. This is also true for 263
particulate P and Fe, which show enrichments in zones where the abundance of MnOx-264
FeOOH-PO4 and FeOOH-PO4 particles increases. When comparing the particulate and 265
dissolved phase, maximum values in the particulate phase are associated with depletions in 266
the dissolved species indicating a relation between phosphate anomalies and formation of P-267
rich particles as postulated earlier by Shaffer (1986). Dissolved Fe generally disappears 268
before dissolved Mn which is in accordance with the aforementioned faster oxidation kinetics 269
of Fe2+. However, there are large discrepancies in concentrations of dissolved and particulate 270
phases because sampling provides only a snapshot of the competition between sinking 271
particles and upward flux of dissolved species. 272
Average molar Fe/P ratios of all analyzed particles limited to Fe contents >5% are highly 273
variable ranging between 1.1 and 3.9 (av. 2.4) thus arguing against the formation of well 274
defined Fe-phosphate minerals (Table 1). This conclusion is in accordance with results from 275
thermodynamic modeling with Phreeq C. For instance, saturation indices of selected samples 276
from across the redoxcline are far away from equilibrium for vivianite (av. -16.9), whereas 277
supersaturation is indicated with respect to goethite (av. +5.2) or hematite (av. +12.3). 278
Therefore, we suggest that sinking MnOx particles act as nuclei for the precipitation of 279
amorphous Fe-oxyhydroxides (FeOOH) as pseudomorphs either by direct oxidation of 280
upward diffusing Fe2+ by either oxygen or MnOx (e.g. Hartmann, 1985) causing irregular 281

12
FeOOH coatings on MnOx particles. If Fe2+ is directly oxidized by MnOx, rather than by 282
oxygen or nitrate (e.g. van Cappellen and Wang, 1996; van der Zee et al., 2005), the textural 283
similarities may be explained by the stepwise replacement of Mn(IV) by Fe(III). A similar 284
process was proposed e.g. by Danielsson et al. (1980) and Hartmann (1985) for anoxic brines 285
of the Red Sea. Concomitant with the formation of solid Fe(III) phases, phosphate is adsorbed 286
or even co-precipitated (e.g. Berner, 1973; Slomp et al., 1996; Thibault et al., 2009) forming a 287
new solid phase. This contains variable amounts of Mn, Fe, and P (MnOx-FeOOH-PO4), and 288
preserves the morphology of original MnOx particles. It should be noted, however, that the 289
mean Fe/P ratios observed in the water column particulates (Table 1) are similar to the ratios 290
observed for colloidal P-bearing hydrous ferric oxides (Thibault et al., 2009). 291
To assess the relative importance of both oxidants oxygen and MnOx for oxidation of Fe2+ 292
batch-type experiments were carried out using biogenic MnOx particles (Fig. 6). Although, 293
the MnOx particles used do not possess the identical star-shaped structure of natural particles 294
sampled from the water column, SEM photographs also show a fractal structure as well as 295
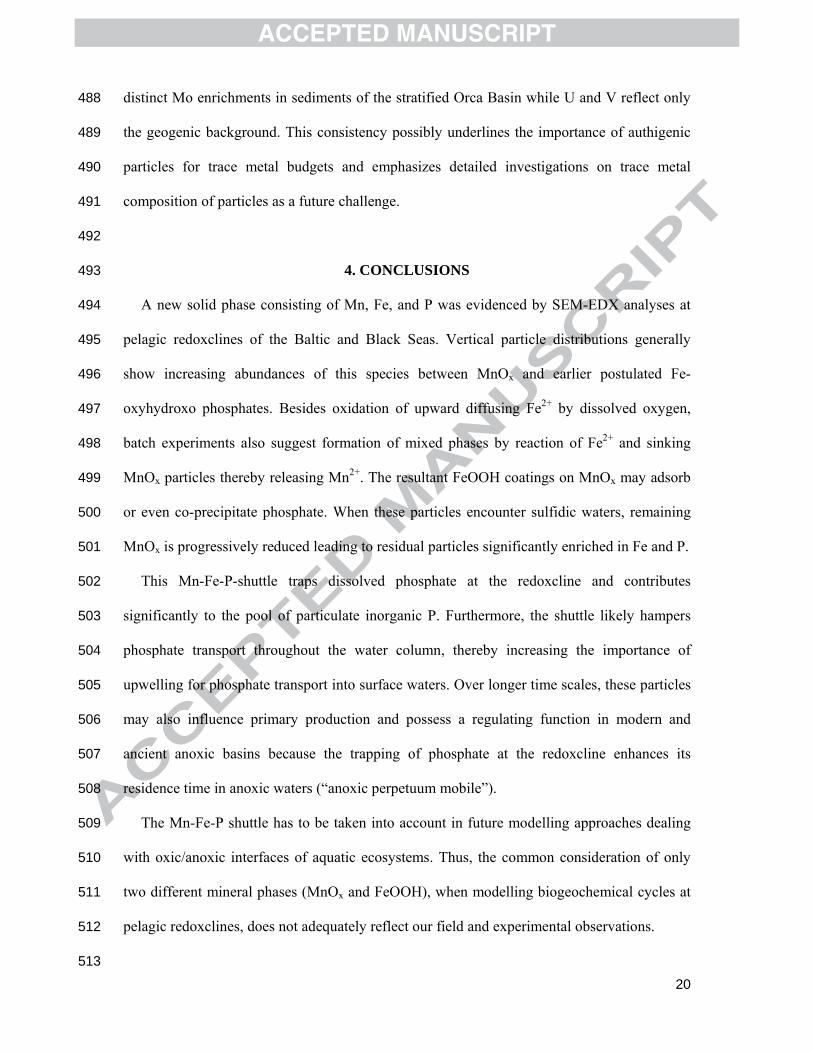
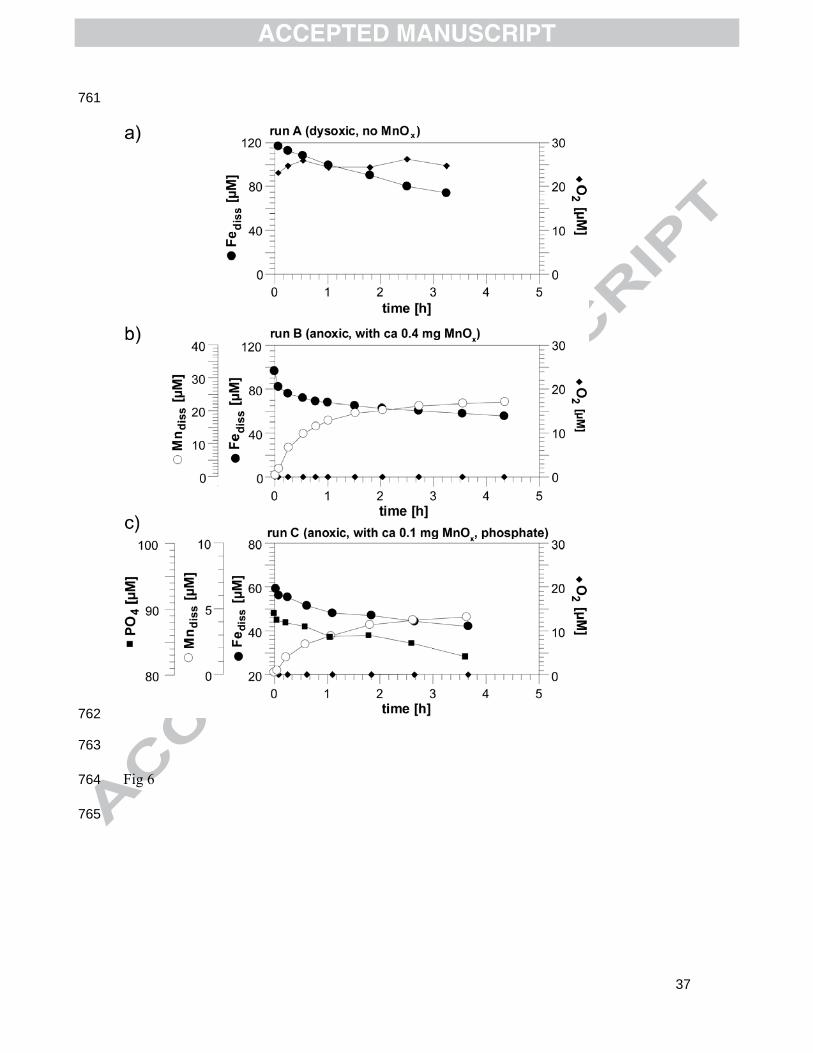
comparable sizes (Fig. 7a). Under dysoxic conditions (O2: ca 25 µM) run A shows an almost 296
linear decrease of Fediss during the experiment with an average loss of 13 µM h-1 (Fig. 6a). 297
This rate is slightly higher than in the anoxic run B containing biogenic MnOx particles with 298
an average loss rate of 10 µM h-1 (Fig. 6b). However, during the initial phase of run B a steep 299
but non-linear decrease of Fediss is apparent tending towards equilibrium until the end of the 300
experiment. Consequently, the pattern of Mndiss distinctly increases at the onset of the 301
experiment indicating a very fast reaction between MnOx and Fe2+, which is in accordance 302
with experiments carried out with Fe2+ and artificial birnessite by Postma (1985). After 4 303
hours, no significant changes in Fe and Mn concentrations were observed as the number of 304
MnOx particles and free reaction sites on mineral surfaces tends towards zero, respectively. 305
While the total loss in Fediss amounts to 43 µM, the gain in Mndiss reaches 25 µM, which is 306
almost compatible with the following stoichiometry: 307

13
MnO2 + 2 Fe2+ + 4 H2O => Mn2+ + 2 FeOOH + 2 H+ 308
As shown by Postma (1985) the stoichiometry of the reaction between MnOx and Fe2+ is 309
strongly pH dependent. While at pH <4 all reaction products remain in solution, precipitation 310
of FeOOH occurs only at pH levels >4. A pH dependence was also reported for the oxidation 311
of Fe2+ by oxygen (e.g. Roekens and van Grieken, 1983; Millero et al., 1987). Therefore, the 312
pH level of the present experiments is compatible with the precipitation of solid FeOOH on 313
the MnOx particles. SEM-EDX analyses clearly show a change from pure MnOx particles 314
towards mixed MnOx-FeOOH phases and even almost pure FeOOH phases containing only 315
minor amounts of Mn (Figs. 7b and c). This conclusion is supported by automated SEM-EDX 316
particle analysis at the end of run B where no remaining MnOx particles were identified when 317
compared with the onset of the experiment (87% of total particles). Moreover, the particle 318
composition after the experiment is dominated by mixed MnOx-FeOOH phases (85%) along 319
with a certain contribution of FeOOH (9%). 320
Going one step further, the addition of phosphate in run C suggests the formation of mixed 321
particles containing Mn, Fe, and P (Fig. 6c). Generally, the average loss of Fe is much smaller 322
(5 µM h-1) than in run B, which is apparently due to the lower amount of MnOx particles (see 323
section 2.4). Furthermore, a surface effect of phosphate lowering the reaction rates at the 324
solids` surfaces may also play a role. For instance, Yao and Millero (1993) reported a 325
significant inhibition of the oxidation of H2S by MnOx in the presence of phosphate. 326
Simultaneously decreasing concentrations of Fediss and dissolved phosphate imply the 327
formation of MnOx-FeOOH-PO4 and/or even almost pure FeOOH-PO4 phases which were 328
identified by SEM-EDX (Figs. 7d-f) and particle analysis reaching an abundance of almost 329
95% at the end of run C. Molar Fe/P ratios are on average 1.5 (range: 1.2-2.5; n=20), which is 330
distinctly lower when compared with the natural particles (Table 1). This difference is most 331
likely due to different concentration levels, element ratios and lacking complexation of 332
dissolved components in the experiments compared to the natural situation. Although, the 333
14
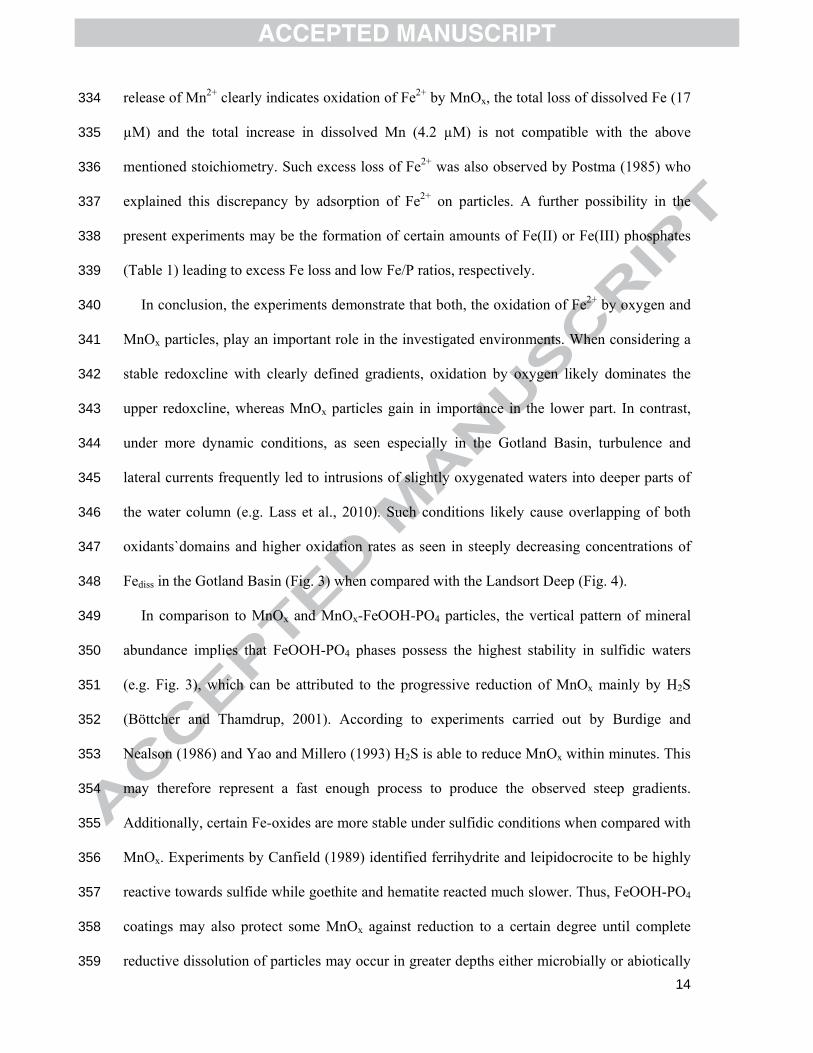
release of Mn2+ clearly indicates oxidation of Fe2+ by MnOx, the total loss of dissolved Fe (17 334
µM) and the total increase in dissolved Mn (4.2 µM) is not compatible with the above 335
mentioned stoichiometry. Such excess loss of Fe2+ was also observed by Postma (1985) who 336
explained this discrepancy by adsorption of Fe2+ on particles. A further possibility in the 337
present experiments may be the formation of certain amounts of Fe(II) or Fe(III) phosphates 338
(Table 1) leading to excess Fe loss and low Fe/P ratios, respectively. 339
In conclusion, the experiments demonstrate that both, the oxidation of Fe2+ by oxygen and 340
MnOx particles, play an important role in the investigated environments. When considering a 341
stable redoxcline with clearly defined gradients, oxidation by oxygen likely dominates the 342
upper redoxcline, whereas MnOx particles gain in importance in the lower part. In contrast, 343
under more dynamic conditions, as seen especially in the Gotland Basin, turbulence and 344
lateral currents frequently led to intrusions of slightly oxygenated waters into deeper parts of 345
the water column (e.g. Lass et al., 2010). Such conditions likely cause overlapping of both 346
oxidants`domains and higher oxidation rates as seen in steeply decreasing concentrations of 347
Fediss in the Gotland Basin (Fig. 3) when compared with the Landsort Deep (Fig. 4). 348
In comparison to MnOx and MnOx-FeOOH-PO4 particles, the vertical pattern of mineral 349
abundance implies that FeOOH-PO4 phases possess the highest stability in sulfidic waters 350
(e.g. Fig. 3), which can be attributed to the progressive reduction of MnOx mainly by H2S 351
(Böttcher and Thamdrup, 2001). According to experiments carried out by Burdige and 352
Nealson (1986) and Yao and Millero (1993) H2S is able to reduce MnOx within minutes. This 353
may therefore represent a fast enough process to produce the observed steep gradients. 354
Additionally, certain Fe-oxides are more stable under sulfidic conditions when compared with 355
MnOx. Experiments by Canfield (1989) identified ferrihydrite and leipidocrocite to be highly 356
reactive towards sulfide while goethite and hematite reacted much slower. Thus, FeOOH-PO4 357
coatings may also protect some MnOx against reduction to a certain degree until complete 358
reductive dissolution of particles may occur in greater depths either microbially or abiotically 359
15
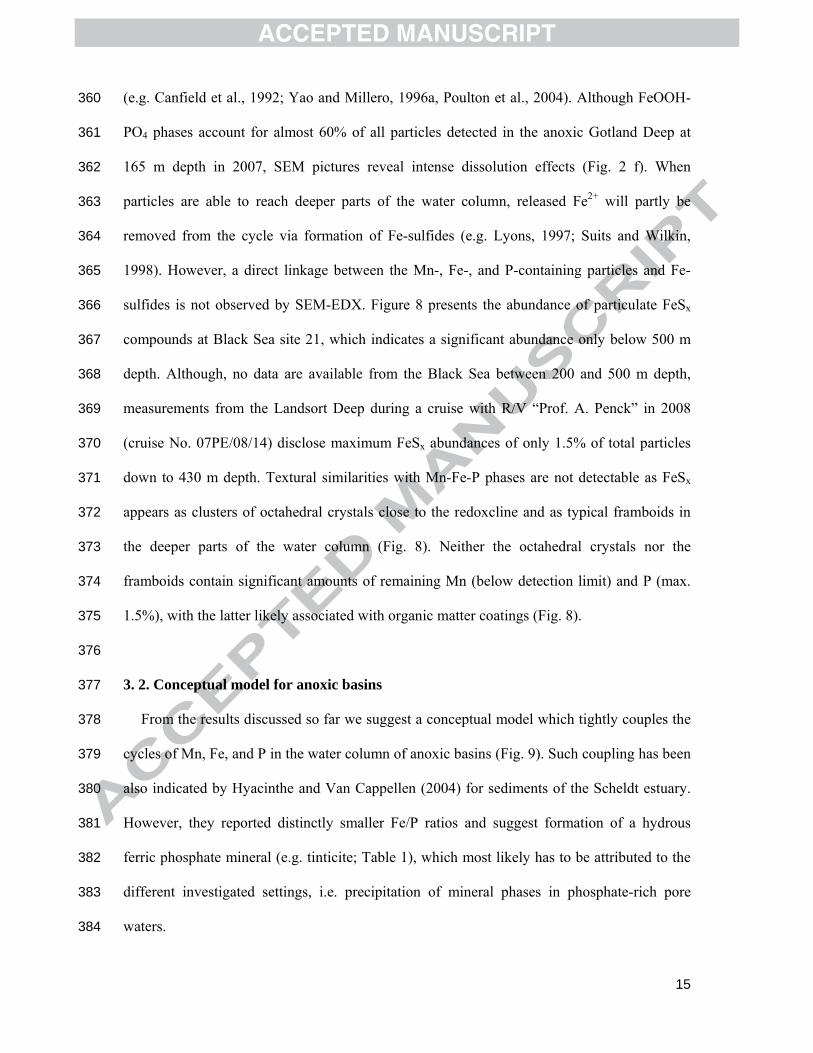
(e.g. Canfield et al., 1992; Yao and Millero, 1996a, Poulton et al., 2004). Although FeOOH-360
PO4 phases account for almost 60% of all particles detected in the anoxic Gotland Deep at 361
165 m depth in 2007, SEM pictures reveal intense dissolution effects (Fig. 2 f). When 362
particles are able to reach deeper parts of the water column, released Fe2+ will partly be 363
removed from the cycle via formation of Fe-sulfides (e.g. Lyons, 1997; Suits and Wilkin, 364
1998). However, a direct linkage between the Mn-, Fe-, and P-containing particles and Fe-365
sulfides is not observed by SEM-EDX. Figure 8 presents the abundance of particulate FeSx 366
compounds at Black Sea site 21, which indicates a significant abundance only below 500 m 367
depth. Although, no data are available from the Black Sea between 200 and 500 m depth, 368
measurements from the Landsort Deep during a cruise with R/V “Prof. A. Penck” in 2008 369
(cruise No. 07PE/08/14) disclose maximum FeSx abundances of only 1.5% of total particles 370
down to 430 m depth. Textural similarities with Mn-Fe-P phases are not detectable as FeSx 371
appears as clusters of octahedral crystals close to the redoxcline and as typical framboids in 372
the deeper parts of the water column (Fig. 8). Neither the octahedral crystals nor the 373
framboids contain significant amounts of remaining Mn (below detection limit) and P (max. 374
1.5%), with the latter likely associated with organic matter coatings (Fig. 8). 375
376
3. 2. Conceptual model for anoxic basins 377
From the results discussed so far we suggest a conceptual model which tightly couples the 378
cycles of Mn, Fe, and P in the water column of anoxic basins (Fig. 9). Such coupling has been 379
also indicated by Hyacinthe and Van Cappellen (2004) for sediments of the Scheldt estuary. 380
However, they reported distinctly smaller Fe/P ratios and suggest formation of a hydrous 381
ferric phosphate mineral (e.g. tinticite; Table 1), which most likely has to be attributed to the 382
different investigated settings, i.e. precipitation of mineral phases in phosphate-rich pore 383
waters. 384

16
Generally, the model is divided into two modes, a euxinic (left) and an anoxic non-sulfidic 385
(right) mode. Nevertheless, the initial point in both modes is the formation of MnOx particles 386
from upward diffusing Mn2+ released from the sediments and particles at depth. Once these 387
particles are formed they sink down, thereby acting as nuclei for precipitation of FeOOH 388
coatings resulting from oxidation of upward diffusing Fe2+ either by molecular oxygen or 389
MnOx. This Fe2+ originates from reduction of detrital Fe(III) compounds contributed by rivers 390
and aeolian input. Additionally, sedimentary reflux of Fe2+ is also feasible in the anoxic but 391
non-sulfidic mode as well as a contribution from oxic/suboxic shelf sediments (e.g. Wijsman 392
et al., 2001; Raiswell and Anderson, 2005; Lyons and Severmann, 2006). Simultaneously, 393
phosphate, which is preferentially released from the sediments under euxinic conditions as 394
indicated by the bold arrow in Figure 9 (Ingall et al., 2005), adsorbs on and/or even co-395
precipitates with FeOOH. Although, Yao and Millero (1996b) suggested Mn-oxides as 396
possible adsorbents for phosphate in natural waters, the MnOx particles of this study contain 397
only small amounts of P when compared with the Fe-containing phases (Fig. 2a, Table 1). 398
Therefore, the affinity of phosphate towards FeOOH appears to be much higher in this 399
environment than towards MnOx. This difference is possibly due to negative surface charges 400
of MnOx, which hamper adsorption of anions (e.g. Murray, 1974). On the other hand, the 401
content of phosphate adsorbed on the surface of MnOx is possibly underestimated by SEM-402
EDX measurements as the electron beam penetrates the particles to a depth of app. 1-2 µm. 403
During oxidation of Fe2+ by MnOx dissolved Mn2+ is released as seen especially in the 404
profile of the Gotland Basin in 2006 (Fig. 3). Regarding the remaining profiles in Figures 3 to 405
5 an immediate release of Mn2+ is possibly retarded by re-adsorption on MnOx-FeOOH-PO4 406
phases thereby contributing to the solid phase content (e.g. van der Zee et al., 2001). 407
Morphological similarities clearly indicate the mixed phases as a geochemically variable 408
transitional phase between almost pure MnOx and FeOOH-PO4 phases. Thus, phosphate is 409

17
transferred into the particulate pool within the redoxcline likely producing dissolved 410
phosphate anomalies seen in vertical profiles of Figures 3 to 5. 411
Such P-rich particles may also contribute significantly to the particulate inorganic P (PIP) 412
observed for instance in sediment traps from the Cariaco Basin (Benitez-Nelson et al., 2004, 413
2007). The authors identified PIP as a major component of the total particulate P reaching 414
maximum values in a sediment trap close to the redoxcline. In deeper waters this PIP 415
significantly decreases and shows no relation to the particulate organic P pool. Therefore, the 416
authors concluded that PIP forms an important source for dissolved P in the Cariaco Basin 417
whereas the origin of this PIP remained enigmatic. Considering a significant contribution of 418
the redoxcline-derived Mn-Fe-P-shuttle to the PIP pool, these particles would explain the high 419
PIP abundance close to the redoxcline as well as the decreasing amount of PIP with 420
increasing water depth due to dissolution of particles in sulfidic waters. Thus, our data 421
underline the trapping function of the Mn-Fe-P-shuttle for phosphate which will affect the 422
upward phosphate transport and consequently also primary production. We propose that this 423
shuttle exhibits a regulatory function within the complex element and nutrient cycles of 424
anoxic basins. As such systems are often characterized by elevated sedimentary fluxes of 425
dissolved phosphate (Ingall et al., 2005) unimpeded access of released phosphate to the photic 426
zone would significantly enhance primary production. The formation of MnOx-FeOOH-PO4 427
phases at the redoxclines, however, causes retention of phosphate and possibly keeps the 428
system balanced. Although, both anoxic systems investigated here operate on different time 429
scales, phosphate levels in the anoxic parts of the water column are similar in the Baltic and 430
Black Seas, which has to be attributed to such regulating mechanism. 431
While anoxic bottom water conditions were established in the Black Sea since about 7.500 432
years BP, the deeps of the Baltic Sea are frequently subjected to inflowing pulses of 433
oxygenated sea water from the North Sea (e.g. Huckriede and Meischner, 1996). Such inflow 434
events cause fundamental environmental shifts as the oxygenation of former anoxic deep 435
18
waters will lead to the pronounced precipitation of MnOx-FeOOH-PO4 phases. After 436
reduction of deposited particles at the still anoxic sediment/water interface elevated amounts 437
of phosphate are again released. This process will increase primary production and favours 438
the re-establishment of anoxic conditions after several months or a few years, thus forming a 439
kind of an “anoxic perpetuum mobile”. However, comparable phosphate levels in anoxic 440
waters of the Black and Baltic Seas point towards re-establishment of the redoxcline with its 441
regulating function during an early stage of this cycle. 442
443
3.3. Paleoenvironmental implications 444
The regulating function of the Mn-Fe-P shuttle is assumed to be relevant in Earth`s history, 445
as well. During the Phanerozoic for instance, when oceanic anoxic events resulted in 446
widespread black shale formation, large parts of the ancient ocean basins were affected by 447
anoxic or even sulfidic bottom water conditions (Brumsack, 2006). Although, euxinic 448
conditions are generally assumed to enhance sedimentary phosphate reflux (Ingall et al., 449
2005) certain P enrichments during oceanic anoxic events reflect periods of elevated P burial 450
(e.g. Föllmi, 1996; Handoh and Lenton, 2003). In particular, cyclic P enrichments within 451
certain intervals of Cretaceous black shales from the Demerara Rise (März et al., 2008), 452
which might be caused by fundamental changes in ancient ocean circulation, likely reflect the 453
deposition of such particles within a temporarily anoxic but non-sulfidic water column (Fig. 454
9, anoxic mode). Contrasting to the sulfidic mode, the particles have a higher chance of 455
sedimentary burial when H2S is absent. Independent sequential P and Fe extraction 456
procedures applied to one of such highly P-enriched layers indicate that about 50% of the 457
sedimentary P is bound to Fe minerals. Thus, coupled Fe and P cycles comparable to those in 458
the Black and Baltic Seas water columns are likely reflected in the sedimentary record and 459
may serve as a proxy over long time intervals (März et al., 2008). Molar Fe/P ratios of 1.0-1.5 460
(Table 1) found in black shale layers suggest that remaining Fe-P phases are composed of a 461

19
vivianite-strengite mixture. However, direct comparison of Fe/P ratios of pure mineral phases 462
and particles to those of sediments is limited by the potential transfer of particle-bound Fe and 463
P to form diagenetic Fe sulfides and apatite, respectively. In addition, transformation of fresh 464
Fe-P particles into well-crystallized Fe-P minerals might take place with progressive sediment 465
burial, and affect original Fe/P ratios. Similar recrystallisation processes are a well-known 466
phenomenon for other minerals (e.g. opal-quartz, ferrihydrite-hematite) as well. Still, under 467
certain conditions (low sedimentation rates, anoxic non-sulfidic bottom waters, a deep 468
redoxcline) Fe-P particles formed at the redoxcline of an anoxic basin may be preserved in 469
organic-rich sediments. Interestingly, P enrichments in these black shales are paralleled by 470
lowest TOC/Al ratios, which might be due to lower primary production resulting from the 471
suggested phosphate trapping at the redoxcline. We conclude that despite difficulties to 472
quantify the original contribution of Fe-P particles in ancient anoxic systems, traces of the 473
activity of a water column Mn-Fe-P-shuttle may be preserved in black shales, offering the 474
possibility for more detailed studies of similar deposits that experienced anoxic non-sulfidic 475
conditions. 476
The Mn-Fe-P-shuttle may also play an important role for the transfer of trace metals from 477
oxygenated waters into anoxic basins. Since seawater is considered to be an important source 478
for certain trace metal enrichments in sapropels and black shales, diffusion from oxygenated 479
waters into the anoxic zone forms a limiting factor for sustaining the trace metal inventory of 480
anoxic bottom waters (e.g. Brumsack, 2006). Therefore, settling of Mn- and Fe-rich particles, 481
which trap trace metals at the redoxcline via scavenging or co-precipitation, may provide an 482
additional mechanism for refreshing the trace metal reservoir of the anoxic bottom waters. For 483
instance, preliminary analyses of particles from the modern redoxclines of this study reveal 484
maximum values of 152 µg g-1 As, 21 µg g-1 Cd, 263 µg g-1 Mo, and 79 µg g-1 Sb. By 485
contrast, for U (5.2 µg g-1) and V (173 µg g-1) only slight enrichments were attained. Such 486
findings are in accordance with observations of Tribovillard et al. (2008) who reported 487
20
distinct Mo enrichments in sediments of the stratified Orca Basin while U and V reflect only 488
the geogenic background. This consistency possibly underlines the importance of authigenic 489
particles for trace metal budgets and emphasizes detailed investigations on trace metal 490
composition of particles as a future challenge. 491
492
4. CONCLUSIONS 493
A new solid phase consisting of Mn, Fe, and P was evidenced by SEM-EDX analyses at 494
pelagic redoxclines of the Baltic and Black Seas. Vertical particle distributions generally 495
show increasing abundances of this species between MnOx and earlier postulated Fe- 496
oxyhydroxo phosphates. Besides oxidation of upward diffusing Fe2+ by dissolved oxygen, 497
batch experiments also suggest formation of mixed phases by reaction of Fe2+ and sinking 498
MnOx particles thereby releasing Mn2+. The resultant FeOOH coatings on MnOx may adsorb 499
or even co-precipitate phosphate. When these particles encounter sulfidic waters, remaining 500
MnOx is progressively reduced leading to residual particles significantly enriched in Fe and P. 501
This Mn-Fe-P-shuttle traps dissolved phosphate at the redoxcline and contributes 502
significantly to the pool of particulate inorganic P. Furthermore, the shuttle likely hampers 503
phosphate transport throughout the water column, thereby increasing the importance of 504
upwelling for phosphate transport into surface waters. Over longer time scales, these particles 505
may also influence primary production and possess a regulating function in modern and 506
ancient anoxic basins because the trapping of phosphate at the redoxcline enhances its 507
residence time in anoxic waters (“anoxic perpetuum mobile”). 508
The Mn-Fe-P shuttle has to be taken into account in future modelling approaches dealing 509
with oxic/anoxic interfaces of aquatic ecosystems. Thus, the common consideration of only 510
two different mineral phases (MnOx and FeOOH), when modelling biogeochemical cycles at 511
pelagic redoxclines, does not adequately reflect our field and experimental observations. 512
513

21
ACKNOWLEDGEMENTS 514
The authors wish to thank Rainer Bahlo for his assistance during SEM-EDX analyses, 515
Vera Winde, Conny Lenz, and Frank Schoster for their assistance during the Baltic Sea cruise 516
in April 2007, Siggi Krüger for his PUMP-CTD support. OD wishes to thank Antje Wegwerth 517
for inspiring comments on an earlier version of this manuscript. In particular, we wish to 518
thank B. M. Tebo for providing biogenic MnOx particles from culture experiments. Further 519
thanks go to B. B. Jørgensen for his support within the Black Sea project, the captains and 520
crews of R/V “Professor Albrecht Penck” and R/V “Meteor”, and to the respective cruise 521
leaders G. Jost (Penck 2006) and C. Borowski (cruise M72-5). This study benefited from the 522
constructive comments of two anonymous reviewers which significantly helped us to improve 523
the original manuscript. The study was supported by the Leibniz Institute for Baltic Sea 524
Research (IOW). BS and HJB were supported by the Deutsche Forschungsgemeinschaft 525
(DFG) through grant BR 775/23-1. 526
527
REFERENCES 528
Benitez-Nelson C. R., O’Neill L., Kolowith L. C., Pellechia P. and Thunell R. (2004) 529
Phosphonates and particulate organic phosphorus cycling in an anoxic marine basin. 530
Limnol. Oceanogr. 49, 1593–1604. 531
Benitez-Nelson C. R., O`Neill Madden L. P., Styles R. M., Thunell R. C. and Astor Y. (2007) 532
Inorganic and organic sinking particulate phosphorus fluxes across the oxic/anoxic water 533
column of Cariaco Basin, Venezuela. Mar. Chem. 105, 90-100. 534
Bernard P. C, van Grieken R. and Brügmann L. (1989) Geochemistry of suspended matter 535
from the Baltic Sea. 1. Results of individual particle characterization by automated electron 536
microprobe. Mar. Chem. 26,155-177. 537
Berner R.A. (1973) Phosphate removal from sea water by adsorption on volcanogenic ferric 538
oxides. Earth Planet. Sci. Lett. 18, 77-86. 539

22
Böttcher M. E and Thamdrup B. (2001) Anaerobic sulfide oxidation and stable isotope 540
fractionation associated with bacterial sulfur disproportionation in the presence of MnO2. 541
Geochim. Cosmochim. Acta 65, 1573-1581. 542
Brumsack H.-J. (2006) The trace metal content of recent organic carbon-rich sediments: 543
Implications for Cretaceous black shale formation. Palaeogeogr. Palaeoclimat. 544
Palaeoecol. 232, 344-361. 545
Buffle J., De Vitre R. R., Perret D. and Leppard G. G. (1989) Physico-chemical 546
characteristics of a colloidal iron phosphate species formed at the oxic-anoxic interface of 547
a eutrophic lake. Geochim. Cosmochim. Acta 53, 399-408. 548
Burdige D. J. and Nealson K. H. (1986) Chemical and microbiological studies on sulfide-549
mediated manganese reduction. Geomircobiol. J. 4, 361-387. 550
Canfield D. E. (1989) Reactive iron in marine sediments. Geochim. Cosmochim. Acta 53, 551
619-632. 552
Canfield D. E., Raiswell R. and Bottrell S. (1992) The reactivity of sedimentary iron minerals 553
toward sulfide. Am. J. Sci. 292, 659-683. 554
Cline J. D. (1969) Spectrophotometric determination of hydrogen sulfide in natural waters. 555
Limnol. Oceanogr. 14, 454-458. 556
Danielsson L.-G., Dyrssen D. and Graneli A. (1980) Chemical investigations of Atlantis II 557
and Discovery brines in the Red Sea. Geochim. Cosmochim. Acta 44, 2051-2065. 558
Davison W., Woof C. and E. Rigg E. (1982) The dynamics of iron and manganese in a 559
seasonally anoxic lake; direct measurement of fluxes using sediment traps. Limnol. 560
Oceanogr. 27(6), 987-1003. 561
de Lange G. J., Catalano G., Klinkhammer G. P. and Luther III G. W. (1990) The interface 562
between oxic seawater and the anoxic Bannock brine; its sharpness and the consequences 563
for the redox-related cycling of Mn and Ba. Mar. Chem. 31, 205-217. 564

23
Dyrssen D. and Kremling K. (1990) Increasing hydrogen sulfide concentration and trace 565
metal behavior in the anoxic Baltic waters. Mar. Chem. 30, 193-204. 566
Einsele W. (1938) Über chemische und kolloidchemische Vorgänge in Eisen-Phosphat-567
Systemen unter limnochemischen und limnogeologischen Gesichtspunkten. Arch. 568
Hydrobiol. 33, 361-387. 569
Föllmi K. B. (1996) The phosphorus cycle, phosphogenesis and marine phosphate-rich 570
deposits. Earth-Sci. Rev. 40, 55-124. 571
Fox L. E. (1993) The chemistry of aquatic phosphate: inorganic processes in rivers. 572
Hydrobiol. 253, 1-16. 573
Friedrich G. E., Codispoti L. A., Sakamoto C. M. (1988) Bottle and pumpcast data from the 574
1988 Black Sea expedition. MBARI, Technical Report No. 90-3. Pacific Grove, Monterey, 575
CA 93950, USA. 576
Grasshoff K., Ehrhardt M. and Kremling K. (1983) Methods of seawater analysis. Verlag 577
Chemie, Weinheim. 578
Gunnars A., Blomqvist S., Johansson P. and Andersson C. (2002) Formation of Fe(III) 579
oxyhydroxide colloids in freshwater and brackish seawater with incorporation of phosphate 580
and calcium. Geochim. Cosmochim. Acta. 66, 745-758. 581
Handoh I. C. and Lenton T. M. (2003) Periodic mid-Cretaceous oceanic anoxic events linked 582
by oscillations of the phosphorus and oxygen biogeochemical cycles. Glob. Biogeochem. 583
Cycl. 17, 1092. 584
Hartmann M. (1985) Atlantis-II Deep geothermal brine system. Chemical processes between 585
hydrothermal brines and Red Sea deep water. Mar. Geol. 64, 157-177. 586
Huckriede H. and Meischner D. (1996) Origin and environment of manganese-rich sediments 587
within black-shale basins. Geochim. Cosmochim. Acta 60,1399-1413. 588
Hyacinthe C. and Van Cappellen P. (2004) An authigenic iron phosphate phase in estuarine 589
sediments: composition, formation and chemical reactivity. Mar. Chem. 91, 227-251. 590

24
Ingall E. D., Kolowith L., Lyons T. W. and Hurtgen M. (2005) Sediment carbon nitrogen and 591
phosphorus cycling in an anoxic fjord Effingham Inlet British Columbia. Am. J. Sci. 305, 592
240-258. 593
Ingri J., Löfvendahl R. and Boström K. (1991) Chemistry of suspended particles in the 594
southern Baltic Sea. Mar. Chem. 32, 73-87. 595
Lass H.-U., Mohrholz V., Nausch G. and Siegel H. (2010) On phosphate pumping into the 596
surface layer of the eastern Gotland Basin by upwelling. J. Mar. Sys. 80, 71–89. 597
Leipe T., Löffler A. and Bahlo R. (1996) Untersuchungen an Schwebstoffen mittels 598
Rasterelektronenmikroskopie und automatisierter Röntgenmikroanalyse (EDX) - Beispiele 599
aus der Ostsee. Zentralbl. Geol. Paläont. Teil I H5/6, 485-501. 600
Leipe T., Löffler A., Bahlo R. and Zahn W. (1999) Automated particle analysis of water 601
samples by scanning electron microscopy and X-ray microanalysis. Vom Wasser 93, 21-37. 602
Lyons, T. W. (1997) Sulfur isotopic trends and pathways of iron sulphide formation in upper 603
Holocene sediments of the anoxic Black Sea. Geochim. Cosmochim. Acta 61, 3367-3382. 604
Lyons T. W. and Severmann S. (2006) A critical look at iron paleoredox proxies: New 605
insights from modern euxinic marine basins. Geochim. Cosmochim. Acta 70, 5698-5722. 606
März C., Poulton S. W., Beckmann B., Kuester K., Wagner T. and Kasten S. (2008) Redox 607
sensitivity of P cycling during marine black shale formation: Dynamics of sulfidic and 608
anoxic non-sulfidic bottom waters. Geochim. Cosmochim. Acta 72, 3703-3717. 609
Millero F. J., Sotolongo S. and Izaguirre M. (1987) The oxidation kinetics of Fe(II) in 610
seawater. Geochim. Cosmochim. Acta 51, 793-801. 611
Murray J. W. (1974) The surface chemistry of hydrous manganese dioxide. J. Colloid 612
Interlace Sci. 46, 357 37l. 613
Neretin L. N., Pohl C., Jost G., Leipe T. and Pollehne F. (2003) Manganese cycling in the 614
Gotland Deep Baltic Sea. Mar. Chem. 82, 125-143. 615

25
Postma D. (1985) Concentration of Mn and separation from Fe in sediments – I. Kinetics and 616
stoichiometry of the reaction between birnessite and dissolved Fe(II) at 10°C. Geochim. 617
Cosmochim. Acta 49, 1023-1033. 618
Poulton S.W., Krom M.D. and Raiswell R. (2004) A revised scheme for the reactivity of iron 619
(oxyhydr)oxide minerals towards dissolved sulfide. Geochim. Cosmochim. Acta 68, 3703-620
3715. 621
Poulton S. W. and Canfield D. E. (2006) Co-diagenisis of iron and phosphorus in 622
hydrothermal sediments from the southern East Pacific Rise: Implications for the 623
evaluation of palaeoseawater phosphate concentrations. Geochim. Cosmochim. Acta 70, 624
5883-5898. 625
Raiswell, R., and Anderson, T. F. (2005) Reactive iron enrichment in sediments deposited 626
beneath euxinic bottom waters: constraints on supply by shelf recycling. In Mineral 627
Deposits and Earth Evolution (eds I. McDonald, , A.J. Boyce, I.B. Butler, R.J. Herrington 628
and D.A. Polya), Geological Society Special Publication Vol. 248, pp. 179–194. 629
Roekens E. J. and van Grieken R. E. (1983) Kinetics of iron(II) oxidation in seawater of 630
various pH. Mar. Chem. 13, 195-202. 631
Schippers A., Neretin L. N., Lavik G., Leipe T. and Pollehne F. (2005) Manganese (II) 632
oxidation driven by lateral oxygen intrusions in the western Black Sea. Geochim. 633
Cosmochim. Acta 69, 2241-52. 634
Shaffer G. (1986) Phosphate pumps and shuttles in the Black Sea. Nature 321, 515-517. 635
Sheldon R. W. (1967) A practical manual on the use of the Coulter Counter in marine science. 636
Coulter Electronics, Toronto. Pp. 66. 637
Slomp C. P., Van der Gaast S. J. and Van Raaphorst W. (1996) Phosphorus binding by poorly 638
crystalline iron oxides in North Sea sediments. Mar. Chem. 52, 55-73. 639

26
Strady E., Pohl C., Yakushev E. V., Krüger S. and Hennings U. (2008) PUMP-CTD-System 640
for trace metal sampling with a high vertical resolution. A test in the Gotland Basin Baltic 641
Sea. Chemosphere 70, 1309-1319. 642
Stumm W., Morgan J. J. (1996) Aquatic chemistry. Wiley, New York. 643
Suits N. S. and Wilkin R. T. (1998) Pyrite formation in the water column and sediments of a 644
meromictic lake. Geology 26(12), 1099-1102. 645
Taylor G. T., Iabichella M., Ho T.-Y., Scranton M. I., Thunell R. C., Muller-Karger F. and 646
Varela R. (2001) Chemoautotrophy in the redox transition zone oft he Cariaco Basin: A 647
significant midwater source of organic carbon production. Limnol. Oceanogr. 46, 148-163. 648
Tebo B. M., Bargar J. R., Clement B. G., Dick G. J., Murray K. J., Parker D., Verity R. and 649
Webb S. M. (2004) Biogenic manganese oxides: Properties and mechanisms of formation. 650
Ann. Rev. Earth Planet. Sci. 32, 287-328. 651
Tessenow U. (1974) Lösungs-, Diffusions- und Sorptionsprozesse in der Oberschicht von 652
Seesedimenten: IV. Reaktionsmechanismen und Gleichgewichte im System Eisen-653
Mangan-Phosphat im Hinblick auf die Vivianitakkumulation im Ursee. Arch. Hydrobiol. 654
Suppl. 47, 1–79. 655
Thibault P.-J., Rancourt D. G., Evans J. and Dutrizac J. E. (2009) Mineralogical confirmation 656
of a near-P:Fe=1:2 limiting stoichiometric ratio in colloidal P-bearing ferrihydrite-like 657
hydrous ferric oxide. Geochim. Cosmochim. Acta 73, 364-376. 658
Trefry J. H., Presley B. J., Keeney-Kennicutt W. L. and Trocine R. P. (1984) Distribution and 659
chemistry of manganese iron ans suspended particulates in Orca Basin. Geo-Mar. Lett. 4, 660
125-130. 661
Tribovillard N., Bout-Roumazeilles V., Algeo T., Lyons T. W., Sionneau T., Montero-662
Serrano J. C., Riboulleau A. and Baudin F. (2008) Paleodepositional conditions in the Orca 663
Basin as inferred from organic matter and trace metal contents. Mar. Geol. 254, 62-72. 664

27
Trouwborst R. E., Clement B. G., Tebo B. M., Glazer B. T. and Luther III G. W. (2006) 665
Soluble Mn(III) in suboxic zones. Science 313, 1955-1957. 666
Tsandev I. and Slomp C. P. (2009) Modeling phosphorus cycling and carbon burial during 667
Cretaceous Oceanic Anoxic Events. Earth Planet. Sci. Lett. 286, 71-79. 668
Tyrrell T. (1999) The relative influences of nitrogen and phosphorus on oceanic primary 669
production. Nature 400, 525-531. 670
Van Cappellen P., Ingall E. D. (1996) Redox stabilization of the atmosphere and oceans by 671
phosphorus-limited marine productivity. Science 271, 493-496. 672
Van Cappellen P. and Wang Y. (1996) Cycling of iron and Manganese in surface sediments: 673
A general theory for the coupled transport and reaction of carbon, oxygen, nitrogen, sulfur, 674
Iron, and Manganese. Am. J. Sci. 296, 197-243. 675
van der Zee C., van Raaphorst W. and Epping E. (2001) adsorbed Mn2+ and Mn redox 676
cycling in Iberian continental margin sediments (northeast Atlantic Ocean). J. Mar. Res. 677
59, 133-166. 678
van der Zee C., Slomp C. P., Rancourt D. G., de Lange G. J. and van Raaphorst W. (2005) A 679
Mössbauer spectroscopic study of the iron redox transition in eastern Mediterranean 680
sediments. Geochim. Cosmochim. Acta 69, 441-453. 681
Wijsman J. W. M., Middelburg J. J., Heip C.H.R. (2001) Reactive iron in Black Sea 682
sediments: implications for iron cycling. Mar. Geol. 172, 167-180. 683
Yakushev E. V., Pollehne F., Jost G., Kuznetsov I., Schneider B. and Umlauf L. (2007) 684
Analysis of the water column oxic/anoxic interface in the Black and Baltic seas with a 685
numerical model. Mar. Chem. 107, 388-410. 686
Yao W. and Millero F. J. (1993) The rate of sulfide oxidation by δMnO2. Geochim. 687
Cosmochim. Acta 57, 3359-3365. 688
Yao W. and Millero F. J. (1996a) Oxidation of hydrogen sulfide by hydrous Fe(III) oxides in 689
seawater. Mar. Chem. 52, 1-16. 690

28
Yao W. and Millero F. J. (1996b) Adsorption of phosphate on manganese dioxide in seawater. 691
Environ. Sci Techno. 30(2), 536-541. 692

29
693
Figure Captions: 694
695
Fig. 1. Maps of the study sites in the Baltic (a) and Black Seas (b). 696
697
Fig. 2. Textural and elemental properties of authigenic particles around pelagic redoxclines 698
from the Baltic and Black Seas. SEM photographs show typical star-shaped particles and 699
globular examples (b and d) along with results from EDX-analyses. Positions of EDX 700
measurements are marked by white arrows and contents of Mn, Fe, and P in weight% are 701
given below. 702
703
Fig. 3. Geochemical gradients around the pelagic redoxcline of the Gotland Basin (Baltic Sea) 704
in July 2006 and April 2007. Relative particle abundances originate from SEM-EDX 705
measurements. The gray bars denote the approximate position of the redoxcline. 706
707
Fig. 4. Geochemical gradients around the pelagic redoxclines of the Landsort Deep in July 708
2006 and April 2007. Relative particle abundances originate from SEM-EDX measurements. 709
The gray bars denote the approximate position of the redoxcline. 710
711
Fig. 5. Geochemical gradients around the pelagic redoxclines of the Black Sea (site 21 and 712
27, June 2007). Relative particle abundances originate from SEM-EDX measurements. The 713
gray bars denote the approximate position of the redoxcline. 714
715
Fig. 6. Concentrations of dissolved Mn, Fe, P, and O2 during dysoxic (a) and anoxic (b and c) 716
batch-type experiments in diluted seawater (salinity 12) versus the time. Iron(II)sulfate was 717

30
added to all runs. The anoxic runs B and C also contained biogenic MnOx particles and 718
phosphate was added to the solution in run C. 719
720
Fig. 7. Textural and elemental properties of particles sampled during the batch-type 721
experiments of run B and C. Areas of SEM-EDX measurements are marked by white zones. 722
The contents of Mn, Fe, and P are given in weight%. 723
724
Fig. 8. Depth profile of FeSx abundance from the Black Sea site 21 derived from automated 725
particle analyses by SEM-EDX. The upper profile shows results from across the redoxcline 726
and the lower plot displays the entire profile until 2.400 m depth. The gray bars denote the 727
approximate position of the redoxcline. Textural and elemental properties of FeSx particles 728
are shown on the right (b.d.l.=below detection limit). 729
730
Fig. 9. Conceptual model of the Mn-Fe-P shuttle for pelagic redoxclines of anoxic basins. The 731
left part describes the “euxinic mode” of H2S containing basins like the Black Sea. The right 732
part illustrates an anoxic, non-sulfidic basin, a situation presumably relevant for certain time 733
periods during Cretaceous black shale formation. The distinct difference between both 734
settings forms the stability of mineral phases during sinking and the possibility of sedimentary 735
burial. 736
737
738

31
739
740
741
742
Fig 1 743
744

33
746

34
747
748
749
Fig 3 750
751

35
752
753
754
Fig 4 755
756
36
757
758
Fig 5 759
760
37
761
762
763
Fig 6 764
765

38
766
767
768
Fig 7 769
770

39
771
772
773
Fig 8 774
775

40
776
777
778
779
Fig 9 780
781

42
782
Table 1. SEM-EDX analyses of particles from the Baltic and Black Seas showing average weight% of Al, Ca, Mg, Si, Mn, Fe, and P along with 783
molar P/Si and Fe/P ratios (n denotes the number of particles; standard deviations are given in brackets). Fe/P ratios are presented for particles with 784
Fe contents >5%. Ratios for Cretaceous black shales were calculated from sequential Fe and P extractions (März et al., 2008). 785
Location Depth [m] Particle type n Al Ca Mg Si Mn Fe P P/Si Fe/P
Gotland Basin 2007 Landsort Deep 2007 Black Sea 2007 (site 27)
Cretaceous Black Shales Vivianitea Barbosalitea
Tinticitea Strengitea
120 134 145 165 65 70 91 105 115 135
MnOx MnOx-FeOOH-PO4 FeOOH-PO4 FeOOH-PO4 MnOx MnOx-FeOOH-PO4 FeOOH-PO4 MnOx MnOx-FeOOH-PO4 FeOOH-PO4
FeII
3(PO4)2*8 H2O FeIIFeIII
2(OH,PO4)2 FeIII
4(PO4,OH)3*5 H2OFeIIIPO4*2 H2O
15 9 9 7 4 15 9 6 10 8
0.3 (0.2) 0.4 (0.3) 0.7 (0.6) 0.7 (0.7) 0.4 (0.2) 0.4 (0.4) 0.6 (0.2) 1.0 (1.0) 0.3 (0.2) 0.8 (0.5)
2.6 (0.6) 2.3 (0.2) 1.8 (0.4) 1.2 (0.5) 2.6 (0.7) 1.9 (0.5) 2.5 (0.4) 2.1 (0.8) 1.9 (0.6) 2.8 (0.9)
2.0 (0.4) 0.9 (0.5) 2.3 (0.6) 2.0 (0.4) 2.2 (0.5) 0.9 (0.4) 2.2 (0.3) 2.7 (0.3) 1.1 (0.3) 2.4 (0.6)
1.6 (1.7) 1.5 (0.6) 1.8 (1.1) 1.2 (0.5) 1.1 (0.4) 1.4 (0.5) 1.1 (0.5) 1.2 (1.1) 1.6 (1.0) 1.6 (0.8)
50 (5.0) 21 (10.0) 3.7 (1.7) 1.3 (0.8) 49 (0.9) 19 (14.4) 1.2 (0.3) 42 (5.6) 27 (9.2) 4.6 (1.1)
2.9 (1.5) 19 (4.9) 30 (8.1) 37 (8.7) 3.4 (1.6) 24 (9.0) 33 (3.2) 2.4 (1.0) 23 (6.6) 25 (6.6)
0.8 (0.4) 4.8 (1.0) 8.1 (2.7) 7.0 (1.1) 1.3 (1.6) 7.0 (2.7) 8.2 (0.8) 1.6 (0.8) 6.0 (1.4) 4.9 (0.9)
1.0 (0.6) 3.3 (1.3) 6.0 (4.3) 7.3 (5.2) 1.1 (0.3) 5.1 (2.2) 7.2 (3.7) 1.6 (0.9) 4.4 (2.1) 3.7 (2.2)
2.2 (0.4) 2.1 (0.6) 2.9 (0.5) 2.0 (0.4) 2.2 (0.2) 2.1 (0.5) 2.9 (0.6)
1.0-1.5 1.5 1.5 1.3 1.0
aknown Fe and P minerals 786 787
788