Accepted Manuscript - CORE
59
Accepted Manuscript This is a post-peer-review, pre-copyedit version of an article published in Biogeochemistry by Springer. The final authenticated version is available online at: http://dx.doi.org/10.1007/s10533-014-0060-5 de Wit, H.A., Austnes, K., Hylen, G. et al. A carbon balance of Norway: terrestrial and aquatic carbon fluxes. Biogeochemistry (2015) 123: 147. It is recommended to use the published version for citation. brought to you by CORE View metadata, citation and similar papers at core.ac.uk provided by NIVA Open Access Archive
-
Upload
khangminh22 -
Category
Documents
-
view
1 -
download
0
Transcript of Accepted Manuscript - CORE

Accepted Manuscript
This is a post-peer-review, pre-copyedit version of an article published in Biogeochemistry by Springer. The final authenticated version is available online at:
http://dx.doi.org/10.1007/s10533-014-0060-5
de Wit, H.A., Austnes, K., Hylen, G. et al. A carbon balance of Norway: terrestrial and aquatic carbon fluxes. Biogeochemistry (2015) 123: 147.
It is recommended to use the published version for citation.
brought to you by COREView metadata, citation and similar papers at core.ac.uk
provided by NIVA Open Access Archive
1
A carbon balance of Norway: terrestrial and aquatic carbon fluxes.
Heleen A. de Wit1*
Kari Austnes1
Gro Hylen2
Lise Dalsgaard2
1 Norwegian Institute for Water Research, Gaustadalléen 21, NO-0349 Norway
2 Norwegian Forest and Landscape Institute, Mailbox 115, NO-1431 Ås, Norway
*corresponding author
Email: [email protected]
Phone: +47 2218 5100

2
Abstract
Northern landscapes accumulate carbon in vegetation and soils while rivers transport significant
amounts of land-derived carbon to coastal areas. Here, we quantify carbon sources and sinks in main
ecosystems (forests, peatlands, mountains, agricultural areas, lakes) in Norway for 1990-2008, and
compare riverine carbon transport with terrestrial carbon accumulation in Norway’s four major
discharge areas. Mean annual carbon accumulation (6.0 ± 0.9 Tg C; 19 g C m-2) in terrestrial
ecosystems balanced 40% of national greenhouse gas emissions. The area-normalized terrestrial sink
strength declined in the following order (in g C m-2 yr-1): tree biomass (40±3) >peatlands (19±15)
>forest soils (9±1) >>lakes (2±1) >mountains (0.5±0.3), while agricultural soils were sources of
carbon (-36±74). The most precise estimate in the carbon balance was for tree biomass, because of the
underlying forest inventory data. Poor data on land management and soil type in agricultural soils, and
on (former) drainage and peatland type resulted in high uncertainty in carbon loss and uptake estimates
in agricultural soils and peatlands, which impacted the uncertainty in total terrestrial carbon
accumulation. Also, carbon losses from disturbance in organic soil types were poorly constrained.
Riverine coastal inputs of land-derived organic carbon (OC) were 1.0 ± 0.1 Tg C yr-1 (3.0 g C m-2 yr-1),
with highest area-specific riverine export in western (4.5 g C m-2 yr-1) and lowest (1.7 g C m-2 yr-1) in
subarctic Norway. In west and middle Norway, river OC export was approximately equal to carbon
accumulation in soils and wetlands, while it was 50% of soil and wetland carbon accumulation in
southeast and subarctic Norway. Lateral aquatic transport of carbon is not explicitly accounted for in
forest soil carbon accumulation estimates, although aquatic fluxes represent a climate-dependent
carbon loss from soil carbon pools. The lack of methods that adequately account for lateral fluxes in
carbon balances adds considerable uncertainty to soil carbon sink estimates. Climate warming and
associated changes in precipitation may result in substantial alterations of terrestrial and aquatic
carbon fluxes, with uncertain implications for the terrestrial carbon sink of northern landscapes.
Keywords: carbon balance; aquatic carbon transport; drainage basins; terrestrial carbon sink; forest
biomass; forest soil model; river; peatland; lake; agriculture; uncertainty; boreal landscape; subarctic
landscape
3
Introduction
Terrestrial ecosystems play an important role in mitigating climate change by absorbing a substantial
part of global fossil fuel emissions. The size and location of the terrestrial CO2 sink are under debate
while its future strength is uncertain (Schimel 2007). A global carbon balance showed that the land
sink between 2000 and 2006 was 2.7 Pg C yr-1 (Canadell et al. 2007). This was similar to the global
carbon uptake in forest of 2.5 Pg C yr-1 estimated by Pan et al. (2011), although Canadell et al. (2007)
estimated the land sink as the residual of the balance of CO2 emissions from fossil fuels and land use
change, and atmospheric and oceanic CO2 uptake. A more recent analysis suggests that carbon uptake
in land and ocean is not diminishing, while mechanisms and locations responsible for carbon uptake
need better identification (Ballantyne et al. 2012).
Very often, land and oceans are treated separately in analyses of (global) carbon budgets.
Aquatic systems, if considered at all, have often been described as part of the terrestrial landscape
rather than as conduits and active processors of carbon between land and ocean (Battin et al. 2009).
Recent estimates of aquatic systems as channels for carbon processing and transport indicate that
losses of land-derived carbon from surface waters from CO2 evasion and sedimentation could be in the
same order of magnitude as net carbon fluxes between atmosphere and land, i.e. 0.9 to 2.0 Pg C yr-1
(Cole et al. 2007; Tranvik et al. 2009).
A recent estimate of the European carbon budget was corrected for lateral fluxes of carbon,
including riverine transport and international transport of wood products, where the size of the lateral
transport was similar to total carbon uptake in forests (Ciais et al. 2008). Riverine carbon export
equalled approximately 50% of the soil carbon sink in European forest (Luyssaert et al. 2010). The
implications of a sizable export of aquatic carbon for the terrestrial carbon sink are not immediately
obvious. Positive relations between precipitation and catchment dissolved organic carbon (DOC)
export (Raike et al. 2012), and between precipitation and soil carbon density (Post et al. 1982) are
well-documented, and could imply that wetter climates promote both riverine carbon export and soil
carbon accumulation. Soil carbon models usually do not explicitly take vertical and lateral transport of
carbon into account but consider soil carbon accumulation primarily as a function of litter
decomposition influenced by chemical composition and temperature (Liski et al. 2005; Sitch et al.

4
2003; White et al. 2000; Ågren et al. 2007b) although there are exceptions (Kleja et al. 2008;
Michalzik et al. 2003).
Regional scale carbon balances where both terrestrial and aquatic carbon fluxes were
estimated include the 3025 km2 forested Öreälven catchment (Jonsson et al. 2007), the 4000 km2
subarctic Lake Torneträsk catchment (Christensen et al. 2007) in northern Sweden, and the 6400 km2
Northern Highlands Lake District in the northern US (Buffam et al. 2011). Here, terrestrially fixed
carbon was estimated based on eddy covariance techniques that quantify net ecosystem exchange
(NEE) of carbon, and thus do not differentiate between carbon uptake in soils and biomass. In such
cases, the correction of net ecosystem carbon uptake with aquatic export is straightforward (Randerson
et al. 2002), and the terrestrial carbon sink was reduced by 6 to 19% when aquatic carbon export was
included. However, none of these studies quantified the soil carbon sink, and thus no insights in the
possible role of aquatic carbon export for soil carbon sequestration were provided. Climate factors –
temperature, precipitation - that drive soil carbon accumulation (Post et al. 1982) also drive lateral
flows of carbon (Hope et al. 1994), and climatic effects on aquatic carbon export may counteract or
balance climatic effects on soil carbon sequestration.
Regional carbon balances in northern landscapes are determined to a large extent by the
presence of forest, but also peatlands, mountains, lake sediments and agricultural lands can contribute
significantly to carbon uptake and losses at the regional scale (Kortelainen et al. 2004; Maljanen et al.
2010; Yu 2012). Here, we aim to estimate a carbon balance for Norway between 1990 and 2008,
taking into account all major ecosystems (forests, peatlands, mountains, lakes, agricultural lands), and
include all key terrestrial and aquatic carbon fluxes and their uncertainties. Secondly, we aim to
evaluate the relative importance of terrestrial and aquatic carbon fluxes along climatic and productivity
gradients under a uniform and consistent framework by comparing these in Norway’s four main
drainage areas. A comparison of terrestrial and aquatic fluxes will contribute to a better understanding
of terrestrial and aquatic linkages in the carbon cycle and to further integration of aquatic carbon
fluxes in estimations of terrestrial carbon accumulation.

5
Materials and methods
Study area
Mainland Norway (excluding the arctic islands Svalbard and Jan Mayen) has a surface area of 324,000
km2, where the main land cover types in declining order of area are mountains, forest, peatlands,
surface waters and agricultural areas (Table 1, Figure 1). Less than 2% of the land area in Norway is
developed, i.e. roads and buildings. Because of its elongation northwards and the mountainous areas in
the south, Norway has strong climate and associated vegetation gradients from maritime mild
temperate in the south (nemoral vegetation zone) and southwest to continental subarctic in inland
valleys (boreal vegetation zone) to polar tundra above the treeline and subarctic climate furthest north
(alpine vegetation zone) (Moen 1987). The four main drainage areas of Norway are Skagerrak in the
southeast, the North Sea in the southwest, the Norwegian Sea in middle Norway, and the Barents Sea
in the north.
Calculation method and uncertainty analysis
For the terrestrial ecosystems, a carbon balance was calculated for the different land cover categories
and summed to give the total (equation 1 in Table 3). For forests, carbon uptake was calculated by
region and then summed to all forested area. Regions were delineated according to county, climate and
data availability (see below). For all other land cover categories, carbon uptake was not differentiated
according to region. Aquatic organic carbon (OC) fluxes were calculated according to drainage area
and then summed for Norway. In the comparison of terrestrial and aquatic fluxes in each drainage
basin, forest carbon fluxes were summed according to the drainage areas to which they belonged.
Some drainage basins divided a forest region in two, and here the forest carbon fluxes attributed to
each drainage basin by assuming area-normalized carbon uptake (Table 1).
Uncertainties in the carbon balance of Norway and its components were calculated in two
steps. First, uncertainties in a specific carbon flux were calculated by considering sources of error in
the individual variables included in the equations (Table 3). Second, these uncertainties were used to
calculate total uncertainties in the carbon balance for forest, and for all of Norway. A normal
distribution was attributed to each component as default, expressed as relative standard errors, except

6
where specified (see below). Each constituent of the carbon balance was either a product of variables
and/or a sum of variables. Where constituents of the carbon balance had normal distributions, we used
the following rules to calculate uncertainty in products or sums of variables, as recommended in IPCC
guidelines for greenhouse gas inventories (IPCC 2006): Uncertainties in products were calculated as
the root of the squared sum of relative uncertainties in the variables, while uncertainties in sums were
calculated as the root of the squared sum of absolute uncertainties. For calculations of uncertainty with
other error distributions, and for all of Norway, we used a Monte Carlo method with the Excel add-on
Crystall Ball (Oracle Crystall Ball, Fusion Edition, release 11.1.2.0.00).
Forest biomass
The method and data for the calculation of the forest carbon balance are described in (De Wit et al.
2006). In short, data from the National Forest Inventory (NFI) and municipal statistics of commercial
round wood removals provide standing living biomass and harvested volume, respectively, which in
turn are used to calculate litter inputs for a soil model.
Forested Norway was divided into eight regions taking into account differences in climate
(mean annual temperature, input variable to the soil model) and data availability (Table 1). The forest
carbon balance was calculated by subtracting carbon pools in 1990 from carbon pools in 2008
(Equation 2 in Table 3). Regions 1 to 6 are below the coniferous forest limit, with data collected in a
uniform design, in three repeated samplings, for the period 1990 to 2008 (Tomter et al. 2010). In
region 7 (northernmost county of Finnmark) and 8 (forest above the coniferous forest limit in region 1
to 6), data collection started in 2005. Living biomass (above- and belowground) in region 1 to 6 and 8
was calculated with single tree allometric equations for Norway spruce, Scots pine and deciduous trees
(mostly birch) (Marklund 1988; Petersson & Ståhl 2006) (Equation 3 in Table 3). Biomass in region 7
was calculated by converting growing stock with biomass expansion factors (Lehtonen et al. 2004)
(Equation 4 in Table 3). The growing stock in 2008 in region 7 was 15.0 million m3, distributed as
30% pine-dominated forest and 70% birch-dominated forest (S. Tomter, Norwegian Forest and
Landscape Institute, pers. comm). Forest birch biomass in 1990 in region 7 and 8 was constructed
using the estimated 11% increase in birch biomass growth between 1990 and 2008 in 50% of region 7
7
(Tommervik et al. 2009). Biomass in pine forest in 1990 in region 7 was calculated using 2006
biomass estimate, assuming a constant annual increment of 1.3% and natural mortality of 15%
between 1990 and 2008 (S. Tomter, pers. comm). Biomass and annual increment in 1990 and 2008 in
region 8 were estimated using the biomass estimate from 2006 ( based on 4 years of the 5-year
inventory cycle (2005-2008)), and assuming a constant annual increment between 1990 and 2008
while taking into account natural mortality (20% for coniferous, 25% for birch: S. Tomter, , pers.
comm).
Ground vegetation biomass (bryophytes, lichens, herbs and grasses and dwarf shrubs) and litter
production was estimated for each NFI plot using empirical models relating aboveground ground
vegetation biomass to vegetation type and stand age (Muukkonen & Mäkipää 2006) (Equation 5 in
Table 3). Belowground biomass was estimated as a fixed proportion of aboveground biomass and
biomass turnover factors were associated with all above- and belowground biomass components
(Peltoniemi et al. 2004).
For mountain forest ground vegetation biomass, a time series for 1990 to 2008 was constructed
using the same procedure as for growing stock, assuming that the temporal development for ground
vegetation biomass was similar as for stem volume. Because of missing NFI data in region 7, we used
the relative temporal change in ground vegetation biomass in birch forest reported for 50% of region 7
(Tommervik et al. 2009).
Uncertainty in the variables in the equations for carbon pools were based on reported
uncertainty where available and otherwise on expert judgement. Uncertainty in the conversion factors
(CF) was calculated from the standard deviations in the conversion factors reported for each biomass
component (Lehtonen et al. 2004; Marklund 1988). Uncertainty for the whole tree biomass was
calculated by mass-weighing each biomass compartment to the whole tree, resulting in 2.2%, 1.7%
and 3.0% for pine, spruce and birch respectively. Standard deviations in the CF for biomass
components in ground vegetation were based on those reported for the ground vegetation model
parameters (Muukkonen & Mäkipää 2006), resulting in 18%, 23% and 34% for pine, spruce and birch
forest respectively. Uncertainty in forest and ground vegetation biomass in each region was weighted
according to proportion of dominating vegetation type.

8
Uncertainty in measurements of diameter and height in individual trees in the Austrian NFI,
which uses similar methods as the Norwegian NFI, was found to be 1% and 3% for coniferous trees,
respectively, resulting in an uncertainty of 11% for volume of individual trees (Berger et al. 2014).
The authors concluded that uncertainty in volume of individual trees were negligible for stock
estimates of nationwide assessments. We set the uncertainty related to volume estimates for region 1
to 6, and for region 8 in 2008, at a maximum of 1%. We assume that these uncertainties were threefold
larger (3%) for the 1990 input values in region 8, where measurements were not available. For region
7, biomass in 2008 was estimated from regional volume estimates where uncertainty is estimated to be
ca 5% (S. Tomter, pers. comm). Similar to biomass in region 8 in 1990, we assume a threefold
increase in uncertainty for the 1990 biomass in region 8. Uncertainty in stand age is substantially
larger than in volume, but data on the uncertainty were not available. We assumed a 10% uncertainty
in all cases except for 1990 and 2008 for region 7, and for 1990 in region 8 in 1990 where we set
uncertainty at 25%.
Forest soils
The forest soil carbon sink in each region was estimated using the Yasso model (Liski et al. 2005),
using annual litter flow and mean annual temperature as inputs. Yasso is designed to process data
derived from forest inventories and simulates the forest soil carbon stock down to 1 m depth on a
yearly time step (Liski et al. 2005). The balance between litter inputs and decomposition (the only
process responsible for carbon loss from soil organic matter (SOM) in Yasso) drives soil carbon
accumulation. Litter flow is divided in non-woody (foliage and fine roots), fine woody (branches,
coarse roots, bark) and coarse woody (stem and stumps) litter. Three SOM compartments are
simulated, i.e. undecomposed, quickly decomposable and slowly decomposable SOM. Decomposition
and transition of OM from one OM compartment to the next is described by process rates.
Temperature sensitivity and litter quality dependency of process rates were calibrated on litter bag
studies with widely varying litter quality and under varying climate. Process rates were calibrated to
give a correct soil carbon pool for a forest stand in Sweden, where key ecosystem carbon pools and
9
fluxes were measured and used as input to Yasso (Liski et al. 2005). We used the standard parameters
in Yasso for spruce, pine and birch litter.
Annual litter flows were calculated as the sum of litter from living biomass, ground
vegetation, natural mortality and harvest residues. Turnover factors (species-specific, for each biomass
compartment) for living biomass are given in De Wit et al. (2006). Natural mortality was estimated as
a fixed percentage of annual increment (region 1 to 6: 6% and 10% , region 8: 20% and 25%, in
coniferous and deciduous forest, respectively), as in De Wit et al. (2006). Unrecovered fellings were
calculated as 6% and 10% of the volume of the commercial round wood removals of coniferous and
deciduous trees, respectively, as in De Wit et al. (2006). Harvest residues were estimated by
subtracting ‘biomass associated with fellings’ from biomass of stem and bark.
A steady state soil carbon pool in 1990 (i.e. litter inputs equal decomposition carbon losses)
was not likely given the estimation of an active, non-steady state soil carbon pool for southeast
Norway in 1990 in De Wit et al. (2006). This agrees with the reasoning from Liski et al. (2006) and
Ågren et al. (2007b) where an increased growing stock is associated with increased litter input, which
– given a constant climate – results in a positive SOM accumulation rate. We estimated the initial soil
carbon pool by reducing the estimated steady state soil carbon pool in 1990, with the percentage
difference in 1990 soil pool calculated using litter input time series starting in 1960. The litter input
series was calculated from national NFI statistics, which document an increase in national growing
stock since 1919 (Granhus et al. 2012) (see (Supplementary information (SI 1)). The 1990 soil carbon
pools was calculated using the litter inputs time series starting in 1960, and a steady-state 1990 soil
carbon pool was calculated using the 1990 litter inputs in the time series. The %-difference between
the (non-steady state) soil carbon pool and the steady state soil in 1990 was assumed to indicate the
non-steady state forest soil carbon pool in all regions, and was 79%, 72% and 60% in spruce-
dominated, pine-dominated and birch-dominated forest, respectively.
The uncertainty of the soil carbon sink was related to litter flow inputs, decomposition rates
and initialization. The uncertainties in these components are difficult to quantify but they are
considerably higher than uncertainties in growing stock estimates, as these are based on systematic,
large-scale measurements in the NFI. Thus, we choose to set high uncertainty intervals for the
10
components where little quantitative information was available. Uncertainty in harvest residues,
natural losses and ground vegetation biomass (Peltoniemi et al. 2006) were set at 25%, 30% and 25%
respectively. Uncertainty in litter from standing biomass was set at 25% (non-woody litter), 15% (fine
woody litter) and 10% (coarse woody litter), in agreement with the associated increasing uncertainty in
the allometric equations (Marklund 1988). By region, this resulted in an uncertainty of 11 to 20% in
litter inputs. Uncertainty in decomposition rates was set at 10%, which is within uncertainty intervals
given by Liski et al. (2005). The uncertainty related to the initialization was set at 25% (De Wit et al.
2006).
Peatlands
Uptake of carbon in peatlands in Norway was calculated separately for drained and undisturbed
peatlands. Undisturbed peatland were separated into boreal and subarctic bogs. Peatland carbon
accumulation rates in undisturbed peatlands and carbon losses from disturbed peatlands were taken
from literature and multiplied with area for their respective peatland type (Equation 6 in Table 3).
Peatland area and type have not been assessed in great detail in Norway. The Norwegian
Forest Inventory supplies a number of 4.7% of treeless peatlands (>30 cm organic layer) while Moen
et al. (2011) assessed that circa 8% of Norway is covered by peatlands (>30 cm organic layer),
including cultivated and drained peatlands, forest on organic soils (>30 cm organic layer), and wooded
mire (Table 2). The areas defined as ‘peatlands’ by Moen thus belong partly to other land cover types
than the NFI classification of ‘peatlands’. Circa 15-30% of all peatlands has been drained for
cultivation and forest growth in the 20th century, most actively until the 1960s (Johansen 1997). This
practice was less common in treeless peatlands than in forests, suggesting that drainage of treeless
peatlands was at the lower end of the indicated interval of 15-30%. We use the lower end of the
interval, i.e. 15%, to calculate area of drained peatlands (170 km2) in Norway except for Finnmark
(subarctic Norway). In Finnmark, we assume that no draining occurred due to low population and land
use pressures.
The dominating type of peatlands at lower elevation in Norway are bogs (acidic, and nutrient-
poor, mostly rain-water fed, and deeper), while fens (more alkaline, fed by groundwater, shallower)
11
are more common at higher elevation and latitude (A. Moen, NTNU, pers.comm.). A field-survey
based estimate for mean depth of Norwegian boreal peatlands is 1.7 m (A. Moen, NTNU, pers.
comm), higher than the mean estimate of boreal and subarctic peatlands in Fennoscandia of 1.1 m,
given by Gorham (1991). In southeast and middle Norway, the dominating peatlands are typical raised
bogs, an ombrotrophic peatland type (Moen et al. 2011). Atlantic raised bogs (blanket bogs) are found
at the westernmost coast of western and northern Norway. Their limited surface area does not justify a
separate treatment in our approach. In northern Norway, arctic-alpine shallow fens dominate the
peatlands, with relatively low contents of organic matter and considerable mixing with mineral parent
material (Moen & Øien 2011).
To estimate carbon accumulation rates for Norwegian peatlands, we used published data on
measured carbon balances from representative undisturbed boreal and subarctic peatlands (Table 4).
Only a few full carbon balances for northern peatlands exist (i.e. Nilsson et al. (2008), Roulet et al.
(2007), Olefeldt et al. (2012)) where the net ecosystem carbon balance (NECB) is calculated as the
sum of net ecosystem exchange (NEE) corrected for CH4 emissions and DOC export (Yu 2012).
Several other studies (i.e. Sagerfors et al. (2008), Lund et al. (2007), Aurela et al. (2007), Aurela et al.
(2009), Aurela et al. (2004) ) measured only NEE and we chose to estimate CH4 emissions and DOC
export for these ecosystems in order to extend the basis for a robust estimate of carbon accumulation
rates for Norwegian peatlands. A separate rate was estimated for subarctic peatlands as these appear to
be less productive and have lower carbon stores (Lund et al. 2010; Turunen et al. 2002). Methane
emissions were estimated by attributing measured rates to those sites for which they were most
representative. The DOC export was estimated by calculating discharge for each site by correcting
precipitation for evapotranspiration, and multiplying discharge by a default DOC concentration (i.e.
the ratio of DOC export per mm discharge from the studies with the full carbon balance). The ratios
were attributed to those sites for which they were most representative, while the uncertainties in the
rates were derived from the full carbon balances (see notes under Table 4).
For drained peatlands, a longer-term estimate of losses of 30 g C m-2 yr-1 was given by
Armentano and Menges (1986), between the IPCC mean emission factors for boreal and temperate
drained forest land of 39 and 26 g C m-2 yr-1, respectively (IPCC 2014). We set the relative uncertainty

12
equal to the peat accumulation rate in undisturbed peatlands. Losses from cultivated peatlands are
treated under the ‘agricultural areas’.
Agricultural areas
Carbon emissions from agricultural soils depend on soil and management type (Maljanen et al. 2010).
65% of all agricultural land in Norway is temporary or permanent grassland and the remainder is
arable land (primarily cereal and oil seed crops, and potatoes). Approximately 70% of the grasslands is
fully cultivated (including plowing) while the remainder is surface-cultivated (Rognstad & Steinset
2012). Agricultural areas in Norway have been classified into mineral and organic soil types, which
cover 10.18 and 0.83 thousand km2, respectively (Grønlund et al. 2008b). Combined statistics on soil
type and land use are not available. We assume that cultivation of arable crops (35% of all agricultural
land) is restricted to mineral soil types and distribute the remaining 65% grasslands proportionally
over the remaining mineral and organic soil types (Table 5).
Carbon emissions from cultivated soils are highly variable. We use the carbon emission factor
(590 ±290 g C m-2 yr-1) for cultivated boreal drained inland organic grassland soils in the IPCC
Wetlands Supplement (IPCC 2014). Conversion from tillage to no-tillage management usually reduces
carbon emission rates from agricultural soils (West & Post 2002). Paustian et al. (2000) showed an up
to two times longer residence of SOM under no-till compared with intensive tillage. Based on this, we
assume that carbon emissions from the surface-cultivated grasslands on organic soils are 50% of the
carbon emissions from fully cultivated grassland soils. For mineral soils, we do not differentiate
according to cultivation practice because of lacking land-use specific carbon emission factors. A
model study by Andren et al. (2008) indicated that mineral soil types were close to balance in Swedish
agriculture, and we set the carbon loss rate for mineral soils to zero. The uncertainty in the loss rate for
mineral soils was assumed to be proportional to the uncertainty in the loss rates for organic soils, and
was calculated as the ratio of mineral and organic soil density multiplied by the uncertainty in the loss
rate for fully cultivated organic grassland soils (Table 5). Mineral and organic agricultural soil types in
Norway have estimated mean soil carbon densities of 15 and 56 kg m-2 (Grønlund et al. 2008b).
13
Mean annual change in soil carbon storage in cultivated soils was calculated by cultivation
type and soil type and summed (Equation 7 in Table 3). Changes in biomass were not considered, as
agricultural crops and grass cultivated in Norway are not considered long-term sinks of carbon.
Mountains
Mountain areas were defined as high elevation areas with little or no vegetation, consisting of four
NFI land cover types, i.e. other wooded land (OWL) (circa 10% of the total), bare rock and shallow
soils, , wooded mire and Calluna heath (Table 2). Few data are available for carbon pools and changes
therein in mountainous regions in Norway. NFI statistics provided growing stock per region for OWL
between 2005 and 2008, i.e. <0.5% (region 1-3, 6), ~1% (region 4, 5) and 5% (region 8) of forest
growing stock. Increased vegetation cover in mountainous areas occurs as a consequence of reduced
summer farming and grazing pressure (Bryn 2008), suggesting in increase in biomass. Tree biomass in
mountainous regions were estimated on the NFI statistics shown above, while ground vegetation
biomass was assumed to be similar to tree biomass (mosses, bushes and shrubs are a common form of
mountain vegetation in the tundra ecotone, see for instance Tommervik et al. (2009)). Biomass
increase was estimated assuming a similar %-increase as forest biomass in region 7 (northern
Norway), i.e. 0.01%, with an uncertainty interval of 50% (Equation 8 in Table 2). Changes in soil
organic matter were considered as too uncertain to allow a meaningful contribution to the calculated
carbon balance.
Lake sedimentation
No nation-wide data on lake carbon sediments and sedimentation rates exist for Norway. We applied a
Finnish model for lake carbon sediment pools (Kortelainen et al. 2004), developed for Finnish lakes in
the Nordic Lake survey database sampled in 1995 (Henriksen et al. 1998). Here, the lake sediment
carbon pool is quantitatively related to lake area, % agricultural area, and concentrations of dissolved
total iron and dissolved nitrate. The Nordic lake database includes lakes from Finland, Sweden and
Norway; selected using stratified random sampling and thus considered representative for the Nordic
countries. Data collection with regard to catchment, lake and water chemistry was uniform across the
14
survey. Finland and Norway have similar climate, vegetation and geology suggesting that the relations
found for Finland may also apply to Norway. We used the model to estimate sediments in circa 1000
Norwegian lakes, resulting in a mean lake sediment carbon density of 17.8±8.2 kg C m-2. The
estimated annual lake carbon sedimentation rates was 1.8 g C m-2 lake yr-1, assuming a linear
development of the lake sediment stocks since the last Ice Age (10 000 years ago). Uncertainty in lake
sediment pools and sedimentation rates was set at 50%, i.e. roughly the standard deviation of the lake
sediment pools (Equation 9 in Table 2).
Aquatic carbon fluxes
Aquatic fluxes of carbon were separated into riverine transport of total organic carbon (TOC) and
dissolved inorganic carbon (DIC), and in evasion of CO2 from lakes and rivers.
• TOC transport
Riverine transport of TOC were estimated based on water chemistry and discharge from 46 major river
outlets in Norway, monitored under the RID (Riverine Inputs and Direct Discharges) programme
(OSPAR 2013; Skarbøvik et al. 2013) (Table 1, Table 6, Figure 1). The monitored river catchments
cover 48% of Norway. Three drainage areas extend into Sweden, Finland and Russia. Carbon fluxes
were corrected for this by assuming constant areal export coefficients and constant relative
uncertainty.
The availability of water chemistry and discharge depended on river size. In the 10 largest
rivers, water was sampled at monthly intervals while discharge was measured (1999-2008). In 36
smaller rivers, water was sampled annually between 1999 and 2003 and quarterly between 2004 and
2008, while discharge was modelled with the spatially distributed version of the hydrological HBV-
model (Beldring et al. 2003). Concentrations of TOC were assumed to be equal to dissolved organic
carbon (DOC). Concentrations of phytoplankton in Norwegian rivers are generally considered to be
low because of low nutrient levels (Skarbøvik et al. 2009). The particulate fraction is small – on
average, DOC in the largest rivers constitutes >95% of TOC (Austnes, unpublished data). In other
Nordic studies of surface waters, DOC is more than 90% of TOC (Kortelainen et al. 2006; Mattsson et
al. 2005)
15
For each river, annual flow-weighted concentrations of TOC (FWC TOC) for the years 1999-
2008 were calculated by dividing annual TOC export with annual discharge. Annual TOC export was
summed from daily TOC export, calculated by multiplying daily discharge by daily TOC
concentration. Daily TOC concentrations were linear interpolations of measured TOC. Mean annual
FWC TOC and associated uncertainty was calculated for each river as the average and standard
deviation of annual FWC TOC for 1999-2008. For each drainage area, a catchment area-weighted
mean FWC TOC was calculated based on the individual rivers, and multiplied by mean annual
discharge (1990-2008) to obtain riverine TOC export (1990-2008) for the entire drainage area
(Equation 10 in Table 2). Uncertainty in river TOC export was calculated using the standard
deviations of area-weighted mean FWC TOC and mean annual discharge. Total riverine TOC
transport for Norway was obtained by summing per drainage area.
• CO2 evasion
CO2 evasion was estimated separately for lakes and rivers. For lakes, CO2 evasion rates were
calculated the 1000 Norwegian lakes in the Nordic lake survey (Henriksen et al. 1998). The rates were
calculated using the equation describing flux of CO2 over lake surfaces given in Jonsson et al. (2007),
with the gas exchange velocity (k) applied in Humborg et al. (2010) (2 cm hr-1), CO2water from the
TOC-pCO2 relationship (GLM model) for Norwegian lakes (Larsen et al. 2011) and Henry’s law, and
CO2eq calculated using Henry’s law, a pCO2air of 360 µatm and a water temperature of 8°C. Details on
the methodology is found in Cole and Caraco (1998). Estimating pCO2 from DOC has been done
elsewhere (Humborg et al. 2010; Rantakari & Kortelainen 2008; Sobek et al. 2003; Worrall & Burt
2005). Similar to Humborg et al. (2010), median CO2 evasion rate in five lake size categories (0-0.1,
0.1-1, 1-10, 10-100 and >100) was calculated (30.9, 28.8, 27.2, 26.7 and 27.7 g C m-2 yr-2,
respectively) and multiplied by the total area for each lake category, to give total lake CO2 evasion.
There was a lack of relevant data for a direct calculation of CO2 evasion in Norwegian rivers,
and we relied on Humborg et al. (2010), a comprehensive study on river CO2 evasion from Sweden.
The area-weighted mean river CO2 evasion rate estimate for Sweden is 1698 g C m-2 yr-2. This rate is
probably lower in Norway because of lower forest cover and shallower soils in Norway than Sweden,
and therefore a less abundant source of heterotrophic and autotrophic CO2 production and –transport

16
to rivers. Therefore, we calculated the CO2 evasion rate from Norwegian rivers (902 g C m-2 yr-2) by
multiplying the ratio of CO2 evasion in Norwegian and Swedish lakes by the Swedish river CO2
evasion rate, and multiplied the rate by river area to give total river CO2 evasion. River area (1237
km2) was estimated as the difference between surface water area (Table 1) and total lake area (19162
km2). The uncertainty of the CO2 evasion was estimated from the 10- and 90-percentiles for the lake
evasion rates in each size category, which were area-weighted to give the percentiles for all lake sizes.
The relative percentiles were applied to the overall CO2 evasion to give the uncertainty range.
• DIC transport
No representative data for DIC or alkalinity in Norwegian rivers are available. The only land-
representative water chemistry dataset with relevant parameters was the Norwegian lake dataset from
the Nordic lake survey (Henriksen et al. 1998). DIC concentration was calculated from the sum of
HCO3+CO3 (estimated from alkalinity and pH) and dissolved CO2 (see method description under ‘CO2
evasion’) (Jonsson et al. 2007). Lake DIC was multiplied by the catchment-lake-specific normal
discharge (1961-1990) (Beldring et al. 2002) to give lake DIC fluxes in g C m-2 yr-1. Multiplying the
different lake DIC fluxes by the area of Norway gave a range of DIC export, of which the median was
chosen as the DIC export for Norway. The DIC fluxes were calculated for 1990 to 2008 by
multiplication by the ratio of 1990-2008 discharge and 1961-1990 normal discharge for Norway. The
10- and 90-percentile of the lake DIC export, adjusted for discharge in the same way, was used as
uncertainty range.
The use of lake instead of river chemistry might introduce a bias to the DIC export estimate. In
Sweden, river mouth and stream DIC was found to be systematically higher than lake DIC, which was
attributed to increasing groundwater inputs of carbonates (Humborg et al. 2010). However, no
systematic differences between stream order and DIC were found in headwaters in Sweden and
Finland (Huotari et al. 2013; Olefeldt et al. 2013; Wallin et al. 2013). An opposite effect to DIC
estimates might be the declining oversaturation of dissolved CO2 with stream order. Without
additional data, biases in the DIC export are difficult to evaluate.

17
Results
Carbon balance of Norway
The mean annual uptake of carbon in terrestrial ecosystems in Norway between 1990 and 2008 was
6.0±0.9 Tg C, which equalled 40% of Norway’s mean annual greenhouse gas (GHG) emissions for the
same period (Figure 2A). The summed riverine transport of OC and DIC was almost 25% of the
terrestrial carbon uptake, or 1.0±0.1 and 0.3 (0.1-0.8) Tg C yr-1, respectively. It is important to note
that the net change in the terrestrial carbon pool size is not simply found by reducing the terrestrial
carbon uptake with the riverine OC export. Links between terrestrial carbon sequestration and lateral
aquatic carbon transport may be conceptually clear, but methodologically it is not straightforward to
incorporate estimates of lateral aquatic carbon transport in terrestrial carbon accumulation estimates at
a regional scale. We will return to this issue in the discussion. Evasion of CO2 from surface waters was
1.7 (0.6 – 4.0) Tg C yr-1, which includes CO2 from in-lake processing of OC, from autotrophic and
heterotrophic respiration on land and from weathering processes. The largest terrestrial carbon uptake
was in forest biomass (4.9±0.4 Tg C yr-1), followed by forest soils (1.1±0.2 Tg C yr-1). Carbon uptake
in peatlands and carbon losses from agricultural areas almost balanced each other (0.3±0.2 and -
0.4±0.8 Tg C yr-1, respectively). Mountains and lakes were the smallest carbon sinks (<0.1 Tg C yr-1).
On an area basis, the most effective carbon sinks were forest biomass (40 ±3 g C m-2 yr-1) and
peatland soils (19±15 g C m-2 yr-1), while the agricultural soils lost carbon (-36±74 g C m-2 yr-1)
(Figure 2B). The lowest rates of carbon accumulation were found in forest soils (9±1 g C m-2 yr-1),
lake sediments (1.8±0.9 g C m-2 yr-1) and mountain vegetation biomass (0.5±0.3 g C m-2 yr-1).
The uncertainty in the total terrestrial carbon uptake was 16%, primarily related to the
uncertainty in three components of the carbon balance, i.e. carbon uptake in tree biomass, peatlands
and agricultural soils. The uncertainty in carbon loss rate was larger than the rate itself for agricultural
soils (Table 5). The relative uncertainty was lowest in tree biomass and forest soils, followed by
peatlands. Mountain biomass and lake sediments had similar relative uncertainty but because of their
modestly sized sink, mountains and lakes hardly contributed to the uncertainty in carbon uptake at the
national scale.
18
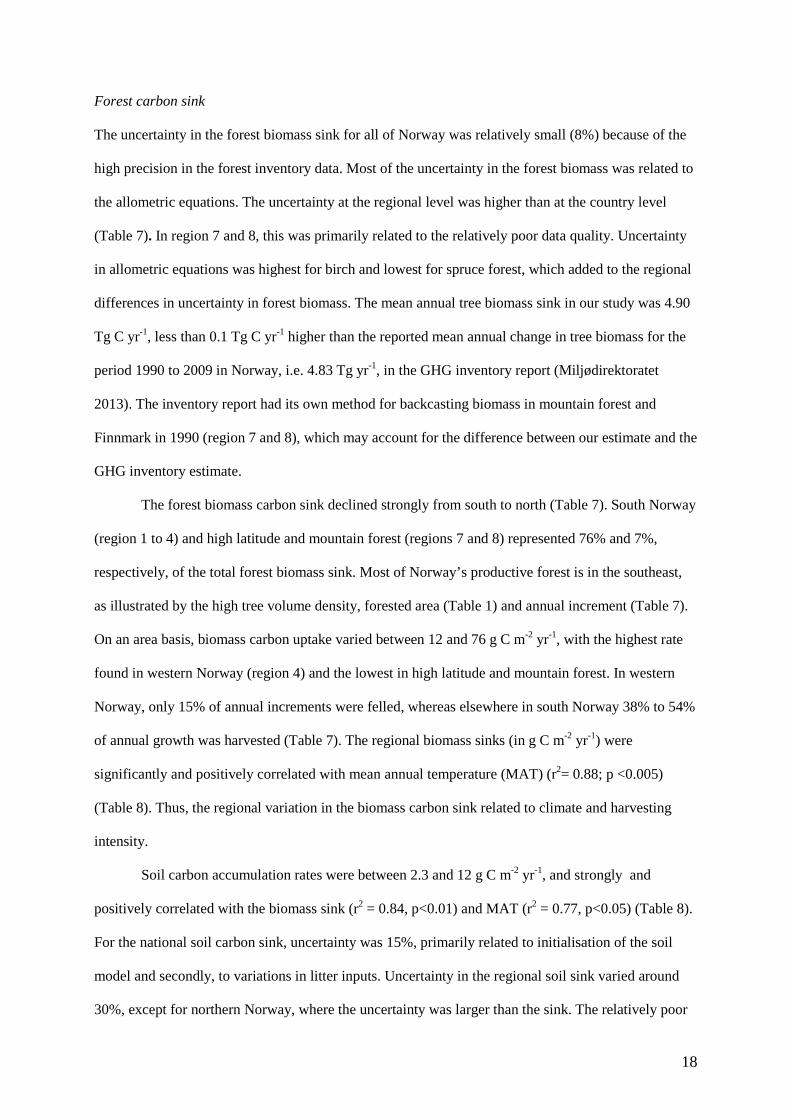
Forest carbon sink
The uncertainty in the forest biomass sink for all of Norway was relatively small (8%) because of the
high precision in the forest inventory data. Most of the uncertainty in the forest biomass was related to
the allometric equations. The uncertainty at the regional level was higher than at the country level
(Table 7). In region 7 and 8, this was primarily related to the relatively poor data quality. Uncertainty
in allometric equations was highest for birch and lowest for spruce forest, which added to the regional
differences in uncertainty in forest biomass. The mean annual tree biomass sink in our study was 4.90
Tg C yr-1, less than 0.1 Tg C yr-1 higher than the reported mean annual change in tree biomass for the
period 1990 to 2009 in Norway, i.e. 4.83 Tg yr-1, in the GHG inventory report (Miljødirektoratet
2013). The inventory report had its own method for backcasting biomass in mountain forest and
Finnmark in 1990 (region 7 and 8), which may account for the difference between our estimate and the
GHG inventory estimate.
The forest biomass carbon sink declined strongly from south to north (Table 7). South Norway
(region 1 to 4) and high latitude and mountain forest (regions 7 and 8) represented 76% and 7%,
respectively, of the total forest biomass sink. Most of Norway’s productive forest is in the southeast,
as illustrated by the high tree volume density, forested area (Table 1) and annual increment (Table 7).
On an area basis, biomass carbon uptake varied between 12 and 76 g C m-2 yr-1, with the highest rate
found in western Norway (region 4) and the lowest in high latitude and mountain forest. In western
Norway, only 15% of annual increments were felled, whereas elsewhere in south Norway 38% to 54%
of annual growth was harvested (Table 7). The regional biomass sinks (in g C m-2 yr-1) were
significantly and positively correlated with mean annual temperature (MAT) (r2= 0.88; p <0.005)
(Table 8). Thus, the regional variation in the biomass carbon sink related to climate and harvesting
intensity.
Soil carbon accumulation rates were between 2.3 and 12 g C m-2 yr-1, and strongly and
positively correlated with the biomass sink (r2 = 0.84, p<0.01) and MAT (r2 = 0.77, p<0.05) (Table 8).
For the national soil carbon sink, uncertainty was 15%, primarily related to initialisation of the soil
model and secondly, to variations in litter inputs. Uncertainty in the regional soil sink varied around
30%, except for northern Norway, where the uncertainty was larger than the sink. The relatively poor

19
data quality for the tree biomass in this region cascades down to the soil sink, as tree data drive soil
carbon dynamics in our scheme of calculation.
Carbon uptake in peatlands, mountains, lakes and agricultural areas
The carbon sinks and sources of peatlands, mountains, lakes and agricultural areas were based on a
combination of published studies with relevance for Norwegian conditions combined with what was
available of national data. The annual change in the peatland carbon pool was calculated for
undisturbed boreal and arctic (0.29±0.22 and 0.06±0.04 Tg C yr-1, respectively), and disturbed boreal
peatlands (-0.05±0.04 Tg C yr-1), giving a total of 0.29±0.23 Tg C yr-1 (19.3±15.2 g C m-2 yr-1). The
uncertainty in the carbon sink for peatlands was related to variation in the carbon accumulation rates
of the three full carbon balances for boreal and subarctic peatlands. Norway does not report on
unmanaged wetlands in its national GHG inventories (Miljødirektoratet 2013).
The lake carbon sink in the sediments was modest (<0.1 Tg C yr-1), calculated using an
estimate of the Holocene lake sedimentation rate and large uncertainty, which was a reflection of
spatial variation in lake sediment pools estimates. Mountainous Norway was a small carbon sink (0.07
Tg C yr-1), related to increased biomass on wooded mires. Mountains are an inhomogeneous type of
landscape with generally little vegetation and shallow soils, except for wooded mires.The reported
change in biomass pools on wooded mires in 2011 in the National GHG Inventory Report was 0.02 Tg
C (Miljødirektoratet 2013). Estimates for 1990 to 2008 were not available. Agricultural areas, by
contrast, were a large but highly uncertain source of carbon to the atmosphere (-0.40±0.80 Tg C-1).
The main reason for the net losses from agricultural areas was subsidence of cultivated organic soils
from cultivation. The uncertainty interval opened for the possibility that agricultural areas in Norway
gain carbon, which was primarily related to the large uncertainty in the carbon balance of mineral
soils. The national inventory report for GHG emissions between 1990 and 2008 estimated a mean
annual loss from agricultural land (cropland and grassland) of 0.57 Tg C, primarily related to organic
soils (Miljødirektoratet 2010), and the estimate was lowered to 0.48 Tg C in a subsequent inventory
report, related to improved data quality (Miljødirektoratet 2013).
20
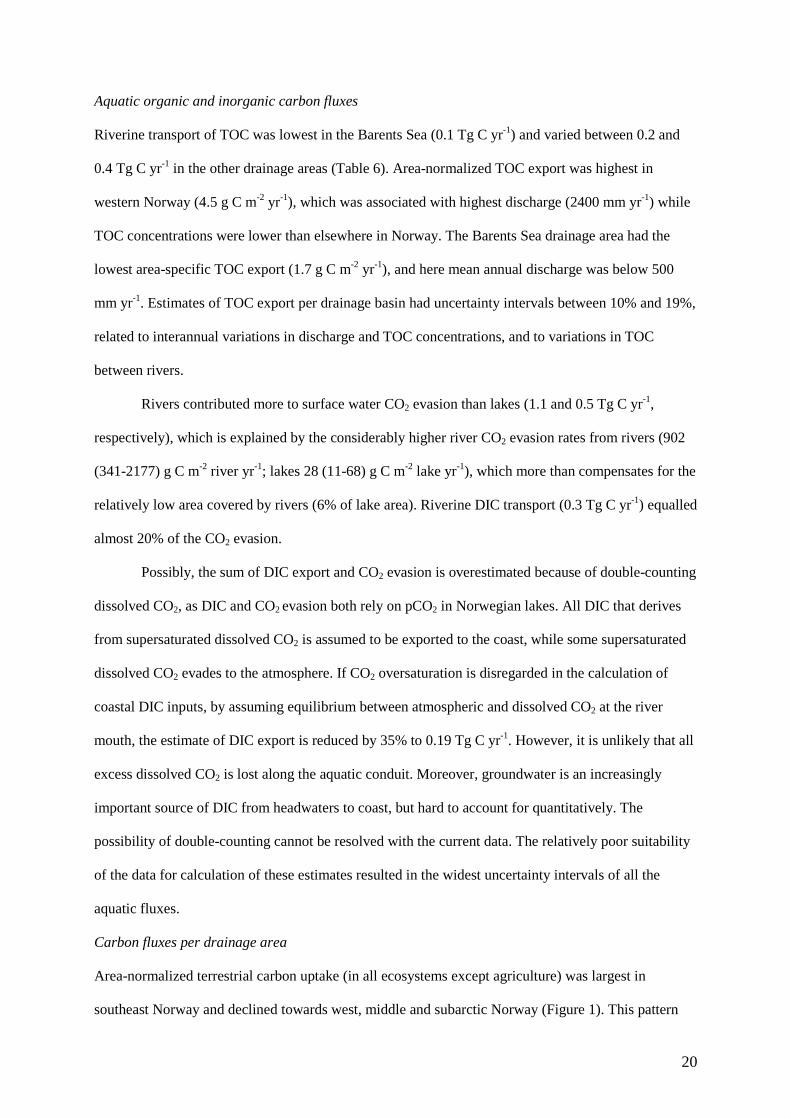
Aquatic organic and inorganic carbon fluxes
Riverine transport of TOC was lowest in the Barents Sea (0.1 Tg C yr-1) and varied between 0.2 and
0.4 Tg C yr-1 in the other drainage areas (Table 6). Area-normalized TOC export was highest in
western Norway (4.5 g C m-2 yr-1), which was associated with highest discharge (2400 mm yr-1) while
TOC concentrations were lower than elsewhere in Norway. The Barents Sea drainage area had the
lowest area-specific TOC export (1.7 g C m-2 yr-1), and here mean annual discharge was below 500
mm yr-1. Estimates of TOC export per drainage basin had uncertainty intervals between 10% and 19%,
related to interannual variations in discharge and TOC concentrations, and to variations in TOC
between rivers.
Rivers contributed more to surface water CO2 evasion than lakes (1.1 and 0.5 Tg C yr-1,
respectively), which is explained by the considerably higher river CO2 evasion rates from rivers (902
(341-2177) g C m-2 river yr-1; lakes 28 (11-68) g C m-2 lake yr-1), which more than compensates for the
relatively low area covered by rivers (6% of lake area). Riverine DIC transport (0.3 Tg C yr-1) equalled
almost 20% of the CO2 evasion.
Possibly, the sum of DIC export and CO2 evasion is overestimated because of double-counting
dissolved CO2, as DIC and CO2 evasion both rely on pCO2 in Norwegian lakes. All DIC that derives
from supersaturated dissolved CO2 is assumed to be exported to the coast, while some supersaturated
dissolved CO2 evades to the atmosphere. If CO2 oversaturation is disregarded in the calculation of
coastal DIC inputs, by assuming equilibrium between atmospheric and dissolved CO2 at the river
mouth, the estimate of DIC export is reduced by 35% to 0.19 Tg C yr-1. However, it is unlikely that all
excess dissolved CO2 is lost along the aquatic conduit. Moreover, groundwater is an increasingly
important source of DIC from headwaters to coast, but hard to account for quantitatively. The
possibility of double-counting cannot be resolved with the current data. The relatively poor suitability
of the data for calculation of these estimates resulted in the widest uncertainty intervals of all the
aquatic fluxes.
Carbon fluxes per drainage area
Area-normalized terrestrial carbon uptake (in all ecosystems except agriculture) was largest in
southeast Norway and declined towards west, middle and subarctic Norway (Figure 1). This pattern

21
was primarily related to a decline in carbon accumulation in biomass. Carbon sequestration in soils
and peatlands varied between the drainage areas, because of a considerable proportion of peatlands in
middle and subarctic Norway (Table 1), and because of a higher carbon sequestration rate in peatlands
than in forest soils (Figure 2B). In subarctic Norway, carbon accumulation in peatlands dominated
over carbon accumulation in forest soils. Riverine transport of OC varied more between drainage areas
(1.7 to 4.5 g C m-2 yr-1) than accumulation of carbon in soils (3.7 to 6.1 g C m-2 yr-1). The riverine OC
flux equalled 10% of the terrestrial carbon uptake in southeast Norway and 19% to 23% in the other
drainage basins (Figure 3). In subarctic Norway, about half of what was stored in biomass annually
was transported as OC to the Barents Sea. For the other drainage areas, this percentage varied between
13% and 25%. In west Norway, the riverine carbon flux exceeded the combined accumulation of
carbon in peatlands and forest soils, and was elsewhere 46% to 77% of combined forest soil and
peatland accumulation.

22
Discussion
Carbon accumulation in boreal landscapes - forests
Boreal landscapes in Norway are important sinks for atmospheric CO2: uptake in biomass and soils
was equal to circa 40% of anthropogenic greenhouse gas emissions (in CO2 equivalents) in Norway
between 1990 and 2008 (Miljødirektoratet 2010). Globally, the land carbon sink – not included
emissions from land use change – amounts to 30% of CO2 emissions from fossil fuel and cement (Le
Quéré et al. 2013 ).
In Norway, forests comprise the largest carbon sink, as well as in Sweden and Finland.
Combined annual forest carbon uptake in the Nordic countries (this study, Ågren et al. (2007b) and
Liski et al. (2006)) around the start of the 21st century was 21 Tg C, corresponding to circa 0.3% of
global carbon emissions from fossil fuels and cement production (Canadell et al. 2007). Expressed on
an area basis, forest biomass in Norway accumulated 40 g C m-2 yr-1 (1990-2008) (this study). In
Sweden, a comparable estimate is 23 (1926-2006) (Ågren et al. 2007b), and in Finland 28 (1990-1999)
(Liski et al. 2006) g C m-2 yr-1. The soil carbon sink in these studies is 23%, 35% and 39% of the
biomass sink, respectively. Luyssaert et al. (2010) calculated a biomass and soil carbon sink in
European forests between 1990 and 2005 of 54 and 22 g C m-2 yr-1, respectively. Luyssaert et al’s
estimate of the biomass sink was primarily based on forest inventory data, just like the Fennoscandian
studies, and is therefore expected to be of similar certainty. The present rates of biomass increase in
Scandinavia are largely a legacy of reduced logging intensity and the age-structure of the forest
(Anton-Fernandez & Astrup 2012), suggesting that future growth rates may decline (Liski et al. 2006;
Luyssaert et al. 2010). Old forests can still be strong carbon sinks, but less effective than younger,
middle-age forests (Luyssaert et al. 2010; Luyssaert et al. 2008).
Interestingly, the soil carbon sink for Europe is considerably larger than the national forest soil
sink estimates for Fennoscandia, suggesting that present rates of soil carbon accumulation of
temperate forests exceed those of boreal forests. However, soil carbon pools in boreal forests are
higher than in temperate forests (Lal 2005; Post et al. 1982), implying lower Holocene soil carbon
accumulation rates in temperate than in boreal forests. Luyssaert et al. (2010) calculated the soil
carbon sink with a simple soil model (Nabuurs et al. 2003), somewhat comparable to the Yasso model
23
(Liski et al. 2005) and the Q-model (Ågren et al. 2007b) used in the Fennoscandian studies. These
models describe soil carbon accumulation as driven by litter decomposition and dependent on litter
quality, with fixed (Nabuurs) or temperature-dependent (Yasso, Q-model) decay rates. Soil carbon
accumulation rates in European forests might be higher than in Fennoscandian forests, possibly due to
higher levels of nitrogen deposition in Europe (de Vries et al. 2009). Nitrogen deposition, however, is
not included as a driver of soil carbon accumulation in the aforementioned models. None of the
models has detailed descriptions of soil-forming processes, probably because they were developed for
processing data derived from forest inventories, with calibration of process rates based on litter bag
studies (Hyvonen & Ågren 2001; Liski et al. 2003; Liski et al. 2005). Thus, soil carbon accumulation
in these models was simply defined as the balance between litter production and heterotrophic
respiration of litter and SOM, where litter quality and temperature-dependent decay rates are central
features.
Our approach for calculating the soil carbon sink hinges on the assumption that vegetation
dynamics are the dominant driver of soil carbon sequestration (Liski et al. 2006), an assumption which
is also used in global vegetation models, i.e. Sitch et al. (2008). Using temperature as a climatic driver
of soil carbon sequestration, however, is a gross simplification of well-understood climatic effects on
soil carbon cycling. For instance, Post (1982) suggests that precipitation is a strong positive driver of
soil carbon accumulation in biomes. Within northern and temperate climates, soil organic matter
accumulation is strongly and positively related to precipitation (Callesen et al. 2003; Michalzik et al.
2001; Michalzik et al. 2003) in addition to temperature, adsorption processes and organic matter
quality (Lundstrom et al. 2000). Whether the net effect of increased forest growth and higher
temperatures is more soil carbon storage is under debate (Davidson & Janssens 2006; Jandl et al.
2007; Kammer et al. 2009). Possible biases in the forest carbon soil sink estimates for Europe and
Fennoscandia, related to the overly simplified soil models, are hard to evaluate, as few other estimates
for soil sinks at regional scales are available.

24
Carbon accumulation in boreal landscapes - mountains, peatlands, agricultural areas, lakes
Our estimates of ecosystem carbon sinks indicate that the other dominating ecosystems in Norway are
far less effective carbon accumulators than forests. Mountainous Norway sequesters little carbon,
despite covering most of Norway. The most likely process for increasing carbon stores in the
mountains is birch forest expansion related to reduced summer farming and grazing pressure (Bryn
2008; Speed et al. 2014), however, carbon pools in mountain forest and tundra vegetation are low
compared with forest. De Wit et al. (2014) concluded that mountain forest expansion has limited
potential to increase the terrestrial carbon sink in Norway.
The net carbon accumulation in peatlands is the result of accumulation in undisturbed
peatlands and losses of carbon from drained peatlands. The estimated overall carbon accumulation rate
(19 g C m-2 yr-1) is somewhat lower than the long-term (29 g C m-2 yr-1) and recent (23 g C m-2 yr-1)
carbon accumulation rate in northern peatlands (Gorham 1991). A synthesis of eddy covariance carbon
flux studies at five northern peatland sites indicated a much higher carbon accumulation rate during
the last decade (32 g C m-2 yr-1) than during the last 7000 years (11 g C m-2 yr-1) (Yu 2012). Some of
the peatland flux studies in Yu’s study were from bogs in oceanic climates with longer growing
seasons (Ireland, Scotland), which could account for the relatively high carbon accumulation rates.
Our estimate appears to be in reasonable agreement with other studies on peatland carbon
accumulation.
Agricultural soils are a significant, but highly uncertain source of atmospheric carbon.
Subsidence of cultivated organic soils was the main driver of the agricultural carbon source, based on
an IPCC emission factor of 570 g C m-2 yr-1 which is close to emission factors estimated for
Norwegian cultivated peat soils (i.e., 800, 860 and 600 g C m-2 yr-1) (Grønlund et al. 2008a).
Agricultural, cultivated organic soils cover 3% of Norway, and their importance in the national carbon
balance is disproportionate to their size. Other studies of greenhouse gas emissions from northern
agricultural soils also emphasize carbon losses from organic soils (Kasimir-Klemedtsson et al. 1997;
Maljanen et al. 2010).
The estimate for the lake carbon sink in Norway is modest compared with global estimates of
sedimentation in lakes (Cole et al. 2007). Lake carbon sedimentation was insignificant compared with
25
transport and mineralization of terrestrial organic carbon in a large catchment in Northern Sweden
(Jonsson et al. 2007), similar to our study. We used the mean Holocene carbon of 1.8 g C m-2 lake area
yr-1 as an estimate of lake carbon accumulation rates, with a variation between 0.2 and 8.5 g C m-2 yr-1.
This range is wider than measured rates of lake carbon sedimentation in boreal regions (i.e. 1.0 to 5.7
g C m-2 lake area yr-1) (Algesten et al. 2004). Paleolimnological studies of Norwegian lakes document
substantial variation in lake sedimentation over time (Balascio & Bradley 2012). Still, even a tripling
of the lake carbon sink will not turn it into a significant factor in the carbon balance of Norway. It
seems reasonable to conclude that lake sedimentation is a process of minor importance for recent
carbon accumulation in northern landscapes, although in a longer-term perspective boreal lakes
sequester significant amounts of carbon (Kortelainen et al. 2004).
Riverine carbon export from boreal landscapes
The river OC export estimate for Norway (3.0 g C m-2 yr-1) is firmly grounded in monitoring data,
similar to the forest biomass carbon uptake, and therefore considered relatively certain and unlikely to
be strongly biased. It agrees with other estimates of riverine OC export of OC from northern
landscapes, such as from Finland to the Baltic Sea (3.5 g C m-2 yr-1) (Raike et al. 2012), while Swedish
coastal inputs are 2.7 g C m-2 yr-1 (Humborg et al. 2010). Riverine OC transport to Arctic seas varied
between 0.8 and 2.3 g C m-2 yr-1 (Holmes et al. 2012), on average 1.6 g C m-2 yr-1, almost equal to
riverine OC export in subarctic Norway (1.7 g C m-2 yr-1). Ciais et al. (2008) estimated riverine OC
export from northern Europe (>50 oN) to 2.9 g C m-2 yr-1. All estimates of riverine OC export from
large drainage areas in boreal and arctic regions fall within a narrow range, roughly 1 to 5 g C m-2 yr-1.
Riverine inorganic carbon export is more uncertain than the OC export. The mean DIC export
of 1.0 g C m-2 yr-1 and its uncertainty interval (0.4-2.5 g C m-2 yr-1) falls in the range of DIC export
reported for Northern landscapes elsewhere: Lake Pääjärvi in southern Finland (1.0 g C m-2 yr-1
(Huotari et al. 2013)), the Krycklan catchment in northern Sweden (0.4 g C m-2 yr-1 (Wallin et al.
2013)), the Öreälven catchment in northern Sweden (0.9 g C m-2 yr-1 (Jonsson et al. 2007)) and for all
of Sweden (1.6 g C m-2 yr-1 (Humborg et al. 2010)). Riverine IC export from northern Europe (2.2 g C
m-2 yr-1 (Ciais et al. 2008)) also falls within the uncertainty range, although this region includes areas
26
with more limestone than what is found in Norway. Clair et al. (1994) observed a wide range of DIC
export from large Canadian rivers (0.04-4.19 g C m-2 yr-1), attributed to differences in sources of IC,
i.e. bedrock and associated weathering rates, and autotrophic and heterotrophic respiration.
The lake CO2 evasion rate (28 g C m-2 lake yr-1) is similar to the estimates for large catchments
in mid-northern Sweden (28 g C m-2 lake yr-1 (Algesten et al. 2004)), but lower than in the Öreälven
catchment (63 g C m-2 lake yr-1 (Jonsson et al. 2007)) and the estimate for Sweden (53 g C m-2 lake yr-1
(Humborg et al. 2010)). The latter are within the uncertainty range of the Norwegian estimate (11-68 g
C m-2 lake yr-1). Also for river CO2 evasion rate, the results from other studies fall within or overlap
with the uncertainty range (902 (341-2177) g C m-2 river yr-1): 471 g C m-2 yr-1 in Jonsson et al.
(2007), 1690 g C m-2 river yr-1 in Huotari et al. (2013) and 1455-6411 g C m-2 river yr-1 in (Wallin et
al. 2013). Algesten et al. (2004) applied the same evasion rate to rivers and lakes, resulting in a much
lower rate (47 g C m-2 river yr-1).
Cole et al. (2007) estimated that circa 50% of all headwater land-derived carbon inputs on a
global scale are lost on its way from headwater to coast, either through CO2 evasion or by sediment
storage. The sum of CO2 evasion and sediment storage for Norway is 2.0 Tg C yr-1, slightly higher
than the total OC inputs to the coast, i.e. 1.7 Tg C yr-1. However, given the large uncertainty in these
numbers, our estimates agree with Cole et al. (2007). This implies that headwater OC export in
Norway might be higher than coastal OC inputs (6 g C m-2 yr-1 or 2 Tg C yr-1). Reported headwater
TOC export from boreal landscapes presents a wide range, from <2 to >50 g C m-2 yr-1, with median
exports of 7.6 and 9.6 g C m-2 yr-1 for North America and Europe, respectively (Hope et al. 1994).
Headwater catchments in Northern Sweden and eastern Finland exported 1.5 to 10 g C m-2 yr-1 (Ågren
et al. 2007a), and 2.3 and 15 g C m-2 yr-1 (Rantakari et al. 2010), respectively. Buffam et al. (2011)
estimated that forested and wetland catchments exported 4 and 11 g C m-2 yr-1, respectively.
Headwater DOC concentrations have shown wide-spread increases in northern lakes and
rivers, including in Fennoscandia (De Wit et al. 2007; Erlandsson et al. 2008; Monteith et al. 2007;
Vuorenmaa et al. 2006). Given the strong relation between discharge and DOC export (Clair et al.
2013; Gielen et al. 2011; Haaland et al. 2008; Raike et al. 2012), the positive trends in headwater
DOC, and observed and predicted increases in discharge in the Nordic countries due to climate

27
warming (Wilson et al. 2010), a future increase in headwater catchment DOC aquatic export appears
likely, with possible impacts on soil carbon sequestration in forests soils and peatlands.
Coastal margin sediments are the main recipient of land-derived organic matter, but the fate of
deposited terrestrial organic matter is poorly understood (Borges et al. 2005; Hedges et al. 1997).
Degradation of land-derived organic matter in lakes and rivers, and further transformations in coastal
areas, can lead to highly refractory organic matter, with potentially long residence times in coastal
sediments and deeper oceans (Dittmar & Kattner 2003; Raymond & Bauer 2001). This is especially
true for arctic oceans, as there are very few removal mechanisms for organic matter (Dittmar &
Kattner 2003), suggesting a long-term sink for atmospheric carbon from land-derived organic carbon.
Integration of terrestrial and aquatic carbon fluxes
A key question with regard to the role of riverine OC transport in the terrestrial cycle relates to the
source of OC in rivers. If the OC in rivers is recently mobilized, formerly stable soil organic matter,
aquatic OC export would reduce soil carbon stores and bring the terrestrial carbon pool from one
(semi-) steady state to the next. If not, river OC transport represents a flux of carbon from soils in
steady state with the carbon flux from vegetation to soils and is a fixed proportion of terrestrial
productivity. If lateral aquatic carbon fluxes impact present rates of terrestrial carbon accumulation, it
may not be adequately accounted for in terrestrial carbon balances (Cole et al. 2007; Luyssaert et al.
2010).
In the carbon balance for European forest (Luyssaert et al. 2010), river OC export equals circa
50% of the soil carbon sink. The estimated river OC export for Norway (this study), Sweden
(Humborg et al. 2010) and Finland (Raike et al. 2012) is 32% to 37% of the national forest soil carbon
sinks. Luyssaert et al. (2010) state explicitly that their methods were not conclusive with regard to the
necessity of correcting the soil carbon sink with riverine OC transport, and therefore no correction was
done.
Net Ecosystem Production (NEP) can be determined as the balance of all major carbon fluxes
in and out of the ecosystem: gross primary production (GPP), ecosystem respiration (Reco)
(autotrophic (Ra) and heterotrophic (Rh)) and lateral transport including riverine carbon transport

28
(Randerson et al. 2002). This approach is common in single-site carbon balances in peatlands (Yu
2012) and forests (Gielen et al. 2011), but few regional carbon balances follow this concept.
Three carbon balances for several thousand km2 catchments have been reported based on
upscaled eddy covariance measurements of vertical CO2 fluxes, to give Net Ecosystem Exchange
(NEE), from which the lateral riverine carbon flux could be subtracted in order to quantify the
terrestrial sink or NEP.
The first was made by Jonsson et al. (2007) at the 3000 km2 Öreälven river basin in boreal
Sweden. Here, headwater aquatic export of TOC was 8.6 g C m-2 yr-1 and made up 6% of headwater
catchment NEE (139 g C m-2 yr-1). For the entire river basin, the ratio of TOC export to NEE was 3%,
as river basin TOC export was reduced to 3.6 g C m-2 yr-1 because of in-stream and in-lake processes.
The second was conducted by Christensen et al. (2007) at the 4000 km2 Lake Torneträsk river basin in
subarctic Sweden. Aquatic DOC export was 2 g C m-2 yr-1 and comprised 19% of NEE (10.6 g C m-2
yr-1). The third was carried by Buffam et al. (2011) at the 6400 km2 Northern Highlands Lake (NHL)
District in the northern US. Here, riverine organic carbon export (5.3 g C m-2 yr-1) was 3% of
catchment NEE (175 g C m-2 yr-1). The NHL district and the Öreälven catchment included large areas
of productive forest, driving the relatively high NEE. For a single forest stand, Gielen et al. (2011)
found that DOC export from a pine forest was 11% of NEP (91 g C m-2 yr-1), where NEP was
estimated as the balance of all major carbon fluxes. None of these carbon balances supplied a separate
estimate of the soil carbon sink. Thus, an evaluation of the relative importance of DOC export for
catchment soil carbon accumulation is not possible. A review of five full carbon balances in northern
peatlands showed that DOC export was on average 40% of NEP (Yu 2012).
At the landscape scale, the simplicity of defining NEP based on theoretical fluxes contrasts
with the complexity of measuring GPP and Reco (Luyssaert et al. 2009) and upscaling of point
measurements of NEE. In our approach, we estimated NEP as the change in ecosystem carbon pools in
biomass and soils, similar to Luyssaert et al. (2010). Using a consistent approach across four
climatically contrasting drainage basins, we calculated that riverine OC export ranged from 10% to
23% of drainage basin NEP, and 46% to 113% of soil carbon accumulation (summed for forests and
peatlands). If we assume that an unbiased estimate of NEP with regard to lateral carbon fluxes is
29
obtained by simply subtracting riverine OC export from NEP, drainage basin NEP is reduced by
between 10% and 23%. This is lower than the DOC flux correction of NEP in peatlands (Yu 2012),
similar to Lake Torneträsk in northern Sweden) (Christensen et al. 2007), and much higher than the
NHL District in northern US (Buffam et al. 2011) and Öreälven catchment (Jonsson et al. 2007). NEP
would be reduced even more if we had used headwater OC export, instead of coastal OC inputs. As
river OC originates from soils, we might correct the soil carbon sink by subtracting riverine OC fluxes.
This results in a circa 50% reduction of the soil sink in southeast and subarctic Norway, and a switch
of the soil in western Norway from sink to source of carbon. The latter appears to be an unreasonable
result, from which it may be concluded that either 1) NEP should not be corrected by subtracting
riverine OC fluxes, 2) the estimate for the soil sink is too low, or 3) the soil sink should be at least
equal to the riverine OC flux to compensate for lateral losses of OC. The latter point might be
considered as a way to contribute to validation of regional scale soil carbon sink estimates. For this,
better estimates of headwater OC export would be extremely useful. For better quantification and
understanding of the role of northern landscapes in the carbon cycle, there is a clear need for
validation of soil sink estimates and tools to investigate the role of lateral carbon fluxes in soil carbon
sequestration.
The role of management for landscape carbon accumulation
Land use and management set a strong mark on the global carbon cycle due to greenhouse gas
emissions from deforestation (Bala et al. 2007), peatland drainage, burning and planting (Frolking et
al. 2011) and agriculture (Schulze et al. 2009). The current increase in carbon pools in forests in the
northern hemisphere may be largely a legacy of former land use (Goodale et al. 2002), although
additional factors such as nitrogen deposition (Thomas et al. 2010) and climate warming (Boisvenue
& Running 2006) also are likely to contribute.
Greenhouse gas balances in cultivated peatlands in the Nordic countries are strongly
dependent on site characteristics and land-use practices (Maljanen et al. 2010). Drainage for
cultivation and forestry has turned peatlands into significant sources of CO2. In our carbon balance,
annual losses of carbon from cultivated organic soils in agricultural areas and from disturbed peatlands
30
were 0.40 and 0.05 Tg C, respectively, exceeding carbon accumulation in undisturbed peatlands (0.29
Tg C). Undisturbed peatlands could become significant sources of atmospheric CO2 under higher
temperatures (Dorrepaal et al. 2009) and drought (Mettrop et al. 2014). However, the threat from land
use to destabilization of peatland carbon stores in boreal landscapes appears larger. Between 15 and
30% of Norwegian peatlands may have been drained for cultivation and forestry until the 1960s
(Johansen 1997; Maljanen et al. 2010), which is likely to have led to large losses of carbon. Little is
known about the current carbon sink or source strength of these drained, forested peatlands in Norway,
but other studies suggest that formerly drained peatlands continue to be carbon sources for decades
(Armentano & Menges 1986). For cultivated organic soils in Norway, there are measurements of
subsidence rates and CO2 effluxes (Grønlund et al. 2008a) but to what extent these rates are
representative for various combinations of soil type and management is not clear. Quantifying
greenhouse gas emissions taking into a combination of management system and soil type such as done
by Andren et al. (2008) would improve the reliability of the carbon balance in Norwegian agricultural
soils. Without improved geographic data and understanding of effects of past on current land use on
carbon-rich soils, especially those under agricultural land use, peatlands will continue to represent a
large source of uncertainty in the national carbon balance.
Conclusions
Terrestrial carbon accumulation and riverine transport of land-derived carbon in northern landscapes
are significant compared with anthropogenic emissions of CO2. Terrestrial carbon uptake in Norway
was largest in the south. Riverine carbon fluxes were similar in size compared with changes in soil
carbon pools in forests and peatlands. Where accumulation of carbon in forest biomass and riverine
fluxes of organic carbon are relatively well-constrained because of their empirical basis in monitoring
databases, accumulation and losses of soil carbon continue to create considerable uncertainty in
landscape carbon balances. This is related to inadequately validated tools for estimation of the forest
soil carbon sink, and to the role of land use and management in agricultural and peatland areas. Future
drivers of terrestrial carbon stores are climate and land use, which are expected to impact the
ecosystems in northern landscapes differently. Integration of lateral and vertical carbon fluxes
31
deserves more attention, especially in cold and wet boreal landscapes of low productivity, for a better
understanding and quantification of the terrestrial carbon cycle.
Acknowledgements
This work was funded by the Norwegian Research Council projects “Terrestrial C sequestration
potential in Norway under present and future climate (TerraC)” (184681/S30), ECCO (224779/E10),
and by NIVA's Strategic Institute Initiative "Climate effects from mountains to fjords" (Research
Council of Norway, contract no. 208279). This work profited from the Top Level Research Initiative
Collaborative Project financed by Nordforsk (Domqua, 60501). Two anonymous referees and the
editor are gratefully acknowledged.
32
List of tables and figures
Table 1 Description of drainage areas and regions in Norway. Details on the land cover categories are
given in Table 2.
Table 2 Description of land cover categories based on statistics Norwegian Forest Inventory
Table 3 Equations used in the carbon balance for Norway.
Table 4 Peatland carbon balance studies and estimates of peatland carbon accumulation rates for
common Norwegian peatland types.
Table 5 Carbon balance for agricultural areas
Table 6 Key characteristics of river monitoring in four main drainage areas of Norway, and riverine
carbon fluxes for the period 1990 to 2008.
Table 7 Mean annual forest carbon uptake in eight regions in Norway between 1990 and 2008.
Table 8 Multivariate correlations of forest carbon fluxes and forest and climate characteristics for eight
regions. Bold and italic fonts indicate that pairwise correlations were significant at the 0.01 and 0.05
level, respectively.
Figure 1 Norway – drainage basins with mean annual area-normalized fluxes of carbon in g C m-2 yr-1.
Vertical arrows terrestrial fluxes, horizontal arrows show aquatic fluxes of organic carbon.
B=biomass, S=soils and sediments. Included ecosystems are forest, lakes, mountains and peatlands.
Figure 2 Carbon balance of Norway for 1990 to 2008 in Tg C yr-1 (panel A) and area-normalized per
ecosystem in g C m-2 yr-1 (panel B). Greenhouse gas (GHG) emissions are mean emissions from
Norway in CO2_C equivalents (Miljødirektoratet 2010)
Figure 3 TOC export in % of terrestrial sink, biomass sink, forest and peatland sink, and forest soil
sink for each drainage basin and summed for Norway

33
References
Agren A, Buffam I, Jansson M, Laudon H (2007a) Importance of seasonality and small streams for the
landscape regulation of dissolved organic carbon export. Journal of Geophysical Research-
Biogeosciences 112(G3): G03003. DOI 10.1029/2006jg000381
Agren GI, Hyvonen R, Nilsson T (2007b) Are Swedish forest soils sinks or sources for CO2 - model
analyses based on forest inventory data. Biogeochemistry 82(3): 217-227
Algesten G, Sobek S, Bergstrom AK, Agren A, Tranvik LJ, Jansson M (2004) Role of lakes for
organic carbon cycling in the boreal zone. Global Change Biology 10(1): 141-147
Andren O, Katterer T, Karlsson T, Eriksson J (2008) Soil C balances in Swedish agricultural soils
1990-2004, with preliminary projections. Nutrient Cycling in Agroecosystems 81(2): 129-144
Anton-Fernandez C, Astrup R (2012) Empirical harvest models and their use in regional business-as-
usual scenarios of timber supply and carbon stock development. Scandinavian Journal of
Forest Research 27(4): 379-392
Armentano TV, Menges ES (1986) Patterns of change in the carbon balance of organic soil-wetlands
of the temperate zone. Journal of Ecology 74(3): 755-774
Aurela M, Laurila T, Tuovinen JP (2004) The timing of snow melt controls the annual CO2 balance in
a subarctic fen. Geophysical Research Letters 31(16). DOI 10.1029/2004gl020315
Aurela M, Lohila A, Tuovinen JP, Hatakka J, Riutta T, Laurila T (2009) Carbon dioxide exchange on
a northern boreal fen. Boreal Environment Research 14(4): 699-710
Aurela M, Riutta T, Laurila T, Tuovinen JP, Vesala T, Tuittila ES, Rinne J, Haapanala S, Laine J
(2007) CO2 exchange of a sedge fen in southern Finland - The impact of a drought period.
Tellus Series B-Chemical and Physical Meteorology 59(5): 826-837
Bala G, Caldeira K, Wickett M, Phillips TJ, Lobell DB, Delire C, Mirin A (2007) Combined climate
and carbon-cycle effects of large-scale deforestation. Proceedings of The National Academy
of Sciences of The United States of America 104(16): 6550-6555

34
Balascio NL, Bradley RS (2012) Evaluating Holocene climate change in northern Norway using
sediment records from two contrasting lake systems. Journal of Paleolimnology 48(1): 259-
273
Ballantyne AP, Alden CB, Miller JB, Tans PP, White JWC (2012) Increase in observed net carbon
dioxide uptake by land and oceans during the past 50 years. Nature 488(7409): 70-+
Battin TJ, Luyssaert S, Kaplan LA, Aufdenkampe AK, Richter A, Tranvik LJ (2009) The boundless
carbon cycle. Nature Geoscience 2(9): 598-600
Beldring S, Engeland K, Roald LA, Sælthun NR, Voksø A (2003) Estimation of parameters in a
distributed precipitation-runoff model for Norway. Hydrology and Earth System Sciences 7:
304-316
Beldring S, Roald LA, Voksø A (2002) Avrenningskart for Norge. Årsmiddelverdier for avrenning
1961-1990. In. Norges vassdrags- og energidirektorat. p 50
Berger A, Gschwantner T, McRoberts RE, Schadauer K (2014) Effects of Measurement Errors on
Individual Tree Stem Volume Estimates for the Austrian National Forest Inventory. For. Sci.
60(1): 14-24
Boisvenue C, Running SW (2006) Impacts of climate change on natural forest productivity - evidence
since the middle of the 20th century. Global Change Biology 12(5): 862-882
Borges AV, Delille B, Frankignoulle M (2005) Budgeting sinks and sources of CO2 in the coastal
ocean: Diversity of ecosystems counts. Geophysical Research Letters 32(14): L14601. DOI
10.1029/2005gl023053
Bryn A (2008) Recent forest limit changes in south-east Norway: Effects of climate change or
regrowth after abandoned utilisation? Norwegian Journal of Geography 62(4): 251-270
Buffam I, Turner MG, Desai AR, Hanson PC, Rusak JA, Lottig NR, Stanley EH, Carpenter SR (2011)
Integrating aquatic and terrestrial components to construct a complete carbon budget for a
north temperate lake district. Global Change Biology 17(2): 1193-1211
Callesen I, Liski J, Raulund-Rasmussen K, Olsson MT, Tau-Strand L, Vesterdal L, Westman CJ
(2003) Soil carbon stores in Nordic well-drained forest soils - relationships with climate and
texture class. Global Change Biology 9(3): 358-370

35
Canadell JG, Le Quere C, Raupach MR, Field CB, Buitenhuis ET, Ciais P, Conway TJ, Gillett NP,
Houghton RA, Marland G (2007) Contributions to accelerating atmospheric CO2 growth from
economic activity, carbon intensity, and efficiency of natural sinks. Proceedings Of The
National Academy Of Sciences Of The United States Of America 104(47): 18866-18870
Christensen TR, Johansson T, Olsrud M, Strom L, Lindroth A, Mastepanov M, Malmer N, Friborg T,
Crill P, Callaghan TV (2007) A catchment-scale carbon and greenhouse gas budget of a
subarctic landscape. Philosophical Transactions of the Royal Society a-Mathematical Physical
and Engineering Sciences 365(1856): 1643-1656
Ciais P, Borges AV, Abril G, Meybeck M, Folberth G, Hauglustaine D, Janssens IA (2008) The
impact of lateral carbon fluxes on the European carbon balance. Biogeosciences 5(5): 1259-
1271
Clair TA, Dennis IF, Belanger S (2013) Riverine nitrogen and carbon exports from the Canadian
landmass to estuaries. Biogeochemistry 115(1-3): 195-211
Clair TA, Pollock TL, Ehrman JM (1994) Exports of carbon and nitrogen from river basins in Canadas
Atlantic provinces. Global Biogeochemical Cycles 8(4): 441-450
Cole JJ, Caraco NF (1998) Atmospheric exchange of carbon dioxide in a low-wind oligotrophic lake
measured by the addition of SF6. Limnology and Oceanography 43(4): 647-656
Cole JJ, Prairie YT, Caraco NF, McDowell WH, Tranvik LJ, Striegl RG, Duarte CM, Kortelainen P,
Downing JA, Middelburg JJ, Melack J (2007) Plumbing the global carbon cycle: Integrating
inland waters into the terrestrial carbon budget. Ecosystems 10(1): 171-184
Davidson EA, Janssens IA (2006) Temperature sensitivity of soil carbon decomposition and feedbacks
to climate change. Nature 440(7081): 165-173
de Vries W, Solberg S, Dobbertin M, Sterba H, Laubhann D, van Oijen M, Evans C, Gundersen P,
Kros J, Wamelink GWW, Reinds GJ, Sutton MA (2009) The impact of nitrogen deposition on
carbon sequestration by European forests and heathlands. Forest Ecology and Management
258(8): 1814-1823

36
De Wit HA, Bryn A, Hofgaard A, Karstensen J, Kvalevag MM, Peters GP (2014) Climate warming
feedback from mountain birch forest expansion: reduced albedo dominates carbon uptake.
Global Change Biology 20(7): 2344-2355
De Wit HA, Mulder J, Hindar A, Hole L (2007) Long-term increase in dissolved organic carbon in
streamwaters in Norway is response to reduced acid deposition. Environmental Science &
Technology 41(22): 7706-7713
De Wit HA, Palosuo T, Hylen G, Liski J (2006) A carbon budget of forest biomass and soils in
southeast Norway calculated using a widely applicable method. Forest Ecology And
Management 225(1-3): 15-26
Dittmar T, Kattner G (2003) The biogeochemistry of the river and shelf ecosystem of the Arctic
Ocean: a review. Marine Chemistry 83(3-4): 103-120
Dorrepaal E, Toet S, van Logtestijn RSP, Swart E, van de Weg MJ, Callaghan TV, Aerts R (2009)
Carbon respiration from subsurface peat accelerated by climate warming in the subarctic.
Nature 460(7255): 616-U679
Erlandsson M, Buffam I, Folster J, Laudon H, Temnerud J, Weyhenmeyer GA, Bishop K (2008)
Thirty-five years of synchrony in the organic matter concentrations of Swedish rivers
explained by variation in flow and sulphate. Global Change Biology 14(5): 1191-1198
Frolking S, Talbot J, Jones MC, Treat CC, Kauffman JB, Tuittila ES, Roulet N (2011) Peatlands in the
Earth's 21st century climate system. Environmental Reviews 19: 371-396
Gielen B, Neirynck J, Luyssaert S, Janssens IA (2011) The importance of dissolved organic carbon
fluxes for the carbon balance of a temperate Scots pine forest. Agricultural and Forest
Meteorology 151(3): 270-278
Goodale CL, Apps MJ, Birdsey RA, Field CB, Heath LS, Houghton RA, Jenkins JC, Kohlmaier GH,
Kurz W, Liu SR, Nabuurs GJ, Nilsson S, Shvidenko AZ (2002) Forest carbon sinks in the
Northern Hemisphere. Ecol. Appl. 12(3): 891-899
Gorham E (1991) Northern peatlands - role in the carbon-cycle and probable responses to climatic
warming. Ecol. Appl. 1(2): 182-195
37
Granhus A, Hylen G, Nilsen J (2012) Skogen i Norge. Statistics of Forest Conditions and Resources in
Norway.In Norwegian with English summary. In: Ressursoversikt fra Skog og landskap
03/2012. . Ås, Norway. p 85
Grønlund A, Hauge A, Hovde A, Rasse DP (2008a) Carbon loss estimates from cultivated peat soils in
Norway: a comparison of three methods. Nutrient Cycling in Agroecosystems 81(2): 157-167
Grønlund A, Knoth de Zarruk K, Rasse DP, Riley H, Klakegg O, Nystuen I (2008b) Status for
emission and sequestration of carbon in cultivated soils. Kunnskapsstatus for utslipp og
binding av karbon i jordbruksjord (in Norwegian). Bioforsk Rapport. Bioforsk, Ås, Norway.
Haaland S, Austnes K, Kaste O, Mulder J, Riise G, Vestgarden LS, Stuanes AO (2008) Manipulation
of precipitation in small headwater catchments at Storgama, Norway: Effects on leaching of
organic carbon and nitrogen species. Ambio 37(1): 48-55
Hedges JI, Keil RG, Benner R (1997) What happens to terrestrial organic matter in the ocean? Organic
Geochemistry 27(5-6): 195-212
Henriksen A, Skjelkvale BL, Mannio J, Wilander A, Harriman R, Curtis C, Jensen JP, Fjeld E,
Moiseenko T (1998) Northern European Lake Survey, 1995 - Finland, Norway, Sweden,
Denmark, Russian Kola, Russian Karelia, Scotland and Wales. Ambio 27(2): 80-91
Holmes RM, McClelland JW, Peterson BJ, Tank SE, Bulygina E, Eglinton TI, Gordeev VV,
Gurtovaya TY, Raymond PA, Repeta DJ, Staples R, Striegl RG, Zhulidov AV, Zimov SA
(2012) Seasonal and Annual Fluxes of Nutrients and Organic Matter from Large Rivers to the
Arctic Ocean and Surrounding Seas. Estuaries and Coasts 35(2): 369-382
Hope D, Billett MF, Cresser MS (1994) A review of the export of carbon in river water – fluxes and
processes. Environ. Pollut. 84(3): 301-324
Humborg C, Mörth C-M, Sundbom M, Borg H, Blenckner T, Giesler R, Ittekot V (2010) CO2
supersaturation along the aquatic conduit in Swedish watersheds as constrained by terrestrial
respiration, aquatic respiration and weathering. Global Change Biology 16: 1966-1978
Huotari J, Nykänen H, Forsius M, Arvola L (2013) Effect of catchment characteristics on aquatic
carbon export from a boreal catchment and its importance in regional carbon cycling. Global
Change Biology 19(12): 3607-3620

38
Hyvonen R, Ågren GI (2001) Decomposer invasion rate, decomposer growth rate, and substrate
chemical quality: how they influence soil organic matter turnover. Canadian Journal of Forest
Research-Revue Canadienne De Recherche Forestiere 31(9): 1594-1601
IPCC (2006) Chapter 3: Uncertainty. In: Guidelines for National Greenhouse Gas Inventories.
Volume 1: General Guidance and Reporting. Eggleston H.S., Buendia L., Miwa K., Ngara T.
and Tanabe K. (eds), IGES, Japan.
IPCC (2014) 2013 Supplement to the 2006 IPCC Guidelines for National Greenhouse Gas Inventories:
Wetlands. In: Hiraishi T, Krug T, Tanabe K, Srivastava N, Baasansuren J, Fukuda M &
Troxler TG (eds). IPCC, Switzerland.
Jandl R, Lindner M, Vesterdal L, Bauwens B, Baritz R, Hagedorn F, Johnson DW, Minkkinen K,
Byrne KA (2007) How strongly can forest management influence soil carbon sequestration?
Geoderma 137(3-4): 253-268
Johansen A (1997) Myrarealer og torvressurser i Norge. (Peatland area and turf-resources in Norway).
In. Jordforsk, Ås, Norway. p 37 (In Norwegian)
Jonsson A, Algesten G, Bergstrom AK, Bishop K, Sobek S, Tranvik LJ, Jansson M (2007) Integrating
aquatic carbon fluxes in a boreal catchment carbon budget. Journal Of Hydrology 334(1-2):
141-150
Kammer A, Hagedorn F, Shevchenko I, Leifeld J, Guggenberger G, Goryacheva T, Rigling A,
Moiseev P (2009) Treeline shifts in the Ural mountains affect soil organic matter dynamics.
Global Change Biology 15(6): 1570-1583
Kasimir-Klemedtsson A, Klemedtsson L, Berglund K, Martikainen P, Silvola J, Oenema O (1997)
Greenhouse gas emissions from farmed organic soils: a review. Soil Use and Management
13(4): 245-250
Kleja DB, Svensson M, Majdi H, Jansson PE, Langvall O, Bergkvist B, Johansson MB, Weslien P,
Truusb L, Lindroth A, Agren GI (2008) Pools and fluxes of carbon in three Norway spruce
ecosystems along a climatic gradient in Sweden. Biogeochemistry 89(1): 7-25

39
Kortelainen P, Mattsson T, Finer L, Ahtiainen M, Saukkonen S, Sallantaus T (2006) Controls on the
export of C, N, P and Fe from undisturbed boreal catchments, Finland. Aquatic Sciences
68(4): 453-468
Kortelainen P, Pajunen H, Rantakari M, Saarnisto M (2004) A large carbon pool and small sink in
boreal Holocene lake sediments. Global Change Biology 10(10): 1648-1653
Lal R (2005) Forest soils and carbon sequestration. Forest Ecology And Management 220(1-3): 242-
258
Larsen S, Andersen T, Hessen DO (2011) The pCO(2) in boreal lakes: Organic carbon as a universal
predictor? Global Biogeochemical Cycles 25: Gb2012. DOI 10.1029/2010gb003864
Le Quéré C, Peters GP, Andres RJ, Andrew RM, Boden T, Ciais P, Friedlingstein P, Houghton RAM,
G., R. M, Sitch S, Tans P, Arneth A, Arvanitis A, Bakker DCE, Bopp L, J.G. C, al. e (2013 )
Global carbon budget 2013. Earth System Sciences Data Discussion 6: 689-760
Lehtonen A, Makipaa R, Heikkinen J, Sievanen R, Liski J (2004) Biomass expansion factors (BEFs)
for Scots pine, Norway spruce and birch according to stand age for boreal forests. Forest
Ecology and Management 188(1-3): 211-224
Liski J, Lehtonen A, Palosuo T, Peltoniemi M, Eggers T, Muukkonen P, Makipaa R (2006) Carbon
accumulation in Finland's forests 1922-2004 - an estimate obtained by combination of forest
inventory data with modelling of biomass, litter and soil. Annals of Forest Science 63(7): 687-
697
Liski J, Nissinen A, Erhard M, Taskinen O (2003) Climatic effects on litter decomposition from arctic
tundra to tropical rainforest. Global Change Biology 9(4): 575-584
Liski J, Palosuo T, Peltoniemi M, Sievanen R (2005) Carbon and decomposition model Yasso for
forest soils. Ecological Modelling 189(1-2): 168-182
Lund M, Lafleur PM, Roulet NT, Lindroth A, Christensen TR, Aurela M, Chojnicki BH, Flanagan
LB, Humphreys ER, Laurila T, Oechel WC, Olejnik J, Rinne J, Schubert P, Nilsson MB
(2010) Variability in exchange of CO2 across 12 northern peatland and tundra sites. Global
Change Biology 16(9): 2436-2448

40
Lund M, Lindroth A, Christensen TR, Strom L (2007) Annual CO2 balance of a temperate bog. Tellus
Series B-Chemical and Physical Meteorology 59(5): 804-811
Lundstrom US, van Breemen N, Bain D (2000) The podzolization process. A review. Geoderma 94(2-
4): 91-107
Luyssaert S, Ciais P, Piao SL, Schulze ED, Jung M, Zaehle S, Schelhaas MJ, Reichstein M, Churkina
G, Papale D, Abril G, Beer C, Grace J, Loustau D, Matteucci G, Magnani F, Nabuurs GJ,
Verbeeck H, Sulkava M, van der Werf GR, Janssens IA, Team C-IS (2010) The European
carbon balance. Part 3: forests. Global Change Biology 16(5): 1429-1450
Luyssaert S, Reichstein M, Schulze ED, Janssens IA, Law BE, Papale D, Dragoni D, Goulden ML,
Granier A, Kutsch WL, Linder S, Matteucci G, Moors E, Munger JW, Pilegaard K, Saunders
M, Falge EM (2009) Toward a consistency cross-check of eddy covariance flux-based and
biometric estimates of ecosystem carbon balance. Global Biogeochemical Cycles 23:
Luyssaert S, Schulze ED, Borner A, Knohl A, Hessenmoller D, Law BE, Ciais P, Grace J (2008) Old-
growth forests as global carbon sinks. Nature 455(7210): 213-215
Maljanen M, Sigurdsson BD, Guomundsson J, Oskarsson H, Huttunen JT, Martikainen PJ (2010)
Greenhouse gas balances of managed peatlands in the Nordic countries - present knowledge
and gaps. Biogeosciences 7(9): 2711-2738
Marklund LG (1988) Biomassafunktioner för tall, gran och björk i Sverige. Biomass functions for
pine, spruce and birch in Sweden. In. . Sveriges Lantbruksuniversitet, Institutionen för
skogstaxering. p 1-79
Mattsson T, Kortelainen P, Raike A (2005) Export of DOM from boreal catchments: impacts of land
use cover and climate. Biogeochemistry 76(2): 373-394
Mettrop IS, Cusell C, Kooijman AM, Lamers LPM (2014) Nutrient and carbon dynamics in peat from
rich fens and Sphagnum-fens during different gradations of drought. Soil Biology &
Biochemistry 68: 317-328
Michalzik B, Kalbitz K, Park JH, Solinger S, Matzner E (2001) Fluxes and concentrations of dissolved
organic carbon and nitrogen - a synthesis for temperate forests. Biogeochemistry 52(2): 173-
205
41
Michalzik B, Tipping E, Mulder J, Lancho JFG, Matzner E, Bryant CL, Clarke N, Lofts S, Esteban
MAV (2003) Modelling the production and transport of dissolved organic carbon in forest
soils. Biogeochemistry 66(3): 241-264
Miljødirektoratet (2010) Greenhouse gas emissions 1990-2008. National Inventory Report 2010
Norway. TA 2639/2010. In: Agency CaP (ed). Climate and Pollution Agency, Oslo.
Miljødirektoratet (2013) Greenhouse Gas Emissions 1990-2011. National Inventory Report
Norway.TA 3030/2013. In: Norway CaPA (ed). Climate and Pollution Agency Norway, Oslo.
Moen A (1987) The regional vegetation of Norway; that of Central Norway in particular. Norsk
Geografisk Tidsskrift-Norwegian Journal of Geography 41: 179-226
Moen A, Lyngstad A, Øien D-I (2011) Faglig grunnlag til handlingsplan for høgmyr i innlandet
(typisk høgmyr). (Background for conservation of raised mires in inland Norway). In:
Rapport botanisk serie 2011-3. Norges teknisk-naturvitenskapelige universitet,
Vitenskapsmuseet, Trondheim. p 66. In Norwegian with English summary
Moen A, Øien D-I (2011) Faktaark fra to prosjekter med vurdering av truethet og vernestatus for
våtmark (myr og kilde) i Norge. (Factsheet from two projects with assessment of threats and
conservation status for wetlands in Norway). In. Norges teknisk-naturvitenskapelige
universitet, Vitenskapsmuseet, Trondheim, Norway. p 68p
Monteith DT, Stoddard JL, Evans CD, de Wit HA, Forsius M, Hogasen T, Wilander A, Skjelkvale BL,
Jeffries DS, Vuorenmaa J, Keller B, Kopacek J, Vesely J (2007) Dissolved organic carbon
trends resulting from changes in atmospheric deposition chemistry. Nature 450(7169): 537-
U539
Muukkonen P, Mäkipää R (2006) Empirical biomass models of understorey vegetation in boreal
forests according to stand and site attributes. Boreal Environment Research 11(5): 355-369
Nabuurs GJ, Schelhaas MJ, Mohren GMJ, Field CB (2003) Temporal evolution of the European forest
sector carbon sink from 1950 to 1999. Global Change Biology 9(2): 152-160
Nilsson M, Sagerfors J, Buffam I, Laudon H, Eriksson T, Grelle A, Klemedtsson L, Weslien P,
Lindroth A (2008) Contemporary carbon accumulation in a boreal oligotrophic minerogenic
42
mire - a significant sink after accounting for all C-fluxes. Glob. Change Biol. 14(10): 2317-
2332
Olefeldt D, Roulet N, Giesler R, Persson A (2013) Total waterborne carbon export and DOC
composition from ten nested subarctic peatland catchments-importance of peatland cover,
groundwater influence, and inter-annual variability of precipitation patterns. Hydrol. Process.
27(16): 2280-2294
Olefeldt D, Roulet NT, Bergeron O, Crill P, Backstrand K, Christensen TR (2012) Net carbon
accumulation of a high-latitude permafrost palsa mire similar to permafrost-free peatlands.
Geophysical Research Letters 39: L03501. DOI 10.1029/2011gl050355
OSPAR (2013) OSPAR Contracting Parties' RID 2011 Data Report. In. vol ISBN 978-1-909159-31-0.
OSPAR, London. p 77
Pan YD, Birdsey RA, Fang JY, Houghton R, Kauppi PE, Kurz WA, Phillips OL, Shvidenko A, Lewis
SL, Canadell JG, Ciais P, Jackson RB, Pacala SW, McGuire AD, Piao SL, Rautiainen A, Sitch
S, Hayes D (2011) A Large and Persistent Carbon Sink in the World's Forests. Science
333(6045): 988-993
Paustian K, Six J, Elliott ET, Hunt HW (2000) Management options for reducing CO2 emissions from
agricultural soils. Biogeochemistry 48(1): 147-163
Peltoniemi M, Makipaa R, Liski J, Tamminen P (2004) Changes in soil carbon with stand age - an
evaluation of a modelling method with empirical data. Global Change Biology 10(12): 2078-
2091
Peltoniemi M, Palosuo T, Monni S, Makipaa R (2006) Factors affecting the uncertainty of sinks and
stocks of carbon in Finnish forests soils and vegetation. Forest Ecology and Management
232(1-3): 75-85
Petersson H, Ståhl G (2006) Functions for below-ground biomass of Pinus sylvestris, Picea abies,
Betula pendula and Betula pubescens in Sweden. Scandinavian Journal of Forest Research 21:
84-93
Post WM, Emanuel WR, Zinke PJ, Stangenberger AG (1982) Soil carbon pools and world life zones.
Nature 298(5870): 156-159
43
Raike A, Kortelainen P, Mattsson T, Thomas DN (2012) 36 year trends in dissolved organic carbon
export from Finnish rivers to the Baltic Sea. Science of the Total Environment 435: 188-201
Randerson JT, Chapin FS, Harden JW, Neff JC, Harmon ME (2002) Net ecosystem production: A
comprehensive measure of net carbon accumulation by ecosystems. Ecol. Appl. 12(4): 937-
947
Rantakari M, Kortelainen P (2008) Controls of organic and inorganic carbon in randomly selected
Boreal lakes in varied catchments. Biogeochemistry 91(2-3): 151-162
Rantakari M, Mattsson T, Kortelainen P, Piirainen S, Finer L, Ahtiainen M (2010) Organic and
inorganic carbon concentrations and fluxes from managed and unmanaged boreal first-order
catchments. Science of the Total Environment 408(7): 1649-1658
Raymond PA, Bauer JE (2001) Riverine export of aged terrestrial organic matter to the North Atlantic
Ocean. Nature 409(6819): 497-500
Rognstad O, Steinset TA (2012) Landbruket i Norge 2011. Agriculture in Norway 2011. In. Statistics
Norway, Oslo-Kongsvinger.
Roulet NT, Lafleur PM, Richard PJH, Moore TR, Humphreys ER, Bubier J (2007) Contemporary
carbon balance and late Holocene carbon accumulation in a northern peatland. Glob. Change
Biol. 13(2): 397-411
Sagerfors J, Lindroth A, Grelle A, Klemedtsson L, Weslien P, Nilsson M (2008) Annual CO2
exchange between a nutrient-poor, minerotrophic, boreal mire and the atmosphere. Journal of
Geophysical Research-Biogeosciences 113(G1). DOI 10.1029/2006jg000306
Schimel D (2007) Carbon cycle conundrums. Proceedings Of The National Academy Of Sciences Of
The United States Of America 104(47): 18353-18354
Schulze ED, Luyssaert S, Ciais P, Freibauer A, Janssens IA, Soussana JF, Smith P, Grace J, Levin I,
Thiruchittampalam B, Heimann M, Dolman AJ, Valentini R, Bousquet P, Peylin P, Peters W,
Rodenbeck C, Etiope G, Vuichard N, Wattenbach M, Nabuurs GJ, Poussi Z, Nieschulze J,
Gash JH, CarboEurope T (2009) Importance of methane and nitrous oxide for Europe's
terrestrial greenhouse-gas balance. Nature Geoscience 2(12): 842-850

44
Sitch S, Huntingford C, Gedney N, Levy PE, Lomas M, Piao SL, Betts R, Ciais P, Cox P,
Friedlingstein P, Jones CD, Prentice IC, Woodward FI (2008) Evaluation of the terrestrial
carbon cycle, future plant geography and climate-carbon cycle feedbacks using five Dynamic
Global Vegetation Models (DGVMs). Global Change Biology 14(9): 2015-2039
Sitch S, Smith B, Prentice IC, Arneth A, Bondeau A, Cramer W, Kaplan JO, Levis S, Lucht W, Sykes
MT, Thonicke K, Venevsky S (2003) Evaluation of ecosystem dynamics, plant geography and
terrestrial carbon cycling in the LPJ dynamic global vegetation model. Global Change Biology
9(2): 161-185
Skarbøvik E, Stålnacke PG, Austnes K, Selvik JR, Pengerud A, Tjomsland T, Høgåsen T, Beldring S
(2013) Riverine inputs and direct discharges to Norwegian coastal waters - 2012. In: NIVA
report. vol 6584-2012. NIVA, Oslo. p 67
Skarbøvik E, Stålnacke PG, Kaste Ø, Selvik JR, Tjomsland T, Høgåsen T, Aakerøy PA, Haaland S,
Beldring S (2009) Riverine inputs and direct discharges to Norwegian coastal waters - 2008.
In. NIVA, Oslo. p 75
Sobek S, Algesten G, Bergström AK, Jansson M, Tranvik LJ (2003) The catchment and climate
regulation of pCO2 in boreal lakes. Global Change Biology 9(4): 630-641
Speed JDM, Martinsen V, Mysterud A, Mulder J, Holand O, Austrheim G (2014) Long-Term Increase
in Aboveground Carbon Stocks Following Exclusion of Grazers and Forest Establishment in
an Alpine Ecosystem. Ecosystems 17(7): 1138-1150
Thomas RQ, Canham CD, Weathers KC, Goodale CL (2010) Increased tree carbon storage in
response to nitrogen deposition in the US. Nature Geoscience 3(1): 13-17
Tommervik H, Johansen B, Riseth JA, Karlsen SR, Solberg B, Hogda KA (2009) Above ground
biomass changes in the mountain birch forests and mountain heaths of Finnmarksvidda,
northern Norway, in the period 1957-2006. Forest Ecology and Management 257(1): 244-257
Tomter S, Hylen G, Nilsen J (2010) National Forest Inventories. Pathways for Common Reporting.
Norway. In: Erkki Tomppo TG, Mark Lawrence, Ronald E. McRoberts (ed) Norway.
Springer. p 411-424

45
Tranvik LJ, Downing JA, Cotner JB, Loiselle SA, Striegl RG, Ballatore TJ, Dillon P, Finlay K,
Fortino K, Knoll LB, Kortelainen PL, Kutser T, Larsen S, Laurion I, Leech DM, McCallister
SL, McKnight DM, Melack JM, Overholt E, Porter JA, Prairie Y, Renwick WH, Roland F,
Sherman BS, Schindler DW, Sobek S, Tremblay A, Vanni MJ, Verschoor AM, von
Wachenfeldt E, Weyhenmeyer GA (2009) Lakes and reservoirs as regulators of carbon cycling
and climate. Limnology And Oceanography 54(6): 2298-2314
Turunen J, Tomppo E, Tolonen K, Reinikainen A (2002) Estimating carbon accumulation rates of
undrained mires in Finland - application to boreal and subarctic regions. Holocene 12(1): 69-
80
Vuorenmaa J, Forsius M, Mannio J (2006) Increasing trends of total organic carbon concentrations in
small forest lakes in Finland from 1987 to 2003. Science of the Total Environment 365(1-3):
47-65
Wallin MB, Grabs T, Buffam I, Laudon H, Agren A, Oquist MG, Bishop K (2013) Evasion of CO2
from streams - The dominant component of the carbon export through the aquatic conduit in a
boreal landscape. Global Change Biology 19(3): 785-797
West TO, Post WM (2002) Soil organic carbon sequestration rates by tillage and crop rotation: A
global data analysis. Soil Science Society of America Journal 66(6): 1930-1946
White AM, Thornton PE, Running SW, Nemani RR (2000) Parameterization and Sensitivity Analysis
of the BIOME–BGC Terrestrial Ecosystem Model: Net Primary Production Controls. Earth
Interactions 4: 1-85
Wilson D, Hisdal H, Lawrence D (2010) Has streamflow changed in the Nordic countries? - Recent
trends and comparisons to hydrological projections. Journal Of Hydrology 394(3-4): 334-346
Worrall F, Burt T (2005) Reconstructing long-term records of dissolved CO2. Hydrological Processes
19(9): 1791-1806
Yu ZC (2012) Northern peatland carbon stocks and dynamics: a review. Biogeosciences 9(10): 4071-
4085

te
biomass
soil
aquatic
Barents Sea B 3.8±2.2 S 3.7±1.8 R 1.7±0.3
Norwegian Sea B 12.4±1.2 S 4.0±0.9 R 3.1±0.5
North Sea B 18.0±1.6 S 4.0±0.8 R 4.5±0.8
Skagerrak B 22.3±2.6 S 6.1±1.1 R 2.8±0.4

Trees Ground Veg
Soil
peatland mountains
Soil 0.29±0.23
agriculture forest
4.90±0.38 0.00±0.14 1.07±0.16
lakes
Sediment 0.04±0.02
Biomass 0.07±0.04
Soil -0.40±0.81
Atmosphere
5.96±0.94 14.9
GHG emissions
Riverine inputs to coast DOC DIC
0.96±0.08 0.32 (0.14-0.81)
Terrestrial C uptake
Terrestrial export to surface waters
Aquatic conduit
≥ DIC 0.3(0.1-0.8) ≥ DOC 1.0±0.1
CO2 evasion 1.65 (0.63 – 3.99)
A
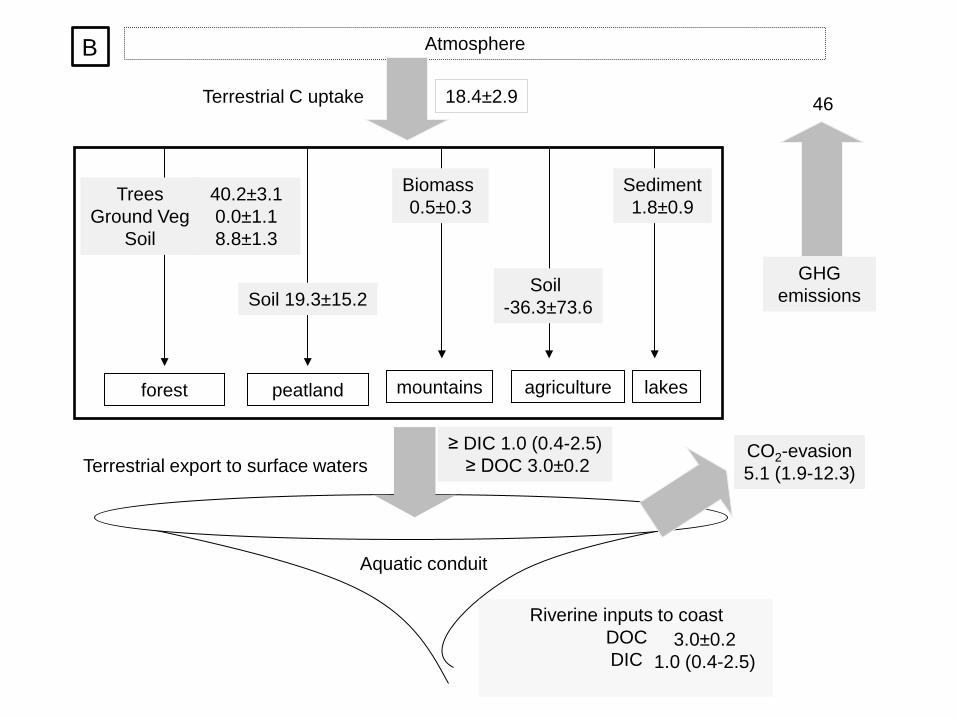
Trees Ground Veg
Soil
peatland mountains
Soil 19.3±15.2
agriculture forest
40.2±3.1 0.0±1.1 8.8±1.3
lakes
Sediment 1.8±0.9
Biomass 0.5±0.3
Soil -36.3±73.6
Atmosphere
18.4±2.9 46
GHG emissions
Riverine inputs to coast DOC DIC
3.0±0.2 1.0 (0.4-2.5)
Terrestrial C uptake
Terrestrial export to surface waters
Aquatic conduit
≥ DIC 1.0 (0.4-2.5) ≥ DOC 3.0±0.2
CO2-evasion 5.1 (1.9-12.3)
B

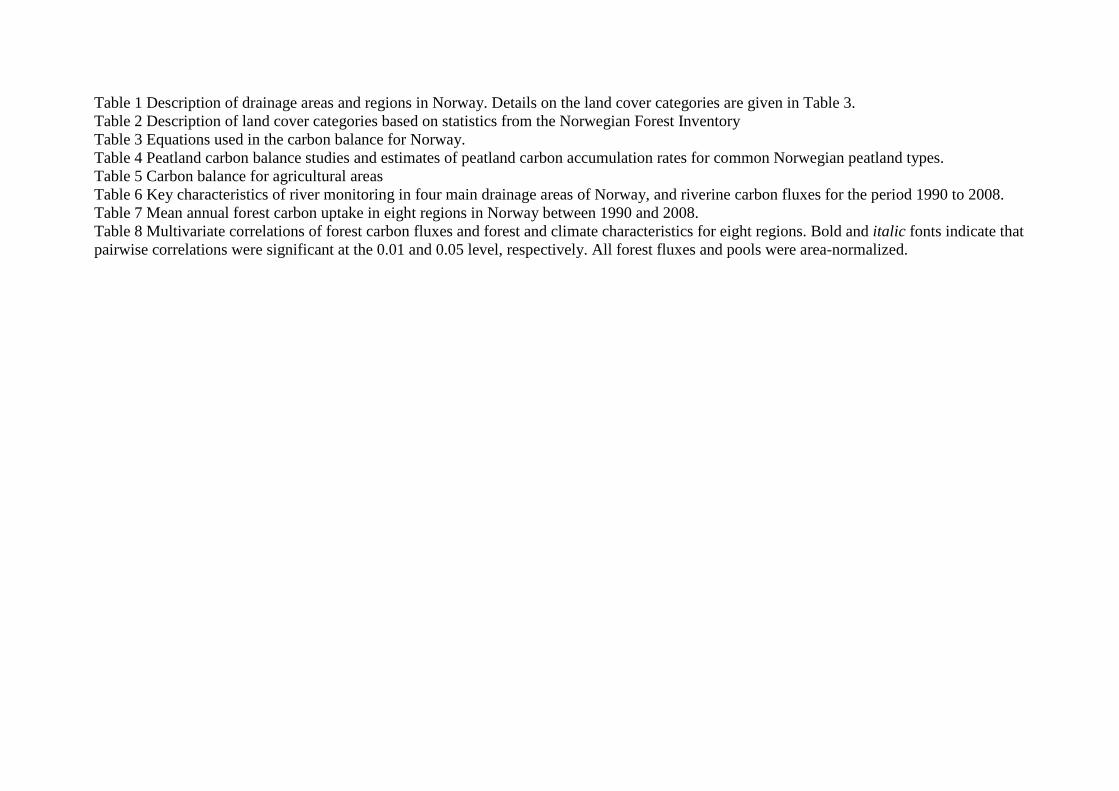
Table 1 Description of drainage areas and regions in Norway. Details on the land cover categories are given in Table 3. Table 2 Description of land cover categories based on statistics from the Norwegian Forest Inventory Table 3 Equations used in the carbon balance for Norway. Table 4 Peatland carbon balance studies and estimates of peatland carbon accumulation rates for common Norwegian peatland types. Table 5 Carbon balance for agricultural areas Table 6 Key characteristics of river monitoring in four main drainage areas of Norway, and riverine carbon fluxes for the period 1990 to 2008. Table 7 Mean annual forest carbon uptake in eight regions in Norway between 1990 and 2008. Table 8 Multivariate correlations of forest carbon fluxes and forest and climate characteristics for eight regions. Bold and italic fonts indicate that pairwise correlations were significant at the 0.01 and 0.05 level, respectively. All forest fluxes and pools were area-normalized.
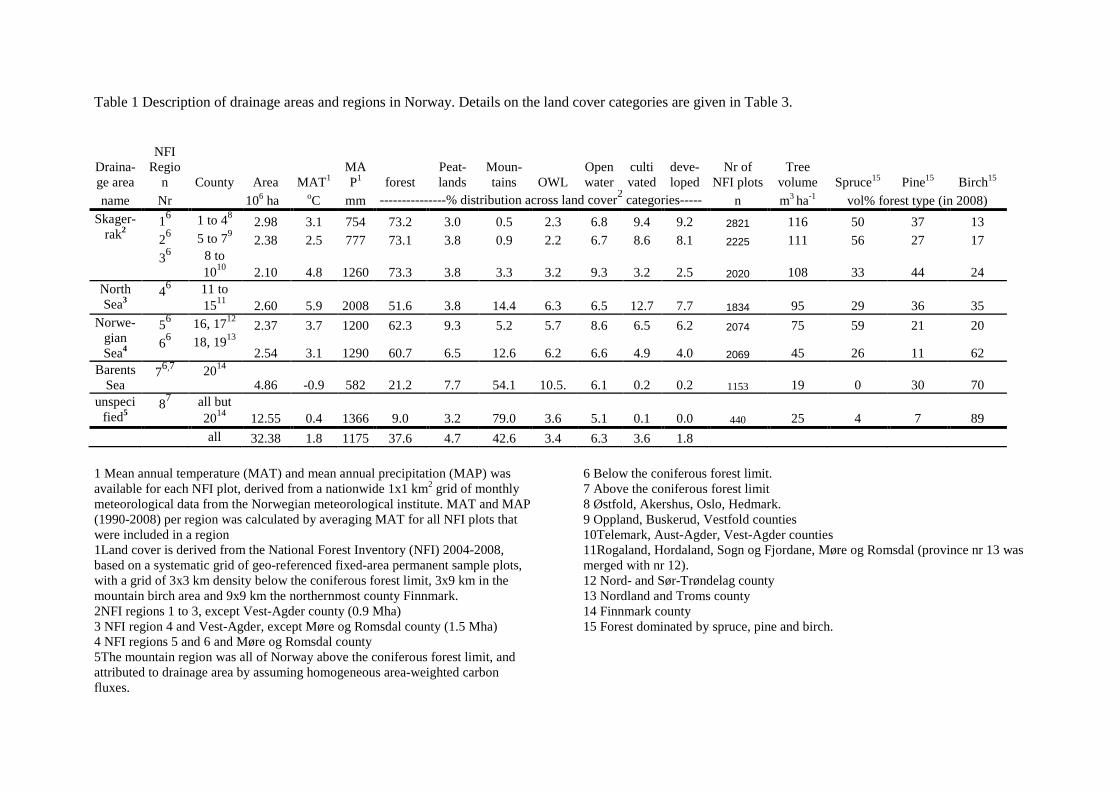
Table 1 Description of drainage areas and regions in Norway. Details on the land cover categories are given in Table 3.
Draina-ge area
NFI Regio
n County Area MAT1 MAP1 forest
Peat-lands
Moun-tains OWL
Open water
cultivated
deve-loped
Nr of NFI plots
Tree volume Spruce15 Pine15 Birch15
name Nr 106 ha oC mm ---------------% distribution across land cover2 categories----- n m3 ha-1 vol% forest type (in 2008) Skager-
rak2 16 1 to 48 2.98 3.1 754 73.2 3.0 0.5 2.3 6.8 9.4 9.2 2821 116 50 37 13 26 5 to 79 2.38 2.5 777 73.1 3.8 0.9 2.2 6.7 8.6 8.1 2225 111 56 27 17 36 8 to
1010 2.10 4.8 1260 73.3 3.8 3.3 3.2 9.3 3.2 2.5 2020 108 33 44 24 North Sea3
46 11 to 1511 2.60 5.9 2008 51.6 3.8 14.4 6.3 6.5 12.7 7.7 1834 95 29 36 35
Norwe-gian Sea4
56 16, 1712 2.37 3.7 1200 62.3 9.3 5.2 5.7 8.6 6.5 6.2 2074 75 59 21 20 66 18, 1913
2.54 3.1 1290 60.7 6.5 12.6 6.2 6.6 4.9 4.0 2069 45 26 11 62 Barents
Sea 76,7 2014
4.86 -0.9 582 21.2 7.7 54.1 10.5. 6.1 0.2 0.2 1153 19 0 30 70 unspeci
fied5 87 all but
2014 12.55 0.4 1366 9.0 3.2 79.0 3.6 5.1 0.1 0.0 440 25 4 7 89 all 32.38 1.8 1175 37.6 4.7 42.6 3.4 6.3 3.6 1.8
1 Mean annual temperature (MAT) and mean annual precipitation (MAP) was available for each NFI plot, derived from a nationwide 1x1 km2 grid of monthly meteorological data from the Norwegian meteorological institute. MAT and MAP (1990-2008) per region was calculated by averaging MAT for all NFI plots that were included in a region 1Land cover is derived from the National Forest Inventory (NFI) 2004-2008, based on a systematic grid of geo-referenced fixed-area permanent sample plots, with a grid of 3x3 km density below the coniferous forest limit, 3x9 km in the mountain birch area and 9x9 km the northernmost county Finnmark. 2NFI regions 1 to 3, except Vest-Agder county (0.9 Mha) 3 NFI region 4 and Vest-Agder, except Møre og Romsdal county (1.5 Mha) 4 NFI regions 5 and 6 and Møre og Romsdal county 5The mountain region was all of Norway above the coniferous forest limit, and attributed to drainage area by assuming homogeneous area-weighted carbon fluxes.
6 Below the coniferous forest limit. 7 Above the coniferous forest limit 8 Østfold, Akershus, Oslo, Hedmark. 9 Oppland, Buskerud, Vestfold counties 10Telemark, Aust-Agder, Vest-Agder counties 11Rogaland, Hordaland, Sogn og Fjordane, Møre og Romsdal (province nr 13 was merged with nr 12). 12 Nord- and Sør-Trøndelag county 13 Nordland and Troms county 14 Finnmark county 15 Forest dominated by spruce, pine and birch.

Table 2 Description of land cover categories based on statistics from the Norwegian Forest Inventory Definition Area category Name Crown cover Description Forest Productive forest >10% Potential yield (stemwood incl bark) >1 m3 ha-1 yr-1 Unproductive forest >10% Potential yield (stemwood incl bark) <1 m3 ha-1 yr-1 Peatlands Peat <10% Peatland without tree cover or with less than 10% vegetated cover (shrubs, bushes) Lakes Lake and rivers - Water bodies
Mountains Other wooded land 5-10% Mineral soil type. Low productivity: trees with potential to reach 5 m height; alternatively, cover of shrubs, bushes, trees >10%
Wooded mire 5-10% Organic soil type. Productivity as for other wooded land Tundra, bare rock <10%- Bare rocks, shallow soil with or without vegetated cover (shrubs, bushes) less than 10% during any time of the
year. Calluna heath n.d. Dominance of calluna heath Agricultural Grazing land - Grazing land, not regularly cultivated Arable land - Arable land, regularly cultivated Developed Other areas - Dominated by roads, asphalt, buildings and other constructed materials
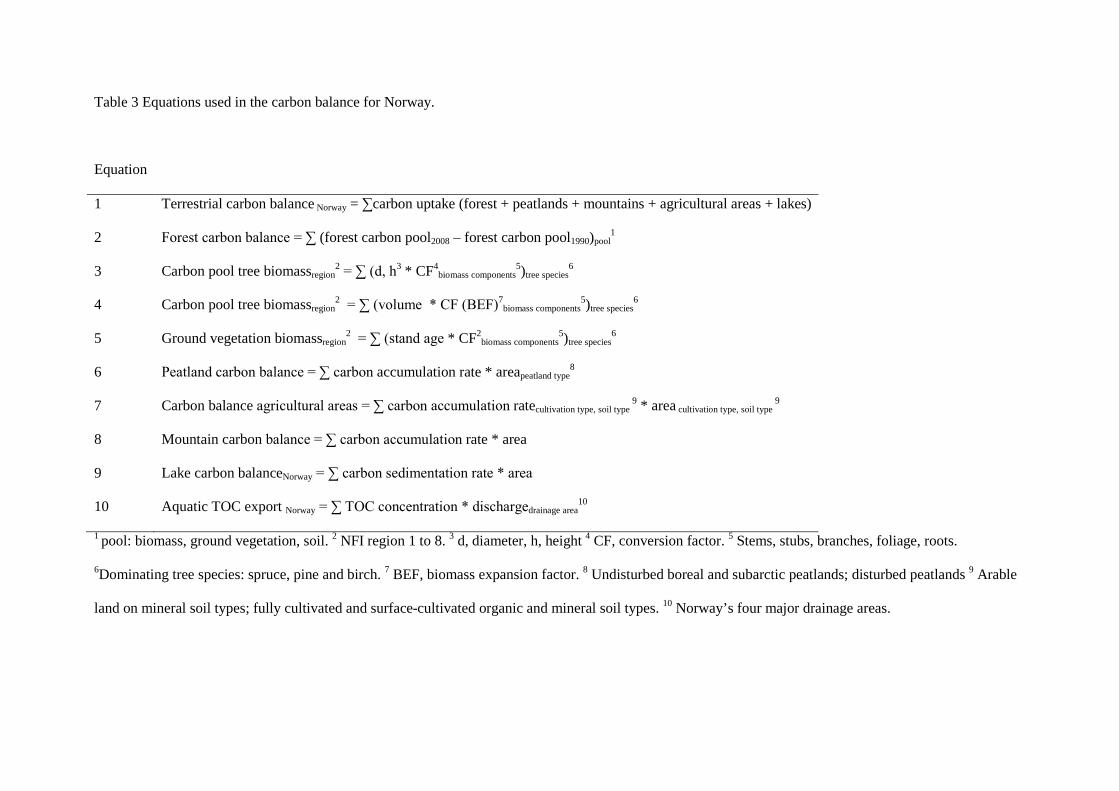
Table 3 Equations used in the carbon balance for Norway.
Equation
1 Terrestrial carbon balance Norway = ∑carbon uptake (forest + peatlands + mountains + agricultural areas + lakes)
2 Forest carbon balance = ∑ (forest carbon pool2008 – forest carbon pool1990)pool1
3 Carbon pool tree biomassregion2 = ∑ (d, h3 * CF4
biomass components5)tree species
6
4 Carbon pool tree biomassregion2 = ∑ (volume * CF (BEF)7
biomass components5)tree species
6
5 Ground vegetation biomassregion2 = ∑ (stand age * CF2
biomass components5)tree species
6
6 Peatland carbon balance = ∑ carbon accumulation rate * areapeatland type8
7 Carbon balance agricultural areas = ∑ carbon accumulation ratecultivation type, soil type 9 * area cultivation type, soil type
9
8 Mountain carbon balance = ∑ carbon accumulation rate * area
9 Lake carbon balanceNorway = ∑ carbon sedimentation rate * area
10 Aquatic TOC export Norway = ∑ TOC concentration * dischargedrainage area10
1 pool: biomass, ground vegetation, soil. 2 NFI region 1 to 8. 3 d, diameter, h, height 4 CF, conversion factor. 5 Stems, stubs, branches, foliage, roots.
6Dominating tree species: spruce, pine and birch. 7 BEF, biomass expansion factor. 8 Undisturbed boreal and subarctic peatlands; disturbed peatlands 9 Arable
land on mineral soil types; fully cultivated and surface-cultivated organic and mineral soil types. 10 Norway’s four major drainage areas.

Table 4 Peatland carbon balance studies and estimates of peatland carbon accumulation rates for common Norwegian peatland types. St
udy1
Clim
ate2
Peat
lan
d3
Coun
try
Perio
d (n
yrs
)
Name Latit
ude
(N)
Long
itude
MAT MAP Q4,5 C balance NEC
B4
NEE
4
CH44 ,6
DOC4.
7
DOC
/Q
(oC) mm mm g C
m-2
yr-1
Stde
v
g C
m-2
yr-1
Stde
v
g C
m-2
yr-1
stde
v
g C
m-2
yr-1
stde
v
g C
m-2
mm
-1
yr-1
1 B OMF Sweden 2004-2005(2) Degero Stormyr 64o11.10 19o13.30E 1.2 685 448 full 23.5 3.4 52 2 -8.2 2.1 -13.0 1.4 0.029 2 B OB Canada 1998-2004(7) Mer Bleue 45.41oN 75.48oW 6 943 391 full 21.5 39 40 41 -3.7 0.5 -14.9 3.1 0.038 3 SA PPM Sweden 2008-2009(2) Stordalen 68.37 19.05E 0 336 227 full 44.5 16.3 50 17 -2.0
-3.2 0.6 0.014
4 B OMF Sweden 2001-2003(3) Degero Stormyr 64o11.10 19o13.30E 1.2 453 296 estimate 36.8
55 7 -8
-9.9
5 B, T B Sweden 2005 (1) Fajemyr 56◦15 13◦33E 6.2 700 290 estimate 5.7
21 6 -6
-9.7
6 B SF Finland 2006-2008(3) Lompolojankka 67o89.532 24o12.55E -1.4 484 317 estimate 27.3
44 38 -6
-10.6
7 SA OB Finland 1997-2002(5) Kaamanen 69.14 27.3E 0.2 471 308 estimate 15.2
22 20 -2
-4.3
8 B SF Finland 2004 (1) Not given 61.83 24.19E 4.2 713 466 estimate 48.9 71 0 -6 -15.6
all
Mean8 254 19.79 40.9 18.89 -4.6 0.69 -10.2 1.79
B OB mean 29.6 23.09 51.5 23.79 -6.5 0.89 -14.5 2.49
SA-PPM OB mean 23.5 18.29 29.6 13.69 -2.0 0.39 -4.0 0.79
SA OB mean 15.2 11.79 21.5 9.99 -2.0 0.39 -4.3 0.79
1 references S1; Nilsson ea 2008; S2, Roulet ea 2007; S3: Olefeldt ea 2012; S4: Sagerfoss ea 2007; S5 Lund ea 2007; S6: Aurela ea 2007; S7: Aurela ea 2009; S8: Aurela ea 2004. 2 B, boreal; SA, subarctic, T, temperate 3 O, oligotrophic; M, minerogenic; F, fen; b, bog; PPM, permafrost-palsamire; SF, sedge fen. 4 estimates in italics. 5 discharge estimated as MAP - EP: in S4, 6, 7, 8 EP is proportional to S1; in S5, EP is proportional to S2. 6 CH4 emissions: S4= S1; S5,6,8: mean of S1+S2; S7 = S3. 7 estimated DOC export (g C m-2yr-1) = ratio of DOC export and discharge (g C m-2yr-1 mm-1) x discharge (mm). S4, from S1; S5,6,8, from mean S1,2; S7, from S3 8 mean is weighted on number of years in each study. 9 stdev, standard deviation, is estimated as average of the relative standard devations from study 1-3 multiplied by the estimated mean.
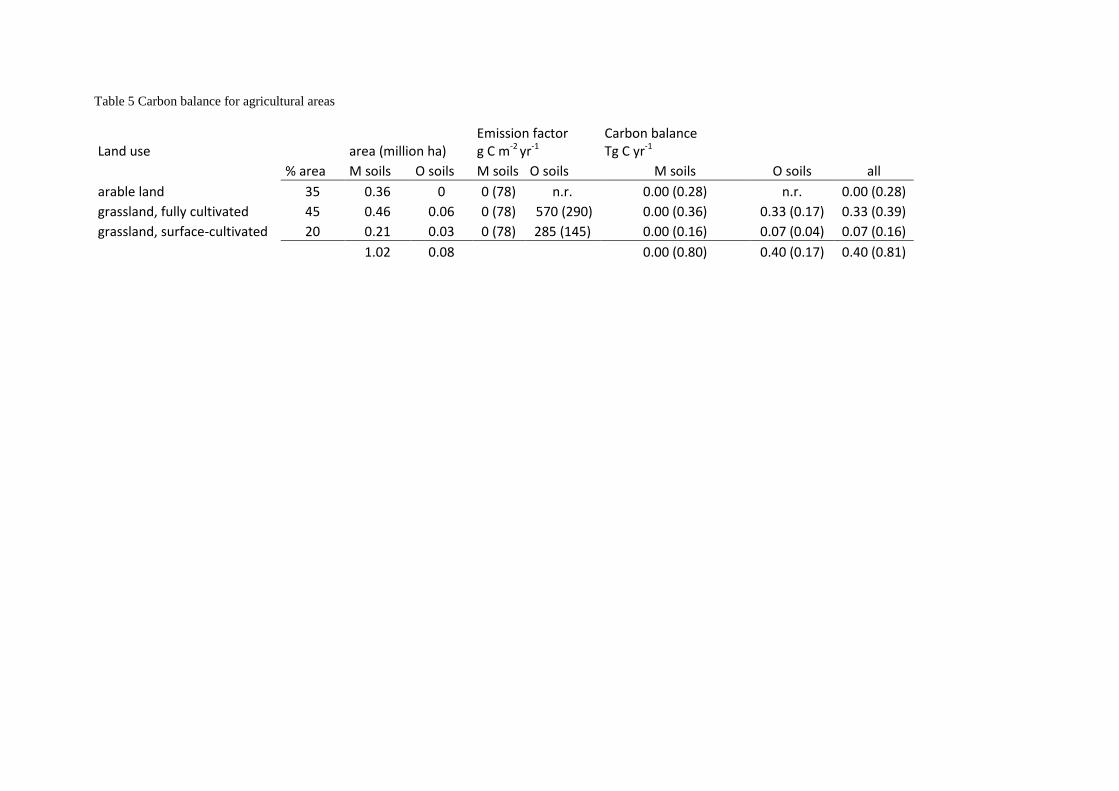
Table 5 Carbon balance for agricultural areas
Land use
area (million ha) Emission factor g C m-2 yr-1
Carbon balance Tg C yr-1
% area M soils O soils M soils O soils M soils O soils all arable land 35 0.36 0 0 (78) n.r. 0.00 (0.28) n.r. 0.00 (0.28) grassland, fully cultivated 45 0.46 0.06 0 (78) 570 (290) 0.00 (0.36) 0.33 (0.17) 0.33 (0.39) grassland, surface-cultivated 20 0.21 0.03 0 (78) 285 (145) 0.00 (0.16) 0.07 (0.04) 0.07 (0.16)
1.02 0.08
0.00 (0.80) 0.40 (0.17) 0.40 (0.81)

Table 6 Key characteristics of river monitoring in four main drainage areas of Norway, and riverine carbon fluxes for the period 1990 to 2008.
Drainage area Area in Norway total area Monitored
area Nr of monitored rivers Discharge1 TOC2 TOC flux3 DIC flux CO2 evasion
106 ha 106 ha % n mm yr-1 mg L-1 Tg C yr-1 g C/m2/ yr Tg C yr-1
Skagerrak 10.70 10.94 82 10 720 (101) 3.8 (0.2) 0.29 (0.04) 2.8 (0.4)
North Sea 4.75 4.75 26 18 2395 (419) 1.9 (0.1) 0.21 (0.04) 4.5 (0.8)
Norwegian Sea 11.88 12.23 30 15 1312 (164) 2.4 (0.2) 0.37 (0.06) 3.1 (0.5)
Barents Sea 4.95 7.52 55 3 477 (46) 3.6 (0.5) 0.10 (0.01) 1.7 (0.3)
Norway 32.27 35.45 51 46
0.96 (0.08) 3.0 (0.3) 0.32 (0.14-0.81) 1.65 (0.63 – 3.99) 1 Discharge expressed as mean annual discharge (1990-2008) and standard deviation. 2 Flow-weighted, area-weighted mean (1999-2008) and standard deviation 3 TOC flux and calculated from discharge and TOC with combined standard deviation

Table 7 Mean annual forest carbon uptake in eight regions in Norway between 1990 and 2008.
Region 1 Region 2 Region 3 Region 4 Region 5 Region 6 Region 7 Region 8
unit year East East East West Middle North Finnmark Mountains Norway
region Forested area Mha
2.18 1.74 1.54 1.34 1.47 1.54 1.03 1.13 12.18
MAT1 oC 3.1 2.5 4.8 5.9 3.7 3.1 -0.9 0.4
biomass tree biomass Tg C 2008 98.7 (2.7) 80.3 (2.2) 68.5 (1.8) 56.1 (1.5) 50.3 (1.4) 34.4 (0.9) 10.6 (0.8) 14.7 (1.1) 415.9 (4.7)
GV2 biomass ’’
3.6 (2.3) 2.4 (1.9) 2.6 (2.4) 1.9 (1.3) 2.3 (1.6) 1.5 (0.4) 2.0 (1.9) 0.5 (0.0) 16.8 (4.8)
tree biomass kg C m-2 4.53 4.61 4.44 4.18 3.41 2.23 1.03 1.30 3.40
tree sink Tg C yr-1 1990-2008 1.10 (0.19) 0.67 (0.16) 0.96 (0.13) 0.99 (0.10) 0.40 (0.10) 0.46 (0.06) 0.13 (0.08) 0.19 (0.13) 4.90 (0.38)
ground veg sink ’’
0.0 0.0 0.0 0.0 0.0 0.0 0.0 0.0 0.00 (0.14)
biomass sink g C m-2 yr-1 50 38 62 74 27 30 12 17 40
annual increment Mm3 yr-1 1990-2008 7.1 5.0 3.7 3.3 2.5 1.6 0.2 0.7 23.9
fellings
’’
3.9 2.7 1.4 0.5 1.1 0.3 0.0 0.0 10.0
Tg C yr-1
1.6 1.1 0.6 0.2 0.5 0.1 0.0 0.0 4.1
litter flow tree + GV Tg Cyr-1 1990-2008 4.4 (1.0) 3.4 (0.7) 2.9 (0.6) 2.2 (0.5) 2.7 (0.6) 1.6 (0.3) 0.6 (0.1) 0.6 (0.1) 18.5 (1.6)
mortality ’’
0.2 (0.1) 0.2 (0.1) 0.1 (0.0) 0.1 (0.0) 0.1 (0.0) 0.1 (0.0) 0.0 (0.0) 0.1 (0.0) 0.9 (0.1)
harvest residues ’’
0.8 (0.2) 0.6 (0.2) 0.3 (0.1) 0.1 (0.0) 0.2 (0.1) 0.1 (0.0) 0.0 (0.0) 0.0 (0.0) 2.1 (0.3)
all ’’
5.5 4.2 3.4 2.5 3.0 1.7 0.6 0.7 21.5
all kg C m-2 yr-1 0.25 0.24 0.22 0.18 0.20 0.11 0.06 0.06 0.18
soil sink Tg C 1990-2008 0.24 (0.07) 0.16 (0.05) 0.17 (0.05) 0.16 (0.05) 0.11 (0.03) 0.11 (0.03) 0.02 (0.03) 0.10 (0.03) 1.07 (0.12)
sink g C m-2 yr-1 11 9.5 11 12 7.2 7.1 2.3 8.5 8.8 1 Mean annual temperature. 2 Ground vegetation

Table 8 Multivariate correlations of forest carbon fluxes and forest and climate characteristics for eight regions. Bold and italic fonts indicate that pairwise correlations were significant at the 0.01 and 0.05 level, respectively. All forest fluxes and pools were area-normalized. Tree sink Soil sink MAT1 MAP2 Tree biomass Litter flux Ann. Incr3 Tree sink 1
Soil sink 0.84 1 MAT1 0.88 0.77 1
MAP2 0.54 0.51 0.65 1 Tree biomass 0.80 0.80 0.78 0.13 1
Litter flux 0.66 0.69 0.68 -0.05 0.97 1 Ann. Incr3 0.61 0.72 0.51 -0.16 0.88 0.91 1
1 mean annual temperature. 2 mean annual precipitation. 3 annual increment.