Supplementary material - ACCEPTED VERSION SUBJECT ...
273
FINAL DRAFT Chapter 4 Supplementary Material IPCC WGII Sixth Assessment Report Do Not Cite, Quote or Distribute SM4-1 Total pages: 273 1 Chapter 4: Water 2 Supplementary Material 3 4 Coordinating Lead Authors: Martina Angela Caretta (Sweden), Aditi Mukherji (India) 5 6 Lead Authors: Md Arfanuzzaman (Bangladesh), Richard A. Betts (United Kingdom), Alexander Gelfan 7 (Russian Federation), Yukiko Hirabayashi (Japan), Tabea Katharina Lissner (Germany), Elena Lopez Gunn 8 (Spain), Junguo Liu (China), Ruth Morgan (Australia), Sixbert Mwanga (Tanzania), Seree Supratid 9 (Thailand) 10 11 Contributing Authors: Malcolm Araos (Canada/USA), Soumya Balasubramanya (Sri Lanka/India), 12 Angelica Katharina Casparina Brackel (The Netherlands), John Caesar (United Kingdom), Holly B. 13 Caggiano (USA), Benjamin Cook (USA), Constantino Dockendorff (Germany/Chile), Calynn Dowler 14 (USA), Robert Dunn (UK/Germany), Lina Elisabeth Erika Eklund (Sweden), Zhang Fan (China), Valeria 15 Fanghella (Italy), Colin M. Finlayson (Australia), Sabine Fuss (Germany), Animesh Kumar Gain 16 (Italy/Bangladesh), Freya Garry (United Kingdom), Laila Gohar (United Kingdom), Valentin Golosov 17 (Russian Federation), Sharlene Liane Gomes (The Netherlands/Canada), Benjamin Jerome Gray (USA), 18 Lukas Gudmundsson (Switzerland/Germany/Iceland), Tania Guillen Bolaneos (Germany/Nicaragua), Kate 19 Halladay (United Kingdom), Ed Hawkins (United Kingdom), Greeshma Hegde (India), Masoud Irannezhad 20 (China/Iran), Bjørn Kløve (Finland/Norway), Aristeidis G. Koutroulis (Greece), Manish Kumar (India), 21 Jonathan Lautze (South Africa/USA), Deborah Ley (Mexico/Guatemala), Ashwina Mahanti (India), 22 Ganquan Mao (China), Deborah McGregor (Canada), Mamta Mehar (India), Megan Mills-Novoa (USA), 23 Tessa Möller (Germany/Luxemburg), Sanchari Mukhopadhyay (India), Tero Mustonen (Finland), 24 Lakshmikantha N R (India), Gustavo Naumann (Italy/Argentina/Germany), Prajjwal Kumar Panday 25 (USA/Nepal), Vishnu Prasad Pandey (Nepal), Jagadish Parajuli (USA/Nepal), Assela Pathirana 26 (Netherlands/Sri Lanka), Ritu Priya (India), B. Uday Bhaskar Reddy (India), Ekaterina Rets (Russian 27 Federation), Rodrigo Fernandez Reynosa (USA/Guatemala), Pamela Rittelmeyer (USA), Conrado M. 28 Rudorff (Brazil), Orie Sasaki (Japan), Corinne Schuster Wallace (Canada/Wales), Christopher A. Scott 29 (USA), Cydney Kate Seigerman (USA), Sonali Senaratna Sellamuttu (Myanmar/Sri Lanka), Rinan Shah 30 (India), Mohammad Shamsudduha (United Kingdom/Bangladesh), Gitta Shrestha (Nepal), Afreen Siddiqui 31 (USA/Pakistan), Balsher Singh Sidhu (Canada/India), Aprajita Singh (USA/India), Anna Sinisalo 32 (Norway/Finland), Francesca Spagnuolo (Italy), Jaishri Srinivasan (USA/India), Makere Stewart-Harawira 33 (Canada/New Zealand), Debra Tan (Hong Kong, Special Administrative Region, China/Malaysia), Masahiro 34 Tanoue (Japan), Brock Ternes (USA), William Rigoberto Delgado Thompson (USA/United 35 Kingdom/Mexico), Peter Uhe (United Kingdom/Australia), Astrid Ulloa (Colombia), Nicole van Maanen 36 (Germany/The Netherlands), Shuchi Vora (India), Yashoda Yashoda (India) 37 38 39 Review Editors: Blanca Elena Jimenez Cisneros (France/Mexico), Zbigniew Kundzewicz (Poland) 40 41 Chapter Scientists: Vishnu Prasad Pandey (Nepal), Rodrigo Fernandez Reynosa (USA/Guatemala) 42 43 Date of Draft: 1 October 2021 44 45 Notes: TSU Compiled Version 46 47 48 Table of Contents 49 50 SM4.1 Methodological Developments in Climate and Hydrological Sciences since AR5 .................. 3 51 SM4.1.1 Advances in Detecting Hydrological Changes from In-Situ Measurements .......................... 3 52 SM4.1.2 Advances in Detecting Hydrological Changes from Satellite Data........................................ 3 53 SM4.1.3 Advances in Hydrological Modelling for Impact Assessment ................................................ 3 54 SM4.1.4 Detection and Attribution: How Much of the Changes are Attributable to Climate Change? 55 ................................................................................................................................................. 5 56 SM4.1.5 Scenarios for Projecting Change – RCPs and SSPs............................................................... 6 57 ACCEPTED VERSION SUBJECT TO FINAL EDITS
-
Upload
khangminh22 -
Category
Documents
-
view
3 -
download
0
Transcript of Supplementary material - ACCEPTED VERSION SUBJECT ...
FINAL DRAFT Chapter 4 Supplementary Material IPCC WGII Sixth Assessment Report
Do Not Cite, Quote or Distribute SM4-1 Total pages: 273
1
Chapter 4: Water 2
Supplementary Material 3 4 Coordinating Lead Authors: Martina Angela Caretta (Sweden), Aditi Mukherji (India) 5 6 Lead Authors: Md Arfanuzzaman (Bangladesh), Richard A. Betts (United Kingdom), Alexander Gelfan 7 (Russian Federation), Yukiko Hirabayashi (Japan), Tabea Katharina Lissner (Germany), Elena Lopez Gunn 8 (Spain), Junguo Liu (China), Ruth Morgan (Australia), Sixbert Mwanga (Tanzania), Seree Supratid 9 (Thailand) 10 11 Contributing Authors: Malcolm Araos (Canada/USA), Soumya Balasubramanya (Sri Lanka/India), 12 Angelica Katharina Casparina Brackel (The Netherlands), John Caesar (United Kingdom), Holly B. 13 Caggiano (USA), Benjamin Cook (USA), Constantino Dockendorff (Germany/Chile), Calynn Dowler 14 (USA), Robert Dunn (UK/Germany), Lina Elisabeth Erika Eklund (Sweden), Zhang Fan (China), Valeria 15 Fanghella (Italy), Colin M. Finlayson (Australia), Sabine Fuss (Germany), Animesh Kumar Gain 16 (Italy/Bangladesh), Freya Garry (United Kingdom), Laila Gohar (United Kingdom), Valentin Golosov 17 (Russian Federation), Sharlene Liane Gomes (The Netherlands/Canada), Benjamin Jerome Gray (USA), 18 Lukas Gudmundsson (Switzerland/Germany/Iceland), Tania Guillen Bolaneos (Germany/Nicaragua), Kate 19 Halladay (United Kingdom), Ed Hawkins (United Kingdom), Greeshma Hegde (India), Masoud Irannezhad 20 (China/Iran), Bjørn Kløve (Finland/Norway), Aristeidis G. Koutroulis (Greece), Manish Kumar (India), 21 Jonathan Lautze (South Africa/USA), Deborah Ley (Mexico/Guatemala), Ashwina Mahanti (India), 22 Ganquan Mao (China), Deborah McGregor (Canada), Mamta Mehar (India), Megan Mills-Novoa (USA), 23 Tessa Möller (Germany/Luxemburg), Sanchari Mukhopadhyay (India), Tero Mustonen (Finland), 24 Lakshmikantha N R (India), Gustavo Naumann (Italy/Argentina/Germany), Prajjwal Kumar Panday 25 (USA/Nepal), Vishnu Prasad Pandey (Nepal), Jagadish Parajuli (USA/Nepal), Assela Pathirana 26 (Netherlands/Sri Lanka), Ritu Priya (India), B. Uday Bhaskar Reddy (India), Ekaterina Rets (Russian 27 Federation), Rodrigo Fernandez Reynosa (USA/Guatemala), Pamela Rittelmeyer (USA), Conrado M. 28 Rudorff (Brazil), Orie Sasaki (Japan), Corinne Schuster Wallace (Canada/Wales), Christopher A. Scott 29 (USA), Cydney Kate Seigerman (USA), Sonali Senaratna Sellamuttu (Myanmar/Sri Lanka), Rinan Shah 30 (India), Mohammad Shamsudduha (United Kingdom/Bangladesh), Gitta Shrestha (Nepal), Afreen Siddiqui 31 (USA/Pakistan), Balsher Singh Sidhu (Canada/India), Aprajita Singh (USA/India), Anna Sinisalo 32 (Norway/Finland), Francesca Spagnuolo (Italy), Jaishri Srinivasan (USA/India), Makere Stewart-Harawira 33 (Canada/New Zealand), Debra Tan (Hong Kong, Special Administrative Region, China/Malaysia), Masahiro 34 Tanoue (Japan), Brock Ternes (USA), William Rigoberto Delgado Thompson (USA/United 35 Kingdom/Mexico), Peter Uhe (United Kingdom/Australia), Astrid Ulloa (Colombia), Nicole van Maanen 36 (Germany/The Netherlands), Shuchi Vora (India), Yashoda Yashoda (India) 37 38 39 Review Editors: Blanca Elena Jimenez Cisneros (France/Mexico), Zbigniew Kundzewicz (Poland) 40 41 Chapter Scientists: Vishnu Prasad Pandey (Nepal), Rodrigo Fernandez Reynosa (USA/Guatemala) 42 43 Date of Draft: 1 October 2021 44 45 Notes: TSU Compiled Version 46 47
48 Table of Contents 49 50 SM4.1 Methodological Developments in Climate and Hydrological Sciences since AR5 .................. 3 51
SM4.1.1 Advances in Detecting Hydrological Changes from In-Situ Measurements .......................... 3 52 SM4.1.2 Advances in Detecting Hydrological Changes from Satellite Data ........................................ 3 53 SM4.1.3 Advances in Hydrological Modelling for Impact Assessment ................................................ 3 54 SM4.1.4 Detection and Attribution: How Much of the Changes are Attributable to Climate Change?55
................................................................................................................................................. 5 56 SM4.1.5 Scenarios for Projecting Change – RCPs and SSPs ............................................................... 6 57
ACCEPTED VERSIO
N
SUBJECT TO FIN
AL EDITS

FINAL DRAFT Chapter 4 Supplementary Material IPCC WGII Sixth Assessment Report
Do Not Cite, Quote or Distribute SM4-2 Total pages: 273
SM4.2 Methodological Note on Measuring Benefits of Observed Adaptation, and Effectiveness of 1 Projected Adaptation ............................................................................................................................... 7 2 SM4.2.1 Measuring Benefits of Current (Observed) Adaptation .......................................................... 7 3 SM4.2.2 Projected Effectiveness of Adaptation .................................................................................... 9 4
References ............................................................................................................................................. 224 5 6 7
ACCEPTED VERSIO
N
SUBJECT TO FIN
AL EDITS

FINAL DRAFT Chapter 4 Supplementary Material IPCC WGII Sixth Assessment Report
Do Not Cite, Quote or Distribute SM4-3 Total pages: 273
SM4.1 Methodological Developments in Climate and Hydrological Sciences since AR5 1
2 Since AR5, there have been methodological improvements in the climate change impact and hydrological 3 studies, including advances in in-situ and satellite data applications, development of models and scenarios 4 and detection and attribution studies. These methodological developments are aligned with the recently 5 formulated priorities in climate and hydrological sciences (Cudennec et al., 2016; Blöschl et al., 2019a). 6 7 SM4.1.1 Advances in Detecting Hydrological Changes from In-Situ Measurements 8 9 Global investments in the in-situ monitoring infrastructure continue to decline, leading to consistently 10 Decrease numbers of observation stations, especially in difficult-to-access environments (Fekete et al., 2015; 11 Ceola et al., 2016; Feki et al., 2016). Such monitoring limitations impede advances in hydrological change 12 and water security assessments (Blume et al., 2017; Young et al., 2019)(high confidence). Despite these 13 limitations, there has been the development of novel experimental stations (e.g., Environment Change 14 Network (Rennie et al., 2020) and TERENORur (Bogena et al., 2018) and observational techniques, 15 resulting in new sources of information for a better understanding of the hydrological changes. These new 16 methods include innovative approaches for high-resolution and low-cost estimation of rainfall (e.g. camera 17 rain gauges (Allamano et al., 2015), moving car rain gauges (Rabiei et al., 2016), video analysis for deriving 18 river stage fluctuations (Michelsen et al., 2016) and gauging extreme floods (Le Boursicaud et al., 2016), 19 image-based techniques, such as particle tracking velocimetry (Tauro and Grimaldi, 2017), unmanned aerial 20 vehicles flow tracking (Perks et al., 2016). In addition, the techniques rooted in open-source controllers are 21 intensively elaborated (Cressey, 2017; Lettenmaier, 2017; Tauro et al., 2018). These combined efforts have 22 promoted the implementation of public hydrological data collection platforms (Tauro et al., 2018) (Crowd 23 Hydrology and OPEnS Lab are among the recent examples) within a framework of increased use of citizen 24 science data in hydrological research. In this framework, novel tools for accumulating citizen-collected data 25 of water insecurity measures are beginning to develop (Young et al., 2019). 26 27 SM4.1.2 Advances in Detecting Hydrological Changes from Satellite Data 28 29 Discharge estimation from altimetry (Zakharova et al., 2020) and optical/microwave detection of snow and 30 ice cover (Tarpanelli et al., 2017) have helped improved understanding of past changes in the hydrological 31 cycle at large scales, particularly in ungauged and poorly-gauged river basins (medium confidence). Progress 32 has been made in algorithms and satellite product development relating to estimations of streamflow 33 discharge (Durand et al., 2016; Sichangi et al., 2016), drainage network (Wang et al., 2021)and river channel 34 surface area (Allen and Pavelsky, 2018; Wang et al., 2018c). Advancements in the processing of satellite 35 data allow monitoring past changes in surface (Donchyts et al., 2016; Pekel et al., 2016; Busker et al., 2019), 36 soil (Nicolai-Shaw et al., 2017; Deng et al., 2020), and the GRACE satellite-based total water storage 37 (Rodell et al., 2018; Pokhrel et al., 2021) changes. Satellite-derived improved DEM together with new 38 floodplain and river network products (Yamazaki et al., 2017; Nardi et al., 2019; Yamazaki et al., 2019) 39 make it possible to obtain more realistic river routing at continental to global scales. Several space missions 40 launched after AR5 provide new insights into changes in surface soil moisture (SMAP and Sentinel-1B), 41 surface water elevation (Jason-3, ICESat-2), total water storage (GRACE-FO), etc. (McCabe et al., 2017). 42 After AR5, a multi-satellite approach (Sichangi et al., 2016; Wang et al., 2017b; Zhang et al., 2019b) became 43 a comprehensive tool for satellite-based detection of hydrological changes. 44 45 SM4.1.3 Advances in Hydrological Modelling for Impact Assessment 46 47 Until recently, approaches to the projections of hydrological consequences of climate change include 48 (Kundzewicz et al., 2018): (1) climate models ensemble simulations (Koirala et al., 2014; Ficklin et al., 49 2018); (2) hydrological models simulations driven by the climate models ensemble projections (Krysanova 50 et al., 2017; Zaherpour et al., 2018). 51 52 Following the climate model-hydrological model-impact assessment chain, a methodological shift has 53 occurred after AR5. This shift involved moving away from using one hydrological model with a large 54 ensemble of climate projections to use hydrological model sets (Hattermann et al., 2017). Even when driven 55 by the same climate projections, different hydrological models can provide different results, so the impact 56 assessments based on averaging over the hydrological model ensemble are assumed to be more credible than 57
ACCEPTED VERSIO
N
SUBJECT TO FIN
AL EDITS

FINAL DRAFT Chapter 4 Supplementary Material IPCC WGII Sixth Assessment Report
Do Not Cite, Quote or Distribute SM4-4 Total pages: 273
a single model-based assessment (Kundzewicz et al., 2018) (medium confidence), though possible extremes 1 can be ubreasonably smoothed by averaging. Both global and regional (basin-scale) hydrological model sets 2 have been Increasely used for impact studies, particularly within the Inter-Sectoral Impact Model Inter-3 comparison Project (see Box 4.S.1.1 ISIMIP). Global hydrological models show weaker performance in the 4 historical period at the basin scale and provide more uncertain runoff projections than the regional models 5 (Gosling and Arnell, 2016; Hattermann et al., 2017). Global hydrological models also demonstrate a more 6 pronounced increase in impact uncertainty with time (robust evidence, medium agreement) (Hattermann et 7 al., 2018). The difference in assessment uncertainty is due partly to the fact that global hydrological models 8 are used without any calibration and testing, unlike regional hydrological models (Krysanova et al., 2018; 9 Kundzewicz et al., 2018). It has been further demonstrated that climate projections are commonly the main 10 source of uncertainty in hydrological impact assessments (Krysanova et al., 2016; Vetter et al., 2017; Joseph 11 et al., 2018) (robust evidence, medium agreement). However, hydrological model-based uncertainty can also 12 be notable for some variables (Hattermann et al., 2018) and basins (Giuntoli et al., 2015; Hattermann et al., 13 2018). Studies published after AR5 focused on quantifying the contribution of internal atmospheric 14 variability in hydrological projection uncertainty (Seiller and Anctil, 2014; Gelfan et al., 2015). 15 Computational cost reduction and advancement in computationally efficient schemes allow evaluation of 16 hydrological models performance for different reference periods and more detailed assessment with higher 17 spatial and temporal resolutions. Evaluation of hydrological models can also include multiple climate and 18 socio-economic scenarios, attribution of impacts and accounting for complex water processes at regional and 19 continental scales. Herewith, methodological differences can lead to markedly different outputs for several 20 hydrological assessments of climate change (Koutroulis et al., 2018). 21 Accumulation of statistics on hazard, exposure and vulnerability has improved model-based estimation of 22 impacts, loss and damage, and cost and benefit of adaptations to water-related disasters (medium agreement). 23 For example, reported exposures caused by water-related disasters on databases such as EM-DAT and 24 NatCat SERVICE had been used to calibrate modelled exposures or past trends in vulnerabilities (Jongman 25 et al., 2015; Tanoue et al., 2016). In addition, current local resilience to hazard (e.g., flood protection 26 standard (Scussolini et al., 2016) provides an initial condition and helps to quantify additional adaptations 27 required to projected changes. 28 29 30
[START BOX SM4.1 HERE] 31 32 Box SM4. 1: Inter-Sectoral Impact Model Intercomparison Project (ISI-MIP) 33 34 ISI-MIP is a community-driven activity bringing together impact modellers to create a framework for multi-35 model climate-impact simulations across sectors and scales. Following the first ISI-MIP involving 28 global 36 impact models from five sectors: water, agriculture, biomes, health, coastal systems (Warszawski et al., 2014) 37 and aimed at providing outcomes for AR5, the current longer-term phase incorporates regional impact models, 38 additional eight sectors (regional water, fisheries and marine ecosystems, permafrost, terrestrial biodiversity, 39 regional forests, agro-economies, lakes, and energy), and involves more than 100 modelling groups. The main 40 output of ISI-MIP is an open-access archive (isimip.org/gettingstarted/data-access/#for-external-non-41 participant-users) of simulations. 42 43 The key research results obtained within the ISI-MIP Water sector can be broadly divided into the following 44 three groups: 45 46
Evaluation of regional hydrological models (rHMs) and rHMs-based impact assessment: Comprehensive 47
studies were carried out for 12 large river basins worldwide using nine calibrated rHMs driven by five 48
climate projections for four RCPs (see synthesis in (Krysanova et al., 2017). The models’ 49
performance evaluated with 14 criteria was suitable for the monthly and seasonal dynamics and high 50
flow but weaker for low flow indicators. Total contribution of GCMs and RCPs to mean annual and 51
high flows projections uncertainty turned out to be five times greater than the contribution of rHMs. 52
Evaluation of global hydrological models (gHMs): An ensemble of six gHMs for 40 large river basins 53
worldwide was evaluated (Zaherpour et al., 2018). The gHMs models generally perform better in the 54
wetter equatorial and northern hydro belts than in drier southern hydro belts for monthly runoff. 55
Nevertheless, the authors found a general trend towards overestimating mean annual runoff and 56
ACCEPTED VERSIO
N
SUBJECT TO FIN
AL EDITS

FINAL DRAFT Chapter 4 Supplementary Material IPCC WGII Sixth Assessment Report
Do Not Cite, Quote or Distribute SM4-5 Total pages: 273
indicators of upper and lower extremes for most models. In several cases, gHMs failed to capture the 1
timing and magnitude of the seasonal runoff cycle. The study highlights the need for improvement of 2
gHMs and models weighting based upon their performance. 3
Cross-scale comparison of performance and impacts: A cross-scale intercomparison of performances 4
in the reference period and simulated climate impacts was performed using nine rHMs (calibrated) 5
and nine gHMs (not calibrated except one) for 11 large river basins (see synthesis in (Hattermann et 6
al., 2017). In the reference conditions, gHMs often show considerable biases in mean monthly and 7
annual discharges and incorrect seasonality, whereas rHMs show a much better reproduction of 8
discharge. 9 10
[END BOX SM4.1 HERE] 11 12 13 SM4.1.4 Detection and Attribution: How Much of the Changes are Attributable to Climate Change? 14 15
Since AR5, tracing the effects of human influence on extreme weather events has become a major 16
emerging area of enquiry (Scott and Sugg, 2015; Easterling et al., 2016). Following an impactful 17
extreme event such as a heatwave, wildfire, drought, or flood, the demand for information about the 18
role of climate change is intensified mainly from the media, regional disaster risk managers, insurance 19
industry, litigators, and policymakers. Furthermore, planning for disaster risk management requires 20
reassessments of the magnitude of impact-related variables expected to be experienced at different 21
likelihood levels. Attribution of hydrometeorological impacts to anthropogenic climate change 22
consists of two steps: attribution of impacts to climate change, regardless of the cause, and attribution 23
to anthropogenic causes. (Cramer et al., 2014)Cramer et al., 2014, presented evidence that several 24
water-related impacts could be attributed to climate change, but with little attribution to drivers of 25
climate change, whether anthropogenic or natural. However, (Bindoff et al., 2013a)Bindoff et al., 26
2013a presented new, stronger evidence that hydrometeorological changes could be attributed to 27
anthropogenic influence through Increase radiative forcing by greenhouse gas (GHG) and aerosol 28
emissions, and also presented emerging evidence that some aspects of land hydrological change could 29
be attributed to the anthropogenic influence of atmospheric CO2 concentrations acting on land 30
ecosystems. Most attribution studies assessed in WGI focused on long-term trends, with a few on 31
extreme events. 32
33
The techniques for detecting and attributing extreme weather events have improved substantially 34
since the AR5 (Bindoff et al., 2013b). An event attribution (EA) statement is based on a specific 35
metric that characterizes the extreme nature of the event in question, rendering relevance for the 36
occurrence of similar types of events in the future. The change in the likelihood of an extreme event 37
due to human influences on the climate is usually expressed in terms of the fraction of attributable 38
risk (FAR) (Allen, 2003) or the probability ratio. 39
40
Different event attribution approaches have been developed. For example, coupled Model 41
Approaches extracts large samples of the impact-related climatic variable from general circulation 42
model (GCM) ensembles of the factual and counterfactual (a world that might have been without 43
human influences) worlds to estimate the probabilities of the event of interest under both scenarios, 44
from which estimates of the FAR or Relative Risk (RR) are obtained. For such attribution 45
assessments, the models must be rigorously evaluated against long term observational data (Perkins 46
et al., 2014). 47
48
Sea Surface Temperature Forced Atmosphere Only Model Approaches are similar to the GCM 49
approach but uses atmosphere-only climate model (AGCM) with simulations representing the factual 50
world conditioned on the observed evolution of sea surface temperature (SST) and ice cover, and 51
simulations of the counterfactual world conditioned on SSTs and ice cover of a ‘world that might 52
have been,’ had there been no human influence on climate (Ciavarella et al., 2018). Prescribed SSTs 53
ACCEPTED VERSIO
N
SUBJECT TO FIN
AL EDITS

FINAL DRAFT Chapter 4 Supplementary Material IPCC WGII Sixth Assessment Report
Do Not Cite, Quote or Distribute SM4-6 Total pages: 273
in an AGCM are used rather than coupled models, as this can reduce model biases and enable more 1
ensemble members to be simulated. This is because atmosphere-only simulations are less 2
computationally expensive. This approach potentially results in a better representation of extreme 3
events and an improved signal-to-noise ratio. However, the lack of atmosphere-ocean coupling could 4
lead to a less accurate representation of extreme events strongly affected by atmosphere-ocean 5
interactions (Stott et al., 2016). While removing the anthropogenic GHG forcing from the modelled 6
atmosphere is straightforward, estimating the pattern of warming to be removed from the observed 7
SSTs and sea ice is the largest source of uncertainty in this approach that cannot be evaluated against 8
observations. 9
10
Confidence in the attribution of water-related extremes (extreme precipitation events, droughts, and 11
storms) can sometimes be lower than for extreme temperature events (Stott et al., 2016). The 12
observational basis is regarded as less secure, and climate models may not always perform well in 13
capturing relevant features of the events. Confidence depends on the processes involved. (Seneviratne 14
et al., 2021) draw an important distinction between dynamic (atmospheric circulation) and 15
thermodynamic (energy balance, including evaporation) effects. (Seneviratne et al., 2021) assign high 16
confidence to thermodynamic contributions to Increase drought severity from greenhouse forcing but 17
low confidence to dynamic contributions. They also assign high confidence to anthropogenic 18
contributions to the increased intensification of precipitation, dominated by thermodynamic effects 19
with some dynamic contributions. Confidence in attribution results increases if independent methods 20
lead to similar conclusions. For example, the consensus among different process-based models can 21
increase confidence and explain well-founded conceptual models. 22
23
Europe, North America, Australasia, and Asia currently have a disproportional amount of published 24
EA studies. Among other publications, annual reports of the Bulletin of the American Meteorological 25
Society (BAMS) on explaining extreme events of the previous year from a climate perspective have 26
been published since 2012 (Peterson et al., 2012) and contributed to the increase in the geographical 27
coverage of event attribution studies. However, given the regional differences in modes of climate 28
variability, such as El Niño / Southern Oscillation, and responses to external climate forcings, it is 29
important to close gaps in global coverage (Central and South America, Africa, West Asia and 30
Eastern Europe) of detection and attribution studies. 31
32
In general, studies have shown clear evidence that human influence has increased the likelihood of 33
many extremely warm seasonal temperatures and reduced the likelihood of extremely cold seasonal 34
temperatures in many parts of the world. The influence on the probability of extreme precipitation 35
events, droughts, and storms is less evident, but some evidence is emerging for some cases. Most of 36
the published studies have focused on the meteorological nature of events rather than their impacts 37
which would in many cases require the consideration of additional geophysical and socio-economic 38
(e.g., exposure and vulnerability to natural hazards) processes. For instance, stream flows computed 39
using hydrological models come closer to the drivers of flood or drought impacts on people. As the 40
attribution techniques are extended to account for additional impact-relevant variables, it is expected 41
that the results will become more suitable for regional to local decision making on management of 42
water resources and disasters risk. 43 44 SM4.1.5 Scenarios for Projecting Change – RCPs and SSPs 45
46 The Representative Concentration Pathways (RCPs) and the Shared Socioeconomic Pathways (SSPs) 47 provide scenarios of future changes in climate forcings and socio-economic changes. They are used, among 48 other things, to quantify the water-related impacts of climate change. Differences in climate model responses 49 to RCP forcing lead to significant uncertainties in projected regional water impacts. Projected risks for 50 people and society also depend very strongly on the choice of socio-economic scenario. For example, the 51 risk of water insecurity depends not only on the limited availability of freshwater but also on the number of 52 people exposed to this and their sensitivity to reduced water availability. These, in turn, depend on socio-53
ACCEPTED VERSIO
N
SUBJECT TO FIN
AL EDITS
FINAL DRAFT Chapter 4 Supplementary Material IPCC WGII Sixth Assessment Report
Do Not Cite, Quote or Distribute SM4-7 Total pages: 273
economic factors such as population size and demographics, local infrastructure, the character and state of 1 the economy, and other factors that affect access to water. 2 3 RCPs are primarily defined in terms of the concentrations of CO2, other GHGs and short-lived forcing 4 agents such as ozone and aerosols, and in CMIP5-based research assessed in AR5, the RCPs were also 5 accompanied by standardized scenarios of land use and land cover change (van Vuuren et al., 2011). One 6 development since AR5 is the inclusion of different mixes of CO2 and other forcing agents for a given 7 radiative forcing, which could potentially affect hydrological cycle processes sensitive to the concentration 8 of CO2 and/or the geographical pattern of radiative forcing or land use (see 4.1.3). Another development is 9 that the RCPs used in the 6th Coupled Model Intercomparison Project (CMIP6) climate models are paired 10 with specific SSPs, including land-use scenarios associated with that SSP. 11 12 SSPs provide quantitative scenarios of the key characteristic of human society over the 21st century (O’Neill 13 et al., 2017). These consist of quantified scenarios and accompanying narratives representing possible future 14 trends in large-scale (global and world regional) societal character and natural systems over the 21st century. 15 The five SSPs are designed to cover diverging sets of societal conditions representing combinations of high 16 and low challenges to climate change mitigation and adaptation. They are quantified in terms of 17 demographics (Jones and O’Neill, 2016), economic development, welfare, environmental and ecological 18 factors, resources, metrics for governance, technological development, policies (excluding climate policy) 19 and broader societal factors, and feature narratives describing the scenario of the evolution of these 20 pathways. These pathways affect the exposure and vulnerability of people to hydrological hazards and hence 21 affects the risks and impacts of climate change relating to water. 22
23
24 SM4.2 Methodological Note on Measuring Benefits of Observed Adaptation, and Effectiveness of 25
Projected Adaptation 26
27 SM4.2.1 Measuring Benefits of Current (Observed) Adaptation 28
29 The current (observed) adaptation assessment focuses on measuring outcomes (positive or negative) of 30 water-related adaptation responses across several dimensions. We define water-related adaptation as a 31 response if the hazard or the adaptation intervention is water-related. For example, any response to water 32 induced hazards like floods, droughts, groundwater depletion, melting of the cryosphere, soil moisture 33 depletion etc., is counted as a water-related adaptation. Similarly, water specific adaptation response (e.g., 34 irrigation, water “saving” technologies, rainwater harvesting, soil moisture conservation etc.), irrespective of 35 the nature of the hazard, is also considered water-related adaptation. 36 37 For assessing the outcomes (both positive and negative) of current adaptation responses, we use a database 38 of 1819 documented case studies of adaptation across all sectors published since 2014. Of these, 1682 papers 39 are from the Global Adaptation Mapping Initiative (GAMI) database (Berrang-Ford et al., 2021), and the 40 remaining 137 papers are cited in relevant adaptation sections of this chapter (Section 4.6). Of these, only 41 359 (19.7%) case studies measure outcomes of water-related adaptation responses in concrete ways. Since a 42 single paper often dealt with more than one adaptation, a total of 1038 responses were coded from these 359 43 papers. Therefore, we only include studies that measure outcomes of adaptation response by using one or 44 multiple indicators. We define any current adaptation response to be beneficial if it leads to positive 45 outcomes. Of the 359 articles, as many as 319 articles document (88.8%) show positive outcomes. An 46 adaptation is deemed to be beneficial when any outcomes in any of these categories is positive: 47 48
• Economic and financial indicators, such as improvements in crop yields and resulting incomes; 49 increase in profits, greater savings, or decreased losses from hazards, etc.; 50
• Impacts on vulnerable people, e.g., on women, children; Indigenous Peoples; 51
• Water-related impacts, e.g., improved water use efficiency, water saving, reduction in water 52 withdrawals and application, etc.; 53
• Ecological and environmental impacts such as lesser energy use, better soil structures, and better 54 thermal comfort, etc.; 55
ACCEPTED VERSIO
N
SUBJECT TO FIN
AL EDITS
FINAL DRAFT Chapter 4 Supplementary Material IPCC WGII Sixth Assessment Report
Do Not Cite, Quote or Distribute SM4-8 Total pages: 273
• Institutional and socio-cultural impacts such as better group dynamics and action, better bargaining 1 power among vulnerable people; and strengthening of local institutions or national policies; and 2
• Any other positive outcomes not captured by the above five indicators. 3 4 Given the focus on measuring outcomes of water-related adaptations, our inclusion criteria were: 5
• The article was about water-related adaptation; 6
• The article documents implemented case study of water-related adaptation responses as opposed to 7 responses planned for the future; 8
• The article documents outcomes of adaptation in measurable ways; 9
• The article includes at least one tangible (either quantitative or qualitative) indicator of outcomes. 10 Those indicators could be economic/financial indicators; indicators on impacts on vulnerable people; 11 water-related indicators, environmental and ecological indicators; socio-political indicators; or any 12 other indicators not captured by the above categories; 13
• The article was published in, or after 2014; 14
• The paper contained enough data about the water-related adaptation response/intervention that is 15 being coded. 16
17 Each paper was coded for roughly 100 variables. The first was the inclusion/exclusion criteria mentioned 18 above. To be included, an article had to meet all six inclusion criteria mentioned above. The second section 19 coded the nature of adaptation response. This included: category of water adaptation response (coded across 20 16 categories); water use sub-sectors in which adaptation was taking place (all water-use sections in this 21 chapter); the scale of intervention (local, national, regional, and global); geographic location (country and 22 continent); details about the initiator of adaptation (government, civil society, private companies etc.) and 23 whether adaptation response included Indigenous Knowledge and local knowledge. The 16 adaptation 24 categories were: 25 26
• Improved cultivars and agronomic practices 27
• Changes in cropping pattern and crop systems 28
• On-farm irrigation and water management 29
• Water and soil moisture conservation 30
• Collective action, policies, institutions 31
• Migration & off-farm diversification 32
• Economic/financial incentives 33
• Training and capacity building 34
• Agro-forestry and forestry interventions 35
• Flood risk reduction measures 36
• Livestock and Fishery related 37
• IK and LK based adaptations 38
• Urban water management 39
• Energy-related adaptations 40
• WaSH related adaptations 41
• Any other (includes coping) 42 43 The third section of the protocol coded hazards (e.g., floods, droughts, extreme rainfall, groundwater 44 depletion, melting of the cryosphere, etc.), vulnerability (how did the communities experience vulnerability), 45 and risk. Here 11 risk categories were defined. Section four coded evidence on the outcomes of adaptation, 46 including maladaptation and co-benefits. Studies were coded on six outcome parameters mentioned earlier, 47 and these were used to understand beneficial (or indifferent, detrimental and maladaptive) outcomes of 48 adaptation across different parameters. Finally, we classified the studies in terms of confidence with which 49 adaptation responses were linked to adaptation outcomes and accordingly, studies were classified into three 50 categories: 51
• studies that establish causal linkages between the adaptation response and outcomes; 52
• studies that show a correlation between the adaptation response and outcome but does not 53 necessarily establish causality; 54
ACCEPTED VERSIO
N
SUBJECT TO FIN
AL EDITS
FINAL DRAFT Chapter 4 Supplementary Material IPCC WGII Sixth Assessment Report
Do Not Cite, Quote or Distribute SM4-9 Total pages: 273
• Studies neither establish causality nor show any correlation between adaptation response and 1 outcomes in tangible ways. 2
In addition to answering the question, coders were required to copy and paste relevant text from the papers to 3 support their answers. Two or more coders coded each article, and inconsistency was checked and resolved. 4 5 We used the online SysREV platform for coding the papers. This online tool enables multiple coders to code 6 simultaneously, and all results are saved on the SysREV server as .csv files. Cleaned data were analyzed 7 using Excel, R (R Core Team), and Stata software. (Further details about the protocol can be found in 8 (Mukherji et al., Accepted), and the database is available at https://doi.org/10.5337/2021.220) 9
10 SM4.2.2 Projected Effectiveness of Adaptation 11 The assessment of future adaptation effectiveness focuses on the ability of a given adaptation response 12 option to return the system under analysis to the baseline state as defined within each study, relative to a 13 projected climate change hazard or risk. For example, projections within a given study might indicate yield 14 reduction at a given point in the future and assess whether Increase irrigation efficiency under a study-15 specific implementation is able to compensate for the yield reduction relative to the baseline conditions. 16 Effectiveness is here defined as the degree to which the assessed option is able to compensate projected 17 losses. To compare effectiveness across different studies and timeframes, we calculate the effectiveness as a 18 percentage of the risk that the option is able to reduce. We further translate the study-specific scenario and 19 assessment timeframes into Global Warming Levels (GWL) relative to an 1850-1900 baseline. 20 21 Studies for the assessment were selected based on several criteria: 22
• the provision of quantitative projections of climate risk for a given sector, including specification of 23 baseline and scenario timeframes 24
• the provision of a quantitative assessment of the effectiveness of a specific water-related adaptation 25 option 26
• clear identification of timeframes for baseline and future projections as well as identification of 27 scenarios (SRES, RCP etc.) and climate models 28
• an assessment of counterfactuals: impacts without adaptation vs with adaptation; values for baseline 29 state. 30
31
A total of 45 studies were identified as suitable for inclusion (see data table in Supplementary Table SM4.7). 32 For each study, all discrete combinations of scenarios, timeframes and adaptation options were treated as an 33 individual data point, leading to several data points from each study and a total of 450 data points for 34 assessment. To make studies comparable across different scenarios and timeframes, we converted each study 35 into a representation of GWL (http://wlcalc.climateanalytics.org), relative to an 1850-1900 baseline, based 36 on the HadCrut4 dataset. We then rounded temperature change to classify each study within the ranges of 37 policy-relevant temperature classes of 1.5°C, 2°C, 3°C and 4°C: 38 39
• 1.5°C = below 1.5° up to 1.75°C 40
• 2°C = above 1.75°C and up to 2.5°C 41
• 3°C = above 2.5 °C and up to 3.5°C 42
• 4°C = above 3.5°C 43 44
For each study, we assessed the potential for the adaptation option to return the system to baseline conditions 45 relative to the projected climate risk under consideration, assuming that current conditions represent a 46 desirable state. Since units across options are not comparable, we used the percentage change as an indicator. 47 Therefore, we defined each option’s effectiveness as a per cent reduction of the risk (projected risk with 48 adaptation - projected risk without adaptation) relative to the overall projected risk (projected risk without 49 adaptation – baseline state). 50 51 We only included data points where either the adaptation option or the measured unit of effectiveness were 52 related to freshwater-related issues. We then grouped the studies based on the core focus of the intervention 53 identified: 54 55
• Improved cultivars and agronomic practices (Option 1) 56
ACCEPTED VERSIO
N
SUBJECT TO FIN
AL EDITS

FINAL DRAFT Chapter 4 Supplementary Material IPCC WGII Sixth Assessment Report
Do Not Cite, Quote or Distribute SM4-10 Total pages: 273
• Changes in cropping pattern and crop systems (Option 2) 1
• On-farm irrigation and water management (Option 3) 2
• Water and soil moisture conservation (Option 4) 3
• Multiple agricultural adaptation options (Option 5) 4
• Agro-forestry and forestry (Option 6) 5
• Flood risk reduction measures (Option 7) 6
• Urban water (Option 8) 7
• Energy-related adaptation (Option 9). 8 9 We defined Multiple agricultural adaptation options (Option 5) as any combination of at least two of the 10 other agricultural-related options (Option 1-4). 11 12 Each data point is classified according to the effectiveness of the measure: 13
• Effectiveness 14 o Above 100% = Co-Benefits 15 o 80 to 100% = Large 16 o 50 to 80% = Moderate 17 o 30 to 50% = Small 18 o Below 30% = Insufficient 19
20 Here, co-benefits means that adaptation reduces projected impacts and leads to an overall improvement 21 relative to the baseline state. 22 23 We further assessed the residual impact after adaptation as percent of remaining impact after adaptation has 24 been implemented (100% - Effectiveness in %): 25
• Residual impact 26 o Below 5% = Negligible 27 o 5 to 30% = Small 28 o 30 to 50% = Moderate 29 o Above 50% = Large 30 o Above 100% = Maladaptation 31
32 Here, maladaptation means that adaptation is disadvantageous and leads to an overall deterioration relative to 33 the baseline state and the projected impact without adaptation. 34 35 We grouped the data points according to their IPCC region (Africa, Asia, Australasia, Central and South 36 America, Europe, North America) or Global. For the location of each data point (see Figure 1 in Section 37 4.7.2 Projected effectiveness of adaptation options), we used the given coordinates from each study or an 38 approximation from the given location. If a study assessed an adaptation option over a region or area, we 39 positioned the data point in the geographic center of the given region or area. 40
ACCEPTED VERSIO
N
SUBJECT TO FIN
AL EDITS

FINAL DRAFT Chapter 4 Supplementary Material IPCC WGII Sixth Assessment Report
Do Not Cite, Quote or Distribute SM4-11 Total pages: 273
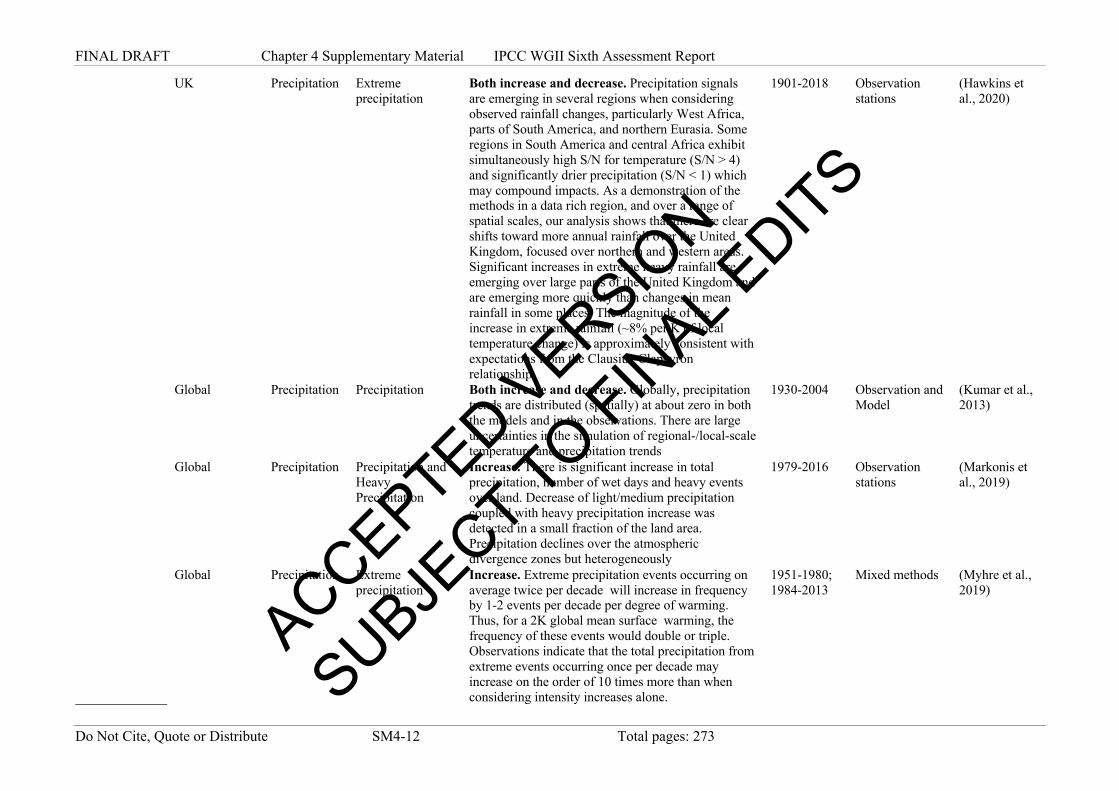
Table SM4.1: Observed Changes to the Hydrological Cyle Across Eegions 1 Region Contry(ies) Hydrological
Component Which Component of the hydrological component is Impacted
Observed trend with quantitative estimates Time Period Dataset e.g. observation station, gridded datasets, reanalysis
References
Global Precipitation Mean precipitation
No trend 1979-2014 Observation stations
(Adler et al., 2017)
Precipitation Mean precipitation
Increase. 1901-2018 Observation stations
(Dunn et al., 2020)
Global Precipitation Extreme precipitation
Increase. The contribution from very wet days (days exceeding the 95th percentile of daily precipitation) is Increase globally, with now an extra 2% of precipitation falling during very wet days. Maximum 1day precipitation, Rx1day, shows strong increases of around 2 mm per decade in the eastern half of North America, as well as the eastern parts of southern South America, parts of India, and China. Smaller increases are seen over Europe. This is reflected in the global time series with around 2 mm more falling in recent years than in 1961-1990..
1901-2018 Observation stations
(Hawkins et al., 2020)
Global Precipitation Extreme precipitation
Increase. The findings imply that what was a 1-in-1000 day heavy rainfall in 1951-1980 occurred about 45% more often in the 1981- 2013 period, a frequency change consistent in sign but much more pronounced than a global model-based estimate. The increase in heavy precipitation days is substantially larger than expected from internal variability only
1951-1980 Mixed methods (Fischer and Knutti, 2016)
Global Precipitation Precipitation Both increase and decrease. Precipitation increases in the Northern Hemisphere (NH) mid- to high-latitude lands observed in GPCC can also be found in RECONS and model simulations. Over tropical/subtropical land areas, precipitation reductions generally appear in all products, but with large discrepancies on regional scales. Over ocean, consistent spatial structures of precipitation change also exist between RECONS and models. It is further found that these long-term changes/trends might be due to both anthropogenic GHG and aerosols.
1901-2010 Observation stations
(Gu and Adler, 2015)
ACCEPTED VERSIO
N
SUBJECT TO FIN
AL EDITS
FINAL DRAFT Chapter 4 Supplementary Material IPCC WGII Sixth Assessment Report
Do Not Cite, Quote or Distribute SM4-12 Total pages: 273
UK Precipitation Extreme precipitation
Both increase and decrease. Precipitation signals are emerging in several regions when considering observed rainfall changes, particularly West Africa, parts of South America, and northern Eurasia. Some regions in South America and central Africa exhibit simultaneously high S/N for temperature (S/N > 4) and significantly drier precipitation (S/N < 1) which may compound impacts. As a demonstration of the methods in a data rich region, and over a range of spatial scales, our analysis shows that there are clear shifts toward more annual rainfall over the United Kingdom, focused over northern and western areas. Significant increases in extreme heavy rainfall are emerging over large parts of the United Kingdom and are emerging more quickly than changes in mean rainfall in some places. The magnitude of the increase in extreme rainfall (~8% per K of local temperature change) is approximately consistent with expectations from the Clausius-Clapeyron relationship.
1901-2018 Observation stations
(Hawkins et al., 2020)
Global Precipitation Precipitation Both increase and decrease. Globally, precipitation trends are distributed (spatially) at about zero in both the models and in the observations. There are large uncertainties in the simulation of regional-/local-scale temperature and precipitation trends
1930-2004 Observation and Model
(Kumar et al., 2013)
Global Precipitation Precipitation and Heavy Precipitation
Increase. There is significant increase in total precipitation, number of wet days and heavy events over land. Decrease of light/medium precipitation coupled with heavy precipitation increase was detected in a small fraction of the land area. Precipitation declines over the atmospheric divergence zones but heterogeneously
1979-2016 Observation stations
(Markonis et al., 2019)
Global Precipitation Extreme precipitation
Increase. Extreme precipitation events occurring on average twice per decade will increase in frequency by 1-2 events per decade per degree of warming. Thus, for a 2K global mean surface warming, the frequency of these events would double or triple. Observations indicate that the total precipitation from extreme events occurring once per decade may increase on the order of 10 times more than when considering intensity increases alone.
1951-1980; 1984-2013
Mixed methods (Myhre et al., 2019)
ACCEPTED VERSIO
N
SUBJECT TO FIN
AL EDITS

FINAL DRAFT Chapter 4 Supplementary Material IPCC WGII Sixth Assessment Report
Do Not Cite, Quote or Distribute SM4-13 Total pages: 273
Global Precipitation Extreme precipitation
Increase. Most of the observed Increase trends in extreme precipitation are found to be explained by anthropogenic greenhouse gas forcing with anthropogenic aerosols and natural forcings having marginal influences. Further, the greenhouse gas‚ induced changes are consistent with the expected physical mechanism of extreme precipitation intensification following atmospheric moisture increase under warming via the C- relation.
1951-2015 Observation and Model
(Paik et al., 2020)
Global Precipitation Frequency of extreme precipitation
Increase. For frequency, most regions of the world have a larger number of stations with positive trends than negative, with a global positive/negative ratio equal to 1.5. In Eurasia (NE zone) this ratio is 2.8 with 74% of records showing positive trends. The ratio of significant-positive to significant-negative trends, however, is much higher, with a global value of 2.4 and reaching up to 7.0 for the NE zone. Globally, 66.4% show positive changes. For magnitude, analysis of the stations indicates that Increase trends are slightly more frequent than Decrease; that is, the global positive/negative trends ratio is 1.1. The significant-positive to significant-negative trends ratio is higher (1.3 for the globe), yet it does reveal a striking difference.
1964-2013 Observation stations
(Papalexiou and Montanari, 2019)
Global Precipitation Mean precipitation
Both increase and decrease. 1961-1990; 1951-2005
Observation and Model
(Sarojini et al., 2016)
Global Precipitation Mean precipitation
Constant. The comparisons of precipitation for the consecutive 30-year reference periods from 1931-1960 up to 1981-2010 revealed no significant overall trend. After a slight increase in annual precipitation from the early periods 1931-1960 and 1941-1970 with 784.6 and 781.2 mm, respectively, to 791.2 mm in 1961-1990, the annual precipitation decreased over the recent reference periods to 786.4 mm (1971-2000) and only 776.9 mm in 1981-2010
1951-2000 Observation stations
(Schneider et al., 2017)
Global Precipitation Heavy precipitation
Both increase and decrease. The global median sensitivity, percentage change in extreme precipitation per 1 K increase in GMST is 6.6% (5.1% to 8.2%; 5%–95% confidence interval) for Rx1day and is slightly smaller at 5.7% (5.0% to 8.0%) for Rx5day.
1950-2018 Observation stations
(Sun et al., 2020) ACCEPTED V
ERSION
SUBJECT TO FIN
AL EDITS

FINAL DRAFT Chapter 4 Supplementary Material IPCC WGII Sixth Assessment Report
Do Not Cite, Quote or Distribute SM4-14 Total pages: 273
Global Precipitation Annual precipitation
Constant. The global changes in precipitation over the Earth's land mass excluding Antarctica relative to 1961 were estimated to be: -1.2 ± 1.7, 2.6 ± 2.5 and -5.4 ± 8.1% per century for the periods 1850-2000, 1900-2000 and 1950-2000, respectively. A change of 1% per century corresponds to a precipitation change of 0.09 mm/year
1961-90 Observation stations
(van Wijngaarden and Syed, 2015) (Bernacchi and VanLoocke, 2015)
ET Evapotranspiration
Decrease. ET is on average 6 % lower for plants grown in elevated CO2 relative to ambient conditions.
(Bernacchi and VanLoocke, 2015)
ET Global Evapotranspiration
Increase. Global ET increase over land between early 1980s and late 1990s.
early 1980s Observations (Hartmann, 2013)
ET Evapotranspiratio
n Increase. Observation-based ET trend estimate 1982 to 2010 is 1.18 mmyr-2, and modelled trend is 0.93 +/- 0.31 mmyr.-2.
1982-2010 Observations (Mao et al., 2015)
Global ET Evapotranspiration
Increase. Positive ET trends are found for 62 % of the continental surface. The global trend is slightly positive but not significant.
1980-2011 GLEAM model (Miralles et al., 2013)
Global ET Evapotranspiration
Increase. An ensemble of ET reconstructions suggests an increase of 7.65 mm per year per decade. More than 50% attributed to vegetation greening.
1982-2011 Satellite observations
(Zeng Z et al., 2018)
Global ET Evapotranspiration
Increase. Global Increase trend in ET (1982 - 2013) of 0.88 mm yr-2
1982-2011 Satellite observations
(Zhang K et al., 2015; Zhang et al., 2016a)
Global ET Evapotranspiration
Increase. Estimate of global ET trend from 1981 to 2012 is +0.54 mm/year-2
1981-2012 Satellite observations
(Zhang et al., 2016a)
Global Soil moisture
Soil moisture Decrease of approximately 1.4 x 10⁻³ m3/m3 1979-2017 Observed quantitative (satellite remote sensing) and reanalysis
(Deng et al., 2020)
Global Soil moisture
Soil moisture Decrease over 22% of global land, increase over 7% of global land
1979-2013 Observed (satellite remote sensing)
(Feng and Zhang, 2015)
Streamflow Mean runoff
simulated Decreased. by 1.3% 1971-2001 WATCH
Forcing Data (Asadieh et al., 2016)
ACCEPTED VERSIO
N
SUBJECT TO FIN
AL EDITS
FINAL DRAFT Chapter 4 Supplementary Material IPCC WGII Sixth Assessment Report
Do Not Cite, Quote or Distribute SM4-15 Total pages: 273
based simulation
Sreamflow Trends in wetting and drying over land
Both increase and decrease. Changes towards more arid conditions (red/orange) are found in many parts of Africa, especially in the Sahel and eastern Africa, eastern Asia, eastern Australia and partly in the westernMediterranean and northeastern Brazil. In contrast, drying trends in the northern Mediterranean and small parts of the Sahel are due to changes in the water availability (pink/green). Note
1948-2005 observation station
(Greve et al., 2018)
Streamflow River flow trends Increase. in WNA, AMZ, NEU, CEU. Decrease in
ENA, NER:,SSA,MED,SAS. 1971-2010 observation
station (Gudmundsson et al., 2019b)
Streamflow Runoff to Precipitation ratio
Both increase and decrease 1901-2000 WATCH model ensemble data
(Berghuijs et al., 2017b)
Streamflow Runoff relative anomalies
Both increase and decrease. Decrease in Africa, Increase in Asia, North America, South America, Austria
1958-2004 observation station
(Alkama et al., 2013)
Streamflow Mean runoff
simulated Both increase and decrease 1948-2012 observation
station (Dai, 2016)
Streamflow Asian rivers’
contribution on streamflow trends for world’s large rivers over past decade
Both increase and decrease
observation station
(Li et al., 2020c)
Cryosphere Carbon Stocks
and Fluxes Decrease. A gradual and prolonged release of greenhouse gas emissions in a warming climate within Arctic and sub-Arctic permafrostregions
N/A Literature review
(Schuur et al., 2015; Allchin and Déry, 2017)
Cryosphere Snow Cover Both increase and decrease 1971-2014 Satellite Observations
(Allchin and Déry, 2017)
Cryosphere Snow Cover Decrease. But no quantitative trend. 1971-2014 Satellite Observations
(Hernández-Henríquez et al., 2015)
Cryosphere Permafrost temperature
Increase, 0.29 oC 2007-2016 Observations (Biskaborn et al., 2019)
Cryosphere Cryosphere Snow metrics Decrease. But no quantitative trend. N/A Literature review
(Thackeray et al., 2019)
Cryosphere Snow cover extent, snowfall
Decrease. But no quantitative trend. 1960-2015 Observations (Kunkel et al., 2016)
ACCEPTED VERSIO
N
SUBJECT TO FIN
AL EDITS

FINAL DRAFT Chapter 4 Supplementary Material IPCC WGII Sixth Assessment Report
Do Not Cite, Quote or Distribute SM4-16 Total pages: 273
Cryosphere Glacier mass
change Decrease. -0.54 m w.e. a-1 for the period of 2001-2010
2001-2010 World Glacier Monitoring Service
(Zemp et al., 2015a)
Cryosphere Glacial loss Decrease. 0.1 metres to 1.2 metres of water
equivalent per year, resulting in a global sea-level contribution of 0.92 ± 0.39 millimetres, per year
1961-2016 Glaciological and Geodetic observations
(Zemp et al., 2019)
Cryosphere Snow cover
extent Decrease 1981-2010 Gridded datasets (Mudryk et
al., 2017) Cryosphere Sea level rise No trend 1992-2011 Modelled (Rye et al.,
2014) Cryosphere snow persistence Both increase and decrease. Areas with Decrease
SP trends cover 5.8% of snow zone areas, whereas those with Increase trends cover 1.0% of this area
2001-2016 Observations (Hammond et al., 2018)
Cryosphere snow extent (SE)
and snow mass (SM)
Decrease. Snow extent trend = - 50 × 103 km2 yr-1 (November to May), Snow mass trends = -5 Gt yr-1 (December to May).
1981-2018 Observations (Mudryk et al., 2020)
Cryosphere glacier mass Decarese. Glaciers lost a mass of 267 ± 16
gigatonnes per year 2000-2019 Satellite
Observations (Hugonnet et al., 2021)
Cryosphere global glacier lake volume, number, area
Increase. 48% (lake volume), 53% (lake number), 51% (lake area)
1990-2018 Satellite Observations
(Shugar et al., 2020)
Cryosphere annual glacier
mass balance Decrease. the mean annual mass balance was -0.90 m w.e. per year. This is 20% more negative than the mean annual mass balance for the first decade of the 21st century (2001–2010: -0.76 m w.e. per year)
2013-2015 Observations (Zemp et al., 2015b)
Global Floods Frequency and ruation of flooding
Both increase and decrease. 1985-2015 Observation stations, Satellite observations
(Najibi and Devineni, 2018)
Global Groundwater Groundwater depletion
Increase. Depletion rate of groundwater resources has increased during the last decades.
Variable but most from 2000 to 2013
Both observed and simulated
(Bierkens and Wada, 2019)
Various regions
Groundwater Groundwater depletion
Increase. 77.4 km3/year depletion 2003-13 GRACE-derived total terrestrial water storage changes
(Famiglietti, 2014)
Endorheic basins across globe
Groundwater Groundwater depletion
Increase. ~40 (±17.6) Gt/year 2002-16 GRACE-derived total terrestrial water storage changes
(Wang et al., 2018a)
ACCEPTED VERSIO
N
SUBJECT TO FIN
AL EDITS
FINAL DRAFT Chapter 4 Supplementary Material IPCC WGII Sixth Assessment Report
Do Not Cite, Quote or Distribute SM4-17 Total pages: 273
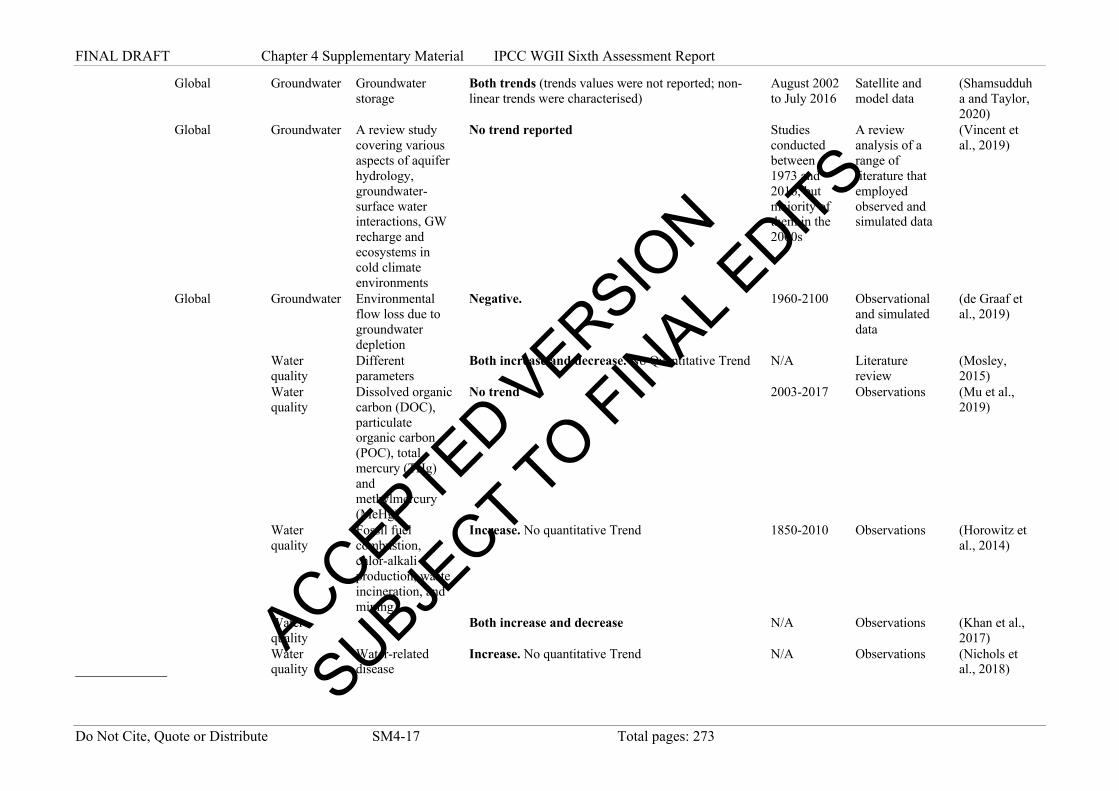
Global Groundwater Groundwater storage
Both trends (trends values were not reported; non-linear trends were characterised)
August 2002 to July 2016
Satellite and model data
(Shamsudduha and Taylor, 2020)
Global Groundwater A review study covering various aspects of aquifer hydrology, groundwater-surface water interactions, GW recharge and ecosystems in cold climate environments
No trend reported Studies conducted between 1973 and 2016, but majority of them in the 2000s
A review analysis of a range of literature that employed observed and simulated data
(Vincent et al., 2019)
Global Groundwater Environmental flow loss due to groundwater depletion
Negative. 1960-2100 Observational and simulated data
(de Graaf et al., 2019)
Water quality
Different parameters
Both increase and decrease. No Quantitative Trend N/A Literature review
(Mosley, 2015)
Water quality
Dissolved organic carbon (DOC), particulate organic carbon (POC), total mercury (THg) and methylmercury (MeHg)
No trend 2003-2017 Observations (Mu et al., 2019)
Water quality
Fossil fuel combustion, chlor-alkali production, waste incineration, and mining
Increase. No quantitative Trend 1850-2010 Observations (Horowitz et al., 2014)
Water quality
Both increase and decrease N/A Observations (Khan et al.,
2017) Water quality
Water-related disease
Increase. No quantitative Trend N/A Observations (Nichols et al., 2018)
ACCEPTED VERSIO
N
SUBJECT TO FIN
AL EDITS
FINAL DRAFT Chapter 4 Supplementary Material IPCC WGII Sixth Assessment Report
Do Not Cite, Quote or Distribute SM4-18 Total pages: 273
Antarctica Water quality
Coastal Benthos Increase. No quantitative Trend 1994, 1998, and 2010
Benthos Community Surveys
(Sahade et al., 2015)Sahade et al 2015
SESL Soil Erosion Both increase and decrease. generally follow the trend of precipitation
N/A Metaanalysis of soil erosion studies
(Garcia and Sheehan, 2015)
SESL Sediment flux Decrease. 20.8% N/A Observation stations
(Li et al., 2020b)
Africa Precipitation Mean precipitation
Both increase and decrease. 1979-2008 Observation and Model
(Alter et al., 2015)
Precipitation Extreme precipitation
Increase. At a threshold of 0.70C, the trend at 1800 utc amounts to a remarkable 3.5-fold increase over 35 years, or a 3.7-fold increase over 35 years when averaged over 24hours. The rise in intense MCS frequency is driven by a downward trend in MCS mean temperature (0.78 C per decade for 0.40C systems.
1982-2016 Observation stations
(Taylor et al., 2017)
Sahel Soil moisture
P-ET Mostly increase of up to 6 mm / month 1902-2014 Data-driven model reconstruction
(Padrón et al., 2020)
North Africa including Sahara and Sahel
Soil moisture
Soil moisture Mostly decrease except for parts of western Africa 1979-2016 Observed (satellite remote sensing)
(Pan et al., 2019)
Horn of Africa Soil moisture
P-ET Decrease of up to 4 mm / month 1902-2014 Data-driven model reconstruction
(Padrón et al., 2020)
Central Africa Soil moisture
P-ET Decrease of up to 4 mm / month 1902-2014 Data-driven model reconstruction
(Padrón et al., 2020)
South-eastern Africa
Soil moisture
P-ET Mostly increase of up to 6 mm / month 1902-2014 Data-driven model reconstruction
(Padrón et al., 2020)
Easy Africa and central southern Africa
Soil moisture
Soil moisture Mostly increase. 1979-2016 Observed (satellite remote sensing)
(Pan et al., 2019)
Sahel zone (Niger River Basin)
Floods Annual maximum streamflow
Increase. gradients 0.87, 1.61,2.37 and 2.42. 1950-2005 Model (Aich et al., 2015)
ACCEPTED VERSIO
N
SUBJECT TO FIN
AL EDITS
FINAL DRAFT Chapter 4 Supplementary Material IPCC WGII Sixth Assessment Report
Do Not Cite, Quote or Distribute SM4-19 Total pages: 273
11 catchments in West Africa
Floods Aannual maximum discharge
Increase. Significant Both increase and decrease signal by Mann-Kendall test
1970-2010 Observation stations
(Nka et al., 2015)
1907 stations around the world
Floods Annual maximum streamflow
Both increase and decrease. 1955-2014 Observation stations
(Do et al., 2017)
over 30,000 sites around the world.
Floods Q10, annual maximum daily discharge
Both increase and decrease. 1951-2010 (1951-1990, 1961-2000 and 1971-2010).
Observation stations
(Gudmundsson et al., 2019a)
5317 stations around the world
Floods 99 percentile of peak streamflow
Both increase and decrease. more than 10-year record before 2015
Observation stations
(Wasko and Sharma, 2017)
East Africa (Kenya, Somalia, Ethiopia)
Drought Rainfall, evapotranspiration, soil moisture
Decrease. 1900-2014 Observation stations
(Funk et al., 2015)
Southern Africa
Drought Rainfall N/A - Significant reduction during 2016 El Nino 1981-2016 Observation stations
(Funk et al., 2018)
South Africa (Western cape)
Drought Rainfall (SPI-12) Increase - Increase the risk of long-lasting drought 1933-2017 Observation stations and Satellite observations
(Kam et al.)
Southern Africa
Drought Rainfall and Nino 3.4
N/A - Stronger drought signal during strong El Nino 1921-2016 Observation stations
(Funk et al., 2015)
Easthern Africa
Drought Rainfall Increase - More drought risk of seasonal and decadal time scales
1900-2017 Observation stations
(Funk et al., 2019)
West Africa Drought Drought intensity /frequency
Increase. 1951-2016 Observation-based gridded data
(Spinoni et al., 2019)
Alegeria, Libya, Tunisia
Groundwater Groundwater depletion
Increase. 2.7 km3/yr 2003-2012 GRACE-derived total terrestrial water storage changes
(Richey et al., 2015)
North Africa, Saharan Aquifer
Groundwater Groundwater storage and recharge
Decrease. Mainly Decrease trends (20 mm/year in North-Western Sahara aquifer (North Africa),
Present (1981-2010) and future (2041-2070)
Simulated (Herbert and Döll, 2019) ACCEPTED V
ERSION
SUBJECT TO FIN
AL EDITS
FINAL DRAFT Chapter 4 Supplementary Material IPCC WGII Sixth Assessment Report
Do Not Cite, Quote or Distribute SM4-20 Total pages: 273
Tanzania Groundwater Groundwater levels and recharge
No trend. Episodic nature of recharge detected 1955-2010 Observational and climate data
(Taylor et al., 2013)
Kongo (Lake Tanganyika)
Water quality
Potential fishery production
Decrease. Reductions in lake mixing have depressed algal production and shrunk the oxygenated benthic habitat by 38% in our study areas, yielding fish and mollusc declines
Paleoclimate and instrumental records: 1400 to 2000
Paleoclimate and instrumental records
(Cohen-Shacham et al., 2016)
Algeria SESL Sediment load Increase. Doubled 1970-2010 Observation stations
(Achite and Ouillon, 2016)
682 catchments
SESL Sediment Yield Both increase and decrease N/A Literature review
(Vanmaercke et al., 2014)
Asia Precipitation Snowfall and snow height
Not assessed. Snow height at the end of the summer is higher in central Karakoram when irrigation is increased (+6 cm) , due to an increase in snowfall in September (+10% of total September snowfall,
1979-2009 Model (de Kok et al., 2018)
Precipitation Precipitation and
Monsoon onset date
Both increase and decrease. Over the Indian peninsula where irrigation is high during winter and spring, a delay of 6 days is found for the mean monsoon onset date when irrigation is activated, leading to a significant decrease in precipitation during May to July
1850-2018 Model (Guimberteau et al., 2012)
Precipitation Heavy
precipitation Increase. Using daily rainfall from observations and LMDZ4 simulations, we counted the number of heavyprecipitation events over Central India having rainfall intensity 100 mm day, The counts were determined for the JJAS season (122 days) of each year, so as to produce year-wise time-series of frequency-count of heavy-precipitation events over Central India (Fig. 1c). An assessment of linear trends in these time-series during 1951-2005 and their statistical significance is presented in Table 4 (see Auxiliary Fig. A1). Significant (P < 0.01) increases in the frequency of heavy-precipitation occurrences are seen in observations (~30 %) and the HIST1 (~30 %) and HIST2 (~42 %) simulations; but not in HISTNAT1 and HISTNAT2. Also the future projection under RCP4.5 shows further increase in the frequency of such heavy-precipitation events.
1951-2005 Mixed method (Krishnan et al., 2016)
ACCEPTED VERSIO
N
SUBJECT TO FIN
AL EDITS
FINAL DRAFT Chapter 4 Supplementary Material IPCC WGII Sixth Assessment Report
Do Not Cite, Quote or Distribute SM4-21 Total pages: 273
Precipitation Precipitation Both increase and decrease. Results show that no
significant progress has been achieved in our ability to simulate basic quantities like observed seasonal mean and trend, and hence to project the regional climate system, namely CIM, with reasonable certainty.
1951-2005 Mixed methods (Ramesh and Goswami, 2014)
Precipitation Indian Summer
Monsoon Rainfall Decrease. We find that, majority of new generation climate models from Coupled Model Intercomparison Project phase5 (CMIP5) fail to simulate the post-1950 Decrease trend of Indian Summer Monsoon Rainfall.
1950-2005 Model (Saha et al., 2014)
Northern Asia Soil moisture
P-ET Mostly decrease of up to 5 mm / month except for parts of Arctic with increase of up to 5 mm / month
1902-2014 Data-driven model reconstruction
(Padrón et al., 2020)
South-west Asia including Middle East
Soil moisture
P-ET Mostly decrease of up to 5 mm / month but with some regions with increase of up to 1 mm / month
1902-2014 Data-driven model reconstruction
(Padrón et al., 2020)
South-East Asia
Soil moisture
P-ET Mostly increase of over 6 mm / month but with some regions with decrease of up to 5 mm / month
1902-2014 Data-driven model reconstruction
(Padrón et al., 2020)
Central Asia Soil moisture
Soil moisture Both increase and decrease 1979-2016 Observed (satellite remote sensing)
(Pan et al., 2019)
China Soil moisture
Soil moisture Both increase and decrease 1979-2016 Observed (satellite remote sensing)
(Pan et al., 2019)
China Soil moisture
Soil moisture Both increase and decrease 1996-2010 Observed Quantitative; Observed Reconstructed; Mixed methods; Observed RS&GIS
(Qiu et al., 2016)
Indian Subcontinent
Soil moisture
Soil moisture Increase 1979-2016 Observed (satellite remote sensing)
(Pan et al., 2019)
China Streamflow Total flow Increased. by 2.18 ×10⁹ m3 1960-2010 observation station
(Zang and Liu, 2013)
China Streamflow
Increase 1965-2013 Inter-Sectoral Impact Model Intercomparison
(Zhou et al., 2012)
ACCEPTED VERSIO
N
SUBJECT TO FIN
AL EDITS
FINAL DRAFT Chapter 4 Supplementary Material IPCC WGII Sixth Assessment Report
Do Not Cite, Quote or Distribute SM4-22 Total pages: 273
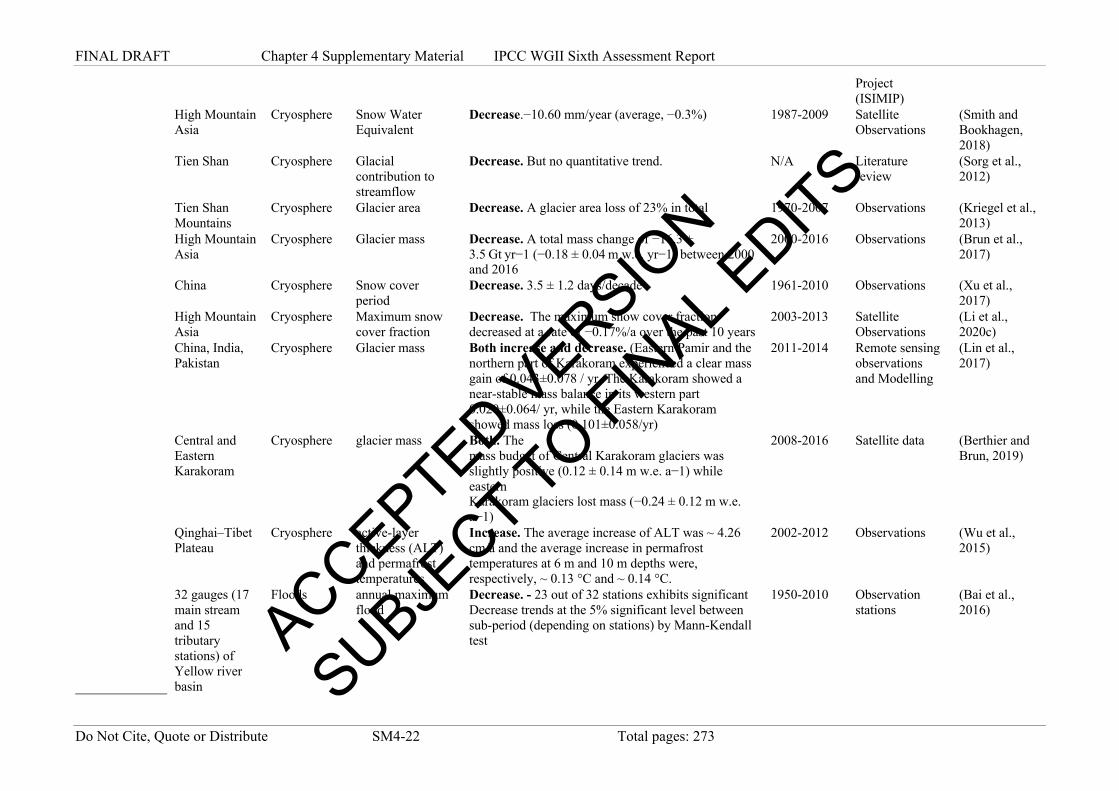
Project (ISIMIP)
High Mountain Asia
Cryosphere Snow Water Equivalent
Decrease.−10.60 mm/year (average, −0.3%) 1987-2009 Satellite Observations
(Smith and Bookhagen, 2018)
Tien Shan Cryosphere Glacial contribution to streamflow
Decrease. But no quantitative trend. N/A Literature review
(Sorg et al., 2012)
Tien Shan Mountains
Cryosphere Glacier area Decrease. A glacier area loss of 23% in total 1970-2007 Observations (Kriegel et al., 2013)
High Mountain Asia
Cryosphere Glacier mass Decrease. A total mass change of −16.3 ± 3.5 Gt yr−1 (−0.18 ± 0.04 m w.e. yr−1) between 2000 and 2016
2000-2016 Observations (Brun et al., 2017)
China Cryosphere Snow cover period
Decrease. 3.5 ± 1.2 days/decade 1961-2010 Observations (Xu et al., 2017)
High Mountain Asia
Cryosphere Maximum snow cover fraction
Decrease. The maximum snow cover fraction decreased at a rate of −0.17%/a over the past 10 years
2003-2013 Satellite Observations
(Li et al., 2020c)
China, India, Pakistan
Cryosphere Glacier mass Both increase and decrease. (Eastern Pamir and the northern part of Karakoram experienced a clear mass gain of 0.043±0.078 / yr. The Karakoram showed a near-stable mass balance in its western part 0.020±0.064/ yr, while the Eastern Karakoram showed mass loss (0.101±0.058/yr)
2011-2014 Remote sensing observations and Modelling
(Lin et al., 2017)
Central and Eastern Karakoram
Cryosphere glacier mass Both. The mass budget of Central Karakoram glaciers was slightly positive (0.12 ± 0.14 m w.e. a−1) while eastern Karakoram glaciers lost mass (−0.24 ± 0.12 m w.e. a−1)
2008-2016 Satellite data (Berthier and Brun, 2019)
Qinghai–Tibet Plateau
Cryosphere active-layer thickness (ALT) and permafrost temperatures
Increase. The average increase of ALT was ~ 4.26 cm/a and the average increase in permafrost temperatures at 6 m and 10 m depths were, respectively, ~ 0.13 °C and ~ 0.14 °C.
2002-2012 Observations (Wu et al., 2015)
32 gauges (17 main stream and 15 tributary stations) of Yellow river basin
Floods annual maximum flood
Decrease. - 23 out of 32 stations exhibits significant Decrease trends at the 5% significant level between sub-period (depending on stations) by Mann-Kendall test
1950-2010 Observation stations
(Bai et al., 2016) ACCEPTED V
ERSION
SUBJECT TO FIN
AL EDITS

FINAL DRAFT Chapter 4 Supplementary Material IPCC WGII Sixth Assessment Report
Do Not Cite, Quote or Distribute SM4-23 Total pages: 273
1907 stations around the world
Floods annual maximum streamflow
Decrease. 1955-2014 Observation stations
(Do et al., 2017)
Over 30,000 sites around the world.
Floods Q10, annual maximum daily discharge
Both increase and decrease. 1951-2010 (1951-1990, 1961-2000 and 1971-2010).
Observation stations
(Gudmundsson et al., 2019b)
5317 stations around the world
Floods 99 percentile of peak streamflow
Both increase and decrease. more than 10-year record before 2015
Observation stations
(Wasko and Sharma, 2017)
East River, part of Pearl River basin, China
Floods annual maximum streamflow
Decrease. Clear Decrease tendency is mostly explained by reservoir model and natural climate variability
1954-2009 Observation stations
(Zhang Q. et al., 2015)
Middle east and southwest Asia
Drought Rainfall Decrease. 1950-2014 Observation stations
(Barlow and Hoell, 2015)
Middle east, Lavant region
Drought Rainfall Decrease. 1980-2014 Observation stations and Model
(Bergaoui et al., 2015)
Thailand Drought Rainfall, ENSO N/A - low during ENSO (2015-2016) 1900-2016 Observation stations
(Christidis et al., 2018)
China (Beijing)
Drought Consecutive dry days
Increase 3.2 days per decade 1960-2018 Observation stations
(Du et al., 2020a)
South China Drought Precipitation and P-ET
Increase. - Drought risk increase 1951-2018 Observation stations and Model
Zhang et al 2020
Southwest China
Drought Fire weather index
Increase. 1960-2019 Observation stations
(Du et al., 2021)
Southwest China
Drought Precipitation and Consecutive dry days
Increase Strong drying trend due to anthropogenic climate change
1960-2019 Observation stations
(Lu et al., 2021)
Southwest China (Yunan)
Drought Precipitation and temperature
Increase risk of hot and dry extremes 1961-2019 Observation stations
(Wang et al., 2021)
Central China Drought Drought intensity /frequency: self-calibrating Palmer Drought Severity Index (scPDSI)
Increase. 1961-2009 Observation stations
(Wang et al., 2017a)
ACCEPTED VERSIO
N
SUBJECT TO FIN
AL EDITS
FINAL DRAFT Chapter 4 Supplementary Material IPCC WGII Sixth Assessment Report
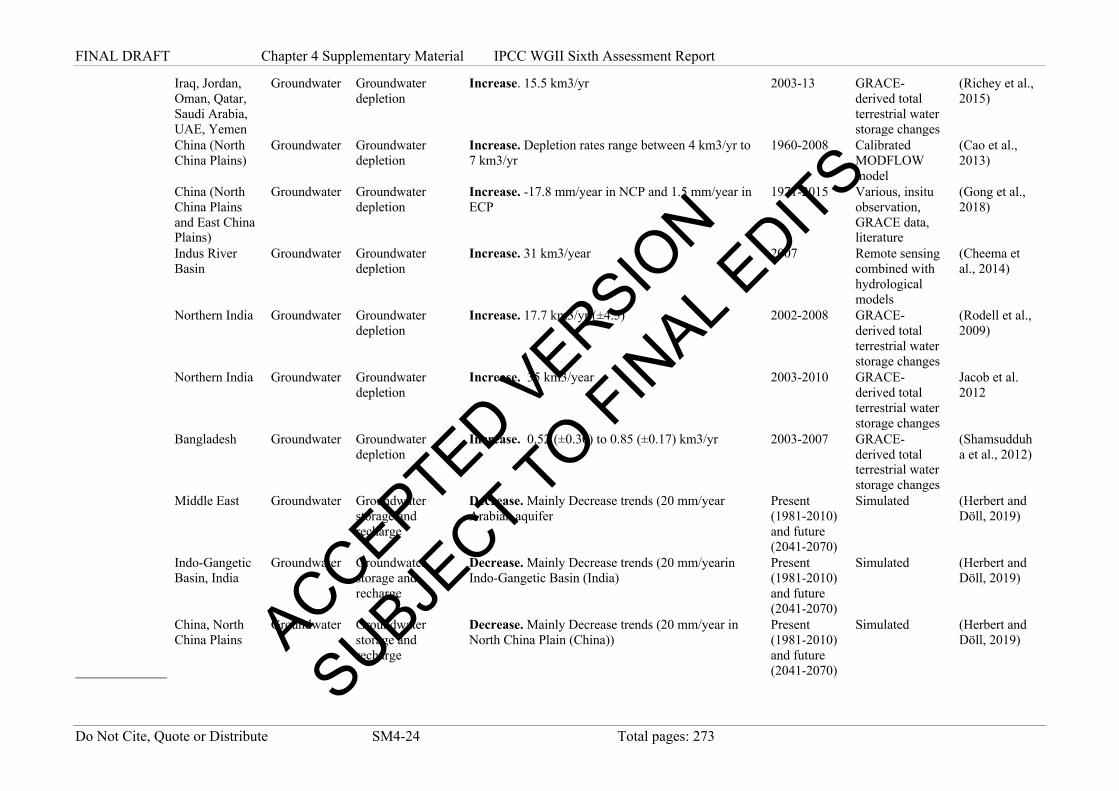
Do Not Cite, Quote or Distribute SM4-24 Total pages: 273
Iraq, Jordan, Oman, Qatar, Saudi Arabia, UAE, Yemen
Groundwater Groundwater depletion
Increase. 15.5 km3/yr 2003-13 GRACE-derived total terrestrial water storage changes
(Richey et al., 2015)
China (North China Plains)
Groundwater Groundwater depletion
Increase. Depletion rates range between 4 km3/yr to 7 km3/yr
1960-2008 Calibrated MODFLOW model
(Cao et al., 2013)
China (North China Plains and East China Plains)
Groundwater Groundwater depletion
Increase. -17.8 mm/year in NCP and 1.5 mm/year in ECP
1971-2015 Various, insitu observation, GRACE data, literature
(Gong et al., 2018)
Indus River Basin
Groundwater Groundwater depletion
Increase. 31 km3/year 2007 Remote sensing combined with hydrological models
(Cheema et al., 2014)
Northern India Groundwater Groundwater depletion
Increase. 17.7 km3/yr (±4.5) 2002-2008 GRACE-derived total terrestrial water storage changes
(Rodell et al., 2009)
Northern India Groundwater Groundwater depletion
Increase. 35 km3/year 2003-2010 GRACE-derived total terrestrial water storage changes
Jacob et al. 2012
Bangladesh Groundwater Groundwater depletion
Increase. 0.52 (±0.30) to 0.85 (±0.17) km3/yr 2003-2007 GRACE-derived total terrestrial water storage changes
(Shamsudduha et al., 2012)
Middle East Groundwater Groundwater storage and recharge
Decrease. Mainly Decrease trends (20 mm/year Arabian aquifer
Present (1981-2010) and future (2041-2070)
Simulated (Herbert and Döll, 2019)
Indo-Gangetic Basin, India
Groundwater Groundwater storage and recharge
Decrease. Mainly Decrease trends (20 mm/yearin Indo-Gangetic Basin (India)
Present (1981-2010) and future (2041-2070)
Simulated (Herbert and Döll, 2019)
China, North China Plains
Groundwater Groundwater storage and recharge
Decrease. Mainly Decrease trends (20 mm/year in North China Plain (China))
Present (1981-2010) and future (2041-2070)
Simulated (Herbert and Döll, 2019) ACCEPTED V
ERSION
SUBJECT TO FIN
AL EDITS
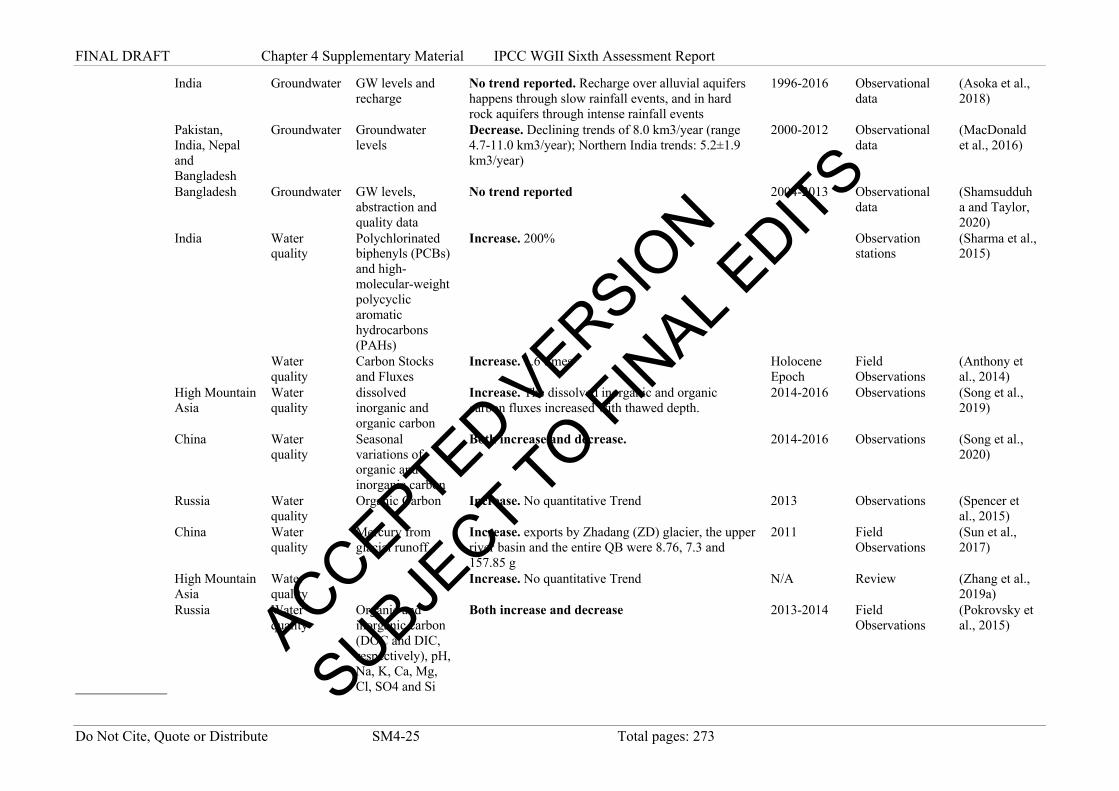
FINAL DRAFT Chapter 4 Supplementary Material IPCC WGII Sixth Assessment Report
Do Not Cite, Quote or Distribute SM4-25 Total pages: 273
India Groundwater GW levels and recharge
No trend reported. Recharge over alluvial aquifers happens through slow rainfall events, and in hard rock aquifers through intense rainfall events
1996-2016 Observational data
(Asoka et al., 2018)
Pakistan, India, Nepal and Bangladesh
Groundwater Groundwater levels
Decrease. Declining trends of 8.0 km3/year (range 4.7-11.0 km3/year); Northern India trends: 5.2±1.9 km3/year)
2000-2012 Observational data
(MacDonald et al., 2016)
Bangladesh Groundwater GW levels, abstraction and quality data
No trend reported 2004-2013 Observational data
(Shamsudduha and Taylor, 2020)
India Water quality
Polychlorinated biphenyls (PCBs) and high-molecular-weight polycyclic aromatic hydrocarbons (PAHs)
Increase. 200%
Observation stations
(Sharma et al., 2015)
Water quality
Carbon Stocks and Fluxes
Increase. 1.6 times Holocene Epoch
Field Observations
(Anthony et al., 2014)
High Mountain Asia
Water quality
dissolved inorganic and organic carbon
Increase. The dissolved inorganic and organic carbon fluxes increased with thawed depth.
2014-2016 Observations (Song et al., 2019)
China Water quality
Seasonal variations of organic and inorganic carbon
Both increase and decrease. 2014-2016 Observations (Song et al., 2020)
Russia Water quality
Organic Carbon Increase. No quantitative Trend 2013 Observations (Spencer et al., 2015)
China Water quality
Mercury from glacial runoff
Increase. exports by Zhadang (ZD) glacier, the upper river basin and the entire QB were 8.76, 7.3 and 157.85 g
2011 Field Observations
(Sun et al., 2017)
High Mountain Asia
Water quality
Increase. No quantitative Trend N/A Review (Zhang et al.,
2019a) Russia Water
quality Organic and inorganic carbon (DOC and DIC, respectively), pH, Na, K, Ca, Mg, Cl, SO4 and Si
Both increase and decrease 2013-2014 Field Observations
(Pokrovsky et al., 2015) ACCEPTED V
ERSION
SUBJECT TO FIN
AL EDITS

FINAL DRAFT Chapter 4 Supplementary Material IPCC WGII Sixth Assessment Report
Do Not Cite, Quote or Distribute SM4-26 Total pages: 273
Bangladesh Water quality
Salt affected areas induced by sea level rise
Increase. Salt affected areas induced by sea level rise in coastal areas of Bangladesh was reported increased by almost 27%
1973-2009 Field Observations
(Rahman Talukder et al., 2015)
China SESL Soil Erosion No trend 1956-2014 Observations (Tian et al., 2019)
Russia SESL Sediment flux Decrease. 49-82% 1970-2010 Observation stations
(Potemkina and Potemkin, 2015)
China SESL sediment flux Decrease. The sediment fluxes in the Jialing River basin decreased by 57-77% from the baseline period (1950-1984) to the post-change period (1985-2017)
1950-2017 Observation stations
(Zhou et al., 2020)
Tibetan Plateau
SESL sediment flux Increase. The sediment flux has substantially increased at rate of 5.9± 1.9 %/yr (0.034±0.01 Mt/yr) over the period of 1985-2017
1985-2017 Observation stations
(Li et al., 2021)
Tibetan Plateau
SESL sediment flux Increase. No Quantitative Trend 1985-2016 Observation stations
(Li et al., 2020a)
Australasia Northern, western and central Australia
Soil moisture
P-ET Decrease of up to 6 mm / month 1902-2014 Data-driven model reconstruction
(Padrón et al., 2020)
Australia Soil moisture
Soil moisture Mostly no trend. Some regions of decrease in western, northern, south-central and eastern Autralia. Increase near southern coast of mainland Australia and in Tasmania
1979-2016 Observed (satellite remote sensing)
(Pan et al., 2019)
Eastern Australia
Floods more than 1/30 flood
Increase. 2.4 % 1980-2009 Observation stations
(Berghuijs et al., 2017a)
213 stations in Australia
Floods peak streamflow Both increase and decrease. -87% of the sites display Decrease trends, and the magnitude of the decreases is much larger than those displayed in the peak rainfall. 5-year flood show Decrease 4%/decade. Flood magnitude larger than 10-year begins to increase. Only for the most extreme flows (40-year flood) show similar in magnitude to the peak rainfall trend (2-3 %/decade).
1950-2014 Observation stations
(Wasko and Nathan, 2019)
1907 stations around the world
Floods annual maximum streamflow
Decrease. 1955-2014 Observation stations
(Do et al., 2017)
Over 30,000 sites around the world
Floods Q10, annual maximum daily discharge
Both increase and decrease. 1951-2010 (1951-1990, 1961-2000
Observation stations
(Gudmundsson et al., 2019b)
ACCEPTED VERSIO
N
SUBJECT TO FIN
AL EDITS
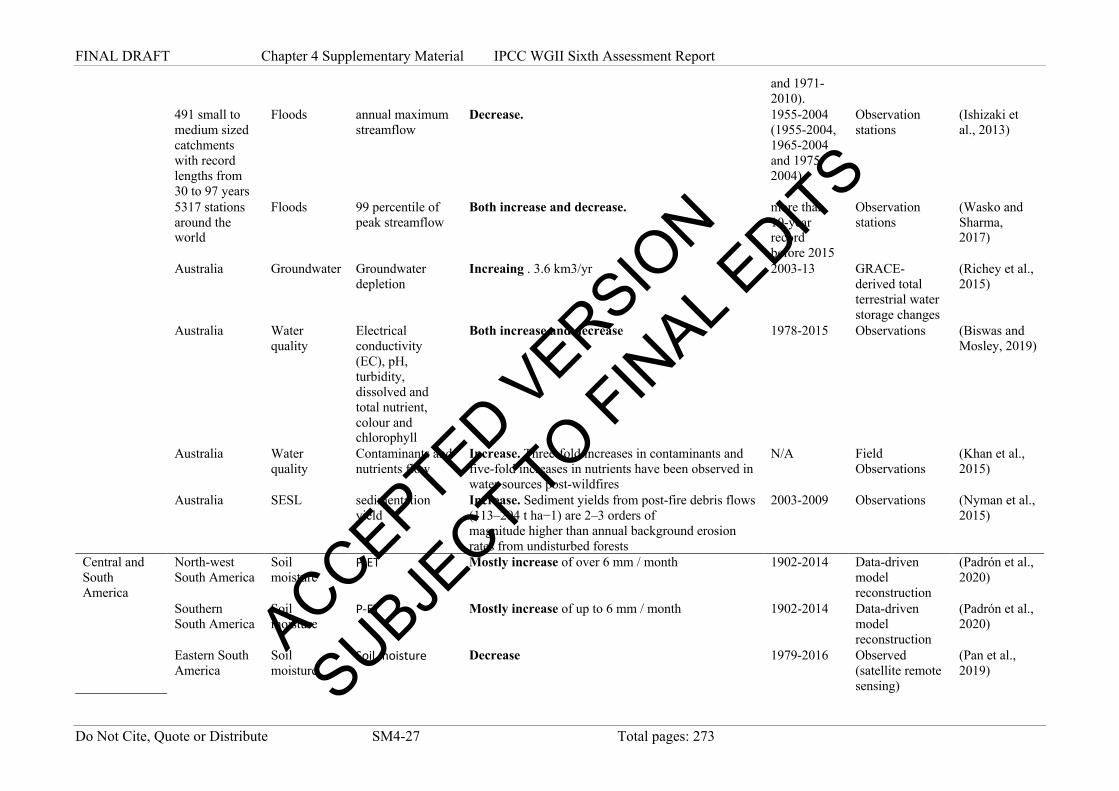
FINAL DRAFT Chapter 4 Supplementary Material IPCC WGII Sixth Assessment Report
Do Not Cite, Quote or Distribute SM4-27 Total pages: 273
and 1971-2010).
491 small to medium sized catchments with record lengths from 30 to 97 years
Floods annual maximum streamflow
Decrease. 1955-2004 (1955-2004, 1965-2004 and 1975-2004).
Observation stations
(Ishizaki et al., 2013)
5317 stations around the world
Floods 99 percentile of peak streamflow
Both increase and decrease. more than 10-year record before 2015
Observation stations
(Wasko and Sharma, 2017)
Australia Groundwater Groundwater depletion
Increaing . 3.6 km3/yr 2003-13 GRACE-derived total terrestrial water storage changes
(Richey et al., 2015)
Australia Water quality
Electrical conductivity (EC), pH, turbidity, dissolved and total nutrient, colour and chlorophyll
Both increase and decrease 1978-2015 Observations (Biswas and Mosley, 2019)
Australia Water quality
Contaminants and nutrients flow
Increase. Three-fold increases in contaminants and five-fold increases in nutrients have been observed in water sources post-wildfires
N/A Field Observations
(Khan et al., 2015)
Australia SESL sedimentation yield
Increase. Sediment yields from post-fire debris flows (113–294 t ha−1) are 2–3 orders of magnitude higher than annual background erosion rates from undisturbed forests
2003-2009 Observations (Nyman et al., 2015)
Central and South America
North-west South America
Soil moisture
P-ET Mostly increase of over 6 mm / month 1902-2014 Data-driven model reconstruction
(Padrón et al., 2020)
Southern South America
Soil moisture
P-ET Mostly increase of up to 6 mm / month 1902-2014 Data-driven model reconstruction
(Padrón et al., 2020)
Eastern South America
Soil moisture
Soil moisture Decrease 1979-2016 Observed (satellite remote sensing)
(Pan et al., 2019)
ACCEPTED VERSIO
N
SUBJECT TO FIN
AL EDITS

FINAL DRAFT Chapter 4 Supplementary Material IPCC WGII Sixth Assessment Report
Do Not Cite, Quote or Distribute SM4-28 Total pages: 273
Southern South America
Soil moisture
Soil moisture Decrease 1979-2016 Observed (satellite remote sensing)
(Pan et al., 2019)
Ecuador Runoff and sreamflow
Water use Increase. Increased trend in western area, Decrease trends in Andes from may to september
1879-2015 Observation stations
(Quishpe‐Vásquez et al., 2019)
Southern Brazil
Streamflow Streamflow Both increase and decrease 1975-2010 Observation stations
(Chagas and Chaffe, 2018)
Eastern Brazil Floods more than 1/30 flood
Increase. 1.4 % 1980-2009 Observation stations
(Berghuijs et al., 2017b)
1907 stations around the world
Floods annual maximum streamflow
Both increase and decrease. 1955-2014 Observation stations
(Do et al., 2017)
over 30,000 sites around the world.
Floods Q10, annual maximum daily discharge
Both increase and decrease. 1951-2010 (1951-1990, 1961-2000 and 1971-2010).
Observation stations
(Gudmundsson et al., 2019b)
5317 stations around the world
Floods 99 percentile of peak streamflow
Both increase and decrease. more than 10-year record before 2015
Observation stations
(Wasko and Sharma, 2017)
Southeast Brazil
Drought Precipitation and P-ET
Increase - Decrease precipitation/P-E in 25-50% 1941-2010 Observation stations
(Funk et al., 2015)
Northeast Brazil
Drought Precipitation and P-ET
Decrease. - decrease in drought risk 1900-2016 Observation stations
(Martins et al., 2019)
Argentina, Brazil, Paraguay, Uruguay (Guarani Aquifer)
Groundwater Groundwater depletion
Increase. 1 km3/year 2003-13 GRACE-derived total terrestrial water storage changes
(Richey et al., 2015)
Ecuador Water quality
Macroinvertebrates
Decrease 2008-2010 Observations (Jacobsen et al., 2014)
Colombia SESL Sediment load Increase. 34% 1980-2010 Observation stations
(Restrepo and Escobar, 2018)
Europe Western Europe
Soil moisture
Soil moisture Decrease 1979-2016 Observed (satellite remote sensing)
(Pan et al., 2019)
ACCEPTED VERSIO
N
SUBJECT TO FIN
AL EDITS

FINAL DRAFT Chapter 4 Supplementary Material IPCC WGII Sixth Assessment Report
Do Not Cite, Quote or Distribute SM4-29 Total pages: 273
Eastern Europe Soil moisture
Soil moisture Decrease 1979-2016 Observed (satellite remote sensing)
(Pan et al., 2019)
UK Streamflow Annual runoff Increase. Scotland: 22.2%, Wales: 14.7%, England: 1.7%, English lowlands: 0.9%
1961-2010 observation station
(Hannaford, 2015)
Streamflow Runoff Decrease. Drying trends in the Mediterranean region and weak wetting trends in northern Europe(0-0.4s.d./y), drying trends in the south and weakwetting trends in the north(0-0.4 s.d./y).
1956-2005 observation station
(Gudmundsson et al., 2017)
Streamflow Annual
streamflow volumes across
Both increase and decrease 1950-2015 observation station
(Masseroni et al., 2020)
Norway Cryosphere Glacial melt Decrease. But no quantitative trend. 1960-2010 Observations (Fleming and Dahlke, 2014)
Switzerland Cryosphere Snow cover, Snow Depth, Snow season duration
Decrease. Cover 8.9 days/decade, depth 3.9-10.6%, season starts 12 days later and ends 26 days earlier
1970-2015 Observations (Klein et al., 2016)
Swiss Alps Cryosphere snow cover duration
Decrease. Snow cover duration has significantly shortened at all sites, on average by 8.9 days per decade
1970-2015 Observations (Klein et al., 2016)
Russia Cryosphere glacier/snow melt runoff
Increase. 5-30 % in the foothills and by 30-70% in the plain area
1945-2010 Observations (Rets et al., 2018)
European Alps Cryosphere glacier/snow melt runoff
Increase. A clear increase appears for basins with glacial regimes, with a trend magnitude of 36%.
1961–2005 Observations (Bard et al., 2015)
North Caucasus
Cryosphere glacier/snow melt runoff
Decrease. Mean annual peak discharge has dropped by 1–5% per decade in the central North Caucasus, and it occurs 1–2 weeks earlier
2007–2020 compared with 1968–1978
Observations (Rets et al., 2020)
Europe Floods The highest discharge (daily mean or instantaneous)
Both increase and decrease. - Ranging from an increase of about 11% per decade to a decrease of 23 % per decade
1960-2010 Observation stations
(Blöschl et al., 2019b)
Spain Floods Annual maximum streamflow, peaks-over-threshold flow
Both increase and decrease. -27 gauges (44%) show decrease, 1 gauge (2%) show increase.
1942-2009 Observation stations
(Mediero et al., 2014)
Europe Floods more than 1/30 flood
9.9% Increase 1980-2009 Observation stations
(Berghuijs et al., 2017a)
3,738 basins in Europe
Floods Annual maximum streamflow
Both increase and decrease. 1960-2010 Observation stations
(Blöschl et al., 2017)
ACCEPTED VERSIO
N
SUBJECT TO FIN
AL EDITS

FINAL DRAFT Chapter 4 Supplementary Material IPCC WGII Sixth Assessment Report
Do Not Cite, Quote or Distribute SM4-30 Total pages: 273
1907 stations around the world
Floods Annual maximum streamflow
Both increase and decrease. 1955-2014 Observation stations
(Do et al., 2017)
Volga river Floods Spring peak flow Decrease. (5-20%), 5-10 days earlier 1946-2010 Observation stations
(Frolova et al., 2017a)
37 stations in Selenga River
Floods Annual maximum streamflow
Decrease. 1946-2010 Observation stations
(Frolova et al., 2017b)
Over 30,000 sites around the world.
Floods Q10, annual maximum daily discharge
Both increase and decrease. 1951-2010 (1951-1990, 1961-2000 and 1971-2010).
Observation stations
(Gudmundsson et al., 2019b)
55 stations in European part of Russia
Floods Annual maximum streamflow
Decrease. 1-2 months earlier in spring floods (July to May and June)
1936-2015 Observation stations
(Kireeva et al., 2020)
Western Austria
Floods 30-day moving average of daily streamflow
N/A - earlier annual peak snowmelt discharge 1980-2010 Observation stations
(Kormann et al., 2015)
5317 stations around the world
Floods 99 percentile of peak streamflow
Decrease. more than 10-year record before 2015
Observation stations
(Wasko and Sharma, 2017)
Norway Floods Floods Increase. - Western Norway; Decrease Trends Northern Norway
1962-2012 Observation stations
(Vormoor et al., 2016)
Sweden Floods Floods (flood magnitude, flood occurrence)
Both increase and decrease. - flood magnitude changes from -10% to 12%; flood occurrence changes from -11 days to 14 days
1990-2013 Observation stations
(Matti et al., 2016)
Spain Floods Flood (snowmelt flood peak timing)
Decrease. Changes in streamflow timing (the day when the maximum flow in spring is recorded): -0.49 ±0.43 days per decade (Table 1)
1976-2008 Observation stations
(Morán-Tejeda et al., 2014)
Southern Europe
Drought Meteorological drought intensity / frequency: SPI and SPIE
Increase. 1958-2001 and 1979-2014
Observations and re-analysis
(Stagge et al., 2017)
Scandinavia, Belarus, Ukraine and Russia
Drought Drought intensity / frequency using SPI, SPEI, and RDI
Decrease. 1950-2012 Observation-based gridded data
(Spinoni et al., 2015)
Northern Europe
Drought Meteorological drought intensity /
Decrease. 1958-2001 and 1979-2014
Observations and re-analysis
(Stagge et al., 2017)
ACCEPTED VERSIO
N
SUBJECT TO FIN
AL EDITS

FINAL DRAFT Chapter 4 Supplementary Material IPCC WGII Sixth Assessment Report
Do Not Cite, Quote or Distribute SM4-31 Total pages: 273
frequency: SPI and SPIE
Northern Europe
Groundwater Groundwater storgae
Decrease. But no quantitative trend. 1980-1989 and 2001-2010
Observational and climate data
(Nygren et al., 2020)
England Water quality
Metal elements in river and river banks
Increase. No quantitative Trend N/A Literature review
(Lynch et al., 2014)
Wales Water quality
Flood Sediment contamination
Increase. a fator of 82, up to 1900kg of Pb 2012 Observation stations
(Foulds et al., 2014)
Water quality
Iron Concentrations
Increase. No quantitative Trend 2000-2012 Field Observations
(Hawkings et al., 2014)
Switzerland Water quality
Oxygen and phosphorus concentration
Decrease 1972-2010 Observations North et al 2015
Italy WAter quality
Groundwater resources
Increase. Effects (piezometric drop) 1930-2009 Modelled reconstruction
(Romanazzi et al., 2015)
Czech Republic
Water quality
Concentrations of ammonia, phosphorus and chlorophyll-a
Increase. Up to 10-fold increases in the concentrations of ammonia, phosphorus and chlorophyll-a at minimum flow levels
1990-2008 Observations (Hrdinka et al., 2015)
Svalbard SESL Sediment load Increase. from 240 to 450 Mg/Km*yr 1950-2010 Multivariate modeling
(Schiefer et al., 2018)
Russia SESL Sedimentation rates
Decrease. No Quantitative trend 1963-1985; 1986-2015
Recostruction of Radioactive Elements
(Golosov et al., 2018)
SESL Sediment flux Increase. No Quantitative Trend 1967-2012 Photogrametry (Micheletti et
al., 2015) Germany SESL Soil Erosion Increase. No Quantitative Trend 2000-2016 Observations (Steinhoff-
Knopp and Burkhard, 2018)
Italy SESL Sediment load Both increase and decrease 1810-2010 Modelled (Diodato et al., 2018)
Italy SESL Sediment flux Both increase and decrease 1986-2014 Observation stations
(Rainato et al., 2017)
Russian Arctic Cryosphere mean annual ground temperature for permafrost
Increase. Permafrost is warming after 2000 with a rate of 0.1−0.8 °C decade-1 in Russian Arctic
2000-2019 Observations (Romanovsky et al., 2019)
ACCEPTED VERSIO
N
SUBJECT TO FIN
AL EDITS
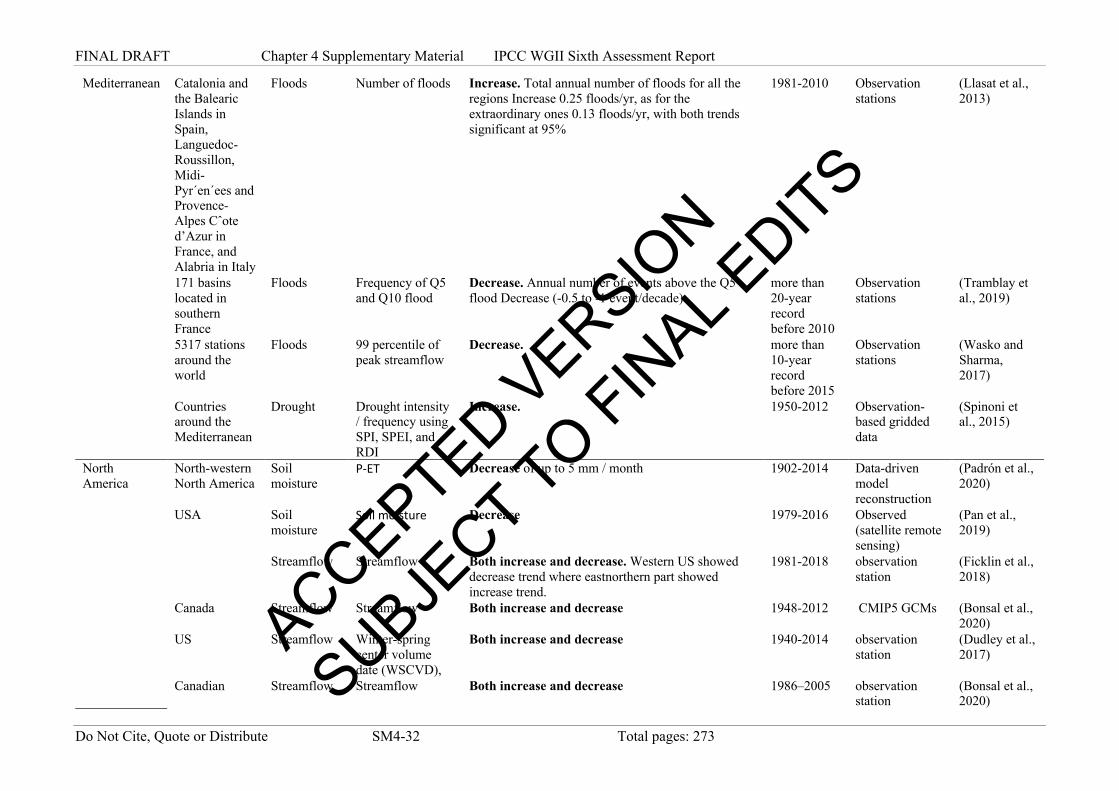
FINAL DRAFT Chapter 4 Supplementary Material IPCC WGII Sixth Assessment Report
Do Not Cite, Quote or Distribute SM4-32 Total pages: 273
Mediterranean Catalonia and the Balearic Islands in Spain, Languedoc-Roussillon, Midi-Pyr´en´ees and Provence-Alpes Cˆote d’Azur in France, and Alabria in Italy
Floods Number of floods Increase. Total annual number of floods for all the regions Increase 0.25 floods/yr, as for the extraordinary ones 0.13 floods/yr, with both trends significant at 95%
1981-2010 Observation stations
(Llasat et al., 2013)
171 basins located in southern France
Floods Frequency of Q5 and Q10 flood
Decrease. Annual number of events above the Q5 flood Decrease (-0.5 to -1 event/decade)
more than 20-year record before 2010
Observation stations
(Tramblay et al., 2019)
5317 stations around the world
Floods 99 percentile of peak streamflow
Decrease. more than 10-year record before 2015
Observation stations
(Wasko and Sharma, 2017)
Countries around the Mediterranean
Drought Drought intensity / frequency using SPI, SPEI, and RDI
Increase. 1950-2012 Observation-based gridded data
(Spinoni et al., 2015)
North America
North-western North America
Soil moisture
P-ET Decrease of up to 5 mm / month 1902-2014 Data-driven model reconstruction
(Padrón et al., 2020)
USA Soil moisture
Soil moisture Decrease 1979-2016 Observed (satellite remote sensing)
(Pan et al., 2019)
Streamflow Streamflow Both increase and decrease. Western US showed
decrease trend where eastnorthern part showed increase trend.
1981-2018 observation station
(Ficklin et al., 2018)
Canada Streamflow Streamflow Both increase and decrease 1948-2012 CMIP5 GCMs (Bonsal et al., 2020)
US Streamflow Winter-spring center volume date (WSCVD),
Both increase and decrease 1940-2014 observation station
(Dudley et al., 2017)
Canadian Streamflow Streamflow Both increase and decrease 1986–2005 observation station
(Bonsal et al., 2020)
ACCEPTED VERSIO
N
SUBJECT TO FIN
AL EDITS
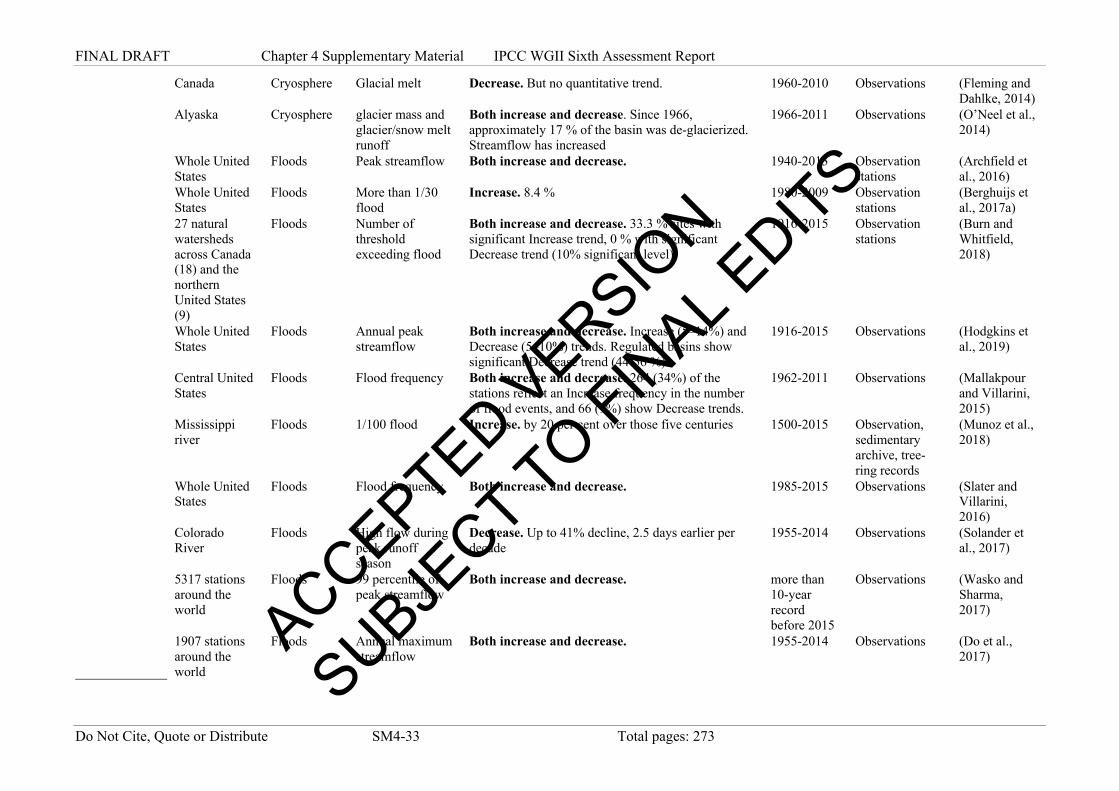
FINAL DRAFT Chapter 4 Supplementary Material IPCC WGII Sixth Assessment Report
Do Not Cite, Quote or Distribute SM4-33 Total pages: 273
Canada Cryosphere Glacial melt Decrease. But no quantitative trend. 1960-2010 Observations (Fleming and Dahlke, 2014)
Alyaska Cryosphere glacier mass and glacier/snow melt runoff
Both increase and decrease. Since 1966, approximately 17 % of the basin was de-glacierized. Streamflow has increased
1966-2011 Observations (O’Neel et al., 2014)
Whole United States
Floods Peak streamflow Both increase and decrease. 1940-2013 Observation stations
(Archfield et al., 2016)
Whole United States
Floods More than 1/30 flood
Increase. 8.4 % 1980-2009 Observation stations
(Berghuijs et al., 2017a)
27 natural watersheds across Canada (18) and the northern United States (9)
Floods Number of threshold exceeding flood
Both increase and decrease. 33.3 % sites with significant Increase trend, 0 % with significant Decrease trend (10% significant level).
1916-2015 Observation stations
(Burn and Whitfield, 2018)
Whole United States
Floods Annual peak streamflow
Both increase and decrease. Increase (5–14%) and Decrease (5–10%) trends. Regulated basins show significant Decrease trend (44-56 %).
1916-2015 Observations (Hodgkins et al., 2019)
Central United States
Floods Flood frequency Both increase and decrease. 264 (34%) of the stations reflect an Increase frequency in the number of flood events, and 66 (9%) show Decrease trends.
1962-2011 Observations (Mallakpour and Villarini, 2015)
Mississippi river
Floods 1/100 flood Increase. by 20 per cent over those five centuries 1500-2015 Observation, sedimentary archive, tree-ring records
(Munoz et al., 2018)
Whole United States
Floods Flood frequency Both increase and decrease. 1985-2015 Observations (Slater and Villarini, 2016)
Colorado River
Floods High flow during peak runoff season
Decrease. Up to 41% decline, 2.5 days earlier per decade
1955-2014 Observations (Solander et al., 2017)
5317 stations around the world
Floods 99 percentile of peak streamflow
Both increase and decrease. more than 10-year record before 2015
Observations (Wasko and Sharma, 2017)
1907 stations around the world
Floods Annual maximum streamflow
Both increase and decrease. 1955-2014 Observations (Do et al., 2017) ACCEPTED V
ERSION
SUBJECT TO FIN
AL EDITS
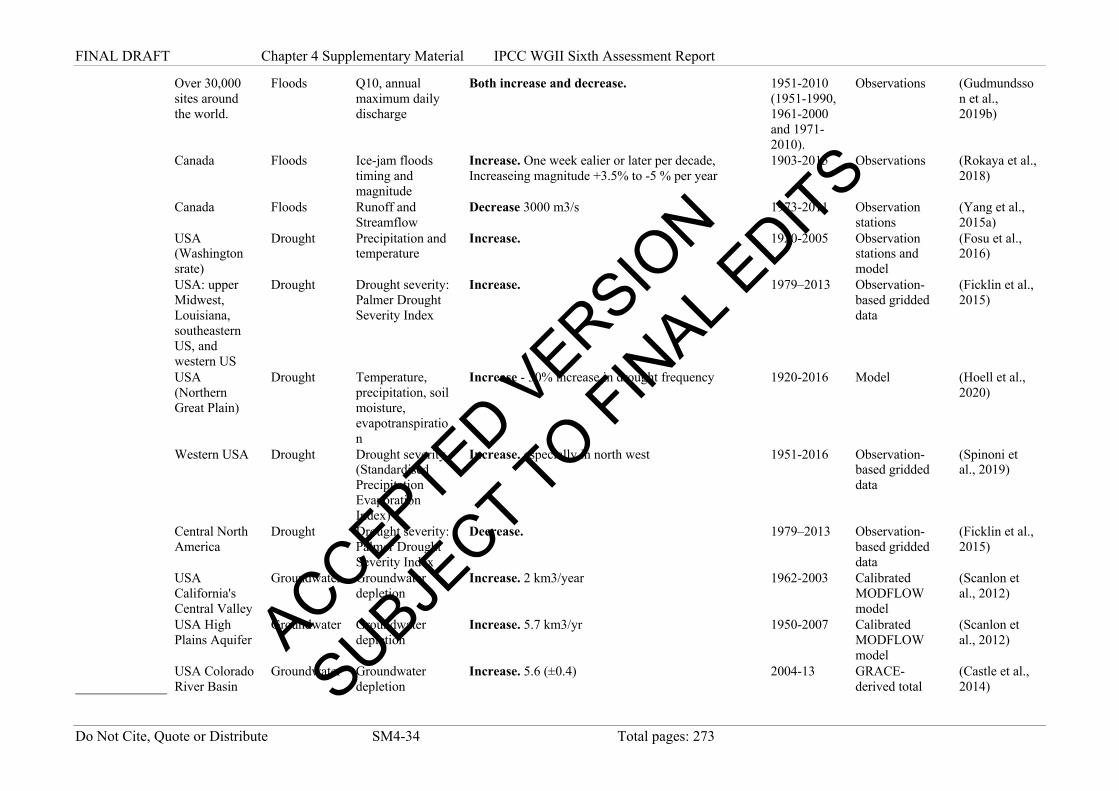
FINAL DRAFT Chapter 4 Supplementary Material IPCC WGII Sixth Assessment Report
Do Not Cite, Quote or Distribute SM4-34 Total pages: 273
Over 30,000 sites around the world.
Floods Q10, annual maximum daily discharge
Both increase and decrease. 1951-2010 (1951-1990, 1961-2000 and 1971-2010).
Observations (Gudmundsson et al., 2019b)
Canada Floods Ice-jam floods timing and magnitude
Increase. One week ealier or later per decade, Increaseing magnitude +3.5% to -5 % per year
1903-2015 Observations (Rokaya et al., 2018)
Canada Floods Runoff and Streamflow
Decrease 3000 m3/s 1973-2011 Observation stations
(Yang et al., 2015a)
USA (Washington srate)
Drought Precipitation and temperature
Increase. 1920-2005 Observation stations and model
(Fosu et al., 2016)
USA: upper Midwest, Louisiana, southeastern US, and western US
Drought Drought severity: Palmer Drought Severity Index
Increase. 1979–2013 Observation-based gridded data
(Ficklin et al., 2015)
USA (Northern Great Plain)
Drought Temperature, precipitation, soil moisture, evapotranspiration
Increase - 30% increase in drought frequency 1920-2016 Model (Hoell et al., 2020)
Western USA Drought Drought severity (Standardised Precipitation Evaporation Index)
Increase. especially in north west 1951-2016 Observation-based gridded data
(Spinoni et al., 2019)
Central North America
Drought Drought severity: Palmer Drought Severity Index
Decrease. 1979–2013 Observation-based gridded data
(Ficklin et al., 2015)
USA California's Central Valley
Groundwater Groundwater depletion
Increase. 2 km3/year 1962-2003 Calibrated MODFLOW model
(Scanlon et al., 2012)
USA High Plains Aquifer
Groundwater Groundwater depletion
Increase. 5.7 km3/yr 1950-2007 Calibrated MODFLOW model
(Scanlon et al., 2012)
USA Colorado River Basin
Groundwater Groundwater depletion
Increase. 5.6 (±0.4) 2004-13 GRACE-derived total
(Castle et al., 2014)
ACCEPTED VERSIO
N
SUBJECT TO FIN
AL EDITS

FINAL DRAFT Chapter 4 Supplementary Material IPCC WGII Sixth Assessment Report
Do Not Cite, Quote or Distribute SM4-35 Total pages: 273
terrestrial water storage changes
USA High Plains and California Central Valley Aquifer
Groundwater Groundwater storage and recharge
Decrease. Mainly Decrease trends (20 mm/year in High Plains and California Central Valley aquifers (USA)
Present (1981-2010) and future (2041-2070)
Simulated (Herbert and Döll, 2019)
USA Groundwater GW levels, recharge and meteorological data
No trend reported 2000-2015 Observational and satellite data
(Thomas et al., 2016)
USA Groundwater GW levels and abstraction data
No trend reported 1940-2019 (4.2 million records)
Observational data
(Jasechko and Taylor, 2015)
USA Groundwater Spring discharge data
Decrease. Of 57 springs, 26 exhibited negative trends in springflow;
1907-2018 Observational data
Work, 2020
Canada Water quality
Methylmercury Increase. No quantitative Trend 2006-2013 Observation stations
(MacMillan et al., 2015)
Alaska, US Water quality
Elemental export from upland thermokarst
Increase. No quantitative Trend 2011-2012 Observation stations
(Abbott et al., 2015)
Arctic region Water quality
Dissolved organic and inorganic carbon
Increase. No quantitative Trend
Ice observations (Fritz et al., 2015)
Alaska, US Water quality
Dissolved organic and inorganic carbon
Increase. No quantitative Trend 2011-2012 Observation stations
(Abbott et al., 2014)
USA Water quality
Dissolved oxygen, turbidity
Both increase and decrease. Droughts either deteriorate or enhance water systems, depending on the parameter of interest.
1950-2010 Observation stations
(Ahmadi and Moradkhani, 2019)
Alaska, US Water quality
Dissolved Organic Carbon, Nitrate, Dissolved Organic Matter
Decrease. No Quantitative Trend 2010 Field Observations
(Harms et al., 2016)
US Water quality
Benthic Macroinvertebrates
Decrease. No Quantitative Trend 2009-2012 Field survey (Smith et al., 2019)
Canada Water quality
Tritium concentration
Increase. No quantitative Trend 2016-2017 Observations (Bond and Carr, 2018)
Canada Water quality
Methyl mercury concentrations
Increase. 5% of stored mercury in historic permafrost to be released
2015-2016 Observations (St. Pierre et al., 2018)
ACCEPTED VERSIO
N
SUBJECT TO FIN
AL EDITS

FINAL DRAFT Chapter 4 Supplementary Material IPCC WGII Sixth Assessment Report
Do Not Cite, Quote or Distribute SM4-36 Total pages: 273
Canada Water quality
Particulate organic carbon, particulate nitrate
Increase. 78% 2008 Observations (Lamoureux and Lafrenière, 2014)
Canada Water quality
Cyanophage S-EIV1
Increase. No quantitative Trend 1999-2001 Field Observations
(Chénard et al., 2015)
Canada Water quality
Microbially derived NO3
Increase. No quantitative Trend 2012 Field Observations
(Louiseize et al., 2014)
Canada Water quality
Fallout radionuclides and other contaminants
No trend 2008-2011 Observations (Owens et al., 2019)
US Water quality
Dilution factor for waste water
Decrease
Modelled (Rice and Westerhoff, 2017)
Canada Water quality
Physiochemical properties
Increase. SO4 concentrations 1.4-2.1 times per year 2003-2016 Observation Stations
(Roberts et al., 2017)
Canada SESL Sediment transport
Constant 2003-2017 Observation stations
(Beel et al., 2018)
Alyaska SESL Riverbank Erosion
Increase. 70,000metrictons (t) of soil solids including 880t of organic carbon, were transported to the river from the retreating bank annually
1949-2010 Remote sensing observations
(Kanevskiy et al., 2016)
Canada SESL Sediment load Increase. No Quantitative Trend 2005-2010 Satellite Observations
(Kokelj et al., 2017)
USA SESL sedimentation yield
Increase. Increase in fire severity leads to substantially increase in sediment yield (+26.0 t/ha)
1979-2010 Modeling results
(Gould et al., 2016)
USA SESL sedimentation rate Increase. From 0.6 cm/year (1918) to 3.2 cm/year (2018)
1918-2014 Isotope analysis (Polyakov et al., 2017)
Northern Hemisphere
Cryosphere annual maximum snow mass
Decrese. Diferent continental trends over the 39-year satellite record. For example, snow mass decreased by 46 gigatonnes per decade across North America but had a negligible trend across Eurasia
1980-2018 Satellite data (GlobSnow 3.0 dataset)
(Pulliainen et al., 2020)
Northern Hemisphere
Cryosphere spring snow cover extent (SCE)
Decrease. -0.43 ± 0.17 10^6 km^2 decade^-1 1981-2010 Modelled. CMIP5 GCMs
(Thackeray et al., 2016)
Western North Americaoutside of Alaska
Cryosphere glacier mass Decrease. These glaciers lost 117 ± 42 gigatons (Gt) of mass. Fourfold increase in mass loss rates between 2000–2009 [ 2.9 ± 3.1 Gt yr 1] and 2009–2018 [ 12.3 ± 4.6 Gt yr 1]
2000-2018 Satellite data (Menounos et al., 2019)
Small Islands Antarctica Water quality
Cultivable Fungi Increase. No quantitative Trend Observations (Alves et al., 2019)
ACCEPTED VERSIO
N
SUBJECT TO FIN
AL EDITS

FINAL DRAFT Chapter 4 Supplementary Material IPCC WGII Sixth Assessment Report
Do Not Cite, Quote or Distribute SM4-37 Total pages: 273
Sourth America
Andes Cryosphere glacier mass Decrease. The total mass change over this period was −22.9 ± 5.9 Gt yr−1 (−0.72 ± 0.22 m w.e. yr−1).
2000-2018 Satellite data (ASTER stereo images)
(Dussaillant et al., 2019)
Central Pyrenees
Water quality
Natural acid rock drainage
Increase. River length affected by natural acid rock drainage increases from 5 km (1945) to 35 km (2018)
1945-2018 A historical series of aerial photographs
(Zarroca et al., 2021)
1 2 Table SM4.2: Projected Changes to the Hydrological Cyle across regions 3
Region Contry(ies) Hydrological Component
Which Component of the hydrological component is Impacted
Projected trend with quantitative estimates Time Period
Dataset e.g. observation station, gridded datasets, reanalysis
References
Global Global Precipitation Annual maximum 5-day precipitation (RX5day)
Increase - global mean increase of between 1.1 mm and 4.6 mm (ensemble mean 3.6 mm)
1981-2010 to 2030-2055
1.5°C with RCP8.5; HadGEM3 driven by SST and sea ice patterns from selected CMIP5 models
(Betts et al., 2018)
Global Precipitation Annual maximum 5-day precipitation (RX5day)
Increase - global mean increase of between 3.5 mm and 6.9 mm (ensemble mean 5.9 mm)
1981-2010 to 2030-2055
2°C with RCP8.5; HadGEM3 driven by SST and sea ice patterns from selected CMIP5 models
(Betts et al., 2018)
Global Precipitation Annual maximum number of Consecutive Dry Days (CDD)
Decrease in most ensemble members - global mean change of between -5.4 days and +0.7 days (ensemble mean -1.6 days)
1981-2010 to 2030-2055
1.5°C with RCP8.5; HadGEM3 driven by SST and sea ice patterns from selected CMIP5 models
(Betts et al., 2018)
Global Precipitation Annual maximum number of Consecutive Dry Days (CDD)
Decrease in most ensemble members - global mean change of between -5.7 days and +0.9 days (ensemble mean -2.9 days)
1981-2010 to 2030-2055
2°C with RCP8.5; HadGEM3 driven by SST and sea ice patterns from selected CMIP5 models
(Betts et al., 2018)
Global Precipitation Ratio of Precipitation to Potential
Increase in area of drylands (Precipitation / Potential Evapotranspiration < 0.65) by 5.8 × 106 km2 (10 % increase)
1961 - 1990 to 2071-2100
RCP4.5 & RCP8.5; CMIP5 models
(Feng and Fu, 2013)
ACCEPTED VERSIO
N
SUBJECT TO FIN
AL EDITS

FINAL DRAFT Chapter 4 Supplementary Material IPCC WGII Sixth Assessment Report
Do Not Cite, Quote or Distribute SM4-38 Total pages: 273
Evapotranspiration
Global Precipitation Mean precipitation
Both increase and decrease 2000-2100 Perturbed-parameter ensembles with HadGEM3; RCP8.5
(Lowe et al., 2018)
Global Precipitation Heavy precipitation (daily precipitation >95th percentile of historical)
Increase: exceedance frequency increases to 60 - 100%
2071-2100 1.5 degrees global warming; CESM large ensembe
(Zhang and Villarini, 2017)
Global Precipitation Heavy precipitation (daily precipitation >95th percentile of historical)
Increase: exceedance frequency increases to 100 - 150%
2071-2100 2 degrees global warming; CESM large ensembe
(Zhang and Villarini, 2017)
Global Precipitation Heavy precipitation (daily precipitation >95th percentile of historical)
Increase: exceedance frequency increases approximately 60%
2071-2100 RCP2.6; CESM large ensembe
(Zhang and Villarini, 2017)
Global Precipitation Heavy precipitation (daily precipitation >95th percentile of historical)
Increase: exceedance frequency increases approximately 120%
2071-2100 RCP4.5; CESM large ensembe
(Zhang and Villarini, 2017)
Global Precipitation Heavy precipitation (daily precipitation >95th percentile of historical)
Increase: exceedance frequency increases approximately 220%
2071-2100 RCP8.5; CESM large ensembe
(Zhang and Villarini, 2017) ACCEPTED V
ERSION
SUBJECT TO FIN
AL EDITS

FINAL DRAFT Chapter 4 Supplementary Material IPCC WGII Sixth Assessment Report
Do Not Cite, Quote or Distribute SM4-39 Total pages: 273
ET
Increase. until 2100 RCP8.5; CMIP5 (Berg and
Sheffield, 2019) Global ET
Decrease. baseline:
1979-2008, amip, and amip4K
Individual models (Chadwick et al., 2019)
Global
literature review
(Kamae et al., 2015)
Global ET
Both increase and decrease N/A a single GCM, CO2 increases at 1% yr-1
(Kooperman et al., 2018)
ET
Both increase and decrease N/A 6 Earth system model
forced with a single GCM, CO2 increases at 1% yr-1
(Lemordant et al., 2018)
Global ET transpiration Both increase and decrease 2080-2100 to 1980-2005
a single GCM, RCP8.5, AOGCM with CO2 increases at 1% yr-1
(Skinner et al., 2017)
Global ET
Both increase and decrease N/A 7 CMIP5 ESMs, CO2 increases at 1% yr-1
(Swann et al., 2016))
Streamflow Precipitation Both increase and decrease. Relative
change in rainfall from models with large uncertainty except for increases in high northern latitudes, decreases around the mediterranean and increases in sub-saharan africa.
1990-2090 CMIP5 GCMs (Warszawski et al., 2014)
Streamflow Runoff/Streamf
low Both increase and decrease. Compelling evidence for projected runoff changes for the Rhine (decrease), Tagus (decrease) and Lena (increase) river basins, the sign and magnitude of change for other global basins is unclear.
Cat-HM (Gosling et al.,
2017)
Streamflow Streamflow Both increase and decrease
GCMs: GFDL-ESM2M, HadGEM2-ES, IPSL-CM5A-LR, MIROC-ESM-CHEM, NorESM1-M
(Falkner, 2016)
ACCEPTED VERSIO
N
SUBJECT TO FIN
AL EDITS
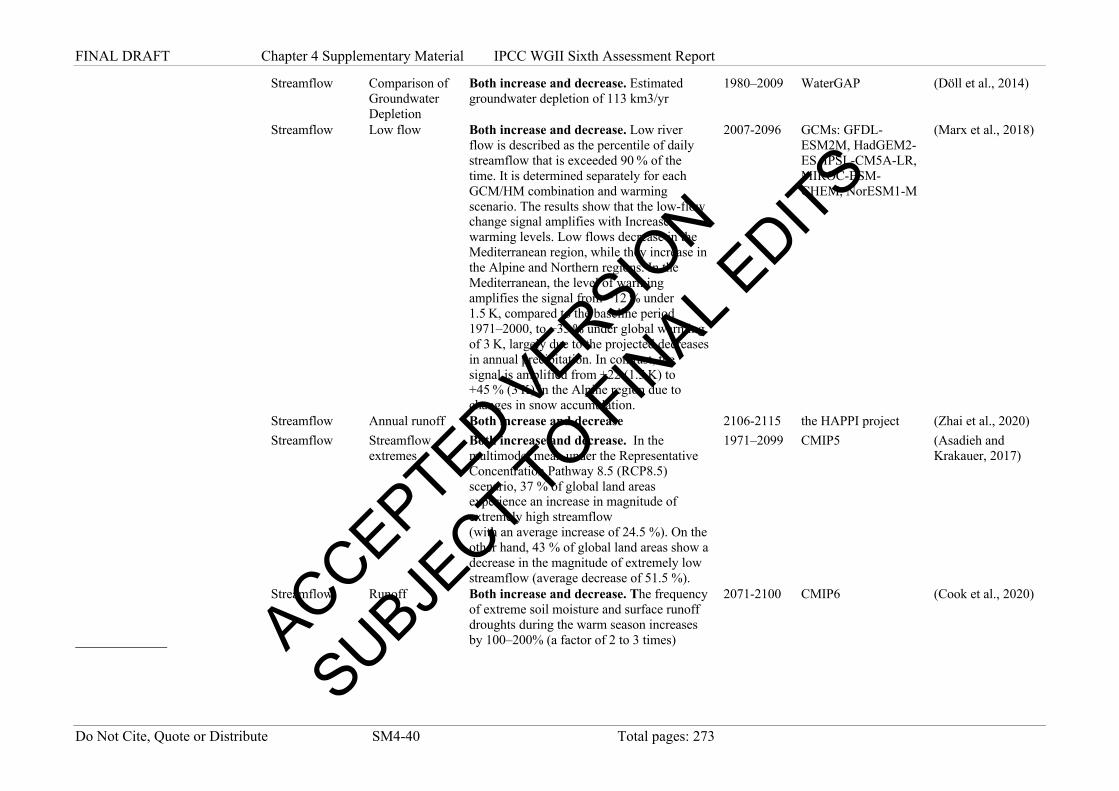
FINAL DRAFT Chapter 4 Supplementary Material IPCC WGII Sixth Assessment Report
Do Not Cite, Quote or Distribute SM4-40 Total pages: 273
Streamflow Comparison of
Groundwater Depletion
Both increase and decrease. Estimated groundwater depletion of 113 km3/yr
1980–2009 WaterGAP (Döll et al., 2014)
Streamflow Low flow Both increase and decrease. Low river
flow is described as the percentile of daily streamflow that is exceeded 90 % of the time. It is determined separately for each GCM/HM combination and warming scenario. The results show that the low-flow change signal amplifies with Increase warming levels. Low flows decrease in the Mediterranean region, while they increase in the Alpine and Northern regions. In the Mediterranean, the level of warming amplifies the signal from −12 % under 1.5 K, compared to the baseline period 1971–2000, to −35 % under global warming of 3 K, largely due to the projected decreases in annual precipitation. In contrast, the signal is amplified from +22 (1.5 K) to +45 % (3 K) in the Alpine region due to changes in snow accumulation.
2007-2096 GCMs: GFDL-ESM2M, HadGEM2-ES, IPSL-CM5A-LR, MIROC-ESM-CHEM, NorESM1-M
(Marx et al., 2018)
Streamflow Annual runoff Both increase and decrease 2106-2115 the HAPPI project (Zhai et al., 2020) Streamflow Streamflow
extremes Both increase and decrease. In the multimodel mean under the Representative Concentration Pathway 8.5 (RCP8.5) scenario, 37 % of global land areas experience an increase in magnitude of extremely high streamflow (with an average increase of 24.5 %). On the other hand, 43 % of global land areas show a decrease in the magnitude of extremely low streamflow (average decrease of 51.5 %).
1971–2099 CMIP5 (Asadieh and Krakauer, 2017)
Streamflow Runoff Both increase and decrease. The frequency
of extreme soil moisture and surface runoff droughts during the warm season increases by 100–200% (a factor of 2 to 3 times)
2071-2100 CMIP6 (Cook et al., 2020)
ACCEPTED VERSIO
N
SUBJECT TO FIN
AL EDITS

FINAL DRAFT Chapter 4 Supplementary Material IPCC WGII Sixth Assessment Report
Do Not Cite, Quote or Distribute SM4-41 Total pages: 273
Streamflow Streamflow Both increase and decrease. Projected
changes of streamflow regimes are statistically not significant in 8–32% (19–59%) of the world under RCP8.5 (RCP4.5). The model agreement on projected increase or decrease in mean and high flows is stronger under RCP8.5 than that under RCP4.5. The projected changes in low flow are robust in both scenarios with strong model agreement. In ∼7% (4%) of the world, high flow is projected to increase and low flow is projected to decrease, whereas in ∼29% (13%) all mean, high, and low flows are projected to increase under RCP8.5 (RCP4.5).
2071-2100 CMIP5 (Koirala et al., 2014)
Streamflow Runoff Both increase and decrease. High flows in
the Ganges and Lena are generally expected to increase (up to ~100 % and ~40 % respectively), while reduction is generally shown for Tagus (up to −50 %). The pattern of changes in the Niger basin is not clear. Low flows in the Lena and Niger basins are expected to increase, while a reduction is shown for Rhine and Tagus (up to −50 % in the end-century). Results for Ganges are quite uncertain.
2006–2035,2036–2065,2070–2099
n five GCMs and four emission scenarios
(Pechlivanidis et al., 2017)
Streamflow Mean annual
streamflow Both increase and decrease. 7 day high flow is projected to increase significantly on 11% and 21% of the global land area at 1.5 °C and 2 °C, respectively.
2006–2015 CMIP5 Doll et al 2018
Streamflow Runoff Both increase and decrease. Positive trends
for Q90 in the MacKenzie, Q10 and MF in the Ganges, Q10 in the Rhine and Mississippi; and negative trends for MF and Q90 in the Rhine, all—with a moderate certainty
2070–2099 WATCH forcing data
Krysanova et al 2017
ACCEPTED VERSIO
N
SUBJECT TO FIN
AL EDITS

FINAL DRAFT Chapter 4 Supplementary Material IPCC WGII Sixth Assessment Report
Do Not Cite, Quote or Distribute SM4-42 Total pages: 273
Streamflow Runoff Both increase and decrease. 2008-2099 five CMIP5 Earth
System Models: GFDL-ESM2M, HadGEM2-ES, IPSLCM5A-LR, MIROC-ESM-CHEM and NorESM1-M w
(Vetter et al., 2017)
Streamflow Drought
magnitude Increase. Future climate projections from the 5 GCMs under the RCP8.5 scenario show a moderate increase in monthly precipitation with respect to the reference period 1981-2010 for the entire Rhine river basin. A change of 3.8 % is expected for the period 2006-2035 and 1.0 % for 2070-2099. Under scenario RCP2.6, those changes are approximately 2.3 % and 6.6 %, respectively.
1971-2099 CMIP5 (Samaniego et al., 2018)
Cryosphere Glacier volume Decrease. The ensemble mean volume loss
at the end of the century is −64 ± 5 % for all glaciers excluding those on the peripheral of the Antarctic ice sheet
until 2100 RCP8.5 (Shannon et al., 2019)
Cryosphere Net snow
accumulation Decrease. Ensemble 50-year trend for net snow accumulation: Alaska= - 21.3%; W.US = -44.93%; N.Europe= -29.72%; Central Asia= -11.98%; N.E Asia=0.74%
2000-2060 SRES A1B (Mankin and Diffenbaugh, 2015)
Cryosphere Permafrost Decrease. Under RCP8.5, almost no
permafrost is expected to remain in China, the United States, and the Tibetan Plateau.
until 2100 RCP2.6, RCP4.5, RCP6.0, RCP8.5
(Guo and Wang, 2016)
Cryosphere snow extent Decrease. With a projected 4 °C global
mean temperature increase mean Northern Hemisphere snow cover decreases from 19% to 11%
2063-2092 4 °C global warming (Henderson et al., 2018)
Cryosphere annual glacier
mass and area Decrease. Global mass loss of all glaciers by 2100 relative to 2015 averaged over all model runs varies from 18 ± 7% (RCP2.6) to 36 ± 11% (RCP8.5)
2015-2100 RCP2.6, RCP4.5, RCP6.0, RCP8.5
(Hock et al., 2019) ACCEPTED VERSIO
N
SUBJECT TO FIN
AL EDITS
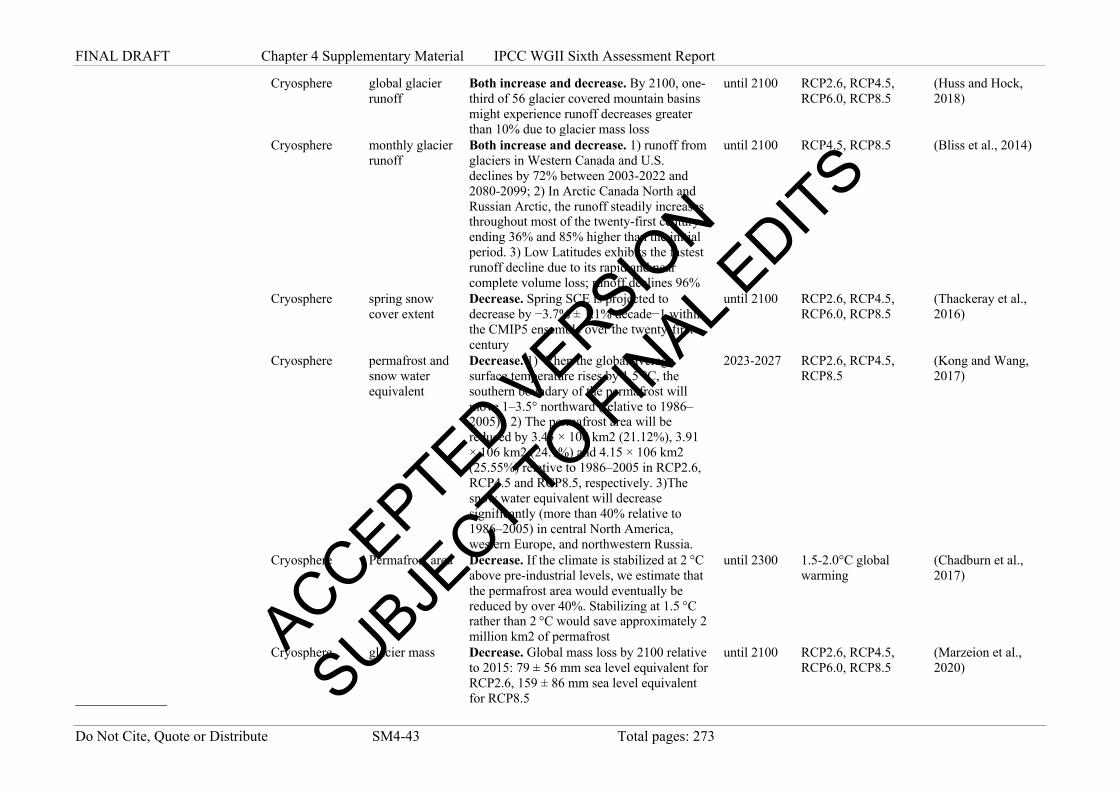
FINAL DRAFT Chapter 4 Supplementary Material IPCC WGII Sixth Assessment Report
Do Not Cite, Quote or Distribute SM4-43 Total pages: 273
Cryosphere global glacier
runoff Both increase and decrease. By 2100, one-third of 56 glacier covered mountain basins might experience runoff decreases greater than 10% due to glacier mass loss
until 2100 RCP2.6, RCP4.5, RCP6.0, RCP8.5
(Huss and Hock, 2018)
Cryosphere monthly glacier
runoff Both increase and decrease. 1) runoff from glaciers in Western Canada and U.S. declines by 72% between 2003-2022 and 2080-2099; 2) In Arctic Canada North and Russian Arctic, the runoff steadily increases throughout most of the twenty-first century ending 36% and 85% higher than the initial period. 3) Low Latitudes exhibits the fastest runoff decline due to its rapid and near complete volume loss; runoff declines 96%
until 2100 RCP4.5, RCP8.5 (Bliss et al., 2014)
Cryosphere spring snow
cover extent Decrease. Spring SCE is projected to decrease by −3.7% ± 1.1% decade−1 within the CMIP5 ensemble over the twenty-first century
until 2100 RCP2.6, RCP4.5, RCP6.0, RCP8.5
(Thackeray et al., 2016)
Cryosphere permafrost and
snow water equivalent
Decrease. 1) When the global average surface temperature rises by 1.5 °C, the southern boundary of the permafrost will move 1–3.5° northward (relative to 1986–2005) ; 2) The permafrost area will be reduced by 3.43 × 10⁶ km2 (21.12%), 3.91 × 10⁶ km2 (24.1%) and 4.15 × 10⁶ km2 (25.55%) relative to 1986–2005 in RCP2.6, RCP4.5 and RCP8.5, respectively. 3)The snow water equivalent will decrease significantly (more than 40% relative to 1986–2005) in central North America, western Europe, and northwestern Russia.
2023-2027 RCP2.6, RCP4.5, RCP8.5
(Kong and Wang, 2017)
Cryosphere Permafrost area Decrease. If the climate is stabilized at 2 °C
above pre-industrial levels, we estimate that the permafrost area would eventually be reduced by over 40%. Stabilizing at 1.5 °C rather than 2 °C would save approximately 2 million km2 of permafrost
until 2300 1.5-2.0°C global warming
(Chadburn et al., 2017)
Cryosphere glacier mass Decrease. Global mass loss by 2100 relative
to 2015: 79 ± 56 mm sea level equivalent for RCP2.6, 159 ± 86 mm sea level equivalent for RCP8.5
until 2100 RCP2.6, RCP4.5, RCP6.0, RCP8.5
(Marzeion et al., 2020)
ACCEPTED VERSIO
N
SUBJECT TO FIN
AL EDITS
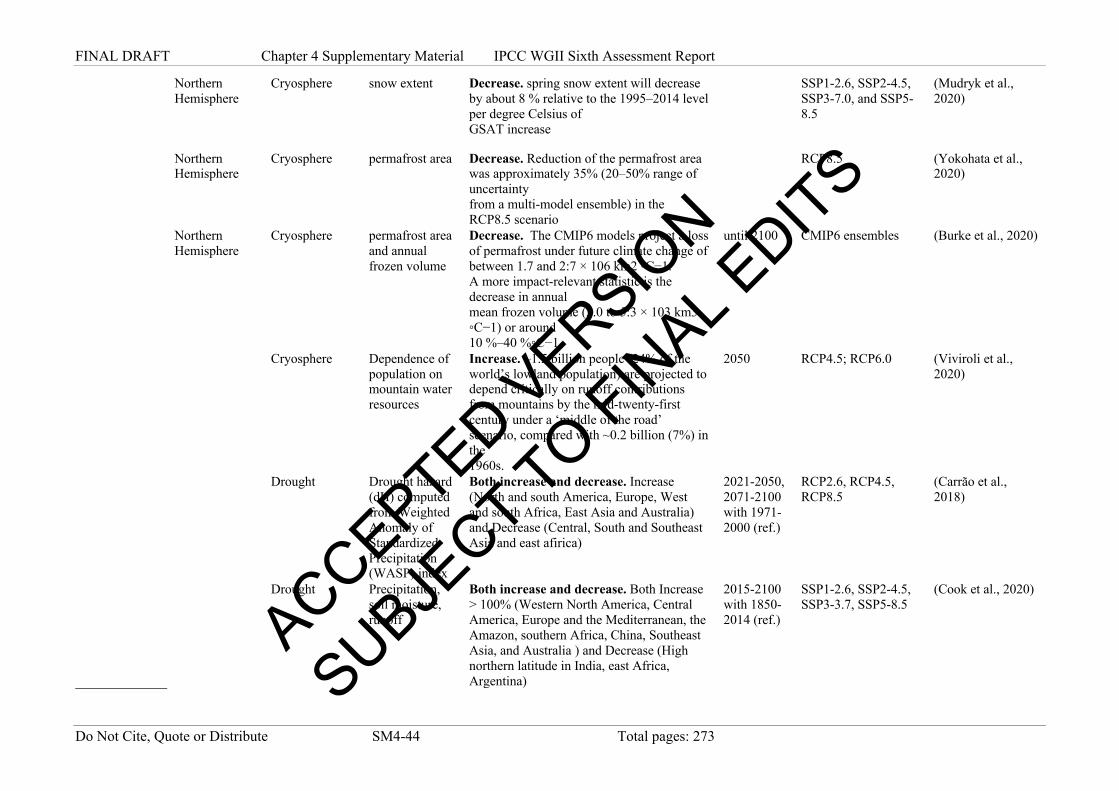
FINAL DRAFT Chapter 4 Supplementary Material IPCC WGII Sixth Assessment Report
Do Not Cite, Quote or Distribute SM4-44 Total pages: 273
Northern Hemisphere
Cryosphere snow extent Decrease. spring snow extent will decrease by about 8 % relative to the 1995–2014 level per degree Celsius of GSAT increase
SSP1-2.6, SSP2-4.5, SSP3-7.0, and SSP5-8.5
(Mudryk et al., 2020)
Northern Hemisphere
Cryosphere permafrost area Decrease. Reduction of the permafrost area was approximately 35% (20–50% range of uncertainty from a multi-model ensemble) in the RCP8.5 scenario
RCP8.5 (Yokohata et al.,
2020)
Northern Hemisphere
Cryosphere permafrost area and annual frozen volume
Decrease. The CMIP6 models project a loss of permafrost under future climate change of between 1.7 and 2:7 × 10⁶ km2 ◦C−1. A more impact-relevant statistic is the decrease in annual mean frozen volume (3.0 to 5:3 × 10³ km3 ◦C−1) or around 10 %–40 %◦C−1
until 2100 CMIP6 ensembles (Burke et al., 2020)
Cryosphere Dependence of
population on mountain water resources
Increase. ~1.5 billion people (24% of the world’s lowland population) are projected to depend critically on runoff contributions from mountains by the mid-twenty-first century under a ‘middle of the road’ scenario, compared with ~0.2 billion (7%) in the 1960s.
2050 RCP4.5; RCP6.0 (Viviroli et al., 2020)
Drought Drought hazard
(dH) computed from Weighted Anomaly of Standardized Precipitation (WASP) index
Both increase and decrease. Increase (North and south America, Europe, West and south Africa, East Asia and Australia) and Decrease (Central, South and Southeast Asia and east afirica)
2021-2050, 2071-2100 with 1971-2000 (ref.)
RCP2.6, RCP4.5, RCP8.5
(Carrão et al., 2018)
Drought Precipitation,
soil moisture, runoff
Both increase and decrease. Both Increase > 100% (Western North America, Central America, Europe and the Mediterranean, the Amazon, southern Africa, China, Southeast Asia, and Australia ) and Decrease (High northern latitude in India, east Africa, Argentina)
2015-2100 with 1850-2014 (ref.)
SSP1-2.6, SSP2-4.5, SSP3-3.7, SSP5-8.5
(Cook et al., 2020)
ACCEPTED VERSIO
N
SUBJECT TO FIN
AL EDITS

FINAL DRAFT Chapter 4 Supplementary Material IPCC WGII Sixth Assessment Report
Do Not Cite, Quote or Distribute SM4-45 Total pages: 273
Drought River discharge
(Qm, Q5, Q95) Both increase and decrease. Long-term mean, high, low stream flow increase (northern North America, northern Eurasia, Asia, eastern and central Africa and Australia) but decrease (Europe, Middle East, Central Asia, northern and southern Africa, southwestern United States and Central America)
2071-2100 with 1971-2000 (ref.)
RCP2-4.5, RCP5-8.5 (Koirala et al., 2014)
Drought SPEI-12 Increase. Avg. drought lengths increase
from 9, 11, 18 months with a doubling of drought magnitude in 30%, 38%, and 51% of global land surface under 1.5, 2, and 3°C of warming (most of Africa, southern Europe, the Caribbean, Central America, West Asia, and Australia accumulated water deficits could become more than fivefold in size under 3°C of warming.).
2027, 2040, 2062 with 1976-2005 (ref.)
1.5, 2, 3 oC warming (Naumann et al., 2018)
Drought Terrestial water
storage (TWS) Increase. more than double in future drought drought from 3% during 1976–2005 to 7% and 8%
1976-2005 (ref.)
CMIP5-RCP (Pokhrel et al., 2021)
Drought Global Deficit
Index (GDI), Regional Deficit Index (RDI)
Increase. Drought severity, Mean GDI increase of 3.9% under RCP2.6, 6.3% for RCP4.5, and 7.4% for RCP6.0 and reaching 13% under RCP8.5. Mean RDI increases 0 (Eastern Africa)-28% (South and Meso-America, Caribbean, central and western Europe) under RCP8.5
2070-2099 with 1976-2005 (ref.)
RCP2.6, RCP4.5, RCP6.0, RCP8.5
(Prudhomme et al., 2014)
Drought The
Standardized Precipitation Index (SPI), the Standardized Runoff Index (SRI), the Standardized Precipitation–Evapotranspiration Index (SPEI) and the Supply–Demand
Increase. drought risk in the spatial extent, duration and occurrence of ‘‘excep- tional’’ drought in subtropical and tropical regions. Increases in SPEI and SDDI drought in the higher latitudes of southern hemisphere (Southern South America, South Africa and Southern Australia) and in the northern hemisphere. (Northeastern Europe and Central North America)
2010-2054, 2055-2099 with 1961-2005 (ref.)
RCP8.5 (Touma et al., 2015)
ACCEPTED VERSIO
N
SUBJECT TO FIN
AL EDITS
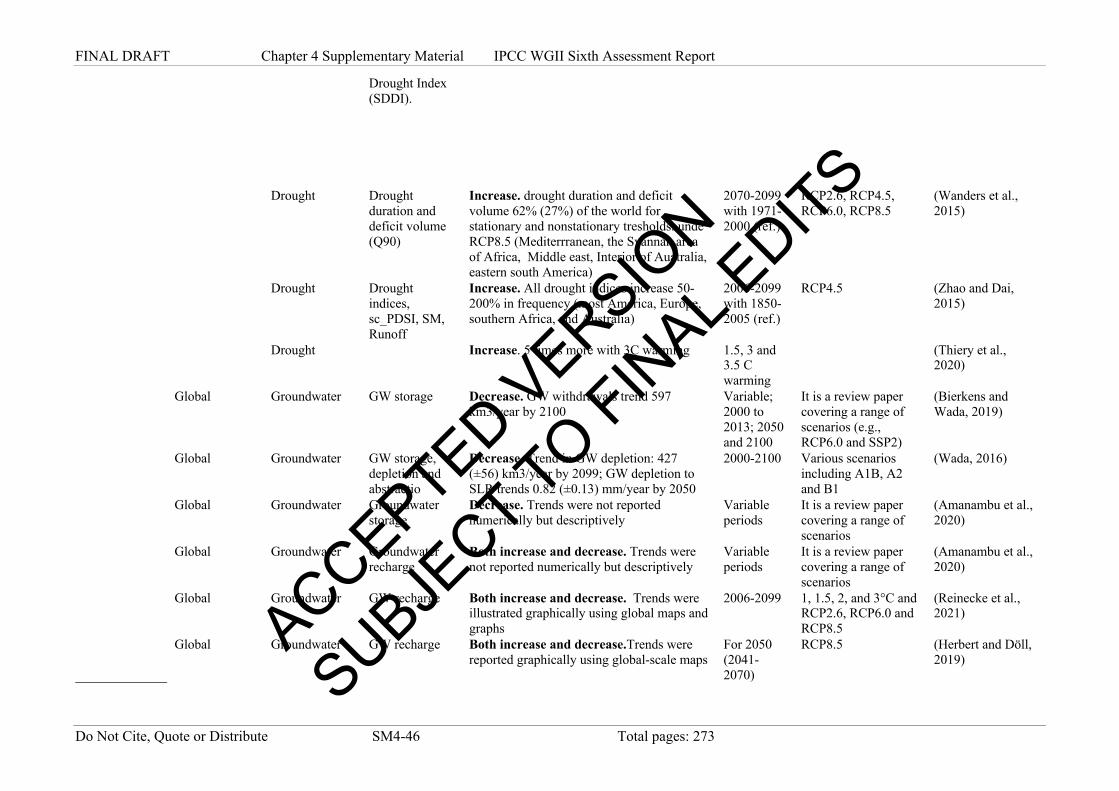
FINAL DRAFT Chapter 4 Supplementary Material IPCC WGII Sixth Assessment Report
Do Not Cite, Quote or Distribute SM4-46 Total pages: 273
Drought Index (SDDI).
Drought Drought
duration and deficit volume (Q90)
Increase. drought duration and deficit volume 62% (27%) of the world for stationary and nonstationary tresholds. unde RCP8.5 (Mediterrranean, the Svannah area of Africa, Middle east, Interior of Auatralia, eastern south America)
2070-2099 with 1971-2000 (ref.)
RCP2.6, RCP4.5, RCP6.0, RCP8.5
(Wanders et al., 2015)
Drought Drought
indices, sc_PDSI, SM, Runoff
Increase. All drought indices increase 50-200% in frequency (most America, Europe, southern Africa, and Australia)
2006-2099 with 1850-2005 (ref.)
RCP4.5 (Zhao and Dai, 2015)
Drought
Increase. 5 times more with 3C warming 1.5, 3 and
3.5 C warming
(Thiery et al., 2020)
Global Groundwater GW storage Decrease. GW withdrawals trend 597 km3/year by 2100
Variable; 2000 to 2013; 2050 and 2100
It is a review paper covering a range of scenarios (e.g., RCP6.0 and SSP2)
(Bierkens and Wada, 2019)
Global Groundwater GW storage, depletion and abstractio
Decrease. Trend in GW depletion: 427 (±56) km3/year by 2099; GW depletion to SLR trends 0.82 (±0.13) mm/year by 2050
2000-2100 Various scenarios including A1B, A2 and B1
(Wada, 2016)
Global Groundwater Groundwater storage
Decrease. Trends were not reported numerically but descriptively
Variable periods
It is a review paper covering a range of scenarios
(Amanambu et al., 2020)
Global Groundwater Groundwater recharge
Both increase and decrease. Trends were not reported numerically but descriptively
Variable periods
It is a review paper covering a range of scenarios
(Amanambu et al., 2020)
Global Groundwater GW recharge Both increase and decrease. Trends were illustrated graphically using global maps and graphs
2006-2099 1, 1.5, 2, and 3°C and RCP2.6, RCP6.0 and RCP8.5
(Reinecke et al., 2021)
Global Groundwater GW recharge Both increase and decrease.Trends were reported graphically using global-scale maps
For 2050 (2041-2070)
RCP8.5 (Herbert and Döll, 2019)
ACCEPTED VERSIO
N
SUBJECT TO FIN
AL EDITS

FINAL DRAFT Chapter 4 Supplementary Material IPCC WGII Sixth Assessment Report
Do Not Cite, Quote or Distribute SM4-47 Total pages: 273
Global Groundwater Environmental flow loss due to groundwater depletion
Decrease. Trends were reported graphically using global-scale maps
2011-2100 RCP8.5 (de Graaf et al., 2019)
Global Groundwater GW quality Both increase and decrease. Mostly decline in quality)
For 2050 RCP8.5 (McDonough et al., 2020)
Water quality Climate elasticity of river water quality
Both increase and decrease. Temperature and precipitation elasticities of 12 water quality parameters, highlighted by N- and P-nutrients, are assessed.
N/A N/A (Jiang et al., 2014)
Parts of Africa, Asia, Australasia, North America and Central and South America
Precipitation Annual total precipitation
Both: change of approximately -2.3 to +3.0 1951-1980 to 2071-2100
RCP8.5; CMIP5 (Donat et al., 2019)
Parts of Africa, Asia, Australasia, North America and Central and South America
Precipitation Heavy precipitation: maximum 1-day precipitation Rx1day
Both: change of approximately -0.1 to +0.3 1951-1980 to 2071-2100
RCP8.5; CMIP5 (Donat et al., 2019)
Parts of Africa, Asia, Europe, North America and Central and South America
Precipitation Annual total precipitation
Increase of approximately 0.08 to 0.17 1951-1980 to 2071-2100
RCP8.5; CMIP5 (Donat et al., 2019)
Parts of Africa, Asia, Europe, North America and Central and South America
Precipitation Heavy precipitation: maximum 1-day precipitation Rx1day
Increase of approximately 0.15 to 0.35 1951-1980 to 2071-2100
RCP8.5; CMIP5 (Donat et al., 2019)
ACCEPTED VERSIO
N
SUBJECT TO FIN
AL EDITS

FINAL DRAFT Chapter 4 Supplementary Material IPCC WGII Sixth Assessment Report
Do Not Cite, Quote or Distribute SM4-48 Total pages: 273
Parts of Africa, Asia, Australasia, Europe, North America and Central and South America
Precipitation Annual total precipitation
Both: change of approximately -1.0 mm to +1.0
1951-1980 to 2071-2100
RCP8.5; CMIP5 (Donat et al., 2019)
Parts of Africa, Asia, Australasia, Europe, North America and Central and South America
Precipitation Heavy precipitation: maximum 1-day precipitation Rx1day
Increase of approximately 0.10 to 0.21 1951-1980 to 2071-2100
RCP8.5; CMIP5 (Donat et al., 2019)
Parts of Africa, Asia, Australasia, Europe, North America and Central and South America
Precipitation Annual total precipitation
Increase of approximately 0.05 to 0.19 1951-1980 to 2071-2100
RCP8.5; CMIP5 (Donat et al., 2019)
Parts of Africa, Asia, Australasia, Europe, North America and Central and South America
Precipitation Heavy precipitation: maximum 1-day precipitation Rx1day
Increase of approximately 0.15 to 0.25 1951-1980 to 2071-2100
RCP8.5; CMIP5 (Donat et al., 2019)
Africa Africa Precipitation Total precipitation
Both increase and decrease Various Ensembles from CMIP5, CMIP6, HAPPI, HELIX, UKCP18. 2C global warming
(Uhe et al., 2021)
Africa Precipitation Heavy precipitation: maximum 1-day precipitation Rx1day
Increase Various Ensembles from CMIP5, CMIP6, HAPPI, HELIX, UKCP18. 2C global warming
(Uhe et al., 2021)
ACCEPTED VERSIO
N
SUBJECT TO FIN
AL EDITS
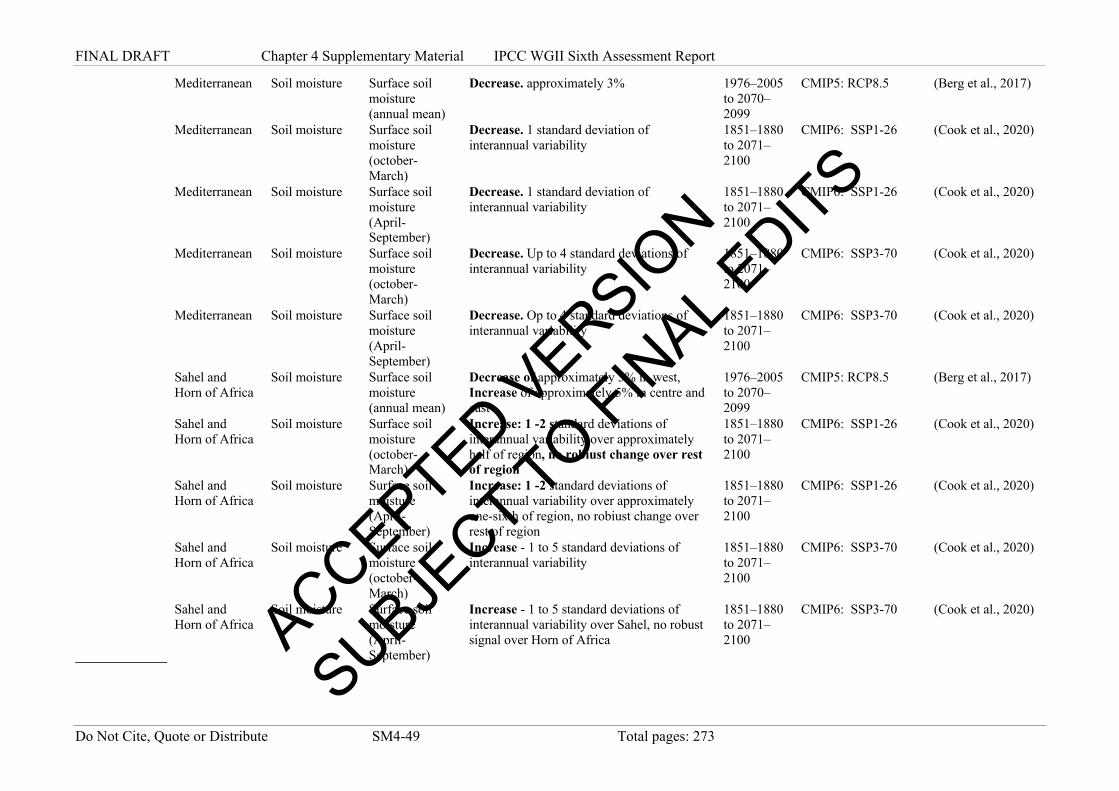
FINAL DRAFT Chapter 4 Supplementary Material IPCC WGII Sixth Assessment Report
Do Not Cite, Quote or Distribute SM4-49 Total pages: 273
Mediterranean Soil moisture Surface soil moisture (annual mean)
Decrease. approximately 3% 1976–2005 to 2070–2099
CMIP5: RCP8.5 (Berg et al., 2017)
Mediterranean Soil moisture Surface soil moisture (october-March)
Decrease. 1 standard deviation of interannual variability
1851–1880 to 2071–2100
CMIP6: SSP1-26 (Cook et al., 2020)
Mediterranean Soil moisture Surface soil moisture (April-September)
Decrease. 1 standard deviation of interannual variability
1851–1880 to 2071–2100
CMIP6: SSP1-26 (Cook et al., 2020)
Mediterranean Soil moisture Surface soil moisture (october-March)
Decrease. Up to 4 standard deviations of interannual variability
1851–1880 to 2071–2100
CMIP6: SSP3-70 (Cook et al., 2020)
Mediterranean Soil moisture Surface soil moisture (April-September)
Decrease. Op to 4 standard deviations of interannual variability
1851–1880 to 2071–2100
CMIP6: SSP3-70 (Cook et al., 2020)
Sahel and Horn of Africa
Soil moisture Surface soil moisture (annual mean)
Decrease of approximately 5% in west, Increase of approximately 5% in centre and east
1976–2005 to 2070–2099
CMIP5: RCP8.5 (Berg et al., 2017)
Sahel and Horn of Africa
Soil moisture Surface soil moisture (october-March)
Increase: 1 -2 standard deviations of interannual variability over approximately half of region, no robiust change over rest of region
1851–1880 to 2071–2100
CMIP6: SSP1-26 (Cook et al., 2020)
Sahel and Horn of Africa
Soil moisture Surface soil moisture (April-September)
Increase: 1 -2 standard deviations of interannual variability over approximately one-sixth of region, no robiust change over rest of region
1851–1880 to 2071–2100
CMIP6: SSP1-26 (Cook et al., 2020)
Sahel and Horn of Africa
Soil moisture Surface soil moisture (october-March)
Increase - 1 to 5 standard deviations of interannual variability
1851–1880 to 2071–2100
CMIP6: SSP3-70 (Cook et al., 2020)
Sahel and Horn of Africa
Soil moisture Surface soil moisture (April-September)
Increase - 1 to 5 standard deviations of interannual variability over Sahel, no robust signal over Horn of Africa
1851–1880 to 2071–2100
CMIP6: SSP3-70 (Cook et al., 2020) ACCEPTED VERSIO
N
SUBJECT TO FIN
AL EDITS

FINAL DRAFT Chapter 4 Supplementary Material IPCC WGII Sixth Assessment Report
Do Not Cite, Quote or Distribute SM4-50 Total pages: 273
Angola, Zambia, Malawi, Mozambique, Namibia, Botswana, Zimbabwe, South Africa, Lesotho, Eswatini
Soil moisture Surface soil moisture (annual mean)
Decrease of approximately 5% to 10% 1976–2005 to 2070–2099
CMIP5: RCP8.5 (Berg et al., 2017)
Angola, Zambia, Malawi, Mozambique, Namibia, Botswana, Zimbabwe, South Africa, Lesotho, Eswatini
Soil moisture Surface soil moisture (october-March)
Decrease: 1 - 2 standard deviations of interannual variability
1851–1880 to 2071–2100
CMIP6: SSP1-26 (Cook et al., 2020)
Angola, Zambia, Malawi, Mozambique, Namibia, Botswana, Zimbabwe, South Africa, Lesotho, Eswatini
Soil moisture Surface soil moisture (April-September)
Decrease: 1 - 2 standard deviations of interannual variability
1851–1880 to 2071–2100
CMIP6: SSP1-26 (Cook et al., 2020)
Angola, Zambia, Malawi, Mozambique, Namibia, Botswana, Zimbabwe, South Africa, Lesotho, Eswatini
Soil moisture Surface soil moisture (october-March)
Decrease - 1 to 4 standard deviations of interannual variability
1851–1880 to 2071–2100
CMIP6: SSP3-70 (Cook et al., 2020)
ACCEPTED VERSIO
N
SUBJECT TO FIN
AL EDITS

FINAL DRAFT Chapter 4 Supplementary Material IPCC WGII Sixth Assessment Report
Do Not Cite, Quote or Distribute SM4-51 Total pages: 273
Angola, Zambia, Malawi, Mozambique, Namibia, Botswana, Zimbabwe, South Africa, Lesotho, Eswatini
Soil moisture Surface soil moisture (April-September)
Decrease - 1 to 4 standard deviations of interannual variability
1851–1880 to 2071–2100
CMIP6: SSP3-70 (Cook et al., 2020)
Northern Tunisia
Streamflow Discharge Both increase and decrease. A decrease of 20 to 37% of discharge is expected for RCP 4.5 and 41 to 58% for RCP 8.5.
2040-2100 three rainfall-runoff models (RRMs): HBV, GR4 and IHACRES
(Dakhlaoui et al., 2020)
West Africa (Niger River Basin)
Floods Q10 discharge Increase. Increase (+15-44%) for RCP 4.5 and (-5 to 37% for RCP 8.5.
2021-2050 RCP4.5, RCP8.5 (Aich et al., 2016)
Niger, Upper Blue Nile, Oubangui, Limpopo
Floods Q10 discharge Increase. All climate models and both RCPs show an increase from ~10% to ~50 %.
2020-2049, 2070-2099
RCP2.6, RCP8.5 (Aich et al., 2014)
Africa Floods Frequency of 1/100 flood, affected population and asset
Increase. 2006-2130 RCP8.5 (Alfieri et al., 2017)
Africa Floods Frequency of 1/100 flood
Both increase and decrease. 2050s SRES A1B (Arnell and Gosling, 2016)
Africa Floods 7-day high flow Both increase and decrease. 1.5 and 2C warming
RCP4.5, RCP8.5 (Döll et al., 2018)
Africa Floods Direct flood damage, death toll and walfare loss
Both increase and decrease. 1.5, 2, 3C warming
RCP8.5 (Dottori et al., 2018)
Volta river Floods Q5 discharge Increase. 11% and 36% at 2050s and 2090s, respectively.
2030-2059, 2070-2099
RCP8.5 (Jin et al., 2018)
Blue Nile river in Ethiopia
Floods 100-year flood Increase. Increase magnitude (19-27%), flooded area (3-5.7%) and inundation depth (10.6-17.3%).
2020-2079 RCP4.5 (Robi et al., 2019)
Tunisia Groundwater GW levels Dcreasing. Mostly Decrease trends; trends were reported graphically
2036–2065 RCP4.5 (Guermazi et al., 2019)
ACCEPTED VERSIO
N
SUBJECT TO FIN
AL EDITS

FINAL DRAFT Chapter 4 Supplementary Material IPCC WGII Sixth Assessment Report
Do Not Cite, Quote or Distribute SM4-52 Total pages: 273
East Africa, Sahara, Southern Africa, Westren Africa
Groundwater GW recharge Constant and Decrease. Slight Decrease trends at all GWLs
2006-2099 1, 1.5, 2, and 3°C and RCP2.6, RCP6.0 and RCP8.5
(Reinecke et al., 2021)
Ethiopia Groundwater GW recharge Decrease. Mainly Decrease trends; projected decreases of 3.4% for RCP 2.6 and 1.3% for RCP 4.5 scenarios
2020-2079 RCP2.6 and RCP4.5 (Kahsay et al., 2018)
Morocco SESL Soil Erosion Increase 2070-2100 NA (Simonneaux et al., 2015)
Burkina Faso SESL Suspended sediment
Increase. 19-37% increase of suspended sediment
2021-2050 RCP4.5, RCP8.5 (Op de Hipt et al., 2018)
Ethiopia SESL Sediment yield Decrease. Projected trend: Decrease (-11-52%)
2041-2070 RCP4.5, RCP8.5 (Gadissa et al., 2018)
Asia Asia Precipitation Total precipitation
Both increase and decrease Various Ensembles from CMIP5, CMIP6, HAPPI, HELIX, UKCP18. 2C global warming
(Uhe et al., 2021)
Tibetan Plateau
Cryosphere Glacier melt and total runoff
Decrease. No quantitative trend 2011-2070 RCP2.6, RCP4.5, RCP8.5
(Su et al., 2016)
Tibetan Plateau
Cryosphere Glasier mass Decrease. Projections for RCP4.5,RCP6.0 and RCP8.5 reveal that much of the glacier ice is likely to disappear, with projected mass losses of 49±7 per cent, 51±6 per cent and 64±5 per cent, respectively, by the end of the century
2020-2100 RCP2.6, RCP4.5, RCP6.0, RCP8.5
(Kraaijenbrink et al., 2017)
Cryosphere Glacier melt
and total runoff Increase. No quantitative trend 2040-2050 RCP4.5, RCP8.5 (Lutz et al., 2014)
High Mountain Asia
Cryosphere Glacier mass Decrease. Glaciers in High Mountain Asia will lose between 29 ± 12% (RCP 2.6) and 67 ± 10% (RCP 8.5) of their total mass relative to 2015
until 2100 RCP2.6, RCP4.5, RCP6.0, RCP8.5
(Rounce et al., 2020)
Iran SESL Sediment yield Increase 2040-2069 SRES A2, SRES B1, SRES A1B
(Azari et al., 2016)
Pakistan SESL Sediment yield Increase 2011-2070 SRES A2, SRES B2 (Azim et al., 2016) Thailand SESL Soil erosion
and deposition Increase 2016-2045 SRES A1B, SRES
B1, SRES A2, SRES B2
(Plangoen et al., 2013)
ACCEPTED VERSIO
N
SUBJECT TO FIN
AL EDITS

FINAL DRAFT Chapter 4 Supplementary Material IPCC WGII Sixth Assessment Report
Do Not Cite, Quote or Distribute SM4-53 Total pages: 273
Asia Precipitation Heavy precipitation: maximum 1-day precipitation Rx1day
Increase Various Ensembles from CMIP5, CMIP6, HAPPI, HELIX, UKCP18. 2C global warming
(Uhe et al., 2021)
Arctic Russia Soil moisture Surface soil moisture (annual mean)
Both: decrease and increase of approximately 5% to 10% in different parts of region
1976–2005 to 2070–2099
CMIP5: RCP8.5 (Berg et al., 2017)
Arctic Russia Soil moisture Surface soil moisture (october-March)
Decrease: up to 4 standard deviations of interannual variability
1851–1880 to 2071–2100
CMIP6: SSP1-26 (Cook et al., 2020)
Arctic Russia Soil moisture Surface soil moisture (April-September)
Decrease: up to 3 standard deviations of interannual variability
1851–1880 to 2071–2100
CMIP6: SSP1-26 (Cook et al., 2020)
Arctic Russia Soil moisture Surface soil moisture (october-March)
Decrease - 4 to 5 standard deviations of interannual variability in approximately two-thirds of region, increase of 1 standard deviation over remaining third
1851–1880 to 2071–2100
CMIP6: SSP3-70 (Cook et al., 2020)
Arctic Russia Soil moisture Surface soil moisture (April-September)
Decrease - 4 to 5 standard deviations of interannual variability in approximately two-thirds of region, increase of 1 standard deviation over remaining third
1851–1880 to 2071–2100
CMIP6: SSP3-70 (Cook et al., 2020)
Central Asia Soil moisture Surface soil moisture (annual mean)
Increase of approximately 10% 1976–2005 to 2070–2099
CMIP5: RCP8.5 (Berg et al., 2017)
Central Asia Soil moisture Surface soil moisture (october-March)
Increase: up to 2 standard deviations of interannual variability
1851–1880 to 2071–2100
CMIP6: SSP1-26 (Cook et al., 2020)
Central Asia Soil moisture Surface soil moisture (April-September)
No robust change over most of region 1851–1880 to 2071–2100
CMIP6: SSP1-26 (Cook et al., 2020)
Central Asia Soil moisture Surface soil moisture (october-March)
Increase - 1 to 5 standard deviations of interannual variability
1851–1880 to 2071–2100
CMIP6: SSP3-70 (Cook et al., 2020) ACCEPTED VERSIO
N
SUBJECT TO FIN
AL EDITS

FINAL DRAFT Chapter 4 Supplementary Material IPCC WGII Sixth Assessment Report
Do Not Cite, Quote or Distribute SM4-54 Total pages: 273
Central Asia Soil moisture Surface soil moisture (April-September)
Both. Decrease over half the region - 1 standard deviation of interannual variability; Increase over half the region - 1 standard deviation of interannual variability
1851–1880 to 2071–2100
CMIP6: SSP3-70 (Cook et al., 2020)
Tibetan Plateau
Soil moisture Surface soil moisture (annual mean)
Decrease of approximately 10% 1976–2005 to 2070–2099
CMIP5: RCP8.5 (Berg et al., 2017)
Tibetan Plateau
Soil moisture Surface soil moisture (october-March)
Decrease: over 5 standard deviations of interannual variability
1851–1880 to 2071–2100
CMIP6: SSP1-26 (Cook et al., 2020)
Tibetan Plateau
Soil moisture Surface soil moisture (April-September)
Decrease: over 5 standard deviations of interannual variability
1851–1880 to 2071–2100
CMIP6: SSP1-26 (Cook et al., 2020)
Tibetan Plateau
Soil moisture Surface soil moisture (october-March)
Increase - over 5 standard deviations of interannual variability
1851–1880 to 2071–2100
CMIP6: SSP3-70 (Cook et al., 2020)
Tibetan Plateau
Soil moisture Surface soil moisture (April-September)
Increase - over 5 standard deviations of interannual variability
1851–1880 to 2071–2100
CMIP6: SSP3-70 (Cook et al., 2020)
Central and Southern China
Soil moisture Surface soil moisture (annual mean)
Decrease of approximately 5% 1976–2005 to 2070–2099
CMIP5: RCP8.5 (Berg et al., 2017)
Central and Southern China
Soil moisture Surface soil moisture (october-March)
Decrease: 1 - 2 standard deviations of interannual variability
1851–1880 to 2071–2100
CMIP6: SSP1-26 (Cook et al., 2020)
Central and Southern China
Soil moisture Surface soil moisture (April-September)
Decrease: 1 - 2 standard deviations of interannual variability in western half of region. No robust change in eastern half
1851–1880 to 2071–2100
CMIP6: SSP1-26 (Cook et al., 2020)
Central and Southern China
Soil moisture Surface soil moisture (october-March)
Decrease - 1 to 5 standard deviations of interannual variability
1851–1880 to 2071–2100
CMIP6: SSP3-70 (Cook et al., 2020)
Central and Southern China
Soil moisture Surface soil moisture
Decrease - 1 to 5 standard deviations of interannual variability
1851–1880 to 2071–2100
CMIP6: SSP3-70 (Cook et al., 2020)
ACCEPTED VERSIO
N
SUBJECT TO FIN
AL EDITS

FINAL DRAFT Chapter 4 Supplementary Material IPCC WGII Sixth Assessment Report
Do Not Cite, Quote or Distribute SM4-55 Total pages: 273
(April-September)
Indian Subcontinent
Soil moisture Surface soil moisture (annual mean)
Increase of approximately 5% in central and northern regions
1976–2005 to 2070–2099
CMIP5: RCP8.5 (Berg et al., 2017)
Indian Subcontinent
Soil moisture Surface soil moisture (october-March)
no robust signal 1851–1880 to 2071–2100
CMIP6: SSP1-26 (Cook et al., 2020)
Indian Subcontinent
Soil moisture Surface soil moisture (April-September)
no robust signal 1851–1880 to 2071–2100
CMIP6: SSP1-26 (Cook et al., 2020)
Indian Subcontinent
Soil moisture Surface soil moisture (october-March)
Increase of approximately 1 standard deviation of interannual variability, up to 5 standard deviations regions in north-west
1851–1880 to 2071–2100
CMIP6: SSP3-70 (Cook et al., 2020)
Indian Subcontinent
Soil moisture Surface soil moisture (April-September)
Increase of approximately 1 to 2 standard deviations of interannual variability in north-west, no robust signal over rest of region
1851–1880 to 2071–2100
CMIP6: SSP3-70 (Cook et al., 2020)
Streamflow Glacier runoff
volume Decrease. the total glacier runoff volume in all the investigated basins is projected to decrease by 43 ± 14% (RCP2.6), 58 ± 13% (RCP4.5) and 74 ± 11% (RCP8.5).
2040–2060,2080-2100
CMIP5 (Huss and Hock, 2018)
Kazakhstan Cryosphere Glacier volume and glacier runoff discharge
Both increase and decrease 2006-2095 RCP2.6, RCP8.5, SRES A1B
(Shahgedanova et al., 2020)
China Cryosphere Glacier area Decrease. Decline in glacier area of −90% to −32% until 2099 (reference to 2008)
until 2099 RCP2.6, RCP4.5, RCP8.5, SRES A1B
(Duethmann et al., 2016)
Asia Floods Frequency of 1/100 flood, affected population and asset
Increase. 2006-2130 RCP8.5 (Alfieri et al., 2017)
High latitude Asia
Floods Frequency of 1/100 flood
Increase. 2050s SRES A1B (Arnell and Gosling, 2016)
Asia Floods Direct flood damage, death
Increase. 1.5, 2, 3C warming
RCP8.5 (Dottori et al., 2018)
ACCEPTED VERSIO
N
SUBJECT TO FIN
AL EDITS
FINAL DRAFT Chapter 4 Supplementary Material IPCC WGII Sixth Assessment Report
Do Not Cite, Quote or Distribute SM4-56 Total pages: 273
toll and welfare loss.
Mekong basin (Vientiane, Mukdahan and Kratie gauge)
Floods Q5 (95 percentile) discharge
Increase. 8%, 5%, and 6% at Vientiane, Mukdahan, and Kratie, respectively
2036-2065 RCP4.5, RCP8.5 (Hoang et al., 2016)
Lena, Ganges Floods Q10 discharge Increase. 2006-2035, 2036-2065, 2070-2099
RCP2.6, RCP4.5, RCP6.0, RCP8.5
(Krysanova et al., 2017)
Jakarta, Indonesia
Floods Inundation area Increase. 6-31% 2020-2039 compared to 1985-2004
RCP4.5, RCP8.5 (Mishra et al., 2018)
Indonesia Floods 1/100 flood, coastal flood
Increase. Increase in exposure76% and 120% for river and coastal floods.
2010-2049 SRES A1B, RCP8.5 (Muis et al., 2015)
Japan Floods 3-day peak flow
Increase. 1.0–1.3 times. 2081-2000 RCP2.6, RCP4.5, RCP8.5
(Momiyama et al., 2020)
Lower Mekong
Floods Q5 discharge Decrease. Decrease for all rivers, and for most time horizons and GCMs. In 2030s, Decrease in 9 rivers (4-69%) Increase in 2 rivers (1-31%). In the 2090s time period, Q5 is predicted to increase only one river (Chikreng) for all GCMs.
2021-2040, 2051-2070, 2081-2100
RCP6.0 (Oeurng et al., 2019)
Pearl River delta, China
Floods Flood vulnerability index
Increase. Inundation area in current condition (0.97 % of the whole PRD plain) increase 2.12% below 1 m, 2.12 % below 2m, and 7.86 % below 3 m.
2005-2100 RCP2.6, RCP4.5, RCP8.5
(Yang L. et al., 2015)
Ganges, Brahmaputra and Meghna (GBM) river systems
Floods Q5 discharge Increase. by 15% 2041-2060, 2081-2099
SRES A1B (Whitehead et al., 2015)
Ganges, Brahmaputra and Meghna (GBM) river systems
Floods Q5 discharge Increase. 5.9-35.2% in 2050s, 13.7-97.7% in 2090s
2041-2060, 2079-2098
RCP8.5 (Whitehead et al., 2018)
ACCEPTED VERSIO
N
SUBJECT TO FIN
AL EDITS

FINAL DRAFT Chapter 4 Supplementary Material IPCC WGII Sixth Assessment Report
Do Not Cite, Quote or Distribute SM4-57 Total pages: 273
Upstream domains of Indus, Ganges, and Brahmaputra
Floods 1/50 flood Increase. up to about 305% under RCP8.5 2011-2100 RCP2.6, RCP4.5, RCP8.5
(Wijngaard et al., 2017)
Iran (Zayandeh Rud river basin)
Droughts Standard ized Precipitation Index (SPI), Standardized Runoff Index (SRI)
Increase. Increase significant drought in winter and spring
2006-2040, 2041-2075, 2076-2100
RCP8.5 (Ostad-Ali-Askari et al., 2020)
Central Asia, East Asia, North Asia, West Asia
Groundwater GW recharge Constant 2006-2099 1, 1.5, 2, and 3°C and RCP2.6, RCP6.0 and RCP8.5
(Reinecke et al., 2021)
South and Southeast Asia
Groundwater GW recharge Decrease and Increase. Decrease at 1.5 and 2°C and Increase at 3°C
2006-2099 1, 1.5, 2, and 3°C and RCP2.6, RCP6.0 and RCP8.5
(Reinecke et al., 2021)
Middle East Groundwater GW storage Decrease 2006-2100 RCP8.5 (Wu et al., 2020) India Groundwater GW storage Both increase and decrease. Decrease till
mid century and Increase from mid century to end century.
2006-2100 RCP8.5 (Wu et al., 2020)
China, North China Plains
Groundwater GW storage Increase. Slight Increase trends 2006-2100 RCP8.5 (Wu et al., 2020)
India Groundwater GW levels and storage
Decrease. 2006-2050 RCP8.5 (Zaveri et al., 2016)
India Groundwater GW recharge Increase. Projected increase in future rainfall projected to lead to increased groundwater recharge
2040-2069 RCP8.5 (Sishodia et al., 2018)
China Water Quality Total nitrogen (TN) and total phosphorous (TP) pollution
Increase. For TN pollution, the incidence of pollution was 97.1% to 97.3%, in drought–flood abrupt alternation months. For TP pollution, the incidence of pollution was 8.1% to 13.5%, in drought–flood abrupt alternation months
2020-2050 RCP2.6, RCP4.5, RCP8.5
(Bi et al., 2019)
Bangladesh Water Quality River water salinity
Increase. Moderate to high saline river area is likely to increase from 8% at the baseline to 17% and 27% in the best and worst case scenarios
until 2050 SRES B1; SRES A1B; SRES A2
(Dasgupta et al., 2013) ACCEPTED V
ERSION
SUBJECT TO FIN
AL EDITS

FINAL DRAFT Chapter 4 Supplementary Material IPCC WGII Sixth Assessment Report
Do Not Cite, Quote or Distribute SM4-58 Total pages: 273
Vietnam and Laos
SESL Sediment yield Increase. Projected trend: Increase (+5-16%)
2030, 2060, 2090
SRES B1, SRES B2, SRES A2
(Giang et al., 2014)
Vietnam and Laos
SESL Soil erosion Increase. Projected trend: Increase (+5-23%)
2030, 2060, 2090
SRES B1, SRES B2, SRES A2
(Giang et al., 2017)
Australasia Australia Soil moisture Surface soil moisture (annual mean)
Decrease of approximately 5% to 10% 1976–2005 to 2070–2099
CMIP5: RCP8.5 (Berg et al., 2017)
Australia Water quality Chlorophyll-a concentrations
Both increase and decrease to 2100 NA (Nguyen et al., 2017)
Australia Water quality Water Quality Indexes
Constant
(Dyer et al., 2014)
Australia Soil moisture Surface soil moisture (october-March)
Decrease: 1 standard deviation of interannual variability over south-western and southern Australia, no robust signal over rest of region
1851–1880 to 2071–2100
CMIP6: SSP1-26 (Cook et al., 2020)
Australia Soil moisture Surface soil moisture (April-September)
Decrease: 1 standard deviation of interannual variability over south-western and southern Australia, no robust signal over rest of region
1851–1880 to 2071–2100
CMIP6: SSP1-26 (Cook et al., 2020)
Australia Soil moisture Surface soil moisture (october-March)
Decrease - 1 to 3 standard deviations of interannual variability over south-western and southern Australia, no robust signal over rest of region
1851–1880 to 2071–2100
CMIP6: SSP3-70 (Cook et al., 2020)
Australia Soil moisture Surface soil moisture (April-September)
Decrease - 1 to 3 standard deviations of interannual variability over south-western and southern Australia, no robust signal over rest of region
1851–1880 to 2071–2100
CMIP6: SSP3-70 (Cook et al., 2020)
Australia Floods Frequency of 1/100 flood, affected population and asset
Increase. 2006-2130 RCP8.5 (Alfieri et al., 2017)
Australia Floods Frequency of 1/100 flood
Increase. 2050s SRES A1B (Arnell et al., 2016)
Australia Floods Direct flood damage, death toll and walfare loss
Increase. 1.5, 2, 3C warming
RCP8.5 (Dottori et al., 2018) ACCEPTED V
ERSION
SUBJECT TO FIN
AL EDITS

FINAL DRAFT Chapter 4 Supplementary Material IPCC WGII Sixth Assessment Report
Do Not Cite, Quote or Distribute SM4-59 Total pages: 273
South Australia/New Zealand
Groundwater GW recharge Decrease. Slight Decrease trend at all GWLs
2006-2099 1, 1.5, 2, and 3°C and RCP2.6, RCP6.0 and RCP8.5
(Reinecke et al., 2021)
Australia, Canning Aquifer
Groundwater GW storage Constant 2006-2100 RCP8.5 (Wu et al., 2020)
Australia Groundwater GW storage Trends not reported 2020-2035 RCP8.5 (Mehran et al., 2017)
Australia SESL Rainfall erosivity and hillslope erosion
Increase. 1) The rainfall erosivity and hillslope erosion in the Alpine region are projected to increase about 2 and 8% for the near future (2020-2039), further increase to 8 and 18% for the far future (2060-2079). 2) For the entire study area, rainfall erosivity and hillslope erosion are likely to increase about 10 and 14% in the near future, about 24 and 30% in the far future on average across the study area.
2020-2039; 2060-2079
SRES A2 (Zhu et al., 2020)
Australia SESL Soil erosion Increase. Projected trend: Increase (+7-19%)
2020-2039, 2060-2079
SRES A2 (Yang et al., 2015c)
Australia Precipitation Total precipitation
Both increase and decrease Various Ensembles from CMIP5, CMIP6, HAPPI, HELIX, UKCP18. 2C global warming
(Uhe et al., 2021)
Australia Precipitation Heavy precipitation: maximum 1-day precipitation Rx1day
Increase Various Ensembles from CMIP5, CMIP6, HAPPI, HELIX, UKCP18. 2C global warming
(Uhe et al., 2021)
Central and South America
Central and South America
Precipitation Total precipitation
Both increase and decrease Various Ensembles from CMIP5, CMIP6, HAPPI, HELIX, UKCP18. 2C global warming
(Uhe et al., 2021)
Central and South America
Precipitation Heavy precipitation: maximum 1-day
Increase Various Ensembles from CMIP5, CMIP6, HAPPI, HELIX, UKCP18. 2C global warming
(Uhe et al., 2021) ACCEPTED VERSIO
N
SUBJECT TO FIN
AL EDITS

FINAL DRAFT Chapter 4 Supplementary Material IPCC WGII Sixth Assessment Report
Do Not Cite, Quote or Distribute SM4-60 Total pages: 273
precipitation Rx1day
ET
Both increase and decrease N/A 4 CMIP5 GCMs,
CO2 increases at 1% yr-1
(Halladay and Good, 2017)
Central America
Soil moisture Surface soil moisture (annual mean)
Decrease - approximately 5 to 10% 1976–2005 to 2070–2099
CMIP5: RCP8.5 (Berg et al., 2017)
Central America
Soil moisture Surface soil moisture (october-March)
Decrease - 1 to 2 standard deviations of interannual variability
1851–1880 to 2071–2100
CMIP6: SSP1-26 (Cook et al., 2020)
Central America
Soil moisture Surface soil moisture (April-September)
Decrease - 1 to 2 standard deviations of interannual variability
1851–1880 to 2071–2100
CMIP6: SSP1-26 (Cook et al., 2020)
Central America
Soil moisture Surface soil moisture (october-March)
Decrease - 2 to 4 standard deviations of interannual variability
1851–1880 to 2071–2100
CMIP6: SSP3-70 (Cook et al., 2020)
Central America
Soil moisture Surface soil moisture (April-September)
Decrease - 2 to 4 standard deviations of interannual variability
1851–1880 to 2071–2100
CMIP6: SSP3-70 (Cook et al., 2020)
Peru, Ecuador, Colombia, Venezuela, Guyana, Suriname, French Guiana, Brazil, Bolivia
Soil moisture Surface soil moisture (annual mean)
Decrease - approximately 5 to 15% 1976–2005 to 2070–2099
CMIP5: RCP8.5 (Berg et al., 2017)
Peru, Ecuador, Colombia, Venezuela, Guyana, Suriname, French Guiana, Brazil, Bolivia
Soil moisture Surface soil moisture (october-March)
Decrease - 1 to 4 standard deviations of interannual variability
1851–1880 to 2071–2100
CMIP6: SSP1-26 (Cook et al., 2020)
ACCEPTED VERSIO
N
SUBJECT TO FIN
AL EDITS

FINAL DRAFT Chapter 4 Supplementary Material IPCC WGII Sixth Assessment Report
Do Not Cite, Quote or Distribute SM4-61 Total pages: 273
Peru, Ecuador, Colombia, Venezuela, Guyana, Suriname, French Guiana, Brazil, Bolivia
Soil moisture Surface soil moisture (April-September)
Decrease - 1 to 3 standard deviations of interannual variability
1851–1880 to 2071–2100
CMIP6: SSP1-26 (Cook et al., 2020)
Peru, Ecuador, Colombia, Venezuela, Guyana, Suriname, French Guiana, Brazil, Bolivia
Soil moisture Surface soil moisture (october-March)
Decrease - 3 to 5 standard deviations of interannual variability
1851–1880 to 2071–2100
CMIP6: SSP3-70 (Cook et al., 2020)
Peru, Ecuador, Colombia, Venezuela, Guyana, Suriname, French Guiana, Brazil, Bolivia
Soil moisture Surface soil moisture (April-September)
Decrease - 3 to 5 standard deviations of interannual variability
1851–1880 to 2071–2100
CMIP6: SSP3-70 (Cook et al., 2020)
Northern and Central Argentina
Soil moisture Surface soil moisture (annual mean)
Increase - approximately 5% 1976–2005 to 2070–2099
CMIP5: RCP8.5 (Berg et al., 2017)
Northern and Central Argentina
Soil moisture Surface soil moisture (october-March)
No robust signal 1851–1880 to 2071–2100
CMIP6: SSP1-26 (Cook et al., 2020)
Northern and Central Argentina
Soil moisture Surface soil moisture (April-September)
No robust signal 1851–1880 to 2071–2100
CMIP6: SSP1-26 (Cook et al., 2020)
Northern and Central Argentina
Soil moisture Surface soil moisture (october-March)
No robust signal 1851–1880 to 2071–2100
CMIP6: SSP3-70 (Cook et al., 2020)
Northern and Central Argentina
Soil moisture Surface soil moisture (April-September)
No robust signal 1851–1880 to 2071–2100
CMIP6: SSP3-70 (Cook et al., 2020) ACCEPTED VERSIO
N
SUBJECT TO FIN
AL EDITS
FINAL DRAFT Chapter 4 Supplementary Material IPCC WGII Sixth Assessment Report
Do Not Cite, Quote or Distribute SM4-62 Total pages: 273
Chile, southern Argentina
Soil moisture Surface soil moisture (annual mean)
Decrease - approximately 5 to 10% 1976–2005 to 2070–2099
CMIP5: RCP8.5 (Berg et al., 2017)
Chile, southern Argentina
Soil moisture Surface soil moisture (october-March)
Decrease - 1 to 3 standard deviations of interannual variability
1851–1880 to 2071–2100
CMIP6: SSP1-26 (Cook et al., 2020)
Chile, southern Argentina
Soil moisture Surface soil moisture (April-September)
Decrease - 1 to 3 standard deviations of interannual variability
1851–1880 to 2071–2100
CMIP6: SSP1-26 (Cook et al., 2020)
Chile, southern Argentina
Soil moisture Surface soil moisture (october-March)
Decrease - 4 to 5 standard deviations of interannual variability
1851–1880 to 2071–2100
CMIP6: SSP3-70 (Cook et al., 2020)
Chile, southern Argentina
Soil moisture Surface soil moisture (April-September)
Decrease - 4 to 5 standard deviations of interannual variability
1851–1880 to 2071–2100
CMIP6: SSP3-70 (Cook et al., 2020)
Central and South America
Floods Frequency of 1/100 flood, affected population and asset
Both increase and decrease. 2006-2130 RCP8.5 (Alfieri et al., 2017)
Central and South America
Floods Frequency of 1/100 flood
Both increase and decrease. 2050s SRES A1B (Arnell et al., 2016)
Brazil Floods Flood vulnerability index
Decrease. In central Brazil, decrease in vulnerability ranging from 0.15 to 0.25 (15–25%) and and almost the entire portion of Brazil an average decrease of 20%
2071-2100 RCP4.5, RCP8.5 (Debortoli et al., 2017)
Central and South America
Floods 7-day high flow Both increase and decrease. 1.5 and 2C warming
RCP4.5, RCP8.5 (Döll et al., 2018)
Central and South America
Floods Direct flood damage, death toll and welfare loss
Increase. 1.5, 2, 3C warming
RCP8.5 (Dottori et al., 2018)
Brazil (Amazon)
Droughts Precipitation, temperature,
Increase. drought risk in the eastern and 2005-2100 SSP1-2.6, SSP3-3.7 (Parsons, 2020) ACCEPTED VERSIO
N
SUBJECT TO FIN
AL EDITS
FINAL DRAFT Chapter 4 Supplementary Material IPCC WGII Sixth Assessment Report
Do Not Cite, Quote or Distribute SM4-63 Total pages: 273
Amazon, Central America/Mexico; Northeast Brazil, Southeastern South America, West Coast South America
Groundwater GW recharge Decrease. 2006-2099 1, 1.5, 2, and 3°C and RCP2.6, RCP6.0 and RCP8.5
(Reinecke et al., 2021)
Guarani Aquifer
Groundwater GW storage Increase. 2006-2100 RCP8.5 (Wu et al., 2020)
Europe Europe Precipitation Total precipitation
Both increase and decrease Various Ensembles from CMIP5, CMIP6, HAPPI, HELIX, UKCP18. 2C global warming
(Uhe et al., 2021)
UK Precipitation Mean precipitation
Increase in winter, decrease in summer 2000-2100 Perturbed-parameter ensembles with HadGEM3; RCP8.5
(Lowe et al., 2018)
Europe Precipitation Heavy precipitation: maximum 1-day precipitation Rx1day
Increase Various Ensembles from CMIP5, CMIP6, HAPPI, HELIX, UKCP18. 2C global warming
(Uhe et al., 2021)
UK Precipitation Heavy precipitation
Increase in all seasons 2000-2100 Perturbed-parameter ensembles with HadGEM3; RCP8.5
(Lowe et al., 2018)
Tropical forests
ET transpiration Decrease. baseline: 1979-2008
amip; amip4K (Chadwick et al., 2017)
Spain ET
Decrease. annual and summer Decrease 2021-2050, 2071-2100
RCP4.5, RCP8.5, regional climate model driven by 2 GCMs
(Ojeda et al., 2021)
Europe Soil moisture Surface soil moisture (annual mean)
Decrease - approximately 5% in most of region, up to 18% in Iberian Peninsula
1976–2005 to 2070–2099
CMIP5: RCP8.5 (Berg et al., 2017)
The Netherlands
Water quality Pharmaceuticals, a herbicide and its
Increase until 2015 NA (Sjerps et al., 2017)
ACCEPTED VERSIO
N
SUBJECT TO FIN
AL EDITS

FINAL DRAFT Chapter 4 Supplementary Material IPCC WGII Sixth Assessment Report
Do Not Cite, Quote or Distribute SM4-64 Total pages: 273
metabolite and an artificial sweetener
UK SESL Sediment yield Both increase and decrease until 2050 SRES A1B, SRES B1
(Bussi et al., 2016a)
France SESL Erosion and sustainability of soil
Increase until 2100 SRES A1B (Paroissien et al., 2015)
European Alps Cryosphere Runoff from glacierized surfaces
Decrease. For an average emission scenario (RCP 4.5), annual runoff contributions from presently glacierized surfaces are expected to decrease by 16% by 2070–2099
2070-2099 RCP2.6, RCP4.5, RCP8.5
(Farinotti et al., 2016)
Italy, Austria, France, Switzerland
Cryosphere Temperatures, precipitation, radiation, air humidity, floods, droughts, snow cover
Both increase and decrease until 2100 SRES A1B, SRES A2, SRES B2
(Gobiet et al., 2014)
Switzerland Cryosphere Glacier/snow melt runoff
Increase. 50% for high flow and low flow 2071-2100 RCP2.6, RCP4.5, RCP8.5
(Brunner et al., 2019)
Austrian Alps Cryosphere mean annual snow water equivalent, glacier volume, runoff volume
Decrease. Snow water equivalent (up to 20%), glacier volume (4-20%), runoff volume (up to 39%)
until 2100 RCP2.6, RCP4.5, RCP8.5
(Hanzer et al., 2018)
Europe Soil moisture Surface soil moisture (october-March)
Decrease: 1 standard deviation of interannual variability
1851–1880 to 2071–2100
CMIP6: SSP1-26 (Cook et al., 2020)
Europe Soil moisture Surface soil moisture (April-September)
Decrease: 1 standard deviation of interannual variability around Mediterranean, 2 to 3 standard deviations in Scandinavia, no robust trend in rest of region
1851–1880 to 2071–2100
CMIP6: SSP1-26 (Cook et al., 2020)
Europe Soil moisture Surface soil moisture (october-March)
Decrease - 3 to 5 standard deviations of interannual variability
1851–1880 to 2071–2100
CMIP6: SSP3-70 (Cook et al., 2020)
Europe Soil moisture Surface soil moisture
Decrease - 3 to 5 standard deviations of interannual variability
1851–1880 to 2071–2100
CMIP6: SSP3-70 (Cook et al., 2020)
ACCEPTED VERSIO
N
SUBJECT TO FIN
AL EDITS
FINAL DRAFT Chapter 4 Supplementary Material IPCC WGII Sixth Assessment Report
Do Not Cite, Quote or Distribute SM4-65 Total pages: 273
(April-September)
Streamflow Mean annual
runoff Both increase and decrease. Disagreement between model in magnitude and direction except for increased runoff in Scandinavia an most of Northern Europe
2071–2100 CMIP5 GCMs (Koutroulis et al., 2018)
Spain and Portugal
Streamflow Runoff Decrease. 2071–2100 Euro-CORDEX model
(Yeste et al., 2021)
British Columbia
Streamflow Runoff Increase. Thompson–Nicola exhibits the largest relative change (+140 %) from the 1990s to 2080s, although it is historically the driest of the sub-basins, while the runoff at Hope increases by 71 % between the same epochs. With respect to annual runoff, only the Coast Mountains and the Chilko sub-basin display substantial increases (but much smaller in relative terms than cold season increases), with little change elsewhere .In addition, by the 2080s, the runoff mean and standard deviation more than double, at over 83 % and 71 % of the FRB, respectively
,2070–2099 CMIP5 (Islam et al., 2019b)
Spain, Duro Basin
Streamflow Streamflow Decrease. Annual Decrease aroun 40% 2040–2060,2080-2100
Euro-CORDEX (Yeste et al., 2021)
European Alps Cryosphere Glacier volume Decrease. Total glacier volume in the coming decades is relatively similar under the various representative concentrations pathways With RCP2.6, 4.5 and 8.5, volume losses are about 47 %–52 % in 2050 with respect to 2017. Under RCP8.5, glaciers are projected to largely disappear by 2100 (94.4±4.4 % volume loss vs. 2017).
2050, 2100 RCP2.6, RCP4.5, RCP8.5
(Zekollari et al., 2019)
Swiss Alps Cryosphere Glacier area Decrease. 73% of all glaciers that were smaller than 0.1 km2 in the inventory of 2010 are expected to have disappeared by 2030 according to the A1B median scenario, and 97% are gone by 2060
until 2060 SRES A1B; SRES A2
(Huss and Fischer, 2016)
Crewe drainage catchment,
Floods Risk of urban flooding
Increase. 1.04-1.09 depending on return period in 2080s in A1F1 scenario
2070-2099 A1F1, B2 (Abdellatif et al., 2015)
ACCEPTED VERSIO
N
SUBJECT TO FIN
AL EDITS
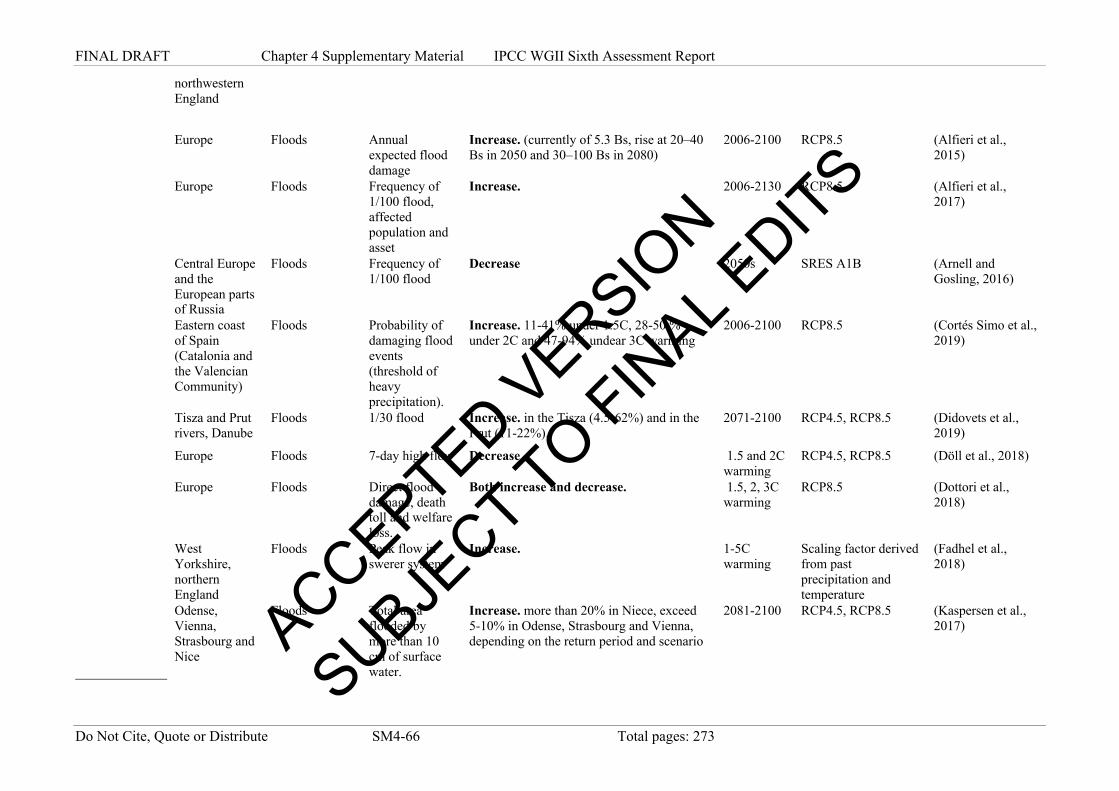
FINAL DRAFT Chapter 4 Supplementary Material IPCC WGII Sixth Assessment Report
Do Not Cite, Quote or Distribute SM4-66 Total pages: 273
northwestern England
Europe Floods Annual expected flood damage
Increase. (currently of 5.3 Bs, rise at 20–40 Bs in 2050 and 30–100 Bs in 2080)
2006-2100 RCP8.5 (Alfieri et al., 2015)
Europe Floods Frequency of 1/100 flood, affected population and asset
Increase. 2006-2130 RCP8.5 (Alfieri et al., 2017)
Central Europe and the European parts of Russia
Floods Frequency of 1/100 flood
Decrease 2050s SRES A1B (Arnell and Gosling, 2016)
Eastern coast of Spain (Catalonia and the Valencian Community)
Floods Probability of damaging flood events (threshold of heavy precipitation).
Increase. 11-41% under 1.5C, 28-50 % under 2C and 47-94% undear 3C warming
2006-2100 RCP8.5 (Cortés Simo et al., 2019)
Tisza and Prut rivers, Danube
Floods 1/30 flood Increase. in the Tisza (4.5-62%) and in the Prut (11-22%).
2071-2100 RCP4.5, RCP8.5 (Didovets et al., 2019)
Europe Floods 7-day high flow Decrease 1.5 and 2C warming
RCP4.5, RCP8.5 (Döll et al., 2018)
Europe Floods Direct flood damage, death toll and welfare loss.
Both increase and decrease. 1.5, 2, 3C warming
RCP8.5 (Dottori et al., 2018)
West Yorkshire, northern England
Floods Peak flow in swerer system
Increase. 1-5C warming
Scaling factor derived from past precipitation and temperature
(Fadhel et al., 2018)
Odense, Vienna, Strasbourg and Nice
Floods Total area flooded by more than 10 cm of surface water.
Increase. more than 20% in Niece, exceed 5-10% in Odense, Strasbourg and Vienna, depending on the return period and scenario
2081-2100 RCP4.5, RCP8.5 (Kaspersen et al., 2017) ACCEPTED V
ERSION
SUBJECT TO FIN
AL EDITS

FINAL DRAFT Chapter 4 Supplementary Material IPCC WGII Sixth Assessment Report
Do Not Cite, Quote or Distribute SM4-67 Total pages: 273
Rhine, Missisippi, Tagus
Floods Q10 discharge Both increase and decrease. 2006-2035, 2036-2065, 2070-2099
RCP2.6, RCP4.5, RCP6.0, RCP8.5
(Krysanova et al., 2017)
Paceco urban area, southern Italy
Floods Frequency of drainage system surcharge episodes
Increase 2025, 2050 compared to 1950-2008
Extreme precipitation scenario based on satatistics of the past
(Notaro et al., 2015)
Europe Floods Q10, Qmax Decrease. Significant decrease in high flows from -11% at 1.5 K up to -330%
3C warming
RCP2.6, RCP6.0, RCP8.5
(Thober et al., 2018)
Central Europe Groundwater GW recharge Constant and Increase. Slight Increase trends at all GWLs
2006-2099 1, 1.5, 2, and 3°C and RCP2.6, RCP6.0 and RCP8.5
(Reinecke et al., 2021)
North Europe Groundwater GW recharge Increase. Strong Increase trend in recharge at all levels of GWLs
2006-2099 1, 1.5, 2, and 3°C and RCP2.6, RCP6.0 and RCP8.5
(Reinecke et al., 2021)
Southern Europe/Mediterranean
Groundwater GW recharge Decrease. Strong Decrease trends at all GWLs.
2006-2099 1, 1.5, 2, and 3°C and RCP2.6, RCP6.0 and RCP8.5
(Reinecke et al., 2021)
Spain Groundwater GW recharge Both increase and decrease. Trends were reported using maps and graphs
1996-2005 and 2011-2045
RCP8.5 (Pulido-Velazquez et al., 2018)
Northern Italy Water Quality Amount nutrients (i.e. NO3−, NH4+, PO43−)
Increase. Greater increase for both river flow and nutrients loadings are predicted under the medium and long term RCP8.5 scenarios.
2041-2100 RCP4.5, RCP8.5 (Sperotto et al., 2019)
UK Water Quality Nitrate concentration
Both increase and decrease. Climate change alone should reduce the average nitrate concentration, although just by a small amount, by the 2050s in the Lower Thames, due to reduced runoff and increased instream denitrification, and should increase the average phosphorus concentration by 12%
until 2050 SRES A1B, SRES B1, Land use scenarios
(Bussi et al., 2017)
UK Water Quality River phytoplankton concentration, cyanobacteria
Increase. An increase in average phytoplankton concentration due to climate change is highly likely to occur along the River Thames. Cyanobacteria show significant increases under future climate change and land use change
2030s UK Climate Projections 09 (UKCP09) for the 2030s
(Bussi et al., 2016b) ACCEPTED V
ERSION
SUBJECT TO FIN
AL EDITS

FINAL DRAFT Chapter 4 Supplementary Material IPCC WGII Sixth Assessment Report
Do Not Cite, Quote or Distribute SM4-68 Total pages: 273
UK Water Quality Nutrient concentration
Increase. Under future scenarios (+4.0°C increase by the end of the century), the average nutrient will be triple of current in a shallow lake
N/A RCP8.5 (mesocosms-based experiment)
(Richardson et al., 2019)
Spain SESL Soil erosion rate
Increase. 34-55% depending on the scenario 2031-2050, 2081-2100
RCP4.5, RCP8.5 (Eekhout and de Vente, 2019a)
Czech Republic
SESL Rainfall erosivity
Increase. Increase of rainfall erosovity of 18-51% depending on scenario.
2020-2049, 2070-2099
SRES A1B, RCP4.5, RCP8.5
(Svoboda et al., 2016)
Belgium SESL Soil erosion Increase. 10-22% increase of soil erosion 2016-2035, 2036-2055
1.5-2.0°C global warming
(Mullan et al., 2019)
Greece SESL Rainfall erosivity
Decrease. 3-9% decrease of rainfall erosivity depending on scenario
2040, 2070, 2100
RCP4.5, RCP8.5 (Vantas et al., 2020)
Spain SESL Suspended sediment
Decrease. 8-11% decrease of suspended sediment
2031-2060, 2069-2098
SRES A1B (Rodríguez-Blanco et al., 2016)
Germany SESL Rainfall erosivity
Increase. Projected trend: Increase (+36-78%)
2011-2055, 2051-2095
RCP4.5, RCP8.5 (Gericke et al., 2019)
Spain SESL Soil erosion Both increase and decrease. Projected trend: Increase (+36-74%) and Decrease (-7%)
2031-2050, 2081-2100
RCP8.5 (Eekhout and De Vente, 2019b)
Spain SESL Soil erosion Increase. Projected trend: Increase (+24-46%)
2031-2050, 2081-2100
RCP4.5, RCP8.5 (Eekhout et al., 2018)
Mediterranean Mediterranean Floods frequency of 1/100 flood
Decrease. 2050s SRES A1B (Arnell and Gosling, 2016)
Mediterranean Floods 7-day high flow Decrease. 1.5 and 2C warming
RCP4.5, RCP8.5 (Döll et al., 2018)
Mediterranean Floods direct flood damage, death toll and welfare loss
Decrease. 1.5, 2, 3C warming
RCP8.5 (Dottori et al., 2018)
Giofyros basin Floods Spring flood volume
Decrease. 5-12 for 2021-2050, 17-55% for 2071-2100
2021-2050, 2071-2100
RCP2.6, RCP4.5, RCP8.5
(Vozinaki et al., 2018)
North America
North America Precipitation Total precipitation
Both increase and decrease Various Ensembles from CMIP5, CMIP6, HAPPI, HELIX, UKCP18. 2C global warming
(Uhe et al., 2021)
North America Precipitation Heavy precipitation: maximum 1-day
Increase Various Ensembles from CMIP5, CMIP6, HAPPI, HELIX, UKCP18. 2C global warming
(Uhe et al., 2021) ACCEPTED VERSIO
N
SUBJECT TO FIN
AL EDITS

FINAL DRAFT Chapter 4 Supplementary Material IPCC WGII Sixth Assessment Report
Do Not Cite, Quote or Distribute SM4-69 Total pages: 273
precipitation Rx1day
Canada Soil moisture Surface soil moisture (annual mean)
Both. Increase up to 5% in central north, decrease up to 10% in east
1976–2005 to 2070–2099
CMIP5: RCP8.5 (Berg et al., 2017)
Canada Soil moisture Surface soil moisture (october-March)
Decrease - up to 5 standard deviations of interannual variability
1851–1880 to 2071–2100
CMIP6: SSP1-26 (Cook et al., 2020)
Canada Soil moisture Surface soil moisture (April-September)
Decrease - up to 2 standard deviations of interannual variability in most of region, up to 5 standard deviations in eastern Canada
1851–1880 to 2071–2100
CMIP6: SSP1-26 (Cook et al., 2020)
Canada Soil moisture Surface soil moisture (october-March)
Decrease - up to 5 standard deviations of interannual variability
1851–1880 to 2071–2100
CMIP6: SSP3-70 (Cook et al., 2020)
Canada Soil moisture Surface soil moisture (April-September)
Decrease - up to 5 standard deviations of interannual variability
1851–1880 to 2071–2100
CMIP6: SSP3-70 (Cook et al., 2020)
USA Soil moisture Surface soil moisture (annual mean)
Decrease - approximately 5 to 12% 1976–2005 to 2070–2099
CMIP5: RCP8.5 (Berg et al., 2017)
USA Soil moisture Surface soil moisture (october-March)
Decrease - 1 to 2 standard deviations of interannual variability in approximately half of region. No robust change in about one-third of region
1851–1880 to 2071–2100
CMIP6: SSP1-26 (Cook et al., 2020)
USA Soil moisture Surface soil moisture (April-September)
Decrease - 1 to 2 standard deviations of interannual variability in approximately half of region. No robust change in about one-third of region
1851–1880 to 2071–2100
CMIP6: SSP1-26 (Cook et al., 2020)
USA Soil moisture Surface soil moisture (october-March)
Decrease - 1 to 5 standard deviations of interannual variability
1851–1880 to 2071–2100
CMIP6: SSP3-70 (Cook et al., 2020)
USA Soil moisture Surface soil moisture
Decrease - 1 to 5 standard deviations of interannual variability
1851–1880 to 2071–2100
CMIP6: SSP3-70 (Cook et al., 2020) ACCEPTED V
ERSION
SUBJECT TO FIN
AL EDITS

FINAL DRAFT Chapter 4 Supplementary Material IPCC WGII Sixth Assessment Report
Do Not Cite, Quote or Distribute SM4-70 Total pages: 273
(April-September)
Western Canadian
Streamflow Streamflow Both increase and decrease 2031-2050,2081-2100
32 CMIP5 GCM (Bonsal et al., 2020)
Canada Streamflow Mean flow Both increase and decrease 2071–2100 CMIP5 (Shrestha et al., 2019b)
Canada Streamflow Streamflow Both increase and decrease 2043–2053,2083–2093
CORDEX (Zhang et al., 2018a)
USA Cryosphere Snowmelt runoff
Decrease. By 2100, the contribution of snowmelt to runoff will decrease by one third for the western U.S. in the RCP8.5 scenario
until 2100 RCP8.5 (Li et al., 2017a)
Northern-western North America
Cryosphere snow drought Increase. Maximum increase in frequency of snow drought is 19-83% with respect to baseline period 1961–2000 under +4.0 °C GMT change
1.0-4.0°C global warming
(Shrestha et al., 2021)
USA Cryosphere ability of snow to predict seasonal drought
Decrease. By mid-century (2036–2065), 69% of historically snowmelt-dominated areas of the western United States see a decline in the ability of snow to predict seasonal drought, Increase to 83% by late century (2070–2099)
2036-2065; 2070-2099
RCP8.5 (Livneh and Badger, 2020)
USA Cryosphere frequency of consecutive snow drought years
Increase. From 6.6% of years( 1970-1999) to 42.2% (2050-2079)
2050-2079 RCP8.5 (Marshall et al., 2019)
USA Floods Rain-on-snow floods
Increase. 20–200% until 2100 RCP8.5 (Musselman et al., 2018)
North America Floods Frequency of 1/100 flood, affected population and asset
Increase. 2006-2130 RCP8.5 (Alfieri et al., 2017)
North America Floods Frequency of 1/100 flood
Both increase and decrease. 2050s SRES A1B (Arnell et al., 2016)
North America Floods 7-day high flow Both increase and decrease. 1.5 and 2C warming
RCP4.5, RCP8.5 (Döll et al., 2018)
ACCEPTED VERSIO
N
SUBJECT TO FIN
AL EDITS

FINAL DRAFT Chapter 4 Supplementary Material IPCC WGII Sixth Assessment Report
Do Not Cite, Quote or Distribute SM4-71 Total pages: 273
North America Floods Direct flood damage, death toll and welfare loss
Increase. 1.5, 2, 3C warming
RCP8.5 (Dottori et al., 2018)
Boston, Massachusetts, Houston, Texas, Miami, Florida, Oklahoma
Floods Flash flood index
Increase. Loss of road network 3-11% 2006-2100 RCP4.5, RCP8.5 (Kermanshah et al., 2017)
Mississippi river
Floods Q10 discharge Increase. 2006-2035, 2036-2065, 2070-2099
RCP2.6, RCP4.5, RCP6.0, RCP8.5
(Krysanova et al., 2017)
100 most populous cities in Canada
Floods 1/100, 1/250 flood
Increase. 40–60% of the analysed cities. 2061-2100 RCP4.5, RCP6.0, RCP8.5
(Gaur et al., 2019)
Delaware River Basin, USA
Floods Peak flood discharge
Increase. -6% to 58% 2020-2099 compared to 1990-2009
RCP4.5, RCP8.5 (Woltemade et al., 2020)
Bronx River watershed in New York City
Floods Q10 discharge Increase. 54-110% 2030-2059 RCP2.6, RCP4.5, RCP6.0, RCP8.5
(Zahmatkesh et al., 2015)
USA Groundwater Groundwater recharge due to higher ET
Decrease. Trends were not reported numerically but descriptively
Not applicable
1.5, 2, and 4 °C (Condon et al., 2020)
Central North America
Groundwater GW recharge Decrease. Slight Decrease trend at all GWLs
2006-2099 1, 1.5, 2, and 3°C and RCP2.6, RCP6.0 and RCP8.5
(Reinecke et al., 2021)
East North Africa
Groundwater GW recharge Increase. Slight Increase trends at all GWLs 2006-2099 1, 1.5, 2, and 3°C and RCP2.6, RCP6.0 and RCP8.5
(Reinecke et al., 2021)
USA Central Valley
Groundwater GW storage Constant 2006-2100 RCP8.5 (Wu et al., 2020)
USA Southern Plains
Groundwater GW storage Decrease 2006-2100 RCP8.5 (Wu et al., 2020)
USA Groundwater GW recharge Decrease. Average declines of 10–20% in total recharge across the southern aquifers, consistent declines in all montane aquifers, and no change in northern aquifers
2050-2100 Various scenarios including A1, A1B, B1, B2, doubled CO2; RCP2.6 and RCP8.5
(Meixner et al., 2016) ACCEPTED V
ERSION
SUBJECT TO FIN
AL EDITS
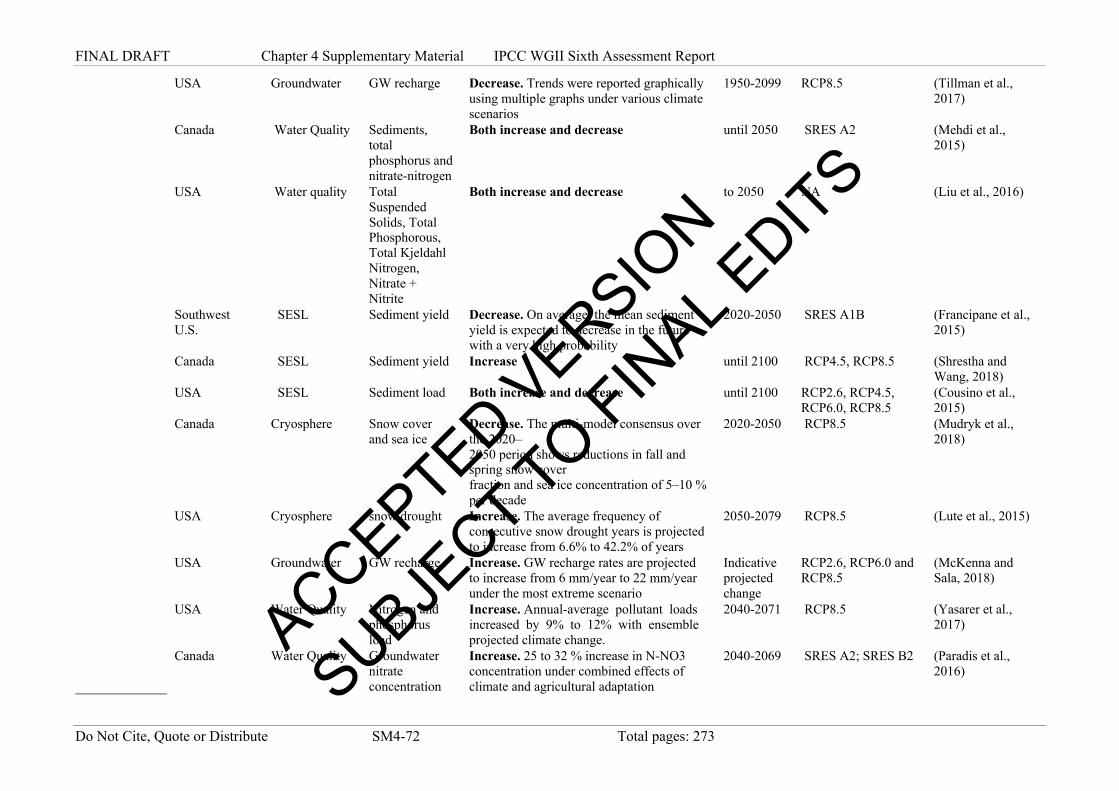
FINAL DRAFT Chapter 4 Supplementary Material IPCC WGII Sixth Assessment Report
Do Not Cite, Quote or Distribute SM4-72 Total pages: 273
USA Groundwater GW recharge Decrease. Trends were reported graphically using multiple graphs under various climate scenarios
1950-2099 RCP8.5 (Tillman et al., 2017)
Canada Water Quality Sediments, total phosphorus and nitrate-nitrogen
Both increase and decrease until 2050 SRES A2 (Mehdi et al., 2015)
USA Water quality Total Suspended Solids, Total Phosphorous, Total Kjeldahl Nitrogen, Nitrate + Nitrite
Both increase and decrease to 2050 NA (Liu et al., 2016)
Southwest U.S.
SESL Sediment yield Decrease. On average, the mean sediment yield is expected to decrease in the future with a very high probability
2020-2050 SRES A1B (Francipane et al., 2015)
Canada SESL Sediment yield Increase until 2100 RCP4.5, RCP8.5 (Shrestha and Wang, 2018)
USA SESL Sediment load Both increase and decrease until 2100 RCP2.6, RCP4.5, RCP6.0, RCP8.5
(Cousino et al., 2015)
Canada Cryosphere Snow cover and sea ice
Decrease. The multi-model consensus over the 2020– 2050 period shows reductions in fall and spring snow cover fraction and sea ice concentration of 5–10 % per decade
2020-2050 RCP8.5 (Mudryk et al., 2018)
USA Cryosphere snow drought Increase. The average frequency of consecutive snow drought years is projected to increase from 6.6% to 42.2% of years
2050-2079 RCP8.5 (Lute et al., 2015)
USA Groundwater GW recharge Increase. GW recharge rates are projected to increase from 6 mm/year to 22 mm/year under the most extreme scenario
Indicative projected change
RCP2.6, RCP6.0 and RCP8.5
(McKenna and Sala, 2018)
USA Water Quality Nitrogen and phosphorus load
Increase. Annual-average pollutant loads increased by 9% to 12% with ensemble projected climate change.
2040-2071 RCP8.5 (Yasarer et al., 2017)
Canada Water Quality Groundwater nitrate concentration
Increase. 25 to 32 % increase in N-NO3 concentration under combined effects of climate and agricultural adaptation
2040-2069 SRES A2; SRES B2 (Paradis et al., 2016)
ACCEPTED VERSIO
N
SUBJECT TO FIN
AL EDITS
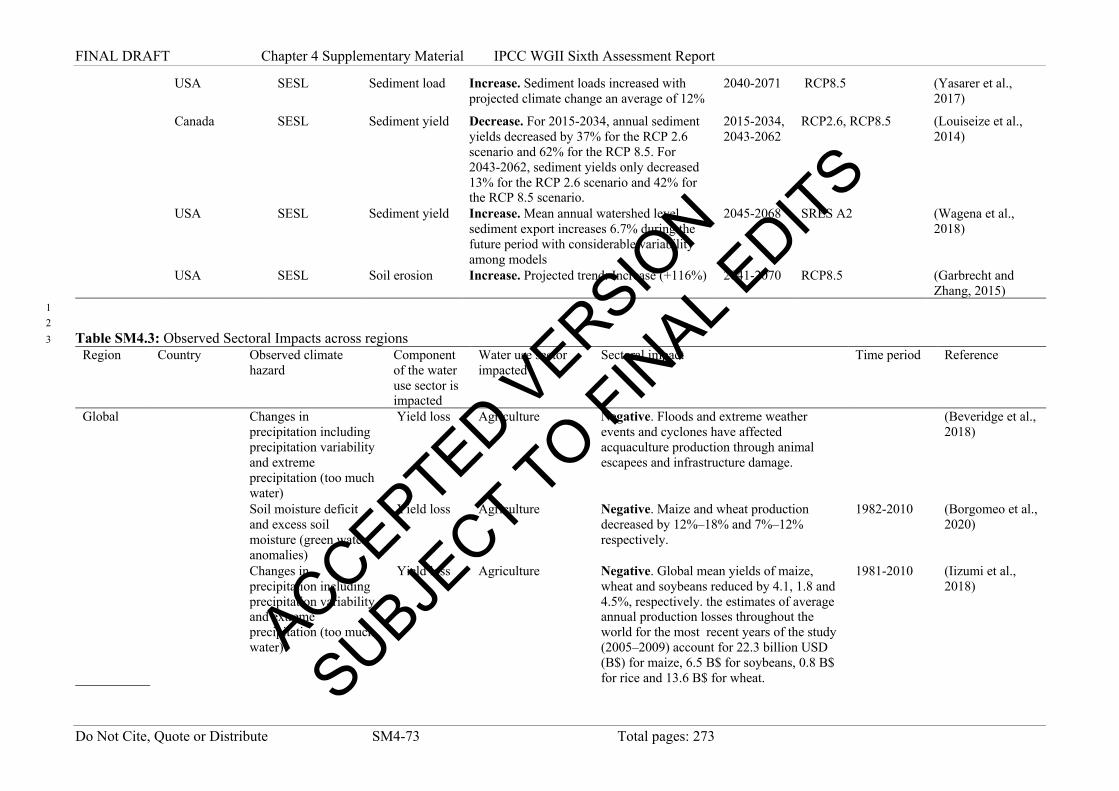
FINAL DRAFT Chapter 4 Supplementary Material IPCC WGII Sixth Assessment Report
Do Not Cite, Quote or Distribute SM4-73 Total pages: 273
USA SESL Sediment load Increase. Sediment loads increased with projected climate change an average of 12%
2040-2071 RCP8.5 (Yasarer et al., 2017)
Canada SESL Sediment yield Decrease. For 2015-2034, annual sediment yields decreased by 37% for the RCP 2.6 scenario and 62% for the RCP 8.5. For 2043-2062, sediment yields only decreased 13% for the RCP 2.6 scenario and 42% for the RCP 8.5 scenario.
2015-2034, 2043-2062
RCP2.6, RCP8.5 (Louiseize et al., 2014)
USA SESL Sediment yield Increase. Mean annual watershed level sediment export increases 6.7% during the future period with considerable variability among models
2045-2068 SRES A2 (Wagena et al., 2018)
USA SESL Soil erosion Increase. Projected trend: Increase (+116%) 2041-2070 RCP8.5 (Garbrecht and Zhang, 2015)
1 2 Table SM4.3: Observed Sectoral Impacts across regions 3
Region Country Observed climate hazard
Component of the water use sector is impacted
Water use sector impacted
Sectoral impact Time period Reference
Global Changes in precipitation including precipitation variability and extreme precipitation (too much water)
Yield loss Agriculture Negative. Floods and extreme weather events and cyclones have affected acquaculture production through animal escapees and infrastructure damage.
(Beveridge et al., 2018)
Soil moisture deficit and excess soil moisture (green water anomalies)
Yield loss Agriculture Negative. Maize and wheat production decreased by 12%–18% and 7%–12% respectively.
1982-2010 (Borgomeo et al., 2020)
Changes in precipitation including precipitation variability and extreme precipitation (too much water)
Yield loss Agriculture Negative. Global mean yields of maize, wheat and soybeans reduced by 4.1, 1.8 and 4.5%, respectively. the estimates of average annual production losses throughout the world for the most recent years of the study (2005–2009) account for 22.3 billion USD (B$) for maize, 6.5 B$ for soybeans, 0.8 B$ for rice and 13.6 B$ for wheat.
1981-2010 (Iizumi et al., 2018)
ACCEPTED VERSIO
N
SUBJECT TO FIN
AL EDITS
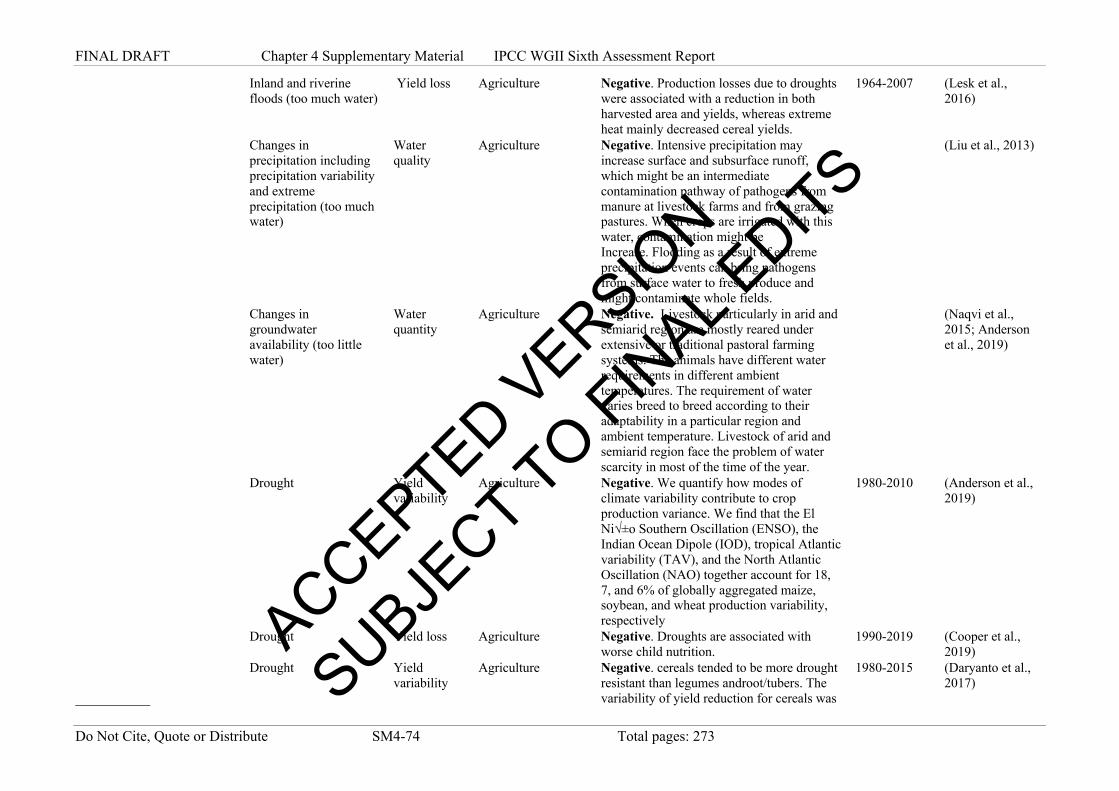
FINAL DRAFT Chapter 4 Supplementary Material IPCC WGII Sixth Assessment Report
Do Not Cite, Quote or Distribute SM4-74 Total pages: 273
Inland and riverine floods (too much water)
Yield loss Agriculture Negative. Production losses due to droughts were associated with a reduction in both harvested area and yields, whereas extreme heat mainly decreased cereal yields.
1964-2007 (Lesk et al., 2016)
Changes in precipitation including precipitation variability and extreme precipitation (too much water)
Water quality
Agriculture Negative. Intensive precipitation may increase surface and subsurface runoff, which might be an intermediate contamination pathway of pathogens from manure at livestock farms and from grazing pastures. When crops are irrigated with this water, contamination might be Increase. Flooding as a result of extreme precipitation events can bring pathogens from surface water to fresh produce and might contaminate whole fields.
(Liu et al., 2013)
Changes in groundwater availability (too little water)
Water quantity
Agriculture Negative. Livestock particularly in arid and semiarid region are mostly reared under extensive or traditional pastoral farming systems. The animals have different water requirements in different ambient temperatures. The requirement of water varies breed to breed according to their adaptability in a particular region and ambient temperature. Livestock of arid and semiarid region face the problem of water scarcity in most of the time of the year.
(Naqvi et al., 2015; Anderson et al., 2019)
Drought Yield
variability Agriculture Negative. We quantify how modes of
climate variability contribute to crop production variance. We find that the El Niño Southern Oscillation (ENSO), the Indian Ocean Dipole (IOD), tropical Atlantic variability (TAV), and the North Atlantic Oscillation (NAO) together account for 18, 7, and 6% of globally aggregated maize, soybean, and wheat production variability, respectively
1980-2010 (Anderson et al., 2019)
Drought Yield loss Agriculture Negative. Droughts are associated with
worse child nutrition. 1990-2019 (Cooper et al.,
2019) Drought Yield
variability Agriculture Negative. cereals tended to be more drought
resistant than legumes androot/tubers. The variability of yield reduction for cereals was
1980-2015 (Daryanto et al., 2017)
ACCEPTED VERSIO
N
SUBJECT TO FIN
AL EDITS
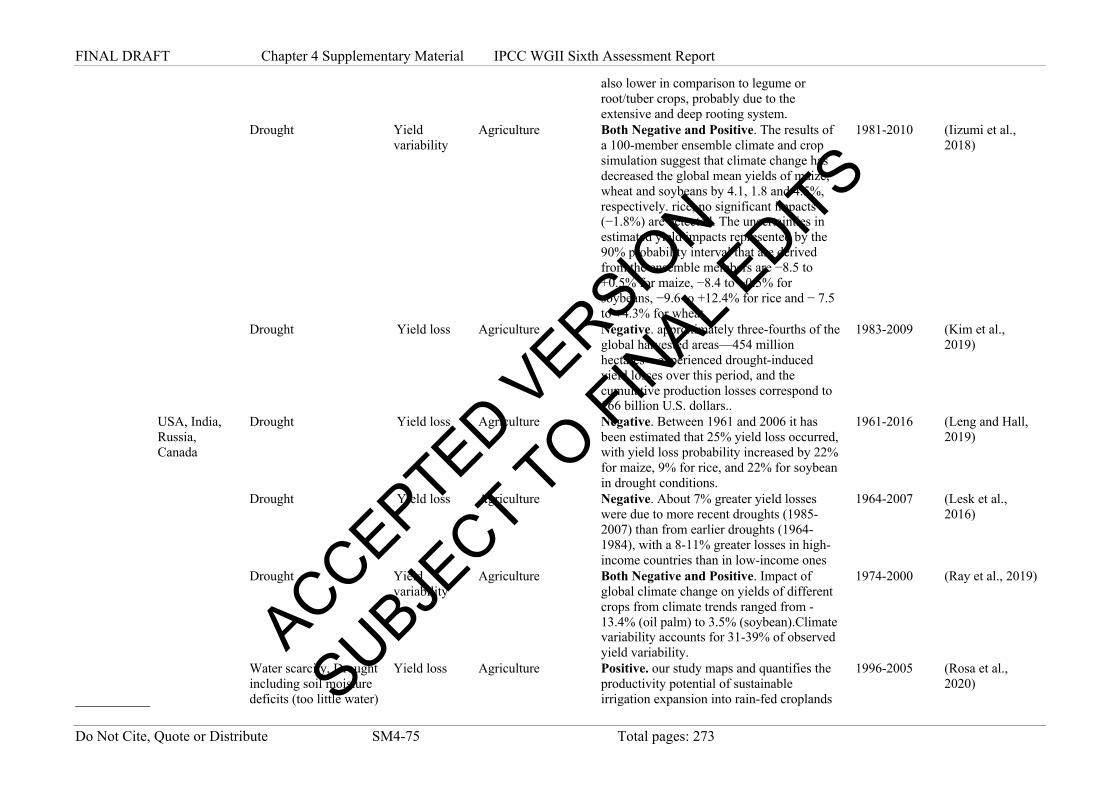
FINAL DRAFT Chapter 4 Supplementary Material IPCC WGII Sixth Assessment Report
Do Not Cite, Quote or Distribute SM4-75 Total pages: 273
also lower in comparison to legume or root/tuber crops, probably due to the extensive and deep rooting system.
Drought Yield variability
Agriculture Both Negative and Positive. The results of a 100-member ensemble climate and crop simulation suggest that climate change has decreased the global mean yields of maize, wheat and soybeans by 4.1, 1.8 and 4.5%, respectively. rice, no significant impacts (−1.8%) are detected. The uncertainties in estimated yield impacts represented by the 90% probability interval that are derived from the ensemble members are −8.5 to +0.5% for maize, −8.4 to −0.5% for soybeans, −9.6 to +12.4% for rice and − 7.5 to +4.3% for wheat.
1981-2010 (Iizumi et al., 2018)
Drought Yield loss Agriculture Negative. approximately three-fourths of the
global harvested areas—454 million hectares—experienced drought-induced yield losses over this period, and the cumulative production losses correspond to 166 billion U.S. dollars..
1983-2009 (Kim et al., 2019)
USA, India, Russia, Canada
Drought Yield loss Agriculture Negative. Between 1961 and 2006 it has been estimated that 25% yield loss occurred, with yield loss probability increased by 22% for maize, 9% for rice, and 22% for soybean in drought conditions.
1961-2016 (Leng and Hall, 2019)
Drought Yield loss Agriculture Negative. About 7% greater yield losses
were due to more recent droughts (1985-2007) than from earlier droughts (1964-1984), with a 8-11% greater losses in high-income countries than in low-income ones
1964-2007 (Lesk et al., 2016)
Drought Yield
variability Agriculture Both Negative and Positive. Impact of
global climate change on yields of different crops from climate trends ranged from -13.4% (oil palm) to 3.5% (soybean).Climate variability accounts for 31-39% of observed yield variability.
1974-2000 (Ray et al., 2019)
Water scarcity, Drought including soil moisture deficits (too little water)
Yield loss Agriculture Positive. our study maps and quantifies the productivity potential of sustainable irrigation expansion into rain-fed croplands
1996-2005 (Rosa et al., 2020)
ACCEPTED VERSIO
N
SUBJECT TO FIN
AL EDITS

FINAL DRAFT Chapter 4 Supplementary Material IPCC WGII Sixth Assessment Report
Do Not Cite, Quote or Distribute SM4-76 Total pages: 273
that are economically water scarce. Sustainable irrigation expansion has the potential to increase food production without degrading terrestrial and aquatic habitats by claiming uncultivated land or environmental flows.
Changes in precipitation including precipitation variability and extreme precipitation (too much water)
Food insecurity
Agriculture Both Negative and Positive. People widely report changes in the seasonality and predictability of weather (46% of localities, 96 countries).In addition to obvious detrimental consequences for agriculture (including altered cropping calendars and weed and pest cycles), such changes can affect fishing and hunting because these activities are often planned in conjunction with specific seasonal conditions or weather patterns.
1955-2005 (Savo et al., 2016)
Changes in precipitation including precipitation variability and extreme precipitation (too much water)
Yield loss Agriculture Negative. Floods are shown to lead to harvest failure, crop and fungal contamination.
(Uyttendaele et al., 2015)
Changes in precipitation including precipitation variability and extreme precipitation (too much water)
Yield variability
Agriculture Negative. growing season climate factors— including mean climate as well as climate extremes—explain 20%–49% of the variance of yield anomalies (the range describes the differences between crop types), with 18%–43% of the explained variance attributable to climate extremes, depending on crop type - maize and rice.
1961- 2008 (Vogel et al., 2019)
Water scarcity Energy Thermoelectric.
Freshwater availability for thermo-electric cooling
Negative. Among coal fired power plants (CFFPs), 32% (625 GW) exhibit water scarcity for five or more months per year and 43% (830GW) of the world’s CFPPs face regional water scarcity for at least one month per year.
2011-2015 (Rosa et al., 2020)
Drought Energy Hydroelectricity
generation Negative. The utilization rate of hydropower a was reduced by 5.2% during drought years, as compared to long-term average values.
1981-2010 (van Vliet et al., 2016a)
ACCEPTED VERSIO
N
SUBJECT TO FIN
AL EDITS

FINAL DRAFT Chapter 4 Supplementary Material IPCC WGII Sixth Assessment Report
Do Not Cite, Quote or Distribute SM4-77 Total pages: 273
Drought Energy Thermoelectricity
generation Negative. The utilization rate of thermoelectric power was reduced by 3.8% during drought years, as compared to long-term average values.
1981-2010 (van Vliet et al., 2016a)
Precipitation WaSH Rainfall effects on
diarrhoeal disease Both Negative and Positive. The model predicts a 1.5/1000 increase in diarrhoea for each week with heavy rainfall after a dry period and a decrease of 1/1000 with heavy rainfall after wet periods.
2004-2012 (Carlton et al., 2014)
Water quality WaSH Drinking water Negative. Child diarrhoea was associated
with 1-log10 higher faecal indicator bacteria concentrations in drinking water and on children’s hands .
2005-2021 (Goddard et al., 2020)
Natural disasters WaSH Women health Negative. Women helalth is more vulnerable
to disaster.
(Goodman, 2016)
Global Heavy precipitation Urban and Peri-Urban
Precipitation patterns
Negative. 17% of sites showed a statistically significant increase p-value <0.05.
1973-2012 (Mishra, 2015)
Increased air temperature, acidification and hypoxia
Freshwater Ecosystems
Algal blooms, Ecosystem functioning
Negative. Thermal extremes, low dissolved oxygen, and low pH, biodiversity loss.
(Griffith and Gobler, 2020)
Intense rainstorms, Warmer-than-average summer temperatures and low winds
Freshwater Ecosystems
Harmful algal blooms
Negative. Increased algal bloom events.
(Michalak, 2016)
Increased air and water, soil erosion
Freshwater Ecosystems
Carbon storage and sequestration
Negative. Increase in methane emissions, reduced carbion storage and sequestrations.
(Moomaw et al., 2018)
Increased air and water temperature, changes in stream flow
Freshwater Ecosystems
Species population dynamics
Negative. Mistmatch in estimated decline of fish populations, Salmonid abundance decreased in 89.5% of documented effects, with most evidence from North America and Europe and gaps in evidence elsewhere.
1985-2015 (Myers et al., 2017)
Increased air temperature
Freshwater Ecosystems
Biodiversity loss, Methane emissions, Ecosystem functioning
Negative. 20 % increase in algal blooms, 5 % increase in toxic blooms, 4 % increase in Methane emissions; Increase trends in lake surface temperature by 0.72 degC/decade and 0.53 degC/decade for seasonally ice-covered and ice-free lakes respectively.
1985-2009 (O'Reilly et al., 2015)
Increased air and water temperature.
Freshwater Ecosystems
Species range shifts Negative. Upstream shift in freshwater fish. Decline in Atlantic salmon due to expansion
(Pecl et al., 2017)
ACCEPTED VERSIO
N
SUBJECT TO FIN
AL EDITS

FINAL DRAFT Chapter 4 Supplementary Material IPCC WGII Sixth Assessment Report
Do Not Cite, Quote or Distribute SM4-78 Total pages: 273
of its predator, the northern pike in Finland, Unexpected emergence of Vibrio infections, a bacterial waterborne disease, in northern Europe due to changes in sea surface temperature, Poleward range shift in the coastal fish species, Argyrosomus coronus, from Angola into Namibia.
Increased air and water, soil erosion, precipitation changes
Freshwater Ecosystems
Biodiversity loss, Methane emissions, Ecosystem functioning, ecosystem services, water quality
Negative. 81% of inland wetland species populations and 36% of coastal and marine species have declined.
(Ramsar Convention, 2018)
Increased air and water temperature, Reduction in the duration of ice cover, and the alteration of the seasonal duration of thermal stability or stratification of the water column
Freshwater Ecosystems
Species range shifts Negative. Hybridization between freshwater species like invasive rainbow trout (Oncorhynchus mykiss) and native cutthroat trout (O. clarkia) and the coastal species like West Coast dusky cob (Argyrosomus coronus); temperature-dependent sex determination (TSD) of species in marine and terrestrial systems like Snake pipefish (Entelurus aequoreus) in the northeastern Atlantic, advances in the timing of annual phytoplankton blooms; Shifts in spawning times have been documented for 43 fish species in the northeast Pacific Ocean.
(Scheffers et al., 2016)
Increased air temperature, lowering wtaer tables, peat fires
Freshwater Ecosystems
Peat fires, carbon storage
Negative. deep-burning peat fies in Indonesia in 1997 and 1998 released approximately 0.95 Gt of carbon24,37, equivalent to ~15% of global fossil fuel emissions at that time.
1991-2010, 2081-2100
(Turetsky et al., 2015)
General climate impacts Conflict Deviations from
normal precipitation and mild temperature
Negative. Increase risk of conflict. From 10,000 BCE to 2013
(Hsiang and Burke, 2014)
General climate impacts Conflict Precipitations Positive. Deviations from moderate
temperatures and precipitation patterns systematically increase conflict risk.
(Burke et al., 2015)
Water security Conflict Transboundary
conflict Positive. country dyads governed by treaties with water allocation mechanisms exhibiting
1948-2001 (Dinar et al., 2015)
ACCEPTED VERSIO
N
SUBJECT TO FIN
AL EDITS

FINAL DRAFT Chapter 4 Supplementary Material IPCC WGII Sixth Assessment Report
Do Not Cite, Quote or Distribute SM4-79 Total pages: 273
both flexibility and secificity evince more cooperative behaviour
Drought Mobility and Migration
Drought, conflict and refugee migration
Both Negative and Positive. A one (within-country) standard deviation decrease in the SPEI leads on average to an increase of approximately 0.03 in the probability of asylum seeking flows from the country experiencing this change in climatic conditions.
2006-2015 (Abel et al., 2019)
Precipitation and temperature anomalies
Mobility and Migration
Effects on migration
Negative. Both climate variables show a positive and significant effect. More specifically, a 1° Celsius higher average temperature in the countries of origin is associated with a 1.9 percentage increase in migration flows between a country pair over one year. Further, a change in average precipitation in the countries of origin by 1 millimetre corresponds to a 0.5 percentage change in emigration flows.
1995-2006 (Backhaus et al., 2015)
Temperature anomalies Mobility and
Migration Effects on migration
Both Negative and Positive. "a one percent increase in temperature increases international migration rates by 4% in middle-income countries, whereas it decreases emigration rates in poor countries by 16%, ceteris paribus. This implies a middleincome country with an average yearly temperature of 22 ◦ C(the average of our sample) would experience a 20% increase in the rate of emigration if its average yearly temperature increased by 1◦ (roughly a 5% increase)."
1960-2000 (Cattaneo and Peri, 2016)
General climate impacts Mobility and
Migration Effects on migration
Both Negative and Positive.
(Cattaneo et al., 2019)
Precipitation and temperature anomalies
Mobility and Migration
Effects on migration
Positive. We thus find that an increase in temperature over the trend, during a 10-year period, induces people especially from poor income countries to emigrate, an effect estimated with great precision.
1960-2010 (Falco et al., 2019) ACCEPTED V
ERSION
SUBJECT TO FIN
AL EDITS
FINAL DRAFT Chapter 4 Supplementary Material IPCC WGII Sixth Assessment Report
Do Not Cite, Quote or Distribute SM4-80 Total pages: 273
other (specify) Mobility and
Migration Internal Displacement due to disasters
Positive. 2008-2020 (IDMC., 2020)
General climate impacts Mobility and
Migration Weather changes and migration
None. 2003-2018 (Kaczan and Orgill-Meyer, 2020)
Floods, droughts and other disasters
Mobility and Migration
Temperature and precipitation fluctuations and asylum applications to Europe
Negative. The change in the volume of applications is highly nonlinear: A 1°C warming results in a relative modest 6% increase in applications, but a 5°C warming leads to a 175% increase. Rainfall had no significant effect on asylum applications.
2000-2014 (Missirian and Schlenker, 2017)
General climate impacts Mobility and
Migration International environmental migration
Both negative and positive
(Obokata et al., 2014)
Precipitation and temperature anomalies
Mobility and Migration
Climate variability effects on asylum applications to EU
None. 1999-2018 (Schutte et al., 2021)
Ghana, Tanzania, Guatemala, Peru, Bangladesh, India, Thailand and Vietnam
Change in precipitation variability and extreme precipitation
Mobility and Migration
Effects on migration
Both Negative and Positive. (Afifi et al., 2016)
Africa
Ethiopia ENSO Yield loss Agriculture Both Negative and Positive. ENSO is responsible for the 30 to 41% of wheat production variability.
1980-2010 (Anderson et al., 2019)
Kenya, Tanzania
Drought Yield variability
Agriculture Both Negative and Positive. Decreased and increased maize yield variability across contries.
1981-2010 (Iizumi and Ramankutty, 2016)
Drought Yield loss Agriculture Negative. Anthropogenic emissions increased the chances of October-December droughts over the region by 1.4 to 4.3 times and resulted in below average harvests in Zambia and South Africa.
2018 (Nangombe et al., 2020)
Kenya General climate impacts Yield variability
Agriculture Negative. Irrigation water availability has become more available and more sporadic negatively affecting agricultural production.
1980-2010 (Caretta and Börjeson, 2015)
ACCEPTED VERSIO
N
SUBJECT TO FIN
AL EDITS

FINAL DRAFT Chapter 4 Supplementary Material IPCC WGII Sixth Assessment Report
Do Not Cite, Quote or Distribute SM4-81 Total pages: 273
Rwanda, Kenya, Tazmania, Zimbabwe, Swaziland
Drought Food insecurity, malnutrition, yield loss
Agriculture Negative. Between 2006 to 2016 drought contributed to food insecurity and malnutrition in northern, eastern and southern Africa, Asia and the Pacific. In 36% of these nations – mostly in Africa – where severe droughts hit, undernourishment rose.
2006-2016 (Phalkey et al., 2015)
Madagascar, Togo, South Africa, Zimbabwe, Ghana, Tanzania
Drought Yield variability
Agriculture Negative. Maize and sugarcane yields decreased by 5.8% and 3.9%, respectively. In contrast, recent climate change caused yields to increase in the more heat- and drought-tolerant sorghum (0.7%) and cassava (1.7%). Maize yield losses are highest in South Africa (-22%), with the highest losses occurring in the provinces of The Free State and North West.
1974-2000 (Ray et al., 2019)
West Africa Changes in precipitation including precipitation variability and extreme precipitation (too much water)
Yield loss Agriculture Negative. regional average yield reductions 10-20% for miller 5-15% for sourghum between 2000-2009. Loss of 2.33-4.02 BUSD for miller and 0-73-2.17 sorghum.
2000-2009 (Sultan et al., 2019)
Ghana Rainfall variability Energy Hydroelectricity generation
Negative. Rainfall variability accounted for 21% of inter-annual variations in hydropower generation.
1970-1990 (Boadi and Owusu, 2019)
South Africa Water scarcity Energy Thermoelectric. Freshwater availability for thermo-electric cooling
Negative. In South Africa, 34GW of thermoelectric capacity face water scarcity for at least five months per year.
2011-15 (Rosa et al., 2020)
Temperature and precipitation
WaSH WaSH impacts on childhood diarrhoea
Negative. Monthly average temperature and monthly average rainfall were positively associated with the rate of childhood diarrhea, whereas the relative humidity was negatively associated with the rate of childhood diarrhea.
2013-2015 (Azage et al., 2017)
Zambia, Ghana, Tanzania
Precipitation WaSH Rainfall effects on diarrhoeal disease
Both Negative and Positive. The model predicts a 1.5/1000 increase in diarrhoea for each week with heavy rainfall after a dry period and a decrease of 1/1000 with heavy rainfall after wet periods.
2004-2006 (Carlton et al., 2014) ACCEPTED V
ERSION
SUBJECT TO FIN
AL EDITS

FINAL DRAFT Chapter 4 Supplementary Material IPCC WGII Sixth Assessment Report
Do Not Cite, Quote or Distribute SM4-82 Total pages: 273
Changes in precipitation; temperature
WaSH Vector borne diseases
Negative. Increase vector borne diseases.
(Chinwendu et al., 2017)
Floods WaSH Disaster
vulnerability Negative. 84% of households feeling that there is more rainfall now than before. 65% reported that their household has been affected by flooding disaster.
(Cissé et al., 2016)
Central African Republic Chad Congo DR, Ghana Kenya Ghana Togo Nigeria Sierra Leone Somalia South Sudan Sudan Swaziland Mauritania Tunisia Zimbabwe
WaSH WaSH access
impacts on child mortality
Negative. Living in a household where members did not usually use a flush toilet was associated with 9–12% greater relative risk of child death than living in a household where members usually used flush toilets; Those children born into communities with > 90% improved sanitation usage were 12% less likely to die than those born into communities with ≤20% usage. An increase in the odds of a child under five years of age being reported to have had diarrhoea in the previous two weeks (10–13%) was associated with children collecting water. Using unimproved drinking water supply compared to improved drinking water supply was associated with an increase in the odds of diarrhoea by 5%. Improved sanitation usage was associated with the odds of childhood diarrhoea reducing by 8% to 21% .
2009-2016 (Geere and Hunter, 2020)
DR Congo, Tanzania, Mozambique, Rwanda, Zambia, Kenya
Water quality WaSH Drinking water Negative. Child diarrhoea was associated with 1-log10 higher faecal indicator bacteria concentrations in drinking water and on children’s hands .
2005-2019 (Goddard et al., 2020)
Mozambique Precipitation WaSH Malaria incidence Negative. ENSO is the dominant driver of precipitation driving malaria incidence, but the SIOD [Subtropical Indian Ocean Dipole] is also an important driver of climate variability over the region. Two dominant spatio-temporal modes related to precipitation account for more than 80% of malaria variability.
2010-2017 (Harp et al., 2021)
ACCEPTED VERSIO
N
SUBJECT TO FIN
AL EDITS
FINAL DRAFT Chapter 4 Supplementary Material IPCC WGII Sixth Assessment Report
Do Not Cite, Quote or Distribute SM4-83 Total pages: 273
Mozambique Precipitation WaSH Diarrhoeal disease Negative. One additional wet day per week was associated with a 1.86%, 1.37%, 2.09%, and 0.63% increase in diarrheal disease in Mozambique‚ northern, central, southern, and coastal regions, respectively
1997-2014 (Horn et al., 2018)
Tanzania, Mozambique, Nigeria, South Africa, Malawi
Precipitation WaSH Drinking water Negative. Fecal contamination in improved drinking water sources follows a statistically significant seasonal trend of greater contamination during the wet season that is consistent across fecal indicator bacteria, five source types, twelve Köppen–Geiger climate zones, and across both rural and urban areas.
(Kostyla et al., 2015)
Ghana, Nigeria, Ethiopia, Uganda, Kenya, Tanzania, Malawi
Water insecurity (general)
WaSH Water insecurity Negative. 90% of women indicated that water insecurity impacted infant feeding; Water insecurity is associated with increased mental, emotional, and physical stress, particularly for women and caregivers
2017-2018 (Schuster et al., 2020)
Precipitation and temperature
WaSH Diarrhoeal disease Negative. There is positive association between diarrhoeal incidence and high average temperature of 36 C and above and high cumulative monthly rainfall at 57 mm and above.
2011-2014 (Thiam et al., 2017)
Malawi Floods WaSH Water-induced disasters
Negative. Floods exacerbate poor WaSH conditions; coverage decreased from 65% to 51% as a result of damage from earthquakes and floods; increase WaSH-related diseases in hospitals.
(Wanda et al., 2017)
Ghana, Nigeria, Ethiopia, Uganda, Kenya, Tanzania, Malawi
Water insecurity (general)
WaSH Water fetching and health
Negative. 13% of respondents reported at least one water- fetching injury. Of 879 injuries, fractures and dislocations were the most commonly specified type (29.2%), and falls were the most commonly specified mechanism (76.4%). Where specified, 61.1% of injuries occurred to the lower limbs, and dangerous terrain (69.4%) was the most frequently reported context. Significant correlates included being female; rural or periurban
2017-2018 (Venkataramanan et al., 2020)
ACCEPTED VERSIO
N
SUBJECT TO FIN
AL EDITS
FINAL DRAFT Chapter 4 Supplementary Material IPCC WGII Sixth Assessment Report
Do Not Cite, Quote or Distribute SM4-84 Total pages: 273
residence; higher household water insecurity scores and reliance on surface water or off- premise water sources that required queueing.
Lesotho Rainfall, drought, water quality
WaSH Water scarcity and psychological health
Negative. Insufficient supply and contamination. Half the respondents reported having fallen ill from drinking dirty water. All three water insecurity indicators correlated significantly with reported levels of depression, with access and cleanliness also exhibiting significant relationships with anxiety and overall reported levels of distress.
2011 (Workman and Ureksoy, 2017)
South Africa Drought Urban and Peri-Urban
Water insecurity Negative. by a factor of three, 95% confidence interval 1.5-6.
1930-2017 (Otto et al., 2018)
Burkina Faso Flood Urban and Peri-Urban
Precipitation patterns
Negative. Increase recurrence of flooding in the Ougadougo region since the early 2000s due to urbanisation.
1961-2015 (Tazen et al., 2019)
South Africa Increased air temperature, Seasonal shifts in warming
Freshwater Ecosystems
Freshwater birds Negative. Phenological shifts in migratory patterns of waterbirds.
1987–1991, 2007-2012
(Bussière et al., 2015)
DR Congo Drought Conflict Drought Negative. Increase support for the use of political violence.
(von Uexkull et al., 2016)
Perceived climate change, precipitation and temperature anomalies
Mobility and Migration
Perceptions of climate change and variability together with rainfall and temperature
None. 1988–2007 (de Longueville et al., 2020)
Kenya, Uganda, Nigeria, Burkina Faso and Senegal
Precipitation and temperature anomalies
Mobility and Migration
Effects on migration
Both Negative and Positive. With one unit increase in temperature the number of migrants sent per household increases 123 % in Uganda (p = 0.008), decreases 42 % in Kenya (p = 0.003), decreases 71 % in Burkina Faso (p < 0.001), and does not significantly change in Nigeria (p = 0.35) or Senegal (p = 0.75).
2004-2009 (Gray and Wise, 2016)
South Africa Precipitation and temperature anomalies
Mobility and Migration
Effects on migration
Negative. A 10% relative increase in positive maximum temperature anomalies and in negative precipitation anomalies, or one percentage point increase in soil moisture, result in a percentage change in
1997-2001; 2007-2011
(Mastrorillo et al., 2016) ACCEPTED V
ERSION
SUBJECT TO FIN
AL EDITS

FINAL DRAFT Chapter 4 Supplementary Material IPCC WGII Sixth Assessment Report
Do Not Cite, Quote or Distribute SM4-85 Total pages: 273
migration flow of about 1.9, 2.2 and 5 respectively. A 10% increase in positive precipitation anomalies increases migration flows by approximately 1% (albeit its effect is only marginally significant).
Uganda, Malawi, Ethiopia, Tanzania
Precipitation and temperature anomalies
Mobility and Migration
Effects on migration
Positive. One Standard deviation temperature increase --> 10% decline in out migration. One Standard deviation rainfall decrease --> 12% decline in out migration.
2009-2014 (Mueller et al., 2020)
Burkina Faso and Senegal
Precipitation and temperature anomalies
Mobility and Migration
Climate variability, agriculture and migration
Both Negative and Positive. For Burkina Faso, an increase of 10% in heatwave months (about 7 months across the 6-year observation period) led to a decline n the odds of an international move by 20% [...] for Senegal, an increase of 10% in months with excessive precipitation led to an approximately four times higher probability of international migration
1960-2010 (Nawrotzki and Bakhtsiyarava, 2017)
Tanzania Natural disasters Mobility and Migration
Droughts, floods, crop diseases and severe water shortages impacts on internal migration
Negative. Respondents who experienced drought or floods were 49 % less likely to migrate.
2008-2009 (Ocello et al., 2015)
Multiple Drought and temperature anomalies
Mobility and Migration
Climate variability, conflict and displacement
Both Negative and Positive. 1963-2014 (Owain and Maslin, 2018)
Kenya Water insecurity (general)
WaSH Water insecurity Negative. Water insecurity had a predictive effect on food security with greater depressive symptomatology t 21 months postpartum. One point increase in water insecurity associated with a 0.06 point increase in depression scores.
2014-2015 (Boateng et al., 2020)
Tanzania, Burundi, Sudan, South Afri-ca, Uganda, Zambia, Malawi, Nigeria,
Natural disasters WaSH Cholera risk and WaSH
Both Positive and Negative. WaSH is preventive of cholera - stat sig relationships with boiling, municipal/piped with no outbreak, rainwater, handwashing. Statistically significant relationships with untreated water , surface water open defecation , shared facilities.
(Jones et al., 2020)
ACCEPTED VERSIO
N
SUBJECT TO FIN
AL EDITS

FINAL DRAFT Chapter 4 Supplementary Material IPCC WGII Sixth Assessment Report
Do Not Cite, Quote or Distribute SM4-86 Total pages: 273
Zimbabwe, Kenya, Cameroon, Ghana, Madagas-car Sierra Leo-ne Guinea-Bissau Guinea Zambia Kenya Democratic Republic of the Congo Ghana Senegal Ethiopia Ivory Coast Uganda South Africa Benin Rwanda Mozambique Cameroon The Gambia Zimbabwe Egypt
Water quality WaSH Wash impacts on childhood diarrhoea
Positive. Point-of-use filter interventions with safe storage reduced diarrhoea risk by 61% ; piped water to premises of higher quality and continuous availability by 75% and 36%, respectively compared to a baseline of unimproved drinking water; sanitation interventions by 25% with evidence for greater reductions when high sanitation coverage is reached; and interventions promoting handwashing with soap by 30% vs. no intervention.
1970-2020 (Wolf et al., 2018)
Asia China, India ENSO Yield variability
Agriculture Both Negative and Positive. ENSO accounts for 26 and 25% of maize production variability but has a much smaller influence on wheat production because of extensive irrigation of wheat.
1980-2010 (Anderson et al., 2019)
China, Bangladesh, Myanmar, Indonesia
Drought Yield variability
Agriculture Both Negative and Positive. Across the whole continent a mixed of Both increase and decrease yield variability of maize, soybean, rice and wheat across the continent, even within the same countries between 1981-2010.
1981-2010 (Iizumi and Ramankutty, 2016)
Bangladesh Drought Water scarcity
Agriculture Negative. In 2009–2010, extreme weather caused late maturity of fish for breeding in Bangladesh. Fish farmers are struggling with
2009-2010 (Islam and Wong, 2017)
ACCEPTED VERSIO
N
SUBJECT TO FIN
AL EDITS

FINAL DRAFT Chapter 4 Supplementary Material IPCC WGII Sixth Assessment Report
Do Not Cite, Quote or Distribute SM4-87 Total pages: 273
higher production costs due to water scarcity.
China Drought Yield loss Agriculture Negative. In China the gap between rainfed and irrigated maize yield widened from 5% in the 1980s to 10% in the 2000s.
1980-2009 (Meng et al., 2016)
India, Bangladesh
Drought Food insecurity, malnutrition, yield loss
Agriculture Negative. Between 2006 to 2016 drought contributed to food insecurity and malnutrition in northern, eastern and southern Africa, Asia and the Pacific. In 36% of these nations – mostly in Africa – where severe droughts hit, undernourishment rose
2006-2016 (Phalkey et al., 2015)
China, Vietnam, Philippines, Turkey, Iran, Nepal, India, Bangladesh
Drought Yield variability
Agriculture Both Negative and Positive. Climate change’s impacts on crop yield and consumable calories in Asia are varied. In China, mean climate changes overall benefitted crop yields and increased consumable food calories in these ten crops by ~2% (or ~1% across all consumable food calories), though there are exceptions such as decreases in rice yields in Guangxi and Fujian or wheat yields in Sichuan and Guizhou.
1974-2000 (Ray et al., 2019)
China Drought Yield loss Agriculture Negative. Agricultural production has been affected by Increase droughts. Additionally, despite the Increasely active role of women in managing water during the drought, they are excluded from community-level decision-making about water.
(Su et al., 2017)
Cambodia, Laos, Myanmar, Thailand, Vietnam
Changes in precipitation including precipitation variability and extreme precipitation (too much water)
Yield loss Agriculture Negative. Important climate-related risks included rapid changes in temperature, intense rainfall events, and floods. Farmers who had experienced significant losses from any climate-related source were more concerned with risks. Women and higher educated farmers perceived higher risks.
1998-2018 (Lebel et al., 2020)
India Water scarcity Water scarcity
Agriculture Negative. The livestock sector contributes 1.4 % of the world’s gross domestic product (GDP) with 2.2 % growth rate over ten years (1995–2005). Globally livestock contribute 40 % of the agricultural GDP, but water
(Naqvi et al., 2015) ACCEPTED V
ERSION
SUBJECT TO FIN
AL EDITS

FINAL DRAFT Chapter 4 Supplementary Material IPCC WGII Sixth Assessment Report
Do Not Cite, Quote or Distribute SM4-88 Total pages: 273
reserve in this globe is depleting day by day and prediction hints severe water scarcity in the near future.
Nepal Changes in precipitation including precipitation variability and extreme precipitation (too much water)
Yield loss Agriculture Negative. Farmers have modified traditional cropping patterns and calendar, changed crop varieties and increased fertilizer and pesticide applications in order to maintain crop yields. They have also sought off-farm employment. However, agricultural productivity in the area is declining and only one third of all households in the area were food secure.
1980-2009 (Shrestha and Nepal, 2016)
Nepal Soil erosion and sediment load
Yield loss Agriculture Negative. Farmers reported increases in crop pests, hailstorms, landslides, floods, thunderstorms, and erratic precipitation as climate-related hazards affecting agriculture.
1979-2009 (Sujakhu et al., 2016)
India Changes in precipitation including precipitation variability and extreme precipitation (too much water)
Yield loss Agriculture Negative. 81% of farmers experienced Decrease and unpredictable rain fall which led to crop failures, declining crops and livestock yields
1994-2011 (Varadan and Kumar, 2014)
China Water scarcity Energy Thermoelectric. Freshwater availability for thermo-electric cooling
Negative. China more than 30% of the installed capacity of coal fired power plants (CFFPs) faces water scarcity from March to October.
2011-15 (Rosa et al., 2020)
India Water scarcity Energy Thermoelectric. Freshwater availability for thermo-electric cooling
Negative. More than 40% of India’s coal fired power plants (CFPP) capacity faces water scarcity in the dry season (December–June).
2011-15 (Rosa et al., 2020)
Central Asia Drought Energy Hydroelectricity generation
Negative. Utilisation rates were reduced significantly (p<0.05) compared to the average over 1981–2010 in the years 1995,2001 and 2002 which were drought years.
1981-2010 (van Vliet et al., 2016a)
East Asia Drought Energy Hydroelectricity generation
Negative. Utilisation rates were reduced significantly (p<0.05) compared to the average over 1981–2010 in the years 1998, 1999 which were drought years.
1981-2010 (van Vliet et al., 2016a)
ACCEPTED VERSIO
N
SUBJECT TO FIN
AL EDITS

FINAL DRAFT Chapter 4 Supplementary Material IPCC WGII Sixth Assessment Report
Do Not Cite, Quote or Distribute SM4-89 Total pages: 273
South Asia Drought Energy Hydroelectricity generation
Negative. Utilisation rates were reduced significantly (p<0.05) compared to the average over 1981–2010 in the years 1983, 1992 which were drought years.
1981-2010 (van Vliet et al., 2016a)
Mediterranean Drought Energy Thermoelectricity generation
Negative. Utilisation rates were reduced significantly (p<0.05) compared to the average over 1981–2010 in the year 2003 which was a drought year.
1981-2010 (van Vliet et al., 2016a)
East Asia Drought Energy Thermoelectricity generation
Negative. Utilisation rates were reduced significantly (p<0.05) compared to the average over 1981–2010 in the year 1997which was a drought year.
1981-2010 (van Vliet et al., 2016a)
Bangladesh Natural disasters WaSH Water-induced disasters
Positive. having experienced a typhoon women are better able to adapt eg collecting water from further away Thsi has negative impacts on family food security, women׳s occupation, women׳s health and sexual harassment of women and adolescent girls 89% of women cited lack of separate toilet and washroom facility in shelters as problem; 78% lack of freshwater supply.
(Alam and Rahman, 2014)
Nepal Temperature and precipitation
WaSH Diarrhoeal disease Negative. Increases over monthly averages in temperature and rainfall increased monthly diarrhoea cases in Nepal 8.1%. Similarly, rainfall was found to have significant effect on the monthly diarrhoea count, with a 0.9% increase in cases for every 10mm increase in rainfall above the monthly cumulative value recorded within that month.
(Bhandari et al., 2020)
Afghanistan Bhutan Indonesia Iraq Vietnam Mongolia Nepal Pakistan Kazakhstan Lao PDR Lebanon
Water quality WaSH WaSH access impacts on child mortality
Negative. Living in a household where members did not usually use a flush toilet was associated with 9–12% greater relative risk of child death than living in a household where members usually used flush toilets; Those children born into communities with > 90% improved sanitation usage were 12% less likely to die than those born into communities with ≤20% usage. An increase in the odds of a child under five years of age being reported to have had
2009-2014 (Geere and Hunter, 2020)
ACCEPTED VERSIO
N
SUBJECT TO FIN
AL EDITS

FINAL DRAFT Chapter 4 Supplementary Material IPCC WGII Sixth Assessment Report
Do Not Cite, Quote or Distribute SM4-90 Total pages: 273
diarrhoea in the previous two weeks (10–13%) was associated with children collecting water. Using unimproved drinking water supply compared to improved drinking water supply was associated with an increase in the odds of diarrhoea by 5%. Improved sanitation usage was associated with the odds of childhood diarrhoea reducing by 8% to 21% .
India, Bangladesh, Cambodia
Water quality WaSH Drinking water Negative. Child diarrhoea was associated with 1-log10 higher faecal indicator bacteria concentrations in drinking water and on children’s hands .
2005-2020 (Goddard et al., 2020)
Natural disasters WaSH Diarrhoeal disease Negative. Floods were significantly
associated with infectious diarrhea. 2004-2011 (Liu et al., 2018)
Bangladesh Temperature and precipitation
WaSH Diarrhoeal disease Negative. Study found an 8% increase in the incidence of diarrheagenic E. coli for each 10C increase in mean monthly temperature.
1975 (Philipsborn et al., 2016)
Lebanon, Tajikistan, Pakistan, Nepal
Water insecurity (general)
WaSH Water insecurity Negative. 90% of women indicated that water insecurity impacted infant feeding; Water insecurity is associated with increased mental, emotional, and physical stress, particularly for women and caregivers.
2017-2018 (Schuster et al., 2020)
Precipitation, drought WaSH Water insecurity Negative. Springs have been drying up over
the past decade due to decreased rainfall and increase dry seasons.
(Shrestha et al., 2019c)
Lebanon, Tajikistan, Pakistan, Nepal
Water insecurity (general)
WaSH Water fetching and health
Negative. 13% of respondents reported at least one water- fetching injury. Of 879 injuries, fractures and dislocations were the most commonly specified type (29.2%), and falls were the most commonly specified mechanism (76.4%). Where specified, 61.1% of injuries occurred to the lower limbs, and dangerous terrain (69.4%) was the most frequently reported context. Significant correlates included being female; rural or periurban residence; higher household water insecurity scores and reliance on surface water or off- premise water sources that required queueing.
2017-2018 (Venkataramanan et al., 2020)
ACCEPTED VERSIO
N
SUBJECT TO FIN
AL EDITS
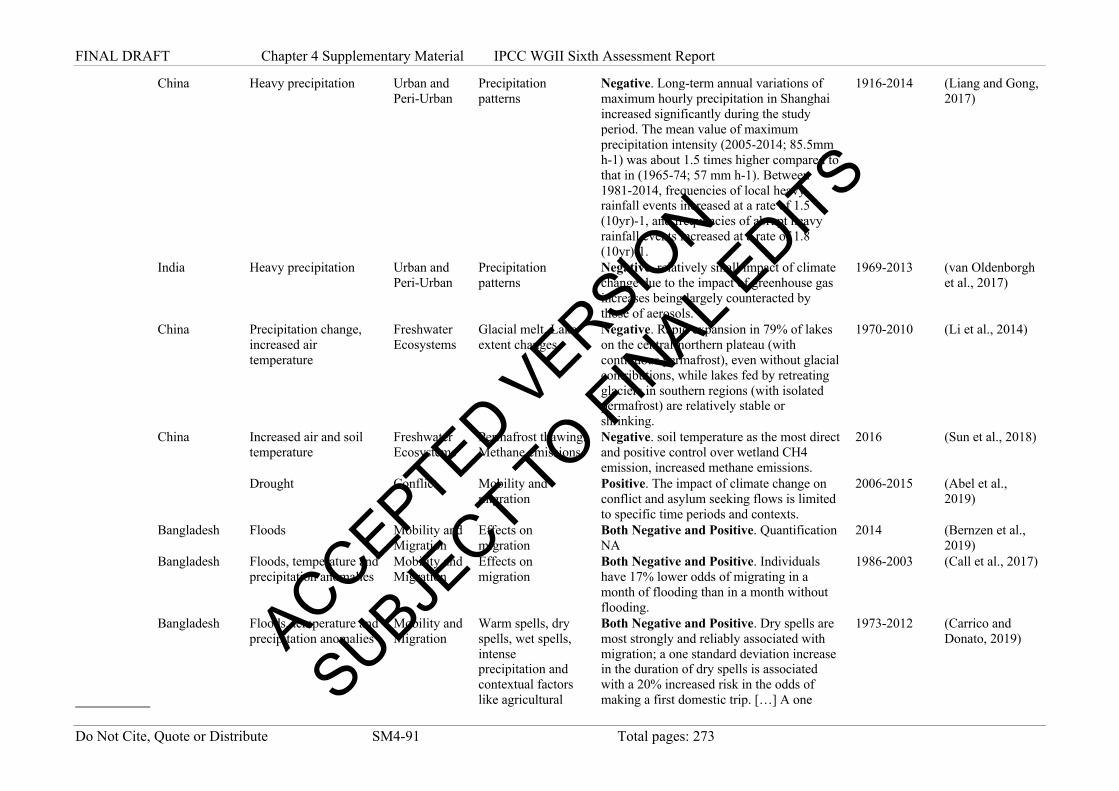
FINAL DRAFT Chapter 4 Supplementary Material IPCC WGII Sixth Assessment Report
Do Not Cite, Quote or Distribute SM4-91 Total pages: 273
China Heavy precipitation Urban and Peri-Urban
Precipitation patterns
Negative. Long-term annual variations of maximum hourly precipitation in Shanghai increased significantly during the study period. The mean value of maximum precipitation intensity (2005-2014; 85.5mm h-1) was about 1.5 times higher compared to that in (1965-74; 57 mm h-1). Between 1981-2014, frequencies of local heavy rainfall events increased at a rate of 1.5 (10yr)-1, and frequencies of abrupt heavy rainfall events increased at a rate of 1.8 (10yr)-1.
1916-2014 (Liang and Gong, 2017)
India Heavy precipitation Urban and Peri-Urban
Precipitation patterns
Negative. relatively small impact of climate change due to the impact of greenhouse gas increases being largely counteracted by those of aerosols.
1969-2013 (van Oldenborgh et al., 2017)
China Precipitation change, increased air temperature
Freshwater Ecosystems
Glacial melt, Lake extent changes
Negative. Rapid expansion in 79% of lakes on the central-northern plateau (with continuous permafrost), even without glacial contributions, while lakes fed by retreating glaciers in southern regions (with isolated permafrost) are relatively stable or shrinking.
1970-2010 (Li et al., 2014)
China Increased air and soil temperature
Freshwater Ecosystems
Permafrost thawing. Methane emissions
Negative. soil temperature as the most direct and positive control over wetland CH4 emission, increased methane emissions.
2016 (Sun et al., 2018)
Drought Conflict Mobility and
migration Positive. The impact of climate change on conflict and asylum seeking flows is limited to specific time periods and contexts.
2006-2015 (Abel et al., 2019)
Bangladesh Floods Mobility and Migration
Effects on migration
Both Negative and Positive. Quantification NA
2014 (Bernzen et al., 2019)
Bangladesh Floods, temperature and precipitation anomalies
Mobility and Migration
Effects on migration
Both Negative and Positive. Individuals have 17% lower odds of migrating in a month of flooding than in a month without flooding.
1986-2003 (Call et al., 2017)
Bangladesh Floods, temperature and precipitation anomalies
Mobility and Migration
Warm spells, dry spells, wet spells, intense precipitation and contextual factors like agricultural
Both Negative and Positive. Dry spells are most strongly and reliably associated with migration; a one standard deviation increase in the duration of dry spells is associated with a 20% increased risk in the odds of making a first domestic trip. […] A one
1973-2012 (Carrico and Donato, 2019) ACCEPTED V
ERSION
SUBJECT TO FIN
AL EDITS
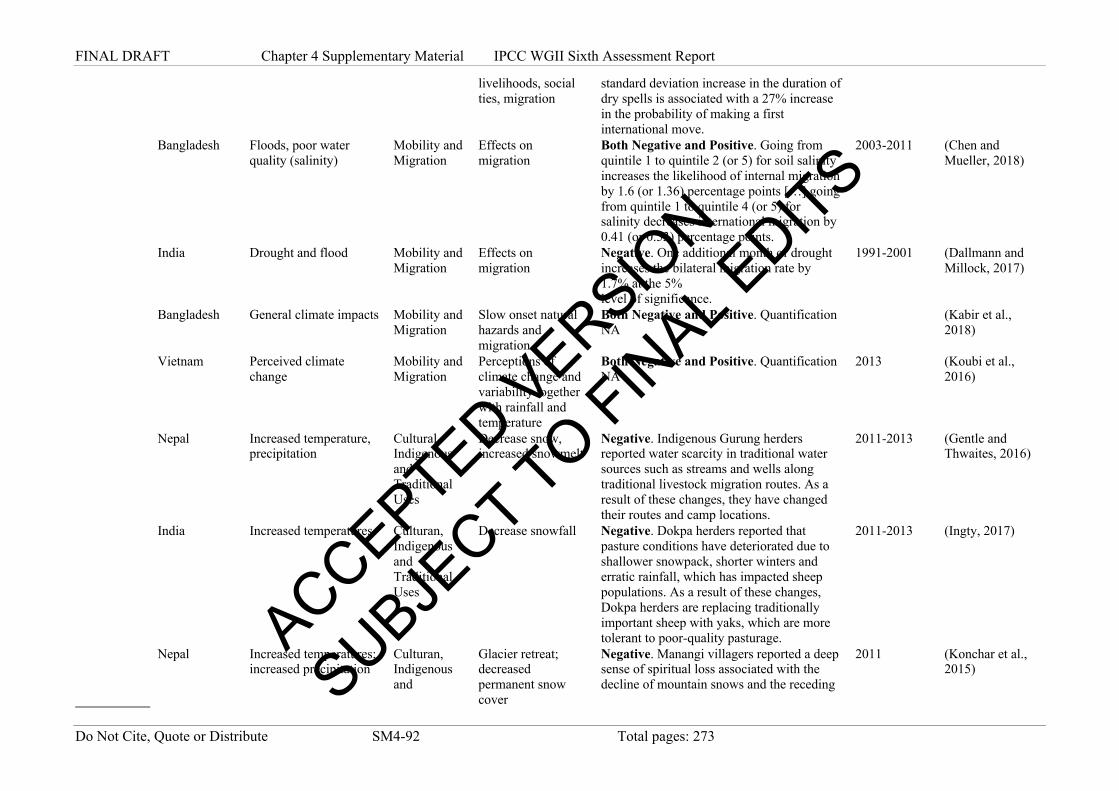
FINAL DRAFT Chapter 4 Supplementary Material IPCC WGII Sixth Assessment Report
Do Not Cite, Quote or Distribute SM4-92 Total pages: 273
livelihoods, social ties, migration
standard deviation increase in the duration of dry spells is associated with a 27% increase in the probability of making a first international move.
Bangladesh Floods, poor water quality (salinity)
Mobility and Migration
Effects on migration
Both Negative and Positive. Going from quintile 1 to quintile 2 (or 5) for soil salinity increases the likelihood of internal migration by 1.6 (or 1.36) percentage points […] going from quintile 1 to quintile 4 (or 5) for salinity decreases international migration by 0.41 (or 0.53) percentage points.
2003-2011 (Chen and Mueller, 2018)
India Drought and flood Mobility and Migration
Effects on migration
Negative. One additional month of drought increases the bilateral migration rate by 1.7% at the 5% level of significance.
1991-2001 (Dallmann and Millock, 2017)
Bangladesh General climate impacts Mobility and Migration
Slow onset natural hazards and migration
Both Negative and Positive. Quantification NA
(Kabir et al., 2018)
Vietnam Perceived climate change
Mobility and Migration
Perceptions of climate change and variability together with rainfall and temperature
Both Negative and Positive. Quantification NA
2013 (Koubi et al., 2016)
Nepal Increased temperature, precipitation
Cultural, Indigenous and Traditional Uses
Decrease snow, increased snowmelt
Negative. Indigenous Gurung herders reported water scarcity in traditional water sources such as streams and wells along traditional livestock migration routes. As a result of these changes, they have changed their routes and camp locations.
2011-2013 (Gentle and Thwaites, 2016)
India Increased temperatures Culturan, Indigenous and Traditional Uses
Decrease snowfall Negative. Dokpa herders reported that pasture conditions have deteriorated due to shallower snowpack, shorter winters and erratic rainfall, which has impacted sheep populations. As a result of these changes, Dokpa herders are replacing traditionally important sheep with yaks, which are more tolerant to poor-quality pasturage.
2011-2013 (Ingty, 2017)
Nepal Increased temperatures; increased precipitation
Culturan, Indigenous and
Glacier retreat; decreased permanent snow cover
Negative. Manangi villagers reported a deep sense of spiritual loss associated with the decline of mountain snows and the receding
2011 (Konchar et al., 2015)
ACCEPTED VERSIO
N
SUBJECT TO FIN
AL EDITS

FINAL DRAFT Chapter 4 Supplementary Material IPCC WGII Sixth Assessment Report
Do Not Cite, Quote or Distribute SM4-93 Total pages: 273
Traditional Uses
glacier, which some attributed to a lack of spiritual devotion.
Nepal Increased temperatures; increased precipitation
Culturan, Indigenous and Traditional Uses
Glacier retreat; decreased permanent snow cover
Negative. Manangi villagers reported a deep sense of spiritual loss associated with the decline of mountain snows and the receding glacier, which some attributed to a lack of spiritual devotion.
(Mukherji et al., 2019)
Tibet Autonomous Region, People's Republic of China
Increased temperatures Culturan, Indigenous and Traditional Uses
Glacier melt Negative. Due to the expansion of the majority of large lakes on the Tibetan Plateau, herders in Jagshung Village have lost large areas of pastures to inundation. As a result, the quality of nearby feed has also deteriorated, which has led to reduced livestock populations and productivity.
2015-2016 (Nyima and Hopping, 2019)
India Bangladesh Philippines Thailand Vietnam Pakistan Iran
Natural disasters WaSH Cholera risk and WaSH
Both Positive and Negative. WaSH is preventive of cholera - stat sig relationships with boiling, municipal/piped with no outbreak, rainwater, handwashing. Statistically significant relationships with untreated water , surface water open defecation , shared facilities.
(Jones et al., 2020)
China Bangladesh India Afghanistan Cambodia Vietnam Philippines Pakistan Saudi Arabia Yemen Thailand Uzbekistan
Water quality WaSH Wash impacts on childhood diarrhoea
Positive. Point-of-use filter interventions with safe storage reduced diarrhoea risk by 61% ; piped water to premises of higher quality and continuous availability by 75% and 36%, respectively compared to a baseline of unimproved drinking water; sanitation interventions by 25% with evidence for greater reductions when high sanitation coverage is reached; and interventions promoting handwashing with soap by 30% vs. no intervention.
1970-2019 (Wolf et al., 2018)
Australasia Australia ENSO Yield variability
Agriculture Both Negative and Positive. ENSO is responsible for the 30 to 41% of wheat production variability.
1980-2010 (Anderson et al., 2019)
Australia Changes in precipitation including precipitation variability and extreme
Yield loss Agriculture Both Negative and Positive. Water-limited yield potential declined by 27% over a 26 year period from 1990 to 2015. We attribute this decline to reduced rainfall and to rising temperatures while the positive effect of
1990-2015 (Hochman et al., 2017) ACCEPTED V
ERSION
SUBJECT TO FIN
AL EDITS

FINAL DRAFT Chapter 4 Supplementary Material IPCC WGII Sixth Assessment Report
Do Not Cite, Quote or Distribute SM4-94 Total pages: 273
precipitation (too much water)
elevated atmospheric CO2 concentrations prevented a further 4% loss relative to 1990 yields.
Australia Drought Yield loss Agriculture Negative. Forage and herd characteristics were significantly affected by drought intensities and durations. Series of consecutive dry years are not unusual in northern Queensland as exemplified by the periods 1992–1996, 2001–2004 and 2013– 2015, which showed annual precipitations below 500 mm.
1992-2015 (Godde et al., 2019)
Australia Drought Yield variability
Agriculture Negative. Significant increase in wheat yield variability between 1981-2010.
1981-2010 (Iizumi and Ramankutty, 2016)
Papa New Guinea
Drought Yield loss Agriculture Negative. Between 2006 to 2016 drought contributed to food insecurity and malnutrition in northern, eastern and southern Africa, Asia and the Pacific. In 36% of these nations ‚mostly in Africa where severe droughts hit, undernourishment rose.
2006-2016 (Phalkey et al., 2015)
Australia Drought Yield variability
Agriculture Negative. ~ 9% reduction in current Australian wheat yields. Reductions in barley, maize, sorghum and soybean yields, but overall increases in rapeseed, rice, and sugarcane yields. Climate change reduced Australian consumable crop calorie production in the ten crops by ~6% (or ~-3% in overall calories) annually.
1974-2000 (Ray et al., 2019)
Australia Water scarcity Energy Thermoelectric. Freshwater availability for thermo-electric cooling
Negative. In Australia, 12 GW of thermoelectric capacity face water scarcity for at least five months per year
2011-15 (Rosa et al., 2020)
Australia Drought Energy Hydroelectricity generation
Negative. Utilisation rates were reduced significantly (p<0.05) compared to the average over 1981–2010 in the years 2003 which was a drought year
1981-2010 (Rosa et al., 2020)
Pooled including Australia,
Precipitation WaSH Rainfall effects on diarrhoeal disease
Both Negative and Positive. The model predicts a 1.5/1000 increase in diarrhoea for each week with heavy rainfall after a dry
2004-2008 (Carlton et al., 2014)
ACCEPTED VERSIO
N
SUBJECT TO FIN
AL EDITS

FINAL DRAFT Chapter 4 Supplementary Material IPCC WGII Sixth Assessment Report
Do Not Cite, Quote or Distribute SM4-95 Total pages: 273
New Zealand, Fiji,
period and a decrease of 1/1000 with heavy rainfall after wet periods.
Micronesia, Papua New Guinea, Marshall Islands
Natural disasters WaSH Cholera risk and WaSH
Both Positive and Negative. WaSH is preventive of cholera - stat sig relationships with boiling, municipal/piped with no outbreak, rainwater, handwashing. Statistically significant relationships with untreated water , surface water open defecation , shared facilities.
(Jones et al., 2020)
Australia Increased air temperature, Increased nutrients
Freshwater Ecosystems
Species richness Negative. Decline in macroinvertebrates and fish species.
2002-2010 (Mantyka-Pringle et al., 2014)
Central and South America
Dominican Republic Haiti
Water quality WaSH Wash impacts on childhood diarrhoea
Positive. Point-of-use filter interventions with safe storage reduced diarrhoea risk by 61% ; piped water to premises of higher quality and continuous availability by 75% and 36%, respectively compared to a baseline of unimproved drinking water; sanitation interventions by 25% with evidence for greater reductions when high sanitation coverage is reached; and interventions promoting handwashing with soap by 30% vs. no intervention.
1970-2018 (Wolf et al., 2018)
Colombia, Haiti, Peru Ecuador El Salvador
Natural disasters WaSH Cholera risk and WaSH
Both Positive and Negative. WaSH is preventive of cholera - stat sig relationships with boiling, municipal/piped with no outbreak, rainwater, handwashing. Statistically significant relationships with untreated water , surface water open defecation , shared facilities.
(Jones et al., 2020)
Brazil Guatemala Panama Bolivia Puerto Rico Argentina Peru Honduras
Water quality WaSH Wash impacts on childhood diarrhoea
Positive. Point-of-use filter interventions with safe storage reduced diarrhoea risk by 61% ; piped water to premises of higher quality and continuous availability by 75% and 36%, respectively compared to a baseline of unimproved drinking water; sanitation interventions by 25% with evidence for greater reductions when high sanitation coverage is reached; and interventions promoting handwashing with soap by 30% vs. no intervention.
1970-2017 (Wolf et al., 2018)
ACCEPTED VERSIO
N
SUBJECT TO FIN
AL EDITS

FINAL DRAFT Chapter 4 Supplementary Material IPCC WGII Sixth Assessment Report
Do Not Cite, Quote or Distribute SM4-96 Total pages: 273
Brazil, ENSO Yield variability
Agriculture Both Negative and Positive. above median precipitation leads to above normal yields for maize and soybeans but lower yields for weath.
1980-2010 (Anderson et al., 2019)
Argentina Drought Yield variability
Agriculture Negative. Increased maize, rice and wheat yield variabilty between1981-2010.
1981-2010 (Iizumi and Ramankutty, 2016)
Guatemala, Panama, Honduras, Belize, Uruguay, Venezuela, Brazil, Argentina, Paraguay, Cuba, Dominican Republic, Ecuador, Bolivia
Drought Yield variability
Agriculture Both Negative and Positive. Major losses in consumable food calories have occurred in the Dominican Republic, Ecuador, Bolivia, Uruguay and Venezuela whereas in Brazil, Argentina Paraguay and Cuba consumable food calories overall increased.
1974-2000 (Ray et al., 2019)
Brazil Changes in precipitation, changes in streamflow
Energy Hydroelectricity generation
Negative. In Brazil‚ during drought events in 2016 and 2017, hydropower plants operated with an average capacity factor of only 23% and 17% respectively).
1961-1990 (de Jong et al., 2018)
Southern Central Amercia
Drought Energy Hydroelectricity generation
Negative. Utilisation rates were reduced significantly (p<0.05) compared to the average over 1981–2010 in the years 2006,which was drought year
1981-2010 (van Vliet et al., 2016a)
Pooled including Peru, Ecuador and global tropics
Precipitation WaSH Rainfall effects on diarrhoeal disease
Both Negative and Positive. The model predicts a 1.5/1000 increase in diarrhoea for each week with heavy rainfall after a dry period and a decrease of 1/1000 with heavy rainfall after wet periods.
2004-2009 (Carlton et al., 2014)
Argentina, Belize, Santa Lucia, Jamaica, Barbados, Costa Rica
Water quality WaSH WaSH access impacts on child mortality
Negative. Living in a household where members did not usually use a flush toilet was associated with 9–12% greater relative risk of child death than living in a household where members usually used flush toilets; Those children born into communities with > 90% improved sanitation usage were 12%
2009-2015 (Geere and Hunter, 2020) ACCEPTED V
ERSION
SUBJECT TO FIN
AL EDITS

FINAL DRAFT Chapter 4 Supplementary Material IPCC WGII Sixth Assessment Report
Do Not Cite, Quote or Distribute SM4-97 Total pages: 273
Cuba Suriname
less likely to die than those born into communities with ≤20% usage. An increase in the odds of a child under five years of age being reported to have had diarrhoea in the previous two weeks (10–13%) was associated with children collecting water. Using unimproved drinking water supply compared to improved drinking water supply was associated with an increase in the odds of diarrhoea by 5%. Improved sanitation usage was associated with the odds of childhood diarrhoea reducing by 8% to 21% .
Colombia Water quality WaSH Drinking water Negative. Child diarrhoea was associated with 1-log10 higher faecal indicator bacteria concentrations in drinking water and on children’s hands .
2005-2021 (Goddard et al., 2020)
Guatemala, Haiti, Colombia, Bolivia, Mexico,
Water insecurity (general)
WaSH Water insecurity Negative. 90% of women indicated that water insecurity impacted infant feeding; Water insecurity is associated with increased mental, emotional, and physical stress, particularly for women and caregivers
2017-2018 (Schuster et al., 2020)
Guatemala, Haiti, Colombia, Bolivia
Water insecurity (general)
WaSH Water fetching and health
Negative. 13% of respondents reported at least one water- fetching injury. Of 879 injuries, fractures and dislocations were the most commonly specified type (29.2%), and falls were the most commonly specified mechanism (76.4%). Where specified, 61.1% of injuries occurred to the lower limbs, and dangerous terrain (69.4%) was the most frequently reported context. Significant correlates included being female; rural or periurban residence; higher household water insecurity scores and reliance on surface water or off- premise water sources that required queueing.
2017-2018 (Venkataramanan et al., 2020)
Brazil Drought Urban and Peri-Urban
Water insecurity Negative. more likely driven by water use changes and accelerated population growth.
1941-2015 (Otto et al., 2015)
ACCEPTED VERSIO
N
SUBJECT TO FIN
AL EDITS

FINAL DRAFT Chapter 4 Supplementary Material IPCC WGII Sixth Assessment Report
Do Not Cite, Quote or Distribute SM4-98 Total pages: 273
Mexico and USA
Change in precipitation variability and extreme precipitation
Mobility and Migration
Effects on migration
Positive. A 20% point higher-than-normal level of rainfall leads to a predicted 10.3% decrease in migration.
1998-2005 (Barrios Puente et al., 2016)
Bolivia Changes in cryosphere Mobility and Migration
Effects on migration
Both Negative and Positive.
(Raoul, 2015)
Costa Rica Natural disasters Mobility and Migration
Effects on migration
Both Negative and Positive. An additional emergency in the canton of origin would increase emigration rates to another canton by 0.0010 percentage points of the total population in the canton of origin.
1995-2000 (Robalino et al., 2015)
Multiple Precipitation and temperature anomalies
Mobility and Migration
Effects on migration
Both Negative and Positive. Each month of exposure to negative temperature shocks is associated with a 9.9% increase in the odds of inter-province moves to urban destinations, with a corresponding positive effect of an approximately 3.6% for each month of exposure to positive temperature shocks. Effects vary between countries and demographic characteristics.
1970-2011 (Thiede et al., 2016)
Peru Increased temperatures; reduced rainfall; Increase rainfall variability
Culturan, Indigenous and Traditional Uses
Decreased snow and ice
Negative. Pastoralists reported water scarcity in traditional water sources along migration routes. As a result, women pastoralists had to herd livestock farther to find water. Pastoralists also reported the deterioration of pasture due to Decrease water availability.
2007-2020 (Postigo, 2020)
Bolivia Increased temperatures Culturan, Indigenous and Traditional Uses
Glacier loss Negative. Decrease rain and snow have led to degraded and dry peatland pastures (bofedales). This reduction of pasture contributes to out-migration, over-grazing, and the loss of ancestral practices and community commitment to pasture management.
1986-2017 (Yager et al., 2019)
Europe Scandinavia, Balkans
ENSO Yield variability
Agriculture Both Negative and Positive. Climate variability accounts for ∼14% of winter wheat production variance in Europe.
1980-2010 (Anderson et al., 2019)
United Kingdom, Spain, France, Italy, Sweden, Finland,
Changes in precipitation including precipitation variability and extreme
Yield variability
Agriculture Both Negative and Positive. Crop failures in Northern and Eastern Europe, higher than usual yields in Southern Europe.
1901-2018 (Beillouin et al., 2020) ACCEPTED V
ERSION
SUBJECT TO FIN
AL EDITS

FINAL DRAFT Chapter 4 Supplementary Material IPCC WGII Sixth Assessment Report
Do Not Cite, Quote or Distribute SM4-99 Total pages: 273
Germany, Denmark, Belgium, Netherlands, Luxemborg
precipitation (too much water)
Changes in precipitation
Yield variability
Agriculture Both Negative and Positive. A longer growing season, arising from warmer temperatures, allows a greater number of vegetables to be cultivated, contributing to greater annual yields. However, some vegetables need a period of cold accumulation to produce a harvest.
1990-2017 (Bisbis et al., 2018)
Drought Yield loss Agriculture Negative. Cereal yields decreased by 9-
7.3%, non cereal yields decreased by 3.8-3-1%. These losses intensified by 3% per year.
1961-2018 (Brás et al., 2021)
France, Ukraine
Drought Yield variability
Agriculture Negative. Increased maize, rice and wheat yield variabilty between 1981-2010.
1981-2010 (Iizumi and Ramankutty, 2016)
Drought Yield loss Agriculture Negative. Sensitivity analysis shows that temperature plays an important role in determining drought impacts, through reducing or amplifying drought-driven yield loss risk. Compared to present conditions, an ensemble of 11 crop models simulated an increase in yield loss risk by 9%‚12%, 5.6%‚6.3%, 18.1%, 19.4% and 15.1%‚16.1 for wheat, maize, rice and soybeans by the end of 21st century, respectively, without considering the bene!ts of CO2 fertilization and adaptations.
1961-2016 (Leng and Hall, 2019; Ray et al., 2019)
Spain, Ukraine, Russia, Germany,
Drought Yield loss Agriculture Negative. Yields for all the dominant (non-tropical) crops in western and southern Europe decreased 6.3–21.2% because of climate change.
1974-2000 (Ray et al., 2019)
UK Changes in precipitation; increased frequency and intensity of extreme heat
Energy Thermoelectric. Freshwater availability for thermo-electric cooling
Negative. On extreme days (p99), almost 50% (7GWe) of freshwater thermal capacity is unavailable.
1975-2004 (Byers et al., 2020) ACCEPTED V
ERSION
SUBJECT TO FIN
AL EDITS
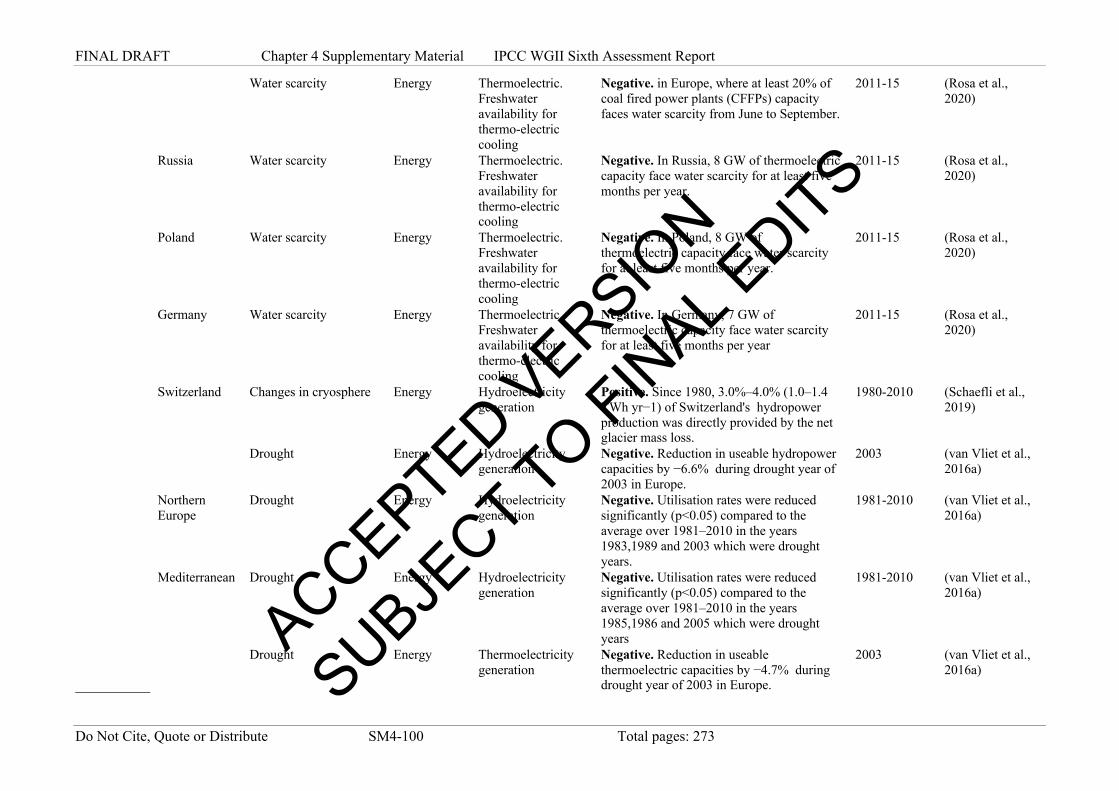
FINAL DRAFT Chapter 4 Supplementary Material IPCC WGII Sixth Assessment Report
Do Not Cite, Quote or Distribute SM4-100 Total pages: 273
Water scarcity Energy Thermoelectric.
Freshwater availability for thermo-electric cooling
Negative. in Europe, where at least 20% of coal fired power plants (CFFPs) capacity faces water scarcity from June to September.
2011-15 (Rosa et al., 2020)
Russia Water scarcity Energy Thermoelectric. Freshwater availability for thermo-electric cooling
Negative. In Russia, 8 GW of thermoelectric capacity face water scarcity for at least five months per year.
2011-15 (Rosa et al., 2020)
Poland Water scarcity Energy Thermoelectric. Freshwater availability for thermo-electric cooling
Negative. In Poland, 8 GW of thermoelectric capacity face water scarcity for at least five months per year.
2011-15 (Rosa et al., 2020)
Germany Water scarcity Energy Thermoelectric. Freshwater availability for thermo-electric cooling
Negative. In Germany, 7 GW of thermoelectric capacity face water scarcity for at least five months per year
2011-15 (Rosa et al., 2020)
Switzerland Changes in cryosphere Energy Hydroelectricity generation
Positive. Since 1980, 3.0%–4.0% (1.0–1.4 TWh yr−1) of Switzerland's hydropower production was directly provided by the net glacier mass loss.
1980-2010 (Schaefli et al., 2019)
Drought Energy Hydroelectricity
generation Negative. Reduction in useable hydropower capacities by −6.6% during drought year of 2003 in Europe.
2003 (van Vliet et al., 2016a)
Northern Europe
Drought Energy Hydroelectricity generation
Negative. Utilisation rates were reduced significantly (p<0.05) compared to the average over 1981–2010 in the years 1983,1989 and 2003 which were drought years.
1981-2010 (van Vliet et al., 2016a)
Mediterranean Drought Energy Hydroelectricity generation
Negative. Utilisation rates were reduced significantly (p<0.05) compared to the average over 1981–2010 in the years 1985,1986 and 2005 which were drought years
1981-2010 (van Vliet et al., 2016a)
Drought Energy Thermoelectricity
generation Negative. Reduction in useable thermoelectric capacities by −4.7% during drought year of 2003 in Europe.
2003 (van Vliet et al., 2016a)
ACCEPTED VERSIO
N
SUBJECT TO FIN
AL EDITS

FINAL DRAFT Chapter 4 Supplementary Material IPCC WGII Sixth Assessment Report
Do Not Cite, Quote or Distribute SM4-101 Total pages: 273
Northern Europe
Drought Energy Thermoelectricity generation
Negative. Utilisation rates were reduced significantly (p<0.05) compared to the average over 1981–2010 in the years 1991 and 2003 which were a drought years
1981-2010 (van Vliet et al., 2016a)
Pooled including England, Wales, Scotland, Netherlands, 10 country study in Europe
Precipitation WaSH Rainfall effects on diarrhoeal disease
Both Negative and Positive. The model predicts a 1.5/1000 increase in diarrhoea for each week with heavy rainfall after a dry period and a decrease of 1/1000 with heavy rainfall after wet periods.
2004-2010 (Carlton et al., 2014)
Bosnia and Herzegovina Belarus Moldova Montenegro Serbia Ukraine
Water quality WaSH WaSH access impacts on child mortality
Negative. In households where women carried the water the relative risk of child death was 1.05 (95% confidence intervals 1.02–1.08). Where men carried the water, the risk was similar (1.04, 95%CI 1.00–1.07); Living in a household where members did not usually use a flush toilet was associated with 9–12% greater relative risk of child death than living in a household where members usually used flush toilets; Those children born into communities with > 90% improved sanitation usage were 12% less likely to die than those born into communities with ≤20% usage. "An increase in the odds of a child under five years of age being reported to have had diarrhoea in the previous two weeks (10–13%) was associated with children collecting water, but not with adults collecting water, when compared to households in which no one collects water; Using unimproved drinking water supply compared to improved drinking water supply was associated with an increase in the odds of diarrhoea by 5%. Use of an improved or unimproved toilet and open defecation in comparison to a flush toilet was also associated with an increase in the
2009-2017 (Geere and Hunter, 2020)
ACCEPTED VERSIO
N
SUBJECT TO FIN
AL EDITS
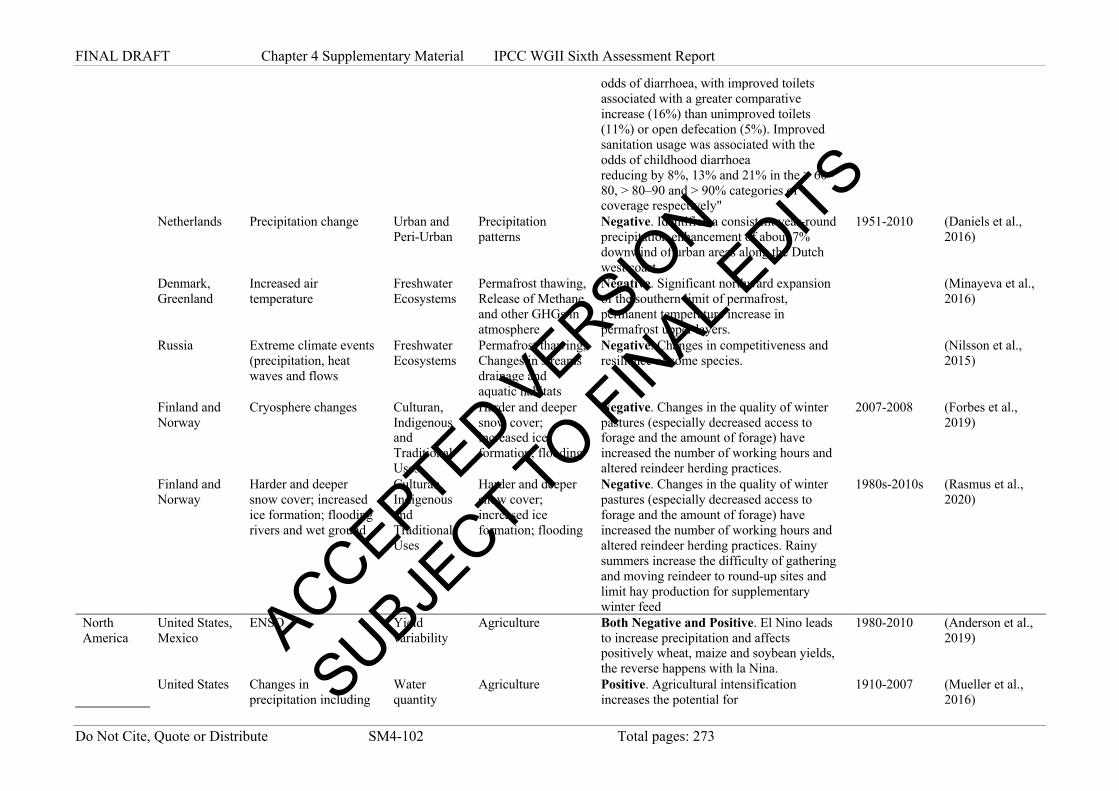
FINAL DRAFT Chapter 4 Supplementary Material IPCC WGII Sixth Assessment Report
Do Not Cite, Quote or Distribute SM4-102 Total pages: 273
odds of diarrhoea, with improved toilets associated with a greater comparative increase (16%) than unimproved toilets (11%) or open defecation (5%). Improved sanitation usage was associated with the odds of childhood diarrhoea reducing by 8%, 13% and 21% in the > 60–80, > 80–90 and > 90% categories of coverage respectively"
Netherlands Precipitation change Urban and Peri-Urban
Precipitation patterns
Negative. Identified a consistent year-round precipitation enhancement of about 7% downwind of urban areas along the Dutch west coast.
1951-2010 (Daniels et al., 2016)
Denmark, Greenland
Increased air temperature
Freshwater Ecosystems
Permafrost thawing, Release of Methane and other GHGs in atmosphere
Negative. Significant northward expansion of the southern limit of permafrost, permanent temperature increase in permafrost upper layers.
(Minayeva et al., 2016)
Russia Extreme climate events (precipitation, heat waves and flows
Freshwater Ecosystems
Permafrost thawing, Changes in streams drainage and aquatic habitats
Negative. Changes in competitiveness and resilience of some species.
(Nilsson et al., 2015)
Finland and Norway
Cryosphere changes Culturan, Indigenous and Traditional Uses
Harder and deeper snow cover; increased ice formation; flooding
Negative. Changes in the quality of winter pastures (especially decreased access to forage and the amount of forage) have increased the number of working hours and altered reindeer herding practices.
2007-2008 (Forbes et al., 2019)
Finland and Norway
Harder and deeper snow cover; increased ice formation; flooding rivers and wet ground
Culturan, Indigenous and Traditional Uses
Harder and deeper snow cover; increased ice formation; flooding
Negative. Changes in the quality of winter pastures (especially decreased access to forage and the amount of forage) have increased the number of working hours and altered reindeer herding practices. Rainy summers increase the difficulty of gathering and moving reindeer to round-up sites and limit hay production for supplementary winter feed
1980s-2010s (Rasmus et al., 2020)
North America
United States, Mexico
ENSO Yield variability
Agriculture Both Negative and Positive. El Nino leads to increase precipitation and affects positively wheat, maize and soybean yields, the reverse happens with la Nina.
1980-2010 (Anderson et al., 2019)
United States Changes in precipitation including
Water quantity
Agriculture Positive. Agricultural intensification increases the potential for
1910-2007 (Mueller et al., 2016)
ACCEPTED VERSIO
N
SUBJECT TO FIN
AL EDITS

FINAL DRAFT Chapter 4 Supplementary Material IPCC WGII Sixth Assessment Report
Do Not Cite, Quote or Distribute SM4-103 Total pages: 273
precipitation variability and extreme precipitation (too much water)
evapotranspiration, leading to cooler temperatures and contributing to increased precipitation.
United States Drought Yield loss Agriculture Negative. Since 1978,crop yield declines were reported on 11-21% of total irrigated acres, mostly due to surface water shortage.
1978-2012 (Elias et al., 2016)
United States Drought Yield variability
Agriculture Positive. Decreased maize, rice and wheat variability between 1981-2010.
1981-2010 (Iizumi and Ramankutty, 2016)
United States, Canada
Drought Yield variability
Agriculture Both Negative and Positive. Overall in the United States barley, rice and wheat yields reduced whereas maize, sorghum, soybean and sugarcane yields increased.
1974-2000 (Ray et al., 2019)
USA Drought Yield variability
Agriculture Both Negative and Positive. Between 2007 and 2007 yields maize and soybeans have increased, but meteorological drought has been associated with 13% of overall yield variability, but not in areas where irrigation is prevalent.
1958-2007 (Zipper et al., 2016)
USA Changes in precipitation; Increased frequency and intensity of extreme heat
Energy Thermoelectric. Freshwater availability for thermo-electric cooling
Negative. In the US, social costs of water scarcity between 2001-2012 was estimated to be US$330,000 (at 2015 value) per month for every power plant that experienced water scarcity.
2001-2012 (Eyer and Wichman, 2018)
USA Water scarcity Energy Thermoelectric. Freshwater availability for thermo-electric cooling
Negative. In the United States, at least 20% of coal fired power plants (CFFPs) CFPP capacity faces water scarcity from April to November.
2011-15 (Rosa et al., 2020)
Drought Energy Hydroelectricity
generation Negative. Reduction in useable capacities by −6.1% in hydropower a due to 2007 drought in eastern North America.
2007 (van Vliet et al., 2016a)
Western North America
Drought Energy Hydroelectricity generation
Negative. Utilisation rates were reduced significantly (p<0.05) compared to the average over 1981–2010 in the years 1988, 2001 and 2002 which were drought years.
1981-2010 (van Vliet et al., 2016a)
Central North America
Drought Energy Hydroelectricity generation
Negative. Utilisation rates were reduced significantly (p<0.05) compared to the average over 1981–2010 in the years 1988, which was drought year.
1981-2010 (van Vliet et al., 2016a)
ACCEPTED VERSIO
N
SUBJECT TO FIN
AL EDITS

FINAL DRAFT Chapter 4 Supplementary Material IPCC WGII Sixth Assessment Report
Do Not Cite, Quote or Distribute SM4-104 Total pages: 273
Eastern North America
Drought Energy Hydroelectricity generation
Negative. Utilisation rates were reduced significantly (p<0.05) compared to the average over 1981–2010 in the years 2001 and 2007 which were drought years.
1981-2010 (van Vliet et al., 2016a)
Drought Energy Thermoelectricity
generation Negative. Reduction in useable capacities by −9.0% in thermoelectric power due to 2007 drought in eastern North America.
2007 (van Vliet et al., 2016a)
Western North America
Drought Energy Thermoelectricity generation
Negative. Utilisation rates were reduced significantly (p<0.05) compared to the average over 1981–2010 in the year 1981 which was a drought year.
1981-2010 (van Vliet et al., 2016a)
Eastern North America
Drought Energy Thermoelectricity generation
Negative. Utilisation rates were reduced significantly (p<0.05) compared to the average over 1981–2010 in the year 2007 which was a drought year.
1981-2010 (van Vliet et al., 2016a)
Pooled including Canada
Precipitation WaSH Rainfall effects on diarrhoeal disease
Both Negative and Positive. The model predicts a 1.5/1000 increase in diarrhoea for each week with heavy rainfall after a dry period and a decrease of 1/1000 with heavy rainfall after wet periods.
2004-2011 (Carlton et al., 2014)
Canada Water quality WaSH Gastrointestinal illness
Negative. Most common exposure reported to gastrointenstinal illnness are municipal water and bottled water as drinking sources (71·8% and 57·0%, respectively).
2009-2020 (David et al., 2014)
USA Precipitation WaSH Gastrointestinal illness
Negative. Combined sewer overflows to drinking water sources increase hospital visits up to 13% for gastrointestinal illness lasting up to 15 days after heavy periods of rainfall; stronger associations for children and the elderly.
2003-2007 (Jagai et al., 2015)
Canada Water scarcity WaSH Water quantity Positive. Domestic rainwater harvesting in an Inuit community increased consumption of water for general purposes (i.e., personal hygiene, washing clothes and dishes, and household cleaning, not drinking water) by 17%, reduced water retrieval efforts by 40.92%, improved perceptions of psychological health, and resulted in savings of $12.70 CDN per household per week. Community design improvements (hose pipe
2016 (Mercer and Hanrahan, 2017)
ACCEPTED VERSIO
N
SUBJECT TO FIN
AL EDITS
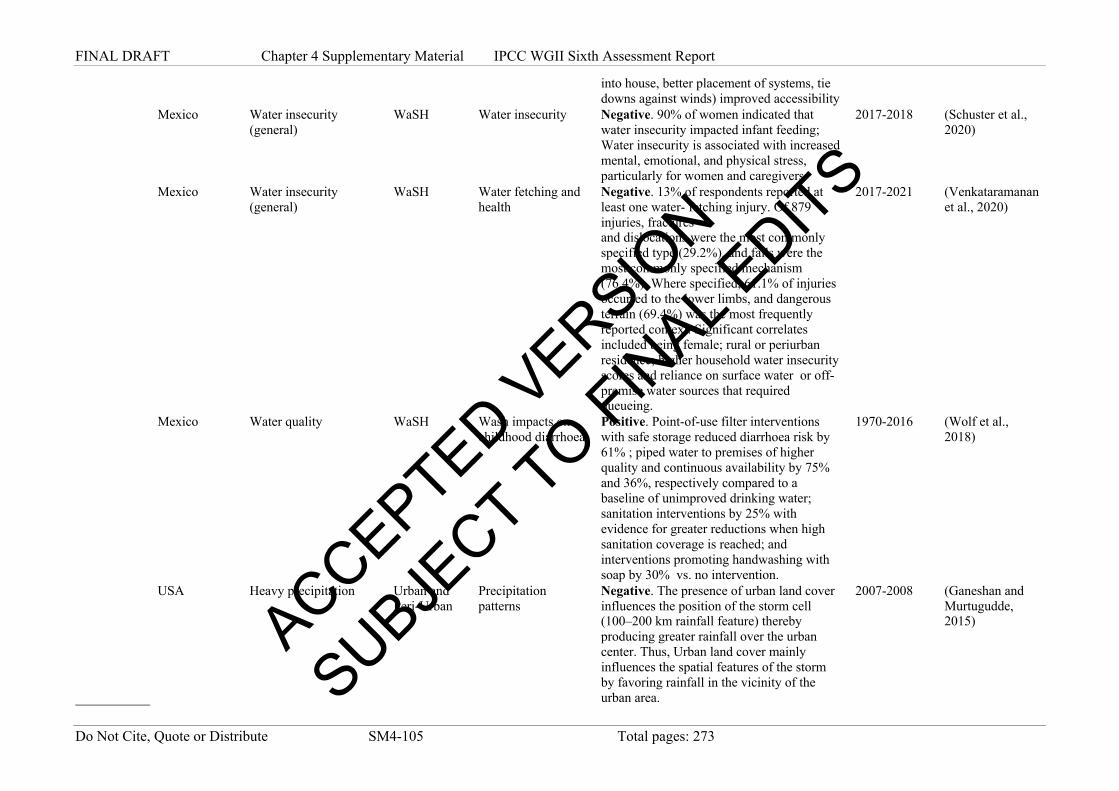
FINAL DRAFT Chapter 4 Supplementary Material IPCC WGII Sixth Assessment Report
Do Not Cite, Quote or Distribute SM4-105 Total pages: 273
into house, better placement of systems, tie downs against winds) improved accessibility
Mexico Water insecurity (general)
WaSH Water insecurity Negative. 90% of women indicated that water insecurity impacted infant feeding; Water insecurity is associated with increased mental, emotional, and physical stress, particularly for women and caregivers
2017-2018 (Schuster et al., 2020)
Mexico Water insecurity (general)
WaSH Water fetching and health
Negative. 13% of respondents reported at least one water- fetching injury. Of 879 injuries, fractures and dislocations were the most commonly specified type (29.2%), and falls were the most commonly specified mechanism (76.4%). Where specified, 61.1% of injuries occurred to the lower limbs, and dangerous terrain (69.4%) was the most frequently reported context. Significant correlates included being female; rural or periurban residence; higher household water insecurity scores and reliance on surface water or off- premise water sources that required queueing.
2017-2021 (Venkataramanan et al., 2020)
Mexico Water quality WaSH Wash impacts on childhood diarrhoea
Positive. Point-of-use filter interventions with safe storage reduced diarrhoea risk by 61% ; piped water to premises of higher quality and continuous availability by 75% and 36%, respectively compared to a baseline of unimproved drinking water; sanitation interventions by 25% with evidence for greater reductions when high sanitation coverage is reached; and interventions promoting handwashing with soap by 30% vs. no intervention.
1970-2016 (Wolf et al., 2018)
USA Heavy precipitation Urban and Peri-Urban
Precipitation patterns
Negative. The presence of urban land cover influences the position of the storm cell (100–200 km rainfall feature) thereby producing greater rainfall over the urban center. Thus, Urban land cover mainly influences the spatial features of the storm by favoring rainfall in the vicinity of the urban area.
2007-2008 (Ganeshan and Murtugudde, 2015) ACCEPTED V
ERSION
SUBJECT TO FIN
AL EDITS

FINAL DRAFT Chapter 4 Supplementary Material IPCC WGII Sixth Assessment Report
Do Not Cite, Quote or Distribute SM4-106 Total pages: 273
USA Heavy precipitation Urban and Peri-Urban
Precipitation patterns
Negative. Statistically significant (p<0.001) anomalies in daily precipitation were found over (3.4), east (3.2) and northeast (3.4) of Atlanta during summer.
2002-2015 (McLeod et al., 2017)
USA Flood Urban and Peri-Urban
Urban discharge Negative. Climate change alone has increased peak discharge by about 20%; CC and urbanisation combined increased peak discharge by 84%.
1900-2017 (Sebastian et al., 2019)
USA Flood Urban and Peri-Urban
Precipitation patterns
Negative. probability of an event has increased by a factor of 1.4 due to radiative forcing.
1971-2015 (Wiel et al., 2017)
Canada, USA Increased air and water temperatures
Freshwater Ecosystems
Lake water temperature
Negative. shallow (1 m depth) lakes have warmed substantially over the last 30 years (2.4°C), with MABT above freezing 5 of the last 7 years.
1969-2015 (Arp et al., 2016)
Canada Increased air temperature
Freshwater Ecosystems
seasonal snow cover, mountain glaciers, permafrost, freshwater ice cover, and river discharge.
Negative. Mountain glaciers to recede at all latitudes, permafrost to thaw at its southern limit, and active layers over permafrost to thicken.
1950-2010 (DeBeer et al., 2016)
USA Global warming, increase in shrubification
Freshwater Ecosystems
Species range shifts of American Beaver (Castor canadensis)
Positive. Shift in species range to higher latitudes in tundra habitat.
2015 (Jung et al., 2016)
Canada Increased air temperature
Freshwater Ecosystems
Permafrost thawing, Release of Methane and other GHGs in atmosphere
Negative. Significant northward expansion of the southern limit of permafrost, permanent temperature increase in permafrost upper layers.
(Minayeva et al., 2016)
Canada Climatic: Extreme climate events (precipitation, heat waves and flows
Freshwater Ecosystems
Permafrost thawing, Changes in streams drainage and aquatic habitats
Negative. Changes in competitiveness and resilience of some species.
(Nilsson et al., 2015)
Canada Increased air and water temperature, extreme events, general climate change impacts
Freshwater Ecosystems
Fish Community composition and diversity
Negative. loss of coldwater refugia, mismatches between environmental phenology and life history, and increased competition from eurythermal species.
(Poesch et al., 2016)
Canada Increased air temperature, droughts, wildfires
Freshwater Ecosystems
Vegetation community
Negative. reductions in stem density and conifer seedling dominance leading to a lowered overall conifer biomass in wetlands
1984-2016 (Whitman et al., 2019)
ACCEPTED VERSIO
N
SUBJECT TO FIN
AL EDITS

FINAL DRAFT Chapter 4 Supplementary Material IPCC WGII Sixth Assessment Report
Do Not Cite, Quote or Distribute SM4-107 Total pages: 273
Mexico and USA
Precipitation and temperature anomalies
Mobility and Migration
Effects on migration
Both Negative and Positive. A one standard deviation unit increase in warm spell duration leads to an increase of the odds of international migration by 15% while a one standard deviation unit increase in wet spell duration leads to an increase in the odds of an international move by 5%.
1986-1999 (Nawrotzki et al., 2015)
USA Increased temperatures Culturan, Indigenous and Traditional Uses
Increase temperature of freshwater lakes; permafrost melt; thinning ice
Negative. In Alaska, permafrost melting and the shorter ice season make it more difficult for hunters to access traditional hunting grounds. Increased temperatures are changing the habitats and migration patterns of culturally important freshwater species. Declining fish health and populations threaten requirements of treaty rights and tribal shares of harvestable fish populations.
2006-2018 (Albert et al., 2018)
Canada Increased temperature, precipitation
Culturan, Indigenous and Traditional Uses
Early snowmelt Negative. Inuit in Labrador, Canada, are grieving the rapid decline of culturally significant caribou, which is partly due to rising temperatures in the circumpolar north and the associated changes to caribou habitat and migration. In addition, the decline of this species is negatively affecting their sense of cultural identity because of the importance of hunting and cultural continuity.
(Cunsolo, 2017)
Canada Cryosphere changes Culturan, Indigenous and Traditional Uses
Changing ice conditions
Negative. Trail access models showed that overall land and water trail access in the Inuit Nunangat had been minimally affected by temperature increase between 1985 to 2016. However, these findings illustrate that although Inuit are developing new trails and alternative forms of transport, these changes could negatively impact cultural identity and well-being.
2015-2017 (Ford et al., 2019)
Canada Increased temperatures Culturan, Indigenous and Traditional Uses
Flooding Negative. The timing and extent of spring flooding have changed, which, combined with inadequate infrastructure, has increased the frequency and risk of flooding for the Kashechewan community. Earlier snowmelt has also affected the migration patterns of
2016 (Khalafzai et al., 2019) ACCEPTED V
ERSION
SUBJECT TO FIN
AL EDITS
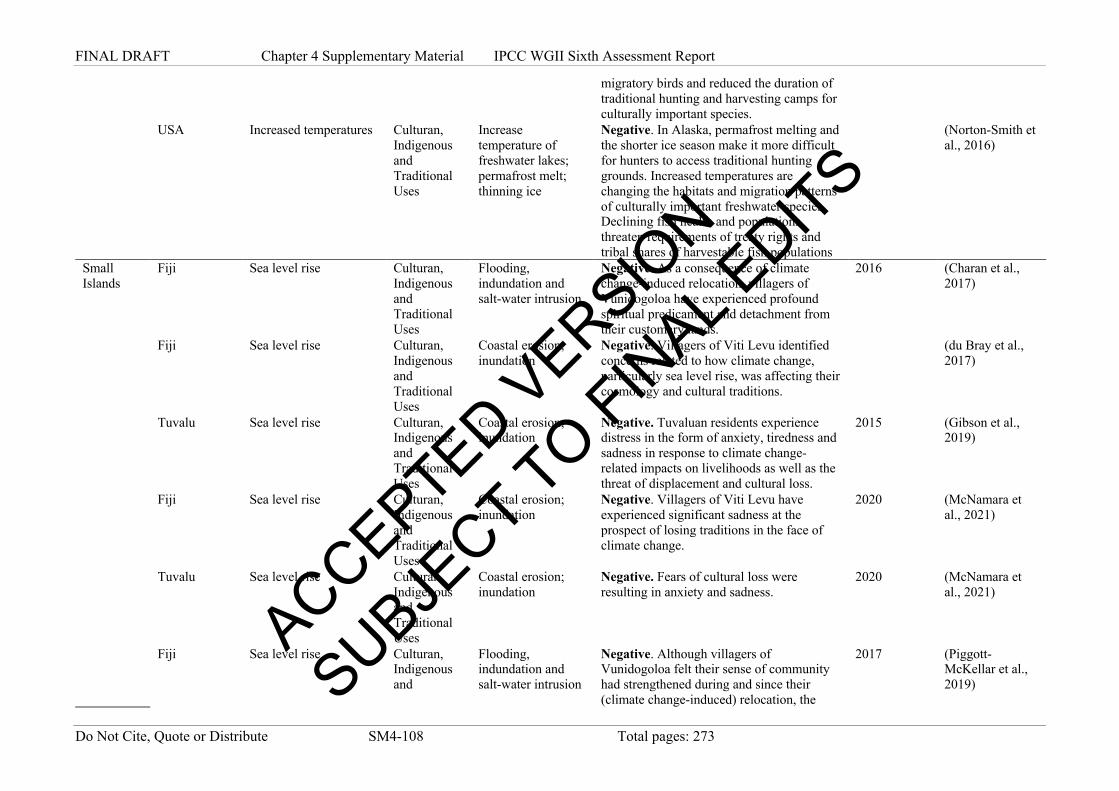
FINAL DRAFT Chapter 4 Supplementary Material IPCC WGII Sixth Assessment Report
Do Not Cite, Quote or Distribute SM4-108 Total pages: 273
migratory birds and reduced the duration of traditional hunting and harvesting camps for culturally important species.
USA Increased temperatures Culturan, Indigenous and Traditional Uses
Increase temperature of freshwater lakes; permafrost melt; thinning ice
Negative. In Alaska, permafrost melting and the shorter ice season make it more difficult for hunters to access traditional hunting grounds. Increased temperatures are changing the habitats and migration patterns of culturally important freshwater species. Declining fish health and populations threaten requirements of treaty rights and tribal shares of harvestable fish populations
(Norton-Smith et al., 2016)
Small Islands
Fiji Sea level rise Culturan, Indigenous and Traditional Uses
Flooding, indundation and salt-water intrusion
Negative. As a consequence of climate change-induced relocation, villagers of Vunidogoloa have experienced profound spiritual predicament and detachment from their customary lands.
2016 (Charan et al., 2017)
Fiji Sea level rise Culturan, Indigenous and Traditional Uses
Coastal erosion; inundation
Negative. Villagers of Viti Levu identified concerns related to how climate change, particularly sea level rise, was affecting their cosmology and cultural traditions.
(du Bray et al., 2017)
Tuvalu Sea level rise Culturan, Indigenous and Traditional Uses
Coastal erosion; inundation
Negative. Tuvaluan residents experience distress in the form of anxiety, tiredness and sadness in response to climate change-related impacts on livelihoods as well as the threat of displacement and cultural loss.
2015 (Gibson et al., 2019)
Fiji Sea level rise Culturan, Indigenous and Traditional Uses
Coastal erosion; inundation
Negative. Villagers of Viti Levu have experienced significant sadness at the prospect of losing traditions in the face of climate change.
2020 (McNamara et al., 2021)
Tuvalu Sea level rise Culturan, Indigenous and Traditional Uses
Coastal erosion; inundation
Negative. Fears of cultural loss were resulting in anxiety and sadness.
2020 (McNamara et al., 2021)
Fiji Sea level rise Culturan, Indigenous and
Flooding, indundation and salt-water intrusion
Negative. Although villagers of Vunidogoloa felt their sense of community had strengthened during and since their (climate change-induced) relocation, the
2017 (Piggott-McKellar et al., 2019)
ACCEPTED VERSIO
N
SUBJECT TO FIN
AL EDITS
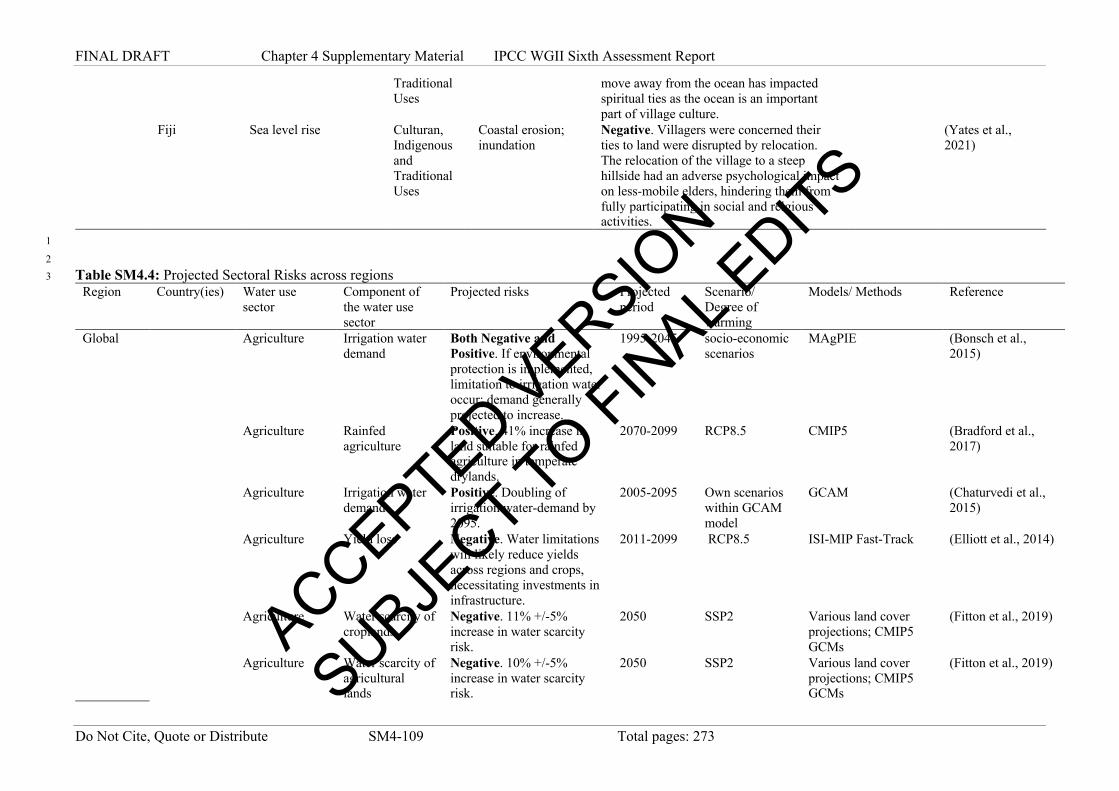
FINAL DRAFT Chapter 4 Supplementary Material IPCC WGII Sixth Assessment Report
Do Not Cite, Quote or Distribute SM4-109 Total pages: 273
Traditional Uses
move away from the ocean has impacted spiritual ties as the ocean is an important part of village culture.
Fiji Sea level rise Culturan, Indigenous and Traditional Uses
Coastal erosion; inundation
Negative. Villagers were concerned their ties to land were disrupted by relocation. The relocation of the village to a steep hillside had an adverse psychological impact on less-mobile elders, hindering them from fully participating in social and relgious activities.
(Yates et al., 2021)
1
2 Table SM4.4: Projected Sectoral Risks across regions 3
Region Country(ies) Water use sector
Component of the water use sector
Projected risks Projected period
Scenario/ Degree of warming
Models/ Methods Reference
Global Agriculture Irrigation water demand
Both Negative and Positive. If environmental protection is implemented, limitation to irrigation water occur; demand generally projected to increase.
1995-2045 socio-economic scenarios
MAgPIE (Bonsch et al., 2015)
Agriculture Rainfed
agriculture Positive. 41% increase in land suitable for rainfed agriculture in temperate drylands.
2070-2099 RCP8.5 CMIP5 (Bradford et al., 2017)
Agriculture Irrigation water
demand Positive. Doubling of irrigation water-demand by 2095.
2005-2095 Own scenarios within GCAM model
GCAM (Chaturvedi et al., 2015)
Agriculture Yield loss Negative. Water limitations
will likely reduce yields across regions and crops, necessitating investments in infrastructure.
2011-2099 RCP8.5 ISI-MIP Fast-Track (Elliott et al., 2014)
Agriculture Water scarcity of
croplands Negative. 11% +/-5% increase in water scarcity risk.
2050 SSP2 Various land cover projections; CMIP5 GCMs
(Fitton et al., 2019)
Agriculture Water scarcity of
agricultural lands
Negative. 10% +/-5% increase in water scarcity risk.
2050 SSP2 Various land cover projections; CMIP5 GCMs
(Fitton et al., 2019) ACCEPTED V
ERSION
SUBJECT TO FIN
AL EDITS

FINAL DRAFT Chapter 4 Supplementary Material IPCC WGII Sixth Assessment Report
Do Not Cite, Quote or Distribute SM4-110 Total pages: 273
Agriculture Irrigation water
demand Positive. Required irrigation water demand to meet food security above safe operating space for water security.
2050 GFWS platform GFWS platform (Grafton et al., 2015)
Agriculture Livestock water
demand Positive. from 18 km3/year in 2005 to 24– 63 km3/year.
2095 GCAM, own scenarios
GCAM (Hejazi et al., 2014)
Agriculture Irrigation water demand
Positive. from 2481 km3/year in 2005 to 3830– 9182 km3/year.
2095 GCAM, own scenarios
GCAM (Hejazi et al., 2014)
Agriculture Irrgation water
consumption Positive. 14% increase in irrigation water demand driven by climate change.
2090 RCP6.0 GCAM; WATCH; ISIMIP
(Huang et al., 2019)
Agriculture Cotton
production Both Negative and Positive. Decrease in virtual water content with full Co2 fertilisation; increase without.
2011-2099 All RCPs LPJmL model; ISIMIP fast-track
(Jans et al., 2018)
Agriculture Expected annual
output losses Negative. EAOL approx. 16%.
2024 to 2027 (30yr centered)
1.5°C Lisflood; asset damage assessment; MRIA model
(Koks et al., 2019)
Agriculture Expected annual
output losses Negative. EAOL approx. 17%.
2033-2039 (30 yr centered)
2°C Lisflood; asset damage assessment; MRIA model
(Koks et al., 2019)
Agriculture Expected annual
output losses Negative. EAOL approx. 20%.
2053-2061 (30yr centered)
3°C Lisflood; asset damage assessment; MRIA model
(Koks et al., 2019)
Agriculture Yield loss Negative. Projected increase
in yield loss risk for wheat, maize, rice and soybeans by the end of 21st century, respectively. Yield loss risk tends to grow faster when experiencing a shift in drought severity.
2071-2100 RCP8.5 ISI-MIP Fast-Track (Leng and Hall, 2019)
Agriculture Irrigation water
demand Positive. Increase irrigation water demand to compensate climate change - depending on crop and Co2 fertilisation as low as 3% increase for some projections.
2081-2100 RCP4.5 CMIP5 (Levis et al., 2018) ACCEPTED VERSIO
N
SUBJECT TO FIN
AL EDITS

FINAL DRAFT Chapter 4 Supplementary Material IPCC WGII Sixth Assessment Report
Do Not Cite, Quote or Distribute SM4-111 Total pages: 273
Agriculture Irrigation water
demand Positive. Increase irrigation water demand to compensate climate change - depending on crop and Co2 fertilisation as high as 23% increase for some projections.
2081-2100 RCP8.5 CMIP5 (Levis et al., 2018)
Agriculture Yield change
(CO2-fert.) Positive. 3% yield gain. 2061-2080 RCP4.5 CMIP5 (Ren et al., 2018)
Agriculture Yield change
(CO2-fert.) Positive. 8% yield gain. 2061-2080 RCP8.5 CMIP5 (Ren et al., 2018)
Agriculture Yield change
(NO-CO2-fert.) Negative. 16% yield loss. 2061-2080 RCP4.5 CMIP5 (Ren et al., 2018)
Agriculture Yield change
(NO-CO2-fert.) Negative. 23 % yield loss. 2061-2080 RCP8.5 CMIP5 (Ren et al., 2018)
Agriculture Growing season
change Negative. Increase heat extremes and drought during growing season.
2091-2100 RCP2.6 CMIP5 (Ruane et al., 2018)
Agriculture Growing season
change Negative. Increase heat extremes and drought during growing season; 1.5°C and 2°C.
2091-2100 RCP4.5 CMIP5 (Ruane et al., 2018)
Agriculture Yield change
(CO2-fert.) Both Negative and Positive. Positive for wheat and maize; no water limitations taken into account.
2091-2100 1.5°C CMIP5 (Schleussner et al., 2018)
Agriculture Yield change
(CO2-fert.) Both Negative and Positive. Negative in tropical regions. No water limitations to crops taken into account.
2091-2100 2°C CMIP5 (Schleussner et al., 2018)
Energy Thermoelectric.
Freshwater demand for thermo-electric cooling
Negative. 2 °C result in EC water withdrawals changing between −10% and 611% relative to base year (2000) conditions.
2000 to 2100 2°C Different GCM ensembles
(Fricko et al., 2016)
Energy Hydroelectricity
generation Both negative and positive. +5% to -5% increase or decrease by 2080s.
2080s (End of century)
RCP8.5 Different GCM ensembles
(Turner et al., 2017) ACCEPTED VERSIO
N
SUBJECT TO FIN
AL EDITS

FINAL DRAFT Chapter 4 Supplementary Material IPCC WGII Sixth Assessment Report
Do Not Cite, Quote or Distribute SM4-112 Total pages: 273
Energy Hydroelectricity
generation Positive. Global gross hydropower potential is expected to increase between +2.4% (GCM-GHM ensemble mean for RCP 2.6) and +6.3% (RCP 8.5) for the 2080s compared to 1971–2000.
1971-2000 (baseline) to 2080s
RCP 2.6 and 8.5 Different GCM ensembles
(van Vliet et al., 2016a; van Vliet et al., 2016b; van Vliet et al., 2016c)
Energy Thermoelectric
generation Negative. Reductions in usable capacity 81–86% of the thermoelectric power plants worldwide.
Baseline: 1971–2000; Endline: 2040-2069
RCP 2.6 and 8.5 Different GCM ensembles
(van Vliet et al., 2016a; van Vliet et al., 2016b; van Vliet et al., 2016c)
Energy Thermoelectric. Freshwater availability for thermo-electric cooling
Negative. Global mean cooling water discharge capacity is projected to decrease by 4.5-15% (2080s).
1971-2000 (baseline) to 2080s
RCP 2.6 and 8.5 Different GCM ensembles
(van Vliet et al., 2016a; van Vliet et al., 2016b; van Vliet et al., 2016c)
Energy Hydroelectricity
generation Negative. Reductions in usable capacity for 61–74% of the hydropower plants.
Baseline: 1971–2000; Endline: 2040-2069
RCP 2.6 and 8.5 Different GCM ensembles
(van Vliet et al., 2016a)
Energy Thermoelectric.
Freshwater availability for thermo-electric cooling
Negative. Global cooling water sufficiency is projected to decline by -7.9% to -11.4% by 2040-2069 and -11.3% to -18.6% by 2070-90.
2040-69 and 2070-90
RCP 8.5 SSP2 Different GCM ensembles
(Zhou et al., 2018)
WaSH Water-related
diseases Negative. Sunlight, temperature, and microbial grazing are among the environmental factors promoting the inactivation of viral pathogens in surface waters.
(Carratalà et al., 2020)
WaSH Disease and
death Negative. Compared with a future without climate change, the following additional deaths are projected for the year 2030: 38 000 due to heat exposure in elderly people, 48 000 due
2030-2050 SRES A1B
(WHO, 2014)
ACCEPTED VERSIO
N
SUBJECT TO FIN
AL EDITS

FINAL DRAFT Chapter 4 Supplementary Material IPCC WGII Sixth Assessment Report
Do Not Cite, Quote or Distribute SM4-113 Total pages: 273
to diarrhoea, 60 000 due to malaria, and 95 000 due to childhood undernutrition.
Urban and Peri-Urban
Surface-water deficit
Negative. 27% of cities studied will experience surface-water deficits.
1971-2000 (Baseline); 2050 (Future)
RCP6.0; SSP2 5 GCMs associated with RCP6.0 and SSP2; 482 cities
(Flörke et al., 2018)
Urban and Peri-Urban
Water demand Negative. 44% of cities vulnerable due to increased agricultural and urban water demands.
2010-2040 does not account for climate change
City Water Map Initiative; global databases (71 cities)
(Padowski and Gorelick, 2014)
Urban and Peri-Urban
Water demand Negative. 50 to 250% increase in water demand depending on scenario by 2050
2010-2050 SSP1-5; RCP4.5 and RCP6.0;
SSP1-5; RCP4.5 and RCP6.0; H08; PCR-GLOBWB; WaterGAP
(Wada et al., 2016)
Global Freshwater Ecosystems
Climatic vulnerability of ray-finned fishes (Actinopterygii)
Negative. Change in fish thermal sensitivity, reduced warming tolerance for many freshwater fishes across the Northern Hemisphere, lowest warming tolerances in the oceans are projected for tropical fishes, Freshwater basins located in southern Europe, southeast North America and central Asia highlighted for conservation priority, highest projected physiological sensitivity of the marine faunas, especially in the tropical eastern Pacific, central and western Indo-Pacific.
Modern day (1951–2000) and future climate (2061–2080) scenarios
RCP8.5 In-situ observations, Multi-climate-model ensembles
(Comte and Olden, 2017)
Global Freshwater Ecosystems
Species population dynamics
Negative. 35.7% of studies reporoted projected negative effects
Not provided
Several papers used different scenarios.
Systematic review (Myers et al., 2017)
Global Freshwater Ecosystems
Species range shifts
Negative. Skipjack tuna is projected to become less abundant in western, and more abundant in eastern,
Mid-Late century (2050, 2100)
Several papers used different scenarios.
Systematic review (Pecl et al., 2017) ACCEPTED VERSIO
N
SUBJECT TO FIN
AL EDITS

FINAL DRAFT Chapter 4 Supplementary Material IPCC WGII Sixth Assessment Report
Do Not Cite, Quote or Distribute SM4-114 Total pages: 273
areas of the Western and Central Pacific Ocean (WCPO).
Global Freshwater Ecosystems
Lake nutrient dynamics
Negative. 2 °C leads to a net increase in CH4 emissions by 101 –183% in hypereutrophic lakes and 47 –56% in oligotrophic lakes
Not applicable
Simulation of lake reponses to hypothetical values of temperature increase
In situ measurements, linear mixed effect models
(Sepulveda-Jauregui et al., 2018)
Global Freshwater Ecosystems
Lake stratification
Negative. Under the highgreenhouse-gas-emission scenario, stratification will begin 22.0 ± 7.0 days earlier and end 11.3 ± 4.7 days later by the end of this century. Accelerated lake deoxygenation with subsequent effects on nutrient mineralization and phosphorus release from lake sediments.
Historic period (1901-2005), Future period (2006-2099)
RCP2.6; RCP6.0; RCP8.5
In situ observations, Multi-model ensemble under the ISIMIP phase 2b (ISIMIP2b) lake sector
(Woolway et al., 2021)
Conflict Transboundary
waters Negative. Combination of climate and population growth dynamics is expected to impact negatively on overall hydro-political risk.
2050-2100 5 GCMs from CMIP5 and two RCP scenarios (RCP4.5 and 8.5)
Future scenarios of 2050-2100 were calculated by using the multi-model mean of the daily temperature and precipitation estimated from 5 GCM's belonging to the Coupled Model Intercomparison Project Phase 5 (CMIP5) considering two different emission and radiative forcing scanrioes RCP 4.5 and 8.5 for the 15 years period before the reference time
(Farinosi et al., 2018)
ACCEPTED VERSIO
N
SUBJECT TO FIN
AL EDITS
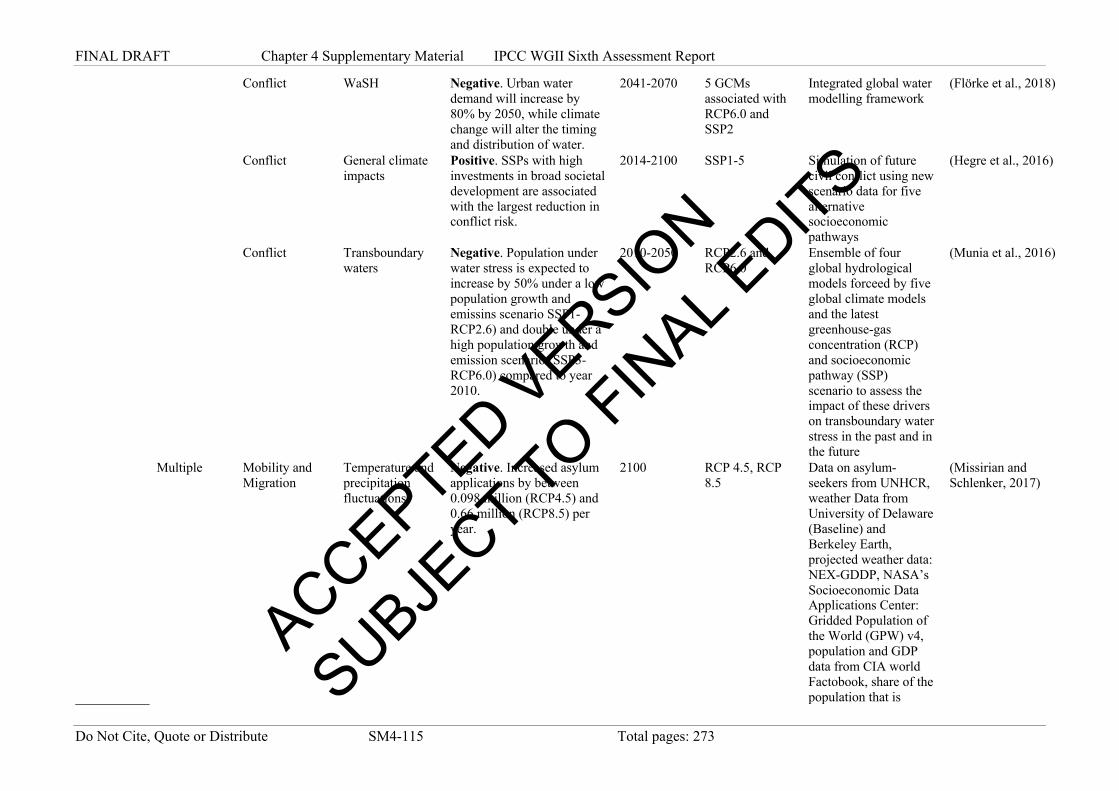
FINAL DRAFT Chapter 4 Supplementary Material IPCC WGII Sixth Assessment Report
Do Not Cite, Quote or Distribute SM4-115 Total pages: 273
Conflict WaSH Negative. Urban water
demand will increase by 80% by 2050, while climate change will alter the timing and distribution of water.
2041-2070 5 GCMs associated with RCP6.0 and SSP2
Integrated global water modelling framework
(Flörke et al., 2018)
Conflict General climate
impacts Positive. SSPs with high investments in broad societal development are associated with the largest reduction in conflict risk.
2014-2100 SSP1-5 Simulation of future civil conflict using new scenario data for five alternative socioeconomic pathways
(Hegre et al., 2016)
Conflict Transboundary
waters Negative. Population under water stress is expected to increase by 50% under a low population growth and emissins scenario SSP1-RCP2.6) and double under a high population growth and emission scenario (SSP3-RCP6.0) compared to year 2010.
2010-2050 RCP2.6 and RCP6.0
Ensemble of four global hydrological models forceed by five global climate models and the latest greenhouse-gas concentration (RCP) and socioeconomic pathway (SSP) scenario to assess the impact of these drivers on transboundary water stress in the past and in the future
(Munia et al., 2016)
Multiple Mobility and Migration
Temperature and precipitation fluctuations
Negative. Increased asylum applications by between 0.098 million (RCP4.5) and 0.66 million (RCP8.5) per year.
2100 RCP 4.5, RCP 8.5
Data on asylum-seekers from UNHCR, weather Data from University of Delaware (Baseline) and Berkeley Earth, projected weather data: NEX-GDDP, NASA’s Socioeconomic Data Applications Center: Gridded Population of the World (GPW) v4, population and GDP data from CIA world Factobook, share of the population that is
(Missirian and Schlenker, 2017)
ACCEPTED VERSIO
N
SUBJECT TO FIN
AL EDITS

FINAL DRAFT Chapter 4 Supplementary Material IPCC WGII Sixth Assessment Report
Do Not Cite, Quote or Distribute SM4-116 Total pages: 273
working in agriculture from World Bank, Corruption data from Transparency International, Conflict data from UCDP/PRIO (v4).
Multiple Mobility and Migration
Climate related disasters
Negative. Increase, between 31 and 143 million IDPs by 2050.
2020-2050 SSP2 and SSP4, RCP 2.6 and RCP 8.5
Model of slow-onset climate impacts in relation to projections of future population distribution
(Rigaud et al., 2018)
Africa Kenya Agriculture Tea production impacts
Both Negative and Positive. Decrease under most models and scenrios, increases for some.
2069-2099 All RCPs LPJmL model; ISIMIP fast-track
(Beringer et al., 2020)
Agriculture Irrigation Negative. Irrigation
potential of the water- shed is projected to be at least halved by mid-century in all scenario combinations.
2040, 2090 RCP2.6 CMIP5 (Duku et al., 2018)
Agriculture Yield loss Negative. Projected
decrease in maize yield is mainly caused by increased temperature and reduced growing season rainfall, which resulted in a shortened growing period of maize by 9-22 %.
2040-2069 RCP8.5 CSIRO-MK3-6-0, CanESM2, HadGEM2-ES
(Kassie et al., 2015)
Malawi Agriculture Yield loss Negative. Rainfed maize production in the Lilongwe District of Malawi is projected to decrease up to 14 % by mid-century due to climate change, rising to as much as 33 % loss by the century.
2050, 2090 SRES B1 AR4 model ensemble (Msowoya et al., 2016)
East &Central Africa
Energy Hydroelectricity generation
Positive. Around 3-4 studies in this systematic review shows increase in NT (2030s)-MC (2050s) and 1
2010-2039 (2030s, Near Term NT) and 2040-69
Several papers used different scenarios.
Systematic review (Emodi et al., 2019) ACCEPTED VERSIO
N
SUBJECT TO FIN
AL EDITS

FINAL DRAFT Chapter 4 Supplementary Material IPCC WGII Sixth Assessment Report
Do Not Cite, Quote or Distribute SM4-117 Total pages: 273
study shows increase in EC in East Africa (2080).
(Middle of the century MC 2050s), 2070-99 (2080s, End of the century EC)
Northern Africa
Energy Hydroelectricity generation
Negative. 3 studies project decreases in NT-MC, and 2 studies project decreases in NC.
2010-2039 (2030s, Near Term NT) and 2040-69 (Middle of the century MC 2050s), 2070-99 (2080s, End of the century EC)
Several papers used different scenarios.
Systematic review (Emodi et al., 2019)
Southern Africa (Zambezi Basin)
Energy Hydroelectricity generation
Negative. Decline by 10–20% under a drying climate.
1948-2008 (baseline)-2010-2070 (endline)
Different GCM ensembles
Different GCM ensembles
(Spalding-Fecher et al., 2017)
WaSH Water-related
diseases Negative. There will be an increase in the incidence rate of measles, diarrheal cases, guinea worm infestation, malaria, cholera, cerebro-spinal meningitis and other water related diseases due to the current climate projections and variability.
2020-2080
Review study (Asante and Amuakwa-Mensah, 2015)
Tanzania Urban and Peri-Urban
Water shortage (due to groundwater decline)
Negative. Increase of urban footprint will reduce groundwater recharge by 23%. With climate change, groundwater recharge may fall 30-44% by 2050.
2015-2050 RCP8.5 Observations; LULC; WetSpass-M; databases; RCP8.5
(Olarinoye et al., 2020)
Africa Freshwater Ecosystems
Spcecies life history disruption, range shifts, Species
Negative. Approximately 80% of fish species in Africa will experience substantially different hydrologic regimes
Current (1961–1990),
Several papers used different scenarios.
Systematic review (Knouft and Ficklin, 2017)
ACCEPTED VERSIO
N
SUBJECT TO FIN
AL EDITS

FINAL DRAFT Chapter 4 Supplementary Material IPCC WGII Sixth Assessment Report
Do Not Cite, Quote or Distribute SM4-118 Total pages: 273
Assemblages and Novel Interactions
in 2050, high frequency of range shifts in southeastern Australia
Midcentury (2041–2070)
Conflict Agriculture Negative. Growing population and rising temperatures will lead to higher levels of violence if political rights do not improve. If political rights continue to improve at the same rate as observed over the last three decades, there is reason for optimisms that overall levels of violence will hold steady or even decline in Africa, in spite of projected population increases and rising temperatures.
1980-2012 SSP1-5 Climate-sensitive approach to model sub-Saharan African violence in the past (geolocated to the nearest settlements) and then forecast future violence using sociiopolitical factors such as population size and politilca rights coupled with temperature anomalies
(Witmer et al., 2017)
Asia China, India Agriculture Tea production impacts
Positive. Increase under assumption of no water limitations.
2069-2099 All RCPs LPJmL model; ISIMIP fast-track
(Beringer et al., 2020)
Indonesia, Sri Lanka, Bangaldesh
Agriculture Tea production impacts
Both Negative and Positive. Decrease under most models and scenrios, increases for some.
2069-2099 All RCPs LPJmL model; ISIMIP fast-track
(Beringer et al., 2020)
China Agriculture Drought Negative. Increased drought will pose additional challenges to the agricultural productivity in the dry regions where water shortage is already severe and at a time when irrigation is expected to become more important to stabilize and in- crease food production for a growing population.
2020-2049 RCP8.5 ISI-MIP Fast-Track (Leng et al., 2015)
Iran Agriculture Rainfed agriculture
Both Negative and Positive. Regional increases in green water for humid regions; decreases in green
2041-2070 All RCPs CMIP5 (Shahsavari et al., 2019)
ACCEPTED VERSIO
N
SUBJECT TO FIN
AL EDITS

FINAL DRAFT Chapter 4 Supplementary Material IPCC WGII Sixth Assessment Report
Do Not Cite, Quote or Distribute SM4-119 Total pages: 273
water and increase in drought severity in dry areas.
Nepal Agriculture Agricultural damage area due to flooding
Negative. Increase in flood damage area for paddy rice up to 50%.
2075-2099 RCP8.5 MRI-AGCM3.2S for precipitation projections; RRI model for flood projections
(Shrestha et al., 2019a)
Phillipines Agriculture Agricultural damage area due to flooding
Negative. Increase in flood damage area for paddy rice up to 16%.
2075-2099 RCP8.5 MRI-AGCM3.2S for precipitation projections; RRI model for flood projections
(Shrestha et al., 2019a)
Cambodia and Vietnam
Agriculture Agricultural damage area due to flooding
Negative. Increase in flood damage area for paddy rice up to 23%.
2075-2099 RCP8.5 MRI-AGCM3.2S for precipitation projections; RRI model for flood projections
(Shrestha et al., 2019a)
Thailand Agriculture Agricultural damage area due to flooding
Negative. Increase in flood damage area for paddy rice up to 13%.
2075-2099 RCP8.5 MRI-AGCM3.2S for precipitation projections; RRI model for flood projections
(Shrestha et al., 2019a)
Indonesia Agriculture Agricultural damage area due to flooding
Negative. Increase in flood damage area for paddy rice up to 55%.
2075-2099 RCP8.5 MRI-AGCM3.2S for precipitation projections; RRI model for flood projections
(Shrestha et al., 2019a)
India Energy Hydroelectricity generation
Both negative and positive. Due to the projected increase in precipitation, hydropower production (up to +25%) is projected to rise under the future climate. However, hydropower production is projected to decline in snow dominated hydropower projects due to cryospheric melting.
2040–2069 RCP 8.5 Different GCM ensembles
(Ali et al., 2018)
Eastern, Southern and Southeastern Asia
Energy Hydroelectricity generation
Positive. Around 3 studies in this systematic review shows increase in NT (2030s)-MC (2050s) and 1 study shows increase in EC (2080).
2010-2039 (2030s, Near Term NT) and 2040-69 (Middle of the century MC 2050s),
Several papers used different scenarios.
Systematic review (Emodi et al., 2019)
ACCEPTED VERSIO
N
SUBJECT TO FIN
AL EDITS

FINAL DRAFT Chapter 4 Supplementary Material IPCC WGII Sixth Assessment Report
Do Not Cite, Quote or Distribute SM4-120 Total pages: 273
2070-99 (2080s, End of the century EC)
Eastern and Southeast Asia
Energy Thermoelectric generation
Positive. 2 studies project increases by EC.
2070-99 (2080s, End of the century EC)
Several papers used different scenarios.
Systematic review (Emodi et al., 2019)
China Energy Hydroelectricity generation
Negative. The total changes of hydropower output caused by climate factors by 2100 under the RCP8.5, RCP4.5 and RCP2.6 scenarios are 153.29 billion kWh, 67.49 billion kWh and 22.10 billion kWh, respectively.
2100 RCP 2.6, 4.5 and 8.5
Different GCM ensembles
(Fan et al., 2018)
Southeast Asia, Mekong Basin
Energy Hydroelectricity generation
Negative. The hydropower generation decreases by 49.82%, 20.48% and 56.21% under the sce- narios of 1.5 ◦C (RCP2.6), 1.5 ◦C (RCP6.0) and 2 ◦C (RCP6.0), sepa- rately, compared to the historical period.
Time horizons corresponding to 1.5°C is 2036 under RCP2.6 and in 2033 under RCP6.0; 2°C in 2056 under RCP6.0.
1.5°C and 2°C warming
Different GCM ensembles
(Meng et al., 2021)
Energy Thermoelectric
generation Negative. Coal power plants annual usable capacity factor in Mongolia, Southeast Asia, and parts of China and India are projected to decrease due to water constraints.
NA 2°C warming Different GCM ensembles
(Wang et al., 2019b)
Freshwater Ecosystems
Water quality Both Negative and Positive. Deterioration of the microbial water quality (E. coli, enterococci) (+75% by the 2090s) due to socio-economic changes, such as
2031-2050, 2081-2100
SSP3 Water quality model (MIKE21FM-ECOLab).
(Islam et al., 2018a) ACCEPTED VERSIO
N
SUBJECT TO FIN
AL EDITS
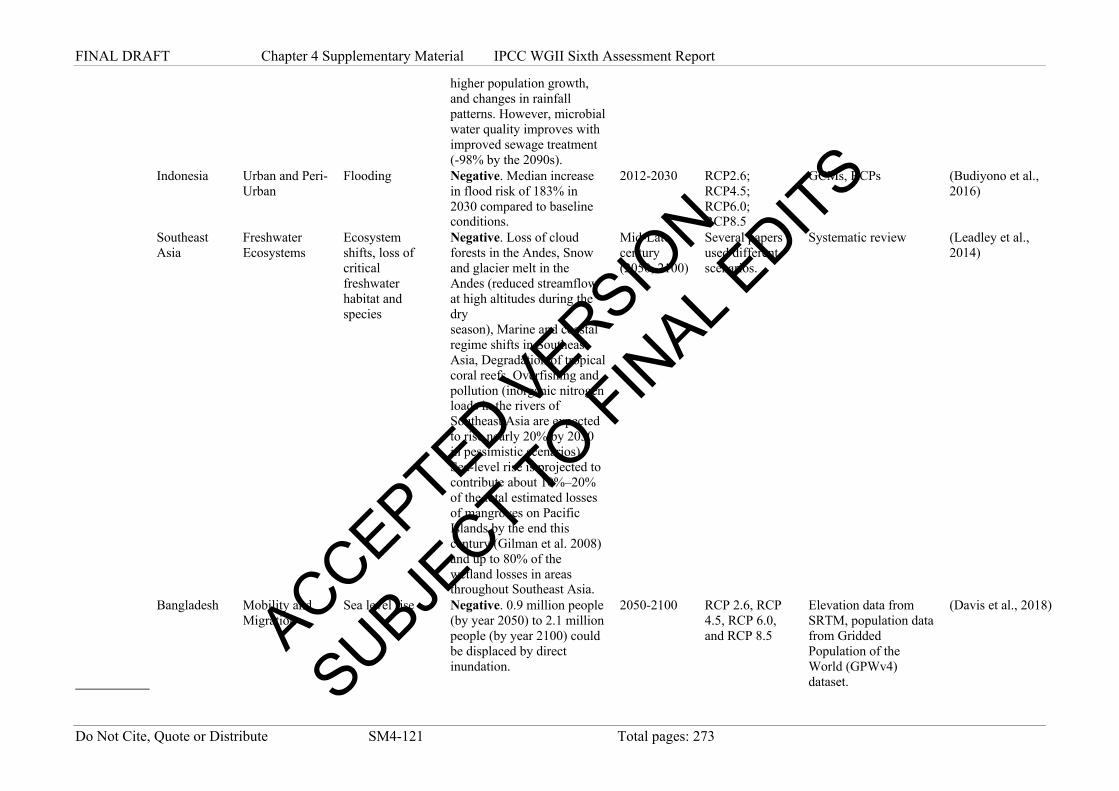
FINAL DRAFT Chapter 4 Supplementary Material IPCC WGII Sixth Assessment Report
Do Not Cite, Quote or Distribute SM4-121 Total pages: 273
higher population growth, and changes in rainfall patterns. However, microbial water quality improves with improved sewage treatment (-98% by the 2090s).
Indonesia Urban and Peri-Urban
Flooding Negative. Median increase in flood risk of 183% in 2030 compared to baseline conditions.
2012-2030 RCP2.6; RCP4.5; RCP6.0; RCP8.5
GCMs, RCPs (Budiyono et al., 2016)
Southeast Asia
Freshwater Ecosystems
Ecosystem shifts, loss of critical freshwater habitat and species
Negative. Loss of cloud forests in the Andes, Snow and glacier melt in the Andes (reduced streamflow at high altitudes during the dry season), Marine and coastal regime shifts in Southeast Asia, Degradation of tropical coral reefs, Overfishing and pollution (inorganic nitrogen loads in the rivers of Southeast Asia are expected to rise nearly 20% by 2030 in pessimistic scenarios), Sea-level rise is projected to contribute about 10%–20% of the total estimated losses of mangroves on Pacific Islands by the end this century (Gilman et al. 2008) and up to 80% of the wetland losses in areas throughout Southeast Asia.
Mid-Late century (2050, 2100)
Several papers used different scenarios.
Systematic review (Leadley et al., 2014)
Bangladesh Mobility and Migration
Sea level rise Negative. 0.9 million people (by year 2050) to 2.1 million people (by year 2100) could be displaced by direct inundation.
2050-2100 RCP 2.6, RCP 4.5, RCP 6.0, and RCP 8.5
Elevation data from SRTM, population data from Gridded Population of the World (GPWv4) dataset.
(Davis et al., 2018)
ACCEPTED VERSIO
N
SUBJECT TO FIN
AL EDITS

FINAL DRAFT Chapter 4 Supplementary Material IPCC WGII Sixth Assessment Report
Do Not Cite, Quote or Distribute SM4-122 Total pages: 273
Philippines Cultural, Indigenous and Traditional Uses
Increased risk of water deficit
Negative. Increases in future wet season rainfall pose increase risks of excess surface water runoff and potential for soil erosion, which may cause the collapse of Ifugao rice terraces. Reductions in future dry season rainfall and warmer temperatures indicate significant water deficits during the growing season of local tinawon rice.
2014-2016 compared to 2041-2050; 2091-2100
RCP4.5; RCP8.5
Hydrological model; GCMs
(Soriano and Herath, 2020)
China WaSH WASH-related diseases (diarrhoea, malaria, dengue, Japanese encephalitis) (DALYs)
Negative. Climate change is projected to delay China’s rapid progress towards reducing WaSH-attributable infectious disease burden by 8–85 months. From 2008 to 2030 climate change is projected to slow the rate of decrease in diarrhoeal disease burden by 6.5% under RCP 2.6 and 8.9% under RCP 8.5, between 2008 and 2030 climate change slows the rate of decrease in vector-borne disease burden by 21.2% under RCP 2.6 and by 27.8% under RCP 8.5. These delays amount to more than 400,000 DALYs lost that would have been prevented by climate change mitigationassuming linear increases in WASH infrastructure.
2020 (2018–2022); 2030 (2028–2032)
HadGEM2-ES model outputs for the four representative concentration pathway (RCP) scenarios were used to project semidecadal provincial temperature deviation (Td)
(Hodges et al., 2014)
Australasia Australia Urban and Peri-Urban
Water shortage risk
Negative. As future demand on the reservoir system increases from 0.7 to 0.9 of
1961-1990 (Baseline);
RCP2.6; RCP4.5;
CMIP5; Australian Water Availability Project (observations)
(Henley et al., 2019)
ACCEPTED VERSIO
N
SUBJECT TO FIN
AL EDITS

FINAL DRAFT Chapter 4 Supplementary Material IPCC WGII Sixth Assessment Report
Do Not Cite, Quote or Distribute SM4-123 Total pages: 273
observed annual average inflow, the severe water supply shortage risk at 2C of global warming increases rapidly (without desalination). At an annual demand of 0.75 of mean inflow, median water supply shortage risk is 0.6% with 90th percentile limits of [0.1%, 4.3%] at 1.5C of warming. This increases to 2.9% [0.1%, 12.1%] at 2C of warming. At the higher demand level of 0.85, median water supply shortage risk is 9.6% [3.8%, 24.4%] at 1.5C, and 20.4% [3.9%, 39.5%] at 2C of global warming.
2040-2050 (Future)
RCP6.0; RCP8.5
Australia Freshwater Ecosystems
Spcecie life history disruption, range shifts, Species Assemblages and Novel Interactions
Negative. High frequency of range shifts in southeastern Australia by 2050
Mid-century (2030)
Several papers used different scenarios.
Systematic review (Knouft and Ficklin, 2017)
New Zealand Cultural, Indigenous and Traditional Uses
Ecosystem change
Negative. Changes in temperature and precipitation are projected to shift the range of wetland plants (Kūmarahou and Kuta) in New Zealand, which may decrease access to these culturally significant species, which are used for medicinal and weaving purposes. The changing distribution of these plants may lead to a loss of Indigenous Knowledge and
2021-2050; 2051-2080
RCP2.6; RCP8.5
Species distribution modelling
(Bond et al., 2019)
ACCEPTED VERSIO
N
SUBJECT TO FIN
AL EDITS

FINAL DRAFT Chapter 4 Supplementary Material IPCC WGII Sixth Assessment Report
Do Not Cite, Quote or Distribute SM4-124 Total pages: 273
affect inter-tribal reciprocity and gifting practices.
New Zealand Cultural, Indigenous and Traditional Uses
Flooding impact on significant fish species
Negative. Increase flood events may negatively impact spawning and fishing sites of the culturally important īnaka (whitebait; Galaxias maculates) in the Waikōuaiti River.
Fieldwork; interviews (Carter, 2019)
Australia Cultural, Indigenous and Traditional Uses
Flooding of waterholes and wetlands
Negative. Culturally important coastal waterholes, wetlands and sites are at risk of saltwater inundation due to rising sea levels. If inundated, traditional owners may not be able to maintain cultural connections to these important sites.
Until 2100 RCP4.5; RCP8.5
Fieldwork; interviews; climate projections
(Lyons et al., 2019)
Central and South America
Colombia Energy Hydroelectricity generation
Negative. ~10% decrease under the RCP4.5 dry scenario.
2050 RCP4.5 Different GCM ensembles
(Arango-Aramburo et al., 2019)
Brazil Energy Hydroelectricity generation
Negative. Dry season hydropower potential could decline by −7.4 to −5.4%.
2026-2045 RCP 4.5 Different GCM ensembles
(Arias et al., 2020)
Ecuador Energy Hydroelectricity generation
Both negative and positive. Hydropower production is projected to increase by +7% to +21% or decline by -25% to -44% by 2050.
2071-2100 RCP4.5, and various policy scenarios
Wet and dry scenarios under RCP4.5, and various policy scenarios
(Carvajal et al., 2019)
Brazil Energy Hydroelectricity generation
Negative. In the São Francisco basin of Brazil, hydropower production is projected to reduce by -15% to -20%.
2100 IPCC A1B scenario
IPCC A1B scenario (de Jong et al., 2018)
Venezuela Cultural, Indigenous and Traditional Uses
Flooding Negative. The partial or total inundation of the Orinoco Delta will result in the loss of freshwater wetlands and species, which will produce rapid shifts in
2008-2100 RCP2.6; RCP4.5; RCP6.0; RCP8.5
SLR forecasts; population growth model
(Vegas-Vilarrúbia et al., 2015) ACCEPTED V
ERSION
SUBJECT TO FIN
AL EDITS

FINAL DRAFT Chapter 4 Supplementary Material IPCC WGII Sixth Assessment Report
Do Not Cite, Quote or Distribute SM4-125 Total pages: 273
the culturally significant lands and resources of the Warao. Among the affected species is the Mauritia palm, on which Warao culture and livelihoods are based.
Argentina Agriculture Changes in livestock suitability
Both Negative and Positive. Shift in suitable areas; potential increase in overall suitability, but Increase water requirements for fodder.
2015-2039 RCP4.5 CCSM4; CMIP5 (Rolla et al., 2019)
Argentina Agriculture Changes in livestock suitability
Both Negative and Positive. Shift in suitable areas; potential increase in overall suitability, but Increase water requirements for fodder.
2075-2099 RCP4.5 CCSM4; CMIP6 (Rolla et al., 2019)
central South america
Freshwater Ecosystems
Ecosystem shifts, loss of critical freshwater habitat and species
Negative. Loss of cloud forests in the Andes, Snow and glacier melt in the Andes (reduced streamflow at high altitudes during the dry season), Marine and coastal regime shifts in Southeast Asia, Degradation of tropical coral reefs, Overfishing and pollution (inorganic nitrogen loads in the rivers of Southeast Asia are expected to rise nearly 20% by 2030 in pessimistic scenarios), Sea-level rise is projected to contribute about 10%–20% of the total estimated losses of mangroves on Pacific Islands by the end this century (Gilman et al. 2008) and up to 80% of the
Late century (2075, 2100)
Several papers used different scenarios.
Systematic review (Leadley et al., 2014)
ACCEPTED VERSIO
N
SUBJECT TO FIN
AL EDITS
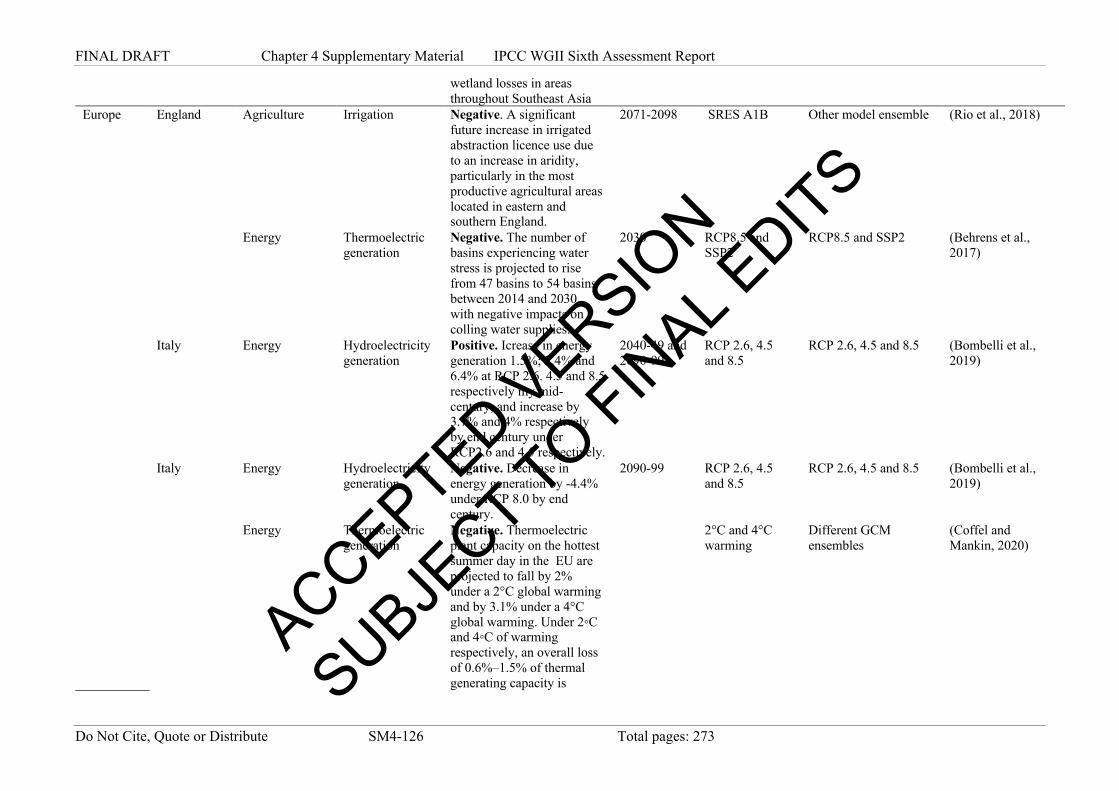
FINAL DRAFT Chapter 4 Supplementary Material IPCC WGII Sixth Assessment Report
Do Not Cite, Quote or Distribute SM4-126 Total pages: 273
wetland losses in areas throughout Southeast Asia
Europe England Agriculture Irrigation Negative. A significant future increase in irrigated abstraction licence use due to an increase in aridity, particularly in the most productive agricultural areas located in eastern and southern England.
2071-2098 SRES A1B Other model ensemble (Rio et al., 2018)
Energy Thermoelectric
generation Negative. The number of basins experiencing water stress is projected to rise from 47 basins to 54 basins between 2014 and 2030, with negative impacts on colling water supplies.
2030 RCP8.5 and SSP2
RCP8.5 and SSP2 (Behrens et al., 2017)
Italy Energy Hydroelectricity generation
Positive. Icrease in energy generation 1.5%; 2.4% and 6.4% at RCP 2.6. 4.5 and 8.5 respectively my mid-century, and increase by 3.7% and 4% respectively by end century under RCP2.6 and 4.5 respectively.
2040-49 and 2090-99
RCP 2.6, 4.5 and 8.5
RCP 2.6, 4.5 and 8.5 (Bombelli et al., 2019)
Italy Energy Hydroelectricity generation
Negative. Decrease in energy generation by -4.4% under RCP 8.0 by end century.
2090-99 RCP 2.6, 4.5 and 8.5
RCP 2.6, 4.5 and 8.5 (Bombelli et al., 2019)
Energy Thermoelectric
generation Negative. Thermoelectric plant capacity on the hottest summer day in the EU are projected to fall by 2% under a 2°C global warming and by 3.1% under a 4°C global warming. Under 2◦C and 4◦C of warming respectively, an overall loss of 0.6%–1.5% of thermal generating capacity is
2°C and 4°C warming
Different GCM ensembles
(Coffel and Mankin, 2020)
ACCEPTED VERSIO
N
SUBJECT TO FIN
AL EDITS

FINAL DRAFT Chapter 4 Supplementary Material IPCC WGII Sixth Assessment Report
Do Not Cite, Quote or Distribute SM4-127 Total pages: 273
projected for summer months of July-August.
Northern Europe
Energy Hydroelectricity generation
Positive. Around 3-4 studies in this systematic review projects consistent increase in NT (2030s)-MC (2050s) and 2-3 studies projects consistent increase in EC (2080).
2010-2039 (2030s, Near Term NT) and 2040-69 (Middle of the century MC 2050s), 2070-99 (2080s, End of the century EC)
Several papers used different scenarios.
Systematic review (Emodi et al., 2019)
Southern & Eastern Europe
Energy Hydroelectricity generation
Negative. 4 studies in studies project decreases in NT-MC. 3 studies in Southern Europe, and 3 studies in Eastern Europe project decreases by EC.
2010-2039 (2030s, Near Term NT) and 2040-69 (Middle of the century MC 2050s), 2070-99 (2080s, End of the century EC)
Several papers used different scenarios.
Systematic review (Emodi et al., 2019)
Southern & Eastern & Western Europe
Energy Thermoelectric generation
Negative. ~14 studies project decreases in NT-MC; and ~7 stuides project decreases in NC.
2010-2039 (2030s, Near Term NT) and 2040-69 (Middle of the century MC 2050s), 2070-99 (2080s, End of the century EC)
Several papers used different scenarios.
Systematic review (Emodi et al., 2019)
Switzerland Energy Hydroelectricity generation
Negative. Production reduction of about 1.0 TWh/yr is projected.
2070-90 Not mentioned explicitly.
Not mentioned explicitly.
(Schaefli et al., 2019)
Portugal Energy Hydroelectricity generation
Negative. Results show that hydropower generation may
2050 Climate scenarios include: SRES
Climate scenarios include: SRES A2c
(Teotónio et al., 2017)
ACCEPTED VERSIO
N
SUBJECT TO FIN
AL EDITS
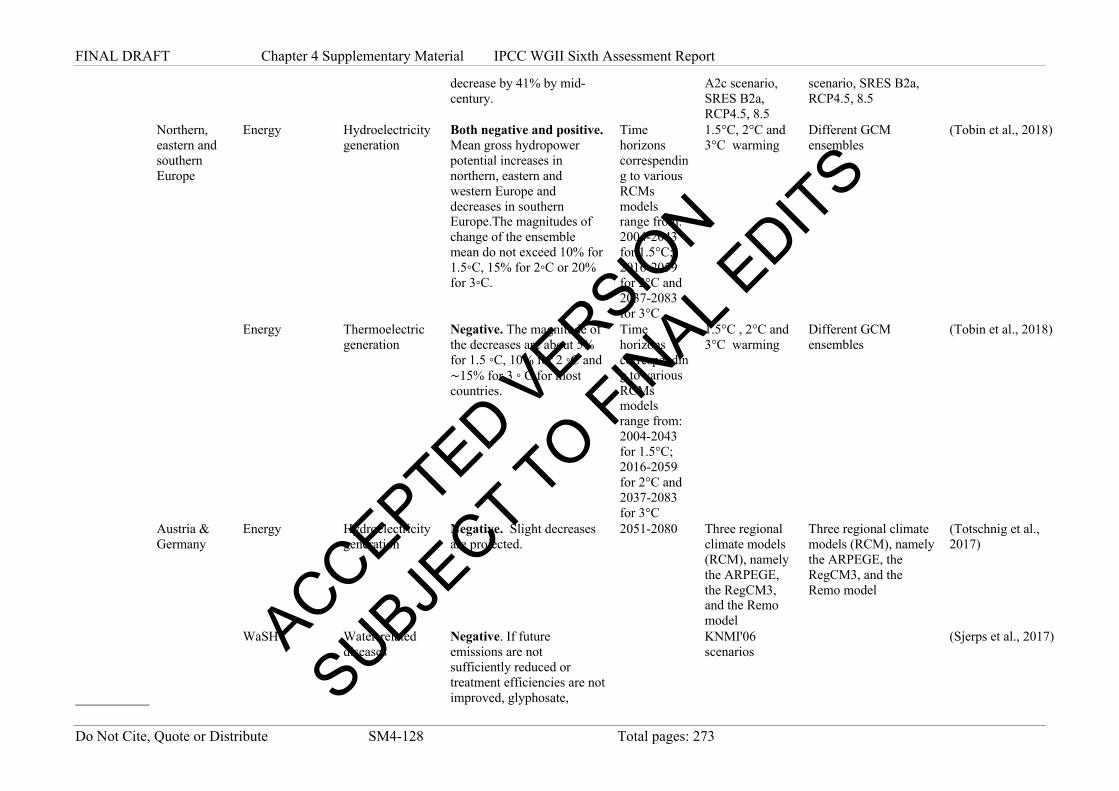
FINAL DRAFT Chapter 4 Supplementary Material IPCC WGII Sixth Assessment Report
Do Not Cite, Quote or Distribute SM4-128 Total pages: 273
decrease by 41% by mid-century.
A2c scenario, SRES B2a, RCP4.5, 8.5
scenario, SRES B2a, RCP4.5, 8.5
Northern, eastern and southern Europe
Energy Hydroelectricity generation
Both negative and positive. Mean gross hydropower potential increases in northern, eastern and western Europe and decreases in southern Europe.The magnitudes of change of the ensemble mean do not exceed 10% for 1.5◦C, 15% for 2◦C or 20% for 3◦C.
Time horizons correspending to various RCMs models range from: 2004-2043 for 1.5°C; 2016-2059 for 2°C and 2037-2083 for 3°C
1.5°C, 2°C and 3°C warming
Different GCM ensembles
(Tobin et al., 2018)
Energy Thermoelectric
generation Negative. The magnitude of the decreases are about 5% for 1.5 ◦C, 10% for 2 ◦C and ∼15% for 3 ◦ C for most countries.
Time horizons correspending to various RCMs models range from: 2004-2043 for 1.5°C; 2016-2059 for 2°C and 2037-2083 for 3°C
1.5°C , 2°C and 3°C warming
Different GCM ensembles
(Tobin et al., 2018)
Austria & Germany
Energy Hydroelectricity generation
Negative. Slight decreases are projected.
2051-2080 Three regional climate models (RCM), namely the ARPEGE, the RegCM3, and the Remo model
Three regional climate models (RCM), namely the ARPEGE, the RegCM3, and the Remo model
(Totschnig et al., 2017)
WaSH Water-related
diseases Negative. If future emissions are not sufficiently reduced or treatment efficiencies are not improved, glyphosate,
KNMI'06 scenarios
(Sjerps et al., 2017) ACCEPTED V
ERSION
SUBJECT TO FIN
AL EDITS

FINAL DRAFT Chapter 4 Supplementary Material IPCC WGII Sixth Assessment Report
Do Not Cite, Quote or Distribute SM4-129 Total pages: 273
aminomethylphosphonic acid (AMPA), carbamazepine, metoprolol, diatrizoic acid, acesulfame will Increasely be found in drinking water.
Urban and Peri-Urban
Drought Negative. Drought conditions are expected to intensify in southern European cities under all impact scenarios. High impact scenario: only 2% of cities are not projected to exceed the HMD; 21 cities in Southern Europe have more than 70% probability that the HMD will be exceeded in any given month; 30% of cities projected to have at least a 30% probability of exceeding the historical maximum in any given month. (HMD is historical maximum Drought Severity Index, DSI).
1951-2000 (Baseline ); 2051-2100 (Future)
RCP8.5 CMIP5 for RCP8.5 (571 cities from Urban Audit database)
(Guerreiro et al., 2018)
Urban and Peri-Urban
Flooding Negative. Low impact scenario: 68% of cities show no change or a reduction in Q10; 85% of UK cities see a projected increase in Q10. Medium impact scenario: 72% cities projected to experience an increase in Q10; some cities in the UK, Ireland and Norway could experience an increase in Q10 of more than 50%; most cities in south of Europe have no change or a decrease. High impact
1951-2000 (Baseline ); 2051-2100 (Future)
RCP8.5 CMIP5 for RCP8.5 (571 cities from Urban Audit database)
(Guerreiro et al., 2018)
ACCEPTED VERSIO
N
SUBJECT TO FIN
AL EDITS
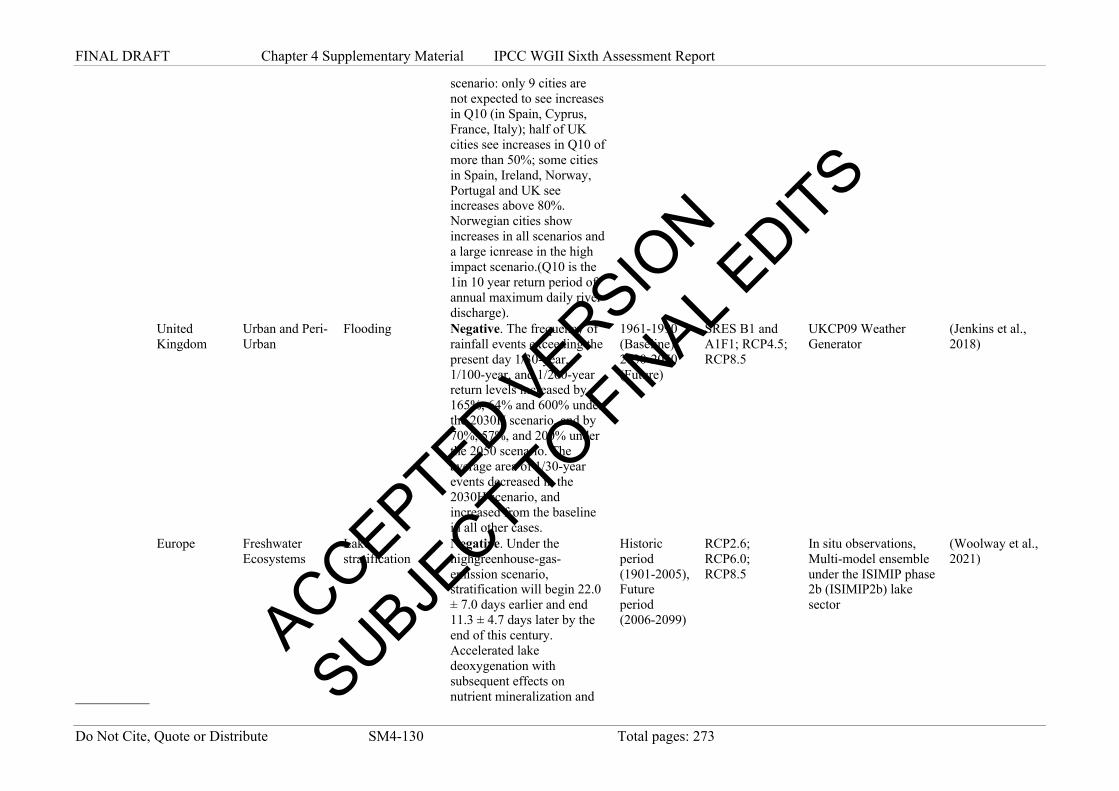
FINAL DRAFT Chapter 4 Supplementary Material IPCC WGII Sixth Assessment Report
Do Not Cite, Quote or Distribute SM4-130 Total pages: 273
scenario: only 9 cities are not expected to see increases in Q10 (in Spain, Cyprus, France, Italy); half of UK cities see increases in Q10 of more than 50%; some cities in Spain, Ireland, Norway, Portugal and UK see increases above 80%. Norwegian cities show increases in all scenarios and a large icnrease in the high impact scenario.(Q10 is the 1in 10 year return period of annual maximum daily river discharge).
United Kingdom
Urban and Peri-Urban
Flooding Negative. The frequency of rainfall events exceeding the present day 1/30-year, 1/100-year, and 1/200-year return levels increased by 165%, 64% and 600% under the 2030H scenario, and by 70%, 57%, and 200% under the 2050 scenario. The average area of 1/30-year events decreased in the 2030H scenario, and increased from the baseline in all other cases.
1961-1990 (Baseline); 2030-2050 (Future)
SRES B1 and A1F1; RCP4.5; RCP8.5
UKCP09 Weather Generator
(Jenkins et al., 2018)
Europe Freshwater Ecosystems
Lake stratification
Negative. Under the highgreenhouse-gas-emission scenario, stratification will begin 22.0 ± 7.0 days earlier and end 11.3 ± 4.7 days later by the end of this century. Accelerated lake deoxygenation with subsequent effects on nutrient mineralization and
Historic period (1901-2005), Future period (2006-2099)
RCP2.6; RCP6.0; RCP8.5
In situ observations, Multi-model ensemble under the ISIMIP phase 2b (ISIMIP2b) lake sector
(Woolway et al., 2021)
ACCEPTED VERSIO
N
SUBJECT TO FIN
AL EDITS

FINAL DRAFT Chapter 4 Supplementary Material IPCC WGII Sixth Assessment Report
Do Not Cite, Quote or Distribute SM4-131 Total pages: 273
phosphorus release from lake sediments.
North America
Freshwater Ecosystems
Lake stratification
Negative. Under the highgreenhouse-gas-emission scenario, stratification will begin 22.0 ± 7.0 days earlier and end 11.3 ± 4.7 days later by the end of this century. Accelerated lake deoxygenation with subsequent effects on nutrient mineralization and phosphorus release from lake sediments.
Historic period (1901-2005), Future period (2006-2099)
RCP2.6; RCP6.0; RCP8.5
In situ observations, Multi-model ensemble under the ISIMIP phase 2b (ISIMIP2b) lake sector
(Woolway et al., 2021)
Finland Cultural, Indigenous and Traditional Uses
Winter thaw Negative. Climate change poses risks to reindeer health and health of reindeer herders in terms of increased risks for accidents and future health prospects. Most prominent health effects are mental heath effects, such as increased stress, concern over the future of Saami way of life, and pressures to abandon traditional lifeways and livelihoods.
Literature review (Jaakkola et al.,
2018)
Finland Cultural, Indigenous and Traditional Uses
Winter thaw Negative. Changes in ecosystems may erode cultural meanings, stories, memories and traditional knowledge attached to them, and affect nature-based traditional livelihoods.
2100 Increase in global mean temperature of 1.5°C by 2100
Literature review; survey
(Markkula et al., 2019)
North America
Agriculture Yield loss Negative. Reduction of irrigation availability causes a decrease in total corn production 20-30% and total wheat production about 10%
2015-2099 RCP8.5 CMIP5 (Cotterman et al., 2018) ACCEPTED V
ERSION
SUBJECT TO FIN
AL EDITS

FINAL DRAFT Chapter 4 Supplementary Material IPCC WGII Sixth Assessment Report
Do Not Cite, Quote or Distribute SM4-132 Total pages: 273
for each of the climate scenarios.
Agriculture Evaporative loss ratio
None. The climate change induced higher Evaporative Loss Ratio is associated with a reduction in return flows, thus negatively impacting downstream water availability.
2030-2060 RCP4.5 CMIP5 (Malek et al., 2018)
USA Energy Hydroelectricity generation
Negative. Average summertime generating capacity projected to reduce by 1.1% to 3.0%, with overall reductions of up to 7.2-8.8%.
2040-2060 RCP4.5 RCP4.5 (Bartos and Chester, 2015)
USA Energy Thermoelectric generation
Negative. Thermoelectric plant capacity on the hottest summer day in the EU are projected to fall by 2% under a 2°C global warming and by 3.1% under a 4°C global warming. Under 2◦C and 4◦C of warming respectively, an overall loss of 0.6%–1.5% of thermal generating capacity is projected for summer months of July-August.
2°C and 4°C warming
Different GCM ensembles
(Coffel and Mankin, 2020)
Energy Hydroelectricity
generation Positive. More than 4 studies project consistent increase in NT (2030s)-MC (2050s). Around 2-3 studies projects consistent increase in EC.
2010-2039 (2030s, Near Term NT) and 2040-69 (Middle of the century MC 2050s), 2070-99 (2080s, End of the century EC)
Systematic review based on several papers and several scenarios
Systematic review based on several papers and several scenarios
(Emodi et al., 2019)
ACCEPTED VERSIO
N
SUBJECT TO FIN
AL EDITS

FINAL DRAFT Chapter 4 Supplementary Material IPCC WGII Sixth Assessment Report
Do Not Cite, Quote or Distribute SM4-133 Total pages: 273
USA Energy Hydroelectricity generation
Negative. Using projections of future drought index and power demand, the study suggest a reductions in hydropower generation by 1.6% by mid-century.
2051-2062 Climate scenario is not specified
Climate scenario is not specified
(Eyer and Wichman, 2018)
USA Energy Thermoelectric generation
Negative. Consistent increase in water stress will affect about 27% of the power production by 2030s.
2021– 2035
RCP-2.6, 4.5, 6, and 8.5
Different GCM ensembles
(Ganguli et al., 2017)
USA Energy Hydroelectricity generation
Both negative and positive. Increase (+ 19%) in the winter/ spring, and Decrease (- 29%) in the summer by the 2080s.
2080s (2070–2099)
Echam5 A1B scenario as a representative climate change scenario
Echam5 A1B scenario as a representative climate change scenario
(Lee et al., 2016)
USA Energy Thermoelectric generation
Negative. Climate change alone may reduce average generating capacity by 2–3% by the 2060s.
2060s The RCP4.5 and RCP8.5 scenarios project moderate (2.4 ◦C) and high (4.9 ◦C) respectively
Different GCM ensembles
(Liu et al., 2017)
USA Energy Hydroelectricity generation
Negative. Climate change is expected to decrease the average annual hydropower generation by 3.1% under RCP 4.5, but decline is neglible under RCP 8.5.
2050 RCP 4.5 , 8.5 RCP 4.5 , 8.5 (Tarroja et al., 2016)
Canada WaSH Waterborne disease
Negative. The risk model estimated that, with limited treatment and handling interventions (i.e., 30% water treatment compliance rate and no boiling of water prior to consumption, referred to hereafter as the baseline scenario), the sum of DALYs attributed to the two protozoa could increase by factors of 11 and 25 by
2041– 2070; 2071–2100
2 and 4oC QMRA (Smith et al., 2015)
ACCEPTED VERSIO
N
SUBJECT TO FIN
AL EDITS

FINAL DRAFT Chapter 4 Supplementary Material IPCC WGII Sixth Assessment Report
Do Not Cite, Quote or Distribute SM4-134 Total pages: 273
the 2050s and 2080s, respectively . Positive. The risk model demonstrated that when treatment and boiled water compliance were increased to 95% and 80%, respectively, risks from Giardia were effectively maintained at baseline levels in the period represented by the 2050s, compensating for the estimated impact of climate change on source water contamination with Giardia.
WaSH Urban permeability
Negative. Increased urban permeability - likely offsets climate change impacts.
2055-2066 RCP2.6 CMIP5 (Tariq et al., 2017)
USA Freshwater Ecosystems
Ecological flows, species reproductive cycles
Negative. annual zero-flow day frequency to increase by 27% by midcentury, 17% increase in the frequency of stream drying events, Flowing portions of the river network will diminish between 8% and 20% in spring and early summer; midcentury and late century climate will reduce network-wide hydrologic connectivity for native fishes by 6–9% over the course of a year and up to 12–18% during spring spawning months.
Current (1988–2006), Midcentury (2046–2064), and Late century (2080–2098) time periods
RCP8.6 In-situ observations, Modified SWAT hydrologic models, 16 GCM ensembles
(Jaeger et al., 2014)
USA Freshwater Ecosystems
Spcecie life history disruption, range shifts, Species Assemblages
Negative. Increase in thermal stress and range contractions for salmon throughout the Columbia River Basin by 2050,
Historic (1971–2000) and future (2071–2100), Near
Several papers used different scenarios.
Systematic review (Knouft and Ficklin, 2017) ACCEPTED V
ERSION
SUBJECT TO FIN
AL EDITS

FINAL DRAFT Chapter 4 Supplementary Material IPCC WGII Sixth Assessment Report
Do Not Cite, Quote or Distribute SM4-135 Total pages: 273
and Novel Interactions
increase in water temperature by 3.7-7 degC
end century (2080s)
USA Culturan, Indigenous and Traditional Uses
Flooding Negative. Climate-related degradation and flooding of wetlands and streams in the Lumbee River watershed will negatively affect cultural practices of fishing and harvesting that rely on access to and resources obtained from the area.
Until 2050 RCP8.5 Climate projections (Emanuel, 2018)
1 2
ACCEPTED VERSIO
N
SUBJECT TO FIN
AL EDITS
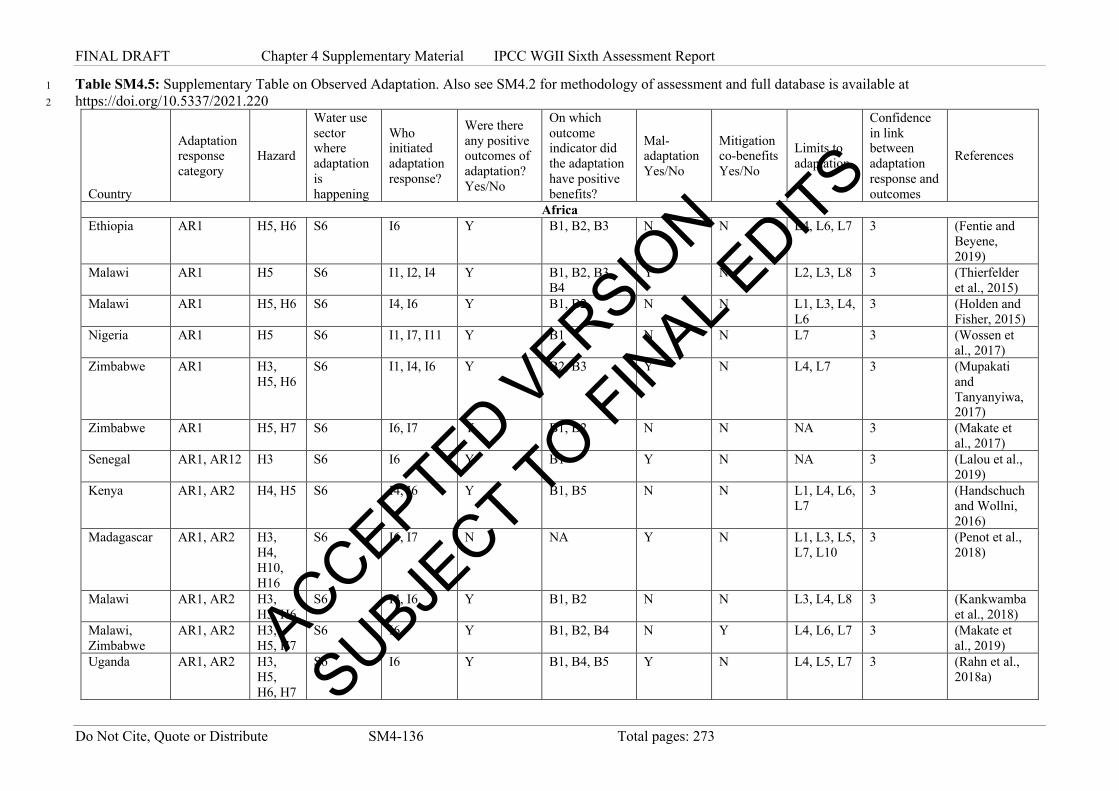
FINAL DRAFT Chapter 4 Supplementary Material IPCC WGII Sixth Assessment Report
Do Not Cite, Quote or Distribute SM4-136 Total pages: 273
Table SM4.5: Supplementary Table on Observed Adaptation. Also see SM4.2 for methodology of assessment and full database is available at 1 https://doi.org/10.5337/2021.220 2
Country
Adaptation response category
Hazard
Water use sector where adaptation is happening
Who initiated adaptation response?
Were there any positive outcomes of adaptation? Yes/No
On which outcome indicator did the adaptation have positive benefits?
Mal-adaptation Yes/No
Mitigation co-benefits Yes/No
Limits to adaptation
Confidence in link between adaptation response and outcomes
References
Africa Ethiopia AR1 H5, H6 S6 I6 Y B1, B2, B3 N N L4, L6, L7 3 (Fentie and
Beyene, 2019)
Malawi AR1 H5 S6 I1, I2, I4 Y B1, B2, B3, B4
Y N L2, L3, L8 3 (Thierfelder et al., 2015)
Malawi AR1 H5, H6 S6 I4, I6 Y B1, B2 N N L1, L3, L4, L6
3 (Holden and Fisher, 2015)
Nigeria AR1 H5 S6 I1, I7, I11 Y B1 N N L7 3 (Wossen et al., 2017)
Zimbabwe AR1 H3, H5, H6
S6 I1, I4, I6 Y B2, B3 Y N L4, L7 3 (Mupakati and Tanyanyiwa, 2017)
Zimbabwe AR1 H5, H7 S6 I6, I7 Y B1, B2 N N NA 3 (Makate et al., 2017)
Senegal AR1, AR12 H3 S6 I6 Y B1 Y N NA 3 (Lalou et al., 2019)
Kenya AR1, AR2 H4, H5 S6 I4, I6 Y B1, B5 N N L1, L4, L6, L7
3 (Handschuch and Wollni, 2016)
Madagascar AR1, AR2 H3, H4, H10, H16
S6 I6, I7 N NA Y N L1, L3, L5, L7, L10
3 (Penot et al., 2018)
Malawi AR1, AR2 H3, H5, H6
S6 I4, I6 Y B1, B2 N N L3, L4, L8 3 (Kankwamba et al., 2018)
Malawi, Zimbabwe
AR1, AR2 H3, H5, H7
S6 I6 Y B1, B2, B4 N Y L4, L6, L7 3 (Makate et al., 2019)
Uganda AR1, AR2 H3, H5, H6, H7
S6 I6 Y B1, B4, B5 Y N L4, L5, L7 3 (Rahn et al., 2018a)
ACCEPTED VERSIO
N
SUBJECT TO FIN
AL EDITS
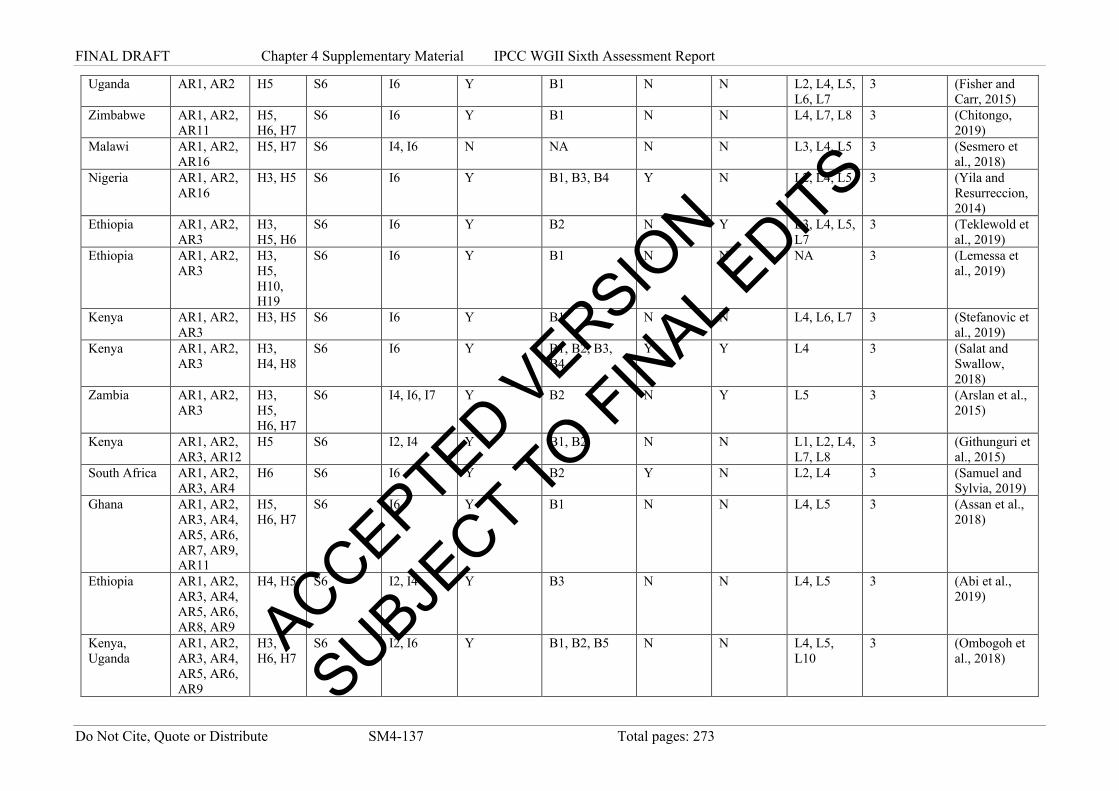
FINAL DRAFT Chapter 4 Supplementary Material IPCC WGII Sixth Assessment Report
Do Not Cite, Quote or Distribute SM4-137 Total pages: 273
Uganda AR1, AR2 H5 S6 I6 Y B1 N N L2, L4, L5, L6, L7
3 (Fisher and Carr, 2015)
Zimbabwe AR1, AR2, AR11
H5, H6, H7
S6 I6 Y B1 N N L4, L7, L8 3 (Chitongo, 2019)
Malawi AR1, AR2, AR16
H5, H7 S6 I4, I6 N NA N N L3, L4, L5 3 (Sesmero et al., 2018)
Nigeria AR1, AR2, AR16
H3, H5 S6 I6 Y B1, B3, B4 Y N L2, L4, L5 3 (Yila and Resurreccion, 2014)
Ethiopia AR1, AR2, AR3
H3, H5, H6
S6 I6 Y B2 N Y L3, L4, L5, L7
3 (Teklewold et al., 2019)
Ethiopia AR1, AR2, AR3
H3, H5, H10, H19
S6 I6 Y B1 N N NA 3 (Lemessa et al., 2019)
Kenya AR1, AR2, AR3
H3, H5 S6 I6 Y B1 N N L4, L6, L7 3 (Stefanovic et al., 2019)
Kenya AR1, AR2, AR3
H3, H4, H8
S6 I6 Y B1, B2, B3, B4
Y Y L4 3 (Salat and Swallow, 2018)
Zambia AR1, AR2, AR3
H3, H5, H6, H7
S6 I4, I6, I7 Y B2 N Y L5 3 (Arslan et al., 2015)
Kenya AR1, AR2, AR3, AR12
H5 S6 I2, I4 Y B1, B2 N N L1, L2, L4, L7, L8
3 (Githunguri et al., 2015)
South Africa AR1, AR2, AR3, AR4
H6 S6 I6 Y B2 Y N L2, L4 3 (Samuel and Sylvia, 2019)
Ghana AR1, AR2, AR3, AR4, AR5, AR6, AR7, AR9, AR11
H5, H6, H7
S6 I6 Y B1 N N L4, L5 3 (Assan et al., 2018)
Ethiopia AR1, AR2, AR3, AR4, AR5, AR6, AR8, AR9
H4, H5 S6 I2, I4 Y B3 N N L4, L5 3 (Abi et al., 2019)
Kenya, Uganda
AR1, AR2, AR3, AR4, AR5, AR6, AR9
H3, H6, H7
S6 I2, I6 Y B1, B2, B5 N N L4, L5, L10
3 (Ombogoh et al., 2018)
ACCEPTED VERSIO
N
SUBJECT TO FIN
AL EDITS
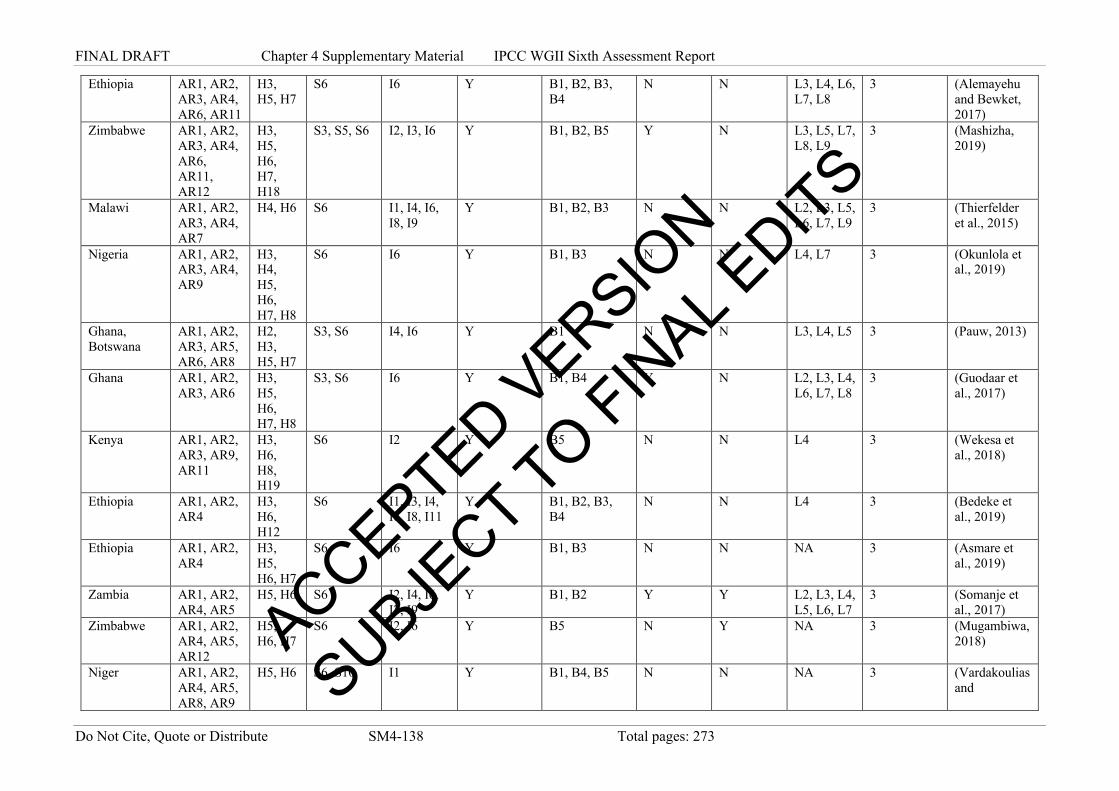
FINAL DRAFT Chapter 4 Supplementary Material IPCC WGII Sixth Assessment Report
Do Not Cite, Quote or Distribute SM4-138 Total pages: 273
Ethiopia AR1, AR2, AR3, AR4, AR6, AR11
H3, H5, H7
S6 I6 Y B1, B2, B3, B4
N N L3, L4, L6, L7, L8
3 (Alemayehu and Bewket, 2017)
Zimbabwe AR1, AR2, AR3, AR4, AR6, AR11, AR12
H3, H5, H6, H7, H18
S3, S5, S6 I2, I3, I6 Y B1, B2, B5 Y N L3, L5, L7, L8, L9
3 (Mashizha, 2019)
Malawi AR1, AR2, AR3, AR4, AR7
H4, H6 S6 I1, I4, I6, I8, I9
Y B1, B2, B3 N N L2, L3, L5, L6, L7, L9
3 (Thierfelder et al., 2015)
Nigeria AR1, AR2, AR3, AR4, AR9
H3, H4, H5, H6, H7, H8
S6 I6 Y B1, B3 N N L4, L7 3 (Okunlola et al., 2019)
Ghana, Botswana
AR1, AR2, AR3, AR5, AR6, AR8
H2, H3, H5, H7
S3, S6 I4, I6 Y B1 N N L3, L4, L5 3 (Pauw, 2013)
Ghana AR1, AR2, AR3, AR6
H3, H5, H6, H7, H8
S3, S6 I6 Y B1, B4 Y N L2, L3, L4, L6, L7, L8
3 (Guodaar et al., 2017)
Kenya AR1, AR2, AR3, AR9, AR11
H3, H6, H8, H19
S6 I2 Y B5 N N L4 3 (Wekesa et al., 2018)
Ethiopia AR1, AR2, AR4
H3, H6, H12
S6 I1, I3, I4, I6, I8, I11
Y B1, B2, B3, B4
N N L4 3 (Bedeke et al., 2019)
Ethiopia AR1, AR2, AR4
H3, H5, H6, H7
S6 I6 Y B1, B3 N N NA 3 (Asmare et al., 2019)
Zambia AR1, AR2, AR4, AR5
H5, H6 S6 I2, I4, I6, I7, I9
Y B1, B2 Y Y L2, L3, L4, L5, L6, L7
3 (Somanje et al., 2017)
Zimbabwe AR1, AR2, AR4, AR5, AR12
H5, H6, H7
S6 I2, I6 Y B5 N Y NA 3 (Mugambiwa, 2018)
Niger AR1, AR2, AR4, AR5, AR8, AR9
H5, H6 S6, S10 I1 Y B1, B4, B5 N N NA 3 (Vardakoulias and
ACCEPTED VERSIO
N
SUBJECT TO FIN
AL EDITS

FINAL DRAFT Chapter 4 Supplementary Material IPCC WGII Sixth Assessment Report
Do Not Cite, Quote or Distribute SM4-139 Total pages: 273
Nicholles, 2021)
Nigeria AR1, AR2, AR4, AR6
H3, H5, H6, H8
S6 I6 Y B1, B2 N N L3, L4 3 (Ojo and Baiyegunhi, 2020)
Kenya AR1, AR2, AR4, AR6, AR7, AR16
H3, H5, H6
S6 I6 Y B1 N N L7 3 (Waldman et al., 2019)
Tanzania AR1, AR2, AR4, AR6, AR9, AR11
H3, H5, H6
S6 I6 Y B1, B3 Y N L2, L7 3 (Brüssow et al., 2017)
Burkina Faso, Senegal, Ghana
AR1, AR2, AR4, AR9, AR11
H6 S6 I6 Y B1, B5 N N L3, L7 3 (Douxchamps et al., 2016)
Ghana AR1, AR2, AR5, AR6, AR8
H3, H6, H7
S6 I2, I6, I7 Y B1, B2, B3, B5
Y N L4, L5 3 (Dapilah et al., 2020)
Burkina Faso AR1, AR2, AR5, AR8
H3, H5 S6 I1, I2, I6, I11
Y B1, B4, B5 N Y L5, L7 3 (Vom Brocke et al., 2014)
Benin AR1, AR2, AR5, AR9
H3, H5, H6, H10, H18
S2, S6, S10
I1, I2, I4, I6
Y B1, B2, B3, B4, B5
Y Y L1, L2, L3, L6, L7, L9, L10
3 (Kloos and Renaud, 2014)
Niger AR1, AR2, AR6
H2, H5, H6
S6 I6 Y B1, B2 N N L5 3 (Asfaw et al., 2018)
Zambia AR1, AR2, AR6, AR11
H3, H5, H6
S6, S10 I4, I6 Y B1 N N L3, L4 3 (Asfaw et al., 2018)
Benin AR1, AR2, AR6, AR7
H5, H6 S3, S6 I6 Y B1, B5 N N L3, L6 3 (Yegbemey et al., 2017)
Ghana AR1, AR2, AR6, AR8, AR12
H3, H5, H6, H10, H11
S6 I6 Y B1, B4 Y Y L1, L4, L5 3 (Aniah et al., 2019)
Tanzania AR1, AR2, AR6, AR9
H3, H5, H6
S6 I6 Y B1 Y N L4, L5, L6, L8
3 (Balama et al., 2017)
Zimbabwe AR1, AR2, AR8
H5 S6 I4, I5, I6 Y B1, B2 N N L5, L7 3 (Makate and Makate, 2019)
ACCEPTED VERSIO
N
SUBJECT TO FIN
AL EDITS

FINAL DRAFT Chapter 4 Supplementary Material IPCC WGII Sixth Assessment Report
Do Not Cite, Quote or Distribute SM4-140 Total pages: 273
Ghana AR1, AR2, AR9
H4, H5, H6
S6 I1, I4, I6 Y B1, B3, B5 N Y NA 3 (Weston et al., 2015)
Uganda AR1, AR2, AR9
H3, H5, H6, H7
S6 I1, I2 Y B3, B4 N N NA 3 (Sarmiento-Soler et al., 2019)
Kenya AR1, AR3 H3, H5, H6
S6 I6 Y B1, B2 N N L4, L5, L7, L8
3 (Asayehegn et al., 2017)
Algeria AR1, AR3, AR4
H2, H5, H6
S6 I4, I6, I11 Y B1, B3 Y N L5, L6, L7, L8
3 (Rouabhi et al., 2016)
Ethiopia AR1, AR3, AR4
H5, H6, H8, H10, H18
S6 I6 Y B1, B2, B5 N N L4, L5, L6, L7
3 (Teklewold et al., 2017)
Mali AR1, AR4 H3, H4 S6 I1, I6, I11 Y B1, B2, B3 N N L6 3 (Traore et al., 2017)
Vietnam, Kenya
AR1, AR4, AR6
H3, H5, H8
S6 I4, I6 Y B1, B2 Y Y L4, L5 3 (Hoang et al., 2014)
Niger AR1, AR4, AR7, AR8, AR11
H6 S5, S6, S10
I1, I4, I6, I7
Y B1, B4, B5 N N L7 3 (Tabbo and Amadou, 2017)
Ghana AR1, AR5, AR6, AR7, AR8
H2, H6 S6, S9 I1, I2, I6 Y B1, B2, B3, B5
Y N L4, L5 3 (Soeters, 2016)
Nigeria AR1, AR5, AR6, AR7, AR8, AR9, AR10
H3, H5, H6, H7, H8
S3, S5, S6, S10
I2, I4, I6 Y B1, B3, B5 N N L5 3 (Choko et al., 2019)
Several African countries
AR1, AR5, AR8
H3, H5, H9
S6 I2, I3, I6 Y B5 Y N NA 3 (Mapfumo et al., 2017)
Ghana AR1, AR6, AR12
H3, H5, H7
S3, S6 I6 Y B1, B3, B4 Y N L4 3 (Antwi-Agyei et al., 2018)
Kenya AR1, AR6, AR7, AR11
H3, H5 S3, S6 I6 Y B1 N N L2, L3 3 (Ng’ang’a et al., 2016)
Tanzania AR1, AR6, AR9
H3, H4, H7, H10, H12, H14
S2, S3, S6, S7, S11
I6 N NA Y N L5, L7, L9 3 (Suckall et al., 2014) ACCEPTED V
ERSION
SUBJECT TO FIN
AL EDITS
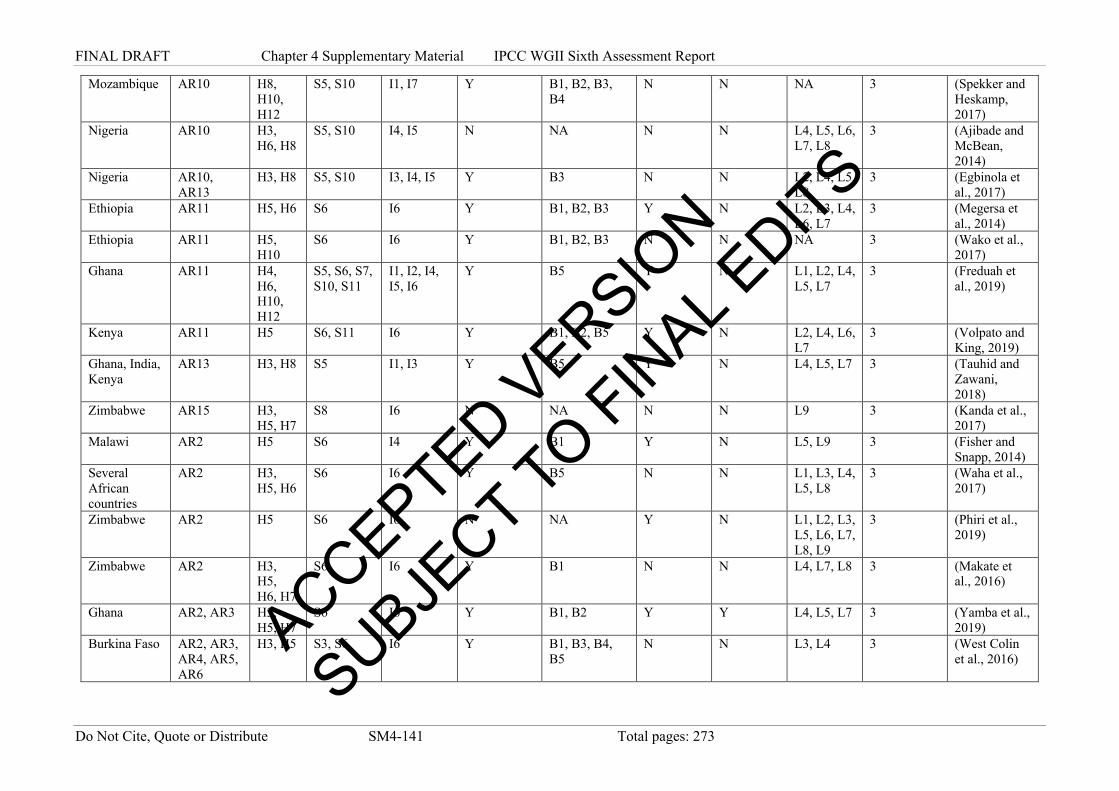
FINAL DRAFT Chapter 4 Supplementary Material IPCC WGII Sixth Assessment Report
Do Not Cite, Quote or Distribute SM4-141 Total pages: 273
Mozambique AR10 H8, H10, H12
S5, S10 I1, I7 Y B1, B2, B3, B4
N N NA 3 (Spekker and Heskamp, 2017)
Nigeria AR10 H3, H6, H8
S5, S10 I4, I5 N NA N N L4, L5, L6, L7, L8
3 (Ajibade and McBean, 2014)
Nigeria AR10, AR13
H3, H8 S5, S10 I3, I4, I5 Y B3 N N L2, L4, L5, L8
3 (Egbinola et al., 2017)
Ethiopia AR11 H5, H6 S6 I6 Y B1, B2, B3 Y N L2, L3, L4, L6, L7
3 (Megersa et al., 2014)
Ethiopia AR11 H5, H10
S6 I6 Y B1, B2, B3 N N NA 3 (Wako et al., 2017)
Ghana AR11 H4, H6, H10, H12
S5, S6, S7, S10, S11
I1, I2, I4, I5, I6
Y B5 Y N L1, L2, L4, L5, L7
3 (Freduah et al., 2019)
Kenya AR11 H5 S6, S11 I6 Y B1, B2, B5 Y N L2, L4, L6, L7
3 (Volpato and King, 2019)
Ghana, India, Kenya
AR13 H3, H8 S5 I1, I3 Y B5 Y N L4, L5, L7 3 (Tauhid and Zawani, 2018)
Zimbabwe AR15 H3, H5, H7
S8 I6 N NA N N L9 3 (Kanda et al., 2017)
Malawi AR2 H5 S6 I4 Y B1 Y N L5, L9 3 (Fisher and Snapp, 2014)
Several African countries
AR2 H3, H5, H6
S6 I6 Y B5 N N L1, L3, L4, L5, L8
3 (Waha et al., 2017)
Zimbabwe AR2 H5 S6 I6 N NA Y N L1, L2, L3, L5, L6, L7, L8, L9
3 (Phiri et al., 2019)
Zimbabwe AR2 H3, H5, H6, H7
S6 I6 Y B1 N N L4, L7, L8 3 (Makate et al., 2016)
Ghana AR2, AR3 H3, H5, H7
S6 I6 Y B1, B2 Y Y L4, L5, L7 3 (Yamba et al., 2019)
Burkina Faso AR2, AR3, AR4, AR5, AR6
H3, H5 S3, S6 I6 Y B1, B3, B4, B5
N N L3, L4 3 (West Colin et al., 2016)
ACCEPTED VERSIO
N
SUBJECT TO FIN
AL EDITS
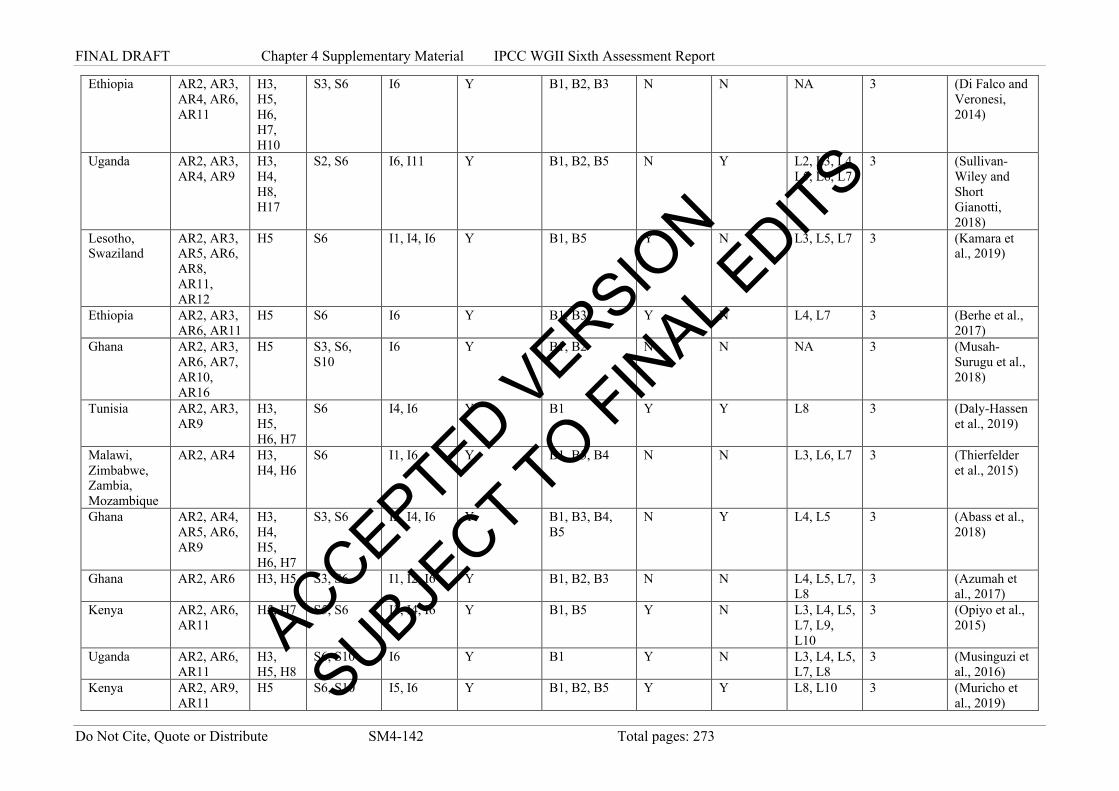
FINAL DRAFT Chapter 4 Supplementary Material IPCC WGII Sixth Assessment Report
Do Not Cite, Quote or Distribute SM4-142 Total pages: 273
Ethiopia AR2, AR3, AR4, AR6, AR11
H3, H5, H6, H7, H10
S3, S6 I6 Y B1, B2, B3 N N NA 3 (Di Falco and Veronesi, 2014)
Uganda AR2, AR3, AR4, AR9
H3, H4, H8, H17
S2, S6 I6, I11 Y B1, B2, B5 N Y L2, L3, L4, L5, L6, L7
3 (Sullivan-Wiley and Short Gianotti, 2018)
Lesotho, Swaziland
AR2, AR3, AR5, AR6, AR8, AR11, AR12
H5 S6 I1, I4, I6 Y B1, B5 Y N L3, L5, L7 3 (Kamara et al., 2019)
Ethiopia AR2, AR3, AR6, AR11
H5 S6 I6 Y B1, B3 Y N L4, L7 3 (Berhe et al., 2017)
Ghana AR2, AR3, AR6, AR7, AR10, AR16
H5 S3, S6, S10
I6 Y B1, B2 N N NA 3 (Musah-Surugu et al., 2018)
Tunisia AR2, AR3, AR9
H3, H5, H6, H7
S6 I4, I6 Y B1 Y Y L8 3 (Daly-Hassen et al., 2019)
Malawi, Zimbabwe, Zambia, Mozambique
AR2, AR4 H3, H4, H6
S6 I1, I6 Y B1, B3, B4 N N L3, L6, L7 3 (Thierfelder et al., 2015)
Ghana AR2, AR4, AR5, AR6, AR9
H3, H4, H5, H6, H7
S3, S6 I2, I4, I6 Y B1, B3, B4, B5
N Y L4, L5 3 (Abass et al., 2018)
Ghana AR2, AR6 H3, H5 S3, S6 I1, I2, I6 Y B1, B2, B3 N N L4, L5, L7, L8
3 (Azumah et al., 2017)
Kenya AR2, AR6, AR11
H5, H7 S5, S6 I3, I4, I6 Y B1, B5 Y N L3, L4, L5, L7, L9, L10
3 (Opiyo et al., 2015)
Uganda AR2, AR6, AR11
H3, H5, H8
S6, S10 I6 Y B1 Y N L3, L4, L5, L7, L8
3 (Musinguzi et al., 2016)
Kenya AR2, AR9, AR11
H5 S6, S10 I5, I6 Y B1, B2, B5 Y Y L8, L10 3 (Muricho et al., 2019)
ACCEPTED VERSIO
N
SUBJECT TO FIN
AL EDITS
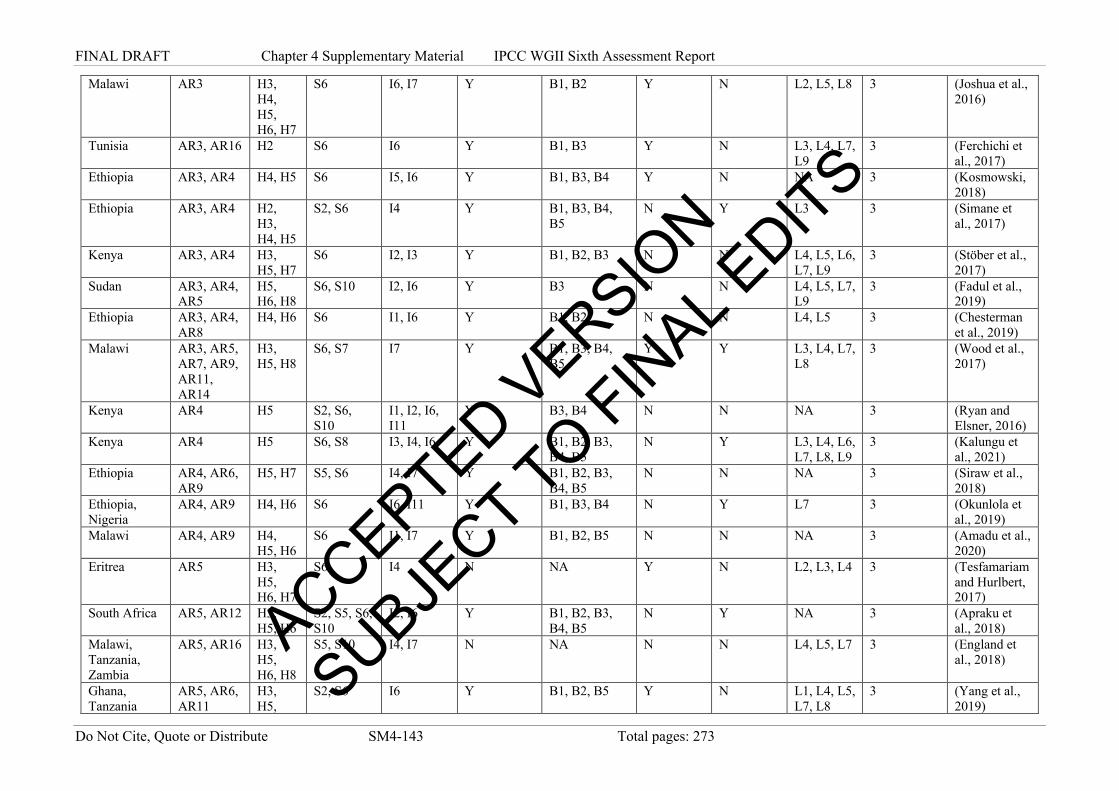
FINAL DRAFT Chapter 4 Supplementary Material IPCC WGII Sixth Assessment Report
Do Not Cite, Quote or Distribute SM4-143 Total pages: 273
Malawi AR3 H3, H4, H5, H6, H7
S6 I6, I7 Y B1, B2 Y N L2, L5, L8 3 (Joshua et al., 2016)
Tunisia AR3, AR16 H2 S6 I6 Y B1, B3 Y N L3, L4, L7, L9
3 (Ferchichi et al., 2017)
Ethiopia AR3, AR4 H4, H5 S6 I5, I6 Y B1, B3, B4 Y N NA 3 (Kosmowski, 2018)
Ethiopia AR3, AR4 H2, H3, H4, H5
S2, S6 I4 Y B1, B3, B4, B5
N Y L3 3 (Simane et al., 2017)
Kenya AR3, AR4 H3, H5, H7
S6 I2, I3 Y B1, B2, B3 N N L4, L5, L6, L7, L9
3 (Stöber et al., 2017)
Sudan AR3, AR4, AR5
H5, H6, H8
S6, S10 I2, I6 Y B3 N N L4, L5, L7, L9
3 (Fadul et al., 2019)
Ethiopia AR3, AR4, AR8
H4, H6 S6 I1, I6 Y B1, B2 N N L4, L5 3 (Chesterman et al., 2019)
Malawi AR3, AR5, AR7, AR9, AR11, AR14
H3, H5, H8
S6, S7 I7 Y B1, B3, B4, B5
Y Y L3, L4, L7, L8
3 (Wood et al., 2017)
Kenya AR4 H5 S2, S6, S10
I1, I2, I6, I11
Y B3, B4 N N NA 3 (Ryan and Elsner, 2016)
Kenya AR4 H5 S6, S8 I3, I4, I6 Y B1, B2, B3, B4, B5
N Y L3, L4, L6, L7, L8, L9
3 (Kalungu et al., 2021)
Ethiopia AR4, AR6, AR9
H5, H7 S5, S6 I4, I7 Y B1, B2, B3, B4, B5
N N NA 3 (Siraw et al., 2018)
Ethiopia, Nigeria
AR4, AR9 H4, H6 S6 I6, I11 Y B1, B3, B4 N Y L7 3 (Okunlola et al., 2019)
Malawi AR4, AR9 H4, H5, H6
S6 I1, I7 Y B1, B2, B5 N N NA 3 (Amadu et al., 2020)
Eritrea AR5 H3, H5, H6, H7
S6 I4 N NA Y N L2, L3, L4 3 (Tesfamariam and Hurlbert, 2017)
South Africa AR5, AR12 H3, H5, H6
S2, S5, S6, S10
I2, I6 Y B1, B2, B3, B4, B5
N Y NA 3 (Apraku et al., 2018)
Malawi, Tanzania, Zambia
AR5, AR16 H3, H5, H6, H8
S5, S10 I4, I7 N NA N N L4, L5, L7 3 (England et al., 2018)
Ghana, Tanzania
AR5, AR6, AR11
H3, H5,
S2, S6 I6 Y B1, B2, B5 Y N L1, L4, L5, L7, L8
3 (Yang et al., 2019)
ACCEPTED VERSIO
N
SUBJECT TO FIN
AL EDITS

FINAL DRAFT Chapter 4 Supplementary Material IPCC WGII Sixth Assessment Report
Do Not Cite, Quote or Distribute SM4-144 Total pages: 273
H6, H7, H9, H10, H12, H13, H16
Ethiopia AR5, AR6, AR7, AR8
H3, H5 S3, S6 I4, I6 Y B1, B2 Y N L4, L5 3 (Gao and Mills, 2018)
Uganda AR5, AR6, AR8
H3, H5, H6, H8
S5 I1, I2, I6 Y B1, B2, B3, B5
N Y NA 3 (Dobson et al., 2015)
Malawi AR5, AR7 H3, H5, H6
S6 I4, I6 Y B1, B2 N N L4, L5 3 (Kawaye and Hutchinson, 2018)
South Africa AR5, AR7 H3, H6, H8
S7, S10 I2, I6 Y B1, B2, B5 Y N L2, L4 3 (Shale, 2014)
Uganda, Spain
AR5, AR7, AR13
H5, H6 S5, S8 I3 Y B1, B2, B3 N N NA 3 (Kayaga and Smout, 2014)
Zimbabwe, Mozambique, Malawi
AR5, AR8 H3, H5 S6 I1, I7 Y B1, B2, B5 N N L2, L3, L4, L5
3 (Nyikahadzoi et al., 2017)
Uganda AR5, AR8, AR16
H3, H5, H7
S6 I2, I4, I9 Y B1, B2, B5 Y N L4, L5 3 (Cooper and Wheeler, 2015)
Cameroon AR5, AR9 H3, H5, H6
S2, S5, S6, S10
I1, I3, I6, I7
Y B2, B4 N N L5 3 (Brown and Sonwa, 2015)
Kenya AR5, AR9 H3 S6 I1, I3, I6 Y B1, B2 N N L5, L6, L7 3 (Fuchs et al., 2019)
Botswana AR6 H6, H8 S3, S5, S10
I4, I6 N NA Y N L5, L8 3 (Shinn et al., 2014)
Kenya AR6 H3, H5, H7
S2, S5, S6, S9, S11
I2, I4, I6, I8, I9
Y B1, B3, B4 Y N L1, L3, L5 3 (Bedelian and Ogutu, 2017)
Senegal AR6 H4, H5 S3, S8 I6 Y B1, B2, B3, B5
Y N L1, L2, L4, L5, L8
3 (Romankiewicz et al., 2016)
Ethiopia AR6, AR11, AR12
H5, H7 S6 I6 Y B1, B2 N N L2, L4, L8 3 13_Berhau and Beyene_2015
Ethiopia AR6, AR7 H5 S3, S6, S10
I4, I6, I7 Y B1, B4 Y N NA 3 (Mersha and van
ACCEPTED VERSIO
N
SUBJECT TO FIN
AL EDITS
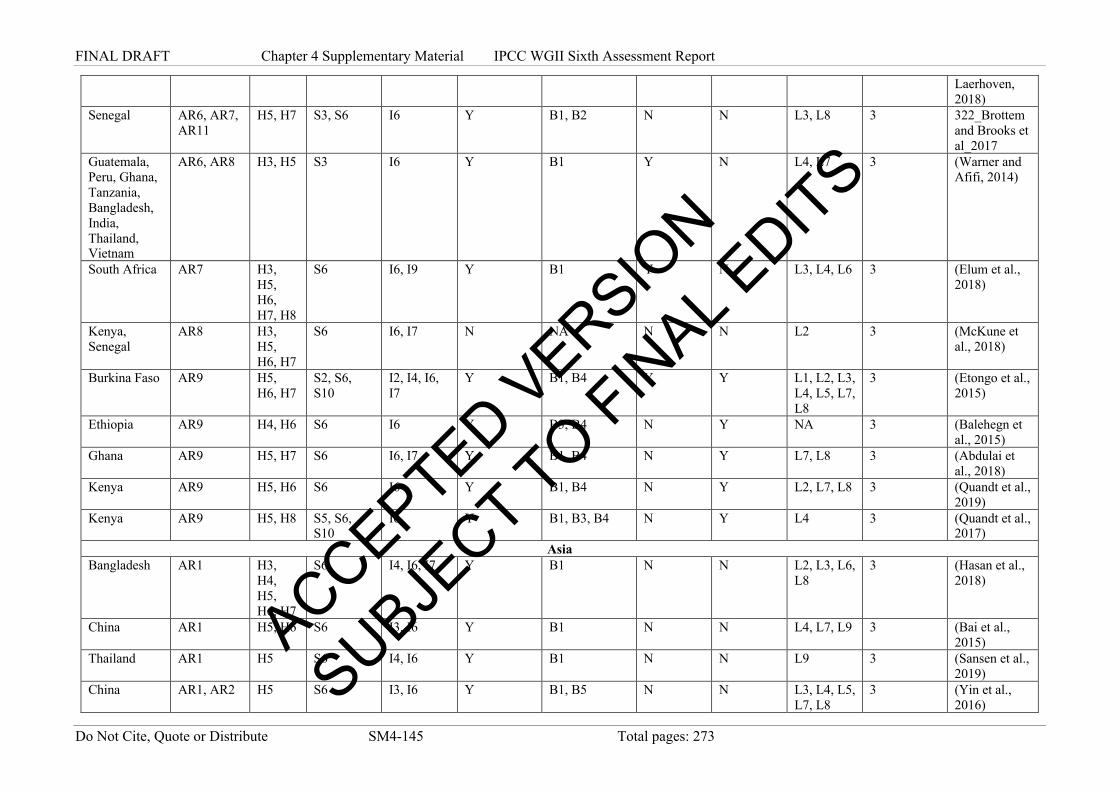
FINAL DRAFT Chapter 4 Supplementary Material IPCC WGII Sixth Assessment Report
Do Not Cite, Quote or Distribute SM4-145 Total pages: 273
Laerhoven, 2018)
Senegal AR6, AR7, AR11
H5, H7 S3, S6 I6 Y B1, B2 N N L3, L8 3 322_Brottem and Brooks et al_2017
Guatemala, Peru, Ghana, Tanzania, Bangladesh, India, Thailand, Vietnam
AR6, AR8 H3, H5 S3 I6 Y B1 Y N L4, L7 3 (Warner and Afifi, 2014)
South Africa AR7 H3, H5, H6, H7, H8
S6 I6, I9 Y B1 Y N L3, L4, L6 3 (Elum et al., 2018)
Kenya, Senegal
AR8 H3, H5, H6, H7
S6 I6, I7 N NA N N L2 3 (McKune et al., 2018)
Burkina Faso AR9 H5, H6, H7
S2, S6, S10
I2, I4, I6, I7
Y B1, B4 Y Y L1, L2, L3, L4, L5, L7, L8
3 (Etongo et al., 2015)
Ethiopia AR9 H4, H6 S6 I6 Y B3, B4 N Y NA 3 (Balehegn et al., 2015)
Ghana AR9 H5, H7 S6 I6, I7 Y B1, B4 N Y L7, L8 3 (Abdulai et al., 2018)
Kenya AR9 H5, H6 S6 I6 Y B1, B4 N Y L2, L7, L8 3 (Quandt et al., 2019)
Kenya AR9 H5, H8 S5, S6, S10
I6 Y B1, B3, B4 N Y L4 3 (Quandt et al., 2017)
Asia Bangladesh AR1 H3,
H4, H5, H6, H7
S6 I4, I6, I7 Y B1 N N L2, L3, L6, L8
3 (Hasan et al., 2018)
China AR1 H5, H6 S6 I3, I6 Y B1 N N L4, L7, L9 3 (Bai et al., 2015)
Thailand AR1 H5 S6 I4, I6 Y B1 N N L9 3 (Sansen et al., 2019)
China AR1, AR2 H5 S6 I3, I6 Y B1, B5 N N L3, L4, L5, L7, L8
3 (Yin et al., 2016)
ACCEPTED VERSIO
N
SUBJECT TO FIN
AL EDITS

FINAL DRAFT Chapter 4 Supplementary Material IPCC WGII Sixth Assessment Report
Do Not Cite, Quote or Distribute SM4-146 Total pages: 273
China AR1, AR2 H3, H5 S6 I6 Y B1, B2 Y N L3, L4, L5, L7, L9
3 (Lei et al., 2016b)
China AR1, AR2 H3, H5, H8
S6 I6 Y B1 N N NA 3 (Huang et al., 2015)
Pakistan AR1, AR2 H3, H6, H7
S6 I6 Y B1 N N L4, L6, L7, L10
3 (Ali and Erenstein, 2017)
Pakistan AR1, AR2 H3, H5 S6 I6 Y B1 N N L4, L7 3 (Abid et al., 2016)
India AR1, AR2, AR3
H2, H3 S6 I6 Y B1, B2, B3 N N L6, L8 3 (Jain et al., 2015)
Nepal AR1, AR2, AR3
H3, H5, H19
S6 I6 Y B1 N N L3, L4, L5, L6, L7
3 (Khanal et al., 2018)
Nepal AR1, AR2, AR3
H3, H5, H8
S6 I6 Y B1 Y N L6, L7 3 (Khanal et al., 2018)
Pakistan AR1, AR2, AR3
H2, H3, H5, H6, H9, H10, H15
S6 I7 Y B1, B3, B4, B5
N N L4, L6, L7, L8, L9
3 (Imran et al., 2018)
Bangladesh AR1, AR2, AR3, AR11
H3, H4, H6, H9, H10, H15
S6 I6 Y B1, B2, B3, B4
Y N L3, L5, L9 3 (Kabir et al., 2016)
Bangladesh AR1, AR2, AR3, AR11
H3, H5, H6, H8, H10, H15
S6 I6 Y B1, B3, B5 Y N L1, L4, L5, L6, L10
3 (Arfanuzzaman et al., 2016)
Nepal AR1, AR2, AR3, AR11
H3, H5, H6, H7
S6 I6 Y B1 Y N L4 3 (Dhakal et al., 2016)
Pakistan AR1, AR2, AR3, AR4
H3, H5, H6, H7
S6 I3, I6 Y B1, B3 Y N L4, L5 3 (Gorst et al., 2018)
ACCEPTED VERSIO
N
SUBJECT TO FIN
AL EDITS

FINAL DRAFT Chapter 4 Supplementary Material IPCC WGII Sixth Assessment Report
Do Not Cite, Quote or Distribute SM4-147 Total pages: 273
Vietnam AR1, AR2, AR3, AR4, AR6
H5, H10, H15
S6 I4, I5, I6, I9
Y B1 N N L7 3 (Ho and Shimada, 2019)
India AR1, AR2, AR3, AR4, AR6, AR7
H3, H7 S3, S6 I6 Y B1, B2, B5 N N NA 3 (Jha et al., 2018)
India AR1, AR2, AR3, AR4, AR6, AR7, AR11
H2, H3, H5, H6
S3, S6 I1, I5, I6 Y B1, B2, B5 Y N L3, L4, L7 3 (Singh et al., 2019)
Pakistan AR1, AR2, AR3, AR4, AR6, AR7, AR11
H3, H5, H6
S6, S8 I6 Y B1 N N L2, L4, L5, L6, L7, L9
3 (Ahmad et al., 2016)
India AR1, AR2, AR3, AR4, AR6, AR8, AR11
H5 S6 I4, I6, I7 Y B1, B2 N N L3, L4 3 (Kumar et al., 2016)
Bangladesh AR1, AR2, AR3, AR4, AR6, AR8, AR11, AR12
H2, H3, H5, H6, H7
S6 I2, I6 Y B1, B3, B4 N N L4, L7, L8 3 (Hossain et al., 2016)
Nepal AR1, AR2, AR3, AR4, AR7, AR9, AR16
H3, H5, H6
S2, S6 I2, I3, I6 Y B3, B4 N Y L3, L5, L8 3 (Bhatta et al., 2015)
Nepal AR1, AR2, AR3, AR4, AR9
H2, H3, H5, H6, H7
S6 I6 Y B1, B2 N N NA 3 (Khanal et al., 2018)
China AR1, AR2, AR3, AR5
H2, H5, H10, H15
S6 I2, I6 Y B4, B5 Y N L1, L4, L5, L8
3 (Zhou et al., 2014)
India AR1, AR2, AR3, AR5, AR7
H3, H5 S6 I6 Y B3, B5 N N L3, L5, L7 3 (Nambi et al., 2015)
Indonesia AR1, AR2, AR3, AR5, AR7, AR8,
H5, H6 S6 I1, I6 Y B1, B3, B5 N N L5, L6, L7 3 (Rahmawati and Lestari, 2019)
ACCEPTED VERSIO
N
SUBJECT TO FIN
AL EDITS

FINAL DRAFT Chapter 4 Supplementary Material IPCC WGII Sixth Assessment Report
Do Not Cite, Quote or Distribute SM4-148 Total pages: 273
AR11, AR12
Bangladesh AR1, AR2, AR3, AR6
H2, H5, H7
S6 I3, I4, I6, I11
Y B1, B4 Y N L4 3 (Islam et al., 2019a)
India AR1, AR2, AR3, AR6, AR11
H2, H5 S6 I6 Y B1, B2, B4 Y N L8 3 (Kattumuri et al., 2017)
India AR1, AR2, AR3, AR8
H3, H5, H6
S6 I1, I2, I4 Y B1, B3, B4 Y Y L5, L7 3 (Kakumanu et al., 2018)
India AR1, AR2, AR4
H3, H5 S6 I1, I3, I6, I7
Y B1, B2 N N L4, L7 3 (Patnaik and Das, 2017)
Myanmar AR1, AR2, AR4
H3, H5, H7
S3, S6 I6 Y B1, B3 N N NA 3 (Zin et al., 2019)
Myanmar AR1, AR2, AR4, AR11
H3, H5 S6 I6 Y B1 N N L1, L4, L8 3 (Tun Oo et al., 2017)
Bangladesh, India, Nepal
AR1, AR2, AR4, AR5
H2, H3, H5, H7, H8, H15
S6 I3, I6, I9 Y B1, B2, B3, B5
Y N L5 3 (Ojha et al., 2014)
Nepal AR1, AR2, AR4, AR6, AR9, AR11
H3, H5, H6, H7, H16, H17, H18
S3, S6 I3, I6 Y B1, B4 Y Y L8 3 (Sujakhu et al., 2016)
Philippines AR1, AR2, AR5, AR6, AR7, AR8, AR11, AR12
H3, H4, H5, H6, H7, H16, H17, H18
S6 I2, I3, I6 Y B1, B2 N Y L2, L5, L7 3 (Nelson et al., 2019)
Nepal AR1, AR2, AR5, AR6, AR8, AR9, AR11,
H3, H4, H5, H6
S6, S8 I2, I4, I6, I7
Y B1, B3, B4 N Y L4, L5, L7, L8
3 (Adhikari et al., 2018) ACCEPTED V
ERSION
SUBJECT TO FIN
AL EDITS
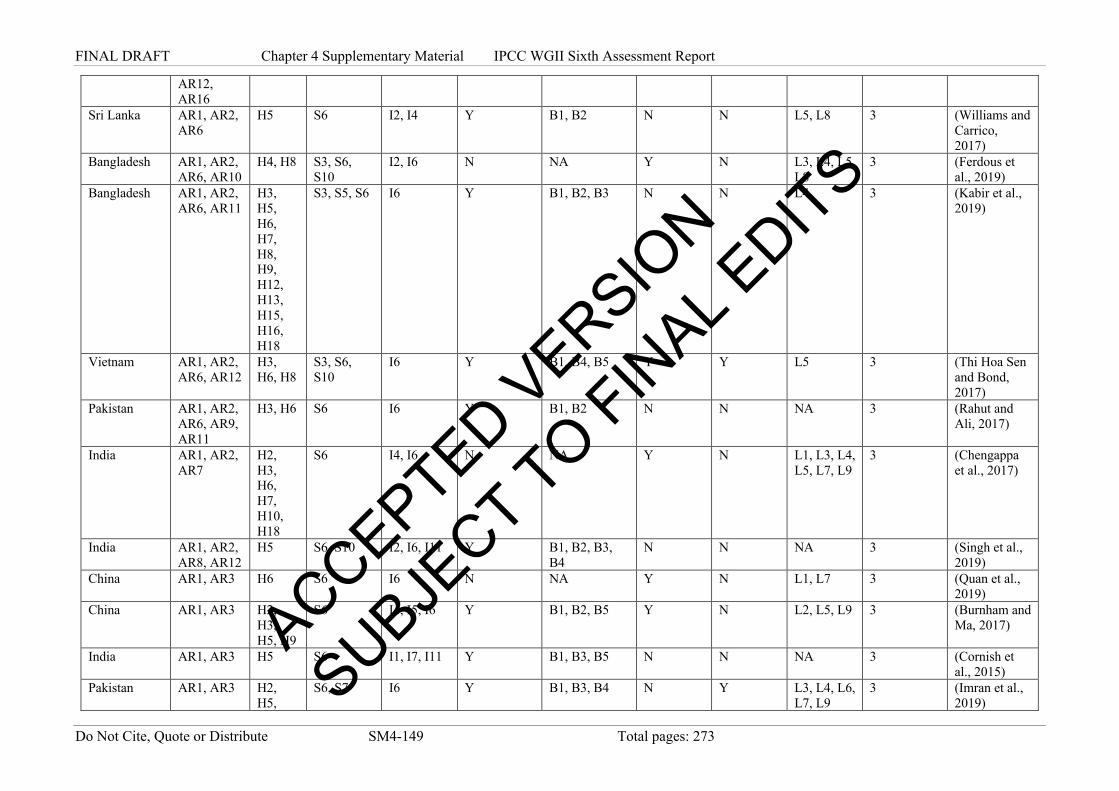
FINAL DRAFT Chapter 4 Supplementary Material IPCC WGII Sixth Assessment Report
Do Not Cite, Quote or Distribute SM4-149 Total pages: 273
AR12, AR16
Sri Lanka AR1, AR2, AR6
H5 S6 I2, I4 Y B1, B2 N N L5, L8 3 (Williams and Carrico, 2017)
Bangladesh AR1, AR2, AR6, AR10
H4, H8 S3, S6, S10
I2, I6 N NA Y N L3, L4, L5, L8
3 (Ferdous et al., 2019)
Bangladesh AR1, AR2, AR6, AR11
H3, H5, H6, H7, H8, H9, H12, H13, H15, H16, H18
S3, S5, S6 I6 Y B1, B2, B3 N N L4 3 (Kabir et al., 2019)
Vietnam AR1, AR2, AR6, AR12
H3, H6, H8
S3, S6, S10
I6 Y B1, B4, B5 Y Y L5 3 (Thi Hoa Sen and Bond, 2017)
Pakistan AR1, AR2, AR6, AR9, AR11
H3, H6 S6 I6 Y B1, B2 N N NA 3 (Rahut and Ali, 2017)
India AR1, AR2, AR7
H2, H3, H6, H7, H10, H18
S6 I4, I6 N NA Y N L1, L3, L4, L5, L7, L9
3 (Chengappa et al., 2017)
India AR1, AR2, AR8, AR12
H5 S6, S10 I2, I6, I11 Y B1, B2, B3, B4
N N NA 3 (Singh et al., 2019)
China AR1, AR3 H6 S6 I6 N NA Y N L1, L7 3 (Quan et al., 2019)
China AR1, AR3 H2, H3, H5, H9
S6 I4, I5, I6 Y B1, B2, B5 Y N L2, L5, L9 3 (Burnham and Ma, 2017)
India AR1, AR3 H5 S6 I1, I7, I11 Y B1, B3, B5 N N NA 3 (Cornish et al., 2015)
Pakistan AR1, AR3 H2, H5,
S6, S7 I6 Y B1, B3, B4 N Y L3, L4, L6, L7, L9
3 (Imran et al., 2019)
ACCEPTED VERSIO
N
SUBJECT TO FIN
AL EDITS

FINAL DRAFT Chapter 4 Supplementary Material IPCC WGII Sixth Assessment Report
Do Not Cite, Quote or Distribute SM4-150 Total pages: 273
H6, H9, H10, H15
China AR1, AR3, AR4, AR5, AR6, AR8
H2, H5 S3, S6 I3, I4 Y B1, B2, B3, B5
Y N NA 3 (Tan and Liu, 2017)
Nepal AR1, AR3, AR4, AR5, AR8
H3, H6 S6 I10 Y B1, B2, B3, B4, B5
N N L4, L9 3 (Rai et al., 2018)
Bangladesh AR1, AR3, AR4, AR7, AR11
H3, H5, H7, H8
S6 I1, I4, I6 N NA Y N L5 3 (Hossain and Paul, 2019)
India AR1, AR3, AR8
H5, H6 S6 I4, I6, I7 Y B1, B2, B3 Y N L4, L8 3 (Kakumanu et al., 2019)
Nepal AR1, AR4 H3, H5, H6, H18
S6 I1, I2, I6 Y B1, B2, B3, B4
N N L4 3 (Subedi et al., 2019)
India AR1, AR4, AR5, AR11
H3, H4, H5, H6, H7, H10, H16
S5, S6 I3, I4, I5, I6
Y B1, B3, B4, B5
N Y L4, L6, L7 3 (Srinivasa Rao et al., 2016)
Iran AR1, AR4, AR6
H5, H7 S6 I6 Y B4 Y N L3, L4, L6, L7, L9
3 (Keshavarz et al., 2014)
Sri Lanka AR1, AR5 H2, H3, H5
S6 I6 Y B1, B5 Y N L2, L4 3 (Burchfield and Gilligan, 2016a)
Bangladesh, India, Nepal
AR1, AR5, AR8, AR12
H3 S6 I1, I7 Y B1, B2, B5 N N L5 3 (Roschinsky et al., 2016)
Bangladesh AR10 H3, H10, H12, H16
S10 I1, I2, I4 N NA Y N L4 3 (Islam et al., 2018b)
India AR10 H3, H8 S5, S10 I4 N NA Y N L2, L3, L5, L7
3 (Pritchard and Thielemans, 2014)
ACCEPTED VERSIO
N
SUBJECT TO FIN
AL EDITS

FINAL DRAFT Chapter 4 Supplementary Material IPCC WGII Sixth Assessment Report
Do Not Cite, Quote or Distribute SM4-151 Total pages: 273
Indonesia AR10, AR13
H6, H10, H12, H13, H15
S5, S10 I1, I3, I4, I6
Y B1, B5 Y N L4, L5, L7 3 (Wijaya, 2015)
Pakistan AR10, AR16
H8 S6, S10 I2, I4, I6 Y B1 Y N L3, L4 3 (Abbas et al., 2018)
Philippines AR11 H3, H5, H7, H8, H16
S6 I2, I6 Y B1, B2 Y N L3, L5, L7 3 (Escarcha et al., 2018)
India AR11, AR12
H3, H4, H5, H7, H8
S2, S6 I6 Y B1, B3, B4 N Y NA 3 (Sarkar et al., 2018)
Bangladesh AR13 H6, H8 S5 I6 Y B2, B3, B5 N N L5, L8 3 (Birtchnell et al., 2019)
Nepal AR14 NA S7, S9 I4, I8 Y B1, B3 N Y L4, L5, L7 3 (Shrestha et al., 2015)
Nepal AR14 NA S7 I4 N NA N N L10 3 (Balasubramanya et al., 2014)
Taiwan AR14 H3, H8 S5, S6, S7, S10
I2, I3, I5, I6, I9
Y B1, B3, B4 N N NA 3 (Lin and Chen, 2016)
Bangladesh AR15 H9 S8 I2, I4, I7 Y B2 N N L2 3 (Dey et al., 2019)
Indonesia AR16 H3, H5 S6 I6 N NA Y N NA 3 (Pramudya et al., 2016)
Bangladesh AR2 H3, H8 S6 I6 N NA N N L4, L5, L6 3 (Younus and Harvey, 2014)
China AR2 H5, H7 S6 I6 Y B1 N N L8 3 (Yu et al., 2014)
Bangladesh AR2, AR12 H3, H5, H6, H7
S6 I6 Y B1, B2, B4 N N L6, L7 3 (Ahmed and Atiqul Haq, 2019)
China AR2, AR3 H5, H6 S6 I4, I6 Y B1 Y N L3, L5 3 (Wang et al., 2014)
India AR2, AR3 H3, H5 S6 I6 N NA N N L4, L9 3 (Taraz, 2017)
ACCEPTED VERSIO
N
SUBJECT TO FIN
AL EDITS

FINAL DRAFT Chapter 4 Supplementary Material IPCC WGII Sixth Assessment Report
Do Not Cite, Quote or Distribute SM4-152 Total pages: 273
India AR2, AR3 H2, H3, H5, H6, H8
S6 I6 Y B1, B2, B3, B4, B5
N Y L5, L7, L9 3 (Singh et al., 2014)
India AR2, AR3, AR4
H3, H5, H7
S6 I7, I11 Y B1, B2, B3 Y N L1, L2, L3, L4, L5, L6, L7, L8, L9
3 (Aryal et al., 2020)
Vietnam AR2, AR3, AR4, AR10, AR11
H3, H5, H6, H8, H9, H10, H15
S6, S10 I6 Y B1, B3, B4, B5
N Y L3, L4, L7, L8, L9
3 (Tran and Rodela, 2019)
Sri Lanka AR2, AR3, AR4, AR5, AR12
H5, H6 S6 I2, I4, I6 Y B1 N N L5 3 (Oka et al., 2015)
Afghanistan AR2, AR3, AR4, AR5, AR6, AR16
H2, H3, H5
S3, S6, S9 I2, I5, I6 Y B2, B3, B5 Y N L3, L5, L9 3 (Iqbal et al., 2018)
Bangladesh AR2, AR3, AR4, AR5, AR6, AR9, AR10, AR11, AR12, AR14, AR16
H2, H3, H4, H6, H7, H8, H10, H16, H17, H18, H19
S2, S6, S7, S8, S10
I3, I6 Y B1, B3, B4 N N NA 3 (Rahman and Alam, 2016)
China AR2, AR3, AR4, AR5, AR7
H5, H6 S6 I2, I3, I8 Y B1, B3, B5 N N L4, L5 3 (Zhang et al., 2018b)
India AR2, AR3, AR4, AR5, AR8
H3, H5 S6 I6, I11 Y B1, B3 Y N L5, L7, L8, L9
3 (Hochman et al., 2017)
China AR2, AR3, AR4, AR6
H5, H6, H7
S6, S10 I5, I6 Y B1, B3, B4 Y N L4, L5, L6, L7, L9, L10
3 (Yang et al., 2015b)
ACCEPTED VERSIO
N
SUBJECT TO FIN
AL EDITS
FINAL DRAFT Chapter 4 Supplementary Material IPCC WGII Sixth Assessment Report
Do Not Cite, Quote or Distribute SM4-153 Total pages: 273
Bangladesh AR2, AR3, AR4, AR6, AR7
H2, H3, H4, H5, H8, H10, H16
S3, S6, S10
I6 Y B1, B2, B3 Y N L5 3 (Ayeb-Karlsson et al., 2016)
India AR2, AR3, AR4, AR6, AR7
H2, H4, H5, H6, H7
S3, S6 I1, I2, I3, I4, I5, I6, I7, I11
Y B1, B3, B4 Y Y L5, L6, L7, L8
3 (Singh et al., 2019)
India AR2, AR3, AR4, AR6, AR7, AR11
H3, H5, H6
S6 I3, I5, I7 Y B1, B3 Y N NA 3 (Patnaik and Das, 2017)
China AR2, AR3, AR4, AR6, AR7, AR8
H3, H5, H10, H18
S6 I6 Y B1, B2 Y N L4, L6, L7 3 (Shi et al., 2019)
India, Nepal AR2, AR3, AR4, AR9
H1, H3, H6, H7
S6 I6 Y B1, B3, B4 Y N L2, L3, L4, L8
3 (Macchi et al., 2015)
Thailand AR2, AR3, AR5, AR6
H5 S6 I3, I6, I8 Y B1 N N L4, L8 3 (Pak-Uthai and Faysse, 2018)
Indonesia AR2, AR3, AR5, AR7, AR8, AR12
H3, H5, H6, H7, H10, H18
S6 I2, I6 Y B1, B2, B3, B4, B5
N Y L2, L5, L8, L9
3 (Hapsari et al., 2019)
India AR2, AR3, AR7
H3, H5, H6, H7
S6 I6 Y B1, B3, B4 N Y L4, L5 3 (Raghavendra and Suresh, 2018)
Pakistan AR2, AR3, AR9
H4, H5, H8, H10, H16, H18
S6 I6 N NA Y N L4 3 (Ullah et al., 2019)
China AR2, AR4, AR9
H2, H3, H5
S6, S10 I4 Y B1, B3, B4, B5
Y Y NA 3 (Lei et al., 2014)
ACCEPTED VERSIO
N
SUBJECT TO FIN
AL EDITS
FINAL DRAFT Chapter 4 Supplementary Material IPCC WGII Sixth Assessment Report
Do Not Cite, Quote or Distribute SM4-154 Total pages: 273
Nepal AR2, AR5, AR6
H3, H5, H7
S3, S6 I6 N NA Y N L2, L3, L4 3 (Sapkota et al., 2016)
Indonesia, Timor-Leste
AR2, AR6 H6 S6 I6 Y B1 N N L5 3 (Paulus et al., 2019)
Bangladesh AR2, AR6, AR10, AR11
H8 S2, S3, S6, S10
I2, I6 Y B1, B3 Y Y L4, L5, L7, L8
3 (Fenton et al., 2017)
China AR3 H5 S6 I6 N NA N N L7 3 (Wang and Chen, 2018)
China AR3 H3, H5 S6 I6 Y B1 Y N L3, L4, L5, L7, L9
3 (Song et al., 2018)
China AR3 H3, H5, H6
S6 I3, I4 Y B1, B3, B4 N N L6, L8 3 (Lei et al., 2016a)
China AR3 H5 S6 I6 Y B1, B3 N N NA 3 (Wang et al., 2018b)
India AR3, AR12 H1, H5 S6 I1, I2, I6 Y B1, B2, B3, B4, B5
Y Y L2, L3, L6, L7
3 (Sudan and McKay, 2015)
China AR3, AR4 H2, H5 S6 I6 Y B1 N N NA 3 (Wang et al., 2019a)
India AR3, AR4, AR5
H3, H5, H6, H18
S6, S8 I2, I3, I6, I11
Y B3, B4, B5 Y N L3, L4, L5, L10
3 (Banerjee, 2015)
Sri Lanka AR3, AR4, AR5, AR12
H5 S6 I2, I3, I5, I6
Y B2, B5 N N L5, L8, L9 3 (Burchfield and Gilligan, 2016b)
China AR3, AR4, AR6, AR15
H5, H6 S6, S8 I2, I3, I4, I6, I9
Y B1, B2, B3 N N L2, L5, L6, L8
3 (Su et al., 2017)
India AR3, AR4, AR9, AR12
H2, H3, H5, H15, H18
S1, S6, S8 I1, I6 Y B1, B2, B3, B4
N N L2, L5 3 (Sarkar et al., 2015)
India AR3, AR5, AR8
H3, H5 S6 I6 Y B1, B3 N Y NA 3 (Kakumanu et al., 2018)
China AR3, AR7 H2, H3, H5, H7
S6 I6 Y B1, B3 Y N L1, L4, L5 3 (Zhang et al., 2016b)
Indonesia AR4 H5 S6 I4 Y B1, B2, B3, B4, B5
N Y L1, L3, L4, L5, L7, L8
3 (Muttaqin et al., 2019)
ACCEPTED VERSIO
N
SUBJECT TO FIN
AL EDITS

FINAL DRAFT Chapter 4 Supplementary Material IPCC WGII Sixth Assessment Report
Do Not Cite, Quote or Distribute SM4-155 Total pages: 273
Nepal AR4 H3, H5, H6
S6 I4 Y B1, B2, B5 N N L4, L5, L8 3 (Adhikari et al., 2018)
Malaysia AR4, AR10, AR13
H3, H8 S5, S10 I3, I4 Y B3, B4 N Y NA 3 (Chan et al., 2019)
Nepal AR4, AR5, AR13, AR15, AR16
H2, H5, H6, H9
S5, S8 I2, I6 Y B1, B3 N N L4 3 (Rai et al., 2019)
Jordan AR4, AR8, AR14, AR16
H3, H5, H7
S2, S7 I2, I6 Y B3, B4, B5 N N NA 3 (Jamaliah and Powell, 2019)
Bangladesh AR5 H2, H3, H4, H7, H8
S5, S6 I2, I6 Y B2, B3, B5 Y N L2, L3, L4, L5, L7
3 (Karim and Thiel, 2017)
Bangladesh AR5 H3, H6, H7, H8, H13, H15
S5 I3, I4, I5 N NA N N L4, L5, L6 3 (Araos et al., 2017)
Bangladesh AR5 H3, H5, H6, H8, H10, H15
S10 I1, I2, I3 Y B1, B5 N N L4, L5 3 (Roy, 2018)
India AR5 H3, H10, H16
S10 I1, I3, I5, I7
Y B5 N N L5 3 (Walch, 2019)
Nepal, Bangladesh
AR5 H1, H3, H4, H5, H6, H8
S9 I2, I3, I6, I11
Y B1, B2, B3, B5
N N L5 3 (Sultana et al., 2019)
Indonesia AR5, AR10 H3, H4, H8, H10,
S5, S8, S10
I2, I6 Y B2, B5 Y N L1, L2, L3, L4, L5, L7
3 (Bott and Braun, 2019) ACCEPTED V
ERSION
SUBJECT TO FIN
AL EDITS

FINAL DRAFT Chapter 4 Supplementary Material IPCC WGII Sixth Assessment Report
Do Not Cite, Quote or Distribute SM4-156 Total pages: 273
H12, H16
Taiwan AR5, AR10 H3, H8, H10, H12, H13, H17
S5, S8, S10
I1, I2, I3, I4
Y B1, B5 Y N L5 3 (Lu, 2016)
Japan AR5, AR12 H5, H7 S2, S5, S6, S7, S8
I2, I3, I4, I8, I11
Y B3, B4, B5 N N L5 3 (Tembata and Takeuchi, 2018)
Mongolia AR5, AR6, AR7, AR8, AR11, AR12
H1, H6, H19
S3, S6 I4, I6, I7 Y B1, B2, B4, B5
Y N L1, L3, L4, L5, L6, L8
3 (Fernández-Giménez et al., 2015)
Bangladesh AR5, AR6, AR8, AR9, AR10, AR11, AR12
H3, H4, H6, H8, H12, H13, H15, H16
S2, S6, S8, S10
I1, I4, I7 Y B1, B2, B3, B4, B5
N Y L1, L3, L5, L8
3 (Rahman et al., 2019)
Bangladesh AR5, AR7, AR8
H3, H8 S10 I2, I6, I9, I11
Y B1, B2, B3, B5
Y N L4, L8 3 (Fenton et al., 2017)
India AR5, AR7, AR8, AR13
H3, H5, H9
S5, S8 I1, I2, I3, I5
Y B3, B5 N N L3, L4, L5, L7
3 (Chu, 2017)
India AR5, AR8 H6, H8, H10, H16
S10 I1, I2, I3, I5
Y B1, B5 N N NA 3 (Bahinipati and Patnaik, 2015)
Vietnam AR5, AR8, AR10, AR12
H8, H12, H15, H16
S5, S6, S10
I6 N NA Y N L4, L5, L8 3 (Ling et al., 2015)
Indonesia AR5, AR8, AR10, AR15
H6, H8 S5, S8, S10
I1, I3, I11 Y B1, B5 N N L7, L9 3 (Sari and Prayoga, 2018)
Bangladesh AR6 H10, H12,
S3, S5 I2 Y B1, B2, B3 Y N L4, L6 3 (Islam et al., 2014)
ACCEPTED VERSIO
N
SUBJECT TO FIN
AL EDITS
FINAL DRAFT Chapter 4 Supplementary Material IPCC WGII Sixth Assessment Report
Do Not Cite, Quote or Distribute SM4-157 Total pages: 273
H13, H16
Cambodia AR6 H5, H10, H12, H15
S3 I6, I11 Y B1, B5 Y N L2, L4, L6 3 (Asif, 2019)
China AR6 H3, H5, H7, H8
S3 I5 Y B1, B2, B5 Y N NA 3 (Lei et al., 2017)
Pakistan AR6 H1, H4, H8, H10, H17
S3 I6 Y B1, B5 Y N L2, L4 3 (Gioli et al., 2014)
Philippines AR6, AR10 H6, H10, H12, H13
S3, S5, S10
I3, I6 N NA Y N L1, L2, L3, L4, L5, L8
3 (Jamero et al., 2017)
India AR6, AR11 H3 S6 I6 N NA Y N L2, L7, L9 3 (Venugopal et al., 2019)
Pakistan AR6, AR11 H5, H6, H7
S6 I6 Y B1 Y N L3, L4, L5 3 (Rahut and Ali, 2018)
Pakistan AR6, AR7 H6, H8 S6 I6 N NA N N NA 3 (Ullah and Shah, 2019)
Bangladesh AR6, AR7, AR9, AR10
H3, H4, H8, H10, H12, H16
S3, S5, S10
I4, I5, I6 Y B4 N N L4, L5, L7 3 (Barua et al., 2017)
China AR6, AR8 H3, H4, H5, H6, H7, H9, H18, H19
S6 I6 Y B5 N N L1, L3, L5, L7, L8, L9
3 (Burnham and Ma, 2018)
Indonesia AR7 H5, H6,
S6 I4 N NA N N L4, L7 3 (Dewi et al., 2018)
ACCEPTED VERSIO
N
SUBJECT TO FIN
AL EDITS

FINAL DRAFT Chapter 4 Supplementary Material IPCC WGII Sixth Assessment Report
Do Not Cite, Quote or Distribute SM4-158 Total pages: 273
H8, H18
Thailand, Cambodia, Laos, Vietnam,
AR7, AR14 NA S2, S7 I4, I9 N NA Y N L5 3 (Suhardiman et al., 2014)
Philippines AR8 H3, H5, H6, H8
S6, S10 I2, I3 Y B1, B2, B3, B5
N Y L4, L5, L7 3 (Bacud, 2018)
Vietnam AR8 H3, H5, H6, H7
S6, S11 I6 Y B1, B2, B5 N N NA 3 (Phuong et al., 2018)
Vietnam AR8, AR10 H3, H8 S10 I1, I2, I3, I6
Y B1, B5 N N NA 3 (Tran and Rodela, 2019)
Bangladesh AR8, AR10, AR12
H3, H8 S6, S10 I1, I2 Y B3 N N L5, L7 3 (Bremer et al., 2019)
Nepal AR8, AR10, AR12
H3, H8 S10 I2, I6 Y B2 N N L5 3 (Devkota et al., 2014)
China AR8, AR16 H5 S6 I3, I4, I5, I6
Y B2 N N L4, L5, L6, L7, L9
3 (Li et al., 2017b)
India AR9 H3, H6 S6 I6 Y B1, B2, B3, B4
Y Y L5, L7 3 (Pandey et al., 2017)
Bangladesh AR9, AR10 H3, H8, H10, H12, H15, H16
S2, S5, S10
I4, I6, I7 Y B1, B2, B3, B4
N Y L1, L2, L3, L5, L8, L9
3 (Saroar, 2018)
India AR9, AR12 H5, H6, H7, H16
S6 I2, I6 Y B1, B2, B4, B5
N Y NA 3 (Kodirekkala, 2018)
Australasia Australia AR1, AR3,
AR11 H5 S6 I6 Y B3 Y N NA 3 (Kirby et al.,
2014) Australia AR16 H6 S2 I3 Y B1, B3, B4 Y Y L4, L5, L7,
L8 3 (Lukasiewicz
et al., 2016) New Zealand AR5 H6,
H7, S5 I2 Y B1, B2, B5 N Y NA 3 (Simon et al.,
2020)
ACCEPTED VERSIO
N
SUBJECT TO FIN
AL EDITS

FINAL DRAFT Chapter 4 Supplementary Material IPCC WGII Sixth Assessment Report
Do Not Cite, Quote or Distribute SM4-159 Total pages: 273
H12, H13
Australia AR5, AR13 H3, H5, H7, H10, H12, H16
S5, S8 I3 Y B5 N Y L4, L5, L6 3 (Fallon and Sullivan, 2014)
Solomon Islands
AR5, AR7, AR12
H8, H16
S10 I6 Y B2, B5 N N L5 3 (Ha'apio et al., 2019)
Solomon Islands, USA
AR6, AR12 H1, H6, H7, H12, H13
S3, S5, S6, S10
I2, I3, I5 Y B5 N N L2, L4 3 (Albert et al., 2018)
Central and Southern America Argentina AR1, AR2,
AR11 H5, H11
S6 I6 N NA N N L2, L3, L5 3 (Wehbe et al., 2018)
Bolivia AR1, AR2, AR3
H3, H5, H6, H7, H8, H10, H19
S6 I6 Y B1, B3 Y N L1, L8 3 (Taboada et al., 2017)
Chile AR1, AR2, AR3, AR4, AR9
H3, H5, H6
S6 I6 Y B1, B3 N N L4, L6, L7 3 (Roco et al., 2017)
Guatemala AR1, AR3, AR4, AR9
H5, H7 S6 I4 Y B1, B4 N Y L4 3 (Sain et al., 2017)
Bolivia AR1, AR4, AR5
H5, H7 S6 I2, I6 Y B1, B2, B4, B5
N Y L4, L5, L7 3 (Jacobi et al., 2015)
Guatemala AR1, AR4, AR5, AR12
H6 S6, S9 I1, I7 Y B1, B2, B3, B4, B5
N Y NA 3 (Hellin et al., 2018)
Costa Rica AR1, AR4, AR9
H3, H5, H7
S6 I6 Y B1, B2, B4 N Y NA 3 (Viguera et al., 2019)
Peru AR1, AR5, AR8, AR12
H1 S1, S2, S5, S6
I2, I6 Y B1, B2, B4, B5
N N L1, L5, L6, L8
3 (Sayre et al., 2017)
Brazil AR11, AR12
H3, H5, H6,
S2, S6 I2, I4, I5, I6
Y B1, B2, B3, B4, B5
N N L2, L5 3 (Oviedo et al., 2016)
ACCEPTED VERSIO
N
SUBJECT TO FIN
AL EDITS
FINAL DRAFT Chapter 4 Supplementary Material IPCC WGII Sixth Assessment Report
Do Not Cite, Quote or Distribute SM4-160 Total pages: 273
H7, H8, H9
Argentina, Canada, Colombia
AR2, AR3, AR5, AR6, AR7, AR9, AR12
H1, H5, H8, H17, H18, H19
S6 I4, I6 Y B1, B3 Y N L4, L5, L6, L7, L9
3 (Mussetta et al., 2016)
Colombia AR2, AR4, AR9
H1, H2, H3
S5, S6 I1 Y B1, B2, B3, B4, B5
N Y NA 3 (Acevedo-Osorio et al., 2017)
Costa Rica AR2, AR6 H5 S6 I6 Y B2, B3 Y N L2, L3, L5, L8
3 (Warner et al., 2015)
Peru, US, Italy
AR3 H1 S6, S8 I2, I3, I6 Y B2, B3 Y N L3, L5, L8, L9
3 (Orlove et al., 2019)
Brazil AR3, AR11 H5, H7 S6 I2 Y B1, B3, B5 Y N L1, L8 3 (Burney et al., 2014)
Costa Rica AR3, AR4, AR5, AR13
H5 S5, S6, S8 I3 Y B3 N N L4, L8, L9 3 (Madrigal-Ballestero and Naranjo, 2015)
Brazil AR3, AR4, AR8
H5 S6, S8 I3, I4, I5, I6
Y B1, B2, B3, B4, B5
N N L4, L6, L7, L8
3 (Lindoso et al., 2018)
Chile AR3, AR4, AR9
H5 S6, S10 I2, I4, I9, I11
Y B1 N N L5 3 (Lillo-Ortega et al., 2019)
Peru AR4, AR5, AR7, AR8
H3, H6 S2, S5, S8 I1, I2, I4, I5, I7
Y B1, B3, B4, B5
N Y L5, L6 3 (Lindsay, 2018)
Costa Rica AR5 H5 S5, S6, S8, S9
I2, I3, I9 Y B3, B5 N N L5, L6 3 (Kuzdas et al., 2016)
Nicaragua AR6 H3, H5, H6, H7
S3, S6 I6 Y B1 Y N L3, L4, L5, L6
3 (Radel et al., 2018)
Guatemala, Mexico
AR6, AR9, AR11
H5, H6, H16, H18
S3, S6 I6 Y B4, B5 Y Y L3, L4, L5 3 (Rodriguez-Solorzano, 2014)
Brazil AR7 H5, H7 S6 I4 Y B1, B5 N N L1, L3, L5, L8
3 (Mesquita and Bursztyn, 2017)
Brazil AR9 H4, H6 S2, S6 I2, I3, I4, I6, I8
Y B1, B3, B4 N Y L3, L4, L5, L7
3 (Schembergue et al., 2017)
ACCEPTED VERSIO
N
SUBJECT TO FIN
AL EDITS

FINAL DRAFT Chapter 4 Supplementary Material IPCC WGII Sixth Assessment Report
Do Not Cite, Quote or Distribute SM4-161 Total pages: 273
Colombia AR9 H5, H6 S6 I6 N NA Y N L5, L7 3 (Barrucand et al., 2017)
Ecuador AR9 H1, H5, H6, H7
S6 I6 Y B1, B3, B4 N Y L1, L8 3 (Córdova et al., 2019)
Several Central and Southern America countries, and Mexico
AR9 H4, H5, H6
S2, S6 I6 Y B1, B4 Y Y L7, L8 3 (Krishnamurthy et al., 2019)
Europe Sweden, Finland
AR1 H3, H5, H6, H7
S6 I6 N NA Y N NA 3 (Neset et al., 2019)
France AR1, AR2 H4, H5, H6
S6 I6 Y B1 N N L1, L3, L4 3 194_Havet et al_2014
UK AR1, AR2, AR3, AR4, AR5, AR7
H5 S6 I6, I11 Y B1, B5 N N L4, L5, L9 3 (Rey et al., 2017)
Czech Republic
AR10 H3, H8 S5, S10 I6 N NA N N L3, L4 3 (Duží et al., 2017)
Sweden AR10, AR13
H8, H10, H12
S2, S5, S10, S11
I3, I4, I7 Y B1, B4, B5 N Y L4, L5, L6 3 (Wamsler et al., 2016)
Finland AR12, AR16
H1, H3, H6
S3, S7 I2, I6 N NA N N L4, L5, L6, L8
3 (Kaján, 2014)
France AR13 H7 S5 I3 Y B4 N N NA 3 (Hendel and Royon, 2015)
Spain AR13 H3, H6, H7, H8, H9
S5, S7 I3, I9 Y B1, B3, B4 N Y L8, L9 3 (Rodríguez-Sinobas et al., 2018)
Spain AR13 H5, H6 S5, S6, S8 I3, I4, I5 Y B3, B4 N Y L4, L5, L9 3 (Morote et al., 2019)
Spain, Israel AR13 H2, H5 S5, S6 I4 Y B3 Y N L1, L3, L9 3 (Martínez-Alvarez et al., 2018)
Netherlands AR3 H10, H15
S2, S6 I6 Y B1, B3, B4 N N NA 3 (van Duinen et al., 2015)
ACCEPTED VERSIO
N
SUBJECT TO FIN
AL EDITS

FINAL DRAFT Chapter 4 Supplementary Material IPCC WGII Sixth Assessment Report
Do Not Cite, Quote or Distribute SM4-162 Total pages: 273
Portugal AR3, AR4 H3, H5, H6
S2, S6, S8 I6 Y B3, B4 Y Y NA 3 (Santos et al., 2018)
France, USA AR3, AR4, AR5, AR10, AR13
H1, H3, H4, H5, H7, H8, H10, H13
S2, S5, S6, S7, S8, S10
I2, I3, I4, I5
Y B1, B3, B4 N N L1, L4, L5, L8
3 (Andrew and Sauquet, 2017)
Germany AR4, AR5, AR10, AR13
H3, H7, H8, H13
S5, S8, S10
I2, I3, I11 Y B3, B5 N Y L5 3 (Tosun and Leopold, 2019)
The Netherlands
AR5, AR10 H3, H8, H13
S2, S5, S10
I4 Y B3, B4, B5 N N L5, L7, L9 3 (Zevenbergen et al., 2015)
UK AR5, AR10 H4, H10, H12, H13
S5, S10, S11
I6 N NA Y N L2, L8 3 (Petzold, 2018)
Norway AR5, AR13 H6, H8 S5, S10 I3, I4 Y B5 N N L5, L6, L7 3 (Flyen et al., 2018)
Spain, USA AR5, AR13 H3, H7, H8, H13, H16
S5 I3, I5 Y B3, B4 N Y L5, L9 3 (Sánchez and Izzo, 2017)
Sweden AR5, AR13 H6, H8 S5 I3 Y B3, B4, B5 N Y L10 3 (Fitzgerald and Lenhart, 2016)
Sweden AR5, AR7, AR10, AR12
H6, H8, H10, H12
S10 I4, I5, I7 Y B5 Y N L5, L7 3 (Hedelin, 2016)
Germany, Spain, Estonia, Denmark,
AR7, AR8, AR13
H2, H5, H9
S5, S8 I3, I8 Y B1, B3 N N L8, L9 3 (Stavenhagen et al., 2018)
UK AR8, AR10 H2, H3,
S7, S10 I4, I8 Y B1, B3, B4, B5
N Y L5 3 (Energy UK, 2015)
ACCEPTED VERSIO
N
SUBJECT TO FIN
AL EDITS

FINAL DRAFT Chapter 4 Supplementary Material IPCC WGII Sixth Assessment Report
Do Not Cite, Quote or Distribute SM4-163 Total pages: 273
H5, H6, H7, H8, H10, H12, H16, H17
North America Mexico AR1, AR2,
AR3, AR5, AR6, AR7
H5 S6 I2, I6 Y B1, B3, B5 N N L3, L4, L5 3 (Villamayor-Tomas and García-López, 2017)
Mexico AR1, AR2, AR6
H3, H6, H8, H10, H17
S3, S6 I4, I6 N NA Y N L4, L5 3 (Ruiz Meza, 2015)
Canada AR1, AR4, AR10
H5 S6, S10 I2, I4 Y B1, B3 Y N L4, L5, L6, L8
3 (McMartin and Hernani Merino, 2014)
Mexico AR11 H10, H14
S6 I1, I2, I4 Y B1, B4, B5 N N L5 3 (Finkbeiner, 2015)
USA AR11 H1, H5, H6, H7, H8
S2, S6 I5, I6 Y B1 Y N L1, L2, L8 3 (Lamborn and Smith, 2019)
USA AR11 H5, H6 S6 I6 Y B1, B4, B5 Y N L2, L4, L5, L8
3 (Yung et al., 2015)
Canada AR12 H6, H9 S1, S2, S5, S11
I6 Y B1, B2, B5 N N L2, L5 3 (Abu and Reed, 2018)
USA AR2, AR11 H1, H3, H4, H6
S1, S3, S5, S6, S11
I6 N NA N N L4 3 (Wilson, 2014)
Mexico AR2, AR4, AR5, AR6
H3, H5 S3, S6 I6 Y B1, B2, B3 Y N L4 3 (Mardero et al., 2015)
Canada AR3, AR4, AR7, AR11
H5 S6 I5, I6 Y B1, B3, B4, B5
N N L4, L6 3 (Hurlbert and Pittman, 2014)
ACCEPTED VERSIO
N
SUBJECT TO FIN
AL EDITS

FINAL DRAFT Chapter 4 Supplementary Material IPCC WGII Sixth Assessment Report
Do Not Cite, Quote or Distribute SM4-164 Total pages: 273
USA AR4, AR11 H5, H6, H7
S2, S6 I1, I2, I3 Y B4 N N NA 3 (Jacobi et al., 2015)
USA AR4, AR7, AR10
H3, H6, H7
S6, S10 I8, I9 Y B1, B3, B4 N N NA 3 (Schattman et al., 2018)
USA AR5, AR10 H1, H6, H8
S10 I5 Y B1, B2, B5 N N NA 3 (Kontar et al., 2015)
USA AR5, AR10 H6, H10, H13
S5, S9, S10
I2, I3, I4, I5
Y B4, B5 N N L2, L5, L8 3 (Pinto et al., 2018)
Canada AR5, AR10, AR16
H3, H6, H8
S2, S4, S5, S10
I2, I3, I5 Y B1, B3, B5 N N L4, L5, L6 3 (Picketts, 2015)
Mexico AR5, AR8, AR12
H4, H17, H19
S1, S2, S6, S8
I6 Y B4, B5 N Y L5 3 (Kernecker et al., 2017)
Mexico AR7 H3, H5, H6, H7, H8, H11, H18
S2, S6, S8, S10
I4 Y B1, B2, B4, B5
Y Y L2, L4, L7, L10
3 (Newsham et al., 2018)
Canada AR7, AR11, AR16
H5, H6 S6 I4, I5 Y B1, B3, B4, B5
N Y L5 3 (Hurlbert, 2014)
USA AR8, AR9 H3, H5, H6, H10, H11, H18
S2, S6, S10
I6 Y B1, B3, B4, B5
N N NA 3 (Fischer, 2019)
Small Island and States Jamaica AR1, AR2,
AR4, AR7 H6, H10, H16
S6 I1, I4 Y B1, B3, B5 N N L4 3 (Moulton, 2017)
Puerto Rico AR1, AR3, AR4
H3, H5 S6 I4, I7 N NA N N L5, L6 3 (Álvarez-Berríos et al., 2018)
Belize AR10 H10, H12
S5, S10, S11
I2, I4, I6 Y B2, B4, B5 Y N L5, L9 3 (Karlsson and Hovelsrud, 2015)
ACCEPTED VERSIO
N
SUBJECT TO FIN
AL EDITS
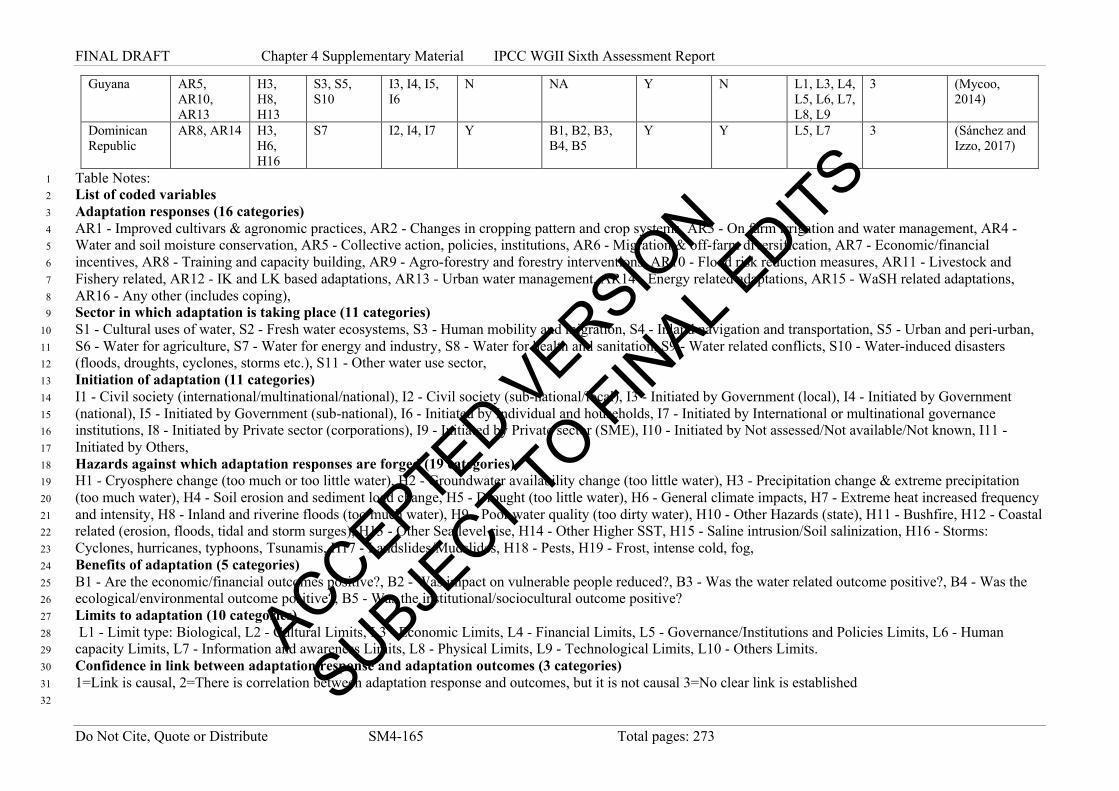
FINAL DRAFT Chapter 4 Supplementary Material IPCC WGII Sixth Assessment Report
Do Not Cite, Quote or Distribute SM4-165 Total pages: 273
Guyana AR5, AR10, AR13
H3, H8, H13
S3, S5, S10
I3, I4, I5, I6
N NA Y N L1, L3, L4, L5, L6, L7, L8, L9
3 (Mycoo, 2014)
Dominican Republic
AR8, AR14 H3, H6, H16
S7 I2, I4, I7 Y B1, B2, B3, B4, B5
Y Y L5, L7 3 (Sánchez and Izzo, 2017)
Table Notes: 1 List of coded variables 2 Adaptation responses (16 categories) 3 AR1 - Improved cultivars & agronomic practices, AR2 - Changes in cropping pattern and crop systems, AR3 - On farm irrigation and water management, AR4 - 4 Water and soil moisture conservation, AR5 - Collective action, policies, institutions, AR6 - Migration & off-farm diversification, AR7 - Economic/financial 5 incentives, AR8 - Training and capacity building, AR9 - Agro-forestry and forestry interventions, AR10 - Flood risk reduction measures, AR11 - Livestock and 6 Fishery related, AR12 - IK and LK based adaptations, AR13 - Urban water management, AR14 - Energy related adaptations, AR15 - WaSH related adaptations, 7 AR16 - Any other (includes coping), 8 Sector in which adaptation is taking place (11 categories) 9 S1 - Cultural uses of water, S2 - Fresh water ecosystems, S3 - Human mobility and migration, S4 - Inland navigation and transportation, S5 - Urban and peri-urban, 10 S6 - Water for agriculture, S7 - Water for energy and industry, S8 - Water for health and sanitation, S9 - Water related conflicts, S10 - Water-induced disasters 11 (floods, droughts, cyclones, storms etc.), S11 - Other water use sector, 12 Initiation of adaptation (11 categories) 13 I1 - Civil society (international/multinational/national), I2 - Civil society (sub-national/local), I3 - Initiated by Government (local), I4 - Initiated by Government 14 (national), I5 - Initiated by Government (sub-national), I6 - Initiated by Individual and households, I7 - Initiated by International or multinational governance 15 institutions, I8 - Initiated by Private sector (corporations), I9 - Initiated by Private sector (SME), I10 - Initiated by Not assessed/Not available/Not known, I11 - 16 Initiated by Others, 17 Hazards against which adaptation responses are forged (19 categories) 18 H1 - Cryosphere change (too much or too little water), H2 - Groundwater availability change (too little water), H3 - Precipitation change & extreme precipitation 19 (too much water), H4 - Soil erosion and sediment load change, H5 - Drought (too little water), H6 - General climate impacts, H7 - Extreme heat increased frequency 20 and intensity, H8 - Inland and riverine floods (too much water), H9 - Poor water quality (too dirty water), H10 - Other Hazards (state), H11 - Bushfire, H12 - Coastal 21 related (erosion, floods, tidal and storm surges), H13 - Other Sea level rise, H14 - Other Higher SST, H15 - Saline intrusion/Soil salinization, H16 - Storms: 22 Cyclones, hurricanes, typhoons, Tsunamis, H17 - Landslides/Mudslides, H18 - Pests, H19 - Frost, intense cold, fog, 23 Benefits of adaptation (5 categories) 24 B1 - Are the economic/financial outcomes positive?, B2 - Was impact on vulnerable people reduced?, B3 - Was the water related outcome positive?, B4 - Was the 25 ecological/environmental outcome positive?, B5 - Was the institutional/sociocultural outcome positive? 26 Limits to adaptation (10 categories) 27 L1 - Limit type: Biological, L2 - Cultural Limits, L3 - Economic Limits, L4 - Financial Limits, L5 - Governance/Institutions and Policies Limits, L6 - Human 28 capacity Limits, L7 - Information and awareness Limits, L8 - Physical Limits, L9 - Technological Limits, L10 - Others Limits. 29 Confidence in link between adaptation response and adaptation outcomes (3 categories) 30 1=Link is causal, 2=There is correlation between adaptation response and outcomes, but it is not causal 3=No clear link is established 31 32
ACCEPTED VERSIO
N
SUBJECT TO FIN
AL EDITS
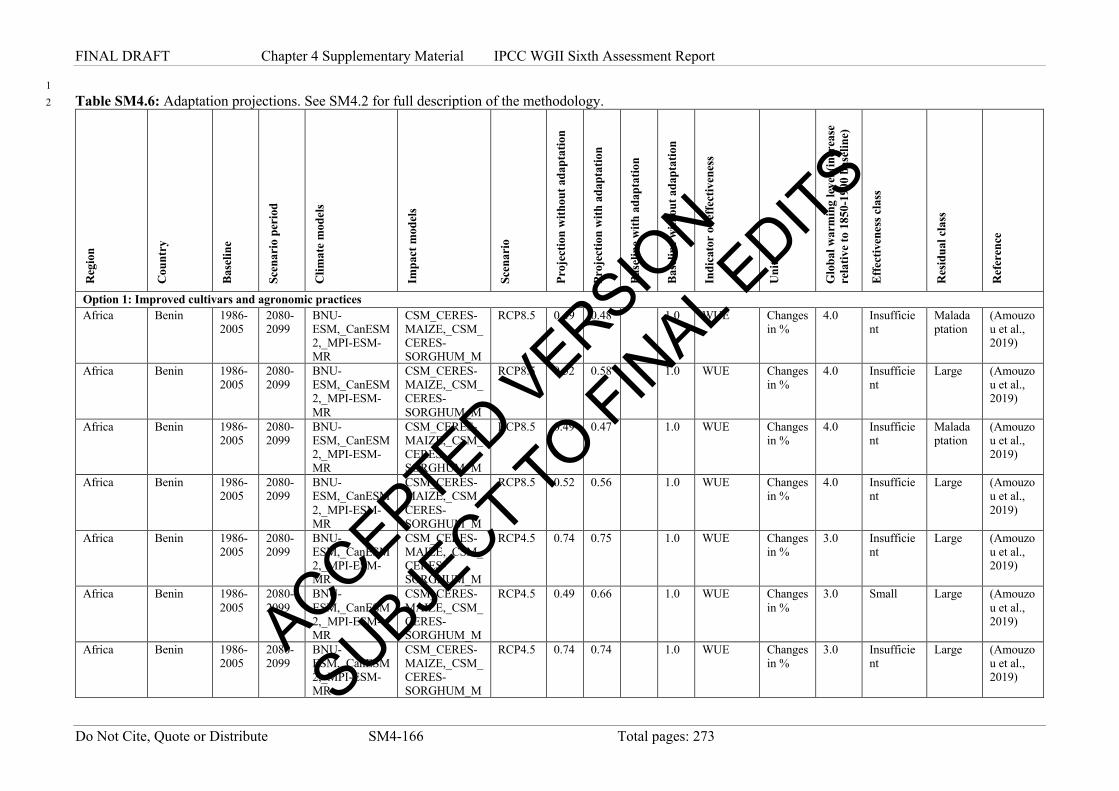
FINAL DRAFT Chapter 4 Supplementary Material IPCC WGII Sixth Assessment Report
Do Not Cite, Quote or Distribute SM4-166 Total pages: 273
1 Table SM4.6: Adaptation projections. See SM4.2 for full description of the methodology. 2
Reg
ion
Cou
ntry
Base
line
Scen
ario
per
iod
Clim
ate
mod
els
Impa
ct m
odel
s
Scen
ario
Proj
ectio
n w
ithou
t ada
ptat
ion
Proj
ectio
n w
ith a
dapt
atio
n
Base
line
with
ada
ptat
ion
Base
line
with
out a
dapt
atio
n
Indi
cato
r of
effe
ctiv
enes
s
Uni
t
Glo
bal w
arm
ing
leve
l (in
crea
se
rela
tive
to 1
850-
1900
bas
elin
e)
Effe
ctiv
enes
s cla
ss
Res
idua
l cla
ss
Ref
eren
ce
Option 1: Improved cultivars and agronomic practices Africa Benin 1986-
2005 2080-2099
BNU-ESM,_CanESM2,_MPI-ESM-MR
CSM_CERES-MAIZE,_CSM_CERES-SORGHUM_M
RCP8.5 0.49 0.48 1.0 WUE Changes in %
4.0 Insufficient
Maladaptation
(Amouzou et al., 2019)
Africa Benin 1986-2005
2080-2099
BNU-ESM,_CanESM2,_MPI-ESM-MR
CSM_CERES-MAIZE,_CSM_CERES-SORGHUM_M
RCP8.5 0.52 0.58 1.0 WUE Changes in %
4.0 Insufficient
Large (Amouzou et al., 2019)
Africa Benin 1986-2005
2080-2099
BNU-ESM,_CanESM2,_MPI-ESM-MR
CSM_CERES-MAIZE,_CSM_CERES-SORGHUM_M
RCP8.5 0.49 0.47 1.0 WUE Changes in %
4.0 Insufficient
Maladaptation
(Amouzou et al., 2019)
Africa Benin 1986-2005
2080-2099
BNU-ESM,_CanESM2,_MPI-ESM-MR
CSM_CERES-MAIZE,_CSM_CERES-SORGHUM_M
RCP8.5 0.52 0.56 1.0 WUE Changes in %
4.0 Insufficient
Large (Amouzou et al., 2019)
Africa Benin 1986-2005
2080-2099
BNU-ESM,_CanESM2,_MPI-ESM-MR
CSM_CERES-MAIZE,_CSM_CERES-SORGHUM_M
RCP4.5 0.74 0.75 1.0 WUE Changes in %
3.0 Insufficient
Large (Amouzou et al., 2019)
Africa Benin 1986-2005
2080-2099
BNU-ESM,_CanESM2,_MPI-ESM-MR
CSM_CERES-MAIZE,_CSM_CERES-SORGHUM_M
RCP4.5 0.49 0.66 1.0 WUE Changes in %
3.0 Small Large (Amouzou et al., 2019)
Africa Benin 1986-2005
2080-2099
BNU-ESM,_CanESM2,_MPI-ESM-MR
CSM_CERES-MAIZE,_CSM_CERES-SORGHUM_M
RCP4.5 0.74 0.74 1.0 WUE Changes in %
3.0 Insufficient
Large (Amouzou et al., 2019)
ACCEPTED VERSIO
N
SUBJECT TO FIN
AL EDITS
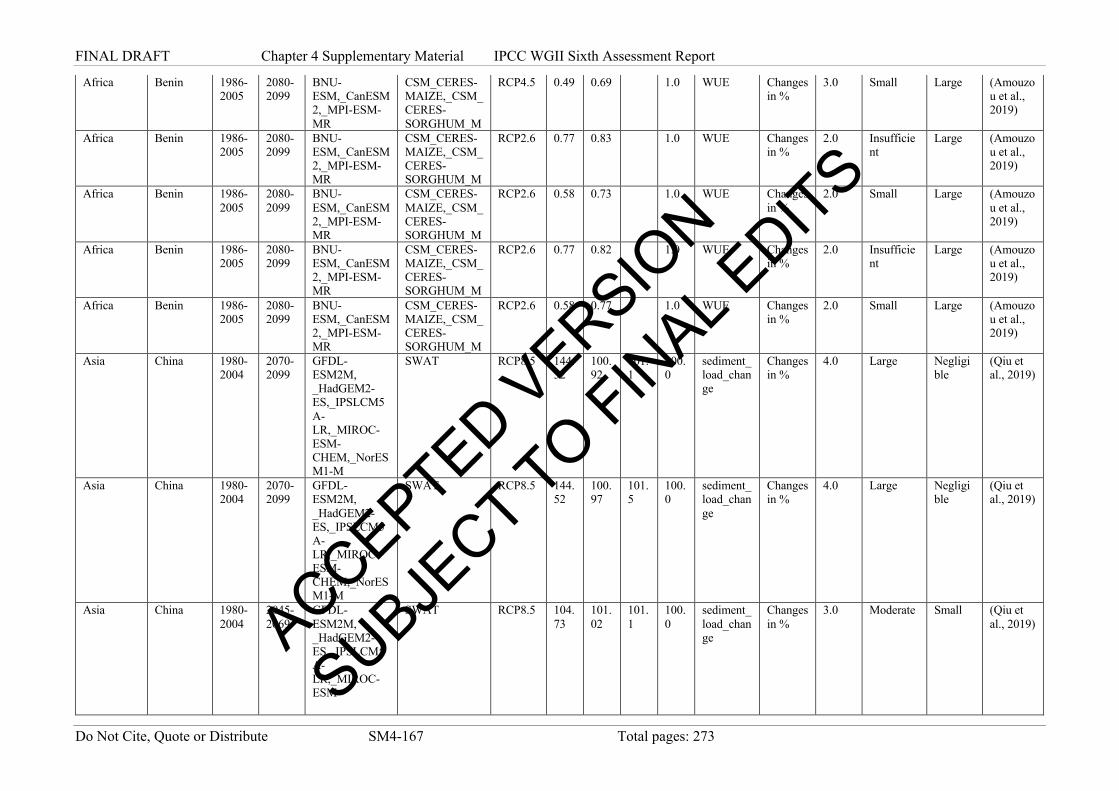
FINAL DRAFT Chapter 4 Supplementary Material IPCC WGII Sixth Assessment Report
Do Not Cite, Quote or Distribute SM4-167 Total pages: 273
Africa Benin 1986-2005
2080-2099
BNU-ESM,_CanESM2,_MPI-ESM-MR
CSM_CERES-MAIZE,_CSM_CERES-SORGHUM_M
RCP4.5 0.49 0.69 1.0 WUE Changes in %
3.0 Small Large (Amouzou et al., 2019)
Africa Benin 1986-2005
2080-2099
BNU-ESM,_CanESM2,_MPI-ESM-MR
CSM_CERES-MAIZE,_CSM_CERES-SORGHUM_M
RCP2.6 0.77 0.83 1.0 WUE Changes in %
2.0 Insufficient
Large (Amouzou et al., 2019)
Africa Benin 1986-2005
2080-2099
BNU-ESM,_CanESM2,_MPI-ESM-MR
CSM_CERES-MAIZE,_CSM_CERES-SORGHUM_M
RCP2.6 0.58 0.73 1.0 WUE Changes in %
2.0 Small Large (Amouzou et al., 2019)
Africa Benin 1986-2005
2080-2099
BNU-ESM,_CanESM2,_MPI-ESM-MR
CSM_CERES-MAIZE,_CSM_CERES-SORGHUM_M
RCP2.6 0.77 0.82 1.0 WUE Changes in %
2.0 Insufficient
Large (Amouzou et al., 2019)
Africa Benin 1986-2005
2080-2099
BNU-ESM,_CanESM2,_MPI-ESM-MR
CSM_CERES-MAIZE,_CSM_CERES-SORGHUM_M
RCP2.6 0.58 0.77 1.0 WUE Changes in %
2.0 Small Large (Amouzou et al., 2019)
Asia China 1980-2004
2070-2099
GFDL-ESM2M, _HadGEM2-ES,_IPSLCM5A-LR,_MIROC-ESM-CHEM,_NorESM1-M
SWAT RCP8.5 144.52
100.92
101.1
100.0
sediment_load_change
Changes in %
4.0 Large Negligible
(Qiu et al., 2019)
Asia China 1980-2004
2070-2099
GFDL-ESM2M, _HadGEM2-ES,_IPSLCM5A-LR,_MIROC-ESM-CHEM,_NorESM1-M
SWAT RCP8.5 144.52
100.97
101.5
100.0
sediment_load_change
Changes in %
4.0 Large Negligible
(Qiu et al., 2019)
Asia China 1980-2004
2045-2069
GFDL-ESM2M, _HadGEM2-ES,_IPSLCM5A-LR,_MIROC-ESM-
SWAT RCP8.5 104.73
101.02
101.1
100.0
sediment_load_change
Changes in %
3.0 Moderate Small (Qiu et al., 2019) ACCEPTED V
ERSION
SUBJECT TO FIN
AL EDITS

FINAL DRAFT Chapter 4 Supplementary Material IPCC WGII Sixth Assessment Report
Do Not Cite, Quote or Distribute SM4-168 Total pages: 273
CHEM,_NorESM1-M
Asia China 1980-2004
2045-2069
GFDL-ESM2M, _HadGEM2-ES,_IPSLCM5A-LR,_MIROC-ESM-CHEM,_NorESM1-M
SWAT RCP8.5 104.73
101.07
101.5
100.0
sediment_load_change
Changes in %
3.0 Moderate Small (Qiu et al., 2019)
Asia China 1961-1990
2080-2100
HadCM3 APSIM-OzCot A2 3.44 3.69 1.9 4.0 CWP (=yield/water used)
kg/m3 4.0 Small Large (Yang et al., 2014)
Asia China 1961-1990
2080-2100
HadCM3 APSIM-OzCot A2 3.44 3.75 1.3 4.0 CWP (=yield/water used)
kg/m3 4.0 Moderate Moderate
(Yang et al., 2014)
North America
United States
1991-2005
2040-2059
CCSM4,_GFDL-ESM2G,_IPSL-CM5A-LR,_MIROC5
SWAT,_CLM_(Community_Land_Model)
RCP4.5 18.31
16.83
16.2 16.3 IWR (=ETC-P)
1E9m3/y
2.0 Moderate Small (Yang et al., 2014)
North America
United States
1991-2005
2080-2099
CCSM4,_GFDL-ESM2G,_IPSL-CM5A-LR,_MIROC5
SWAT,_CLM_(Community_Land_Model)
RCP4.5 18.70
16.85
16.2 16.3 IWR (=ETC-P)
1E9m3/y
2.0 Moderate Small (Yang et al., 2014)
North America
United States
1991-2005
2040-2059
CCSM4,_GFDL-ESM2G,_IPSL-CM5A-LR,_MIROC5
SWAT,_CLM_(Community_Land_Model)
RCP8.5 18.88
17.14
16.2 16.3 IWR (=ETC-P)
1E9m3/y
2.0 Moderate Moderate
(Yang et al., 2014)
North America
United States
1991-2005
2080-2099
CCSM4,_GFDL-ESM2G,_IPSL-CM5A-LR,_MIROC5
SWAT,_CLM_(Community_Land_Model)
RCP8.5 21.13
17.67
16.2 16.3 IWR (=ETC-P)
1E9m3/y
4.0 Moderate Small (Yang et al., 2014) ACCEPTED V
ERSION
SUBJECT TO FIN
AL EDITS
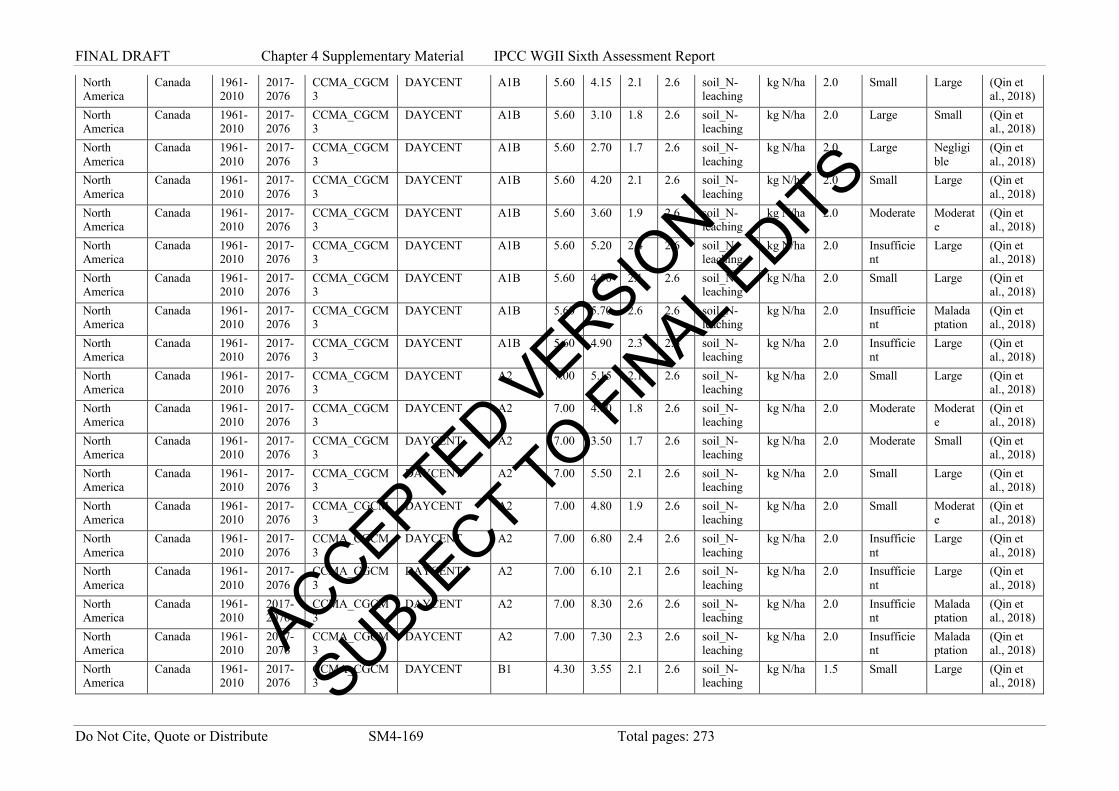
FINAL DRAFT Chapter 4 Supplementary Material IPCC WGII Sixth Assessment Report
Do Not Cite, Quote or Distribute SM4-169 Total pages: 273
North America
Canada 1961-2010
2017-2076
CCMA_CGCM3
DAYCENT A1B 5.60 4.15 2.1 2.6 soil_N-leaching
kg N/ha 2.0 Small Large (Qin et al., 2018)
North America
Canada 1961-2010
2017-2076
CCMA_CGCM3
DAYCENT A1B 5.60 3.10 1.8 2.6 soil_N-leaching
kg N/ha 2.0 Large Small (Qin et al., 2018)
North America
Canada 1961-2010
2017-2076
CCMA_CGCM3
DAYCENT A1B 5.60 2.70 1.7 2.6 soil_N-leaching
kg N/ha 2.0 Large Negligible
(Qin et al., 2018)
North America
Canada 1961-2010
2017-2076
CCMA_CGCM3
DAYCENT A1B 5.60 4.20 2.1 2.6 soil_N-leaching
kg N/ha 2.0 Small Large (Qin et al., 2018)
North America
Canada 1961-2010
2017-2076
CCMA_CGCM3
DAYCENT A1B 5.60 3.60 1.9 2.6 soil_N-leaching
kg N/ha 2.0 Moderate Moderate
(Qin et al., 2018)
North America
Canada 1961-2010
2017-2076
CCMA_CGCM3
DAYCENT A1B 5.60 5.20 2.4 2.6 soil_N-leaching
kg N/ha 2.0 Insufficient
Large (Qin et al., 2018)
North America
Canada 1961-2010
2017-2076
CCMA_CGCM3
DAYCENT A1B 5.60 4.50 2.1 2.6 soil_N-leaching
kg N/ha 2.0 Small Large (Qin et al., 2018)
North America
Canada 1961-2010
2017-2076
CCMA_CGCM3
DAYCENT A1B 5.60 5.70 2.6 2.6 soil_N-leaching
kg N/ha 2.0 Insufficient
Maladaptation
(Qin et al., 2018)
North America
Canada 1961-2010
2017-2076
CCMA_CGCM3
DAYCENT A1B 5.60 4.90 2.3 2.6 soil_N-leaching
kg N/ha 2.0 Insufficient
Large (Qin et al., 2018)
North America
Canada 1961-2010
2017-2076
CCMA_CGCM3
DAYCENT A2 7.00 5.15 2.1 2.6 soil_N-leaching
kg N/ha 2.0 Small Large (Qin et al., 2018)
North America
Canada 1961-2010
2017-2076
CCMA_CGCM3
DAYCENT A2 7.00 4.00 1.8 2.6 soil_N-leaching
kg N/ha 2.0 Moderate Moderate
(Qin et al., 2018)
North America
Canada 1961-2010
2017-2076
CCMA_CGCM3
DAYCENT A2 7.00 3.50 1.7 2.6 soil_N-leaching
kg N/ha 2.0 Moderate Small (Qin et al., 2018)
North America
Canada 1961-2010
2017-2076
CCMA_CGCM3
DAYCENT A2 7.00 5.50 2.1 2.6 soil_N-leaching
kg N/ha 2.0 Small Large (Qin et al., 2018)
North America
Canada 1961-2010
2017-2076
CCMA_CGCM3
DAYCENT A2 7.00 4.80 1.9 2.6 soil_N-leaching
kg N/ha 2.0 Small Moderate
(Qin et al., 2018)
North America
Canada 1961-2010
2017-2076
CCMA_CGCM3
DAYCENT A2 7.00 6.80 2.4 2.6 soil_N-leaching
kg N/ha 2.0 Insufficient
Large (Qin et al., 2018)
North America
Canada 1961-2010
2017-2076
CCMA_CGCM3
DAYCENT A2 7.00 6.10 2.1 2.6 soil_N-leaching
kg N/ha 2.0 Insufficient
Large (Qin et al., 2018)
North America
Canada 1961-2010
2017-2076
CCMA_CGCM3
DAYCENT A2 7.00 8.30 2.6 2.6 soil_N-leaching
kg N/ha 2.0 Insufficient
Maladaptation
(Qin et al., 2018)
North America
Canada 1961-2010
2017-2076
CCMA_CGCM3
DAYCENT A2 7.00 7.30 2.3 2.6 soil_N-leaching
kg N/ha 2.0 Insufficient
Maladaptation
(Qin et al., 2018)
North America
Canada 1961-2010
2017-2076
CCMA_CGCM3
DAYCENT B1 4.30 3.55 2.1 2.6 soil_N-leaching
kg N/ha 1.5 Small Large (Qin et al., 2018)
ACCEPTED VERSIO
N
SUBJECT TO FIN
AL EDITS

FINAL DRAFT Chapter 4 Supplementary Material IPCC WGII Sixth Assessment Report
Do Not Cite, Quote or Distribute SM4-170 Total pages: 273
North America
Canada 1961-2010
2017-2076
CCMA_CGCM3
DAYCENT B1 4.30 2.90 1.8 2.6 soil_N-leaching
kg N/ha 1.5 Large Small (Qin et al., 2018)
North America
Canada 1961-2010
2017-2076
CCMA_CGCM3
DAYCENT B1 4.30 2.70 1.7 2.6 soil_N-leaching
kg N/ha 1.5 Large Small (Qin et al., 2018)
North America
Canada 1961-2010
2017-2076
CCMA_CGCM3
DAYCENT B1 4.30 3.30 2.1 2.6 soil_N-leaching
kg N/ha 1.5 Moderate Moderate
(Qin et al., 2018)
North America
Canada 1961-2010
2017-2076
CCMA_CGCM3
DAYCENT B1 4.30 3.00 1.9 2.6 soil_N-leaching
kg N/ha 1.5 Moderate Small (Qin et al., 2018)
North America
Canada 1961-2010
2017-2076
CCMA_CGCM3
DAYCENT B1 4.30 4.00 2.4 2.6 soil_N-leaching
kg N/ha 1.5 Insufficient
Large (Qin et al., 2018)
North America
Canada 1961-2010
2017-2076
CCMA_CGCM3
DAYCENT B1 4.30 3.50 2.1 2.6 soil_N-leaching
kg N/ha 1.5 Small Large (Qin et al., 2018)
North America
Canada 1961-2010
2017-2076
CCMA_CGCM3
DAYCENT B1 4.30 4.40 2.6 2.6 soil_N-leaching
kg N/ha 1.5 Insufficient
Maladaptation
(Qin et al., 2018)
North America
Canada 1961-2010
2017-2076
CCMA_CGCM3
DAYCENT B1 4.30 3.80 2.3 2.6 soil_N-leaching
kg N/ha 1.5 Insufficient
Large (Qin et al., 2018)
North America
Canada 1961-2010
2017-2076
CanESM2 DAYCENT RCP4.5 10.75
8.30 2.1 2.6 soil_N-leaching
kg N/ha 2.0 Small Large (Qin et al., 2018)
North America
Canada 1961-2010
2017-2076
CanESM2 DAYCENT RCP4.5 10.75
6.80 1.8 2.6 soil_N-leaching
kg N/ha 2.0 Small Large (Qin et al., 2018)
North America
Canada 1961-2010
2017-2076
CanESM2 DAYCENT RCP4.5 10.75
6.10 1.7 2.6 soil_N-leaching
kg N/ha 2.0 Moderate Moderate
(Qin et al., 2018)
North America
Canada 1961-2010
2017-2076
CanESM2 DAYCENT RCP4.5 10.75
7.90 2.1 2.6 soil_N-leaching
kg N/ha 2.0 Small Large (Qin et al., 2018)
North America
Canada 1961-2010
2017-2076
CanESM2 DAYCENT RCP4.5 10.75
6.80 1.9 2.6 soil_N-leaching
kg N/ha 2.0 Small Large (Qin et al., 2018)
North America
Canada 1961-2010
2017-2076
CanESM2 DAYCENT RCP4.5 10.75
8.70 2.4 2.6 soil_N-leaching
kg N/ha 2.0 Insufficient
Large (Qin et al., 2018)
North America
Canada 1961-2010
2017-2076
CanESM2 DAYCENT RCP4.5 10.75
7.20 2.1 2.6 soil_N-leaching
kg N/ha 2.0 Small Large (Qin et al., 2018)
North America
Canada 1961-2010
2017-2076
CanESM2 DAYCENT RCP4.5 10.75
9.80 2.6 2.6 soil_N-leaching
kg N/ha 2.0 Insufficient
Large (Qin et al., 2018)
North America
Canada 1961-2010
2017-2076
CanESM2 DAYCENT RCP4.5 10.75
7.40 2.3 2.6 soil_N-leaching
kg N/ha 2.0 Small Large (Qin et al., 2018)
North America
Canada 1961-2010
2017-2076
CanESM2 DAYCENT RCP8.5 19.65
14.25
2.1 2.6 soil_N-leaching
kg N/ha 3.0 Small Large (Qin et al., 2018)
North America
Canada 1961-2010
2017-2076
CanESM2 DAYCENT RCP8.5 19.65
11.50
1.8 2.6 soil_N-leaching
kg N/ha 3.0 Small Large (Qin et al., 2018)
ACCEPTED VERSIO
N
SUBJECT TO FIN
AL EDITS
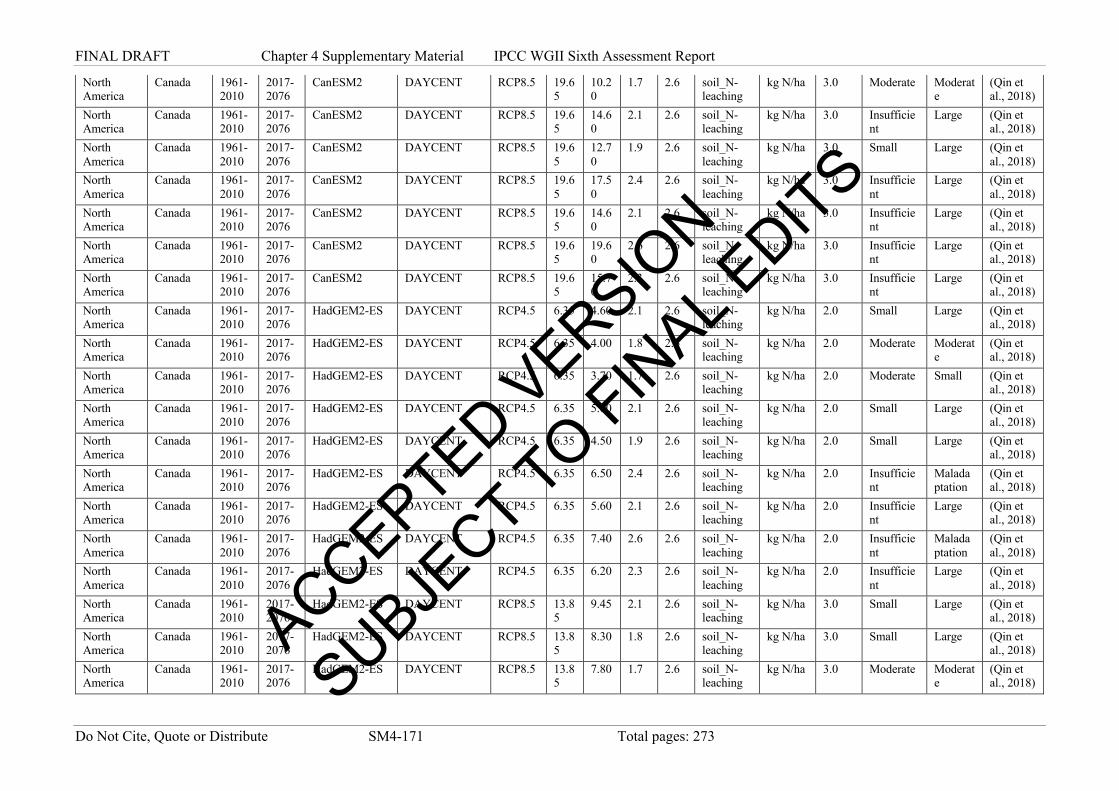
FINAL DRAFT Chapter 4 Supplementary Material IPCC WGII Sixth Assessment Report
Do Not Cite, Quote or Distribute SM4-171 Total pages: 273
North America
Canada 1961-2010
2017-2076
CanESM2 DAYCENT RCP8.5 19.65
10.20
1.7 2.6 soil_N-leaching
kg N/ha 3.0 Moderate Moderate
(Qin et al., 2018)
North America
Canada 1961-2010
2017-2076
CanESM2 DAYCENT RCP8.5 19.65
14.60
2.1 2.6 soil_N-leaching
kg N/ha 3.0 Insufficient
Large (Qin et al., 2018)
North America
Canada 1961-2010
2017-2076
CanESM2 DAYCENT RCP8.5 19.65
12.70
1.9 2.6 soil_N-leaching
kg N/ha 3.0 Small Large (Qin et al., 2018)
North America
Canada 1961-2010
2017-2076
CanESM2 DAYCENT RCP8.5 19.65
17.50
2.4 2.6 soil_N-leaching
kg N/ha 3.0 Insufficient
Large (Qin et al., 2018)
North America
Canada 1961-2010
2017-2076
CanESM2 DAYCENT RCP8.5 19.65
14.60
2.1 2.6 soil_N-leaching
kg N/ha 3.0 Insufficient
Large (Qin et al., 2018)
North America
Canada 1961-2010
2017-2076
CanESM2 DAYCENT RCP8.5 19.65
19.60
2.6 2.6 soil_N-leaching
kg N/ha 3.0 Insufficient
Large (Qin et al., 2018)
North America
Canada 1961-2010
2017-2076
CanESM2 DAYCENT RCP8.5 19.65
15.70
2.3 2.6 soil_N-leaching
kg N/ha 3.0 Insufficient
Large (Qin et al., 2018)
North America
Canada 1961-2010
2017-2076
HadGEM2-ES DAYCENT RCP4.5 6.35 4.60 2.1 2.6 soil_N-leaching
kg N/ha 2.0 Small Large (Qin et al., 2018)
North America
Canada 1961-2010
2017-2076
HadGEM2-ES DAYCENT RCP4.5 6.35 4.00 1.8 2.6 soil_N-leaching
kg N/ha 2.0 Moderate Moderate
(Qin et al., 2018)
North America
Canada 1961-2010
2017-2076
HadGEM2-ES DAYCENT RCP4.5 6.35 3.70 1.7 2.6 soil_N-leaching
kg N/ha 2.0 Moderate Small (Qin et al., 2018)
North America
Canada 1961-2010
2017-2076
HadGEM2-ES DAYCENT RCP4.5 6.35 5.00 2.1 2.6 soil_N-leaching
kg N/ha 2.0 Small Large (Qin et al., 2018)
North America
Canada 1961-2010
2017-2076
HadGEM2-ES DAYCENT RCP4.5 6.35 4.50 1.9 2.6 soil_N-leaching
kg N/ha 2.0 Small Large (Qin et al., 2018)
North America
Canada 1961-2010
2017-2076
HadGEM2-ES DAYCENT RCP4.5 6.35 6.50 2.4 2.6 soil_N-leaching
kg N/ha 2.0 Insufficient
Maladaptation
(Qin et al., 2018)
North America
Canada 1961-2010
2017-2076
HadGEM2-ES DAYCENT RCP4.5 6.35 5.60 2.1 2.6 soil_N-leaching
kg N/ha 2.0 Insufficient
Large (Qin et al., 2018)
North America
Canada 1961-2010
2017-2076
HadGEM2-ES DAYCENT RCP4.5 6.35 7.40 2.6 2.6 soil_N-leaching
kg N/ha 2.0 Insufficient
Maladaptation
(Qin et al., 2018)
North America
Canada 1961-2010
2017-2076
HadGEM2-ES DAYCENT RCP4.5 6.35 6.20 2.3 2.6 soil_N-leaching
kg N/ha 2.0 Insufficient
Large (Qin et al., 2018)
North America
Canada 1961-2010
2017-2076
HadGEM2-ES DAYCENT RCP8.5 13.85
9.45 2.1 2.6 soil_N-leaching
kg N/ha 3.0 Small Large (Qin et al., 2018)
North America
Canada 1961-2010
2017-2076
HadGEM2-ES DAYCENT RCP8.5 13.85
8.30 1.8 2.6 soil_N-leaching
kg N/ha 3.0 Small Large (Qin et al., 2018)
North America
Canada 1961-2010
2017-2076
HadGEM2-ES DAYCENT RCP8.5 13.85
7.80 1.7 2.6 soil_N-leaching
kg N/ha 3.0 Moderate Moderate
(Qin et al., 2018)
ACCEPTED VERSIO
N
SUBJECT TO FIN
AL EDITS
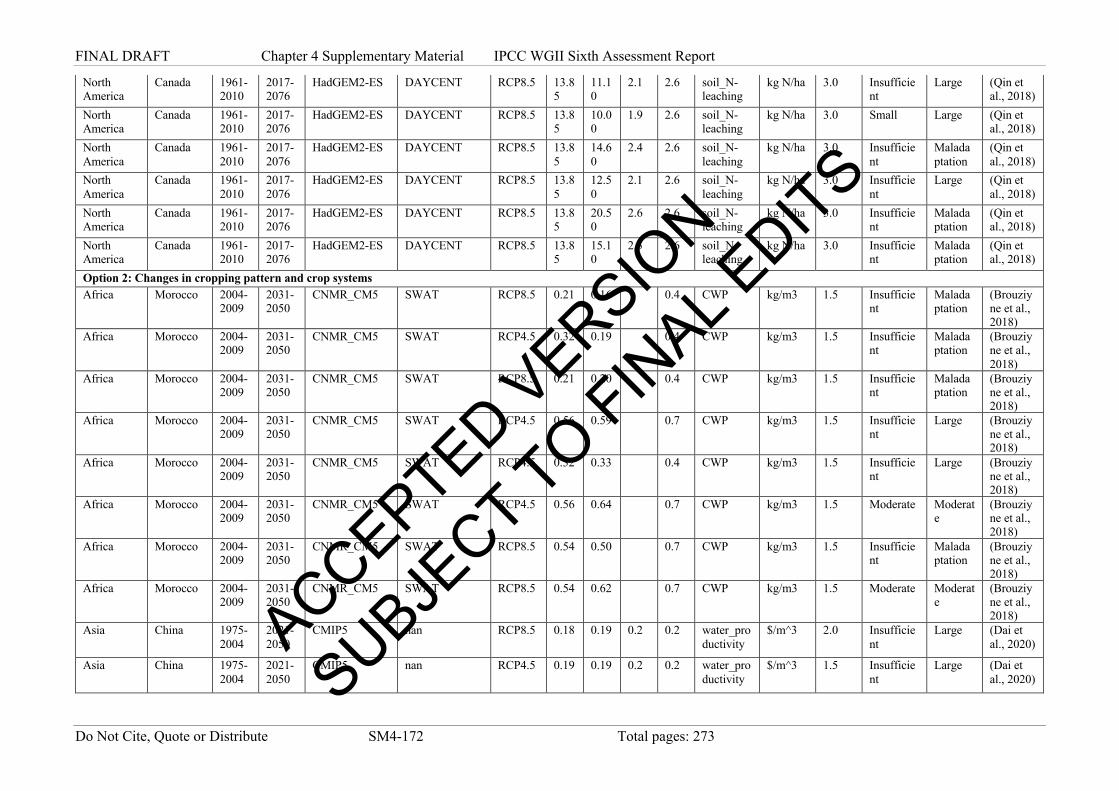
FINAL DRAFT Chapter 4 Supplementary Material IPCC WGII Sixth Assessment Report
Do Not Cite, Quote or Distribute SM4-172 Total pages: 273
North America
Canada 1961-2010
2017-2076
HadGEM2-ES DAYCENT RCP8.5 13.85
11.10
2.1 2.6 soil_N-leaching
kg N/ha 3.0 Insufficient
Large (Qin et al., 2018)
North America
Canada 1961-2010
2017-2076
HadGEM2-ES DAYCENT RCP8.5 13.85
10.00
1.9 2.6 soil_N-leaching
kg N/ha 3.0 Small Large (Qin et al., 2018)
North America
Canada 1961-2010
2017-2076
HadGEM2-ES DAYCENT RCP8.5 13.85
14.60
2.4 2.6 soil_N-leaching
kg N/ha 3.0 Insufficient
Maladaptation
(Qin et al., 2018)
North America
Canada 1961-2010
2017-2076
HadGEM2-ES DAYCENT RCP8.5 13.85
12.50
2.1 2.6 soil_N-leaching
kg N/ha 3.0 Insufficient
Large (Qin et al., 2018)
North America
Canada 1961-2010
2017-2076
HadGEM2-ES DAYCENT RCP8.5 13.85
20.50
2.6 2.6 soil_N-leaching
kg N/ha 3.0 Insufficient
Maladaptation
(Qin et al., 2018)
North America
Canada 1961-2010
2017-2076
HadGEM2-ES DAYCENT RCP8.5 13.85
15.10
2.3 2.6 soil_N-leaching
kg N/ha 3.0 Insufficient
Maladaptation
(Qin et al., 2018)
Option 2: Changes in cropping pattern and crop systems Africa Morocco 2004-
2009 2031-2050
CNMR_CM5 SWAT RCP8.5 0.21 0.16 0.4 CWP kg/m3 1.5 Insufficient
Maladaptation
(Brouziyne et al., 2018)
Africa Morocco 2004-2009
2031-2050
CNMR_CM5 SWAT RCP4.5 0.32 0.19 0.4 CWP kg/m3 1.5 Insufficient
Maladaptation
(Brouziyne et al., 2018)
Africa Morocco 2004-2009
2031-2050
CNMR_CM5 SWAT RCP8.5 0.21 0.20 0.4 CWP kg/m3 1.5 Insufficient
Maladaptation
(Brouziyne et al., 2018)
Africa Morocco 2004-2009
2031-2050
CNMR_CM5 SWAT RCP4.5 0.56 0.59 0.7 CWP kg/m3 1.5 Insufficient
Large (Brouziyne et al., 2018)
Africa Morocco 2004-2009
2031-2050
CNMR_CM5 SWAT RCP4.5 0.32 0.33 0.4 CWP kg/m3 1.5 Insufficient
Large (Brouziyne et al., 2018)
Africa Morocco 2004-2009
2031-2050
CNMR_CM5 SWAT RCP4.5 0.56 0.64 0.7 CWP kg/m3 1.5 Moderate Moderate
(Brouziyne et al., 2018)
Africa Morocco 2004-2009
2031-2050
CNMR_CM5 SWAT RCP8.5 0.54 0.50 0.7 CWP kg/m3 1.5 Insufficient
Maladaptation
(Brouziyne et al., 2018)
Africa Morocco 2004-2009
2031-2050
CNMR_CM5 SWAT RCP8.5 0.54 0.62 0.7 CWP kg/m3 1.5 Moderate Moderate
(Brouziyne et al., 2018)
Asia China 1975-2004
2021-2050
CMIP5 nan RCP8.5 0.18 0.19 0.2 0.2 water_productivity
$/m^3 2.0 Insufficient
Large (Dai et al., 2020)
Asia China 1975-2004
2021-2050
CMIP5 nan RCP4.5 0.19 0.19 0.2 0.2 water_productivity
$/m^3 1.5 Insufficient
Large (Dai et al., 2020)
ACCEPTED VERSIO
N
SUBJECT TO FIN
AL EDITS

FINAL DRAFT Chapter 4 Supplementary Material IPCC WGII Sixth Assessment Report
Do Not Cite, Quote or Distribute SM4-173 Total pages: 273
Asia Iran 1961-1990
2080 FIO-ESM,_GFDL-ESM2_M,_IPSL-CM5A-LR,_MIROC-ESM-CHEM
(CSM)-CERES-Wheat_(DSSAT)_version_4.6
RCP4.5 0.23 0.25 0.4 CWP (=yield/water used)
kg/m3 2.0 Insufficient
Large (Paymard et al., 2018)
Asia Iran 1961-1990
2080 FIO-ESM,_GFDL-ESM2_M,_IPSL-CM5A-LR,_MIROC-ESM-CHEM
(CSM)-CERES-Wheat_(DSSAT)_version_4.6
RCP8.5 0.20 0.22 0.4 CWP (=yield/water used)
kg/m3 4.0 Insufficient
Large (Paymard et al., 2018)
Asia Iran 1961-1990
2020 FIO-ESM,_GFDL-ESM2_M,_IPSL-CM5A-LR,_MIROC-ESM-CHEM
(CSM)-CERES-Wheat_(DSSAT)_version_4.6
RCP4.5 0.29 0.31 0.4 CWP (=yield/water used)
kg/m3 1.5 Small Large (Paymard et al., 2018)
Asia Iran 1961-1990
2020 FIO-ESM,_GFDL-ESM2_M,_IPSL-CM5A-LR,_MIROC-ESM-CHEM
(CSM)-CERES-Wheat_(DSSAT)_version_4.6
RCP4.5 1.04 1.07 1.1 CWP (=yield/water used)
kg/m3 1.5 Small Large (Paymard et al., 2018)
Asia Iran 1961-1990
2020 FIO-ESM,_GFDL-ESM2_M,_IPSL-CM5A-LR,_MIROC-ESM-CHEM
(CSM)-CERES-Wheat_(DSSAT)_version_4.6
RCP8.5 0.27 0.29 0.4 CWP (=yield/water used)
kg/m3 1.5 Insufficient
Large (Paymard et al., 2018)
Asia Iran 1961-1990
2020 FIO-ESM,_GFDL-ESM2_M,_IPSL-CM5A-LR,_MIROC-ESM-CHEM
(CSM)-CERES-Wheat_(DSSAT)_version_4.6
RCP8.5 0.99 1.04 1.1 CWP (=yield/water used)
kg/m3 1.5 Small Large (Paymard et al., 2018)
Asia Iran 1961-1990
2050 FIO-ESM,_GFDL-ESM2_M,_IPSL-CM5A-LR,_MIROC-ESM-CHEM
(CSM)-CERES-Wheat_(DSSAT)_version_4.6
RCP4.5 0.26 0.29 0.4 CWP (=yield/water used)
kg/m3 2.0 Small Large (Paymard et al., 2018) ACCEPTED V
ERSION
SUBJECT TO FIN
AL EDITS

FINAL DRAFT Chapter 4 Supplementary Material IPCC WGII Sixth Assessment Report
Do Not Cite, Quote or Distribute SM4-174 Total pages: 273
Asia Iran 1961-1990
2050 FIO-ESM,_GFDL-ESM2_M,_IPSL-CM5A-LR,_MIROC-ESM-CHEM
(CSM)-CERES-Wheat_(DSSAT)_version_4.6
RCP4.5 0.96 1.02 1.1 CWP (=yield/water used)
kg/m3 2.0 Small Large (Paymard et al., 2018)
Asia Iran 1961-1990
2080 FIO-ESM,_GFDL-ESM2_M,_IPSL-CM5A-LR,_MIROC-ESM-CHEM
(CSM)-CERES-Wheat_(DSSAT)_version_4.6
RCP4.5 0.87 0.92 1.1 CWP (=yield/water used)
kg/m3 2.0 Insufficient
Large (Paymard et al., 2018)
Asia Iran 1961-1990
2050 FIO-ESM,_GFDL-ESM2_M,_IPSL-CM5A-LR,_MIROC-ESM-CHEM
(CSM)-CERES-Wheat_(DSSAT)_version_4.6
RCP8.5 0.24 0.27 0.4 CWP (=yield/water used)
kg/m3 3.0 Insufficient
Large (Paymard et al., 2018)
Asia Iran 1961-1990
2050 FIO-ESM,_GFDL-ESM2_M,_IPSL-CM5A-LR,_MIROC-ESM-CHEM
(CSM)-CERES-Wheat_(DSSAT)_version_4.6
RCP8.5 0.89 0.99 1.1 CWP (=yield/water used)
kg/m3 3.0 Small Large (Paymard et al., 2018)
Asia Iran 1961-1990
2080 FIO-ESM,_GFDL-ESM2_M,_IPSL-CM5A-LR,_MIROC-ESM-CHEM
(CSM)-CERES-Wheat_(DSSAT)_version_4.6
RCP8.5 0.81 0.89 1.1 CWP (=yield/water used)
kg/m3 4.0 Insufficient
Large (Paymard et al., 2018)
Asia Iran 1976-2005
2020-2049
CMIP5 nan RCP2.6 0.27 0.21 0.2 water_resource_vulnerability_index
% 1.5 Large Small (Mehrazar et al., 2020)
Asia Iran 1976-2005
2020-2049
CMIP5 nan RCP4.5 0.36 0.31 0.2 water_resource_vulnerability_index
% 1.5 Small Large (Mehrazar et al., 2020)
Asia Iran 1976-2005
2020-2049
CMIP5 nan RCP8.5 0.44 0.38 0.2 water_resource_vulnerability_index
% 2.0 Insufficient
Large (Mehrazar et al., 2020) ACCEPTED V
ERSION
SUBJECT TO FIN
AL EDITS

FINAL DRAFT Chapter 4 Supplementary Material IPCC WGII Sixth Assessment Report
Do Not Cite, Quote or Distribute SM4-175 Total pages: 273
Asia Iran 1976-2005
2020-2049
CMIP5 nan RCP2.6 0.27 0.23 0.2 water_resource_vulnerability_index
% 1.5 Moderate Moderate
(Mehrazar et al., 2020)
Asia Iran 1976-2005
2020-2049
CMIP5 nan RCP4.5 0.36 0.33 0.2 water_resource_vulnerability_index
% 1.5 Insufficient
Large (Mehrazar et al., 2020)
Asia Iran 1976-2005
2020-2049
CMIP5 nan RCP8.5 0.44 0.40 0.2 water_resource_vulnerability_index
% 2.0 Insufficient
Large (Mehrazar et al., 2020)
Australasia Australia 1980-1999
2020-2039
GFDL,_CSIRO-Mark3.5_ MPI,_MIROC
CSIRO-OZCOT
A2 96.89
91.44
100.0
WUE Changes in %
1.5 Insufficient
Maladaptation
(Luo et al., 2016)
Australasia Australia 1980-1999
2020-2039
GFDL,_CSIRO-Mark3.5_ MPI,_MIROC
CSIRO-OZCOT
A2 96.89
99.22
100.0
WUE Changes in %
1.5 Moderate Small (Luo et al., 2016)
Australasia Australia 1980-1999
2020-2039
GFDL,_CSIRO-Mark3.5_ MPI,_MIROC
CSIRO-OZCOT
A2 96.89
103.00
100.0
WUE Changes in %
1.5 Co-benefits
Negligible
(Luo et al., 2016)
Option 3: On farm irrigation and water management Africa South
Africa 1990-2010
2040-2060
CSIRO IMPACT,_GTAP-W
B1 100532.03
119243.77
116222.0
production
Million_tons
1.5 Co-benefits
Negligible
(Calzadilla et al., 2014)
Africa Ethiopia 1980-2009
2040-2069
CanESM2,_CSIRO-MK3-6-0,_HadGEM2-ES
DSSAT,_WOFOST
RCP4.5 5.47 6.10 7.2 6.7 yield Mg/ha 2.0 Moderate Moderate
(Kassie et al., 2015)
Africa Ethiopia 1980-2009
2040-2069
CanESM2,_CSIRO-MK3-6-0,_HadGEM2-ES
DSSAT,_WOFOST
RCP8.5 5.23 5.97 7.2 6.7 yield Mg/ha 3.0 Small Large (Kassie et al., 2015)
ACCEPTED VERSIO
N
SUBJECT TO FIN
AL EDITS
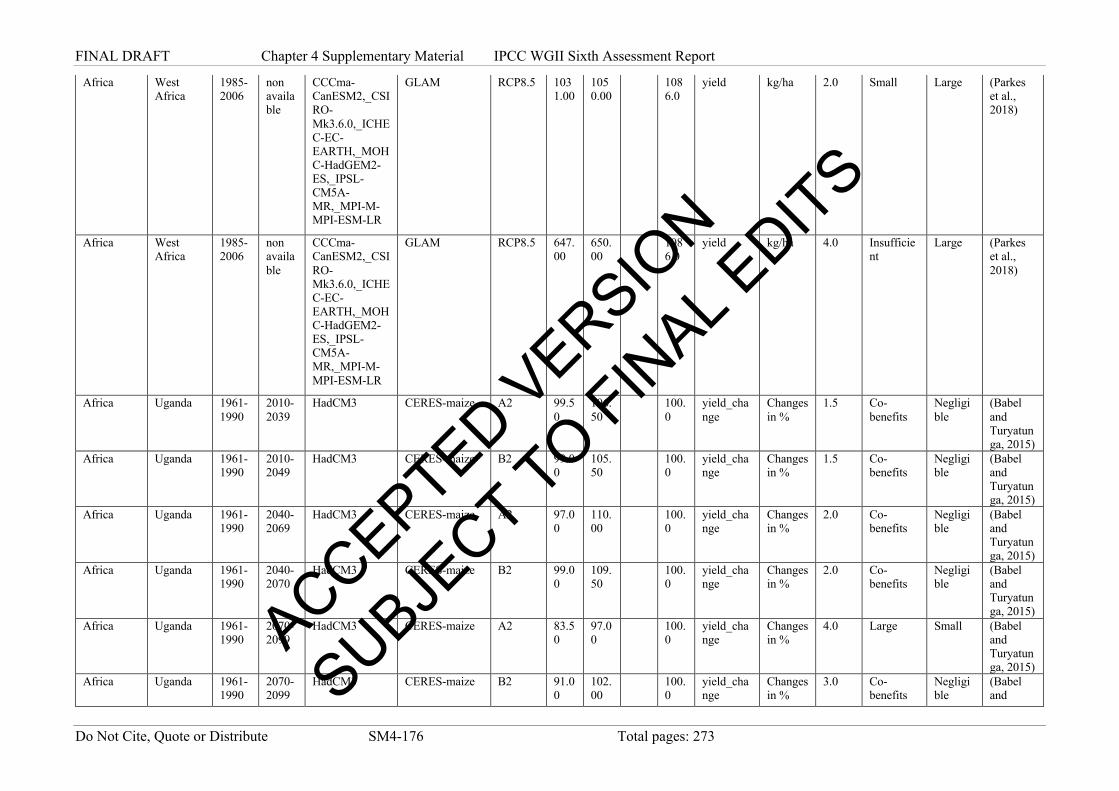
FINAL DRAFT Chapter 4 Supplementary Material IPCC WGII Sixth Assessment Report
Do Not Cite, Quote or Distribute SM4-176 Total pages: 273
Africa West Africa
1985-2006
non available
CCCma-CanESM2,_CSIRO-Mk3.6.0,_ICHEC-EC-EARTH,_MOHC-HadGEM2-ES,_IPSL-CM5A-MR,_MPI-M-MPI-ESM-LR
GLAM RCP8.5 1031.00
1050.00
1086.0
yield kg/ha 2.0 Small Large (Parkes et al., 2018)
Africa West Africa
1985-2006
non available
CCCma-CanESM2,_CSIRO-Mk3.6.0,_ICHEC-EC-EARTH,_MOHC-HadGEM2-ES,_IPSL-CM5A-MR,_MPI-M-MPI-ESM-LR
GLAM RCP8.5 647.00
650.00
1086.0
yield kg/ha 4.0 Insufficient
Large (Parkes et al., 2018)
Africa Uganda 1961-1990
2010-2039
HadCM3 CERES-maize A2 99.50
106.50
100.0
yield_change
Changes in %
1.5 Co-benefits
Negligible
(Babel and Turyatunga, 2015)
Africa Uganda 1961-1990
2010-2049
HadCM3 CERES-maize B2 99.00
105.50
100.0
yield_change
Changes in %
1.5 Co-benefits
Negligible
(Babel and Turyatunga, 2015)
Africa Uganda 1961-1990
2040-2069
HadCM3 CERES-maize A2 97.00
110.00
100.0
yield_change
Changes in %
2.0 Co-benefits
Negligible
(Babel and Turyatunga, 2015)
Africa Uganda 1961-1990
2040-2070
HadCM3 CERES-maize B2 99.00
109.50
100.0
yield_change
Changes in %
2.0 Co-benefits
Negligible
(Babel and Turyatunga, 2015)
Africa Uganda 1961-1990
2070-2099
HadCM3 CERES-maize A2 83.50
97.00
100.0
yield_change
Changes in %
4.0 Large Small (Babel and Turyatunga, 2015)
Africa Uganda 1961-1990
2070-2099
HadCM3 CERES-maize B2 91.00
102.00
100.0
yield_change
Changes in %
3.0 Co-benefits
Negligible
(Babel and
ACCEPTED VERSIO
N
SUBJECT TO FIN
AL EDITS

FINAL DRAFT Chapter 4 Supplementary Material IPCC WGII Sixth Assessment Report
Do Not Cite, Quote or Distribute SM4-177 Total pages: 273
Turyatunga, 2015)
Asia India 1971-2000
2036-2065
HadCM3,_ECHAM5
LPJmL A1B 67.35
74.33
70.4 Renewable_water_usage_relative_to_groundwater_in_crop_production
Changes in %
2.0 Co-benefits
Negligible
(Biemans et al., 2013)
Asia India 1971-2000
2036-2065
HadCM3,_ECHAM6
LPJmL A1B 67.35
71.95
70.4 crop_production_relative_to_water_resources
Changes in %
2.0 Co-benefits
Negligible
(Biemans et al., 2013)
Asia India 1971-2000
2036-2065
HadCM3,_ECHAM7
LPJmL A1B 67.35
78.76
70.4 crop_production_relative_to_water_resources
Changes in %
2.0 Co-benefits
Negligible
(Biemans et al., 2013)
Asia Thailand 1980-2004
2020-2044
ACCESS1.0,_CNRM-CM5,_MPI-ESM-LR,_EC-EARTH
DSSAT_v_4.6,_CERES_rice_crop
RCP4.5 1.94 2.23 2.0 yield t/ha 1.5 Co-benefits
Negligible
(Boonwichai et al., 2019)
Asia Thailand 1980-2004
2045-2069
ACCESS1.0,_CNRM-CM5,_MPI-ESM-LR,_EC-EARTH
DSSAT_v_4.6,_CERES_rice_crop
RCP4.5 1.82 2.13 2.0 yield t/ha 2.0 Co-benefits
Negligible
(Boonwichai et al., 2019)
Asia Thailand 1980-2004
2070-2094
ACCESS1.0,_CNRM-CM5,_MPI-ESM-LR,_EC-EARTH
DSSAT_v_4.6,_CERES_rice_crop
RCP4.5 1.75 2.11 2.0 yield t/ha 2.0 Co-benefits
Negligible
(Boonwichai et al., 2019)
Asia Thailand 1980-2004
2020-2044
ACCESS1.0,_CNRM-CM5,_MPI-ESM-LR,_EC-EARTH
DSSAT_v_4.6,_CERES_rice_crop
RCP8.5 1.95 2.23 2.0 yield t/ha 1.5 Co-benefits
Negligible
(Boonwichai et al., 2019)
Asia Thailand 1980-2004
2045-2069
ACCESS1.0,_CNRM-CM5,_MPI-ESM-LR,_EC-EARTH
DSSAT_v_4.6,_CERES_rice_crop
RCP8.5 1.76 2.08 2.0 yield t/ha 3.0 Co-benefits
Negligible
(Boonwichai et al., 2019)
ACCEPTED VERSIO
N
SUBJECT TO FIN
AL EDITS

FINAL DRAFT Chapter 4 Supplementary Material IPCC WGII Sixth Assessment Report
Do Not Cite, Quote or Distribute SM4-178 Total pages: 273
Asia Thailand 1980-2004
2070-2094
ACCESS1.0,_CNRM-CM5,_MPI-ESM-LR,_EC-EARTH
DSSAT_v_4.6,_CERES_rice_crop
RCP8.5 1.68 2.01 2.0 yield t/ha 4.0 Co-benefits
Negligible
(Boonwichai et al., 2019)
Asia China 1975-2004
2021-2050
CMIP5 nan RCP8.5 0.18 0.20 0.2 0.2 water_productivity
$/m^3 2.0 Large Small (Dai et al., 2020)
Asia China 1975-2004
2021-2050
CMIP5 nan RCP8.5 0.18 0.19 0.2 0.2 water_productivity
$/m^3 2.0 Moderate Moderate
(Dai et al., 2020)
Asia China 1975-2004
2021-2050
CMIP5 nan RCP4.5 0.19 0.19 0.2 0.2 water_productivity
$/m^3 1.5 Small Large (Dai et al., 2020)
Asia China 1975-2004
2021-2050
CMIP5 nan RCP4.5 0.19 0.19 0.2 0.2 water_productivity
$/m^3 1.5 Insufficient
Large (Dai et al., 2020)
Asia China 1980-2004
2070-2099
GFDL-ESM2M, _HadGEM2-ES,_IPSLCM5A-LR,_MIROC-ESM-CHEM,_NorESM1-M
SWAT RCP8.5 144.52
128.54
133.0
100.0
sediment_load_change
Changes in %
4.0 Small Large (Qin et al., 2018)
ACCEPTED VERSIO
N
SUBJECT TO FIN
AL EDITS
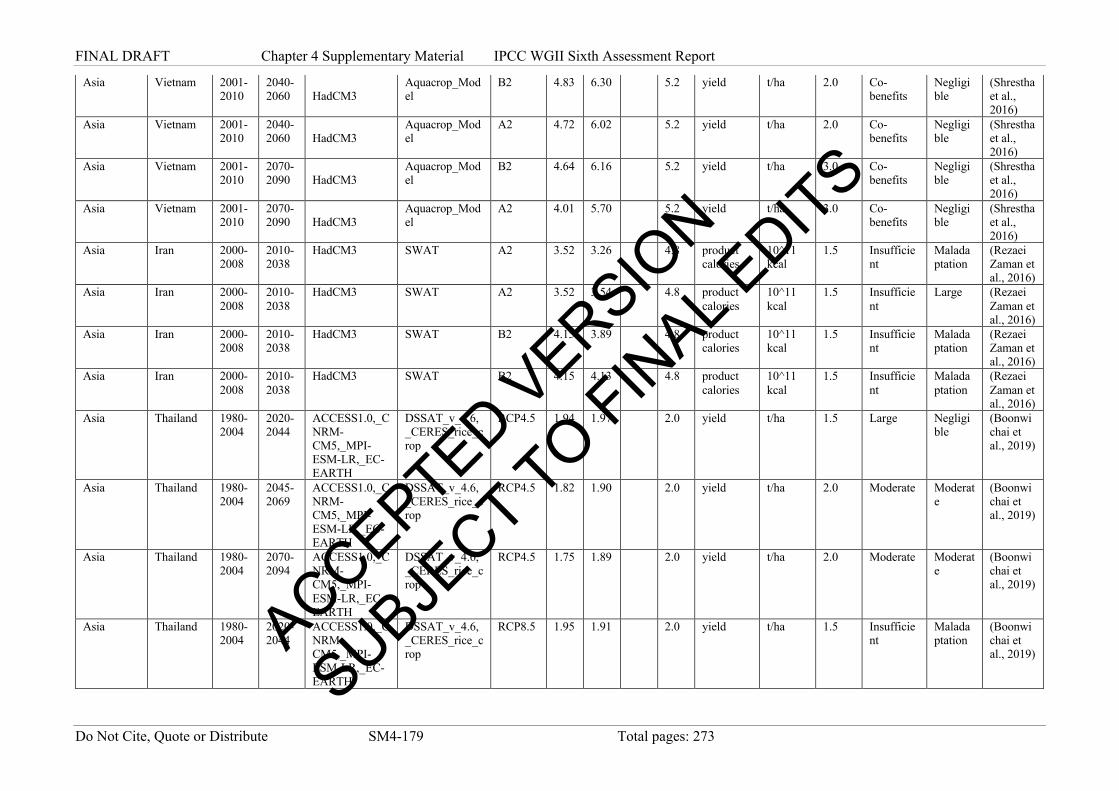
FINAL DRAFT Chapter 4 Supplementary Material IPCC WGII Sixth Assessment Report
Do Not Cite, Quote or Distribute SM4-179 Total pages: 273
Asia Vietnam 2001-2010
2040-2060
HadCM3
Aquacrop_Model
B2 4.83 6.30 5.2 yield t/ha 2.0 Co-benefits
Negligible
(Shrestha et al., 2016)
Asia Vietnam 2001-2010
2040-2060
HadCM3
Aquacrop_Model
A2 4.72 6.02 5.2 yield t/ha 2.0 Co-benefits
Negligible
(Shrestha et al., 2016)
Asia Vietnam 2001-2010
2070-2090
HadCM3
Aquacrop_Model
B2 4.64 6.16 5.2 yield t/ha 3.0 Co-benefits
Negligible
(Shrestha et al., 2016)
Asia Vietnam 2001-2010
2070-2090
HadCM3
Aquacrop_Model
A2 4.01 5.70 5.2 yield t/ha 3.0 Co-benefits
Negligible
(Shrestha et al., 2016)
Asia Iran 2000-2008
2010-2038
HadCM3 SWAT A2 3.52 3.26 4.8 product calories
10^11 kcal
1.5 Insufficient
Maladaptation
(Rezaei Zaman et al., 2016)
Asia Iran 2000-2008
2010-2038
HadCM3 SWAT A2 3.52 3.54 4.8 product calories
10^11 kcal
1.5 Insufficient
Large (Rezaei Zaman et al., 2016)
Asia Iran 2000-2008
2010-2038
HadCM3 SWAT B2 4.15 3.89 4.8 product calories
10^11 kcal
1.5 Insufficient
Maladaptation
(Rezaei Zaman et al., 2016)
Asia Iran 2000-2008
2010-2038
HadCM3 SWAT B2 4.15 4.13 4.8 product calories
10^11 kcal
1.5 Insufficient
Maladaptation
(Rezaei Zaman et al., 2016)
Asia Thailand 1980-2004
2020-2044
ACCESS1.0,_CNRM-CM5,_MPI-ESM-LR,_EC-EARTH
DSSAT_v_4.6,_CERES_rice_crop
RCP4.5 1.94 1.97 2.0 yield t/ha 1.5 Large Negligible
(Boonwichai et al., 2019)
Asia Thailand 1980-2004
2045-2069
ACCESS1.0,_CNRM-CM5,_MPI-ESM-LR,_EC-EARTH
DSSAT_v_4.6,_CERES_rice_crop
RCP4.5 1.82 1.90 2.0 yield t/ha 2.0 Moderate Moderate
(Boonwichai et al., 2019)
Asia Thailand 1980-2004
2070-2094
ACCESS1.0,_CNRM-CM5,_MPI-ESM-LR,_EC-EARTH
DSSAT_v_4.6,_CERES_rice_crop
RCP4.5 1.75 1.89 2.0 yield t/ha 2.0 Moderate Moderate
(Boonwichai et al., 2019)
Asia Thailand 1980-2004
2020-2044
ACCESS1.0,_CNRM-CM5,_MPI-ESM-LR,_EC-EARTH
DSSAT_v_4.6,_CERES_rice_crop
RCP8.5 1.95 1.91 2.0 yield t/ha 1.5 Insufficient
Maladaptation
(Boonwichai et al., 2019) ACCEPTED V
ERSION
SUBJECT TO FIN
AL EDITS
FINAL DRAFT Chapter 4 Supplementary Material IPCC WGII Sixth Assessment Report
Do Not Cite, Quote or Distribute SM4-180 Total pages: 273
Asia Thailand 1980-2004
2045-2069
ACCESS1.0,_CNRM-CM5,_MPI-ESM-LR,_EC-EARTH
DSSAT_v_4.6,_CERES_rice_crop
RCP8.5 1.76 1.77 2.0 yield t/ha 3.0 Insufficient
Large (Boonwichai et al., 2019)
Asia Thailand 1980-2004
2070-2094
ACCESS1.0,_CNRM-CM5,_MPI-ESM-LR,_EC-EARTH
DSSAT_v_4.6,_CERES_rice_crop
RCP8.5 1.68 1.67 2.0 yield t/ha 4.0 Insufficient
Maladaptation
(Boonwichai et al., 2019)
Asia Thailand 1980-2004
2045-2069
ACCESS1.0,_CNRM-CM5,_MPI-ESM-LR,_EC-EARTH
DSSAT_v_4.6,_CERES_rice_crop
RCP4.5 1.94 1.82 2.0 yield t/ha 2.0 Insufficient
Maladaptation
(Boonwichai et al., 2019)
Asia Thailand 1980-2004
2070-2094
ACCESS1.0,_CNRM-CM5,_MPI-ESM-LR,_EC-EARTH
DSSAT_v_4.6,_CERES_rice_crop
RCP4.5 1.93 1.75 2.0 yield t/ha 2.0 Insufficient
Maladaptation
(Boonwichai et al., 2019)
Asia Thailand 1980-2004
2045-2069
ACCESS1.0,_CNRM-CM5,_MPI-ESM-LR,_EC-EARTH
DSSAT_v_4.6,_CERES_rice_crop
RCP8.5 1.77 1.76 2.0 yield t/ha 3.0 Insufficient
Maladaptation
(Boonwichai et al., 2019)
Asia Thailand 1980-2004
2070-2094
ACCESS1.0,_CNRM-CM5,_MPI-ESM-LR,_EC-EARTH
DSSAT_v_4.6,_CERES_rice_crop
RCP8.5 1.71 1.68 2.0 yield t/ha 4.0 Insufficient
Maladaptation
(Boonwichai et al., 2019)
Asia Thailand 1980-2004
2045-2069
ACCESS1.0,_CNRM-CM5,_MPI-ESM-LR,_EC-EARTH
DSSAT_v_4.6,_CERES_rice_crop
RCP4.5 1.94 1.94 2.0 yield t/ha 2.0 Insufficient
Large (Boonwichai et al., 2019)
Asia Thailand 1980-2004
2070-2094
ACCESS1.0,_CNRM-CM5,_MPI-ESM-LR,_EC-EARTH
DSSAT_v_4.6,_CERES_rice_crop
RCP4.5 1.93 1.95 2.0 yield t/ha 2.0 Small Moderate
(Boonwichai et al., 2019)
Asia Thailand 1980-2004
2045-2069
ACCESS1.0,_CNRM-CM5,_MPI-ESM-LR,_EC-EARTH
DSSAT_v_4.6,_CERES_rice_crop
RCP8.5 1.77 1.79 2.0 yield t/ha 3.0 Insufficient
Large (Boonwichai et al., 2019)
ACCEPTED VERSIO
N
SUBJECT TO FIN
AL EDITS
FINAL DRAFT Chapter 4 Supplementary Material IPCC WGII Sixth Assessment Report
Do Not Cite, Quote or Distribute SM4-181 Total pages: 273
Asia Thailand 1980-2004
2070-2094
ACCESS1.0,_CNRM-CM5,_MPI-ESM-LR,_EC-EARTH
DSSAT_v_4.6,_CERES_rice_crop
RCP8.5 1.71 1.74 2.0 yield t/ha 4.0 Insufficient
Large (Boonwichai et al., 2019)
Asia Thailand 1980-2004
2045-2069
ACCESS1.0,_CNRM-CM5,_MPI-ESM-LR,_EC-EARTH
DSSAT_v_4.6,_CERES_rice_crop
RCP4.5 1.94 1.86 2.0 yield t/ha 2.0 Insufficient
Maladaptation
(Boonwichai et al., 2019)
Asia Thailand 1980-2004
2070-2094
ACCESS1.0,_CNRM-CM5,_MPI-ESM-LR,_EC-EARTH
DSSAT_v_4.6,_CERES_rice_crop
RCP4.5 1.93 1.84 2.0 yield t/ha 2.0 Insufficient
Maladaptation
(Boonwichai et al., 2019)
Asia Thailand 1980-2004
2045-2069
ACCESS1.0,_CNRM-CM5,_MPI-ESM-LR,_EC-EARTH
DSSAT_v_4.6,_CERES_rice_crop
RCP8.5 1.77 1.77 2.0 yield t/ha 3.0 Insufficient
Large (Boonwichai et al., 2019)
Asia Thailand 1980-2004
2070-2094
ACCESS1.0,_CNRM-CM5,_MPI-ESM-LR,_EC-EARTH
DSSAT_v_4.6,_CERES_rice_crop
RCP8.5 1.71 1.72 2.0 yield t/ha 4.0 Insufficient
Large (Boonwichai et al., 2019)
Asia Iran 1976-2005
2020-2049
CMIP5 nan RCP2.6 0.27 0.17 0.2 water_resource_vulnerability_index
% 1.5 Co-benefits
Negligible
(Mehrazar et al., 2020)
Asia Iran 1976-2005
2020-2049
CMIP5 nan RCP4.5 0.36 0.22 0.2 water_resource_vulnerability_index
% 1.5 Large Small (Mehrazar et al., 2020)
Asia Iran 1976-2005
2020-2049
CMIP5 nan RCP8.5 0.44 0.25 0.2 water_resource_vulnerability_index
% 2.0 Moderate Small (Mehrazar et al., 2020)
Asia India 1980-2010
2040-2069
MPI-ESM-MR, _MIROC5,_CCSM4_HadGEM2-ES
DSSAT-CROPGRO-Peanut
RCP8.5 98.80
114.40
100.0
yield_change
Changes in %
3.0 Co-benefits
Negligible
(Kadiyala et al., 2015)
ACCEPTED VERSIO
N
SUBJECT TO FIN
AL EDITS

FINAL DRAFT Chapter 4 Supplementary Material IPCC WGII Sixth Assessment Report
Do Not Cite, Quote or Distribute SM4-182 Total pages: 273
Asia Vietnam 1971-2000
2011-2040
ECHAM4,_CCSR,_UKMO-HadCM3,_CSIRO-Mk2.0,_CGCM2.0,_GFDL-R30
AquaCrop4.0 A2 91.00
95.83
100.0
yield_change
Changes in %
1.5 Moderate Moderate
(Deb et al., 2016)
Asia Vietnam 1971-2000
2041-2070
ECHAM4,_CCSR,_UKMO-HadCM3,_CSIRO-Mk2.0,_CGCM2.0,_GFDL-R30
AquaCrop4.0 A2 87.50
95.33
100.0
yield_change
Changes in %
2.0 Moderate Moderate
(Deb et al., 2016)
Asia Vietnam 1971-2000
2071-2099
ECHAM4,_CCSR,_UKMO-HadCM3,_CSIRO-Mk2.0,_CGCM2.0,_GFDL-R30
AquaCrop4.0 A2 83.33
90.67
100.0
yield_change
Changes in %
3.0 Small Large (Deb et al., 2016)
Asia Vietnam 1971-2000
2011-2040
ECHAM4,_CCSR,_UKMO-HadCM3,_CSIRO-Mk2.0,_CGCM2.0,_GFDL-R30
AquaCrop4.0 B2 93.00
100.00
100.0
yield_change
Changes in %
1.5 Large Negligible
(Deb et al., 2016)
Asia Vietnam 1971-2000
2041-2070
ECHAM4,_CCSR,_UKMO-HadCM3,_CSIRO-Mk2.0,_CGCM2.0,_GFDL-R30
AquaCrop4.0 B2 90.67
96.33
100.0
yield_change
Changes in %
2.0 Moderate Moderate
(Deb et al., 2016)
Asia Vietnam 1971-2000
2071-2099
ECHAM4,_CCSR,_UKMO-HadCM3,_CSIRO-Mk2.0,_CGCM2.0,_GFDL-R30
AquaCrop4.0 B2 88.00
92.50
100.0
yield_change
Changes in %
3.0 Small Large (Deb et al., 2016)
Australasia Australia 1980-1999
2020-2039
GFDL,_CSIRO-Mark3.5_ MPI,_MIROC
CSIRO-OZCOT
A2 96.64
98.30
100.0
yield Changes in %
1.5 Small Large (Luo et al., 2016)
ACCEPTED VERSIO
N
SUBJECT TO FIN
AL EDITS
FINAL DRAFT Chapter 4 Supplementary Material IPCC WGII Sixth Assessment Report
Do Not Cite, Quote or Distribute SM4-183 Total pages: 273
Australasia Australia 1980-1999
2020-2039
GFDL,_CSIRO-Mark3.5_ MPI,_MIROC
CSIRO-OZCOT
A2 96.89
97.71
100.0
WUE Changes in %
1.5 Insufficient
Large (Luo et al., 2016)
Central and South America
Ecuador 1961-1990
2070-2099
CCSM4,_ECHAM6
Lumped-Témez_Hydrological_Model
RCP8.5 181.75
185.30
109.8
agricultural_gross_water_demand
hm^3 4.0 Insufficient
Maladaptation
(Rivadeneira Vera et al., 2020)
Central and South America
Ecuador 1961-1990
2070-2099
CCSM4,_ECHAM6
Lumped-Témez_Hydrological_Model
RCP8.5 181.75
164.75
109.8
agricultural_gross_water_demand
hm^3 4.0 Insufficient
Large (Rivadeneira Vera et al., 2020)
Central and South America
Ecuador 1961-1990
2040-2069
CCSM4,_ECHAM6
Lumped-Témez_Hydrological_Model
RCP8.5 150.95
154.00
109.8
agricultural_gross_water_demand
hm^3 3.0 Insufficient
Maladaptation
(Rivadeneira Vera et al., 2020)
Central and South America
Ecuador 1961-1990
2040-2069
CCSM4,_ECHAM6
Lumped-Témez_Hydrological_Model
RCP8.5 150.95
136.90
109.8
agricultural_gross_water_demand
hm^3 3.0 Small Large (Rivadeneira Vera et al., 2020)
Central and South America
Ecuador 1961-1990
2070-2099
CCSM4,_ECHAM6
Lumped-Témez_Hydrological_Model
RCP4.5 137.80
140.55
109.8
agricultural_gross_water_demand
hm^3 2.0 Insufficient
Maladaptation
(Rivadeneira Vera et al., 2020)
Central and South America
Ecuador 1961-1990
2070-2099
CCSM4,_ECHAM6
Lumped-Témez_Hydrological_Model
RCP4.5 137.80
124.90
109.8
agricultural_gross_water_demand
hm^3 2.0 Small Large (Rivadeneira Vera et al., 2020)
Central and South America
Ecuador 1961-1990
2040-2069
CCSM4,_ECHAM6
Lumped-Témez_Hydrological_Model
RCP4.5 136.20
138.85
109.8
agricultural_gross_water_demand
hm^3 2.0 Insufficient
Maladaptation
(Rivadeneira Vera et al., 2020)
Central and South America
Ecuador 1961-1990
2040-2069
CCSM4,_ECHAM6
Lumped-Témez_Hydrological_Model
RCP4.5 136.20
123.40
109.8
agricultural_gross_water_demand
hm^3 2.0 Small Large (Rivadeneira Vera et al., 2020)
Central and South America
Ecuador 1961-1990
2010-2039
CCSM4,_ECHAM6
Lumped-Témez_Hydrological_Model
RCP8.5 122.45
124.90
109.8
agricultural_gross_water_demand
hm^3 1.5 Insufficient
Maladaptation
(Rivadeneira Vera et al., 2020)
ACCEPTED VERSIO
N
SUBJECT TO FIN
AL EDITS

FINAL DRAFT Chapter 4 Supplementary Material IPCC WGII Sixth Assessment Report
Do Not Cite, Quote or Distribute SM4-184 Total pages: 273
Central and South America
Ecuador 1961-1990
2010-2039
CCSM4,_ECHAM6
Lumped-Témez_Hydrological_Model
RCP8.5 122.45
110.95
109.8
agricultural_gross_water_demand
hm^3 1.5 Large Small (Rivadeneira Vera et al., 2020)
Central and South America
Ecuador 1961-1990
2010-2039
CCSM4,_ECHAM6
Lumped-Témez_Hydrological_Model
RCP4.5 124.65
127.10
109.8
agricultural_gross_water_demand
hm^3 1.5 Insufficient
Maladaptation
(Rivadeneira Vera et al., 2020)
Central and South America
Ecuador 1961-1990
2010-2039
CCSM4,_ECHAM6
Lumped-Témez_Hydrological_Model
RCP4.5 124.65
113.00
109.8
agricultural_gross_water_demand
hm^3 1.5 Moderate Small (Rivadeneira Vera et al., 2020)
Europe Spain 1980-2010
2070-2099
GFDL-CM3,_GISS-E2-R,_HadGEM2-ES,_MIROC5,_MPI-ESM-MR
AdaptaOlive RCP8.5 18.00
28.74
100.0
yield_change
Changes in %
4.0 Insufficient
Large (Cabezas et al., 2020)
Europe Spain 1980-2010
2070-2099
GFDL-CM3,_GISS-E2-R,_HadGEM2-ES,_MIROC5,_MPI-ESM-MR
AdaptaOlive RCP8.5 18.00
35.56
100.0
yield_change
Changes in %
4.0 Insufficient
Large (Cabezas et al., 2020)
Europe Spain 1980-2010
2040-2069
GFDL-CM3,_GISS-E2-R,_HadGEM2-ES,_MIROC5,_MPI-ESM-MR
AdaptaOlive RCP8.5 55.98
68.78
100.0
yield_change
Changes in %
3.0 Insufficient
Large (Cabezas et al., 2020)
Europe Spain 1980-2010
2040-2069
GFDL-CM3,_GISS-E2-R,_HadGEM2-ES,_MIROC5,_MPI-ESM-MR
AdaptaOlive RCP8.5 55.98
77.54
100.0
yield_change
Changes in %
3.0 Small Large (Cabezas et al., 2020)
Europe Spain 1980-2010
2070-2099
GFDL-CM3,_GISS-E2-R,_HadGEM2-ES,_MIROC5,_MPI-ESM-MR
AdaptaOlive RCP4.5 62.26
70.22
100.0
yield_change
Changes in %
3.0 Insufficient
Large (Cabezas et al., 2020) ACCEPTED V
ERSION
SUBJECT TO FIN
AL EDITS
FINAL DRAFT Chapter 4 Supplementary Material IPCC WGII Sixth Assessment Report
Do Not Cite, Quote or Distribute SM4-185 Total pages: 273
Europe Spain 1980-2010
2070-2099
GFDL-CM3,_GISS-E2-R,_HadGEM2-ES,_MIROC5,_MPI-ESM-MR
AdaptaOlive RCP4.5 62.26
77.52
100.0
yield_change
Changes in %
3.0 Small Large (Cabezas et al., 2020)
Europe Spain 1980-2010
2040-2069
GFDL-CM3,_GISS-E2-R,_HadGEM2-ES,_MIROC5,_MPI-ESM-MR
AdaptaOlive RCP4.5 96.04
97.48
100.0
yield_change
Changes in %
2.0 Small Large (Cabezas et al., 2020)
Europe Spain 1980-2010
2040-2069
GFDL-CM3,_GISS-E2-R,_HadGEM2-ES,_MIROC5,_MPI-ESM-MR
AdaptaOlive RCP4.5 96.04
101.10
100.0
yield_change
Changes in %
2.0 Co-benefits
Negligible
(Cabezas et al., 2020)
Europe UK 2008-2017
2041-2050
HadCM3 Aquacrop B1 6.00 11.10
9.0 7.8 yield t/ha 1.5 Co-benefits
Negligible
(El Chami and Daccache, 2015)
Europe UK 2008-2017
2041-2050
HadCM3 Aquacrop A1 6.25 11.25
9.0 7.8 yield t/ha 2.0 Co-benefits
Negligible
(El Chami and Daccache, 2015)
Europe Portugal 1981-2005
2041-2070
MPI-M-MPI-ESM-LR,_CNRM-CM5
STICS RCP8.5 79.42
90.83
100.0
yield_change
Changes in %
3.0 Moderate Moderate
(Fraga et al., 2018)
Europe Italy 1981-2020
2021-2060
CNRM-CM5 SPI-Q,_GMAT RCP4.5 521.70
535.80
664.3
annual_cumulated_ground_water_discharge
1E6m3 1.5 Insufficient
Large (Guyennon et al., 2017)
Europe Italy 1981-2020
2021-2060
CNRM-CM5 SPI-Q,_GMAT RCP4.5 521.70
560.90
664.3
annual_cumulated_ground_water_discharge
1E6m4 1.5 Insufficient
Large (Guyennon et al., 2017) ACCEPTED V
ERSION
SUBJECT TO FIN
AL EDITS

FINAL DRAFT Chapter 4 Supplementary Material IPCC WGII Sixth Assessment Report
Do Not Cite, Quote or Distribute SM4-186 Total pages: 273
Europe Italy 1981-2020
2021-2060
CNRM-CM5 SPI-Q,_GMAT RCP8.5 417.60
428.90
720.4
annual_cumulated_ground_water_discharge
1E6m5 2.0 Insufficient
Large (Guyennon et al., 2017)
Europe Italy 1981-2020
2021-2060
CNRM-CM5 SPI-Q,_GMAT RCP8.5 417.60
456.80
720.4
annual_cumulated_ground_water_discharge
1E6m6 2.0 Insufficient
Large (Guyennon et al., 2017)
Europe Italy 1981-2020
2061-2100
CNRM-CM5 SPI-Q,_GMAT RCP4.5 492.60
507.80
664.3
annual_cumulated_ground_water_discharge
1E6m3 2.0 Insufficient
Large (Guyennon et al., 2017)
Europe Italy 1981-2020
2061-2100
CNRM-CM5 SPI-Q,_GMAT RCP4.5 492.60
610.10
664.3
annual_cumulated_ground_water_discharge
1E6m4 2.0 Moderate Moderate
(Guyennon et al., 2017)
Europe Italy 1981-2020
2061-2100
CNRM-CM5 SPI-Q,_GMAT RCP8.5 312.20
324.60
720.4
annual_cumulated_ground_water_discharge
1E6m5 4.0 Insufficient
Large (Guyennon et al., 2017)
Europe Italy 1981-2020
2061-2100
CNRM-CM5 SPI-Q,_GMAT RCP8.5 312.20
387.70
720.4
annual_cumulated_ground_water_discharge
1E6m6 4.0 Insufficient
Large (Guyennon et al., 2017)
Europe Portugal 1981-2005
2021-2041
MPI-M-MPI-ESM-LR,_CNRM-CM5,_EC-EARTH,_IPSL-CM5A-MR
dynamic_olive_crop_model_by_Viola_et_al_2012
RCP4.5 88.00
99.00
100.0
yield_change
Changes in %
1.5 Large Small (Fraga et al., 2020)
Europe Portugal 1981-2005
2021-2041
MPI-M-MPI-ESM-LR,_CNRM-CM5,_EC-EARTH,_IPSL-CM5A-MR
dynamic_olive_crop_model_by_Viola_et_al_2012
RCP8.5 77.00
97.00
100.0
yield_change
Changes in %
1.5 Large Small (Fraga et al., 2020)
ACCEPTED VERSIO
N
SUBJECT TO FIN
AL EDITS

FINAL DRAFT Chapter 4 Supplementary Material IPCC WGII Sixth Assessment Report
Do Not Cite, Quote or Distribute SM4-187 Total pages: 273
Europe Portugal 1981-2005
2041-2061
MPI-M-MPI-ESM-LR,_CNRM-CM5,_EC-EARTH,_IPSL-CM5A-MR
dynamic_olive_crop_model_by_Viola_et_al_2012
RCP4.5 84.00
98.50
100.0
yield_change
Changes in %
2.0 Large Small (Fraga et al., 2020)
Europe Portugal 1981-2005
2041-2061
MPI-M-MPI-ESM-LR,_CNRM-CM5,_EC-EARTH,_IPSL-CM5A-MR
dynamic_olive_crop_model_by_Viola_et_al_2012
RCP8.5 79.00
98.50
100.0
yield_change
Changes in %
3.0 Large Small (Fraga et al., 2020)
Europe Portugal 1981-2005
2061-2081
MPI-M-MPI-ESM-LR,_CNRM-CM5,_EC-EARTH,_IPSL-CM5A-MR
dynamic_olive_crop_model_by_Viola_et_al_2012
RCP4.5 84.00
101.00
100.0
yield_change
Changes in %
2.0 Co-benefits
Negligible
(Fraga et al., 2020)
Europe Portugal 1981-2005
2061-2081
MPI-M-MPI-ESM-LR,_CNRM-CM5,_EC-EARTH,_IPSL-CM5A-MR
dynamic_olive_crop_model_by_Viola_et_al_2012
RCP8.5 80.00
100.50
100.0
yield_change
Changes in %
4.0 Co-benefits
Negligible
(Fraga et al., 2020)
Global Global 1986-2005
2081-2100
CESM post-4.5_version_of_the_Community_Land_Model_(CLM)
RCP4.5 6.70 11.00
10.7 6.9 yield t/ha 2.0 Co-benefits
Negligible
(Levis et al., 2018)
Global Global 1986-2005
2081-2100
CESM post-4.5_version_of_the_Community_Land_Model_(CLM)
RCP4.5 6.20 11.00
10.7 6.9 yield t/ha 2.0 Co-benefits
Negligible
(Levis et al., 2018)
Global Global 1986-2005
2081-2100
CESM post-4.5_version_of_the_Community_Land_Model_(CLM)
RCP8.5 6.20 10.70
10.7 6.9 yield t/ha 4.0 Co-benefits
Negligible
(Levis et al., 2018)
Option 4: Water and soil moisture conservation Africa Morocco 2004-
2009 2031-2050
CNMR_CM5 SWAT RCP4.5 0.56 0.68 0.7 CWP kg/m3 1.5 Large Small (Brouziyne et al., 2018)
ACCEPTED VERSIO
N
SUBJECT TO FIN
AL EDITS

FINAL DRAFT Chapter 4 Supplementary Material IPCC WGII Sixth Assessment Report
Do Not Cite, Quote or Distribute SM4-188 Total pages: 273
Africa Morocco 2004-2009
2031-2050
CNMR_CM5 SWAT RCP8.5 0.21 0.33 0.4 CWP kg/m3 1.5 Moderate Small (Brouziyne et al., 2018)
Africa Morocco 2004-2009
2031-2050
CNMR_CM5 SWAT RCP8.5 0.54 0.63 0.7 CWP kg/m3 1.5 Moderate Moderate
(Brouziyne et al., 2018)
Africa Morocco 2004-2009
2031-2050
CNMR_CM5 SWAT RCP4.5 0.32 0.50 0.4 CWP kg/m3 1.5 Co-benefits
Negligible
(Brouziyne et al., 2018)
Africa South Africa
1976-2005
2070-2099
CanESM2,_CNRM-CMS,_CSIROMk3.6.0,_IPSL-CM5A,_MIROC5,_MPI-ESM-LR
WEAP RCP8.5 1251.00
1092.00
847.0
1006.0
unmet_water_demand
million_cubic_meter
4.0 Moderate Moderate
(Olabanji et al., 2020)
Africa South Africa
1976-2005
2070-2099
CanESM2,_CNRM-CMS,_CSIROMk3.6.0,_IPSL-CM5A,_MIROC5,_MPI-ESM-LR
WEAP RCP8.5 1251.00
940.00
765.0
1006.0
unmet_water_demand
million_cubic_meter
4.0 Co-benefits
Negligible
(Olabanji et al., 2020)
Africa South Africa
1976-2005
2070-2099
CanESM2,_CNRM-CMS,_CSIROMk3.6.0,_IPSL-CM5A,_MIROC5,_MPI-ESM-LR
WEAP RCP8.5 1251.00
887.00
723.0
1006.0
unmet_water_demand
million_cubic_meter
4.0 Co-benefits
Negligible
(Olabanji et al., 2020)
Africa South Africa
1976-2005
2070-2099
CanESM2,_CNRM-CMS,_CSIROMk3.6.0,_IPSL-CM5A,_MIROC5,_MPI-ESM-LR
WEAP RCP8.5 1251.00
551.00
398.0
1006.0
unmet_water_demand
million_cubic_meter
4.0 Co-benefits
Negligible
(Olabanji et al., 2020)
Africa South Africa
1976-2005
2070-2099
CanESM2,_CNRM-CMS,_CSIROMk3.6.0,_IPSL-CM5A,_MIROC5,_MPI-ESM-LR
WEAP RCP4.5 1205.00
1046.00
847.0
1006.0
unmet_water_demand
million_cubic_meter
3.0 Moderate Small (Olabanji et al., 2020) ACCEPTED V
ERSION
SUBJECT TO FIN
AL EDITS

FINAL DRAFT Chapter 4 Supplementary Material IPCC WGII Sixth Assessment Report
Do Not Cite, Quote or Distribute SM4-189 Total pages: 273
Africa South Africa
1976-2005
2070-2099
CanESM2,_CNRM-CMS,_CSIROMk3.6.0,_IPSL-CM5A,_MIROC5,_MPI-ESM-LR
WEAP RCP4.5 1205.00
927.00
765.0
1006.0
unmet_water_demand
million_cubic_meter
3.0 Co-benefits
Negligible
(Olabanji et al., 2020)
Africa South Africa
1976-2005
2070-2099
CanESM2,_CNRM-CMS,_CSIROMk3.6.0,_IPSL-CM5A,_MIROC5,_MPI-ESM-LR
WEAP RCP4.5 1205.00
872.00
723.0
1006.0
unmet_water_demand
million_cubic_meter
3.0 Co-benefits
Negligible
(Olabanji et al., 2020)
Africa South Africa
1976-2005
2070-2099
CanESM2,_CNRM-CMS,_CSIROMk3.6.0,_IPSL-CM5A,_MIROC5,_MPI-ESM-LR
WEAP RCP4.5 1205.00
497.00
398.0
1006.0
unmet_water_demand
million_cubic_meter
3.0 Co-benefits
Negligible
(Olabanji et al., 2020)
Africa Malawi 2007-2012
2010-2030
Reg4CM,_global_climate_model_unspecified
DSSAT,_CERES-Maize
A1B 3937.20
4335.80
5002.0
4271.0
yield kg/ha 1.5 Co-benefits
Negligible
(Ngwira et al., 2014)
Asia China 1980-2004
2070-2099
GFDL-ESM2M, _HadGEM2-ES,_IPSLCM5A-LR,_MIROC-ESM-CHEM,_NorESM1-M
SWAT RCP8.5 144.52
109.74
106.8
100.0
sediment_load_change
Changes in %
4.0 Moderate Small (Qiu et al., 2019)
Asia China 1980-2004
2070-2099
GFDL-ESM2M, _HadGEM2-ES,_IPSLCM5A-LR,_MIROC-ESM-CHEM,_NorESM1-M
SWAT RCP8.5 144.52
109.82
113.1
100.0
sediment_load_change
Changes in %
4.0 Moderate Small (Qiu et al., 2019)
ACCEPTED VERSIO
N
SUBJECT TO FIN
AL EDITS

FINAL DRAFT Chapter 4 Supplementary Material IPCC WGII Sixth Assessment Report
Do Not Cite, Quote or Distribute SM4-190 Total pages: 273
Asia China 1980-2004
2070-2099
GFDL-ESM2M, _HadGEM2-ES,_IPSLCM5A-LR,_MIROC-ESM-CHEM,_NorESM1-M
SWAT RCP8.5 144.52
108.99
107.8
100.0
sediment_load_change
Changes in %
4.0 Moderate Small (Qiu et al., 2019)
Asia China 1980-2004
2070-2099
GFDL-ESM2M, _HadGEM2-ES,_IPSLCM5A-LR,_MIROC-ESM-CHEM,_NorESM1-M
SWAT RCP8.5 144.52
113.49
117.6
100.0
sediment_load_change
Changes in %
4.0 Moderate Moderate
(Qiu et al., 2019)
Asia China 1980-2004
2070-2099
GFDL-ESM2M, _HadGEM2-ES,_IPSLCM5A-LR,_MIROC-ESM-CHEM,_NorESM1-M
SWAT RCP8.5 144.52
118.97
129.2
100.0
sediment_load_change
Changes in %
4.0 Moderate Moderate
(Qiu et al., 2019)
Asia China 1980-2004
2070-2099
GFDL-ESM2M, _HadGEM2-ES,_IPSLCM5A-LR,_MIROC-ESM-CHEM,_NorESM1-M
SWAT RCP8.5 144.52
131.30
136.0
100.0
sediment_load_change
Changes in %
4.0 Insufficient
Large (Qiu et al., 2019)
Asia China 1980-2004
2070-2099
GFDL-ESM2M, _HadGEM2-ES,_IPSLCM5A-LR,_MIROC-ESM-CHEM,_NorESM1-M
SWAT RCP8.5 144.52
119.08
121.6
100.0
sediment_load_change
Changes in %
4.0 Moderate Moderate
(Qiu et al., 2019)
ACCEPTED VERSIO
N
SUBJECT TO FIN
AL EDITS
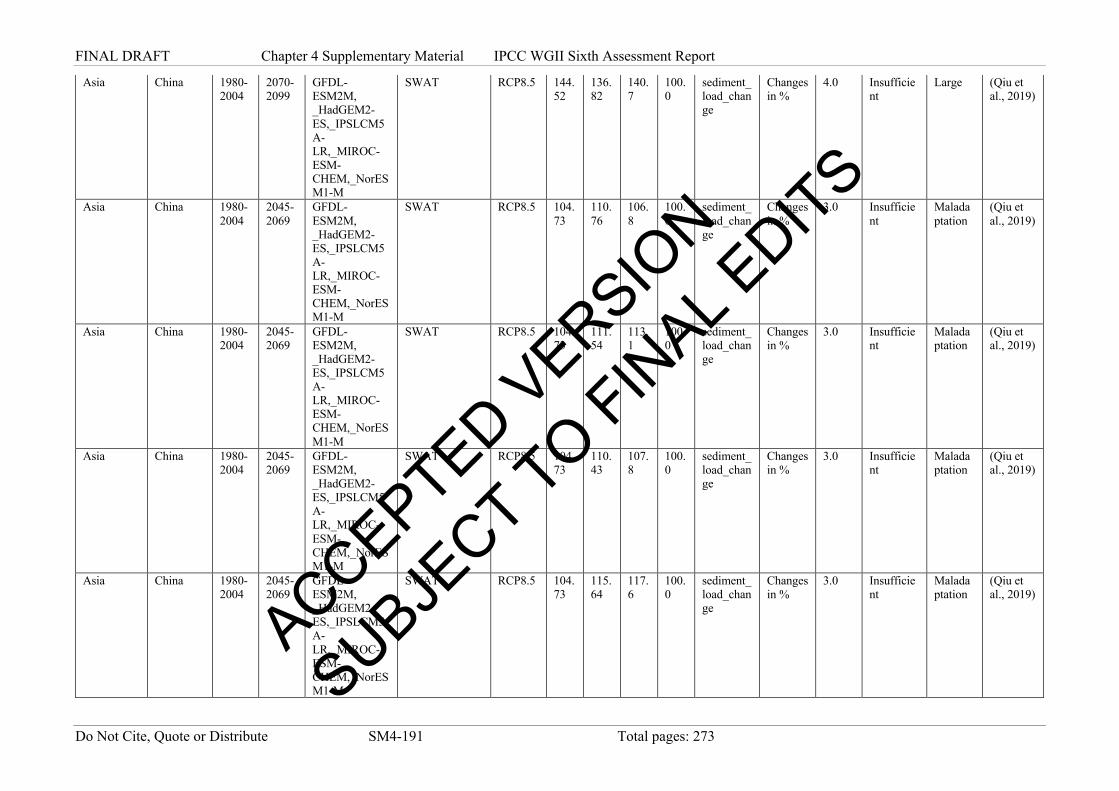
FINAL DRAFT Chapter 4 Supplementary Material IPCC WGII Sixth Assessment Report
Do Not Cite, Quote or Distribute SM4-191 Total pages: 273
Asia China 1980-2004
2070-2099
GFDL-ESM2M, _HadGEM2-ES,_IPSLCM5A-LR,_MIROC-ESM-CHEM,_NorESM1-M
SWAT RCP8.5 144.52
136.82
140.7
100.0
sediment_load_change
Changes in %
4.0 Insufficient
Large (Qiu et al., 2019)
Asia China 1980-2004
2045-2069
GFDL-ESM2M, _HadGEM2-ES,_IPSLCM5A-LR,_MIROC-ESM-CHEM,_NorESM1-M
SWAT RCP8.5 104.73
110.76
106.8
100.0
sediment_load_change
Changes in %
3.0 Insufficient
Maladaptation
(Qiu et al., 2019)
Asia China 1980-2004
2045-2069
GFDL-ESM2M, _HadGEM2-ES,_IPSLCM5A-LR,_MIROC-ESM-CHEM,_NorESM1-M
SWAT RCP8.5 104.73
111.54
113.1
100.0
sediment_load_change
Changes in %
3.0 Insufficient
Maladaptation
(Qiu et al., 2019)
Asia China 1980-2004
2045-2069
GFDL-ESM2M, _HadGEM2-ES,_IPSLCM5A-LR,_MIROC-ESM-CHEM,_NorESM1-M
SWAT RCP8.5 104.73
110.43
107.8
100.0
sediment_load_change
Changes in %
3.0 Insufficient
Maladaptation
(Qiu et al., 2019)
Asia China 1980-2004
2045-2069
GFDL-ESM2M, _HadGEM2-ES,_IPSLCM5A-LR,_MIROC-ESM-CHEM,_NorESM1-M
SWAT RCP8.5 104.73
115.64
117.6
100.0
sediment_load_change
Changes in %
3.0 Insufficient
Maladaptation
(Qiu et al., 2019)
ACCEPTED VERSIO
N
SUBJECT TO FIN
AL EDITS

FINAL DRAFT Chapter 4 Supplementary Material IPCC WGII Sixth Assessment Report
Do Not Cite, Quote or Distribute SM4-192 Total pages: 273
Asia China 1980-2004
2045-2069
GFDL-ESM2M, _HadGEM2-ES,_IPSLCM5A-LR,_MIROC-ESM-CHEM,_NorESM1-M
SWAT RCP8.5 104.73
121.66
129.2
100.0
sediment_load_change
Changes in %
3.0 Insufficient
Maladaptation
(Qiu et al., 2019)
Asia China 1980-2004
2045-2069
GFDL-ESM2M, _HadGEM2-ES,_IPSLCM5A-LR,_MIROC-ESM-CHEM,_NorESM1-M
SWAT RCP8.5 104.73
135.69
136.0
100.0
sediment_load_change
Changes in %
3.0 Insufficient
Maladaptation
(Qiu et al., 2019)
Asia China 1980-2004
2045-2069
GFDL-ESM2M, _HadGEM2-ES,_IPSLCM5A-LR,_MIROC-ESM-CHEM,_NorESM1-M
SWAT RCP8.5 104.73
132.55
133.0
100.0
sediment_load_change
Changes in %
3.0 Insufficient
Maladaptation
(Qiu et al., 2019)
Asia China 1980-2004
2045-2069
GFDL-ESM2M, _HadGEM2-ES,_IPSLCM5A-LR,_MIROC-ESM-CHEM,_NorESM1-M
SWAT RCP8.5 104.73
123.64
121.6
100.0
sediment_load_change
Changes in %
3.0 Insufficient
Maladaptation
(Qiu et al., 2019)
Asia China 1980-2004
2045-2069
GFDL-ESM2M, _HadGEM2-ES,_IPSLCM5A-LR,_MIROC-ESM-CHEM,_NorESM1-M
SWAT RCP8.5 104.73
141.99
140.7
100.0
sediment_load_change
Changes in %
3.0 Insufficient
Maladaptation
(Qiu et al., 2019)
ACCEPTED VERSIO
N
SUBJECT TO FIN
AL EDITS
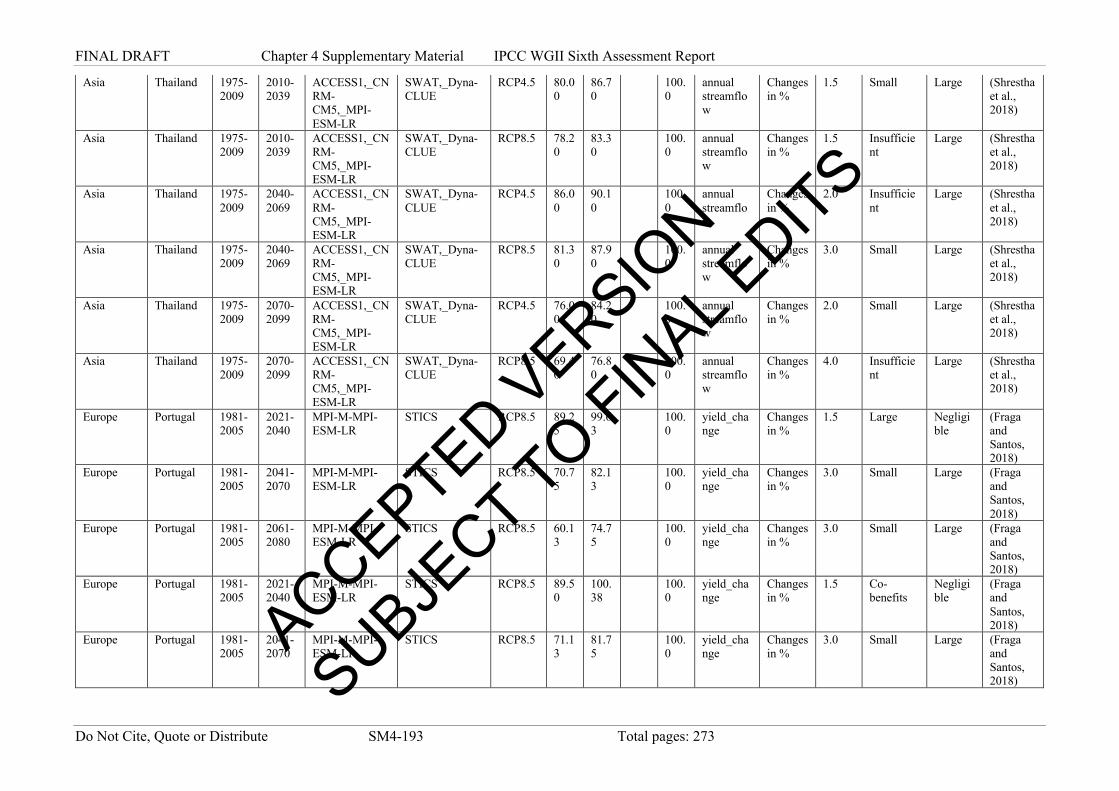
FINAL DRAFT Chapter 4 Supplementary Material IPCC WGII Sixth Assessment Report
Do Not Cite, Quote or Distribute SM4-193 Total pages: 273
Asia Thailand 1975-2009
2010-2039
ACCESS1,_CNRM-CM5,_MPI-ESM-LR
SWAT,_Dyna-CLUE
RCP4.5 80.00
86.70
100.0
annual streamflow
Changes in %
1.5 Small Large (Shrestha et al., 2018)
Asia Thailand 1975-2009
2010-2039
ACCESS1,_CNRM-CM5,_MPI-ESM-LR
SWAT,_Dyna-CLUE
RCP8.5 78.20
83.30
100.0
annual streamflow
Changes in %
1.5 Insufficient
Large (Shrestha et al., 2018)
Asia Thailand 1975-2009
2040-2069
ACCESS1,_CNRM-CM5,_MPI-ESM-LR
SWAT,_Dyna-CLUE
RCP4.5 86.00
90.10
100.0
annual streamflow
Changes in %
2.0 Insufficient
Large (Shrestha et al., 2018)
Asia Thailand 1975-2009
2040-2069
ACCESS1,_CNRM-CM5,_MPI-ESM-LR
SWAT,_Dyna-CLUE
RCP8.5 81.30
87.90
100.0
annual streamflow
Changes in %
3.0 Small Large (Shrestha et al., 2018)
Asia Thailand 1975-2009
2070-2099
ACCESS1,_CNRM-CM5,_MPI-ESM-LR
SWAT,_Dyna-CLUE
RCP4.5 76.00
84.20
100.0
annual streamflow
Changes in %
2.0 Small Large (Shrestha et al., 2018)
Asia Thailand 1975-2009
2070-2099
ACCESS1,_CNRM-CM5,_MPI-ESM-LR
SWAT,_Dyna-CLUE
RCP8.5 69.40
76.80
100.0
annual streamflow
Changes in %
4.0 Insufficient
Large (Shrestha et al., 2018)
Europe Portugal 1981-2005
2021-2040
MPI-M-MPI-ESM-LR
STICS RCP8.5 89.25
99.63
100.0
yield_change
Changes in %
1.5 Large Negligible
(Fraga and Santos, 2018)
Europe Portugal 1981-2005
2041-2070
MPI-M-MPI-ESM-LR
STICS RCP8.5 70.75
82.13
100.0
yield_change
Changes in %
3.0 Small Large (Fraga and Santos, 2018)
Europe Portugal 1981-2005
2061-2080
MPI-M-MPI-ESM-LR
STICS RCP8.5 60.13
74.75
100.0
yield_change
Changes in %
3.0 Small Large (Fraga and Santos, 2018)
Europe Portugal 1981-2005
2021-2040
MPI-M-MPI-ESM-LR
STICS RCP8.5 89.50
100.38
100.0
yield_change
Changes in %
1.5 Co-benefits
Negligible
(Fraga and Santos, 2018)
Europe Portugal 1981-2005
2041-2070
MPI-M-MPI-ESM-LR
STICS RCP8.5 71.13
81.75
100.0
yield_change
Changes in %
3.0 Small Large (Fraga and Santos, 2018)
ACCEPTED VERSIO
N
SUBJECT TO FIN
AL EDITS

FINAL DRAFT Chapter 4 Supplementary Material IPCC WGII Sixth Assessment Report
Do Not Cite, Quote or Distribute SM4-194 Total pages: 273
Europe Portugal 1981-2005
2061-2080
MPI-M-MPI-ESM-LR
STICS RCP8.5 59.13
74.88
100.0
yield_change
Changes in %
3.0 Small Large (Fraga and Santos, 2018)
North America
United States
1960-2006
2020-2050
CMIP5 HSPF_v2.3 RCP4.5 6.71 6.38 6.1 6.4 runoff m3/second
1.5 Co-benefits
Negligible
(Dudula and Randhir, 2016)
North America
United States
1960-2006
2050-2080
CMIP5 HSPF_v2.3 RCP4.5 8.52 8.11 6.1 6.4 runoff m3/second
2.0 Insufficient
Large (Dudula and Randhir, 2016)
North America
United States
1991-2015
2021-2045
CCSM4,_CSIRO-MK3-6-0,_GFDL-ESM2G,_IPSL-CM5A-LR,_MIROC5,_MPI-ESM-LR
SWAT RCP8.5 1340.00
750.00
1280.0
total_phosphore
kg/year 1.5 Co-benefits
Negligible
(Giri et al., 2020)
North America
United States
1991-2015
2021-2045
CCSM4,_CSIRO-MK3-6-0,_GFDL-ESM2G,_IPSL-CM5A-LR,_MIROC5,_MPI-ESM-LR
SWAT RCP8.5 1340.00
1160.00
1280.0
total_phosphore
kg/year 1.5 Co-benefits
Negligible
(Giri et al., 2020)
North America
United States
1991-2015
2021-2045
CCSM4,_CSIRO-MK3-6-0,_GFDL-ESM2G,_IPSL-CM5A-LR,_MIROC5,_MPI-ESM-LR
SWAT RCP8.5 1340.00
1330.00
1280.0
total_phosphore
kg/year 1.5 Insufficient
Large (Giri et al., 2020)
North America
United States
1991-2015
2021-2045
CCSM4,_CSIRO-MK3-6-0,_GFDL-ESM2G,_IPSL-CM5A-LR,_MIROC5,_and_MPI-ESM-LR
SWAT RCP4.5 162.00
158.44
154.0
runoff mm/year
1.5 Small Large (Giri et al., 2020)
ACCEPTED VERSIO
N
SUBJECT TO FIN
AL EDITS
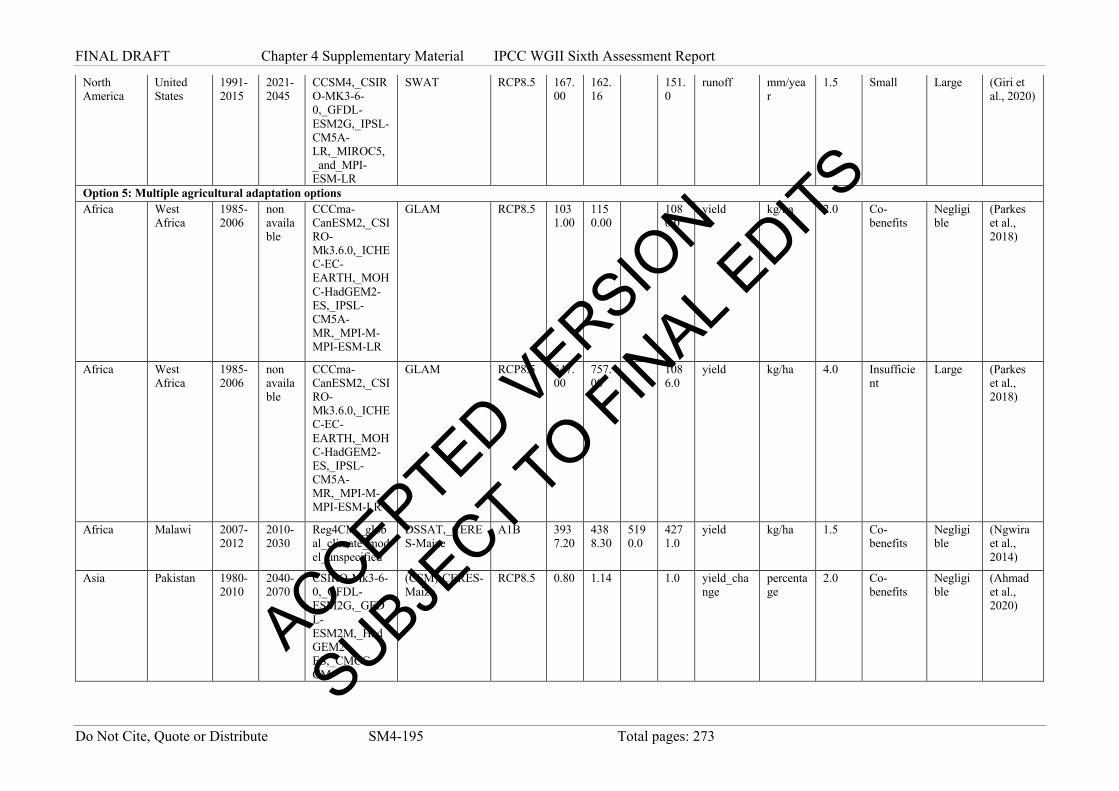
FINAL DRAFT Chapter 4 Supplementary Material IPCC WGII Sixth Assessment Report
Do Not Cite, Quote or Distribute SM4-195 Total pages: 273
North America
United States
1991-2015
2021-2045
CCSM4,_CSIRO-MK3-6-0,_GFDL-ESM2G,_IPSL-CM5A-LR,_MIROC5,_and_MPI-ESM-LR
SWAT RCP8.5 167.00
162.16
151.0
runoff mm/year
1.5 Small Large (Giri et al., 2020)
Option 5: Multiple agricultural adaptation options Africa West
Africa 1985-2006
non available
CCCma-CanESM2,_CSIRO-Mk3.6.0,_ICHEC-EC-EARTH,_MOHC-HadGEM2-ES,_IPSL-CM5A-MR,_MPI-M-MPI-ESM-LR
GLAM RCP8.5 1031.00
1150.00
1086.0
yield kg/ha 2.0 Co-benefits
Negligible
(Parkes et al., 2018)
Africa West Africa
1985-2006
non available
CCCma-CanESM2,_CSIRO-Mk3.6.0,_ICHEC-EC-EARTH,_MOHC-HadGEM2-ES,_IPSL-CM5A-MR,_MPI-M-MPI-ESM-LR
GLAM RCP8.5 647.00
757.00
1086.0
yield kg/ha 4.0 Insufficient
Large (Parkes et al., 2018)
Africa Malawi 2007-2012
2010-2030
Reg4CM,_global_climate_model_unspecified
DSSAT,_CERES-Maize
A1B 3937.20
4388.30
5190.0
4271.0
yield kg/ha 1.5 Co-benefits
Negligible
(Ngwira et al., 2014)
Asia Pakistan 1980-2010
2040-2070
CSIRO-Mk3-6-0,_GFDL-ESM2G,_GFDL-ESM2M,_HadGEM2-ES,_CMCC-CM
(CSM)-CERES-Maize
RCP8.5 0.80 1.14 1.0 yield_change
percentage
2.0 Co-benefits
Negligible
(Ahmad et al., 2020)
ACCEPTED VERSIO
N
SUBJECT TO FIN
AL EDITS
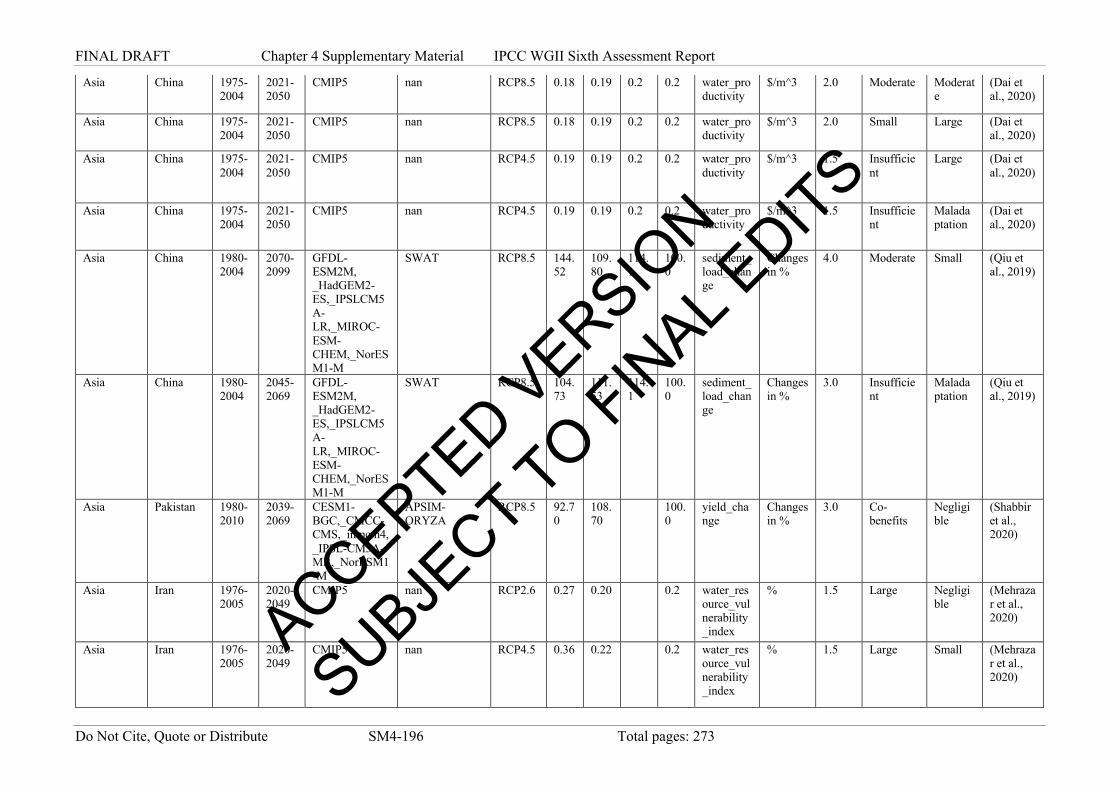
FINAL DRAFT Chapter 4 Supplementary Material IPCC WGII Sixth Assessment Report
Do Not Cite, Quote or Distribute SM4-196 Total pages: 273
Asia China 1975-2004
2021-2050
CMIP5 nan RCP8.5 0.18 0.19 0.2 0.2 water_productivity
$/m^3 2.0 Moderate Moderate
(Dai et al., 2020)
Asia China 1975-2004
2021-2050
CMIP5 nan RCP8.5 0.18 0.19 0.2 0.2 water_productivity
$/m^3 2.0 Small Large (Dai et al., 2020)
Asia China 1975-2004
2021-2050
CMIP5 nan RCP4.5 0.19 0.19 0.2 0.2 water_productivity
$/m^3 1.5 Insufficient
Large (Dai et al., 2020)
Asia China 1975-2004
2021-2050
CMIP5 nan RCP4.5 0.19 0.19 0.2 0.2 water_productivity
$/m^3 1.5 Insufficient
Maladaptation
(Dai et al., 2020)
Asia China 1980-2004
2070-2099
GFDL-ESM2M, _HadGEM2-ES,_IPSLCM5A-LR,_MIROC-ESM-CHEM,_NorESM1-M
SWAT RCP8.5 144.52
109.80
114.1
100.0
sediment_load_change
Changes in %
4.0 Moderate Small (Qiu et al., 2019)
Asia China 1980-2004
2045-2069
GFDL-ESM2M, _HadGEM2-ES,_IPSLCM5A-LR,_MIROC-ESM-CHEM,_NorESM1-M
SWAT RCP8.5 104.73
111.53
114.1
100.0
sediment_load_change
Changes in %
3.0 Insufficient
Maladaptation
(Qiu et al., 2019)
Asia Pakistan 1980-2010
2039-2069
CESM1-BGC,_CMCC-CMS,_inmcm4,_IPSL-CM5A-MR,_NorESM1-M
APSIM-ORYZA
RCP8.5 92.70
108.70
100.0
yield_change
Changes in %
3.0 Co-benefits
Negligible
(Shabbir et al., 2020)
Asia Iran 1976-2005
2020-2049
CMIP5 nan RCP2.6 0.27 0.20 0.2 water_resource_vulnerability_index
% 1.5 Large Negligible
(Mehrazar et al., 2020)
Asia Iran 1976-2005
2020-2049
CMIP5 nan RCP4.5 0.36 0.22 0.2 water_resource_vulnerability_index
% 1.5 Large Small (Mehrazar et al., 2020)
ACCEPTED VERSIO
N
SUBJECT TO FIN
AL EDITS

FINAL DRAFT Chapter 4 Supplementary Material IPCC WGII Sixth Assessment Report
Do Not Cite, Quote or Distribute SM4-197 Total pages: 273
Asia Iran 1976-2005
2020-2049
CMIP5 nan RCP8.5 0.44 0.22 0.2 water_resource_vulnerability_index
% 2.0 Large Small (Mehrazar et al., 2020)
Asia Iran 1976-2005
2020-2049
CMIP5 nan RCP2.6 0.27 0.16 0.2 water_resource_vulnerability_index
% 1.5 Co-benefits
Negligible
(Mehrazar et al., 2020)
Asia Iran 1976-2005
2020-2049
CMIP5 nan RCP4.5 0.36 0.20 0.2 water_resource_vulnerability_index
% 1.5 Large Negligible
(Mehrazar et al., 2020)
Asia Iran 1976-2005
2020-2049
CMIP5 nan RCP8.5 0.44 0.23 0.2 water_resource_vulnerability_index
% 2.0 Large Small (Mehrazar et al., 2020)
Asia India 1980-2010
2040-2069
MPI-ESM-MR, _MIROC5,_CCSM4_HadGEM2-ES
DSSAT-CROPGRO-Peanut
RCP8.5 98.80
120.00
100.0
yield_change
Changes in %
3.0 Co-benefits
Negligible
(Kadiyala et al., 2015)
Australasia Australia 1980-1999
2020-2039
GFDL,_CSIRO-Mark3.5_ MPI,_MIROC
CSIRO-OZCOT
A2 96.64
94.78
100.0
yield Changes in %
1.5 Insufficient
Maladaptation
(Luo et al., 2016)
Australasia Australia 1980-1999
2020-2039
GFDL,_CSIRO-Mark3.5_ MPI,_MIROC
CSIRO-OZCOT
A2 96.64
96.11
100.0
yield Changes in %
1.5 Insufficient
Maladaptation
(Luo et al., 2016)
Australasia Australia 1980-1999
2020-2039
GFDL,_CSIRO-Mark3.5_ MPI,_MIROC
CSIRO-OZCOT
A2 96.64
97.22
100.0
yield Changes in %
1.5 Insufficient
Large (Luo et al., 2016)
Australasia Australia 1980-1999
2020-2039
GFDL,_CSIRO-Mark3.5_ MPI,_MIROC
CSIRO-OZCOT
A2 96.89
92.56
100.0
WUE Changes in %
1.5 Insufficient
Maladaptation
(Luo et al., 2016)
Australasia Australia 1980-1999
2020-2039
GFDL,_CSIRO-Mark3.5_ MPI,_MIROC
CSIRO-OZCOT
A2 96.89
99.89
100.0
WUE Changes in %
1.5 Large Negligible
(Luo et al., 2016)
Australasia Australia 1980-1999
2020-2039
GFDL,_CSIRO-Mark3.5_ MPI,_MIROC
CSIRO-OZCOT
A2 96.89
101.89
100.0
WUE Changes in %
1.5 Co-benefits
Negligible
(Luo et al., 2016) ACCEPTED V
ERSION
SUBJECT TO FIN
AL EDITS

FINAL DRAFT Chapter 4 Supplementary Material IPCC WGII Sixth Assessment Report
Do Not Cite, Quote or Distribute SM4-198 Total pages: 273
Europe Italy/France
1991-2010
2021-2040
NOResm,_MIROC_ESM,_HadGEM2-ES,_GISS_ES
STICS,_WARM
RCP2.6 6.71 9.23 7.2 yield t/ha 1.5 Co-benefits
Negligible
(Bregaglio et al., 2017)
Europe Italy/France
1991-2010
2021-2040
NOResm,_MIROC_ESM,_HadGEM2-ES,_GISS_ES
STICS,_WARM
RCP8.5 6.58 9.23 7.2 yield t/ha 1.5 Co-benefits
Negligible
(Bregaglio et al., 2017)
Europe Italy/France
1991-2010
2061-2080
NOResm,_MIROC_ESM,_HadGEM2-ES,_GISS_ES
STICS,_WARM
RCP2.6 6.69 9.52 7.2 yield t/ha 1.5 Co-benefits
Negligible
(Bregaglio et al., 2017)
Europe Italy/France
1991-2010
2061-2080
NOResm,_MIROC_ESM,_HadGEM2-ES,_GISS_ES
STICS,_WARM
RCP8.5 5.90 8.48 7.2 yield t/ha 3.0 Co-benefits
Negligible
(Bregaglio et al., 2017)
Global Global 1980-2009
2070-2099
CMIP5 LPJmL RCP2.6 97.00
112.60
100.0
kcal_production
Changes in %
1.5 Co-benefits
Negligible
(Jägermeyr et al., 2016)
Global Global 1980-2009
2070-2099
CMIP5 LPJmL RCP2.6 97.00
138.40
100.0
kcal_production
Changes in %
1.5 Co-benefits
Negligible
(Jägermeyr et al., 2016)
Global Global 1980-2009
2070-2099
CMIP5 LPJmL RCP4.5 92.40
108.10
100.0
kcal_production
Changes in %
2.0 Co-benefits
Negligible
(Jägermeyr et al., 2016)
Global Global 1980-2009
2070-2099
CMIP5 LPJmL RCP4.5 92.40
133.10
100.0
kcal_production
Changes in %
2.0 Co-benefits
Negligible
(Jägermeyr et al., 2016)
Global Global 1980-2009
2070-2099
CMIP5 LPJmL RCP6.0 90.60
105.80
100.0
kcal_production
Changes in %
3.0 Co-benefits
Negligible
(Jägermeyr et al., 2016)
Global Global 1980-2009
2070-2099
CMIP5 LPJmL RCP6.0 90.60
130.80
100.0
kcal_production
Changes in %
3.0 Co-benefits
Negligible
(Jägermeyr et al., 2016)
Global Global 1980-2009
2070-2099
CMIP5 LPJmL RCP8.5 81.80
96.20
100.0
kcal_production
Changes in %
4.0 Moderate Small (Jägermeyr et al., 2016)
Global Global 1980-2009
2070-2099
CMIP5 LPJmL RCP8.5 81.80
118.90
100.0
kcal_production
Changes in %
4.0 Co-benefits
Negligible
(Jägermeyr et al., 2016)
Option 6: Agro-forestry and forestry
ACCEPTED VERSIO
N
SUBJECT TO FIN
AL EDITS

FINAL DRAFT Chapter 4 Supplementary Material IPCC WGII Sixth Assessment Report
Do Not Cite, Quote or Distribute SM4-199 Total pages: 273
Africa Uganda 1950-2000
2040-2069
HadGEM2-ES SpCAF,_CAF2014
RCP6.0 91.50
98.00
97.5 100.0
yield_change
Changes in %
2.0 Moderate Small (Rahn et al., 2018b)
Africa Tanzania 1950-2000
2040-2069
HadGEM2-ES SpCAF,_CAF2014
RCP6.0 95.50
115.00
109.0
100.0
yield_change
Changes in %
2.0 Co-benefits
Negligible
(Rahn et al., 2018b)
Africa Tanzania 1950-2000
2040-2069
HadGEM2-ES SpCAF,_CAF2014
RCP6.0 79.50
101.00
109.0
100.0
yield_change
Changes in %
2.0 Co-benefits
Negligible
(Rahn et al., 2018b)
Asia China 1980-2004
2070-2099
GFDL-ESM2M, _HadGEM2-ES,_IPSLCM5A-LR,_MIROC-ESM-CHEM,_NorESM1-M
SWAT RCP8.5 144.52
112.76
114.7
100.0
sediment_load_change
Changes in %
4.0 Moderate Small (Qiu et al., 2019)
Asia China 1980-2004
2070-2099
GFDL-ESM2M, _HadGEM2-ES,_IPSLCM5A-LR,_MIROC-ESM-CHEM,_NorESM1-M
SWAT RCP8.5 144.52
110.02
111.2
100.0
sediment_load_change
Changes in %
4.0 Moderate Small (Qiu et al., 2019)
Asia China 1980-2004
2045-2069
GFDL-ESM2M, _HadGEM2-ES,_IPSLCM5A-LR,_MIROC-ESM-CHEM,_NorESM1-M
SWAT RCP8.5 104.73
115.01
114.7
100.0
sediment_load_change
Changes in %
3.0 Insufficient
Maladaptation
(Qiu et al., 2019)
Asia China 1980-2004
2045-2069
GFDL-ESM2M, _HadGEM2-ES,_IPSLCM5A-LR,_MIROC-ESM-CHEM,_NorESM1-M
SWAT RCP8.5 104.73
111.77
111.2
100.0
sediment_load_change
Changes in %
3.0 Insufficient
Maladaptation
(Qiu et al., 2019)
ACCEPTED VERSIO
N
SUBJECT TO FIN
AL EDITS
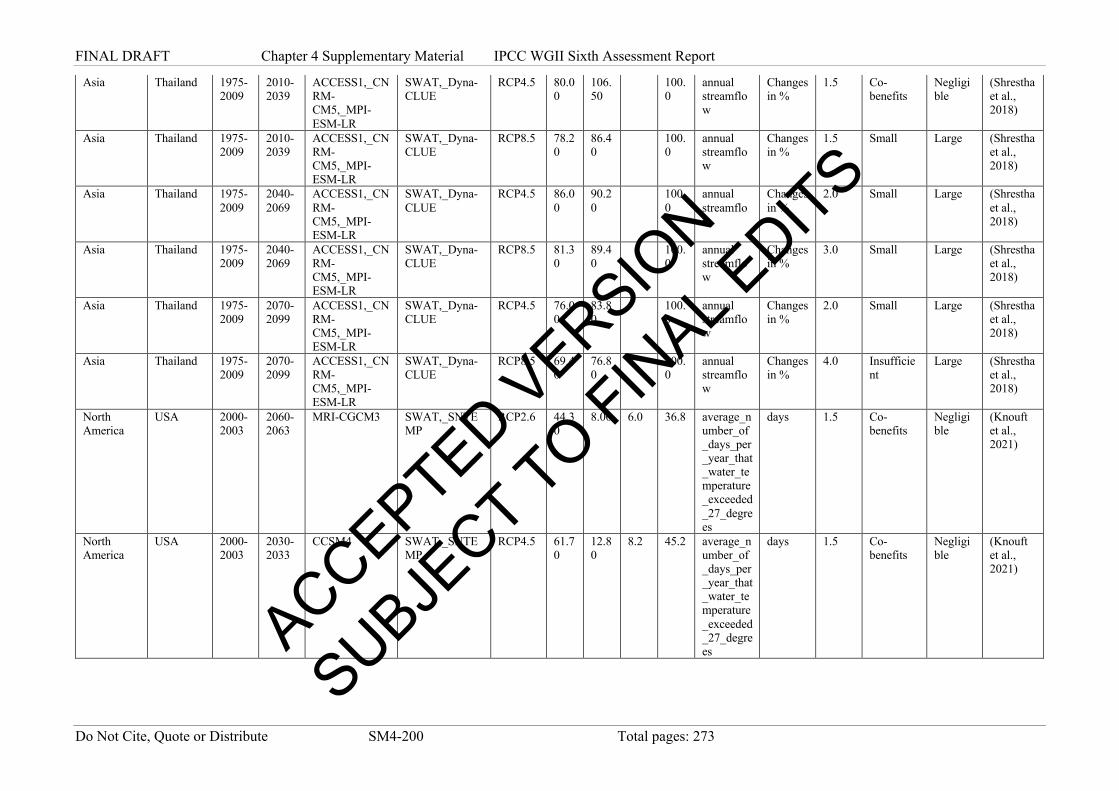
FINAL DRAFT Chapter 4 Supplementary Material IPCC WGII Sixth Assessment Report
Do Not Cite, Quote or Distribute SM4-200 Total pages: 273
Asia Thailand 1975-2009
2010-2039
ACCESS1,_CNRM-CM5,_MPI-ESM-LR
SWAT,_Dyna-CLUE
RCP4.5 80.00
106.50
100.0
annual streamflow
Changes in %
1.5 Co-benefits
Negligible
(Shrestha et al., 2018)
Asia Thailand 1975-2009
2010-2039
ACCESS1,_CNRM-CM5,_MPI-ESM-LR
SWAT,_Dyna-CLUE
RCP8.5 78.20
86.40
100.0
annual streamflow
Changes in %
1.5 Small Large (Shrestha et al., 2018)
Asia Thailand 1975-2009
2040-2069
ACCESS1,_CNRM-CM5,_MPI-ESM-LR
SWAT,_Dyna-CLUE
RCP4.5 86.00
90.20
100.0
annual streamflow
Changes in %
2.0 Small Large (Shrestha et al., 2018)
Asia Thailand 1975-2009
2040-2069
ACCESS1,_CNRM-CM5,_MPI-ESM-LR
SWAT,_Dyna-CLUE
RCP8.5 81.30
89.40
100.0
annual streamflow
Changes in %
3.0 Small Large (Shrestha et al., 2018)
Asia Thailand 1975-2009
2070-2099
ACCESS1,_CNRM-CM5,_MPI-ESM-LR
SWAT,_Dyna-CLUE
RCP4.5 76.00
83.80
100.0
annual streamflow
Changes in %
2.0 Small Large (Shrestha et al., 2018)
Asia Thailand 1975-2009
2070-2099
ACCESS1,_CNRM-CM5,_MPI-ESM-LR
SWAT,_Dyna-CLUE
RCP8.5 69.40
76.80
100.0
annual streamflow
Changes in %
4.0 Insufficient
Large (Shrestha et al., 2018)
North America
USA 2000-2003
2060-2063
MRI-CGCM3 SWAT,_SNTEMP
RCP2.6 44.30
8.00 6.0 36.8 average_number_of_days_per_year_that_water_temperature_exceeded_27_degrees
days 1.5 Co-benefits
Negligible
(Knouft et al., 2021)
North America
USA 2000-2003
2030-2033
CCSM4 SWAT,_SNTEMP
RCP4.5 61.70
12.80
8.2 45.2 average_number_of_days_per_year_that_water_temperature_exceeded_27_degrees
days 1.5 Co-benefits
Negligible
(Knouft et al., 2021)
ACCEPTED VERSIO
N
SUBJECT TO FIN
AL EDITS

FINAL DRAFT Chapter 4 Supplementary Material IPCC WGII Sixth Assessment Report
Do Not Cite, Quote or Distribute SM4-201 Total pages: 273
North America
USA 2000-2003
2060-2063
CCSM4 SWAT,_SNTEMP
RCP4.5 69.80
25.30
8.2 45.2 average_number_of_days_per_year_that_water_temperature_exceeded_27_degrees
days 2.0 Co-benefits
Negligible
(Knouft et al., 2021)
North America
USA 2000-2003
2030-2033
MIROC-ESM SWAT,_SNTEMP
RCP8.5 69.00
13.70
1.7 36.8 average_number_of_days_per_year_that_water_temperature_exceeded_27_degrees
days 2.0 Co-benefits
Negligible
(Knouft et al., 2021)
North America
USA 2000-2003
2060-2063
MIROC-ESM SWAT,_SNTEMP
RCP8.5 86.50
59.30
1.7 36.8 average_number_of_days_per_year_that_water_temperature_exceeded_27_degrees
days 3.0 Moderate Moderate
(Knouft et al., 2021)
Option 7: Flood risk reduction measures (excluding coastal flooding) Asia Vietnam 2010-
2020 2040-2060
CMIP5 TELEMAC-2D,_Damage-Scanner-Model
RCP4.5,_SSP2
1.49E+09
1.56E+09
#######
1144970470.9
estimates_of_expected_anual_damage_(EAD)
$/year 1.5 Insufficient
Maladaptation
(Scussolini et al., 2017)
Asia Vietnam 2010-2020
2040-2060
CMIP5 TELEMAC-2D,_Damage-Scanner-Model
RCP4.5,_SSP2
1.49E+09
6.73E+08
#######
1144970470.9
estimates_of_expected_anual_damage_(EAD)
$/year 1.5 Co-benefits
Negligible
(Scussolini et al., 2017)
Asia Vietnam 2010-2020
2040-2060
CMIP5 TELEMAC-2D,_Damage-Scanner-Model
RCP4.5,_SSP2
1.49E+09
2.88E+08
#######
1144970470.9
estimates_of_expected_anual_damage_(EAD)
$/year 1.5 Co-benefits
Negligible
(Scussolini et al., 2017) ACCEPTED V
ERSION
SUBJECT TO FIN
AL EDITS

FINAL DRAFT Chapter 4 Supplementary Material IPCC WGII Sixth Assessment Report
Do Not Cite, Quote or Distribute SM4-202 Total pages: 273
Asia Vietnam 2010-2020
2040-2060
CMIP5 TELEMAC-2D,_Damage-Scanner-Model
RCP4.5,_SSP2
1.49E+09
9.49E+08
#######
1144970470.9
estimates_of_expected_anual_damage_(EAD)
$/year 1.5 Co-benefits
Negligible
(Scussolini et al., 2017)
Asia Vietnam 2010-2020
2040-2060
CMIP5 TELEMAC-2D,_Damage-Scanner-Model
RCP4.5,_SSP2
1.49E+09
1.79E+08
#######
1144970470.9
estimates_of_expected_anual_damage_(EAD)
$/year 1.5 Co-benefits
Negligible
(Scussolini et al., 2017)
Asia Vietnam 2010-2020
2040-2060
CMIP5 TELEMAC-2D,_Damage-Scanner-Model
RCP4.5,_SSP2
1.49E+09
9.88E+08
1144970470.9
estimates_of_expected_anual_damage_(EAD)
$/year 1.5 Co-benefits
Negligible
(Scussolini et al., 2017)
Asia Vietnam 2010-2020
2090-2110
CMIP5 TELEMAC-2D,_Damage-Scanner-Model
RCP4.5,_SSP2
1.92E+09
1.77E+09
#######
1144970470.9
estimates_of_expected_anual_damage_(EAD)
$/year 2.0 Insufficient
Large (Scussolini et al., 2017)
Asia Vietnam 2010-2020
2090-2110
CMIP5 TELEMAC-2D,_Damage-Scanner-Model
RCP4.5,_SSP2
1.92E+09
8.67E+08
#######
1144970470.9
estimates_of_expected_anual_damage_(EAD)
$/year 2.0 Co-benefits
Negligible
(Scussolini et al., 2017)
Asia Vietnam 2010-2020
2090-2110
CMIP5 TELEMAC-2D,_Damage-Scanner-Model
RCP4.5,_SSP2
1.92E+09
4.79E+08
#######
1144970470.9
estimates_of_expected_anual_damage_(EAD)
$/year 2.0 Co-benefits
Negligible
(Scussolini et al., 2017)
Asia Vietnam 2010-2020
2090-2110
CMIP5 TELEMAC-2D,_Damage-Scanner-Model
RCP4.5,_SSP2
1.92E+09
1.11E+09
#######
1144970470.9
estimates_of_expected_anual_damage_(EAD)
$/year 2.0 Co-benefits
Negligible
(Scussolini et al., 2017)
Asia Vietnam 2010-2020
2090-2110
CMIP5 TELEMAC-2D,_Damage-Scanner-Model
RCP4.5,_SSP2
1.92E+09
2.18E+08
#######
1144970470.9
estimates_of_expected_anual_damage_(EAD)
$/year 2.0 Co-benefits
Negligible
(Scussolini et al., 2017)
Asia Vietnam 2010-2020
2090-2110
CMIP5 TELEMAC-2D,_Damage-Scanner-Model
RCP4.5,_SSP2
1.92E+09
1.29E+09
1144970470.9
estimates_of_expected_anual_damage_(EAD)
$/year 2.0 Large Small (Scussolini et al., 2017)
ACCEPTED VERSIO
N
SUBJECT TO FIN
AL EDITS

FINAL DRAFT Chapter 4 Supplementary Material IPCC WGII Sixth Assessment Report
Do Not Cite, Quote or Distribute SM4-203 Total pages: 273
Asia Vietnam 2010-2020
2040-2060
CMIP5 TELEMAC-2D,_Damage-Scanner-Model
RCP8.5,_SSP5
1.49E+09
1.56E+09
#######
1144970470.9
estimates_of_expected_anual_damage_(EAD)
$/year 2.0 Insufficient
Maladaptation
(Scussolini et al., 2017)
Asia Vietnam 2010-2020
2040-2060
CMIP5 TELEMAC-2D,_Damage-Scanner-Model
RCP8.5,_SSP5
1.49E+09
6.73E+08
#######
1144970470.9
estimates_of_expected_anual_damage_(EAD)
$/year 2.0 Co-benefits
Negligible
(Scussolini et al., 2017)
Asia Vietnam 2010-2020
2040-2060
CMIP5 TELEMAC-2D,_Damage-Scanner-Model
RCP8.5,_SSP5
1.49E+09
2.88E+08
#######
1144970470.9
estimates_of_expected_anual_damage_(EAD)
$/year 2.0 Co-benefits
Negligible
(Scussolini et al., 2017)
Asia Vietnam 2010-2020
2040-2060
CMIP5 TELEMAC-2D,_Damage-Scanner-Model
RCP8.5,_SSP5
1.49E+09
9.49E+08
#######
1144970470.9
estimates_of_expected_anual_damage_(EAD)
$/year 2.0 Co-benefits
Negligible
(Scussolini et al., 2017)
Asia Vietnam 2010-2020
2040-2060
CMIP5 TELEMAC-2D,_Damage-Scanner-Model
RCP8.5,_SSP5
1.49E+09
1.79E+08
#######
1144970470.9
estimates_of_expected_anual_damage_(EAD)
$/year 2.0 Co-benefits
Negligible
(Scussolini et al., 2017)
Asia Vietnam 2010-2020
2040-2060
CMIP5 TELEMAC-2D,_Damage-Scanner-Model
RCP8.5,_SSP5
1.49E+09
9.88E+08
1144970470.9
estimates_of_expected_anual_damage_(EAD)
$/year 2.0 Co-benefits
Negligible
(Scussolini et al., 2017)
Asia Vietnam 2010-2020
2090-2110
CMIP5 TELEMAC-2D,_Damage-Scanner-Model
RCP8.5,_SSP5
2.15E+09
2.02E+09
#######
1144970470.9
estimates_of_expected_anual_damage_(EAD)
$/year 4.0 Insufficient
Large (Scussolini et al., 2017)
Asia Vietnam 2010-2020
2090-2110
CMIP5 TELEMAC-2D,_Damage-Scanner-Model
RCP8.5,_SSP5
2.15E+09
1.01E+09
#######
1144970470.9
estimates_of_expected_anual_damage_(EAD)
$/year 4.0 Co-benefits
Negligible
(Scussolini et al., 2017)
Asia Vietnam 2010-2020
2090-2110
CMIP5 TELEMAC-2D,_Damage-Scanner-Model
RCP8.5,_SSP5
2.15E+09
6.53E+08
#######
1144970470.9
estimates_of_expected_anual_damage_(EAD)
$/year 4.0 Co-benefits
Negligible
(Scussolini et al., 2017)
ACCEPTED VERSIO
N
SUBJECT TO FIN
AL EDITS
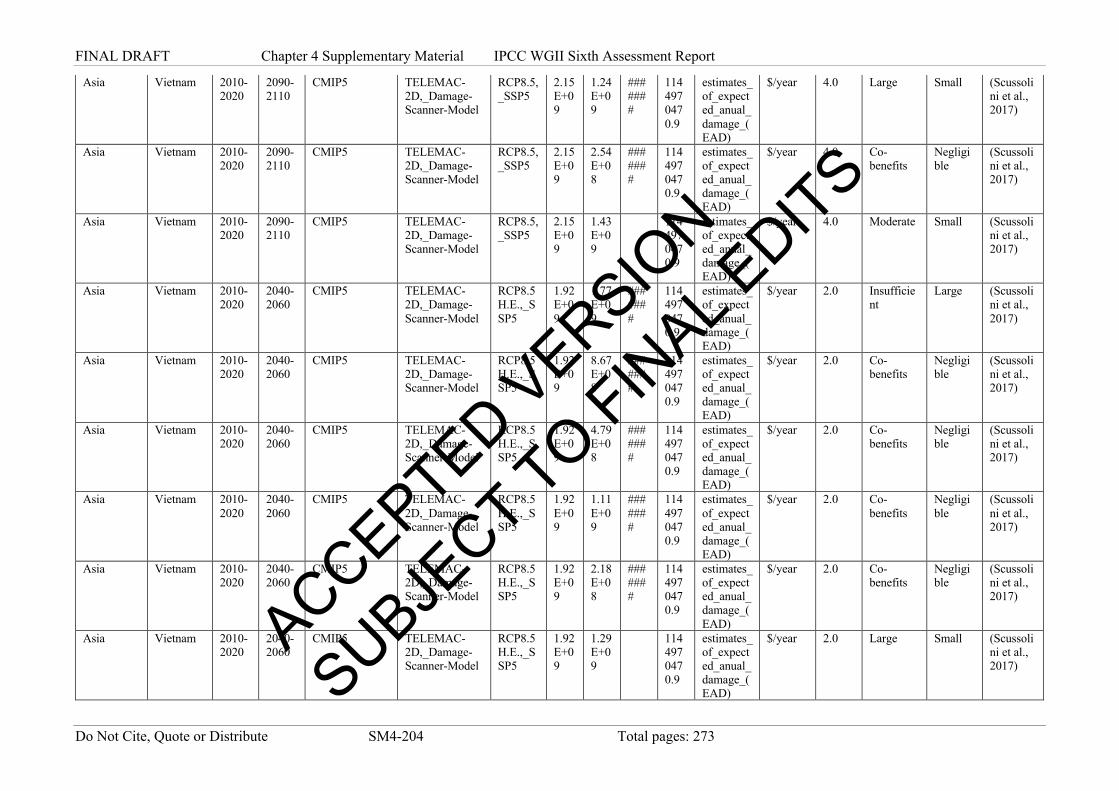
FINAL DRAFT Chapter 4 Supplementary Material IPCC WGII Sixth Assessment Report
Do Not Cite, Quote or Distribute SM4-204 Total pages: 273
Asia Vietnam 2010-2020
2090-2110
CMIP5 TELEMAC-2D,_Damage-Scanner-Model
RCP8.5,_SSP5
2.15E+09
1.24E+09
#######
1144970470.9
estimates_of_expected_anual_damage_(EAD)
$/year 4.0 Large Small (Scussolini et al., 2017)
Asia Vietnam 2010-2020
2090-2110
CMIP5 TELEMAC-2D,_Damage-Scanner-Model
RCP8.5,_SSP5
2.15E+09
2.54E+08
#######
1144970470.9
estimates_of_expected_anual_damage_(EAD)
$/year 4.0 Co-benefits
Negligible
(Scussolini et al., 2017)
Asia Vietnam 2010-2020
2090-2110
CMIP5 TELEMAC-2D,_Damage-Scanner-Model
RCP8.5,_SSP5
2.15E+09
1.43E+09
1144970470.9
estimates_of_expected_anual_damage_(EAD)
$/year 4.0 Moderate Small (Scussolini et al., 2017)
Asia Vietnam 2010-2020
2040-2060
CMIP5 TELEMAC-2D,_Damage-Scanner-Model
RCP8.5H.E.,_SSP5
1.92E+09
1.77E+09
#######
1144970470.9
estimates_of_expected_anual_damage_(EAD)
$/year 2.0 Insufficient
Large (Scussolini et al., 2017)
Asia Vietnam 2010-2020
2040-2060
CMIP5 TELEMAC-2D,_Damage-Scanner-Model
RCP8.5H.E.,_SSP5
1.92E+09
8.67E+08
#######
1144970470.9
estimates_of_expected_anual_damage_(EAD)
$/year 2.0 Co-benefits
Negligible
(Scussolini et al., 2017)
Asia Vietnam 2010-2020
2040-2060
CMIP5 TELEMAC-2D,_Damage-Scanner-Model
RCP8.5H.E.,_SSP5
1.92E+09
4.79E+08
#######
1144970470.9
estimates_of_expected_anual_damage_(EAD)
$/year 2.0 Co-benefits
Negligible
(Scussolini et al., 2017)
Asia Vietnam 2010-2020
2040-2060
CMIP5 TELEMAC-2D,_Damage-Scanner-Model
RCP8.5H.E.,_SSP5
1.92E+09
1.11E+09
#######
1144970470.9
estimates_of_expected_anual_damage_(EAD)
$/year 2.0 Co-benefits
Negligible
(Scussolini et al., 2017)
Asia Vietnam 2010-2020
2040-2060
CMIP5 TELEMAC-2D,_Damage-Scanner-Model
RCP8.5H.E.,_SSP5
1.92E+09
2.18E+08
#######
1144970470.9
estimates_of_expected_anual_damage_(EAD)
$/year 2.0 Co-benefits
Negligible
(Scussolini et al., 2017)
Asia Vietnam 2010-2020
2040-2060
CMIP5 TELEMAC-2D,_Damage-Scanner-Model
RCP8.5H.E.,_SSP5
1.92E+09
1.29E+09
1144970470.9
estimates_of_expected_anual_damage_(EAD)
$/year 2.0 Large Small (Scussolini et al., 2017)
ACCEPTED VERSIO
N
SUBJECT TO FIN
AL EDITS

FINAL DRAFT Chapter 4 Supplementary Material IPCC WGII Sixth Assessment Report
Do Not Cite, Quote or Distribute SM4-205 Total pages: 273
Asia Vietnam 2010-2020
2090-2110
CMIP5 TELEMAC-2D,_Damage-Scanner-Model
RCP8.5H.E.,_SSP5
4.10E+09
4.28E+09
#######
1144970470.9
estimates_of_expected_anual_damage_(EAD)
$/year 4.0 Insufficient
Maladaptation
(Scussolini et al., 2017)
Asia Vietnam 2010-2020
2090-2110
CMIP5 TELEMAC-2D,_Damage-Scanner-Model
RCP8.5H.E.,_SSP5
4.10E+09
3.14E+09
#######
1144970470.9
estimates_of_expected_anual_damage_(EAD)
$/year 4.0 Small Large (Scussolini et al., 2017)
Asia Vietnam 2010-2020
2090-2110
CMIP5 TELEMAC-2D,_Damage-Scanner-Model
RCP8.5H.E.,_SSP5
4.10E+09
3.26E+09
#######
1144970470.9
estimates_of_expected_anual_damage_(EAD)
$/year 4.0 Insufficient
Large (Scussolini et al., 2017)
Asia Vietnam 2010-2020
2090-2110
CMIP5 TELEMAC-2D,_Damage-Scanner-Model
RCP8.5H.E.,_SSP5
4.10E+09
3.51E+09
#######
1144970470.9
estimates_of_expected_anual_damage_(EAD)
$/year 4.0 Insufficient
Large (Scussolini et al., 2017)
Asia Vietnam 2010-2020
2090-2110
CMIP5 TELEMAC-2D,_Damage-Scanner-Model
RCP8.5H.E.,_SSP5
4.10E+09
1.47E+09
#######
1144970470.9
estimates_of_expected_anual_damage_(EAD)
$/year 4.0 Large Small (Scussolini et al., 2017)
Asia Vietnam 2010-2020
2090-2110
CMIP5 TELEMAC-2D,_Damage-Scanner-Model
RCP8.5H.E.,_SSP5
4.10E+09
2.90E+09
1144970470.9
estimates_of_expected_anual_damage_(EAD)
$/year 4.0 Small Large (Scussolini et al., 2017)
Asia China 2005-2020
2090-2100
HadGEM2-ES,IPSL-CM5A-LR,_MIROC-ESM-CHEM,NORESM1-M
TOMAWAC,_TELEMAC,_and_MIKE_1_D/2_D
RCP8.5 9.00E+01
3.50E+01
0.0 0.1 annual_damage
billion_US$
4.0 Moderate Moderate
(Du et al., 2020b)
Asia China 2005-2020
2090-2100
HadGEM2-ES,IPSL-CM5A-LR,_MIROC-ESM-CHEM,NORESM1-M
TOMAWAC,_TELEMAC,_and_MIKE_1_D/2_D
RCP8.5 9.00E+01
4.00E-01
0.1 0.1 annual_damage
billion_US$
4.0 Large Negligible
(Du et al., 2020b) ACCEPTED V
ERSION
SUBJECT TO FIN
AL EDITS

FINAL DRAFT Chapter 4 Supplementary Material IPCC WGII Sixth Assessment Report
Do Not Cite, Quote or Distribute SM4-206 Total pages: 273
Asia China 2005-2020
2090-2100
HadGEM2-ES,IPSL-CM5A-LR,_MIROC-ESM-CHEM,NORESM1-M
TOMAWAC,_TELEMAC,_and_MIKE_1_D/2_D
RCP4.5 5.00E+01
9.00E+00
0.0 0.1 annual_damage
billion_US$
3.0 Large Small (Du et al., 2020b)
Asia China 2005-2020
2090-2100
HadGEM2-ES,IPSL-CM5A-LR,_MIROC-ESM-CHEM,NORESM1-M
TOMAWAC,_TELEMAC,_and_MIKE_1_D/2_D
RCP4.5 5.00E+01
8.50E-02
0.1 0.1 annual_damage
billion_US$
3.0 Co-benefits
Negligible
(Du et al., 2020b)
Asia China 2005-2020
2040-2060
HadGEM2-ES,IPSL-CM5A-LR,_MIROC-ESM-CHEM,NORESM1-M
TOMAWAC,_TELEMAC,_and_MIKE_1_D/2_D
RCP8.5 5.00E+00
8.50E-01
0.0 0.1 annual_damage
billion_US$
2.0 Large Small (Du et al., 2020b)
Asia China 2005-2020
2040-2060
HadGEM2-ES,IPSL-CM5A-LR,_MIROC-ESM-CHEM,NORESM1-M
TOMAWAC,_TELEMAC,_and_MIKE_1_D/2_D
RCP8.5 5.00E+00
6.00E-03
0.1 0.1 annual_damage
billion_US$
2.0 Co-benefits
Negligible
(Du et al., 2020b)
Asia China 2005-2020
2040-2060
HadGEM2-ES,IPSL-CM5A-LR,_MIROC-ESM-CHEM,NORESM1-M
TOMAWAC,_TELEMAC,_and_MIKE_1_D/2_D
RCP4.5 4.00E+00
6.00E-03
0.1 0.1 annual_damage
billion_US$
2.0 Co-benefits
Negligible
(Du et al., 2020b)
Europe Austria 1971-2000
2016-2045
ECHAM5 Hqsim,_Hydro_AS-2D,_Dyna-CLUE
A2 2.50E+04
1.80E+04
9000.0
13000.0
estimates_of_expected_anual_damage_(EAD)
Euros 1.5 Moderate Moderate
(Thieken et al., 2016)
Europe Austria 1971-2000
2016-2045
HadGem2 Hqsim,_Hydro_AS-2D,_Dyna-CLUE
A1B 7.00E+04
4.90E+04
9000.0
13000.0
estimates_of_expected_anual_damage_(EAD)
Euros 1.5 Small Large (Thieken et al., 2016)
ACCEPTED VERSIO
N
SUBJECT TO FIN
AL EDITS
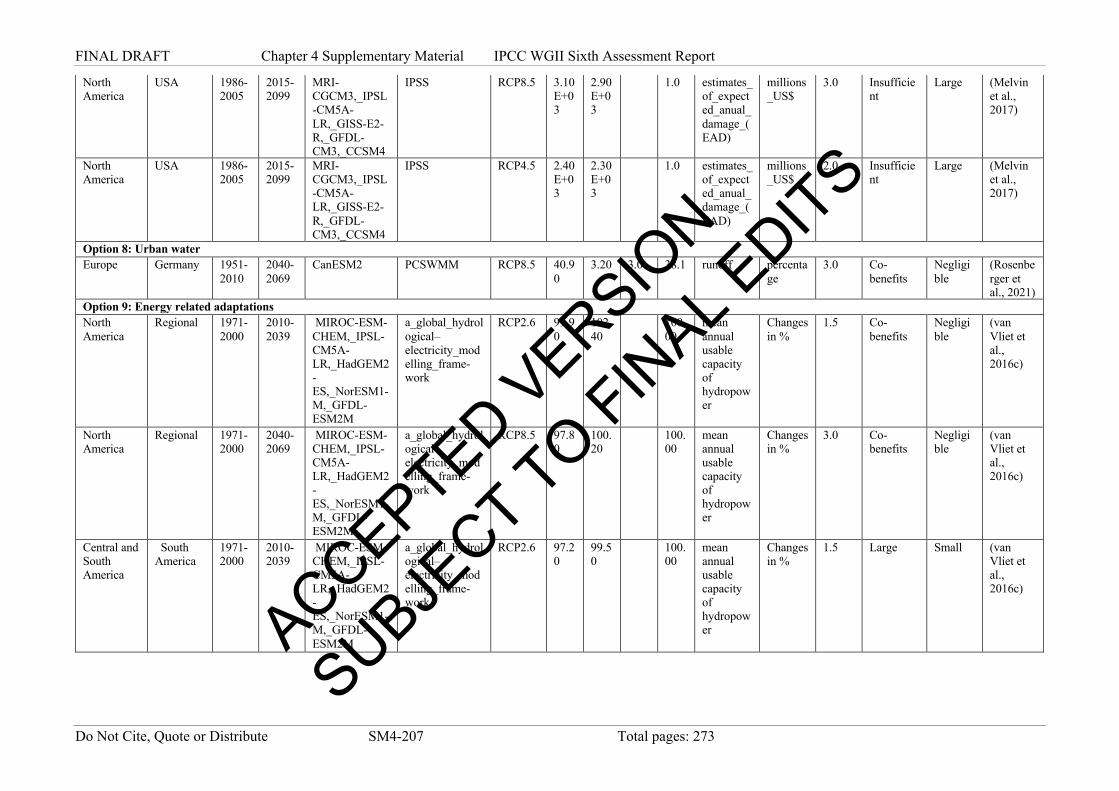
FINAL DRAFT Chapter 4 Supplementary Material IPCC WGII Sixth Assessment Report
Do Not Cite, Quote or Distribute SM4-207 Total pages: 273
North America
USA 1986-2005
2015-2099
MRI-CGCM3,_IPSL-CM5A-LR,_GISS-E2-R,_GFDL-CM3,_CCSM4
IPSS RCP8.5 3.10E+03
2.90E+03
1.0 estimates_of_expected_anual_damage_(EAD)
millions_US$
3.0 Insufficient
Large (Melvin et al., 2017)
North America
USA 1986-2005
2015-2099
MRI-CGCM3,_IPSL-CM5A-LR,_GISS-E2-R,_GFDL-CM3,_CCSM4
IPSS RCP4.5 2.40E+03
2.30E+03
1.0 estimates_of_expected_anual_damage_(EAD)
millions_US$
2.0 Insufficient
Large (Melvin et al., 2017)
Option 8: Urban water Europe Germany 1951-
2010 2040-2069
CanESM2 PCSWMM RCP8.5 40.90
3.20 3.0 38.1 runoff percentage
3.0 Co-benefits
Negligible
(Rosenberger et al., 2021)
Option 9: Energy related adaptations North America
Regional 1971-2000
2010-2039
MIROC-ESM-CHEM,_IPSL- CM5A-LR,_HadGEM2-ES,_NorESM1-M,_GFDL-ESM2M
a_global_hydrological–electricity_modelling_frame-work
RCP2.6 99.90
102.40
100.00
mean annual usable capacity of hydropower
Changes in %
1.5 Co-benefits
Negligible
(van Vliet et al., 2016c)
North America
Regional 1971-2000
2040-2069
MIROC-ESM-CHEM,_IPSL- CM5A-LR,_HadGEM2-ES,_NorESM1-M,_GFDL-ESM2M
a_global_hydrological–electricity_modelling_frame-work
RCP8.5 97.80
100.20
100.00
mean annual usable capacity of hydropower
Changes in %
3.0 Co-benefits
Negligible
(van Vliet et al., 2016c)
Central and South America
South America
1971-2000
2010-2039
MIROC-ESM-CHEM,_IPSL- CM5A-LR,_HadGEM2-ES,_NorESM1-M,_GFDL-ESM2M
a_global_hydrological–electricity_modelling_frame-work
RCP2.6 97.20
99.50
100.00
mean annual usable capacity of hydropower
Changes in %
1.5 Large Small (van Vliet et al., 2016c)
ACCEPTED VERSIO
N
SUBJECT TO FIN
AL EDITS

FINAL DRAFT Chapter 4 Supplementary Material IPCC WGII Sixth Assessment Report
Do Not Cite, Quote or Distribute SM4-208 Total pages: 273
Central and South America
South America
1971-2000
2040-2069
MIROC-ESM-CHEM,_IPSL- CM5A-LR,_HadGEM2-ES,_NorESM1-M,_GFDL-ESM2M
a_global_hydrological–electricity_modelling_frame-work
RCP2.6 96.30
98.60
100.00
mean annual usable capacity of hydropower
Changes in %
2.0 Moderate Moderate
(van Vliet et al., 2016c)
Central and South America
South America
1971-2000
2010-2039
MIROC-ESM-CHEM,_IPSL- CM5A-LR,_HadGEM2-ES,_NorESM1-M,_GFDL-ESM2M
a_global_hydrological–electricity_modelling_frame-work
RCP8.5 96.90
99.30
100.00
mean annual usable capacity of hydropower
Changes in %
1.5 Moderate Small (van Vliet et al., 2016c)
Central and South America
South America
1971-2000
2040-2069
MIROC-ESM-CHEM,_IPSL- CM5A-LR,_HadGEM2-ES,_NorESM1-M,_GFDL-ESM2M
a_global_hydrological–electricity_modelling_frame-work
RCP8.5 94.50
96.80
100.00
mean annual usable capacity of hydropower
Changes in %
3.0 Small Large (van Vliet et al., 2016c)
Europe Regional 1971-2000
2010-2039
MIROC-ESM-CHEM,_IPSL- CM5A-LR,_HadGEM2-ES,_NorESM1-M,_GFDL-ESM2M
a_global_hydrological–electricity_modelling_frame-work
RCP2.6 98.50
102.80
100.00
mean annual usable capacity of hydropower
Changes in %
1.5 Co-benefits
Negligible
(van Vliet et al., 2016c)
Europe Regional 1971-2000
2040-2069
MIROC-ESM-CHEM,_IPSL- CM5A-LR,_HadGEM2-ES,_NorESM1-M,_GFDL-ESM2M
a_global_hydrological–electricity_modelling_frame-work
RCP2.6 99.90
104.20
100.00
mean annual usable capacity of hydropower
Changes in %
2.0 Co-benefits
Negligible
(van Vliet et al., 2016c)
ACCEPTED VERSIO
N
SUBJECT TO FIN
AL EDITS

FINAL DRAFT Chapter 4 Supplementary Material IPCC WGII Sixth Assessment Report
Do Not Cite, Quote or Distribute SM4-209 Total pages: 273
Europe Regional 1971-2000
2010-2039
MIROC-ESM-CHEM,_IPSL- CM5A-LR,_HadGEM2-ES,_NorESM1-M,_GFDL-ESM2M
a_global_hydrological–electricity_modelling_frame-work
RCP8.5 99.30
103.60
100.00
mean annual usable capacity of hydropower
Changes in %
1.5 Co-benefits
Negligible
(van Vliet et al., 2016c)
Europe Regional 1971-2000
2040-2069
MIROC-ESM-CHEM,_IPSL- CM5A-LR,_HadGEM2-ES,_NorESM1-M,_GFDL-ESM2M
a_global_hydrological–electricity_modelling_frame-work
RCP8.5 95.80
99.90
100.00
mean annual usable capacity of hydropower
Changes in %
3.0 Large Negligible
(van Vliet et al., 2016c)
Africa Regional 1971-2000
2040-2069
MIROC-ESM-CHEM,_IPSL- CM5A-LR,_HadGEM2-ES,_NorESM1-M,_GFDL-ESM2M
a_global_hydrological–electricity_modelling_frame-work
RCP2.6 99.10
101.20
100.00
mean annual usable capacity of hydropower
Changes in %
2.0 Co-benefits
Negligible
(van Vliet et al., 2016c)
Africa Regional 1971-2000
2040-2069
MIROC-ESM-CHEM,_IPSL- CM5A-LR,_HadGEM2-ES,_NorESM1-M,_GFDL-ESM2M
a_global_hydrological–electricity_modelling_frame-work
RCP8.5 99.10
101.20
100.00
mean annual usable capacity of hydropower
Changes in %
3.0 Co-benefits
Negligible
(van Vliet et al., 2016c)
Asia Regional 1971-2000
2010-2039
MIROC-ESM-CHEM,_IPSL- CM5A-LR,_HadGEM2-ES,_NorESM1-M,_GFDL-ESM2M
a_global_hydrological–electricity_modelling_frame-work
RCP2.6 97.80
101.80
100.00
mean annual usable capacity of hydropower
Changes in %
1.5 Co-benefits
Negligible
(van Vliet et al., 2016c)
ACCEPTED VERSIO
N
SUBJECT TO FIN
AL EDITS

FINAL DRAFT Chapter 4 Supplementary Material IPCC WGII Sixth Assessment Report
Do Not Cite, Quote or Distribute SM4-210 Total pages: 273
Asia Regional 1971-2000
2040-2069
MIROC-ESM-CHEM,_IPSL- CM5A-LR,_HadGEM2-ES,_NorESM1-M,_GFDL-ESM2M
a_global_hydrological–electricity_modelling_frame-work
RCP2.6 99.10
103.10
100.00
mean annual usable capacity of hydropower
Changes in %
2.0 Co-benefits
Negligible
(van Vliet et al., 2016c)
Asia Regional 1971-2000
2010-2039
MIROC-ESM-CHEM,_IPSL- CM5A-LR,_HadGEM2-ES,_NorESM1-M,_GFDL-ESM2M
a_global_hydrological–electricity_modelling_frame-work
RCP8.5 96.90
100.90
100.00
mean annual usable capacity of hydropower
Changes in %
1.5 Co-benefits
Negligible
(van Vliet et al., 2016c)
Asia Regional 1971-2000
2040-2069
MIROC-ESM-CHEM,_IPSL- CM5A-LR,_HadGEM2-ES,_NorESM1-M,_GFDL-ESM2M
a_global_hydrological–electricity_modelling_frame-work
RCP8.5 97.00
101.00
100.00
mean annual usable capacity of hydropower
Changes in %
3.0 Co-benefits
Negligible
(van Vliet et al., 2016c)
Australasia Australia 1971-2000
2010-2039
MIROC-ESM-CHEM,_IPSL- CM5A-LR,_HadGEM2-ES,_NorESM1-M,_GFDL-ESM2M
a_global_hydrological–electricity_modelling_frame-work
RCP2.6 89.60
95.50
100.00
mean annual usable capacity of hydropower
Changes in %
1.5 Moderate Moderate
(van Vliet et al., 2016c)
Australasia Australia 1971-2000
2040-2069
MIROC-ESM-CHEM,_IPSL- CM5A-LR,_HadGEM2-ES,_NorESM1-M,_GFDL-ESM2M
a_global_hydrological–electricity_modelling_frame-work
RCP2.6 93.60
99.60
100.00
mean annual usable capacity of hydropower
Changes in %
2.0 Large Small (van Vliet et al., 2016c)
ACCEPTED VERSIO
N
SUBJECT TO FIN
AL EDITS
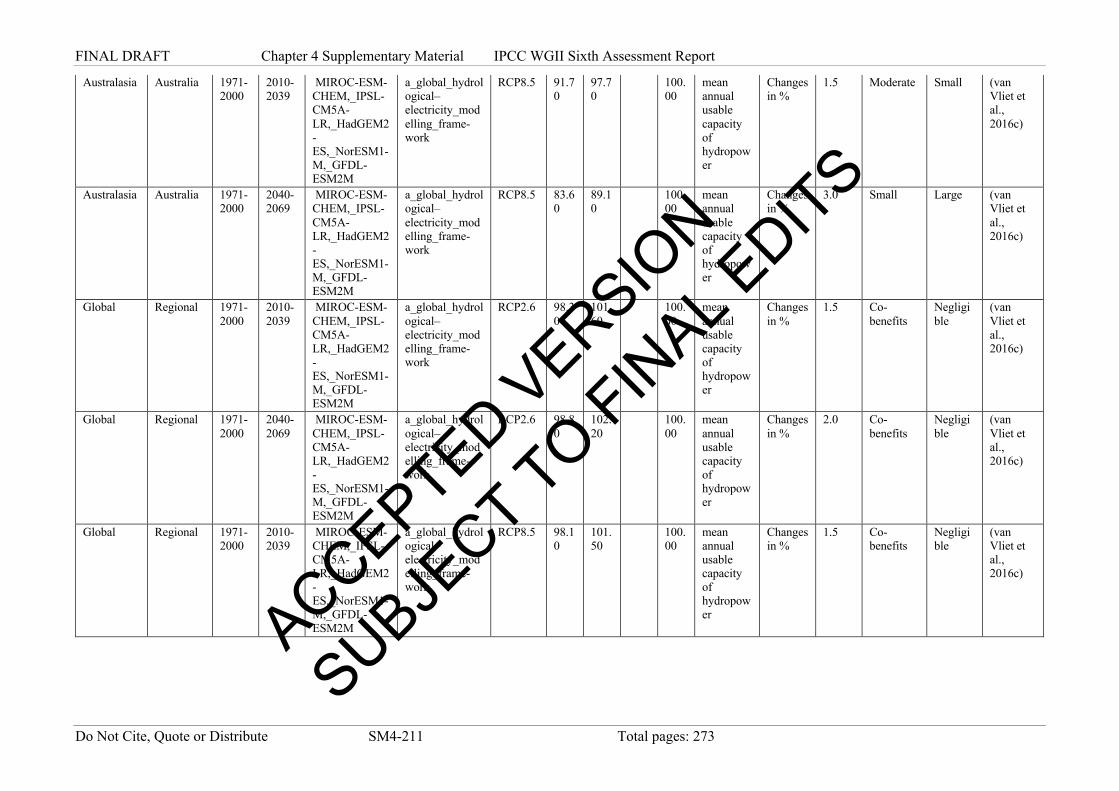
FINAL DRAFT Chapter 4 Supplementary Material IPCC WGII Sixth Assessment Report
Do Not Cite, Quote or Distribute SM4-211 Total pages: 273
Australasia Australia 1971-2000
2010-2039
MIROC-ESM-CHEM,_IPSL- CM5A-LR,_HadGEM2-ES,_NorESM1-M,_GFDL-ESM2M
a_global_hydrological–electricity_modelling_frame-work
RCP8.5 91.70
97.70
100.00
mean annual usable capacity of hydropower
Changes in %
1.5 Moderate Small (van Vliet et al., 2016c)
Australasia Australia 1971-2000
2040-2069
MIROC-ESM-CHEM,_IPSL- CM5A-LR,_HadGEM2-ES,_NorESM1-M,_GFDL-ESM2M
a_global_hydrological–electricity_modelling_frame-work
RCP8.5 83.60
89.10
100.00
mean annual usable capacity of hydropower
Changes in %
3.0 Small Large (van Vliet et al., 2016c)
Global Regional 1971-2000
2010-2039
MIROC-ESM-CHEM,_IPSL- CM5A-LR,_HadGEM2-ES,_NorESM1-M,_GFDL-ESM2M
a_global_hydrological–electricity_modelling_frame-work
RCP2.6 98.30
101.60
100.00
mean annual usable capacity of hydropower
Changes in %
1.5 Co-benefits
Negligible
(van Vliet et al., 2016c)
Global Regional 1971-2000
2040-2069
MIROC-ESM-CHEM,_IPSL- CM5A-LR,_HadGEM2-ES,_NorESM1-M,_GFDL-ESM2M
a_global_hydrological–electricity_modelling_frame-work
RCP2.6 98.80
102.20
100.00
mean annual usable capacity of hydropower
Changes in %
2.0 Co-benefits
Negligible
(van Vliet et al., 2016c)
Global Regional 1971-2000
2010-2039
MIROC-ESM-CHEM,_IPSL- CM5A-LR,_HadGEM2-ES,_NorESM1-M,_GFDL-ESM2M
a_global_hydrological–electricity_modelling_frame-work
RCP8.5 98.10
101.50
100.00
mean annual usable capacity of hydropower
Changes in %
1.5 Co-benefits
Negligible
(van Vliet et al., 2016c)
ACCEPTED VERSIO
N
SUBJECT TO FIN
AL EDITS

FINAL DRAFT Chapter 4 Supplementary Material IPCC WGII Sixth Assessment Report
Do Not Cite, Quote or Distribute SM4-212 Total pages: 273
Global Regional 1971-2000
2040-2069
MIROC-ESM-CHEM,_IPSL- CM5A-LR,_HadGEM2-ES,_NorESM1-M,_GFDL-ESM2M
a_global_hydrological–electricity_modelling_frame-work
RCP8.5 96.40
99.70
100.00
mean annual usable capacity of hydropower
Changes in %
3.0 Large Small (van Vliet et al., 2016c)
North America
Regional 1971-2000
2010-2039
MIROC-ESM-CHEM,_IPSL- CM5A-LR,_HadGEM2-ES,_NorESM1-M,_GFDL-ESM2M
a_global_hydrological–electricity_modelling_frame-work
RCP2.6 93.90
98.10
100.00
mean annual usable capacity of thermoelectric power plant
Changes in %
1.5 Moderate Moderate
(van Vliet et al., 2016c)
North America
Regional 1971-2000
2040-2069
MIROC-ESM-CHEM,_IPSL- CM5A-LR,_HadGEM2-ES,_NorESM1-M,_GFDL-ESM2M
a_global_hydrological–electricity_modelling_frame-work
RCP2.6 92.80
97.00
100.00
mean annual usable capacity of thermoelectric power plant
Changes in %
2.0 Moderate Moderate
(van Vliet et al., 2016c)
North America
Regional 1971-2000
2010-2039
MIROC-ESM-CHEM,_IPSL- CM5A-LR,_HadGEM2-ES,_NorESM1-M,_GFDL-ESM2M
a_global_hydrological–electricity_modelling_frame-work
RCP8.5 94.60
98.70
100.00
mean annual usable capacity of thermoelectric power plant
Changes in %
1.5 Moderate Small (van Vliet et al., 2016c)
North America
South America
1971-2000
2040-2069
MIROC-ESM-CHEM,_IPSL- CM5A-LR,_HadGEM2-ES,_NorESM1-M,_GFDL-ESM2M
a_global_hydrological–electricity_modelling_frame-work
RCP8.5 87.00
91.50
100.00
mean annual usable capacity of thermoelectric power plant
Changes in %
3.0 Small Large (van Vliet et al., 2016c) ACCEPTED V
ERSION
SUBJECT TO FIN
AL EDITS

FINAL DRAFT Chapter 4 Supplementary Material IPCC WGII Sixth Assessment Report
Do Not Cite, Quote or Distribute SM4-213 Total pages: 273
Central and South America
South America
1971-2000
2010-2039
MIROC-ESM-CHEM,_IPSL- CM5A-LR,_HadGEM2-ES,_NorESM1-M,_GFDL-ESM2M
a_global_hydrological–electricity_modelling_frame-work
RCP2.6 98.70
104.50
100.00
mean annual usable capacity of thermoelectric power plant
Changes in %
1.5 Co-benefits
Negligible
(van Vliet et al., 2016c)
Central and South America
South America
1971-2000
2040-2069
MIROC-ESM-CHEM,_IPSL- CM5A-LR,_HadGEM2-ES,_NorESM1-M,_GFDL-ESM2M
a_global_hydrological–electricity_modelling_frame-work
RCP2.6 97.40
103.30
100.00
mean annual usable capacity of thermoelectric power plant
Changes in %
2.0 Co-benefits
Negligible
(van Vliet et al., 2016c)
Central and South America
South America
1971-2000
2010-2039
MIROC-ESM-CHEM,_IPSL- CM5A-LR,_HadGEM2-ES,_NorESM1-M,_GFDL-ESM2M
a_global_hydrological–electricity_modelling_frame-work
RCP8.5 98.10
103.40
100.00
mean annual usable capacity of thermoelectric power plant
Changes in %
1.5 Co-benefits
Negligible
(van Vliet et al., 2016c)
Central and South America
South America
1971-2000
2040-2069
MIROC-ESM-CHEM,_IPSL- CM5A-LR,_HadGEM2-ES,_NorESM1-M,_GFDL-ESM2M
a_global_hydrological–electricity_modelling_frame-work
RCP8.5 93.50
100.20
100.00
mean annual usable capacity of thermoelectric power plant
Changes in %
3.0 Co-benefits
Negligible
(van Vliet et al., 2016c)
Europe Regional 1971-2000
2010-2039
MIROC-ESM-CHEM,_IPSL- CM5A-LR,_HadGEM2-ES,_NorESM1-M,_GFDL-ESM2M
a_global_hydrological–electricity_modelling_frame-work
RCP2.6 91.40
99.20
100.00
mean annual usable capacity of thermoelectric power plant
Changes in %
1.5 Large Small (van Vliet et al., 2016c) ACCEPTED V
ERSION
SUBJECT TO FIN
AL EDITS
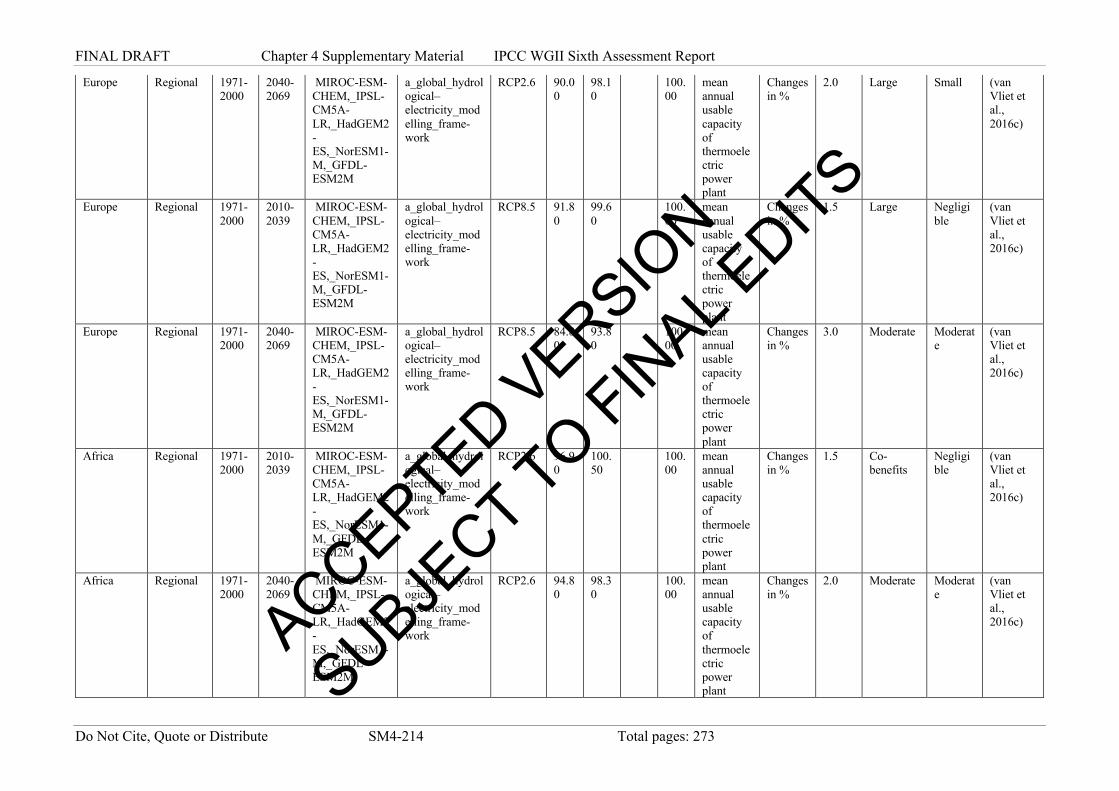
FINAL DRAFT Chapter 4 Supplementary Material IPCC WGII Sixth Assessment Report
Do Not Cite, Quote or Distribute SM4-214 Total pages: 273
Europe Regional 1971-2000
2040-2069
MIROC-ESM-CHEM,_IPSL- CM5A-LR,_HadGEM2-ES,_NorESM1-M,_GFDL-ESM2M
a_global_hydrological–electricity_modelling_frame-work
RCP2.6 90.00
98.10
100.00
mean annual usable capacity of thermoelectric power plant
Changes in %
2.0 Large Small (van Vliet et al., 2016c)
Europe Regional 1971-2000
2010-2039
MIROC-ESM-CHEM,_IPSL- CM5A-LR,_HadGEM2-ES,_NorESM1-M,_GFDL-ESM2M
a_global_hydrological–electricity_modelling_frame-work
RCP8.5 91.80
99.60
100.00
mean annual usable capacity of thermoelectric power plant
Changes in %
1.5 Large Negligible
(van Vliet et al., 2016c)
Europe Regional 1971-2000
2040-2069
MIROC-ESM-CHEM,_IPSL- CM5A-LR,_HadGEM2-ES,_NorESM1-M,_GFDL-ESM2M
a_global_hydrological–electricity_modelling_frame-work
RCP8.5 84.80
93.80
100.00
mean annual usable capacity of thermoelectric power plant
Changes in %
3.0 Moderate Moderate
(van Vliet et al., 2016c)
Africa Regional 1971-2000
2010-2039
MIROC-ESM-CHEM,_IPSL- CM5A-LR,_HadGEM2-ES,_NorESM1-M,_GFDL-ESM2M
a_global_hydrological–electricity_modelling_frame-work
RCP2.6 96.90
100.50
100.00
mean annual usable capacity of thermoelectric power plant
Changes in %
1.5 Co-benefits
Negligible
(van Vliet et al., 2016c)
Africa Regional 1971-2000
2040-2069
MIROC-ESM-CHEM,_IPSL- CM5A-LR,_HadGEM2-ES,_NorESM1-M,_GFDL-ESM2M
a_global_hydrological–electricity_modelling_frame-work
RCP2.6 94.80
98.30
100.00
mean annual usable capacity of thermoelectric power plant
Changes in %
2.0 Moderate Moderate
(van Vliet et al., 2016c) ACCEPTED V
ERSION
SUBJECT TO FIN
AL EDITS

FINAL DRAFT Chapter 4 Supplementary Material IPCC WGII Sixth Assessment Report
Do Not Cite, Quote or Distribute SM4-215 Total pages: 273
Africa Regional 1971-2000
2010-2039
MIROC-ESM-CHEM,_IPSL- CM5A-LR,_HadGEM2-ES,_NorESM1-M,_GFDL-ESM2M
a_global_hydrological–electricity_modelling_frame-work
RCP8.5 95.20
98.80
100.00
mean annual usable capacity of thermoelectric power plant
Changes in %
1.5 Moderate Small (van Vliet et al., 2016c)
Africa Regional 1971-2000
2040-2069
MIROC-ESM-CHEM,_IPSL- CM5A-LR,_HadGEM2-ES,_NorESM1-M,_GFDL-ESM2M
a_global_hydrological–electricity_modelling_frame-work
RCP8.5 82.20
85.80
100.00
mean annual usable capacity of thermoelectric power plant
Changes in %
3.0 Insufficient
Large (van Vliet et al., 2016c)
Asia Regional 1971-2000
2010-2039
MIROC-ESM-CHEM,_IPSL- CM5A-LR,_HadGEM2-ES,_NorESM1-M,_GFDL-ESM2M
a_global_hydrological–electricity_modelling_frame-work
RCP2.6 96.40
102.70
100.00
mean annual usable capacity of thermoelectric power plant
Changes in %
1.5 Co-benefits
Negligible
(van Vliet et al., 2016c)
Asia Regional 1971-2000
2040-2069
MIROC-ESM-CHEM,_IPSL- CM5A-LR,_HadGEM2-ES,_NorESM1-M,_GFDL-ESM2M
a_global_hydrological–electricity_modelling_frame-work
RCP2.6 95.30
101.70
100.00
mean annual usable capacity of thermoelectric power plant
Changes in %
2.0 Co-benefits
Negligible
(van Vliet et al., 2016c)
Asia Regional 1971-2000
2010-2039
MIROC-ESM-CHEM,_IPSL- CM5A-LR,_HadGEM2-ES,_NorESM1-M,_GFDL-ESM2M
a_global_hydrological–electricity_modelling_frame-work
RCP8.5 96.80
103.00
100.00
mean annual usable capacity of thermoelectric power plant
Changes in %
1.5 Co-benefits
Negligible
(van Vliet et al., 2016c) ACCEPTED V
ERSION
SUBJECT TO FIN
AL EDITS

FINAL DRAFT Chapter 4 Supplementary Material IPCC WGII Sixth Assessment Report
Do Not Cite, Quote or Distribute SM4-216 Total pages: 273
Asia Regional 1971-2000
2040-2069
MIROC-ESM-CHEM,_IPSL- CM5A-LR,_HadGEM2-ES,_NorESM1-M,_GFDL-ESM2M
a_global_hydrological–electricity_modelling_frame-work
RCP8.5 91.60
98.40
100.00
mean annual usable capacity of thermoelectric power plant
Changes in %
3.0 Large Small (van Vliet et al., 2016c)
Australasia Australia 1971-2000
2010-2039
MIROC-ESM-CHEM,_IPSL- CM5A-LR,_HadGEM2-ES,_NorESM1-M,_GFDL-ESM2M
a_global_hydrological–electricity_modelling_frame-work
RCP2.6 93.70
103.40
100.00
mean annual usable capacity of thermoelectric power plant
Changes in %
1.5 Co-benefits
Negligible
(van Vliet et al., 2016c)
Australasia Australia 1971-2000
2040-2069
MIROC-ESM-CHEM,_IPSL- CM5A-LR,_HadGEM2-ES,_NorESM1-M,_GFDL-ESM2M
a_global_hydrological–electricity_modelling_frame-work
RCP2.6 95.20
105.00
100.00
mean annual usable capacity of thermoelectric power plant
Changes in %
2.0 Co-benefits
Negligible
(van Vliet et al., 2016c)
Australasia Australia 1971-2000
2010-2039
MIROC-ESM-CHEM,_IPSL- CM5A-LR,_HadGEM2-ES,_NorESM1-M,_GFDL-ESM2M
a_global_hydrological–electricity_modelling_frame-work
RCP8.5 94.50
104.30
100.00
mean annual usable capacity of thermoelectric power plant
Changes in %
1.5 Co-benefits
Negligible
(van Vliet et al., 2016c)
Australasia Australia 1971-2000
2040-2069
MIROC-ESM-CHEM,_IPSL- CM5A-LR,_HadGEM2-ES,_NorESM1-M,_GFDL-ESM2M
a_global_hydrological–electricity_modelling_frame-work
RCP8.5 88.70
100.20
100.00
mean annual usable capacity of thermoelectric power plant
Changes in %
3.0 Co-benefits
Negligible
(van Vliet et al., 2016c) ACCEPTED V
ERSION
SUBJECT TO FIN
AL EDITS
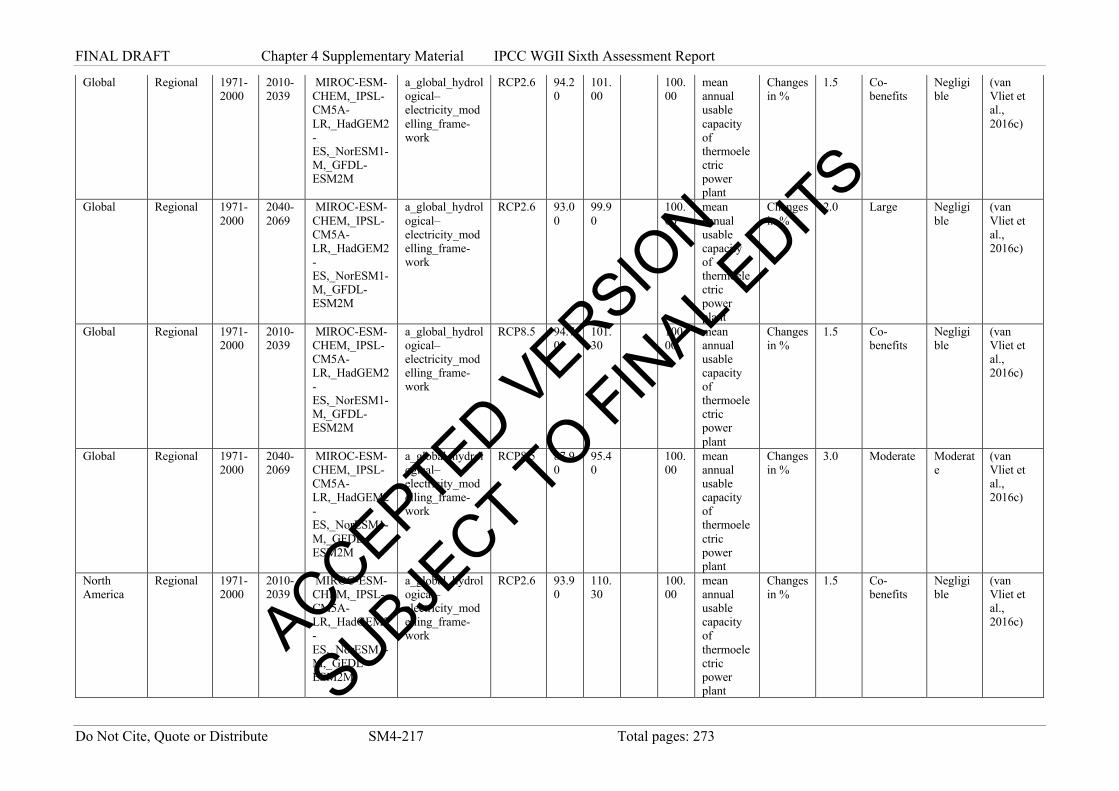
FINAL DRAFT Chapter 4 Supplementary Material IPCC WGII Sixth Assessment Report
Do Not Cite, Quote or Distribute SM4-217 Total pages: 273
Global Regional 1971-2000
2010-2039
MIROC-ESM-CHEM,_IPSL- CM5A-LR,_HadGEM2-ES,_NorESM1-M,_GFDL-ESM2M
a_global_hydrological–electricity_modelling_frame-work
RCP2.6 94.20
101.00
100.00
mean annual usable capacity of thermoelectric power plant
Changes in %
1.5 Co-benefits
Negligible
(van Vliet et al., 2016c)
Global Regional 1971-2000
2040-2069
MIROC-ESM-CHEM,_IPSL- CM5A-LR,_HadGEM2-ES,_NorESM1-M,_GFDL-ESM2M
a_global_hydrological–electricity_modelling_frame-work
RCP2.6 93.00
99.90
100.00
mean annual usable capacity of thermoelectric power plant
Changes in %
2.0 Large Negligible
(van Vliet et al., 2016c)
Global Regional 1971-2000
2010-2039
MIROC-ESM-CHEM,_IPSL- CM5A-LR,_HadGEM2-ES,_NorESM1-M,_GFDL-ESM2M
a_global_hydrological–electricity_modelling_frame-work
RCP8.5 94.70
101.30
100.00
mean annual usable capacity of thermoelectric power plant
Changes in %
1.5 Co-benefits
Negligible
(van Vliet et al., 2016c)
Global Regional 1971-2000
2040-2069
MIROC-ESM-CHEM,_IPSL- CM5A-LR,_HadGEM2-ES,_NorESM1-M,_GFDL-ESM2M
a_global_hydrological–electricity_modelling_frame-work
RCP8.5 87.90
95.40
100.00
mean annual usable capacity of thermoelectric power plant
Changes in %
3.0 Moderate Moderate
(van Vliet et al., 2016c)
North America
Regional 1971-2000
2010-2039
MIROC-ESM-CHEM,_IPSL- CM5A-LR,_HadGEM2-ES,_NorESM1-M,_GFDL-ESM2M
a_global_hydrological–electricity_modelling_frame-work
RCP2.6 93.90
110.30
100.00
mean annual usable capacity of thermoelectric power plant
Changes in %
1.5 Co-benefits
Negligible
(van Vliet et al., 2016c) ACCEPTED V
ERSION
SUBJECT TO FIN
AL EDITS
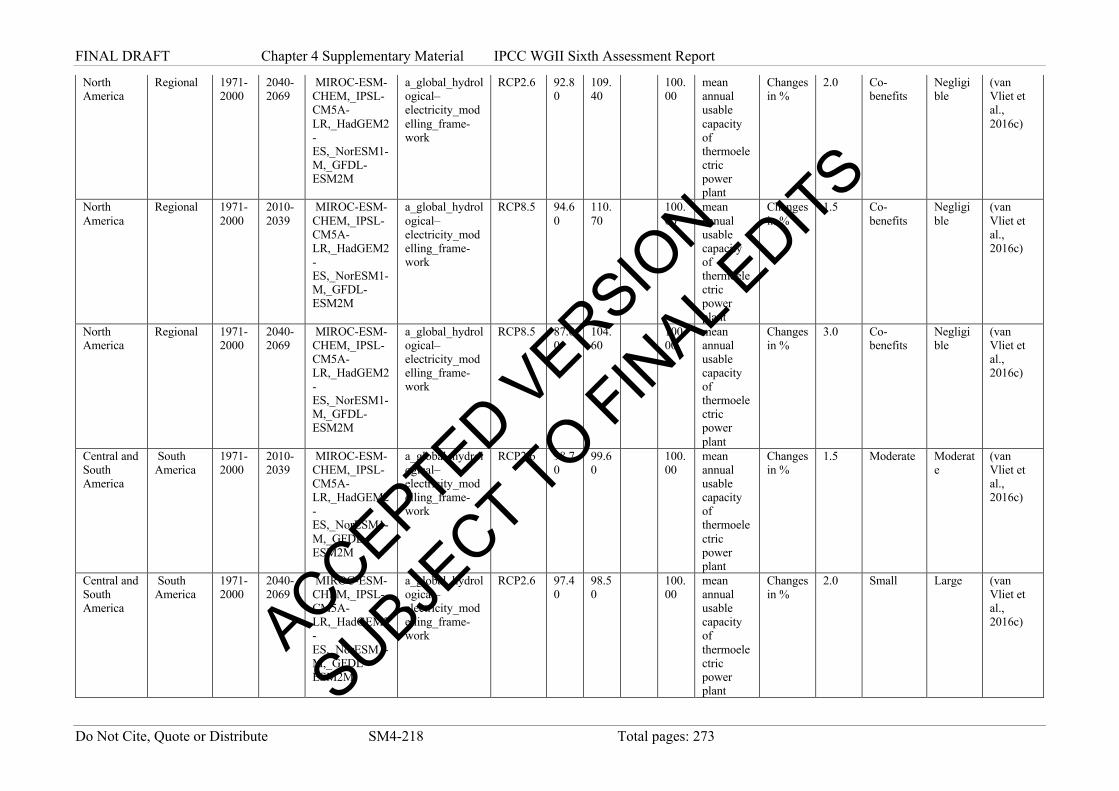
FINAL DRAFT Chapter 4 Supplementary Material IPCC WGII Sixth Assessment Report
Do Not Cite, Quote or Distribute SM4-218 Total pages: 273
North America
Regional 1971-2000
2040-2069
MIROC-ESM-CHEM,_IPSL- CM5A-LR,_HadGEM2-ES,_NorESM1-M,_GFDL-ESM2M
a_global_hydrological–electricity_modelling_frame-work
RCP2.6 92.80
109.40
100.00
mean annual usable capacity of thermoelectric power plant
Changes in %
2.0 Co-benefits
Negligible
(van Vliet et al., 2016c)
North America
Regional 1971-2000
2010-2039
MIROC-ESM-CHEM,_IPSL- CM5A-LR,_HadGEM2-ES,_NorESM1-M,_GFDL-ESM2M
a_global_hydrological–electricity_modelling_frame-work
RCP8.5 94.60
110.70
100.00
mean annual usable capacity of thermoelectric power plant
Changes in %
1.5 Co-benefits
Negligible
(van Vliet et al., 2016c)
North America
Regional 1971-2000
2040-2069
MIROC-ESM-CHEM,_IPSL- CM5A-LR,_HadGEM2-ES,_NorESM1-M,_GFDL-ESM2M
a_global_hydrological–electricity_modelling_frame-work
RCP8.5 87.00
104.60
100.00
mean annual usable capacity of thermoelectric power plant
Changes in %
3.0 Co-benefits
Negligible
(van Vliet et al., 2016c)
Central and South America
South America
1971-2000
2010-2039
MIROC-ESM-CHEM,_IPSL- CM5A-LR,_HadGEM2-ES,_NorESM1-M,_GFDL-ESM2M
a_global_hydrological–electricity_modelling_frame-work
RCP2.6 98.70
99.60
100.00
mean annual usable capacity of thermoelectric power plant
Changes in %
1.5 Moderate Moderate
(van Vliet et al., 2016c)
Central and South America
South America
1971-2000
2040-2069
MIROC-ESM-CHEM,_IPSL- CM5A-LR,_HadGEM2-ES,_NorESM1-M,_GFDL-ESM2M
a_global_hydrological–electricity_modelling_frame-work
RCP2.6 97.40
98.50
100.00
mean annual usable capacity of thermoelectric power plant
Changes in %
2.0 Small Large (van Vliet et al., 2016c) ACCEPTED V
ERSION
SUBJECT TO FIN
AL EDITS
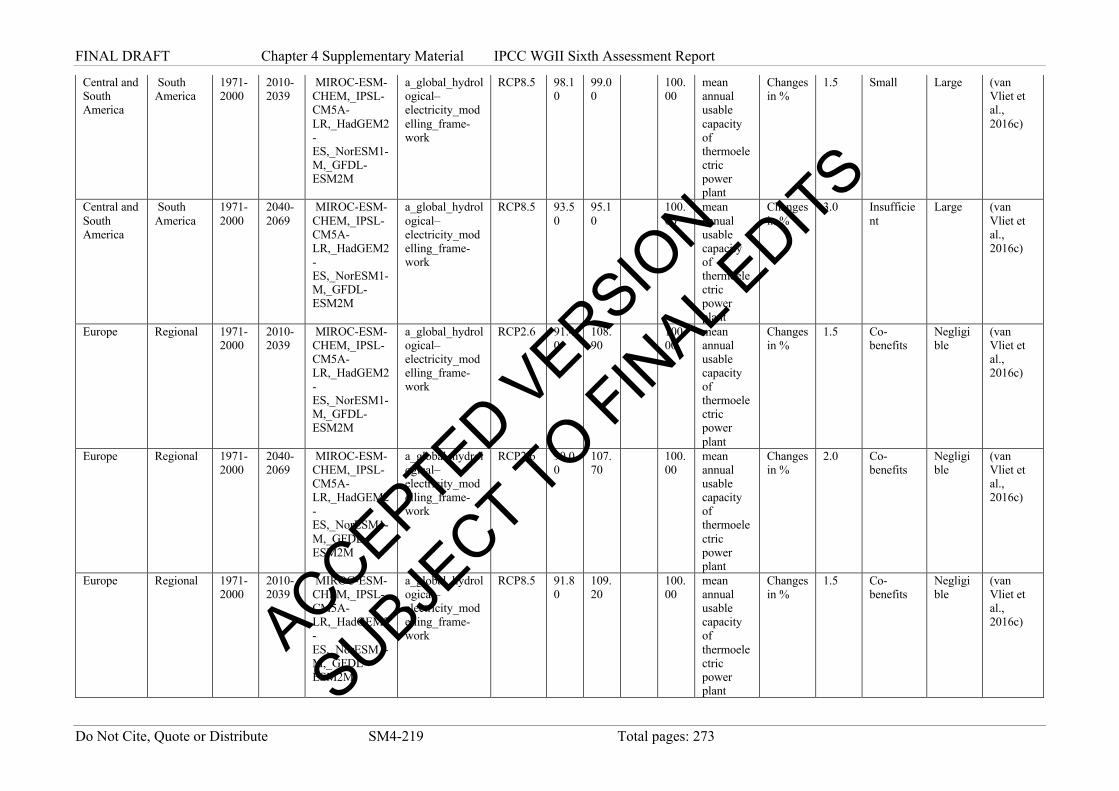
FINAL DRAFT Chapter 4 Supplementary Material IPCC WGII Sixth Assessment Report
Do Not Cite, Quote or Distribute SM4-219 Total pages: 273
Central and South America
South America
1971-2000
2010-2039
MIROC-ESM-CHEM,_IPSL- CM5A-LR,_HadGEM2-ES,_NorESM1-M,_GFDL-ESM2M
a_global_hydrological–electricity_modelling_frame-work
RCP8.5 98.10
99.00
100.00
mean annual usable capacity of thermoelectric power plant
Changes in %
1.5 Small Large (van Vliet et al., 2016c)
Central and South America
South America
1971-2000
2040-2069
MIROC-ESM-CHEM,_IPSL- CM5A-LR,_HadGEM2-ES,_NorESM1-M,_GFDL-ESM2M
a_global_hydrological–electricity_modelling_frame-work
RCP8.5 93.50
95.10
100.00
mean annual usable capacity of thermoelectric power plant
Changes in %
3.0 Insufficient
Large (van Vliet et al., 2016c)
Europe Regional 1971-2000
2010-2039
MIROC-ESM-CHEM,_IPSL- CM5A-LR,_HadGEM2-ES,_NorESM1-M,_GFDL-ESM2M
a_global_hydrological–electricity_modelling_frame-work
RCP2.6 91.40
108.90
100.00
mean annual usable capacity of thermoelectric power plant
Changes in %
1.5 Co-benefits
Negligible
(van Vliet et al., 2016c)
Europe Regional 1971-2000
2040-2069
MIROC-ESM-CHEM,_IPSL- CM5A-LR,_HadGEM2-ES,_NorESM1-M,_GFDL-ESM2M
a_global_hydrological–electricity_modelling_frame-work
RCP2.6 90.00
107.70
100.00
mean annual usable capacity of thermoelectric power plant
Changes in %
2.0 Co-benefits
Negligible
(van Vliet et al., 2016c)
Europe Regional 1971-2000
2010-2039
MIROC-ESM-CHEM,_IPSL- CM5A-LR,_HadGEM2-ES,_NorESM1-M,_GFDL-ESM2M
a_global_hydrological–electricity_modelling_frame-work
RCP8.5 91.80
109.20
100.00
mean annual usable capacity of thermoelectric power plant
Changes in %
1.5 Co-benefits
Negligible
(van Vliet et al., 2016c) ACCEPTED V
ERSION
SUBJECT TO FIN
AL EDITS

FINAL DRAFT Chapter 4 Supplementary Material IPCC WGII Sixth Assessment Report
Do Not Cite, Quote or Distribute SM4-220 Total pages: 273
Europe Regional 1971-2000
2040-2069
MIROC-ESM-CHEM,_IPSL- CM5A-LR,_HadGEM2-ES,_NorESM1-M,_GFDL-ESM2M
a_global_hydrological–electricity_modelling_frame-work
RCP8.5 84.80
103.60
100.00
mean annual usable capacity of thermoelectric power plant
Changes in %
3.0 Co-benefits
Negligible
(van Vliet et al., 2016c)
Africa Regional 1971-2000
2010-2039
MIROC-ESM-CHEM,_IPSL- CM5A-LR,_HadGEM2-ES,_NorESM1-M,_GFDL-ESM2M
a_global_hydrological–electricity_modelling_frame-work
RCP2.6 96.90
119.10
100.00
mean annual usable capacity of thermoelectric power plant
Changes in %
1.5 Co-benefits
Negligible
(van Vliet et al., 2016c)
Africa Regional 1971-2000
2040-2069
MIROC-ESM-CHEM,_IPSL- CM5A-LR,_HadGEM2-ES,_NorESM1-M,_GFDL-ESM2M
a_global_hydrological–electricity_modelling_frame-work
RCP2.6 94.80
118.70
100.00
mean annual usable capacity of thermoelectric power plant
Changes in %
2.0 Co-benefits
Negligible
(van Vliet et al., 2016c)
Africa Regional 1971-2000
2010-2039
MIROC-ESM-CHEM,_IPSL- CM5A-LR,_HadGEM2-ES,_NorESM1-M,_GFDL-ESM2M
a_global_hydrological–electricity_modelling_frame-work
RCP8.5 95.20
118.20
100.00
mean annual usable capacity of thermoelectric power plant
Changes in %
1.5 Co-benefits
Negligible
(van Vliet et al., 2016c)
Africa Regional 1971-2000
2040-2069
MIROC-ESM-CHEM,_IPSL- CM5A-LR,_HadGEM2-ES,_NorESM1-M,_GFDL-ESM2M
a_global_hydrological–electricity_modelling_frame-work
RCP8.5 82.20
115.80
100.00
mean annual usable capacity of thermoelectric power plant
Changes in %
3.0 Co-benefits
Negligible
(van Vliet et al., 2016c) ACCEPTED V
ERSION
SUBJECT TO FIN
AL EDITS

FINAL DRAFT Chapter 4 Supplementary Material IPCC WGII Sixth Assessment Report
Do Not Cite, Quote or Distribute SM4-221 Total pages: 273
Asia Regional 1971-2000
2010-2039
MIROC-ESM-CHEM,_IPSL- CM5A-LR,_HadGEM2-ES,_NorESM1-M,_GFDL-ESM2M
a_global_hydrological–electricity_modelling_frame-work
RCP2.6 96.40
101.90
100.00
mean annual usable capacity of thermoelectric power plant
Changes in %
1.5 Co-benefits
Negligible
(van Vliet et al., 2016c)
Asia Regional 1971-2000
2040-2069
MIROC-ESM-CHEM,_IPSL- CM5A-LR,_HadGEM2-ES,_NorESM1-M,_GFDL-ESM2M
a_global_hydrological–electricity_modelling_frame-work
RCP2.6 95.30
101.30
100.00
mean annual usable capacity of thermoelectric power plant
Changes in %
2.0 Co-benefits
Negligible
(van Vliet et al., 2016c)
Asia Regional 1971-2000
2010-2039
MIROC-ESM-CHEM,_IPSL- CM5A-LR,_HadGEM2-ES,_NorESM1-M,_GFDL-ESM2M
a_global_hydrological–electricity_modelling_frame-work
RCP8.5 96.80
102.40
100.00
mean annual usable capacity of thermoelectric power plant
Changes in %
1.5 Co-benefits
Negligible
(van Vliet et al., 2016c)
Asia Regional 1971-2000
2040-2069
MIROC-ESM-CHEM,_IPSL- CM5A-LR,_HadGEM2-ES,_NorESM1-M,_GFDL-ESM2M
a_global_hydrological–electricity_modelling_frame-work
RCP8.5 91.60
98.40
100.00
mean annual usable capacity of thermoelectric power plant
Changes in %
3.0 Large Small (van Vliet et al., 2016c)
Australasia Australia 1971-2000
2010-2039
MIROC-ESM-CHEM,_IPSL- CM5A-LR,_HadGEM2-ES,_NorESM1-M,_GFDL-ESM2M
a_global_hydrological–electricity_modelling_frame-work
RCP2.6 93.70
119.20
100.00
mean annual usable capacity of thermoelectric power plant
Changes in %
1.5 Co-benefits
Negligible
(van Vliet et al., 2016c) ACCEPTED V
ERSION
SUBJECT TO FIN
AL EDITS

FINAL DRAFT Chapter 4 Supplementary Material IPCC WGII Sixth Assessment Report
Do Not Cite, Quote or Distribute SM4-222 Total pages: 273
Australasia Australia 1971-2000
2040-2069
MIROC-ESM-CHEM,_IPSL- CM5A-LR,_HadGEM2-ES,_NorESM1-M,_GFDL-ESM2M
a_global_hydrological–electricity_modelling_frame-work
RCP2.6 95.20
120.20
100.00
mean annual usable capacity of thermoelectric power plant
Changes in %
2.0 Co-benefits
Negligible
(van Vliet et al., 2016c)
Australasia Australia 1971-2000
2010-2039
MIROC-ESM-CHEM,_IPSL- CM5A-LR,_HadGEM2-ES,_NorESM1-M,_GFDL-ESM2M
a_global_hydrological–electricity_modelling_frame-work
RCP8.5 94.50
119.40
100.00
mean annual usable capacity of thermoelectric power plant
Changes in %
1.5 Co-benefits
Negligible
(van Vliet et al., 2016c)
Australasia Australia 1971-2000
2040-2069
MIROC-ESM-CHEM,_IPSL- CM5A-LR,_HadGEM2-ES,_NorESM1-M,_GFDL-ESM2M
a_global_hydrological–electricity_modelling_frame-work
RCP8.5 88.70
117.20
100.00
mean annual usable capacity of thermoelectric power plant
Changes in %
3.0 Co-benefits
Negligible
(van Vliet et al., 2016c)
Global Regional 1971-2000
2010-2039
MIROC-ESM-CHEM,_IPSL- CM5A-LR,_HadGEM2-ES,_NorESM1-M,_GFDL-ESM2M
a_global_hydrological–electricity_modelling_frame-work
RCP2.6 94.20
108.20
100.00
mean annual usable capacity of thermoelectric power plant
Changes in %
1.5 Co-benefits
Negligible
(van Vliet et al., 2016c)
Global Regional 1971-2000
2040-2069
MIROC-ESM-CHEM,_IPSL- CM5A-LR,_HadGEM2-ES,_NorESM1-M,_GFDL-ESM2M
a_global_hydrological–electricity_modelling_frame-work
RCP2.6 93.00
107.40
100.00
mean annual usable capacity of thermoelectric power plant
Changes in %
2.0 Co-benefits
Negligible
(van Vliet et al., 2016c) ACCEPTED V
ERSION
SUBJECT TO FIN
AL EDITS

FINAL DRAFT Chapter 4 Supplementary Material IPCC WGII Sixth Assessment Report
Do Not Cite, Quote or Distribute SM4-223 Total pages: 273
Global Regional 1971-2000
2010-2039
MIROC-ESM-CHEM,_IPSL- CM5A-LR,_HadGEM2-ES,_NorESM1-M,_GFDL-ESM2M
a_global_hydrological–electricity_modelling_frame-work
RCP8.5 94.70
108.60
100.00
mean annual usable capacity of thermoelectric power plant
Changes in %
1.5 Co-benefits
Negligible
(van Vliet et al., 2016c)
Global Regional 1971-2000
2040-2069
MIROC-ESM-CHEM,_IPSL- CM5A-LR,_HadGEM2-ES,_NorESM1-M,_GFDL-ESM2M
a_global_hydrological–electricity_modelling_frame-work
RCP8.5 87.90
103.70
100.00
mean annual usable capacity of thermoelectric power plant
Changes in %
3.0 Co-benefits
Negligible
(van Vliet et al., 2016c)
1 2 3
ACCEPTED VERSIO
N
SUBJECT TO FIN
AL EDITS

FINAL DRAFT Chapter 4 Supplementary Material IPCC WGII Sixth Assessment Report
Do Not Cite, Quote or Distribute SM4-224 Total pages: 273
References 1 2 Abass, R., A. Mensah and B. Fosu-Mensah, 2018: The role of formal and informal institutions in smallholder 3
agricultural adaptation: The case of lawra and nandom districts, Ghana. West African Journal of 4 Applied Ecology, 26 (Special Issue), 56-72. 5
Abbas, A. et al., 2018: Sustainable survival under climatic extremes: linking flood risk mitigation and coping 6 with flood damages in rural Pakistan. Environmental Science and Pollution Research, 25 (32), 32491-7 32505, doi:10.1007/s11356-018-3203-8. 8
Abbott, B. W. et al., 2015: Patterns and persistence of hydrologic carbon and nutrient export from collapsing 9 upland permafrost. Biogeosciences, 12 (12), 3725-3740, doi:10.5194/bg-12-3725-2015. 10
Abbott, B. W. et al., 2014: Elevated dissolved organic carbon biodegradability from thawing and collapsing 11 permafrost. Journal of Geophysical Research: Biogeosciences, 119 (10), 2049-2063, 12 doi:10.1002/2014jg002678. 13
Abdellatif, M., W. Atherton, R. Alkhaddar and Y. Z. Osman, 2015: Quantitative assessment of sewer 14 overflow performance with climate change in northwest England. Hydrological Sciences Journal, 60 15 (4), 636-650. 16
Abdulai, I. et al., 2018: Characterization of cocoa production, income diversification and shade tree 17 management along a climate gradient in Ghana. PLOS ONE, 13 (4), 1-17, 18 doi:10.1371/journal.pone.0195777. 19
Abel, G. J., M. Brottrager, J. Crespo Cuaresma and R. Muttarak, 2019: Climate, conflict and forced 20 migration. Global Environmental Change, 54, 239-249, 21 doi:https://doi.org/10.1016/j.gloenvcha.2018.12.003. 22
Abi, M., A. Kessler, P. Oosterveer and D. Tolossa, 2019: Adapting the current mass mobilization approach 23 in Ethiopia to enhance its impact on sustainable land management: Lessons from the Sago-kara 24 watershed. Journal of environmental management, 248 (September 2018), 109336-109336, 25 doi:10.1016/j.jenvman.2019.109336. 26
Abid, M., U. A. Schneider and J. Scheffran, 2016: Adaptation to climate change and its impacts on food 27 productivity and crop income: Perspectives of farmers in rural Pakistan. Journal of Rural Studies, 47, 28 254-266, doi:10.1016/j.jrurstud.2016.08.005. 29
Abu, R. and M. G. Reed, 2018: Adaptation through bricolage: Indigenous responses to long-term social-30 ecological change in the Saskatchewan River Delta, Canada. The Canadian Geographer / Le 31 Géographe canadien, 62 (4), 437-451, doi:10.1111/cag.12469. 32
Acevedo-Osorio, Á., A. A. Leiton, M. V. L. Durán and K. L. F. Quiroga, 2017: Sustentabilidad y 33 variabilidad climática: Acciones agroecológicas participativas de adaptación y resiliencia 34 socioecológica en la región alto-andina colombiana. Revista Luna Azul, 44 (44), 6-26, 35 doi:10.17151/luaz.2017.44.2. 36
Achite, M. and S. Ouillon, 2016: Recent changes in climate, hydrology and sediment load in the Wadi Abd, 37 Algeria (1970&ndash;2010). Hydrology and Earth System Sciences, 20 (4), 1355-1372, 38 doi:10.5194/hess-20-1355-2016. 39
Adhikari, S., H. Baral and C. Nitschke, 2018: Adaptation to climate change in Panchase Mountain ecological 40 regions of Nepal. Environments, 5 (3), 42. 41
Adler, R. F. et al., 2017: Global Precipitation: Means, Variations and Trends During the Satellite Era (1979–42 2014). Surveys in Geophysics, 38 (4), 679-699, doi:10.1007/s10712-017-9416-4. 43
Afifi, T. et al., 2016: Human mobility in response to rainfall variability: opportunities for migration as a 44 successful adaptation strategy in eight case studies. Migration and Development, 5 (2), 254-274, 45 doi:10.1080/21632324.2015.1022974. 46
Ahmad, I., B. Ahmad, K. Boote and G. Hoogenboom, 2020: Adaptation strategies for maize production 47 under climate change for semi-arid environments. European Journal of Agronomy, 115, 126040, 48 doi:https://doi.org/10.1016/j.eja.2020.126040. 49
Ahmad, M., G. Mustafa and M. Iqbal, 2016: Impact of farm households' adaptations to climate change on 50 food security: Evidence from different agro-ecologies of Pakistan. Pakistan Development Review, 55 51 (4), 561-588, doi:10.30541/v55i4i-iipp.561-588. 52
Ahmadi, B. and H. Moradkhani, 2019: Revisiting hydrological drought propagation and recovery 53 considering water quantity and quality. Hydrological Processes, 33 (10), 1492-1505, 54 doi:10.1002/hyp.13417. 55
ACCEPTED VERSIO
N
SUBJECT TO FIN
AL EDITS
FINAL DRAFT Chapter 4 Supplementary Material IPCC WGII Sixth Assessment Report
Do Not Cite, Quote or Distribute SM4-225 Total pages: 273
Ahmed, M. N. Q. and S. M. Atiqul Haq, 2019: Indigenous people’s perceptions about climate change, forest 1 resource management, and coping strategies: a comparative study in Bangladesh. Environment, 2 Development and Sustainability, 21 (2), 679-708, doi:10.1007/s10668-017-0055-1. 3
Aich, V. et al., 2015: Climate or land use?—attribution of changes in river flooding in the Sahel Zone. 4 Water, 7 (6), 2796-2820. 5
Aich, V. et al., 2016: Flood projections within the Niger River Basin under future land use and climate 6 change. Science of The Total Environment, 562, 666-677. 7
Aich, V. et al., 2014: Comparing impacts of climate change on streamflow in four large African river basins. 8 Hydrology and Earth System Sciences, 18 (4), 1305-1321. 9
Ajibade, I. and G. McBean, 2014: Climate extremes and housing rights: A political ecology of impacts, early 10 warning and adaptation constraints in Lagos slum communities. Geoforum, 55, 76-86, 11 doi:https://doi.org/10.1016/j.geoforum.2014.05.005. 12
Alam, K. and M. H. Rahman, 2014: Women in natural disasters: A case study from southern coastal region 13 of Bangladesh. International Journal of Disaster Risk Reduction, 8, 68-82, 14 doi:https://doi.org/10.1016/j.ijdrr.2014.01.003. 15
Albert, S. et al., 2018: Heading for the hills: climate-driven community relocations in the Solomon Islands 16 and Alaska provide insight for a 1.5 °C future. Regional Environmental Change, 18 (8), 2261-2272, 17 doi:10.1007/s10113-017-1256-8. 18
Alemayehu, A. and W. Bewket, 2017: Smallholder farmers’ coping and adaptation strategies to climate 19 change and variability in the central highlands of Ethiopia. Local Environment, 22 (7), 825-839, 20 doi:10.1080/13549839.2017.1290058. 21
Alfieri, L. et al., 2017: Global projections of river flood risk in a warmer world. Earth's Future, 5 (2), 171-22 182, doi:10.1002/2016ef000485. 23
Alfieri, L., L. Feyen, F. Dottori and A. Bianchi, 2015: Ensemble flood risk assessment in Europe under high 24 end climate scenarios. Global Environmental Change, 35, 199-212. 25
Ali, A. and O. Erenstein, 2017: Assessing farmer use of climate change adaptation practices and impacts on 26 food security and poverty in Pakistan. Climate Risk Management, 16, 183-194, 27 doi:10.1016/j.crm.2016.12.001. 28
Ali, S. A., S. Aadhar, H. L. Shah and V. Mishra, 2018: Projected increase in hydropower production in India 29 under climate change. Scientific Reports, 8 (1), 1-12. 30
Alkama, R., L. Marchand, A. Ribes and B. Decharme, 2013: Detection of global runoff changes: results from 31 observations and CMIP5 experiments. Hydrology and Earth System Sciences, 17 (7), 2967-2979, 32 doi:10.5194/hess-17-2967-2013. 33
Allamano, P., A. Croci and F. Laio, 2015: Toward the camera rain gauge. Water Resources Research, 51 (3), 34 1744-1757. 35
Allchin, M. I. and S. J. Déry, 2017: A spatio-temporal analysis of trends in Northern Hemisphere snow-36 dominated area and duration, 1971–2014. Annals of Glaciology, 58 (75pt1), 21-35, 37 doi:10.1017/aog.2017.47. 38
Allen, G. H. and T. M. Pavelsky, 2018: Global extent of rivers and streams. Science, 361 (6402), 585, 39 doi:10.1126/science.aat0636. 40
Allen, M., 2003: Liability for climate change. Nature, 421 (6926), 891-892, doi:10.1038/421891a. 41 Alter, R. E., E.-S. Im and E. A. B. Eltahir, 2015: Rainfall consistently enhanced around the Gezira Scheme in 42
East Africa due to irrigation. Nature Geoscience, 8, 763, doi:10.1038/ngeo2514 43 https://www.nature.com/articles/ngeo2514#supplementary-information. 44 Álvarez-Berríos, N. L. et al., 2018: Correlating drought conservation practices and drought vulnerability in a 45
tropical agricultural system. Renewable Agriculture and Food Systems, 33 (3), 279-291, 46 doi:10.1017/S174217051800011X. 47
Alves, I. M. S. et al., 2019: The diversity, distribution, and pathogenic potential of cultivable fungi present in 48 rocks from the South Shetlands archipelago, Maritime Antarctica. Extremophiles, 23 (3), 327-336, 49 doi:10.1007/s00792-019-01086-8. 50
Amadu, F. O., D. C. Miller and P. E. McNamara, 2020: Agroforestry as a pathway to agricultural yield 51 impacts in climate-smart agriculture investments: Evidence from southern Malawi. Ecological 52 Economics, 167 (August 2019), 106443-106443, doi:10.1016/j.ecolecon.2019.106443. 53
Amanambu, A. C. et al., 2020: Groundwater system and climate change: Present status and future 54 considerations. Journal of Hydrology, 589, 125163, doi:https://doi.org/10.1016/j.jhydrol.2020.125163. 55
ACCEPTED VERSIO
N
SUBJECT TO FIN
AL EDITS

FINAL DRAFT Chapter 4 Supplementary Material IPCC WGII Sixth Assessment Report
Do Not Cite, Quote or Distribute SM4-226 Total pages: 273
Amouzou, K. A. et al., 2019: Climate change impact on water- and nitrogen-use efficiencies and yields of 1 maize and sorghum in the northern Benin dry savanna, West Africa. Field Crops Research, 235, 104-2 117, doi:https://doi.org/10.1016/j.fcr.2019.02.021. 3
Anderson, W. et al., 2019: Synchronous crop failures and climate-forced production variability. Science 4 Advances, 5 (7), eaaw1976. 5
Andrew, J. T. and E. Sauquet, 2017: Climate Change Impacts and Water Management Adaptation in Two 6 Mediterranean-Climate Watersheds: Learning from the Durance and Sacramento Rivers. Water, 9 (2), 7 doi:10.3390/w9020126. 8
Aniah, P., M. K. Kaunza-Nu-Dem and J. A. Ayembilla, 2019: Smallholder farmers' livelihood adaptation to 9 climate variability and ecological changes in the savanna agro ecological zone of Ghana. Heliyon, 5 (4), 10 e01492-e01492, doi:10.1016/j.heliyon.2019.e01492. 11
Anthony, K. M. W. et al., 2014: A shift of thermokarst lakes from carbon sources to sinks during the 12 Holocene epoch. Nature, 511 (7510), 452-456, doi:10.1038/nature13560. 13
Antwi-Agyei, P., A. J. Dougill, L. C. Stringer and S. N. A. Codjoe, 2018: Adaptation opportunities and 14 maladaptive outcomes in climate vulnerability hotspots of northern Ghana. Climate Risk Management, 15 19 (September 2017), 83-93, doi:10.1016/j.crm.2017.11.003. 16
Apraku, A., W. Akpan and P. Moyo, 2018: Indigenous Knowledge, Global Ignorance? Insights from an 17 Eastern Cape Climate Change Study. South African Review of Sociology, 49 (2), 1-21, 18 doi:10.1080/21528586.2018.1532813. 19
Arango-Aramburo, S. et al., 2019: Climate impacts on hydropower in Colombia: A multi-model assessment 20 of power sector adaptation pathways. Energy Policy, 128, 179-188, 21 doi:https://doi.org/10.1016/j.enpol.2018.12.057. 22
Araos, M. et al., 2017: Climate change adaptation planning for Global South megacities: the case of Dhaka. 23 Journal of Environmental Policy and Planning, 19 (6), 682-696, doi:10.1080/1523908X.2016.1264873. 24
Archfield, S. A., R. M. Hirsch, A. Viglione and G. Blöschl, 2016: Fragmented patterns of flood change 25 across the United States. Geophysical Research Letters, 43 (19), 10,232-10,239. 26
Arfanuzzaman, M. et al., 2016: Evaluation of adaptation practices in the agriculture sector of Bangladesh: 27 An ecosystem based assessment. Climate, 4 (1), doi:10.3390/cli4010011. 28
Arias, M. E. et al., 2020: Impacts of climate change and deforestation on hydropower planning in the 29 Brazilian Amazon. Nature Sustainability, 3 (6), 430-436, doi:10.1038/s41893-020-0492-y. 30
Arnell, N. W. et al., 2016: The impacts of climate change across the globe: A multi-sectoral assessment. 31 Climatic Change, 134 (3), 457-474, doi:10.1007/s10584-014-1281-2. 32
Arnell, N. W. and S. N. Gosling, 2016: The impacts of climate change on river flood risk at the global scale. 33 Climatic Change, 134 (3), 387-401, doi:10.1007/s10584-014-1084-5. 34
Arp, C. D. et al., 2016: Threshold sensitivity of shallow Arctic lakes and sublake permafrost to changing 35 winter climate. Geophysical Research Letters, 43 (12), 6358-6365. 36
Arslan, A. et al., 2015: Climate Smart Agriculture? Assessing the Adaptation Implications in Zambia. 37 Journal of Agricultural Economics, 66 (3), 753-780, doi:10.1111/1477-9552.12107. 38
Aryal, J. P. et al., 2020: Learning adaptation to climate change from past climate extremes:: Evidence from 39 recent climate extremes in Haryana, India. International Journal of Climate Change Strategies and 40 Management, 12 (1), 128-146, doi:10.1108/IJCCSM-09-2018-0065. 41
Asadieh, B., N. Krakauer and B. Fekete, 2016: Historical Trends in Mean and Extreme Runoff and 42 Streamflow Based on Observations and Climate Models. Water, 8, 189, doi:10.3390/w8050189. 43
Asadieh, B. and N. Y. Krakauer, 2017: Global change in streamflow extremes under climate change over the 44 21st century. Hydrol. Earth Syst. Sci., 21 (11), 5863-5874, doi:10.5194/hess-21-5863-2017. 45
Asante, F. A. and F. Amuakwa-Mensah, 2015: Climate change and variability in Ghana: Stocktaking. 46 Climate, 3 (1), 78-99. 47
Asayehegn, K., L. Temple, B. Sanchez and A. Iglesias, 2017: Perception of climate change and farm level 48 adaptation choices in central Kenya. Cahiers Agricultures, 26 (2), 1-10, doi:10.1051/cagri/2017007. 49
Asfaw, S., G. Pallante and A. Palma, 2018: Diversification Strategies and Adaptation Deficit: Evidence from 50 Rural Communities in Niger. World Development, 101, 219-234, 51 doi:https://doi.org/10.1016/j.worlddev.2017.09.004. 52
Asif, F., 2019: From sea to city: Migration and social well-being in coastal Cambodia. Springer 53 International Publishing, 149-177 pp. 54
Asmare, F., H. Teklewold and A. Mekonnen, 2019: The effect of climate change adaptation strategy on farm 55 households welfare in the Nile basin of Ethiopia: Is there synergy or trade-offs? International Journal 56 of Climate Change Strategies and Management, 11 (4), 518-535, doi:10.1108/IJCCSM-10-2017-0192. 57
ACCEPTED VERSIO
N
SUBJECT TO FIN
AL EDITS
FINAL DRAFT Chapter 4 Supplementary Material IPCC WGII Sixth Assessment Report
Do Not Cite, Quote or Distribute SM4-227 Total pages: 273
Asoka, A., Y. Wada, R. Fishman and V. Mishra, 2018: Strong Linkage Between Precipitation Intensity and 1 Monsoon Season Groundwater Recharge in India. Geophysical Research Letters, 45 (11), 5536-5544, 2 doi:10.1029/2018gl078466. 3
Assan, E., M. Suvedi, L. S. Olabisi and A. Allen, 2018: Coping with and adapting to climate change: A 4 gender perspective from smallholder farming in Ghana. Environments, 5 (8), 1-19, 5 doi:10.3390/environments5080086. 6
Ayeb-Karlsson, S. et al., 2016: A people‐centred perspective on climate change, environmental stress, and 7 livelihood resilience in Bangladesh. Sustainability Science, 11 (4), 679-694. 8
Azage, M. et al., 2017: Effect of climatic variability on childhood diarrhea and its high risk periods in 9 northwestern parts of Ethiopia. PLOS ONE, 12 (10), e0186933, doi:10.1371/journal.pone.0186933. 10
Azari, M., H. R. Moradi, B. Saghafian and M. Faramarzi, 2016: Climate change impacts on streamflow and 11 sediment yield in the North of Iran. Hydrological Sciences Journal, 61 (1), 123-133, 12 doi:10.1080/02626667.2014.967695. 13
Azim, F., A. S. Shakir, R. Habib ur and A. Kanwal, 2016: Impact of climate change on sediment yield for 14 Naran watershed, Pakistan. International Journal of Sediment Research, 31 (3), 212-219, 15 doi:https://doi.org/10.1016/j.ijsrc.2015.08.002. 16
Azumah, S. B., S. A. Donkoh and I. G. K. Ansah, 2017: Contract farming and the adoption of climate 17 change coping and adaptation strategies in the northern region of Ghana. Environment, Development 18 and Sustainability, 19 (6), 2275-2295, doi:10.1007/s10668-016-9854-z. 19
Babel, M. S. and E. Turyatunga, 2015: Evaluation of climate change impacts and adaptation measures for 20 maize cultivation in the western Uganda agro-ecological zone. Theoretical and Applied Climatology, 21 119 (1), 239-254, doi:10.1007/s00704-014-1097-z. 22
Backhaus, A., I. Martinez-Zarzoso and C. Muris, 2015: Do climate variations explain bilateral migration? A 23 gravity model analysis. IZA Journal of Migration, 4 (1), 3, doi:10.1186/s40176-014-0026-3. 24
Bacud, S. T., 2018: Integration of Indigenous and Scientific Knowledge in Disaster Risk Reduction: 25 Resilience Building of a Marginalized Sampaguita Growing Community in the Philippines. Procedia 26 Engineering, 212, 511-518. 27
Bahinipati, C. S. and U. Patnaik, 2015: The damages from climatic extremes in India: do disaster-specific 28 and generic adaptation measures matter? Environmental Economics and Policy Studies, 17 (1), 157-29 177, doi:10.1007/s10018-014-0094-x. 30
Bai, J., Z. Xu, H. Qiu and H. Liu, 2015: Optimising seed portfolios to cope ex ante with risks from bad 31 weather: Evidence from a recent maize farmer survey in China. Australian Journal of Agricultural and 32 Resource Economics, 59 (2), 242-257, doi:10.1111/1467-8489.12056. 33
Bai, P., X. Liu, K. Liang and C. Liu, 2016: Investigation of changes in the annual maximum flood in the 34 Yellow River basin, China. Quaternary International, 392, 168-177. 35
Balama, C., S. Augustino, S. Eriksen and F. B. S. Makonda, 2017: The role of priority non-timber forest 36 products in enhancing local adaptive capacity to climate change stresses in Kilombero district, 37 Tanzania. Climate and Development, 9 (3), 231-243, doi:10.1080/17565529.2016.1167662. 38
Balasubramanya, S., M. Giordano, D. Wichelns and T. Sherpa, 2014: Sharing hydropower revenues in 39 Nepal, over time and across districts and regions. Water Resources and Rural Development, 4, 104-111, 40 doi:https://doi.org/10.1016/j.wrr.2014.10.007. 41
Balehegn, M., L. O. Eik and Y. Tesfay, 2015: Silvopastoral system based on Ficus thonningii: an adaptation 42 to climate change in northern Ethiopia. African Journal of Range and Forage Science, 32 (3), 183-191, 43 doi:10.2989/10220119.2014.942368. 44
Banerjee, R. R., 2015: Farmers’ perception of climate change, impact and adaptation strategies: a case study 45 of four villages in the semi-arid regions of India. Natural Hazards, 75 (3), 2829-2845, 46 doi:10.1007/s11069-014-1466-z. 47
Bard, A. et al., 2015: Trends in the hydrologic regime of Alpine rivers. Journal of Hydrology, 529, 1823-48 1837, doi:https://doi.org/10.1016/j.jhydrol.2015.07.052. 49
Barlow, M. and A. Hoell, 2015: Drought in the Middle East and Central–Southwest Asia During Winter 50 2013/14. Bulletin of the American Meteorological Society, 96 (12), S71-S76, doi:10.1175/BAMS-D-15-51 00127.1. 52
Barrios Puente, G., F. Perez and R. J. Gitter, 2016: The Effect of Rainfall on Migration from Mexico to the 53 United States. International Migration Review, 50 (4), 890-909, doi:10.1111/imre.12116. 54
Barrucand, M. G., C. Giraldo Vieira and P. O. Canziani, 2017: Climate change and its impacts: perception 55 and adaptation in rural areas of Manizales, Colombia. Climate and Development, 9 (5), 415-427, 56 doi:10.1080/17565529.2016.1167661. 57
ACCEPTED VERSIO
N
SUBJECT TO FIN
AL EDITS
FINAL DRAFT Chapter 4 Supplementary Material IPCC WGII Sixth Assessment Report
Do Not Cite, Quote or Distribute SM4-228 Total pages: 273
Bartos, M. D. and M. V. Chester, 2015: Impacts of climate change on electric power supply in the Western 1 United States. Nature Climate Change, 5, 748, doi:10.1038/nclimate2648 2
https://www.nature.com/articles/nclimate2648#supplementary-information. 3 Barua, P., H. Rahman Syed and H. Molla Morshed, 2017: Sustainable adaptation for resolving climate 4
displacement issues of south eastern islands in Bangladesh. International Journal of Climate Change 5 Strategies and Management, 9 (6), 790-810, doi:10.1108/IJCCSM-02-2017-0026. 6
Bedeke, S. et al., 2019: Adoption of climate change adaptation strategies by maize-dependent smallholders 7 in Ethiopia. NJAS - Wageningen Journal of Life Sciences, 88 (August), 96-104, 8 doi:10.1016/j.njas.2018.09.001. 9
Bedelian, C. and J. O. Ogutu, 2017: Trade-offs for climate-resilient pastoral livelihoods in wildlife 10 conservancies in the Mara ecosystem, Kenya. Pastoralism, 7 (1), 1-22, doi:10.1186/s13570-017-0085-11 1. 12
Beel, C. R., S. F. Lamoureux and J. F. Orwin, 2018: Fluvial Response to a Period of Hydrometeorological 13 Change and Landscape Disturbance in the Canadian High Arctic. Geophysical Research Letters, 45 14 (19), 10,446-10,455, doi:10.1029/2018gl079660. 15
Behrens, P. et al., 2017: Climate change and the vulnerability of electricity generation to water stress in the 16 European Union. Nature Energy, 2, nenergy2017114, doi:10.1038/nenergy.2017.114. 17
Beillouin, D. et al., 2020: Impact of extreme weather conditions on European crop production in 2018. 18 Philosophical Transactions of the Royal Society B, 375 (1810), 20190510. 19
Berg, A. and J. Sheffield, 2019: Evapotranspiration Partitioning in CMIP5 Models: Uncertainties and Future 20 Projections. Journal of Climate, 32 (10), 2653-2671, doi:10.1175/jcli-d-18-0583.1. 21
Berg, A., J. Sheffield and P. C. D. Milly, 2017: Divergent surface and total soil moisture projections under 22 global warming. Geophysical Research Letters, 44 (1), 236-244, doi:10.1002/2016gl071921. 23
Bergaoui, K. et al., 2015: 14. THE CONTRIBUTION OF HUMAN-INDUCED CLIMATE CHANGE TO 24 THE DROUGHT OF 2014 IN THE SOUTHERN LEVANT REGION. Bulletin of the American 25 Meteorological Society, 96 (12), S66-S70. 26
Berghuijs, W. R. et al., 2017a: Recent changes in extreme floods across multiple continents. Environmental 27 Research Letters, 12 (11), 114035, doi:10.1088/1748-9326/aa8847. 28
Berghuijs, W. R., J. R. Larsen, T. H. M. van Emmerik and R. A. Woods, 2017b: A Global Assessment of 29 Runoff Sensitivity to Changes in Precipitation, Potential Evaporation, and Other Factors. Water 30 Resources Research, 53 (10), 8475-8486, doi:10.1002/2017wr021593. 31
Berhe, M. et al., 2017: The effects of adaptation to climate change on income of households in rural 32 Ethiopia. Pastoralism, 7 (1), doi:10.1186/s13570-017-0084-2. 33
Beringer, T. et al., 2020: First process-based simulations of climate change impacts on global tea production 34 indicate large effects in the World’s major producer countries. Environmental Research Letters, 15 (3), 35 034023, doi:10.1088/1748-9326/ab649b. 36
Bernacchi, C. J. and A. VanLoocke, 2015: Terrestrial Ecosystems in a Changing Environment: A Dominant 37 Role for Water. Annual Review of Plant Biology, 66 (1), 599-622, doi:10.1146/annurev-arplant-043014-38 114834. 39
Bernzen, A., J. C. Jenkins and B. Braun, 2019: Climate change-induced migration in coastal Bangladesh? A 40 critical assessment of migration drivers in rural households under economic and environmental stress. 41 Geosciences, 9 (1), 51. 42
Berrang-Ford, L. et al., 2021: The Global Adaptation Mapping Initiative (GAMI): Part 1 – Introduction and 43 overview of methods. Protocol Exchange, doi:10.21203/rs.3.pex-1240/v1. 44
Berthier, É. and F. Brun, 2019: Karakoram geodetic glacier mass balances between 2008 and 2016: 45 persistence of the anomaly and influence of a large rock avalanche on Siachen Glacier. Journal of 46 Glaciology, 65 (251), 494-507. 47
Betts, R. A. et al., 2018: Changes in climate extremes, fresh water availability and vulnerability to food 48 insecurity projected at 1.5°C and 2°C global warming with a higher-resolution global 49 climate model. Philosophical Transactions of the Royal Society A: Mathematical, Physical and 50 Engineering Sciences, 376 (2119), 20160452, doi:doi:10.1098/rsta.2016.0452. 51
Beveridge, M. et al., 2018: Climate change and aquaculture: interactions with fisheries and agriculture. 52 Bhandari, D. et al., 2020: Assessing the effect of climate factors on childhood diarrhoea burden in 53
Kathmandu, Nepal. International journal of hygiene and environmental health, 223 (1), 199-206. 54 Bhatta, L. D., B. E. H. Van Oort, N. E. Stork and H. Baral, 2015: Ecosystem services and livelihoods in a 55
changing climate: Understanding local adaptations in the Upper Koshi, Nepal. International Journal of 56
ACCEPTED VERSIO
N
SUBJECT TO FIN
AL EDITS
FINAL DRAFT Chapter 4 Supplementary Material IPCC WGII Sixth Assessment Report
Do Not Cite, Quote or Distribute SM4-229 Total pages: 273
Biodiversity Science, Ecosystem Services and Management, 11 (2), 145-155, 1 doi:10.1080/21513732.2015.1027793. 2
Bi, W. et al., 2019: Evolution of Drought⁻Flood Abrupt Alternation and Its Impacts on Surface Water 3 Quality from 2020 to 2050 in the Luanhe River Basin. International Journal of Environmental 4 Research and Public Health, 16 (5), 691, doi:10.3390/ijerph16050691. 5
Biemans, H. et al., 2013: Future water resources for food production in five South Asian river basins and 6 potential for adaptation — A modeling study. Science of The Total Environment, 468-469, S117-S131, 7 doi:https://doi.org/10.1016/j.scitotenv.2013.05.092. 8
Bierkens, M. F. P. and Y. Wada, 2019: Non-renewable groundwater use and groundwater depletion: a 9 review. Environmental Research Letters, 14 (6), 063002, doi:10.1088/1748-9326/ab1a5f. 10
Bindoff, N., P., K. Stott and a. o. AchutaRao, 2013a: Climate Phenomena and their Relevance for Future 11 Regional Climate Change. In: Intergovernmental Panel on Climate Change [ed.], Climate Change 2013 12 - The Physical Science Basis. Cambridge University Press, 1217–1308. 13
Bindoff, N. L. et al., 2013b: Detection and Attribution of Climate Change: from Global to Regional. In: 14 Climate Change 2013 - The Physical Science Basis. Contribution of Working Group I to the Fifth 15 Assessment Report of the Intergovernmental Panel on Climate Change [Stocker, T. F., D. Qin, G. K. 16 Plattner, M. Tignor, S. K. Allen, J. Boschung, A. Nauels, Y. Xia, V. Bex and P. M. Midgley (eds.)]. 17 Cambridge University Press, Cambridge University Press, Cambridge, United Kingdom and New York, 18 NY, USA, 1217–1308. 19
Birtchnell, T., N. Gill and R. Sultana, 2019: Sleeper cells for urban green infrastructure: Harnessing latent 20 competence in greening Dhaka’s slums. Urban Forestry & Urban Greening, 40, 93-104, 21 doi:https://doi.org/10.1016/j.ufug.2018.05.014. 22
Bisbis, M. B., N. Gruda and M. Blanke, 2018: Potential impacts of climate change on vegetable production 23 and product quality–A review. Journal of Cleaner Production, 170, 1602-1620. 24
Biskaborn, B. K. et al., 2019: Permafrost is warming at a global scale. Nature Communications, 10 (1), 264, 25 doi:10.1038/s41467-018-08240-4. 26
Biswas, T. K. and L. M. Mosley, 2019: From Mountain Ranges to Sweeping Plains, in Droughts and 27 Flooding Rains; River Murray Water Quality over the Last Four Decades. Water Resources 28 Management, 33 (3), 1087-1101, doi:10.1007/s11269-018-2168-1. 29
Bliss, A., R. Hock and V. Radić, 2014: Global response of glacier runoff to twenty-first century climate 30 change. Journal of Geophysical Research: Earth Surface, 119 (4), 717-730, doi:10.1002/2013jf002931. 31
Blöschl, G. et al., 2019a: Twenty-three unsolved problems in hydrology (UPH) – a community perspective. 32 Hydrological Sciences Journal, 64 (10), 1141-1158, doi:10.1080/02626667.2019.1620507. 33
Blöschl, G. et al., 2017: Changing climate shifts timing of European floods. Science, 357 (6351), 588-590, 34 doi:10.1126/science.aan2506. 35
Blöschl, G. et al., 2019b: Changing climate both increases and decreases European river floods. Nature, 573 36 (7772), 108-111, doi:10.1038/s41586-019-1495-6. 37
Blume, T., I. van Meerveld and M. Weiler, 2017: The role of experimental work in hydrological sciences – 38 insights from a community survey. Hydrological Sciences Journal, 62 (3), 334-337, 39 doi:10.1080/02626667.2016.1230675. 40
Boadi, S. A. and K. Owusu, 2019: Impact of climate change and variability on hydropower in Ghana. 41 African Geographical Review, 38 (1), 19-31, doi:10.1080/19376812.2017.1284598. 42
Boateng, G. O. et al., 2020: The syndemic effects of food insecurity, water insecurity, and HIV on depressive 43 symptomatology among Kenyan women. Social Science & Medicine, 113043. 44
Bogena, H. et al., 2018: The TERENO‐Rur hydrological observatory: A multiscale multi‐compartment 45 research platform for the advancement of hydrological science. Vadose Zone Journal, 17 (1), 1-22. 46
Bombelli, G. M., A. Soncini, A. Bianchi and D. Bocchiola, 2019: Potentially modified hydropower 47 production under climate change in the Italian Alps. Hydrological Processes, 33 (17), 2355-2372, 48 doi:https://doi.org/10.1002/hyp.13473. 49
Bond, M. J. and J. Carr, 2018: Permafrost thaw and implications for the fate and transport of tritium in the 50 Canadian north. Journal of Environmental Radioactivity, 192, 295-311, 51 doi:https://doi.org/10.1016/j.jenvrad.2018.07.006. 52
Bond, N. R., R. M. Burrows, M. J. Kennard and S. E. Bunn, 2019: Chapter 6 - Water Scarcity as a Driver of 53 Multiple Stressor Effects. In: Multiple Stressors in River Ecosystems [Sabater, S., A. Elosegi and R. 54 Ludwig (eds.)]. Elsevier, 111-129. 55
Bonsal, B. et al., 2020: Western Canadian freshwater availability: Current and future vulnerabilities. 56 Environmental Reviews, 28 (4), 528-545. 57
ACCEPTED VERSIO
N
SUBJECT TO FIN
AL EDITS

FINAL DRAFT Chapter 4 Supplementary Material IPCC WGII Sixth Assessment Report
Do Not Cite, Quote or Distribute SM4-230 Total pages: 273
Bonsch, M. et al., 2015: Environmental flow provision: Implications for agricultural water and land-use at 1 the global scale. Global Environmental Change, 30, 113-132, 2 doi:https://doi.org/10.1016/j.gloenvcha.2014.10.015. 3
Boonwichai, S. et al., 2019: Evaluation of climate change impacts and adaptation strategies on rainfed rice 4 production in Songkhram River Basin, Thailand. Science of The Total Environment, 652, 189-201, 5 doi:https://doi.org/10.1016/j.scitotenv.2018.10.201. 6
Borgomeo, E. et al., 2020: Impact of green water anomalies on global rainfed crop yields. Environmental 7 Research Letters, 15 (12), 124030. 8
Bott, L.-M. and B. Braun, 2019: How do households respond to coastal hazards? A framework for 9 accommodating strategies using the example of Semarang Bay, Indonesia. International Journal of 10 Disaster Risk Reduction, 37, 101177, doi:https://doi.org/10.1016/j.ijdrr.2019.101177. 11
Bradford, J. B. et al., 2017: Future soil moisture and temperature extremes imply expanding suitability for 12 rainfed agriculture in temperate drylands. Scientific Reports, 7 (1), 12923, doi:10.1038/s41598-017-13 13165-x. 14
Brás, T. A., J. Seixas, N. Carvalhais and J. Jägermeyr, 2021: Severity of drought and heatwave crop losses 15 tripled over the last five decades in Europe. Environmental Research Letters, 16 (6), 065012. 16
Bregaglio, S. et al., 2017: Identifying trends and associated uncertainties in potential rice production under 17 climate change in Mediterranean areas. Agricultural and Forest Meteorology, 237-238, 219-232, 18 doi:https://doi.org/10.1016/j.agrformet.2017.02.015. 19
Bremer, S., M. M. Haque, S. B. Aziz and S. Kvamme, 2019: ‘My new routine’: Assessing the impact of 20 citizen science on climate adaptation in Bangladesh. Environmental Science & Policy, 94, 245-257, 21 doi:https://doi.org/10.1016/j.envsci.2018.12.029. 22
Brouziyne, Y. et al., 2018: Modeling sustainable adaptation strategies toward a climate-smart agriculture in a 23 Mediterranean watershed under projected climate change scenarios. Agricultural Systems, 162, 154-24 163. 25
Brown, H. C. P. and D. J. Sonwa, 2015: Rural local institutions and climate change adaptation in forest 26 communities in Cameroon. Ecology and Society, 20 (2), doi:10.5751/ES-07327-200206. 27
Brun, F. et al., 2017: A spatially resolved estimate of High Mountain Asia glacier mass balances from 2000 28 to 2016. Nature Geoscience, 10, 668, doi:10.1038/ngeo2999 29
https://www.nature.com/articles/ngeo2999#supplementary-information. 30 Brunner, M. I. et al., 2019: Future shifts in extreme flow regimes in Alpine regions. Hydrol. Earth Syst. Sci., 31
23 (11), 4471-4489, doi:10.5194/hess-23-4471-2019. 32 Brüssow, K., A. Faße and U. Grote, 2017: Implications of climate-smart strategy adoption by farm 33
households for food security in Tanzania. Food Security, 9 (6), 1203-1218. 34 Budiyono, Y., J. C. J. H. Aerts, D. Tollenaar and P. J. Ward, 2016: River flood risk in Jakarta under 35
scenarios of future change. Nat. Hazards Earth Syst. Sci., 16 (3), 757-774, doi:10.5194/nhess-16-757-36 2016. 37
Burchfield, E. K. and J. Gilligan, 2016a: Agricultural adaptation to drought in the Sri Lankan dry zone. 38 Applied Geography, 77, 92-100, doi:https://doi.org/10.1016/j.apgeog.2016.10.003. 39
Burchfield, E. K. and J. M. Gilligan, 2016b: Dynamics of individual and collective agricultural adaptation to 40 water scarcity. In 2016 Winter Simulation Conference (WSC) (pp. 1678-1689), IEEE, 1678-1689. 41
Burke, E. J., Y. Zhang and G. Krinner, 2020: Evaluating permafrost physics in the Coupled Model 42 Intercomparison Project 6 (CMIP6) models and their sensitivity to climate change. The Cryosphere, 14 43 (9), 3155-3174. 44
Burke, M., S. M. Hsiang and E. Miguel, 2015: Climate and Conflict. Annual Review of Economics, 7 (1), 45 577-617, doi:10.1146/annurev-economics-080614-115430. 46
Burn, D. H. and P. H. Whitfield, 2018: Changes in flood events inferred from centennial length streamflow 47 data records. Advances in Water Resources, 121, 333-349. 48
Burney, J. et al., 2014: Climate change adaptation strategies for smallholder farmers in the Brazilian Sertão. 49 Climatic Change, 126 (1-2), 45-59, doi:10.1007/s10584-014-1186-0. 50
Burnham, M. and Z. Ma, 2017: Climate change adaptation: factors influencing Chinese smallholder farmers’ 51 perceived self-efficacy and adaptation intent. Regional Environmental Change, 17 (1), 171-186, 52 doi:10.1007/s10113-016-0975-6. 53
Burnham, M. and Z. Ma, 2018: Multi-Scalar Pathways to Smallholder Adaptation. World Development, 108 54 (September), 249-262, doi:10.1016/j.worlddev.2017.08.005. 55
Busker, T. et al., 2019: A global lake and reservoir volume analysis using a surface water dataset and 56 satellite altimetry. Hydrol. Earth Syst. Sci., 23 (2), 669-690, doi:10.5194/hess-23-669-2019. 57
ACCEPTED VERSIO
N
SUBJECT TO FIN
AL EDITS

FINAL DRAFT Chapter 4 Supplementary Material IPCC WGII Sixth Assessment Report
Do Not Cite, Quote or Distribute SM4-231 Total pages: 273
Bussi, G., S. J. Dadson, C. Prudhomme and P. G. Whitehead, 2016a: Modelling the future impacts of climate 1 and land-use change on suspended sediment transport in the River Thames (UK). Journal of Hydrology, 2 542, 357-372, doi:https://doi.org/10.1016/j.jhydrol.2016.09.010. 3
Bussi, G. et al., 2017: Dynamic response of land use and river nutrient concentration to long-term climatic 4 changes. Science of The Total Environment, 590-591, 818-831, 5 doi:https://doi.org/10.1016/j.scitotenv.2017.03.069. 6
Bussi, G. et al., 2016b: Impacts of climate change, land-use change and phosphorus reduction on 7 phytoplankton in the River Thames (UK). Science of The Total Environment, 572, 1507-1519, 8 doi:https://doi.org/10.1016/j.scitotenv.2016.02.109. 9
Bussière, E. M. S., L. G. Underhill and R. Altwegg, 2015: Patterns of bird migration phenology in South 10 Africa suggest northern hemisphere climate as the most consistent driver of change. Global Change 11 Biology, 21 (6), 2179-2190, doi:10.1111/gcb.12857. 12
Byers, E. A., G. Coxon, J. Freer and J. W. Hall, 2020: Drought and climate change impacts on cooling water 13 shortages and electricity prices in Great Britain. Nature Communications, 11 (1), 2239, 14 doi:10.1038/s41467-020-16012-2. 15
Cabezas, J. M. et al., 2020: Identifying adaptation strategies to climate change for Mediterranean olive 16 orchards using impact response surfaces. Agricultural Systems, 185, 102937, 17 doi:https://doi.org/10.1016/j.agsy.2020.102937. 18
Call, M. A., C. Gray, M. Yunus and M. Emch, 2017: Disruption, not displacement: environmental variability 19 and temporary migration in Bangladesh. Global Environmental Change, 46, 157-165. 20
Calzadilla, A. et al., 2014: Climate change and agriculture: Impacts and adaptation options in South Africa. 21 Water Resources and Economics, 5, 24-48, doi:https://doi.org/10.1016/j.wre.2014.03.001. 22
Cao, G., D. Han and J. Moser, 2013: Groundwater exploitation management under land subsidence 23 constraint: empirical evidence from the Hangzhou–Jiaxing–Huzhou Plain, China. Environmental 24 Management, 51 (6), 1109-1125. 25
Caretta, M. A. and L. Börjeson, 2015: Local gender contract and adaptive capacity in smallholder irrigation 26 farming: a case study from the Kenyan drylands. Gender, Place & Culture, 22 (5), 644-661, 27 doi:10.1080/0966369X.2014.885888. 28
Carlton, E. J. et al., 2014: Heavy Rainfall Events and Diarrhea Incidence: The Role of Social and 29 Environmental Factors. American Journal of Epidemiology, 179 (3), 344-352, doi:10.1093/aje/kwt279. 30
Carrão, H., G. Naumann and P. Barbosa, 2018: Global projections of drought hazard in a warming climate: a 31 prime for disaster risk management. Climate Dynamics, 50 (5-6), 2137-2155. 32
Carratalà, A., V. Bachmann, T. R. Julian and T. Kohn, 2020: Adaptation of Human Enterovirus to Warm 33 Environments Leads to Resistance against Chlorine Disinfection. Environmental Science & 34 Technology, 54 (18), 11292-11300, doi:10.1021/acs.est.0c03199. 35
Carrico, A. R. and K. Donato, 2019: Extreme weather and migration: evidence from Bangladesh. Population 36 and Environment, 41 (1), 1-31, doi:10.1007/s11111-019-00322-9. 37
Carter, L., 2019: He korowai o Matainaka / The cloak of Matainaka 38 Traditional ecological knowledge in climate change adaptation – Te Wai Pounamu, New Zealand. New 39
Zealand Journal of Ecology, 43 (3), 1-8. 40 Carvajal, P. E. et al., 2019: Large hydropower, decarbonisation and climate change uncertainty: Modelling 41
power sector pathways for Ecuador. Energy Strategy Reviews, 23, 86-99, 42 doi:https://doi.org/10.1016/j.esr.2018.12.008. 43
Castle, S. L. et al., 2014: Groundwater depletion during drought threatens future water security of the 44 Colorado River Basin. Geophysical Research Letters, 41 (16), 5904-5911. 45
Cattaneo, C. et al., 2019: Human migration in the era of climate change. Review of Environmental 46 Economics and Policy, 13 (2), 189-206. 47
Cattaneo, C. and G. Peri, 2016: The migration response to increasing temperatures. Journal of Development 48 Economics, 122, 127-146, doi:https://doi.org/10.1016/j.jdeveco.2016.05.004. 49
Ceola, S. et al., 2016: Adaptation of water resources systems to changing society and environment: a 50 statement by the International Association of Hydrological Sciences. Hydrological Sciences Journal, 61 51 (16), 2803-2817, doi:10.1080/02626667.2016.1230674. 52
Chadburn, S. E. et al., 2017: An observation-based constraint on permafrost loss as a function of global 53 warming. Nature Climate Change, 7, 340, doi:10.1038/nclimate3262 54
https://www.nature.com/articles/nclimate3262#supplementary-information. 55 Chadwick, R., D. Ackerley, T. Ogura and D. Dommenget, 2019: Separating the Influences of Land 56
Warming, the Direct CO2 Effect, the Plant Physiological Effect, and SST Warming on Regional 57
ACCEPTED VERSIO
N
SUBJECT TO FIN
AL EDITS

FINAL DRAFT Chapter 4 Supplementary Material IPCC WGII Sixth Assessment Report
Do Not Cite, Quote or Distribute SM4-232 Total pages: 273
Precipitation Changes. Journal of Geophysical Research: Atmospheres, 124 (2), 624-640, 1 doi:10.1029/2018jd029423. 2
Chadwick, R., H. Douville and C. B. Skinner, 2017: Timeslice experiments for understanding regional 3 climate projections: applications to the tropical hydrological cycle and European winter circulation. 4 Climate Dynamics, 49 (9), 3011-3029, doi:10.1007/s00382-016-3488-6. 5
Chagas, V. and P. Chaffe, 2018: The role of land cover in the propagation of rainfall into streamflow trends. 6 Water Resources Research, 54 (9), 5986-6004. 7
Chan, N. W., M. L. Tan, A. A. Ghani and N. A. Zakaria, 2019: Sustainable urban drainage as a viable 8 measure of coping with heat and floods due to climate change. IOP Conference Series: Earth and 9 Environmental Science, 257, 012013, doi:10.1088/1755-1315/257/1/012013. 10
Charan, D., M. Kaur and P. Singh, 2017: Customary Land and Climate Change Induced Relocation—A Case 11 Study of Vunidogoloa Village, Vanua Levu, Fiji. In: Climate Change Adaptation in Pacific Countries: 12 Fostering Resilience and Improving the Quality of Life [Leal Filho, W. (ed.)]. Springer International 13 Publishing, Cham, 19-33. 14
Chaturvedi, V. et al., 2015: Climate mitigation policy implications for global irrigation water demand. 15 Mitigation and Adaptation Strategies for Global Change, 20 (3), 389-407, doi:10.1007/s11027-013-16 9497-4. 17
Cheema, M., W. Immerzeel and W. Bastiaanssen, 2014: Spatial quantification of groundwater abstraction in 18 the irrigated Indus basin. Groundwater, 52 (1), 25-36. 19
Chen, J. and V. Mueller, 2018: Coastal climate change, soil salinity and human migration in Bangladesh. 20 Nature Climate Change, 8 (11), 981-985. 21
Chénard, C., A. M. Chan, W. F. Vincent and C. A. Suttle, 2015: Polar freshwater cyanophage S-EIV1 22 represents a new widespread evolutionary lineage of phages. The ISME Journal, 9 (9), 2046-2058, 23 doi:10.1038/ismej.2015.24. 24
Chengappa, P. G., C. M. Devika and C. S. Rudragouda, 2017: Climate variability and mitigation: perceptions 25 and strategies adopted by traditional coffee growers in India. Climate and Development, 9 (7), 593-604, 26 doi:10.1080/17565529.2017.1318740. 27
Chesterman, N. S. et al., 2019: The effects of trainings in soil and water conservation on farming practices, 28 livelihoods, and land-use intensity in the Ethiopian highlands. Land Use Policy, 87, 104051. 29
Chinwendu, O., S. Sadiku, A. Okhimamhe and J. Eichie, 2017: Households Vulnerability and Adaptation to 30 Climate Variability Induced Water Stress on Downstream Kaduna River Basin. American Journal of 31 Climate Change, 6, 247-267, doi:10.4236/ajcc.2017.62013. 32
Chitongo, L., 2019: Rural livelihood resilience strategies in the face of harsh climatic conditions. The case of 33 ward 11 Gwanda, South, Zimbabwe. Cogent Social Sciences, 5 (1), 34 doi:10.1080/23311886.2019.1617090. 35
Choko, O. P. et al., 2019: A resilience approach to community-scale climate adaptation. Sustainability 36 (Switzerland), 11 (11), doi:10.3390/su11113100. 37
Christidis, N., K. Manomaiphiboon, A. Ciavarella and P. A. Stott, 2018: 25. THE HOT AND DRY APRIL 38 OF 2016 IN THAILAND. EXPLAINING EXTREME EVENTS OF 2016, 99 (1), 25. 39
Chu, E. K., 2017: Urban climate adaptation and the reshaping of state–society relations: The politics of 40 community knowledge and mobilisation in Indore, India. Urban Studies, 55 (8), 1766-1782, 41 doi:10.1177/0042098016686509. 42
Ciavarella, A. et al., 2018: Upgrade of the HadGEM3-A based attribution system to high resolution and a 43 new validation framework for probabilistic event attribution. Weather and Climate Extremes, 20, 9-32, 44 doi:https://doi.org/10.1016/j.wace.2018.03.003. 45
Cissé, G. et al., 2016: Vulnerabilities of water and sanitation at households and community levels in face of 46 climate variability and change: trends from historical climate time series in a West African medium-47 sized town. International Journal of Global Environmental Issues, 15 (1-2), 81-99, 48 doi:10.1504/IJGENVI.2016.074360. 49
Coffel, E. D. and J. S. Mankin, 2020: Thermal power generation is disadvantaged in a warming world. 50 Environmental Research Letters, doi:10.1088/1748-9326/abd4a8. 51
Cohen-Shacham, E., G. Walters, C. Janzen and S. Maginnis, 2016: What are Nature-based Solutions?, 1-32, 52 doi:10.2305/IUCN.CH.2016.13.en. 53
Comte, L. and J. D. Olden, 2017: Climatic vulnerability of the world’s freshwater and marine fishes. Nature 54 Climate Change, 7, 718, doi:10.1038/nclimate3382 55
https://www.nature.com/articles/nclimate3382#supplementary-information. 56
ACCEPTED VERSIO
N
SUBJECT TO FIN
AL EDITS
FINAL DRAFT Chapter 4 Supplementary Material IPCC WGII Sixth Assessment Report
Do Not Cite, Quote or Distribute SM4-233 Total pages: 273
Condon, L. E., A. L. Atchley and R. M. Maxwell, 2020: Evapotranspiration depletes groundwater under 1 warming over the contiguous United States. Nature Communications, 11 (1), 873, doi:10.1038/s41467-2 020-14688-0. 3
Cook, B. et al., 2020: Twenty‐first century drought projections in the CMIP6 forcing scenarios. Earth's 4 Future, 8 (6). 5
Cooper, M. W. et al., 2019: Mapping the effects of drought on child stunting. Proceedings of the National 6 Academy of Sciences, 116 (35), 17219-17224. 7
Cooper, S. J. and T. Wheeler, 2015: Adaptive governance: Livelihood innovation for climate resilience in 8 Uganda. Geoforum, 65, 96-107, doi:10.1016/j.geoforum.2015.07.015. 9
Córdova, R., N. J. Hogarth and M. Kanninen, 2019: Mountain farming systems' exposure and sensitivity to 10 climate change and variability: Agroforestry and conventional agriculture systems compared in 11 Ecuador's Indigenous Territory of Kayambi people. Sustainability (Switzerland), 11 (9), 1-30, 12 doi:10.3390/su11092623. 13
Cornish, P. S. et al., 2015: Improving crop production for food security and improved livelihoods on the East 14 India Plateau II. Crop options, alternative cropping systems and capacity building. Agricultural 15 Systems, 137, 180-190, doi:10.1016/j.agsy.2015.02.011. 16
Cortés Simo, M. et al., 2019: Changes in flood damage with global warming on the eastern coast of Spain. 17 Natural hazards and earth system sciences, 19, 2855-2877. 18
Cotterman, K. A., A. D. Kendall, B. Basso and D. W. Hyndman, 2018: Groundwater depletion and climate 19 change: future prospects of crop production in the Central High Plains Aquifer. Climatic Change, 146 20 (1), 187-200, doi:10.1007/s10584-017-1947-7. 21
Cousino, L. K., R. H. Becker and K. A. Zmijewski, 2015: Modeling the effects of climate change on water, 22 sediment, and nutrient yields from the Maumee River watershed. Journal of Hydrology: Regional 23 Studies, 4, 762-775, doi:https://doi.org/10.1016/j.ejrh.2015.06.017. 24
Cramer, W. et al., 2014: Detection and attribution of observed impacts. In: Climate Change 2014: Impacts, 25 Adaptation, and Vulnerability. Part A: Global and Sectoral Aspects. Contribution of Working Group II 26 to the Fifth Assessment Report of the Intergovernmental Panel on Climate Change [Field, C. B., V. R. 27 Barros, D. J. Dokken, K. J. Mach, M. D. Mastrandrea, T. E. Bilir, M. Chatterjee, K. L. Ebi, Y. O. 28 Estrada, R. C. Genova, B. Girma, E. S. Kissel, A. N. Levy, S. MacCracken, P. R. Mastrandrea and L. L. 29 White (eds.)]. Cambridge University Press, Cambridge, United Kingdom and New York, NY, USA, 30 979-1037. 31
Cressey, D., 2017: Age of the arduino. Nature, 544 (7648), 125-126. 32 Cudennec, C., A. Gelfan, L. Ren and M. Slimani, 2016: Hydrometeorology and Hydroclimate. Advances in 33
Meteorology, 2016, 1487890, doi:10.1155/2016/1487890. 34 Cunsolo, A. B., David; Harper, Sherilee L.; Snook, Jamie; Shiwak, Inez; Wood, Michele; Committee, The 35
Herd Caribou Project Steering 2017: Emotion, Coping, and Climate Change in Island Nations: 36 Implications for Environmental Justice. Environmental Justice, 10 (4), 102-107, 37 doi:10.1089/env.2016.0025. 38
Dai, A., 2016: Historical and Future Changes in Streamflow and Continental Runoff. In: Terrestrial Water 39 Cycle and Climate Change, 17-37. 40
Dai, C., X. S. Qin, W. T. Lu and Y. Huang, 2020: Assessing adaptation measures on agricultural water 41 productivity under climate change: A case study of Huai River Basin, China. Science of The Total 42 Environment, 721, 137777, doi:https://doi.org/10.1016/j.scitotenv.2020.137777. 43
Dakhlaoui, H., J. Seibert and K. Hakala, 2020: Sensitivity of discharge projections to potential 44 evapotranspiration estimation in Northern Tunisia. Regional Environmental Change, 20 (2), 1-12. 45
Dallmann, I. and K. Millock, 2017: Climate Variability and Inter-State Migration in India. CESifo Economic 46 Studies, 63 (4), 560-594, doi:10.1093/cesifo/ifx014. 47
Daly-Hassen, H., M. Annabi and C. King-Okumu, 2019: Social and private profitability of tree-based 48 adaptation options to climate change in a dryland area of Tunisia. New Medit, 18 (2), 89-104, 49 doi:10.30682/nm1902f. 50
Daniels, E., G. Lenderink, R. Hutjes and A. Holtslag, 2016: Observed urban effects on precipitation along 51 the Dutch West coast. International Journal of Climatology, 36 (4), 2111-2119. 52
Dapilah, F., J. Ø. Nielsen and C. Friis, 2020: The role of social networks in building adaptive capacity and 53 resilience to climate change: a case study from northern Ghana. Climate and Development, 12 (1), 42-54 56, doi:10.1080/17565529.2019.1596063. 55
Daryanto, S., L. Wang and P.-A. Jacinthe, 2017: Global synthesis of drought effects on cereal, legume, tuber 56 and root crops production: A review. Agricultural Water Management, 179, 18-33. 57
ACCEPTED VERSIO
N
SUBJECT TO FIN
AL EDITS

FINAL DRAFT Chapter 4 Supplementary Material IPCC WGII Sixth Assessment Report
Do Not Cite, Quote or Distribute SM4-234 Total pages: 273
Dasgupta, S. et al., 2013: River Salinity and Climate Change: Evidence from Coastal Bangladesh. In: World 1 Scientific Reference on Asia and the World Economy. WORLD SCIENTIFIC, 205-242. 2
David, J. M. et al., 2014: Assessing multiple foodborne, waterborne and environmental exposures of healthy 3 people to potential enteric pathogen sources: effect of age, gender, season, and recall period. 4 Epidemiology and infection, 142 (1), 28-39, doi:10.1017/S0950268813000770. 5
Davis, W., R. Narra and E. D. Mintz, 2018: Cholera. Current Epidemiology Reports, 5 (3), 303-315, 6 doi:10.1007/s40471-018-0162-z. 7
de Graaf, I. E. M. et al., 2019: Environmental flow limits to global groundwater pumping. Nature, 574 8 (7776), 90-94, doi:10.1038/s41586-019-1594-4. 9
de Jong, P. et al., 2018: Hydroelectric production from Brazil's São Francisco River could cease due to 10 climate change and inter-annual variability. Science of The Total Environment, 634, 1540-1553, 11 doi:https://doi.org/10.1016/j.scitotenv.2018.03.256. 12
de Kok, R. J., O. A. Tuinenburg, P. N. J. Bonekamp and W. W. Immerzeel, 2018: Irrigation as a Potential 13 Driver for Anomalous Glacier Behavior in High Mountain Asia. Geophysical Research Letters, 45 (4), 14 2047-2054, doi:10.1002/2017gl076158. 15
de Longueville, F. et al., 2020: Comparing climate change perceptions and meteorological data in rural West 16 Africa to improve the understanding of household decisions to migrate. Climatic Change, 1-19. 17
Deb, P., D. A. Tran and P. D. Udmale, 2016: Assessment of the impacts of climate change and brackish 18 irrigation water on rice productivity and evaluation of adaptation measures in Ca Mau province, 19 Vietnam. Theoretical and Applied Climatology, 125 (3), 641-656, doi:10.1007/s00704-015-1525-8. 20
DeBeer, C. M., H. S. Wheater, S. K. Carey and K. P. Chun, 2016: Recent climatic, cryospheric, and 21 hydrological changes over the interior of western Canada: a review and synthesis. Hydrology and Earth 22 System Sciences, 20 (4), 1573-1598. 23
Debortoli, N. S., P. I. M. Camarinha, J. A. Marengo and R. R. Rodrigues, 2017: An index of Brazil’s 24 vulnerability to expected increases in natural flash flooding and landslide disasters in the context of 25 climate change. Natural Hazards, 86 (2), 557-582. 26
Deng, Y. et al., 2020: Variation trend of global soil moisture and its cause analysis. Ecological Indicators, 27 110, 105939, doi:https://doi.org/10.1016/j.ecolind.2019.105939. 28
Devkota, R. P., G. Cockfield and T. N. Maraseni, 2014: Perceived community-based flood adaptation 29 strategies under climate change in Nepal. International Journal of Global Warming, 6 (1), 113-124, 30 doi:10.1504/IJGW.2014.058758. 31
Dewi, N., Kusnandar and E. S. Rahayu, 2018: Risk mitigation of climate change impacts on rice farming 32 through crop insurance: An analysis of farmer's willingness to participate (a case study in Karawang 33 Regency, Indonesia). IOP Conference Series: Earth and Environmental Science, 200 (1), 34 doi:10.1088/1755-1315/200/1/012059. 35
Dey, N. C. et al., 2019: Effectiveness of a community-based water, sanitation, and hygiene (WASH) 36 intervention in reduction of diarrhoea among under-five children: Evidence from a repeated cross-37 sectional study (2007–2015) in rural Bangladesh. International journal of hygiene and environmental 38 health, 222 (8), 1098-1108, doi:10.1016/j.ijheh.2019.08.006. 39
Dhakal, S., G. K. Sedhain and S. C. Dhakal, 2016: Climate change impact and adaptation practices in 40 agriculture: A case study of Rautahat District, Nepal. Climate, 4 (4), 1-22, doi:10.3390/cli4040063. 41
Di Falco, S. and M. Veronesi, 2014: Managing Environmental Risk in Presence of Climate Change: The 42 Role of Adaptation in the Nile Basin of Ethiopia. Environmental and Resource Economics, 57 (4), 553-43 577, doi:10.1007/s10640-013-9696-1. 44
Didovets, I. et al., 2019: Climate change impact on regional floods in the Carpathian region. Journal of 45 Hydrology: Regional Studies, 22, 100590. 46
Dinar, S., D. Katz, L. De Stefano and B. Blankespoor, 2015: Climate change, conflict, and cooperation: 47 Global analysis of the effectiveness of international river treaties in addressing water variability. 48 Political Geography, 45, 55-66, doi:https://doi.org/10.1016/j.polgeo.2014.08.003. 49
Diodato, N. et al., 2018: Climate-scale modelling of suspended sediment load in an Alpine catchment debris 50 flow (Rio Cordon-northeastern Italy). Geomorphology, 309, 20-28, 51 doi:https://doi.org/10.1016/j.geomorph.2018.02.026. 52
Do, H. X., S. Westra and M. Leonard, 2017: A global-scale investigation of trends in annual maximum 53 streamflow. Journal of Hydrology, 552, 28-43, doi:https://doi.org/10.1016/j.jhydrol.2017.06.015. 54
Dobson, S., H. Nyamweru and D. Dodman, 2015: Local and participatory approaches to building resilience 55 in informal settlements in Uganda. Environment and Urbanization, 27 (2), 605-620, 56 doi:10.1177/0956247815598520. 57
ACCEPTED VERSIO
N
SUBJECT TO FIN
AL EDITS

FINAL DRAFT Chapter 4 Supplementary Material IPCC WGII Sixth Assessment Report
Do Not Cite, Quote or Distribute SM4-235 Total pages: 273
Döll, P. et al., 2014: Global-scale assessment of groundwater depletion and related groundwater abstractions: 1 Combining hydrological modeling with information from well observations and GRACE satellites. 2 Water Resources Research, 50 (7), 5698-5720, doi:10.1002/2014wr015595. 3
Döll, P. et al., 2018: Risks for the global freshwater system at 1.5 °C and 2 °C global warming. 4 Environmental Research Letters, 13 (4), 044038, doi:10.1088/1748-9326/aab792. 5
Donat, M. G., O. Angélil and A. M. Ukkola, 2019: Intensification of precipitation extremes in the world’s 6 humid and water-limited regions. Environmental Research Letters, 14 (6), 065003, doi:10.1088/1748-7 9326/ab1c8e. 8
Donchyts, G. et al., 2016: Earth’s surface water change over the past 30 years. Nature Climate Change, 6, 9 810, doi:10.1038/nclimate3111. 10
Dottori, F. et al., 2018: Increased human and economic losses from river flooding with anthropogenic 11 warming. Nature Climate Change, 8 (9), 781-786, doi:10.1038/s41558-018-0257-z. 12
Douxchamps, S. et al., 2016: Linking agricultural adaptation strategies, food security and vulnerability: 13 evidence from West Africa. Regional Environmental Change, 16 (5), 1305-1317, doi:10.1007/s10113-14 015-0838-6. 15
du Bray, M. V. et al., 2017: Emotion, coping, and climate change in island nations: Implications for 16 environmental justice. Environmental Justice, 10 (4), 102-107. 17
Du, J., K. Wang and B. Cui, 2021: Attribution of the Extreme Drought-Related Risk of Wildfires in Spring 18 2019 over Southwest China. Bulletin of the American Meteorological Society, 102 (1), S83-S90. 19
Du, J. et al., 2020a: Attribution of the Record-Breaking Consecutive Dry Days in Winter 2017/18 in Beijing. 20 Bulletin of the American Meteorological Society, 101 (1), S95-S102. 21
Du, S. et al., 2020b: Hard or soft flood adaptation? Advantages of a hybrid strategy for Shanghai. Global 22 Environmental Change, 61, 102037, doi:https://doi.org/10.1016/j.gloenvcha.2020.102037. 23
Dudley, R. W. et al., 2017: Trends in snowmelt-related streamflow timing in the conterminous United States. 24 Journal of Hydrology, 547, 208-221. 25
Dudula, J. and T. O. Randhir, 2016: Modeling the influence of climate change on watershed systems: 26 Adaptation through targeted practices. Journal of Hydrology, 541, 703-713, 27 doi:https://doi.org/10.1016/j.jhydrol.2016.07.020. 28
Duethmann, D., C. Menz, T. Jiang and S. Vorogushyn, 2016: Projections for headwater catchments of the 29 Tarim River reveal glacier retreat and decreasing surface water availability but uncertainties are large. 30 Environmental Research Letters, 11 (5), 054024, doi:10.1088/1748-9326/11/5/054024. 31
Duku, C., S. Zwart and L. Hein, 2018: Impacts of climate change on cropping patterns in a tropical, sub-32 humid watershed. PLOS ONE, 13, e0192642, doi:10.1371/journal.pone.0192642. 33
Dunn, R. J. H. et al., 2020: Development of an Updated Global Land In Situ-Based Data Set of Temperature 34 and Precipitation Extremes: HadEX3. Journal of Geophysical Research: Atmospheres, 125 (16), 35 e2019JD032263, doi:10.1029/2019JD032263. 36
Durand, M. et al., 2016: An intercomparison of remote sensing river discharge estimation algorithms from 37 measurements of river height, width, and slope. Water Resources Research, 52 (6), 4527-4549, 38 doi:10.1002/2015WR018434. 39
Dussaillant, I. et al., 2019: Two decades of glacier mass loss along the Andes. Nature Geoscience, 12 (10), 40 802-808. 41
Duží, B. et al., 2017: Household measures for river flood risk reduction in the Czech Republic. Journal of 42 Flood Risk Management, 10 (2), 253-266, doi:10.1111/jfr3.12132. 43
Dyer, F. et al., 2014: The effects of climate change on ecologically-relevant flow regime and water quality 44 attributes. Stochastic Environmental Research and Risk Assessment, 28 (1), 67-82, doi:10.1007/s00477-45 013-0744-8. 46
Easterling, D. R., K. E. Kunkel, M. F. Wehner and L. Sun, 2016: Detection and attribution of climate 47 extremes in the observed record. Weather and Climate Extremes, 11, 17-27, 48 doi:https://doi.org/10.1016/j.wace.2016.01.001. 49
Eekhout, J. P., J. E. Hunink, W. Terink and J. de Vente, 2018: Why increased extreme precipitation under 50 climate change negatively affects water security. Hydrology and Earth System Sciences, 22 (11), 5935-51 5946. 52
Eekhout, J. P. C. and J. de Vente, 2019a: Assessing the effectiveness of Sustainable Land Management for 53 large-scale climate change adaptation. Science of The Total Environment, 654, 85-93, 54 doi:https://doi.org/10.1016/j.scitotenv.2018.10.350. 55
ACCEPTED VERSIO
N
SUBJECT TO FIN
AL EDITS

FINAL DRAFT Chapter 4 Supplementary Material IPCC WGII Sixth Assessment Report
Do Not Cite, Quote or Distribute SM4-236 Total pages: 273
Eekhout, J. P. C. and J. De Vente, 2019b: How soil erosion model conceptualization affects soil loss 1 projections under climate change. Progress in Physical Geography: Earth and Environment, 44 (2), 2 212-232, doi:10.1177/0309133319871937. 3
Egbinola, C. N., H. D. Olaniran and A. C. Amanambu, 2017: Flood management in cities of developing 4 countries: the example of Ibadan, Nigeria. Journal of Flood Risk Management, 10 (4), 546-554, 5 doi:10.1111/jfr3.12157. 6
El Chami, D. and A. Daccache, 2015: Assessing sustainability of winter wheat production under climate 7 change scenarios in a humid climate — An integrated modelling framework. Agricultural Systems, 140, 8 19-25, doi:https://doi.org/10.1016/j.agsy.2015.08.008. 9
Elias, E. et al., 2016: Climate Change, Agriculture and Water Resources in the Southwestern United States. 10 Journal of Contemporary Water Research & Education, 158 (1), 46-61, doi:10.1111/j.1936-11 704X.2016.03218.x. 12
Elliott, J. et al., 2014: Constraints and potentials of future irrigation water availability on agricultural 13 production under climate change. Proceedings of the National Academy of Sciences, 111 (9), 3239-14 3244, doi:10.1073/pnas.1222474110. 15
Elum, Z. A., G. Nhamo and M. A. Antwi, 2018: Effects of climate variability and insurance adoption on crop 16 production in select provinces of South Africa. Journal of Water and Climate Change, 9 (3), 500-511, 17 doi:10.2166/wcc.2018.020. 18
Emanuel, R. E., 2018: Climate Change in the Lumbee River Watershed and Potential Impacts on the Lumbee 19 Tribe of North Carolina. Journal of Contemporary Water Research & Education, 163 (1), 79-93, 20 doi:10.1111/j.1936-704X.2018.03271.x. 21
Emodi, N. V., T. Chaiechi and A. B. M. R. A. Beg, 2019: The impact of climate variability and change on 22 the energy system: A systematic scoping review. Science of The Total Environment, 676, 545-563, 23 doi:https://doi.org/10.1016/j.scitotenv.2019.04.294. 24
Energy UK, 2015: Climate change risks & adaptation responses for UK electricity generation: A sector 25 overview. Energy UK, London, UK [Available at: 26 https://assets.publishing.service.gov.uk/government/uploads/system/uploads/attachment_data/file/478927 38/clim-adrep-energy-uk-2015.pdf]. 28
England, M. I. et al., 2018: Climate change adaptation and cross-sectoral policy coherence in southern 29 Africa. Regional Environmental Change, 18 (7), 2059-2071, doi:10.1007/s10113-018-1283-0. 30
Escarcha, J. F., J. A. Lassa, E. P. Palacpac and K. K. Zander, 2018: Understanding climate change impacts 31 on water buffalo production through farmers’ perceptions. Climate Risk Management, 20, 50-63. 32
Etongo, D., I. N. S. Djenontin, M. Kanninen and K. Fobissie, 2015: Smallholders' tree planting activity in the 33 ziro province, southern burkina faso: Impacts on livelihood and policy implications. Forests, 6 (8), 34 2655-2677, doi:10.3390/f6082655. 35
Eyer, J. and C. J. Wichman, 2018: Does water scarcity shift the electricity generation mix toward fossil 36 fuels? Empirical evidence from the United States. Journal of Environmental Economics and 37 Management, 87, 224-241, doi:https://doi.org/10.1016/j.jeem.2017.07.002. 38
Fadhel, S., M. A. Rico-Ramirez and D. Han, 2018: Sensitivity of peak flow to the change of rainfall 39 temporal pattern due to warmer climate. Journal of Hydrology, 560, 546-559. 40
Fadul, E., I. Masih and C. De Fraiture, 2019: Adaptation strategies to cope with low, high and untimely 41 floods: Lessons from the Gash spate irrigation system, Sudan. Agricultural Water Management, 217, 42 212-225, doi:https://doi.org/10.1016/j.agwat.2019.02.035. 43
Falco, C., M. Galeotti and A. Olper, 2019: Climate change and migration: Is agriculture the main channel? 44 Global Environmental Change, 59, 101995, doi:https://doi.org/10.1016/j.gloenvcha.2019.101995. 45
Falkner, R., 2016: The Paris Agreement and the new logic of international climate politics. International 46 Affairs, 92 (5), 1107-1125, doi:10.1111/1468-2346.12708. 47
Fallon, D. S. M. and C. A. Sullivan, 2014: Are We There Yet? NSW local governments’ progress on climate 48 change. Australian Geographer, 45 (2), 221-238, doi:10.1080/00049182.2014.899030. 49
Famiglietti, J. S., 2014: The global groundwater crisis. Nature Climate Change, 4, 945, 50 doi:10.1038/nclimate2425. 51
Fan, J.-L. et al., 2018: Impacts of climate change on hydropower generation in China. Mathematics and 52 Computers in Simulation, doi:https://doi.org/10.1016/j.matcom.2018.01.002. 53
Farinosi, F. et al., 2018: An innovative approach to the assessment of hydro-political risk: A spatially 54 explicit, data driven indicator of hydro-political issues. Global Environmental Change, 52, 286-313, 55 doi:https://doi.org/10.1016/j.gloenvcha.2018.07.001. 56
ACCEPTED VERSIO
N
SUBJECT TO FIN
AL EDITS

FINAL DRAFT Chapter 4 Supplementary Material IPCC WGII Sixth Assessment Report
Do Not Cite, Quote or Distribute SM4-237 Total pages: 273
Farinotti, D., A. Pistocchi and M. Huss, 2016: From dwindling ice to headwater lakes: could dams replace 1 glaciers in the European Alps? Environmental Research Letters, 11 (5), 054022, doi:10.1088/1748-2 9326/11/5/054022. 3
Fekete, B. M. et al., 2015: Time for in situ renaissance. Science, 349 (6249), 685-686, 4 doi:10.1126/science.aac7358. 5
Feki, H., M. Slimani and C. Cudennec, 2016: Geostatistically based optimization of a rainfall monitoring 6 network extension: case of the climatically heterogeneous Tunisia. Hydrology Research, 48 (2), 514-7 541, doi:10.2166/nh.2016.256. 8
Feng, H. and M. Zhang, 2015: Global land moisture trends: drier in dry and wetter in wet over land. 9 Scientific Reports, 5, 18018, doi:10.1038/srep18018. 10
Feng, S. and Q. Fu, 2013: Expansion of global drylands under a warming climate. Atmos. Chem. Phys., 13 11 (19), 10081-10094, doi:10.5194/acp-13-10081-2013. 12
Fentie, A. and A. D. Beyene, 2019: Climate-smart agricultural practices and welfare of rural smallholders in 13 Ethiopia: Does planting method matter? Land Use Policy, 85 (May 2018), 387-396, 14 doi:10.1016/j.landusepol.2019.04.020. 15
Fenton, A., J. Paavola and A. Tallontire, 2017: Autonomous adaptation to riverine flooding in Satkhira 16 District, Bangladesh: implications for adaptation planning. Regional Environmental Change, 17 (8), 17 2387-2396, doi:10.1007/s10113-017-1159-8. 18
Ferchichi, I., S. Marlet and A. Zairi, 2017: How Farmers Deal with Water Scarcity in Community-Managed 19 Irrigation SYSTEMS: A Case Study in Northern Tunisia. Irrigation and Drainage, 66 (4), 556-566, 20 doi:10.1002/ird.2135. 21
Ferdous, M. R. et al., 2019: The costs of living with floods in the Jamuna floodplain in Bangladesh. Water, 22 11 (6), 1238. 23
Fernández-Giménez, M. E., B. Batkhishig, B. Batbuyan and T. Ulambayar, 2015: Lessons from the dzud: 24 Community-based rangeland management increases the adaptive capacity of Mongolian herders to 25 winter disasters. World Development, 68, 48-65. 26
Ficklin, D. L. et al., 2018: Natural and managed watersheds show similar responses to recent climate change. 27 Proceedings of the National Academy of Sciences, 115 (34), 8553-8557, doi:10.1073/pnas.1801026115. 28
Ficklin, D. L., J. T. Maxwell, S. L. Letsinger and H. Gholizadeh, 2015: A climatic deconstruction of recent 29 drought trends in the United States. Environmental Research Letters, 10 (4), 044009, doi:10.1088/1748-30 9326/10/4/044009. 31
Finkbeiner, E. M., 2015: The role of diversification in dynamic small-scale fisheries: Lessons from Baja 32 California Sur, Mexico. Global Environmental Change, 32, 139-152, 33 doi:10.1016/j.gloenvcha.2015.03.009. 34
Fischer, A. P., 2019: Adapting and coping with climate change in temperate forests. Global Environmental 35 Change, 54 (October 2018), 160-171, doi:10.1016/j.gloenvcha.2018.10.011. 36
Fischer, E. M. and R. Knutti, 2016: Observed heavy precipitation increase confirms theory and early models. 37 Nature Climate Change, 6, 986, doi:10.1038/nclimate3110 38
https://www.nature.com/articles/nclimate3110#supplementary-information. 39 Fisher, M. and E. R. Carr, 2015: The influence of gendered roles and responsibilities on the adoption of 40
technologies that mitigate drought risk: The case of drought-tolerant maize seed in eastern Uganda. 41 Global Environmental Change, 35, 82-92, doi:10.1016/j.gloenvcha.2015.08.009. 42
Fisher, M. and S. Snapp, 2014: Smallholder farmers' perceptions of drought risk and adoption of modern 43 maize in southern malawi. Experimental Agriculture, 50 (4), 533-548, 44 doi:10.1017/S0014479714000027. 45
Fitton, N. et al., 2019: The vulnerabilities of agricultural land and food production to future water scarcity. 46 Global Environmental Change, 58, 101944, doi:https://doi.org/10.1016/j.gloenvcha.2019.101944. 47
Fitzgerald, J. and J. Lenhart, 2016: Eco-districts: can they accelerate urban climate planning? Environment 48 and Planning C: Government and Policy, 34 (2), 364-380, doi:10.1177/0263774X15614666. 49
Fleming, S. W. and H. E. Dahlke, 2014: Modulation of linear and nonlinear hydroclimatic dynamics by 50 mountain glaciers in Canada and Norway: Results from information-theoretic polynomial selection. 51 Canadian Water Resources Journal / Revue canadienne des ressources hydriques, 39 (3), 324-341, 52 doi:10.1080/07011784.2014.942164. 53
Flörke, M., C. Schneider and R. I. McDonald, 2018: Water competition between cities and agriculture driven 54 by climate change and urban growth. Nature Sustainability, 1 (1), 51-58, doi:10.1038/s41893-017-55 0006-8. 56
ACCEPTED VERSIO
N
SUBJECT TO FIN
AL EDITS
FINAL DRAFT Chapter 4 Supplementary Material IPCC WGII Sixth Assessment Report
Do Not Cite, Quote or Distribute SM4-238 Total pages: 273
Flyen, C., L. Hauge Åshild, A.-J. Almås and L. Godbolt Åsne, 2018: Municipal collaborative planning 1 boosting climate resilience in the built environment. International Journal of Disaster Resilience in the 2 Built Environment, 9 (1), 58-69, doi:10.1108/IJDRBE-10-2016-0042. 3
Forbes, B. C. et al., 2019: Changes in mountain birch forests and reindeer management: Comparing different 4 knowledge systems in Sápmi, northern Fennoscandia. Polar Record, 55 (6), 507-521, 5 doi:10.1017/S0032247419000834. 6
Ford, J. D. et al., 2019: Changing access to ice, land and water in Arctic communities. Nature Climate 7 Change, 9 (4), 335-339, doi:10.1038/s41558-019-0435-7. 8
Fosu, B. O., S.-Y. S. Wang and J.-H. Yoon, 2016: 5. THE 2014/15 SNOWPACK DROUGHT IN 9 WASHINGTON STATE AND ITS CLIMATE FORCING. Bulletin of the American Meteorological 10 Society, 97 (12), S19-S24. 11
Foulds, S. A. et al., 2014: Flood-related contamination in catchments affected by historical metal mining: An 12 unexpected and emerging hazard of climate change. Science of The Total Environment, 476-477, 165-13 180, doi:https://doi.org/10.1016/j.scitotenv.2013.12.079. 14
Fraga, H., I. García de Cortázar Atauri and J. A. Santos, 2018: Viticultural irrigation demands under climate 15 change scenarios in Portugal. Agricultural Water Management, 196, 66-74, 16 doi:https://doi.org/10.1016/j.agwat.2017.10.023. 17
Fraga, H., J. G. Pinto and J. A. Santos, 2020: Olive tree irrigation as a climate change adaptation measure in 18 Alentejo, Portugal. Agricultural Water Management, 237, 106193, 19 doi:https://doi.org/10.1016/j.agwat.2020.106193. 20
Fraga, H. and J. A. Santos, 2018: Vineyard mulching as a climate change adaptation measure: Future 21 simulations for Alentejo, Portugal. Agricultural Systems, 164, 107-115, 22 doi:https://doi.org/10.1016/j.agsy.2018.04.006. 23
Francipane, A., S. Fatichi, V. Y. Ivanov and L. V. Noto, 2015: Stochastic assessment of climate impacts on 24 hydrology and geomorphology of semiarid headwater basins using a physically based model. Journal of 25 Geophysical Research: Earth Surface, 120 (3), 507-533, doi:10.1002/2014jf003232. 26
Freduah, G., P. Fidelman and T. F. Smith, 2019: Adaptive capacity of small-scale coastal fishers to climate 27 and non-climate stressors in the Western region of Ghana. Geographical Journal, 185 (1), 96-110, 28 doi:10.1111/geoj.12282. 29
Fricko, O. et al., 2016: Energy sector water use implications of a 2 °C climate policy. Environmental 30 Research Letters, 11 (3), 034011, doi:10.1088/1748-9326/11/3/034011. 31
Fritz, M. et al., 2015: Dissolved organic carbon (DOC) in Arctic ground ice. The Cryosphere, 9 (2), 737-752, 32 doi:10.5194/tc-9-737-2015. 33
Frolova, N. L. et al., 2017a: Recent changes of annual flow distribution of the Volga basin rivers. 34 Geography, Environment, Sustainability, 10 (2), 28-39. 35
Frolova, N. L. et al., 2017b: Runoff fluctuations in the Selenga River Basin. Regional Environmental 36 Change, 17 (7), 1965-1976, doi:10.1007/s10113-017-1199-0. 37
Fuchs, L. E., L. Orero, N. Namoi and H. Neufeldt, 2019: How to Effectively Enhance Sustainable 38 Livelihoods in Smallholder Systems: A Comparative Study from Western Kenya. Sustainability, 11 (6), 39 doi:10.3390/su11061564. 40
Funk, C. et al., 2018: 18. Anthropogenic enhancement of moderate-to-strong El Niño events likely 41 contributed to drought and poor harvests in southern Africa during 2016. Bull. Am. Meteorol. Soc, 99, 42 S91-S96. 43
Funk, C. et al., 2019: Examining the potential contributions of extreme “Western V” sea surface 44 temperatures to the 2017 March–June East African drought. Bulletin of the American Meteorological 45 Society, 100 (1), S55-S60. 46
Funk, C. et al., 2015: The climate hazards infrared precipitation with stations—a new environmental record 47 for monitoring extremes. Scientific Data, 2 (1), 1-21. 48
Gadissa, T., M. Nyadawa, F. Behulu and B. Mutua, 2018: The Effect of Climate Change on Loss of Lake 49 Volume: Case of Sedimentation in Central Rift Valley Basin, Ethiopia. Hydrology, 5 (4), 50 doi:10.3390/hydrology5040067. 51
Ganeshan, M. and R. Murtugudde, 2015: Nocturnal propagating thunderstorms may favor urban “hot-spots”: 52 A model-based study over Minneapolis. Urban Climate, 14, 606-621. 53
Ganguli, P., D. Kumar and A. R. Ganguly, 2017: US Power Production at Risk from Water Stress in a 54 Changing Climate. Scientific Reports, 7 (1), 11983, doi:10.1038/s41598-017-12133-9. 55
Gao, J. and B. F. Mills, 2018: Weather Shocks, Coping Strategies, and Consumption Dynamics in Rural 56 Ethiopia. World Development, 101, 268-283, doi:https://doi.org/10.1016/j.worlddev.2017.09.002. 57
ACCEPTED VERSIO
N
SUBJECT TO FIN
AL EDITS
FINAL DRAFT Chapter 4 Supplementary Material IPCC WGII Sixth Assessment Report
Do Not Cite, Quote or Distribute SM4-239 Total pages: 273
Garbrecht, J. D. and X. C. Zhang, 2015: Soil Erosion from Winter Wheat Cropland under Climate Change in 1 Central Oklahoma. Applied Engineering in Agriculture, 31 (3), 439-454, 2 doi:https://doi.org/10.13031/aea.31.10998. 3
Garcia, D. M. and M. C. Sheehan, 2015: Extreme Weather-driven Disasters and Children’s Health. 4 International Journal of Health Services, 46 (1), 79-105, doi:10.1177/0020731415625254. 5
Gaur, A., A. Gaur, D. Yamazaki and S. P. Simonovic, 2019: Flooding Related Consequences of Climate 6 Change on Canadian Cities and Flow Regulation Infrastructure. Water, 11 (1), 63. 7
Geere, J.-A. L. and P. R. Hunter, 2020: The association of water carriage, water supply and sanitation usage 8 with maternal and child health. A combined analysis of 49 Multiple Indicator Cluster Surveys from 41 9 countries. International journal of hygiene and environmental health, 223 (1), 238-247, 10 doi:https://doi.org/10.1016/j.ijheh.2019.08.007. 11
Gelfan, A. et al., 2015: Large-basin hydrological response to climate model outputs: uncertainty caused by 12 internal atmospheric variability. Hydrol. Earth Syst. Sci., 19 (6), 2737-2754, doi:10.5194/hess-19-2737-13 2015. 14
Gentle, P. and R. Thwaites, 2016: Transhumant pastoralism in the context of socioeconomic and climate 15 change in the mountains of Nepal. Mountain Research and Development, 36 (2), 173-182. 16
Gericke, A., J. Kiesel, D. Deumlich and M. Venohr, 2019: Recent and Future Changes in Rainfall Erosivity 17 and Implications for the Soil Erosion Risk in Brandenburg, NE Germany. Water, 11 (5), 18 doi:10.3390/w11050904. 19
Giang, P. Q., L. T. Giang and K. Toshiki, 2017: Spatial and Temporal Responses of Soil Erosion to Climate 20 Change Impacts in a Transnational Watershed in Southeast Asia. Climate, 5 (1), 21 doi:10.3390/cli5010022. 22
Giang, P. Q., K. Toshiki, M. Sakata and S. Kunikane, 2014: Modelling the Seasonal Response of Sediment 23 Yield to Climate Change in the Laos-Vietnam Transnational Upper Ca River Watershed. 24 EnvironmentAsia, 7 (2). 25
Gibson, K., N. Haslam and I. Kaplan, 2019: Distressing encounters in the context of climate change: Idioms 26 of distress, determinants, and responses to distress in Tuvalu. Transcultural Psychiatry, 56 (4), 667-696, 27 doi:10.1177/1363461519847057. 28
Gioli, G., T. Khan, S. Bisht and J. Scheffran, 2014: Migration as an adaptation strategy and its gendered 29 implications: A case study from the Upper Indus Basin. Mountain Research and Development, 34 (3), 30 255-265. 31
Giri, S., R. G. Lathrop and C. C. Obropta, 2020: Climate change vulnerability assessment and adaptation 32 strategies through best management practices. Journal of Hydrology, 580, 124311, 33 doi:https://doi.org/10.1016/j.jhydrol.2019.124311. 34
Githunguri, C. M., E. G. Lung’ahi, J. Kabugu and R. Musili, 2015: Cassava Farming Transforming 35 Livelihoods Among Smallholder Farmers in Mutomo a Semi-arid District in Kenya. In: Adapting 36 African Agriculture to Climate Change: Transforming Rural Livelihoods [Leal Filho, W., A. O. Esilaba, 37 K. P. C. Rao and G. Sridhar (eds.)]. Springer International Publishing, Cham, 225-233. 38
Giuntoli, I., J.-P. Vidal, C. Prudhomme and D. M. Hannah, 2015: Future hydrological extremes: the 39 uncertainty from multiple global climate and global hydrological models. 40
Gobiet, A. et al., 2014: 21st century climate change in the European Alps—a review. Science of The Total 41 Environment, 493, 1138-1151. 42
Goddard, F. G. et al., 2020: Faecal contamination of the environment and child health: a systematic review 43 and individual participant data meta-analysis. The Lancet Planetary Health, 4 (9), e405-e415. 44
Godde, C. et al., 2019: Climate change and variability impacts on grazing herds: Insights from a system 45 dynamics approach for semi-arid Australian rangelands. Global Change Biology, 25 (9), 3091-3109, 46 doi:10.1111/gcb.14669. 47
Golosov, V. N. et al., 2018: Application of bomb- and Chernobyl-derived radiocaesium for reconstructing 48 changes in erosion rates and sediment fluxes from croplands in areas of European Russia with different 49 levels of Chernobyl fallout. Journal of Environmental Radioactivity, 186, 78-89, 50 doi:https://doi.org/10.1016/j.jenvrad.2017.06.022. 51
Gong, H. et al., 2018: Long-term groundwater storage changes and land subsidence development in the 52 North China Plain (1971–2015). Hydrogeology Journal, 26 (5), 1417-1427. 53
Goodman, A., 2016: In the aftermath of disasters: the impact on women’s health. Critical Care Obstetrics 54 and Gynecology, 2 (6), 29, doi:10.21767/2471-9803.100037. 55
Gorst, A., A. Dehlavi and B. Groom, 2018: Crop productivity and adaptation to climate change in Pakistan. 56 Environment and Development Economics, 23 (6), 679-701. 57
ACCEPTED VERSIO
N
SUBJECT TO FIN
AL EDITS
FINAL DRAFT Chapter 4 Supplementary Material IPCC WGII Sixth Assessment Report
Do Not Cite, Quote or Distribute SM4-240 Total pages: 273
Gosling, S. N. and N. W. Arnell, 2016: A global assessment of the impact of climate change on water 1 scarcity. Climatic Change, 134 (3), 371-385, doi:10.1007/s10584-013-0853-x. 2
Gosling, S. N. et al., 2017: A comparison of changes in river runoff from multiple global and catchment-3 scale hydrological models under global warming scenarios of 1 °C, 2 °C and 3 °C. Climatic Change, 4 141 (3), 577-595, doi:10.1007/s10584-016-1773-3. 5
Gould, G. K. et al., 2016: The effects of climate change and extreme wildfire events on runoff erosion over a 6 mountain watershed. Journal of Hydrology, 536, 74-91, 7 doi:https://doi.org/10.1016/j.jhydrol.2016.02.025. 8
Grafton, R. Q., J. Williams and Q. Jiang, 2015: Food and water gaps to 2050: preliminary results from the 9 global food and water system (GFWS) platform. Food Security, 7 (2), 209-220, doi:10.1007/s12571-10 015-0439-8. 11
Gray, C. and E. Wise, 2016: Country-specific effects of climate variability on human migration. Climatic 12 Change, 135 (3), 555-568, doi:10.1007/s10584-015-1592-y. 13
Greve, P. et al., 2018: Global assessment of water challenges under uncertainty in water scarcity projections. 14 Nature Sustainability, 1 (9), 486-494, doi:10.1038/s41893-018-0134-9. 15
Griffith, A. W. and C. J. Gobler, 2020: Harmful algal blooms: a climate change co-stressor in marine and 16 freshwater ecosystems. Harmful Algae, 91, 101590. 17
Gu, G. and R. F. Adler, 2015: Spatial Patterns of Global Precipitation Change and Variability during 1901–18 2010. Journal of Climate, 28 (11), 4431-4453, doi:10.1175/jcli-d-14-00201.1. 19
Gudmundsson, L. et al., 2019a: Detection of Human influence in global accounts of observed indicators of 20 low, mean and high streamflow. In: Geophysical Research Abstracts, 21. 21
Gudmundsson, L. et al., 2019b: Observed Trends in Global Indicators of Mean and Extreme Streamflow. 22 Geophysical Research Letters, 46 (2), 756-766, doi:10.1029/2018gl079725. 23
Gudmundsson, L., S. I. Seneviratne and X. Zhang, 2017: Anthropogenic climate change detected in 24 European renewable freshwater resources. Nature Climate Change, 7, 813, doi:10.1038/nclimate3416 25
https://www.nature.com/articles/nclimate3416#supplementary-information. 26 Guermazi, E., M. Milano, E. Reynard and M. Zairi, 2019: Impact of climate change and anthropogenic 27
pressure on the groundwater resources in arid environment. Mitigation and Adaptation Strategies for 28 Global Change, 24 (1), 73-92, doi:10.1007/s11027-018-9797-9. 29
Guerreiro, S. B. et al., 2018: Future heat-waves, droughts and floods in 571 European cities. Environmental 30 Research Letters, 13 (3), 034009, doi:10.1088/1748-9326/aaaad3. 31
Guimberteau, M., K. Laval, A. Perrier and J. Polcher, 2012: Global effect of irrigation and its impact on the 32 onset of the Indian summer monsoon. Climate Dynamics, 39 (6), 1329-1348, doi:10.1007/s00382-011-33 1252-5. 34
Guo, D. and H. Wang, 2016: CMIP5 permafrost degradation projection:A comparison among different 35 regions. Journal of Geophysical Research: Atmospheres, 121 (9), 4499-4517, 36 doi:10.1002/2015jd024108. 37
Guodaar, L., A. Beni and P. Benebere, 2017: Using a mixed-method approach to explore the spatiality of 38 adaptation practices of tomato farmers to climate variability in the Offinso North District, Ghana. 39 Cogent Social Sciences, 3 (1), doi:10.1080/23311886.2016.1273747. 40
Guyennon, N., F. Salerno, I. Portoghese and E. Romano, 2017: Climate Change Adaptation in a 41 Mediterranean Semi-Arid Catchment: Testing Managed Aquifer Recharge and Increased Surface 42 Reservoir Capacity. Water, 9 (9), doi:10.3390/w9090689. 43
Ha'apio, M. O., R. Gonzalez and M. Wairiu, 2019: Is there any chance for the poor to cope with extreme 44 environmental events? Two case studies in the Solomon Islands. World Development, 122, 514-524, 45 doi:https://doi.org/10.1016/j.worlddev.2019.06.023. 46
Halladay, K. and P. Good, 2017: Non-linear interactions between CO2 radiative and physiological effects on 47 Amazonian evapotranspiration in an Earth system model. Climate Dynamics, 49 (7), 2471-2490, 48 doi:10.1007/s00382-016-3449-0. 49
Hammond, J. C., F. A. Saavedra and S. K. Kampf, 2018: Global snow zone maps and trends in snow 50 persistence 2001–2016. International Journal of Climatology, 38 (12), 4369-4383. 51
Handschuch, C. and M. Wollni, 2016: Improved production systems for traditional food crops: the case of 52 finger millet in western Kenya. Food Security, 8 (4), 783-797. 53
Hannaford, J., 2015: Climate-driven changes in UK river flows:A review of the evidence. Progress in 54 Physical Geography: Earth and Environment, 39 (1), 29-48, doi:10.1177/0309133314536755. 55
ACCEPTED VERSIO
N
SUBJECT TO FIN
AL EDITS

FINAL DRAFT Chapter 4 Supplementary Material IPCC WGII Sixth Assessment Report
Do Not Cite, Quote or Distribute SM4-241 Total pages: 273
Hanzer, F., K. Förster, J. Nemec and U. Strasser, 2018: Projected cryospheric and hydrological impacts of 1 21st century climate change in the Ötztal Alps (Austria) simulated using a physically based approach. 2 Hydrol. Earth Syst. Sci., 22 (2), 1593-1614, doi:10.5194/hess-22-1593-2018. 3
Hapsari, H., D. Hapsari, T. Karyani and S. Fatimah, 2019: Adaptation of indigenous community agricultural 4 systems on climate change (case study of Kasepuhan Ciptagelar, Sukabumi Regency, West Java). IOP 5 Conference Series: Earth and Environmental Science, 306 (1), doi:10.1088/1755-1315/306/1/012031. 6
Harms, T. K. et al., 2016: Catchment influence on nitrate and dissolved organic matter in Alaskan streams 7 across a latitudinal gradient. Journal of Geophysical Research: Biogeosciences, 121 (2), 350-369, 8 doi:10.1002/2015jg003201. 9
Harp, R. D. et al., 2021: Interannual Climate Variability and Malaria in Mozambique. GeoHealth, 5 (2), 10 e2020GH000322. 11
Hartmann, D. L., A.M.G. Klein Tank, M. Rusticucci, L.V. Alexander, S. Bronnimann, Y. Charabi, F.J. 12 Dentener, E.J. Dlugokencky, D.R. Easterling, A. Kaplan, B.J. Soden, P.W. Thorne, M. Wild and P.M. 13 Zhai, 2013: Observations: Atmosphere and Surface. In: Climate Change 2013: The Physical Science 14 Basis. Contribution of Working Group I to the Fifth Assessment Report of the Intergovernmental Panel 15 on Climate Change [Stocker, T. F., D. Qin, G.-K. Plattner, M. Tignor, S.K. Allen, J. Boschung, A. 16 Nauels, Y. Xia, V. Bex and P. M. Midgley (eds.)]. Cambridge University Press, Cambridge, United 17 Kingdom and New York, NY, USA. 18
Hasan, M. K., S. Desiere, M. D’Haese and L. Kumar, 2018: Impact of climate-smart agriculture adoption on 19 the food security of coastal farmers in Bangladesh. Food Security, 10 (4), 1073-1088, 20 doi:10.1007/s12571-018-0824-1. 21
Hattermann, F. F. et al., 2017: Cross‐scale intercomparison of climate change impacts simulated by regional 22 and global hydrological models in eleven large river basins. Climatic Change, 141 (3), 561-576, 23 doi:10.1007/s10584-016-1829-4. 24
Hattermann, F. F. et al., 2018: Sources of uncertainty in hydrological climate impact assessment: a cross-25 scale study. Environmental Research Letters, 13 (1), 015006, doi:10.1088/1748-9326/aa9938. 26
Hawkings, J. R. et al., 2014: Ice sheets as a significant source of highly reactive nanoparticulate iron to the 27 oceans. Nature Communications, 5 (1), 3929, doi:10.1038/ncomms4929. 28
Hawkins, E. et al., 2020: Observed Emergence of the Climate Change Signal: From the Familiar to the 29 Unknown. Geophysical Research Letters, 47 (6), e2019GL086259, doi:10.1029/2019GL086259. 30
Hedelin, B., 2016: The EU Floods Directive trickling down: tracing the ideas of integrated and participatory 31 flood risk management in Sweden. Water Policy, 19 (2), 286-303, doi:10.2166/wp.2016.092. 32
Hegre, H. et al., 2016: Forecasting civil conflict along the shared socioeconomic pathways. Environmental 33 Research Letters, 11 (5), 054002, doi:10.1088/1748-9326/11/5/054002. 34
Hejazi, M. et al., 2014: Long-term global water projections using six socioeconomic scenarios in an 35 integrated assessment modeling framework. Technological Forecasting and Social Change, 81, 205-36 226, doi:https://doi.org/10.1016/j.techfore.2013.05.006. 37
Hellin, J., B. D. Ratner, R. Meinzen-Dick and S. Lopez-Ridaura, 2018: Increasing social-ecological 38 resilience within small-scale agriculture in conflict-affected Guatemala. Ecology and Society, 23 (3), 5, 39 doi:https://doi.org/10.5751/ES-10250-230305. 40
Hendel, M. and L. Royon, 2015: The effect of pavement-watering on subsurface pavement temperatures. 41 Urban Climate, 14, 650-654, doi:https://doi.org/10.1016/j.uclim.2015.10.006. 42
Henderson, G. R., Y. Peings, J. C. Furtado and P. J. Kushner, 2018: Snow–atmosphere coupling in the 43 Northern Hemisphere. Nature Climate Change, 8 (11), 954-963, doi:10.1038/s41558-018-0295-6. 44
Henley, B. J. et al., 2019: Amplification of risks to water supply at 1.5 °C and 2 °C in drying climates: a case 45 study for Melbourne, Australia. Environmental Research Letters, 14 (8), 084028, doi:10.1088/1748-46 9326/ab26ef. 47
Herbert, C. and P. Döll, 2019: Global Assessment of Current and Future Groundwater Stress With a Focus 48 on Transboundary Aquifers. Water Resources Research, 55 (6), 4760-4784, 49 doi:10.1029/2018WR023321. 50
Hernández-Henríquez, M. A., S. J. Déry and C. Derksen, 2015: Polar amplification and elevation-51 dependence in trends of Northern Hemisphere snow cover extent, 1971–2014. Environmental Research 52 Letters, 10 (4), 044010, doi:10.1088/1748-9326/10/4/044010. 53
Ho, T. T. and K. Shimada, 2019: The effects of climate smart agriculture and climate change adaptation on 54 the technical efficiency of rice farming—An empirical study in the Mekong Delta of Vietnam. 55 Agriculture, 9 (5), 99. 56
ACCEPTED VERSIO
N
SUBJECT TO FIN
AL EDITS
FINAL DRAFT Chapter 4 Supplementary Material IPCC WGII Sixth Assessment Report
Do Not Cite, Quote or Distribute SM4-242 Total pages: 273
Hoang, L. P. et al., 2016: Mekong River flow and hydrological extremes under climate change. Hydrology 1 and Earth System Sciences, 20 (7), 3027-3041. 2
Hoang, M. H. et al., 2014: Farmer portfolios, strategic diversity management and climate-change adaptation 3 - implications for policy in Vietnam and Kenya. Climate and Development, 6 (3), 216-225, 4 doi:10.1080/17565529.2013.857588. 5
Hochman, Z. et al., 2017: Smallholder farmers managing climate risk in India: 1. Adapting to a variable 6 climate. Agricultural Systems, 150, 54-66. 7
Hock, R. et al., 2019: GlacierMIP – A model intercomparison of global-scale glacier mass-balance models 8 and projections. Journal of Glaciology, 65 (251), 453-467, doi:10.1017/jog.2019.22. 9
Hodges, M. et al., 2014: Delays in reducing waterborne and water-related infectious diseases in China under 10 climate change. Nature Climate Change, 4, 1109, doi:10.1038/nclimate2428 11
https://www.nature.com/articles/nclimate2428#supplementary-information. 12 Hodgkins, G., R. Dudley, S. A. Archfield and B. Renard, 2019: Effects of climate, regulation, and 13
urbanization on historical flood trends in the United States. Journal of Hydrology, 573, 697-709. 14 Hoell, A. et al., 2020: Lessons learned from the 2017 flash drought across the US Northern Great Plains and 15
Canadian Prairies. Bulletin of the American Meteorological Society, 101 (12), E2171-E2185. 16 Holden, S. T. and M. Fisher, 2015: Subsidies promote use of drought tolerant maize varieties despite 17
variable yield performance under smallholder environments in Malawi. Food Security, 7 (6), 1225-18 1238, doi:10.1007/s12571-015-0511-4. 19
Horn, L. M. et al., 2018: Association between Precipitation and Diarrheal Disease in Mozambique. 20 International Journal of Environmental Research and Public Health, 15 (4), 21 doi:10.3390/ijerph15040709. 22
Horowitz, H. M. et al., 2014: Historical Mercury Releases from Commercial Products: Global 23 Environmental Implications. Environmental Science & Technology, 48 (17), 10242-10250, 24 doi:10.1021/es501337j. 25
Hossain, M. N., S. Chowdhury and S. K. Paul, 2016: Farmer-level adaptation to climate change and 26 agricultural drought: empirical evidences from the Barind region of Bangladesh. Natural Hazards, 83 27 (2), 1007-1026, doi:10.1007/s11069-016-2360-7. 28
Hossain, M. N. and P. Paul, 2019: Impacts of climatic variability on agriculture and options for adaptation in 29 the Surma River basin, Bangladesh. Environmental Monitoring and Assessment, 191 (2), 30 doi:10.1007/s10661-019-7256-z. 31
Hrdinka, T., P. Vlasák, L. Havel and E. Mlejnská, 2015: Possible impacts of climate change on water quality 32 in streams of the Czech Republic. Hydrological Sciences Journal, 60 (2), 192-201. 33
Hsiang, S. M. and M. Burke, 2014: Climate, conflict, and social stability: what does the evidence say? 34 Climatic Change, 123 (1), 39-55, doi:10.1007/s10584-013-0868-3. 35
Huang, J., J. Wang and Y. Wang, 2015: Farmers' adaptation to extreme weather events through farm 36 management and its impacts on the mean and risk of rice yield in China. American Journal of 37 Agricultural Economics, 97 (2), 602-617, doi:10.1093/ajae/aav005. 38
Huang, Z. et al., 2019: Global agricultural green and blue water consumption under future climate and land 39 use changes. Journal of Hydrology, 574, 242-256, doi:https://doi.org/10.1016/j.jhydrol.2019.04.046. 40
Hugonnet, R. et al., 2021: Accelerated global glacier mass loss in the early twenty-first century. Nature, 592 41 (7856), 726-731. 42
Hurlbert, M., 2014: Adaptive institutional design in agri-environmental programs. International Journal of 43 Climate Change Strategies and Management, 6 (2), 145-165, doi:10.1108/IJCCSM-12-2012-0076. 44
Hurlbert, M. and J. Pittman, 2014: Exploring adaptive management in environmental farm programs in 45 Saskatchewan, Canada. Journal of Natural Resources Policy Research, 6 (2-3), 195-212. 46
Huss, M. and M. Fischer, 2016: Sensitivity of Very Small Glaciers in the Swiss Alps to Future Climate 47 Change. Frontiers in Earth Science, 4 (34), doi:10.3389/feart.2016.00034. 48
Huss, M. and R. Hock, 2018: Global-scale hydrological response to future glacier mass loss. Nature Climate 49 Change, 8 (2), 135-140, doi:10.1038/s41558-017-0049-x. 50
IDMC., 2020: 2020 Global Report on Internal Displacement. 51 Iizumi, T. and N. Ramankutty, 2016: Changes in yield variability of major crops for 1981–2010 explained by 52
climate change. Environmental Research Letters, 11 (3), 034003. 53 Iizumi, T. et al., 2018: Crop production losses associated with anthropogenic climate change for 1981–2010 54
compared with preindustrial levels. International Journal of Climatology, 38 (14), 5405-5417. 55 Imran, M. A. et al., 2018: Impact of Climate Smart Agriculture (CSA) practices on cotton production and 56
livelihood of farmers in Punjab, Pakistan. Sustainability, 10 (6), doi:10.3390/su10062101. 57
ACCEPTED VERSIO
N
SUBJECT TO FIN
AL EDITS

FINAL DRAFT Chapter 4 Supplementary Material IPCC WGII Sixth Assessment Report
Do Not Cite, Quote or Distribute SM4-243 Total pages: 273
Imran, M. A. et al., 2019: Impact of climate smart agriculture (CSA) through sustainable irrigation 1 management on Resource use efficiency: A sustainable production alternative for cotton. Land Use 2 Policy, 88, 104113, doi:https://doi.org/10.1016/j.landusepol.2019.104113. 3
Ingty, T., 2017: High mountain communities and climate change: adaptation, traditional ecological 4 knowledge, and institutions. Climatic Change, 145 (1), 41-55, doi:10.1007/s10584-017-2080-3. 5
Iqbal, M. W., S. Donjadee, B. Kwanyuen and S.-y. Liu, 2018: Farmers’ perceptions of and adaptations to 6 drought in Herat Province, Afghanistan. Journal of Mountain Science, 15 (8), 1741-1756, 7 doi:10.1007/s11629-017-4750-z. 8
Ishizaki, Y. et al., 2013: Dependence of Precipitation Scaling Patterns on Emission Scenarios for 9 Representative Concentration Pathways. Journal of Climate, 26 (22), 8868-8879, doi:10.1175/jcli-d-12-10 00540.1. 11
Islam, M. M., M. S. Iqbal, R. Leemans and N. Hofstra, 2018a: Modelling the impact of future socio-12 economic and climate change scenarios on river microbial water quality. International journal of 13 hygiene and environmental health, 221 (2), 283-292. 14
Islam, M. M., S. Sallu, K. Hubacek and J. Paavola, 2014: Migrating to tackle climate variability and change? 15 Insights from coastal fishing communities in Bangladesh. Climatic Change, 124 (4), 733-746. 16
Islam, M. S., M. Z. Hossain and M. B. Sikder, 2019a: Drought adaptation measures and their effectiveness at 17 Barind Tract in northwest Bangladesh: a perception study. Natural Hazards, 97 (3), 1253-1276. 18
Islam, M. S. and A. T. Wong, 2017: Climate Change and Food In/Security: A Critical Nexus. Environments, 19 4 (2), 38. 20
Islam, M. Z., O. Kolade and G. Kibreab, 2018b: Post-disaster Housing Reconstruction: The Impact of 21 Resourcing in Post-cyclones Sidr and Aila in Bangladesh. Journal of International Development, 30 22 (6), 934-960, doi:10.1002/jid.3367. 23
Islam, S. U., C. L. Curry, S. J. Déry and F. W. Zwiers, 2019b: Quantifying projected changes in runoff 24 variability and flow regimes of the Fraser River Basin, British Columbia. Hydrology and Earth System 25 Sciences, 23 (2), 811-828. 26
Jaakkola, J. J. K., S. Juntunen and K. Näkkäläjärvi, 2018: The Holistic Effects of Climate Change on the 27 Culture, Well-Being, and Health of the Saami, the Only Indigenous People in the European Union. 28 Current Environmental Health Reports, 5 (4), 401-417, doi:10.1007/s40572-018-0211-2. 29
Jacobi, J. et al., 2015: Farm Resilience in Organic and Nonorganic Cocoa Farming Systems in Alto Beni, 30 Bolivia. Agroecology and Sustainable Food Systems, 39 (7), 798-823, 31 doi:10.1080/21683565.2015.1039158. 32
Jacobsen, D. et al., 2014: Runoff and the longitudinal distribution of macroinvertebrates in a glacier-fed 33 stream: implications for the effects of global warming. Freshwater Biology, 59 (10), 2038-2050, 34 doi:10.1111/fwb.12405. 35
Jaeger, K. L., J. D. Olden and N. A. Pelland, 2014: Climate change poised to threaten hydrologic 36 connectivity and endemic fishes in dryland streams. Proceedings of the National Academy of Sciences, 37 111 (38), 13894-13899, doi:10.1073/pnas.1320890111. 38
Jagai, J. S. et al., 2015: Extreme Precipitation and Emergency Room Visits for Gastrointestinal Illness in 39 Areas with and without Combined Sewer Systems: An Analysis of Massachusetts Data, 2003-2007. 40 Environmental Health Perspectives, 123 (9), 873-879, doi:10.1289/ehp.1408971. 41
Jägermeyr, J. et al., 2016: Integrated crop water management might sustainably halve the global food gap. 42 Environmental Research Letters, 11 (2), 025002, doi:10.1088/1748-9326/11/2/025002. 43
Jain, M. et al., 2015: Understanding the causes and consequences of differential decision-making in 44 adaptation research: Adapting to a delayed monsoon onset in Gujarat, India. Global Environmental 45 Change, 31, 98-109, doi:10.1016/j.gloenvcha.2014.12.008. 46
Jamaliah, M. M. and R. B. Powell, 2019: Integrated vulnerability assessment of ecotourism to climate 47 change in Dana Biosphere Reserve, Jordan. Current Issues in Tourism, 22 (14), 1705-1722, 48 doi:10.1080/13683500.2017.1401982. 49
Jamero, M. L. et al., 2017: Small-island communities in the Philippines prefer local measures to relocation in 50 response to sea-level rise. Nature Climate Change, 7 (8), 581-586, doi:10.1038/NCLIMATE3344. 51
Jans, Y. et al., 2018: Biomass production in plantations: Land constraints increase dependency on irrigation 52 water. GCB Bioenergy, 10 (9), 628-644, doi:https://doi.org/10.1111/gcbb.12530. 53
Jasechko, S. and R. G. Taylor, 2015: Intensive rainfall recharges tropical groundwaters. Environmental 54 Research Letters, 10 (12), 124015, doi:10.1088/1748-9326/10/12/124015. 55
Jenkins, K., J. Hall, V. Glenis and C. Kilsby, 2018: A Probabilistic Analysis of Surface Water Flood Risk in 56 London. Risk Analysis, 38 (6), 1169-1182, doi:10.1111/risa.12930. 57
ACCEPTED VERSIO
N
SUBJECT TO FIN
AL EDITS
FINAL DRAFT Chapter 4 Supplementary Material IPCC WGII Sixth Assessment Report
Do Not Cite, Quote or Distribute SM4-244 Total pages: 273
Jha, C. K., V. Gupta, U. Chattopadhyay and B. Amarayil Sreeraman, 2018: Migration as adaptation strategy 1 to cope with climate change: A study of farmers’ migration in rural India. International Journal of 2 Climate Change Strategies and Management, 10 (1), 121-141, doi:10.1108/IJCCSM-03-2017-0059. 3
Jiang, J., A. Sharma, B. Sivakumar and P. Wang, 2014: A global assessment of climate–water quality 4 relationships in large rivers: An elasticity perspective. Science of The Total Environment, 468-469, 877-5 891, doi:https://doi.org/10.1016/j.scitotenv.2013.09.002. 6
Jin, L. et al., 2018: Modeling future flows of the Volta River system: Impacts of climate change and socio-7 economic changes. Science of The Total Environment, 637, 1069-1080. 8
Jones, B. and B. C. O’Neill, 2016: Spatially explicit global population scenarios consistent with the Shared 9 Socioeconomic Pathways. Environmental Research Letters, 11 (8), 084003. 10
Jones, M. W. et al., 2020: Climate Change Increases the Risk of Wildfires. 11 Jongman, B. et al., 2015: Declining vulnerability to river floods and the global benefits of adaptation. 12
Proceedings of the National Academy of Sciences, 112 (18), E2271-E2280, 13 doi:10.1073/pnas.1414439112. 14
Joseph, J., S. Ghosh, A. Pathak and A. K. Sahai, 2018: Hydrologic impacts of climate change: Comparisons 15 between hydrological parameter uncertainty and climate model uncertainty. Journal of Hydrology, 566, 16 1-22, doi:https://doi.org/10.1016/j.jhydrol.2018.08.080. 17
Joshua, M. K. et al., 2016: Climate change in semi-arid Malawi: Perceptions, adaptation strategies and water 18 governance. Jàmbá: Journal of Disaster Risk Studies, 8 (3), 1-10, doi:10.4102/jamba.v8i3.255. 19
Jung, T., J. Frandsen, D. Gordon and D. Mossop, 2016: Colonization of the Beaufort Coastal Plain by beaver 20 (Castor canadensis): a response to shrubification of the tundra? Canadian Field Naturalist, 130, 132-21 135, doi:10.22621/cfn.v130i4.1927. 22
Kabir, M. E. et al., 2018: Drivers and temporality of internal migration in the context of slow-onset natural 23 hazards: Insights from north-west rural Bangladesh. International Journal of Disaster Risk Reduction, 24 31, 617-626, doi:https://doi.org/10.1016/j.ijdrr.2018.06.010. 25
Kabir, M. J., R. Cramb, M. Alauddin and D. S. Gaydon, 2019: Farmers’ perceptions and management of risk 26 in rice-based farming systems of south-west coastal Bangladesh. Land Use Policy, 86 (December 27 2018), 177-188, doi:10.1016/j.landusepol.2019.04.040. 28
Kabir, M. J., R. Cramb, M. Alauddin and C. Roth, 2016: Farming adaptation to environmental change in 29 coastal Bangladesh: shrimp culture versus crop diversification. Environment, Development and 30 Sustainability, 18 (4), 1195-1216, doi:10.1007/s10668-015-9697-z. 31
Kaczan, D. J. and J. Orgill-Meyer, 2020: The impact of climate change on migration: a synthesis of recent 32 empirical insights. Climatic Change, 158 (3), 281-300. 33
Kadiyala, M. D. M. et al., 2015: An integrated crop model and GIS decision support system for assisting 34 agronomic decision making under climate change. Science of The Total Environment, 521-522, 123-35 134, doi:https://doi.org/10.1016/j.scitotenv.2015.03.097. 36
Kahsay, K. D., S. M. Pingale and S. D. Hatiye, 2018: Impact of climate change on groundwater recharge and 37 base flow in the sub-catchment of Tekeze basin, Ethiopia. Groundwater for Sustainable Development, 38 6, 121-133, doi:https://doi.org/10.1016/j.gsd.2017.12.002. 39
Kaján, E., 2014: Arctic Tourism and Sustainable Adaptation: Community Perspectives to Vulnerability and 40 Climate Change. Scandinavian Journal of Hospitality and Tourism, 14 (1), 60-79, 41 doi:10.1080/15022250.2014.886097. 42
Kakumanu, K. R. et al., 2018: Building farm‐level capacities in irrigation water management to adapt to 43 climate change. Irrigation and Drainage, 67 (1), 43-54. 44
Kakumanu, K. R. et al., 2019: Adaptation to climate change and variability: A case of direct seeded rice in 45 Andhra Pradesh, India. Journal of Water and Climate Change, 10 (2), 419-430, 46 doi:10.2166/wcc.2018.141. 47
Kalungu, J. W., W. L. Filho, D. O. Mbuge and H. K. Cheruiyot, 2021: Assessing the Impact of Rainwater 48 HarvestingRainwater harvestingTechnology as Adaptation Strategy for Rural Communities in Makueni 49 County, KenyaMakueni County. In: Handbook of Climate Change Adaptation [Leal Filho, W. (ed.)]. 50 Springer Berlin Heidelberg, Berlin, Heidelberg, 1-17. 51
Kam, J., S.-K. Min, P. Wolski and J.-S. Kug, Anthropogenic Influence on the Long Sustained Western Cape 52 Drought. 53
Kamae, Y. et al., 2015: Rapid Adjustments of Cloud and Hydrological Cycle to Increasing CO2: a Review. 54 Current Climate Change Reports, 1 (2), 103-113, doi:10.1007/s40641-015-0007-5. 55
Kamara, J. K., K. Agho and A. M. Renzaho, 2019: Understanding disaster resilience in communities affected 56 by recurrent drought in Lesotho and Swaziland—A qualitative study. PLOS ONE, 14 (3), e0212994. 57
ACCEPTED VERSIO
N
SUBJECT TO FIN
AL EDITS
FINAL DRAFT Chapter 4 Supplementary Material IPCC WGII Sixth Assessment Report
Do Not Cite, Quote or Distribute SM4-245 Total pages: 273
Kanda, A., M. Murongazvombo and F. Ncube, 2017: Adapting household water use in rural Zimbabwe. 1 International Journal of Environmental Studies, 74 (3), 471-485, doi:10.1080/00207233.2017.1319622. 2
Kanevskiy, M. et al., 2016: Patterns and rates of riverbank erosion involving ice-rich permafrost (yedoma) in 3 northern Alaska. Geomorphology, 253, 370-384, doi:https://doi.org/10.1016/j.geomorph.2015.10.023. 4
Kankwamba, H., M. Kadzamira and K. Pauw, 2018: How diversified is cropping in Malawi? Patterns, 5 determinants and policy implications. Food Security, 10 (2), 323-338, doi:10.1007/s12571-018-0771-x. 6
Karim, M. R. and A. Thiel, 2017: Role of community based local institution for climate change adaptation in 7 the Teesta riverine area of Bangladesh. Climate Risk Management, 17, 92-103, 8 doi:10.1016/j.crm.2017.06.002. 9
Karlsson, M. and G. K. Hovelsrud, 2015: Local collective action: Adaptation to coastal erosion in the 10 Monkey River Village, Belize. Global Environmental Change, 32, 96-107, 11 doi:10.1016/j.gloenvcha.2015.03.002. 12
Kaspersen, P. S. et al., 2017: Comparison of the impacts of urban development and climate change on 13 exposing European cities to pluvial flooding. Hydrology and Earth System Sciences, 21 (8), 4131-4147. 14
Kassie, B. T. et al., 2015: Exploring climate change impacts and adaptation options for maize production in 15 the Central Rift Valley of Ethiopia using different climate change scenarios and crop models. Climatic 16 Change, 129 (1), 145-158, doi:10.1007/s10584-014-1322-x. 17
Kattumuri, R., D. Ravindranath and T. Esteves, 2017: Local adaptation strategies in semi-arid regions: study 18 of two villages in Karnataka, India. Climate and Development, 9 (1), 36-49, 19 doi:10.1080/17565529.2015.1067179. 20
Kawaye, F. P. and M. F. Hutchinson, 2018: Are Increases in Maize Production in Malawi Due to Favourable 21 Climate or the Farm Input Subsidy Program (FISP)? In: Theory and practice of climate adaptation. 22 Springer, 375-390. 23
Kayaga, S. and I. Smout, 2014: Tariff structures and incentives for water demand management. Proceedings 24 of the Institution of Civil Engineers: Water Management, 167 (8), 448-456, 25 doi:10.1680/wama.12.00120. 26
Kermanshah, A., S. Derrible and M. Berkelhammer, 2017: Using Climate Models to Estimate Urban 27 Vulnerability to Flash Floods. Journal of Applied Meteorology and Climatology, 56 (9), 2637-2650, 28 doi:10.1175/jamc-d-17-0083.1. 29
Kernecker, M., C. R. Vogl and A. A. Meléndez, 2017: Women's local knowledge of water resources and 30 adaptation to landscape change in the mountains of Veracruz, Mexico. Ecology and Society, 22 (4). 31
Keshavarz, M., E. Karami and M. Zibaei, 2014: Adaptation of Iranian farmers to climate variability and 32 change. Regional Environmental Change, 14 (3), 1163-1174. 33
Khalafzai, M.-A. K., T. K. McGee and B. Parlee, 2019: Flooding in the James Bay region of Northern 34 Ontario, Canada: Learning from traditional knowledge of Kashechewan First Nation. International 35 Journal of Disaster Risk Reduction, 36, 101100. 36
Khan, A. U., J. Jiang, P. Wang and Y. Zheng, 2017: Influence of watershed topographic and socio-economic 37 attributes on the climate sensitivity of global river water quality. Environmental Research Letters, 12 38 (10), 104012, doi:10.1088/1748-9326/aa8a33. 39
Khan, S. J. et al., 2015: Extreme weather events: Should drinking water quality management systems adapt 40 to changing risk profiles? Water Research, 85, 124-136. 41
Khanal, U., C. Wilson, B. L. Lee and V.-N. Hoang, 2018: Climate change adaptation strategies and food 42 productivity in Nepal: a counterfactual analysis. Climatic Change, 148 (4), 575-590. 43
Kim, W., T. Iizumi and M. Nishimori, 2019: Global patterns of crop production losses associated with 44 droughts from 1983 to 2009. Journal of Applied Meteorology and Climatology, 58 (6), 1233-1244. 45
Kirby, M. et al., 2014: Sustainable irrigation: How did irrigated agriculture in Australia's Murray–Darling 46 Basin adapt in the Millennium Drought? Agricultural Water Management, 145, 154-162. 47
Kireeva, M. B. et al., 2020: Occasional Floods On The Rivers Of Russian Plain In The 20 Th–21 St 48 Centuries. Geography, Environment, Sustainability, 13 (2), 84-95. 49
Klein, G. et al., 2016: Shorter snow cover duration since 1970 in the Swiss Alps due to earlier snowmelt 50 more than to later snow onset. Climatic Change, 139 (3), 637-649, doi:10.1007/s10584-016-1806-y. 51
Kloos, J. and F. G. Renaud, 2014: Organic cotton production as an adaptation option in north-west Benin. 52 Outlook on Agriculture, 43 (2), 91-100, doi:10.5367/oa.2014.0166. 53
Knouft, J. H. et al., 2021: Forested Riparian Buffers as Climate Adaptation Tools for Management of 54 Riverine Flow and Thermal Regimes: A Case Study in the Meramec River Basin. Sustainability, 13 (4), 55 doi:10.3390/su13041877. 56
ACCEPTED VERSIO
N
SUBJECT TO FIN
AL EDITS
FINAL DRAFT Chapter 4 Supplementary Material IPCC WGII Sixth Assessment Report
Do Not Cite, Quote or Distribute SM4-246 Total pages: 273
Knouft, J. H. and D. L. Ficklin, 2017: The Potential Impacts of Climate Change on Biodiversity in Flowing 1 Freshwater Systems. Annual Review of Ecology, Evolution, and Systematics, 48 (1), 111-133, 2 doi:10.1146/annurev-ecolsys-110316-022803. 3
Kodirekkala, K. R., 2018: Cultural adaptation to climate change among indigenous people of South India. 4 Climatic Change, 147 (1), 299-312, doi:10.1007/s10584-017-2116-8. 5
Koirala, S., Y. Hirabayashi, R. Mahendran and S. Kanae, 2014: Global assessment of agreement among 6 streamflow projections using CMIP5 model outputs. Environmental Research Letters, 9 (6), 064017, 7 doi:10.1088/1748-9326/9/6/064017. 8
Kokelj, S. V. et al., 2017: Climate-driven thaw of permafrost preserved glacial landscapes, northwestern 9 Canada. Geology, 45 (4), 371-374, doi:10.1130/g38626.1. 10
Koks, E. E. et al., 2019: The macroeconomic impacts of future river flooding in Europe. Environmental 11 Research Letters, 14 (8), 084042, doi:10.1088/1748-9326/ab3306. 12
Konchar, K. M. et al., 2015: Adapting in the shadow of Annapurna: a climate tipping point. Journal of 13 Ethnobiology, 35 (3), 449-471. 14
Kong, Y. and C.-H. Wang, 2017: Responses and changes in the permafrost and snow water equivalent in the 15 Northern Hemisphere under a scenario of 1.5 °C warming. Advances in Climate Change Research, 8 16 (4), 235-244, doi:https://doi.org/10.1016/j.accre.2017.07.002. 17
Kontar, Y. Y. et al., 2015: Interdisciplinary approach to hydrological hazard mitigation and disaster response 18 and effects of climate change on the occurrence of flood severity in central Alaska. Proceedings of the 19 International Association of Hydrological Sciences, 369, 13-17. 20
Kooperman, G. J. et al., 2018: Plant Physiological Responses to Rising CO2 Modify Simulated Daily Runoff 21 Intensity With Implications for Global-Scale Flood Risk Assessment. Geophysical Research Letters, 45 22 (22), 12,457-12,466, doi:10.1029/2018gl079901. 23
Kormann, C., T. Francke, M. Renner and A. Bronstert, 2015: Attribution of high resolution streamflow 24 trends in Western Austria–an approach based on climate and discharge station data. Hydrology and 25 Earth System Sciences, 19 (3), 1225-1245. 26
Kosmowski, F., 2018: Soil water management practices (terraces) helped to mitigate the 2015 drought in 27 Ethiopia. Agricultural Water Management, 204 (February), 11-16, doi:10.1016/j.agwat.2018.02.025. 28
Kostyla, C., R. Bain, R. Cronk and J. Bartram, 2015: Seasonal variation of fecal contamination in drinking 29 water sources in developing countries: A systematic review. Science of The Total Environment, 514, 30 333-343, doi:https://doi.org/10.1016/j.scitotenv.2015.01.018. 31
Koubi, V., S. Stoll and G. Spilker, 2016: Perceptions of environmental change and migration decisions. 32 Climatic Change, 138 (3), 439-451, doi:10.1007/s10584-016-1767-1. 33
Koutroulis, A. G. et al., 2018: Simulating Hydrological Impacts under Climate Change: Implications from 34 Methodological Differences of a Pan European Assessment. Water, 10 (10), 1331. 35
Kraaijenbrink, P. D. A., M. F. P. Bierkens, A. F. Lutz and W. W. Immerzeel, 2017: Impact of a global 36 temperature rise of 1.5 degrees Celsius on Asia’s glaciers. Nature, 549, 257, doi:10.1038/nature23878 37
https://www.nature.com/articles/nature23878#supplementary-information. 38 Kriegel, D. et al., 2013: Changes in glacierisation, climate and runoff in the second half of the 20th century 39
in the Naryn basin, Central Asia. Global and Planetary Change, 110, 51-61, 40 doi:https://doi.org/10.1016/j.gloplacha.2013.05.014. 41
Krishnamurthy, L., P. K. Krishnamurthy, I. Rajagopal and A. Peralta Solares, 2019: Can agroforestry 42 systems thrive in the drylands? Characteristics of successful agroforestry systems in the arid and semi-43 arid regions of Latin America. Agroforestry Systems, 93 (2), 503-513, doi:10.1007/s10457-017-0143-0. 44
Krishnan, R. et al., 2016: Deciphering the desiccation trend of the South Asian monsoon hydroclimate in a 45 warming world. Climate Dynamics, 47 (3), 1007-1027, doi:10.1007/s00382-015-2886-5. 46
Krysanova, V. et al., 2018: How the performance of hydrological models relates to credibility of projections 47 under climate change. Hydrological Sciences Journal, 63 (5), 696-720, 48 doi:10.1080/02626667.2018.1446214. 49
Krysanova, V., Z. Kundzewicz, M. Piniewski and V. Singh, 2016: Assessment of climate change impacts on 50 water resources. In: Handbook of applied hydrology. McGraw-Hill Education, 148-1-148-12. 51
Krysanova, V. et al., 2017: Intercomparison of regional-scale hydrological models and climate change 52 impacts projected for 12 large river basins worldwide—a synthesis. Environmental Research Letters, 12 53 (10), 105002, doi:10.1088/1748-9326/aa8359. 54
Kumar, S., V. Merwade, J. L. Kinter and D. Niyogi, 2013: Evaluation of Temperature and Precipitation 55 Trends and Long-Term Persistence in CMIP5 Twentieth-Century Climate Simulations. Journal of 56 Climate, 26 (12), 4168-4185, doi:10.1175/JCLI-D-12-00259.1. 57
ACCEPTED VERSIO
N
SUBJECT TO FIN
AL EDITS

FINAL DRAFT Chapter 4 Supplementary Material IPCC WGII Sixth Assessment Report
Do Not Cite, Quote or Distribute SM4-247 Total pages: 273
Kumar, S. N. et al., 2016: Adaptation of farming community to climatic risk: does adaptation cost for 1 sustaining agricultural profitability? Current Science, 1216-1224. 2
Kundzewicz, Z. W. et al., 2018: Uncertainty in climate change impacts on water resources. Environmental 3 Science & Policy, 79, 1-8, doi:https://doi.org/10.1016/j.envsci.2017.10.008. 4
Kunkel, K. E. et al., 2016: Trends and Extremes in Northern Hemisphere Snow Characteristics. Current 5 Climate Change Reports, 2 (2), 65-73, doi:10.1007/s40641-016-0036-8. 6
Kuzdas, C. et al., 2016: Identifying the potential of governance regimes to aggravate or mitigate local water 7 conflicts in regions threatened by climate change. Local Environment, 21 (11), 1387-1408. 8
Lalou, R., B. Sultan, B. Muller and A. Ndonky, 2019: Does climate opportunity facilitate smallholder 9 farmers’ adaptive capacity in the Sahel? Palgrave Communications, 5 (1), 1-11. 10
Lamborn, C. C. and J. W. Smith, 2019: Human perceptions of, and adaptations to, shifting runoff cycles: A 11 case-study of the Yellowstone River (Montana, USA). Fisheries Research, 216 (January), 96-108, 12 doi:10.1016/j.fishres.2019.04.005. 13
Lamoureux, S. F. and M. J. Lafrenière, 2014: Seasonal fluxes and age of particulate organic carbon exported 14 from Arctic catchments impacted by localized permafrost slope disturbances. Environmental Research 15 Letters, 9 (4), 045002, doi:10.1088/1748-9326/9/4/045002. 16
Le Boursicaud, R. et al., 2016: Gauging extreme floods on YouTube: application of LSPIV to home movies 17 for the post‐event determination of stream discharges. Hydrological Processes, 30 (1), 90-105. 18
Leadley, P. et al., 2014: Interacting Regional-Scale Regime Shifts for Biodiversity and Ecosystem Services. 19 BioScience, 64 (8), 665-679, doi:10.1093/biosci/biu093. 20
Lebel, L. et al., 2020: Aquaculture farmers’ perceptions of climate-related risks in the Mekong Region. 21 Regional Environmental Change, 20 (3), 1-14. 22
Lee, S.-Y., A. F. Hamlet and E. E. Grossman, 2016: Impacts of climate change on regulated streamflow, 23 hydrologic extremes, hydropower production, and sediment discharge in the Skagit River Basin. 24 Northwest Science, 90 (1), 23-43. 25
Lei, Y. et al., 2017: Using government resettlement projects as a sustainable adaptation strategy for climate 26 change. Sustainability, 9 (8), 1373. 27
Lei, Y., C. Liu, L. Zhang and S. Luo, 2016a: How smallholder farmers adapt to agricultural drought in a 28 changing climate: A case study in southern China. Land Use Policy, 55, 300-308, 29 doi:10.1016/j.landusepol.2016.04.012. 30
Lei, Y. et al., 2014: How adjustments in land use patterns contribute to drought risk adaptation in a changing 31 climate-A case study in China. Land Use Policy, 36, 577-584, doi:10.1016/j.landusepol.2013.10.004. 32
Lei, Y., H. Zhang, F. Chen and L. Zhang, 2016b: How rural land use management facilitates drought risk 33 adaptation in a changing climate - A case study in arid northern China. Science of The Total 34 Environment, 550, 192-199, doi:10.1016/j.scitotenv.2016.01.098. 35
Lemessa, S. D., M. D. Watebaji and M. A. Yismaw, 2019: Climate change adaptation strategies in response 36 to food insecurity: The paradox of improved potato varieties adoption in eastern Ethiopia. Cogent Food 37 & Agriculture, 5 (1), 1640835. 38
Lemordant, L. et al., 2018: Critical impact of vegetation physiology on the continental hydrologic cycle in 39 response to increasing CO<sub>2</sub>. Proceedings of the National Academy of Sciences, 115 (16), 40 4093-4098, doi:10.1073/pnas.1720712115. 41
Leng, G. and J. Hall, 2019: Crop yield sensitivity of global major agricultural countries to droughts and the 42 projected changes in the future. Science of The Total Environment, 654, 811-821, 43 doi:https://doi.org/10.1016/j.scitotenv.2018.10.434. 44
Leng, G., Q. Tang, M. Huang and L.-y. R. Leung, 2015: A comparative analysis of the impacts of climate 45 change and irrigation on land surface and subsurface hydrology in the North China Plain. Regional 46 Environmental Change, 15 (2), 251-263, doi:10.1007/s10113-014-0640-x. 47
Lesk, C., P. Rowhani and N. Ramankutty, 2016: Influence of extreme weather disasters on global crop 48 production. Nature, 529, 84, doi:10.1038/nature16467 49
https://www.nature.com/articles/nature16467#supplementary-information. 50 Lettenmaier, D. P., 2017: Observational breakthroughs lead the way to improved hydrological predictions. 51
Water Resources Research, 53 (4), 2591-2597. 52 Levis, S. et al., 2018: CLMcrop yields and water requirements: avoided impacts by choosing RCP 4.5 over 53
8.5. Climatic Change, 146 (3), 501-515, doi:10.1007/s10584-016-1654-9. 54 Li, D., Z. Li, Y. Zhou and X. Lu, 2020a: Substantial increases in the water and sediment fluxes in the 55
headwater region of the Tibetan Plateau in response to global warming. Geophysical Research Letters, 56 47 (11), e2020GL087745. 57
ACCEPTED VERSIO
N
SUBJECT TO FIN
AL EDITS

FINAL DRAFT Chapter 4 Supplementary Material IPCC WGII Sixth Assessment Report
Do Not Cite, Quote or Distribute SM4-248 Total pages: 273
Li, D. et al., 2021: Air Temperature Regulates Erodible Landscape, Water, and Sediment Fluxes in the 1 Permafrost‐Dominated Catchment on the Tibetan Plateau. Water Resources Research, 57 (2), 2 e2020WR028193. 3
Li, D. et al., 2017a: How much runoff originates as snow in the western United States, and how will that 4 change in the future? Geophysical Research Letters, 44 (12), 6163-6172, doi:10.1002/2017gl073551. 5
Li, L. et al., 2020b: Global trends in water and sediment fluxes of the world’s large rivers. Science Bulletin, 6 65 (1), 62-69. 7
Li, X., Y. Yang, Y. Liu and H. Liu, 2017b: Impacts and effects of government regulation on farmers’ 8 responses to drought: A case study of North China Plain. Journal of Geographical Sciences, 27 (12), 9 1481-1498, doi:10.1007/s11442-017-1448-7. 10
Li, Y. et al., 2014: Patterns and potential drivers of dramatic changes in Tibetan lakes, 1972–2010. PLOS 11 ONE, 9 (11), e111890. 12
Li, Z. et al., 2020c: Partitioning the contributions of glacier melt and precipitation to the 1971–2010 runoff 13 increases in a headwater basin of the Tarim River. Journal of Hydrology, 583, 124579, 14 doi:https://doi.org/10.1016/j.jhydrol.2020.124579. 15
Liang, L. and P. Gong, 2017: Climate change and human infectious diseases: A synthesis of research 16 findings from global and spatio-temporal perspectives. Environment International, 103, 99-108, 17 doi:https://doi.org/10.1016/j.envint.2017.03.011. 18
Lillo-Ortega, G. et al., 2019: On the evaluation of adaptation practices: a transdisciplinary exploration of 19 drought measures in Chile. Sustainability Science, 14 (4), 1057-1069. 20
Lin, H. et al., 2017: A decreasing glacier mass balance gradient from the edge of the Upper Tarim Basin to 21 the Karakoram during 2000–2014. Scientific Reports, 7 (1), 6712, doi:10.1038/s41598-017-07133-8. 22
Lin, S.-h. and S.-m. Chen, 2016: The Localization of Actions for Climate Change Adaptation: A Case Study 23 of Post-Morakot Reconstruction in Coastal Taiwan. DEStech Transactions on Computer Science and 24 Engineering, (cmsam). 25
Lindoso, D. P. et al., 2018: Harvesting Water for Living with Drought: Insights from the Brazilian Human 26 Coexistence with Semi-Aridity Approach towards Achieving the Sustainable Development Goals. 27 Sustainability, 10 (3), doi:10.3390/su10030622. 28
Lindsay, A., 2018: Social learning as an adaptive measure to prepare for climate change impacts on water 29 provision in Peru. Journal of Environmental Studies and Sciences, 8 (4), 477-487, doi:10.1007/s13412-30 017-0464-3. 31
Ling, F. H. et al., 2015: Reducing flood risks in rural households: survey of perception and adaptation in the 32 Mekong delta. Climatic Change, 132 (2), 209-222. 33
Liu, C., N. Hofstra and E. Franz, 2013: Impacts of climate change on the microbial safety of pre-harvest 34 leafy green vegetables as indicated by Escherichia coli O157 and Salmonella spp. International Journal 35 of Food Microbiology, 163 (2-3), 119-128. 36
Liu, J., Q. Liu and H. Yang, 2016: Assessing water scarcity by simultaneously considering environmental 37 flow requirements, water quantity, and water quality. Ecological Indicators, 60, 434-441, 38 doi:https://doi.org/10.1016/j.ecolind.2015.07.019. 39
Liu, L. et al., 2017: Vulnerability of US thermoelectric power generation to climate change when 40 incorporating state-level environmental regulations. Nature Energy, 2 (8), 17109, 41 doi:10.1038/nenergy.2017.109. 42
Liu, Z. et al., 2018: Association between floods and infectious diarrhea and their effect modifiers in Hunan 43 province, China: A two-stage model. Science of The Total Environment, 626, 630-637, 44 doi:https://doi.org/10.1016/j.scitotenv.2018.01.130. 45
Livneh, B. and A. M. Badger, 2020: Drought less predictable under declining future snowpack. Nature 46 Climate Change, 10 (5), 452-458. 47
Llasat, M. et al., 2013: Towards a database on societal impact of Mediterranean floods within the framework 48 of the HYMEX project. Natural hazards and earth system sciences, 13 (5), 1337. 49
Louiseize, N. L., M. J. Lafrenière and M. G. Hastings, 2014: Stable isotopic evidence of enhanced export of 50 microbially derived $${\text{NO}}_{3}^{ - }$$NO3-following active layer slope disturbance in the 51 Canadian High Arctic. Biogeochemistry, 121 (3), 565-580, doi:10.1007/s10533-014-0023-x. 52
Lowe, J. A. et al., 2018: UKCP18 Science Overview Report. UK Met Office [Available at: 53 https://www.metoffice.gov.uk/pub/data/weather/uk/ukcp18/science-reports/UKCP18-Overview-54 report.pdf]. 55
Lu, C. et al., 2021: Anthropogenic influence on 2019 May-June extremely low precipitation in southwestern 56 China. Bulletin of the American Meteorological Society, 102 (1), S97-S102. 57
ACCEPTED VERSIO
N
SUBJECT TO FIN
AL EDITS

FINAL DRAFT Chapter 4 Supplementary Material IPCC WGII Sixth Assessment Report
Do Not Cite, Quote or Distribute SM4-249 Total pages: 273
Lu, P., 2016: Spatial planning to promote urban resilience in coping with climate change and flooding: 1 Exploring two cases in Kaohsiung, Taiwan. 45-67. 2
Lukasiewicz, A., J. Pittock and C. M. Finlayson, 2016: Are we adapting to climate change? A catchment-3 based adaptation assessment tool for freshwater ecosystems. Climatic Change, 138 (3-4), 641-654, 4 doi:10.1007/s10584-016-1755-5. 5
Luo, Q., M. Bange, M. Braunack and D. Johnston, 2016: Effectiveness of agronomic practices in dealing 6 with climate change impacts in the Australian cotton industry — A simulation study. Agricultural 7 Systems, 147, 1-9, doi:https://doi.org/10.1016/j.agsy.2016.05.006. 8
Lute, A. C., J. T. Abatzoglou and K. C. Hegewisch, 2015: Projected changes in snowfall extremes and 9 interannual variability of snowfall in the western United States. Water Resources Research, 51 (2), 960-10 972, doi:10.1002/2014wr016267. 11
Lutz, A. F., W. W. Immerzeel, A. B. Shrestha and M. F. P. Bierkens, 2014: Consistent increase in High 12 Asia's runoff due to increasing glacier melt and precipitation. Nature Climate Change, 4, 587, 13 doi:10.1038/nclimate2237 14
https://www.nature.com/articles/nclimate2237#supplementary-information. 15 Lynch, S., L. Batty and P. Byrne, 2014: Environmental Risk of Metal Mining Contaminated River Bank 16
Sediment at Redox-Transitional Zones. Minerals, 4, 52, doi:10.3390/min4010052. 17 Lyons, I. et al., 2019: Putting uncertainty under the cultural lens of Traditional Owners from the Great 18
Barrier Reef Catchments. Regional Environmental Change, 19 (6), 1597-1610, doi:10.1007/s10113-19 019-01468-w. 20
Macchi, M., A. M. Gurung and B. Hoermann, 2015: Community perceptions and responses to climate 21 variability and change in the Himalayas. Climate and Development, 7 (5), 414-425, 22 doi:10.1080/17565529.2014.966046. 23
MacDonald, A. M. et al., 2016: Groundwater quality and depletion in the Indo-Gangetic Basin mapped from 24 in situ observations. Nature Geoscience, 9, 762, doi:10.1038/ngeo2791 25
https://www.nature.com/articles/ngeo2791#supplementary-information. 26 MacMillan, G. A. et al., 2015: High methylmercury in Arctic and subarctic ponds is related to nutrient levels 27
in the warming eastern Canadian Arctic. Environmental Science & Technology, 49 (13), 7743-7753. 28 Madrigal-Ballestero, R. and M. A. Naranjo, 2015: Adaptive capacity, drought and the performance of 29
community-based drinking water organizations in Costa Rica. Journal of Water and Climate Change, 6 30 (4), 831-847, doi:10.2166/wcc.2015.154. 31
Makate, C. and M. Makate, 2019: Interceding role of institutional extension services on the livelihood 32 impacts of drought tolerant maize technology adoption in Zimbabwe. Technology in Society, 56 33 (September), 126-133, doi:10.1016/j.techsoc.2018.09.011. 34
Makate, C., M. Makate, N. Mango and S. Siziba, 2019: Increasing resilience of smallholder farmers to 35 climate change through multiple adoption of proven climate-smart agriculture innovations. Lessons 36 from Southern Africa. Journal of environmental management, 231, 858-868, 37 doi:https://doi.org/10.1016/j.jenvman.2018.10.069. 38
Makate, C., R. Wang, M. Makate and N. Mango, 2016: Crop diversification and livelihoods of smallholder 39 farmers in Zimbabwe: adaptive management for environmental change. SpringerPlus, 5 (1), 1135. 40
Makate, C., R. Wang, M. Makate and N. Mango, 2017: Impact of drought tolerant maize adoption on maize 41 productivity, sales and consumption in rural Zimbabwe. Agrekon, 56 (1), 67-81. 42
Malek, K., J. C. Adam, C. O. Stöckle and R. T. Peters, 2018: Climate change reduces water availability for 43 agriculture by decreasing non-evaporative irrigation losses. Journal of Hydrology, 561, 444-460, 44 doi:https://doi.org/10.1016/j.jhydrol.2017.11.046. 45
Mallakpour, I. and G. Villarini, 2015: The changing nature of flooding across the central United States. 46 Nature Climate Change, 5, 250, doi:10.1038/nclimate2516 47
https://www.nature.com/articles/nclimate2516#supplementary-information. 48 Mankin, J. S. and N. S. Diffenbaugh, 2015: Influence of temperature and precipitation variability on near-49
term snow trends. Climate Dynamics, 45 (3), 1099-1116, doi:10.1007/s00382-014-2357-4. 50 Mantyka-Pringle, C. S. et al., 2014: Understanding and predicting the combined effects of climate change 51
and land-use change on freshwater macroinvertebrates and fish. Journal of Applied Ecology, 51 (3), 52 572-581, doi:doi:10.1111/1365-2664.12236. 53
Mao, J. et al., 2015: Disentangling climatic and anthropogenic controls on global terrestrial 54 evapotranspiration trends. Environmental Research Letters, 10 (9), 094008, doi:10.1088/1748-55 9326/10/9/094008. 56
ACCEPTED VERSIO
N
SUBJECT TO FIN
AL EDITS

FINAL DRAFT Chapter 4 Supplementary Material IPCC WGII Sixth Assessment Report
Do Not Cite, Quote or Distribute SM4-250 Total pages: 273
Mapfumo, P. et al., 2017: Pathways to transformational change in the face of climate impacts: an analytical 1 framework. Climate and Development, 9 (5), 439-451. 2
Mardero, S. et al., 2015: Smallholders adaptations to droughts and climatic variability in southeastern 3 Mexico. Environmental Hazards, 14 (4), 271-288, doi:10.1080/17477891.2015.1058741. 4
Markkula, I., M. Turunen and S. Rasmus, 2019: A review of climate change impacts on the ecosystem 5 services in the Saami Homeland in Finland. Science of The Total Environment, 692, 1070-1085, 6 doi:https://doi.org/10.1016/j.scitotenv.2019.07.272. 7
Markonis, Y., S. M. Papalexiou, M. Martinkova and M. Hanel, 2019: Assessment of Water Cycle 8 Intensification Over Land using a Multisource Global Gridded Precipitation DataSet. Journal of 9 Geophysical Research: Atmospheres, 124 (21), 11175-11187, doi:10.1029/2019JD030855. 10
Marshall, A. M., J. T. Abatzoglou, T. E. Link and C. J. Tennant, 2019: Projected Changes in Interannual 11 Variability of Peak Snowpack Amount and Timing in the Western United States. Geophysical Research 12 Letters, 46 (15), 8882-8892, doi:https://doi.org/10.1029/2019GL083770. 13
Martínez-Alvarez, V. et al., 2018: Seawater desalination for crop irrigation—Current status and perspectives. 14 In: Emerging Technologies for Sustainable Desalination Handbook [Gude, V. G. (ed.)]. Butterworth-15 Heinemann, 461-492. 16
Martins, M. A., J. Tomasella and C. G. Dias, 2019: Maize yield under a changing climate in the Brazilian 17 Northeast: Impacts and adaptation. Agricultural Water Management, 216, 339-350, 18 doi:https://doi.org/10.1016/j.agwat.2019.02.011. 19
Marx, A. et al., 2018: Climate change alters low flows in Europe under global warming of 1.5, 2, and 3 °C. 20 Hydrol. Earth Syst. Sci., 22 (2), 1017-1032, doi:10.5194/hess-22-1017-2018. 21
Marzeion, B. et al., 2020: Partitioning the Uncertainty of Ensemble Projections of Global Glacier Mass 22 Change. Earth's Future, e2019EF001470. 23
Mashizha, T. M., 2019: Adapting to climate change: Reflections of peasant farmers in Mashonaland West 24 Province of Zimbabwe. Jàmbá: Journal of Disaster Risk Studies, 11 (1), 1-8. 25
Masseroni, D. et al., 2020: 65-year changes of annual streamflow volumes across Europe with a focus on the 26 Mediterranean basin. Hydrology and Earth System Sciences Discussions, 1-16. 27
Mastrorillo, M. et al., 2016: The influence of climate variability on internal migration flows in South Africa. 28 Global Environmental Change, 39, 155-169, doi:https://doi.org/10.1016/j.gloenvcha.2016.04.014. 29
Matti, B., H. E. Dahlke and S. W. Lyon, 2016: On the variability of cold region flooding. Journal of 30 Hydrology, 534, 669-679, doi:https://doi.org/10.1016/j.jhydrol.2016.01.055. 31
McCabe, M. F. et al., 2017: The future of Earth observation in hydrology. Hydrol. Earth Syst. Sci., 21 (7), 32 3879-3914, doi:10.5194/hess-21-3879-2017. 33
McDonough, L. K. et al., 2020: Changes in global groundwater organic carbon driven by climate change and 34 urbanization. Nature Communications, 11 (1), 1279, doi:10.1038/s41467-020-14946-1. 35
McKenna, O. P. and O. E. Sala, 2018: Groundwater recharge in desert playas: current rates and future effects 36 of climate change. Environmental Research Letters, 13 (1), 014025, doi:10.1088/1748-9326/aa9eb6. 37
McKune, S. et al., 2018: Reaching the end goal: Do interventions to improve climate information services 38 lead to greater food security? Climate Risk Management, 22, 22-41. 39
McLeod, J., M. Shepherd and C. E. Konrad II, 2017: Spatio-temporal rainfall patterns around Atlanta, 40 Georgia and possible relationships to urban land cover. Urban Climate, 21, 27-42. 41
McMartin, D. W. and B. H. Hernani Merino, 2014: Analysing the links between agriculture and climate 42 change: Can 'best management practices' be responsive to climate extremes? International Journal of 43 Agricultural Resources, Governance and Ecology, 10 (1), 50-62, doi:10.1504/IJARGE.2014.061042. 44
McNamara, K. E., R. Westoby and A. Chandra, 2021: Exploring climate-driven non-economic loss and 45 damage in the Pacific Islands. Current opinion in environmental sustainability, 50, 1-11, 46 doi:https://doi.org/10.1016/j.cosust.2020.07.004. 47
Mediero, L., D. Santillán, L. Garrote and A. Granados, 2014: Detection and attribution of trends in 48 magnitude, frequency and timing of floods in Spain. Journal of Hydrology, 517, 1072-1088. 49
Megersa, B. et al., 2014: Livestock Diversification: An Adaptive Strategy to Climate and Rangeland 50 Ecosystem Changes in Southern Ethiopia. Human Ecology, 42 (4), 509-520, doi:10.1007/s10745-014-51 9668-2. 52
Mehdi, B. et al., 2015: Simulated impacts of climate change and agricultural land use change on surface 53 water quality with and without adaptation management strategies. Agriculture, Ecosystems & 54 Environment, 213, 47-60, doi:https://doi.org/10.1016/j.agee.2015.07.019. 55
Mehran, A. et al., 2017: Compounding Impacts of Human-Induced Water Stress and Climate Change on 56 Water Availability. Scientific Reports, 7 (1), 6282, doi:10.1038/s41598-017-06765-0. 57
ACCEPTED VERSIO
N
SUBJECT TO FIN
AL EDITS

FINAL DRAFT Chapter 4 Supplementary Material IPCC WGII Sixth Assessment Report
Do Not Cite, Quote or Distribute SM4-251 Total pages: 273
Mehrazar, A. et al., 2020: Adaptation of Water Resources System to Water Scarcity and Climate Change in 1 the Suburb Area of Megacities. Water Resources Management, 34 (12), 3855-3877, 2 doi:10.1007/s11269-020-02648-8. 3
Meixner, T. et al., 2016: Implications of projected climate change for groundwater recharge in the western 4 United States. Journal of Hydrology, 534, 124-138, doi:https://doi.org/10.1016/j.jhydrol.2015.12.027. 5
Melvin, A. M. et al., 2017: Climate change damages to Alaska public infrastructure and the economics of 6 proactive adaptation. Proceedings of the National Academy of Sciences, 114 (2), E122-E131, 7 doi:10.1073/pnas.1611056113. 8
Meng, Q. et al., 2016: Growing sensitivity of maize to water scarcity under climate change. Scientific 9 Reports, 6, 19605. 10
Meng, Y. et al., 2021: Undermined co-benefits of hydropower and irrigation under climate change. 11 Resources, Conservation and Recycling, 167, 105375, 12 doi:https://doi.org/10.1016/j.resconrec.2020.105375. 13
Menounos, B. et al., 2019: Heterogeneous changes in western North American glaciers linked to decadal 14 variability in zonal wind strength. Geophysical Research Letters, 46 (1), 200-209. 15
Mercer, N. and M. Hanrahan, 2017: “Straight from the heavens into your bucket”: domestic rainwater 16 harvesting as a measure to improve water security in a subarctic indigenous community. International 17 Journal of Circumpolar Health, 76 (1), 1312223, doi:10.1080/22423982.2017.1312223. 18
Mersha, A. A. and F. van Laerhoven, 2018: The interplay between planned and autonomous adaptation in 19 response to climate change: Insights from rural Ethiopia. World Development, 107, 87-97. 20
Mesquita, P. S. and M. Bursztyn, 2017: Food acquisition programs in the Brazilian semi-arid region: benefits 21 to farmers and impacts of climate change. Food Security, 9 (5), 1041-1051. 22
Michalak, A. M., 2016: Study role of climate change in extreme threats to water quality. Nature News, 535 23 (7612), 349. 24
Micheletti, N., C. Lambiel and S. N. Lane, 2015: Investigating decadal-scale geomorphic dynamics in an 25 alpine mountain setting. Journal of Geophysical Research: Earth Surface, 120 (10), 2155-2175, 26 doi:10.1002/2015jf003656. 27
Michelsen, N. et al., 2016: YouTube as a crowd-generated water level archive. Science of The Total 28 Environment, 568, 189-195. 29
Minayeva, T., A. Sirin, P. Kershaw and O. Bragg, 2016: Arctic peatlands. In: The Wetland Book. Springer, 30 Dordrecht, 1-15. 31
Miralles, D. G. et al., 2013: El Niño–La Niña cycle and recent trends in continental evaporation. Nature 32 Climate Change, 4, 122, doi:10.1038/nclimate2068 33
https://www.nature.com/articles/nclimate2068#supplementary-information. 34 Mishra, A. K., 2015: A study on the occurrence of flood events over Jammu and Kashmir during September 35
2014 using satellite remote sensing. Natural Hazards, 78 (2), 1463-1467, doi:10.1007/s11069-015-36 1768-9. 37
Mishra, B. K. et al., 2018: Assessment of future flood inundations under climate and land use change 38 scenarios in the Ciliwung River Basin, Jakarta. Journal of Flood Risk Management, 11, S1105-S1115. 39
Missirian, A. and W. Schlenker, 2017: Asylum applications respond to temperature fluctuations. Science, 40 358 (6370), 1610-1614, doi:10.1126/science.aao0432. 41
Momiyama, S., M. Sagehashi and M. Akiba, 2020: Assessment of the climate change risks for inflow into 42 Sagami Dam reservoir using a hydrological model. Journal of Water and Climate Change, 11 (2), 367-43 379. 44
Moomaw, W. R. et al., 2018: Wetlands In a Changing Climate: Science, Policy and Management. Wetlands, 45 38 (2), 183-205, doi:10.1007/s13157-018-1023-8. 46
Morán-Tejeda, E. et al., 2014: Streamflow timing of mountain rivers in Spain: Recent changes and future 47 projections. Journal of Hydrology, 517, 1114-1127, doi:https://doi.org/10.1016/j.jhydrol.2014.06.053. 48
Morote, Á.-F., J. Olcina and M. Hernández, 2019: The Use of Non-Conventional Water Resources as a 49 Means of Adaptation to Drought and Climate Change in Semi-Arid Regions: South-Eastern Spain. 50 Water, 11 (1), 93. 51
Mosley, L. M., 2015: Drought impacts on the water quality of freshwater systems; review and integration. 52 Earth-Science Reviews, 140, 203-214, doi:https://doi.org/10.1016/j.earscirev.2014.11.010. 53
Moulton, A. A., 2017: Agrarian change and the development of the greenhouse farming sector in Jamaica. 54 Caribbean Geography, 22 (September 2017), 1-20. 55
Msowoya, K. et al., 2016: Climate Change Impacts on Maize Production in the Warm Heart of Africa. Water 56 Resources Management, 30 (14), 5299-5312, doi:10.1007/s11269-016-1487-3. 57
ACCEPTED VERSIO
N
SUBJECT TO FIN
AL EDITS
FINAL DRAFT Chapter 4 Supplementary Material IPCC WGII Sixth Assessment Report
Do Not Cite, Quote or Distribute SM4-252 Total pages: 273
Mu, C. et al., 2019: Carbon and mercury export from the Arctic rivers and response to permafrost 1 degradation. Water Research, 161, 54-60, doi:https://doi.org/10.1016/j.watres.2019.05.082. 2
Mudryk, L. et al., 2020: Historical Northern Hemisphere snow cover trends and projected changes in the 3 CMIP6 multi-model ensemble. The Cryosphere, 14 (7), 2495-2514. 4
Mudryk, L. R. et al., 2018: Canadian snow and sea ice: historical trends and projections. The Cryosphere, 12 5 (4), 1157-1176, doi:10.5194/tc-12-1157-2018. 6
Mudryk, L. R., P. J. Kushner, C. Derksen and C. Thackeray, 2017: Snow cover response to temperature in 7 observational and climate model ensembles. Geophysical Research Letters, 44 (2), 919-926, 8 doi:10.1002/2016gl071789. 9
Mueller, N. D. et al., 2016: Cooling of US Midwest summer temperature extremes from cropland 10 intensification. Nature Climate Change, 6 (3), 317-322. 11
Mueller, V., C. Gray and D. Hopping, 2020: Climate-Induced migration and unemployment in middle-12 income Africa. Global Environmental Change, 65, 102183. 13
Mugambiwa, S. S., 2018: Adaptation measures to sustain indigenous practices and the use of indigenous 14 knowledge systems to adapt to climate change in Mutoko rural district of Zimbabwe. Jàmbá: Journal of 15 Disaster Risk Studies, 10 (1), 1-9. 16
Muis, S. et al., 2015: Flood risk and adaptation strategies under climate change and urban expansion: A 17 probabilistic analysis using global data. Science of The Total Environment, 538, 445-457, 18 doi:https://doi.org/10.1016/j.scitotenv.2015.08.068. 19
Mukherji, A. et al., Accepted: A methodology for measuring effectiveness of current and future water-related 20 adaptation responses. Climate and Development. 21
Mukherji, A. et al., 2019: Contributions of the cryosphere to mountain communities in the Hindu Kush 22 Himalaya: a review. Regional Environmental Change, 19 (5), 1311-1326, doi:10.1007/s10113-019-23 01484-w. 24
Mullan, D. et al., 2019: Climate impacts on soil erosion and muddy flooding at 1.5 versus 2°C warming. 25 Land Degradation & Development, 30 (1), 94-108, doi:10.1002/ldr.3214. 26
Munia, H. et al., 2016: Water stress in global transboundary river basins: significance of upstream water use 27 on downstream stress. Environmental Research Letters, 11 (1), 014002, doi:10.1088/1748-28 9326/11/1/014002. 29
Munoz, S. E. et al., 2018: Climatic control of Mississippi River flood hazard amplified by river engineering. 30 Nature, 556 (7699), 95-98. 31
Mupakati, T. and V. I. Tanyanyiwa, 2017: Cassava production as a climate change adaptation strategy in 32 Chilonga Ward, Chiredzi District, Zimbabwe. Jàmbá: Journal of Disaster Risk Studies, 9 (1), 1-10, 33 doi:10.4102/jamba.v9i1.348. 34
Muricho, D. N., D. J. Otieno, W. Oluoch-Kosura and M. Jirström, 2019: Building pastoralists’ resilience to 35 shocks for sustainable disaster risk mitigation: Lessons from West Pokot County, Kenya. International 36 Journal of Disaster Risk Reduction, 34 (December 2018), 429-435, doi:10.1016/j.ijdrr.2018.12.012. 37
Musah-Surugu, I. J., A. Ahenkan, J. N. Bawole and S. A. Darkwah, 2018: Migrants’ remittances. 38 International Journal of Climate Change Strategies and Management. 39
Musinguzi, L. et al., 2016: Fishers’ perceptions of climate change, impacts on their livelihoods and 40 adaptation strategies in environmental change hotspots: a case of Lake Wamala, Uganda. Environment, 41 Development and Sustainability, 18 (4), 1255-1273, doi:10.1007/s10668-015-9690-6. 42
Musselman, K. N. et al., 2018: Projected increases and shifts in rain-on-snow flood risk over western North 43 America. Nature Climate Change, 8 (9), 808-812. 44
Mussetta, P., S. Turbay and A. J. Fletcher, 2016: Adaptive Strategies Building Resilience to Climate 45 Variability in Argentina, Canada and Colombia. In: Climate Change Adaptation, Resilience and 46 Hazards. Springer, 225-240. 47
Muttaqin, Z., A. Yulianti and K. Karmanah, 2019: Climate village program (ProKlim) in Simurugul Sub-48 Village, Margawati Village, Garut Kota Sub-Regency, Garut Regency, West Java Province, Indonesia. 49 IOP Conference Series: Earth and Environmental Science, 299 (1), 0-17, doi:10.1088/1755-50 1315/299/1/012046. 51
Mycoo, M. A., 2014: Autonomous household responses and urban governance capacity building for climate 52 change adaptation: Georgetown, Guyana. Urban Climate, 9, 134-154, 53 doi:https://doi.org/10.1016/j.uclim.2014.07.009. 54
Myers, B. J. E. et al., 2017: Global synthesis of the documented and projected effects of climate change on 55 inland fishes. Reviews in Fish Biology and Fisheries, 27 (2), 339-361, doi:10.1007/s11160-017-9476-z. 56
ACCEPTED VERSIO
N
SUBJECT TO FIN
AL EDITS
FINAL DRAFT Chapter 4 Supplementary Material IPCC WGII Sixth Assessment Report
Do Not Cite, Quote or Distribute SM4-253 Total pages: 273
Myhre, G. et al., 2019: Frequency of extreme precipitation increases extensively with event rareness under 1 global warming. Scientific Reports, 9 (1), 16063, doi:10.1038/s41598-019-52277-4. 2
Najibi, N. and N. Devineni, 2018: Recent trends in the frequency and duration of global floods. Earth Syst. 3 Dynam., 9 (2), 757-783, doi:10.5194/esd-9-757-2018. 4
Nambi, A. A., S. Bahinipati Chandra, R. Raghunath and R. Nagendran, 2015: Farm household level 5 adaptation metrics for agriculture and water sectors. International Journal of Climate Change Strategies 6 and Management, 7 (1), 27-40, doi:10.1108/IJCCSM-04-2013-0048. 7
Nangombe, S., T. Zhou, L. Zhang and W. Zhang, 2020: Attribution Of The 2018 October–December 8 Drought Over South Southern Africa. Bulletin of the American Meteorological Society, 101 (1), S135-9 S140. 10
Naqvi, S. M. K., D. Kumar, K. De and V. Sejian, 2015: Climate Change and Water Availability for 11 Livestock: Impact on Both Quality and Quantity. In: Climate Change Impact on Livestock: Adaptation 12 and Mitigation [Sejian, V., J. Gaughan, L. Baumgard and C. Prasad (eds.)]. Springer India, New Delhi, 13 81-95. 14
Nardi, F. et al., 2019: GFPLAIN250m, a global high-resolution dataset of Earth’s floodplains. Scientific 15 Data, 6, 180309, doi:10.1038/sdata.2018.309. 16
Naumann, G. et al., 2018: Global Changes in Drought Conditions Under Different Levels of Warming. 17 Geophysical Research Letters, 45 (7), 3285-3296, doi:10.1002/2017gl076521. 18
Nawrotzki, R. J. and M. Bakhtsiyarava, 2017: International Climate Migration: Evidence for the Climate 19 Inhibitor Mechanism and the Agricultural Pathway. Population, Space and Place, 23 (4), e2033, 20 doi:10.1002/psp.2033. 21
Nawrotzki, R. J., L. M. Hunter, D. M. Runfola and F. Riosmena, 2015: Climate change as a migration driver 22 from rural and urban Mexico. Environmental Research Letters, 10 (11), 114023, doi:10.1088/1748-23 9326/10/11/114023. 24
Nelson, G. L. et al., 2019: The Indigenous Practices and Climate Change Responses of Ati and Suludnon 25 Farmers in Iloilo, Philippines. Journal of Environmental Science and Management, 22 (1). 26
Neset, T.-S. et al., 2019: Maladaptation in Nordic agriculture. Climate Risk Management, 23, 78-87, 27 doi:https://doi.org/10.1016/j.crm.2018.12.003. 28
Newsham, A. et al., 2018: Ecosystems-based adaptation: Are we being conned? Evidence from Mexico. 29 Global Environmental Change, 49, 14-26, doi:https://doi.org/10.1016/j.gloenvcha.2018.01.001. 30
Ng’ang’a, S. K. et al., 2016: Migration and Self-Protection Against Climate Change: A Case Study of 31 Samburu County, Kenya. World Development, 84, 55-68, 32 doi:https://doi.org/10.1016/j.worlddev.2016.04.002. 33
Nguyen, H. H. et al., 2017: Modelling the impacts of altered management practices, land use and climate 34 changes on the water quality of the Millbrook catchment-reservoir system in South Australia. Journal of 35 environmental management, 202, 1-11, doi:https://doi.org/10.1016/j.jenvman.2017.07.014. 36
Ngwira, A. R., J. B. Aune and C. Thierfelder, 2014: DSSAT modelling of conservation agriculture maize 37 response to climate change in Malawi. Soil and Tillage Research, 143, 85-94, 38 doi:https://doi.org/10.1016/j.still.2014.05.003. 39
Nichols, G., I. Lake and C. Heaviside, 2018: Climate change and water-related infectious diseases. 40 Atmosphere, 9 (10), 385. 41
Nicolai-Shaw, N. et al., 2017: A drought event composite analysis using satellite remote-sensing based soil 42 moisture. Remote Sensing of Environment, 203, 216-225. 43
Nilsson, C., L. E. Polvi and L. Lind, 2015: Extreme events in streams and rivers in arctic and subarctic 44 regions in an uncertain future. Freshwater Biology, 60 (12), 2535-2546. 45
Nka, B. et al., 2015: Trends in floods in West Africa: Analysis based on 11 catchments in the region. 46 Hydrology and Earth System Sciences, 19 (11), 4707-4719. 47
Norton-Smith, K. et al., 2016: Climate change and indigenous peoples: a synthesis of current impacts and 48 experiences. 49
Notaro, V., L. Liuzzo, G. Freni and G. La Loggia, 2015: Uncertainty analysis in the evaluation of extreme 50 rainfall trends and its implications on urban drainage system design. Water, 7 (12), 6931-6945. 51
Nygren, M. et al., 2020: Changes in seasonality of groundwater level fluctuations in a temperate-cold climate 52 transition zone. Journal of Hydrology X, 8, 100062, doi:https://doi.org/10.1016/j.hydroa.2020.100062. 53
Nyikahadzoi, K., A. Adekunle, Fatunbi and B. Zamasiya, 2017: Promoting production and marketing of root 54 crops in Southern Africa in a changing climate using integrated agricultural research for development 55 (IAR4D) pathway. African Journal of Food, Agriculture, Nutrition and Development, 17 (1), 11787-56 11802, doi:10.18697/ajfand.77.13765. 57
ACCEPTED VERSIO
N
SUBJECT TO FIN
AL EDITS

FINAL DRAFT Chapter 4 Supplementary Material IPCC WGII Sixth Assessment Report
Do Not Cite, Quote or Distribute SM4-254 Total pages: 273
Nyima, Y. and K. A. Hopping, 2019: Tibetan lake expansion from a pastoral perspective: local observations 1 and coping strategies for a changing environment. Society & Natural Resources, 32 (9), 965-982. 2
Nyman, P. et al., 2015: Predicting sediment delivery from debris flows after wildfire. Geomorphology, 250, 3 173-186, doi:https://doi.org/10.1016/j.geomorph.2015.08.023. 4
O'Reilly, C. M. et al., 2015: Rapid and highly variable warming of lake surface waters around the globe. 5 Geophysical Research Letters, 42 (24), 10,773-10,781. 6
O’Neel, S., E. Hood, A. Arendt and L. Sass, 2014: Assessing streamflow sensitivity to variations in glacier 7 mass balance. Climatic Change, 123 (2), 329-341, doi:10.1007/s10584-013-1042-7. 8
O’Neill, B. C. et al., 2017: The roads ahead: Narratives for shared socioeconomic pathways describing world 9 futures in the 21st century. Global Environmental Change, 42, 169-180. 10
Obokata, R., L. Veronis and R. McLeman, 2014: Empirical research on international environmental 11 migration: a systematic review. Population and Environment, 36 (1), 111-135, doi:10.1007/s11111-12 014-0210-7. 13
Ocello, C., A. Petrucci, M. R. Testa and D. Vignoli, 2015: Environmental aspects of internal migration in 14 Tanzania. Population and Environment, 37 (1), 99-108, doi:10.1007/s11111-014-0229-9. 15
Oeurng, C. et al., 2019: Assessing climate change impacts on river flows in the Tonle Sap Lake Basin, 16 Cambodia. Water, 11 (3), 618. 17
Ojeda, M. G.-V. et al., 2021: Projected changes in the Iberian Peninsula drought characteristics. Science of 18 The Total Environment, 757, 143702. 19
Ojha, H. R. et al., 2014: Is South Asian Agriculture Adapting to Climate Change? Evidence from the Indo-20 Gangetic Plains. Agroecology and Sustainable Food Systems, 38 (5), 505-531, 21 doi:10.1080/21683565.2013.841607. 22
Ojo, T. O. and L. J. S. Baiyegunhi, 2020: Determinants of climate change adaptation strategies and its impact 23 on the net farm income of rice farmers in south-west Nigeria. Land Use Policy, 95, 103946, 24 doi:https://doi.org/10.1016/j.landusepol.2019.04.007. 25
Oka, N., T. Higashimaki, D. D. P. Witharana and M. B. Wakeyo, 2015: Constrains and Consensus on Water 26 Use and Land Allocation in Minor Scheme Tanks in the Dry Zone of Sri Lanka. Scientific Papers 27 Series Management, Economic Engineering in Agriculture and Rural Development, 15 (4), 185-190. 28
Okunlola, J., D. Oke, V. Adekunle and K. Owolabi, 2019: Effects of climate change and coping strategies 29 among crop farmers in South West, Nigeria. Agroforestry Systems, 93 (4), 1399-1408. 30
Olabanji, M. F., T. Ndarana, N. Davis and E. Archer, 2020: Climate change impact on water availability in 31 the olifants catchment (South Africa) with potential adaptation strategies. Physics and Chemistry of the 32 Earth, Parts A/B/C, 120, 102939, doi:https://doi.org/10.1016/j.pce.2020.102939. 33
Olarinoye, T. et al., 2020: Exploring the future impacts of urbanization and climate change on groundwater 34 in Arusha, Tanzania. Water International, 45 (5), 497-511, doi:10.1080/02508060.2020.1768724. 35
Ombogoh, D. B. et al., 2018: Enhancing adaptation to climate variability in the East African highlands: a 36 case for fostering collective action among smallholder farmers in Kenya and Uganda. Climate and 37 Development, 10 (1), 61-72, doi:10.1080/17565529.2016.1174665. 38
Op de Hipt, F. et al., 2018: Modeling the impact of climate change on water resources and soil erosion in a 39 tropical catchment in Burkina Faso, West Africa. CATENA, 163, 63-77, 40 doi:https://doi.org/10.1016/j.catena.2017.11.023. 41
Opiyo, F. et al., 2015: Drought Adaptation and Coping Strategies Among the Turkana Pastoralists of 42 Northern Kenya. International Journal of Disaster Risk Science, 6 (3), 295-309, doi:10.1007/s13753-43 015-0063-4. 44
Orlove, B. et al., 2019: Framing climate change in frontline communities: anthropological insights on how 45 mountain dwellers in the USA, Peru, and Italy adapt to glacier retreat. Regional Environmental Change, 46 19 (5), 1295-1309. 47
Ostad-Ali-Askari, K., H. Ghorbanizadeh Kharazi, M. Shayannejad and M. J. Zareian, 2020: Effect of climate 48 change on precipitation patterns in an arid region using GCM models: case study of Isfahan-Borkhar 49 Plain. Natural Hazards Review, 21 (2), 04020006. 50
Otto, F. et al., 2015: Factors Other Than Climate Change, Main Drivers of 2014/15 Water Shortage in 51 Southeast Brazil. Bulletin of the American Meteorological Society, 96, S35-S40, doi:10.1175/BAMS-52 EEE_2014_ch8.1. 53
Otto, F. E. L. et al., 2018: Anthropogenic influence on the drivers of the Western Cape drought 2015–2017. 54 Environmental Research Letters, 13 (12), 124010, doi:10.1088/1748-9326/aae9f9. 55
ACCEPTED VERSIO
N
SUBJECT TO FIN
AL EDITS

FINAL DRAFT Chapter 4 Supplementary Material IPCC WGII Sixth Assessment Report
Do Not Cite, Quote or Distribute SM4-255 Total pages: 273
Oviedo, A. F. P., S. Mitraud, D. G. McGrath and M. Bursztyn, 2016: Implementing climate variability at the 1 community level in the Amazon floodplain. Environmental Science and Policy, 63, 151-160, 2 doi:10.1016/j.envsci.2016.05.017. 3
Owain, E. L. and M. A. Maslin, 2018: Assessing the relative contribution of economic, political and 4 environmental factors on past conflict and the displacement of people in East Africa. Palgrave 5 Communications, 4 (1), 47, doi:10.1057/s41599-018-0096-6. 6
Owens, P. N., W. H. Blake and G. E. Millward, 2019: Extreme levels of fallout radionuclides and other 7 contaminants in glacial sediment (cryoconite) and implications for downstream aquatic ecosystems. 8 Scientific Reports, 9 (1), 12531, doi:10.1038/s41598-019-48873-z. 9
Padowski, J. C. and S. M. Gorelick, 2014: Corrigendum: Global analysis of urban surface water supply 10 vulnerability (2014 Environ. Res. Lett. 9 104004). Environmental Research Letters, 9 (11), 119501, 11 doi:10.1088/1748-9326/9/11/119501. 12
Padrón, R. S. et al., 2020: Observed changes in dry-season water availability attributed to human-induced 13 climate change. Nature Geoscience, 13 (7), 477-481. 14
Paik, S. et al., 2020: Determining the Anthropogenic Greenhouse Gas Contribution to the Observed 15 Intensification of Extreme Precipitation. Geophysical Research Letters, 47 (12), e2019GL086875, 16 doi:10.1029/2019GL086875. 17
Pak-Uthai, S. and N. Faysse, 2018: The risk of second-best adaptive measures: Farmers facing drought in 18 Thailand. International Journal of Disaster Risk Reduction, 28, 711-719. 19
Pan, N. et al., 2019: Global Surface Soil Moisture Dynamics in 1979–2016 Observed from ESA CCI SM 20 Dataset. Water, 11 (5), doi:10.3390/w11050883. 21
Pandey, R. et al., 2017: Agroecology as a Climate Change Adaptation Strategy for Smallholders of Tehri-22 Garhwal in the Indian Himalayan Region. Small-scale forestry, 16 (1), 53-63, doi:10.1007/s11842-016-23 9342-1. 24
Papalexiou, S. M. and A. Montanari, 2019: Global and Regional Increase of Precipitation Extremes Under 25 Global Warming. Water Resources Research, 55 (6), 4901-4914, doi:10.1029/2018WR024067. 26
Paradis, D. et al., 2016: Groundwater nitrate concentration evolution under climate change and agricultural 27 adaptation scenarios: Prince Edward Island, Canada. Earth Syst. Dynam., 7 (1), 183-202, 28 doi:10.5194/esd-7-183-2016. 29
Parkes, B., B. Sultan and P. Ciais, 2018: The impact of future climate change and potential adaptation 30 methods on Maize yields in West Africa. Climatic Change, 151 (2), 205-217, doi:10.1007/s10584-018-31 2290-3. 32
Paroissien, J.-B. et al., 2015: A method for modeling the effects of climate and land use changes on erosion 33 and sustainability of soil in a Mediterranean watershed (Languedoc, France). Journal of environmental 34 management, 150, 57-68, doi:https://doi.org/10.1016/j.jenvman.2014.10.034. 35
Parsons, L. A., 2020: Implications of CMIP6 Projected Drying Trends for 21st Century Amazonian Drought 36 Risk. Earth's Future, 8 (10), e2020EF001608, doi:https://doi.org/10.1029/2020EF001608. 37
Patnaik, U. and P. K. Das, 2017: Do Development Interventions Confer Adaptive Capacity? Insights from 38 Rural India. World Development, 97, 298-312, doi:https://doi.org/10.1016/j.worlddev.2017.04.017. 39
Paulus, C. A., M. R. Pellokila, Y. U. L. Sobang and E. Azmanajaya, 2019: The alternative livelihood 40 development strategy in order to improve local fishermen revenue in the Border region of Indonesia and 41 timor leste. AACL Bioflux, 12 (1), 269-279. 42
Pauw, P., 2013: The role of perception in subsistence farmer adaptation in Africa: Enriching the climate 43 finance debate. International Journal of Climate Change Strategies and Management, 5 (3), 267-284, 44 doi:10.1108/IJCCSM-03-2012-0014. 45
Paymard, P., M. Bannayan and R. S. Haghighi, 2018: Analysis of the climate change effect on wheat 46 production systems and investigate the potential of management strategies. Natural Hazards, 91 (3), 47 1237-1255, doi:10.1007/s11069-018-3180-8. 48
Pechlivanidis, I. G. et al., 2017: Analysis of hydrological extremes at different hydro-climatic regimes under 49 present and future conditions. Climatic Change, 141 (3), 467-481, doi:10.1007/s10584-016-1723-0. 50
Pecl, G. T. et al., 2017: Biodiversity redistribution under climate change: Impacts on ecosystems and human 51 well-being. Science, 355 (6332), eaai9214, doi:10.1126/science.aai9214. 52
Pekel, J.-F., A. Cottam, N. Gorelick and A. S. Belward, 2016: High-resolution mapping of global surface 53 water and its long-term changes. Nature, 540 (7633), 418-422. 54
Penot, E., V. Fevre, P. Flodrops and H. M. Razafimahatratra, 2018: Conservation Agriculture to buffer and 55 alleviate the impact of climatic variations in Madagascar: Farmers' perception. Cahiers Agricultures, 27 56 (2), doi:10.1051/cagri/2018009. 57
ACCEPTED VERSIO
N
SUBJECT TO FIN
AL EDITS

FINAL DRAFT Chapter 4 Supplementary Material IPCC WGII Sixth Assessment Report
Do Not Cite, Quote or Distribute SM4-256 Total pages: 273
Perkins, S. E., S. Lewis, A. D. King and L. Alexander, 2014: Increased simulated risk of the hot Australian 1 summer of 2012/13 due to anthropogenic activity as measured by heat wave frequency and intensity. 2 Am. Meteorol. Soc. Bull., 95, S34–S37. 3
Perks, M. T., A. J. Russell and A. R. Large, 2016: Technical Note: Advances in flash flood monitoring using 4 unmanned aerial vehicles (UAVs). Hydrology & Earth System Sciences, 20 (10). 5
Peterson, T. C., P. A. Stott and S. Herring, 2012: Explaining Extreme Events of 2011 from a Climate 6 Perspective. Bulletin of the American Meteorological Society, 93 (7), 1041-1067, doi:10.1175/BAMS-7 D-12-00021.1. 8
Petzold, J., 2018: Social adaptability in ecotones: sea-level rise and climate change adaptation in Flushing 9 and the Isles of Scilly, UK. Island Studies Journal, 13, 101+. 10
Phalkey, R. K. et al., 2015: Systematic review of current efforts to quantify the impacts of climate change on 11 undernutrition. Proceedings of the National Academy of Sciences, 112 (33), E4522-E4529. 12
Philipsborn, R., S. M. Ahmed, B. J. Brosi and K. Levy, 2016: Climatic Drivers of Diarrheagenic Escherichia 13 coli Incidence: A Systematic Review and Meta-analysis. The Journal of Infectious Diseases, 214 (1), 6-14 15, doi:10.1093/infdis/jiw081. 15
Phiri, K. et al., 2019: Small grains “resistance”? Making sense of Zimbabwean smallholder farmers’ 16 cropping choices and patterns within a climate change context. Cogent Social Sciences, 5 (1), 17 doi:10.1080/23311886.2019.1622485. 18
Phuong, L. T. H. et al., 2018: Using a social learning configuration to increase Vietnamese smallholder 19 farmers’ adaptive capacity to respond to climate change. Local Environment, 23 (8), 879-897, 20 doi:10.1080/13549839.2018.1482859. 21
Picketts, I. M., 2015: Practitioners, priorities, plans, and policies: assessing climate change adaptation actions 22 in a Canadian community. Sustainability Science, 10 (3), 503-513, doi:10.1007/s11625-014-0271-7. 23
Piggott-McKellar, A. E., K. E. McNamara, P. D. Nunn and J. E. M. Watson, 2019: What are the barriers to 24 successful community-based climate change adaptation? A review of grey literature. Local 25 Environment, 24 (4), 374-390, doi:10.1080/13549839.2019.1580688. 26
Pinto, P. J., G. M. Kondolf and P. L. R. Wong, 2018: Adapting to sea level rise: Emerging governance issues 27 in the San Francisco Bay Region. Environmental Science and Policy, 90 (August), 28-37, 28 doi:10.1016/j.envsci.2018.09.015. 29
Plangoen, P. et al., 2013: Simulating the Impact of Future Land Use and Climate Change on Soil Erosion and 30 Deposition in the Mae Nam Nan Sub-Catchment, Thailand. Sustainability, 5, 3244-3274, 31 doi:10.3390/su5083244. 32
Poesch, M. S. et al., 2016: Climate change impacts on freshwater fishes: a Canadian perspective. Fisheries, 33 41 (7), 385-391. 34
Pokhrel, Y. et al., 2021: Global terrestrial water storage and drought severity under climate change. Nature 35 Climate Change, 11 (3), 226-233. 36
Pokrovsky, O. S. et al., 2015: Permafrost coverage, watershed area and season control of dissolved carbon 37 and major elements in western Siberian rivers. Biogeosciences, 12 (21), 6301-6320, doi:10.5194/bg-12-38 6301-2015. 39
Polyakov, V. O., M. N. Nichols and M. A. Nearing, 2017: Determining soil erosion rates on semi-arid 40 watersheds using radioisotope-derived sedimentation chronology. Earth Surface Processes and 41 Landforms, 42 (6), 987-993, doi:doi:10.1002/esp.4057. 42
Postigo, J. C., 2020: The role of social institutions in indigenous Andean Pastoralists’ adaptation to climate-43 related water hazards. Climate and Development, 1-12. 44
Potemkina, T. G. and V. L. Potemkin, 2015: Sediment load of the main rivers of Lake Baikal in a changing 45 environment (east Siberia, Russia). Quaternary International, 380-381, 342-349, 46 doi:https://doi.org/10.1016/j.quaint.2014.08.029. 47
Pramudya, Y. et al., 2016: Remote sensing for estimating agricultural land use change as the impact of 48 climate change. Land Surface and Cryosphere Remote Sensing III, 9877, 987720-987720, 49 doi:10.1117/12.2223878. 50
Pritchard, B. and R. Thielemans, 2014: 'Rising Waters Don't Lift All Boats': a sustainable livelihood analysis 51 of recursive cycles of vulnerability and maladaptation to flood risk in rural Bihar, India. Australian 52 Geographer, 45 (3), 325-339, doi:10.1080/00049182.2014.930001. 53
Prudhomme, C. et al., 2014: Hydrological droughts in the 21st century, hotspots and uncertainties from a 54 global multimodel ensemble experiment. Proceedings of the National Academy of Sciences, 111 (9), 55 3262-3267, doi:10.1073/pnas.1222473110. 56
ACCEPTED VERSIO
N
SUBJECT TO FIN
AL EDITS

FINAL DRAFT Chapter 4 Supplementary Material IPCC WGII Sixth Assessment Report
Do Not Cite, Quote or Distribute SM4-257 Total pages: 273
Pulido-Velazquez, D., A.-J. Collados-Lara and F. J. Alcalá, 2018: Assessing impacts of future potential 1 climate change scenarios on aquifer recharge in continental Spain. Journal of Hydrology, 567, 803-819, 2 doi:https://doi.org/10.1016/j.jhydrol.2017.10.077. 3
Pulliainen, J. et al., 2020: Patterns and trends of Northern Hemisphere snow mass from 1980 to 2018. 4 Nature, 581 (7808), 294-298. 5
Qin, X. et al., 2018: Simulated adaptation strategies for spring wheat to climate change in a northern high 6 latitude environment by DAYCENT model. European Journal of Agronomy, 95, 45-56, 7 doi:https://doi.org/10.1016/j.eja.2017.12.005. 8
Qiu, J., Q. Gao, S. Wang and Z. Su, 2016: Comparison of temporal trends from multiple soil moisture data 9 sets and precipitation: The implication of irrigation on regional soil moisture trend. International 10 Journal of Applied Earth Observation and Geoinformation, 48, 17-27, 11 doi:https://doi.org/10.1016/j.jag.2015.11.012. 12
Qiu, J. et al., 2019: Impacts of climate change on watershed systems and potential adaptation through BMPs 13 in a drinking water source area. Journal of Hydrology, 573, 123-135, 14 doi:https://doi.org/10.1016/j.jhydrol.2019.03.074. 15
Quan, S. et al., 2019: Adaptation to Climate Change and its Impacts on Wheat Yield: Perspective of Farmers 16 in Henan of China. Sustainability, 11 (7), doi:10.3390/su11071928. 17
Quandt, A., H. Neufeldt and J. T. McCabe, 2017: The role of agroforestry in building livelihood resilience to 18 floods and drought in semiarid Kenya. Ecology and Society, 22 (3), doi:10.5751/ES-09461-220310. 19
Quandt, A., H. Neufeldt and J. T. McCabe, 2019: Building livelihood resilience: what role does agroforestry 20 play? Climate and Development, 11 (6), 485-500, doi:10.1080/17565529.2018.1447903. 21
Quishpe‐Vásquez, C. et al., 2019: Tropical Pacific sea surface temperature influence on seasonal streamflow 22 variability in Ecuador. International Journal of Climatology, 39 (10), 3895-3914. 23
R Core Team, R: A language and environment for statistical computing. R Foundation for Statistical 24 Computing, Vienna, Austria. 25
Rabiei, E. et al., 2016: Areal rainfall estimation using moving cars-computer experiments including 26 hydrological modeling. Hydrology and Earth System Sciences 20 (2016), 3907-3922. 27
Radel, C., B. Schmook, L. Carte and S. Mardero, 2018: Toward a political ecology of migration: Land, labor 28 migration, and climate change in northwestern Nicaragua. World Development, 108, 263-273. 29
Raghavendra, K. J. and A. Suresh, 2018: Risk management in rainfed agriculture: An analysis of strategies 30 and adaptations followed by farmers in Madhya Pradesh. Indian Journal of Agricultural Sciences, 88 31 (6), 895-901. 32
Rahman, M. H. and K. Alam, 2016: Forest Dependent Indigenous Communities’ Perception and Adaptation 33 to Climate Change through Local Knowledge in the Protected Area—A Bangladesh Case Study. 34 Climate, 4 (1), 12. 35
Rahman, S., M. S. Islam, M. N. H. Khan and M. Touhiduzzaman, 2019: Climate change adaptation and 36 disaster risk reduction (DRR) through coastal afforestation in South-Central Coast of Bangladesh. 37 Management of Environmental Quality: An International Journal, 30 (3), 498-517, doi:10.1108/MEQ-38 01-2018-0021. 39
Rahman Talukder, M. R., S. Rutherford and C. Chu, 2015: Salinization of Drinking Water in the Context of 40 Climate Change and Sea Level Rise: A Public Health Priority for Coastal Bangladesh. International 41 journal of climate change: Impacts & responses, 8. 42
Rahmawati, H. and A. M. T. Lestari, 2019: Tackling everyday risks through climate adaptive organic 43 farming. Disaster Prevention and Management: An International Journal, 28 (1), 60-68, 44 doi:10.1108/DPM-06-2018-0201. 45
Rahn, E. et al., 2018a: Opportunities for sustainable intensification of coffee agro-ecosystems along an 46 altitudinal gradient on Mt. Elgon, Uganda. Agriculture, Ecosystems and Environment, 263 (February), 47 31-40, doi:10.1016/j.agee.2018.04.019. 48
Rahn, E. et al., 2018b: Exploring adaptation strategies of coffee production to climate change using a 49 process-based model. Ecological Modelling, 371, 76-89, 50 doi:https://doi.org/10.1016/j.ecolmodel.2018.01.009. 51
Rahut, D. B. and A. Ali, 2017: Coping with climate change and its impact on productivity, income, and 52 poverty: Evidence from the Himalayan region of Pakistan. International Journal of Disaster Risk 53 Reduction, 24, 515-525, doi:https://doi.org/10.1016/j.ijdrr.2017.05.006. 54
Rahut, D. B. and A. Ali, 2018: Impact of climate-change risk-coping strategies on livestock productivity and 55 household welfare: empirical evidence from Pakistan. Heliyon, 4 (10), e00797, 56 doi:https://doi.org/10.1016/j.heliyon.2018.e00797. 57
ACCEPTED VERSIO
N
SUBJECT TO FIN
AL EDITS
FINAL DRAFT Chapter 4 Supplementary Material IPCC WGII Sixth Assessment Report
Do Not Cite, Quote or Distribute SM4-258 Total pages: 273
Rai, R. K., L. D. Bhatta, U. Acharya and A. P. Bhatta, 2018: Assessing climate-resilient agriculture for 1 smallholders. Environmental Development, 27, 26-33, doi:10.1016/j.envdev.2018.06.002. 2
Rai, R. K. et al., 2019: Economics of climate adaptive water management practices in Nepal. Heliyon, 5 (5), 3 e01668-e01668, doi:10.1016/j.heliyon.2019.e01668. 4
Rainato, R. et al., 2017: Three decades of monitoring in the Rio Cordon instrumented basin: Sediment 5 budget and temporal trend of sediment yield. Geomorphology, 291, 45, 6 doi:10.1016/j.geomorph.2016.03.012. 7
Ramesh, K. V. and P. Goswami, 2014: Assessing reliability of regional climate projections: the case of 8 Indian monsoon. Scientific Reports, 4, 4071-4071, doi:10.1038/srep04071. 9
Ramsar Convention, 2018: Global Wetland Outlook: State of the world’s wetlands and their services to 10 people 2018. Ramsar Convention Secretariat, Gland, Switzerland [Available at: 11 https://www.ramsar.org/sites/default/files/flipbooks/ramsar_gwo_english_web.pdf]. 12
Raoul, K., 2015: Can glacial retreat lead to migration? A critical discussion of the impact of glacier 13 shrinkage upon population mobility in the Bolivian Andes. Population and Environment, 36 (4), 480-14 496, doi:10.1007/s11111-014-0226-z. 15
Rasmus, S. et al., 2020: Climate change and reindeer management in Finland: Co-analysis of practitioner 16 knowledge and meteorological data for better adaptation. Science of The Total Environment, 710, 17 136229, doi:https://doi.org/10.1016/j.scitotenv.2019.136229. 18
Ray, D. K. et al., 2019: Climate change has likely already affected global food production. PLOS ONE, 14 19 (5), e0217148. 20
Reinecke, R. et al., 2021: Uncertainty of simulated groundwater recharge at different global warming levels: 21 a global-scale multi-model ensemble study. Hydrol. Earth Syst. Sci., 25 (2), 787-810, doi:10.5194/hess-22 25-787-2021. 23
Ren, X., Y. Lu, B. C. O’Neill and M. Weitzel, 2018: Economic and biophysical impacts on agriculture under 24 1.5 °C and 2 °C warming. Environmental Research Letters, 13 (11), 115006, doi:10.1088/1748-25 9326/aae6a9. 26
Rennie, S. et al., 2020: The UK Environmental Change Network datasets–integrated and co-located data for 27 long-term environmental research (1993–2015). Earth System Science Data, 12 (1), 87-107. 28
Restrepo, J. D. and H. A. Escobar, 2018: Sediment load trends in the Magdalena River basin (1980–2010): 29 Anthropogenic and climate-induced causes. Geomorphology, 302, 76-91, 30 doi:https://doi.org/10.1016/j.geomorph.2016.12.013. 31
Rets, E. P. et al., 2020: Past ‘peak water’in the North Caucasus: deglaciation drives a reduction in glacial 32 runoff impacting summer river runoff and peak discharges. Climatic Change, 163 (4), 2135-2151. 33
Rets, E. P. et al., 2018: Recent Trends Of River Runoff In The North Caucasus. Geography, Environment, 34 Sustainability, 11 (3), 61-70. 35
Rey, D., I. P. Holman and J. W. Knox, 2017: Developing drought resilience in irrigated agriculture in the 36 face of increasing water scarcity. Regional Environmental Change, 17 (5), 1527-1540, 37 doi:10.1007/s10113-017-1116-6. 38
Rezaei Zaman, M., S. Morid and M. Delavar, 2016: Evaluating climate adaptation strategies on agricultural 39 production in the Siminehrud catchment and inflow into Lake Urmia, Iran using SWAT within an 40 OECD framework. Agricultural Systems, 147, 98-110, doi:https://doi.org/10.1016/j.agsy.2016.06.001. 41
Rice, J. and P. Westerhoff, 2017: High levels of endocrine pollutants in US streams during low flow due to 42 insufficient wastewater dilution. Nature Geoscience, 10, 587, doi:10.1038/ngeo2984 43
https://www.nature.com/articles/ngeo2984#supplementary-information. 44 Richardson, J. et al., 2019: Response of cyanobacteria and phytoplankton abundance to warming, extreme 45
rainfall events and nutrient enrichment. Global Change Biology, 25 (10), 3365-3380, 46 doi:https://doi.org/10.1111/gcb.14701. 47
Richey, A. S. et al., 2015: Quantifying renewable groundwater stress with GRACE. Water Resources 48 Research, 51 (7), 5217-5238, doi:10.1002/2015WR017349. 49
Rigaud, K. et al., 2018: Groundswell : Preparing for Internal Climate Migration. 50 Rio, M., D. Rey, C. Prudhomme and I. P. Holman, 2018: Evaluation of changing surface water abstraction 51
reliability for supplemental irrigation under climate change. Agricultural Water Management, 206, 200-52 208, doi:https://doi.org/10.1016/j.agwat.2018.05.005. 53
Rivadeneira Vera, J. F., Y. E. Zambrano Mera and M. Á. Pérez-Martín, 2020: Adapting water resources 54 systems to climate change in tropical areas: Ecuadorian coast. Science of The Total Environment, 703, 55 135554, doi:https://doi.org/10.1016/j.scitotenv.2019.135554. 56
ACCEPTED VERSIO
N
SUBJECT TO FIN
AL EDITS
FINAL DRAFT Chapter 4 Supplementary Material IPCC WGII Sixth Assessment Report
Do Not Cite, Quote or Distribute SM4-259 Total pages: 273
Robalino, J., J. Jimenez and A. Chacón, 2015: The Effect of Hydro-Meteorological Emergencies on Internal 1 Migration. World Development, 67, 438-448, doi:https://doi.org/10.1016/j.worlddev.2014.10.031. 2
Roberts, K. E. et al., 2017: Climate and permafrost effects on the chemistry and ecosystems of High Arctic 3 Lakes. Scientific Reports, 7 (1), 13292, doi:10.1038/s41598-017-13658-9. 4
Robi, M. A., A. Abebe and S. M. Pingale, 2019: Flood hazard mapping under a climate change scenario in a 5 Ribb catchment of Blue Nile River basin, Ethiopia. Applied Geomatics, 11 (2), 147-160. 6
Roco, L., B. Bravo-Ureta, A. Engler and R. Jara-Rojas, 2017: The impact of climatic change adaptation on 7 agricultural productivity in Central Chile: A stochastic production frontier approach. Sustainability 8 (Switzerland), 9 (9), doi:10.3390/su9091648. 9
Rodell, M. et al., 2018: Emerging trends in global freshwater availability. Nature, 557 (7707), 651-659, 10 doi:10.1038/s41586-018-0123-1. 11
Rodell, M., I. Velicogna and J. S. Famiglietti, 2009: Satellite-based estimates of groundwater depletion in 12 India. Nature, 460 (7258), 999-1002. 13
Rodríguez-Blanco, M. L. et al., 2016: Potential Impact of Climate Change on Suspended Sediment Yield in 14 NW Spain: A Case Study on the Corbeira Catchment. Water, 8 (10), doi:10.3390/w8100444. 15
Rodríguez-Sinobas, L., S. Zubelzu, S. Perales-Momparler and S. Canogar, 2018: Techniques and criteria for 16 sustainable urban stormwater management. The case study of Valdebebas (Madrid, Spain). Journal of 17 Cleaner Production, 172, 402-416, doi:https://doi.org/10.1016/j.jclepro.2017.10.070. 18
Rodriguez-Solorzano, C., 2014: Unintended outcomes of farmers’ adaptation to climate variability: 19 deforestation and conservation in Calakmul and Maya biosphere reserves. Ecology and Society, 19 (2). 20
Rokaya, P., S. Budhathoki and K.-E. Lindenschmidt, 2018: Trends in the timing and magnitude of ice-jam 21 floods in Canada. Scientific Reports, 8 (1), 1-9. 22
Rolla, A. L., M. N. Nuñez, J. J. Ramayón and M. E. Ramayón, 2019: Impacts of climate change on bovine 23 livestock production in Argentina. Climatic Change, 153 (3), 439-455. 24
Romanazzi, A., F. Gentile and M. Polemio, 2015: Modelling and management of a Mediterranean karstic 25 coastal aquifer under the effects of seawater intrusion and climate change. Environmental Earth 26 Sciences, 74 (1), 115-128, doi:10.1007/s12665-015-4423-6. 27
Romankiewicz, C., M. Doevenspeck, M. Brandt and C. Samimi, 2016: Adaptation as by-product: migration 28 and environmental change in Nguith, Senegal. DIE ERDE–Journal of the Geographical Society of 29 Berlin, 147 (2), 95-108. 30
Romanovsky, V. et al., 2019: Terrestrial permafrost [in “State of the Climate in 2018”]. Bulletin of the 31 American Meteorological Society, 100 (9). 32
Rosa, L., J. A. Reimer, M. S. Went and P. D’Odorico, 2020: Hydrological limits to carbon capture and 33 storage. Nature Sustainability, 3 (8), 658-666, doi:10.1038/s41893-020-0532-7. 34
Roschinsky, R. et al., 2016: Facilitating Climate Change Adaptation on Smallholder Farms Through 35 Farmers’ Collective Led On-Farm Adaptive Research: The SAF-BIN Project. In: Implementing Climate 36 Change Adaptation in Cities and Communities: Integrating Strategies and Educational Approaches 37 [Leal Filho, W., K. Adamson, R. M. Dunk, U. M. Azeiteiro, S. Illingworth and F. Alves (eds.)]. 38 Springer International Publishing, Cham, 205-219. 39
Rosenberger, L., J. Leandro, S. Pauleit and S. Erlwein, 2021: Sustainable stormwater management under the 40 impact of climate change and urban densification. Journal of Hydrology, 596, 126137, 41 doi:https://doi.org/10.1016/j.jhydrol.2021.126137. 42
Rouabhi, A., A. Mekhlouf, S. Mokhneche and N. Elkolli, 2016: Farming transitions under Socio-economic 43 and climatic constraints in the southern part of Sétif, Algeria. Journal of Agriculture and Environment 44 for International Development, 110 (1), 139-153, doi:10.12895/jaeid.20161.429. 45
Rounce, D. R., R. Hock and D. E. Shean, 2020: Glacier Mass Change in High Mountain Asia Through 2100 46 Using the Open-Source Python Glacier Evolution Model (PyGEM). Frontiers in Earth Science, 7 (331), 47 doi:10.3389/feart.2019.00331. 48
Roy, R., 2018: Evaluating the Suitability of Community-Based Adaptation: A Case Study of Bangladesh. In: 49 Handbook of Climate Change Communication: Vol. 1. Springer, 39-59. 50
Ruane, A. C., M. M. Phillips and C. Rosenzweig, 2018: Climate shifts within major agricultural seasons for 51 +1.5 and +2.0 °C worlds: HAPPI projections and AgMIP modeling scenarios. Agricultural and Forest 52 Meteorology, 259, 329-344, doi:https://doi.org/10.1016/j.agrformet.2018.05.013. 53
Ruiz Meza, L. E., 2015: Adaptive capacity of small-scale coffee farmers to climate change impacts in the 54 Soconusco region of Chiapas, Mexico. Climate and Development, 7 (2), 100-109, 55 doi:10.1080/17565529.2014.900472. 56
ACCEPTED VERSIO
N
SUBJECT TO FIN
AL EDITS
FINAL DRAFT Chapter 4 Supplementary Material IPCC WGII Sixth Assessment Report
Do Not Cite, Quote or Distribute SM4-260 Total pages: 273
Ryan, C. and P. Elsner, 2016: The potential for sand dams to increase the adaptive capacity of East African 1 drylands to climate change. Regional Environmental Change, 16 (7), 2087-2096. 2
Rye, C. D. et al., 2014: Rapid sea-level rise along the Antarctic margins in response to increased glacial 3 discharge. Nature Geoscience, 7, 732, doi:10.1038/ngeo2230 4
https://www.nature.com/articles/ngeo2230#supplementary-information. 5 Saha, A., S. Ghosh, A. S. Sahana and E. P. Rao, 2014: Failure of CMIP5 climate models in simulating post-6
1950 decreasing trend of Indian monsoon. Geophysical Research Letters, 41 (20), 7323-7330, 7 doi:10.1002/2014gl061573. 8
Sahade, R. et al., 2015: Climate change and glacier retreat drive shifts in an Antarctic benthic ecosystem. 9 Science Advances, 1 (10), e1500050, doi:10.1126/sciadv.1500050. 10
Sain, G. et al., 2017: Costs and benefits of climate-smart agriculture: The case of the Dry Corridor in 11 Guatemala. Agricultural Systems, 151, 163-173. 12
Salat, M. and B. Swallow, 2018: Resource Use Efficiency as a Climate Smart Approach: Case of 13 Smallholder Maize Farmers in Nyando, Kenya. Environments, 5 (8), 93. 14
Samaniego, L. et al., 2018: Anthropogenic warming exacerbates European soil moisture droughts. Nature 15 Climate Change, 8 (5), 421-426. 16
Samuel, O. O. and T. S. Sylvia, 2019: Establishing the nexus between climate change adaptation strategy and 17 smallholder farmers’ food security status in South Africa: A bi-casual effect using instrumental variable 18 approach. Cogent Social Sciences, 5 (1), 1656402, doi:10.1080/23311886.2019.1656402. 19
Sánchez, A. and M. Izzo, 2017: Micro hydropower: an alternative for climate change mitigation, adaptation, 20 and development of marginalized local communities in Hispaniola Island. Climatic Change, 140 (1), 21 79-87, doi:10.1007/s10584-016-1865-0. 22
Sansen, K., W. Wongboon, J. Jairin and Y. Kato, 2019: Farmer-participatory evaluation of mechanized dry 23 direct-seeding technology for rice in northeastern Thailand. Plant Production Science, 22 (1), 46-53, 24 doi:10.1080/1343943X.2018.1557530. 25
Santos, A. et al., 2018: Artificial lakes as a climate change adaptation strategy in drylands: evaluating the 26 trade-off on non-target ecosystem services. Mitigation and Adaptation Strategies for Global Change, 23 27 (6), 887-906. 28
Sapkota, P., R. J. Keenan, J. A. Paschen and H. R. Ojha, 2016: Social production of vulnerability to climate 29 change in the rural middle hills of Nepal. Journal of Rural Studies, 48, 53-64, 30 doi:10.1016/j.jrurstud.2016.09.007. 31
Sari, A. D. and N. Prayoga, 2018: Enhancing citizen engagement in the face of climate change risks: A case 32 study of the flood early warning system and health information system in Semarang City, Indonesia. In: 33 Climate Change in Cities. Springer, 121-137. 34
Sarkar, S. et al., 2015: Assessing the potential of indigenous technological knowledge (ITK) for adaptation 35 to climate change in the Himalayan and arid ecosystems. Indian Journal of Traditional Knowledge, 14 36 (2), 251-257. 37
Sarkar, U. K., K. Roy, G. Karnatak and S. K. Nandy, 2018: Adaptive climate change resilient indigenous 38 fisheries strategies in the floodplain wetlands of West Bengal, India. Journal of Water and Climate 39 Change, 9 (3), 449-462, doi:10.2166/wcc.2018.271. 40
Sarmiento-Soler, A. et al., 2019: Water use of Coffea arabica in open versus shaded systems under 41 smallholder's farm conditions in Eastern Uganda. Agricultural and Forest Meteorology, 266-267 42 (December 2018), 231-242, doi:10.1016/j.agrformet.2018.12.006. 43
Saroar, M. M., 2018: Ecosystem-Based Adaptation (EbA) for Coastal Resilience Against Water Related 44 Disasters in Bangladesh. Climate Change Management, 187-205, doi:10.1007/978-3-319-70703-7_10. 45
Sarojini, B. B., P. A. Stott and E. Black, 2016: Detection and attribution of human influence on regional 46 precipitation. Nature Climate Change, 6, 669, doi:10.1038/nclimate2976. 47
Savo, V. et al., 2016: Observations of climate change among subsistence-oriented communities around the 48 world. Nature Climate Change, 6, 462, doi:10.1038/nclimate2958 49
https://www.nature.com/articles/nclimate2958#supplementary-information. 50 Sayre, M., T. Stenner and A. Argumedo, 2017: You can't grow potatoes in the sky: building resilience in the 51
face of climate change in the Potato Park of Cuzco, Peru. Culture, Agriculture, Food and Environment, 52 39 (2), 100-108. 53
Scanlon, B. R., L. Longuevergne and D. Long, 2012: Ground referencing GRACE satellite estimates of 54 groundwater storage changes in the California Central Valley, USA. Water Resources Research, 48 (4), 55 doi:doi:10.1029/2011WR011312. 56
ACCEPTED VERSIO
N
SUBJECT TO FIN
AL EDITS
FINAL DRAFT Chapter 4 Supplementary Material IPCC WGII Sixth Assessment Report
Do Not Cite, Quote or Distribute SM4-261 Total pages: 273
Schaefli, B. et al., 2019: The role of glacier retreat for Swiss hydropower production. Renewable Energy, 1 132, 615-627. 2
Schattman, R. E., V. E. Méndez, S. C. Merrill and A. Zia, 2018: Mixed methods approach to understanding 3 farmer and agricultural advisor perceptions of climate change and adaptation in Vermont, United States. 4 Agroecology and Sustainable Food Systems, 42 (2), 121-148, doi:10.1080/21683565.2017.1357667. 5
Scheffers, B. R. et al., 2016: The broad footprint of climate change from genes to biomes to people. Science, 6 354 (6313), aaf7671, doi:10.1126/science.aaf7671. 7
Schembergue, A. et al., 2017: Sistemas agroflorestais como estratégia de adaptação aos desafios das 8 mudanças climáticas no Brasil. Revista de Economia e Sociologia Rural, 55 (1), 9-30. 9
Schiefer, E. et al., 2018: Fluvial suspended sediment yields over hours to millennia in the High Arctic at 10 proglacial Lake Linnévatnet, Svalbard. Earth Surface Processes and Landforms, 43 (2), 482-498, 11 doi:doi:10.1002/esp.4264. 12
Schleussner, C.-F. et al., 2018: Crop productivity changes in 1.5 °C and 2 °C worlds under climate sensitivity 13 uncertainty. Environmental Research Letters, 13 (6), 064007, doi:10.1088/1748-9326/aab63b. 14
Schneider, U. et al., 2017: Evaluating the Hydrological Cycle over Land Using the Newly-Corrected 15 Precipitation Climatology from the Global Precipitation Climatology Centre (GPCC). Atmosphere, 8 16 (3), doi:10.3390/atmos8030052. 17
Schuster, R. C. et al., 2020: “If there is no water, we cannot feed our children”: The far-reaching 18 consequences of water insecurity on infant feeding practices and infant health across 16 low- and 19 middle-income countries. American Journal of Human Biology, 32 (1), e23357, 20 doi:10.1002/ajhb.23357. 21
Schutte, S., J. Vestby, J. Carling and H. Buhaug, 2021: Climatic conditions are weak predictors of asylum 22 migration. Nature Communications, 12 (1), 1-10. 23
Schuur, E. A. G. et al., 2015: Climate change and the permafrost carbon feedback. Nature, 520, 171, 24 doi:10.1038/nature14338. 25
Scott, C. and Z. Sugg, 2015: Global Energy Development and Climate-Induced Water Scarcity— Physical 26 Limits, Sectoral Constraints, and Policy Imperatives. Energies, 8, 8211-8225, doi:10.3390/en8088211. 27
Scussolini, P. et al., 2016: FLOPROS: an evolving global database of flood protection standards. Nat. 28 Hazards Earth Syst. Sci., 16 (5), 1049-1061, doi:10.5194/nhess-16-1049-2016. 29
Scussolini, P. et al., 2017: Adaptation to Sea Level Rise: A Multidisciplinary Analysis for Ho Chi Minh City, 30 Vietnam. Water Resources Research, 53 (12), 10841-10857, 31 doi:https://doi.org/10.1002/2017WR021344. 32
Sebastian, A. et al., 2019: Disentangling the impacts of human and environmental change on catchment 33 response during Hurricane Harvey. Environmental Research Letters, 14 (12), 124023, 34 doi:10.1088/1748-9326/ab5234. 35
Seiller, G. and F. Anctil, 2014: Climate change impacts on the hydrologic regime of a Canadian river: 36 comparing uncertainties arising from climate natural variability and lumped hydrological model 37 structures. Hydrol. Earth Syst. Sci., 18 (6), 2033-2047, doi:10.5194/hess-18-2033-2014. 38
Seneviratne, S. I. et al., 2021: Weather and Climate Extreme Events in a Changing Climate. In: Climate 39 Change 2021: The Physical Science Basis. Contribution of Working Group I to the Sixth Assessment 40 Report of the Intergovernmental Panel on Climate Change [Masson-Delmotte, V., P. Zhai, A. Pirani, S. 41 L. Connors, C. Péan, S. Berger, N. Caud, Y. Chen, L. Goldfarb, M. I. Gomis, M. Huang, K. Leitzell, E. 42 Lonnoy, J. B. R. Matthews, T. K. Maycock, T. Waterfield, O. Yelekçi, R. Yu and B. Zhou (eds.)]. 43 Cambridge University Press. 44
Sepulveda-Jauregui, A. et al., 2018: Eutrophication exacerbates the impact of climate warming on lake 45 methane emission. Science of The Total Environment, 636, 411-419, 46 doi:https://doi.org/10.1016/j.scitotenv.2018.04.283. 47
Sesmero, J., J. Ricker-Gilbert and A. Cook, 2018: How do african farm households respond to changes in 48 current and past weather patterns? A structural panel data analysis from Malawi. American Journal of 49 Agricultural Economics, 100 (1), 115-144, doi:10.1093/ajae/aax068. 50
Shabbir, G., T. Khaliq, A. Ahmad and M. Saqib, 2020: Assessing the climate change impacts and adaptation 51 strategies for rice production in Punjab, Pakistan. Environmental Science and Pollution Research, 27 52 (18), 22568-22578, doi:10.1007/s11356-020-08846-6. 53
Shahgedanova, M. et al., 2020: Emptying Water Towers? Impacts of Future Climate and Glacier Change on 54 River Discharge in the Northern Tien Shan, Central Asia. Water, 12 (3), 627. 55
ACCEPTED VERSIO
N
SUBJECT TO FIN
AL EDITS
FINAL DRAFT Chapter 4 Supplementary Material IPCC WGII Sixth Assessment Report
Do Not Cite, Quote or Distribute SM4-262 Total pages: 273
Shahsavari, F., F. Karandish and P. Haghighatjou, 2019: Potentials for expanding dry-land agriculture under 1 global warming in water-stressed regions: a quantitative assessment based on drought indices. 2 Theoretical and Applied Climatology, 137 (1), 1555-1567, doi:10.1007/s00704-018-2689-9. 3
Shale, M. T., 2014: Can burial societies be used to overcome flooding? Insurance and resilience in poor, 4 urban South Africa. Climate and Development, 6 (3), 256-265, doi:10.1080/17565529.2013.844674. 5
Shamsudduha, M., R. Taylor and L. Longuevergne, 2012: Monitoring groundwater storage changes in the 6 highly seasonal humid tropics: Validation of GRACE measurements in the Bengal Basin. Water 7 Resources Research, 48 (2). 8
Shamsudduha, M. and R. G. Taylor, 2020: Groundwater storage dynamics in the world's large aquifer 9 systems from GRACE: uncertainty and role of extreme precipitation. Earth Syst. Dynam., 11 (3), 755-10 774, doi:10.5194/esd-11-755-2020. 11
Shannon, S. et al., 2019: Global glacier volume projections under high-end climate change scenarios. The 12 Cryosphere, 13 (1), 325-350, doi:10.5194/tc-13-325-2019. 13
Sharma, B. M. et al., 2015: Melting Himalayan glaciers contaminated by legacy atmospheric depositions are 14 important sources of PCBs and high-molecular-weight PAHs for the Ganges floodplain during dry 15 periods. Environmental Pollution, 206, 588-596, doi:https://doi.org/10.1016/j.envpol.2015.08.012. 16
Shi, X., L. Sun, X. Chen and L. Wang, 2019: Farmers' perceived efficacy of adaptive behaviors to climate 17 change in the Loess Plateau, China. Science of The Total Environment, 697, 134217-134217, 18 doi:10.1016/j.scitotenv.2019.134217. 19
Shinn, J. E., B. King, K. R. Young and K. A. Crews, 2014: Variable adaptations: Micro-politics of 20 environmental displacement in the Okavango Delta, Botswana. Geoforum, 57, 21-29, 21 doi:10.1016/j.geoforum.2014.08.006. 22
Shrestha, B. B. et al., 2019a: Assessing flood disaster impacts in agriculture under climate change in the river 23 basins of Southeast Asia. Natural Hazards, 97 (1), 157-192, doi:10.1007/s11069-019-03632-1. 24
Shrestha, N. K. and J. Wang, 2018: Predicting sediment yield and transport dynamics of a cold climate 25 region watershed in changing climate. Science of The Total Environment, 625, 1030-1045, 26 doi:https://doi.org/10.1016/j.scitotenv.2017.12.347. 27
Shrestha, R. P. and N. Nepal, 2016: An assessment by subsistence farmers of the risks to food security 28 attributable to climate change in Makwanpur, Nepal. Food Security, 8 (2), 415-425, 29 doi:10.1007/s12571-016-0554-1. 30
Shrestha, R. R. et al., 2021: Heterogeneous snowpack response and snow drought occurrence across river 31 basins of northwestern North America under 1.0°C to 4.0°C global warming. Climatic Change, 164 (3), 32 40, doi:10.1007/s10584-021-02968-7. 33
Shrestha, R. R., A. J. Cannon, M. A. Schnorbus and H. Alford, 2019b: Climatic controls on future 34 hydrologic changes in a subarctic river basin in Canada. Journal of Hydrometeorology, 20 (9), 1757-35 1778. 36
Shrestha, S., A. K. Anal, P. A. Salam and M. Van Der Valk, 2015: Managing water resources under climate 37 uncertainty: Examples from Asia, Europe, Latin America, and Australia. 1-438. 38
Shrestha, S., B. Bhatta, M. Shrestha and P. K. Shrestha, 2018: Integrated assessment of the climate and 39 landuse change impact on hydrology and water quality in the Songkhram River Basin, Thailand. 40 Science of The Total Environment, 643, 1610-1622, doi:https://doi.org/10.1016/j.scitotenv.2018.06.306. 41
Shrestha, S., P. S. Chapagain and M. Ghimire, 2019c: Gender Perspective on Water Use and Management in 42 the Context of Climate Change: A Case Study of Melamchi Watershed Area, Nepal. SAGE Open, 9 (1), 43 2158244018823078, doi:10.1177/2158244018823078. 44
Shrestha, S., P. Deb and T. T. T. Bui, 2016: Adaptation strategies for rice cultivation under climate change in 45 Central Vietnam. Mitigation and Adaptation Strategies for Global Change, 21 (1), 15-37, 46 doi:10.1007/s11027-014-9567-2. 47
Shugar, D. H. et al., 2020: Rapid worldwide growth of glacial lakes since 1990. Nature Climate Change, 10 48 (10), 939-945. 49
Sichangi, A. W. et al., 2016: Estimating continental river basin discharges using multiple remote sensing 50 data sets. Remote Sensing of Environment, 179, 36-53. 51
Simane, B., T. Tulu, A. Lantideru and D. Dawit, 2017: Fostering the use of rainwater for off-season small-52 scale irrigation in arid and semi-arid areas of Ethiopia. 147-158. 53
Simon, K., G. Diprose and A. C. Thomas, 2020: Community-led initiatives for climate adaptation and 54 mitigation. Kōtuitui: New Zealand Journal of Social Sciences Online, 15 (1), 93-105, 55 doi:10.1080/1177083X.2019.1652659. 56
ACCEPTED VERSIO
N
SUBJECT TO FIN
AL EDITS
FINAL DRAFT Chapter 4 Supplementary Material IPCC WGII Sixth Assessment Report
Do Not Cite, Quote or Distribute SM4-263 Total pages: 273
Simonneaux, V. et al., 2015: Land use and climate change effects on soil erosion in a semi-arid mountainous 1 watershed (High Atlas, Morocco). Journal of Arid Environments, 122, 64-75, 2 doi:https://doi.org/10.1016/j.jaridenv.2015.06.002. 3
Singh, C. et al., 2019: What shapes vulnerability and risk management in semi-arid India? Moving towards 4 an agenda of sustainable adaptation. Environmental Development, 30 (April), 35-50, 5 doi:10.1016/j.envdev.2019.04.007. 6
Singh, R. K. et al., 2014: Adaptation in rice-wheat based sodic agroecosystems: A case study on climate 7 resilient farmers' practices. Indian Journal of Traditional Knowledge, 13 (2), 377-389. 8
Siraw, Z., M. Adnew Degefu and W. Bewket, 2018: The role of community-based watershed development in 9 reducing farmers’ vulnerability to climate change and variability in the northwestern highlands of 10 Ethiopia. Local Environment, 23 (12), 1190-1206. 11
Sishodia, R. P. et al., 2018: Future irrigation expansion outweigh groundwater recharge gains from climate 12 change in semi-arid India. Science of The Total Environment, 635, 725-740. 13
Sjerps, R. M. A., T. L. ter Laak and G. J. J. G. Zwolsman, 2017: Projected impact of climate change and 14 chemical emissions on the water quality of the European rivers Rhine and Meuse: A drinking water 15 perspective. Science of The Total Environment, 601-602, 1682-1694, 16 doi:https://doi.org/10.1016/j.scitotenv.2017.05.250. 17
Skinner, C. B. et al., 2017: The Role of Plant CO2 Physiological Forcing in Shaping Future Daily-Scale 18 Precipitation. Journal of Climate, 30 (7), 2319-2340, doi:10.1175/jcli-d-16-0603.1. 19
Slater, L. J. and G. Villarini, 2016: Recent trends in U.S. flood risk. Geophysical Research Letters, 43 (24), 20 12,428-12,436, doi:10.1002/2016gl071199. 21
Smith, A. J. et al., 2019: Resilience of benthic macroinvertebrates to extreme floods in a Catskill Mountain 22 river, New York, USA: Implications for water quality monitoring and assessment. Ecological 23 Indicators, 104, 107-115, doi:https://doi.org/10.1016/j.ecolind.2019.04.057. 24
Smith, B. A. et al., 2015: A risk modeling framework to evaluate the impacts of climate change and 25 adaptation on food and water safety. Food Research International, 68, 78-85, 26 doi:https://doi.org/10.1016/j.foodres.2014.07.006. 27
Smith, T. and B. Bookhagen, 2018: Changes in seasonal snow water equivalent distribution in High 28 Mountain Asia (1987 to 2009). Science Advances, 4 (1), e1701550, doi:10.1126/sciadv.1701550. 29
Soeters, S., 2016: Building Bonds and Breaking Bridges: Community Based Adaptation (CBA) as a Source 30 of Conflict in a Northern Ghanaian Landscape. In: Adaptation to Climate Change and Variability in 31 Rural West Africa [Yaro, J. A. and J. Hesselberg (eds.)]. Springer International Publishing, Cham, 103-32 120. 33
Solander, K. C., K. E. Bennett and R. S. Middleton, 2017: Shifts in historical streamflow extremes in the 34 Colorado River Basin. Journal of Hydrology: Regional Studies, 12, 363-377. 35
Somanje, A. N., O. Crespo and N. Zinyengere, 2017: Conservation Agriculture Among Farmers in Kalomo, 36 Zambia: Potential for Productivity Under Climate Change. Elsevier Inc., 77-99. 37
Song, C., R. Liu, L. Oxley and H. Ma, 2018: The adoption and impact of engineering-type measures to 38 address climate change: evidence from the major grain-producing areas in China. Australian Journal of 39 Agricultural and Resource Economics, 62 (4), 608-635, doi:10.1111/1467-8489.12269. 40
Song, C. et al., 2019: Importance of active layer freeze-thaw cycles on the riverine dissolved carbon export 41 on the Qinghai-Tibet Plateau permafrost region. PeerJ, 7, e7146-e7146, doi:10.7717/peerj.7146. 42
Song, C. et al., 2020: Spatiotemporal Variability and Sources of DIC in Permafrost Catchments of the 43 Yangtze River Source Region: Insights From Stable Carbon Isotope and Water Chemistry. Water 44 Resources Research, 56 (1), e2019WR025343, doi:10.1029/2019wr025343. 45
Sorg, A. et al., 2012: Climate change impacts on glaciers and runoff in Tien Shan (Central Asia). Nature 46 Climate Change, 2 (10), 725-731, doi:10.1038/nclimate1592. 47
Soriano, M. A. and S. Herath, 2020: Climate change and traditional upland paddy farming: a Philippine case 48 study. Paddy and Water Environment, 18 (2), 317-330, doi:10.1007/s10333-019-00784-5. 49
Spalding-Fecher, R., B. Joyce and H. Winkler, 2017: Climate change and hydropower in the Southern 50 African Power Pool and Zambezi River Basin: System-wide impacts and policy implications. Energy 51 Policy, 103, 84-97, doi:https://doi.org/10.1016/j.enpol.2016.12.009. 52
Spekker, H. and J. Heskamp, 2017: Flood protection for the City of Beira: An exemplary climate adaptation 53 project in Mozambique. Bautechnik, 94 (12), 872-874. 54
Spencer, R. G. M. et al., 2015: Detecting the signature of permafrost thaw in Arctic rivers. Geophysical 55 Research Letters, 42 (8), 2830-2835, doi:10.1002/2015gl063498. 56
ACCEPTED VERSIO
N
SUBJECT TO FIN
AL EDITS

FINAL DRAFT Chapter 4 Supplementary Material IPCC WGII Sixth Assessment Report
Do Not Cite, Quote or Distribute SM4-264 Total pages: 273
Sperotto, A. et al., 2019: A Bayesian Networks approach for the assessment of climate change impacts on 1 nutrients loading. Environmental Science & Policy, 100, 21-36, 2 doi:https://doi.org/10.1016/j.envsci.2019.06.004. 3
Spinoni, J. et al., 2019: A new global database of meteorological drought events from 1951 to 2016. Journal 4 of Hydrology: Regional Studies, 22, 100593, doi:https://doi.org/10.1016/j.ejrh.2019.100593. 5
Spinoni, J., G. Naumann, J. Vogt and P. Barbosa, 2015: European drought climatologies and trends based on 6 a multi-indicator approach. Global and Planetary Change, 127, 50-57, 7 doi:https://doi.org/10.1016/j.gloplacha.2015.01.012. 8
Srinivasa Rao, C. et al., 2016: Chapter Four - Climate Resilient Villages for Sustainable Food Security in 9 Tropical India: Concept, Process, Technologies, Institutions, and Impacts. In: Advances in Agronomy 10 [Sparks, D. L. (ed.)]. Academic Press, 140, 101-214. 11
St. Pierre, K. A. et al., 2018: Unprecedented increases in total and methyl mercury concentrations 12 downstream of retrogressive thaw slumps in the western Canadian Arctic. Environmental Science & 13 Technology, 52 (24), 14099-14109. 14
Stagge, J. H., D. G. Kingston, L. M. Tallaksen and D. M. Hannah, 2017: Observed drought indices show 15 increasing divergence across Europe. Scientific Reports, 7 (1), 14045, doi:10.1038/s41598-017-14283-16 2. 17
Stavenhagen, M., J. Buurman and C. Tortajada, 2018: Saving water in cities: Assessing policies for 18 residential water demand management in four cities in Europe. Cities, 79, 187-195, 19 doi:https://doi.org/10.1016/j.cities.2018.03.008. 20
Stefanovic, J. O. et al., 2019: Adaption to climate change: a case study of two agricultural systems from 21 Kenya. Climate and Development, 11 (4), 319-337, doi:10.1080/17565529.2017.1411241. 22
Steinhoff-Knopp, B. and B. Burkhard, 2018: Soil erosion by water in Northern Germany: long-term 23 monitoring results from Lower Saxony. CATENA, 165, 299-309, 24 doi:https://doi.org/10.1016/j.catena.2018.02.017. 25
Stöber, S., C. Moraza, L. Zahl and E. Kagai, 2017: Low-Tech irrigation strategies for smallholder vegetable 26 farmers in Kenya. 215-233. 27
Stott, P. A. et al., 2016: Attribution of extreme weather and climate-related events. Wiley Interdisciplinary 28 Reviews: Climate Change, 7 (1), 23-41, doi:10.1002/wcc.380. 29
Su, F. et al., 2016: Hydrological response to future climate changes for the major upstream river basins in the 30 Tibetan Plateau. Global and Planetary Change, 136, 82-95, 31 doi:https://doi.org/10.1016/j.gloplacha.2015.10.012. 32
Su, Y. et al., 2017: Gendered Responses to Drought in Yunnan Province, China. Mountain Research and 33 Development, 37, 24-34, doi:10.1659/MRD-JOURNAL-D-15-00041.1. 34
Subedi, R. et al., 2019: Climate-smart practices for improvement of crop yields in mid-hills of Nepal. Cogent 35 Food & Agriculture, 5 (1), 1631026-1631026, doi:10.1080/23311932.2019.1631026. 36
Suckall, N., E. Tompkins and L. Stringer, 2014: Identifying trade-offs between adaptation, mitigation and 37 development in community responses to climate and socio-economic stresses: Evidence from Zanzibar, 38 Tanzania. Applied Geography, 46, 111-121, doi:10.1016/j.apgeog.2013.11.005. 39
Sudan, F. K. and J. McKay, 2015: Climate Adaptation and Governance and Small-Scale Farmers’ 40 Vulnerability Through Artificial Glacier Technology: Experiences from the Cold Desert of Leh in 41 North-West Himalaya, India. In: Managing Water Resources under Climate Uncertainty: Examples 42 from Asia, Europe, Latin America, and Australia [Shrestha, S., A. K. Anal, P. A. Salam and M. van der 43 Valk (eds.)]. Springer International Publishing, Cham, 319-342. 44
Suhardiman, D., D. Wichelns, L. Lebel and S. S. Sellamuttu, 2014: Benefit sharing in Mekong Region 45 hydropower: Whose benefits count? Water Resources and Rural Development, 4, 3-11, 46 doi:https://doi.org/10.1016/j.wrr.2014.10.008. 47
Sujakhu, N. M. et al., 2016: Farmers' perceptions of and adaptations to changing climate in the Melamchi 48 Valley of Nepal. Mountain Research and Development, 36 (1), 15-30, doi:10.1659/MRD-JOURNAL-49 D-15-00032.1. 50
Sullivan-Wiley, K. A. and A. G. Short Gianotti, 2018: Pursuing productivity gains and risk reduction in a 51 multi-hazard landscape: A case study from eastern Uganda. Land Use Policy, 79 (August), 671-683, 52 doi:10.1016/j.landusepol.2018.08.035. 53
Sultan, B., D. Defrance and T. Iizumi, 2019: Evidence of crop production losses in West Africa due to 54 historical global warming in two crop models. Scientific Reports, 9 (1), 12834, doi:10.1038/s41598-55 019-49167-0. 56
ACCEPTED VERSIO
N
SUBJECT TO FIN
AL EDITS
FINAL DRAFT Chapter 4 Supplementary Material IPCC WGII Sixth Assessment Report
Do Not Cite, Quote or Distribute SM4-265 Total pages: 273
Sultana, P. et al., 2019: Transforming local natural resource conflicts to cooperation in a changing climate: 1 Bangladesh and Nepal lessons. Climate Policy, 19 (sup1), S94-S106, 2 doi:10.1080/14693062.2018.1527678. 3
Sun, L. et al., 2018: Wetland-atmosphere methane exchange in Northeast China: A comparison of permafrost 4 peatland and freshwater wetlands. Agricultural and Forest Meteorology, 249, 239-249. 5
Sun, Q. et al., 2020: A global, continental and regional analysis of changes in extreme precipitation. Journal 6 of Climate, 1-52, doi:10.1175/JCLI-D-19-0892.1. 7
Sun, X. et al., 2017: The role of melting alpine glaciers in mercury export and transport: An intensive 8 sampling campaign in the Qugaqie Basin, inland Tibetan Plateau. Environmental Pollution, 220, 936-9 945, doi:https://doi.org/10.1016/j.envpol.2016.10.079. 10
Svoboda, V., M. Hanel, P. Máca and J. Kyselý, 2016: Projected changes of rainfall event characteristics for 11 the Czech Republic. Journal of Hydrology and Hydromechanics, 64 (4), 415-425, 12 doi:doi:10.1515/johh-2016-0036. 13
Swann, A. L. S., F. M. Hoffman, C. D. Koven and J. T. Randerson, 2016: Plant responses to increasing CO2 14 reduce estimates of climate impacts on drought severity. Proceedings of the National Academy of 15 Sciences, 113 (36), 10019-10024, doi:10.1073/pnas.1604581113. 16
Tabbo, A. M. and Z. Amadou, 2017: Assessing newly introduced climate change adaptation strategy 17 packages among rural households: Evidence from Kaou local government area, Tahoua State, Niger 18 Republic. Jàmbá: Journal of Disaster Risk Studies, 9, 1-7. 19
Taboada, C. et al., 2017: Can warmer be better? Changing production systems in three Andean ecosystems in 20 the face of environmental change. Journal of Arid Environments, 147, 144-154. 21
Tan, Y. and X. Liu, 2017: Water shortage and inequality in arid Minqin oasis of northwest China: adaptive 22 policies and farmers’ perceptions. Local Environment, 22 (8), 934-951. 23
Tanoue, M., Y. Hirabayashi and H. Ikeuchi, 2016: Global-scale river flood vulnerability in the last 50 years. 24 Scientific Reports, 6, 36021, doi:10.1038/srep36021 25
https://www.nature.com/articles/srep36021#supplementary-information. 26 Taraz, V., 2017: Adaptation to climate change: historical evidence from the Indian monsoon. Environment 27
and Development Economics, 22 (5), 517-545, doi:10.1017/S1355770X17000195. 28 Tariq, A. et al., 2017: A climate stress test of Los Angeles’ water quality plans. Climatic Change, 144 (4), 29
625-639, doi:10.1007/s10584-017-2062-5. 30 Tarpanelli, A. et al., 2017: Discharge estimation and forecasting by MODIS and altimetry data in Niger-31
Benue River. Remote Sensing of Environment, 195, 96-106. 32 Tarroja, B., A. AghaKouchak and S. Samuelsen, 2016: Quantifying climate change impacts on hydropower 33
generation and implications on electric grid greenhouse gas emissions and operation. Energy, 111, 295-34 305, doi:https://doi.org/10.1016/j.energy.2016.05.131. 35
Tauhid, F. A. and H. Zawani, 2018: Mitigating climate change related floods in urban poor areas: green 36 infrastructure approach. Journal of Regional and City Planning, 29 (2), 98-112. 37
Tauro, F. and S. Grimaldi, 2017: Ice dices for monitoring stream surface velocity. Journal of Hydro-38 environment Research, 14, 143-149. 39
Tauro, F. et al., 2018: Measurements and Observations in the XXI century (MOXXI): innovation and multi-40 disciplinarity to sense the hydrological cycle. Hydrological Sciences Journal, 63 (2), 169-196. 41
Taylor, C. M. et al., 2017: Frequency of extreme Sahelian storms tripled since 1982 in satellite observations. 42 Nature, 544 (7651), 475-478, doi:10.1038/nature22069. 43
Taylor, R. G. et al., 2013: Evidence of the dependence of groundwater resources on extreme rainfall in East 44 Africa. Nature Climate Change, 3 (4), 374-378, doi:10.1038/nclimate1731. 45
Tazen, F. et al., 2019: Trends in flood events and their relationship to extreme rainfall in an urban area of 46 Sahelian West Africa: The case study of Ouagadougou, Burkina Faso. Journal of Flood Risk 47 Management, 12 (S1), e12507, doi:10.1111/jfr3.12507. 48
Teklewold, H., T. Gebrehiwot and M. Bezabih, 2019: Climate smart agricultural practices and gender 49 differentiated nutrition outcome: An empirical evidence from Ethiopia. World Development, 122, 38-50 53, doi:10.1016/j.worlddev.2019.05.010. 51
Teklewold, H., A. Mekonnen, G. Kohlin and S. Di Falco, 2017: Does adoption of multiple climate-smart 52 practices improve farmers' climate resilience? Empirical evidence from the Nile Basin of Ethiopia. 53 Climate Change Economics, 8 (1), doi:10.1142/S2010007817500014. 54
Tembata, K. and K. Takeuchi, 2018: Collective decision making under drought: An empirical study of water 55 resource management in Japan. Water Resources and Economics, 22, 19-31, 56 doi:https://doi.org/10.1016/j.wre.2017.11.001. 57
ACCEPTED VERSIO
N
SUBJECT TO FIN
AL EDITS

FINAL DRAFT Chapter 4 Supplementary Material IPCC WGII Sixth Assessment Report
Do Not Cite, Quote or Distribute SM4-266 Total pages: 273
Teotónio, C. et al., 2017: Assessing the impacts of climate change on hydropower generation and the power 1 sector in Portugal: A partial equilibrium approach. Renewable and Sustainable Energy Reviews, 74, 2 788-799, doi:https://doi.org/10.1016/j.rser.2017.03.002. 3
Tesfamariam, Y. and M. Hurlbert, 2017: Gendered adaptation of Eritrean dryland farmers. International 4 Journal of Climate Change Strategies and Management, 9 (2), 207-224, doi:10.1108/IJCCSM-07-2016-5 0096. 6
Thackeray, C. W., C. Derksen, C. G. Fletcher and A. Hall, 2019: Snow and Climate: Feedbacks, Drivers, and 7 Indices of Change. Current Climate Change Reports, 5 (4), 322-333, doi:10.1007/s40641-019-00143-8 w. 9
Thackeray, C. W., C. G. Fletcher, L. R. Mudryk and C. Derksen, 2016: Quantifying the Uncertainty in 10 Historical and Future Simulations of Northern Hemisphere Spring Snow Cover. Journal of Climate, 29 11 (23), 8647-8663, doi:10.1175/jcli-d-16-0341.1. 12
Thi Hoa Sen, L. and J. Bond, 2017: Agricultural adaptation to flood in lowland rice production areas of 13 Central Vietnam: understanding the ‘regenerated rice’ ratoon system. Climate and Development, 9 (3), 14 274-285, doi:10.1080/17565529.2016.1149440. 15
Thiam, S. et al., 2017: Association between Childhood Diarrhoeal Incidence and Climatic Factors in Urban 16 and Rural Settings in the Health District of Mbour, Senegal. International Journal of Environmental 17 Research and Public Health, 14 (9), doi:10.3390/ijerph14091049. 18
Thiede, B., C. Gray and V. Mueller, 2016: Climate variability and inter-provincial migration in South 19 America, 1970–2011. Global Environmental Change, 41, 228-240, 20 doi:https://doi.org/10.1016/j.gloenvcha.2016.10.005. 21
Thieken, A. H. et al., 2016: Estimating changes in flood risks and benefits of non-structural adaptation 22 strategies - a case study from Tyrol, Austria. Mitigation and Adaptation Strategies for Global Change, 23 21 (3), 343-376, doi:10.1007/s11027-014-9602-3. 24
Thierfelder, C., R. Matemba-Mutasa and L. Rusinamhodzi, 2015: Yield response of maize (Zea mays L.) to 25 conservation agriculture cropping system in Southern Africa. Soil and Tillage Research, 146, 230-242. 26
Thiery, W. et al., 2020: Warming of hot extremes alleviated by expanding irrigation. Nature 27 Communications, 11 (1), 290, doi:10.1038/s41467-019-14075-4. 28
Thober, S. et al., 2018: Multi-model ensemble projections of European river floods and high flows at 1.5, 2, 29 and 3 degrees global warming. Environmental Research Letters, 13 (1), 014003. 30
Thomas, B., A. Behrangi and J. Famiglietti, 2016: Precipitation Intensity Effects on Groundwater Recharge 31 in the Southwestern United States. Water, 8, doi:10.3390/w8030090. 32
Tian, S. et al., 2019: Temporal variations of runoff and sediment load in the upper Yellow River, China. 33 Journal of Hydrology, 568, 46-56, doi:https://doi.org/10.1016/j.jhydrol.2018.10.033. 34
Tillman, F. D., S. Gangopadhyay and T. Pruitt, 2017: Changes in Projected Spatial and Seasonal 35 Groundwater Recharge in the Upper Colorado River Basin. Groundwater, 55 (4), 506-518, 36 doi:10.1111/gwat.12507. 37
Tobin, I. et al., 2018: Vulnerabilities and resilience of European power generation to 1.5 °C, 2 °C and 3 °C 38 warming. Environmental Research Letters, 13 (4), 044024, doi:10.1088/1748-9326/aab211. 39
Tosun, J. and L. Leopold, 2019: Aligning Climate Governance with Urban Water Management: Insights 40 from Transnational City Networks. Water, 11 (4), 701. 41
Totschnig, G. et al., 2017: Climate change impact and resilience in the electricity sector: The example of 42 Austria and Germany. Energy Policy, 103, 238-248, doi:https://doi.org/10.1016/j.enpol.2017.01.019. 43
Touma, D. et al., 2015: A multi-model and multi-index evaluation of drought characteristics in the 21st 44 century. Journal of Hydrology, 526, 196-207, doi:https://doi.org/10.1016/j.jhydrol.2014.12.011. 45
Tramblay, Y., L. Mimeau, F. Vinet and E. Sauquet, 2019: Detection and attribution of flood trends in 46 Mediterranean basins. 47
Tran, T. A. and R. Rodela, 2019: Integrating farmers’ adaptive knowledge into flood management and 48 adaptation policies in the Vietnamese Mekong Delta: A social learning perspective. Global 49 Environmental Change, 55, 84-96, doi:https://doi.org/10.1016/j.gloenvcha.2019.02.004. 50
Traore, K., D. K. Sidibe, H. Coulibaly and J. Bayala, 2017: Optimizing yield of improved varieties of millet 51 and sorghum under highly variable rainfall conditions using contour ridges in Cinzana, Mali. 52 Agriculture & Food Security, 6 (1), 11, doi:10.1186/s40066-016-0086-0. 53
Tun Oo, A., G. Van Huylenbroeck and S. Speelman, 2017: Determining factors for the application of climate 54 change adaptation strategies among farmers in Magwe District, dry zone region of Myanmar. 55 International Journal of Climate Change Strategies and Management, 9 (1), 36-55, 56 doi:10.1108/IJCCSM-09-2015-0134. 57
ACCEPTED VERSIO
N
SUBJECT TO FIN
AL EDITS
FINAL DRAFT Chapter 4 Supplementary Material IPCC WGII Sixth Assessment Report
Do Not Cite, Quote or Distribute SM4-267 Total pages: 273
Turetsky, M. R. et al., 2015: Global vulnerability of peatlands to fire and carbon loss. Nature Geoscience, 8 1 (1), 11-14. 2
Turner, S. W. D., J. Y. Ng and S. Galelli, 2017: Examining global electricity supply vulnerability to climate 3 change using a high-fidelity hydropower dam model. Science of The Total Environment, 590-591, 663-4 675, doi:https://doi.org/10.1016/j.scitotenv.2017.03.022. 5
Uhe, P. et al., 2021: Method-uncertainty is essential for reliable confidence statements of precipitation 6 projections. Journal of Climate., 34 (3), 1227–1240, doi:https://doi.org/10.1175/JCLI-D-20-0289.1. 7
Ullah, R. and J. Shah, 2019: Economic costs of managing climatic risks in agriculture: Evidences from 8 Khyber Pakhtunkhwa Province of Pakistan. Sarhad Journal of Agriculture, 35 (1), 155-160, 9 doi:10.17582/journal.sja/2019/35.1.155.160. 10
Ullah, W., M. Nafees, M. Khurshid and T. Nihei, 2019: Assessing farmers’ perspectives on climate change 11 for effective farm-level adaptation measures in Khyber Pakhtunkhwa, Pakistan. Environmental 12 Monitoring and Assessment, 191 (9), doi:10.1007/s10661-019-7651-5. 13
Uyttendaele, M. et al., 2015: Special issue on the impacts of climate change on food safety. Food Research 14 International, (68), 1-6. 15
van Duinen, R., T. Filatova, P. Geurts and A. van der Veen, 2015: Coping with drought risk: empirical 16 analysis of farmers’ drought adaptation in the south-west Netherlands. Regional Environmental 17 Change, 15 (6), 1081-1093, doi:10.1007/s10113-014-0692-y. 18
van Oldenborgh, G. J., F. E. L. Otto, K. Haustein and K. AchutaRao, 2017: The Heavy Precipitation Event 19 of December 2015 in Chennai, India. Bulletin of the American Meteorological Society, 97 (12), S87-20 S91, doi:10.1175/BAMS-D-16-0129.1. 21
van Vliet, M. T. H., J. Sheffield, D. Wiberg and E. F. Wood, 2016a: Impacts of recent drought and warm 22 years on water resources and electricity supply worldwide. Environmental Research Letters, 11 (12), 23 124021, doi:10.1088/1748-9326/11/12/124021. 24
van Vliet, M. T. H. et al., 2016b: Multi-model assessment of global hydropower and cooling water discharge 25 potential under climate change. Global Environmental Change, 40, 156-170, 26 doi:https://doi.org/10.1016/j.gloenvcha.2016.07.007. 27
van Vliet, M. T. H., D. Wiberg, S. Leduc and K. Riahi, 2016c: Power-generation system vulnerability and 28 adaptation to changes in climate and water resources. Nature Climate Change, 6, 375, 29 doi:10.1038/nclimate2903 30
https://www.nature.com/articles/nclimate2903#supplementary-information. 31 van Vuuren, D. P. et al., 2011: The representative concentration pathways: an overview. Climatic Change, 32
109 (1), 5, doi:10.1007/s10584-011-0148-z. 33 van Wijngaarden, W. A. and A. Syed, 2015: Changes in annual precipitation over the Earth’s land mass 34
excluding Antarctica from the 18th century to 2013. Journal of Hydrology, 531, 1020-1027, 35 doi:https://doi.org/10.1016/j.jhydrol.2015.11.006. 36
Vanmaercke, M., J. Poesen, J. Broeckx and J. Nyssen, 2014: Sediment yield in Africa. Earth-Science 37 Reviews, 136, 350-368, doi:https://doi.org/10.1016/j.earscirev.2014.06.004. 38
Vantas, K., E. Sidiropoulos and A. Loukas, 2020: Estimating Current and Future Rainfall Erosivity in 39 Greece Using Regional Climate Models and Spatial Quantile Regression Forests. Water, 12 (3), 40 doi:10.3390/w12030687. 41
Varadan, R. and P. Kumar, 2014: Indigenous knowledge about climate change: Validating the perceptions of 42 dryland farmers in Tamil Nadu. Indian Journal of Traditional Knowledge, 13, 390-397. 43
Vardakoulias, O. and N. Nicholles, 2021: Handbook of Climate Change Adaptation. Handbook of Climate 44 Change Adaptation, 1-29, doi:10.1007/978-3-642-40455-9. 45
Vegas-Vilarrúbia, T., E. Hernández, V. Rull and E. Rull Vegas, 2015: The Orinoco megadelta as a 46 conservation target in the face of the ongoing and future sea level rise. Science of The Total 47 Environment, 515-516, 129-142, doi:https://doi.org/10.1016/j.scitotenv.2015.01.056. 48
Venkataramanan, V. et al., 2020: In pursuit of ‘safe’water: the burden of personal injury from water fetching 49 in 21 low-income and middle-income countries. BMJ Global Health, 5 (10), e003328. 50
Venugopal, S. et al., 2019: Adapting traditional livelihood practices in the face of environmental disruptions 51 in subsistence communities. Journal of Business Research, 100 (December), 400-409, 52 doi:10.1016/j.jbusres.2018.12.023. 53
Vetter, T. et al., 2017: Evaluation of sources of uncertainty in projected hydrological changes under climate 54 change in 12 large-scale river basins. Climatic Change, 141 (3), 419-433, doi:10.1007/s10584-016-55 1794-y. 56
ACCEPTED VERSIO
N
SUBJECT TO FIN
AL EDITS
FINAL DRAFT Chapter 4 Supplementary Material IPCC WGII Sixth Assessment Report
Do Not Cite, Quote or Distribute SM4-268 Total pages: 273
Viguera, B. et al., 2019: Climate change perceptions and adaptive responses of small-scale coffee farmers in 1 Costa Rica. Agronomy Mesoamerican, 30 (2), 333-351, doi:10.15517/am.v30i2.32905. 2
Villamayor-Tomas, S. and G. García-López, 2017: The influence of community-based resource management 3 institutions on adaptation capacity: A large-n study of farmer responses to climate and global market 4 disturbances. Global Environmental Change, 47, 153-166, 5 doi:https://doi.org/10.1016/j.gloenvcha.2017.10.002. 6
Vincent, A., S. Violette and G. Aðalgeirsdóttir, 2019: Groundwater in catchments headed by temperate 7 glaciers: A review. Earth-Science Reviews, 188, 59-76, 8 doi:https://doi.org/10.1016/j.earscirev.2018.10.017. 9
Viviroli, D. et al., 2020: Increasing dependence of lowland populations on mountain water resources. Nature 10 Sustainability, 1-12. 11
Vogel, E. et al., 2019: The effects of climate extremes on global agricultural yields. Environmental Research 12 Letters, 14 (5), 054010. 13
Volpato, G. and E. G. King, 2019: From cattle to camels: trajectories of livelihood adaptation and social-14 ecological resilience in a Kenyan pastoralist community. Regional Environmental Change, 19 (3), 849-15 865, doi:10.1007/s10113-018-1438-z. 16
Vom Brocke, K. et al., 2014: Helping farmers adapt to climate and cropping system change through 17 increased access to sorghum genetic resources adapted to prevalent sorghum cropping systems in 18 Burkina Faso. Experimental Agriculture, 50 (2), 284-305, doi:10.1017/S0014479713000616. 19
von Uexkull, N., M. Croicu, H. Fjelde and H. Buhaug, 2016: Civil conflict sensitivity to growing-season 20 drought. Proceedings of the National Academy of Sciences, 113 (44), 12391-12396, 21 doi:10.1073/pnas.1607542113. 22
Vormoor, K. et al., 2016: Evidence for changes in the magnitude and frequency of observed rainfall vs. 23 snowmelt driven floods in Norway. Journal of Hydrology, 538, 33-48. 24
Vozinaki, A.-E., E. Tapoglou and I. Tsanis, 2018: Hydrometeorological impact of climate change in two 25 Mediterranean basins. International Journal of River Basin Management, 16 (2), 245-257. 26
Wada, Y., 2016: Modeling Groundwater Depletion at Regional and Global Scales: Present State and Future 27 Prospects. Surveys in Geophysics, 37 (2), 419-451, doi:10.1007/s10712-015-9347-x. 28
Wada, Y. et al., 2016: Modeling global water use for the 21st century: the Water Futures and Solutions 29 (WFaS) initiative and its approaches. Geosci. Model Dev., 9 (1), 175-222, doi:10.5194/gmd-9-175-30 2016. 31
Wagena, M. B. et al., 2018: Impact of climate change and climate anomalies on hydrologic and 32 biogeochemical processes in an agricultural catchment of the Chesapeake Bay watershed, USA. Science 33 of The Total Environment, 637-638, 1443-1454, doi:https://doi.org/10.1016/j.scitotenv.2018.05.116. 34
Waha, K. et al., 2017: Climate change impacts in the Middle East and Northern Africa (MENA) region and 35 their implications for vulnerable population groups. Regional Environmental Change, 17 (6), 1623-36 1638, doi:10.1007/s10113-017-1144-2. 37
Wako, G., M. Tadesse and A. Angassa, 2017: Camel management as an adaptive strategy to climate change 38 by pastoralists in southern Ethiopia. Ecological Processes, 6 (1), 26, doi:10.1186/s13717-017-0093-5. 39
Walch, C., 2019: Adaptive governance in the developing world: disaster risk reduction in the State of 40 Odisha, India. Climate and Development, 11 (3), 238-252, doi:10.1080/17565529.2018.1442794. 41
Waldman, K. B. et al., 2019: The salience of climate change in farmer decision-making within smallholder 42 semi-arid agroecosystems. Climatic Change, 156 (4), 527-543, doi:10.1007/s10584-019-02498-3. 43
Wamsler, C. et al., 2016: Operationalizing ecosystem-based adaptation: Harnessing ecosystem services to 44 buffer communities against climate change. Ecology and Society, 21 (1), doi:10.5751/ES-08266-45 210131. 46
Wanda, E. M. M. et al., 2017: Governing WASH for disaster risk reduction in Karonga Town, Malawi. 47 International Journal of Disaster Risk Reduction, 26, 69-77, 48 doi:https://doi.org/10.1016/j.ijdrr.2017.09.034. 49
Wanders, N., Y. Wada and H. A. J. Van Lanen, 2015: Global hydrological droughts in the 21st century under 50 a changing hydrological regime. Earth Syst. Dynam., 6 (1), 1-15, doi:10.5194/esd-6-1-2015. 51
Wang, J., J. Feng and Z. Yan, 2018a: Impact of Extensive Urbanization on Summertime Rainfall in the 52 Beijing Region and the Role of Local Precipitation Recycling. Journal of Geophysical Research: 53 Atmospheres, 123 (7), 3323-3340, doi:10.1002/2017jd027725. 54
Wang, J. et al., 2017a: Growing water scarcity, food security and government responses in China. Global 55 Food Security, 14, 9-17, doi:https://doi.org/10.1016/j.gfs.2017.01.003. 56
ACCEPTED VERSIO
N
SUBJECT TO FIN
AL EDITS

FINAL DRAFT Chapter 4 Supplementary Material IPCC WGII Sixth Assessment Report
Do Not Cite, Quote or Distribute SM4-269 Total pages: 273
Wang, J., Y. Yang, J. Huang and B. Adhikari, 2019a: Adaptive irrigation measures in response to extreme 1 weather events: empirical evidence from the North China plain. Regional Environmental Change, 19 2 (4), 1009-1022, doi:10.1007/s10113-018-1442-3. 3
Wang, S., J. Huang and X. Yuan, 2021: Attribution of 2019 Extreme Spring–Early Summer Hot Drought 4 over Yunnan in Southwestern China. Explaining Extreme Events of 2019 from a Climate Perspective, 5 102 (1). 6
Wang, Y. et al., 2019b: Vulnerability of existing and planned coal-fired power plants in Developing Asia to 7 changes in climate and water resources. Energy & Environmental Science, 12 (10), 3164-3181, 8 doi:10.1039/C9EE02058F. 9
Wang, Y. and X. Chen, 2018: Are farmers’ adaptations enhancing food production? Evidence from China. 10 Regional Environmental Change, 18 (7), 2183-2196, doi:10.1007/s10113-018-1410-y. 11
Wang, Y., J. Huang, J. Wang and C. Findlay, 2018b: Mitigating rice production risks from drought through 12 improving irrigation infrastructure and management in China. Australian Journal of Agricultural and 13 Resource Economics, 62 (1), 161-176, doi:10.1111/1467-8489.12241. 14
Wang, Y. et al., 2017b: Contrasting runoff trends between dry and wet parts of eastern Tibetan Plateau. 15 Scientific Reports, 7 (1), 1-7. 16
Wang, Y. j., J. k. Huang and J. x. Wang, 2014: Household and community assets and farmers' adaptation to 17 extreme weather event: The case of drought in china. Journal of Integrative Agriculture, 13 (4), 687-18 697, doi:10.1016/S2095-3119(13)60697-8. 19
Wang, Z., J. Liu, J. Li and D. D. Zhang, 2018c: Multi-spectral water index (MuWI): a native 10-m multi-20 spectral water index for accurate water mapping on Sentinel-2. Remote Sensing, 10 (10), 1643. 21
Warner, B. P., C. Kuzdas, M. G. Yglesias and D. L. Childers, 2015: Limits to adaptation to interacting global 22 change risks among smallholder rice farmers in Northwest Costa Rica. Global Environmental Change, 23 30, 101-112, doi:https://doi.org/10.1016/j.gloenvcha.2014.11.002. 24
Warner, K. and T. Afifi, 2014: Where the rain falls: Evidence from 8 countries on how vulnerable 25 households use migration to manage the risk of rainfall variability and food insecurity. Climate and 26 Development, 6 (1), 1-17, doi:10.1080/17565529.2013.835707. 27
Warszawski, L. et al., 2014: The Inter-Sectoral Impact Model Intercomparison Project (ISI–MIP): Project 28 framework. Proceedings of the National Academy of Sciences, 111 (9), 3228-3232, 29 doi:10.1073/pnas.1312330110. 30
Wasko, C. and R. Nathan, 2019: Influence of changes in rainfall and soil moisture on trends in flooding. 31 Journal of Hydrology, 575, 432-441. 32
Wasko, C. and A. Sharma, 2017: Global assessment of flood and storm extremes with increased 33 temperatures. Scientific Reports, 7 (1), 1-8. 34
Wehbe, M. B., R. A. Seiler, M. G. Vinocur and I. E. Tarasconi, 2018: Is it possible to completely adapt 35 agriculture production to the effects of climate variability and change in Central Argentina? New 36 approaches in face of new challenges. Climate Change Management, 443-463, doi:10.1007/978-3-319-37 72874-2_25. 38
Wekesa, B. M., O. I. Ayuya and J. K. Lagat, 2018: Effect of climate-smart agricultural practices on 39 household food security in smallholder production systems: Micro-level evidence from Kenya. 40 Agriculture and Food Security, 7 (1), 1-14, doi:10.1186/s40066-018-0230-0. 41
West Colin, T., C. Roncoli and P. Yaka, 2016: Climate Variability in West Africa: A Case Study in 42 Vulnerability and Adaptation on the Northern Central Plateau, Burkina Faso. In: The Economics of 43 Ecology, Exchange, and Adaptation: Anthropological Explorations. Emerald Group Publishing Limited, 44 36, 57-76. 45
Weston, P., R. Hong, C. Kaboré and C. A. Kull, 2015: Farmer-Managed Natural Regeneration Enhances 46 Rural Livelihoods in Dryland West Africa. Environmental Management, 55 (6), 1402-1417, 47 doi:10.1007/s00267-015-0469-1. 48
Whitehead, P. et al., 2015: Impacts of climate change and socio-economic scenarios on flow and water 49 quality of the Ganges, Brahmaputra and Meghna (GBM) river systems: low flow and flood statistics. 50 Environmental Science: Processes & Impacts, 17 (6), 1057-1069. 51
Whitehead, P. G. et al., 2018: Modelling impacts of climate change and socio-economic change on the 52 Ganga, Brahmaputra, Meghna, Hooghly and Mahanadi river systems in India and Bangladesh. Science 53 of The Total Environment, 636, 1362-1372. 54
Whitman, E., M.-A. Parisien, D. K. Thompson and M. D. Flannigan, 2019: Short-interval wildfire and 55 drought overwhelm boreal forest resilience. Scientific Reports, 9 (1), 1-12. 56
ACCEPTED VERSIO
N
SUBJECT TO FIN
AL EDITS
FINAL DRAFT Chapter 4 Supplementary Material IPCC WGII Sixth Assessment Report
Do Not Cite, Quote or Distribute SM4-270 Total pages: 273
WHO, 2014: Quantitative risk assessment of the effects of climate change on selected causes of death, 2030s 1 and 2050s. . World Health Organization. [Available at: https://apps.who.int/iris/handle/10665/134014]. 2
Wiel, K. v. d. et al., 2017: Rapid attribution of the August 2016 flood-inducing extreme precipitation in 3 south Louisiana to climate change. Hydrology and Earth System Sciences, 21 (2), 897-921. 4
Wijaya, N., 2015: Climate Change Adaption Measures in the Coastal City of Semarang, Indonesia: Current 5 Practices and Performance. Journal of Regional and City Planning; Vol 26, No 1 (2015). 6
Wijngaard, R. R. et al., 2017: Future changes in hydro-climatic extremes in the Upper Indus, Ganges, and 7 Brahmaputra River basins. PLOS ONE, 12 (12). 8
Williams, N. E. and A. Carrico, 2017: Examining adaptations to water stress among farming households in 9 Sri Lanka’s dry zone. Ambio, 46 (5), 532-542, doi:10.1007/s13280-017-0904-z. 10
Wilson, N. J., 2014: The Politics of Adaptation: Subsistence Livelihoods and Vulnerability to Climate 11 Change in the Koyukon Athabascan Village of Ruby, Alaska. Human Ecology, 42 (1), 87-101, 12 doi:10.1007/s10745-013-9619-3. 13
Witmer, F. D. et al., 2017: Subnational violent conflict forecasts for sub-Saharan Africa, 2015–65, using 14 climate-sensitive models. Journal of Peace Research, 54 (2), 175-192, 15 doi:10.1177/0022343316682064. 16
Wolf, J. et al., 2018: Impact of drinking water, sanitation and handwashing with soap on childhood 17 diarrhoeal disease: updated meta-analysis and meta-regression. Tropical Medicine & International 18 Health, 23 (5), 508-525, doi:10.1111/tmi.13051. 19
Woltemade, C. J., T. W. Hawkins, C. Jantz and S. Drzyzga, 2020: impact of changing climate and land cover 20 on flood magnitudes in the Delaware River Basin, USA. JAWRA Journal of the American Water 21 Resources Association. 22
Wood, B. T., C. H. Quinn, L. C. Stringer and A. J. Dougill, 2017: Investigating Climate Compatible 23 Development Outcomes and their Implications for Distributive Justice: Evidence from Malawi. 24 Environmental Management, 60 (3), 436-453, doi:10.1007/s00267-017-0890-8. 25
Woolway, R. I. et al., 2021: Lake heatwaves under climate change. Nature, 589 (7842), 402-407, 26 doi:10.1038/s41586-020-03119-1. 27
Workman, C. L. and H. Ureksoy, 2017: Water insecurity in a syndemic context: Understanding the psycho-28 emotional stress of water insecurity in Lesotho, Africa. Social Science & Medicine, 179, 52-60, 29 doi:10.1016/j.socscimed.2017.02.026. 30
Wossen, T. et al., 2017: Measuring the impacts of adaptation strategies to drought stress: The case of drought 31 tolerant maize varieties. Journal of environmental management, 203, 106-113, 32 doi:https://doi.org/10.1016/j.jenvman.2017.06.058. 33
Wu, Q., Y. Hou, H. Yun and Y. Liu, 2015: Changes in active-layer thickness and near-surface permafrost 34 between 2002 and 2012 in alpine ecosystems, Qinghai–Xizang (Tibet) Plateau, China. Global and 35 Planetary Change, 124, 149-155. 36
Wu, W.-Y. et al., 2020: Divergent effects of climate change on future groundwater availability in key mid-37 latitude aquifers. Nature Communications, 11 (1), 3710, doi:10.1038/s41467-020-17581-y. 38
Xu, W. et al., 2017: Spatial–temporal variability of snow cover and depth in the Qinghai–Tibetan Plateau. 39 Journal of Climate, 30 (4), 1521-1533. 40
Yager, K. et al., 2019: Socio-ecological dimensions of Andean pastoral landscape change: bridging 41 traditional ecological knowledge and satellite image analysis in Sajama National Park, Bolivia. 42 Regional Environmental Change, 19 (5), 1353-1369. 43
Yamazaki, D. et al., 2019: MERIT Hydro: A High-Resolution Global Hydrography Map Based on Latest 44 Topography Dataset. Water Resources Research, 55 (6), 5053-5073, doi:10.1029/2019WR024873. 45
Yamazaki, D. et al., 2017: A high-accuracy map of global terrain elevations. Geophysical Research Letters, 46 44 (11), 5844-5853, doi:10.1002/2017gl072874. 47
Yamba, S., D. O. Appiah and L. P. Siaw, 2019: Smallholder farmers’ perceptions and adaptive response to 48 climate variability and climate change in southern rural Ghana. Cogent Social Sciences, 5 (1), 49 doi:10.1080/23311886.2019.1646626. 50
Yang, D., X. Shi and P. Marsh, 2015a: Variability and extreme of Mackenzie River daily discharge during 51 1973–2011. Quaternary International, 380, 159-168. 52
Yang, J., V. Owusu, E. Andriesse and A. Dziwornu Ablo, 2019: In-Situ Adaptation and Coastal 53 Vulnerabilities in Ghana and Tanzania. The Journal of Environment & Development, 28 (3), 282-308, 54 doi:10.1177/1070496519852992. 55
ACCEPTED VERSIO
N
SUBJECT TO FIN
AL EDITS

FINAL DRAFT Chapter 4 Supplementary Material IPCC WGII Sixth Assessment Report
Do Not Cite, Quote or Distribute SM4-271 Total pages: 273
Yang, J. et al., 2015b: Drought adaptation in the Ningxia Hui Autonomous Region, China: Actions, 1 planning, pathways and barriers. Sustainability (Switzerland), 7 (11), 15029-15056, 2 doi:10.3390/su71115029. 3
Yang, X., B. Yu and Q. G. Zhu, 2015c: Climate change impacts on rainfall erosivity and hillslope erosion in 4 NSW. Proc. - 21st Int. Congr. Model. Simulation, MODSIM 2015, 1572-1578, 5 doi:10.36334/modsim.2015.g4.yang. 6
Yang, Y. et al., 2014: Prediction of cotton yield and water demand under climate change and future 7 adaptation measures. Agricultural Water Management, 144, 42-53, 8 doi:https://doi.org/10.1016/j.agwat.2014.06.001. 9
Yasarer, L. M. W. et al., 2017: Climate Change Impacts on Runoff, Sediment, and Nutrient Loads in an 10 Agricultural Watershedin the Lower Mississippi River Basin. Applied Engineering in Agriculture, 33 11 (3), 379-392, doi:https://doi.org/10.13031/aea.12047. 12
Yates, O. E. T., S. Manuela, A. Neef and S. Groot, 2021: Reshaping ties to land: a systematic review of the 13 psychosocial and cultural impacts of Pacific climate-related mobility. Climate and Development, 1-18, 14 doi:10.1080/17565529.2021.1911775. 15
Yegbemey, R. N., E. O. Yegbemey and J. A. Yabi, 2017: Sustainability analysis of observed climate change 16 adaptation strategies in maize farming in Benin, West Africa. Outlook on Agriculture, 46 (1), 20-27, 17 doi:10.1177/0030727016689638. 18
Yeste, P. et al., 2021: Projected hydrologic changes over the north of the Iberian Peninsula using a Euro-19 CORDEX multi-model ensemble. Science of The Total Environment, 777, 146126. 20
Yila, J. O. and B. P. Resurreccion, 2014: Gender perspectives on agricultural adaptation to climate change in 21 drought-prone Nguru Local Government Area in the semiarid zone of northeastern Nigeria. 22 International Journal of Climate Change Strategies and Management, 6 (3), 250-271, 23 doi:10.1108/IJCCSM-12-2012-0068. 24
Yin, X. et al., 2016: Adapting maize production to drought in the Northeast Farming Region of China. 25 European Journal of Agronomy, 77, 47-58, doi:10.1016/j.eja.2016.03.004. 26
Yokohata, T. et al., 2020: Model improvement and future projection of permafrost processes in a global land 27 surface model. Progress in Earth and Planetary Science, 7 (1), 69, doi:10.1186/s40645-020-00380-w. 28
Young, H. R., R. J. Cornforth, A. T. Gaye and E. Boyd, 2019: Event Attribution science in adaptation 29 decision-making: the context of extreme rainfall in urban Senegal. Climate and Development, 11 (9), 30 812-824, doi:10.1080/17565529.2019.1571401. 31
Younus, M. A. F. and N. Harvey, 2014: Economic consequences of failed autonomous adaptation to extreme 32 floods: A case study from Bangladesh. Local Economy, 29 (1-2), 22-37, 33 doi:10.1177/0269094213515175. 34
Yu, Q.-y. et al., 2014: Interpretation of Climate Change and Agricultural Adaptations by Local Household 35 Farmers: a Case Study at Bin County, Northeast China. Journal of Integrative Agriculture, 13 (7), 36 1599-1608, doi:https://doi.org/10.1016/S2095-3119(14)60805-4. 37
Yung, L. et al., 2015: Drought Adaptation and Climate Change Beliefs among Working Ranchers in 38 Montana. Weather, Climate, and Society, 7 (4), 281-293, doi:10.1175/WCAS-D-14-00039.1. 39
Zaherpour, J. et al., 2018: Worldwide evaluation of mean and extreme runoff from six global-scale 40 hydrological models that account for human impacts. Environmental Research Letters, 13 (6), 065015, 41 doi:10.1088/1748-9326/aac547. 42
Zahmatkesh, Z., M. Karamouz, E. Goharian and S. J. Burian, 2015: Analysis of the effects of climate change 43 on urban storm water runoff using statistically downscaled precipitation data and a change factor 44 approach. Journal of Hydrologic Engineering, 20 (7), 05014022. 45
Zakharova, E., K. Nielsen, G. Kamenev and A. Kouraev, 2020: River discharge estimation from radar 46 altimetry: Assessment of satellite performance, river scales and methods. Journal of Hydrology, 583, 47 124561. 48
Zang, C. and J. Liu, 2013: Trend analysis for the flows of green and blue water in the Heihe River basin, 49 northwestern China. Journal of Hydrology, 502, 27-36, 50 doi:https://doi.org/10.1016/j.jhydrol.2013.08.022. 51
Zarroca, M. et al., 2021: Natural acid rock drainage in alpine catchments: A side effect of climate warming. 52 Science of The Total Environment, 778, 146070. 53
Zaveri, E. et al., 2016: Invisible water, visible impact: groundwater use and Indian agriculture under climate 54 change. Environmental Research Letters, 11 (8), 084005, doi:10.1088/1748-9326/11/8/084005. 55
ACCEPTED VERSIO
N
SUBJECT TO FIN
AL EDITS
FINAL DRAFT Chapter 4 Supplementary Material IPCC WGII Sixth Assessment Report
Do Not Cite, Quote or Distribute SM4-272 Total pages: 273
Zekollari, H., M. Huss and D. Farinotti, 2019: Modelling the future evolution of glaciers in the European 1 Alps under the EURO-CORDEX RCM ensemble. The Cryosphere, 13 (4), 1125-1146, doi:10.5194/tc-2 13-1125-2019. 3
Zemp, M. et al., 2015a: Historically unprecedented global glacier decline in the early 21st century. Journal 4 of Glaciology, 61 (228), 745-762, doi:10.3189/2015JoG15J017. 5
Zemp, M. et al., 2015b: Global glacier change bulletin no. 1 (2012–2013). Global Glacier Change Bulletin, 6 1. 7
Zemp, M. et al., 2019: Global glacier mass changes and their contributions to sea-level rise from 1961 to 8 2016. Nature, 568 (7752), 382-386, doi:10.1038/s41586-019-1071-0. 9
Zeng Z et al., 2018: Impact of Earth Greening on the Terrestrial Water Cycle. Journal of Climate, 31 (7), 10 2633-2650, doi:10.1175/jcli-d-17-0236.1. 11
Zevenbergen, C., J. Rijke, S. Van Herk and P. J. T. M. Bloemen, 2015: Room for the River: a stepping stone 12 in Adaptive Delta Management. International Journal of Water Governance, 3 (3), 121-140, 13 doi:10.7564/14-IJWG63. 14
Zhai, R. et al., 2020: Larger Drought and Flood Hazards and Adverse Impacts on Population and Economic 15 Productivity Under 2.0 than 1.5°C Warming. Earth's Future, 8 (7), e2019EF001398, 16 doi:https://doi.org/10.1029/2019EF001398. 17
Zhang, B. et al., 2018a: Quantifying the impacts of climate change on streamflow dynamics of two major 18 rivers of the Northern Lake Erie Basin in Canada. Sustainability, 10 (8), 2897. 19
Zhang, F. et al., 2019a: Water availability on the Third Pole: A review. Water Security, 7, 100033, 20 doi:https://doi.org/10.1016/j.wasec.2019.100033. 21
Zhang, J., B. S. Felzer and T. J. Troy, 2016a: Extreme precipitation drives groundwater recharge: the 22 Northern High Plains Aquifer, central United States, 1950–2010. Hydrological Processes, 30 (14), 23 2533-2545, doi:10.1002/hyp.10809. 24
Zhang K et al., 2015: Vegetation Greening and Climate Change Promote Multidecadal Rises of Global Land 25 Evapotranspiration. Scientific Reports, 5, 15956, doi:10.1038/srep15956 26
https://www.nature.com/articles/srep15956#supplementary-information. 27 Zhang, L., J. Hu, Y. Li and N. S. Pradhan, 2018b: Public-private partnership in enhancing farmers’ 28
adaptation to drought: Insights from the Lujiang Flatland in the Nu River (Upper Salween) valley, 29 China. Land Use Policy, 71 (September 2017), 138-145, doi:10.1016/j.landusepol.2017.11.034. 30
Zhang, L., J. Wang, G. Zhang and Q. Huang, 2016b: Impact of the methods of groundwater access on 31 irrigation and crop yield in the North China Plain: Does climate matter? China Agricultural Economic 32 Review, 8 (4), 613-633, doi:10.1108/CAER-12-2015-0177. 33
Zhang Q. et al., 2015: Evaluation of flood frequency under non-stationarity resulting from climate indices 34 and reservoir indices in the East River basin, China. Journal of Hydrology, 527, 565-575. 35
Zhang, W. and G. Villarini, 2017: Heavy precipitation is highly sensitive to the magnitude of future 36 warming. Climatic Change, 145 (1), 249-257, doi:10.1007/s10584-017-2079-9. 37
Zhang, Y. et al., 2019b: The relative contributions of precipitation, evapotranspiration, and runoff to 38 terrestrial water storage changes across 168 river basins. Journal of Hydrology, 579, 124194. 39
Zhao, T. and A. Dai, 2015: The Magnitude and Causes of Global Drought Changes in the Twenty-First 40 Century under a Low–Moderate Emissions Scenario. Journal of Climate, 28 (11), 4490-4512, 41 doi:10.1175/jcli-d-14-00363.1. 42
Zhou, D. et al., 2014: Resilience of traditional rice-dominated agricultural communities to precipitation 43 variability in the North China Plain. Climate Research, 62 (2), 149-161, doi:10.3354/cr01264. 44
Zhou, F. et al., 2020: Deceleration of China’s human water use and its key drivers. Proceedings of the 45 National Academy of Sciences, 117 (14), 7702-7711. 46
Zhou, Q. et al., 2018: Cooling Water Sufficiency in a Warming World: Projection Using an Integrated 47 Assessment Model and a Global Hydrological Model. Water, 10 (7), 872. 48
Zhou, X. et al., 2012: Benchmarking global land surface models against the observed mean annual runoff 49 from 150 large basins. Journal of Hydrology, 470-471, 269-279, 50 doi:https://doi.org/10.1016/j.jhydrol.2012.09.002. 51
Zhu, Q. et al., 2020: Extreme rainfall, rainfall erosivity, and hillslope erosion in Australian Alpine region and 52 their future changes. International Journal of Climatology, 40 (2), 1213-1227, 53 doi:https://doi.org/10.1002/joc.6266. 54
Zin, W. Y. L., P. Teartisup and P. Kerdseub, 2019: Evaluating traditional knowledge on climate change 55 (TKCC): A case study in the central dry zone of Myanmar. Environment and Natural Resources 56 Journal, 17 (2), 1-29, doi:10.32526/ennrj.17.2.2019.09. 57
ACCEPTED VERSIO
N
SUBJECT TO FIN
AL EDITS

FINAL DRAFT Chapter 4 Supplementary Material IPCC WGII Sixth Assessment Report
Do Not Cite, Quote or Distribute SM4-273 Total pages: 273
Zipper, S. C., J. Qiu and C. J. Kucharik, 2016: Drought effects on US maize and soybean production: 1 spatiotemporal patterns and historical changes. Environmental Research Letters, 11 (9), 094021. 2
ACCEPTED VERSIO
N
SUBJECT TO FIN
AL EDITS