AUTHOR ACCEPTED MANUSCRIPT - Open Knowledge ...
38
© 2022 World Bank AUTHOR ACCEPTED MANUSCRIPT FINAL PUBLICATION INFORMATION Comparative Analysis of Tomato Value Chain Competitiveness in Selected Areas of Malawi and Mozambique The definitive version of the text was subsequently published in Cogent Economics & Finance, 3(1), 2015-09-25 Published by Taylor and Francis and found at http://dx.doi.org/10.1080/23322039.2015.1088429 THE FINAL PUBLISHED VERSION OF THIS MANUSCRIPT IS AVAILABLE ON THE PUBLISHER’S PLATFORM This Author Accepted Manuscript is copyrighted by World Bank and published by Taylor and Francis. It is posted here by agreement between them. Changes resulting from the publishing process—such as editing, corrections, structural formatting, and other quality control mechanisms—may not be reflected in this version of the text. You may download, copy, and distribute this Author Accepted Manuscript for noncommercial purposes. Your license is limited by the following restrictions: (1) You may use this Author Accepted Manuscript for noncommercial purposes only under a CC BY-NC-ND 3.0 IGO license http://creativecommons.org/licenses/by-nc-nd/3.0/igo/. (2) The integrity of the work and identification of the author, copyright owner, and publisher must be preserved in any copy. (3) You must attribute this Author Accepted Manuscript in the following format: This is an Author Accepted Manuscript by Mango, Nelson; Mapemba, Lawrence; Tchale, Hardwick; Makate, Clifton; Dunjana, Nothando; Lundy, Mark Comparative Analysis of Tomato Value Chain Competitiveness in Selected Areas of Malawi and Mozambique © World Bank, published in the Cogent Economics & Finance3(1) 2015-09-25 CC BY-NC-ND 3.0 IGO http://creativecommons.org/licenses/by-nc-nd/3.0/igo/ http:// dx.doi.org/10.1080/23322039.2015.1088429
-
Upload
khangminh22 -
Category
Documents
-
view
0 -
download
0
Transcript of AUTHOR ACCEPTED MANUSCRIPT - Open Knowledge ...

© 2022 World Bank
AUTHOR ACCEPTED MANUSCRIPTFINAL PUBLICATION INFORMATION
Comparative Analysis of Tomato Value Chain Competitiveness in Selected Areas of Malawi and Mozambique
The definitive version of the text was subsequently published in
Cogent Economics & Finance, 3(1), 2015-09-25
Published by Taylor and Francis and found at http://dx.doi.org/10.1080/23322039.2015.1088429
THE FINAL PUBLISHED VERSION OF THIS MANUSCRIPTIS AVAILABLE ON THE PUBLISHER’S PLATFORM
This Author Accepted Manuscript is copyrighted by World Bank and published by Taylor and Francis. It is postedhere by agreement between them. Changes resulting from the publishing process—such as editing, corrections,structural formatting, and other quality control mechanisms—may not be reflected in this version of the text.
You may download, copy, and distribute this Author Accepted Manuscript for noncommercial purposes. Your licenseis limited by the following restrictions:
(1) You may use this Author Accepted Manuscript for noncommercial purposes only under a CC BY-NC-ND3.0 IGO license http://creativecommons.org/licenses/by-nc-nd/3.0/igo/.
(2) The integrity of the work and identification of the author, copyright owner, and publisher must be preservedin any copy.
(3) You must attribute this Author Accepted Manuscript in the following format: This is an Author AcceptedManuscript by Mango, Nelson; Mapemba, Lawrence; Tchale, Hardwick; Makate, Clifton; Dunjana,Nothando; Lundy, Mark Comparative Analysis of Tomato Value Chain Competitiveness in SelectedAreas of Malawi and Mozambique © World Bank, published in the Cogent Economics & Finance3(1)2015-09-25 CC BY-NC-ND 3.0 IGO http://creativecommons.org/licenses/by-nc-nd/3.0/igo/ http://dx.doi.org/10.1080/23322039.2015.1088429

Comparative Analysis of Tomato Value Chain Competitiveness in Selected Areas of Malawi and Mozambique
1. Nelson Mango*, Social Scientist, International Centre for Tropical Agriculture (CIAT), P.O. Box MP 228, Mt. Pleasant, Harare, Zimbabwe. + 263772572726 [email protected]
2. Dr. Lawrence Mapemba. Senior Lecturer, Department of Applied Economics, Lilongwe University of Agriculture and Natural Resources, Bunda College Campus, P.O. Box 219, Lilongwe, Malawi. +2659998033700 [email protected]
3. Dr. Hardwick Tchale, Senior Agricultural Economist, Agriculture and Rural Development Department, World Bank Liaison Office, 14 Wilberforce Street, Freetown, Sierra Leone. +232 222 488, [email protected]
4. Mr. Clifton Makate, Socio-economist, International centre for Tropical Agriculture (CIAT), P.O. Box MP 228, Mt. Pleasant, Harare, Zimbabwe. +263772658514 [email protected]
5. Ms Nothando Dunjana, Marondera College of Agricultural Science and Technology, University of Zimbabwe P.O. Box 35, Marondera, Zimbabwe. + 263 772 965442 [email protected]
6. Dr Mark Lundy, Senior Scientist, International Centre for Tropical (CIAT), Apartado Aereo 6713, Cali, Colombia. +572 445 0000, [email protected]
* Corresponding Author
1

Abstract
This paper discusses Tomato value-chain performance in Malawi and Mozambique using data collected
from a market study commissioned by the International Centre for Tropical Agriculture (CIAT) as part of
a regional research on conservation agriculture in maize-based farming systems in Sub-Saharan Africa
(SSA). The results show that Malawi has a slightly higher competitive advantage in the production of
tomato compared to Mozambique. Malawi’s relative competitiveness in tomato is mainly due to slightly
higher productivity and the cost advantage in labour (low wages) and irrigation costs. The paper
proposes policy implications aimed at raising the productivity and trade competitiveness of tomato, as
this will ensure the overall productivity of the maize-based smallholder farming systems in the two
countries.
Key words: Tomato, value chain, competitiveness, Malawi, Mozambique
2

1. INTRODUCTION
Malawi and Mozambique are among the world’s poor countries. Subsistence agriculture
continues to employ the vast majority of the country's work force and smallholder agricultural
productivity and productivity growth is weak (Cunguara et al. 2011; Chinsinga, 2007). In both
countries, the agricultural sector is dualistic comprising of smallholder and commercial
subsectors. The smallholder subsector cultivates most of the land and produces most of the food
crops. The smallholder subsector is characterized by small land holdings of sizes averaging 0.5
hectares and 1.8 hectares in Malawi and Mozambique, respectively.
The Malawi economy is predominately agricultural with about 80% of the population living in
rural areas. Agriculture, which has benefited from fertilizer subsidies since 2006, accounts for
more than one-third of GDP (33.4%) and 90% of export revenues (Chinsinga, 2007; Government
of Malawi, 2007). The contributions of the industry and services sectors to the GDP in 2010
were reported to be 21.7 percent and 44.9 percent, respectively. Malawi’s real growth rate was
estimated at 6.6 percent in 2010 with a per capita GDP of US$800 (Government of Malawi,
2010).
Mozambique’s real growth rate in 2010 was reported at 7 percent with GDP per capita (in
purchasing power parity) of US$1,000 (Donovan and Tostão, 2010). In Mozambique, the
contributions of agriculture, industry and services to the GDP, in 2010, were reported to be 28.8
percent, 26 percent and 45.2 percent, respectively (Cunguara et al. 2011). Agriculture provides
work for 80 percent of the economically active population, and 60 percent of the people working
in the sector are female (Cunguara and Darnhofer, 2011).
3

The horticultural sector in both countries has the potential to generate considerably higher
foreign exchange earnings compared to traditional cash crops. Improving the production of high-
value horticultural crops would boost export revenues and reduce risks from the heavy reliance
on a few export crops like tobacco, tea and sugar. Moti (2007) in his study of econometric
analysis of horticulture production in Central and Eastern Ethiopia found out that horticulture
could be away out for agricultural commercialization of small-scale farmers with relatively better
agricultural resources potential. In addition to economic competitiveness, horticultural crops also
offer other opportunities that make them more attractive than traditional cash crops.
Traditionally, the rural areas have been bound to subsistence farming aimed at food security.
However, after liberalizing the economy, more emphasis is put on market-oriented production.
Horticultural crops have the potential to generate increased income in the rural areas. Increased
income will allow farmers to have access to inputs (fertilizers and chemicals) as well as food.
The result will be improved outputs, increased profitability and increased food security.
Tomato is an important vegetable in Malawi and Mozambique (Kumwenda and Chilanga, 2002;
Mondjana et al., 2010). It is grown throughout the year both for cash and food (Spurling, 1972).
A study by Thindwa and Khonje (2005) reported that most farmers (98%) reported tomato as the
most profitable vegetable crop in Malawi. The main districts that grow tomato in Malawi include
Mzuzu, Mzimba, Nkhatabay, Salima, Lilongwe, Dedza, Ntcheu and Thyolo. Similarly, tomato is
an important source of food and income generation in Mozambique, and the crop is grown, all
year around, in areas where favorable agro climatic conditions (temperature, water and soils) for
horticulture production prevail (Roberta, 2009). These high potential regions include the valleys
4
of the Incomati, Umbeluzi and Limpopo Rivers in the south of Mozambique and the high altitude
areas of Manica, Angonia, Lioma and Lichinga (Tembe, 1990).
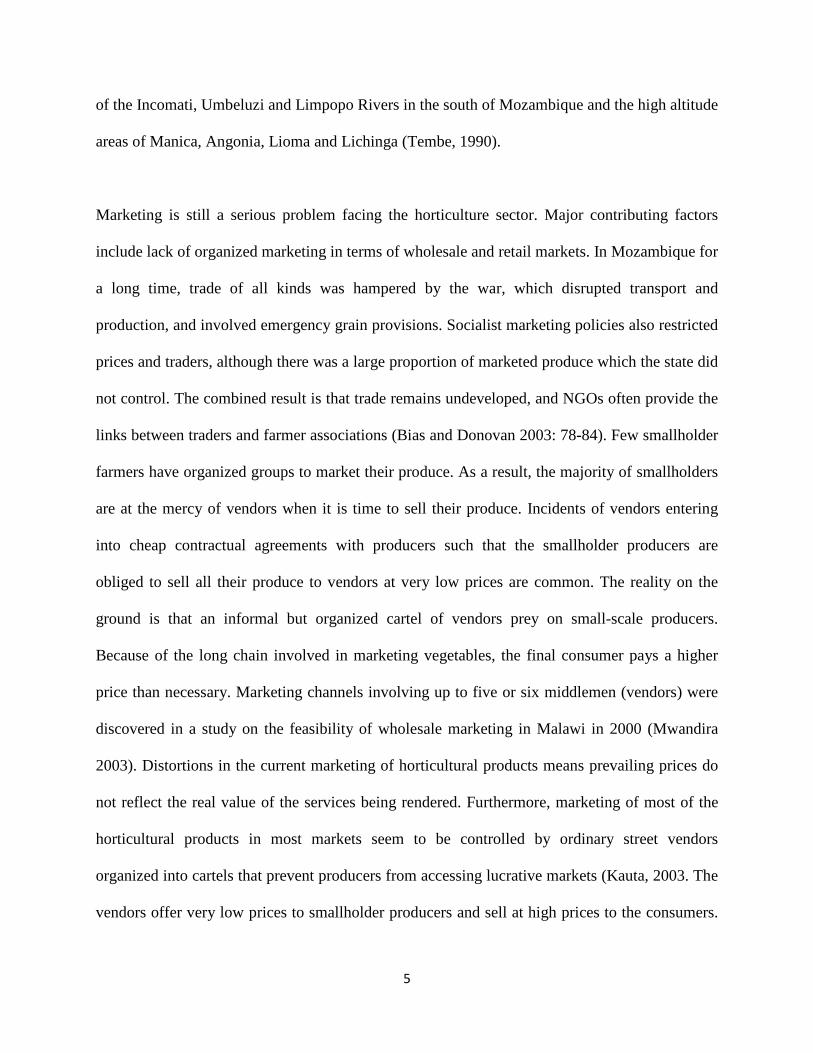
Marketing is still a serious problem facing the horticulture sector. Major contributing factors
include lack of organized marketing in terms of wholesale and retail markets. In Mozambique for
a long time, trade of all kinds was hampered by the war, which disrupted transport and
production, and involved emergency grain provisions. Socialist marketing policies also restricted
prices and traders, although there was a large proportion of marketed produce which the state did
not control. The combined result is that trade remains undeveloped, and NGOs often provide the
links between traders and farmer associations (Bias and Donovan 2003: 78-84). Few smallholder
farmers have organized groups to market their produce. As a result, the majority of smallholders
are at the mercy of vendors when it is time to sell their produce. Incidents of vendors entering
into cheap contractual agreements with producers such that the smallholder producers are
obliged to sell all their produce to vendors at very low prices are common. The reality on the
ground is that an informal but organized cartel of vendors prey on small-scale producers.
Because of the long chain involved in marketing vegetables, the final consumer pays a higher
price than necessary. Marketing channels involving up to five or six middlemen (vendors) were
discovered in a study on the feasibility of wholesale marketing in Malawi in 2000 (Mwandira
2003). Distortions in the current marketing of horticultural products means prevailing prices do
not reflect the real value of the services being rendered. Furthermore, marketing of most of the
horticultural products in most markets seem to be controlled by ordinary street vendors
organized into cartels that prevent producers from accessing lucrative markets (Kauta, 2003. The
vendors offer very low prices to smallholder producers and sell at high prices to the consumers.
5
The other problem is poor processing and packaging. Adding value in processing, packaging,
grading and sorting is also very limited and this contributes to the price distortions in the
marketing chain. Lack of value adding prevents realizing the real value of horticultural produce.
There is a need to invest in proper marketing infrastructure, which must include pack houses and
refrigerated vans.
The rest of the article is organized as follows: Section 2 discusses the value chain approach
followed by methodology and data sources in section 3: Section 4 is a discussion of underlying
analytical framework which guided the study while section 5 deals with main results and discussion.
Synthesis of the main findings, conclusions and policy implications are dealt with in sections 6
and 7, respectively.
2. THE VALUE CHAIN APPROACH
The value chain methodology is a tradition developed from two strains of literature: the business
literature on strategy and organization of Porter (Porter 1990) and the literature of global
commodity chains promoted by Gereffi (Gereffi, 1994, Gereffi and Korzeniewicz 1994; Gereffi,
1999; Gereffi and Kaplinsky, 2001; Gereffi and Memodovic, 2003; Gereffi, et al. 2005) and
developed in numerous studies in the late 1990s. Agricultural value chains link urban
consumption with rural production. Changing demand, as a consequence of urbanization,
emergence of modern consumption patterns or new trends in international trade, impacts on rural
areas along value chains and spills over to marketing and production systems (Hoffler and
Maingi, 2005). Value chain analysis has gained considerable importance in recent years.
6
Although many definitions are applied, value chains essentially represent enterprises in which
different producers and marketing companies work within their respective businesses to pursue
one or more end-markets. The “value chain” is defined by Kaplinsky as “the full range of
activities which are required to bring a product or service from conception, through the
intermediary phases of production, delivery to final consumers, and final disposal after use”
(Kaplinsky 2000). UNIDO (2009) describes it as the entire range of activities undertaken to
bring a product from the initial input-supply stage, through various phases of processing, to its
final market destination, and it includes its disposal after use. For instance, agro-food value
chains encompass activities that take place at the farm or rural level, including input supply, and
continue through handling, processing, storage, packaging, and distribution. As products move
successively through the various stages, transactions take place between multiple chain
stakeholders, money changes hands, information is exchanged and value is progressively added.
Value chain participants sometimes cooperate to improve the overall competitiveness of the final
product, but may also be completely unaware of the linkages between their operation and other
upstream or downstream participants (Karl et al. 2009). Value chains therefore encompass all of
the factors of production including land, labor, capital, technology, and inputs as well as all
economic activities including input supply, production, transformation, handling, transport,
marketing, and distribution necessary to create, sell, and deliver a product to a certain
destination. By revealing strengths and weaknesses, value chain analysis helps identify possible
corrective measures (UNIDO, 2009).
The value chain approach, by its conceptualization, provides an indicative picture of underlying
costs, profits, and trade competitiveness of various crops at a particular point in time (Karl et al
2009). The competitiveness is measured against a defined benchmark at a particular point in
7

time. The results make sense only when defined within the specific context, both in terms of
space and time. The analysis does not capture the variations existing among individual
producers, local traders and processors who have their own cost structures that may vary
significantly from the estimates used for this study. It is also worth noting that it was not possible
to get relevant input from a wide range of stakeholders. As such the results may only be
indicative of major trends, without the accuracy required to define specific cost structures
associated with majority of players in the value-chains. The analysis does not also take into
account seasonal variations in crop yield, price and market opportunities. As such, the results of
the analysis should be interpreted with caution as they only provide indicative trade-offs
associated with different investment decisions and policy mechanisms aimed at enhancing
smallholder agricultural competitiveness in the three countries.
The specific value chain analysis we have done starts with the input supply level, then farm
production and assembly. Due to data limitations, we have not considered the processing and
distribution stages. At every stage, the analysis is based on enterprise budgets for the most
typical crop production models and assembly transactions for each commodity up to the point
where total accumulated value can most realistically be compared with an import or export parity
price as a final measure of trade competitiveness. By identifying the types of costs that account
for the majority of total value and where these costs occur, the approach is designed to help
stakeholders, focus on critical areas where attention is required to overall competitiveness along
the value chain.
This paper presents the results of an analysis of the competitiveness of Malawi and Mozambique
in the production of smallholder tomato. The analysis is based on data collected through a market
8

study conducted in selected areas of the two countries at prices prevailing in the 2010/11
agriculture season. The analysis covers only the low level of smallholder management of tomato.
The specific objectives of the comparative value-chain study across the two countries were:
• To determine private costs and profitability of different stages in the value chain:
Only by understanding the costs and returns to farming and the other stages of
production and distribution until the final market that policy makers and development
practitioners able to understand the incentives for production, processing, and
exportation as well as the incentives for improvement in each stage along the chain.
• To understand cost composition of smallholder farm production: By analyzing the
detailed cost structures of individual value chain participants, value chain analysis
(VCA) can identify the types of costs that account for the majority of total value, and
therefore focus on specific areas where new investment or other improvement could
have the greatest impact on sector profitability and growth.
• To measure baseline trade competitiveness among smallholder farmers that will
benefit from the project: This was aimed at exploring smallholder farmers’
competitiveness in regional and global markets so as to assess how best to facilitate
farmers’ access to such markets as a way of optimizing their potential benefits from
the project.
3. METHODOLOGY AND DATA
9

In value chain analysis, all inputs and outputs carry forward their inherited value from the
previous stage. This concept is important to stress in value chain analysis where the focus is on
accumulated costs at different stages as a key determinant of trade competitiveness (Karl et al.
2009; Sunderman et al. 2010). The competitiveness of any domestic product depends on the
efficiency of input supply, farm production, assembly, processing, and logistics up to final
delivery point where the good competes internationally as an export or import substitute. By
looking at the cost composition at each stage of the value chain and comparing these costs with
world standards, the methodology not only shows if the country is internationally competitive,
but also helps identify key stages where costs could most effectively be reduced as a strategy for
sector growth.
Figure 1: Stages of the Value Chain
Source: Tchale and Keyser, 2009
Data for this article was collected in selected sites of central Mozambique and Southern Malawi
from July to September in 2011. These regions are dominated by the maize-mixed farming
system. Principal livelihoods are based on maize, tobacco, cotton, grain legumes, small
Assembly Processing
Farm Production
Logistics / Distribution
Input Supply
10

ruminants, and poultry and off-farm work activities. In each country, 48 tomato farmers were
randomly chosen and interviewed.
In addition, a limited number of input suppliers and crop traders were interviewed. The sample
size of 48 was considered well enough considering the nature of our research problem. The
sample size of 48 tomato farmers including other value chain actors interviewed provided
enough data to answer the research questions of the study.
In addition to the household and trader interviews, complementary data on cost structure were
obtained from brief literature review, key informant interviews, and sourcing of production
information from crop research institutes and statistical abstracts. Some of the Malawi cost and
return estimates were obtained from Mapemba (2009). Subsequent to the data collection and
preliminary analysis, agricultural experts were consulted to validate the draft results and seek
feedback on major bottlenecks and recommendations for improvement. The agricultural experts
included agribusiness experts within CIAT, agribusiness experts from government research and
development institutions in Malawi and Mozambique and agricultural value chain specialists
from FAO. The initial crop budgets were examined against comments from industry
stakeholders, corrected where appropriate and used to calibrate the models which have produced
the results we have presented and discussed in this paper.
Table 1: Description of the smallholder and trader samples in the two countries
Study countries
Malawi Mozambique
Tomato farmers 48 48
11
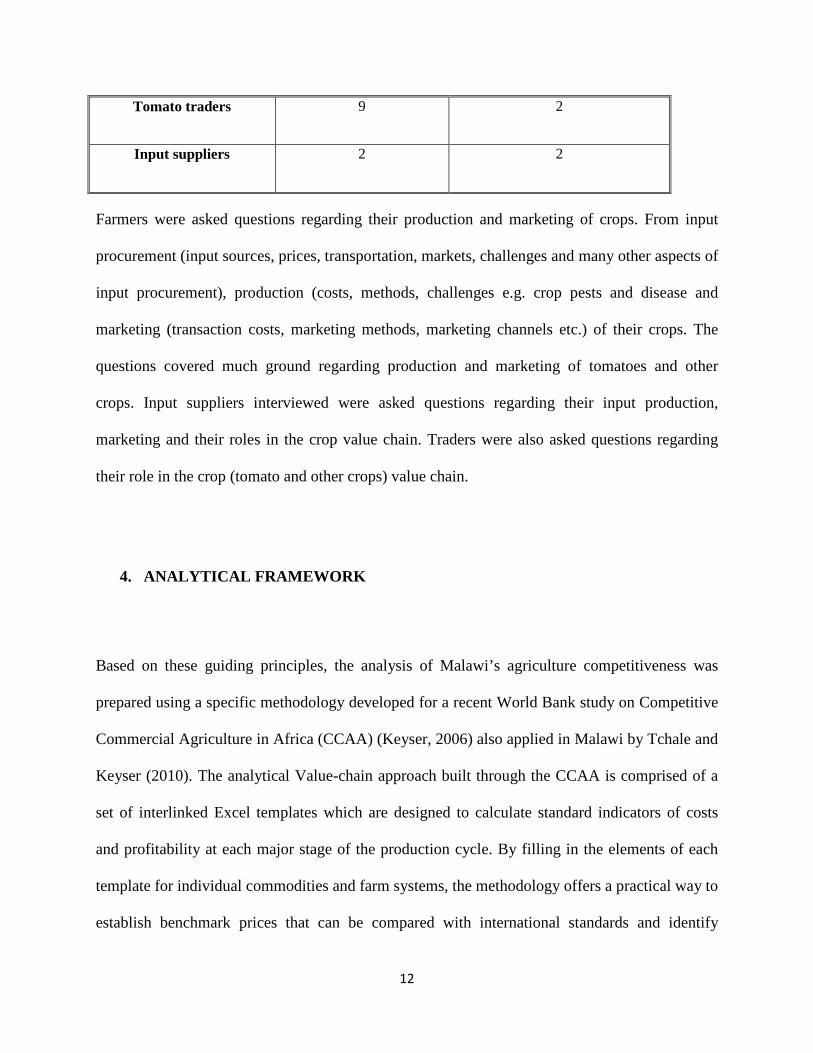
Tomato traders 9 2
Input suppliers 2 2
Farmers were asked questions regarding their production and marketing of crops. From input
procurement (input sources, prices, transportation, markets, challenges and many other aspects of
input procurement), production (costs, methods, challenges e.g. crop pests and disease and
marketing (transaction costs, marketing methods, marketing channels etc.) of their crops. The
questions covered much ground regarding production and marketing of tomatoes and other
crops. Input suppliers interviewed were asked questions regarding their input production,
marketing and their roles in the crop value chain. Traders were also asked questions regarding
their role in the crop (tomato and other crops) value chain.
4. ANALYTICAL FRAMEWORK
Based on these guiding principles, the analysis of Malawi’s agriculture competitiveness was
prepared using a specific methodology developed for a recent World Bank study on Competitive
Commercial Agriculture in Africa (CCAA) (Keyser, 2006) also applied in Malawi by Tchale and
Keyser (2010). The analytical Value-chain approach built through the CCAA is comprised of a
set of interlinked Excel templates which are designed to calculate standard indicators of costs
and profitability at each major stage of the production cycle. By filling in the elements of each
template for individual commodities and farm systems, the methodology offers a practical way to
establish benchmark prices that can be compared with international standards and identify
12

specific areas where costs can most effectively be reduced through policy change or other types
of investments.
In the analytical approach, total costs are measured in terms of Domestic Value Added (DVA)
and Shipment Value (SV), which constitute the main value chain indicators as follows.
(1) 𝐷𝐷𝐷𝐷𝐷𝐷 = 𝑋𝑋 + 𝑌𝑌 + 𝑍𝑍 where DVA is the domestic value-added expressed in domestic or
international currency units; X is the sum total of domestic costs and mark-ups by
various players along the value-chain; Y is the sum total of domestic duties and taxes;
and Z is the sum total of all unofficial charges and extra costs incurred along the
value-chain.
(2) 𝑆𝑆𝐷𝐷 = 𝐷𝐷𝐷𝐷𝐷𝐷 + 𝐹𝐹𝐹𝐹 where SV is the shipment value, representing the total cost of
producing and shipping the commodity to a foreign market; and FC is the sum total of
all foreign costs incurred in the process of shipping a commodity to a foreign market,
including any duties and taxes.
Individual countries mainly have influence over prices within their own borders. As such, the
methodology is particularly interested in the composition of DVA as a leverage point for
enhanced sector performance. These costs include legitimate business costs and mark-ups,
official customs duties and taxes, and unofficial payments and bribes that sometimes have to be
made to facilitate a particular operation. However for Malawi information on unofficial costs
was unavailable and “domestic extras” were excluded from the analysis. We could not gather the
information from the farmers and value chain actors included in the study. We therefore assumed
zero unofficial costs in Malawi for that particular study period. If some cost accounts for a large
13

share of total value, or is significantly higher than an equivalent international benchmark, then
new policies or investments focused on reducing that cost would likely be an effective strategy
for improved competitiveness.
The final shipment value including foreign components is the most comprehensive measure of
actual and potential competitiveness, when compared against regional or international
benchmarks. Therefore, for any given commodity, trade competitiveness is determined by
comparing SV at the final market with an equivalent parity price (either a Free on Board (FOB)
price for exports or Cargo, Insurance, Freight (CIF) price for import substitutes). By examining
the build-up of SV (and DVA) from stage to stage, the methodology reveals the competitiveness
of the overall value-chain, including the various segments, and the key players along the chain.
For example, if one stage accounts for a disproportionately large share of final shipment value,
interventions focused on that part of the value chain is likely to have a significant impact on the
overall competitiveness of the chain.
This approach to value chain analysis allows for comparisons of production cost and other
aspects of sector performance across countries, so long as the structures being compared are
relatively homogenous. Such comparative analysis has been applied to African countries such as
Mozambique, Nigeria, Zambia and Cameroon, and international benchmark countries such as
Brazil and Thailand (World Bank 2008). This type of cross-country comparisons produces some
interesting results that help better understand development opportunities across countries.
However, differences in data collection and the typification of crop models may imply that
results cannot be compared exactly. Keyser (2008) gives more details of the CCAA results and
discussion of the limitations of cross-country analysis.
14

It is also important to note that agricultural commodities take on different forms at each stage of
the value chain. For example, the difference may be between a recently harvested farm product
with high moisture content and one that has been assembled in a warehouse and dried for several
months. Agricultural raw materials or intermediate goods may also be processed into one or
more finished goods. For instance, seed cotton is processed into lint and seed while leaf tobacco
is threshed to remove the tips and stems before export. Similarly, maize grain is processed into
flour and tomato is processed into various commodities. DVA and SV are thus measured
according to equations [1] and [2] on a per ton basis for the following product forms:
Farm production Farm gate product
Assembly Assembled raw material
Processing Processed raw material
International logistics Traded commodity
Finally, the value chain analysis is also interested in the private costs and returns that accrue to
individual participants. Agriculture production, processing, and marketing begins with the
decisions private investors make and it is important to have a sense of the underlying financial
costs and profitability of competing enterprises first to determine if the system is viable and
second to identify opportunities for poverty reduction. Because the methodology is constructed
around enterprise budgets, these measurements are easy to make. At the farm level, private costs
and returns are measured in per hectare and per ton terms; at later stages, values are measured in
per MT terms only. From these indicators, calculations showing the rate of return to variable and
15

fixed expenditure, total investment requirements, demand for labor, and other components of
private and social importance can be made.
In order to undertake the value-chain analysis using the quantitative methodology outlined
above, a number of assumptions were used. These are presented as follows:
(i) Farm management: The analysis covers only the low level of management
because over 90% of the farmers interviewed in all the two countries were
classified under this category. This category is classified as FAM-low and implies
that farmers follow a fairly basic management regime and use only the most
essential farm inputs.
(ii) Agriculture prices: Unless noted, all prices reported in this paper are for the
2010/11 agriculture season. Farm input and output prices include transport up to
the farm gate or other place where the next participant in the value chain takes
over responsibility for that commodity. All prices are quoted in the local currency
unit and are all expressed in the US$ using relevant exchange rates.
(iii) Crop yields. Crop yields reflect a realistic expectation in a year with “normal”
growing conditions using low levels of inputs at smallholder farmer level. There
are many variations, including seasonal growing conditions, local soil type,
farmer skill, seed quality, and many other factors, that may affect the actual yields
across countries, but we assume that factors affecting smallholder farming
systems in these two countries are fairly similar, and therefore their yields should
be comparable. The yields of fresh tomato were assumed to be 890 kg/ha and 950
kg/ha for Malawi and Mozambique, respectively. Tomato prices at farm level
16

were assumed to be US$320.00/ton and US$532.51/ton for Malawi and
Mozambique, respectively. Tomato prices at assembly level were assumed to be
US$431.30/ton and US$613.23/ton for Malawi and Mozambique, respectively.
The average distance to tomato markets was estimated to be 6km for Malawi and
1.7 km for Mozambique.
(iv) Family labor: In calculating the DVA and SV, the value chain analysis uses an
aggregate cost of all factors used in the production and marketing of each
agricultural commodity. Since family labor often accounts for a large share of
production costs, some proxy value is applied to impute the value of family
labour. We therefore applied a proportion of the wage to value family labour i.e.
at 60% of the rate for hired labor. Smallholder farmers rarely have the opportunity
to sell their labor at the full wage rate and this approach is a simple way to impute
the cost of family labour for purposes of competitiveness analysis. In all cases, the
quantity of family labor was estimated on the basis of adult equivalents computed
from household members based on their respective ages and gender, and applying
proportionate adjustments for tasks that must be carried out over a limited number
of days. Data on hired labour was collected directly using the structured
household survey applied to households in selected areas in the two countries.
(v) Investment costs. The estimated per hectare (or per ton) cost of long term
investments used at each stage of the value chain were estimated using the capital
recovery cost method. The annual payment for simple equipment was estimated
over its useful life as a basis for an estimated economic rate of return on the
investment. This approach has the advantage over the simple division of an
17

input’s value by its useful life as it accounts for the fact that if the farmer did not
purchase the equipment, the money could have been invested in the next best
alternative enterprise. This thus can be computed as follows:
Annual cost per hectare (or per MT) = purchase price of implement * per hectare
(or per MT) share of total use * capital recovery factor. CRF =
((1+i)^n)*i/(1+i)^n-1 where i = real interest on savings and n = number of years
in the implement’s useful life. See Monke and Pearson, 1989 for a detailed
discussion of this methodology.
(vi) Domestic and international transportation costs. For domestic routes a
financial price of US$0.13 per ton per kilometer has been assumed based on
average domestic transport costs in the two countries. This is the average price
reported during data collection. The price is significantly low due to the
prevalence of collective action in transporting tomato produce to the domestic
markets. Moreover, the influence of adopting local means of transporting produce
to markets e.g. scotch carts in most parts of Mozambique and Malawi lowered the
average domestic transportation costs. International transport. The value chain
analysis compares a country’s final SV for each commodity with an international
parity price, assumptions regarding road and sea freight prices are required. Since
this data was not collected through the study instruments, assumptions were made
based on national and international sources. For Malawi, information provided by
the Ministry of Transport was used. For international transport costs for Malawi
and Mozambique, an average cost of USD 80 per MT was used to calculate
freight costs based on the SAFEX reference point at Randfontein to Harare plus
18

USD 40 per MT for onward freight from Harare to Blantyre (Malawi). Half the
rates were used for Mozambique due to its proximity to the deep sea ports of
Nacala and Beira.
5. MAIN RESULTS AND DISCUSSIONS
5.1 Farm-level
Table 2: Key variables used in the analysis
Variable Malawi Mozambique
Tomato yield (kg/ha) 890 950
Tomato price (farm-level) (US$/ton)* 320.00 532.51
Tomato price (assembly-level) (US$/ton) 431.30 613.23
Average distance to tomato markets (km) 6.00 1.7
(*) denotes fresh tomato.
Data on tomato production cost structure and returns, as well as value-chain profitability
indicators are shown in Tables 2 and 3, respectively. In the case of Malawi, the results show that
the average yield among tomato producers is 890 kg/ha (combined yield from two harvests per
season). The tomato model assumes, as per the data, a seed-rate of 10kg/ha, application of both
basal and top dressing fertilizer (NPK and Urea) and takes into the cost of the chemicals and the
labour involved in spraying chemicals. As tomato production is labour-intensive, the model also
19

accounts for hired and family labour used. At the assembly level, transport costs and margins for
the traders are considered in the analysis.
As shown in Table 3 below, the gross margin which accrues to Malawian smallholder farmers
growing tomato is estimated at US$207.50 per hectare or US$233.15 per ton of tomato
produced. In Malawi, most of the tomato is grown under small-scale irrigation systems in
dambos (low lying areas with residual moisture and next to streams/rivers). Some farmers do
grow tomato during the rainy season, but these are normally few because of high pest and
disease infestation. In the analysis, we considered two harvests, the irrigated crop being the main
crop.
The main variable costs incurred in tomato production include labour, both hired and family
labour (29%), fertilizer (24%), chemicals (4%), seed (1%) and depreciation of capital equipment
used for cultivation, irrigation, and harvesting (23%), and marketing (12%).
In the case of Mozambique, the results show that the average yield among tomato producers is
950 kg/ha (combined yield from two harvests per season). As with the other models, the tomato
model assumes, as per the data, a seed-rate of 10kg/ha, application of both basal and top dressing
fertilizer (NPK and Urea). The analysis takes into account the cost of the chemicals and the
labour involved in spraying chemicals. The model also accounts for hired and family labour
used. At the assembly level, transport costs and margins for the traders are considered in the
analysis.
Farmers make a margin of about US$424/ha or US$449/ton of fresh tomato produced and sold.
These high margins are attributed to the relatively higher tomato yield and farm-gate price
20
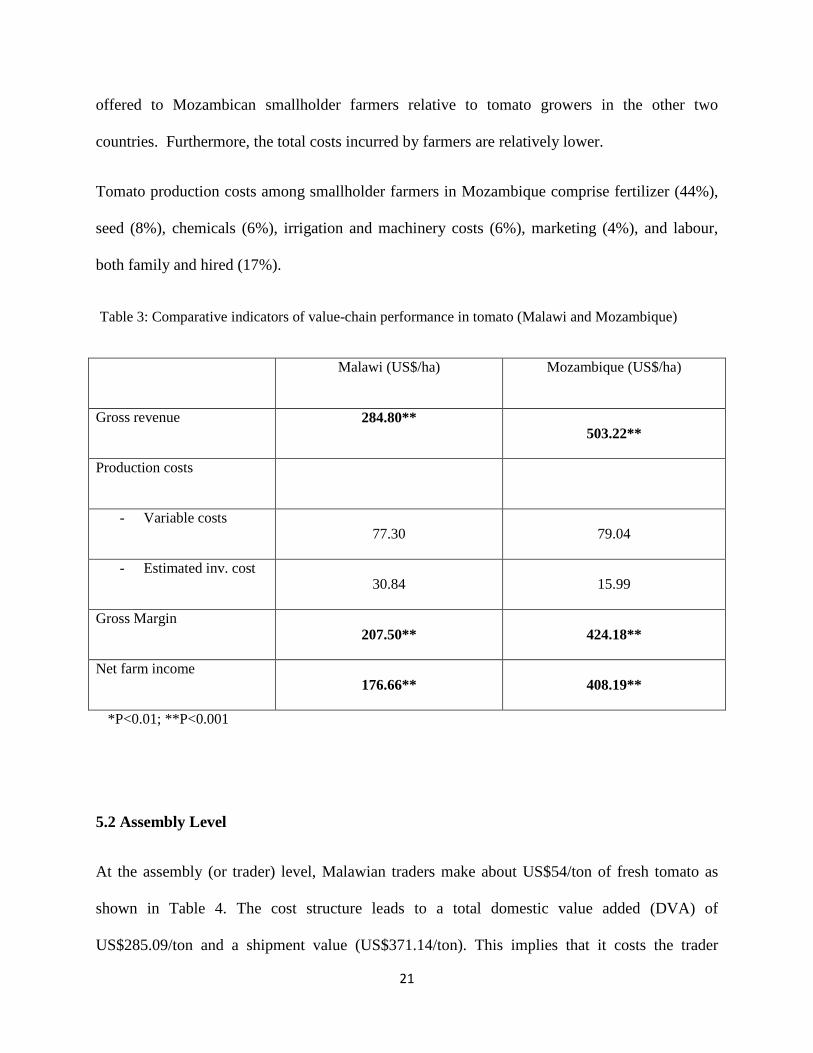
offered to Mozambican smallholder farmers relative to tomato growers in the other two
countries. Furthermore, the total costs incurred by farmers are relatively lower.
Tomato production costs among smallholder farmers in Mozambique comprise fertilizer (44%),
seed (8%), chemicals (6%), irrigation and machinery costs (6%), marketing (4%), and labour,
both family and hired (17%).
Table 3: Comparative indicators of value-chain performance in tomato (Malawi and Mozambique)
Malawi (US$/ha) Mozambique (US$/ha)
Gross revenue 284.80** 503.22**
Production costs
- Variable costs 77.30 79.04
- Estimated inv. cost 30.84 15.99
Gross Margin 207.50** 424.18**
Net farm income 176.66** 408.19**
*P<0.01; **P<0.001
5.2 Assembly Level
At the assembly (or trader) level, Malawian traders make about US$54/ton of fresh tomato as
shown in Table 4. The cost structure leads to a total domestic value added (DVA) of
US$285.09/ton and a shipment value (US$371.14/ton). This implies that it costs the trader
21

US$138.29 to procure a ton of fresh tomato, inclusive of the farm-level costs. If traders were to
sell the fresh tomato outside of Malawi, they would incur about US$371 per ton. If the SV is
higher than the export parity price, and against other competiting exporters, Malawian traders
would not be competitive to export fresh tomato. Based on the comparison with the indicators for
Mozambique, Malawian traders are more competitive even at the assembly level. However, the
fresh tomato parity price, estimated at US$340/ton is much lower and therefore Malawian tomato
would not be competitive against the export parity.
In the case of Mozambique, at the assembly level, the trader margins are estimated at about
US$35 per ton of fresh tomato traded. Over 60% of the traders’ costs are payments to tomato
farmers, implying a much competitive price that is offered to tomato farmers, as shown in Table
4.
This implies that assembly level DVA is estimated at US$524/ton with an SV estimated at about
US$594/ton of fresh tomato, as shown in Table 4 below. These are indicators are fairly high
relative to those of Malawi, and would perhaps reduce the competitive edge that traders have
over competitors. Given the low cost structure of tomato traders, the high domestic cost and
shipment value indicators are mainly attributed to the high farm-gate price provided to farmers
by assemblers, which may be a reflection of increased demand among consumers, and a fair
amount of competition among tomato traders, thereby ensuring that higher consumer prices are
passed on to the farmers through higher relative farm-gate prices. However, in many cases, the
dilemna with high farm-gate prices is that they might lead to less competitiveness because they
invariably increase the final shipment value.
22

Table 4: Assembly-level comparative indicators of value-chain performance in tomato (Malawi and
Mozambique)
Malawi (US$/ton) Mozambique (US$/ton)
Gross revenue 383.89* 579.50*
Production costs
- Crop purchase 284.80 503.22
- Variable costs 34.35 42.94
- Estimated inv. cost 11.16 15.11
Gross margin 64.73 33.34
Net farm income 53.57*
18.23*
*P<0.01; **P<0.001
5.3 Comparison of competitiveness in tomato trade
In terms of trade competitiveness, for Malawi, the total domestic value added (DVA) is
estimated at US$285.09/ton and a shipment value (US$371.14/ton). This implies that it costs the
farmer US$285 to produce a ton of tomato using the low management system. Due to foreign
costs (most of which comprise transport costs), it costs the farmer US$371 to produce and export
a ton of tomato from Malawi (around Ntcheu/Dedza area).
In the case of Mozambique, the total domestic value-added is US$524.34/ton with a shipment
value of US$593.94/ton. As shown in Table 4, this high shipment value is due to the high
23

purchase price at the farm-level (US$503.22/ton, which is much higher compared to Malawi’s
US$284.80/ton). The duties, taxes and foreign costs for Mozambique are lower than those of
Malawi, but Malawi still has competitive advantage in smallholder tomato production due to the
lower purchase price at the farm-level (see Figure 2).
Table 5: Comparative indicators of tomato trade competitiveness (Malawi and Mozambique)
Malawi (US$/ha) Mozambique (US$/ha)
Domestic costs 262.42 502.31
Duties and tax 22.68 22.03
Additional expenses - -
Total DVA 285.09 524.34
Foreign costs 86.05 69.60
Total SV 371.14 593.94
0
100
200
300
400
500
600
700
800
900
1000
1991
1992
1993
1994
1995
1996
1997
1998
1999
2000
2001
2002
2003
2004
2005
2006
2007
2008
2009
Malawi tomatoes Mozambique tomatoes
24
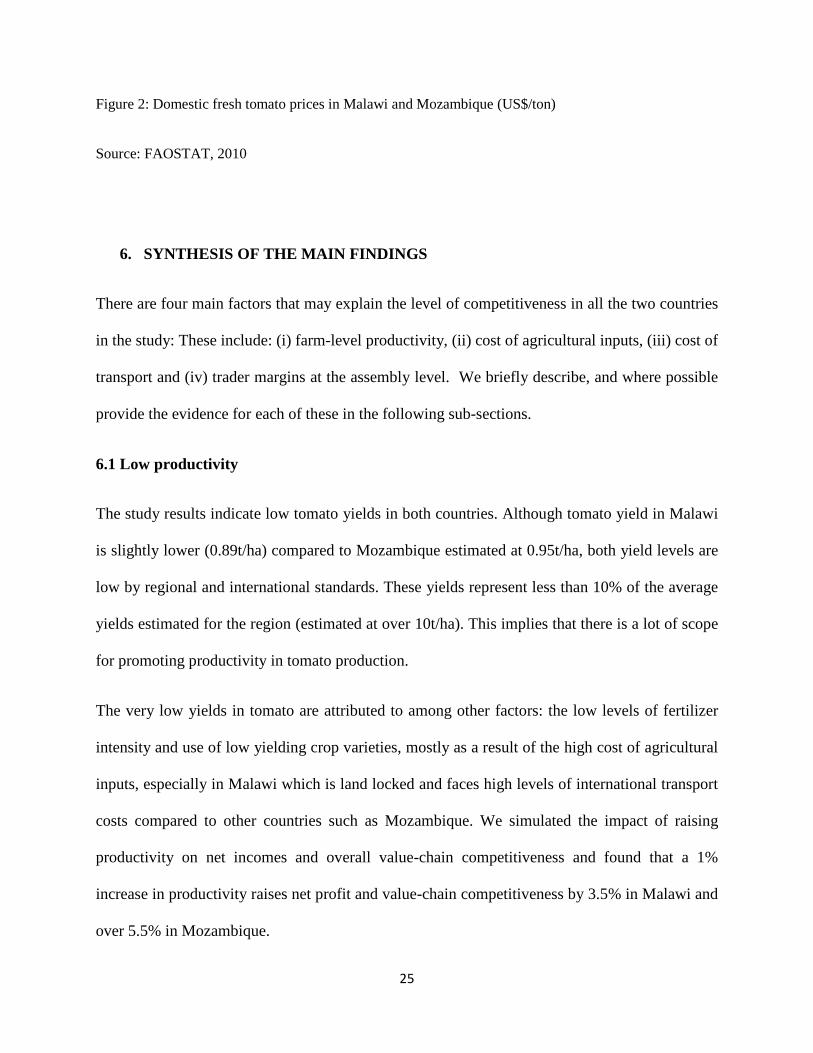
Figure 2: Domestic fresh tomato prices in Malawi and Mozambique (US$/ton)
Source: FAOSTAT, 2010
6. SYNTHESIS OF THE MAIN FINDINGS
There are four main factors that may explain the level of competitiveness in all the two countries
in the study: These include: (i) farm-level productivity, (ii) cost of agricultural inputs, (iii) cost of
transport and (iv) trader margins at the assembly level. We briefly describe, and where possible
provide the evidence for each of these in the following sub-sections.
6.1 Low productivity
The study results indicate low tomato yields in both countries. Although tomato yield in Malawi
is slightly lower (0.89t/ha) compared to Mozambique estimated at 0.95t/ha, both yield levels are
low by regional and international standards. These yields represent less than 10% of the average
yields estimated for the region (estimated at over 10t/ha). This implies that there is a lot of scope
for promoting productivity in tomato production.
The very low yields in tomato are attributed to among other factors: the low levels of fertilizer
intensity and use of low yielding crop varieties, mostly as a result of the high cost of agricultural
inputs, especially in Malawi which is land locked and faces high levels of international transport
costs compared to other countries such as Mozambique. We simulated the impact of raising
productivity on net incomes and overall value-chain competitiveness and found that a 1%
increase in productivity raises net profit and value-chain competitiveness by 3.5% in Malawi and
over 5.5% in Mozambique.
25

6.2 Low levels of organization
The other challenge affecting tomato productivity is the low value obtained by smallholder
farmers who mainly produce and sell the primary fresh tomato to consumers and processors. The
value obtained at the farm-gate is only a small proportion of the total value of processed products
such as canned peeled tomatoes, tomato paste, tomato sauce, dehydrated tomato flakes, tomato
powder, tomato ketchup and many other processed products. Farmers should therefore be
encouraged to organize themselves and undertake semi-processing (cleaning, grading and
packing) so that they can obtain higher than the primary value. Both Malawi and Mozambique
are easily accessible to the growing South African market, but to be able to compete there is need
to raise productivity and be more organized than is currently the case where many farmers
operate on an individual basis.
6.3 High cost of agricultural inputs as a result of high transport costs
Malawi’s costs for fertilizer and other agricultural inputs are generally higher than most
comparator countries. These countries, which are both far from deep water ports, normally face
very high transport costs. The high costs of transport invariably increase the domestic price of
inputs. We have limited evidence from the study, given that we did not control for the specific
types of inputs, but indicative results attest to the fact that the cost structure faced by Malawian
smallholder farmers is highly dominated by high input costs as a result of high foreign costs that
largely constitute transport costs. For example, the major cost in Malawi is fertilizer (44%) while
in Mozambique fertilizer constitutes only 24% of the total farm costs. See figure 3 and 4
respectively. The cost of pest management and irrigation is much lower in Mozambique (5%)
compared to about 12% in the case of Malawi. Incidence of pest and disease attack was reported
26

slightly high in Malawi as compared to Mozambique. This to a certain extent justify high costs
of chemicals, pest and disease management as shown in figures 3 and 4.
Figure 3: Composition of farm-level costs for tomato production in Mozambique
Seed7%
Fertilizer24%
Chemicals4%
Spraying, irrigation & machinery
1%
Marketing costs12%
Hired labor10%
Family labor19%
Overheads & management
0%
Depreciation23%
Mozambique tomato (low management)Composition of Farm-level Costs
27
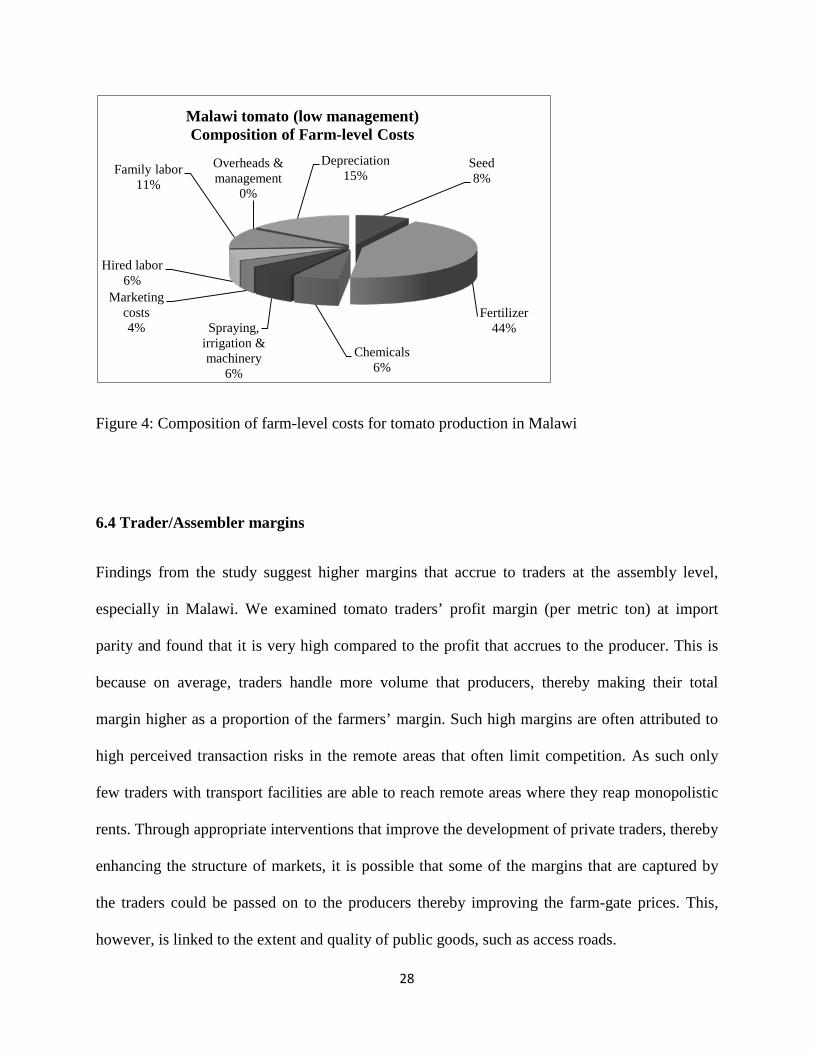
Figure 4: Composition of farm-level costs for tomato production in Malawi
6.4 Trader/Assembler margins
Findings from the study suggest higher margins that accrue to traders at the assembly level,
especially in Malawi. We examined tomato traders’ profit margin (per metric ton) at import
parity and found that it is very high compared to the profit that accrues to the producer. This is
because on average, traders handle more volume that producers, thereby making their total
margin higher as a proportion of the farmers’ margin. Such high margins are often attributed to
high perceived transaction risks in the remote areas that often limit competition. As such only
few traders with transport facilities are able to reach remote areas where they reap monopolistic
rents. Through appropriate interventions that improve the development of private traders, thereby
enhancing the structure of markets, it is possible that some of the margins that are captured by
the traders could be passed on to the producers thereby improving the farm-gate prices. This,
however, is linked to the extent and quality of public goods, such as access roads.
Seed8%
Fertilizer44%
Chemicals6%
Spraying, irrigation & machinery
6%
Marketing costs4%
Hired labor6%
Family labor11%
Overheads & management
0%
Depreciation15%
Malawi tomato (low management)Composition of Farm-level Costs
28

6.5. Trading of tomatoes
Tomato producers in the study were mainly found to trade their tomato at primary level. That is
to say they sell their produce at the nearby trading center. Secondary trading to major cities in the
two countries was found to be done mainly by individuals from outside production areas and
with capital to do so. Tertiary level trading of tomato was done mainly in the city. The situation
was the same in both Mozambique and Malawi.
7. CONCLUSION AND POLICY IMPLICATIONS
The study’s main findings are that smallholder farmers from Malawi and Mozambique face
different, albeit similar levels of competitiveness in the production of tomatoes produced under
the rain-fed farming systems. Competiveness indicators for smallholder tomato show that
Malawi has indicatively some competitive advantage in the production of tomato over
Mozambican farmers.
The key factor that determines such low levels of competitive edge is the very low productivity
in all the crops under study. Estimated smallholder productivity levels in both Mozambique and
Malawi are quite low by regional and international standards. Secondly, due to high transport
costs, Malawi faces relatively higher trader margins and intermediation costs along the value
chains. Inorganic fertilizer and other agricultural inputs are costly mainly due to high
international and domestic transport costs as well as high trader margins as a result of high
transaction risks associated with agricultural input trading. It is therefore likely that the high cost
of inputs further leads to low uptake of fertilizer and improved seed, leading to low uptake of
improved technology.
29

The results imply that interventions in the smallholder sector should focus on improving
agricultural productivity, because keeping all factors constant, it is likely that raising productivity
alone would significantly raise the competitiveness of smallholder farmers in the two countries.
Otherwise it will be futile to link these farmers to regional and international markets at such low
levels of productivity, because they are unlikely to compete. Productivity is the most important
factor towards improving agricultural competitiveness as a basis for improving farmer returns.
Among other interventions, promotion of proven technological and institutional innovations that
provide an incentive for private and public sector investments in agricultural research and
development is critical and primary in order to unlock smallholder potential.
The study shows that productivity gains are more important than other cost savings along the
value chain. Other gains aimed at improving returns and competitiveness among smallholder
farmers would accrue from interventions aimed at reducing the cost of fertilizer, seed and other
agricultural inputs. Among others, Governments need to continue investing in public goods
aimed at reducing the transport costs, such as for example, reduction in domestic taxes and
duties. These are relatively more critical for land-locked countries such as Malawi which face
high transport costs. Furthermore, there is need to consider promoting innovative approaches in
the management of fertilizer and other input supply chains i.e. through timely procurement and
bulk-buying arrangements with other countries in the region so as to be able to get lower prices
at the origin. Increasing the efficiency of inorganic fertilizers through technologies such as
conservation agriculture would also improve the cost-effectiveness of inorganic fertilizer. The
pay-off for smallholder farmers of such technologies is significant and would justify increased
investments in research and development. Given the high cost of establishing viable research and
development initiatives, it is worthwhile to promote regional investments.
30

The overall performance of value-chains, and the pay-off to smallholder farmers would also
improve if appropriate interventions are made to improve the development of private traders,
thereby enhancing the structure of commodity markets. This is likely to help smallholder farmers
because some the margins that are captured by the traders, in both the input and output market,
could be passed on to the producers thereby improving the farm-gate prices.
Acknowledgment
We gratefully acknowledge research funding from the Forum of Agricultural Research in Africa
(FARA) and International Centre for Tropical Agriculture (CIAT). We also thank all reviewers
for their comments and suggestions on earlier drafts of this article. In particular we are grateful
to Dr. Katherine Snyder of CIAT for her detailed review of all sections of the paper. The authors
would like to thank Janine Smit editorial services for editing the English language in this paper.
31
REFERENCES
Bias, C. & Donovan, C., (2003). Gaps and opportunities for agricultural sector development in
Mozambique. Research Report No. 54E. Maputo: Ministry of Agriculture and Rural
Development.
Chinsinga, B., (2007). Decentralization and Poverty Reduction in Malawi: A Critical Appraisal.
In: Gordon C., and Thomas H. (eds.): Decentralization, Poverty Reduction and Conflict
Management in Africa. Netherlands: EADI Publishers,
Cunguara, B., and Darnhofer, I., 2011. Assessing the Impact of Improved Agricultural
Technologies on Household Income in Rural Mozambique. Food Policy 36(2011) 378-390.
Cunguara, B., Langyintuo, A., Darnhofer, I., (2011). The Role of Nonfarm Income in Coping
with Effects of Drought in Southern Mozambique. Journal of Agricultural Economics 00 (2011)
1-13.
32

Donovan, C. & Tostão, E., (2010). Staple food prices in Mozambique. Food Security
Collaborative Working Papers 58561, Michigan State University: Department of Agricultural,
Food, and Resource Economics.
Food and Agriculture Organization of the United Nations, FAOSTAT database
(FAOSTAT, 2010), available at http://faostat.fao.org/site/362/DesktopDefault.aspx?PageID=362
Gereffi, G., Humphrey, J., Sturgeon, T., (2005). The governance of global value chains. Review
of International Political Economy 12:1 February 2005: 78–104
Gereffi, G. and Memodovic, O., (2003). The Global Apparel Value Chain: What Prospects for
Upgrading by Developing Countries? United Nations Industrial Development Organization
(UNIDO), Sectoral Studies Series. Retrieved from http://www.unido.org/doc/12218
Gereffi, G. and Kaplinsky, R. (eds), (2001). The Value of Value Chains, IDS Bulletin, 32(3),
special issue.
Gereffi, G., (1999). International Trade and Industrial Upgrading in the Apparel Commodity
Chain. Journal of International Economics, 48: 37–70.
Gereffi, G., (1994). ‘The Organization of Buyer-Driven Global Commodity Chains: How U.S.
Retailers Shape Overseas Production Networks’, in G. Gereffi and M. Korzeniewicz (eds),
Commodity Chains and Global Capitalism. Westport: Praeger, pp. 95–122.
33

Gereffi, G. and Korzeniewicz, M. eds, (1994). Commodity Chains and Global Capitalism,
Westport: Praeger.
Government of Malawi, (2010). Malawi Millennium Development Goals Report. Lilongwe,
Malawi: Ministry of Development Planning and Cooperation. 2010.
Government of Malawi, (2007). Malawi Growth and Development Strategy (2006-2011).
Lilongwe, Malawi: Ministry of Economic Planning and Ministry of Finance Report.
Höffler H. and Maingi G. (2005). Promotion of Private Sector Development in Agriculture
(PSDA). Nairobi, Kenya: GTZ – German Technical Cooperation.
Kaplinsky, R. (2000). Globalization and Unequalization: What Can Be Learned from Value
Chain Analysis. Journal of Development Studies 37 (2), pp. 117-146.
Karl M.R., Baker, D., Negassa, A., and Brent R.R. (2009). Concepts, applications, and
extensions of value chain analysis to livestock systems in developing countries. Contributed
Paper prepared for presentation at the International Association of Agricultural Economists
Conference, Beijing, China, August 16-22, 2009.
Kauta G.J.C. (2003). The role of the Horticulture and Food Crops Development Project in
vegetable production, marketing and export. In. M.L. Chadha, M.O. Oluoch, A.R. Saka, A.P.
Mtukuso, and A.T. Daudi, (eds.) 2003. Vegetable Research and Development in Malawi.
34
Review and Planning Workshop Proceedings Lilongwe, Malawi 23-24 September 2003
Organizers: AVRDC
Keyser, J.C., (2008). Competitive Commercial Agriculture in Africa (CCAA) Synthesis of
Quantitative Results. Washington DC. The World Bank, Environmental, Rural and Social
Development Unit.
Keyser, J.C., 2006. Definition of Methodology and Presentation of Templates for Value Chain
Analysis, Competitive Commercial Agriculture in Africa (CCAA). Washington DC. The World
Bank, Environmental, Rural and Social Development Unit.
Kumwenda, R.C. and Chilanga, T.G., 2002. Evaluation of Tomato Lines for Adaptation, Yield
and Quality under Malawi Field Conditions. Malawi Journal of Agricultural Sciences 1 (1) 2002.
Mapemba, L. (2009). Cost of production and gross margins analysis for selected crops under
low input management in Malawi. Lilongwe, Malawi. Ministry of Agriculture Report.
Mondjana, A., Ecole, C., Santos, L., Francisco, B. and Nhaulaho, B. (2010). Tomato Curl stunt
Virus Management Strategies for all year round Tomato Production in Mozambique. Entebe,
Uganda. Second RUFORUM Biennial Meeting 20-24 September 2010
Monke, E.A., and S.R. Pearson, 1989. The Policy Analysis Matrix for Agricultural Development.
Ithaca, N.Y.: Cornell University Press, 1989.
35

Moti, J., 2007. Econometric analysis of Horticultural Production and Marketing in Central and
Eastern Ethiopia. PhD Dissertation. Wageningen University and Research Centre. The
Netherlands.
Mwandira C., 2003. The status of the vegetable industry in Malawi: current and future prospects:
In. M.L. Chadha, M.O. Oluoch, A.R. Saka, A.P. Mtukuso, and A.T. Daudi, (eds.) 2003.
Vegetable Research and Development in Malawi. Review and Planning Workshop Proceedings
Lilongwe, Malawi 23-24 September 2003 Organizers: AVRDC
Porter, M. (1990). The Competitive Advantage of Nations. New York. Free Press.
Roberta Pellizzoli 2009. Gender, agriculture, and the “efficient producer” discourse: a case
study from Mozambique, and lessons from South Africa. Paper presented at the FAO-IFAD-ILO
Workshop on Gaps, trends and current research in gender dimensions of agricultural and rural
employment: differentiated pathways out of poverty Rome, 31 March - 2 April 2009
Spurling A.T. 1972. A handbook of vegetable production in Malawi. Bvumbwe Research
Station.
Sunderman, A., Karl, M.R., Randolph, T., and Unger, F. (2010). Poultry value chains and HPAI
in Indonesia: The case of Bogor. Africa/Indonesia Team Working Paper No. 27 April 2010.
Tchale H. and J. Keyser. Quantitative Value Chain Analysis: An application to Malawi. Policy
Research Working Paper 5242, The World Bank, Africa Region, Agricultural and Rural Unit,
March 2010.
36
Tembe, J. 1990. Hortícolas mais conhecidas em Moҫambique, INIA. Ediҫão não publicida. 48p.
Thindwa, H., Khonje, P., 2005. Whiteflies as pests and vectors of viruses in vegetable]e and
legume mixed cropping systems in eastern and southern Africa. In: Whitefly and Whitefly-Borne
Viruses in the Tropics: Building a Knowledge Base for Global Action. P.K. Anderson & F.J. PK,
Morales (eds.). CIAT Publication, Number 34. Chapter 2.5. p. 150- 56.
United Nations Industrial Development Organization, 2009. Agro-Value Chain Analysis and
Development. Vienna. The UNIDO Approach. A Staff Working Paper.
World Bank, 2008. Cameroon Agriculture Value Chain Competitiveness Study. Washington DC.
Agriculture and Rural Development (AFTAR) Sustainable Development Network.
37