Accepted Manuscript Not Copyedited - Squarespace
21
Design of a specialized tractor to replace draft animals in small farms Guillermo F. Diaz Lankenau * PhD Candidate Global Engineering and Research Laboratory Department of Mechanical Engineering Massachusetts Institute of Technology Cambridge, Massachusetts 02139 Email: [email protected] Amos G. Winter, V Associate Professor Global Engineering and Research Laboratory Department of Mechanical Engineering Massachusetts Institute of Technology Cambridge, Massachusetts 02139 Email: [email protected] This paper describes the motivation, design, and testing of a specialized farm tractor designed to replace draft animals in small farms, particularly in rural India. The proposed tractor matches the low capital cost of draft animals and has their unique ability to operate between growing crops in narrow inter-row spaces while retaining the major advan- tages of conventional tractors, such as low maintenance cost and reduced operator physical effort. The proposed trac- tor was conceived based on user needs and our implemen- tation of a detailed terramechanics model. This tractor has a higher drawbar pull per unit mass compared to conven- tional tractors – a high drawbar force is needed to match the peak pull of animals, and a low mass is necessary to reduce material and vehicle costs. This quality is achieved by ap- plying nearly the full vehicle’s weight on the drive wheels, placing drive wheels in line, and locating the tillage tool be- tween both axles. A proof-of-physics prototype of the design was instrumented to measure drawbar pull and tire slip to validate the terramechanics model and quantify traction per- formance. It was capable of pulling with more drawbar force per unit mass than conventional tractors and its performance can be accurately predicted by the model. During field tests on a working farm, the vehicle successfully operated in the narrow spaces between growing crops that would typically not be accessible to a low-cost, conventional small tractor. Initial farmer feedback on the design confirmed its high po- tential for performing farming operations. * Address all correspondence to this author. Nomenclature p soil (normal) pressure c soil cohesion k ′ c cohesion constant γ s soil bulk density k ′ φ friction constant z depth below the surface n depth exponent s soil shear strength φ soil friction angle k soil shear modulus j soil shear deformation i slip at tire-soil interface H tractor traction force B tractor bulldozing force F tractor drawbar pull V vertical soil reaction force w tire width R tire outer radius at contact point η tractive efficiency F pulling force generated by tire S actual forward speed of vehicle P power delivered to wheels D draft force B soil bulldozing force ψ tool angle of attack q distance from load cell to tool x f distance of tractor CG to front axle x r distance of tractor CG to rear axle W T weight of the tractor 1 Accepted Manuscript Not Copyedited Journal of Mechanical Design. Received November 30, 2019; Accepted manuscript posted March 09, 2020. doi:10.1115/1.4046811 Copyright © 2020 by ASME Downloaded from https://asmedigitalcollection.asme.org/mechanicaldesign/article-pdf/doi/10.1115/1.4046811/6521543/md-19-1858.pdf by Massachusetts Inst Of Tech. user on 19 July 2020
-
Upload
khangminh22 -
Category
Documents
-
view
7 -
download
0
Transcript of Accepted Manuscript Not Copyedited - Squarespace

Design of a specialized tractor to replace draftanimals in small farms
Guillermo F. Diaz Lankenau*
PhD CandidateGlobal Engineering and Research Laboratory
Department of Mechanical EngineeringMassachusetts Institute of Technology
Cambridge, Massachusetts 02139Email: [email protected]
Amos G. Winter, VAssociate Professor
Global Engineering and Research LaboratoryDepartment of Mechanical EngineeringMassachusetts Institute of Technology
Cambridge, Massachusetts 02139Email: [email protected]
This paper describes the motivation, design, and testing ofa specialized farm tractor designed to replace draft animalsin small farms, particularly in rural India. The proposedtractor matches the low capital cost of draft animals andhas their unique ability to operate between growing cropsin narrow inter-row spaces while retaining the major advan-tages of conventional tractors, such as low maintenance costand reduced operator physical effort. The proposed trac-tor was conceived based on user needs and our implemen-tation of a detailed terramechanics model. This tractor hasa higher drawbar pull per unit mass compared to conven-tional tractors – a high drawbar force is needed to match thepeak pull of animals, and a low mass is necessary to reducematerial and vehicle costs. This quality is achieved by ap-plying nearly the full vehicle’s weight on the drive wheels,placing drive wheels in line, and locating the tillage tool be-tween both axles. A proof-of-physics prototype of the designwas instrumented to measure drawbar pull and tire slip tovalidate the terramechanics model and quantify traction per-formance. It was capable of pulling with more drawbar forceper unit mass than conventional tractors and its performancecan be accurately predicted by the model. During field testson a working farm, the vehicle successfully operated in thenarrow spaces between growing crops that would typicallynot be accessible to a low-cost, conventional small tractor.Initial farmer feedback on the design confirmed its high po-tential for performing farming operations.
*Address all correspondence to this author.
Nomenclature
p soil (normal) pressurec soil cohesionk′c cohesion constantγs soil bulk densityk′
φfriction constant
z depth below the surfacen depth exponents soil shear strengthφ soil friction anglek soil shear modulusj soil shear deformationi slip at tire-soil interfaceH tractor traction forceB tractor bulldozing forceF tractor drawbar pullV vertical soil reaction forcew tire widthR tire outer radius at contact pointη tractive efficiencyF pulling force generated by tireS actual forward speed of vehicleP power delivered to wheelsD draft forceB soil bulldozing forceψ tool angle of attackq distance from load cell to toolx f distance of tractor CG to front axlexr distance of tractor CG to rear axleWT weight of the tractor
1
Accep
ted
Manus
crip
t Not
Cop
yedi
ted
Journal of Mechanical Design. Received November 30, 2019;Accepted manuscript posted March 09, 2020. doi:10.1115/1.4046811Copyright © 2020 by ASME
Dow
nloaded from https://asm
edigitalcollection.asme.org/m
echanicaldesign/article-pdf/doi/10.1115/1.4046811/6521543/md-19-1858.pdf by M
assachusetts Inst Of Tech. user on 19 July 2020

θ ground slope angleyg distance from tractor CG to groundyD depth of tilling COPxD horz. distance from tractor rear axle to COPα angle of draft force vectorWI weight of the tillage toolxI horz. distance from rear axle to tool CGyI vert. distance from rear axle to tool CG
1 Introduction
A tractor designed specifically to meet the needs ofsmall farmers in India, who would otherwise use draft an-imals, has the potential to create significant impact by im-proving farmers’ economic health and India’s overall foodproduction capacity [1–3]. Small farms (< 2 ha) are com-mon, in India the average farm size has steadily decreasedfrom 2.28 ha in 1971 to 1.08 ha in 2016 [4], and globally(84%) of farms are less than 2 ha in size [5]. Most smallfarmers use a pair of bovine draft animals known as bullocks(sometimes called oxen in other countries) for all or most oftheir farming operations, supplemented by manual labor or ahired tractor [6, 7]. Bullocks are compact, highly maneuver-able, and have a low capital cost, making them well-suited tothe technical and economic constraints of small farms.
Conventional tractors, which are an icon of modernfarming, are able to produce much higher farm yields thanbullocks [8–11]. Farm tractors increase the capacity of eachagricultural worker and enable larger, more profitable farms[12]. The Indian Agricultural Ministry estimates that farmtractors increase farm yields by 5 to 20%, reduce wastedseeds and fertilizer by 15 to 20%, and reduce farm laborby 20 to 30% [6]. However, tractors have not yet beenable to replace key bullock features of maneuverability andcompactness that are essential to work on a small Indianfarm [13]. Tractors also have a high upfront cost that putsthem out of reach of many small farmers in low income re-gions [14]. As a result, small-scale farmers are constrainedto the slow speed of bullocks and a lack of access to suitablemodern, more effective made-for-tractor tools [7, 15].
Although tractors are more expensive upfront, they areless expensive than bullocks in the long term. Fig. 1 showsthe initial cost and 15 year operating costs for a bullock pair,a financed tractor, and a tractor bought upfront. A bullockpair is approximately twice as expensive as using tractorsover 15 years. There are alternatives to acquiring tractors atfull price up front, like financing and renting, but they areinaccessible to many farmers [14, 16, 17] and have financialdrawbacks. For example, those who rent tractors forgo usingthe tractor for supplemental income work and risk not hav-ing access a tractor when they need one if demand is high.An ideal vehicle would retain the low upfront cost of the bul-locks and the low overall cost of the tractor (e.g. the proposedvehicle in Fig. 1). Such a vehicle would have an higher valueproposition than both bullocks and tractors.
To elucidate both the financial and functional require-ments of a tractor specialized for small farmers, the authorsinterviewed stakeholders of small farming in India regard-
Fig. 1. CUMULATIVE COSTS OF FARMING 1 HA WITH BUL-LOCKS OR SMALL FARM TRACTORS. Calculations in Supplemen-tal Material A. Values are from [7,15,18–21]. .
ing local agricultural practices and the suitability of existingalternatives. The authors spoke with stakeholders at 12 lo-cations in the Indian states of Maharashtra, Tamil Nadu, Gu-jarat, Rajasthan, Madhya Pradesh, and West Bengal. Stake-holders included farmers, research organizations, govern-ments, and tractor manufacturers and dealers. A key obser-vation from these visits was that small farmers used bullocksboth because of their low capital cost and because of bul-locks’ suitability to the narrow inter-row spaces in a farmfield. Bullocks have a smaller width than tractors and aremore maneuverable. These characteristics allow bullocks towalk between rows of growing crops later into the seasonwhen crops are taller and wider, leaving less space betweencrop rows. Compared to tractors, bullocks require less spaceto turn at row ends, and can better traverse unfinished dirtpaths leading to farm fields. These critical features of lowupfront cost and ability to access narrow spaces are generallynot present in commercially available small tractors. The fewtractors that approach the purchase price of bullocks cannotmatch the bullock’s maximum pulling force, a key require-ment for seamlessly replacing them.
In conventional tractors, lower cost often comes at theexpense of pulling force. Pulling force is related to a trac-tor’s mass, which is correlated to purchase price. To be soldfor a price comparable to bullocks (∼100k INR, as shown inFig. 1), a tractor would likely have a mass between 350 and500 kg given the current trends of the Indian tractor market(Fig. 2) [7, 22]. The layout of a conventional, rear-wheel-drive tractor with a mass of 350-500 kg would only pro-duce a maximum pulling force of ∼60% of its weight (2060N to 2940 N) in near ideal tilling conditions, and closer to∼35% of its weight in soft soils (1200 N to 1720 N) [22–24].This could not, under most conditions, match the maximumpulling force of a bullock pair (∼2800 N [25, 26]).
A lightweight tractor capable of replacing bullocks insmall farms, and thereby improving farmers’ livelihoods,
2
Accep
ted
Manus
crip
t Not
Cop
yedi
ted
Journal of Mechanical Design. Received November 30, 2019;Accepted manuscript posted March 09, 2020. doi:10.1115/1.4046811Copyright © 2020 by ASME
Dow
nloaded from https://asm
edigitalcollection.asme.org/m
echanicaldesign/article-pdf/doi/10.1115/1.4046811/6521543/md-19-1858.pdf by M
assachusetts Inst Of Tech. user on 19 July 2020
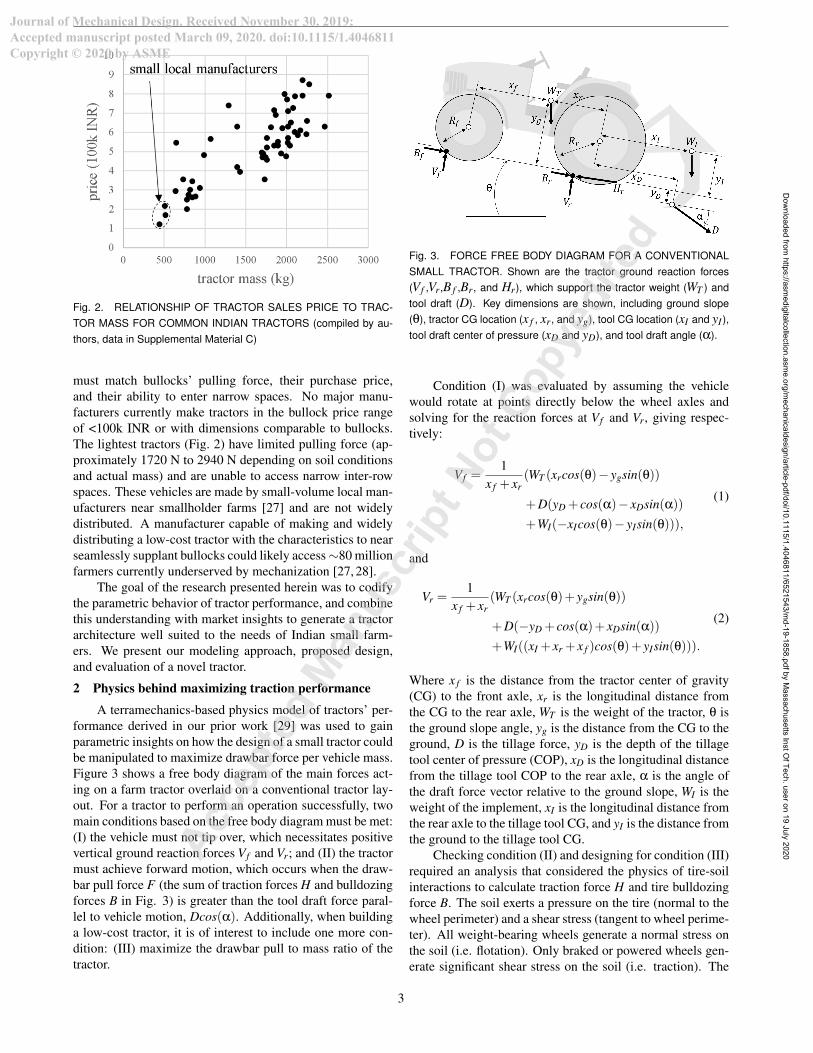
Fig. 2. RELATIONSHIP OF TRACTOR SALES PRICE TO TRAC-TOR MASS FOR COMMON INDIAN TRACTORS (compiled by au-thors, data in Supplemental Material C)
must match bullocks’ pulling force, their purchase price,and their ability to enter narrow spaces. No major manu-facturers currently make tractors in the bullock price rangeof <100k INR or with dimensions comparable to bullocks.The lightest tractors (Fig. 2) have limited pulling force (ap-proximately 1720 N to 2940 N depending on soil conditionsand actual mass) and are unable to access narrow inter-rowspaces. These vehicles are made by small-volume local man-ufacturers near smallholder farms [27] and are not widelydistributed. A manufacturer capable of making and widelydistributing a low-cost tractor with the characteristics to nearseamlessly supplant bullocks could likely access ∼80 millionfarmers currently underserved by mechanization [27, 28].
The goal of the research presented herein was to codifythe parametric behavior of tractor performance, and combinethis understanding with market insights to generate a tractorarchitecture well suited to the needs of Indian small farm-ers. We present our modeling approach, proposed design,and evaluation of a novel tractor.
2 Physics behind maximizing traction performance
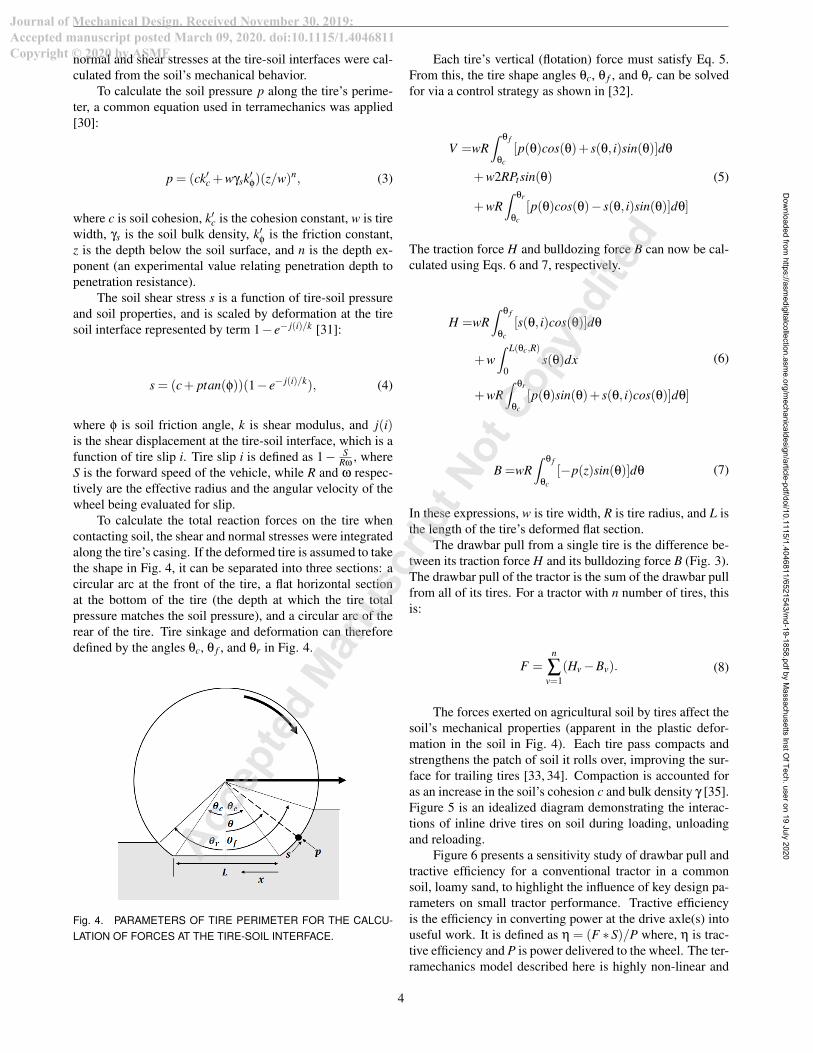
A terramechanics-based physics model of tractors’ per-formance derived in our prior work [29] was used to gainparametric insights on how the design of a small tractor couldbe manipulated to maximize drawbar force per vehicle mass.Figure 3 shows a free body diagram of the main forces act-ing on a farm tractor overlaid on a conventional tractor lay-out. For a tractor to perform an operation successfully, twomain conditions based on the free body diagram must be met:(I) the vehicle must not tip over, which necessitates positivevertical ground reaction forces Vf and Vr; and (II) the tractormust achieve forward motion, which occurs when the draw-bar pull force F (the sum of traction forces H and bulldozingforces B in Fig. 3) is greater than the tool draft force paral-lel to vehicle motion, Dcos(α). Additionally, when buildinga low-cost tractor, it is of interest to include one more con-dition: (III) maximize the drawbar pull to mass ratio of thetractor.
Fig. 3. FORCE FREE BODY DIAGRAM FOR A CONVENTIONALSMALL TRACTOR. Shown are the tractor ground reaction forces(Vf ,Vr ,B f ,Br , and Hr), which support the tractor weight (WT ) andtool draft (D). Key dimensions are shown, including ground slope(θ), tractor CG location (x f , xr , and yg), tool CG location (xI and yI ),tool draft center of pressure (xD and yD), and tool draft angle (α).
Condition (I) was evaluated by assuming the vehiclewould rotate at points directly below the wheel axles andsolving for the reaction forces at Vf and Vr, giving respec-tively:
Vf =1
x f + xr(WT (xrcos(θ)− ygsin(θ))
+D(yD + cos(α)− xDsin(α))
+WI(−xIcos(θ)− yIsin(θ))),
(1)
and
Vr =1
x f + xr(WT (xrcos(θ)+ ygsin(θ))
+D(−yD + cos(α)+ xDsin(α))
+WI((xI + xr + x f )cos(θ)+ yIsin(θ))).
(2)
Where x f is the distance from the tractor center of gravity(CG) to the front axle, xr is the longitudinal distance fromthe CG to the rear axle, WT is the weight of the tractor, θ isthe ground slope angle, yg is the distance from the CG to theground, D is the tillage force, yD is the depth of the tillagetool center of pressure (COP), xD is the longitudinal distancefrom the tillage tool COP to the rear axle, α is the angle ofthe draft force vector relative to the ground slope, WI is theweight of the implement, xI is the longitudinal distance fromthe rear axle to the tillage tool CG, and yI is the distance fromthe ground to the tillage tool CG.
Checking condition (II) and designing for condition (III)required an analysis that considered the physics of tire-soilinteractions to calculate traction force H and tire bulldozingforce B. The soil exerts a pressure on the tire (normal to thewheel perimeter) and a shear stress (tangent to wheel perime-ter). All weight-bearing wheels generate a normal stress onthe soil (i.e. flotation). Only braked or powered wheels gen-erate significant shear stress on the soil (i.e. traction). The
3
Accep
ted
Manus
crip
t Not
Cop
yedi
ted
Journal of Mechanical Design. Received November 30, 2019;Accepted manuscript posted March 09, 2020. doi:10.1115/1.4046811Copyright © 2020 by ASME
Dow
nloaded from https://asm
edigitalcollection.asme.org/m
echanicaldesign/article-pdf/doi/10.1115/1.4046811/6521543/md-19-1858.pdf by M
assachusetts Inst Of Tech. user on 19 July 2020
normal and shear stresses at the tire-soil interfaces were cal-culated from the soil’s mechanical behavior.
To calculate the soil pressure p along the tire’s perime-ter, a common equation used in terramechanics was applied[30]:
p = (ck′c +wγsk′φ)(z/w)n, (3)
where c is soil cohesion, k′c is the cohesion constant, w is tirewidth, γs is the soil bulk density, k′
φis the friction constant,
z is the depth below the soil surface, and n is the depth ex-ponent (an experimental value relating penetration depth topenetration resistance).
The soil shear stress s is a function of tire-soil pressureand soil properties, and is scaled by deformation at the tiresoil interface represented by term 1− e− j(i)/k [31]:
s = (c+ ptan(φ))(1− e− j(i)/k), (4)
where φ is soil friction angle, k is shear modulus, and j(i)is the shear displacement at the tire-soil interface, which is afunction of tire slip i. Tire slip i is defined as 1− S
Rω, where
S is the forward speed of the vehicle, while R and ω respec-tively are the effective radius and the angular velocity of thewheel being evaluated for slip.
To calculate the total reaction forces on the tire whencontacting soil, the shear and normal stresses were integratedalong the tire’s casing. If the deformed tire is assumed to takethe shape in Fig. 4, it can be separated into three sections: acircular arc at the front of the tire, a flat horizontal sectionat the bottom of the tire (the depth at which the tire totalpressure matches the soil pressure), and a circular arc of therear of the tire. Tire sinkage and deformation can thereforedefined by the angles θc, θ f , and θr in Fig. 4.
Fig. 4. PARAMETERS OF TIRE PERIMETER FOR THE CALCU-LATION OF FORCES AT THE TIRE-SOIL INTERFACE.
Each tire’s vertical (flotation) force must satisfy Eq. 5.From this, the tire shape angles θc, θ f , and θr can be solvedfor via a control strategy as shown in [32].
V =wR∫
θ f
θc
[p(θ)cos(θ)+ s(θ, i)sin(θ)]dθ
+w2RPtsin(θ)
+wR∫
θr
θc
[p(θ)cos(θ)− s(θ, i)sin(θ)]dθ]
(5)
The traction force H and bulldozing force B can now be cal-culated using Eqs. 6 and 7, respectively.
H =wR∫
θ f
θc
[s(θ, i)cos(θ)]dθ
+w∫ L(θc,R)
0s(θ)dx
+wR∫
θr
θc
[p(θ)sin(θ)+ s(θ, i)cos(θ)]dθ]
(6)
B =wR∫
θ f
θc
[−p(z)sin(θ)]dθ (7)
In these expressions, w is tire width, R is tire radius, and L isthe length of the tire’s deformed flat section.
The drawbar pull from a single tire is the difference be-tween its traction force H and its bulldozing force B (Fig. 3).The drawbar pull of the tractor is the sum of the drawbar pullfrom all of its tires. For a tractor with n number of tires, thisis:
F =n
∑v=1
(Hv −Bv). (8)
The forces exerted on agricultural soil by tires affect thesoil’s mechanical properties (apparent in the plastic defor-mation in the soil in Fig. 4). Each tire pass compacts andstrengthens the patch of soil it rolls over, improving the sur-face for trailing tires [33, 34]. Compaction is accounted foras an increase in the soil’s cohesion c and bulk density γ [35].Figure 5 is an idealized diagram demonstrating the interac-tions of inline drive tires on soil during loading, unloadingand reloading.
Figure 6 presents a sensitivity study of drawbar pull andtractive efficiency for a conventional tractor in a commonsoil, loamy sand, to highlight the influence of key design pa-rameters on small tractor performance. Tractive efficiencyis the efficiency in converting power at the drive axle(s) intouseful work. It is defined as η = (F *S)/P where, η is trac-tive efficiency and P is power delivered to the wheel. The ter-ramechanics model described here is highly non-linear and
4
Accep
ted
Manus
crip
t Not
Cop
yedi
ted
Journal of Mechanical Design. Received November 30, 2019;Accepted manuscript posted March 09, 2020. doi:10.1115/1.4046811Copyright © 2020 by ASME
Dow
nloaded from https://asm
edigitalcollection.asme.org/m
echanicaldesign/article-pdf/doi/10.1115/1.4046811/6521543/md-19-1858.pdf by M
assachusetts Inst Of Tech. user on 19 July 2020
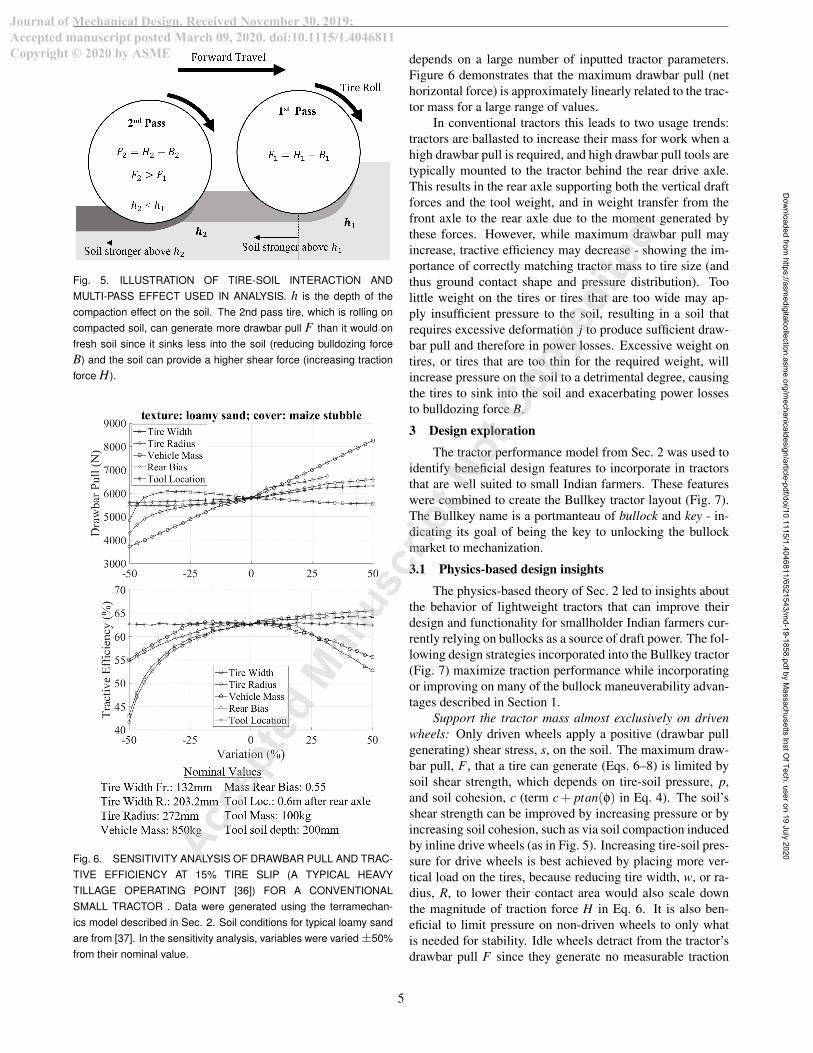
Fig. 5. ILLUSTRATION OF TIRE-SOIL INTERACTION ANDMULTI-PASS EFFECT USED IN ANALYSIS. h is the depth of thecompaction effect on the soil. The 2nd pass tire, which is rolling oncompacted soil, can generate more drawbar pull F than it would onfresh soil since it sinks less into the soil (reducing bulldozing forceB) and the soil can provide a higher shear force (increasing tractionforce H).
Fig. 6. SENSITIVITY ANALYSIS OF DRAWBAR PULL AND TRAC-TIVE EFFICIENCY AT 15% TIRE SLIP (A TYPICAL HEAVYTILLAGE OPERATING POINT [36]) FOR A CONVENTIONALSMALL TRACTOR . Data were generated using the terramechan-ics model described in Sec. 2. Soil conditions for typical loamy sandare from [37]. In the sensitivity analysis, variables were varied ±50%from their nominal value.
depends on a large number of inputted tractor parameters.Figure 6 demonstrates that the maximum drawbar pull (nethorizontal force) is approximately linearly related to the trac-tor mass for a large range of values.
In conventional tractors this leads to two usage trends:tractors are ballasted to increase their mass for work when ahigh drawbar pull is required, and high drawbar pull tools aretypically mounted to the tractor behind the rear drive axle.This results in the rear axle supporting both the vertical draftforces and the tool weight, and in weight transfer from thefront axle to the rear axle due to the moment generated bythese forces. However, while maximum drawbar pull mayincrease, tractive efficiency may decrease - showing the im-portance of correctly matching tractor mass to tire size (andthus ground contact shape and pressure distribution). Toolittle weight on the tires or tires that are too wide may ap-ply insufficient pressure to the soil, resulting in a soil thatrequires excessive deformation j to produce sufficient draw-bar pull and therefore in power losses. Excessive weight ontires, or tires that are too thin for the required weight, willincrease pressure on the soil to a detrimental degree, causingthe tires to sink into the soil and exacerbating power lossesto bulldozing force B.
3 Design exploration
The tractor performance model from Sec. 2 was used toidentify beneficial design features to incorporate in tractorsthat are well suited to small Indian farmers. These featureswere combined to create the Bullkey tractor layout (Fig. 7).The Bullkey name is a portmanteau of bullock and key - in-dicating its goal of being the key to unlocking the bullockmarket to mechanization.
3.1 Physics-based design insights
The physics-based theory of Sec. 2 led to insights aboutthe behavior of lightweight tractors that can improve theirdesign and functionality for smallholder Indian farmers cur-rently relying on bullocks as a source of draft power. The fol-lowing design strategies incorporated into the Bullkey tractor(Fig. 7) maximize traction performance while incorporatingor improving on many of the bullock maneuverability advan-tages described in Section 1.
Support the tractor mass almost exclusively on drivenwheels: Only driven wheels apply a positive (drawbar pullgenerating) shear stress, s, on the soil. The maximum draw-bar pull, F , that a tire can generate (Eqs. 6–8) is limited bysoil shear strength, which depends on tire-soil pressure, p,and soil cohesion, c (term c+ ptan(φ) in Eq. 4). The soil’sshear strength can be improved by increasing pressure or byincreasing soil cohesion, such as via soil compaction inducedby inline drive wheels (as in Fig. 5). Increasing tire-soil pres-sure for drive wheels is best achieved by placing more ver-tical load on the tires, because reducing tire width, w, or ra-dius, R, to lower their contact area would also scale downthe magnitude of traction force H in Eq. 6. It is also ben-eficial to limit pressure on non-driven wheels to only whatis needed for stability. Idle wheels detract from the tractor’sdrawbar pull F since they generate no measurable traction
5
Accep
ted
Manus
crip
t Not
Cop
yedi
ted
Journal of Mechanical Design. Received November 30, 2019;Accepted manuscript posted March 09, 2020. doi:10.1115/1.4046811Copyright © 2020 by ASME
Dow
nloaded from https://asm
edigitalcollection.asme.org/m
echanicaldesign/article-pdf/doi/10.1115/1.4046811/6521543/md-19-1858.pdf by M
assachusetts Inst Of Tech. user on 19 July 2020
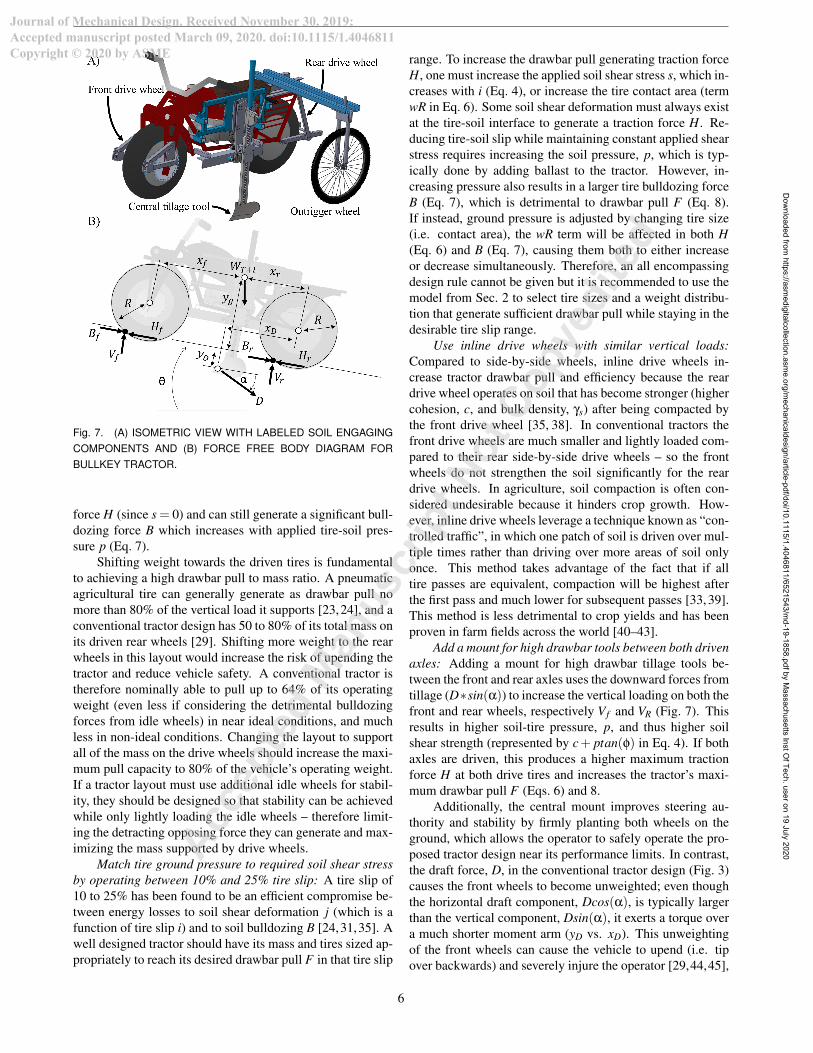
Fig. 7. (A) ISOMETRIC VIEW WITH LABELED SOIL ENGAGINGCOMPONENTS AND (B) FORCE FREE BODY DIAGRAM FORBULLKEY TRACTOR.
force H (since s = 0) and can still generate a significant bull-dozing force B which increases with applied tire-soil pres-sure p (Eq. 7).
Shifting weight towards the driven tires is fundamentalto achieving a high drawbar pull to mass ratio. A pneumaticagricultural tire can generally generate as drawbar pull nomore than 80% of the vertical load it supports [23,24], and aconventional tractor design has 50 to 80% of its total mass onits driven rear wheels [29]. Shifting more weight to the rearwheels in this layout would increase the risk of upending thetractor and reduce vehicle safety. A conventional tractor istherefore nominally able to pull up to 64% of its operatingweight (even less if considering the detrimental bulldozingforces from idle wheels) in near ideal conditions, and muchless in non-ideal conditions. Changing the layout to supportall of the mass on the drive wheels should increase the maxi-mum pull capacity to 80% of the vehicle’s operating weight.If a tractor layout must use additional idle wheels for stabil-ity, they should be designed so that stability can be achievedwhile only lightly loading the idle wheels – therefore limit-ing the detracting opposing force they can generate and max-imizing the mass supported by drive wheels.
Match tire ground pressure to required soil shear stressby operating between 10% and 25% tire slip: A tire slip of10 to 25% has been found to be an efficient compromise be-tween energy losses to soil shear deformation j (which is afunction of tire slip i) and to soil bulldozing B [24,31,35]. Awell designed tractor should have its mass and tires sized ap-propriately to reach its desired drawbar pull F in that tire slip
range. To increase the drawbar pull generating traction forceH, one must increase the applied soil shear stress s, which in-creases with i (Eq. 4), or increase the tire contact area (termwR in Eq. 6). Some soil shear deformation must always existat the tire-soil interface to generate a traction force H. Re-ducing tire-soil slip while maintaining constant applied shearstress requires increasing the soil pressure, p, which is typ-ically done by adding ballast to the tractor. However, in-creasing pressure also results in a larger tire bulldozing forceB (Eq. 7), which is detrimental to drawbar pull F (Eq. 8).If instead, ground pressure is adjusted by changing tire size(i.e. contact area), the wR term will be affected in both H(Eq. 6) and B (Eq. 7), causing them both to either increaseor decrease simultaneously. Therefore, an all encompassingdesign rule cannot be given but it is recommended to use themodel from Sec. 2 to select tire sizes and a weight distribu-tion that generate sufficient drawbar pull while staying in thedesirable tire slip range.
Use inline drive wheels with similar vertical loads:Compared to side-by-side wheels, inline drive wheels in-crease tractor drawbar pull and efficiency because the reardrive wheel operates on soil that has become stronger (highercohesion, c, and bulk density, γs) after being compacted bythe front drive wheel [35, 38]. In conventional tractors thefront drive wheels are much smaller and lightly loaded com-pared to their rear side-by-side drive wheels – so the frontwheels do not strengthen the soil significantly for the reardrive wheels. In agriculture, soil compaction is often con-sidered undesirable because it hinders crop growth. How-ever, inline drive wheels leverage a technique known as “con-trolled traffic”, in which one patch of soil is driven over mul-tiple times rather than driving over more areas of soil onlyonce. This method takes advantage of the fact that if alltire passes are equivalent, compaction will be highest afterthe first pass and much lower for subsequent passes [33, 39].This method is less detrimental to crop yields and has beenproven in farm fields across the world [40–43].
Add a mount for high drawbar tools between both drivenaxles: Adding a mount for high drawbar tillage tools be-tween the front and rear axles uses the downward forces fromtillage (D*sin(α)) to increase the vertical loading on both thefront and rear wheels, respectively Vf and VR (Fig. 7). Thisresults in higher soil-tire pressure, p, and thus higher soilshear strength (represented by c+ ptan(φ) in Eq. 4). If bothaxles are driven, this produces a higher maximum tractionforce H at both drive tires and increases the tractor’s maxi-mum drawbar pull F (Eqs. 6) and 8.
Additionally, the central mount improves steering au-thority and stability by firmly planting both wheels on theground, which allows the operator to safely operate the pro-posed tractor design near its performance limits. In contrast,the draft force, D, in the conventional tractor design (Fig. 3)causes the front wheels to become unweighted; even thoughthe horizontal draft component, Dcos(α), is typically largerthan the vertical component, Dsin(α), it exerts a torque overa much shorter moment arm (yD vs. xD). This unweightingof the front wheels can cause the vehicle to upend (i.e. tipover backwards) and severely injure the operator [29,44,45],
6
Accep
ted
Manus
crip
t Not
Cop
yedi
ted
Journal of Mechanical Design. Received November 30, 2019;Accepted manuscript posted March 09, 2020. doi:10.1115/1.4046811Copyright © 2020 by ASME
Dow
nloaded from https://asm
edigitalcollection.asme.org/m
echanicaldesign/article-pdf/doi/10.1115/1.4046811/6521543/md-19-1858.pdf by M
assachusetts Inst Of Tech. user on 19 July 2020

and limits the operator’s confidence when operating the trac-tor near its performance limits. In India, tractors account forover 25% of farming accidents and the upending of tractorsis a common cause of serious injury [46]. This risk is mit-igated by the added stability of mounting the drawbar toolbetween the front and rear axles.
3.2 Comparison of tractor layouts
Bullkey was designed by combining the strategies dis-cussed in Sec. 3.1 resulting from physics modeling with in-sights gathered from farmer interviews, while utilizing ad-vantageous characteristics of existing small tractor designs.Major needs of Indian small farmers are unmet by existingdesigns, including the ability to enter narrow (<70 cm) inter-row spaces like bullocks can, and achieving a purchase pricecomparable to bullocks (∼100k INR) while generating suffi-cient drawbar pull. A successful design should meet theseneeds and also account for other important considerationsfarmers use when evaluating tractors, like soil compactionand ease of operation. Additionally, the design must main-tain desirable features of existing tractors relative to bullocks,such as reduced ownership costs, reduced drudgery, and im-proved farming productivity [6, 7, 28]. The analysis in thissection shows that Indian small farmer needs could be bettermet by a novel tractor layout – particularly with respect tothe location of drive wheels and the location of tillage tools.
Possible tractor layouts (Fig. 8) were selected for evalu-ation with respect to user needs because they are either cur-rently popular in India (layouts A and B), have been welladopted in other countries by farms smaller than their na-tional average (layout C) [29], or include the features iden-tified as desirable for the Bullkey design (layout D). Theselayouts have distinct configurations: (A) is a conventionalsmall farm tractor with side-by-side steering idle wheels onthe front axle, side-by-side drive wheels on the rear axle, andtools behind the rear axle, (B) is a tricycle tractor similar tothe conventional tractor layout but with a single front idlewheel, and (C) has a design similar to a conventional tractorbut with tools ahead of the rear axle. The proposed Bullkeylayout, (D), has inline drive wheels and tillage tools betweenthe front and rear drive wheels.
Tool location impacts user comfort and safety, alongwith the tractor’s drawbar pull capability. Placing the toolbehind the rear axle, as in layouts (A) and (B), improvescomfort by keeping soil detritus away from the driver dur-ing tillage and, more importantly, improves drawbar pullby transferring weight to the driven rear axle during tillage.However, this weight transfer is also detrimental to comfortand safety, as it unweights the front wheels, resulting in lossof steering authority or, ultimately, in upending the tractor.Placing the tool between the front and rear axles, as in lay-outs (C) and (D), improves comfort and safety by placingthe tool’s action near the farmer’s driving line of sight andeliminating the risk of upending the tractor.
Layout (D) is singular in its ability to enter narrowspaces. Layouts (A), (B), and (C) are limited by their side-by-side drive wheels, which prevent them from straddlingcrop rows taller than their low ground clearance. In the case
Fig. 8. TRACTOR LAYOUTS CONSIDERED FOR BULLKEY. A andB are typical small tractor layouts in India. C is an alternative vintagedesign that was considered. D is the chosen Bullkey layout.
of (B), the situation is worsened by the front wheel requiringa third travel lane – meaning the rows must be widened toaccommodate the full vehicle in a single inter-row space orthe vehicle must straddle two rows of crop. In these layouts,the major mass components – engine, transmission, and op-erator – are between, not in line, with the drive wheels. Assuch, for a vehicle of this configuration to straddle crops, alarge amount of mass would have to be elevated above thecrop height. In tall crops, this is deleterious to the vehicle’sstability and would limit its ability to use ground engagingtools. The inline drive wheels configuration of Bullkey, lay-out (D), places all the major mass components in line withthe drive wheels. This narrow packaging, allows access tointer-row lanes and maintains a low center of mass. Since theoutrigger wheel does not generate traction or provide steer-ing, it does not need to bear much weight and can be attachedvia a simple high ground clearance extension arm from themain tractor frame (Fig.7A). This allows the outrigger armto straddle tall crops and the tractor to generate a single com-paction lane (under its drive wheels).
The side-by-side drive wheel configuration in layouts(A), (B) and (C) allows for differential steering, which can bean advantage in some situations. Differential steering is thesimultaneous application of different torques on each of twoside-by-side drive wheels, which generates a moment on thetractor body and causes it to rotate in yaw. Differential steer-ing can reduce the tractor’s turning radius and enables thedriver to maintain some control even when the steering au-thority of the front wheel is low (e.g., when the front wheelsare unweighted). This could be replicated in (D) by a differ-ential drive-line and steering system that allows the rear tireto be completely braked (i.e. stopped) while the front wheelis turned 90∘ and driven, therefore pivoting the whole vehiclearound the rear tire’s contact patch.
The novel layout, (D), was selected for Bullkey becauseit combines the drawbar pull advantages of weight transfer of(A) and (B) with the improved safety and comfort of (C). Ad-ditionally, Bullkey has a unique ability to operate in narrowspaces. The advantages of Bullkey, both in terms of draw-
7
Accep
ted
Manus
crip
t Not
Cop
yedi
ted
Journal of Mechanical Design. Received November 30, 2019;Accepted manuscript posted March 09, 2020. doi:10.1115/1.4046811Copyright © 2020 by ASME
Dow
nloaded from https://asm
edigitalcollection.asme.org/m
echanicaldesign/article-pdf/doi/10.1115/1.4046811/6521543/md-19-1858.pdf by M
assachusetts Inst Of Tech. user on 19 July 2020
Tractor Layout
Beneficial Design Features User Need Met A B C D
Weight transfer during tillage improves drawbar pull drawbar pull
Weight transfer during tillage improves steering authority safety, comfort
Safe to operate near tillage force limits (will not upend) safety, drawbar pull
Tillage tool is near farmer’s driving line of sight comfort, ease-of-use
All drive tires are in a single lane with farmer and tool narrow, low soil compaction
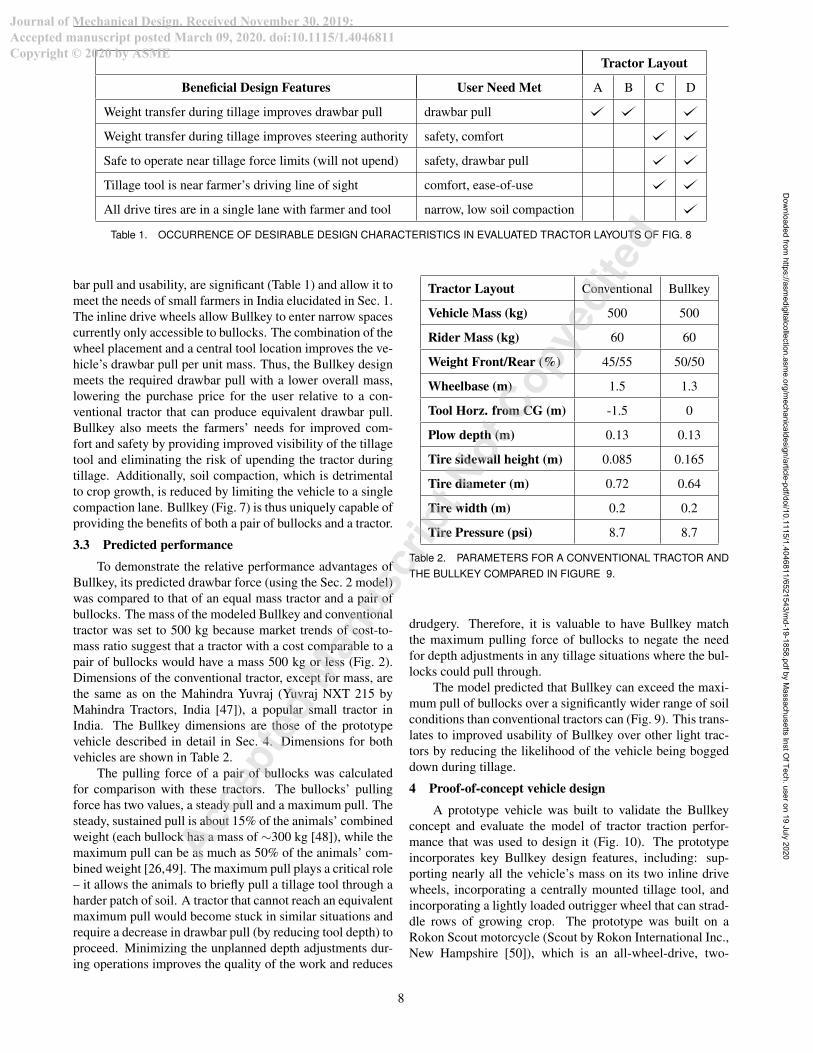
Table 1. OCCURRENCE OF DESIRABLE DESIGN CHARACTERISTICS IN EVALUATED TRACTOR LAYOUTS OF FIG. 8
bar pull and usability, are significant (Table 1) and allow it tomeet the needs of small farmers in India elucidated in Sec. 1.The inline drive wheels allow Bullkey to enter narrow spacescurrently only accessible to bullocks. The combination of thewheel placement and a central tool location improves the ve-hicle’s drawbar pull per unit mass. Thus, the Bullkey designmeets the required drawbar pull with a lower overall mass,lowering the purchase price for the user relative to a con-ventional tractor that can produce equivalent drawbar pull.Bullkey also meets the farmers’ needs for improved com-fort and safety by providing improved visibility of the tillagetool and eliminating the risk of upending the tractor duringtillage. Additionally, soil compaction, which is detrimentalto crop growth, is reduced by limiting the vehicle to a singlecompaction lane. Bullkey (Fig. 7) is thus uniquely capable ofproviding the benefits of both a pair of bullocks and a tractor.
3.3 Predicted performance
To demonstrate the relative performance advantages ofBullkey, its predicted drawbar force (using the Sec. 2 model)was compared to that of an equal mass tractor and a pair ofbullocks. The mass of the modeled Bullkey and conventionaltractor was set to 500 kg because market trends of cost-to-mass ratio suggest that a tractor with a cost comparable to apair of bullocks would have a mass 500 kg or less (Fig. 2).Dimensions of the conventional tractor, except for mass, arethe same as on the Mahindra Yuvraj (Yuvraj NXT 215 byMahindra Tractors, India [47]), a popular small tractor inIndia. The Bullkey dimensions are those of the prototypevehicle described in detail in Sec. 4. Dimensions for bothvehicles are shown in Table 2.
The pulling force of a pair of bullocks was calculatedfor comparison with these tractors. The bullocks’ pullingforce has two values, a steady pull and a maximum pull. Thesteady, sustained pull is about 15% of the animals’ combinedweight (each bullock has a mass of ∼300 kg [48]), while themaximum pull can be as much as 50% of the animals’ com-bined weight [26,49]. The maximum pull plays a critical role– it allows the animals to briefly pull a tillage tool through aharder patch of soil. A tractor that cannot reach an equivalentmaximum pull would become stuck in similar situations andrequire a decrease in drawbar pull (by reducing tool depth) toproceed. Minimizing the unplanned depth adjustments dur-ing operations improves the quality of the work and reduces
Tractor Layout Conventional Bullkey
Vehicle Mass (kg) 500 500
Rider Mass (kg) 60 60
Weight Front/Rear (%) 45/55 50/50
Wheelbase (m) 1.5 1.3
Tool Horz. from CG (m) -1.5 0
Plow depth (m) 0.13 0.13
Tire sidewall height (m) 0.085 0.165
Tire diameter (m) 0.72 0.64
Tire width (m) 0.2 0.2
Tire Pressure (psi) 8.7 8.7
Table 2. PARAMETERS FOR A CONVENTIONAL TRACTOR ANDTHE BULLKEY COMPARED IN FIGURE 9.
drudgery. Therefore, it is valuable to have Bullkey matchthe maximum pulling force of bullocks to negate the needfor depth adjustments in any tillage situations where the bul-locks could pull through.
The model predicted that Bullkey can exceed the maxi-mum pull of bullocks over a significantly wider range of soilconditions than conventional tractors can (Fig. 9). This trans-lates to improved usability of Bullkey over other light trac-tors by reducing the likelihood of the vehicle being boggeddown during tillage.
4 Proof-of-concept vehicle design
A prototype vehicle was built to validate the Bullkeyconcept and evaluate the model of tractor traction perfor-mance that was used to design it (Fig. 10). The prototypeincorporates key Bullkey design features, including: sup-porting nearly all the vehicle’s mass on its two inline drivewheels, incorporating a centrally mounted tillage tool, andincorporating a lightly loaded outrigger wheel that can strad-dle rows of growing crop. The prototype was built on aRokon Scout motorcycle (Scout by Rokon International Inc.,New Hampshire [50]), which is an all-wheel-drive, two-
8
Accep
ted
Manus
crip
t Not
Cop
yedi
ted
Journal of Mechanical Design. Received November 30, 2019;Accepted manuscript posted March 09, 2020. doi:10.1115/1.4046811Copyright © 2020 by ASME
Dow
nloaded from https://asm
edigitalcollection.asme.org/m
echanicaldesign/article-pdf/doi/10.1115/1.4046811/6521543/md-19-1858.pdf by M
assachusetts Inst Of Tech. user on 19 July 2020

Fig. 9. A COMPARISON OF THE DRAWBAR PULL VERSUS SLIPPERFORMANCE IN WEAK TO STRONG AGRICULTURAL SOILFOR A 500 KG HYPOTHETICAL IMPLEMENTATION OF A CON-VENTIONAL TRACTOR AND BULLKEY (more details Table 2). Thedrawbar pull of a bullock pair has been added for reference. Soil datain Supplemental Material A.
Fig. 10. BULLKEY PROTOTYPE VEHICLE HIGHLIGHTING THEIMPLEMENTATION OF DESIRABLE DESIGN FEATURES FOR ASMALL TRACTOR INTENDED TO REPLACE A PAIR OF BUL-LOCKS. These features include two inline drive wheels support-ing almost the full vehicle weight, a manually controlled and cen-trally mounted heavy tillage tool, and motorcycle-type controls. Gymweights were used for ballast at the front, rear, and over the outriggerwheel.
Bullkey proof-of-physics prototype
Base Vehicle ROKON Scout [50]
Mass unballasted 192 kg
Mass supported by front wheel 82.5 kg
Mass supported by rear wheel 94 kg
Mass supported by outrigger 15 kg
Wheelbase 1.3 m
Rear ballast to rear axle 0.56 m
Front ballast to front axle 0.48 m
Turn radius (no lean) 1.4 m
Tire pressure 7 psi
Tire model TITAN 489XT [51]
Tire size 12" rim, 8" x 25"
Tool used 0.3 m wide furrower
Table 3. BASIC PARAMETERS FOR BULLKEY PROTOTYPE.
wheeled motorcycle meant for heavy off-road duty. A re-movable frame (next to the driver in Fig. 10) was attachedto the left side of the motorcycle to control the tillage toolposition and record the forces it experienced. An outriggerarm extended parallel to the rear axle of the motorcycle, alsoon the left side (behind the driver’s left in Fig. 10). The out-rigger wheel’s axle was in the same vertical plane as the reardrive wheel axle, making side-slip during slow speed turningnegligible for the outrigger wheel. The parameters of the testvehicle are given in Table 3.
The prototype mass could be varied between 192 kg and305 kg during testing. This mass range allowed testing of thetractor physics model at drawbar pull loads comparable tobullocks but without overloading the stock frame and trans-mission of the Rokon. The transmission began slipping atdrawbar forces produced by the 305 kg tested configuration,and so the prototype could not be tested at the maximum ex-pected production mass of 500 kg. The Rokon, which weighsonly 98 kg, had crucial benefits not present in other heaviervehicles, including a unique inline drive wheel system anda frame designed for 20 cm wide tires. Building the Bul-lkey prototype with a commercially-available base vehicleallowed its most critical features to be evaluated without thetime and financial burden of manufacturing an entirely newoperator-safe vehicle. The prototype design incorporated thefull proposed novel layout and was thus suitable for evalu-ating the drawbar pull force and overall functionality of theBullkey concept. In combination with our prior work val-idating the traction model with published data for heaviercommercial tractors [29], the prototype can be used to vali-date the physics model presented here, and so its predictionsfor other mass configurations should be accurate.
The prototype was designed to evaluate if the
9
Accep
ted
Manus
crip
t Not
Cop
yedi
ted
Journal of Mechanical Design. Received November 30, 2019;Accepted manuscript posted March 09, 2020. doi:10.1115/1.4046811Copyright © 2020 by ASME
Dow
nloaded from https://asm
edigitalcollection.asme.org/m
echanicaldesign/article-pdf/doi/10.1115/1.4046811/6521543/md-19-1858.pdf by M
assachusetts Inst Of Tech. user on 19 July 2020
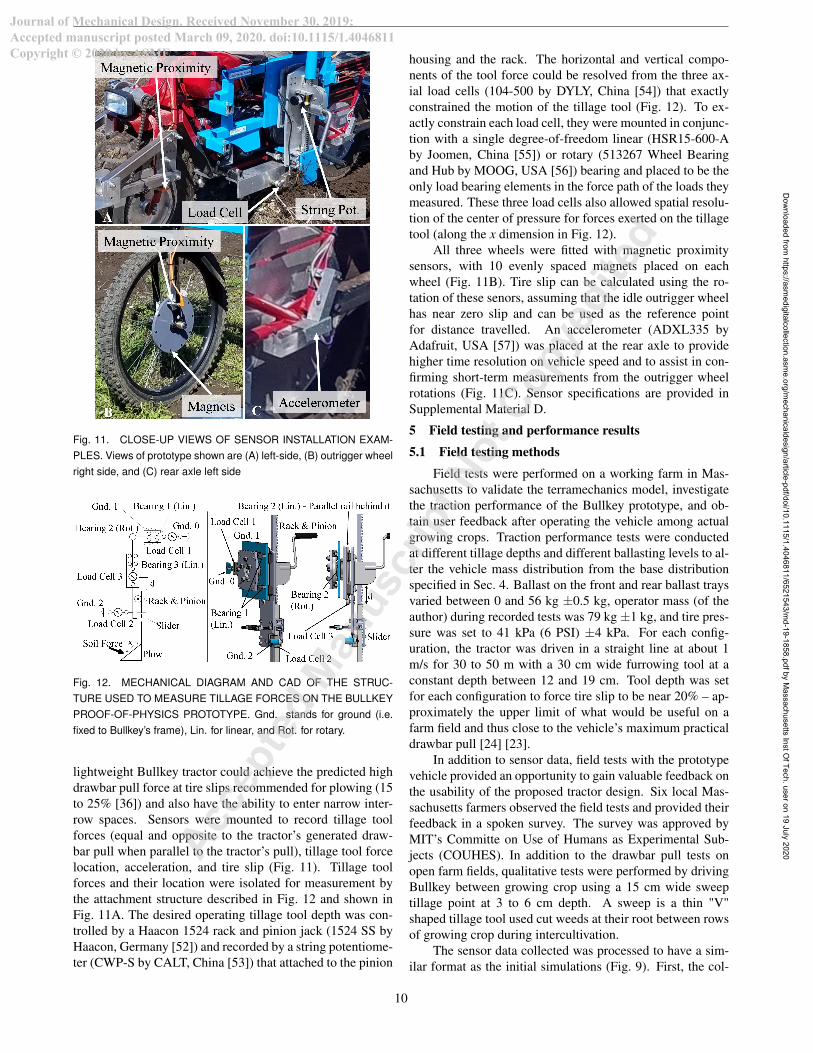
Fig. 11. CLOSE-UP VIEWS OF SENSOR INSTALLATION EXAM-PLES. Views of prototype shown are (A) left-side, (B) outrigger wheelright side, and (C) rear axle left side
Fig. 12. MECHANICAL DIAGRAM AND CAD OF THE STRUC-TURE USED TO MEASURE TILLAGE FORCES ON THE BULLKEYPROOF-OF-PHYSICS PROTOTYPE. Gnd. stands for ground (i.e.fixed to Bullkey’s frame), Lin. for linear, and Rot. for rotary.
lightweight Bullkey tractor could achieve the predicted highdrawbar pull force at tire slips recommended for plowing (15to 25% [36]) and also have the ability to enter narrow inter-row spaces. Sensors were mounted to record tillage toolforces (equal and opposite to the tractor’s generated draw-bar pull when parallel to the tractor’s pull), tillage tool forcelocation, acceleration, and tire slip (Fig. 11). Tillage toolforces and their location were isolated for measurement bythe attachment structure described in Fig. 12 and shown inFig. 11A. The desired operating tillage tool depth was con-trolled by a Haacon 1524 rack and pinion jack (1524 SS byHaacon, Germany [52]) and recorded by a string potentiome-ter (CWP-S by CALT, China [53]) that attached to the pinion
housing and the rack. The horizontal and vertical compo-nents of the tool force could be resolved from the three ax-ial load cells (104-500 by DYLY, China [54]) that exactlyconstrained the motion of the tillage tool (Fig. 12). To ex-actly constrain each load cell, they were mounted in conjunc-tion with a single degree-of-freedom linear (HSR15-600-Aby Joomen, China [55]) or rotary (513267 Wheel Bearingand Hub by MOOG, USA [56]) bearing and placed to be theonly load bearing elements in the force path of the loads theymeasured. These three load cells also allowed spatial resolu-tion of the center of pressure for forces exerted on the tillagetool (along the x dimension in Fig. 12).
All three wheels were fitted with magnetic proximitysensors, with 10 evenly spaced magnets placed on eachwheel (Fig. 11B). Tire slip can be calculated using the ro-tation of these senors, assuming that the idle outrigger wheelhas near zero slip and can be used as the reference pointfor distance travelled. An accelerometer (ADXL335 byAdafruit, USA [57]) was placed at the rear axle to providehigher time resolution on vehicle speed and to assist in con-firming short-term measurements from the outrigger wheelrotations (Fig. 11C). Sensor specifications are provided inSupplemental Material D.
5 Field testing and performance results
5.1 Field testing methods
Field tests were performed on a working farm in Mas-sachusetts to validate the terramechanics model, investigatethe traction performance of the Bullkey prototype, and ob-tain user feedback after operating the vehicle among actualgrowing crops. Traction performance tests were conductedat different tillage depths and different ballasting levels to al-ter the vehicle mass distribution from the base distributionspecified in Sec. 4. Ballast on the front and rear ballast traysvaried between 0 and 56 kg ±0.5 kg, operator mass (of theauthor) during recorded tests was 79 kg ±1 kg, and tire pres-sure was set to 41 kPa (6 PSI) ±4 kPa. For each config-uration, the tractor was driven in a straight line at about 1m/s for 30 to 50 m with a 30 cm wide furrowing tool at aconstant depth between 12 and 19 cm. Tool depth was setfor each configuration to force tire slip to be near 20% – ap-proximately the upper limit of what would be useful on afarm field and thus close to the vehicle’s maximum practicaldrawbar pull [24] [23].
In addition to sensor data, field tests with the prototypevehicle provided an opportunity to gain valuable feedback onthe usability of the proposed tractor design. Six local Mas-sachusetts farmers observed the field tests and provided theirfeedback in a spoken survey. The survey was approved byMIT’s Committe on Use of Humans as Experimental Sub-jects (COUHES). In addition to the drawbar pull tests onopen farm fields, qualitative tests were performed by drivingBullkey between growing crop using a 15 cm wide sweeptillage point at 3 to 6 cm depth. A sweep is a thin "V"shaped tillage tool used cut weeds at their root between rowsof growing crop during intercultivation.
The sensor data collected was processed to have a sim-ilar format as the initial simulations (Fig. 9). First, the col-
10
Accep
ted
Manus
crip
t Not
Cop
yedi
ted
Journal of Mechanical Design. Received November 30, 2019;Accepted manuscript posted March 09, 2020. doi:10.1115/1.4046811Copyright © 2020 by ASME
Dow
nloaded from https://asm
edigitalcollection.asme.org/m
echanicaldesign/article-pdf/doi/10.1115/1.4046811/6521543/md-19-1858.pdf by M
assachusetts Inst Of Tech. user on 19 July 2020

lected time-force signals were passed through a 1 Hz lowpass filter. This filtering frequency was selected because the30 cm long tool travels at least three characteristic lengthsevery second. Then, the distance traveled by all wheels wascalculated by summing the new distance traveled each time awheel magnet (Fig. 11B) was detected, using linear interpo-lation to fill in the distance travelled for intervals betweendetections. The distance travelled between magnet detec-tions is 2π/10 *R, where 2π/10 is the angular spacing be-tween neighboring magnets in radians (there are 10 magnetsper wheel) and R is the effective radius of the wheel (esti-mated by counting the number of wheel rotations to travel30 m under the test conditions). The three (one per wheel)distance-travelled vectors were then processed through a 1Hz low pass filter as well.
The drawbar pull versus tire slip binned data shown inFig. 13 were generated by the following procedure: (1) Thehighest drive tire slip was selected at each timestamp andstored along with the drawbar pull measured at that times-tamp to generate a slip vs. drawbar matrix. (2) This ma-trix was then rearranged so that all drawbar pull instanceswere assigned to the closest integer slip (i.e. all slip instances≥13.5% and <14.5% were assigned to the 14% slip bin). (3)Finally, in each slip bin the average, minimum, and maxi-mum drawbar pull were obtained and stored. As presentedin Fig. 13, squares represent the average drawbar pull at thattire slip bin while the error bars represent that maximum andminimum drawbar pull recorded at that tire slip bin. Furtherdetails are presented in Supplemental Material E.
5.2 Field performance results
Figure 13 compares the drawbar pull performance foreach of the Bullkey mass configurations tested against thesteady state and the maximum pulling force of a bullockpair [25, 26, 49], as well as to the model-predicted perfor-mance for the soil conditions during the test and for the rangeof common farm soil conditions (provided in Supplemen-tal Material D). The results validated that the physics modelfrom Sec. 2 made predictions for the maximum drawbar pullthat are sufficiently accurate to inform tractor design. Themodel average absolute error compared to experimental datawas 7% at 15% slip, 9% at 20% slip, and 12% at 25% slip.The standard deviation for the absolute error was 4% at 15%slip, 5% at 20% slip, and 8% at 25% slip (full results in Sup-plemental Material B). All tested configurations comfortablysurpassed the steady-state pulling of bullocks. The maxi-mum drawbar pull for the 305 kg Bullkey configuration, de-spite being limited by the test soil not being at the upper limitof strength for agricultural soils, was near to the maximumpulling force for a pair bullocks. More importantly, giventhe demonstrated accuracy of the model, it is expected thata heavier Bullkey (up to 500 kg) would be able to matchor exceed the maximum pulling force of a bullock pair forany common agricultural soil condition, as was predicted inFig. 9. This cannot be matched by a conventional tractor lay-out of the same mass.
Fig. 13. EXAMPLES OF MEASURED FORCES FOR PROTOTYPECONFIGURATIONS TESTED. Indicated in each plot are the massessupported by the Bullkey prototype’s front and rear wheels whenstatic and with no driver on board. The masses were adjusted byadding and removing ballast.
5.3 User feedback
On-site farmers who observed the Bullkey prototypeduring field tests said that the vehicle had valuable andunique benefits for small farmers. Farmers appreciated theease with which the tool could be observed during tillage andthe tall height of the outrigger arm, which allowed the vehicleto easily straddle crop rows. They also commented positivelyon the Bullkey prototype’s ability to plough deeper than theywould have expected from such a small vehicle. Farmerswere initially concerned that the tillage tool’s lateral offsetfrom the drive tires might cause Bullkey to veer off-track –this concern was allayed when they watched Bullkey maneu-ver and saw that it was easy to drive the vehicle in a straightline under all conditions. The farmers also had some sug-gestions for improving the vehicle. They suggested havinga mount for low drawbar force tools, like those used duringintercultivation, set up behind the rear axle and in line withthe drive wheels in order to provide better access to narrowrows while crops are growing.
6 Discussion
The Bullkey prototype’s measured maximum drawbarpull matched well to model predictions in both trends andabsolute values. This showed that the model is a useful tool
11
Accep
ted
Manus
crip
t Not
Cop
yedi
ted
Journal of Mechanical Design. Received November 30, 2019;Accepted manuscript posted March 09, 2020. doi:10.1115/1.4046811Copyright © 2020 by ASME
Dow
nloaded from https://asm
edigitalcollection.asme.org/m
echanicaldesign/article-pdf/doi/10.1115/1.4046811/6521543/md-19-1858.pdf by M
assachusetts Inst Of Tech. user on 19 July 2020

to evaluate potential tractor designs for traction performanceand identify promising design directions. The average abso-lute error of the model at high slips (when maximum drawbarpull occurs) was generally less than 10%. The model’s per-formance and its parametric, physics-based foundation makeit useful for exploring a large design space of previously un-realized tractor designs. These capabilities make it a power-ful tool for identifying and establishing the Bullkey design.
The prototype’s field performance showed that the Bul-lkey design satisfied the outlined user needs for an easyto use, highly maneuverable lightweight vehicle with highdrawbar pull capability for a low mass device. Bullkey wasable to straddle rows of growing crops on the field becauseof its configuration of inline drive wheels with an outrig-ger arm. This enabled Bullkey to operate in narrow inter-row spaces like bullocks do – something that is not possiblewith conventional tractors. Bullkey generated more drawbarpull per unit mass than conventional tractors with rear drivewheels and rear mounted tools – this is significant becausemass is correlated approximately linearly with cost (Fig. 2).Bullkey’s performance on the field therefore suggests that aproduction-version of the tractor could be sold at a lower costfor a given drawbar pull capacity than available tractors, en-abling the distribution of a tractor that can compete with themaximum pulling force and the purchase price of bullocks.
Bullkey was comfortable to operate after some adjust-ments were made. A 20 kg ballast was added to the out-rigger wheel after early field tests and mitigated the risk ofthe tractor rolling over sideways. During instrumented test-ing the operator would sit side saddle - a remnant habit froman earlier, taller version of the tillage tool attachment mech-anism shown in Fig 12 - which shifted the overall centerof mass away from the outrigger wheel and decreased sta-bility. During later driving the operator sat as is conven-tional, straddling the motorcycle frame and the tillage toolmounting frame, which was an improvement in comfort. Thefront drive wheel never became unweighted during tests withheavy drawbar loads (a common occurrence with conven-tional tractors [58–60]), which makes Bullkey safer near itstraction limits than conventional tractors.
The proof-of-physics Bullkey prototype allowed testingto find its drawbar pull at slips relevant to tillage and nearits traction limits (15 to 25% tire slip). A limitation of thepresented work is that the accuracy of the modeled drawbarpull drops for slips under 10% (Fig. 13). It is possible that atlower slip the assumed soil deformation mechanics are lessapplicable, or that the vehicle was at least partially relying onother methods of forward propulsion during low slips (like itsinertia when slowing down). These errors could have beenaccentuated by the experimental methods, which focused onfinding the tractor’s maximum drawbar pull at high tire slipsand not on generating steady drawbar pull at low tire slips.Future work could include experiments at constant low tireslips, to better capture the performance of the model in thoseconditions and identify strategies for model improvements.The model is usable for its design purposes in this paper,which is to estimate the maximum drawbar pull of multipledesigns, which occurs at high tire slips.
The Bullkey prototype was usable for farming opera-tions that could be performed with tillage tools mounted cen-trally on the vehicle (like plowing and furrowing). To addflexibility, a future prototype could allow low drawbar forcefarming tools via conventional mounting points behind thetractor, like a three point hitch and a pin or ball hitch. Fu-ture work could also allow for ballast to be added withoutextending the overall length of the vehicle. A key next stepis to discuss the Bullkey vehicle with small Indian farmers– the target users – to solicit feedback on the vehicle designand usability. In these discussions, farmers could also beasked if they might use Bullkey (with some attachments re-moved) as a conventional two-wheel motorcycle for personaltransportation. If Bullkey is viable as a two-wheeler, it couldreplace both a pair of bullocks and a motorcycle for farmers,further increasing its value proposition.
7 Conclusions
The presented tractor design, Bullkey, is novel in its highpotential to concurrently match bullocks’ sales price, pullingstrength, and unique ability to access a field with growingcrop, while also offering farmers major conventional trac-tor benefits like increased productivity, lower maintenancecosts, and improved comfort. This allows Bullkey to fulfillthe unique needs of small farmers in India, which are notcurrently being met by commercially available tractors.
Bullkey has inline drive-wheels that support the major-ity of the its mass, a crop clearance similar to a bullockteam yoke, and a centrally located tillage tool attachment.Inline drive enabled improved traction, reduced soil com-paction, and operating in narrow inter-row spaces betweengrowing crop. Central tool attachment increased traction andimproved safety while also facilitating the operator main-taining control over the direction they are driving as wellas the tillage operation being performed. These beneficialdesign features were identified by combining insights froma physics-based traction model and farmer interviews. Thetraction performance predicted by the model was validatedby field testing an instrumented prototype of Bullkey.
Replacing bullocks with a suitable farm tractor, such asthe Bullkey design proposed here, could increase farmer in-come by 20% and reduce their recurring expenses by 60%.Farmer income could increase because of higher crop yieldsfrom more precise and timely farm operations. Recurringexpenses would be reduced because tractor maintenance ismuch lower over the course of a year than the daily feed andcare costs of bullocks. The findings presented in this pa-per will be useful to engineers developing lightweight, highdrawbar pull vehicles and/or vehicles that are well suited toin-field use by small farmers in emerging markets.
Acknowledgements
The authors would like to thank Mahindra Tractors forsponsoring this work, as well as their technical and logisticalsupport. Thank you also to the MIT Tata Center for sponsor-ing this work. Thank you to Gwyndaf Jones, Dan Dorsch,Shane Pratt , Susan Amrose, Julia Sokol, and Brett Johnsonfor their help with field tests and reviewing this manuscript.
12
Accep
ted
Manus
crip
t Not
Cop
yedi
ted
Journal of Mechanical Design. Received November 30, 2019;Accepted manuscript posted March 09, 2020. doi:10.1115/1.4046811Copyright © 2020 by ASME
Dow
nloaded from https://asm
edigitalcollection.asme.org/m
echanicaldesign/article-pdf/doi/10.1115/1.4046811/6521543/md-19-1858.pdf by M
assachusetts Inst Of Tech. user on 19 July 2020

References
[1] Hazell, P. B. R., 2015. “Is small farm-led developmentstill a relevant strategy for africa and asia?”. OxfordScholarship.
[2] Yadav, S., and Lohan, S. K., 2006. “Tractor and imple-ment ownership and utilization of haryana”. Agricul-tural Mechanization in Asia, Africa AND Latin Amer-ica, 37.
[3] Mehta, C., Chandel, N., Jena, P., and Jha, A., 2019.“Indian agriculture counting on farm mechanization”.Agricultural Mechanization in Asia, Africa AND LatinAmerica, 50.
[4] of Agriculture for Government of India, M., 2019.“Agriculture census 2015-2016”. Agriculture CensusDivision.
[5] Lowder, S., Skoet, J., and Singh, S., 2014. “What do wereally know about the number and distribution of fam-ily farms worldwide? background paper for the stateof food and agriculture”. ESA Paper No. 14-02. RomeFAO.
[6] Indian Agrigultural Ministry, 2013. “Presentation onfarm mechanization before parliamentary consultativecommittee”.
[7] Engineers at Mahindra and Mahindra Co. “Conversa-tions with mahindra and mahindra tractor company ontractor adoption in india. met multiple times from 2014to jan. 2019.”.
[8] Foster, A., and Rosenzweig, M. R., 2010. “Barriersto farm profitability in india: Mechanization, scale andcredit markets.”. World Bank Resources.
[9] FAO (Food and Agricultural Organization), 2013.“Mechanization for rural development: A review ofpatterns and progress from around the world”. Inte-grated Crop Management.
[10] NSL Srivastava, 2006. “Farm power sources, theiravailability and future requirements to sustain agricul-tural production”. Indian Council of Agricultural Re-search.
[11] G Spoor and R Carillon and L Bournas and EH Brown,"1987. The Impact of Mechanization. John Wiley andSons Ltd., Chichester, New York.
[12] USA Census Bureau, 1950. “Agriculture 1950:Changes in agriculture, 1900 to 1950”. Web PDF.
[13] Lankenau, G. F. D., Daigle, L., Ihns, S. H., Koch, E.,Saadi, J., Tornes, P., Wu, J. M., and Amos G. Winter,V., 2019. “Design of a human-powered roll stabiliza-tion attachment for utilitarian two-wheeled vehicles”.ASME IDETC. Anaheim, CA.
[14] Singh, S., 2009. “Agricultural machinery industry inindia a study of grwoth, market strategy, and businessstrategies”. Centre for Management in Agriculture. In-dian Institute of Management Ahmedabad.
[15] Engineers at Mahindra and Mahindra Co. “Conversa-tions with farmers and researchers in india on tractoradoption. met multiple times from 2014 to sept. 2019.”.
[16] Department of Agriculture, Cooperation and FarmerWelfare, 2019. “Annual report 2017 to 2018”. Govern-
ment of India Ministry of Agriculture Farmers Welfare.[17] Food, Advisory, A. S., Research (FASAR), Y. B.,
and at OAV German Asia-Pacific Business Associa-tion (GAA), G. A. A., 2016. “Farm mechanization inindia. the custom hiring perspective”. Indian Ministryof Agriculture and Farmers Welfare.
[18] Prabu M J, 2010. “A tilting cart offers relief to animalsand workers in the field.”. The Hindu. April 21.
[19] Philip, A J, 2017. “Cow protection”. Indian Currents.April 10.
[20] Damodaran, Harish, 2017. “What it might cost to savegauvansh countrywide.”. The Indian Express. April 24.
[21] H. Goel, V. Kumar, 2013. “Automobiles, sixth gear”.Kotak Institutional Equities, Jan.
[22] Arelekatti, V. N. M., Björkdal, D. H., Graves, C. W.,Wong, A., Mkrtchyan, A., and V, A. G. W., 2014.“Proof-of-concept evaluation of a low-cost and low-weight tractor for small-scale farms”. In ASME IDETC2014.
[23] Brixius, W., 1987. “Traction prediction equations forbias ply tires.”. ASAE Paper.
[24] Zoz, F. M., and Grisso, R. D., 2003. “Traction andtractor performance”. In Agricultural Equipment Tech-nology Conference, pp. 1–47.
[25] Goe, M. R., and McDowell, R. E., 1980. “Animal trac-tion guidelines for utilization”. Cornell InternationalAgriculture Mimeograph.
[26] Watson, P. R., 1981. “Animal traction”. Peace Corps.by TransCentury Corporation.
[27] Reddy, B. S., Srinivas, I., Adake, R. V., Thyagraj, C.,Reddy, K. S., and Rao, C. S., 2015. “Small farm mech-anization technologies and transfer strategies”. IndianFarming, 65.
[28] of Food, I. C., and Agriculture, 2017. “Farm mecha-nization national round table conference”.
[29] Guillermo F. Diaz Lankenau and Amos G. Winter V,2018. “An engineering review of the farm tractor’s evo-lution to a dominant design”. ASME Journal of Me-chanical Design. doi:10.1115/DETC2018-86285.
[30] J.Y. Wong and A. Reece, 1967. “Prediction of rigidwheel performance based on the analysis of soil-wheelstresses part i. performance of driven rigid wheels”.Journal of Terramechanics, pp. 81–98.
[31] Bekker, M. G., 1956. Theory of Land Locomotion. Uni-versity of Michigan Press.
[32] Senatore, C., 2010. “Prediction of mobility, handling,and tractive efficiency of wheeled off-road vehicles”.PhD dissertation, Virginia Polytechnic Institute andState University, Department of Mechanical Engineer-ing.
[33] Holm, I., 1969. “Multi-pass behaviour of pneumatictires”. Journal of Terramechanics, pp. 47–71.
[34] Ghotbi, B., Gonzàlez, F., Kövecses, J., and Angeles, J.,2015. “Effect of multi-pass on the mobility of wheeledrobots on soft terrain”. In ECCOMAS Thematic Con-ference on Multibody Dynamics.
[35] Wong, J., 2010. Terramechanics and Off-Road VehicleEngineering. Elsevier, Oxford, UK.
13
Accep
ted
Manus
crip
t Not
Cop
yedi
ted
Journal of Mechanical Design. Received November 30, 2019;Accepted manuscript posted March 09, 2020. doi:10.1115/1.4046811Copyright © 2020 by ASME
Dow
nloaded from https://asm
edigitalcollection.asme.org/m
echanicaldesign/article-pdf/doi/10.1115/1.4046811/6521543/md-19-1858.pdf by M
assachusetts Inst Of Tech. user on 19 July 2020

[36] Smitth and Grisso, 1990. “Using tillage horsepowermore efficiently: Selecting speed, slip and ballast”. InConservation Tillage Proceeding 9:79-81.
[37] Battiato, A., Diserens, E., and Sartori, L., 2013.“Traction performance simulation for mechanical frontwheel drive tractors: towards a practical computertool”. Journal of Agricultural Engineering.
[38] Battiato, A., Diserens, E., and Sartori, L., 2017. “Trac-tor traction performance simulation on differently tex-tured soils and validation: a basic study to make trac-tion and energy requirements accessible to the prac-tice”. Soil and Tillage Research.
[39] Shibly, H., 2017. “Analysis of the effect of soft soil’sparameters change on planetary vehicles’ dynamic re-sponse”. Journal of Automation, Mobile Robotics andIntelligent Systems, 11.
[40] Antille, D. L., Bennett, J. M., and Jensen, T. A., 2016.“Soil compaction and controlled traffic considerationsin australian cotton-farming systems”. Crop and Pas-ture Science.
[41] de Souza, G. S., de Souza, Z. M., da Silva, R. B., Bar-bosa, R. S., and Araùjo, F. S., 2014. “Effects of trafficcontrol on the soil physical quality and the cultivationof sugarcane”. Revista Brasileira de Ciência do Solo.
[42] Onal, I., 2012. “Controlled traffic and widespan trac-tors”. Tarim Makinalari Bilimi Dergisi (Journal ofAgricultural Machinery Science).
[43] Chamen, T., 2014. “Controlled traffic farming – fromworldwide research to adoption in europe and its futureprospects”. In International Conference of AgriculturalEngineering.
[44] Oden, D. S., 2006. “Harvest of hazards the farm safetymovement”. PhD thesis at Iowa State University.
[45] Farm, Safety, R., and of British Columbia, H. A., 2016.“Agricultural equipment safety”. SAFE Work ManitobaCommunicatios.
[46] NAG, P. K., and NAG, A., 2004. “Drudgery, accidentsand injuries in indian agriculture”. Journal of IndustrialHealth, 42.
[47] Mahindra Tractors, 2019. Yuvraj nxt 215.https://www.mahindratractor.com.
[48] Aruna Pal and P.N. Chatterjee, 2013. “Field level studyon the buffalo bullock, an excellent draught animal”.Buffalo Bulletin, 32.
[49] Research and Experimental Centre for Tropical Me-chanical Agricultural Equipment, 1972. “The employ-ment of draught animals in agriculture”. Food andAgriculture Organization of the United Nations.
[50] Rokon International Inc., 2019. Com-pany website with details on vehicles.https://www.rokon.com/bikes/scout.
[51] Titan Tire, 2019. 489 xt, Oct.http://www.titantirestore.com.
[52] Haacon Lifting Technology, 2019. Model 1524 pinionand rack. https://www.haacon.com.
[53] CALT 500mm Measure Range 0-5Kohm Draw WirePotentiometer, 2019. Website with details on sensor.https://www.amazon.com/dp/B01FHDL81Y.
[54] China Enconder, 2019. Pull pressure forcesensor s-type load cell 300kg 500kg 1.5t forconcrete mixing station batching scale hop-per scale pressure testing machine (500kg), Oct.https://www.amazon.com/dp/B01HHO5RNQ.
[55] Joomen, 2019. Joomen cnc set 15-600mm 2x linearguideway rail 4x square type carriage bearing block,Oct. https://www.amazon.com/dp/B01CMG0OMS.
[56] MOOG Suspension Parts, 2019. moog-513267 | frontwheel bearing hub assembly | acura mdx 4wd, Oct.https://www.moog-suspension-parts.com.
[57] Adafruit, 2019. Adxl335 - 5v ready triple-axis accelerometer (+-3g analog out), Oct.https://www.adafruit.com/product/163.
[58] Abubakar, M. S., Ahmad, D., and Akande, F. B., 2010.“A review of farm tractor overturning accidents andsafety”. Petranika Journal of Science and Technology.
[59] Demsar, I., BERNIK, R., and Duhovnik, J. “A mathe-matical model and numerical simulation of the staticstability of a tractor”. Agric. conspec. sci. Vol. 77(2012) No. 3.
[60] Smith, D. W. “Safe tractor operation: Rollover preven-tion”. Texas Agricultural and Mechanical University.AgriLife Extension. 2005.
[61] Mital, M., and Gawade, R., 2019. Tractor price,new tractors, buy and sell used tractors, Oct.https://tractorguru.in/.
[62] Tractor Junction, 2019. New tractors price in india, toptractor brands, specs, photos, reviews and videos, Oct.https://www.tractorjunction.com/tractors.
[63] Tacuna Systems, 2019. Load cell amplifier strain gaugeamplifier, Oct. https://tacunasystems.com.
[64] Automation Direct, 2019. Mafm1-a0-1h, Oct.https://www.automationdirect.com.
[65] DataQ Instruments, 2019. Di-2108 8-channelhigh speed usb data acquisition system, Oct.https://www.dataq.com/products/di-2108/.
14
Accep
ted
Manus
crip
t Not
Cop
yedi
ted
Journal of Mechanical Design. Received November 30, 2019;Accepted manuscript posted March 09, 2020. doi:10.1115/1.4046811Copyright © 2020 by ASME
Dow
nloaded from https://asm
edigitalcollection.asme.org/m
echanicaldesign/article-pdf/doi/10.1115/1.4046811/6521543/md-19-1858.pdf by M
assachusetts Inst Of Tech. user on 19 July 2020
Supplemental Material is provided next
15
Accep
ted
Manus
crip
t Not
Cop
yedi
ted
Journal of Mechanical Design. Received November 30, 2019;Accepted manuscript posted March 09, 2020. doi:10.1115/1.4046811Copyright © 2020 by ASME
Dow
nloaded from https://asm
edigitalcollection.asme.org/m
echanicaldesign/article-pdf/doi/10.1115/1.4046811/6521543/md-19-1858.pdf by M
assachusetts Inst Of Tech. user on 19 July 2020
Supplemental Material A: Costs for farming with bullocks or conventional tractors in Indian small farms
Aspect Variable Tractor Bullock Pair Units
Capital Cost C 200000 80000 INR
Principal on Loan P 20 N/A % of C
Interest on Loan I 16 N/A % of C
Annual operating cost 1 hectare O 12500 60000 INR/year
Time before replacement T 10 13 years
Resale value when replaced R 50000 0 INR
Time elapsed t 15 15 years
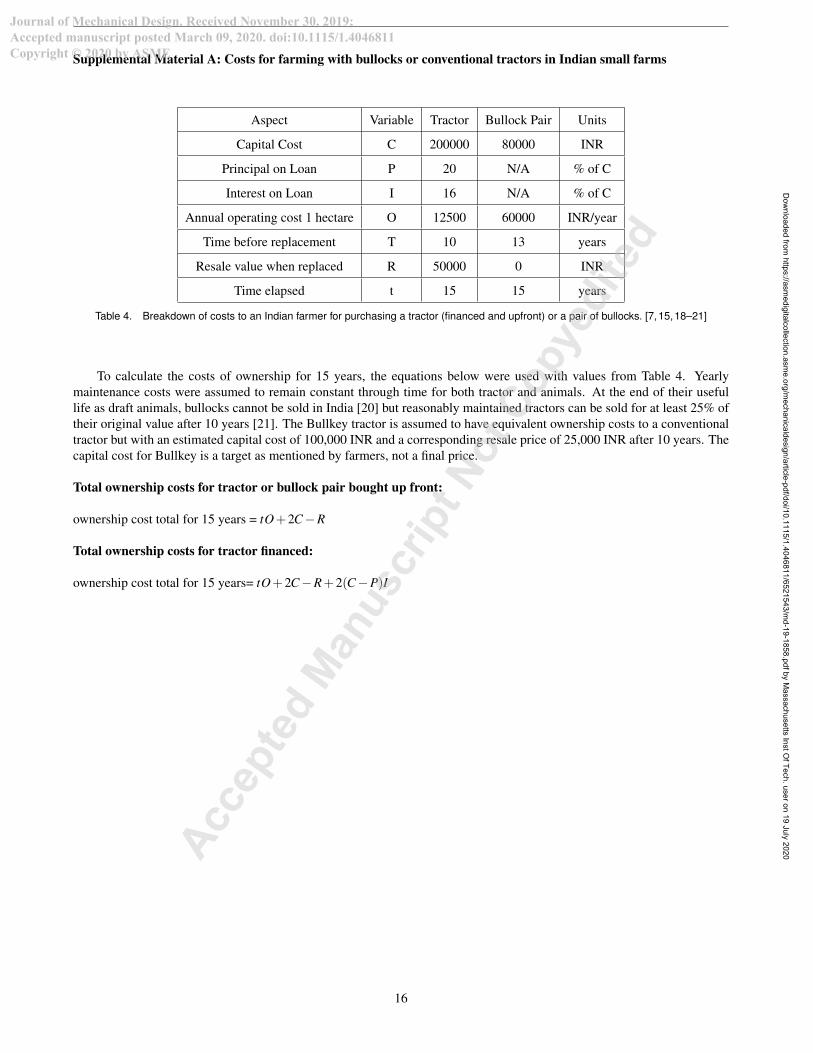
Table 4. Breakdown of costs to an Indian farmer for purchasing a tractor (financed and upfront) or a pair of bullocks. [7,15,18–21]
To calculate the costs of ownership for 15 years, the equations below were used with values from Table 4. Yearlymaintenance costs were assumed to remain constant through time for both tractor and animals. At the end of their usefullife as draft animals, bullocks cannot be sold in India [20] but reasonably maintained tractors can be sold for at least 25% oftheir original value after 10 years [21]. The Bullkey tractor is assumed to have equivalent ownership costs to a conventionaltractor but with an estimated capital cost of 100,000 INR and a corresponding resale price of 25,000 INR after 10 years. Thecapital cost for Bullkey is a target as mentioned by farmers, not a final price.
Total ownership costs for tractor or bullock pair bought up front:
ownership cost total for 15 years = tO+2C−R
Total ownership costs for tractor financed:
ownership cost total for 15 years= tO+2C−R+2(C−P)I
16
Accep
ted
Manus
crip
t Not
Cop
yedi
ted
Journal of Mechanical Design. Received November 30, 2019;Accepted manuscript posted March 09, 2020. doi:10.1115/1.4046811Copyright © 2020 by ASME
Dow
nloaded from https://asm
edigitalcollection.asme.org/m
echanicaldesign/article-pdf/doi/10.1115/1.4046811/6521543/md-19-1858.pdf by M
assachusetts Inst Of Tech. user on 19 July 2020
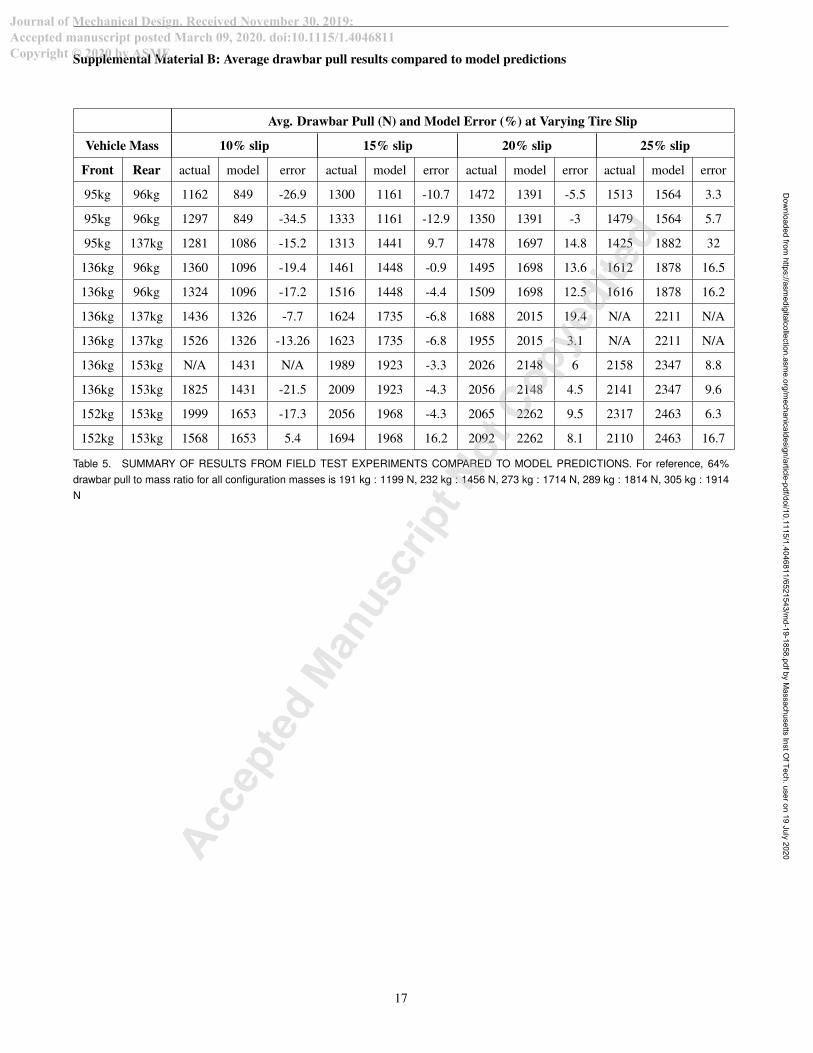
Supplemental Material B: Average drawbar pull results compared to model predictions
Avg. Drawbar Pull (N) and Model Error (%) at Varying Tire Slip
Vehicle Mass 10% slip 15% slip 20% slip 25% slip
Front Rear actual model error actual model error actual model error actual model error
95kg 96kg 1162 849 -26.9 1300 1161 -10.7 1472 1391 -5.5 1513 1564 3.3
95kg 96kg 1297 849 -34.5 1333 1161 -12.9 1350 1391 -3 1479 1564 5.7
95kg 137kg 1281 1086 -15.2 1313 1441 9.7 1478 1697 14.8 1425 1882 32
136kg 96kg 1360 1096 -19.4 1461 1448 -0.9 1495 1698 13.6 1612 1878 16.5
136kg 96kg 1324 1096 -17.2 1516 1448 -4.4 1509 1698 12.5 1616 1878 16.2
136kg 137kg 1436 1326 -7.7 1624 1735 -6.8 1688 2015 19.4 N/A 2211 N/A
136kg 137kg 1526 1326 -13.26 1623 1735 -6.8 1955 2015 3.1 N/A 2211 N/A
136kg 153kg N/A 1431 N/A 1989 1923 -3.3 2026 2148 6 2158 2347 8.8
136kg 153kg 1825 1431 -21.5 2009 1923 -4.3 2056 2148 4.5 2141 2347 9.6
152kg 153kg 1999 1653 -17.3 2056 1968 -4.3 2065 2262 9.5 2317 2463 6.3
152kg 153kg 1568 1653 5.4 1694 1968 16.2 2092 2262 8.1 2110 2463 16.7
Table 5. SUMMARY OF RESULTS FROM FIELD TEST EXPERIMENTS COMPARED TO MODEL PREDICTIONS. For reference, 64%drawbar pull to mass ratio for all configuration masses is 191 kg : 1199 N, 232 kg : 1456 N, 273 kg : 1714 N, 289 kg : 1814 N, 305 kg : 1914N
17
Accep
ted
Manus
crip
t Not
Cop
yedi
ted
Journal of Mechanical Design. Received November 30, 2019;Accepted manuscript posted March 09, 2020. doi:10.1115/1.4046811Copyright © 2020 by ASME
Dow
nloaded from https://asm
edigitalcollection.asme.org/m
echanicaldesign/article-pdf/doi/10.1115/1.4046811/6521543/md-19-1858.pdf by M
assachusetts Inst Of Tech. user on 19 July 2020
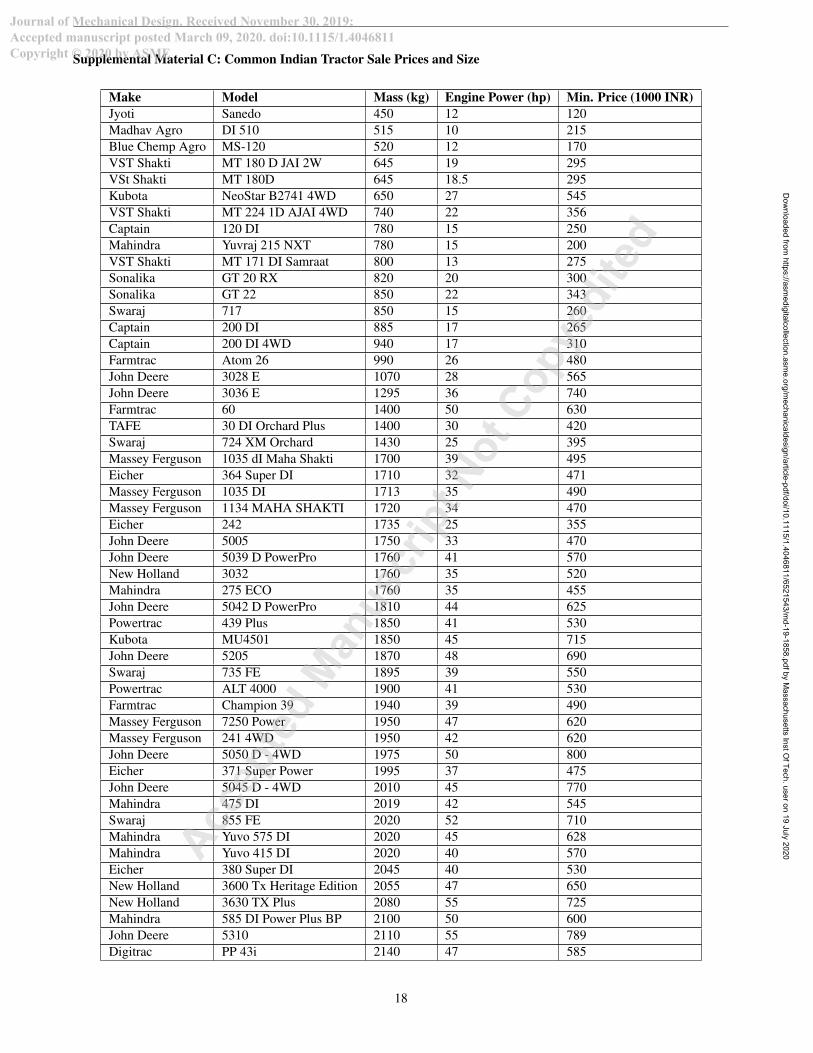
Supplemental Material C: Common Indian Tractor Sale Prices and Size
Make Model Mass (kg) Engine Power (hp) Min. Price (1000 INR)Jyoti Sanedo 450 12 120Madhav Agro DI 510 515 10 215Blue Chemp Agro MS-120 520 12 170VST Shakti MT 180 D JAI 2W 645 19 295VSt Shakti MT 180D 645 18.5 295Kubota NeoStar B2741 4WD 650 27 545VST Shakti MT 224 1D AJAI 4WD 740 22 356Captain 120 DI 780 15 250Mahindra Yuvraj 215 NXT 780 15 200VST Shakti MT 171 DI Samraat 800 13 275Sonalika GT 20 RX 820 20 300Sonalika GT 22 850 22 343Swaraj 717 850 15 260Captain 200 DI 885 17 265Captain 200 DI 4WD 940 17 310Farmtrac Atom 26 990 26 480John Deere 3028 E 1070 28 565John Deere 3036 E 1295 36 740Farmtrac 60 1400 50 630TAFE 30 DI Orchard Plus 1400 30 420Swaraj 724 XM Orchard 1430 25 395Massey Ferguson 1035 dI Maha Shakti 1700 39 495Eicher 364 Super DI 1710 32 471Massey Ferguson 1035 DI 1713 35 490Massey Ferguson 1134 MAHA SHAKTI 1720 34 470Eicher 242 1735 25 355John Deere 5005 1750 33 470John Deere 5039 D PowerPro 1760 41 570New Holland 3032 1760 35 520Mahindra 275 ECO 1760 35 455John Deere 5042 D PowerPro 1810 44 625Powertrac 439 Plus 1850 41 530Kubota MU4501 1850 45 715John Deere 5205 1870 48 690Swaraj 735 FE 1895 39 550Powertrac ALT 4000 1900 41 530Farmtrac Champion 39 1940 39 490Massey Ferguson 7250 Power 1950 47 620Massey Ferguson 241 4WD 1950 42 620John Deere 5050 D - 4WD 1975 50 800Eicher 371 Super Power 1995 37 475John Deere 5045 D - 4WD 2010 45 770Mahindra 475 DI 2019 42 545Swaraj 855 FE 2020 52 710Mahindra Yuvo 575 DI 2020 45 628Mahindra Yuvo 415 DI 2020 40 570Eicher 380 Super DI 2045 40 530New Holland 3600 Tx Heritage Edition 2055 47 650New Holland 3630 TX Plus 2080 55 725Mahindra 585 DI Power Plus BP 2100 50 600John Deere 5310 2110 55 789Digitrac PP 43i 2140 47 585
18
Accep
ted
Manus
crip
t Not
Cop
yedi
ted
Journal of Mechanical Design. Received November 30, 2019;Accepted manuscript posted March 09, 2020. doi:10.1115/1.4046811Copyright © 2020 by ASME
Dow
nloaded from https://asm
edigitalcollection.asme.org/m
echanicaldesign/article-pdf/doi/10.1115/1.4046811/6521543/md-19-1858.pdf by M
assachusetts Inst Of Tech. user on 19 July 2020
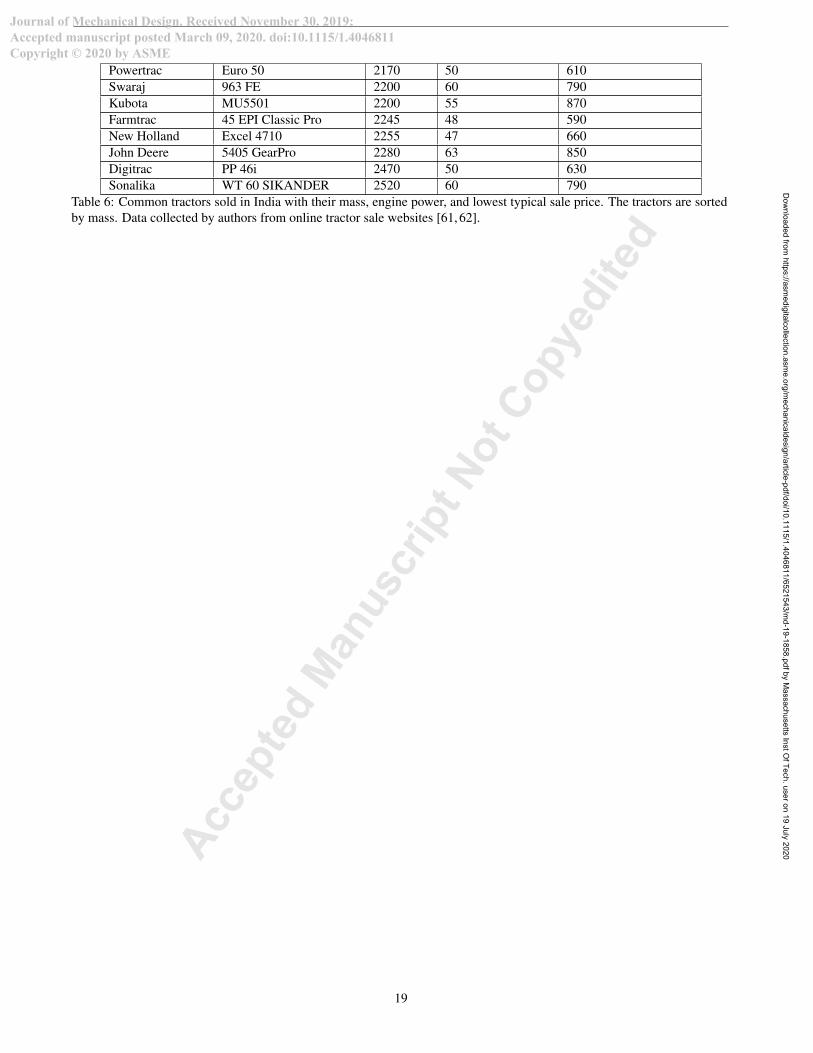
Powertrac Euro 50 2170 50 610Swaraj 963 FE 2200 60 790Kubota MU5501 2200 55 870Farmtrac 45 EPI Classic Pro 2245 48 590New Holland Excel 4710 2255 47 660John Deere 5405 GearPro 2280 63 850Digitrac PP 46i 2470 50 630Sonalika WT 60 SIKANDER 2520 60 790
Table 6: Common tractors sold in India with their mass, engine power, and lowest typical sale price. The tractors are sortedby mass. Data collected by authors from online tractor sale websites [61, 62].
19
Accep
ted
Manus
crip
t Not
Cop
yedi
ted
Journal of Mechanical Design. Received November 30, 2019;Accepted manuscript posted March 09, 2020. doi:10.1115/1.4046811Copyright © 2020 by ASME
Dow
nloaded from https://asm
edigitalcollection.asme.org/m
echanicaldesign/article-pdf/doi/10.1115/1.4046811/6521543/md-19-1858.pdf by M
assachusetts Inst Of Tech. user on 19 July 2020

Supplemental Material D: Soil properties and sensors used for tests
Soil Type
Property Weak Strong Actual
n 1.1 0.79 1
Cohesion (kPa) 0.6 20 3.3
Friction angle (deg) 28 18 33.7
k′c (kN/m2) 0.990 2354 74.6
k′φ
(kN/m3) 1528 -4130 2080
Bulk density (kg/m3) 1310 1580 1557
Table 7. Soil properties used to generate plots. Soils properties forlimit conditions are the upper and lower strength limits of soils pub-lished soil traction parameter tables [35] [38]. Actual soil strength forfield tests is from matching soil type, cone penetromenter data, andsoil moisture data from field test to the most appropriate soil param-eters in [35].
String Potentiometer (Tool Position)
Sensor [53] CALT CWP-S
String Length 500 mm
Resistance Range 0-500 kOhm
Force (Tool Loads)
Sensor [54] DYLY 104-500
Load Range ±500 kg
Sensitivity 2.0 ± 0.05 mV/V
Non-Linearity ±0.03≤%F·S
Hysteresis ±0.03≤%F·S
Amplifier [63] Tacuna EMBSGB200
Amplification 1&2 @550x, 3 @220x
Magnetic Proximity (Wheel Rotations)
Sensor [64] MAFM1-A0-1H
Switching Freq. 5 kHz
Magnets Neodymium 10x3 mm
Magnets per rotation 10
sensor to magnet 5 mm
Acceleration (Vehicle Motion)
Sensor [57] Adafruit ADXL335
Range ±3 g
Bandwidth 50 Hz
Data Acquisition (All Sensors)
Device [65] DATAQ DI2108
Resolution 16 bit
Capture Rate 10 kHz
Table 8. Overview of electronics used for data collection.
20
Accep
ted
Manus
crip
t Not
Cop
yedi
ted
Journal of Mechanical Design. Received November 30, 2019;Accepted manuscript posted March 09, 2020. doi:10.1115/1.4046811Copyright © 2020 by ASME
Dow
nloaded from https://asm
edigitalcollection.asme.org/m
echanicaldesign/article-pdf/doi/10.1115/1.4046811/6521543/md-19-1858.pdf by M
assachusetts Inst Of Tech. user on 19 July 2020

Supplemental Material E: Data processing from experiments
Processing of the collected sensor data was performed in MATLAB. First, the drawbar force components were calculatedat every instant. To define the drawbar components and their point of application, soil force D and center-of-pressure positionx are calculated from Eqns 9, 10 and 11.
D =√(RA −RB)2 +R2
C (9)
α = tan−1(
RC
RA −RB
)(10)
x =−RA * (d + l +q)+RB * (d +2l +q)(RA −RB * sin(ψ)−RC * cos(ψ)
(11)
Where, in reference to Figs. 12 and 3, RA is the tension force on Load Cell 1, RB is the tension force on Load Cell 2,RC is the tension force on Load Cell 3, l is the vertical distance from Load Cell 1 to Load Cell 2, q is the vertical verticaldistance from Load Cell 2 to the origin of distance x when d = 0, d is the distance the tool jack has been lowered from itsstorage position, and γ is the angle of attack for the plow.
After the data was loaded into MATLAB, the resulting time-force signals were processed through a 1 Hz low passfilter, selected at this frequency because 1 second is the time it takes the tool to travel three characteristic lengths. Then,the distance traveled by all wheels was calculated by summing the new distance traveled each time a magnet was detected(2π/10 *Re f f ective) and using linear interpolation to fill in gaps when no magnet was detected. The three (one per wheel)distance-travelled vectors were then processed through another 1 Hz low pass filter. The highest drive tire slip was selectedat each instant, along with its corresponding drawbar pull. This matrix was then rearranged so that all drawbar pull instanceswere assigned to the closest integer slip (i.e. all slip instances between 13.5% and 14.5% were assigned to the 14% slip bin).Finally, the drawbar pull values in each slip bin were averaged.
21
Accep
ted
Manus
crip
t Not
Cop
yedi
ted
Journal of Mechanical Design. Received November 30, 2019;Accepted manuscript posted March 09, 2020. doi:10.1115/1.4046811Copyright © 2020 by ASME
Dow
nloaded from https://asm
edigitalcollection.asme.org/m
echanicaldesign/article-pdf/doi/10.1115/1.4046811/6521543/md-19-1858.pdf by M
assachusetts Inst Of Tech. user on 19 July 2020