Marwan-Reviewed manuscript
31
1 AN EMPIRICAL ANALYSIS OF THE RELATIONSHIP BETWEEN NEW INVESTORS AND THE TELECOMMUNICATIONS STOCKS 'BUBBLE POST THE EGYPTIAN REVOLUTION Marwan Mohamed Abdeldayem Faculty of Commerce-Business & Finance Department -Cairo University-Egypt And Applied Science University (ASU)-Kingdom of Bahrain ABSTRACT The Egyptian Exchange (EGX) declined 6.25% following the beginning of the Egyptian Revolution of 2011 on the 25 th January. The EGX was closed after the revolution for a period of 55 days, till it was reopened on Wednesday 23 rd March and the market fell by a further 8.9% on reopening. Subsequently, all the market indices soared during the period from the 23 rd of March till the end of May 2011. Therefore, this study shares with some existing works the objective of getting a better understanding of investor behavior during financial bubbles and aims to analyze empirically the relationship between new investors (NI) and the telecommunications stocks’ bubble that occurs after the Egyptian revolution. A similar methodology is employed as that used in previous studies in particular, the study of Gong, Pan and Shi (2015). The empirical findings of this research effort reveal that (1) the new investors initiated the telecommunications stocks’ bubble; (2) the continuous entrance of new investors in the EGX sustained this bubble; and (3) the slow decline of the average price of telecommunications stocks over time is due to the new investors. Compared with other factors, the continuous stream of new investors was the most robust driving force of the bubble over the whole trading period. Key Words: Telecommunications Stocks- Financial Bubble- New Investors (NI)-Behavioral Finance- Egyptian Exchange (EGX) -Egyptian Revolution- EGX 30 Index- Black- Scholes value- Volatility- Market Return
Transcript of Marwan-Reviewed manuscript

1
AN EMPIRICAL ANALYSIS OF THE
RELATIONSHIP BETWEEN NEW INVESTORS
AND THE TELECOMMUNICATIONS STOCKS
'BUBBLE POST THE EGYPTIAN REVOLUTION
Marwan Mohamed Abdeldayem Faculty of Commerce-Business & Finance Department -Cairo University-Egypt
And Applied Science University (ASU)-Kingdom of Bahrain
ABSTRACT The Egyptian Exchange (EGX) declined 6.25% following the beginning of
the Egyptian Revolution of 2011 on the 25th January. The EGX was closed after the
revolution for a period of 55 days, till it was reopened on Wednesday 23rd March and
the market fell by a further 8.9% on reopening. Subsequently, all the market indices
soared during the period from the 23rd of March till the end of May 2011. Therefore,
this study shares with some existing works the objective of getting a better
understanding of investor behavior during financial bubbles and aims to analyze
empirically the relationship between new investors (NI) and the telecommunications
stocks’ bubble that occurs after the Egyptian revolution. A similar methodology is
employed as that used in previous studies in particular, the study of Gong, Pan and
Shi (2015). The empirical findings of this research effort reveal that (1) the new
investors initiated the telecommunications stocks’ bubble; (2) the continuous
entrance of new investors in the EGX sustained this bubble; and (3) the slow decline
of the average price of telecommunications stocks over time is due to the new
investors. Compared with other factors, the continuous stream of new investors was
the most robust driving force of the bubble over the whole trading period.
Key Words:
Telecommunications Stocks- Financial Bubble- New Investors (NI)-Behavioral
Finance- Egyptian Exchange (EGX) -Egyptian Revolution- EGX 30 Index- Black-
Scholes value- Volatility- Market Return

2
1. INTRODUCTION In the 1990s, a lot of the focus of academic research shifted away from these
econometric analyses of time series of prices, earnings and dividends toward
developing models of human psychology in its relation to financial markets (Shiller,
2003). Hence, the field of behavioral finance developed and researchers, around the
world, had seen too many anomalies, too little inspiration that the theoretical models
captured important fluctuations.
Abdeldayem and Reda (2013) argue that behavioral finance means finance from a
broader social science perspective including psychology and sociology. Behavioral
finance is considered nowadays as one of the most vital research programs, and the
current study, which analyzes the behavior of new investors and the financial bubble
after the Egyptian revolution, is among this category.
Financial Bubbles occur when prices for a particular item rise far above the item's
real value. Examples include houses, stocks, and gold or baseball cards. Sooner or
later, the high prices become unsustainable and they fall dramatically until the item
is valued at or even below its true worth. While most people agree that asset bubbles
are a real phenomenon, they don't always agree on whether a specified asset bubble
exists at a given time. There is no definitive, universally accepted explanation of
how bubbles form. Each school of economics has its own view (See for example:
King et al (1993); Lahrat (2008); Shiller (2012); Robert et al (2010) Levine et al
(2007) and Krugman (2013)).
Shiller (2003) and Garber (1990) also argue that many individual grew suddenly
rich. A golden bait hung temptingly out before the people, and one after another,
they rushed to the stock markets like flies around the honey-pot. Eventually,
however, the more prudent start to see that this folly could not last forever. Rich
people no longer bought the flowers to keep them in their garden, but to sell them
again at penny by penny profit. It seems that somebody must lose fearfully in the
end. As this conviction spread, prices fell and never rose again.
Furthermore, Frehen, Goetzmann and Rouwenhorst (2011) argue that asset bubbles
are important puzzles in financial economics, important because of their
extraordinarily potential for disruption; puzzles because they defy standard notions
of rationality. Recent research has highlighted the role of technological innovation
in asset bubbles. This approach makes some cross-sectional empirical estimation
about security prices during periods of technological change. Nicholas (2008) for
example, utilizes ex post patent citations to prove that the U.S. stock market boom
in the late 1920‟s was driven by expected returns to companies invested in
technological innovation. Further, Macleod (1986) highlights the association
between stock market investing and the growth in patent filings in the late 17th
century in Britain. In addi t ion , Pastor and Veronesi (2006) introduce a model

3
that reveals how imputed growth rates in innovative industries can appear
irrationally high ex post and that industries in which bubbles occur will be
characterized by high return volatility, high uncertainty and rapid adoption of the
new technology. They test these predictions on 19th century railroad securities
listed on the New York Stock Exchange (NYSE).
In the Egyptian context, following the 25th of January 2011 revolution, Egypt has
embarked on a political and economic transition. The period has also witnessed
deterioration in the macroeconomic framework, and economic growth has slowed
substantially following the events post revolution. The uncertainty surrounding
policies of the new administration have a major effect not only on the
Telecommunications sector, but more important on the future of Egyptian economic
and financial sector development.
The Egyptian Exchange (EGX) witnessed a severe decline in the value traded during
2011 to record LE 148 billion, as opposed to LE 321 billion in 2010 (worth
mentioning that the EGX was closed after the revolution for a period of 55 days in
2011).Moreover, the volume traded recorded 18.5 billion securities in 2011
compared to 33 billion securities in 2010. Likewise, the number of transactions
recorded 5.6 million transactions versus 10 million in 2010.
But then, Over the Counter market (OTC) has witnessed a remarkable decline in the
trading activity in 2011, registering a trading value of LE 17.5 billion as opposed to
LE 48 billion in 2010. This decline is mainly attributed to the OTC (Orders market)
which recorded a trading value of LE 463 million down from LE 5 billion in 2010.
Additionally, the Deals market has registered a trading value amounted to LE 17
billion in 2011 as opposed to LE 43 billion in 2010.
The trading suspension continued till the banks re-open, meanwhile, EGX and EFSA
undertook several precautionary measures to assure the highest level of protection
of investors' rights. Trading was resumed on the 23rd of March and the market
witnessed a sharp decline during the first two sessions following the trading
resumption. However, the market then showed a stable performance amid the
parliamentary elections and the prevalence of a relative political stability which
restored the investors’ confidence and appetite.
Consequently, all the market indices soared during the period from the 23rd of March
till the end of May 2011 whereas EGX 30 rose by 7 %, while EGX 70 and EGX 100
surged by 32 % and 25 %, respectively. Therefore, attention was given to explore
and analyze a potential financial bubble that may exist in the EGX after the Egyptian
revolution (refer to table (1) that summarizes the Egyptian indices performance in
2011 and Figure (1) which illustrates the EGX 30 Index during January to December
2011).

4
Table (1) Indices Performance in 2011 Index Open High Low Close
EGX 30 Index (in Local Currency
Terms) 7142 7210 3587 3622
EGX 30 Index (in US$ Terms) 4176 4223 2018 2038
EGX 70 Index 722 788 393 416
EGX 100 Index 1166 1245 629 643
DJ EGX Egypt Titans 20 Index 1533 1545 809 817
S&P/EGX ESG Index 1113 1178 576 598
EGX 20 Capped Index 8024 8172 3871 3925
Source: The Egyptian Exchange Annual Report (2011)
Before Figure (1) EGX 30 Index Performance During (January -
December 2011) Elections
7750 Revolution 11%
21% Trading Trading Resumption The period of trials and US debt Crisis
6900
1 Suspension 7% 33%
6050 2
4 5
5200 3
6
8 9
4350
7
10 11
12
3500
Jan-11 Feb-11 Mar-11 Apr-11 May-11 Jun-11 Jul-11 Aug-11 Sep-11 Oct-11 Nov-11 Dec-11
Before Revolution: January Trading Suspension: 28 Jan – 23 March After Revolution: Resume Trading
The period of Trials and US Debt Crisis: 1 June – 22 November Elections Period: 23 November – 1 December
5
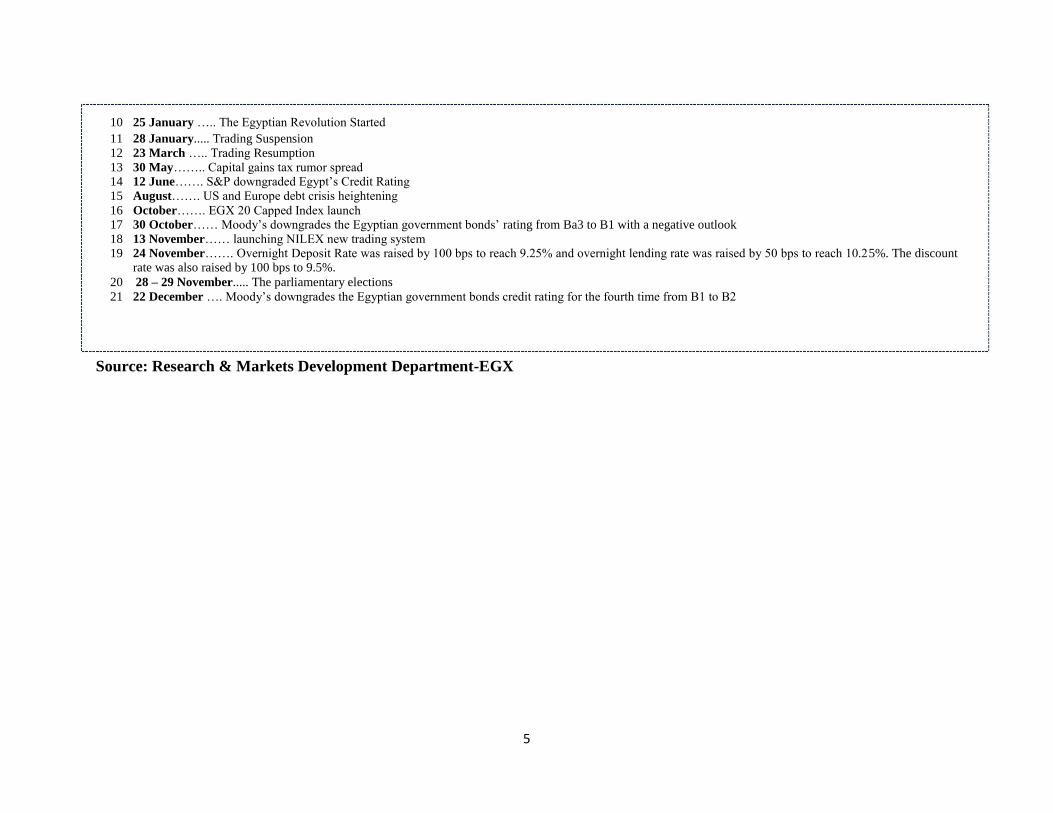
10 25 January ….. The Egyptian Revolution Started 11 28 January..... Trading Suspension
12 23 March ….. Trading Resumption
13 30 May…….. Capital gains tax rumor spread 14 12 June……. S&P downgraded Egypt’s Credit Rating
15 August……. US and Europe debt crisis heightening
16 October……. EGX 20 Capped Index launch 17 30 October…… Moody’s downgrades the Egyptian government bonds’ rating from Ba3 to B1 with a negative outlook
18 13 November…… launching NILEX new trading system 19 24 November……. Overnight Deposit Rate was raised by 100 bps to reach 9.25% and overnight lending rate was raised by 50 bps to reach 10.25%. The discount
rate was also raised by 100 bps to 9.5%.
20 28 – 29 November..... The parliamentary elections 21 22 December …. Moody’s downgrades the Egyptian government bonds credit rating for the fourth time from B1 to B2
Source: Research & Markets Development Department-EGX

6
It should also be noted that the parliamentary elections of 2011 influenced the market
positively, as all the indices surged at good rates. During the elections week, EGX
30 increased by 11 %, EGX 70 and EGX 100 rose by 19 % and 15 %, respectively.
However, the political unrest hindered the market rise amid a sharp decline in the
trading aggregates, and EGX 30 concluded the year with a decline of 49 %, EGX 70
declined by 42 % and EGX 100 decreased by 45 %. In addition, the market
capitalization concluded the year 2011 at LE 294 billion as opposed to LE 488 billion
at the end of 2010, with a decline of 40 %and representing 21 %of GDP.
Sector Indices Performance in the Egyptian Exchange (EGX)
All the traded sectors in the Egyptian Market witnessed a significant falling during
2011. It can be seen from Figure (2) and Table (2) that the lowest of which was
recorded by the Healthcare and Pharmaceuticals sector of around 16 %.,followed by
the Personal and Household Products sector in the second place retreating by 25 %.
The third and fourth places were captured by the Chemicals sector and Construction
and Materials sector recording a 25 % and 30 % decline, respectively. Worth
mentioning, the Construction and Materials sector came forth in terms of volume
traded recording 1.5 billion securities worth LE 13.6 billion. Recording a 35 %
decline, the Telecommunications sector occupied the fifth place in terms of volume
traded recording around 1.5 billion securities worth LE 9.7 billion. Figure (2) Sector Indices Performance in 2011
Healthcare and Pharmaceuticals
-16%
Personal and Household Products
-25%
Chemicals
-25%
Construction and Material
-30%
Telecommunication
-35%
Food and Beverage
-41%
Industrial Goods Services and
Automobiles
-51%
Financial Services excluding Banks
-56%
Banks
-59%
Travel and Leisure
-66%
Real Estate
-67%
Basic Resources
-
76%
-90% -75% -60% -45% -30% -15% 0%
Source: The Egyptian Exchange (2011)
7
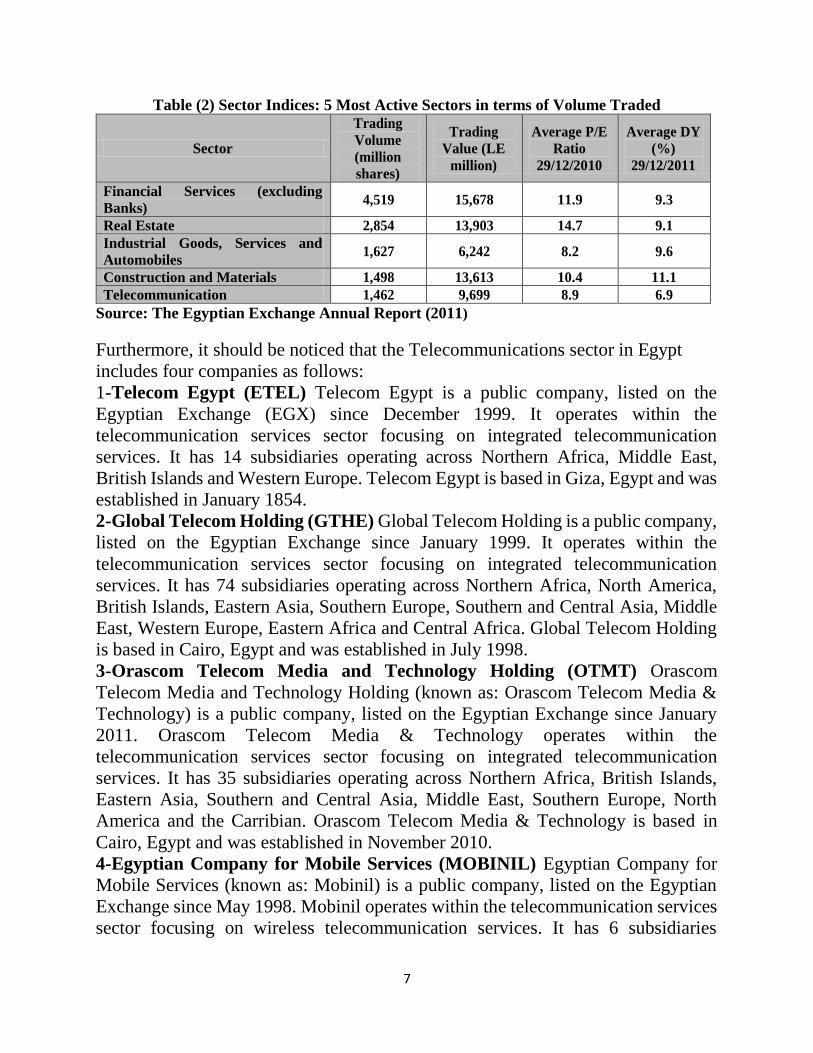
Table (2) Sector Indices: 5 Most Active Sectors in terms of Volume Traded
Sector
Trading
Volume
(million
shares)
Trading
Value (LE
million)
Average P/E
Ratio
29/12/2010
Average DY
(%)
29/12/2011
Financial Services (excluding
Banks) 4,519 15,678 11.9 9.3
Real Estate 2,854 13,903 14.7 9.1
Industrial Goods, Services and
Automobiles 1,627 6,242 8.2 9.6
Construction and Materials 1,498 13,613 10.4 11.1
Telecommunication 1,462 9,699 8.9 6.9
Source: The Egyptian Exchange Annual Report (2011)
Furthermore, it should be noticed that the Telecommunications sector in Egypt
includes four companies as follows:
1-Telecom Egypt (ETEL) Telecom Egypt is a public company, listed on the
Egyptian Exchange (EGX) since December 1999. It operates within the
telecommunication services sector focusing on integrated telecommunication
services. It has 14 subsidiaries operating across Northern Africa, Middle East,
British Islands and Western Europe. Telecom Egypt is based in Giza, Egypt and was
established in January 1854.
2-Global Telecom Holding (GTHE) Global Telecom Holding is a public company,
listed on the Egyptian Exchange since January 1999. It operates within the
telecommunication services sector focusing on integrated telecommunication
services. It has 74 subsidiaries operating across Northern Africa, North America,
British Islands, Eastern Asia, Southern Europe, Southern and Central Asia, Middle
East, Western Europe, Eastern Africa and Central Africa. Global Telecom Holding
is based in Cairo, Egypt and was established in July 1998.
3-Orascom Telecom Media and Technology Holding (OTMT) Orascom
Telecom Media and Technology Holding (known as: Orascom Telecom Media &
Technology) is a public company, listed on the Egyptian Exchange since January
2011. Orascom Telecom Media & Technology operates within the
telecommunication services sector focusing on integrated telecommunication
services. It has 35 subsidiaries operating across Northern Africa, British Islands,
Eastern Asia, Southern and Central Asia, Middle East, Southern Europe, North
America and the Carribian. Orascom Telecom Media & Technology is based in
Cairo, Egypt and was established in November 2010.
4-Egyptian Company for Mobile Services (MOBINIL) Egyptian Company for
Mobile Services (known as: Mobinil) is a public company, listed on the Egyptian
Exchange since May 1998. Mobinil operates within the telecommunication services
sector focusing on wireless telecommunication services. It has 6 subsidiaries

8
operating across Egypt. Mobinil is based in Cairo, Egypt and was established in
March 1998. Accordingly, due to the political situation in Egypt, it can be seen from
figures (3) and (4) that the EGX recorded the lowest performance vs. all global
markets before the 28th of January, 2011 recording 21 % losses before the revolution.
This was mainly driven by the losses that took place during the two sessions prior
to the 28th of January according to MSCI Price Index.
Figure (3) Percentage Change in MSCI Egypt vs. Other Emerging Markets in 2011 (Before Revolution:
1-27 January)
Hungary
15%
Czech Republic
11%
Morocco
9%
Korea
5%
Poland
3%
Malaysia
2%
China
1%
Brazil
-2%
Turkey -6%
Indonesia
-6%
Chile -8%
South Africa
-8%
India -11%
Peru
-11%
Egypt -21%
-30% -20% -10% 0% 10% 20%
Source: Morgan Stanley Website Figure (4) Percentage Change in MSCI Egypt vs. Other Emerging Markets in 2011 (After
Revolution: 23 March - End of Year)
Indonesia 4%
Malaysia ‐4%
South Africa ‐10%
Korea ‐12%
Chile ‐13%
Peru ‐15%
China ‐20% Czech
Republic ‐21%
Morocco ‐24%
Brazil ‐24%
Egypt ‐28%
India ‐30%
Turkey ‐32%
Poland ‐35%
Hungary ‐43%
‐50% ‐40% ‐30% ‐20% ‐10% 0% 10% Source: Morgan Stanley Website

9
This paper is organized as follows: section (1) is an introduction to the study. Section
(2) includes the literature review of new investors and financial bubbles and gives
background to the Egyptian Exchange (EGX). The research methodology and
analysis are in section (3) and (4) respectively. Section (5) presents the empirical
findings of the study, while section (6) concludes.
2- LITERATURE REVIEW
Greenwood and Nagel (2009) argue that stock market folklore is rich in anecdotes
about new investors drawn into the market during financial market bubbles. In his
classic history of financial speculation, Kindleberger (1979) argues that bubbles
bring in "segments of the population that are normally a loaf from such ventures."
In addition, both Garber (1990) and Froot et al (1991) suggest that it has been
variously suggested that bubbles may be rational, intrinsic and contagious (Topol,
1991).To date, there is no widely accepted theory to explain their occurrence.
Recent computer-generated agency models suggest excessive leverage could be a
key factor in causing financial bubbles (Bunchanan, 2008)
One possible cause of bubbles is excessive monetary liquidity in the financial
system, inducing lax or inappropriate lending standards by the banks, which makes
markets vulnerable to volatile asset price inflation caused by short-term, leveraged
speculation. For example, Axel A. Weber, the former president of the Deutsche
Bundesbank, has argued that "The past has shown that an overly generous provision
of liquidity in global financial markets in connection with a very low level of interest
rates promotes the formation of asset-price bubbles (Caginalp and Balenovich, 1999)
Moreover, herding is a very interesting and important phenomenon in the financial
sphere as it is a common notion that herding is associated with volatility in stock
prices and stock returns as well as the destabilization of financial markets
(Bikhchandani and Sharma (2000); and Dasgupta et al. (2011)). Moreover, herding
is also known to account for the momentum in as well as the reversal of stock prices
(Nofsinger and Sias 1999)
Herding has also been believed to be a main driver of asset price bubbles. Rannou
(2010) postulate a model to explain the presence of speculative bubbles and they
assume that the increase in the intensity of herding increases the size of the bubble.
This is because as investors follow each other, they push the prices up even more.
Similarly, DeMarzo et al. (2008) explain that herding is a primary component for
the birth and sustainability of a financial bubble which leads to the conclusion that
asset bubbles are a social phenomenon. Also, Caparelli et al. (2004) claim that
herding is an indicator of inefficient markets that often have speculative bubbles.
Frehen, Goetzmann and Rouwenhorst (2011) revisit the first global financial
bubbles w h i c h occurred in 1720 in France, Great-Britain and the Netherlands.
They argue that the explanations for these linked bubbles mainly focus on the

10
irrationality of investor speculation and the corresponding stock price behavior of
two large companies: the South Sea Company in Great Britain and the Mississippi
Company in France. In this paper they collect and examine a broad cross-section
of security price data to evaluate the causes of the bubbles. Using newly available
stock prices for British and Dutch firms in 1720, they find evidence against
indiscriminate irrational exuberance and evidence in favor of speculation about
fundamental financial and economic innovations in the European economy. These
factors include the emergent Atlantic trade, new institutional forms of risk sharing
and the innovative potential of the joint-stock company form itself. These factors
ultimately had long-lasting transformative economic effects which may have been
anticipated by the markets at the time. They use the cross-sectional data to test
the hypothesis that the bubble in 1720 was driven by innovation by dividing the
London share market into “old” and “new” economy stocks. Further, they
find that companies associated with the Atlantic trade and with the new joint-
stock insurance form had the highest price increases and had return dynamics
consistent with current models of "New Economy" stocks. Moreover, the
avai labi l i ty of new, high frequency data allow them to pinpoint the date of the
1720 crash and track its international propagation.
Greenwood and Nagel (2009) argue that asset market experiments suggest that
inexperienced investors play a vital role in the formation of asset price bubbles.
Without first-hand experience of a downturn, these investors are more optimistic and
likely to exhibit trend chasing in their portfolio decisions. They examine this
hypothesis with mutual fund manager data from the technology bubble. Using age
as a proxy for managers' investment experience, they find that around the peak of
the bubble, mutual funds run by younger managers are more heavily invested in
technology stocks, relative to their style benchmarks, than their older colleagues.
Consistent with the experimental evidence, they find that young managers, but
not old managers, exhibit trend-chasing behavior in their technology stock
investments. As a result, young managers increase their technology holdings during
the run-up, and decrease them during the downturn. The economic significance of
young managers' actions is amplified by large inflows into their funds prior to the
peak in technology stock prices. Their results are unlikely to be explained by
standard career concerns models or by differences in the ability to pick technology
stocks between young and old managers.
Furthermore, Gong, Pan and Shi, (2015) argue that the crucial role of new investors
in financial bubbles and their dynamics were explained by Anderson (1787) more
than two centuries ago. Anderson argues that good potential gains lead to increasing
investment, resulting in price appreciation that attracts new investors. The novel
sources of funds lead to further price appreciation that continues to attract new
investors. Despite the same mechanism underlying bubbles is widely believed to
11
repeat itself over the centuries and across countries, few empirical and experimental
research have concluded that there is a direct link between new investors and
financial bubbles
Furthermore, the theoretical literature on bubbles has mainly investigated the macro
and micro conditions under which a bubble exists, but has not examined the role of
new investors in either initiating, aggravating or sustaining a bubble. This is mainly
because of the lack of account level data, empirical research using naturally
occurring data has not conducted much to highlight this issue, either. Greenwood
and Nagel (2009) find that around the peak of the technology bubble, mutual funds
run by younger managers invested in technology stocks more heavily than those run
by older ones. Younger managers, however, are not equivalent to new investors.
Since Smith, Suchanek, and Williams (1988) introduced their pioneer methodology
and concluded that market prices strongly deviate from fundamental value, so many
replications and modifications to its experimental settings have followed, in order to
test how factors such as experience, information, short sale constraints, cash to asset
ratio, constant or changing fundamental value, futures markets and excess money,
affect bubble formation. However, all existing experimental research merely
emphasizes a certain set of subjects for example: Noussair, Robin, and Ruffieux
(2001) and Huber, Kirchler, and Stockl (2010) find that increasing cash to asset ratio
has a positive effect on bubble formation. However, they only look at the effect of
new money held by old investors, not new investors entering the market.
The only study that empirically examined the effect of new investors in the bubble
of the Baosteel call warrant in China is the study of Gong, Pan and Shi, (2015). In
their comprehensive study, they provide an empirical analysis of the trading
behavior and the impact of new investors on the bubble surrounding the Baosteel
call warrant, the first derivative traded in China after a nine-year suspension. They
find that First, the new investors initiated the bubble. Second, echoing common
wisdom, further, they empirically show that the continuous entries of new investors
sustained the bubble. Third, they attribute the slow drop of the warrant price at the
approach of maturity to new investors. Finally, they concluded that compared with
other factors, the continuous inflow of new investors was the most powerful driving
force of the bubble over the whole trading period. Therefore, this research effort is
adopting the same methodology and following the same procedures of this pioneer
study. Hence, the aim of this study is to analyze the Telecommunications stocks
bubble in the Egyptian Exchange (EGX) that occurs after the Egyptian revolution
on the 25thof January, 2011. The period followed that revolution attracted frenzied
speculation and generated a large bubble. After the Egyptian revolution, the average
price of telecommunications stocks was on average three times higher than the
fundamental value estimated with the Black-Scholes equation. The empirical
analysis of the effect of new investors is made possible in this study by the available
12
data, in which orders and transactions of every investor can be identified.
Background of the Egyptian Exchange (EGX): Egypt's Stock Exchange is among the oldest stock exchanges in the world. The
Egyptian Exchange (EGX), comprises two exchanges, Cairo and Alexandria, both
governed by the same board of directors and sharing the same trading, clearing and
settlement systems (Abdeldayem and Assran, 2013).
The Alexandria Stock Exchange was officially established in 1883, with Cairo
following in 1903. Both exchanges were very active in the 1940s, and the combined
Egyptian Stock Exchange ranked fifth in the world. The central planning
and socialist policies adopted in the mid-1950s led to the exchange becoming
dormant between 1961 and 1992.
In the 1990s, the Egyptian government's restructuring and economic reform program
resulted in the revival of the Egyptian stock market, and a major change in the
organization of the Cairo and Alexandria stock exchanges took place in January
1997 with the election of a new board of directors and the establishment of a number
of board committees.
EGX 30 Index
The Egyptian Exchange has launched its main index EGX30 on February 1,
2003 The index includes top 30 companies in terms of liquidity and activity. The
Index is weighted by market capitalization and adjusted by free float. EGX30 avoids
concentration on one industry and therefore has a good representation of various
industries/sectors in the economy. The Egyptian Exchange started publishing
EGX30 Index, the previously named CASE30 on 2 February 2003, which has a base
date of 1/1/1998 and a base value of 1000 points. As of 1 March 2009, the Egyptian
exchange started publishing EGX30 in US$ terms, and renamed CASE30 to EGX30
reflecting the replacement of Cairo and Alexandria Stock Exchanges by the Egyptian
Exchange (EGX), as per the amendments in the Capital Market Law No. 95/1992.
EGX Index Committee is an independent committee consists of 4 members and
chaired by EGX Chairman. The members are market participants from member
firms, fund managers and banks.
Eligibility Criteria:
1- Liquidity: is the most important criteria for selecting the constituents that
comprise EGX30. All traded companies are ranked according to total value
traded for the period prior to the next rebalance, after excluding “OPR” deals.
2- Number of trading days: Eligible companies that met the liquidity criteria
must be traded at least 50% of the trading days during this period. For
example, if the total number of traded days during the last six month period is
120 (5 x 4 x 6), the company must be traded at least 60 days during this period
to join the index.

13
3- Free float: EGX has amended the required free float of any company included
3 in the index to be at least 15%. The free float is the freely floated shares that
are traded and held by the public (tradable shares).
Worth mentioning that the Index Rebalance EGX30 constituents are reviewed on
semi-annual base (1 February and 1 August) by EGX Index Committee, whereby
constituents are changed (added or deleted), if necessary, based on the above-
mentioned criteria.
3. RESEARCH METHODOLOGY In order to analyze the relationship between new investors and the
telecommunications stocks’ bubble after the Egyptian revolution, as mentioned
earlier, a similar methodology is employed as that used in previous studies in
particular, the study of Gong, Pan, and Shi (2015). Data
The starting point of data collection in this study is the daily opening and closing
prices of the 30 most traded stocks in the Egyptian Exchange (EGX), which is called
the EGX 30 for a period of 3 years (i.e. from 1st January 2011 till 2nd January 2014).
The data was gathered from the website of Arab Capital Markets Resource Center
(http://www.btflive.net) and the website of the Egyptian Exchange
(http://www.egyptse.com).The study follows the notion of Blasco and Ferrerulela
(2008) who assumed that analyzing highly traded stocks which proxy for familiar
stocks, would increase the chance that if bubble is indeed found, then it is intentional
not spurious. Moreover, the ranking of the stocks was obtained from Mubasher
website (http://www.mubasher.info).
It is important to note that some of the stocks in the ranking list were not considered
because they were launched in the Egyptian Exchange during the period of the study.
Therefore, the data collected was for the 30 most actively traded stocks which had
complete data during the period of the study. Furthermore, the four stocks of the
telecommunications sector in the EGX 30 (I.e. the stocks of Telecom Egypt, Global
Telecom Holding, Orascom Telecom Media and Technology; and MOBINIL)
during the above mentioned period had extremely high price/sales ratios compared
to the other stocks included in this index Therefore, the study examines only the
prices of the telecommunications stocks over a period of 3 years. Specifically the
starting date of data gathering is on January 1st 2011 and the end date is on January
2nd 2014.
Consequently, the researcher requires data on the performance and types of
investors of all t h e telecommunications stocks in t h e E G X 3 0 at the beginning
of 2011. The end of 2010 was chosen as the pre-bubble cutoff because the following
year is the first time when telecommunications stocks meaningfully outperform the

14
market after the Egyptian revolution on the 25thof January 2011.
Defining the Bubble Segment
This study starts by defining the segment of the EGX that comprised the financial
bubble of the late 2011.As described in Ofek and Richardson (2003), the stocks
affected by the bubble tended to be in the internet and technology sectors. Lewellen
(2003) reports that almost all internet stocks in March 2000 had extremely high
prices/sales ratios, compared with other stocks. The researcher follows
Brunnermeier and Nagel (2004) and Greenwood and Nagel (2009) and uses the
price/sales ratio to identify the segment of the market most affected by the financial
bubble. Figure (5) illustrates that the telecommunications sector in the EGX is the
most segment in the Egyptian market that has been affected by the bubble after the
Egyptian revolution. This conclusion was made by plotting the buy-and-hold
returns of a value-weighted portfolio of NASDAQ stocks in the highest price/sales
quintile (rebalanced monthly) from January2011to January2012 (thick line) against
the buy-and-hold return on the CRSP (the center for research in security prices)
value-weighted index. Prices of high price/sales NASDAQ stocks almost
quadrupled over a one-year period, only to lose all of these gains in the subsequent
two years.
4. ANALYSIS One of the oldest theories about financial markets is "a price to price feedback
theory" (Shiller, 2003). Based on this theory, when speculative prices go up,
providing successes for some investors, this may attract public attention; promote
word of mouth enthusiasm, and increasing expectations for further price increases.
This process in turn increases investors demand and therefore, generates another
round of price increases. If the feedback is not interpreted and justified, it may
produce after several rounds a speculative bubble, in which high expectations for
further price increases support the very high current prices. Eventually, the high
prices are not sustainable, because they are high only due to the expectations of
further price increases and thus the bubble ultimately bursts, and price come falling
down. The feedback that led the bubble carries the seeds of its own destruction and
hence, the end of the bubble perhaps unrelated to new stories about fundamentals.
The same feedback may also generate a negative bubble, downward price
movements propelling further downward price movements, promoting word of
mouth pessimism, until the market reaches unsustainably low level.
In any empirical study, it is not easy to determine the fundamental value of an asset,
since fundamentals are in general unobservable. An exception is the fundamental
value of telecommunications stocks that are determined by the average price and
volatility of the underlying stock (Gong, Pan and Shi, 2015). The celebrated Black-
Scholes model provides a reliable tool for estimating the stocks fundamental value.

15
The daily closing price and previous one-year rolling daily return volatility of the
telecommunications stocks leads to the Black-Scholes value. Moreover, under
alternative assumptions about volatility such as GARCH (1, 1) and Garman and
Klass (1980), the Black-Scholes value will change a little, but the gap between the
average price of telecommunications stocks and Black-Scholes value is still large
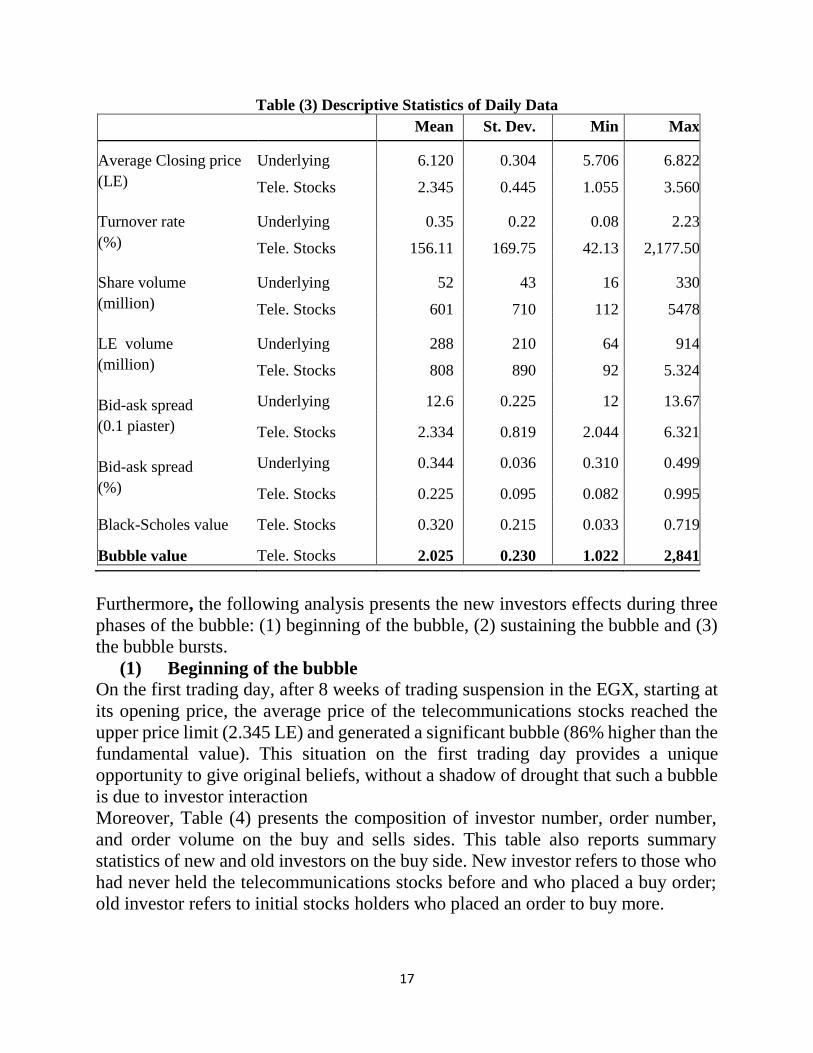
and significant. Table (3) presents summary statistics of the daily data. A couple of
points are noteworthy when we compare the average price of stocks and the
fundamental value. First, it is a large bubble. The average telecommunications stocks
price amounts to 2.34LE, more than seven times higher than the average
fundamental value of 0.32 LE. Second, this is a textbook bubble in the sense that the
average price declined during the last several days, and hit the fundamental value in
the last minute.
Figure (5) daily average prices of the Telecommunications Stocks along with the closing
prices and the Black-Scholes value, 5
4
Closing price
3
Pri
ce
Av. Price of
Telecomm.
Stocks
2
1
Benchmark price Black-Scholes price
0 .
Jan.11 Feb.11 Mar11 Apr.11 May11 Jun. 11Jul.11 Aug.11 Sep.11 Oct.11 Nov.11. Dec.11 Jan. 12
Furthermore, Table (3) shows the mean, standard deviation, minimum and
maximum of time-series of the underlying stocks and the telecommunications
stocks, which includes the average daily closing price, turnover rate, trading volume
(in million stocks and Egyptian Pound), and bid-ask spread (in 0.1 piaster and
percent), the Black-Scholes value calculated with the previous one year daily return
volatility, and the bubble value calculated as average price minus Black-Scholes
value
The first concern of any empirical study on a possible bubble is whether it
is indeed a bubble. Even for historically famous bubbles, such as the South
16
Sea bubble of 1720, there is an open debate, as in Garber (2000); Frehen,
Goetzmann and Rouwenhorst (2011) or Pastor and Veronesi (2006).
However, the bubble of the Telecommunications Stocks seems indubitable
for the following reasons:
First, the over valuation in the average price of telecommunications stocks
is not due to lack of liquidity. Low liquidity in less developed financial
markets, like the case of EGX, from time to time leads to temporary but
rather persistent deviations from fundamentals. These deviations should
not be considered bubbles. However, even though the Egyptian Exchange
(EGX) is far from fully developed, temporary shocks hardly affect the
average price of telecommunications stocks because the liquidity is really
good (as seen in the bid-ask spread in Table (3)
Second, there is no evidence of price manipulation. Investors held the
telecommunications stocks evenly, with a minimum of 12.30.
Furthermore, the Market Surveillance Department (MSD) of the EGX paid
extra attention and deterred any suspicious trading immediately. In
addition, the EGX members tried their best to make relevant information
transparent so that misunderstandings and rumors were clarified
imminently.
Third, investors can judge the bubble through comparing the profitability
and safety of the telecommunications stocks and the underlying stock.
Although the Black-Scholes model does not generate a precise estimation
of fundamental value for the stock because it builds on an arbitrage
mechanism that is not applicable for preventing short selling in Egypt, the
much worse profitability and safety of the telecommunications stocks
compared to the underlying stock clearly reveal that the
telecommunications stocks are substantially overpriced. Almost every
investor would agree that the probability of the underlying stock price
increasing more than 86% is very low, so it is obvious that investors
buying the telecommunications stocks do not think the price is reasonable
but want only to sell the stocks to another investor at a higher price.
17
Table (3) Descriptive Statistics of Daily Data
Mean St. Dev. Min Max
Average Closing price Underlying 6.120 0.304 5.706 6.822
(LE) Tele. Stocks 2.345 0.445 1.055 3.560
Turnover rate Underlying 0.35 0.22 0.08 2.23
(%) Tele. Stocks 156.11 169.75 42.13 2,177.50
Share volume Underlying 52 43 16 330
(million) Tele. Stocks 601 710 112 5478
LE volume Underlying 288 210 64 914
(million) Tele. Stocks 808 890 92 5.324
Bid-ask spread Underlying 12.6 0.225 12 13.67
(0.1 piaster) Tele. Stocks 2.334 0.819 2.044 6.321
Bid-ask spread Underlying 0.344 0.036 0.310 0.499
(%) Tele. Stocks 0.225 0.095 0.082 0.995
Black-Scholes value Tele. Stocks 0.320 0.215 0.033 0.719
Bubble value Tele. Stocks 2.025 0.230 1.022 2,841
Furthermore, the following analysis presents the new investors effects during three
phases of the bubble: (1) beginning of the bubble, (2) sustaining the bubble and (3)
the bubble bursts.
(1) Beginning of the bubble On the first trading day, after 8 weeks of trading suspension in the EGX, starting at
its opening price, the average price of the telecommunications stocks reached the
upper price limit (2.345 LE) and generated a significant bubble (86% higher than the
fundamental value). This situation on the first trading day provides a unique
opportunity to give original beliefs, without a shadow of drought that such a bubble
is due to investor interaction
Moreover, Table (4) presents the composition of investor number, order number,
and order volume on the buy and sells sides. This table also reports summary
statistics of new and old investors on the buy side. New investor refers to those who
had never held the telecommunications stocks before and who placed a buy order;
old investor refers to initial stocks holders who placed an order to buy more.

18
Table (4) Summary statistics of the First Trading Day
Investor
Order Prices of orders (LE.)
volume
number
Mean
Difference
St. Dev.
Difference
(million)
(p-value) (p-value)
Institutions 207 56.1 0.811 0.209
New 170 33.2 0.766 0.045 0.197 0.042
Old 37 22.9 0.625
(0.000)
0.155
(0.000)
Individuals 9516 414 0.733 0.211
Buy New 8116 351.5 0.625 0.024 0.209 0.023
Old 1400 62.5 0.601
(0.000)
0.186
(0.000)
Both 9723 470.1 0.610 0.208
New 8286 384.2 0.755 0.145 0.218 0.003
Old 1437 85.9 0.610
(0.000)
0.188
(0.000)
Institutions 23 0.545 0.705 0.111
Sell Individuals 319 1.340 0.715 0.133
Both 324 1.885 0.710 0.130
From Table (4), three main points should be highlighted: (1) the average bid and ask
prices were not far from the fundamental value, (2) the large standard deviation
reveals huge diversity in investor belief; and (3) there is an extreme imbalance
between buying and selling. The number of investors on the buy side is about 30
times more than that on the sell side (9723/324), while the ratio is about 249 when
it comes to order volume (470.1/1.885).
The three points mentioned above provide support for a suggestion by Miller (1977)
and Gong, Pan, and Shi (2015). In a static setting, where short selling is prohibited
and investors hold different beliefs about the fundamental value, Both Miller, and
Gong, Pan and Shi suggest that the asset price is biased toward the beliefs of
optimists, because pessimists cannot sell short.
Table (4) also shows that the overwhelming majority of the buy orders came from
new investors. On the buy side, new investors account for 88% of the total investor
number, 94% of the order number, and 74% of order volume. On average, new
19
investors buy significantly higher prices than old investors did. If we take standard
deviation of order price as an indicator of heterogeneity, it is obvious that new
investors’ opinions seem to be more diverse than old investors are. Moreover, all the
buy orders at the upper limit price (47.65LE) come from new investors rather than
old ones. As far as the order volume is concerned, it exceeds the total volume at all
prices on the sell side.
(2) Sustaining the bubble As mentioned earlier, the EGX was closed after the Egyptian revolution for a period
of 55 days. From the opening of the EGX (I.e. 23rd March, 2011) on the first trading
day to the last minute on the last trading day, the average price of
telecommunications stocks hit fundamental value, the bubble of the
telecommunications was sustained for the entire trading period (Figure 5).
The term new investors here refers to those who held the telecommunications stocks
for the first time. A logical measure of new investors (NI) is the number of shares
they purchased on the market, but this variable is highly correlated with trading
volume. To distinguish the impacts of new investors and trading volume, percentage
of shares purchased by new investors was utilized as the measure of new investors
instead, that is:
Net shares purchased by new investors (1)
NI= Net shares purchased by new and old investors
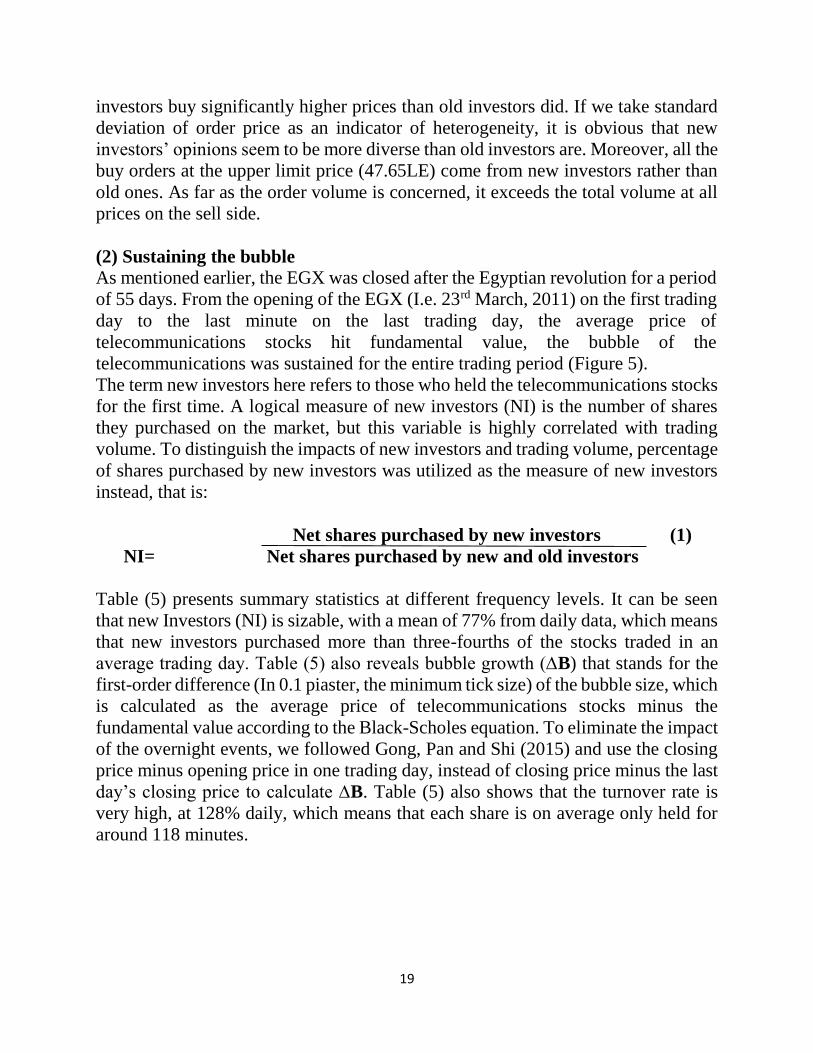
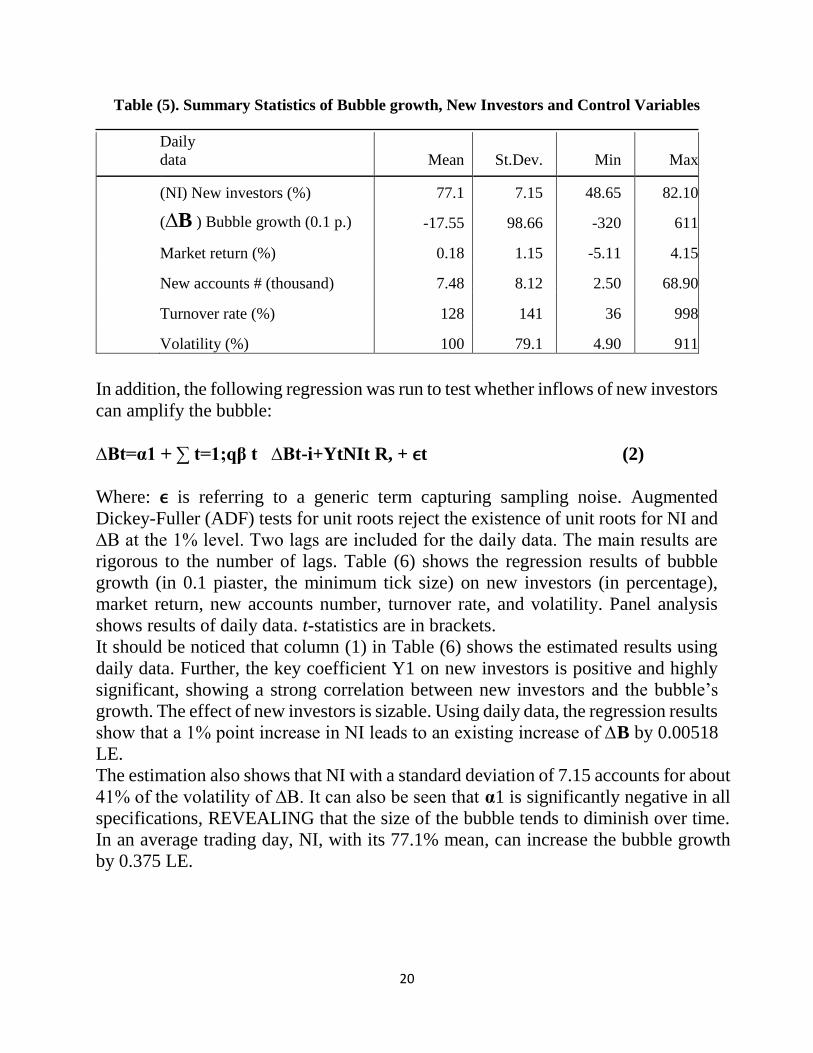
Table (5) presents summary statistics at different frequency levels. It can be seen
that new Investors (NI) is sizable, with a mean of 77% from daily data, which means
that new investors purchased more than three-fourths of the stocks traded in an
average trading day. Table (5) also reveals bubble growth (∆B) that stands for the
first-order difference (In 0.1 piaster, the minimum tick size) of the bubble size, which
is calculated as the average price of telecommunications stocks minus the
fundamental value according to the Black-Scholes equation. To eliminate the impact
of the overnight events, we followed Gong, Pan and Shi (2015) and use the closing
price minus opening price in one trading day, instead of closing price minus the last
day’s closing price to calculate ∆B. Table (5) also shows that the turnover rate is
very high, at 128% daily, which means that each share is on average only held for
around 118 minutes.
20
Table (5). Summary Statistics of Bubble growth, New Investors and Control Variables
Daily
data
Mean St.Dev. Min Max
(NI) New investors (%) 77.1 7.15 48.65 82.10
(∆B ) Bubble growth (0.1 p.) -17.55 98.66 -320 611
Market return (%) 0.18 1.15 -5.11 4.15
New accounts # (thousand) 7.48 8.12 2.50 68.90
Turnover rate (%) 128 141 36 998
Volatility (%) 100 79.1 4.90 911
In addition, the following regression was run to test whether inflows of new investors
can amplify the bubble:
∆Bt=α1 + ∑ t=1;qβ t ∆Bt-i+YtNIt R, + ϵt (2)
Where: ϵ is referring to a generic term capturing sampling noise. Augmented
Dickey-Fuller (ADF) tests for unit roots reject the existence of unit roots for NI and
∆B at the 1% level. Two lags are included for the daily data. The main results are
rigorous to the number of lags. Table (6) shows the regression results of bubble
growth (in 0.1 piaster, the minimum tick size) on new investors (in percentage),
market return, new accounts number, turnover rate, and volatility. Panel analysis
shows results of daily data. t-statistics are in brackets.
It should be noticed that column (1) in Table (6) shows the estimated results using
daily data. Further, the key coefficient Y1 on new investors is positive and highly
significant, showing a strong correlation between new investors and the bubble’s
growth. The effect of new investors is sizable. Using daily data, the regression results
show that a 1% point increase in NI leads to an existing increase of ∆B by 0.00518
LE.
The estimation also shows that NI with a standard deviation of 7.15 accounts for about
41% of the volatility of ∆B. It can also be seen that α1 is significantly negative in all
specifications, REVEALING that the size of the bubble tends to diminish over time.
In an average trading day, NI, with its 77.1% mean, can increase the bubble growth
by 0.375 LE.

21
Table (6) Regressions of Bubble Growth Panel analysis of daily data, AR. (2)
(1) (2) (3) (4) (5) (6)
Constant,α
-485.77 -31.22 -30.75 -40.67 -22.50 -443.80
(t-stat) (-6.43) (-2.95) (-3.36) (-4.11) (-2.09) (-5.60)
New investors, Y1
6.70 5.55
(t-stat) (7.88) (5.32)
Market return, Y2
11.95 10.80
(t-stat) (3.86) (2.59)
New acc. no., Y3
0.08
(t-stat) (0.11)
Turnover rate, Y4
0.13 0.610
(t-stat) (2.10) (1.18)
Volatility, Y5
-0.0218
(t-stat) (-0.15)
Adj. R2
0.1175 0.0185 -0.0374 0.0412 0.0071 0.0445
Furthermore, new investors are not the only factor affecting the bubble. Hence, other
factors were included in the regression such as: volatility, turnover rate, market
return, and the number of new accounts on the Egyptian Exchange (EGX). We
started by regressing the bubble growth on each of these variables alone, as follows:
∆Bt=α2+∑t=1;qβ t ∆Bt-i+YXt+ ϵt (3)
Where X, refers to one of the above variables. Here, volatility refers to the return
volatility built from one-minute intraday return. Market return is measured by the
return of the EGX30 Index, the most popular index in Egypt. As for ∆B, the closing
index minus the opening index for one trading day, was used to calculate market
return.
The regression results in Columns (2) to (5) of table (6) show the estimated results
of the above mentioned factors. It can be seen that turnover rate has a significant
positive effect on bubble growth at a daily frequency. This finding is consistent with
the findings of Gong, Pan, and Shi (2015); and Xiong and Yu (2011) However, it
should also be noticed that, compared with new investors, the contribution of

22
turnover rate is small. During each trading day, turnover rate, with its 128% mean,
can increase the bubble growth only by 0.017 LE. Volatility shows no significance
using daily data. A positive correlation between the bubble growth and market return
is confirmed. However, the effect is economically trivial, at an average of only 0.003
LE in an average trading day.
Eventually, new investors, market return and turnover rate are combined in a single
regression. Column (6) in Table (6) shows the estimated results. The impact of each
variable solely on the bubble’s growth is quite similar to that resulted from the
individual regressions. The aggregate regression results in Table (6) reveal that new
investors are the main power sustaining the bubble.
(3) The bubble bursts The telecommunications stocks have a predetermined last trading day. During the
last 42 trading days, the average price of telecommunication stocks declined from
above 47 LE to 12.30 LE. While there was a clear downward trend, the price drop
was slow in that there was no dramatic crash. This pattern of gradual price drop over
time has also occurred in the bubbles of other securities such as the warrant in China
in the study of Gong, Binglin, Deng Pan, and Donghui Shi (2015).
For the sake of further check, we examine the new investor (NI) effect from the
perspective of conditional quantiles. This method allows estimation of the new
investor effect in different quantile ranges, and identification of the quantile range
for which new investors are relevant. Particularly, we run this regression:
∆Bt=α(r) + ∑ t=1;qβI (r)∆Bt-i+Y(r) NIt+ ϵt (4)
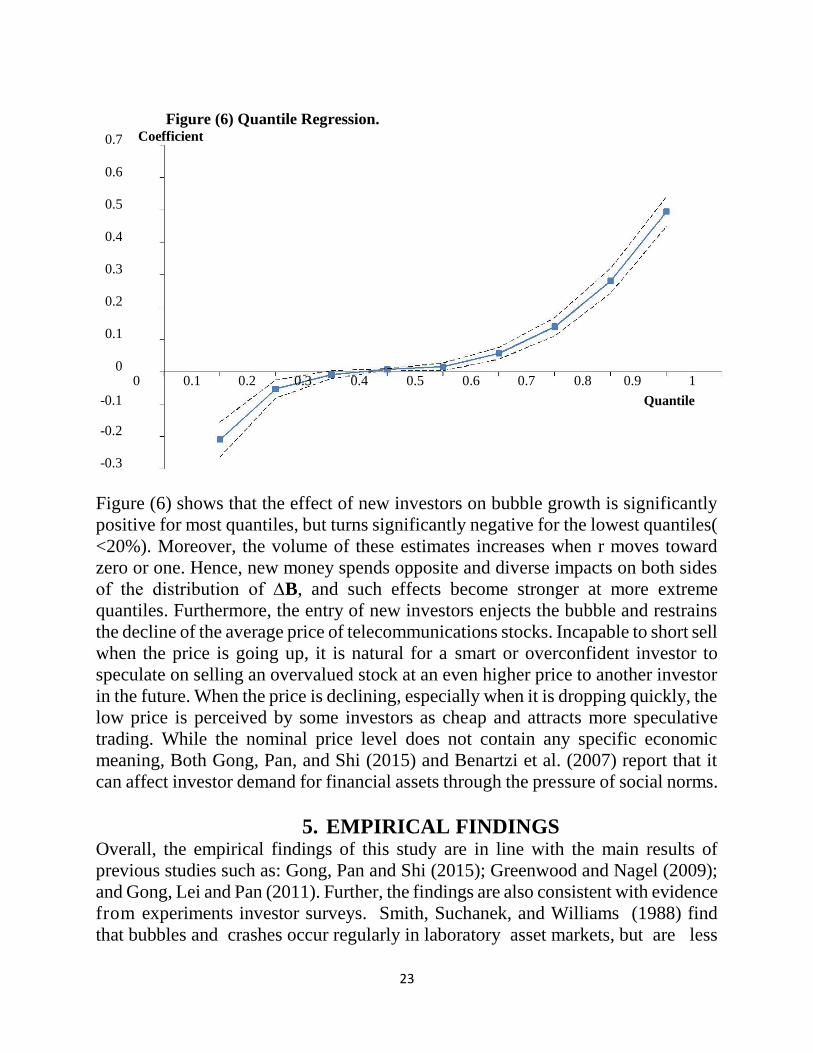
Where; r ϵ (0, 1) refers to the r-th quantile. Figure (6) illustrates the estimated Y (r)
from the regressions and their 95% confidence interval against r.
23
Figure (6) Quantile Regression.
0.7 Coefficient
0.6
0.5
0.4
0.3
0.2
0.1
0 0 0.1 0.2 0.3 0.4 0.5
0.6 0.7 0.8 0.9 1
-0.1
Quantile
-0.2
-0.3
Figure (6) shows that the effect of new investors on bubble growth is significantly
positive for most quantiles, but turns significantly negative for the lowest quantiles(
<20%). Moreover, the volume of these estimates increases when r moves toward
zero or one. Hence, new money spends opposite and diverse impacts on both sides
of the distribution of ∆B, and such effects become stronger at more extreme
quantiles. Furthermore, the entry of new investors enjects the bubble and restrains
the decline of the average price of telecommunications stocks. Incapable to short sell
when the price is going up, it is natural for a smart or overconfident investor to
speculate on selling an overvalued stock at an even higher price to another investor
in the future. When the price is declining, especially when it is dropping quickly, the
low price is perceived by some investors as cheap and attracts more speculative
trading. While the nominal price level does not contain any specific economic
meaning, Both Gong, Pan, and Shi (2015) and Benartzi et al. (2007) report that it
can affect investor demand for financial assets through the pressure of social norms.
5. EMPIRICAL FINDINGS Overall, the empirical findings of this study are in line with the main results of
previous studies such as: Gong, Pan and Shi (2015); Greenwood and Nagel (2009);
and Gong, Lei and Pan (2011). Further, the findings are also consistent with evidence
from experiments investor surveys. Smith, Suchanek, and Williams (1988) find
that bubbles and crashes occur regularly in laboratory asset markets, but are less

24
likely when subjects have experienced bubbles and crashes in prior trading
sessions. Summarizing data from investor surveys, Huber et al (2010) reported that
new investors had the highest stock market return expectations in the late 1990s.
Defining new investors as those who had never owned the telecommunications
stocks before, the main findings of this research effort are summarized as follows:
(1) New investors in the EGX initiated the bubble. On the first trading day,
after the 55 days of EGX suspension followed the Egyptian revolution,
(I.e. on the 23rd of March 2011),the average opening price of the
telecommunications stocks reached their upper limit (average of 47.65
LE) and generated a significant bubble (86 %) higher than the estimated
fundamental value). Because the opening price on the first trading day
released no information during the process, it gives an infrequent
opportunity to get original beliefs without having to account for investor
interactions. The order prices reveals big diversity within investor opinion
about the telecommunications stocks’ prices. Under the restriction on
short sale, the price is not determined by the majority of investors, but
rather by the most optimistic ones. Moreover, the findings show that
although diversity exists in both the original stocks holders and the new
investors, the most aggressive buyers are mainly the new ones. New
investors (NI) account for 79% of purchasing orders. Indeed, all the bids
at the upper limit price come from new investors, and the order volume
already exceeds the total volume at all prices on the sell side. Hence, there
is no doubt that the new investors in the EGX created this financial
bubble.
(2) New investors sustained the telecommunications stocks’ bubble. From its
opening on the first trading day until the last minute on the last trading
day, when the average price of the stocks eventually hit the fundamental
value, the bubble of the Telecommunications stocks was sustained for the
whole trading period (126 trading days). Using daily data, and defining
new investors as those who held the telecommunications stocks for the
first time on that day, the regressions results reveal that the contribution
of new investors to the bubble is huge. In an average trading day, new
investors increased the bubble size by 0.375 LE and accounted for about
41% of the volatility of the bubble growth on average. Without the
continuous inflow of new investors, the telecommunications stocks’
bubble would have vanished in few trading days rather than sticking to
throughout the whole trading period. Furthermore, new investors
contributed to the bubble much more than other factors such as, volatility,
market return and turnover rate.
25
(3) New investors in the Egyptian Exchange (EGX) explain the slow drop of
the average price of telecommunications stocks over time. During the last
42 trading days, the average price of telecommunications stocks declined
from above 47 LE to 12.30 LE. While there was a clear downward trend,
the price drop was slow in that there was no dramatic crash. The quantile
regressions show that entrance of new investors restrained the sharp
decline of the telecommunications stocks prices.
In addition, the empirical findings highlight the importance of new investors in the
lifecycle of a financial bubble. The impact of new investors is consistent with the
standard assumption of heterogeneous investor belief made in theoretical works such
as Scheinkman and Xiong (2003), and empirically confirmed in Gong, , Pan, and
Shi (2015); Ofek and Richardson (2003); and Xiong and Yu (2011). Despite the
empirical literature misses the mark to identify where the heterogeneity comes from,
theoretical models in Scheinkman and Xiong (2003); and Allen, Morris, and
Postlewaite (1993) explain it in terms of different learning schemes and asymmetric
information, respectively. The findings also reveal that the continuous stream of new
investors to the EGX is an important source of persistent heterogeneity.
Furthermore, in line with the study of Gong, Pan, and Shi (2015), the results also
help to explain the puzzling phenomenon of more and more frequent financial
bubbles in the recent two decades. Both empirical research and experimental
research have concluded a strong learning impact once investors have experienced
a bubble and subsequent crash, they are hesitant to participate the next time.
Therefore, a bubble can exist only following the arrival of a new generation of
investors willing to invest their capital to purchase overpriced stocks. Hommes et al
(2005) even claim that a period of two decades is the normal time it takes for the
recollection of one disaster to be vanished. However, the recent reoccurring bubbles
seem to imply that experience alone may not be a sufficient condition to ensure the
prevention of financial bubbles. As the market environment changes rapidly under
the influences of factors such as emerging markets and globalization, new investors
can flood in much more quickly than before and hence, it does not take as long to
create a new bubble. This also suggests that experimental research may have ignored
certain important factors occurring in the field of asset markets, such as the constant
entries of new investor.
6. CONCLUSIONS The current study had some limitations. This study was primarily limited to its small
time horizon (I.e. data covered only three years of opening and closing prices of the
telecommunications stocks in the EGX from 2011 till 2014) which resulted in small
sample size. A larger sample with a longer time period would have benefited our
results and enhanced the generalizability of the study. Another possible
26
improvement could have been interviewing some new investors (NI) from the EGX.
Personal interviews could elicit greater information regarding new investors’
behavior. This method could have added important qualitative data and greater
insight into the new investors’ thoughts and opinions, so that better understanding
and interpretation of the telecommunications stocks’ bubble would have achieved.
Many studies have followed the pioneering work of Smith, Suchanek and Williams
(1988) in order to test the robustness of the price bubble phenomenon. To date, the
only treatment variable that appears to consistently eliminate the existence of the
price bubble is the experience of all or some of the market participants gained
through participation in previous asset market sessions of the same kind (Van
Boening, Williams and LaMaster(1993); Dufwenberg, Lindqvist and Moore,
2005)). More specifically, experience in these experimental studies means living
through an experimental bubble and its subsequent crash.
The objective of this study is to get a better understanding of investor behavior
during financial bubbles by analyzing empirically the relationship between new
investors (NI) and the telecommunications stocks’ bubble that occurs after the
Egyptian revolution. The empirical findings of this research effort reveal that (1) the
new investors initiated the telecommunications stocks’ bubble; (2) the continuous
entries of new investors in the EGX sustained this bubble; and (3) the slow decline
of the average price of telecommunications stocks over time is due to the new
investors. Compared with other factors, the continuous stream of new investors was
the most robust driving force of the bubble over the whole trading period.
It should be noticed here that, as mentioned earlier, this study adopted the same
methodology and followed the same procedures of the pioneer study of Gong, Pan,
and Shi (2015). Furthermore, the main findings of this research effort coming almost
consistent and in line with their results and findings.
In this research effort, it is obvious that, if new investors (NI) were just attracted by
an existing bubble, their role would be much less important. However, regarding the
Egyptian telecommunications’ bubble, we believe that it is not the case, for the
following reasons: (1) new investors initiated the bubble in the telecommunications
stocks on the first day after the reopening of the EGX on 23rd of March, 2011, when
no one could have known of the existence of the bubble. (2) To explore how the
stream of new investors responds to the growth in bubble size, a bi-viariate structural
vector autoregressive regression (SVAR) was conducted. The results are similar to
those in Table (6). (3) During the last 42 trading days, when the bubble began to
diminish, new investors continued to flood in.
Moreover, in this study, old investors as well as new ones should be considered
inexperienced, since the telecommunications stocks were the first trading stocks in
the EGX after a two-month suspension, and therefore neither new nor old investors

27
had experienced a crash in the Egyptian Exchange (EGX). Hence, the new investor
effect found in this study is not equivalent to the inexperienced investor impact of
Greenwood and Nagel (2009).
Historically, the bubbles usually happened long after the preceding ones, which is
consistent with the experience effect. Nonetheless, more frequent occurrences of
financial bubbles in the last two decades than before seem to reveal that experience
alone may not be a sufficient condition to ensure the elimination of bubbles. The
findings of this research effort might suggest that the experience effect was only
invisible in the Egyptian telecommunications bubble, because too many new
investors entered the EGX after the Egyptian revolution and washed the effect away.
Finding the precise relationship between the new investor effect and the
inexperienced investor effect awaits Future empirical investigation with richer data
or well-designed experimental studies. Moreover, a comparative study measuring
and analyzing the financial bubbles’ effect in more than one country could be an
interesting topic to some researchers around the globe.
REFERENCES Abdeldayem, Marwan M. and Assran, Mohamed Saleh (2013), “Testing the Market
Timing Theory of Capital Structure: The Case of Egypt”, International
Research Journal of Finance and Economics” (IRJFE), EBSCO.
Abdeldayem, Marwan M. and Reda, Mohamed M. (2013), “An Examination into
the impact of Trading Motives on the Dynamic relationship between Stock
Returns and Trading volume: Evidence from Egypt” Global Advanced
Research Journal of Management and Business Studies (GARJMBS) ISSN:
2315-5086, April, Vol. 2(4), pp. 206-221
Allen, F., Morris, S., Postlewaite, A., (1993), “Finite bubbles with short sale
constraints and asymmetric information”. Journal of Economic Theory, Vol.
61, pp. 206-229.
Anderson, A. (1787). “A Historical and Chronological Deduction of the Origin of
Commerce, From the Earliest Accounts”, Volume III. (London: J. Walter).
Arab Capital Markets Resource Center Website (http://www.btflive.net). Accessed
on 19th July, 2014
Benartzi, S., Michaely, R., Thaler, R., Weld, W., (2007). “The nominal price
puzzle”. Unpublished working paper, University of California, Los Angeles.
Bikhchandani, S., Sharma, S. (2000), “Herd Behavior in Financial Markets”. IMF
Staff Papers, vol. 47, No (3), pp. 279-310.
Blasco, N., Ferreruela, S. (2008), “Testing Intentional Herding in Familiar Stocks:
An Experiment in an International Context.” The Journal of Behavioral
Finance, vol. 9, No (2), pp. 72-84.

28
Brunnermeir, M., Nagle, S., (2004). “Hedge funds and the technology bubble”.
Journal of Finance, Vol. 59, pp. 2013-2040.
Buchanan, Mark (2008). "Why economic theory is out of whack". New Scientist.
Retrieved 15 December 2008.
Caginalp, G.; Balenovich, D. (1999). "Asset flow and momentum: deterministic
and stochastic equations". Philosophical Transactions of the Royal Society
A. Vol. 357, No. (1758) pp. 2119–2133
Caparrelli, F., D’Arcangelis, A.M., Cassuto, A. (2004), Herding in the Italian
Stock Market: A Case of Behavioral Finance. In: The Journal of Behavioral
Finance, vol. 5, No (4), pp. 222-230.
Dasgupta, A., Prat, A., Verardo, M. (2011), “The Price Impact of Institutional
Herding.” The Review of Financial Studies, vol. 24, No (3), pp. 892-925.
DeMarzo, P.M, Kaniel, R., Kremer, I. (2008), “Relative Wealth Concerns and
Financial Bubbles.” The Review of Financial Studies, vol. 21, No (1), pp.
19-50.
Dufwenberg, M., Lindqvist, T., Moore, E., (2005). “Bubbles and experience: an
experiment on speculation”. American Economic Review, Vol. 95, pp.
1731–1737.
Frehen, Rik G.P., Goetzmann, William M. and Rouwenhorst, Greert K.(2011),
“New Evidence on the First Financial Bubble”, Unpublished NBER
Working Paper Series 15332, Cambridge-UK
Froot, Kenneth A.; Obstfeld, Maurice (1991). "Intrinsic Bubbles: The Case of
Stock Prices". American Economic Review, Vol. 81, pp. 1189–1214
Garber, Peter M. (1990). "Famous First Bubbles". The Journal of Economic
Perspectives, Vol. 4, No. (2) pp. 35–54
Garber, Peter (2000). “Famous First Bubbles: The Fundamentals of Early Manias”.
Cambridge, MA: MIT Press. ISBN 0-262-57153-6.
Garman, M., Klass, M., (1980). “On the estimation of security price volatilities
from historical data”. Journal of Business, Vol. 53, pp. 67-78
Greenwood, R., Nagel, S., (2009). “Inexperienced investors and bubbles”. Journal
of Financial Economics, Vol. 93, pp. 239-258.
Gong, Binglin; Pan, Deng, and Shi, Donghui (2015), “New Investors and Bubbles:
An Analysis of the Baosteel Call Warrant Bubble”, Management Science,
forthcoming
Gong, B., Lei, V., Pan, D., (2011). “Before and after: the impact of a real bubble
crash on investors' trading behavior in the lab”. Unpublished working paper,
Fudan University, Shanghai.
Hommes, Cars; Sonnemans, Joep; Tuinstra, Jan; Velden, Henk van de (2005).
"Coordination of Expectations in Asset Pricing Experiments". Review of

29
Financial Studies. Vol. 18, No. (3) pp. 955–980
Huber, J., Kirchler, M., Stockl, T., (2010). “Thar she bursts - a critical
investigation of bubble experiments”. Unpublished working paper,
University of Innsbruck, Austria.
King, Ronald R.; Smith, Vernon L.; Williams, Arlington W. and van Boening,
Mark V. (1993). "The Robustness of Bubbles and Crashes in Experimental
Stock Markets". In R. H. Day and P. Chen. Nonlinear Dynamics and
Evolutionary Economics. New York: Oxford University Press. ISBN 0-19-
507859-4.
Krugman, Paul (2013). "Bernanke, Blower of Bubbles?". New York Times.
Retrieved 10 May 2013.
Lahart, Justin (2008). "Bernanke's Bubble Laboratory, Princeton Protégés of Fed
Chief Study the Economics of Manias". The Wall Street Journal. p. A1.
Levine, Sheen S.; Zajac, Edward J. (2007). “The Institutional Nature of Price
Bubbles.” SSRN 960178.
Lewellen, Jonathan, (2003), “ Discussion of "The Internet Downturn:
Finding Valuation Factors in Spring 2000," Journal of Accounting
and Economics, Vol. 34, pp. 237-247.
Macleod, Christine, (1986) “The 1690s Patents Boom: Invention or Stock-
Jobbing?” The Economic History Review, pp. 549-571.
Miller, E., (1977). “Risk, uncertainty, and divergence of opinion”. Journal of
Finance, Vol. 32, pp. 1151-1168.
Morgan Staley Website www.morganstanley.com. Accessed on 15th February,
2012
Mubasher Website http://www.mubasher.info. Accessed on 23rd June, 2014
Nagel, S., Malmendier, U., (2011). “Depression babies: do macroeconomic
experiences affect risk-taking?” Quarterly Journal of Economics, Vol. 126,
pp. 373-416.
Nicholas, Tom. (2008), “Does Innovation Cause Stock Market
Runups? Evidence from Historical Patent Citations.” American
Economic Review, pp. 1370-1396.
Nofsinger, J.R., Sias, R.W. (1999), Herding and Feedback Trading by Institutional
and Individual Investors. In: The Journal of Finance, vol. 54, No (6), pp. 2263-
2295
Noussair, C., Robin, S., Ruffieux, B., (2001). “Price bubbles in laboratory asset
markets with constant fundamental values”. Experimental Economics, Vol. 4,
pp. 87–105.
Ofek, E., Richardson, M., (2003). “Dotcom mania: The rise and fall of internet stock
prices”. Journal of Finance, Vol. 58, pp. 1113-1137.

30
Pastor, L., Veronesi, P., (2006). “Was there a NASDAQ bubble in the late 1990s?”
Journal of Financial Economics, Vol. 81, pp. 61-100
Rannou, Y. (2010), “Banking Regulation, Behavioral Finance, and the Financial
Crisis in Europe: Looking to the Kindleberger-Minsky Paradigm.” Journal of
Risk Management in Financial Institutions, vol. 3, No (3), pp. 278-295.
Robert E. Wright, (2010), “ Fubarnomics: A Lighthearted, Serious Look at
America's Economic Ills” (Buffalo, N.Y.: Prometheus) pp. 51–52.
Scheinkman, J., Xiong, W., (2003). “Overconfidence and speculative bubbles”.
Journal of Political Economy, Vol. 111, pp. 1183-1219.
Shiller, Robert, J. (2003), “From Efficient Market Theory to Behavioral Finance”.
Cowles Foundation paper No. 1055
Shiller, Robert (2012). "Bubbles without Markets". Project Syndicate. Retrieved 17
August 2012.
Smith, Vernon L.; Suchanek, Gerry L.; Williams, Arlington W. (1988). "Bubbles,
Crashes, and Endogenous Expectations in Experimental Spot Asset
Markets". Econometrica. Vol. 56, No. (5), pp.1119–1151
Temin, P., Voth, H., (2004). “Riding the South Sea bubble”. American Economic
Review, Vol. 94, pp. 1654-1668.
The Egyptian Exchange Annual Report (2011);(2012) and (2013)
The Egyptian Exchange Website http://www.egyptse.com. Accessed on 28th
October, 2014
Topol, Richard (1991). "Bubbles and Volatility of Stock Prices: Effect of Mimetic
Contagion". The Economic Journal, Vol. 101, No. (407) pp. 786–800.
Van Boening, M., Williams, A., LaMaster, S., (1993). “Price Bubbles and Crashes
in Experimental Call Markets”. Economics Letters, Vol. 41, pp. 179-185.
Xiong, W. Yu, J., (2011). “The Chinese warrants bubble”. American Economic
Review, Vol. 101, pp. 2723-2753.

31