Manuscript Details - Repository@Nottingham
26
Manuscript Details Manuscript number IJBIOMAC_2019_1010_R2 Title Effect of drying temperature on structural and thermomechanical properties of konjac glucomannan-zein blend films Article type Research Paper Abstract Konjac glucomannan (KGM)/zein blend films were successfully prepared by solution casting at different drying temperatures (40, 50, 60, 70 and 80 °C). The effects of drying temperature on the films’ structural, thermomechanical, mechanical and water barrier properties were investigated. Microstructural observations indicated that zein particles were homogeneously dispersed in KGM continuous matrix, and the blend film dried at 60 °C showed the most compact and smooth surface. Dynamic mechanical thermal analysis curves showed that with increasing drying temperature from 40 to 60 °C, glass transition temperature (Tg) of films increased; however, with further increase in temperature, the Tg decreased, indicating the compatibility of film components was the highest when dried at 60 °C. The hydrophobicity of blend film dried at 60 °C was significantly stronger than that of other blend films, supported by the highest water contact angle, and the lowest swelling ratio and solubility. Moreover, the film dried at 60 °C showed the highest tensile strength, elongation at break, and the lowest water vapor permeability. Therefore 60 °C was preferred for KGM/zein blend film preparation. This study indicated that intermolecular interactions among film components were greatly influenced by the drying temperature, and should be carefully noticed for film preparation. Keywords Drying temperature; particles distribution; physical properties Manuscript category Carbohydrates, Natural Polyacids and Lignins Corresponding Author Xuewen Ni Corresponding Author's Institution School of Food and Biological Engineering Order of Authors chong Li, Kao Wu, Yuehong Su, S.B. Riffat, Xuewen Ni, Fatang Jiang Suggested reviewers Ian Ratcliff, Harold Corke, David Gray Submission Files Included in this PDF File Name [File Type] cover letter.docx [Cover Letter] Responding letter.docx [Response to Reviewers] Highlights.doc [Highlights] abstract.docx [Abstract] manuscript.docx [Manuscript File] Figures.docx [Figure] Tables.docx [Table] To view all the submission files, including those not included in the PDF, click on the manuscript title on your EVISE Homepage, then click 'Download zip file'.
-
Upload
khangminh22 -
Category
Documents
-
view
1 -
download
0
Transcript of Manuscript Details - Repository@Nottingham

Manuscript Details
Manuscript number IJBIOMAC_2019_1010_R2
Title Effect of drying temperature on structural and thermomechanical properties ofkonjac glucomannan-zein blend films
Article type Research Paper
Abstract
Konjac glucomannan (KGM)/zein blend films were successfully prepared by solution casting at different dryingtemperatures (40, 50, 60, 70 and 80 °C). The effects of drying temperature on the films’ structural, thermomechanical,mechanical and water barrier properties were investigated. Microstructural observations indicated that zein particleswere homogeneously dispersed in KGM continuous matrix, and the blend film dried at 60 °C showed the mostcompact and smooth surface. Dynamic mechanical thermal analysis curves showed that with increasing dryingtemperature from 40 to 60 °C, glass transition temperature (Tg) of films increased; however, with further increase intemperature, the Tg decreased, indicating the compatibility of film components was the highest when dried at 60 °C.The hydrophobicity of blend film dried at 60 °C was significantly stronger than that of other blend films, supported bythe highest water contact angle, and the lowest swelling ratio and solubility. Moreover, the film dried at 60 °C showedthe highest tensile strength, elongation at break, and the lowest water vapor permeability. Therefore 60 °C waspreferred for KGM/zein blend film preparation. This study indicated that intermolecular interactions among filmcomponents were greatly influenced by the drying temperature, and should be carefully noticed for film preparation.
Keywords Drying temperature; particles distribution; physical properties
Manuscript category Carbohydrates, Natural Polyacids and Lignins
Corresponding Author Xuewen Ni
Corresponding Author'sInstitution
School of Food and Biological Engineering
Order of Authors chong Li, Kao Wu, Yuehong Su, S.B. Riffat, Xuewen Ni, Fatang Jiang
Suggested reviewers Ian Ratcliff, Harold Corke, David Gray
Submission Files Included in this PDF
File Name [File Type]
cover letter.docx [Cover Letter]
Responding letter.docx [Response to Reviewers]
Highlights.doc [Highlights]
abstract.docx [Abstract]
manuscript.docx [Manuscript File]
Figures.docx [Figure]
Tables.docx [Table]
To view all the submission files, including those not included in the PDF, click on the manuscript title on your EVISEHomepage, then click 'Download zip file'.

1 Effect of drying temperature on structural and thermomechanical
2 properties of konjac glucomannan-zein blend films
3
4 Chong Lia,b, Kao Wua,b, Yuehong Suc, Saffa B. Riffatc, Xuewen Nia,b,*, Fatang
5 Jianga,b,c,**
6
7 aGlyn O. Philips Hydrocolloid Research Centre at HUT, Hubei University of
8 Technology, Wuhan 430068, China
9 bSchool of Biological Engineering and Food Science, Hubei University of
10 Technology, Wuhan 430068, China
11 cDepartment of Architecture and Built Environment, Faculty of Engineering,
12 University of Nottingham, University Park, Nottingham, NG7 2RD, UK
13
14 *Corresponding author at: Glyn O. Philips Hydrocolloid Research Centre at HUT,
15 Hubei University of Technology, Wuhan 430068, China
16 **Corresponding author at: Glyn O. Philips Hydrocolloid Research Centre at HUT,
17 Hubei University of Technology, Wuhan 430068, China
18 E-mail addresses: [email protected] (X. Ni), [email protected] (F.
19 Jiang).
20
1234567891011121314151617181920212223242526272829303132333435363738394041424344454647484950515253545556575859
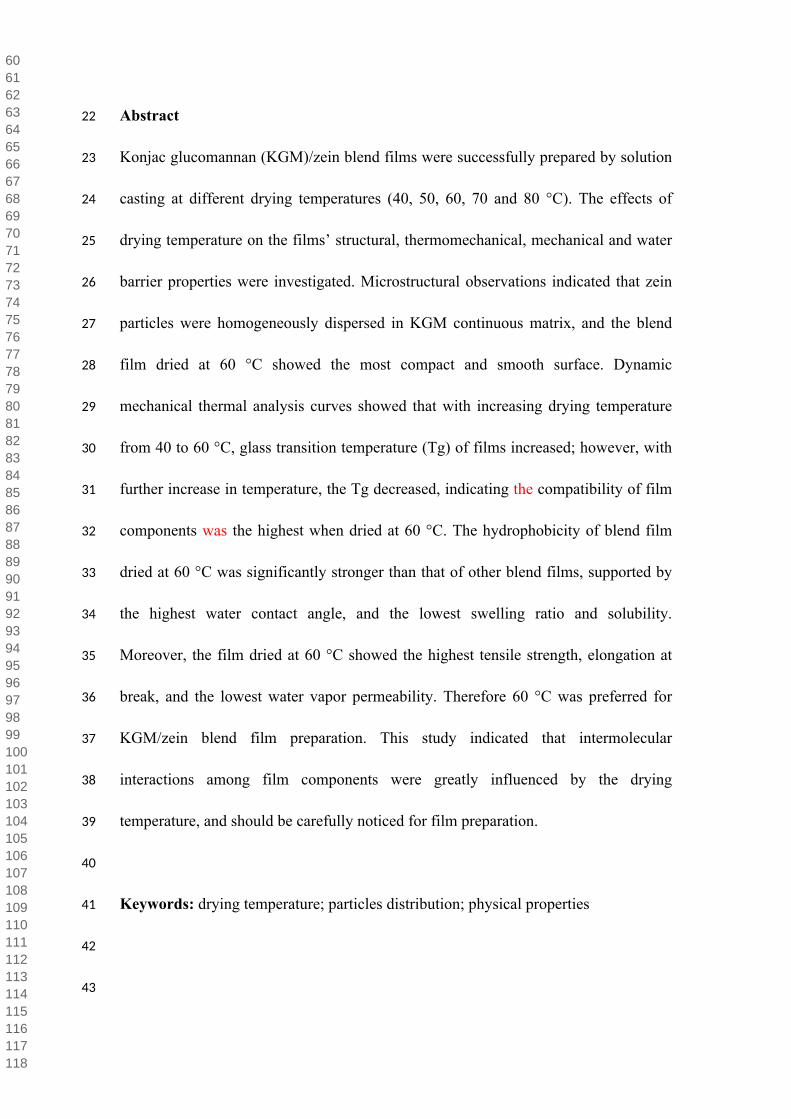
22 Abstract
23 Konjac glucomannan (KGM)/zein blend films were successfully prepared by solution
24 casting at different drying temperatures (40, 50, 60, 70 and 80 °C). The effects of
25 drying temperature on the films’ structural, thermomechanical, mechanical and water
26 barrier properties were investigated. Microstructural observations indicated that zein
27 particles were homogeneously dispersed in KGM continuous matrix, and the blend
28 film dried at 60 °C showed the most compact and smooth surface. Dynamic
29 mechanical thermal analysis curves showed that with increasing drying temperature
30 from 40 to 60 °C, glass transition temperature (Tg) of films increased; however, with
31 further increase in temperature, the Tg decreased, indicating the compatibility of film
32 components was the highest when dried at 60 °C. The hydrophobicity of blend film
33 dried at 60 °C was significantly stronger than that of other blend films, supported by
34 the highest water contact angle, and the lowest swelling ratio and solubility.
35 Moreover, the film dried at 60 °C showed the highest tensile strength, elongation at
36 break, and the lowest water vapor permeability. Therefore 60 °C was preferred for
37 KGM/zein blend film preparation. This study indicated that intermolecular
38 interactions among film components were greatly influenced by the drying
39 temperature, and should be carefully noticed for film preparation.
40
41 Keywords: drying temperature; particles distribution; physical properties
42
43
60616263646566676869707172737475767778798081828384858687888990919293949596979899100101102103104105106107108109110111112113114115116117118
44 1. Introduction
45 Edible packaging is a stand-alone sheet of material which can provide a barrier to
46 mass transfer (moisture, oxygen, and solute movement) within the food itself or
47 between the food and environment (Bourlieu, Guillard, Vallès-Pamiès, et al., 2009).
48 The unique advantage of edible packaging is envisioned to simplify packaging system
49 and to improve stability, safety and quality of food products, representing a better
50 choice for food packaging in daily life (Janjarasskul et al., 2018). Edible packaging is
51 developing rapidly by utilizing edible biopolymers as structural matrices. Generally,
52 they are prepared from natural polysaccharides, proteins, lipids or combinations of
53 these components (Jia, Fang, & Yao, 2009; Shi, & Dumont, 2014; Wu et al., 2018;
54 Cheng et al., 2008; Homez-Jara et al., 2018). Among them, konjac glucomannan
55 (KGM) as one natural water-soluble polysaccharide derived from the konjac tuber has
56 special nutritional and health promoting functions as well as excellent film-forming
57 capability, and it has bright application prospect for edible packaging preparation (Li
58 et al., 2015; Wu et al., 2012; Chen et al., 2008; Lu, Wang, & Xiao, 2008). Zein is the
59 major storage protein of corn and comprises ≈ 45-50% of the protein in corn (Shukla,
60 & Cheryan, 2001). It is insoluble in pure water, and has good film-forming ability,
61 relatively low price and abundant sources (Liang et al., 2015; Bisharat et al., 2018; Gu
62 et al., 2013). According to our previous research (Wang et al., 2017; Ni et al., 2018),
63 KGM and zein could form a stable homogeneous dispersion with appropriate mixing
64 formula, and KGM/zein blend films could be formed by solution casting. KGM/zein
65 blend films showed better mechanical, thermal, water vapor and oxygen barrier
119120121122123124125126127128129130131132133134135136137138139140141142143144145146147148149150151152153154155156157158159160161162163164165166167168169170171172173174175176177

66 properties than pure KGM and zein films. The hydrophobicity of KGM/zein blend
67 films was significantly stronger than that of pure KGM film (Wang et al., 2017). As
68 an edible packaging material, KGM/zein blend films have promising prospects for
69 development.
70
71 Drying is one of most challenging steps in the production of films, and improper
72 drying conditions (e.g. high temperature or a long time) may lead to a variety of
73 drying-induced defects such as blisters, warping, and cracks (Zhou et al., 2018).
74 Presently, the influence of drying conditions on films has received considerable
75 attention. During the drying period, with solvent evaporation and solute migration,
76 various phenomena may occur such as molecular assembly and interaction, a
77 transition from a rubbery to a vitreous phase, a phase separation (thermodynamic
78 incompatibility), or crystallization (Liu et al., 2015; Denavi et al., 2009). This can be
79 largely impacted by the drying temperature, as the solvent evaporation efficiency is
80 mainly affected by temperature. For example, increasing drying temperature (from 30
81 to 50 °C) improved tensile stress at yield and elastic modulus of the konjac flour
82 films, while decreasing its thickness, percent elongation at yield and water vapor
83 permeability (Jomlapeeratikul, Poomsa-Ad, & Wiset, 2016). Liu et al. (2016) found
84 drying temperature could be used to modulate the relative amount of triple helices and
85 covalent bonds, and therefore control the physical properties of transglutaminase-
86 modified gelatin films. Moreover, with increased drying temperature, the network
87 structure of the films became more compact. Homez-Jara et al. (2018) found that the
178179180181182183184185186187188189190191192193194195196197198199200201202203204205206207208209210211212213214215216217218219220221222223224225226227228229230231232233234235236

88 properties of chitosan edible film were largely influenced by drying temperature, e.g.
89 low drying temperature (e.g. 2 and 25 °C) could improve moisture content, solubility,
90 water vapor permeability, and optical properties; high drying temperature (40 °C)
91 combined with higher chitosan concentration resulted in enhanced tensile strength,
92 swelling power, and greenness value of the films, while diminishing their luminosity
93 and decreasing the melting temperature.
94
95 As a continuation of our previous work on KGM/zein blend films (Wang et al., 2017),
96 the objective of the current study was to assess the effect of drying temperature on
97 structural and physicochemical properties of KGM/zein blend films. Films prepared
98 under different drying conditions were characterized regarding microstructure,
99 thermal, mechanical and water barrier properties. Aggregation and distribution of zein
100 in films were observed using scanning electron microscopy (SEM), atomic force
101 microscopy (AFM) and confocal laser scanning microscopy (CLSM). Thermal
102 stability of films was analyzed through dynamic mechanical thermal analysis. The
103 results obtained in this study could be used for function optimization of the films, and
104 would contribute to a deeper understanding of the molecular interactions among
105 KGM/zein blend films.
106
107 2. Materials and methods
108 2.1 Materials
237238239240241242243244245246247248249250251252253254255256257258259260261262263264265266267268269270271272273274275276277278279280281282283284285286287288289290291292293294295

109 Konjac glucomannan (KGM, Mw = 9.67 × 10⁵ Da) was purchased from Li Cheng
110 Biological Technology Co., Ltd. (Hubei, China). Zein (MW = 2.5-4.5 × 10⁴ Da) from
111 corn was purchased from Beijing J & K Technology Co., Ltd. (Beijing, China).
112 Glycerol (AR, purity ≧ 99%) and ethanol (AR, purity ≧ 99.5%) were purchased from
113 Sinopharm (Chemical Reagent Co., Ltd., Shanghai, China). Rhodamine B (AR, purity
114 ≧ 99%) was purchased from Aladdin Bio-Chem Technology Co., Ltd. (Shanghai,
115 China).
116
117 2.2 Blend films preparation
118 Zein solution was prepared by dissolving 0.1 g zein with glycerol (15% based on total
119 amount of KGM and zein, w/w) in 20 mL of ethanol/water solvent (80:20, v/v) under
120 constant stirring at 500 rpm using a magnetic stirrer (ZNCL-S-5D KEER instrument
121 Co., Ltd., China) for 15 min at 25 °C. KGM solution was prepared by dissolving 0.9 g
122 KGM in 100 mL water with a continuous stirring electric mixer (OS20-Pro
123 SCILOGEX Co., Ltd., American) at 600 rpm at 60 °C for 1.5 h. The blend film-
124 forming solutions were prepared by slowly dropping zein solution into KGM solution
125 at 60 °C for 30 min at stirring speed 1000 rpm. Then the blend solutions were
126 carefully poured onto a glass plate (14 cm × 14 cm × 1.5 cm), and dried in an oven
127 (DNG-9031A, Jing Hong Co., Ltd., Shanghai, China) to a moisture content
128 approximately 9% (w.b.) in order to facilitate peeling films from the glass plate. The
129 total content of KGM and zein was kept as 1.0 g per casting plate, and KGM/zein
130 weight ratio was 9/1 (w/w).
296297298299300301302303304305306307308309310311312313314315316317318319320321322323324325326327328329330331332333334335336337338339340341342343344345346347348349350351352353354

131
132 The blend solutions were dried at different temperatures (40, 50, 60, 70 and 80 °C) in
133 an oven, with corresponding drying time (24 h, 18 h, 14 h, 10 h and 7 h) to achieve
134 approximate 9% moisture content (w.b.). According to drying temperature, the film
135 samples were coded as 40 °C KZ, 50 °C KZ, 60 °C KZ, 70 °C KZ and 80 °C KZ,
136 respectively. The impacts of air flow rate and moisture content of inlet air were not
137 studied as the machine did not have corresponding functions to adjust/monitor them,
138 and they were considered to be the same for all samples. Both with 15% glycerol
139 addition based on total solid content, pure KGM film and pure zein film were
140 prepared by separately drying 100 mL KGM solution (1%, w/v) and 20 mL zein
141 solution (5%, w/v) on glass plates (14 cm × 14 cm × 1.5 cm) at 60 °C, as the reference
142 samples. All film samples were conditioned at 25 ± 1 °C, 40 ± 2% relative humidity
143 for 48 h before testing.
144
145 2.3 Atomic force microscopy
146 The topography of films was obtained using Veeco MultiMode atomic force
147 microscopy (SPM9700, Shimadzu Co., Ltd., Japan) in tapping mode with silicon
148 nitride probes. Resonance frequencies of 306-388 KHz were employed, and films
149 were scanned at speed 1 Hz with resolution 256 × 256 pixels. AFM images with scan
150 sizes of 5 μm × 5 μm were acquired. The roughness values of films were obtained.
151
152 2.4 Scanning electron microscopy
355356357358359360361362363364365366367368369370371372373374375376377378379380381382383384385386387388389390391392393394395396397398399400401402403404405406407408409410411412413

153 Samples were cut into 4 mm × 4 mm pieces for surface observation. The cross-section
154 of samples was prepared by breaking samples (4 mm × 8 mm) after freezing in liquid
155 nitrogen. The surface and cross-section of films were coated with gold at 7.5 Pa with
156 thickness 20 nm, and then observed by Bio-Rad type SC 502 SEM (JEOL, Tokyo,
157 Japan). The sputtered time was about 90 s and an accelerating voltage was 30KV.
158 Images with the magnification of 1000 (cross-section) and 100 (surface) were
159 recorded.
160
161 2.5 Confocal laser scanning microscopy
162 CLSM analysis (Leica TCS SP8) was used to visualize the distribution of zein in
163 blend films. The zein was stained with rhodamine B (Rogers, Roos, & Goff, 2006).
164 The dye solution was first prepared by mixing 4 mg of rhodamine B in 1 mL of water.
165 Then 20 μL of the dye solution was added into 20 mL of zein solution, mixed at 150
166 rpm for 15 min at 25 °C to ensure that the solution was homogenous, and also to give
167 time for the dye to bind to the protein. The dyed zein solution was dropped into the
168 KGM solution and dried to obtain the dyed films. Before placed on the confocal plate
169 for observation, the dyed films were rinsed with distilled water three times and cut
170 into small pieces (0.5 cm × 0.5 cm). Film samples were excited by a red laser beam at
171 638 nm. Image-Pro Plus software (Media Cybernetics Inc., Maryland, America) was
172 used to evaluate the particle size of zein in KGM/zein blend films based on 6
173 representative CLSM images. A total of 300 points were counted for each sample.
174
414415416417418419420421422423424425426427428429430431432433434435436437438439440441442443444445446447448449450451452453454455456457458459460461462463464465466467468469470471472

175 2.6 Dynamic mechanical thermal analysis (DMTA)
176 The thermomechanical properties of films were carried out using a dynamic
177 mechanical thermal analyzer (Diamond DMTA, PerkinElmer Instruments Co., Ltd.,
178 America) by the following methodology. Films were cut into 1 cm × 4 cm size and
179 clamped in the tensile geometry of the instrument. A temperature sweep test from -25
180 to 150 °C was performed at a heating rate of 3 °C/min, and fixed deformation
181 amplitude of 10 μm (within the linear viscoelastic region). The test was performed in
182 a single frequency mode (1 Hz). The storage modulus (Gˊ) and loss factor (tan δ) of
183 each film sample were obtained as a function of temperature.
184
185 2.7 Mechanical properties
186 Measurement of film samples was done according to ASTM D882-09 standard
187 method (ASTM, 2009). The tensile strength (TS) and elongation at break (EAB) of
188 films were tested by a Texture Analyzer (TA. XT Plus, Stable Micro Systems Co.,
189 Ltd., UK). Films were cut into strips of 10 mm × 50 mm size for the measurement and
190 clamped between grips. An initial grip length was 50 mm and cross-head speed was
191 set at 0.5 mm/s. The curves of force (N) as a function of deformation(mm)were
192 recorded using Texture Expert software. Film thickness (μm) was measured by a
193 micrometer (Shanghai Liu-ling Instrument Company, Shanghai, China). TS (MPa)
194 and EAB (%) were calculated using the following equations (1) and (2):
195TS =
FT × W (1)
196 Where F is the maximum force, T is the thickness of the film, W is the width of the
473474475476477478479480481482483484485486487488489490491492493494495496497498499500501502503504505506507508509510511512513514515516517518519520521522523524525526527528529530531

197 film.
198EAB =
L − L0
L0× 100%1
(2)
199 Where L0 is the starting length of the film, L is the length after stretching of the film.
200
201 2.8 Water contact angle
202 The wettability of films was evaluated by water contact angle measured by a contact
203 angle meter (DSA25, Krüss Co., Ltd., Germany) equipped with a CCD camera and an
204 image analysis software. A droplet of distilled water (2.0 μL) was deposited on the air
205 side surface of the film (2.0 cm × 2.0 cm) with a precision syringe, and the drop
206 image was recorded by a camera. The contact angle was measured after stabilizing for
207 30 s.
208
209 2.9 Swelling and solubility in water
210 Film sample (2 cm × 2 cm) was immersed in 30 mL deionized water at 25 °C for 5 h,
211 then the wet sample was taken out and wiped with filter paper to remove excess liquid
212 and weighed. Swelling ratio was calculated by the following formula:
213
Swelling (%) =m2 − m1
m1× 100
(3)
214 Where m1 (mg) is the dry weight of the sample before immersion in water, m2 (mg) is
215 the sample weight after immersion in water for 5 h.
216
217 Film sample (3 cm × 3 cm) was immersed in 100 mL deionized water at 25 °C for 24
532533534535536537538539540541542543544545546547548549550551552553554555556557558559560561562563564565566567568569570571572573574575576577578579580581582583584585586587588589590

218 h, then the sample was taken out and dried at 105 °C for 1 h. The water solubility of
219 the film can be calculated by the following formula:
220
Water solubility (%) =w2 − w1
w2× 100
(4)
221 Where W2 (mg) is the dry weight of the sample before immersion in water, W1 (mg) is
222 the dry weight of the sample after immersion in water.
223
224 2.10 Water vapor permeability (WVP)
225 The water vapor permeability (WVP; 10-13·g·cm/(cm2·s·Pa)) of films was determined
226 by water vapor permeability tester (PERME W3/031, Labthink international, China).
227 The testing principle was according to Chinese National Standard GB/T 1037-1988. A
228 sheet-cup (25 mm × 65 mm) was filled with deionized water (20 mL) before sealed
229 with the film samples, and then put in the test chamber. The temperature and relative
230 humidity of the test chamber were controlled at 25 °C and 90%, respectively.
231
232 2.11 Statistical analysis
233 All experiments were performed at least in triplicate for each sample. Origin 2017
234 (Originlab Corporation, Northampton MA) and Adobe Photoshop CS 6 (Adobe
235 Systems, San Jose, CA) were used for statistical analysis and figure drawing. One-
236 way analysis of variance (ANOVA) was performed at p < 0.05 by the Tukey's
237 multiple range test using SPSS (version 19, Endicott, NY, USA).
238
591592593594595596597598599600601602603604605606607608609610611612613614615616617618619620621622623624625626627628629630631632633634635636637638639640641642643644645646647648649

239 3. Results and discussion
240 3.1 Microstructure of films and zein particles distribution
241 Significant surface topography differences were observed among different film
242 samples (Fig. 1) by AFM, and the roughness parameters (Ra, average roughness; Rq,
243 root-mean-square roughness) of films are shown in Table 1. Both pure KGM film
244 (Ra=8.69 nm, Rq=12.99 nm) and zein film (Ra=4.46 nm, Rq=5.77 nm) had more
245 smooth and homogenous surfaces compared with the blend films. For the blend films,
246 with increased drying temperature, their Ra and Rq values showed a V-shape
247 changing trend (Table 1). 40 °C KZ had the highest Ra(36.11 nm) and Rq (44.59
248 nm), and 60 °C KZ had the lowest Ra (20.22 nm) and Rq (26.78 nm). This indicated
249 that the blend film dried at 60 °C had more uniform and compact surface than other
250 blend samples.
251
252 Compared with that of pure films, the relatively rough film surfaces of blend films
253 may be explained as follows. Before drying, zein particles were homogeneously
254 distributed in KGM/zein film-forming solution as reported previously (Ni et al.,
255 2018). During the drying process, the evaporation rate of ethanol was faster than that
256 of water and increased the hydrophilic character of the solvent, leading to enhanced
257 hydrophobic interactions between zein molecules and a higher degree of zein
258 aggregation (Bisharat et al., 2018; Kim, & Xu, 2008). Thus the surfaces of blend films
259 were relatively rough, and this phenomenon could be affected by drying temperature
260 due to different solvent evaporation situation. When the drying temperature was
650651652653654655656657658659660661662663664665666667668669670671672673674675676677678679680681682683684685686687688689690691692693694695696697698699700701702703704705706707708

261 increased from 40 to 60 °C, the roughness values of blend films had a downward
262 changing trend. This might due to that film formation time became shorter as a result
263 of the higher solvent evaporation rate, which reduced the time for zein migration and
264 aggregation and resulted in smaller zein aggregates. Therefore the film surfaces
265 became less rough. However, when the drying temperature was further increased from
266 60 to 80 °C, the blend film surfaces became rougher, indicating increased zein
267 aggregates. Cabra et al. (2008) reported temperature-dependent behavior of the Z19 α-
268 zein aggregates. They found there were increments in protein aggregation during
269 heating and this was particularly evident in the 60-80 °C range, where the increment
270 in high molecular weight aggregates and the decrement in the monomeric form were
271 higher. Similarly, protein aggregation may be more favored with higher temperature
272 in the range 60-80 °C, though with shorter evaporation time.
273
274 The microstructures of film surface and cross-section were observed by SEM (Fig. 2).
275 For pure KGM film and zein film, the surface and cross-section were smooth and
276 dense, whereas some pores appeared in pure zein film due to residual air. For blend
277 films, the surface was rougher compared with that of pure films, with particles evenly
278 distributed and embedded in the films. Among blend films, the surface of 60 °C KZ
279 was relatively smooth, and the cross section of 40 °C KZ showed the loosest structure
280 with the largest size of particles.
281
282 To further clarify the impact of drying temperature on zein aggregation in the blend
709710711712713714715716717718719720721722723724725726727728729730731732733734735736737738739740741742743744745746747748749750751752753754755756757758759760761762763764765766767
283 films, a CLSM microstructure observation through protein staining (Fig. 3) was
284 performed to visualize zein association states, and size distribution map of zein
285 particles was also drawn (Fig. 4). Homogeneous distribution of zein particles in KGM
286 continuous matrix was observed in all blend films (Fig. 3), and clearly 60 °C KZ
287 showed the smallest zein particles. In the drying process, protein molecules unfolded
288 due to heating, and in solvent exposure of hydrophobic residues and sulfhydryl groups
289 led to the conformational changes and aggregation of protein particles (Broersen et
290 al., 2006). A wave crest (5-20 μm) was found containing 62%, 64.7%, 80%, 77.3%
291 and 73.3% of total zein particles in 40 °C KZ, 50 °C KZ, 60 °C KZ, 70 °C KZ and 80
292 °C KZ, respectively. The size of zein particles decreased with increased drying
293 temperature from 40 to 60 °C, but increased with drying temperature from 60 to 80 °C.
294 Thus drying temperature 60 °C g resulted in the most uniform and minimum zein
295 particles in the films, and was preferred for film preparation. This was in agreement
296 with previous analysis on AFM results. These results indicate that drying temperature
297 is an important factor for KGM/zein blend film preparation due to its impact on zein
298 aggregation.
299
300 3.2 Thermomechanical properties
301 The thermomechanical behavior of films was studied using a dynamic mechanical
302 thermal analyzer (DMTA). The variation of storage modulus (Gˊ) and loss factor
303 (tan δ) against temperature for pure KGM film, pure zein film, and the blend films
304 were shown in Fig. 5. As the testing temperature increased, the Gˊ values of all
768769770771772773774775776777778779780781782783784785786787788789790791792793794795796797798799800801802803804805806807808809810811812813814815816817818819820821822823824825826

305 samples decreased, suggesting reduced stiffness and increased segmental motion of
306 polymers. With increased drying temperature, the Gˊ values of the blend films
307 decreased first and then increased, and that of 60 °C KZ was the lowest. This
308 difference can possibly be attributed to the internal microstructure differences.
309
310 When the temperature rises to the glass transition point (Tg), the molecules enhance
311 thermal motion due to sufficient thermal energy, and the free volume begins to
312 expand, changing from freezing stage to moving stage. At this temperature, a sharp
313 drop in the storage modulus is observed where the polymer changes from a glassy
314 state to a rubber state. The loss factor (tan δ) is very sensitive to molecular mobility,
315 thus Tg is usually determined as the temperature corresponding to the maximum of
316 tan δ peak (α-relaxations) (Qiao, Tang, & Sun, 2011; Motedayen, Khodaiyan, &
317 Salehi, 2013). Tg of pure KGM film and zein film were 79.8 and 108.1 °C,
318 respectively. The lower Tg of KGM film in comparison to that of zein film may be
319 due to more hydrophilic nature and flexibility of polymer chains. Blending zein with
320 other hydrophilic polymers can often result in the composite films with lower Tg, e.g.,
321 polycaprolactone, whey protein concentrate (Corradini et al., 2004; Ghanbarzadeh, &
322 Oromiehi, 2009). Similarly, 40 °C KZ, 50 °C KZ, 60 °C KZ, 70 °C KZ and 80 °C KZ
323 showed Tg at 81.4, 89.7, 103.4, 96.5 and 90.8 °C, respectively (Fig. 5), and all were
324 lower than the Tg of zein film. Change in Tg can also be an indicator of the
325 compatibility of polymers. If two polymers are compatible, there is only one Tg in
326 their mixtures; if they are incompatible, phase separation occurs and two Tg are
827828829830831832833834835836837838839840841842843844845846847848849850851852853854855856857858859860861862863864865866867868869870871872873874875876877878879880881882883884885

327 observed in their mixtures, whose values are close to that of each component
328 (Motedayen, Khodaiyan, & Salehi, 2013). All blend films had only one α-relaxations
329 (a single Tg), indicating good miscibility/compatibility between the film components.
330 With drying temperature from 40 to 60 °C, Tg increased from 81.4 to 103.4 °C.
331 However, further higher drying temperature (60-80 °C) caused Tg decrease (from
332 103.4 to 90.8 °C). The shift of the main relaxation to a higher temperature usually
333 indicates restricted molecular movement (Piyada, Waranyou, & Thawien, 2013). Tg
334 of 60 °C KZ was the highest, and this may indicate that at this unique drying
335 temperature, the film components had the highest compatibility and strongest
336 intermolecular interactions. This can also be supported by previous results. As zein
337 particles in 60 °C KZ were the smallest, they should have the largest surface area in
338 the KGM continuous phase, benefiting molecular interactions due to the greater
339 contact opportunities.
340
341 3.3 Tensile strength (TS) and elongation at break (EAB)
342 The dependence of the thickness, tensile strength (TS) and elongation at break (EAB)
343 on drying temperature for the blend films were shown in Fig. 6. The thickness of
344 blend films decreased with increased drying temperature, and the thickness of 80 °C
345 KZ was even lower than that of pure KGM film (Fig. 6a). This was explained by that
346 higher drying temperature may lead to denser film structure, like alginate films
347 (Bagheri, Radi, & Amiri, 2019), konjac flour films (Jomlapeeratikul, Poomsa-Ad, &
348 Wiset, 2016) and whey protein films (Alcantara et al., 1998). EAB values of all blend
886887888889890891892893894895896897898899900901902903904905906907908909910911912913914915916917918919920921922923924925926927928929930931932933934935936937938939940941942943944

349 films were higher than those of pure KGM film and zein film (Fig. 6b), due to
350 hydrogen bond interactions and Maillard reactions between KGM and zein molecules
351 (Wang et al., 2017). This also supported the homogeneous distribution of zein
352 particles in blend matrix. TS of all blend films was higher than that of pure zein film,
353 and only TS of 60 °C KZ and 70 °C KZ were higher than that of pure KGM film.
354 With increased drying temperature, a Λ-shape changing trend was found for TS and
355 EAB of blend films, and 60 °C drying temperature resulted in the greatest TS and
356 EAB values. This again supported the strongest interactions and the highest
357 compatibility between KGM and zein at this drying temperature.
358
359 3.4 Surface hydrophobicity and water vapor permeability (WVP)
360 Water contact angle was determined to evaluate the surface hydrophobicity of films.
361 Generally, films with larger contact angle values have higher surface hydrophobicity
362 and lower surface wettability (Gu, Wang, & Zhou, 2013). Pure KGM film, pure zein
363 film, and blend films exhibited significant differences in water contact angle (Fig. 7a).
364 Pure KGM film and zein film showed the lowest and highest surface hydrophobicity.
365 For the blend films, water contact angle values increased first and then decreased with
366 increased drying temperature. The largest contact angle value was observed in 60 °C
367 KZ and 70 °C KZ, indicating 60 °C KZ and 70 °C KZ had the highest surface
368 hydrophobicity among blend films. This result was probably ascribed to the stronger
369 intermolecular interactions between KGM and zein at this drying temperature (60, 70
370 °C), as well as the lower surface roughness of films.
9459469479489499509519529539549559569579589599609619629639649659669679689699709719729739749759769779789799809819829839849859869879889899909919929939949959969979989991000100110021003

371
372 Water vapor permeability (WVP) is an important property of packaging materials and
373 is influenced by the hydrophobic or hydrophilic nature of the material and the
374 presence of void spaces (Wang, & Padua, 2005). During water transmission through
375 the films, the absorbed water could plasticize the film matrix, leading to a less dense
376 structure where the chain ends had greater mobility, and thus increased the
377 permeability of films (Gu, Wang, & Zhou, 2013). Pure KGM film had the highest
378 WVP value due to its high hydrophilic nature, pure zein film had the lowest WVP
379 because of its high hydrophobicity, and WVP values of the blend films were in the
380 middle (Fig. 7b). Among blend films, the WVP values of 40 °C KZ, and 50 °C KZ
381 were higher than that of 60 °C KZ, 70 °C KZ and 80 °C KZ. This was ascribed to that
382 the distribution of large zein particles in 40 °C KZ and 50 °C KZ shortened the water
383 diffusion path, as well as 40 °C KZ and 50 °C KZ had higher hydrophilicity. In many
384 studies, the decrease in the WVP of a nanocomposite film was explained by an
385 extended diffusive trajectory (Oymaci, & Altinkaya, 2016). Ozcalik and Tihminlioglu
386 (2013) reported when layered silicates effectively distributed in the polymer film and
387 created impermeable obstacles to permeating water vapor molecules, the effective
388 path that a permeating water molecule must travel increased and the water vapor
389 permeability decreased.
390
391 3.5 Swelling and solubility properties
392 The swelling and solubility of films in water were measured to assess the water
393 resistance properties of films (Fig. 8), demonstrating the hydrophobicity from another
10041005100610071008100910101011101210131014101510161017101810191020102110221023102410251026102710281029103010311032103310341035103610371038103910401041104210431044104510461047104810491050105110521053105410551056105710581059106010611062

394 aspect. Pure KGM film could not be tested as it was quickly dissolved. Pure zein film
395 showed the lowest swelling and solubility, indicating the greatest hydrophobicity.
396 Both swelling and solubility curves had a clear V-shape changing trend in the blend
397 films. Increased drying temperature (40-60 °C) led to a rapid decrease in both
398 swelling and solubility, followed by an increase at 60-80 °C. Therefore 60 °C KZ
399 showed the highest hydrophobicity indicated by the highest water resistance
400 properties, in agreement with the results of water contact angle of films. This may
401 result from the changes in film microstructure and intermolecular forces.
402
403 4. Conclusion
404 The zein particles were evenly dispersed in KGM/zein blend films, and the particle
405 size was significantly affected by drying temperature. Compared with other drying
406 temperatures, 60 °C was found to confer the blend film with the superior properties,
407 such as the highest tensile strength, elongation at break, water contact angle, the
408 lowest water vapor permeability, swelling and solubility. Either higher or lower
409 drying temperature led to weakened film properties. These phenomena were
410 explained by that drying temperature 60 °C may contribute to the strongest
411 intermolecular interactions between KGM and zein in the films, as the most uniform
412 and smooth film surface, minimum size of zein aggregates in the film were observed
413 with this drying temperature. Also at this drying temperature, the two components
414 may reach the highest compatibility, as Tg was the highest at this temperature. The
415 results indicated that drying temperature was of great importance for film preparation,
10631064106510661067106810691070107110721073107410751076107710781079108010811082108310841085108610871088108910901091109210931094109510961097109810991100110111021103110411051106110711081109111011111112111311141115111611171118111911201121

416 as they significantly impacted the intermolecular interactions among film
417 components, and it may be used to modulate the physical properties of the film for
418 future applications.
419
420 Acknowledgement
421 This work was financially supported by the European Commission for the H2020
422 Marie Skł odowska-Curie Actions Individual Fellowships-2017 Project (Grant ID:
423 794680), National Natural Science Foundation of China (Grant No. 31671827) and
424 the technical support program of Hubei University of Technology (Grant No.
425 CPYF2018004).
426
427 References
428 Alcantara, C., Rumsey, T., & Krochta, J. (1998). Drying rate effect on the properties
429 of whey protein films. Journal of Food Process Engineering, 21(5), 387-405.
430 ASTM (2009). Standard test method for tensile properties of thin plastic sheeting.
431 (Vol. ASTM D882-09). West Conshohocken, PA.
432 Bagheri, F., Radi, M., & Amiri, S. (2019). Drying conditions highly influence the
433 characteristics of glycerol-plasticized alginate films. Food Hydrocolloids, 90,
434 162-171.
435 Bourlieu, C., Guillard, V., Vallès-Pamiès, B., Guilbert, S., & Gontard, N. (2009).
436 Edible moisture barriers: how to assess of their potential and limits in food
437 products shelf-life extension? Food Science and Nutrition, 49, 474-499.
438 Bisharat, L., Berardi, A., Perinelli, D. R., Bonacucina, G., Casettari, L., Cespi, M.,
11221123112411251126112711281129113011311132113311341135113611371138113911401141114211431144114511461147114811491150115111521153115411551156115711581159116011611162116311641165116611671168116911701171117211731174117511761177117811791180

439 AlKhatib, H. S., & Palmieri, G. F. (2018). Aggregation of zein in aqueous
440 ethanol dispersions: effect on cast film properties. International Journal of
441 Biological Macromolecules, 106, 360-368.
442 Broersen, K., Ven Teeffelen, A. M. M., Vries, A., Voragen, A. G. J., Hamer, R. J., &
443 De Jongh, H. H. J. (2006). Do sulfhydryl groups affect aggregation and
444 gelation properties of ovalbumin? Journal of Agricultural and Food Chemistry,
445 54, 5166-5174.
446 Cabra, V., Vázquez-Contreras, E., Moreno, A., & Arreguin-Espinosa, R. (2008). The
447 effect of sulfhydryl groups and disulphide linkage in the thermal aggregation of
448 Z19α-zein. Biochimica et Biophysica Acta, 1784, 1028-1036.
449 Chen, J., Liu, C., Chen, Y., Chen, Y., & Chang, P. R. (2008). Structural
450 characterization and properties of starch/konjac glucomannan blend films.
451 Carbohydrate Polymers, 74, 946-952.
452 Cheng, L. H., Karim, A. A., & Seow, C. C. (2008). Characterisation of composite
453 films made of konjac glucomannan (KGM), carboxymethyl cellulose (CMC)
454 and lipid. Food Chemistry, 107, 411-418.
455 Corradini, E., Mattoso, L. H. C., Guedes, C. G. F., & Rosa, D. S. (2004). Mechanical,
456 thermal and morphological properties of poly (ˊ-caprolactone)/zein blends.
457 Polymer Advanced Technology, 15, 340-345.
458 Denavi, G., Tapia-Blácido, D. R., Añón, M. C., Sobral, P. J. A., Mauri, A. N., &
459 Menegalli, F. C. (2009). Effects of drying conditions on some physical
460 properties of soy protein films. Journal of Food Engineering, 90(3), 341-349.
11811182118311841185118611871188118911901191119211931194119511961197119811991200120112021203120412051206120712081209121012111212121312141215121612171218121912201221122212231224122512261227122812291230123112321233123412351236123712381239

461 Gu, L., Wang, M., & Zhou, J. (2013). Effects of protein interactions on properties and
462 microstructure of zein-gliadin composite films. Journal of Food Engineering,
463 119, 288-298.
464 Ghanbarzadeh, B., & Oromiehi, A. R. (2009). Thermal and mechanical behavior of
465 laminated protein films. Journal of Food Engineering, 90, 517-524.
466 Homez-Jara, A., Daza, L. D., Aguirre, D. M., Muñoz, J. A., Solanilla, J. F., & Vá
467 quiro, H. A. (2018). Characterization of chitosan edible films obtained with
468 various polymer concentrations and drying temperatures. International Journal
469 of Biological Macromolecules, 113, 1233-1240.
470 Janjarasskul, T., Tananuwong, K., Leuangsukrerk, M., Phupoksakul, T., &
471 Borompichaichartkul, C. (2018). Effects of hasten drying and storage
472 conditions on properties and microstructure of konjac glucomannan-whey
473 protein isolate blend films. Food Biophysics, 13(1), 49-59.
474 Jia, D., Fang, Y., & Yao, K. (2009). Water vapor barrier and mechanical properties of
475 konjac glucomannan-chitosan-soy protein isolate edible films. Food and
476 Bioproducts Processing, 87, 7-10.
477 Jomlapeeratikul, P., Poomsa-Ad, N., & Wiset, L. (2016). Effect of drying
478 temperatures and plasticizers on the properies of konjac flour film. Journal of
479 Food Process Engineering, 6, 1-9.
480 Kim, S., & Xu, J. (2008). Aggregate formation of zein and its structural inversion in
481 aqueous ethanol. Journal of Cereal Science, 47, 1-5.
482 Li, X., Jiang, F., Ni, X., Yan, W., Fang, Y., Corke, H., & Xiao, M. (2015).
12401241124212431244124512461247124812491250125112521253125412551256125712581259126012611262126312641265126612671268126912701271127212731274127512761277127812791280128112821283128412851286128712881289129012911292129312941295129612971298

483 Preparation and characterization of konjac glucomannan and ethyl cellulose
484 blend films. Food Hydrocolloids, 44, 229-236.
485 Liang, J., Xia, Q., Wang, S., Li, J., Huang, Q., & Ludescher, R. D. (2015). Influence
486 of glycerol on the molecular mobility, oxygen permeability and microstructure
487 of amorphous zein films. Food Hydrocolloids, 44, 94-100.
488 Liu, F., Antoniou, J., Li, Y., Ma, J., & Zhong, F. (2015). Effect of sodium acetate and
489 drying temperature on physicochemical and thermomechanical properties of
490 gelatin films. Food Hydrocolloids, 45, 140-149.
491 Liu, F., Majeed, H., Antoniou, J., Li, Y., Ma, Y., Yokoyama, W., Ma, J., & Zhong,
492 Fang. (2016). Tailoring physical properties of transglutaminase-modified
493 gelatin films by varying drying temperature. Food Hydrocolloids, 58, 20-28.
494 Lu, J., Wang, X. D., & Xiao, C. B. (2008). Preparation and characterization of konjac
495 glucomannan/poly (diallydimethylammonium chloride) antibacterial blend
496 films. Carbohydrate Polymers, 73(3), 427-437.
497 Motedayen, A. A., Khodaiyan, F., & Salehi, E. A. (2013). Development and
498 characterisation of composite films made of kefiran and starch. Food
499 Chemistry, 136, 1231-1238.
500 Ni, X., Wang, K., Wu, K., Corke, H., Nishinari, K., & Jiang, F. (2018). Stability,
501 microstructure and rheological behavior of konjac glucomannan-zein mixed
502 systems. Carbohydrate Polymers, 188, 260-267.
503 Oymaci, P., & Altinkaya, S. A. (2016). Improvement of barrier and mechanical
504 properties of whey protein isolate based food packaging films by incorporation
12991300130113021303130413051306130713081309131013111312131313141315131613171318131913201321132213231324132513261327132813291330133113321333133413351336133713381339134013411342134313441345134613471348134913501351135213531354135513561357

505 of zein nanoparticles as a novel bionanocomposite. Food Hydrocolloids, 54, 1-
506 9.
507 Ozcalik, O., & Tihminlioglu, F. (2013). Barrier properties of corn zein nanocomposite
508 coated polypropylene films for food packaging applications. Journal of Food
509 Engineering, 114, 505-513.
510 Piyada, K., Waranyou, S., & Thawien, W. (2013). Mechanical, thermal and structural
511 properties of rice starch films reinforced with rice starch nanocrystals.
512 International Food Research Journal, 20(1), 439-449.
513 Qiao, X., Tang, Z., & Sun, K. (2011). Plasticization of corn starch by polyol mixtures.
514 Carbohydrate Polymers, 83, 659-664.
515 Rogers, M. A., Roos, Y. H., & Goffa, H. D. (2006). Structural heterogeneity and its
516 effect on the glass transition in sucrose solutions containing protein and
517 polysaccharide. Food Hydrocolloids, 20, 774-779.
518 Shi, W., & Dumont, M. (2014). Review: bio-based films from zein, keratin, pea, and
519 rapeseed protein feedstocks. Journal of Materials Science, 49, 1915-1930.
520 Shukla, R., & Cheryan, M. (2001). Zein: the industrial protein from corn. Industrial
521 Crops and Products, 13, 171-192.
522 Wang, K., Wu, K., Xiao, M., Kuang, Y., Corke, H., Ni, X., & Jiang, F. (2017).
523 Structural characterization and properties of konjac glucomannan and zein
524 blend films. International Journal of Biological Macromolecules, 105, 1096-
525 1104.
526 Wang, Q., & Padua, G. W. (2005). Properties of zein films coated with drying oils.
13581359136013611362136313641365136613671368136913701371137213731374137513761377137813791380138113821383138413851386138713881389139013911392139313941395139613971398139914001401140214031404140514061407140814091410141114121413141414151416

527 Journal of Agricultural and Food Chemistry, 53, 3444-3448.
528 Wu, C., Peng, S., Wen, C., Wang, X., Fan, L., Deng, R., & Pang, J. (2012). Structural
529 characterization and properties of konjac glucomannan/curdlan blend films.
530 Carbohydrate Polymers, 89 (2), 497-503.
531 Wu, K., Zhu, Q., Qian, H., Xiao, M., Corke, H., Nishinari, K., & Jiang, F. (2018).
532 Controllable hydrophilicity-hydrophobicity and related properties of konjac
533 glucomannan and ethyl cellulose composite films. Food Hydrocolloids, 79,
534 301-309.
535 Zhou, Y., Huang, M., Deng, F., & Xiao, Q. (2018). Effect of Temperature on Drying
536 Characteristics of Pullulan-alginate Based Edible Films. Food Science and
537 Technology Research, 24(1), 55-62.
538
14171418141914201421142214231424142514261427142814291430143114321433143414351436143714381439144014411442144314441445144614471448144914501451145214531454145514561457145814591460146114621463146414651466146714681469147014711472147314741475