MSEA-D-18-02704R1 Ti - Repository@Nottingham
122
Elsevier Editorial System(tm) for Materials Science & Engineering A Manuscript Draft Manuscript Number: MSEA-D-18-02704R1 Title: INVESTIGATION OF SHORT-TERM CREEP DEFORMATION MECHANISMS IN MARBN STEEL AT ELEVATED TEMPERATURES Article Type: Research Paper Keywords: MARBN Steel; Dislocation Climb; Plastic Instability; Short-Term Creep. Corresponding Author: Dr. Adil Benaarbia, Corresponding Author's Institution: First Author: Adil Benaarbia Order of Authors: Adil Benaarbia; Xu XU, DR.; Wei SUN, Prof.; Adib BECKER, Prof.; Mark JEPSON, DR. Abstract: This paper reports the short-term creep behavior at elevated temperatures of a MarBN steel variant. Creep tests were performed at 3 different temperatures (625oC, 650oC and 675oC) with applied stresses ranging from 160 MPa to 300 MPa, and failure times from 1 to 350 hours. Analysis of the macroscopic creep data indicates that the steady-state creep exhibits a power-law stress dependence with an exponent of 7 and an activation energy of 307 kJ.mol-1, suggesting that dislocation climb is the dominant rate-controlling creep mechanism for MarBN steel. Macroscopic plastic instability has also been observed, highlighted by an obvious necking at the rupture region. All the macroscopic predictions have been combined with microstructural data, inferred from an examination of creep ruptured samples, to build up relations between macroscopic features (necking, damage, etc.) and underlying microstructural mechanisms. Analysis of the rupture surfaces has revealed a ductile fracture mode. Electron Backscatter Diffraction (EBSD) analysis near to the rupture surface has indicated significant distortion and refinement of the original martensitic substructure, which is evidence of long-range plastic flow. Dislocation pile-ups and tangles from TEM were also observed near substructure boundaries and precipitate particles. All of these microstructural observations suggest that creep is influenced by a complex interaction between several elements of the microstructure, such as dislocations, precipitates and structure boundaries. The calculated stress exponent and activation energy have been found to agree quantitatively with the highlighted microstructural features, bearing some relationships to the true observed creep microstructures.
-
Upload
khangminh22 -
Category
Documents
-
view
2 -
download
0
Transcript of MSEA-D-18-02704R1 Ti - Repository@Nottingham

Elsevier Editorial System(tm) for Materials
Science & Engineering A
Manuscript Draft
Manuscript Number: MSEA-D-18-02704R1
Title: INVESTIGATION OF SHORT-TERM CREEP DEFORMATION MECHANISMS IN MARBN
STEEL AT ELEVATED TEMPERATURES
Article Type: Research Paper
Keywords: MARBN Steel; Dislocation Climb; Plastic Instability; Short-Term
Creep.
Corresponding Author: Dr. Adil Benaarbia,
Corresponding Author's Institution:
First Author: Adil Benaarbia
Order of Authors: Adil Benaarbia; Xu XU, DR.; Wei SUN, Prof.; Adib
BECKER, Prof.; Mark JEPSON, DR.
Abstract: This paper reports the short-term creep behavior at elevated
temperatures of a MarBN steel variant. Creep tests were performed at 3
different temperatures (625oC, 650oC and 675oC) with applied stresses
ranging from 160 MPa to 300 MPa, and failure times from 1 to 350 hours.
Analysis of the macroscopic creep data indicates that the steady-state
creep exhibits a power-law stress dependence with an exponent of 7 and an
activation energy of 307 kJ.mol-1, suggesting that dislocation climb is
the dominant rate-controlling creep mechanism for MarBN steel.
Macroscopic plastic instability has also been observed, highlighted by an
obvious necking at the rupture region. All the macroscopic predictions
have been combined with microstructural data, inferred from an
examination of creep ruptured samples, to build up relations between
macroscopic features (necking, damage, etc.) and underlying
microstructural mechanisms. Analysis of the rupture surfaces has revealed
a ductile fracture mode. Electron Backscatter Diffraction (EBSD) analysis
near to the rupture surface has indicated significant distortion and
refinement of the original martensitic substructure, which is evidence of
long-range plastic flow. Dislocation pile-ups and tangles from TEM were
also observed near substructure boundaries and precipitate particles. All
of these microstructural observations suggest that creep is influenced by
a complex interaction between several elements of the microstructure,
such as dislocations, precipitates and structure boundaries. The
calculated stress exponent and activation energy have been found to agree
quantitatively with the highlighted microstructural features, bearing
some relationships to the true observed creep microstructures.

Dr. Adil Benaarbia
University of Nottingham
Nottingham, NG7 2RD, UK
+44(0)1158467683
Professor E. J. Lavernia
Editor – in – Chief
Materials Science and Engineering A
June 14, 2018
Dear Editor – in – Chief,
We are pleased to submit a revised version of the original research article entitled “Investigation
of short-term creep deformation mechanisms in MarBN steel at elevated temperatures” by Dr.
Xu, Prof. Becker, Dr. Jepson, Prof. Sun and I, to be considered for publication in Materials
Science and Engineering A. This revised manuscript incorporates all of the helpful remarks made
by the reviewer in his assessment of the article.
In this manuscript, we study the short-term creep behaviour at elevated temperatures of a MarBN
steel variant. A great deal of attention is given to investigate rate-controlling creep deformation
mechanisms and local plasticity instability observed in failed MarBN specimens. We believe that
this manuscript is appropriate for publication by Materials Science and Engineering A.
We also would like to undertake that:
- All authors of this research paper have directly participated in the planning, execution, or
analysis of this study;
- All authors of this paper have read and approved the final version submitted;
- The contents of this manuscript have not been copyrighted or published previously;
- The contents of this manuscript are not now under consideration for publication elsewhere;
- The contents of this manuscript will not be copyrighted, submitted, or published elsewhere,
while acceptance by the Journal is under consideration;
- There are no directly related manuscripts or abstracts, published or unpublished, by any
authors of this paper.
The authors would like to take this opportunity to express their sincere gratitude to both the
editorial team and the anonymous reviewer for their assistance in enhancing the presented work.
Thank you for your consideration.
Sincerely,
Dr Adil Benaarbia
University of Nottingham, UK
Cover Letter

Response to reviewer The authors are very grateful to both the editor and reviewer for their constructive comments and suggestions and have carefully addressed each of the referee’s comments as indicated below and trust that these have resulted in a much improved manuscript. Replies to reviewer: All the major changes in the revised manuscript have been highlighted in red.
Reviewer 1: Reviewer #1: This study investigated the short-term creep behavior of a MarBN steel at elevated temperatures, and the mechanisms governing the creep behavior are discussed by combines the macroscopic creep data and microstructural data. The results obtained from this paper are meaningful, and can let researchers get a deeper understanding on short-term creep behavior of MarBN steel. The paper can be accepted for publication in MSEA after minor revision. 1. In Eq.1-Eq.4, the symbol representing various parameters should use the normative symbols, such as T for temperature, <sigma> for stress and <epsilon> for strain. Authors:
All symbols have been changed as suggested by the reviewer in the revised manuscript. 2. The lattice self-diffusion energy of Cr mentioned at line 5, page 17 and at line 8, page 34 are different, why? Please explain it. Authors:
The reviewer is indeed correct that there has been an error in reporting the activation energy of Cr. This error has been corrected in the revised manuscript. The correct value is 308.6kJ.mol-1.
3. In Section 2, the composition of the etching solution for the OM and TEM should be added. Authors:
All SEM images were collected from specimens in the as-polished state, so no chemical etching was used to reveal microstructural features. The authors have provided additional information about the ion beam induced secondary electron imaging which was used in-situ XeF2 gas etching (line 7-9,
Detailed Response to Reviewers

page 10) and the preparation procedure of TEM specimens by using focused ion beam microscopy (line 14-18, page 10).
4. In Fig. 11 (e) and (f), the existence of nano-scale MX carbonitrides is not obvious and you should provide more evidence to prove the existence of the phase. Moreover, at line 6 page 26, you made a conclusion that "Nano-scale precipitate particles, predominantly less than 5 nm in size were also observed within the laths". While in the reference [19, 31] which help you identified the phase, the size of MX carbonitrides is about 20nm. What is the reason for the difference in the size of the precipitates? Will the precipitates grow up during the creep? Will its growth affect the creep property? Authors:
Additional evidence supporting the observations of nano-scale precipitates has been provided by the TEM micrographs from creep exposed materials (Figure 15). The observation of these precipitates after creep testing indicated that these phases did not significantly grow in size during creep exposure, which is therefore likely to enhance creep resistance by effectively pinning dislocations. Additional information has been included in the revised manuscript (line 20, page 33 – line 2, page 34). In terms of the two references used to discuss the size of MX precipitates, reference [19] provides information from the more conventional 9% Cr steel variants with higher N contents than the MarBN steel investigated here. Therefore, the size of the MX carbonitrides reported in these alloys is commonly larger (i.e. ~20 nm) compared to the MX in MarBN in which the concentration of N is lower (i.e. 180 ppm in this case). The reference [31] summarises earlier work on the development of MarBN steel in Japan. In this reference, the size of the MX carbonitrides (Figure 9 in [31]) is very close to the observations in this study, which supports that the nano-scale particles observed in this study are MX carbonitrides. We have also amended the relevant parts as can be seen in the revised manuscript (line 18-22, page 26).
5. At line 14 page 29, you made a conclusion that "Compared to the head portion, the normalised intercept lengths are higher in the regions at 0.1 mm and 20 mm away from the rupture surface in the specimens tested under an applied stress of 280MPa, whereas this characteristic is only higher in the region at 0.1 mm away from the rupture surface in the specimen tested under 200 MPa". But why? Further explanation and discussion should be added. Authors:
The measurement of the normalised intercept length from the EBSD maps indicates a change in the dimension of the martensitic substructure along the principal stress direction. This change may be caused by either plastic deformation in the necked area or by a diffusion-controlled creep mechanism
(or a combination of each of these) in the regions further away from the rupture surface. For the specimen tested at 200 MPa, the stress level in the non-necked gauge region is close to the nominal stress which is lower than the threshold stress level, whereas the stress level in the necked area may well exceed the threshold stress level upon a significantly reduced cross-sectional area. The higher intercept length in the necked area (close to the rupture surface) is likely to be a result of significant plastic deformation along the principal stress direction. In the non-necked area, the substructure was not significantly changed in dimension. In this area the stress level is lower than the threshold stress and hence the distortion of grain structure by plastic deformation is negligible. For the specimen tested at 280 MPa, the stress level was close to the threshold stress level, and so the creep test specimen ruptured after a much shorter time. The higher level of nominal stress has, therefore, led to an even higher local stress level in the necked area, which caused a greater extent of distortion of the substructure along the principal stress direction. This is reflected by a longer normalised intercept length in the necked area of this specimen. The higher level of nominal stress which is close to the threshold stress level may also cause plastic deformation in combination with a creep deformation mechanism in the non-necked area, which distorted the original substructure and caused a longer normalised intercept length in the local area away from the rupture surface. The higher average value of the normalised intercept length also reflected a higher extent of the overall plastic strain in the specimen tested at 280 MPa. We have amended the relevant parts and included essential information for further clarification in the updated version (line 20, page 29 to line 9, page 30).
1
INVESTIGATION OF SHORT-TERM CREEP DEFORMATION 1
MECHANISMS IN MARBN STEEL AT ELEVATED 2
TEMPERATURES 3
A Benaarbia*1, X. Xu
2, W. Sun
1, A. A. Becker
1, Mark A. E. Jepson
2 4
1 Department of Mechanical, Materials and Manufacturing Engineering, University of 5
Nottingham, Nottingham, Nottinghamshire, NG7 2RD, UK 6 2
Department of Materials, Loughborough University, Loughborough, Leicestershire 7
LE11 3TU, UK 8
9
10
Abstract 11
This paper reports the short-term creep behavior at elevated temperatures of a MarBN 12
steel variant. Creep tests were performed at 3 different temperatures (625oC, 650
oC and 13
675oC) with applied stresses ranging from 160 MPa to 300 MPa, and failure times from 14
1 to 350 hours. Analysis of the macroscopic creep data indicates that the steady-state 15
creep exhibits a power-law stress dependence with an exponent of 7 and an activation 16
energy of 307 kJ.mol-1
, suggesting that dislocation climb is the dominant rate-17
controlling creep mechanism for MarBN steel. Macroscopic plastic instability has also 18
been observed, highlighted by an obvious necking at the rupture region. All the 19
macroscopic predictions have been combined with microstructural data, inferred from 20
an examination of creep ruptured samples, to build up relations between macroscopic 21
features (necking, damage, etc.) and underlying microstructural mechanisms. Analysis 22
of the rupture surfaces has revealed a ductile fracture mode. Electron Backscatter 23
Diffraction (EBSD) analysis near to the rupture surface has indicated significant 24
distortion and refinement of the original martensitic substructure, which is evidence of 25
long-range plastic flow. Dislocation pile-ups and tangles from TEM were also observed 26
*ManuscriptClick here to view linked References

2
near substructure boundaries and precipitate particles. All of these microstructural 1
observations suggest that creep is influenced by a complex interaction between several 2
elements of the microstructure, such as dislocations, precipitates and structure 3
boundaries. The calculated stress exponent and activation energy have been found to 4
agree quantitatively with the highlighted microstructural features, bearing some 5
relationships to the true observed creep microstructures. 6
Keywords: MARBN Steel; Dislocation Climb; Plastic Instability; Short-Term Creep. 7
*Corresponding Author: [email protected] 8
1. INTRODUCTION 9
The 9-12% Cr steels have a combination of good creep properties and sufficient 10
oxidation resistance, with additional benefits from good thermal properties and cost 11
effectiveness [1,2]. The recently developed tempered martensitic MarBN steel (9Cr-12
3W-3Co-VNbBN) belongs to the family of the 9-12% Cr steel and is expected to be 13
used in ultra-supercritical power plant (USC) [3]. This material contains boron and 14
nitrogen at minor levels in combination with solid solution and precipitation 15
strengthening elements to deliver improved microstructural stability that is beneficial 16
for long-term creep performance. 17
Following Andrade [4], three stages can be considered in a typical creep curve: the 18
reduced stage, the steady-state stage and the accelerated stage. Studying these three 19
stages helps in understanding the whole creep process. Creep occurs as a result of 20
interaction (or competition) of both the work hardening process caused by the applied 21
force (experienced as a decrease of the strain rate) and annealing process due to elevated 22
3
temperature [5], resulting in strong microstructural changes (grain boundary sliding, 1
dislocation climb, etc.) [6,7]. These microstructural changes can significantly affect the 2
mechanical features of the material. As the creep deformation begins to increase 3
(reduced stage), the number of dislocations in the material increases and the material 4
becomes harder to deform. Dislocations can thus climb and re-arrange themselves 5
(recovery process). This results in a dynamic equilibrium between the new dislocations 6
caused by plastic deformation and cancellation in the recovery process. Thus, the creep 7
rate becomes almost constant (steady state) and local stress concentrations at grain 8
boundaries causes nucleation of cavities and pores [5]. Most of the creep life is spent in 9
the steady stage with its duration being material-dependent. When these microstructural 10
changes develop into large-scale structural damage, the material fails due to formation 11
of micro-cracks within grains and cavitation at grain boundaries (accelerated stage). 12
The steady-state creep rate often shows a power law dependence on the applied stress 13
and an Arrhenius type law dependence on the temperature . A number of creep-related 14
material properties can be deduced from the steady-state data. The steady-state creep 15
rate (SSCR), the stress exponent , the activation energy for creep , and the mean 16
creep rate ( ), where and are the fracture strain and rupture time respectively, 17
are the most important creep features. These properties can be determined, when a 18
threshold stress is considered, by simple prominent phenomenological laws known 19
as the Park et al. [8] and the modified Monkman-Grant (MG) [9] formulae: 20
where is a material function, is the Young’s modulus that depends on temperature, 21
and denotes the universal gas constant, while terms and stand for the MG 22
constants which are temperature independent. These equations are extensively used in 23

4
power plant engineering applications to predict both SSCR and by extrapolation to 1
lower stress levels. The Monkman-Grant relation is no longer valid for materials that 2
exhibit large tertiary creep and limited steady state (a correction in terms of the fracture 3
strain and the strain at the onset of tertiary stage has to be incorporated [10]). A 4
number of studies have been reported in the literature on extrapolation methods based 5
on creep rupture curves to characterise the change in creep mechanisms [11,12], and 6
development has been made in assigning specific values of both and to the 7
underlying microstructural processes [13–16]. Indeed, creep is generally controlled by 8
diffusion at a low stress when the exponent is close to unity1 [17]. This behaviour is 9
denoted as “Nabarro-Herring” creep (atoms diffuse through the lattice causing grains to 10
elongate along the stress axis) for higher homologous temperatures and “Coble creep” 11
(atoms diffuse along the grain boundaries resulting in grain elongation in the direction 12
of stress) at lower temperatures. At an intermediate stress level, creep is attributed to 13
dislocation movement (“ -power-law” regime) for which the exponent is typically 14
between 3 and 7 [14]. However, the values of exceed 7 at higher stress levels and 15
the behaviour is termed power-law-breakdown or exponential creep [18]. The 16
mechanism of steady-state creep deformation in the power-law-breakdown regime is 17
more complicated and still not completely understood. 18
The creep properties of the 9% Cr steels are, indeed, linked with microstructural 19
characteristics. The initial microstructure of these steels is typically composed of a 20
tempered martensitic matrix in combination with secondary precipitate phases including 21
1 Although fundamental creep deformation theory suggests a value of one in the diffusion creep
regime, there are some reports of higher values up to about 3 (for example see. [66]).

5
grain boundary M23C6 carbides and intragranular MX carbonitrides [19]. A high 1
dislocation density in the matrix, as commonly observed in martensitic steels, provides 2
a structural strengthening effect that contributes to good mechanical properties and 3
creep resistance, whereas secondary precipitate phases deliver additional precipitation 4
strengthening by stabilizing lath and grain boundaries and hindering dislocation 5
movement [20]. Upon creep exposure, the degradation of the martensitic matrix is 6
typically identified by a decrease in dislocation density and the coarsening of the 7
substructure, accompanied with extensive dislocation interactions such as dislocation 8
tangles and dislocation jogs [21–26]. The formation of sub-grains within the martensitic 9
laths also occurs during creep via the formation of dislocation networks within the lath 10
interiors, leading to a decrease in dislocation density upon further growth of sub-grains 11
during creep [24]. Both the coarsening of pre-existing laths and the formation of sub-12
grains are accelerated under increased temperature and stress levels, with the latter 13
being more influential on the rate of microstructural degradation [20,24]. 14
The coarsening of the pre-existing secondary precipitates during creep was also 15
extensively reported in the previous studies on the 9% Cr steels [27–30]. This was 16
linked with the deterioration of creep resistance, particularly under the long-term creep 17
testing conditions, due to a loss of particle pinning effects to stabilise the martensitic 18
microstructure [19,27,31]. Although not as significant as for long-term creep exposure, 19
the coarsening of secondary precipitates was also observed in the 9% Cr steels after 20
short-term creep and was considered as a possible microstructural factor contributing to 21
the deterioration of creep resistance [27,32]. 22

6
Fractography examination and damage assessments have also been conducted to 1
investigate the formation of damage in the 9% Cr steels during short-term creep test. 2
Fractography examinations have revealed a typical ductile fracture surface consisting of 3
dimples formed by transgranular fracture [26,32,33]. The association of dimples and 4
creep cavities with inclusion particles was also reported in previous studies [26,33], 5
suggesting that creep damage is preferentially nucleated on inclusion particles. Detailed 6
observation from the cross-section after short-term creep test also revealed the presence 7
of elongated micro-voids and micro-cracks [26,33] that are similar to plasticity induced 8
damage formed under a high strain rate [7]. 9
Most of the existing studies on the 9% Cr steels were conducted in the medium to the 10
long term creep regimes, whereas limited studies [26,33] were conducted in the short 11
duration creep to understand the related creep mechanisms. The research work 12
presented here was mainly carried out at high stress conditions and elevated 13
temperatures, and aims in developing an insight into the rate-controlling creep 14
deformation processes in the MarBN steel. The relationship that may exist between the 15
macroscopic behaviour (in terms of creep deformation parameters, such as stress 16
exponent, activation energy and cross-section reduction) and the underlying 17
microscopic mechanisms (dislocation interaction, coarsening of precipitates and lath 18
structure, damage characteristics, etc.) has been investigated. Another objective consists 19
in decoupling both creep and local plasticity instability observed in failed MarBN 20
specimens. The elucidation of these global and local creep mechanisms will facilitate 21
the identification of the operating creep mechanisms in the MarBN steel, and thus 22
contribute to the understanding of the creep rupture behaviour after short-term creep 23
exposure. 24

7
1
2
2. MATERIAL AND EXPERIMENTAL METHODS 3
The experimental investigation was conducted on a recently developed creep-resistant 4
MarBN steel. The chemical composition of the steel is given in Table 1. Cylindrical 5
uniaxial specimens with a 50 mm gauge length and a 10 mm gauge diameter (see Fig. 1) 6
were machined from forged bars. Before manufacturing the samples, the as-forged bars 7
were normalised at 1200°C for 4 hours and tempered at 765°C for 3 hours, to obtain a 8
coarse-grained tempered martensitic microstructure, Fig. 2. 9
10
Table 1: Chemical composition of the investigated material (all elements are in wt. %, B 11
and N are in ppm). 12
C Si Mn P S Cr Mo Ni
0.1 0.45 0.54 0.012 0.004 8.74 0.05 0.14
Al B Co Cu Nb V W N
0.007 120 3.02 0.04 0.06 0.21 2.53 180
13
14
Fig. 1: Uniaxial creep test samples used for the experimental work. 15
8
1
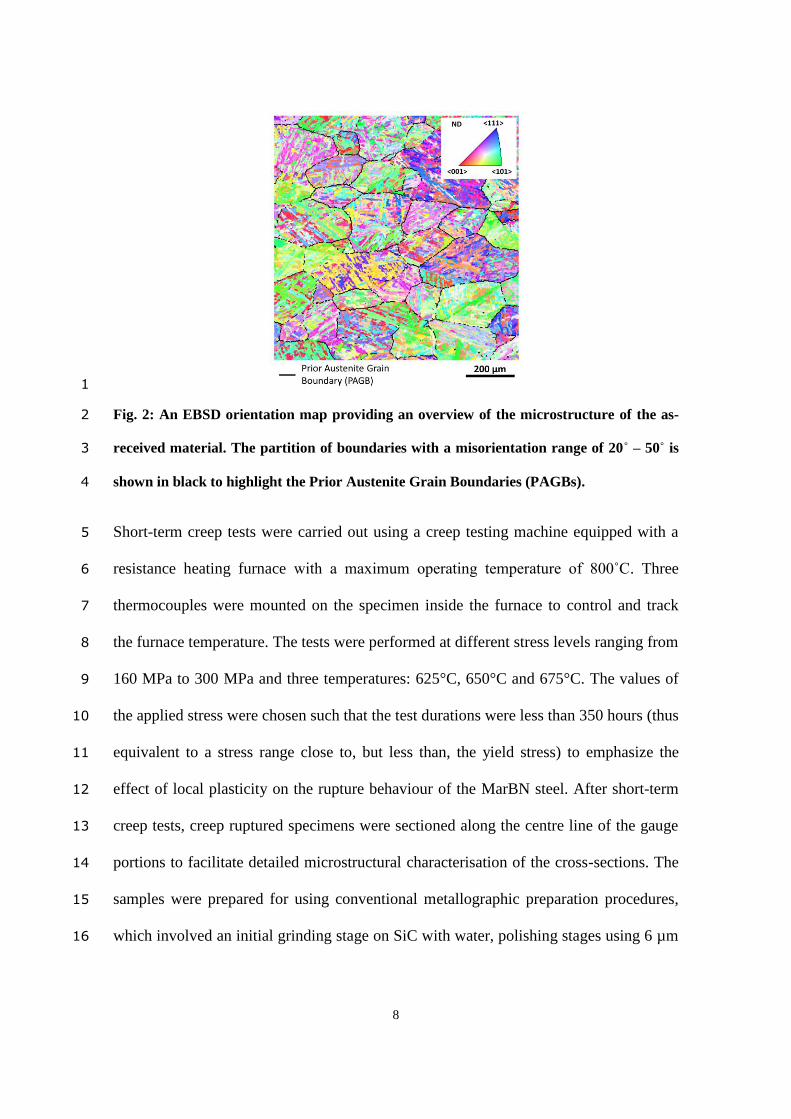
Fig. 2: An EBSD orientation map providing an overview of the microstructure of the as-2
received material. The partition of boundaries with a misorientation range of 20˚ – 50˚ is 3
shown in black to highlight the Prior Austenite Grain Boundaries (PAGBs). 4
Short-term creep tests were carried out using a creep testing machine equipped with a 5
resistance heating furnace with a maximum operating temperature of 800˚C. Three 6
thermocouples were mounted on the specimen inside the furnace to control and track 7
the furnace temperature. The tests were performed at different stress levels ranging from 8
160 MPa to 300 MPa and three temperatures: 625°C, 650°C and 675°C. The values of 9
the applied stress were chosen such that the test durations were less than 350 hours (thus 10
equivalent to a stress range close to, but less than, the yield stress) to emphasize the 11
effect of local plasticity on the rupture behaviour of the MarBN steel. After short-term 12
creep tests, creep ruptured specimens were sectioned along the centre line of the gauge 13
portions to facilitate detailed microstructural characterisation of the cross-sections. The 14
samples were prepared for using conventional metallographic preparation procedures, 15
which involved an initial grinding stage on SiC with water, polishing stages using 6 µm 16

9
and 1 µm diamond suspensions and a final chemo-mechanical polishing stage using a 1
suspension of 0.06 µm colloidal silica. 2
Fractography of the rupture surfaces was conducted using a Leo 1530VP Field 3
Emission Gun (FEG) Scanning Electron Microscope (SEM) with Secondary Electron 4
(SE) micrographs collected using an Inlens annular detector. Back Scattered Electron 5
(BSE) micrographs were collected using a JOEL® JSM-7800F FEG-SEM to study the 6
distribution of damage and inclusions in the as-received material, gauge and head 7
portions of the ruptured specimens. In the as-received material and the head portions, 25 8
BSE micrographs covering a total area of ~300,000 µm2 were collected from each 9
location. BSE micrographs were also collected along the centre of each specimen at 10
intervals of 0.5 mm to determine the variation of damage within the gauge portions. The 11
characteristics of the martensitic microstructure were investigated using Electron 12
Backscatter Diffraction (EBSD) in an FEI®
Nova Nanolab 600 dual-beam Focused Ion 13
Beam (FIB)/FEG-SEM equipped with an EDAX® Hikari EBSD camera. In the as-14
received material and the head portions, 5 EBSD maps measuring 50 µm × 50 µm were 15
collected to quantitatively analyse the grain structure with sufficient statistical 16
significance. Three EBSD maps of the same size were also collected from the gauge 17
portions of the specimens that were tested at 650°C to investigate the grain structures in 18
the regions 0.1 mm, 5.0 mm and 20.0 mm from the rupture surface. The area of 19
individual martensitic blocks and the length density of martensitic boundaries were 20
quantitatively measured from the EBSD maps. The elongation of the martensitic 21
microstructure along the principal stress direction was also determined using the line 22
intercept method with the direction of lines in parallel with the nominal stress direction. 23

10
The intercept length of the grains in the gauge portion was normalised for comparison 1
with the head portion using the following equation: 2
where , , and are the normalised intercept length, the 3
experimentally measured intercept length, the average area of the grains in the head and 4
the gauge portions, respectively. The distribution characteristics of secondary 5
precipitates were quantitatively analysed using ion beam induced SE imaging enhanced 6
using in-situ XeF2 gas etching in the dual beam FIB/FEG-SEM with a Ga+ ion source 7
operated at an accelerating voltage of 30 kV. From each specimen, 10 micrographs 8
covering a total area of ~1,500 µm2 were collected at random areas with a minimum 9
spacing of 500 µm. The number density and the average size of secondary precipitates 10
were measured from the obtained micrographs using a grey scale segmentation method. 11
Thin-foil specimens were prepared using a FIB-based lift-out technique [34] in the dual 12
beam FIB/FEG-SEM with specimen surfaces at approximately 45° to the principal 13
stress direction. The thinning process was conducted using the Ga+ ion source operated 14
at an accelerating voltage of 30 kV with a minimum ion beam current of 0.1 nA. A final 15
cleaning process was also performed on the electron-transparent region at a lower 16
accelerating voltage of 5 kV. An FEI®
Tecnai® F20 Transmission Electron Microscope 17
(TEM) was used for diffraction contrast imaging of dislocations in the Bright Field 18
Scanning Transmission Electron Microscopy (BF-STEM) mode with an electron beam 19
direction close to the <001> zone axis [35,36]. The chemical composition of 20
precipitates was also analysed using Energy Dispersive X-ray spectroscopy (EDX) with 21

11
an Oxford Instruments X-Max 80N TLE EDX system in the same TEM system at an 1
accelerating voltage of 200 kV. 2
3. RESULTS 3
3.1. Creep behaviour analysis 4
The short-term creep curves that were obtained under different temperatures and 5
stresses are presented in Fig. 3 with corresponding creep properties in Table 2. All data 6
extracted from the creep curves exhibit the following main characteristics: i) the steady-7
state is of long duration and, in most cases, does not exceed 3% strain, ii) the 8
accumulation of strain in the tertiary stage ( ) is much higher compared to that in both 9
reduced ( ) and steady-state ( ) creep regimes, and iii) significant necking is 10
observed during the final stage of creep (see Fig. 4). All these observations suggest that 11
the dramatic increase in strain observed in the tertiary stage is a result of macroscopic 12
plastic instability prior to the fracture (a loss of balance between the increase in strength 13
due to hardening and increase in stress due to the reduction in cross-section area (RA)). 14
The specimen fractured when the reduction in cross-section reached 59 to 83% 15
depending on the temperature and applied stress levels. 16
A number of creep material properties can be deduced from the uniaxial creep curves, 17
including the value of the steady-state creep rate (SSCR), the time to fracture ( ) and 18
the mean creep rate ( ). The interaction between all of these creep properties is 19
shown in Fig. 5. For all the selected temperatures, the creep properties can be 20
comprehensively expressed using the following expressions (simple power-law and 21
modified Monkman-Grant relationships): 22

12
1
where and are temperature-dependent creep functions while 2
and stand for the Monkman-Grant (MG) constants which are found to be temperature 3
independent. The apparent values of the creep properties defining rupture life-stress 4
(respectively SSCR) relationships at the selected temperatures (respectively applied 5
stresses) are given in Table 3. The computed values of apparent stress exponents and 6
are very high due to the high stresses employed2. Good correlation with the modified 7
Monkman-Grant (MG) relationship was also observed for the rupture creep-life data 8
(Fig. 5c). With the increase of SSCR, the mean creep rate ( ) increases in a roughly 9
straight line slope of 0.88. It is worth noting that such approach is widely used in high-10
temperature engineering to determine the creep life of structural components. 11
Developing predictive models to estimate rupture time of MarBN from the results of 12
short term tests is of particular interest. The Monkman-Grant relationship has been 13
shown to be valid for most metals and alloys used in creep resistant applications [37]. 14
However, such an approach cannot be valid for long-term behaviour since the prediction 15
of longer term creep properties from short term creep data may be inaccurate causing 16
overestimation of long term creep rupture time [38]. 17
The creep strain accumulation is also a thermally-activated process. According to the 18
creep data presented beforehand, the functional dependence of the steady-state rates on 19
temperature follows an Arrhenius-type law where the apparent activation energy for 20
2 To rationalise the high apparent stress exponents, a threshold stress, defined as the stress
below which no creep deformation occurs [67], is often considered to elucidate the true creep
mechanisms.

13
creep is a stress-dependent function. Values of the apparent activation energy at 1
the selected stress levels are also compiled in Table 3 (these values decrease with 2
increasing applied stress). It can be seen that these values are much higher and do not 3
reflect the true value of the activation energy. Higher apparent creep activation energies 4
for different high strength Cr-Mo steels have also been reported by different studies 5
[39,40]. 6
7
8
9
10

14
1
Fig. 3: Strain-time curves for creep tests conducted on MarBN samples at the selected 2
temperatures: (a) 625°C, (b) 650°C, (c) 675°C. 3
4
Table 2: Material creep features associated with the uniaxial creep curves plotted in Fig. 3. 5
denotes the transient creep time. 6
[°C]
[MPa]
[%]
[h]
[%]
[h]
SSCR
]
[h]
[%]
RA
[%]
625
240 1.42 33.54 2.97 168.51 1.14 242.88 14.21 60.31
260 1.43 8.68 2.87 32.15 6.34 58.04 12.43 70.84
280 1.43 1.73 2.54 6.71 27.03 13.93 12.02 79.75
300 1.44 0.52 2.79 1.44 149.01 2.93 10.65 82.02
650
200 1.04 46.84 2.18 243.41 0.61 342.91 11.93 62.05
220 1.09 11.33 2.63 66.71 2.91 95.47 9.36 73.68
240 0.82 3.73 2.26 10.05 28.03 13.73 11.48 74.29
260 0.78 0.21 2.31 2.01 100.02 4.43 10.43 75.11
280 0.78 0.08 2.79 0.51 485.12 0.94 14.88 81.08
675
160 0.55 18.07 1.44 185.01 0.54 309.53 8.89 59.04
180 0.71 8.61 1.91 61.68 2.33 99.82 9.82 72.96
200 0.81 0.99 2.26 11.03 15.13 19.36 8.93 77.62
220 0.83 0.35 2.26 2.49 69.27 4.88 10.33 81.42 7

15
1
Fig. 4: MarBN specimens after creep testing showing necking. 2
3
4 Fig. 5: (a) Time to fracture as a function of applied stress. (b) SSCR versus applied stress. 5
(c) Mean creep rate ( ) versus SSCR plotted according to the modified Monkman-6
Grant relation-ship (see. Eq. (3)). 7
8
Table 3: Apparent values of creep function coefficients for MarBN steel. The values of MG 9
constants are found independent of temperature. In the Arrhenius law, stands for a 10
material constant that depends on temperature. The values of are extracted by plotting 11
ln (SSCR) against the reciprocal temperature under the constant stress level and 12
assuming that the apparent stress exponent is constant over the regime examined. 13 14
Applied temperature
[°C]
625
650
675
Time to fracture
[(MPa)-1
.h]
2.69
7.59
1.91
[-]
19.77
17.53
13.02
Steady-state creep rate
[(MPa.h)-1
]
1.25
1.07
1.17
[-]
21.84
19.88
15.27
Monkman-Grant relationship
[-]
0.635
0.631
0.636
[-]
0.86
0.87
0.89
Applied stress
220
240
260

16
[MPa]
Activation energy
[kJ.mol-1
]
923.07
882.69
760.58
1
As mentioned previously, both the values of apparent stress exponent, and apparent 2
activation energy , obtained beforehand, are high and cannot reflect the true rate-3
controlling creep mechanism. This is because they were computed for a constant 4
substructure model by assuming that the microstructure remains constant during creep 5
and subsequent failure, which is not entirely true for the MarBN steel where substantial 6
microstructural evolution is observed during creep exposure (e.g. dynamic precipitate 7
distribution, dislocation structure and lath/grain structure). Some researchers have 8
pointed out that the true values of the stress exponent, and activation energy, 9
can be assessed by considering the variation of Young’s modulus with temperature 10
and by introducing the concept of creep threshold stress [41]. The stress threshold, 11
denoted hereafter by , is introduced to explain variations of the stress exponent and 12
activation energy with the applied stress. Using Eq. 1, the effective stress (i.e. 13
) can be determined following the equation given below: 14
Several values of stress exponent, were considered to emphasize whether the rate-15
controlling creep mechanism is viscous glide3 ( 3), climb
4 ( 4-7) or lattice-16
3 Viscous glide creep is generally characterized by the absence of subgrains [18].
4 Climb-controlled creep is characterized by the formation of subgrains whose size is inversely
proportional to the applied stress [18].

17
diffusion5 ( 8). The threshold stress, was estimated by plotting 1
against , and linearly extrapolating these creep data to a zero value of the creep rate 2
(the interaction of the extrapolated line with the X-axis gives the threshold stress at a 3
particular temperature). Examination of creep data reveals that both 7 and 8 yield 4
to the best linear fit between and (see. Fig. 6a), with a correlation 5
coefficient greater than 0.99 (see Table 4) for the three selected temperatures. The 6
corresponding values of the threshold stress are gathered in Table 4. The threshold 7
stress is found to be strongly sensitive to the applied temperature ( increases with 8
decreasing temperature). To determine the relationship between the threshold stress and 9
the assumed stress exponent, SSCR was plotted against the normalized effective stress 10
on logarithmic plot in Fig. 6b. All correctional values of the real stress exponent ( ) 11
are found to be close to the assumed values of 7 and 8 (see. Table 4). According to Eq. 12
4, the real activation energy for creep can be evaluated as , where is the 13
slope of the natural logarithm of with respect to the reciprocal temperature . 14
Given Young’s modulus values for the selected temperatures (see Table 4), the real 15
activation energy values are found equal to 307.82 kJ.mol-1
and 297.56 kJ.mol-1
for = 16
7 and 8, respectively. These values are largely lower than the apparent activation 17
energies obtained beforehand. They are close to the lattice self-diffusion energy for Cr 18
( 308.6 kJ.mol-1
) [42]. It can thus be suggested that dislocation climb is the dominant 19
rate-controlling creep mechanism in the MarBN steel. The steady-state creep is 20
therefore exhibiting a power-law stress dependence with an exponent of 7 and a real 21
activation energy of 307.82 kJ. mol-1
. 22
5 The lattice diffusion-controlled creep requires that the subgrain size remains constant over the
entire stress range [68].

18
1
2
Fig. 6: (a) Minimum creep rate to one-seventh (-eighth) power versus applied stress, (b) 3
Minimum creep rate as function of the normalized effective stress ( ) for the three 4
selected temperatures. 5
6
Table 4: Values of the threshold stress , the correctional true stress exponent 7
and the corresponding correlation coefficient computed for the selected real 8
stress exponents = 7 and 8. Table 4 includes also the values of the corresponding 9
Young’s modulus extracted from tensile data conducted on MarBN steel at the selected 10
temperatures. 11
[°C]
= 7 = 8
[GPa]
[MPa]
[MPa]
625 182.71 6.68 0.994 170.29 7.72 0.996 152.73
650 154.86 6.61 0.992 143.17 7.67 0.994 148.46
675 104.62 6.65 0.992 92.56 7.69 0.993 145.52
12
By analysing the foregoing results, it is still hard to explore all the deformation 13
mechanisms governing the creep behaviour of the MarBN steel. The power law regime 14
is very flexible and it is feasible to change expressions of the stress exponent and 15
activation energy by adding some internal variables like dislocation density and 16
subgrain size. A fundamental understanding of the microstructural configuration and 17
evolution is therefore needed to emphasize the dominant creep deformation mechanism. 18
All the local changes occurring under creep conditions are of great importance in high-19
temperature advanced steels because they strongly affect their creep and failure 20

19
properties. The creep process is naturally accompanied by many different 1
microstructural rearrangements including dislocation movement and grain-boundary 2
cavitation. The emphasis of creep modelling is to combine the macroscopic behaviour 3
and these underlying microscopic mechanisms, in order to build up a direct relation 4
between the strain rate and internal variables such as dislocation density, velocity of 5
climb, internal stress and subgrain size. 6
3.2 Fractographic examination and damage assessment after short-term 7
creep 8
The topography of the rupture surfaces and the damage within the cross-sections were 9
characterised using SE imaging. Fig. 7 shows SE micrographs that were collected from 10
the rupture surface and the cross-section of a specimen that was tested at 650ºC with an 11
applied stress of 200 MPa. 12

20
1
Fig. 7. SE micrographs showing (a and b) the topography of the rupture surface and (c 2
and d) micro-voids or cavities in the cross-section after creep testing at 650ºC and 200 3
MPa. 4
The rupture surfaces of all the ruptured specimens consist of a shear lip close to the 5
outer rim and a dimpled fracture surface in the central region (Fig. 7a). Similar 6
topography of rupture surfaces have been observed in previous studies of similar 7
material, and was linked with ductile fracture behaviour [26,32,33]. Elongated micro-8
voids with a size from less than 1 µm to approximately 3 µm were also observed close 9
to the rupture surface from cross-sections (Fig. 7c). In the regions away from the rupture 10
surface, creep induced damage is predominantly in the form of cavities with sizes of 11
less than 1 µm (Fig. 7d). 12

21
Micro-voids and cavities that were developed during the short-term creep test were 1
further studied using SE imaging, with the microstructural features associated with 2
micro-voids and cavities identified using EDX (Fig. 8). The association of inclusion 3
particles with micro-voids and cavities was extensively observed in creep ruptured 4
specimens (Fig. 8a). EDX analysis revealed the association of the micro-voids in the 5
necked area with both the BN and MnS type inclusions (Fig. 8c-d), whereas the cavities 6
in the regions away from the rupture surface are predominantly associated with the BN 7
inclusion particles (Fig. 8b). 8
9
Fig. 8. SE micrographs showing the details of (a) micro-voids near to the rupture surface 10
in the necked area and (b) cavities and inclusions in the regions away from rupture 11
surface after creep testing at 650°C with an applied stress of 200 MPa. The EDX spectra 12
that were collected from (c) MnS and (d) BN inclusions are also included. 13

22
The distribution of damage and inclusions along the longitudinal direction of the gauge 1
portions was also quantitatively assessed from the cross-section of specimens creep 2
tested at 650ºC, Fig. 9. 3
4

23
Fig. 9. Graphs showing (a) number per unit area, (b) size and (c) area fraction of creep 1
induced damage and inclusions along the gauge portion of specimens after creep testing at 2
650ºC. The distribution of inclusions in the stress-free head portions and the as-received 3
materials are also included for comparisons. 4
The distribution of inclusions in the head portion (i.e. the hollow circles) is not 5
significantly different from the distribution in the as-received material (i.e. the grey 6
box). However, the average size and the area fraction are higher in all the regions from 7
the gauge portions (i.e. the solid circles) than the head portions (Figs. 9b-c), whereas the 8
number density in the gauge portions is higher only in the regions from the necked part 9
(less than ~5 mm from the rupture surface) (Fig. 9a). Since the measurements from BSE 10
micrographs both included the pre-existing inclusion particles and the associated creep 11
induced damage, the distribution characteristics of damage in the gauge portion can be 12
determined from the difference in distribution between the gauge and the head portions. 13
A higher extent of damage was therefore identified in the necked part than in the 14
regions further away from the rupture surface (i.e. > 5 mm) in both of the specimens 15
tested at 200 MPa and 280 MPa. The damage presented in the necked part is higher in 16
number density and lower in average size in the specimen tested at 280 MPa (Figs. 9a-17
b), whereas the area fraction of damage is similar between both specimens (Fig. 9c). In 18
addition, it was observed that the number density, in the regions that are over 5 mm 19
from the rupture surface, is similar to the number density of inclusions in the as-20
received material (Fig. 9a). The similar distribution of particles in the region over 5 mm 21
away from the rupture surface to the as-received material indicates that the local 22
damage was preferentially nucleated on inclusion particles, whilst the higher number 23

24
density in the necked part suggests that the local damage may not be necessarily formed 1
on inclusion particles. 2
3.3 Microstructural changes during short-term creep 3
3.3.1. Initial microstructure in the as-received material 4
The as-received material shows a typical tempered martensitic microstructure in which 5
Prior Austenite Grains (PAGs) are hierarchically divided into packets, blocks and sub-6
block laths [43]. The PAGs in the as-received material are typically over 100 µm in size 7
with the misorientation of PAGBs in a range of 20º - 50º (Fig. 2 and Fig. 10) [44]. The 8
martensitic blocks are approximately 1.5 µm in width, whereas the misorientation of 9
block boundaries are within a range of 2º - 20º and 50º - 60º due to a Kurdjumov-Sachs 10
orientation relationship with the parental austenitic phases (Fig. 10b) [45]. The size of 11
the martensitic blocks and the length density of martensitic boundaries were 12
quantitatively measured and are presented in Table 5. 13
14

25
Fig. 10. (a) EBSD orientation and (b) EBSD grain boundary maps showing the 1
characteristics of grain structure and the distribution of grain orientation in the as-2
received material. 3
Table 5. The average size of martensitic blocks and the average length density of 4
martensitic boundaries in the as-received material, in which 5 EBSD maps covering an 5
area of ~12,500 µm2 were collected. The martensitic blocks were defined using a 6
misorientation tolerance of 2°. 7
Average area of blocks
[µm2]
Block size in intercept length
[µm]
Boundary length per unit area
[mm/mm-2
]
79.9 ± 33.3
1.7 ± 0.5
1.9×10³ ± 1.7×10
2
8
The martensitic substructure in the as-received material was further analysed in detail 9
by using STEM. Fig. 11 presents the EDX maps and the high resolution BF-STEM 10
micrographs showing elemental distribution and dislocation structure in sub-block laths, 11
respectively. 12

26
1
Fig. 11. (a) BF-STEM and (b-d) EDX maps showing the distribution of elements within an 2
individual martensitic lath. The precipitate phase particles that are enriched in Cr and W 3
are indicated by arrows in (a). (e and f) BF-STEM micrographs showing the detailed 4
dislocation structure from the regions as indicated by the black boxes in (a). The nano-5
scale precipitates presented in the same regions are indicated by white circles in (e and f). 6
The martensitic substructure within an individual block is composed of elongated sub-7
block laths that are typically a few microns in size and precipitate particles that are 8
distributed both on sub-grain boundaries and within the sub-grain interiors (Fig. 11a). 9
The precipitates that are distributed on sub-grain boundaries are predominantly a few 10

27
hundred nanometres in size and are relatively more abundant in Cr and W than in the 1
matrix (Figs. 11b-d), which is similar to previously reported observations of M23C6 2
carbides [46]. The dislocation structure within individual sub-block laths is similar to 3
the existing observations from the tempered martensitic microstructure [36,47], which is 4
a highly-dense dislocation network consisting of straight dislocation lines (Figs. 11e-f). 5
Nano-scale precipitate particles, predominantly less than 5 nm in size were also 6
observed within the laths (Figs. 11e-f). Thorough analysis of the precipitate particles is 7
difficult due to small sizes, but the existing observations from 9% Cr steels suggest that 8
these are fine-scale Nb/V-rich MX carbonitrides [31]. It is worth noting that the MX 9
carbonitrides in MarBN steels are normally smaller in size than the more conventional 10
9% Cr steels with a higher level of N addition (i.e. 300-700 ppm in Grade 91 and 92 11
[48]) [19]. MarBN steel is designed to have a lower N level to mitigate the formation of 12
detrimental BN intermetallics as well as to contribute to a well dispersed MX 13
distribution [31]. 14
3.3.2. Microstructural characterisation of creep exposed materials 15
EBSD maps of samples creep-exposed at 650˚C are shown in Fig. 12. 16

28
1
Fig. 12. (a-d) EBSD-IQ and (e-l) EBSD-IPF showing the characteristics of grain structure 2
and distribution of grain orientation after creep testing at 650ºC. The boundaries with a 3
misorientation of 20º - 50º and 2º - 20º/50º - 60º are outlined in (e-h) and (i-l), respectively. 4
After short-term creep testing with an applied stress of 200 MPa, the martensitic 5
microstructure in the region ~20 mm away from the rupture surface (Fig. 12a) is similar 6
to the microstructure in the as-received material (Fig. 10). However, the martensitic 7
microstructure in the specimen tested at 280 MPa is more refined, consisting of blocks 8
with a similar width to the as-received material and smaller grains that are typically 2 – 9
3 µm in size (Fig. 12b). In the necked part close to the rupture surface, the pre-existing 10
martensitic microstructure was significantly distorted along the principal stress direction 11

29
(Figs. 12c-d) at both applied stress levels, accompanied with the formation of a finer 1
martensitic substructure within individual blocks (Figs. 12k-l) in the region 0.1 mm 2
away from the rupture surface. The micro-voids in the regions close to the rupture 3
surface are also elongated in parallel with the principal stress direction (Figs. 12c-d). A 4
higher extent of grain structure distortion and refinement was observed in the specimen 5
tested at a higher applied stress of 280 MPa. 6
The size of the martensitic blocks and the length of boundaries per unit area were 7
quantitatively measured from EBSD maps. Fig. 13 compares the block size and 8
boundary length densities between the necked gauge regions, non-necked gauge regions 9
and the head portion after creep testing at 650°C. 10
11
Fig. 13. Graphs comparing (a) average area of martensitic blocks, (b) length density of 12
boundaries, (c) average intercept length and (d) normalised intercept length in the regions 13
that are 0.1 mm and 20.0 mm away from the rupture surface and in the head portion. The 14
data from the as-received material are also included in (a-c) for comparison (grey bar). 15

30
The standard deviations between the measurements from the same distance from the 1
rupture surface are indicated by half of the lengths of error bars. 2
In both specimens tested at 650°C, the average area and the average intercept length in 3
the head portions are slightly higher than the as-received material (Figs. 13a and 13c), 4
whereas the length density of the martensitic boundaries from the same regions is 5
slightly lower (Fig. 13b). The characteristics of the martensitic microstructure vary as a 6
function of distance from the rupture surface in the gauge portion. The average area 7
increases, whereas the length density of boundaries decreases as distance from the 8
rupture is increased (Figs. 13a-b). Compared to the specimen tested under 200 MPa, the 9
650°C/280 MPa specimen shows a lower average area in the regions that are 0.1 mm 10
from the rupture surface (Fig. 13a). This is consistent with previous observations from 11
the martensitic steels in which the substructure becomes more refined at an higher 12
applied stress in the dislocation-climb-controlled creep regime [22,49,50]. 13
The distortion of the original martensitic microstructure under the effect of plastic strain 14
can be better identified by normalising the intercept length along the principal stress 15
direction using the average area in the head portions (Eq. 2). Compared to the head 16
portion, the normalised intercept lengths are higher in the regions at 0.1 mm and 20 mm 17
away from the rupture surface in the specimens tested under an applied stress of 280 18
MPa, whereas this characteristic is only higher in the region at 0.1 mm away from the 19
rupture surface in the specimen tested under 200 MPa (Fig. 13d). This indicates that the 20
original microstructure in the regions 20 mm away from the rupture surface was also 21
distorted along the principal stress direction in the specimen tested under an applied 22
stress of 280 MPa, whereas the distortion of the original microstructure only occurred in 23
the region close to the rupture surface in the specimen tested at 200 MPa. This has 24
31
further suggested that plastic deformation was preferentially accumulated in the necked 1
area close to the rupture surface in the specimen tested at 200 MPa, whereas plastic 2
deformation also occurred in the region further away from the rupture surface in the 3
specimen tested at 280 MPa. The average values of the normalised intercept length are 4
also higher in the 650°C/280 MPa specimen compared to the 650°C/200 MPa specimen 5
(Fig. 13d). This observation suggests a higher extent of plastic instability for the 6
specimen tested under an applied stress of 280 MPa, which is also in agreement with the 7
macroscopic observation that confirmed a higher reduction of area for the specimen 8
tested at 280 MPa than 200 MPa (Table 2). 9
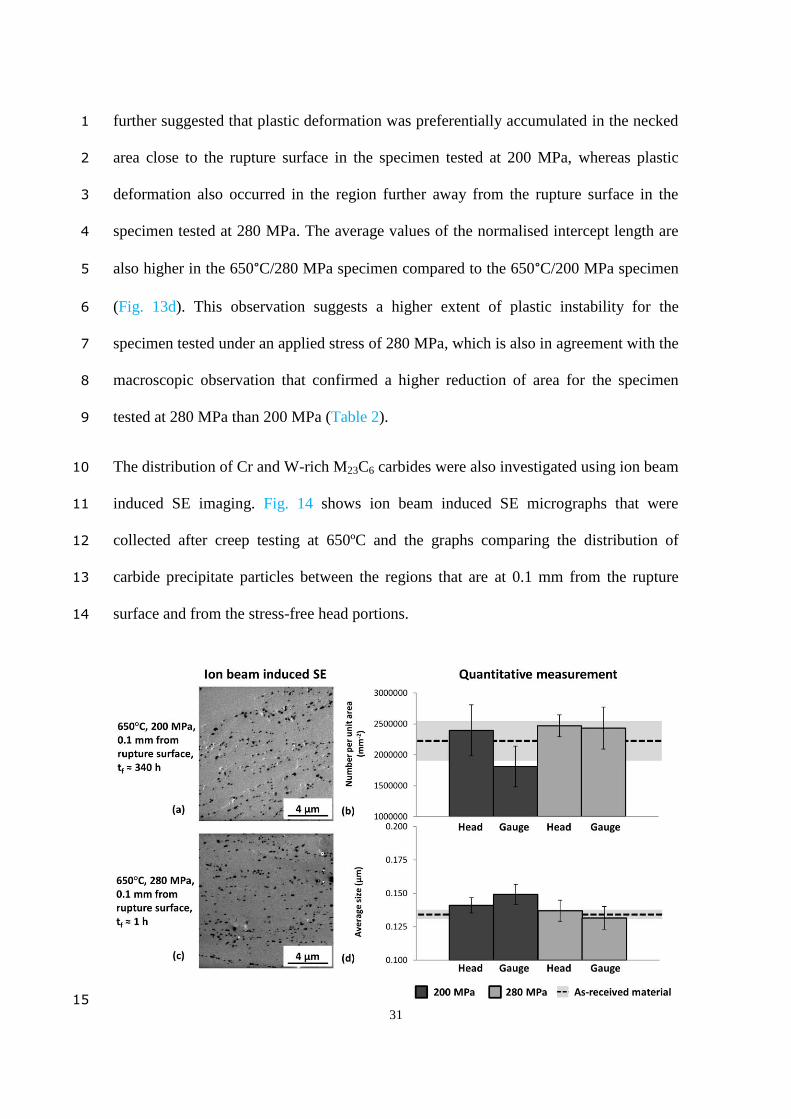
The distribution of Cr and W-rich M23C6 carbides were also investigated using ion beam 10
induced SE imaging. Fig. 14 shows ion beam induced SE micrographs that were 11
collected after creep testing at 650ºC and the graphs comparing the distribution of 12
carbide precipitate particles between the regions that are at 0.1 mm from the rupture 13
surface and from the stress-free head portions. 14
15

32
Fig. 14. (a and c) Ion beam induced SE micrographs showing the grain boundary M23C6 carbides in 1
the regions at 0.1 mm from the rupture surface after creep testing at 650ºC. (b and d) Graphs 2
comparing the distribution of precipitate particles between the regions at 0.1 mm from the rupture 3
surface (gauge), the stress-free head portions (head) and as-received material. 4
In previous studies of 9% Cr steels, the use of ion beam induced SE imaging has been 5
successful in the quantitative analysis of the M23C6 carbides [51–53]. In the 9% Cr 6
MarBN steel being analysed in this study, this technique was again capable of 7
differentiating the relatively larger M23C6 carbides (Fig. 13a) as dark particles from a 8
relatively brighter background of the matrix (Figs. 14a and 14c). As shown, there are 9
minor differences between the as-received material and the stress-free head portions for 10
both of the specimens tested at 650°C. In the specimen tested at an applied stress of 200 11
MPa, the average value of the number of M23C6 per unit area is slightly lower for the 12
region at 0.1 mm from the rupture surface, whereas the average size in the same region 13
is slightly higher than the stress-free head portion (Figs. 14b and 14d). This indicates 14
that the pre-existing M23C6 carbide particles are slightly coarsened during short-term 15
creep test at an applied stress of 200 MPa, whereas the carbides in the specimen tested 16
at 280 MPa were not significantly changed due to the short test time period (i.e. ~ 1 17
hour). The coarsening of carbide particles is detrimental to creep resistance as this 18
deteriorates microstructural stability by losing the pinning effect of substructure 19
boundaries and dislocations [27,32]. 20
The characteristics of the martensitic substructure and dislocation structure in the 21
specimens that were tested at 650ºC/200 MPa and 650ºC/280 MPa were also studied 22
using BF-S/TEM imaging as shown in Fig. 15. 23

33 1

34
Fig. 15. (a and b) BF-TEM and representative (c-h) BF-STEM micrographs showing the 1
characteristics of the martensitic substructure and dislocation structure within individual 2
sub-grains in the regions 0.5 mm from the rupture surface after creep testing at 650ºC 3
with an applied stress of (a, c, e and g) 200 MPa and (b, d, f and h) 280 MPa. 4
In the specimen that was tested at 650ºC with an applied stress of 200 MPa (Fig. 15a), 5
the sub-block laths are predominantly 1 – 2 µm in length, whereas a more refined 6
martensitic substructure consisting of sub-block laths of less than 1 µm in length was 7
observed in the specimen tested at an applied stress of 280 MPa (Fig. 15b). In the 8
specimen tested at an applied stress of 200 MPa, some of the laths exhibited a 9
dislocation network consisting of straight dislocation lines (Fig. 15c), similar to the 10
dislocation structure in the as-received material (Fig. 11e-f), whereas a much lower 11
number of dislocations was observed within other sub-block laths in the same specimen 12
(Fig. 15e). Extensive dislocation interactions in the form of dislocation jogs and the 13
interaction of dislocations with nano-scale precipitate particles were also observed in 14
the same laths showing a lower number of dislocations (Fig. 15g). Dislocation pile-ups 15
were also observed close to the relatively larger precipitates on lath boundaries (Fig. 16
15e). In the specimen tested at an applied stress of 280 MPa, the number of the 17
dislocations within sub-block laths was lower than the as-received material (Figs. 15d 18
and 15f). Dislocation jogs, tangles and pile-ups were also extensively observed within 19
individual laths from the same specimen (Figs. 15d-h). The nano-scale precipitates 20
(MX) in the creep-exposed specimens (Figs. 15g and 15h) are similar in size to those in 21
the as-received material without creep exposure (Fig. 11). This indicates that the MX 22
carbonitrides were not significantly changed in size during short-term creep, which is 23
consistent with existing observations of MX carbonitrides being more resistant to 24

35
coarsening than M23C6 during creep exposure [19,54]. The stable MX precipitates 1
enhance the creep resistance of the MarBN steel by improving the stability of the 2
dislocation structure [31,55]. These observations indicate that the microstructure of the 3
MarBN steel is stabilised via structural strengthening and precipitation strengthening 4
mechanisms [19,30,56] to deliver satisfactory creep resistance for industrial 5
applications. 6
4. DISCUSSION 7
Experiments have been conducted on MarBN steel over a range of applied stresses and 8
temperatures to 1) build up a direct relationship between the creep strain rate and 9
internal variables, 2) decouple both creep and local plasticity-driven mechanisms, and 10
3) elucidate the true rate-controlling creep deformation mechanism. The main results are 11
summarised as follows: i) the steady-state creep rate exhibits a power-law stress 12
dependence with an exponent of seven (SSCR ), ii) the corresponding real 13
activation energy has been determined to be 307 kJ.mol-1
, which is close to the lattice 14
self-diffusion energy in Cr (308.6 kJ.mol-1
) [42], and iii) a macroscopic plastic 15
instability was observed, highlighted by an obvious necking within the gauge length 16
towards the rupture surface. 17
The dominant creep deformation mechanism for MarBN can be inferred from 18
the and values. Following i) and ii), it has been suggested that dislocation climb 19
is the rate-controlling mechanism of creep at both high stress and elevated temperature. 20
Based on the existing studies of creep in polycrystalline metallic materials [18,57] and 21
the more recent studies on other 9% Cr steels [33,58,59], dislocation climb is stated as 22
an out-of-plane movement for edge dislocations. Its rate depends on many factors, 23

36
including chemical forces, the mobility of jogs and the rate of migration of vacancies 1
[60]. The operation of dislocation climb normally requires more energy and is 2
associated with a slower rate than dislocation glide in most of the alloys, and was hence 3
considered as the rate-controlling factor for creep [18,57]. 4
Among the possible aforementioned deformation mechanisms which accelerate the 5
creep rate and may strongly contribute to the creep deformation, necking instability is 6
generally observed. In the power-law equation, the creep strain is considered to be 7
homogeneous along the specimen axis, which is not entirely true. The creep curves 8
obtained are, thus, a combination of the operating creep mechanisms in the material and 9
the development of a neck. Indeed, the local deformation behaviour is expected to be 10
creep influenced in the regions away from the necked region. However, at the regions 11
near to rupture surface, the behaviour is mainly plasticity driven. This can be 12
consolidated by a FE analysis conducted on MarBN steel using a Benchmark neck-13
based model under creep conditions (Fig. 16). It can be seen from the FE results that, at 14
the necked region (region B), the equivalent plastic strain is predominantly 15
accommodated (mostly concentrated at the rupture surface). However, at the regions 16
away from the rupture surface (region A), the values of the equivalent plastic strain are 17
tenfold lower compared to those of region B, where spatial distributions seem to be 18
strongly heterogeneous. 19

37
1
Fig. 16: FE analysis conducted on a MarBN steel specimen using a Benchmark necked-2
based model showing the spatial distribution, at the onset and during the necking, of the 3
equivalent plastic strain. 4
Although the power-law equation is found to be in good agreement with the 5
experimental observations, it cannot reflect the possible physical mechanisms involved 6
during the creep process. In order to have a better understanding of the physical 7
processes during short-term creep testing of MarBN, detailed microstructural 8
characterisation was conducted in both the non-necked and the necked parts of gauge 9
portion (i.e. typically 5 mm and 20 mm away from the rupture surface, respectively) to 10
link with the characteristics of global creep behaviour as presented above. Important 11
observations of the microstructure after short-term creep testing are summarised as 12
follows: i) the martensitic microstructure in the non-necked part of gauge portion 13
appears similar to the stress-free head portion, whereas the original microstructure was 14
significantly changed in the necked part during short-term creep (Figs. 12-13), ii) a 15
much higher extent of damage is presented in the necked part of the gauge portion than 16
the non-necked part (Fig. 9), with a close association between damage and inclusion 17
particles observed in both areas (Fig. 8), iii) compared to the specimen tested under a 18
lower stress (i.e. 200 MPa), the specimen tested under a higher stress (i.e. 280 MPa) 19
shows a lower average area of martensitic blocks and a longer normalised intercept 20

38
length along the principal stress direction in both the non-necked and the necked parts 1
of gauge portion (Fig. 13), iv) significant refinement of the martensitic lath structure 2
was observed in the necked part of the gauge portion in both of the specimens tested at 3
650°C, whereas the lath structure in the specimen tested under a high stress (i.e. 280 4
MPa) is more refined (Fig. 15), v) dislocation interactions, such as dislocation jogs, 5
tangles and pile-ups, and the interaction between dislocations and secondary precipitates 6
were extensively observed within the lath interiors (Fig. 15). Fig. 17 shows schematic 7
diagrams summarising the microstructural observations from both the stress-free head 8
portion and the non-necked and necked parts from the gauge portion. 9
10

39
Fig. 17. Schematic diagrams illustrating the microstructural states in (a) the stress-free 1
head portion, (b) the non-necked part in gauge portion, the necked part in the gauge 2
portion after creep tests at an applied stress of (c) 200 MPa and (d) 280 MPa. 3
The different characteristics of the microstructure and damage distribution between the 4
necked and the non-necked parts of gauge portion are attributed to the significant plastic 5
strain presented in the necked part in addition to the creep strain accumulated in the 6
same area before the onset of necking (Fig. 17). The distorted, refined martensitic 7
microstructure in the necked part is evidence of plastic strain as this microstructure is 8
similar to the cell block grain structure formed after extensive plastic deformation with 9
a high strain rate [61–63]. The scale of the cell block grain structure is also decreased at 10
an increased strain intensity [62], and this is consistent with the observation of a more 11
refined substructure presented in the specimen showing significant necking (i.e. 81.8% 12
for the 650°C/280 MPa specimen, Table 2). 13
Under the influence of plastic strain, the damage presented in the necked part is formed 14
as micro-voids elongated along the principal stress direction as a result of plastic flow in 15
the surrounding matrix [7]. The close association between the plasticity induced micro-16
voids and the inclusion particles in the necked part (Fig. 8) is consistent with the 17
previous report of plastic damage, which is preferentially formed on secondary phase 18
particles [6,7]. However, one should also bear in mind that the micro-voids might be 19
formed via a more complex scenario by transforming from the ‘pre-existing’ creep 20
damage formed before the onset of necking. This is supported by the observation that 21
damage was also formed on inclusion particles in the non-necked part of gauge portions 22
(Fig. 8) (i.e. similar to the previous reports from other 9% Cr steels [52,64,65]). 23

40
It can be inferred from the aforementioned observations that both dislocation climb-1
controlled creep and plastic instability (necking development) can occur, interact and 2
strongly contribute to the macroscopic degradation of the material at high stress regimes 3
and elevated temperatures. Note that other “secondary” creep mechanisms such as grain 4
boundary sliding and/or lattice diffusion, may be active, even with small contributions, 5
and can play an important role in the short-term creep deformation of MarBN steel. The 6
theoretical computations and microstructural observations have been combined to better 7
elucidate and emphasize the dominant deformation mechanisms. Although, literature is 8
abundant of empirical equations for the power-law regime, there is still a need to 9
understand and thus track most of the physical mechanisms occurring during the creep 10
deformation process. The demand for an accurate and reliable modelling framework that 11
accounts for the microstructural evolution is of prime importance to gain further insight 12
into the deformation mechanisms of the MarBN steel. Models based on dislocation 13
density should have a stronger physical meaning. Dislocation densities can thus be 14
incorporated as internal state variables, and their evolution can be modelled based on 15
the storage and annihilation processes for dislocations. 16
5. CONCLUSIONS 17
An extensive experimental investigation has been conducted to understand the short-18
term creep behaviour of MarBN steel at high temperature. The experimental study 19
combines macroscopic predictions (through empirical formulations) and microstructural 20
evidence (through SEM, EBSD and TEM investigations). The main objectives of the 21
experimental work were to 1) investigate the possible relationships that may exist 22
between the creep strain rate and internal variables, 2) decouple both creep- and local 23

41
plasticity-driven mechanisms, and 3) emphasize the true rate-controlling creep 1
mechanism in the MarBN steel at the selected temperatures and stress levels. The 2
findings obtained are thus summarized as follows: 3
1- The steady-state creep of the MarBN steel obeys the power and Arrhenius laws 4
as well as the modified Monkman-Grant empirical formulae. High values of 5
apparent stress exponents and activation energies have been obtained. 6
2- A power-law stress dependence with an exponent of 7 (SSCR ) has been 7
obtained. The corresponding real activation energy was about 307.82kJ.mol-1
, 8
which is found close to the lattice self-diffusion energy in Cr. These values 9
suggest that the climb-controlled creep is likely to be the dominating rate-10
controlling mechanism in MarBN steel at high temperature and high stresses. 11
3- Necking instability was also observed in the failed specimens, highlighting the 12
local plasticity at the necked region. Micro-voids were nucleated on inclusions 13
and tend to elongate near the rupture surface due to the high plasticity. Grain 14
refinement and distortion of the grain structure under plastic flow has also been 15
observed. An inhomogeneous dislocation structure including jogs, tangles and 16
pile-ups has been demonstrated near the rupture surface. 17
Note that the power law is very flexible and can easily change expressions by adding 18
the aforementioned internal variables, hence the real stress exponent and real activation 19
energy can be re-evaluated to better emphasize the rate-controlled creep mechanism. By 20
analysing the foregoing results, most of the mechanisms governing the creep behaviour 21
of the MarBN steel have been highlighted. Both dislocation climb-controlled creep and 22
plastic instability (necking development) can occur, interact and strongly contribute to 23

42
the macroscopic degradation of the material at high stress regimes and elevated 1
temperatures. 2
6. ACKNOWLEDGMENTS 3
This work is supported by the Engineering and Physical Sciences Research Council 4
(grant numbers: EP/N509991/1 and EP/N509942/1). 5
The authors gratefully acknowledge the following partners for their valuable 6
contributions: Doosan Babcock, GE Power, Uniper Technologies, Metrode Products, 7
Goodwin Steel Castings and Wyman-Gordon. Specific acknowledgments to M. Bartosz 8
Polomski (GE Power) for providing the test material and M. Shane Maskill (University 9
of Nottingham) for his support in the experimental testing. The authors also 10
acknowledge use of facilities within the Loughborough Materials Characterisation 11
Centre. 12
The authors would also like to warmly thank Dr. Martin Strangwood (University of 13
Birmingham) for the fruitful discussions about the microstructure analysis and 14
complementary suggestions. 15
16
7. REFERENCES 17
[1] B. Fournier, F. Dalle, M. Sauzay, J. Longour, M. Salvi, C. Caës, I. Tournié, P.F. Giroux, 18
S.H. Kim, Comparison of various 9-12%Cr steels under fatigue and creep-fatigue 19
loadings at high temperature, Mater. Sci. Eng. A. 528 (2011) 6934–6945. 20
doi:10.1016/j.msea.2011.05.046. 21
[2] D.J. Benac, H.S. Reemsnyder, Failure Analysis And Life Assessment Of Structural 22
Components And Equipment, ASM Int. Handb. Fail. Anal. Prev. 11 (2002) 184. 23

43
doi:10.1361/asmhba0003512. 1
[3] F. Abe, M. Tabuchi, H. Semba, M. Igarashi, M. Yoshizawa, N. Komar, A. Fujita, 2
Feasibility of MARBN steel for application to thick section boiler components in USC 3
power plant at 650°C, in: Adv. Mater. Technol. Foss. Power Plants - Proc. from 5th Int. 4
Conf., 2008: pp. 92–106. doi:10.1361/cp2007epri0092. 5
[4] E.N. da C. Andrade, On the Viscous Flow in Metals, and Allied Phenomena, Proc. R. 6
Soc. A Math. Phys. Eng. Sci. 84 (1910) 1–12. doi:10.1098/rspa.1910.0050. 7
[5] F.R.N. Nabarro, H.L. Villiers, The Physics of Creep, Elsevier Sci. 17 (1995) 413. 8
doi:10.1016/0966-9795(96)00037-4. 9
[6] M.E. Kassner, T.A. Hayes, Creep cavitation in metals, Int. J. Plast. 19 (2003) 1715–10
1748. 11
[7] J. Lin, Y. Liu, T.A. Dean, A review on damage mechanisms, models and calibration 12
methods under various deformation conditions, Int. J. Damage Mech. 14 (2005) 299–13
319. 14
[8] K.T. Park, E.J. Lavernia, F.A. Mohamed, High temperature creep of silicon carbide 15
particulate reinforced aluminum, Acta Metall. Mater. 38 (1990) 2149–2159. 16
doi:10.1016/0956-7151(90)90082-R. 17
[9] F.C. Monkman, N.J. Grant, An empirical relationship between rupture life and minimum 18
creep rate in creep-rupture tests, in: Proc. ASTM, 1956: pp. 593–620. 19
[10] V.M. Radhakrishnan, The relationship between minimum creep rate and rupture time in 20
Cr-Mo steels, J. Mater. Eng. Perform. 1 (1992) 123–128. doi:10.1007/BF02650043. 21
[11] G. Dimmler, P. Weinert, H. Cerjak, Extrapolation of short-term creep rupture data-The 22
potential risk of over-estimation, Int. J. Press. Vessel. Pip. 85 (2008) 55–62. 23
doi:10.1016/j.ijpvp.2007.06.003. 24
[12] B. Wilshire, P.J. Scharning, Extrapolation of creep life data for 1Cr-0.5Mo steel, Int. J. 25
Press. Vessel. Pip. 85 (2008) 739–743. doi:10.1016/j.ijpvp.2008.04.002. 26
[13] M.F. Ashby, A first report on deformation-mechanism maps, Acta Metall. 20 (1972) 27
44
887–897. doi:10.1016/0001-6160(72)90082-X. 1
[14] M.F. Ashby, H.J. Frost, Deformation-mechanism maps, Oxford Pergamon Press. (1982) 2
44–45. 3
[15] J.P. Poirier, Creep of Crystals, Cambridge University Press, 1985. 4
[16] O.D. Sherby, A.K. Miller, Combining Phenomenology and Physics in Describing the 5
High Temperature Mechanical Behavior of Crystalline Solids, J. Eng. Mater. Technol. 6
101 (1979) 387–395. doi:10.1115/1.3443708. 7
[17] R.L. Coble, A Model for Boundary Diffusion Controlled Creep in Polycrystalline 8
Materials, J. Appl. Phys. 34 (1963) 1679–1682. doi:10.1063/1.1702656. 9
[18] P.M. Burke, O.D. Sherby, Mechanical Behavior of Crystalline Solids at Elevated 10
Temperature., Prog. Mater. Sci. 13 (1968) 323–390. 11
[19] P.J. Ennis, A. Czyrska-Filemonowicz, Recent advances in creep-resistant steels for 12
power plant applications, Sadhana. 28 (2003) 709–730. 13
[20] K. Maruyama, K. Sawada, J. Koike, Strengthening mechanisms of creep resistant 14
tempered martensitic steel, ISIJ Int. 41 (2001) 641–653. 15
[21] J. Pešička, R. Kužel, A. Dronhofer, G. Eggeler, The evolution of dislocation density 16
during heat treatment and creep of tempered martensite ferritic steels, Acta Mater. 51 17
(2003) 4847–4862. doi:10.1016/S1359-6454(03)00324-0. 18
[22] C.G. Panait, A. Zielińska-Lipiec, T. Koziel, A. Czyrska-Filemonowicz, A.-F. Gourgues-19
Lorenzon, W. Bendick, Evolution of dislocation density, size of subgrains and MX-type 20
precipitates in a P91 steel during creep and during thermal ageing at 600 C for more than 21
100,000 h, Mater. Sci. Eng. A. 527 (2010) 4062–4069. 22
[23] M. Mitsuhara, S. Yamasaki, M. Miake, H. Nakashima, M. Nishida, J. Kusumoto, A. 23
Kanaya, Creep strengthening by lath boundaries in 9Cr ferritic heat-resistant steel, 24
Philos. Mag. Lett. 96 (2016) 76–83. doi:10.1080/09500839.2016.1154200. 25
[24] W. Yan, W. Wang, Y.-Y. Shan, K. Yang, Microstructural stability of 9–12% Cr 26
ferrite/martensite heat-resistant steels, Front. Mater. Sci. 7 (2013) 1–27. 27

45
[25] P.-F. Giroux, F. Dalle, M. Sauzay, J. Malaplate, B. Fournier, A.-F. Gourgues-Lorenzon, 1
Mechanical and microstructural stability of P92 steel under uniaxial tension at high 2
temperature, Mater. Sci. Eng. A. 527 (2010) 3984–3993. 3
[26] B. Xiao, L. Xu, L. Zhao, H. Jing, Y. Han, Z. Tang, Microstructure evolution and fracture 4
mechanism of a novel 9Cr tempered martensite ferritic steel during short-term creep, 5
Mater. Sci. Eng. A. 707 (2017) 466–477. doi:10.1016/j.msea.2017.09.086. 6
[27] E. Cerri, E. Evangelista, S. Spigarelli, P. Bianchi, Evolution of microstructure in a 7
modified 9Cr–1Mo steel during short term creep, Mater. Sci. Eng. A. 245 (1998) 285–8
292. doi:https://doi.org/10.1016/S0921-5093(97)00717-X. 9
[28] F. ABe, Effect of fine precipitation and subsequent coarsening of Fe2W Laves phase on 10
the creep deformation behavior of tempered martensitic 9Cr-W steels, Metall. Mater. 11
Trans. A. 36 (2005) 321–332. 12
[29] G. Eggeler, The effect of long-term creep on particle coarsening in tempered martensite 13
ferritic steels, Acta Metall. 37 (1989) 3225–3234. 14
[30] J. Hald, L. Korcakova, Precipitate Stability in Creep Resistant Ferritic Steels-15
Experimental Investigations and Modelling, ISIJ Int. 43 (2003) 420–427. 16
doi:10.2355/isijinternational.43.420. 17
[31] F. Abe, Precipitate design for creep strengthening of 9% Cr tempered martensitic steel 18
for ultra-supercritical power plants, Sci. Technol. Adv. Mater. 9 (2008) 13002. 19
[32] L. Maddi, D. Barbadikar, M. Sahare, A.R. Ballal, D.R. Peshwe, R.K. Paretkar, K. Laha, 20
M.D. Mathew, Microstructure Evolution During Short Term Creep of 9Cr--0.5Mo--21
1.8W Steel, Trans. Indian Inst. Met. 68 (2015) 259–266. doi:10.1007/s12666-015-0586-22
9. 23
[33] T. Shrestha, M. Basirat, I. Charit, G.P. Potirniche, K.K. Rink, Creep rupture behavior of 24
Grade 91 steel, Mater. Sci. Eng. A. 565 (2013) 382–391. 25
doi:10.1016/j.msea.2012.12.031. 26
[34] L.A. Giannuzzi, B.W. Kempshall, S.M. Schwarz, J.K. Lomness, B.I. Prenitzer, F.A. 27

46
Stevie, FIB Lift-Out Specimen Preparation Techniques, in: L.A. Giannuzzi, F.A. Stevie 1
(Eds.), Introd. to Focus. Ion Beams Instrumentation, Theory, Tech. Pract., Springer US, 2
Boston, MA, 2005: pp. 201–228. doi:10.1007/0-387-23313-X_10. 3
[35] D.R. Jara, 9-12 % Cr heat resistant steels : alloy design , TEM characterisation of 4
microstructure evolution and creep response at 650 ° C, 2011. 5
[36] J. Pe??i??ka, A. Aghajani, C. Somsen, A. Hartmaier, G. Eggeler, How dislocation 6
substructures evolve during long-term creep of a 12% Cr tempered martensitic ferritic 7
steel, Scr. Mater. 62 (2010) 353–356. doi:10.1016/j.scriptamat.2009.10.037. 8
[37] D.C. Dunand, B.Q. Han, a. M. Jansen, Monkman-grant analysis of creep fracture in 9
dispersion-strengthened and particulate-reinforced aluminum, Metall. Mater. Trans. A. 10
30 (1999) 829–838. doi:10.1007/s11661-999-1016-6. 11
[38] H. Ghassemi Armaki, K. Maruyama, M. Yoshizawa, M. Igarashi, Prevention of the 12
overestimation of long-term creep rupture life by multiregion analysis in strength 13
enhanced high Cr ferritic steels, Mater. Sci. Eng. A. 490 (2008) 66–71. 14
doi:10.1016/j.msea.2008.01.072. 15
[39] L. Kloc, V. Sklenička, Transition from power-law to viscous creep behaviour of p-91 16
type heat-resistant steel, Mater. Sci. Eng. A. 234–236 (1997) 962–965. 17
doi:10.1016/S0921-5093(97)00364-X. 18
[40] B.K. Choudhary, E. Isaac Samuel, Creep behaviour of modified 9Cr-1Mo ferritic steel, J. 19
Nucl. Mater. 412 (2011) 82–89. doi:10.1016/j.jnucmat.2011.02.024. 20
[41] R.S. Mishra, A.B. Pandey, Some observations on the high-temperature creep behavior of 21
6061 Al-SiC composites, Metall. Trans. A. 21 (1990) 2089–2090. 22
doi:10.1007/BF02647258. 23
[42] J.R. Cahoon, O.D. Sherby, Activation energy for lattice self-diffusion and the Engel-24
Brewer theory, Metall. Trans. A, Phys. Metall. Mater. Sci. 23 A (1992) 2491–2500. 25
[43] J. Onoro, Martensite microstructure of 9–12% Cr steels weld metals, J. Mater. Process. 26
Technol. 180 (2006) 137–142. 27

47
[44] L. Ryde, Application of EBSD to analysis of microstructures in commercial steels, 1
Mater. Sci. Technol. 22 (2006) 1297–1306. 2
[45] H. Kitahara, R. Ueji, N. Tsuji, Y. Minamino, Crystallographic features of lath martensite 3
in low-carbon steel, Acta Mater. 54 (2006) 1279–1288. 4
[46] T. Hamaguchi, H. Okada, S. Kurihara, H. Hirata, M. Yoshizawa, A. Iseda, 5
Microstructural Evaluation of 9Cr-3W-3Co-Nd-B Heat-Resistant Steel (SAVE12AD) 6
After Long-Term Creep Deformation, (2017) V06AT06A064. 7
http://dx.doi.org/10.1115/PVP2017-65241. 8
[47] A. Chauhan, D. Litvinov, Y. de Carlan, J. Aktaa, Study of the deformation and damage 9
mechanisms of a 9Cr-ODS steel: microstructure evolution and fracture characteristics, 10
Mater. Sci. Eng. A. 658 (2016) 123–134. 11
[48] D. Richardot, J.C. Vaillant, A. Arbab, W. Bendick, The T92/P92 book Vallourec-12
Mannesmann tubes, (2000). 13
[49] P. Polcik, T. Sailer, W. Blum, S. Straub, J. urš k, A. Orlová, On the microstructural 14
development of the tempered martensitic Cr-steel P 91 during long-term creep—a 15
comparison of data, Mater. Sci. Eng. A. 260 (1999) 252–259. 16
doi:https://doi.org/10.1016/S0921-5093(98)00887-9. 17
[50] A. Orlová, J. Čadek, Dislocation structure in the high temperature creep of metals and 18
solid solution alloys: a review, Mater. Sci. Eng. 77 (1986) 1–18. 19
[51] P.Z. L. Li G. West, R.C. Thomson, the effect of stress relief heat treatments on 20
microstructural evolution and mechanical properties in Grade 91 and 92 power plant 21
steels, (2011) 679–692. 22
[52] Y. Gu, G.D. West, R.C. Thomson, J. Parker, Investigation of creep damage and 23
cavitation mechanisms in P92 steels, (2014). 24
[53] X. Xu, G.D. West, J.A. Siefert, J.D. Parker, R.C. Thomson, Microstructural 25
Characterization of the Heat-Affected Zones in Grade 92 Steel Welds: Double-Pass and 26
Multipass Welds, Metall. Mater. Trans. A. 49 (2018) 1211–1230. doi:10.1007/s11661-27

48
017-4446-6. 1
[54] J. Hald, Microstructure and long-term creep properties of 9–12% Cr steels, Int. J. Press. 2
Vessel. Pip. 85 (2008) 30–37. 3
[55] F. Abe, M. Taneike, K. Sawada, Alloy design of creep resistant 9Cr steel using a 4
dispersion of nano-sized carbonitrides, Int. J. Press. Vessel. Pip. 84 (2007) 3–12. 5
[56] H. Semba, F. Abe, Alloy design and creep strength of advanced 9%Cr USC boiler steels 6
containing high concentration of boron, Energy Mater. 1 (2006) 238–244. 7
doi:10.1179/174892406X173611. 8
[57] J.E. Dorn, Some fundamental experiments on high temperature creep, J. Mech. Phys. 9
Solids. 3 (1955) 85–116. doi:https://doi.org/10.1016/0022-5096(55)90054-5. 10
[58] L. Falat, A. Výrostková, V. Homolová, M. Svoboda, Creep deformation and failure of 11
E911/E911 and P92/P92 similar weld-joints, Eng. Fail. Anal. 16 (2009) 2114–2120. 12
[59] T. Shrestha, M. Basirat, S. Alsagabi, A. Sittiho, I. Charit, G.P. Potirniche, Creep rupture 13
behavior of welded Grade 91 steel, Mater. Sci. Eng. A. 669 (2016) 75–86. 14
doi:https://doi.org/10.1016/j.msea.2016.05.065. 15
[60] D. Hull, D.J. Bacon, Introduction to dislocations, Elsevier, 2011. 16
[61] Z.B. Zhang, O. V Mishin, N.R. Tao, W. Pantleon, Microstructure and annealing 17
behavior of a modified 9Cr−1Mo steel after dynamic plastic deformation to different 18
strains, J. Nucl. Mater. 458 (2015) 64–69. 19
doi:https://doi.org/10.1016/j.jnucmat.2014.12.001. 20
[62] X. Huang, S. Morito, N. Hansen, T. Maki, Ultrafine Structure and High Strength in 21
Cold-Rolled Martensite, Metall. Mater. Trans. A. 43 (2012) 3517–3531. 22
doi:10.1007/s11661-012-1275-5. 23
[63] C.Y. Barlow, N. Hansen, Y.L. Liu, Fine scale structures from deformation of aluminium 24
containing small alumina particles, Acta Mater. 50 (2002) 171–182. 25
doi:https://doi.org/10.1016/S1359-6454(01)00330-5. 26
[64] K. Sakuraya, H. Okada, F. Abe, BN type inclusions formed in high Cr ferritic heat 27

49
resistant steel, Energy Mater. (2013). 1
[65] K. Sakuraya, H. Okada, F. Abe, Influence of heat treatment on formation behavior of 2
boron nitride inclusions in P122 heat resistant steel, ISIJ Int. 46 (2006) 1712–1719. 3
[66] S. Spigarelli, Constitutive equations in creep of Mg-Al alloys, Mater. Sci. Eng. A. 492 4
(2008) 153–160. doi:10.1016/j.msea.2008.03.007. 5
[67] T. Shrestha, M. Basirat, I. Charit, G.P. Potirniche, K.K. Rink, U. Sahaym, Creep 6
deformation mechanisms in modified 9Cr-1Mo steel, J. Nucl. Mater. 423 (2012) 110–7
119. doi:10.1016/j.jnucmat.2012.01.005. 8
[68] O.D. Sherby, R.H. Klundt, A.K. Miller, Flow stress, subgrain size, and subgrain stability 9
at elevated temperature, Metall. Trans. A. 8 (1977) 843–850. doi:10.1007/BF02661565. 10
11
12

1
INVESTIGATION OF SHORT-TERM CREEP DEFORMATION 1
MECHANISMS IN MARBN STEEL AT ELEVATED 2
TEMPERATURES 3
A Benaarbia*1, X. Xu
2, W. Sun
1, A. A. Becker
1, Mark A. E. Jepson
2 4
1 Department of Mechanical, Materials and Manufacturing Engineering, University of 5
Nottingham, Nottingham, Nottinghamshire, NG7 2RD, UK 6 2
Department of Materials, Loughborough University, Loughborough, Leicestershire 7
LE11 3TU, UK 8
9
10
Abstract 11
This paper reports the short-term creep behavior at elevated temperatures of a MarBN 12
steel variant. Creep tests were performed at 3 different temperatures (625oC, 650
oC and 13
675oC) with applied stresses ranging from 160 MPa to 300 MPa, and failure times from 14
1 to 350 hours. Analysis of the macroscopic creep data indicates that the steady-state 15
creep exhibits a power-law stress dependence with an exponent of 7 and an activation 16
energy of 307 kJ.mol-1
, suggesting that dislocation climb is the dominant rate-17
controlling creep mechanism for MarBN steel. Macroscopic plastic instability has also 18
been observed, highlighted by an obvious necking at the rupture region. All the 19
macroscopic predictions have been combined with microstructural data, inferred from 20
an examination of creep ruptured samples, to build up relations between macroscopic 21
features (necking, damage, etc.) and underlying microstructural mechanisms. Analysis 22
of the rupture surfaces has revealed a ductile fracture mode. Electron Backscatter 23
Diffraction (EBSD) analysis near to the rupture surface has indicated significant 24
distortion and refinement of the original martensitic substructure, which is evidence of 25
long-range plastic flow. Dislocation pile-ups and tangles from TEM were also observed 26
*Marked-up Manuscript

2
near substructure boundaries and precipitate particles. All of these microstructural 1
observations suggest that creep is influenced by a complex interaction between several 2
elements of the microstructure, such as dislocations, precipitates and structure 3
boundaries. The calculated stress exponent and activation energy have been found to 4
agree quantitatively with the highlighted microstructural features, bearing some 5
relationships to the true observed creep microstructures. 6
Keywords: MARBN Steel; Dislocation Climb; Plastic Instability; Short-Term Creep. 7
*Corresponding Author: [email protected] 8
1. INTRODUCTION 9
The 9-12% Cr steels have a combination of good creep properties and sufficient 10
oxidation resistance, with additional benefits from good thermal properties and cost 11
effectiveness [1,2]. The recently developed tempered martensitic MarBN steel (9Cr-12
3W-3Co-VNbBN) belongs to the family of the 9-12% Cr steel and is expected to be 13
used in ultra-supercritical power plant (USC) [3]. This material contains boron and 14
nitrogen at minor levels in combination with solid solution and precipitation 15
strengthening elements to deliver improved microstructural stability that is beneficial 16
for long-term creep performance. 17
Following Andrade [4], three stages can be considered in a typical creep curve: the 18
reduced stage, the steady-state stage and the accelerated stage. Studying these three 19
stages helps in understanding the whole creep process. Creep occurs as a result of 20
interaction (or competition) of both the work hardening process caused by the applied 21
force (experienced as a decrease of the strain rate) and annealing process due to elevated 22

3
temperature [5], resulting in strong microstructural changes (grain boundary sliding, 1
dislocation climb, etc.) [6,7]. These microstructural changes can significantly affect the 2
mechanical features of the material. As the creep deformation begins to increase 3
(reduced stage), the number of dislocations in the material increases and the material 4
becomes harder to deform. Dislocations can thus climb and re-arrange themselves 5
(recovery process). This results in a dynamic equilibrium between the new dislocations 6
caused by plastic deformation and cancellation in the recovery process. Thus, the creep 7
rate becomes almost constant (steady state) and local stress concentrations at grain 8
boundaries causes nucleation of cavities and pores [5]. Most of the creep life is spent in 9
the steady stage with its duration being material-dependent. When these microstructural 10
changes develop into large-scale structural damage, the material fails due to formation 11
of micro-cracks within grains and cavitation at grain boundaries (accelerated stage). 12
The steady-state creep rate often shows a power law dependence on the applied stress 13
and an Arrhenius type law dependence on the temperature . A number of creep-related 14
material properties can be deduced from the steady-state data. The steady-state creep 15
rate (SSCR), the stress exponent , the activation energy for creep , and the mean 16
creep rate ( ), where and are the fracture strain and rupture time respectively, 17
are the most important creep features. These properties can be determined, when a 18
threshold stress is considered, by simple prominent phenomenological laws known 19
as the Park et al. [8] and the modified Monkman-Grant (MG) [9] formulae: 20
where is a material function, is the Young’s modulus that depends on temperature, 21
and denotes the universal gas constant, while terms and stand for the MG 22
constants which are temperature independent. These equations are extensively used in 23

4
power plant engineering applications to predict both SSCR and by extrapolation to 1
lower stress levels. The Monkman-Grant relation is no longer valid for materials that 2
exhibit large tertiary creep and limited steady state (a correction in terms of the fracture 3
strain and the strain at the onset of tertiary stage has to be incorporated [10]). A 4
number of studies have been reported in the literature on extrapolation methods based 5
on creep rupture curves to characterise the change in creep mechanisms [11,12], and 6
development has been made in assigning specific values of both and to the 7
underlying microstructural processes [13–16]. Indeed, creep is generally controlled by 8
diffusion at a low stress when the exponent is close to unity1 [17]. This behaviour is 9
denoted as “Nabarro-Herring” creep (atoms diffuse through the lattice causing grains to 10
elongate along the stress axis) for higher homologous temperatures and “Coble creep” 11
(atoms diffuse along the grain boundaries resulting in grain elongation in the direction 12
of stress) at lower temperatures. At an intermediate stress level, creep is attributed to 13
dislocation movement (“ -power-law” regime) for which the exponent is typically 14
between 3 and 7 [14]. However, the values of exceed 7 at higher stress levels and 15
the behaviour is termed power-law-breakdown or exponential creep [18]. The 16
mechanism of steady-state creep deformation in the power-law-breakdown regime is 17
more complicated and still not completely understood. 18
The creep properties of the 9% Cr steels are, indeed, linked with microstructural 19
characteristics. The initial microstructure of these steels is typically composed of a 20
tempered martensitic matrix in combination with secondary precipitate phases including 21
1 Although fundamental creep deformation theory suggests a value of one in the diffusion creep
regime, there are some reports of higher values up to about 3 (for example see. [66]).

5
grain boundary M23C6 carbides and intragranular MX carbonitrides [19]. A high 1
dislocation density in the matrix, as commonly observed in martensitic steels, provides 2
a structural strengthening effect that contributes to good mechanical properties and 3
creep resistance, whereas secondary precipitate phases deliver additional precipitation 4
strengthening by stabilizing lath and grain boundaries and hindering dislocation 5
movement [20]. Upon creep exposure, the degradation of the martensitic matrix is 6
typically identified by a decrease in dislocation density and the coarsening of the 7
substructure, accompanied with extensive dislocation interactions such as dislocation 8
tangles and dislocation jogs [21–26]. The formation of sub-grains within the martensitic 9
laths also occurs during creep via the formation of dislocation networks within the lath 10
interiors, leading to a decrease in dislocation density upon further growth of sub-grains 11
during creep [24]. Both the coarsening of pre-existing laths and the formation of sub-12
grains are accelerated under increased temperature and stress levels, with the latter 13
being more influential on the rate of microstructural degradation [20,24]. 14
The coarsening of the pre-existing secondary precipitates during creep was also 15
extensively reported in the previous studies on the 9% Cr steels [27–30]. This was 16
linked with the deterioration of creep resistance, particularly under the long-term creep 17
testing conditions, due to a loss of particle pinning effects to stabilise the martensitic 18
microstructure [19,27,31]. Although not as significant as for long-term creep exposure, 19
the coarsening of secondary precipitates was also observed in the 9% Cr steels after 20
short-term creep and was considered as a possible microstructural factor contributing to 21
the deterioration of creep resistance [27,32]. 22

6
Fractography examination and damage assessments have also been conducted to 1
investigate the formation of damage in the 9% Cr steels during short-term creep test. 2
Fractography examinations have revealed a typical ductile fracture surface consisting of 3
dimples formed by transgranular fracture [26,32,33]. The association of dimples and 4
creep cavities with inclusion particles was also reported in previous studies [26,33], 5
suggesting that creep damage is preferentially nucleated on inclusion particles. Detailed 6
observation from the cross-section after short-term creep test also revealed the presence 7
of elongated micro-voids and micro-cracks [26,33] that are similar to plasticity induced 8
damage formed under a high strain rate [7]. 9
Most of the existing studies on the 9% Cr steels were conducted in the medium to the 10
long term creep regimes, whereas limited studies [26,33] were conducted in the short 11
duration creep to understand the related creep mechanisms. The research work 12
presented here was mainly carried out at high stress conditions and elevated 13
temperatures, and aims in developing an insight into the rate-controlling creep 14
deformation processes in the MarBN steel. The relationship that may exist between the 15
macroscopic behaviour (in terms of creep deformation parameters, such as stress 16
exponent, activation energy and cross-section reduction) and the underlying 17
microscopic mechanisms (dislocation interaction, coarsening of precipitates and lath 18
structure, damage characteristics, etc.) has been investigated. Another objective consists 19
in decoupling both creep and local plasticity instability observed in failed MarBN 20
specimens. The elucidation of these global and local creep mechanisms will facilitate 21
the identification of the operating creep mechanisms in the MarBN steel, and thus 22
contribute to the understanding of the creep rupture behaviour after short-term creep 23
exposure. 24

7
1
2
2. MATERIAL AND EXPERIMENTAL METHODS 3
The experimental investigation was conducted on a recently developed creep-resistant 4
MarBN steel. The chemical composition of the steel is given in Table 1. Cylindrical 5
uniaxial specimens with a 50 mm gauge length and a 10 mm gauge diameter (see Fig. 1) 6
were machined from forged bars. Before manufacturing the samples, the as-forged bars 7
were normalised at 1200°C for 4 hours and tempered at 765°C for 3 hours, to obtain a 8
coarse-grained tempered martensitic microstructure, Fig. 2. 9
10
Table 1: Chemical composition of the investigated material (all elements are in wt. %, B 11
and N are in ppm). 12
C Si Mn P S Cr Mo Ni
0.1 0.45 0.54 0.012 0.004 8.74 0.05 0.14
Al B Co Cu Nb V W N
0.007 120 3.02 0.04 0.06 0.21 2.53 180
13
14
Fig. 1: Uniaxial creep test samples used for the experimental work. 15

8
1
Fig. 2: An EBSD orientation map providing an overview of the microstructure of the as-2
received material. The partition of boundaries with a misorientation range of 20˚ – 50˚ is 3
shown in black to highlight the Prior Austenite Grain Boundaries (PAGBs). 4
Short-term creep tests were carried out using a creep testing machine equipped with a 5
resistance heating furnace with a maximum operating temperature of 800˚C. Three 6
thermocouples were mounted on the specimen inside the furnace to control and track 7
the furnace temperature. The tests were performed at different stress levels ranging from 8
160 MPa to 300 MPa and three temperatures: 625°C, 650°C and 675°C. The values of 9
the applied stress were chosen such that the test durations were less than 350 hours (thus 10
equivalent to a stress range close to, but less than, the yield stress) to emphasize the 11
effect of local plasticity on the rupture behaviour of the MarBN steel. After short-term 12
creep tests, creep ruptured specimens were sectioned along the centre line of the gauge 13
portions to facilitate detailed microstructural characterisation of the cross-sections. The 14
samples were prepared for using conventional metallographic preparation procedures, 15
which involved an initial grinding stage on SiC with water, polishing stages using 6 µm 16

9
and 1 µm diamond suspensions and a final chemo-mechanical polishing stage using a 1
suspension of 0.06 µm colloidal silica. 2
Fractography of the rupture surfaces was conducted using a Leo 1530VP Field 3
Emission Gun (FEG) Scanning Electron Microscope (SEM) with Secondary Electron 4
(SE) micrographs collected using an Inlens annular detector. Back Scattered Electron 5
(BSE) micrographs were collected using a JOEL® JSM-7800F FEG-SEM to study the 6
distribution of damage and inclusions in the as-received material, gauge and head 7
portions of the ruptured specimens. In the as-received material and the head portions, 25 8
BSE micrographs covering a total area of ~300,000 µm2 were collected from each 9
location. BSE micrographs were also collected along the centre of each specimen at 10
intervals of 0.5 mm to determine the variation of damage within the gauge portions. The 11
characteristics of the martensitic microstructure were investigated using Electron 12
Backscatter Diffraction (EBSD) in an FEI®
Nova Nanolab 600 dual-beam Focused Ion 13
Beam (FIB)/FEG-SEM equipped with an EDAX® Hikari EBSD camera. In the as-14
received material and the head portions, 5 EBSD maps measuring 50 µm × 50 µm were 15
collected to quantitatively analyse the grain structure with sufficient statistical 16
significance. Three EBSD maps of the same size were also collected from the gauge 17
portions of the specimens that were tested at 650°C to investigate the grain structures in 18
the regions 0.1 mm, 5.0 mm and 20.0 mm from the rupture surface. The area of 19
individual martensitic blocks and the length density of martensitic boundaries were 20
quantitatively measured from the EBSD maps. The elongation of the martensitic 21
microstructure along the principal stress direction was also determined using the line 22
intercept method with the direction of lines in parallel with the nominal stress direction. 23

10
The intercept length of the grains in the gauge portion was normalised for comparison 1
with the head portion using the following equation: 2
where , , and are the normalised intercept length, the 3
experimentally measured intercept length, the average area of the grains in the head and 4
the gauge portions, respectively. The distribution characteristics of secondary 5
precipitates were quantitatively analysed using ion beam induced SE imaging enhanced 6
using in-situ XeF2 gas etching in the dual beam FIB/FEG-SEM with a Ga+ ion source 7
operated at an accelerating voltage of 30 kV. From each specimen, 10 micrographs 8
covering a total area of ~1,500 µm2 were collected at random areas with a minimum 9
spacing of 500 µm. The number density and the average size of secondary precipitates 10
were measured from the obtained micrographs using a grey scale segmentation method. 11
Thin-foil specimens were prepared using a FIB-based lift-out technique [34] in the dual 12
beam FIB/FEG-SEM with specimen surfaces at approximately 45° to the principal 13
stress direction. The thinning process was conducted using the Ga+ ion source operated 14
at an accelerating voltage of 30 kV with a minimum ion beam current of 0.1 nA. A final 15
cleaning process was also performed on the electron-transparent region at a lower 16
accelerating voltage of 5 kV. An FEI®
Tecnai® F20 Transmission Electron Microscope 17
(TEM) was used for diffraction contrast imaging of dislocations in the Bright Field 18
Scanning Transmission Electron Microscopy (BF-STEM) mode with an electron beam 19
direction close to the <001> zone axis [35,36]. The chemical composition of 20
precipitates was also analysed using Energy Dispersive X-ray spectroscopy (EDX) with 21

11
an Oxford Instruments X-Max 80N TLE EDX system in the same TEM system at an 1
accelerating voltage of 200 kV. 2
3. RESULTS 3
3.1. Creep behaviour analysis 4
The short-term creep curves that were obtained under different temperatures and 5
stresses are presented in Fig. 3 with corresponding creep properties in Table 2. All data 6
extracted from the creep curves exhibit the following main characteristics: i) the steady-7
state is of long duration and, in most cases, does not exceed 3% strain, ii) the 8
accumulation of strain in the tertiary stage ( ) is much higher compared to that in both 9
reduced ( ) and steady-state ( ) creep regimes, and iii) significant necking is 10
observed during the final stage of creep (see Fig. 4). All these observations suggest that 11
the dramatic increase in strain observed in the tertiary stage is a result of macroscopic 12
plastic instability prior to the fracture (a loss of balance between the increase in strength 13
due to hardening and increase in stress due to the reduction in cross-section area (RA)). 14
The specimen fractured when the reduction in cross-section reached 59 to 83% 15
depending on the temperature and applied stress levels. 16
A number of creep material properties can be deduced from the uniaxial creep curves, 17
including the value of the steady-state creep rate (SSCR), the time to fracture ( ) and 18
the mean creep rate ( ). The interaction between all of these creep properties is 19
shown in Fig. 5. For all the selected temperatures, the creep properties can be 20
comprehensively expressed using the following expressions (simple power-law and 21
modified Monkman-Grant relationships): 22

12
1
where and are temperature-dependent creep functions while 2
and stand for the Monkman-Grant (MG) constants which are found to be temperature 3
independent. The apparent values of the creep properties defining rupture life-stress 4
(respectively SSCR) relationships at the selected temperatures (respectively applied 5
stresses) are given in Table 3. The computed values of apparent stress exponents and 6
are very high due to the high stresses employed2. Good correlation with the modified 7
Monkman-Grant (MG) relationship was also observed for the rupture creep-life data 8
(Fig. 5c). With the increase of SSCR, the mean creep rate ( ) increases in a roughly 9
straight line slope of 0.88. It is worth noting that such approach is widely used in high-10
temperature engineering to determine the creep life of structural components. 11
Developing predictive models to estimate rupture time of MarBN from the results of 12
short term tests is of particular interest. The Monkman-Grant relationship has been 13
shown to be valid for most metals and alloys used in creep resistant applications [37]. 14
However, such an approach cannot be valid for long-term behaviour since the prediction 15
of longer term creep properties from short term creep data may be inaccurate causing 16
overestimation of long term creep rupture time [38]. 17
The creep strain accumulation is also a thermally-activated process. According to the 18
creep data presented beforehand, the functional dependence of the steady-state rates on 19
temperature follows an Arrhenius-type law where the apparent activation energy for 20
2 To rationalise the high apparent stress exponents, a threshold stress, defined as the stress
below which no creep deformation occurs [67], is often considered to elucidate the true creep
mechanisms.

13
creep is a stress-dependent function. Values of the apparent activation energy at 1
the selected stress levels are also compiled in Table 3 (these values decrease with 2
increasing applied stress). It can be seen that these values are much higher and do not 3
reflect the true value of the activation energy. Higher apparent creep activation energies 4
for different high strength Cr-Mo steels have also been reported by different studies 5
[39,40]. 6
7
8
9
10

14
1
Fig. 3: Strain-time curves for creep tests conducted on MarBN samples at the selected 2
temperatures: (a) 625°C, (b) 650°C, (c) 675°C. 3
4
Table 2: Material creep features associated with the uniaxial creep curves plotted in Fig. 3. 5
denotes the transient creep time. 6
[°C]
[MPa]
[%]
[h]
[%]
[h]
SSCR
]
[h]
[%]
RA
[%]
625
240 1.42 33.54 2.97 168.51 1.14 242.88 14.21 60.31
260 1.43 8.68 2.87 32.15 6.34 58.04 12.43 70.84
280 1.43 1.73 2.54 6.71 27.03 13.93 12.02 79.75
300 1.44 0.52 2.79 1.44 149.01 2.93 10.65 82.02
650
200 1.04 46.84 2.18 243.41 0.61 342.91 11.93 62.05
220 1.09 11.33 2.63 66.71 2.91 95.47 9.36 73.68
240 0.82 3.73 2.26 10.05 28.03 13.73 11.48 74.29
260 0.78 0.21 2.31 2.01 100.02 4.43 10.43 75.11
280 0.78 0.08 2.79 0.51 485.12 0.94 14.88 81.08
675
160 0.55 18.07 1.44 185.01 0.54 309.53 8.89 59.04
180 0.71 8.61 1.91 61.68 2.33 99.82 9.82 72.96
200 0.81 0.99 2.26 11.03 15.13 19.36 8.93 77.62
220 0.83 0.35 2.26 2.49 69.27 4.88 10.33 81.42 7

15
1
Fig. 4: MarBN specimens after creep testing showing necking. 2
3
4 Fig. 5: (a) Time to fracture as a function of applied stress. (b) SSCR versus applied stress. 5
(c) Mean creep rate ( ) versus SSCR plotted according to the modified Monkman-6
Grant relation-ship (see. Eq. (3)). 7
8
Table 3: Apparent values of creep function coefficients for MarBN steel. The values of MG 9
constants are found independent of temperature. In the Arrhenius law, stands for a 10
material constant that depends on temperature. The values of are extracted by plotting 11
ln (SSCR) against the reciprocal temperature under the constant stress level and 12
assuming that the apparent stress exponent is constant over the regime examined. 13 14
Applied temperature
[°C]
625
650
675
Time to fracture
[(MPa)-1
.h]
2.69
7.59
1.91
[-]
19.77
17.53
13.02
Steady-state creep rate
[(MPa.h)-1
]
1.25
1.07
1.17
[-]
21.84
19.88
15.27
Monkman-Grant relationship
[-]
0.635
0.631
0.636
[-]
0.86
0.87
0.89
Applied stress
220
240
260

16
[MPa]
Activation energy
[kJ.mol-1
]
923.07
882.69
760.58
1
As mentioned previously, both the values of apparent stress exponent, and apparent 2
activation energy , obtained beforehand, are high and cannot reflect the true rate-3
controlling creep mechanism. This is because they were computed for a constant 4
substructure model by assuming that the microstructure remains constant during creep 5
and subsequent failure, which is not entirely true for the MarBN steel where substantial 6
microstructural evolution is observed during creep exposure (e.g. dynamic precipitate 7
distribution, dislocation structure and lath/grain structure). Some researchers have 8
pointed out that the true values of the stress exponent, and activation energy, 9
can be assessed by considering the variation of Young’s modulus with temperature 10
and by introducing the concept of creep threshold stress [41]. The stress threshold, 11
denoted hereafter by , is introduced to explain variations of the stress exponent and 12
activation energy with the applied stress. Using Eq. 1, the effective stress (i.e. 13
) can be determined following the equation given below: 14
Several values of stress exponent, were considered to emphasize whether the rate-15
controlling creep mechanism is viscous glide3 ( 3), climb
4 ( 4-7) or lattice-16
3 Viscous glide creep is generally characterized by the absence of subgrains [18].
4 Climb-controlled creep is characterized by the formation of subgrains whose size is inversely
proportional to the applied stress [18].

17
diffusion5 ( 8). The threshold stress, was estimated by plotting 1
against , and linearly extrapolating these creep data to a zero value of the creep rate 2
(the interaction of the extrapolated line with the X-axis gives the threshold stress at a 3
particular temperature). Examination of creep data reveals that both 7 and 8 yield 4
to the best linear fit between and (see. Fig. 6a), with a correlation 5
coefficient greater than 0.99 (see Table 4) for the three selected temperatures. The 6
corresponding values of the threshold stress are gathered in Table 4. The threshold 7
stress is found to be strongly sensitive to the applied temperature ( increases with 8
decreasing temperature). To determine the relationship between the threshold stress and 9
the assumed stress exponent, SSCR was plotted against the normalized effective stress 10
on logarithmic plot in Fig. 6b. All correctional values of the real stress exponent ( ) 11
are found to be close to the assumed values of 7 and 8 (see. Table 4). According to Eq. 12
4, the real activation energy for creep can be evaluated as , where is the 13
slope of the natural logarithm of with respect to the reciprocal temperature . 14
Given Young’s modulus values for the selected temperatures (see Table 4), the real 15
activation energy values are found equal to 307.82 kJ.mol-1
and 297.56 kJ.mol-1
for = 16
7 and 8, respectively. These values are largely lower than the apparent activation 17
energies obtained beforehand. They are close to the lattice self-diffusion energy for Cr 18
( 308.6 kJ.mol-1
) [42]. It can thus be suggested that dislocation climb is the dominant 19
rate-controlling creep mechanism in the MarBN steel. The steady-state creep is 20
therefore exhibiting a power-law stress dependence with an exponent of 7 and a real 21
activation energy of 307.82 kJ. mol-1
. 22
5 The lattice diffusion-controlled creep requires that the subgrain size remains constant over the
entire stress range [68].

18
1
2
Fig. 6: (a) Minimum creep rate to one-seventh (-eighth) power versus applied stress, (b) 3
Minimum creep rate as function of the normalized effective stress ( ) for the three 4
selected temperatures. 5
6
Table 4: Values of the threshold stress , the correctional true stress exponent 7
and the corresponding correlation coefficient computed for the selected real 8
stress exponents = 7 and 8. Table 4 includes also the values of the corresponding 9
Young’s modulus extracted from tensile data conducted on MarBN steel at the selected 10
temperatures. 11
[°C]
= 7 = 8
[GPa]
[MPa]
[MPa]
625 182.71 6.68 0.994 170.29 7.72 0.996 152.73
650 154.86 6.61 0.992 143.17 7.67 0.994 148.46
675 104.62 6.65 0.992 92.56 7.69 0.993 145.52
12
By analysing the foregoing results, it is still hard to explore all the deformation 13
mechanisms governing the creep behaviour of the MarBN steel. The power law regime 14
is very flexible and it is feasible to change expressions of the stress exponent and 15
activation energy by adding some internal variables like dislocation density and 16
subgrain size. A fundamental understanding of the microstructural configuration and 17
evolution is therefore needed to emphasize the dominant creep deformation mechanism. 18
All the local changes occurring under creep conditions are of great importance in high-19
temperature advanced steels because they strongly affect their creep and failure 20

19
properties. The creep process is naturally accompanied by many different 1
microstructural rearrangements including dislocation movement and grain-boundary 2
cavitation. The emphasis of creep modelling is to combine the macroscopic behaviour 3
and these underlying microscopic mechanisms, in order to build up a direct relation 4
between the strain rate and internal variables such as dislocation density, velocity of 5
climb, internal stress and subgrain size. 6
3.2 Fractographic examination and damage assessment after short-term 7
creep 8
The topography of the rupture surfaces and the damage within the cross-sections were 9
characterised using SE imaging. Fig. 7 shows SE micrographs that were collected from 10
the rupture surface and the cross-section of a specimen that was tested at 650ºC with an 11
applied stress of 200 MPa. 12

20
1
Fig. 7. SE micrographs showing (a and b) the topography of the rupture surface and (c 2
and d) micro-voids or cavities in the cross-section after creep testing at 650ºC and 200 3
MPa. 4
The rupture surfaces of all the ruptured specimens consist of a shear lip close to the 5
outer rim and a dimpled fracture surface in the central region (Fig. 7a). Similar 6
topography of rupture surfaces have been observed in previous studies of similar 7
material, and was linked with ductile fracture behaviour [26,32,33]. Elongated micro-8
voids with a size from less than 1 µm to approximately 3 µm were also observed close 9
to the rupture surface from cross-sections (Fig. 7c). In the regions away from the rupture 10
surface, creep induced damage is predominantly in the form of cavities with sizes of 11
less than 1 µm (Fig. 7d). 12

21
Micro-voids and cavities that were developed during the short-term creep test were 1
further studied using SE imaging, with the microstructural features associated with 2
micro-voids and cavities identified using EDX (Fig. 8). The association of inclusion 3
particles with micro-voids and cavities was extensively observed in creep ruptured 4
specimens (Fig. 8a). EDX analysis revealed the association of the micro-voids in the 5
necked area with both the BN and MnS type inclusions (Fig. 8c-d), whereas the cavities 6
in the regions away from the rupture surface are predominantly associated with the BN 7
inclusion particles (Fig. 8b). 8
9
Fig. 8. SE micrographs showing the details of (a) micro-voids near to the rupture surface 10
in the necked area and (b) cavities and inclusions in the regions away from rupture 11
surface after creep testing at 650°C with an applied stress of 200 MPa. The EDX spectra 12
that were collected from (c) MnS and (d) BN inclusions are also included. 13

22
The distribution of damage and inclusions along the longitudinal direction of the gauge 1
portions was also quantitatively assessed from the cross-section of specimens creep 2
tested at 650ºC, Fig. 9. 3
4

23
Fig. 9. Graphs showing (a) number per unit area, (b) size and (c) area fraction of creep 1
induced damage and inclusions along the gauge portion of specimens after creep testing at 2
650ºC. The distribution of inclusions in the stress-free head portions and the as-received 3
materials are also included for comparisons. 4
The distribution of inclusions in the head portion (i.e. the hollow circles) is not 5
significantly different from the distribution in the as-received material (i.e. the grey 6
box). However, the average size and the area fraction are higher in all the regions from 7
the gauge portions (i.e. the solid circles) than the head portions (Figs. 9b-c), whereas the 8
number density in the gauge portions is higher only in the regions from the necked part 9
(less than ~5 mm from the rupture surface) (Fig. 9a). Since the measurements from BSE 10
micrographs both included the pre-existing inclusion particles and the associated creep 11
induced damage, the distribution characteristics of damage in the gauge portion can be 12
determined from the difference in distribution between the gauge and the head portions. 13
A higher extent of damage was therefore identified in the necked part than in the 14
regions further away from the rupture surface (i.e. > 5 mm) in both of the specimens 15
tested at 200 MPa and 280 MPa. The damage presented in the necked part is higher in 16
number density and lower in average size in the specimen tested at 280 MPa (Figs. 9a-17
b), whereas the area fraction of damage is similar between both specimens (Fig. 9c). In 18
addition, it was observed that the number density, in the regions that are over 5 mm 19
from the rupture surface, is similar to the number density of inclusions in the as-20
received material (Fig. 9a). The similar distribution of particles in the region over 5 mm 21
away from the rupture surface to the as-received material indicates that the local 22
damage was preferentially nucleated on inclusion particles, whilst the higher number 23

24
density in the necked part suggests that the local damage may not be necessarily formed 1
on inclusion particles. 2
3.3 Microstructural changes during short-term creep 3
3.3.1. Initial microstructure in the as-received material 4
The as-received material shows a typical tempered martensitic microstructure in which 5
Prior Austenite Grains (PAGs) are hierarchically divided into packets, blocks and sub-6
block laths [43]. The PAGs in the as-received material are typically over 100 µm in size 7
with the misorientation of PAGBs in a range of 20º - 50º (Fig. 2 and Fig. 10) [44]. The 8
martensitic blocks are approximately 1.5 µm in width, whereas the misorientation of 9
block boundaries are within a range of 2º - 20º and 50º - 60º due to a Kurdjumov-Sachs 10
orientation relationship with the parental austenitic phases (Fig. 10b) [45]. The size of 11
the martensitic blocks and the length density of martensitic boundaries were 12
quantitatively measured and are presented in Table 5. 13
14
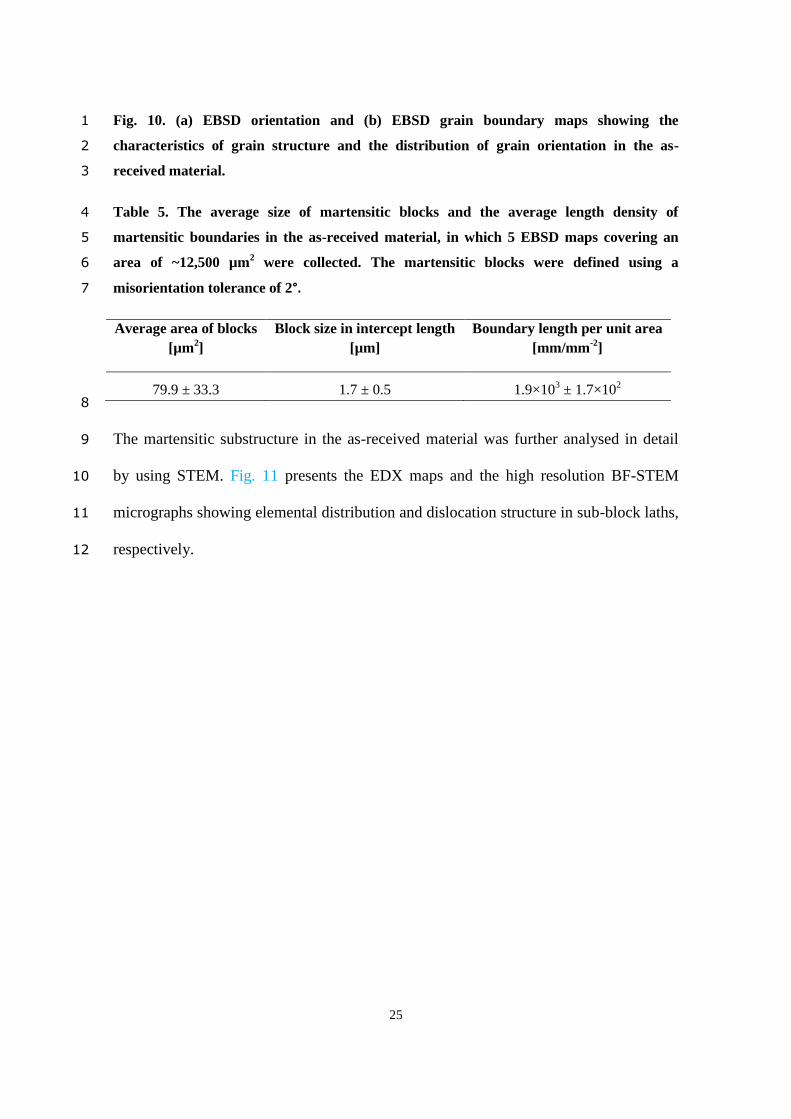
25
Fig. 10. (a) EBSD orientation and (b) EBSD grain boundary maps showing the 1
characteristics of grain structure and the distribution of grain orientation in the as-2
received material. 3
Table 5. The average size of martensitic blocks and the average length density of 4
martensitic boundaries in the as-received material, in which 5 EBSD maps covering an 5
area of ~12,500 µm2 were collected. The martensitic blocks were defined using a 6
misorientation tolerance of 2°. 7
Average area of blocks
[µm2]
Block size in intercept length
[µm]
Boundary length per unit area
[mm/mm-2
]
79.9 ± 33.3
1.7 ± 0.5
1.9×10³ ± 1.7×10
2
8
The martensitic substructure in the as-received material was further analysed in detail 9
by using STEM. Fig. 11 presents the EDX maps and the high resolution BF-STEM 10
micrographs showing elemental distribution and dislocation structure in sub-block laths, 11
respectively. 12

26
1
Fig. 11. (a) BF-STEM and (b-d) EDX maps showing the distribution of elements within an 2
individual martensitic lath. The precipitate phase particles that are enriched in Cr and W 3
are indicated by arrows in (a). (e and f) BF-STEM micrographs showing the detailed 4
dislocation structure from the regions as indicated by the black boxes in (a). The nano-5
scale precipitates presented in the same regions are indicated by white circles in (e and f). 6
The martensitic substructure within an individual block is composed of elongated sub-7
block laths that are typically a few microns in size and precipitate particles that are 8
distributed both on sub-grain boundaries and within the sub-grain interiors (Fig. 11a). 9
The precipitates that are distributed on sub-grain boundaries are predominantly a few 10

27
hundred nanometres in size and are relatively more abundant in Cr and W than in the 1
matrix (Figs. 11b-d), which is similar to previously reported observations of M23C6 2
carbides [46]. The dislocation structure within individual sub-block laths is similar to 3
the existing observations from the tempered martensitic microstructure [36,47], which is 4
a highly-dense dislocation network consisting of straight dislocation lines (Figs. 11e-f). 5
Nano-scale precipitate particles, predominantly less than 5 nm in size were also 6
observed within the laths (Figs. 11e-f). Thorough analysis of the precipitate particles is 7
difficult due to small sizes, but the existing observations from 9% Cr steels suggest that 8
these are fine-scale Nb/V-rich MX carbonitrides [31]. It is worth noting that the MX 9
carbonitrides in MarBN steels are normally smaller in size than the more conventional 10
9% Cr steels with a higher level of N addition (i.e. 300-700 ppm in Grade 91 and 92 11
[48]) [19]. MarBN steel is designed to have a lower N level to mitigate the formation of 12
detrimental BN intermetallics as well as to contribute to a well dispersed MX 13
distribution [31]. 14
3.3.2. Microstructural characterisation of creep exposed materials 15
EBSD maps of samples creep-exposed at 650˚C are shown in Fig. 12. 16

28
1
Fig. 12. (a-d) EBSD-IQ and (e-l) EBSD-IPF showing the characteristics of grain structure 2
and distribution of grain orientation after creep testing at 650ºC. The boundaries with a 3
misorientation of 20º - 50º and 2º - 20º/50º - 60º are outlined in (e-h) and (i-l), respectively. 4
After short-term creep testing with an applied stress of 200 MPa, the martensitic 5
microstructure in the region ~20 mm away from the rupture surface (Fig. 12a) is similar 6
to the microstructure in the as-received material (Fig. 10). However, the martensitic 7
microstructure in the specimen tested at 280 MPa is more refined, consisting of blocks 8
with a similar width to the as-received material and smaller grains that are typically 2 – 9
3 µm in size (Fig. 12b). In the necked part close to the rupture surface, the pre-existing 10
martensitic microstructure was significantly distorted along the principal stress direction 11

29
(Figs. 12c-d) at both applied stress levels, accompanied with the formation of a finer 1
martensitic substructure within individual blocks (Figs. 12k-l) in the region 0.1 mm 2
away from the rupture surface. The micro-voids in the regions close to the rupture 3
surface are also elongated in parallel with the principal stress direction (Figs. 12c-d). A 4
higher extent of grain structure distortion and refinement was observed in the specimen 5
tested at a higher applied stress of 280 MPa. 6
The size of the martensitic blocks and the length of boundaries per unit area were 7
quantitatively measured from EBSD maps. Fig. 13 compares the block size and 8
boundary length densities between the necked gauge regions, non-necked gauge regions 9
and the head portion after creep testing at 650°C. 10
11
Fig. 13. Graphs comparing (a) average area of martensitic blocks, (b) length density of 12
boundaries, (c) average intercept length and (d) normalised intercept length in the regions 13
that are 0.1 mm and 20.0 mm away from the rupture surface and in the head portion. The 14
data from the as-received material are also included in (a-c) for comparison (grey bar). 15

30
The standard deviations between the measurements from the same distance from the 1
rupture surface are indicated by half of the lengths of error bars. 2
In both specimens tested at 650°C, the average area and the average intercept length in 3
the head portions are slightly higher than the as-received material (Figs. 13a and 13c), 4
whereas the length density of the martensitic boundaries from the same regions is 5
slightly lower (Fig. 13b). The characteristics of the martensitic microstructure vary as a 6
function of distance from the rupture surface in the gauge portion. The average area 7
increases, whereas the length density of boundaries decreases as distance from the 8
rupture is increased (Figs. 13a-b). Compared to the specimen tested under 200 MPa, the 9
650°C/280 MPa specimen shows a lower average area in the regions that are 0.1 mm 10
from the rupture surface (Fig. 13a). This is consistent with previous observations from 11
the martensitic steels in which the substructure becomes more refined at an higher 12
applied stress in the dislocation-climb-controlled creep regime [22,49,50]. 13
The distortion of the original martensitic microstructure under the effect of plastic strain 14
can be better identified by normalising the intercept length along the principal stress 15
direction using the average area in the head portions (Eq. 2). Compared to the head 16
portion, the normalised intercept lengths are higher in the regions at 0.1 mm and 20 mm 17
away from the rupture surface in the specimens tested under an applied stress of 280 18
MPa, whereas this characteristic is only higher in the region at 0.1 mm away from the 19
rupture surface in the specimen tested under 200 MPa (Fig. 13d). This indicates that the 20
original microstructure in the regions 20 mm away from the rupture surface was also 21
distorted along the principal stress direction in the specimen tested under an applied 22
stress of 280 MPa, whereas the distortion of the original microstructure only occurred in 23
the region close to the rupture surface in the specimen tested at 200 MPa. This has 24

31
further suggested that plastic deformation was preferentially accumulated in the necked 1
area close to the rupture surface in the specimen tested at 200 MPa, whereas plastic 2
deformation also occurred in the region further away from the rupture surface in the 3
specimen tested at 280 MPa. The average values of the normalised intercept length are 4
also higher in the 650°C/280 MPa specimen compared to the 650°C/200 MPa specimen 5
(Fig. 13d). This observation suggests a higher extent of plastic instability for the 6
specimen tested under an applied stress of 280 MPa, which is also in agreement with the 7
macroscopic observation that confirmed a higher reduction of area for the specimen 8
tested at 280 MPa than 200 MPa (Table 2). 9
The distribution of Cr and W-rich M23C6 carbides were also investigated using ion beam 10
induced SE imaging. Fig. 14 shows ion beam induced SE micrographs that were 11
collected after creep testing at 650ºC and the graphs comparing the distribution of 12
carbide precipitate particles between the regions that are at 0.1 mm from the rupture 13
surface and from the stress-free head portions. 14
15

32
Fig. 14. (a and c) Ion beam induced SE micrographs showing the grain boundary M23C6 carbides in 1
the regions at 0.1 mm from the rupture surface after creep testing at 650ºC. (b and d) Graphs 2
comparing the distribution of precipitate particles between the regions at 0.1 mm from the rupture 3
surface (gauge), the stress-free head portions (head) and as-received material. 4
In previous studies of 9% Cr steels, the use of ion beam induced SE imaging has been 5
successful in the quantitative analysis of the M23C6 carbides [51–53]. In the 9% Cr 6
MarBN steel being analysed in this study, this technique was again capable of 7
differentiating the relatively larger M23C6 carbides (Fig. 13a) as dark particles from a 8
relatively brighter background of the matrix (Figs. 14a and 14c). As shown, there are 9
minor differences between the as-received material and the stress-free head portions for 10
both of the specimens tested at 650°C. In the specimen tested at an applied stress of 200 11
MPa, the average value of the number of M23C6 per unit area is slightly lower for the 12
region at 0.1 mm from the rupture surface, whereas the average size in the same region 13
is slightly higher than the stress-free head portion (Figs. 14b and 14d). This indicates 14
that the pre-existing M23C6 carbide particles are slightly coarsened during short-term 15
creep test at an applied stress of 200 MPa, whereas the carbides in the specimen tested 16
at 280 MPa were not significantly changed due to the short test time period (i.e. ~ 1 17
hour). The coarsening of carbide particles is detrimental to creep resistance as this 18
deteriorates microstructural stability by losing the pinning effect of substructure 19
boundaries and dislocations [27,32]. 20
The characteristics of the martensitic substructure and dislocation structure in the 21
specimens that were tested at 650ºC/200 MPa and 650ºC/280 MPa were also studied 22
using BF-S/TEM imaging as shown in Fig. 15. 23

33 1

34
Fig. 15. (a and b) BF-TEM and representative (c-h) BF-STEM micrographs showing the 1
characteristics of the martensitic substructure and dislocation structure within individual 2
sub-grains in the regions 0.5 mm from the rupture surface after creep testing at 650ºC 3
with an applied stress of (a, c, e and g) 200 MPa and (b, d, f and h) 280 MPa. 4
In the specimen that was tested at 650ºC with an applied stress of 200 MPa (Fig. 15a), 5
the sub-block laths are predominantly 1 – 2 µm in length, whereas a more refined 6
martensitic substructure consisting of sub-block laths of less than 1 µm in length was 7
observed in the specimen tested at an applied stress of 280 MPa (Fig. 15b). In the 8
specimen tested at an applied stress of 200 MPa, some of the laths exhibited a 9
dislocation network consisting of straight dislocation lines (Fig. 15c), similar to the 10
dislocation structure in the as-received material (Fig. 11e-f), whereas a much lower 11
number of dislocations was observed within other sub-block laths in the same specimen 12
(Fig. 15e). Extensive dislocation interactions in the form of dislocation jogs and the 13
interaction of dislocations with nano-scale precipitate particles were also observed in 14
the same laths showing a lower number of dislocations (Fig. 15g). Dislocation pile-ups 15
were also observed close to the relatively larger precipitates on lath boundaries (Fig. 16
15e). In the specimen tested at an applied stress of 280 MPa, the number of the 17
dislocations within sub-block laths was lower than the as-received material (Figs. 15d 18
and 15f). Dislocation jogs, tangles and pile-ups were also extensively observed within 19
individual laths from the same specimen (Figs. 15d-h). The nano-scale precipitates 20
(MX) in the creep-exposed specimens (Figs. 15g and 15h) are similar in size to those in 21
the as-received material without creep exposure (Fig. 11). This indicates that the MX 22
carbonitrides were not significantly changed in size during short-term creep, which is 23
consistent with existing observations of MX carbonitrides being more resistant to 24

35
coarsening than M23C6 during creep exposure [19,54]. The stable MX precipitates 1
enhance the creep resistance of the MarBN steel by improving the stability of the 2
dislocation structure [31,55]. These observations indicate that the microstructure of the 3
MarBN steel is stabilised via structural strengthening and precipitation strengthening 4
mechanisms [19,30,56] to deliver satisfactory creep resistance for industrial 5
applications. 6
4. DISCUSSION 7
Experiments have been conducted on MarBN steel over a range of applied stresses and 8
temperatures to 1) build up a direct relationship between the creep strain rate and 9
internal variables, 2) decouple both creep and local plasticity-driven mechanisms, and 10
3) elucidate the true rate-controlling creep deformation mechanism. The main results are 11
summarised as follows: i) the steady-state creep rate exhibits a power-law stress 12
dependence with an exponent of seven (SSCR ), ii) the corresponding real 13
activation energy has been determined to be 307 kJ.mol-1
, which is close to the lattice 14
self-diffusion energy in Cr (308.6 kJ.mol-1
) [42], and iii) a macroscopic plastic 15
instability was observed, highlighted by an obvious necking within the gauge length 16
towards the rupture surface. 17
The dominant creep deformation mechanism for MarBN can be inferred from 18
the and values. Following i) and ii), it has been suggested that dislocation climb 19
is the rate-controlling mechanism of creep at both high stress and elevated temperature. 20
Based on the existing studies of creep in polycrystalline metallic materials [18,57] and 21
the more recent studies on other 9% Cr steels [33,58,59], dislocation climb is stated as 22
an out-of-plane movement for edge dislocations. Its rate depends on many factors, 23

36
including chemical forces, the mobility of jogs and the rate of migration of vacancies 1
[60]. The operation of dislocation climb normally requires more energy and is 2
associated with a slower rate than dislocation glide in most of the alloys, and was hence 3
considered as the rate-controlling factor for creep [18,57]. 4
Among the possible aforementioned deformation mechanisms which accelerate the 5
creep rate and may strongly contribute to the creep deformation, necking instability is 6
generally observed. In the power-law equation, the creep strain is considered to be 7
homogeneous along the specimen axis, which is not entirely true. The creep curves 8
obtained are, thus, a combination of the operating creep mechanisms in the material and 9
the development of a neck. Indeed, the local deformation behaviour is expected to be 10
creep influenced in the regions away from the necked region. However, at the regions 11
near to rupture surface, the behaviour is mainly plasticity driven. This can be 12
consolidated by a FE analysis conducted on MarBN steel using a Benchmark neck-13
based model under creep conditions (Fig. 16). It can be seen from the FE results that, at 14
the necked region (region B), the equivalent plastic strain is predominantly 15
accommodated (mostly concentrated at the rupture surface). However, at the regions 16
away from the rupture surface (region A), the values of the equivalent plastic strain are 17
tenfold lower compared to those of region B, where spatial distributions seem to be 18
strongly heterogeneous. 19

37
1
Fig. 16: FE analysis conducted on a MarBN steel specimen using a Benchmark necked-2
based model showing the spatial distribution, at the onset and during the necking, of the 3
equivalent plastic strain. 4
Although the power-law equation is found to be in good agreement with the 5
experimental observations, it cannot reflect the possible physical mechanisms involved 6
during the creep process. In order to have a better understanding of the physical 7
processes during short-term creep testing of MarBN, detailed microstructural 8
characterisation was conducted in both the non-necked and the necked parts of gauge 9
portion (i.e. typically 5 mm and 20 mm away from the rupture surface, respectively) to 10
link with the characteristics of global creep behaviour as presented above. Important 11
observations of the microstructure after short-term creep testing are summarised as 12
follows: i) the martensitic microstructure in the non-necked part of gauge portion 13
appears similar to the stress-free head portion, whereas the original microstructure was 14
significantly changed in the necked part during short-term creep (Figs. 12-13), ii) a 15
much higher extent of damage is presented in the necked part of the gauge portion than 16
the non-necked part (Fig. 9), with a close association between damage and inclusion 17
particles observed in both areas (Fig. 8), iii) compared to the specimen tested under a 18
lower stress (i.e. 200 MPa), the specimen tested under a higher stress (i.e. 280 MPa) 19
shows a lower average area of martensitic blocks and a longer normalised intercept 20

38
length along the principal stress direction in both the non-necked and the necked parts 1
of gauge portion (Fig. 13), iv) significant refinement of the martensitic lath structure 2
was observed in the necked part of the gauge portion in both of the specimens tested at 3
650°C, whereas the lath structure in the specimen tested under a high stress (i.e. 280 4
MPa) is more refined (Fig. 15), v) dislocation interactions, such as dislocation jogs, 5
tangles and pile-ups, and the interaction between dislocations and secondary precipitates 6
were extensively observed within the lath interiors (Fig. 15). Fig. 17 shows schematic 7
diagrams summarising the microstructural observations from both the stress-free head 8
portion and the non-necked and necked parts from the gauge portion. 9
10

39
Fig. 17. Schematic diagrams illustrating the microstructural states in (a) the stress-free 1
head portion, (b) the non-necked part in gauge portion, the necked part in the gauge 2
portion after creep tests at an applied stress of (c) 200 MPa and (d) 280 MPa. 3
The different characteristics of the microstructure and damage distribution between the 4
necked and the non-necked parts of gauge portion are attributed to the significant plastic 5
strain presented in the necked part in addition to the creep strain accumulated in the 6
same area before the onset of necking (Fig. 17). The distorted, refined martensitic 7
microstructure in the necked part is evidence of plastic strain as this microstructure is 8
similar to the cell block grain structure formed after extensive plastic deformation with 9
a high strain rate [61–63]. The scale of the cell block grain structure is also decreased at 10
an increased strain intensity [62], and this is consistent with the observation of a more 11
refined substructure presented in the specimen showing significant necking (i.e. 81.8% 12
for the 650°C/280 MPa specimen, Table 2). 13
Under the influence of plastic strain, the damage presented in the necked part is formed 14
as micro-voids elongated along the principal stress direction as a result of plastic flow in 15
the surrounding matrix [7]. The close association between the plasticity induced micro-16
voids and the inclusion particles in the necked part (Fig. 8) is consistent with the 17
previous report of plastic damage, which is preferentially formed on secondary phase 18
particles [6,7]. However, one should also bear in mind that the micro-voids might be 19
formed via a more complex scenario by transforming from the ‘pre-existing’ creep 20
damage formed before the onset of necking. This is supported by the observation that 21
damage was also formed on inclusion particles in the non-necked part of gauge portions 22
(Fig. 8) (i.e. similar to the previous reports from other 9% Cr steels [52,64,65]). 23

40
It can be inferred from the aforementioned observations that both dislocation climb-1
controlled creep and plastic instability (necking development) can occur, interact and 2
strongly contribute to the macroscopic degradation of the material at high stress regimes 3
and elevated temperatures. Note that other “secondary” creep mechanisms such as grain 4
boundary sliding and/or lattice diffusion, may be active, even with small contributions, 5
and can play an important role in the short-term creep deformation of MarBN steel. The 6
theoretical computations and microstructural observations have been combined to better 7
elucidate and emphasize the dominant deformation mechanisms. Although, literature is 8
abundant of empirical equations for the power-law regime, there is still a need to 9
understand and thus track most of the physical mechanisms occurring during the creep 10
deformation process. The demand for an accurate and reliable modelling framework that 11
accounts for the microstructural evolution is of prime importance to gain further insight 12
into the deformation mechanisms of the MarBN steel. Models based on dislocation 13
density should have a stronger physical meaning. Dislocation densities can thus be 14
incorporated as internal state variables, and their evolution can be modelled based on 15
the storage and annihilation processes for dislocations. 16
5. CONCLUSIONS 17
An extensive experimental investigation has been conducted to understand the short-18
term creep behaviour of MarBN steel at high temperature. The experimental study 19
combines macroscopic predictions (through empirical formulations) and microstructural 20
evidence (through SEM, EBSD and TEM investigations). The main objectives of the 21
experimental work were to 1) investigate the possible relationships that may exist 22
between the creep strain rate and internal variables, 2) decouple both creep- and local 23
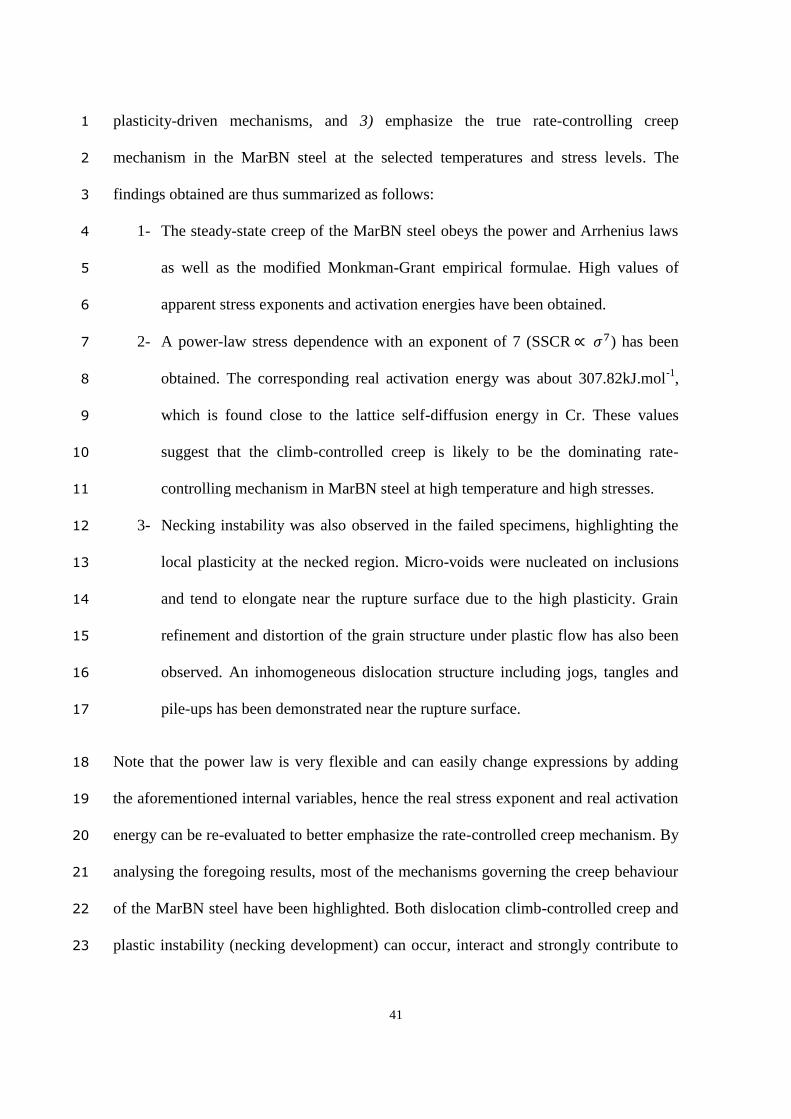
41
plasticity-driven mechanisms, and 3) emphasize the true rate-controlling creep 1
mechanism in the MarBN steel at the selected temperatures and stress levels. The 2
findings obtained are thus summarized as follows: 3
1- The steady-state creep of the MarBN steel obeys the power and Arrhenius laws 4
as well as the modified Monkman-Grant empirical formulae. High values of 5
apparent stress exponents and activation energies have been obtained. 6
2- A power-law stress dependence with an exponent of 7 (SSCR ) has been 7
obtained. The corresponding real activation energy was about 307.82kJ.mol-1
, 8
which is found close to the lattice self-diffusion energy in Cr. These values 9
suggest that the climb-controlled creep is likely to be the dominating rate-10
controlling mechanism in MarBN steel at high temperature and high stresses. 11
3- Necking instability was also observed in the failed specimens, highlighting the 12
local plasticity at the necked region. Micro-voids were nucleated on inclusions 13
and tend to elongate near the rupture surface due to the high plasticity. Grain 14
refinement and distortion of the grain structure under plastic flow has also been 15
observed. An inhomogeneous dislocation structure including jogs, tangles and 16
pile-ups has been demonstrated near the rupture surface. 17
Note that the power law is very flexible and can easily change expressions by adding 18
the aforementioned internal variables, hence the real stress exponent and real activation 19
energy can be re-evaluated to better emphasize the rate-controlled creep mechanism. By 20
analysing the foregoing results, most of the mechanisms governing the creep behaviour 21
of the MarBN steel have been highlighted. Both dislocation climb-controlled creep and 22
plastic instability (necking development) can occur, interact and strongly contribute to 23

42
the macroscopic degradation of the material at high stress regimes and elevated 1
temperatures. 2
6. ACKNOWLEDGMENTS 3
This work is supported by the Engineering and Physical Sciences Research Council 4
(grant numbers: EP/N509991/1 and EP/N509942/1). 5
The authors gratefully acknowledge the following partners for their valuable 6
contributions: Doosan Babcock, GE Power, Uniper Technologies, Metrode Products, 7
Goodwin Steel Castings and Wyman-Gordon. Specific acknowledgments to M. Bartosz 8
Polomski (GE Power) for providing the test material and M. Shane Maskill (University 9
of Nottingham) for his support in the experimental testing. The authors also 10
acknowledge use of facilities within the Loughborough Materials Characterisation 11
Centre. 12
The authors would also like to warmly thank Dr. Martin Strangwood (University of 13
Birmingham) for the fruitful discussions about the microstructure analysis and 14
complementary suggestions. 15
16
7. REFERENCES 17
[1] B. Fournier, F. Dalle, M. Sauzay, J. Longour, M. Salvi, C. Caës, I. Tournié, P.F. Giroux, 18
S.H. Kim, Comparison of various 9-12%Cr steels under fatigue and creep-fatigue 19
loadings at high temperature, Mater. Sci. Eng. A. 528 (2011) 6934–6945. 20
doi:10.1016/j.msea.2011.05.046. 21
[2] D.J. Benac, H.S. Reemsnyder, Failure Analysis And Life Assessment Of Structural 22
Components And Equipment, ASM Int. Handb. Fail. Anal. Prev. 11 (2002) 184. 23

43
doi:10.1361/asmhba0003512. 1
[3] F. Abe, M. Tabuchi, H. Semba, M. Igarashi, M. Yoshizawa, N. Komar, A. Fujita, 2
Feasibility of MARBN steel for application to thick section boiler components in USC 3
power plant at 650°C, in: Adv. Mater. Technol. Foss. Power Plants - Proc. from 5th Int. 4
Conf., 2008: pp. 92–106. doi:10.1361/cp2007epri0092. 5
[4] E.N. da C. Andrade, On the Viscous Flow in Metals, and Allied Phenomena, Proc. R. 6
Soc. A Math. Phys. Eng. Sci. 84 (1910) 1–12. doi:10.1098/rspa.1910.0050. 7
[5] F.R.N. Nabarro, H.L. Villiers, The Physics of Creep, Elsevier Sci. 17 (1995) 413. 8
doi:10.1016/0966-9795(96)00037-4. 9
[6] M.E. Kassner, T.A. Hayes, Creep cavitation in metals, Int. J. Plast. 19 (2003) 1715–10
1748. 11
[7] J. Lin, Y. Liu, T.A. Dean, A review on damage mechanisms, models and calibration 12
methods under various deformation conditions, Int. J. Damage Mech. 14 (2005) 299–13
319. 14
[8] K.T. Park, E.J. Lavernia, F.A. Mohamed, High temperature creep of silicon carbide 15
particulate reinforced aluminum, Acta Metall. Mater. 38 (1990) 2149–2159. 16
doi:10.1016/0956-7151(90)90082-R. 17
[9] F.C. Monkman, N.J. Grant, An empirical relationship between rupture life and minimum 18
creep rate in creep-rupture tests, in: Proc. ASTM, 1956: pp. 593–620. 19
[10] V.M. Radhakrishnan, The relationship between minimum creep rate and rupture time in 20
Cr-Mo steels, J. Mater. Eng. Perform. 1 (1992) 123–128. doi:10.1007/BF02650043. 21
[11] G. Dimmler, P. Weinert, H. Cerjak, Extrapolation of short-term creep rupture data-The 22
potential risk of over-estimation, Int. J. Press. Vessel. Pip. 85 (2008) 55–62. 23
doi:10.1016/j.ijpvp.2007.06.003. 24
[12] B. Wilshire, P.J. Scharning, Extrapolation of creep life data for 1Cr-0.5Mo steel, Int. J. 25
Press. Vessel. Pip. 85 (2008) 739–743. doi:10.1016/j.ijpvp.2008.04.002. 26
[13] M.F. Ashby, A first report on deformation-mechanism maps, Acta Metall. 20 (1972) 27

44
887–897. doi:10.1016/0001-6160(72)90082-X. 1
[14] M.F. Ashby, H.J. Frost, Deformation-mechanism maps, Oxford Pergamon Press. (1982) 2
44–45. 3
[15] J.P. Poirier, Creep of Crystals, Cambridge University Press, 1985. 4
[16] O.D. Sherby, A.K. Miller, Combining Phenomenology and Physics in Describing the 5
High Temperature Mechanical Behavior of Crystalline Solids, J. Eng. Mater. Technol. 6
101 (1979) 387–395. doi:10.1115/1.3443708. 7
[17] R.L. Coble, A Model for Boundary Diffusion Controlled Creep in Polycrystalline 8
Materials, J. Appl. Phys. 34 (1963) 1679–1682. doi:10.1063/1.1702656. 9
[18] P.M. Burke, O.D. Sherby, Mechanical Behavior of Crystalline Solids at Elevated 10
Temperature., Prog. Mater. Sci. 13 (1968) 323–390. 11
[19] P.J. Ennis, A. Czyrska-Filemonowicz, Recent advances in creep-resistant steels for 12
power plant applications, Sadhana. 28 (2003) 709–730. 13
[20] K. Maruyama, K. Sawada, J. Koike, Strengthening mechanisms of creep resistant 14
tempered martensitic steel, ISIJ Int. 41 (2001) 641–653. 15
[21] J. Pešička, R. Kužel, A. Dronhofer, G. Eggeler, The evolution of dislocation density 16
during heat treatment and creep of tempered martensite ferritic steels, Acta Mater. 51 17
(2003) 4847–4862. doi:10.1016/S1359-6454(03)00324-0. 18
[22] C.G. Panait, A. Zielińska-Lipiec, T. Koziel, A. Czyrska-Filemonowicz, A.-F. Gourgues-19
Lorenzon, W. Bendick, Evolution of dislocation density, size of subgrains and MX-type 20
precipitates in a P91 steel during creep and during thermal ageing at 600 C for more than 21
100,000 h, Mater. Sci. Eng. A. 527 (2010) 4062–4069. 22
[23] M. Mitsuhara, S. Yamasaki, M. Miake, H. Nakashima, M. Nishida, J. Kusumoto, A. 23
Kanaya, Creep strengthening by lath boundaries in 9Cr ferritic heat-resistant steel, 24
Philos. Mag. Lett. 96 (2016) 76–83. doi:10.1080/09500839.2016.1154200. 25
[24] W. Yan, W. Wang, Y.-Y. Shan, K. Yang, Microstructural stability of 9–12% Cr 26
ferrite/martensite heat-resistant steels, Front. Mater. Sci. 7 (2013) 1–27. 27

45
[25] P.-F. Giroux, F. Dalle, M. Sauzay, J. Malaplate, B. Fournier, A.-F. Gourgues-Lorenzon, 1
Mechanical and microstructural stability of P92 steel under uniaxial tension at high 2
temperature, Mater. Sci. Eng. A. 527 (2010) 3984–3993. 3
[26] B. Xiao, L. Xu, L. Zhao, H. Jing, Y. Han, Z. Tang, Microstructure evolution and fracture 4
mechanism of a novel 9Cr tempered martensite ferritic steel during short-term creep, 5
Mater. Sci. Eng. A. 707 (2017) 466–477. doi:10.1016/j.msea.2017.09.086. 6
[27] E. Cerri, E. Evangelista, S. Spigarelli, P. Bianchi, Evolution of microstructure in a 7
modified 9Cr–1Mo steel during short term creep, Mater. Sci. Eng. A. 245 (1998) 285–8
292. doi:https://doi.org/10.1016/S0921-5093(97)00717-X. 9
[28] F. ABe, Effect of fine precipitation and subsequent coarsening of Fe2W Laves phase on 10
the creep deformation behavior of tempered martensitic 9Cr-W steels, Metall. Mater. 11
Trans. A. 36 (2005) 321–332. 12
[29] G. Eggeler, The effect of long-term creep on particle coarsening in tempered martensite 13
ferritic steels, Acta Metall. 37 (1989) 3225–3234. 14
[30] J. Hald, L. Korcakova, Precipitate Stability in Creep Resistant Ferritic Steels-15
Experimental Investigations and Modelling, ISIJ Int. 43 (2003) 420–427. 16
doi:10.2355/isijinternational.43.420. 17
[31] F. Abe, Precipitate design for creep strengthening of 9% Cr tempered martensitic steel 18
for ultra-supercritical power plants, Sci. Technol. Adv. Mater. 9 (2008) 13002. 19
[32] L. Maddi, D. Barbadikar, M. Sahare, A.R. Ballal, D.R. Peshwe, R.K. Paretkar, K. Laha, 20
M.D. Mathew, Microstructure Evolution During Short Term Creep of 9Cr--0.5Mo--21
1.8W Steel, Trans. Indian Inst. Met. 68 (2015) 259–266. doi:10.1007/s12666-015-0586-22
9. 23
[33] T. Shrestha, M. Basirat, I. Charit, G.P. Potirniche, K.K. Rink, Creep rupture behavior of 24
Grade 91 steel, Mater. Sci. Eng. A. 565 (2013) 382–391. 25
doi:10.1016/j.msea.2012.12.031. 26
[34] L.A. Giannuzzi, B.W. Kempshall, S.M. Schwarz, J.K. Lomness, B.I. Prenitzer, F.A. 27

46
Stevie, FIB Lift-Out Specimen Preparation Techniques, in: L.A. Giannuzzi, F.A. Stevie 1
(Eds.), Introd. to Focus. Ion Beams Instrumentation, Theory, Tech. Pract., Springer US, 2
Boston, MA, 2005: pp. 201–228. doi:10.1007/0-387-23313-X_10. 3
[35] D.R. Jara, 9-12 % Cr heat resistant steels : alloy design , TEM characterisation of 4
microstructure evolution and creep response at 650 ° C, 2011. 5
[36] J. Pe??i??ka, A. Aghajani, C. Somsen, A. Hartmaier, G. Eggeler, How dislocation 6
substructures evolve during long-term creep of a 12% Cr tempered martensitic ferritic 7
steel, Scr. Mater. 62 (2010) 353–356. doi:10.1016/j.scriptamat.2009.10.037. 8
[37] D.C. Dunand, B.Q. Han, a. M. Jansen, Monkman-grant analysis of creep fracture in 9
dispersion-strengthened and particulate-reinforced aluminum, Metall. Mater. Trans. A. 10
30 (1999) 829–838. doi:10.1007/s11661-999-1016-6. 11
[38] H. Ghassemi Armaki, K. Maruyama, M. Yoshizawa, M. Igarashi, Prevention of the 12
overestimation of long-term creep rupture life by multiregion analysis in strength 13
enhanced high Cr ferritic steels, Mater. Sci. Eng. A. 490 (2008) 66–71. 14
doi:10.1016/j.msea.2008.01.072. 15
[39] L. Kloc, V. Sklenička, Transition from power-law to viscous creep behaviour of p-91 16
type heat-resistant steel, Mater. Sci. Eng. A. 234–236 (1997) 962–965. 17
doi:10.1016/S0921-5093(97)00364-X. 18
[40] B.K. Choudhary, E. Isaac Samuel, Creep behaviour of modified 9Cr-1Mo ferritic steel, J. 19
Nucl. Mater. 412 (2011) 82–89. doi:10.1016/j.jnucmat.2011.02.024. 20
[41] R.S. Mishra, A.B. Pandey, Some observations on the high-temperature creep behavior of 21
6061 Al-SiC composites, Metall. Trans. A. 21 (1990) 2089–2090. 22
doi:10.1007/BF02647258. 23
[42] J.R. Cahoon, O.D. Sherby, Activation energy for lattice self-diffusion and the Engel-24
Brewer theory, Metall. Trans. A, Phys. Metall. Mater. Sci. 23 A (1992) 2491–2500. 25
[43] J. Onoro, Martensite microstructure of 9–12% Cr steels weld metals, J. Mater. Process. 26
Technol. 180 (2006) 137–142. 27

47
[44] L. Ryde, Application of EBSD to analysis of microstructures in commercial steels, 1
Mater. Sci. Technol. 22 (2006) 1297–1306. 2
[45] H. Kitahara, R. Ueji, N. Tsuji, Y. Minamino, Crystallographic features of lath martensite 3
in low-carbon steel, Acta Mater. 54 (2006) 1279–1288. 4
[46] T. Hamaguchi, H. Okada, S. Kurihara, H. Hirata, M. Yoshizawa, A. Iseda, 5
Microstructural Evaluation of 9Cr-3W-3Co-Nd-B Heat-Resistant Steel (SAVE12AD) 6
After Long-Term Creep Deformation, (2017) V06AT06A064. 7
http://dx.doi.org/10.1115/PVP2017-65241. 8
[47] A. Chauhan, D. Litvinov, Y. de Carlan, J. Aktaa, Study of the deformation and damage 9
mechanisms of a 9Cr-ODS steel: microstructure evolution and fracture characteristics, 10
Mater. Sci. Eng. A. 658 (2016) 123–134. 11
[48] D. Richardot, J.C. Vaillant, A. Arbab, W. Bendick, The T92/P92 book Vallourec-12
Mannesmann tubes, (2000). 13
[49] P. Polcik, T. Sailer, . lum, S. Straub, J. urš k, A. Orlová, On the microstructural 14
development of the tempered martensitic Cr-steel P 91 during long-term creep—a 15
comparison of data, Mater. Sci. Eng. A. 260 (1999) 252–259. 16
doi:https://doi.org/10.1016/S0921-5093(98)00887-9. 17
[50] A. Orlová, J. Čadek, Dislocation structure in the high temperature creep of metals and 18
solid solution alloys: a review, Mater. Sci. Eng. 77 (1986) 1–18. 19
[51] P.Z. L. Li G. West, R.C. Thomson, the effect of stress relief heat treatments on 20
microstructural evolution and mechanical properties in Grade 91 and 92 power plant 21
steels, (2011) 679–692. 22
[52] Y. Gu, G.D. West, R.C. Thomson, J. Parker, Investigation of creep damage and 23
cavitation mechanisms in P92 steels, (2014). 24
[53] X. Xu, G.D. West, J.A. Siefert, J.D. Parker, R.C. Thomson, Microstructural 25
Characterization of the Heat-Affected Zones in Grade 92 Steel Welds: Double-Pass and 26
Multipass Welds, Metall. Mater. Trans. A. 49 (2018) 1211–1230. doi:10.1007/s11661-27

48
017-4446-6. 1
[54] J. Hald, Microstructure and long-term creep properties of 9–12% Cr steels, Int. J. Press. 2
Vessel. Pip. 85 (2008) 30–37. 3
[55] F. Abe, M. Taneike, K. Sawada, Alloy design of creep resistant 9Cr steel using a 4
dispersion of nano-sized carbonitrides, Int. J. Press. Vessel. Pip. 84 (2007) 3–12. 5
[56] H. Semba, F. Abe, Alloy design and creep strength of advanced 9%Cr USC boiler steels 6
containing high concentration of boron, Energy Mater. 1 (2006) 238–244. 7
doi:10.1179/174892406X173611. 8
[57] J.E. Dorn, Some fundamental experiments on high temperature creep, J. Mech. Phys. 9
Solids. 3 (1955) 85–116. doi:https://doi.org/10.1016/0022-5096(55)90054-5. 10
[58] L. Falat, A. Výrostková, V. Homolová, M. Svoboda, Creep deformation and failure of 11
E911/E911 and P92/P92 similar weld-joints, Eng. Fail. Anal. 16 (2009) 2114–2120. 12
[59] T. Shrestha, M. Basirat, S. Alsagabi, A. Sittiho, I. Charit, G.P. Potirniche, Creep rupture 13
behavior of welded Grade 91 steel, Mater. Sci. Eng. A. 669 (2016) 75–86. 14
doi:https://doi.org/10.1016/j.msea.2016.05.065. 15
[60] D. Hull, D.J. Bacon, Introduction to dislocations, Elsevier, 2011. 16
[61] Z.B. Zhang, O. V Mishin, N.R. Tao, W. Pantleon, Microstructure and annealing 17
behavior of a modified 9Cr−1Mo steel after dynamic plastic deformation to different 18
strains, J. Nucl. Mater. 458 (2015) 64–69. 19
doi:https://doi.org/10.1016/j.jnucmat.2014.12.001. 20
[62] X. Huang, S. Morito, N. Hansen, T. Maki, Ultrafine Structure and High Strength in 21
Cold-Rolled Martensite, Metall. Mater. Trans. A. 43 (2012) 3517–3531. 22
doi:10.1007/s11661-012-1275-5. 23
[63] C.Y. Barlow, N. Hansen, Y.L. Liu, Fine scale structures from deformation of aluminium 24
containing small alumina particles, Acta Mater. 50 (2002) 171–182. 25
doi:https://doi.org/10.1016/S1359-6454(01)00330-5. 26
[64] K. Sakuraya, H. Okada, F. Abe, BN type inclusions formed in high Cr ferritic heat 27
49
resistant steel, Energy Mater. (2013). 1
[65] K. Sakuraya, H. Okada, F. Abe, Influence of heat treatment on formation behavior of 2
boron nitride inclusions in P122 heat resistant steel, ISIJ Int. 46 (2006) 1712–1719. 3
[66] S. Spigarelli, Constitutive equations in creep of Mg-Al alloys, Mater. Sci. Eng. A. 492 4
(2008) 153–160. doi:10.1016/j.msea.2008.03.007. 5
[67] T. Shrestha, M. Basirat, I. Charit, G.P. Potirniche, K.K. Rink, U. Sahaym, Creep 6
deformation mechanisms in modified 9Cr-1Mo steel, J. Nucl. Mater. 423 (2012) 110–7
119. doi:10.1016/j.jnucmat.2012.01.005. 8
[68] O.D. Sherby, R.H. Klundt, A.K. Miller, Flow stress, subgrain size, and subgrain stability 9
at elevated temperature, Metall. Trans. A. 8 (1977) 843–850. doi:10.1007/BF02661565. 10
11
12

M16x211.00 13.80
10.00 +/- 0.02
R550.0015.0025.00
130.00
ALL DIMENSIONS IN mm
Figure(s)

Figure(s)Click here to download high resolution image

0 50 100 150 200 250
Creep time [h]
0
5
10
15C
reep
str
ain
[%
]
240 MPa
260 MPa
280 MPa
300 MPa
(a) 625°CFigure(s)

0 50 100 150 200 250 300 350
Creep time [h]
0
5
10
15C
reep
str
ain
[%
]
200 MPa
220 MPa
240 MPa
260 MPa
280 MPa
(b) 650°CFigure(s)

0 50 100 150 200 250 300
Creep time [h]
0
5
10
15C
reep
str
ain
[%
]
160 MPa
180 MPa
200 MPa
220 MPa
675°C(c)
Figure(s)

Figure(s)Click here to download high resolution image

150 200 250 300
Stress [MPa]
10 -4
10 -3
10 -2
SS
CR
[h
-1]
625 °C
650 °C
675 °C
150 200 250 300
Stress [MPa]
100
102
Tim
e t
o F
ract
ure
[h
]
625 °C
650 °C
675 °C
10 -5 100
SSRC [h-1
]
10 -2
100
102
Mean
cre
ep
rate
[%
.h-1
]
625 °C
650 °C
675 °C
(c)(b)(a)Figure(s)

150 200 250 300
Stress [MPa]
0.2
0.3
0.4
0.5
0.6
0.7S
SC
R1/n
* [h
-1/n
* ]625 °C - n* = 7
650 °C - n* = 7
675 °C - n* = 7
625 °C - n* = 8
650 °C - n* = 8
675 °C - n* = 8
4 6 8 10
Normalized threshold stress ×10-4
10-4
10-2
100
SS
CR
[h
-1]
625 °C - n*exp
= 6.68
650 °C - n*exp
= 6.61
675 °C - n*exp
= 6.65
625 °C - n*exp
= 7.72
650 °C - n*exp
= 7.68
675 °C - n*exp
= 7.69
(a) (b)
Figure(s)

Figure(s)Click here to download high resolution image

Figure(s)Click here to download high resolution image

Figure(s)Click here to download high resolution image
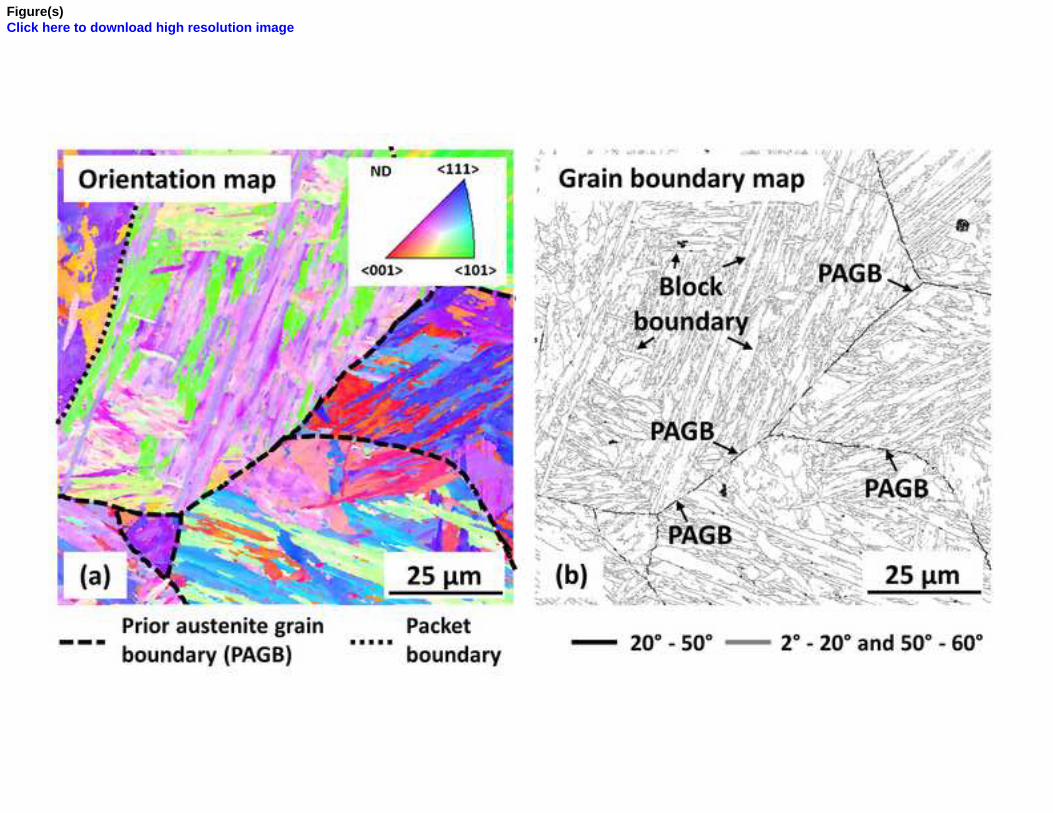
Figure(s)Click here to download high resolution image

Figure(s)Click here to download high resolution image

Figure(s)Click here to download high resolution image

Figure(s)Click here to download high resolution image

Figure(s)Click here to download high resolution image

Figure(s)Click here to download high resolution image

Figure(s)Click here to download high resolution image

Figure(s)Click here to download high resolution image