rtec, eq, -r-C-Mca, - - Nottingham ePrints
335
ril T- -ý' V-T, 'ýC--, ')T'-`-, jC . LL, L-, Ll, t--O, I ETIPOOL Cl-'ýILLDII--Lll t 4C. Univ Doctor OL rtec, eq, -r-C-Mca, i: i'. 11(( .>1-, L, ý
-
Upload
khangminh22 -
Category
Documents
-
view
0 -
download
0
Transcript of rtec, eq, -r-C-Mca, - - Nottingham ePrints

ril T- -ý' V-T, 'ýC--, ')T'-`-, jC . LL, L-, Ll, t--O, I
ETIPOOL Cl-'ýILLDII--Lll
t 4C. Univ
Doctor OL rtec, eq,
-r-C-Mca,
i: i'. 11((
.>1-, L, ý

ii
PAGE
LIST OF C014TENTS 11
LI, SIT OF TABLES iv
ACKI-101 ̀LEDGEf-, IElITS vii
ABSTRACT viii
CHAPTER OIIE INýTRODUCTION 1
C Y-, p
_-'E R TV70 THE CHILDREN 11131D THEIR SCHOOLS
CIE'LiPTER THREE HEARIIIG LOSS 50
CHAPTER FOUR THE READING ABILITY OF
DEAF CHILDREN 60
CHAPTER FIVE DELL-' CIFILDREN'S LANGUAGE IN
CONVERSATIOF WITH '_, 'F, ýEIR TEACHERS 106
CHAPTER SIX CHILD-CHILD COMMU, 4 ITICATIC11 188
CHAPTER SEVEN THE TiTRITTEN LANGUAGE OF
DEAF CHILDREN 221

iii
CONTEN IS
PAGE
CHAPTER EIGHT COMBINING ALL FOUR LANGUAGE
1,, iEASURES 238
I'l CHAPTER PINE CONCLUSION 252
REFERENCES 260
APPE17DICES: 276
ONE NOTES FOR TEACHERS 278
TW'O FURTFER INFORl-ILATION ABOUT
CHILDREN IN THE STUDY 285
THREE EDIN'J--"URGH READING TEST:
A FURTHER SAI, ýIPLE 2(-`ýO
FOUR . ý, 7 CODING SYSTEII FOR SYNTACTIC
ANALYSIS OF REFERE11TIAL
VL C01,111UNI CAT IC' "S 301
FIVE EXAl,,, 'lPLES OF TRANISCRIPTS 311
six DATA FOR 1,1ULTIPLE REGRESSICII
ANALYSES 318
p

iv
LIST OF TALLES
TABLE NUMBER TITLE PAGE
3.1 Means and stanuard deviations for each hearing loss ri,, easure. 58
4.1 Ileans and stanciard deviations on Edinburgh Reading Test subtest and overall scores. 94
11 ri", urgh Reading Test -cubtest i. 2 Edi-I K, correlations. 95
4.3 Edinburgh I'leading Test subtest correlations (boys) . 97
4.4 Edinburgh Reading Test subtest correlations (girls) . 97
4.5 Significance levels (Fischer Z) between Edinburgh Reading "est subtest correlations for boys and girls. 98
5.1 The function1s, of teacher r,. ioves for all 8 conversation sessions (percentages). 143
5.2 The functions of teacher moves for all 8 conversation sessions 1.71ood et al (1982). 143
5.3 V, -Ine percentage of each type of teacher move (levels of control) in EL11 8 conversation sessions. 145
5.4. Proportion of high control moves for teacher and chilCiren (in all 8 conversation sessions). 146
5.5 Levels of child re-ciponse to teacher moves (averages of all 8 conversation sessions in percentages). 150

V
5.6 Levels of chilci response to teacher moves (avera(-: ie. -P of all 8 conversation sessions in percentages) from WooC. - et al (1982). 150
5.7 Relationship betweer, moves in child speech anci ensuing teacher ii-ioves, fror. -i Vlood' et al (1982). 154
5. C01 Relationships between teachers, move type an6 child mean length of turn. 155
5.9 Chiltýý mean length of turn for all all 8 conversation sesSions. 1S. 6
5.10 Paired comparisons of mean length of turn from children after each type of teacher move (combined CZata r' fror. -i all 8 conversation sessionL) 157
6.1 A suriiii, iary of all correctiGns ma6e in order to idealise the 37 spok. en utterances. 213
7.1 sumi--iiary of all corrections made in order to icl'eali, -L:; e the 38 written messages. 23-3
8.1 Correlations between 4 main measures (Edinburgh Reading I'llestr average '-Iean
-I Length ol ri'urnr Written , -, Iccuracy and Spoken Accuracy) n=34.239
8.2 A comparison of models from the multiple regression analysis no. l. 243
3ýI A con. -parison of models from the multilple regression analysiS no. 2.246
8.4 A comparison of models from the r,,, ultiple regression analysis no. 3.249

vi
LIS!: ý -U
TABLES III, THE APPENDICES
A. 1 '., ýeans and standard deviations or, Edinburgh Readin(, r. "'est subtest and overall scores for further sample. 295
AS-2. Edinburgh Reacing Te",, t suLýtest correlations tor further samrAe. 296
LIdinburgh Readincý 'I'est subtest correlations
(boj7S only) for
further san. : _-,,, le - 298
'Oest subtest A. 4 Edinburgh Reading r. correlations (girls only) for J:: . 1-urther sample. 298
A. 5 Significance levels (Fischer Z) betweon subtest correlations for boys anc! girls (further sample). 29ý,
. r. ':: ar., A. 6 q-, le of scoring table for the syntClctic analysis of referential comm unications. 310
I 7 RaW ta for multiple regression analyses reporteu in Chapter 8. 321
A. S Correlations between main measures inserting Ill as a score in cases where children failed to score at
, ritten least 50% accuracy on the v. and/or Spolý. en r,, icasures. 323
A. 9 Correlations between i. -tain measures in, serting 1491 as a score in cases v, here chilGren failed to score at least 500-o accuracy on the written anc/or spoLen Y., teasures. 323
10 Correlations be! --,, --een main measures *, -ing only those children who scored L7., ý at least 50% on written &nd spoken accuracy measures (n=25). 324

vii
QL11-EL
I would like to express my sincere thanks to the follow- ing people:
Dr. David Wood,, my supervisor, for the very considerable amount of help given an( ýA enthusiasm shown throughout tine course of this research.
Chris Blunsdon, for his patience and advice on all con, puter- related problemis, especially for his help in masterincj the word processor, witi-, which this thesis ý-, 7as written.
larr e 1-11arian Kingsi, 'Lillr for her help in transcribing a proportion of the videotapes.
Penny 'F', c--. u-cliffe,, for her a-id in all secretarial and org&ndisational i,.. atters.
Steve Sharp ancý Tony Falla, for their skills concerning all video and other technical equipment.
For helpful and stiviulating discussions durinc the course oi: this research: Jack French,, Sue Gregoryy Ian Howarth, Pat Howarth,, Des Powerr Janta Silvey,, Alec ý'jlebster anu. Heather Wood.
The hea6s, teachers and technicians from, the schools involved,, for their vAlling cooperation.
The fifty children who partici,,, ated in this stucty.

viii
LaSTRACT
Observation of deaf children in conversation with their teachers might lead one to believe they are behav- ing in a somewhat contrived way in comparison with their behaviour when coy, ty. -Lunicating with their their peers. Examination of the performance of deaf and hearing chil- dren on various reading tests has shown the deaf to be pursuing markedly different strategies from the hearing (eg. word (-:,,, ssociation) . Such observations lead us to ask, is the linquistic behaviour of the, e children then simply a selection of 'special tricks' developed to cope with everyda,,, 7 uemands? or, if various measures of their language intercorrelate, can we assume the existence of a unitary linguistic competence? 0
To answer this question and to investigate the vali- dity of the mec-ýtsures chosenr a group of 50 profoundly deaf children from two schools for the deaf were studied (where necessary usinc, videorecor(ýings) in 4 situations. These were a) in conversation with their teachers, b) in
z: a referential coromunic&tion game with their peers, c) their perfcrmance on the Edinburch Reading Test and d) their writinc. Since deSree of hearing loss, age, se,.,. and intelligence have been shown to be influential, we included these together with teacher ratings of oral proL-iciencY, general ability, attitude to school, written ability and speech intelligibility. The result-c showeQ all language measures intercorrelated With varying degrees of Significance. 1ý,, -fultiple regression analysis showed that the -L. iain measure taken from the conversation with teachers (namely, average length of turn) r-roved to be the most powerful rjrec_!! ictor of reading. Written syn- tactic accuracy was the second most powerful predictor. Since reliable measures of deaf children's lingui&tic abilities are badly needed (especially in the wake of recent legislation advocating the education of deaf chil- dren in ordinEry schools) the potential use of these measures is discussed. Since these language abilities are good predictors of each other,, future research r. Aght investigate the possibility that concentrated teaching in
one area of language use could have positive effects on other linguistic abilities.

CHAPTER ONE
INTRODUCTION

2
CHAPTER QIIFL
INTRODUCTION
Desiqn and analvsis.
The research presented in this thesis concerns the
linguistic abilities of a group of 50 deaf children. We
looked at their language in four Cifferent situationss,
namely, in conversation with their teachers, during a
referential communication game with their peers, t eir
performance on a reading test and their writing. Each of
these situations yielded one overall measure for each
child. These were:
a) average length of utterance in conversation with their teacher.
b) . yntactic accuracy of spoken utterances s during a referential communication game with their peers.
c) total score on the Edinburgh reading Test.
d) syntactic accuracy of written language.
However, the first and third of these overall measures
can be broken down into several sub-measures. The aver-
age length of utterance during the conversation session
can be broken down into those utterances that follow

3
teacher questions, those that follow personal contribu-
tions or statements f rom the teacher and those that
follow utterances from other children. Also available
from the conversations sessions were data concerning the
nature of the teachers' behaviour. Their contributions
could be analysed accor6ing to how much control was
exerted over the children's next utterance and by looking
at the functions they pursued in conversation. Simi-
larly,, the reading test contains f our subtests which tap
vocabulary, syntactic, sequencing and comprehension
skills. Each of these subtests can be scored separately.
All these variables will be discussed in much more detail
later on, but suffice it to say at this stage that there
were at least 15 measures in all.
As well as these 'correlatorl variables, there were
various 'predictor' variables included in the design.
These were degree of hearing loss, age, measured intelli-
gence, and sex. Also included were five teacher ratings
of the children's ability, namelyr oral proficiency, gen-
eral abilityr attitude to school, written ability and
speech intelligibility. We hoped to explore the rela-
tionships between all three sets of variables, namely our
linguistic measures, the predictor variables and the
teacher ratings. One major question to be addressed was
whether or not it would be reasonable to infer the
existence of an overall linguistic ability in deaf

4
children.
The statistical analysis needed to answer such ques-
tions required careful consideration. As far as multiple
correlations are concernedr some would say one simply
needs more subjects than variables,, but Edwards (1976)
recommends a ratio of at least 10 subjects to each
variable. This presented no problem when investigating
the four overall measures since we had, in most cases, 50
subjects. However, we should emphasi-se that when looking
at the breakdown of these main measuresr we are only
looking for patterns of relaticnships between these vari-
ables. This issue is currently one of concern to other
researchers. Hinde (in Porter and Collins, 1982)
discusses similar problems in his study of temperamental
differences in children from 40 families. He too has
many measures taken from one group of children.
The present study was intended both as an investiga-
tion of the relationships between the four main measures
as well as an exploratory exercise, rather than one in
which we hoped to establish the existence of hard and
fast relationships between deaf children's various
linguistic abilities. Any patterns we found were then to
be used as a basis for future research and to establish
the usefulness of our measures both for research and
classroom purposes. The data obtained from the teacher-

5
child conversation sessions, however, were to be used for
an additional purpose, namely to replicate some former
research we had undertaken in this area. In this section
of the study, therefore, we did have certain hypotheses.
These will be outlined in the relevant chapter.
The use of correlational data presents several other
problems for the researcher. When considering many
correlations, it is hard to escape the possibility that
some of these will be a result of chance. We also have
to be aware of the problem of the causal relationships
involved in correlations. The fact that two variables
appear to be highly correlated does not necessarily mean
that they are causally connected. This is an issue we
shall consider in more detail in Chapter 5. In Chapter 8
(and in Appendix VI) we shall present a more detailed
consideration of the methodological and statistical prob-
lems we encountered. Some of these (eg. establishing the
independence of measures) are as yet insuperable, and are
an inevitable consequence of analysing 'real' behaviour
as opposed to the more easily defined and measured events
that occur within the formal and experimental tradition.
However, it appears that new analyses are currently being
developed to cope with such difficulties.
It would not be useful to discuss the inter-
relationships of these linguistic abilities without hav-

6
ing f irst discussed them individually. We shall there-
-ore, f rst of all#, devote four chapters (numbers 4,5,6
and 7) to a detailed consideration of each area. How-
ever, in study -such as this that covers such a very wide
field of child language, it would be impossible to intro-
duce a complete survey of the previous research relevant
to each of the four areas. Each chapter will therefore
begin with a brief introduction to the area, followed by
details of the measures used, the children's performance
anc, the importance of the predictor variables (degree of
hearing loss, age, intelligence and sex). This introduc-
tion is therefore only brief since most of the material
one might usually 6-iscuss at this stage is presented in
these four chapters. We shall then (in Chapter 8) draw
all the linguistic measures together in order to investi-
gate in detail their inter-relationships and the involve-
ment of the variables mentioned above.
Chapter 2 concerns the variables known to affect the
linguistic development of children (both deaf and hear-
ing) that should be borne in mind when interpreting our
results. In a study of this size, it would be an impos-
sible task to account for differences in linguistic abil-
ity with reference to these variables. One WOUld need
thousands of subjects and we have only 50. Chapter 3 is
really a short methodological digression from the main
theme of the research and concerns the measurement of

7
hearing loss.
kractical details of the study.
Two schools for the deaf were approached in the hope
that they would participate in the present investigation
and both agreed. Details about these schools are avail-
able in the next chapter. Initial permission having been
gained from the headteachers, handouts (reproduced in
full in Appendix I) were sent on to be distributed to all
teachers in those schools with children in the 7-12 year
age range with a view to recruiting them to participate
in the study. The Lirst sheet was an introductory letter
outlining the sort of research we had done and were
doing. The second sheet gave details of the study pro-
posed, together with an outline of the aims. I thought
it useful for the teachers to know that the ultimate
purpose of our research was of a practical and applied
nature rather than a 'data-swoop', the results of which
would never be communicated to them. Response and atti-
tudes to the research were very positive; teachers were
interested and helpful. The emphasis in the handout was
laid on looking at the child's behaviour: if the teacher
felt that her conversation style was going to be under
scrutiny as well (which, indirectly at least, it was)

8
this may have affected her behaviour above and beyond the
effects produced by the mere presence of a researcher in
the school. I do not underestimate the 'threat' that
some teachers may feel when their children, and ulti-
mately themselves,, may appear to be under scrutiny from
psychologists. Every opportunity was taken to avoid the
formation of such notions.
It was explained that we wanted to obtain a set of 4
language measures for as large a group of children as
possible in order to explore the relationships between
their linguistic skills. Our ultimate aim was to piece
together as elaborate a picture as possible about the
problems a deaf child faces lec-;, rning language as well as
the techniques that teachers use to try and overcome
them. It was proposed to spend one week with each class,
during which I would attempt to obtain all 4 measures for
each child as well as gather information (along the lines
described in Chapter 2) about the children. The follow-
ing extract is taken in full from the teachers' handout
and provides brief descriptions of how we hoped to obtain
these measures.
1. News/Conversation Session
We have found the 'News Session' useful as a start- ing point for investigating the language used by 7-12
year old deaf children. Here, the teacher typically has

9
a small group of children with which she conducts a conversation about their activities over the weekend and other matters. It is therefore useful to record these sessions on a Monday, when the weekend is still fresh in the children's minds. However, not all teachers use this method, and we are anxious to look at conversation ses- sions as they occur naturally, since we feel that teach- ers will gain most from information which relates to real classroom situations. In practical terms, this involves putting a small video-recorder in the corner of the classroom to record what happens. If at the end of a session the teacher is unhappy with it, or feels that it is not typical then she/he should not hesitate to say so and the tape can be erased. Needless to say, all tapes remain strictly confidential and are not shown to outside parties unless the teacher involved has given express permission.
2. Child-Child Communication
We have found the communication game outlined below a useful tool for studying the language used by deaf children with each other. Since the ensuing conversation revolves around a known subject (a picture) we have some clues to aid later transcrir-tion. Two children sit fac- ing each other each with a copy of the same book. A
small screen on the table between them makes it impossi- ble for one to see the other's book. One child then describes a picture in the book so that his partner can find it in his book. Each child does this several times.
I-, Te have used children and have successful, in soii Furthermore, they expressed interest classroom.
I. writina
this game with both deaf and hearing found that the deaf are surprisingly
. ie ways more so than hearinc, children. usually enjoy it. Several teachers have in using these games themselves in the
We are also interested in obtaining samples of the
children's writing. After the pairs of children have
completed the child-child communication game, they will be asked to describe one other picture to their partner in writing. We will then see how effective these mes- sages are when handed over to partners.
Readip-, q Test

10
We propose to give the Edinburgh Reading Test (Stage 1) to each child, either singly or in pairs, preferably in a quiet room where they can concentrate. The Edin- burgh Reading Test has been chosen because as well as giving a reading age, it provides more information about the nature of a child's reading ability than more common reading tests. We hope to gain more insight into the deaf child's reading problems by looking at the profile of his score on the subtests (vocabulary, syntaxt sequencing and comprehension). The test manual recom- mends a break in the middle of a test ; if possible the first half will be given in the morning and the second in the af ternoon.
For conveniencel, I refer to the children in this
study as 'deaf'. I appreciate that the latest tendency
is to use the term 'hearing-impaired' but in a study such
as this such terminology adds appreciably to it's
longwindedness. In similar vein, when referring to indi-
vidual children I shall adopt 'he' as pronoun and when
referring to the teacher shall use 'she'.

11
CHAPTER TWO
THE CHILDREN MID THEIR SCHOOLS

12
CHA TER TWO : CONTENTS
Page
Hecaring loss 15
Additional handicaps 20
Ethnic background 21
Sex C-lifferences 24
Handedness 29
r- I-Iome and language environment 35
Intelligence 37
Social Class 42
Teacher Ratings 46
Schools 47

13
-CHAPTER TWO
THE CHILDREN AM THEI SCHOOLS
An assumption has often been made, by researcher and
layman alike, that the deaf child is basically the same
as any other except that he cannot hear. In this
chapter, as in the previous one, we shall briefly attempt
to show this to be a verJ7 questionable view and that many
factors need to be taken into account in any study of the
performance of deaf children, especially, although not
exclusively, when considering their language. It is no 0
longer excusable for a deaf sample to be included as
'controls' in studies of the role of hearing in the
performance of other groups of individuals without a
hearing loss. We shall also outline other factors that
are known to affect both deaf and hearing children's
linguistic development.
Previous research has shown that the linguistic and
academic abilities of deaf children are constrained by a
number of factors. These,, together with other informa-
tion (such as teacher ratings of child ability) are
listed below.

14
1. hearinS loss
2. additional handicaps
3. ethnic background
4. sex differences
5. handedness
6. home and language environment
7. intelligence
8. social class
9. teacher ratings
10. schools.
Although we attempted to gather as much of the necessary
information as possible for each of the children in the
study, success was not always possible. Frequentlyr for
example, the cause of deafness, an important indicator of
academic achievement, remains unknown. In this chapter
we shall discuss each of these factors. Although any
investigation of the linguistic abilities of deaf chil-
dren needs to bear these factors in mind, it is not
always possible (especially with sample sizes of 50) to
include them all in subsequent statistical analyses.

15
Hearip-a Loss.
There appear to be 4 major relevant aspects to a
child's hearing loss which may have an effect on his
linguistic development. These are:
1. cause
2. age of onset
3. degree
4. delay in diagnosis and hearing aid provision.
Major causes of deafness are rubella, prematurity, men-
ingitis,, rhesus incompatibility and heredity. The EEC
report on childhood deafness (Commission of the Europec-; Ln
Communities,, 1979) found maternal rubella to be the larg-
est identifiable cause of deafness in all countries stu-
died. The tragedy of this, of course, is that maternal
rubella is easily prevented. HOWever, for a very large
proportion of deaf children,, cause of deafness is never
established. Both Conrad (1979) , in England and Jensema
(1975) , in the United States, give a figure of 45%. There
have been suggestions that these 'unknowns' comprise
large numbers of rubella children (EEC Report, 1979) and
those with hereditary deafness (Nance and McConnell,
1973) . The reasons why cause of deafness are relevant
are interesting. As discussed in the 'Handedness' sec-
tion below, the hereditary deaf, when compared with other

16
deaf groupst have far more similar profiles to hearing
children along certain dimensions (eg. intelligence,
incidence of lef t-handedness and other handicaps) . This
may reflect the lack of neurological disturbances thought
to be associated with conditions such as maternal
rubella. There is evidence to show that 'rubella' chil-
dren are less intelligent than others (see Jensema,
1975) . Maternal rubella is also associated with heart
disease, visual disorders and emotional or behavioural
problems in children (jensema and Trybus, 1975). This
last group of problems is almost twice as common in boys
than in girls.
Usually, the earlier the occurrence of the lossr the
more severe is the effect on cognitive development.
Obviously any language acquired by the child before the
onset of hearing loss will be of tremendous value to his
subsequent progress. Children whose deafness is caused
by mumps, for exampler tend to do better educationally
than other deaf groups because their hearing loss is not
present at birth and they therefore have had some normal
exposure to language. The position is not totally clear
cut, however. jensema's data, for example, showed that
children with a hearing loss at birth actually did better
than children whose loss occurred after birth but before
age 3. This, howeverr probably reflects the inclusion in
the former group of children with hereditary deafness who

17
are known to have fewer additional handicaps (Jensema and
tiullinso, 1974) and have a higher mean IQ (Brill, 1960,
1970) . These children are also most likely to have
parents or relatives who are familiar with the problems
of deafness.
I It seems hiqhly likely that the sooner the loss is
discovered, confirmed and hearing aids provided, the
better are the child's chances of learning language (EEC
Report, 1979). We know that many preverbal. skills (such
as turn taking and shared reference) are learnt before
the hearing child even begins to speak and much of this
is communicated to the child by the mother using language
4
anci other sounds. Gregory,, Mogfor6 and Bishop (1979)
found that these turn-taking skills are not well
-1 developed between mothers and their deaf children.
Clearly,, any amplification available during these very
early stages might be of great help. The EEC report
(1979) found that only 50% of deaf children have had
their hearing loss confirmed by their 3rd birthday and
only 70% of children had hearing aids by their 6th
birthC-ay. This is partly due to a system operating in
France and Belgium where parents and children undergo a
period of 'special training' before hearing aids are
supplied. The nature and purpose of this 'special train-
ing' are not divulged. Of course, even if a child has
hearing ai6s, this is no guarantee that he Will wear

18
them. How much a child is encouraged to use his aids and
how well they are maintained are two further important
variables (EEC Report, 1979r Jensema, 1975).
Degree of deafness is not always as 'given' or
stable as many,, including Conra6i (1979) , would believe.
lie found that it was very rare for children to show an
improvement in their measured hearing loss of more than
30 dB and rejected notions that a child's hearing loss is
affected by experience. Flowever,, as Wood (1980) points
out, this is a very stringent criterion since an improve-
ment of 30 dB would move a child through 3 of Conrad's
own hearing loss bands which Kyle (1977) has shown to be
associated with significant differences in speech intel-
ligibility. Teachers would say that with time and
encouragement, children can become much more sensitive to
sound with experience and there is some evidence that
improvements of up to 10 or 15 dB do occur throughout the
school years (Hine and Furness, 1975).
It is generally acceptec-,,, as a rule,, that the more
severe a child's hearing loss is, the more severe will be
his language iiiý. pairnient. Howeverr whilst generally true,
there are important exceptions. It is the existence of
such exceptional children who, despite a profound hearing
loss, make remarkable progress in their linguistic
developmentr that inspires us to try to discover which

19
factors are associated with success.
There is now a neW generation of children coming
into schools for the deaf whose hearing loss is being
detected (in some areas of the country) far earlier than
ever beffore. Experienced teachers and associated profes-
sionals say that the speech quality of these children who
have had their loss detected and aids provided very early
on is excellent and quite unlike that of previous genera-
tions. This has yet to be confirmed by objective
methods. Research is currently going on to discover the
possibilities of detecting hearing loss in neonates.
Although the current method (the Linco-Bennett cradle) is
looking promising, its reliability is yet to established
objectively. One also needs to consider the possible
effects of 'false positives'. There are also consider-
able problems yet to be overcome in enabling such young
babies to support hearing aids.
In the present sample, the cause of hearinS loss is
only confirmed for 17 of the 50 children (33%) . 10 are
thought to be deaf because of maternal rubella, 2 from
jaundice, 1 from meningitis, 1 from rhesus incompatibil-
ity and 3 from hereditary factors. All are thought to
have been deaf from birth or,, at least,, very soon after-
wards. The usual cut-off point for determining a child
as being prelingually deaf is 3 years old. For the

20
remaining 66%, cause of deafness was either unknown or no
data were available. This is a higher figure than that
given in some other studies,? such as Conrad's (1979) p,
where 45% of the children had unknown causes of deafness.
In a recent study of the mathematical abilities of 6eaf
school leavers (Wood, Wood and Howarth, 1983) , the figure
is 51%. The high figure in the present study may reflect
the inclusion of a number of immigrant children (22%)
whose mothers may well be relatively uninformed about
Western standards of prenatal care; cause of deafness has
only been established for 1 of the 11 immigrant children
in this study. Exact data were not available for all
children about age of diagnosis and hearing aid provi-
sion. In the next chapter we shall discuss the degree of
deafness and its measurement in more detailt but Suffice
it to say at this stage that most of the children are
very deaf, 92dB beinc" the average loss.
Additional handicavs
it is frequently reported in the literature that any
population of deaf children includes a large propor ion
of children with additional handicaps. In his sample of
6,871 childrenv Jensema (1975) found 27% with at least
one educationally significant handicap. A recent report
published by the Commission of the European Communities
(1979) puts the figure at 29%. It is particularly

21
important to bear this f inding in mind when considering
both the interpretation of research data as well as the
nature of educational provision for these children.
lklajor categories of such handicaps include mental retar-
dation, visual deficits, cerebral dysfunction (such as
cerebral palsy, epilepsy and hydrocephalus) . The figures
above only include those children with major and easily
identifiable handicaps. However, there are likely to be
cases, such as minor brain damage (often suspected to be
associated with deafness as described in the section
below on handedness) that go undetected and yet still may
be of educational significance. Jensema found that in
all categories of additional handicap, students achieved
scores on all tests that were well below those of deaf
children of similar age but without additional handicap.
It also appears that the problems increase when there is
more than just one o-. cL these handicaps. Jensema and
Trybus (1975) report a higher incidence of emotional and
behavioural problems among those children with other han-
6icapping conditions. In the present sample, only 1 of
the 50 children showed evidence of an additional handicap
(spasticity).
Ethnic Background
report on the mathematical and reading abilities
of 16 year old hearing immigrant children was compiled

22
f rom data f rom the National Child Development Stud-y-
(Essen and Ghodsian,, 1979) . Overall, these children were
found to achieve lower scores than 'indigenous' children,
but when social and financial circumstances were taken in
to account, the pattern changed. It was then found that
when first-generation immigrants (those children born
abroad to foreign-born parents) were considered, they had
lower scores on both tests than indigenous children,, but
only the West Indian children had significantly lower
scores in the second-generation group (children born in
Britain to foreign-born parents). Among first-generation
immigrants, length of stay in Britain was found to be
related to reacing achievement but not to achievement on
the maths test.
In the United Statesi, Riesr Bateman and Schildroth
5) 'found that each of the major ethnic groups is (19 75
represented among the deaf population in similar propor-
tions to those found in the hearing population. They
quote evidence, however, which suggests that the hearing
losses of these children from ethnic minority backgrounds
tend to be identified at a later age than those of white
children. In Jensema's study (1975) of deaf children in
the USA, 65% of his sample were white, 30% from minority
backgrounds and 5% had no ethnic background reported.
T. -Thite children achieved higher scores on the tests than
those children from ethnic minorities, thus following the

23
same pattern shown in similar studies of hearing chil-
dren. Amonc the various groups of ethnic minorities,
Asian Americans had the highest achievement levels,
whereas the Spanish American group (where spanish is
frequently the language used in the home) had the lowest
reading and vocabulary scores.
It would therefore seem possible to conclude that
certain immigrant children who are also deaf will, in
, with two handicaps to their educa- effect, be dealinc-,
tional achievement. Essen and Ghodsian conclude, how-
ever,, that this setback that some immigrant hearing chil-
dren experience is "relatively short-term and language-
specific" (p. 428) . One wonders if the prognosis for the
immigrant deaf is as optimistic. The American data would
suggest not, although is is 6ifficult to disentangle the
effects of socio-economic background. Jensemals report
does not give a breakdown of the social and financial
circumstances of his immigrant G"eaf group so we are not
able to form any firm conclusions. Certainly any delay
in diagnosis of handicap, such as that found in the
United States, may well, according to some recent
theories (see below) severely impede rapid linguistic
development.
I-I'any of the deaf children in England are f rom Asian
Zest Indian homes. Reports from schools in areas with orT,,

24
a particularly high proportion of immigrant populations
(some put the figure at 30%) suggest that the incidence
of deafness among Asian families is increasing,, a fact
which is partly ascribed to their custom of inter-
marriage. At present we are not aware of any large-scale
study which has compared the performance of immigrant and
indigenous deaf children in Britain. Conrad (1979) j, for
example, did not include children who came from non-
english speaking backgrounds in his survey of the reading
ability of deaf children. Presumably, therefore, he did
include 1-ý'est Indian children. As mentioned above,, Essen
and Ghodsian (1979) found that even second generation
(hearing) 17, est Indian children appeared to be education-
ally handicapped although their home language is english.
One cannot predict the effects that deafness would have
on the patterns of immigrant children's achievement as
found by Essen and Ghodsian. Deafness might attenuate
the problenis of "the strange language and the culture
shock" or it might interact to form a double handicap.
In the present sampler drawn from two towns of
relatively high immigrant populationst 22% (11 out of 50)
children were of immigrant backgrounds where english, in
5 cases, was not spoken in their homes.
sex differences

25
The literature on hearing children abounds with
references to the linguistic superiority of girls and the
reputedly superior abilities of boys on some spatial
tasks and in tests of arithmetic and numerical manipula-
tion (Maccoby and Jacklin, 1974, Nash, 1975f Fairweatherr
1974) In the past,, it is likely that such differences
have been overemphasised and that " over the years
differences in the language ability of the two sexes have
actually become less pronounced in keeping with the shift
towards a single standard in child care and training in
the last few decades" (Templin, 1957j, p. 147). Cherry
(1975) reaches a similar conclusion in a review of
teacher-child verbal interaction. Viells (1979) describes
study in Bristol in which it was found that aaults
initiated a far greater proportion of conversations in
contexts of play with boys than with girlsr whereas more
conversations during helping and non-1play activities were
initiated with girls than with boys. "This suggests that
adults emphasise more 'useful' and domestic activities in
their interaction with girls,, whilst the emphasis with
boys is towards a more free-rangingr exploratory manipu-
lation of the environr. -.. ent" (p. 385) . This may well go
some of the way towarc's explaining the origins of
incidences of boys' superior spatial ability. Theories
of the aetiology of sex differences include those of an
environmental nature (such as this last one), those

26
involving heredity (there is some evidence for familial
patterns of spatial ability) and those involving physio-
logical differences such as hemispheric lateral isation.
There is evidence to show that both language and spatial
abilities are more bilaterally represented in females
than in males (McGlone, 1978) . Exactly how these differ-
ences in functional asymmetry add to our understanding of
sex differences in linguistic and spatial abilities is
not yet clear. Bilateral representation of verbal func-
tions is associated with verbal superiority in femalest
yet bilateral representation of spatial functions is
clearly not associated with spatial superiority in this
group. Wabe r (1976) , in a study of the verbal and
spatial abilities of early and late maturers suggests
that it is not sex itself which is responsible for these
differences but a variable which is associated with sext
namely rate of maturation.
Sex differences in the linguistic ability of deaf
children have also been reported (Mykiebusto, 1964) . so
whatever the reasons for such differences they clearly
persist to some degree in deafness. Myklebust reports
significant sex differences on certain measures of writ-
ten language, speech and lipreading but not in reading
(using the Columbia Vocabulary Test). Similarly, Jensema
(1975) found no sex difference in vocabulary and con-
cluded that there were no significant sex differences in

27
academic achievement for C. eaf children with the exception
of reading comprehension, Norden (1975),, on the other
hand, found that deaf girls were superior in all the
verbal tests she administered, but that there was no sex
difference among the 'hard of hearing' group Ue. the
less deaf) . She concluded that there was a stronger
relationship between hearing loss and language impairment
for the boys than for the girls. Unfortunatelyt, Conrad
(1979) does not give any information about sex differ-
ences in reading in his study of deaf children. He does
reportr however, that there is no difference between boys
and girls in the incidence of inner speech. Norden
(1975) reports that the boys in her sample were superior
in mechanical and technical tests. We have recently
undertaken a study of the mathematical abilities of deaf
school-leavers- (Woodo, Wood and Ilowarth, 1983) and found
that although deaf boys achieved higher scores than deaf
girls, the difference failed to achieve statistical siq-
nificance. With the hearing control group there was a
significant difference. The authors suggest that "wha-C-
ever influences the relative performances Of hearing
adolescents in mathematics to produce sex differences is
attenuated by deafness". There was a significanti, but
small, correlation between hearing loss and maths age.
Using the data from this study (originally in order
to look at the different ways of calculating audiogram

28
averages as described in chapter 3) 1,1 found that when
the sample was divide6i into groups of boys and girls,
there was no significant relationship between hearing
loss and maths age for the boys, but there Was for the
girls (p <. Ol) . This provides an interesting parallel
with Norden's data (described above) which showed that
when we are considering lanquag-e abilities, the opposite
pattern holds true, namely that there is a stronger
relationship between deafness and these abilities for
boys. Perhaps one might argue (Wood et al, 1983) , admit-
tedly in the absence of any data on the linguistic
abilities of this group, that there is a stronger rela-
tionship between verbal functioning and mathematical
ability in girls than in boys. Perhaps girls actually
solve these problems in a different way from boys. Nor-
den concludes that there is a lack of relation between
language ability and thinking, especially in the case of
cleaf boys, whereas the deaf girls' performance was con-
sistently more even (p. 68) . She found that measures of
language ability intercorrelated more highly for girls
than boys: for girls any one measure was a better predic-
tor of pert-ormance on another measure than it was for
boys. The question she asks isc whether this result is due
to girls having a stronger general desire to do well or
whether there is a greater interdependence between
language anrA intellectual development in girls. . -, ioores

29
(1967) provides data which suggest that this latter pos-
sibility may well be true.
It was possible that the scope of the present study
was too small (only 50 children) for us to be able to say
anything definite about sex differences. In their review
of the lateralisation of functionsp Springer and Deutch
point out that there is a lot of variation within
each sex and it is often difficult to detect small (but
real) differences when one is considering small groups.
The same point is probably relevant when considering
differences in abilities. However, it was a variable
that we took into account in all our analyses to see if
any interesting differences emerge6. our sample con-
sisted of 20 girls (with an average hearing loss of 94 dB
and an average age of 10 years 7 months) and 30 boys
(with an average hearing loss of 92 dB and an average age
of 10 years 9 months).
Handedness
It is generally accepted that the right anc-1 left
hemispheres of the brain tend to have specialised func-
tions (Springer and Deutsch, 1981) . The left hemisphere
is largely involved in " verbalt sequential, analytic,
logical and computer-like" processes whereas the right
hemisphere is more concerned with "non-verbalf spatialf
30
syntEetic, insightful and Gestalt-like" processes
(Sperry, 1971, p. 34). However, this is an over-
simplification of the case. Studies of Split-brain
patients have shown that in fact the right hemisphere
possesses "a remarkable.. variety of linguistic abili-
ties " (Beaumont, 1981 p. 197) although speech is not
included among them. Bryden, Hecaerl and DeAgostini
(1983) cite studies which show that although for most
right-handed males the hemispheres seem to serve quite
different processes, in the case of left-handers (Hecaen
and Sauguet, 1971r Herron, 1980) and right-handed females
(McGlone,, 1980) there is a certain amount of bilateral
representation. Sperry cites studies in which an anatom-
ical asymmetry has been found that corresponds to the
lateralisation of language and cerebral dominance
(Geschwindii, 1970) and is also present at birth (Wadar
1969) .
In an interesting paper, Kimura (1981) reviews stu-
dies of brain damaged deaf individuals and f rom these as
well as anecdotal evidence concludes that,, at least for
right-handed people, manual signing is just as dependent
on the left hemispherc as is vocal communication. Lef t
hemisphere damage tends to be associated with disorders
of speechr motor control of arms and hands and of the
oral musculature. These disorders are apparent both when
the intended movements are representational and when they

31
are meaningless (Kimura and Archibald,, 1972) . "The fact
that errors in speaking and in manual signing are at
least superf icially sii. dlar to each other is not an
argument that the similarity stems from the fact that
both are linguistic systems... -We know that speech
ap1hasia is nearly always accompanied by C-Aifficulties in
the production of nonverbal oral movements as well
(Flateer and Kimura-,, 1977) . If one considers both the
oral and manual apraxia as motor selection deficits in
the broad sense of the term, then it is quite reasonable
to consider them not as associated deficits but as the
major basis for most aphasic disorc-ers, whether in spoken
or signed languages" (p. 308).
Sperry (1971) concludes that environmental influ-
ences are unlikely to be important in the origins of
han6edness. F-Towever, the very high incidence of lef t-
1972) would han,. -edness among clinical populations (Satz,
lead one to suspect that -prenatal environmental inf lu-
ences may well be in operation. Satz himself concludes
that much of the incidence of lef t handedness is of
pathological origin. The incidence of left handedness
among twins is twice as high as that in the normal
population. Twins also have a high incidence of neuro-
logical disorders thought to result from damage due to
intrauterine crowding (Howard and Brown, 1970) . However,
twins are not very useful examples when considering

32
asymmetries since pairs tend to exhibit "mirror imaging"
in various ways. It is true, however, that the incidence
of lef t hanc'edness is high among individuals known to
have suffered minor brain injury before or at birth, such
as the mentally retardedy children with learning disord-
ers and epileptics (Springer and Deutsch,, 1981,, p. 115) .
There is also evidence that early left hemisphere damage
results in a shift of both hand preference and language
hemisphere (Rasmussen and Milner, 1977) . Springer and
Deutsch quote studies which showed that left handers have
a much higher incidence of bilaterally represented speech
than right handers and thC--t left handers recover f rom the
aphasia caused by a stroke much better than right
handerE.
The literature about the deaf and handedness is very
interesting. Conrad (1979) finds that the incidence of
lef t-hanciedness (17%) in his sample is almost twice what
one would expect (10.6%) in the normal population
(Annett, 1970) . The criterion used for both these fig-
ures was hand-preference for writing. However, if one
looks only at the hereditary deaf, the incidence is the
same as that of the normal population, namely 10.7%.
Myklebust (1964) cites various studies that established
disturbed laterality as being associated with certain
learning disorders (eg. Orton, 1937) and confused
laterality being associated with disabilities in

33
speaking, reading and writing (p. 197). When distur-
bances of laterality are present there are usually motor
disorder. c, too. It seems reasonable to suppose, as 14yk-
lebust points out, that deafness is associated with a
higher incidence of neurological (Asorders. In his own
research Myklebust found that deaf children were twice as
likely to be left-handed as hearing children. The actual
percentages he gives are half the size of Conrad's but
criteria for establishing handedness have not always been
consistent (Annett, 1970). The proportions however, are
the same for the two studies. Unfortunately, Myklebust
does not give a percentage of left-handedness for his
herecAtary deaf . As he says, the causal relationship
between han6edness and deafness is not clear from his
data. "It seems unlikelyr however, that deafness per se
is influential in the development of laterality... A more
logical presumption is that the higher incidence of atyp-
ical laterality in the 6eaf can be attributed to a higher
incidence of disorders of the central nervous system" (p.
198) . In the light of Conrad's more recent data, reveal-
ing that the hereditary deaf have a similar incidence of
left-handedness to the hearing, it seems likely that
ilyklebustis lpresumption' has some factual basis. Addi-
tional support for this view can be founu by looking at
the deaf children in Conrad's study with further handi-
caps since these are also the ones most likely to have
34
neurological disturbances. 26 . 7% of these children are
left-handed. This figure is three times that found for
hearing children and twice as high as Satz's figure
(1972) for other clinical populations.
If the pathological model of the origin of handed-
ness is true, one might predict that left handers would
not perform as well as right handers on tests of cogni-
tive ability. Springer and Deutsch (1981) review the
evidence for the hearin. g population and conclude (r,. 120)
that "despite the suggestion of ceficits in left
hant'-Ie rs... it is evident that any differences in the cog-
nitive abilities of left and right handers in general are
very small and of little practical importance. In bis
own saMple of deaf childreno, Conrad (1979) found no
differences between right-handers and left-handers using
Raven's Eatrices. Certainly the evidence to date does
not enable one to conclude that left handers are cogni-
tively inferior to right handers. In this connection
Conrad (1979) looked at the relationship of handedness to
the use or- internal speech. He found that 47% of left-
handers use internal speech and 57% of right-handers do.
I-Then looking only at children with acquired Ceafnessr
however, these f igures change to 35% and 56%, although
neither of these sets of figures reaches statistical
significance. This may provide partial support for the
view that acquired deafness is associated with a higher

35
. .1 associated incidence of lef t handedness Which may also
with neurological disturbancer which may turn be associ-
ated with less, intelligence which is known to correlated
highly with use of internal speech. The argument becomes
somewhat tortuous.
In the present sample, 14% of the children were left
handed.
The child's home and languag_Q environment.
This is an area that we shall pursue in some detail
in chapter 5 in our discussion of the effects of various
conversational strategies on the chilGIs linguistic
development. However, there are many other such factors
that could be described as relevant to his development.
Far. -iily size iss associated with social class,, results of
intelligence tests,, nutrition and physical growth
(Plowden, 1967, para. 153b) .A late birth order and
increasing family size have been generally held to have a
negative effect on intelligence (Altus, 1966, Zajonc and
flarkus,, 1975) althouSh Marjoribanks and Wallberg (1975)
I conclude that birth order may be a superfluous variable
and that the child's intellectual ability depends on the
amount of parental attention available to him, which in
turn de-pends on the number of childiren in the family.
This theory of available attention is interesting in the

36
light of a study concerning families of Asian-African
origin in Israel (Davis, Cahan and Bashi, 1977) . They
report that the usual correlation between birth order and
the child's ability is reversed in this group, whereas if
the families were of European origin the normal pattern
was found Ue. a late birth order is associated with
lower intelligence) . This finding is attributed to the
effect of older brothers and sisters on the younger child
in families where the parents are uneducated. At least
83% of the children of Asian-African origin (as compared
with only 31% of the European group) say that they ask
older siblings for help with their homework.
Such studies are rare in their attempt to focus on
individuals other than mothers or teachers as being
instrumental in a child's development. Cicirelli (1972),
.C
for example, found that older sisters were significantly
more effective at teaching their younger siblings a con-
cept learning task than were older brothers. Particu-
larly interesting was that there was no di', ---: ference in
effectiveness of older boys and girls as teachers of
unrelated children. Furthermorer it appears that the
different way in which children react to instruction or
help from older siblings transfers to situations where
the mother is offering help (Cicirelli, 1976) . Recent
research by Dunn and Kendrick (1982) also shows that
there are many interesting and subtle relationships

37
between different 'arrangements' of siblings and their
mother. Wells (1974) suggests that the expression of
possession is likely to emerge earlier in children who
have older siblings than in those who do not. Evidence
for the importance of other individuals in the home is
cited by Creber (1972) who reports that in one particular
negro culturel the presence of grandparents in the home
was shown to relate to superior linguistic performance of
the children.
Bradley (1968) found that first-born children (as
well as only children) in universities and colleges in
the United States were massively over-represented.
Unpublished studies (cited by Clarke and Clarke, 1972)
from the psychology departments of Sheffield and Hull
,, S. Universities confirm these findinc
We are obviously dealing here with extremely subtle
environmental differences. Quite how much effect they
would have on the development of deafr as opposed to
hearing, children is a matter for speculation. It is
certainly not possible to include, for example., birth
order or sibling 'constellations' in analyses for the
present stucyr although we did gather the data.
Intelligence

38
It is not within the scope of the present study to
debate the nature and usefulness of intelligence tests.
However, measured intelligence is known to be a relevant
factor when considering a child's linguistic achieve-
ments. Children's performance on intelligence tests has
been shown to be related to parental occupation. This
difference in measured intelligence between children frorn
working class and middle class homes (as defined by
parento. 1 occupation) increases over both the preschool
(Hindley, 1962) and the primary years (Douglas, 1964) .
It k..,, ould appear that when given a- test that does not
rely too heavily on verbal ability, deaff children perf orm
equally well as do hearinc, children. Children who are
I deaf because of hereditary factors have been found to
have significantly higher IQ's than those with acquired
deafness (Brill, 1960 and 1970, Conrad, 1979) . It is
likely that this difference reflects the neurological
-, le have disturbances associated with acquired deafness. IV
discussed this more fully in the section on handedness
above. An alternative explanation is that intelligence
is instrumental in the cause of deaf ness. This seey. -, s
unlikely. It has also been found that profoundly deaf
children are no less intelligent than partially hearing
children (Conrad, 1979).
There is a marked tendency for measured IQ to be

39
regarded as aI given' . Conrad (1979) , in his survey of
the reading ability of deaf school leavers, says "virtu-
ally all studies which have made any comparisons of the
perf ormance ot grLoups of deaf children have treated
intelligence test scores as an independent variable which
needs to be controlled. We have done no more than follow
this convention. Erring then - if error it is - on the
side of prudence and convention, we have also regarded
intelligence as 'given', in the same sense as cause of
deafness is, or degree of 6eaf ness, or sex, etc. " (p. 53) .
This is something with which we take issue. Intelligence
is a measurement. It is now well documented that meas-
ured intelligence can vary enormously in the same child
with variations in the environment (Clarke and Clarke,
1976) . "In growth of all kinds, the interaction of
powerful genetic forces and POWerful environmental forces
is at work cumulatively over long periods of development.
In optimum environments genetic factors will appear
predominant and environmental will appear less important
because its influence is roughly constant. In sub-
optimum environments,, environmental effects will appear
more obvious" (Clarke and Clarker 1972, p. 321).
VandenBerg (1971) found no correlation between deaf
children's intelligence and their language or educational
achievement. She considers this to be in line with
f indings of previous researchers and that nonverbal 0

40
assessments of intelligence do not usually bear any clear
relationship with verbal abilities. She agrees with
Levine (1956) that although deaf children characteristi-
cally obtain very low scores on verbal tests of intelli-
gence, verbal tests are better predictors 0 r, -- their
academic progress than are nonverbal tests (as is the
case for hearing children). Clarke-Carter (personal com-
munication) found no correlation between deaf children's
intelligence and their scores on a vocabulary test. Con-
rad (1979) , however, considers that a child's reading
ability, as measured by the Brimer Wide-span Reading Test
(1972) , is virtually solely determined by his degree of
deafness aind his intelligence (we shall return to this in
chapter 4) . In fact, his data show that although, at
most, 26% of the variance in reading ability is accounted
for by intelligence and hecaring loss, there still remains
. -I a considerable amount unaccounted' for. Also,, in assuming
tilat intelligence and hearing loss are givens and in
concluding that reading ability is virtually solely
dependent on hearing loss and intelligencer Conrad might
well be saying that factors such as variations in teach-
ing technique have no effect at all either on the
children's ability to read or on their general ability.
Many teachers would take issue with this view. One
cannot Just 'abandon' 75% of the variance without further
question. Furthermore, any group of individuals selected

41
for homogeneity in intelligence at one particular moment
will show many variations with time and become increas-
ingly heterogenous. Interestingly, later in his books,
Conrad considers one of the reasons why deaf children of
deaf parents are more intelligent than those of hearing
parents is that they have been exposed to language (in
this case, signing) early in life. This seems somewhat
at odds with his argument that intelligence is as 'given'
as is degree of deafness and is also unlikely to be the
sole reason,, as indicated by other research outlined in
Ule section on hearing loss and its causes.
Children in the ipresent study were given Ravenis
Progressive Matrices (Raven, 1958) to provide a measure
of intelligence. The reasons for this choice were
firstly, that the test is basically nonverbal and
secondly,, that it is easy and quick to administer. A
third consideration was that it was also used by Conrad
(1979) who provides the most thorough recent review of
the reading ability of deaf children in Britain. We
discovered, however, that the children from one school
had recently done this test. Rather than submit them to
further testing (so as to avoid test practice and so on)
we accepted these results for use in the present study.
It should be borne in mind, however, that in these cases
the children were tested by their teacher, whereas the
rest of the children were tested by a researcher. Since
42
the children were not given an intelligence test at the
same time as the other measures of linguistic performance
were taken? we did not use raw scores in our subsequent
analyses, but percentile scores, calculated from the nor-
mal Qistribution curve. In allo, information about the
children's performance on Raven's Progressive Mlatrices
was available for 44 of the 50 children. We found the
average percentile point to be 46.5. Also available were
teacher ratings of general ability. These are discussed
more fully towards the end of this chapter.
Social Class
The existence of a "class" factor has been well-
documented in the literature concerning the development
of hearing children. Middle class mothers make more use
of medical facilitiest visiting post-natal and ante-natal
clinics more often than working class mothers O'. 'evison and
Newsono, 1968). !,, --edge and Prosser (1973) give an account
of the physical conditions in which a child lives and
relate them to attainment: the poorer the conditions, the
lower the attainment. Douglas (1964) cites a study which
controlled for the family size, parental interest and the
academic record of the school and yet still found that
both working class and rLaiddle class children from poor
housing conditions achieved lower scores on tests than

43
than those living in "good" homes. Two interesting find-
ings emerge from the National Child Development Survey
(Davie . Butler and Goldstein, 1ý, 72) . Firstly, the
difference in reading performance between children from
class V and non-manual homes increases with age. In
other words, that education (the alleged "great equal-
izer") is not having the same effect on all children. We
1; shal 1 return to aiscuss this point in chapter /0
Secondly, upward social mobility appears to have a posi-
tive effect on reading ability.
The literature on class differences in discipline
techniques and the nature of the language experienced by
u'. -. e child at home is extensive (eg. Becker, 1964f Newson
and Newson, 1968) It has often been thought that the
differences in the language used by children from dif-
ferent backgroundsr as reportec- by Bernstein M64) , may
be due in some part to the nature of the language they
encounter at home anci other associated variables such as
parental interest in school life. More recent research
on these apparent class differences, however, would sug-
gest that the picture is not as simple as previously
painted. Furthermorer research of this nature can often
be criticised on the grounds of being formulated within
an educational ideology that appears to be "conspiring"
to make the working classes emulate the middle classes.
Dittmar (1976) provides an extremely useful discussion of

44
these problems. As far as differences in grammatical
complexity are concerned, Wells (1979) considers that
"Insofar as this question has been properly investigated,
the evidence does not support the hypothesis that lower
class children show a general developmental delay"
although he does mention a study (Edwards, 1976) which
suggests that "they do not habitually exploit their gram-
ri-tatical resources to as full an extent as their middle
class peers" (p. 389) . Tizardl, Carmichael, Hughes and
Pinkerton (1980) , found that although children f rora both
working and middle class backgrounds have similarly
extencie(fl, and egalitarian conversations at home, at school
the picture was quite different. In other words,? there
was no consistent relationship between the way a working
class child was talked to at home and at school. These
children seemed to bring different attitudes to school
and this may well be partly responsible for the nature of
their Ciscourse with the teacher; they ask fewer ques-
tions, give information less oftent make smaller contri-
butions to conversations and appear Senerally less confi-
dent than the middle class children. We shall discuss
this, and other relevant research in more detail in
Chapter
As far as the deaf are concerned,, although we are
not a-,. -7are of any large-scale reser-arch concerning social
class and incidence of deafness in this country, we do

45
have some C. ata f rom the United States. jensema and
Trybus (1978) found that both teachers and parents used
more speech (as opposec, to sign) in their communications
with children from higher income fai-ailies than they did
with with children from lower income farailies. In the
Unites States, however, this difference probably reflects
the fact thc-; it different types of educational programme s
(with established preferences for different communication
r. aodes) serve ve ry different kinds of deaf children.
Rawlings anc-, Jensema (1977) found that deaf children come
from fai-Alies whose distribution of income is lower than
that of the general population. Children from higher
income homes were also appear less likely to become deaf
after birth. This coula mean either that they have
better post-natal medical care or that, in fact, children
from lower income f amil ies have their hearing loss
detected at a later age. Deaf children from higher
income families were more likely to use their hearing
aids, to conte f rom a white backgrounCl, to attenu
preschool programmes and to do better academically.
Of the children in the present sample, data were not
available from school records as to the exact nature of
all their parents' occupations. Most parents, howeverr
appeared to be working in local industry (usually at
shopfloor level) or were plasterers, welders, mechanics,
lorry drivers#, gardenerst labourers and some were

46
unemployed.
Teacher Ratinqs.
The teachers provided ratings for each child on 5
aspects of their ability and performance. These were:
oral proficiency
2. general ability
3. attitude to school
4. written language
5. speech intelligibility.
It should be emphasised that these ratings were only
obtained as a very rough guide to the teachers' views
about their children. We thought it might be interest-
ing,, for example,, to see how well the teachers' ideas of
their children's ability correlated with their scores on
Raven's Progressive Matrices (Raven, 1958) . Wle
were also
interested in discovering which, if any, of the two
indices of a child's intelligence correlated more signi-
ficantly with our functional measures of his linquistic
performance. Vandenberg (1971) , in a study in New Zea-
land, foun6 that ratings of children's intelligence actu-
ally correlated better with their academic achievement

47
than with objective measures of intelligence. Thus,,
these teachers' assessi,, -tent of their children's ability
seemed to be based on achievement rather than current
potential. Interestingly, although objective measures of
the ability of Maori children showed no significant
differences to that of 'European' children in this study,
teachers' ratings showed that the Maoris were considered
less able. Ijorden (1975) CAscusses whether differences
in teacher ratings about boys and girls have some basis
in reality or whether they reflect 6ifferent expecta-
tions. In her study, carried out in Sweden, she found
that these differences in the teachers' views about boys
and girls were not always reflected in the children's
performances. Ratings clearly need interpreting with
creat caution but we may reasonably suppose that those
which correlate consistently with objective measures may
well have some real basis, providing that we are confi-
dent about the validity of the measures themselves.
The schools.
Educational provision for deaf children can be
broadly divided into 8 different categories. These are:
1. traditional boarding schools, often run by
charitable trusts.
2. local education authority schools, usually

48
established in cities, at the end of the
nineteenth century.
3. private, fee-paying schools.
4. local authority schools, established in the
post-war period, usually to cater for
special needs (eg. grammar or technical
-chools) .
5. schools established in the 1950's especially
for 'partially hearing' children (usually
boarding).
6. schools for the dually or multiple-handicapped
children.
7. partially hearing units attached to schools
for hearing children. These, together with
peripatetic teachers of the deaf, proliferated
in the 1950's and 1960's.
8. the integration of deaf children into hearing
schools witl-i specialised support from the
peripatetic service.
The children in the present study attended one of
tv,,, o schoolsr (let us call them schools A and D) , both of
which can be described as belonging to the category 2

49
above. School A caters only for nursery and primary age
children, with all seniors going on to attend a partially
hearing unitr while School B caters for the entire age
rance. The latter school coes, however, send some of its
senior pupils into local units. Both schools are
situated in large industrial cities, each with a catch-
ment area of some 20 miles in ra6ius. These cities are
characterised by a large immigrant population; approxi-
mately 15% of School A's children are from immigrant
backgrounds, while the figure for School B is rising
towr--rds 30%. The makeup of these -ý-., opulat-ions is not the
same; the former includes children from both West Indian
a, n Asian cultures while the latter cor. q. ýrises mostly
Asian children. I-lost of the Asians in both schools come
f rom the northern regions of the Inc-ian subcontinent
(Kashmir, Pakistan) and are therefore Muslims. A few
children are of Seikh origin. The languages spoken in
their homes are gujeratir punjabir urdu and pushtu.
Teaching in both schools is ostensibly oral in
nature,, although School B does offer signing classes for
the less able children. F. ssentially, however, the two
schools are of very similar character.

50
CHAPTER THREE
'EARING LOSS

51
CHAPTER THREE
HEARING LOSS
I NT R G'D UCT 10 N
As with any other stu(fty of deaf children we needed
to provide a rough guide to the child's hearing loss for
statistical purposes. Since Conrc-;., d's study (1977,1979)
is the most recent large-scale investigation of deaf
children's linguistic ability, we had decided to use the
San, e conventions for calculating the average hearing
losses. However, there appeared to be three methods
currently in popular use. The first takes the average of
losses at 250t 500t 10OOr 2000, and 4000 Hz in the better
ear using 110,125,125F 125 and 140 dB in calculations
where the child has shown no response at those particular
frequencies. This method follows a convention suggested
by Hine (1973) who gives a statistical arcument for such
a procedure, based on his analysis-, of many audiograms.
fie argues that such a method is likely to give a more
realistic description of hearing losses. Providing that
the 6istribution of hearing loss i-s normal and that "the
no responses represent a relatively small proportion o-. L-:
the total number of cases" (P-19) one can use parCa-metric

52
statistics. The national executive cou-imittee of BATOD
(the British Association for Teachers of the Deaf)
recently suggested that teachers and associated profes-
sionals shoulO adopt this latter method in an attempt at
standardisation (1981).
L The second method is similar to the f irst except
that it uses 120 dB as a no response value at all
frequencies. Conrad (1979) adopted this system. The
thir(f. .. -iethod (Eir. --., h 1-052) takes the average of 3 points
on the auCiogram (500,1000 and 2000 Hz) j, also using 120
dD as a no response value at all frequencies. Quigley
and his colleagues in the United States use this system
in their ex-tensive studies of the language of deaf chil-
dren. I! lIj 'rhile most research to date has in fact used this
, ument for third metho6i, Conrad (1979) provides an arc
using the average of five rather than three frequencies,
based on some research reported by Kyle (1-1. ý77) Using
speech intelligibility as a measure, Kyle found that
although most of the predictive information can be pro-
vide6 by the average of three f rec,,, uencies, signif icantly
more can be found by using the average of five. Look ing
at the (3,, ata from various of our research pro-'ýects at
Nottingham, r we have found that the average of five fre-
quencies makes children appearr on average, 2 or 3 deci-
bels deaf er thc-n the average of three. Conrad reports
the sar. rie f inding.

53
Each of these methods, however, leave much of the
variance in linguistic ability unaccounted for. Risberg
(1976) reports that often children with identical
audiograms have very different speech discrimination
abilities. No doubt other factors such as IQ,, type of I
education, parental support an6 so forth come into opera-
tion here as well, but to the best of our knowledge there
is no study which has investigated the various methods of
I. audiogran, calculation in orCer to see how miuch of the
variance they each account for when other important vari-
ables have been partiallek--A ' out. Norden (1980) wonders
whether some of the hitherto unexplained differences in
speech discrimination between deaf indiviC-, uals with
equivalent audiograms (as reported by Martony, 1975)
rý. Aght be clarified by the fact that some individuals
might have usable hearing in the lef t ear only. There is
evidence from several studies that there are differences
in sound perception between the right and left ears
(Kir. -. ura, 1967, Nagafuchir 1970, Knox and Kir.,, ura, 1970,
Bever,, 1971t Morse,, 1572;, I-Iliscock and Kinsbourne, 1977).
The right ear has been found to have better speech-sound
perception. Glanville et al (1977) report a right ear
preference as early as three months of age. one would
suspect howeverf that the number of children with signi-
ficant differences in hearing losses between right and
left ears is too small to make any difference. In the

54
present study only one child (out of 50) shows a differ-
ence of more than 10 dB between right and left ears and
"better ears" appear to be evenly distributed; 27 out of
50 children show their left ears as being less impaired
than their right.
'I'liere are situ. E,, tions where two individuals can be
allocatec-; the same average hearing loss (90 dB) and yet
whose audicgrams look very different. One child may show
a 'flat loss' at ý, O dB over the frequencies concerned
whereas the other may have a 'ski-slope' shaped loss
which, when averagedr also gives a figure of 90 dB.
Lhese children are likely to have different speech hec-. L
ing abilities. The latter x,,,, ill hear fewer fricatives
and 'k' for example) but will be better ec-fuipped
to perceive prosody and rhythm than the former. There is
also evidence that differencec-, in audiogram shape are
indicative of different medical histories (D. E. S 1967,
O'Neill and Oyer, 1970) .
RisberS and f-lartony (1972) describe a system, which
rfoes some way towarcis dealing with the problems outlined ýj
above. Their categorization of audiograms accounts for
not only the degree of loss at five frequencies but also
the shape of the audiogram, providing 20 categories of
hearing loss. Conrad (1979) reports that 15 of these
groups were needed to describe all of his sample and that

55
this was "fzýr too many for statistical purposes" (p. 45) - Conrad's study involved 468 children, and since the
present one only involves 50, this systeri unfortunately
provides too many categories for our purposes as well.
However, Bamford (personal communication with D. J. Wood)
finds that only 8 of the 20 categories are, in fact,
common. Large-scale studies of the linguistic abilities
of deaf children, such as those undertaken in the United
States, could analyse the the amount of extra variance
this syst eTa provides for, but to the best 0f our
knowledge this has not been done. Bamford's data also
provide partial support for the view that it is the lower
f requencies Ue. up to and includincý 1000 Hz) that are
the Post functionally important ones.
In the face of all this confusionr we deciUed to use
all three metnods described above in our analyses, hoping
to c-Iiscover i,; hether any one of them correlates more
highly than the others with the sort of functional meas-
ures we are usinc'. These measures are likely to give a
I more "global" view of the chilQls linguistic ability t.,, an
those used in studies to date.
As well as looking for differences in correlations
between these hearing loss measures and certain vari-
ablesi, we were obviously also interested in the relation-
ships themselves. As mentioned in the previous chapter,

56
some believe that a deaf child's linguistic performance
is virtually solely dependent on two factors, namely his
hearing loss and his intelligence (Conrad, 1979). In
this chapter, however, we shall concern ourselves only
with looking at which, if any, of the three averages
correlates more highly with our current measures of the
child's linguistic ability. In the chapters concerned
with these measures theraselves (chapters 4 to 7) we shall
look at the signif icance of the actual relationships, z
using the hec--; ring loss average that we found to be "the
best" (see below). In Chapter 8 we will go on to examine
the relative importance of each predictor variable (IQ,
age and sex as well as hearing loss) and how much vari-
ance in linguistic ability each one accounts for.

57
LIE5MD
Hearing losses were calculated for each of the 50
children in tile study according to the following three
metho6s:
I-IETHOD 1: using the average of five frequencies
(250j, 500r 1000,2000 and 4000 Hz)
and 110,125,125r 125, and 140 dB
as no response values
METHOD 2: using the average of five frequencies
(250j, 500, r 1000;, 2000 and 4000 Hz)
and 120 dB for all no responses
INETHOD 3: using the average of three frequencies
(500,1000 and 2000 Hz)
and 120 dB for all no responses
The ear with the least hearing impairment Ue. that (ý, ave
the lower of the two averages) was used in analyses.

58
The means and standard deviations of each hearing
loss measure are shown in Table 3: 1 (below) As with
other samples we have looked at, method 3 gives an
average hearing loss 2 dB higher that the other two
methocis.
Decibels --------------------------------------
I Mean I StG.. Dev. ------------------------------------
I'lethod 1 92.0 1 14.7
Method 2 92.6 1 15.4
1 Methoo 3 94.1 1 14.9
-------------------------------------
Table 3: 1 : Means and standard Oeviations for each hearing loss measure.
T7
,!, je correlated each of the three hearing loss aver-
ages with all the measures of linguistic ability found in
the study. Not all 50 subjects were involved in all
these correlations. In the teacher-child conversation
section, for example, data are unavailable for 8 chil-
dren. Similarly, not all children completed every sub-
test in the reading section. The reasons and details
concerning these numbers (as well as details of the
actual measures) are available in the relevant chapters.

59
Eoweverl, we used as many children as the data from each
section would allow. Using an analysis of variance, we
attempted to discover whether any one average measure of
hearing loss provided significantly different siz ed
correlations with the language measures than any other.
The result indicated that the differences were not sta-
tistically different (p=. 23). Howevert, if one "eyo-
balled" the uata, it was apparent that in the vast
majority of cases, the average of three miethoCA did corre-
late slightly more highly with the language measures than
di6 the other two methods. Interestinglyr there was one
where the average of five frequencies method of
calculation correlated i, -., uch more highly with a language
r.,, easure than the average of three. This was speech
intelligibility (a teacher rating, in fact) , the same as
that used by Kyle (1977) which persuaded Conrad that f ive
frequencies provided -significantly more information than
three.
In conclusiont although the . ifference between the
three r,, iethods was not statistically significant, we felt
justif ied in choosing the liý. ethod that provided the
highest correlationst namely the average of three. Hen-
; loss is mentioned,, it ceforth, when an average hearing
will have been calculated by this method.

60
CHAPTER FOUR
THE READING ABILITY OF DEAF CHILDREN

61
CHAPTER FOU : CONTEUTS
Page
II, rTRODUCTION 62
Reading rfests for deaf children 67
. -1 70 Brimer Ilide-span Reading Test
Southgate Sentence Completion Tests 73
Picture Assisted Reading Test (Hamp) 77
The Edinburgh Reading Test 80
The teachilng of reading 86
METHOD 88
Sub-'iects 88 j
Procedure 88
RESULTS 93
Edinburgh Reading Test subtest scores 94
Edinburgh Reading r-', -Iest subtest correlations ý,, 5
Sex Cifferences on subtest correlations 95
Reading age and other child variables 100
DISCUSSIO14 101

62
THE READING ABILITY Qf DEAF CEILDREN
It is of ten not obvious to the layman that (ýeaf
individuals should have any problem at all with reading.
However, large scale surveys have shown how devastating
an effect deafness has on a child's ability to learn to
read. A recent survey of the reading ability of deaf
school leavers (Conrad, 1977 and 1979) showed the average
reading age to be around 9 years. Children leaving
partially hearing units (as opposed to schools for the
deaf as in the figure above) were found to have an
average reading age of 11 years (Kyler 1978) . Surveys in
other countries reveal similar results. In the USA the
average reading age for 16 year old deaf children was
between 9 years 3 months and 9 years 6 months
(Difrancesca 1972, Jensema 1975). Norden (1975)#,
Rasmussen (1973) and VandenBerg (1971) find similarly
depressing results in Sweden, Denmark and Nev-7 Zealand
respectively. Furthermore, it is generally accepted that
deaf children's reading ages tend to plateau at about
this age with very minimal improvement. Wilson (1979) I
would argue, however, that this plateau may be partly a

63
function of the measures used, An examination of reading
tests shows a sudden increase in linguistic complexity at
this age. Webster (in preparation) argues that "the very
information we need about the deaf reader's performance
is lost when insensitive procedures are applied".
Perhaps more sensitive measures of reading would reveal
an improvement in deaf children's reading after the age
of 9. Indeed, Webster, using a newly devised test bat-
tery,, found that children's reading scores showed
increases across all age ranges tested between the ages
of 8 to 12. We shall return to the question of measure-
ment later in this chapter.
Typical problems that the deaf encounter with
language development have been thoroughly investigated
anC; documented by Quigley and his colleagues in the USA
(Brasel, 1975,, Brasel and Quigleyr 1977, Power and Quia- .1
ley, 1973f Quigleyy 1969F Quigley, 1979f Quigley and
Power, 1971, Quigley,? Montanelli and Wilbur, 1976o, Quig-
ley, Wilbur and biontanelli,, 1976, r Quigley and Kretschmer,,
1982,, Steinkamp and Quigley, 1977, Wilburr Montanelli and
Quigley, r 1976). They f ind that 18 year old deaf students
are,, as a rulej, unable to cope with sentences that are
well within the grasp of hearing 10 year-olds. Particu-
larly interesting is the finding by Quigley et al (1976)
that certain syntactic structures that frequently appear
in the writing of deaf children are accepted as

64
grammatical by these children when used as distractor
items in the Test of Syntactic Abilities (Quigley et al.
1978) even when the correct version is available among
the choices given. The most common tendency observed was
that of imposing SVO (subject-verb-object) patterns on
sentences; for exampler"the boy was helped by the girl"
was often understood as "the boy helped the girl". The
two sentences "The boy kissed the girl" and "The boy ran
awayll presented no problem for deaf children but the
second part of the sentence "the boy who kissed the girl
ran away" was interpreted as meaning that it was the girl
who ran away. "The acceptance and use of these struc-
tures by deaf students in reading and writing indicates
that they are part of the internalized language structure
of deaf individuals. This point may have major signif i-
cance in explaining the reading problems of deafE stu-
dents" (Quigley and Kretschmer, 1982, p. 71).
Conrad's survey (1979) of various linguistic abili-
ties of deaf children raises a number of issues. Most of
these are speculative, arising from his interpretation of
the data and are not strictly relevant to the present
study. They are concerned not so much with the measure-
mient and understanding of the processes involved in read-
ing, but with the form of communication used in schools.
As we shall go on to discuss later, it is possible that
many of the fundamental language problems of the deaf

65
persist regardless of the mode of communication currently
favoured in the classroom. The data from Conrad's study,
however, are interesting. He found that hearing loss,
intelligence and inner speech (the apparent ability to
think in sounds rather than about the visual appearance
of words in print) were all correlated with reading age,
lipreading ability and speech intelligibility. If, for
example, two children of similar hearing loss and intel-
ligence were found to have very different reading ages,
it is likely that the child with the superior reading
ability exhibits inner speech while the other does not.
As a rule, however, the deafer children are less likely
to possess inner speech than those with a less pronounced
loss. Similarly, children of low intelligence are less
likely to exhibit inner speech than those who are more
intelligent. What is not clear is the causal mechanisms
involved between intelligence, hearing loss and inner
speech, on the one hand, and reading ager lipreading
ability and speech intelligibility on the other.
However important inner speech may be in relation to
reading age, it still leaves the majority of the differ-
ence in reading age between the deaf and the hearing
unaccounted for Ue. 5 out of an average of 7 years'
difference); Conrad found a group of hearing children who
performed no better on the test of inner speech than the
deaf children but these children were still 5 years in

66
advance of the deaf group in their reading. Interest-
ingly, when the deaf children were split into groups
according to their hearing loss, the correlation between
intelligence and reading age is highest for the least
deaf children. One wonders whether this might reflect a
slight verbal element in the "non-verbal" intelligence
test used (Raven's Progressive Matrices). Some of the
items towards the end of the Ravens Test could well be
more easily solved with verbal strategies. However, for
no hearing loss group did intelligence account for more
than 26% of the variance in reading test scores. From
Conrad's data we can conclude that although hearing loss,
inner speech and intelligence account for some of the
variation in reading ability, there is likely to be some
variance which has not been accounted for or identified.
One can only speculate at present as to what others
factors might be involved. Jensema (1975) finds that
immigrant deaf children, for example,. tend to do less
well at school in the United States than do children from
white backgrounds. Essen and Ghodsian (1979) report on
the academic achievements of immigrant hearing children.
As detailed in chapter 2,, these children tended to have
lower test scores than indigenous children. Conrad did
not include such children in his study of the deaf so we
have no comparable data in Britain. Other possible fac-
tors in operation include the educational experience of

67
the child and the role of "short-term" memory. Quigley
anct Kretchmer (1982) report that several investigations
have found a correlation between short-term memory span
an6i reading ability. All such factors are matters for
future enquiry.
So, as a rule, research shows that the majority of
deaf school leavers do not achieve what is generally
accepted as a level of functional literacy. Howeverr as
Quigley and Kretschmer (1962) point out, national demo-
graphic data can obscure individually encouraging pic-
tures. They cite examples of studies in which deaf
students continue to show marked improvement in reading
skills even after leaving school. Before we conclude
f rom this evidence,, as does Conrad,, that C., eaf children
cannot be taught to read, two major areas merit thorough
investigation. Firstlyr are the measures we are using to
test deaf children's reading ability adequate? Secondlyr
are our teachin_q methods appropriate and efficient?
Since the purpose of the present study was to establish
if and how deaf children's reading ability relates to
other areas of language user we needed to f ind a reading
test in which we could place some confidence.
Readin_q Tests fOr Deaf Children
As far as we know, there is no reading test to date

68
which has been both devised and standardised especially
for deaf children. Hamp's Picture Assisted Reading Test
(Hamp, 1975) is an exception but suffers from two major
problems. Firstly, as we shall describe later, hearing
and deaf children appear to be approaching the test in
different ways, and secondly, it only taps the child's
knowledge of vocabulary. As we shall go on to argue
later,, this lack of a reading test for deaf children is
of no extreme significance providing that the hearin_q
referenced tests that we are using measure the same
abilities in both groups of children. In order to estab-
lish this, we need to consider the tests that are used in
schools in some detail. Under pressure to chart their
children's progress, teachers use what is available,
namely tests devised for hearing children. Those that
have complicated verbal instructions or that require ver-
bal answers tend to be discarded leaving a limited choice
of material. Such tests are often used solely to provide
a figure for the records,, with little or no diagnostic or
direct educational value.
Suspecting that deaf children were employing dif- L.,
ferent strategies from the hearing to tackle reading
testso, we were concerned about the use of hearing refer-
enced tests with deaf children. Such concern is not new
(see Myklebust, 1964, for example) but little has been
done to demonstrate the problem in detail or to provide

69
any alternative. I Host such tests are standardised using
only the 'normal' school population; special schools are
not included. The reading ability of deaf children would
therefore be effectively underestimated, providing, of
course, that we are measuring the same things in both
populations. Also unjustified, we would argue, is the
assumption that a reading age of 8 in a hearing child
aged 8 means the same thing as a reading age of 8 in a 12
year old deaf child. The manual to the Edinburgh Reading
Test, Stage 1 (1977) , states that these children "may
well not encounter the same difficulties" and that the
tests are "not, therefore, recommended for older severely
retarded readers" (p. 3). Such warnings, however, are
rare.
Evidence is, accumulating that the same reading age
is likely to be obtained by deaf and hearing children in
quite different ways. A study by Moores (1967) reports
that even when apparently matched for reading age, deaf
students showed considerable deficiencies in syntax and
vocabulary when compared to hearing students. Similarly,
O'Neill (1973) reports that deaf students were not as
able as hearing students to judge which of a pair of
sentences was syntactically correct, even though both
groups of students had been matched for reading age. It
therefore appears possible that large-scale surveys of
the reading ages of deaf children such as those reported

70
above are actually -overestimating these children's abil-
ity. The picture might well be even gloomier than we
thought. Members of the Deafness Research Group at Not-
tingham University have looked in detail at the results
of three reading tests that are commonly used with deaf
children, namely the Brimer Wide-span Reading Test (Bri-
mer, 1972) , the Southgate Sentence Completion Test
(Southgate,, 1962) and the Picture Assisted Reading Test
(Hamp,, 1975).
Brimer Wide-span Readinq Test
We compared the performance of 60 deaf and 60 hear-
ing children (Webster, Wood and Griffithsv 1981) on the
Brimer Wide-span Reading Test (Brimer, 1972). This test,
also used by Conrad (1979) in his survey of deaf school
leavers,, requires the child to read a sentence on the
left hand side of the page and from it choose one word
that will 'fit' into the space in the (unrelated) sen-
tence on the right hand side of the pager for example :
Pack the eggs in the box Hens lay
Choice is obviously governed by the words presented in
the first sentence, and allows an analysis to be made of
the proportions of various errors. Two major categories
of error were identified, namely linguistic and non-
linguistic. Linguistic errors could be broken down into

71
3 types -,
a) where the completed sentence was grammatically
correct but the sense (although acceptable) was
in fact wrong,
eg. Alongside the wardrobe stood a tall chest
of wood (drawers).
b) where the word chosen fitted the syntactical
constraints of the sentence but did not make
sense,
eg. Slowly he lifted the glass not wishing
to pick (spill) a drop.
c) where the chosen word was associated with an
adjacent word in the new sentence,
eg. An foolish (only) child is one who has no
brothers or sisters.
Non-linguistic errors were those where there was no obvi-
ous connection between the chosen word and the new sen-
tence. The existence of a third category of errors was
hypothesised, namely those where the word chosen occupied
the same location (eg. fourth) in each sentence.
Deaf children were found to make more errors than
hearing children over(-: Lll and a significantly lower pro-
portion of these errors was linguistic. Since the deaf

72
children continued to answer items well beyond their
reading ability (the deaf group attempted an average of
47 questions compared to the hearing's 22), it could be
argued that this resulted in the lower proportion of
linguistic errors in this group. However, if a cut-off
point is made at the point in the test where the reading
age is attained and attention is only paid to items
before this point, a similar pattern of errors emerges.
It has been reported that deaf 'children have problems in
recognising and correcting their own errors (Clay, 1977).
This may be one of the reasons why a deaf child goes on
to the end of a test when he obviously no longer under-
stands the items. Another possible reason for this
phenomenon (also found in the Southgate study described
below) is suggested by Furth (1973) who refers to occa-
sions where the teacher encourages the deaf child to
participate even though the limited amount of information
he is receiving means he is unlikely to fully understand
a situation. We all know that deaf children will fre-
quently shake or nod their heads to any question posed.
It is relatively easy, for example, for them to grasp
that the force of a teacher's utterance is questioning,
but sometimes not so easy to understand important details
that would enable the desired response to be made. A
11yes" or "no" response often gives a 50/50 chance of
being right. Furth claims that teachers encourage this

73
losenseless perseverative behaviour" (p. 90) . Webster et
al conclude, nThus, the child's test score serves as a
poor guide for any attempt, sayr to estimate the types of
material he or she is able to read in books, television
subtitles and so forth. Had the deaf child's error
patterns prior to the reading ceiling been substantially
different in kind from those made beyond the ceiling we
might have been able to conclude that the additionalr
non-linguistic errors were merely the result of persever-
ance beyond his or her functional reading level. The
fact that they were not different indicates that the deaf
child's performance throughout the test is different in
kind from that of a matched hearing counterpart. This
clearly raises questions about the value of reading esti-
mates of the deaf child, using norms based on studies of
the hearing. They are likely not to indicate a similar
delayed process but the outcome of quite different read-
ing abilities" (p. 146) - It is interesting to note how-
ever, that this 'perseverance' has not been found in a
large scale survey of the maths abilities of deaf school
leavers (wood, Wood and Howarth, in preparation). When
tackling a maths test the children seem to know when they
hc-, -ve reached their 'ceiling' and, like hearing children,
stop.
southqate Sentence Completion Test
74
I'vloodo, Griffiths and Webster (1981) compared 60 deaf
and 60 hearing children's performances on this widely
used test (SouthSate,, 1962) . The child is required to
complete a sentence with one word out of a possible five
that are given (for example, Ducks can pond swim water
arm sinq. ) It was f ound that the deaf children
attempted more questions than the hearing (92% as opposed
to F5%) and made more errors (47% as opposed to the
hearing's 18%). As with the Brimer Wide-span study we
needed to ascertain whether or not this meant that the
deaf children were simply answering questions at random
above their reading 'ceilings'. By doing a linear
regression between attempt-frequency and probability of
success for each item,, it was found that both deaf and
hearing groups were less likely to answer questions that
were often incorrectly answered by those children who did
attempt them. The least successful question was
attempted by 70% of hearing children who met with 40%
success whereas the least successful question for the
deaf children was attempted by 81% of them with only a 4%
success rate. The hearing children achieved less than
50% success on only 2 questions whereas this was true for
17 questions in the deaf group.
An item analysis was undertaken to check whether or
not the deaf children were simply answering these more
difficult items at random. Results showed that on 39 out

75
of a possible 42 items the deaf children showed signif i-
cant agreement as to which was the right answer. (11 of
these were in fact incorrect. ) The hearing group agreed
on all but the last 4 items of the test and all of the
remaining 38 items did in fact constitute the right
answer. This result (tociether with those described in 0
the previous paragraph) reveal that the hearing children
tend to select the right answer or do not attempt the
question. Analysis of the second most popular choices
revealed that deaf children showed significant agreement
on 9 questions whereas this was not true for the hearing
group on any question. This once again points to some
sort of non-random strategy being employed by the deaf.
Detailed analysis of the individual questions
revealed a possibility that one of the strategies deaf
children used involved word association. The following
examples (where the most popular answer is underlined)
illustrate the point:
Ducks can - pond swim water farm sing.
Careless driving leads to - happiness cars tractors
accidents improvements.
It was found that on the three most successfully answered
questionýs (by the deaf) there was only one word among the
five possible given that could be considered highly asso-

76
ciated with the initial part of the sentence frame.
These words also represented the correct answer.
Conrad (1979) says that in tests such as these "it
may be hard to evade the probability that the most
familiar word is also the correct word" but claims that
this "does not necessarily give spurious reading ages to
deaf children. If deaf children give the sante responses
as the average hearing child aged 8 years, then they have
a reading age of 8 years. The possibility that deaf
children might always have chosen the one word familiar
to them, whilst hearing children carry out a sophisti-
cated linguistic analysis of the sentencev cannot be a
major criticism; it remains a pure speculation" (p. 150) .
our analyses of the performance of deaf and hearing
children on several reading tests to date now render such
a criticism valid and not just "pure speculation. "
In conclusion, these analyses showed that (5eaf and
hearing children were using very different answering
strategies on this test and that the deaf children's
response distributions were not of a random nature. If
hearing children could not successfully complete a ques-
tion, they tended to leave it, whereas the deaf persisted
well beyond the point in the reading test which could
normally be described as their 'ceiling'.

77
Picture Azosisted Reading Test (Barnp)
r Beggs and Breslaw (1982) e,. rý, amined deaf and hearing
children's performance on the Picture Assisted Reading
Test (Hamp 1975) . This test requires the child to look
at a stimulus word on a page, which when turned over
reveals four pictures. One of these pictures corresponds
to the stimulus word. The child must point to the
picture that represents his choice. This test is really
a vocabulary test, not a reading test. Analysis revealed
that deaf and hearing children achieve the same score by
identifying quite different subsets of words. Flamp
(1971) also reports this finding. He standardised the
test on a deaf population of 367 subjects. Beggs and
Breslaw found that the vast majority of errors made by
the deaf children were not of a randon, nature. Hearing
children were asked, "Will you pick out the picture that
you think 'stands out' from the page - by this I mean the
one you think is interesting' or 'nice' or 'exciting'. "
Once again, the vast majority of itenis were reported as
having non-random response distributions. A quarter of
the most popular choices coincided with the correct
answer on the 'real' test. (Thus one could actually
score on the test simply by choosing the most exciting
picture. ) However, leaving these latter items aside
(since one coulc, not reliably attribute the deaf
children's success on these items to a "reading" strategy

78
or a "choose the most exciting" strategy) in 11 out of 15
cases, deaf children showed the same pattern of choice as
the hearing. It is thus likely that 'salience' is yet
another non-linguistic strategy that deaf children use to
cope with reading tests. It is also possible, therefore,
that the child's measured reading age on this particular
test is an over-estimate. A further criticism of this
test is that it only measures vocabulary. It may well be
a mistake to presume that since the various skills
involved in reading develop at similar rates in hearing
children, the same is true for the deaf. We cannot
conclude that a measure of vocabulary in the deaf is a
good indication of,, for example, his syntactic develop-
n, ent.
The results of these three studies cast serious
doubt on both the validity of using these tests to
compare the reading ability of deaf and hearing children
as well as the claim that they are infact measuring
reading in the deaf at all (at least in the sense that
the devisers of the tests would like them to) . We
therefore either need to find a hearing-referenced test
on which deaf children's performance is comparable to
hearing children's -Qr we need to devise and standardise a
-1 . reading test specifically for use with deaf children.
Time, however, diC-". ' not allow the latter course of action

79
to be pursued before this particular study began.
One test that we might have used was the Test of
Syntactic Abilities (Quigley, Steinkampf Power and Jones,
1978) . This is not strictly speaking a reading test, as
the authors point out. The acquisition of syntax is a
major problem for the deaf and over recent years has
received some attention as a possible source of reading
difficulties. Success in reading and writing depends on
more than just a knowledge of syntax but if a child has
not mastered the nine syntactic structures covered in the
TSA he cannot, according to Quigley et all be expected to
learn to read and write. The aim of the test is to help
teachers determine exactly with which aspects of reading
a child has problems. They can then compare the perfor-
mance of this child with others since the test has been
standardised on 450 deaf childrenr all of whom had an
average hearing loss of at least 90 dB. The TSA fills a
gap in the choice of tests available, since in the USA
"tests of the reading process do not include rigorously
constructed standardised tests of syntactic abilities"
(Quigley et al. 1978) . With the exception of the test
that we finally chose. a similar situation exists in this
country. The TSA itself, however would have been too
lengthy to administer : it involves 20 individual tests,
each containing 70 multiple choice items. A much shorter
screening version exists which would be more useful for

80
research purposes. Unfortunately, this test was developed for, and standardised on, an American popula-
tion and for this reason alone would not have been
suitable for our purposes. However, we also wanted a
measure which would give a fairly global view of a
child's reading abilityr covering areas other than syn-
tax. While actually writing up this work we were glad to
hear that there are plans afoot to standardise the TSA on
an English population. We were anxious to look at the
children's reading ability as fairly as possible within
the limits imposed upon us by the tests readily avail-
able. A test which seemed to offer more than most was
the Edinburgh Reading Test (1977) even though the manual
frankly admits that the test is not recommended for older
severely retarded readers.
The Edinburgh Reading Test
The four stages of the Edinburgh Reading Test were
commissioned by the Scottish Education Department and the
Educational Institute of Scotland and constructed by the
Godfrey Thomson Unit for Academic Assessment at the
University of Edinburgh. These bodies considered such
tests were necessary not so much as a means to obtain a
score but "to assist in the teaching of reading". Each
test comprises four or nio re subtests der., >igned for

81
investigating varicus aspects of a child's reading abil-
ity. In Stage 1 (the onlY test used in this particular
study and therefore the only one referred to from now on)
the four subtests aim to tap Vocabularyr Syntactict
Sequencing and Comprehension skills. An overall score as
well as a score for each of the subtests can be obtained
for each child. This inforniation can then be transferred
to a 'profile sheet' on the back of the test booklet
revealing whether the subtest scores are unusually high
or low in comparison with each other. Using the tables
provided, the total score can be converted into a quo-
tient (either for both sexes combined or for boys and
girls separately) that relates that child's performance
to that of the general population. One can also discover
the strengths and weaknesses of a whole group of children
(eg. a class or school) . This test. has been standardised
using children from state schools in Englandv Scotland
In the case of deaf children whose range of and Wales.
chronological ages and scores does not usually permit use
of these tables, we can use the Reading Age table, which
relates a particular score to the age at which that score
is typical. The test can be administered either indivi-
dually or in groups and exists in parallel forms.
Reasons JD-L choosin-q the Edinbur-_q-h Readinq Test
There were four main reasons for choosing the

82
Edinburgh Reading Test (henceforth referred to as the
ERT) to measure reading ability in the present study.
Firstly, it is a recently developed test (published in
1977) and its contents are noti, thereforer out6ated or
unusual as is frequently the case with other tests.
Similarly, as it has been recently standardised (on over
5,000 children) it is more likely to fit contemporary
reading standards (at least in the hearing population)
than tests of a more antique nature. Secondly, the ERT .L
appears to involve a far wider range of reading skills
than other tests. Since reading appears to involve so
many skills, it would clearly be valuable not only to be
tapping as many of these skills as possible but also to
be able to assess them separately. The structure of the
ERT,, with it's four subtests involving eight different
sets of items,, allows such separate assessment to be
made. It is not possible for a child just to hit on a
strategy at the beginning (as he might in the tests
investigated above) , blindly pursue it and yet still meet
with some success on the test: if he does not grasp the
nature of and understand the contents of the task it
seems less likely that he will succeed using lundesir-
able' strategies. Thirdly, the very existence of the
subtests means that the teacher can diagnose reasonably
accurately the locus of a child's problem (eg. vocabu-
lary, syntaxi, sequencing or comprehension) . The items

83
within each question are chosen so as to provide deli-
berate distractors. One can then look at the child's
errors in a more informed light. A child could fail on a
particular question in the Vocabulary section because
a) he fails to read the whole word
(tend for tentr tress for tree, chase for chain)
he looks at the shape of the word and
ignores individual letters
(boot for boat, test for tent, tram for train)
c) he accepts similar sounding words
(shake for snake, drain for train, stair for chair).
In the syntax section on page 4 the child is required to
identify the whole structure of a sentence and cross out
the redundant word. These words could be obviously inap-
propriate (eg. Phillip borrowed off my bicycle, Janet
of tens reads a story chair) , or only seen inappropriate
if one reads several more words (eg. Do you want break-
fast a cup of tea? Give your ball needs blowing up). In
the Comprehension section, some items simply require the
child to extract information from the picture, while
others require him to draw conclusions from the informa-
tion provided. The final items in this section require
the child to infer what someone is feeling from what is
being said anC to summarise this in a new form. These

84
are just examples of the rationale behind some of the
itei-, is; there is clearly great scope here for the teacher
to locate where a child might be experiencing difficulty.
The final and perhaps the most important reason for
choosing the ERT for this study was that we had obtained
data and analyses (f rom Edinburgh University) on over
2500 hearing children's performance on Stage 1. The
major interest here lay in a detailed breakdown of
answers to each test item. This would enable us to
investigate what proportion of children chose the correct
answer and whether any interesting patterns emerged among
the incorrect answers (in other wordsr to do a very
similar sort of analysis to that used on the the
Southgate test). We therefore had a vast amount of data
from hearing chilOren with which to compare the perfor-
mance of the present deaf sample and any other samples we
might gather.
To sum up, it has been shown that deaf children use
many different strategies to cope with a reading testr
some of which have little to do with reading. The study
of the Southgate test revealed word association as an
important factor. Kyle (1980) reports that word recogni-
tion tends to be more advanced than text comprehension in
deaf children. Perhaps in the Southgate test "they capi-
talise on their memory for individual familiar words and

85
upon associations between these (where possible) to pro-
vide systematic answers" (Wood et al, 1981, p. 155). In
the Brimer Wide-span reading test deaf children sometimes
appeared to choose words on the basis of their location
in the sentence. On the Hamp test 6eaf children's
choices bore a marked similarity to those of hearing
children instructed to choose the more 'salient' picture.
So, as Wood et al conclude (p. 155/156) , "This leads us to
argue that deaf children tend to search for cues or
features of the test they are confronted with in an
attempt to make sense of the problems they face.
Overwhelmed by the linguistic aspects of the test,, they
capi a ize on any feature of the test Situation that
enables them to develop and use a consistent strategy.
We cannot yet i0entify all the features of questions that
lead them to commonj erroneous answers, but it seems
clear that such features do exist ... Hearing-referenced
tests would seem to generate unreliable data and act as
poor guides to the reading processes of hearing-impaired
children. "
This particular section of the present study was
therefore designed not only to look at the relationship
of reading to other linguistic skills, but also to begin
to investigate the appropriateness of the ERT for assess-
ing deaf children's reading ability using techniques
similar to those eri-,. ployed on the three tests described

86
above.
The each-in of xeadinq
The other areas of necessary research mentioned
above involve looking at the teaching of reading and
examining exactly why deaf children experience so much
difficulty learning to read. There have been many papers
about ztandards of reading in the deaf but few on how
deaf children are actually taught to read. A study by
HOWarth, Woodl Griffiths and Howarth (1981) goes some of
the way towards remedying this. An examination of video-
tapes of reading lessons showed that the deaf stopped
reading or were stopped by their teachers significantly
more often than hearing controls. Furthermore, an
analysis of the reasons for stopping suggested that the
teachers of the deaf have very different goals from the
teachers of hearing children and stop for many different
reasons; teachers of the deaf tend to use the reading
lesson as an opportunity for teaching language itself.
Consequently the deaf spent significantly less time actu-
ally reading (decoding print into speech) than the hear-
ing (p<. 00003). Indeed, given the frequency and length
of stops during the reading lesson as well as the slow
reading rate, it would be surprising if deaf children
manage to grasp any meaning from the text at all.

87
As a result of their extensive studies of &eaf
children's reading abilities, Quigley and his colleagues
in the United States (eg. Quigley and King, 1981) have
prepared reading materials designed especially to suit
the needs of deaf children. An alternative, or perhaps
complementaryt approach is that which tries to modify the
x-eader rather than the materials. Clay (1977) shows how
good hearing readers construct hypotheses for themselves
about the meaning of the text. Perhaps teachers should
help children develop this skill and to search for cues,
anticipate meaning and to respond to dissonance in a
constructive manner. However, as Webster (in prepara-
tion) observes, such an approach would be very difficult
with deaf childreni, since their strategies are not as
easy to infer as are hearing children's (eg. hearing
children often correct themselves when reading aloud).
It is possible that one reason why deaf children
fail to acquire certain linguistic structures is that
they are not exposed to them in the classroom. Preposi-
tions and prcnounsr for example, may be very difficult to
pick up from spoken language going on around the child.
This may not be simply a matter of such words being too
lismall" to lipread, but rather that when used in context
by a teacher, they are easily made redundant by the
pointing or other gestures that often accompany them in
order to help clear up any possible ambiguity.

88
Alternativelyr teachers may avoid the use of such words
at -all, knowing that the children have problems with them
and thus perpetuate a 'vicious circle' . With such lim-
ited experience of these words,, deaf children would be
bound to have probleras recognising them in reading and
using them in writing. Clearlyl, this is an area which
merits far more study,, both of a descriptive and inter-
ventional nature. We hope to be tackling some of the
questions ourselves in the near future.
MITHOD
Subiects
Data are available for 41 children (20 boys and 21
girls) with an average hearing loss in the better ear of
and 94dB and an average age of 11 years 7 months. Those
who did not at least attempt every subtest (9 children)
were not included in the following analyses.
Procedure
As explained in chapter 2.1 arranged to work %,, ith
, =-ach class f or one week. At convenient moments during
this time (ie. disturbing routine as little as possible)
the children were taken, either singly or in pairs, to a

89
quiet spot in order to do the reading test. The 30
minutes officially allowed for the whole test (which
includes time for instructions) was not strictly
observed. Administering the test would have become far
too clumsy if one had to calculate the amount of extra
time spent giving instructions and add this onto the time
allowed while actually testing the child. Obviously
instructions take far longer with a deaf child than with
a hearing child. However, in all cases testing was
probably completed within this limit. Although the ERT
is usually a group test,, the nature of a deaf child's
handicap makes it preferable to administer individually
or in very small groups. Communicating the requirements
o, the task to only one deaf child is quite difficult
enough, especially with a relative stranger as tester.
It is possible,, however, that this may introduce other
factors. In the manual to Ravens 14atrices (1978) , for
example, it is stated that administering tests individu-
ally is likely to involve more stress. This is why two
different standardisation tables are provided for Raven's
Matrices, one for children who have done the test on
their own, the other for those who have done it in
groups.
Since instructions for reading tests are designed
for hearing children, certain adaptations have to be made
for the deaf if they are to grasp the nature of the task.

90
This is particularly true of the ERT where there are 8
different sets of items, each of which requires a dif-
ferent explanation. Certain items are self-explanatory,
such as those on paces 1 and 2 where the child merely has 11 to draw a circle round one of the 4 words (nouns) that
describes an adjacent picture. However,, on page 8 the
child not only has to rearrange the words provided (for
examplej, "start when I'll to you tell") into a meaningful
and grammatically correct sentence, but also has to draw
a circle round the first word of that sentence. This is
particularly difficult to explain to deaf children. A
set of cards was made for practice so that the children
cou dp ysically manipulate the words. This made expla-
nation much easier. This idea could initially be intro-
duced by writing up an extra example on the board.
child called Fred, for example, usually knows what to do
With "narne my Fred is".
There were several occasions where I considered it
necessary to abandon a particular set of items with a
child. This was either because my (admittedly limited)
knowledge of a child told me that he was incapable of
succeeding on those items. Of course,, it is entirely
possible that I was incapable of explaining the nature of
the task in such a fashion that he would understand. If
the child's own teacher had administered the test she
would probably have been in a i-auch better position than a

91
researcher to judge his limitations and to find the most
effective way of explaining the problem to him. The ERT,
to a much greater extent than other reading testsr
requires a good deal of explanation from the teacher
throughout the entire procedure. However, as several
teachers were involved in this study the fact that one
person conducted all the reading tests did impose some
sort of uniformity over the proceedings. If a child had
been tested by his own teacher he may well have achieved
a higher score. Informal observation of some of the
children's test performances 6 months later suggested
that this might well have been the case.
Being concerned about these possibly contaminating
factors mentioned above, I thought it might be useful to
obtain another sample of children (from a different
school) and examine their performances on the ERT. A
school was found which ideally suited our requirements.
This school has been using the ERT for at least four
years. One teacher has taken a particular interest and
has kept records of the children's progress. 'She has
-1 . discovered what she considers to be the best method for
giving instructions, has devised extra examples for prac-
tice and administers the ERT as a group test (strictly
timed) in a large room with several invigilators, all of
whom have discussed the test and it's administration in
detail. The invigilators are all teachers who are

92
familiar with the children and are available to check that the instructions to the test have been understood.
I felt that the ERT results from this school were
more likely to be representative of the children's capa-
bilities than results from the two other schools where I
had administered the test myself. If, however, the
results from these two sets of data were fairly similar
then I could be more content with the validity of the
first results. Test booklets were collected from this
school for 31 children who had completed the ERT Stage 1
this year. For the purposes of this comparison we were
only interested in examining Form B of the two parallel
forms because the children in the present study had only
done Form B. However, several teachers had mentioned
that they considered Form A to be r.,, uch easier for Cteaf
children than Form B. I have therefore begun to collect
further test booklets from children who have completed
Form A in order that we might look at results from the
two forms to see if any interesting differences emerge.
This is not part of the present study but something to be
pursued in the future. All the results outlined below
concern Form B and refer to children in the present study
unless otherwise specified. Results f rom the second sam-
ple are mentioned where relevant but details of the
analyses together with tables are available in Appendix
III.

93
As noted by other researchers, the children in the
study did not seem to be exercising any form of self-
correction. This is best illustrated by the following
examples where the children are required to indicate
which word they consider to be 'unnecessary' in each
sentence. In both cases the most popular choice of
unnecessary word is given in brackets. Both these
choices are incorrect.
I want to (my) dinner.
Give your ball (needs) blowing up.
These and other cases illustrate a tendency to operate on
a tword-by-word' strategy. The children tended not to
delete a word that 'fits' with the word directly preced-
ing it. However, I feel sure that in most casesr given
the choice between "I want to dinner" and "I want my
dinner", they would have chosen the latter as making the
most sense. If they were in the habit of checking their
work, this would have become apparent.

94
Edinburgh eadinq Test subtest _qýý
Table 4: 1 shows means and standard deviations for
each subtest as well as the overall score. Scores on the
comprehension subtest 6., o appear to be lower but this
might be due to a floor ef fect since some of the children
only attempted a few items. A very similar pattern of
results was found with the 31 children from the second
sample (see Appendix III) , their mean subtest scores
being 15.5.16,14.5 and 13F with a mean total score of
59.5.
----------------- II
--------------- I-
-----------
Means
-----------
----------------
St(ý. Dev. I
--------------- Vocabulary 1 14 3.6
Syntax 1 14 4.1
Sequencing 1 11.5 4.4
1 Comprehension 1 I --------------- I
9 -------------
3.9 ---------------
I Total 1 -----------------
48.5 -------------
13.2 ---------------
Table 4: 1 !, Ieans and standard deviations on Edinburgh Reading Test subtest and overall scores.

95
dlDl-uu, q-h Readi-nq Test subtest correlations
As can be clearly seen in Table 4: 2 (below), all the
subtest scores correlate highly with each other as well
as with the total score. A very similar pattern of
correlations was found with the second sample (see Appen-
dix III) .
------------- -------------------------------
Vocab Syntax Seq Comp
lVocab I ------- I III ISyntaxi . 51 ------- I III ISeq 1 . 62 . 65 ------- I III lComp 1 . 58 . 46 . 53 ------- I III ITotal 1 . 81 . 81 . 87 978 ***1 ----------------------------------------------------
Table 4: 2 : Edinburgh Reading Test subtest correlations.
p< . 05 p< . 01 p< . 001
Sex differences on subtest correlations
we split the data on the subtest scores into 2
groups (20 boys and 21 girls) in order to see whether
there were any sex differences in the pattern of

96
correlations. The results (see Tables 4: 3 and 4: 4 below)
show that the overall subtest correlations were masking
large sex differences. The girls' subtest scores inter-
correlate much more significantly than the boys' scores.

97
Vocab Syntax Seq Comp
I Vocab I -------
ISyntaxl . 43 -------- II ISeq 1 . 49 . 36 ------- II ICOMP 1 . 40 . 04 . 21 ------- II ITotal 1 . 82 . 65 . 74 . 59
jable 4: 3 Edinburgh Reading Test subtest T correlations (boys only).
Vocab Syntax Seq Comp
lVocab I -------
ISyntaxl . 48 II ISeq 1 . 67 . 80 II ICOMP 1 . 71 . 72 . 72 ------- I III ITotal 1 . 80 . 87 . 92 '90 1
Table 4: 4 Edinburgh Reading Test subtest correlations (girls only).
p< . 05
. 01
. 001

98
VJTe used the Fischer Z statistic to see whether these
differences between the boys and the girls' intercorrela-
tions were significant. The results (shown below in
Table 4: 5) reveal that most of these differences were
significant. Although the girls obtained higher total
scores than the boys on the reading test, the difference -1 . -1
did not &ýchieve significance (p<. 09).
------------------------------------------
Vocab Syntax Seq Comp
lVocab I -------
ISyntaxl . 42 ------- II ISeq 1 . 21 . 0136 II ICOMP 1 . 07 . 0039 . 0170 II ITotal 1 . 43 . 0436 . 26 . 0075 **1
--------------------------------------------------------
Table 4: 5 Significance levels (Fischer Z) between Edinburgh Reading Test subtest correlations for boys and girls.
p< . 05 p< . 01 p< . 001
It is worth looking at the results from the second sample -1 .
of children (in Appendix III) to note the striking simi-
larities between their and the present children's subtest
intercorrelations. Once again the girls' subtest scores

99
intercorrelated much more highly than the boys'.

100
. ag eading a, e An-d other child variables
The correlation between the overall score on the
reading test and hearing loss did not reach significance.
Feither did the correlation between age and reading per-
tormance. In former studies such as those by Hamp
(1972) , Jensema (1975) and Conrad (1979) a correlation
between hearing loss and reading age is nearly always
reported. We looked at the data from our study of the
Southgate test (1,4-ood et al,, 1981) and found there was
also a significant correlation there. It was possible
that the ran, -,, e of hearing loss in the present sample was :j
too narrow to show up any correlation. Montgomery (1968)
failed to find a correlation between hearing loss and
reading ability but all his sample were also very deaf.
Ff I'le therefore ran an analysis of variance to see whether
the children in the Southgate study (which did reveal a I
significant correlation between reading score and hearing
loss) had a different range of hearing losses than the
children in the present study. The analysis revealed
quite clearly that the hearing losses for the two samples
were different (p<. 03) . Ijad the present sample included
children with a wider range of hearing loss, we suspect
that we would have found a significant correlation.
We failed to find a significant correlation between
IQ and reading. Howeveri, the children's scores on the

101
ERT correlated with teacher ratings of general ability as
well as oral ability, attitude and written language but
not with ratings of speech intelligibility. However,
once again, these overall correlations masked sex differ-
ences. When the data were split into two groups (21
0 girls and 20 boys) we found that the boys' total scores
on the ERT were not in fact correlated with c-any of the
teacher ratings. The girls' total scores, on the other
hand, showed a strong correlation with all teacher rat-
ings except speech intelligibility. Many of the girls'
subtest scores also correlate with teacher ratings; we
would expect to find this given the fact that the girls'
subtest and total scores were highly intercorrelated (see
Table 4: 4).
My concern about my ability as a researcher to draw
the 'best' from the children in the reading test was
somewhat allayed by finding a very similar pattern of
results (in termis of sex differences and subtest correla-
tions) f rom a second sample of children who had been
tested by teachers. Obviously one cannot compare the
absolute levels of achievement but it seems reasonable to
suppose that if any undesirable factors were operating
during the testing then the pattern of subtest

102
correlations would have been different for the two groups
and that we would not have found the results from the
children in the present study to correlate with other
measures of their language. Conrad certainly voiced no
concern over this issue.
The overall superiority of the girls (although not
c 1-uite reaching statistical significance) supports the
findings of other researchers (MYklebust, 1964 and Van-
denBerg, 1971) The verbal superiority of adolescent
girls is well established in the 'hearing' literature
(eg. Fairweather, 1974) but it now seems certain that
this superiority persists in deafness. The sex differ-
ences in the pattern of subtest correlations are also of
interest. Norden (1975) found that any measure of
language ability in deaf girls was a better predictor of
their ability on other rrýeasures than it was for the boys.
The reasons for this are, as yet, a matter for specula-
tion.
Although the relationship between hearing loss and
reading ability failed to achieve significancer this does
not suggest to us that the measure is insensitive. As
mentioned in the results section, such a relationship is
usuE,,. lly found. Conradr however, notes a sharp change in
performance around an 85dB hearing loss. The average
loss of the present children is 94dB. We were not

103
therefore surprised that the correlation did not achieve
significance. Kyle (1980) suggests that as far as read-
ing vocabulary is concerned, there is no such correlation
if one only considers children with a hearing loss
greater than 85dB. Of course, the Edinburgh reading test
probably taps far more skills than a vocabulary test.
Kyle suggests that "the nature or reading changes during
the ages 7 years to 9 years and vocabulary knowledge per
se becomes less of an indicator of the higher level
skills of reading" (p. 95). Webster (in preparation)
examined the relationship between sentence comprehension
and hearing loss and found hearing loss accounted for
very little off the variance in scores. Another reason
why we are fairly confident that the ERT is tapping the
children's linguistic competencer is that we find other
measures of the children's linguistic ability (in their
conversations with both peers and teachers and in their
writing) to correlate with their performance on the read-
ing test (see Chapters 8and 9).
We found no significant correlation between reading
and IQj, a result that we have in common with Vandenberg
(1971) 1 Webster (in preparation) and Clarke-Carter (per-
sonal communication) . Conrad (1979) , on the other hand,
did. our measures of IQ do correlate significantly with
other measures taken, such as average lencth of turn in
conversation with teachers (see Chapter 5). Similarly,

104
the reading score.. c, - correlate highly with other measures
(see Chapter 8). So, it seems unlikely that our failure
to find such a correlation is due to insensitivity Of
either measure since both are significantly related to
other variables. Perhaps we should bear several other
factors in mind. Conrad reports a decreasing size in the
correlation between reading and intelligence v7ith an
increase in hearing loss. He, however, considers that we
should not attach too much importance to this since it
probably ref lects the inclusion in the deaf er groups of
children who cannot read at all. However, the children
in Webster's study were all severely or profoundly deaf,
those in Clarke-Carter's study were all profoundly deaf
anc], the children in the present study are also very deaf
(average hearing loss being 92 dB) . In the light of
these factors it seems reasonable to conclude that read-
ing performance only correlates with IQ when studying a
large heterogeneous population, such as Conrad's, with a
wide rance of reading abilities.
Tj
vie are not claiming that the reading tests discussed
in the introduction (Brimer, Southgate anu Flamp) do not
measure some sort of linguistic ability; they obviously
do. The problemir however, is that they are not designed
ir, such a way as to measure the same things in deaf and
hearing children. We suspect that the design of the ERT
may avoid some of these problems that appear to be

105
inherent in other tests. 1,,! e shall f ind the answer to
this question in & detailed analysis of the errors made
bY both deaf and hearing children on this test.
Purely for interestr I administered a second reading
test (the Southgate Sentence Completion) to one group of
children in the study. Both this and the Edinburgh
reading test took place within a week. On average, using
the SoutEgate test, the children achieved a reading age
Months higher than that they achieved using the Edin-
burgh. Interestinglyr their teacher, who is experienced
in teaching both deaf and hearincj childrenr volunteered
that she thought the Edinburgh test provided a much more
realistic comparison of deaf and hearing children's read-
ing abilities than did the Southgate test. The results
of our future error analysis may enable us to confirm her
suspicions.

106
CHZIPTER FIVE
DEAF CHILDREN'S LANGUAGE IN CONVERSATION WITH THEIR TEACHERS

107
CHAPTER FIVE : CONTENTS
Page
INTRODUCTION 109
NETHOD 121
Subjects 121
Recorcinc: the sessions on tape 122
.L Transcription 124
CODII,,. G SYSTEMS 125
Co6ing : The functions of teacher r-,. oves (SRC) 126
SRC : Decision rules 126
Coding : Levels Analysis 128
Levels : Decision rules 129
Lean length of turn (LILT) 134
IILT : Decision rules 137
Reliability of coding s-,, steats 140
RESULTS 142
I: ALL 8 CONVERSATION SESSIO14S 142
The functions of teacher moves (SRC) 142
Levels of control of teac her moves 144
Level of child response to teacher moves 148
Level of teacher response to child moves 154
Lean length of turn 155

108
II: RESUMPS FROM ANALYSES ON EACH CHILD 15 _9
Functions of teacher moves (SRC) 160
Levels of teacher control 161
Child-child moves 162
Hec-.. Lring loss 163
Intelligence and mean length of turn 166
Age and all language r.,, easures 166
m leacher rankings 167
Summary off results 170
DISCUSSIO14 172

109
DEAF CHILDREN'li LANGUAGE IJI, CONVERSATION WITH THEI TEACHERS
In this part of the study we wanted to obtain a
corpus of speech from the children, preferably in the
form of a naturally occurring conversation with their
teachers. We were anxious to look at this aspect of the
children's language in as natural and non-invasive a
manner as possible for two reasons; firstly, because we
would thus be more likely to obtain a sample of the
child's 'normal' language and secondly, because the
results and information that we hoped (ultimately) to
return to the teachers would have more meaning and,
perhapst value for them if related to what actually goes
on in the classroom rather than to a situation that has
been artificially imposed by a researcher.
A successful technique for obtaining just such a
corpus of language from deaf children of this age was
used by Wood, Wood, Griffithsr Howarth and Howarth
(1982). This involved video-recording a conversation
between the teacher and her whole class. Observation in
schools for the deaf had revealed that such conversation

110
sessions of ten took place, usually af ter a weekend or an
unusual occurrence. The videotapes thus obtained are
transcribed (word for word) , coded and analysed. Such
sessions are potentially interesting in that we can
observe deaf children using language to communicate with
their teachers about experiences outside the present con-
text. They are therefore less likely to resort to large
scale non-verbal and esoteric strategies than when com-
municating with their peers.
The 'conversation' section of this study is the only
one which required the direct involvement of the teacher.
The literature on such interactions between adults (usu-
ally teachers or mothers) and children is expanding. It
is now becoming apparent that it is not just the factors
that a child brings to such interactions (age, intelli-
gence, confidence, social background and so on) that
affect how he behaves. The adult's behaviour also
appears to exert some influence. Such correlational stu-
dies, however, do need careful interpretation. As we
shall go on to argue in the conclusion to this chapter,
the direction of cause in such relationships is not
always immediately apparent. What is interesting, how-
ever, is that it is not only the type of language that a
child receives that appears to determine his own language
output, but also the patterns of control and management.
Karnes, Teska and Hodgins (1972) looked at several types

ill
of preschool provision and concluded that one major vari-
able associated with these (hearing) children's achieve-
ments was the nature of the relationship between the
adult and children. Those children who were often left
to their own devices fared less well than those in
set-ups where frequent one-to-one activities and conver-
sations were encouraged. Hartmaan and Haarvind (1977)
found that children whose mothers have a very controlling
style responded more passively to a strange adult (asking
fewer questions and usually waiting to be told what to
do) than children with less controlling mothers.
Robinson and Rackstraw (1967) showed that mothers dif-
fered in the way they answered their children's ques-
tions. Working class mothers often gave "because they
do" type responses, whereas the middle class mothers gave
more factually accurate responsest often mentioning cause
and effect,, analogies and so forth. These differences
were clearly reflected in the way their children answered
questions some years later (Robinsonj 1972). The intel-
lectual and linguistic 'superiority' of certain children
in one negro culture was attributed to the presence of
grandparents in their home (cited by Creber,, 1972). The
reason given for this was that these children experienced
more conversation t an the others.
our earlier study of the conversations between deaf

112
children and their teachers (Wood et al, 1982) used
coding systems developed from those used in a study of
the interactions between adults and children in preschool
playgroups (Wood, McMahon and Cranstoun, 1980). The
main aim of this latter study was "to try to discover the
effects of different styles of working with children on
the experiences of the children and the part that they,
in turn, play in interactions with the practitioners.
Are there any general principles to be discovered which
will help people who work with the under-f ives achieve
their own objectives more effectively? " (p. 4). The major
finding of this study was that the language performance
displayed by the children appeared dependent on the way
the adult 'stage managed' the conversations. The more
control an adult exerts in conversation, the less
language she receives back from the child. Furthermore,
where the level of management from an adult was high, her
children often approached her for management. In con-
trast, r adults who made many conversational moves were
often approached for conversation. The interactions
characterised by a high level of management tended to
concern the "here-and-now" and the child himself, whereas
those with a low level of management focused more on
other people and on the environment in general. it
seemed that the practitioners often adopted certain stra-
tegies that appeared to defeat their own objectives.

113
However, "any evaluation of what occurred on a transcript
and any chosen direction for change... was largely the
decision of the practitioners themselves. It was their
reaction to their own experiences, reflected back to them
by our recordings and analyses- that formed the principle
basis for any change" (p. 191). The discrepancy between
the practitioners' goals and their behaviour seemed to
involve ignoring overtures from the children, asking too
many (and often unnatural) questions and not giving the
children enough time to express themselves.
The later study (Wood et al. 1982) ? involving deaf
children, r was pursued with similar goals in mind. Were
the effects found in the preschool study also in opera-
tion in conversations between deaf children and their
teachers? The answer to this question seems to be "yes".
The more control a teacher exerted (in the form of
questions and requests for repetition) , the less language
Ue. shorter response lengths) was volunteered by the
children. These same effects have been further demon-
strated in follow-up studies of both deaf and hearing
children (Wood and Wood, in press, Wood and Wood, in
press) and with university undergraduates in conversation
with their tutees (Kingdon, in preparation).
of courser there many variables other than those we
are looking at here which affect the linguistic ability

114
of a child and his readiness to participate in conversa-
tions. This area is too vast too discuss in detail, but
the studies described below give some idea of the range
of work that is now being done in this area. The earlier
emphasis of research on syntax in an attempt to throw
some light on language acquisition may have been of
limited value. Dittmar (1976, p. 185) is worth quoting at
length on this matter:
"Rather, a qualitative change in grammatical and semantic theory, more in keeping with anthropological and interactional linguistics, should lead to a consideration of the pragmatic conditions of speech acts, which are uttered in certain situations, at a certain time, in a certain place and under certain dynamic conditions of interaction. The grammatical categories are insufficient for a description of verbal interaction through speech acts, and for an adequate understanding of the processes by which speaker-hearers understand one another. The description of speech acts requires a comprehensive model of speech behaviour that includes the psychological and social configurations of interaction, as well as containing, amongst others, rules of interaction, interpretation and production specific to speaker-hearers. The concept of communicative competence seems the most promising for the foundation of a pragmatic model of social communication. on the basis of such a model it will also be possible to explain in greater depth depth the phonological and syntactic descriptions of speech variation. "
Similar lines of thought, albeit on a more specific
level, are being followed by individual researchers.
Wells (1974) . for exampler suggests that the ideal situa-
tion for a learning a linguistic structure would be "a
shared activity with an adult in which the adult gave
115
linguistic expression to just those meanings in the
situation which the child was capable of intending and to
which he was at that particular moment paying attention"
(p. 267) - In similar vein, Cross (1977) concludes that
we may have been asking the wrong questions about the
nature of (in this case) mother language and its relation
to child language development. "It may have been better
to ask how much of the input can be described in terms of
learning situations in which specific linguistic acquisi-
tions may take place. The answer to this question may
tell us how better to balance the child's and mother's
contribution to the acquisition process" (p. 182).
It would also be interesting to know,, for example,
how social class affects the communicative competence of
deaf children. One would imagine that the effects of
deafness on a child's language development are so drastic
that, in comparison, social class effects are minimal.
Jensema (1975) reports that deaf children from "ethnic
minority" backgrounds do less well at school than white
children. We have discussed this in more detail in
Chapter 2. It would appearr however, that this view that
social class is straightforwardly associated with the
child's linguistic ability may be an over-simplified one.
Thi s is discussed fully by Dittmar (1976) but more
relevant to our discussion of, specifically, conversa-
tion, is the finding (also mentioned in Chapter 2) by

116
Tizard and her colleagues (1980) that although children
Of both working and middle class backgrounds have simi-
larly extended and egalitarian conversations at home, at
school the picture is different. Working class children
"clam up" more at school than middle class childrent
asking fewer questions and engaging in fewer extended
conversations. This, once again, is only correlational
data,, so we do not know whether working class children
are bringing a different attitude to authority with them
to school or whether it is some unspecified action on the
part of the teachers which has this effect. This work of
Tizard's has parallels with earlier studies such as those
of Labov (1968) and Labov et al (1970) who observed that
working class children reveal linguistic creativity in
their home environment, if not at school. Whatever the
reason, however, this relative lack of success of working
class children is not necessarily (as has often been
suggested) the result of an 'impoverished' linguistic
background. Exactly what is responsible for this ine-
quality is a matter for interesting speculation and prob-
ably beyond the scope of this thesis.
A recent study (Murphyi, in preparation) has focused
on yet another variable that determines the language
produced by young children. She videotaped 3 year old .A
hearing children conversing with their mothers about a
pre-school television programme that the child had just

117
watched. Children either watched the programme with
their mothers or alone. Conversations were much more
successful (in the terms of the measures of teacher power
and child participation that are used in the present
study) when the viewing was by both mother and child at
the same time. Murphy argues that the shared experience
enables more interesting talk to take place because moth-
ers can use the programme as a springboard for further
discussion. When mothers have not seen the programme the
ensuing conversations tend to be of the "and what hap-
pened next? " variety. of course, a lot depends on the
conversational skill of the mother. If she is not very
skillful, the latter type of conversation can occur even
if she has seen the programme. Furthermore, if the child
finds the programme exceptionally interestingr the
conversation will be a success whether his mother has
seen it or not. Interestingly, the provision of pro-
gramme notes for some mothers who were not watching the
television with their children, often rendered the fol-
lowing conversations even less successful than if she
knew nothing about the programme at all. Whether similar
situations would have comparable effects on the conversa-
tions of children with their teachers is a matter for
future research. Would teachers have more successful
conversations with their children about shared experi-
ences?

118
The importance of 'shared knowledge' as a variable
in te success of conversations has also been investi-
gated by Wood and Cooper (1980). Informal observation of
the conversations between young hearing children and
adults (wood, McMahon and Cranstoun, 1980) suggested that
children were unwilling to elaborate their answers to the
very large proportion of 'test-like' questions they
received (eg. n What colour is your dress? ") . By con-
trast, where the children believed that the adult did not
actually know the answer to the questions posed, they
appeared to be much more willing to participate in the
conversations. wood and Cooper tested this experimen-
tally with 4 to 5 year old children and their mothers.
The results confirmed the initial observations. At first
sight this result may seem to contradict the results
described above of Murphy (in preparation) but the nature
of the 'task' may well be the crucial factor. In Wood
and Cooper's study the task centred around the child's
memory (aided by his mother's strategy for eliciting
recall) about a play session, whereas in Murphy's study
the 'task' was a discussion of a television programme.
It is possible that in the former study the children
considered the more 'test-like' discussion not to be
legitimate when they believed that their mothers knew the
answers. In the case of the television programme, how-
ever, more lengthy and interesting conversations took

119
place when the mothers used their shared knowledge as a
point from which to 'take off' into a more interesting
discussion. When mothers hadn't seen the programme, the
discussions tended to tzake on the more 'test-like' char-
acter that epitomised the discussions in Wood and
Cooper's study and were therefore less successful. A
second possible reason for this difference in results
between the two studies is that they have touched upon
another discontinuity in development, namely the under-
standing of another's state of knowledge. Perhaps the
older children in Wood and Cooper's study were beginning
to realise that it was not legitimate for their mothers
to ask questions to which they knew the answers and were
therefore less willing to participate. This hypothesis
could be tested experimentally with children of different
ages involved in the same task. Of courser with all the
studies mentioned above, we cannot extrapolate their
findings or hypotheses concerning hearing children
directly to deaf children since the deaf child's social
and linguistic experience is so vastly different from
that of the hearing child. Howeverr this type of study
may well be worth doing with deaf children and with
teachers,
It would therefore seem that, although there are
many other variables that affect the responses of chil-
dren to an adult's language, those concerning the

120
function and level of control of teacher speech to young
deaf children have immediate and clearly identifiable
effects. The purpose of this part of the present study
was twofold; firstly, to attempt to replicate the results
of Wood et al (1982) and secondly to investigate whether
the language a child produces under these circumstances
relates to his performance in other areas of language
use. If we succeed in these aims we can place a certain
amount of confidence in both the reliability of the
immediate effects of teachers' conversational style on
children's responses as well as the likelihood that these
measures are tapping some sort of central linguistic
ability. Furthermorer the measures themselves could be
of practical value.

121
The majority of the method, coding systems and ana-
lyses used in this part of the study are similar to those
used by Wood et al (1982). Various changes had to be
made since our interests lie in the individual child's
behaviour in the conversation sessions and not just in
the group as a whole as before.
ubjects
42 children participated in this part of the study.
This is a smaller nuraber thEn in the other c--ctions
becauzse one teacher ý,, 7as appearing on video
and declined to take part. Her children took part in all
other aspects of the study, however. Another teacher
arranged for a stand-in for similar reasons (session 3) .
The teachers had an average of 6 children in each conver-
sation session. There is one exception to this. One
teacher decided that she would pref er to split her class
into two groups of 3. Sessions 7 and 8 represent this
teacher with her two groups. Similarly, sessions 4 and 5
are run by the same teacher. This is because children of
that age had different teachers according to which aspect
of the curriculum was being covered. As my study
involved language, the language teacher for these chil-

122
dren (12 of them) split the group into two and held both
sessions. In analyseso, however, we have treated each
session as a separate one (since they have different
children in them) rather than combine the data from the
two teachers who ran two sessions each. This should be
borne in mind when interpreting the results, although its
effect is likely to be negligible.
The children were aged between 8.0 and 13.7, with an
average age of 10.11. Hearing loss ranged between 60 dB
and 118 dB,, with an average of 92 dB. There were 17
girls and 25 boys. A more detailed description of the
children is available in Chapter 2 and Appendix II.
Recording the session on tape
Arrangements were made with each teacher to recorCý a
conversation session with her children. Every effort was
made not to make the session unusual in any way. The
sessions were recorded at the same times that they would
have normally occurred. Some teachers, for example,
always have a conversation session on a Monday to talk
about the weekend. Others take the opportunity for a
chat after a school visit or an occasion such as bonfire
night.
I decided that it would be less disturbing for the
children and (especially) the teacher if I were not

123
actually in the classroom peering through the camera
while they were talking. I therefore set up the equip-
ment (a small portable tape recorder and a camera on a
tripod) in the corner of the room and, having established
that all was functioning smoothly and that all the chil-
dren were in view, set the tape-recorder going and left
the room for half an hour. The video equipment is
actually fairly unobtrusive and after an initial flurry
of excitement and explanations the children seemeC-. to
forget about it. This method does leave one open to -0
various problems; for example, if a child decides to
stand up or move about while talking one risks losing him
from the picture. Howeveri, I thought that getting as
much 'natural' conversation as possible the most impor-
tant consideration.
The question one must ask about this method of
recording conversations is how much does the presence of
a camera alter the behaviour of a teacher? There is, of
course, no real way of establishing this. It is possible
that a teacher, knowing that -someone will be looking at
the tapes laterr will unconsciously expand or 'translate'
her children's utterances during the conversation more
frequently than she would otherwise have done. 11onethe-
less, as we shall go on to describe later, the wor6l--for-
word transcripts that we obtain from these tapes always
yield enough data for interesting speculation about the

124
nature of these conversations to be made. As mentioned
in the introduction to this chapter, we have used this
method now for over twenty teachers with impressively
simi ar results on all occasions.
Transcription
Each videotape is subsequently analysed in detail to
establish (as far as is possible) what is being said.
Every word and important gesture is noted. All the
children in this study were ostensibly oral so signing
rarely arose in these sessions. A large space is left on
the right-hand side of the page to allow for later
coding. The coding systems are described below. A typi-
cal transcript would look like this:
TEACHER I CHILD
T -What diC'I you do on Saturday? I
C3-shopping
T -0h, you went shopping
C3-and Mummy
T -I see. What did you do, Peter? l
C2-I watch television
T -Pardon?
C2-I watch television ------------------------

125
Obviously there are occasions with deaf children when one
cannot understand what they are saying. Very oftent
however, one can establish how many words they have said.
We therefore note this in the transcript. If,, for exam-
ple, we are fairlY certain that a4 word utterance has
been made, we note this as If we think one
of the words has 2 syllables we note this by Joining two
of the lines together (-u-) . Where it is evident from
the intonation that a question has been asked we put
- _? No-responses or non-verbal responses are also
noted. Of course, whether a failure to respond is a
no-response depends on how much time the teacher leaves
for an answer. In order to give a 'flavourl of the
conversations sessions, several extracts from the tran-
scripts are presented in Appendix V. When the transcript
has been completed we move on to code both the teacher's
and the children's utterances using the coding systems
below.
CODING SYSTEMS
In the earlier study (Wood et al, 1982) three major
codings systems were used to analyse the conversations of
deaf children with their teacher. One (SRC) focuses on
the teacher's utterancer one (MLT) on the child's. and
one (Levels) is used to look at both the child's and the

126
teacher's utterance. These three systems are described
below. For convenience we call the last part of the
teacher's utterance a teacher 'move' and it is this that
is usually the stimulus for what the child says next. It
is this part of the teacher's utterance is codedr
although a teacher may well have said several things
before it. In all these analysest utterances from either
c 11 or teacher that are not strictly 'conversational'
are excluded (for example, the teacher might say "fetch
that chair" or "turn your microphone off").
Coding : The functions of teacher moves (SRC)
The first major analysis we carried out was to
establish the function of each teacher move. A simple
coding system has been developed (Wood et al. 1982) which
enables the coder to describe the teacher's contributions
to the conversation in a simple way which is both quali-
tative and quantitative. The ultimate aim was to provide
the teachers themselves with a simple tool for analysing
their own conversations.
SRC : Decision Rules.
Teacher moves can be allocated to one of 3 major
categories. A 'substantive' (S) move is one which car-
ries the conversation forward in the same subject or

127
changes to a new one. These moves are usually questions
or statements. A 'continuity' (C) move is one which
maintains the status quo in the the conversation by
letting the child know that the teacher is still listen-
ing and encouraging him to go on. Examples of continuity
moves are, "mmm.. . 'it "I see", "how lovely" and so forth.
Finally aI repair I (R) move is one which takes the
conversation backwards, going over old ground in order to
clear up misunderstandings, to repeat questions that have
not been answered or to correct mispronunciations. It is
then a short step to calculate the percentage of each
type of move that takes place within any conversation or
with any particular child. We refer to this process as
the 'SRCI analysis. Obviously we encounter teacher moves
which do not fit our system. An example of this is the
S/R move, which as it's label would suggest, is both a
substantive and a repair move. When the teacher coes
round the whole class asking each child in turn a certain
question ("and what colour are your pyjamas? ") we call
this an SIR move. Similarly, a teacher could be checking
that one particular child is understanding the conversa-
tion involving other individuals by askinS him about it.
This too would be called an SIR move. Given below are
some examples of each type of move :
SUBSTANTIVE : Tell me about your Cog.
What happened on Saturday?

128
Yesp I like cream cakes too.
CONTINUITY : How nice.
Oh, lovely!
Yes, go on.
REPAIR : Say that again.
You had what for your tea?
I can't understand.
Once again using the same example of transcript, we now
have:
I TEACHER I CHILD I ------------ I ----------- I SRC Level I Level MLTI I ------------ I ----------- I
T -What diC. ' you do on Saturday? ISII III
C3-shopping III III
T -Oh, you went shopping ICII III
C3-Cand flummy III III
T -I see. What did you do, Peter? l SII III
C2-I watch television R
T -Pardon?
C2-I watch television
------------------------
Coding: Levels AnalySiS
The second method used to analyse these conversa-
tions is called the 'Levels Analysis'. The major point

129
of interest is how much control is being exerted by the
teacher on the child's next utterance. This type of
coding system enables us to establish, for example, how
the teacher's level of control might affect both the type
and the length of the child's next utterance. The
child's moves can also be classified according to this
system with the addition of a few more categories.
Levels. : Decision rules.
Five major levels of control have been identified.
These, together with some examples, are outlined below.
Level 1: ENFORCED REPETITION.
This usually occurs when the teacher tells the
child to repeat something for pronunciation
failure or because she has not understood
(eg. "Say that again" or "Say robin, robin").
Level 2: TWO-CHOICE QUESTIONS.
These utterances require a yes/no response or a
choice of two given responses (eg. "Did you go
to the zoo? " or "Did you go with Mummy or Daddy? ").
Level 3: WH QUESTIONS.
This category includes all when/v7here/who/what/
why questions as well as moves like "Tell me
what you did".

130
Level 4: STATEMENTS/PERSONAL CONTRIBUTIONS.
These utterances characterise more "genuine"
Ue. hearing adult) conversO-., tions where no real
force is exerted over the child's next
utterance : the teacher makes a statement (eg.
"They call this a zoom lens") or gives her
views or experiences (eg. "I like them too"
or "I went to Jersey last year").
Level 5: PHATICS.
This category is characterised by moves like
"I see". "How nice"r "Lovely", "umhm, ah" and
so forth, where no real force is being exerted
over the next move. These moves exist to show
the child that he is being understood and
listened to.
There are occasions where the teacher's utterance is
ambiguous (eg. "Do you know what the time is? " could be a
2 or a 3 .) When this happens a decision is made on the
basis of the way the child interprets it. If the child
answers as if the question was a type 3 ('12 o'clock")
then it is coded as a type 3. If he responds as if the
teacher's move was a2 ("Yes") we code it as a 2. There
are also three other types of moves which do not tend to
fit easily into the five types described above. These
are:

131
4.2 : Where a statement is "tagged" (eg. "Plartin had a
lot of fun at the fair, didn't you Plartin? ")
5.2 Where a phatic is "tagged" (eg. "Oh, you went to
the fair, did you? )
5.1 Where a repetition of an utterance is requested
(usually "What? " or "Pardon? ")
Finally, the child's utterance can also be classi-
fied according to this system with the addition of
several other categories. These are:
tick : where an appropriate response is given to
a question or request for repetition.
tick4 : where an appropriate response plus a
contribution is made.
x: where an inappropriate response is made.
NR : where no response is made.
This latter set of primarily responsive moves can
also be used to categorise the teacher's moves when, for
example, she is answering a question posed by one of the
children. This is fairly unusual however, and in the
majority of cases such answers are immediately followed
by another move fron, the teacher, so are actuC--lly go

132
uncoded. An example of this would be:
Child -"Did you go? "
Teacher -"Yes, I did. Did you like it? "
A final category is that of 'chairing' when the
teacher (and on occasions a child) uses certain moves as
a chairperson would. Some teachers frequently determine
a topic of conversation and/or hand over to a chilc-.
Examples of these moves are "Now listen to Miarcus,,
because this morning on the school bus something funny
happened. 1,7hat happened Marcus? " or "Right,, Jerry's turn
nowil , The former example would be coded as a mixture of
chairing and questioning Ue. a Ch/3) although for the
purposes of most analyses we use which ever part of the
utterance the child respona's to. If, for example, in
response to "Tell us what you did" the child says "No"
this would be used in analyses as a Ch. If, however, he
does proceed to tell us what he did this would be used as
a 3. There are other oddities which do not quite fit
into the system but their description would render this
section somewhat unwieldy. only a basic outline is
presented here but it will suffice to understand the
f inc-. ings presented later. Finallyr the original example
of transcript has been coded with this system and the now
completed version is shown below. Where the child's
response has been noted "tick" this means it is a

133
straightforward answer with no elaboration, the actual
sign for a tick being unavailable to the typist.
I TEACHER -----
I CHILD
SRC ------- I
Level -----------
I Level MLTI
T -What did you do on Saturday? I -----
S ------- I
31 ----------- I
1
C3-shopping I tick I
T -0h, you went shopping. I C 5 II 11
1 C3-and Mummy 1
1 1 14
T -I see. What Cid you dor Peter? l 1
S 31 1
C2-I watch television I tick
T -Pardon? I R 5.1 1
C2-I watch television
----- --------
I tick -----------
These levels of utterance easily show how much con-
trol is being used in any conversation. Obviously,, a
conversation which includes a large proportion of l's
(enforced repetition) and 2's (two-choice questions) will
be of a very directed and unspontaneous nature (high
control) whereas a conversation with many 4's
(statements/personal contributions) and 5's (phatics) on
both sides will be more like an egalitarian adult conver-
sation with meaningful exchange of information. Using
this analysis combined with the MLT (Mean Length of Turn)
analysis we can find out whether, for example, low-
control moves (41 s and 51 s) f rom the teacher prompt the
children to say more or less than high-control moves(lls,

134
2's and 31s).
Re-an Lencith of Turn
Idean Length of Utterance (MLU) is often used as a
measure o-. cL: language development. Brown (1973) believes
the NLU "to be an excellent simple index of grammatical
development because almost every new kind of knowledge
increases length" (p. 77). However, once the child
reaches a certain stage of language development the MLU
becomes less siicý. ple an index because it is more dependent
on the type of interaction in which the utterance is
taking place. Brown argues that children matched for I.,, -., LU
are much more likely to have speech of similar construc-
tional complexity than children matched for age. Thisr
one would think,, is likely to be even more true for ý: eaf
children since one also has the very influential factor
of degree of hearing loss to consider. He argues that
during the early stages of language development it is the
"compounding of relations" which causes MLU to rise,
whereas later on (when IILU becomes larger than 4 mor-
phemes) many others factors come into play depending on
the circumstances (p. 221). Of coursej, Brown's work
relates to hearing children and as there is no comparable
work on the development of the MLU in deaf children, we

135
cannot make any such decision about the limits of the
value of the MLU for our present sample. However these
children rarely produce utterances that are longer than 4
morphemes.
Several authors (eg Crystal#, Fletcher and Garman,
1976 and Ivimey, 1982) have drawn attention to the prob-
lemis involved in using NILU as a measure of language
development. Crystal et al discuss MLU in relation to
hearing children, whereas Ivimey is particularly con-
cerned with its use in studies concerning deaf children.
Ivimey discusses three major criticisms of the MLU in
such cases. Firstly, since finding the MLU involves cal-
culating the average sentence length one needs a widely
accepted and rigorous definition of e;., actly what consti-
tutes a sentence. Unfcrtunately such a definition does
not exist. Secondly,, the jl,. 'iLU does not provide answers to
several important questions about the content of utter-
ances. For exampler even though a 17 year old deaf child
rt-iay well achieve the same MLU as an 11 year old hearing
child (Myklebust, 1964) this does not necessarily mean
that the language being used is similar. Ivimey reports
that the belief that these two groups of children have
imil ar language skills Ue. that deaf children's
lanrýuage iS simply lagging 6 years behind hearing
children's) has been widely held for rt-, any yearso, even
though examination of Myklebust's examples of speech show

136
quite clearly that this view is unfounded. Increasingly,
evidence is suggesting that 6eaf children's language is
not just (5elayed but is different right from the start
(eg. Gregory and Mogford, 1981, Quigley, Steinkamp, Power
and Jones,, 1978) . It is obviously important not to
generalise data that are relevant to hearing children's
MLU to deaf children. In the present study we are only
comparing deaf children with other deaf children. A
third criticism of the IILU is that it does not answer
questions about exactly what changes in language charac-
terise an increase in MLU. "we ca: ýre not told whether a
deaf child, or a hearing child for that matter,, merely
adds new worC. s to the ends of old sentences as he grows
older, or make-s- intra-sentence adjustments, first adding
adjectives to noun phrases then auxiliaries to his verbs?
Does he abandon earlier incorrect structures or does he
reconstitute them? " (Ivimey, 15,82, p. 139) . Brown (1973)
would say that this consideration is les, -ý, -- important in
I- L 1---n, --uage development (with hearinc- the earlier stages o-i
f-1, an in the later stages. If the same is true
of the c-., eaf then we can assume that an increase in 1,1LU in
Stage I means "compounuling relations". Of course, there
is an additional problem in detecting morphemes in the
speech of profoundly deaf children. If speech quality is
very poor it is. very difficult to determine whether a
word. has been said, let alone whether or not it has an

137
Is' or 'edl (and so forth) on the end.
Uhile recognising the theoretical Grawbacks of using
MLU as a measure, we nevertheless use it in a modified
f orm, namely the Mean Length of Turn (MLT) . This avoids
the problem of sentence-length criteria,, for examplep
since we are interested in the whole utterance. There
are certain exceptions to this rule; we exclude false
starts and repetitions (though what constitutes a repeti-
tion is open to question) . Also,, we are not using it to
compare deaf v. 7ith hearing children. The rules for calcu-
lating the MLT are detailed below. As a measurey the MLT
has proved to be remarkably robust, both in reliably
showing up differences in children's responses to various
teacher moves and, as we shall go on to describe in
Chapter 8, in correlations with other measures of a
child's language production. Furthermore, it has been
used in studies of both c-leaf and hearing children., as
well as with adults, with very similar results. For
these reasons we f ind that MLT has practical and analyti-
cal value as a measure of linguistic performance in a
broad sense, but not as an indication of linguistic
structure.
MLT : Dgcision Rules.
In th i --) particular f orm of MLT 0, words, not

138
morphemes, form the basis of the score. Standard con-
strictions such as "I'll" and "shouldn't" count as one
word. For this analysis it is usually necessary to work
with both the transcript and the original video-recording
since it requires very fine e-,. amination to discriminate
between what is a word and what is not. This is espe-
cially difficult when working with recordings of deaf
children. There are occasions when the child's utterance
is almost or completely untranscribable. It is wiser to
exclude these chunks f rom the analysis rather than risk
biasing the IILT in one direction or another. More com-
ri. -ionly,, however, we have made an intelligent cuess as to
how many words we have not been able to transcribe and
have made a note of these in their appropriate places in
the transcript. Details of this are in the section above
on transcription. A distinction is made between where
there has been no response and where there has been a
non-verbal response, although both of these count as zero
in the MLT calculations. Obvious repetitions such as
those included in "Daddy goes,, Daddy goes with me" are
excluded from the count. This example woulQ receive a
score of 4. not 6. We also exclude false starts, such as
"I. er, I went too". Using the same example of conversa-
tion given in the section above on transcription, one
would fill in the column for the child's DILT as follows:

139
TEACHER ------------
I CHILD I
I
ISRC I ----
Level ------
I Level I
MLTI
T -What did you do on Saturday? IS -
3 --------- 1
--- I 1
C3-shopping 1 I
1 I tick
1 11
T -0h, you went shopping .A
1 IC I
5 1 1
1
C_: ) and Mumray 1 I 14 21
T -I see. What Cid you do, Peter ?lS 3 1 1
C2-I watch television I tick 31
T -Pardon? IR 5.1 1
C2-I watch television ---- -------
I tick ---------
31 ---
Formerly we have used this analysis to calculate the
?"q PILT for a group of children in order to see whether
di ferent teaches moves result in different lengths of
turn (LT's) from the children. In this study, howevert
since we are interested in the individual chilaren's
I'LT'sj, several MLT's were calculated for each child as
well as for the group as a whole. These were:
1) an overall average DILT
2) MLT after teachers' 2's (two-choice questions)
3) DILT after teachers' 3's (open questions)
4) LELT after teachers' 4's (personal contributions)
5) MLT after teachers' 5's (phatics)
6) MLT after teachers' 4.2's and 5.2's (tags)
7) MLT after another child's contribution.

140
This last category is also a new one because while
looking at so many tapes,, it became apparent that teach-
ers vary considerably in how much free reign they will
give to children who talk to each other during these
conversation sessions. This variation can considerably
alter the tone and character of conversations which in
itself may well change the children's behaviour and type
of response. We therefore thought this might be worth
including in our calculations. An overall MLT for each
group of children was also calculated. We did not
include MLT's after l's (enforced repetitions) in our
analyses either in the earlier study or in the present
one. These moves are usually 'strings' of requests for
the refpetition of one or more words, either for reasons
of pronunciation or 'word. ' learning and, as such, do not
represent genuine conversational moves. We have found
th, at teachers do not a,, r-)pear to succeed when trying to
encourage a child to produce an utterance (by means of
enforced repetition) thLat is longer than his average MLT.
Reliability of codinq svstems
Two coders independently coded samples of tran-
scripts of deaf children in conversation výith their
teachers using the s stents described above. On the func- jy
tions analysis (SRC) they showed 91.4% agreement and on
the levels analysis,, 90.8% agreeinent.

141

BLANK IN ORIGINAL

142
So as to give some idea of how far the results of
this study replicate those previously mentioned (Wood et
al, 1980 and 1982) 1 shall begin in this first section
with a description of the overall patterns emerSing from
all 8 conversation sessions. This section does not,
therefore, consider individual children as Ca factor, but
only to the group's behaviour as a whole. The next
section (II : Results of Analyses on each Child) will
deal with the pattern of correlations found between each
child's MLT's, teacher moves addressed specifically to
him, 'givens' such as age and hearing loss as well as
teacher rankings of ability, attitude, oral ability,
written ability and speech quality.
OVERALL RESULTS FOR LLL ý C014VERSATION SESSIONS
The functions (SRC) j2f teacher moves (aU sessions).
Table 5.1 shows the proportion of each type of
function move made in each conversation session (in per-
centages). The average age and hearing loss of the
children in each session are shown on the right-hand side
of the table.
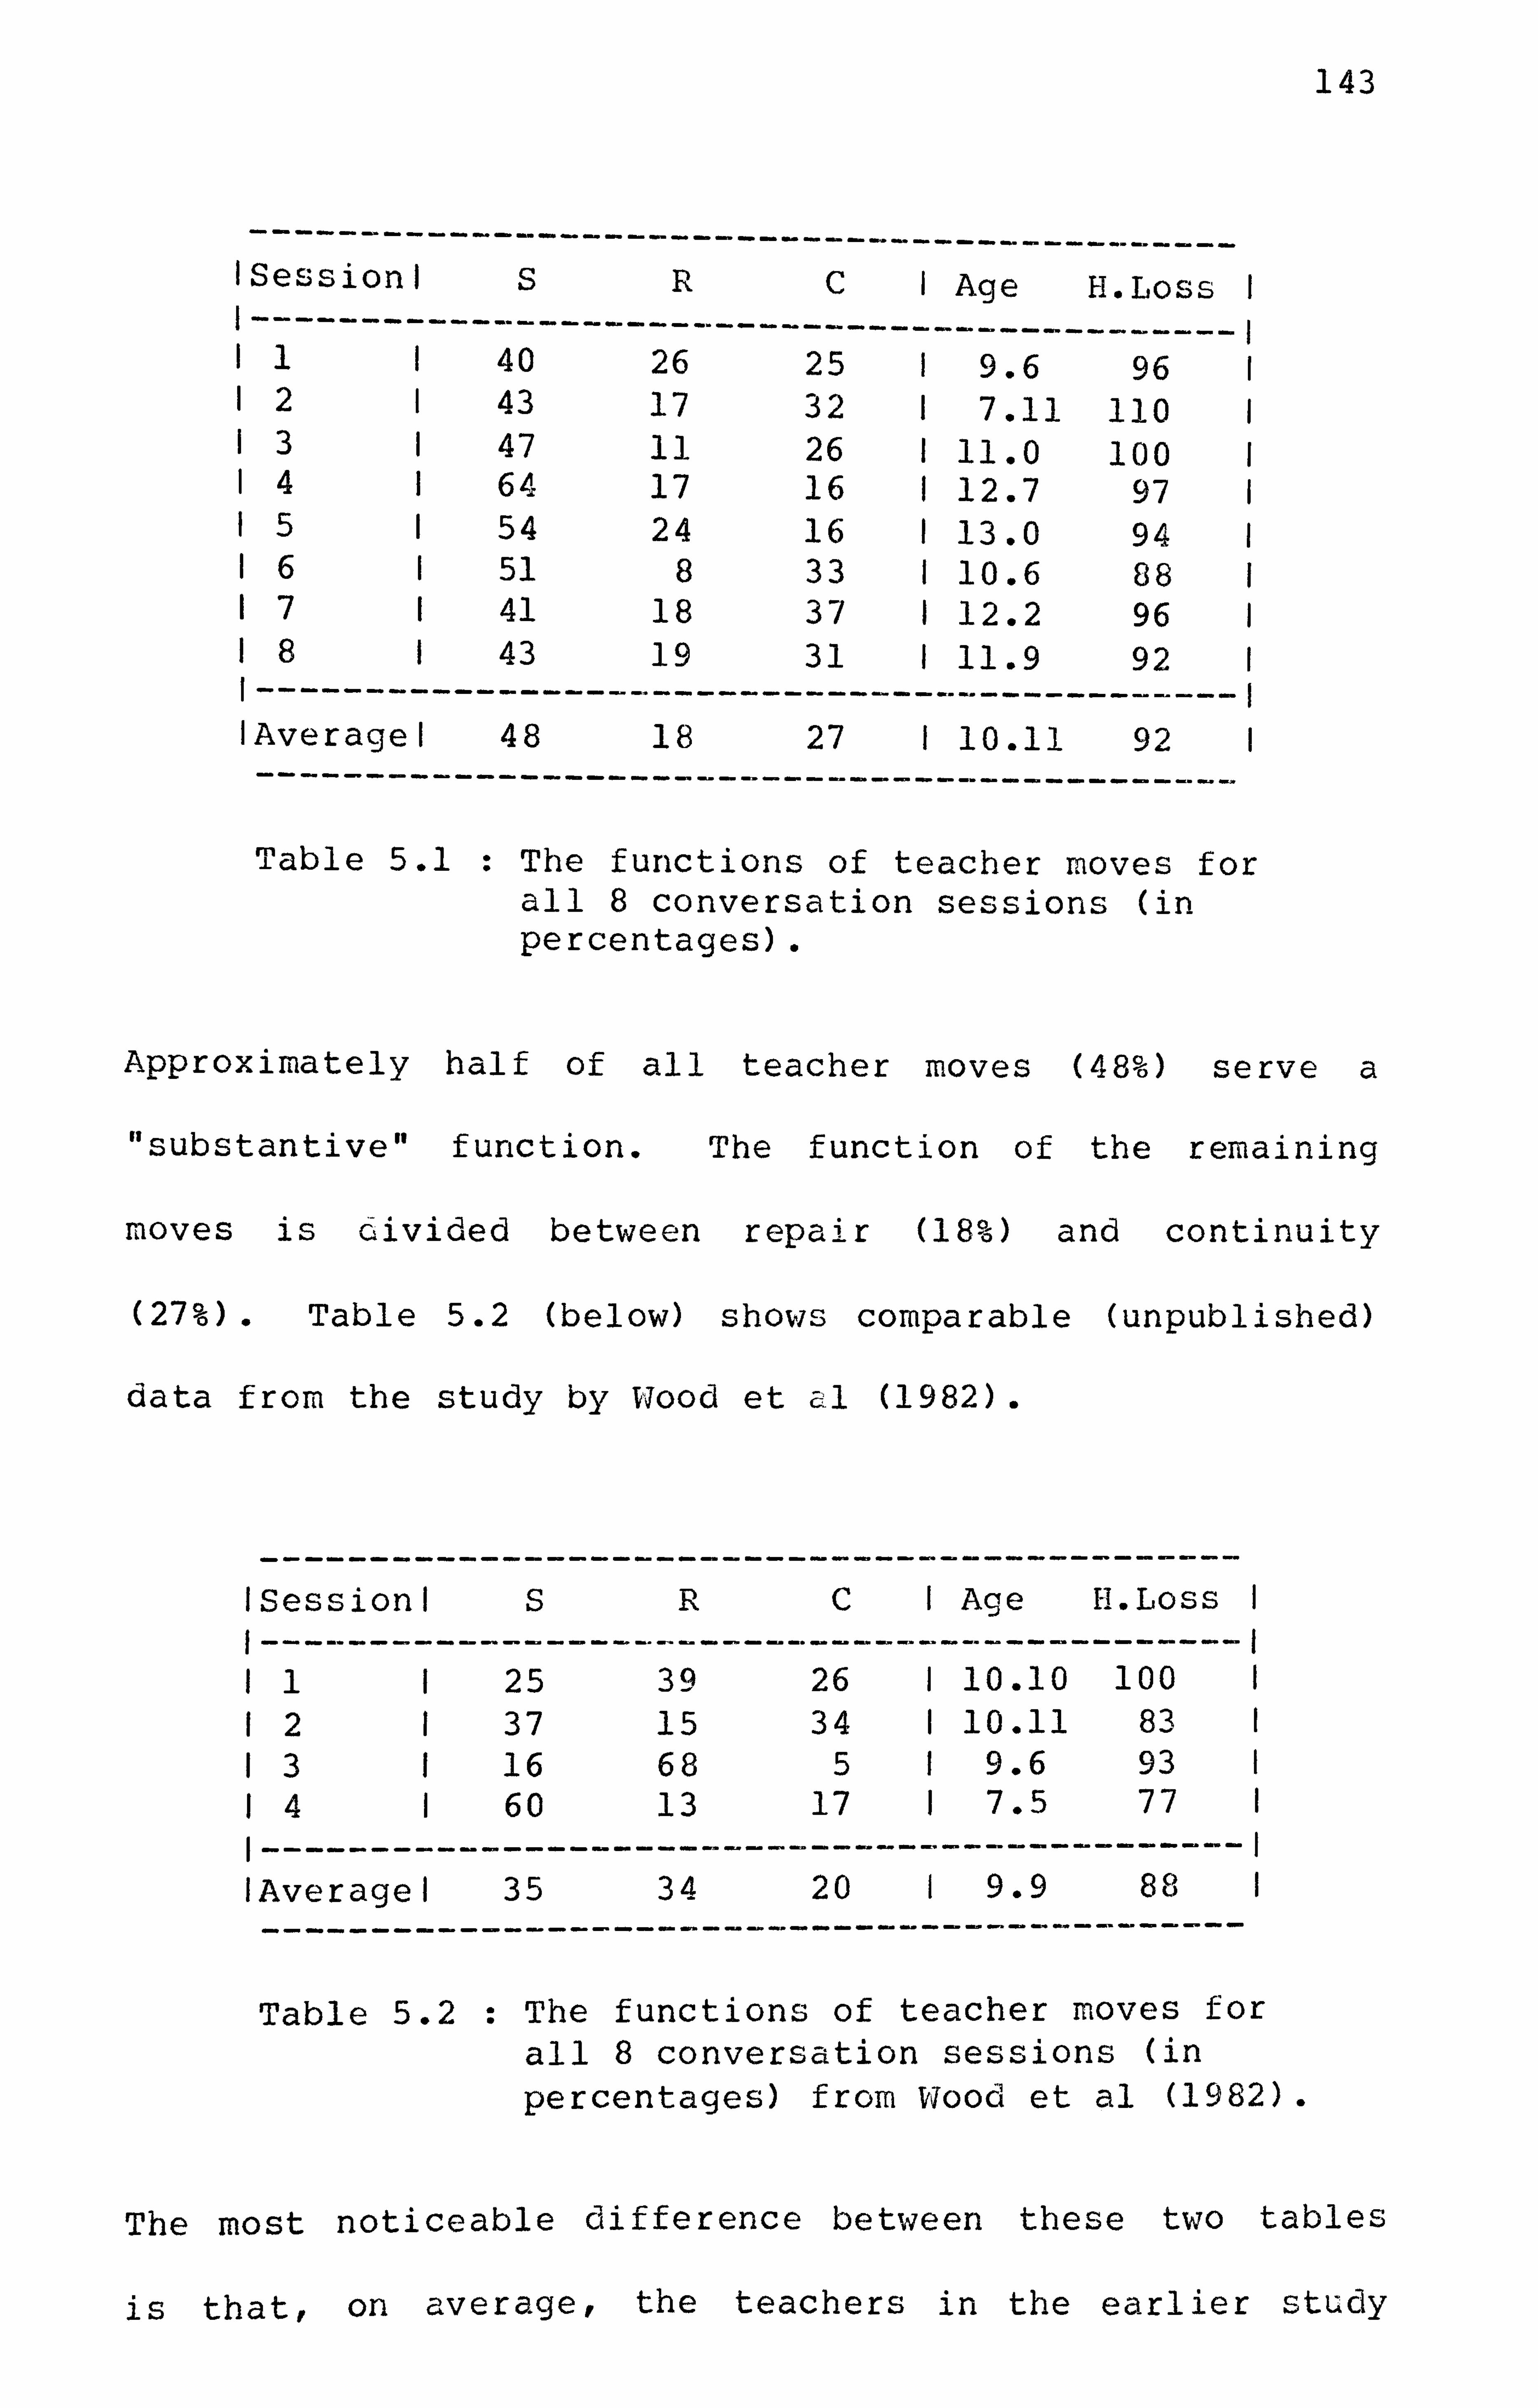
143
----------
ISessionl I ----------
------
S ---------
R ----
C --------
I Age ---------
H. Loss I
111 ------ 40
---------- 26
---- 25
-------- 1 9.6
-------- I 96 1
121 43 17 32 1 7.11 110 1 131 47 11 26 1 11.0 100 1 141 64 17 16 1 12.7 97 1 151 54 24 16 1 13.0 94 1 161 51 8 33 1 10.6 88 1 171 41 18 37 1 12.2 96 1 181 1 ----------
43 ------
19 ----------
31 ----
1 11.9 ---------
92 1 -------- I
lAveragel ----------
48 ------
18 ---------
27 ----
1 10.11 --------
92 1 --------
Table 5.1 : The functions of teacher moves for all 8 convers ation sessio ns (in percentages) .
Approximately half of all teacher moves (48%) serve a
"substantive" function. The function of the remaining
moves is civided between repair (18%) and continuity
(27%) . Table 5.2 (below) shows comparable (unpublished)
data from the study by Wood et C-1 (1982).
---------
ISessionl -------
s -------
R ------
c ---------
I Age -------
H. Loss I I ---------- 111
------- 25
-------- 39
------- 26
--------- 1 10.10
------- I 100 1
121 37 15 34 1 10.11 83 1 131 16 68 5 1 9.6 93 1 141 60 13 17 1 7.5 77 1
-------- I 1 --------- lAveragel ---------
------ 35
------
-------- 34
--------
------ 20
------
-------- 1 9.9
-------- 88 1
--------
Table 5.2 : The functions of teacher moves for
all 8 conversr--Ltion sessions (in
percentages) from Wood et al (1982).
The most noticeable difference between these two tables
is that, on averager the teachers in the earlier study

144
use more repair than those in the present study. This is
especially noticeable in sessions 1 and 3. Taken
together, the results from these 12 sessions show the
extent to which the functions pursued in teacher speech
vary between teachers. The proportion of substantive
moves varies between 16% and 64%. Continuity moves
comprise between 5% and 37%,, while the proportion of
repair can be as low as 8% or as high as 68%.
The levels of control j2i teacher moves (LIJ sessions).
Firstly, we simply count the number of each type of
move made by the teachers. Table 5.3 (below) gives some
indication of the range of styles found using these
simple criteria. The figures shown in the table are
percentages of the total number of moves made by that
teacher (an average of 230 moves in each of the 8 ses-
sions) . There are various other moves made (an average
of 7% by each teacher) that are not shown in the table.

145
---------- --- ------ Teacher move type
ISessionl ----------
-- 1/5.1 2 ------------
---------- 3
--------------
------ 4
---
---- ---- 5
-------------- 4.2/5.2 1
11 15 14 23 --
14 ---- -----
19 ---------- I
61 121 9 24 26 5 12 18 1 131 2 30 26 10 13 16 1 141 7 13 32 25 11 71 151 8 20 31 21 4 10 1 161 3 22 14 16 21 14 1 171 4 17 21 15 25 13 1 181 I ----------
7 ---
21 ---------
15 -----
17 20 11 1
lAveragel ----------
7 --
20 ---------
---- 23
---------
------ 15
------
----
----
---- 16
----
------------ 12
------------
Table 5.3 The percentage of each type of teacher move (levels of control) in all 8 conversation sessions.
It can be seen from Table 5.3 that the 'spread' of
moves types among teachers, unlike that revealed by the
functions analysis above, is fairly uniform. The teacher
in session 1 uses an unusual number of requests for
repetition (15%) while the teacher in session 3 is unusu-
ally low in personal contributions (5%) . It seems, how-
ever, that questions (21s and 31s) form the largest
category of teacher moves in these sessions.
Using the data above we form several Is umma ry I
statistics. Table 5.4 shows the proportion of high con-
trol moves made by each teacher (column titled T. Ctrl) .
High control moves are questions (21s and 31s) or
requests f or repetition (5.1 1s and 11 s) . Low control
moves are personal contributions (41s) and phatics (51s) .

146
The remaining three columns show how often (ie. e, ý., pressed
percentage of all tlieir utterances) the children
gave elaborated answers to teacher c,, Tuestion., -ý as oppose6 0
to straightf or,,,, ard answers (C. V-11, Db) j, how often they made
controlling moves themselves (ec. questions and personal I -L
contributions) and generally show initiative (C. Ctri) and
finally, the proportion of all child moves that are made
after another child as opposed to after the teacher
(C. af t C. ).
------------------------------------------
ISessioni T. Ctril C. Elab I C. Ctrl I C. aft C
111 53 1 16 1 37 1 16 121 58 1 26 1 41 1 7 131 57 1 17 1 34 1 9 141 52 1 20 14 55 1 11 1 151 55- 8 1 20 1 39 1 17 161 40 1 17 1 47 1 33 171 42 1 20 1 46 1 8 181 43 1 26 1 50 1 12 1 --------- lAveragel
---------
------ 50
------
----- I ----- 1 20 ----------
---------- 1 42 1
-----------
--------- 14
---------
Table 5.4 : Proportion of high control i, ý; oves for teacher and children (in all 8 conversation sessions).
The most obvious finding here is that the more
control the teacher exerts, the les. - likelv are the group L
of children concerned to make contrclling or initiating
r. -ioves themselves. How often the children feel able to
converse with each other also tends to be related ito how

147
much control the teacher takes in the conversation
although a correlation using group data fails to achieve
significance. As we shall go on to describe in the next
section of results, however, analysis using each indivi-
dual child's results does yield a significant result. In
session 2, although a verbally able group, the children
very rarely contribute moves after each other (7%) . This
teacher is not much higher in control than the others but
it is interesting that she had only just taken this class
over from a very controlling teacher. In a previous
visit to the school (a year earlier) we had recorded this
same group of children in a conversEttion session with
this very controlling teacher. Analysis of the tran-
script from this session shOV7ed up an atypical pattern of
moves, r especially when one considered that the children
were actually more 'normal' (ie. verbally able) than
most. In this particular session, the children never
made a conversational move af ter another child, whereas
the average proportion of such moves in the present study
is 145.. The pattern of conversation always went teacher-
child-teacher-child throughout. These children were
either never given the opportunity to contribute after
each other or, for some reason, did not feel free to do
so. Similarly, in sessions 7 and 8 which are also low in
control (42% and 43% ) the children do not often contri-
bute conversational moves af ter each other (8% and 12%) .

148
These children, however, are a particularly slow group.
It is clearly riot of much value, therefore, to read
too much in these gross figures. They only serve to give
some idea of the ranc,, e of styles we are dealing with. We
shall go on to investigate in more detail the relation-
ship between teacher power and the children's behaviour
later in this chapter by looking at each child's
responses to teacher moves addressed specif ically to him.
The relationships between teacher style and child
response will then become much clearer.
Levels of child resy)onse to teacher moves
In order to find out v7hether or not children respond
in a systematic fashion to different teacher moves, we
analysed all pairs of teacher-child moves in each conver-
sation session. The patterns of child response were very
similar for all 8 sessions. The averages from all 8
sessions are tabulated belowl followed by the comparable
table from the earlier study (Wood et al, 198', cl. ) . Only
categories which involve 5% or more of each teacher's
moves have been presented. Examination of these two
tables reveals remarkable similarities.
In these tables, the f irst two child response
columns (entitled lans' and Ia+elab') refer to those

149
occasions where a child simply answered and those when he
both answere6 and elaborated.

150
Child responses
T. move I ---------
an s ----
a+elab -----------
2/3 -------
4 ---------
5 ---
x ----
other I
11 1 98 0 0 0 0 ----
1 ----------- I
11 12 1 54 25 1 2 0 4 14 1 13 1 69 4 2 2 1 11 11 1 14 1 0 0 8 67 21 0 41 15 1 0 0 5 74 20 0 11 15.2 1
--------- 62
--- 36
---------- 0
------
1
--------- 0
----
0
------- 11
---
Table 5.5 Levels of child response to teacher moves (averages of all 8 conversation sessions in percentages) .
Child responses
I T. riiove I I
ans ------
a+elab ---------
2/3
-------
45
--------- x
------- othe rI
----------- 1 96 0 0 00 3 1
12 1 61 21 0 10 8 9 13 1 74 3 0 10 12 10 14 1 0 2 2 69 22 0 5 15 1 0 0 1 75 19 0 5 15.2 1
-------
56
-----
32
----------
0
-------
10
---------
7
-------
4
-----------
Table 5.6 : Levels of child response to teac her moves (averages of all 8 conver sation sessions in percen tages) from wood et al, 1982.
The vast majority of teacher questions (21s and 31s) are
followed by straightforward answers from the children
with no elaboration. Personal contributions and phatics
Ws and 51s) however,, are usually followed by 4's and
5's from the children. It is clear from these tables
that these patterns of child response hold true for both
studies. We are now fairly confident that these patterns
are consistent across many different classes of children.

151
Such a conclusion is clearly of educational importance
since, as we shall go on to discuss in the next sectionr
not only is the level of response to teacher moves
consistent,, but also the length of response. Straight-
forv: ard answers from the childrent for example, are much
shorter than their personal contributions. Thus, if the
teacher v; ants to encourage lengthy personal contributions
f rom her children,, it is clear that a successful tech-
nique would be one which involved r., iany personal contribu-
tions from herself.
Tagged personal contributions and phatics (4.2's and
5.21s) are followed by similar responses to those which
follow two-choice questions (21s), namely a large propor-
tion of straightforward answers with no elaboration. The
pattern of child responses to 4.2's has not been
presented in the table because in many cases they form
less than 5% of all teacher moves. However, using the
vary small amount of data available, the responses to
4.2's are dividec-, almost equally between straightforward
answers cand answers accompanied by elaboration. The
responses to 5.2's more closely resemble the responses to
2's since children are far more likely just to answer the
question and stop: the proportion of straightforward as
opposed to elaborated answers after 5.2's is c-; ipproxi-
r. -tately 2: 1#, which would imply that the children find
4.2's less controlling than 5.2's. Since teachers vary

152
both in the way they use these tagged moves and in how
often they use them,, we shall not provi0e details of the
analyses concerning them in the main body of texto, but
only in the appendices.
As in the previous study,, children offered inap-
propriate responses most frequently after teacher 3's
(open questions). After such a misunderstanding, teach-
ers often break down the question from an open one to a
two-choice one, reducing the ambiguity for the child.
typical (but fictitious) example would be:
T- Where die' you go on Sun6ay? C- Hummy T- Nof on Sunda N7
-4 C- (nods) T- Where did you go? To the park or to Grandma's? C- Grandma's
14ost of the entries in the 'other' column are actually
$no responses', particularly after teacher 2's and 31s.
M . Lo sum up this section, it would appear that , -, uestions
f roT, -, the teacher are the -., ýioves most likely to result in
ii--lappropriatCe -espo, -. <-jes, nc, response at all and in short
responses (see next section on MLT for details) . In
particular, open questions are followed by unelaborated
answers. Personal contributions and phatics frcm the
teacher, on the other hand, stimulate a very high propor-
tion of personal contributions from the children.
In the discussion at the end of this chapter, we

153
shall consider the role of questions in more detail.
However, as far as type of response in concerned,, the
overall tone of the conversation can determine how chil-
dren respond to moves within the conversation session
itself. We have found that in cases where the teacher is
very low in control, on those occasions when she doe-s:
actually ask questions she is more likely to receive
elaborated answers to theya than is a teacher who normally
asks many questions (1.,, i-ood et al, 1982) . In a study which
will be cescribed in more detail later on in this
chapter, teachers were asked to change their conver-, 7- a-
tional style in 5 different sessions (Wood and TvTood, in
press) . The aim was for thern to 'load' each session with
as many of a specified move-type (lls,, 2's,, 3's,, 4's or
51s) as was possible without grinding to a halt. The
results ofE this study suggest that if children are fre-
quently given the opportunity to take control of the
conversation (ie. if they are engaged in one of the low
control sessions with a. high proportion of 4's and 51s)
they are more likely to take advantage of those opportun-
ities than they are when engaged in a high control
session. In earlier stu les we have also found that
teachers who are normally high in controll will usually
receive a higher proportion of unelaborated answers to
their questions than will low control teachers (vlood et
1980, wood et al, 1982) .

154
Devel -of
teachel response to child moves
Wood et al (1982) found no systematic pattern of
teacher responses to child moves. This is probably for
two reasons. Firstly, teachers have far more 'choice' in
what to say (ie. their command of language allows it)
than do the children. Secondly, a child move (whatever
its type) does not exert any force on the teacher's next
move since it is the teacher who is deciding how she
wants the conversation to run : the balance of power is
very much on her side. Indeed, calling the move she
, makes following a child's raove a 'response' is probably
inaý--, proprlate. Examination of the data from the present
study suggests that the same is true here. (A detailed
analysis like the former one was not carried out, how-
ever, since it is exceptionally time consur,. iing. ) The
results froi, the earlier study are tabulated below.
I- L. eacher resp onse ---------
lCh. movel ----
1 -------
2 -----
3 -----
4 --
----- 5
-----
------ 4.2
------
------- 5.2
-------
-------- Oth
--------- I --------- I tick 1
---- 13
------- 21
----- 30
-- - 9 13 2 6 4
1 tick4 1 5 16 18 13 22 4 14 8 14 3 14 25 16 23 0 12 7 15 3 28 19 17 25 4 4 0 1x1 ---------
0 ----
31 -------
34 -----
26 -----
3 -----
0 -----
6 ------
0 ---------
Table 5.7 Relationship between moves in child speech and ensuing teacher moves (from Wood et al. 1982)

155
ChildleLila M_e_an length of turn (all B- zessions) .
As it, the previous study, we were interested to see
whether certain teacher moves resulted in longer MILT's
f rom the children.
Results of a two-way analysis of variance on lengths
of turn from all children in all 8 sessions (see table
5.8 below) are very similar to those of the earlier study
(Wood et al, 1982) .
----------
Isource I
----------
-----------
df F -----------
------------
df 2
------------
-----------
PI I
Iteacher 1 7 21.4 1322 ----------- . 00000 1
II Ir.. iove 1 3 16.1 1322
I
. 00000 1 II It xM1 ----------
21 2. F-, -----------
1322 ------------
I
. 00002 1 ------------
Table 5.8 : Pelationships between teachersr move type and children's m ean length of turn.
p< . 05 p< . 01 p< . 001
This table says three things. Children in some of the
sessions clearly said more than children in others. Some
moves are clearly producing utterances of different
lengths from the children than are other moves, although
we need to go on to other analyses (see below) to f irmly
establish which moves these are. Finally, the associa-
tion between r., love type and fdLT varies across teachers.

156
The MLT's for each group of children were calculated
and are presented below in Table 5.9. This table shows
the mean length of turn QILT) f rom all groups of children
in each conversation session after teacher 2's (two-
choice questions) , teacher 3 Is (open questions) , teacher
41s (personal contributions) . teacher SIs (phatics) and
the MLT after moves frcrC, another child. The r-inal column
shows the overall I-ILT for all children (42) after all
those moves shown in the table as well as those after
4.2's an6 5.21s.
--------- ISessionI
-------
2's --------
3's --------
4's --------
SIS --------
child --------
overalll I --------- 111
------- 1.42
-------- 1.32
-------- 2.06
-------- 1.71
-------- 1.91
-------- I 1.58 1
121 2.12 2.51 3.39 3.66 2.96 2.65 1 131 1.17 2.37 2. ':
-,, 8 2.95 2.35 1.93 1
141 1.93 2.20 2.25 2.23 2.62 2.14 1 151 1.61 2.06 2.33 2.67 2.16 2.23 1 161 1.93 5.96 8.78 10.20 5.31 6.40 1 171 0.77 1.38 2.52 4.49 3.07 2.35 1 181 1.44 1.67 1.69
- 3.17
-------- 1.93
------- 1.88 1
---------- I 1 --------- 10veralll
---------
------- 1.55
-------
-------- 2.28
--------
------- 3.06
--------
4.11
-------
3.29
--------
2.73 1
----------
Table 5.9 : Children's mean length of turn for all conversation sessions.
The IILT's after chairing moves from the teacher have not
been included since some teachers hardly use sucD moves
at all,, while some make frequent use of them. However,
chairing reliably yields a high r,;, ILT. The overall MLT
after such moves was 3.59 words.

157
It can be seen from table 5.9 that certain teacher
moves sec-, Ez to ; produce reliably longer MLT's from the
children than others. We compared the MLT's produced
after every teacher 2 with those produced after every
teacher 3, every teacher 4 and so on until we had a
comparison for every possible pair of move types (using
analyses of variance) . Table 5.10 (below) shows the
results of these comparisons.
- 2
------- 3
------- 45
------------------ HEANS
2 1.547 3 2.279
31 . 0001(- 4 3.064 1 *** 1 5 4.106
41 00000 . 01758 ------ 1 Ch 3.292
51 00000 00000 . 03807 ------ 1 1 *** 1
Chl 00000 . 00020 . 56624 . 05941 1 1
-------- -------
NS NS 1
------------------
Table 5.10 : Paired comparisons of mean length of turn from children after each type of teacher move (combined data from all 8 conversation -essions).
p< . 05 p< . 01 p< . 001
The children's responses after teacher 4's and 5's as
well as after moves from another child (noted as 'Ch' in
the table) are significantly longer than those proauced

158
after 2's and 31s. The response length after 5's is
longer than that after 4's (p <. 05) but neither of these
two moves elicits MLT's significantly longer than those
produced after moves from another child. Thus, as in the
earlier study, when less control is exerted over the
children they Say more. QuestionsF perhaps contrary to
our intuitions, are not the best way to stimulate chil-
dren to talk. This finding is true of both deaf and
hearing children (Wood et al. 1980, Wood et al, 1982).
Ideally, of course, children would have been treated
as a factor in this analysis. However, not all children
received all types of moves from the teacher and some-
times the numbers of certain moves to children was very
small. Vle are therefore left vidth the possibility that
these differences in MLT's are attributable to only Some
children. To investigate this possibility we used
Kendall's coefficient of concordance (Siegel, 1956) which
would tell us whether the pattern of I. 'LTIs (21s and Ps
producing shorter utter&nces than 4's and 51s) was true
for each child. Where there were no moves of a certain
type to a child we allocated an average rank. The result
of the analysis for all 42 children showed that they were
reliably producing the same pattern of results (p <. 001).

159
RESULTS FROM AIIALY, 9ES QB EACH CHILD
As mentioned in the introduction to the previous
section, we will now deal with the correlations found
between all children's MLT's after the different teacher
moves addressed specifically to them, the teacher rank-
ings of the children's overall ability, attitude, oral
ability, written ability and speech qualityr toSether
with the various 'child' variables such as age and hear-
ing loss.
It is possible, for example, that some children say
more than others because they are older, brighter, less
deaf or beccause they are given more opportunities to
speak Ue. more moves are addressed to them) than to
other chilc-, ren. 17fe ran a series of correlations (Pearson
product-moment) using data from all 42 children 4L--o inves-
tigate these possibilities. The correlations of interest
are described below. There are obviously too many to
discuss them all here. The correlations are discussed
under various headings (eg. 'hearing loss' or 'the func-
tions of teacher moves'). Those correlations that could
appear in two sections are only dealt with in one to
avoid repetition. The fact that teacher rankings of
ability is negatively correlated with repair, for e-, -. am-
ple,, is dealt with in the 'teacher rankings' section
rather than in the 'functions' section. The decision

160
about where to deal with such correlations was an ari'--.. i-
trary one,, but the reader is warned that each section
does not, tnerE'fore, provide an exhaustive description of
all correlations.
The f irst major observation is that the total number
of moves (expressed as a proportion of all moves in that
session) addressed to children did not vary significantly
with their age, hearing loss or any other variable.
Indeed, the correlation with hearing loss is notably low
when one considers that Wood et al (1982) round
a significant correlation here (r=. 44, p <. 05) . Once
again this lack of a significant correlation in the
present study may be a reflection of the very narrow
range of hearing loss. This restricted range effectively
L. -tinimises ones chances of getting a correlation. It is
also possible that the teachers in the two groups are
actually different in this respect.
no explanation for this discrepancy.
Functions of teacher moves
otherwise, we have
Two major tendencies can be observed here. The
deafer children tend to receive fewer substantive moves
(r=-. 1539) and more repairing moves (r=. 2358) . Neither
of these correlations reaches statistical significance.
wood et al (1982), however, found both the comparable

161
correlations to be significant (r=-. 65f p <. Ol and r=. 49r
<. 05) . As mentioned above failure to find significant
correlations with hearing loss in the present study m-4ý
be due to the fact that we have an unusually narrow range
of hearing loss which effectively minimises ones chances
of getting a correlation. Several (of the f ew)
discrepancies between the results of Wood et al's study
and the present one could be explained this way. Those
children who receive a lot of repair are also those who
are unlikely to show initiative themselves in the conver-
sation (p <. 01). The correlation between intelligence
and amount of repair failed to achieve significance (r=-
. 2358) .
Levels of teacher control
T-ý, e know from the previous section that those teach-
ers who repair frequently are also those who make a large
proportion of high controlling moves (enforced repetition
and questions) . As one might expect,, the correlations
reveal that those children who receive a large proportion
of controlling moves are also those who receive a large
proportion of repair (p <. 001). The more control a
teacher e-. (,. erts in a conversationy the less likely the
child is to show initiative in the conversation (p
<. 001) . One might have expected high teacher control to

162
be negatively correlated with how frequently the child
gives elaborated answers to questions. In fact, this
correlation fails to achieve significance (r= -. 2406) .
Teacher power iss also negatively correlated with all
MLT's except those after teacher 21s. So, children who
receive more high controlling moves are also those who
, LT I s. produce shorter I. e also found that it is the less
intelligent children who receive more high control moves
(r=-. 4195, p <. 02) . Discussed in the section on teacher
rankings is the f indinc, that the children whom the teach-
ers consider to be less able and those whose writiiig
ability iS considered poor, are also those who are con-
trolled Yaore.
C-hild-child moves
For reasons mentioned in the description of coding
syste-I. -ts, we looked in detail at those moves which a child
made af ter another child. Of all child movest on average
16% are those which follow another child's move as _rA.
opposed to a move from the teacher ranging from 0% to
56%. Although data from the croup results suggest that 0
teacher control bears no relationship to how often chil-
dren talk af ter each otherr data using each child does
show a relationship. If a child receives a large propor-
tion of high controlling moves from his teacher, he is

163
also likely to make a small proportion of moves after
another child (p <. 05).
Results from a recent study also suggest that
teacher power anc't the frequency of these child-child
moves are negatively correlated (wood and T, -Iood, in
press) . This study involved, the same children in both
low and high control conversation sessions with their
teachers. In low control sessions the proportion of
child-child moves was 15%, whereas in high control ses-
sions this proportion dropped to 2%. What is also
interesting here, is that children who often make moves
af ter another child are also those x7ho have relatively
long MLT's after teacher 3's (open questions) anc-!. who
score well on the readinS test (p <. 001 and p <. Ol
respectively). So, it is possible that we should be
concentrating both on the general verbal ability of the
child as well as the immediate effects of high control
r,.: ýoves from the teacher as a determiners of how likely he
is to r-, iake moves after another child. Vie shall return to
the problem of direction of cause in correlational aata
later in this chapter.
Hearin_q loss
The correlation between hearing los. s anu 'teacher

164
power' is . 3054 (p <. 05) - Deafer children receive more
high control moves (requests for repetiticn, q,,. uestions
and tags) than do children with more hearing. There is
also a (non-significant) ten6ency for the deafer children
to take the initiative Ue. ask questions, give ela-
borated answers to questions, make personal contributions
an(., so forth) less frequently than the less deaf chil-
dren.
Overall MLT was not significantly associated witkl I
hearing loss (r= -. 2923) . This result is slightly dif-
ferent from that of the earlier study since the latter
found a significant correlation between hearing loss and
I iLT (p <. 01) . However, as mentioned abover this
r, .
disscre- . pancy may be a result of the difference between the
ranges of hearing loss in the two sam-ples. Alternatively
there is no correlation between hearing loss and average
f-; ILT from the children although we suspect that this is
unlikely.
A detailed analysis of hearing loss's relationships
with MLT's after different teacher move types proves more
interesting. As mentioned in the chapter on the use of
averaged audiograms (Chapter 3) taking the average of 3
frequencies tends to give higher correlations with meas-
ures of the child's language ability than the two other
methocs which use five frequencies. The correlation

165
between MLT's after teacher 3's (open c ., uestions) and
hearing loss is a case where using the average of 3
frequencies method actually yields a significant correla-
tion (p <. 05) whereas the other two methods do not. When
we draw all the language measures together in chapter 8,
it will become evident that r, -ILT after teacher Ps looks
like a very sensitive measure of the child's linguistic
ability. We do not know yet, of course, whether an
increase in MLT for these children actually means an
increase in syntactic complexity but we strongly suspect
this would be the case. V. 7e care currently investigating
the feasibility oA'-' using the computer to analyse larc ,e
numbers of transcripts to test our hVpotheses. I-ILT Is J
after 3's also correlate very highly with the total score
on the Edinburgh Reading Test. This will be discussed
more fully in Chapter 8. It would make sense for 1, '-LT's
; uQ after teacher 3's to be a good measure of lanc age
ability (even when compared to MLT after 41s) because
such moves tap both receptive and expressive language;
the child not only has to understand the questicn, but he
also has to ý, -, 'roduce a response to it. Furthermore, we
know thz. ý, t the children are not just saying anything after
teacher 31s; in only 11% of responses to teacher 3's were
the children judged to have misunderstood the question
anci answered inappropriately. With personal contribu-
tions, however, the child only needs to read the force of

166
the teacher's utterance (rather than its content) and
follow it with his own contribution.
Another interesting correlation is that between
hearing loss (all three averages) and the children's MLT
after moves from another child. Using the average of 3
frequencies, this correlation is significant at the
<. Ol level. Usinc, the other two methods of averaging the
correlation is significant at p< . 02. The children with
more hearing say more to their peers than the deafer
children. It is interesting that these particular child
moves represent tl,. -, e only moves not directly elicite6 by
the teacher.
Intelligence and 1, lean Length of Turn.
have data about the IQ of 34 of the 42 children
I 7ho participated in conversation sessions (see Chapter 2
-C for details) The overall correlation (Pearson
between IQ and average MLT was 1-Aghly sicimif icant
(r=. 5501, p <. 001) - 11hen only MLT's after teacherZ--'
ticns arid personal cort-ibutions (T:. 'LT3 and 14U], 241) v. 3ere cue LI LI
used,, the f igures Were similarly high (r=. 6212 and . 5380,
<. 001) .
,, ua" raeasures anci all larL(---
The age-c! of the children range from 8.0 to 13.7.

167
Despite this large range, none of the child language
measures or the teacher measures correlates significantly
wit'lv- age. This replicates the findinc, - of the earlier
study where the range was almost as large (6.6 to 10.8)
anct where no such relationships were found. It would
therefore appear that although many child variables are
c-:. -ssociated with both teacher and child language measures,
age is not among them.
Teachel rankings
Teacher rankings of the children's speech quality
correlated with hearing loss (p <. Ol) , with average MLT
(p <. 01) j, r-ILT Is af ter teacher 31s, 41s, 51s (p <. 01) and
after another chiid 's move (p <. 001) , but not i,, -fith LELT' s
after 21s. This pattern of correlations between IELT's
and teacher rankings of all f ive types (oral ability,
speech ouality, written ability, attitude and general
ability) remains virtually identical. ELT after 2's con-
sistently show no correlation with the teacher rankings.
Teacher rankings of general ability (intelligence)
correlatec- negatively with the amount of repair the chil-
dren received front the teachers (p <. 05) and with the
'-rom ar, iount of hic, -h controlling moves L. the teacher (p
<. 01) . These two results agree with similar comparisons
using data from the intelligence test, although in these

168
cases the correlation with amount of repair did not
achieve signif icance. So, the less able children, as a
rule, seem to be controlleu and repaired more than the
abler ones. The less able children also receive fewer
continuity moves (p <. 05). Using a measure of mental
age, Wood et al (1982) did not find a correlation with
repair and control. In the present study,, all the
children's U-LT's are significantly correlated with the
teacher rankings of ability (p <. 001) , whereas in the
original study 1. -ILT'S were not found to be correlated with
mental age. The correlations between 'ability' and other
variables found in the present study could result from
the 'subjectivity, of ranking : the language ability of
the child (as shown by I%ILT) might colour how intelligent
the teacher thinks he is. (As mentioned in Chapter 2,,
VandenBerg (1971) found th-Elt teacher rankings of ability
correlated r. iore closely with actual achievement than with
an ob-'ýective measure of intelligence) one might well j
expect the lanquage ability of a child to correlate with
the amount of control or repai r he receiveS. This
clearly needs further investigation before any firm con-
clusions can be drawn.
Sij, -. ilarly,, teacher rankings of written ability
correlate negatively with the proportion of high control-
ling moves the children receive, and positively with the
proportion of such moves that the children themselvess

169
make. Soj according to these rankst the children who can
write well are more likely to take a fairly active and
controlling role in the conversation and are less likely
to receive controlling moves (questions and so on) from
t!. e teacher. There is clearly some overlap or similarity
here with the teacher rankings of general ability. Quig-
ley anc-' Kretschmer (1982) , however, say that "probably
the best sinýje indicator of a deaf person's command of
english is the quality of his/her spontaneously pro6uced
written language" (P. 81). As mentioned above, all
teacher rankings, (including v7ritten ability) correlate
significantly with all MLT's except those after 21s.
Teacher rankings of oral ability and attitude did
not correlate significantly with any variables other than
the ELT' s. Unfortunately this does not enable us to draw
any conclusions since either there are no such relation-
ships or the measures and/or ranks we are using are not
valid.
These teacher rankings, as mentioned in chapter 2,,
are open to criticism on several accounts. However,, the
fCXt that despite this, significant correlations have
been found between some of these rankings and functional
' language is worthy of and 'objective' measures of child
note.

170
S-ummarý4 _Qj xesults
The vast majority of the results from this stu(ýy
replicate those of Wood et al (1982) . The teachers' more
controlling moves are followed by shorter responses from
the children than the less controlling moves. The func-
tions of speech pursued in conversation vary between
teachers whereas the levels of control are more uniform.
Children's responses to different teacher moves follow a
very systematic pattern. Deafer children tend to receive
more repairing moves than those with a less severe hear-
ing impairment.
The age of the children did not seem to be an
irt,. portant variable in determining either their own or
their teacher's language outputr whereas ability, speech
intelligibility and written ability (as determined, by
teacher ranikings) i, ý, ere predictive of the language pro-
duced by both teacher and child. In brief, the less able
children and those whose writing ability was considered
poor, received a higher proportion of repair and high
control rcioves than the more able children. The children
whose speech intelligibility was rated as good had less
hearing impairment and longer MLT's than those with poor
speech intelligibility.
The correlation between overall child ELT and hear-
ing loss did not achieve significance as in wood et al

171
(1982) The less deaf children, however, Oid produce
longer FIT Is after teacher Ps and after moves from
another child than did the children with more pronounced
hearing losses. Both the above-mentioned discrepancies
I betvieen the results of the present study and those of
V-, looct et a! are discussed in terms of the relatively
restricted range of hearing loss of children in the
present study.
7

172
DISCUSSION
In this discussion we shall consider the following
four points:
1. tLe problems involved in the interpretation of
correlational data,
2. the role of questions and repair in conversation,
3. possible discontinuities in the effects of teacher
style on children's language,
4. the applications of this research.
The fact that two variables are highly correlated
coes not necessarily imply that there is any causal
connection between them. , E: m. ven if we suspect there is a
causal connection, the direction of the relationship is
not always clear. Furthermoref a correlation between two
variables may be Imediated' by yet another (perhaps)
unaccounted-for variable. The degree of teacher control
is negatively correlated with the length of the MLT's
that the child has produced during that conversation (p
<. 0 01) . This relationship is obviously a fairly strong
one. Does it mean that a large proportion of controlling
moves reduces the MLT's of children? Alternatively, does
it mean that children who produce short MLT's 'stimulate'
their teachers to ask them more questions? If Sor
why? Furthermore, since we are looking at so many

173
correlations in this section, it is possible that some
will be a result of chance. These few points give some
idea of the difficulty involved in interpreting correla-
tions. Ideally, such correlational data should be used
as & basis for the design and execution of intervention
studies. An attempt has been made to try to establish if
the teaching styles C. Aescribed in this study are causally
related to child IMT (Leesj, 1981) - This is described
below. Several other studies provide evidence to suggest
that where such correlations exist, the causal relation-
ship tends to be from teaching to learning (eg. Robinson
and Robinson, 1981, T. Tright and Nuthall,, 1970) 0
It is still a possibilitý that, despite all the
attempts we have made to determine that it is not the
child who is determining the teacher's conversation style
and its ensuing responses, and there remains some child
variable which is responsible. in other words, that the
direction of cause is from child to teacher. In order to
resolve this problem, a teacher might, for example, adopt
different strategies with the same children on different
occasions. If these strategies are found to have similar
effects on the children's responses to those previously
reported,, then we could reliably conclude that it is
teachinc, style per se that is producing these patterns of
child response. Lees (1981) ,a teacher of the deaf ,
investigated this problem with her own class of 5 deaf

174
children. She con6ucted several conversation sessions
with these children. Firstly she recorded a 'normal'
conversation session, then over a period ok a few weeks
recorded three other sessions xv., ith
1. a high proportion of questions.
2. a high proportion of phatics.
3. a high proportion of personal contributions.
This was followed. by a return to a normal conversation
style a ga in. Inalysis of the transcripts tC---ken from
these taEes suggested that it was not factors within the
children that were determining teacher stvle,, but that
systematic chanc ýes in her style of conversation produced
predictable changes in the responses obtained from the
children. The educational significance of this finding
is clear: it is not the child's linguistic abilities
alone Which determidne how he performs in these conversa-
tion sessions, but how his teacher conducts them.
We have often found that teachers are surprised when
they see themselves on videotape. The usual feeling is
that they find themselves to be much more 'controlling'
than they would like. Lees (1981) describes this.
q,,. erin. ent,, the author would have stated "Prior to the e).
that her "new-c" sessions involved informal conversations,
with the children chatting freely about events frora home
of interest to themselves. She believed that a genuine

175
exchange of inf or'Mation was involved and that conversa-
tions were not restricted to the here-and-now or shared
ex-periences. Results show, howeveri, that the author was
mistaken, for what she intended to happen and believed to
occur,, was not takinc ; place. Even before the initial
experimental tapes were made it had been realised that,
with a home-school book open between the teacher and
conversations were in danger of being limited to
the here-and-now as illustrations were discussect. In
addition, the initial tapes indicated that the teacher
did not allow the children to chat freely about events at
home but cýuickly forced them into a quest i on-answe ring
role. " (P. 278-9) .
This teacher felt thr-,. t it was the personal contribution
session that produced the most 'superior' language from
her children. As is usual, these teacher moves produced
lona DILT's but they also seemed to prompt questions or a
series of questions from the children. Althou,;, h the use
of many phatics (session 2) also produce6 long DILT's, the
teacher felt that she was more able to successfully
direct the conversations using personal contributions and
that the conversations were generally more interesting.
She also reported that when she tried to go back to her
original style of conversation the children seemed 0
resist this return to a 'passive' role.

176
No long-term intervention prograxime has been carrie6
out. This would enable one to see whether the long-term
use of, for example, personal contributions does lead to
more 'forthcoming' styles (Leesr 1981) from the children
compared with a group of comparable children exposed to
very controlled styles of teaching over a long period.
Such a study would also enable us to decide how teacher
style affects the development of a child's syntactic
ability (a point we shall return to towards the end of
this discussion). This sort of research may be undesir-
able from an ethical point of view, and might be con-
strued as a somewhat oversimplif iecý approach to what the
teachers are tryinc , to do in these sessions. We are not
claiming that cuestions themselves are unciesirable.
ExC. ctly what a teacher wants to accomplish and how she
does it are determined by her. There may well be situa-
tions in which questioning would achieve the desired
effect. They are often needed to set up a conversation
or to pursue a point of interest anG sometimes, no doubt,
to sound interested! It does seem likely, however, that
the overuse of questions has effects which are probabl,,,,
not among the goals of most teachers, such as encouraging
a passive and undemanding role from the child. In time,
these effects could lead to ra further limitation on the
child' s linguistic experience, only increasing what
Howarth and 157, ood, described as the "cycle of isolation"

177
(1977) . This point may well be worth considering in more
detail in view of the fact that the sincle larcýest group
of teacher moves in the conversation sessions studied so
far is that of questions. In the present study,, 43% of
all teacher rioves were cjuestions anCI in the earlier study
I (IXTood' et al.. 1982) the f igure was 01: 8%. Observation of
conversations where the teacher is deliberately very low
in control (Lees, 1981 , Wood and Wood, in press) reveal
that althourýh the chilC-ren became much more talkativer
the conversation tended to meander and lack coherence.
I'Then this starts to happen in a normal conversation, it
would seem sensible to ask a question (for e-x: ample) in
order to direct the childrens' attention to a common
topic. Wood and Wood (in press) conclude that what
constitutes "good teaching" is a level of control that
continually takes into account the child's success or
failure and adjusts accordingly.
Pis a function of teacher speech, repair tends to be
divided equally among enforced repetition, two choice
questions and open questions (1 1 s, 21s and 31 s) . Thus ,
the high controlling teachers (ie. those who use a high
proportion of questions) are, inevitably,, also those who
use a high proportion of repair. There has been much
discussion of 'repair' as a tactic. There is some doubt
as to its ef f icacy as an aid to lanquage development. .1
Howeverr Robinson and Robinson (1981) report that those

178
preschool children whose mothers used a strategy such as
saying "I don't know what you mean" when atterapting to
clear up iiii,, -, understandings,, had a irtore advanced under-
standinq of communication failure at the age of 6 than
those children whcse mothers simply asked questions in
such situations. I! e F-; re not aware of any compelling
evidence to sucjgest that repair (in the form of enforced
repe 1 ion or imitation) is a useful technique for pro-
niotinc speech (as opposer-i to language) development. Yet
it can be seen in table 5.1 that, on average, 18% of all
teacher moves are re,, --ýC-A ring. The type of repair moves
used varies between teachers. Only 3 teachers use "I
don't know what you mean" type mov es. The sar,, -., e three
teachers were also those who never used enforced repeti-
tion. Some of all the teachers repairing moves were
questions. The proportion of repair moves also varies
considerably between teachers, with a ra. nc,, e ei-Itending
f rorm only 8% to as r, -, uch as 26%. Combining the present
results with data From the earlier study (Wood' et al.
' to 68% 1S82) reveals a range of repair extending from 8%
of all teacher moves. There is clearly r-ý-, uch scope here
for teachers to vary in the amount of repair they use in
their conversations with deaf children. If the f inding
(1,, Iood et al, 1982) that the deafer children receive the
most repair is true, then they are doubly handicapped.
Not only do they have more difficulty hearing what is

179
being said, but they also receive a larger proportion of
high control teacher moves which are known to stimulate
short responses. They also tend to show less initiative,
but we are unable to say whether this means that the
teachers' repair moves depress the child's initiative, or
whether these children participate miniT, %c-ally anyway,,
perhaps because they are not so verbally able.
The classical view that chil6ren learn language
through imitation (and therefore that repair has a useful
tunction) is no longer widely held. It is now thought
L. hat that 4- children actively work out the rules of
lanc. 1-uage from their experience of it and then apply the
rules which they think are appropriate to nev situations.
"Language acquisition is more CE maIL-ter of maturation of
the child's own internal grammar than one of imitation"
(Crystal, 1976, p. 35) . The observation that children
often use "I goed" instead of "I went" and "mouses"
instead of "mice" suggests that they are over-
generalising the "rules" they have formulated. "Far from
be. ing an error, to be criticisedr the Lýroduction of such
forms is one of the most important stages in normal
language development: it shows th(--t the child is adopting
an intelligent, deductive, creative role towards his
language. And it suggestsr along with the other evi-
dence , that an explanation for the facts of language
cevelopment must lie elsewhere than under the heading of

180
iraitC-tion" (CrystcLlr 1976, p. 35) .
It is likely that deaf children too, h&ve a 'gram-
mar' of their ownr albeit one that is not the same Cas
that of hearinc, children. Analysis of the mistakes that
Leaf children character i sti cally make shows that they too
may be usinq rule systen, s (Wood, in 1-., repara-tion)
shall discuss these hypothesised rules in more detail in
,L Cha,,, -L-er 9. Such rules,, however, only account for most of
the language the deaf child encounters. It is on thoSe
occasions when the rules fail that we observe the typical
errors of the de-;: -f child ( 'deaf isms' ). Perhaps the only
way to ensure that the exceptions to these rules are
incorporated into the child's language system is to
expose hir,, 11 to plenty of normal language. For these
purposes, the conversation session could be a useful
vehicle, although we really need to know more about the
type of situGation in which language learning most readily
takes place. We shall return to discuss these 'rules' in
Chapter ý.
The inevitable question that arises in studies such
as these is what are teachers trying to achieve in their
conversation sessions? Are they trying to foster commiun- 1.
ication and social skil-l,.. or are theýý concentrating on
', Fn. rruj1ge and, sT. -ýeech? These two goals may v, eil
The teacher's stated ai,,,,,, in b. difficul to disentangle. t

181
a reading lesýý-son, for might be to teach the
child to reaC. However, the study of' rea(]ing lessons J-
described in the previous chapter (Howarth et al,, 1981)
strongly suggests that teachers of deaf chilc--reri have
many aims other that this wi,, en ostensibly engaged in a
reading lesson. Language and speech development are two
such examples. Teachers of hearing children seem to be
more concerned that their children spend time actualiý,,?
decoding the printed worC. If in fp-ct,, teachers of 1--he
deaf also consider their conversation sessions as a vehi-
cle for the teachina of language then we catinot really
expect the pattern of riove-, ý to resemble a normal conver-
sation. A point that may be relevant here, is that a
teacher usually holds tinese conversations with about 6
children. This will deposit 'control' very much in her
hands. 1,, Then talking on a one-to-one basis with a chilar
discipline is rarely a problem. However, the presence of
several children will change the tone of the conversation
away from the 'normal' towards the more controlling one,
br inc, ing about the I clamming up' that characterises
children's responses in such situations. The ideal
conversation would be one in which the teacher strikes a
balance between her control and the participation of the
children. In the hands of an unskilled conversational-
ist, these two goals could well be mutually exclusive.
-hat children of Cifferent ages (or, it is possible It

182
more precisely in the case of deaf children, of cifferent
linguistic abilities) react differently to teacher styles
if conversation. In other words, just as there are
normally discontinuities in children's development in
other areas (Clarke and Clarl, ' -e 1976) there are also
discontinuities in their reactions to language input.
Two further studies of conversations have been carried
out v., ith 3-4 year ol6i hearimýj children (Wood and wood, in
press) and a group of deaf children of the same age (Wood
and v7ood, in preparation) which may shed some light on
this matter. These studies suggest that teacher control
does have sliqhtly different effects at this age, partic-
ularly with the young deaf group, for v,, hom questions
elicit responses which are as long,, if not longer,, than
personal contributions. While the pattern for the young
nearing children looks similar to that reportec-A before
Ue. personal contributions producing longer MLT's thr-;,., n
questions) it is inter est that the pattern of
responses of the two children who come from non-english
speaking ho, -. ies showed similarities to the that of the
young deaf group. Perhaps one micýht tentatively suggest
that children need to reach a certain level of linguistic
competence before they are able to take advantage of the
initiative offered to them by the teacher's less control-
ling iuoves.
Until then, they might need the guidance

183
that questioning provides if they are to make the most of
their abilities. Another possible discontinuity in the
behaviour of children in their reactions to teacher style
may have been touched upon, as mentioned in the introduc-
tion to this chapter, by the studies on shared knowledge
(11, . ooc, and Cooper, 1980, Murphy, in preparation) . Chil-
6ren may begin to realise (at a certain zýge) that if an
adult asks a cýýuestion to which she obviously knows the
answer, this is not a legitimate conversational move and
children are therefore less willing to converse on that
subject.
In conclusion, it sceems that we can place a fair
ari,, ount of conf i6'ence in the reliability of - the effects
that teacher conversation style have on how the children
respond. Having established this, we can go on to say
that the method of studying the language of deaf children
used in the present study is a useful one for two main
reasons.
Firstly,, sorne of the measures produced by this
method appear to give a reliable indication of the
1,7
child's linguistic ability. e will not know this for
certain until we have completed the analysis of how the
under these circumstances relate , -; LriL" s produced to syn-
tactic complexity. It would seem likely that MLT's after
teacher 3's an(II 4's will be the most useful measures. As

184
we shall go on to discuss ir, Chapter 8.. these two meas-
ures of conversation 'behaviour' correlate fairly impres-
sively with the other measures of linguistic ability that
we obtained. This in itself is a good indication that
not only do children have some sort of overall linguistic
ability (a point we shall return to in Chapters 8 and 9)
but also that the measures themselves are reliable and
va 1. One might expect that responses to teacher 3's
will be syntactically different to those following
teacher 4's because when answering a question it is quite
valid to omit words which would otherwise obscure the
meaning. After a teacher 4, the child has to set up his
own utterance without the structure that a question f rom
the teacher would give him. However, (as we shall go on
to discuss in Chapters 8 and 9) since MLT's after teacher
3's correlate significantly performance on the read-
ing test in particulart, it is possible that of all the
conversation measures, FLT's after teacher 3's may be the
most useful for assessment purposes. Whatever the case,
it looks as though this technique could be useful to
p OV4 r ide a set of measures of the language ability of a
child. Such measures might be useu when evaluating, for
example, the linguistic development of chilOren in a
chaný: e of educational environr,, ient or during an interven-
tion StUdy.
Seconcly, this method of -ctudying deaf chilC-, Iren's

185
language is clearly of potential use to the teacher who
would like to know how what she actually doeo corresponds
to what she woulG like to be doing. She can then change
her conversation style accor(-. 'ing to her own ideas of how
she wants her sessions to run and i,,, hat she hopes to
achieve in them. If certain teacher moves are reliably
followed by utterances from the children that are both
longer (as confirmed in this study) and syntactically
more complex (as future studies may reveal) this will be
useful for the teachers to know. It might also be
interesting for herr occasionally, to monitor her conver-
sation style over the years to see how and if it changes
and whether certain styles are more productive with cer-
tain types of children. This technique is beinS used at
Lady Spencer Churchill College in 0-ý;: ford for teacher
training. Student teachers of the beaf make a videotape
of themselves early on in their first teaching practice.
They are then taught the coding systems and use the
resulL. S in discussion and tape themselves later on in I
their course. It appears that the technique is a very
useful one as a 'focus' on conversation.
We are assuming in all these discussions that teach-
ers, mothers, preschool playgroup helpers or any other
aciult C. 11 play the same (or a similar) role in the
development of a child's language. The same assumption
applies in our interpretation of Brown's answer to the

186
hypothetical question "how can a concerned mother facili-
tate her child's learning of language? " he says (1577,
p. 26) j, "Believe that your child can un6erstand more than
he or she cr--kn say, anCi seek, above all, to communicate.
To uncerstan& and be understood. To keep your minds fi
Xed on the same target. In doing that, you willf
without thinking about it make 100 or maybe 1000 altera-
tions in your speech and action. Do not try to practice
them as suc1h. There is no set of rules of how to talk to
a child that can even approach what you subconsciously
know. If you concentrate on communicatinc everything 'i
- follow. " else wil L For teachers (and mothers) of the
deaf, the case might not be quite so simple. Our studies
have shown that adults appear to be introducing f ine
I. adjustments to the normal structure of discourse that, in
large 1--roportions,, are not necessarily encourac., -incj the .1
full participation of deaf children. Of course,, we are
also assuming in these discussions that full participa-
tion of the children is a key factor in the development
of their language. This assumption is not based on
educational research, but on the wishes of teachers. TP he
. L-%- teachers, who appear to facilitate their children's r,,, -rti-
cipation are also those who will sometimes pass over a
misunderstanding, thus avoiding repair,, high control and
the inevitable breakdown of the flow of conversation.
Perhaps it is not necessarily true that with deaf chil-

187
dren "i you concentrate on communicating, everythinc.,
else will tollow".
Finally, this type of study of language use shows up
what enormous skill and sensitivity is nee6ed IL-o hold a
successful conversation witL deaf children. To deal with
a completely incomprehensible utterance from a child and
yet to maintain a non-repairing and egalitarian framework
Lor a conversation is no mean feat. The impression one -1:
receives is that some teachers do achieve this ballance
between gui6ing the conversation and ensuring that the
children participate to the maximum. There are bound to
be such teachers wI-, o are 'natural' conversationalists.
This type of study woulC, be reassuring for them and
potentially useful for those of us who do not bring such
skill effortlessly to our conversations with children.

188
CHAPTER SIX
CHILD-CHILD COMMUNICATION

189
CHAPTER ZIX : CONTENTS
Il, ý
ITRRODUCT-1014 190
METHOD 199
Subjects 199
Procedure 200
Transcription 202
RESULTS 204
Examples of the children's descriptions 204
Pictures to solution 208
Syntactic accuracy 210
Reliability of syntactic accuracy analysis 216
School differences 216
Correlations with other child variables 217
DISCUSSION 217

190
CHAPTER ZIX
CHILD-CHILD COLIMURICATION
The 'pragmatics' of language, such as the context in
which it takes place, have not generally received as much
attention as the structure of language itself. In the
last decade, however, the literature on the language of
hearing children shows that far more attention is now
being paid to these functional aspects (eg. Ca-. 7den,
1970). The same cannot be said of studies of the deaf;
there are very few that consider the functional effec-
tiveness of the language of deaf people. Rather,
research has concentrated on structural abnormalities.
, ceptions to this are studies by Hoemann (1972) and Two ex
Schlesinger (1971) but in both, the mode of communication
was sign.
There is now evidence to show that the language that
hearing children use varies considerably as a function of
such factors as interlocutor,, task and content. If the
same holds true for deaf children, then a study such as

191
this should incorporate a situation other than the
teacher-child conversation described in the previous
chapter in order to investigate how their language varies
and how it relates to other areas of language use. So we
needed to obtain a corpus of language from each child,
not only in conversation with his teacher,, but also in
conversation with, for example, his peers. Casual obser-
va ion suggests that the conversations that take place
between deaf children in the playground or in other
informal situE! tions are very lively and extended. The
problem arises when we, as hearing adultsf try to under-
stand thei r communications. This presents particular
difficulties for researchers in their desire to establish
both the nature and efficacy of these communications as
well exactly how they differ from the somewhat more
'faltering' conversations sometimes held with their
teachers. If it were to be established, for example,
that these communications with their peers were more
linguistically sophisticated than communications with
teachers, then more use could be made of these peer
interactions as an educational technique. At present,
most of the formal education taking place in the class-
room is in the teacher-to-child direction. On the other
hand, if such communications only encourage the develop-
ri-Lent of esoteric (restricted to that particular class or
school) r linguistically limited or context-dependent

192
forms of communication then they may be of less value to
the deaf child in his attempts to integrate into a
hearing world. This is, of course, presunting that the
aim of an "oral" school for the deaf is that these
children should integrate into a hearing world.
It has been supposed by many that comr. -ýunications
between deaf individuals tend to be context-dependent.
As mentioned above, it is difficult to establish this
objectively because the researcher faces the problem of
'translation'. One technique which has been used in an
attempt to overcome this problem is the referential com-
munication task. Such a task usually requires one indi-
vidual to describe an object or event from a given set of
alternatives in such a way that a second individual cari
identify it from his ovin identical set of alternatives.
The advantage of this technique is that the researcher is
aware of the referents. This simplifies the procedure of
understanding the communications a great deal. However,
care must be taken in the interpretation of data obtained
from this type of study because the communications may be
task-specific and have little relevance in other situa-
tions. Using such a technique alone to assess an
individual's linguistic competencer for example, would be
a hazardous business. Used in an investigative or com-
parative manner, howeverr the referential communication
task can be useful.

193
Using this techniquer both Schlesinger (1971) and
Hoemann (1972) found that deaf adults and deaf chilc'. ren
were not as successful as hearing controls. Schlesinger
attributed this failure to the limitations of sign
language. Hoemann, on the other hand, concluded that his
8 year-old signing children were linguistically capable
of dealing with the task but that they did not know how
to communicate effectively.
This problem, however, is not exclusive to the deaf.
Recent work by the Robinsons has shed light on similar
difficulties experienced by young hearing children. They
have found, using referential communication tasks, th<-:;. t
as a rule, 5 year-olds are not very successful at giving
informative communications. Furthermore, they do not
take into account all possible 'objects' in the set when
trying to describe only one of them. In other words,
that these children do not effectively eliminate all the
'wrong' objects in their description and therefore tend
to give ambiguous messages. It seems that children fall
into two groups according to whom they blame when a
message is unsuccessful (Robinson and Robinson, 1982).
Some think the listener is at fault and that perhaps if
he tries harder he would succeed (listener-blamers)
whereas others realise that the message itself is ambigu-
ous (speaker-blamers). Interestingly, those children who
realise that messages may be ambiguous are also those who
194
give more informative communications. This ties in well
with Hoemann's suspicion that his children's failure to
succeed in a referential communication task was not (5ue
to limitations in their language but rEther to their
failure to understand the demands of communication, and,
as the Robinsons' study would suggest, their failure to
realise that messages can be ambiguous. Special caution
is therefore necessary to interpret the efficacy of the
deaf in such tasks. It seems that the difficulty that
children have in realising that messages can be ambiguous
is not specific to verbal communication. From the
results of a study using ambiguous visual messages,
Robinson and Robinson (in press) conclude that
"children's failure to realise that verbal messages are
ambiguous is but one aspect of a more general failure to
realise when one has insufficient information at one's
disposal to guarantee a correct interpretation of what
the world is like".
Since deaf children have such a limited experience
of linguistic and social interactions in comparison with
their hearing peers, one might well expect them to show a
delay in mastering those skills which require an aware-
ness of and adaptation to the linguistic abilities of
others. Schatz and Gelman (1973) have shown that 4
year-old hearing children are able to simplify their
speech when talking to 2 year-olds but we are unaware of

195
comparable study with deaf children. There is some
evidence (eg. Furth, 1966) that deaf children are delayed
in the acquisition of de-centred thinking and one might
therefore expect them to perform less successfully than
hearing children of the same age in referential comrauni-
cation tasks.
In their investigation of the communication skills
of deaf and hearing children Breslaw, Criffiths, v, 7ood and
Howarth (1981) used two referential communication tasks:
one made very limited linguistic demands while the second
was potentially more complex. In the first part of the
study,, with children of an average age of 9,, a set of
blocks with three dimensions (shape, size and colour) was
used. One child, out of sight of his partner,, chose a
block and placed it on a board upon which were drawn
representations of the same set of blocks. He then
instructed his partner to do the same. Predictably, the
language that emerged during this task was very limited
but the performance measures were interesting. Deaf and
hearing children performed equally well in terms of how
often the correct block was chosen at the first attempt.
However, if one looked at the amount of information
contained in the messagesr an unexpected finding emerged.
Hearing children gave sufficient information for their
partners to identify the correct solution in 39% of their
initial utterances, whereas for the deaf this figure was

196
62%. So, the deaf children gave all the necessary infor-
mation at once much more frequently than their hearing
peers (p<. 05). It could be argued that this is a sophis-
ticated technique developed by deaf children to avoid the
problems that would be caused by an 'attention split'
between communicating and carrying out a task. Hearing
children could, of course, begin an activitY while still
listening to instructions or advice. This is an option
not normally available to deaf children. There is other
evidence that the (adult) deaf may be sensitive to the
particular communication needs of another deaf indivi-
dual. Deaf mothers pace their actions and communicationS
to fit their deaf child's patterns of attention much more
effectively than do hearing mothers of deaf children
(Mogford, Gregory, Hartley and Bishop, 1980).
Given all the information in the initial utterance,
deaf and hearing children were equally likely to go on to
choose the correct solution on their first attempt.
Furthermore, it Cid not seem that the deaf children's use
of language was more egocentric or context-dependent than
that of the hearing children. The results from this
study therefore suggest that "where deaf children possess
an adequate and familiar vocabulary to fulfil a task,,
there is no evidence of a communicative handicap not also
shared by hearing children of similar age" (Breslaw et
al,, 1981 j, p. 27 4) . Whilst this study using blocks

197
elicited behaviour that was easily measured,, it by no
means encouraged natural and spontaneous language from
the children. Indeed, one teacher commented, "You're
deafening my children! " By this she meant that we were
forcing them to communicate in artificial situations
about a subject that they were not interested in and that
the resulting language reflected this.
The second part of the study aimed to elicit more
natural language from children (of an average age of 10) r
by asking one child to describe a picture from a book
such that his partner might f ind it in his (identical)
book. The videotapes of the 82 deaf and hearing children
who participated were then transcribed and analysed.
There are many questions that one could ask about such
data. Is the information given semantically appropriate?
How easily does the information allow the listener to
find the correct picture? What 6oes the speaker do if
his partner offers an incorrect picture? Does he do
nothing,, does he repeat his original utteranceF does he
offer a modified utterance or does he offer new informa-
tion? Are some pictures more 'difficult' to describe or
locate than others? What are the syntactic characteris-
tics of the children's speech? Do some children describe
pictures differently (eg. egocentrically, analytically
and so forth) from others? If so,, do these differences
bear any relationship with IQ, hearing loss, age or

19 ul
school background?
these questions.
Breslaw et al only looked at some of
As far as the content of the descriptions is con-
cerned, there were differences between the deaf and the
hearing. The deaf children were more likely to include
'actions' in their descriptions than were the hearing.
However, on other measures the children from one of the 3
schools for the deaf were found to be performing at a.
very similar level to the hearing children, and signifi-
cantly better than the children from the other two
schools for the deaf. The measures used here were
firstly, how many (wrong) pictures were shown before the
correct one and secondly, how many major features were
included in the descriptions. So, in whatever skill it
was that the task (and these two measures) were tapping,
children from one school for the deaf were relatively
advanced. All four groups of children had similar aver-
age ages and IQ's and all deaf groups had a similar
average hearing loss. Conrad (1979) argues that most
differences in the linguistic skills of deaf children can
be accounted for by hearing loss and intelligence. He
argues that school background is not a significant fac-
tor. one might interpret Conrad's position as meaning
that whatever goes on in the classroom is irrelevant to
the child's linguistic development. This is a theory
that rr, -ost teachers) would f ind hard to accept. Tle now

199
know of several aspects of conversational technique that
reliably affect the type and length of responses from
children. It is not an unreasonable step to hypothesise
the existence of a relationship between large-scale
exposure to 'successful' (in terms of what the teachers
are trying to achieve) teaching techniques and language
development. Howeverr establishing exactly which teach-
ing skills contribute to the development of which
linguistic skills is a very difficult business.
Since the second referential communication task used
by Breslaw et al (1981) was found to be sensitive to
school differences, we decided to incorporate it into the
present study (with one or two modifications to the
design and several to the analysis) in the hope that it
would also be sensitive to individual differences in
children and would perhaps correlate with other measures
of language use.
METHOD
Subiects
All 50 children took part in this section of the
study. However, 4 were eliminated from the final
analysis because they did not understand the rules of

200
the game. These children included two who were evidently
of very low intelligence and one with an additional
handicap. The other child was one the youngest children
in the group. By definition,, if a child did not under-
stand the rules of the game, he was not able to perform
in such a way that yielded data comparable to those
children who did understand the rules. Unfortunately
this meant that these children's partners also had to be
excluded. This left 21 pairs of children (42) who suc-
cessfully understood and completed the game.
P-rocedure
The children were taken to a quiet room or area
where they could play the game relatively undisturbed. A
portable video-recorder and a camera with a wide angle
lens were set up so as to get both children clearly in
view from the side. Children were paired off by the
teacher in a way that she thought would best suit the
demands of the task. Children sat opposite each otherr
at either side of a small table with a low barrier across
the middle that prevented them from seeing each other's
book. Each child had a copy of the identical book (a
common English reading primer) that had a few lines of
text and a large coloured picture on each page. The game
required one child (the sender) to describe a given
picture in his book such that his partner (the receiver)

201
could find it in his copy. Once the receiver thought he
had found the correct picture,, he had to show it to the
sender for confirmation and carry on until he succeeded.
The children then alternated roles until the game was
completed. In this study, we decided to use the same set
of Pictures presented in the same orderr for each pair.
The former study (Breslaw et al, 1981) presented the
pictures as drawn randomly from the book by the experi-
menter. However, this strategy might have allowed some
children to come across more 'difficult' pictures than
others. It was evident from the earlier study that some
picturesr particularly those where an easily defined
action was taking place, guaranteed a 'first ti me
correct' far more frequently than other pictures. In the
present study pictures were chosen such that each member
of a pair would have to describe pictures of similar
difficulty. In 8 out of the possible 10 pictures, there
was no other picture in the book with which they would be
easily confused. Each member of a pair, however, was
certain to have to describe one picture that was chosen
as easily confused with another in the book; for certain
success, these two pictures need very careful descrip-
tion. The accompanying text was covered up while the
children described the pictures. It was thought that it
might be interesting to see if and how the children would
offer information to help correct a choice of picture

202
which was 'nearly' right. Once the rules of the game had
been established (using practice examples) the children
went on to describe 5 pictures each. This was recorded.
Other than the 4 children described abover most children
caught on immediately and proceeded to enjoy themselves.
Indeed, on many occasions, once the statutory 10 pictures
(5 each) had been described, more were demanded.
It was sometimes difficult for the experimenter to
decide when to help (or interfere) in the event of
mi sunde rslt and ings. Sometimes, if an attempt to find a
picture had gone on for a long time and if the child was
showing signs of frustration,, it v., as deemed necessary to
offer help or encouragement. This usually took the form
of asking the sender of the message to repeat it or to
offer more information. Alternatively, the receiver was
helped to remember crucial clues about the picture he was
looking for or it was pointed out to him why the pictures
he had been offering were wrong.
however, was rare.
Transcrirition
Such interference,
The videotapes were subsequently transcribed, noting
every word, gesture and recognizable sign. On the occa-
sions where it was impossible to establish exactlY what
was being said, a similar procedure to that used in the

203
teacher- child conversation tapes was used. If. for
example, we thought that the child had said 4 words, this
was noted by 4 blank lines (-- -- -- --) . If we thought
that a worC had two syllables, this was noted by joining
two lines together (--u--) . As mentioned in the chapter
about conversations between teachers and their children,
transcribing the utterances of deaf children is not easY.
Par icu ar difficulties include deciding ý7hether some of
the less obvious inflections are present or not (go/goes,
tree/trees, look/looked and so forth) . If uncertainr we
did not give the children the benefit of the doubt. This
procedure,, of course, is open to the criticism of bias
against the child whose speech intelligibility is poor.
However, knowing what the children were talking about
made transcription in this section of the study easier
than that in the teacher-child conversation section. So
as to facilitate later analysis, spoken communications
were noted in a different colour from nonverbal communi-
cations. For the present purposes (changes in colour
being unavailable to the typist) examples of signed or
gestured communications will be denoted in (square brack-
ets] . If a spoken word is supp rted or accompanied by a
sign or gesture as opposed to being replaced by such
nonverbal communication (as above) this is noted by a [G]
in square brackets after the relevant word.

204
Examples _Qj childrenla descriptions
The following 9 examples are all attempts by dif-
ferent children to describe the same picture. As men-
tioned above, words in square brackets are signed or
gestured. The picture shows a pirate with long lair hair
climbing up a rope step ladder on the side of a sailing
ship. He is wearing dark blue trousers, a pale blue
shirt and black boots and is carrying a bag over his
right shoulder.
The boy were climbing boat [up and over], climbing.
2. The man, [bag] on shoulder [walk] look [G] the boat [G] climb [G]. The boat IGI man (holding something over shoulder].
3. The man, the man carry the bag (over shoulder] and climb the ship.
4. The woman IGI climb [G] boat.
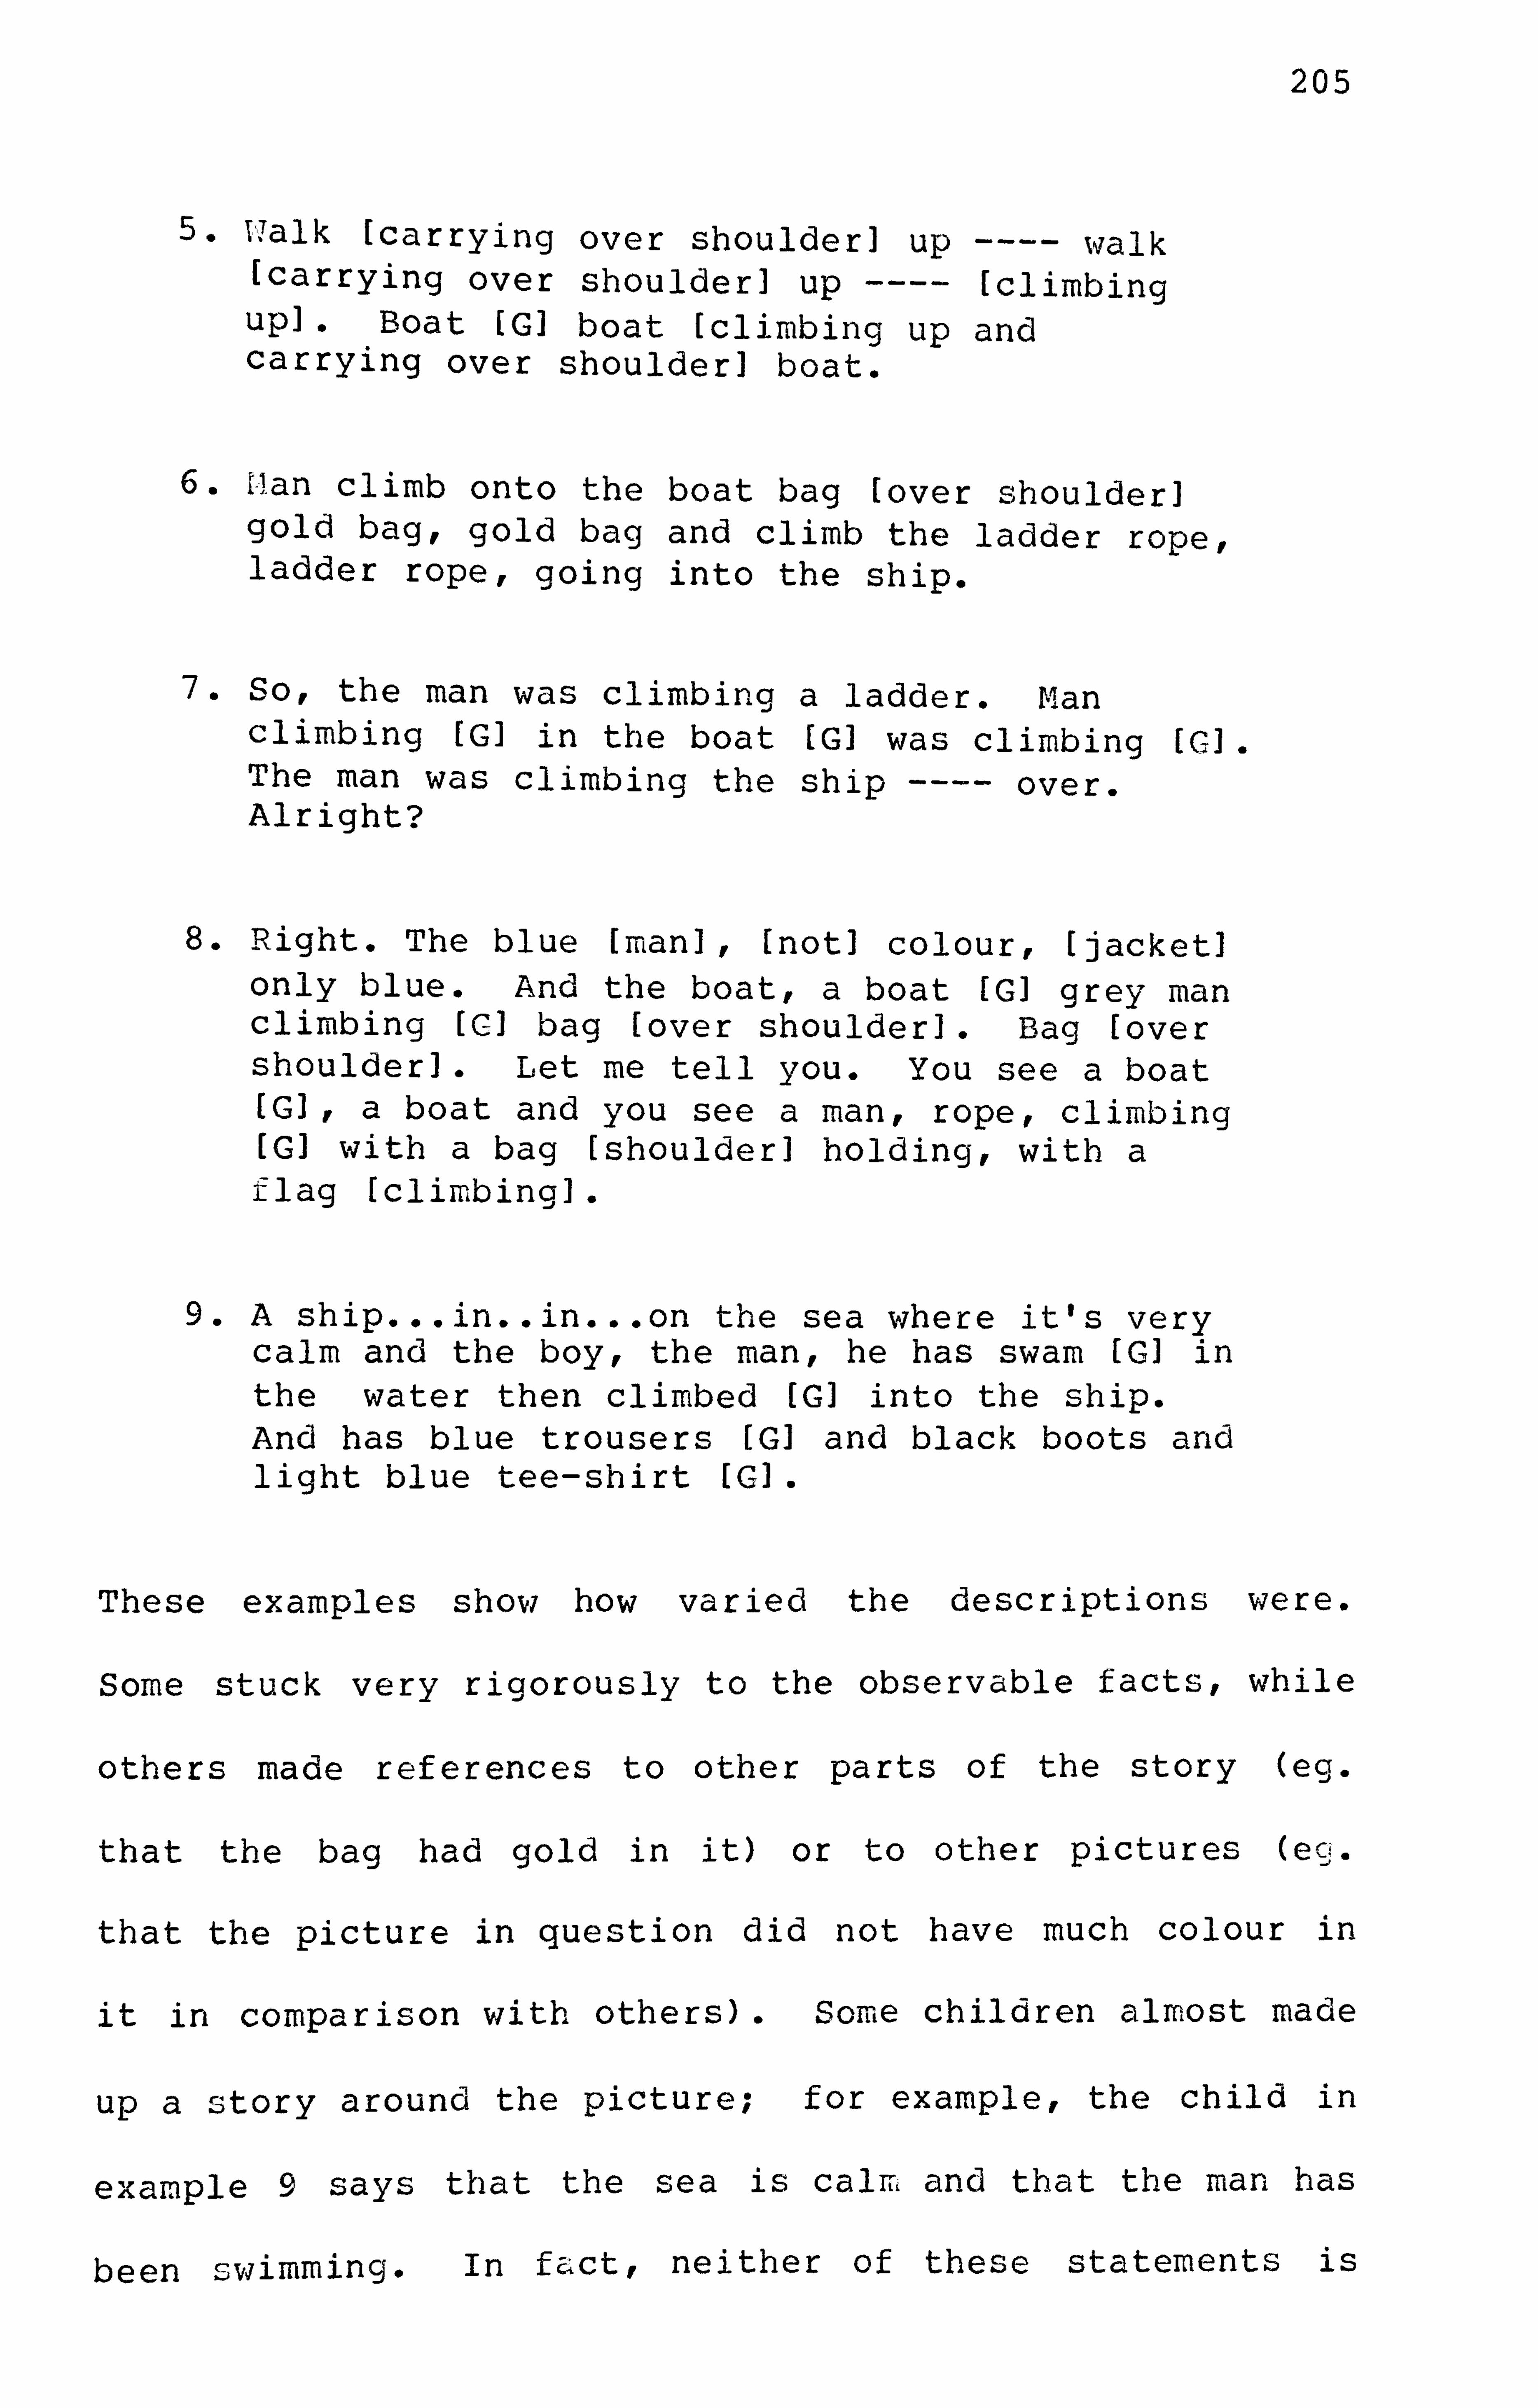
205
5.1,7alk [carrying over shoulder] up ---- walk [carrying over shoulder] up ---- [climbing up]. Boat IGI boat (climbing up and carrying over shoulder] boat.
6. Nan climb onto the boat bag [over shoulder] gold bag, gold bag and climb the ladder rope, ladder rope, going into the ship.
7. Sor the man was climbing a ladder. Man climbing [G] in the boat IGI was climbing (C]. The man was climbing the ship ---- over. Alright?
8. Right. The blue [man], [not] colour, [jacket] only blue. And the boatt a boat IGI grey man climbing ICI bag [over shoulder]. Bag [over shoulder]. Let me tell you. You see a boat (G], a boat and you see a man, rope, climbing [G] with a bag [shoulder] holding, with a flag [climbing] .
9. A ship... in.. in... on the sea where it's very calm and the boy, the man, he has swam IGI in the water then climbed [G] into the ship. And has blue trousers IGI and black boots and light blue tee-shirt [G].
These examples show how varied the descriptions were.
Some stuck very rigorously to the observable facts, while
others made references to other parts of the story (eg.
that the bag had gold in it) or to other pictures (eg.
that the picture in question did not have much colour in
it in comparison with others). Some children almost made
up a story around the picture; for example, the child in
example 9 says that the sea is calm and that the man has
been swimming. In fact, neither of these statements is

206
supported by the picturef nor are we told such things in
the accompanying text. The child in example 4 (obviously
unfamiliar with pirates or hippies) presumes that the man
with long hair is a woman.
Looking at the occasions when wrong pictures were
offered, it was not evident that the children made any
attempt to provide any additional information. It would
appear that these children were still at the 'listener-
blamer' stage, although we have no objective measure of
this. It was unusual for the children even to volunteer
a repeat of their original utterance, let alone new
information.
It was apparent from the number of failures to
correctly identify the correct picture on the first
attempt, that some pictures were more 'difficult' to
describe or to locate than others. These were usually
those pictures where the 'action' was limited. A picture
of a very small ship, barely identifiable in front of a
sunset was found much more difficult than a picture of a
very hot pirate wiping his forehead with a handkerchief.
In the former casel, only 8 from a possible 21 children
offered the correct choice on their first attempty
whereas in the latter, 19 children achieved a 'first time
correct'.
One of tile f irst striking characteristics of the

207
children's attempts at corai. -tunication was the ingenuity
used where standarc. words were unimown. The best e-l! -ar. -;. i-; le
of this comes from the original study; a child described
a map as a "where-you-live". However, not all such
attempts were verbal. Many children used nonverbal com-
munication where words failed theLi. One also suspected
that some children used nonverbal strategies, not because
words failed them, but because they simply preferred to.
Far more saigning and gesturing was evident in the commun-
ications of the children during the game than %ýýas eviCent
in their conversations with their teacher, --. It seemed
(although we have no objective measure of this) that for
most of the children 'receiving' the deScriptions,, the
sen(ý, ers I signing and gesturing was more helpful than
speaking. In one case, imitating the position of the man
in the picture provided sufficient informa'Cion to enable
the receiver to f ind, the picture immediately. It has
become apparent that we need to develop methods of coding
and analysing not only the nonverbal elements of such
communications, but r-also the way they are ussec. in con-
junction with speech. However, for the present we are
confining ourselves to the study of oral corra-,, unication.
Interestingly, these signeo' mesSages also seemed less
#egocentric' than the spoken utterances. Some children
A- -, yntactically correcu produced very shortf c. utterances to
describe a picture, but this seemed to be at the expense

208
of the amount of information given. "There is a man on a boat" is an example of such an utterance that would, in
facti, describe many of the 31 pictures in the book. it
is possible that some children were still constrained
enough by the presence of a hearinc,, adult (the experi-
menter) to try and produce what they might feel is
'acceptable language'. It is unlikely, although possi-
ble,, that these children would produce such utterances in
the playground. It also seemed that the younger children
gave more egocentric Ue. short and relatively uninforma-
tive) descriptions than the older children.
Pictures to Solution
This analysis simply looked at the number of pic-
tures each child showed to his partner (the sender) in
his attempts to find the correct one. On average, a
total of 7 wrong pictures was offered by each child over
the five trials. By calculating a correlation (Pearson
Product Moment) between the total number of wrong pic-
tures to solution offered by both members of a pair,, we
were able to establish that there was no significant
relationship between how well one member of a pair did
with how well his partner performed (r=. 3 2) . This
enabled ust for the moment, to treat each child's perfor-
mance separately rather than as a member of a pair.

209
similar sort of analysis to that above involved
calculating the number of occasions that a child offered
the correct picture first. The average number of tirr. es
that each child achieved a first time correct (out of a
possible 5) was 2.6. Once againr there was no signif i-
cant correlation between how often one member o. -L' a pair
achieved this with how often his partner did (r=. 4).
There are still problems in 'separating' the sender
and receiver. Although we have established that there is
no statistically significant correlation between the per-
formance of members of a pair (as measured by the number
of wrong pictures to solution and the number of first
time corrects) it is still possible that there is some
variable operating between the two that might affect the
language produced. The case described in the discussion
below where one child was clearly lowering the complexity
of her communications to suit the linguistic ability of
her partner, is an example. We therefore needed a more
objective measure of the language produced. If this did
not correlc-; Lte with any of the other language measures
obtained (reading, writing and teacher-child conversa-
tion) then we could conclude either that the measure and
coding system were unreliable or that there was no rela-
tionship between the language produced under these condi-
tions and the other measures of language obtained. The
measure developed was a score of syntactic accuracy.

210
Svntactic -accuracv
The method we used to establish how syntactically
correct these utterances were, involved lidealisation'.
We confined ourselves to idealising only those descrip-
tions which gave rise to a correct solution at the first
attempt on the grounds that the quantity of information
given was adequate. This analysis was developed by D. J.
I'lood in order to look in more detail at the data f rom the
earlier study (Ereslaw et al, 1981) , but has not so far
been published. A similar strategy has also been used
by Quigley to analyse deaf children's writing (personal
communication) . Detailed guidelines for this analysis
are available in Appendix IV, but a brief description is
provided below.
The children's utterances had to meet certain
requirements before we proceeded with the analysis.
Firstly, we only looked at those descriptions which
enabled the-, correct choice of picture to be made on the
first attempt. In these cases, whatever the nature of
the communicationr the semantic content was likely to be
have been adequate. There were five children who gave
descriptions that never enabled their partner to make the
correct choice on first attempt, so we omitted them from
this part of the analysis. Secondly, if idealising these
utterances required more morphemes to be added, changeu-r

211
deleted or relocated than were already spoken by the
child, then such utterances were discarded from the
analysis. False starts, repetitions and utterances which
were later corrected by the child himself were also not
included. There was much repetition in these utterances.
It was not always an easy decision as to whether a
repeated word was simply a repetition or whether it was
there for a different purpose; the latter is quite common
in the language of Ceaf children, possibly where they are
trying to disambiguate their utterances. We shall return
to discuss this possible function of repetition in a more 3
detailed consideration of 6e a-, f children's grammar in
Chapter 9. If two or more versions of what was essen-
tially the same utterance were given., we chose the more
'advanced' or meaningful version to be included in the
analysis. Furthermore, we had to exclude chunks of
utterances that we had been unable to transcribe. This
meant, once again, that the ensuing scores may well be
penalising the less intelligible children. Howeverr this
had to be done since we could not begin to idealise
utterances which we had not understood.
This procedure left us with (usually) several utter-
ances for each of the 37 children that we could then
analyse. Firstly#, we presumed that each utterance was
tacitly begun with a phrase like "the picture shows" or
"there is". Sot even if such introductions were not

212
present,, we did not penc-lise those children who began
their descriptions with "a man, a boat and a dragon"
since, under the circumstances, these were considered as
syntactically correct. If the form of communication used
was written, however, such an utterc-,,, nce would not be T considered correct. týje tried to maintc-ain the word order
of the original utterance wherever possible in our
attempts at idealisation. Wherever any 'correction' was
used, (such as c-66dng an inflection, pronoun or auxiliary
verb), it did as much justice as possible to the child's
original utterance. In other words,, we did not try to
'put words into their mouths' any more than was abso-
lutely necessary. On balance, we would say that our
idealisations lost rather than gained meaning in com-
parison with the original utterance. Of course it is
entirely possible that we completely missed the meaning
of certain utterances; being 'outsiders' there were bound
to be some rather esoteric communications going on
between these children that we could not grasp.
1,7e tried to keep tense consistent; if the majority
of the child's utterance was expressed in the past tensej,
for example, we kept to this in our idealisations.
Often, both past and present tense were used in the same
utterance; in these cases we changed tense where
appropriate. Where there were several alternative ways
of idealising an utterance, we used the one which

213
required the least modification. If a child's utterance
included signs or gestures such as "red [boat] blue
[trousers] yellow and black [tee-shirt]". as was often
the case, then we did include these in our score. As
mentioned above, further details about this analysis are
available in Appendix IV.
89% of all the corrections that we had to make in
order to idealise the 37 utterances were those of addi-
tion rather than changep, deletion or relocation. The
most common omissions were determiners, inflections and
prepositions. The table below (Table 6.1) gives a sum- 0
mary of all these changes.
I
I add Ichange
I Idelete Irelocatel I
linflexion 1 23 - 11 II
1111 lprepostion 1 18 13 1111 Ideterminer 1 28 1 1 Inoun 1 10 1 21 laux. verb 19 1 lconjunction 13 ladjective 11 lpronoun 1 11 1 111 Iverb 1 14 12 11
117 1 14
Table 6.1 :A summary of all corrections made in order to idealise the 37
spoken utterances.
This pattern of results agrees with the unpublished
analysis using data f rom Breslaw et al (1981) where 87%

214
of all changes were those of addition and the most common
change involved determiners.
Having established a perfected utterancer it was
then a relatively easy task to obtain a score. One simply
ada's the number of morphemes that have had to be added,
changed, deleted, or relocated to the number of morphemes
in the original utterance to calculate a denominator.
The number of morphemes in the original utterance is then
expressed as a percentage of this. If no changes had to
be made, then an utterance would receive a score of 100%.
Since we had already decided that those utterances which
would have scored less than 50% were not to be included,
the final scores varied between 50% and 100%. A morpheme
count does show, as a rule, how much the children are
saying. One possible disadvantage, however, is that
children who often used 'baked' phrases (such as "have a
look" and "a little bit") almost as if they were one
word,, will appear to get a higher score. This, in the
event, rarely happened. The average number of morphemes
present in the original 37 utterances used in this
analysis was 12-5. Where there were several analysable
utterances for one childi, we used the most syntactically
correct one in our subsequent analyses. The average
syntactic accuracy score was 76%.
Looking only at those children who scored over 50%

215
accuracy, we found no significant sex differences in
accuracy but there was a difference in the length of the
original messages. Girls gave longer utterances than
boys (P<. 005).
It might well be useful to give some examples of
idealised utterances. The morphemes or words in brackets
show those that have been addedy changed, deleted or
relocated.
1. The man drop(s) the paper into the sea.
(The) sea, rocks, (a) boat (and the) sky.
3. (The) man watch(ed). (He) saw a dragon
on the rock.
4. (A) dragon (with) fire (and a) rock. (The)
blue pirate (is) near (the dragon). A man
(with a) blue (jacket), black boots, blue
trousers, (a) red belt, (holding a) blue
bag, looking at (the) dragon.
Obviously, these idealised utterances are not examples of
highly polished, concise and stylish prose, but are
nonetheless syntactically correct.

216
Reliability of Syntactic Accuracy analysis
In all, 91 utterances from the original study
(Breslaw et al,, 1981) ivere independently analysed by two
coders using the sarie system as the present study. The
overall measure of agreement was 92%. This figure
represents agreement on category of error. If. for exam-
ple . one coder inserted "boot" and the other "shoe".
these are still considered members of the same category
(ie. nouns) even though the actual word is different.
School differences
In the original study (Breslaw et al, 1982) we
discovered there was a significant difference in the
performance on measures of numbers of pictures to solu-
tion and numbers of 'first time corrects' between some
schools. Children from one school for the the deaf, in
particular, showed a similar performance to hearing chil-
dren but a very different performance from children in
two other schools for the deaf. Since the children in
the present study came from two schools we investigated
the possibility that their performance was different, but
found that this was not the case. Using an Analysis of
Variance, the difference between children from the two
schools on the pictures to solution measure was not
significant (p=. 10) - Neither was it on the f irst time

217
correct measure (p=. 14) Siiiiilarly the length and accu-
racy of utterance were not different across the schools.
Correlations with other child variables
We did several correlations to establish whether or
not a child's performance on the game (as defined by how
many wronc pictures were offered in all and how many
times they achieved af irst time correct) was related to
any other variable such as hearing loss, age or teacher
rankings of ability anc' so on. 17, one of these correla-
tions were significant.
The correlation between the length of the descri. -
tions (as def ined by the number of morphemes) and hearing
loss was signif icant (r=-. 47 j, p<. 01) . The deaf er chil-
dren said less about the pictures than the children with
`7 a less severe impairment. Also correlated with length o-L
utterance were teacher ratings of oral ability (p<. 05)
and speech quality (p<. 01). The correlation between
hearing loss an6 syntactic accuracy, however, was not
significant. The measure of syntactic accuracy corre-
lated negatively with age (r=-. 37, p<. 05) and positively
with teachers rankings of oral ability (p<. Ol) - Syntac-
tic accuracy and IQ were not significantly correlated.

218
There was a clear relationship between the
children's hearing loss anC, the length of their utter-
ances while syntactic accuracy was found to be negatively
correlated with age. Relationships with age or hearincj
loss were not found elsewhere in the present study, even
in the reading section. Since a correlation between
hearing loss and reading ability is normally found, we
argued that it's absence in this study was due to the
unusually narrow range of hearing loss. So, to find such
a strong correlation in this section between hearing loss
and a language measure (p<. Ol) leads us to wonder whether
this particular measure is in fact a, more sensitive one
than any other that we have so far investigated. It is
especially interesting that the children's length of
utterance in conversation with their peers is correlated
with hearinc loss whereas no such correlation is found I
from their conversations with their teachers. One might
therefore speculate that the comparatively spontaneous
conversations held with their peers provide a more real-
istic inoication of the linguistic performance of deaf
children than are their conversations with teachers.
Perhaps teachers have an "levelling out" effect on their
children's language, even though there are demonstrable
-1 .
differences for each child in the length of response they
produce after different teacher moves types. once again,
one could also speculate that hearing loss is not the

219
prime determiner of how well the children do in conversa-
tions %,., ith their teacher.. Howeverf Wood et al (11582)
found that hearing loss and MILT were correlated (p<. Ol)
so this latter explanation may be unsatisfactory. We
should however remember that in the present section,
hearing loss was only associated with how much the chil-
dren said, and not with its accuracy.
The finding that syntactic accuracy is negatively
correlated with age is an interesting one. Vandenberg
(1971) , in her survey of the written language of deaf
children, reports exactly the same finding. It appears
that "af ter children had reached the stage of lariguage
development at which they were able to attempt to con-
struct sentences the errors of syntax they made increased
according to their age" (p. 53).
In their analys--is of the errors deaf children make
in the Test of Syntactic Abilities (TSA) o, Quigley et al
(1978) found that deaf children have problems with -simi-
lar constructions to those found in the present stL: dy.
Only three of the 131 changes we made involved changing
word or(fer. Quigley et al also founa-, that there were
very few SVO (subject-verb-object) violations in the
f errors that children made on the TSA. of course, deaf
children only use simple sentence constructions, very
rarely tacklingr for example, the passive. Hearing

220
children master the passive voice by the age of 8 or 9,,
whereas only 40% of 17 and 18 year-old deaf children were
found to have done so (Power and Quigley, 1973) . The
similarities between Quigley's results and ours give us
confidence that our coding systems are valid.
Another reason for concluding that our measures anc'
coding systems are valid is that we find syntactic accu-
racy to correlate with other measures of the children's
linguistic ability taken in this study. As mentioned
before, we shall draw all these correlations together in
Chapters 8 and 9. There are many possible reasons why we
night not have found such correlations with our measure
of syntC-, ctic accurCýcy. Firstly, the corpus of language
was obtained in an experimental situation. This Taight
have produced results that were task-specific. Secondly,
it is an I interactive' measure Ue. two children are
involved) which may have introduced some contamination
that we had not accounted for. Thirdly, ý7e only looked
at 'first-time-corrects' which is imposing our own vali-
dation on the data and fourthly, the coding system itself
is fairly complicated and one might have argued, arbi-
trary. So,, the fact that we find correlations despite
these possible criticisms gives extra weight to our faith
in the measure.

221
CHAPTER SEVEN
THE WRITTEN LANGULGE OF DEAF CHILDREI, ý; '

222
CHAPTER SEVEN
INTRODUCTION
VIETHOD
Subjects
ProceClure
RESULTS
: CONTENTS
Correlations with other child variables
DISCUSSIO14
223
229
229
229
230
234
235

223
CHAPTER SEVEN
THE WRITTEN LANGUAGE OF DEAF CHILDREN
INTRODUCTION'
Quigley and 1:; ýretchmer (1982) consider that "probably
the best single indicator of a deaf person's command of
English is the quality of his/her spontaneously produced
written language" (p. 81) . They take the view that once
"Standard English is soundly established as the basic or
secondary internal language of a deaf child and if com-
petent reading is established on this internal language,
then the 6evelopment of written language should be a
relatively simple matter" (p. 82). The written ability of
deaf children has been by far the most studied, aspect of
their language. Before the recent arrival of video
equipment as a tool for research, other areas of language
use (such as speech) were much more inaccessible.
Previous research into the nature of deaf children's
language has revealed characteristic patterns and errors.
In generalr when compared to the written language of
hearing children, deaf children's written language "was
found to contain shorter and simpler sentences, to

224
display a somewhat different cistribution of the parts of
speech, to appear atore rigid anct more stereotyped and to
exhibit numerous errors or departures form Staný. ard
English use" (Cooper and Rosenstein, 1966,, p. 66) . Both
Ilyklebust (1964) and Vanden. Berg (1971) , studying separate
populations in America and New Zealand,, found that the r
most commonly usec! words were nouns and verbs whereas
'function' words such &s prepositions X ý, 7 ere rarer. Quig-
ley and Kretchmer conclude from available evidence that
even at the age of 16 most deaf children are still unable
to use relative clausesi, nominals,, complements and other
more complex structures.
Recently, studies of deaff children's written
language have hypothesised the e. -, -. istence of a 'grammar of
rules' that generates these characteristic writing pat-
terns , rather than viewing them as a mass of 'silly
mistakes'. These errors are remarkably similar for most
deaf children and can be seen in quite indepenc-A'ently
developing populations in different countries. Quigley
and Kretchmer point out that many of these characteristic
; as well as writing. Analysis errors are made in readinc
of the errors made on the multiple-choice Test of Syntac-
tic Abilities (Quigley et al, 1978) shows this to be true
even when the correct version is available among the
choice of items. Probably the best way to illustrate the
unusual nature of deaf children's writing is to give an

225
example. The following e. -,, ýtract is from a story about
bonfire night.
Father say I have bo.. - - fireworks box and the Bonfire is very big wood, Father say "wait First night now allright,, Hother cooked marking a toffee apples and toffee with jacket potatoes, Sarah say, Please now f Lireworks was and Rock three please, Father, say, "wait a minute allright, Paul, say where bonfire a small or big, say lovely hurry firework beautiful yes like Bonfire and something foodp Father, say Sarah, you like firework was very good girl,...
This extract was written by one of the children in the
present study (subject number 22,, see Appendix ID but
such stories were only available for 11 subjects and were
therefore not included in analyses.
The studies of Myklebust (1964) and VandenDerq
(1971) included children from the ages of approximately 7
to 15, providing C-Ilata on how the character of deaf
children's written lan, ý, uage varies with age. Broadly
speaking, the picture looks fairly gloomy. Myklebust
reports that "in some aspects of lancuage the C! eaf child
shows virtually no progress beyond 11 years of age"
(1964, p. 333) . VandenBerg (1971) found "that the deaf
children made no significant progress in either the
variety or the frequency of their word usage after the
age of eight" (P-41) and that they lacked "any real
ability to abstract and express ideas" (p. 48). She con-
j the deaf in New cluded that current methods of teachinc

226
Zealand were badly in need of reconsideration since they
appeared to become less effective as the children became
older.
One of Illyklebust's suggestions for overcoming these
problems is a system "which provides for self-correction
by alerting and rem indiDg the child of his
errors. .. While it can be assumed that pre-progra-a-mmed,
automated approaches using electronic instrumentation
will be available and beneficial in such training, the
teacher can now inaugurate systems of this type" (p. 334).
He envisages a system of codes for immediate feedback
about the child's errors (0= omission error, S= substitu-
17 tion error and so on) . .e have detailed the problems
involved in such 'repairing' frameworks in chapter 5 ancA
shall return to the subject of Imetalinquistic awareness'
in the final chapter but suffice it to say at this point
that it is not necessarily a valid assumption that such
an awareness of the structure of language will actually
help, although in some cases this may well be true. it
cannot just 'be assumed' that computer teaching will be
useful and beneficial to the development of deaf
children's written language without verification. No
doubt the current explosion of research in this area will
soon enable us to make a more scholarly decision. Van-
denBerg, on a slightly more realistic note,, concludes
that "no current method of teaching grammar has helped

227
deaf children to express themselves in correct syntactic
patterns. In the light of these findiný,, -s it would
clearly seen, superficial to suggest that m-erely correct-
ing the forms of a deaf child's expression will enable
him to formulate and express his thoughts in the conven-
tional structures" (p. 52). Indeed, it seems that
irrespective of degree of deafness, the children in her
study tenced to be more orally proficient if they had
been late starting at a special school for the 6eaf.
Quigley anci' his colleagues, who have documentec- very
thoroughly the errors, that d-eaf children make in both
reading and %, -, ritirrT, have produced materials 6, esigned
specially to give children practice in these very areas
and we await their evaluation. For now, however, we
an DrIall return to a consideration of the measures one cc-,
use to assess written language.
Although written language is often considered to be
a useful indication of a deaf child's linguistic develop-
mento, "unfortunatelyo, instruments and methods for elicit-
ing and measuring samples of written language are not
well developed'' (Quigley and Kretchmer, 1982, p. 82). The
usual procedure i-F-volves presenting pictures or f ilms to
elicit writing. Both Dlyklebust and Vanden! ý, erg used the
Picture Story Language Test (1, wyk-lebust r 1965) which
requires children to write a story about a picture
presented to them. Their efforts are subsequently

228
analysed along various c! imensions (word prcductivity,
sentence productivity, sentence length, syntax and degree
of abstraction). Although all these 5 aspects of written
language intercorrelated for the deaf group, the sarcie was
not found to be true for hearing children over seven
years old. This may well indicate a 'ceiling effect' on
the test.
As far as we knowo, the written language of deaf
children has not been extensively istudied in relation to
other aspects of their language. This is something the
present study sought to remedy. Both Myklebust and Van-
denBerg included teacher ratings of oral proficiency and
articulation in their surveys, but did not include any
objective measure. These studies also included a vocabu-
lary test, but, for reasons detailed in chapter 4, we are
concerned about the validity of using such tests with
'I deaf children. Furthermore,, the test used was developed
in the 1-0.30's (Columbia Vocabulary Testv Gansl and Gar-
ret, 1939) . I-Iyklebust, for example, did not find a
relationship between reading ability (score on tý-e voca-
bulary test) and oral language (teacher r-atings) .We
wonder whether such a relationship might in fact eXist
I jout can only be revealed by more sensitive measures.
Both Myklebust and VandenBerc, -,, on the other hand, did
find a relationship between some aspects of oral language
(teacher ratings of lipreading and articulation but not

229
of oral proficiency) and written language. It might well
be of value here to clarify both the nature of these
relationships as well as the sensitivity of the measures.
V7e therefore sought to include a measure of written
language in the present stuC-4y in order to see how it
related to our measures of the children's speech E. nd
reading ability. The procedure we decided upon was an
adaptation of the referential communication task as
descri ed in the previous chapter. This would yield two
basic measures of written language, namely productivity
and syntactic accurCaicy.
RETHOD
Subiects
As in the previous section, all 50 children
attempted to take part in this section of the study, 4 of
whom did not understand the rules of the game. These 4
children, together with their partners, were therefore
eliminated from the final analysis. This left 21 pairs
of children (42) who successfully understood and com-
pleted the game.
Procedure
This part of the study took piace immediately the
children had finished the referential communication task

230
as described in the previous chapter. The video equip-
ment was turned off and the children, still in their
places, were given pencils and pieces of paper. It was
ex. plained to them that instead of talking about the
picture, they were to write about it. They were told
that when they had finished writing they would exchange
pieces of paper in order that their partners might find
the pictLre described. Once it was establisheC, as far
as was possible,, that the procedure had been understoo6
they were each given a different picture to write about.
As in the previous section, these pictures were chosen on
the basis that it was thought they were of equal Qiffi-
culty. It subsequently emerged that a few of the chil-
dren had not in fact correctly understood the procedure
since they began to draw a copy of the picture rC-I. -ther
than write about it. HOWever, these raisunderstandim; s
were soon cleared u-p, of ten with help volunteered by the . i: - if
child's partner.
RESULTS
As with the spoken data, the children's descriptions
vC-.; ried greatly both in quality an(f,. quantity. Detalle
below are 9 descriptions c; -! iven about the same picture,,
each with original spelling and other mistakes. This

22-31
picture shows a man hiding behind some trees and looking
at a 6ragon on ZL rock. In between the man and the dragon
is a stream. The man has long fair hair (tied back) an6
is wearin(ý a light blue shirt, dark blue trousers and
some wellington boots.
1. The is saw Daddy dragon
The is water dragon
2. the Pirate is a water look
3. The blue man hiding dragon
4. Iden look is dragon.
The dragon on look the col&.
The men tree hide and look.
5. The man is looked the rock,
the man hides the tree
the rock was sleep on the srore.
6. The Blue Pirate was is hide.
The tree in the hide is looked in the dragon.
The dragon on the rock.
The dragon is looked everybody for ship.
7. The man Island. trees looked and looked
-1 dragon to see in kill man No! oh no ship
dragon to cover then him to we said not
man went from.

232
8. The boy is looking at the dragon.
The dragon is a sleep. There is lots of
trees. There is a few grass. There is
some hard black rock. he has black boots.
And blue trouser and yellow hair.
9. The man was hidden by the tree and saw
the dragon on the bicj rock But dragon
did't see him.
Once aciain some children (see the description in number :j
7) seemed to be making up stories about the picturev
, 7hile others stuck r. -, ore rigorously to what was in actu-
ally visible. The last example provides the only
instance where a child made use of the passive voice.
17e submitted the written descriptions to exactly the
same analysis of Syntactic Accuracy as describen6 in the
previous chapter. Unlilýe that analysis however, we
looked at all the descriptions, not just those which
allowed a 'first-time-correct' choice to be made. This
was because our real purpose was to obtain a. written
description of the picture, rather akin to the procedure
used by Myklebust (1964. -). It was hoped that by adding
the (hopefully) motivating ]---actor of communication we
would obtain descriptions that would be more comparable
with the spoken data. From then on, the -procedure

233
employed was the same. We idealised each description and
calculated it's length and accuracy. Those descriptions
to which we hac, to add or change ri. iore morl-hemes than were
already present were not included in subsequent analy-ces.
This left us, as in the previous section, with 37 per-
fected descrii-, tions. HOWever, these were not all from
the same 37 childrcn as in the spoken descriptions. 6
children who scored more than 50% accuracy in their
writing f(-WLiled do to so when speaking to their partners.
The 6 children who failed to obtain more than 50% in this
section all succeeded when spealling.
74% of all changes razide in order to idealise these
utterances involved addition. This is a lower f igure
than that f rom the seoken data (89%) Table 7.1 (below)
ar gives a sur,,.. -iary of all the correcticn. -: )*
linflexion lprepostion Ideterminer Inoun laux. verb lconjunction ladjective lpronoun Iverb I ---I
add Ichange Idelete Irelocatel III
32 12121 16 121212 20 1181
3121 612121 7
1 6131211
11 91 1 31 1
Table 7.1 A summary of all corrections made in order to i6ealise the 37 written messages.

234
These written messaoes tended to be longer than the
spoken messages (15 rý,, orphemes in comparison with 12) but
despite this increase in length, the former were slightly
more accurate than the latter (80% compared with 76%) .
There were clear se. -,: differences revealed by these
measures. Of those children who scored more than 50%
accuracy (37 from a possible 42) , the girls produced
significantly longer messages than the boys (p<. 005) .
Similarly, the girls' efforts were more syntactically
accurate than the boys (p<. 04).
Correlations with other child variables.
As with the spoken data, we did several analyses to
establish whether the length or accuracy of the
children's written messages correlated with variables
such as hearing loss, age or teacher ratings. Unlike the
results from the spoken data, neither 1-., -_aring loss nor
age correlated with these measures. Teacher ratings of
writin(ý!, ability were correlated with both the length of
the originalf uncorrected written messages (p<. 02) anct
with their accuracy (p<. Ol) - Teacher ratings of attitude
also correlated with both these measures (p<. 001 and
p<. Ol respectively) . These are two of the ver, ý., - rare z
occasions where this particular rating shows a correla-
tion with any of our measures. Ratincs of oral ability L

235
were correlateC with the length of message (p<. 02) and
judgements of general ability (intelligence) were corre-
lated with accuracy (p<. 02) - IQ was riot signif icantly
correlated with accuracy.
DISCUSSION
The sex differences revealed in the wri'L-ten lanSuage
of the chilcren support the finLlngs of earlier research-
ers. 1.1-yjt-. -lebust (1964) reports an advantage for girls in
verbal fluency an6 an advantage in syntactic accuracy up
-until the age of 13 when the boys began to catch up.
vanci 'en-. er-Q (1971) fLound that girls oj, -- all ages scored
better on measures of syntactic accuracy than ddCA the
I boys. Yost of the present sample are younger than 13 so
we are unable to shed any liiý, ht on the minor a, ý, e
Iiý Z7 'enBerg's results. discrepancy between " klebust's and Vand
As far as the categories of error are concerned, we
found, as dic-i' both 1.1-, -7klebust and VandenBerg, that by far I
., uage the most common error in deaf children's written lanc
was that of on ission. However, we do not present a, count
of which categories of words were actually used since
such analyses are commonplace in the literature.
It is notable that we failed to find a correlation
236
between between age or hearing loss an(', our measures of
the children's writing. As explained in the previous
chapter, r such a failure could be due to several factors
such as the unsuitability of the measure, inadequacy of
the coding system, the unusually restricted ran(;, e of
hearing loss, contamination due to the 'interaction' of 2
children, tc--s; l,. specificity of the experimental situation
and so on. Of course,, such a, failure could al-so mean
that there is no such relationship. Another point worth
mentioning in connection with failure to find correla-
tions with this j-)(articular IL-. easure, is that chilc. ren who
scored less than 50% accuracy Ere not even incluQed in
the calculations. This may also probably bias one's
chances towards not getting a correlation.
However, we have no explanation as to i,, 7hy we failed
'C to f inc] a negative correlation between age and syntactic
accuracy as we did in the previous section. Anticipating
Cha,.., ters 8 and 9a little, we found that the accuracy
scores in the written and spoken sections were not corre-
lated whereas the length of the messages were correlated.
However, using a parametric test that enabled us to to
include those children who scored less than . 1.50% in these
two sections, we did find a significant correlation
between accuracy in the written and spoken messages.
As we shall go on to discuss in Chapters 8 airli-,, 9,

237
the measures oi--- the length and accuracy of the written
messages do correlate with other objective measures of
the child's language use such a-s reading and the length
of utterances after questions and personal contributions
f rom his teacher. 'So, even though we have failed in this
case to f in6 correlr--, -tions with heariný,,, loss anci age, we
nevertheless have some faith in the measure's ability to
tal) the child's linguistic ability.

238
CHAPTER EIGHT
COI, IBINII, '4'G ALL FOUR LANGUAGE PIEASURES

239
CHAPTER EIGHT
COMB NINO AJIL FOU LANGUAGE MEASURES
When we combine all four language measures (Reading,
average M IL TF V: Tt. ritten and Spoken Accuracy) we can see
that they intercorrelate at various levels of signifi-
cance with the exception of Spoken Accuracy, v., hich only
correlates significantly with Written Accuracy. In Table
we present a summary of these correlations together
W . 41. th their levels of significance. For reasons explained
below and elseWhere in this thesis, the correlations in
this chapter are based on scores from 38 children. Hear-
ing Loss was not significantly correlated with any of
these 4 measures.
---------------------------------------------------------- ERT NIL T WRITTEN SPOKEN
--------------------------------------------------- ERT ------
I IILT 1 . 6345 ------
'RIT 1 . 7399 . 4483
I SPOK 1 . 2528 . 2603 . 4195
--------------------------------------------------------
Table 8: 1 Correlations between 4 main measures (Edinburgh Reading Testr average 14ean Length of Turnj, Written Accuracy and Spoken Accuracy), n=38.

240
From the results so farr we can conclude that these
main measures intercorrelate. However, there are several
possible interpretations that would ex. plain these rela-
tionships. Taking Reading as our correlator (or c-'ef)en- :3 dent) variable,, one explanation could be that all other
measures account for the same variance. In other words
that there is a single factor determining reading ability
and, by implication, a unitary linguistic competence.
Alternatively, some variables may account for &, ifferent
aspects of the variance in reading scores. This would
suggest the e,... istence of more than one influence on
reading.
To explore these possibilities, we made use of rrul-
tiple regression analysis. Such a procedure enables us
to examine the contribution that each of our main 'pred-
ictorl variables (VILTr ý-', Tritten Accuracy and Spoken Accu-
racy) makes to variations in reading score. We have
chosen Reading as our main (correlator) variable here so
as to facilitate comparisons with other research involv-
ing investigations of the reading ability of deaf chil-
dren (eg. Conrad, 1979 and Myklebustj 1S, `64). However, we
also performed the same analyses described below using
the other variables as correlators; the results of- these
analyses are given at the end of Appen ix VI.
Pe present three analyses. The first involves only V

241
the main measures of average MLLTj, written syntactic accu-
racy and. spoken syntactic accuracy as predictor vari-
ables. The second analysis is basically the same but
does not use average I-J, T; MLT after teachers' questions
(MLT3) and IILT after teachers' personal contributions
(MLT4) were used instead. This second analysis suggested
itself from casual inspection of the data which suggested
that these two variables correlated pretty well with
other variables. The third analysis introduces IQ as an
additional variable. Although we have said (in Chapters
1 and 2) that an 'explanation' of linguistic Competence
lies outside the scope of this study, there already
exists work (eg. Conrad, 1979) which suggests IQ to be an
important (ýeterminer of reading ability. Since we have
information about the IQ of a large subset of the chil-
dren, it seer, -ted worthwhile to explore this relationship
further.
All 3 analyses below were carrieci out using data
lor reasons fro, -.,. a subset of the children, since, i
explained in the relevant chapters, data were not avail-
able for every child on every measure. By definition, we
were only able to perf orm multiple regression analyses
using data from children who successfully completed every
part of the study. This leaves us with a set of 38
children who meet this criterion. In the case of
Analysis 3r however, the subset is smaller (34

242
children) . Full details of these children and the raw I data are available in Appendix VI.
Analvsis 1
We chose Reading as the correlator variable (number
2). The table below (Table 8: 2) shows the significance
of variables 3.4 and 5 (average MLT,, Written Accuracy
aI nd Spoken Accuracy) in accounting for the variance in
rea ing scores. Although initially we did calculations
with hearing loss (variable 1) as one of the variables,,
we found it to have no precictive power. So, for ease of
presentation,, we have only shown below those comparisons
that co not involve hearing loss. However, all raw data
are presented in Pippendix VI, should anyone wish to
repeat the exercise for their own purposes.

Interpretation of Lhultii)le Regresgion Tablea.
Each of the three multiple reeression tables begins by listing the variables included In each oi: the mo(:, els. Model 1 (the complete model) in table 8: 2 overleaf includes variables 1,3,4 and 5 (hearincý loss, average length of tL: rr,.,? written accuracy and spoken accuracy) - lJodel 2 includes only variables 3,4 and 5, whereas model 3 incluC_4es only variables 4 ancli 5 (and so on). The significance levels on the far right hand side of the table show whether or not the variables included in that model account for a significant amount of the variance in reading scores. !, c7e can see from this tC-;, ble (8: 2) that the only variable that accounts for a non-significant amount of this variance is variable 5 (spoj",. en accuracy) - All other variables and combinations of variables are significant. Reference to the column entitled IR square' tells us that the cai.,, ount of variance in reading scores accounted for by variable 5 is only 6% Ue. . 05984).
The second section of the tables (entitled 'Compar- inodeIs shows what happens when we drop certain variables from certain models. 28 such comparisons are -possible although not all would be inforoative. In table 8: 2 we list those that Cifferentiate crucial from non- crucial variables only. 1ýýThen we compare models 2 and 3 (in Otlner words, droppinc variable 3 from a rzioc. I el con- taining variables 3,4 and 5) this leads to a siianificant crop in the predictive power of model 2. lie can also see that the difference in variance accounted -for between these tv-ý, o models is approximately 121% which is signifi- cant at the . 0022 level. The thir(ý comparison (involving
models 3 and 5) shows that dropping variable 5 from a model containing 3,4 and 5 makes no significant (ýiffer- ence to the anount of variance in reading scores accounted for. Once again, reference to the column enti- tled IR square' tells us that the exact figure is 0.342%
of the variance.

243
\7C' C
114odl HL I, 'ILT WR SPI multiple RI R squarel F ratiol p
1111 3 4 51 . 78822 1 . 62130 1 13.535 1 . 0000 1 121 3 4 51 . 78821 1 . 62127 1 18.591 1 . 0000 1 131 4 51 . 706110 1 . 49901 1 17.431 1 . 0000 1 141 3 51 . 59076 1 . 34900 1 9.382 1 . 0005 1 151 3 4 1 . 78604 1 . 61786 1 28.294 1 . 0000 1 161 3 1 . 58314 1 . 34005 1 18.550 1 . 0001 1 171 4 1 . 70638 1 . 49897 1 35.852 1 . 0000 1 181 I --------- --- ---
51 ----
. 24463 --- -- -
1 . 05984 1 2.291 1 . 1388 INS I
I I -------- --- --- ----
- -- -- COMPARING
----------
---------- MODELS
-----------
-----------
----------
------ I
------ IH, odsIHL I ---- I ---
ERT ---
WR ---
SPI --- I
R squares ----------
Idifferenc - ---------
elF ratiol -I ------- I
p ------
12 1 3 4 51 . 62127 11 13 1 1 ------- ----
4 ---
51 ----
. 49901 ----------
1 . 12227 ------------
110.97651 ----------
. 0022 1 ------ 1
12 1 3 4 51 . 62127 1 11 1 14 1 1 -----
3 ---- ---
51 ----
. 27227 ----------
1 . 34900 -----------
124.44301 ----------
. 0000 1 ------ 1 --
12 1 3 4 51 . 62127 1 11 1 15 1 I -------
3 ----
4 ---
1 ----
. 61786 ----------
1 . 00342 -----------
1 0.30661 ----------
. 5834 INS ------
12 1 3 4 51 . 62127 1 11 16 1 3
--- --- 1
---- . 34005
---------- 1 . 28122
-----------
112.62331 ----- ------
. 0001 1 ------ 1 -------
12 1 -
3 4 51 . 62127 1 11 17 1 4
--- 1
---- . 49897
----------
1 . 12230 -----------
1 5.4 897 1 ----------
. 0086 1 ------ 1 -------
12 1 ----
3 4 51 . 62127 1 11 18 1 51 . 05984
-------
1 . 56143 -----------
125.20111 ----------
-0000 1
------ 1 1 ------- 15 1
---- 3
--- 4
---- 1 ---
. 61786 1 1 11
16 1 3 -1 ---
. 34005 ----------
1 . 27781 -----------
125.4441 ---------
1.0000 1 ------- 1 1 -------
15 1 ----
3 ---
4 -
1 . 61786 1 1 11
17 1 ------- ----
4 ---
1 ----
. 49897 ----------
1 . 11888 ----------
110.88841.0022 1 -----------------
Table 8: 2 A comparison of models from the
multiple regression analysis no. l.

244
From this preliminary comparison of i, -, odels (in par-
ticular, from comparison 3) we can see that the only
variable that seems to exert no effeCL- when dropped, is
01 Spoj,: ýen Syntactic Accuracy (variable 5) Both the others
UILT and I. -Iritten Accuracy) j, when dropped#, exert a signi-
ficant ef f ect on the amount of variance accounted for
(see comparisons 1 and 2) . From comparison 7, we can see
that dropping Written Accuracy from a model containing
only itself an6 MLTr produces a Significant result.
Similarly (f rorf, comparison 8) , it appears that dropping
LIALT f rom a model containing only itself and Tv, Tritten
Accurac, v, el: erts a significant effect. From the results
of these two comparisons, we can conclude that I-ILT anQ
IT k, ritten Accur(---, -cy are accounting for different proportions
of tlhe variance. Since, when diroppedt 1ILT e:,. erts a more
significant effect that Written Accuracy, it is possible
that LILT is the more powerful predlictor of reading. So,
ITT) we can tentatively conclu6e that variable 3 (averoge 0,
appears to be the most powerful preG-ictor of reading,
followed by variable 4 (Written Accuracy) r with variable
(Spoken Accuracy) only accounting for variance already
covered by Written Accuracy.

245
A-Ilalvsis 2
This analysis - i% basically the same as Analysis 1
except that instead of using average 1.1, LTr we used two
subscores: LIM (EILT after the teacher's open questions)
and 1 -4, LT4 (11ý, -. LT after the teacher's personal contribu-
tions) . The same pattern emerges in the initial com-
parisons of moCels as in the analysi--- albove, namely that
V, 7ritten Piccuracy remains an important predictor of read-
ing, while Spoken Accuracy (variable 6 in this case) can
be dropped with little effect on predictive power. How- J.
ever, when we come to look in cietail at comparisons
involving only the 3 apparently important variables (in
this table,, numbers 3j, 4 and 5) an interesting pattern
emerges. This is shown belOW in the comparisons
presented in Table 8: 3.

246
ANALYSIS 2 - ---- - --- --- --- ---- --- ------ - ------------------- --------- I Mod I IIL IILT3 MLT4 VIR SP II n, ultiple RIR squarelF ratio Ip
1 3 4 56 1 . 78881 1 . 57643 1 10.541 1 . 0000 1 121 3 4 56 1 . 78869 1 . 62204 1 13.578 1 . 0000 1 131 4 56 1 . 75331 1 . 56748 1 14.870 1 . 0000 1 141 3 56 1 . 78621 1 . 61812 1 18.345 1 . 0000 1 151 3 4 6 1 . 61406 1 . 37707 1 6.860 1 . 0010 1 161 3 4 5 1 . 78463 1 . 61564 1 18.153 1 . 0000 1 171 56 1 . 70640 1 . 49901 1 17.431 1 . 0000 1 181 4 6 1 . 49124 1 . 24132 1 5.566 1 . 0080 1 191 4 5 1 . 75245 1 . 56618 1 22.839 1 . 0000 1 1 101 3 6 1 . 60805 1 . 36972 1 10.266 1 . 0003 1 1 ill 3 5 1 . 78195 1 . 61144 1 27.539 1 . 0000 1 1 121 3 4 1 . 61255 1 . 37521 1 10.510 1 . 0003 1 1 131 3 1 . 60662 1 . 36799 1 20.961 1 . 0001 1 1 141 4 1 . 46859 1 . 21958 1 10.129 1 . 0030 1 1 151 5 1 . 70638 1 . 49897 1 35.852 1 . 0000 1 1 161
------- ----- - -- 6
------ 1 . 24463 1
----------- . 05984 1 2.291 1 . 1388 114S
------- ----- - -- COM
------
--- PARING MODELS ---------
------- ------------ ------
I1'.. odsIHL I -------
LIM ----- -
MLT4 WR --------
----- ----------------- SPIR squares IdifferencelF ratiol ----------------------
------ pI
161 3 4 5 1 . 61564 1 - ----------
11 ------ I
1 191 1 ------- ----- -
4 --
5 ------
1 . 56618 1 --------------
. 04946 --------
1 4.37531 -----------
. 0440 1 ------ I
161 3 4 5 1 . 61564 1 11 1 11 1
------- 3
----- - -- 5
------ 1 . 61144 1
-------------- . 00420 --------
1 0.37111 ----------
. 5464 INS ------ I
161 3 4 5 1 . 61564 1 11 1 1 12 1 1 -------
3 ----- -
4 -- ------
1 . 375?. l 1 --------------
. 24043 --------
121.26791 ----------
. 0001 1 ----- I
161 3 4 5 1 . 61564 1 11 -
1 1 13 1 1 --------
3 ---- - -- ------
1 . 36799 1 --------------
. 24765 --------
110 . 953 61 ----------
. 000 21 - -
161 3 4 5 1 . 61564 1 11 - --- I
1 1 14 1 I --
4 1 . 21958 1 . 39606 117.518 1 . 0000 1 ------
161 ----
3 - --
4 ------
5 --------------
1 . 61564 1 -------- ----------
11 ------ I
1 1 15 1 5 1 . 49897 1 . 11667 1 5.16011 . 0110 1 1 -------- 1 12 1
---- 3
- -- 4
------ -------------- 1 . 37521 1
-------- -- * -------- 11
------ I 1
1 13 1 3 1 . 36799 1 - ------
. 00723 --------
1 0.40481 ----------
. 5288 NS ----- I ---------
1 12 1 ----
3 - --
4 ------ ------ -
1 . 37521 1 11 1 1 14 1 4 1 . 21958 1 . 15564 1 8.71871 . 0056 1
Table 8: 3 A comparison of models from the multiple regression analysis no-2.

247
Where IMT3 anct tý`,, LT4 are both dropped from a model
containing MLT3, LILT4 anc', Written Accuracy (comparison 6)
there i-, ) a significant effect (p=. 0110). 11hen dropped
individually from such a model, however, the picture is
6ifferent; droppincj MLT3 (comparison 1) produces a result
U that is only just significant (1; =. 0440) while dropping
1ILT4 (comparison 2) produces a nonsignificant result
G; =. 5464) . These results would suggest that i, '-LT3 and
VILT4 co-vary in the prediction of reading. From the last
two comparisons (7 and 8) we can see that MLT3 is, in
the more powerful predictor of reading than I"ILT4.
When MLT3 is d1roppeci f rom a model containing only itself
and MLT4 j, it occasions a signif icant drop in the amount
of variance accounted for (p=. 0056) , whereas the converse
is not true: dropping MLT4 from this model exerts no
signif icant ef f ect (p=. 5288) . So, from the results of
this and the former analysis, we suggest that the highest
correlates of reading are FILT after a teacher's questions
and, written syntax. I-Te shall go on to discuss this
later.

248
Analvsi-s 3.
This analysis contains the same variables as
Analysis 1 with the addition if IQ (variable number 6) -
Once again, reauing (variable number 2) is the correla-
tor . In the comparisons of models we find, as in the
previous two analysest that the only variable that exerts
no significant effect, when dropped from a model contain-
ing average M. LT,, Written Accuracyr Spoken Accuracy and
IQr is Spoken Syntax (p=. 1832). We do not show all these
comparisons again in the table below (Table 8: 4) but only
present those that add new information to the picture.

249
ANALYSIS 3
llocj HL IýILT WR SP IQI T. -tultijýle Rl R squarel F ratio I
1111 3 4 5 61 . 83936 1 . 70452 1 13.352 1.0000 1 121 3 4 5 61 . 83840 1 . 70291 1 17.153 1 . 0000 1 131 4 5 61 . 70596 1 . 49839 1 9.936 1.0001 1 141 3
. 5 61 . 6ý; 082 1 . 47724 1 9.129 1 . 0002 1
151 3 4 61 . 82696 1 . 68386 1 21.632 1 . 0000 1 161 3 4 5 1 . 80168 1 . 64268 1 17.986 1 . 0000 1 171 5 61 . 28234 1 . 07971 1 1.343 1 . 2759 INS 181 4 61 . 70306 1 . 49430 1 15.150 1.0000 1 191 4 5 1 . 70595 1 . 49836 1 15.399 1.0000 1 1 101 3 61 . 68963 1 . 47558 1 14.057 1.0000 1 I ill 3 5 1 . 64096 1 . 41083 1 10.808 1.0003 1 1 121 3 4 1 . 79557 1 . 63293 1 26.726 1.0000 1 1 131 3 1 . 63450 1 . 40258 1 21.564 1.0001 1 1 141 4 1 . 70298 1 . 49418 1 31.264 1.0000 1 1 151 5 1 . 25283 1 . 06392 1 2.185 1.1491 1111, S 1 161 I -------- --- --- ---
61 ----
. 12345 -----------
1 . 01524 ----------
1 0.495 ----------
1.4867 -------
INS I
I COMPARING LODELS ------------------ ---------- ------- -------
If-! oClsiHL I ---- I --
---- MU-2,
----
--- WR
---
--- SP
---
---- IQ. I
--- I
---- R squaresl
---------- I differencelF ratio
----------- I -------- I I ------
I I
121 3 4 5 61 . 70291 1 1 1 1 161 1 -------
3 ----
4 ---
5 ---
1 ----
. 64268 1 -----------
. 06023 -----------
1 5.8789 ----------
I. 021E, -------
1 I
1 10 1 3 61 . 47558 1 1 1 1 1 13 1 1 -------
3 ---- --- ---
1 ----
. 40258 1 -----------
. 07300 ----------
1 4.3152 ----------
1.0461 -------
1 I
1 10 1 3 61 . 47558 1 1 1 1 1 16 1 I ---- --- ---
61 ----
. 01524 1 -----------
. 46034 ---------
127.2124 -----------
1.0000 ------
1 -I -------
181 4 61 . 49430 1 1 1 1 1 14 1 4 1 . 49418 1
-------- . 00012
---------
1 0.0071 ------------
1.9335
------
INS
-I I ------- 181
---- --- 4
--- ---- 61
--- . 49430 1 1 1 1
1 16 1
------- ---- --- ,
---
61
---- . 01524 1
----------- . 47906
---------
129.3667
-----------
1.0000
------
1
-
Table 8: 4 A comparison of models from the
r,. -iultiple regression analysis no-3.
250
Intelligence does not correlate significantly with
reading (r=. 1234) but cloes correlate highly with average
TILT (r=. 5501 ,P<- 001) - It does not correlate with
either of the other measures (Written and Spoken Accu-
racy) . When vý, e drop IQ from a model also containing
MLTAVI Written Accuracy and Spoken Accuracy (comparison
the result is significant (-r; =. 0083) when dropped
from a model just containin,,,, ý itself and MLT (comparison
2) , the resulting drop in variance is also just signif i-
cant (p=. 04C-1) . T., 7hen MLT is dropped from a model con-
taining just itself anCI IQ, the result is, once aciain,
significant (comparison 3). So, we can conclude that IQ
is predicting a proportion (probably small) of the vari-
ance in reading thalt is unaccounted for by MILT. In the
r..:,, oQel involving only IQ and Written Accuracy, dropping IQ
has no significant effect (comparison 4) whereas droppinS
liritten Accuracy has a araukatic effect (comparison
IQ does not, therefore, appear to be contributing to any
variance in reading that is not already accounted for by
Written Accuracy. Written Accuracy would seem to be a
far better predictor of reading within the present sample
of children than nonverbal IQ-
To conclude, it seems that Reading is best predicted
by average r, 'LLTr followed by Written Accuracy. Spoken
Accuracy does not provide any real predictive power.
,.,, -fhen we &,. Gd IQ to the picture, it appears to provide no

251
additional pre6ictive power that is not already accounted
f or Ly Written Accuracy, but Coes provi6e some that is
not proviGed by average MLT- For reasons given in
Chapter 2, it seems likely that for a small and rela-
tively homogeneous group of deaf children? IQ has only a
small amount of pre6ictive power in accounting for vari-
ance in reading performance.

252
CHAPTER NINE
CONCLUSION

253
CEAPTER NINE
CONCLUSION
Casual observation of ci teaf children's perforrMance in
conversation with their teachers might suggest that their
language is somewhat stilted when compared with their
communications with their peers. This, together with the
results ot- our investigations into their often non-
linguistic strategies in coping with reading tests, might
have lea one to conclude that their linguistic competence
was a selection of special tricks' learnt to enable them
to cope with the specific demands placed upon them at
school. The central question pose(f. ý at the beginning of
this research was 'Is there an overall linguistic com-
petence? ' The answer, as shown in Chapter 8, woulU
appear to be I yes I, despite possibilities to the con-
trary. Reading,, average DILT and Written Accuracy seem to
be good predictors of each other. In other words, a
child who Cioes well on the reading test is also likely to
make long utterances in conversation with his teacher
(particularly af ter open questions) and to produce syn-
tactically accurate writing.
Before we go on to discuss the implications of these
254
results,, both for the classroom and for future research,
we should discuss one aspect ot the child's linguistic
competence that we have not so far touched upon. it
appears that not only does the teacher's conversational
strategy akfect the way the child responds, in the short
term at least, but also the child's linguistic competence
seen. s to relate to the way the teacher behaves towards
him in the first place. This is an issue of current
debate among those studying chilC language. Snow and
Ferguson (1977) , for exampleo, are among those who argue
that it is chances in mother language that affect the
child's language, whereas Cross (1977) places more
emphasis on the child as initiator of changes in the way
the mother uses language. In the present study we have
found that the proportion of high control moves a child
receives from his teacher is significantly correlateci
with his MLT's followinc; most types of teacher move,, be .o
they controlling or not. In other wordso, a child who
habitually receives few opportunities from his teacher to
elaborate anc: contribute will make short utterances in
conversation even on those relatively rare occasions when
he is given such an opportunity. Children who were
considered less able by their teachers and those whose
writing quality was poor also received more high control
movest as di6 those children who were less intelligent.
Although we found no significant correlation between

255
hearing loss and the total number of moves addressed to a
child (expressed as a proportion of all moves in that
session) , Wood et al (1982) did f ind such a relationship.
In the latter study, the deafer children received fewer
moves from their teacher than those with a less marked
hearing loss. Since the present stuCy replicates the
majority of Wood et al' s findings so clearly, it is
possi le that our failure to find such a relationship in
the present study could well be attributed to the unusu-
ally restricted range of hearing loss (discussed. in
detail in Chapters 4 ana 5) We also foundir common in
with I'Tood et al (1982) , that the deaf er children received
fewer substantive moves and, more repair moves. There
are further examples that serve to illustrate this trend
in Chapter 5. Since vi, e now know (from the results of
Chapter 8) that the child's linguistic competence in the
conversation session is related to other linguistic per-
forro, ance in which the teacher was not directly involveQ
Ue. Reading and Written AccurEcy) j, we need to consider
carefully the effect that such differences in teacher
behaviour may be having. Certainlyr it seems that teach-
ers tend to pursue conversational strategies with their
dear-er children that are counterproductive to their own
air, -is (getting children talking). Of courser firmly
establishing the direction of cause in such relationships
is a pervasive problem. What is also needed is C-L

256
thorouch investigation of the J interaction between
linc; uistic competence and response to chanc ;e in teaching
strc-ýtegy. We shall cor,. ie on to this later in a discussion
of possible future research.
The Warnock Report on tile education of handicapped
children (D. E. S.? 1978) and the resulting legislation
(1981 Education Act,, D. E. S. ) recommen6 that these chil-
Ci dren be educate-, within orclinary schools as far as is
possible. It will therefore become increasingly ii-al! por-
tarit Eýor ecucational psychologists and the peri, -. atetic
teachers involved in specialist back-up services for such
children to have access to reliable and valid tests
of achievement. These tests will be necessary not only
to establish which children are likely to succeed in
or6inary schools, but also to monitor their progress once
there. It would be an extremely difficult task otherwise
to (fietermine the success of a deaf childr especially when
surroundecil by hearing childiren and isolated, from his
peers. Our work on the use of hearing-referenced reading
tests with deaf children has pointed to the pitfalls
involved. We hope to find a reading test which will give
a more useful anct valid indication of a deaf child's
progress in reading than those that a. re commonly in use,
and are going on to ex. amine the perf ormance of deaf and
heEý, rinc children on the Edinburgh Read'ing Test with this
ismin c-,,, - The results o. -L' this study will enable us to see

257
whether or not the use of this test enables us to compare
the performance of deaf and hearing chil6iren's reading;
realistically.
Wc have identified three measures of linguitic cora- s
petence which seem to intercorrelate highly. Since there
is an overall linguistic competen'ce, it razýy well be a
useful e: -: ercise not only to use these measures for the
two purposes outlined above, but also to identify excep-
tions to the rule and look more closely at children who
do not follow the pattern. It is possible,, for example,
that a child who has relatively Iong IL', *. 'L-, T's but who
performs poorly on the reading test may be dyslexic.
There is no reason to suppose, if dyslexia is an identif-
4
. Lable syndrome, that it 6oes not e,,,., ist in similar propor-
tions in any population of children,, regardless of other
hancicaps. At such children go undetected
because poor reading ability is simply attributed to
deafness. For these three reasons, the development of a
diagnostic battery of tests (based on such measures as
used in the present study) which are simple to administer
and interpret would clearly be of value.
As far as the pedagogical implications of this
research are concerned, it would be simple-minced to
presume that paying more attention to one of the vari-
ables we have shOWn to be important (eg. encouraging the

258
production of longer utterances in conversation) will
automatically result in an improvement in another (eg.
reading) or vice versa. Firstly, we need to establish
beyond doubt whether or not avoidinS apparently unprof it-
able strategies in conversation will lead to long-term
changes in both the quantity and quality of the child's
conversational ability. Then it would be worth investi-
gating whether such improvements bore any relationship to
progress in reading anc writing. Alternatively, one
could research the possibility that an intensive course
of reaciing lessons might have some spin-off in the
development of a child's conversational ability. What
would be especially interesting here,, in the lic.. ht of
Howarth et al's finding (1981) that C. 7urinq a reacinc, ý
lesson deaf children spend relatively little time actu-
ally readinq, would be a study in which the teachers
attempted to avoid usincf the reading lesson as a general
language lesson. Another interesting tack to pursue
would be to investigate just how far inner speech (as
used by Conrad, 1S-79) monitors the linguistic competence
shown in this study. Since Conrad has shown inner speech
to be a very good predictor of reading in a large hetero-
geneous sample, it is possible that it is also a good
predictor of T.,,. 'ritten liccuracy and average Mean Length of
Turn.

259
On a final note, all the research in this study has
been conc-., ucted with children f rom ostensibly oral
schools. It is possible, however,, that the prcblems,
strategies, teaching techniques and educational goals
that it highlights may be relevant to all deaf children
regar(ýless of the actual form of communication (oral
method, sign language, cued speech and so forth) that is
used. The next stage in our research involves concen-
tratinlý, on these very areas that we have so far
neglected. It would be very interesting, other than
conductin, ý studies similar to this one with signing chil-
dren, to see how children in signing schools are taught
to rea6. It may be that the actual form of i cation
used is orily an initial and in some ways superficial step
towar6s enabling deaf children to learn language. The
problems that these children face require far more 'in
depthl investigations, analysis and (ultimately) inter-
vention studies if we are to make any headway in facili-
tating the task that the deaf child faces in learning to
communicate with his , Lfellow hunian beings.

260
REFERENCES
261
ALTUS, W. D. (1966) Birth order and its sequelae. sci- ence,, 151,44-49.
ANNETTj, M. (1970) The classification of hand preference by association analysis. Bxitish Journal of Psychology, 61,303-321.
ASHTON, r R. and BEASLEY, M. (1982) Cerebral Laterality in Deaf and Hearing Chil dren. Development al Psychol- oqv, 18, (2)r 294-300.
BEAUMONTF J. G. (1981) Split brain studies and the duality of c onsciousness. In G. Underwood and R. Stevens (eds) Aspects of Consciousness: volume II. Struc- tural Issues. London: Academic Press.
BECKER, r W. C. (1964) Consequences of Parental Discipline. In DI. L. Hoffman and L. W. Hoffman (eds) Review of Child Development Research, Volume I. Russel Sage Foundation.
BEGGSj, W. D. A. and BRESLAVII P. I. B. (1982) Reading Retarda- tion or Linguistic Deficit (111) :A further exami- nation of response strategies in a, reading test completed by hearing-impaired children. To appear in Journal gf Research in Reading.
BERNSTEIN, B. (1964) Elaborated and restricted codes: their social origins and some consequences. In J. J. Gumperz and D. Hymes (eds) The Ethnography of COM- munication. American Anthropologistr special publi- cation, vol. 66.
BEVER, r T. G. (1971) The nature of cerebral dominance in
speech behaviour of the child and adult. In R. Huxley and E. Ingram (eds) Language Acguisition: Models and Methods. London: Academic Press.
BISHOP, J. (1983) The Transition of the Deaf Child fro
Home to School. PhD. thesis. University of Notting- ham.
BOWEj, F. (1974) Deafness and mental retardation. In J. D. Schein (ed) Education and Rehab-ilitation of Deaf
Persons with Other Disabilities. New York: New York
University Deafness Research and Training Center.
BRADLEY, R. W. (1968) Birth order and school related

262
behaviour. PsvcholoQica. 1 Bulletin, 70,45-51.
BRASELl, K. (1975) The influence of early language and -communication envi onments on the development g-f lanquacie in deaf children. Ph. D thesis,, University of Illinois.
BRASEL, K. and QUIGLEY,, S. P. (1977) The influence of certain language and communication environments in early childhood on the development of language in deaf individuals. Journal of SiDeech and Hearina Research, 20,95-107.
BRESLAWj, P. I. B. r GRIFFITHSF A. J. r WOOD, D. J. and HOWARTH, C. I. (1981) The referential communication skills of deaf children from different educational environ- r-.,, ents. Journal of Child Psychology and Psychiatry, 22r 269-282.
BRILL,, R. G. (1960) A study in adjustment of three groups of G-eaf children. Excep: Lional Children, 26,464- 466.
BRILLj, R. G. (1970) The superior I. Q's of deaf children of dealf parents. Journal of Rehabilitation ý2-f the Deaf, 1, (2), 45-53.
BRINLER, A. (1972) Wide-span Readinq Test. London: Nel- son.
BRITISH ASSOCIATION OF TEACHERS OF THE THE DEAF (1981) Audiological definitions and forpas for recording
audiometric information. Journal of the British Association of Teachers of the Deaf, a, (3) , 83-87.
BROWNj, R. (1973) A First Language The Early Staqes. Harmondsworth: Penguin.
BRYDENF M. P., HECAEI-Jo, H. and DEAGOSTINI#, M. (1983) Pat- terns of Cerebral Organization. (Manuscript submit- ted for publication).
CHERRYr L. (1975) Teacher-child verbal interaction: an
approach to the study of sex differences. In B. Thorne and N. Henley (eds) Langua and Sex: Differ-
ence and Domination. Rowleyr Mass.: Newbury House.
CICIRELLI#, V. G. (1972) The effect of sibling relation-
ships on concept learning of young children. Chil
Development, 43r 282-2-87.
CICIRELLIF V. G. (1976) Sibling structure and intellectual

263
ability. Devel-Qpmental Psvcholoqy,, 12,, 369-70.
CLARKE, A. D. D. and CLARKE,, A. P. (1972) Consistency and variability in the growth of human characteristics. In W. D. Wall and V. P. Varma (eds) Nd-vances in Educa- tional Psychology. University of London Press.
CLARKE, A. M. and CLARKE, A. D. B. (1976) Early Experience: Myth and Evidence. London: Open Books.
CLAY, M. M. (1977) Readi Th-a Patterning of Comt)lex Behaviour, London: Heinemann.
CONRADj, R. (1977) The reading ability of deaf school- leavers. British Journal of Educational Psychology, 47r 138-148.
CONRAD, v R. (1979) The Deaf School Child. London: Harper and Row.
COOPER, R. and ROSENSTEINF J. (1966) IL, anguage acquisition of deaf children. Volta Review, 68,58-67.
CREBERr J. W. P. (1972) Lost for Words. Harmondsworth: Penguin.
CROSSj, T. G. (1977) Mothers' speech adjustments: the con- tribution of selected child listener variables. In C. E. Snow and C. A. Ferguson (eds) Talking to Chil- dren: LanguaýLg Input and Acguisition. Cambridge University Press.
CRYSTALF D. (1976) Child Lanciuagki, Learninct and Linguis- tics. London: Arnold.
CRYSTALf D., FLETCHER, P. and GARMANF M. (1976) The Grammatical AnalVSis of Langua Disability. Lon- don: Arnold.
", j, H DAVIE8, R. j, BUTLERj, N. and GOLDSTEIN (1972) Fro Birth
to Seven. London: Longman.
DAVIS, r D. J. r CAHANr S. C. and BASHIr J. (1977) Birth order
and intellectual development: the confluence model in the light of cross-cultural evidence. _Science, 196F 1470.
DEPARTMENT OF EDUCATION AND SCIENCE (1967) Units for
Partially Hearing Children. London: H. M. S. O.
DEPARTMENT OF EDUCATION AND SCIENCE (1978) S-oec-i&l Educ-a-
tional Needs; Report of the wa nock Commilt-g-'a of

264
Enauiry into the Education of Handicapped Children and Young People. London: H. M. S. O.
DEPARTMENT OF EDUCATIO14 AND SCIENCE (1981) Education Act (1981) London: H. N. S. O.
DIFRANCESCAj, S. (1972) Academic Achievement Test Results of 'I _Q
National Testin_q Program Lo_j Bear in_q-Impai red Students, Spring 1971. Series D, Number 9. Washing- ton DC: Gallaudet College, Office of Demographic Studies.
DITTMAR, N. (1976) Sociolinguistics: a Critical Survey of Theory and Application. London: Arnold.
DOUGLAS, J. W. B. (1964) The Home and the School. London: Macgibbon and Kee Ltd.
DUNN, F J. and KENDRICK, C. (1982) Siblingg 2: Love, Envy and Understanding. London: Grant McIntyre.
EDINBURGH READING TESTS (1977) Manual of Instructions. London: Hodder and StouShton.
EDWARDS, A. D. (1976) Lanctuagg- in Culture and Class. Lon- don: Heinemann.
EDWARDS, A. L. (1976) An Introduction to Linear Rearession and Correlation. San Francisco: W. H. Freeman and Co.
EEC REPORT (1979) Childhood Deafness in the European Community. Brussels: Commission of the European Communities.
ESSENO, J. and GHODSIAN, M. (1979) The children of immi- grants: school performance. Journal of the Commis-
sion for Racial Equality, 1, (3), 422-429.
EVANSF J. (1977) The significance of adult feedback on
child lanquage develo-piment. M. Ed. Dissertationr University of Bristol.
FAIRWEATHERp, H. (1974) Sex differences in cognition. Coqnition, 4,231-280.
FUý, '1,12, P`r H. G. (1973) Deafness and Learning- a Psychosocial
Approac - California: Wadsworth.
GAI, 'JSL,, I. and GARRET,, H. (1939) Columbia Vocabulary Test.
New York: Psychological Corporation.
265
GESCHWINDF N. (1970) The organization of language and the brain. Science, 170,940-944.
GLANVILLE j, B. B. p, BEST 0. C. T. and LEVENSON, R. (1977) A cardiac measure of cerebral asymmetries in infant auditory perception. Devel-opmental Psychology, 13, (1), 54-59.
GOODENOUGII#, F. (1926) Reasurement of Intelligence Drawinaa. New York: World Book.
GREGORYj, S-f, MOGFORD#, K. and BISHOP,, J. (1979) Mother's speech to young hear ing-impai red children, Journal of the British Association of Teachers of the Deaf, 1j, (2) j, 42.
GREGORY, S. and MOGFORD, K. (1981) Early language development in deaf children. In B. Woll,, J. Kyle and M. Deuchar (eds) Perspectives on British Sign Lanqua_qg and Deafness. London: Croon, Helm.
171,11Pr N. I. I. (1971) Reading attainment -and -some associated factors jn deaf and partially-hearing children. Unpublished M. Ed. thesis. University of Leicester.
HAMP, N. W. (1975) Picture Assisted Readinq Test. Northampton: Hamp.
HARTMAANF E. and HAARVINDO, H. (1977) Flothers as teachers and their children as learners. Report No. lt Institute of Psychology, University of Bergen,, Nor- v; ay.
HECAENj, H. and SAUGUET,, J. (1971) Cerebral dominance in left-handed subjects. Cortex, If 19-48.
HERRON, v J. (1980) Neuropsychology of left-handedness.
New York: Academic Press.
HINDLEYF C. B. (1962) Social class influences on the
development of ability in the first five years. In A. G. Skard and T. Husen (eds) Child Education. Copenhagen: Munksgaard.
HIIII'Ej, W. D. (1973) The no-response problem. British Jour-
nal of Audiol_Q! ayi, 7j, 16-20.
HINEF W. D. and FURNESS, H. J. S. (1975) Does wearing a hearing aid damage residual hearing? Journa-1 of jb-e
British Association of Teachers of the Deaf, 73,
261-271.

266
HIRSH, I. J. (1952) The Measurement of 11-earin_q. New York: McGraw-Hill.
HISCOCKF M. and KINSBOURNE, M. (1977) LI Selective listening asymmetry in preschool children. Develoy)mental Psvchologv, 1-3,217-224.
HOEMANN j, H. W. (1972) The development of communication skills in deaf and hearing children. Child Develop- ment, 43,990-1003.
HOWARD, R. G. and BROV7N,, A. M.. (1970) Twinning: A marker for biological insults. Child Development, 41,519- 530.
HOWARTHF C. I. and WOOD,, D. J. (1977) A research programme on the intellectual development of deaf children. Journal of the British Association of Teachers of the Deaf, 1, (1), 5-12.
HOWARTH, S. P. j WOODF D. J., GRIFFITHSj, A. J. and HOWARTH, C. I. (1981) A comparative study of the reading les- sons of deaf and hearing primary school children. British Journal of Educational Psvchologv, 51,156- 162.
IVII, FIEY, G. P. (1982) Assessing the language skills of hearing-impaired children -a critical review. 1: U'ork carried out within a behaviourist paradigm. Journal of the British Association of Teachers of the Deaf, 6. (5), 133-144.
JENSEMAF C. J. (1974) Post-rubella children in special educational programs for the hearing impaired. Volta Review, 76,466-473.
JENSEMAI C. J. (1975) The Relationship BetkZeen Academic
Achievement ADd the DeMOq aphic Characteristics of Hear inq-Imai red Children and Youth. Washington: Gallaudet College, Office of Demographic Studies,
Series R, Number 2.
JENSEMAj, C. J. and MULLINSj, J. (1974) Onset, cause and
additional handicaps in hearing impaired children. American Annals
-o-, t the Deaf, 119,701-705.
JENSEMA#, C. J. and TRYBUSr R. J. (1975) Reported
emotional/behavio ural Droblems among hearinq
childre n in special educational programs: 1972-11. Washington : office of Demo-
graphic Studiest Gallaudet College, Series R, Number
1.

267
JENSEMA, C. J. and TRYBUS,, R. J. (1978) Communication pat- terns and Educational Achievement of Bearinq Impaired
-Students. Washington: Office of Demo- graphic Studies, Gallaudet Colleger Series T. Number 2.
KARNESj, 1-1. B. j, TESKA,, J. A. and HODGINS,, A. S. (1970) The effects of four programs of classroom intervention on the intellectual and language development of four year old disadvantaged children. In J. M. Whitehead (ed) for The Open University (1975), Personality and Learnijj(j 1. London: Hodder and Stoughton.
KIMURA, D. (1967) Functional asymmetry of the brain in dichotic listening. Cortext It 163-178.
J KII-AiRAj, D. (1981) Neural mechanisms in manual signing. Sign Language Studies, 33,291-312.
KIMURA, r D. and ARCHIBALD,, Y. (1972) Motor functions of the left hemisphere. Brain, 97,337-350.
KINGDON, J. (in preparation) Relationships between tutors' conversational styles and students' contri- butions in university tutorial groupa. To be sub- mitted tow-trcs ca Ph. Dr University of Nottingham.
KNOX, C. and KIMURA,, D. (1979) Cerebral processing of nonverbal sounds by boys and girls. Neuropoycholo- cfia,, 8,, 227-238.
KYLEF J. G. (1977) Audiometric speech intelligibility. oqv, 11,51-58.
analysis as a predictor of British Journal of Audiol-
KYLE,, J. G. (1980) Reading development of 6eaf children. journal of Research in Reading, 1,86-97.
KYLE, J. G., CONRAD, R. #, MCKENZIE, M. G. #, MORRIS'r A. J. M. and 1: 1, 'EISKRANTZF B. C. (1978) Language abilities in deaf school leavers. Journal of the British Associ-
ation of Teachers of the Deaf, 2,38-42.
LABOVF W. (1970) The logic of non-standard english. In N. Keddie (ed) Tinker, Tailor ... The Llyth of Cultural
Deprivation. Harmondsworth: Penquin.
LABOVj, W. COHENs, P. 0, ROBINSr C and LEWIS, J. (1968) &
Stud of the Non-Standard English _QJ I-legro
--aij-d Puerto Rican speakers in New York CitYr I and II.
Final Reporty Cooperative Research Project 3288.
Washington, DC: US Off ice of Healthr Education and

268
Welfare.
LEESO, J. M. (1981) Conversational Strategies with Deaf Children. Unpublished DI. Phil. thesis. University of Nottingham.
LEVINE, E. S. (1956) Youth in a Soundless World: A Search f, Qx- Personality. New York: University Press.
DIACCOBY, E. E. and JACKLIN, C. N. (1974) The Psychology of Sex Differences. Stanford: Stanford University Press.
HARJORIBANKSj, K. and WALLBERG,, U. J. (1975) Mental abili- ties: sibling constellation and social class corre- lates. British Journal of Clinical and Social PsycholoQv, 14,109-116.
MARTONYg, J. (1975) On speech perception in the severel-y hearin_q imp ired and the deaf. Doctoral thesis. Stockholm: Institute of Technology.
DIATEERj, C. and KIMURA, D. (1977) Impairment of nonverbal oral movements in aphasia. Brain and Lanqua! ag,, Ar 262-276.
NICKEEVERO, H. 0, HOEMANNj, H. j, FLORIANj, V. and VANDEVENTERp, A. (1976) Evidence of minimal cerebral asymmetries for the processing of english words and American Sign Language in the congenitally deaf. NeuroP--
sychologia, 14,413-423.
11CGLONE j, J. (1978) Sex differences in functional brain asymmetry. Cortex, 14,122-128.
MCGLONEr J. (1980) Sex differences in human brain organi- zation: a critical survey. The Behavioural and Brain Sciences, 3,215-227.
MERCERF N. (1981) Langua_qe in School and Commun Lon-
don: Arnold.
MOGFORD, K. , GREGORY#, S., HARTLEY, G. and BISHOP, J. (1980) Deaf Children of Deaf Parents and Deaf Chil- dren of Hearing Parents; A Study of Adult-Child
Interaction. Paper presented to the XXIInd Interna- tional Congress of Psychology,, Leipzig;, East Ger-
many.
MONTGOMERY, G. W. G. (1968) A tion and ability in
journal of Educational
factorial study of communica- deaf school leavers. Briti-sh
Psychologyr 31,27-37.

269
DIOORES, r D. (1967) Applic-ations of procedures _t_Q the assessment
_Qj psycholinquistic abilities of the -deaf . Unpublished doctoral dissertation. Univer- sity of Illinois, Urbana.
MORSE, P. A. (1972) The discrimination of speech and non- speech stimuli in early infancy. Journal of Experi- mental Child P-sychology, 14,477-492.
MORLEY;, E. (1957) The Development and Disorders of Speech in Childhood. Edinburgh: Livingstone.
MURPHY, C. M. (1983) Talking About Television: opportuni- ties for Language Development in Younq Children. IBA Fellowship Report.
MYKLEBUSTj, H. (1964) The Psychology of Deafness. New York: Grune and Stratton.
LIAIYKLEBUST, H. (1965) Development and Disorders of Written Lanqua_q_Q: Picture Story Languag-e Test. New York: Grune and Stratton.
NAGAFUCHIF M. (1970) Development of dichotic and monaural hearing abilities. Acta Otolarvnq. r 69,409-414.
NANCEF W. and MCCONNELLr F. (1973) Status and prospects of research in hereditary deafness. In H. Harris and K. Firschhorn (eds) Advances in Human Genetics. New York: Plenum Press.
NASH, J. (1975) Sex differences and their origins. In J. Sants and H. J. Butcher (eds) Developmental Psychol- oqv: Selected Reading-s. Harmondsworth: Penguin.,
NORDEN, K. (1975) Psychological Studies of Deaf Adoles- cents. Studia Psychologica et Pedagogicaj, Seria Altera, 39. Lund: Gleerup.
NORDEN, r K. (1980) Hearing impaired children. In Research
and development concerning integration of handi-
capped pupils into the ordin school system. Stockholm: National Swedish Board of Education.
OINEILL, r J. J. and OYERrH. J. (1970) Applied Audiometry. New York: Dodd, Mead.
OINEILL, r M. (1973) The receptive lanqua_q-e cometenc-e of
deaf children in the use of th_Q base structure rules
_Q, t transformational generative grammer. Unpublished
doctoral dissertation. University of Pittsbursh,
Pennsylvania.

270
ORTON, S. (1937) Readinq,, Writing and Lpsi-Qý Problems in Children. New York: W. W. Norton.
PLOWDEN F B. (1967) Children, and their PximarY Schools. (Vol. l. ) A report of the Central Advisory Council for Education. London: H. M. S. O.
POOLEr R. (1975) Social Class and the SiDeech, Comi: )rehen- sion and Communicative Abilities of -4 and 5 year-old Children. PhD thesis. University of Hull.
PORTER, R. and COLLINS, G. M. (1982) Temperamental Differ- ences in Infants and Young Children. Ciba Founda- tion Symposium 89. London: Pitman.
POWER, r D. J. and QUIGLEY, S. P. (1973) Deaf children's acquisition of the passive voice. Journal of Speech and Hearinq Research, 16,5-11.
QUIGLEYF S. P. (1969) The influence of finqer spelling on the development of languagg, communication and edu- cational achievement in deaf children. Urbana: University of Illinois.
QUIGLEYr S. P. (1979) Environment and communication in the language development of deaf children. In W. Bradford and W. D. Hardy (eds) Hearin! a and Hearing Impairment. Pew York: Grune and Stratton.
QUIGLEY,, S. P. and POVIER, D. J. (1971) Test of Syntactic Ability: Rationale,, Test Logistics and Instructions. Urbana: Institute for Research on Exceptional Chil- dren.
QUIGLEYF S. P., r MONTANELLIF D. S. and V7ILBUR,, R. B. (1976)
Some aspects of the verb system in the language of cAeaf students. Journal of Speech and Hear
Research, 19,36-50.
QUIGLEY#, S. P., WILBUR,, R. B. and MONTANELLI#, D. S. (1976)
Complement Structures in the language of deaf stu- dents. Journal of Speec A-n-d Hearing Research, 19,
448-457.
QUIGLEYr S. P. j WILBUR, R. B. r POVIERj D. J. r MONTANELLIj
D. S. and STEINKAMP,, M. W. (1976) Syntactic Struc-
tures in the Lanquaqe of Deaf Chilýren. Urbana,
Illinois: Institute for Child Behaviour and Develop-
ment.
QUIGLEYj S. P., POWER, D. J. and STEINKAMP, M. W. (1977) The
language structure of deaf children. Volta Review,?

271
79,73-84.
QUIGLEYj, S-P. j, STEINKAMPr M-W-r POVIERr D. J. and JONES,? B. W. (1978) The Test of Syntactic Abilities. Beaverton, Oregon: Dormac.
QUIGLEY, S. P. and KING, C. (1981) Reading Milestones, Teaches-Is Guide. Levels 1,, 2 and 3. Beavertont Oregon: Dormac.
QUIGLEYr S. P. and KRETSCHMER,, R. E. (1982) The Education of Deaf Children: Issues,, Theory and Practice. Bal- timore: University Park Press.
RASMUSSEN, P. V. (1973) Evaluation of reading achievements of deaf children. In E. Kammp (ed. ) Evaluation of Hearin_q Handicapped Children. (Fifth Danavox Sympo- sium). Viborg: Polytekniska Forlag, 22-23.
RASMUSSEL,, T. and MILNER,, B. (11-3,77) The role of early left brain injury in determining lateralization of cerebral speech functions. In S. Dimond and D. Bliz- zarc' (eds) Evolution and Lateralization of the Brain. New York: New York Academy of Sciences.
RAVILINGSj, B. W. and JENSEPIAr C. J. (1977) Two Studies of the Families of Hearing Impaired Children. Washing- ton: Office of Demographic Studieso, Gallaudet Col- lege, Series RF Number 5.
RAVEN, J. C. (1958) Standard Progressive matrices. Lon- don: H. K. Lewis & Co. Ltd.
RAVEN, J. C. (1978) Flanual for Raven I -s
Progressive Platrices and Vocabulary Scales (revised edition) London: H. K. Lewis and Co. Ltd.
RIESj, P. W. 0, BATEMAN, D. L. and SCHILDROTH, A. (1975) Eth-
nic Background in Relation to other Characteristics
of Hearing Impaired Students in the United States.
washington: Office of Demographic Studiesr Gallaudet Collegef Series D, Number 15.
RISBERGj, A. (1976) A diagnostic rhyme test for speech audiometry with severely hard of hearing and pro- foundly deaf children. IEM-OPSR 40-57.
RISBERG, r A. and MARTONY, J. (1972) A method for the
classification of audiogramsr in G. Fant (ed)
Proceedinna-s of the International SvmT)osiu on Speech
Communication Ability and Profound Deafness. Stock-
holm 1970p 135-139. Washington DC: A. G. Bell

272
Association for the Deaf.
ROBINSONF E. J. and ROBIESON, W. P. (1981) V, Jays of reacting to communication failure in relation to the develop- ment of the child's understanding about verbal com- munication. EuroiDean Journal of Social Psychology, 11,189-208.
ROBINSON, E. J. and ROBIESON, W. P. (in press) Knowing when you don't know enough: children's judgements about ambiguous information. To appear in Co! ýnition.
ROBINSON, E. J. and ROBINSON,, W. P. (1982) The advancement of children's verbal referential communica-L-i0i'i L)k. ills: the role of metacognitive guidance. Inter- nationsal Journal of Behaviour Development, 5L, (3), 329-355
ROBINSONr W. P. (1972) Language and Social Behaviour. Harmondsworth: Penguin Education.
ROBINSONF W. P. and RACKSTRAW,, S. J. (1967) Variations in mothers' answers to children's questions as a func- tion of social class, verbal intelligence scores and sex. Sociolgay, 1,259-76.
SATZ, P. (1972) Pathological left-handedness: an explana- tory model. CorteK. 8,121-135.
SCHLESINGER#, I. H. (1971) The grammar of sign language and the problems of language universals. In J. Morton (ed) Biological 2ap_d Social Factora in Psycholinquis- tics. 11.; ew Jersey: Logos Press.
SHATZF M. and GELMANF R. (1973) The development of com-
munication skills: modifications in the speech of young children as a function of listener. 14ono-
graphs of the Society- for Researc in Child Develop-
ment, 38,1-38.
SIEGELF S. (1956) Nonoarametric Statistic-s for the
Behavioural Sciences. New York: McGraw-Hill.
SNOW,, C. E and FERGUSONf, C. A. (1977) Talkin-q to Childr! 2-n: Langua(le Input and Acguisition. Cambridge Univer-
sity Press.
SOUTHGATE,? V. (1962) Group Re ding Test (Test2j Form A-
Sentence Completion). London: Hodder and Stoughton.
SPERRYj, R. W. (1971) How a developing brain ge ts itself
properly wired for adaptive function. In J. Sants

273
and H. J. Butcher (eds) Developm ental Psychology: Select-Q-d Readings. Harmondsworth: Penguin.
SPRINGERl, S. P. and DEUTSCH,, G. (1981) Left B-rain,, Right Brain. San FranSisco: W. H. Freeman.
STEINKAMPr M. W. and QUIGLEYF S. P. (1977) Assessing deaf children's written language. Volta Review, 79,10- 18.
TEMPLIN, M. C. (1957) Certain Langua Skills in Children. Minneapolis: University of Minnesota Press.
TIZARDj, B., CARMICHAEL, H., HUGHESr M. (1980) Four year olds talking to ers. In L. A. Hersov and D1. Berger Lanctuaqe Disorder in Childhood. Book supplement to Journal of Ch Psychiatry.
and PINKERTON, G. mothers and teach- (eds) Language and Oxf ord: Pergamon.
ild Psychology and
TURNER, I. F. (1977) Preschool Playgroups Research and
. Evaluation Project. Final report submitted to the government of Northern Ireland Department of Health and Social Servicesf Department of Psychologyr Queen's Universityr Belfast.
'BERG#, D. E.. (1971) The Written Language of Deaf VAIMEN 0 I Children. Wellington: New Zealand Council for Edu- cational Research.
WABERj, D. (1976) Sex differences in cognition: a function
of maturation rate? science, 1_22r 572-573.
T-CIADA J. (1969) Interhemispheric sharing and shift of cerebral speech function. Excervta. Med. Found.
Int. Congr. Ser., Abstract no. 193, p. 296.
WEBSTER, A. (in preparation) Readin_q and Writinm in the
Severej, y Hearing ImiDaired. To be submitted towards the degree of Ph. D, University of Nottingham.
WEBSTERF A., WOOD, D. J. and GRIFFITHSj, A. J. (1981) Read- ing retardation or linguistic deficit? 1: interpret-
ing reading test performances of hearing-impaired
adolescents. Journal of Research in ReadiD_qr 4r
136-147.
j, 7 EDGEr P. and PROSSER, H. (1973) Born to Fail? London:
Arrow Books.
WELLS, v C. G. (1974) Learning to code experience through
language. Journal j2j Child Lanqua , lF 243-, 269.

274
WELLSj, C. G. (1979) Variation in child language. In P. Fletcher and rd. Garman (eds) Lanciuaq-Q Acsauisition. Cambridge University Press.
WILBURj, R. B. j, MONTANELLI, D. S. and QUIGLEY,, S. P. (1976) Pronominal izati on in the language of deaf students. Journal of Speech and Hearin_q Research., 21,9_, 120-140. WILSONi, K. (1979) Inference and Language Processing in Hearing and Deaf Children. Unpublished PhD. thesis. University of Boston (cited in Quigley and Kretchmer, 1982).
WOLFRAMr W. and FASOLD,, R. (1974) The Study of Social Dialect in American English. New Jersey: Prentice- Hall. re TIOOD, D. J. (1980) Review : The Deaf School Child (Conrad,, 1979) Journal
_Qj the British Associa-
tion of Teachers of the Deaf, A, (1) , 29-33.
WOOD r D- -I- (inn pre-paration) Deafness and the Minimu Distance Principle.
WOODj, D. J. j MCHAHON, L. and CRANSTOUNr Y. (1980) workiD-(j with Under Fives. London: Grant McIntyre.
WOOD,, D. J. and COOPERr P. J. (1980) An Experimental Study of Maternal Facilitation for A to 5L year Qjd Children's Memorv for Recent Events. Paper to XXI- Ind International Congress of Psychologyr Leipzig, East Germany.
WOODj, D. J., GRIFFITHS;, A. J. and EBSTERr A. (1981) Read ing retardation or linguistic deficit? II: test
answering strategies in hearing and hear ing-impai red
school children. Journal of Research in Reading, A,
148-156.
WOOD, D. J. #, WOOD,, H. A., GRIFFITHS#, A. J.,, HOWARTHj, S. P.
an c, HOWARTH C-I- (1982) The structure of conversa-
tions with 6 to 10 year-old deaf children. journal
o't.. Child psychology and Psychiatry, 23,295-308.
WOODF D. J. r VIOODI H. A. and HOWARTH, S. P. (1983) Lanctuager deafness and mathematical reasoninq. Procedings of
the NATO Conference on Symbolic Skills, Keele
University, july 1982.
WOOD, r H. A. and WOOD, D. J. (in press) Questioning the
preschool child. To appear in Educational Egayiew.
V70ODF H. A. and WOOD,, D. J. (in press) An experimental
evaluation of the effects of five styles of teacher
conversation on the language of hearing-impaired

275
children. To appear in Journal of Child Psycholoq and Psychiatry.
VIOODj, HI. A. and WOOD, D. J. (in preparation) Conversations witll`-ý deaf nursery school children.
WRIGHT;, C. J. and NUTHALL,, G. (1970) The relationships between teacher behaviors and pupil achievement in three elementary science lessons. American Educa- tion Research Journal, 7,477-491.
ZAJOIICF R. B. and MARKUS, G. B. (1975) Birth order and intellectual development. Psychological Review, B-Zr 74-88.

276
APPENDICES

277
LIST OF APPELIDILLO)
PAGE
I
II
III
IV
V
vi
IN VIýTION PROVIDE IFOP ýX I'D FOR TEACHERS 278
FURTHER Il''FORMATION1 ABOUT CHILDREN It,?. THE STUDY 285
EDINBURGH READING TEST :A FURTHER SALPLE 290
CODIIIG SYSTMI : THE SYIJTACTIC AITAT, YSIS OF REFERENTIAL C01111UNICATICIIIS 301
p -- IL 311
EXLEPLES OF TP--2'NSCRIPTL-.
DATA FOR IdULTIPLE REGRESSION : 'ýýIALYSES 318

278
APPENDIX I
INFORMATION PROVIDED FOR TEACHERS

279
APPENDIX I
INFORMATION PROVIDED FOR TEACHERS
This appendix is an exact copy of the information
sheet sent on ahead to the participating schools to be
distributed among those teachers with children in the
7-12 age range. As described in the introduction, I was
anxious to inform teachers fully about the details of our
research so that we did not appear to represent any
mysterious threat. I also felt their cooperation was
more likely to be gained if they were aware that the
ultimate purpose of our research was of an applied
nature.
NOTES FOR TEACHERS
The Deafness Research Group at Nottingham University
is funded by the Medical Research Council to study and
report on what has been broadly entitled "The Intellec-
tual Development of the Deaf "- Part of our previous
research has been directed towards gaining some insight
into deaf children's language learningr the structure of
their conversations with their teacher. -- and with other

280
children, an6A into their problems in learning to read.
However,, most of this research has been undertaken
by several researchers working in different schools withr
of course,, different children. We f eel it would now be
.C useful to obtain measures of all these language skills
for a single group of children, thus providing a
"linguistic profile" for every child involved.
This prof ile may be of use in the short term to the
school since it might serve to pinpoint specific problems
or fortes and help confirm the teacher's knowledge of a
child's ability. We hope to explore the relationship
between these language skills and use them to piece 0
together a more elaborate picture of language development
in deaf children, with a view to looking at their rela-
tionships to teaching style. Examples of possible ques-
tions to ask are : when is a deaf child most receptive to
the teaching of reading? Should a deaf child be taught
the structure of language deliberately and systematically
or is it possible for him to develop it more "naturally"?
Vie have tried to keep the teachers' active involve-
ment in this research to a minimum so as not to impose
too many demands on their time and patience. Howeverr
the News (or Conversation) Session is the one part of the
study which it is impossible to do without them. None of
this work can be productive or useful without the help of

281
the teachers ; we 6o not have the practical skills, nor
do we know the children well enough. We should emphasise
that our overall aim is not to produce a general critical
evaluation of oral education, but to help identify some
of the specific learning problems that aeaf children face
and to the describe the techniques that teachers use to
try anci overcome them.
therefore hope that teachers will be interested
in joining in our research and that with their help, we
will be able to offer some useful information for them to
consider.
Amanda Griffiths
LINGUISTIC PROFILE STUDY : OUTLINE
Detailed below are brief outlines of the four sec-
tions of the study. Apart from the conversation sessions
with their teachers on (if convenient) a Monciay,, I pro-
pose to take the children two at a time into an area or
room preferably away from their classmates where they can
do the game or task involved. I would hope to arrange
with each involved to begin work with them on a specified
Moniý'ay, and complete the remaining games/tasks with their

282
children on the following few days, in other words, to
devote one week to each class. Obviously, all these
arrangements will have to be fitted in without disturbing
the normal school routine, and causing as little disrup-
tion as possible to the activities that teacher has
prepared for that week.
1. News/C-onversation Session
Vte have found the "News Session" useful as a start-
ing point for investigating the language used by 7-11
year old deaf children. Here,, the teacher typically has
a small group of children with which she conducts a
conversation about their activities over the weekend and
other matters. It is therefore useful to record these
sessions on a Flonday, when the weekend is still fresh in
the children's minds. However, not all teachers use this
method, and we are anxious to look at conversation ses-
sions as they occur naturally, since we feel that teach-
ers will aain most from information which relates to real 0
classroom situations. In prFactical terms, this involves
putting a small video-recorder in the corner of the
classroom to record what happens. if at the end of a
session the teacher is unhappy with it, or feels that it
is not typical then she/he should not hesitate to say so
and the tape can be erased. Needless to say, all tapes
remain strictly confidential and are not shown to outside

283
parties unless the teacher involved has given express
permission.
2. Child-Child Conimunication
I'le have found the communication game outlined below
a useful tool for studying the language used by deaf
children with each other. Since the ensuing conversation
revolves around a known subject (a picture) we have some
clues to aid later transcription. Two children sit fac-
ing each other each with a copy of the sartle book. A
small screen on the table between them makes it impossi-
ble for one to see the other's book. One child then
describes a picture in the book so that his partner can
finc" it in his book. Each child does this several times.
I 7e have used this game with both deaf and hearing
children and have found that the deaf are surprisingly
successfulf in some ways more so than hearing children.
Furthermore, they usually enjoy it. Several teachers have
expressed interest in using these games themselves in the
classroom.
. 1. Writin-q
We are also interested in obtaining samples of the
children's writing. After the pairs of children have
completed the child-child comuiunication game, they will

284
be asked to describe one other picture to their partner
in writing. We will then see how effective these mes-
sages are when handed over to partners.
A. Reading Test
1,7e propose to give the Edinburgh Reading Test (Stage
1) to each child, either singly or in pairs, preferably
in a quiet room where they can concentrate. The Edin-
burgh Reading Test has been chosen because as well as
giving a reading age, it provides more information about
the nature of a child's reading ability than more common
reading tests. We hope to gain more insight into the
deaf child's reading problems by looking at the profile
of his score on the subtests (vocabulary, syntax,
sequencing and comprehension). The test manual recom-
mends a break in the middle of a test ; if possible the
first half will be given in the morning and the second in
the af ternoon.

285
APPENDIX II
FURTHER INFORMATION ABOUT CHILDREN IN THE STUDY
286
APPENDIX 11
FURTHER IEFORMATION ABOUT THE CHILDREN JLq THE STUDY
Information about the children is divided into 9
groups. The first 8 such groups represent the children
in each of the conversation sessions, while the final
group concerns those children who took part in all parts
of the study except the conversation session. The total
number of children is 50.
Hearing loss is measured as described in chapter 3.
The pure tone audiogram averages in the following tables
are calculated using the average of three frequencies
(50OF 1000 and 200 Hz) - Age is noted in years and
nearest month. An asterisk to the right of the child's
number indicates that his family is of Asian origin. Two
asterisks indicate West Indian origin. The teacher rank-
ings represent oral abilityv general abilityr attituder
writing ability and speech quality (noted in the tables
as Or, Abf Att Wr and Sp respectively) - The column
entitled "Cause" indicates cause of deafness where known.
Frequently the cause in not known and this is indicated

287
by "NE, ". All these variables and their effects are dis-
cussed in detail in chapter 2.
Group 1 --------- ------
Teacher rankings
I Child I I
-- H. Loss
-
----- Age
----- Sex
----------- Cause
-- Or
---- Ab
-- At
---- Wr
---- Sp I
1 -------
118 -----
9.0 -----
111 ----------
NK --- D
---- C
-- D
---- D
---- I DI
121 95 9.0 DI rubella C D C D CI 131 93 9.4 r, I NK D C C D DI 14 **1 68 9.8 m NK C C C C CI 151 103 10.2 F meningi C D C D DI 161 I ------- I
98 -------
9.0 ------
M -----
NK ---------
D ---
C ----
C ---
D ---
DI -----
lAveragel --------
96 -------
9.6 ------ ----- ---------
D ---
C ---
C ---
D ---
D -----
Group 2 Teacher rankiný;,, s
I Child I H. Loss Age Sex Cause Or Ab At --
Wr ----
Sp I
---- I ------- I 171
-------- 112
------ 6.10
----- 1,1
--------- rubella
--- A
--- C A B B
181 102 7.0 F hered. B A A B B 191 90 8.9 M here6. C B C C CI 1 10 1 113 8.6 M NK B B B C CI 1 11 1 87 8.4 F NK C D C D BI 1 12 1 47
-- 8.0
----- INI
------ rubella
---------- C --
C ---
D ---
D ----
CI ---- I I ------- I
lAveragel ------
110 7.11 B C ---
B ---
C ---
CI ----- --------
Group 3 -------- -----
-----
-----
-----
----------
----------
-- Teacher
--------- rankings -------- --------
I Child I --------
H. Loss Age ---
Sex -----
Cause ---------
Or -- *-
Ab ---
At ---
Wr ---
Sp ------ I ------- I
1 13 1 -------
80 ---
11.0 DI-I rubella B B B C B 1 14 1 118 10.5 F NK D D C D D
1 15 1 107 11.2 F NK C C C C C
1 16 **1 95 11.4 M NK D D B E D 1 17 1 98 11.3 m NK
-----
B
----
B
---
B
---
B
---
C
----- I ------- I lAveragel
--------
------- 100
-------
------ 11.0
------
------
-----
----
---------
C ---
C ---
B ---
C ---
C -----

288
Group 4 --------- -------- ------- ------- ---------
Teacher rankings
I Chilo I I ------- I-
H. Loss -------
Age ------
Sex -----
- Cause
---------
--- Or ----
--- Ab ---
-- At --
---- Wr
----
---- Sp I -----
1 18 **1 88 12.3 14 NK C C C B C 1 19 1 95 12.2 m NK C C C C B 1 20 1 88 12.7 F NK C C C D B 1 21 1 93 12.11 F rubella B C C C B 1 22 1 113 12.11 F rubella D C C D C 1 23 1 107 12.8 1,11 NK C C C C E I ------- I- lAveragel ---------
------- 97
-------
------ 12.7 ------
-----
-
--------- --- C
--- C
-- C
---- C
----- CI
Group 5 -------- -------- ----
---- --------- ---------- Teacher
---------- rankings
I Child I I ------- I
H. Loss --------
-- Age
------
----- Sex- -----
----------- Cause
---------
--- Or ---
--- Ab ---
-- At --
----- Wr
-----
---- Sp ----
1 24 **1 97 13.7 F rubella D C C C E 1 25 1 88 13.1 DI NK C C B C C 1 26 1 112 12.10 F I'll' C C C C D 1 27 1 100 12.8 m jaundic C C C C D 1 28 1 103 12.10 M NK A C A B B 1 29 1 65 13.0 11 NK C D C D B
itiveragel --------
------- 94
-------
------- 13.0
-------
----
-----
---------
---------
--- C
---
---- C
---
* --- C
---
---- C
----
---- C ----
Group 6 -------- ------- ------ ----- ---------
Teacher ----------
rankings --------
I Child I H. Loss Age Sex Cause -
Or ---
Ab ----
At Wr -------
Sp ----- I ------- I
1 30 1 -------
90 ------
9.6 -----
F ---------
NK A A A A A 1 31 1 97 11.6 F ITK C C C D C 1 32 1 8 -50 10.10 F rubella B C A B F, 1 33 1 88 10.10 F NK A A B B B
1 34 1 93 9.2 F 14K D C B D D 1 35 1 103 10.11 F IqTK C A A D D
1 36 1 60 10.9 F IJK ------
A ---
C ----
A --
B ----
A ------ I ------- I
lAveragel -------
88 ------
10.6 ------ ----
B B B B B
-------- Group 7
-------
----
------
-------
-----
-----
---------
----------
--- Te
---
--- ach ---
-- er ---
--------- rankings
--------- -------- I Child I
--- H. Loss Age Sex.
---- Cause
--------- Or
--- Ab
--- At Wr
------ Sp
----- I ------- I 1 37 1
-------- 98
------ 12.1
-- m NK C B C B C
1 38 1 98 12.6 I'l 11K D C B B C
1 39 1 93 11.10 m 11K --
B -- *-
C ---
B --
B ----
B ------ I --------
lAveragel --------
------- 96
--------
------ 12.2
------
-----
-----
-------
---------
C ---
C ---
B --
B ----
C -----

289
Group 8 --------- ------- ------ ------ -
Teacher rankings
I Child I ---------
11-Loss --------
Age ------
Sex -------
---------- Cause
--- Or
----- Ab
-- At
------ Wr
---- Sp I
1 40 1 75 12.4 -
1.1 -----------
NK --- B
--- D
-- A
---- D
---- B
1 41 1 103 11.6 i 1, rhesus D D D E EI 1 42 1 I ------- I
98 --
11.7 m NK C C C C CI
lAveragel --------
----- 92
--------
------ 11.9
------
-------
-----
----------
----------
-- C
---
--- D
--
--- C
---- D -
----- I CI
- Group 9
-------- -------- ------ ----- ----------
---- Teacher ---------
- ----- rankings --------
I Child I 's H. Loc Age d Se,: Cause Or Ab At V7r Sp I ------- I 1 43 1
------- 98
------ 9.7
----- 11
---------- NK
-- C
--- C
--- C
--- C
----- C
1 44 1 78 9.5 F rubella A C A B A 1 45 **1 87 9.6 M NK A A A B B 1 46 1 65 10.0 m NK A D E D A 1 47 1 77 8.1 F hered A C A A A 1 48 1 115 10.7 M rubella B B B C C 1 49 1 97 8.6 F jaundic D C D D D 1 50 **1
I 93
- --- 8.9
------ m
----- 1"M
--------- D
--- C
--- D
--- D
--- C
----- I ------- lAveragel --------
- -- 89
------- 9.4
------ ----- --------- B
--- C
--- C
--- C
--- B
-----

290
APPE11DIX III
EDINBURGH READING TEST :A FURTHER SAHPLE

291
APPENDIX, Ila : CONTENTS
a, ge
INTRODUCr., 'IOIJ 292
NIETHOD 292
RESULTS AMD DISCUSSION 294
Edinburgh Reading Test subtest scores 295
Edinburgh Reading Test subtest correlations 296
Edinburgh Reading Test subtest scores: 297 sex differences
Correlations with other chilc variables 299

292
APP. LL, Ua, ý, L I ,U
EDINDIMM RE DING TEST :L FURTHER SAMPLE
INTRODUCTION
As explained in the chapter on reading (no. 4) there
were several reasons why I was concerned about placing
too much emphasis on the results of the reading tests I
had administered. To recap, the main problem was that I
did not know the children very well and therefore was
open to misinterpreting their difficulties. On several
occasions I abandoned a particular set of items with a
child because I judged him unable to continue: obviously
was open to error here. Furthermore, it is possible
that my explanation o-. ', ' the task was inadequate. If the
child's own teacher had admini-sitered the test she would
probably have been in a much better position than me to
judge his limitations and to find the most effective way
of explaining the problem to him. The Edinburgh Reading
""est (hencef orth referred to as the ERT) far more than i
most reading tests, requires a lot of explanation from
the teacher: there are 8 different sets of items in the
test, each of which requires a different explanation. I
suspected that the children would probably have achieved
higher scores if their own teachers had administered the

293
test. Informal observation of some of the children's
test performances 6 months later suggested that this
might well have been the case even allowing for 'normal'
improvement. Since there was a possibility that I rdcýht
have been a factor in determining how well some of these
children would do on certain items, it was also possible
that I would bias the pattern of subtest scores and their
intercorrelations.
One way of checking these possibilities and easing
n -, 7 own mind about the validity of the ERT data was to
gather another sample of ERT's from deaf chil6ren whose
own teachers had administered the tests. If the two sets
of (ýata yielded fairly similar patterns of results, then
I could be reasonably conf ident that the f ir--t set of
data was not unduly abnormal.
As describe6 in chapter 4f a school was found from
which we could gather data that was free from some of
these problems. one teacher has taken a particular
interest in the ERT over the four or five years that- the
school has been using it anct keeps records of each
child's progress over the years. She has discovered what
she considers to be the best method for giving instruc-
tions, has devised extra examples for practice and admin-
isters the ERT as a group test (strictly time(f.. ) in a
large room with several invigilators, all of whom have

294
discussed the test and its administration in detail. The
invigilators are teachers who are familiar with the chil-
-I Gren and are there to check that the test instructions
have been understood.
METHOD
Data were gathered from this school for 31 subjects.
These constituted all children in this school who had
done the ERT Stage lr Form B (since all my original
sample did only Stage 1, Form B) in that year. Using the
latest audiograms available from the s-chool, it was cal-
culated that these children had an average hearing loss
in the better ear of 104 dB and had an average age of 13
years. There is no reason to believe that these children
are in any way significantly different from those in the
original sample, apart from the fact that they attend a
boarding school.
RESULTS LIM DISCUSSION
The data from this second sample were analysed in
much the sarne way as those from the original sample. For
ease of comparison they will be presented in the same .L
way.

295
Edinburgh ReadiLiq Test subtest scor2s
Table A: l shovis the means and standard deviations
for each subtest and the overall score. It can be by
comparing these with the original means that a very
siruilar pattern of results has emerc,., ed, with this later
group doing slightly better overall. This sample is
slightly older (13 years as compared with 11 years 7
months) than the sample in the present study. They are
also slightly deaf er (103dB as compared with 94dB) -
--------------------------------------------- II Means Std. Dev. I ---------------- I ---------------------------- I Vocabulary 1 15.5 3.5 111
Syntax 1 16 4.5
1 Sequencing 1 14.5 3.5 111 1 Comprehension 1 13 3.5 1 ---------------- ---------------------------- I Total 59.5 12.5
--------------------------------------------
Table Ii: 1 : Means and stanuard deviations on ECinburgh Reading Test subtest and overall scores for further
sample.

296
Edinburgh Reading Test subtest correlations
As can be seen in Table A: 2 (below) all the subtest
scores correlate highly with each other as well as with
the total score. If anything,, these results intercorre-
late more highly with each other than in the original
sample,, but the differences would not be significant
using the Fischer Z statistic.
----------------------------------------
Vocab Syntax Seq Comp
1 Voc ab
ISyntax 1 II
. 69 -------
ISeq 1 II
. 60 . 71 -------
ICOMP 1 . 55 . 79 966 ------- II ITotal 1
-------- . 82 . 93 . 81 . 86
------------------------------------------------
Table A: 2 : Edinbur(ýh Reading Test subtes-t correlations for further sample.
p< . 05 p< . 01
p< . 001

297
Edinburcih Reading subtest scorQs : sex differences
As with the original saiý,, ple we split the 6ata into
two groups to look at sex cifferences. The results
overleaf (Figs. A: 3 anci A: 4) shoT., I-, a very similar pattern
to that found in the original sample, namely that the
overall ERT subtest correlations mask large sex (fiffer-
ences; the girls' (n=16) subtest scores intercorrelate
much more significantly than the boys' (n=15) scores. We
used the Fischer Z statistic to see whether the differ-
ence between the boys' and girls' intercorrelations
achieved significance. This revealed that as a rule,
these differences were more significant than those in the
original sample (see Table A: 5). once again this con-
firms the findings of Nor(fen (1975) that one particular
measure of linguistic ability for girls is a much better
predictor of performance on other linguistic measures
than it is for boys. Unfortunately the data that we
currently have available from the test devisors in Edin-
burgh do not c-,;. Jlow us to make such a comparison with the
performance of hearing children.

298
Vocab Syntax Seq Comp ----------------------------------------------
lVocab I
ISyntax 1 . 56 ------- II ISeq 1 . 24 . 54 ------- II ICOMP 1 . 24 . 74 . 57 ------- I III ITotal 1 . 67 . 92 . 72 . 79 ***1
Table A: 3 : Edinburgh Reading Test subtest correlations (boys only) for f urther sample.
II
I - ---- Vocab
------------ Syntax Seq Comp
---------------------------------- -- - lVocab I -------
ISyntax 1 I
. 80 ------- I ISeq 1
I . 85 . 83 -------
I ICOMP 1 II
. 76 . 82 . 71 ------- II
ITotal 1
-------- . 93
------- --- . 94 . 87 . 90 ***1
--------------------------------------
Table A: 4 : Edinburgh Reading Test subtest correlations (girls only) for
f urther sample.
p< . 05 p< . 01
< . 001

299
Vocab Syntax Seq Comp ---------------------------------------------------
lVocab I -------
ISyntax 1 . 0014 ------- II ISeq 1 . 00003 oOO03 ------- II ICOMP 1 . 00003 . 098 . 0689
ITotal 1 . 00003 . 3336 . 004 . 0102 1 --------------------------------------------------------
"'able A: 5 : Significance levels (Fischer Z) between Edinburgh Reading Test subtest correlations for boys and girls for further sample.
p< . 05 p< . 01 p< . 001
Correlations with other child variables.
As with the original sample of children, we did not
find a significant correlation between hearing loss and
reading ability. However, as explained in chapter 4. the
reason for this is probably due to the fact that the
children were all very deaf. Indeedi, the children in
this further sample were even deafer than those in the
original sample (103 dB as compared with 94dB) .
One unexpected correlation that emerged was that
-e and between &cjý hearing loss (P<. 01). However, t 11 is 1, i, ý
the result of a slightly odd sampling procedure. As the

300
original sample consisted of children who all did Stage
on the ERTr I was only interested to obtain test booklets
from another school from children Who had done this, same
stage. I therefore took results from this school for all
children who had Ci This complete. Stage I that year.
resulted in a different cut-off point for age, since in
the original sample I had aime6 to get children between
the ages of 9 and 12. This further sample included
children who were much older,, less able Ue. they were
doing Stage I when their peers had probably moved on to
Stage II) and,, as one would e-. %I. pect,, more deaf. It
4 these children who contribute to th A. ýC correlation. This
was checked by dividing the sample in half;: those who
were older than the mean acie (13 years) and those who
were younger. The two groups' hearing losses were then
cor-iipared and found to be significantly different (p<. 03).
The older children were inCeed much deafer.
In conclusion, the results from the two samples of
children showed clear similarities. Thi-, s enabled us to
be reasonably confident that the fact that a stranc-er
administered the tests did not have too profound an
effect on their performance.

301
APPENDIX), IV
CODII, -,, C SYSTEll : THE SYNTACTIC ANLLYSIS
OF REFERENTIAL COMMUNICATIONS

302
APPENDIX IV
CODING SYSTEM : THE SYNTACTIC ANALYSIS
OF REFERENTIAL COMMUNICATIONS
Below is reproduced D. J. Vlood's detailed guidelines
for the syntactic accuracy coding system that was briefly
described in Chapter 6. Ue used this system to analyse
both the speech used during the referential communication
task (Chapter 6) as well as the Written messages (Chapter
7)
What do we analyse?
On meeting a particular transcript, the first c-,, eci-
4 sion to make Lnvolves the i., --olation of words or groups of
words which will not be subject to further analysis for
the syntactic component. There are a number of these: -
i. If it is clear that you must use more morphemes
than are spoken b,,,;, the child in order to construct .L
the simplesty appropriate sentence(s) you can
think of, the transcript or section of transcript
is rejected as lunanalysablel.

303
ii. Occasionally, a child will correct himself, eg.
"the pirate had a paper .. map ... and tbe map
Was... the wind ... the map was blown by the wind "
In these cases, the individual word or phrase which
is repeated is only scored once, choosing the iTaost
fladvc-,, riced" or meaningful version (e. g. in the above
"the pirate had a map: the map was blown by the
wi nc-, ". The arrows indicate the unit of utterance
in the self-correction).
vii. All comments which are to do with the regulation
of the game (whether from the receiver, sender
or the e. -, -perimenter) are not considered in this
this part of the analysis, though they will be of
considerable interest in E; separc-ate analysis of
control of the dialogue. So, for example, where
the sender says "Ok? " or "Look for it" or (to E)
"llhat's this called? "f these are cut out.
iv. Very rarely, a child moves beyond the picture
to describe earlier subsequent made-up events.
Since there is no independent semantic support
for analysing these utterances, they too are
ignoreeý-

304
Allowing for the inter-subjective Component.
Many of the transcripts (particularly of the deaf
chil6ren) begin with -, L def inite article and noun, eg.
"The pirate has a blue coat... ". In writ'Cen syntax this
might appear inaccurate since "The" serves as an ana-
phoric reference to an entity already specified. How-
ever, since the child knows the rules of the game Ue.
that they are describing pictures to eýach other, which
have a pirate, dragon, ship etc. ) it could be argued that
a measure of inter-subjective understanding obviates the
neeC for definition of the entity (although we shall also
examdne starting phrases as a way of looking into egocen-
In view of this possibil- L-risi-ir conte.,;, t cependency) -
ity, each opening utterance is assume6 to be prefacet-i by
a tacit utterance along tile lines of "The , Dicture shows
It It 00S or "In the picture there is ... 0 Thus, any opening
wit". a determiner is C-IccepteC at this level of analysis,
though an openingo, say, with a verb would not since
entity in this case (noun, pronoun etc. . .) has been
deleted.
The Analvsis ProT)er.
There are a number of constraints to bear in mind
when trying to idealise an utterance in relation to its
referent picture. These are: -

305
i. Wherever possible keep all words used by the
child (subject to exclusions in (ii) above) . Only as a last resort should a word be changed
or dropped.
ii. Similarly, try to maintain word order as far
as possible. Only when other, counter
indications in the child's own syntaý-. clearly
mark a word order error or when it is
ir. possible to make sense of the existing
one wit'l-. out inserting many words should
worC order be chanced.
iii. Any 'correction' which is &PPlied (such as
adding an inflexion, pronoun, auxiliary verb
and so forth should do justice to as many
of the selectional constraints imposed by the
child Is OV7n synta; x. as possible.
iv. Where more than one option Suqqests itself
then always take the one which demands
least addition/modification. Fortunately,
tl-ýe semantic constraints imposed by the
pictures themselves keeps the range of
options small except in (1-i) which we
ignore anyway.
The following list are all e.,,, amples found in the

306
transcripts together with the sorts of changes/ ac-I'd it ions
'I macie to theirt. These will be presented in turn (in no
particular order) and an atter, -ipt made to speciLy the
general decision rules to which they yield. No attempt
is made, as yet, to specify how representative/frequent
each of these chancies is arid it is highly likely that new
data will yield its own crop of new cilange rules. As a
rule, the transcripts are moCif: ie6i using actual words..
althoucfh it is now proving possible to categorise the
chancies using quite standarc" grammatical terms (eg.
change determiner, add infleLion, add auxiliary verb and
so forth). This is the way in which we will eventually
catallogue errors - the great advantage of this is that it
enables us to make direct comparisons with Quigley's data
on reading/v, -riting and it ties us into mainstream
linguistics. The weakness at the moment is that we are
not too sure of some of the linguistic classes needed at
the moment. These are simply marked with (? ) after them.
Example and 'change rules'.
In the following examples, those words in brackets are
those that have been changed. Those not in brackets form
the originalr uncorrected versions.
EX ! LI£1. LE- 1

307
The man throw(s) the map
(add infle.,: ion)
E. ' "AMPLE 2
The man throw(s) the map (into the) sea.
VTe add an inf lexion, a preposition anci a determiner.
EXALIPLE 3
(A man with a) hat, long hair,, boots,, reading (a) paper.
I-le add a determiner, noun, an6 2 prepositions. The
second determiner (a hat) n. ay seem a bit pedantic,, but
seems on balance to warrant inclusion.
EXAMPLE 4
He (is) wear (ing) (a) black hat and he wear (has) black hair and he (is) hold (ing) (his) han6 out because the wind goes C'i,,, hoosh") (and) the f-, iap blow(s) away.
Here we have an ex-ample of adding an auxiliary verb, an
inflexion, and a determiner. "ITear" has been chancied to
"has" and has been treated as a violation of a semantic
selection rule. Then we add another auxiliary verb, an
inflexion and a (possessive) . -, ronoun. This is r-ollowed
by inserting the verb "Whoosh" but it is not critical
exactly iý,, hich verb is used. This particular verb is
called for both by the gestu.,. res accompanying the utter-
ance and by the syntactic frame ziround the 'gap' in the

308
speech. Finally we add a conjunction and an inflexion.
E, 'i', L, 111PLE
pirate got (wz,, s) read (ing) the map ... um, was sitting on his deck, but the ... (rc. ELP) ... went down and the winc, came and the map blew out of his hands.
This is given to illustrate again an example of a change
of morpheme, since e), -ample of adding "map" since map is
so clearly called for given both speech and gestural
context.
EXAMPLE
blan he try (ies) to catch it.
This shows an example where we delete the word "Elan"
since the pronoun renders it inappropriate. Had a long
ga-,.. been indicated between "Man" and "he", we might have
acided a determiner (The man ........ he tries... ). Another
alternative is "The man try(ies) to cz: ltch it" but this i---,
rejected because it ignores the "he" (and thus also
involves deletion) plus other chanc, -! e rules.
EXALIPLE
The hat the wind blew.
This became "tile wind blew the hat". This is a bit
hazardous since the child might have meant the hat
(which) the wind blew (adding a pronoun) but this seemed
an unlikely semantic and syntactic possibility for a

309
young deaf child. It might also have been simply otarkec
by a pause The hat ... the wind blew ("the hat" being
then tacit) - but it is doubtful.
EXAMIPLE 8
(a man with) black hair, touching his head. (He has a) red cat and black W.
This transcript only -just gets accepted as codable - and
the result probably flatters the child involved. "Black
hair", the first words of his utterance, demands the
. addition of a Ceterminer, a noun and a preposition. The
"touchincý his head" just scrapes by without needling
another phrase ("he is touching".. ) but the "red coat and
black" after must surely demand another pronouni, verb,,
Ia noun determiner and
-T
The pirate with a black h, -; it with a red coat and trousers, with black bootS (and a boat) with a red sail.
The f irst set of propositions is a bit ungainly ("with a .L
T-ost sug- rec, coat") and "trousers with blacil: boots" alL,
gests that "boots " are an attribute of "coat and
trousers". Howevero, it is probably just acce, i--,, table
(though probably flatters the child). However "with a
11 reC! sail" tagged on (without specifying the entity which
pos, sesses it) clearly cannot be allowed. So we have
added a conjunctiont a 6eterminer and a noun.

310
Scor-i-ag systera
All corrections for each utterance or message can be
summarised on a table such as the one below. Similarlyr
one can used such a table to summarise all corrections
for certain groups of children if lookinS for differences
between croups. I The actual figures in Table L: 6
represent a summary of the corrections r, -. ade to 37 written
messages by deaf children.
I add Ichange I
Idelete Irelocatel II
linflexion 1 32 12 121 lprepostion 1 16 12 1212 Ideterminer 1 20 1 181 Inoun 13 11 121 laux. verb 16 12 121 Iconjuriction 17 1 11 ladjective I I II lpronoun 11 1 111 Iverb 16 13 1211
91 1 31
Table A. 6 : Exaiiple of a scoring table for syntactic analysis of referential comi. ýunications.
An accuracy score can be calculated for each message. We
a6d the number of morphemes that have had to be change6
(deleted,, relocated,, etc) to the number of morphemes in
the original utterance; this forms the denominator. The
number of morphemes in the original (uncorrected) version
is then expressec as a. percentage of this. An example

3 11
is:
(The) sea, rocks, (a) boat (and the) sky.
Here 4 i. iorphemes have had to be added to the original 4.
This gives a score of 4/8 or 50% accuracy.

312
APPENDIX V
EXAMPLES OF TRANSCRIPTS

313
APPELDIX v
EXAMPLES OF TRANSCR-IPTS
Below are reproduced e,,, -, tracts f rom the conversations
held between the teacher and her children as describe6 in
chapter 5. The teacher--- I turns are noted by a '-L' and
the children Is by a 'C' . Each child is given a number to
facilitate transcription. Details about all the children
are given in Appendix II. Thus,, in the f irst extract
below (taken from conversation session number 5) , the
Cietails about C2 are given in the second row of tbe table
in the Appendix entitled 'Session Five'. A description
of how we transcribe tl--a. pes is, given in Chapter S. A
series of: blank lines ( ---- ) represents a word that we
cannot understand. W'ords in brackets are not not spoken
but are usually ex-r-lanations o-', -- signs or actions. Even
viith a fairly complete idea of what is being said (as is
the case with the examples below) it is still not possi-
ble to code the conversation without the presence of the
original tape since the the meaning is not alway.., 3 clear
without clues provided by intonation, expressions and
gestures. However, these ex. tracts do provide a '. Leell of
ther F-,, v, 7 material for the analysis of convers-'ations as
described in Chapter 5.

314
EXTRACT No. 1 (from session 5)
I saw someone collecting wood for a bonfire and he had a pram, an old pram. And every time they found some wood they put it in the old pram and pushed it.
C4- Who did that? T-I saw someone the other week doing
that. C4. - Oh. T- Have you ever seen anyone doing that? C4- No! Pram ---- ---- carrying. T- Using a prcam- (to C2) Did you ever
see anyone using an old pram? C2- 1, -ý, o. T- To put the wood in so you don't have
to carry it? C2- All people carry it. T- Pardon? C2- People carry it. T- People carriec-, it. Did you have to
carry a lot? C2- 170 - ---- ---- dirty!
EXTRACT No. 2 (from session 5)
T- Does anyone know, can anyone remember why we put a Guy Fawkes on the bonfire?
C4- T- Can anyone remember? C2- (puts up hand)
'amid T- (to C2) L C2- Fire T- Why do we put a Guy Fawkes on the firer
why? Can you remember? C2- Put man on because people want. T- Pardon? C2- Because all people like.
T- 1--fo! lt', 'ot because all people like it.
1,7hy do we put it on the fire?

315
C4- Why put guy? (said for O's benefit) T I. L "here's a story, there's story- Cl- Yes! Good, very good, very good fire! T- It does i-nke a good fire,, yes,, but that's
not it. C2- Story! T- Stella, can you remember why do we put
the Guy Fcawkes on it? C5- Oh! Guy Fawkes (gestures a bonfire with
something on top). T- Yesj, but why? Cl- Hamidt look T-A long tiiL-,, e ago, there was a man called
C, uY Fawkes and he wanted to kill the king.
C6- Kill? T- He wanted to kill the king. He thought
the king was evil and bad so he wanted to kill the king. So he waited and waited until the king came to Parliament,
'erneath held ajot Lig boi. es of and unc, gunpowder. What's gunpowder?
C4- Gunpowder, ah! r-'rs. Jenkins! (mimes
elaborately the action of looking down the barrel of a gun and then pushing something down it) Psshh! (shoots gun)
T- That's right! Good girl, yes! It goes in guns.
C4- Ba(ý, a little bag. T- And a little bag. it used to be like
that. 1, -Ow it's inside the bulletr the
gunpowder. And something else you know that's got gunpowder in?
C4- Bulletst fire, snap! T- 1-7hat's in the gun, what else has got
gunpowder in? .... Firel7orks! Fireworks have cot gun-r)o,,,,,, der ins Anyway, it
IL makes c-A big bang and blows up. And__, Guy Fawkes Put lots and lots of in the cellarr in the cellar, and he was going to light it when the king came ....

316
T- C5- T-
C5- T- cl- T-
EXTPJiCT No. 3 (from session 6)
Now then! C,,, oocA' r.,, orniny, Jenny. Good morning, Mrs. Robinson. I think. Judith is a little bit morninc, ý. You tcll them ýý, Thatls
Auntie Bella died. Yes, Auntie Bella (Aecl. Oh!
sad this happened.
You riý-cei; iber,, Judith's Auntie Bella? She's been poorly for a lonq time, hasn't she?
C3- (to Cl) You remember, ---- ----- (s-igns-poorly)
cl- T-
C5- M. C5- rL-l - C5- T- C5- T-
c5- T- c5-
Ahh! So, on I-Jednesday Judith v, ýill go on a long journey, won't you, Judith? (nods) You co with Mui. ir, --.,,: - and Daddy? Elummv, Dadc-Av, Donald and me. In the car? (no6s) Who will drive? DaGdy . Daddly will drive. Will a little bit? No! 1-1-1v? TFi7ot me, briver.
you drive

317
E'. '., '. '--, "RACT No. 4 (from session 7)
T- 1-1hat's this? Cl- People pull! T- 11hat's this? Cl- Root. T- Good boy! C3- Red! T- It is red, it is red,, but what's
it called? Cl- Root. C" -, - It's & root, yes, it's root. C3 - ---------- T-I think you've forgotten. Radish! Cl- Raciish. C3- Racish. 7- Rac,! ishr a radish. Cl- In my house, ugh! (mAmes pu-'Lling somethincr
out of his mouth and not liking it). T- (laughs) C3- Uhere? T (to C3) Yes, I got these from my garden. CZ1- GarCen.
1. T- (picking something else up) Where's this one come from? Where did I get this one?
C2- Your! C3- Yourr the garden (points to outside). T- Yes. Ourr the garden outside, the garden
outside. C2- Dead, dead! T- Ah, well ... no, it's still alive, but .... C2- Laby, grow.

318
APPENDIX VI
DATA FOR 1111ULTIPLE REGRESSION ANALYSES

319
APPE DIX 3ZI
DATA FOR MULTIPLE REGRESSIOU ANALYSES
Given belOV7 (in Table A: 7) are the raw data used in
the multiple regression analyses described in Chapter 8.
Each child is noted by a nuiuber in the f irst column which
i. zw) the samie as that ýJven in Appendix II (entitle, '
I Furtli, er Information about the Children') . So,, further
information about the children, should it be requiredr is
readily obtained by reference to that Appendix. The
blank spaces in the table represent data unavailable for
ti-at particular child. The reasons for lack of (f. ata are
-, resented in the relevant chapters. It can be seen from ký
the table thzat 6ata concerning IQ, for are only
available for 34 of those children who have scores on
every rc4easure. Therefore, in the multiple regression
analysis involvinc! IQ (ie. Analysi_s 3 in Chapter 8) only
34 children were involved. Each of the other two ana-
lyses involves 38 children. Each column gives inf orma-
ticn about performance on the main linguistic measures.
Further details about these measures are available in the
chapters referred to in brackets below.

320
The main measurec.; we used, in three separate combina-
tions, for the iaultiple regression analyses are:
1- IlL Hearing Loss (Chapter 2)
2. ERT Edinburgh Reading Test score (Chapter 4)
L-LTAV [lean Length of Turn (ChEpter 5)
4. I-ILT3 Mean Length of Turn after teacher open questions (Chapter 5)
lean Length of Turn after teacher PLT4 r, personal contributions (Chapter 5)
6. WRIT % V.! ritten accuracy score (Chapter 7)
7. SPOIKE % Spoken accuracy score (Chapter 6)
8. iQ Percentile point for Ravens Progressive Matrices (Chapter 2).
Overleaf:
Table A: 7 Ravi data I-or multiple regression analyses reported in Chapter 8.

321
I Cldld I I'M ERT MLTAV HILT3 I-ILT4 WRIT SPOKE Io 111 118 41, 1 .3 -1' 0.57 3.50 1/49 50.0 50 1 12 1 95 01 1.26 1.00 2.00 1/49 1/49 63 1 13 1 93 24 1.72 1.50 1.33 1/49 1/49 38 1 14 1 68 12 2.00 1.72 2.44 56.3 1/49 86 1 15 1 103 6 1.28 1.67 1.29 - - 10 1 16 1 98 5 1.55 1.00 1.87 1/49 62.5 44 1 17 1 112 26 3.62 1.83 3.62 1/49 87.5 -I 18 1 102 27 1.8-0ý 3.14 1.00 73.9 75.0 50 1 19 1 90 28 2.72 1.82 2.80 76.9 62.5 -I 1 10 1 113 28 2.12 1.72 3.00 72.7 100. 51 1 11 1 87 28 3.00 3.29 4.75 70.6 93.5 -I 1 12 1 47 44 3.47 2.89 4.00 90.9 82.9 90 1 1 13 1 C, 0 53 2.70 2.83 3.22 100. 64.7 50 1 1 14 1 118 32 0.65 0.57 2.50 91.7 100. 38 1 1 15 1 107 45 2.01 2.94 22 .64 82.0 70.0 41 1 1 16 1 95 18 1.58 1.77 2.00 1/49 75.0 21 1 1 17 1 98 66 2.80 2.87 1.37 100. 100. -I 1 18 1 88 60 2.07 1.89 2.90 76.9 1/49 46 1 1 1ýj 1 9-5 60 2.17 2.39 1.92 72.7 83.3 24 1 1 20 1 8c 33 2.71 3.00 2.50 76.9 60.0 31 1 1 21 193 66 1.97 1.77 1.75 95.2 83.3 21 1 1 22 1 113 53 2.22 3.00 1.80 67.8 50.0 22 1 1 23 1 107 49 2.54 1.67 3.12 100. 80.0 24 1 1 24 1 97 46 2.23 2.00 0.50 92.0 62.5 50 1 1 25 1 88 39 2.13 2.00 2.13 54.2 50.0 10 1
26 1 112 51 l. Cl 1.75 2.40 75.0 1/49 21 1 1 27 1 loo 46 2.33 1.60 2.20 3 8). 3 1/49 16 1
1 28 1 103 32 1.61 1.80 1.50 1/49 62.5 50 1 1 29 1 65 4ý -'ý' 2.87 2.91 2. S, 'l 60.0 66.7 -I 1 30 1 90 78 8.95 5.00 15.86 loo. 64.3 96 1
1 31 1 97 33 2.44 1.00 1.00 72.2 68.8 50 1 1 32 1 85 61 4.41 4.46 6.00 93.2 78.7 50 1
13 -3, 1 68 54 7.06 8.17 7.75 S,, 5.6 93.3 75 1
1 34 1 9s 52 3.15 3.44 4.50 - - 81
1 35 1 103 63 8.15 8.00 8.00 04.4 80.0 96 1
1 36 1 60 69 6.16 7.75 6.33 90.0 -012.5 45 1
1 37 1 98 21 2.42 1.45 2.75 75.0 73.3 69 1
1 38 1 98 22 1.64 1.00 2.33 84.6 62.5 22 1
1 39 1 93 26 3.28 1.80 2.12 1/49 22 1 1 40 1 75 24 2.02 1.55 2.22 1/49 75.0 51
41 1 103 5 0.62 0.17 0.80 - - -I 42 1 98 34 2.37 3.00 1.94 1/49 1/ 49 6 09 1
43 1 96 38 - - - 55.2 6 . 3, .6 75 1
44 1 78 56 - - 88.2 79.0 45 1
45 1 87 52 - - 88.5 88.8 75 1
46 1 65 4 - - 50.0 loo. 22 1
47 1 77 28 - - - 100. 90.0 75 1
48 1 115 48 - - - 76.9 78.3 75
49 1 97 14 - - - 77.8 - 87
50 1 93 21 - - - 66.7 67

322
It can be seen from the table on the previous page
that some children are noted as 'having a score of 11/49'
in the columns representing written and spoken syntactic
accuracy. As explained in Chapter 6,, our analysis and
scoring system for these communications only allowed us
to proceec-4' when had to change fewer morphemes than were
-1 a-i reaaN7 present in the original message. In other v., ords,
those messages or utterances that required more morphemes
to be changed or added than were present in the original
were considered unanalysable. So,, the lowest score a
child could achieve was 50%. If we had e-1': clude6 tho.,.. )e
chi 16 r en who scored less than 50% accuracy frcm our
Tý. ultiL--Le regression analyses we would have reduced the -I
. ple size (38) by 13. We therefore calculated three -ar, -, -
separcate correlation matrices in order to see how the
.e corre-laticns varied. These were: size of tj'-i
Inserting Ill as a score in those cases where children failed to ý2, core at least 50% on the
written and spoken accuracy measure-,.
2) Inserting '491 as a score in those cases where children failed to score at least 50% on the
written anc- spoken accuracy measures.
3) Leaving out those children who failed to score
at least 50% on the written and spoken accuracy
r. -ý. easures. This reduced the sample size to 25.
In the three tables below (A: 8FA: 9 and A: 10) , that
i -,
show the results of these three methods, the variables
are as foll0wc-3: 1) hearing loss (HL) , 2) Edinburgh Read-

323
Test tot3Ill score (ERT) , 3) mean lenc"th of turn after
teacher open questions CILT3) 4) mean length of turn
after teacher personal contributions (MLT4) , 5) written
accuracy (V, -RIT) anCt 6) spoken accuracy.
------------- -- ----- -- --------- -- ---------- ------- 1 (FIL) 2 (E R-T) 3 QlLT3) 4 GILT4) 5 (WRIT)
12 1-. 18112 ----- 13 1-. 3178 . 606G 14 1-. 1801 . 4686 . 6682
-, 1C . 7064 . 4302 . 3151 15 1-. 1 ), 16 1 . 0016 446 . 3386- . 2147 . 3583 ------------------------------------------------------------
'2a , -) 1eA: 8 Correlations between main measures inserting Illas a score in cases vvhere children failed to score at least 50% accuracy on the written and/or spolken measures (n=38).
-------------------------------------------------- -
1 (HL) 2 (ERT) 3 (IILT3) 4 GILT4) 5 WRIT)
11 1 ----- 1 12 1-. 1842 ----- 13 1 -. 317 U" . 6066 14 1-. 1801 . 4686 . 6682 ------ 15 1-. 0841 . 7346 . 4728 . 4022 ------ 16 1-. 0282 . 2821 . 3676 . 2057 . 4471
----------------------------------------------------------
Table A: 9 Correlations between main measures inserting 149' as a score in cases
where chilc., ren failed to score at least 50-00 accuracy on the written and/or spob, -, en measures (n=338) .
p <. 001 p <. Ol p <. 05

324
1 (IIL) 2 (ERT) 3 CILT-3» 4 GIILT4) 5
11 1 ----- -1
12 1-. 2420 ----- 13 1 -. 3 2552 . 5754 14 1-. 2165 . 5206 . 6586 15 1-. 0201
. 5234 . 3184 . 3967 16 1-. 0254 . 1278 . 2201 . 0958 . 3783 -------------------------------------------------------------
Table t',.: 10 Correlations between main measures using only those subjects who scored at least . 10% on the written and spoken accuracy measures (n=25).
It can be seen from these correlation matrices that a
siriAlar pattern of correlations emerge ý,, 71iich ever methoc,
one uses. 'Erring' on the side of caution,? therefore,? we
chose to use the first met-hod (inserting Ill as C-;., score)
-'Ultiple regression analyses because it gave the for our rL.
lower correlations. To use iethod three would have meant
losing 13 subjects. The similar patterns of correlations
6
obtained from methods 1 and 2, r on the one han(ý, an t
r,, ethod 3, on the other,, also somewhat allaYed our fears
about the legitimacy of using parametric statistics on a
J 'normal'. Evidently distribution of data that was not
the unusual distribution at the lower end is not unduly
influencing the pattern of correlations.
As a further check on the legitinnacy of using data
with a slightly skewed distribution in our analyses, we
calculated the correlation between the written and spoken
syntactic accuracy scores in 3 ways:

t I, LL the r ýiýýetr ic, t(--, c t T, rcuu,. ct ! ýo-. ient) E-, correic-, ticii It ý r= I- -L i ý- ýL -) -, , [ýý <0 5)
17- ttI 4ai, ie cr
-ic r i,, r c.. i
cor r C-ý ý, t-) r
ic
LI ý) 11 '('! pej 11011 aJ 11 ,i)Lt;; JLt Grut Gile Uli i ler ei! Ihr
ICC) r e(-, i Lli 5ü% Ei ccur acy th Co Co rr ei at i0 r',
t tereSttc, -,. ) err ýt
1ý,, Qr e-, 1 oil JN7'- j. , (,, rrcao ot,
- t,
c. rrcI t- c) r , s-. oj, c-rl i-ccur, ýcý,., coess not -, --o be
ii'o--, or tan ts0e0 rl iy pr cý sente1 (D t c, r E. S Lý ror. ýI
E, -- currelatürs. t
17 ; -ýc cT(TcG
i-D iE, best -ýrcc, lcte
- ý- ý, i - 1.
, r, .-th0 -C ,")i Eý b Eý 'u r o (72 a (' ý-
,; - te 1-1 T-
r i Jil-iCf to rec re L
ictec, j- ie It rcc! cl
iL" I
r e sc ý-
4. LT' i best recictec by rLT