UNIVERSITY OF NOTTINGHAM DEPARTMENT OF ...
78
UNIVERSITY OF NOTTINGHAM DEPARTMENT OF ARCHITECTURE AND BUILT ENVIROMENT Design Optimization of a Stand-alone Energy System for a Rural Off-grid Dwelling Edward Paul Atherton Groves 13 May 2019 Word Count: 9,423 A dissertation submitted in partial fulfilment of regulations for the Degree of Bachelor of Engineering in Architectural Environmental Engineering at the University of Nottingham, 2019,
-
Upload
khangminh22 -
Category
Documents
-
view
1 -
download
0
Transcript of UNIVERSITY OF NOTTINGHAM DEPARTMENT OF ...

UNIVERSITY OF NOTTINGHAM
DEPARTMENT OF ARCHITECTURE AND BUILT ENVIROMENT
Design Optimization of a Stand-alone Energy System for a Rural Off-grid
Dwelling
Edward Paul Atherton Groves 13 May 2019 Word Count: 9,423
A dissertation submitted in partial fulfilment of regulations for the Degree of Bachelor of
Engineering in Architectural Environmental Engineering at the University of Nottingham, 2019,

i
Abstract Domestic buildings in the UK are leading source of CO2 emission, which is the major contributor
to global warming. The importance of renewable energies being used to supply houses to reduce
carbon emissions is growing, with more people becoming environmentally conscious, stand-
alone renewable energy systems are growing in popularity.
This report investigates and shows the process taken when designing and optimizing a
standalone renewable energy system for an off-grid property in Callender, Scotland. The
finalized system proposed in this report would supply the building with all the heating, electrical
and domestic hot water demands through the year. The literature review investigated similar
case studies which outlined potential technologies to use in energy generation and energy
storage. Each technology was then re-searched further to assess its suitability for the project. A
model was built in excel to size each component and ensuring the system would meet the hourly
energy demands all year round.
The most important part when optimizing a stand-alone renewable energy system is to reduce
the energy consumption of the building. By adding insulation, a significant reduction in the
required heating load can be seen throughout the year. With a smaller energy demand a more
practical sized system can attain the energy demand requirements, whilst also being cheaper.
Some of the major problems when designing a renewable energy system is the absence of
longterm electrical energy storage. This means throughout the year there needs to be significant
energy generation to ensure the building can operate all year round. Short term energy storage
methods like batteries can be used to supply electrical energy during the evenings, for example
when there will be no solar generation. A solar thermal store heated by solar thermal panels,
also stores energy which could be used to require emergency space heating if there wasn’t
enough energy generation.
The final system was comprised of the following components, 24kW Kensa Twin Compact Heat
Pump, a wind turbine with a radius of 2.5 m, a solar PV array of 37.8 m2 (23 panels) and a solar
array of 25 m2. The electrical storage is provided by two Tesla Powerwalls and a 2000 litre
thermal store.

ii
Acknowledgements
I would first like to thank my supervi`sor, Dr Christopher Wood, whose knowledge was
invaluable throughout this process, without which I wouldn’t’ve been able to complete this.
I would also like to thank Dr John Calautit, whom I often sought for assistance and a reliable
second opinion.
Also Thanks to www.meteoblue.com for providing me with weather data.
Finally, I would like to give thanks to my Parents who have been incredible throughout and
always supported me.

iii
Contents Abstract ........................................................................................................................................ i
Acknowledgements ..................................................................................................................... ii
Glossary of Symbols ................................................................................................................. vii
1 Introduction .............................................................................................................................. 1
1.1 Introduction to Property and Challenges ...................................................................... 2
1.1.1 Property and Location ................................................................................................ 2
1.1.2 General Weather Conditions ...................................................................................... 3
1.1.3 Building Fabric ........................................................................................................... 3
1.1.4 Planning permission ................................................................................................... 3
1.1.5 Main Challenges ......................................................................................................... 5
2 Methodology ............................................................................................................................ 5
3 Energy Assessment and Optimization ...................................................................................... 7
3.1 Occupancy .................................................................................................................... 7
3.2 Heating Schedule .......................................................................................................... 8
3.3 Electricity Usage from Lighting and Equipment .......................................................... 9
3.4 Fabric Upgrade ........................................................................................................... 10
3.5 Domestic Hot Water ................................................................................................... 12
4 Literature Review ................................................................................................................... 13
4.1 Similar case studies .................................................................................................... 14
4.2 Energy Generation ...................................................................................................... 15
4.2.1 Wind turbines ........................................................................................................... 15
4.2.2 Solar PV panels ........................................................................................................ 15
4.2.3 Solar thermal panels ................................................................................................. 17

iv
4.3 Energy Storage ................................................................................................................ 18
4.3.1 Ground Source Heat Pumps ..................................................................................... 18
4.3.2 Lead acid and Lithium-ion batteries ......................................................................... 20
4.3.3 Redox Flow Battery ................................................................................................. 21
4.3.4 Hydrogen as a method of energy storage ................................................................. 22
4.4 Summary ..................................................................................................................... 23
5 Resource Assessment ............................................................................................................. 24
5.1 Wind data .................................................................................................................... 25
5.2 Solar data .................................................................................................................... 25
5.2.1 Solar irradiance ........................................................................................................ 25
5.2.2 Solar altitude and azimuth ........................................................................................ 26
6 Theory - Creating System Sizing Model ................................................................................ 26
6.1 Electrical Generation .................................................................................................. 27
6.1.1 Ground Source Heat Pump ....................................................................................... 27
6.1.2 Wind ......................................................................................................................... 28
6.2 Electrical Energy Storage – Lithium Ion Battery ....................................................... 30
6.3 Domestic Hot Water ................................................................................................... 30
6.3.1 Solar Evacuated Tubes ............................................................................................. 31
6.4 Independent Variables for Energy Generation Technologies .................................... 33
7 Results .................................................................................................................................... 35
7.1 Initial Component Selection ....................................................................................... 35
7.1.1 Ground Source Heat Pump ....................................................................................... 35
7.1.2 Wind Turbine ........................................................................................................... 37
7.1.3 Solar PV Panel ......................................................................................................... 37
7.1.4 Lithium Ion Batteries ............................................................................................... 38

v
7.1.5 Solar Thermal Panels ............................................................................................... 39
7.2 Electrical Energy Sizing Process ................................................................................ 39
7.2.1 Final Size for Wind Turbine and Solar PV array ..................................................... 42
7.3 Solar Domestic Hot Water Sizing ............................................................................. 43
7.3.1 Final Solar Thermal Array and Thermal Store ......................................................... 45
7.4 Final System Size ....................................................................................................... 46
8 Conclusion .............................................................................................................................. 47
8.1 System Problems ........................................................................................................ 47
8.1.1 Solar Thermal Array Stagnation .............................................................................. 48
8.1.2 Alternative to Supply DHW Demand ...................................................................... 48
8.2 Further Investigation and Improvements .................................................................... 49
References ................................................................................................................................. 50
Appendices ................................................................................................................................ 58
Appendix A – Building Information ..................................................................................... 59
Appendix B – IES calculations of U-Values ......................................................................... 61
Appendix C – Example Calculations .................................................................................... 64
Generation Resources ............................................................................................................ 66
Energy Demand Tables ..................................................................................................... 67
Generation Tables .............................................................................................................. 68
Storage tables .................................................................................................................... 68
Domestic Hot Water .......................................................................................................... 69

vi
No table of figures entries found.
No table of figures entries found.

vii
Glossary of Symbols Symbol Definition Unit
𝐸𝐷𝐻𝑊 Energy needed to heat Domestic Hot Water (kWh.day) 𝑉 Volume of water (litres) ∆𝑇 Temperature difference (oC) 𝐶𝑃 Specific heat capacity of water (kJ/kg.oC)
𝐸𝑇𝑂𝑇𝐴𝐿 Total electrical energy demand of the building (kWh) 𝐸𝑃𝑈 Heating energy post upgrade (kWh) 𝑆𝐶𝑜𝑃 Seasonal Co-efficient of Performance -
𝐸𝐴𝑝𝑝𝑙𝑖𝑎𝑛𝑐𝑒 Appliance electrical energy demand (kWh) 𝐴𝑆 Swept Area (m2) 𝑟 Radius (m) 𝑊𝐾 Powerflow from wind (kWh) 𝜌 Density of air (kg/m3) 𝑐 Wind speed (m/s) 𝑊𝐸 Electrical energy generated from wind turbine (kWh) 𝜂𝑊 Efficiency of wind turbine - 𝐼ℎ Intensity of solar irradiance hitting the panel (kWh//m2) 𝛼 Tilt of panel (o) 𝐴𝐿 Solar altitude (o) 𝜙 Angle between orientation and azimuth (o) 𝑂 Angle between tilt and altitude (o) 𝐴𝑍 Solar Azimuth (o) 𝜃 Angle between orientation and azimuth (o) 𝑆 Solar irradiance reaching the site (kWh/m2) 𝐴𝑃𝑉 Area of PV array (m2) 𝐿𝑃 Length of solar PV panel (m) 𝑊𝑃 Width of solar panel (m) 𝑁𝑝 Number of Panels - 𝐸𝑃𝑉 Energy generated from PV array (kWh) 𝜂𝑃𝑉 Efficiency of solar PV panels - 𝐿 Solar PV system losses - 𝐸𝑆𝑇 Hourly useful energy from solar thermal (kWh/m2) 𝜂𝑆𝑇 Efficiency of solar thermal panel - 𝐸𝑆𝑇𝑥 Useful energy from solar thermal at time ‘x’ (kWh/m2)
𝐸𝑑𝑎𝑖𝑙𝑦/𝑚2 Useful daily energy from solar thermal (kWh/m2 .day)

viii
𝐸𝑑𝑎𝑖𝑙𝑦/𝑚𝑖𝑛/𝑚2 Minimum useful daily energy from solar thermal (kWh/m2 .day) 𝐸𝑑𝑎𝑖𝑙𝑦 Useful daily energy from solar thermal (kWh.day) 𝐸𝑒𝑥𝑐𝑒𝑠𝑠 Excess energy (kWh.day)

1
1 Introduction
The combustion of fossil fuels produces CO2 which is the major contributor to global
warming and the UK produced 366.9 million tonnes of CO2 in 2017 [1]. Domestic
buildings are a leading consumer of fossil fuels in the UK and a major contributor to
the amount of CO2 produced.
Figure 1.1 - Energy Consumption by Section [2]
As the urgency to reduce the consumption of fossil fuels increases to stop climate change people
are looking towards renewable energies as a sustainable alternative. By applying renewable energy
technologies to buildings there is a potential for a large reduction in CO2 emissions within the UK
housing sector. There are a number of renewable energy technologies for buildings such as solar
thermal panels, solar photovoltaic panels and domestic wind turbines which can all reduce the
amount of energy a house needs from the grid. People are now realizing the importance of reducing
their fossil fuel consumption. Renewable stand-alone energy systems for houses are becoming
increasingly popular with people trying to reduce their carbon footprint and make a significant
impact.
This report investigates how an off-grid dwelling can be powered completely by an
optimized renewable energy system throughout the year. A stand-alone energy system
is comprised of renewable energy generation technologies and energy storage systems.

2
Each component will be sized optimized to provide the house with sufficient energy
all year round.
1.1 Introduction to Property and Challenges
An initial review of the property fabric, location and weather are introduced with an
overview of what the main challenges being faced will entail.
1.1.1 Property and Location
The property is an old Farmhouse with plenty of outbuildings located in Callender,
Scotland.
Figure 1.2 – Picture of dwelling the energy system is going to supply [3]
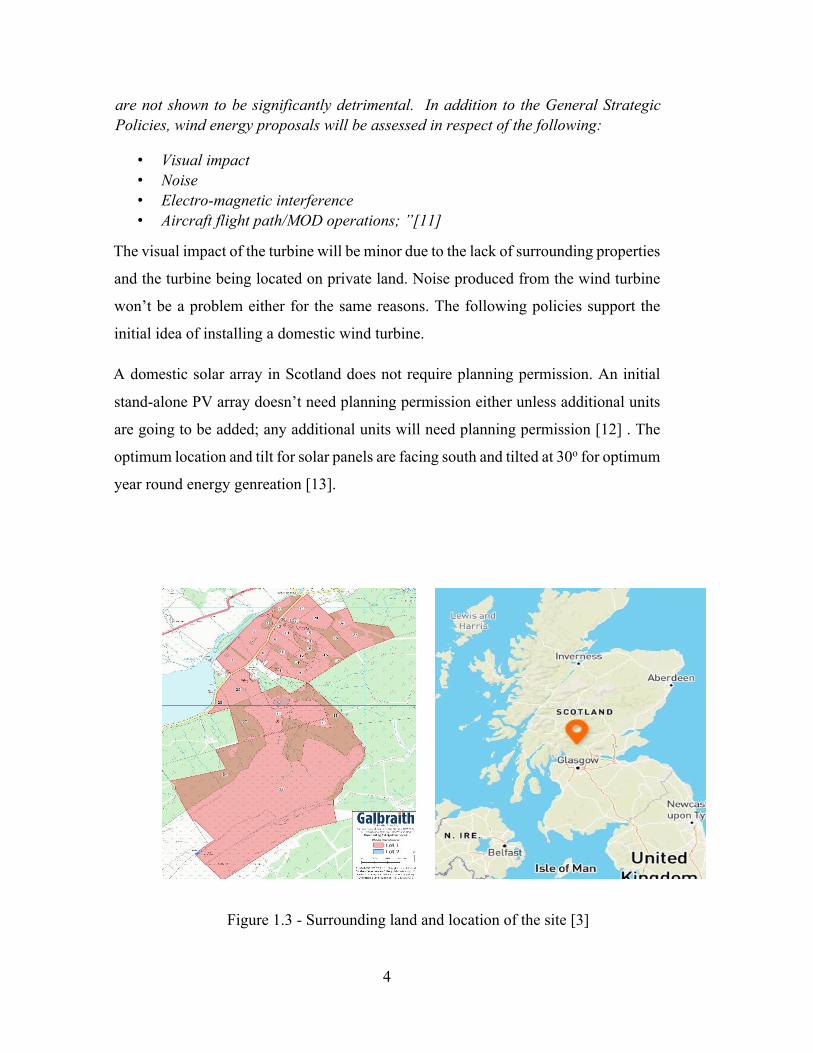
Large amounts of land (shown in Figure 1.3) are also included in the property and this
will be perfect for the installation of solar arrays and wind turbines to supply the
property with renewable energy. Having such large spaces around the property means
the size of the technologies is not restricted allowing larger energy demands to be met.
The property is also isolated meaning there will be no neighbors affected by the
addition of modern technologies to the buildings and surrounding lands.
3
1.1.2 General Weather Conditions
Typically, Callender has mild Summers (15oC) and cold Winters (5-7oC) with more
frequent cloud cover and rain than other parts of the UK which will reduce the
effectiveness of a potential solar arrays. Callender, is consistently windy due to its high
setting on the highland boundary. This is beneficial as it means a domestic wind
turbine will be able to provide energy all year round. [4][5]
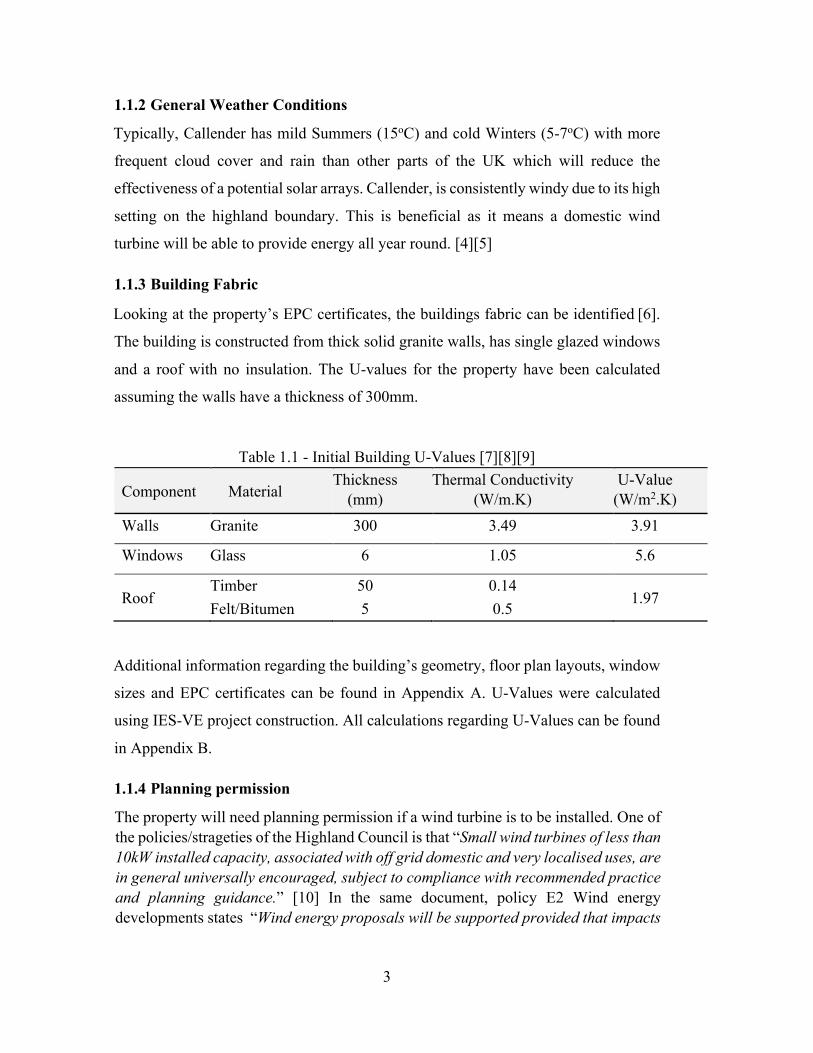
1.1.3 Building Fabric
Looking at the property’s EPC certificates, the buildings fabric can be identified [6].
The building is constructed from thick solid granite walls, has single glazed windows
and a roof with no insulation. The U-values for the property have been calculated
assuming the walls have a thickness of 300mm.
Table 1.1 - Initial Building U-Values [7][8][9]
Component Material Thickness
(mm) Thermal Conductivity
(W/m.K) U-Value
(W/m2.K) Walls Granite 300 3.49 3.91
Windows Glass 6 1.05 5.6
Roof Timber Felt/Bitumen
50 5
0.14 0.5
1.97
Additional information regarding the building’s geometry, floor plan layouts, window
sizes and EPC certificates can be found in Appendix A. U-Values were calculated
using IES-VE project construction. All calculations regarding U-Values can be found
in Appendix B.
1.1.4 Planning permission
The property will need planning permission if a wind turbine is to be installed. One of the policies/strageties of the Highland Council is that “Small wind turbines of less than 10kW installed capacity, associated with off grid domestic and very localised uses, are in general universally encouraged, subject to compliance with recommended practice and planning guidance.” [10] In the same document, policy E2 Wind energy developments states “Wind energy proposals will be supported provided that impacts
4
are not shown to be significantly detrimental. In addition to the General Strategic Policies, wind energy proposals will be assessed in respect of the following:
• Visual impact • Noise • Electro-magnetic interference • Aircraft flight path/MOD operations; ”[11]
The visual impact of the turbine will be minor due to the lack of surrounding properties
and the turbine being located on private land. Noise produced from the wind turbine
won’t be a problem either for the same reasons. The following policies support the
initial idea of installing a domestic wind turbine.
A domestic solar array in Scotland does not require planning permission. An initial
stand-alone PV array doesn’t need planning permission either unless additional units
are going to be added; any additional units will need planning permission [12] . The
optimum location and tilt for solar panels are facing south and tilted at 30o for optimum
year round energy genreation [13].
Figure 1.3 - Surrounding land and location of the site [3]

5
1.1.5 Main Challenges
The main aim of the project is to size an energy system which can provide an off-grid
dwelling with enough energy to function twenty-four hours a day all year round. This
means the renewable energy system must consistently have energy being generated or
have enough energy stored from excess generation to power the houses appliances.
The storage is important so when there are days with no wind for example, there is
enough energy to keep the house at a comfortable temperature for the occupants and
to still power all the appliances.
The two main sources of renewable energy, and most likely to make up the core of the
energy generation, are wind and solar power. Typically, the Winter will have more
wind generation and the Summer will have more solar generation. The buildings
energy demands will be highest throughout the Winter, during which the potential
energy generated from PV panels will be very low. This presents a problem of
balancing the energy generation with demand and ensuring that the renewable energy
technologies are not oversized for other parts of the year.
Due to the inability to store energy on a long-term basis there is also a challenge faced
on a day by day basis. During Winter the energy loads of the building will be large in
the morning and evenings but during these periods there will be no generation from
solar as it will be dark. Being able to have a system which can balance generation,
storage and usage without largely oversizing components is crucial and is the crux of
the project. The system will likely have a wind turbine and a solar array with a battery
providing short term electrical energy storage.
2 Methodology
The building will be modelled in Integrated Environmental Solutions – Virtual
Environment. IES-VE uses ASHRAE weather data providing realistic heating and

6
electrical loads for the property. The loads then provide the demand the energy system
must satisfy. Further detail about the model can be found in Section 3.
A literature review will be conducted to investigate and identify potential technologies
used in stand-alone energy systems. Case studies of stand-alone energy systems in
similar climates will be reviewed to identify suitable methods of energy generation
and storage. Once a range of components and methods have been identified further
research into each of these technologies will be done by looking at academic papers
and journals to provide more insight into how they work and why they may or may
not be appropriate for this project.
Upon completion of the model and literature review, appropriate weather data will be
collected for the site. This will include data such as hourly wind speeds and hourly
solar irradiance. The data will be sourced from www.meteoblue.com as it can provide
hourly data for any site in the world for the past 35 years allowing more accurate
averages to be calculated. Using this weather data and the hourly heating and electrical
loads of the building produced from IES-VE the renewable energy technologies can
be sized to create an optimized energy system which supplies the house’s energy
demand all year round.
The system sizing model will be created in excel using a number of different equations
used to calculate hourly generation for each technology. Independent variables such
as tilt of a PV array and area will be changeable to ensure the generation meets the
demand with optimum design. The final section of the model will combine energy
demand, storage and generation in order to see if the system is viable. From there
modifications can be made to size each component in order to satisfy the energy
demand all year round.

7
3 Energy Assessment and Optimization
A model of the house will be created in IES Virtual Environment using the buildings
initial U-values from 1.1.3 to simulate energy loads throughout the year. Once the
energy loads have been found, an understanding of how, where and when the building
uses energy can be developed and this will be crucial in finding the best solution.
3.1 Occupancy
The building has 4 occupants. The occupancy is the most important factor as both the
electrical and heating schedules are dependent on this. The occupancy will be
modelled from Figure (3.1) and shows both weekday and weekend schedules for
homes in the UK. From this the model will have no occupants present from 09:00 to
16:00 during weekdays and have a full occupancy during weekends.

8
Figure 3.1 - Occupancy Schedules [14]
3.2 Heating Schedule
An investigation was conducted looking at how UK houses heat their homes. This
allowed the IES model to follow a similar pattern and thus validating its heating
demands.
The majority of UK people, when heating their properties, kept their thermostats at
20oC. The heating period for a typical day in Winter would be eight hours and is broken
down into two heating periods. Looking at the occupancy schedules there will be
separate heating schedules for weekdays and weekends. For a weekday the heating
would be on for two hours in the morning, 07:00 to 09:00 and during the evening
operating from 16:00 to 22:00. Weekends will have a slightly longer heating period
due to the consistent occupancy throughout the day, operating from 09:00 to 13:00 and
16:00 to 22:00 [15].
The heating will not be used during the Summer months (from July to August).

9
Figure 3.2 - Heating schedules for weekday (left) and weekend (right)
3.3 Electricity Usage from Lighting and Equipment
The electrical load will vary from weekdays to weekends however the seasonal
changes of electrical usage won’t produce large changes, therefore when modelled for
this project the electrical load will be kept on a constant weekly profile throughout the
year.
The average electrical energy usage for a house is between 8.5 kWh and 10 kWh [16],
with appliances on stand-by mode contributing 15% of this load [17]. Assuming the
building in this project on average uses 10kWh of electricity a day we can break this
down into hourly usage with the use of the occupancy schedule in Section 3.1. When
occupants are active at home the appliances are on and when sleeping or out of the
house the devices are on stand-by. On a weekday the occupants are active 9 hours and
are asleep or away for the remaining 15 hours.
Total Daily electrical load - 10 kWh
Stand-by electrical load = 0.15 x 10 = 1.5 kWh
Hourly stand-by electrical load = 1.5 (kW) ÷ 15 (h) = 0.100 kW
Operating electrical load = 8.5 kWh
Hourly operational electrical load = 8.5 (kWh)÷ 9 (h) = 0.944 kW
Using the same hourly stand-by and operational loads a daily profile can be built for
weekends following the weekend occupancy schedule. Both breakdowns can be seen
in Table (3.1).

10
Table 3.1 - Weekday and weekend electrical loads Electrical energy usage throughout the day (kWh)
3.4 Fabric Upgrade
The initial heating loads of the building produced from IES-VE are shown in Table
(3.2). The peak day for each month has been shown. For the system to be functional
all year round it must be able to supply the peak loads throughout the year.
Table 3.2 - Buildings initial heating load
The buildings current U-Values are very high causing the building to lose a lot of heat
through the fabric making it very in-efficient and requiring a large heating demand (as
seen in Table (3.2)). The in-efficiency of the building is further backed up by the F
rating from the EPC certificate. The initial heating loads are a problem when sizing
the energy system as could only be produced with very large solar arrays or wind
turbines, not suitable to a domestic property. Not only is this impractical but the cost
of implanting such a large system would be very expensive. The larger the energy
demand of the building the more difficult it becomes to generate and store the
electricity the house needs.
By making some quick and easy improvements to the building’s fabric, the energy
efficiency of the building can be significantly increased. Such changes include adding
insulation to the roof and walls and installing double glazed windows. Reducing the
energy consumption is far more efficient in every aspect than generating the energy
needed before the fabric upgrade. The following upgrades to the fabric have been made
to the model.
Peak day/month00:00 01:00 02:00 03:00 04:00 05:00 06:00 07:00 08:00 09:00 10:00 11:00 12:00 13:00 14:00 15:00 16:00 17:00 18:00 19:00 20:00 21:00 22:00 23:00
Daily Load (kWh.day)
January 17th 4.40 4.47 4.54 4.61 4.67 4.73 37.69 29.94 4.91 4.79 4.57 4.34 4.15 4.03 3.95 3.87 35.28 28.19 27.37 26.75 26.18 25.73 3.80 3.87 306.82February 16th 5.57 5.72 5.80 5.89 5.97 5.95 5.83 5.73 5.73 43.13 33.41 32.21 31.07 5.16 4.89 4.68 38.12 30.09 29.31 28.68 28.06 27.42 4.68 4.63 397.72March 15th 4.48 4.62 4.73 4.73 4.64 4.60 4.56 4.51 4.42 33.04 25.13 23.69 22.56 3.17 3.03 2.89 27.12 21.31 21.09 21.05 20.89 20.75 3.72 3.78 294.50April 9th 4.30 4.39 4.46 4.53 4.59 4.65 32.01 24.63 4.35 3.75 2.97 2.29 1.59 0.94 0.53 0.45 19.23 13.76 13.21 13.59 14.50 15.49 3.17 3.57 196.93May 1st 3.48 3.70 3.83 3.81 3.77 3.75 27.37 20.88 3.36 3.09 2.73 2.35 2.02 1.71 1.41 1.20 18.00 13.12 12.12 12.16 12.65 13.57 2.67 3.09 175.83June 14th 0.11 0.11 0.11 0.12 0.12 0.13 0.13 0.14 0.15 0.16 0.16 0.17 0.17 0.17 0.16 0.16 0.15 0.15 0.14 0.14 0.14 0.13 0.13 0.13 3.38July 1st 0.01 0.00 0.00 0.00 0.00 0.00 0.00 0.00 0.00 0.00 0.00 0.00 0.00 0.00 0.00 0.00 0.00 0.00 0.00 0.00 0.00 0.00 0.00 0.00 0.01August 9th 0.01 0.01 0.02 0.02 0.03 0.03 0.04 0.04 0.05 0.05 0.05 0.06 0.06 0.06 0.06 0.06 0.06 0.05 0.04 0.04 0.03 0.02 0.01 0.01 0.90September 30th 2.24 2.32 2.53 2.83 3.06 3.24 20.87 16.41 3.12 2.67 2.12 1.66 1.31 1.12 1.05 0.89 13.30 9.91 10.01 10.74 11.32 11.76 2.52 2.74 139.73October 21st 4.12 4.34 4.52 4.65 4.74 4.81 29.88 23.91 4.70 4.55 4.27 3.88 3.48 3.16 2.88 2.62 26.16 19.83 18.97 18.23 17.57 17.00 2.43 2.41 233.10November 18th 4.82 4.96 5.09 5.21 5.32 5.40 37.64 29.85 5.53 5.32 4.98 4.58 4.24 4.08 4.02 3.97 35.96 27.65 26.63 25.82 25.13 24.51 3.84 3.83 308.38December 9th 4.39 4.34 4.30 4.26 4.23 4.21 34.07 26.57 4.27 4.16 4.02 3.90 3.79 3.68 3.59 3.54 32.49 25.00 24.09 23.33 22.74 22.34 3.61 3.68 274.60
Peak Room Heating Load (kW)
00:00 01:00 02:00 03:00 04:00 05:00 06:00 07:00 08:00 09:00 10:00 11:00 12:00 13:00 14:00 15:00 16:00 17:00 18:00 19:00 20:00 21:00 22:00 23:00 Weekday 0.10 0.10 0.10 0.10 0.10 0.10 0.10 0.94 0.94 0.10 0.10 0.10 0.10 0.10 0.10 0.10 0.94 0.94 0.94 0.94 0.94 0.94 0.94 0.10 Weekend 0.10 0.10 0.10 0.10 0.10 0.10 0.10 0.94 0.94 0.94 0.94 0.94 0.94 0.94 0.94 0.94 0.94 0.94 0.94 0.94 0.94 0.94 0.94 0.10 Stand-by On

11
Table 3.3 - Building Fabric Upgrade U-Values [18][19][20]
Component Material Thickness (mm)
Thermal Conductivity (W/m.K)
U-Value (W/m2.K)
Walls Granite 300 3.49
Polyurethane foam 100 0.025 0.24
Windows Glass 6 1.05
Argon cavity 9 - 2 Glass 6 1.05
Roof
Timber Mineral wool
50 270
0.14 0.038 0.13
Table 3.4 - Buildings heating load post upgrade
Table (3.4), shows the heating demand after the fabric upgrades have been applied. A quick analysis was conducted to see the amount of energy saved the and the percentage of energy saved by upgrading the system.
Table 3.5 - Reduction in heating load
Peak day/month00:00 01:00 02:00 03:00 04:00 05:00 06:00 07:00 08:00 09:00 10:00 11:00 12:00 13:00 14:00 15:00 16:00 17:00 18:00 19:00 20:00 21:00 22:00 23:00
Daily Load (kWh.day)
January 17th 0.31 0.32 0.32 0.33 0.33 0.34 11.41 7.07 0.36 0.37 0.37 0.38 0.38 0.39 0.39 0.38 10.45 6.62 6.31 6.12 5.93 5.76 0.36 0.36 65.36February 16th 0.44 0.44 0.43 0.43 0.43 0.43 0.43 0.43 0.44 14.13 8.25 7.47 7.02 0.47 0.47 0.47 10.55 7.07 6.99 6.91 6.80 6.66 0.45 0.45 88.06March 15th 0.23 0.24 0.25 0.25 0.26 0.27 0.28 0.29 0.29 9.77 5.62 4.95 4.59 0.32 0.32 0.32 6.76 4.68 4.76 4.79 4.64 4.52 0.29 0.29 58.99April 9th 0.22 0.22 0.22 0.23 0.24 0.24 9.14 4.57 0.27 0.28 0.28 0.29 0.29 0.29 0.28 0.27 4.08 2.13 1.93 2.53 3.39 3.73 0.18 0.17 35.46May 1st 0.19 0.19 0.20 0.20 0.20 0.21 7.29 3.67 0.22 0.23 0.23 0.23 0.23 0.23 0.23 0.22 3.10 1.64 1.41 1.43 1.96 2.93 0.16 0.16 26.79June 14th 0.11 0.11 0.11 0.12 0.12 0.13 0.13 0.14 0.15 0.16 0.16 0.17 0.17 0.17 0.16 0.16 0.15 0.15 0.14 0.14 0.14 0.13 0.13 0.13 3.38July 1st 0.01 0.00 0.00 0.00 0.00 0.00 0.00 0.00 0.00 0.00 0.00 0.00 0.00 0.00 0.00 0.00 0.00 0.00 0.00 0.00 0.00 0.00 0.00 0.00 0.01August 9th 0.01 0.01 0.02 0.02 0.03 0.03 0.04 0.04 0.05 0.05 0.05 0.06 0.06 0.06 0.06 0.06 0.06 0.05 0.04 0.04 0.03 0.02 0.01 0.01 0.90September 30th 0.12 0.12 0.12 0.12 0.13 0.13 5.71 2.62 0.15 0.16 0.16 0.17 0.17 0.17 0.17 0.16 2.14 1.27 1.54 2.23 2.39 2.39 0.12 0.12 22.55October 21st 0.20 0.21 0.21 0.22 0.23 0.24 9.05 5.62 0.27 0.28 0.29 0.29 0.30 0.31 0.31 0.31 6.83 4.23 4.02 3.79 3.58 3.42 0.27 0.26 44.72November 18th 0.33 0.33 0.33 0.34 0.34 0.35 11.65 7.20 0.37 0.38 0.38 0.39 0.39 0.40 0.40 0.40 10.69 6.50 6.11 5.83 5.60 5.39 0.38 0.37 64.85December 9th 0.33 0.33 0.33 0.33 0.33 0.34 10.09 6.14 0.34 0.35 0.35 0.35 0.35 0.35 0.35 0.35 9.59 5.87 5.59 5.41 5.24 5.10 0.33 0.33 58.45
Peak Room Heating Load (kW)

12
Peak day/month Daily Energy Reduction (kWh.day)
Daily Percentage Energy Reduction (%)
January 17th 241.46 78.7 February 16th 309.66 77.9 March 15th 235.51 80.0 April 9th 161.48 82.0 May 1st 149.03 84.8 June 14th 0.00 0.0 July 1st 0.00 0.0 August 9th 0.00 0.0 September 30th 117.18 83.9 October 21st 188.38 80.8 November 18th 243.53 79.0 December 9th 216.15 78.7
The daily energy reduction was calculated by subtracting the new daily heat load from
the initial daily energy load. From Table (3.5) it is very clear how much of a significant
effect adding insulation to the building can have. Reducing the energy demands of the
building by adding insulation is far more time and cost effective than trying to meet
the initial heating loads of the building with renewable energy technologies.
3.5 Domestic Hot Water
The maximum daily hot water usage is 115 l/person and supplied at 45oC [21] to
prevent scalding when coming out of taps. For the best performing homes 80 l/person
of hot water is recommended. In order to keep the system as small as possible the
occupants should use a maximum of 80 l/person [22]. The domestic hot water must be
stored at a temperature of 65oC to prevent the growth of legionnaires diseases [23].
The volume of water stored at 65oC that is required to provide 320 litres of water at
45oC can be calculated as the energy they have will be the same.
With the average mains water temperature being 7.3oC [24] the energy needed to heat
320 litres of water to 45oC can be calculated using Equation (3.1),
𝐸𝐷𝐻𝑊=(𝑉×∆𝑇×𝐶𝑝)÷3600 (3.1)
Where: 𝐸𝐷𝐻𝑊= Daily energy needed to heat DHW (kWh.day)

13
𝑉 = Volume of water (litres)
∆𝑇 = Temperature difference (oC)
𝐶𝑝 = Specific heat capacity of water (kJ/kg.oC)
The specific heat capacity of water is taken to be 4.187 kJ/kg.oC [25], divided by 3600
converts kilojoules/second into kilowatt/hour.
𝐸𝐷𝐻𝑊=(320×(45−7.3)×4.187)÷3600
𝐸𝐷𝐻𝑊=14.031𝑘𝑊ℎ.𝑑𝑎𝑦
The volume of water needed to be stored at 65oC can then be calculated using the same
equation but re-arranged to find volume as the energy the bodies of water have is the
same,
𝑉=
𝑉=209.08𝑙𝑖𝑡𝑟𝑒𝑠
The dwelling will have a Kingspan Ultrasteel 210 Litre Indirect - Solar Unvented Hot
Water Cylinder [26] to store the hot water. To simplify the model the DHW demand
was calculated on a daily basis.
4 Literature Review

14
The literature review will investigate case studies of other stand-alone energy systems
to explore the technologies used and why. Once a range of energy generation and
storage methods have been identified an investigation of each technology will be
conducted.
4.1 Similar case studies
The initial research was investigating stand-alone energy systems. In the “Comparative
study of stand-alone and hybrid solar energy systems suitable for off-grid rural
electrification”[27], it was first mentioned that the most successful systems used
hybrid energy systems with two or more energy sources. With the most common being
wind and solar as these two energies offset each other well. Times of high wind speeds
are often the same time as lower solar irradiance and vice versa. The report also gave
information on the flow of energy through the system.
Figure 4.1 - Energy flow through a renewable system[27]
The SmartRegion Pellworm Project also used a hybrid system. This project is about a
small island in Germany which runs solely on renewable energy throughout the year
using a hybrid energy system. It does so using a combination of solar and wind power.
Initially the island produced three times the amount of energy needed but due to lack
of storage methods they still relied on the grid to provide energy during certain periods.
However, E.ON implemented 2 large batteries, a redox flow battery and a lithium-ion
battery to supply the island with renewable energy all year round. [28][29][30][31]
A study looking into stand-alone hybrid energy systems for applications in
Newfoundland [32] also had solar and wind as forerunners of renewable energy

15
generation. In the study they discounted solar due to the site location. The study also
mentioned the use of an electrolyzer and being able to store energy in the medium of
hydrogen, although this was discounted due to the high cost at the time (2004).
Hydrogen, as a method to store energy, will also be researched due to recent advances
in this technology.
After reviewing the following literature, the energy system will be a hybrid system
using a combination of solar and wind power. (Hybrid systems with the inclusion of
fossil fuels will be ruled out as this system is to be powered by renewable energy only).
In terms of energy storage, the technologies focused on are redox flow batteries,
lithium-ion batteries and hydrogen storage as they have all been used in similar case
studies.
4.2 Energy Generation
Both wind turbines and solar thermal arrays were used in the SmartRegion Pellworm
project and will most likely be the core of this project’s energy generation. Solar
thermal panels to supply hot water are also investigated.
4.2.1 Wind turbines
Wind turbines have been used on the SmartRegion Pellworm project to provide some
of the electrical demand of the island. The Isle of Eigg off the coast of Scotland also
used 3 x 6kW wind turbines to help provide electrical energy to 38 houses and 5
commercial properties. Wind power was selected to be part of that system due to its
high wind resource. Callander. Scotland also has a reliable wind resource (section
1.1.2) suggesting a wind turbine should be included in the energy system. The
remining energy demand on the Isle of Eigg is provided by a PVarray, hydro turbine
and a diesel generator providing the energy to the island [33].
4.2.2 Solar PV panels
There are a variety of solar-PV panels available to use, the most common of them
being the monocrystalline silicon, polycrystalline silicon and the amorphous silicon.
The typical efficiencies for each panel are shown in Table (4.1),
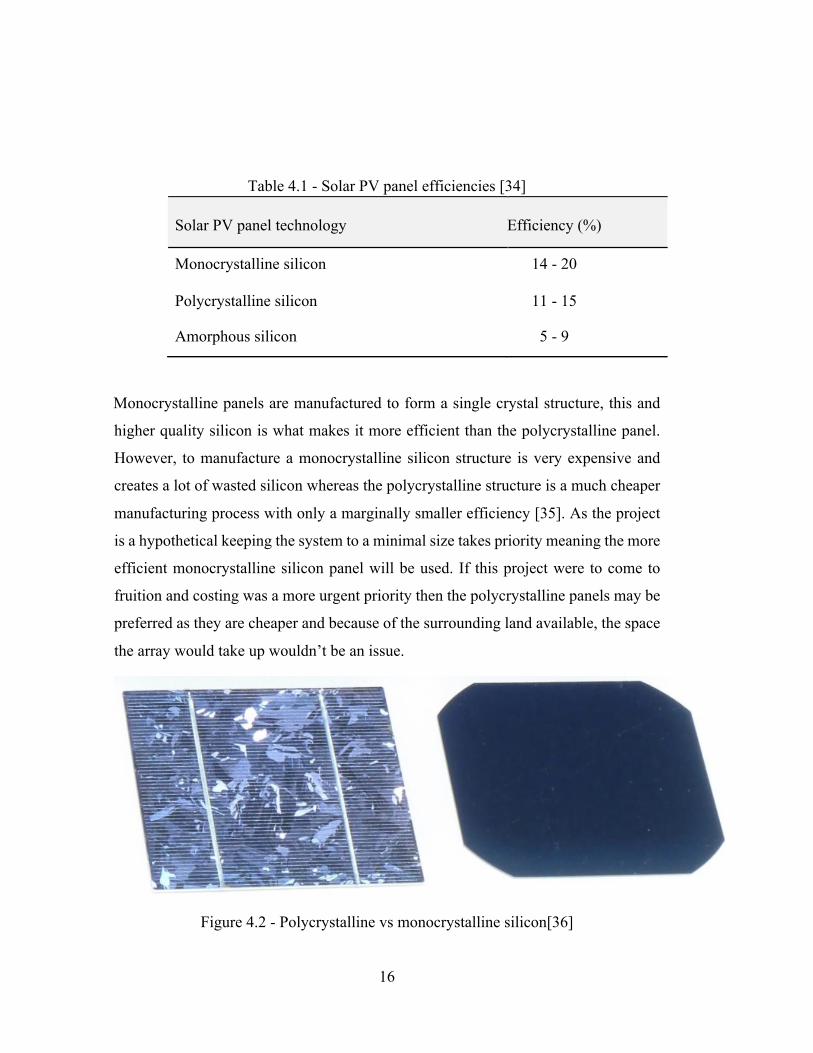
16
Table 4.1 - Solar PV panel efficiencies [34]
Solar PV panel technology Efficiency (%)
Monocrystalline silicon 14 - 20
Polycrystalline silicon 11 - 15
Amorphous silicon 5 - 9
Monocrystalline panels are manufactured to form a single crystal structure, this and
higher quality silicon is what makes it more efficient than the polycrystalline panel.
However, to manufacture a monocrystalline silicon structure is very expensive and
creates a lot of wasted silicon whereas the polycrystalline structure is a much cheaper
manufacturing process with only a marginally smaller efficiency [35]. As the project
is a hypothetical keeping the system to a minimal size takes priority meaning the more
efficient monocrystalline silicon panel will be used. If this project were to come to
fruition and costing was a more urgent priority then the polycrystalline panels may be
preferred as they are cheaper and because of the surrounding land available, the space
the array would take up wouldn’t be an issue.
Figure 4.2 - Polycrystalline vs monocrystalline silicon[36]

17
In Figure (4.2), the separate crystals of the polycrystalline panels can be seen whereas
the monocrystalline has a smooth block appearance.
4.2.3 Solar thermal panels
The two main solar thermal panels used on buildings are- flat-plate collectors and
evacuated tube collectors.
Figure 4.3 - Flat-plate collector[37]
Flat plate solar collectors have a heat absorbing backplate which absorbs the energy
from solar irradiance hitting the panel. The energy is then transferred from the absorber
plate to the cold water flowing through tubes across it. The panel has a transparent
cover to reduce convection losses. In colder climates however the convection losses
are still considerable meaning flat-plate collectors aren’t well suited to colder climates
due to the their reduction in efficiency.

18
Figure 4.4 - Evacuated tube[38]
Evacuated tubes have a heat pipe within a vacuum tube and this has many benefits.
The vacuum greatly reduces the conduction and convection losses allowing the heat
pipe to operate at a much higher temperature and efficiency. Another benefit that
evacuated tubes have is that they work far better in colder climates than flat-plate
collectors as they lose far less heat through conduction and convection to the
surrounding air. The Winters in Scotland can be very cold and for evacuated tubes to
still to work efficiently under such conditions is very beneficial for the property in this
report.[39]
4.3 Energy Storage
Energy storage is crucial in a stand-alone system as excess energy generated can be
stored for when the energy generation doesn’t meet demand, the stored energy can
then supply the building in these downperiods, thus ensuring the building always has
power.
4.3.1 Ground Source Heat Pumps
Most of the space heating in houses is provided by a gas boiler. However electrical
energy generated from renewables can provide power to an electrical boiler to provide
space heating. Electrical boilers typically have an efficiency of 100%. Section 3.4
talked about how reducing the energy demand would shrink the system however, a
ground source heat pump is another way to provide space heating and also an effective

19
way of reducing energy demand. GSHPs convert the heating load into a smaller
electrical load as they have efficiencies between 300 – 600% [40].
Ground source heat pumps work by transferring low grade heat from the ground to a
water/antifreeze solution flowing through a ground-loop array. The fluid is then fed
into an evaporator where the heat from the fluid is transferred to a refrigerant which
boils and turns into a gas. The gas then flows into a compressor which further increases
the temperature of the refrigerant gas. The hot refrigerant gas is passed into a
condenser. The condenser is where the water needing to be heated passes through. The
heat energy from the hot refrigerant is transferred to the water by condensing on the
pipe which then goes on to supply the space heating requirements. The condensed
refrigerant passes through an expansion valve back to the evaporator for the process
to be repeated.[41][42]
Figure 4.5 - Components of a ground source heat pump [43]
GSHP’s are able to work effectively all year long as the temperature of the ground
below the frost line stays relatively constant. At 15m deep the ground temperature is
similar to that of the average UK air temperature which is between 8-11 oC [44]. The
ability to be an effective source of heat energy all year round is ideal for this project
due the high heating loads in Winter. They do require electrical energy to operate with
the CoP depending on the outflow and inlet temperatures of the water being heated.

20
The high efficiency means that the heating load is turned into a significantly reduced
electrical load.
As mentioned earlier, the co-efficient of performance for GSHP’s is dependent on a
few factors, the main one being the outlet temperature of the water supplying the
house.
Figure 4.6 -Relationship between the CoP and outlet temperature [45] Figure (4.6) shows how co-efficients of performance can change with the outlet
temperature. A higher outlet temperature can lead to a much lower CoP. The outlet
temperature is important to consider when deciding what heating system to use.
Having a lower outlet temperature means the system won’t be able to supply radiators
as effectively. Underfloor heating is also more efficient as the heat is distributed evenly
across rooms and requires water at only 45oC [46] which is much lower than that which
would be needed to supply radiators[47][48]. Supplying an underfloor heating system
would be more appropriate, as a higher CoP could be achieved. However having lower
supply temperatures means that the GSHP won’t be able to provide domestic hot water
as it must be stored at 65oC or above due to the previously mentioned risk of legionella
bacteria growing in the storage tank. [49]
4.3.2 Lead acid and Lithium-ion batteries
Traditionally storing PV and other renewable energy has been done so using lead acid
batteries, an alternative to this would be a lithium-ion battery (Li-Ion) whilst they have
a higher initial cost their benefits are far superior to the lead acid battery, summarized
in Table (4.2) [50][51]

21
Table 4.2 - Lead acid battery vs lithium-ion battery
Parameter Lead acid Battery Lithium-ion battery
Cost Low initial cost High initial cost
Storage efficiency Low High
Life span 3 – 5 years 10 years
Charging/Discharging rate Medium Fast
Energy density Low (requires more cells) High
Lithium-ion batteries work well with renewables energies due to their ability to be
continuously charged and discharged quickly whilst not losing their storage capacity.
The higher energy density and lighter weight of the Li-ion means to have the
equivalent storage supplied with leadacid batteries you would need significantly more
cells.
4.3.3 Redox Flow Battery
It was mentioned in the case study on SmartRegion Pellworm project that the island
used a redox flow battery. This led to the research into redox flow batteries and if they
would be applicable on a domestic scale. When reviewing “Redox flow batteries for
the storage of renewable energy” [52] it was found they have many properties which
make them ideal for energy storage produced by renewable energy. They have high
round trip efficiencies, meaning less energy is wasted charging and discharging.
Redox flow batteries have a discharge time of between 1 and 10 hours. Their storage
time is in the range of 4 – 12 hours depending on the size of the storage tanks [53].
This could be a problematic, if the property is without generation for periods longer
than 12 hours which is a high possibility then the house will have no energy from
storage. The life span is estimated to be 15 years and could potentially have up to 5000
recharges [54]. Although most of the mentioned properties are perfect for renewable
energy storage this would only be applicable if it could be applied on a domestic scale.
In “Possible use of vanadium redoxflow batteries for energy storage in small grids and

22
stand-alone photovoltaic systems” [55], it mentioned their ability to load level and
peak shave further supporting the reasons its ideal for renewable energy storage on a
domestic level. The battery uses tanks and by changing the size of these the redox
battery can be scaled down to be used domestically. Size of tanks is proportional to
energy stored making them very flexible [54][56].
Figure 4.7 – Redox Flow battery diagram[57]
4.3.4 Hydrogen as a method of energy storage
Hydrogen has also been identified as a potential method of storing energy long term.
It has been most successful when paired with a battery for short term storage and the
hydrogen acting as the long-term storage [58]. Hydrogen is good for long term storage
as there is negligible leakage unlike with batteries. Having the largest energy content
of any fuel makes hydrogen an ideal medium for energy storage[59]. The process of
extracting hydrogen involves the electrolysis of water, if the energy used for the
electrolysis is from renewable source this is ‘green hydrogen’ meaning the hydrogen
produced is done so cleanly. A technology called the SOLENCO Powerbox [60] uses
solar panels on the roof to generate energy which powers appliances. Excess energy
powers the electrolyzer which removes the hydrogen from water so it can be stored in
a tank. Hydrogen can then be used to power a boiler and other appliances when the

23
solar panels aren’t providing electricity. This could be a potential technology that is
used in the final system.
Figure 4.8 - SOLENCO Powerbox plan[60]
4.4 Summary
Having investigated a variety of technologies the electrical energy generation for the
property will come from a combination of a domestic wind turbine and a solar array
with excess energy being stored in a lithium ion battery. A Ground Source Heat Pumps
ability to significantly reduce the heating load and convert it into an electrical load
means it shall also be included within the system. With a solar thermal array also being
employed to provide the domestic hot water for the property.

24
5 Resource Assessment
With the energy generation technologies selected, relevant weather data for each can
be collected for Callander, Scotland. This includes wind speeds and solar irradiance
for the site. In order to get hourly data for the respective resources all the data was
collected from www.meteoblue.com. The energy generation will be calculated on an
hourly basis to ensure the demand of the building is being met consistently throughout
the day.

25
5.1 Wind data
The initial wind data collected was the hourly wind speed every day across five years
(from 2014 to 2018). From this an average hourly wind speed was found for each
month. Due to the nature of wind speeds being so different year-on-year and
throughout the month, finding an average hourly velocity based on over 150 values
gave the hourly velocities consistency and improved the accuracy of the wind
generation calculations for a typical year.
Table 5.1 - Average Hourly wind speeds (m/s)
5.2 Solar data
In order to size the solar PV panels and solar thermal panels hourly solar irradiance
data was collected along with the solar altitude and azimuth.
5.2.1 Solar irradiance
Solar irradiance data is much more predictable and consistent than wind speeds due to
its direct correlation between time of year and because of this an average hourly solar
irradiance for each month was only found across one year.
Table 5.2 - Solar Irradiance (W/m2)
Month 00:00 01:00 02:00 03:00 04:00 05:00 06:00 07:00 08:00 09:00 10:00 11:00 12:00 13:00 14:00 15:00 16:00 17:00 18:00 19:00 20:00 21:00 22:00 23:00Jan 7.1 7.1 7.1 7.1 7.1 7.1 7.1 7.1 7.2 7.2 7.2 7.4 7.8 7.5 7.7 7.8 7.6 7.3 7.1 7.1 7.1 7.2 7.2 7.2Feb 6.8 6.8 6.9 6.8 6.9 6.9 7.0 7.2 7.3 7.3 7.6 8.1 8.7 8.3 8.4 8.5 8.4 8.0 7.6 7.2 7.1 6.9 6.9 7.0Mar 6.1 6.1 6.0 6.0 6.1 6.2 6.2 6.2 6.3 6.8 7.3 7.8 8.1 7.8 8.0 8.1 8.0 7.9 7.6 7.0 6.5 6.2 6.2 6.1Apr 5.3 5.2 5.2 5.1 5.1 5.1 5.1 5.2 5.7 6.1 6.4 6.6 6.8 6.8 6.9 7.0 6.9 6.8 6.7 6.4 5.9 5.5 5.3 5.3May 4.3 4.2 4.1 4.2 4.1 4.1 4.2 4.5 4.9 5.3 5.7 6.0 6.2 6.3 6.4 6.3 6.4 6.4 6.2 5.9 5.6 5.0 4.5 4.3Jun 4.1 4.1 4.0 4.0 3.9 3.9 4.0 4.3 4.6 4.8 5.0 5.2 5.4 5.3 5.4 5.5 5.6 5.6 5.6 5.5 5.3 4.8 4.3 4.1Jul 3.8 3.8 3.8 3.8 3.7 3.7 3.8 4.0 4.4 4.8 5.0 5.3 5.5 5.5 5.6 5.7 5.7 5.7 5.6 5.4 5.2 4.6 4.1 3.9Aug 4.4 4.4 4.3 4.3 4.3 4.3 4.3 4.4 4.7 5.2 5.5 5.7 6.0 6.2 6.3 6.3 6.3 6.2 6.1 5.9 5.4 4.9 4.7 4.5Sep 4.5 4.4 4.4 4.5 4.5 4.5 4.5 4.5 4.6 4.9 5.3 5.6 5.9 6.1 6.2 6.3 6.2 6.1 5.8 5.3 4.8 4.7 4.6 4.6Oct 5.5 5.5 5.5 5.5 5.4 5.4 5.5 5.5 5.5 5.7 6.0 6.4 6.7 6.9 7.0 7.0 6.9 6.7 6.2 5.8 5.7 5.6 5.6 5.6Nov 6.1 6.0 6.0 6.0 6.0 5.9 5.9 5.9 5.9 5.9 6.0 6.4 6.8 6.6 6.6 6.6 6.4 6.1 6.0 6.1 6.2 6.3 6.3 6.2Dec 6.4 6.5 6.5 6.5 6.6 6.7 6.8 6.8 6.8 6.8 6.8 7.0 7.3 7.3 7.3 7.3 7.2 6.9 6.8 6.7 6.6 6.6 6.5 6.5
Average hourly wind speed for each month across 5 years (m/s)

26
5.2.2 Solar altitude and azimuth
The altitude and azimuth are important when determining the intensity of the solar
irradiance throughout the day. The altitude and azimuths were acquired from the IES
Virtual Environment model as meteo blue did not have this data available. Despite the
model being simulated in Glasgow, the difference between the altitudes and azimuths
at Glasgow and Callander will be negligible, thus was deemed acceptable in producing
accurate results.
Table 5.3 – Solar Azimuths
Solar azimuths are used when calculating the optimum orientation for the solar PV
array.
Table 5.4 - Solar Altitude
The solar altitude is used to find the optimum tilt of the solar PV and solar thermal
panels.
6 Theory - Creating System Sizing Model
Month 00:00 01:00 02:00 03:00 04:00 05:00 06:00 07:00 08:00 09:00 10:00 11:00 12:00 13:00 14:00 15:00 16:00 17:00 18:00 19:00 20:00 21:00 22:00 23:00Jan 0 0 0 0 0 0 0 0 0 1 6.5 10.4 12.5 12.6 10.6 6.7 1.3 0 0 0 0 0 0 0Feb 0 0 0 0 0 0 0 0 0.8 7.9 13.9 18.3 20.7 20.9 18.9 14.9 9.2 2.3 0 0 0 0 0 0Mar 0 0 0 0 0 0 0 2.1 10.1 17.5 23.8 28.4 30.9 31 28.6 24 17.8 10.5 2.4 0 0 0 0 0Apr 0 0 0 0 0 0 0 3 11.2 19.4 27 33.5 38.3 40.8 40.5 37.5 32.2 25.4 17.7 9.5 1.3 0 0 0May 0 0 0 0 0 0 2 9.9 18.1 26.3 34.1 40.9 45.9 48.4 47.8 44.3 38.5 31.3 23.3 15.1 6.9 0 0 0Jun 0 0 0 0 0 2 8.7 16.3 24.4 32.7 40.7 47.9 53.6 56.5 56 52.2 46.1 38.5 30.4 22.1 14.2 6.8 0.3 0Jul 0 0 0 0 0 1.5 8.2 15.8 23.9 32.1 40.2 47.5 53.2 56.4 56.1 52.5 46.4 39 30.8 22.6 14.6 7.1 0.6 0Aug 0 0 0 0 0 0 1.9 9.6 17.8 26 33.9 40.9 46.3 49.2 49.1 45.9 40.3 33.2 25.3 17 8.9 1.2 0 0Sep 0 0 0 0 0 0 0 0 4.6 12.4 19.5 25.3 29.2 30.9 30.1 27 21.8 15.1 7.5 0 0 0 0 0Oct 0 0 0 0 0 0 0 0 0 6.2 12.8 18.1 21.7 23 22.1 19 14 7.6 0.1 0 0 0 0 0Nov 0 0 0 0 0 0 0 0 0 4.8 9.8 13.1 14.4 13.6 10.8 6.2 0.1 0 0 0 0 0 0 0Dec 0 0 0 0 0 0 0 0 0 0.8 5.8 9.2 10.7 10.2 7.7 3.4 0 0 0 0 0 0 0 0
Altitude (°)
27
The next stage is to build a model which will size the individual system components.
This will be created in Microsoft Excel. The following equations in this section will
be applied in the model to provide hourly values for energy generation from each
component. The final part of the model will bring generation and demand together to
ensure the hourly demand is satisfied throughout the year.
The model uses the peak energy load for each month to see whether typical weather
data could supply this peak day. If so, it’s assumed it can meet the demand for the
other days in the month. Example calculations can be seen in Appendix C.
6.1 Electrical Generation
The Ground Source Heat pump will be selected first as it converts the heating demand,
traditionally provided by a gas boiler, into a significantly reduced electrical load. The
sizes of the wind turbine and solar array are dependent on the electrical load, hence
the GSHP will be sized first to provide a target for electrical generation. From there
the wind turbine and solar arrays can be sized.
6.1.1 Ground Source Heat Pump
Once a GSHP has been selected a Seasonal Co-efficient of Performance has been
identified and a finalized hourly electrical heating load can be calculated then summed
with the electric appliance demand using Equation (6.1),
𝐸Total= \]^_`ab+𝐸deefghijk (6.1)
Where: 𝐸𝑇𝑜𝑡𝑎𝑙 = Total hourly electrical energy needed (kWh)
𝐸𝑃𝑈 = Hourly building heating load, post fabric upgrade (kWh)
𝑆𝐶𝑜𝑃 = Seasonal Co-efficient of Performance
𝐸𝐴𝑝𝑝𝑙𝑖𝑎𝑛𝑐𝑒 = Hourly electrical demand of appliances (kWh)
Hourly values for 𝐸𝑃𝑈 and 𝐸𝐴𝑝𝑝𝑙𝑎𝑖𝑛𝑐𝑒 can be found in Section (3.4) and (3.3)
respectively and are constants within these equations. A GSHP will be selected in
Section (7.1.1) to provide a SCoP.

28
6.1.2 Wind
The following equations in the model are used to calculate the hourly electrical energy
produced from the domestic wind turbine, first the swept area of the turbine must be
calculated using Equation (6.2).
𝐴𝑆=∏𝑟2 (6.2)
Where : 𝐴𝑆 = Swept area (m2)
𝑟 = radius of the turbine (m)
The hourly kinetic energy of the wind is calculated using Equation (6.3)[75].
𝑊m = no𝜌𝐴_𝑐p (6.3)
Where: 𝑊𝐾 = Hourly power flow from wind (kWh)
𝜌 = Density of air (kg/m3)
𝑐 = hourly wind speed (m/s)
The constants in this equation include the density of air 1.225 kg/m3 [61]and the hourly
wind speeds.
The kinetic energy of the wind is then multiplied by the efficiency of the wind turbine.
This gives the electrical energy generated by the wind turbine. There would be small
additional losses in the generator but for simplicity these haven’t been considered for
the wind generation.[75]
𝑊\ = 𝑊m𝜂q(6.4)
Where: 𝑊𝐸 = Hourly electrical generation from wind (kWh)

29
𝜂𝑊 = Efficiency
6.1.3 Solar PV
The solar PV array generation calculation uses the hourly solar irradiance. To improve
the accuracy of the calculation the tilt and orientation have been taken into
consideration along with the solar azimuth and altitude from the peak load days. When
the solar irradiance is perpendicular to a surface it receives it’s full intensity. As the
angle between the Sun and the panel changes so does the intensity and this has been
modelled like so, [76]
𝐼ℎ=𝑆×𝐶𝑂𝑆(𝐴𝑍−𝑂)×𝑆𝐼𝑁(𝐴𝑙+𝛼)
𝐼ℎ = 𝑆 × 𝐶𝑂𝑆(𝜙) × 𝑆𝐼𝑁(𝜃)
(6.5) Where: 𝐼ℎ = Intensity of solar irradiance hitting surface every hour (kWh/m2)
𝛼 = Tilt (o)
𝐴𝐿 = Solar Altitude (o)
θ = Angle between tilt of the surface and solar altitude (o)
𝑂 = Orientation (o)
𝐴𝑍 = Solar Azimuth (o)
𝜙 = Angle between the orientation and solar azimuth (o) (Absolute Value)
𝑆 = Hourly solar irradiance at the site (kWh/m2)
Incooperating tilt and orientation of the PV panels into the model will allow an
optimum angle to be found for the PV array to ensure they are generating the most
electricity when the demand is highest.
The area of the PV area will depend on the area of the solar panels and the number the
array is comprised of,
𝐴=𝐿𝑃𝑊𝑃𝑁𝑃 (6.6)

30
Where: A = Area of the solar PV array (m2)
𝐿𝑃 = Length of the solar PV panel (m)
𝑊𝑃 = Width of solar PV panel (m)
𝑁𝑃 = Number of panels
The electrical generation from the solar PV array is calculated using Equation (6.7),
𝐸𝑃𝑉=𝐼ℎ𝜂𝑃𝑉𝐿𝐴 (6.7)
Where: 𝐸𝑃𝑉 = Hourly electrical energy generated from PV (kWh)
𝜂𝑃𝑉 = Solar PV Panel efficiency
𝐿 = System Losses
𝐴 = Area of solar PV array (m2)
6.2 Electrical Energy Storage – Lithium Ion Battery
To model the energy stored it is assumed that the batteries will initially start off with
no charge. The excess hourly energy will be summed creating an hourly storage
profile. When the generation doesn’t meet the demand, the energy required will be
subtracted from the storage at that hour. If the demand exceeds the storage the
remaining difference will give a demand still required value. If there is no storage but
generation doesn’t meet demand, then that value stays as the generation still needed.
The storage value can’t go below zero and is modeled likewise.
6.3 Domestic Hot Water
The DHW demand for the building will be calculated on a daily basis. With total DHW
demand being provided by solar thermal panels.

31
6.3.1 Solar Evacuated Tubes
The solar array needs to supply 14.03 kWh.day. The area required to satisfy the
demand is calculated in the model by the method below[77].
Firstly, the hourly energy the solar thermal panels receive, per m2 is calculated using
Equation
(6.8),
𝐸𝑆𝑇=(𝑆×𝑆𝐼𝑁(𝛼+𝐴𝐿)×𝜂𝑆𝑇) (6.8)
Where: 𝐸𝑆𝑇 = Hourly useful energy from solar thermal (kWh/m2)
𝜂𝑆𝑇 = Solar Evacuated tube efficiency (%)
𝛼 = Tilt (o)
𝐴𝐿 = Solar altitude
𝑆= Hourly solar irradiance at the site (kWh/m2)
The equation does not consider the Azimuth of the Sun as it won’t change the intensity
of the solar irradiance on the evacuated tubes as they are cylindrical. Thus, the
horizontal component of irradiance will always be perpendicular to the absorber.
The hourly energy from the solar thermal panels throughout the day is then summed
to provide the daily heating energy per m2.
𝐸𝑑𝑎𝑖𝑙𝑦/𝑚2=𝛴(𝐸𝑆𝑇,00:00∶𝐸𝑆𝑇,23:00) (6.9)
Where: 𝐸𝑆𝑇,𝑥 = Hourly heating energy at time ‘x’ (kWh/m2)
𝐸𝑑𝑎𝑖𝑙𝑦/𝑚2 = Daily energy from solar thermal per m2 (kWh/m2.day)
The minimum daily energy value is then used in Equation (6.10) to calculate the area
needed to supply the DHW needs during Winter,

32
𝐴 = \𝐷𝐻𝑊\whgfx/ygi/yo
(6.10)
Where: 𝐴 = Area of Solar thermal array (m2)
𝐸𝑑𝑎𝑖𝑙𝑦/𝑚𝑖𝑛/𝑚2 = Minimum daily energy from solar thermal per m2 (kWh/m2.day)
𝐸𝐷𝐻𝑊 = Daily energy demand to heat DHW (kWh.day)
The area calculated provides the minimum area needed to supply DHW needs during
Winter.
6.3.2 Solar Thermal Store
In order for the solar thermal array to provide sufficient DHW during the Winter it will
required to have a large area meaning during the rest of the year the solar thermal array
isn’t being used to its full potential. To prevent this energy going to waste a thermal
store will be sized so that in the warmer months the excess energy can be used to fill
the thermal store.
On occasions when there is insufficient energy generation and not enough energy has
been stored in the lithium-ion batteries to meet the electrical energy demand, the
thermal store can help provide some of the space heating requirements, reducing the
work needed to be done by the GSHP pump so it requires less electrical energy. This
allows for the electrical energy that is stored and being generated to still power
appliances but without sacrificing the heating requirements for the house as the
thermal store will provide this.
In order for the thermal store to be sized the excess energy produced by the solar
thermal array needs to be calculated and this was done in the model using the following
method,
By re-arranging Equation (6.10) to find the daily energy demand at a set area, the daily
energy produced for each month can calculated. [77]
𝐸𝑑𝑎𝑖𝑙𝑦 = 𝐴𝐸𝑑𝑎𝑖𝑙𝑦/𝑚2 (6.11)
Where: 𝐸𝑑𝑎𝑖𝑙𝑦 = Daily energy produced from solar thermal (kWh.day)
33
𝐸𝑑𝑎𝑖𝑙𝑦/𝑚2 = Daily energy from 1 m2 of solar thermal
𝐴 = Area of solar thermal array (m2)
The excess energy generated is found by subtracting the DHW demand, 14.03
kWh.day, from daily energy generated,
𝐸𝑒𝑥𝑐𝑒𝑠𝑠=𝐸𝑑𝑎𝑖𝑙𝑦−𝐸𝐷𝐻𝑊 (6.12)
Where: 𝐸𝑒𝑥𝑐𝑒𝑠𝑠 = Excess energy produced a day from solar thermal (kWh/.day)
𝐸𝑑𝑎𝑖𝑙𝑦 = Total daily energy produced from solar thermal (kWh.day)
𝐸𝐷𝐻𝑊 = Daily energy demand to heat DHW (kWh.day)
The excess energy is then used to calculate how much water could be stored in a
thermal store.
The water volume is calculated by re-arranging Equation
(3.1)
𝑉 = pz{{\|}~���∆�`]
(6.13)
The thermal store will store water at 45oC, the same temperature the underfloor heating
requires. The volume of water is found for each month and a store can be sized based
on requirements and volume.
The solar thermal store can only be calculated once the final optimized size of the solar
thermal array has been calculated. This will be done in Section (7.3)
6.4 Independent Variables for Energy Generation Technologies
Once the excel model sizing the components is built the independent variables for each
can be identified.

34
The independent variable for the wind generation was the turbine radius. Altering the
radius affected the swept area which is directly proportional to the electrical energy
generation. An optimum size can then be found.
The effectiveness of the solar PV array was dependent on the tilt and orientation of the
PV panels and the total area of the array. The area of the array was controlled by the
number of panels, adding panels if more generation was needed. The tilt and
orientation of the panel effect the intensity of the solar irradiance hitting the panel. For
optimum generation the angle between the solar irradiance and the surface must be
perpendicular, knowing this allows the panels to be angled so that they produce the
most electricity when the demand requires it.
Like the solar PV array the solar thermal array is dependent on the area and the tilt of
the panels. As previously mentioned, the orientation isn’t considered due to the solar
irradiance always being perpendicular to the cylindrical shape of the tubes.

35
7 Results
The aim of the report was to size and optimize a stand-alone energy system for an off-
grid dwelling, this requires the energy system to be able to supply the house with
electricity, heating and hot water consistently throughout the year. In order to achieve
a practical sized system with enough energy generation, an iterative approach was
taken. The iterative sizing process is explained in the following section.
7.1 Initial Component Selection
For the sizes of each component to be selected many of the equations require
efficiencies of technologies. Component models are selected here to find efficiencies
allowing the generation to be calculated.
7.1.1 Ground Source Heat Pump
When selecting a GSHP the lower the outlet temperature the more efficient the GSHP
becomes.
The average mains water temperature is 7.3oC [24]. The manufactures website has
information for inlet temperatures of 0oC, 2 oC, 4 oC, 6 oC, 8 oC and 10 oC. Rounding
down from 7.3 oC was used to assume an inlet temperature of 6 oC. The GSHP will
supply an underfloor heating system which requires an outlet temperature of 45oC.

36
Figure 7.1 - Kensa 24kW GSHP [62]
The 24kW Kensa Twin Compact Heat Pump was selected. The Seasonal Co-efficient
of Performance of this model is 3.84. Assuming the GSHP has an SCoP of 3.84 all
year round an electrical demand was calculated by dividing the heating loads in Table
(3.4) by 3.84.
Table 7.1 - Electrical Heating Load (kWh)
A finalized hourly electrical load was then found by adding the hourly lighting and equipment
loads to the hourly electrical heating loads.
Table 7.2 - Total Electrical Load
Month/Day 00:00 01:00 02:00 03:00 04:00 05:00 06:00 07:00 08:00 09:00 10:00 11:00 12:00 13:00 14:00 15:00 16:00 17:00 18:00 19:00 20:00 21:00 22:00 23:00 Daily (kW)17-Jan 0.1 0.1 0.1 0.1 0.1 0.1 3.0 1.8 0.1 0.1 0.1 0.1 0.1 0.1 0.1 0.1 2.7 1.7 1.6 1.6 1.5 1.5 0.1 0.1 17.016-Feb 0.1 0.1 0.1 0.1 0.1 0.1 0.1 0.1 0.1 3.7 2.1 1.9 1.8 0.1 0.1 0.1 2.7 1.8 1.8 1.8 1.8 1.7 0.1 0.1 22.915-Mar 0.1 0.1 0.1 0.1 0.1 0.1 0.1 0.1 0.1 2.5 1.5 1.3 1.2 0.1 0.1 0.1 1.8 1.2 1.2 1.2 1.2 1.2 0.1 0.1 15.409-Apr 0.1 0.1 0.1 0.1 0.1 0.1 2.4 1.2 0.1 0.1 0.1 0.1 0.1 0.1 0.1 0.1 1.1 0.6 0.5 0.7 0.9 1.0 0.0 0.0 9.201-May 0.1 0.1 0.1 0.1 0.1 0.1 1.9 1.0 0.1 0.1 0.1 0.1 0.1 0.1 0.1 0.1 0.8 0.4 0.4 0.4 0.5 0.8 0.0 0.0 7.014-Jun 0.0 0.0 0.0 0.0 0.0 0.0 0.0 0.0 0.0 0.0 0.0 0.0 0.0 0.0 0.0 0.0 0.0 0.0 0.0 0.0 0.0 0.0 0.0 0.0 0.901-Jul 0.0 0.0 0.0 0.0 0.0 0.0 0.0 0.0 0.0 0.0 0.0 0.0 0.0 0.0 0.0 0.0 0.0 0.0 0.0 0.0 0.0 0.0 0.0 0.0 0.009-Aug 0.0 0.0 0.0 0.0 0.0 0.0 0.0 0.0 0.0 0.0 0.0 0.0 0.0 0.0 0.0 0.0 0.0 0.0 0.0 0.0 0.0 0.0 0.0 0.0 0.230-Sep 0.0 0.0 0.0 0.0 0.0 0.0 1.5 0.7 0.0 0.0 0.0 0.0 0.0 0.0 0.0 0.0 0.6 0.3 0.4 0.6 0.6 0.6 0.0 0.0 5.921-Oct 0.1 0.1 0.1 0.1 0.1 0.1 2.4 1.5 0.1 0.1 0.1 0.1 0.1 0.1 0.1 0.1 1.8 1.1 1.0 1.0 0.9 0.9 0.1 0.1 11.618-Nov 0.1 0.1 0.1 0.1 0.1 0.1 3.0 1.9 0.1 0.1 0.1 0.1 0.1 0.1 0.1 0.1 2.8 1.7 1.6 1.5 1.5 1.4 0.1 0.1 16.909-Dec 0.1 0.1 0.1 0.1 0.1 0.1 2.6 1.6 0.1 0.1 0.1 0.1 0.1 0.1 0.1 0.1 2.5 1.5 1.5 1.4 1.4 1.3 0.1 0.1 15.2
Heating Electrical demand (kWh)

37
7.1.2 Wind Turbine
There are far fewer domestic wind turbine manufactures than solar panel
manufactures, but they are produced in a range of sizes for domestic uses. Some
turbines which may be applicable to this project are the, Swift Wind Turbine System
(diameter 2.1m) [63], Kestrel E300/400 (diameters of 3m and 4m respectively)[64]
and the Kingspan KW6 (5.6m diameter)[65]. As the size of the wind turbine hasn’t
been decided the efficiency is modeled as 35% [66].
7.1.3 Solar PV Panel
The selected solar panel is the Perlight 320 Watt Mono Panel – Black +[67]. It’s a
monocrystalline solar panel and was selected due to its high efficiency of 19.67% , the
highest from the manufacturer allowing for a smaller array. Each panel has dimensions
of 1640 x 982 x 35mm. The solar array will have system losses modelled at 25% [68].
Figure 7.2 - Perlight 320 Watt solar PV panel[67]
Date 00:00 01:00 02:00 03:00 04:00 05:00 06:00 07:00 08:00 09:00 10:00 11:00 12:00 13:00 14:00 15:00 16:00 17:00 18:00 19:00 20:00 21:00 22:00 23:00 Daily (kW)17-Jan 0.18 0.18 0.18 0.18 0.19 0.19 3.07 2.78 1.04 0.20 0.20 0.20 0.20 0.20 0.20 0.20 3.67 2.67 2.59 2.54 2.49 2.45 1.03 0.19 27.016-Feb 0.21 0.21 0.21 0.21 0.21 0.21 0.21 1.05 1.05 4.62 3.09 2.89 2.77 1.06 1.06 1.06 3.69 2.78 2.76 2.74 2.71 2.68 1.06 0.22 38.815-Mar 0.16 0.16 0.16 0.17 0.17 0.17 0.17 1.01 1.02 3.49 2.40 2.23 2.14 1.02 1.02 1.02 2.70 2.16 2.18 2.19 2.15 2.12 1.02 0.17 31.209-Apr 0.16 0.16 0.16 0.16 0.16 0.16 2.48 2.13 1.01 0.17 0.17 0.17 0.18 0.17 0.17 0.17 2.01 1.50 1.45 1.60 1.83 1.92 0.99 0.15 19.201-May 0.15 0.15 0.15 0.15 0.15 0.15 2.00 1.90 1.00 0.16 0.16 0.16 0.16 0.16 0.16 0.16 1.75 1.37 1.31 1.32 1.45 1.71 0.98 0.14 17.014-Jun 0.13 0.13 0.13 0.13 0.13 0.13 0.13 0.98 0.98 0.98 0.98 0.98 0.98 0.98 0.98 0.98 0.98 0.98 0.98 0.98 0.98 0.98 0.98 0.13 16.701-Jul 0.10 0.10 0.10 0.10 0.10 0.10 0.10 0.94 0.94 0.94 0.94 0.94 0.94 0.94 0.94 0.94 0.94 0.94 0.94 0.94 0.94 0.94 0.94 0.10 15.809-Aug 0.10 0.10 0.10 0.11 0.11 0.11 0.11 0.95 0.95 0.95 0.95 0.95 0.96 0.96 0.96 0.96 0.95 0.95 0.95 0.95 0.95 0.95 0.95 0.10 16.130-Sep 0.13 0.13 0.13 0.13 0.13 0.13 1.59 1.63 0.98 0.14 0.14 0.14 0.14 0.14 0.14 0.14 1.50 1.27 1.35 1.52 1.57 1.57 0.97 0.13 15.921-Oct 0.15 0.15 0.16 0.16 0.16 0.16 2.46 2.41 1.01 0.17 0.17 0.18 0.18 0.18 0.18 0.18 2.72 2.05 1.99 1.93 1.88 1.83 1.01 0.17 21.618-Nov 0.19 0.19 0.19 0.19 0.19 0.19 3.13 2.82 1.04 0.20 0.20 0.20 0.20 0.20 0.20 0.20 3.73 2.64 2.54 2.46 2.40 2.35 1.04 0.20 26.909-Dec 0.19 0.19 0.19 0.19 0.19 0.19 2.73 2.54 1.03 0.19 0.19 0.19 0.19 0.19 0.19 0.19 3.44 2.47 2.40 2.35 2.31 2.27 1.03 0.18 25.2
Total Hourly Electrical Demand (kW)

38
7.1.4 Lithium Ion Batteries
To ensure the electrical demand is being constantly met even if there is little or no
electrical generation, the excess electrical energy will be stored in a lithium ion battery.
When there is no generation the excess electrical energy in the battery can be used to
meet the demand of the building. The battery system will use Tesla Powerwalls, with
each Powerwall storing up to 13.5 kWh of usable electricity [69].
The system will have two Powerwall’s providing a total of 27 kWh of electrical energy
storage. When fully charged two batteries would be enough to supply the total
electrical demand of the building for a day if there was no wind generation allowing
the house still to function. A single Powerwall wouldn’t be able to meet the daily
electrical demand of the house if there was no wind generation meaning the electrical
demand wouldn’t be met. For a third battery to be useful it would mean the system is
exceeding the demand by 27 kWh, suggesting the system is oversized. The likelihood
of this happening would be during Summer when the excess storage isn’t needed.
Figure 7.3 - Tesla Powerwall[70]
In the model there is no time when there will be no wind generation, this is because
the hourly wind speed is an average across 5 years, with the minimum wind speed in

39
the model at 3.7 m/s. Turbines kick in when the wind speed is greater than 3 m/s [71].
In reality there will be days during winter where this value is not exceeded and there
is no wind generation, hence the need for two Powerwall’s needed to be able to supply
a days’ worth of electricity. There will also be days where the wind speeds exceed the
average and the battery capacity will become full so that they can be unloaded when
there is no generation. These scenarios aren’t seen in the excel model.
7.1.5 Solar Thermal Panels
In order for the solar thermal array to provide 100% of the DHW needs for the
property, the solar thermal array needs to be able to provide 14.03 kWh.day (Section
3.5). To ensure the solar thermal array is as small as possible to meet this demand the
panel selected was the Kingspan Varisol DF and was chosen for its high efficiency of
78.3% [72]. The efficiency of the panels is taken as the zero-loss collector efficiency.
The model size is based on a tube by tube basis meaning the size is very flexible
7.2 Electrical Energy Sizing Process
The sizing process was initiated by inputting an estimate for the size of each
component. This included a 10-panel solar PV array (16 m) with orientation facing
directly South (180o) to ensure they receive the most Sunlight as possible and tilted
30o with a wind turbine having a 1 m radius. Table (7.3) was generated by subtracting
the energy demand from the sum of wind and solar generation.
Table 7.3 - Initial Generation - Demand
Table (7.3) shows the initial feedback from the model, large areas (shown in pink) are
not meeting the energy demand by a considerable amount, especially when the heating
Month00:00 01:00 02:00 03:00 04:00 05:00 06:00 07:00 08:00 09:00 10:00 11:00 12:00 13:00 14:00 15:00 16:00 17:00 18:00 19:00 20:00 21:00 22:00 23:00
Jan 0.1 0.1 0.1 0.1 0.1 0.0 -2.8 -2.5 -0.8 0.1 0.1 0.3 0.4 0.4 0.4 0.3 -3.3 -2.4 -2.4 -2.3 -2.3 -2.2 -0.8 0.0Feb 0.0 0.0 0.0 0.0 0.0 0.0 0.0 -0.8 -0.8 -4.3 -2.6 -2.1 -1.8 -0.1 -0.1 -0.3 -3.1 -2.4 -2.5 -2.5 -2.5 -2.5 -0.8 0.0Mar 0.0 0.0 0.0 0.0 0.0 0.0 0.0 -0.9 -0.8 -3.1 -1.7 -1.3 -1.0 0.1 0.0 -0.1 -2.0 -1.7 -1.9 -2.0 -2.0 -2.0 -0.9 0.0Apr -0.1 -0.1 -0.1 -0.1 -0.1 -0.1 -2.4 -2.0 -0.9 0.1 0.3 0.5 0.7 0.8 0.8 0.6 -1.4 -1.0 -1.1 -1.4 -1.7 -1.8 -0.9 0.0May -0.1 -0.1 -0.1 -0.1 -0.1 -0.1 -2.0 -1.8 -0.9 0.1 0.4 0.7 1.0 1.1 1.1 0.9 -1.0 -0.8 -1.0 -1.2 -1.3 -1.6 -0.9 -0.1Jun -0.1 -0.1 -0.1 -0.1 -0.1 -0.1 -0.1 -0.9 -0.9 -0.8 -0.6 -0.3 -0.1 0.1 0.1 0.0 -0.3 -0.6 -0.8 -0.9 -0.9 -0.9 -0.9 -0.1Jul -0.1 -0.1 -0.1 -0.1 -0.1 -0.1 -0.1 -0.9 -0.9 -0.8 -0.6 -0.3 -0.1 0.1 0.1 0.0 -0.3 -0.5 -0.8 -0.8 -0.8 -0.9 -0.9 -0.1Aug 0.0 0.0 -0.1 -0.1 -0.1 -0.1 -0.1 -0.9 -0.9 -0.8 -0.6 -0.4 -0.3 -0.1 -0.1 -0.2 -0.3 -0.5 -0.7 -0.8 -0.8 -0.9 -0.9 0.0Sep -0.1 -0.1 -0.1 -0.1 -0.1 -0.1 -1.5 -1.6 -0.9 0.1 0.2 0.4 0.7 0.8 0.8 0.6 -0.9 -0.9 -1.1 -1.4 -1.5 -1.5 -0.9 -0.1Oct 0.0 0.0 0.0 0.0 -0.1 -0.1 -2.3 -2.3 -0.9 0.0 0.2 0.3 0.5 0.6 0.6 0.5 -2.2 -1.7 -1.8 -1.8 -1.8 -1.7 -0.9 -0.1Nov 0.0 0.0 0.0 0.0 0.0 -0.1 -3.0 -2.7 -0.9 0.0 0.1 0.2 0.3 0.3 0.2 0.1 -3.5 -2.5 -2.4 -2.3 -2.2 -2.2 -0.9 0.0Dec 0.0 0.0 0.0 0.0 0.0 0.0 -2.5 -2.3 -0.8 0.0 0.1 0.2 0.3 0.3 0.3 0.2 -3.2 -2.3 -2.2 -2.2 -2.1 -2.1 -0.8 0.0
Demand > GenerationDemand < Generation
Generation meeting demand (kWh)

40
comes on during the evening. It is clear from the table that even if the excess energy
was being stored, the hourly demand being met is still a long way off. As the peak
energy loads for each month were used, it means the Summer months peak days are
all weekends which have a higher electrical appliance load throughout the day, hence
the demand not being met despite the heating being turned off.
Due to a larger amount of electrical energy needing to be generated, the wind turbine
was increased to have a radius of 3 m. The solar array was also doubled in size to 32
m2 and tilt altered to 70o to favour Winter generation.
Table 7.4 - Second Generation - Demand
Despite the changes made to the sizes of the wind turbine and PV array the energy
generation still doesn’t meet the hourly demand of the building. Table (7.4) shows
during the day there is a large amount of excess energy which can be stored in the
Tesla Powerwalls in order to supply the demand in the evening.
During periods when there is not enough energy generation to match the demand the
additional energy needed can be supplied from the excess energy stored in the
Powerwall. Table (7.5) shows the surplus energy stored in the Powerwall after
supplying the demand for the building, hence larger areas of green. There are 3 hours
Month00:00 01:00 02:00 03:00 04:00 05:00 06:00 07:00 08:00 09:00 10:00 11:00 12:00 13:00 14:00 15:00 16:00 17:00 18:00 19:00 20:00 21:00 22:00 23:00
Jan 2.0 1.9 2.0 1.9 2.0 1.9 -0.9 -0.6 1.2 2.0 2.2 2.6 3.2 3.0 3.1 3.0 -0.9 -0.4 -0.5 -0.4 -0.4 -0.2 1.2 2.0Feb 1.6 1.6 1.7 1.7 1.7 1.7 1.9 1.1 1.2 -2.2 0.0 1.1 2.2 3.6 3.6 3.4 0.2 0.4 -0.2 -0.6 -0.6 -0.8 0.9 1.8Mar 1.2 1.2 1.1 1.1 1.2 1.3 1.2 0.4 0.6 -1.2 0.8 1.9 2.5 3.4 3.4 3.2 1.0 1.0 0.5 -0.1 -0.5 -0.7 0.4 1.2Apr 0.7 0.7 0.7 0.6 0.6 0.6 -1.7 -1.3 0.1 1.4 1.9 2.5 3.1 3.2 3.3 3.0 0.8 0.9 0.6 0.0 -0.6 -0.9 -0.1 0.7May 0.3 0.3 0.3 0.3 0.3 0.3 -1.6 -1.4 -0.3 1.1 1.8 2.6 3.2 3.6 3.6 3.1 1.1 0.9 0.4 -0.1 -0.4 -1.0 -0.4 0.3Jun 0.3 0.3 0.3 0.2 0.2 0.2 0.3 -0.5 -0.4 -0.2 0.4 1.0 1.6 1.9 2.0 1.7 1.2 0.6 0.2 0.0 -0.1 -0.3 -0.5 0.3Jul 0.2 0.2 0.2 0.2 0.2 0.2 0.2 -0.6 -0.4 -0.2 0.3 0.9 1.5 1.9 1.9 1.8 1.3 0.7 0.2 0.0 -0.1 -0.4 -0.5 0.3Aug 0.4 0.4 0.4 0.4 0.4 0.4 0.4 -0.4 -0.3 0.0 0.4 0.9 1.4 1.8 2.0 1.8 1.5 1.0 0.6 0.2 0.0 -0.3 -0.3 0.4Sep 0.4 0.4 0.4 0.4 0.4 0.4 -1.1 -1.1 -0.4 0.8 1.3 1.8 2.5 2.7 2.8 2.5 0.7 0.6 0.0 -0.6 -0.9 -0.9 -0.4 0.4Oct 0.8 0.8 0.8 0.8 0.8 0.8 -1.5 -1.4 0.0 1.0 1.5 2.1 2.6 2.9 3.0 2.8 -0.1 0.0 -0.5 -0.8 -0.8 -0.8 0.0 0.9Nov 1.1 1.1 1.1 1.1 1.1 1.1 -1.9 -1.6 0.2 1.1 1.4 1.8 2.3 2.2 2.0 1.8 -2.1 -1.3 -1.2 -1.1 -1.0 -0.9 0.4 1.2Dec 1.4 1.4 1.4 1.4 1.5 1.6 -0.8 -0.7 0.9 1.7 1.8 2.2 2.6 2.6 2.5 2.3 -1.2 -0.5 -0.5 -0.6 -0.6 -0.5 0.6 1.4
Demand > GenerationDemand < Generation
Generation meeting demand (kWh)

41
when the generation and storage is insufficient to meet the demand. However, the
model assumes that at the start of everyday the batteries are empty, in reality however
the energy stored at the end of each day will be carried over. It is important for the
system to be able to meet the demand if the batteries are empty, hence the energy
carried over hasn’t been modelled. The energy stored energy at the end of the day can
be carried over manually. By assuming the day in May starts with the energy stored
from the end of the day in the same month then we can see that 19.7kWh (the energy
stored at the end of the day in May) will supply the demand of 1.2 kWh and 0.3 kWh.
Table 7.5 - Second Storage + Generation - Demand
With a wind turbine of radius 3 m and a 32 m2 solar array, this system is capable of
suppling the buildings electrical energy demand. This system is very oversized
however, producing far more energy than it needs. There is excessive amounts of the
energy being produced from December to March suggesting the wind turbine is too
large as the wind resource is higher during this period. The next stage of the modelling
is to shrink the size of the wind turbine, so less energy is wasted but ensuring the
Month 00:00 01:00 02:00 03:00 04:00 05:00 06:00 07:00 08:00 09:00 10:00 11:00 12:00 13:00 14:00 15:00 16:00 17:00 18:00 19:00 20:00 21:00 22:00 23:00Jan 2.0 3.9 5.9 7.8 9.8 11.7 10.8 10.2 11.3 13.4 15.5 18.2 21.3 24.3 27.0 27.0 27.0 27.0 27.0 27.0 27.0 27.0 27.0 27.0Feb 1.6 3.2 4.9 6.6 8.4 10.1 12.0 13.1 14.3 12.2 12.2 13.3 15.5 19.1 22.7 26.1 26.3 26.7 26.5 26.0 25.3 24.6 25.5 27.0Mar 1.2 2.4 3.5 4.6 5.7 7.0 8.2 8.7 9.3 8.1 8.9 10.7 13.3 16.7 20.1 23.3 24.3 25.3 25.9 25.8 25.2 24.6 24.9 26.1Apr 0.7 1.4 2.0 2.7 3.3 3.9 2.3 1.0 1.1 2.5 4.4 7.0 10.0 13.3 16.6 19.6 20.4 21.3 21.8 21.8 21.2 20.3 20.2 20.9May 0.3 0.6 0.9 1.1 1.4 1.7 0.1 -1.2 -0.3 1.1 2.9 5.5 8.6 12.3 15.9 19.0 20.1 21.0 21.3 21.2 20.8 19.8 19.4 19.7Jun 0.3 0.6 0.8 1.1 1.3 1.5 1.8 1.3 0.9 0.7 1.1 2.1 3.6 5.6 7.5 9.2 10.3 10.9 11.1 11.1 11.0 10.7 10.2 10.5Jul 0.2 0.5 0.7 0.9 1.1 1.3 1.5 1.0 0.6 0.4 0.7 1.7 3.1 5.0 7.0 8.7 10.0 10.7 10.9 10.9 10.8 10.5 9.9 10.2Aug 0.4 0.8 1.1 1.5 1.9 2.2 2.6 2.2 1.8 1.8 2.2 3.2 4.6 6.3 8.4 10.2 11.6 12.6 13.2 13.5 13.5 13.2 12.9 13.3Sep 0.4 0.8 1.2 1.6 2.0 2.4 1.3 0.3 -0.1 0.8 2.1 3.9 6.4 9.1 11.9 14.4 15.2 15.7 15.7 15.1 14.2 13.2 12.9 13.3Oct 0.8 1.7 2.5 3.3 4.1 4.9 3.4 2.0 2.0 3.0 4.5 6.5 9.1 12.0 15.0 17.8 17.7 17.7 17.2 16.5 15.7 14.9 14.9 15.8Nov 1.1 2.2 3.3 4.5 5.5 6.6 4.7 3.1 3.3 4.4 5.8 7.6 9.9 12.1 14.1 15.9 13.9 12.6 11.4 10.3 9.3 8.4 8.8 10.1Dec 1.4 2.8 4.3 5.7 7.2 8.8 8.0 7.3 8.2 9.9 11.7 13.9 16.5 19.1 21.7 24.0 22.8 22.3 21.8 21.2 20.6 20.0 20.7 22.1
Energy still neededStored in Powerwall
Stored in power wall (kWh)

42
demand is still met. This process continues until an optimum solution is found, i.e.
where energy demand is always met but without large amounts of potential energy
going to waste.
7.2.1 Final Size for Wind Turbine and Solar PV array
A continuation of the iterative process was conducted until a final optimized solution
was found. The optimized design solution consists of a wind turbine with a radius of
2.5m and a solar array of 37.8 m2 (23 panels).
Table (7.6) shows that for every hour, during the day with the peak energy load in each
month, the demand is met. Where there is still energy needed, the energy stored at the
end of the day can be assumed for the previous day and thus can be carried over to
supply these demands.
Table 7.6 – Final Generated + Stored - Demand
The limiting factor for the final size of the system is the wind generation in November.
During
Winter months most of the energy is supplied by the wind turbine, shown in Figure
(7.4),
Month00:00 01:00 02:00 03:00 04:00 05:00 06:00 07:00 08:00 09:00 10:00 11:00 12:00 13:00 14:00 15:00 16:00 17:00 18:00 19:00 20:00 21:00 22:00 23:00
Jan 1.3 1.3 1.3 1.3 1.3 1.3 -1.6 -1.3 0.5 1.4 1.5 1.9 2.4 2.3 2.3 2.2 -1.7 -1.1 -1.1 -1.1 -1.0 -0.9 0.5 1.3Feb 1.1 1.1 1.1 1.1 1.1 1.1 1.2 0.5 0.5 -2.8 -0.7 0.3 1.2 2.7 2.7 2.4 -0.8 -0.5 -1.0 -1.2 -1.3 -1.3 0.3 1.2Mar 0.8 0.8 0.7 0.7 0.8 0.8 0.8 0.0 0.2 -1.7 0.2 1.2 1.8 2.7 2.7 2.4 0.2 0.2 -0.3 -0.7 -1.0 -1.1 0.0 0.8Apr 0.4 0.4 0.4 0.4 0.4 0.4 -1.9 -1.5 -0.2 1.0 1.6 2.2 2.7 2.9 2.9 2.6 0.3 0.4 0.0 -0.5 -1.0 -1.2 -0.4 0.5May 0.2 0.1 0.1 0.1 0.1 0.1 -1.7 -1.5 -0.5 0.9 1.6 2.4 3.0 3.5 3.5 2.9 0.8 0.5 0.0 -0.5 -0.7 -1.2 -0.6 0.2Jun 0.2 0.2 0.1 0.1 0.1 0.1 0.1 -0.7 -0.6 -0.3 0.2 0.9 1.5 1.9 2.0 1.6 1.0 0.4 -0.1 -0.3 -0.4 -0.5 -0.7 0.2Jul 0.1 0.1 0.1 0.1 0.1 0.1 0.1 -0.7 -0.6 -0.3 0.2 0.8 1.4 1.9 1.9 1.7 1.1 0.5 -0.1 -0.3 -0.4 -0.5 -0.7 0.2Aug 0.2 0.2 0.2 0.2 0.2 0.2 0.2 -0.6 -0.5 -0.2 0.2 0.7 1.2 1.5 1.8 1.5 1.2 0.7 0.2 -0.1 -0.3 -0.5 -0.5 0.3Sep 0.2 0.2 0.2 0.2 0.3 0.2 -1.2 -1.3 -0.5 0.6 1.1 1.7 2.3 2.6 2.5 2.2 0.4 0.2 -0.3 -0.9 -1.1 -1.1 -0.6 0.3Oct 0.5 0.5 0.5 0.5 0.5 0.5 -1.8 -1.7 -0.3 0.7 1.1 1.7 2.2 2.5 2.5 2.3 -0.7 -0.5 -0.9 -1.1 -1.1 -1.1 -0.3 0.6Nov 0.7 0.7 0.7 0.7 0.7 0.7 -2.3 -2.0 -0.2 0.7 1.0 1.4 1.8 1.8 1.6 1.3 -2.5 -1.7 -1.6 -1.5 -1.4 -1.3 0.0 0.8Dec 0.9 0.9 0.9 0.9 1.0 1.1 -1.4 -1.2 0.3 1.1 1.3 1.6 2.0 2.0 1.9 1.7 -1.9 -1.1 -1.1 -1.1 -1.1 -1.1 0.1 0.9
Demand > GenerationDemand < Generation
Generation meeting demand (kWh)

43
Figure 7.4 - Daily Comparison between electrical generation and demand at the final size During November the daily wind generation doesn’t meet the total daily energy demand, however the solar array supplies enough energy for the demand to be met. When sizing the system, the size of the wind turbine could have been increased to meet the demand for November. However, it would then be oversized and the generation from wind would greatly exceed the demand during the other Winter months. Having the solar array sized so that it could ensure November received just enough generation but then not be oversized during the Summer was crucial when finding the balance for the final system size. If the turbine size had been reduced and the solar array was increased to provide the rest of the energy it would mean during Summer the solar array would be greatly oversized and the majority of energy generation would come during the Summer when there is the smallest demand which isn’t optimal design. The pattern of wind generation is similar to that of the energy demand; hence the wind turbine was sized to provide the majority of the energy.
7.3 Solar Domestic Hot Water Sizing
December has the lowest solar irradiance meaning for the solar array to provide all the
DHW for December it will require the largest area. To minimize the area that the solar
array occupies, the tilt of the panel will be angled for optimum performance during
December. Table (7.7) is calculated using Equation (6.8) and (6.9),
Table 7.7- Energy collected by the solar evacuated tube to heat DHW
0.0 5.0
10.0 15.0 20.0 25.0 30.0 35.0 40.0 45.0
Jan Feb Mar Apr May Jun Jul Aug Sep Oct Nov Dec
Dia
ly L
oad
(kW
h.da
y)
Month
Daily Comparison between generation and demand
Solar Generation Wind Generation Total Energy Demand

44
The area is calculated by using Equation (6.10) and by varying tilt we can see how this
effects the area needed;
Figure 7.5 - Tilt affecting Area of Solar thermal array
Figure (7.5) shows that the optimum tilt angle for the solar array to be the smallest size
would be 80o. There is a small change in area from 60o to 900. As the angle increases
from 60o there are small changes in area but large reductions in the amount of hot
water produced in the Summer.
An optimum tilt of 800 was decided as the excess hot water produced in the Summer
will have little use meaning the area for the solar thermal array will be 36.3 m2. The
model then used Equation (6.11) from Section 6.3.1 which allowed the size of the
thermal array to be reduced and showed how much energy would be needed to meet
the remaining demand. Assuming an immersion heater has an efficiency of 0.9 [73],
by dividing the energy needed to heat the water by the efficiency of the heater the
electrical energy can be calculated to provide the remaining demand.
Month 00:00 01:00 02:00 03:00 04:00 05:00 06:00 07:00 08:00 09:00 10:00 11:00 12:00 13:00 14:00 15:00 16:00 17:00 18:00 19:00 20:00 21:00 22:00 23:00 Kwh/m2.dayJan 0.00 0.00 0.00 0.00 0.00 0.00 0.00 0.00 0.00 0.00 0.03 0.07 0.10 0.10 0.10 0.07 0.03 0.00 0.00 0.00 0.00 0.00 0.00 0.00 0.51Feb 0.00 0.00 0.00 0.00 0.00 0.00 0.00 0.00 0.00 0.04 0.11 0.15 0.18 0.20 0.19 0.16 0.11 0.05 0.00 0.00 0.00 0.00 0.00 0.00 1.20Mar 0.00 0.00 0.00 0.00 0.00 0.00 0.00 0.01 0.07 0.13 0.19 0.23 0.25 0.24 0.24 0.22 0.19 0.13 0.06 0.01 0.00 0.00 0.00 0.00 1.96Apr 0.00 0.00 0.00 0.00 0.00 0.00 0.00 0.02 0.08 0.14 0.18 0.21 0.23 0.24 0.23 0.21 0.20 0.18 0.14 0.11 0.05 0.01 0.00 0.00 2.23May 0.00 0.00 0.00 0.00 0.00 0.00 0.02 0.08 0.16 0.24 0.29 0.32 0.32 0.33 0.34 0.32 0.31 0.31 0.27 0.21 0.13 0.05 0.00 0.00 3.71Jun 0.00 0.00 0.00 0.00 0.00 0.00 0.04 0.10 0.16 0.20 0.25 0.27 0.27 0.28 0.29 0.30 0.30 0.28 0.26 0.22 0.15 0.09 0.02 0.00 3.48Jul 0.00 0.00 0.00 0.00 0.00 0.00 0.03 0.09 0.15 0.20 0.24 0.24 0.24 0.26 0.27 0.29 0.30 0.28 0.25 0.21 0.14 0.07 0.01 0.00 3.26Aug 0.00 0.00 0.00 0.00 0.00 0.00 0.00 0.02 0.07 0.11 0.15 0.18 0.19 0.19 0.22 0.22 0.22 0.21 0.18 0.13 0.08 0.02 0.00 0.00 2.19Sep 0.00 0.00 0.00 0.00 0.00 0.00 0.00 0.00 0.03 0.09 0.15 0.18 0.24 0.24 0.24 0.21 0.19 0.17 0.12 0.06 0.01 0.00 0.00 0.00 1.92Oct 0.00 0.00 0.00 0.00 0.00 0.00 0.00 0.00 0.00 0.03 0.09 0.14 0.17 0.18 0.18 0.17 0.14 0.09 0.04 0.00 0.00 0.00 0.00 0.00 1.24Nov 0.00 0.00 0.00 0.00 0.00 0.00 0.00 0.00 0.00 0.02 0.05 0.08 0.11 0.12 0.10 0.07 0.03 0.00 0.00 0.00 0.00 0.00 0.00 0.00 0.58Dec 0.00 0.00 0.00 0.00 0.00 0.00 0.00 0.00 0.00 0.00 0.02 0.06 0.08 0.09 0.08 0.05 0.01 0.00 0.00 0.00 0.00 0.00 0.00 0.00 0.38
Energy collected by solar thermal panel (kWh/m2)
252
116 77
59 49 43 39 37 36 37
0
50
100
150
200
250
300
0 10 20 30 40 50 60 70 80 90 100
Are
a (m
2)
Tilt (o)
Area needed to supply hot water changing with tilt

45
Figure 7.6 - Electrical energy required to meet remaining DHW demand
7.3.1 Final Solar Thermal Array and Thermal Store
Once the final electrical demands were calculated it could be seen from Table (7.6)
that the excess energy stored in January and December could be used to supply an
immersion heater in the thermal store, thus allowing the solar thermal array to be
shrunk down. At the end of the peak load day in December there is 8.6 kWh of
electrical energy stored. Figure (7.6) shows that if 4.9 kWh.d of the stored energy is
used to supply the immersion heater it would shrink the solar thermal array by 11 m2.
It’s important that not all the stored energy is used in case the generation the next day
doesn’t meet the demand and relies on some storage from the Powerwall. January will
need 1.3 kWh.day due to the smaller solar thermal array, however the electrical energy
generated and stored in the January day is sufficient to meet this demand allowing the
thermal array to be reduced, giving the solar thermal array a final size of 25m2.
The excess energy produced throughout the year from the 25 m2 solar thermal array
is shown below in Table (7.8).
Table 7.8 - Solar thermal excess energy and equivalent volume of water Month Area (m2) Excess Energy (kWh.day) Volume of Water at 45oC (litres.day)
0 1 2 3 4 5 6 7 8 9
10
40 35 30 25 20 15
Elec
tric
al e
nerg
y ne
eded
(kW
h.da
y)
Area of solar thermal array (m 2 )
Electrical energy needed to supply remaing DHW
Jan Nov Dec

46
Jan Feb Mar Apr May Jun Jul 25
0 15.89 35.04 41.64 78.83 72.93 67.48
0 362 799 950 1798 1663 1539
Aug 40.81 931
Sep 34.06 777
Oct 16.98 387
Nov 0.36 8
Dec 0.00 0
Looking at volume of excess hot water produced and the heating loads throughout the
year, the largest daily heating load is 88.1 kWh.day during February. The equivalent
volume of water at 45oC is 2009.3 litres. A 2000 litre thermal store would be able to
provide the peak heating demand if full. From Table (7.8) the volume of hot water
produced per day will quickly supply the thermal store of 2000 litres and continue to
keep it heated throughout the year as water has such a high heat capacity. This will
allow for emergency heating to be supplied if the electrical energy generation cannot
supply the GSHP.
7.4 Final System Size
The finalized system is compromised of the 24kW Kensa Twin Compact Heat Pump,
a wind turbine with a radius of 2.5 m, a solar PV array of 37.8 m2 (23 panels) and a
solar array of 25 m2. The electrical storage is provided by two Tesla Powerwalls and
a 2000 litre thermal store which stores heat energy to supply emergency space heating

47
8 Conclusion In this report a process was taken to design and optimize a stand-alone renewable
energy system to provide an off-grid dwelling with all its energy demands being met
throughout the year. As domestic buildings are one of the leading consumers of fossil
fuels in the UK the demand for renewable energy systems to power houses is becoming
more prevalent. This report has shown that a system can be created to meet the demand
however there are still various issues holding back stand-alone energy systems
becoming wide spread.
The solution created in this report is just one way of satisfying the buildings energy
demands. There are many other potential solutions using a variety of other
technologies for this project which haven’t been investigated or used during this report.
Synonymous with all stand-alone renewable energy systems the best optimization to
save energy is by adding quick changes such as insulation and double glazing. These
changes are cheap and easy when compared to the cost and size of the energy system
needed before the changes. These changes significantly reduce the energy demand and
thus the size of the components. In this report although modifications were made, if
stricter standards such as PassivHaus were applied to the building the energy
consumption could be reduced even further making the energy demand much more
achievable and realistic across other homes.
Another issue with stand-alone renewable energy-systems in similar climates with
such varying seasons, is there will always be a demand to generation imbalance, where
the demand is highest when the potential for generation is at its lowest. Overcoming
this is the main factor affecting the minimum size of the system components and
ensuring the system isn’t oversized during the Summer. This issue was solved in the
project by having a large wind turbine supplemented with a small solar PV array.
8.1 System Problems
There are problems which come with the proposed system size, for example the size
of the solar thermal array being oversized in Summer due to the large area required to
supply the DHW demand in Winter.

48
8.1.1 Solar Thermal Array Stagnation
The large solar thermal array which is required for Winter means that during Summer
the solar array will heat up the solar thermal store to the correct temperature very early
on in the day. Once it has achieved this it means the fluid in the solar thermal panels
stops circulating and sits in the Sun becoming very hot and potentially damaging the
evacuated tube. This process is called stagnation. When solar thermal panels overheat
the absorber coating starts to degrade along with rubber seals within the system, both
reducing efficiency[74] meaning the solar array won’t be able to supply the DHW
needs during Winter.
To prevent this from occurring it is recommended that the panels are covered to
prevent overheating. Alternatively, as the GSHP is not in operation during the Summer
months, once the solar thermal store has reached its desired temperature the solar
thermal system could feed the un-used ground-loop array. This would allow the solar
array to deposit its excess heat into the ground and preventing the panels becoming
overheated and damaged whilst simultaneously heating the ground. After 3 months of
the ground being heated it would lead to a small increase in the temperature
surrounding the ground-loop. The excess heat would slowly dissipate during the
autumnal months but during these months the temperature of the ground will be higher
meaning more heat energy would be absorbed into the ground-loop array increasing
the temperature of the fluid flowing through. The GSHP will then require less
electrical energy as the amount the fluid needs to be compressed by to reach the same
temperature is less because the initial temperature is higher. This would increase the
GSHP’s co-efficient of performance for a short period after the Summer and reducing
electrical demand meaning more energy could be stored in the batteries.
8.1.2 Alternative to Supply DHW Demand
The solar array is 25 m2, and this would cost a lot of money and resources to install
when much of the year the excess area is not necessary. A potential alternative to a 25
m2 solar thermal array would be a biomass boiler providing the heating energy to
supply the domestic hot water during the Winter months whilst a significantly smaller
solar thermal array would provide the DHW needs for the Summer and the warmer

49
shoulder months. Biomass boilers are a renewable energy technology and are carbon
neutral meaning anyone who chooses to use a biomass boiler is taking a step in using
fewer fossil fuels.
8.2 Further Investigation and Improvements
The model used hourly wind speeds across five years to produce an hourly wind speed
average for each month. This was done as only the peak day in month was modelled.
In reality a consistent wind speed throughout the month is very unlikely and there will
be large fluctuations throughout the day and month. There will also be days where
there will be no wind generation at all, and the model wasn’t tested against this. By
modelling hourly everyday throughout the year and using raw weather data without
averages, a more realistic simulation could be created and the model would be tested
against generation flat spots. A more realistic model could then be sized.

50
References
[1] Department for Business Energy & Industrial Strategy, “UK Greenhouse Gas
Emissions, Provisional”, 2017
[2] Department for Business Energy & Industrial Strategy, “Energy Consumption
in the UK,” 2016.
[3] “Wester Gartchonzie”, Galbraith Group, 2018. [Online].
Available:
https://www.galbraithgroup.com/property/str160014-wester-gartchonzie-
callanderstirlingshire-fk17-8hq. [Accessed 14/11/2018]
[4] “Scotland Weather and Climate”, Scotland Info Guide, 2018. [Online]. Available: https://www.scotlandinfo.eu/scotland-weather-and-climate/. [Accessed 14/11/2018] [5] “Climate & Weather Averages in Stirling, Scotland, United Kingdom”,
Timeanddate.com, 2018. [Online]. Available:
https://www.timeanddate.com/weather/uk/stirling/climate. [Accessed 15/11/2018]
[6] “EPC Certificates”, Energy Saving Trust, 2018. [Online]. Available:
https://www.scottishepcregister.org.uk/CustomerFacingPortal/EPCPostcodeS
earchResults. [Accessed 19/11/2018]
[7] D,Braham, “Guide A Environmental Design” revised 2017, Table 3.23, Single
glazing U-value
[8] D.Braham “Guide A Environmental Design” revised 2017, Table 3.37, Granite
- thermal conductivity
[9] D.Braham “Guide A Environmental Design” revised 2017, Table 3.35, Glass
soda-lime thermal conductivity
[10] The Highland Council, “Highland Renewable Energy Strategy and Planning
Guideline” 2006. Page 21, 6.2.2.5 E11

51
[11] The Highland Council, “Highland Renewable Energy Strategy and Planning
Guideline” 2006. Page 5, 1.3 Existing policy commitments. E2
[12] “Solar PV systems, Do I Need Planning Permission For Solar Panels”,
Evergreen Energy 2019. [Online]. Available:
https://www.evergreenenergy.co.uk/solar-panels/do-i-needplanning-
permission-for-solar-panels/. [Accessed 3/02/19]
[13] “Solar PV choosing a site and getting planning permission”, Energy Saving
Trust.
2018[Online]. Available:
https://www.energysavingtrust.org.uk/sites/default/files/reports/Choosing%20a%20si
te%20an d%20getting%20planning%20permission.pdf. [Accessed 3/02/19]
[14] Victoria Argon, November 2017, Developing English domestic occupancy
profiles, Building research and information.
[15] “What’s the average room temperature and thermostat setting in the UK?”,
Ovo Energy, 2018. [Online]. Available:
https://www.ovoenergy.com/guides/energy-guides/average-
roomtemperature.html. [Accessed 20/22/18]
[16] “Average Gas & Electricity Usage in the UK”, Smarter Business, 2018.
[Online]. Available: https://smarterbusiness.co.uk/average-gas-electricity-
usage-uk/. [Accessed 25/03/2018]
[17] “Does Having Appliances on Standby Use Power?”, Energy Saving Secrets. 2018. [Online]. Available: http://www.energysavingsecrets.co.uk/does-appliances-standby-usepower.html. [Accessed 25/03/2018]
[18] D. Braham “Guide A Environmental Design” , revised 2017, Table 3.46,
Polyurethane foam thermal conductivity
[19] D. Braham “Guide A Environmental Design” , revised 2017, Table 3.46,
Mineral wool batts thermal conductivity
[20] D. Braham “Guide A Environmental Design” , revised 2017, Table 3.23,
Vertical glazing U-value argon filled cavity

52
[21] D. Braham “CIBSE Guide G Public Health and Plumbing Engineering”
Paragraph 2.7
[22] D. Braham “CIBSE Guide G Public Health and Plumbing Engineering” Table
2.11
[23] Glenn Hawkins “BSRIA Rules of Thumb Guidelines for building services”.
Table 24 [24] “Record Low for Water temperature”, BBC News, 2010.
[Online]. Available https://www.bbc.co.uk/news/uk-england-12073944.
[Accessed 17/02/2090]
[25] D.Braham “CIBSE Guide G Public Health and Plumbing Engineering”
Paragraph
2.4.4.2
[26] “Kingspan Ultrasteel 210 Litre Indirect”, Fuel Tank Shop. [2019]. [Online].
Available:
https://www.fueltankshop.co.uk/kingspan-ultrasteel-210-litre-indirect-solar-
unvented-hotwater-cylinder/p5522. [Accessed 19/02/2019]
[27] R.K.AKIKURA, R.SAIDURAB, H.W.PINGA and K.R.ULLAHA (2013).
Comparative study of stand-alone and hybrid solar energy systems suitable for
off-grid rural electrification. Renewable and Sustainable Energy Reviews,
volume 27, Pages 738-752
[28] “Smart Region Pellworm Project Completes Phase One”, Modern Power
System, 2016. [Online]. Available:
https://www.modernpowersystems.com/features/featuresmart-
regionpellworm-project-completes-phase-one-5694168/. [Accessed
10/12/2019]
[29] S.KOOPMANN; A.NICOLAI; A.SCHNETTLER (2014). Multifunctional
operation of a virtual power plant in an active distribution grid: Modelling
approaches and first field test experiences from the SmartRegion Pellworm.
Published in IEEE PES Innovative Smart Grid Technologies, Europe
[30] “Smart Region Pellworm: An island becomes power-independent” Kraftwerk
Forshung (2013). [Online]. Available:

53
https://kraftwerkforschung.info/en/smart-region-pellworm-anisland-becomes-
power-independent/. [Accessed 10/12/2019].
[31] T.BLANK (2015). Successful Aggregation of Behind-the-Meter Energy
Storage.
[32] M.J. KHAN,(2005). Pre-feasibility study of stand-alone hybrid energy systems
for applications in Newfoundland. Renewable Energy - Volume 30, Issue 6,
May 2005, Pages 835854
[33] Z.CHMIEL; S.C. BHATTACHARYAA. Analysis of off-grid electricity
system at Isle of Eigg (Scotland): Lessons for developing countries -
Renewable Energy
Volume 81, September 2015, Pages 578-588
[34] A.NDIAYE; A.CHARKI; A.KOBI; C.M.F KEB; P.A. NDIAYE;
V.SAMBOU.
Degradations of silicon photovoltaic modules: A literature review. Solar Energy
Volume 96, October 2013, Pages 140-151
[35] L.EL CHARR; L.A LAMONT; N.EL ZEIN. Review of photovoltaic
technologies. Renewable and Sustainable Energy Reviews, Volume 15, June
2011, Pages 2165-2175 [36] Picture comparing Monocrystalline and
Crystalline Silicon, 2019. [Online]. Available:
https://en.wikipedia.org/wiki/Crystalline_silicon#/media/File:Comparison_so
lar_cell_polySi_vs_mono-Si.png. [Accessed 09/04/2019]
[37] Picture of Flat Plate Collector, 2019. [Online]. Available:
http://www.alternativeenergy-tutorials.com/solar-hot-water/flat-plate-
collector.html. [Accessed 09/04/2019]
[38] Picture of Evacuated Tube Collector, 2019. [Online]: Available
http://www.reuk.co.uk/wordpress/solar/evacuated-tube-solar-water-heating/.
[Accessed 09/04/2019]
[39] S.A.KALOGIROU. Solar thermal collectors and applications. Progress in
Energy and Combustion Science, Volume 30, Issue 3, 2004, Pages 231-295

54
[40] S.A.SELF; B.V. REDDY; M.A.ROSEN. Geothermal heat pump systems: Status review and comparison with other heating options. Applied Energy, Volume 101, January 2013, Pages 341-348
[41] “Ground Source Heat Pumps”, Energy saving Trust, 2019, [Online]. Available:
https://www.energysavingtrust.org.uk/renewable-energy/heat/ground-source-heat-
pumps. [Accessed 03/03/2019]
[42] “Domestic Ground Source Heat Pumps”, Ground Source Heat Pump
Association, 2019.
[Online]. Available:
https://www.gshp.org.uk/ground_source_heat_pumps_Domestic.html. [Accessed
03/03/2019]
[43] Picture of GSHP, 2011, [Online]. Available:
https://www.youtube.com/watch?v=KE3SvNRmwcQ. [Accessed 03/03/2019]
[44] “Ground Source Heat Pump”, British Geological Survey, 2019, [Online].
Available: http://www.bgs.ac.uk/reference/gshp/gshp_report.html. [Accessed]
04/03/2019]
[45] B. Sannera; C. Karytsas; D. Mendrinos; L. Rybach. Current status of ground
source heat pumps and underground thermal energy storage in Europe,
Geothermics, Volume 32, Issues 4– 6, August–December 2003, Pages 579-
588.
[46] “What is the Water Flow Temperature”, Underfloor Heating Systems Ltd, 2019. [Online]. Available: https://www.underfloorheatingsystems.co.uk/self-installinformation/questions-and-answers/what-is-the-water-flow-temperature/. [Accessed 22/03/2019].
[47] A.M. Omer .Ground-source heat pumps systems and applications, Renewable
and
Sustainable Energy Reviews, Volume 12, Issue 2, February 2008, Pages 344-371
Renewable and Sustainable Energy Reviews
[48] “Ground Source Heat Pump: Green Energy Made More Affordable”
GreenMatch, 2019. [Online]. Available: https://www.greenmatch.co.uk/heat-
pump/ground-source-heat-pump.
[Accessed 05/03/2019]

55
[49] “Managing Legionella in hot and coldwater systems”, Health and Safety
Executive,
2019, [Online]. Available : http://www.hse.gov.uk/healthservices/legionella.htm.
[Accessed 28/04/2019]
[50] “Are Li-Ion or Lead-Acid Batteries better for Home Energy Storage?”
C.MEEHAN (2018) [Online]. Available:
https://www.solarreviews.com/blog/are-li-ion-or-lead-acidbatteries-better-
for-home-energy-storage [Accessed 14/12/2019]
[51] B. DIOUF Potential of lithium-ion batteries in renewable energy (2015).
Renewable Energy, Volume 76, April 2015, Pages 375-380
[52] P. ALOTTO; M. GUARNIERI; F. MORO (2014). Redox flow batteries for the
storage of renewable energy. Renewable and Sustainable Energy Reviews -
Volume 29 Pages 325-335 [53] “Redox flow batteries could be the answer to
our energy storage needs” M. ATKINS (2015) [Online]. Available:
http://theconversation.com/redox-flow-batteries-could-be-theanswer-to-our-
energy-storage-needs-51496 [Accessed 13/12/2019]
[54] “Redox flow – the longest-lived battery yet?”, British Gas (2016) [Online].
Available:
https://www.britishgas.co.uk/business/blog/redox-flow-the-longest-lived-battery-yet/
[Accessed 13/12/2019]
[55] L. JOERISSENA; J. GARCHEA; F.G. TOMAZIC (2004). Possible use of
vanadium redox-flow batteries for energy storage in small grids and stand-
alone photovoltaic systems. Journal of Power Sources Volume 127, Issues 1–
2, Pages 98-104
[56] “Redox Flow Batteries”, Energy Storage Association, 2018. [Online]. Available: http://energystorage.org/energy-storage/technologies/redox-flow-batteries. [Accessed 13/12/2019]
[57] P. ALOTTO; M. GUARNIERI; F. MORO (2014). Redox flow batteries for the
storage of renewable energy. Renewable and Sustainable Energy Reviews -
Volume 29 Pages 325-335 [58] K. AGBOSSOU; M. KOLHE; J. HAMELIN;
T.K BOSE (2004). Performance of a stand-alone renewable energy system

56
based on energy storage as hydrogen. Transactions on Energy Conversion
(Volume: 19 , Issue: 3)
[59] “Hydrogen Energy Storage: A New Solution To the Renewable Energy Intermittency
Problem.” M. SCHIILER (2014). [Online] Available:
https://www.renewableenergyworld.com/articles/2014/07/hydrogen-energy-storage-
a-newsolution-to-the-renewable-energy-intermittency-problem.html. [Accessed
14/12/2019] [60] Picture of Solenco Power box System. Giacomini Video Projects,
(2018). [Online] Available: https://www.youtube.com/watch?v=4UjcTR1vlNI.
[Accessed 15/12/2019].
[61] “What is the Density of Air?” Thoughts Co. 2019. [Online] Available:
https://www.thoughtco.com/density-of-air-at-stp-607546. [Accessed
23/04/2019]
[62] Kensa Ground Source Heat Pump Technical Sheet, 2019 [Online]. Available:
https://www.kensaheatpumps.com/wp-content/uploads/2014/03/TI-Actual-
ThermalOutputs.pdf. [Accessed 30/04/2019]
[63] Product: SWIFT Wind turbine system, 2019.
[Online]. Available:
https://www.ecopowershop.com/wind-turbines. [Accessed 04/05/2019]
[64] Product: Kesteral E300, 2019. [Online]. Available
https://regenpower.com/residential/other-products/wind-turbines/. [Accessed
04/05/2019]
[65] Product: Kingspan Wind Turbine KW6, 2019. [Online].
Available:
https://www.ecopowershop.com/wind-turbines. [Accessed 04/05/2019]
[66] V. KINHAL, “Efficiency of Wind Energy” 2018. [Online]. Available:
https://greenliving.lovetoknow.com/Efficiency_of_Wind_Energy. [Accessed
28/04/2019]
[67] Product: Perlight PV Panel. 2019. [Online]. Available:
https://www.buypvdirect.com/shop/perlight-320-watt-mono-panel-
black/#prettyPhoto.
[Accessed 04/05/2019]

57
[68] M. Gillott, "Photovoltaics (PV)", The University of Nottingham, 2018.
[69] Tesla PowerWall Capacity. 2019. [Online]. Available
https://www.tesla.com/en_GB/support/powerwall/how-long-will-powerwall-
last-in-an-outage. [Accessed 04/05/2019]
[70] “Tesla Walls are in high demand, Installers just don’t have them”, GTM. 2019.
[Online]. Available: https://www.greentechmedia.com/articles/read/tesla-
powerwalls-but-installersdont-have-them#gs.a7g2fy. [Accessed 04/05/2019]
[71] “Wind Turbine Technology”, The British Wind Energy Association. 2019
[Online]. Available:
https://www.nottingham.ac.uk/renewableenergyproject/documents/windturbinetechn
ology.pdf
. [Accessed 04/05/2019]
[72] Product: Kingspan Varisol Evacuated Tube Collector 2019. [Online].
Available:
https://www.kingspan.com/gb/en-gb/products/renewable-technologies/solar-
thermal/solarevacuated-tube-collectors/varisol-evacuated-tube-collectors. [Accessed
04/05/2019] [73] “Replacing your Water Heater”. Smarter House. 2019. [Online].
Available: https://smarterhouse.org/water-heating/replacing-your-water-heater.
[Accessed 05/05/2019] [74] E. FRANK; F. MAUTHER; S. FISCHER. Overheating
prevention and stagnation handling in solar process heat applications. 2015. [Online].
Available: Overheating prevention and stagnation handling in solar process heat
applications. [Accessed 06/05/2019] [75] M. Gillott, "Wind Energy: Introduction",
University of Nottingham, 2018.
[76] J. Darkwa, “Solar Thermal Lecture”, University of Nottingham,2018 [77] D. Braham. “Capturing Solar Energy” CIBSE Knowledge Series.

58
Appendices Appendix A: Building Information
Appendix B: IES Calculations of U-Values
Appendix C: Example Calculations
Appendix D: Final Tables

59
Appendix A – Building Information
Figure A.A.1 - Floor plans of property
Figure A.A.2 - EPC certificate

60
Table A.A.1 - Building dimensions
Length
(m)
Width (m) Height (m) Floor
(m2)
Area Volume
(m3)
Volume
(m3)
Interior
12.3 6.7 5.5 128.8 453.3 708.5
Table A.A.2 - Building dimensions
Façade Area Wall Area Wind. Total Area
NW 54.7 13.0 67.7
NE 36.9 0.0 36.9
SE 54.7 13.0 67.7
SW 36.9 0.0 36.9

61
Appendix B – IES calculations of U-Values
Figure A.B.1 - Initial Roof U-Value Calculation
Figure A.B.2 - Initial Glazing U-Value

62
Figure A.B.3 - Initial Wall U-Value
Figure A.B.4- Post-Upgrade Roof U-Value
Figure A.B.5 - Post Upgrade Glazing U-Value

63
Figure 0.1 - Post Upgrade Wall U-Value

64
Appendix C – Example Calculations
Example calculation are all for the final size of the model
Total hourly electrical energy During January at 18:00,
2.583(𝑘𝑊ℎ)= +0.94 (6.1)
Wind turbine Generation
19.635(𝑚2)=∏(2.5)2 (6.2)
4.306(𝑘𝑊ℎ)=( (1.225)(19.64)(7.1)3)/1000 (6.3)
1.52(𝑘𝑊ℎ)=(4.3)(0.35) (6.4)
Solar PV Generation, for January at 11:00,
𝐼ℎ=86×𝐶𝑂𝑆(158.3−180)×𝑆𝐼𝑁(10.4+70)
78.79(𝑊/𝑚2)=86×𝐶𝑂𝑆(21.7)×𝑆𝐼𝑁(80.4) (6.5)
37.8(𝑚2)=(1.66)×(0.99)×23 (6.6)
440(𝑊/𝑚2)=78.79×0.197×0.75×37.8 (6.7)
Solar thermal panels, for December at 11:00,
57.936(𝑊/𝑚2)=(74×𝑆𝐼𝑁(80+9.2)×0.783) (6.8)
0.387 (𝑘𝑊ℎ/𝑚2. 𝑑𝑎𝑦) = (0.025 + 0.058 + 0.084 + 0.087 + 0.076 + 0.047 + 0.01)
(6.9)
36.3(𝑚2)= (6.10)
Solar thermal store, for May using final area of solar array,

65
92.75 (kWh.day) = 25 × 3.71
(6.11)
78.72(𝑘𝑊ℎ.𝑑𝑎𝑦)=97.75−14.03 (6.12)
3600×78.72 1795𝑙𝑖𝑡𝑟𝑒𝑠=
(45−7.3)×(4.187)

66
Appendix D – Final Tables
Generation Resources
Example table of hourly wind data through a month, Jan 2018. Wind Speeds (m/s) 00:00 01:00 02:00 03:00 04:00 05:00 06:00 07:00 08:00 09:00 10:00 11:00 12:00 13:00 14:00 15:00 16:00 17:00 18:00 19:00 20:00 21:00 22:00
23:00 01-Jan-18 5 3.4 2.62 2.6 2.11 0.7 3.09 3.4 2.33 1.6 2.83 4 4.43 3.81 4.21 4.3 5.32 5.57 5.16 4.75 5.2 6.39 5.69 5.44 02-Jan-18 5.32 4.43 3.91 3.42 2.82 2.42 2.7 3.88 2.98 2.6 4.11 5.22 5.32 6.84 9.87 10.71 8.71 8.72 7.61 6.41 5.76 5.43 4.49 2.72 03-Jan-18 5.57 3.8 3.69 4.55 6.86 9.14 9 6.61 7.14 8 6.57 8.8 10.24 6.63 7.82 8.09 6.6 6.18 7.09 7.8 6.33 6.48 5.69 4.91 04-Jan-18 4.58 3.76 3.18 2.62 2.42 1.8 1.2 1.06 1.75 2.4 4.04 5.35 6.31 5.28 4.7 3.66 2.22 1.5 1.49 1.8 2.31 1.34 1 1.8 05-Jan-18 2.32 2.4 2.42 2.33 1.6 1.7 2.16 2.69 3.52 3.83 4.94 7.52 8.76 4.6 3.98 4.2 4.69 5.11 7.29 8.19 7.6 8.1 7.47 7.52 06-Jan-18 8.26 8.26 9.86 11.07 12.09 11.84 10.76 9.55 9.05 9.28 9.58 9.79 9.08 6.08 5.98 5.4 4.99 5.23 5.37 5.39 5.12 4.73 4.37 4.16 07-Jan-18 4.04 3.92 3.81 3.5 3.62 3.57 3.06 2.45 2.09 1.9 1.68 1.49 0.94 1.25 1.7 1.7 1.55 1.4 1.57 1.49 1.44 1.36 1.65 2.25 08-Jan-18 2.56 2.69 2.82 2.86 3.01 3.21 3.16 3.11 3.16 3.38 3.71 4.33 4.92 4.37 5.52 6.14 5.99 6.13 6.08 6.36 6.71 6.93 7.67 7.66 09-Jan-18 7.27 7.5 7.87 7.72 7.47 7.04 6.87 7.55 7.99 8.36 8.73 8.25 7.71 9.11 10.01 11.1 11.05 10.31 9.26 8.83 8.1 7.84 7.65 7.2 10-Jan-18 6.5 5.73 4.8 3.85 2.79 2.24 1.3 1.17 1.61 2.48 2.88 3.31 4.4 3.26 3.58 3.76 3.86 4.32 3.83 3.92 3.72 4.01 4 4.3 11-Jan-18 4.8 5 4.9 4.81 5.02 4.9 4.71 4.33 4.03 3.95 4.04 3.91 3.42 2.14 1.91 1.71 1.6 1.53 1.28 1.9 2.66 3.09 2.95 3.11 12-Jan-18 3.34 3.41 3.5 4.16 4.55 4.49 4.12 4.11 4.95 5.26 5.16 5.39 6.22 5.74 5.9 6.13 6.49 6.32 6.55 6.88 6.98 6.8 7 7.37 13-Jan-18 7.21 6.94 7.03 6.8 6.65 6.67 6.31 5.98 6.3 6.6 6.76 6.44 7.28 6.79 6.83 6.44 6.24 5.54 5.24 5.24 5.68 5.73 5.59 5.6 14-Jan-18 5.57 5.39 5.15 5.07 5.29 5.19 5.22 5.32 5.47 5.63 6.04 6.6 8.58 9.3 10.42 11.01 11.79 12.26 12.2 12.85 13.15 13.73 13.4 12.73 15-Jan-18 11.08 9.75 9.14 8.68 8.18 8.24 8.35 7.68 7.33 8.01 8.1 8.15 9.11 9.2 9.17 8.52 8.2 8.37 7.99 8.4 8.71 9.69 9.96 10.21 16-Jan-18 10.41 10.61 10.83 10.95 10.95 11.08 11.24 11.53 11.71 11.99 11.92 11.99 11.47 11.87 11.92 11.75 12.04 11.89 11.53 10.78 10.17 9.75 9.85 9.4 17-Jan-18 11.4 14.67 13.68 13.21 12.74 11.37 13.29 15.12 13.56 12.71 12.11 12.81 12.65 12.94 10.51 8.71 9.71 9.85 8.7 7.81 7.26 7.31 6.66 6.42 18-Jan-18 4.26 2.56 2.42 2.7 3.6 4.63 5.41 7.31 8.06 6.82 6.2 7.43 8.62 9.34 9.75 9.74 9.39 8.1 7.57 7.48 8.14 7.89 7.62 6.74 19-Jan-18 9.25 9.73 9.56 8.96 10.01 9.53 8.58 8.8 8.47 8.68 9.22 9.72 9.96 10.2 10.4 10.39 9.08 7.48 7.33 6.21 5.69 6.33 7.01 7.72 20-Jan-18 8.95 7.71 7.76 8.56 7.33 6.69 5.7 5.33 5.44 5.88 5.81 5.09 5.38 3 3.49 3.61 2.95 2.69 2.73 2.62 2.5 2.44 2.25 1.99 21-Jan-18 1.96 1.75 1.61 1.6 1.12 1.14 1.5 2.21 2.91 3.58 4.81 4.72 5.15 7.39 8.99 10.2 10.06 8.66 7.69 5.04 3.01 3.91 9.93 10.31 22-Jan-18 10.82 11.1 11.1 11 10.72 10.94 11.47 12.17 12.66 13.33 13.51 14 14.6 9.52 9.53 9.54 9.43 8.5 8.1 7.61 7.07 6.45 5.72 6.06 23-Jan-18 5.66 6.1 6.94 6.97 6.96 6.64 7.21 6.89 8.46 8.99 9.44 9.16 9.49 10.43 9.74 8.86 9.27 8.77 9.38 10.65 11.01 9.73 8.68 7.92 24-Jan-18 7.03 6.78 7.61 8.35 12.62 13.45 12.9 12.84 13.67 12.74 12.52 12.54 12.25 13.64 12.75 12.59 12.16 11.18 10.51 9.45 9.42 9.69 8.98 9.84 25-Jan-18 11.54 10.29 9.54 9.13 9.48 9.42 9.21 8.86 8.44 8.29 8.46 8.03 7.26 4.95 4.39 3.44 2.01 1.42 2.11 2.52 3.08 3.31 3.28 3.4 26-Jan-18 3.8 3.8 3.71 3.6 3.71 4.22 4.49 3.77 3.31 2.9 2.6 2.34 1.73 2.83 3.81 3.81 3.98 3.07 2.56 2.64 3.13 4.03 4.63 5.47 27-Jan-18 5.32 5.87 7.22 7.27 6.75 6.75 5.95 5.6 5.5 4.39 4.54 4.57 5.95 12.65 12.72 13.42 14.32 14.11 13.8 13.6 13.3 13.1 12.9 12.8 28-Jan-18 12.5 12.41 11.81 11.5 11.3 10.33 9.14 7.02 6.25 5.05 4.98 5.51 6.17 9.41 9.17 9.34 10.16 11.4 11.5 12.54 12.78 12.88 13.05 12.42 29-Jan-18 11.11 10.02 8 7.57 7.12 7.03 8.52 7.97 7.68 7.91 7.98 8.99 10.06 9.3 9.3 9.17 9 8.19 7.19 6.8 6.48 6.16 5.35 4.7 30-Jan-18 4.8 6.42 6.41 6.4 5.85 5.78 6.66 6.9 6.65 6.74 7.18 7.68 8.11 9.22 9.74 10.41 10.69 10.62 10.3 10.74 10.53 10.68 10.82 10.58 31-Jan-18 10.52 10.26 10.07 9.77 9.69 9.28 9.44 10.69 11 11.26 11.45 10.68 13.12 14.51 13.95 12.49 11.4 10.12 9.06 10.73 10.85 12.04 12.98 12.91
Average Wind Speeds used in calculation
Average hourly wind speed for each month across 5 years (m/s)
Month 00:00 01:00 02:00 03:00 04:00 05:00 06:00 07:00 08:00 09:00 10:00 11:00 12:00 13:00 14:00 15:00 16:00 17:00 18:00 19:00 20:00 21:00 22:00 23:00 Jan 7.1 7.1 7.1 7.1 7.1 7.1 7.1 7.1 7.2 7.2 7.2 7.4 7.8 7.5 7.7 7.8 7.6 7.3 7.1 7.1 7.1 7.2 7.2 7.2 Feb 6.8 6.8 6.9 6.8 6.9 6.9 7.0 7.2 7.3 7.3 7.6 8.1 8.7 8.3 8.4 8.5 8.4 8.0 7.6 7.2 7.1 6.9 6.9 7.0 Mar 6.1 6.1 6.0 6.0 6.1 6.2 6.2 6.2 6.3 6.8 7.3 7.8 8.1 7.8 8.0 8.1 8.0 7.9 7.6 7.0 6.5 6.2 6.2 6.1 Apr 5.3 5.2 5.2 5.1 5.1 5.1 5.1 5.2 5.7 6.1 6.4 6.6 6.8 6.8 6.9 7.0 6.9 6.8 6.7 6.4 5.9 5.5 5.3 5.3 May 4.3 4.2 4.1 4.2 4.1 4.1 4.2 4.5 4.9 5.3 5.7 6.0 6.2 6.3 6.4 6.3 6.4 6.4 6.2 5.9 5.6 5.0 4.5 4.3 Jun 4.1 4.1 4.0 4.0 3.9 3.9 4.0 4.3 4.6 4.8 5.0 5.2 5.4 5.3 5.4 5.5 5.6 5.6 5.6 5.5 5.3 4.8 4.3 4.1 Jul 3.8 3.8 3.8 3.8 3.7 3.7 3.8 4.0 4.4 4.8 5.0 5.3 5.5 5.5 5.6 5.7 5.7 5.7 5.6 5.4 5.2 4.6 4.1 3.9 Aug 4.4 4.4 4.3 4.3 4.3 4.3 4.3 4.4 4.7 5.2 5.5 5.7 6.0 6.2 6.3 6.3 6.3 6.2 6.1 5.9 5.4 4.9 4.7 4.5 Sep 4.5 4.4 4.4 4.5 4.5 4.5 4.5 4.5 4.6 4.9 5.3 5.6 5.9 6.1 6.2 6.3 6.2 6.1 5.8 5.3 4.8 4.7 4.6 4.6 Oct 5.5 5.5 5.5 5.5 5.4 5.4 5.5 5.5 5.5 5.7 6.0 6.4 6.7 6.9 7.0 7.0 6.9 6.7 6.2 5.8 5.7 5.6 5.6 5.6 Nov 6.1 6.0 6.0 6.0 6.0 5.9 5.9 5.9 5.9 5.9 6.0 6.4 6.8 6.6 6.6 6.6 6.4 6.1 6.0 6.1 6.2 6.3 6.3 6.2 Dec 6.4 6.5 6.5 6.5 6.6 6.7 6.8 6.8 6.8 6.8 6.8 7.0 7.3 7.3 7.3 7.3 7.2 6.9 6.8 6.7 6.6 6.6 6.5 6.5 Solar Irradiances Uses,

67
Energy Demand Tables
Appliance Generation,
Heating load,
Electrical Heating Load,
Total Electrical Demand (Final demand),
Month 00:00 01:00 02:00 03:00 04:00 05:00 06:00 07:00 08:00 09:00 10:00 11:00 12:00 13:00 14:00 15:00 16:00 17:00 18:00 19:00 20:00 21:00 22:00 23:00Jan 0 0 0 0 0 0 0 0 0 3 44 86 129 132 122 95 43 3 0 0 0 0 0 0Feb 0 0 0 0 0 0 0 0 5 57 136 192 239 255 248 200 143 64 5 0 0 0 0 0Mar 0 0 0 0 0 0 0 14 83 171 248 306 339 330 327 295 242 165 76 8 0 0 0 0Apr 0 0 0 0 0 0 0 25 102 176 243 293 333 358 346 302 272 243 183 135 65 7 0 0May 0 0 0 0 0 0 26 106 207 322 412 477 501 545 547 499 447 419 357 263 168 71 6 0Jun 0 0 0 0 0 2 49 122 205 282 366 434 483 527 532 518 473 411 349 288 198 111 29 0Jul 0 0 0 0 0 0 33 113 198 275 349 394 426 483 488 499 469 406 341 279 179 88 18 0Aug 0 0 0 0 0 0 1 29 88 152 204 268 296 319 356 341 332 297 243 171 96 23 0 0Sep 0 0 0 0 0 0 0 2 40 115 188 242 318 327 322 287 254 213 156 72 12 0 0 0Oct 0 0 0 0 0 0 0 0 2 42 114 174 223 241 236 226 180 117 47 4 0 0 0 0Nov 0 0 0 0 0 0 0 0 1 27 68 105 142 147 122 88 35 1 0 0 0 0 0 0Dec 0 0 0 0 0 0 0 0 0 1 32 74 107 111 98 60 10 0 0 0 0 0 0 0
Solar irradiance (W/m2)
00:00 01:00 02:00 03:00 04:00 05:00 06:00 07:00 08:00 09:00 10:00 11:00 12:00 13:00 14:00 15:00 16:00 17:00 18:00 19:00 20:00 21:00 22:00 23:00 Daily (kW)
Weekday 0.10 0.10 0.10 0.10 0.10 0.10 0.10 0.94 0.94 0.10 0.10 0.10 0.10 0.10 0.10 0.10 0.94 0.94 0.94 0.94 0.94 0.94 0.94 0.10 10.0Weekend 0.10 0.10 0.10 0.10 0.10 0.10 0.10 0.94 0.94 0.94 0.94 0.94 0.94 0.94 0.94 0.94 0.94 0.94 0.94 0.94 0.94 0.94 0.94 0.10 15.8
Appliance Electrical load (kW)
Peak day/month 00:00 01:00 02:00 03:00 04:00 05:00 06:00 07:00 08:00 09:00 10:00 11:00 12:00 13:00 14:00 15:00 16:00 17:00 18:00 19:00 20:00 21:00 22:00 23:00 Daily (kW)January 17th 0.31 0.32 0.32 0.33 0.33 0.34 11.41 7.07 0.36 0.37 0.37 0.38 0.38 0.39 0.39 0.38 10.45 6.62 6.31 6.12 5.93 5.76 0.36 0.36 65.4February 16th 0.44 0.44 0.43 0.43 0.43 0.43 0.43 0.43 0.44 14.13 8.25 7.47 7.02 0.47 0.47 0.47 10.55 7.07 6.99 6.91 6.80 6.66 0.45 0.45 88.1March 15th 0.23 0.24 0.25 0.25 0.26 0.27 0.28 0.29 0.29 9.77 5.62 4.95 4.59 0.32 0.32 0.32 6.76 4.68 4.76 4.79 4.64 4.52 0.29 0.29 59.0April 9th 0.22 0.22 0.22 0.23 0.24 0.24 9.14 4.57 0.27 0.28 0.28 0.29 0.29 0.29 0.28 0.27 4.08 2.13 1.93 2.53 3.39 3.73 0.18 0.17 35.5May 1st 0.19 0.19 0.20 0.20 0.20 0.21 7.29 3.67 0.22 0.23 0.23 0.23 0.23 0.23 0.23 0.22 3.10 1.64 1.41 1.43 1.96 2.93 0.16 0.16 26.8June 14th 0.11 0.11 0.11 0.12 0.12 0.13 0.13 0.14 0.15 0.16 0.16 0.17 0.17 0.17 0.16 0.16 0.15 0.15 0.14 0.14 0.14 0.13 0.13 0.13 3.4July 1st 0.01 0.00 0.00 0.00 0.00 0.00 0.00 0.00 0.00 0.00 0.00 0.00 0.00 0.00 0.00 0.00 0.00 0.00 0.00 0.00 0.00 0.00 0.00 0.00 0.0August 9th 0.01 0.01 0.02 0.02 0.03 0.03 0.04 0.04 0.05 0.05 0.05 0.06 0.06 0.06 0.06 0.06 0.06 0.05 0.04 0.04 0.03 0.02 0.01 0.01 0.9September 30th 0.12 0.12 0.12 0.12 0.13 0.13 5.71 2.62 0.15 0.16 0.16 0.17 0.17 0.17 0.17 0.16 2.14 1.27 1.54 2.23 2.39 2.39 0.12 0.12 22.6October 21st 0.20 0.21 0.21 0.22 0.23 0.24 9.05 5.62 0.27 0.28 0.29 0.29 0.30 0.31 0.31 0.31 6.83 4.23 4.02 3.79 3.58 3.42 0.27 0.26 44.7November 18th 0.33 0.33 0.33 0.34 0.34 0.35 11.65 7.20 0.37 0.38 0.38 0.39 0.39 0.40 0.40 0.40 10.69 6.50 6.11 5.83 5.60 5.39 0.38 0.37 64.9December 9th 0.33 0.33 0.33 0.33 0.33 0.34 10.09 6.14 0.34 0.35 0.35 0.35 0.35 0.35 0.35 0.35 9.59 5.87 5.59 5.41 5.24 5.10 0.33 0.33 58.4
Heating demand (kWh)
Month/Day 00:00 01:00 02:00 03:00 04:00 05:00 06:00 07:00 08:00 09:00 10:00 11:00 12:00 13:00 14:00 15:00 16:00 17:00 18:00 19:00 20:00 21:00 22:00 23:00 Daily (kW)
17-Jan 0.1 0.1 0.1 0.1 0.1 0.1 3.0 1.8 0.1 0.1 0.1 0.1 0.1 0.1 0.1 0.1 2.7 1.7 1.6 1.6 1.5 1.5 0.1 0.1 17.016-Feb 0.1 0.1 0.1 0.1 0.1 0.1 0.1 0.1 0.1 3.7 2.1 1.9 1.8 0.1 0.1 0.1 2.7 1.8 1.8 1.8 1.8 1.7 0.1 0.1 22.915-Mar 0.1 0.1 0.1 0.1 0.1 0.1 0.1 0.1 0.1 2.5 1.5 1.3 1.2 0.1 0.1 0.1 1.8 1.2 1.2 1.2 1.2 1.2 0.1 0.1 15.409-Apr 0.1 0.1 0.1 0.1 0.1 0.1 2.4 1.2 0.1 0.1 0.1 0.1 0.1 0.1 0.1 0.1 1.1 0.6 0.5 0.7 0.9 1.0 0.0 0.0 9.201-May 0.1 0.1 0.1 0.1 0.1 0.1 1.9 1.0 0.1 0.1 0.1 0.1 0.1 0.1 0.1 0.1 0.8 0.4 0.4 0.4 0.5 0.8 0.0 0.0 7.014-Jun 0.0 0.0 0.0 0.0 0.0 0.0 0.0 0.0 0.0 0.0 0.0 0.0 0.0 0.0 0.0 0.0 0.0 0.0 0.0 0.0 0.0 0.0 0.0 0.0 0.901-Jul 0.0 0.0 0.0 0.0 0.0 0.0 0.0 0.0 0.0 0.0 0.0 0.0 0.0 0.0 0.0 0.0 0.0 0.0 0.0 0.0 0.0 0.0 0.0 0.0 0.009-Aug 0.0 0.0 0.0 0.0 0.0 0.0 0.0 0.0 0.0 0.0 0.0 0.0 0.0 0.0 0.0 0.0 0.0 0.0 0.0 0.0 0.0 0.0 0.0 0.0 0.230-Sep 0.0 0.0 0.0 0.0 0.0 0.0 1.5 0.7 0.0 0.0 0.0 0.0 0.0 0.0 0.0 0.0 0.6 0.3 0.4 0.6 0.6 0.6 0.0 0.0 5.921-Oct 0.1 0.1 0.1 0.1 0.1 0.1 2.4 1.5 0.1 0.1 0.1 0.1 0.1 0.1 0.1 0.1 1.8 1.1 1.0 1.0 0.9 0.9 0.1 0.1 11.618-Nov 0.1 0.1 0.1 0.1 0.1 0.1 3.0 1.9 0.1 0.1 0.1 0.1 0.1 0.1 0.1 0.1 2.8 1.7 1.6 1.5 1.5 1.4 0.1 0.1 16.909-Dec 0.1 0.1 0.1 0.1 0.1 0.1 2.6 1.6 0.1 0.1 0.1 0.1 0.1 0.1 0.1 0.1 2.5 1.5 1.5 1.4 1.4 1.3 0.1 0.1 15.2
Heating Electrical demand (kWh)

68
Generation Tables
Wind Generation,
Solar Electrical Generation,
Total Generation,
Storage tables
Generation/Demand without Storage
Peak day/month 00:00 01:00 02:00 03:00 04:00 05:00 06:00 07:00 08:00 09:00 10:00 11:00 12:00 13:00 14:00 15:00 16:00 17:00 18:00 19:00 20:00 21:00 22:00 23:00 Daily (kW)January 17th 0.182 0.18 0.18 0.18 0.19 0.19 3.07 2.78 1.04 0.20 0.20 0.20 0.20 0.20 0.20 0.20 3.67 2.67 2.59 2.54 2.49 2.45 1.03 0.19 27.0February 16th 0.21 0.21 0.21 0.21 0.21 0.21 0.21 1.05 1.05 4.62 3.09 2.89 2.77 1.06 1.06 1.06 3.69 2.78 2.76 2.74 2.71 2.68 1.06 0.22 38.8March 15th 0.16 0.16 0.16 0.17 0.17 0.17 0.17 1.01 1.02 3.49 2.40 2.23 2.14 1.02 1.02 1.02 2.70 2.16 2.18 2.19 2.15 2.12 1.02 0.17 31.2April 9th 0.16 0.16 0.16 0.16 0.16 0.16 2.48 2.13 1.01 0.17 0.17 0.17 0.18 0.17 0.17 0.17 2.01 1.50 1.45 1.60 1.83 1.92 0.99 0.15 19.2May 1st 0.15 0.15 0.15 0.15 0.15 0.15 2.00 1.90 1.00 0.16 0.16 0.16 0.16 0.16 0.16 0.16 1.75 1.37 1.31 1.32 1.45 1.71 0.98 0.14 17.0June 14th 0.13 0.13 0.13 0.13 0.13 0.13 0.13 0.98 0.98 0.98 0.98 0.98 0.98 0.98 0.98 0.98 0.98 0.98 0.98 0.98 0.98 0.98 0.98 0.13 16.7July 1st 0.10 0.10 0.10 0.10 0.10 0.10 0.10 0.94 0.94 0.94 0.94 0.94 0.94 0.94 0.94 0.94 0.94 0.94 0.94 0.94 0.94 0.94 0.94 0.10 15.9August 9th 0.10 0.10 0.10 0.11 0.11 0.11 0.11 0.95 0.95 0.95 0.95 0.95 0.96 0.96 0.96 0.96 0.95 0.95 0.95 0.95 0.95 0.95 0.95 0.10 16.1September 30th 0.13 0.13 0.13 0.13 0.13 0.13 1.59 1.63 0.98 0.14 0.14 0.14 0.14 0.14 0.14 0.14 1.50 1.27 1.35 1.52 1.57 1.57 0.97 0.13 15.9October 21st 0.15 0.15 0.16 0.16 0.16 0.16 2.46 2.41 1.01 0.17 0.17 0.18 0.18 0.18 0.18 0.18 2.72 2.05 1.99 1.93 1.88 1.83 1.01 0.17 21.6November 18th 0.19 0.19 0.19 0.19 0.19 0.19 3.13 2.82 1.04 0.20 0.20 0.20 0.20 0.20 0.20 0.20 3.73 2.64 2.54 2.46 2.40 2.35 1.04 0.20 26.9December 9th 0.19 0.19 0.19 0.19 0.19 0.19 2.73 2.54 1.03 0.19 0.19 0.19 0.19 0.19 0.19 0.19 3.44 2.47 2.40 2.35 2.31 2.27 1.03 0.18 25.2
Total Demand (kWh)
Peak day/month 00:00 01:00 02:00 03:00 04:00 05:00 06:00 07:00 08:00 09:00 10:00 11:00 12:00 13:00 14:00 15:00 16:00 17:00 18:00 19:00 20:00 21:00 22:00 23:00 Daily (kW)
January 17th 1.50 1.46 1.51 1.48 1.49 1.48 1.48 1.51 1.54 1.54 1.53 1.68 1.93 1.77 1.91 1.95 1.84 1.57 1.46 1.46 1.45 1.54 1.53 1.52 38.1February 16th 1.27 1.27 1.33 1.32 1.36 1.35 1.44 1.52 1.58 1.60 1.78 2.19 2.70 2.38 2.47 2.55 2.41 2.15 1.78 1.51 1.45 1.33 1.36 1.41 41.5March 15th 0.93 0.93 0.88 0.88 0.94 1.00 0.97 0.99 1.04 1.27 1.61 1.94 2.16 1.99 2.10 2.18 2.15 2.03 1.84 1.44 1.13 1.00 0.97 0.94 33.3April 9th 0.60 0.56 0.56 0.56 0.55 0.56 0.56 0.59 0.75 0.93 1.07 1.21 1.30 1.27 1.34 1.38 1.35 1.30 1.24 1.10 0.85 0.68 0.62 0.61 21.6May 1st 0.32 0.30 0.29 0.30 0.29 0.29 0.31 0.38 0.50 0.62 0.77 0.89 0.98 1.04 1.07 1.05 1.10 1.06 0.99 0.86 0.71 0.51 0.38 0.33 15.3June 14th 0.29 0.29 0.27 0.26 0.25 0.25 0.27 0.32 0.40 0.47 0.53 0.59 0.64 0.62 0.66 0.70 0.72 0.72 0.73 0.68 0.61 0.47 0.33 0.29 11.4July 1st 0.23 0.22 0.23 0.22 0.21 0.21 0.22 0.27 0.35 0.45 0.52 0.60 0.68 0.70 0.73 0.76 0.76 0.76 0.72 0.65 0.58 0.41 0.29 0.25 11.0August 9th 0.34 0.34 0.33 0.32 0.33 0.32 0.33 0.35 0.43 0.56 0.68 0.78 0.87 0.98 1.05 1.05 1.03 1.00 0.95 0.83 0.66 0.48 0.42 0.37 14.8September 30th 0.38 0.36 0.36 0.37 0.39 0.38 0.37 0.37 0.39 0.49 0.61 0.73 0.86 0.93 1.00 1.02 0.97 0.92 0.80 0.60 0.46 0.43 0.41 0.40 14.0October 21st 0.69 0.69 0.68 0.67 0.67 0.65 0.67 0.69 0.70 0.75 0.89 1.06 1.23 1.34 1.42 1.43 1.36 1.24 0.98 0.81 0.76 0.72 0.72 0.72 21.6November 18th 0.92 0.89 0.89 0.91 0.89 0.87 0.86 0.86 0.84 0.84 0.89 1.09 1.27 1.17 1.20 1.19 1.08 0.95 0.91 0.94 0.97 1.04 1.02 1.00 23.5December 9th 1.11 1.11 1.13 1.11 1.20 1.26 1.31 1.30 1.32 1.30 1.31 1.42 1.58 1.61 1.61 1.61 1.54 1.37 1.29 1.22 1.20 1.20 1.14 1.12 31.4
Electrical Generation from wind (kW)
Peak day/month 00:00 01:00 02:00 03:00 04:00 05:00 06:00 07:00 08:00 09:00 10:00 11:00 12:00 13:00 14:00 15:00 16:00 17:00 18:00 19:00 20:00 21:00 22:00 23:00 Daily (kW)
January 17th 0.00 0.00 0.00 0.00 0.00 0.00 0.00 0.00 0.00 0.01 0.19 0.44 0.70 0.72 0.62 0.42 0.15 0.01 0.00 0.00 0.00 0.00 0.00 0.00 3.3February 16th 0.00 0.00 0.00 0.00 0.00 0.00 0.00 0.00 0.01 0.19 0.58 0.96 1.30 1.40 1.27 0.88 0.50 0.15 0.01 0.00 0.00 0.00 0.00 0.00 7.2March 15th 0.00 0.00 0.00 0.00 0.00 0.00 0.00 0.01 0.15 0.52 1.01 1.50 1.82 1.77 1.61 1.22 0.75 0.32 0.05 0.00 0.00 0.00 0.00 0.00 10.7April 9th 0.00 0.00 0.00 0.00 0.00 0.00 0.00 0.00 0.03 0.27 0.67 1.13 1.56 1.83 1.75 1.37 0.99 0.61 0.24 0.01 0.00 0.00 0.00 0.00 10.5May 1st 0.00 0.00 0.00 0.00 0.00 0.00 0.00 0.00 0.00 0.39 1.00 1.68 2.20 2.62 2.58 2.05 1.41 0.84 0.28 0.00 0.00 0.00 0.00 0.00 15.1June 14th 0.00 0.00 0.00 0.00 0.00 0.00 0.00 0.00 0.00 0.18 0.67 1.28 1.87 2.31 2.28 1.89 1.26 0.62 0.11 0.00 0.00 0.00 0.00 0.00 12.5July 1st 0.00 0.00 0.00 0.00 0.00 0.00 0.00 0.00 0.00 0.16 0.62 1.14 1.63 2.11 2.11 1.85 1.28 0.64 0.13 0.00 0.00 0.00 0.00 0.00 11.7August 9th 0.00 0.00 0.00 0.00 0.00 0.00 0.00 0.00 0.00 0.15 0.45 0.90 1.26 1.51 1.68 1.42 1.08 0.63 0.21 0.00 0.00 0.00 0.00 0.00 9.3September 30th 0.00 0.00 0.00 0.00 0.00 0.00 0.00 0.00 0.04 0.26 0.64 1.07 1.62 1.77 1.69 1.35 0.97 0.58 0.24 0.02 0.00 0.00 0.00 0.00 10.3October 21st 0.00 0.00 0.00 0.00 0.00 0.00 0.00 0.00 0.00 0.11 0.43 0.81 1.17 1.33 1.26 1.08 0.71 0.33 0.08 0.00 0.00 0.00 0.00 0.00 7.3November 18th 0.00 0.00 0.00 0.00 0.00 0.00 0.00 0.00 0.00 0.10 0.32 0.55 0.78 0.79 0.59 0.36 0.11 0.00 0.00 0.00 0.00 0.00 0.00 0.00 3.6December 9th 0.00 0.00 0.00 0.00 0.00 0.00 0.00 0.00 0.00 0.00 0.15 0.38 0.58 0.59 0.48 0.25 0.03 0.00 0.00 0.00 0.00 0.00 0.00 0.00 2.5
Usable Electrical Generation from solar (Kw/m2)
Peak day/month 00:00 01:00 02:00 03:00 04:00 05:00 06:00 07:00 08:00 09:00 10:00 11:00 12:00 13:00 14:00 15:00 16:00 17:00 18:00 19:00 20:00 21:00 22:00 23:00 Daily (kW)
January 17th 1.50 1.46 1.51 1.48 1.49 1.48 1.48 1.51 1.54 1.55 1.72 2.12 2.63 2.49 2.53 2.37 1.99 1.58 1.46 1.46 1.45 1.54 1.53 1.52 41.4February 16th 1.27 1.27 1.33 1.32 1.36 1.35 1.44 1.52 1.59 1.78 2.36 3.15 4.00 3.78 3.74 3.43 2.91 2.30 1.79 1.51 1.45 1.33 1.36 1.41 48.8March 15th 0.93 0.93 0.88 0.88 0.94 1.00 0.97 1.00 1.19 1.79 2.62 3.44 3.97 3.76 3.72 3.40 2.89 2.35 1.90 1.44 1.13 1.00 0.97 0.94 44.1April 9th 0.60 0.56 0.56 0.56 0.55 0.56 0.56 0.59 0.79 1.20 1.74 2.34 2.86 3.10 3.09 2.75 2.34 1.91 1.48 1.11 0.85 0.68 0.62 0.61 32.0May 1st 0.32 0.30 0.29 0.30 0.29 0.29 0.31 0.38 0.50 1.02 1.77 2.58 3.18 3.67 3.65 3.10 2.51 1.90 1.27 0.86 0.71 0.51 0.38 0.33 30.4June 14th 0.29 0.29 0.27 0.26 0.25 0.25 0.27 0.32 0.40 0.65 1.20 1.87 2.51 2.93 2.95 2.59 1.98 1.34 0.83 0.68 0.61 0.47 0.33 0.29 23.8July 1st 0.23 0.22 0.23 0.22 0.21 0.21 0.22 0.27 0.35 0.61 1.14 1.74 2.32 2.81 2.84 2.61 2.04 1.41 0.85 0.65 0.58 0.41 0.29 0.25 22.7August 9th 0.34 0.34 0.33 0.32 0.33 0.32 0.33 0.35 0.43 0.72 1.13 1.68 2.13 2.49 2.73 2.46 2.11 1.62 1.17 0.83 0.66 0.48 0.42 0.37 24.1September 30th 0.38 0.36 0.36 0.37 0.39 0.38 0.37 0.37 0.44 0.75 1.25 1.80 2.48 2.69 2.69 2.37 1.94 1.50 1.03 0.63 0.46 0.43 0.41 0.40 24.2October 21st 0.69 0.69 0.68 0.67 0.67 0.65 0.67 0.69 0.70 0.86 1.32 1.87 2.41 2.67 2.68 2.51 2.07 1.58 1.06 0.82 0.76 0.72 0.72 0.72 28.9November 18th 0.92 0.89 0.89 0.91 0.89 0.87 0.86 0.86 0.85 0.95 1.21 1.64 2.05 1.95 1.80 1.55 1.19 0.95 0.91 0.94 0.97 1.04 1.02 1.00 27.1December 9th 1.11 1.11 1.13 1.11 1.20 1.26 1.31 1.30 1.32 1.30 1.46 1.80 2.17 2.20 2.09 1.86 1.57 1.37 1.29 1.22 1.20 1.20 1.14 1.12 33.8
Total Generation (kW)

69
Generation with demand and storge
Domestic Hot Water
Usable energy from solar thermal panels
Month00:00 01:00 02:00 03:00 04:00 05:00 06:00 07:00 08:00 09:00 10:00 11:00 12:00 13:00 14:00 15:00 16:00 17:00 18:00 19:00 20:00 21:00 22:00 23:00
Jan 1.3 1.3 1.3 1.3 1.3 1.3 -1.6 -1.3 0.5 1.4 1.5 1.9 2.4 2.3 2.3 2.2 -1.7 -1.1 -1.1 -1.1 -1.0 -0.9 0.5 1.3Feb 1.1 1.1 1.1 1.1 1.1 1.1 1.2 0.5 0.5 -2.8 -0.7 0.3 1.2 2.7 2.7 2.4 -0.8 -0.5 -1.0 -1.2 -1.3 -1.3 0.3 1.2Mar 0.8 0.8 0.7 0.7 0.8 0.8 0.8 0.0 0.2 -1.7 0.2 1.2 1.8 2.7 2.7 2.4 0.2 0.2 -0.3 -0.7 -1.0 -1.1 0.0 0.8Apr 0.4 0.4 0.4 0.4 0.4 0.4 -1.9 -1.5 -0.2 1.0 1.6 2.2 2.7 2.9 2.9 2.6 0.3 0.4 0.0 -0.5 -1.0 -1.2 -0.4 0.5May 0.2 0.1 0.1 0.1 0.1 0.1 -1.7 -1.5 -0.5 0.9 1.6 2.4 3.0 3.5 3.5 2.9 0.8 0.5 0.0 -0.5 -0.7 -1.2 -0.6 0.2Jun 0.2 0.2 0.1 0.1 0.1 0.1 0.1 -0.7 -0.6 -0.3 0.2 0.9 1.5 1.9 2.0 1.6 1.0 0.4 -0.1 -0.3 -0.4 -0.5 -0.7 0.2Jul 0.1 0.1 0.1 0.1 0.1 0.1 0.1 -0.7 -0.6 -0.3 0.2 0.8 1.4 1.9 1.9 1.7 1.1 0.5 -0.1 -0.3 -0.4 -0.5 -0.7 0.2Aug 0.2 0.2 0.2 0.2 0.2 0.2 0.2 -0.6 -0.5 -0.2 0.2 0.7 1.2 1.5 1.8 1.5 1.2 0.7 0.2 -0.1 -0.3 -0.5 -0.5 0.3Sep 0.2 0.2 0.2 0.2 0.3 0.2 -1.2 -1.3 -0.5 0.6 1.1 1.7 2.3 2.6 2.5 2.2 0.4 0.2 -0.3 -0.9 -1.1 -1.1 -0.6 0.3Oct 0.5 0.5 0.5 0.5 0.5 0.5 -1.8 -1.7 -0.3 0.7 1.1 1.7 2.2 2.5 2.5 2.3 -0.7 -0.5 -0.9 -1.1 -1.1 -1.1 -0.3 0.6Nov 0.7 0.7 0.7 0.7 0.7 0.7 -2.3 -2.0 -0.2 0.7 1.0 1.4 1.8 1.8 1.6 1.3 -2.5 -1.7 -1.6 -1.5 -1.4 -1.3 0.0 0.8Dec 0.9 0.9 0.9 0.9 1.0 1.1 -1.4 -1.2 0.3 1.1 1.3 1.6 2.0 2.0 1.9 1.7 -1.9 -1.1 -1.1 -1.1 -1.1 -1.1 0.1 0.9
Generation meeting demand (kWh)
Month 00:00 01:00 02:00 03:00 04:00 05:00 06:00 07:00 08:00 09:00 10:00 11:00 12:00 13:00 14:00 15:00 16:00 17:00 18:00 19:00 20:00 21:00 22:00 23:00Jan 1.3 2.6 3.9 5.2 6.5 7.8 6.2 4.9 5.4 6.8 8.3 10.2 12.7 14.9 17.3 19.5 17.8 16.7 15.6 14.5 13.4 12.5 13.0 14.4Feb 1.1 2.1 3.2 4.3 5.5 6.6 7.9 8.3 8.9 6.0 5.3 5.6 6.8 9.5 12.2 14.6 13.8 13.3 12.3 11.1 9.8 8.5 8.8 10.0Mar 0.8 1.5 2.2 3.0 3.7 4.6 5.4 5.4 5.5 3.8 4.1 5.3 7.1 9.8 12.5 14.9 15.1 15.3 15.0 14.3 13.2 12.1 12.1 12.8Apr 0.4 0.9 1.3 1.7 2.0 2.4 0.5 -1.0 -0.2 1.0 2.6 4.8 7.4 10.4 13.3 15.9 16.2 16.6 16.7 16.2 15.2 14.0 13.6 14.0May 0.2 0.3 0.5 0.6 0.7 0.9 -0.8 -1.5 -0.5 0.9 2.5 4.9 7.9 11.4 14.9 17.8 18.6 19.1 19.1 18.6 17.9 16.7 16.1 16.3Jun 0.2 0.3 0.5 0.6 0.7 0.8 1.0 0.3 -0.3 -0.3 0.2 1.1 2.6 4.6 6.5 8.2 9.1 9.5 9.4 9.1 8.7 8.2 7.6 7.7Jul 0.1 0.3 0.4 0.5 0.6 0.7 0.9 0.2 -0.4 -0.3 0.2 1.0 2.4 4.2 6.1 7.8 8.9 9.4 9.3 9.0 8.6 8.1 7.4 7.6Aug 0.2 0.5 0.7 0.9 1.1 1.4 1.6 1.0 0.5 0.2 0.4 1.1 2.3 3.8 5.6 7.1 8.3 8.9 9.2 9.0 8.7 8.3 7.8 8.0Sep 0.2 0.5 0.7 0.9 1.2 1.4 0.2 -1.0 -0.5 0.6 1.7 3.4 5.7 8.3 10.8 13.0 13.5 13.7 13.4 12.5 11.4 10.2 9.7 10.0Oct 0.5 1.1 1.6 2.1 2.6 3.1 1.3 -0.4 -0.3 0.7 1.8 3.5 5.8 8.2 10.7 13.1 12.4 12.0 11.0 9.9 8.8 7.7 7.4 7.9Nov 0.7 1.4 2.1 2.9 3.6 4.2 2.0 0.0 -0.2 0.7 1.8 3.2 5.0 6.8 8.4 9.7 7.2 5.5 3.9 2.4 0.9 -0.4 0.0 0.8Dec 0.9 1.8 2.8 3.7 4.7 5.8 4.4 3.1 3.4 4.5 5.8 7.4 9.4 11.4 13.3 15.0 13.1 12.0 10.9 9.7 8.6 7.6 7.7 8.6
Generation meeting demand with use of stored energy (kWh)