Manuscript Details Submission Files Included in this PDF
46
HAL Id: hal-02928806 https://hal.archives-ouvertes.fr/hal-02928806 Submitted on 2 Sep 2020 HAL is a multi-disciplinary open access archive for the deposit and dissemination of sci- entific research documents, whether they are pub- lished or not. The documents may come from teaching and research institutions in France or abroad, or from public or private research centers. L’archive ouverte pluridisciplinaire HAL, est destinée au dépôt et à la diffusion de documents scientifiques de niveau recherche, publiés ou non, émanant des établissements d’enseignement et de recherche français ou étrangers, des laboratoires publics ou privés. Distributed under a Creative Commons Attribution - NonCommercial - NoDerivatives| 4.0 International License Methods for the experimental study of 220Rn homogeneity in calibration chambers Krasimir Mitev, Philippe Cassette, D. Pressyanov, S. Georgiev, Chavdar Dutsov, Nathalie Michielsen, Benoît Sabot To cite this version: Krasimir Mitev, Philippe Cassette, D. Pressyanov, S. Georgiev, Chavdar Dutsov, et al.. Methods for the experimental study of 220Rn homogeneity in calibration chambers. Applied Radiation and Isotopes, Elsevier, 2020, 165, pp.109259. 10.1016/j.apradiso.2020.109259. hal-02928806
-
Upload
khangminh22 -
Category
Documents
-
view
0 -
download
0
Transcript of Manuscript Details Submission Files Included in this PDF

HAL Id: hal-02928806https://hal.archives-ouvertes.fr/hal-02928806
Submitted on 2 Sep 2020
HAL is a multi-disciplinary open accessarchive for the deposit and dissemination of sci-entific research documents, whether they are pub-lished or not. The documents may come fromteaching and research institutions in France orabroad, or from public or private research centers.
L’archive ouverte pluridisciplinaire HAL, estdestinée au dépôt et à la diffusion de documentsscientifiques de niveau recherche, publiés ou non,émanant des établissements d’enseignement et derecherche français ou étrangers, des laboratoirespublics ou privés.
Distributed under a Creative Commons Attribution - NonCommercial - NoDerivatives| 4.0International License
Methods for the experimental study of 220Rnhomogeneity in calibration chambers
Krasimir Mitev, Philippe Cassette, D. Pressyanov, S. Georgiev, ChavdarDutsov, Nathalie Michielsen, Benoît Sabot
To cite this version:Krasimir Mitev, Philippe Cassette, D. Pressyanov, S. Georgiev, Chavdar Dutsov, et al.. Methodsfor the experimental study of 220Rn homogeneity in calibration chambers. Applied Radiation andIsotopes, Elsevier, 2020, 165, pp.109259. �10.1016/j.apradiso.2020.109259�. �hal-02928806�
Manuscript Details
ARI_2019_310_R1
Methods for the experimental study of 220Rn homogeneity in calibration chambers
Article type Full Length Article
AbstractThis work presents two experimental methods for the evaluation of 220Rn homogeneity in calibration chambers. The first method is based on LSC of the 220Rn decay products captured in silica aerogel. The second method is based on application of solid state nuclear track detectors facing the air of the calibration chambers. The performances of the two methods are evaluated by dedicated experiments. The repeatability of the method, estimated as relative standard deviation of the LSC measurements of ten silica aerogel samplers exposed under the same conditions is found to be 1.6%. Both methods are applied to study thoron homogeneity in a 50 L empty AlphaGuard emanation and calibration container with its fan turned on, and it was found that the 220Rn distribution is homogeneous within 10%. Both methods are also applied to test the thoron homogeneity in the BACCARA chamber at IRSN during a thoron calibration exercise. The results show that, at the centre of the chamber where the inputs of the sampling systems of the instruments were put close to each other, the thoron inhomogeneity is less than 10%. However, regions of higher thoron concentrations are clearly identified near the walls and the upper part of the chamber, with 220Rn concentrations being up to 60% higher compared to the concentration at the reference point. These results highlight the importance of the control and assessment of thoron homogeneity in thoron calibrations and in the cases when radon monitors are checked for thoron influence.
Manuscript number
Title
Keywords
Manuscript category
Corresponding Author
Corresponding Author's Institution
Order of Authors
Suggested reviewers
Thoron (220Rn), Thoron calibration, Thoron homogeneity, LSC, nuclear track detectors
Radiation Measurements
Krasimir Mitev
Sofia University "St. Kliment Ohtridski"
Krasimir Mitev, Philippe Cassette, Dobromir Pressyanov, Strahil Georgiev, Chavdar Dutsov, Nathalie Michielsen, Benoit Sabot
marco capogni, Luigi Tommasino
Submission Files Included in this PDF
File Name [File Type]CoverLetter.docx [Cover Letter]
Response_Decision_Letter_R1.docx [Response to Reviewers]
78_Mitev_Et_Al_highlights_Rev _1.docx [Highlights]
78_Mitev_Et_Al_manuscript_Rev_1.docx [Manuscript File]
78_Mitev_Et_Al_figures_Rev_1.docx [Figure]
Fig2_scale_only.tif [Figure]
78_Mitev_Et_Al_tables_Rev_1.docx [Table]
declaration-of-competing-interests.docx [Conflict of Interest]
AuthorStatement.docx [Author Statement]
To view all the submission files, including those not included in the PDF, click on the manuscript title on your EVISE Homepage, then click 'Download zip file'.

Dear Editor,
Please find enclosed the revised version of our manuscript (Ref: ARI_2019_310) entitled:
Methods for the experimental study of 220Rn homogeneity in calibration chambers, by authors:
K. Mitev, P. Cassette, D. Pressyanov, S. Georgiev, Ch. Dutsov, N. Michielsen, B. Sabot. This is
the first revision of the manuscript.
I attach also a separate file, in which we have replied to all the comments and suggestions made
by the reviewers. We would like to thank the reviewers for their comments and suggestions,
which were very constructive and helped to improve the manuscript.
For all the correspondence regarding this manuscript, please do not hesitate to contact me as a
corresponding author.
Sincerely yours,
Krasimir Mitev
/On behalf of all the co-authors/
Response to Comments & suggestions of Reviewer #1
A well written paper worthy of publication. I have made a few comments and suggestions for minor changes.Thank you for this encouraging opinion.
AbstractRepeatability of NTD ? - Our long-term experience with NTD of Kodak-Pathe LR-115/II indicates that the repeatability within a set of detectors exposed at identical conditions is within the Poisson track counting statistics.
Chapter 2. Evaluation of thoron homogeneity by LSC of silica aerogel> The following logical rearrangement of test sessions is proposed - accepted, thank you.> Ref to BIPM SI brochure. - corrected to 10 min, thank you.> What do you mean? To enable LS cocktain to be fast absorbed in the aerogel for LSC measurement ? - That is exactly what was meant, Thank you.“The silica aerogel was crushed and sieved (from ~0.5 mm to 3.0 mm) to get grains with suitable size - not too large so they can fit in the sampler without punctuating the closing filters at the same time not too small (e.g. dust) to enable LS cocktail to be fast absorbed in the aerogel for the LSC measurement after the exposure.”
> Results ? under which point of view ? which type amng the three mentioned ?Thank you for these questions, we have added some more comments in the text to elucidate how we judged the performance of the filters. In short, what we did is to compare the net LS counting rate, which is expected from the thoron activity in the sampler (available form Eq. 3) with the measured net LS counting rate. This way we found that the glass microfiber filters always give higher measured counting rates, which we interpret as inability to stop (filter) entirely the thoron progeny to penetrate in the sampler from the outside. The membrane filters (both types ADVANTEC and Millipore), however, showed good agreement of the net LS counting rates (when placed two of them on each side of the sampler), and that was our criterion to choose membrane filters.
> Usually the repeatability is given as standard deviation and not as maximum deviation. Furthermore, if you want to separate the variability components due to the thoron sampling and counting statistics, you should subtract (quadratically) the repeatablity of the count per unit mass for a single sampler, that you can assume as a poissin variable. So, I guess the real repeatability in lewer than 2.3%.
Thank you for this suggestion, which we accepted and presented the repeatability as a relative standard deviation.
We agree with the referee that it is in principle possible to perform analysis of the different contributions to the overall variance. In this particular case we prefer to stay with the “overall” variance, since it is instructive what one can expect from the application of the method as a whole, including: careful preparation of the samplers, weighing, transfer of aerogel from the samplers to the cocktail, LSC measurement, etc.
Chapter 3. Evaluation of thoron homogeneity by SSNTDsPlease, add a reference. ; Please, add a reference - The corresponding references were added in the revised manuscript.> What about the second one ??? - The second one is the calibration exercise at BACCARA.
Figure captions:> Which filter type ? Millipore filters, that was added in the caption.> What is the difference between the two vials? There is no difference between the vials ( same vials, same aerogel, same LS cocktail), we simply made a snapshot of two of them.
Response to Comments & suggestions of Reviewer #2
Dear Authors,
You présent results of a study of two different experimental methods to measure homogeneity of thoron concentrations in calibration chambers. I regard this as an important contribution to the quality assurance of thoron calibration and measurement. The quality of the first method that involves liquid scintillation counting seems to be high. However, I have a few comments regarding the presentation of the results, where I am not sure what is meant.
According to my understanding, the second method that makes use of sold-state nuclear track detectors seems to rely on several assumptions where I am not sure if they are justified. Please see my specific comments.
(Page numbers refer to the numbers of pages in the Word document, with the Introduction starting on page 3.)
page 3, "from thoron series": I suggest to write "decay series" or "decay chain" instead of "series" in order to clarify what is meant. - changed to thoron decay series, thank you.
page 3, Aerogel sampling in general: The aerogel acts as a sink to the thoron concentration (in contrast to the SSNTD and also in contrast to actively sampling measurement devices such as the AlphaGuard in pump mode if the outlet air goes back into the chamber). I guess that this effect is negligible. However, this should be assessed and mentioned. We think that each volume of the chamber, which is available for thoron, acts as a sink of the thoron concentration, as long as thoron decays happen everywhere. It is difficult to evaluate the degree to which a given volume in the chamber acts as a thoron sink, since this depends on the transport of the air through the volume, the air circulation in the chamber etc. However, given the high air circulation rate needed to ensure thoron homogeneity, we also think that the effect of the presence of the sampler on the thoron distribution in the chamber is negligible. In addition, the thoron activity distribution inside the sampler depends on the ratio of the thickness of the sampler to the diffusion length (Eqs 2 and 3 ). If L/2LD<<1, then the thoron distribution in the sampler tends to uniform distribution. According to our experience, ratios L/2LD<<0.4 are a good compromise, in this particular case of the samplers the ratio is L/2LD =0.17, which leads to a 1.4% deviation of the activity in the middle of the sampler compared to the activity on its surface. This is the maximal deviation and this result imply almost uniform thoron distribution inside the sampler, hence the sampler acts in the same way as the other air volumes in the chamber. This is also an argument for choosing thinner samplers with thickness 1 cm (see below).
page 5, "The best results were obtained": What does "best results" mean? What are the criteria to make a result a good one? And how was this tested? - we had the same question from Reviewer #1. Please see the reply to him, as well as the revised version of the manuscript in this part.
page 5, "Ultima Gold LLT LS cocktail": As far as I know there are LSC cocktails based on polar liquids ("water-based") and nonpolar liquids, where radon and thoron are retained to a higher degree in nonpolar cocktails. (For example, such nonpolar cocktails are used for measuring radon in water: The radon is transferred from the water to the cocktail because it is retained there much stronger.) What type of cocktail is the cocktail that you used? - We have tried both types of LS cocktails. Our non-polar cocktail was a home-made toluene-based (Toluene+PPO+Bis-MSB) cocktail, which is not miscible in water and which has excellent radon solubility. We have a long term experience with this cocktail for radon measurements, but in this case we observed something which looks like excitation of the cocktail (similar to chemi-luminscence) when it gets in contact with the aerogel (not shown in the manuscript). The Ultima Gold LLT cocktail, which is a commercially available polar cocktail and which contains surfactants, does not exhibit the drawback of the non-polar cocktail. It enters easily in the aerogel (the ultra sonic bath is necessary to remove the bubbles from the aerogel) and allows reliable LS counting. That is why we have chosen to use the polar cocktail UG LLT.
page 6, "The results are shown in Table 1 and indicate that the thinnest samples have highest net counting rate per unit mass.": Is this not obvious from Equations 2 and 3? The aerogel close to the surface gets the highest activity of thoron whereas the aerogel in the middle of the sampler gets the smallest activity. Therefore, thin packs of aerogel will have the highest specific activity (activity per mass). However, I think for the LSC measurement not the specific activity (or net counting rate per mass) but the total activity (or net counting rate) matters.
If we take a look at the equation which describes the thoron activity profile inside the sampler (Eq. 2), we see that C(x) behaves like cosh(x), which states that the activity will be higher close to the surface and will tend to decrease in the middle of the sampler. Thus, the thinner the sample the higher the specific activity. We agree that what matters in the LSC is the total activity, thus larger volumes of aerogel would be beneficial as there is a tradeoff sensitivity vs. volume. However, we cannot make the volumes too large as we want to place the entire content of one sampler easily in one standard LS vial (which volume is 22 ml) and, for practical purposes, we do not want to fill the vial entirely with aerogel. That is why we believe that the optimal samplers are with 1 cm thickness.
Figure 3: It looks as if the aerogel gets translucent in the LSC cocktails. Is this true? I think that matters for the LSC measurement. If it was not translucent, decays of thoron and thoron progeny that stay in the aerogel, which is soaked with LSC cocktail, cannot be detected by the LSC counter. - Yes! The aerogel, when it is filled with LSC cocktail becomes translucent and the thoron progenies sucked in the aerogel are detected by the LSC counter.
Table 1: L is given in units of cm3. This is probably a typo and should read cm. - Yes, it was a typo and we corrected it to "L, cm”. Thank you!
Table 2: I see that the uncertainty of each single measurement is larger than the deviation from the mean. I understand that the uncertainty of the mean is reduced by repeated or multiple measurements. However, in this case you compare single measurements with each other. Therefore, the uncertainty of the single measurements (e.g. 4.0% for AG 1) should be taken into account.
By the way, I would expect that measurement results with an uncertainty of that level should deviate from the mean more strongly, just because of the stochastic nature of uncertainty, even if the measurements are perfectly reproducible. The mean value of the relative uncertainties is 2.9%. I do not know if you applied a coverage factor (e.g. coverage factor k=2 in order to get an expanded uncertainty which covers approximately 95% of the results), but if the uncertainties are standard uncertainties, there should only be a not too big amount of the measurement

results within a range of the mean +- the uncertainty (about 68% in case the values are normally distributed). Maybe the uncertainties are too big?
Yes, we have been conservative in the estimation of the uncertainties of the net counting rate at the end of the
exposure. This is due to the experimental method we use to deduce the net counting rates of the samples at the end of the exposure. The uncertainty of the net counting rate at the end of the exposure has several components which contribute to it, please see our reply to the next comment. We are confident that our experimental approach to determine the net LS counting rate at the end of the thoron exposure n_0(t=0) is unbiased and robust and the estimate of the uncertainties is adequate. All the reported uncertainties in the tables are standard uncertainties, i.e. coverage factor was not applied (k=1).
page 7, "The net counting rate of each of the samples was followed for 60 h": Is there a reason why you performed the measurements for such a long time? How did you get the count rate at the beginning? Did you calculate it from the total counts within this measurement time or did you read the count rate in several short intervals and used only the first one?
Our procedure for these measurements is as follows: we place all the LS samples in the LS analyzer and we perform series of consecutive measurements of all the samples with fixed counting time for each measurement (5 minutes in each case). We repeat the measurements of all the samples in a row for 60h. Thus, we obtain a series of measurements, and we fit the data ln(net counting rate) vs. t with a straight line. Hence, we determine the net counting rate at the beginning (n_0(t=0)) for each sample as well as the effective half-life of the nuclides in the sample. This procedure is necessary and advantageous for two reasons: 1.) Technically we cannot measure the net counting rate at the end of the exposure (t=0) for all the samples simultaneously; 2) We have to wait at least 4 hours after the end of the thoron exposure in order to attain secular equilibrium between Pb-212 and its short lived progeny. The uncertainty of the net counting rate at t=0 includes the uncertainty components due to counting statistics, background correction as well as the component due to the fitting.
page 8, "in this case 220Rn and its progeny atoms": Is there a reason why you do not mention Tl-208? I see that it does not emit alpha radiation but Pb-212 does not either (at least not this isotope itself). Tl-208 was mentioned in the list, thank you.
page 8, "Parallel measurements of the activity concentrations of 222Rn": The amount of deposited progeny depends on the surface to volume ratio of the chamber and on the unattached fraction of the progeny. A 1 m3 chamber has a smaller surface to volume ratio that the 200 l spherical chamber; therefore a smaller amount of progeny might be deposited on the walls. A small unattached fraction (because of aerosol particles in the air inside the chamber) reduces the deposition velocity; this also leads to a smaller amount of deposited progeny.
Although surface to volume ratio of the empty 1 m3 cylindrical BACCARA chamber is somewhat smaller (within 50%) than that of the 200 L spherical chamber, we do not consider this to change significantly the conditions assumed (almost all of the 220Rn progeny: 212Pb, 212Bi+212Po/208Tl is deposited on the internal surface of the chamber) for the following reasons: (1) In the experiment described radon/thoron monitors were put in the BACCARA chamber, which increased the surface at which progeny atoms may deposit and decreased the free internal volume, thus increasing the surface to volume ratio; (2) Experiments at much larger than 1 m3 volumes (e. g. rooms, as in the cited reference of Harley et al. (2010)) demonstrate extreme disequilibrium between 220Rn and its progeny in the air. The following sentence in the text: "Results of other authors (Harley et. al., 2010) also show extreme disequilibrium in air between 220Rn and its progeny, even for much larger volumes (e.g. rooms) than the volumes of 200 L or 1 m3” was amended to make this more clear.
page 8, "They register alpha particles of energy within 1.5 - 4.0 MeV and incident angle <55°": I wonder if this

assumption is justified. I know that the energy and angular range of LR-115 is limited but according to my understanding that only means that within this range LR-115 are best suited as a meauserement device whereas outside this range the sensitivity is smaller but not zero. I do not have access to the references literature Pressyanov 2012 but this publication
Mheemeed et al., Characterization of alpha-particle tracks in cellulose nitrate LR-115 detectors at various incident energies and angles. Applied Radiation and Isotopes 79 (2013) 48-55.
presents results that show that LR-115 is sensitive also to higher energies (in this publication presented up to 5 MeV), especially at large angles of incidence. I think the proposition that LR-115 is not sensitive to energies above 4 MeV should be justified more strongly.
The energy and angular window of the SSNTDs depends on the etching conditions and the mode of track counting. Essential for the application is the energy of alpha particles of 220Rn progeny to be outside of this window, to avoid registration of alphas from the plate-out on the detector surface. This is valid as for the conditions we use, as well as for these reported by Mheemeed et al. (2013). The corresponding paragraph in the text was revised, to make this more clear.
Highlights paper 78 Mitev et al.:
• Two new methods for checking Thoron homogeneity in chambers are suggested.
• The first method is based on trapping of Thoron progeny in aerogel and LSC.
• The second method is based on solid state nuclear track detectors.
• Both methods studied in laboratory experiments and found feasible.
• Both methods are applied in the BACCARA 2018 Thoron calibration exercise.

1234567891011121314151617181920212223242526272829303132333435363738394041424344454647484950515253545556575859
Methods for the experimental study of 220Rn homogeneity incalibration chambers
K. Miteva’*, P. Cassetteb, D. Pressyanova, S. Georgieva, Ch. Dutsova, N. Michielsenc,
B. Sabotb
a Sofia University “St. Kliment Ohridski”, Faculty of Physics, 1164 Sofia, Bulgaria.
b CEA, LIST, Laboratoire National Henri Becquerel (LNE-LNHB), 91191 Gif-sur-
Yvette Cedex, France.
c Institut de Radioprotection et de Sûreté Nucléaire (IRSN), 92262 Fontenay aux
Roses, France.
Abstract
This work presents two experimental methods for the evaluation of 220Rn homogeneity
in calibration chambers. The first method is based on LSC of the 220Rn decay products
captured in silica aerogel. The second method is based on application of solid state
nuclear track detectors facing the air of the calibration chambers. The performances of
the two methods are evaluated by dedicated experiments. The repeatability of the
method, estimated as relative standard deviation of the LSC measurements of ten silica
aerogel samplers exposed under the same conditions is found to be 1.6%. Both methods
are applied to study thoron homogeneity in a 50 L empty AlphaGuard emanation and
calibration container with its fan turned on, and it was found that the 220Rn distribution
is homogeneous within 10%. Both methods are also applied to test the thoron
homogeneity in the BACCARA chamber at IRSN during a thoron calibration exercise.
* Corresponding author. Tel.: + 359 889 714 226. E-mail address: [email protected] (K. Mitev).

60616263646566676869707172737475767778798081828384858687888990919293949596979899100101102103104105106107108109110111112113114115116117118
The results show that, at the centre of the chamber where the inputs of the sampling
Systems of the instruments were put close to each other, the thoron inhomogeneity is
less than 10%. However, regions of higher thoron concentrations are clearly identified
near the walls and the upper part of the chamber, with 220Rn concentrations being up to
60% higher compared to the concentration at the reference point. These results highlight
the importance of the control and assessment of thoron homogeneity in thoron
calibrations and in the cases when radon monitors are checked for thoron influence.
Keywords: Thoron (220Rn), Thoron calibration, Thoron homogeneity, LSC, nuclear
track detectors.
119120121122123124125126127128129130131132133134135136137138139140141142143144145146147148149150151152153154155156157158159160161162163164165166167168169170171172173174175176177
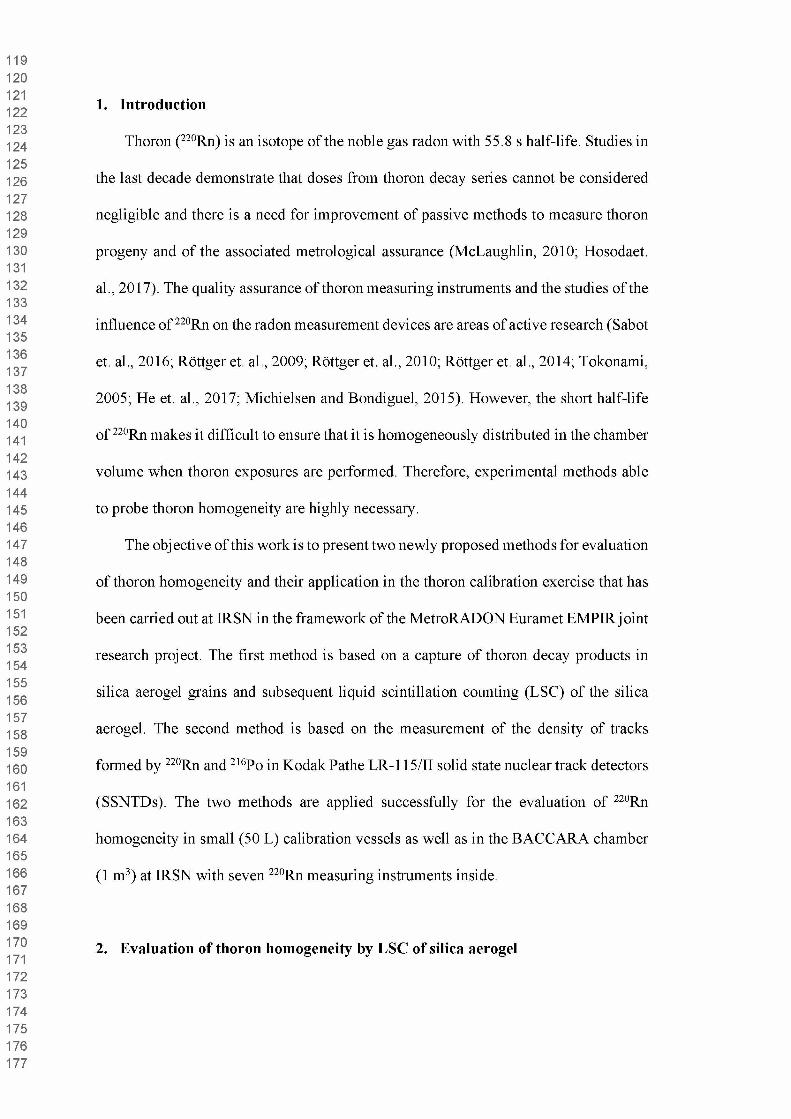
1. Introduction
Thoron (220Rn) is an isotope of the noble gas radon with 55.8 s half-life. Studies in
the last decade demonstrate that doses from thoron decay series cannot be considered
negligible and there is a need for improvement of passive methods to measure thoron
progeny and of the associated metrological assurance (McLaughlin, 2010; Hosodaet.
al., 2017). The quality assurance of thoron measuring instruments and the studies of the
influence of 220Rn on the radon measurement devices are areas of active research (Sabot
et. al., 2016; Rottger et. al., 2009; Rottger et. al., 2010; Rottger et. al., 2014; Tokonami,
2005; He et. al., 2017; Michielsen and Bondiguel, 2015). However, the short half-life
of 220Rn makes it difficult to ensure that it is homogeneously distributed in the chamber
volume when thoron exposures are performed. Therefore, experimental methods able
to probe thoron homogeneity are highly necessary.
The objective of this work is to present two newly proposed methods for evaluation
of thoron homogeneity and their application in the thoron calibration exercise that has
been carried out at IRSN in the framework of the MetroRADON Euramet EMPIR joint
research project. The first method is based on a capture of thoron decay products in
silica aerogel grains and subsequent liquid scintillation counting (LSC) of the silica
aerogel. The second method is based on the measurement of the density of tracks
formed by 220Rn and 216Po in Kodak Pathe LR-115/II solid state nuclear track detectors
(SSNTDs). The two methods are applied successfully for the evaluation of 220Rn
homogeneity in small (50 L) calibration vessels as well as in the BACCARA chamber
(1 m3) at IRSN with seven 220Rn measuring instruments inside.
2. Evaluation of thoron homogeneity by LSC of silica aerogel
178179180181182183184185186187188189190191192193194195196197198199200201202203204205206207208209210211212213214215216217218219220221222223224225226227228229230231232233234235236
This method makes use of a silica aerogel as thoron sampler and its subséquent
mixing with a LS cocktail for LSC counting. The idea of the sampler is to allow thoron
to enter freely from the environmental air into the cylindrical volume through the filters
and to stop the thoron decay products on the filters. Thus, when 220Rn decays inside the
sampler, its decay products (216Po, 212Pb, 212Bi, 212Po and 208Tl) will attach to the silica
aerogel and their activity in the silica aerogel will be proportional to the 220Rn activity
that has entered in the cylinder. The latter is proportional to the ambient 220Rn activity
concentration in the air surrounding the sampler. The usage of silica aerogel provides a
large / sufficient amount of free space in the sampler for thoron to diffuse in and at the
same time allows the effective capture of its decay products.
The 220Rn transport inside the sampler (assumed to have a cylindrical geometry)
can be described by the diffusion equation with a term accounting for radioactive decay.
As the thoron half-life is 55.8 s, for constant thoron concentration and exposures longer
than 10 min, a steady state diffusion can be assumed:
d2C dC dC°~dx2 ~XC = dt ’ With dt = 0 (1)
where C is the 220Rn activity concentration, D is the diffusion coefficient of 220Rn in the
material, A is the 220Rn decay constant, x is the space coordinate along the cylinder axis
and t is the time variable. The solution of the above equation in plate parallel geometry
along the axis of the sampler is:
coshC(x) = Cout (2)
and the 220Rn activity in the sampler (ATn) is given by
Ld LAfn = 2^out^~ïtanh (2ld) , (3)
237238239240241242243244245246247248249250251252253254255256257258259260261262263264265266267268269270271272273274275276277278279280281282283284285286287288289290291292293294295
where Cout is the outside 220Rn activity concentration (assuming that the filters are
transparent to thoron), L and V are the height and the volume of the cylinder and
Ld=(D/X)1/2 is the diffusion length of 220Rn in the material (air or silica aerogel). Taking
into account that the diffusion coefficient of 220Rn in air is D=10-5 m2/s (Ishimori et. al.,
2013) which gives LD=3.0 cm, from Eq. 2 it follows that one can expect non-
homogeneous thoron distribution inside the sampler. Thus, it is important, as shown
hereafter, to choose carefully the thickness of the samplers to ensure best performance.
Specially designed thoron samplers were developed as shown in Fig 1. The sampler
consists of a cylindrical body and two end caps, which serve to fix and support two air
filters (bottom and top) at the ends of the cylinder (Fig. 1a). The inner and the outer
diameters of the cylinder are 4.4 cm and 4.7 cm, respectively. The diameters were
chosen to fit the diameter of the filters (d=4.7 cm). The silica aerogel was crushed and
sieved (from ~0.5 mm to 3.0 mm) to get grains with suitable size - small enough so
they can fit in the sampler without punctuating the closing filters and, at the same time,
large enough (e.g. larger than dust particles) to allow the aerogel to absorb the LS
cocktail quickly in order to perform the LSC measurement as soon as possible after the
exposure. The silica aerogel is placed in the cylinder (Fig. 1b) and the sampler is closed
tight (Fig. 1c). All plastic parts of the thoron sampler are locally made with a 3D printer.
In order to evaluate the thoron homogeneity during the calibration exposures the
thoron samplers can be positioned at any point of interest in the calibration chamber.
After the end of the thoron exposure, the samplers are removed and the silica aerogel
from each sampler is carefully transferred in a high performance LS glass vial. The
mass of the transferred silica aerogel is determined by weighing the LS vials. The vials
are then filled with 15 mL Ultima Gold LLT LS cocktail and placed for 10 min in an
296297298299300301302303304305306307308309310311312313314315316317318319320321322323324325326327328329330331332333334335336337338339340341342343344345346347348349350351352353354
ultrasonic bath in order to facilitate the full pénétration of the scintillation cocktail in
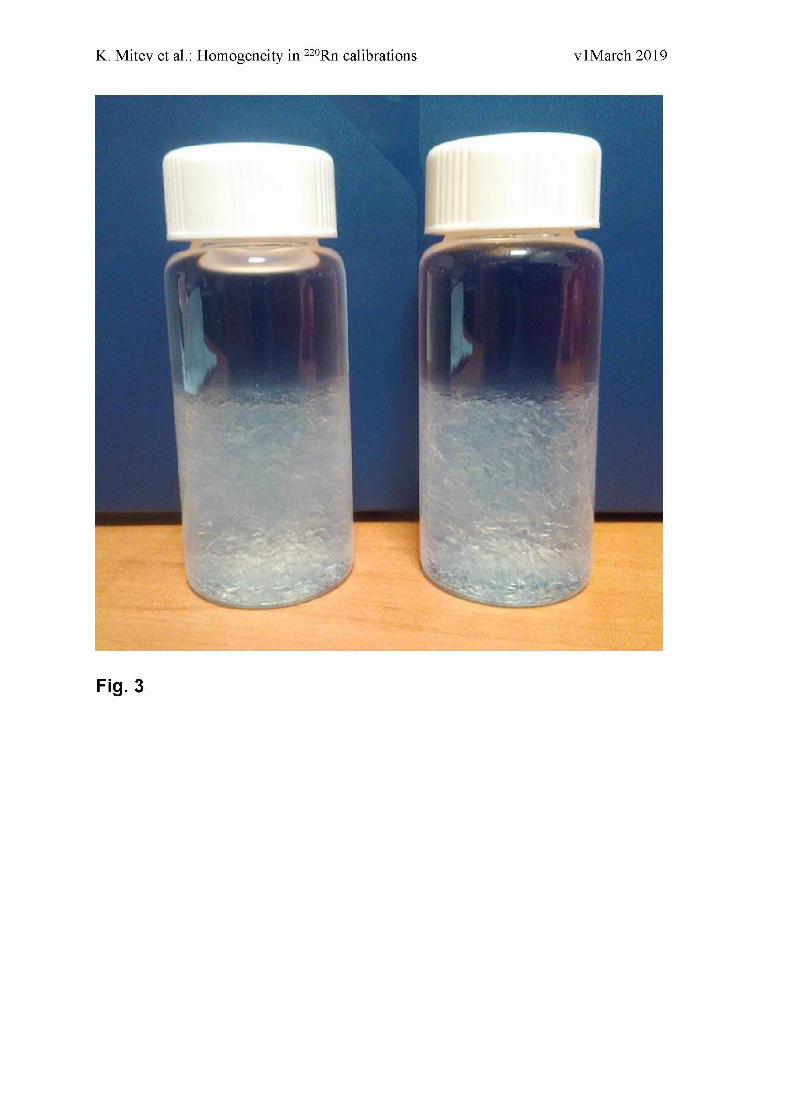
the silica aerogel and to remove air bubbles from it (Fig. 3).
Different types of filters were tested - glass microfiber filter with an equivalent
pore size of 1.2 pm and thickness 260 pm (LLG-Labware 9045867), mixed cellulose
ester membrane filter with an equivalent pore size of 0.2 pm and thickness 130 pm
(ADVANTEC A20A047A) and mixed cellulose ester membrane filter with 0.3 pm
equivalent pore size and thickness 150 pm (Millipore PHWP04700). The performance
criterion for the choice of the filter is the agreement between the measured net LS
counting rate and the expected net LS counting rate from the activity, absorbed in the
aerogel, which is determined from Eq. 3.
The results from the tests showed that net LS counting rate obtained with the glass
microfiber filters is always higher than the net LS counting rate expected from the
absorbed activity (Eq. 3). Therefore, we conclude that the used glass microfiber filters
do not completely stop the thoron progeny from penetrating in the samplers. The best
agreement between the measured and the expected net LS counting rate was obtained
with two membrane filters placed on each entry of the sampler. Both types of filters
ADVANTEC A20A047A and Millipore PHWP04700 show excellent performance.
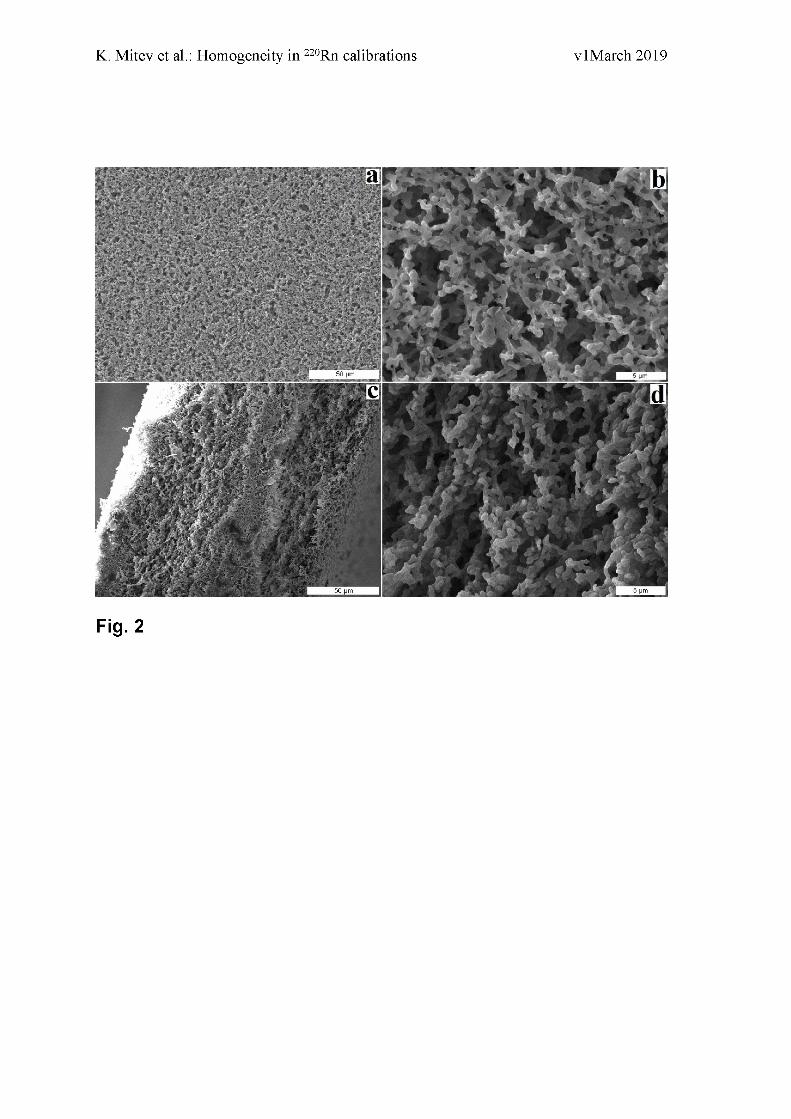
Scanning electron microscope images of the used membrane filters are shown in Fig.
2.
In order to choose the optimal thickness, three different samplers were produced
with L=1.0 cm, 1.5 cm and 2.0 cm. Six samplers (two of each thickness) were exposed
to thoron in a 50 L AlphaGuard calibration container with an AlphaGuard PQ2000 PRO
(Rn/Tn) reference monitor placed inside. The 220Rn activity concentration during the
exposure was Cout=612(61) kBq/m3 and the exposure duration was 68.2 h. The samplers
were placed at the bottom of the vessel close to each other with a special focus on 220Rn
355356357358359360361362363364365366367368369370371372373374375376377378379380381382383384385386387388389390391392393394395396397398399400401402403404405406407408409410411412413
freely reaching each sampler and passing through the filters. After the exposure the
silica aerogel from each sampler was transferred in a high performance glass vial and
the vials were measured on a RackBeta 1219 LS counter (Wallac, Finland). The results
are shown in Table 1 and indicate that the thinnest samples have the highest net
counting rate per unit mass. Considering the results in Table 1 and noting that the net
LS counting rate is due to several thoron progenies (212Pb, 212Bi , 212Po and 208Tl) it can
be concluded that samplers with thickness L=1 cm which contain around 5 g of silica
aerogel provide sufficiently good sensitivity of the method to be applied for the
evaluation of 220Rn homogeneity.
The most important characteristic of the proposed method from the point of view of
practical applications is its repeatability. It is studied in this work with the experimental
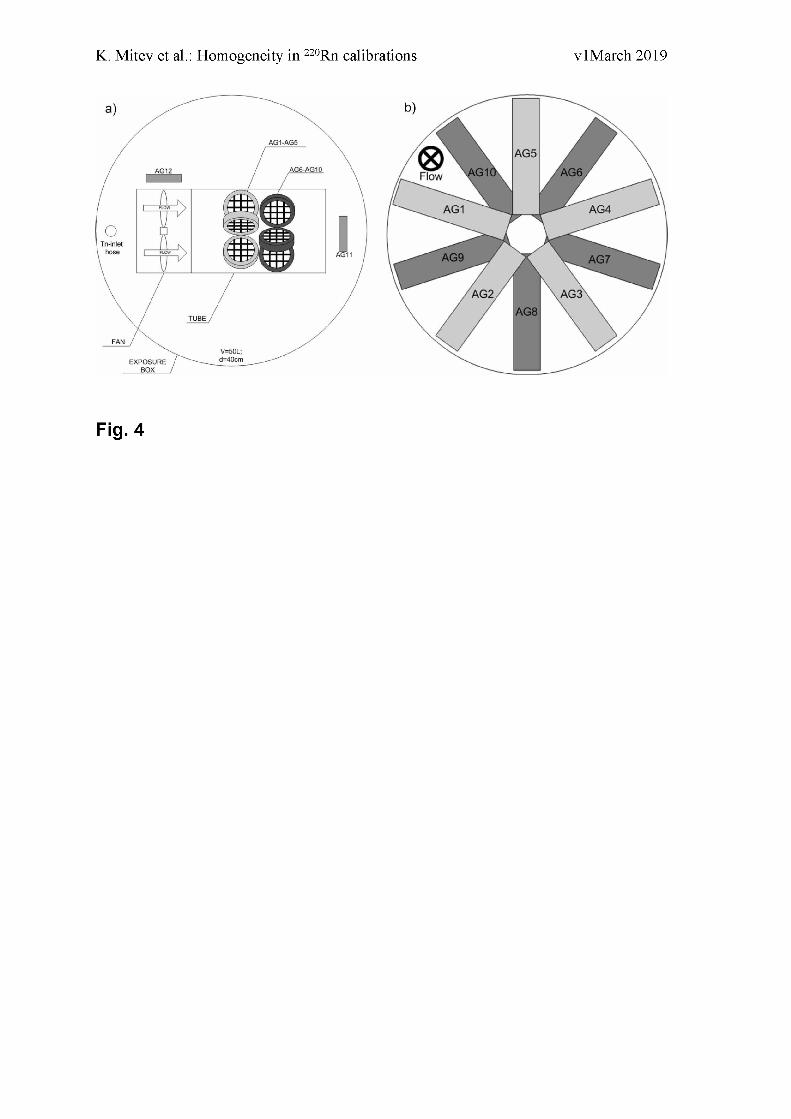
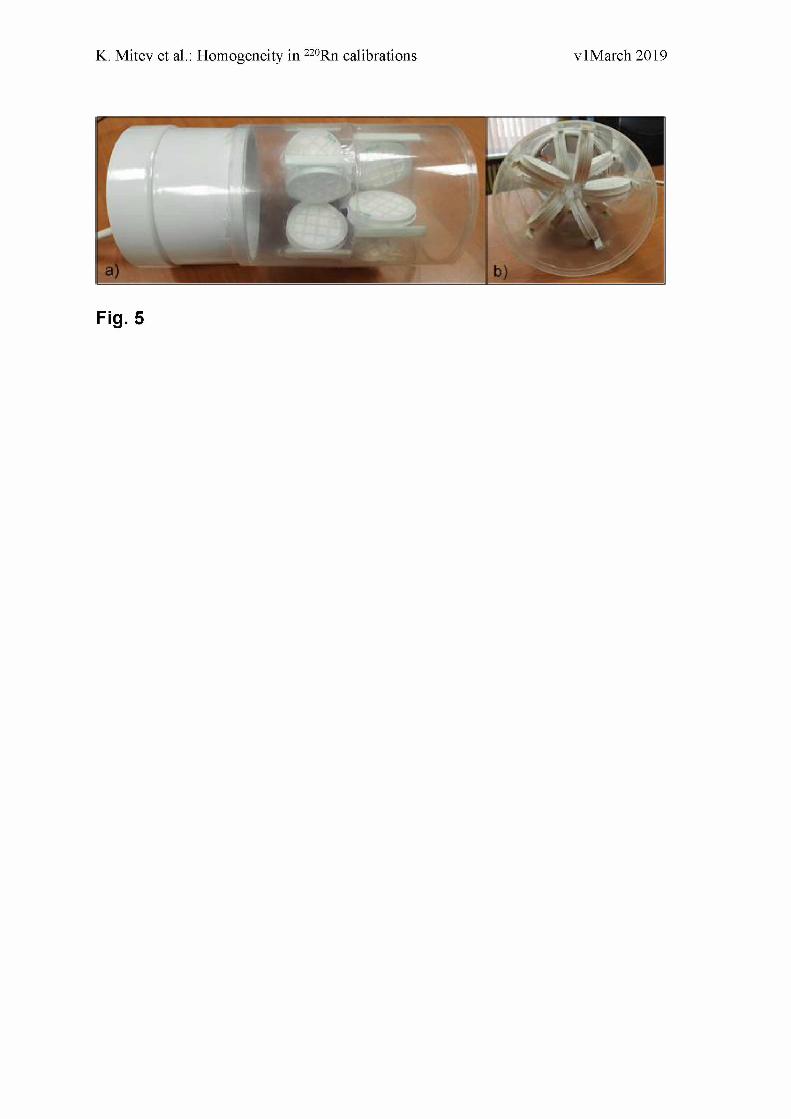
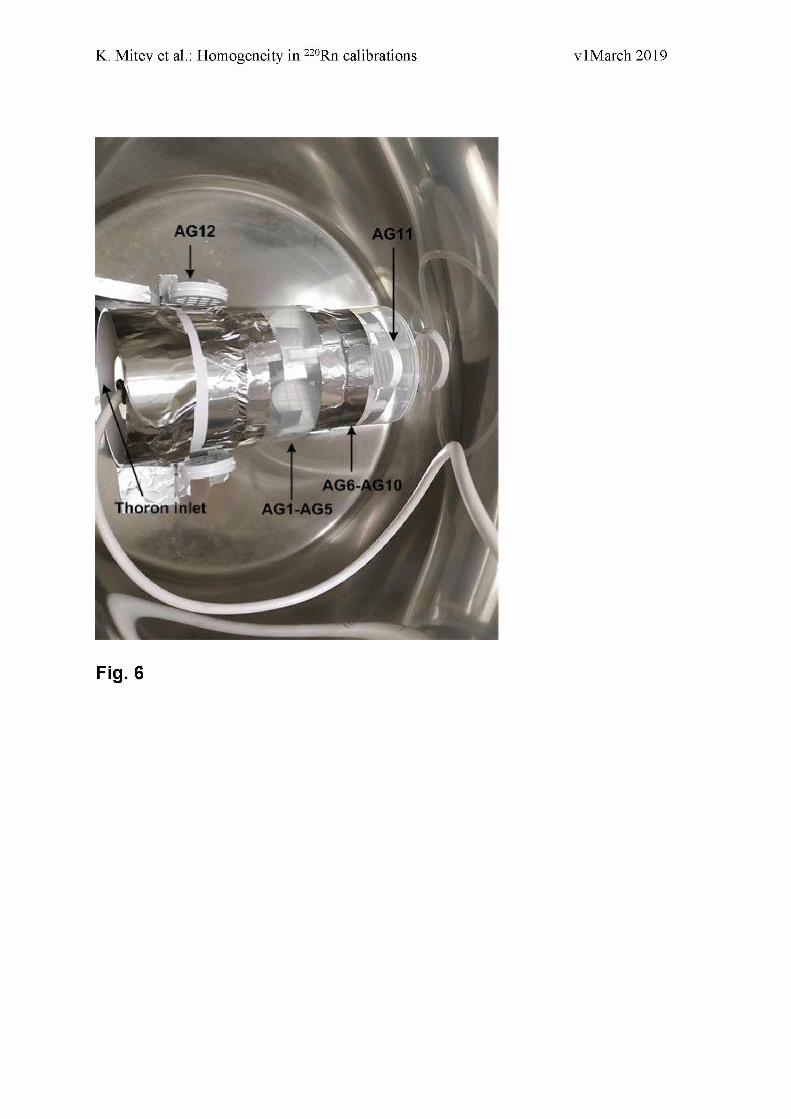
set-up shown schematically in Fig. 4 and on the photo in Fig. 5. The set-up consists of
a powerful fan (gas-flow 2.5 m3/min) mounted to a tube. Inside the tube there are 10
thoron samplers divided in two groups (AG1 to AG5 mounted closer to the fan and
AG6 to AG10 just behind them, see Fig. 4a and Fig 5a). The samplers are positioned
with their filter-sides parallel to the air-flow (see Fig. 4b and Fig 5b). The entire system
is placed in a 50 L calibration container (Fig. 6) with one thoron sampler placed at the
exit of the tube perpendicular to the gas-flow (AG11) and another sampler placed
outside beside the tube (AG12), see Fig. 4a and Fig. 6. The thoron inlet is positioned
right in front of the fan and the container is closed hermetically. The gas-flow of the
fan (150 m3/h) is chosen large enough to guarantee that all the samplers in the tube
(AG1-AG10) are exposed to the same thoron concentration and the volume refresh rate
(50 times per min) is sufficient to assume that AG11 and AG12 are also exposed to the
same concentration. The duration of the 220Rn exposure was 66 h and the thoron activity
concentration in the container was 474(47) kBq/m3. After the exposure, the silica
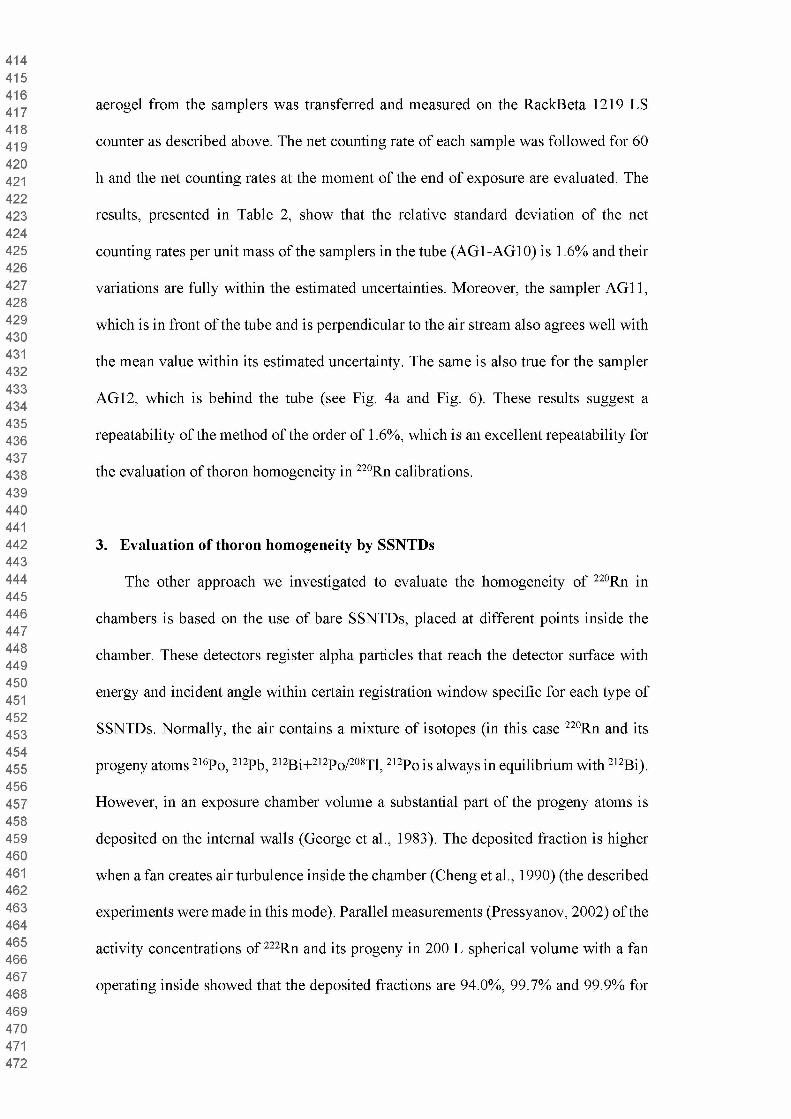
414415416417418419420421422423424425426427428429430431432433434435436437438439440441442443444445446447448449450451452453454455456457458459460461462463464465466467468469470471472
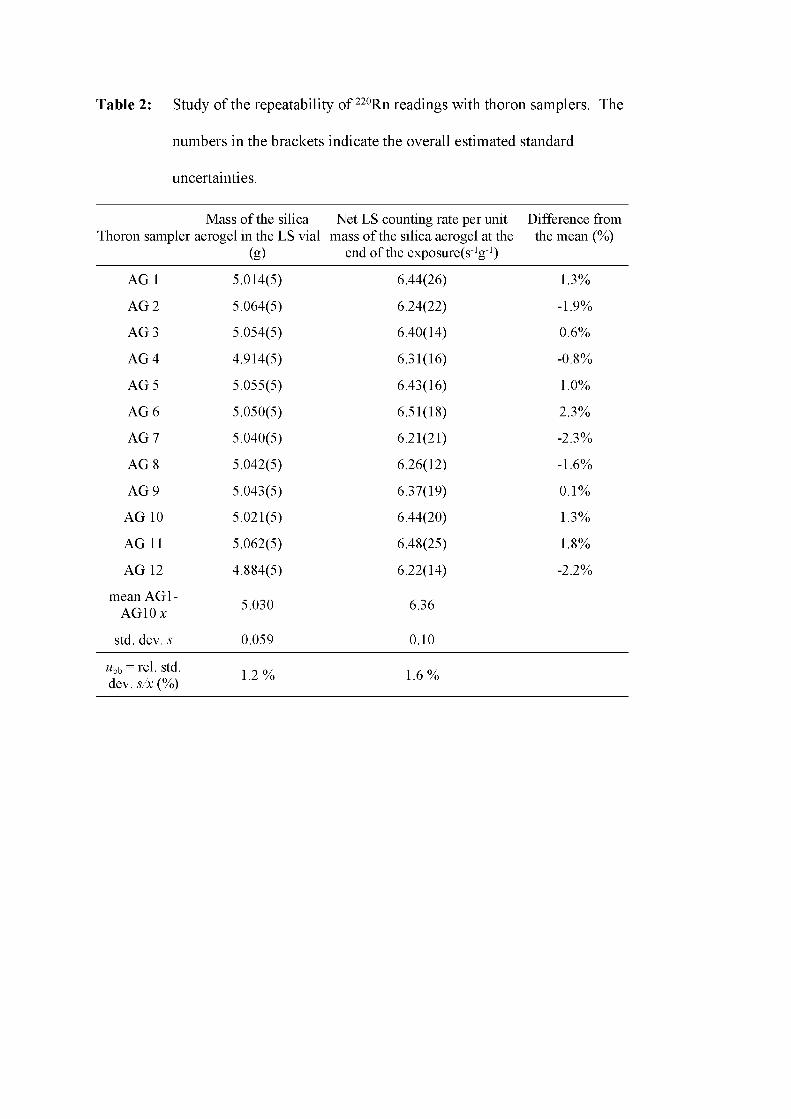
aerogel from the samplers was transferred and measured on the RackBeta 1219 LS
counter as described above. The net counting rate of each sample was followed for 60
h and the net counting rates at the moment of the end of exposure are evaluated. The
results, presented in Table 2, show that the relative standard deviation of the net
counting rates per unit mass of the samplers in the tube (AG1-AG10) is 1.6% and their
variations are fully within the estimated uncertainties. Moreover, the sampler AG11,
which is in front of the tube and is perpendicular to the air stream also agrees well with
the mean value within its estimated uncertainty. The same is also true for the sampler
AG12, which is behind the tube (see Fig. 4a and Fig. 6). These results suggest a
repeatability of the method of the order of 1.6%, which is an excellent repeatability for
the evaluation of thoron homogeneity in 220Rn calibrations.
3. Evaluation of thoron homogeneity by SSNTDs
The other approach we investigated to evaluate the homogeneity of 220Rn in
chambers is based on the use of bare SSNTDs, placed at different points inside the
chamber. These detectors register alpha particles that reach the detector surface with
energy and incident angle within certain registration window specific for each type of
SSNTDs. Normally, the air contains a mixture of isotopes (in this case 220Rn and its
progeny atoms 216Po, 212Pb, 212Bi+212Po/208Tl, 212Po is always in equilibrium with 212Bi).
However, in an exposure chamber volume a substantial part of the progeny atoms is
deposited on the internal walls (George et al., 1983). The deposited fraction is higher
when a fan creates air turbulence inside the chamber (Cheng et al., 1990) (the described
experiments were made in this mode). Parallel measurements (Pressyanov, 2002) of the
activity concentrations of 222Rn and its progeny in 200 L spherical volume with a fan
operating inside showed that the deposited fractions are 94.0%, 99.7% and 99.9% for
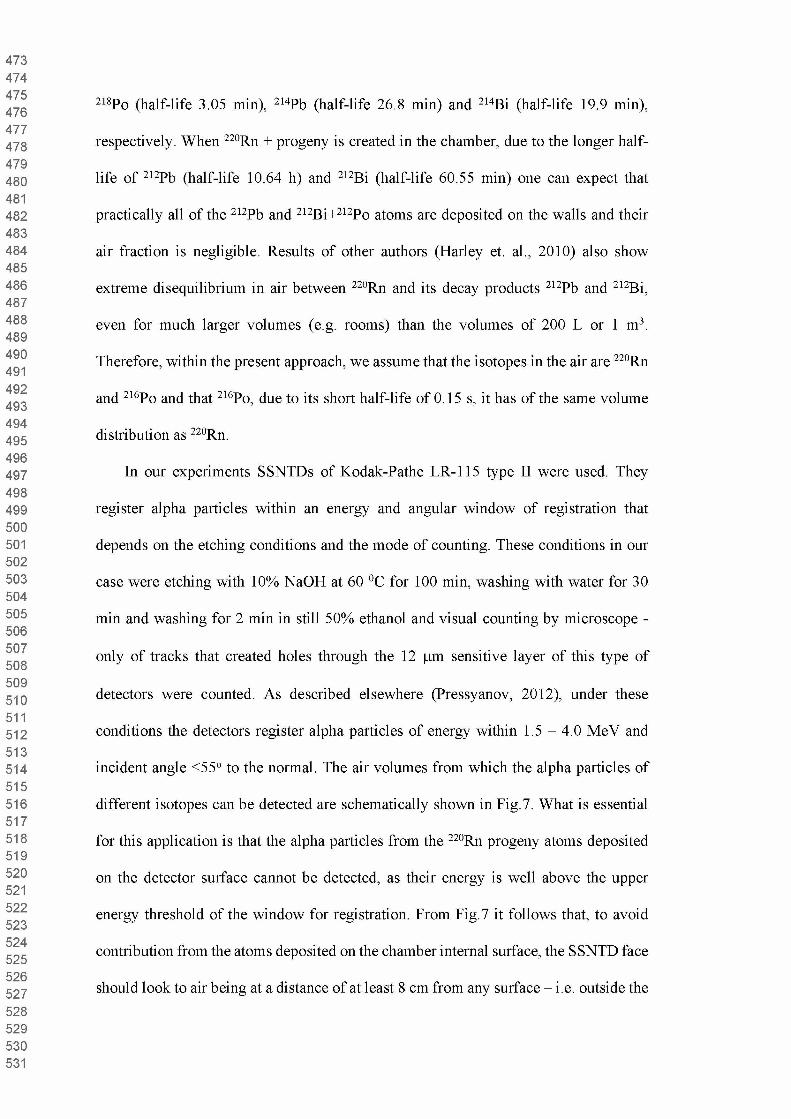
473474475476477478479480481482483484485486487488489490491492493494495496497498499500501502503504505506507508509510511512513514515516517518519520521522523524525526527528529530531
218Po (half-life 3.05 min), 214Pb (half-life 26.8 min) and 214Bi (half-life 19.9 min),
respectively. When 220Rn + progeny is created in the chamber, due to the longer half-
life of 212Pb (half-life 10.64 h) and 212Bi (half-life 60.55 min) one can expect that
practically all of the 212Pb and 212Bi+212Po atoms are deposited on the walls and their
air fraction is negligible. Results of other authors (Harley et. al., 2010) also show
extreme disequilibrium in air between 220Rn and its decay products 212Pb and 212Bi,
even for much larger volumes (e.g. rooms) than the volumes of 200 L or 1 m3.
Therefore, within the present approach, we assume that the isotopes in the air are 220Rn
and 216Po and that 216Po, due to its short half-life of 0.15 s, it has of the same volume
distribution as 220Rn.
In our experiments SSNTDs of Kodak-Pathe LR-115 type II were used. They
register alpha particles within an energy and angular window of registration that
depends on the etching conditions and the mode of counting. These conditions in our
case were etching with 10% NaOH at 60 0C for 100 min, washing with water for 30
min and washing for 2 min in still 50% ethanol and visual counting by microscope -
only of tracks that created holes through the 12 pm sensitive layer of this type of
detectors were counted. As described elsewhere (Pressyanov, 2012), under these
conditions the detectors register alpha particles of energy within 1.5 - 4.0 MeV and
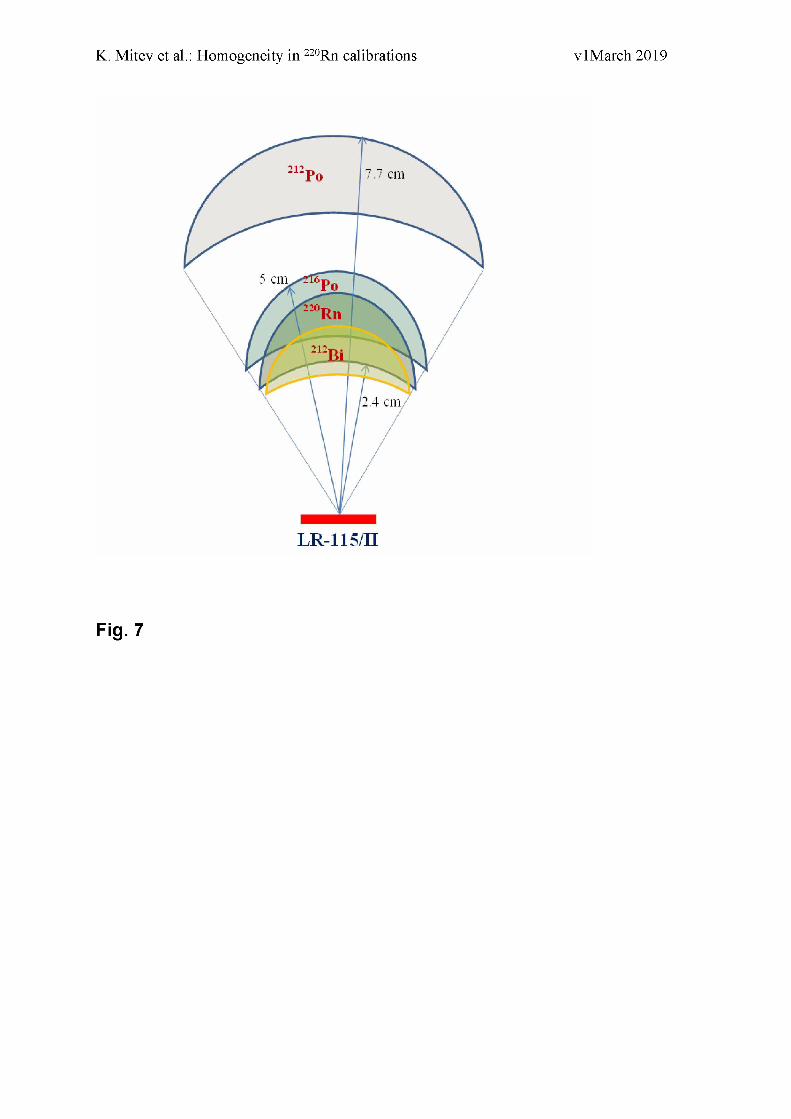
incident angle <55o to the normal. The air volumes from which the alpha particles of
different isotopes can be detected are schematically shown in Fig.7. What is essential
for this application is that the alpha particles from the 220Rn progeny atoms deposited
on the detector surface cannot be detected, as their energy is well above the upper
energy threshold of the window for registration. From Fig.7 it follows that, to avoid
contribution from the atoms deposited on the chamber internal surface, the SSNTD face
should look to air being at a distance of at least 8 cm from any surface - i.e. outside the

532533534535536537538539540541542543544545546547548549550551552553554555556557558559560561562563564565566567568569570571572573574575576577578579580581582583584585586587588589590
range of 212Po alphas. Under these conditions the tracks will be due only to the alpha
particles from the sources in the air (220Rn and 216Po) and the registered tracks will
originate from the isotopes that are in a small volume within a distance of 2.4 - 5.0 cm
from the detector surface (“detection volumes”, see Fig. 7).
Respecting the above rule, Kodak-Pathe LR-115/II detectors were used in two
experiments. The first was in 50 L cylindrical exposure chamber in which 33 pieces of
detectors were placed. The map of the “detection volumes” is shown in Fig. 8. The
exposure was made at the laboratory facility, described elsewhere (Pressyanov et. al.,
2017). The exposure was made at an average 220Rn concentration of 800(50) kBq m-3
for 220 min. During exposure the 220Rn concentrations were followed by a reference
instrument AlphaGUARD PQ2000 PRO (Rn/Tn). The analysis of the results showed
that the distribution of 220Rn in the air is homogeneous within 10%. The variations
between the results can be explained by the detector reading uncertainty and sub
volumes of significantly higher or lower concentrations cannot be identified. Similar
homogeneity (i.e. within 10%) of the empty 50 L AlphaGuard calibration volume with
its own fan turned on is obtained by the LS counting of the silica aerogel (not shown).
4. Application of the methods during the thoron calibration exercise, performed
at BACCARA chamber at IRSN
A thoron calibration exercise was carried out in May 2018 in the framework of the
MetroRADON Euramet project using the IRSN reference radon chamber called
BACCARA. The BACCARA chamber is a 1 m3 stainless steel chamber with a thoron
reference instrument attached to it (Sabot et. al., 2016), which is used to create reference
radon and thoron atmospheres for calibration of radon and thoron measuring devices.
During the thoron calibration exercise, four AlphaGuards and three RAD7 instruments

591592593594595596597598599600601602603604605606607608609610611612613614615616617618619620621622623624625626627628629630631632633634635636637638639640641642643644645646647648649
were placed in the chamber and their thoron measurement performance was checked
against the reference instrument (Fig. 9). The thoron calibration exercise and its results
will be described in detail elsewhere. In order to test the thoron homogeneity in the
BACCARA chamber during the calibration exercise12 silica aerogel thoron samplers
and 22 pieces of SSNTDs were placed at different positions in the chamber (Fig. 9).
The SSNTDs were placed in all parts of BACCARA internal volume, but respecting
the stated above rule for detector position. The thoron exposure duration was 48 h and
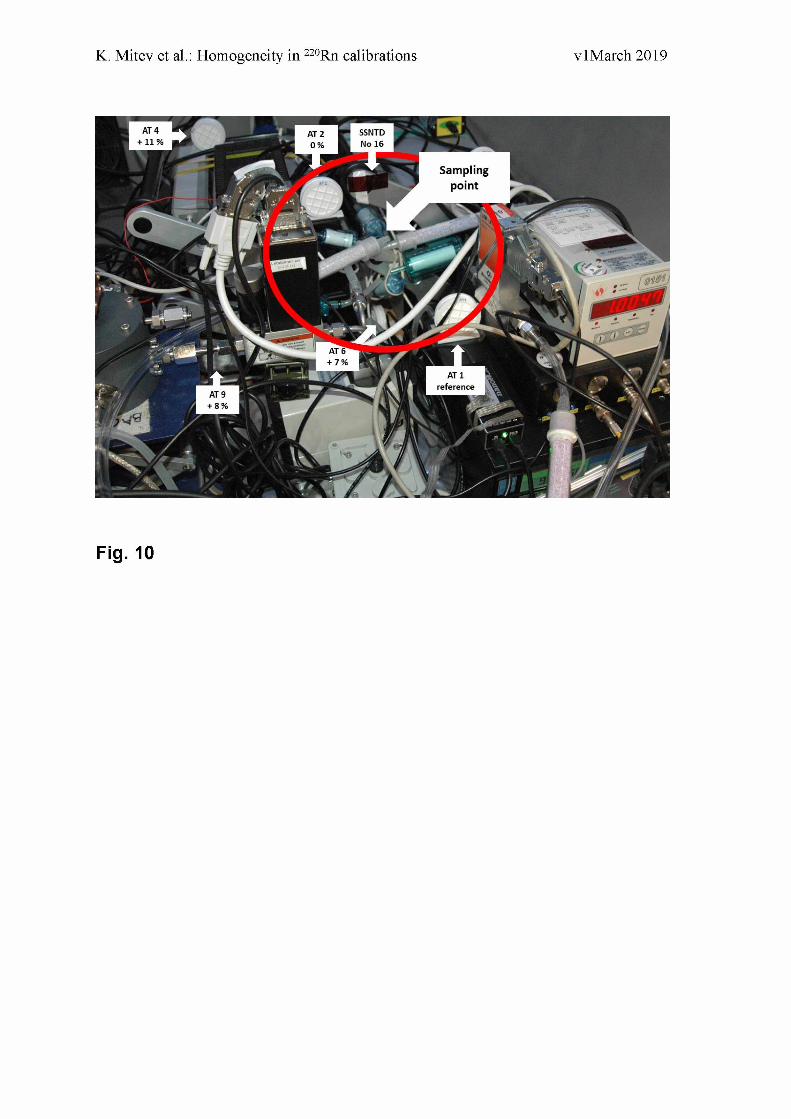
the 220Rn activity concentration in the chamber was 46 kBq/m3. In order to avoid the
effect of possible 220Rn inhomogeneity during the calibration, the inputs of the
instruments sampling systems were put close to each other as much as possible to the
extent of forming a sampling point in the chamber (Fig. 10). The silica aerogel samples
and the SSNTDs were placed around the sampling and all other parts of the chamber,
trying to cover the upper part of the chamber (Figures 11 and 12) as well as the space
around the sampling points and around and between the detectors (Fig. 13).
After the end of the exposure, the silica aerogel samples were treated as described
above. The activity in the samples is measured on a Wallac Guardian LS counter at
LNHB and the results are shown in Table 3. For better visualization, the values obtained
with the different samplers are shown relative to the reference point in Figures 11-13.
The results in Table 3 and Fig. 11 show that the differences between the 220Rn
concentrations in positions “C”, near the center of the chamber, close to the
instruments’ sampling points, do not exceed 10%. But, one can observe higher
differences for positions “W”, far from the center of the chamber, for example the 220Rn
concentrations near the upper wall of the chamber (AT7) are up to 61% higher than
those in the center (Fig. 11). Similarly, the thoron concentration near the walls of the
chamber are higher than those at the reference point (see, for example AT4, AT5, AT11
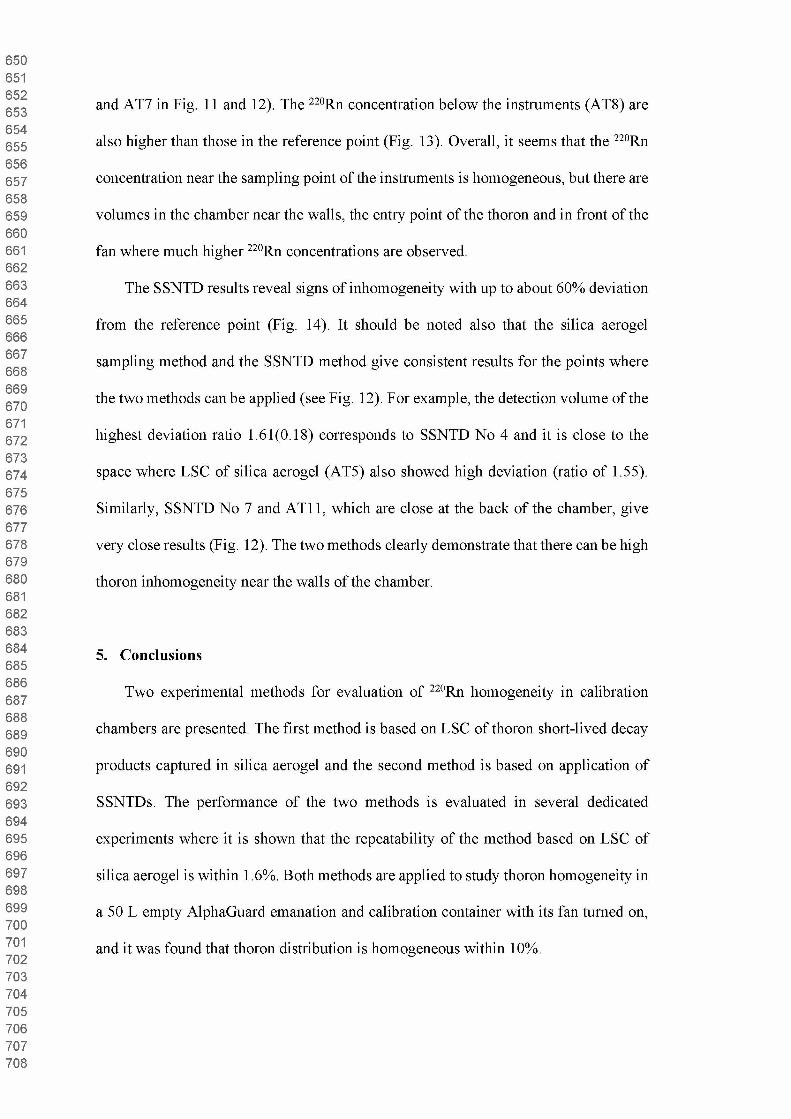
650651652653654655656657658659660661662663664665666667668669670671672673674675676677678679680681682683684685686687688689690691692693694695696697698699700701702703704705706707708
and AT7 in Fig. 11 and 12). The 220Rn concentration below the instruments (AT8) are
also higher than those in the reference point (Fig. 13). Overall, it seems that the 220Rn
concentration near the sampling point of the instruments is homogeneous, but there are
volumes in the chamber near the walls, the entry point of the thoron and in front of the
fan where much higher 220Rn concentrations are observed.
The SSNTD results reveal signs of inhomogeneity with up to about 60% deviation
from the reference point (Fig. 14). It should be noted also that the silica aerogel
sampling method and the SSNTD method give consistent results for the points where
the two methods can be applied (see Fig. 12). For example, the detection volume of the
highest deviation ratio 1.61(0.18) corresponds to SSNTD No 4 and it is close to the
space where LSC of silica aerogel (AT5) also showed high deviation (ratio of 1.55).
Similarly, SSNTD No 7 and AT11, which are close at the back of the chamber, give
very close results (Fig. 12). The two methods clearly demonstrate that there can be high
thoron inhomogeneity near the walls of the chamber.
5. Conclusions
Two experimental methods for evaluation of 220Rn homogeneity in calibration
chambers are presented. The first method is based on LSC of thoron short-lived decay
products captured in silica aerogel and the second method is based on application of
SSNTDs. The performance of the two methods is evaluated in several dedicated
experiments where it is shown that the repeatability of the method based on LSC of
silica aerogel is within 1.6%. Both methods are applied to study thoron homogeneity in
a 50 L empty AlphaGuard emanation and calibration container with its fan turned on,
and it was found that thoron distribution is homogeneous within 10%.
709710711712713714715716717718719720721722723724725726727728729730731732733734735736737738739740741742743744745746747748749750751752753754755756757758759760761762763764765766767
Both methods are applied successfully to test the thoron homogeneity in the
BACCARA chamber during the thoron calibration exercise that was carried out at
IRSN, France in the framework of the MetroRADON Euramet EMPIR project. The
results show that, at the centre of the chamber, where the inputs of the instruments
sampling systems were put close to each other, the thoron inhomogeneity is less than
10%. However, regions of higher thoron concentrations are clearly identified near the
walls and the upper part of BACCARA, with 220Rn concentrations being up to 60%
higher compared to the concentration at the reference point. These results highlight the
importance of the control and assessment of thoron homogeneity in thoron calibrations
and in the case when radon monitors are checked for thoron influence. The assessment
of 220Rn homogeneity will be particularly important in the case of checking passive
radon monitors for thoron influence. That is because, contrary to the case of active
monitors, there are no inputs of the passive detectors, so they cannot be put together
near a common sampling point in the calibration chamber. Thus, an experimental
method for checking thoron homogeneity as those described in this work will be highly
necessary.
Acknowledgements
This work is supported by the European Metrology Programme for Innovation
and Research (EMPIR), JRP-Contract 16ENV10 MetroRADON (www.euramet.org).
The EMPIR initiative is co-funded by the European Union’s Horizon 2020 research
and innovation programme and the EMPIR Participating States.

768769770771772773774775776777778779780781782783784785786787788789790791792793794795796797798799800801802803804805806807808809810811812813814815816817818819820821822823824825826
References
Cheng, Y. S., Su, Y. F., Chen, B. T., 1990. Plate-out rates of radon progeny and particles
in a spherical chamber. Proc. XXIX Hanford Symposium on Health and the
Environment, pp. 65-79.
George, A. C., Knutson, E. O., Tu, K. W., 1983. Radon daughter plateout - I
measurements. Health Phys. 45, 439-444.
Harley, N., Chitaporn, P., Medora, R., Merrill, R., 2010. Measurement of the indoor
and outdoor 220Rn (thoron) equilibrium factor: Application to lung dose. Radiat.
Prot. Dosimetry 141, 357-362.
He, Z., Xiao, D., Lv, L., Zhou, Q., Wu, X., Shan, J., 2017. Stable control of thoron
progeny concentration in a thoron chamber for calibration of active sampling
monitors, Radiation Measurements. 102, 27-33.
Hosoda, M., Kudo, K., Iwaoka, K., Yamada, R., Suzuki, T., Tamakuma, Y., Tokonami,
S., 2017. Characteristic of thoron (220Rn) in environment, Appl. Radiat. Isot. 120,
7-10.
Ishimori,Y., Lange, K., Martin. P., Mayya, Y.S., Phaneuf, M., 2013. Measurement and
calculation of radon releases from NORM residues, IAEA technical reports series
No. 474.
Kobayashi, Y., Tokonami, S., Takahashi, H., Zhuo, W., Yonehara, H., 2005.
International Congress Series, 1276, 281-282.
McLaughlin, J., 2010. An overview of thoron and its progeny in the indoor
environment, Radiat. Prot. Dosimetry. 141, 316-321.
Michielsen, N., Bondiguel, S., 2015. The influence of thoron on instruments measuring
radon activity concentration, Radiat. Prot. Dosimetry. 141, 289-292.

827828829830831832833834835836837838839840841842843844845846847848849850851852853854855856857858859860861862863864865866867868869870871872873874875876877878879880881882883884885
Pressyanov, D., 2002. Evaluation of the radiological hazards in houses and working
places by integrated measurements of the individual 222Rn progeny in air. Research
contract between the Ghent University and Sofia University “St. Kliment
Ohridski” (DOB/HB/RS/02), final report.
Pressyanov. D, 2012. Radon and Radon Progeny: Methodological Points and Case
Studies. Lambert Academic Publishing GmbH & Co. KG, Saarbruecken,
Germany. ISBN: 978-3-8484-8604-5
Pressyanov D., Mitev K., Georgiev S., Dimitrova I., Kolev J. (2017) Laboratory facility
to create reference radon + thoron atmosphere under dynamic exposure conditions.
J. Env. Radioact.166, 181-187.
Rottger, A., Honig, A., Arnold, D., 2009. The German thoron progeny chamber -
Concept and application, Appl. Radiat. Isot. 67, 839-842.
Rottger, A., Honig, A., Dersch, R., Ott, O., Arnold, D., 2010. A primary standard for
activity concentration of 220Rn (thoron) in air, Appl. Radiat. Isot. 68, 1292-1296.
Rottger, A., Honig, A., Linzmaier, D., 2014. Calibration of commercial radon and
thoron monitors at stable activity concentrations, Appl. Radiat. Isot. 87, 44-47.
Sabot, B., Pierre, S., Michielsen, N., Bondiguel, S., Cassette, P., 2016. A new thoron
atmosphere reference measurement system, Appl. Radiat. Isot. 109, 205-209.

886887888889890891892893894895896897898899900901902903904905906907908909910911912913914915916917918919920921922923924925926927928929930931932933934935936937938939940941942943944
Figure captions:
Fig. 1. A photograph of a thoron sampler. a) - Empty sampler, with bottom air filter,
ready to be filled with silica aerogel and the top end cap with top air filter
mounted; b) the sampler filled with silica aerogel; c) closed sampler ready to
be placed in thoron chamber.
Fig. 2. Scanning electron microscope images of the Millipore membrane filters used
for the samplers. a) and b) -surface view, c) and d) - cross-sectional view.
Fig. 3. High performance LS glass vials (20 ml) filled with silica aerogel and Ultima
Gold LLT LS cocktail. The photograph is taken after the vials had been placed
for 10 min in a ultrasonic bath. When filled with LSC cocktail, the aerogel
becomes translucent.
Fig. 4. Schematic view of the geometry used to test the repeatability of the silica
aerogel method. a) Schematic view of the exposure vessel, the 220Rn inlet, the
fan and the tube with the thoron samplers; b) Illustration of the arrangement
of the thoron samplers in the tube.
Fig. 5. Photographs of the experimental arrangement used to test the repeatability of
the silica aerogel method: the fan, the tube and the thoron samplers can be
seen in the picture.
Fig. 6. Photograph of the exposure set-up used to test the repeatability of the silica
aerogel method. The fan and the tube with the samplers are placed in a 50 L
vessel. Additional samplers are placed in front and near the tube.
Fig. 7. Air-volumes from which alpha particles can be detected by LR-115/II
SSNTD. The volumes are shaped taking into account the fact that energy
window for track registration get narrow when the incident angle is increasing.

9459469479489499509519529539549559569579589599609619629639649659669679689699709719729739749759769779789799809819829839849859869879889899909919929939949959969979989991000100110021003
Fig. 8. The picture shows the spots in the chamber volume from where activity can
be detected by the placed in a grid Kodak Pathe LR-115/II SSNTD
(“detection” volumes).
Fig. 9. A photograph of the BACCARA chamber showing the experimental set-up
used in the thoron calibration exercise. The thoron inlet nozzle and the fan
used to homogenize the air in the chamber are indicated as well as the
positions of some of the thoron samplers and the SSNTDs.
Fig. 10. Photograph showing the sampling point, where the inlets of the thoron
measuring instruments are located. There are thoron samplers (AT1, AT2 and
AT6) and a SSNTD (No 16) around the sampling point. The percent in the
boxes with the sampler number indicate the sampler’s readings relative
deviation with respect to the reference (AT1).
Fig. 11. Position and relative deviation with respect to the reference position of the
readings of the thoron samplers in the upper half of the BACCARA.
Fig. 12. Position and relative deviation with respect to the reference position of the
readings of the thoron samplers in the upper half of the BACCARA and near
the sampling point.
Fig. 13. Position and relative deviation with respect to the reference position of the
readings of the thoron samplers located below and between the 220Rn
measuring instruments.
Fig. 14. The ratio of the SSNTD signal (net track density) to the signal of the detector
that is at closest distance to the reference point (detector No 16).

K. Mitev et al.: Homogeneity in 220Rn calibrations vlMarch 2019
Fig. 1
K. Mitev et al.: Homogeneity in 220Rn calibrations vlMarch 2019
Fig. 2
K. Mitev et al.: Homogeneity in 220Rn calibrations vlMarch 2019
Fig. 3
K. Mitev et al.: Homogeneity in 220Rn calibrations vlMarch 2019
Fig. 4
K. Mitev et al.: Homogeneity in 220Rn calibrations vlMarch 2019
Fig. 5
K. Mitev et al.: Homogeneity in 220Rn calibrations vlMarch 2019
Fig. 6
K. Mitev et al.: Homogeneity in 220Rn calibrations vlMarch 2019
Fig. 7

K. Mitev et al.: Homogeneity in 220Rn calibrations vlMarch 2019
Fig. 8

K. Mitev et al.: Homogeneity in 220Rn calibrations vlMarch 2019
Fig. 9
K. Mitev et al.: Homogeneity in 220Rn calibrations vlMarch 2019
Fig. 10

K. Mitev et al.: Homogeneity in 220Rn calibrations vlMarch 2019
Fig. 11

K. Mitev et al.: Homogeneity in 220Rn calibrations vlMarch 2019
Fig. 12

K. Mitev et al.: Homogeneity in 220Rn calibrations vlMarch 2019
Fig. 13.

K. Mitev et al.: Homogeneity in 220Rn calibrations vlMarch 2019
Fig. 14
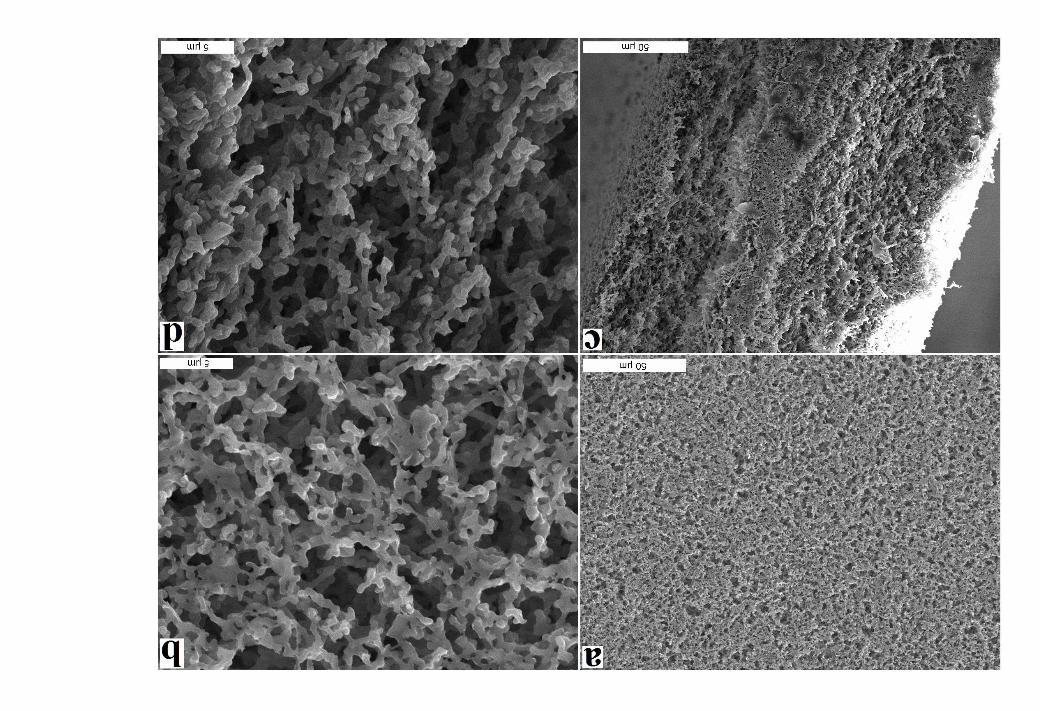

Table 1: Net counting rates per unit mass of thoron samplers with different heights
exposed together to 220Rn in air.
Sampler L, cm V, cm3 Mass of the silica aerogel in the samplers, g
Net LS counting rate per unit mass of the silica
aerogel, s-1g-1
S1 1.0 15.21 5.421(5) 10.290(58)
S2 1.0 15.21 5.202(5) 10.415(60)
M1 1.5 22.81 8.649(5) 9.119(56)
M2 1.5 22.81 8.472(5) 9.054(58)
L1 2.0 30.41 11.932(5) 7.761(56)
L2 2.0 30.41 11.920(5) 7.714(55)
numbers in the brackets indicate the overall estimated standard
uncertainties.
Table 2: Study of the repeatability of 220Rn readings with thoron samplers. The
Mass of the silicaThoron sampler aerogel in the LS vial
(g)
Net LS counting rate per unit mass of the silica aerogel at the
end of the exposure(s-1g-1)
Difference from the mean (%)
AG 1 5.014(5) 6.44(26) 1.3%
AG 2 5.064(5) 6.24(22) -1.9%
AG 3 5.054(5) 6.40(14) 0.6%
AG 4 4.914(5) 6.31(16) -0.8%
AG 5 5.055(5) 6.43(16) 1.0%
AG 6 5.050(5) 6.51(18) 2.3%
AG 7 5.040(5) 6.21(21) -2.3%
AG 8 5.042(5) 6.26(12) -1.6%
AG 9 5.043(5) 6.37(19) 0.1%
AG 10 5.021(5) 6.44(20) 1.3%
AG 11 5.062(5) 6.48(25) 1.8%
AG 12 4.884(5) 6.22(14) -2.2%
mean AG1- AG10 x 5.030 6.36
std. dev. 5 0.059 0.10
ubb = rel. std. dev. s/x (%) 1.2 % 1.6 %

exercise performed in the BACCARRA chamber. The numbers in the
brackets indicate the overall estimated standard uncertainties.
Table 3: Homogeneity study with thoron samplers during the thoron calibration
Sample
Decaycorrected net counting rate,
cpm
Mass of the silica aerogel in the LS vial
(g)
Specific net LS counting rate at the
end of the exposure(s-1g-1)
Center (C) / Walls (W) Normalized to
AT1
AT1 108.2(17) 5.346(5) 20.24(32) C 1.00
AT2 111.9(18) 5.546(5) 20.17(33) C 1.00
AT3 139.1(20) 5.444(5) 25.56(37) W 1.26
AT4 122.6(20) 5.471(5) 22.41(37) C 1.11
AT5 169.6(24) 5.402(5) 31.39(44) W 1.55
AT6 116.2(22) 5.361(5) 21.68(41) C 1.07
AT7 179.2(26) 5.503(5) 32.57(48) W 1.61
AT8 119.6(24) 5.550(5) 21.54(44) W 1.06
AT9 119.5(26) 5.454(5) 21.91(47) C 1.08
AT10 127.7(27) 5.550(5) 23.00(50) C 1.14
AT11 125.8(29) 5.598(5) 22.47(51) W 1.11

Déclaration of interests
□ The authors declare that they have no known competing financial interests or personal relationships that could have appeared to influence the work reported in this paper.
□The authors declare the following financial interests/personal relationships which may be considered as potential competing interests:
Conceptualization: K. Mitev, P. Cassette, D. Pressyanov;
Methodology: K. Mitev, S. Georgiev, D. Pressyanov;
Validation: Ch. Dutsov, N. Michielsen, B. Sabot, K. Mitev, D. Pressyanov;
Formai analysis: S. Georgiev, K. Mitev, D. Pressyanov;
Writing: - Original Draft: K. Mitev, D. Pressyanov;
Writing: - Review & Editing: all authors
Funding acquisition: - K. Mitev and D. Pressyanov.