Supplementary Figure S1 - JCI
8
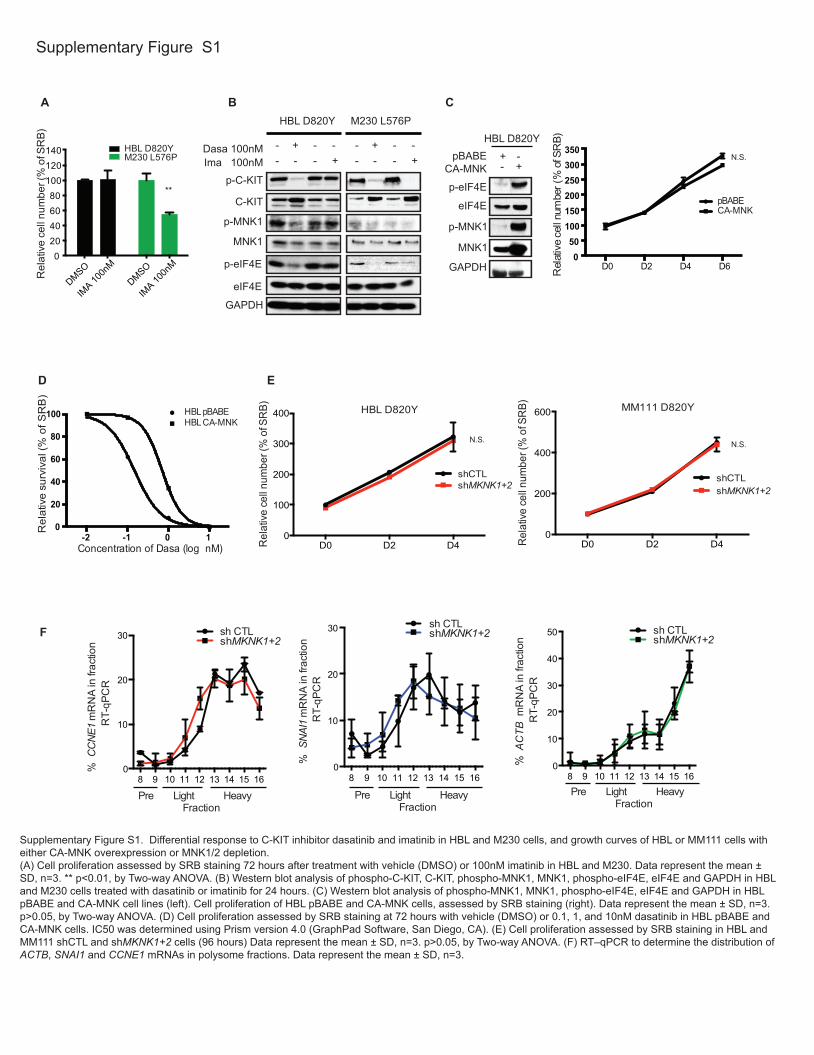
Supplementary Figure S1 A p-C-KIT Dasa 100nM C-KIT p-eIF4E eIF4E MNK1 GAPDH p-MNK1 Ima 100nM - - + - - - - + M230 L576P HBL D820Y B p-eIF4E eIF4E MNK1 p-MNK1 GAPDH HBL D820Y pBABE + - CA-MNK - + D0 D2 D4 D6 0 50 100 150 200 250 300 350 Relative cell number (% of SRB) pBABE CA-MNK C D -2 -1 0 1 0 20 40 60 80 100 Concentration of Dasa (log nM) Relative survival (% of SRB) HBL CA-MNK HBL pBABE - - + - - - - + D0 D2 D4 0 100 200 300 400 HBL D820Y Relative cell number (% of SRB) shCTL shMKNK1+2 D0 D2 D4 0 200 400 600 Relative cell number (% of SRB) shCTL MM111 D820Y shMKNK1+2 E DMSO IMA 100nM DMSO IMA 100nM 0 20 40 60 80 100 120 140 Relative cell number (% of SRB) HBL D820Y M230 L576P ** F 8 9 10 11 12 13 14 15 16 0 10 20 30 % CCNE1 mRNA in fraction RT-qPCR sh CTL shMKNK1+2 Fraction Pre Light Heavy Fraction Pre Light Heavy 8 9 10 11 12 13 14 15 16 0 10 20 30 40 50 % ACTB mRNA in fraction RT-qPCR sh CTL shMKNK1+2 8 9 10 11 12 13 14 15 16 0 10 20 30 % SNAI1 mRNA in fraction RT-qPCR sh CTL shMKNK1+2 Fraction Pre Light Heavy N.S. N.S. N.S. Supplementary Figure S1. Differential response to C-KIT inhibitor dasatinib and imatinib in HBL and M230 cells, and growth curves of HBL or MM111 cells with either CA-MNK overexpression or MNK1/2 depletion. (A) Cell proliferation assessed by SRB staining 72 hours after treatment with vehicle (DMSO) or 100nM imatinib in HBL and M230. Data represent the mean ± SD, n=3. ** p<0.01, by Two-way ANOVA. (B) Western blot analysis of phospho-C-KIT, C-KIT, phospho-MNK1, MNK1, phospho-eIF4E, eIF4E and GAPDH in HBL and M230 cells treated with dasatinib or imatinib for 24 hours. (C) Western blot analysis of phospho-MNK1, MNK1, phospho-eIF4E, eIF4E and GAPDH in HBL pBABE and CA-MNK cell lines (left). Cell proliferation of HBL pBABE and CA-MNK cells, assessed by SRB staining (right). Data represent the mean ± SD, n=3. p>0.05, by Two-way ANOVA. (D) Cell proliferation assessed by SRB staining at 72 hours with vehicle (DMSO) or 0.1, 1, and 10nM dasatinib in HBL pBABE and CA-MNK cells. IC50 was determined using Prism version 4.0 (GraphPad Software, San Diego, CA). (E) Cell proliferation assessed by SRB staining in HBL and MM111 shCTL and shMKNK1+2 cells (96 hours) Data represent the mean ± SD, n=3. p>0.05, by Two-way ANOVA. (F) RT–qPCR to determine the distribution of ACTB, SNAI1 and CCNE1 mRNAs in polysome fractions. Data represent the mean ± SD, n=3.
-
Upload
khangminh22 -
Category
Documents
-
view
4 -
download
0
Transcript of Supplementary Figure S1 - JCI
Supplementary Figure S1
A
p-C-KIT
Dasa 100nM
C-KIT
p-eIF4E
eIF4E
MNK1
GAPDH
p-MNK1
Ima 100nM--
+ - -- - +
M230 L576PHBL D820Y
B
p-eIF4E
eIF4E
MNK1
p-MNK1
GAPDH
HBL D820Y pBABE + -
CA-MNK - +
D0 D2 D4 D60
50100150200250300350
Rel
ativ
e ce
ll nu
mbe
r (%
of S
RB)
pBABECA-MNK
C
D
-2 -1 0 10
20
40
60
80
100
Concentration of Dasa (log nM)
Rel
ativ
e su
rviv
al (%
of S
RB
)
HBL CA-MNKHBL pBABE
--
+ - -- - +
D0 D2 D40
100
200
300
400 HBL D820Y
Rel
ativ
e ce
ll nu
mbe
r (%
of S
RB)
shCTLshMKNK1+2
D0 D2 D40
200
400
600
Rel
ativ
e ce
ll num
ber (
% o
f SR
B)
shCTL
MM111 D820Y
shMKNK1+2
E
DMSO
IMA 10
0nM
DMSO
IMA 10
0nM
020406080
100120140
Rel
ativ
e ce
ll nu
mbe
r (%
of S
RB)
HBL D820YM230 L576P
**
F
8 9 10 11 12 13 14 15 160
10
20
30
%
C
CN
E1 m
RN
A in
frac
tion
RT-
qPC
R
sh CTLshMKNK1+2
FractionPre Light Heavy
FractionPre Light Heavy
8 9 10 11 12 13 14 15 160
10
20
30
40
50
% A
CTB
mR
NA
in fr
actio
nR
T-qP
CR
sh CTLshMKNK1+2
8 9 10 11 12 13 14 15 160
10
20
30
% S
NAI
1 m
RN
A in
frac
tion
RT-
qPC
R
sh CTLshMKNK1+2
FractionPre Light Heavy
N.S.
N.S. N.S.
Supplementary Figure S1. Differential response to C-KIT inhibitor dasatinib and imatinib in HBL and M230 cells, and growth curves of HBL or MM111 cells with either CA-MNK overexpression or MNK1/2 depletion. (A) Cell proliferation assessed by SRB staining 72 hours after treatment with vehicle (DMSO) or 100nM imatinib in HBL and M230. Data represent the mean ± SD, n=3. ** p<0.01, by Two-way ANOVA. (B) Western blot analysis of phospho-C-KIT, C-KIT, phospho-MNK1, MNK1, phospho-eIF4E, eIF4E and GAPDH in HBL and M230 cells treated with dasatinib or imatinib for 24 hours. (C) Western blot analysis of phospho-MNK1, MNK1, phospho-eIF4E, eIF4E and GAPDH in HBL pBABE and CA-MNK cell lines (left). Cell proliferation of HBL pBABE and CA-MNK cells, assessed by SRB staining (right). Data represent the mean ± SD, n=3. p>0.05, by Two-way ANOVA. (D) Cell proliferation assessed by SRB staining at 72 hours with vehicle (DMSO) or 0.1, 1, and 10nM dasatinib in HBL pBABE and CA-MNK cells. IC50 was determined using Prism version 4.0 (GraphPad Software, San Diego, CA). (E) Cell proliferation assessed by SRB staining in HBL and MM111 shCTL and shMKNK1+2 cells (96 hours) Data represent the mean ± SD, n=3. p>0.05, by Two-way ANOVA. (F) RT–qPCR to determine the distribution of ACTB, SNAI1 and CCNE1 mRNAs in polysome fractions. Data represent the mean ± SD, n=3.
Supplementary Figure S2
MN
K1
0 1
2 3
C-KIT Wild Type C-KIT Aberrations0
2
4
6
8
10
12
MN
K1 IH
C s
tain
ing
(cas
es)
negative(0-1)positive(2-3)
N=14 N=10
Chi square= 5.662p= 0.0173
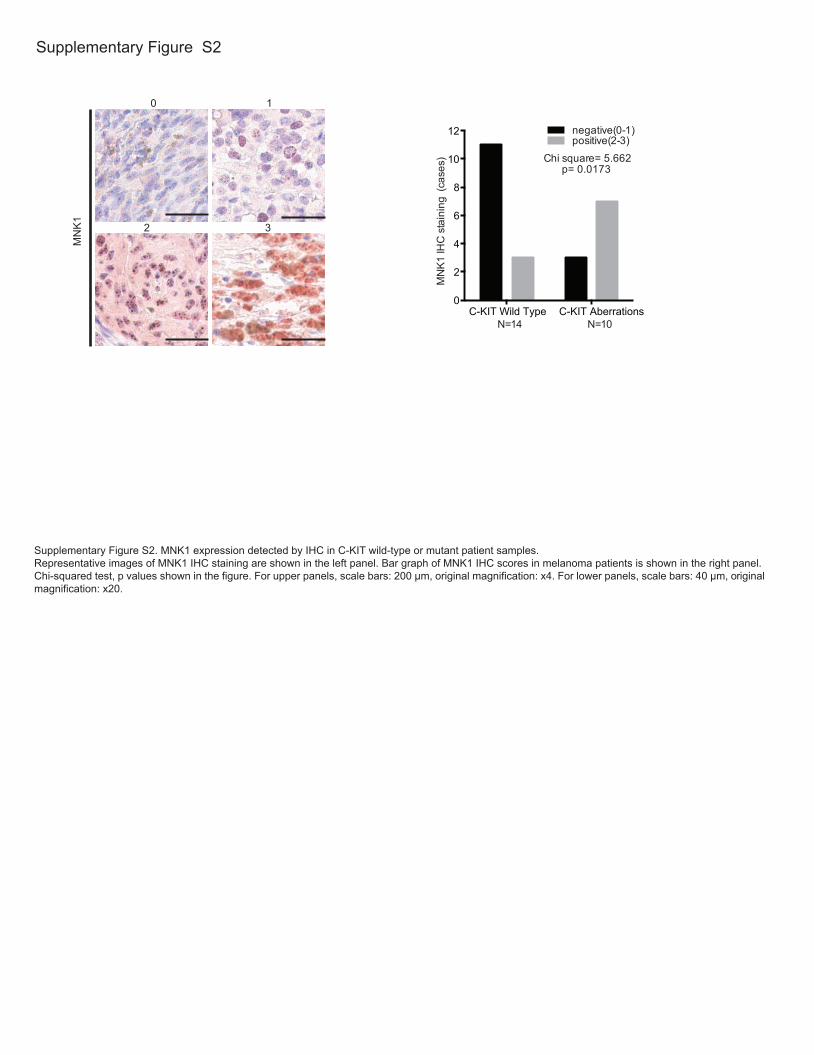
Supplementary Figure S2. MNK1 expression detected by IHC in C-KIT wild-type or mutant patient samples.Representative images of MNK1 IHC staining are shown in the left panel. Bar graph of MNK1 IHC scores in melanoma patients is shown in the right panel. Chi-squared test, p values shown in the figure. For upper panels, scale bars: 200 µm, original magnification: x4. For lower panels, scale bars: 40 µm, original magnification: x20.
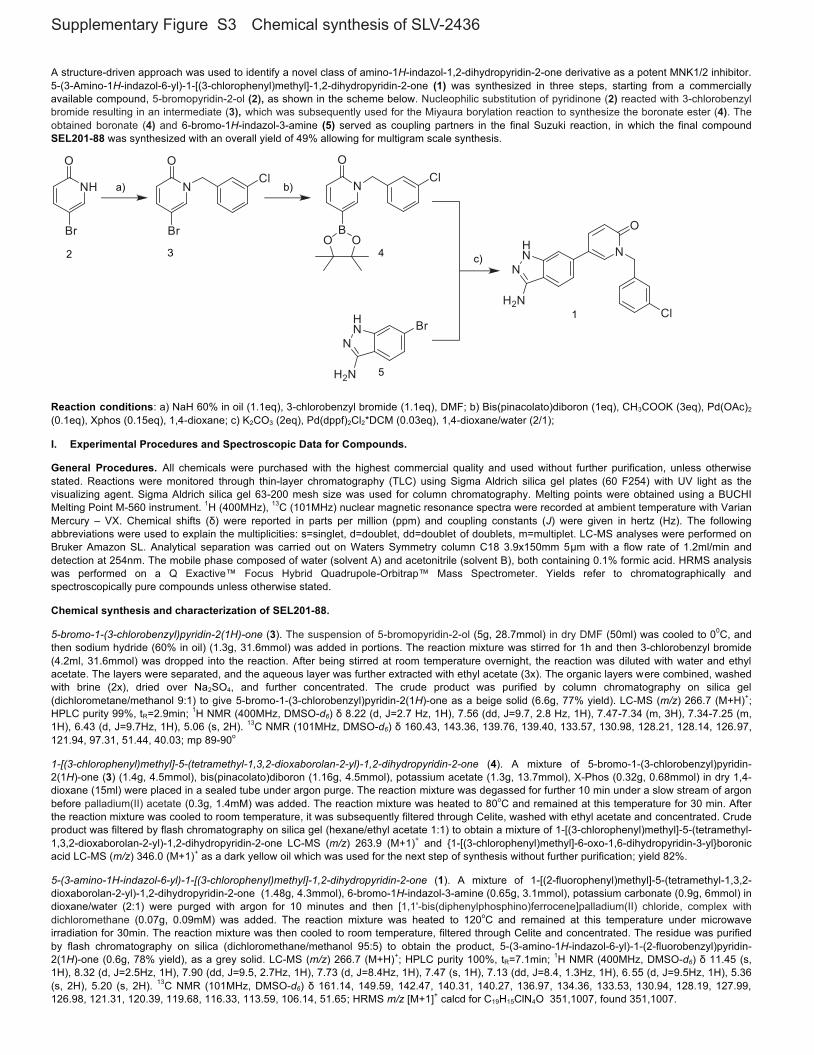
A structure-driven approach was used to identify a novel class of amino-1H-indazol-1,2-dihydropyridin-2-one derivative as a potent MNK1/2 inhibitor. 5-(3-Amino-1H-indazol-6-yl)-1-[(3-chlorophenyl)methyl]-1,2-dihydropyridin-2-one (1) was synthesized in three steps, starting from a commercially available compound, 5-bromopyridin-2-ol (2), as shown in the scheme below. Nucleophilic substitution of pyridinone (2) reacted with 3-chlorobenzyl bromide resulting in an intermediate (3), which was subsequently used for the Miyaura borylation reaction to synthesize the boronate ester (4). The obtained boronate (4) and 6-bromo-1H-indazol-3-amine (5) served as coupling partners in the final Suzuki reaction, in which the final compound SEL201-88 was synthesized with an overall yield of 49% allowing for multigram scale synthesis.
Reaction conditions: a) NaH 60% in oil (1.1eq), 3-chlorobenzyl bromide (1.1eq), DMF; b) Bis(pinacolato)diboron (1eq), CH3COOK (3eq), Pd(OAc)2 (0.1eq), Xphos (0.15eq), 1,4-dioxane; c) K2CO3 (2eq), Pd(dppf)2Cl2*DCM (0.03eq), 1,4-dioxane/water (2/1);
I. Experimental Procedures and Spectroscopic Data for Compounds.
General Procedures. All chemicals were purchased with the highest commercial quality and used without further purification, unless otherwise stated. Reactions were monitored through thin-layer chromatography (TLC) using Sigma Aldrich silica gel plates (60 F254) with UV light as the visualizing agent. Sigma Aldrich silica gel 63-200 mesh size was used for column chromatography. Melting points were obtained using a BUCHI Melting Point M-560 instrument. 1H (400MHz), 13C (101MHz) nuclear magnetic resonance spectra were recorded at ambient temperature with Varian Mercury – VX. Chemical shifts ( ) were reported in parts per million (ppm) and coupling constants (J) were given in hertz (Hz). The following abbreviations were used to explain the multiplicities: s=singlet, d=doublet, dd=doublet of doublets, m=multiplet. LC-MS analyses were performed on Bruker Amazon SL. Analytical separation was carried out on Waters Symmetry column C18 3.9x150mm 5µm with a flow rate of 1.2ml/min and detection at 254nm. The mobile phase composed of water (solvent A) and acetonitrile (solvent B), both containing 0.1% formic acid. HRMS analysis was performed on a Q Exactive™ Focus Hybrid Quadrupole-Orbitrap™ Mass Spectrometer. Yields refer to chromatographically and spectroscopically pure compounds unless otherwise stated.
Chemical synthesis and characterization of SEL201-88.
5-bromo-1-(3-chlorobenzyl)pyridin-2(1H)-one (3). The suspension of 5-bromopyridin-2-ol (5g, 28.7mmol) in dry DMF (50ml) was cooled to 00C, and then sodium hydride (60% in oil) (1.3g, 31.6mmol) was added in portions. The reaction mixture was stirred for 1h and then 3-chlorobenzyl bromide (4.2ml, 31.6mmol) was dropped into the reaction. After being stirred at room temperature overnight, the reaction was diluted with water and ethyl acetate. The layers were separated, and the aqueous layer was further extracted with ethyl acetate (3x). The organic layers were combined, washed with brine (2x), dried over Na2SO4, and further concentrated. The crude product was purified by column chromatography on silica gel (dichlorometane/methanol 9:1) to give 5-bromo-1-(3-chlorobenzyl)pyridin-2(1H)-one as a beige solid (6.6g, 77% yield). LC-MS (m/z) 266.7 (M+H)+; HPLC purity 99%, tR=2.9min; 1H NMR (400MHz, DMSO-d6) 8.22 (d, J=2.7 Hz, 1H), 7.56 (dd, J=9.7, 2.8 Hz, 1H), 7.47-7.34 (m, 3H), 7.34-7.25 (m, 1H), 6.43 (d, J=9.7Hz, 1H), 5.06 (s, 2H). 13C NMR (101MHz, DMSO-d6) 160.43, 143.36, 139.76, 139.40, 133.57, 130.98, 128.21, 128.14, 126.97, 121.94, 97.31, 51.44, 40.03; mp 89-90o
1-[(3-chlorophenyl)methyl]-5-(tetramethyl-1,3,2-dioxaborolan-2-yl)-1,2-dihydropyridin-2-one (4). A mixture of 5-bromo-1-(3-chlorobenzyl)pyridin-2(1H)-one (3) (1.4g, 4.5mmol), bis(pinacolato)diboron (1.16g, 4.5mmol), potassium acetate (1.3g, 13.7mmol), X-Phos (0.32g, 0.68mmol) in dry 1,4-dioxane (15ml) were placed in a sealed tube under argon purge. The reaction mixture was degassed for further 10 min under a slow stream of argon before palladium(II) acetate (0.3g, 1.4mM) was added. The reaction mixture was heated to 80oC and remained at this temperature for 30 min. After the reaction mixture was cooled to room temperature, it was subsequently filtered through Celite, washed with ethyl acetate and concentrated. Crude product was filtered by flash chromatography on silica gel (hexane/ethyl acetate 1:1) to obtain a mixture of 1-[(3-chlorophenyl)methyl]-5-(tetramethyl-1,3,2-dioxaborolan-2-yl)-1,2-dihydropyridin-2-one LC-MS (m/z) 263.9 (M+1)+ and {1-[(3-chlorophenyl)methyl]-6-oxo-1,6-dihydropyridin-3-yl}boronic acid LC-MS (m/z) 346.0 (M+1)+ as a dark yellow oil which was used for the next step of synthesis without further purification; yield 82%.
5-(3-amino-1H-indazol-6-yl)-1-[(3-chlorophenyl)methyl]-1,2-dihydropyridin-2-one (1). A mixture of 1-[(2-fluorophenyl)methyl]-5-(tetramethyl-1,3,2-dioxaborolan-2-yl)-1,2-dihydropyridin-2-one (1.48g, 4.3mmol), 6-bromo-1H-indazol-3-amine (0.65g, 3.1mmol), potassium carbonate (0.9g, 6mmol) in dioxane/water (2:1) were purged with argon for 10 minutes and then [1,1'-bis(diphenylphosphino)ferrocene]palladium(II) chloride, complex with dichloromethane (0.07g, 0.09mM) was added. The reaction mixture was heated to 120oC and remained at this temperature under microwave irradiation for 30min. The reaction mixture was then cooled to room temperature, filtered through Celite and concentrated. The residue was purified by flash chromatography on silica (dichloromethane/methanol 95:5) to obtain the product, 5-(3-amino-1H-indazol-6-yl)-1-(2-fluorobenzyl)pyridin-2(1H)-one (0.6g, 78% yield), as a grey solid. LC-MS (m/z) 266.7 (M+H)+; HPLC purity 100%, tR=7.1min; 1H NMR (400MHz, DMSO-d6) 11.45 (s, 1H), 8.32 (d, J=2.5Hz, 1H), 7.90 (dd, J=9.5, 2.7Hz, 1H), 7.73 (d, J=8.4Hz, 1H), 7.47 (s, 1H), 7.13 (dd, J=8.4, 1.3Hz, 1H), 6.55 (d, J=9.5Hz, 1H), 5.36 (s, 2H), 5.20 (s, 2H). 13C NMR (101MHz, DMSO-d6) 161.14, 149.59, 142.47, 140.31, 140.27, 136.97, 134.36, 133.53, 130.94, 128.19, 127.99, 126.98, 121.31, 120.39, 119.68, 116.33, 113.59, 106.14, 51.65; HRMS m/z [M+1]+ calcd for C19H15ClN4O 351,1007, found 351,1007.
2 3 4
5
a) b)
c)
1
Chemical synthesis of SLV-2436Supplementary Figure S3

Pharmacodynamics and pharmacokinetic properties of SEL201Supplementary Figure S4
A
10 25 500
50
100
150
200
SEL201 in mouse plasma (24 hour time point)
Conc
entra
tion
(ng/
mL)
10 25 500
1000
2000
3000
4000
SEL201 in mouse plasma (4 hour time point)Co
ncen
tratio
n (n
g/m
L)
mg/kg BID mg/kg BID
BSEL201 PK in mouse plasma
0 5 10 15 20 250
200
400
600
800
1000
12002 mg/kg, IV5 mg/kg, PO
Hours
Conc
entra
tion
(ng/
mL)
Supplementary Figure S4. Pharmacokinetic properties of SEL201 in mice. (A) Pharmacodynamic properties of SEL201 at the doses of 10, 25 and 50 mg/kg BID (i.e. equivalents of 20, 50 and 100 mg/kg/day) were determined in mice (six animals per group). After a total of five oral administrations, three animals per 4h and 24h time point were sacrificed. Plasma concentration of SEL201 (mean ± SD) was determined. (B) Pharmacokinetic profile of SEL201 in mice (three animals per each of eight time points) was determined after oral and intrave-nous administration. PO – per os, IV – intravenous.
Supplementary Figure S5
A
-2 -1 0 10
20
40
60
80
100
120
Log Concentration (μM)
% o
f Inh
ibiti
on
IC50: 17.84
DMSO SEL 1µM SEL 2.5µM SEL 5µM0
50
100
150
Rel
ativ
e ce
ll nu
mbe
r (%
of S
RB)
HBL D820Y
B
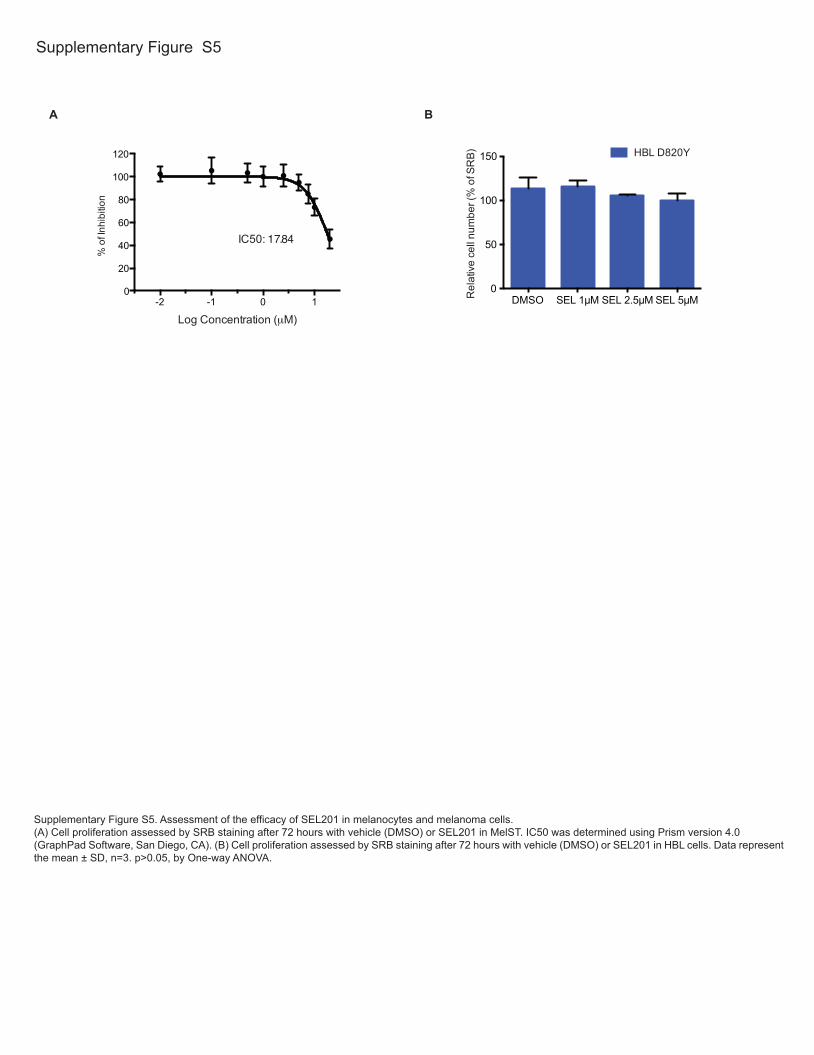
Supplementary Figure S5. Assessment of the efficacy of SEL201 in melanocytes and melanoma cells.(A) Cell proliferation assessed by SRB staining after 72 hours with vehicle (DMSO) or SEL201 in MelST. IC50 was determined using Prism version 4.0 (GraphPad Software, San Diego, CA). (B) Cell proliferation assessed by SRB staining after 72 hours with vehicle (DMSO) or SEL201 in HBL cells. Data represent the mean ± SD, n=3. p>0.05, by One-way ANOVA.
Supplementary Figure S6
A #1 Veh #5 Veh#4 Veh#3 Veh#2 Veh
#1 SEL201 #5 SEL201#4 SEL201#3 SEL201#2 SEL201p-eI
F4E
B #1 Veh #5 Veh#4 Veh#3 Veh#2 Veh
#1 SEL201 #5 SEL201#4 SEL201#3 SEL201#2 SEL201eIF4
E
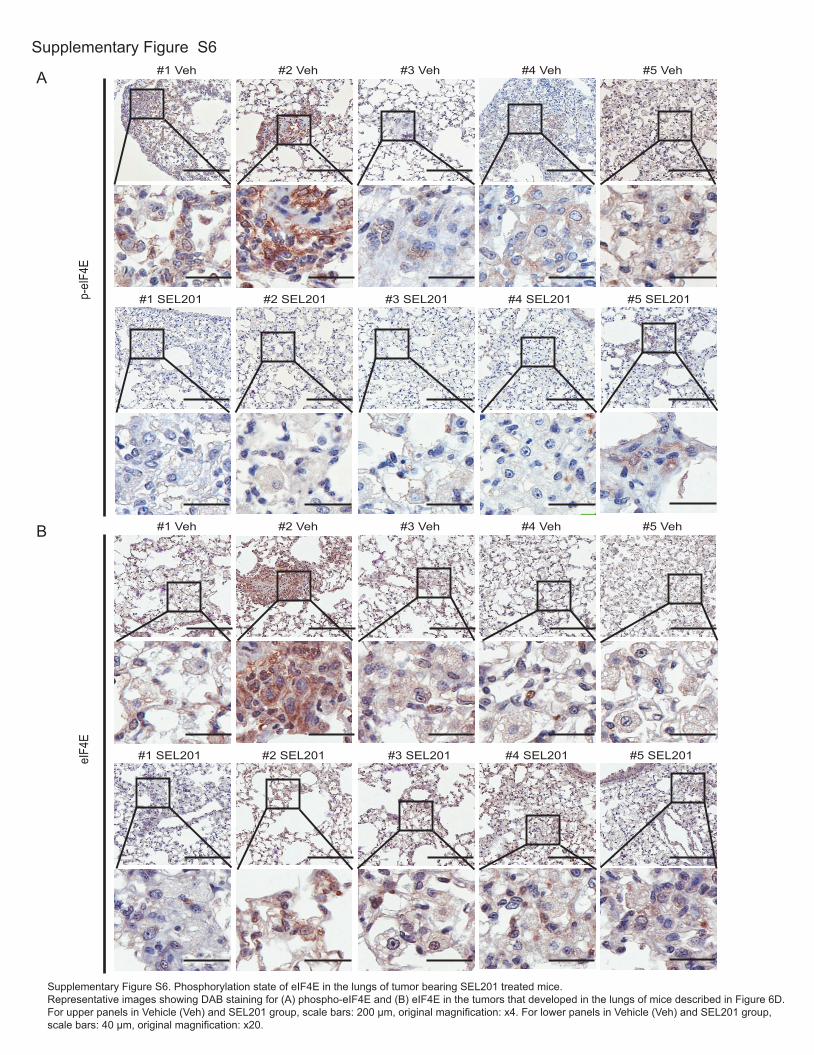
Supplementary Figure S6. Phosphorylation state of eIF4E in the lungs of tumor bearing SEL201 treated mice. Representative images showing DAB staining for (A) phospho-eIF4E and (B) eIF4E in the tumors that developed in the lungs of mice described in Figure 6D. For upper panels in Vehicle (Veh) and SEL201 group, scale bars: 200 µm, original magnification: x4. For lower panels in Vehicle (Veh) and SEL201 group, scale bars: 40 µm, original magnification: x20.

Supplementary Table S1 Clinical information, including age, sex, thickness (Breslow), ulceration (The scores of phospho-eIF4E, phospho-MNK1 and MNK1 IHC staining are provided.)
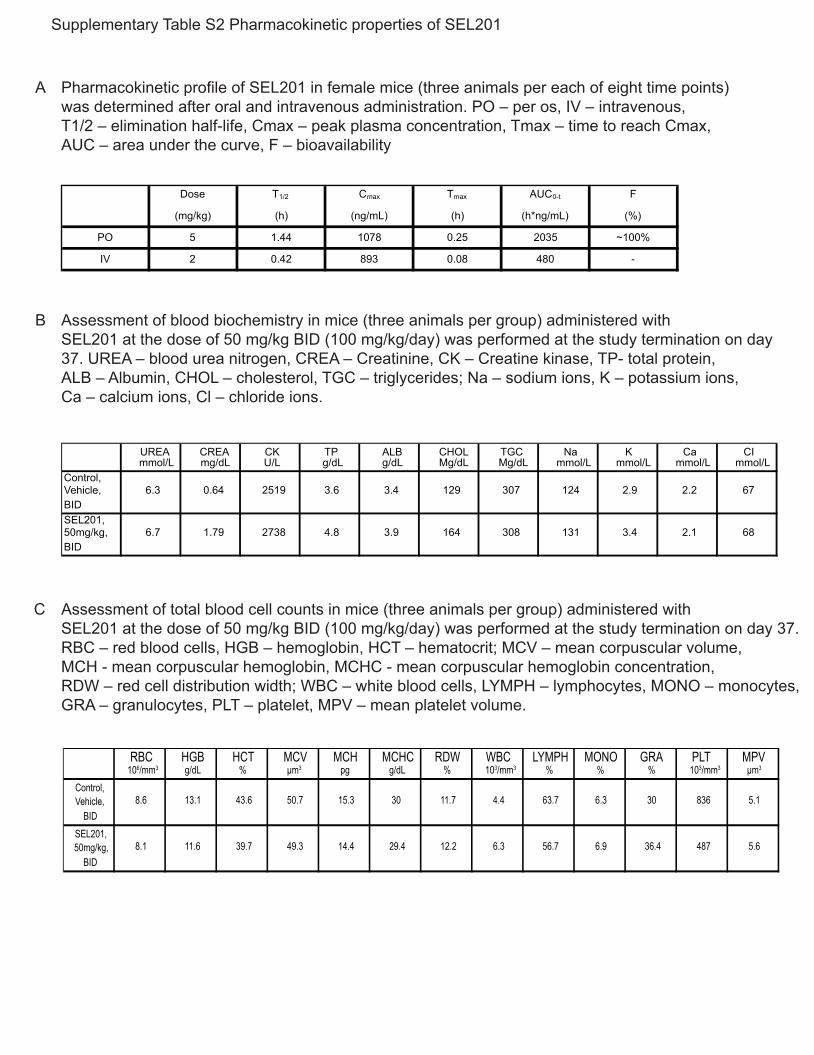
Supplementary Table S2 Pharmacokinetic properties of SEL201
A
Dose T1/2 Cmax Tmax AUC0-t F
(mg/kg) (h) (ng/mL) (h) (h*ng/mL) (%)
PO 5 1.44 1078 0.25 2035 ~100%
IV 2 0.42 893 0.08 480 -
Pharmacokinetic profile of SEL201 in female mice (three animals per each of eight time points) was determined after oral and intravenous administration. PO – per os, IV – intravenous, T1/2 – elimination half-life, Cmax – peak plasma concentration, Tmax – time to reach Cmax, AUC – area under the curve, F – bioavailability
UREA CREA CK TP ALB CHOL TGC Na K Ca CImmol/L mg/dL U/L g/dL g/dL Mg/dL Mg/dL mmol/L mmol/L mmol/L mmol/L
Control,Vehicle, 6.3 0.64 2519 3.6 3.4 129 307 124 2.9 2.2 67BIDSEL201,50mg/kg, 131 3.4 2.1 68BID
3.9 164 3086.7 1.79 2738 4.8
B Assessment of blood biochemistry in mice (three animals per group) administered with SEL201 at the dose of 50 mg/kg BID (100 mg/kg/day) was performed at the study termination on day 37. UREA – blood urea nitrogen, CREA – Creatinine, CK – Creatine kinase, TP- total protein, ALB – Albumin, CHOL – cholesterol, TGC – triglycerides; Na – sodium ions, K – potassium ions, Ca – calcium ions, Cl – chloride ions.
RBC HGB HCT MCV MCH MCHC RDW WBC LYMPH MONO GRA PLT MPV106/mm3 g/dL % µm3 pg g/dL % 103/mm3 % % % 103/mm3 µm3
Control,Vehicle,
BID
SEL201,50mg/kg,
BID5.612.2 6.3 56.7 6.9 36.4 4878.1 11.6 39.7 49.3 14.4 29.4
4.4 63.7 6.3 30 836 5.18.6 13.1 43.6 50.7 15.3 30 11.7
C Assessment of total blood cell counts in mice (three animals per group) administered with SEL201 at the dose of 50 mg/kg BID (100 mg/kg/day) was performed at the study termination on day 37. RBC – red blood cells, HGB – hemoglobin, HCT – hematocrit; MCV – mean corpuscular volume, MCH - mean corpuscular hemoglobin, MCHC - mean corpuscular hemoglobin concentration, RDW – red cell distribution width; WBC – white blood cells, LYMPH – lymphocytes, MONO – monocytes, GRA – granulocytes, PLT – platelet, MPV – mean platelet volume.