Screening and Progress Monitoring Accepted Version - CORE
28
Screening and progress monitoring 1 The definitive version is available at www.blackwell-synergy.com Running Head: SCREENING AND PROGRESS MONITORING Response to intervention screening and progress monitoring practices in 41 local schools Daryl F. Mellard, Melinda McKnight, and Kari Woods Center for Research on Learning University of Kansas For the definitive version, please see: Mellard, D., McKnight, M., & Woods, K. (2009). Response to intervention screening and progress-monitoring practices in 41 local schools. Learning Disabilities Research & Practice, 24(4), 186–195. brought to you by CORE View metadata, citation and similar papers at core.ac.uk provided by KU ScholarWorks
-
Upload
khangminh22 -
Category
Documents
-
view
2 -
download
0
Transcript of Screening and Progress Monitoring Accepted Version - CORE

Screening and progress monitoring 1
The definitive version is available at www.blackwell-synergy.com
Running Head: SCREENING AND PROGRESS MONITORING
Response to intervention screening and progress monitoring practices in 41 local schools
Daryl F. Mellard, Melinda McKnight, and Kari Woods
Center for Research on Learning
University of Kansas
For the definitive version, please see:
Mellard, D., McKnight, M., & Woods, K. (2009). Response to intervention screening and
progress-monitoring practices in 41 local schools. Learning Disabilities Research &
Practice, 24(4), 186–195.
brought to you by COREView metadata, citation and similar papers at core.ac.uk
provided by KU ScholarWorks
Screening and progress monitoring 2
The definitive version is available at www.blackwell-synergy.com
Abstract
This study describes response to intervention (RTI) screening and progress monitoring
instruments and procedures in 41 local school settings. For screening the schools most often used
published reading assessments or commercial products; a three times per year screening schedule
was most prevalent. For progress monitoring schools most often relied on published reading
assessments; a weekly progress monitoring schedule was most prevalent. The variability between
local school practices is discussed with regard to efficiency, equity, and viability of RTI.

Screening and progress monitoring 3
The definitive version is available at www.blackwell-synergy.com
Since its inclusion in the 2004 reauthorization of the Individuals with Disabilities
Education Act (IDEA; P.L. 108-446), educators are increasingly hearing about the concept of
“response to intervention” (RTI), and numerous RTI products have been introduced in the
educational marketplace. Although RTI is new to many educators, researchers and some state
and local school districts have more than a decade of experiences with an mélange of models and
methods called by the name RTI. Many differing ideas about what RTI is, why schools should
use it, and how schools should implement it have developed during that time. Recently, however,
the emerging consensus is that RTI is a framework that includes (a) universal screening, (b)
tiered levels of high quality interventions, (c) progress monitoring, and (d) data-based curricular
decisions; and that the RTI framework, when implemented with fidelity, can serve the dual
purposes of improving all students' academic and behavioral outcomes and identifying those
students with specific learning disabilities (LD) (Batsche, Curtis, Dorman, Castillo, & Porter,
2008; Fuchs & Fuchs, 2005; Mellard & Johnson, 2007; Shinn, 2008; Chun & Witt, 2008;
Vaughn, 2005).
Assessment elements, particularly screening and progress monitoring, are vital to any
RTI model. They underlie an RTI principle: data-based decisions are important to conclusions
about students’ responsiveness and unresponsiveness to curriculum and instruction. That is, the
assessment scores help educators decide whether or not students have been appropriately
matched to curricula and instructional practices. Screening identifies those students who may be
at-risk of having learning or behavioral difficulties and may need interventions to avert such
difficulties. Progress monitoring determines students’ responsiveness and unresponsiveness to
the provided interventions, and thus dictates their movements among intervention tiers.
Extensive research documents the value and validity of numerous individual screening and

Screening and progress monitoring 4
The definitive version is available at www.blackwell-synergy.com
progress monitoring instruments (Fuchs & Fuchs, 2006). Further, a synthesis of RTI research
supports the claim that RTI, as a whole, “is an effective method for identifying children at-risk of
learning difficulties and for providing specialized interventions” (Coleman, Buysse, & Neitzel,
2006, p. 2). However, less is known about how schools have implemented RTI.
This article adds to the literature by describing screening and progress monitoring
instruments and practices in 41 local schools during the 2003-04 academic year. Many of the
RTI school sites readily admitted the details of their screening and progress monitoring were
“works in progress” as they continued to determine which assessments and data were most
helpful to them. With their own experiences and the emergence of numerous RTI products in the
marketplace during the 5 years since our survey (e.g., National Center on Response to
Intervention, 2009), we assume these specific schools have refined their RTI programs.
However, we speculate that our observations from these schools are fairly representative of the
many schools today that are just beginning their RTI implementations, and thus may be
beneficial to many readers.
Assessment Concepts
Screening, considered a key feature of early intervention and an important first step for
identification of students at-risk for learning and behavioral difficulties, ideally uses tests that are
quick, low-cost, and repeatable to assess age-appropriate critical skills (Mellard & Johnson,
2007). These tests must meet empirical psychometric qualities of reliability and validity. A
useful screening measure must also balance accuracy, which is a validity construct, and
efficiency, which is an administrative concern (Jenkins, 2003). A perfect screening instrument
would result in the valid identification of all students who are at-risk (i.e., all of whom later
develop problems) and all students not at-risk (i.e., none of whom later develop problems).

Screening and progress monitoring 5
The definitive version is available at www.blackwell-synergy.com
Given the unlikelihood of perfection, Mellard and Johnson advise casting a wider net and
identifying a larger number of potentially at-risk students—the majority, but not all, of whom
will later develop problems, thus including some false positives—rather than identifying a
smaller number of potentially at-risk students, thus missing some students who will indeed later
develop problems. All the while, the ease of assessment administration and the costs in time and
other resources should be kept in mind.
Progress monitoring is a formative assessment to determine if students are benefiting
from instruction and whether those benefits are accruing at an adequate rate. By collecting and
analyzing learning and performance data, teachers and school teams are better able to make
decisions about appropriate subsequent instruction, particularly for those students not succeeding
(Mellard & Johnson, 2007; Stecker, Fuchs, & Fuchs, 2005). Compton, Fuchs, Fuchs, and Bryant
(2006) suggest that conducting screening for all students three times over the course of the
school year, followed by 5 or 6 weeks of progress monitoring of those students scoring below a
specified score to confirm at-risk status, provides efficiency and at the same time reduces the
number of students incorrectly identified as being at-risk (i.e., false positives). Thus, in their
recommendations they link screening and progress monitoring assessments. In other RTI
frameworks, the screening scores alone are used in determining student placements in
interventions.
In addition to screening and progress monitoring, schools may use diagnostic
assessments. The difference among these three types of assessments may be explained with an
analogy to caring for a child. A mother takes her child to the doctor for a yearly “well-child”
exam. The doctor checks the child’s throat, ears, temperature, etc. If the doctor should find that
the child has a red inflamed eardrum and a slight fever, medicine might be prescribed for an ear

Screening and progress monitoring 6
The definitive version is available at www.blackwell-synergy.com
infection. The mother gives the child medicine, watches for other symptoms, and frequently
monitors the child’s temperature, hoping to see the medicine work. If the child continues to have
a fever, experiences increased ear pain, or develops other symptoms, such as a cough or sore
throat, another trip to the doctor and perhaps a throat culture may be in order for a more detailed
diagnosis of the illness. Screening to identify students in need of intervening services is like
taking the child for a yearly medical exam. Progress monitoring to determine if an intervention is
producing desired results is like taking more temperature readings and looking for other
symptoms of the illness, and hopefully seeing improvements. Administering diagnostic
assessments, such as an individual reading inventory (IRI) or running records, is akin to a doctor
ordering a throat culture to diagnose the root cause of the illness and perhaps prescribing a
different course of treatment. Progress monitoring would both precede and follow diagnostic
assessment.
Using the above analogy, readers may conclude that any teacher can use screening and
progress monitoring, even if the school system does not practice full-blown RTI. This concept is
sometimes referred to as “assessment that drives instruction.” To accrue the benefits of
assessments and avoid impeding learner progress, however, practitioners must be able to
differentiate and properly apply screening, progress monitoring, and diagnostic assessment
instruments and procedures. Figure 1 highlights several of the distinguishing features of these
three types of assessments. Two important points of this figure should be noted. First, because
each type of assessment is fundamentally intended to address a different question, they differ
from one another across many features. Second, the assessments can be used in concert to
identify students experiencing difficulties, plan interventions, and evaluate the degree to which

Screening and progress monitoring 7
The definitive version is available at www.blackwell-synergy.com
students are benefiting from instructional and curricular changes.
Assessments in an RTI framework
Screening assessments are important to an RTI framework, especially when the RTI
focus is on the prevention of academic and behavioral difficulties. Thus, screening measures are
generally appropriate for school-wide use as a broad index of student knowledge, skills, and
abilities for the purpose of predicting students who may be at-risk of learning or behavioral
difficulty. Screening is generally scheduled periodically as a first step leading to intervention
planning within the class/school instruction and curriculum.
Progress monitoring is appropriately applied with a class, small group, or single students
to measure changes in specific academic skills or behaviors. Thus, if a student or group of
LEARNING DISABILITIES PRACTICE 187
is a validity construct, and efficiency, which is an administra-tive concern (Jenkins, 2003). A perfect screening instrumentwould result in the valid identification of all students who areat risk (i.e., all of whom later develop problems) and all stu-dents not at risk (i.e., none of whom later develop problems).Given the unlikelihood of perfection, Mellard and Johnsonadvise casting a wider net and identifying a larger numberof potentially at-risk students—the majority, but not all, ofwhom will later develop problems, thus including some falsepositives—rather than identifying a smaller number of po-tentially at-risk students, thus missing some students whowill indeed later develop problems. All the while, the easeof assessment administration and the costs in time and otherresources should be kept in mind.
Progress monitoring is a formative assessment to deter-mine if students are benefiting from instruction and whetherthose benefits are accruing at an adequate rate. By collect-ing and analyzing learning and performance data, teachersand school teams are better able to make decisions about ap-propriate subsequent instruction, particularly for those stu-dents not succeeding (Mellard & Johnson, 2007; Stecker,Fuchs, & Fuchs, 2005). Compton, Fuchs, Fuchs, and Bryant(2006) suggest that conducting screening for all studentsthree times over the course of the school year, followed by 5or 6 weeks of progress monitoring of those students scoringbelow a specified score to confirm at-risk status, providesefficiency and at the same time reduces the number of stu-dents incorrectly identified as being at risk (i.e., false pos-itives). Thus, in their recommendations they link screeningand progress-monitoring assessments. In other RTI frame-works, the screening scores alone are used in determiningstudent placements in interventions.
In addition to screening and progress monitoring, schoolsmay use diagnostic assessments. The difference among thesethree types of assessments may be explained with an analogyto caring for a child. A mother takes her child to the doctorfor a yearly “well child” exam. The doctor checks the child’sthroat, ears, temperature, etc. If the doctor should find that thechild has a red inflamed eardrum and a slight fever, medicinemight be prescribed for an ear infection. The mother givesthe child medicine, watches for other symptoms, and fre-quently monitors the child’s temperature, hoping to see themedicine work. If the child continues to have a fever, ex-periences increased ear pain, or develops other symptoms,such as a cough or sore throat, another trip to the doctorand perhaps a throat culture may be in order for a more de-tailed diagnosis of the illness. Screening to identify studentsin need of intervening services is like taking the child for ayearly medical exam. Progress monitoring to determine if anintervention is producing desired results is like taking moretemperature readings and looking for other symptoms of theillness, and hopefully seeing improvements. Administeringdiagnostic assessments, such as an individual reading inven-tory or running records, is akin to a doctor ordering a throatculture to diagnose the root cause of the illness and perhapsprescribing a different course of treatment. Progress moni-toring would both precede and follow diagnostic assessment.
Using the above analogy, readers may conclude that anyteacher can use screening and progress monitoring, even ifthe school system does not practice full-blown RTI. This
Screening Progress Monitoring Diagnostic Tests
Population School-wide Class/small group/student Individual student
Uses Broad benchmark
attainment index
Specific academic skill or
behavioral target
Specific academic
domains of
knowledge, skills,
or abilities
Frequency Annually/3 x per year Every 3 weeks/
weekly
Annually
Purpose Predict students who are
at-risk
Regroup students Identify specific
student deficits
Focus School focus Student/class focus Student focus
Instruction Class/school instruction
and curriculum decisions
Intervention effectiveness
(curriculum/instruction)
Selecting
curriculum and
instructional
methods
Implications As first step for
intervention planning
Continue or revise
placement
Planning or
specifying
intervention
FIGURE 1 Purposes of three types of assessments.
concept is sometimes referred to as “assessment that drivesinstruction.” To accrue the benefits of assessments and avoidimpeding learner progress, however, practitioners must beable to differentiate and properly apply screening, progress-monitoring, and diagnostic assessment instruments and pro-cedures. Figure 1 highlights several of the distinguishingfeatures of these three types of assessments. Two importantpoints of this figure should be noted. First, because eachtype of assessment is fundamentally intended to address adifferent question, they differ from one another across manyfeatures. Second, the assessments can be used in concert toidentify students experiencing difficulties, plan interventions,and evaluate the degree to which students are benefiting frominstructional and curricular changes.
Assessments in an RTI Framework
Screening assessments are important to an RTI framework,especially when the RTI focus is on the prevention of aca-demic and behavioral difficulties. Thus, screening measuresare generally appropriate for school-wide use as a broad indexof student knowledge, skills, and abilities for the purpose ofpredicting students who may be at risk of learning or behav-ioral difficulty. Screening is generally scheduled periodicallyas a first step leading to intervention planning within theclass/school instruction and curriculum.
Progress monitoring is appropriately applied with a class,small group or single students to measure changes inspecific academic skills or behaviors. Thus, if a student or
Screening and progress monitoring 8
The definitive version is available at www.blackwell-synergy.com
students were receiving targeted instruction (e.g., to improve fluency in basic math facts),
progress monitoring is useful to inform decisions about continuing or revising students’
placements or regrouping students for instructional or curricular interventions. The progress
monitoring measure should be particularly sensitive to the effects of the intervention and thus
should be similar to the tasks on which the learner has received the instruction. Progress
monitoring occurs on a variable frequency. That frequency (e.g., every 3 weeks, weekly, daily)
should be guided in part by the sensitivity of the skill or ability to change. For example, teaching
letter naming can be comparatively easier with more immediate results than developing a
student’s reading comprehension. Therefore more frequent measures would be used with letter
naming interventions than with comprehension skills interventions.
Diagnostic assessments are conducted with individual students to identify deficits in
specific academic domains of knowledge, skills, or abilities so that teachers may select
appropriate curriculum and instruction or plan intervention(s) to overcome these deficits.
Diagnostic assessment is likely to be an infrequent (e.g., annual) event and would appropriately
be conducted in the context of targeting specific deficits on which instruction might focus. While
screening and progress monitoring measures should be highly linked to the curriculum,
diagnostic measures should evaluate underlying skills and abilities that are necessary for
adequate response to high quality instruction with a validated curriculum.
Research to Practice Issues
Consistent use of valid and reliable screening and progress monitoring is important to the
implementation of RTI. However, variations among schools or districts may undermine the
potential value of RTI as an educational construct. Differing screening methods may result in a
highly disparate number of students identified as at-risk for academic failure (Hollenbeck, 2007).

Screening and progress monitoring 9
The definitive version is available at www.blackwell-synergy.com
Similarly, varying progress monitoring methods can produce “as much or greater variation in the
number and type of children identified as having LD than the variation produced by use of IQ
achievement discrepancy” (Fuchs & Deshler, 2007, p. 134; Fuchs, Fuchs, & Compton, 2004),
particularly if diagnostic and other assessments are not a part of the process. As Hollenbeck
(2007) points out, very few examples of RTI implementation at the local level exist in the
literature. Thus, the purpose of this study is to describe the screening and progress monitoring
efforts of 41 local schools during the 2003-04 academic year and to discuss the implications with
regard to efficiency, equity, and viability of RTI.
Survey of RTI Assessments in Practice
Beginning in 2002, the National Research Center on Learning Disabilities (NRCLD;
www. NRCLD.org) worked with school sites that were implementing RTI practices (Johnson,
Mellard, Fuchs, & McKnight, 2006). The U.S. Department of Education specifically requested
that NRCLD identify, describe, and evaluate the implementation of RTI in elementary schools
across the nation. In conjunction with the six federally-funded Regional Resource Centers,
NRCLD staff solicited the participation of more than 60 schools potentially using RTI practices,
and identified 41 schools in 16 states that met three levels of selection criteria indicating the
schools, in fact, had implemented an RTI model. These 41 schools subsequently completed
extensive surveys and provided detailed documentation to describe their RTI practices.
Selection criteria. The first criterion to simply qualify as a school with an RTI model
consisted of seven benchmarks based on findings from Mellard, Byrd, Johnson, Tollefson, and
Boesche's (2004) survey of practitioners, researchers, and policy makers. A school had to
indicate that it had (a) at least two tiers of intervention; (b) a reliable, valid system for monitoring
learner progress; (c) leadership and professional development supporting RTI; (d) scientifically-

Screening and progress monitoring 10
The definitive version is available at www.blackwell-synergy.com
based reading practices in general education; (e) scientifically-based reading practices with
appropriate intensity beyond the first tier; (f) an objective cut point or procedure for demarcating
responsiveness; and (g) LD identification procedures that followed regulatory requirements. At
the time of our survey, RTI in schools generally focused on reading skills and instruction.
Second, a school's RTI implementation had to contain sufficient elements of an RTI
working model. Five broad categories with a total of 27 elements factored into this second level
of selection criteria: (a) general education practices, (b) student assessment practices,
(c) intervention model practices, (d) disability determination practices, and (e) student outcome
data (Mellard et al., 2004). The third and final condition for inclusion was the school
administrator's willingness to provide detailed information for a case study through
documentation, surveys, and interviews.
The schools that met these criteria completed surveys and interviews and provided
supporting documentation describing their RTI practices. Schools listed, for each grade level (K–
5), the following information related to the Tier 1 school-wide screening practices used to
identify students needing Tier 2 intervention:
(a) measures used to track reading improvement
(b) the frequency of measurement for tracking reading improvement
(c) the index used to demarcate inadequate response to general education
(d) cut point used to demarcate inadequate response to general education.
The schools listed, for each grade level, the following information related to Tier 2 progress
monitoring practices:
(a) measures used to track responsiveness
(b) the frequency of measurement for tracking response to intervention

Screening and progress monitoring 11
The definitive version is available at www.blackwell-synergy.com
(c) the index used to demarcate inadequate response
(d) the cut point to demarcate inadequate response.
School demographics. The selected schools were fairly affluent, with only 3% of the 41
schools serving a high proportion of low SES students. The schools had varying degrees of racial
and ethnic diversity: 49% of the schools were more than five percentage points above their state's
average White Non-Hispanic enrollment; 20% were more than five percentage points below
average; and 31% were within five percentage points of average. Thirty-two of the schools
served K–5 students, three K–4, two 1–4, and four K–3. School size varied widely, with about
two-thirds of the schools having enrollments of fewer than 500 students. Forty-two percent of
schools had less than 1% of students classified as English language learners (ELLs), 39% had
between 1% and 9%, and 19% had more than 10% of students. The schools served a relatively
low proportion of students with specific learning disabilities (SLD), with over half the sites
having 5% or less of students with SLD, and only 10% of sites having more than 10% of
students with SLD.
Analytical categories. We established nine broad categories of screening and progress
monitoring instruments in order to summarize the measurement instruments used in the schools.
Our categories are as follows:
1. Published reading program assessments—published in conjunction with reading
programs designed to be used as supplements to a core reading program or additional
reading practice for struggling readers
2. Published reading assessments / inventories—published “stand alone” assessments (i.e.,
not a part of an intervention or core curriculum programs)

Screening and progress monitoring 12
The definitive version is available at www.blackwell-synergy.com
3. Comprehensive core reading program assessments—published in conjunction with a core
reading program designed as a primary instructional reading program for a school to
address the needs of the majority of students
4. Informal classroom assessment—teacher-created measures of student ability compared to
a predetermined benchmark or a student's own prior performance
5. Curriculum-based measurement (CBM)—assessments of a skill (e.g., oral reading
fluency) tied to the curriculum of instruction that directly and repeatedly measures
student performance
6. DIBELS (Dynamic Indicators of Basic Early Literacy Skills; Good & Kaminski, 2002)—
a published a set of standardized, individually administered measures of early literacy
development
7. District or state assessment—standard assessments developed by and administered across
the district or state
8. Standardized achievement tests—nationally standardized tests that provide a
comprehensive assessment of student achievement (e.g., Iowa Test of Basic Skills;
Hoover, Dunbar, & Frisbie, 2001)
9. Other—measures of performance such as classroom grades or portfolio assessment;
standardized intelligence tests
Screening Practices
Measurement instruments. Most schools (90%) reported using three or more screening
instruments, up to as many as eleven, for their Tier 1 or general education screening. Although
schools reported many different types of assessments used to screen for reading difficulty (Table

Screening and progress monitoring 13
The definitive version is available at www.blackwell-synergy.com
1), three types of instruments were reported most often: published reading assessments (36%),
DIBELS (13%), and district or state assessments (11%).
Frequency. The frequency of screening activities also varied widely among schools with
23% of schools performing tri-annual assessments, in many cases as a result of the DIBELS
structure; 14% reported using annual assessments, primarily due to the schedule for district and
state assessments; and 14% reported using quarterly and biannual assessments, frequencies often
suggested by published reading assessments.
Cut points. More than a third of the schools reported that their cut points to determine
which students were academically at-risk were based on norms set by the published materials
they used for screening (e.g., DIBELS, Harcourt). For example, DIBELS oral reading fluency
recommends that 1st grade students be considered at some risk if at the end of the school year
they read less than 40 correct words per minute (cwpm). Harcourt suggests 1st grade students be
considered at-risk if at mid-year their oral reading fluency is less than 55 cwpm. Although each
method empirically derives an at-risk group of students, data are not available to indicate
whether these instruments would identify the same set of students.
The next most frequently reported method (approximately one out of six schools) for
determining which students needed further interventions or more intense instruction was the use
of percentages of their local student population, most often targeting students in the lowest 25%,
although several schools used 20%, 16%, or 15%. Using an approach that is not connected to a
national norm or an external standard may err to the detriment of students or school resources. In
schools with low prevalence of truly at-risk students, schools may over-identify risk and waste
school resources serving students who do not need intensive instruction; in schools with high
prevalence of truly at-risk students, schools may not provide needed instruction to students.

Screening and progress monitoring 14
The definitive version is available at www.blackwell-synergy.com Other infrequently used types of Other
190 MELLARD, MCKNIGHT, AND WOODS: SCREENING AND PROGRESS MONITORING
TABL
E1
Sam
ple
Tier
1Sc
reen
ing
Inst
rum
ents
byFr
eque
ncy
ofAd
min
istra
tion
Perc
enta
geAs
ofTo
tal
Instr
umen
tTyp
eD
aily
Wee
kly
Biwe
ekly
Mon
thly
Qua
rterly
Tria
nnua
llyBi
annu
ally
Annu
ally
Need
edO
ther
Uns
peci
fied
Repo
rtsRe
ports
Publ
ished
read
ing
prog
ram
asse
ssm
ents
11
1–
1–
––
12
613
6%Pu
blish
edre
adin
gas
sess
men
ts/in
vent
orie
s–
1–
–13
1515
613
115
7936
%Co
mpr
ehen
sive
core
read
ing
prog
ram
asse
ssm
ents
–2
––
42
1–
–9
422
10%
Info
rmal
clas
sroo
mas
sess
men
ts–
1–
–4
2–
––
–3
105%
Curr
icul
umba
sed
mea
sure
s–
––
–2
6–
–3
–4
157%
DIB
ELS
–1
–1
320
4–
––
–29
13%
Dist
ricto
rsta
teas
sess
men
ts–
––
––
26
101
–5
2411
%St
anda
rdiz
edac
hiev
emen
ttes
ts–
––
–1
1–
12–
–3
178%
Oth
er–
––
–2
24
––
–3
136%
Tota
lrep
orts
16
11
3050
3030
1812
4322
210
0%%
ofto
talr
epor
ts0%
3%0%
0%14
%23
%14
%14
%8%
5%19
%10
0%
Note
:n=
41.T
hem
ostp
reva
lent
instr
umen
tsan
dfre
quen
cies
are
show
nin
bold
.
local norms, grade-level determinations, discrepancy ratios,and frustration reading levels.
About one out of six schools reported using no specificcut points but rather a convergence of data from a vari-ety of assessments to determine which students were notsucceeding in the general education curriculum. This moreclinical approach to identifying risk status puts the onus onschool personnel to correctly judge risk. Groups or individ-uals making such decisions have experience, intuition, anddata from which to draw. However, they also may face im-pediments to accurate judgments such as those articulatedby Arkes (1986): covariation misestimation, preconceivednotions, lack of awareness, overconfidence, and hindsightbias.
Prevalence Rates
On average the schools placed about 16 percent of their en-rollment in Tier 2 instruction. However, the Tier 2 at-riskprevalence rate ranged from a low of 3 percent to a highof 34 percent. Figure 2 displays the frequency of schools’prevalence rates, with about two-thirds of the schools report-ing rates near the 15 percent rate often cited in the literature.The schools with rates from 26 percent to 34 percent of en-rollment may have school-wide curriculum issues rather thana high prevalence of students at risk. On the other hand, theschools with rates below 10 percent of enrollment may notbe meeting the needs of at-risk students.
Exemplar Screening Practice
Although all the surveyed schools qualified as using anRTI model, not all aspects of RTI were of equal qual-ity among the schools. We describe here a good exampleof screening in a school with total enrollment of 500 K–fifth-grade students. The school staff assessed kinder-garten and first-grade students three times a year—fall,winter, and spring—using DIBELS1 (Good & Kaminski,2002) to screen for students at risk of reading difficulty.On the same schedule, staff assessed second- and third-grade students using DIBELS fluency and accuracy as-sessments. In addition, second- through fifth-grade studentstook the ITBS (Hoover et al., 2001) in November andthe Gates-MacGinitie assessment (MacGinitie, MacGini-tie, Maria, Dreyer, & Hughes, 2002) in April. Second-grade students were also given the Gates-MacGinitie inOctober.
Three times each year, immediately following the district-wide student screenings, the school’s Literacy Team helda “Literacy Day” allowing team members to review district-wide screening data in addition to data from their own school.The Literacy Team, comprising general and special educa-tors, Reading Plus teachers, area educational agency staff,the curriculum director, and the principal, used the screen-ing data to make decisions about changing current studentinterventions and to identify students who required more in-dividualized and more intensive interventions.

Screening and progress monitoring 15
The definitive version is available at www.blackwell-synergy.com
Other infrequently used types of empirical benchmarks included local norms, grade level
determinations, discrepancy ratios, and frustration reading levels.
About one out of six schools reported using no specific cut points but rather a
convergence of data from a variety of assessments to determine which students were not
succeeding in the general education curriculum. This more clinical approach to identifying risk
status puts the onus on school personnel to correctly judge risk. Groups or individuals making
such decisions have experience, intuition and data from which to draw. However, they also may
face impediments to accurate judgments such as those articulated by Arkes (1986): covariation
misestimation, preconceived notions, lack of awareness, overconfidence, and hindsight bias.
Prevalence rates. On average the schools placed about 16% of their enrollment in Tier 2
instruction. However, the Tier 2 at-risk prevalence rate ranged from a low of 3% to a high of
34%. Figure 2 displays the frequency of schools’ prevalence rates, with about two-thirds of the
schools reporting rates near the 15% rate often cited in the literature. The schools with rates from
26% to 34% of enrollment may have schoolwide curriculum issues rather than a high prevalence
of students at-risk. On the other hand, the schools with rates below 10% of enrollment may not
be meeting the needs of at-risk students.
LEARNING DISABILITIES PRACTICE 191
FIGURE 2 Schools reporting Tier 2 placements by percentage of enrollment.
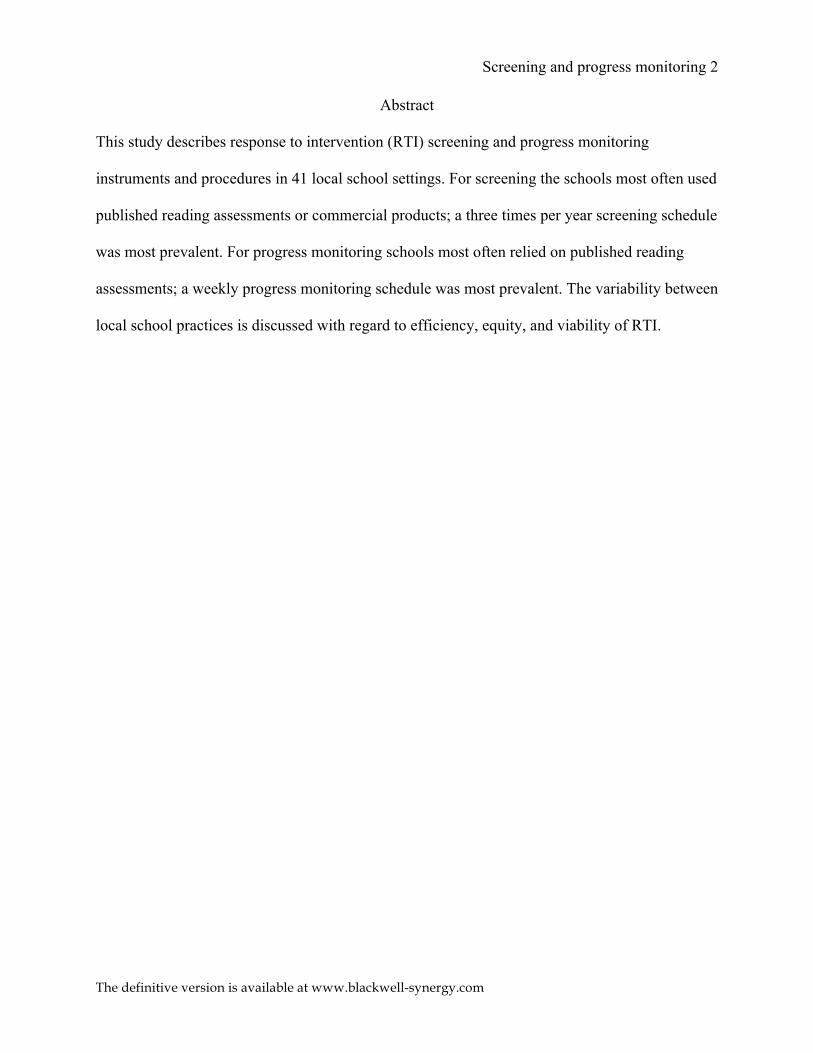
Progress-Monitoring Practices
Measurement Instruments
With regard to progress monitoring during Tier 2 interven-tions, 39 percent of schools reported using one or two instru-ments, 44 percent three to five instruments, and 17 percentbetween 6 and 11 instruments. The types of instruments theyused varied, with 33 percent of schools using published read-ing assessments for progress monitoring, 19 percent usingCBM, 13 percent using DIBELS, and 12 percent using pub-lished reading program assessments.
Frequency
Frequency of Tier 2 progress monitoring in schools alsovaried greatly. The schools most often indicated they ad-ministered progress measures weekly (24 percent) and quar-terly (12 percent). However, a few (5 percent) reported dailyprogress monitoring while others (4 percent) only monitoredprogress annually (Table 2).
Cut Points
Just as for screening, the most frequently named cut points forprogress monitoring were those based on published norms,reported by more than a third of the schools. About onein five schools reported using a variety of assessments andbasing decisions about the need for other interventions ormore intense instruction on a body of evidence. More thanone in ten schools reported using percentages of studentsin an intervention group. Again, most often they designatedstudents in the lowest 25 percent as not responding to theintervention, although several schools used cut points of20 percent, 16 percent, or 15 percent.
A large majority of the schools used the same types ofcut scores for both screening and progress monitoring. How-ever, several (approximately 1 out of 12) schools reportedusing one type of cut score for screening and another type
for progress monitoring. No consistent pattern existed in thismixed use of cut points. For example, one school used lo-cal norms for screening and convergent data for progressmonitoring. Another used convergent data for screening andpublished norms for progress monitoring. Yet another usedpublished norms for screening and grade-level determina-tions for progress monitoring.
Prevalence Rates
The average placements among the 41 schools were 7 percentof enrollment in Tier 3 (range 1 percent to 22 percent) and4 percent of enrollment in Tier 4 (range < 1 percent to 10 per-cent). Figure 3 shows great variability among schools, withonly about 20 percent of schools reporting Tier 3 placementsnear the 5 percent rate anticipated by the literature.
Exemplar Progress-Monitoring Practice
One example of strong progress-monitoring practices is in aprimary school (preschool through third grade) with an en-rollment of 440 students. The school staff monitored studentprogress and made decisions about instruction for studentswithin the following tiers: core curriculum (Tier 1), core plussupplemental instructional support (Tier 2), and core plussupplemental instructional support and interventions (Tier3). Progress monitoring, via DIBELS assessments, occurredweekly for students receiving instruction in the core cur-riculum who met one of three criteria: (a) the student wasnew to the district and an initial assessment showed thathe or she was at risk, (b) the student previously receivedsupplemental or intervention support but was subsequentlyperforming at benchmark level, or (c) the student’s rate ofprogress was a concern for his or her teacher. Progress mon-itoring in the core curriculum (Tier 1) was discontinued forstudents who scored at or above a benchmark performancelevel. For students scoring below the benchmark, schoolstaff further analyzed their performance, with the goal ofmatching instruction to student needs. These students either

Screening and progress monitoring 16
The definitive version is available at www.blackwell-synergy.com
Exemplar screening practice. Although all the surveyed schools qualified as using an
RTI model, not all aspects of RTI were of equal quality among the schools. We describe here a
good example of screening in a school with total enrollment of 500 K–5th grade students. The
school staff assessed kindergarten and 1st grade students three times a year—fall, winter, and
spring—using DIBELS1 (Good & Kaminski, 2002) to screen for students at-risk of reading
difficulty. On the same schedule, staff assessed 2nd and 3rd grade students using DIBELS
fluency and accuracy assessments. In addition, 2nd through 5th grade students took the Iowa
Test of Basic Skills (ITBS; Hoover, Dunbar, & Frisbie, 2001) in November and the Gates-
MacGinitie assessment (MacGinitie, MacGinitie, Maria, Dreyer, & Hughes, 2002) in April.
Second grade students were also given the Gates-MacGinitie in October.
Three times each year, immediately following the district-wide student screenings, the
school’s Literacy Team held a “Literacy Day” allowing team members to review district-wide
screening data in addition to data from their own school. The Literacy Team, comprised of
general and special educators, Reading Plus teachers, area educational agency staff, the
curriculum director, and the principal, used the screening data to make decisions about changing
current student interventions and to identify students who required more individualized and more
intensive interventions.
Progress Monitoring Practices
Measurement instruments. With regard to progress monitoring during Tier 2
interventions, 39% of schools reported using one or two instruments, 44% three to five
instruments, and 17% between six and eleven instruments. The types of instruments they used
varied, with 33% of schools using published reading assessments for progress monitoring, 19%
using CBM, 13% using DIBELS, and 12% using published reading program assessments.

Screening and progress monitoring 17
The definitive version is available at www.blackwell-synergy.com
Frequency. Frequency of Tier 2 progress monitoring in schools also varied greatly. The
schools most often indicated they administered progress measures weekly (24%) and quarterly
(12%). However, a few (5%) reported daily progress monitoring while others (4%) only
monitored progress annually (Table 2).
Cut points. Just as for screening, the most frequently named cut points for progress
monitoring were those based on published norms, reported by more than a third of the schools.
About one in five schools reported using a variety of assessments and basing decisions about the
need for other interventions or more intense instruction on a body of evidence. More than one in
ten schools reported using percentages of students in an intervention group. Again, most often
they designated students in the lowest 25% as not responding to the intervention, although
several schools used cut points of 20%, 16%, or 15%.
A large majority of the schools used the same types of cut scores for both screening and
progress monitoring. However, several (approximately one out of twelve) schools reported using
one type of cut score for screening and another type for progress monitoring. No consistent
pattern existed in this mixed use of cut points. For example, one school used local norms for
screening and convergent data for progress monitoring. Another used convergent data for
screening and published norms for progress monitoring. Yet another used published norms for
screening and grade level determinations for progress monitoring.
Prevalence rates. The average placements among the 41 schools were 7% of enrollment
in Tier 3 (range 1% to 22%) and 4% of enrollment in Tier 4 (range < 1% to 10%). Figure 3
shows great variability among schools, with only about 20% of schools reporting Tier 3
placements near the 5% rate anticipated by the literature.

Screening and progress monitoring 18
The definitive version is available at www.blackwell-synergy.com
192 MELLARD, MCKNIGHT, AND WOODS: SCREENING AND PROGRESS MONITORING
TABL
E2
Sam
ple
Tier
2Pr
ogre
ssM
onito
ring
Inst
rum
ents
byFr
eque
ncy
ofAd
min
istra
tion
Perc
enta
geAs
ofTo
tal
Inst
rum
entT
ype
Dai
lyW
eekl
yBi
week
lyM
onth
lyQ
uart
erly
Tria
nnua
llyBi
annu
ally
Annu
ally
Nee
ded
Oth
erU
nspe
cifie
dRe
port
sRe
port
s
Publ
ished
read
ing
prog
ram
asse
ssm
ents
25
––
2–
1–
2–
416
12%
Publ
ished
read
ing
asse
ssm
ents/
inve
ntor
ies
–4
––
98
81
73
1050
33%
Com
preh
ensiv
eco
rere
adin
gpr
ogra
mas
sess
men
ts1
2–
11
––
––
11
75%
Info
rmal
clas
sroo
mas
sess
men
ts2
21
1–
1–
–1
–2
107%
Curr
icul
umba
sed
mea
sure
s1
95
12
2–
–3
–4
2719
%D
IBEL
S1
134
––
––
–1
––
1913
%D
istric
torS
tate
asse
ssm
ents
––
1–
31
13
––
211
8%St
anda
rdiz
edac
hiev
emen
ttes
ts–
––
––
––
2–
––
21%
Oth
er–
––
–1
12
––
––
43%
Tota
lrep
orts
735
113
1813
126
144
2314
610
0%%
ofto
talr
epor
ts5%
24%
7%2%
12%
9%8%
4%10
%3%
16%
100%
Not
e:n
=41
.The
mos
tpre
vale
ntin
strum
ents
and
frequ
enci
esar
esh
own
inbo
ld.
remained in Tier 1 with changes to instruction or practice orwere placed in core plus supplemental instructional support(Tier 2). Options for instructional support included moreinstructional time, smaller instructional groups, more pre-cisely targeted instruction at the right level, more explicitexplanations, more systematic instructional sequences, moreextensive opportunities for guided practice, and more op-portunities for corrective feedback. For those students whoreceived this supplemental instruction, progress was moni-tored, again with DIBELS measures, often twice each weekrather than only once as was done when they were in Tier 1.For students scoring above the benchmark or whose perfor-mance was on the goal line, two options were considered: areturn to core instruction with progress monitoring occurringweekly or continued core plus supplemental instruction. Forstudents with four consecutive scores below the benchmark,or whose slope of performance (i.e., rate of improvement)fell below the goal line, three options were considered: fur-ther analysis or diagnostic assessment, continued core plussupplemental support with changes to the support mecha-nisms, or core plus supplemental instruction plus intervention(Tier 3).
Implementation
In addition to our survey of 41 schools, we conducted in-depth interviews with principals, general educators, specialeducators, and school psychologists in five schools. Fromtheir stories we culled several practical issues when imple-menting screening and progress monitoring. First, the impor-tance of good recordkeeping systems was a recurring theme.Data collection forms and expectations should be in place be-fore the school year begins so that screening can be done earlyand with consistency from classroom to classroom. Further,some schools recommended devising methods for makingscreening and progress-monitoring records easily accessi-ble to those who need them for instructional decision making(e.g., online access with password protections). Some schoolsstated the importance of sharing student data with school staffmembers from year to year, so that valuable information andtime for helping students is not lost. For example, if a studentfailed to show progress in a particular intervention, but re-sponded well to another type, his new teacher would benefitfrom being told rather than rediscovering this information.
Even with good recordkeeping systems, however, someschools had issues with staff engagement with the process.For example, a teacher expressed having internal conflict overgiving up teaching time to conduct screening and progressmonitoring, believing the time spent on assessments wasnot as valuable as time in general instruction. Other schoolsavoided this conflict by providing extra help in the class-room to conduct assessments and keep records. One spe-cial educator emphasized the importance of everyone do-ing their part; without screening and progress-monitoringdata from the instructor, a support team cannot make gooddecisions about the students’ instructional needs or SLDdeterminations.
Finally, phrases like “take it slow,” “be patient,” “do whatyou can” were common words of advice to other schools

Screening and progress monitoring 19
The definitive version is available at www.blackwell-synergy.com
Exemplar progress monitoring practice. One example of strong progress monitoring
practices is in a primary school (preschool through 3rd grade) with an enrollment of 440
students. The school staff monitored student progress and made decisions about instruction for
students within the following tiers: core curriculum (Tier 1), core plus supplemental instructional
support (Tier 2), and core plus supplemental instructional support and interventions (Tier 3).
Progress monitoring, via DIBELS assessments, occurred weekly for students receiving
instruction in the core curriculum who met one of three criteria: (a) the student was new to the
district and an initial assessment showed that he or she was at-risk, (b) the student previously
received supplemental or intervention support but was subsequently performing at benchmark
level, or (c) the student’s rate of progress was a concern for his or her teacher. Progress
monitoring in the core curriculum (Tier 1) was discontinued for students who scored at or above
a benchmark performance level. For students scoring below the benchmark, school staff further
analyzed their performance, with the goal of matching instruction to student needs. These
students either remained in Tier 1 with changes to instruction or practice, or were placed in core
plus supplemental instructional support (Tier 2). Options for instructional support included more
instructional time, smaller instructional groups, more precisely targeted instruction at the right
level, more explicit explanations, more systematic instructional sequences, more extensive
opportunities for guided practice, and more opportunities for corrective feedback. For those
students who received this supplemental instruction, progress was monitored, again with
DIBELS measures, often twice each week rather than only once as was done when they were in
Tier 1. For students scoring above the benchmark or whose performance was on the goal line,
two options were considered: a return to core instruction with progress monitoring occurring
weekly, or continued core plus supplemental instruction. For students with four consecutive

Screening and progress monitoring 20
The definitive version is available at www.blackwell-synergy.com
scores below the benchmark, or whose slope of performance (i.e., rate of improvement) fell
below the goal line, three options were considered: further analysis or diagnostic assessment,
continued core plus supplemental support with changes to the support mechanisms, or core plus
supplemental instruction plus intervention (Tier 3).
Implementation. In addition to our survey of 41 schools, we conducted in-depth
interviews with principals, general educators, special educators, and school psychologists in five
schools. From their stories we culled several practical issues when implementing screening and
progress monitoring. First, the importance of good recordkeeping systems was a recurring theme.
Data collection forms and expectations should be in place before the school year begins so that
screening can be done early and with consistency from classroom to classroom. Further, some
schools recommended devising methods for making screening and progress monitoring records
easily accessible to those who need them for instructional decision-making (e.g., on-line access
with password protections). Some schools stated the importance of sharing student data with
school staff members from year-to-year, so that valuable information and time for helping
students is not lost. For example, if a student failed to show progress in a particular intervention,
but responded well to another type, his new teacher would benefit from being told rather than
rediscovering this information.
LEARNING DISABILITIES PRACTICE 193
FIGURE 3 Schools reporting Tiers 3 and 4 placements by percentage of enrollment.
interested in beginning RTI. Perhaps one of the most helpfulbits of advice came from a special educator who said, “beprepared for a process, not an end.” Screening all studentsyear after year, progress monitoring some students week af-ter week, and making instructional changes to meet studentneeds are not the goal; they are the means to the goal, whichis student success.
DISCUSSION
Perhaps the first observation that we should make is that theschools selected for our study were relatively affluent. Inde-pendent implementation of RTI and participation in a studysuch as ours may be a luxury afforded by higher socioeco-nomic status schools with few ELLs or students with SLD.As early adopters of ideas presented in the literature, dur-ing workshops or other forms of professional development,these schools were willing and able to devote resources toinnovation and school-wide change. We believe, however,that schools of every socioeconomic level can learn fromtheir experiences as they develop RTI schema that fit theirparticular contexts.
We anticipated that schools would conduct school-widescreening to predict which students were at risk of academicfailure using a few broad measures between one and threetimes per year. Instead, we found that schools tended to usemultiple instruments with greater frequency and a variety ofmethods and levels for the cut points demarcating studentsacademically at risk. A school clearly sacrifices efficiencywhen more time than is necessary to make a valid predictionof risk is spent screening students. If multiple instruments im-prove accuracy of the predictions, the time may be well spent.We suspect, however, that the reasons for using a variety ofinstruments may relate to the need to measure a broad rangeof students and skills, uncertainty about which instrumentswould provide the data they needed, or perhaps even compro-mises based on competing teacher preferences. We cautionschools to be parsimonious in both the frequency and num-ber of screening instruments in their RTI process. However,if multiple measures are used for screening, documented ra-tionale and procedures for aggregating or weighting of thenumerous assessments and associated cut points are impor-
tant (e.g., Does a student have to meet the at-risk cut pointon all of the screens or only some?).
We did not attempt to determine which instruments werebest for screening. Rather we observed that the schools them-selves most often chose to use published reading assess-ments/inventories (i.e., not a part of an intervention or corecurriculum programs), DIBELS, and district or state assess-ments to identify students who struggled with reading. Wespeculate that schools selected these instruments for prag-matic reasons, such as previous experience with and own-ership of an instrument or the desire for an off-the-shelfsolution. In our study, we selected schools using reliableand valid instruments, which is a standard we encourage allschools implementing RTI to adopt. This adoption shouldbe easier with the work of technical review committees thatprovide ratings on screening and progress monitoring tools(e.g., National Center on Response to Intervention’s Web siterti4success.org).
We expected that each school would use different instru-ments to answer the unique questions posed by screening (Isthis student at risk?) and progress monitoring (Is this studentresponding to an intervention?). However, the schools wesurveyed frequently used the same instruments to screen andmonitor progress (e.g., assessments published with interven-tions, DIBELS). By using the same instruments for screeningand progress monitoring schools may create measurementvalidity issues (e.g., test familiarity or practice effects). Doesa measure that is designed to predict a future outcome (e.g.,reading achievement) have the same psychometric utility inassessing a learner’s current status for rate of learning orlevel of performance? Generally the answer is no. Both pro-cesses require sensitivity of the instrument but for differentpurposes—screening for prediction, progress monitoring foridentifying changes due to the curricular and instructionalintervention. The practice of using the same instrument forboth processes may stem from pragmatic decisions or a lackof conceptual understanding of the different purposes for themeasurements.
The frequency with which schools reported screening andprogress monitoring give further insight into the variabil-ity in how these schools understood RTI. Although mostschools seemed to screen just a few times a year, a fewschools reported screening weekly, biweekly, and monthly.

Screening and progress monitoring 21
The definitive version is available at www.blackwell-synergy.com
Even with good recordkeeping systems, however, some schools had issues with staff
engagement with the process. For example, a teacher expressed having internal conflict over
giving up teaching time to conduct screening and progress monitoring, believing the time spent
on assessments was not as valuable as time in general instruction. Other schools avoided this
conflict by providing extra help in the classroom to conduct assessments and keep records. One
special educator emphasized the importance of everyone doing their part; without screening and
progress monitoring data from the instructor, a support team cannot make good decisions about
the students’ instructional needs or SLD determinations.
Finally, phrases like “take it slow,” “be patient,” “do what you can” were common words
of advice to other schools interested in beginning RTI. Perhaps one of the most helpful bits of
advice came from a special educator who said, “be prepared for a process, not an end.”
Screening all students year after year, progress monitoring some students week after week, and
making instructional changes to meet student needs are not the goal; they are the means to the
goal, which is student success.
Discussion
Perhaps the first observation that we should make is that the schools selected for our
study were relatively affluent. Independent implementation of RTI and participation in a study
such as ours may be a luxury afforded by higher socio-economic status schools with few ELLs or
students with SLD. As early adopters of ideas presented in the literature, during workshops or
other forms of professional development, these schools were willing and able to devote resources
to innovation and school-wide change. We believe, however, that schools of every socio-
economic level can learn from their experiences as they develop RTI schema that fit their
particular contexts.

Screening and progress monitoring 22
The definitive version is available at www.blackwell-synergy.com
We anticipated that schools would conduct school-wide screening to predict which
students were at-risk of academic failure using a few broad measures between one and three
times per year. Instead, we found that schools tended to use multiple instruments with greater
frequency and a variety of methods and levels for the cut points demarcating students
academically at-risk. A school clearly sacrifices efficiency when more time than is necessary to
make a valid prediction of risk is spent screening students. If multiple instruments improve
accuracy of the predictions, the time may be well spent. We suspect, however, that the reasons
for using a variety of instruments may relate to the need to measure a broad range of students and
skills, uncertainty about which instruments would provide the data they needed, or perhaps even
compromises based on competing teacher preferences. We caution schools to be parsimonious in
both the frequency and of number screening instruments in their RTI process. However, if
multiple measures are used for screening, documented rationale and procedures for aggregating
or weighting of the numerous assessments and associated cut points are important (e.g., Does a
student have to meet the at-risk cut point on all of the screens or only some?).
We did not attempt to determine which instruments were best for screening. Rather we
observed that the schools themselves most often chose to use published reading assessments /
inventories (i.e., not a part of an intervention or core curriculum programs), DIBELS, and district
or state assessments to identify students who struggled with reading. We speculate schools
selected these instruments for pragmatic reasons, such as previous experience with and
ownership of an instrument, or the desire for an “off the shelf” solution. In our study, we selected
schools using reliable and valid instruments, which is a standard we encourage all schools
implementing RTI to adopt. This adoption should be easier with the work of technical review

Screening and progress monitoring 23
The definitive version is available at www.blackwell-synergy.com
committees that provide ratings on screening and progress monitoring tools (e.g. National Center
on Response to Intervention’s website RTI4Success.org).
We expected that each school would use different instruments to answer the unique
questions posed by screening (Is this student at-risk?) and progress monitoring (Is this student
responding to an intervention?). However, the schools we surveyed frequently used the same
instruments to screen and monitor progress (e.g., assessments published with interventions,
DIBELS). By using the same instruments for screening and progress monitoring schools may
create measurement validity issues (e.g., test familiarity or practice effects). Does a measure that
is designed to predict a future outcome (e.g., reading achievement) have the same psychometric
utility in assessing a learner’s current status for rate of learning or level of performance?
Generally the answer is no. Both processes require sensitivity of the instrument but for different
purposes—screening for prediction, progress monitoring for identifying changes due to the
curricular and instructional intervention. The practice of using the same instrument for both
processes may stem from pragmatic decisions or a lack of conceptual understanding of the
different purposes for the measurements.
The frequency with which schools reported screening and progress monitoring give
further insight into the variability in how these schools understood RTI. Although most schools
seemed to screen just a few times a year, a few schools reported screening weekly, biweekly, and
monthly. Many schools reported progress monitoring only annually, biannually, tri-annually, or
quarterly. These two patterns gave us the impression these schools did not understand the
purposes of the measurements or have the ability to use the information in practical decisions. As
we suggested above, best practice suggests that multiple probes are needed on a regular interval
Screening and progress monitoring 24
The definitive version is available at www.blackwell-synergy.com
to make judgments about instructional effectiveness. As the intensity of the intervention
increases, we would expect to see a higher frequency of progress monitoring.
Equity issues may exist for the nearly two-thirds of schools that relied on such
nonstandard cut points as percentages of their local population or convergent data. As
Hollenbeck (2007) suggested, such differences between schools or districts may result in a
highly disparate number of students identified as at-risk in the screening process, or as
potentially having learning disabilities in the progress monitoring process. Thus, schools may be
putting themselves at-risk of litigation when making referral decisions for a special education
comprehensive evaluation. Parents may have the right to sue the district for arbitrary use of
practices that differ from the research standards or other communities.
Conclusion
Screening, progress monitoring, and diagnostic assessments reflect the values of a school
or district with regard to accuracy, equity, and economics. Therefore, we are not surprised by the
variability in these practices in schools around the nation. Will RTI mature as a framework for
prevention, early intervention, and as a component of SLD determination as less effective
methods drop out of the picture and more effective methods rise to the top? Or will confusion
reign and RTI be abandoned altogether?
As researchers and practitioners consider the answers to these questions, we note that in
our survey of schools with RTI practices, teachers who experienced data-based decision making
through screening and progress monitoring said they greatly prefer it over non-data-based
determination of instructional needs. In order for data-based decisions to be of the highest value,
we believe rational, equitable, and efficient assessment elements must be at the foundation. Thus

Screening and progress monitoring 25
The definitive version is available at www.blackwell-synergy.com
states, districts, and schools must devote financial resources, continue staff development, and
provide technical assistance for scaling up RTI practices with fidelity.
NOTE
1. We are not endorsing the products mentioned in the examples we give, but make specific note
of them because in some instances the schools’ choices for assessments had particular influences
on how their screening and progress monitoring RTI components were implemented.

Screening and progress monitoring 26
The definitive version is available at www.blackwell-synergy.com
References
Arkes, H. (1998). Impediments to accurate clinical judgment and possible ways to minimize
their impact. In H. Arkes & K. Hammond (Eds.) Judgment and decision making (pp. 582–
592.
Batsche, G., Curtis, J., Dorman, C., Castillo, J., & Porter, L.J. (2008). The Florida problem
solving/response to intervention model: Implementing a statewide initiative. In Jimerson, S.,
Burns, M., & VanDerHeyden, A. (Eds.) Handbook of response to intervention: The science
and practice of assessment and intervention (pp. 378–395). New York, NY: Springer.
Chun, M., & Witt, J. (2008). System to enhance educational performance. Retrieved July 7,
2008, from http://www.isteep.com/index.html
Coleman, M., Buysse, V., & Neitzel, J. (2006). Recognition and response: An early intervening
system for young children at-risk for learning disabilities. Full report. Chapel Hill: The
University of North Carolina at Chapel Hill, FPG Child Development Institute.
Compton, D. L., Fuchs, D. Fuchs, L.S., & Bryant, J. D. (2006). Selecting at-risk readers in first
grade for early intervention: A two-year longitudinal study of decision rules and
procedures. Journal of Educational Psychology, 98, 394–409.
Fuchs, D., & Deshler, D. (2007). What we need to know about responsiveness to intervention
(and shouldn’t be afraid to ask). Learning Disabilities Research and Practice 22(2), 129–
136.
Fuchs, D., & Fuchs, L.S. (2005). Responsiveness-to-intervention: A blueprint for practitioners,
policymakers, and parents. Teaching Exceptional Children, 38(1), 57–61.
Fuchs, D. & Fuchs, L. (2006). Introduction to response to intervention: What, why, and how
valid is it? Reading Research Quarterly, 41(1), 93–99.

Screening and progress monitoring 27
The definitive version is available at www.blackwell-synergy.com
Fuchs, D., Fuchs, L. & Compton, D. (2004). Identifying reading disabilities by responsiveness-
to-instruction: Specifying measures and criteria. Learning Disabilities Quarterly, 27(4),
216–227.
Good, R. & Kaminski, R. (2002). Dynamic Indicators of Basic Early Literacy Skills (6th ed.).
Eugene, OR: Institute for the Development of Educational Achievement. Retrieved June
7, 2006 from http://dibels.uoregon.edu/measures/orf.php
Hollenbeck, A. (2007). From IDEA to implementation: A discussion of foundational and future
responsiveness-to-intervention research. Learning Disabilities Research and Practice
22(2), 137–146.
Hoover, H., Dunbar, S., & Frisbie, D. (2001). Iowa tests of basic skills. Rolling Meadows, IL:
Riverside.
Jenkins, J. (2003, December). Candidate measures for screening at-risk students. Paper
presented at the NRCLD responsiveness-to-intervention symposium, Kansas City, MO.
Retrieved April 3, 2006, from http://www.nrcld.org/symposium2003/jenkins/index.html
Johnson, E., Mellard, D., Fuchs, D., & McKnight, M. (2006). Responsiveness to intervention
(RTI): How to do it. Lawrence, KS: National Research Center on Learning Disabilities.
MacGinitie, W., MacGinitie, R., Maria, K., Dreyer, L., & Hughes, K. (2002). Gates-MacGinitie
reading tests (4th ed.). Rolling Meadows, IL: Riverside.
Mellard, D., Byrd, S., Johnson, E., Tollefson, J., & Boesche, L. (2004). Foundations and research
on identifying model responsiveness-to-intervention sites. Learning Disabilities
Quarterly, 27(4), 243–256.
Mellard, D. & Johnson, E. (2007). RTI: A practitioner’s guide to implementing response to
intervention. Thousand Oaks, CA: Corwin Press.

Screening and progress monitoring 28
The definitive version is available at www.blackwell-synergy.com
National Center on Response to Intervention. (2009). RTI Library. Retrieved from
http://www.rti4success.org/ on June 15, 2009.
Shinn, M. (2008). Implementation in secondary schools. In S.Fernley, , S.D. LaRue, & J. Norlin
(Eds.). What do I do when: Answer book on RTI. (pp. 8:1–17). Arlington, VA: LRP
Publications.
Stecker, P., Fuchs, L.S. & Fuchs, D. (2005). Using curriculum-based measurement to improve
student achievement: Review of research. Psychology in the Schools, 42, 795–819.