Chapter2 CompiledV2.xlsx - IPCC
129
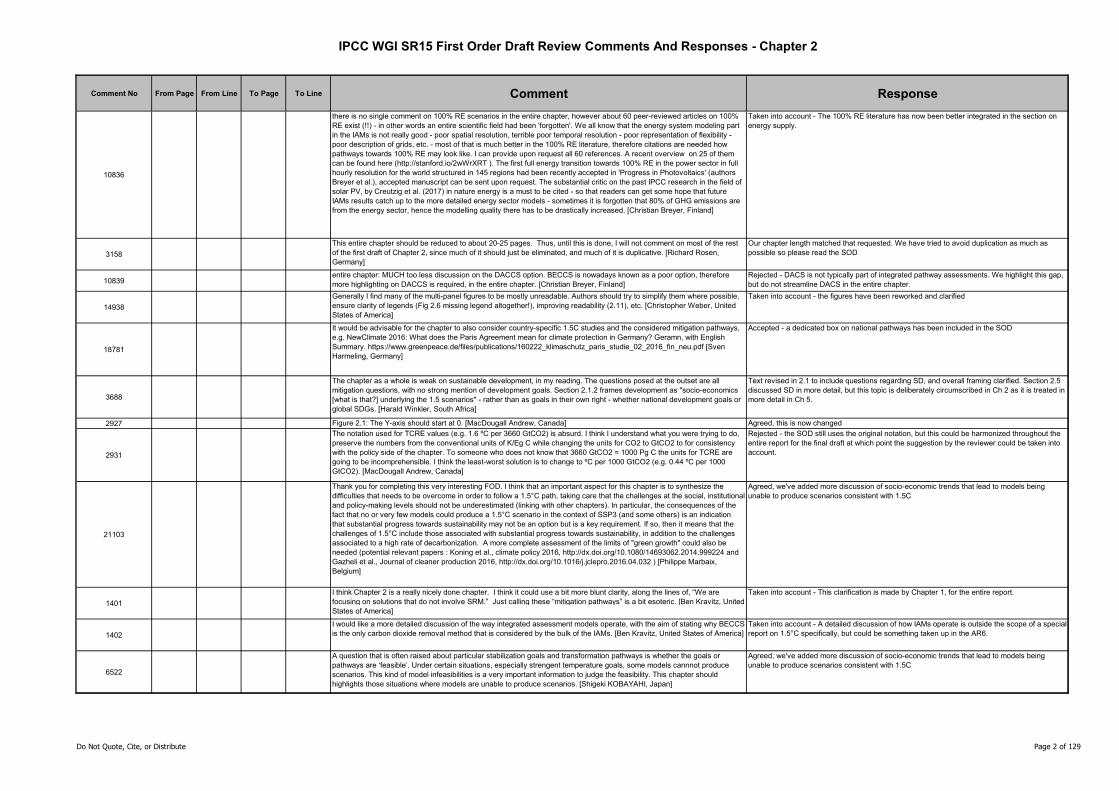
IPCC WGI SR15 First Order Draft Review Comments And Responses - Chapter 2 Comment No From Page From Line To Page To Line Comment Response 7937 Overall, I find this chapter to be well-written and balanced, sufficiently underpinned with recent research. [Jasmin Kemper, United Kingdom (of Great Britain and Northern Ireland)] Thank you. 11025 in general: discussion on technological and economic dimension of feasibility is underutilized [Oliver Geden, Germany] Point of clarification: aspects of feasibility are part of Chapter 4 and hence not included in Chapter 2. They are brought together, though, in the SPM. 1301 General comment on the whole chapter: Given that cities/urbanisation is one of the cross-chapter linking elements in this SR (and will be an area of particular attention in the main assessment report) it seems that more emphasis should be placed on highlighting the different SSP urbanisation projections and how those may or may not influence possible mitigation pathways and options. This is critical as cities will be a key entry point for practitioners and policy makers seeking to drive transformative change in pursuit of 1.5 and will allow for a more comprehensive narrative to be developed in the SR. [Debra Roberts, South Africa] Rejected - There is no literature known to the author team that links these aspects explicitly. 7194 Table 2.2. in the chapter context. Many figures show radiative forcing targets but the table does not relate temperature targets to forcing targets. The reader gets easily lost. [Nico Bauer, Germany] Taken into account. Both are important in various places as each is relevant but these are not the same. We emphasize temperature where practical. 17440 At least one scenario that avoids an overshoot of temperature goals and CDR should be explored. Perhaps including differentiation between various CDR options. Given the major human rights implications between the scenarios. Several studies exist for a non-overshoot non CDR options. Millar, R. J., Fuglestvedt, J. S., Friedlingstein, P., Rogelj, J., Grubb, M. J., Matthews, H. D., … Allen, M. R. (2017). Emission budgets and pathways consistent with limiting warming to 1.5[thinsp][deg]C. Nature Geosci, advance online publication. Retrieved from http://dx.doi.org/10.1038/ngeo3031 [Aki Kachi, Germany] The chapter has been revised to consider non-overshoot scenarios in response to several reviewer comments. As noted in the response to other comments, sustainable development issues are treated in ch 5 but not considered directly in ch 2 17441 differences between afforestation and ecosystem restauration should be highlighted including that afforestation efforts often result in tendency towards monoculture [Aki Kachi, Germany] Taken into account — this difference is now clarified 20515 The near to midterm time frame is far more critical as guidance to addressing mitigation in the coming 5 year timeframe. [Lili Fuhr, Germany] Noted, while it remains unclear which action the reviewer wishes the authors to undertake here. 12070 It would be good to have consistency in the terminology across the chapters. In this chapter, the term scenario is being used in the sense of pathways highlighted in Chapter 1. [Silvia Serrao-Neumann, Australia] We believe we have harmonized these usages. 14382 The results of Millar et al, 2017, https://doi.org/10.1038/NGEO3031 need to be included in the next iteration. [JACEK PISKOZUB, Poland] Agreed - this is now referenced 7984 The pressure and impact of energy crops on agriculture and forest exploitation can be strongly reduced by using technologies for enhanced biofuel production. 300 EJ biomass could be replaced by only 120 EJ biomass + 100 EJ electricity for producing the same amount of approx. 100 EJ second generation biofuel. The required 100 EJ electricity could be an additionnal way to store electricity from intermittent wind or solar electricity (with 50% energy yield) and/or could be produced from nuclear plants. Reference: Seiler J.M., Hohwiller C., Imbach J., Luciani J.F. Technical and economical evaluation of enhanced biomass to liquid fuel processes. Energy 35 (2010) 3587-3592 [Jean Marie Seiler, France] Noted 7985 The question of the feasibility of soil conversion, for instance: from pasture to energy crops, is not discussed. Quality of soils and pluviometry may not be compatible with such conversion, particularly if elevated yields are expected. [Jean Marie Seiler, France] Feasibility - real-world scalability of mitigation measures is part of the Chapter 4 assessment. 20512 The lack of transparency, and insufficient treatment of cost-benefit calculations incorporated into the IAMS on which the report is fundamentally based is unacceptable, and serves only to obfuscate and misguide policymakers who struggle to grasp the implications of models and scenarios. The importance of realistic incorporation of avoided damages has recently been clearly demonstrated in the wake of destruction from hurricanes Harvey, Irma and Maria. Texas, Puerto Rico and the Carribean Islands are faced with many billions in damages and reconstruction costs. These events and costs for reconstruction will only escalate as warming progresses and realistic treatment of such consequences should be clearly embedded in any economic analyses. [Lili Fuhr, Germany] Rejected - The CBA-IAM literature on the social costs of carbon (including avoided impacts) is assessed in Chapter 3 to the extent it pertains to the subject of 1.5°C warming. Furthermore, the impacts of mitigation (cost, benefits, co-impacts, trade-offs) on sustainable development are explicitly treated in Ch5. Chapter 2 does not assess the literature on cost-benefit IAMs. 1836 Coherence with Chapter 5: Some of the critical assessments provided in Chapter 2 are not adequately taken into account in Ch. 5, especially those which indicate to need for robust global emission reductions already by 2030 (otherwise: “the modest emissions reductions until 2030 imply subsequent reductions and transformations that are too steep and too abrupt to be achieved by the mitigation options in the models”). Therefore, a better coherence is needed especially concerning the conclusions on the emission mitigation pathways and on the CRDPs in line with the 1.5°C target for the shorter term period by 2030. [Tibor Farago, Hungary] Accepted - Section 2.5.3 now directly draws upon the assessment of Chapter 5 to link pathways and portfolios in the context of sustainable development, ensuring, however, that no overlap exist between the chapters. 7222 The estimates of required changes in renewable energy investment, electricity investment and coal divestment are extremley useful. But do these estimates factor in the rapidly falling cost of renewable energy - in 2016 capacity increased 9% but annual investment actually decreased do to falling costs (if Ren21 can be believed). This has implications for IAM assestion that a more ambitious temperature target will impose a higher economic cost. The set of options for both reducing emission and saving money is increasing annually. [Anton Cartwright, South Africa] Discussion on investment was added. 17211 The executive summary needs to be simplified in a way that is usable by policymakers. [Carlos Garci Soto, Spain] Accepted - we hope the SOD ES is more accessible now and that the SPM is even better Do Not Quote, Cite, or Distribute Page 1 of 129
-
Upload
khangminh22 -
Category
Documents
-
view
0 -
download
0
Transcript of Chapter2 CompiledV2.xlsx - IPCC

IPCC WGI SR15 First Order Draft Review Comments And Responses - Chapter 2
Comment No From Page From Line To Page To Line Comment Response
7937Overall, I find this chapter to be well-written and balanced, sufficiently underpinned with recent research. [Jasmin Kemper, United Kingdom (of Great Britain and Northern Ireland)]
Thank you.
11025in general: discussion on technological and economic dimension of feasibility is underutilized [Oliver Geden, Germany] Point of clarification: aspects of feasibility are part of Chapter 4 and hence not included in
Chapter 2. They are brought together, though, in the SPM.
1301
General comment on the whole chapter: Given that cities/urbanisation is one of the cross-chapter linking elements in this SR (and will be an area of particular attention in the main assessment report) it seems that more emphasis should be placed on highlighting the different SSP urbanisation projections and how those may or may not influence possible mitigation pathways and options. This is critical as cities will be a key entry point for practitioners and policy makers seeking to drive transformative change in pursuit of 1.5 and will allow for a more comprehensive narrative to be developed in the SR. [Debra Roberts, South Africa]
Rejected - There is no literature known to the author team that links these aspects explicitly.
7194Table 2.2. in the chapter context. Many figures show radiative forcing targets but the table does not relate temperature targets to forcing targets. The reader gets easily lost. [Nico Bauer, Germany]
Taken into account. Both are important in various places as each is relevant but these are not the same. We emphasize temperature where practical.
17440
At least one scenario that avoids an overshoot of temperature goals and CDR should be explored. Perhaps including differentiation between various CDR options. Given the major human rights implications between the scenarios. Several studies exist for a non-overshoot non CDR options. Millar, R. J., Fuglestvedt, J. S., Friedlingstein, P., Rogelj, J., Grubb, M. J., Matthews, H. D., … Allen, M. R. (2017). Emission budgets and pathways consistent with limiting warming to 1.5[thinsp][deg]C. Nature Geosci, advance online publication. Retrieved from http://dx.doi.org/10.1038/ngeo3031 [Aki Kachi, Germany]
The chapter has been revised to consider non-overshoot scenarios in response to several reviewer comments. As noted in the response to other comments, sustainable development issues are treated in ch 5 but not considered directly in ch 2
17441differences between afforestation and ecosystem restauration should be highlighted including that afforestation efforts often result in tendency towards monoculture [Aki Kachi, Germany]
Taken into account — this difference is now clarified
20515The near to midterm time frame is far more critical as guidance to addressing mitigation in the coming 5 year timeframe. [Lili Fuhr, Germany]
Noted, while it remains unclear which action the reviewer wishes the authors to undertake here.
12070It would be good to have consistency in the terminology across the chapters. In this chapter, the term scenario is being used in the sense of pathways highlighted in Chapter 1. [Silvia Serrao-Neumann, Australia]
We believe we have harmonized these usages.
14382The results of Millar et al, 2017, https://doi.org/10.1038/NGEO3031 need to be included in the next iteration. [JACEK PISKOZUB, Poland]
Agreed - this is now referenced
7984
The pressure and impact of energy crops on agriculture and forest exploitation can be strongly reduced by using technologies for enhanced biofuel production. 300 EJ biomass could be replaced by only 120 EJ biomass + 100 EJ electricity for producing the same amount of approx. 100 EJ second generation biofuel. The required 100 EJ electricity could be an additionnal way to store electricity from intermittent wind or solar electricity (with 50% energy yield) and/or could be produced from nuclear plants. Reference: Seiler J.M., Hohwiller C., Imbach J., Luciani J.F. Technical and economical evaluation of enhanced biomass to liquid fuel processes. Energy 35 (2010) 3587-3592 [Jean Marie Seiler, France]
Noted
7985
The question of the feasibility of soil conversion, for instance: from pasture to energy crops, is not discussed. Quality of soils and pluviometry may not be compatible with such conversion, particularly if elevated yields are expected. [Jean Marie Seiler, France]
Feasibility - real-world scalability of mitigation measures is part of the Chapter 4 assessment.
20512
The lack of transparency, and insufficient treatment of cost-benefit calculations incorporated into the IAMS on which the report is fundamentally based is unacceptable, and serves only to obfuscate and misguide policymakers who struggle to grasp the implications of models and scenarios. The importance of realistic incorporation of avoided damages has recently been clearly demonstrated in the wake of destruction from hurricanes Harvey, Irma and Maria. Texas, Puerto Rico and the Carribean Islands are faced with many billions in damages and reconstruction costs. These events and costs for reconstruction will only escalate as warming progresses and realistic treatment of such consequences should be clearly embedded in any economic analyses. [Lili Fuhr, Germany]
Rejected - The CBA-IAM literature on the social costs of carbon (including avoided impacts) is assessed in Chapter 3 to the extent it pertains to the subject of 1.5°C warming. Furthermore, the impacts of mitigation (cost, benefits, co-impacts, trade-offs) on sustainable development are explicitly treated in Ch5. Chapter 2 does not assess the literature on cost-benefit IAMs.
1836
Coherence with Chapter 5: Some of the critical assessments provided in Chapter 2 are not adequately taken into account in Ch. 5, especially those which indicate to need for robust global emission reductions already by 2030 (otherwise: “the modest emissions reductions until 2030 imply subsequent reductions and transformations that are too steep and too abrupt to be achieved by the mitigation options in the models”). Therefore, a better coherence is needed especially concerning the conclusions on the emission mitigation pathways and on the CRDPs in line with the 1.5°C target for the shorter term period by 2030. [Tibor Farago, Hungary]
Accepted - Section 2.5.3 now directly draws upon the assessment of Chapter 5 to link pathways and portfolios in the context of sustainable development, ensuring, however, that no overlap exist between the chapters.
7222
The estimates of required changes in renewable energy investment, electricity investment and coal divestment are extremley useful. But do these estimates factor in the rapidly falling cost of renewable energy - in 2016 capacity increased 9% but annual investment actually decreased do to falling costs (if Ren21 can be believed). This has implications for IAM assestion that a more ambitious temperature target will impose a higher economic cost. The set of options for both reducing emission and saving money is increasing annually. [Anton Cartwright, South Africa]
Discussion on investment was added.
17211 The executive summary needs to be simplified in a way that is usable by policymakers. [Carlos Garci Soto, Spain] Accepted - we hope the SOD ES is more accessible now and that the SPM is even better
Do Not Quote, Cite, or Distribute Page 1 of 129
IPCC WGI SR15 First Order Draft Review Comments And Responses - Chapter 2
Comment No From Page From Line To Page To Line Comment Response
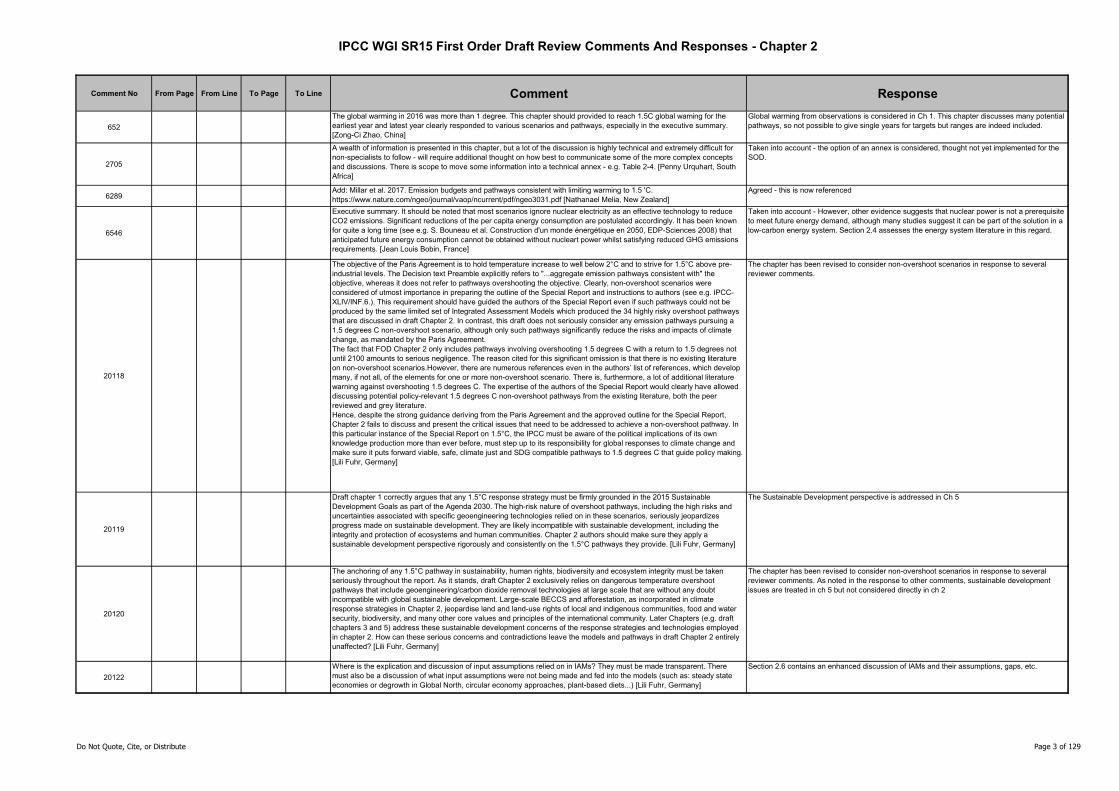
10836
there is no single comment on 100% RE scenarios in the entire chapter, however about 60 peer-reviewed articles on 100% RE exist (!!) - in other words an entire scientific field had been 'forgotten'. We all know that the energy system modeling part in the IAMs is not really good - poor spatial resolution, terrible poor temporal resolution - poor representation of flexibility - poor description of grids, etc. - most of that is much better in the 100% RE literature, therefore citations are needed how pathways towards 100% RE may look like. I can provide upon request all 60 references. A recent overview on 25 of them can be found here (http://stanford.io/2wWrXRT ). The first full energy transition towards 100% RE in the power sector in full hourly resolution for the world structured in 145 regions had been recently accepted in 'Progress in Photovoltaics' (authors Breyer et al.), accepted manuscript can be sent upon request. The substantial critic on the past IPCC research in the field of solar PV, by Creutzig et al. (2017) in nature energy is a must to be cited - so that readers can get some hope that future IAMs results catch up to the more detailed energy sector models - sometimes it is forgotten that 80% of GHG emissions are from the energy sector, hence the modelling quality there has to be drastically increased. [Christian Breyer, Finland]
Taken into account - The 100% RE literature has now been better integrated in the section on energy supply.
3158
This entire chapter should be reduced to about 20-25 pages. Thus, until this is done, I will not comment on most of the rest of the first draft of Chapter 2, since much of it should just be eliminated, and much of it is duplicative. [Richard Rosen, Germany]
Our chapter length matched that requested. We have tried to avoid duplication as much as possible so please read the SOD
10839entire chapter: MUCH too less discussion on the DACCS option. BECCS is nowadays known as a poor option, therefore more highlighting on DACCS is required, in the entire chapter. [Christian Breyer, Finland]
Rejected - DACS is not typically part of integrated pathway assessments. We highlight this gap, but do not streamline DACS in the entire chapter.
14938
Generally I find many of the multi-panel figures to be mostly unreadable. Authors should try to simplify them where possible, ensure clarity of legends (Fig 2.6 missing legend altogether!), improving readability (2.11), etc. [Christopher Weber, United States of America]
Taken into account - the figures have been reworked and clarified
18781
It would be advisable for the chapter to also consider country-specific 1.5C studies and the considered mitigation pathways, e.g. NewClimate 2016: What does the Paris Agreement mean for climate protection in Germany? Geramn, with English Summary. https://www.greenpeace.de/files/publications/160222_klimaschutz_paris_studie_02_2016_fin_neu.pdf [Sven Harmeling, Germany]
Accepted - a dedicated box on national pathways has been included in the SOD
3688
The chapter as a whole is weak on sustainable development, in my reading. The questions posed at the outset are all mitigation questions, with no strong mention of development goals. Section 2.1.2 frames development as "socio-economics [what is that?] underlying the 1.5 scenarios" - rather than as goals in their own right - whether national development goals or global SDGs. [Harald Winkler, South Africa]
Text revised in 2.1 to include questions regarding SD, and overall framing clarified. Section 2.5 discussed SD in more detail, but this topic is deliberately circumscribed in Ch 2 as it is treated in more detail in Ch 5.
2927 Figure 2.1: The Y-axis should start at 0. [MacDougall Andrew, Canada] Agreed, this is now changed
2931
The notation used for TCRE values (e.g. 1.6 ºC per 3660 GtCO2) is absurd. I think I understand what you were trying to do, preserve the numbers from the conventional units of K/Eg C while changing the units for CO2 to GtCO2 to for consistency with the policy side of the chapter. To someone who does not know that 3660 GtCO2 = 1000 Pg C the units for TCRE are going to be incomprehensible. I think the least-worst solution is to change to ºC per 1000 GtCO2 (e.g. 0.44 ºC per 1000 GtCO2). [MacDougall Andrew, Canada]
Rejected - the SOD still uses the original notation, but this could be harmonized throughout the entire report for the final draft at which point the suggestion by the reviewer could be taken into account.
21103
Thank you for completing this very interesting FOD. I think that an important aspect for this chapter is to synthesize the difficulties that needs to be overcome in order to follow a 1.5°C path, taking care that the challenges at the social, institutional and policy-making levels should not be underestimated (linking with other chapters). In particular, the consequences of the fact that no or very few models could produce a 1.5°C scenario in the context of SSP3 (and some others) is an indication that substantial progress towards sustainability may not be an option but is a key requirement. If so, then it means that the challenges of 1.5°C include those associated with substantial progress towards sustainability, in addition to the challenges associated to a high rate of decarbonization. A more complete assessment of the limits of "green growth" could also be needed (potential relevant papers : Koning et al., climate policy 2016, http://dx.doi.org/10.1080/14693062.2014.999224 and Gazheli et al., Journal of cleaner production 2016, http://dx.doi.org/10.1016/j.jclepro.2016.04.032 ) [Philippe Marbaix, Belgium]
Agreed, we've added more discussion of socio-economic trends that lead to models being unable to produce scenarios consistent with 1.5C
1401
I think Chapter 2 is a really nicely done chapter. I think it could use a bit more blunt clarity, along the lines of, “We are focusing on solutions that do not involve SRM.” Just calling these “mitigation pathways” is a bit esoteric. [Ben Kravitz, United States of America]
Taken into account - This clarification is made by Chapter 1, for the entire report.
1402
I would like a more detailed discussion of the way integrated assessment models operate, with the aim of stating why BECCS is the only carbon dioxide removal method that is considered by the bulk of the IAMs. [Ben Kravitz, United States of America]
Taken into account - A detailed discussion of how IAMs operate is outside the scope of a special report on 1.5°C specifically, but could be something taken up in the AR6.
6522
A question that is often raised about particular stabilization goals and transformation pathways is whether the goals or pathways are ‘feasible’. Under certain situations, especially strengent temperature goals, some models cannnot produce scenarios. This kind of model infeasibilities is a very important information to judge the feasibility. This chapter should highlights those situations where models are unable to produce scenarios. [Shigeki KOBAYAHI, Japan]
Agreed, we've added more discussion of socio-economic trends that lead to models being unable to produce scenarios consistent with 1.5C
Do Not Quote, Cite, or Distribute Page 2 of 129
IPCC WGI SR15 First Order Draft Review Comments And Responses - Chapter 2
Comment No From Page From Line To Page To Line Comment Response
652
The global warming in 2016 was more than 1 degree. This chapter should provided to reach 1.5C global waming for the earliest year and latest year clearly responded to various scenarios and pathways, especially in the executive summary. [Zong-Ci Zhao, China]
Global warming from observations is considered in Ch 1. This chapter discusses many potential pathways, so not possible to give single years for targets but ranges are indeed included.
2705
A wealth of information is presented in this chapter, but a lot of the discussion is highly technical and extremely difficult for non-specialists to follow - will require additional thought on how best to communicate some of the more complex concepts and discussions. There is scope to move some information into a technical annex - e.g. Table 2-4. [Penny Urquhart, South Africa]
Taken into account - the option of an annex is considered, thought not yet implemented for the SOD.
6289Add: Millar et al. 2017. Emission budgets and pathways consistent with limiting warming to 1.5 'C. https://www.nature.com/ngeo/journal/vaop/ncurrent/pdf/ngeo3031.pdf [Nathanael Melia, New Zealand]
Agreed - this is now referenced
6546
Executive summary. It should be noted that most scenarios ignore nuclear electricity as an effective technology to reduce CO2 emissions. Significant reductions of the per capita energy consumption are postulated accordingly. It has been known for quite a long time (see e.g. S. Bouneau et al. Construction d'un monde énergétique en 2050, EDP-Sciences 2008) that anticipated future energy consumption cannot be obtained without nucleart power whilst satisfying reduced GHG emissions requirements. [Jean Louis Bobin, France]
Taken into account - However, other evidence suggests that nuclear power is not a prerequisite to meet future energy demand, although many studies suggest it can be part of the solution in a low-carbon energy system. Section 2.4 assesses the energy system literature in this regard.
20118
The objective of the Paris Agreement is to hold temperature increase to well below 2°C and to strive for 1.5°C above pre-industrial levels. The Decision text Preamble explicitly refers to "...aggregate emission pathways consistent with" the objective, whereas it does not refer to pathways overshooting the objective. Clearly, non-overshoot scenarios were considered of utmost importance in preparing the outline of the Special Report and instructions to authors (see e.g. IPCC- XLIV/INF.6.). This requirement should have guided the authors of the Special Report even if such pathways could not be produced by the same limited set of Integrated Assessment Models which produced the 34 highly risky overshoot pathways that are discussed in draft Chapter 2. In contrast, this draft does not seriously consider any emission pathways pursuing a 1.5 degrees C non-overshoot scenario, although only such pathways significantly reduce the risks and impacts of climate change, as mandated by the Paris Agreement.The fact that FOD Chapter 2 only includes pathways involving overshooting 1.5 degrees C with a return to 1.5 degrees not until 2100 amounts to serious negligence. The reason cited for this significant omission is that there is no existing literature on non-overshoot scenarios.However, there are numerous references even in the authors’ list of references, which develop many, if not all, of the elements for one or more non-overshoot scenario. There is, furthermore, a lot of additional literature warning against overshooting 1.5 degrees C. The expertise of the authors of the Special Report would clearly have allowed discussing potential policy-relevant 1.5 degrees C non-overshoot pathways from the existing literature, both the peer reviewed and grey literature.Hence, despite the strong guidance deriving from the Paris Agreement and the approved outline for the Special Report, Chapter 2 fails to discuss and present the critical issues that need to be addressed to achieve a non-overshoot pathway. In this particular instance of the Special Report on 1.5°C, the IPCC must be aware of the political implications of its own knowledge production more than ever before, must step up to its responsibility for global responses to climate change and make sure it puts forward viable, safe, climate just and SDG compatible pathways to 1.5 degrees C that guide policy making. [Lili Fuhr, Germany]
The chapter has been revised to consider non-overshoot scenarios in response to several reviewer comments.
20119
Draft chapter 1 correctly argues that any 1.5°C response strategy must be firmly grounded in the 2015 Sustainable Development Goals as part of the Agenda 2030. The high-risk nature of overshoot pathways, including the high risks and uncertainties associated with specific geoengineering technologies relied on in these scenarios, seriously jeopardizes progress made on sustainable development. They are likely incompatible with sustainable development, including the integrity and protection of ecosystems and human communities. Chapter 2 authors should make sure they apply a sustainable development perspective rigorously and consistently on the 1.5°C pathways they provide. [Lili Fuhr, Germany]
The Sustainable Development perspective is addressed in Ch 5
20120
The anchoring of any 1.5°C pathway in sustainability, human rights, biodiversity and ecosystem integrity must be taken seriously throughout the report. As it stands, draft Chapter 2 exclusively relies on dangerous temperature overshoot pathways that include geoengineering/carbon dioxide removal technologies at large scale that are without any doubt incompatible with global sustainable development. Large-scale BECCS and afforestation, as incorporated in climate response strategies in Chapter 2, jeopardise land and land-use rights of local and indigenous communities, food and water security, biodiversity, and many other core values and principles of the international community. Later Chapters (e.g. draft chapters 3 and 5) address these sustainable development concerns of the response strategies and technologies employed in chapter 2. How can these serious concerns and contradictions leave the models and pathways in draft Chapter 2 entirely unaffected? [Lili Fuhr, Germany]
The chapter has been revised to consider non-overshoot scenarios in response to several reviewer comments. As noted in the response to other comments, sustainable development issues are treated in ch 5 but not considered directly in ch 2
20122
Where is the explication and discussion of input assumptions relied on in IAMs? They must be made transparent. There must also be a discussion of what input assumptions were not being made and fed into the models (such as: steady state economies or degrowth in Global North, circular economy approaches, plant-based diets...) [Lili Fuhr, Germany]
Section 2.6 contains an enhanced discussion of IAMs and their assumptions, gaps, etc.
Do Not Quote, Cite, or Distribute Page 3 of 129

IPCC WGI SR15 First Order Draft Review Comments And Responses - Chapter 2
Comment No From Page From Line To Page To Line Comment Response
20123
IAMs must be run with non-growth-oriented economic assumptions, absolute decreases in resource and energy consumption, and other radical emission reductions pathways. Such assumptions may yield non-overshoot scenarios and they are no more politically unrealistic than geoengineering options that are considered in the models. [Lili Fuhr, Germany]
Rejected - This report (or the IPCC as an institution) does not produce scenarios (at least not anymore since its 2000 Special Report). The assessment thus relies on the published literature on this topic.
20124
Since AR5, the IPCC has been criticised for the use of BECCS in RCP scenarios. SR1.5 should not continue relying on large-scale deployment of BECCS, and also afforestation. The risks and adverse impacts are manifold. One such risk is that reliance on negative-emissions technologies coming into existence locks in carbon-intensive economic developments and infrastructure (Anderson/Peters 2016 The trouble with negative emissions). [Lili Fuhr, Germany]
Noted - The IPCC assesses the literature in this regard. This Chapter assesses the various configurations that exist in terms of CDR, highlighting that some scenarios use no BECCS - yet require drastic reductions in per capita energy demand.
20125
In terms of technology development, BECCS is still in its infancy, and CCS-based technologies are failing across the board (see media reports about Kemper project etc.). Nevertheless, models assume a mature and large-scale rollout as soon as 2030. It is irresponsible and unscientific for the IPCC to adopt these assumptions. [Lili Fuhr, Germany]
Noted - The IPCC assesses the literature in this regard. Chapter 4 assesses the maturity of technologies and the possibilities for it to scale up. The combinations of these two assessments will lead to a holistic view on this issue.
20381
Having looked at the literature on the subject, I am extremely skeptical of the published ranges of global 2030 emissions under NDCs. The published estimates are not transparent (there is basically no way to trace the published number), they rely heavily on IAM, are not disaggregated to the country level, and are dependent on the scenarios used. The apparent agreement between a few publications is either forfuitous or because there is interdependency between the studies. Rogelj et al (Nat Comm, 2017) themsemves have revised the range to 47 to 63 GtCO2-eq. We have our own study (still in submitted stage because some resistance from reviewers) showing a larger emission range. It doesn't mean that I believe 2030 emissions to be high, but simply that NDCs do not reflect our best guess of where 2030 emissions will be. In a sense NDCs are less ambitious than current policies embedded in IAM so in any case I wouldn't attribute the 49-58 GtCO2-eq yr-1 range solely to NDCs... [Olivier Boucher, France]
Accepted - The NDC assessment has been made consistent with the cross-chapter assessment of NDCs as reported in the Cross-chapter box on NDCs
20126
BECCS land-use implications could include terrestrial species losses equivalent to at least 2.8°C termperature rise (P. Williamson, Nature 530, 153 (2016)) [Lili Fuhr, Germany]
Noted. This is a correct quote from the paper, which in itself is an adequate reflection of the findings of Newbold et al (2015) Nature. Therefore, in our chapter we have assessed the full literature in this regard and show how there are different options used by scenarios which result in significantly lower levels of bioenergy. The assessment of the impacts of bioenergy deployment is outside the scope of our chapter.
20128Chapter 2 authors should ensure that environmental and social sciences perspectives and concerns are not sidelined but must be at the core of any sustainable development compatible pathway to 1.5°C. [Lili Fuhr, Germany]
The Sustainable Development perspective is addressed in Ch 5
9128
I think it would be worthwhile to consider including national scale studies. Here Oshiro et al (under review) is one of the examples, although national studies are quite limited. I also heard that Jiang Kejun who is the LCA of this chapter has Chinese study paper which is now under review. Here I attach Japanese paper draft link.
Oshiro K, Kainuma M, Masui T, Transformation of Japan's energy system to attain net-zero emission by 2050,Carbon Management.https://fxp.nies.go.jp/public/0uzIwAYNXshAhWkBgBhe492pyxnAoGSwwEnZBDOFBELK [Shinichiro Fujimori, Japan]
Accepted - a dedicated box on national pathways has been included in the SOD
4781
Key findings and big challenges/prerequisites for achieving a 1.5 oC world should be summarized in a last (additional) section at the end of the chapter. [Elena Georgopoulou, Greece]
This is an excellent suggestion, which, however, was not implemented due to limited time for the revisions process. The ES provides an overview of these challenges, which, being situated at the front of the chapter, should also be clearly visible to readers.
692
The global warming in 2016 was more than 1 degree. This chapter should provided to reach 1.5C global waming for the earliest year and latest year clearly responded to various scenarios and pathways, especially in the executive summary. [Zong-Ci Zhao, China]
Global warming from observations is considered in Ch 1. This chapter discusses many potential pathways, so not possible to give single years for targets but ranges are indeed included.
20152
Authors should highlight short-term radical CO2 emission reduction requirements, and address the equity dimension of failing to do so and of relying on large-scale negative emissions ubiquitously, especially for big emitting nations - see Larkin et al. 2017 What if negative emission technologies fail at scale? Implications of the Paris Agreement for big emitting nations, in: Climate Policy, https://doi.org/10.1080/14693062.2017.1346498 [Lili Fuhr, Germany]
Taken into account - the SOD now includes a new section on overshoot and non-overshoot scenarios, highlighting the requirement for near-term emissions reductions for the latter. Equity issues are not part of the approved outline of our chapter.
17593
General comment: Given the profound uncertainties around the possible application of Negative Emission Technologies (NETs - see e.g. Anderson, K. & G. Peters, Science (2016), https://doi.org/10.1126/science.aah4567 ) the SR1.5 report should take care to include as many scenarios as possible that limits the amount of NETs as much as possible. This will be important in order to highlight the possible choices that policymakers face, and to clarify what it would mean to achieve pathways that rely less on large-scale NET deployment. [Bård Lahn, Norway]
The chapter has been revised to consider non-overshoot scenarios in response to several reviewer comments. As noted in the response to other comments, sustainable development issues are treated in ch 5 but not considered directly in ch 2
10431
throughout ch 2 SSP1. Sorry for ignorance of literature, but is there a serious likelihood of the world population falling to 7 bn by the end of the century (other than by disaster)? If this is just an illustrative scenario it might be worth saying so. If it happens as a result of global policy choices we should say so too. The notion of a falling population as part of SSP1 occurs several times in this chapter and it always pulls me up (e.g. discussion on sustainability at p 2-61). If a population fall over the century is possible I submit it’s not widely known and could still be explained. [Jonathan Lynn, Switzerland]
Taken into account - An in-depth assessment of population projections lies outside the scope of this special report on 1.5°C. However, the chapter does now highlight its importance for achieving stringent mitigation objectives.
Do Not Quote, Cite, or Distribute Page 4 of 129
IPCC WGI SR15 First Order Draft Review Comments And Responses - Chapter 2
Comment No From Page From Line To Page To Line Comment Response
10432
Maybe this is just scientific convention, but I have a problem with the way scenarios are described. E.g. p2-5 lines 8-9 “Already by 2030, all end-use sectors, like the building, transport and industry sector, show significant demand reductions in 1.5ºC pathways…” To me this implies that is what is going to happen. But later in the chapter we read that in the real world we're unlikely to hold warming to 1.5 despite the dozens of scenarios and pathways that show how that might happen. So in this example it could be “1.5 pathways imply that by 2030 all end-use sectors, like the building, transport and industry sector, would have to show significant demand reductions…” This is an issue throughout the chapter and report. [Jonathan Lynn, Switzerland]
Clarity is very important. At the same time, a distinction needs to be made between measures that are "required" and evolutions that are merely "consistent". In the SOD, we have attempted to make this clearer wherever possible.
20160
There are approaches to bind CO2 that combine technological readiness, low cost and clear environmental co-benefits, such as ecosystem restoration (forests, conservation agriculture, coastal restoration). Field, C.B./Mach, K.J. (2017) Rightsizing carbon dioxide removal, in: Science, Vol. 356, No. 6339, pp. 706-707; see also Latawiec, A.E. et al (2015) Creating space for large-scale restoration in tropical agricultural landscapes, in: Fron Ecol Environ, 13(4): 211-218, doi:10.1890/140052 [Lili Fuhr, Germany]
rejected - this chapter does assess mitigation pathways. Benefits and opportunities are assessed in chap 4 and 5
10433
Many figures in this chapter have similar structures and could therefore be candidates for building up in an electronic version e.g. 2.1-2.4, and 2.6-2.10, and 2.11-2.13, and 2.16-2.18 + 2.20-2.21, and 2.22-2.27 [Jonathan Lynn, Switzerland]
Noted
20162
For its latest report, the Intergovernmental Panel on Climate Change (IPCC) analyzed about 900 scenarios from about 30 integrated assessment models. These models determine a cost-effective mix of technologies, based on estimated technology costs and on climate policy, including carbon pricing. Of the 116 scenarios with a 66% or better chance of limiting global warming to 2°C by 2100, 101 include CDR, mostly BECCS, in the technology mix for the second half of the 21st centur. Across these scenarios, the median commitment to carbon dioxide removal from BECCS in 2100 is about 12 billion tons of CO2 per year, equivalent to more than 25% of current CO2 emissions. This is truly massive use of a technology with little real-world experience and poorly known economics. The requirements for land and water are large but uncertain. Based on relatively optimistic assumptions about future yields, this BECCS commitment corresponds to 0.4 to 0.7 billion ha of productive land; more conservative assumptions yield a land requirement of 1.2 billion ha. This range is about 25 to 80% of total current global cropland or up o 8% of Earth’s land area. Converting land on this staggering scale would pit climate change responses against food security and biodiversity protection. Massively expanding managed land for CDR could crash through the planetary boundary for sustainable land use. Field, C.B./Mach, K.J. (2017) Rightsizing carbon dioxide removal, in: Science, Vol. 356, No. 6339, pp.706-707. -- Chapter 2 authors should make the implications of the assumptions made in the models very clear to readers and policymakers. See also J. Röckström et al., Ecol. Soc. 14, 32 (2009) on planetary boundaries, W. Steffen et al., Science 347, 1259855 (2015), Smith et al. 2016 Biophysical and economic limits to negative CO2 emissions, in: Nature Climate Change 6, 42-50, doi:10.1038/nclimate2870 [Lili Fuhr, Germany]
Taken into account - The IPCC assesses the literature in this regard. This Chapter assesses the various configurations that exist in terms of CDR, highlighting that some scenarios use no BECCS - yet require drastic reductions in per capita energy demand.
6085
Well written and balanced. For CCS I would recommend review and potential use if appropriate of the papers from International Journal of Greenhouse Gas Control 40 (2015) as this was a 'Special Issue' to review developments in knowledge since the IPCC Special Report on CCS (2005). [Tim Dixon, United Kingdom (of Great Britain and Northern Ireland)]
Noted - Although the assessment of the technology in itself is not part of the assessment in Chapter 2
20166
Chapter 2 and chapter 4 authors should look at Kreidenweis et al. (2016) Afforestation to mitigate climate change: impacts on food prices under consideration of albedo effects, Environmental Research Letters, 11, dx.doi.org/10.1088/1748-9326/11/8/085001 for the impacts of large-scale afforestation on global food prices [Lili Fuhr, Germany]
Taken into account - Chapters 3 and 4 assesses the impacts of individual mitigation options.
20427
From the perspective of policy makers, the discount rate determines to a large extent what is perceived to be cost effective mitigation. A 5% discount rate is, arguably, even high for a private investor discount rate these days, but it is certainly inappropriate for this Special Report. Cost-effective mitigation is a societal imperative not a matter of private profit and loss. [Lili Fuhr, Germany]
Taken into account - where available also scenarios with lower discount rates have been assessed. However, the available literature is limited in this area. This aspect is also highlighted in the limitations section 2.6.
2780
Humberto Llavador, John E. Roemer and Joaquim Silvestre, Sustainability for a Warming Planet, Harvard University Press uses an IAM that is constrained to achieve an emissions trajectory. The book reports results for a 2oC trajectory. They may haveor be able to run a 1.5oC case. In any case the results for this IAM are not reflected in the chapter. [Erik Haites, Canada]
Noted - this chapter provides an assessment of the literature, not an exhaustive review of every single pathway published on either 1.5°C or 2°C
20164
See Boysen, L.R.,W. Lucht, D. Gerten, V. Heck, T. M. Lenton, and H. J. Schellnhuber (2017), The limits to global-warming mitigation by terrestrial carbon removal, Earth’s Future, 5, doi:10.1002/2016EF000469 for an analysis of the profound trade-offs of Terrestrial CDR (tCDR) including loss of natural ecosystems, reductions in food production, and adverse effects of heavy fertilizer application. The authors also conclude that tCDR is not a viable option for countering unabated anthropogenic greenhouse gas emissions, and even in the RCP2.6 scenario, the tCDR amount needed to hold the 2°C warming line requires massive inputs including extensive irrigation. -- Chapter 2 authors should review the sustainable development compatibility of the models used in their chapter and make the implications of the assumptions made in the models very clear to readers and policymakers. [Lili Fuhr, Germany]
Taken into account, discussed in 2.3.4.2.
Do Not Quote, Cite, or Distribute Page 5 of 129

IPCC WGI SR15 First Order Draft Review Comments And Responses - Chapter 2
Comment No From Page From Line To Page To Line Comment Response
968
I found it nearly impossible to follow the detail in this chapter. Some of this reflects that the draft exists even though many scenarios are not yet published or included (as far as I can tell) in the anlalysis, so not sure whether/why we are reading something that is not complete. Even some of the scenarios that seem to be part of the 34 <1.5 scenarios assessed in this chapter are in papers that are not accessible to reviewers (e.g., Rogelj et al, 2017--which is listed as under review at NCC). Some of this opacity is because the figures are mind numbingly complex and not properly captioned (for example, figure 1.8 refers to a coloring scheme in figure 2.17, but as far as I can tell the coloring scheme in 2.17 is totally different). And most disturbing is the lack of hardly any attention to realism of the assumptions--nor to whether the IAM teams have ground-truthed their models. the IPCC will be savaged for this point when people start focusing on the details. this is a very serious blind spot in the report--even when the chapter turns to specific technologies there is almost no discussion of ground-truthing and realism. In a few places where there are implied comparisons with reality (e.g., p.36, line 10; or p.40, line 18 discussing long-lived building infrastructure) they are so think as to raise more questions than they answer. the discussion of building infrastructure does something that only the Trump White house could do--take a topic that is, on balance, a severe constraint on rates of change and rebrand it as an "opportunity". there is some discussion of second-best modeling near the end of the chapter, but that discussion is very thin and does not actually perform much/any of the analysis that was done in AR5 to look at how second-best affects costs. [Victor Davd, United States of America]
Taken into account - the limited amount of literature available at the time of the FOD (only published papers and papers in review were allowed to be cited) indeed resulted in a skewed view. The SOD was able to draw from a much larger literature basis. The IPCC cannot "ground-truth" models as such, but the combination of the pathway assessment of Chapter 2 and the measures and policy assessment of Chapter 4 should provide a kind of reality check for what is technically available. The discussion of second-best literature linked to 1.5°C can (and should) be elaborated as more studies become available.
2779
The chapter has very limited coverage of "bottom-up" studies. Several are listed in Table 2.13 but no attempt is made to indicate whether they can achieve the 1.5oC target. Most of those studies are incomplete in terms of the sources and gases covered and the time period. Perhaps one of the IAM modelling groups could attempt to model each of those studies so they can be compared with the IAM model results that are the focus of the chapter. One bottom-up study missing is Mark Z. Jacobson et al., 2017, 100% clean and renewable wind, water and sunlight all-sector energy roadmaps for 139 countries of the world, Joule. [Erik Haites, Canada]
Accepted - while the IPCC cannot carry out additional research for its assessments, we have included reference to the study cited here. Combining bottom up and top down modelling might indeed provide interesting insights.
9187
I found this chapter really hard and heavy to read. It is not possible to read it all, it is too much. I guess Rogelj et al 2017 will analyse the SSP-RCP1.9 scenarios, and there will be some other literature. But, if Rogelj et al 2017 can get the various points across in 3000 or so words, then how many words are needed in Chapter 2? I know there is an option to go into more detail in the SR, but there needs to be a lot of focus on only writing what is necessary. [Glen Peters, Norway]
Taken into account - the chapter has been restructured and hopefully streamlined so it is more easy to read
4846
On DAC make reference to the Economic and energetic analysis of capturing CO2 from ambient air Kurt Zenz Housea,b,1, Antonio C. Bacligb, Manya Ranjanc, Ernst A. van Nieropb, Jennifer Wilcoxd, and Howard J. Herzogc www.pnas.org/cgi/doi/10.1073/pnas.1012253108 and the Direct Air Capture of CO2 with Chemicals from the American Physical Society (2011) to highlight the challenges of DAC and longer development path to commerciality compared to BECCS. [Wilfried Maas, Netherlands]
The assessment of technology options and their potential for deployment in the real world are assessed in Chapter 4.
7154
Consider adding a box to provide up-to-date information on trends on global GHG emissions, decoupling economic and emissions growth and decarbonization, since AR 5 (2010 data). This will be very useful for addressing the question “where are we?” at the Facilitative Dialogue in 2018. [Iulain Florin VLADU, Germany]
Taken into account —this topics is now addressed in Chap 1
7155
Consider summarizing somewhere when and to what extent mitigation action between 1.5C and 2C pathways starts to differ, to simplify informed comparisons between 1.5 and 2 °C pathways [Iulain Florin VLADU, Germany]
Taken into account - we show that already by 2030 emissions levels between below 1.5C and 2°C pathways differ. More temporal granularity is not warranted by the available literature.
7156
The assessment of the characteristics of 1.5C pathways for near-to-mid-term and after mid-century is useful because it allows for differentiating between near term and long-term options, policies and decisions. [Iulain Florin VLADU, Germany]
Thank you.
2797
The chapter should discuss whether the baselines of the IAMs whose results are reported have been updated since AR5. Chapter 4 notes several areas of rapid technological change since AR5, including solar, wind, batteries, electric vehicles, etc. These should reduce baseline emissions and possibly facilitate achievement of 1.5oC (which none of the IAMs currently achieve without overshoot). If the recent progress of those technologies affects the rate of future adoption of those technologies in the model, it needs to be acknowledged and any results reported need to indicate whether the baseline has been updated. If the recent progress does NOT affect the rate of future adoption, this needs to be stated (hopefully with an explanation) -- one paragraph would be enough. [Erik Haites, Canada]
Accepted - This is an important aspect, which is discussed briefly in Section 2.6.1
2798
The content of this draft provides one key message of interest to negotiators -- IAMs indicate that 1.5oC is not feasible withoout overshoot. But the more relevant question of interest to negotiators -- are there any analyses that can achieve 1.5oC? -- is not addressed by the current draft. The chapter should include an assessment of all analyses that appear to be consistent with a 1.5oC stabilization pathway with no overshoot; that might include the Deep Decarbonisation Pathways, Jacobson et al (Joule, 2017), etc. If any analyses are found, their characteristics should be summarized. So the messages for negotiators are: (1) there are few (no) analyses consistent with 1.5oC and no overshoot; (2) to achieve 1.5oC with no overshoot requires .... (whatever those analyses assume, which may be qualified for example as being historically unprecedented), (3) 1.5oC with overshoot after 2050 is challenging but can be achieved with negative emissions technologies. [Erik Haites, Canada]
The chapter has been revised to consider non-overshoot scenarios in response to several reviewer comments. As noted in the response to other comments, sustainable development issues are treated in ch 5 but not considered directly in ch 2
Do Not Quote, Cite, or Distribute Page 6 of 129

IPCC WGI SR15 First Order Draft Review Comments And Responses - Chapter 2
Comment No From Page From Line To Page To Line Comment Response
9474
I have had insuficient time to provide detailed comments on this chapter. However, my impression from an initial read through is that it is in good shape for a first order draft, and the Executive Summary is clearly written, understandable, and does not containg ambiguities. [David Wratt, New Zealand]
Thank you.
4890
There is a close link between occurence of waste/ sound waste management and emission of greenhouse gases. One particular example is food waste, accounting for greenhouse gas emissions higher than of most single countries (aside of US, China), see e.g. work by FAO. On the other side, sound waste management achieves net reductions in greenhouse gas emissions, see e.g. for Europe the assessments of the European Environment Agency. The context is not limited to food waste, but includes degrading materials in landfills, or around the world in dumps, emitting CH4, while on the other side sound waste management can valorise wastes. Nevertheless, sound waste management is not generally considered when assessing possible mitigation pathways for climate change, and also in this chapter it is not explored (although indeed at least some reference is made to food waste). Please consider amending the topic of sound waste management. [Sigrid Kusch, Germany]
Thank you for this suggestion. However, we have not found any literature addressing the issue of sound waste in the context of mitigation pathways. In case this is a mitigation measure which would not yet be considered, then Chapter 4 will take this up.
6940
What is missing in this chapter is a discussion on the "where" question, i.e. Who contributes to the global reductions, what the contribution of developed and developing countries ought to be. It would be very helpful for policy makers to have some guidance of the reduction percentages to be achieved that reflect an equitable distribution of the global effort, just like the AR4 did for the reduction percentages for 2020. [Bert Metz, Netherlands]
Chapter 2 does not go into regional detail, and equity aspects would be aspects of Chapter 4. A dedicated box on national pathways has been included in the SOD in Chapter 2.
5425Many thanks to the authors for this quite clear chapter. Also the linkages between the executive summary and the underlying chapter are very much apprecaited. [Klaus Radunsky, Austria]
Thank you.
5426
However, what is missing is a linkage to the scenarios described in chapter 3, box 3.12. The chapter is somehow unclear how we would more and more lose the option to meet the 1.5 degrees goal - because of to slow decarbonization - if SRM is not considered to be a viable option. [Klaus Radunsky, Austria]
The use of scenario groups have now been better coordinated across the Chapters
5427
What would also be important is a deeper consideration of the limits of CDR - e.g. because of lack of area, high costs, water availability etc. in the executive summary. In this context it seems important to include also in the executive summary the concept of shared socioeconomic Pathways (SSPs). This concept would also help to link to chapter 3, box 3.12. [Klaus Radunsky, Austria]
taken into account — geophysical limitation of CDR methods will be emphasized in the ES
5428
It is very much appreciated that the authors will update the information of this chapter by considering the latest modelling results, e.g. of IAMs. This is so important because of the significant changes, e.g. with respect to costs of mitigation technologies (renewable energy) and the availability of new research results. [Klaus Radunsky, Austria]
Thank you.
12866 Congratulations to all that have been working an collaborating in this chapter, well done. [Jorge Carrasco, Chile] Thank you
5704Chapter 2 contains some text that is more or less repeated in Chapter 4 and Chapter 5. These three chapters need to be harmonized for logical sequence. [Hong Yang, Switzerland]
Thank you, we have endeavoured to harmonize these three chapters.
17229
General Comment: This chapter is one of the most important of all and will catch international attention and policy makers will take the results seriously. Therefore, it is important to make it more policy friendly, although technical details are important. Explanation must be simple and ready for use. [Himangana Gupta, India]
Noted, revisions have attempted to make language, especially in ES, more policy friendly.
17302
There is a general concern that the FOD, chapter 2, is framed as an analysis of IAM scenarios only, while I am aware that at least 3 scenarios from 2 different non-IAM models (C-ROADS and En-ROADS, both of which are well-specified dynamic systems, or system dynamics, models). Hence, the framing of the report should be generalized to reflect this broader set of model types. [Christian Holz, Canada]
Thank you, the chapter has indeed been revised to address a broader set of modeling tools.
17304
A central point of the chapter is its assertion that all scenarios are considering CDR and in particular BECCS. However, one of the C-ROADS scenarios submitted ("Ratchet no overshoot to 1point5"; journal article submission currently under preparation) has been specifically designed as a non-overshoot 1.5°C scenario and as such does not include any CDR. The report should reflect this information and discuss the relationship between short term mitigation ambition between scenarios with and without CDR to give policy makers and societies the relevant information in making pertinent choices. [Christian Holz, Canada]
The chapter has been revised to consider non-overshoot scenarios in response to several reviewer comments.
17305
Regarding the IAMs summarized in the chapter; there is insufficient information about certain central parameters that would allow readers to evaluate the IAMs used, for example, but not limited to, the discount rate used. [Christian Holz, Canada]
Taken into account - yet not fully due to the limited scope of this special report. The 1.5°C Special Report needs to build off the assessment of the AR5 and focus on questions related to the topic of 1.5°C. An assessment of the actual modelling tools per se can thus not go much beyond AR5, and should be updated in full in AR6.
1181
Ch2 is in pretty good shape! One of the particularly compelling parts of Ch2 for Ch5 is your analysis of different SSP scenarios and their implications for mitigation pathways consistent with the 1.5C target. It is clear that the development trajectories significantly affect the mitigation pathways (i.e. portfolio of measures, pace of implementation) required to limit warming to 1.5C, and that these different M pathways have differential synergies and trade-offs with the SDGs. This strengthens our claim in Ch5 that 'development first' approaches are required to achieve stringent temperature targets, rather than isolated climate-specific interventions. Thanks for the use of x-referencing Ch5 throughout :) [Petra Tschakert, Australia]
Thank you.
Do Not Quote, Cite, or Distribute Page 7 of 129

IPCC WGI SR15 First Order Draft Review Comments And Responses - Chapter 2
Comment No From Page From Line To Page To Line Comment Response
19358
This chapter relies heavily on new calculations using the MAGICC model. The details and methodology of these calculations need to be described, either in the main text, appendix/suplement or in a cited paper. [William Collins, United Kingdom (of Great Britain and Northern Ireland)]
WE agree. Section 2.6 has been expanded accordingly
17303
The chapter states on various occassions (e.g. p4 line 18) that all scenarios evaluated are overshoot scenarios, however, one of the C-ROADS scenarios submitted ("Ratchet no overshoot to 1point5"; journal article submission currently under preparation) has been specifically designed as a non-overshoot scenario. This should be reflected in the report. However, these is an added complication that running the emissions data of this scenario through MAGICC6 evaluates as an overshoot scenario (MAGICC6 calculated median of the global mean temperature increase peaking at 1.63°C in 2050 and returning to 1.52°C by 2100). When evaluated with C-RAODS, the model in which this scenario was created, the temperated increase remains at or below 1.5°C throughout the century; these temperature data were submitted with the scenario data to the SR1.5 scenario database. C-ROADS has consistently performed well in fitting historical observations and compared to other models (see Sterman et al. 2012, https://doi.org/10.1016/j.envsoft.2012.06.004; Sterman et al. 2013, https://doi.org/10.1002/sdr.1474). (without having delved too much into MAGICC documentation, it appears that the misalignment between MAGICC and C-ROADS outputs may result from the different treatment of the (negative) forcing of mineral dust and landuse RF, both of which C-ROADS includes but which seem not to be included in MAGICC). One very plausible reading of the Paris Agreement objective ("....pursue efforts to limit the temperature increase to 1.5 °C above pre-industrial levels") is to keep temperature below 1.5°C throughout the century and therefore discussing the characteristics of scnearios that allow temparatures to remain below 1.5°C throught the century (such as the C-ROADS "Ratchet no overshoot to 1.5" scenario) are of significant importance and relevance for policy makers and societies. [Christian Holz, Canada]
Further text discussing the response of MAGICC has been added to Section 2.6
2467
More of the same, but updated; which is fine. But policy makers/people want ideas or a how-to manual, which we all know is challenging.
Clearly there is compelling evidence; this is the easy part; the challenging part is getting people to change/adapt/transform pretty noticeably. Adaptation is critical to survival, period.
This chapter should come after chapters 3 and 4 to bolster models, goals, etc. [Lisa Lucero, United States of America]
Comments noted, but after consultation with authors across chapters we believe the current chapter order should be retained.
9133
The possible interpretations of "well below 2°C" could be expanded in this report. Currently there is a distinction between pathways for "well below 2°C" and those for 1.5°C. However, one could interpret a "well below 2°C" pathway as being also a 1.5°C scenario - the two are not mutually exclusive. This could be reflected by showing that a "well below 2°C" pathway could also mean "below 1.5°C" with e.g. 66% probability, or a very high probabiliy of remaining below 2°C. This would be an improvement on the current interpretation, which seems to imply that "well below 2°C" is consistent with 66% likelihood of staying below 2°C - this interpretation is not acceptable for some more vulnerable Parties. [Susanna De Beauville-Scott, Saint Lucia]
Taken into account - in order to avoid being policy prescriptive, a new scenario classification has been adopted
12467This chapter could clearly lay out two assessment periods. Not sure why characteristics are important before 2050 but properties is important after 2050 when 1.5 C is projected by 2100? [Dr Noim UDDIN, Australia]
The chapter now looks at 1.5°C over the entire century
13003In all the references, I suggest to delete the details "Accessed…" and web address for papers published on journals, are not necessary. [Caserini Stefano, Italy]
Editorial - References are generated automatically in the style defined by the IPCC TSU
6348
The chapter needs to be careful in its wording, whether its findings refer to (a) the model scenarios from the literature (with all their in-built assumptions) and the focus of most models on intertemporal global cost-minimisation, or (b) whether statements are about necessary conditions for a 1.5 degree compatible real world (in the sense of "unless the world does X by date Y, 1.5 degrees becomes infeasible no matter how hard you try later"). At present, there are many statements that read "By 2030, X is happening". That's nice, but it's not clear whether that's simply the most cost-effective way (regardless of possible distributional effects), and whether one could still achieve 1.5 degrees if the same change happened 10 years later (and how much costs would increase, which may or may not make such a delay a critical issue) or whether such a change is a necessary precondition for achieving the 1.5 degree limit. This is particularly relevant for non-CO2 gases with shorter lifetimes, where you don't get cumulative emissions and hence a delay may be more feasible than for CO2. [Andy Reisinger, New Zealand]
Accepted - in the SOD we have tried to move away from merely descriptive scenario outcomes and also highlight in more detail the interactions due to the underlying scenario assumptions
13004Many references should be improved (i.e. Kauppiula et al). Please don't list De Stercke or van Vuuren ignoring De or van [Caserini Stefano, Italy]
Editorial - References are generated automatically in the style defined by the IPCC TSU
6869
I strongly suggest a restructuring that brings much of the "what, where and when" material from ch 4.2 and 4.3 into ch2, moves the materials on "how" from ch 2.5 to ch 4 and the mterial on SD issues from 2.5.3 to ch 5 (see explanantion in my comments to the entire report). As a result there are no references any more to ch 4 for further details. [Bert Metz, Netherlands]
Comments noted, but after consultation with authors across chapters we believe the current chapter structure should largely be retained although some material has been moved between chapters 2, 4 and 5.
Do Not Quote, Cite, or Distribute Page 8 of 129
IPCC WGI SR15 First Order Draft Review Comments And Responses - Chapter 2
Comment No From Page From Line To Page To Line Comment Response
1014
In Chapter 1 (Box 3.1) it is described that Chapter 2 focuses largely on geophysical and technological feasibility of 1.5 degree target. We can not find this in the table of content, however. If this is in this chapter, that fact should be clearly mentioned here for readers' friendlyness. Also geophysical and technological feasibility should be described in the executive summary. [Mitsutsune Yamaguchi, Japan]
Chapter 2 does assess geophysical and pathway/technological aspects of 1.5°C pathways in the context of sustainable development, without making an assessment of feasibility. This should now be clarified in Chapter 1. The ES of Chapter 2 hence does not describe these aspects.
7419
Consider linking the assessment of pathways with chapter 3 and 4 (4.3.6.1, and also 3.7.2.1.1), which asses that "there is now large agreement that bioenergy potentials in 2050 are restricted to 100 EJ". If this is correct it may be relevant to the pathways used in Chapter 2 (if they use more bioenergy than this level) and thus how you deal with constraints and uncertainties in Chapter 2. Please discuss this as a cross chaptoral issue with authors of these other chapters for consistency. [Øyvind Christophersen, Norway]
Accepted - this is a very important point. However, due to time constraints this integration was not yet achieved in the SOD, but can be considered for the next iteration.
6349
How would the results presented in this chapter differ if models didn't (by and large) use GWP to make trade-offs in abatement choices between different gases? For some countries and policymakers, this is a fairly important question. Note that chapter 1 has a good discussion on metrics, but chapter 2 (where GHG metrics would become most relevant) seems to completely ignore this, which is disappointing. It may well be that the literature is too limited to say anything specific to 1.5 pathways, but even so I would expect the authors to be able to make some statements based on model runs for 2 degrees rather than pretent it's not even an issue. Personally I don't expect the results to change hugely if a model were run with a different GHG metric, given the stringency of the 1.5 degree goal, but it would be so much more helpful if this chapter could put the issue to bed rather than leave it simmering by not even addressing it. [Andy Reisinger, New Zealand]
Added a short discussion on this in section 2.6.1
6870
I am very concerned about the use of the term "well below" in the chapter, as it implies a weakening of the respective temperature thresholds and the Paris Agreement as a whole. As is clear from table 2.3, "well below" is defined here as having at least a 66% chance of staying below a certain temperature level. So the "well below 2 degrees'` clause from the Paris Agreement is set to be a 66% chance of staying below 2 degrees C. However, much of the literature, before and after the Paris Agreement was reached, is using the 66% chance of staying below 2 degrees as the threshold for staying below 2 degrees, not for "well below 2 degrees". In other words, the definition used here is weakening the interpretation of the Paris Agreement and there are no scientific arguments presented for doing so. I think the only reasonable way is to define "well below 2 degrees" as a 66% chance of staying below e.g. 1.75 degrees. For 1.5, 2.5 and 3 degrees the "well below" should be deleted. and be replaced by the 66% probability threshold. Similarly, the "medium" should be replaced with the 50% probability threshold. The other major problem is that in the chapter often the 50 and 66% probability levels are grouped together to discuss the implications of staying beloow a 1.5 or 2 degrees limit. However, there are major differences between studies for a 50 and 66% probability level and there are enough studies in each category, so why do this? I strongly suggest to discuss the 50 and 66% probbabiliy studies separately. [Bert Metz, Netherlands]
Agreed. Scenario names have been revised to eliminate the use of the term 'well-below' and instead only rely upon objective thresholds and probabilities.
6871
The studies using different SSP baselines introduce a major problem in formulating key messages to policy makers on the most important actions on options, timing and equity considerations (the "where"), as the conclusions on these key messages often change dramatically depending on the SSP baseline assumed. I think policy makers should be assisted in how to interpret these findings: is the message they should try to stay out of a certain socio-economic future, implying additional action to influence this? Or is the message they should try to interpret what their particular socio-economic situation is (in SSP terms) and then act according to the findings for that particular SSP? [Bert Metz, Netherlands]
Clarified how conclusions depend on larger socio-economic trends, e.g. that under some SSPs the IAMs are not able to produce 1.5C scenarios, and highlighted these conclusions in larger messaging of chapter.
5601
The report correctly points out that fossil fuel plus CSS will be more expensive than fossil fuel without CSS (because of the fuel and plant cost of CSS, which are not going to completely vanish whatever improvement in technology might occur), which at the current and forecast prices for renewables effectively crowds out CSS in favour of the latter. Indeed, the report explores the potential of BECCS much more than fossil fuel plus CSS. However, it seems strange that a cost-minimisation procedure generates a lot of BECCS and so little renewables. Possibly this is the result of overestimation of current and projected cost for renewables, cost understimation for BECCS (in particular the cost of reliable storage for centuries) and a high discounting rate (which may distortedly show cheaper BECCS in the remote future but, with its time coming, BECCS becoming impossibly expensive as a means of producing electricity). To provide clarity, the report should explicitly mention the price interval used for renewables and BECCS and the discounting rate used by the models surveyed. If the literature is opaque and does not reveal such key elements, it should be discarded from consideration or at least segregated explicitly. A forecast model that does not reveal key assumptions is useless for taking well-thought decisions. [Valentino Piana, Italy]
Accepted - this is a valuable comment. However, because the scenario database underlying this assessment has only been finalized late in the timeline of the SOD preparation, this has not yet been taken into account.
7420Please be consistent when it comest to the use of the term Carbon budget or CO2 budget if it is meant to be the same. [Øyvind Christophersen, Norway]
We have revised to consistently use 'carbon budget'.
7421
In the approved outline to the specialreport (http://www.ipcc.ch/meetings/session44/l2_adopted_outline_sr15.pdf) there are spesific bullets in this chapter where both 1.5C and 2C are excplicitly mentioned. Please be aware of this and be consistent in your treatment of both these temperature levels when you write the next draft. [Øyvind Christophersen, Norway]
The outline indicates that both targets should be included, but does not require that they are given equal attention. Both are addressed, but as the Report's title conveys, the primary attention here is on 1.5C
Do Not Quote, Cite, or Distribute Page 9 of 129
IPCC WGI SR15 First Order Draft Review Comments And Responses - Chapter 2
Comment No From Page From Line To Page To Line Comment Response
4862
The large scale application of net-negative emissions may be problematic. Would also recommend considering MIT Joint Program Report 247 of July 2012, What GHG Concentration Targets are Reachable in this Century? [Wilfried Maas, Netherlands]
rejected — The suggested publication does not speak to net-negative emissions. It rather provides an estimate of various levels of committed warming. Committed warming due to past emissions is part of the framing of the report in Chapter 1. In Chapter 2, we discuss infrastructural inertia, for example in Section 2.3.1.1.
12972In the Executive summary are almost absent the economic implications of the 1.5°C scenario; I suggest including the main findings from par. 2.5.2 and from box 2.2 [Caserini Stefano, Italy]
Accepted - Exec summary has been revised and economic aspects are highlighted as the draft evolves and more literature/data becomes available.
6382
The recent controversy and misinformation/miosinterpretation of the Millar et al paper suggests that the authors should construct a box in which they carefully discuss and present different carbon budgets (most of this text is already there), but include a discussion of the extent to which actual recent observed temperatures should or shouldn't affect remaining carbon budgets (which in my view will have to amount to a critique if not criticism of the Millar et al paper), what scientific changes would change carbon budgets (in my view, a change in TCRE or non-CO2 including aerosol forcing, or changes in natural emissions or forcing - but NOT a specific observed temp unless this justifies revising TCRE or any of those other factors), and relating different ways of expressing uncertainty (i.e. a single budget number for a percentage probability to remain below X degrees of warming - vs a range of budget numbers that would be related to a given temperature). Policymakers need to know whether the budget is more uncertain than they thought, and to what extent findings that lie within the uncertainty range change the overall conclusions. At the moment ande in light of public and media interpretations of Millar et al, the current FOD is probably not strong and clear enough on those points. No fault of the authors I hasten to add, but you need to take the lesson nonetheless and avoid that this chapter may get similarly misintepreted or discredited if it leaves some important perspectives untouched. [Andy Reisinger, New Zealand]
We agree and now specifically address Millar et al. and the carbon budget in Section 2.2, although we think a box is unnecessary. We have made several new figures to support this discussion
4863
A number of statements in the report present 1.5C as far more obtainable than reason and analysis would suggest. For example, 2-28 Line 3 talks about 'A wide variety of pathways', when in fact there are virtually no pathways that could be reasonably delivered by the framework of the Paris Agreement. While it is good to be optimistic, the report does not sufficiently stress the extraordinary task that 1.5C represents, assuming expected climate sensitivities. The Paris Agreement itself has a built in lag of some 5-10 years, meaning that even after tabling the report and having it adopted by the COP, the process itself may take between 1-3 rounds of NDC review to shift the emission goals sufficiently. This is briefly discussed in 2-4, lines 39-45, but needs to feature much more prominently in the report. [Wilfried Maas, Netherlands]
Noted, however the question of what would be required and whether the pathways explored in chapter 2 are 'obtainable' is addressed in Chapter 4, not chapter 2.
21157in many disucssions of role of bioenergy, impact of indirect land use change on net GHG emission reductions appears not to be taken into account. AR5 (wgIII, ch11, appendix) was inconclusive on this. [David Cooper, Canada]
The impacts and side-effects of mitigation measures are assessed by Chapters 4 and 5.
12737
This chapter has to be more consistent in how it treats the SSP scenarios. Sometimes they are refered to as "scenarios1/2/3" (i.e. Fig 2.5) and sometimes according to this SSP label. Personally I am in favour of using the SSP label, but in that case there has to be a section dedicated to how the SSPs have been defined. [Vassilis Daioglou, Netherlands]
We have revised to use the SSP labels following those given in Box 1.1 (in Ch 1), but as we include scenarios beyond the SSPs we must also on occasion refer to them simply as scenario 1, 2, etc., e.g. in Figure 2.7.
1502
As a comrehensive analyis of 2C pathway, I recommend one paper below (Matsumoto, K., Tachiiri, K., and Kawamiya, M. (2016) Evaluating Multiple Emission Pathways for Fixed Cumulative Carbon Dioxide Emissions from Global-scale Socioeconomic Perspectives. Mitigation and Adaptation Strategies for Global Change [dx.doi.org/10.1007/s11027-016-9726-8]) [Ken'ichi Matsumoto, Japan]
Noted - yet, this chapter has the explicit mandate to look at 1.5°C pathways
6483 1 1 Authors' country missing [Roger Bodman, Australia] Added.
20272 1 1 Overall Chapter 2 is well written and structured. [Aaron Glenn, Canada] Thank you.
13154 1 1The report seems to consider only overshoot scenarios, an explaination for this choice is needed. [Christiane Textor, Germany]
Consideration of non-overshoot scenarios, to the extent possible, has been added to the chapter. Thank you.
2934 1 1
A glaring omission is the lack of consideration of solar radiation management. While Chapter 1 gives an indication of why IPCC are wary of including any SRM options, given that the mitigation scenarios leading to 1.5C are so difficult to achieve, shelving SRM is a cop-out. Of all the chapters available, I would have thought this one the most logical place to put a box on SRM geoengineering as arguably SRM is another option for a mitigation pathway. Sticking a discussion in Chapter 3 (which way oversteps its remit) is very odd (Title is “Impacts on natural and human systems”) as it misses out completely on why SRM has been considered in the literature. The box in Chapter 1 on SRM is currently very badly written and does not reflect the literature. [Jim Haywood, United Kingdom (of Great Britain and Northern Ireland)]
Noted - point of clarification: This aspect is covered in a box in Chapter 4. We also highlight in the ES of Chapter 2 that this chapter does not deal with SRM.
10327 1 92
Some figures can be made more selfexplantory. Including making sure that the axes are properly labeled. Ensure that the color codes for same items are matained to facilitate the reading of the figure. Make text below the figure as much as possible easy to read and undestand. [Maria Jose Sanz Sanchez, Spain]
Accepted - figures have been revised with this suggestion in mind
10338 1 92
The language on negative emissions is not suficiently clear across the chapter. Either define it clearly and use this consistently of define each time what is exactly meant by negative emissions. [Maria Jose Sanz Sanchez, Spain]
Accepted - we now clearly distinguish between the various types of carbon dioxide removal and have a dedicated section which explains the different apportioning of CDR (Section 2.3.4)
Do Not Quote, Cite, or Distribute Page 10 of 129

IPCC WGI SR15 First Order Draft Review Comments And Responses - Chapter 2
Comment No From Page From Line To Page To Line Comment Response
2957 1 1
A glaring omission is the lack of consideration of solar radiation management. While Chapter 1 gives an indication of why IPCC are wary of including any SRM options, given that the mitigation scenarios leading to 1.5C are so difficult to achieve, shelving SRM is a cop-out. Of all the chapters available, I would have thought this one the most logical place to put a box on SRM geoengineering as arguably SRM is another option for a mitigation pathway. Sticking a discussion in Chapter 3 (which way oversteps its remit) is very odd (Title is “Impacts on natural and human systems”) as it misses out completely on why SRM has been considered in the literature. The box in Chapter 1 on SRM is currently very badly written and does not reflect the literature. [Jim Haywood, United Kingdom (of Great Britain and Northern Ireland)]
Noted - point of clarification: This aspect is covered in a box in Chapter 4. We also highlight in the ES of Chapter 2 that this chapter does not deal with SRM.
19303 1 1 1 35
While the executive summary is well written and conveys a clear message, the whole chapter gives too many details about the few scenarios and pathways available, which appear based too much on speculations. There should be an effort to find a better balance. [Marco Mazzotti, Switzerland]
We have attempted to provide clearer descriptions within the main chapter text and expanded the modeling approaches considered to address the issue of speculative results. However, by their nature modeling results are possible projections, and many are interested in the details of those projections.
14168 1 1 1 36
There is an excessive number of self-citations across the whole chapter. For example, a single author has almost 100 citations of their own (including co-authored papers) on in this chapter. This may damage the credibility of an independent critical assessment. I am not questioning the importance of those papers, but would recommend using self-citation only when really necessary. [Alexandre Strapasson, Brazil]
Accepted - for the FOD only submitted and published studies were available for citation, and hence the chapter only cited these. For the SOD a much larger set of studies has become available for assessment.
6948 1 1 3 47Although it is described that the drastic changes are necessary in the summary, it should be much emphasized that a variety of stronger measures is inevitable to be on the 1.5 C pathway (or back to it). [Yuki Ishimoto, Norway]
Noted
5153 1 1 81 7
GENERAL: Chapter 2 cites "Clark e.t.al. 2014" 51 (!) times and is used to testify statements about energy models enlarge and in almost all aspects: technology mix, energy demand, investment size etc. The original paper is 18 pages and is written to a large extend by the IPCC lead authors itself. The paper has very few actual other citations, most of them again Clark, Krey et. al. and almost all references are from the years 2007 to 2009. So seriously out of date. Furthermore, the authors not only present their own models (and only those), but they also entirely neglect actual energy pathways from respected models such as the IEA, IRENA (both only get a few short references), DLR and various other institutions specialized on actual energy modelling. Request: Significantly scale down citations of "Clark et. al. and as more references from other experts, especially those from the energy sector. [Sven Teske, Australia]
Rejected - The reviewer seems to misunderstand the nature of the Clarke et al. 2014 reference. This is not a paper, but the AR5 WG3 assessment of the entire pathways literature, and which provides the basis on which this Special Report needs to build. It contains 97 pages, and - being an IPCC assessment - is indeed written by IPCC authors. It is cited where appropriate.
5154 1 1 81 7
GENERAL: Through-out the chapter, only models which are widely used from climate scientists (MESSAGE, EMF etc.) are analysed. However these models are not used in the actual energy sector. The reason why those models are not used is rather simple: They do not at all reflect the reality of the energy industry. Clark et. al. energy models are entirely disconnected from the actual energy sector and therefore never used from the energy industry and/or energy experts. Request: Include energy models - especially those with a 100% RE targets (world, region, country level) and significantly scale down the presentation of results from the modells used in AR5. [Sven Teske, Australia]
The chapter assesses integrated mitigation pathways, and it therefore draws on the literature that provides such pathways. The energy-system-specific models indicated by the reviewer are valuable to understand one part of the overall transformation, the decarbonisation of the energy-supply side. They are thus considered in the section which takes a deeper dive into the supply-side transformation of the energy system (Section 2.4.2).
5155 1 1 81 7
GENERAL: The IAM scenarios are developed on the basis of Riahi et. al 2017 which is cited 57 (!) times throughout chapter 2. My fundamental criticism in regard to the chosen SSP scenario categories is based on figure (3 B) on page 7 Riahi e.t. al. 2017, which classifies scenarios either as coal, oil + gas or Renewable-Nuclear driven. As a matter of fact, 100% renewable energy scenarios are being developed by numerous scientific institutions around the world, without nuclear. The results of these renewable and efficiency based scenarios are increasingly accepted in the energy industry. Not one "renewables only scenario” is documented. This is particularly unfortunate as the renewable industry dominates the global power sector in regard to new build, while the nuclear industry has 1-2% market shares over the past decade (and nuclear power plants are built in less than 10 countries – leaving out the reality of around 190 countries), while the overall nuclear capacity plateaued and starts to decrease as reactor come at age. Request: Include RE and EE scenarios only (excluding nuclear) [Sven Teske, Australia]
Taken into account - this chapter assesses mitigation pathways in line with 1.5°C in the context of sustainable development. To this end, scenarios from models which include interactions between all sectors and cover all greenhouse gases are core. Where appropriate (for example, in the assessment of energy supply) also other, sector-specific studies are included.
5157 1 1 81 7
GENERAL: The entire chapter relies to a large extend on papers from only 3 authors: (Rogelj - 78 citations), (Riahi - 57 citations) and (Clark - 51 citations). The lead author cites his own paper 78 times. Request for SOD: Diversify sources/references. [Sven Teske, Australia]
Accepted - for the FOD only submitted and published studies were available for citation, and hence the chapter only cited these. For the SOD a much larger set of studies has become available for assessment.
5158 1 1 81 7
GENERAL: The large majority of all cited climate models are under the “ADVANCE initiative” and very Eurocentric. I suggested to diversify the models and include specific energy models rather than models which are used in most previous IPCC publications. The lack of realistic assumptions in those models - and their misleading results which have been proven wrong over the past decade - are subject to criticism over several years now and to open up this topic to other institutions (beyond IIASA and PIK) would add to the global ownership of this publication. [Sven Teske, Australia]
The scenario evidence base has been expanded for the SOD. The indicated models, however, remain core representatives of the state of the art of this research domain.
5711 1 1 84 54
Chapter 2 has 28 Figures. Some of them are very complicated (often with several panels) and contain the information that needs a long text to elaborate. It would be good to simplify some of the Figures by presenting only the key messages. [Hong Yang, Switzerland]
Taken into account - many of the figures in Chapter 2 have been updated and revised with these aspects in mind. Nevertheless, some complexity remains, which will be reduced for any figures that are included in the SPM.
Do Not Quote, Cite, or Distribute Page 11 of 129
IPCC WGI SR15 First Order Draft Review Comments And Responses - Chapter 2
Comment No From Page From Line To Page To Line Comment Response
5156 1 1 81 7
GENERAL: see above – in regard to CCS technologies. Chapter 2 (page 2-38, line 43) informs that only 2 industrial CCS plants have come online, but the technology is presented through-out the entire chapter as equally important as renewables and energy efficiency. Thus, the technology choices are seriously biased and not based on real world market experiences. Request: Highlight the market failure of CCS and introduce a new SSP category that only uses technologies which have currently a commercial scale market: renewables and energy efficiency. [Sven Teske, Australia]
The assessment of single mitigation measures and their current development status is provided by Chapter 4. Chapter 2 now also provides a broader variety of scenarios, including some which do not use CCS at all (for example, see Section 2.3).
9806 1 1 84 54
Relates to the whole chapter: As mentioned several times citizens are very important in any transformation pathways. While the impact of transformation pathways on economic growth or output is considered, citizens are or might be more interested in the development of their own prosperity and well-being or the possibility to keep or improve the level of their life-style, respectively along different transformation paths. Inform citizens about the consequences of transformation paths for their own life is crucial for their acceptance and support of policies and measures. These questions are hardly addressed and should be mentionned somewhere, at least as a knowledge gap. If only the strong reduction of energy consumption, etc., are discussed, people tend to believe that transformation might mean a strong reduction of life-style comfort and prosperity. [Urs Neu, Switzerland]
Noted - Sociotechnical transitions are treated whenever clear links with IAM 1.5C pathway literature exists (see e.g. sections 2.5.1 and 2.6.3). Knowledge gaps related to sociotechnical issues and behavioural aspects (e.g. consideration in IAM studies) are further elaborated in section 2.6.4. Please do note that more detailed socio-technical aspects are treated in Ch4, including behavioural aspects and lifestyles changes (e.g. sections 4.2.3 and 4.4.5). Please also note that well-being in the context of sustainable development and 1.5C is explicitly treated in Ch5.
10993 1 2 1 2This is now very much a WG III chapter - I’d expected more from WG I round geophysical aspects of feasibility [Skea Jim, United Kingdom (of Great Britain and Northern Ireland)]
taken into account — geophysical uncertainties and limitation are further developed in the revised SOD
14208 1 5 1 15 Other chapters have country names with author names, is there a reason it wasn’t done here? [Jason Donev, Canada] Added.
9488 2 5 2 1These sentences are rather complex. I recommend substituting these for underlying simple clear sentences (p8 l4-7). [Masato TAKAGI, Japan]
Given the apparently incorrect page and line reference, it is unclear to which precise text this comment applies.
7938 2 13 2 17The second sentence should include reasons, why CDR options other than BECCS an AR are not included in current scenarios (e.g. lack of data, maturity, etc.). [Jasmin Kemper, United Kingdom (of Great Britain and Northern Ireland)]
It is not always clear why exactly modelers decide not to include options. It would not be appropriate to speculate.
3323 2 15 2 28
Section 2.1.2: A scenario is reclamation and remediation which may be between industries and agriculture, such as mining sites reclamation and other industrial sites reclamation. It is unclear if this report includes the scenario. This should be clarified. [Junye Wang, Canada]
We are unaware of any literature on this particular scenario
21158 2 17 2 19need to also consider non-overshhot pathways, consistent with art.2 of Paris Agreement and agreed outline of the SR. [David Cooper, Canada]
Accepted - the SOD pays particular attention to this issue and also includes a new dedicated section to this matter
7157 2 32 3 3Consider harmonizing the terminology and the order of sectors with 2.4.3 (Energy vs Energy supply, End-use sectors vs Energy demand) [Iulain Florin VLADU, Germany]
Editorial - can be taken care of during the final phase of the drafting process.
3711 2 39 2 39 think you mean "model" not 'mode; [Harald Winkler, South Africa] Editorial - will be corrected
1015 2 41 2 43
Please add "unless major countries (including US and China) will drastically re-submit their extremely challenging NDCs" after 21th century in line 43. Reasons are as follows: It is rather doubtful whether NDC would be implemented as is (Ref. David Victor et al. "Prove Paris was more than paper promises", Nature volume 548, 3 August 2017). The description in page 2 that if we are to emit 49-58Gt/CO2 in accordance to NDCs most models cannot produce scenarios in line with 1.5 degree, is a clear message of infeasibility of 1.5 degree target, "unless major countries (including US and China) will drastically re-submit their extremely challenging NDCs". This last message should be added here. [Mitsutsune Yamaguchi, Japan]
Rejected - we do not carry out an assessment of requirements at the regional level, but the SOD now includes a dedicated box on national pathways
6967 3 3References starting on page 85 missing from the contents page. [Sai Ming Lee, China] Layout aspects of the draft are dealt with by the TSU, after chapter authors submit their draft
20264 3 28 Suggest spelling out "Integrated Assessment Models" in the sub-section title [Aaron Glenn, Canada] Has been spelled out
5705 3 29 3 31
These two Boxes are not needed here because Chapter 3 specifically addresses impacts from different aspects, including economic impact. In general, the chapter may be shortened by focusing on mitigation pathways compatible with 1.5C. [Hong Yang, Switzerland]
Noted
1837 4
A reference to the mandate for the SR15 would be useful at the beginning or in the 1st paragraph of the ExSum. indicating that this Chapter is primarily devoted to the “.. related global greenhouse gas emission pathways”, e.g.: In accordance with the invitation from the UNFCCC and the mandate adopted by the IPCC-43, this Special Report provides science-based assessments on the impacts of global warming of 1.5 ºC above preindustrial levels and related global greenhouse gas emission pathways in the context of strengthening the global response to the threat of climate change, sustainable development and efforts to eradicate poverty. This chapter is primarily devoted to the “related global greenhouse gas emission pathways”. [Tibor Farago, Hungary]
We believe this is best addressed in ch 1 which sets the entire report into context with the mandate.
966 4 6
the exeuctive summary needs to be turned into something much more useful--a larger number of key findings, with more informative top level headings. The entirety of p.6 falls under one top-level finding, even though p.6 covers many different topics (CDR. demand constraints, etc.). [Victor Davd, United States of America]
Agree, reorganized.
6407 4 83The whole Chapter 2: In general, this chapter lack of an important sector which must has a great contribution on mitigation pathway, that is Marine and Fisheries Sector [Erlania Erlania, Indonesia]
This sector plays a role, but we are not aware of literature suggesting it plays a major one.
Do Not Quote, Cite, or Distribute Page 12 of 129

IPCC WGI SR15 First Order Draft Review Comments And Responses - Chapter 2
Comment No From Page From Line To Page To Line Comment Response
17298 4 4
This chapter provides an in depth description of future pathways coming out of IAMs, which is good, but I'm missing information on what is our starting point, are the projected rates of decarbonisation consistent with recent trends (e.g. as attempted by Peters et al Nature Climate Change 2017), and on the evaluation of the IAMs. I am also missing a sense of urgency and scale of action in the way the information is presented. 1.5C is extremely challenging and probably unrealistic, and if seriously considered would mean a transformation in the way we use and produce energy and use land across systems. [Corinne Le Quéré, United Kingdom (of Great Britain and Northern Ireland)]
Noted, thank you. More on urgency and on IAMs added to SOD.
7306 4 6Introduce quantitative findings on potential macro-economic implications and trade-offs in regards to achieving other SDGs (e.g. on poverty, economic growth, water scarcity, land use, etc.). [Eleni Kaditi, Austria]
These are addressed in Ch 5
7318 4 84The chapter lacks regional analysis. [Eleni Kaditi, Austria] We have added national/regional analyses, but limited given space constraints. Not a main point
for ES.
7319 4 84Introduce quantitative findings on potential macro-economic implications and trade-offs in regards to achieving other SDGs (e.g. on poverty, economic growth, water scarcity, land use, etc.). [Eleni Kaditi, Austria]
These are addressed in Ch 5
7320 4 84Analysis should elaborate on whether issues related to historical responsibility, CBDR, and means of implementation were taken into consideration when developing and examing the different scenarios. [Eleni Kaditi, Austria]
Not an ES topic, but some coverage (e.g. costs) in chapter. Ethics more a ch 5 topic.
6352 4 1
I'm puzzled by the absence of clear findings in the executive summary about how the costs of mitigation as we go from a 2 degree to a 1.5 degree goal. Yes there are many more dimensions than economic costs but costs do need to be addressed clearly. I would expect to see a para comparing consumption losses, and another para on near-term carbon prices consistent with the 1.5 degree goal (assuming perfect implementation, and considering consequences of excluding sectors or regions from prices). [Andy Reisinger, New Zealand]
Taken into account - carbon prices are now highlighted. Consumption losses have not been assessed in detail by the chapter and are hence not highlighted
6350 4 1
The executive summary needs a lot of work to deliver a set of concise, policy-relevant messages (and to ensure it uses appropriate uncertainty language) rather than the current descriptive narrative. The fact that this was not done for the FOD is unfortunate since it makes it impossible for reviewers to comment on proposed key findings. Remember the executive summary will be a key source for statements in the summary for policymakers. I suggest those key messages should include a focus on how the mitigation challenge differs between 1.5 and higher warming pathways, in addition to characteristics of 1.5 pathways per se (and the extent to which current near-term targets, which are not least-cost but not entirely inconsistent with 2 degrees, may or may not be entirely inconsistent with 1.5 degrees). Plus, there is potentially very important information hidden in the text on how, and how much, mitigation of non-CO2 gases can contribute (and how this is becoming more important the more stringent the mitigation goal is). The exec sum should also contain much clearer information on costs and risks and how they differ from those in a 2 degree and higher efforts. [Andy Reisinger, New Zealand]
Many revisions along suggested lines in SOD.
6351 4 1
I feel the executive summary is missing information on some important issues, such as the extent to which exogenous technological change may have constrained mitigation options and potentials, but also the extent to which the assumption of a global carbon price gives an unrealistic picture of real-world mitigation potential and costs. Plus there is information needed about why all 1.5 pathways give an overshoot - is this economic optimisation relative to a late 21st century goal, or technical or social infeasibility of early emission reductions? In other words, what (some) policy makers will want to know: is it simply impossible to avoid an overshoot of 1.5 (given specific assumptions about what pace of change is or isn't possible), or is it just that the models are set up such that an overshoot appears more plausible/less costly? Also a clarification about the extent to which the findings in this chapter would differ with different discount rates. [Andy Reisinger, New Zealand]
Material on non-overshoot added. Discount rates discussed more fully in chapter.
6353 4 1
It may be useful for the authors to bring a definition of feasibility and related issues into the executive summary, since a lof of other statements in the executive summary will directly or indirectly have to make reference to this. [Andy Reisinger, New Zealand]
The concept of feasibility is an overarching concept to the entire report, which is introduced in Chapter 1.
20127 4 1 4 25
Chapter 2 mentions a cumulative 710-900 GtCO2 to be removed via CDR over the course of the 21st century. Burns/Nicholson 2017 Bioenergy and carbon capture with storage (BECCS): the prospects and challenges of an emerging policy response, in J Environ Stud Sci, DOI 10.1007/s13412-017-0445-6: "Delivery of a relatively modest 3 gigatons of carbon dioxide equivalent negative emissions annually from BECCS would require conversion of a land area of approximately 380–700 million hectares in 2100, translating into 7–25% of agriculture land and 25–46% of arable and permanent crop area (smith et al. 2016; Williamson 2016). The range of land demands would be 2–4 times larger than land areas that have been classified as abandoned or marginal (Smith et al. 2016). This would be in the face of rising demands for food that will require 10–20% more cropland over the course of the next few decades (Creutzig 2017). (Smith et al. 2016 Biophysical and economic limits to negative CO2 emissions. Nat Clim Chang 6:42-50. https://doi.org/10.1038/ nclimate2870; Williamson 2016 Scrutinize CO2 removal methods. Nature 530(7589):153-55); Creutzig F (2017) Govern land as a global commons. Nature, 546:28–9. https://doi.org/10.1038/546028a --- Environmental and social implications of model assumptions must be drawn conclusions from! [Lili Fuhr, Germany]
Noted. Limitations of CDR and BECCS discussed in both chapter and ES.
Do Not Quote, Cite, or Distribute Page 13 of 129
IPCC WGI SR15 First Order Draft Review Comments And Responses - Chapter 2
Comment No From Page From Line To Page To Line Comment Response
20130 4 1 4 25
Impact of large-scale BECCS on food prices: "Demands on land of this magnitude could substantially raise prices on basic food commodity crops (Barrett 2014). One recent assessment that incorporates strict protection of forest ecosystems projects large-scale BECCS deployment could result in the rise of food price indices of 82% in Africa, 73% in Latin America, and 52% in Asia Pacific (Popp et al. 2011). This could imperil food security for many of the world’s most vulnerable, with many families in devel- oping countries already expending 70–80% of their income on food (De Schutter 2013; US Government Accounting Office 2011). One recent study indicated that even modest increases in bioenergy development could increase the number of mal- nourished children in sub-Saharan Africa by 3 million, with an 8% decline in calorie availability (Ewing and Msangi 2008)." quoted from Burns/Nicholson 2017 Bioenergy and carbon capture with storage (BECCS): the prospects and challenges of an emerging policy response, in J Environ Stud Sci, DOI 10.1007/s13412-017-0445-6; Barrett S (2014) Solar geoengineering’s brave new world: thoughts on the governance of an unprecedented technology. Rev Environ Econ Policy 8(2):249–269. https://doi.org/10.1093/reep/reu011; Popp A et al (2014) The effect of bioenergy expansion: food, energy, and environment. Renew Sust Energ Rev 32:559–578; De Schutter O (2013) Note on the impacts of the EU biofuels policy on the right to food, United Nations Office of the high commissioner, Mandate of the special rapporteur on the right to food, Apr 23, 2013; U.S. Government Accounting Office (GAO) (2011) Climate engineering: technical status, future directions, and potential responses, GAO-11- 71; Ewing M, Msangi S (2008) Biofuels production in developing countries: assessing tradeoffs in welfare and food security. Environ Sci Pol 12: 520–528 [Lili Fuhr, Germany]
Noted. The assessment of BECCS, its synergies and trade-offs is coordinated throughout the report. Chapter 4 provides an assessment of sustainable levels of bio-energy (Section 4.3) and Chapter 5 provides an assessment of the interaction of a variety of mitigation measures with sustainable development, including poverty alleviation. These insights are integrated in the pathways assessment of Chapter 2 in its section 2.5.3. The SOD now includes a dedicated and elaborated mitigation measures-sustainable development interaction table (Table 5.1). This table provides the basis for the sustainable development assessment of integrated pathways in chapter 2. Any contributions to literature that can further be included in this table are welcome.
5706 4 1 6 47
The structure and flow of the Executive Summary are not clear, except for the first paragraph. The rest of the text lacks clear story line, making it very difficult to follow. The bold text at the beginning of a few paragraphs is presented in a sub-heading style, but all other paragraphs are in plain text. There is no consistency in this arrangement. It would be good to present the Summary with the commonly used style, that is to give the concrete statement on each point addressed followed with a short elaboration, like what is shown in Chapter 1. [Hong Yang, Switzerland]
Accepted - The ES has been entirely overhauled to ensure a clearer structure and more intuitive flow. Also the layout specifications, as suggested by the expert reviewer have been applied in the SOD.
20131 4 1 4 25
Large-scale BECCS and displacement: "Efforts to develop feedstock for bioenergy can also result in displacement of the poor from land, which can undermine food security, as well as livelihoods, political power, and so- cial identity (Catula et al. 2008; Kartha and Dooley 2016). Some proponents of BECCS have contended that pressures on food production and prices could be substantially ameliorated by using "degraded" or "abandoned" land for expansion of bioenergy feedstock. However, the reality is that hundreds of millions may rely on these lands for income and sustenance (Smolker and Ernsting 2012)." quoted from Burns/Nicholson 2017 Bioenergy and carbon capture with storage (BECCS): the prospects and challenges of an emerging policy response, in J Environ Stud Sci, DOI 10.1007/s13412-017-0445-6; Catula L, Dyer N, Vermeulen S (2008) Fuelling exclusion? The biofuels boom and poor people’s access to land, International Institute for the Environment and Development and Food and Agriculture Organization of the United Nations, IIED Order No: 12551IIED; Kartha S, Dooley K (2016) The risks of relying on tomorrow’s ‘negative emissions’ to guide today’s mitigation action, Stockholm Environment Institute. SEI Working Paper No 2016-08; Smolker R, Ernsting A (2012) BECCS (Bioenergy with Carbon Capture and Storage): climate saviour or dangerous hype?, 1–25. http:// www.biofuelwatch.org.uk/wp-content/uploads/BECCS-report.pdf [Lili Fuhr, Germany]
See response to comment 20130.
20132 4 1 4 25
Large-scale BECCS and water footprint: "BECCS could imperil the right to water in some regions of the world given its Bvery large water footprint, even when implemented at a relatively modest scale of between 1.1 and 3.3 gigatons of carbon dioxide equivalent per year (Smith 2016). By 2100, BECCS feedstock production at scale could require approximately 10% of the current evapotranspiration from all global cropland areas (Smith et al. 2016), or of the same magnitude as all current total agricultural water withdrawals (Bonsch et al. 2016; Chaturvedi et al. 2015). This is at a time that when global water withdrawals are projected to increase by 20% and the number of people experiencing water shortages could grow by billions (Delucchi 2010). Moreover, 800,000 humans currently die annually as a consequence of contaminated drinking water (UN Water 2017). Large deployment of BECCS could exac- erbate this threat by further degrading water quality by salinization, and from fertilizer and pesticide runoff associated with production of bioenergy feedstocks (Delucchi 2010)." quoted from Burns/Nicholson 2017 Bioenergy and carbon capture with storage (BECCS): the prospects and challenges of an emerging policy response, in J Environ Stud Sci, DOI 10.1007/s13412-017-0445-6; Smith P (2016) Soil carbon sequestration and biochar as negative emission technologies. Global Change Biol 22(3):1315–1324. https:// doi.org/10.1111/gcb.13178; Bonsch M, Humpeno?der F, Popp A, Bodirsky B, Dietrich JP, Rolinski S, Biewald A, Lotze-Campen H, Weindl I, Gerten D, Stevanovic M (2016) Trade-offs between land and water requirements for large- scale bioenergy production. GCB Bioenergy 8(1):11–24. https://doi. org/10.1111/gcbb.12226; Chaturvedi V, Hejazi M, Edmonds J, Clarke L, Kyle P, Davies E, Wise M (2015) Climate mitigation policy implications for global irrigation water demand. Mitig Adapt Strateg Glob Chang 20(3):389–407. https://doi.org/10.1007/s11027-013-9497-4; Delucchi MA (2010) Impacts of biofuels on climate change, water use, and land use, 1195(1):28–45; UN Water, Wastewater (2017) The Untapped Resource, 1–198 [Lili Fuhr, Germany]
See response to comment 20130.
Do Not Quote, Cite, or Distribute Page 14 of 129
IPCC WGI SR15 First Order Draft Review Comments And Responses - Chapter 2
Comment No From Page From Line To Page To Line Comment Response
20133 4 1 4 25
Large-scale BECCS and biodiversity loss: "Many of the most propitious areas for bioenergy devel- opment are also characterized by high levels of biodiversity, with a large share of endemic species (Beringer et al. 2011). Recent research indicates that large-scale BECCS deployment could also have profound impacts on biodiversity, primarily due to potential land conversion (Searchinger and Heimlich 2015; Smith and Torn 2013). More specifically, BECCS could Bvastly accelerate the loss of primary forest and natural grassland, (Williamson 2016), resulting in the loss of up to one-fifth of natural forests, grasslands and savannahs (Creutzig 2017). This could precipitate habitat loss for many species, and ultimately, massive changes in species richness and abundance (Wiltshire and Davies-Barnard 2015). Indeed, Williamson concluded that large-scale deployment of BECCS could result in a greater diminution of terrestrial species than temperature increases of 2.8 °C above pre-industrial levels (Williamson 2016)." quoted from Burns/Nicholson 2017 Bioenergy and carbon capture with storage (BECCS): the prospects and challenges of an emerging policy response, in J Environ Stud Sci, DOI 10.1007/s13412-017-0445-6; Searchinger T, Heimlich R (2015) Avoiding bioenergy competition for food crops and land, World Resources Institute, 1–44; Smith L, Torn M (2013) Ecological limits to terrestrial biological carbon dioxide removal. Clim Chang 118(1):89–103; Williamson P (2016) Emissions reduction: scrutinize CO2 removal methods. Nature 530(7589):153–155; Wiltshire A, Davies-Barnard T (2015) Planetary limits to BECCS negative emissions, AVOID2, Version 1.1; Creutzig F (2017) Govern land as a global commons. Nature, 546:28–9. https://doi.org/10.1038/546028a [Lili Fuhr, Germany]
See response to comment 20130.
9805 4 1 6 47
It would be preferable that in all executive summaries (like in chapter 1 and 4) the paragraphs are introduced with two or three short sentences containing the main message (instead of a short title). E.g. for Paragraph p.4 line 17-31 this could read (in bold letters): Pathways holding warming below or close to 1.5°C in 2100 all exhibit overshoot of that temperature level around mid19 century. The carbon budget until carbon neutrality in mid-century in 1.5°C pathways is about 40% lower than the budget in 2°C pathways. [Urs Neu, Switzerland]
Accepted - The layout of ESs has been harmonized
18785 4 1 6 47
The Executive Summary should address the role of SLCF/SLCP in causing temperature rise to overshoot the 1.5C threshold in the near-term period. The more rapid crossing of the threshold due to the role of SLCF/SLCP is an important dimension that should be addressed. [David Waskow, United States of America]
All forcers are given adequate attention in the ES
18818 4 1 6 47
The Executive Summary should address the role of SLCF/SLCP in causing temperature rise to overshoot the 1.5C threshold in the near-term period. The more rapid crossing of the threshold due to the role of SLCF/SLCP is an important dimension that should be addressed. [David Waskow, United States of America]
All forcers are given adequate attention in the ES
10973 4 1 6 47
More needs to be said on methodological aspects, partly to address concerns about heavy reliance on BECCS. For countries, I think some statements that may be too obvious to modellers need to be spelled out. This may not be correct but to illustrate the idea: a) there are no published scenarios that limit warming to 1.5 (overshhot and non-overshoot) without the use of CDR techniques; b) the extent to which CDR is used depnds on socio-economic assumptions and the extent to which other options (renewables etc) ar exercised. [Skea Jim, United Kingdom (of Great Britain and Northern Ireland)]
Agreed, more added on methods and limitations of IAMs as well as non-overshoot scenarios.
20134 4 1 4 25
On BECCS and disruption in nitrogen cycle: "BECCs deployment could require more than doubling fertilizer inputs (Creutzig 2014), exacerbating environmental degradation associated with anthropogenic perturbation of the nitrogen cycle. Current human fixation of atmospheric nitrogen exceeds sustainable levels by 75% (Kartha and Dooley 2016). This results in serious environmental impacts, including large-scale anoxia in oceans, eutrophication of streams and rivers, and changes in nutrient health in forests (Kartha and Dooley 2016; Bernhard 2010). Large-scale deployment of BECCS could require as much as 75% of global annual nitrogen production (Buck 2016), Benhancing the pressure on the planetary boundary for biogeochemical flow (Boysen et al. 2016)." quoted from Burns/Nicholson 2017 Bioenergy and carbon capture with storage (BECCS): the prospects and challenges of an emerging policy response, in J Environ Stud Sci, DOI 10.1007/s13412-017-0445-6; Creutzig F (2014) Economic and ecological views on climate change mitigation with bioenergy and negative emission. Glob Change Biol Bioenergy 8(1):4–10; Buck HJ (2016) Rapid scale-up of negative emissions technologies: so- cial barriers and social implications. Clim Chang 139(2):155–177; Bernhard A (2010) The nitrogen cycle: processes, players, and human impact, Nature Education Knowledge Project, https://www.nature. com/scitable/knowledge/library/the-nitrogen-cycle-processes- players-and-human-15644632; Kartha S, Dooley K (2016) The risks of relying on tomorrow’s ‘negative emissions’ to guide today’s mitigation action, Stockholm Environment Institute. SEI Working Paper No 2016-08 [Lili Fuhr, Germany]
See response to comment 20130.
4865 4 1 6 48
The pathwys presented in the chapter rely extensively on one technology - CCS, yet the Executive Summary doesn't make this clear. This needs to be stated boldly and clearly given the poor state of CCS deployment at the moment. [Wilfried Maas, Netherlands]
The ES now highlights this aspect in more detail
Do Not Quote, Cite, or Distribute Page 15 of 129
IPCC WGI SR15 First Order Draft Review Comments And Responses - Chapter 2
Comment No From Page From Line To Page To Line Comment Response
20790 4 1 6 48
The executive summary lays out some of the main CO2 policy options,but there is little discussion of the methane, HFC (Kigali) options and the degree of effort needed to decrease these. And what are the conclusions on the importance of certain targeted BC emission reductions? And these different scenarios are divorced from the other implications to livelihoods, health and other aspects of sustainable development. There is a discussion about relying only on CO2 measures and how the implementation of SLCF mitigiation can reduce the need to reduce CO2 as much, but this is not further developed in the summary and I would have thought that implementing SLCF mitigation will be much more palatable than biomass and CCS! This could be touched upon. There is also the issue of the rate of reduction of HFC emissions to reach Kigali targets and more rapid reductions could also help - so this summary is not giving strong evidence for which strategy makes most sense and is most easily implemented. [Johan Carl Ivar Kuylenstierna, United Kingdom (of Great Britain and Northern Ireland)]
Agreed, added specific section on non-CO2 to ES.
20843 4 1 6 48
The executive summary lays out some of the main CO2 policy options,but there is little discussion of the methane, HFC (Kigali) options and the degree of effort needed to decrease these. And what are the conclusions on the importance of certain targeted BC emission reductions? And these different scenarios are divorced from the other implications to livelihoods, health and other aspects of sustainable development. There is a discussion about relying only on CO2 measures and how the implementation of SLCF mitigiation can reduce the need to reduce CO2 as much, but this is not further developed in the summary and I would have thought that implementing SLCF mitigation will be much more palatable than biomass and CCS! This could be touched upon. There is also the issue of the rate of reduction of HFC emissions to reach Kigali targets and more rapid reductions could also help - so this summary is not giving strong evidence for which strategy makes most sense and is most easily implemented. [Johan Carl Ivar Kuylenstierna, United Kingdom (of Great Britain and Northern Ireland)]
Agreed, added specific section on non-CO2 to ES.
3140 4 3 4 1
This opening paragraph must be written much more clearly. First of all, isn't this chapter going to compare and contrast the requirements for the phase-out of all greenhouse gas emissions between 1.5 degree non-overshoot and 2.0 degree non-overshoot pathways? It should. It could also compare and contrast the relevant issues affecting overshoot versus non-overshoot pathways for 1.5 degrees C, but this is less interesting. [Richard Rosen, Germany]
This chapter does indeed compare 1.5 and 2C non-overshoot scenarios now.
708 4 3 4 1
From Figure 1 of Chapter 1 we have already reached 1.5 °C following the GISS data. I believe that GSMT is not a good obervable since it is determined by too many stochastic variables, like El Nino, Sea ice disparition pace etc. It would be much safer and cleaner to come back to the radiation forcing like in the RCP method. Furthermore recent discussions on the existence or not of the "hiatus" between 1998 and 2014 show that it is difficult to have a consensus on the way to define the GMST [Herve Nifenecker, France]
Setting of global ambition based on GMST was a political choice made by nations signing the Paris Agreement (as well as prior agreements under the UNFCCC). This report answers to an explicit request of the UNFCCC to assess issues related to 1.5°C of global warming. the framing of the chapter, and the report as a whole, in terms of GMST is thus not something which can be changed.
4239 4 3 4 11That is a really good start. Posing key questions and orienting the reader where the substance to the answer of these questions is. Well done! [Felix Creutzig, Germany]
Thank you
9206 4 3 4 3
Or one could use SRM. This is a major omissions. I wrote this comment above on Chapter 1: Personally, I find this absurd. And if it does not fit in with previous IPCC reports, who cares. This is a new report, and we can change, no? For example, to say that SRM can not be treated as a mitigation option is ridiculous. Clearly, the goal is to mitigate climate change, and if SRM can shave of 0.1C or 1C or whatever, then surely that meets that goal? And, SRM will be traded off with other options, if we do some SRM, it may be that we do less CDR or less conventional mitiation. So, in principle, SRM must be in Chapter 2 (not cuold be, but must be). It may be that there is no literature, fine, but that is a different issue... [Glen Peters, Norway]
We agree that SRM must be in the SR1.5, but feel that the choice of where is editorial and elect to continue with prior decisions (i.e. that it it’s not in Ch 2).
16155 4 3 4 4
This statement seems totally unjustified--careful studies (e.g., by Edmonds et al., in preparation) have found no practical paths of emissions reductions that would keep the rise in temperature below 1.5 C when also giving full consideration is given to the effects of associated changes in aerosol loading and greenhouse gases other than CO2, and the warming that will result as the ocean lag effect is overcome. The present commitments for fulfilling the Paris Accord only get us to over 3 C of warming. It very much seems to me that "requires" needs to be changed, especially given the first word in the sentence is "Limiting" implies not exceeding 1.5 C (it might well be more appropriate to say returning the global average temperature to below 1.5 C ...). I would think the first sentence should make the point that we are presently far from being on a path to 1.5 C and getting on such a path will require much, much more commitment and effort. [Michael MacCracken, United States of America]
Revised to include description of current trajectories and then what 'would' be required for 1.5 scenarios.
965 4 3 4 4
statement is probably overly strong--rapid phase OUT of CO2 emissions? Surely there are some scenarios in which emissions are not zero (indeed, statements on p.35 imply as much) because CCS deployment is high and negative emission are high, etc. [Victor Davd, United States of America]
Refers to net emissions, which must be brought down in these scenarios (e.g. via negative emissions, as the reviewer suggests). Clarified in revision.
6665 4 3 6 47
The executive summary of chapter 2 leaves the reader with the impression that the range of scenarios discussed equals the range of possibilites. This is not the case, as becomes clear from table 2.5: many possibilities, especially demand side measures, are not included in the senarios. This should be made transparent in the summary. [Astrid Schulz, Germany]
Agreed, more on this added.
6666 4 3 6 47To make the summary more policy relevant, a discussion on (technological) path dependencies, lock-in effects and trade offs between (technological) choices should be added. [Astrid Schulz, Germany]
These topics are included in the ES.
Do Not Quote, Cite, or Distribute Page 16 of 129

IPCC WGI SR15 First Order Draft Review Comments And Responses - Chapter 2
Comment No From Page From Line To Page To Line Comment Response
7423 4 3 6 47
Consider adding a paragraph in the ES to explain the risks posed by feedback-loops and how other goals might influence the carbon budget, for example (drawn from page 13 para starting at line 34): "Large uncertainties remain in some Earth system feedback processes that can impact remaining carbon budgets compatible with 1.5°C or 2°C, for example, permafrost feedbacks. Carbon budgets would also be greatly reduced if multiple geophysical climate targets beyond global mean temperature rise were to be simultaneously taken into account {2.2.2.2}." [Øyvind Christophersen, Norway]
Added.
20465 4 3 4 4
As currently drafted this sentence is not correct. While it would clearly not be desirable, it might prove possible to limit warming to 1.5C using SRM alone. Also, the problem is CO2 emissions from fossil fuels: there are clearly routes to a 1.5C world in which CO2 emissions from, eg, algal biofuels persist (see eg p62, lines 32&33). I would suggest that a more accurate opening sentence would read: "Limiting warming to 1.5C above preindustrial levels would best be achieved through a rapid phase-out of global CO2 emissions from fossil fuels and deep reductions in non-CO2 greengouse gas emissions; such cuts might be supplemented by the use of solar radiation management (SRM)." [Oliver Morton, United Kingdom (of Great Britain and Northern Ireland)]
We believe it is important to begin the ES with statements of the larger conclusions, then later to elaborate additional details. We have therefore added language pointing out that this chapter does not assess SRM later in the opening paragraph.
7422 4 3 6 47
Consider adding a new paragraph in the ES, to make the ES more relevant and understandable to policymakers and the public, for example something like: "For the energy, transport, buildings, industrial, or AFOLU sector, the assessment in this chapter shows that multiple options and choices are available in each of these sectors to pursue a 1.5°C pathway. Because the overall net emissions for a pathway is limited by a geophysical carbon budget, choices in one sector affect the efforts that are required from other sectors {2.3.4.4.1}. The long-term characteristics of mitigation pathways are particularly uncertain due to the uncertainty about the ways humankind will use energy and landareas in the second half of the 21st century. The pathways will depend on long-term population levels, trends in economic growth and income convergence, behavioural change and technological progress. Although model-based assessments already project drastic near, medium and long-term transformations in 1.5°C scenarios, projections also often struggle to capture potential and ongoing transformative changes and their associated dynamics; including disruption, innovation, and nonlinear change in human behaviour {2.5.1.2}." [Øyvind Christophersen, Norway]
Much of this material is now included in the ES, though not precisely as presented here.
20191 4 4Ad 'This chapter': This reds as an introduction to the chapter. I would rather write it as a txt that can be read independently of the main txt. [Ton Wildenborg, Netherlands]
Generalized as suggested.
20785 4 4 4 4It metnions non-CO2 GHG emissions - what about black carbon? That is not a GHG, it is a particle, and is it not part of the solution? [Johan Carl Ivar Kuylenstierna, United Kingdom (of Great Britain and Northern Ireland)]
Added.
20838 4 4 4 4It metnions non-CO2 GHG emissions - what about black carbon? That is not a GHG, it is a particle, and is it not part of the solution? [Johan Carl Ivar Kuylenstierna, United Kingdom (of Great Britain and Northern Ireland)]
Added.
20466 4 4 4 5
In the spirit of the previous suggestion, the second sentence here might usefully be amended thus: "This chapter assesses 1.5C mitigation pathways to achieve this purely by limiting or reducing atmospheric GHG levels; it does not consider the possible role of SRM." [Oliver Morton, United Kingdom (of Great Britain and Northern Ireland)]
Added.
9475 4 5 I think "it is" in this line should be "is it" - since it is phrased as a question? [David Wratt, New Zealand] Revised as suggested.
20786 4 5 4 7The question is only placed in terms of CO2 - what about methane, HFCs, BC, ozone etc? [Johan Carl Ivar Kuylenstierna, United Kingdom (of Great Britain and Northern Ireland)]
Added, thank you.
20839 4 5 4 7The question is only placed in terms of CO2 - what about methane, HFCs, BC, ozone etc? [Johan Carl Ivar Kuylenstierna, United Kingdom (of Great Britain and Northern Ireland)]
Added, thank you.
17299 4 5 4 8
I am uncomfortable with the dominant framing of this chapter on the cumulative carbon budget. The carbon budget is good to distinguish across scenarios spanning a range of temperatures. When it comes to limiting to 1.5C, the budget is of limited help given the budget becomes smaller than the associated uncertainties (e.g. the starting point, pre-industrial temperatures, current emissions in land-use change, emissions from non-CO2 GHG). [Corinne Le Quéré, United Kingdom (of Great Britain and Northern Ireland)]
We do not see a good alternative optimal constraint to use, but we both present multiple characteristics of the scenarios examined in the chapter (see, e.g., the large table in section 2.2) and have added additional mention of the uncertainties associated with C budgets in the ES to clarify this valid point.
10972 4 6 4 6
This chapter urgently needs to address non-overshoot of 1.5 to follow through the conceptual framework set up in Chapter 1. Understood that there may be no non-overshoot scenarios in the database, but need to explan why (what questions were the assessed parthways addressing) and use other types of literature to get at the non-overshoot issue which will be of huge interest to some countries Not saying we will please countries but we must not gloss over issues. [Skea Jim, United Kingdom (of Great Britain and Northern Ireland)]
Non-overshoot scenarios now included.
9570 4 7 4 1
Executive Summary as a whole is well written and readable for policy makers. In this chapter, total budget in comparison with 2 degree case, and balance of emission and absorption among some representing pathways (e.g. between case of early emission reduction and case of high overshoot) is important for decision making. A simple illustrative figure to show those differences is recommendable. [Shuzo Nishioka, Japan]
Thank you. No figures are included in the ES, but such a figure will be included in the chapter.
5224 4 7 4 8The 'key question' on 'how can this [carbon] budget be distributed over the coming decades…' feels to close to the top-down approach of Kyoto Protocol. [Bianka SHOAi-TEHRANI, Japan]
Sentence revised to clarify that the issue discussed in this chapter is distribution over time, not across jurisdictions. So not policy prescriptive or top-down.
15026 4 8 4 8Instead of "transformations", better to say "transitions" or "system transitions", or use both "transformations and transitions" as a compromise. [Farhan Akhtar, United States of America]
Agreed, revised.
12727 4 1 4 1 integrated assessment models [Vassilis Daioglou, Netherlands] Added question in opening paragraph about models.
Do Not Quote, Cite, or Distribute Page 17 of 129

IPCC WGI SR15 First Order Draft Review Comments And Responses - Chapter 2
Comment No From Page From Line To Page To Line Comment Response
11911 4 12
I think it is important to caveat the results from analysed 1.5 degree pathways with the fact that many levers available to reduce emissions are not covered by the models used. Table 2.5 is a great illustration of this. For example, no demand reduction levers outside energy efficiency have been studied, when they could deliver very material emissions reductions. As such, the conclusions drawn from the scenarios could be quite conservative (eg we might not need to overshoot the budget in the mid-term if all those levers were also used). It could be done through a short sentence in the executive summary highlighting that given that the field of literature is only emerging, most models have an incomplete coverage of the levers available tor educe emissions and therefore results presented in this report are likely to be conservative. (see other comments for more detail around possibly material levers not covered by models) [Amandine Denis-Ryan, Australia]
Addition discussion on this added, as suggested, later in the ES in a section that now specifically highlights demand side measures.
3708 4 12 4 15This para suggests that IAMs are the only basis for assessing mitigation pathways compatible with 1.5 deg. Assess non-IAM literature as well [Harald Winkler, South Africa]
Agreed, revised to state that both types of literature are assessed.
3141 4 13Exactly which "quantitative descriptions of the energy-land-emissions developments" are included in the database? Give a list. Change this wording - it is very clutzy. [Richard Rosen, Germany]
There are many tens of scenarios in the database, so it is impractical to list these in the ES.
3142 4 17 You need to define the terms "carbon budgets" and "forcers" first in this paragraph. [Richard Rosen, Germany] Agreed, done.
11112 4 17 4 18
Please clarify, whether or not any no-overshoot 1.5 pathways have been studied. If not at all, or just a very limited number of them, please clarify that: 'Note that this does not imply that pathways that do not exceed the 1.5°C limit are infeasible (specify appropriate feasibility definition as layed out in Ch 01).' [Michiel Schaeffer, Netherlands]
Non-overshoot scenarios now included.
16156 4 17 4 19
With this definitive statement that all scenarios overshoot 1.5 C, then going back to line 3, opening with the phrase "Limiting warming to 1.5 C" is thus clearly inappropriate and this should say something like "Due to delays in enacting emissions reductions, there are no plausible scenarios for keeping global warming below 1.5 C throughout the full 21st century; scenarios that bring warming back down to below 1.5 C by 2100 will require ..." [Michael MacCracken, United States of America]
Agreed, non-overshoot scenarios now included.
3143 4 17 4 19
You say "available pathways". What does "available" mean? If it refers to pathways that just happen to have been put into the IIASA database, this is rediculous. There are many other "pathways" in the literature. You can't just rely on the new runs put into the IIASA database for this chapter. For example, Mark Jacobsen of Stanford University has published many papers on other pathways, which are, basically, non-overshoot pathways. Thus, the authors of this chapter have the moral and scientific responsibility to search the literature for relevant non-overshoot pathways. Furthermore, as we will discuss below, the authors of this chapter have to determine why the IIASA database only has overshoot pathways in it. Could the IAMs relied on had various input assumptions changed such that non-overshoot scenarios would result? [Richard Rosen, Germany]
Literature used has been expanded (though we are of course only able to cite published studies) and now includes non-overshoot pathways.
18780 4 17 4 19
First, as mentioned above, it is highly problematic that non-overshoot scenarios are not addressed more in detail, although non-overshoot is discussed in chapter 1.2.3.1. However, here it is said that available pathways "all exhibit overshoot of that temperature level", while chapter 2.4.2, page 56, says that "almost all 1.5C pathways in the literature overshoot". Either it is all or "almost all", but both can not be right. [Sven Harmeling, Germany]
Non-overshoot now included, hence text revised.
19331 4 17 4 19It is now no longer possible to avoid exceeding 1.5°C: all available pathways holding warming below or close .... [Birgit van Munster, United Kingdom (of Great Britain and Northern Ireland)]
Non-overshoot scenarios now included, so text at this point reflects this.
20121 4 17 4 19
If IAMs based on the IIASA database only produce overshoot scenarios, Chapter 2 authors must resort to non-IAM literature to build non-overshoot pathways. Chapter 2 authors have an ethical and scientific obligation to not only include, but to prioritise non-overshoot pathways. There is plenty of relevant literature in the various disciplines, e.g. Millar et al. 2017 Emission budgets and pathways consistent with limiting warming to 1.5°C, in: Nature Geoscience, published online: September 18, 2017. [Lili Fuhr, Germany]
Agreed, non-overshoot scenarios now included.
19359 4 17 4 19
This description assumes the criterion for limiting warming to 1.5 deg is to be below or close to 1.5 deg in the year 2100. While this seems a reasonble choice, it is not obvious it should be the only choice. It would be useful to have more discussion on how relaxing this criterion to a return to 1.5 deg by 2105, 2110... would affect the carbon budgets. [William Collins, United Kingdom (of Great Britain and Northern Ireland)]
The chapter now discusses both pathways that stay below 1.5°C and overshoot it until 2100. Beyond 2100, the chapter has no pathways available.
7424 4 17 4 31
We find the current description of the carbon budgets slightly confusing, please consider a more thorough description. 280/330 GtCO2 seems to correspond to 75 % and 63 % probability to hold warming in 2100 to less than 1,5 C (when looking at the relevant coulmn in Table 2.4), rather than 66 % and 50 % as it is stated here. If the budgets derived from Tab 2.4 are to be used, consider including an exerpt from the table. [Øyvind Christophersen, Norway]
Description expanded and clearer definition added.
7425 4 17 4 31
Consider describing the probability range of each budget to exceed not only for 1.5C but also for 2C pathways, to highlight the "fat tails". This information might contribute to inform policymakers better that there is always a risk of exceeding a temperature threshold, even in low emission pathways. [Øyvind Christophersen, Norway]
Added sentence on 'overlap' between scenario classes pointing out that 1.5C scenarios also have high probabilities of keeping below 2C.
6523 4 17 4 31
There is large uncertainty about the climate sensitivity and its effects on the projections of temperature rise, carbon budgets and so on are significant. This is very important caveat and should be mentioned here on the impact of this uncertainty. [Shigeki KOBAYAHI, Japan]
Added.
709 4 17 4 32Here again refrence to the GMST obscures the question. For politics one needs a clear CO2 or CO2eq budget to be respected by 2100 [Herve Nifenecker, France]
CO2 budgets are clearly given in this paragraph along with associated GMST.
Do Not Quote, Cite, or Distribute Page 18 of 129
IPCC WGI SR15 First Order Draft Review Comments And Responses - Chapter 2
Comment No From Page From Line To Page To Line Comment Response
14209 4 18 4 18I think it may be worth putting some sort of emphasis, bold, italics or underline, on the word ‘all’ in ‘all exhibit overshoot…’ It's easy to miss in the wall of text. [Jason Donev, Canada]
Non-overshoot scenarios now included, so text at this point reflects this.
6138 4 19 4 19delete 'subsequent'. Adds nothing and makes it harder to understand. [Philip Sargent, United Kingdom (of Great Britain and Northern Ireland)]
Agreed, done.
16157 4 2 4 2
The phrasing here is really misleading--there is no holding of warming below 1.5 C, there is a return to temperatures below 1.5 C by 2100. Not making clear that, because of emissions to date, the world will exceed 1.5 C is irresponsible and misleading. [Michael MacCracken, United States of America]
Text revised to reflect that we now discuss both scenarios holding T below and returning to a given threshold.
901 4 2 4 2The 66% and 50% likelihoods calculated for seem rather low, should estimates not be calculated for greater confidence limits? [David Infield, United Kingdom (of Great Britain and Northern Ireland)]
Added text on the implications of choosing higher probability values.
17300 4 2 4 2
why present 'at least 66%' here? the Paris Agreement says 'pursuing efforts to limit to 1.5C', which I would not describe at either 66% or 50%. In my view the framing needs to be broader. [Corinne Le Quéré, United Kingdom (of Great Britain and Northern Ireland)]
Added text on the implications of choosing higher probability values.
7158 4 2 4 21
Decision 1/CP.21, para 17, indicated that the SR1.5 will provide the level of global emissions reductions in 2030. This value is provided as a range (25-41 GtCO2eq/yr) (also in table 2.7). Could an average value be provided (e.g., 33 GtCO2eq/yr) so that it can be compared with the 40 GtCO2eq/yr indicated for the emission reduction level in 2030 corresponding to 2C? [Iulain Florin VLADU, Germany]
Mid-range values now given.
6865 4 2 4 22
The remaining budgets for staying below 1.5oC given here (280 GtCO2 and 330Gt for 66% , resp 50% probability) do not correspond with the numbers presented in table 2.2. or in the tekst of section 2.2.2. This is a problem. It also needs to be explained which budget definition is used and why. [Bert Metz, Netherlands]
Revised to ensure harmonized values.
4861 4 2 4 22Reconcilliaton of the budget stated here with the work presented later in the chapter is unclear. [Wilfried Maas, Netherlands] Revised to ensure harmonized values.
3144 4 2 4 26
These sentences are far too complex for the Exec Summary. First of all "likelihood" would have to be defined, and it is not a probability, so I would leave it out. Use mid-range values only. The fact is no one knows probabilities. You can explain distributions of model results later in text. Make clear that the 330 figure is for a non-overshoot pathway, and the 780 result is for an overshoot scenario. Describe the difference. Omit term "interquartile range". Too complicated! The authors seem to forget that they are writing for policy makers. [Richard Rosen, Germany]
Terms simplified where practical, but we believe it is important to include ranges and not appear overly confident in mid-range values.
7426 4 21 4 21 Please consider including Net in front of "… CO2 emissions emitted…" [Øyvind Christophersen, Norway] net' now included in definition.
12969 4 21 4 21The numbers "280 (150-360)" and "330 (250-490)" are available in Table 2.4, but are not discussed in the text. I suggest providing a detailed explanation in the text of section 2.2.3.2 [Caserini Stefano, Italy]
Revised to ensure harmonized values.
16158 4 21 4 22
This report will be coming out in 2018. The numbers here seem to count emissions only through 2015 when we already know what the 2016 emissions were and can estimate the 2017 emissions to a degree that will not broaden the indicated uncertainty ranges at all. This needs to be done to really clearly indicate the imminence of overrunning the budget. Indeed, I would urge that the sentence also include what the current emissions are (or a range from past couple of years) so there is context provided for the remaining balances. [Michael MacCracken, United States of America]
Up-to-date emissions/budgets now included.
1550 4 22For clarity, a sentence should be added after the description of 280 and 330 GtCO2 budgets : "No pathway compatible with these emissions budgets was available for discussion in this report" [Noé Lecocq, Belgium]
Such pathways are now included.
6140 4 22 4 22delete 'further'. Wrong logically and confusing to the reader. [Philip Sargent, United Kingdom (of Great Britain and Northern Ireland)]
Sentence removed during revisions.
9490 4 22 4 23
Efforts to net-zero emissions are very important to attain stringent emission targets. To strengthen this concept, sentences, "Limiting global mean temperature to any level requires global CO2 emissions to become net zero at some point in the future. At the same time, current (year: 2015) global annual CO2 emissions are of the order of 41 billion metric tons of CO2 per annum (GtCO2 yr -1). Reducing these emissions from their current levels to net zero will require large-scale transformations of the global energy-economy-land system, affecting the way in which energy is produced, agricultural systems are organized, and the extent to which energy and materials are consumed." should be cited here from Sec. 2.3.1. [Masato TAKAGI, Japan]
Sentence removed during revisions. Transitions discussed in later sections of ES.
16159 4 22 4 23
This sentence is not really accurate as written. Once one gets to zero emissions there is further warming due to the ocean thermal lag effect. So, this sentence needs to make clear there is a lag time. [Michael MacCracken, United States of America]
Sentence removed during revisions.
13695 4 22 4 26Not clear for the non-specialist reader – eg is this saying net zero emissions will stop warming, active removal of CO2 will happen spontaneously [Elvira Poloczanska, Germany]
Sentence removed during revisions.
20379 4 23 4 23 Until they peak or "Until their peak" [Olivier Boucher, France] Revised.
1549 4 23 4 26Uncertainties and feasability constraints of negative emissions technologies should be mentionned here, with a reference to Chapter 4 [Noé Lecocq, Belgium]
These are discussed further later in the ES where CDR is covered.
16160 4 23 4 26The meaning of this sentence is not clear. Please improve the wording. What are the 1.5 C scenarios referred to and where do these numbers come from? [Michael MacCracken, United States of America]
Revised and clarified.
Do Not Quote, Cite, or Distribute Page 19 of 129

IPCC WGI SR15 First Order Draft Review Comments And Responses - Chapter 2
Comment No From Page From Line To Page To Line Comment Response
6139 4 23 4 26
This over-complex long sentence is completely unintelligible (and I'm a native English speaker). It needs to be entirely re-written. 'this peak' is confusing as until now there has been no mention of a 'peak'. [Philip Sargent, United Kingdom (of Great Britain and Northern Ireland)]
Revised and clarified.
12970 4 24 4 24As above these figures are available in Table 2.4 but are not discussed in the text. I suggest providing a detailed explanation in the text of section 2.2.3.2 [Caserini Stefano, Italy]
Section 2.2.2 on the carbon budget has been revised to discuss the values more fully.
6968 4 25 4 25 Suggest to replace "CO2 is actively removed" by "CO2 has to be actively removed". [Sai Ming Lee, China] Wording changed during revisions so no longer applicable.
2199 4 25 4 26
This is imprecise. The mitigation pathways feature active CO2 removal from 2030 (median 0.5 Gt/yr). Perhaps what the authors want to explain is that there is a net negative global CO2 balance in the second half of the century. [Kenneth Möllersten, Sweden]
Agreed, clarified as suggested.
7427 4 26 4 26
The outline states that both pathways for 1.5C and 2C should be included/compared in this chapter. Therefore we suggest that you insert a similar text for 2C as you have for 1.5C. This could be done at this place in the para, or you could add a stand alone para about 2C carbon budgets. [Øyvind Christophersen, Norway]
Relationship between budgets for 1.5C and 2C is given, but more details are left to section 2.2 rather than here in the ES.
9491 4 26 4 26As carbon budgets have various definitions, use of a more scientific expression is recommended. [Masato TAKAGI, Japan] Clear definition added.
16161 4 26 4 27
Again, unclear. Perhaps change "is about" to "needs to be about"--and on line 26, change "the carbon budget" to "CO2 emissions" and I don't understand how the phrase 'carbon neutrality" fits in. [Michael MacCracken, United States of America]
Revised to clarify and neutrality changed to zero net CO2.
11113 4 26 4 27Give the respective comparison of the carbon budget with a 2 degree target also for 66% probability. [Michiel Schaeffer, Netherlands]
Relationship between budgets for 1.5C and 2C is given, but more details are left to section 2.2 rather than here in the ES.
3145 4 26 4 31These sentences are incomprehensible, and should be omitted or greatly simplified. [Richard Rosen, Germany] Sentences simplified somewhat, but many reviewers called for additional details and caveats so
we've attempted to balance accuracy/completeness with simplicity concerns.
9492 4 27 4 28Carbon neutrality is the term which confuse readers, as "Carbon neutral" is well used for biomass. More scientific wording, ex. global net zero CO2 emissions" is recommended. [Masato TAKAGI, Japan]
Revised as suggested.
11114 4 28 4 3
It is clear that methane, nitrous oxide and HFCs need to be reduced in addition to stringent CO2 reductions. But why is black carbon mentioned here? This sentence focuses explicitly on 1.5°C pathways, in which co-emitted BC largely disappears under stringent CO2 reductions, and it seems clear that seperate or accelerated black carbon reductions do not make a difference at all. See Rogelj et al (2014a). [Michiel Schaeffer, Netherlands]
BC is one of the warming agents that need to be reduced, so belongs here. Many BC sources are eliminated in low-C scenarios, but there is no guarantee all will vanish due to low-CO2 priorities so important to point out that BC reductions needed (via whatever pathway).
16162 4 28 4 28
The phrase "1.5 C pathways" is really misleading--these are pathways that allow the temperature to overshoot 1.5 C and come back to below 1.5 C by 2100. Such pathways are hardly 1.5 C pathways in terms of impacts through the century. And it also needs to be said somewhere here that this overshooting could lead to nonlinear effects that contribute to warming (e.g., permafrost thawing; ice sheet collapse, etc.) that have traditionally been thought about as consequences of pathways with greater warming. The correct name for such scenarios should reflect the maximum temperature increase during the 21st century and this is well above 1.5 C. This report cannot cover up such situations--it needs to be very clear, and misnaming scenarios is really unfortunate obfuscation. [Michael MacCracken, United States of America]
As noted in reply to similar previous comment, non-overshoot now included. Text added to ES on possibility of feedbacks coming into play that would be likely to reduce C budgets.
7428 4 3 4 31
Please consider rephrasing to make sentence easier to understand. It would be interesting to highlight in the ES what kind of measures that contributes most to such a reduction of the carbon budgets througt Non-CO2 forcers, and also the wording "per degree of warming attribiuted to them" can be slightly cryptic for a policymaker to understand. [Øyvind Christophersen, Norway]
Revised sentence to clarify. Text on non-CO2 controls added to 'properties of transitions' section later.
11049 4 3 4 31
The role of Non-CO2 GHG should be explained in more detail. What is the range of Non-CO2 emissions in the evaluated pathways? Do the given CO2 emission budgets assume a certain amount of Non-CO2 emissions as unavoidable? [Jakob Wachsmuth, Germany]
Clarified that C budgets include non-CO2. Ranges shown in section 2.2.
16163 4 3 4 3
The radiative forcing during the 21st century due to tropospheric ozone is, for BAU scenarios, about half of the CO2 induced forcing from 21st century emissions (so roughly comparable to methane forcing from 21st century methane emissions), so this list needs to include "precursors to tropospheric ozone"--while it may be that these are roughly proportional to CO2 emissions or something else, it is conceivable to reduce the precursors (or change their ratio) separately from emissions of other species, and s precursors to tropospheric ozone need to be mentioned. [Michael MacCracken, United States of America]
Methane is a precursor to tropospheric ozone, and is included. A more general statement would not be accurate as NOx was estimated to have an overall cooling effect in AR5.
Do Not Quote, Cite, or Distribute Page 20 of 129
IPCC WGI SR15 First Order Draft Review Comments And Responses - Chapter 2
Comment No From Page From Line To Page To Line Comment Response
16164 4 3 4 31
This sentence is just not clear. First, I don't understand this phrase "carbon budget;" would it not be better to say "cumulative carbon emissions"? Second, there is really no discussion of the time constant here--is this assuming GWP-100 and referring to the temperature change over a year at the end of this period, or is this referring to the temperature change in 2100, or what? Third, without saying roughly how much warming is presently associated with non-CO2 forcers, it is hard to judge how important reductions in emissions of these species could be. I would think the sentence would say something like: "Reducing cumulative emissions of non-CO2 climate forcers by 50%, which is plausible, would be likely to reduce the average increase in global average temperature through the century by about 0.5 C, roughly equivalent to a decrease in cumulative CO2 emissions of about 1000 GtCO2." [numbers here are of course only illustrative]. In making such a statement, however, context is needed for what the projected cumulative emissions changes would be in the CO2 emissions. The earlier sentences give what emissions need to be for a scenario of returning to 1.5 C by 2100 but do not give a sense of how large the reductions in CO2 emissions have to be to get there from, say, the emissions projected to occur based on the commitments under the Paris agreement. Somehow, the role that cutting non-CO2 emissions needs to be put in context, and this is not at all apparent here. Given numbers available that several hundred GTCO2 is all that is left for emissions, giving the number 2000 GtCO2 for the non-CO2 gases gives to me the mis-impression that cutting such emissions would allow for much more CO2 emissions while staying under 1.5 C, and this is just not correct. [Michael MacCracken, United States of America]
Time being discussed now given explicitly. Temperatures do not follow cumulative non-CO2 emissions, but are proportional to sustained changes so this has been clarified. Impact now given per tenth degree to allow more easy comparison with budgets. Not really practical in ES to include how much warming currently due to non-CO2 or how much non-CO2 reduced in given scenarios as would become very long.
20787 4 3 4 31
Surely there are problems in equating short term forcers to CO2 using CO2 equivalents? This statement assumes that the time dimension of warming is the same, even though it is not. Does this sentence refer to mitigation of non-CO2 climate forcers in 2050?? it is not clear what this means [Johan Carl Ivar Kuylenstierna, United Kingdom (of Great Britain and Northern Ireland)]
Time being discussed now given explicitly. Relationship expressed only using temperature response, so comparison geophysical, but added 'sustained' to help link the differing time dependencies more clearly.
20840 4 3 4 31
Surely there are problems in equating short term forcers to CO2 using CO2 equivalents? This statement assumes that the time dimension of warming is the same, even though it is not. Does this sentence refer to mitigation of non-CO2 climate forcers in 2050?? it is not clear what this means [Johan Carl Ivar Kuylenstierna, United Kingdom (of Great Britain and Northern Ireland)]
Time being discussed now given explicitly. Relationship expressed only using temperature response, so comparison geophysical, but added 'sustained' to help link the differing time dependencies more clearly.
11115 4 3 4 31
This is confusing and not a helpful statement for a summary. I sugest to delete(1) it is unclear to which carbon budgets this applies to. The section includes 2 types (2016 to 2100; and 2016 to peak warming). (2) from the setion itself it is also unclear if this non-CO2 is accounted for in the budgets provided above. (3) finally, it is simply unclear what this sentence contributes to this summary section: indicate additional potential? If so, how & how much? Indicate risk of higher warming / lower budgets? If so, how & how much? [Michiel Schaeffer, Netherlands]
Revised to clarify time dimension, that non-CO2 included in C budget section, and now this portion put into separate section on non-CO2.
20380 4 3 4 31Sentence as standing alone is unclear. Per degree of avoided warming, per degree of existing warming? [Olivier Boucher, France]
Clarified the time periods involved here.
19360 4 3 4 31This relationship of non-CO2 warming to carbon budget will depend linearly on the climate sensitivity hence quoting a single value here doesn't seem useful. [William Collins, United Kingdom (of Great Britain and Northern Ireland)]
All values given here depend on the TCRE, but a good point so text on this sensitivity for all C budgets (not only non-CO2) added to ES.
12971 4 3 4 31The sentence "Non-CO2…to them" is not interesting for an executive summary, I suggest deleting it [Caserini Stefano, Italy] Many other reviewers disagree and requested more on this, an opinion with which we concur.
6354 4 3 4 31
The question of how non-CO2 emissions and mitigation influence the CO2 budget consistent with a temperature goal is critical for countries to understand what to make of the "balance of sources and sinks" ambition in the Paris Agreement, and how much effort to place on mitigation of non-CO2 sources in addition to CO2 mitigation (which of course has to be the primary concern). I suggest that a dedicated and more comrpehensive para focusing on the role of non-CO2 gases/mitigation is drafted for the SOD. This would include the information currently provided, that every degree of warming from non-CO2 reduces the carbon budget by 2000 Gt CO2. (On this specific statement, two points: (a) express this as per tenth of warming so that it speaks to the actual range of warming coming from non-CO2, and (b) the reasoning by which the authors arrive at 2000 Gt CO2 is unclear - see separate comment on this on pages 14/15). [Andy Reisinger, New Zealand]
Paragraph on non-CO2 now included, values expressed per tenth degree.
20192 4 3 4 31To mitigate non-CO2 climate forcers CO2eq budgets need to be reduced by 2000 Gt CO2eq…. [Ton Wildenborg, Netherlands]
Noted.
14317 4 3 4 31The term "carbon bugget" is unclear; this estimate seems to apply to the" threshold return carbon budget" as discussed in section 2.2.2.3. [Serge PLANTON, France]
Clear definition added.
3146 4 33 4 37
Don't use the word "robust" unless you define it first, which is hard. Give approximate figures for these sentences. How much? What is the quantitative difference between an overshoot and non-overshoot scenario? [Richard Rosen, Germany]
Agree, 'robust' deleted. Numbers not appropriate given specific issues addressed (e.g. degree of intl cooperation)
20382 4 33 4 37In which category falls the Paris agreement: the former or the latter? [Olivier Boucher, France] Reorganized so that discussion of the NDCs immediately follows this. Should be clear to
readers that thus far, national pledges are in the latter category.
1838 4 33 4 45These “messages” are especially important for the broader subject of the chapter 5 and not properly are taken into account in that chapter. [Tibor Farago, Hungary]
Noted. Informed Ch 5.
Do Not Quote, Cite, or Distribute Page 21 of 129
IPCC WGI SR15 First Order Draft Review Comments And Responses - Chapter 2
Comment No From Page From Line To Page To Line Comment Response
16165 4 35 4 35
Saying such actions would only "quickly exhaust a large share of the compatible carbon budget" is far too optimistic--such actions would quickly wipe out even the possibility, without resort to climate intervention or very large carbon removal (points that should be made), of returning global average temperature to below 1.5 C by 2100. The situation is really much more dire than indicated by the wording here. [Michael MacCracken, United States of America]
These paragraphs have been revised (urgency grouped together) and the next one (in the SOD) now makes clear that even with negative emissions the goals can't be readily met on the current trajectory.
20788 4 35 4 35Is 'compatible carbon budget' a widely understaood term? It is not clear to me. [Johan Carl Ivar Kuylenstierna, United Kingdom (of Great Britain and Northern Ireland)]
Agreed, text revised.
20841 4 35 4 35Is 'compatible carbon budget' a widely understaood term? It is not clear to me. [Johan Carl Ivar Kuylenstierna, United Kingdom (of Great Britain and Northern Ireland)]
Agreed, text revised.
11116 4 35 4 37change "decreasing the probability of limiting warming" to "increasing the difficulty of limiting warming" [Michiel Schaeffer, Netherlands]
Agreed, done.
16166 4 36 4 36
temporary is too vague a phrase. This will mean "at least several decades" and much longer if emissions reductions are not much stronger than the Paris commitments presently envision. And the overshoot is likely to be above 2 C (or more), not just 1.5 C. [Michael MacCracken, United States of America]
Agreed, 'temporary' deleted.
1839 4 39
“The Nationally Determined Contributions (NDCs) submitted by Parties to the Paris Agreement ..” à The national contributions (INDCs and NDCs) specified in relation to the Paris Agreement .. ((explanation: in many cases there are still the INDCs submitted before the adoption of the PM and which will be updated 5 years later)) [Tibor Farago, Hungary]
Revised as suggested.
13171 4 39 45
Text mentions that models cannot produce scenarios that are compatible with limiting warming below 1.5C. However, this is not necessarily an issue of modeling but it is related to the rather limited, but still significant, cumulative impact of the current NDCs. Perhaps the text can be rephrased to clarify this. [Deger Saygin, Turkey]
Section on 'urgency' in revised ES clarifies these conclusions.
3713 4 39 4 39 replace "result in" with "are estimated to result in" [Harald Winkler, South Africa] Agreed, done.
11495 4 39 4 39It is correct the use ofNDCs achronyms instead of INDCs? Please check it out for consistency betwen sections and chapters [Meimalin Moreno, Venezuela]
Both now used.
9812 4 39 4 41Please check if this is consistenty for the GWPs used in the underlying studie for the 1.5C studies. The NDC studies use mainly GWPs based on SAR, whereas the 15C pathways may use other GWPs [Michel den Elzen, Netherlands]
Topic for 2.3, not the ES, but agreed. This will be dealt with in the cross-chapter box on NDCs.
7159 4 39 4 41
Consider the values for the carbon budget 2016-2100 provided here and in 2.2.2 in the context of the new paper on Emission Budgets and pathways consistent with limiting global warming to 1.5C by Milalr, R. J., and Coauthors (Doi:10.1038/NGE03031) [Iulain Florin VLADU, Germany]
Added in section 2.2.
14929 4 39 4 42
It must be made clear both here and Section 2.3.5 that wherever there is discussion on the mitigation result of near term NDCs, this implies an extrapolation assuming no further ambition ratchet. This is a crucial point, as the entire structure of the Paris Agreement assumes the opposite--that near term NDCs are a starting point, to be ratcheted down following the Facilitative Dialogue and Global Stocktakes. [Christopher Weber, United States of America]
We refer to 'current pledges' which is accurate. Increased ambition is discussed in the chapter.
9810 4 39 4 42
Why are the 1.5C scenarios grouped? The budgets are presented for at least 50% and 66%, whereas fpr the 2030 emission levels this has not been done. It woul dbe btter to be consistent and also present 2030 emission levels for at least 50% and 66% [Michel den Elzen, Netherlands]
Revised text now consistent in scenario groups.
16167 4 39 4 45
It needs to be indicated how the CO2-eq is being calculated. If this is with GWP-100, as has been traditional, this gives a quite misleading indication of the situation being faced over the next few decades. The values here would better be based on making the calculations using GWP-20, which will better give an indication of how important the role is of emissions non-CO2 climate forcers. And it would be helpful to have a chart showing the various contributions to CO2-eq when based on GWP-20. [Michael MacCracken, United States of America]
Rejected. This level of detail seems more appropriate to the chapter than the ES in our opinion.
19332 4 39 4 45
If the Paris Agreement NDCs are fully implemented, annual greenhouse gas emission continue to increase until after 2030. Starting from 2030 GHG levels in line with national pledges …. [Birgit van Munster, United Kingdom (of Great Britain and Northern Ireland)]
Similar text now included.
19333 4 39 4 45
Richard J. Millar et all, Nature Geoscience (2017) doi:10.1038/ngeo3031, this paper suggests that the IPCC AR5 emission limit required to not exceed 1.5°C global warming might be underestimated and that there could be about 19 more years of emissions until 1.5°C is locked, essentially equal to the (old) <2°C lock date of 2036 (>66% all GHG) [Birgit van Munster, United Kingdom (of Great Britain and Northern Ireland)]
Noted. Assumptions affecting budget discussed in section 2.2.
19334 4 39 4 45
Not exceeding the Paris goals (excluding overshoot and unproven negative emissions, and with intergenerational equity which the UN has called for) requires that the intended NDC reduction of about 40 GtCO2 (compared to current policies) must be increased a very difficult 6 times, to a cumulative reduction of about 240 GtCO2 between now and 2030 (IPCC AR5 2°C limit, >66%, accounting for all GHG, or 2017 Millar et all 1.5°C limit) [Birgit van Munster, United Kingdom (of Great Britain and Northern Ireland)]
Noted
19335 4 39 4 45
With temperature 'overshoot' and large amounts of negative emissions(790-900 GtCO2) the intended reduction of about 40 GtCO2 between now and 2030 must be increased by about 2.5 times. [Birgit van Munster, United Kingdom (of Great Britain and Northern Ireland)]
Noted.
6969 4 39 4 49Suggest to clearly state that there is little or no hope to keep warming below 1.5C with the pledges agreed in the Paris Agreement. [Sai Ming Lee, China]
Stated.
Do Not Quote, Cite, or Distribute Page 22 of 129

IPCC WGI SR15 First Order Draft Review Comments And Responses - Chapter 2
Comment No From Page From Line To Page To Line Comment Response
6268 4 39 4 53This conclusion strongly impacts on everything on climate policies. It should therefore be highlighted [Milton Nogueira da Silva, Brazil]
Section on 'urgency' in revised ES highlights these conclusions.
3147 4 39 5 55
the rest of this exec. Summary is far too long and technical. Provide a simple summary of the results described in Chapter 2 keeping in mind that since the chapter has to be much shorter than it is, a lot of material must be left out. [Richard Rosen, Germany]
Text simplified where practical, but most reviewers have asked for additional details rather than saying there is too much. The chapter itself will be consistent with the aspects indicated in the approved chapter outline.
17216 4 4 4 4
UNFCCC in its updated synthesis report on the aggregate effect of NDCs until 2030 estimates the global emission levels of 52.0-59.3 GtCO2 eq in 2030. Is the difference due to different methodology? Has the impact of the US pulling out of the Paris Agreement taken into account? [Himangana Gupta, India]
This number is based on the wider literature including the study by the UNFCCC secretariat. Legally, the US has not yet left the Paris Agreement
6355 4 41 4 43
This is a statement of fundamental importance that needs to be a chapeau for a stand-alone para in the executive summary. It could then be followed up with additional relevant information about implications of delay. [Andy Reisinger, New Zealand]
Section on 'urgency' in revised ES highlights these conclusions.
10434 4 41 4 45 sensitive so needs to be presented carefully [Jonathan Lynn, Switzerland] Noted.
20383 4 44 4 44The 49-58 GtCO2-eq yr-1 emission range does not necessairly imply emissions reductions at the global scale given that 2010 emissions are about 50 GtCO2-eq yr-1. [Olivier Boucher, France]
Agreed, text revised.
7160 4 45 4 45Consider adding at the end - Therefore, current NDCs, if maintained until 2030, will make staying on a 1.5 °C pathway unlikely. [Iulain Florin VLADU, Germany]
Seems already implied by section. Also now stated at start of ES.
9837 4 47 4 48Carbon prices in this sentence mean the marginal abatement costs. If this is correct, "carbon prices" should be deleted because the "mitigaion costs" can include the "carbon prices." [Keigo Akimoto, Japan]
Text revised to reflect that mitigation costs can include both carbon pricing and investment costs.
16168 4 47 4 5The first two sentences are supposed to really be one. Wording needs to be adjusted. [Michael MacCracken, United States of America]
Sentences revised, but kept as two to prevent an overly long one.
6356 4 47 4 53
This para is very generic and provides little new information. Please revise to ensure it provides quantitative information where possible, specific to the 1.5 degree goal, and is tied to the very important statement in lines 41-43. [Andy Reisinger, New Zealand]
Taken into account.
9839 4 48 4 5
Delayed action (…) lead to higher long-term mitigation costs.: This is totally agreed under the perfect forecast of future technologies that are treated in the IAM. However, in the real world, technology innovations that the IAMs cannot consider may be expected for 50-100 years. In such cases, delayed actions do not necessarily lead to higher long-term mitigation costs. It might be better that this note is added. [Keigo Akimoto, Japan]
The models include estimates of technological innovation, but agreed forecasting is not perfect. Added that these are results 'in the models'.
14210 4 49 4 49
The phrase ‘carbon lock-in’ is used without being defined. Given that the commitment to emitting carbon is defined differently by different people, I think a specific definition is better here. [Jason Donev, Canada]
The models use various methods of carbon pricing, and the overall point here is only that these are pushed in the same direction with delayed policies, so we feel not a good use of space to give more details in ES.
7307 4 49 4 49 Delete the text "promote carbon lock-in". [Eleni Kaditi, Austria] As space is severely limited in the ES, we believe this is better left to chapter sections.
13172 4 51Stranded investments are mentioned here, but they are neither quantified nor the chapter mentions them again. It may be helpful to refer to some literature about its potential magnitude to put the sentence in context. [Deger Saygin, Turkey]
Taken into account. The ES was made fully consistent and with a direct line of sight to the underlying chapter.
19336 4 51 4 53
It also leads to generally higher cumulative CO2 emissions until carbon Neutrality and therewith a higher and longer exceeding of the 1.5°C temperature limit, and a higher risk to reach 'tipping points'. [Birgit van Munster, United Kingdom (of Great Britain and Northern Ireland)]
Tipping points' are a topic for ch 3 (impacts not addressed in Ch 2).
900 4 55 6 47
Surprisingly, nuclear energy is completely left out of the mitigation pathway, whereas nuelaera energy is the only decarbonized electricity production technique that can produce very large amounts of energyy whenever it is needed without demanding huge ground areas as hydroelectricity does. With the breeders, the available uranium is sufficient for millenias of electricity production. [Jean Poitou, France]
This is one of the lower carbon sources of energy that is discussed. We've added text to make this clearer.
17217 4 56 5 1 Delete 'and' after 'preferences' [Himangana Gupta, India] Done.
13173 5It may help for the reader to mention the ranges for the carbon budget somewhere in the Executive Summary. [Deger Saygin, Turkey]
Accepted - they are now included
1840 5 1It is extensively discussed in Chapter 5, therefore, such a reference could be here: “.. implications for sustainable development, that is also comprehensively discussed in Chapter 5. {.. [Tibor Farago, Hungary]
The ES need to be traceable to this chapter. Links to ch 5 are in the chapter sections.
6970 5 3 5 3 Suggest to replace "show large reductions" by "require large reductions". [Sai Ming Lee, China] Revised.
3714 5 3 5 3
You state blandly that there 1.5 scenarios require" large reductions of per capita energy demand". That may be fine where people are over-consuming, but for countries where large parts of the population have no access to modern energy services, and very low levels of consumption, this is a heartless statement. Assess the literature on achieving mitigation and increasing affordable energy access; and pleaes revise here and in the underlyingsection [Harald Winkler, South Africa]
Agreed, revised to address consumption levels.
10837 5 3 5 4
better specification needed: reduction in per capita energy demand - final energy or primary energy? For a drastically increase in renewables the per capita primary energy demand can decrease while the per capita final energy demand increases - we see that in our most recent research (not yet published) [Christian Breyer, Finland]
Clarified (see new section on demand-side & behavioural measures).
19304 5 3 5 6The issue of the size of the global population should be mentioned also here, as it is in the body of the chapter. [Marco Mazzotti, Switzerland]
Added to ES.
Do Not Quote, Cite, or Distribute Page 23 of 129
IPCC WGI SR15 First Order Draft Review Comments And Responses - Chapter 2
Comment No From Page From Line To Page To Line Comment Response
16169 5 3 5 3
It seems to me that "show" is jargon--what needs to be said that such emissions paths will require large (even very large) and rapid reductions in per capita use of fossil fuels (and associated CO2 emissions). On the issue of reduced energy demand, it seems to me that this is the wrong way to phrase this as it implies a very large reduction in energy services. Actually, with the increased affordable energy from renewables and with the great potential for increased efficiency to sustain energy services using a lot less energy. I'd suggest revising text to give a better indication that there are at least a few reasons of hope instead of the present phrasing. [Michael MacCracken, United States of America]
We've revised to say that scenarios include these rather than 'show'. Require is difficult as it implies no other possibility, which is generally not the case for any individual aspect.
16170 5 4 5 6
This seems like a pretty vague statement--how much greater and more rapid? [Michael MacCracken, United States of America]
This initial discussion of the transitions is designed to give general changes across transitions within scenarios. Additional quantification for specific transitions given in paragraphs below.
11117 5 5 5 6
Are transitions greater and more rapid than in 2°C mitigation pathways "particularly" in the coming decades and up to mid-century, or ONLY in those periods? from the data in the chapter it seems 2°C ultimately needs transitiona "as great", but later. So it's more rapid, but not "greater" in the coming decades. FIgure 2.6 suggests the only exception is the buildings sector, where even by 2100 1.5°C scenarios are still distinct from 2°C, which perhaps is worth highllighting in this summary para, adding substance to the overly generic statement now [Michiel Schaeffer, Netherlands]
Both greater and more rapid. Details on this given in chapter sections but too complex for ES in our opinion.
16171 5 8 5 9
This phrasing is very strange--the phrasing would better be to the effect that: "To get on an emissions path that would allow returning to below 1.5 C by 2100, there must be significant reductions in the use of fossil-fuel derived energy from all end-use sectors, including ...." Just because a scenario shows significant demand reductions has nothing to do with whether it will occur--the text needs to be explaining what must happen, not show what an integrated assessment model shows is necessary. [Michael MacCracken, United States of America]
Revised to state that these transitions are 'critical parts of 1.5C scenarios'.
6971 5 8 5 9Suggest to replace "show significant demand reductions" by "are required to decrease demand significantly". [Sai Ming Lee, China]
Text revised along lines of suggestion.
3148 5 8 5 9
You use the word "show", which implies that the demand reductions are calculated. I think they are input to/assumed in the models for these two types of scenarios, not a result from the models. Clarify the language. [Richard Rosen, Germany]
They are calculated in the models. Text revised to say the models 'include' these.
21100 5 8 5 9
demand reduction : given that the chapter appears to refer to "Energy end-use sectors" without explicitly writing the word "energy", I have the impression that this could be "energy demand reduction". Please clarify, considering that both energy demand reduction (including trough efficiency improvement) and final product demand reduction might be in these scenarios : the question is whether or not some or all scenarios include a limitation in the consumption of (material) products, in particular for the most wealthy part of the populations or countries. [Philippe Marbaix, Belgium]
Thank you, clarified in new section on demand-side and behavioural changes.
11050 5 9 5 11
The evidence for the claim that demand reductions in IAMs are supported by detailed bottom-up studies in the referenced sub-chapters is rather weak. Either provide additional evidence in those sub-chapters or weaken the statement here. [Jakob Wachsmuth, Germany]
Strengthened in section.
16172 5 9 5 11
Again, phrasing is unfortunate. Rewrite to say something like "Integrated model results for 2030 and 2050 indicate that reductions in emissions from [xxx] sources must continue to occur throughout the century" or something similar--indicate what the models indicate is needed, not what they show wil supposedly happen. [Michael MacCracken, United States of America]
Text revised along lines of suggestion.
20384 5 9 5 9Do you really mean "demand reductions" or "energy demand reductions"? Are these lower GDP scenarios? [Olivier Boucher, France]
Thank you, clarified in new section on demand-side and behavioural changes.
13174 5 11It is not clear to the reader what the scope and how the reductions in demand will be achieved. For instance, is recycling included for the industry sector? [Deger Saygin, Turkey]
Additional details on demand-side measures are in the chapter subsections.
9437 5 13 5 14add 'carbon capture and storage' after 'swictching to lower-carbon fuels' as it is one of the key technical options. [Isabelle Czernichowski-Lauriol, France]
Added.
4840 5 13 5 14Key technical and behavioural options are sector specific, but generally include a portfolio of efficiency improvements, demand reduction, CCS and switching to lower-carbon fuels. [Wilfried Maas, Netherlands]
Agreed, text revised.
14211 5 14 5 14
It may be better to say: ‘lower carbon sources of energy’ rather than ‘lower carbon fuels’. This would then include wind, solar, geothermal, hydro, tidal and nuclear along with biofuels. ‘Fuels’ have a technical meaning that is not represented here (solar, for example is not a fuel, but a flow). [Jason Donev, Canada]
Accepted - Edit has been implemented
7429 5 14 5 15
This is a very relevant finding. Please consider explicitly specifying that the electrification mentioned is assumed to involve a shift/replacement from fossile fuels to play this major role. Please consider to include "replacing fossile fules" after "End-use electrification". This is highly policy relevant in countries where a large portion of electricity already comes from renewables. This is also more consistent within the Buildings section in this chapter. [Øyvind Christophersen, Norway]
Revised as suggested.
3149 5 14 5 15
You say that end-use electrification plays a major role…Isn't that an understatement? Doesn't end-use electrification play the major role in eliminating fossil fuel use from all 1.5 degree C scenarios, because ALL end-uses are ultimately electrified, or as with airline fuels, the fuels are made using electricity as the energy source. [Richard Rosen, Germany]
Rejected - end-uses are not ALL fully electrified
Do Not Quote, Cite, or Distribute Page 24 of 129
IPCC WGI SR15 First Order Draft Review Comments And Responses - Chapter 2
Comment No From Page From Line To Page To Line Comment Response
9811 5 15 5 24I would also present when all GHGs reach zero, and not only CO2 emissions [Michel den Elzen, Netherlands] Rejected - this speaks to the energy sector only, including all gases for all sectors would make
the ES too long
13175 5 17 It may also help to mention what happens to the energy demand emissions [Deger Saygin, Turkey] Taken into account - this is highlighted later
9207 5 17I assume that is global CO2 and not just CO2? Does every country need to be zero 2030 to 2060? [Glen Peters, Norway] Accepted - this is global indeed and has been clarified
4168 5 17 29
This mitigation pathway is based on two assumptions that carbon capture and storage will be implemented around 2020 but does this take into account the reliablity of CCS. According to a report by the Global Warming Policy Foundation-Gordon Hughes the Boundary Dam project in Sask hasn't operated at full capacity. Rather it has operated closer to 40%. This is just one example, but it begs the question: "Can we achieve the mitigation pathway if the technology isn't reliable in its current state?" Additionally, most renewables currently rely on gas or coal as a back up. Until viable storage options or low-carbon baseloads like hydro or nuclear are the back up for renewables they will not serve as sufficient mitigation pathways alone. In Germany for example, most of the wind is backed up by brown coal with most of the fossil energy imported into the country. [Michelle Leslie, Canada]
Rejected - the mitigation pathways do not rely on CCS being implemented by 2020
6972 5 17 5 17Suggest to add "have to" before "decline". [Sai Ming Lee, China] Accepted - yet the entire sentence has been reworded in order for it to be clear that models are
providing us with this insight.
5707 5 17 5 17 net' is missing. [Hong Yang, Switzerland] Accepted - change has been implemented
6141 5 17 5 17energy supply' is ambiguous. Does this mean 'electricity supply' ? Or do you mean primary energy ? [Philip Sargent, United Kingdom (of Great Britain and Northern Ireland)]
Taken into account - energy supply refers to all activities providing energy in all its forms, both electricity and other
11023 5 17 5 18Language should be clearer here: "continued large decreases" means that emissions have to turn negative [Oliver Geden, Germany]
Accepted - the sentence has been edited to clarify this
16173 5 17 5 18
Again, phrasing is backward--say what models say is needed to be on this particular type of scenario--don't phrase as if this is going to be happening if the choice is made to be on (or try to be on) such a scenario. [Michael MacCracken, United States of America]
Accepted - the sentence has been reworded
11118 5 17 5 18 Clarify: Is this referring to negative emissions? If yes, please say so. [Michiel Schaeffer, Netherlands] Accepted - the sentence has been edited to clarify this
6514 5 17 5 18
This sentence is unclear. I assume, it is meant that CO2 emissions from energy supply decline to zero between 2030 and 2060 and that CO2 emission from other sources continue to decline after that date. The way the sentence is worded, it sounds as if CO2 emissions from energy supply continue to decline, which would mean that there were negative emissions from energy supply. If negative emissions from energy supply are actually meant, it should at least be explained, how negative emissions, i.e. a removal of CO2, can be linked to a certain sector like energy. [Heike Hebbinghaus, Germany]
Accepted - the sentence has been edited to clarify this
902 5 17 5 18The "continued large decreases" imply significant negative emissions - this should be made clear in the text as some readers may find this surprising. [David Infield, United Kingdom (of Great Britain and Northern Ireland)]
Accepted - the sentence has been edited to clarify this
20385 5 17 5 18 So CO2 emissions from energy supply become negative after 2060? [Olivier Boucher, France] Yes - for the cases indicated here.
1016 5 17 5 24
It is funny that not a single word is added of the emissions from industry sectors and transport here. At least technological feasibility of zero emissions from iron and cement sectors as well as shipping and aviation should be touched upon here. [Mitsutsune Yamaguchi, Japan]
The ES highlights the most robust and important insights in two pages. The iron and cement sectors' assessment was not selected to be amongst those.
15027 5 17 5 29
These two paragraphs should also comment on other baseload energy sources, particularly nuclear and CCS/CCUS. What is the balance in 1.5C scenarios for the energy sector between BECCS, CCS/CCUS, and nuclear (as well as other carbon sequestration methods when looking outside the energy sector)? [Farhan Akhtar, United States of America]
Rejected - this information is not available from the sectorial assessment in section 2.4
6951 5 17 5 48
All other sources of energy currently in use are mentioned except nuclear energy. NE should be mentioned in this paragraph. See Table 2.8 where annual increase of nuclear power is on average 3.9%, exceeding that of the biomass in relative terms. [Ville Tulkki, Finland]
Accepted - nuclear is now mentioned as part of the low-carbon portfolio
710 5 17 5 3
Curiously enough (is it so curious?) nuclear energy is not even cited, while it is, today, the most efficient way to provide CO2 free electricity (compare France and Germany). As far as biodiversity is concerned it is much more benign than biomass or wind energy. Concerning human fatalities, based on the ExternE European studies Forbes magazine gave the number of fatalities for producing 1000 TWh electricity: 170000 for coal, 4000 for natural gas, 24000 for biomass, 1400 for hydro, 150 forwind, and only 80 for nuclear (including Tchernobyl and Fukushima). Nuclear sustainabliliy can be obtained via the mature use of breeding reactors such as BN800 (Russia) with used fuels reprocessing being a very well known technology (La Hague) providing a division by 100 of the volume of high level activity nuclear wastes. A scenario with an important use of sustanaible nuclear energy was published as an article "How much can nuclear energy do about global warming" (Int. J. Global Energy Issues, Vol. 40, Nos. 1/2, 2017 ). It allows CO2 concentration stabilization in 2070 without need of CCS. and a CO2 concentration of 370ppm in 2100 with some BECCS at the end of the century. An improved version,( however not published yet ) allows a stabilization of the CO2 anthropic cumulated emissions at 800 Gt as soon as 2050, without need of CCS, with option to reach the 1,5°C limit in 2100 with a modest BECCS of 200 Gt. [Herve Nifenecker, France]
Noted
6973 5 18 5 18 Suggest to replace "increases" by "have to increase". [Sai Ming Lee, China] Accepted - change has been implemented
Do Not Quote, Cite, or Distribute Page 25 of 129
IPCC WGI SR15 First Order Draft Review Comments And Responses - Chapter 2
Comment No From Page From Line To Page To Line Comment Response
14212 5 18 5 18
As stating in my overall comment, there’s a framing problem here. Renewable energy is energy that can renew itself. The important aspect that we’re looking for in our primary energy portfolio is ‘low-carbon’. This distinction may sound trivial to people who are already on-board with renewable energy, but for people who need to be convinced to take action on climate change this is a further wedge dividing the population. Many people in the oil&gas sector use this fascination on 'renewable energy' as proof that the climate community doesn't understand people's needs for energy. I realize the foolishness in bending to the will of the fossil fuel industry, but we must be rigorous in how we approach this. [Jason Donev, Canada]
Accepted - also tithe overall low-carbon share is now mentioned
3150 5 18 5 19
This an example of a generic problem throughout this chapter and report. Here where it says that renewables increases rapidly and becomes the dominant source of energy by 2050 in most scenarios, you need to explicitly distinguish between statements that apply to non-overshoot and overshoot 1.5 degree scenarios. After all, in non-overshoot scenarios, renewables have to provide roughly 100% of the energy long BEFORE 2050. Thus, I suggest the all the discussions of scenarios in Chapter 2 be clearly differentiated clearly for the reader between these two basically different types of 1.5 degree scenarios. As you know. the near term implications of these two types of scenarios are very different for the next 10-15 years, and the reader needs to be very clear about that. The whole point of this chapter, and the entire report, should be to compare and contrast those two types of 1.5 degree scenarios with each other, and with a 2.0 degree non-overshoot scenario, along numerous aspects and dimensions. Thus, all sub-sections of chapter 2 need to be completely re-organized so the differences and similarities of those three basically different types of scenarios are clear!!! [Richard Rosen, Germany]
Taken into account - in the SOD we have incorporated new scenario classes that look at overshoot versus non-overshoot. In terms of emissions pathways these differences are clear, because of the underlying physics. However, the assessment has not yet been able to produce clear differences for more disaggregate scenario characteristics.
6974 5 19 5 19 Suggest to replace "is phased out" by "has to be phased out". [Sai Ming Lee, China] Editorial - rejected
3716 5 19 5 2coal usage is phased out rapidly - I assume by phase out you mean zero - by when? Chapter seems to refer to 7% in 2050. [Harald Winkler, South Africa]
Taken into account - the robust insight here is not the exact number in 2050, but rather the speed and the general trend of its reduction
17218 5 2 5 2 Delete 's', turning 'reductions' to 'reduction' [Himangana Gupta, India] Accepted - change has been implemented
2200 5 21 5 23Are the CCS deployment rates "soon after 2020" realistic in the real world? This is extremely important since mitigaton pathways with components that are potentially unrealistic have limitied value. [Kenneth Möllersten, Sweden]
Taken into account - this assessment is part of the Chapter 4 assessment and should come together in the SPM
16174 5 21 5 23
The notion that it will be cost effective to do carbon capture and storage from coal plants is, it seems to me, unrealistically optimistic, especially given how fast the cost effectiveness of renewables technologies is improving compared to the rising costs of capture and storage, some by so much that utilities have even given up trying to do this. Holding out capture and storage at coal plants, instead of taking it out of the atmosphere generally with no coal plants emitting it, just muddles the message about coal--it just needs to be phased out aggressively if there is to be any hope of getting back to 1.5 C by 2100 because we simply can't afford the emissions that will occur until that technology is actually developed. [Michael MacCracken, United States of America]
This is reporting on what the models include, and in cases in which coal is not fully phased out they utilize CCS. The sentence is preceded, however, with the statement (in the SOD) that "Coal usage is phased out rapidly in pathways consistent with 1.5C", so we believe the text is consistent with this review comment already.
11119 5 21 5 23
One would expect EMISSIONS from coal power to be close to completely phased out after 2050. The sentence here is not useful enough, because it does not reflect the chapter insight "As for coal, scenarios with higher natural gas demand require higher penetration of CCS, while lower demand scenarios are able to achieve 1.5°C with lower rates of CCS utilisation". This leaves the urgent question of what is the EJ/yr, or share of global energy supply from residual coal plants without CCS in 2050? This is very relevant and cannot be derived from the current headline message "In case coal use is not yet entirely phased out by 2050, 40-100% of it is combined with carbon capture and storage ... ", because the 40% could be correlated with very small share of coal (no-CCS & CCS) and the near-100% number with larger shares. [Michiel Schaeffer, Netherlands]
Taken into account - text highlighting both the abated and unabated fraction has been added
13176 5 22It is somewhat confusing to the reader when CCS capacity is expressed in terms of EJ. Perhaps the authors can consider the use of another indicator such as GW, emissions etc [Deger Saygin, Turkey]
Rejected - this information is not available at this level of detail
6975 5 22 5 22 Suggest to replace "starts" by "have". [Sai Ming Lee, China] Editorial - this statement has been removed
11120 5 22 5 22The unit “EJ yr-1” is not entirely appropriate for measuring installed capacity, as it makes implicit assumptions regarding the load factor (hours/yr) of power plants. Suggest to use “GW” instead. [Michiel Schaeffer, Netherlands]
Rejected - this information is not available at this level of detail
20386 5 22 5 22 Is the 1.1 EJ yr-1 correspond to primary energy from coal? [Olivier Boucher, France] Yes
16175 5 23 5 24
This sort of indicates it is okay for the usage of oil and natural gas to continue. This is only the case because an overshoot is being allowed by the models. These uses need to be phased out as rapidly as possible and direct air capture of CO2 phased up as rapidly as possible so as to minimize the overshoot that will occur. The wording here just promotes delay and to my mind is unacceptable. What this chapter should be covering is not what models show where one allows overshoot and associated impacts, but what can be accomplished by aggressive action trying to overshoot by as little as possible. [Michael MacCracken, United States of America]
Rejected. The reasoning presented in this comment does not represent the authors' understanding of the literature on this issue.
4870 5 24 5 24 wide range of futures for natural gas, with and without carbon capture and storage. [Wilfried Maas, Netherlands] Accepted - this clarification has been made
Do Not Quote, Cite, or Distribute Page 26 of 129
IPCC WGI SR15 First Order Draft Review Comments And Responses - Chapter 2
Comment No From Page From Line To Page To Line Comment Response
20639 5 26 29
The emphasis on bioenergy was a well justified model for AR5. This chapter should address all technological options for contributing to emission reductions, including CO2 recycling and associated technologies rather than reiterating AR5. Diversification needs to be reflected. The treatment should not fall behind what is already being done at some scale. If scenarios do not cover these aspects the deficit should be mentioned and assessed, possibly mentioning the associated trade-offs and impacts. Table 2.5 seems more balanced than the statement in the executive summary. [Hans Poertner, Germany]
Accepted - a statement on what is included and excluded in mitigation pathways has been included
16176 5 26 5 27This notion that "carbon capture and storage" will be cost effective in the near term seems quite fanciful--that this has yet to be achieved needs to be stated. [Michael MacCracken, United States of America]
Accepted - this has been edited
9208 5 26 5 27 When do most scenarios require BECCS to start? That would be a useful addition. [Glen Peters, Norway] Accepted - a sentence has been added
2201 5 26 5 28As for CCS in the para above, it should be indicated when deployment of biomass with CCS is introduced in the mitigation pathways. [Kenneth Möllersten, Sweden]
Accepted - a sentence has been added
17409 5 26 5 29
How the sink reduction in forests due to increased harvesting has been accounted for the net emissions in these "substantial deployment of biomass" scenarios? According to my understanding most of the IAMs are not capable to include this effect. [Tuomo Kalliokoski, Finland]
This is rather a question to be dealt with in the section than in the ES. As there is an additional Special Report dealing with land-use issues, these questions are not covered in depth in this chapter.
10838 5 26 5 29I miss substantial debate, also in this chapter on the very limited available biomass resource, in particular for BECCS; more references to doi: 10.1111/gcbb.12235 and DOI 10.1007/s13412-017-0445-6 [Christian Breyer, Finland]
Rejected - debate and references cannot be included in the Executive Summary
1017 5 26 5 29
Geophysical and technological feasibility of BECCS should be touched upon here. For example it is understood that a huge amount of CO2 (such as 10Gt) should be captured and stored underground (EOR should not be taken into account here because the purpose of EIR is to extract fossil fuels). This means roughly 10,000 CCS sites are necessary globally. There should be several papers discussing these physical limits. [Mitsutsune Yamaguchi, Japan]
Taken into account - this assessment is part of the Chapter 4 assessment and should come together in the SPM. This might only be possible in the report's next iteration.
1841 5 27“ ..storage. .. “ à .. storage (BECCS). .. ((explanation: in order not to misunderstand the “combined .. storage” with the BE and CCS)) [Tibor Farago, Hungary]
Accepted - has been clarified
6976 5 27 5 27 Suggest to replace "supplies" by "has to supply". [Sai Ming Lee, China] Rejected - we prefer the current wording
903 5 27 5 28The "it" of the second sentence would seem to imply both biomass and carbon capture. These are very different and should be separated out in the description. [David Infield, United Kingdom (of Great Britain and Northern Ireland)]
Accepted - has been clarified
13177 5 28 It is not fully clear whether the compared fossil fuel energy is in 2050 or today. [Deger Saygin, Turkey] Editorial - relative statements have been clarified
7430 5 28 5 28
After the sentence ending with "… by 2050.", please consider adding a new sentence : It is worth noting that the models do not fully capture the possibilities associated with "disruptive change". (2.5.1.2 and 4.2.3.1). Disruptive change in sectors such as transportation and power production, could potentially reduce the need for large scale deployment of biomass energy. (The next sentence, would have to be changed accordingly: Greater implementation of biomass energy combined with carbon capture and storage is required when phase out of fossil fules proceeds more slowly.) [Øyvind Christophersen, Norway]
Taken into account - we have highlighted that the scale of deployment depends on specific choices
12728 5 28 5 29
Greater implementation of this technology…, I assume "this technology" refers to BECCS (as opposed to bioenergy as a whole). This should be stated clearly as one would expect that lower levels of bioenergy are needed if fossil fuels are phased out slowly. [Vassilis Daioglou, Netherlands]
Taken into account - this refers to bioenergy as a whole, including BECCS
13178 5 31 37
Without knowing the current and/or baseline, it is hard to put these cost estimates in perspective. [Deger Saygin, Turkey] Taken into account. The mandate of the SR1.5 and Ch2 is to describe characteristics of 1.5°C pathways. This is why we focus on the estimates that apply to these pathways in particular.
3719 5 31 5 31
40% higher seems a lot, given the rapidly declining costs of RE, with wind and PV cheaper than new coal in many places. That is only electricity, but still - 20 - 140% more? Perhaps some texture on where there are still incremetnal costs, and where investing in lower carbon options is already competitive might help [Harald Winkler, South Africa]
We are unsure how this texture can be provided here in the ES, given the space limitations and the scope of the underlying chapter. This might be something taken up in the SPM with input from all chapters, but probably lies outside the scope of what can be achieved in this report.
3718 5 32 5 32 Replace "optimal" with 'least-cost' [Harald Winkler, South Africa] Accepted - done
12729 5 32 5 32
…assuming optimal energy-supply investments…, is this based on the results of optimization models only? To my knowledge IAMs include non-optimal simulation models as well. Perhaps the word "optimal" should be removed. [Vassilis Daioglou, Netherlands]
Accepted - this has been changed to "least-cost"
1551 5 32 5 33
Comparing costs between climate action scenarios and no climate policy scenario only makes sense if negative feedbacks from destructive climate-change on the economy is fully considered. Otherwise, if the comparison does not include difference in climate damage accross scenarios, these could be considered as "climate denial scenarios". My opinion is that IPCC should not compare costs on a way that ignore climate damages costs (that sort of comparison is only coherent for climate denyers who don't believe in future climate damage). [Noé Lecocq, Belgium]
Taken into account - we have highlighted that climate impacts are not included here.
6977 5 33 5 33 Suggest to replace "is accompanied" by "has to be accompanied". [Sai Ming Lee, China] Rejected - we prefer the current wording
11121 5 33 5 33I would also expect higher investments to be accompanied by lower fuel-related expenses (e.g. due to increased renewable energy). How is that accounted for? I could not find this in the chapter [Michiel Schaeffer, Netherlands]
Intuitively this sounds correct, yet no information was available on this topic.
Do Not Quote, Cite, or Distribute Page 27 of 129
IPCC WGI SR15 First Order Draft Review Comments And Responses - Chapter 2
Comment No From Page From Line To Page To Line Comment Response
16177 5 34 5 36
Basically, what should happen over this period to achieve a maximum reduction in overshoot is a 100% reduction in fossil fuel electricity investment, so it would be helpful to understand what the investment toward the end is going toward. Is this a reflection of of investment switching from coal to natural gas (so less emission of CO2 per dollar of investment), or what (maintenance, etc.)? Is this new investment in fossil fuels that will have a long-term payoff? How sensitive is this to an increasing cost of carbon, which is presumably helping to drive the switch (i.e., how much more needs to be done to get the reduction to be close to 100%?). I just don't think providing the information as is is very useful and what policymakers might want. [Michael MacCracken, United States of America]
Noted. However, what can be said in the ES is determined by the assessment available in the underlying chapter, which in turn relies on the available literature. The suggested statement does not refer to any new literature.
907 5 34 5 36
The text suggests an overall decline in energy infrastructure. Since this is unexpected there should be some appropriate comment added. Also it should be clarified whether the investment includes CO2 reduction technologies. [David Infield, United Kingdom (of Great Britain and Northern Ireland)]
Rejected - the first part of this paragraph suggest an increase in overall energy infrastructure, while the fossil electricity investments decline
6978 5 35 5 35 Suggest to add "have to" before "decline". [Sai Ming Lee, China] Rejected - we prefer the current wording
6979 5 36 5 36 Suggest to add "have to" before "increase". [Sai Ming Lee, China] Rejected - we prefer the current wording
13179 5 39 It is not clear what 'the rates of change' refer to. [Deger Saygin, Turkey] This section has been removed from the Chapter 2 ES
3834 5 39
If we are to switch from reduction by 6 Mha yr-1 to the same increase, while population grows by almost 50%, we need to consider land use for food production and the possible impact on climate by this enormous change! Farming productivity needs to go up, without using extensive amount of firtilizers that need to be transported long distances. [Mats Winroth, Sweden]
This section has been removed from the Chapter 2 ES
27 5 39 5 48
Suggested text: The need for a disruptional shift is further underscored by the study of Herrala and Goel (2016, page 34) regarding the required emission reductions at national level. In a scenario which builds on the criteria laid down in the Paris agreement, the emissions of every nation in 2050 must fall significantly below that of the least emitting nation with a comparable level of GDP in 2012. (ref R Herrala and R.K. Goel (2016), Sharing the emission reduction burden in an uneven world, Energy Policy 94, 29-39) [Risto Herrala, United States of America]
This section has been removed from the Chapter 2 ES
14930 5 39 5 48
I strongly believe the point about the scale of energy transitiion having precedent but the land transition being completely unprecedented needs to be strengthened and elevated considerably in the chapter summaries and executive summary of the SR. This is an incredibly important point for decision-makers to understand. [Christopher Weber, United States of America]
This section has been removed from the Chapter 2 ES
15028 5 39 5 48Could add more sectoral detail to the level of progress, e.g., solar and wind are going well; buildings, industry, transport are "behind the curve" [Farhan Akhtar, United States of America]
The level of progress would be assessed by Chapter 4 and such a comparison could thus be taken up in the SPM which draws upon all chapters
1018 5 41 5 42Authors should consult with political economy papers whether such extremely drastic policies can be introduced or not. [Mitsutsune Yamaguchi, Japan]
This section has been removed from the Chapter 2 ES
17410 5 44 5 46
This kind of modification of the past trends (forest area has not increased from 2010 to 2017) actually means that increase in forest area has to be larger/faster in next decades than reader may understand from the average term. This problem concerns the whole report. Would be much better if interpretation of scenarios started from 2020 in this report although original reports have done analyses e.g. from 2010. [Tuomo Kalliokoski, Finland]
This section has been removed from the Chapter 2 ES
14169 5 44 5 46
The provided changes in forestland area are highly uncertain to be cited as a simple average. It is also worth mentioning that these estimates are in terms of net variation. In addition, it might be useful including the variation range from the modelling simulations. I guess you obtained the -6Mha/y from FAO and the +6Mha/y average from Table 2.9 p. 46 in this same chapter, but this is not very clear. [Alexandre Strapasson, Brazil]
This section has been removed from the Chapter 2 ES
19337 5 5 5 52
Roughly quantifying the scenario assumptions (negative emissions, population growth, per capita energy-, food- and natural resources demand) required to achieve the 1.5°C pathways in the summary is essential to understand the scale of the transformation needed. [Birgit van Munster, United Kingdom (of Great Britain and Northern Ireland)]
Noted. The summary draws from the chapter assessment. Whatever is not assessed in the chapter should not be highlighted in the ES.
6357 5 5 5 55
It would be helpful if the relevance of underlying socio-economic pathway could be demonstrated further with specific quantitative examples, and also by comparing how e.g. costs different for a 1.5 goal and SSP1 and SSP5, and between a 1.5 and 2 degree goal for SSP1, and for SSP5, individually. I.e. when thinking about costs, is the stringency of the climate goal or the underlying development pathway the more critical determinant? Also emphasise which pathways appear to be entirely incompatible with any hope of achieving the 1.5 degree goal. [Andy Reisinger, New Zealand]
Macro-economic costs are not assessed in the chapter and are hence also not highlighted. The ES highlights that "Under conditions of high population growth (and associated low educational attainment for females), low economic development, and limited efforts to reduce energy demand, no 1.5°C pathways have been identified." Given the space constraints of the ES, probably not much more can be said on this topic here.
11122 5 53 5 53 Clarify: "cumulative mitigation" is undefined [Michiel Schaeffer, Netherlands] This sentence was removed
4521 5 55 Explanation of abbreviations SSPx are missing (see page 21). [Radim Tolasz, Czech Republic] This sentence was removed
20595 5 55 5 56
It means there is no low carbon technology that are compulsory. If some societies decide to exclude some ones (bio, CCS, nuclear…), they must be conscious that it will be more difficult or costly to reach the target. But some lifestyle levers are also powerful. The following reference can be considered for France (Promov, 2011) [Eric Vidalenc, France]
This sentence was removed
6981 6 1 6 11
References to relevant sub-sections of Section 4.3, which assessed the current status and development of the carbon dioxide removal (CDR) technology, should be added here. The readers, especially the policymakers, should be alerted that there is huge uncertainty about large scale deployment of the CDR technology as the assesment in Sub-sections 4.3.2.3, 4.3.6.1 - 4.3.6.3 have shown. The CDR technology is still immature as this stage, and the life cycle of power stations should also be taken into account when considering mitigation pathways. [Sai Ming Lee, China]
Rejected - this ES only summarizes the Chapter 2 assessment, not the assessment of Chapter 4
Do Not Quote, Cite, or Distribute Page 28 of 129
IPCC WGI SR15 First Order Draft Review Comments And Responses - Chapter 2
Comment No From Page From Line To Page To Line Comment Response
13155 6 1 6 11CDR techniques are embedded in the scenarios well before mid-century, but this is not obvious in the Executive Summary - please ammend. [Christiane Textor, Germany]
A sentence has been included
1744 6 1 6 47What is the temperature increase in these 1.5 C pathways if in mid-century CDR ends up not being used? [Levi Golston, United States of America]
Roughly 0.3 to 0.4°C higher based on a central TCRE estimate of 1.65°C/1000PgC
16178 6 1 6 11
A few points: (a) it should be mentioned somewhere here that CO2 needs to be pulled down to limit ocean acidification, which is likely as important an objective as limiting global warming: (b) there seems to be an implicit view that getting below 1.5 C is acceptable in terms of reducing environmental and societal impacts as opposed to being an arbitrary number chosen by negotiators as hopefuly possible. In this latter regard, it is really misleading to be implying that the island nations that pushed for a 1.5 C celiling will be much better off with 1.5 C instead of some higher number--basically, at 1.5 C, ongoing loss of ice from the Greenland and Antarctic ice sheets and consequent sea level rise will be so high at 1.5 C that many low lying island nations are doomed. What is needed is to press back to below 0.5 C or even below to slow loss of ice sheet mass. Indicating this and that it will take CO2 direct air capture and removal needs to be indicated as a further rationale for this effort. [Michael MacCracken, United States of America]
Rejected - (a) This report is on 1.5°C of Global Warming not about any other anthropogenic interference with the climate system. This chapter speaks to pathways limiting warming to 1.5°C while impacts and wider context are dealt with in Chapters 3 and 1 respectively. It would thus not be supported to mention this in the ES of Chapter 2. (b) This report indeed speaks to 1.5°C as a policy target, laying out its implications for mitigation (Chapter 2), avoided or residual impacts (Chapter 3), and sustainable development (Chapter 5). Assessing the adequacy of a 1.5°C limit is not part of the mandate of this report.
1979 6 1 6 12
In the new, just published, scenario "Efficiency-N" ( IJGEI V40 N3/4 2017), CDR was only applied as BECCS after 2060. Fossil fuels consumption vanishes by 2060. CCS on fossil fuel emissions is not necessary. Mobility and heat needs are increasingly fulfilled by electricity while coal and gas plants are replaced by nuclear plants. The total amount of CO2 stored is 270 Gt (BECSS),the cumulated amount of CO2 from 2020 to 2060 reaches 900 Gt and decreases to 600 Gt in 2100. The TPES (direct definition) reaches 388 EJ in2060 compared to 438 in 2015. It reaches 700 EJ in 2100 if the nuclear production is kept constant after 2060 but may reach more than 1100 EJ if the increase rate of nuclear power is kept constant after 2060. The feasibility of the level of nuclear production (involving breeding reactors) has been demonstrated in Int. J. Global Energy Issues, Vol. 40, Nos. 1/2, 2017 . [Herve Nifenecker, France]
Noted
967 6 1 6 25
it is really strange to have this attention to CDR (which is welcome) and have zero commentary on the huge literature about the infesability of bold CDR (BECCS, notably) scnarios. It is as if that whole literature does not exist. Indeed, the whole exectuive summary is oddly silent on the writing team's assessment of the literature about the realism of these scenarios. because of the attention to BECCS, in particuoalr, it would be helpful to have findings focused on that before the more general attention to BECCS plus the rest of CDR (including afforestation) all together. i know the models dont make these careful distinctions, but the policy community does. [Victor Davd, United States of America]
Taken into account - Chapter 4 assessed the literature referred to by the reviewer on real-world limits to implementation of large-scale CDR and BECCS. This has come together in the SPM assessment under point 3.4.
3151 6 1 6 47
You need to be very honest in this whole page that many people either oppose relying on CDR technologies for many environmental reasons, or just don't believe they are feasible at anything close to the scale required in many of the IAM runs. Furthermore, there is absolutely no discussion of the economics of CDR technologies relative to renewable energy alternatives. Why has this extemely important subject been omitted from the report??? It is one of the most important issues that this report needs to address!!! Chapter 2 does not even say what the capital and other costs of the various CDR technologies used in the IAMs after 2030 are. THESE COST ASSUMPTIONS MUST BE PROVIDED FOR ALL CDR AND RENEWABLE ENERGY TECHNOLOGIES FOR EVERY IAM RELIED ON so that their costs and benefits can be compared and understood by all policy makers!!! ALSO, THE IMPACTS OF CDR TECHNOLOGIES ON LAND-USE AND AGRICULTURE AS ASSUMED AND MODELLED IN EACH IAM MUST BE EXPLICITLY DESCRIBED AND DISCUSSED. Clearly policy makers might also want to know which IAM relied on in chapter 2 is likely to do the best job (in the opinion of the authors) at modeling the impacts that CDR technologies have on land-use, agricultural output and food prices, and other relevant aspects of the environment. [Richard Rosen, Germany]
Taken into account - in the Chapter 2 ES we now highlight the insights from the most recent literature on pathways which do not use BECCS. Chapter 4 and 5 in addition assess the impacts of BECCS on land-use and agriculture, and sustainable development.
6980 6 2 6 2 Suggest to add "have to" before "maintain". [Sai Ming Lee, China] Rejected - we prefer the current wording
17411 6 5I do really hope that huge uncertainties concerning CDRs are properly expressed in this report. [Tuomo Kalliokoski, Finland] Noted. Chapter 2 in this context relies on the assessment carried out by Chapter 4.
13180 6 5The use of the term 'residual emissions' is somehow confusing. Authors can consider to express these emissions in another way. [Deger Saygin, Turkey]
Accepted - this has been edited
2202 6 5 6 11
A key feature of mitigation pathways for 1,5 degrees that should be highlighted is that CDR is introduced by 2030 and that already at 2050 substantial amounts of CO2 are removed annually. Presenting only the century-level data gives very vague idea of the role of CDR. [Kenneth Möllersten, Sweden]
Accepted - a sentence has been added
4345 6 6 6 7
It may be good to mention that while temperature is relatively easily reversible, other components of the climate system, such as sea level rise, continue to change despite negative emissions. (Please see comment #2 below for references, which partly applies here as well). [Katarzyna B Tokarska, United Kingdom (of Great Britain and Northern Ireland)]
Taken into account - these aspects should come out of the Chapter 3 assessment
908 6 7 6 11
These massive figures for CDR should be emphasied by comparing with total emissions; this would indicate just how central CDR has become in reaching the 1.5 degree target. This is of accute concern since CDR is hardly proven a proven technology. [David Infield, United Kingdom (of Great Britain and Northern Ireland)]
Accepted - the ES includes both the compatible carbon budgets and the amounts of CDR
21096 6 7 6 9
Sentence "The total amount of CDR projected … with a third to half …" would benefit from a clarification : readers of the ES may wonder what the other third (or half) is. I assume that it is CDR before carbone neutrality, but I think that it would be better to write it explicitly. [Philippe Marbaix, Belgium]
Rejected - this has been explained in the previous sentence
Do Not Quote, Cite, or Distribute Page 29 of 129

IPCC WGI SR15 First Order Draft Review Comments And Responses - Chapter 2
Comment No From Page From Line To Page To Line Comment Response
6284 6 8 6 8
a) is it CO2 or CO2 e, and b) Figueres (Nature 2017) comes to a far lower estimate of left GHG budget, and c) if 450 ppm CO2e is 2 C limit with 66% probability (or if not what it is it - because this is what I found in last IPCC report), how does this square with reality that we are already at 407 ppm just CO2 and annually increasing 2-3 ppm. [Mathis Wackernagel, United States of America]
a) This is CO2, b) this is not the CO2 budget, but the total CDR, c) if CO2 emissions become zero, CO2 concentrations decline due to a redistribution of CO2 among the carbon pools in the Earth System. The SOD has been edited for unambiguous clarity.
7431 6 9 6 11Does the 200 GtCO2 number given here imply that the total amount of CDR projected for 2C is 510 to 700 GtCO2 [Øyvind Christophersen, Norway]
This would indeed be what is suggested here.
7936 6 13 6 13usually use Carbon dioxide Capture and Storage (IPCC special report on CCS, 2015) [Ceri Vincent, United Kingdom (of Great Britain and Northern Ireland)]
Rejected - this statement is on BECCS, not on CCS.
16179 6 13 6 13
That BECCS is the only strategy shown for scenarios going through the whole 21st century needs to be indicated as an important shortcoming of this study--and that additional technologies are needed in order to be able to push down to no more than a 0.5 C warming. [Michael MacCracken, United States of America]
Taken into account - A more detailed account of BECCS as a strategy has been included in the SOD, highlighting that there are also instances in which BECCS is used much less. However, this assessment is focussed on issues related to a warming of 1.5°C. The scope for further discussions and issues is thus not available
17412 6 13 6 14This heavy dependence on BECCS emphasizes the problems of IAMs in accounting the real ecosystem changes. [Tuomo Kalliokoski, Finland]
Noted. Chapter 2 in this context relies on the assessment carried out by Chapter 4.
21097 6 13 6 14
What is meant by "all pathways consider BECCS" ? How can a pathway "consider" a technology ? Wouldn't it be more logic to say that a pathways includes or does not include a technology (while an IAM or other 'framework' may 'consider' it) ? I this case, can we say that BECCS is actually included in all 1.5 pathways or not ? Secondarily, if BECCS is always or almost always included, can we say that in practice, a similar pathways might perhaps be achieved with another CDR but that this is not known for the moment? [Philippe Marbaix, Belgium]
Taken into account - this sentence has been updated
20789 6 13 6 17
I know that biomass with CCS has been discussed for a long time as a necessary part of keeping climate below different targets, but the experience of Drax burning biomass at large scale and the backlash against it and claims that this does not help climate means that we are betting on the implementation of quite controversial strategies, and implementing them needs careful consideration if they are ever to come to fruition. This chapter is not dealing with issues of implementation, but presumably all scenarios need to have some degree of realism attached. [Johan Carl Ivar Kuylenstierna, United Kingdom (of Great Britain and Northern Ireland)]
Noted. This degree of realism should come from the integration of the assessments of chapters 2 and 4.
20842 6 13 6 17
I know that biomass with CCS has been discussed for a long time as a necessary part of keeping climate below different targets, but the experience of Drax burning biomass at large scale and the backlash against it and claims that this does not help climate means that we are betting on the implementation of quite controversial strategies, and implementing them needs careful consideration if they are ever to come to fruition. This chapter is not dealing with issues of implementation, but presumably all scenarios need to have some degree of realism attached. [Johan Carl Ivar Kuylenstierna, United Kingdom (of Great Britain and Northern Ireland)]
Noted. This degree of realism should come from the integration of the assessments of chapters 2 and 4.
18834 6 13 6 17
The potential of afforestation is underestimated because recent results of sustainable agroforestry have been published only recently. In fact, large scale, sustainable afforestation is possible and economically interesting given the demographic trends, which show a 50% increase of population between 2020 and 2050. This means workforce will be there to meet the demand of agroforestry in recently (and less recently) deserted areas, which is the best available solution for carbon capture and storage for environmental and economic sustainability. Reference: "Moving carbon between spheres, the potential oxalate-carbonate pathway of Brosimum alicastrum Sw.; Moraceae, M. C. Rowley & H. Estrada-Medina & M. Tzec-Gamboa & A. Rozin & G. Cailleau & E. P. Verrecchia & I. Green, Plant Soil (2017) 412:465–479", https://doi.org/10.1007/s11104-016-3135-3 [Stephan Savarese, France]
Noted - the full assessment of further mitigation options is carried out by Chapter 4
1970 6 13 6 18
The scenario "Efficiency-N" starts BECSS in 2050 in order to reach a total stored of 280 GtCO2 in 2100. Note that the CO2 emissions vanish in 2060. At that time the cumulated amount of CO2 emitted since 2015 saturates at 900 Gt. In order to limit the global mean surface temperature increase to 1.5 °C the increase of the CO2 mass in the atmosphere should not exceed 600 Gt. The decrease of 900 Gt to 600 Gt is obtained by BECSS. One should note that the time during which this transition has to take place is not a strong constraint. Reaching the limiting value of 600 Gt in 2150 rather than 2100 may be acceptable, making it much easier to reach the limiting CO2 concentration in the atmosphere [Herve Nifenecker, France]
Noted. The SOD now addresses overshoot and non-overshoot pathways separately.
16180 6 19 6 19 Need to take out comma after "land" [Michael MacCracken, United States of America] Editorial - accepted and implemented
6484 6 19 6 2 Delete commas and 'respectively' [Roger Bodman, Australia] Editorial - accepted and implemented
9544 6 19 6 25
Since role of land, forest and soil became key, the problem now is that knowledge on their carbon stocks and enriching and degradation mechanism on the spot is still not enough. These bottle-neck needs to be mentioned in the last part (line 41-47). Part of uncertainty is already mentioned in p25, line 21-22. [Shuzo Nishioka, Japan]
Taken into account - these sustainability aspects will further be discussed by Chapters 4 and 5.
18786 6 19 6 25
The Executive Summary should explicitly refer to the sustainable development challenges of BECCS that are raised in Chapters 4 and 5. Since the chapter is meant to address mitigation in the context of sustainable development, it should refer to those sustainable development concerns here. [David Waskow, United States of America]
Taken into account - in as far as possible these challenges are highlighted, yet without attempting to duplicate the effort of Chapter 4. The SPM brings these assessments together.
9571 6 19 6 25
Since role of land, forest and soil became key, the problem now is that knowledge on their carbon stocks and enriching and degradation mechanism on the spot is still not enough. These bottle-neck needs to be mentioned in the last part (line 41-47). Part of uncertainty is already mentioned in p25, line 21-22. [Shuzo Nishioka, Japan]
Taken into account - these sustainability aspects will further be discussed by Chapters 4 and 5.
Do Not Quote, Cite, or Distribute Page 30 of 129

IPCC WGI SR15 First Order Draft Review Comments And Responses - Chapter 2
Comment No From Page From Line To Page To Line Comment Response
18819 6 19 6 25
The Executive Summary should explicitly refer to the sustainable development challenges of BECCS that are raised in Chapters 4 and 5. Since the chapter is meant to address mitigation in the context of sustainable development, it should refer to those sustainable development concerns here. [David Waskow, United States of America]
Taken into account - in as far as possible these challenges are highlighted, yet without attempting to duplicate the effort of Chapter 4. The SPM brings these assessments together.
1019 6 19 6 25
Geophysical and technological feasibility of BECCS should be touched upon here. For example it is understood that a huge amount of CO2 (such as 10Gt) should be daptured and stored underground (EOR should not be taken into account here because the purpose of EIR is to extract fossil fuels). This means roughly 10,000 CCS sites are necessary globally. There should be several papers discussing these physical limits. (same comment to page 5 lines 26-29). [Mitsutsune Yamaguchi, Japan]
Rejected - this is part of the Chapter 4 assessment
18835 6 19 6 25
The land requirement for afforestation is irrelevant, when the appropriate techniques are used: namely, when using techniques that enable afforestation of land which is no longer used because too arid/sterile. The foreseeable increase of population in vast rural and suburban areas makes it possible to consider afforestation on a massive scale, as shown in references [1] and [2]. This is a paradigm shift, since there is no longer any competition between crop agriculture and agroforestry (which enables feeding humans from forest products, rather than crops, thereby regenerating soils instead of exposing soil to erosion). The relative reduction in crop and livestock requirements (compared with other 1.5°C scenarios) enables a complete replacement of BECCS with Agroforestry CCS. The rest of the GHG budget reduction is achieved thanks to low-GHG energy sources [3]. References : [1] https://exitcoalnow.org/WECANcumulCO2_agropermacuture.PNG ; [2] https://exitcoalnow.org/WECANCO2emissionsCCSimpact.PNG ; [3] IJGEI Vol 40, Berger et al., https://doi.org/10.1504/IJGEI.2017.080766 [Stephan Savarese, France]
Noted
7432 6 22 6 24Is the numbers presented here 800-1800 Mha connected to 1.5C? In that case what is the corresponding number for 2C? [Øyvind Christophersen, Norway]
Given the large uncertainty in land developments, this message has been made more general to communicate a more robust insight
16181 6 22 6 24
Given this high demand for land (and some indication of percentage should be given for context), it needs to be indicated that there is potential for shifting at least some of the requirement for CO2 withdrawal to ocean areas, probably using approaches that provide all required nutrients so they can be done in open ocean areas where there is currently little biological activities instead of trying to just add iron in areas where nutrients are apparently being underused, at least in that location. [Michael MacCracken, United States of America]
Taken into account - additional CDR measures would be discussed in Chapter 4
11123 6 22 6 24
To my knowledge, most of biomass consumption from BECCS - around 100 EJ/yr (IPCC SSRN 2012) - can be extracted from agricultural and forestry residues and organic waste alone. This would be sufficient for about 30-50% of the needs in 1.5C and 2C scenarios by the end of the century (Schaeffer et al. 2015, http://climateanalytics.org/files/feasibility_1o5c_2c.pdf). [Michiel Schaeffer, Netherlands]
The source of biomass energy and its land-use implications was not in the focus of the assessment by this chapter because these aspects fall within the scopes of Chapters 4 and 5, as well as the Special Report on Land.
10489 6 22 6 24
To make more clear how much the figure 800-1800 Mha is, could you compare it with the for instance the global area of pasture, in AR5 estimated to be 2300-3000 Mha. Or the global forest area - about 4000 Mha. [Harold Leffertstra, Norway]
Given the large uncertainty in land developments, this message has been made more general to communicate a more robust insight
6269 6 22 6 25how does it compare with present area used by agriculture- is it too big or too small? [Milton Nogueira da Silva, Brazil] Given the large uncertainty in land developments, this message has been made more general to
communicate a more robust insight
13181 6 23 24In order to put the land use numbers in context, it would help to mention total pasture land in the year 2050/2100. [Deger Saygin, Turkey]
Given the large uncertainty in land developments, this message has been made more general to communicate a more robust insight
19338 6 23 6 24
Taken together the combined land demand for both CDR options in 2100 is in the order of 800-1800 Mha, mainly converted from pasture land (about 25 % - 50 % of current pasture land). [Birgit van Munster, United Kingdom (of Great Britain and Northern Ireland)]
Given the large uncertainty in land developments, this message has been made more general to communicate a more robust insight
12730 6 24 6 25 As well as agricultural intensity/projected yields [Vassilis Daioglou, Netherlands] Accepted - this has been included
20387 6 25 6 25food crops and livestock demand : does "demand" apply to food crops? What about assumption in food crop yield? [Olivier Boucher, France]
Accepted - this has been clarified
16182 6 27 6 28
Very strange wording here--given phrase "strongly limited" I'd expect to have information given on what the cutback has to be (e.g., in GDP per unit energy or something) and be provided with what the total increase in energy use is going to be without knowing what it would otherwise be. Basically, the paragraph would read better if the phrase "in which ... scenarios)" was dropped if not replaced by the information indicated in the first part of this comment. [Michael MacCracken, United States of America]
Taken into account - this statement has been edited
13182 6 29It is not fully clear what exactly sustainable material and food consumptions are. It may be necessary to elaborate on these here. [Deger Saygin, Turkey]
Taken into account - there is not much space in the ES to elaborate further on this, but a clarification was included
17413 6 3 6 31
I'm not economist but this decreasing emissions and strong economic growth is questioned by many prominent economists. Shouldn't this report also try to express some other options for fulfilling the mitigation targets than this? [Tuomo Kalliokoski, Finland]
Noted. This report assesses the literature in this regard.
9161 6 31 6 31Any energy security analysis/considerations regarding two thirds of final energy by 20100 met by electricity? [Adelino Ricardo Jacintho Esparta, Brazil]
Not as part of the assessment in this Chapter as no pathway literature is known to the authors which looks into this issue.
4522 6 34The unit Mha is not usual. Add conversion to km2 as footnote or use only km2 (see ch. 3, p. 8, line 28). [Radim Tolasz, Czech Republic]
This statement has been removed
Do Not Quote, Cite, or Distribute Page 31 of 129
IPCC WGI SR15 First Order Draft Review Comments And Responses - Chapter 2
Comment No From Page From Line To Page To Line Comment Response
1842 6 36
It is extensively discussed in Chapter 5, therefore, such a reference could be here: “.. improved public health and other specific objectives included in the 2030 Agenda and its various SDGs, which are comprehensively discussed in Chapter 5. In some cases .. [Tibor Farago, Hungary]
Taken into account - such integrative views will be part of the SPM of the overall report
1020 6 36 6 36 Change "in some cases" to "on the other hand". [Mitsutsune Yamaguchi, Japan] Editorial - we prefer the current wording
9545 6 41 6 47Uncertainties in key input data (absorption and geoengineering?) are also briefly to be mentioned. [Shuzo Nishioka, Japan] Accepted - these uncertainties are now also mentioned
9572 6 41 6 47Uncertainties in key input data (absorption and geoengineering?) are also briefly to be mentioned. [Shuzo Nishioka, Japan] Accepted - these uncertainties are now also mentioned
3717 6 41 6 47
This para (and indeed the chapter) tends to ignore analysis at the national scale. Significant progress has been made, and much more national modeling is needed, espeically with the key role of nationally determined contributions post Paris [Harald Winkler, South Africa]
Accepted - the national scale was indeed not the focus of this chapter. However, a dedicated box on national pathways was included in the chapter
1021 6 41 6 47 Add description of trade-off. [Mitsutsune Yamaguchi, Japan] A description is included where trade-offs were introduced
10840 6 41 6 47
the status of IAMs is still not good enough, see also the general comment in the very beginning. A very good example is the well-known Eom et al. article (http://dx.doi.org/10.1016/j.techfore.2013.09.017), which documents how less understood the potential of renewables is in the entire IAM community (the key conclusion there is that a mitigation strategy cannot work without nuclear of fossil-CCS; however the 60 peer-reviewed 100% RE articles proof that this bold statement is not correct). Even Schellnhuber et al. (2016; nature climate change, 6, 649) criticised the very conservative approach of IAMs in the field of renewables. Creutzig et al. (DOI: 10.1038/nenergy.2017.140) showed recently in a very clear and drastic way how wrong the IAMs are. Breyer et al. (DOI: 10.1002/pip.2885) also recently criticised the fully outdated cost assumptions on renewbles, in particular solar PV in the IAMs. None of this critique is mentioned in the chapter 2, which is form the scientific point, not acceptable at all. It needs to be clearly pointed out, where are all the deficits and that these deficits have to be eliminated in the near future. Such clear words are missing. [Christian Breyer, Finland]
Accepted - The need for modelling exercises to closely track developments in a rapidly changing world has been highlighted
16183 7 3 7 4
This sentence is misleading--at least most of the scenarios evaluated are for getting back below 1.5 C in 2100, and this is not "limiting" warming to 1.5 C as impacts associated with the overshoot temperature reached will be occurring. In the first and then later sentences it needs to be made very clear that the scenarios are aimed at getting back to below 1.5 C. [Michael MacCracken, United States of America]
Revised to state that we examine scenarios that limit or return warming to 1.5C. The chapter now includes non-overshoot scenarios.
16184 7 6 7 6
Rather than "entail" say "require". Indicate what the scenarios/simulations indicate must happen/is required rather than suggesting that this is what they show will happen or will occur. And indicate that, in reality, even more is needed to really stay below 1.5 C to avoid overshoot. [Michael MacCracken, United States of America]
We retain 'entail' as it is typically not possible to establish that a specific transition is required given that there are multiple options and less on one can be compensated for by more of another.
3293 7 9Repeat from Ch1. [Justin Bishop, United Kingdom (of Great Britain and Northern Ireland)] Agreed, now that we've been able to see the FOD version of section 1.1.3 we have reduced
repetition.
9547 7 9 7 21
There are concerns that SDGs can be used as escape/excuse for no-action directly contribute to GHG reduction, as those goals are free from stringent quantitative target, especially beause of 1.5 degree issue needs very urgent and strong reduction policies. So, some words here are recommendable that describes "prioritise climate" among SDGs. [Shuzo Nishioka, Japan]
The text here on SDGs has been deleted as it repeated similar material in Chs 1 & 5. Those are now referred to instead.
9574 7 9 7 21
There are concerns that SDGs can be used as escape/excuse for no-action directly contribute to GHG reduction, as those goals are free from stringent quantitative target, especially beause of 1.5 degree issue needs very urgent and strong reduction policies. So, some words here are recommendable that describes "prioritise climate" among SDGs. [Shuzo Nishioka, Japan]
The text here on SDGs has been deleted as it repeated similar material in Chs 1 & 5. Those are now referred to instead.
13696 7 9 7 9Define climate protection [Elvira Poloczanska, Germany] The text here on SDGs has been deleted as it repeated similar material in Chs 1 & 5 (those are
now pointed to), so this phrase no longer appears.
12941 7 1 7 11There are many overlaps between policies and actions to address climate change and the other SDGs (see Chapter 5). Better to say "there are many synergies and tradeoffs…..". [Joyashree Roy, India]
Good suggestion, but this sentence was deleted as was repetitious from Ch 1.
3152 7 12 7 13
This sentence says that mitigation scenarios are "typically" developed by optimizing costs (and benefits). I assume this means that, in fact, all the scenarios used in chapter 2 WERE, IN FACT, developed by IAMs which rely on some form of cost/benefit analysis or optimization. But the Executive Summary of chapter 1 says that cost benefit methodologies are no longer justified as the basis for scenario development - which I totally agree with, especially when the IAMs used for the IIASA database leave out many major costs and benefits of mitigation scenarios. (Again, see my paper in Climate Change Economics, vol 7, no 1 for a critique of these IAMs.) THIS IS A HUGE AND VERY IMPORTANT CONTRADICTION - THEREFORE THIS WHOLE ISSUE HAS TO BE RESOLVED BY ALL THE AUTHORS AND STEERING COMMITTEE MEMBERS RESPONSIBLE FOR THIS REPORT!!! Either way, if the IAMs relied on are accepted or rejected, Chapter 2 must be thoroughly restructured to discuss the issues and results that arise from the approach taken. If it is decided that BOTH methodologies can be used (cost/benefit analysis and scenarios designed using other approaches including expert judgement), then all issues need to be addressed from both perspectives. [Richard Rosen, Germany]
The chapter analyses cost-optimization scenarios from IAMs, not cost-benefit analyses, so there is not a contradiction with the text in Ch 1. For the SOD, the discussion has been expanded to include scenarios based on other approaches (though not cost-benefit analyses), so the word 'typically' is accurate as that is the most common, but not the only, approach used.
Do Not Quote, Cite, or Distribute Page 32 of 129
IPCC WGI SR15 First Order Draft Review Comments And Responses - Chapter 2
Comment No From Page From Line To Page To Line Comment Response
2782 7 13
The text could be expanded to include Box 2.2 or text relating to cost-effectiveness as the relevant optimization criterion. It should be noted that cost-effectiveness in this context covers only mitigation costs; adaptation costs and residual damages are not considered. Box 2.2 does not make that point. [Erik Haites, Canada]
This text has been expanded to clarify these points, and a pointed to Box 2.2 added.
3153 7 14
Achieving the sustainable development goals is mentioned here very casually. Yet, as far as I know, none of the IAMs relied on for the pathways cited later in Chapter 2 can model and examine the costs and benefits of any of the non-energy-related SDGs. Thus, this subject needs to be discussed more honestly. Which IAMs can model which SDGs, if any can? The policy makers need to know much more about the strengths and weaknesses of each IAM if they are going to continue to be relied on in this report. Perhaps this represents a significant conflict of interest for the report authors who are on IAM research teams. Probably non-IAM research team authors should write up the sections of chapter 2, and other chapters, that deal with the IAMs. [Richard Rosen, Germany]
This section does not talk about achieving the SDGs, but is only pointing out that climate policies will have impacts on the other SDGs. The IAMs do not in general model any of the other SDGs, but as the next sentence discusses, they provide "useful information" on several, "(e.g. land use changes and biodiversity, food security, and air quality)". The implications are discussed in section 2.5 and Ch 5.
20265 7 16Define acronym IAMs at first usage in this Chapter body (although it was defined on page 32 of Chapter 1) [Aaron Glenn, Canada]
Corrected.
12867 7 16 Define IAMs [Jorge Carrasco, Chile] Corrected.
14170 7 16 7 16 Please define IAM acronym (Integrated Assessment Model) when firstly cited. [Alexandre Strapasson, Brazil] Corrected.
13697 7 16 7 16 spell out IAM before using acronym [Elvira Poloczanska, Germany] Corrected.
9935 7 16 7 16The meaning of the Integrated Model Assessment acronym (IAM) it is not explained the first time it appears in the chapter. [Olga Alcaraz, Spain]
Corrected.
9546 7 21In Section 2.5, nothing mentioned on SDGs. If this "sustainable development objectives " includes SDGs, it should be mentioned in 2.5. [Shuzo Nishioka, Japan]
Taken into account - text revised in line with sustainable development (e.g. introduction, section 2.5.3). Please note that SDGs are treated explicitly in Chapter 5.
9573 7 21In Section 2.5, nothing mentioned on SDGs. If this "sustainable development objectives " includes SDGs, it should be mentioned in 2.5. [Shuzo Nishioka, Japan]
Taken into account - text revised in line with sustainable development (e.g. introduction, section 2.5.3). Please note that SDGs are treated explicitly in Chapter 5.
12942 7 23 7 29To save on pages sentences can be dropped and replaced by one or two sentences as these definitions and same references are already in framing chapter 1 in Box. [Joyashree Roy, India]
Done.
20388 7 23 7 29 You may refer back to the Box in Chapter 1. [Olivier Boucher, France] Done.
9209 7 23 7 29 There is a box on this in Chapter 1, and this text is different [Glen Peters, Norway] Revised to match.
1503 7 26 7 26 Pathway is the better word that "path" in the whole chapter [Ken'ichi Matsumoto, Japan] Noted.
3294 7 27This is clarified in a Box in Ch1. The term ‘pathway’ or ‘scenario’ should be agreed on in Ch1 and used from then on, not re-introduced here. [Justin Bishop, United Kingdom (of Great Britain and Northern Ireland)]
Revised to match.
5159 7 27 7 29
The possibility that any single emissions path will occur as described in scenarios is highly uncertain” (Nakicenovic et al. 2000). - source is almost 20 years old and the sentence not really adds any value. While I agree with the overall statement, scenarios are more than pure mathematical exercises and scientists have the responsibility to selected unbiased and realistic assumptions/inputs. The quality of the model results is only as good as the model inputs and assumptions; those who constantly produce unrealistic results should not be cited in IPCC publications any more. Suggest to delete this sentence (7-27 to 7-29) [Sven Teske, Australia]
Removed as suggested.
1944 7 27 7 29Ensure this definition / clarification matches that in Ch1 (and elsewhere) [Andrew Smedley, United Kingdom (of Great Britain and Northern Ireland)]
Revised to match.
1843 7 35 7 36
“..cover all sectors and regions over the 21st century to be associated with a climate change projection out to 2100. The ..“ à cover all sectors and regions over the 21st century to be associated with a climate change projection out to 2100. Such an economy-wide consideration of the emission pathways covering all sectors together with a global approach is also in line with the relevant provisions of the Paris Agreement. The .. ((explanation: PA Article 4.4: “4. Developed country Parties .. undertaking economy-wide absolute emission reduction targets. Developing country Parties .. encouraged to move over time towards economy-wide emission reduction or limitation .. ”)) [Tibor Farago, Hungary]
Noted
5160 7 36 7 37Most energy models do calculate beyond 2040 or 2050 - thus projection period does not exceed 30 to 40 years. Suggest to add this as knowledge gap. [Sven Teske, Australia]
Add to section on knowledge gaps/limitations of IAM (discuss energy models not going past mid-century, hence need to rely on IAMs)?
7025 7 37 Revise accordand subject-verb: The climate change IS derived? [Érika Mata, Sweden] Corrected.
1844 7 4 7 41
“Emission pathways such as those based on current legislation or the pledges incorporated into Nationally Determined Contributions (NDCs) lead to well above 1.5°C warming, hence .. “ à Emission pathways such as those based on current legislation or the pledges incorporated into currently defined national contributions (INDCs and NDCs) specified in relation to the Paris Agreement lead to well above 1.5°C warming, hence ..((explanation: in many cases there are still the INDCs submitted before the adoption of the PM and which will be updated 5 years later; moreover, each Party shall submit new NDCs every five years which “will represent a progression beyond the Party’s then current NDC” – that is why important to mention that the above statement is based on the current contributions/pledges and both the SR15 and the AR6 will hopefully motivate the Parties to raise their ‘ambitions’)) [Tibor Farago, Hungary]
Revised as suggested.
2609 7 4 7 46
how does this relate to other scenarios/pathways already developed by the IPCC? [Zoha Shawoo, United Kingdom (of Great Britain and Northern Ireland)]
The IPCC does not develop scenarios, but assesses published work by others. The relationship of these scenarios to others is described in Box 1.1 and in our later chapter sections that compare with higher emission scenarios including SSPs.
Do Not Quote, Cite, or Distribute Page 33 of 129
IPCC WGI SR15 First Order Draft Review Comments And Responses - Chapter 2
Comment No From Page From Line To Page To Line Comment Response
7026 7 41 The abbreviation NDC has already been presented [Érika Mata, Sweden] Corrected.
3295 7 41Quantify ‘well above’ [Justin Bishop, United Kingdom (of Great Britain and Northern Ireland)] Wording revised to eliminate this phrase (which was hard to quantify as scenario dependent)
16185 7 42 7 42
The text seems to suggest that it is desireable to get to a warming of 1.5 C and then stay there, here referring to 1.5 C as "a normative end point." While the UNFCCC does talk about stabilizing and so perhaps that is why 1.5 C is seen as an end point, but consideration of the impacts of such warming (including impacts on sea level) make clear that real stabilization of all aspects of the climate (including sea level, and broadly considering the impacts from 1.5 C average surface warming) will not occur if the global average temperature is the only variable considered (the ocean will keep warming, ice sheets will keep losing mass, sea level will keep rising affecting all sorts of marine species, forests and ecosystems will keep changing, etc.). Scientifically, getting back to what might call stabilization of all the various components of the climate system likely requires going back to warming well less than 1.5 C. As a second, but related point, seeking to stay at 1.5 C will likely require some effort to sustain that warmer level given that getting down to that level will mean essentially giving up fossil fuels and it would likely be then expensive to continue to sustain CO2 and other GHG levels to keep global warming at 1.5 C. So, again, I simply don't understand this notion of considering 1.5 C as "the normative end point". Instead, we need to be considering 1.5 C as, if at all possible, a peak warming, and otherwise a point along the way to stabilization of the grander climate system (so ice, oceans, and ecosystems also stabilized) at a much lower increase in global average temperature above preindustrial. [Michael MacCracken, United States of America]
The mandate of the report is to examine 1.5C mitigation pathways, but the Paris Agreement does not specify stabilization explicitly (though refers to balance for GHGs). We therefore maintain that 1.5C, and not a lower value, is the target that this report should look at, but we have revised the text to elaborate that there are multiple options for the trend with a reference to the discussion in section 1.2.3. Note that the scenarios include overshoot+cooling, as suggested in this comment.
16186 7 48 8 7
This discussion seems to leave out climate intervention (geoengineering) as a means of limiting the warming to 1.5 C (or to otherwise limiting some impacts via climate intervention). Also, it is not at all clear that removal of enhancing CO2 from the atmosphere is also a possibility. This could be cleared up by providing a bit more encompassing definition of mitigation than is traditionally used. [Michael MacCracken, United States of America]
This section discusses the types of pathways in terms of the shape of their temperature evolution. As it does not cover the mitigation methods employed, we do not believe it would be an appropriate place to add discussion of types of mitigation.
10574 7 49 7 5 It might need redaction review [Elemer Briceño-Elizondo, Costa Rica] Revised
12731 7 5 7 5 may still miss <the target> [Vassilis Daioglou, Netherlands] Removed as suggested.
1504 7 52 7 53The same description (stabilization or overshoot scenarios) is seen just above this sentence. [Ken'ichi Matsumoto, Japan] Agreed, removed here.
12466 8
Developments in climate policies are also considered in scenario generation. These include carbon pricing and technology policies such as research and development funding and subsidies' - needs to be justified why only these matrics are deemed important when considering development of climate policies. If we consider wider social aspects, consumption and should be assessed in each countries own context - not in a general way. (other matrics could be GCF funding, payment for loss and damage) . Please refer to define subsidy as per IPCC AR5, WGIII SPM. [Dr Noim UDDIN, Australia]
The second sentence referred to here gives examples of policies and is not intended to be a complete list. We believe the wording is clear.
20860 8 1 8 1 The metric of “overshoot intensity” is not provided in Ch1. [Heleen de Coninck, Netherlands] Correct, statement removed.
11904 8 1 8 1 It appears that 'overshoot metric' has not yet provided in Chapter 1. [Junichi Tsutsui, Japan] Correct, statement removed.
20389 8 1 8 1 I don't think chapter 1 currently defines any overshoot metric. [Olivier Boucher, France] Correct, statement removed.
12973 8 1 8 1 where overshoot intensity has been defined in chapter 1? [Caserini Stefano, Italy] Correct, statement removed.
16187 8 9 8 11
This paragraph could be expanded to indicate that climate engineering, both CO2 removal and albedo enhancement, are also possible elements of various pathways. [Michael MacCracken, United States of America]
This section discusses the types of pathways in terms of the shape of their temperature evolution. As it does not cover the mitigation methods employed, we do not believe it would be an appropriate place to add discussion of types of mitigation.
2924 8 1 Change "geo-physically" to "geophysically". [MacDougall Andrew, Canada] Done.
3296 8 11 Change to ‘reliably’ [Justin Bishop, United Kingdom (of Great Britain and Northern Ireland)] Done.
17219 8 11 8 11 edit 'reliable' to 'reliably' [Himangana Gupta, India] Done.
7027 8 13 Section 2.1.2 seems underveloped as compared to other in 2.1 [Érika Mata, Sweden] Agreed, merged now into section 2.1.1.
2610 8 15 8 19how are these obtained and how is this linked to the SSPs? [Zoha Shawoo, United Kingdom (of Great Britain and Northern Ireland)]
As described at the end of the following paragraph, Discussion of these assumptions within recently developed 1.5°C scenarios is given in Section 2.1.4
16188 8 15 8 19
It is a bit surprising here that there is no mention here of the possible influence of natural events or variations, so major volcanic eruptions, slight decreases in solar radiation, very large El Nino or occurrence of extreme events, overstressing of the global agricultural system, collapse of key ice streams from Antarctic or Greenalnd ice sheets, etc. A true risk-based analysis would be looking at the risks of such natural or extreme influences, at least giving them some discussion so that the risk-based stress testing of response approaches for governments and businesses could be carried out. [Michael MacCracken, United States of America]
Added sentence on this to previous section on scenario impacts being probabilistic.
14932 8 31
I strongly suggest adding technological learning to the list of reasons why scenarios should not be seen as a realistic future pathway. Substantial work in the grey literature (see BNEF NEO in particular) and recent Creutzig et al. Nature energy paper show the key role that the rate of tech learning can play in the outcomes of scenario analyses. I would like to see a new section somewhere in 2.3.4 on how up to date the key IAMs used in SR1.5 are with respect to the current price and learning rates of renewable energy technology and competitors (fossil energy, BECCS). [Christopher Weber, United States of America]
Added.
Do Not Quote, Cite, or Distribute Page 34 of 129
IPCC WGI SR15 First Order Draft Review Comments And Responses - Chapter 2
Comment No From Page From Line To Page To Line Comment Response
10974 8 33 8 33 Content-free! [Skea Jim, United Kingdom (of Great Britain and Northern Ireland)] First and second sentences merged so as to have one making the relevant point.
10975 8 37 8 37 I havent seen any questions listed [Skea Jim, United Kingdom (of Great Britain and Northern Ireland)] Agreed, 'questions' changed to 'topics'.
1505 8 37 8 37
Temperature target rathar than forcing target? [Ken'ichi Matsumoto, Japan] The models are aimed at temperature but use forcing to guide them. We address limitations and SLCPs later in the chapter, but we maintain the description of the scenarios here as using forcing targets since that's how they were created.
16189 8 37 8 38
The implicit notion here that the target can be based on a forcing in 2100 takes me back to the major Energy Modeling Forum study of several years ago that set a target of something like 2 W/m2 in 2100 and looked at the least expensive ways to get to that. A problem not early on recognized in formulating the problem this way is that what matters for climate is not the forcing in 2100, but the accumulated forcing over time--and this led to some investigators allowing, for example, black carbon to be emitted without controls to 2099 and methane to 2080 or so, for the shorter lifetimes of these species meant that some magic control device could quickly and inexpensively (given the discount rate) bring their concentrations back to necessary levels by 2100--so overshoot was allowed. This was all done not keeping the focus on what the temperature and climate change would be--just what the forcing would be. Well, the study ended up being quite problematic and having to be modified. So, I'd just note that, as far as the climate is concerned, having the IAMs be asked to optimize to forcing in 2100 can give quite misleading results--indeed much less than optimal results--for how best to keep climate change in check. It seems to me that what are needed are IAMs that optimize scenarios based on keeping overall impacts to a minimum and not choosing some single year when radiative forcing must be at a certain value. I am suspicious already--and the text of lines 42-53 does not assuage this concern at all. [Michael MacCracken, United States of America]
The models are aimed at temperature but use forcing to guide them. We address limitations and SLCPs later in the chapter, but we maintain the description of the scenarios here as using forcing targets since that's how they were created, but we note that the temperature responses are what's assessed in the chapter so seem to address this concern.
4761 8 38 8 38What does "otherwise similar scenarios" mean? An explanation or example should be given. [Elena Georgopoulou, Greece] Changed to "scenarios with similar socio-economic assumptions"
5161 8 39 8 4Add a fourth category: d) technology lead scenarios (= 100% RE/EE scenarios) [Sven Teske, Australia] The type of technology used is part of the 'varying socio-economic assumptions' already
included in the variations described for class a.
4762 8 39 8 4
It would be better to say "pairs of scenarios with a path that follows the NDCs until 2030, and much more stringent mitigation actions afterwards", as some NDCs imply stringent actions early on and up to 2050, while others do not share this effort. [Elena Georgopoulou, Greece]
Revised similar to suggested.
12732 8 39 8 4Since there is no single NDC, sentence should be rephrased to "…path that follows the country/regional NDC until 2030." [Vassilis Daioglou, Netherlands]
Revised to plural, and INDCs/NDCs (as in reply to comment 1844).
3297 8 46Quantify ‘few’ - would it be better to say ‘if there is at least one 1.5 deg C pathway….’ [Justin Bishop, United Kingdom (of Great Britain and Northern Ireland)]
Seemed unnecessary to say we could assess these if they existed, as of course they couldn't be assessed if there weren't any, so deleted this phrase.
5162 8 51 8 51
Add technology list and market performance over the past decade to bring technology choice in the context of current markets. Suggest to use REN21 – Global status Report Renewables 2004 till 2017 as a reference for the RE side. [Sven Teske, Australia]
This sentence gives some examples from AR5, but is not meant to be an exhaustive description. We believe that the phrase 'which technologies are important' is enough to describe that various technologies and how they are assumed to change over time were looked at in AR5 and believe it would be distracting to add a list here and go into market performance.
6531 8 55 8 55 The word 'pathways' should be changed to 'pathway' [Victor Ongoma, Kenya] Done.
17594 8 55 9 6
The FOD text remarks that "it is unrealistic that any pathways devleoped today will be exactly followed". It would be appropriate here to make clear that pathways are specifically crafted not to be maps to be "exactly followed", but rather to help clarify the choices facing policymakers and their political implications. In this context, it is important to reflect on the argument by Beck, S. & M. Mahony, Nature Clim Change (2017), https://doi.org/10.1038/nclimate3264 , that "pathways and scenarios do not just represent possible futures, but also help to bring certain futures into being" - that the way pathways are produced and presented have implications for what kind of futures are seen as possible by policymakers, and what kinds of questions they can ask. It would be good if the report more explicitly recognize this aspect of its role. [Bård Lahn, Norway]
Thank you, text on this added to last paragraph in section 2.1.2.
7028 8 56References seem unnecessary for the statement "Society will adjust its response as new information becomes available" [Érika Mata, Sweden]
Agree.
1845 9 1
“2008). These adjustments ..“ à 2008). More concretely, this Special Report was requested by the Parties to the UNFCCC with a view that the assessments of the report will be taken into account in 2018 for the evaluation of the collective efforts of the Parties in relation to progress towards the long-term goal of the Agreement and also for preparation of their subsequent NDCs. Obviously, it is also valid for the AR6 when a global stocktake will be undertaken by the Parties in 2023. These adjustments .. ((explanation: These references are much more concrete indications for those adjustments and the role of the IPCC in that regard.)) [Tibor Farago, Hungary]
Thank you, text on this added to last paragraph in section 2.1.2.
5163 9 1 9 5
Cited literature is based on scenarios developed - to a large extend - 10 years ago some are even older. Those scenarios are modelled before the RE industry developed to a main stream industry (65% global market share in regard to new power plants in 2016). Request: cite new papers / delete current references. [Sven Teske, Australia]
The point here is not the scenarios themselves, just that work using those scenarios has shown that earlier mitigation hedges against unfavourable later developments. We are not aware of work with newer scenarios that supports this point, so retain the citations.
20390 9 3 9 3 technology availability => "future technology availability" [Olivier Boucher, France] Added.
Do Not Quote, Cite, or Distribute Page 35 of 129

IPCC WGI SR15 First Order Draft Review Comments And Responses - Chapter 2
Comment No From Page From Line To Page To Line Comment Response
7029 9 5I could use here some more explanations on what "fixed" and "adaptive" pathways are, and if the authors think about any in particular. [Érika Mata, Sweden]
Example added for adaptive to clarify.
9216 9 8 1 4
The IAM community has a great tradition of putting the scenarios in a public database, though, past experience has shown it is only a subset of the database (particularly in the SSP database). Will this database be made public? Will it be the entire database or subsets? And when will it be made available? And will it be downloadable in one click, or will people have to spend years clicking buttons on an interactive user interface? [Glen Peters, Norway]
These are issues which are not decided by the chapter authors. Generally, in particular those variables which have been assessed by the report are also made public.
9210 9 8 1 4
There is no real mention on how the scenarios were generated? Presumably they come from IAMs, and presumably the authors of the report would assess literature on the ability of IAMs to appropriately generate outcomes that are useful for the SR. If you dont explain and assess the models used, then dont complain when the scenarios and models are later called "black boxes". [Glen Peters, Norway]
Noted. The models underlying the scenario literature have not changed fundamentally since AR5. A technical assessment of these models would be valuable, but rather something the AR6 should take on, as the SR1.5 has been given the explicit guidance to build on AR5 and consider aspects of direct relevance to the question of 1.5°C.
9212 9 8 1 4
With the scenario database approach, there is a real threat that this Chapter is just plotting the scenarios in different ways to show different characteristics. The chapter becomes a description of the scenario database, and not an assessmetn of the literature or scenarios. It would be nice to see the authors really provide an assessment, which yes, may mean critiquing some scenario results. [Glen Peters, Norway]
The SOD now uses both data available in the database and other literature for its assessment. Wherever appropriate a small set of examples is selected to provide further deep dives in the understanding of ranges and the diversity of scenario results in the literature.
9217 9 8 1 4
As of writing not one of the papers in Table 2.1 are published. The literature deadline is in about a month. How can there be any discussion in the literature of the scenarios? The authors will have no literature on which to assess the literature, they will only have the studies? How will the lack of literature be dealt with? Or is the report already biased by only assessing the original publicaations? [Glen Peters, Norway]
The report assesses the literature, so of course must rely on published studies but is designed to evaluate and critique those studies to the extent possible and so does not depend on the existence of other published studies assessing the primary literature. Critiques on scenarios have also already been published in the literature, and these are also taken into account.
9211 9 8 1 4
A scenario database is not assessing the literature, it is assessing the scenario database. I think there needs to be some reflection by the authors on the pros and cons of taking this approach (and there are cons). It makes it easier for the authors, it makes the report less comprehensive and reduces its legitimacy. [Glen Peters, Norway]
We disagree with the reviewer that a scenario database would not be part of assessing the literature. We agree, however, that it cannot be the only source of information drawn upon. In the SOD, several additional teams have submitted information to the database, and it now thus covers a wider body of literature. At the same time, the SOD also includes additional discussion of scenarios beyond those generated by IAMs and deposited into the scenario database. We also disagree that the use of a database would make it easier for the authors, the contrary is probably true. Finally, without a quantitative evidence base on which scenarios can be compared the assessment would not be able to go beyond qualitative and descriptive statements.
9213 9 8 1 4A box in Chapter 1 discusses how feasibility will be an organising principle of all chapters. It would be good for the authors to explain how they follow up on that in this chapter. [Glen Peters, Norway]
Added to introduction of section 2.1
9214 9 8 1 4
How do the authors deal with single studies. Hansen et al https://www.earth-syst-dynam.net/8/577/2017/esd-8-577-2017.html may not enter his scenarios into the database. Maybe he does, but I am sure there will be individual scenarios that are not entered in the database. Can you explain how they are handled in this chapter. [Glen Peters, Norway]
Also studies that have not submitted scenarios to the database are included in the assessment of pathways.
9215 9 8 1 4
There are really critical indpendent studies that may be missed in this approach. For example, the debate on Jacobson et al 2015 PNAS and Clack et al 2016 PNAS has considerable important implications for the credibility of the Chapter, in addition to important implications for designing a future energy system and mitigation. How would the methodology of this chapter allow an assessment of those issues (and there are many), drawing out the implications that would be useful for policy makers? [Glen Peters, Norway]
The SOD includes additional discussion of scenarios beyond those generated by the IAMs and deposited into the scenario database. We include discussion of scenarios with heavy reliance on renewables, as e.g. Jacobson et al.
904 9 22 9 22It would perhaps be useful to list the carbon dioxide removal technologies at this point [David Infield, United Kingdom (of Great Britain and Northern Ireland)]
This is the chapter introduction, and to minimize length we feel that a more detailed discussion of these is better left to later parts of the chapter.
15029 9 22 9 22
Is there any discussion of the IAMs relliance on BECCS as a means of reaching 1.5C by 2100? What is the balance between BECCS, CCS/CCUS, and/or nuclear? Some balance of BECCS, CCUS, and/or nuclear is needed for deep decarbonization, but it doesn't necessary have to fall on only one of these technologies (e.g., it could fall mostly on CCS or nuclear if BECCS doesn't materialize) [Farhan Akhtar, United States of America]
Yes, this is discussed in later sections of the chapter, in particular the energy sector discussion.
3155 9 23
Access to this data base must be given to any official report reviewer who requests access. Otherwise, MATERIAL FROM THIS DATABASE SHOULD NOT BE ALLOWED TO BE USED IN THIS SPECIAL REPORT. It is just as important to review that technical material as the text of the report, in part to check that the database material has been descriibed and interpreted correctly in the report. The basis for all statements in SR1.5 must be transparent to the world. This report is not an exercise of some secret society of IAM modelers. [Richard Rosen, Germany]
Noted
5164 9 23 9 23 Make database publically accessible [Sven Teske, Australia] The database will be made publicly accessible upon publication of the report.
20391 9 23 9 3
Are all these scenarios compatible with say actual 2015 or 2016 GHG emissions? [Olivier Boucher, France] Scenarios have been checked for consistency with historical values. Because the database was only finalized at a late stage during the SOD process, this will be further improved during the following iteration.
4763 9 25 9 26
When you say "..putting 1.5 oC scenarios into context", do you mean that the temperature increase in these 130 scenarios is +1.5 oC? If not, it is useful to add the range of temperature increase in these 130 scenarios. [Elena Georgopoulou, Greece]
Clarified that those are scenarios with higher warming.
Do Not Quote, Cite, or Distribute Page 36 of 129
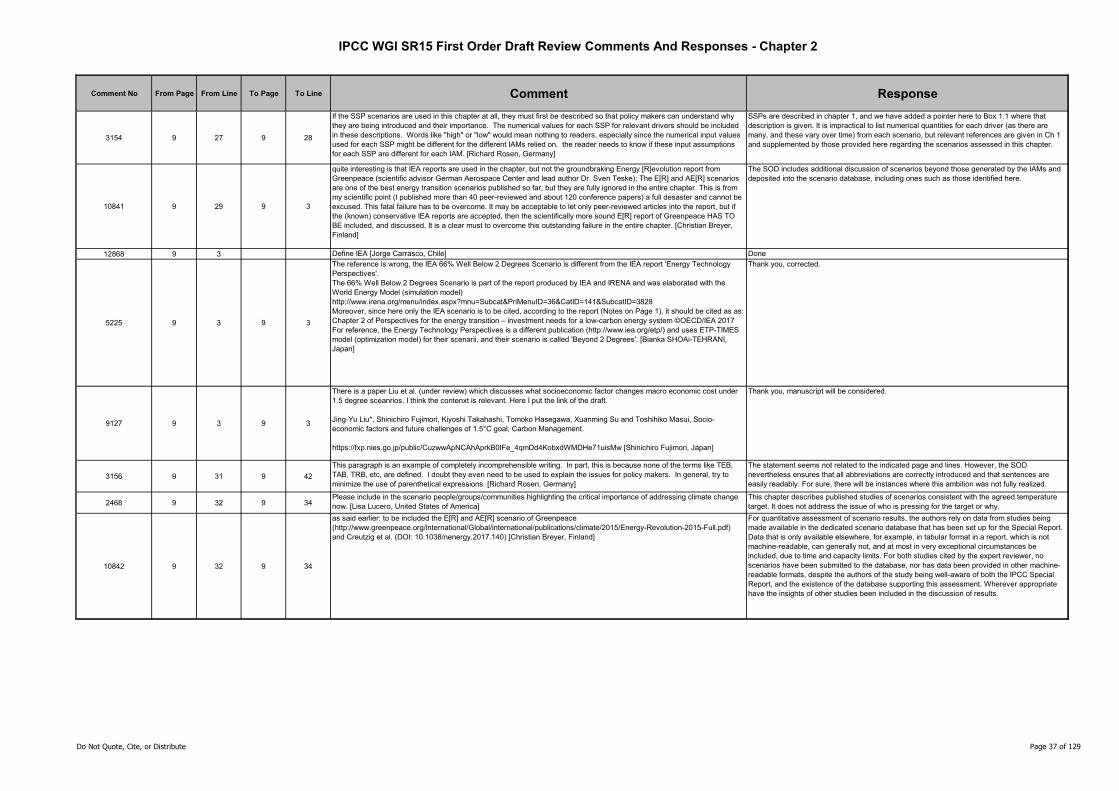
IPCC WGI SR15 First Order Draft Review Comments And Responses - Chapter 2
Comment No From Page From Line To Page To Line Comment Response
3154 9 27 9 28
If the SSP scenarios are used in this chapter at all, they must first be described so that policy makers can understand why they are being introduced and their importance. The numerical values for each SSP for relevant drivers should be included in these descriptions. Words like "high" or "low" would mean nothing to readers, especially since the numerical input values used for each SSP might be different for the different IAMs relied on. the reader needs to know if these input assumptions for each SSP are different for each IAM. [Richard Rosen, Germany]
SSPs are described in chapter 1, and we have added a pointer here to Box 1.1 where that description is given. It is impractical to list numerical quantities for each driver (as there are many, and these vary over time) from each scenario, but relevant references are given in Ch 1 and supplemented by those provided here regarding the scenarios assessed in this chapter.
10841 9 29 9 3
quite interesting is that IEA reports are used in the chapter, but not the groundbraking Energy [R]evolution report from Greenpeace (scientific advisor German Aerospace Center and lead author Dr. Sven Teske); The E[R] and AE[R] scenarios are one of the best energy transition scenarios published so far, but they are fully ignored in the entire chapter. This is from my scientific point (I published more than 40 peer-reviewed and about 120 conference papers) a full desaster and cannot be excused. This fatal failure has to be overcome. It may be acceptable to let only peer-reviewed articles into the report, but if the (known) conservative IEA reports are accepted, then the scientifically more sound E[R] report of Greenpeace HAS TO BE included, and discussed. It is a clear must to overcome this outstanding failure in the entire chapter. [Christian Breyer, Finland]
The SOD includes additional discussion of scenarios beyond those generated by the IAMs and deposited into the scenario database, including ones such as those identified here.
12868 9 3 Define IEA [Jorge Carrasco, Chile] Done
5225 9 3 9 3
The reference is wrong, the IEA 66% Well Below 2 Degrees Scenario is different from the IEA report 'Energy Technology Perspectives'. The 66% Well Below 2 Degrees Scenario is part of the report produced by IEA and IRENA and was elaborated with the World Energy Model (simulation model)http://www.irena.org/menu/index.aspx?mnu=Subcat&PriMenuID=36&CatID=141&SubcatID=3828Moreover, since here only the IEA scenario is to be cited, according to the report (Notes on Page 1), it should be cited as as:Chapter 2 of Perspectives for the energy transition – investment needs for a low-carbon energy system ©OECD/IEA 2017For reference, the Energy Technology Perspectives is a different publication (http://www.iea.org/etp/) and uses ETP-TIMES model (optimization model) for their scenarii, and their scenario is called 'Beyond 2 Degrees'. [Bianka SHOAi-TEHRANI, Japan]
Thank you, corrected.
9127 9 3 9 3
There is a paper Liu et al. (under review) which discusses what socioeconomic factor changes macro economic cost under 1.5 degree sceanrios. I think the contenxt is relevant. Here I put the link of the draft.
Jing-Yu Liu*, Shinichiro Fujimori, Kiyoshi Takahashi, Tomoko Hasegawa, Xuanming Su and Toshihiko Masui, Socio-economic factors and future challenges of 1.5°C goal, Carbon Management. https://fxp.nies.go.jp/public/CuzwwApNCAhAprkB0IFe_4qmDd4KobxdWMDHe71uisMw [Shinichiro Fujimori, Japan]
Thank you, manuscript will be considered.
3156 9 31 9 42
This paragraph is an example of completely incomprehensible writing. In part, this is because none of the terms like TEB, TAB, TRB, etc, are defined. I doubt they even need to be used to explain the issues for policy makers. In general, try to minimize the use of parenthetical expressions. [Richard Rosen, Germany]
The statement seems not related to the indicated page and lines. However, the SOD nevertheless ensures that all abbreviations are correctly introduced and that sentences are easily readably. For sure, there will be instances where this ambition was not fully realized.
2468 9 32 9 34Please include in the scenario people/groups/communities highlighting the critical importance of addressing climate change now. [Lisa Lucero, United States of America]
This chapter describes published studies of scenarios consistent with the agreed temperature target. It does not address the issue of who is pressing for the target or why.
10842 9 32 9 34
as said earlier: to be included the E[R] and AE[R] scenario of Greenpeace (http://www.greenpeace.org/international/Global/international/publications/climate/2015/Energy-Revolution-2015-Full.pdf) and Creutzig et al. (DOI: 10.1038/nenergy.2017.140) [Christian Breyer, Finland]
For quantitative assessment of scenario results, the authors rely on data from studies being made available in the dedicated scenario database that has been set up for the Special Report. Data that is only available elsewhere, for example, in tabular format in a report, which is not machine-readable, can generally not, and at most in very exceptional circumstances be included, due to time and capacity limits. For both studies cited by the expert reviewer, no scenarios have been submitted to the database, nor has data been provided in other machine-readable formats, despite the authors of the study being well-aware of both the IPCC Special Report, and the existence of the database supporting this assessment. Wherever appropriate have the insights of other studies been included in the discussion of results.
Do Not Quote, Cite, or Distribute Page 37 of 129

IPCC WGI SR15 First Order Draft Review Comments And Responses - Chapter 2
Comment No From Page From Line To Page To Line Comment Response
20655 1
Consider shifting section 2.2 to become section 2.3 --> idea to move what is now section 2.5 (starting on page 67) more towards the beginning of chapter 2 so that it would become the new section 2.2. The reasoning is that this subsection again focuses readers and especially decision makers on the major issues around the four pathway types that were introduced in chapter 1. The idea motivating this suggestion is to keep the reader's focus on the four pathway types and the kinds of policy narratives and policy implications they are associated with, followed by all the details like geophysical relationships and constraints, and then diving into more detail about the general characteristics of each of these four pathways in the near-to-medium term and after mid-century. Moving the challenges section (what is now 2.5) up towards the beginning of the chapter would help focus the reader on the types of pathways that decision makers are "contending" with. The whole point is to clarify, and bring these main messages to the fore / not let them get lost in the (important) details. The reader needs the main points and "why this is important" early in the chapter to make sense of the details. [Koko Warner, Germany]
rejected—we prefer to follow the current section that frames geophysical constraint of mitigation pathways before describing them
9936 1 12
Section 2.2.2 and the content of Table 2.2 are useful to explain the state of the art around the carbon budget concept. However, I think it’s necessary to provide a clearer continuity with the AR5. Because of that, I suggest to include a new table updating table TS.1, pag 54, of the Technical Summary Contribution of WG III in AR5. [Olga Alcaraz, Spain]
taken into account — the text on carbon budget has been improved accordingly. We chose to focus on threshold peak budget and threshold return budget that are of a particular relevance in the context of 1.5°C. Therefore TEB and TAB are not in the revised table
18842 1 19
The choice of reference period and measurements used for the report are crucial for the calculations of the remaining carbon budget. However, this is not discussed in Chapter 1 (1.2.1). Nor are the implications of uncertainties in the reference period, or in the measurement data, discussed further in here in section 2.2.2. This topic needs to be covered in one of the sections. (Comment repeated for Chapter 1.) (I wrote this before the publication of Millar et al. 2017, NGeo. After that, it has become clear that the interpretation of differences between realized and modeled temperature change also needs to be discussed in one of the sections.) [Bjørn Samset, Norway]
taken in to account— we have revised the current section. It now includes a clearer description of uncertainties that might impacts the carbon budget; that is (1) the methodological uncertainties and (2) the physical uncertainties that includes climate sensitivity
7309 1 1 Table 2.1, delete the text "locked in". [Eleni Kaditi, Austria] Agreed 'locked in' not needed here.
7308 1 19 The text refering to scenarios above 2oC should be shortened. [Eleni Kaditi, Austria] Table substantially revised. Text largely refers to scenarios below 2C.
14171 1 1 1 1
Table 2.1, line EMF-23. The reference below might also be appropriate to be reviewed:Strapasson, A.; Woods, J.; Chum, H.; Kalas, N.; Shah, N.; Rosillo-Calle, F. (2017). On the Global Limits of Bioenergy and Land Use for Climate Change Mitigation. Global Change Biology, Bioenergy (Wiley). DOI: 10.1111/gcbb.12456Available at: http://onlinelibrary.wiley.com/doi/10.1111/gcbb.12456/full [Alexandre Strapasson, Brazil]
Noted, thank you.
5708 1 1 1 4As the table is not completed, it is difficult to see the information it wants to present. Also IAM needs to be spelt out. As a common practice, table titles should be understandable without reading the main text. [Hong Yang, Switzerland]
Noted. Table revised for SOD.
3298 1 3Consider adding the number of scenarios within each ‘study name’ to the table so readers can appreciate how scenarios are dominated by certain key foci. [Justin Bishop, United Kingdom (of Great Britain and Northern Ireland)]
The amount of scenarios and modelling frameworks are now reported in several of the figures in Section 2.3
707 1 3 1 4
We suggest to take into account the scenarios proposed by the GISOC (Global Initiative to Save Our Climate) collaboration. These scenarios are variants of the MESSAGE Supply and Mix scenarios with accelerated development of Nuclear energy, especially in its sustanaible version:"How much can nuclear energy do about global warming? "André Berger, Tom Blees, Francois-Marie Bréon, Barry W. Brook, Philippe Hansen, Ravi B. Grove, Claude Guet, Weiping Liu, Frederic Livet, Herve Nifenecker, Michel Peti, Gérard Pierre, Henri Prévot, Sébastien Richet, Henri Safa, Massimo Salvatores, Michael Schneeberger, Suyan Zhou https://doi.org/10.1504/IJGEI.2017.080766. These scenarios foresee around 500 EJ/y nuclear energy production in 2100, providing half the TPES. They make it possible not to use massive CCS . Nuclear sustaniability is obtained with breeding reactors with existing and proven technologies. Both Supply-N and Mix-N agree with the RCP 2.6. Work is going on for agreeing with SR1.5,which should be easily obtained with BECCS (CCS applied to biomass combustion). [Herve Nifenecker, France]
The SOD includes additional discussion of scenarios beyond those generated by the IAMs and deposited into the scenario database, including ones such as those identified here.
3707 1 6
I find the use of 'geophysical' in the sub-heading somewhat odd. Much of the discussion is not about geophysical considerations, but others. Was this term given by the approved outline - I suggest reconsidering whether the sub-heading title captures the content of the section [Harald Winkler, South Africa]
taken in to account— the text has been revised and the meaning of 'geophysical' has been clarified
5709 1 6 17 7
The title of the section is about 1.5C and 2C carbon budget. But this special report is about 1.5C. If the authors think 2C is relevant and must be addressed, they should state this at the beginning of the Chapter and also the whole report. Overall, Chapter 2 lacks consistency on the temperature target and mitigation parthways. In some sections, both 1.5 and 2 degrees are addressed, and in others, only 1.5 is addressed. [Hong Yang, Switzerland]
taken in to account —the revised text now focuses on 1.5°C carbon budget (as well as the rest of the section)
9493 1 1 1 11
Carbon budget is a secondary metric estimated by use of pseudo-linear relationship between temperature and cumulative amounts of CO2 emissions which has great uncertainties. Thus, it feels strange that carbon budget is treated in the same line as other three physical parameters, radiative forcing, atmospheric concentrations and temperature. [Masato TAKAGI, Japan]
taken into account — the text has been revised in order to better explain the meaning of the carbon budgets in regards of other climate fields
4354 1 12 1 12 It is necessary toinclude more references regarding 'atmospheric concentrations'. [Gabriel de Oliveira, Brazil] taken in to account — relevant references has been added
1506 1 12 1 12
Masui, T., Matsumoto, K., Hijioka, Y., Kinoshita, T., Nozawa, T., Ishiwatari, S., Kato, E., Shukla, P.R., Yamagata, Y., and Kainuma, M. (2011) An Emission Pathway for Stabilization at 6Wm-2 Radiative Forcing. Climatic Change 109(1-2), 59?76 [dx.doi.org/10.1007/s10584-011-0150-5] should be also cited as a RCP paper. [Ken'ichi Matsumoto, Japan]
taken in to account — this relevant reference has been added as suggested
Do Not Quote, Cite, or Distribute Page 38 of 129
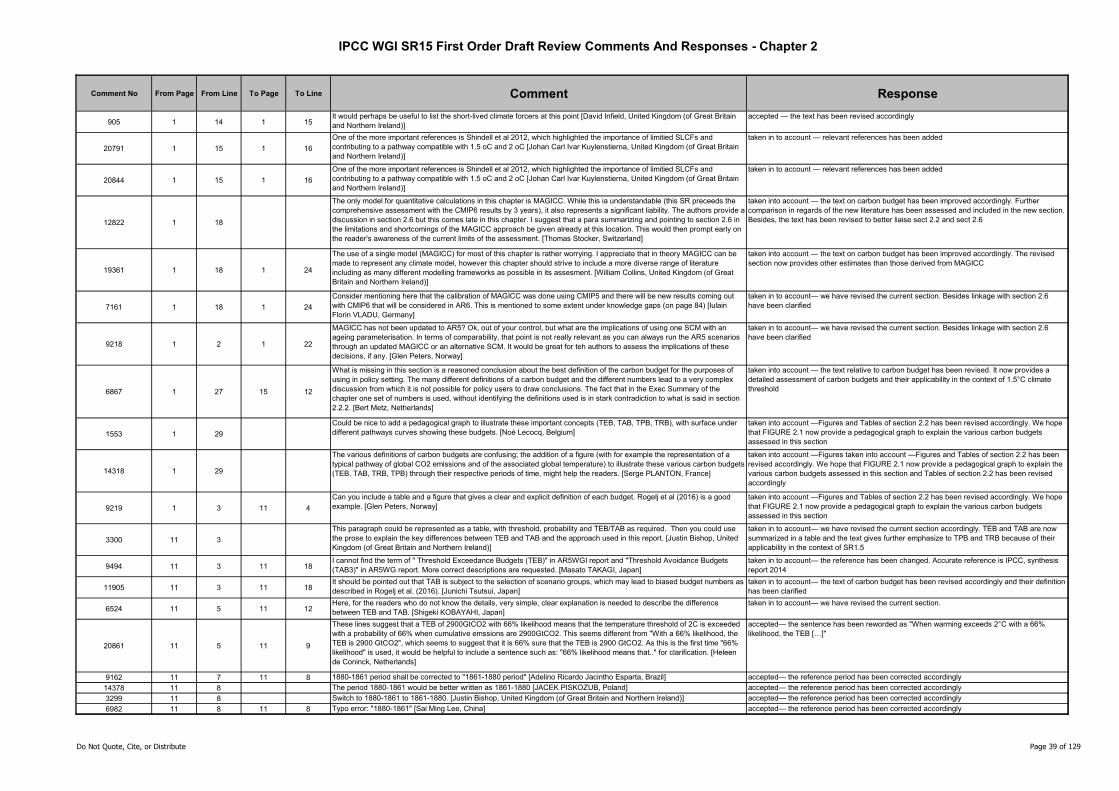
IPCC WGI SR15 First Order Draft Review Comments And Responses - Chapter 2
Comment No From Page From Line To Page To Line Comment Response
905 1 14 1 15It would perhaps be useful to list the short-lived climate forcers at this point [David Infield, United Kingdom (of Great Britain and Northern Ireland)]
accepted — the text has been revised accordingly
20791 1 15 1 16
One of the more important references is Shindell et al 2012, which highlighted the importance of limitied SLCFs and contributing to a pathway compatible with 1.5 oC and 2 oC [Johan Carl Ivar Kuylenstierna, United Kingdom (of Great Britain and Northern Ireland)]
taken in to account — relevant references has been added
20844 1 15 1 16
One of the more important references is Shindell et al 2012, which highlighted the importance of limitied SLCFs and contributing to a pathway compatible with 1.5 oC and 2 oC [Johan Carl Ivar Kuylenstierna, United Kingdom (of Great Britain and Northern Ireland)]
taken in to account — relevant references has been added
12822 1 18
The only model for quantitative calculations in this chapter is MAGICC. While this ia understandable (this SR preceeds the comprehensive assessment with the CMIP6 results by 3 years), it also represents a significant liability. The authors provide a discussion in section 2.6 but this comes late in this chapter. I suggest that a para summarizing and pointing to section 2.6 in the limitations and shortcomings of the MAGICC approach be given already at this location. This would then prompt early on the reader's awareness of the current limits of the assessment. [Thomas Stocker, Switzerland]
taken into account — the text on carbon budget has been improved accordingly. Further comparison in regards of the new literature has been assessed and included in the new section. Besides, the text has been revised to better liaise sect 2.2 and sect 2.6
19361 1 18 1 24
The use of a single model (MAGICC) for most of this chapter is rather worrying. I appreciate that in theory MAGICC can be made to represent any climate model, however this chapter should strive to include a more diverse range of literature including as many different modelling frameworks as possible in its assesment. [William Collins, United Kingdom (of Great Britain and Northern Ireland)]
taken into account — the text on carbon budget has been improved accordingly. The revised section now provides other estimates than those derived from MAGICC
7161 1 18 1 24
Consider mentioning here that the calibration of MAGICC was done using CMIP5 and there will be new results coming out with CMIP6 that will be considered in AR6. This is mentioned to some extent under knowledge gaps (on page 84) [Iulain Florin VLADU, Germany]
taken in to account— we have revised the current section. Besides linkage with section 2.6 have been clarified
9218 1 2 1 22
MAGICC has not been updated to AR5? Ok, out of your control, but what are the implications of using one SCM with an ageing parameterisation. In terms of comparability, that point is not really relevant as you can always run the AR5 scenarios through an updated MAGICC or an alternative SCM. It would be great for teh authors to assess the implications of these decisions, if any. [Glen Peters, Norway]
taken in to account— we have revised the current section. Besides linkage with section 2.6 have been clarified
6867 1 27 15 12
What is missing in this section is a reasoned conclusion about the best definition of the carbon budget for the purposes of using in policy setting. The many different definitions of a carbon budget and the different numbers lead to a very complex discussion from which it is not possible for policy users to draw conclusions. The fact that in the Exec Summary of the chapter one set of numbers is used, without identifying the definitions used is in stark contradiction to what is said in section 2.2.2. [Bert Metz, Netherlands]
taken into account — the text relative to carbon budget has been revised. It now provides a detailed assessment of carbon budgets and their applicability in the context of 1.5°C climate threshold
1553 1 29
Could be nice to add a pedagogical graph to illustrate these important concepts (TEB, TAB, TPB, TRB), with surface under different pathways curves showing these budgets. [Noé Lecocq, Belgium]
taken into account —Figures and Tables of section 2.2 has been revised accordingly. We hope that FIGURE 2.1 now provide a pedagogical graph to explain the various carbon budgets assessed in this section
14318 1 29
The various definitions of carbon budgets are confusing; the addition of a figure (with for example the representation of a typical pathway of global CO2 emissions and of the associated global temperature) to illustrate these various carbon budgets (TEB, TAB, TRB, TPB) through their respective periods of time, might help the readers. [Serge PLANTON, France]
taken into account —Figures taken into account —Figures and Tables of section 2.2 has been revised accordingly. We hope that FIGURE 2.1 now provide a pedagogical graph to explain the various carbon budgets assessed in this section and Tables of section 2.2 has been revised accordingly
9219 1 3 11 4
Can you include a table and a figure that gives a clear and explicit definition of each budget. Rogelj et al (2016) is a good example. [Glen Peters, Norway]
taken into account —Figures and Tables of section 2.2 has been revised accordingly. We hope that FIGURE 2.1 now provide a pedagogical graph to explain the various carbon budgets assessed in this section
3300 11 3
This paragraph could be represented as a table, with threshold, probability and TEB/TAB as required. Then you could use the prose to explain the key differences between TEB and TAB and the approach used in this report. [Justin Bishop, United Kingdom (of Great Britain and Northern Ireland)]
taken in to account— we have revised the current section accordingly. TEB and TAB are now summarized in a table and the text gives further emphasize to TPB and TRB because of their applicability in the context of SR1.5
9494 11 3 11 18I cannot find the term of " Threshold Exceedance Budgets (TEB)" in AR5WGI report and "Threshold Avoidance Budgets (TAB3)" in AR5WG report. More correct descriptions are requested. [Masato TAKAGI, Japan]
taken in to account— the reference has been changed. Accurate reference is IPCC, synthesis report 2014
11905 11 3 11 18It should be pointed out that TAB is subject to the selection of scenario groups, which may lead to biased budget numbers as described in Rogelj et al. (2016). [Junichi Tsutsui, Japan]
taken in to account— the text of carbon budget has been revised accordingly and their definition has been clarified
6524 11 5 11 12Here, for the readers who do not know the details, very simple, clear explanation is needed to describe the difference between TEB and TAB. [Shigeki KOBAYAHI, Japan]
taken in to account— we have revised the current section.
20861 11 5 11 9
These lines suggest that a TEB of 2900GtCO2 with 66% likelihood means that the temperature threshold of 2C is exceeded with a probability of 66% when cumulative emssions are 2900GtCO2. This seems different from "With a 66% likelihood, the TEB is 2900 GtCO2", which seems to suggest that it is 66% sure that the TEB is 2900 GtCO2. As this is the first time "66% likelihood" is used, it would be helpful to include a sentence such as: "66% likelihood means that.." for clarification. [Heleen de Coninck, Netherlands]
accepted— the sentence has been reworded as "When warming exceeds 2°C with a 66% likelihood, the TEB […]"
9162 11 7 11 8 1880-1861 period shall be corrected to "1861-1880 period" [Adelino Ricardo Jacintho Esparta, Brazil] accepted— the reference period has been corrected accordingly
14378 11 8 The period 1880-1861 would be better written as 1861-1880 [JACEK PISKOZUB, Poland] accepted— the reference period has been corrected accordingly
3299 11 8 Switch to 1880-1861 to 1861-1880. [Justin Bishop, United Kingdom (of Great Britain and Northern Ireland)] accepted— the reference period has been corrected accordingly
6982 11 8 11 8 Typo error: "1880-1861" [Sai Ming Lee, China] accepted— the reference period has been corrected accordingly
Do Not Quote, Cite, or Distribute Page 39 of 129
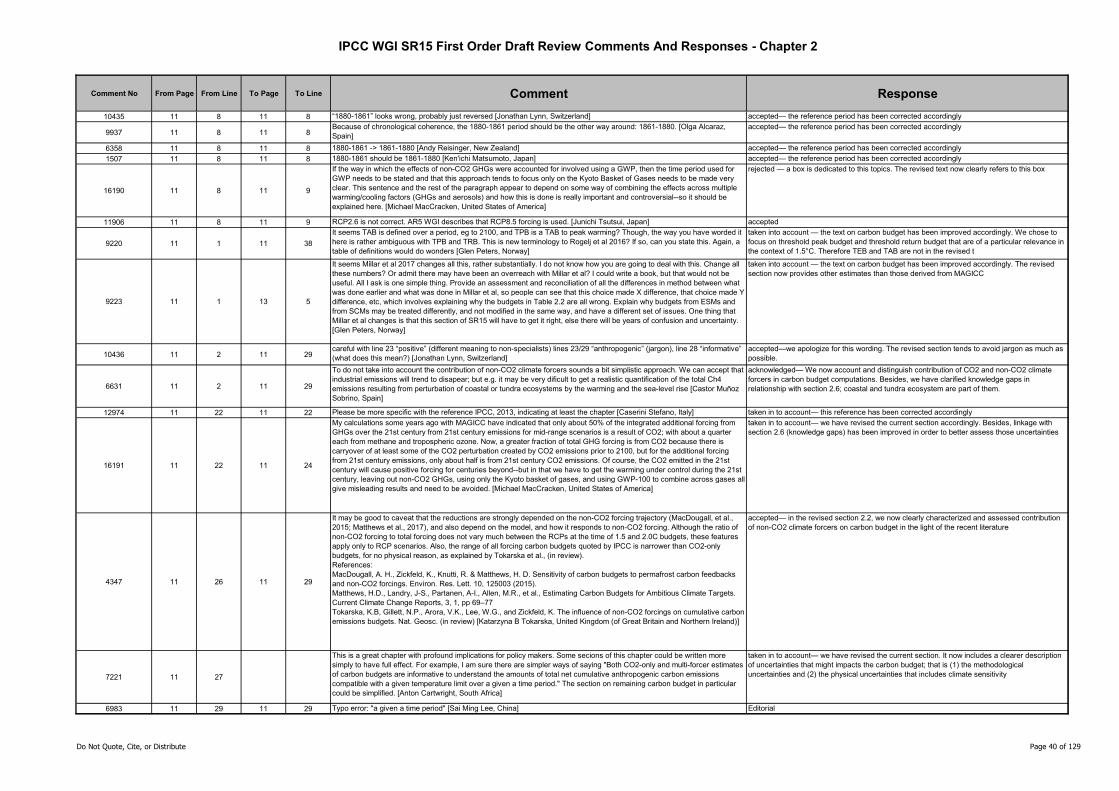
IPCC WGI SR15 First Order Draft Review Comments And Responses - Chapter 2
Comment No From Page From Line To Page To Line Comment Response
10435 11 8 11 8 “1880-1861” looks wrong, probably just reversed [Jonathan Lynn, Switzerland] accepted— the reference period has been corrected accordingly
9937 11 8 11 8Because of chronological coherence, the 1880-1861 period should be the other way around: 1861-1880. [Olga Alcaraz, Spain]
accepted— the reference period has been corrected accordingly
6358 11 8 11 8 1880-1861 -> 1861-1880 [Andy Reisinger, New Zealand] accepted— the reference period has been corrected accordingly
1507 11 8 11 8 1880-1861 should be 1861-1880 [Ken'ichi Matsumoto, Japan] accepted— the reference period has been corrected accordingly
16190 11 8 11 9
If the way in which the effects of non-CO2 GHGs were accounted for involved using a GWP, then the time period used for GWP needs to be stated and that this approach tends to focus only on the Kyoto Basket of Gases needs to be made very clear. This sentence and the rest of the paragraph appear to depend on some way of combining the effects across multiple warming/cooling factors (GHGs and aerosols) and how this is done is really important and controversial--so it should be explained here. [Michael MacCracken, United States of America]
rejected — a box is dedicated to this topics. The revised text now clearly refers to this box
11906 11 8 11 9 RCP2.6 is not correct. AR5 WGI describes that RCP8.5 forcing is used. [Junichi Tsutsui, Japan] accepted
9220 11 1 11 38
It seems TAB is defined over a period, eg to 2100, and TPB is a TAB to peak warming? Though, the way you have worded it here is rather ambiguous with TPB and TRB. This is new terminology to Rogelj et al 2016? If so, can you state this. Again, a table of definitions would do wonders [Glen Peters, Norway]
taken into account — the text on carbon budget has been improved accordingly. We chose to focus on threshold peak budget and threshold return budget that are of a particular relevance in the context of 1.5°C. Therefore TEB and TAB are not in the revised t
9223 11 1 13 5
It seems Millar et al 2017 changes all this, rather substantially. I do not know how you are going to deal with this. Change all these numbers? Or admit there may have been an overreach with Millar et al? I could write a book, but that would not be useful. All I ask is one simple thing. Provide an assessment and reconciliation of all the differences in method between what was done earlier and what was done in Millar et al, so people can see that this choice made X difference, that choice made Y difference, etc, which involves explaining why the budgets in Table 2.2 are all wrong. Explain why budgets from ESMs and from SCMs may be treated differently, and not modified in the same way, and have a different set of issues. One thing that Millar et al changes is that this section of SR15 will have to get it right, else there will be years of confusion and uncertainty. [Glen Peters, Norway]
taken into account — the text on carbon budget has been improved accordingly. The revised section now provides other estimates than those derived from MAGICC
10436 11 2 11 29careful with line 23 “positive” (different meaning to non-specialists) lines 23/29 “anthropogenic” (jargon), line 28 “informative” (what does this mean?) [Jonathan Lynn, Switzerland]
accepted—we apologize for this wording. The revised section tends to avoid jargon as much as possible.
6631 11 2 11 29
To do not take into account the contribution of non-CO2 climate forcers sounds a bit simplistic approach. We can accept that industrial emissions will trend to disapear; but e.g. it may be very dificult to get a realistic quantification of the total Ch4 emissions resulting from perturbation of coastal or tundra ecosystems by the warming and the sea-level rise [Castor Muñoz Sobrino, Spain]
acknowledged— We now account and distinguish contribution of CO2 and non-CO2 climate forcers in carbon budget computations. Besides, we have clarified knowledge gaps in relationship with section 2.6; coastal and tundra ecosystem are part of them.
12974 11 22 11 22 Please be more specific with the reference IPCC, 2013, indicating at least the chapter [Caserini Stefano, Italy] taken in to account— this reference has been corrected accordingly
16191 11 22 11 24
My calculations some years ago with MAGICC have indicated that only about 50% of the integrated additional forcing from GHGs over the 21st century from 21st century emissions for mid-range scenarios is a result of CO2; with about a quarter each from methane and tropospheric ozone. Now, a greater fraction of total GHG forcing is from CO2 because there is carryover of at least some of the CO2 perturbation created by CO2 emissions prior to 2100, but for the additional forcing from 21st century emissions, only about half is from 21st century CO2 emissions. Of course, the CO2 emitted in the 21st century will cause positive forcing for centuries beyond--but in that we have to get the warming under control during the 21st century, leaving out non-CO2 GHGs, using only the Kyoto basket of gases, and using GWP-100 to combine across gases all give misleading results and need to be avoided. [Michael MacCracken, United States of America]
taken in to account— we have revised the current section accordingly. Besides, linkage with section 2.6 (knowledge gaps) has been improved in order to better assess those uncertainties
4347 11 26 11 29
It may be good to caveat that the reductions are strongly depended on the non-CO2 forcing trajectory (MacDougall, et al., 2015; Matthews et al., 2017), and also depend on the model, and how it responds to non-CO2 forcing. Although the ratio of non-CO2 forcing to total forcing does not vary much between the RCPs at the time of 1.5 and 2.0C budgets, these features apply only to RCP scenarios. Also, the range of all forcing carbon budgets quoted by IPCC is narrower than CO2-only budgets, for no physical reason, as explained by Tokarska et al., (in review).References:MacDougall, A. H., Zickfeld, K., Knutti, R. & Matthews, H. D. Sensitivity of carbon budgets to permafrost carbon feedbacks and non-CO2 forcings. Environ. Res. Lett. 10, 125003 (2015).Matthews, H.D., Landry, J-S., Partanen, A-I., Allen, M.R., et al., Estimating Carbon Budgets for Ambitious Climate Targets. Current Climate Change Reports, 3, 1, pp 69–77Tokarska, K.B, Gillett, N.P., Arora, V.K., Lee, W.G., and Zickfeld, K. The influence of non-CO2 forcings on cumulative carbon emissions budgets. Nat. Geosc. (in review) [Katarzyna B Tokarska, United Kingdom (of Great Britain and Northern Ireland)]
accepted— in the revised section 2.2, we now clearly characterized and assessed contribution of non-CO2 climate forcers on carbon budget in the light of the recent literature
7221 11 27
This is a great chapter with profound implications for policy makers. Some secions of this chapter could be written more simply to have full effect. For example, I am sure there are simpler ways of saying "Both CO2-only and multi-forcer estimates of carbon budgets are informative to understand the amounts of total net cumulative anthropogenic carbon emissions compatible with a given temperature limit over a given a time period." The section on remaining carbon budget in particular could be simplified. [Anton Cartwright, South Africa]
taken in to account— we have revised the current section. It now includes a clearer description of uncertainties that might impacts the carbon budget; that is (1) the methodological uncertainties and (2) the physical uncertainties that includes climate sensitivity
6983 11 29 11 29 Typo error: "a given a time period" [Sai Ming Lee, China] Editorial
Do Not Quote, Cite, or Distribute Page 40 of 129
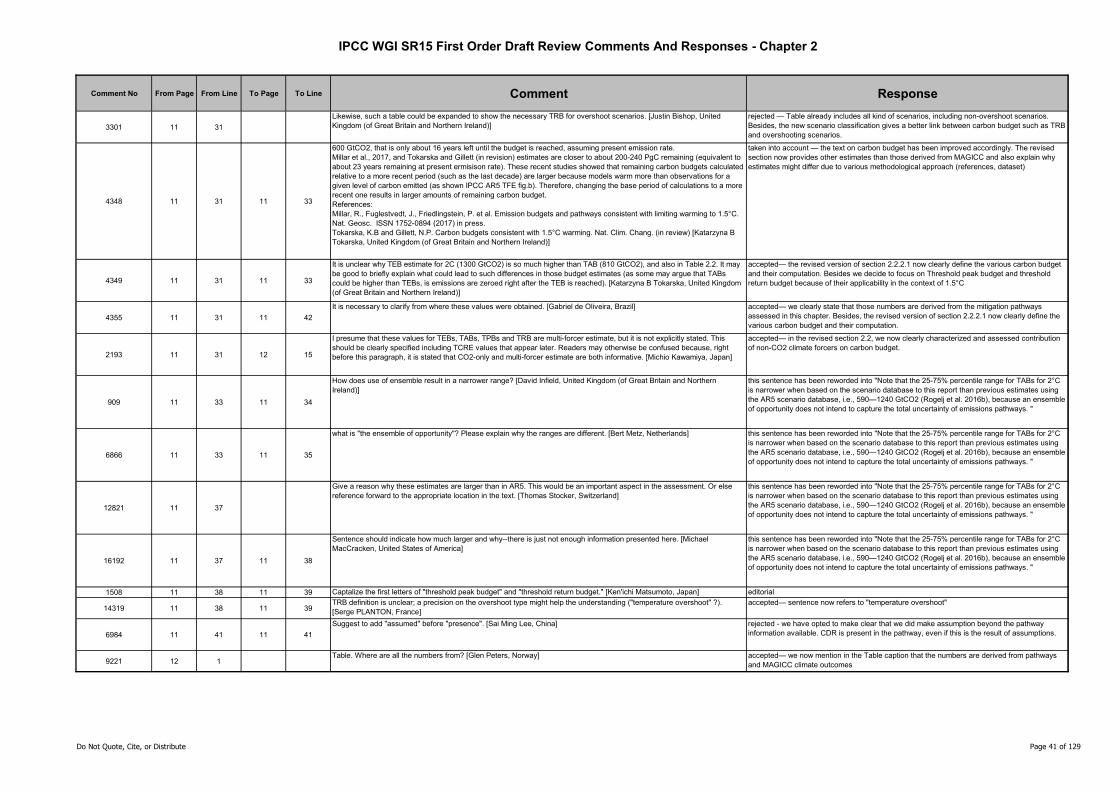
IPCC WGI SR15 First Order Draft Review Comments And Responses - Chapter 2
Comment No From Page From Line To Page To Line Comment Response
3301 11 31
Likewise, such a table could be expanded to show the necessary TRB for overshoot scenarios. [Justin Bishop, United Kingdom (of Great Britain and Northern Ireland)]
rejected — Table already includes all kind of scenarios, including non-overshoot scenarios. Besides, the new scenario classification gives a better link between carbon budget such as TRB and overshooting scenarios.
4348 11 31 11 33
600 GtCO2, that is only about 16 years left until the budget is reached, assuming present emission rate.Millar et al., 2017, and Tokarska and Gillett (in revision) estimates are closer to about 200-240 PgC remaining (equivalent to about 23 years remaining at present ermisison rate). These recent studies showed that remaining carbon budgets calculated relative to a more recent period (such as the last decade) are larger because models warm more than observations for a given level of carbon emitted (as shown IPCC AR5 TFE fig.b). Therefore, changing the base period of calculations to a more recent one results in larger amounts of remaining carbon budget.References:Millar, R., Fuglestvedt, J., Friedlingstein, P. et al. Emission budgets and pathways consistent with limiting warming to 1.5°C. Nat. Geosc. ISSN 1752-0894 (2017) in press.Tokarska, K.B and Gillett, N.P. Carbon budgets consistent with 1.5°C warming. Nat. Clim. Chang. (in review) [Katarzyna B Tokarska, United Kingdom (of Great Britain and Northern Ireland)]
taken into account — the text on carbon budget has been improved accordingly. The revised section now provides other estimates than those derived from MAGICC and also explain why estimates might differ due to various methodological approach (references, dataset)
4349 11 31 11 33
It is unclear why TEB estimate for 2C (1300 GtCO2) is so much higher than TAB (810 GtCO2), and also in Table 2.2. It may be good to briefly explain what could lead to such differences in those budget estimates (as some may argue that TABs could be higher than TEBs, is emissions are zeroed right after the TEB is reached). [Katarzyna B Tokarska, United Kingdom (of Great Britain and Northern Ireland)]
accepted— the revised version of section 2.2.2.1 now clearly define the various carbon budget and their computation. Besides we decide to focus on Threshold peak budget and threshold return budget because of their applicability in the context of 1.5°C
4355 11 31 11 42
It is necessary to clarify from where these values were obtained. [Gabriel de Oliveira, Brazil] accepted— we clearly state that those numbers are derived from the mitigation pathways assessed in this chapter. Besides, the revised version of section 2.2.2.1 now clearly define the various carbon budget and their computation.
2193 11 31 12 15
I presume that these values for TEBs, TABs, TPBs and TRB are multi-forcer estimate, but it is not explicitly stated. This should be clearly specified including TCRE values that appear later. Readers may otherwise be confused because, right before this paragraph, it is stated that CO2-only and multi-forcer estimate are both informative. [Michio Kawamiya, Japan]
accepted— in the revised section 2.2, we now clearly characterized and assessed contribution of non-CO2 climate forcers on carbon budget.
909 11 33 11 34
How does use of ensemble result in a narrower range? [David Infield, United Kingdom (of Great Britain and Northern Ireland)]
this sentence has been reworded into "Note that the 25-75% percentile range for TABs for 2°C is narrower when based on the scenario database to this report than previous estimates using the AR5 scenario database, i.e., 590—1240 GtCO2 (Rogelj et al. 2016b), because an ensemble of opportunity does not intend to capture the total uncertainty of emissions pathways. "
6866 11 33 11 35
what is "the ensemble of opportunity"? Please explain why the ranges are different. [Bert Metz, Netherlands] this sentence has been reworded into "Note that the 25-75% percentile range for TABs for 2°C is narrower when based on the scenario database to this report than previous estimates using the AR5 scenario database, i.e., 590—1240 GtCO2 (Rogelj et al. 2016b), because an ensemble of opportunity does not intend to capture the total uncertainty of emissions pathways. "
12821 11 37
Give a reason why these estimates are larger than in AR5. This would be an important aspect in the assessment. Or else reference forward to the appropriate location in the text. [Thomas Stocker, Switzerland]
this sentence has been reworded into "Note that the 25-75% percentile range for TABs for 2°C is narrower when based on the scenario database to this report than previous estimates using the AR5 scenario database, i.e., 590—1240 GtCO2 (Rogelj et al. 2016b), because an ensemble of opportunity does not intend to capture the total uncertainty of emissions pathways. "
16192 11 37 11 38
Sentence should indicate how much larger and why--there is just not enough information presented here. [Michael MacCracken, United States of America]
this sentence has been reworded into "Note that the 25-75% percentile range for TABs for 2°C is narrower when based on the scenario database to this report than previous estimates using the AR5 scenario database, i.e., 590—1240 GtCO2 (Rogelj et al. 2016b), because an ensemble of opportunity does not intend to capture the total uncertainty of emissions pathways. "
1508 11 38 11 39 Captalize the first letters of "threshold peak budget" and "threshold return budget." [Ken'ichi Matsumoto, Japan] editorial
14319 11 38 11 39TRB definition is unclear; a precision on the overshoot type might help the understanding ("temperature overshoot" ?). [Serge PLANTON, France]
accepted— sentence now refers to "temperature overshoot"
6984 11 41 11 41
Suggest to add "assumed" before "presence". [Sai Ming Lee, China] rejected - we have opted to make clear that we did make assumption beyond the pathway information available. CDR is present in the pathway, even if this is the result of assumptions.
9221 12 1Table. Where are all the numbers from? [Glen Peters, Norway] accepted— we now mention in the Table caption that the numbers are derived from pathways
and MAGICC climate outcomes
Do Not Quote, Cite, or Distribute Page 41 of 129
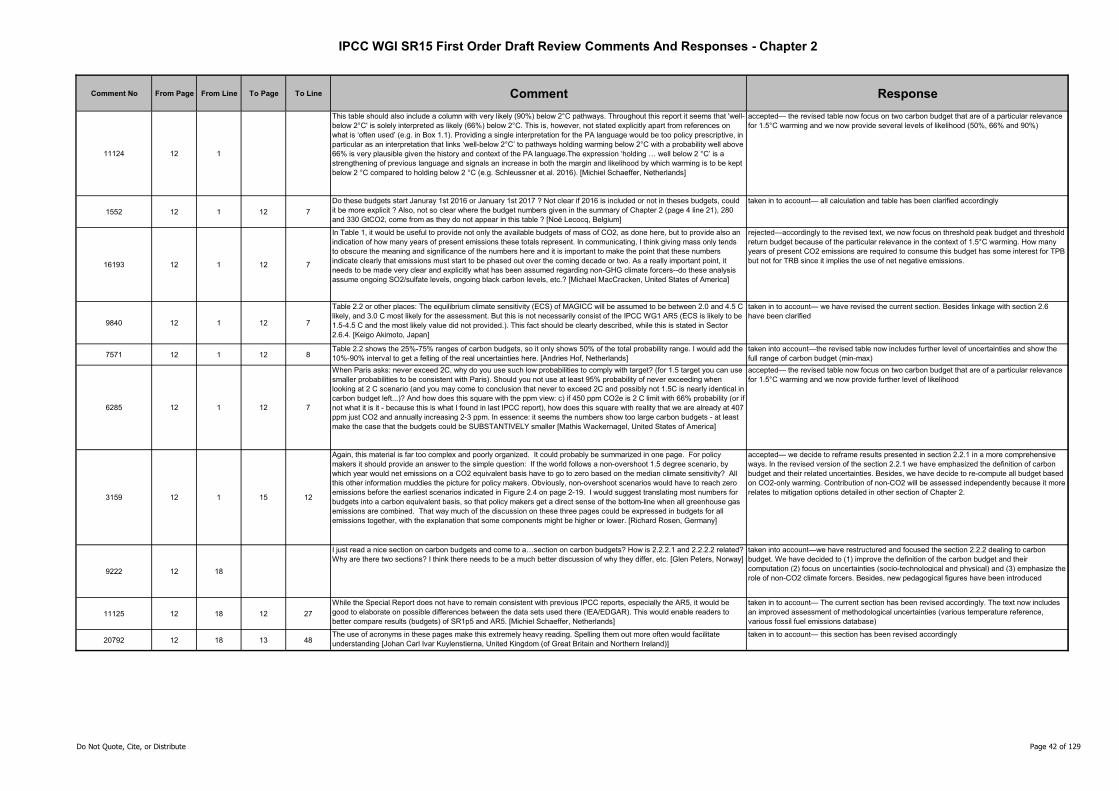
IPCC WGI SR15 First Order Draft Review Comments And Responses - Chapter 2
Comment No From Page From Line To Page To Line Comment Response
11124 12 1
This table should also include a column with very likely (90%) below 2°C pathways. Throughout this report it seems that 'well-below 2°C' is solely interpreted as likely (66%) below 2°C. This is, however, not stated explicitly apart from references on what is ‘often used’ (e.g. in Box 1.1). Providing a single interpretation for the PA language would be too policy prescriptive, in particular as an interpretation that links ‘well-below 2°C’ to pathways holding warming below 2°C with a probability well above 66% is very plausible given the history and context of the PA language.The expression ‘holding … well below 2 °C’ is a strengthening of previous language and signals an increase in both the margin and likelihood by which warming is to be kept below 2 °C compared to holding below 2 °C (e.g. Schleussner et al. 2016). [Michiel Schaeffer, Netherlands]
accepted— the revised table now focus on two carbon budget that are of a particular relevance for 1.5°C warming and we now provide several levels of likelihood (50%, 66% and 90%)
1552 12 1 12 7
Do these budgets start Januray 1st 2016 or January 1st 2017 ? Not clear if 2016 is included or not in theses budgets, could it be more explicit ? Also, not so clear where the budget numbers given in the summary of Chapter 2 (page 4 line 21), 280 and 330 GtCO2, come from as they do not appear in this table ? [Noé Lecocq, Belgium]
taken in to account— all calculation and table has been clarified accordingly
16193 12 1 12 7
In Table 1, it would be useful to provide not only the available budgets of mass of CO2, as done here, but to provide also an indication of how many years of present emissions these totals represent. In communicating, I think giving mass only tends to obscure the meaning and significance of the numbers here and it is important to make the point that these numbers indicate clearly that emissions must start to be phased out over the coming decade or two. As a really important point, it needs to be made very clear and explicitly what has been assumed regarding non-GHG climate forcers--do these analysis assume ongoing SO2/sulfate levels, ongoing black carbon levels, etc.? [Michael MacCracken, United States of America]
rejected—accordingly to the revised text, we now focus on threshold peak budget and threshold return budget because of the particular relevance in the context of 1.5°C warming. How many years of present CO2 emissions are required to consume this budget has some interest for TPB but not for TRB since it implies the use of net negative emissions.
9840 12 1 12 7
Table 2.2 or other places: The equilibrium climate sensitivity (ECS) of MAGICC will be assumed to be between 2.0 and 4.5 C likely, and 3.0 C most likely for the assessment. But this is not necessarily consist of the IPCC WG1 AR5 (ECS is likely to be 1.5-4.5 C and the most likely value did not provided.). This fact should be clearly described, while this is stated in Sector 2.6.4. [Keigo Akimoto, Japan]
taken in to account— we have revised the current section. Besides linkage with section 2.6 have been clarified
7571 12 1 12 8Table 2.2 shows the 25%-75% ranges of carbon budgets, so it only shows 50% of the total probability range. I would add the 10%-90% interval to get a felling of the real uncertainties here. [Andries Hof, Netherlands]
taken into account—the revised table now includes further level of uncertainties and show the full range of carbon budget (min-max)
6285 12 1 12 7
When Paris asks: never exceed 2C, why do you use such low probabilities to comply with target? (for 1.5 target you can use smaller probabilities to be consistent with Paris). Should you not use at least 95% probability of never exceeding when looking at 2 C scenario (and you may come to conclusion that never to exceed 2C and possibly not 1.5C is nearly identical in carbon budget left...)? And how does this square with the ppm view: c) if 450 ppm CO2e is 2 C limit with 66% probability (or if not what it is it - because this is what I found in last IPCC report), how does this square with reality that we are already at 407 ppm just CO2 and annually increasing 2-3 ppm. In essence: it seems the numbers show too large carbon budgets - at least make the case that the budgets could be SUBSTANTIVELY smaller [Mathis Wackernagel, United States of America]
accepted— the revised table now focus on two carbon budget that are of a particular relevance for 1.5°C warming and we now provide further level of likelihood
3159 12 1 15 12
Again, this material is far too complex and poorly organized. It could probably be summarized in one page. For policy makers it should provide an answer to the simple question: If the world follows a non-overshoot 1.5 degree scenario, by which year would net emissions on a CO2 equivalent basis have to go to zero based on the median climate sensitivity? All this other information muddies the picture for policy makers. Obviously, non-overshoot scenarios would have to reach zero emissions before the earliest scenarios indicated in Figure 2.4 on page 2-19. I would suggest translating most numbers for budgets into a carbon equivalent basis, so that policy makers get a direct sense of the bottom-line when all greenhouse gas emissions are combined. That way much of the discussion on these three pages could be expressed in budgets for all emissions together, with the explanation that some components might be higher or lower. [Richard Rosen, Germany]
accepted— we decide to reframe results presented in section 2.2.1 in a more comprehensive ways. In the revised version of the section 2.2.1 we have emphasized the definition of carbon budget and their related uncertainties. Besides, we have decide to re-compute all budget based on CO2-only warming. Contribution of non-CO2 will be assessed independently because it more relates to mitigation options detailed in other section of Chapter 2.
9222 12 18
I just read a nice section on carbon budgets and come to a…section on carbon budgets? How is 2.2.2.1 and 2.2.2.2 related? Why are there two sections? I think there needs to be a much better discussion of why they differ, etc. [Glen Peters, Norway]
taken into account—we have restructured and focused the section 2.2.2 dealing to carbon budget. We have decided to (1) improve the definition of the carbon budget and their computation (2) focus on uncertainties (socio-technological and physical) and (3) emphasize the role of non-CO2 climate forcers. Besides, new pedagogical figures have been introduced
11125 12 18 12 27
While the Special Report does not have to remain consistent with previous IPCC reports, especially the AR5, it would be good to elaborate on possible differences between the data sets used there (IEA/EDGAR). This would enable readers to better compare results (budgets) of SR1p5 and AR5. [Michiel Schaeffer, Netherlands]
taken in to account— The current section has been revised accordingly. The text now includes an improved assessment of methodological uncertainties (various temperature reference, various fossil fuel emissions database)
20792 12 18 13 48The use of acronyms in these pages make this extremely heavy reading. Spelling them out more often would facilitate understanding [Johan Carl Ivar Kuylenstierna, United Kingdom (of Great Britain and Northern Ireland)]
taken in to account— this section has been revised accordingly
Do Not Quote, Cite, or Distribute Page 42 of 129
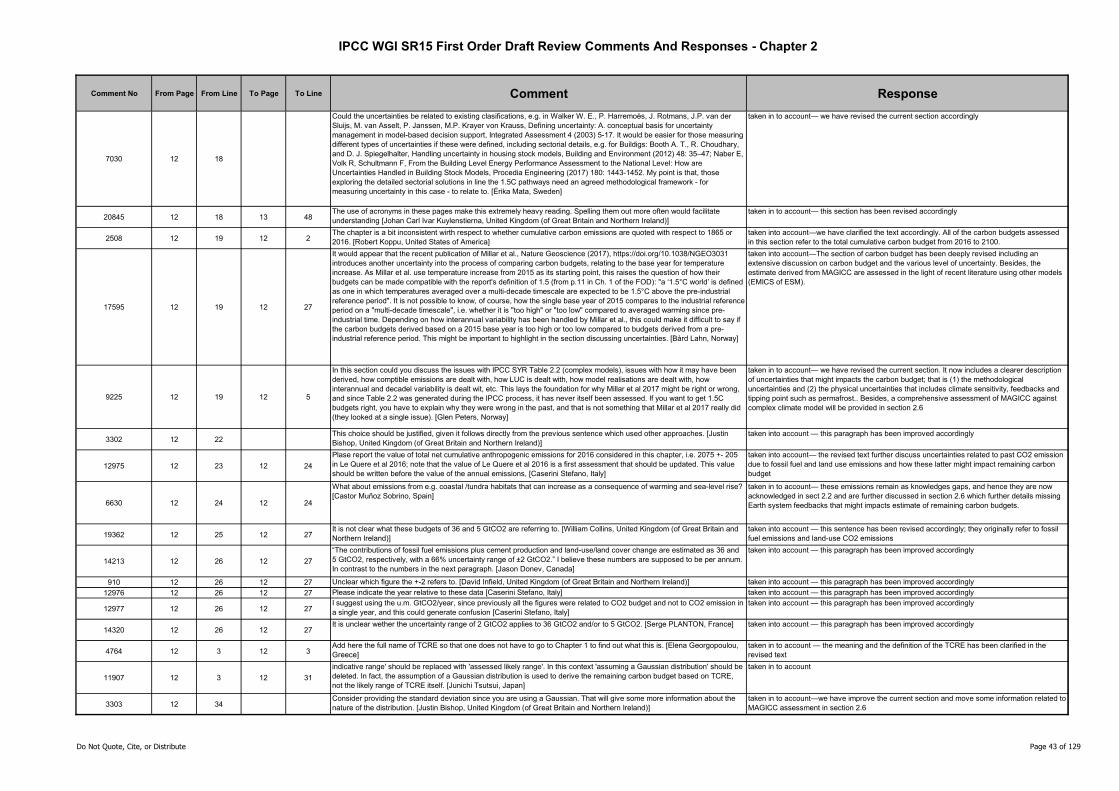
IPCC WGI SR15 First Order Draft Review Comments And Responses - Chapter 2
Comment No From Page From Line To Page To Line Comment Response
7030 12 18
Could the uncertainties be related to existing clasifications, e.g. in Walker W. E., P. Harremoës, J. Rotmans, J.P. van der Sluijs, M. van Asselt, P. Janssen, M.P. Krayer von Krauss, Defining uncertainty: A. conceptual basis for uncertainty management in model-based decision support, Integrated Assessment 4 (2003) 5-17. It would be easier for those measuring different types of uncertainties if these were defined, including sectorial details, e.g. for Buildigs: Booth A. T., R. Choudhary, and D. J. Spiegelhalter, Handling uncertainty in housing stock models, Building and Environment (2012) 48: 35–47; Naber E, Volk R, Schultmann F, From the Building Level Energy Performance Assessment to the National Level: How are Uncertainties Handled in Building Stock Models, Procedia Engineering (2017) 180: 1443-1452. My point is that, those exploring the detailed sectorial solutions in line the 1.5C pathways need an agreed methodological framework - for measuring uncertainty in this case - to relate to. [Érika Mata, Sweden]
taken in to account— we have revised the current section accordingly
20845 12 18 13 48The use of acronyms in these pages make this extremely heavy reading. Spelling them out more often would facilitate understanding [Johan Carl Ivar Kuylenstierna, United Kingdom (of Great Britain and Northern Ireland)]
taken in to account— this section has been revised accordingly
2508 12 19 12 2The chapter is a bit inconsistent wirth respect to whether cumulative carbon emissions are quoted with respect to 1865 or 2016. [Robert Koppu, United States of America]
taken into account—we have clarified the text accordingly. All of the carbon budgets assessed in this section refer to the total cumulative carbon budget from 2016 to 2100.
17595 12 19 12 27
It would appear that the recent publication of Millar et al., Nature Geoscience (2017), https://doi.org/10.1038/NGEO3031 introduces another uncertainty into the process of comparing carbon budgets, relating to the base year for temperature increase. As Millar et al. use temperature increase from 2015 as its starting point, this raises the question of how their budgets can be made compatible with the report's definition of 1.5 (from p.11 in Ch. 1 of the FOD): "a ‘1.5°C world’ is defined as one in which temperatures averaged over a multi-decade timescale are expected to be 1.5°C above the pre-industrial reference period". It is not possible to know, of course, how the single base year of 2015 compares to the industrial reference period on a "multi-decade timescale", i.e. whether it is "too high" or "too low" compared to averaged warming since pre-industrial time. Depending on how interannual variability has been handled by Millar et al., this could make it difficult to say if the carbon budgets derived based on a 2015 base year is too high or too low compared to budgets derived from a pre-industrial reference period. This might be important to highlight in the section discussing uncertainties. [Bård Lahn, Norway]
taken into account—The section of carbon budget has been deeply revised including an extensive discussion on carbon budget and the various level of uncertainty. Besides, the estimate derived from MAGICC are assessed in the light of recent literature using other models (EMICS of ESM).
9225 12 19 12 5
In this section could you discuss the issues with IPCC SYR Table 2.2 (complex models), issues with how it may have been derived, how comptible emissions are dealt with, how LUC is dealt with, how model realisations are dealt with, how interannual and decadel variability is dealt wit, etc. This lays the foundation for why Millar et al 2017 might be right or wrong, and since Table 2.2 was generated during the IPCC process, it has never itself been assessed. If you want to get 1.5C budgets right, you have to explain why they were wrong in the past, and that is not something that Millar et al 2017 really did (they looked at a single issue). [Glen Peters, Norway]
taken in to account— we have revised the current section. It now includes a clearer description of uncertainties that might impacts the carbon budget; that is (1) the methodological uncertainties and (2) the physical uncertainties that includes climate sensitivity, feedbacks and tipping point such as permafrost.. Besides, a comprehensive assessment of MAGICC against complex climate model will be provided in section 2.6
3302 12 22This choice should be justified, given it follows directly from the previous sentence which used other approaches. [Justin Bishop, United Kingdom (of Great Britain and Northern Ireland)]
taken into account — this paragraph has been improved accordingly
12975 12 23 12 24
Plase report the value of total net cumulative anthropogenic emissions for 2016 considered in this chapter, i.e. 2075 +- 205 in Le Quere et al 2016; note that the value of Le Quere et al 2016 is a first assessment that should be updated. This value should be written before the value of the annual emissions, [Caserini Stefano, Italy]
taken into account— the revised text further discuss uncertainties related to past CO2 emission due to fossil fuel and land use emissions and how these latter might impact remaining carbon budget
6630 12 24 12 24
What about emissions from e.g. coastal /tundra habitats that can increase as a consequence of warming and sea-level rise? [Castor Muñoz Sobrino, Spain]
taken in to account— these emissions remain as knowledges gaps, and hence they are now acknowledged in sect 2.2 and are further discussed in section 2.6 which further details missing Earth system feedbacks that might impacts estimate of remaining carbon budgets.
19362 12 25 12 27It is not clear what these budgets of 36 and 5 GtCO2 are referring to. [William Collins, United Kingdom (of Great Britain and Northern Ireland)]
taken into account — this sentence has been revised accordingly; they originally refer to fossil fuel emissions and land-use CO2 emissions
14213 12 26 12 27
“The contributions of fossil fuel emissions plus cement production and land-use/land cover change are estimated as 36 and 5 GtCO2, respectively, with a 66% uncertainty range of ±2 GtCO2.” I believe these numbers are supposed to be per annum. In contrast to the numbers in the next paragraph. [Jason Donev, Canada]
taken into account — this paragraph has been improved accordingly
910 12 26 12 27 Unclear which figure the +-2 refers to. [David Infield, United Kingdom (of Great Britain and Northern Ireland)] taken into account — this paragraph has been improved accordingly
12976 12 26 12 27 Please indicate the year relative to these data [Caserini Stefano, Italy] taken into account — this paragraph has been improved accordingly
12977 12 26 12 27I suggest using the u.m. GtCO2/year, since previously all the figures were related to CO2 budget and not to CO2 emission in a single year, and this could generate confusion [Caserini Stefano, Italy]
taken into account — this paragraph has been improved accordingly
14320 12 26 12 27It is unclear wether the uncertainty range of 2 GtCO2 applies to 36 GtCO2 and/or to 5 GtCO2. [Serge PLANTON, France] taken into account — this paragraph has been improved accordingly
4764 12 3 12 3Add here the full name of TCRE so that one does not have to go to Chapter 1 to find out what this is. [Elena Georgopoulou, Greece]
taken in to account — the meaning and the definition of the TCRE has been clarified in the revised text
11907 12 3 12 31
indicative range' should be replaced with 'assessed likely range'. In this context 'assuming a Gaussian distribution' should be deleted. In fact, the assumption of a Gaussian distribution is used to derive the remaining carbon budget based on TCRE, not the likely range of TCRE itself. [Junichi Tsutsui, Japan]
taken in to account
3303 12 34Consider providing the standard deviation since you are using a Gaussian. That will give some more information about the nature of the distribution. [Justin Bishop, United Kingdom (of Great Britain and Northern Ireland)]
taken in to account—we have improve the current section and move some information related to MAGICC assessment in section 2.6
Do Not Quote, Cite, or Distribute Page 43 of 129
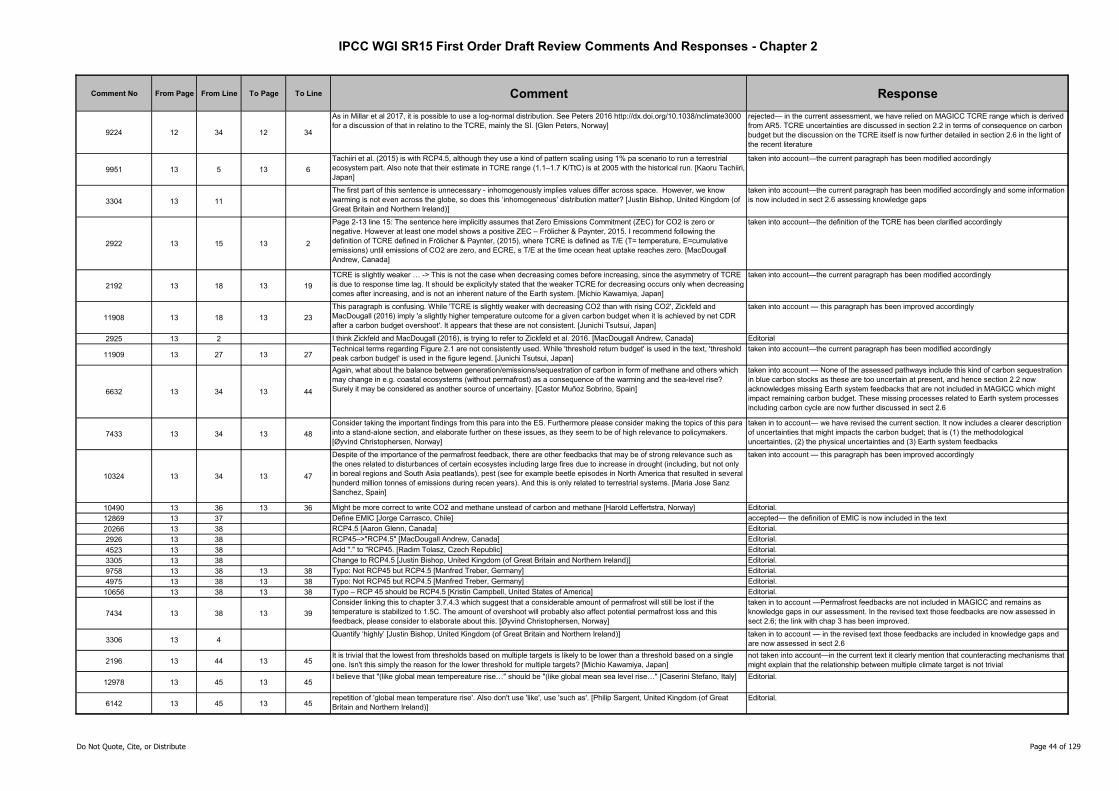
IPCC WGI SR15 First Order Draft Review Comments And Responses - Chapter 2
Comment No From Page From Line To Page To Line Comment Response
9224 12 34 12 34
As in Millar et al 2017, it is possible to use a log-normal distribution. See Peters 2016 http://dx.doi.org/10.1038/nclimate3000 for a discussion of that in relatino to the TCRE, mainly the SI. [Glen Peters, Norway]
rejected— in the current assessment, we have relied on MAGICC TCRE range which is derived from AR5. TCRE uncertainties are discussed in section 2.2 in terms of consequence on carbon budget but the discussion on the TCRE itself is now further detailed in section 2.6 in the light of the recent literature
9951 13 5 13 6
Tachiiri et al. (2015) is with RCP4.5, although they use a kind of pattern scaling using 1% pa scenario to run a terrestrial ecosystem part. Also note that their estimate in TCRE range (1.1–1.7 K/TtC) is at 2005 with the historical run. [Kaoru Tachiiri, Japan]
taken into account—the current paragraph has been modified accordingly
3304 13 11
The first part of this sentence is unnecessary - inhomogenously implies values differ across space. However, we know warming is not even across the globe, so does this ‘inhomogeneous’ distribution matter? [Justin Bishop, United Kingdom (of Great Britain and Northern Ireland)]
taken into account—the current paragraph has been modified accordingly and some information is now included in sect 2.6 assessing knowledge gaps
2922 13 15 13 2
Page 2-13 line 15: The sentence here implicitly assumes that Zero Emissions Commitment (ZEC) for CO2 is zero or negative. However at least one model shows a positive ZEC – Frölicher & Paynter, 2015. I recommend following the definition of TCRE defined in Frölicher & Paynter, (2015), where TCRE is defined as T/E (T= temperature, E=cumulative emissions) until emissions of CO2 are zero, and ECRE, s T/E at the time ocean heat uptake reaches zero. [MacDougall Andrew, Canada]
taken into account—the definition of the TCRE has been clarified accordingly
2192 13 18 13 19
TCRE is slightly weaker … -> This is not the case when decreasing comes before increasing, since the asymmetry of TCRE is due to response time lag. It should be explicityly stated that the weaker TCRE for decreasing occurs only when decreasing comes after increasing, and is not an inherent nature of the Earth system. [Michio Kawamiya, Japan]
taken into account—the current paragraph has been modified accordingly
11908 13 18 13 23
This paragraph is confusing. While 'TCRE is slightly weaker with decreasing CO2 than with rising CO2', Zickfeld and MacDougall (2016) imply 'a slightly higher temperature outcome for a given carbon budget when it is achieved by net CDR after a carbon budget overshoot'. It appears that these are not consistent. [Junichi Tsutsui, Japan]
taken into account — this paragraph has been improved accordingly
2925 13 2 I think Zickfeld and MacDougall (2016), is trying to refer to Zickfeld et al. 2016. [MacDougall Andrew, Canada] Editorial
11909 13 27 13 27Technical terms regarding Figure 2.1 are not consistently used. While 'threshold return budget' is used in the text, 'threshold peak carbon budget' is used in the figure legend. [Junichi Tsutsui, Japan]
taken into account—the current paragraph has been modified accordingly
6632 13 34 13 44
Again, what about the balance between generation/emissions/sequestration of carbon in form of methane and others which may change in e.g. coastal ecosystems (without permafrost) as a consequence of the warming and the sea-level rise? Surely it may be considered as another source of uncertainy. [Castor Muñoz Sobrino, Spain]
taken into account — None of the assessed pathways include this kind of carbon sequestration in blue carbon stocks as these are too uncertain at present, and hence section 2.2 now acknowledges missing Earth system feedbacks that are not included in MAGICC which might impact remaining carbon budget. These missing processes related to Earth system processes including carbon cycle are now further discussed in sect 2.6
7433 13 34 13 48
Consider taking the important findings from this para into the ES. Furthermore please consider making the topics of this para into a stand-alone section, and elaborate further on these issues, as they seem to be of high relevance to policymakers. [Øyvind Christophersen, Norway]
taken in to account— we have revised the current section. It now includes a clearer description of uncertainties that might impacts the carbon budget; that is (1) the methodological uncertainties, (2) the physical uncertainties and (3) Earth system feedbacks
10324 13 34 13 47
Despite of the importance of the permafrost feedback, there are other feedbacks that may be of strong relevance such as the ones related to disturbances of certain ecosystes including large fires due to increase in drought (including, but not only in boreal regions and South Asia peatlands), pest (see for example beetle episodes in North America that resulted in several hunderd million tonnes of emissions during recen years). And this is only related to terrestrial systems. [Maria Jose Sanz Sanchez, Spain]
taken into account — this paragraph has been improved accordingly
10490 13 36 13 36 Might be more correct to write CO2 and methane unstead of carbon and methane [Harold Leffertstra, Norway] Editorial.
12869 13 37 Define EMIC [Jorge Carrasco, Chile] accepted— the definition of EMIC is now included in the text
20266 13 38 RCP4.5 [Aaron Glenn, Canada] Editorial.
2926 13 38 RCP45–>"RCP4.5" [MacDougall Andrew, Canada] Editorial.
4523 13 38 Add "." to "RCP45. [Radim Tolasz, Czech Republic] Editorial.
3305 13 38 Change to RCP4.5 [Justin Bishop, United Kingdom (of Great Britain and Northern Ireland)] Editorial.
9758 13 38 13 38 Typo: Not RCP45 but RCP4.5 [Manfred Treber, Germany] Editorial.
4975 13 38 13 38 Typo: Not RCP45 but RCP4.5 [Manfred Treber, Germany] Editorial.
10656 13 38 13 38 Typo – RCP 45 should be RCP4.5 [Kristin Campbell, United States of America] Editorial.
7434 13 38 13 39
Consider linking this to chapter 3.7.4.3 which suggest that a considerable amount of permafrost will still be lost if the temperature is stabilized to 1.5C. The amount of overshoot will probably also affect potential permafrost loss and this feedback, please consider to elaborate about this. [Øyvind Christophersen, Norway]
taken in to account —Permafrost feedbacks are not included in MAGICC and remains as knowledge gaps in our assessment. In the revised text those feedbacks are now assessed in sect 2.6; the link with chap 3 has been improved.
3306 13 4Quantify ‘highly’ [Justin Bishop, United Kingdom (of Great Britain and Northern Ireland)] taken in to account — in the revised text those feedbacks are included in knowledge gaps and
are now assessed in sect 2.6
2196 13 44 13 45It is trivial that the lowest from thresholds based on multiple targets is likely to be lower than a threshold based on a single one. Isn't this simply the reason for the lower threshold for multiple targets? [Michio Kawamiya, Japan]
not taken into account—in the current text it clearly mention that counteracting mechanisms that might explain that the relationship between multiple climate target is not trivial
12978 13 45 13 45I believe that "(like global mean tempereature rise…" should be "(like global mean sea level rise…" [Caserini Stefano, Italy] Editorial.
6142 13 45 13 45repetition of 'global mean temperature rise'. Also don't use 'like', use 'such as'. [Philip Sargent, United Kingdom (of Great Britain and Northern Ireland)]
Editorial.
Do Not Quote, Cite, or Distribute Page 44 of 129

IPCC WGI SR15 First Order Draft Review Comments And Responses - Chapter 2
Comment No From Page From Line To Page To Line Comment Response
10437 14 14
fig 2.1 the classification of the pathways (dots and lines) in this and 2.2 on p2-15 is only explained in 2.2.3.1 on p2-15 and table 2.3 on p2-16. My failing but could not begin to understand the figures until I had seen the table. Fig 2.3 on p2-17 easier as it follows [Jonathan Lynn, Switzerland]
taken into account —Figures of section 2.2 has been revised accordingly
2783 14 17Figures 2.1, 2.2 and 2.3 show results for warming well over 2oC which are not relevant for the rest of the chapter and severely compress the scale of the results relating to cases with warming of 2oC or less. [Erik Haites, Canada]
taken into account —Figures of section 2.2 has been revised accordingly
3308 14 1 Replot graph with larger font for axis labels [Justin Bishop, United Kingdom (of Great Britain and Northern Ireland)] taken into account —Figure 2.1 has been improved and clarified accordingly
13295 14 1 14 7Figure 2.1: re-order legend items to match order of data in figure (i.e. 3.5 top, 1.5 bottom) [Jordan Harold, United Kingdom (of Great Britain and Northern Ireland)]
taken into account —Figure 2.1 has been improved and clarified accordingly
13296 14 1 14 7Figure 2.1: make the 'non-co2 warming contribution' label horizontal so easier to read. [Jordan Harold, United Kingdom (of Great Britain and Northern Ireland)]
taken into account —Figure 2.1 now focuses on CO2-only warming
17460 14 3 A [Tom Gabriel Johansen, Norway] taken into account —Figure 2.1 has been improved and clarified accordingly
17500 14 3 A [Angela Morelli, Norway] taken into account —Figure 2.1 has been improved and clarified accordingly
20392 14 3 14 3Chapter 1 had adopted 1850-1879 for the reference period. Shouldn't this be followed here ? [OK JUST SEEN THE THE NOTE TO REVEIWERS ON PAGE 15 - IGNORE THIS ONE] [Olivier Boucher, France]
acknowledged— Besides, reference period has been homogenized for SOD between chapter 1 and chapter 2
20393 14 3 14 7
Please explain the meaning of the vertical arrow. According to chapter 1, he intercept on the y-axis of a fit to the triangles should be 1°C, but that doesn't seem to be quite the case here and this needs to be explained. Overall the plot is a bit confusing because the circles refer to hypothetical CO2-only scenarios (not only for the future but also during the historical period in order to compute the T increase relative to 1850-1900, if I understand correctly), so there is a mix of a hypothetical scenario but some reference to a real historical scenario for the quantities plotted on the x and y axis. It would help if you could show what is consistent or not with observations. [Olivier Boucher, France]
taken into account —the vertical arrows are now clearly explained in the text of the revised section. They intended to reflects that changes in TCRE associated to a multi-gas and aerosols scenarios
6143 14 3 14 7What message or conclusions should I be drawing from Figure 2.1 ? I have no idea of the relevance of this: it needs to be explained why it is here. [Philip Sargent, United Kingdom (of Great Britain and Northern Ireland)]
taken into account—the text associated with the figure has been improved in the revised version of the section
4524 14 4 Add index format to "CO2". [Radim Tolasz, Czech Republic] taken into account —Figure 2.1 has been improved and clarified accordingly
18784 14 1 15 3
Section 2.2.2.3 should address the role of SLCF/SLCP in causing temperature rise to overshoot the 1.5C threshold in the near-term period. The more rapid crossing of the threshold due to the role of SLCF/SLCP is an important dimension that should be addressed; Figure 2.2a illustrates the temporal evolution of the temperature contribution, but the narrative does not highlight this dimension. [David Waskow, United States of America]
taken in to account— The text of non-CO2 forcers has been revised. The revised text further emphasizes the role of non-CO2 climate forcers in causing temperature rise to overshoot 1.5°C
18817 14 1 15 3
Section 2.2.2.3 should address the role of SLCF/SLCP in causing temperature rise to overshoot the 1.5C threshold in the near-term period. The more rapid crossing of the threshold due to the role of SLCF/SLCP is an important dimension that should be addressed; Figure 2.2a illustrates the temporal evolution of the temperature contribution, but the narrative does not highlight this dimension. [David Waskow, United States of America]
taken in to account— The text of non-CO2 forcers has been revised. The revised text further emphasizes the role of non-CO2 climate forcers in causing temperature rise to overshoot 1.5°C
6872 14 1 15 3
I miss a discussion here on the possibility for furhter reduction of non-CO2 GHGs as a way to increase the carbon budget for staying below 1.5 degrees. [Bert Metz, Netherlands]
taken in to account— the section on non-CO2 forcers has been revised accordingly. Besides, the new figure 2.4 further description societal choice for non-CO2 mitigation options that might lead to very contrasting carbon budget in case of stringent/weak non-CO2 emission mitigation
10325 14 11 14 21see comment 1, those events include CO2 and non-CO2 emssions, as well as in some cases aerosols, in particular fires. How are those being taken into account?. [Maria Jose Sanz Sanchez, Spain]
taken in to account— we have revised the current section accordingly
6633 14 11 14 21
Most of the shallowest marine waters with low oxigenaion and high organic content may produce biogas by the action of some types of bacteria/archea (e.g. de Carlos et al. (2017), Marine Geology 385:1-12). These are tipical conditions of many costal zones (e.g. bays, estuaries). So the global final balance (emission/sequestration) may be relevant. [Castor Muñoz Sobrino, Spain]
rejected—we prefer to focus on major source of GHG that might impacts remaining CO2 budget. Coastal carbon stock will be assessed in the special report on ocean and cryosphere and are not relevant for this report
19363 14 12 14 12
AR5 (Myhre et al. 2013) used the terminology of Near-Term Climate Forcers, partly to avoid the debate over whether methane was long-lived or short-lived. If this chapter is going to use the Short-lived Climate Forcer terminology it should be defined, and clarified as to whether this is equivalent to the AR5 NTCF definition or not. [William Collins, United Kingdom (of Great Britain and Northern Ireland)]
rejected—we prefer to use this terminology. Besides short-lived climate forcers terminology is now defined in chapter 1. We thus use in chapter 2 the working definition of chapter 1 for short-lived ghg and aerosols
3307 14 13 Quantify ‘shorter’ [Justin Bishop, United Kingdom (of Great Britain and Northern Ireland)] taken into account — the text has been improved accordingly
12979 14 14 14 14over decades should be "over decades and centuries" (and for some HFC maybe also millennia should be indicated) [Caserini Stefano, Italy]
taken into account — the text has been improved accordingly
16194 14 19 14 21
This is a very important point, both because it presents an opportunity for moving rapidly to limit climate change, and because it really creates uncertainties in the CO2/lon-lived species estimates. Given that CO2 is long-lived, making an error here can induce relatively significant effects for centuries into the future. I'd suggest more emphasis on this point is needed. [Michael MacCracken, United States of America]
taken in to account
20793 14 23 14 24Add Shindell et al 2012 and maybe UNEP/WMO 2011. These were the reports that really got people interested in the temperature impacts of SLCFs [Johan Carl Ivar Kuylenstierna, United Kingdom (of Great Britain and Northern Ireland)]
taken in to account
20846 14 23 14 24Add Shindell et al 2012 and maybe UNEP/WMO 2011. These were the reports that really got people interested in the temperature impacts of SLCFs [Johan Carl Ivar Kuylenstierna, United Kingdom (of Great Britain and Northern Ireland)]
taken in to account
Do Not Quote, Cite, or Distribute Page 45 of 129
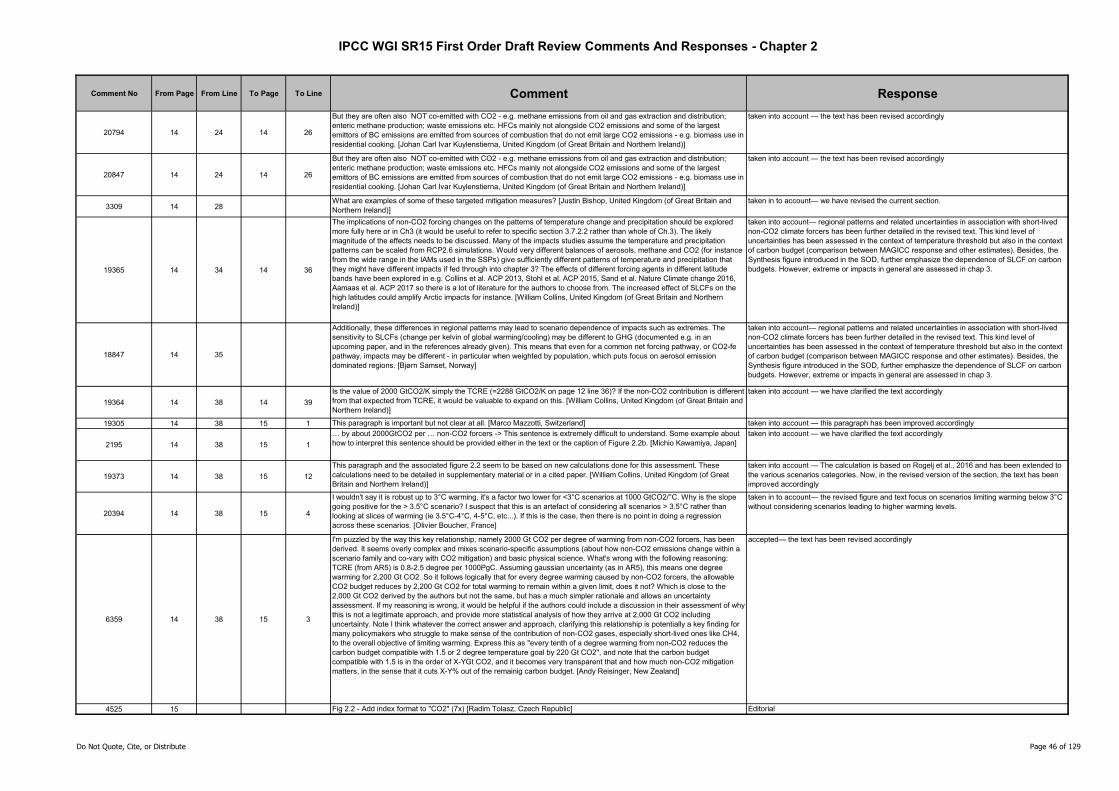
IPCC WGI SR15 First Order Draft Review Comments And Responses - Chapter 2
Comment No From Page From Line To Page To Line Comment Response
20794 14 24 14 26
But they are often also NOT co-emitted with CO2 - e.g. methane emissions from oil and gas extraction and distribution; enteric methane production; waste emissions etc. HFCs mainly not alongside CO2 emissions and some of the largest emittors of BC emissions are emitted from sources of combustion that do not emit large CO2 emissions - e.g. biomass use in residential cooking. [Johan Carl Ivar Kuylenstierna, United Kingdom (of Great Britain and Northern Ireland)]
taken into account — the text has been revised accordingly
20847 14 24 14 26
But they are often also NOT co-emitted with CO2 - e.g. methane emissions from oil and gas extraction and distribution; enteric methane production; waste emissions etc. HFCs mainly not alongside CO2 emissions and some of the largest emittors of BC emissions are emitted from sources of combustion that do not emit large CO2 emissions - e.g. biomass use in residential cooking. [Johan Carl Ivar Kuylenstierna, United Kingdom (of Great Britain and Northern Ireland)]
taken into account — the text has been revised accordingly
3309 14 28What are examples of some of these targeted mitigation measures? [Justin Bishop, United Kingdom (of Great Britain and Northern Ireland)]
taken in to account— we have revised the current section.
19365 14 34 14 36
The implications of non-CO2 forcing changes on the patterns of temperature change and precipitation should be explored more fully here or in Ch3 (it would be useful to refer to specific section 3.7.2.2 rather than whole of Ch.3). The likely magnitude of the effects needs to be discussed. Many of the impacts studies assume the temperature and precipitation patterns can be scaled from RCP2.6 simulations. Would very different balances of aerosols, methane and CO2 (for instance from the wide range in the IAMs used in the SSPs) give sufficiently different patterns of temperature and precipitation that they might have different impacts if fed through into chapter 3? The effects of different forcing agents in different latitude bands have been explored in e.g. Collins et al. ACP 2013, Stohl et al. ACP 2015, Sand et al. Nature Climate change 2016, Aamaas et al. ACP 2017 so there is a lot of literature for the authors to choose from. The increased effect of SLCFs on the high latitudes could amplify Arctic impacts for instance. [William Collins, United Kingdom (of Great Britain and Northern Ireland)]
taken into account— regional patterns and related uncertainties in association with short-lived non-CO2 climate forcers has been further detailed in the revised text. This kind level of uncertainties has been assessed in the context of temperature threshold but also in the context of carbon budget (comparison between MAGICC response and other estimates). Besides, the Synthesis figure introduced in the SOD, further emphasize the dependence of SLCF on carbon budgets. However, extreme or impacts in general are assessed in chap 3.
18847 14 35
Additionally, these differences in regional patterns may lead to scenario dependence of impacts such as extremes. The sensitivity to SLCFs (change per kelvin of global warming/cooling) may be different to GHG (documented e.g. in an upcoming paper, and in the references already given). This means that even for a common net forcing pathway, or CO2-fe pathway, impacts may be different - in particular when weighted by population, which puts focus on aerosol emission dominated regions. [Bjørn Samset, Norway]
taken into account— regional patterns and related uncertainties in association with short-lived non-CO2 climate forcers has been further detailed in the revised text. This kind level of uncertainties has been assessed in the context of temperature threshold but also in the context of carbon budget (comparison between MAGICC response and other estimates). Besides, the Synthesis figure introduced in the SOD, further emphasize the dependence of SLCF on carbon budgets. However, extreme or impacts in general are assessed in chap 3.
19364 14 38 14 39
Is the value of 2000 GtCO2/K simply the TCRE (=2288 GtCO2/K on page 12 line 36)? If the non-CO2 contribution is different from that expected from TCRE, it would be valuable to expand on this. [William Collins, United Kingdom (of Great Britain and Northern Ireland)]
taken into account — we have clarified the text accordingly
19305 14 38 15 1 This paragraph is important but not clear at all. [Marco Mazzotti, Switzerland] taken into account — this paragraph has been improved accordingly
2195 14 38 15 1
… by about 2000GtCO2 per … non-CO2 forcers -> This sentence is extremely difficult to understand. Some example about how to interpret this sentence should be provided either in the text or the caption of Figure 2.2b. [Michio Kawamiya, Japan]
taken into account — we have clarified the text accordingly
19373 14 38 15 12
This paragraph and the associated figure 2.2 seem to be based on new calculations done for this assessment. These calculations need to be detailed in supplementary material or in a cited paper. [William Collins, United Kingdom (of Great Britain and Northern Ireland)]
taken into account — The calculation is based on Rogelj et al., 2016 and has been extended to the various scenarios categories. Now, in the revised version of the section, the text has been improved accordingly
20394 14 38 15 4
I wouldn't say it is robust up to 3°C warming, it's a factor two lower for <3°C scenarios at 1000 GtCO2/°C. Why is the slope going positive for the > 3.5°C scenario? I suspect that this is an artefact of considering all scenarios > 3.5°C rather than looking at slices of warming (ie 3.5°C-4°C, 4-5°C, etc...). If this is the case, then there is no point in doing a regression across these scenarios. [Olivier Boucher, France]
taken in to account— the revised figure and text focus on scenarios limiting warming below 3°C without considering scenarios leading to higher warming levels.
6359 14 38 15 3
I'm puzzled by the way this key relationship, namely 2000 Gt CO2 per degree of warming from non-CO2 forcers, has been derived. It seems overly complex and mixes scenario-specific assumptions (about how non-CO2 emissions change within a scenario family and co-vary with CO2 mitigation) and basic physical science. What's wrong with the following reasoning: TCRE (from AR5) is 0.8-2.5 degree per 1000PgC. Assuming gaussian uncertainty (as in AR5), this means one degree warming for 2,200 Gt CO2. So it follows logically that for every degree warming caused by non-CO2 forcers, the allowable CO2 budget reduces by 2,200 Gt CO2 for total warming to remain within a given limit, does it not? Which is close to the 2,000 Gt CO2 derived by the authors but not the same, but has a much simpler rationale and allows an uncertainty assessment. If my reasoning is wrong, it would be helpful if the authors could include a discussion in their assessment of why this is not a legitimate approach, and provide more statistical analysis of how they arrive at 2,000 Gt CO2 including uncertainty. Note I think whatever the correct answer and approach, clarifying this relationship is potentially a key finding for many policymakers who struggle to make sense of the contribution of non-CO2 gases, especially short-lived ones like CH4, to the overall objective of limiting warming. Express this as "every tenth of a degree warming from non-CO2 reduces the carbon budget compatible with 1.5 or 2 degree temperature goal by 220 Gt CO2", and note that the carbon budget compatible with 1.5 is in the order of X-YGt CO2, and it becomes very transparent that and how much non-CO2 mitigation matters, in the sense that it cuts X-Y% out of the remainig carbon budget. [Andy Reisinger, New Zealand]
accepted— the text has been revised accordingly
4525 15 Fig 2.2 - Add index format to "CO2" (7x) [Radim Tolasz, Czech Republic] Editorial
Do Not Quote, Cite, or Distribute Page 46 of 129
IPCC WGI SR15 First Order Draft Review Comments And Responses - Chapter 2
Comment No From Page From Line To Page To Line Comment Response
9760 15 1 15 3
Is it possible to better explain "This relationship is robust in most of the mitigation pathways limiting warming below 3°C. Above this temperature threshold, this relationship between carbon budget and temperature contribution from non-CO2 forcing does not hold." Why does it not hold? [Manfred Treber, Germany]
This relationship is not robust with class of scenarios leading to higher warming level because it encompasses several family of scenarios (3.5°, 4°, 4.5° and so on) while the other regression were performed within a given class of scenario. This has been clarified and edited in the SOD.
4977 15 1 15 3
Is it possible to better explain "This relationship is robust in most of the mitigation pathways limiting warming below 3°C. Above this temperature threshold, this relationship between carbon budget and temperature contribution from non-CO2 forcing does not hold." Why does it not hold? [Manfred Treber, Germany]
This relationship is not robust with class of scenarios leading to higher warming level because it encompasses several family of scenarios (3.5°, 4°, 4.5° and so on) while the other regression were performed within a given class of scenario. This has been clarified and edited in the SOD.
6144 15 5 15 12
Replot. The y-axis on (a) is the same as the x-axis on (b). Rotate (b) so that both diagrams have the 'non-CO2 warming contribution' on the same axis. Incredibly hard to interpret what this figrare is telling me. [Philip Sargent, United Kingdom (of Great Britain and Northern Ireland)]
taken into account —Figure 2.2 has been modified in order to improve its message. Besides, the text in relation with this figure has been revised accordingly
13297 15 5 15 12Figure 2.2: Suggest moving colour legend to panel a. as readers likely to start to coprehend panel a before panel b. [Jordan Harold, United Kingdom (of Great Britain and Northern Ireland)]
taken into account —Figure 2.2 has been improved accordingly
13298 15 5 15 12Figure 2.2: re-order legend items to match order of data in figure (i.e. 3.5 top, 1.5 bottom) [Jordan Harold, United Kingdom (of Great Britain and Northern Ireland)]
taken into account —Figure 2.2 has been improved accordingly
3157 15 5 15 12
Figure 2.2.a is a perfect illustration a set of results that is not presented in a useful way for policy makers. It basically just communicates the message that any result within the range of 0.2 - 1.2 degrees is possible. One problem is that too many input assumptions for different scenarios are changing at the same time. The authors need to ask themselves what message for policy makers needs to be communicated, and then they need to design a simple figure to communicate that message. Whatever figure or table is made should focus on only the 1.5 and 2.0 degree pathways. This is true also for all the material presented on the following pages - why does the reader really need to have details about scenarios having a temperature increase of more than 2.0? What message is essential for policy makers? The Paris Agreement says the temperature increase should be limited to somewhere between 1.5 and 2.0 degrees C, so higher limits do not need to be addressed in this report. [Richard Rosen, Germany]
taken in to account—the text and figures have been improved accordingly. Besides, the revised section now focus on low warming scenarios
17461 15 7 B [Tom Gabriel Johansen, Norway] taken into account —Figures of section 2.2 has been revised accordingly
17501 15 7 B [Angela Morelli, Norway] taken into account —Figures of section 2.2 has been revised accordingly
20395 15 7 15 12Figure: explain the color code in the caption or refer back to Table 2.3 to make it clear that eg <2°C scenarios only include >1.5°C and <2°C scenarios. [Olivier Boucher, France]
taken into account —Figure 2.2 has been revised in agreement with the new scenario classification used in the chapter
2194 15 1 15 11as function of temperature contribution … per oC of non-CO2 warming. -> This sentence is extremely difficult to understand. Some example about how to interpret Figure 2.2(b) should be provided. [Michio Kawamiya, Japan]
taken into account — the wording of the paragraph has been improved accordingly
3160 15 17 19 1
Again, as I have said before, this is where a couple of interesting 1.5 DEGREE NON-OVERSHOOT SCENARIOS have to be included here, even if they cannot be developed using IAMs. Then, the carbon equivalent remaining budget numbers for all scenarios must be made consistent with, and hopefully identical to, the ones cited in draft Chapter 1. If this is not done, this entire report will be out of compliance with the request stemming from the Paris Agreement. [Richard Rosen, Germany]
taken in to account — the revised scenario database used in the SOD now included several non-overshooting scenarios; they have been assessed accordingly
19306 15 18 15 29 Very important and very well written paragraph [Marco Mazzotti, Switzerland] Noted. Thank you.
9300 15 19 15 19 The first word in "Those differences can be categorised by three key features" may be "These." [Siir KILKIS, Turkey] taken in to account— this paragraph has been merged with section 2.1
16195 15 2 15 21
It really is not helpful scientifically or with respect to long-term impacts to be thinking of 1.5 C as a long-term goal--that is a climate situation that would be quite untenable if, for example, the sea level sensitivity is 15-20 meters per degree, which is what one would derive from considerations during glacial-interglacial cycling, or 10-15 meters per degree C that one might infer from considering Earth's climatic history and warm-period amounts of ice on land. It the goal is to stabilize the climate using the broad definition of climate instead of temperature, global warming in excess of 0.5 C is likely unacceptable---this report should thus be considering various long-term levels of stabilization of temperature (all the way down to near zero above preindustrial) and using 1.5 C are only a marker or maximum acceptable on a pathway to below that level. [Michael MacCracken, United States of America]
Rejected. The suggestion is not in line with the mandate of this Special Report.
906 15 28 15 29Would it not have been possible to convert non-CO2 emissions into CO2 equivalents to make comparisons easier? [David Infield, United Kingdom (of Great Britain and Northern Ireland)]
rejected— we chose to assess non-CO2 forces either in terms of radiative forcings or in terms of temperature.
3310 15 32
Is there any merit in a separate group for pathways which do not include a 1.5 deg or 2 deg overshoot? The distinction between overshoot and non-overshoot pathways was discussed in Ch1 and may it may be useful to see the differences in stringency for the same temperature outcome in 2100. [Justin Bishop, United Kingdom (of Great Britain and Northern Ireland)]
taken in to account— the scenarios classifications has been revised in SOD
Do Not Quote, Cite, or Distribute Page 47 of 129

IPCC WGI SR15 First Order Draft Review Comments And Responses - Chapter 2
Comment No From Page From Line To Page To Line Comment Response
14934 16 1
Labeling of scenario groups: I'm not sure it is accurate to call 66% probability 2C scenarios "well below 2C", and simiar for "well below 1.5C". If this labeling is kept, further justification is needed for why these labels are used, and how this squares with the legal literature on the debated meaning of PA Article 2.1(a). Consistently with Chapter 1, I would like to see more focus on labeling stabilization vs. overshoot scenarios along with these ambition level groupings. Table 2.4 is helpful for this but a visual representation (again, simple if possible!) of each median scenario type, showing the median year of overshoot, degree of overshoot (dC-yr), etc. in emissions and temperature terms [Christopher Weber, United States of America]
Taken into account. The labelling of scenario groups has been revised in the SOD
16196 16 1 16 6
These pathways tend to refer to the maximum value--not the long-term value of warming. Is this notion of stabilizing at 1.5 C really the goal in any of these pathways? The long-term goal should really be to get back to close to zero--and once one starts to come down from an exceedance, stopping at 1.5 C would require undoing much of the change that has been invoked, and this might well involve considerable expense. So, why this focus on stabilizing at 1.5 C? [Michael MacCracken, United States of America]
taken in to account— the classification of scenarios has been updated for the SOD. At the same time, it is the chapter's and this report's mandate to assess the impacts of 1.5°C and associated pathways. The chapter content cannot go beyond the scope indicated by the approved mandate outline to a degree indicated by this reviewer comment.
10976 16 3 16 3Need to build overshoot into this classification? [Skea Jim, United Kingdom (of Great Britain and Northern Ireland)] Taken into account. Two new scenarios classes have been introduced in the SOD pathways
classification
6873 16 3 16 6 On table 2.3 see my general remark on the definition of the term "well below" [Bert Metz, Netherlands] taken in to account — the scenarios classification has been totally revised
7031 16 5Not clear what DATABASE the rightmost column of table 2.3 refers to. [Érika Mata, Sweden] Taking into account. Scenario database is described in the section 2.1.4. of Chapter 2 FOD,
however, the reference will be also provided in section 2.3 in the SOD
1509 16 5 16 5In the Table 2.3, it would be better to show the probabilities that can achieve 1.5C for each pathway as in Figure 2.3 [Ken'ichi Matsumoto, Japan]
Taking into account. This section now includes a table to exhibit probabilities that can achieve 1.5°C or 2°C
10657 16 9 16 22
Additional citation possible to Xu and Ramanathan 2017 (Well below 2°C: Mitigation strategies for avoiding dangerous to catastrophic climate changes, PNAS, doi/10.1073/pnas.1618481114) to show the consequence of delaying mitigation and the ability to achieve net-zero at 2050; delaying even ten years (from 2020 to 2030) requires far more negative emissions in the future to compensate. [Kristin Campbell, United States of America]
Taking into account. The suggested reference has been assessed
17414 16 14 16 16
I would like to see the statement where this overshooting is put to the context i.e. there is high uncertainty of feedbacks and deployment of CDRs which result in high risks in overshoot scenarios. [Tuomo Kalliokoski, Finland]
taken in to account — Because uncertainties related to Earth system feedbacks and deployment of CDR are assessed in other section or subsection, the revised text has been improved to better liaise with those section.
9759 16 14 16 16
It is a serious deficit not to have non-overshoot scenarios. There is some evidence that the possible budget for 1.5 could be higher (see e.g. Millar et al (2017) Emission budgets and pathways consistent with limiting warming to 1.5, nature geoscience, 18 SEPTEMBER 2017) which could allow non overshoot scenarios. Or new results in literature will come. [Manfred Treber, Germany]
taken in to account — the revised scenario database used in the SOD now included several non-overshooting scenarios; they have been assessed accordingly
4976 16 14 16 16
It is a serious deficit not to have non-overshoot scenarios. There is some evidence that the possible budget for 1.5 could be higher (see e.g. Millar et al (2017) Emission budgets and pathways consistent with limiting warming to 1.5, nature geoscience, 18 SEPTEMBER 2017) which could allow non overshoot scenarios. Or new results in literature will come. [Manfred Treber, Germany]
taken in to account — the revised scenario database used in the SOD now included several non-overshooting scenarios; they have been assessed accordingly
12733 16 15 16 15Wy not use the acronyms presented in table 2.3, instead of writing "<1.5degC" or "~1.5degC"? Also true for the rest of the chapter. [Vassilis Daioglou, Netherlands]
taken in to account — the revised scenario database used in the SOD now included several non-overshooting scenarios; they have been assessed accordingly
20403 16 18 16 18Please better define "carbon enutrality". I gather you mean net-zero ANTHROPOGENIC CO2 emissions (ie not accounting for C feedbacks). [Olivier Boucher, France]
taken in to account— the scenarios classifications has been revised in SOD
6145 16 21 16 21missing word 'in': should read 'declines in virtually' [Philip Sargent, United Kingdom (of Great Britain and Northern Ireland)] Editorial
7994 16 21 16 21 declines virtually' should be: 'declines in virtually' [Robert Shapiro, United States of America] Editorial
2203 16 27 16 29
Delete the sentence "In many ways…". This represents the authors' qualitative judgement and gives the false impression that less the less ambitious mitigation pathways would not require fast and forceful action. [Kenneth Möllersten, Sweden]
Editorial
7032 17 18Could references be given for the data shown in Fig 2.3 and Table 2.4? [Érika Mata, Sweden] Taken into account—these table are derived from SR15 scenario database, as explained in the
introduction of the chapter.
13299 17 1 17 7Figure 2.3: rotate "50%-50%" and "66%-66%"labels so text is horizontal, as easier to read. [Jordan Harold, United Kingdom (of Great Britain and Northern Ireland)]
Editorial
13301 17 1 17 7Figure 2.3: for panel b which shows the 50th percentile - is this simply the median? 'Median' may be more readily understood. [Jordan Harold, United Kingdom (of Great Britain and Northern Ireland)]
Editorial
Do Not Quote, Cite, or Distribute Page 48 of 129
IPCC WGI SR15 First Order Draft Review Comments And Responses - Chapter 2
Comment No From Page From Line To Page To Line Comment Response
523 17 1 17 1
It does not seem that any of the scenarios follow the proposed trajectory of 80% elemination of emissions by 2030 and 100% by 2050 as proposed in Figure 2 of Jacobson, M.Z., M.A. Delucchi, Z.A.F. Bauer, S.C. Goodman, W.E. Chapman, M.A. Cameron, Alphabetical: C. Bozonnat, L. Chobadi, H.A. Clonts, P. Enevoldsen, J.R. Erwin, S.N. Fobi, O.K. Goldstrom, E.M. Hennessy, J. Liu, J. Lo, C.B. Meyer, S.B. Morris, K.R. Moy, P.L. O’Neill, I. Petkov, S. Redfern, R. Schucker, M.A. Sontag, J. Wang, E. Weiner, A.S. Yachanin, 100% clean and renewable wind, water, and sunlight (WWS) all-sector energy roadmaps for 139 countries of the world, Joule, 1, doi:10.1016/j.joule.2017.07.005, 2017, http://web.stanford.edu/group/efmh/jacobson/Articles/I/WWS-50-USState-plans.html although some are close. It would be helpful to develp this precise scenario, since this is the scenario many countries, states, cities, munipalities, and companies are considering, particularly as proposed under U.S.Senate Resolution 632, House Resolution 540, Senate Bill 987, and the U.S. House "100 by '50 Act." [Mark Jacobson, United States of America]
Rejected — This figure shows total net CO2 emissions, not just emissions from the energy sector. It includes emissions from land-use and from industrial sources.
13302 17 1 17 7Figure 2.3: re-order legend items to match order of data in figure (i.e. 3.5 top, 1.5 bottom) [Jordan Harold, United Kingdom (of Great Britain and Northern Ireland)]
Editorial
17462 17 2 B [Tom Gabriel Johansen, Norway] Editorial
17502 17 2 B [Angela Morelli, Norway] Editorial
4526 17 3Change "1850-1900" to "1850-1879" to be consistent with Chaper 1. [Radim Tolasz, Czech Republic] rejected— this reference period is now consistent with the working definition used in Chap 1
6146 17 4 17 4replace 'by' with 'in', which is more precise and requires less thought to understand. [Philip Sargent, United Kingdom (of Great Britain and Northern Ireland)]
Editorial
12870 17 7 e horizontal ??? [Jorge Carrasco, Chile] Editorial.
17323 17 7 Extra phrase of 'and e horizontal' is inserted. [Young-Hwan Ahn, Republic of Korea] Editorial.
6985 17 7 17 7 Typo error: "horizontal and e horizontal and vertical axis" [Sai Ming Lee, China] Editorial.
6485 17 7 17 7Figure 2. 3 needs a source reference? (and simillarly for other tables and figures) [Roger Bodman, Australia] rejected—these figures is derived from available scenarios database. The computation used in
this figure relied on published literature
20396 17 7 17 7 some text is duplicated [Olivier Boucher, France] Editorial.
13300 17 7 17 7 typo in this line: 'e horizontal' [Jordan Harold, United Kingdom (of Great Britain and Northern Ireland)] Editorial.
6147 17 7 17 8Sentence about grey area poorly explained and appears to have a typo with 'e' appearing not attached to a word. I can't understand what it is trying to say anyway. [Philip Sargent, United Kingdom (of Great Britain and Northern Ireland)]
taken in to account— the figure caption has been corrected and the text of this section has been improved accordingly
9938 18Table 2.4. The values of TPB presented in this table are not the same than those presented in table 2.2. Please, consider revising these values. [Olga Alcaraz, Spain]
Taking into account. Table 2.4 provides carbon budgets by scenarios categories whereas table 2.2 provides TPB across all scenarios
12871 18 3RFall migth confuse with "all radiative forcing" including non-anthropogenic, I suggest to use the "anRFall" or something similar [Jorge Carrasco, Chile]
taken into account — the table caption has been corrected accordingly
4527 19 Fig 2.4 - Add index format to "CO2" (4x) [Radim Tolasz, Czech Republic] Editorial
3161 19 1 22 45
While it is alright to describe the fact that there are many different pathways to any given temperature target in any given future year, there are many a non-overshoot pathway is much more highly constrained. Yet, such a scenario could lead to beneficial growth in global employment (green growth) because of the higher investment requirements in the next few decades. What pages 21 and 22 need to do much better is to make it clear that input assumptions for scenarios such as those cited for three scenarios in figure 2.5 are only loosely related to the output results for emissions depicted in the graphs at the top of figure 2.5. The reader needs to understand that the emissions results depend on the entire validity of the integrated assessment models used to calculate those emissions, which means that the results depend on hundreds if not thousands of equations, constraints, and input cost and operating assumptions for various energy technologies, among other things. The reader also needs to be clear that each scenario was often run by a different model, so the difference in emissions results is not just due to the differences in basic scenario assumptions as listed in figure 2.5, but also hundreds of other assumptions that differ between IAMs. Therefore, the reader needs to be presented with some tables that give some of the numerical values for a considerable number of key input assumptions that are most important for determining differences in emission results such as technology costs, constraints on how fast renewable energy technologies can penetrate the global mix, etc....This is crucial for TRANSPARENCY sake!!! [Richard Rosen, Germany]
Taking into account. This section has been revised accordingly. An detailed assessment of IAM has been introduced
17415 19 2 19 5This should be stated at the general conclusions of this report in order to indicate how difficult the aim is. [Tuomo Kalliokoski, Finland]
Taking into account. This statement (but in different words) is included in the Executive summary
9226 19 7Net zero CO2, what about net zero GHG, more relevant for Paris. Also, what about the "balance", more relevant for Paris. [Glen Peters, Norway]
taken into account; a discussion of non-CO2 mitigation has been introduce in the revised text, and net zero GHG values are provided in Table 2.7 of the SOD
4765 19 7 19 8
In page 16 (lines 18-19), it says that "Both 1.5°C pathway classes (<1.5°C and ~1.5°C) reach carbon neutrality (or net-zero CO2 emissions) before 2050 in most of those scenarios". Thus, how many scenarios do reach carbon neutrality between 2040-2060? [Elena Georgopoulou, Greece]
Taking into account. The number and probability of scenarios staying below or retuning below 1.5°c has been clarified. Besides the text of this section has been revised in agreement with the new scenario classification
12872 19 12 Is it correct to start a sentence with a number? [Jorge Carrasco, Chile] Editorial.
14321 19 13 19 13With a concentration of 400 ppm in 2015, 430 ppm corrsponds to about 8% of increase rather than about 5%. [Serge PLANTON, France]
Editorial
Do Not Quote, Cite, or Distribute Page 49 of 129
IPCC WGI SR15 First Order Draft Review Comments And Responses - Chapter 2
Comment No From Page From Line To Page To Line Comment Response
16197 19 13 19 14
Talking about the percentage increase above present CO2 values is really misleading--using a baseline of 0 ppm just does not make sense. Instead of the comparison now made on line 13 for 1.5 C, it would be much better to say something like that we are currently about 45% above the preindustrial baseline value, and these scenario pathways allow the exceedance to rise to only 55-65% above preindustrial and then indicate that, at the present rate of emissions, this gap will be reduced to zero in 1-2 decades!!! This type of phrasing is based on same numbers, but would be much more informative--and alarming. And then for the 2 C comparison, the time period is really only about a decade more. Indeed it might be useful to have a plot showing how rapidly, assuming current emissions, one would have to phase out to limit warming to a certain level. [Michael MacCracken, United States of America]
rejected— in section 2.2, all numbers are computed relative to the first jan 2016. By providing both the absolute values and the values expressed relative to today's levels we are able to apply a consistent approach throughout the entire chapter.
3311 19 15 Change ‘contract’ to ‘contrast’ [Justin Bishop, United Kingdom (of Great Britain and Northern Ireland)] Editorial
17416 19 15 19 15 contract -> contrast [Tuomo Kalliokoski, Finland] Editorial
12980 19 15 19 15 contrast instead of contract [Caserini Stefano, Italy] Editorial
12734 19 15 19 15 …in contrast to… [Vassilis Daioglou, Netherlands] Editorial
17417 19 16 19 18
I don't understand this sentence. Based on the figure, the non-linearity is due to scenarios where the temperature changes more than 1.5C. And moreover, how 1.5C could be reached if net carbon balance is zero only at 2100? Is it really possible to be on increasing trend at 2100 if 2C limit is not to be crossed? In fig 2.3b one curve may to be close of this statement but even it seems to cross the 2C limit before 2100. [Tuomo Kalliokoski, Finland]
taken in to account— we have revised the current section accordingly
2204 19 2 19 22
It is claimed that a part of negative emissions is used to compensate for residual warming. Explain how it is determined that that share of the negative emissions are dedicated towards that purpose. Do the models explicitly deploy the quanity of negative emissions that are necessary to neutralise the residual warming? Furthermore, inform the reader also of the use of the remaining part of negative emissions. [Kenneth Möllersten, Sweden]
rejected (here) — but this question is further elaborated in Section 2.3.1.1 of this Chapter
16198 19 24 19 29
I would urge that there also be information given (in text and/or plots) in what would be required to do even more--so to get back to 0 C, 0.5 C, and 1.0 C warming by 2100. So, how much removal of CO2 would be needed to do this, or how much reduction in radiative forcing would be needed to get back to these levels--that is, basically lay out what would be required to get to some particular level, which is indeed what we want to be doing. [Michael MacCracken, United States of America]
rejected — This lies outside the scope of this chapter and probably this entire Special Report on 1.5°C of Global Warming
14173 19 28 19 28Please define AFOLU in the figure description. See also Strapasson et al. (2017, DOI: 10.1111/gcbb.12456) for the AFOLU simulation. See full citation above. [Alexandre Strapasson, Brazil]
taken in to account— we have revised the current section.
13303 19 3 19 36Figure 2.4: re-order legend items to match order of data in figure (i.e. 3.5 top, 1.5 bottom) [Jordan Harold, United Kingdom (of Great Britain and Northern Ireland)]
taken into account —Figure 2.4 has been improved accordingly
13304 19 3 19 36Figure 2.4: space out right/left plots so more space between left plot and right plot y-axis label. [Jordan Harold, United Kingdom (of Great Britain and Northern Ireland)]
taken into account —Figure 2.4 has been improved accordingly
17463 19 32 A [Tom Gabriel Johansen, Norway] taken into account —Figure 2.4 has been improved accordingly
17503 19 32 A [Angela Morelli, Norway] taken into account —Figure 2.4 has been improved accordingly
19381 2
Section 2.3 barely touches on non-CO2 mitigation. Given that the AIM scenario manages particularly deep reductions in methane and ozone, it must involve different pathways than the other models and this should be explored somewhere in section 2.3. Many methane sources do not decrease automatically with a reduction in fossil fuels (e.g. landfill and waste management, agriculture). Literature is available on methane mitigation and should be covered in this section. [William Collins, United Kingdom (of Great Britain and Northern Ireland)]
Accepted - we highlight non-CO2 emissions pathways and discuss the non-CO2 mitigation measures in the AFOLU section in Section 2.4.
1676 2 66
The IAM models used in SR 1.5 (and AR5) are sophisticated, detailed, and target exactly the right questions. Indispensable tools, these. But I believe they share a systemic kind of limitation causing them to overstate the energy use reductions arising from energy efficiency programs and so understate likely future energy demand. At minimum, I would offer, the IAMs understate the up-side uncertainty of future energy demand in response to efficiency gains.
While the problem I see is systemic, it manifests in the models along four different lines, depending on the methodological approach taken: [HARRY SAUNDERS, United States of America]
Accepted - this caveat has been included and further elaborated in Section 2.6 on knowledge gaps and assessment tools
1678 2 66
The IEA acknowledges this “rebound” effect, but reports it out at only around 10%. To illustrate the significance of this, if one were to instead assume that rebound will be 50%, a figure that can be easily supported by the growing literature on rebound effects [3,4,5,6,7,8,9,10,11,12,13,23,26,27], meeting the carbon emissions target in the IEA “New Policies Scenario” would require global clean energy deployment about one-third higher than the agency’s already ambitious targets, about 4.7 Terawatts of additional clean energy by 2035, or slightly more than total US electric power production in 2016. [HARRY SAUNDERS, United States of America]
Accepted - this caveat has been included and further elaborated in Section 2.6 on knowledge gaps and assessment tools
Do Not Quote, Cite, or Distribute Page 50 of 129
IPCC WGI SR15 First Order Draft Review Comments And Responses - Chapter 2
Comment No From Page From Line To Page To Line Comment Response
1677 2 66
1. Too-Rigid Production Functions
A signature example of this limitation is found in the IEA/IRENA model. This model suffers, in my considered opinion, from being too rigid in its depiction of production-side processes. This follows in large part from its development legacy, stretching back some four decades, of employing/assuming what is technically known as Leontief-like behavior (or “fixed-factors behavior”). (2012 documentation I have for GCAM shows it relied on a Leontief production function as well.) In such formulations, energy efficiency gains have the effect of reducing energy demand on a one-for-one basis with engineering calculations of technical efficiency gains, or nearly so. Yet both theoretical considerations and empirical evidence instead show energy demand in response to energy efficiency gains to be highly dependent on the flexibility of the economy (productive side, specifically) to substitute among inputs to production – the higher the “elasticity of substitution” between energy and other factor inputs, the less energy efficiency gains reduce energy use. This is well documented in the literature [references 1,2].
Leontief-type models suffer from a further related limitation. In such models, energy efficiency gains have little to no direct influence on economic output (GDP, roughly). But a so-called “output” effect appears in more flexible formulations, wherein an energy efficiency gain enables higher levels of profitable, lower-cost, output, thus “dragging up” energy use along with it [1,8]. [HARRY SAUNDERS, United States of America]
Accepted - this caveat has been included and further elaborated in Section 2.6 on knowledge gaps and assessment tools
1679 2 66
2. Using Energy Intensity as the Vehicle for Energy Use Projections
The IMAGE and MESSAGE-GLIOBOM models fall in this category. The fundamental limitations of this methodology are two. First, the literature establishes that energy efficiency gains affect the numerator of energy intensity (energy use) in significantly different ways from the denominator (output, or GDP) [9], and the influence differs among industries and regions. Both theoretical and empirical considerations indicate that the linkages between energy efficiency improvements, energy use, and GDP are complex and subtle, involving many intermediate dynamics, so predicting the evolution of the intensity ratio is fraught with peril. Generally speaking, taking energy intensity as a metric of energy efficiency will understate future energy use, as it functions very much like a rigid, Leontief formulation for a given GDP trajectory [9].
Secondly, and more significantly, the energy intensity ratio is affected not just by energy efficiency gains, but by productivity gains in all the other factor inputs – labor, capital, raw materials. To illustrate, even if energy efficiency gains were zero, a productivity gain for any one of the other factors will increase output/GDP and thereby reduce the energy/GDP ratio by itself. Both theory and empirical evidence show that this happens, even absent any energy productivity gain [8,9]. The energy intensity ratio is a poor measure of energy efficiency. Extracting energy-specific productivity/efficiency gains from historical data of energy intensity magnitudes is next to impossible. Too many dynamic pathways exist in a flexible economy to determine future energy intensities. Projecting energy use into the future applying the ratio to assumed or calculated output has a high risk of understating energy demand as it ignores these flexibilities and instead strongly mimics what a rigid, Leontief-like economy would be expected to deliver. [HARRY SAUNDERS, United States of America]
Accepted - this caveat has been included and further elaborated in Section 2.6 on knowledge gaps and assessment tools
1680 2 66
Some researchers identify a further possible problem with the energy intensity projection method [24]. In their review of AR4, these researchers say the scenarios used there employ a kind of double counting of energy efficiency gains, with declining energy intensity in the base case already incorporating future ongoing technology improvements in energy efficiency; yet the scenarios add more on top of that. When viewed this way, these authors show that the assumed magnitudes of energy reductions due to energy efficiency gains are more than double the gains attributed in the scenarios to new efficiency policy initiatives. Whether this remained a problem in AR5 or remains one in SR 1.5 I do not know, but if so, it could exaggerate the energy efficiency demand reductions being reported by energy intensity projection-based models, meaning the corresponding reported scenario results understate future energy demand. [HARRY SAUNDERS, United States of America]
Accepted - this caveat has been included and further elaborated in Section 2.6 on knowledge gaps and assessment tools
Do Not Quote, Cite, or Distribute Page 51 of 129

IPCC WGI SR15 First Order Draft Review Comments And Responses - Chapter 2
Comment No From Page From Line To Page To Line Comment Response
1681 2 66
3. Using Functional Forms for the Production Function that Effectively Assume the Answer
More flexible models (AIM, REMIND-MAgPIE, WITCH) go part way to getting around these problems by employing more flexible production function forms that comprehend the substitution potentials among factor inputs. Both AIM and REMIND employ nested CES production functions. More flexible and more general functional forms are available but difficult, and perhaps impossible, to embed in general equilibrium models, so CES functions are perhaps the best form to use given present simulation capability [14,15]. Computable general equilibrium models are the gold standard of economic modeling and both AIM and REMIND (but not WITCH) use this methodology, increasing their trustworthiness compared to non-CGE models. So their use of the CES structure is understandable.
But here the energy demand behavior projected depends crucially on parameter choices and certain structural choices: specifically, the assumed elasticities of substitution and how energy efficiency gains are introduced to the production function. Both are highly-determinative drivers of energy use projections [9]. [HARRY SAUNDERS, United States of America]
Accepted - this caveat has been included and further elaborated in Section 2.6 on knowledge gaps and assessment tools
1682 2 66
In general, the larger the CES elasticity of substitution between energy and other inputs, the larger will be energy efficiency rebound [1,2,16]. If this elasticity value is too low, the model will overstate energy use reductions from energy efficiency gains. ADVANCE documentation for AIM currently does not show the elasticity magnitudes (broken link), but the REMIND-MAgPIE model uses a value of 0.5 in the highest nest, though it is unclear from the documentation how the nesting for this three-factor structure works. This value is likely low, based on elasticities measured empirically for the US economy [8,10] and for Sweden [25].
More importantly, AIM, REMIND and WITCH apparently select single, fixed values for the substitution elasticity. But theory says that this elasticity is the primary driver of energy rebound [16,1,2], and so assuming a fixed value for this elasticity is tantamount to assuming the answer as to how efficiency gains translate to projected energy use [2].
Empirical evidence is wanting of the appropriate substitution elasticity/elasticities to use in a CES formulation [2], though some work has been done showing very large elasticity for Sweden [25] measured over a 200 year period. Empirical evidence for the more general and flexible Translog function shows multi-factor energy elasticities to be large [8,10] and thus conducive to large rebound magnitudes. [HARRY SAUNDERS, United States of America]
Accepted - this caveat has been included and further elaborated in Section 2.6 on knowledge gaps and assessment tools
1683 2 66
This approach of fixing assumed parameter values also understates the risk. The uncertainty attendant to future energy use depends heavily on uncertainty about the elasticity value. At minimum it is easy to argue that energy use currently projected in the scenarios is highly uncertain, and so contributes to the risk of 1.5 C overshoot.
One way around this particular issue might be to ask the relevant IAM modeling teams to provide sensitivity analyses with respect to their assumed levels of substitution elasticity.
The way efficiency gains are assumed to enter the CES function also has a large effect on projected energy use (not showing in the ADVANCE documentation for AIM or REMIND; I have out-of-date documentation for WITCH). However, a possible problem arises if these use the so-called AEEI method going back to Manne and Richels as this introduces distortions that act to overestimate energy demand reductions due to energy efficiency gains [2,9], and so project energy use in a downward-biased way.
PLEASE SEE COMMENT 3.1 appended at the end of Chapter 2 re use of intensity projections. [HARRY SAUNDERS, United States of America]
Accepted - this caveat has been included and further elaborated in Section 2.6 on knowledge gaps and assessment tools
1684 2 66
4. Ignoring the Role of Non-energy Technology Gains
There is an important dynamic element affecting energy use missing in apparently all IAM models. That is, both theory and empirical evidence [16,8] show that efficiency/productivity improvements for non-energy factors of production (think, e.g., labor productivity gains via automation) have the effect of unequivocally increasing energy use (even while reducing energy intensity). If such efficiency gains are not explicitly introduced into the production function, projections will understate future energy use. In my opinion, this absence in the models creates a large unstated risk of 1.5 C overshoot, and perhaps even the greatest risk, demand side-wise.
Finally, as it appears many of the IAMs to be used in this new report are “fundamentally not different from those underlying the IPCC AR5 assessment" [section 2.6.1], a broader discussion of these issues, comparing 10 of the AR5 models (and 15 others) along these lines, can be found in [9]. In these other models, too, there is strong evidence of a general, systematic understatement of future energy use magnitudes. [HARRY SAUNDERS, United States of America]
Accepted - this caveat has been included and further elaborated in Section 2.6 on knowledge gaps and assessment tools
Do Not Quote, Cite, or Distribute Page 52 of 129
IPCC WGI SR15 First Order Draft Review Comments And Responses - Chapter 2
Comment No From Page From Line To Page To Line Comment Response
1685 2 66
There is one further issue related to the scope comprehended in past and recent studies on efficiency rebound effects. It involves a limitation that plays out differently in industrialized vs. developing economies:
5. Relying on Household Behavior to the Exclusion of the Productive Economy
Globally, only about one-third of energy is used directly by households (household operation and personal transportation); the remaining two-thirds is used in the productive economy to produce goods and services (energy used in industry, commerce, commercial transportation) [17]. Unfortunately, the vast majority of energy efficiency rebound studies have historically evaluated rebound effects in the household sector, and largely in advanced economies. But on the productive side, empirical evidence shows rebound effects to be much larger [9,10,11,12,13]. Studies like Gillingham et al. [18,19], referenced in the SR 1.5 report, do not consider the productive economy, where most energy is used, and so are limited by this fact.
The problem is compounded by the fact that historically, most rebound studies focused on advanced economies (this is changing), where saturation effects in households are shown to limit rebound. In developing countries, this constraint is not binding and rebound will tend to be higher [4,5,11,23,26,27]. [HARRY SAUNDERS, United States of America]
Accepted - this caveat has been included and further elaborated in Section 2.6 on knowledge gaps and assessment tools
1686 2 66
The Good News
The good news in all this is that energy efficiency – and energy rebound itself – increases economic welfare [16,18,19,20]. In developing countries, more efficient lighting, heating, cooking and refrigeration allow poor populations living in energy poverty to consume much more energy. Beyond the household, energy-intensive production sectors such as steel, cement and chemical manufacturing are expected to grow enormously across the globe over much of this century as emerging economies build the basic infrastructure of modernity. Energy efficiency rebound will enhance this economic welfare creation. This means that even though energy use projections may be understated owing to rebound being understated, the capacity of the economy to meet key poverty eradication and equity SDGs is augmented by this rebound dynamic and the tradeoff calculations become less constrained. Nordhaus [21] even argues that the “tradeoff” is not a tradeoff at all but its opposite, since the faster third world consumption of energy grows in the near term the sooner it will peak and be sustained thereafter at a lower level than otherwise. This, owing to the salutary effects of adequate energy use on population growth/birth rates due to broad income gains, and enhanced capacity of a wealthier global population to deliver energy system decarbonization. [HARRY SAUNDERS, United States of America]
Accepted - this caveat has been included and further elaborated in Section 2.6 on knowledge gaps and assessment tools
1687 2 66
Mitigating Rebound
Two statements in the report suggest that policy must be applied to prevent or reduce rebound effects [Sections 4.4.6.2, 4.4.7.2]. But polices designed to thwart cost-effective energy efficiency gains risk reducing the above SDG-enhancing economic welfare gains unless the policies are of a particular nature. Specifically, to offset rebound effects using a carbon tax (or GHG taxes more generally) would substantially reduce economic output, employment, and producer profits/cash flows [22], taken on its own. I estimate the required carbon tax to offset rebound effects would be around $95/tonne for the US productive economy, with substantial corresponding economic welfare losses. Significantly, developing countries may be harmed disproportionately by rebound suppression policies [3,4,23]
HOWEVER, if the tax is “revenue neutral,” with tax proceeds completely recycled to the non-governmental economy, these negative effects appear to be offset [22]. But this would require a substantial global commitment to such a scheme, and would require governments to resist the temptation to use these tax revenues for other purposes; some governments so far have a spotty record honoring such commitments (cf. the UK Climate Change Levy (CCL) ).
Bottom line is: I offer the thought that SR1.5 guidance to suppress rebound should be qualified by the caution that such policies could reduce the capacity to meet other SDG goals, especially for developing countries where energy demand is well below saturation levels [3,4,5] . It may even be better to forgo advising such rebound mitigation policies in the context of the SR1.5 comprehensive framework, at least for developing countries. [HARRY SAUNDERS, United States of America]
Accepted - this caveat has been included and further elaborated in Section 2.6 on knowledge gaps and assessment tools
Do Not Quote, Cite, or Distribute Page 53 of 129

IPCC WGI SR15 First Order Draft Review Comments And Responses - Chapter 2
Comment No From Page From Line To Page To Line Comment Response
1688 2 66
References Cited
1. Saunders, H.D. (2008). “Fuel conserving (and using) production functions.” Energy Economics 30: 2184–2235. http://dx.doi.org/10.1016/j.eneco.2007.11.006. [theory: rebound magnitude depends on flexibility/substitution elasticity; functional forms matter; rebound creates economic welfare]2. S. R. Sorrell (2014), “Energy Substitution, Technical Change and Rebound Effects,” Energies 7, 2850-2873, [showing criticality of substitution elasticity assumption; showing problem with typical AEEI implementations]3. Roy J, Sathaye J, Sanstad A, Mongia P, Schumacher K: Production trends in Indian energy intensive manufacturing industries. Energy J 1999, 20:33-61. [large rebound in Indian manufacturing sector]4. Chackravarty, D.; Dasgupta, S.; Roy, J. (2013), “Rebound effect: how much to worry?” Current Opinion in Environmental Sustainability 5(2), 216-228. [Large but varying rebound measured; rebound effects in developing countries likely to be higher than industrialized countries; rebound mitigation policy may not be appropriate for developing countries]5. ___________________________________, (2015) “Corrigendum to ‘Rebound effect: how much to worry’ [Curr. Opin. Environ. Sustain. 5 (2013) 216–228], Curr Opin Environ Sustain (2015) 1” http://dx.doi.org/10.1016/j.cosust.2015.08.004 [rebound effects understated in original paper]6. Roy, J.; Sanstad, A.H; Sathaye, J.A., Khaddaria, R. (2006), “Substitution and price elasticity estimates using inter-country pooled data in a translog cost model,” Energy Economics 28, 706-719, [substitution elasticities are likely higher than commonly used in IAMs] [HARRY SAUNDERS, United States of America]
Accepted - this caveat has been included and further elaborated in Section 2.6 on knowledge gaps and assessment tools
1689 2 66
7. Druckman, A., M. Chitnis, S. Sorrell and T. Jackson (2011). “Missing carbon reductions? Exploring rebound and backfire effects in UK households” Energy Policy 39: 3572–3581. http://dx.doi.org/10.1016/j.enpol.2011.03.058 . [household rebound can be large, and can even deliver both energy and GHG backfire; I-O model for UK households considering energy “embedded” in goods and services consumed]8. Saunders, H.D. (2013), “Historical evidence for energy consumption rebound in 30 US sectors and a toolkit for rebound analysts.” Technological Forecasting and Social Change 80(7): 1317–1330. [cited in AR5; high measured rebound in US productive economy, some backfire; other factor productivity gains increase energy use]9. Saunders, H.D. (2015), “Recent Evidence for Large Rebound: Elucidating the Drivers and their Implications for Climate Change Models.” The Energy Journal 36(1): 23-48. [evidence for large rebound; problems with energy intensity as a measure of energy efficiency; other factor productivity gains increase energy use]10. Saunders, H.D. (2017), “Response to Cullenward and Koomey critique of ‘historical evidence for energy efficiency rebound in 30 US sectors,” Technological Forecasting and Social Change 119: 184–193. [not cited in AR5; rebuts critique; confirms high measured rebound in US productive economy, some backfire]11. Barker, T. (2013) “Macroeconomic impacts of energy-efficiency policies” Presentation to the IEA Roundtable on Energy Efficiency, 25-26 January, 2013, Paris [total global rebound is about 50% by 2030; industrialized world (OECD) rebound effect is less than the developing world (non-OECD)]12. Barker, T.; Dagoumas, A. and Rubin, J., (2009) "The Macroeconomic Rebound Effect and the World Economy". Energy Efficiency, 2(4): 411-427. [total global rebound is about 50% by 2030] [HARRY SAUNDERS, United States of America]
Accepted - this caveat has been included and further elaborated in Section 2.6 on knowledge gaps and assessment tools
1690 2 66
13. Barker, T., Ekins, P. and Foxon, T. (2007) ‘The macroeconomic rebound effect and the UK economy’, Energy Policy 35: 4935–4946 [large rebound for the UK economy]14. Turner, K. (2009). “Negative rebound and disinvestment effects in response to an improvement in energy efficiency in the UK economy,” Energy Economics 31(5): 648–666. http://dx.doi.org/10.1016/j.eneco.2009.01.008.15. Turner, K. (2013). “‘Rebound’ effects from increased energy efficiency: a time to pause and reflect.” The Energy Journal 34(4): 25–42. doi: http://dx.doi.org/10.5547/01956574.34.4.2.16. Saunders, H.D. (1992) “The Khazzoom-Brookes postulate and neoclassical growth” The Energy Journal, 4): 131 148. http://dx.doi.org/10.5547/ISSN0195-6574-EJ-Vol13-No4-7. [theory: rebound magnitude depends on flexibility/substitution elasticity; functional forms matter; rebound creates economic welfare]17. ExxonMobil, The outlook for energy: a view to 2030, (2009) available at http://www.exxonmobil.com/Corporate/energy_o_view.aspx.18. Gillingham, K., Rapson, D., Wagner, G. (2014) “The Rebound Effect and Energy Efficiency Policy.” Discussion Paper, Resources for the Future, RFF DP 14-39 [HARRY SAUNDERS, United States of America]
Accepted - this caveat has been included and further elaborated in Section 2.6 on knowledge gaps and assessment tools
Do Not Quote, Cite, or Distribute Page 54 of 129
IPCC WGI SR15 First Order Draft Review Comments And Responses - Chapter 2
Comment No From Page From Line To Page To Line Comment Response
1691 2 66
19. Gillingham, K., M. J. Kotchen, D. S. Rapson, and G. Wagner, (2013) “Energy policy: The rebound effect is overplayed.” Nature, 36 493, 475–476, doi:10.1038/493475a. http://www.nature.com/doifinder/10.1038/493475a (Accessed October 7, 2013).20. IEA (2014). “Capturing the Multiple Benefits of Energy Efficiency.” 21. Nordhaus, T., (2017) “The Energy Rebound Battle,” Issues in Science and Technology, Summer 2017, 51-58 [energy efficiency can advance and diminish peak fossil-fuel use despite rebound; energy efficiency can’t solve climate change, but is a key contributor to human progress; see especially Conclusions section]22. Saunders, H.D. (2011). “Mitigating Rebound with Energy Taxes.” (unpublished): https://works.bepress.com/harry_saunders/28/23. Roy, J. (2000). “The rebound effect: some empirical evidence from India.” Energy Policy 28(6-7): 433-43824. Pielke, Jr., R., Wigley, T., Green, C. (2008). “Dangerous assumptions.” Nature 452:531-532. 25. Stern, D.I. and A. Kander (2012). “The role of energy in the industrial revolution and modern economic growth.” The Energy Journal 33(3):125–152. http://dx.doi.org/10.5547/01956574.33.3.5.26. Lin, B., Chen, Y., Zhang, G. (2017). "Technological progress and rebound effect in China's nonferrous metals industry: An empirical study," Energy Policy 109:520-529.27. Lin, B., Tan, R. (2017) "Estimating energy conservation potential in China’s energy intensive industries with rebound effect." Journal of Cleaner Production 156:899-910. [HARRY SAUNDERS, United States of America]
Accepted - this caveat has been included and further elaborated in Section 2.6 on knowledge gaps and assessment tools
1692 2 66
Other References
Allan, G., N. Hanley, P. McGregor, K. Swales and K. Turner (2007). “The impact of increased efficiency in the industrial use of energy: a computable general equilibrium analysis for the United Kingdom.” Energy Economics 29(4): 779 798. http://dx.doi.org/10.1016/j.eneco.2006.12.006.Broadstock, D., Hunt, L. and S. Sorrell (2007). UKERC Review of Evidence for the Rebound Effect, Technical Report 3: Elasticity of Substitution Studies. Available at: http://www.ukerc.ac.uk/Downloads/PDF/07/0710ReboundEffect/0710Techreport3.pdf.Sorrell S, Dimitropoulos J, (2008) “The rebound effect: microeconomic definitions, limitations and extensions. Ecol Econ, 65:636-649.Turner, K. (2009). “Negative rebound and disinvestment effects in response to an improvement in energy efficiency in the UK economy,” Energy Economics 31(5): 648–666. http://dx.doi.org/10.1016/j.eneco.2009.01.008. [rebound effects in a CGE context]Jenkins, J., Nordhaus, T., Shellenberger, M., (2011) “Energy Emergence: Rebound and backfire as emergent phenomena” The Breakthrough Institute, https://thebreakthrough.org/archive/new_report_how_efficiency_can [literature review of rebound to that date]Fouquet, R. and P. J.G. Pearson (2012). “The long run demand for lighting: elasticities and rebound effects in different phases of economic development.” Economics of Energy and Environmental Policy 1(1): 83–100. http://dx.doi.org/10.5547/2160-5890.1.1.8.Greening, L., Greene, D., and C. Difiglio (2000). “Energy efficiency and consumption—the rebound effect—a survey.” Energy Policy 28(6–7): 389–401. http://dx.doi.org/10.1016/S0301-4215(00)00021-5. [HARRY SAUNDERS, United States of America]
Accepted - this caveat has been included and further elaborated in Section 2.6 on knowledge gaps and assessment tools
1693 2 66
Hanley, N., P.G. McGregor, J. Swales, J. Kim and K. Turner (2009). “Do increases in energy efficiency improve environmental quality and sustainability?” Ecological Economics 68(3): 692–709. http://dx.doi.org/10.1016/j.ecolecon.2008.06.004.Khazzoom, J. D. (1980). “Economic Implications of Mandated Efficiency Standards for Household Appliances.” The Energy Journal 1(4): 21–40. doi: 10.5547/ISSN0195-6574-EJ-Vol1-No4-2.Khazzoom, J. D. (1987). “Energy Saving Resulting from the Adoption of More Efficient Appliances.” The Energy Journal 8(4): 85–89. doi: 10.5547/issn0195-6574-ej-vol8-no4-8.Li, L. and H. Yonglei, “The energy efficiency rebound effect in China from three industries perspective.” Energy Procedia 14 (2012): 1105-1110.Lin, B. and X. Liu (2013), Refined oil pricing mechanism reform and energy rebound for passenger transportation in China, Energy Policy (in press).Tsao, J.Y., Saunders, H.D., Creighton, J.R., Coltrin, M.E., Simmons, J.A. (2010). "Solid state lighting: an energy-economics perspective." Journal of Physics D: Applied Physics 43 (35), 354001Saunders, H.D. and Tsao, J.Y. (2012) "Rebound effects for lighting," Energy Policy, 49(2012): 477-478Herring, H. and Sorrell, S., eds. (2009) Energy efficiency and Sustainable Consumption: Dealing with the rebound effect. Palgrave Macmillan [HARRY SAUNDERS, United States of America]
Accepted - this caveat has been included and further elaborated in Section 2.6 on knowledge gaps and assessment tools
Do Not Quote, Cite, or Distribute Page 55 of 129

IPCC WGI SR15 First Order Draft Review Comments And Responses - Chapter 2
Comment No From Page From Line To Page To Line Comment Response
1745 2 1
Article 1 cites several studies on carbon lock-in from energy, and Article 2.3.5 has several more. Could Section 2.3 more explicity discuss how these future commitments (Davis and Socolow 2014, Environ.Res.Lett. 9 (2014) 084018) affect the feasibility of these mitigation pathways? [Levi Golston, United States of America]
Taken into account - this reference has been added, although the feasibility of pathways is assessed by Chapter 4
20328 2 1 66 26
Ch 2.3 Characteristics…. and 2.4 Properties… of 1.5 pathways would appear more well-founded if the causalities and assumptions underlying the resulting characteristics/properties were better described and more thoroughly discussed. Thus, I suggest you start with the causes, restrictions and available mechanisms, then derive the plausible characteristics of the mitigation measures and other outcomes. [Taran Fæhn, Norway]
Taken into account - Section 2.3.2 now includes an introduction to general scenarios characteristics. More detail would, however, go beyond the scope of this Special Report. This chapter draws from a wide variety of models, introduced in Section 2.1. Due to the large number of modelling frameworks, many of which have been assessed in AR5 (see Table A.II.14 in IPCC AR5 WG3), reproducing this here would not be possible.
20329 2 1 66 26
See also my other comment to same lines. Readers should have more information about to what extent the characteristics/properties rely on exogenous assumptions and to what extent they are results of some optimization – and when it comes to the latter – what is optimized and under what restrictions/barriers. This would make the lines of reasoning more transparent and convincing. One natural starting point would be to derive possible cost-effective solutions (from the benchmarks (SSPs)). From there, more complicated worlds can be introduced – to clarify how outcomes depend on barriers, conflicting interests, technological uncertainty, resource situation, available policy actions, etc. The narratives underlying the assumptions, restrictions and optimization objective(s) should be given. The material in Fig. 2.5 is helpful ingredients that could be better integrated. Also, the introduction of 2.4.3.1. seems to be a good way of starting the whole chapter with SSPs. [Taran Fæhn, Norway]
Taken into account - yet, given explicit guidance by the co-chairs the SSPs should not be used exclusively as a framing concept for the chapter. This thus indeed complicates a structured discussion on the topic.
6360 2 19
I would expect a clearer up-front discussion in this section that under some socio-economic development patterns in the baseline, 1.5 pathways are infeasible (with reference to the relevant definition of infeasibility). Plus, I would like to see a clearer discussion of how 1.5 pathways differ from 2 degree pathways, rather than a discussion of what a 1.5 degree pathway looks like. E.g. the statement on page 23 lines 3-8 is useful, because it helps clarify that 1.5 is not primarily achieved by throwing more BEECS at the problem but it does rely on early action at least as much. [Andy Reisinger, New Zealand]
Noted
7033 2 19 21
I find it contradictory that the text says clearly that there are a variety of pathways, but then Fig 2.5 presents only 3 Pathways that are not introduced in the text. [Érika Mata, Sweden]
Taken into account - The three scenarios shown in this FOD figure are an illustrative sample. They are not exhaustive but aimed at illustrating the diversity amongst potential stringent mitigation scenarios. However, this figure has been removed in the SOD
4841 2 19 22 6
Scenario 3 has substantial fossil and requires substantial BECCS (90% of all bio) to offsett. Is a scenario with more application of CCS directly on Fossil not more plausible with the potential limitations on biomass and also as the BECCS power needs to land in the energy system [Wilfried Maas, Netherlands]
Taken into account - The three scenarios shown in the FOD were an illustrative sample. Many other options are possible, which are shown and assessed in the remainder of the chapter. Scenario 3, however, already shows very little residual emissions from fossil fuel and industry, indicating that the potential for further application of CCS on fossils is limited in these very stringent scenarios.
6486 2 2 2 2 Earlier assessments have [Roger Bodman, Australia] Editorial
2611 2 2 2 34
Is some sort of feasibility assessment made of the variety of scenarios that are compatible with 1.5 deg? Eg. if they all have different impacts on economic development, societal inequalities etc., are some automatically written off for being incompatible with the SDGs? [Zoha Shawoo, United Kingdom (of Great Britain and Northern Ireland)]
Taken into account - Chapter 2 introduces the variety of global pathways that can be consistent with 1.5°C. In its section 2.5, it also looks at interactions with sustainable development. Ultimately the assessment of Chapter 2 will be combined with the assessment of Chapter 4 and Chapter 5 to inform the reader about aspects of feasibility.
12981 2 2 2 34
I suggest to place in this chapter a broad introduction to the three scenarios, instead of giving details in the caption of figure 2.5. A connection with what written in Chapter 1 on human-caused radiative forcing (i.e. 1.9 W m-2) could be useful [Caserini Stefano, Italy]
Taken into account - The three scenarios shown here are an illustrative sample. The SOD does not use them anymore
12982 2 2 2 34
I suggest to decide and use the same name for each scenario, writing it also in the first line of Figure 2.5. I suggest not using for S3-SSP5 "energy intensive fossil fuelled" but instead "fossil intensive -technology focused" since this is also a mitigation scenario and the high technological level should be indicated in his name [Caserini Stefano, Italy]
The scenarios are not used anymore
16199 2 21 2 22
While there is no single pathway to 1.5 C, it is worth repeating here that all such pathways involve phasing out net CO2 emissions, and all such pathways that seek to minimize overshoot have this happening by near the middle of the century. So, I'd urge reiterating the commonalities--not just basically say anything is possible, as this sentence does. [Michael MacCracken, United States of America]
Accepted - we make clear that while there is a variety in scenarios, they have distinct characteristics for the phase-out of CO2. We also include a separate section on overshoot vs non-overshoot.
911 2 25 2 25It's not clear how inequalities themselves affect emissions. [David Infield, United Kingdom (of Great Britain and Northern Ireland)]
See a forthcoming publication by Rao and Min: Rao, N. D., and J. Min, Is less global inequality good for climate change? WIREs Clim Chang., in review.
5165 2 28 2 29
Globally coordinated solutions - provide example or delete. As a matter of fact, all successful solutions currently in the actual market are regional driven. Request to reformulate the sentence: "regionally driven" instead of "regionally fragmented" [Sven Teske, Australia]
Taken into account - an example was provided and the sentence was reformulated
2469 2 33 2 34
while you state that 'policy decisions and societal choices are essential in shaping pathways,' you only focus on policy--i.e., only on top-down approaches. [Lisa Lucero, United States of America]
Taken into account - the scenario literature allows to determine under which socioeconomic conditions the challenges to achieving stringent mitigation outcomes are significantly lower. We have tried to include more clearly how these societal choices can affect the outcome in the subsequent sections.
4528 21 Fig 2.5 - Add index format to "Wm-2" (2x) [Radim Tolasz, Czech Republic] The figure has been removed in the SOD.
Do Not Quote, Cite, or Distribute Page 56 of 129
IPCC WGI SR15 First Order Draft Review Comments And Responses - Chapter 2
Comment No From Page From Line To Page To Line Comment Response
9939 21Figure 2.5. The population projections of the three scenarios presented in this figure, are far away from the scenario medium variant of the UNDESA World Population Prospects: The 2017 Revision. [Olga Alcaraz, Spain]
Accepted - the figure has been removed,
7162 21Consider adding the SSP scenario in the figure (e.g., Scenario 1(SSP1), Scenario 2 (SSP2), Scenario 3 (SSP 5) [Iulain Florin VLADU, Germany]
The figure has been removed in the SOD.
6952 21 21Nuclear should not be indicated with a radiation danger sign, as those signs are reserved to indicate a warning. E.g. atom (see for instance IAEA) would be more apt than use of a danger sign. [Ville Tulkki, Finland]
The figure has been removed in the SOD.
10328 21 21
Figure 2.5 presents 3 mitigation pathways for 1.5, it for <1.5 or ?1.5?, Can be clarified how this patways relate or correspond to the Table 2.4 ones?. Why this ones are choosen for illustration?. Are the green, purple and violet colours in the figures corresponding to the same scenrios after in all figures where the colours apear? (it seems no...). [Maria Jose Sanz Sanchez, Spain]
The figure has been removed in the SOD.
14937 21
Figure 2.5 needs some serious work. The visualization of SSPs is incredibly challenging but this graphic doesn't quite cut it yet. First, the black vs. grey vs. white at bottom of graphic are confusing. Second, the CO2 pathway graphics are probably the least interesting part of the graphic; I would suggest deletion. Finally, I would suggest a better visualization of the societal outcomes currently in text. Perhaps a stoplight graphic would work wellshowing the SSPs on one axis and a single indicator for each major parameter (population, GDP/cap, equity, tech shares of key technologies (bio/TPE, nuc/TPE), etc.). Such graphics are widely used in grey literature and I find convey multiple dimension data effectively [Christopher Weber, United States of America]
The figure has been removed in the SOD.
3321 21 65
3.1 A final caution: REMIND is disadvantaged by the fact that it attaches itself to exogenous energy intensity scenario specifications for calibration purposes. As noted in Comment #2 above, this introduces a restriction that may not deliver the proper projection of future total energy use. Limited documentation I have on hand for AIM and WITCH does not reveal if either uses this energy intensity projection technique, but if so, the same caution would apply.
The energy intensity method is in a sense already assuming the answer. It strikes me it would be preferable if models would calculate energy use directly, given visible and explicit input factor technology gains assumptions (and ideally supporting historical evidence), perhaps along with sensitivity analysis to discern energy use uncertainty. From appearances, it seems these models would be fully capable of doing so. [HARRY SAUNDERS, United States of America]
Accepted - this caveat has been included and further elaborated in Section 2.6 on knowledge gaps and assessment tools
10977 21 1 21 1I like the way the tendentious aspects of the SSPs have been played down. But need to mention the capacities to mitigate and adapt that underpin their construction [Skea Jim, United Kingdom (of Great Britain and Northern Ireland)]
The figure has been removed in the SOD.
5166 21 1 21 14
Figure 2.5: Add scenario 4 category - Energy supply portfolio excluding CCS and nuclear, current categories are biased and do not reflect latest state of scientific knowledge. Energy modells excluded CCS and nuclear and moved to 100% BECAUSE of the profound market failure of those technologies, It is a matter of responsibility and precautionary principle to develop climate mitigation scenarios without technologies which are proven unsuccessful in the energy market over the past decade. [Sven Teske, Australia]
The figure has been removed in the SOD.
6525 21 1 21 14 Figure 2.5: Symbols at the bottom of each pathway type is not easy to understand. [Shigeki KOBAYAHI, Japan] The figure has been removed in the SOD.
1182 21 1 21 14
Fig 2.5: this is an interesting illustration. Let's discuss at LAM3 how to illustrate through national or regional case studies that, in reality, a particular nation state may adopt a mixed approach (e.g. Brazil). For readability, have a legend that explains the icons, not text as part of the figure caption. [Petra Tschakert, Australia]
The figure has been removed in the SOD.
13305 21 1 21 14
Figure 2.5: some of the icons at bottom may be very confusing (i.e. may not have intuitive meaning). Suggest provide explanation of symbols in figure and test how people interpret these. [Jordan Harold, United Kingdom (of Great Britain and Northern Ireland)]
The figure has been removed in the SOD.
19307 21 1 21 15Figure 2.5 does not work, in my opinion. It is not clear at all, and the choice of these three scenarios and pathways appear totally arbitrary at this point. It should be reconsidered. [Marco Mazzotti, Switzerland]
The figure has been removed in the SOD.
4869 21 1 21 16
Three different pathways have substantial differences in GDP/cap from 25 to 40 USD/cap . Implications of these differences on economic development and the ability to finance mitigation and adapatation actions are insufficiently adressed. (Linked to the role of energy to enable economic development) [Wilfried Maas, Netherlands]
The figure has been removed in the SOD.
14214 21 1 21 1
Figure 2.5 shows a dramatic increase in nuclear power. This need for nuclear power to work alongside wind, solar biofuels and CCS isn’t reflected in the text. While there are strategies for maintaining warming at 1.5oC that don’t involve nuclear, many of those strategies do. An exploration of how much nuclear has been contributing to carbon-free electricity (or at least very little carbon) and could continue to do so should be included in the text as it is in this figure. The first scenario includes an even contribution of nuclear power, and the second and third both show nuclear power quintupling over the projected period. Additionally, there’s the grey (baseline case) and black (scenario case), and the red-outlined cases all explained, the black outlines around white bars in the scenarios with no explanation, is it uncertainty? [Jason Donev, Canada]
Accepted - the white bars with black contour were depicting "empty placeholders". They were indeed not explained in the caption. However, due to restructuring of the chapter, the figure was now removed.
17464 21 3 C [Tom Gabriel Johansen, Norway] Noted
17504 21 3 C [Angela Morelli, Norway] Noted
Do Not Quote, Cite, or Distribute Page 57 of 129
IPCC WGI SR15 First Order Draft Review Comments And Responses - Chapter 2
Comment No From Page From Line To Page To Line Comment Response
525 21 16 21 16(1) Jacobson, M.Z., and M.A. Delucchi, A path to sustainable energy by 2030, Scientific American, November 2009; [Mark Jacobson, United States of America]
Noted
526 21 16 21 16
(2) Jacobson, M.Z., and M.A. Delucchi, Providing all Global Energy with Wind, Water, and Solar Power, Part I: Technologies, Energy Resources, Quantities and Areas of Infrastructure, and Materials, Energy Policy, 39, 1154-1169, doi:10.1016/j.enpol.2010.11.040, 2011; [Mark Jacobson, United States of America]
Noted
527 21 16 21 16
(3) Delucchi, M.Z., and M.Z. Jacobson, Providing all global energy with wind, water, and solar power, Part II: Reliability, System and Transmission Costs, and Policies, Energy Policy, 39, 1170-1190, doi:10.1016/j.enpol.2010.11.045, 2011; [Mark Jacobson, United States of America]
Noted
528 21 16 21 16
(4) Jacobson, M.Z., R.W. Howarth, M.A. Delucchi, S.R. Scobies, J.M. Barth, M.J. Dvorak, M. Klevze, H. Katkhuda, B. Miranda, N.A. Chowdhury, R. Jones, L. Plano, and A.R. Ingraffea, Examining the feasibility of converting New York State’s all-purpose energy infrastructure to one using wind, water, and sunlight, Energy Policy, 57, 585-601, 2013; [Mark Jacobson, United States of America]
Noted
529 21 16 21 16
(5) Jacobson, M.Z., M.A. Delucchi, A.R. Ingraffea, R.W. Howarth, G. Bazouin, B. Bridgeland, K. Burkhart, M. Chang, N. Chowdhury, R. Cook, G. Escher, M. Galka, L. Han, C. Heavey, A. Hernandez, D.F. Jacobson, D.S. Jacobson, B. Miranda, G. Novotny, M. Pellat, P. Quach, A. Romano, D. Stewart, L. Vogel, S. Wang, H. Wang, L. Willman, T. Yeskoo, A roadmap for repowering California for all purposes with wind, water, and sunlight, Energy, 73, 875-889, doi:10.1016/j.energy.2014.06.099; [Mark Jacobson, United States of America]
Noted
530 21 16 21 16
(6) Jacobson, M.Z., M.A. Delucchi, G. Bazouin, Z.A.F. Bauer, C.C. Heavey, E. Fisher, S. B. Morris, D.J.Y. Piekutowski, T.A. Vencill, T.W. Yeskoo, 100% clean and renewable wind, water, sunlight (WWS) all-sector energy roadmaps for the 50 United States, Energy and Environmental Sciences, 8, 2093-2117, doi:10.1039/C5EE01283J, 2015 [Mark Jacobson, United States of America]
Noted
531 21 16 21 16
(7) Jacobson, M.Z., M.A. Delucchi, G. Bazouin, M.J. Dvorak, R. Arghandeh, Z. A.F. Bauer, A. Cotte, G.M.T.H. de Moor, E.G. Goldner, C. Heier, R.T. Holmes, S.A. Hughes, L. Jin, M. Kapadia, C. Menon, S.A. Mullendore, E.M. Paris, G.A. Provost, A.R. Romano, C. Srivastava, T.A. Vencill, N.S. Whitney, and T.W. Yeskoo, A 100% wind, water, sunlight (WWS) all-sector energy plan for Washington State, Renewable Energy, 86, 75-88 2016; [Mark Jacobson, United States of America]
Noted
532 21 16 21 16
(8) Jacobson, M.Z., M.A. Delucchi, Z.A.F. Bauer, S.C. Goodman, W.E. Chapman, M.A. Cameron, Alphabetical: C. Bozonnat, L. Chobadi, H.A. Clonts, P. Enevoldsen, J.R. Erwin, S.N. Fobi, O.K. Goldstrom, E.M. Hennessy, J. Liu, J. Lo, C.B. Meyer, S.B. Morris, K.R. Moy, P.L. O’Neill, I. Petkov, S. Redfern, R. Schucker, M.A. Sontag, J. Wang, E. Weiner, A.S. Yachanin, 100% clean and renewable wind, water, and sunlight (WWS) all-sector energy roadmaps for 139 countries of the world, Joule, 1, doi:10.1016/j.joule.2017.07.005, 2017 [Mark Jacobson, United States of America]
Noted
524 21 16 21 16
The scenarios 1-3 proposed are unrealistic, in that they include CCS and growths in nuclear (at least in scenarios 2 and 3), when it is shockingly clear that CCS does not and is unlikely to exist at any usefl scale in the future and nuclear costs are so high and nuclear takes so long to implement that current projects have been abandoned (e.g., two South Carolina plants have stoped construction and the Georgia Vogtle plant may soon follow suit). The only nuclear growth at this time is in non-liberalized markets, and those don't make up for the ones being shut down. Most experts agree there is virtually no chance for nuclear to be helpful for solving the climate problem, particularly limiting to 1.5 warming. Further, scenarios do exist that should be citied in this report that do not require either CCS or nuclear to go to zero emissions in the energy sector, namely the following 8 papers involving dozens of authors: [Mark Jacobson, United States of America]
Taken into account - the scenarios shown here are illustrative and combined with the assessments of real-world policies in Chapter 4 their realism can be assessed. Including an exhaustive discussion of this topic is outside the scope of Chapter 2, as it would strongly overlap with other sections of the report. The additional references are appreciated and will be considered in the assessment of the energy system in the appropriate section in this chapter.
9940 22 8 22 14
I recommend to include in this paragraph some comments about the feasibility of the population projections considering that are far away from the scenario medium variant of the UNDESA World Population Prospects: The 2017 Revision. [Olga Alcaraz, Spain]
Accepted - the context of population projections has been provided in a bit more detail - although a detailed discussion of population for climate change mitigation falls outside the scope of a Special Report on 1.5°C
2470 22 8 22 22
It is vital to discuss population management. [Lisa Lucero, United States of America] Accepted - the context of population projections has been provided in a bit more detail - although a detailed discussion of population for climate change mitigation falls outside the scope of a Special Report on 1.5°C
6874 22 8 22 22
It would be appropriate to draw a key conclusion formt his paragraph that keeping population growth under control is one of the priorities for 1.5 consistent strategies. [Bert Metz, Netherlands]
Accepted - the context of population projections has been provided in a bit more detail - although a detailed discussion of population for climate change mitigation falls outside the scope of a Special Report on 1.5°C
14172 22 12 22 12Why just female? [Alexandre Strapasson, Brazil] Taken into account - future female educational attainment has shown to strongly influence
fertility rates
1554 22 14 22 16
GDP projection should be used with caution, explicitelly reminding everytime that climate-change damages are not accounted for in models. Also probably usefull to notice that GDP content varies strongly amongst scenarios, so that GDP cannot be considered as a well-being indicator. [Noé Lecocq, Belgium]
Accepted - this has been highlighted in the introduction of scenarios
16200 22 15 22 16 For context, it would help to give the current US per capita GDP. [Michael MacCracken, United States of America] Accepted - some points of reference have been included
912 22 19 22 19It's not clear what population growth proceeding along an emissions projection means. [David Infield, United Kingdom (of Great Britain and Northern Ireland)]
Editorial - this was a typo and has been clarified, also with an additional discussion on population projections
Do Not Quote, Cite, or Distribute Page 58 of 129
IPCC WGI SR15 First Order Draft Review Comments And Responses - Chapter 2
Comment No From Page From Line To Page To Line Comment Response
16201 22 19 22 2The text says emissions projections while parenthetical numbers are for rlobal population. Is the linkage really this clear? [Michael MacCracken, United States of America]
Editorial - this was a typo and has been clarified, also with an additional discussion on population projections
6875 22 24 22 35
Make clear this is a discussion on the "where" question (both in terms of sector coverage as well as in terms of which countries participate); actually this would require a much deeper discussion on equity and the limitations that a 1.5 objective puts on allowing certain countries to delay action. I don't find that discussion here or elsewhere however. [Bert Metz, Netherlands]
Noted and taken into account - the SOD has been edited to make this clearer. questions of equity are not within the scope of chapter 2, but rather fit in chapter 4.
1846 22 31 22 35
Besides these theoretical variations, there is a concrete legal provision by the Paris Agreement that a global stocktake will take place in 2023 when obviously the assessments from the AR6 can also be taken into account and then such a stocktake will be undertaken every five years thereafter. It would correspond to the “phase-in” variation (between 2020-2040), of course, if the Parties will be ready to raise their policy ‘ambitions’ in accordance with the AR6. Therefore, it would be relevant also to refer to the PA at the end of this paragraph. [Tibor Farago, Hungary]
Rejected - the context of the Paris Agreement is provided in Chapter 1. Here we list the variations found in the scenario ensemble available to the assessment.
7034 22 37 Here come the explanations of Fig 2.5, could they be given before the Fig? [Érika Mata, Sweden] Editorial - they can, although authors have little influence over final page setting
6876 22 48 28 12
Don't group the 50 and 66% probability studies together in discussing the implications for policy, as the resuclts for these different probability levels are very different (see my general comment on the issue for the chapter as a whole) [Bert Metz, Netherlands]
Accepted - a new pathway classification has been implemented
12873 22 49 Is it correct to start a sentence with a number? And other places. [Jorge Carrasco, Chile] Editorial
12103 22 52 22 55
Electrification is focused but it is unlikely to make contribution for maritime and aviation. Now sum of emission from these 2 sectors is 3.5% among world CO2 emission from combustion (by IEA) but it will increase to 6-10% in 2050. I recommend referring maritime and aviation [Takashi Hongo, Japan]
Accepted - aviation and shipping are discussed in the sector section on transport. Section 2.4
16202 22 56 22 57
Indeed, this is a result of having as a goal stabilizing at 1.5 C. In that this allows a quite challenging environment and legacy for society, we should really be aiming for 0.5 C or less, and then there would be an ongoing transition rather than the slower pace described here. Once the transition gets going, the pressure needs to be be kept on to get to a lower increase in global average temperature than 1.5 C. [Michael MacCracken, United States of America]
Taken into account - most scenarios currently included in the FOD do not stabilize, they overshoot 1.5°C and then slowly embark on a downward trajectory facilitated these aspects are now more explicitly discussed in a new section on scenarios which either overshoot or not
7193 23 Figure 2.6 what do the colors of the boxes mean? [Nico Bauer, Germany] Editorial - labels have been included in the top left panel
10440 23 25
figs 2.6, 2.7, 2.8 recall some in AR5 WGIII which were difficult to understand – I think they’re showing that something happens or needs to happen sooner rather than later. If these and 2.9, 2.10 etc are used in the SPM or in presentations the reader/audience will need to be led gently through them [Jonathan Lynn, Switzerland]
Noted
7310 23 23 Figure 2.6, the legend is missing. [Eleni Kaditi, Austria] Editorial - labels have been included in the top left panel
14379 23 1Figure 2.6: If the three scenarios are the same as in Fig 2.5, they should have the same colors. Are they? [JACEK PISKOZUB, Poland]
Taken into account - we have aimed at maintaining consistency in scenario colouring throughout the chapter
9813 23 1 24 31 Please include legends in the figures [Michel den Elzen, Netherlands] Editorial - labels have been included in the top left panel
9941 23 2 23 6In figure 2.6 there should be an indication of which one of the SSP scenarios represent each colour. [Olga Alcaraz, Spain] Editorial - The updated design and labels make this not relevant anymore
3312 23 5Quantify ‘stronger’ [Justin Bishop, United Kingdom (of Great Britain and Northern Ireland)] Taken into account - the quantifications requested here are provided in the following paragraphs
3313 23 6Quantify ‘faster’ in both instances [Justin Bishop, United Kingdom (of Great Britain and Northern Ireland)] Taken into account - the quantifications requested here are provided in the following paragraphs
16203 23 6 23 6 The phrase regarding electrification is not complete. [Michael MacCracken, United States of America] Editorial - corrected
913 23 6 23 6Although energy per capita is an important measure, surely total energy demand (which factors in population assumptions) is more directly linked to impact? [David Infield, United Kingdom (of Great Britain and Northern Ireland)]
Accepted - final energy demand is shown instead
10438 23 6 23 6 “a faster electrification of energy end use” not faster in electrification [Jonathan Lynn, Switzerland] Editorial - corrected
6526 23 1Figure 2.6: not only for this figure, need legends to understand easily what are the bars of different colors without reading captions. [Shigeki KOBAYAHI, Japan]
Editorial - labels have been included in the top left panel
1510 23 1 23 1 What are the bars showing in Figure 2.6? [Ken'ichi Matsumoto, Japan] Editorial - labels have been included in the top left panel
10843 23 1 23 11 Fig. 2.6: colours of the boxes remain unclear - legend to be added [Christian Breyer, Finland] Editorial - labels have been included in the top left panel
4766 23 1 23 11Figure 2.6: a legend should be added explaining to which category of scenarios correspond the yellow, blue and grey shaded bars. Alternatively, this could be explained in the title (as in Figure 2.7). [Elena Georgopoulou, Greece]
Editorial - labels have been included in the top left panel
6148 23 1 23 16
Figure 2.6 does not explain what grey, yellow and blue mean. This is the first time the SSP colouring is used: has this figure been moved from later in the document ? Anyway, colours and which is which need explaining. [Philip Sargent, United Kingdom (of Great Britain and Northern Ireland)]
Editorial - labels have been included in the top left panel
9548 23 1 23 16 Please illustrate color code of pillars in each graph, and pillars themseles [Shuzo Nishioka, Japan] Editorial - labels have been included in the top left panel
9575 23 1 23 16 Please illustrate color code of pillars in each graph, and pillars themseles [Shuzo Nishioka, Japan] Editorial - labels have been included in the top left panel
7035 23 1 23 16 What do the colors (grey, yellow, blue) represent in Fig 2.6? [Érika Mata, Sweden] Editorial - labels have been included in the top left panel
12983 23 1 23 16Fig 2.6 A legend for the three scenario is missing, what written in the first line of the caption of fig.2.7 could be ok (baseline - black.. Etc) [Caserini Stefano, Italy]
Editorial - labels have been included in the top left panel
Do Not Quote, Cite, or Distribute Page 59 of 129

IPCC WGI SR15 First Order Draft Review Comments And Responses - Chapter 2
Comment No From Page From Line To Page To Line Comment Response
13306 23 1 23 16
Figure 2.6: the meaning of the colours (grey, yellow, blue) do not appear to be not explained… (? baseline, 1.5, and 2); label sub-plots a-d for consistency with other figures in chapter; [Jordan Harold, United Kingdom (of Great Britain and Northern Ireland)]
Editorial - labels have been included in the top left panel
9495 23 1 23 17 Figure 2.6: There is no legend which shows 1.5C, 2.0C, and baseline. [Masato TAKAGI, Japan] Editorial - labels have been included in the top left panel
5167 23 1 23 17Figure 2.6: Add information how many difference scenarios have been included for each model - database unclear [Sven Teske, Australia]
Taken into account - a report annex is being proposed which documents the scenarios available in the database and to the assessment
5168 23 1 23 17Figure 2.6: Add figure with energy intensity in [MJ/$GDP] in order to make different assumptions transparent [Sven Teske, Australia]
Rejected - this figures shows a different decomposition
10978 23 11 23 16
Would like to discuss the presentation of this type of information. A recommendation of the Expert Meeting was to make more use of deep dives into marker/archetype scenarios and I am missing that here. I am not sure what value policymakers get out of this diagran with huge ranges for every variable. [Skea Jim, United Kingdom (of Great Britain and Northern Ireland)]
Taken into account - such deep dives will also be available. Not every figure is a deep dive. Section 2.4 will provide deep dives. Policymakers should get the general trends from these large ranges.
12823 23 12 Colors of bars, and definition of whiskers not explained [Thomas Stocker, Switzerland] Editorial - labels have been included in the top left panel
17465 23 12 A [Tom Gabriel Johansen, Norway] Noted
12874 23 12 Figure 2.6. Indicate meaning of the colours, cross bars and dot lines. [Jorge Carrasco, Chile] Editorial - labels have been included in the top left panel
17505 23 12 A [Angela Morelli, Norway] Noted
3314 23 12 What do the colours mean in Fig 2.6? [Justin Bishop, United Kingdom (of Great Britain and Northern Ireland)] Editorial - labels have been included in the top left panel
12735 23 12 23 12A legend should be added describing the colours of the bars (I guess grey=baseline, yellow=2degree, blue=1.5 degree). Also mention in the caption (?) [Vassilis Daioglou, Netherlands]
Editorial - labels have been included in the top left panel
11912 23 12 23 16 The legend doesn't include an explanation of the colours used in the graphs. [Amandine Denis-Ryan, Australia] Editorial - labels have been included in the top left panel
14322 23 12 23 16 The color code is missing. [Serge PLANTON, France] Editorial - labels have been included in the top left panel
3315 23 18 Change ‘are’ to ‘is’ [Justin Bishop, United Kingdom (of Great Britain and Northern Ireland)] Editorial - corrected
533 23 18 23 18
Electrifying the world's energy and providing that electricity with 100% clean, renewable wind, water, and solar power reduces end-use power (and energy) demand world wide by ~42.5%, with approximately 12.6% due to the elimination of mining/transporting/refining fossil fuels, 23% due to the efficiency of electricity over combustion, and ~6.9% due to additional end-use energy efficiency improvements beyond BAU (Jacobson, M.Z., M.A. Delucchi, Z.A.F. Bauer, S.C. Goodman, W.E. Chapman, M.A. Cameron, Alphabetical: C. Bozonnat, L. Chobadi, H.A. Clonts, P. Enevoldsen, J.R. Erwin, S.N. Fobi, O.K. Goldstrom, E.M. Hennessy, J. Liu, J. Lo, C.B. Meyer, S.B. Morris, K.R. Moy, P.L. O’Neill, I. Petkov, S. Redfern, R. Schucker, M.A. Sontag, J. Wang, E. Weiner, A.S. Yachanin, 100% clean and renewable wind, water, and sunlight (WWS) all-sector energy roadmaps for 139 countries of the world, Joule, 1, doi:10.1016/j.joule.2017.07.005, 2017). [Mark Jacobson, United States of America]
Noted
7435 23 18 23 19
Consider more elaboration on the nature of the energy demand reductions. The nature of energy demand reductions is of great policy relevance. Primary energy demand will fall from BAU levels simply because of electrification of society. Jacobsen et al (Jacobson et al., Joule 1, 1–14 September 6, 2017a 2017 Elsevier Inc. http://dx.doi.org/10.1016/j.joule.2017.07.005) estimate that this effect is in the order of a 42,5 % reduction in primary energy demand by 2050 (although within their own scenario modelling). Demand reductions in the models that come about as a consequence of climate mitigation rather than as a mitigation measure actively pursued should be described. This will help policymakers to make efficient policy. [Øyvind Christophersen, Norway]
Taken into account - here the overall picture is provided, while the sectorial subsections in Section 2.4 provide deeper dives for the energy, transport, buildings, industry and AFOLU sectors. Demand reductions are covered there.
10439 23 18 23 28 “energy demand reduction is” or “energy demand reductions are” [Jonathan Lynn, Switzerland] Editorial - has been corrected
3162 23 18 23 3
This discussion of energy demand reductions (efficiency improvements and fuel switching??) does not make it clear whether all these ranges of numbers are for different models, different scenarios, or different sets of input assumptions. For example, it does not state whether or not these numbers are results from models, or input assumptions. Either way this section should explain how they are computed, and key assumptions input to their calculation. Also, are any of the incremental costs for these higher efficiency technologies included in the models? (My understanding is that they are input assumptions for different scenarios, which may differ between different IAMs relied on for this report.) Thus, in general, the report needs to describe and justify the basis for these numbers. [Richard Rosen, Germany]
Taken into account - First, the FOD figure 2.6 has now been updated to also report the # of scenarios and contributing modelling frameworks per class.
3316 23 19How much smaller? [Justin Bishop, United Kingdom (of Great Britain and Northern Ireland)] The size reductions are discussed in the body of this paragraph where various levels of final
energy demand are provided
4767 23 19 23 19 Perhaps 'less challenging" instead of "smaller". [Elena Georgopoulou, Greece] Rejected - "smaller" is precisely what is meant here.
14215 23 2 23 22
This sentence is awkward and should be broken into 2 or more sentences. Additionally, the idea behind it is quite strange, is this in absolute numbers or relative numbers? Could an example be given? “Energy demand reductions are particularly important because end-use efficiency improvements are able to leverage upstream energy reductions which can be several times to an order of magnitude larger than the initial end-use demand reduction.” Sentences before and after may need to be re-written as well. [Jason Donev, Canada]
Accepted - the sentence has been edited and the next sentence already provides an example
3317 23 22 An example would be useful here. [Justin Bishop, United Kingdom (of Great Britain and Northern Ireland)] Taken into account - the example of lighting is provided
17220 23 25 23 25 Delete the last 's' in 'assessments' to make it 'assessment' [Himangana Gupta, India] Editorial
Do Not Quote, Cite, or Distribute Page 60 of 129
IPCC WGI SR15 First Order Draft Review Comments And Responses - Chapter 2
Comment No From Page From Line To Page To Line Comment Response
7036 23 27 28
Good if we could see sectoral and geographic values for these 20and 30% reductions, but I guess they may be given later on in the SR. [Érika Mata, Sweden]
Taken into account - sectoral values are provided further in the sector sections of this chapter. Due to constraints of scope and number of pages, not much space can be dedicated to regional details
13183 23 29 3Here and in other sections of the chapter, authors can consider comparing the projections with data from 2015 instead of 2010 or earlier since this is a rather outdated base year. [Deger Saygin, Turkey]
Taken into account - here a 2010 reference year is provided as this data is available from the submitted scenario data.
13184 23 29 3 Please clarify whether non energy uses are also included. [Deger Saygin, Turkey] Rejected - it is unclear what is meant with non energy uses of energy
12736 23 3 23 3Make it clear that the absolute energy demand numbers quoted here are for a 1.5 scenario [Vassilis Daioglou, Netherlands] Taken into account - this has been clarified
9942 23 3 24 4In figure 2.8 there should be an indication of which one of the SSP scenarios represent each colour. [Olga Alcaraz, Spain] Rejected - this figure has been removed
11126 24Figure 2.8: Suggest to include a legend to the graph (colors associated to bar) in addition to caption. [Michiel Schaeffer, Netherlands]
Accepted - a legend has been added
4529 24 Fig 2.7 - Add index format to "Wm-2" (2x) [Radim Tolasz, Czech Republic] Rejected - this figure has been removed
13307 24 1 24 11Figure 2.7: explain meaning of colour (black, green, blue) in plots, e.g. in a legend. Colour for baseline, 1.5 and 2 should be consistent throughout the report's plots. [Jordan Harold, United Kingdom (of Great Britain and Northern Ireland)]
Rejected - this figure has been removed
13308 24 1 24 11
Figure 2.7: for Panel b - data marks at top of plot may not be noticed against border of plot - could remove top and right hand borders of the plot or extend the y-axis range upwards. [Jordan Harold, United Kingdom (of Great Britain and Northern Ireland)]
Rejected - this figure has been removed
13309 24 1 24 11Figure 2.7: Explain which part of the box plot relates to min and max. [Jordan Harold, United Kingdom (of Great Britain and Northern Ireland)]
Rejected - this figure has been removed
13310 24 1 24 11Figure 2.7: Explain colour of dots in legend in the plot (rather than in caption text, where it may not easily be found) [Jordan Harold, United Kingdom (of Great Britain and Northern Ireland)]
Rejected - this figure has been removed
17466 24 3 A [Tom Gabriel Johansen, Norway] Editorial
17506 24 3 A [Angela Morelli, Norway] Editorial
3318 24 3Colours should be consistent across Fig 2.6 and Fig 2.7 if the boxes represent similar warming limits. [Justin Bishop, United Kingdom (of Great Britain and Northern Ireland)]
Rejected - this figure has been removed
534 24 3 24 3
There is no information in this figure caption about what the demand reductions are due to. Do the demand reductions account for the factors in the comment above (efficiency of electricity, eliminating energy in fossil fuel extraction/transport/refining), which were first identified in Jacobson, M.Z., and M.A. Delucchi, A path to sustainable energy by 2030, Scientific American, November 2009 and Jacobson, M.Z., and M.A. Delucchi, Providing all Global Energy with Wind, Water, and Solar Power, Part I: Technologies, Energy Resources, Quantities and Areas of Infrastructure, and Materials, Energy Policy, 39, 1154-1169, doi:10.1016/j.enpol.2010.11.040, 2011. [Mark Jacobson, United States of America]
Taken into account - This figure indeed shows macro indicators of overall energy demand. The sector sections on building, transport, energy, and industry further in this chapter look into more detail in the demand issues
12876 24 1IMAGE model, MESSAGE-GLOBIOM model and REMIND-MAgPIE model need to be described some how [Jorge Carrasco, Chile]
Rejected - this figure has been removed
6361 24 13 24 28
It would be helpful if this para could provide a clearer link back to the finding about how much non-CO2 warming reduces the carbon budget - use this to demonstrate why and to what extent reduction of non-CO2 emissons from agriculture (which is the biggest source after taking out fossil methane) is a critical element of achieving 1.5 degrees. Then talk about how those reductions could be achieved (supply and demand side). [Andy Reisinger, New Zealand]
Taken into account - a reference has been made to the influence of non-CO2 emissions on the remaining carbon budget
10239 24 13 24 28
with respect to mitigation challenges it is worth mentioning the impact of land/agriculture practices on the sea basins, coasts and global oceas in reducing the level of emissions. [Mendas Zrinka, United Kingdom (of Great Britain and Northern Ireland)]
Rejected - the impact of mitigation pathways on the environment is part of the Chapter 3 assessment. As no reference is provided here by the reviewer it is unclear what can be included in Chapter 2.
6634 24 13 24 31The role of transformation of many coastal ecosystems (human transformation but also the changes promoted by the relative sea-level oscillations) may be another important further aspect to be considered. [Castor Muñoz Sobrino, Spain]
Rejected - the discussion of coastal ecosystems and their transformation for reasons other than climate change mitigation would be outside the scope of this chapter
3163 24 13 24 28
Similarly, this section on the agricultural and land-use aspects of 1.5 degree scenarios must include how non-overshoot scenarios are affected by these issues. Furhermore, the different ways that different IAMs model land-use and agriculture must be discussed to the extent that these different modeling approaches affect major greenhouse gas emissions. The authors might want to focus on the model results that they believe are most credible in order to give policy makers better guidance regarding the importance of policies dealing with these issues. In general, Chapter 2 does not really give policy makers much guidance as to WHAT POLICY CHOICES THEY FACE OVER THE NEXT 10-15 YEARS, and how and to what extent all this modeling work as described can help them evaluate their choices, and when they need to make these decisions. [Richard Rosen, Germany]
Accepted - the SOD now includes a dedicated section on overshoot and non-overshoot. A further dedicated sector section speaks to the land-use and agricultural aspects of the transformation.
3319 24 16How much CO2 is attributed to food and feed production? [Justin Bishop, United Kingdom (of Great Britain and Northern Ireland)]
Rejected - we have not been able to extract these exact numbers from the available data
12738 24 18 24 28
As shown in fig 2.8 (left panel), there are few scenarios that show forest area reduction AND attainment of the 1.5 target. These should at least be mentioned in the text, highlighting that these scenarios probably assume greater (extreme) reductions in agricultural emissions and/or significant use of BECCS/CDR (?) [Vassilis Daioglou, Netherlands]
Accepted - these details, however, are highlighted in section 2.4.6
Do Not Quote, Cite, or Distribute Page 61 of 129
IPCC WGI SR15 First Order Draft Review Comments And Responses - Chapter 2
Comment No From Page From Line To Page To Line Comment Response
6362 24 21 24 24
This sentence is confusing - current text says you can expand forest cover and reduce ag emissions, or you can not expand forest cover and decrease ag emissions only a little - all compatible with 1.5 degrees. Which is true, but presumably in the latter case, the CO2 budget compatible with 1.5 degrees would be a lot smaller (otherwise, why does it make no difference if forest cover increases or not, or if ag emissions are reduced strongly or only a little?). The key point is that there are a lot of alternative pathways for the AFOLU sector, but choices in the AFOLU sector have a strong interplay with consequences for CO2 emissions budget from fossill fuels. This is important to bring out. The question of "how much is it worth if we could reduce agricultural GHG emissions by X%", or "how much do agricultural GHG emissions have to be reduced to be compatible [not incompatible] with a 1.5 degree goal" is very important for folks dealing with climate change and food security (and that's a lot of people and policies!). This chapter could provide a key service to those discussions by clarifying the interplay between sectors (i.e. there are no absolute answers, but here is the change in carbon budget, and here is the additional mitigation cost, if agriculture does or doesn't reduce its emissions by a given amount relative to baselines). [Andy Reisinger, New Zealand]
Taken into account - the link to the carbon budget is a valuable one and is now highlighted in the paragraph. However, a more detailed discussion of this topic up to the level of sectorial mitigation costs currently seems to be outside the scope of this assessment.
3320 24 22 Quantify ‘strongly’ [Justin Bishop, United Kingdom (of Great Britain and Northern Ireland)] Taken into account
6363 24 25 24 25
very hard to eliminate: this is for current technological options. Please make clear to what extent this is contingent on exogenously set technologies in IAMs, and the potential for RD&D to generate abatement potential that may make these emissions easier to abate in future. Examples are methane and soil N2O inhibitors currently under development but not included in any of the models to my knowledge. Noting that for methane at least, even if a technology comes on board only in 2040 or 2050 it would still make a substantial contribution to reducing peak warming and warming by 2100, given the short lifetime of CH4. [Andy Reisinger, New Zealand]
Taken into account - It has been highlighted that this depends on the current state of technology
17221 24 26 24 28
The link between food wastage and reduction of demand for intensive foods is not clear as they are two separate issues. Generating new varieties for less GHG intensive crops is an issue for scientists, but limiting food wastage would be a lifestyle change. It is unrealistinc to think that more than half of the world's population will switch over their staple food from rice (GHG intensive crop) to other foods. [Himangana Gupta, India]
Accepted - These are two separate issues indeed, linked, however, by the fact that the food being wasted is related to the types of food that are being consumed. The comparison of transitions identified in integrated scenarios are compared to real-world policies and barriers in Chapter 4 . A link to Chapter 4 has been included.
2205 24 27 24 27healthier and more sustainable is inexact language that should be avoided. User more informative description. [Kenneth Möllersten, Sweden]
Taken into account - references to key papers on this topic have been included.
14216 24 27 24 28
This sentence doesn’t make sense as written: “Limiting demand for greenhouse gas-intensive foods is thus a key through shifts to healthier and more sustainable diets and lifestyles that limit food waste (Popp et al. 2017).” [Jason Donev, Canada]
Accepted - the sentence has been edited
20267 24 3 24 31 Right panel, y axis, replace "emis" with "emissions" [Aaron Glenn, Canada] Accepted - has been replaced
13311 24 3 25 4Figure 2.8: Explain colours (grey, yellow, blue) in a legend, so to avoid reader having to locate fig 2.17 to understand these. [Jordan Harold, United Kingdom (of Great Britain and Northern Ireland)]
Accepted - a legend has been added
12875 24 31Figure 2.8. Indicate meaning of the colours, cross bars and dot lines. If data plotted in Figures 2.6, 2.7 and 2.8 are similar them maybe it would be good to keep the same colours [Jorge Carrasco, Chile]
Accepted - a legend has been added
4530 25 Fig 2.8 - Add index format to "CH4" and "N2O" [Radim Tolasz, Czech Republic] Editorial
12824 25 1 Colors of bars, and definition of whiskers not explained [Thomas Stocker, Switzerland] Editorial - figures have been
17467 25 1 A [Tom Gabriel Johansen, Norway] Noted
17507 25 1 A [Angela Morelli, Norway] Noted
7311 25 1 25 4 Correct text in order to make reference to Figure 2.6 and not 2.17. [Eleni Kaditi, Austria] Accepted and corrected
14380 25 4“ Highlighted archetypes are colour-coded in the same way as in Figure 2.17.” No, they aren’t. [JACEK PISKOZUB, Poland] Editorial - consistency between figures has been ensured as much as possible and will be
further improved in the next iteration
6487 25 4 25 4 Colour code should be included here rather than with a later figure [Roger Bodman, Australia] Editorial
20397 25 4 25 4 Colors: we have not yet come across figure 2.17 at this point, so please define. [Olivier Boucher, France] Editorial
1511 25 4 25 4 Figure 2.17 in the figure caption may be wrong. [Ken'ichi Matsumoto, Japan] Accepted and corrected
14323 25 4 25 4 A priori "2.6" rather than "2.17". [Serge PLANTON, France] Accepted and corrected
4768 25 6 25 6
It would be useful to mention here (or somewhere else in section 2.3) to what extent the overall effecrt of currently defined NDCs specified under the Paris Agreement deviate from 1.5 oC scenarios in terms of energy demand reduction etc. [Elena Georgopoulou, Greece]
Taken into account - This information is included in section 2.5, and in a specific cross-chapter box on NDC, but only for emissions. No studies are known to the authors which would provide sufficient information with regard to the energy demand reductions of NDCs
7037 25 16 17
Could one provide a more detailed description of how IAMs (e.g. those listed in table 2.1 which is to be updated) include supply and demand mitigation options and required further work to improve this schematic description? Again, this is a key requirement for coordinated bottom-up studies (I understand that this point may be further developed in Chapter 4). [Érika Mata, Sweden]
Taken into account - while this is an important aspect, it is not central to the question of 1.5°C and would rather be an aspect covered in the AR6
20398 25 18 25 18 option => options [Olivier Boucher, France] Editorial
12739 25 18 25 18 …these mitigation technology options or "…this mitigation technology option." [Vassilis Daioglou, Netherlands] Editorial
15679 25 19 25 22
This is a false assertion. Many of the IAMS and scenarios are premised on deployment of CDR technologies such as CCS and BECCS. The following Table 2.5 actually belies this as it presents heavy reliance on CDR technologies as part of the supply-side and demand-side equation. [Elenita Daño, Philippines]
Rejected - this comment mixes IAMs with scenarios. The assertion in this sentence is correct. IAMs cover most of the supply-side mitigation options. This does not mean, however, that the scenarios they create cover all possible outcomes. This would require a structured variation of scenario design parameters.
Do Not Quote, Cite, or Distribute Page 62 of 129
IPCC WGI SR15 First Order Draft Review Comments And Responses - Chapter 2
Comment No From Page From Line To Page To Line Comment Response
15432 25 19 25 22
This is a false assertion. Many of the IAMS and scenarios are premised on deployment of CDR technologies such as CCS and BECCS. The following Table 2.5 actually belies this as it presents heavy reliance on CDR technologies as part of the supply-side and demand-side equation. [Elenita Daño, Philippines]
Rejected - this comment mixes IAMs with scenarios. The assertion in this sentence is correct. IAMs cover most of the supply-side mitigation options. This does not mean, however, that the scenarios they create cover all possible outcomes. This would require a structured variation of scenario design parameters.
7939 25 2 25 22
Please differentiate, CDR options are not equally speculative. On the other hand, demand-side options could also be quite speculative, as the rebound effect reported for energy efficieny measures has proven (e.g. Lambin and Meyfroidt 2011, Erb 2012). [Jasmin Kemper, United Kingdom (of Great Britain and Northern Ireland)]
Taken into account - the revised draft includes a dedicated section (subsection of 2.3) on carbon-dioxide removal in which this is elaborated. This statement has also been modified to clarify this variation.
20399 25 21 25 21Since they are speculative, they could well be "over-included" rather than "partially included" in the IAMs. [Olivier Boucher, France]
Noted
4169 26
Table 2.5: Energy demand reductions could also include technological innovations within the energy sector to make energy production more sustainable, using fewer resources and/or using resources more efficiently. For example, one new proposal in the nuclear space is the Advanced Fuel CANDU Reactor which would take current fuel waste and recycle it to operate the reactor thereby minimizing the waste footprint even further and making better use of resources thereby providing more sustainable energy. [Michelle Leslie, Canada]
Accepted - this suggestion has now been included as "Technological energy production innovations that improve sustainability and efficiency (e.g. advanced nuclear reactor designs)"
7038 26
Table 2.5 (at least the parts related to Buildings) is extremely schematic and raises many questions. E.g. energy demand reductions via energy efficiency improvements: why only "appliances in buildings" is mentioned? Is it the only measure represented in IAMs, or the only the authors can think of? Either A or B, many clarifications are needed. What about the other options? The same applies to "Electrification of demand/Buildings: Heat pumps, electric stoves...": are the authors hopefully thinking of giving a comprehensive list that includes all options? Finally, bottom up research for EU shows that measures addressing electricity use in buildings are rather complex, may even not result in energys savings (specially if DSM shifting heating loads is involved), and may not lead to reduced emissions if the electrical mix is more emissive than the heating mix. (Mata É, Sasic Kalagasidis A, Johnsson F. Energy savings and CO2 emission reductions from building retrofitting in five European countries – Modelling and review of estimates (in review); Nyholm E, Puranik S, Mata É, Odenberger M and Johnsson J, Demand response potential of electrical space heating in Swedish single family dwellings, Building and Environment (2016) 96: 270-282.) [Érika Mata, Sweden]
Noted and taken into account - the table includes appliances in buildings, insulation of buildings, reduced floor space, infrastructure and building configuration. The aim of the table is not to give a comprehensive list, although suggestions by expert reviewers are always welcome.
6784 26Why are syntethic fuels from CO2 in the atmosphere and renewable energy not included? [Arnulf Jaeger-Waldau, Italy] Taken into account - these options are considered under the label "Power-to-gas,
methanisation, synthetic hydrocarbons"
6785 26CCS for power plants is still not in commrcial use. What is the reasoning that this will change? [Arnulf Jaeger-Waldau, Italy] This table does not provide such reasoning. It rather documents measures which are typically
included in the pathways assessed in this chapter.
13185 26
This table seems key, but its purpose is not fully clear. Is this perhaps a list of options included in the assessment presented in this chapter? For instance, white color means the option is excluded from IAMs, however, some of these mitigation options seem to be taken into account in the chapter. Yellow color means options have not been necessarily assessed. Does this mean that it is definitely excluded? These could be made clearer. Another option to present this table could be to only list the options included. [Deger Saygin, Turkey]
Editorial - the table layout has been improved for clarity
6786 26CO2 removal with chemical solvents: What are the environmantal impacts and the Co2 balance? [Arnulf Jaeger-Waldau, Italy]
This chapter does not provide a technology specific assessment of mitigation options.
13186 26 What is 'other demand reductions'? [Deger Saygin, Turkey] Taken into account - the table now contains more specific examples
2784 26Table 2.5 is confusing. Reading across columns in a given row does not make sense. Leave space between the columns to indicate that they are distince. [Erik Haites, Canada]
Editorial - the table layout has been improved for clarity
20193 26Table 2.5; ad DAC - Direct air capture of CO2 using chemical solvents and subsequent storage [Ton Wildenborg, Netherlands]
Accepted - has been included
6953 26 26
Table 2.5Under heading “Decarbonization of non-electric fuels”, also a “Nuclear process heat” should be included - in white background. E.g. in IEA Energy Technologies Perspectives 2017 (e.g. pp 295-296 of IEA ETP 2017) it is stated that nuclear process heat is not included in the analysis; however, ongoing work on nuclear reactor development would facilitate such option which is acknowledged in IEA ETP 2017. Ergo, it should be included in the table.Reduction of emission from maritime freight should be included here as the maritime freight is responsible for few per cents of global CO2 emissions. One of the mitigation options should include nuclear powered crafts, which are already in small use. This is not yet included in analysis, as is noted in Box 5.6 of IEA ETP2017, however its omission should be noted here. [Ville Tulkki, Finland]
Accepted - Nuclear process heat has been included in the table as an option not typically represented in integrated scenarios
20300 26 26 Table 2.5: Use rather more general expression "Ocean energy" instead of "Tidal energy" [Marine Gorner, France] Accepted - the term has been updated
20301 26 26Table 2.5: Fuel switching among fossil fuels from coal or oil to gas not considered, because this measure is already occurring in 2 degree scenarios? [Marine Gorner, France]
Taken into account - Fuel switching has now been included. Measures already being included in 2°C scenarios are not excluded from this table.
3885 26 27This is a very important table (2.5) and I hope that a comprehensive list of all options and technologies would be included. Now the table seems unfinished. [Sanna Syri, Finland]
Taken into account - the aim of the table is not to be fully exhaustive although any suggestions by expert reviewers will be considered and can be included
Do Not Quote, Cite, or Distribute Page 63 of 129
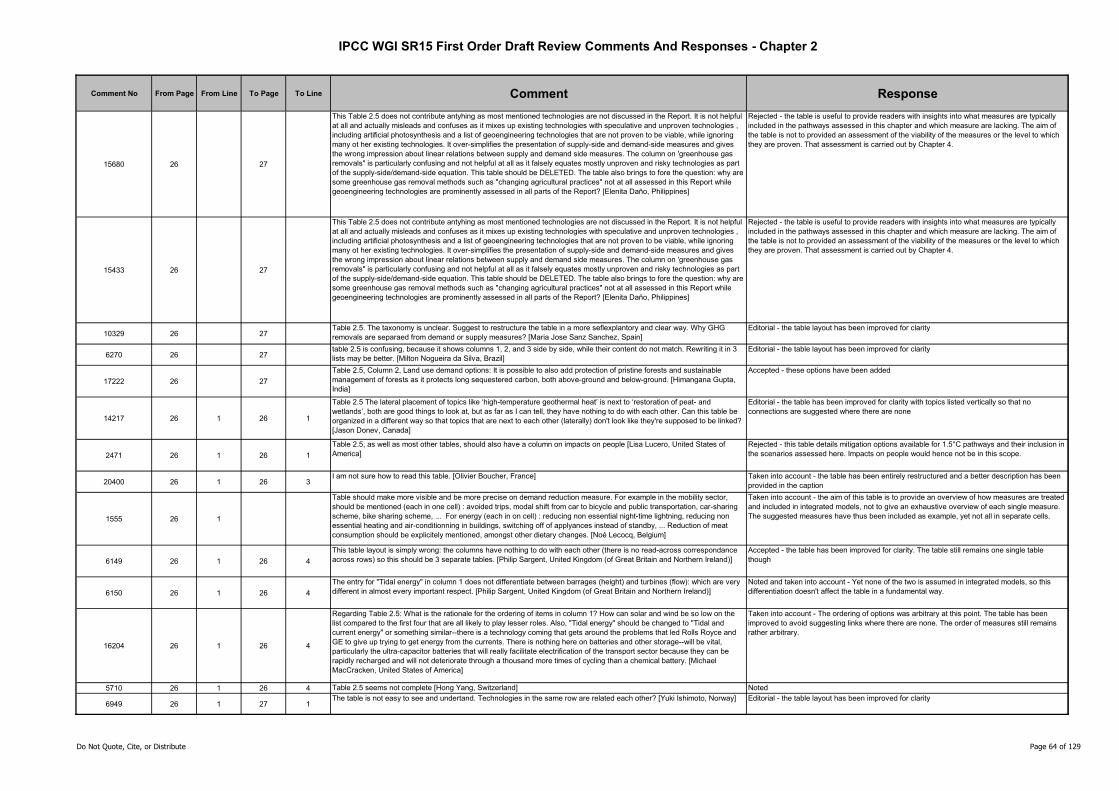
IPCC WGI SR15 First Order Draft Review Comments And Responses - Chapter 2
Comment No From Page From Line To Page To Line Comment Response
15680 26 27
This Table 2.5 does not contribute antyhing as most mentioned technologies are not discussed in the Report. It is not helpful at all and actually misleads and confuses as it mixes up existing technologies with speculative and unproven technologies , including artificial photosynthesis and a list of geoengineering technologies that are not proven to be viable, while ignoring many ot her existing technologies. It over-simplifies the presentation of supply-side and demand-side measures and gives the wrong impression about linear relations between supply and demand side measures. The column on 'greenhouse gas removals" is particularly confusing and not helpful at all as it falsely equates mostly unproven and risky technologies as part of the supply-side/demand-side equation. This table should be DELETED. The table also brings to fore the question: why are some greenhouse gas removal methods such as "changing agricultural practices" not at all assessed in this Report while geoengineering technologies are prominently assessed in all parts of the Report? [Elenita Daño, Philippines]
Rejected - the table is useful to provide readers with insights into what measures are typically included in the pathways assessed in this chapter and which measure are lacking. The aim of the table is not to provided an assessment of the viability of the measures or the level to which they are proven. That assessment is carried out by Chapter 4.
15433 26 27
This Table 2.5 does not contribute antyhing as most mentioned technologies are not discussed in the Report. It is not helpful at all and actually misleads and confuses as it mixes up existing technologies with speculative and unproven technologies , including artificial photosynthesis and a list of geoengineering technologies that are not proven to be viable, while ignoring many ot her existing technologies. It over-simplifies the presentation of supply-side and demand-side measures and gives the wrong impression about linear relations between supply and demand side measures. The column on 'greenhouse gas removals" is particularly confusing and not helpful at all as it falsely equates mostly unproven and risky technologies as part of the supply-side/demand-side equation. This table should be DELETED. The table also brings to fore the question: why are some greenhouse gas removal methods such as "changing agricultural practices" not at all assessed in this Report while geoengineering technologies are prominently assessed in all parts of the Report? [Elenita Daño, Philippines]
Rejected - the table is useful to provide readers with insights into what measures are typically included in the pathways assessed in this chapter and which measure are lacking. The aim of the table is not to provided an assessment of the viability of the measures or the level to which they are proven. That assessment is carried out by Chapter 4.
10329 26 27Table 2.5. The taxonomy is unclear. Suggest to restructure the table in a more seflexplantory and clear way. Why GHG removals are separaed from demand or supply measures? [Maria Jose Sanz Sanchez, Spain]
Editorial - the table layout has been improved for clarity
6270 26 27table 2.5 is confusing, because it shows columns 1, 2, and 3 side by side, while their content do not match. Rewriting it in 3 lists may be better. [Milton Nogueira da Silva, Brazil]
Editorial - the table layout has been improved for clarity
17222 26 27
Table 2.5, Column 2, Land use demand options: It is possible to also add protection of pristine forests and sustainable management of forests as it protects long sequestered carbon, both above-ground and below-ground. [Himangana Gupta, India]
Accepted - these options have been added
14217 26 1 26 1
Table 2.5 The lateral placement of topics like ‘high-temperature geothermal heat’ is next to ‘restoration of peat- and wetlands’, both are good things to look at, but as far as I can tell, they have nothing to do with each other. Can this table be organized in a different way so that topics that are next to each other (laterally) don't look like they're supposed to be linked? [Jason Donev, Canada]
Editorial - the table has been improved for clarity with topics listed vertically so that no connections are suggested where there are none
2471 26 1 26 1
Table 2.5, as well as most other tables, should also have a column on impacts on people [Lisa Lucero, United States of America]
Rejected - this table details mitigation options available for 1.5°C pathways and their inclusion in the scenarios assessed here. Impacts on people would hence not be in this scope.
20400 26 1 26 3I am not sure how to read this table. [Olivier Boucher, France] Taken into account - the table has been entirely restructured and a better description has been
provided in the caption
1555 26 1
Table should make more visible and be more precise on demand reduction measure. For example in the mobility sector, should be mentioned (each in one cell) : avoided trips, modal shift from car to bicycle and public transportation, car-sharing scheme, bike sharing scheme, ... For energy (each in on cell) : reducing non essential night-time lightning, reducing non essential heating and air-conditionning in buildings, switching off of applyances instead of standby, ... Reduction of meat consumption should be explicitely mentioned, amongst other dietary changes. [Noé Lecocq, Belgium]
Taken into account - the aim of this table is to provide an overview of how measures are treated and included in integrated models, not to give an exhaustive overview of each single measure. The suggested measures have thus been included as example, yet not all in separate cells.
6149 26 1 26 4
This table layout is simply wrong: the columns have nothing to do with each other (there is no read-across correspondance across rows) so this should be 3 separate tables. [Philip Sargent, United Kingdom (of Great Britain and Northern Ireland)]
Accepted - the table has been improved for clarity. The table still remains one single table though
6150 26 1 26 4
The entry for "Tidal energy" in column 1 does not differentiate between barrages (height) and turbines (flow): which are very different in almost every important respect. [Philip Sargent, United Kingdom (of Great Britain and Northern Ireland)]
Noted and taken into account - Yet none of the two is assumed in integrated models, so this differentiation doesn't affect the table in a fundamental way.
16204 26 1 26 4
Regarding Table 2.5: What is the rationale for the ordering of items in column 1? How can solar and wind be so low on the list compared to the first four that are all likely to play lesser roles. Also, "Tidal energy" should be changed to "Tidal and current energy" or something similar--there is a technology coming that gets around the problems that led Rolls Royce and GE to give up trying to get energy from the currents. There is nothing here on batteries and other storage--will be vital, particularly the ultra-capacitor batteries that will really facilitate electrification of the transport sector because they can be rapidly recharged and will not deteriorate through a thousand more times of cycling than a chemical battery. [Michael MacCracken, United States of America]
Taken into account - The ordering of options was arbitrary at this point. The table has been improved to avoid suggesting links where there are none. The order of measures still remains rather arbitrary.
5710 26 1 26 4 Table 2.5 seems not complete [Hong Yang, Switzerland] Noted
6949 26 1 27 1The table is not easy to see and undertand. Technologies in the same row are related each other? [Yuki Ishimoto, Norway] Editorial - the table layout has been improved for clarity
Do Not Quote, Cite, or Distribute Page 64 of 129
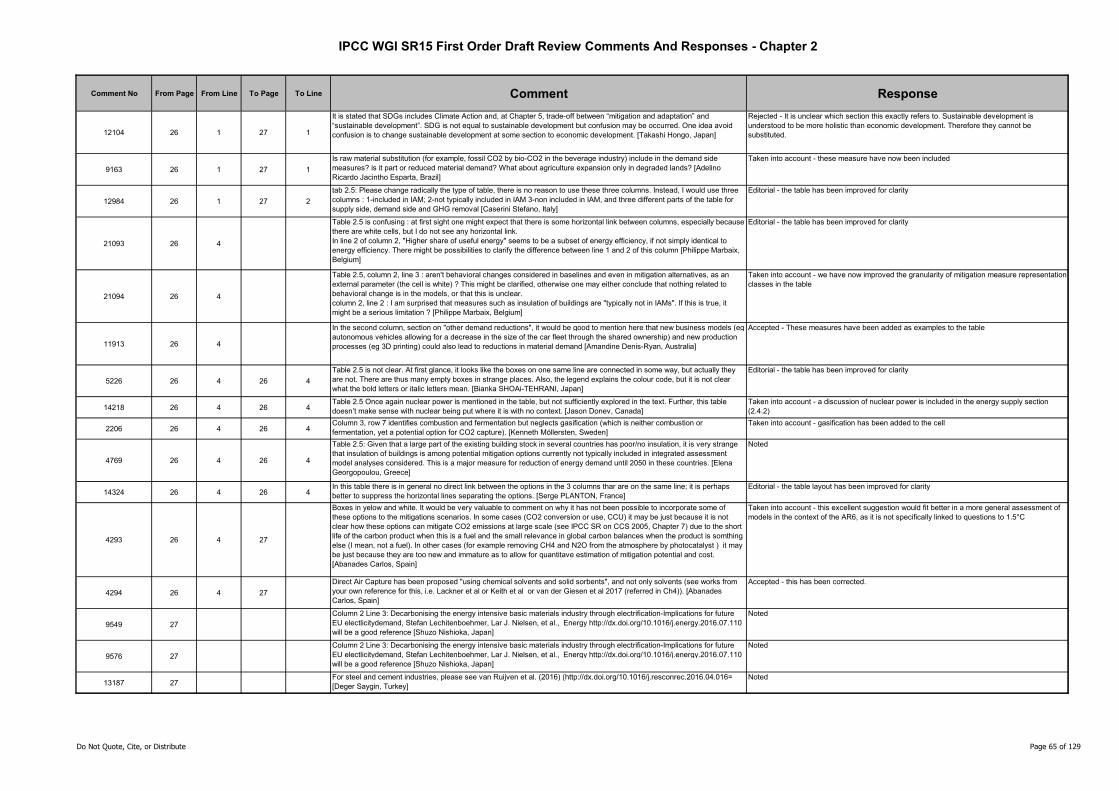
IPCC WGI SR15 First Order Draft Review Comments And Responses - Chapter 2
Comment No From Page From Line To Page To Line Comment Response
12104 26 1 27 1
It is stated that SDGs includes Climate Action and, at Chapter 5, trade-off between “mitigation and adaptation” and “sustainable development”. SDG is not equal to sustainable development but confusion may be occurred. One idea avoid confusion is to change sustainable development at some section to economic development. [Takashi Hongo, Japan]
Rejected - It is unclear which section this exactly refers to. Sustainable development is understood to be more holistic than economic development. Therefore they cannot be substituted.
9163 26 1 27 1
Is raw material substitution (for example, fossil CO2 by bio-CO2 in the beverage industry) include in the demand side measures? is it part or reduced material demand? What about agriculture expansion only in degraded lands? [Adelino Ricardo Jacintho Esparta, Brazil]
Taken into account - these measure have now been included
12984 26 1 27 2
tab 2.5: Please change radically the type of table, there is no reason to use these three columns. Instead, I would use three columns : 1-included in IAM; 2-not typically included in IAM 3-non included in IAM, and three different parts of the table for supply side, demand side and GHG removal [Caserini Stefano, Italy]
Editorial - the table has been improved for clarity
21093 26 4
Table 2.5 is confusing : at first sight one might expect that there is some horizontal link between columns, especially because there are white cells, but I do not see any horizontal link. In line 2 of column 2, "Higher share of useful energy" seems to be a subset of energy efficiency, if not simply identical to energy efficiency. There might be possibilities to clarify the difference between line 1 and 2 of this column [Philippe Marbaix, Belgium]
Editorial - the table has been improved for clarity
21094 26 4
Table 2.5, column 2, line 3 : aren't behavioral changes considered in baselines and even in mitigation alternatives, as an external parameter (the cell is white) ? This might be clarified, otherwise one may either conclude that nothing related to behavioral change is in the models, or that this is unclear.column 2, line 2 : I am surprised that measures such as insulation of buildings are "typically not in IAMs". If this is true, it might be a serious limitation ? [Philippe Marbaix, Belgium]
Taken into account - we have now improved the granularity of mitigation measure representation classes in the table
11913 26 4
In the second column, section on "other demand reductions", it would be good to mention here that new business models (eg autonomous vehicles allowing for a decrease in the size of the car fleet through the shared ownership) and new production processes (eg 3D printing) could also lead to reductions in material demand [Amandine Denis-Ryan, Australia]
Accepted - These measures have been added as examples to the table
5226 26 4 26 4
Table 2.5 is not clear. At first glance, it looks like the boxes on one same line are connected in some way, but actually they are not. There are thus many empty boxes in strange places. Also, the legend explains the colour code, but it is not clear what the bold letters or italic letters mean. [Bianka SHOAi-TEHRANI, Japan]
Editorial - the table has been improved for clarity
14218 26 4 26 4Table 2.5 Once again nuclear power is mentioned in the table, but not sufficiently explored in the text. Further, this table doesn’t make sense with nuclear being put where it is with no context. [Jason Donev, Canada]
Taken into account - a discussion of nuclear power is included in the energy supply section (2.4.2)
2206 26 4 26 4Column 3, row 7 identifies combustion and fermentation but neglects gasification (which is neither combustion or fermentation, yet a potential option for CO2 capture). [Kenneth Möllersten, Sweden]
Taken into account - gasification has been added to the cell
4769 26 4 26 4
Table 2.5: Given that a large part of the existing building stock in several countries has poor/no insulation, it is very strange that insulation of buildings is among potential mitigation options currently not typically included in integrated assessment model analyses considered. This is a major measure for reduction of energy demand until 2050 in these countries. [Elena Georgopoulou, Greece]
Noted
14324 26 4 26 4In this table there is in general no direct link between the options in the 3 columns thar are on the same line; it is perhaps better to suppress the horizontal lines separating the options. [Serge PLANTON, France]
Editorial - the table layout has been improved for clarity
4293 26 4 27
Boxes in yelow and white. It would be very valuable to comment on why it has not been possible to incorporate some of these options to the mitigations scenarios. In some cases (CO2 conversion or use, CCU) it may be just because it is not clear how these options can mitigate CO2 emissions at large scale (see IPCC SR on CCS 2005, Chapter 7) due to the short life of the carbon product when this is a fuel and the small relevance in global carbon balances when the product is somthing else (I mean, not a fuel). In other cases (for example removing CH4 and N2O from the atmosphere by photocatalyst ) it may be just because they are too new and immature as to allow for quantitave estimation of mitigation potential and cost. [Abanades Carlos, Spain]
Taken into account - this excellent suggestion would fit better in a more general assessment of models in the context of the AR6, as it is not specifically linked to questions to 1.5°C
4294 26 4 27
Direct Air Capture has been proposed "using chemical solvents and solid sorbents", and not only solvents (see works from your own reference for this, i.e. Lackner et al or Keith et al or van der Giesen et al 2017 (referred in Ch4)). [Abanades Carlos, Spain]
Accepted - this has been corrected.
9549 27
Column 2 Line 3: Decarbonising the energy intensive basic materials industry through electrification-Implications for future EU electlicitydemand, Stefan Lechitenboehmer, Lar J. Nielsen, et al., Energy http://dx.doi.org/10.1016/j.energy.2016.07.110 will be a good reference [Shuzo Nishioka, Japan]
Noted
9576 27
Column 2 Line 3: Decarbonising the energy intensive basic materials industry through electrification-Implications for future EU electlicitydemand, Stefan Lechitenboehmer, Lar J. Nielsen, et al., Energy http://dx.doi.org/10.1016/j.energy.2016.07.110 will be a good reference [Shuzo Nishioka, Japan]
Noted
13187 27For steel and cement industries, please see van Ruijven et al. (2016) (http://dx.doi.org/10.1016/j.resconrec.2016.04.016= [Deger Saygin, Turkey]
Noted
Do Not Quote, Cite, or Distribute Page 65 of 129
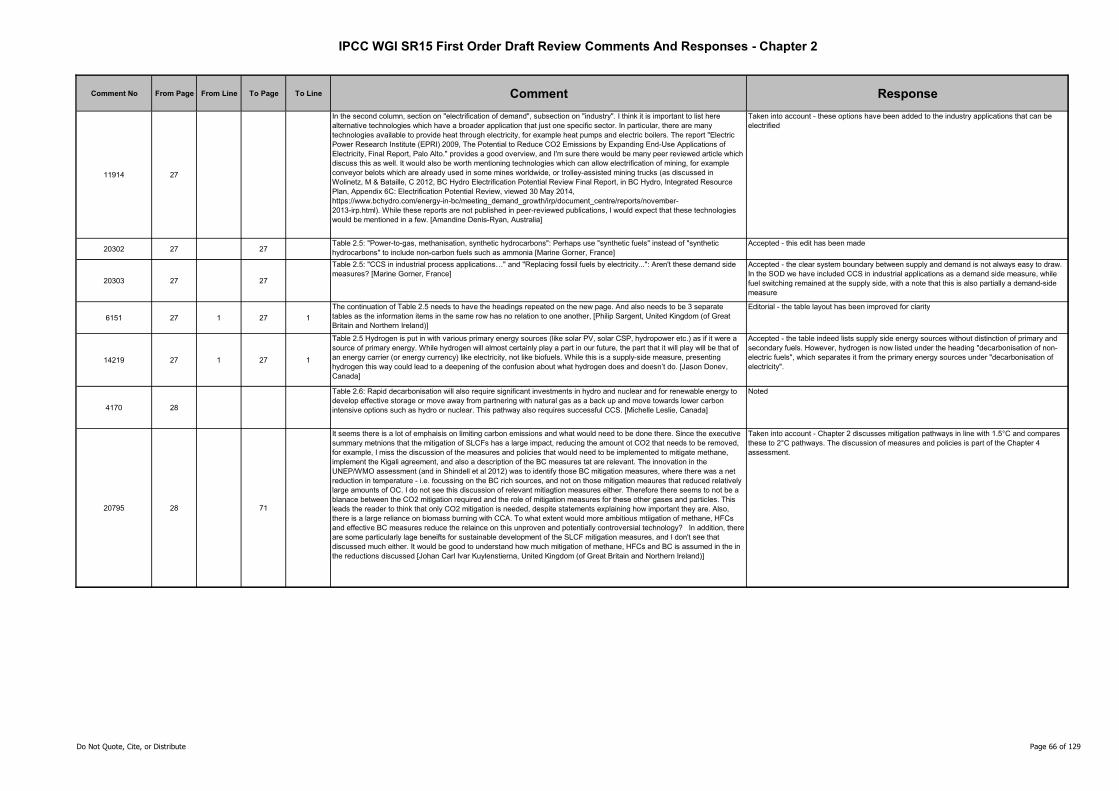
IPCC WGI SR15 First Order Draft Review Comments And Responses - Chapter 2
Comment No From Page From Line To Page To Line Comment Response
11914 27
In the second column, section on "electrification of demand", subsection on "industry". I think it is important to list here alternative technologies which have a broader application that just one specific sector. In particular, there are many technologies available to provide heat through electricity, for example heat pumps and electric boilers. The report "Electric Power Research Institute (EPRI) 2009, The Potential to Reduce CO2 Emissions by Expanding End-Use Applications of Electricity, Final Report, Palo Alto." provides a good overview, and I'm sure there would be many peer reviewed article which discuss this as well. It would also be worth mentioning technologies which can allow electrification of mining, for example conveyor belots which are already used in some mines worldwide, or trolley-assisted mining trucks (as discussed in Wolinetz, M & Bataille, C 2012, BC Hydro Electrification Potential Review Final Report, in BC Hydro, Integrated Resource Plan, Appendix 6C: Electrification Potential Review, viewed 30 May 2014,https://www.bchydro.com/energy-in-bc/meeting_demand_growth/irp/document_centre/reports/november-2013-irp.html). While these reports are not published in peer-reviewed publications, I would expect that these technologies would be mentioned in a few. [Amandine Denis-Ryan, Australia]
Taken into account - these options have been added to the industry applications that can be electrified
20302 27 27Table 2.5: "Power-to-gas, methanisation, synthetic hydrocarbons": Perhaps use "synthetic fuels" instead of "synthetic hydrocarbons" to include non-carbon fuels such as ammonia [Marine Gorner, France]
Accepted - this edit has been made
20303 27 27
Table 2.5: "CCS in industrial process applications…" and "Replacing fossil fuels by electricity...": Aren't these demand side measures? [Marine Gorner, France]
Accepted - the clear system boundary between supply and demand is not always easy to draw. In the SOD we have included CCS in industrial applications as a demand side measure, while fuel switching remained at the supply side, with a note that this is also partially a demand-side measure
6151 27 1 27 1
The continuation of Table 2.5 needs to have the headings repeated on the new page. And also needs to be 3 separate tables as the information items in the same row has no relation to one another, [Philip Sargent, United Kingdom (of Great Britain and Northern Ireland)]
Editorial - the table layout has been improved for clarity
14219 27 1 27 1
Table 2.5 Hydrogen is put in with various primary energy sources (like solar PV, solar CSP, hydropower etc.) as if it were a source of primary energy. While hydrogen will almost certainly play a part in our future, the part that it will play will be that of an energy carrier (or energy currency) like electricity, not like biofuels. While this is a supply-side measure, presenting hydrogen this way could lead to a deepening of the confusion about what hydrogen does and doesn’t do. [Jason Donev, Canada]
Accepted - the table indeed lists supply side energy sources without distinction of primary and secondary fuels. However, hydrogen is now listed under the heading "decarbonisation of non-electric fuels", which separates it from the primary energy sources under "decarbonisation of electricity".
4170 28
Table 2.6: Rapid decarbonisation will also require significant investments in hydro and nuclear and for renewable energy to develop effective storage or move away from partnering with natural gas as a back up and move towards lower carbon intensive options such as hydro or nuclear. This pathway also requires successful CCS. [Michelle Leslie, Canada]
Noted
20795 28 71
It seems there is a lot of emphaisis on limiting carbon emissions and what would need to be done there. Since the executive summary metnions that the mitigation of SLCFs has a large impact, reducing the amount ot CO2 that needs to be removed, for example, I miss the discussion of the measures and policies that would need to be implemented to mitigate methane, implement the Kigali agreement, and also a description of the BC measures tat are relevant. The innovation in the UNEP/WMO assessment (and in Shindell et al 2012) was to identify those BC mitigation measures, where there was a net reduction in temperature - i.e. focussing on the BC rich sources, and not on those mitigation meaures that reduced relatively large amounts of OC. I do not see this discussion of relevant mitiagtion measures either. Therefore there seems to not be a blanace between the CO2 mitigation required and the role of mitigation measures for these other gases and particles. This leads the reader to think that only CO2 mitigation is needed, despite statements explaining how important they are. Also, there is a large reliance on biomass burning with CCA. To what extent would more ambitious mtiigation of methane, HFCs and effective BC measures reduce the relaince on this unproven and potentially controversial technology? In addition, there are some particularly lage beneifts for sustainable development of the SLCF mitigation measures, and I don't see that discussed much either. It would be good to understand how much mitigation of methane, HFCs and BC is assumed in the in the reductions discussed [Johan Carl Ivar Kuylenstierna, United Kingdom (of Great Britain and Northern Ireland)]
Taken into account - Chapter 2 discusses mitigation pathways in line with 1.5°C and compares these to 2°C pathways. The discussion of measures and policies is part of the Chapter 4 assessment.
Do Not Quote, Cite, or Distribute Page 66 of 129

IPCC WGI SR15 First Order Draft Review Comments And Responses - Chapter 2
Comment No From Page From Line To Page To Line Comment Response
20848 28 71
It seems there is a lot of emphaisis on limiting carbon emissions and what would need to be done there. Since the executive summary metnions that the mitigation of SLCFs has a large impact, reducing the amount ot CO2 that needs to be removed, for example, I miss the discussion of the measures and policies that would need to be implemented to mitigate methane, implement the Kigali agreement, and also a description of the BC measures tat are relevant. The innovation in the UNEP/WMO assessment (and in Shindell et al 2012) was to identify those BC mitigation measures, where there was a net reduction in temperature - i.e. focussing on the BC rich sources, and not on those mitigation meaures that reduced relatively large amounts of OC. I do not see this discussion of relevant mitiagtion measures either. Therefore there seems to not be a blanace between the CO2 mitigation required and the role of mitigation measures for these other gases and particles. This leads the reader to think that only CO2 mitigation is needed, despite statements explaining how important they are. Also, there is a large reliance on biomass burning with CCA. To what extent would more ambitious mtiigation of methane, HFCs and effective BC measures reduce the relaince on this unproven and potentially controversial technology? In addition, there are some particularly lage beneifts for sustainable development of the SLCF mitigation measures, and I don't see that discussed much either. It would be good to understand how much mitigation of methane, HFCs and BC is assumed in the in the reductions discussed [Johan Carl Ivar Kuylenstierna, United Kingdom (of Great Britain and Northern Ireland)]
Taken into account - Chapter 2 discusses mitigation pathways in line with 1.5°C and compares these to 2°C pathways. The discussion of measures and policies is part of the Chapter 4 assessment.
12740 28 28In table 2.6 it would be good to have some points describing changes outside the energy system. For instance what are the characteristics of the land system, agricultural production/consumption, etc. [Vassilis Daioglou, Netherlands]
Taken into account - this table depends on the assessment in the underlying sections. If the respective sections did not identify a clear characteristic it cannot be included here.
12741 28 28
This table should be consistent concerning if the "supporting information" is in contrast to a 2degree or baseline scenario. According to the legend it is always with respect to the 2degree scenario, however many of the points are true for that scenario as well. If the 1.5 scenarios is simply "more of that", it should be clear how much more. Given that a 2 degree scenario alread has a huge effort, this table should make it clear what the EXTRA effort is. [Vassilis Daioglou, Netherlands]
Rejected - this table now gives a general overview of characteristics of 1.5°C pathways, sometimes compared to 2°C, sometimes more in general
10844 28 8
Table 2.6: none of the 60 peer-reviewed articles on 100% RE is mentioned; this scientific field is fully 'forgotten' here. Why? A fast decarbonisation towards 100% RE is obviously compatible to a scenario of 2C or better. [Christian Breyer, Finland]
A fast decarbonisation is surely necessary for 1.5°C. This table draws upon the sector assessments in the underlying sections
10979 28 8 28 11I find this table really helpful in synthesising key messages from the modellling. [Skea Jim, United Kingdom (of Great Britain and Northern Ireland)]
Noted
6877 28 8 28 12
As suggested in my general comments on the chapter and the entire report, table 2.6 should integrate the top-down information form the IAMs and the bottom-up information now in ch 4.2 and 4.3 by moving the material from ch 4 to ch 2. I suggest to insert a separate column in the table that discusse the difference between top-down and bottom-up estimates; e.g. the second sentence in the second column of the third row on demand side would fit into such an additional column. [Bert Metz, Netherlands]
Noted - due to time constraints it was not possible to implement this suggestion in the SOD, but it could be taken up for the next iteration
6364 28 8 28 8
Table 2.6: row on "additonal reductions, on top of…": This statement is only true for the exogenous technological change hard-wired into IAMs. A lot of research is currently going on to increase the abatement potential for e.g. CH4 from enteric fermentation, which is by far biggest single CH4 source in IAM runs in 2 or 1.5 deg C scenarios, through methane inhibitors or a vaccine. The table and accompanying text has to make clear where its conclusions are contingent on assumptions about technological development, especially where there are active technology programmes that the IAMs largely ignore. Which is fine - but then you need to make clear that these are IAM assumptions, but there is other literature that says it doesn't have to be that way. [Andy Reisinger, New Zealand]
Accepted - we have ensure that it is clear that this depends on the mitigation measures included in IAMs
9227 28 11 Last row in table, good to include land requirements of the CDR at that scale [Glen Peters, Norway] These can vary strongly and would not be one of the key features
2207 28 11 26 12
Row 12: The first column identifies CDR at scale before mid-century. However the second column only mentions snapshot figures for 2050. The section concerned has the sub-title "Key characteristics of transitions…" so consequently the second column should identify when CDR begins and at what rate it's scaled up. [Kenneth Möllersten, Sweden]
Noted - this table will be further updated after finalisation of the scenario set in the database
535 28 11 28 11Table 2.6 is missing the 100% clean, renewable energy scenarios laid out in the 8 papers above. [Mark Jacobson, United States of America]
This table draws on the assessment of the sectoral sections and the 1.5°C-related literature
21101 28 11
Table 2.6, line 2 : do you mean "demand side" in terms of final product demand or "energy demand side" ? I would guess that the demand for final products is relevant but section 2.3.4.2 suggests that what it meant by "end use sectors" is "energy end-use". The difference could be important, as "enegy demand" is influenced by energy efficiency. If it is "energy demand", then there should probably be a clarification about the difference between this 2nd line and the 3rd line ("energy efficiency"). For example in a building the demand might be related to the size of the room and the desired temperature, in addition to energy efficiency aspects. [Philippe Marbaix, Belgium]
With the demand side we refer to the industry, transport, and buildings sectors. Both energy demand and demand for products play a role here.
5169 28 11 28 12
Table 2.6: add additional raw with scenarios which phase-out fossil fuels (including CCS) rapidly. This statement is misleading as it emphasis that there are no 100% Re pathways / climate mitigation scenarios, which is untrue. [Sven Teske, Australia]
Rejected - we consider the statement pointing towards a phase-out of coal not in any way to imply that there are no 100% RE pathways
Do Not Quote, Cite, or Distribute Page 67 of 129

IPCC WGI SR15 First Order Draft Review Comments And Responses - Chapter 2
Comment No From Page From Line To Page To Line Comment Response
4770 28 11 28 12
Table 2.6: in the line referring to "Additional reductions, on top of reductions from both CO2 and non-CO2 required for 2°C, are mainly from CO2", from which sectors/sub-sectors do these additional reductions come from? [Elena Georgopoulou, Greece]
Mainly from the end-use sectors
4771 28 11 28 12Table 2.6: it would be useful to indicate the differences between 2 oC and 1.5 oC in all lines. [Elena Georgopoulou, Greece] Noted
14220 28 12 28 12
Table 2.6 Considerable shifts in investment patterns could include nuclear power and hydropower as well, as stated elsewhere, the inconsistent treatment of nuclear and hydro in this document is troubling. Nuclear and hydro have each, by themselves contributed far more to low carbon electricity over the course of the 20th and early 21st century than wind, solar, geothermal and tidal combined. Further investment in nuclear and hydro could dramatically reduce GHGs along with the contributions of wind, solar, geothermal and tidal. [Jason Donev, Canada]
Noted
13188 29
It may help the reader if the underlying factors that impact the evolution of emissions are explained in more detail, for example to show the contribution of technologies (in addition to BECCS), impact of structural changes, demand reduction etc. [Deger Saygin, Turkey]
Taken into account - these underlying factors are addressed in the following sections of the chapter
4531 29 Fig 2.9 - Add index format to "CO2" and "Wm-2" (2x) [Radim Tolasz, Czech Republic] Editorial
10330 29 29 Figure 2.9 is difficult to interpret. Se comments above (general) and comment 5. [Maria Jose Sanz Sanchez, Spain] Taken into account - the figure has been modified
20796 29 32
I find this section could be more informative. What exactly is assumed for thr dofferent sources of SLCFs? How much methane abatement is assumed and in which sectors? What is the maximum 5 reduction in methane, and for remaining emissions, what assumptions have been made about the 'difficult to abate' sources. For example, FAO has proposaed that improved management of livestock, through feed and pasture improvement and imrpved livestock fertility, could reduce methane emissions per unit of product (milk or meat ) by up to 40%. Has this been used or is it assumed that this cannot be done? If it is not included, why is this considered to be more difficult than biomass + CCS, which is also unproven on a large scale? It says that reducing methane from paddy fileds is somtimes not included, although widely practised, and what about waste emissions? I miss a discussion of the mitigation potential and how much is assumed, over waht tme period, and what would the advantagges be of more rapid implementation? The same is true for more rapid ilpementatuion of the Kigali agreeement to phase out HFCs more quickly. And also the impact of reducing BC rich sources rapidly on temperature progression. [Johan Carl Ivar Kuylenstierna, United Kingdom (of Great Britain and Northern Ireland)]
Taken into account - these aspects are important yet are not specific to 1.5°C. Given constraints in scope and space, these aspects will be better considered in the overall AR6 assessment.
18783 29 32
Section 2.3.3 should address the role of SLCF/SLCP in causing temperature rise to overshoot the 1.5C threshold in the near-term period (e.g. by 2050). The more rapid crossing of the threshold due to the role of SLCF/SLCP is an important dimension that should be addressed. [David Waskow, United States of America]
Taken into account - the revised draft includes a dedicated section on overshoot and how various aspects contribute (section 2.3.2
20849 29 32
I find this section could be more informative. What exactly is assumed for thr dofferent sources of SLCFs? How much methane abatement is assumed and in which sectors? What is the maximum 5 reduction in methane, and for remaining emissions, what assumptions have been made about the 'difficult to abate' sources. For example, FAO has proposaed that improved management of livestock, through feed and pasture improvement and imrpved livestock fertility, could reduce methane emissions per unit of product (milk or meat ) by up to 40%. Has this been used or is it assumed that this cannot be done? If it is not included, why is this considered to be more difficult than biomass + CCS, which is also unproven on a large scale? It says that reducing methane from paddy fileds is somtimes not included, although widely practised, and what about waste emissions? I miss a discussion of the mitigation potential and how much is assumed, over waht tme period, and what would the advantagges be of more rapid implementation? The same is true for more rapid ilpementatuion of the Kigali agreeement to phase out HFCs more quickly. And also the impact of reducing BC rich sources rapidly on temperature progression. [Johan Carl Ivar Kuylenstierna, United Kingdom (of Great Britain and Northern Ireland)]
Taken into account - these aspects are important yet are not specific to 1.5°C. Given constraints in scope and space, these aspects will be better considered in the overall AR6 assessment.
18816 29 32
Section 2.3.3 should address the role of SLCF/SLCP in causing temperature rise to overshoot the 1.5C threshold in the near-term period (e.g. by 2050). The more rapid crossing of the threshold due to the role of SLCF/SLCP is an important dimension that should be addressed. [David Waskow, United States of America]
Taken into account - the revised draft includes a dedicated section on overshoot and how various aspects contribute (section 2.3.2
1848 29 1
2.3.3 The “Kyoto“ non-CO2 gases include some formerly “non-Montreal” F-gases which future emissions will be controlled in accordance with the Kigali Amendment (2016); these is an important policy-related development, will change the “interplay” between the ODS and GHG mitigation and will have certain implications on the implementation of the Paris Agreement. The Kigali A. is correctly mentioned on p. 39, but here: at least, a reference to it would be important in relation to the non-CO2 GHGs. [Tibor Farago, Hungary]
This new development is highlighted in the framing chapter 1. HFCs are discussed in context of the Kigali Agreement in the revised section 2.3
21095 29 3 29 5 This sentence is quite obvious; is it really useful ? [Philippe Marbaix, Belgium] Accepted - the sentence has been removed
12985 29 4 29 4 Use "should be" instead of "are" [Caserini Stefano, Italy] Editorial - has become obsolete as sentence has been deleted
12742 29 4 29 5 they have to be strongly reduced [Vassilis Daioglou, Netherlands] Editorial - has become obsolete as sentence has been deleted
6878 29 6 29 7peak and start decliing by 2030 is contradicting fig 2.3.a that shows all 1.5 trajectories [Bert Metz, Netherlands] Accepted - in line with data available to the SOD, this has been changed to "peak and start
declining before 2030"
5170 29 7 29 7define "typical" scenario, 100% RE scenarios usually have an emission peak around 2020 (not 2030 as stated) [Sven Teske, Australia]
Accepted - This introduction was unnecessary imprecise. It has been removed so as to more quickly reach the substantive parts of the section
Do Not Quote, Cite, or Distribute Page 68 of 129
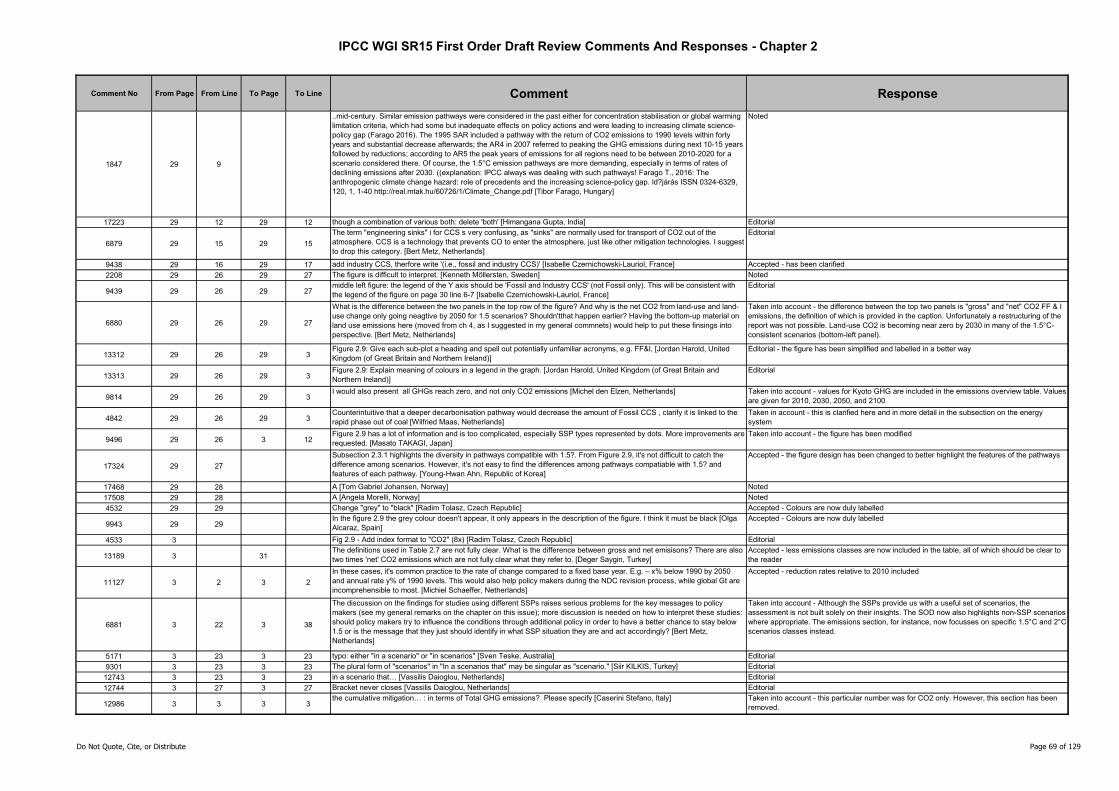
IPCC WGI SR15 First Order Draft Review Comments And Responses - Chapter 2
Comment No From Page From Line To Page To Line Comment Response
1847 29 9
..mid-century. Similar emission pathways were considered in the past either for concentration stabilisation or global warming limitation criteria, which had some but inadequate effects on policy actions and were leading to increasing climate science-policy gap (Farago 2016). The 1995 SAR included a pathway with the return of CO2 emissions to 1990 levels within forty years and substantial decrease afterwards; the AR4 in 2007 referred to peaking the GHG emissions during next 10-15 years followed by reductions; according to AR5 the peak years of emissions for all regions need to be between 2010-2020 for a scenario considered there. Of course, the 1.5°C emission pathways are more demanding, especially in terms of rates of declining emissions after 2030. ((explanation: IPCC always was dealing with such pathways! Farago T., 2016: The anthropogenic climate change hazard: role of precedents and the increasing science-policy gap. Id?járás ISSN 0324-6329, 120, 1, 1-40 http://real.mtak.hu/60726/1/Climate_Change.pdf [Tibor Farago, Hungary]
Noted
17223 29 12 29 12 though a combination of various both: delete 'both' [Himangana Gupta, India] Editorial
6879 29 15 29 15
The term "engineering sinks" i for CCS s very confusing, as "sinks" are normally used for transport of CO2 out of the atmosphere. CCS is a technology that prevents CO to enter the atmosphere, just like other mitigation technologies. I suggest to drop this category. [Bert Metz, Netherlands]
Editorial
9438 29 16 29 17 add industry CCS, therfore write '(i.e., fossil and industry CCS)' [Isabelle Czernichowski-Lauriol, France] Accepted - has been clarified
2208 29 26 29 27 The figure is difficult to interpret. [Kenneth Möllersten, Sweden] Noted
9439 29 26 29 27middle left figure: the legend of the Y axis should be 'Fossil and Industry CCS' (not Fossil only). This will be consistent with the legend of the figure on page 30 line 6-7 [Isabelle Czernichowski-Lauriol, France]
Editorial
6880 29 26 29 27
What is the difference between the two panels in the top row of the figure? And why is the net CO2 from land-use and land-use change only going neagtive by 2050 for 1.5 scenarios? Shouldn'tthat happen earlier? Having the bottom-up material on land use emissions here (moved from ch 4, as I suggested in my general commnets) would help to put these finsings into perspective. [Bert Metz, Netherlands]
Taken into account - the difference between the top two panels is "gross" and "net" CO2 FF & I emissions, the definition of which is provided in the caption. Unfortunately a restructuring of the report was not possible. Land-use CO2 is becoming near zero by 2030 in many of the 1.5°C-consistent scenarios (bottom-left panel).
13312 29 26 29 3Figure 2.9: Give each sub-plot a heading and spell out potentially unfamiliar acronyms, e.g. FF&I, [Jordan Harold, United Kingdom (of Great Britain and Northern Ireland)]
Editorial - the figure has been simplified and labelled in a better way
13313 29 26 29 3Figure 2.9: Explain meaning of colours in a legend in the graph. [Jordan Harold, United Kingdom (of Great Britain and Northern Ireland)]
Editorial
9814 29 26 29 3I would also present all GHGs reach zero, and not only CO2 emissions [Michel den Elzen, Netherlands] Taken into account - values for Kyoto GHG are included in the emissions overview table. Values
are given for 2010, 2030, 2050, and 2100
4842 29 26 29 3Counterintuitive that a deeper decarbonisation pathway would decrease the amount of Fossil CCS , clarify it is linked to the rapid phase out of coal [Wilfried Maas, Netherlands]
Taken in account - this is clarified here and in more detail in the subsection on the energy system
9496 29 26 3 12Figure 2.9 has a lot of information and is too complicated, especially SSP types represented by dots. More improvements are requested. [Masato TAKAGI, Japan]
Taken into account - the figure has been modified
17324 29 27
Subsection 2.3.1 highlights the diversity in pathways compatible with 1.5?. From Figure 2.9, it's not difficult to catch the difference among scenarios. However, it's not easy to find the differences among pathways compatiable with 1.5? and features of each pathway. [Young-Hwan Ahn, Republic of Korea]
Accepted - the figure design has been changed to better highlight the features of the pathways
17468 29 28 A [Tom Gabriel Johansen, Norway] Noted
17508 29 28 A [Angela Morelli, Norway] Noted
4532 29 29 Change "grey" to "black" [Radim Tolasz, Czech Republic] Accepted - Colours are now duly labelled
9943 29 29In the figure 2.9 the grey colour doesn't appear, it only appears in the description of the figure. I think it must be black [Olga Alcaraz, Spain]
Accepted - Colours are now duly labelled
4533 3 Fig 2.9 - Add index format to "CO2" (8x) [Radim Tolasz, Czech Republic] Editorial
13189 3 31The definitions used in Table 2.7 are not fully clear. What is the difference between gross and net emisisons? There are also two times 'net' CO2 emissions which are not fully clear what they refer to. [Deger Saygin, Turkey]
Accepted - less emissions classes are now included in the table, all of which should be clear to the reader
11127 3 2 3 2
In these cases, it's common practice to the rate of change compared to a fixed base year. E.g. – x% below 1990 by 2050 and annual rate y% of 1990 levels. This would also help policy makers during the NDC revision process, while global Gt are incomprehensible to most. [Michiel Schaeffer, Netherlands]
Accepted - reduction rates relative to 2010 included
6881 3 22 3 38
The discussion on the findings for studies using different SSPs raises serious problems for the key messages to policy makers (see my general remarks on the chapter on this issue); more discussion is needed on how to interpret these studies: should policy makers try to influence the conditions through additional policy in order to have a better chance to stay below 1.5 or is the message that they just should identify in what SSP situation they are and act accordingly? [Bert Metz, Netherlands]
Taken into account - Although the SSPs provide us with a useful set of scenarios, the assessment is not built solely on their insights. The SOD now also highlights non-SSP scenarios where appropriate. The emissions section, for instance, now focusses on specific 1.5°C and 2°C scenarios classes instead.
5171 3 23 3 23 typo: either "in a scenario" or "in scenarios" [Sven Teske, Australia] Editorial
9301 3 23 3 23 The plural form of "scenarios" in "In a scenarios that" may be singular as "scenario." [Siir KILKIS, Turkey] Editorial
12743 3 23 3 23 in a scenario that… [Vassilis Daioglou, Netherlands] Editorial
12744 3 27 3 27 Bracket never closes [Vassilis Daioglou, Netherlands] Editorial
12986 3 3 3 3the cumulative mitigation… : in terms of Total GHG emissions? Please specify [Caserini Stefano, Italy] Taken into account - this particular number was for CO2 only. However, this section has been
removed.
Do Not Quote, Cite, or Distribute Page 69 of 129
IPCC WGI SR15 First Order Draft Review Comments And Responses - Chapter 2
Comment No From Page From Line To Page To Line Comment Response
6882 3 35 3 38 How come that BECCS use in SSP1 is lower than in SSP2?; doesn't look logical to me [Bert Metz, Netherlands] This section has been removed from the SOD
10980 3 4 3 4Too much info in a single table? [Skea Jim, United Kingdom (of Great Britain and Northern Ireland)] Taken into account - Less emissions categories are shown now. However, limiting it to less
scenario classes would not be possible without loosing balance.
9815 3 4 31 1
Why are the 1.5C scenarios grouped? The budgets are presented for at least 50% and 66%, whereas fpr the 2030 emission levels this has not been done. It woul dbe btter to be consistent and also present 2030 emission levels for at least 50% and 66% [Michel den Elzen, Netherlands]
Accepted - this information is now presented following an updated scenario classification which separates these different classes
17325 3 4 31 1 Table 2.7 shows almost same information which is represented by Figure 2.9. [Young-Hwan Ahn, Republic of Korea] Taken into account - the table in additional reports reduction rates.
12987 3 4 31 2tab 2.7: in the second column, I suggest using 2°C and 1.5°C instead of 2.6 Wm-2 and 1.9 W m-2 [Caserini Stefano, Italy] Accepted - this information is now presented following an updated scenario classification which
separates these different classes
4843 3 4 31 2The Annual rate of change 2010-2030 needs to be alligned with the 2030-2050 rates. Fossil CCS and BECCS will need build out time to establish 0.2-0.6 GT/a contribtions and need substantial 2010-2030 rates [Wilfried Maas, Netherlands]
This is correct - we are unclear, however, how this can be better communicated in the table.
4847 3 4 31 2
Reference IEAGHG CCS Industry Build-Out Rates – Comparison with Industry Analogues (2017) that it is technically tenable that the anticipated CCS (BECCS) build-out rates can be realised in a supporting environment [Wilfried Maas, Netherlands]
Accepted - this comparison, however, is for the assessment of Chapter 4
2209 31 31The start year of BECCS and corresponding rate of carbon removal should be included in the executive summary. [Kenneth Möllersten, Sweden]
Noted
9440 31 31 1In the right column of the table, it should be written 'Fossil and Industry' CCS (not Fossil only). This will be consisten with the paragraph on page 29 from line 15 to 25. [Isabelle Czernichowski-Lauriol, France]
Accepted - this has been corrected.
20401 31 1 31 1 What is FF&I ? [Olivier Boucher, France] Accepted - this has been clarified
6365 31 3 31 3
despite the limited mitigation options: insert "currently" and add a sentence that considers the extent to which technologies currently under development (such as nitrification inhibitors, and biological nitrification inhibitors that could be bred into pasture and crop species) could increase the mitigation potential beyond what IAMs assume. [Andy Reisinger, New Zealand]
Taken into account - it has been made clear that these values reflect current mitigation options. Agricultural mitigation potentials have been further discussed in Section 2.4, and technologies under development but not included are clarified in the mitigation measures section in 2.3.2.2
6366 31 1 31 1This sentence contradicts the sentence on line 3 of the same page. Insert "in some sectors" since currently, mitigation options are quite limited in some sectors. [Andy Reisinger, New Zealand]
Accepted - this clarification has been included.
6367 31 14 31 15
As per comment on line 3 on same page, add "currently" and clarify that this is based on a very static technology assumption especially in agriculture. I can see why IAMs make this assumption but for an IPCC assessment, you need to cast your net wider and give a more nuanced discussion about mitigation options that may not be captured by IAMs. [Andy Reisinger, New Zealand]
Accepted - this has been clarified
19374 31 2 31 2
Ozone doesn't just warm in the troposphere, it warms in the lower and mid stratosphere as well. Maybe better to say "wheras ozone generated from emissions of precursors causes warming". [William Collins, United Kingdom (of Great Britain and Northern Ireland)]
Accepted - changes accordingly
19375 31 21 31 21
It is not obvious that reducing aerosols decreases regional disruptions. If farmers in equatorial regions have adapted to the southward movement of the ITCZ from aerosols over the last 30 years, they might be equally disrupted if the ITCZ moves back north as aerosols are reduced. [William Collins, United Kingdom (of Great Britain and Northern Ireland)]
Accepted - this sentence has been modified as to not to suggest an unambiguous benefit or reduced disruption
536 31 21 31 23
Reductions in aerosol can have substantial benefits for reducing…surface aerosol and ozone. This was first concluded in the 2002: abstract of Jacobson, M. Z., Control of fossil-fuel particulate black carbon plus organic matter, possibly the most effective method of slowing global warming, J. Geophys. Res., 107 (D19), 4410, doi:10.1029/ 2001JD001376, 2002, which states, ""Controlling BC + OM will not only slow global warming but also improve human health." The ozone and particulate matter health effects of fossil fuel and biofuel soot aerosol particles were quantified in Jacobson, M.Z., Short-term effects of controlling fossil-fuel soot, biofuel soot and gases, and methane on climate, Arctic ice, and air pollution health, J. Geophys. Res., 115, D14209, doi:10.1029/2009JD013795, 2010. [Mark Jacobson, United States of America]
Noted - the mandate of the SR1.5 report is to take AR5 as a basis and assess the more recent literature related to 1.5°C. We have, though, included a reference to these two studies.
19376 31 23 32 2It might be useful to clarify whether reduction in traditional stoves or kerosene lamps is assumed or not in the IAM-generated scenarios. [William Collins, United Kingdom (of Great Britain and Northern Ireland)]
Taken into account - a sentence clarifying this issue has been included.
6883 31 38 32 21
I am surprised that aerosols are grouped together here. Why not discuss OC, BC and other aerosols separately, as they have different warming/cooling properties? Additionally, by bringing the material from ch 4 to this section a more balanced and elaboarte discussion would be possible, which would benefitthe chapter. [Bert Metz, Netherlands]
Taken into account - we now discuss BC and Sulphate aerosols separately. The structure of the report could not be changed at this point.
4534 32 Fig 2.10 - Add index format to "CO2", "N2O" and "Wm-2" (2x) [Radim Tolasz, Czech Republic] Editorial - will be corrected in final draft
537 32 1 32 1
…such as traditional biomass burning stoves or kerosene lamps would be unaffected by climate policies. That is not true under the Jacobson, Delucchi et al. 100% clean, renewable energy plans, which would transitiion all energy, including cookstoves and kerosene lamps (see 8 references above). [Mark Jacobson, United States of America]
Taken into account - It is correct that renewable energy plans can provide clean energy to poor populations. However, the reason for such policies is the provision of clean and reliable energy, not climate mitigation. This statement has been removed.
2210 32 1 32 2
This sweeping statement calls for more detailed explanation. What kind of policies? Eg. the CDM, as a climate policy, has delivered conversion from traditional cooking practices to clean-burning pellet stoves. [Kenneth Möllersten, Sweden]
Taken into account - this statement has been removed
Do Not Quote, Cite, or Distribute Page 70 of 129
IPCC WGI SR15 First Order Draft Review Comments And Responses - Chapter 2
Comment No From Page From Line To Page To Line Comment Response
16205 32 5 32 8
Regarding the further elimination of warming aerosols, the amount of black carbon emissions that can be reduced is really quite large, even in the US. There are significant emissions from aircraft and diesel engines/generators that can be reduced--also from tires, etc. Shindell et al. also list quite a number of sources that could be controlled, etc., so much so that their collective effect was able to cut the projected warming from 2010 to 2050 in half. [Michael MacCracken, United States of America]
Taken into account - Shindell et al list measures relative to a no-mitigation baseline. Compared to that reference a large potential for reductions exists. However, compared to the reductions assumed in the 1.5°C pathways, this potential is limited.
19377 32 1 32 12
Sand et al. 2016 doi:10.1038/nclimate2880 and Stohl et al. 2015 doi:10.5194/acp-15-10529-2015 both showed climate benefits (particularly at high latitudes) of additional action on reducing domestic biomass burning. [William Collins, United Kingdom (of Great Britain and Northern Ireland)]
Accepted - this influence has been further highlighted
7995 32 12 32 13 many proposed measure should be "many proposed measures" [Robert Shapiro, United States of America] editorial
19378 32 12 32 14
This sentence seems dismissive of methane, as if the issue is solved, however the methane emissions in figure 2.10 seem to vary by a factor of 6. This section ought to expand on the different methane scenarios further, as to why the different scenarios give different emphasis to methane. Presumably in the scenarios with high methane emissions there is scope for even further climate reduction through bringing methane emissions down in line with the scenarios with the strongest mitigation. [William Collins, United Kingdom (of Great Britain and Northern Ireland)]
Accepted - the sectorial section on agriculture now expands on further reductions in residual non-CO2 emissions.
13518 32 15 32 17
The large reduction of sulfate and nitrate aerosols is not for 'additional warminig'. It is one of the major warming factors in the near-to-mid term climate change. For exapmle, SO2 emission is begin reduced even from China. Therefore it shold be stated stronger in order to tell policy makers and public. [Toshihiko Takemura, Japan]
Taken into account - the unmasking impact of SO2 emissions reductions in now explicitly highlighted.
9302 32 16 32 16The word "results" in "In such cases, the large reduction in mainly cooling aerosol precursors (sulphur dioxide and nitrogen dioxide) can results" may be singular as "result." [Siir KILKIS, Turkey]
editorial
4772 32 17 32 17 What is 'SLCFs'? It should be SLCPs, is that correct? [Elena Georgopoulou, Greece] Editorial - SLCPs refer only to a subset of warming short-lived climate forcers (SLCFs)
12745 32 18 32 18 SLCF [Vassilis Daioglou, Netherlands] Taken into account - this has been clarified
19379 32 19 32 21
It should be made clear here that IAMs typically use a least cost algorithm to balance CO2 and methane, so if the additional benefits of methane migitation were included (Shindell et al. 2017b should also be cited for this) the IAM algorithms would result in further mitigation. [William Collins, United Kingdom (of Great Britain and Northern Ireland)]
Taken into account - IAMs indeed often use a least-cost approach to mitigation. However, the observation that the inclusion of benefits would result in further mitigation is generally true not just for methane. This caveat is made in section 2.6
13314 32 23 32 33Figure 2.10: Explain meaning of colours in a legend in the graph (easier for readers than matching up text in captions). [Jordan Harold, United Kingdom (of Great Britain and Northern Ireland)]
Accepted - the figure has been updated
17326 32 24
Subsection 2.3.1 highlights the diversity in pathways compatible with 1.5?. From Figure 2.10, it's not difficult to catch the difference among scenarios. However, it's not easy to find the differences among pathways compatiable with 1.5? and features of each pathway. [Young-Hwan Ahn, Republic of Korea]
Taken into account - We now highlight the various differences between pathways in the CO2 overview figure
17469 32 25 A [Tom Gabriel Johansen, Norway] Noted
17509 32 25 A [Angela Morelli, Norway] Noted
4535 32 25 Change "grey" to "black" [Radim Tolasz, Czech Republic] Accepted - the figure has been updated
9944 32 25In the figure 2.10 the grey colour doesn't appear, it only appears in the description of the figure. I think it must be black [Olga Alcaraz, Spain]
Accepted - the figure has been updated
7996 32 25 32 25 no-climate policy baselines (grey) appears black, not grey. [Robert Shapiro, United States of America] Accepted - the figure has been updated
19380 32 25 32 33For figure 2.10 the authors should consider using the GWP* formulation of Allen et al. 2016 to calculate CO2 equivalence. [William Collins, United Kingdom (of Great Britain and Northern Ireland)]
Rejected - The chapter either reports gases separately or Kyoto-GHGs expressed as CO2-equivalence with GWP-100 AR4 metrics
6884 32 25 32 33
The caption of figure 2.10 says that GWPs from AR4 are used. Is this the case througout the chpater or do studies use different GWPs; and if so, does the chapter harmonise the GWP data? [Bert Metz, Netherlands]
Taken into account - throughout the chapter emissions are reported in AR4 GWP100s, and emissions are also reported in the scenario database using that same metric. If studies would be reporting CO2-equivalent emissions in other metrics this is taken into account.
13190 33
Text mentions the magnitude of renewable energy use in the energy sector. It would help if the breakdown of its use for energy supply and energy demand (ideally with a split by transport, buildings and industry) is also provided. This is important to show its role for different sectors. [Deger Saygin, Turkey]
These are included in different sessions, energy session discussed about only energy part, sector session discuss energy use in sectors
4536 33 Fig 2.11 - Add index format to "Wm-2" [Radim Tolasz, Czech Republic] accepted
6408 33 5
Sub chapter 2.3.4 : As a whole, this sub chapter has covered almost all sectors (e.g. Energy, Industry, Building, Transport, Agricultural Sectors) which play important and essential role in mitigation aspect. It is suggested to include Marine and Fisheries Sector which must have a huge mitigation role e.g. open ocean with phytoplankton (microalgae) that absorp CO2 from the environment during photosynthesis and also mangrove, seaweedd (macroalgae) & seagrass ecosystem, as well as seaweed aquaculture activities and microalgae culture for biofuels which can integrate with industries for carbon supply; as many recent research have reported. The micro- and macroalge culture activities (using bioreactors, opened-pond raceway, etc.) have been carried out by several huge company to produce biofuels by using CO2 discharge from other industries. Thereby, it is an important sector in carbon capturing process for 1.5 oC mitigation pathway regarding techno-economic and sustainable development aspects. [Erlania Erlania, Indonesia]
noted, will be discussed among authors
17327 33 1
It seems that figures in this subsection show results from each scenarios calculated by different models. Without any explaining the feactures of each model, showing all results from different models may be redundant. It may be enough to show summarized results from different models. [Young-Hwan Ahn, Republic of Korea]
The discussion about the database and models, together with scenarios will be given in the chapter
Do Not Quote, Cite, or Distribute Page 71 of 129
IPCC WGI SR15 First Order Draft Review Comments And Responses - Chapter 2
Comment No From Page From Line To Page To Line Comment Response
17328 33 1 34 17Infromation in Table 2.8 is overlapped with information represented in Figure 2.11 and 2.12. [Young-Hwan Ahn, Republic of Korea]
The reason to give this table is to show data with rate of change, which is important data to analyse feasibility
3164 33 1 35 24
I strongly recommend omitting all scenarios from these figures and text except for the 1.5 and 2.0 degree scenarios that are supposed to be the focus of this report. This material is confusing enough without reporting results from irrelevant scenarios. Again, the report should just compare and contrast the pros and cons of following a 1.5 degree scenario versus a 2.0 degree scenario. [Richard Rosen, Germany]
Revised
7039 33 1 36 17Figs 2.11 to 2.14, are they global? Are there corresponding regional figures available? [Érika Mata, Sweden] global one, due to space limit, we did not get regional data, tried to use a national pathway box
to show regional cases.
9506 33 1 39 23
In model study, all options are available, but in the real world this is not always true. Especially, I have concerns on large deployment of CCS, bioenergy, and BECCS. I suggest that the report reviews global potentials, costs, matching sources and sinks, and feasibility of these options. [Masato TAKAGI, Japan]
the discussion for key technologies in real progress will be done in chapter 4, by linking with chapter 2, we will co-ordinate on this with chapter 2
21310 33 1 48 1
I suggest a more robust (and largely qualitative) discussion of recent and projected trends in certain key clean energy technologies (e.g. electric vehicles, solar energy, wind energy, smart grids), and how the continuation of rapid clean energy innovation could lead to transformative changes that today's integrated assessment models have difficulty portraying. In other words, the range of scenarios in this report is to some degree biased by the limitations of models that are designed to portray the current energy system, and they should not be interpreted by the reader as the universe of possible scenarios. [Jan Corfee-Morlot, France]
This will be discussed in technology session
20245 33 3 33 39
In the section on Energy, the following statement "a rapid transition towards a zero or negative CO2 emissions energy system is crucial" appears. There are a couple of questions here that could be addressed to add clarity to this section. First, an example or illustration of what is meant by negative emissions energy systems. Second, as the evolution of primary energy contributions over time discusses the mixture of energy sources. This is highly reliant on political and social pressures, policies, and decisions. It would be valuable to discuss how these decisions intersect the evolution of the energy mix. For example, CCS might be a competitor for 'green' dollars which would sap progress on renewable energy. Resurgence of nuclear energy is highly reliant on the public acceptability (and this is also geographically sensitive). It is not clear in the report how the models discussed handle these complexities and what assumptions are being made. [Joshua Loughman, United States of America]
In chapter 2, the discussion for negative emission will be given in section 2.3.1, and the mix of primary energy will be discussed in section 2.3.4. As for the investment need will be discussed in chapter 4
3330 33 3 44 24
I consider before discussing the scenarios of the renewable and their impact on the various sectors, it is essential to discuss ENERGY EFFICIENCY, until the end of the oil is and will be the primary source of energy, renewable without efficiency are not useful, it is also indispensable that further indicate that the USA is one of the countries that demand energy / power and if this country does not change its energy matrix, the other countries will only continue to clean the C02 that causes the burning of fuel. [Fátima Castaneda, Guatemala]
the discussion on energy efficiency will be in sector sessions
3331 33 3 44 24
I can not find the relationship with SDG No. 7 and demand for energy, in the real world, in matters of finance and public policy, changing the only renewable energy matrix is not possible, yet many countries are not prepared for the change of technology. Recognizing that natural disasters and climatic events such as El Niño and La Niña cause drought or rain, make hydroelectric sources vulnerable, so relying solely on renewables is not the best option. [Fátima Castaneda, Guatemala]
The discussion on SDGs linking with scenario will be discussed in chapter 5, chapter 2 will provide information to support them
5172 33 8 33 11
Two aspects are typically emphasised in 1.5°C pathways: one is rapid growth in the share of energy derived from low carbon sources including renewables, nuclear, and fossil fuel with CCS, the other is BECCS which can provide carbon dioxide removal. For both aspects, the rate of change and the required spending are important potential hurdles. Throughout the entire chapter, renewable energies (the single most important technology group in regard to zero-carbon energy production from new installed capacities) are only mentioned in connection with nuclear and CCS as "low carbon technologies". Renewables have nothing to do with nuclear and CCS and therefore they should be mentioned without these technologies. It seems a highly biased scheme throughout the entire document to play down renewables and artificially increase technologies which are unsuccessful on the energy market over the past decade. Request: Replace "low carbon technologies" with "renewables and energy efficiency" wherever possible. [Sven Teske, Australia]
noted, chapter 2 will assess all the technologies based on scenario analysis, the practical issues will be discussed in chapter 4. A revised text in chapter 2.3.4 will keep balance
2211 33 9 33 11The challenge embedded in the rates of change should be highlighted in the executive summary. [Kenneth Möllersten, Sweden]
accepted
6885 33 1 33 1 BECCS should be replaced with CDR, as there are several CDR measures/ technologies. [Bert Metz, Netherlands] will be discussed in next revision
9228 33 14 Needs a discussion of the primary energy accounting used, and the implications of this. [Glen Peters, Norway] Noted
1556 33 14
in this section (text, figures and table), the word "demand" should be replaced by "consumption" : coal consumption, renewable energy consumtion, etc. A demand is not always met, e.g. today some people might want to use more renewable energy but the offer is not there yet, so it is more accurate to talk about consumption in these scenario. [Noé Lecocq, Belgium]
Revised
Do Not Quote, Cite, or Distribute Page 72 of 129
IPCC WGI SR15 First Order Draft Review Comments And Responses - Chapter 2
Comment No From Page From Line To Page To Line Comment Response
1558 33 14
In this section, it should be mentioned that some authors believe that solar energy contribution to mitigation is being underestimated in scenarios (See Creutzig et al. (2017) The underestimated potential of solar energy to mitigate climate change. Nature Energy : https://www.nature.com/articles/nenergy2017140 ). The implications of greater solar energy contribution to mitigation should also be discussed. On the other hand, it should be noted that costs for nuclear energy, CCS and BECCS have been underestimated in the past, and their rate of deployment overestimated. [Noé Lecocq, Belgium]
accepted, some discussion on potential for renewable energy from other studies will be presented
6527 33 14 36 6All the figures in these sections are only for 1.5DS. If possible, comparison with 2DS or higher temperature target scenarios are useful to judge the feasibility of the 1.5DS [Shigeki KOBAYAHI, Japan]
accepted
4171 33 15 25
Installed capacity isn't the same as generation. If renewable energy is to provide half of the energy by 2050, then we must make significant investments and realize proper storage capacity in the near future. If investments into storage and the successful deployment of storage cannot be guaranteed by 2050, then we will most certainly miss all mitigation pathways, especially if absolute capacity from nuclear generations declines and there is no uptake in hydro investment. Current renewable energy is backed up by gas or coal which has a much larger carbon footprint than hydro or nuclear. In fact, even some renewable energies have larger carbon footprints when the entire lifecycle is taken into account. Additionally, the waste issue needs to be addressed. Currently there is no recycling program in place for solar etc. which will cause determential enviornmental impacts if not figured out. What will be done with all the hydrofluoric acid and what are the impacts on land and water supplies from such toxic chemicals which can currently not be removed from the water supply? If renewable energy is to account for half of all energy by 2050 this will have to be looked at in depth in order to ensure sustainable development and environmental protection. Look at inner Mongolia, where over 90% of the rare earths for panels used in North America are mined. While data is missing or deficient, there has been severe environmental ramifications that will undoubtedly influence climate mitigation and most certainly demonstrate the opposite of sustainable development. [Michelle Leslie, Canada]
noted, will be discussed, together with chapter 4
730 33 15 33 16
There is no definition of what is meant by "zero emissions". Given that there will always be a carbon footprint of running a generation facility, even if the facility is a solar farm, it has to be managed and therefore the worker/s have to use up co2 to manage the facility. Also given that nuclear power will be used, running these systems has to have a carbon footprint. If it means that the world daily carbon footprint to operate all generation and distribution systems will be offset by CCS or some other decarbonisation method this should be explained. see page 52 line 21-22 [Moshe Kinn, United Kingdom (of Great Britain and Northern Ireland)]
accepted
1512 33 15 33 18Here it is mentioned that the difference in results are based on the model differences. However, such differences may occur due to the pathways taken by each model to achieve the target [Ken'ichi Matsumoto, Japan]
This is the way to use different modeling results, there is discussion about the scenario setting in this chapter.
6886 33 17 33 18Explain why the WITCH model reaches negative emissions already by 2030; isn't that caused by model limittaions or outliers in terms of assumptions? [Bert Metz, Netherlands]
The discussion was removed. Basically we pick up results from database, there will be some extra scenarios, based on the modeller's analysis
6942 33 19 33 25
The largest part of renewable energy is assumed to come from biomass in all scenarios. Since it takes decades for forests to absorb the carbon released from combustion, there will be a net positive amount of emissions every year. In a very long term, a net zero emission level could be reached, if the amount of biomass combustion remains constant. However, since the amount of biomass use keeps increasing year after year, the emissions will similarly keep growing and the forests of the world will always struggle to absorb the additional carbon. How can negative emissions be achieved if the emissions from biomass combustion keep increasing? [Janne Hirvonen, Finland]
Biomass use will be equipped with CCS, to keep its emission to be very low
6946 33 19 33 25
With only two exceptions, all scenarios have more biomass energy generation than nuclear power, even though nuclear power releases 0 emissions during operation and even considering all life cycle emissions, the emission level is comparable to wind power. Why is the focus here on increasing the use of combustion, when that is the one thing that should be avoided to mitigate climate change? [Janne Hirvonen, Finland]
the choice of different low carbon power generation were decided by modeling teams, here in chapter 2 we will review all the scenario analysis, but will also discuss the various options. Nuclear will be addressed in the chapter
2612 33 19 33 25
does this take into account the feasibility of the different technologies? And how is this differentiated on the regional scale? [Zoha Shawoo, United Kingdom (of Great Britain and Northern Ireland)]
there is a box to talk about feasibility, it is difficult to assess feasibility here in the chapter, there will be some discussion about these technologies based on the scenario analysis. This will be discussed with chapter 4
4241 33 2
The role of biomass is contested, as everyone knows well. The model produce this result under certain assessments (e.g. high yield growth, and good global and local land use goverance). If these conditions are invalid, biomass deployment might fail socially, or from a mitigation perspective (e.g. ILUC emissions). So this sentence should be prhased much more carefully, e.g. "In the IAMs considered,..." [Felix Creutzig, Germany]
accepted
17418 33 2 33 21
It is getting clearer and clearer that this report is fundamentally based on the very large deployment of BECCS. I have to said, at least so far, it has not been opened up enough how the problems of IAMs have been accounted for in the analyses of net emissions. [Tuomo Kalliokoski, Finland]
role of IAM is to identify key options to reach long-term target with combined emission sources, BECCS is in the scenarios, we will discussed about the uncertainty and technology progress
Do Not Quote, Cite, or Distribute Page 73 of 129
IPCC WGI SR15 First Order Draft Review Comments And Responses - Chapter 2
Comment No From Page From Line To Page To Line Comment Response
538 33 2 33 21
…with the largest portion from biomass fuels. Again, this scenario is misleading because there is no discussion of an even cleaner and arguably more realistic scenario with 100% clean, renewable energy as outlined in the 8 papers above. This report is misleading readers into thinking that scenarios that include bioenergy, CCS, and nuclear are needed when they are not, and policy makers are already proposing to go to 100% clean, renewable energy, not energy with nuclear, CCS, or biofuels. Specifically, U.S.Senate Resolution 632, U.S. House Resolution 540, U.S. Senate Bill 987, and the U.S. House "100 by '50 Act." all propose 100% clean and renewable energy, which excludes nuclear, coal with CCS, and biofuels because they are either not clean, not renewable or both. [Mark Jacobson, United States of America]
noted, discussion on 100% renewable energy was given. But this part discusses about the scenarios for 1.5C, have to reflect these studies.
4242 33 22
Add: "Solar PV had historically been underestimated in IAMs and IEA projections, and could alone contribute 30-50% of electricity in competitive markets in 2050 (Creutzig, F., Agoston, P., Goldschmidt, J. C., Luderer, G., Nemet, G., & Pietzcker, R. C. (2017). The underestimated potential of solar energy to mitigate climate change. Nature Energy, 2(9), nenergy2017140.)" [Felix Creutzig, Germany]
noted
4773 33 23 33 25To what extent this moderate increase is consistent with the officially announced intentions of countries in terms of energy planning, at least in EU? [Elena Georgopoulou, Greece]
this will be discussed
14221 33 23 33 29
Nuclear power may exhibit a moderate increase or even a decrease, but it is still contributing significantly to the generation of electricity, without contributing to the generation of CO2. Some of the scenarios in figure (d) show a tenfold increase in the nuclear power demand, this is far too much to shrug off casually as is done in the text. [Jason Donev, Canada]
accepted
6887 33 23 33 33
Clarify if the low or declining use of nuclear and biomss in some trajectories is caused by limits imposed by the models or if this is the result of least cost calculations. And use bottom-up studies (e.g. Moved here from Ch 4) to discuss sustainability limits on biomass and on CDR [Bert Metz, Netherlands]
noted, author will discuss about this
13191 33 24 25If possible, please quantify how much the decline in nuclear power would be. [Deger Saygin, Turkey] nuclear power will not specified treated, we will try to see how to make this in the text, for all key
technologies from scenarios
10845 33 26 33 31
Fig. 2.11: why is there not single IAM scenario with 100% RE(!?), while an entire community with about 60 peer-reviewed articles exists. The IAMs have to catch up with the progress of the energy sector focused community. A clear disclaimer should be added that enegy sector analyses exist with a high RE share (and some of them even show that the fossil-CCS and nuclear option cost more, hence the cost argument against 100% RE passed away. [Christian Breyer, Finland]
IPCC report is a assessment report, we will analysis based on the lecture, not questioning lectures. 100% scenario will be discussion, or add to the figure by including modeling results from outside IAMs
1945 33 26 33 31Figure 2.11 must be updated for clarity, legend text size and not to rely on MS Excel i.e. match preceding figs. This also applies to figs 2.12, 2.13 and 2.14 [Andrew Smedley, United Kingdom (of Great Britain and Northern Ireland)]
editorial
13315 33 26 33 32
Figure 2.11: Suggest simplifying these plots to aid communication. Does each scenario need to be differentiated here - could that information be provided in an annex perhaps? [Jordan Harold, United Kingdom (of Great Britain and Northern Ireland)]
noted, we will discuss how to improve
13316 33 26 33 32Figure 2.11: Explain EJ acronym used in graph to readers. [Jordan Harold, United Kingdom (of Great Britain and Northern Ireland)]
noted
9497 33 26 33 32Figure 2.11 is complicated. The figure does not always have all model's results. More improvements for better understanding are requested. [Masato TAKAGI, Japan]
noted
10575 33 26 33 32
Figure 2.11 cites : "Rogelj et al.2017a" Such reference is missing at the reference list. Additionally, the figure cites "Rogelj et al.2017" as source data. The scenarios and projections are not compatible when comparing information from the article and the figure 2.11. The change to a low carbon or renewables is clear, as an independent chapter the units (EJ) need to be more explicit to the reader, as mentioned the first time. [Elemer Briceño-Elizondo, Costa Rica]
noted
5173 33 26 33 34 Figure 2.11: add "Hydro" as stand-alone figure [Sven Teske, Australia] accepted
5174 33 26 33 34 Figure 2.11: present all sources with the same scale to make them comparable [Sven Teske, Australia] editorial
5175 33 26 33 34Figure 2.11: present values in final energy, not primary energy as this miss-leads the shares of thermal processes versus electric only processes (e.g. solar pv, wind, hydro) [Sven Teske, Australia]
noted
14222 33 27 33 27How are figures (a) and (b) different? What’s being included in ‘renewable’ in (a)? Could more of a description be put in the caption? [Jason Donev, Canada]
noted
17470 33 31 A [Tom Gabriel Johansen, Norway] noted
17510 33 31 A [Angela Morelli, Norway] noted
4240 33 31
Why "demand"? Isn't this the supply? Also I am not sure the numbers are up-to-date. The relevant data on renewables are from Pietzcker et al 2017 and should be used: Pietzcker, Robert C., et al. "System integration of wind and solar power in Integrated Assessment Models: A cross-model evaluation of new approaches." Energy Economics 64 (2017): 583-599. Especially the role of PV had been underestimated both by IEA and IAMs, and could be 30-50% in 2050. [Felix Creutzig, Germany]
accepted
17224 33 31 33 31 Figure 2.11: Images are too small and it is difficult to understand the scenarios. [Himangana Gupta, India] will be revised
6888 33 34 34 11Please discuss what the implications are of the high coal use trajectories in terms of CCS and CDR requirements. Would limits on CDR not disqualify such high coal scenarios? [Bert Metz, Netherlands]
this will be discussed
Do Not Quote, Cite, or Distribute Page 74 of 129
IPCC WGI SR15 First Order Draft Review Comments And Responses - Chapter 2
Comment No From Page From Line To Page To Line Comment Response
12988 33 38 33 38 Natural gas trend is … (instead of natural gas is…) [Caserini Stefano, Italy] accepted
3715 33 38 33 39 refer to time frame up to 2050 once [Harald Winkler, South Africa] accepted
13192 33 38 34 2Given this large variation in natural gas demand projections, it would help if the underlying reasons are explained in more detail. [Deger Saygin, Turkey]
noted
13193 34
The title of Table 2.8 mentions supply whereas the headings say demand. It is therefore also not clear what the 2020 share refers to. Please also mention the period annual growth refers to. It would also help if the level in 2015 is included in the table. [Deger Saygin, Turkey]
Accept
4537 34 Fig 2.12 - Add index format to "Wm-2" [Radim Tolasz, Czech Republic] Editorial - will be adjusted for final version
6954 34 34
Table 2.8 Rows “Renewables”, “Wind+solar” and “biomass” are not practical and actually obfuscating as Renewables encompass all and there should not be any reason to lump wind and solar together. Preferably the categories could be Hydro, Wind, Solar, Biomass, also other renewable if distinction eg with geoenergy etc cannot be done. [Ville Tulkki, Finland]
Accept
10331 34 34Table 2.8. averages do not mean much, what it is important is the range. It should be provided in all cases. [Maria Jose Sanz Sanchez, Spain]
see 1049
10441 34 35
highlights role of CCS/BECCS but does not say how realistic or feasible this is. Is it technically and economically possible? Should point to 2.4.2.3 for discussion of sustainability and to x.x.x.x on technical and economic feasibility (?? Economics at 2.4.3.2 p 2-65 lines 18-21) [Jonathan Lynn, Switzerland]
corrected
13317 34 4 34 1
Figure 2.12: Suggest simplifying these plots to aid communication. Does each scenario need to be differentiated here - could that information be provided in an annex perhaps? [Jordan Harold, United Kingdom (of Great Britain and Northern Ireland)]
revised
13318 34 4 34 1Figure 2.12: Explain EJ acronym used in graph to readers. [Jordan Harold, United Kingdom (of Great Britain and Northern Ireland)]
accepted
10576 34 4 34 1for figure 2.12 similar comments on units as to figure 2.11 and the use of the source material. [Elemer Briceño-Elizondo, Costa Rica]
accepted
9498 34 4 34 11Figure 2.12 is complicated. The figure does not always have all model's results. More improvements for better understanding are requested. [Masato TAKAGI, Japan]
accepted
17471 34 9 A [Tom Gabriel Johansen, Norway] noted
17511 34 9 A [Angela Morelli, Norway] noted
4243 34 13
It would be good to disentangle wind and solar, as they have a quite different generation profile, and different learning curves. PV growth rates are around 38%, and that does not look compatible with the 9.5% cited. PV 2050 estimates in EJ is 67-130EJ (without wind or CSP) (Creutzig, F., Agoston, P., Goldschmidt, J. C., Luderer, G., Nemet, G., & Pietzcker, R. C. (2017). The underestimated potential of solar energy to mitigate climate change. Nature Energy, 2(9), nenergy2017140) [Felix Creutzig, Germany]
accepted
5907 34 13 34 17The sum of renewables, nuclear and fossil fuels in the column for 2050 Share is 103,1 %. Should have been 100 % [Aage Stangeland, Norway]
will be revised
1557 34 13 34 17 In the table, make 2 separate lines for wind and solar. [Noé Lecocq, Belgium] accepted
10846 34 13 34 17
Table 2.8: the highest share of solar+wind is 44% in that table for the year 2050 - this is really extrem conservative - much more progressive peer-reviewed studies exist in the 100% RE community, which are fully ignored in the entire chapter. This is from the scientific point of view a clear deficit and has to be overcome. [Christian Breyer, Finland]
other studies from outside IAM will be included
12989 34 13 34 17tab 2.8: It would be very useful adding as a second column the 2015 (or 2016) share and as a 4th column the 2015 (or 2016) demand [Caserini Stefano, Italy]
accepted
10658 34 13 34 18Table 2.8 could benefit from bolding the aggregation of renewables versus fossil fuels [Kristin Campbell, United States of America]
noted
14226 34 16 34 16Why are hydropower, geothermal and tidal not included in this? Especially hydro, which contributes quite a bit currently! Will they be shut off? [Jason Donev, Canada]
revised
1849 34 19
Deployment of CCS: More careful language is needed here! Riahi et al. 2017: „CCS plays an important role in many of the mitigation scenarios even though its deployment is subject to large uncertainties ..” AR5-WGIII-SPM: ”overshoot scenarios typically rely on the availability and widespread deployment of BECCS and afforestation in the second half of the century. The .. CDR technologies and methods are, to varying degrees, associated with challenges and risks (see Section SPM 4.2) (high confidence)” Therefore, e.g.: Deployment of CCS plays an important role in CO2 many emission reduction pathways consistent with 1.5°C. In these pathways the carbon budget limitation requires a rapid implementation of CCS, soon after 2020. It should also be noted, that the relevant technologies and methods are uncertain, and to varying degrees, associated with challenges and risks (IPCC 2014, Riahi et al. 2017). [Tibor Farago, Hungary]
see 1049
17225 34 19 34 19
Para 2.3.4.1.2: For the CCS to become more popular as a mitigation tool, it is important that the technology is cost-effective. It will be helpful if a review of available CCS options is given that can be used in different scenarios. [Himangana Gupta, India]
see 1049
Do Not Quote, Cite, or Distribute Page 75 of 129
IPCC WGI SR15 First Order Draft Review Comments And Responses - Chapter 2
Comment No From Page From Line To Page To Line Comment Response
15681 34 19 35 2
The sub-section only talks about the projections for CCS in fossil fuel generation (e.g., coal, natural gas) by 2020 without referring to the actual state of the technology and rate of deployment as well as associated legal and policy implications which are key to any prospect of deployment of CCS. These have to be integrated in the discussions. [Elenita Daño, Philippines]
paragraph added on the state of tech and policy to advance CCS with reference to Ch4
15434 34 19 35 2
The sub-section only talks about the projections for CCS in fossil fuel generation (e.g., coal, natural gas) by 2020 without referring to the actual state of the technology and rate of deployment as well as associated legal and policy implications which are key to any prospect of deployment of CCS. These have to be integrated in the discussions. [Elenita Daño, Philippines]
paragraph added on the state of tech and policy to advance CCS with reference to Ch4
5176 34 19 35 28
CCS has been unsuccessful over the past decade. Still it is presented as a very important part of the solution. It requires a discussion in the beginning of this section why this is still unsuccessful and what other measures are required as "a plan B". It is high irresponsible to ignore what happens in the real world over the past decade. [Sven Teske, Australia]
the topic of storage capacity is covered in the section on CDR sustainability
13047 34 19 36 6
The "geographical problem" is not considered: sites available for CCS are not evenly distributed. The counties without (or with limited) possibility of CCS will have greater difficulties in decarbonizing the electric sector and the industrial sector, and they cannot implement BECCS or DACS. [Caserini Stefano, Italy]
see 1049
13194 34 2 23It is not clear why only CCS is considered but not more energy efficiency or renewable energy. Is it because of costs, lack of resource availability, technology? [Deger Saygin, Turkey]
no use of likelihood language is used here. See comment 1049
10981 34 2 34 2Need to state very clearly that it is essential (if it is) [Skea Jim, United Kingdom (of Great Britain and Northern Ireland)] text has been changed to refer to the pathways not what will happen in the future. See comment
1049 on status of CCS
19308 34 2 34 24 Something should be said about feasibility of such large extent of CCS. [Marco Mazzotti, Switzerland] text modified to state that CCS is in all 1.5 pathways assessed in this section
20402 34 2 35 2
I would not use the future sense ("will be equipped") in the context of scenarios. Rather than the share of CCS for coal, gas and biomass, it would be more useful to show the absolute amounts, which may differ less between scenarios. It would also be good to know how much is retrofitted CCS (which some people think is unrealistic costwise) and CCS on brand new plants. Chapter 4 is rather critical on the "feasibility of timely upscaling" of CCS. [Olivier Boucher, France]
see 1049
6890 34 2 35 2
Are models taking into account the low capacity factors of coal and gas plants in a situation with high renewables penetration and the implied high costs of installing CCS for such low operating hours? Please clarify and if they do, please explain why they still have high CCS usage. If the models do not take this into account, would that not disqualify their findings? [Bert Metz, Netherlands]
see 1049
6699 34 2 34 22
Must question whether a pathway can be considered “likely” to limit warming to 1.5 degrees if it relies on NETs that may not have a “likely” chance of proving feasible and providing reliable reductions at the needed scale. See: https://www.sei-international.org/mediamanager/documents/Publications/Climate/SEI-WP-2016-08-Negative-emissions.pdf SUPPLEMEMTAL COMMENTS: See, e.g. Fuss et al (2014), Betting on negative emissions, Nature Climate Change. Available at: http://www.nature.com/nclimate/journal/v4/n10/full/nclimate2392.html?foxtrotcallback=true. In this commentary, Fuss et al. state, among other things, that the "credibility [of BECCS] as a climate change mitigation option is unproven and its widespread deployment in climate stabilization scenarios might become a dangerous distraction." For example, as of 2015, there was only a single BECCS plant operating at-scale but based on a different technology (using CO2 released from an ethanol production process). This project only captures only 11–13% of the carbon in the feedstock. See, Gough and Vaughan (2015), Synthesising Existing Knowledge on the Feasibility of BECCS (D1a) | AVOID 2 Climate Change Research Programme. AVOID2, WPD1a. Some studies have also found carbon positive as well as carbon negative effects of BECCS. See, e.g. Farjady and Mac Dowell (2017), Can BECCS deliver sustainable and negative emission reductions. Avaialble at: http://pubs.rsc.org/en/content/articlelanding/2017/ee/c7ee00465f#!divAbstract.Available at: http://www.avoid.uk.net/2015/07/synthesising-existing-knowledge-on-the-feasibility-of-beccs/. What's more, climate change introduces further uncertainty into bioenergy potential. See, e.g. Smith, P., Bustamante, M., Ahammad, H., Clark, H., Dong, H., et al. (2014). Agriculture, forestry and other land use (AFOLU). In Climate Change 2014: Mitigation of Climate Change.Contribution of Working Group III to the Fifth Assessment Report of the IntergovernmentalPanel on Climate Change. O. Edenhofer, R. Pichs-Madruga, Y. Sokona, E. Farahani, S. Kadner,et al. (eds.). Cambridge University Press, Cambridge, UK, and New York. https://www.ipcc.ch/report/ar5/wg3/. Because of this, some have noted that the “response of bio-energy crops to climate and CO2 fertilization is a leading order uncertainty in the feasibility of BECCS”. See Wiltshire and Davies-Barnard (2015), Planetary Limits to BECCS Negative Emissions, 1104872 / AVOID 2 WPD.2a Report 1, V1.1. AVOID 2 programme. [Jennifer Morgan, Netherlands]
Each model approximates capacity factor issues in different ways. The assessment of this topic is outside of the scope of this section.
17419 34 21 34 22Is there somewhere in this report the detailed description how this large deployment of CCS takes place within this timeframe? [Tuomo Kalliokoski, Finland]
this sub-section is on CCS. Demand reduction and RE are considered in the overlying section on energy
Do Not Quote, Cite, or Distribute Page 76 of 129
IPCC WGI SR15 First Order Draft Review Comments And Responses - Chapter 2
Comment No From Page From Line To Page To Line Comment Response
2212 34 21 34 22
The deployment of CCS soon after 2020 is not many years ahead. This report needs to critically analyse such outcomes of the IAMs simulations. While it is theoretically possible in IAMs it may not be feasible in the real world considering lead times (planning, financing, obtaining permits, construction and commissioning). It is probably possible to make a fairly exact estimate when substantial contributions from CCS can start at the earliest and this kind of reality check should be included. Implications of failure to meet the IAMs outcomes should then be analysed as appropriate. [Kenneth Möllersten, Sweden]
see 1049
13195 34 22
Text mentions that CCS should be deployed soon after 2020, meaning this needs to start in the next 3 years. Here authors may consider adding the level of CCS capacity achieved today (and in which sectors) to show the challenge to 2050/2100. [Deger Saygin, Turkey]
see 1049
6889 34 24 34 25 Why are other models able to accommodate the remaining emissions from coal/CCS? [Bert Metz, Netherlands] the draft text that was contingent on assumed capture extent has been removed
7940 34 24 34 26
SGI and IEAGHG both have looked / are looking at the residual emissions issue. The first study (IEAGHG/SGI 2016) was originally on the unburnable carbon concept, and residual emissions from CCS flagged up as a potential issue why uptake of CCS in models seems more limited than expected. IEAGHG is currently working on a follow up study, but unfortunately it is not citable yet. Capture technology developers to-date have largely focused on designing for capture rates reaching 85% to 90%, leaving 10-15% residual emissions. However, there should be no severe technical or economic drawbacks to get capture to 98% and above. In case residual emissions from CO2 capture cannot be addressed, CDR options become even more important. [Jasmin Kemper, United Kingdom (of Great Britain and Northern Ireland)]
see 1049
11128 34 24 34 26
“Some models consider the residual emissions that are not captured when using coal with CCS to be too high for 1.5°C scenarios.” Another way of presenting the same results would be to show the amount of coal without CCS in 2050. I would expect coal w/o CCS to approach zero by 2050. I would also suggest to mention this in the executive summary as it would be a clear indication to investors and policy makers. [Michiel Schaeffer, Netherlands]
there is discussion of this particular pathway in a following subsection
20194 34 27 …have a very fast phase out... [Ton Wildenborg, Netherlands] corrected
5908 34 27 34 27 Spelling error. Remove the "a" before "have" [Aage Stangeland, Norway] corrected
9441 34 27 34 27 suppress 'a' before 'have' [Isabelle Czernichowski-Lauriol, France] the draft text that was contingent on assumed capture extent has been removed
4538 35 Fig 2.13 - Add index format to "Wm-2" [Radim Tolasz, Czech Republic] see comment 1101
6955 35 35 Fig 2.14 a) and b) are most likely wrong as they do not match the text description. [Ville Tulkki, Finland] see comment 1035
10332 35 36
Figure 2.14. To make the figue more readable suggest to use sam colour code in both graphs for same items. Why in the botom figure the 2015-20 period is not considered (or it is perhaps a mistake in the label)? [Maria Jose Sanz Sanchez, Spain]
see comment 1101
9499 35 3 35 11Figure 2.13 is complicated. The figure does not always have all model's results. More improvements for better understanding are requested. [Masato TAKAGI, Japan]
agree, figure to be modified
14223 35 3 35 3 Graphs go to 120%, that’s not appropriate, can’t have more than 100% in this case. [Jason Donev, Canada] Accept
13319 35 4 35 1
Figure 2.13: Suggest simplifying these plots to aid communication. Does each scenario need to be differentiated here - could that information be provided in an annex perhaps? [Jordan Harold, United Kingdom (of Great Britain and Northern Ireland)]
see 1076
13320 35 4 35 1Figure 2.13: Explain EJ acronym used in graph to readers. [Jordan Harold, United Kingdom (of Great Britain and Northern Ireland)]
see 1076
6891 35 4 35 1 Also show the absolute usage of CCS (in terms of CO2 stored) [Bert Metz, Netherlands] see 1076
14224 35 4 35 4 Different graphs change scale, one is 75% at the top and the others are 120%. [Jason Donev, Canada] see 1076
7941 35 4 35 8Fig. 2.13: I suggest to remove the 120% on the x-axis, as CCS deployment cannot exceed 100%. [Jasmin Kemper, United Kingdom (of Great Britain and Northern Ireland)]
NO CHANGE EJ is common unit for energy
14225 35 5 35 5There would be difficulties with relying so much on natural gas for GHG reduction because of fugitive methane emissions. CCS does nothing to prevent fugitive methane emissions. [Jason Donev, Canada]
this is discussed in the section on CDR sustainability
9229 35 9 Figure. What about industry CCS? Can you please do an assessment of that too? [Glen Peters, Norway] Accept
17472 35 9 A [Tom Gabriel Johansen, Norway] No comment provided
17512 35 9 A [Angela Morelli, Norway] No comment provided
20195 35 9Ad Figure 2.13 c: Share of biomass with CCS (BECCS); ad and c: skip 120.00% (?) [Ton Wildenborg, Netherlands]
see 1049
14174 35 9 35 9
Figure 2.13. Shares with almost 100% of power generation with CCS by 2050 are virtually impossible even in extreme scenarios, given to the existent installed capacity worldwide and the necessary time to retrofit them all, as well as current power plant locations vis-à-vis their distance of geological storage (or aquifers) sites, amortization periods, and the industrial manufacturing speed for building sufficient CCS plants worldwide. Therefore, including extremely speculative curves in the graphs may be misleading, by transmitting the idea for policy makers that they are somehow possible to be achieved by 2050. [Alexandre Strapasson, Brazil]
covered in industry section…note that in that section the status of industry CCS is covered but not here?
19309 35 12 35 16 Something should be said about feasibility of such large extent of BECCS [Marco Mazzotti, Switzerland] see 1081
Do Not Quote, Cite, or Distribute Page 77 of 129
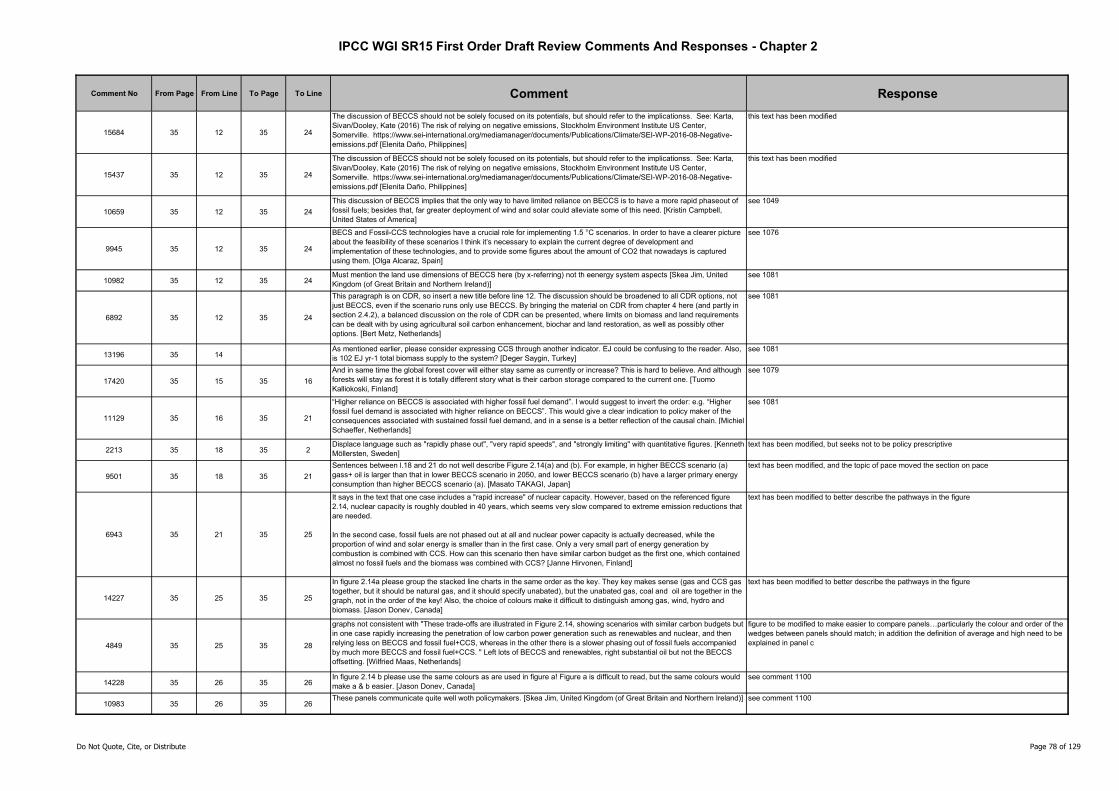
IPCC WGI SR15 First Order Draft Review Comments And Responses - Chapter 2
Comment No From Page From Line To Page To Line Comment Response
15684 35 12 35 24
The discussion of BECCS should not be solely focused on its potentials, but should refer to the implicationss. See: Karta, Sivan/Dooley, Kate (2016) The risk of relying on negative emissions, Stockholm Environment Institute US Center, Somerville. https://www.sei-international.org/mediamanager/documents/Publications/Climate/SEI-WP-2016-08-Negative-emissions.pdf [Elenita Daño, Philippines]
this text has been modified
15437 35 12 35 24
The discussion of BECCS should not be solely focused on its potentials, but should refer to the implicationss. See: Karta, Sivan/Dooley, Kate (2016) The risk of relying on negative emissions, Stockholm Environment Institute US Center, Somerville. https://www.sei-international.org/mediamanager/documents/Publications/Climate/SEI-WP-2016-08-Negative-emissions.pdf [Elenita Daño, Philippines]
this text has been modified
10659 35 12 35 24
This discussion of BECCS implies that the only way to have limited reliance on BECCS is to have a more rapid phaseout of fossil fuels; besides that, far greater deployment of wind and solar could alleviate some of this need. [Kristin Campbell, United States of America]
see 1049
9945 35 12 35 24
BECS and Fossil-CCS technologies have a crucial role for implementing 1.5 °C scenarios. In order to have a clearer picture about the feasibility of these scenarios I think it’s necessary to explain the current degree of development and implementation of these technologies, and to provide some figures about the amount of CO2 that nowadays is captured using them. [Olga Alcaraz, Spain]
see 1076
10982 35 12 35 24Must mention the land use dimensions of BECCS here (by x-referring) not th eenergy system aspects [Skea Jim, United Kingdom (of Great Britain and Northern Ireland)]
see 1081
6892 35 12 35 24
This paragraph is on CDR, so insert a new title before line 12. The discussion should be broadened to all CDR options, not just BECCS, even if the scenario runs only use BECCS. By bringing the material on CDR from chapter 4 here (and partly in section 2.4.2), a balanced discussion on the role of CDR can be presented, where limits on biomass and land requirements can be dealt with by using agricultural soil carbon enhancement, biochar and land restoration, as well as possibly other options. [Bert Metz, Netherlands]
see 1081
13196 35 14As mentioned earlier, please consider expressing CCS through another indicator. EJ could be confusing to the reader. Also, is 102 EJ yr-1 total biomass supply to the system? [Deger Saygin, Turkey]
see 1081
17420 35 15 35 16
And in same time the global forest cover will either stay same as currently or increase? This is hard to believe. And although forests will stay as forest it is totally different story what is their carbon storage compared to the current one. [Tuomo Kalliokoski, Finland]
see 1079
11129 35 16 35 21
“Higher reliance on BECCS is associated with higher fossil fuel demand”. I would suggest to invert the order: e.g. “Higher fossil fuel demand is associated with higher reliance on BECCS”. This would give a clear indication to policy maker of the consequences associated with sustained fossil fuel demand, and in a sense is a better reflection of the causal chain. [Michiel Schaeffer, Netherlands]
see 1081
2213 35 18 35 2Displace language such as "rapidly phase out", "very rapid speeds", and "strongly limiting" with quantitative figures. [Kenneth Möllersten, Sweden]
text has been modified, but seeks not to be policy prescriptive
9501 35 18 35 21
Sentences between l.18 and 21 do not well describe Figure 2.14(a) and (b). For example, in higher BECCS scenario (a) gass+ oil is larger than that in lower BECCS scenario in 2050, and lower BECCS scenario (b) have a larger primary energy consumption than higher BECCS scenario (a). [Masato TAKAGI, Japan]
text has been modified, and the topic of pace moved the section on pace
6943 35 21 35 25
It says in the text that one case includes a "rapid increase" of nuclear capacity. However, based on the referenced figure 2.14, nuclear capacity is roughly doubled in 40 years, which seems very slow compared to extreme emission reductions that are needed.
In the second case, fossil fuels are not phased out at all and nuclear power capacity is actually decreased, while the proportion of wind and solar energy is smaller than in the first case. Only a very small part of energy generation by combustion is combined with CCS. How can this scenario then have similar carbon budget as the first one, which contained almost no fossil fuels and the biomass was combined with CCS? [Janne Hirvonen, Finland]
text has been modified to better describe the pathways in the figure
14227 35 25 35 25
In figure 2.14a please group the stacked line charts in the same order as the key. They key makes sense (gas and CCS gas together, but it should be natural gas, and it should specify unabated), but the unabated gas, coal and oil are together in the graph, not in the order of the key! Also, the choice of colours make it difficult to distinguish among gas, wind, hydro and biomass. [Jason Donev, Canada]
text has been modified to better describe the pathways in the figure
4849 35 25 35 28
graphs not consistent with "These trade-offs are illustrated in Figure 2.14, showing scenarios with similar carbon budgets but in one case rapidly increasing the penetration of low carbon power generation such as renewables and nuclear, and then relying less on BECCS and fossil fuel+CCS, whereas in the other there is a slower phasing out of fossil fuels accompanied by much more BECCS and fossil fuel+CCS. " Left lots of BECCS and renewables, right substantial oil but not the BECCS offsetting. [Wilfried Maas, Netherlands]
figure to be modified to make easier to compare panels…particularly the colour and order of the wedges between panels should match; in addition the definition of average and high need to be explained in panel c
14228 35 26 35 26In figure 2.14 b please use the same colours as are used in figure a! Figure a is difficult to read, but the same colours would make a & b easier. [Jason Donev, Canada]
see comment 1100
10983 35 26 35 26These panels communicate quite well woth policymakers. [Skea Jim, United Kingdom (of Great Britain and Northern Ireland)] see comment 1100
Do Not Quote, Cite, or Distribute Page 78 of 129
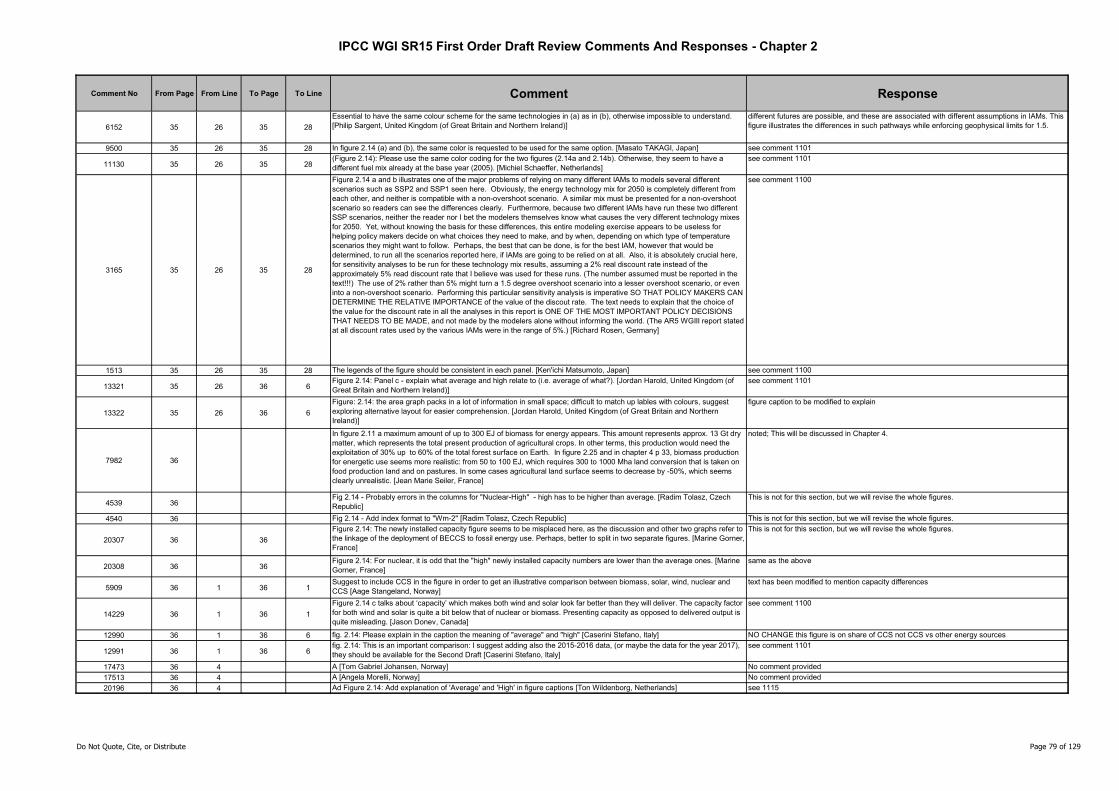
IPCC WGI SR15 First Order Draft Review Comments And Responses - Chapter 2
Comment No From Page From Line To Page To Line Comment Response
6152 35 26 35 28
Essential to have the same colour scheme for the same technologies in (a) as in (b), otherwise impossible to understand. [Philip Sargent, United Kingdom (of Great Britain and Northern Ireland)]
different futures are possible, and these are associated with different assumptions in IAMs. This figure illustrates the differences in such pathways while enforcing geophysical limits for 1.5.
9500 35 26 35 28 In figure 2.14 (a) and (b), the same color is requested to be used for the same option. [Masato TAKAGI, Japan] see comment 1101
11130 35 26 35 28(Figure 2.14): Please use the same color coding for the two figures (2.14a and 2.14b). Otherwise, they seem to have a different fuel mix already at the base year (2005). [Michiel Schaeffer, Netherlands]
see comment 1101
3165 35 26 35 28
Figure 2.14 a and b illustrates one of the major problems of relying on many different IAMs to models several different scenarios such as SSP2 and SSP1 seen here. Obviously, the energy technology mix for 2050 is completely different from each other, and neither is compatible with a non-overshoot scenario. A similar mix must be presented for a non-overshoot scenario so readers can see the differences clearly. Furthermore, because two different IAMs have run these two different SSP scenarios, neither the reader nor I bet the modelers themselves know what causes the very different technology mixes for 2050. Yet, without knowing the basis for these differences, this entire modeling exercise appears to be useless for helping policy makers decide on what choices they need to make, and by when, depending on which type of temperature scenarios they might want to follow. Perhaps, the best that can be done, is for the best IAM, however that would be determined, to run all the scenarios reported here, if IAMs are going to be relied on at all. Also, it is absolutely crucial here, for sensitivity analyses to be run for these technology mix results, assuming a 2% real discount rate instead of the approximately 5% read discount rate that I believe was used for these runs. (The number assumed must be reported in the text!!!) The use of 2% rather than 5% might turn a 1.5 degree overshoot scenario into a lesser overshoot scenario, or even into a non-overshoot scenario. Performing this particular sensitivity analysis is imperative SO THAT POLICY MAKERS CAN DETERMINE THE RELATIVE IMPORTANCE of the value of the discout rate. The text needs to explain that the choice of the value for the discount rate in all the analyses in this report is ONE OF THE MOST IMPORTANT POLICY DECISIONS THAT NEEDS TO BE MADE, and not made by the modelers alone without informing the world. (The AR5 WGIII report stated at all discount rates used by the various IAMs were in the range of 5%.) [Richard Rosen, Germany]
see comment 1100
1513 35 26 35 28 The legends of the figure should be consistent in each panel. [Ken'ichi Matsumoto, Japan] see comment 1100
13321 35 26 36 6Figure 2.14: Panel c - explain what average and high relate to (i.e. average of what?). [Jordan Harold, United Kingdom (of Great Britain and Northern Ireland)]
see comment 1101
13322 35 26 36 6
Figure: 2.14: the area graph packs in a lot of information in small space; difficult to match up lables with colours, suggest exploring alternative layout for easier comprehension. [Jordan Harold, United Kingdom (of Great Britain and Northern Ireland)]
figure caption to be modified to explain
7982 36
In figure 2.11 a maximum amount of up to 300 EJ of biomass for energy appears. This amount represents approx. 13 Gt dry matter, which represents the total present production of agricultural crops. In other terms, this production would need the exploitation of 30% up to 60% of the total forest surface on Earth. In figure 2.25 and in chapter 4 p 33, biomass production for energetic use seems more realistic: from 50 to 100 EJ, which requires 300 to 1000 Mha land conversion that is taken on food production land and on pastures. In some cases agricultural land surface seems to decrease by -50%, which seems clearly unrealistic. [Jean Marie Seiler, France]
noted; This will be discussed in Chapter 4.
4539 36Fig 2.14 - Probably errors in the columns for "Nuclear-High" - high has to be higher than average. [Radim Tolasz, Czech Republic]
This is not for this section, but we will revise the whole figures.
4540 36 Fig 2.14 - Add index format to "Wm-2" [Radim Tolasz, Czech Republic] This is not for this section, but we will revise the whole figures.
20307 36 36
Figure 2.14: The newly installed capacity figure seems to be misplaced here, as the discussion and other two graphs refer to the linkage of the deployment of BECCS to fossil energy use. Perhaps, better to split in two separate figures. [Marine Gorner, France]
This is not for this section, but we will revise the whole figures.
20308 36 36Figure 2.14: For nuclear, it is odd that the "high" newly installed capacity numbers are lower than the average ones. [Marine Gorner, France]
same as the above
5909 36 1 36 1Suggest to include CCS in the figure in order to get an illustrative comparison between biomass, solar, wind, nuclear and CCS [Aage Stangeland, Norway]
text has been modified to mention capacity differences
14229 36 1 36 1
Figure 2.14 c talks about ‘capacity’ which makes both wind and solar look far better than they will deliver. The capacity factor for both wind and solar is quite a bit below that of nuclear or biomass. Presenting capacity as opposed to delivered output is quite misleading. [Jason Donev, Canada]
see comment 1100
12990 36 1 36 6 fig. 2.14: Please explain in the caption the meaning of "average" and "high" [Caserini Stefano, Italy] NO CHANGE this figure is on share of CCS not CCS vs other energy sources
12991 36 1 36 6fig. 2.14: This is an important comparison: I suggest adding also the 2015-2016 data, (or maybe the data for the year 2017), they should be available for the Second Draft [Caserini Stefano, Italy]
see comment 1101
17473 36 4 A [Tom Gabriel Johansen, Norway] No comment provided
17513 36 4 A [Angela Morelli, Norway] No comment provided
20196 36 4 Ad Figure 2.14: Add explanation of 'Average' and 'High' in figure captions [Ton Wildenborg, Netherlands] see 1115
Do Not Quote, Cite, or Distribute Page 79 of 129
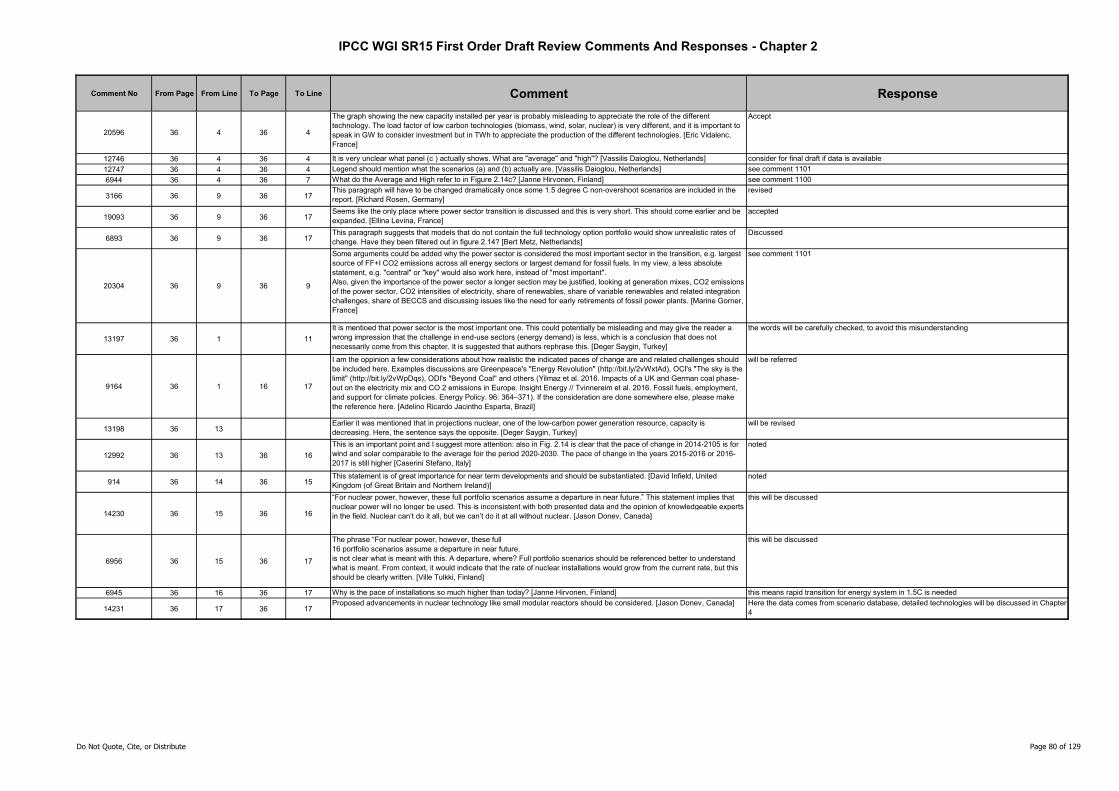
IPCC WGI SR15 First Order Draft Review Comments And Responses - Chapter 2
Comment No From Page From Line To Page To Line Comment Response
20596 36 4 36 4
The graph showing the new capacity installed per year is probably misleading to appreciate the role of the different technology. The load factor of low carbon technologies (biomass, wind, solar, nuclear) is very different, and it is important to speak in GW to consider investment but in TWh to appreciate the production of the different technologies. [Eric Vidalenc, France]
Accept
12746 36 4 36 4 It is very unclear what panel (c ) actually shows. What are "average" and "high"? [Vassilis Daioglou, Netherlands] consider for final draft if data is available
12747 36 4 36 4 Legend should mention what the scenarios (a) and (b) actually are. [Vassilis Daioglou, Netherlands] see comment 1101
6944 36 4 36 7 What do the Average and High refer to in Figure 2.14c? [Janne Hirvonen, Finland] see comment 1100
3166 36 9 36 17This paragraph will have to be changed dramatically once some 1.5 degree C non-overshoot scenarios are included in the report. [Richard Rosen, Germany]
revised
19093 36 9 36 17Seems like the only place where power sector transition is discussed and this is very short. This should come earlier and be expanded. [Ellina Levina, France]
accepted
6893 36 9 36 17This paragraph suggests that models that do not contain the full technology option portfolio would show unrealistic rates of change. Have they been filtered out in figure 2.14? [Bert Metz, Netherlands]
Discussed
20304 36 9 36 9
Some arguments could be added why the power sector is considered the most important sector in the transition, e.g. largest source of FF+I CO2 emissions across all energy sectors or largest demand for fossil fuels. In my view, a less absolute statement, e.g. "central" or "key" would also work here, instead of "most important".Also, given the importance of the power sector a longer section may be justified, looking at generation mixes, CO2 emissions of the power sector, CO2 intensities of electricity, share of renewables, share of variable renewables and related integration challenges, share of BECCS and discussing issues like the need for early retirements of fossil power plants. [Marine Gorner, France]
see comment 1101
13197 36 1 11
It is mentioed that power sector is the most important one. This could potentially be misleading and may give the reader a wrong impression that the challenge in end-use sectors (energy demand) is less, which is a conclusion that does not necessarily come from this chapter. It is suggested that authors rephrase this. [Deger Saygin, Turkey]
the words will be carefully checked, to avoid this misunderstanding
9164 36 1 16 17
I am the oppinion a few considerations about how realistic the indicated paces of change are and related challenges should be included here. Examples discussions are Greenpeace's "Energy Revolution" (http://bit.ly/2vWxtAd), OCI's "The sky is the limit" (http://bit.ly/2vWpDqs), ODI's "Beyond Coal" and others (Yilmaz et al. 2016. Impacts of a UK and German coal phase-out on the electricity mix and CO 2 emissions in Europe. Insight Energy // Tvinnereim et al. 2016. Fossil fuels, employment, and support for climate policies. Energy Policy. 96: 364–371). If the consideration are done somewhere else, please make the reference here. [Adelino Ricardo Jacintho Esparta, Brazil]
will be referred
13198 36 13Earlier it was mentioned that in projections nuclear, one of the low-carbon power generation resource, capacity is decreasing. Here, the sentence says the opposite. [Deger Saygin, Turkey]
will be revised
12992 36 13 36 16
This is an important point and I suggest more attention: also in Fig. 2.14 is clear that the pace of change in 2014-2105 is for wind and solar comparable to the average foir the period 2020-2030. The pace of change in the years 2015-2016 or 2016-2017 is still higher [Caserini Stefano, Italy]
noted
914 36 14 36 15This statement is of great importance for near term developments and should be substantiated. [David Infield, United Kingdom (of Great Britain and Northern Ireland)]
noted
14230 36 15 36 16
“For nuclear power, however, these full portfolio scenarios assume a departure in near future.” This statement implies that nuclear power will no longer be used. This is inconsistent with both presented data and the opinion of knowledgeable experts in the field. Nuclear can’t do it all, but we can’t do it at all without nuclear. [Jason Donev, Canada]
this will be discussed
6956 36 15 36 17
The phrase “For nuclear power, however, these full16 portfolio scenarios assume a departure in near future.is not clear what is meant with this. A departure, where? Full portfolio scenarios should be referenced better to understand what is meant. From context, it would indicate that the rate of nuclear installations would grow from the current rate, but this should be clearly written. [Ville Tulkki, Finland]
this will be discussed
6945 36 16 36 17 Why is the pace of installations so much higher than today? [Janne Hirvonen, Finland] this means rapid transition for energy system in 1.5C is needed
14231 36 17 36 17Proposed advancements in nuclear technology like small modular reactors should be considered. [Jason Donev, Canada] Here the data comes from scenario database, detailed technologies will be discussed in Chapter
4
Do Not Quote, Cite, or Distribute Page 80 of 129
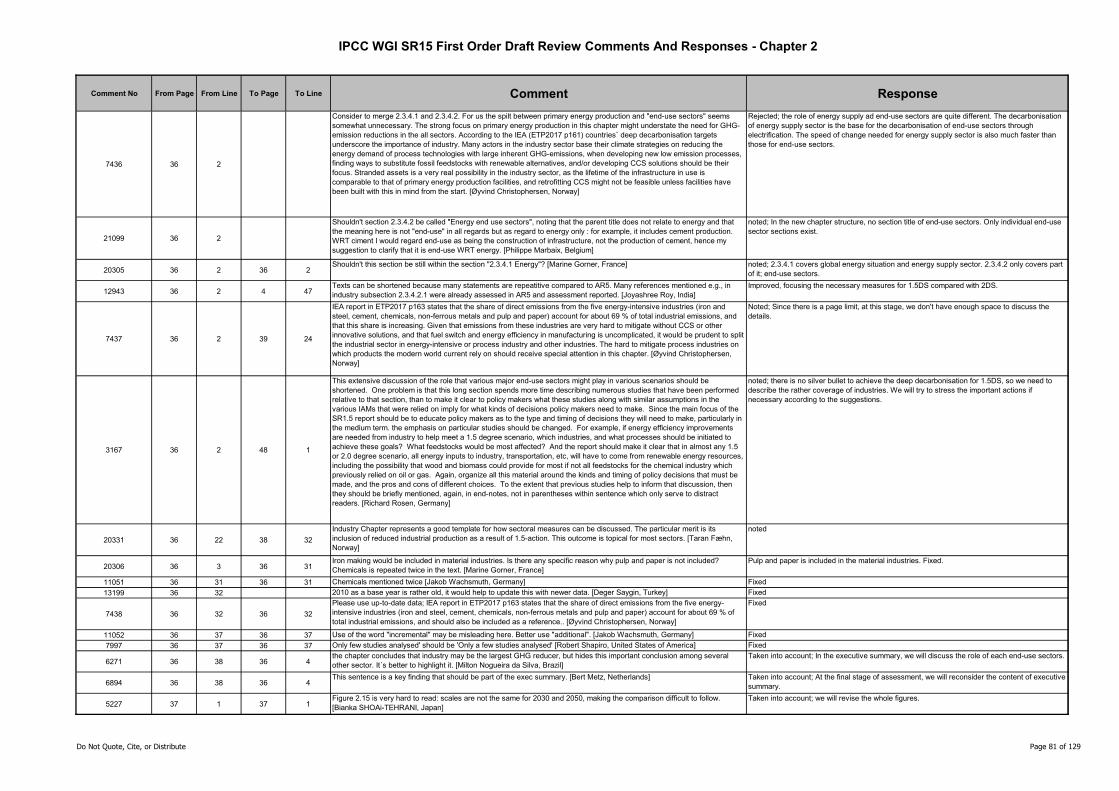
IPCC WGI SR15 First Order Draft Review Comments And Responses - Chapter 2
Comment No From Page From Line To Page To Line Comment Response
7436 36 2
Consider to merge 2.3.4.1 and 2.3.4.2. For us the spilt between primary energy production and "end-use sectors" seems somewhat unnecessary. The strong focus on primary energy production in this chapter might understate the need for GHG-emission reductions in the all sectors. According to the IEA (ETP2017 p161) countries` deep decarbonisation targets underscore the importance of industry. Many actors in the industry sector base their climate strategies on reducing the energy demand of process technologies with large inherent GHG-emissions, when developing new low emission processes, finding ways to substitute fossil feedstocks with renewable alternatives, and/or developing CCS solutions should be their focus. Stranded assets is a very real possibility in the industry sector, as the lifetime of the infrastructure in use is comparable to that of primary energy production facilities, and retrofitting CCS might not be feasible unless facilities have been built with this in mind from the start. [Øyvind Christophersen, Norway]
Rejected; the role of energy supply ad end-use sectors are quite different. The decarbonisation of energy supply sector is the base for the decarbonisation of end-use sectors through electrification. The speed of change needed for energy supply sector is also much faster than those for end-use sectors.
21099 36 2
Shouldn't section 2.3.4.2 be called "Energy end use sectors", noting that the parent title does not relate to energy and that the meaning here is not "end-use" in all regards but as regard to energy only : for example, it includes cement production. WRT ciment I would regard end-use as being the construction of infrastructure, not the production of cement, hence my suggestion to clarify that it is end-use WRT energy. [Philippe Marbaix, Belgium]
noted; In the new chapter structure, no section title of end-use sectors. Only individual end-use sector sections exist.
20305 36 2 36 2Shouldn't this section be still within the section "2.3.4.1 Energy"? [Marine Gorner, France] noted; 2.3.4.1 covers global energy situation and energy supply sector. 2.3.4.2 only covers part
of it; end-use sectors.
12943 36 2 4 47Texts can be shortened because many statements are repeatitive compared to AR5. Many references mentioned e.g., in industry subsection 2.3.4.2.1 were already assessed in AR5 and assessment reported. [Joyashree Roy, India]
Improved, focusing the necessary measures for 1.5DS compared with 2DS.
7437 36 2 39 24
IEA report in ETP2017 p163 states that the share of direct emissions from the five energy-intensive industries (iron and steel, cement, chemicals, non-ferrous metals and pulp and paper) account for about 69 % of total industrial emissions, and that this share is increasing. Given that emissions from these industries are very hard to mitigate without CCS or other innovative solutions, and that fuel switch and energy efficiency in manufacturing is uncomplicated, it would be prudent to split the industrial sector in energy-intensive or process industry and other industries. The hard to mitigate process industries on which products the modern world current rely on should receive special attention in this chapter. [Øyvind Christophersen, Norway]
Noted; Since there is a page limit, at this stage, we don't have enough space to discuss the details.
3167 36 2 48 1
This extensive discussion of the role that various major end-use sectors might play in various scenarios should be shortened. One problem is that this long section spends more time describing numerous studies that have been performed relative to that section, than to make it clear to policy makers what these studies along with similar assumptions in the various IAMs that were relied on imply for what kinds of decisions policy makers need to make. Since the main focus of the SR1.5 report should be to educate policy makers as to the type and timing of decisions they will need to make, particularly in the medium term. the emphasis on particular studies should be changed. For example, if energy efficiency improvements are needed from industry to help meet a 1.5 degree scenario, which industries, and what processes should be initiated to achieve these goals? What feedstocks would be most affected? And the report should make it clear that in almost any 1.5 or 2.0 degree scenario, all energy inputs to industry, transportation, etc, will have to come from renewable energy resources, including the possibility that wood and biomass could provide for most if not all feedstocks for the chemical industry which previously relied on oil or gas. Again, organize all this material around the kinds and timing of policy decisions that must be made, and the pros and cons of different choices. To the extent that previous studies help to inform that discussion, then they should be briefly mentioned, again, in end-notes, not in parentheses within sentence which only serve to distract readers. [Richard Rosen, Germany]
noted; there is no silver bullet to achieve the deep decarbonisation for 1.5DS, so we need to describe the rather coverage of industries. We will try to stress the important actions if necessary according to the suggestions.
20331 36 22 38 32
Industry Chapter represents a good template for how sectoral measures can be discussed. The particular merit is its inclusion of reduced industrial production as a result of 1.5-action. This outcome is topical for most sectors. [Taran Fæhn, Norway]
noted
20306 36 3 36 31Iron making would be included in material industries. Is there any specific reason why pulp and paper is not included? Chemicals is repeated twice in the text. [Marine Gorner, France]
Pulp and paper is included in the material industries. Fixed.
11051 36 31 36 31 Chemicals mentioned twice [Jakob Wachsmuth, Germany] Fixed
13199 36 32 2010 as a base year is rather old, it would help to update this with newer data. [Deger Saygin, Turkey] Fixed
7438 36 32 36 32
Please use up-to-date data; IEA report in ETP2017 p163 states that the share of direct emissions from the five energy-intensive industries (iron and steel, cement, chemicals, non-ferrous metals and pulp and paper) account for about 69 % of total industrial emissions, and should also be included as a reference.. [Øyvind Christophersen, Norway]
Fixed
11052 36 37 36 37 Use of the word "incremental" may be misleading here. Better use "additional". [Jakob Wachsmuth, Germany] Fixed
7997 36 37 36 37 Only few studies analysed' should be 'Only a few studies analysed' [Robert Shapiro, United States of America] Fixed
6271 36 38 36 4the chapter concludes that industry may be the largest GHG reducer, but hides this important conclusion among several other sector. It´s better to highlight it. [Milton Nogueira da Silva, Brazil]
Taken into account; In the executive summary, we will discuss the role of each end-use sectors.
6894 36 38 36 4This sentence is a key finding that should be part of the exec summary. [Bert Metz, Netherlands] Taken into account; At the final stage of assessment, we will reconsider the content of executive
summary.
5227 37 1 37 1Figure 2.15 is very hard to read: scales are not the same for 2030 and 2050, making the comparison difficult to follow. [Bianka SHOAi-TEHRANI, Japan]
Taken into account; we will revise the whole figures.
Do Not Quote, Cite, or Distribute Page 81 of 129
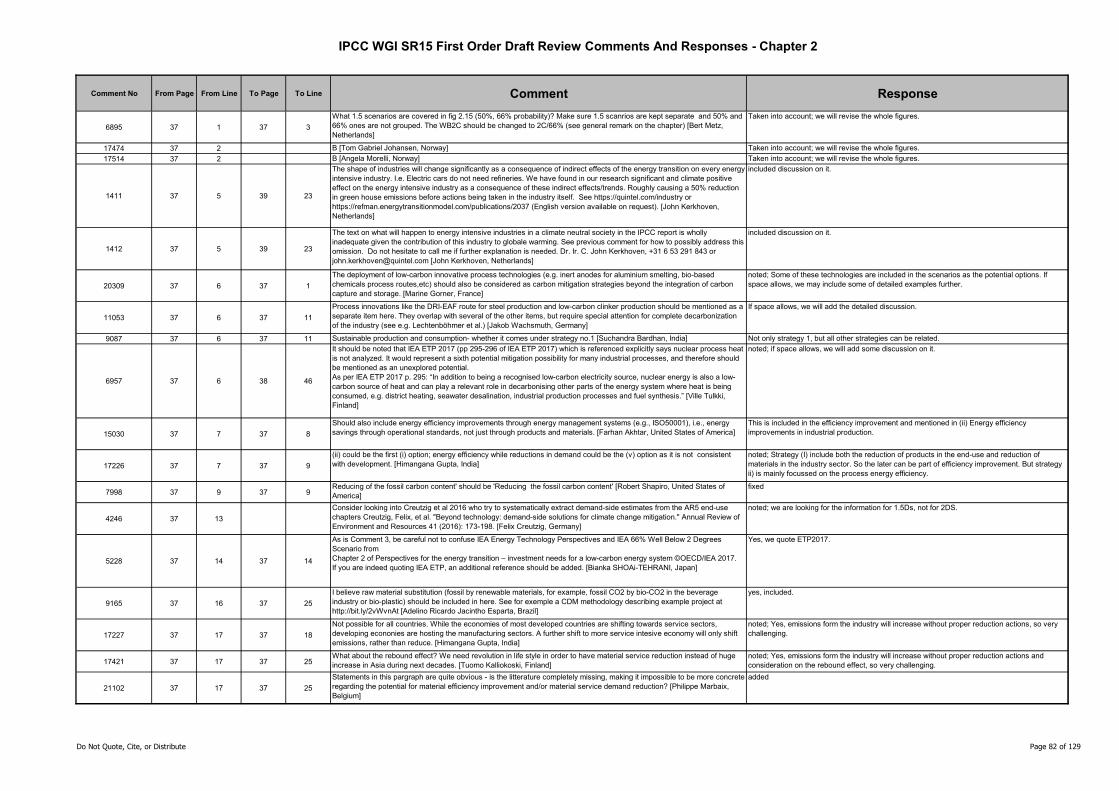
IPCC WGI SR15 First Order Draft Review Comments And Responses - Chapter 2
Comment No From Page From Line To Page To Line Comment Response
6895 37 1 37 3
What 1.5 scenarios are covered in fig 2.15 (50%, 66% probability)? Make sure 1.5 scanrios are kept separate and 50% and 66% ones are not grouped. The WB2C should be changed to 2C/66% (see general remark on the chapter) [Bert Metz, Netherlands]
Taken into account; we will revise the whole figures.
17474 37 2 B [Tom Gabriel Johansen, Norway] Taken into account; we will revise the whole figures.
17514 37 2 B [Angela Morelli, Norway] Taken into account; we will revise the whole figures.
1411 37 5 39 23
The shape of industries will change significantly as a consequence of indirect effects of the energy transition on every energy intensive industry. I.e. Electric cars do not need refineries. We have found in our research significant and climate positive effect on the energy intensive industry as a consequence of these indirect effects/trends. Roughly causing a 50% reduction in green house emissions before actions being taken in the industry itself. See https://quintel.com/industry or https://refman.energytransitionmodel.com/publications/2037 (English version available on request). [John Kerkhoven, Netherlands]
included discussion on it.
1412 37 5 39 23
The text on what will happen to energy intensive industries in a climate neutral society in the IPCC report is wholly inadequate given the contribution of this industry to globale warming. See previous comment for how to possibly address this omission. Do not hesitate to call me if further explanation is needed. Dr. Ir. C. John Kerkhoven, +31 6 53 291 843 or [email protected] [John Kerkhoven, Netherlands]
included discussion on it.
20309 37 6 37 1
The deployment of low-carbon innovative process technologies (e.g. inert anodes for aluminium smelting, bio-based chemicals process routes,etc) should also be considered as carbon mitigation strategies beyond the integration of carbon capture and storage. [Marine Gorner, France]
noted; Some of these technologies are included in the scenarios as the potential options. If space allows, we may include some of detailed examples further.
11053 37 6 37 11
Process innovations like the DRI-EAF route for steel production and low-carbon clinker production should be mentioned as a separate item here. They overlap with several of the other items, but require special attention for complete decarbonization of the industry (see e.g. Lechtenböhmer et al.) [Jakob Wachsmuth, Germany]
If space allows, we will add the detailed discussion.
9087 37 6 37 11 Sustainable production and consumption- whether it comes under strategy no.1 [Suchandra Bardhan, India] Not only strategy 1, but all other strategies can be related.
6957 37 6 38 46
It should be noted that IEA ETP 2017 (pp 295-296 of IEA ETP 2017) which is referenced explicitly says nuclear process heat is not analyzed. It would represent a sixth potential mitigation possibility for many industrial processes, and therefore should be mentioned as an unexplored potential.As per IEA ETP 2017 p. 295: “In addition to being a recognised low-carbon electricity source, nuclear energy is also a low-carbon source of heat and can play a relevant role in decarbonising other parts of the energy system where heat is being consumed, e.g. district heating, seawater desalination, industrial production processes and fuel synthesis.” [Ville Tulkki, Finland]
noted; if space allows, we will add some discussion on it.
15030 37 7 37 8
Should also include energy efficiency improvements through energy management systems (e.g., ISO50001), i.e., energy savings through operational standards, not just through products and materials. [Farhan Akhtar, United States of America]
This is included in the efficiency improvement and mentioned in (ii) Energy efficiency improvements in industrial production.
17226 37 7 37 9
(ii) could be the first (i) option; energy efficiency while reductions in demand could be the (v) option as it is not consistent with development. [Himangana Gupta, India]
noted; Strategy (I) include both the reduction of products in the end-use and reduction of materials in the industry sector. So the later can be part of efficiency improvement. But strategy ii) is mainly focussed on the process energy efficiency.
7998 37 9 37 9Reducing of the fossil carbon content' should be 'Reducing the fossil carbon content' [Robert Shapiro, United States of America]
fixed
4246 37 13
Consider looking into Creutzig et al 2016 who try to systematically extract demand-side estimates from the AR5 end-use chapters Creutzig, Felix, et al. "Beyond technology: demand-side solutions for climate change mitigation." Annual Review of Environment and Resources 41 (2016): 173-198. [Felix Creutzig, Germany]
noted; we are looking for the information for 1.5Ds, not for 2DS.
5228 37 14 37 14
As is Comment 3, be careful not to confuse IEA Energy Technology Perspectives and IEA 66% Well Below 2 Degrees Scenario fromChapter 2 of Perspectives for the energy transition – investment needs for a low-carbon energy system ©OECD/IEA 2017.If you are indeed quoting IEA ETP, an additional reference should be added. [Bianka SHOAi-TEHRANI, Japan]
Yes, we quote ETP2017.
9165 37 16 37 25
I believe raw material substitution (fossil by renewable materials, for example, fossil CO2 by bio-CO2 in the beverage industry or bio-plastic) should be included in here. See for exemple a CDM methodology describing example project at http://bit.ly/2vWvnAt [Adelino Ricardo Jacintho Esparta, Brazil]
yes, included.
17227 37 17 37 18
Not possible for all countries. While the economies of most developed countries are shifting towards service sectors, developing econonies are hosting the manufacturing sectors. A further shift to more service intesive economy will only shift emissions, rather than reduce. [Himangana Gupta, India]
noted; Yes, emissions form the industry will increase without proper reduction actions, so very challenging.
17421 37 17 37 25What about the rebound effect? We need revolution in life style in order to have material service reduction instead of huge increase in Asia during next decades. [Tuomo Kalliokoski, Finland]
noted; Yes, emissions form the industry will increase without proper reduction actions and consideration on the rebound effect, so very challenging.
21102 37 17 37 25
Statements in this pargraph are quite obvious - is the litterature completely missing, making it impossible to be more concrete regarding the potential for material efficiency improvement and/or material service demand reduction? [Philippe Marbaix, Belgium]
added
Do Not Quote, Cite, or Distribute Page 82 of 129
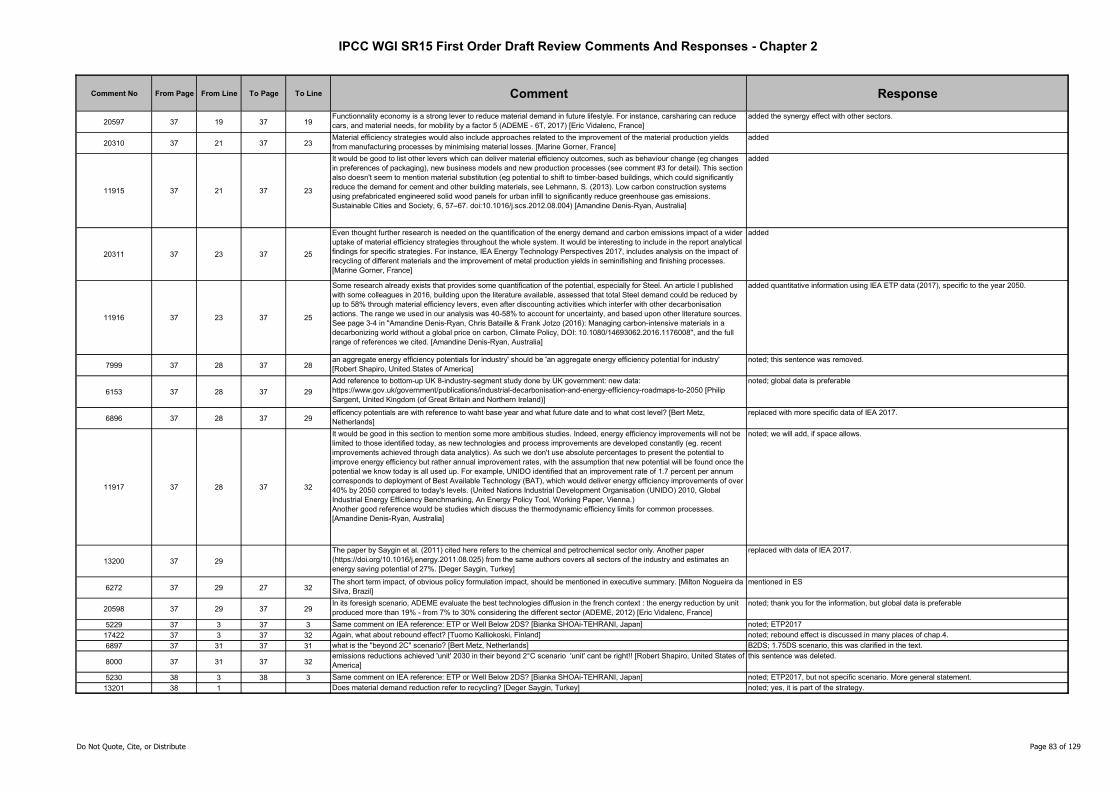
IPCC WGI SR15 First Order Draft Review Comments And Responses - Chapter 2
Comment No From Page From Line To Page To Line Comment Response
20597 37 19 37 19Functionnality economy is a strong lever to reduce material demand in future lifestyle. For instance, carsharing can reduce cars, and material needs, for mobility by a factor 5 (ADEME - 6T, 2017) [Eric Vidalenc, France]
added the synergy effect with other sectors.
20310 37 21 37 23Material efficiency strategies would also include approaches related to the improvement of the material production yields from manufacturing processes by minimising material losses. [Marine Gorner, France]
added
11915 37 21 37 23
It would be good to list other levers which can deliver material efficiency outcomes, such as behaviour change (eg changes in preferences of packaging), new business models and new production processes (see comment #3 for detail). This section also doesn't seem to mention material substitution (eg potential to shift to timber-based buildings, which could significantly reduce the demand for cement and other building materials, see Lehmann, S. (2013). Low carbon construction systems using prefabricated engineered solid wood panels for urban infill to significantly reduce greenhouse gas emissions. Sustainable Cities and Society, 6, 57–67. doi:10.1016/j.scs.2012.08.004) [Amandine Denis-Ryan, Australia]
added
20311 37 23 37 25
Even thought further research is needed on the quantification of the energy demand and carbon emissions impact of a wider uptake of material efficiency strategies throughout the whole system. It would be interesting to include in the report analytical findings for specific strategies. For instance, IEA Energy Technology Perspectives 2017, includes analysis on the impact of recycling of different materials and the improvement of metal production yields in seminifishing and finishing processes. [Marine Gorner, France]
added
11916 37 23 37 25
Some research already exists that provides some quantification of the potential, especially for Steel. An article I published with some colleagues in 2016, building upon the literature available, assessed that total Steel demand could be reduced by up to 58% through material efficiency levers, even after discounting activities which interfer with other decarbonisation actions. The range we used in our analysis was 40-58% to account for uncertainty, and based upon other literature sources. See page 3-4 in "Amandine Denis-Ryan, Chris Bataille & Frank Jotzo (2016): Managing carbon-intensive materials in a decarbonizing world without a global price on carbon, Climate Policy, DOI: 10.1080/14693062.2016.1176008", and the full range of references we cited. [Amandine Denis-Ryan, Australia]
added quantitative information using IEA ETP data (2017), specific to the year 2050.
7999 37 28 37 28an aggregate energy efficiency potentials for industry' should be 'an aggregate energy efficiency potential for industry' [Robert Shapiro, United States of America]
noted; this sentence was removed.
6153 37 28 37 29
Add reference to bottom-up UK 8-industry-segment study done by UK government: new data: https://www.gov.uk/government/publications/industrial-decarbonisation-and-energy-efficiency-roadmaps-to-2050 [Philip Sargent, United Kingdom (of Great Britain and Northern Ireland)]
noted; global data is preferable
6896 37 28 37 29efficency potentials are with reference to waht base year and what future date and to what cost level? [Bert Metz, Netherlands]
replaced with more specific data of IEA 2017.
11917 37 28 37 32
It would be good in this section to mention some more ambitious studies. Indeed, energy efficiency improvements will not be limited to those identified today, as new technologies and process improvements are developed constantly (eg. recent improvements achieved through data analytics). As such we don't use absolute percentages to present the potential to improve energy efficiency but rather annual improvement rates, with the assumption that new potential will be found once the potential we know today is all used up. For example, UNIDO identified that an improvement rate of 1.7 percent per annum corresponds to deployment of Best Available Technology (BAT), which would deliver energy efficiency improvements of over 40% by 2050 compared to today's levels. (United Nations Industrial Development Organisation (UNIDO) 2010, Global Industrial Energy Efficiency Benchmarking, An Energy Policy Tool, Working Paper, Vienna.) Another good reference would be studies which discuss the thermodynamic efficiency limits for common processes. [Amandine Denis-Ryan, Australia]
noted; we will add, if space allows.
13200 37 29
The paper by Saygin et al. (2011) cited here refers to the chemical and petrochemical sector only. Another paper (https://doi.org/10.1016/j.energy.2011.08.025) from the same authors covers all sectors of the industry and estimates an energy saving potential of 27%. [Deger Saygin, Turkey]
replaced with data of IEA 2017.
6272 37 29 27 32The short term impact, of obvious policy formulation impact, should be mentioned in executive summary. [Milton Nogueira da Silva, Brazil]
mentioned in ES
20598 37 29 37 29In its foresigh scenario, ADEME evaluate the best technologies diffusion in the french context : the energy reduction by unit produced more than 19% - from 7% to 30% considering the different sector (ADEME, 2012) [Eric Vidalenc, France]
noted; thank you for the information, but global data is preferable
5229 37 3 37 3 Same comment on IEA reference: ETP or Well Below 2DS? [Bianka SHOAi-TEHRANI, Japan] noted; ETP2017
17422 37 3 37 32 Again, what about rebound effect? [Tuomo Kalliokoski, Finland] noted; rebound effect is discussed in many places of chap.4.
6897 37 31 37 31 what is the "beyond 2C" scenario? [Bert Metz, Netherlands] B2DS; 1.75DS scenario, this was clarified in the text.
8000 37 31 37 32emissions reductions achieved 'unit' 2030 in their beyond 2°C scenario 'unit' cant be right!! [Robert Shapiro, United States of America]
this sentence was deleted.
5230 38 3 38 3 Same comment on IEA reference: ETP or Well Below 2DS? [Bianka SHOAi-TEHRANI, Japan] noted; ETP2017, but not specific scenario. More general statement.
13201 38 1 Does material demand reduction refer to recycling? [Deger Saygin, Turkey] noted; yes, it is part of the strategy.
Do Not Quote, Cite, or Distribute Page 83 of 129
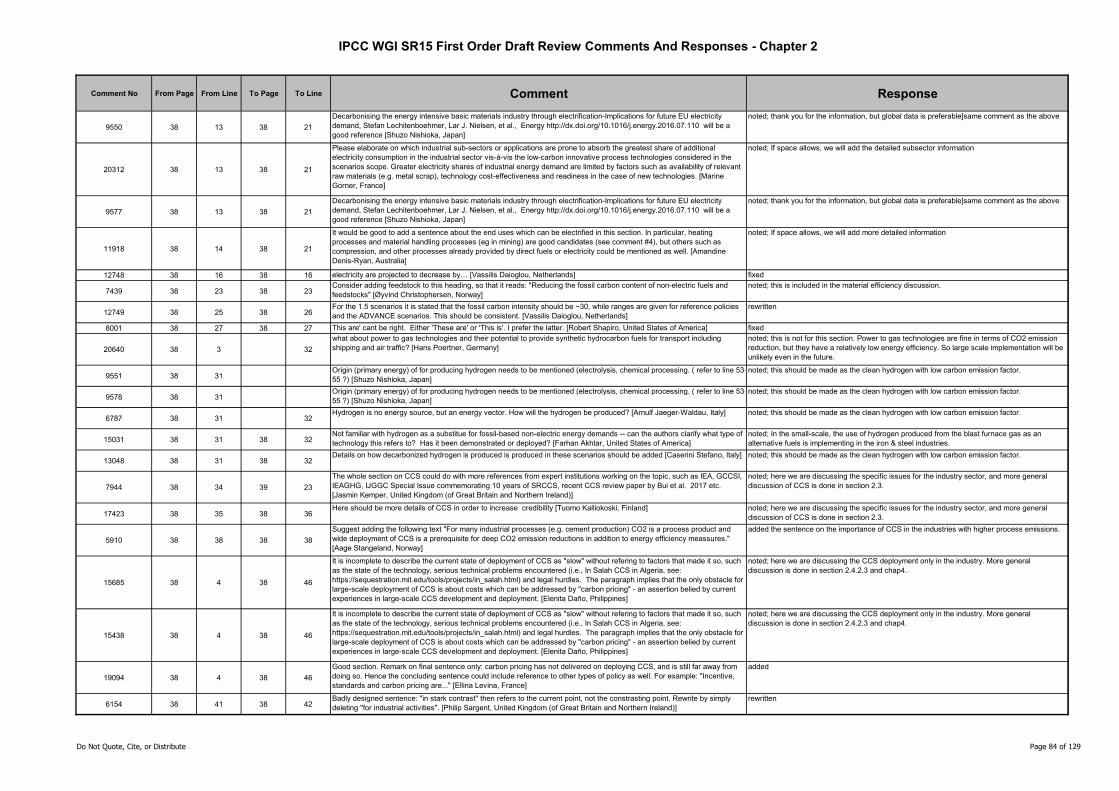
IPCC WGI SR15 First Order Draft Review Comments And Responses - Chapter 2
Comment No From Page From Line To Page To Line Comment Response
9550 38 13 38 21
Decarbonising the energy intensive basic materials industry through electrification-Implications for future EU electricity demand, Stefan Lechitenboehmer, Lar J. Nielsen, et al., Energy http://dx.doi.org/10.1016/j.energy.2016.07.110 will be a good reference [Shuzo Nishioka, Japan]
noted; thank you for the information, but global data is preferable]same comment as the above
20312 38 13 38 21
Please elaborate on which industrial sub-sectors or applications are prone to absorb the greatest share of additional electricity consumption in the industrial sector vis-à-vis the low-carbon innovative process technologies considered in the scenarios scope. Greater electricity shares of industrial energy demand are limited by factors such as availability of relevant raw materials (e.g. metal scrap), technology cost-effectiveness and readiness in the case of new technologies. [Marine Gorner, France]
noted; If space allows, we will add the detailed subsector information
9577 38 13 38 21
Decarbonising the energy intensive basic materials industry through electrification-Implications for future EU electricity demand, Stefan Lechitenboehmer, Lar J. Nielsen, et al., Energy http://dx.doi.org/10.1016/j.energy.2016.07.110 will be a good reference [Shuzo Nishioka, Japan]
noted; thank you for the information, but global data is preferable]same comment as the above
11918 38 14 38 21
It would be good to add a sentence about the end uses which can be electrified in this section. In particular, heating processes and material handling processes (eg in mining) are good candidates (see comment #4), but others such as compression, and other processes already provided by direct fuels or electricity could be mentioned as well. [Amandine Denis-Ryan, Australia]
noted; If space allows, we will add more detailed information
12748 38 16 38 16 electricity are projected to decrease by… [Vassilis Daioglou, Netherlands] fixed
7439 38 23 38 23Consider adding feedstock to this heading, so that it reads: "Reducing the fossil carbon content of non-electric fuels and feedstocks" [Øyvind Christophersen, Norway]
noted; this is included in the material efficiency discussion.
12749 38 25 38 26For the 1.5 scenarios it is stated that the fossil carbon intensity should be ~30, while ranges are given for reference policies and the ADVANCE scenarios. This should be consistent. [Vassilis Daioglou, Netherlands]
rewritten
8001 38 27 38 27 This are' cant be right. Either 'These are' or 'This is'. I prefer the latter. [Robert Shapiro, United States of America] fixed
20640 38 3 32
what about power to gas technologies and their potential to provide synthetic hydrocarbon fuels for transport including shipping and air traffic? [Hans Poertner, Germany]
noted; this is not for this section. Power to gas technologies are fine in terms of CO2 emission reduction, but they have a relatively low energy efficiency. So large scale implementation will be unlikely even in the future.
9551 38 31Origin (primary energy) of for producing hydrogen needs to be mentioned (electrolysis, chemical processing. ( refer to line 53-55 ?) [Shuzo Nishioka, Japan]
noted; this should be made as the clean hydrogen with low carbon emission factor.
9578 38 31Origin (primary energy) of for producing hydrogen needs to be mentioned (electrolysis, chemical processing. ( refer to line 53-55 ?) [Shuzo Nishioka, Japan]
noted; this should be made as the clean hydrogen with low carbon emission factor.
6787 38 31 32Hydrogen is no energy source, but an energy vector. How will the hydrogen be produced? [Arnulf Jaeger-Waldau, Italy] noted; this should be made as the clean hydrogen with low carbon emission factor.
15031 38 31 38 32Not familiar with hydrogen as a substitue for fossil-based non-electric energy demands -- can the authors clarify what type of technology this refers to? Has it been demonstrated or deployed? [Farhan Akhtar, United States of America]
noted; In the small-scale, the use of hydrogen produced from the blast furnace gas as an alternative fuels is implementing in the iron & steel industries.
13048 38 31 38 32Details on how decarbonized hydrogen is produced is produced in these scenarios should be added [Caserini Stefano, Italy] noted; this should be made as the clean hydrogen with low carbon emission factor.
7944 38 34 39 23
The whole section on CCS could do with more references from expert institutions working on the topic, such as IEA, GCCSI, IEAGHG, IJGGC Special Issue commemorating 10 years of SRCCS, recent CCS review paper by Bui et al. 2017 etc. [Jasmin Kemper, United Kingdom (of Great Britain and Northern Ireland)]
noted; here we are discussing the specific issues for the industry sector, and more general discussion of CCS is done in section 2.3.
17423 38 35 38 36Here should be more details of CCS in order to increase credibility [Tuomo Kalliokoski, Finland] noted; here we are discussing the specific issues for the industry sector, and more general
discussion of CCS is done in section 2.3.
5910 38 38 38 38
Suggest adding the following text "For many industrial processes (e.g. cement production) CO2 is a process product and wide deployment of CCS is a prerequisite for deep CO2 emission reductions in addition to energy efficiency meassures." [Aage Stangeland, Norway]
added the sentence on the importance of CCS in the industries with higher process emissions.
15685 38 4 38 46
It is incomplete to describe the current state of deployment of CCS as "slow" without refering to factors that made it so, such as the state of the technology, serious technical problems encountered (i.e., In Salah CCS in Algeria, see: https://sequestration.mit.edu/tools/projects/in_salah.html) and legal hurdles. The paragraph implies that the only obstacle for large-scale deployment of CCS is about costs which can be addressed by "carbon pricing" - an assertion belied by current experiences in large-scale CCS development and deployment. [Elenita Daño, Philippines]
noted; here we are discussing the CCS deployment only in the industry. More general discussion is done in section 2.4.2.3 and chap4.
15438 38 4 38 46
It is incomplete to describe the current state of deployment of CCS as "slow" without refering to factors that made it so, such as the state of the technology, serious technical problems encountered (i.e., In Salah CCS in Algeria, see: https://sequestration.mit.edu/tools/projects/in_salah.html) and legal hurdles. The paragraph implies that the only obstacle for large-scale deployment of CCS is about costs which can be addressed by "carbon pricing" - an assertion belied by current experiences in large-scale CCS development and deployment. [Elenita Daño, Philippines]
noted; here we are discussing the CCS deployment only in the industry. More general discussion is done in section 2.4.2.3 and chap4.
19094 38 4 38 46
Good section. Remark on final sentence only: carbon pricing has not delivered on deploying CCS, and is still far away from doing so. Hence the concluding sentence could include reference to other types of policy as well. For example: "Incentive, standards and carbon pricing are..." [Ellina Levina, France]
added
6154 38 41 38 42Badly designed sentence: "in stark contrast" then refers to the current point, not the constrasting point. Rewrite by simply deleting "for industrial activities". [Philip Sargent, United Kingdom (of Great Britain and Northern Ireland)]
rewritten
Do Not Quote, Cite, or Distribute Page 84 of 129
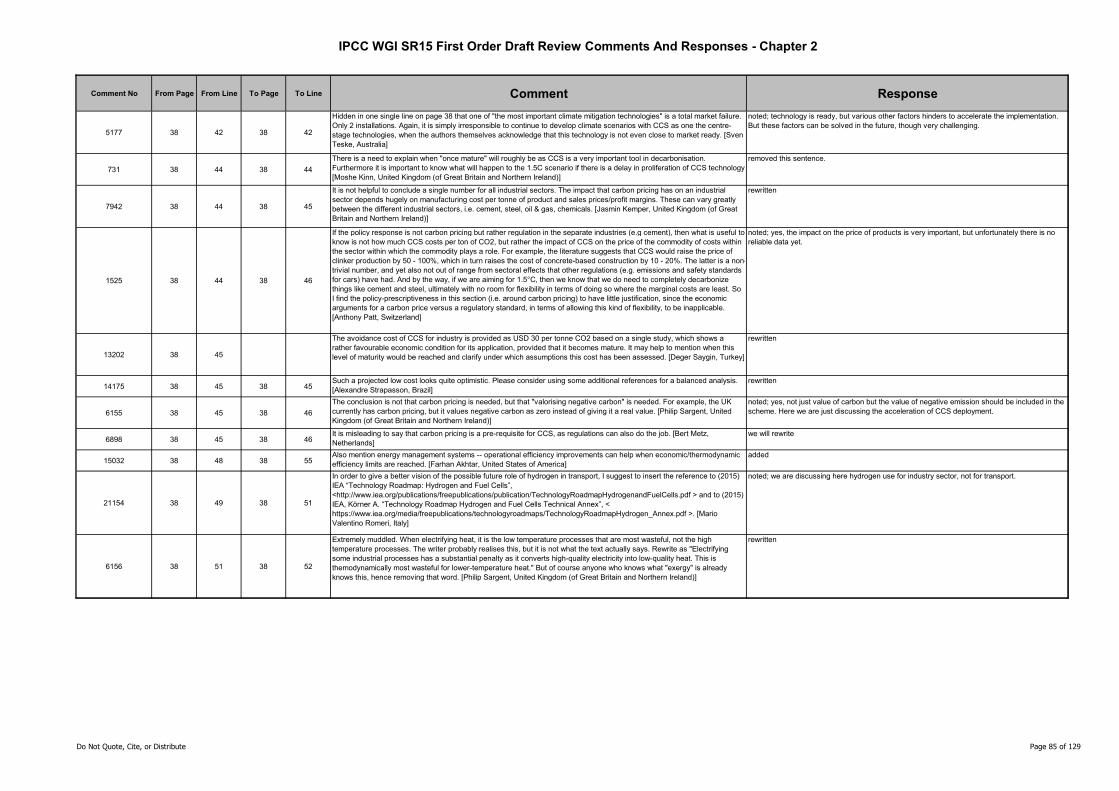
IPCC WGI SR15 First Order Draft Review Comments And Responses - Chapter 2
Comment No From Page From Line To Page To Line Comment Response
5177 38 42 38 42
Hidden in one single line on page 38 that one of "the most important climate mitigation technologies" is a total market failure. Only 2 installations. Again, it is simply irresponsible to continue to develop climate scenarios with CCS as one the centre-stage technologies, when the authors themselves acknowledge that this technology is not even close to market ready. [Sven Teske, Australia]
noted; technology is ready, but various other factors hinders to accelerate the implementation. But these factors can be solved in the future, though very challenging.
731 38 44 38 44
There is a need to explain when "once mature" will roughly be as CCS is a very important tool in decarbonisation. Furthermore it is important to know what will happen to the 1.5C scenario if there is a delay in proliferation of CCS technology [Moshe Kinn, United Kingdom (of Great Britain and Northern Ireland)]
removed this sentence.
7942 38 44 38 45
It is not helpful to conclude a single number for all industrial sectors. The impact that carbon pricing has on an industrial sector depends hugely on manufacturing cost per tonne of product and sales prices/profit margins. These can vary greatly between the different industrial sectors, i.e. cement, steel, oil & gas, chemicals. [Jasmin Kemper, United Kingdom (of Great Britain and Northern Ireland)]
rewritten
1525 38 44 38 46
If the policy response is not carbon pricing but rather regulation in the separate industries (e.g cement), then what is useful to know is not how much CCS costs per ton of CO2, but rather the impact of CCS on the price of the commodity of costs within the sector within which the commodity plays a role. For example, the literature suggests that CCS would raise the price of clinker production by 50 - 100%, which in turn raises the cost of concrete-based construction by 10 - 20%. The latter is a non-trivial number, and yet also not out of range from sectoral effects that other regulations (e.g. emissions and safety standards for cars) have had. And by the way, if we are aiming for 1.5°C, then we know that we do need to completely decarbonize things like cement and steel, ultimately with no room for flexibility in terms of doing so where the marginal costs are least. So I find the policy-prescriptiveness in this section (i.e. around carbon pricing) to have little justification, since the economic arguments for a carbon price versus a regulatory standard, in terms of allowing this kind of flexibility, to be inapplicable. [Anthony Patt, Switzerland]
noted; yes, the impact on the price of products is very important, but unfortunately there is no reliable data yet.
13202 38 45
The avoidance cost of CCS for industry is provided as USD 30 per tonne CO2 based on a single study, which shows a rather favourable economic condition for its application, provided that it becomes mature. It may help to mention when this level of maturity would be reached and clarify under which assumptions this cost has been assessed. [Deger Saygin, Turkey]
rewritten
14175 38 45 38 45Such a projected low cost looks quite optimistic. Please consider using some additional references for a balanced analysis. [Alexandre Strapasson, Brazil]
rewritten
6155 38 45 38 46
The conclusion is not that carbon pricing is needed, but that "valorising negative carbon" is needed. For example, the UK currently has carbon pricing, but it values negative carbon as zero instead of giving it a real value. [Philip Sargent, United Kingdom (of Great Britain and Northern Ireland)]
noted; yes, not just value of carbon but the value of negative emission should be included in the scheme. Here we are just discussing the acceleration of CCS deployment.
6898 38 45 38 46It is misleading to say that carbon pricing is a pre-requisite for CCS, as regulations can also do the job. [Bert Metz, Netherlands]
we will rewrite
15032 38 48 38 55Also mention energy management systems -- operational efficiency improvements can help when economic/thermodynamic efficiency limits are reached. [Farhan Akhtar, United States of America]
added
21154 38 49 38 51
In order to give a better vision of the possible future role of hydrogen in transport, I suggest to insert the reference to (2015) IEA “Technology Roadmap: Hydrogen and Fuel Cells”, <http://www.iea.org/publications/freepublications/publication/TechnologyRoadmapHydrogenandFuelCells.pdf > and to (2015) IEA, Körner A. “Technology Roadmap Hydrogen and Fuel Cells Technical Annex”, < https://www.iea.org/media/freepublications/technologyroadmaps/TechnologyRoadmapHydrogen_Annex.pdf >. [Mario Valentino Romeri, Italy]
noted; we are discussing here hydrogen use for industry sector, not for transport.
6156 38 51 38 52
Extremely muddled. When electrifying heat, it is the low temperature processes that are most wasteful, not the high temperature processes. The writer probably realises this, but it is not what the text actually says. Rewrite as "Electrifying some industrial processes has a substantial penalty as it converts high-quality electricity into low-quality heat. This is themodynamically most wasteful for lower-temperature heat." But of course anyone who knows what "exergy" is already knows this, hence removing that word. [Philip Sargent, United Kingdom (of Great Britain and Northern Ireland)]
rewritten
Do Not Quote, Cite, or Distribute Page 85 of 129

IPCC WGI SR15 First Order Draft Review Comments And Responses - Chapter 2
Comment No From Page From Line To Page To Line Comment Response
9303 38 51 38 53
The statement "Electrifying some energy services, most importantly high temperature heating, has a substantial exergy penalty as it converts a high-quality into a low-quality energy carrier, and thus reduces the overall efficiency of the system" is an excellent and scientifically valid statement. An addition statement following this statement may be inserted as "In contrast, the provision of energy resources with temperature levels in closer proximity to the energy demands improves the exergy performance with associated impacts on reducing CO2 emissions in the energy system (K?lk??, 2014)." Here, the reference is "K?lk??, ?. (2014), Energy system analysis of a pilot net-zero exergy district, Energy Conversion and Management Vol. 87, pp. 1077–1092 <https://doi.org/10.1016/j.enconman.2014.05.014>. An addition reference is: "K?lk??, ?. (2015) Exergy transition planning for net-zero districts, Energy 92 (2015) 515-531." The emphasis on exergy is both statements is in line with the International Energy Agency Annex 64 on "LowEx Communities - Optimised Performance of Energy Supply Systems with Exergy Principles." The Expert Reviewer is willing to provide an information box on the vitality of exergy principles for an energy transition towards successful climate mitigation. The proposed Box title is "Exergy principles and applications for an energy transition" based on the upcoming IEA Annex 64 Summary Report. [Siir KILKIS, Turkey]
thank you for the information. We added the sentence on the heat management systems related to this.
14176 38 51 38 53
This is a very important issue and often neglected. I would suggest to elaborate a bit more this sentence, perhaps in a dedicated paragraph. I would recommend to consider Strapasson and Fagá (2006) paper as an additional reference, particularly in terms of an original methodological approach based on both the first and second law of thermodynamics for an integrated assessment of energy efficiency in the whole energy mix. Reference: Strapasson, A. B.; Fagá, M. T. W. (2007). Energy Efficiency and Heat Generation: An Integrated Analysis of the Brazilian Energy Mix. International Energy Journal (IEJ). V. 8. Asian Institute of Technology. Pathumthani, Thailand.Available at: http://www.rericjournal.ait.ac.th/index.php/reric/article/view/214 [Alexandre Strapasson, Brazil]
noted; thank you for useful information. We need more recent literature to quote.
11919 38 51 38 53
Electrification can also offer significant energy benefits. For example, switching from trucks to conveyor belts in mining offers very significant energy benefits, which are already profitable if mining outputs are large enough. Heat pumps can also offer very attractive efficiencies. [Amandine Denis-Ryan, Australia]
noted; Thank you for the information.
8002 38 52 38 52 exergy' should be 'energy' [Robert Shapiro, United States of America] no, it is exergy.
13203 38 53 55
It may be misleading to put hydrogen as an expensive option without showing any cost estimates from the literature (as was done for the case of CCS earlier on the same page). As in the case of industrial CCS, technology could be cost-effective when it reaches maturity. It is also not necessarily the case that its cost of production will be expensive when produced from renewable energy sources. This depends on the cost of generation of renewable energy technologies which differs across countries. [Deger Saygin, Turkey]
deleted this sentence
4850 38 53 38 54hydrogen is a potential substitute for non-electric fuels, it is an energy carrier which can be produced from fossil and CCS and is relative expensive if …. [Wilfried Maas, Netherlands]
noted; we are discussing hydrogen use in the industry, not in the transport. But we deleted this because H2 is not major issue in the industry sector.
6950 38 53 38 55
The statement "hydrogen is relatively expensive". is due to assumptions taken. The prices of alternative fuels including hydrogen depend largely on perspectives of their technical progress. Therefore it should be noted that technical progress can change the deployment. [Yuki Ishimoto, Norway]
noted; yes, it will change, but in the near future, the price of H2 will be relatively high.
732 38 53 38 54
Given that according to McAlister ( The Solar Hydrogen Economy, ISBN0-9728375-0-7), hydrogen burns at approximately 585 decrees C, which is higher than gasoline (Table 3.5 page 39) and given that McAlister has tested ordinary ICE cars and has shown that the emission particulates on exhaust are less than that on the ordinary air intake, why is hydrogen "an imperfect substitute" for gasoline or LPG for transportation? This statement needs clarification with citations. See also The Philosopher Mechanic ISBN-13: 978-1603220446 about using hydrogen in ordinary cars to clean the air and reduce emmissions [Moshe Kinn, United Kingdom (of Great Britain and Northern Ireland)]
noted; we are discussing hydrogen use in the industry, not in the transport. But we deleted this because H2 is not major issue in the industry sector.
21153 38 53 38 55
In term of cost of the hydrogen energy carrier produced from renewable primary energy sources, I observe that: -without considering possible future technological developments in hydrogen production (for which it would be enough to refer only to the article: (2015) Peter Reuell, Harvard Staff Writer “A leap for ‘artificial leaf’ New technique could open door to producing alternative-energy devices more cheaply” < https://news.harvard.edu/gazette/story/2015/04/a-leap-for-artificial-leaf/>); -I suggest to consider the articles (2017) IEA, Cédric P. in wich he observe that: “Thanks to the recent cost reductions of solar and wind technologies, ammonia production in large-scale plants based on electrolysis of water can compete with ammonia production based on natural gas, in areas with world-best combined solar and wind resources” and “similar H2 prices could be reached in countries with lower-quality renewable resources if “surplus” electricity is considered free”. IEA, Cédric P.: “Commentary: Producing industrial hydrogen from renewable energy” < http://www.iea.org/newsroom/news/2017/april/producing-industrial-hydrogen-from-renewable-energy.html >, IEA, Cédric P.: “Producing ammonia and fertilizers: new opportunities from renewable”, <http://www.iea.org/media/news/2017/FertilizermanufacturingRenewables_1605.pdf >. [Mario Valentino Romeri, Italy]
noted; we are discussing hydrogen use in the industry, not in the transport. But we deleted this because H2 is not major issue in the industry sector.
734 38 53 38 55
In general this statement 'as is' puts a negative 'spin' on the use of hydrogen as a substitute for conventional liquid fuels. However hydrogenis somthing that from my knowledge is only advantagous [Moshe Kinn, United Kingdom (of Great Britain and Northern Ireland)]
noted; we are discussing hydrogen use in the industry, not in the transport. But we deleted this because H2 is not major issue in the industry sector.
Do Not Quote, Cite, or Distribute Page 86 of 129
IPCC WGI SR15 First Order Draft Review Comments And Responses - Chapter 2
Comment No From Page From Line To Page To Line Comment Response
6157 38 54 38 54
insert "especially" and change "relative" to relatively": so that it reads "..is also a relatively expensive energy carrier especially if produced from renewable electricity." [Philip Sargent, United Kingdom (of Great Britain and Northern Ireland)]
deleted this sentence
8003 38 54 38 54a relative expensive energy carrier should be "a 'relatively' expensive energy carrier" [Robert Shapiro, United States of America]
deleted this sentence
733 38 54 38 55
It states that hydrogen is ... a relative expensive energy carrier.. relative to what?, i.e. how does it compare to CCS in mitigating Co2? Perhaps this statement could do with a citation or two and some qualification. Is it relatively expensive today as the proliferation of the technology does not benefit from economy of scale? How is it relative compared to CCS technology, or to what is it relative? [Moshe Kinn, United Kingdom (of Great Britain and Northern Ireland)]
deleted this sentence
6899 39 1 39 3A separate discussion on reducing/ eliminating fossil fuel as feedstock in industry (particularly steel an chemicals) is needed. This one sentence does not do justice to the importance of the issue. [Bert Metz, Netherlands]
noted; we discussed this in the demand reduction subsection.
4844 39 4 39 5
and even many of those installations equipped with CCS are likely to have some residual emissions due to imperfect capture, where the CCS technology can capture at higher rates (>95+), at increased cost and efficiency penalty, and realise net zero by coblending biomass to offset any residual emissions. [Wilfried Maas, Netherlands]
noted; this is taken into account in the models
1526 39 5 39 6
But with cement, it is worth noting the CO2 absorbtion of concrete over time could easily exceed the lack of completeness of CCS, meaning that clinker production with CCS could actually turn out to be CO2 negative over the time scale of 100 years by which we analyze GHGs. [Anthony Patt, Switzerland]
noted; thank you for the information.
9442 39 7 39 7add '(vi) Reducing the HFC emissions' [Isabelle Czernichowski-Lauriol, France] noted; here we are describing the items additional to the issues already discussed, not only
HFCs.
10660 39 14 39 14 Typo - Kigali [Kristin Campbell, United States of America] fixed
10661 39 15 39 15
The Montreal Protocol has historically been a start-and-strengthen treaty, and as such, there exists potential for further mitigation beyond the present phasedown under the Kigali Amendment (Zaelke et al 2012, Strengthening Ambition for Climate Mitigation: The Role of the Montreal Protocol in Reducing Short-lived Climate Pollutants, RECIEL, doi:10.1111/reel.12010). [Kristin Campbell, United States of America]
noted; thank you for the information
10662 39 15 39 15
Switching to more climate friendly refrigerants as mandated by the Kigali Amendment provides an opportunity for redesigning cooling appliances (air conditioners, refrigerators, coolers) to be more efficient for even greater benefit to the climate (Shah et al 2015). [Kristin Campbell, United States of America]
noted; thank you for the information
9443 39 16 39 16 add '(vii) Conclusion for industry's emissions' [Isabelle Czernichowski-Lauriol, France] noted
6900 39 2 39 21industrial coal use needs to be differentiated between coke for steel making and other coal usage, as the approach to eliminating them is different. [Bert Metz, Netherlands]
noted; if space allows it, we will add the discussion on coal.
7943 39 22 39 23
I think the wording "longer term" might be confusing here. What is longer term, can you quantify? It also slightly contradicts the statement on p.38 l. 40-41, that "early scale up of ICCS is essential". [Jasmin Kemper, United Kingdom (of Great Britain and Northern Ireland)]
noted; we deleted "long-term".
735 39 23 39 23It seems like that in this paragraph, the use of hydrogen does not play any role in decarbonisation to 2100. Is this scientifically correct? [Moshe Kinn, United Kingdom (of Great Britain and Northern Ireland)]
noted; some scenario studies show relatively high reliance on the hydrogen, but in the most of studies, hydrogen role is not so important compared with other options..
7440 39 24 39 24
Consider adding a paragraph at the end of 2.3.4.2.1 to explain what the pathways imply for near-term policy action, such as:
"All of the different strategies for long-term decarbonisation of industry, and the process industry in particular, will require considerable RD&D- and upscaling efforts . Given the long lead times of such technology development programmes, and the long lifetimes of heavy industry infrastructure, early action is essential. In the low emission pathways, technologies such as CCS for different emission sources are demonstrated in the near future (in our understanding this means between 2020-2030), as precursors for more widespread use at a later stage. This might not happen without policy intervention under less idealized assumtions than in the models."
Some relevant litterature might be: IEA ETP2017 "Innovative processes and CCS" from page 171; Laffont and Tirole (1996) Pollution permits and complience strategies. Journal of Public economics, 62 (1-2), p 85-125; Golombek, Greaker, Hoel (2010), Carbon taxes and innovation without commitment, The B.E. Journal of economic analysis and policy 10-1, article 32; From AR5, WG3, 6.4.3, p 464-65; The World Bank. (2011). When Starting with the Most Expensive Option Makes sense - Use and Misuse of Marginal Abatement Cost Curves. The World Bank, Office of the Chief Economist. [Øyvind Christophersen, Norway]
noted; Since the policy issues are discussed in section 2.5, so if space allows it, we will add.
13204 39 26 Authors may consider referring to the data from 2015 instead of 2010. [Deger Saygin, Turkey] updated by 2014 data.
7040 39 26 342010 was 7 years ago. Could these figures be updated? The paragraph seems copied from another report (Lucon I guess). [Érika Mata, Sweden]
updated by 2014 data.
14232 39 26 39 26
The way that this is written at the moment it’s confusing how this number (32%) is larger than the contribution of industry (chapter 2, pg 36 line23). I understand how it is possible, but it took some work. A figure, perhaps a pie chart or stacked bar chart, could clarify the different contributions. [Jason Donev, Canada]
noted; this is for energy consumption, not for CO2 emissions.
Do Not Quote, Cite, or Distribute Page 87 of 129
IPCC WGI SR15 First Order Draft Review Comments And Responses - Chapter 2
Comment No From Page From Line To Page To Line Comment Response
20313 39 26 39 31 Possible to use more recent year than 2010 here? [Marine Gorner, France] updated by 2014 data.
5231 39 27 39 27
Black carbon: is there a definition of black carbon before this occurrence? It could be good to have a box on the overlap between air pollutants and GHG in the framing. (2.2.2.3 talks about SLCFs, mentioning NOx and SO2, and Box 1.2 talks about relevance of GWP etc., but there is no mention of Black Carbon and its relationship with other particles). [Bianka SHOAi-TEHRANI, Japan]
noted; Since recent data on BC is not available, so we will cut this part to update all the data in this paragraph.
7041 39 28 31Why is the evolution from 1978 relevant? [Érika Mata, Sweden] noted; not 1978, it is 1970. It is just due to data availability. Anyway, we deleted this sentence
here.
14233 39 33 39 33 “( IEA 2017)” Space before IEA. [Jason Donev, Canada] fixed
736 39 36 39 5
Do these scecarios include the 1.4 billion people who as of 2012 did not have access to electrcity and the 3 billion people who used fossil fuels in the home (Global Energy Assessment ISBN 9781 10700 5198 page xv) ? [Moshe Kinn, United Kingdom (of Great Britain and Northern Ireland)]
noted; Yes, they included those people in the modelling.
6901 39 36 39 5
The statement in line 44-46 sounds contradictory to what is said in lines 42-44. More importantly this paragraph does not do a good job in drawing clear conclusions about the reduction potential of eneergy usage from top-down and bottom-up studies. What is a reasonable number for 2030 and for 2050? [Bert Metz, Netherlands]
noted; we are comparing the three different scenarios here, and no contradictions. But we will rewrite by using the updated figure.
7042 39 44 A summary of these recent IEA studies would be more interesting than a repetition of AR5 [Érika Mata, Sweden] noted; thank you
7043 39 46 S is missing in "mitigation optionS are.." [Érika Mata, Sweden] fixed
6158 39 46 39 46 missing letter: change "option" to "options". [Philip Sargent, United Kingdom (of Great Britain and Northern Ireland)] fixed
7044 39 48 5 Refs are missing. [Érika Mata, Sweden] added
20599 39 48 39 48
Distinction between industrialized and emerging or developing countries must be done concerning energy saving in buildings. For instance, in France, the potential of a massive refurbishment program is a reduction of 50% of final energy consumption in 2050 compared to 2010 (ADEME, 2012). [Eric Vidalenc, France]
discussed in the later part of this section.
13205 4It would help to mention more explicity how growing demand for energy for building cooling and emissions from its generation could be mitigated. [Deger Saygin, Turkey]
take into account; added the discussion on building envelope.
6902 4 1 4 16The discussion on B/U vs T?D finsings is unclear; please present best estimates for the impact of decarbonisation of the energy used [Bert Metz, Netherlands]
rewritten
7045 4 6 8 Does this stronger electrification apply to all regions? [Érika Mata, Sweden] noted; Yes, the rate of change is different.
7046 4 11 12 Which sectorial models? Could you elaborate why these estimate lower electrification? [Érika Mata, Sweden] noted; including IEA-ETP and other bottom-up studies, for example cited in AR5.
7047 4 18 22 I do not think a ref is needed for these three general statements. [Érika Mata, Sweden] removed old ref. Since it is more general and ETP2017 cited below covers this too.
15033 4 18 4 28
Appliances are generally overlooked in the section on buildings. Can the section be titled "buildings and appliances" and address appliances more explicitly? For example, super-efficient A/C technologies have enormous potential and are a rapidly growing area of demand in India, China and elsewhere (see LBNL reports). What is the potential energy/emissions savings from swithcing to LEDs for example? [Farhan Akhtar, United States of America]
noted; No, it is considered here and also many sectoral studies do in the similar way. See also line 23-28.
1528 4 18 4 28
It would be useful to know what the additonal investment cost per square meter are in order to achieve low energy electrified heating buildings. The building chapter of AR5 WGIII relied on a set of review papers that are still relevant. [Anthony Patt, Switzerland]
noted; since space is limited, we can not discuss the details here.
3884 4 18 4 38
More issues and references should be covered. As an example, I suggest two references that show the large potential of significant insulation and solar energy even at very Northern latitudes: Renewable Energy Volume 113, December 2017, Pages 479-493. A long-term performance analysis of three different configurations for community-sized solar heating systems in high latitudes. Rehman, H.U. ,Hirvonen, J., Sirén, K. Applied Energy Volume 167, April 01, 2016, Pages 255-269. Zero energy level and economic potential of small-scale building-integrated PV with different heating systems in Nordic conditions. Hirvonen, J., Kayo, G., Hasan, A, Sirén, K. [Sanna Syri, Finland]
noted; because of page limits, we cannot extend the discussion into the detailed measures to specific areas.
7312 4 19 4 19 Delete the text "lock-in of". [Eleni Kaditi, Austria] rejected; No, it is important to stress the lock-in.
7048 4 22 these measures…which measures? [Érika Mata, Sweden] clarified
4774 4 22 4 22Not necessarily risk. Several studies have shown that many measures related to retrofit of the existing building stock in developed regions are 'win-win' in terms of their net cost per ton of CO2 equiv . [Elena Georgopoulou, Greece]
noted; Yes, so we describe as risk and opportunities.
6903 4 23 4 25This sentence seems to suggest that waiting with deep renovation could be the best strategy, as newer technologies would then be available. Is that really the message you want to send? [Bert Metz, Netherlands]
rephrased to avoid misunderstanding.
7049 4 24 25It would be more interesting to also present the regional results from Güneralp et al. The statement chosen appears kind of evident unless it is properly contextualized and explained. [Érika Mata, Sweden]
noted; if space allows it, we will add it.
7050 4 25 28
It is difficult to understand from where exactly in IEA 2017 this conclusion is drawn, but IEA is most definitely using a non-detailed model that disregards the interactions between electricy use and space heating demand, and that therefore unrealistically shows electrification (heat pumps, LEDS) as a straight-forward winning option (which is not the case). [Érika Mata, Sweden]
noted; IEA model includes the detailed subsector models to consider interaction of energy demand and selection of technologies.
7313 4 25 4 25 Delete the text "lock-in into". [Eleni Kaditi, Austria] same as the comment of 1276
7441 4 25 41 17Please consider to give a more thorought treatment of strategies related to improved insulation of buildings. This is important in realation to both the demand for heating and for air-conditioning. [Øyvind Christophersen, Norway]
noted; we added these.
Do Not Quote, Cite, or Distribute Page 88 of 129
IPCC WGI SR15 First Order Draft Review Comments And Responses - Chapter 2
Comment No From Page From Line To Page To Line Comment Response
14234 4 27 4 27 “( IEA 2017)” Space before IEA. [Jason Donev, Canada] fixed
7442 4 28 4 28
Please consider adding a sentence as follows: "In addition, requirements for low-carbon building materials and solutions could increase the need for implementation of low emission solutions in other sectors, e.g. industry and transport.". Reasoning: Making clear that policy instruments directed towards lowering the carbon footprint of the building sector (building codes, support schemes, r&d) could have indirect emission effects in other sectors, and that this effect is not specifically accounted for in the report. Figures and text can potentially be interpreted as to include these indirect effects, if not specifically mentioned. Also, policy relevant in terms of national and EU policy, to show the linkages between sectors, increasing the focus also on the demand side for climate solutions. Low-carbon builing materials has been documentet for instance in the ZEB-research project http://www.zeb.no/index.php/en/ [Øyvind Christophersen, Norway]
fixed
7051 4 3 38
Could the authours explain why these refs are considered "behavioral literature" (this categorization does not match my own understanding of what isbehavioral literature)? Could they be presented homogeneously, i.e. with procentual savings, metod and regional scope for all of them? In anycase, the literature review is rather limited, and could include other studies with estimates in any of the world regions, emission pathways considered, etc. E.g. for EU: Ó Broin E, Göransson A, Mata É, Johnsson F. The effect of improved efficiency on energy savings in EU-27 buildings. Energy (2013) 57: 134-148; Mata É, Sasic Kalagasidis A, Johnsson F. Energy savings and CO2 emission reductions from building retrofitting in five European countries – Modelling and review of estimates (in review) [Érika Mata, Sweden]
take in to account; rewritten.
16206 4 3 4 38
And what about solar roofs for which Musk/Tesla are already producing solar roof shingles? And what about solar siding for buildings? Lots seems to be happening that should enable, it would seem, greater savings than indicated here. [Michael MacCracken, United States of America]
noted; if space allows, we will add these.
6904 4 3 4 38
This paragraph is suggested to be drawing on literature about behaviour (line 30), but it discusses technical measures on energy efficiency. More imprtantly, the paragraph is very shallow in discussing eneergy efficency measures. A much broader and deeper reduction is warranted. [Bert Metz, Netherlands]
take in to account; here we are discussing the effect of individuals behaviour to select technologies. wording.
12993 4 32 4 35The example reported for the USA in the sentence "By the… thermostats" is not interesting, and now is too old: better deleting it. [Caserini Stefano, Italy]
rewritten
915 4 35 4 35How much must thermostats be set back to achieve this saving? [David Infield, United Kingdom (of Great Britain and Northern Ireland)]
noted; this ref is relatively old, we will replace by new appropriate ref.
4541 41 Fig 2.16 - Add index format to "CO2" and "Wm-2" (2x) [Radim Tolasz, Czech Republic] noted; we use the same format in the entire chapter.
13323 41 1 41 15Figure 2.16 Label sub-plot a-d, and refer to sub-plots in text to direct reader's attention to relevant information. Explain symbols in the plots [Jordan Harold, United Kingdom (of Great Britain and Northern Ireland)]
made new figures
13324 41 1 41 15Figure 2.16: Use a legend to explain the meaning of the symbols in the plots - this should be easier for readers than the explanations in text. [Jordan Harold, United Kingdom (of Great Britain and Northern Ireland)]
made new figures
11134 41 1 41 2
“Due to schemes that avoid deforestation, mitigation that demands land (such as biomass production for BECCS and afforestation) is mainly taking place at the cost of agricultural land for food and feed production”. To my knowledge, most of biomass consumption from BECCS - around 100 EJ/yr (IPCC SSRN 2012) - can be extracted from agricultural and forestry residues and organic waste alone. This would be sufficient for about half of the needs in 1.5C and 2C scenarios (Schaeffer et al. 2015, http://climateanalytics.org/files/feasibility_1o5c_2c.pdf). [Michiel Schaeffer, Netherlands]
this comment is not for this section.
17475 41 3 B [Tom Gabriel Johansen, Norway] made new figures
17515 41 3 B [Angela Morelli, Norway] made new figures
7052 41 7 9Could the "single model studies" of Clarke et al, be given here to facititate the understanding by the reader? And again, regional results and detailed on scenarios would be appreciated, as the authors already point out. [Érika Mata, Sweden]
noted; the reference you mentioned is IPCC-AR5, so we only use this to give the essence of the conclusions
20314 41 11 41 11 Name of the scenario in ETP 2017 is Beyond 2°C Scenario (B2DS). [Marine Gorner, France] fixed
14177 41 18 41 18
Some new alternative references may be useful for subsection 2.3.4.2.3 too. For example, the paper recently published by Cooper et al. (2016):Cooper, E.; Lefevre, B.; Li, X. (2016). Can Transport Deliver GHG Reductions at Scale? An Analysis of Global Transport Initiatives. WRI working paper. Washington D.C., United States. 40p.Available at: http://www.wrirosscities.org/research/publication/can-transport-deliver-ghg-reductions-scale-analysis-global-transport [Alexandre Strapasson, Brazil]
noted; thank you, when we add some introduction of transport sector, we will consider this.
17437 41 18 43 27
Emission mitigation options for shipping should also be mentioned as the challenges for aviation, shipping, freight and passenger road transport are quite different: Bouman, E. A., Lindstad, E., Rialland, A. I., & Strømman, A. H. (2017). State-of-the-art technologies, measures, and potential for reducing GHG emissions from shipping–A review. Transportation Research Part D: Transport and Environment, 52, 408-421. [Aki Kachi, Germany]
noted; we will include some introduction here.
Do Not Quote, Cite, or Distribute Page 89 of 129

IPCC WGI SR15 First Order Draft Review Comments And Responses - Chapter 2
Comment No From Page From Line To Page To Line Comment Response
1703 41 18 44 24
After description on transport, special mention needs to be made about energy consumption on the air transport sector which is enjoying an optimistic growth rate while at the same time eliciting growing concern, due to its environmental impact and its vulnerability with respect to energy security. These issues have put the sector at the forefront of the tide in achieving energy efficiency. Efforts have been made on every front to improve efficiency through better technology, optimized operation, as well as energy-saving infrastructure. [Mishra Santosh Kumar, India]
rewritten
1713 41 18 44 24
After description on transport, special mention needs to be made about energy consumption on the air transport sector which is enjoying an optimistic growth rate while at the same time eliciting growing concern, due to its environmental impact and its vulnerability with respect to energy security. These issues have put the sector at the forefront of the tide in achieving energy efficiency. Efforts have been made on every front to improve efficiency through better technology, optimized operation, as well as energy-saving infrastructure. [Mishra Santosh Kumar, India]
rewritten
1718 41 18 44 24
After description on transport, special mention needs to be made about energy consumption on the air transport sector which is enjoying an optimistic growth rate while at the same time eliciting growing concern, due to its environmental impact and its vulnerability with respect to energy security. These issues have put the sector at the forefront of the tide in achieving energy efficiency. Efforts have been made on every front to improve efficiency through better technology, optimized operation, as well as energy-saving infrastructure. [Mishra Santosh Kumar, India]
rewritten
1723 41 18 44 24
After description on transport, special mention needs to be made about energy consumption on the air transport sector which is enjoying an optimistic growth rate while at the same time eliciting growing concern, due to its environmental impact and its vulnerability with respect to energy security. These issues have put the sector at the forefront of the tide in achieving energy efficiency. Efforts have been made on every front to improve efficiency through better technology, optimized operation, as well as energy-saving infrastructure. [Mishra Santosh Kumar, India]
rewritten
6905 41 18 44 24
This section does not discuss the role of electric vehicle penetration as one of the key strategies to eliminate CO2 from the transport sector. That is a major omission, as it is obvious that that is one of the most prominent options that most automakers are betting on and where remarkable progress is being made. It is also important to specifically discuss the potential for hydrogen fuel cells and biofuels for the heavy transport, shipping and air transport sector. The paragrpah on page 42, lines 1-15 contains so many numbers that the message gets lost. Also here the different SSP baselines create challenges for the policy message: what should policy makers do with the very different results for different SSPs?. The material on page 44, lines 18-24 is on policy instruments and should be moved to chapter 4 (see also my comments on the entire report structure). There seems to be a contradiction between page 41, lines 24-25 (no in-depth study available) and page 44, lines 9-15. It would make sense to involve prof David Lee from Manchester Metropolitan University as a contributor, as he is one of the top experts on aviation. [Bert Metz, Netherlands]
take into account; added more discussion on Eves.
20332 41 18 44 27The Transport Chapter would gain from distinguishing between international and national transportation, because of very different political conditions. [Taran Fæhn, Norway]
noted; Since the space is limited, we can only focus on the subsector-level.
20333 41 18 44 27Reduced transportation - e.g. substitution by digital communication, city-planning, less demand/expensive aviation etc. - is not discussed. [Taran Fæhn, Norway]
noted; Effect of these issues on the demand is still controversial. We limited the discussion to the more important issues.
9304 41 33 41 33The reference format of "Edelenbosch et al. 2016" may be "Edelenbosch et al. (2016)" since it is mentioned within the sentence. [Siir KILKIS, Turkey]
fixed
6532 41 33 41 33 The year 2016 should be enclosed in brackets, i.e (2016) [Victor Ongoma, Kenya] fixed
13207 42Given the rapidly growing use of Evs, it may be useful to provide here more results related to the technology. [Deger Saygin, Turkey]
added
4244 42 3
Suggested addition: "Current trends in road transport electrification and urban mobility solutions could help to half transport sector emissions by 2050 compared to 2010 levels (Creutzig, F., Jochem, P., Edelenbosch, O. Y., Mattauch, L., van Vuuren, D. P., McCollum, D., & Minx, J. (2015). Transport: A roadblock to climate change mitigation?. Science, 350(6263), 911-912.) [Felix Creutzig, Germany]
noted; thank you for the information. This is base on the IAM scenarios, but we already have enough data on IAM, need sectoral studies.
11131 42 3 42 5Please mention that the Beyond 2C scenario from IEA is more in line with 1.75C warming in 2100, rather than 1.5C. Therefore a 1.5C pathway would probably require deeper emission reductions. [Michiel Schaeffer, Netherlands]
noted; No, IEA B2DS is in line with the 1.5DS until 2050. We will discuss this more.
5232 42 4 42 5 Same comment on IEA reference: ETP or Well Below 2DS? [Bianka SHOAi-TEHRANI, Japan] noted; this is IEA B2DS scenario.
20315 42 7 42 8For consistency to the B2DS mentioend in the previous sentence, it would be good to use here the 2DS results from ETP 2017 as well. [Marine Gorner, France]
noted; we will rewrite here.
6534 42 8 42 8 IEA 2014b) should be modified to (IEA 2014b) [Victor Ongoma, Kenya] fixed
Do Not Quote, Cite, or Distribute Page 90 of 129
IPCC WGI SR15 First Order Draft Review Comments And Responses - Chapter 2
Comment No From Page From Line To Page To Line Comment Response
11132 42 8 42 1
The mid-century projection from the IEA analysis is on the low end of the range of the IAM literature because the scenario, by design, looks at how far known clean energy technologies could go if pushed to their practical limits. Please reiterate here that "In several cases, sectorial assessment models have identified different (and often larger) mitigation potentials for single sectors than what is available in global IAMs (for example, see Lucon et al. 2014)" (as reported in Page 2-84, lines 11-13). And also that "the deployment pace of key mitigation technologies, like solar photovoltaic installations and renewables, has been consistently underestimated by key experts over the past decade, showing the difficulty of adequately estimating social and technological transitions (Haegel et al. 2017; Figueres et al. 2017), and illustrating the challenges of producing scenariosconsistent with a quickly evolving market (Sussams and Leaton 2017)." (as reported in page 2-72, lines 41-44). [Michiel Schaeffer, Netherlands]
take into account; we added more discussion on the comparison of IAM and sectoral scenarios.
20316 42 1 42 1
This refers to the B2DS. Please also note that the 2DS includes avoid-and-shift measures, which may be not considered in some of the IAMs (according to Table 2.5), which could explain that CO2 emissions for the transport sector in ETP are lower than the ones in IAMs. [Marine Gorner, France]
noted; we will add more discussion on the comparison of IAM and sectoral scenarios.
11133 42 1 42 15
“Thus, according to these results from multiple models, there exists a fair amount of uncertainty regarding whether transport sector CO2 emissions by mid-century need actually be lower than in 2010 […]”. Those results seem to be in sharp contrast with other findings based on the REMIND and MESSAGE models (Rogelj et al. 2015, DOI: 10.1038/NCLIMATE2572; Supplementary Figure 6), showing emissions from transport at around 2GtCO2 in 2050 (compared to 7 GtCO2 in 2010). I would assume that this uncertainty is mostly driven by model characteristic rather than scenario design, correct (lines 13-15)? Or how can we reconcile those findings? [Michiel Schaeffer, Netherlands]
noted; Since each model assume the different set of many important variables in the modelling, the output results should be different. Therefore, we focus on the range of results of IAM and sectoral studies.
17424 42 11 42 13
Why the uncertainty in transport sector is larger in this term than in other sectors? [Tuomo Kalliokoski, Finland] noted; This is probably due to the recent high pace of change in vehicle technologies, including the passenger fuel economy and electric vehicles. This make the future projections more difficult.
4978 42 17
Would it be helpful to also look at quite ambitious national scenarios (grey literature), e.g. for Germany by Öko-Institut: Erhard, J. et al (2014): Klimafreundlicher Verkehr in Deutschland - Weichenstellungen bis 2050. Herausgeber: WWF Deutschland, Berlin, Juni 2014, 75 S. http://germanwatch.org/de/download/9195.pdf [Manfred Treber, Germany]
noted; thank you. We think the existing sectoral scenarios are already very ambitious and optimistic.
9761 42 17 42 17
Would it be helpful to also look at quite ambitious national scenarios (grey literature), e.g. for Germany by Öko-Institut: Erhard, J. et al (2014): Klimafreundlicher Verkehr in Deutschland - Weichenstellungen bis 2050. Herausgeber: WWF Deutschland, Berlin, Juni 2014, 75 S. http://germanwatch.org/de/download/9195.pdf [Manfred Treber, Germany]
same as the above
11054 42 17 42 21
Though it is true that technology-focused measures show up in all scenarios, there are certain technology options that show up only in a few national scenarios but in particular not in global IAM scenarios, e.g. the use of hydrogen in combustion-engine-based navigation and the electrification of HDVs via trolley trucks (see e.g. the German Climate Protection Scenario 2050). For the latter, there are already demonstration projects in Sweden and Germany. These options may become important to increase ambition in the transport sector. It would therefore be worthwile to elaborate on additional technology options in this paragraph. [Jakob Wachsmuth, Germany]
noted; In the IEA scenarios, this is include in their B2DS. We will add some discussion on this.
10240 42 17 42 3
Ferry transport between islands in island arhipelaogs cannot be replaced with other mode as it simply represents a lifeline to many islanders on small islands. Only super rich countries can do so, e.g. Norway is currently building sea tunnels. This is worth noting, I think, e.g. I wrote paper (Mendas, Z. (2015) “Tracing socio-economic impact of ferry provision in Zadar island archipelago”. Journal of Marine and Island Cultures, Vol. 4, Issue 1, pp. 10-26. Available at: http://dx.doi.org/10.1016/j.imic.2015.06.002 ) [Mendas Zrinka, United Kingdom (of Great Britain and Northern Ireland)]
noted; These region specific issues are very important, but in this report, we should limit the issues whose impact is larger in global scale.
1559 42 17 42 3
Important paragraph. An example of a very rapid and unexpected behavioral change that reduce transport emission is the boom of dockless bike sharing in China : https://www.theguardian.com/cities/2017/mar/22/bike-wars-dockless-china-millions-bicycles-hangzhou . This new trend should be mentioned in the report. [Noé Lecocq, Belgium]
noted; yes this is a good example of behavioural change, but the impact of actual reduction of energy and emissions are still very unclear.
2613 42 17 42 3
how does this apply regionally? Transformational changes here are all described in a very general, globalised manner with little reference to how they can be implemented regionally. [Zoha Shawoo, United Kingdom (of Great Britain and Northern Ireland)]
noted; Yes, regional difference is important, but because of the space limitation, we can not discuss detailed in this report.
13206 42 19It may not be a given that modal shift provides low carbon transportation therefore it may help to add the sentence, provided that the alternative mode is less emission intensive. [Deger Saygin, Turkey]
noted; thank you.
17431 42 19 42 44
Global trade and trade liberalization are factors influencing transport emissions: Hummels, D. (2009, June). How Further Trade Liberalization Would Change Greenhouse-Gas Emissions from International Freight Transport. In NBER Working Paper, Prepared for Global Forum on Trade and Climate Change.Chicago http://www.krannert.purdue.edu/faculty/hummelsd/research/co2%20paper.pdf [Aki Kachi, Germany]
noted; thank you for the information. However, this doesn't speak to 1.5°C pathways in particular. The in-depth assessment of transport emissions is deferred to AR6.
Do Not Quote, Cite, or Distribute Page 91 of 129
IPCC WGI SR15 First Order Draft Review Comments And Responses - Chapter 2
Comment No From Page From Line To Page To Line Comment Response
952 42 23 42 24
A few papers have investigated road freight and have explored whether it is an obstacle to a range of climate policy targets. None of these have been tougher than a target of about 2 degrees by 2100, so it should be noted that low carbon options may become problematic until the later half of the Century. Road freight is likely to be an obstacle to tougher climate targets without innovation and transformation of urban supply chains. You correctly mention rail as having a role, but decreasing the number of freight vehicles entering town centres and replacing them with a lower number of low emission vehicles or encouraging intermodal freight will also be important. Note that while this chapter has been careful in making sure that the studies cited have focused on 1.5 degree targets, I did notice that some of the discussion in chapter 4 has focused on less ambitious targets. Here is a list of the papers that I refer to: Detlef P. van Vuuren, Oreane Y. Edelenbosch, David L. McCollum, Keywan Riahi, A special issue on model-based long-term transport scenarios: Model comparison and new methodological developments to improve energy and climate policy analysis, Transportation Research Part D: Transport and Environment, Volume 55, 2017, Pages 277-280; O.Y. Edelenbosch, D.P. van Vuuren, C. Bertram, S. Carrara, J. Emmerling, H. Daly, A. Kitous, D.L. McCollum, N. Saadi Failali, Transport fuel demand responses to fuel price and income projections: Comparison of integrated assessment models, Transportation Research Part D: Transport and Environment, Volume 55, 2017, Pages 310-321; S. Carrara, T. Longden, Freight futures: The potential impact of road freight on climate policy, Transportation Research Part D: Transport and Environment, Volume 55, 2017, Pages 359-372; Pietzcker, R. C., Longden, T., Chen, W., Fu, S., Kriegler, E., Kyle, P., & Luderer, G. (2014). Long-term transport energy demand and climate policy: alternative visions on transport decarbonization in energy-economy models. Energy, 64, 95-108. [Thomas Longden, Australia]
noted; IEA ETP2017 considered detailed in the transport sector, including the freight transport. They suggested options compatible with the 1.5DS targets.
11920 42 26 42 27
It would be good to mention other possible sources of reductions in travel demand, for example consumer behaviour change to locally sourced products and economic structure change towards more local production (eg through higher recycling rates and increased shift of production towards 3D printing). [Amandine Denis-Ryan, Australia]
noted; if space allows, we will add.
20600 42 28 42 28
But if we consider the necessity of a rapid shift toward less emissions pattern, behavioural measures have huge potentials compared to technological ones. For instance, carpooling reduce the energy consumption and GHG emissions by a factor 2 immediately. In comparison, we need more than 15 years to renew the entire vehicles fleet in Europe. [Eric Vidalenc, France]
noted; yes, behavioural measures are important, and in fact, this is taken into account in IEA's recent mitigation scenarios.
6533 42 28 42 28 (Creutzig 2016) should be modified to Creutzig (2016) [Victor Ongoma, Kenya] fixed
6536 42 28 42 28
I suggest that the word 'debate' be replaced with 'investigation', by so doing, the statement shows that there remains need for confirmation of truth in the current status of the reports. The word 'debate' provokes discussions in cases where something can not proved with ease such as in democratic process where majority have their way. [Victor Ongoma, Kenya]
done
21104 42 32 42 44
The second sentence, about activity growth, could be confusing : I assume that increase in emissions that you indicate relates to the change _attributed_ to the growth in activity, but suspect that non-expert readers may beleive that due to the increased activity, there is a net increase in emissions in all models (which is not the finding from Edelenbosch et al or your own figures). Please consider rewording. I also have the impression that if you could already refer to the net change in emissions (= that in most models there can be a decrease in transport sector emissions in spite of the increased activity), it would be clearer. [Philippe Marbaix, Belgium]
rewritten
737 42 33 42 33When the name of an author is given in Chapters 1 and 3 (which I have so far looked at) the year is given in brackets, in this chapter the brackets are left out. [Moshe Kinn, United Kingdom (of Great Britain and Northern Ireland)]
fixed
4172 42 46 55
What plans are in place to reduce fossil fuel mix by 2030 and what will the implications be of electrification of transport systems? Electrification will require added resources for battery production as well as increased energy demands and investments in infrastructure. For hydrogen some future technologies are looking at dual uses ie: energy and hydrogen production. The World Nuclear Agency highlighted this recently. The Ontario government also recently announced plans to undertake a feasibility study on the use of hydrogen fuel cells to power electric trains. [Michelle Leslie, Canada]
noted; since space is limited, we can not extend our discussions into details.
6535 42 46 42 46The year 2016 should be enclosed in brackets, i.e (2016). The same applies to Line 39 on the same page. [Victor Ongoma, Kenya]
fixed
13049 42 48 42 51
Explain how cheap decarbonized hydrogen is produced or from where it should come from. Actually the "cheap" hydrogen for transportation is produced via SMR (steam methane reforming) of natural gas, with CO2 emission to the atmosphere (since there is not CCS available) [Caserini Stefano, Italy]
noted; all hydrogen must be produced using renewables for the deep decarbonisation. Added the word "clean" before hydrogen.
20317 42 49 42 49 Name of the scenario in ETP 2017 is Beyond 2°C Scenario (B2DS). [Marine Gorner, France] noted; we will use the new definition of scenarios.
16207 42 49 42 54
There is an interesting demo project underway in Pakistan that replaces the jitney engines with an ultra-capacitor battery that is then recharged (in under 30 seconds) at a gas station now roofed over with solar cells. This would save money for all and help reduce air pollution (see http://www.microtrontec.com)--and no need to go to petroleum to provide transportation for all the up and coming population of Africa and South Asia. Technology is advancing rapidly, if it could be promoted. Where is mention here of much greater electrification of transport sector without having to go to hydrogen or biomass? [Michael MacCracken, United States of America]
noted; yes CCS will be very helpful to decarbonise hydrogen and biofuels, but it is not prerequisite.
Do Not Quote, Cite, or Distribute Page 92 of 129

IPCC WGI SR15 First Order Draft Review Comments And Responses - Chapter 2
Comment No From Page From Line To Page To Line Comment Response
5911 42 54 42 55
Suggest including the following sentences between line 54 and 55: "Fuel switching to Hydrogen and increased share of electrification should be accompanied by CCS. Hydrogen and electricity produced from fossil fuels or biomass should include CCS deployment to ensure as low carbon footprint as possible." [Aage Stangeland, Norway]
Considered, text revised to reflect this.
13208 43It would be helpful if the electricity use is split for Evs and for other modes (in the Figure 2.17-right). Please also clarify whether biomethane falls under the category 'gases' or 'bioliquids'. [Deger Saygin, Turkey]
noted; unfortunately most of models did not provide such a detailed data. The share of biomethane is small, and in the most of models, this is ignored or included biofuels.
13209 43In Figure 2.17, a number of scenarios project a large growth of hydrogen use for transport. Does this mean its application is cheaper for transport than for industry? [Deger Saygin, Turkey]
noted; the growth of hydrogen use will be accelerated by cross-sectoral usage. Power sector is a key sector for this.
4542 43 Fig 2.17 - Add index format to "Wm-2" (2x) [Radim Tolasz, Czech Republic] noted
16208 43 7 43 8
While it may take time to scale up low carbon fuels, going electric (e.g., http://www.microtrontec.com) could happen much faster. Manufacture of battery is straightforward, and electric motors are well established technology--get electricity from solar, etc. or off grid. Scale up potential should be much higher than for low carbon fuels. [Michael MacCracken, United States of America]
noted; added more discussion on Evs.
21105 43 11
Figure 2.17: wouldn't it be relevant to add a panel for the net change in emissions here, so that the reader does not need to wait until figure 2.20 to see the net result of those changing factors - and done for buildings in F 2.16 ? (I did not even see a reference to 2.20 in the discussion on transport). [Philippe Marbaix, Belgium]
made new figures
13325 43 11 43 3
Figure 2.17: Unclear how coloured dots in right hand plot relate to coloured dots in left hand plots. Needs explaining (e.g. figure legend). Incllude legend to explain symbols too, as easier than reading text in caption. [Jordan Harold, United Kingdom (of Great Britain and Northern Ireland)]
made new figures
9230 43 12Figure, right panel. What causes the difference between models? For an assessment, not enough to just show results, also have to explain differences between results? [Glen Peters, Norway]
noted; more general discussion on the modelling is given in the section 2.1 and 2.6.
17476 43 14 B [Tom Gabriel Johansen, Norway] made new figures
17516 43 14 B [Angela Morelli, Norway] made new figures
1529 43 33 44 7
But isn't it important to reflect on what these numbers mean if in fact there is also fuel switching taking place, e.g. from gasoline/diesel to decarbonized electricity. If we need the latter to achieve a 1.5°C target, then the emissions reductions associated with behavioral change may be large in the short term, but ultimately much less (or even zero) after fuel switching has taken place. [Anthony Patt, Switzerland]
noted; behavioural change is very important to reduce the demand. Even in the long-term, this is true, because production of vehicles and fuels needs energy and emits CO2 if energy is not fully decarbonized.
4775 44 3 44 5
Such large savings can be achieved only with large-scale switching and are rather theoretical as numerous barriers (e.g.infrastructure, social-demographic, etc.0 exist. 'Could lead' instead of 'would lead' is more appropriate. [Elena Georgopoulou, Greece]
fixed
4776 44 9 44 24
Social and technical barriers to the transformations needed for moving from 2 oC to 1.5 oC should be discussed here, as many mitigation solutions mentioned require large-scale behavioural changes and infrastructure modifications. [Elena Georgopoulou, Greece]
noted; technical issues are discussed in other paragraph.
10577 44 13 44 13 citation not clear. [Elemer Briceño-Elizondo, Costa Rica] noted; this is a paper in review
6537 44 13 44 13The year in which Kauppila et al.was published is missing. The same applies to Lines 15 and 18 on the same page. [Victor Ongoma, Kenya]
noted; this is a paper in review
738 44 13 44 13No date on Kauppila paper, also cant find the paper [Moshe Kinn, United Kingdom (of Great Britain and Northern Ireland)] noted; this is a paper in review
9305 44 13 46 32The reference formats between these lines are not unified. The reference Kauppila et al. requires an insertion of the year and "Havlík et al. 2014" may be "Havlík et al. (2014)." [Siir KILKIS, Turkey]
noted; this is a paper in review
17381 44 18 44 24No mention made here of inland waterway transport or coastal/deep water shipping [Gavin Allwright, United Kingdom (of Great Britain and Northern Ireland)]
noted; Since space is limited, we should focus on the important modes only.
17432 44 26 44 27
Literature does not speficially address the 1.5 degree target, but it does address the 2 degree target resulting ambition level would need to be more ambitious. : Bows?Larkin, A., Mander, S. L., Traut, M. B., Anderson, K. L., & Wood, F. R. (2016). Aviation and Climate Change–The Continuing Challenge. Encyclopedia of aerospace engineering. [Aki Kachi, Germany]
noted; thank you for the information. But we need the paper for 1.5DS.
17438 44 26 44 27
Technological options for international aviation are not completely different from domestic aviation (except where modal shift alternatives exist). Domestic measures cannot be completely separated from international bunkers see EU ETS, efforts for port electrification, etc. [Aki Kachi, Germany]
noted
6958 44 26 44 27
One of the mitigation options should include nuclear powered crafts, which are already in small use. This is not yet included in analysis, as is noted in Box 5.6 of IEA ETP2017, however its omission should be noted here. [Ville Tulkki, Finland]
noted; Since space is limited, we should focus on the important topics only.
20601 44 26 44 27A recent paper with proposal of regional tax for international bunkers in grey littérature : https://hal.archives-ouvertes.fr/hal-01459600 [Eric Vidalenc, France]
noted; thank you for the information. But we need the paper for 1.5DS.
6702 44 28 48 1
The chapter and considered scenarios usually do not specify how much of the considered CDR activities happen in tropical/subtropical landscapes, temperate landscapes and boreal landscapes. This would be important due to the different socio-economic consequences and implication for the wider sustainable development goals and agenda. [Jennifer Morgan, Netherlands]
Noted. The regional characteristics of the scenarios, including tCDR activities are of importance. However, given the fact that chapter 2 is reporting at the global level only we cannot get into regional details here. However, chapter 3 & 4 talk e.g. about regional bioenergy potentials and trade-offs.
Do Not Quote, Cite, or Distribute Page 93 of 129
IPCC WGI SR15 First Order Draft Review Comments And Responses - Chapter 2
Comment No From Page From Line To Page To Line Comment Response
6368 44 29
This section purports to be about agriculture and land-use transitions, but it mostly deals with land-use change. It is disappointing to see no information on changes in e.g. CH4 from agriculture - there must be relevant literature out there, or information that can be extracted from the scenario database? I'm missing a much more substantive discussion about the extent to which mitigation of agricultural non-CO2 emissions could help, or may even by necessary to, achieve 1.5 goals, including by increasing the allowable CO2 budget from other sectors consistent with the temperature limit. [Andy Reisinger, New Zealand]
Accepted. This section now also includes text on CO2 and especially non-CO2 emissions from agricultural production, including mitigation options and potentials.
4173 44 29 41
Various agricultural techniques such as agroforestry, soil carbon sequestration and even increasing investments into local farms could all help to meet the mitigation pathways. Investments and promotion of local agricultural communities will provide food security and lower emissions footprints as produce will not be required to be transported long distances. [Michelle Leslie, Canada]
Taken into account - this is correct. In this section, however, we describe the evolution of the AFOLU sector in available mitigation scenarios. A detailed description of additional measures is provided by Chapter 4, and agroforestry is also included in the table of potential mitigation measures in section 2.3.
3709 44 29
Section 2.3.4.3 would do well to address that emissions from land are dependent on very local factors. The analysis is focused on global and regional (supra-national) scale, while variation - e.g. in soil types, species, crops etc varies signficantly at the sub-national scale. Have you looked assessed literature from AgMIP http://www.agmip.org. And see Rojas Me?ndez, A M 2015. A compilation of agricultural models assessing sectoral dynamics, GHG emissions and abatement opportunities: The cases of Brazil, Chile, Colombia and Peru under the MAPS Programme. . Cape Town, MAPS programme. http://www.mapsprogramme.org/wp-content/uploads/Paper_A-compilation-of-Agricultural-models-assessing-sectoral-dynamics.pdf [Harald Winkler, South Africa]
Rejected. The section 2.3.4.3 indeed reports at the global level but the models and tools referred to in this section operate at the sub-national scale with spatial explicit and heterogeneous drivers like soil types, climatic conditions, crops etc.
14178 44 29 44 29
I would recommend to consider including Strapasson et al. (2017, DOI: 10.1111/gcbb.12456) here, too, because it is very much in line with this content, providing an alternative whole-system modelling approach based on system dynamics and at global level. See full citation above. [Alexandre Strapasson, Brazil]
Rejected. The reviewer suggestion is too unspecific for getting considered.
6700 44 29 48 1
Afforestation and Reforestation have not really been differentiated despite their fundamentally different implications on biodiversity and permanence of the carbon sequestration. Reforestation of former forest lands with native vegetation is usually beneficial for biodiversity and has a high resilience of the sequestered carbon against droughts and heatwaves contrary to afforestation. Despite this fundamental difference the text and scenarios mostly only use the term afforestation assuming that this includes reforestation which leaves usually unclear how much of it is afforestation and how much reforestation. [Jennifer Morgan, Netherlands]
Noted. The models treat induced regrowth of natural vegetation very differently (afforestation or reforestation). We adapted the text by now always talking about afforestation and reforestation. Due to space limitations a more comprehensive and detailed representation in chapter 2 is not possible. However chapter 4 will talk in more detail about the potential consequences of different land-based mitigation options (incl biodiversity).
6701 44 29 48 1
Restoration of existing secondary forests is not considered at all in the scenarios despite its significant potential for CDR, which has been estimated by the Stockholm Environment Institute to be 220-330 Gt CO2 during the rest of this century (www.sei-international.org/mediamanager/documents/Publications/Climate/SEI-WP-2016-08-Negative-emissions.pdf). Restoration comes with strong biodiversity benefits and a high resilience of the sequestered carbon against droughts and heatwaves similarly to reforestation of former former forest lands. Moreover the restoration of existing forests does not require any additional land opposite to BECCS, afforestation and reforestation. [Jennifer Morgan, Netherlands]
Noted. Restoration of forests is indeed not considered in the IAMs. But some of the models consider (non-assisted) regrowth of natural vegetation on abandoned agricultural land. Restoration of secondary forests has been added to the overview table of mitigation measures in Section 2.3.
9633 44 29 48 1
controling of forest fire or pest diaster may be bebifit for conservation carbon stocks.please add some content about forest fire or pest controlling [Jianguo Wu, China]
Accepted - Forest fire, pest disasters and associated heat stress of natural vegetation indeed affects C stocks and dynamics very strongly. Some of the IAMs do have these processes included. However, they do not cover measures to control those. Measures to control forest fire and pest disasters have been added to the overview of mitigation measures in section 2.3 to make clear that these aspects are often not included in the pathways
739 44 3 44 3It reads "The agricultural and other land-use sector (AFOLU)" it should include the word "Forestry" [Moshe Kinn, United Kingdom (of Great Britain and Northern Ireland)]
Editorial
6906 44 3 44 34
Add the role of land use in Carbon Dioxide Removal (sinks). This is a very important function for 1.5C trajectories. And cross reference to page 35, where CDR is being discussed (and where I suggested to include the whole range of CDR options, not just BECCS). [Bert Metz, Netherlands]
Accepted - we highlight this function of land use in 1.5C trajectories. At the same time, in this chapter we discuss the land use implication of mitigation pathways in the context of sustainable development. The discussion of single measures would come from chapter 4.
6907 44 36 44 37
Move the discussion from chapter 4.3 here, so that there is one integrated discussion, rather than having it in two different places (see also my remarks on structural change for the entire report). [Bert Metz, Netherlands]
Rejected - The structure of the report is dictated by the approved scope. This suggestion, while in itself valid, was felt to change the scope of the various chapters as approved by the IPCC.
16209 44 37 44 41
In relying on IAMS, there has been no discussion here of their reliability--how well they have been able to predict/project changes over the last 25-50 years, etc?. Should there not be some section of this report discussing the validity/past performance of IAMs similar to the intense examinations of these issues for climate models used in WG I reports? Somewhere I think it needs to be made clear that IAMs are not based as firmly on fundamental physical laws anywhere near to the extent of climate models and depend significantly on the imagination of the investigator, etc. A good example of the limits and uncertainties of such models and projections might be to consider projections of international oil use from back in the 1960s/70s to the present, and compare the typical results and projections with those of Amory Lovins and observations. Greater change than most models project is possible--with drive and determination. [Michael MacCracken, United States of America]
Rejected - IAMs are not predicting changes but they project how a certain system would evolve under a certain set of assumptions. When projecting changes from historical trends, a comparison to historical changes can be informative yet not give conclusive evidence. This is an important aspect which, however, is more generally applicable to models in their myriad applications. As the SR15 is mandated to focus on the question of 1.5°C and 2°C, the point raised by the expert reviewer would rather be something that would be addressed in the overall AR6 cycle.
Do Not Quote, Cite, or Distribute Page 94 of 129
IPCC WGI SR15 First Order Draft Review Comments And Responses - Chapter 2
Comment No From Page From Line To Page To Line Comment Response
7945 44 54 45 1
This is a very strong statement and needs quantification and ample referencing to give an indication about the certainty of this statement. What is missing at this point is a discussion about the availablity (incl. quantification if possible) of marginal lands, waste feedstocks, so-called additional biomass (i.e. biomass that can lead to a GHG reduction without competing with / replacing other ecosystem services) for BECCS (see e.g. EEA 2011, Searchinger and Heimlich 2015). I'm also missing a discussion and quantification about the possibilities to free land resources through cutting food waste and dietary change here. Bui et al. 2017, section 12.1.1, contains such a discussion, concluding: with far-reaching changes to our diets and land/agricultural systems, we could potentially make enough land available for large-scale deployment of BECCS. [Jasmin Kemper, United Kingdom (of Great Britain and Northern Ireland)]
Accepted. The section has been modified by adding 'Besides that also marginal land is used and biomass is supplied from residues and waste, but at much lower shares'. The importance of demand shifts and freeing up land has not been highlighted here as it is treated in detail in the section on land pathways.
10326 44 54 45 12
How second generation of biofules (from forest poducts) are considered? Or only biofuels from crops are included). It is true that afforestation takes place in formr agricule lands, but how is being consider the suitability of this lands for food productions once degraded, or the fact that shortage in water some times makes agriculture not possible. Is the geographic distributon of lands for afforestaon taken into account and how?. Conections between reducing emissions of deforestation in certain aeas are critical for protecting the water cycle that will be necessary to mantain food production in nearby regions or areas. Are this benefits taken into account, and how?. In summary, the where could be of critical importance to prevent trade offs later, and it might be of critical relacance for mid long emr mitigation poentals to be realized. [Maria Jose Sanz Sanchez, Spain]
Rejected. The chapter cannot deal with details on feedstocks as requested by the reviewer due to space constraints. All these details are given in the references to other publications of these models.
4543 45 Fig 2.18 - Add index format to "Wm-2" (4x) [Radim Tolasz, Czech Republic] Editorial
10333 45 48
The where, how and with which type of land (i.e previously degraded or not) the mitigation activities take place matters more that how many hectares. Suitability of land for a praticular parectices is critical for the sucess and also for fulfilling the multiple objectives. It seems this is a severe limitation for IAMs. Leading to the conclusion that globla results do not mean much and are very difficult or impossible to traslate to actual local or national practices. It is extremly important to provide all the necessary information to undestand that this limitations are there, but this should not discourage action on the sector. By default there are win win practices, such as reducing deforestation, while other practices require more careful assesement on where and how they can happen in order to be sucessful (such as reforestation and afforestation). Enhancement of C socks in forest lands is no where mentioned, but it could be a relevant practice is some areas. In ths context a more comprehnesive and coherent detailed information on drivers of land use change will be necessay not only whithin countries but also across countries and regions if there is a need to implement supply and demand options in an efficient manner up to 2030 and beyond. [Maria Jose Sanz Sanchez, Spain]
Rejected. The section 2.3.4.3 indeed reports at the global level but the models and tools referred to in this section operate at the sub-national scale with spatial explicit and heterogeneous drivers like soil types, climatic conditions, crops etc.
12750 45 6 45 6 compared to its extent in… [Vassilis Daioglou, Netherlands] Editorial
6908 45 7 45 9
This suggests that some models do not use forest expansion as a mitigation option. I would then keep these model results separate from model runs that do include forest expansion, so that it becomes clear what the consequences of this choice will be for other mitigation options. [Bert Metz, Netherlands]
Noted. Scenarios in section 2.3.4.3 based on figure 2.19 are selected along the thoughts of the reviewer (e.g. scenario 3 w/o afforestation). Further disentanglement is impossible as until now no stylized scenarios on separation of land-based mitigation technologies do exist.
12751 45 8 45 8In some cases (admittedly few), forest area even decreases in 1.5 scenarios (SSP2). This should at least be mentioned [Vassilis Daioglou, Netherlands]
Accepted - this is now mentioned
7443 45 11 45 12
Cropland area for food and feed production decreases in most 1.5 scenarios - how is this related to food production? Do the scenarios assume increased yield? It would be nice to have a sentence about how decreased cropland area for food production relates to changes in yield. Are agricultural efficiency included in the models? [Øyvind Christophersen, Norway]
Accepted. This section has been extended by a clarification on drivers for decreasing agricultural land.
6909 45 11 45 12
Clarify that the reduction in cropland is a result of enhanced productivity and discuss the assumptions that models make on prodcutivity increase and the bottom-up knowledge of possible productivity increase and its barriers. [Bert Metz, Netherlands]
Accepted. It is not cropland decreasing but mainly pastureland. Sentence added for listing the drivers of decreasing agricultural land. A more detailed comparison and discussion of simulated agricultural intensification is placed in chapter 4.
13326 45 13 45 22Figure 2.18: explain colours in legend rather than caption. [Jordan Harold, United Kingdom (of Great Britain and Northern Ireland)]
Accepted - a legend has been added
17477 45 15 B [Tom Gabriel Johansen, Norway] Editorial
17517 45 15 B [Angela Morelli, Norway] Editorial
14235 45 24 45 26These numbers lack context, putting in the total land use for perspective would clarify this a great deal. [Jason Donev, Canada]
Accepted - Numbers on agricultural land use in 2005 have been added to this section.
6910 45 24 45 33The statements on change in pasture pand in line 27 seems to be in contradiction to that in line 31-32 [Bert Metz, Netherlands]
Taken into account - We have clarified that it is the general trend which is referred to here.
10491 45 26 45 27The sentence seems to indicate that there are 1,5 degree scenarios with an increase of pasture + 3 Mha/yr between 2010 and 2030. This seems to be in contradiction with table 2.9 [Harold Leffertstra, Norway]
Rejected - it isn't. Table 2.9 also reports a potential increase.
12752 45 31 45 32
Decreasing pasture areas […] are prolongations of historical […] and baseline trends…. I don’t follow this. Historical trends are 8.7MHa/yr while baseline trends span expansion and contraction. The mitigation scenarios have a clear negative trends, particularily after 2030. I think the word "prolongation" is incorrect. [Vassilis Daioglou, Netherlands]
Taken into account - We have clarified that it is the general trend which is referred to here, with a qualification of the other potential scenarios.
10241 46 5 46 15It is worth mentioning that there is currently a trend for creating "multifunctional forests and value chains", (see.https://ec.europa.eu/eip/agriculture) [Mendas Zrinka, United Kingdom (of Great Britain and Northern Ireland)]
Rejected. This section treats 3 main drivers , and hence operates at a different level of detail.
Do Not Quote, Cite, or Distribute Page 95 of 129

IPCC WGI SR15 First Order Draft Review Comments And Responses - Chapter 2
Comment No From Page From Line To Page To Line Comment Response
6703 46 5 47 4
Factors affecting the AFOLU sector should also include efficiency of use. Less wasteful use of wood and other biomass resources and increasing their efficiency of use through product cascades as well as more waste- and residue based biomass for energy production can limit overall demand for wood and other biomass which is a crucial precondition for the successful restoration of forests and other ecosystems. This affects the bio-economy at large way beyond issues like food waste. In this context it is also important to indicate the share of waste- and residue-based bioenergy assumed for BECCS which is currently missing in the text and most scenarios, as it has implications eg for land demand. [Jennifer Morgan, Netherlands]
Accepted - We modified this section accordingly.
14236 46 23 46 23What are the units for pasture 8.7 and 0.9? likewise total cropland 4.6 0.6? Are these Wm-2? Percents? [Jason Donev, Canada]
Editorial - as indicated in both the caption and the table, these values are in Mha/yr unless stated otherwise.
6538 46 25 46 252017 should be enclosed in brackets. The same applies to 2014 in Line 32 on the same page. [Victor Ongoma, Kenya] Editorial - references are formatted automatically by the reference software and will be
harmonized
10242 46 25 46 32
I must be stated clearly which region these studies refer to beside reference point. It is subjective to say that this study relate to a whole world. I would advise inserting the key words on the particular region the study refers to and apply this to the rest of the report. [Mendas Zrinka, United Kingdom (of Great Britain and Northern Ireland)]
Accepted. Changed accordingly.
10334 46 25 46 32When quoting percentages of reduction, it will be good is it is clearly stated "of what" or related to what. [Maria Jose Sanz Sanchez, Spain]
Accepted. Changed accordingly.
20268 46 28Year missing from Weindl et al. citation [Aaron Glenn, Canada] Editorial - references are formatted automatically by the reference software and will be
harmonized
6369 46 29 46 32
substantial CO2 emission abatement: presumably you mean CO2-eq, not CO2? Most of the abatement comes from reduced emissions intensity of CH4/unit of product. Also, please remove (or provide convincing references) for the claim that the abatement potential in intensive systems is limited because of trade-offs with soil carbon stocks. I don't think there is clear evidence that it's soil carbon stocks that are the issue. The abatement potential is limited simply because intensive systems are already quite productive and lifecycle assessments (e.g. Gerber et al 2011, 2013) show that the emissions per unit of product reach an asymptote beyond a certain level simply because of emissions in generating additional animal feed, fertiliser use, and N2O from livestock excreta offset any further gains from increased productivity. [Andy Reisinger, New Zealand]
Noted. This section only refers to land dynamics driven by livestock production systems and related CO2 emissions from land-use change. We improved the section for clarification. In addition, an additional section on non-Co2 emissions has been added to this chapter.
10335 47 12 47 15This is a extremly important point that should be inserted right at the begening. [Maria Jose Sanz Sanchez, Spain] Taken into account - we agree that this is an important point, but feel it is better included at this
point of the text.
7946 47 17 47 4
These results are somehow concerning, in that there is a strong focus on BECCS in a scenario that seems to be least able to afford the land resources for it, among all scenarios. It might be interesting to elaborate more on alternative scenario designs, i.e. where the amount of BECCS does not vary that much but is rather constrained to more constant, sustainable values and complimented by other mitigation options. Nevertheless, it would be good to highlight the importance of mitigation portfolios at this point. [Jasmin Kemper, United Kingdom (of Great Britain and Northern Ireland)]
Accepted - this section aims to display different land based mitigation portfolios and hence is not based on diagnostic bioenergy scenarios only. We adapted this section to highlight the importance of mitigation portfolios even more.
6911 47 17 47 4
the message from this paragraph is rather confusing for policy makers. Four different strategies are sketched, but how should policy makers choose between them? It is important to assist the reader in identifying what would be the best strategy for what circumstances. [Bert Metz, Netherlands]
Accepted - references are made to synergies and trade-offs which the various strategies can provide. These should help decisionmakers understand which strategy would be preferred
12753 47 2 48 11
This entire paragraph and figure 2.19 use the terminology "scenario 1","scenario 2", "scenario 3". Are these base don the SSPs, which are the basis for the rest of the results? If not, then what exactly are these scenarios? [Vassilis Daioglou, Netherlands]
Taken into account - these scenarios have been selected based on their archetypical characteristics for various land mitigation strategies. They are in part based on the SSPs, but this is only coincidental, because the SSPs show an important variation across socioeconomic assumptions and strategies.
10578 47 26 47 26
Is it to be understuood that dedicated bioenergy crops are considered agriculture?. If this is the case, it must be considered that a bioenergy crop can include woody biomass forestry plantations which by definition are not considered agriculture, but a different silvicultural package. Other bioebnergy crops (such as jatropha curcas) are oily crops or Agriculural Organic Waste (AOW) which demand a different technological package to be processed into energy. It would be better to include bioenergy crops of woody biomass within the use of forest biomass, or to speak of dedicated forest biomass. [Elemer Briceño-Elizondo, Costa Rica]
Noted. Yes, all kind of second generation bioenergy plants (such as miscanthus (herbaceous) and poplar, eucalyptus (woody) are considered as perennial crops in this case. The aim was to characterize in a simple way the area needed for purposely grown dedicated 2nd generation plantations.
8004 47 29 47 3By 2050, global food production is reduced to 10%??? Shouldn't it be 'by 10%' [Robert Shapiro, United States of America] Taken into account - this was a typo
16210 47 29 47 31How can this be right--global food production is reduced to 10% (so by 90%) and the world population still survives? Is the phrasing here correct? [Michael MacCracken, United States of America]
Taken into account - this was a typo
10492 47 29 47 31I suppose that global food production is reduced with, or by 10 %, not to 10% as written in the text. [Harold Leffertstra, Norway]
Accepted - and corrected
7444 47 37 48 1
Here you mention for the first time a new scenario, Scenario 4. Please consider presenting the characteristics of this scenario in a manner similar to the one provided for scenario 1-3 in figure 2.5. One could think that this is a scenario based on SSP4, but then again Scenario 3 is based on SSP5. If the scenario is based on SSP3 og SSP4, please consider providing the characteristic of the SSP. It would be useful to have the characteristics of all the five SSPs presented early in this chapter, as all are refered to later. [Øyvind Christophersen, Norway]
Accepted - the SSPs provide us with an extensive and broad set of scenarios. Characteristics are introduced in Chapter 1, as well as at the beginning of Chapter 2. In this section the defining characteristics for the land and agricultural sector are highlighted. In this case, the focus of this particular scenario to consider afforestation as a mitigation measure.
Do Not Quote, Cite, or Distribute Page 96 of 129

IPCC WGI SR15 First Order Draft Review Comments And Responses - Chapter 2
Comment No From Page From Line To Page To Line Comment Response
7947 47 38 47 4
Did the scenarios have constraints with regards to AR? I.e. did the design make sure only AR options that do not lead to detrimental changes in albedo were considered? [Jasmin Kemper, United Kingdom (of Great Britain and Northern Ireland)]
Accepted - No, the scenarios did not account for albedo. We added biophysical effects (albedo) to the overview table of potential mitigation measures in Section 2.3
9552 48Figure 2.19. This figure is imporant to grasp 4 scenarios, but illustration is a bit no enough to understand right and below figures of each box. [Shuzo Nishioka, Japan]
Noted
9579 48Figure 2.19. This figure is imporant to grasp 4 scenarios, but illustration is a bit no enough to understand right and below figures of each box. [Shuzo Nishioka, Japan]
Noted
4544 48 Fig 2.19 - Add index format to "Wm-2" (6x) [Radim Tolasz, Czech Republic] Noted - editorial and layout consistency will be ensured for the final draft
10336 48 48Figure 2.19. How this pathways types fit with the pathways indicated right at the start of the chapter?. [Maria Jose Sanz Sanchez, Spain]
Not relevant anymore as the pathways at the start of the chapter have been removed
12944 48 49
2.3.4.4.1 talks of mitigation protfolio as a new concept but in AR5 it was used quite often that mitigation portfolio can have system wide /economy wide impact and SPM also developed figures to show that how across sectors invetsment needs can be expected to change under various concentration targets. It needs to be placed in right persoective instead of positing this as a new category. Continuation of AR5 is needed. [Joyashree Roy, India]
Accepted - a reference and link to AR5 WG3 SPM was included
13327 48 1 48 1
Figure 2.19: Plot background colours are distracting - drawing attention away from the data. Suggest removing background colours (can retain colour for the Sceanario heading banners) [Jordan Harold, United Kingdom (of Great Britain and Northern Ireland)]
Accepted - background colours have been removed
10579 48 1 48 1
Figure 2.19. An increase in relation to baseline indicates teh increase of energy crops. Woody energy crops, which would not compete with agricultural land can be considered as a forestry activity. If a new conceptual correction could be considere to specify that teh concept of energy crops include both dry and wet biomass, it would not be neccesary to alter teh graph, on the other hand, if teh proportion of both could be distinguished, it would increase teh detail of contribution from both. [Elemer Briceño-Elizondo, Costa Rica]
Noted. Dedicated woody 2nd generation energy crops (such as poplar, eucalyptus) are included in the category 'energy crop' and those compete with agricultural land. Biomass feedstock from forestry activities are an additional important feedstock. To account for this we added and analysed scenario 2 where forest area in comparison to the other scenarios is strongly increasing for mitigation purposes (feedstock provision).
1946 48 1 48 1Background colour behind figure makes this figure harder to read and understand [Andrew Smedley, United Kingdom (of Great Britain and Northern Ireland)]
Accepted - background colours have been removed
17478 48 3 C [Tom Gabriel Johansen, Norway] Editorial
17518 48 3 C [Angela Morelli, Norway] Editorial
6159 48 3 48 1
Figure 2.19. Extremely confusing labelling: in a figure caption, a,b,c always refer to the different sub-figures. But here they are used to refer to the 3 sub-parts of each of the 4 sub figures. Rewrite to describe the 4 scenarios first as a,b,c,d then describe the sub-figures as i, ii, iii. [Philip Sargent, United Kingdom (of Great Britain and Northern Ireland)]
Accepted - the layout and description of the figure has been updated
5912 48 3 48 1The text should be worked on in order to much better explain the difference between Scenario 1 , 2, 3 and 4, [Aage Stangeland, Norway]
Taken into account - these differences are highlighted in the preceding paragraph
17425 48 3 48 3Why initial situation is different in different scenarios? It undermines the credibility of these analyses. Moreover, I personally do not like the idea of using year 2010 as the first year of these scenarios. [Tuomo Kalliokoski, Finland]
Taken into account - Due to the uncertainty in LU, models differ in the amounts the apportion to each LU type in 2010.
1183 48 15 5 11
There needs to better co-ordination between Ch2 and 5 to avoid undue overlap when discussing mitigation measures and their implications for non-climate policy objectives. Ch 5 discusses synergies and trade-offs of M measures with SDGs in section 5.4. Link to 5.4 needed in paragraph p. 49, l5-23. [Petra Tschakert, Australia]
Noted
1184 48 15 5 11
A clear distinction between individual mitigation 'measures', 'portfolios' and 'pathways' would be helpful here and in other chapters. We understand measures to be individual M response options; portfolios to be combinations of individual M response options (or clusters); and pathways to be the dynamic implementation of an individual response option, or the interplay between M measures within a portfolio, over time. This should either be discussed here, or in Ch1 in Box 1.1 (scenarios and pathways). [Petra Tschakert, Australia]
Accepted - should be discussed in the Chapter 1 Box on scenarios and pathways
4777 48 16 49 23The purpose of section 2.3.4.4.1 is not clear. The link with societal objectives is not elaborated in detail. [Elena Georgopoulou, Greece]
Noted
9946 48 21 I think it's not necessary to put two times the word "model" [Olga Alcaraz, Spain] Accepted - one "model" was removed
4545 49 Fig 2.20 - Add index format to "CO2" and "Wm-2" (2x) [Radim Tolasz, Czech Republic] Noted - editorial and layout consistency will be ensured for the final draft
6912 49 5 49 23
This paragraph addresses two different issues:(1) implications for other non-climate and sustainability issues; (2) the implications of different socio-0economic baselines (SSPs). It would be much more logical to deal with issue (2) here and leave the discussion on the implications of other and SD issues to chapter 5 (not section 2.5 that also should be moved to chapter 5 (see also my comments on the entire report regarding restructuring). The different SSP baseline assumptions lead to very different conclusions about the best mitigation portfolio's for reaching 1.5C (see for instance also the 2030 CO2 emission levels that are around 22 GT for SSP1/SSP2 and around 35 Gt for SSP5. What should policvy makers conclude from this in terms of what approach to select. Do they try to influence the socio-economic context or just identify in which situation they are? (see also my comments on the SSP issue for the chapter as a whole). [Bert Metz, Netherlands]
Taken into account and partially rejected - The SSPs indeed show differences in the near term depending on socio-economic assumptions, as well as policy assumptions. SSP5 assumes not only high energy demand, but also a slower phase-in of climate policy than SSP1. Both are levers on which policymakers can act. We have tried to make this clearer in the paragraph. The restructuring between chapters was not possible, but part of this discussion has been moved to Section 2.5.3. Furthermore, this section has been condensed.
10337 49 5 49 6
True, but how this implications can be properly assessed at the scale of the implementation?, in other words how to make the right choice?... Is the key question. What is preventing this, can we link this to identifed gaps at the end of the chapter more closely? [Maria Jose Sanz Sanchez, Spain]
Taken into account - we highlight that being aware of these links and of their interactions can be an important first step.
Do Not Quote, Cite, or Distribute Page 97 of 129
IPCC WGI SR15 First Order Draft Review Comments And Responses - Chapter 2
Comment No From Page From Line To Page To Line Comment Response
7053 49 6 7It does not seem accurate to label as "recently integrated studies" a reference from 2014 that only includes literature before e.g. 2012. [Érika Mata, Sweden]
Taken into account - we have included more adequate "recent" references
13210 49 7The sentence reads as if 'decarbonisation' and 'energy efficiency' are comparable. This could be rephrased since energy efficiency is one way of realizing a decarbonisation. [Deger Saygin, Turkey]
This sentence was removed from this section
8005 49 11 49 12This highlights the importance of mitigation portfolio choices, particular when should be 'particularly when' or 'in particular when' [Robert Shapiro, United States of America]
Noted
13211 49 2It would be important to mention which emissions are difficult to mitigate from which sectors and what options would be required to deal with them. [Deger Saygin, Turkey]
Rejected - while important it does not seem to add to the point made in this subsection
6160 49 2 49 2 change 'mitigation' to 'mitiagate' [Philip Sargent, United Kingdom (of Great Britain and Northern Ireland)] Rejected - the suggestion does not seem to be correct either
6913 49 24 49 28
CO2 sequestration in the land use sector in the SSP5 run in figure 2.20 by 2050 is around 20 GtCO2/yr, leading to net CO2 emissions of minus 12 Gt/yr. These are extremely high numbers, whose realism could be questioned. It would be important to discuss this or, even better, put limits on CO2 sequestration in land use (and CDR) to stay within reasonable territory. [Bert Metz, Netherlands]
Taken into account - we agree that both the real-world achievability and desirability of such large amounts of CDR vary strongly between scenarios. In the SOD we discuss several scenario options. Chapter 4 provides an assessment of the potential of measures.
13328 49 24 49 28Figure: 2.20: Use a legend to explain the meaning of the symbols in the plots - this should be easier for readers than the explanations in text. [Jordan Harold, United Kingdom (of Great Britain and Northern Ireland)]
Noted
10580 49 24 5 11
Figure 2.20 shows a concerning AFOLU, a significant emission reduction from 2030 to 2050 (1.5°C reduction scenario), however the range on reduction to 2050 is too ample. The scenarios in the bottom right panel indicate a significant contribution to emission reduction from the AFOLU sector (purple dots, purple line). Could it be possible to specify this beyond refering to technological use?. Is there a shift in land use policies involved? [Elemer Briceño-Elizondo, Costa Rica]
Taken into account - this section only speaks to the portfolio of measures and how they fit together. Details about the land-use sector transition are provided in Section 2.4
17479 49 26 B [Tom Gabriel Johansen, Norway] Noted
17519 49 26 B [Angela Morelli, Norway] Noted
13214 5It is not clear from the text whether the investment needs are net or additional to baseline. Please clarify what the values refer to. [Deger Saygin, Turkey]
Taken into account - The numbers are total. Baseline numbers are now also shown, in order to make this clear.
13215 5 51The section on 'investments' will be key part of the chapter, however, as it currently reads it is not very easy to follow. Therefore authors may consider simplifying the text and focusing on the key results. [Deger Saygin, Turkey]
Editorial - We have simplified the text.
6161 5 5 5 5 change "not" to "net". [Philip Sargent, United Kingdom (of Great Britain and Northern Ireland)] Accepted
14180 5 14 51 29
It might be useful to elaborate a bit more the investment analysis for carbon mitigation. For example, there is no clear consideration about the different interest rates, oil price and GDP growth trends used, which can significantly distort a balanced comparative analysis. [Alexandre Strapasson, Brazil]
Rejected - The assessment of interest rates, oil price and GDP growth trends is outside the scope of this Special Report focussing on 1.5°C. It might be part of the AR6.
4778 5 14 51 29Th regional distribution of investments needed shoud also be discussed here. [Elena Georgopoulou, Greece] Taken into account - A small discussion of investment needs at the regional level has been
added to the text.
20318 5 14 5 14
Besides the challenge to scale-up investment in low-carbon technologies, there is also the risk of creating stranded assets, especially in a 1.5 degree scenario. The IEA/IRENA study "Perspectives for the Energy Transition" estimates for a 66% 2°C scenario that "In the power sector, stranded assets in the 66% 2°C Scenario would total USD 320 billion worldwide over the period to 2050 in terms of fossil fuelled power plants that would need to be retired prior to recovering their capital investment. " [Marine Gorner, France]
Accepted - A sentence has been added to make the point that there is a risk that some unabated fossil investments that will be made over the next few years – or those made in the last few – will need to be ‘stranded’ at some point in the future (i.e., retired prior to fully recovering their capital investment).
14179 5 14 5 18
A quite well detailed cost estimates for 2C pathways was also published by Shah et al.'s (2013) Imperial College report (see also the report annex, which is a separate supporting document with all the equations and adopted assumptions):Shah, N., Vallejo, L., Cockerill, T., Gambhir, A., Heyes, A., Hills, A., Jennings, M., Jones, O., Kalas, N., Keirstead, J., Khor, C., Mazur, C., Napp, T., Strapasson, A., Tong, D., and Woods, J. (2013). Halving Global CO2 by 2050: Technologies and Costs. Summary and Descriptive Reports. Imperial College London, in collaboration with the AREVA Group.Available at: https://www.imperial.ac.uk/grantham/publications/mitigation/halving-global-co2-by-2050-technologies-and-costs.php [Alexandre Strapasson, Brazil]
Rejected - While providing cost estimates for 2°C pathways, "halving global CO2 by 2050" is far from what is in line with 1.5°C
6914 5 14 51 1
The message from this section seems to be that investments needs to be increased drastically, both at the supply and the demand side. This is contrary to most other studies (see for instance the Better energy, Greater prosperity study from the Energy Transition Commission) that indicate it is more a matter of shifting investments (from fossil fuel explortation, production and usage to renewable energy supply and demand side efficiency) than a matter of large increases. this needs to be corrected. When presenting numbers for the amounts needed, please add the baseline numbers for comparison. [Bert Metz, Netherlands]
Accepted - The discussion has been adapted to focus less on the upscaling requirements and more on the portfolio shifts. A comparison to the baseline numbers has also been added.
7054 5 15 3Is there a scale gap in this paragraph? I.e. do the brow-narrow definitions really apply to technology assessments in IAMs? And to what extent are those broad-narrow definitions usefull? [Érika Mata, Sweden]
Taken into account - We do not have the space to elaborate on the details of "broad-narrow" definitions, and have therefore reduced their discussion.
Do Not Quote, Cite, or Distribute Page 98 of 129
IPCC WGI SR15 First Order Draft Review Comments And Responses - Chapter 2
Comment No From Page From Line To Page To Line Comment Response
5178 5 15 51 34
This section obscures the investment trends of the energy sector over the past 10 years and confuses the reader. It conveys the incorrect impression that there is no data. Chapter 2.3.4.4.2 must therefore be completely rewritten in the next draft I recommend to use publically available data such as REN21 Renewable Energy Status Reports, Bloomberg New Energy Finance and the IEA. [Sven Teske, Australia]
Accepted - We now cite the IEA's “World Energy Investment 2016” report and a recent report by the Frankfurt School-UNEP Centre/BNEF (2017), which looks at global trends in renewable energy investment. The "data" from these reports are in many cases only estimates, calculated in a similar way as the global models do (i.e., known capacity installations multiplied by estimated capital costs per capacity unit).
9306 5 16 5 18
The statement, "Literature on climate change mitigation investments is sparse, with most detailed literature still focusing on 2°C pathways" is valid in a relative sense but may be modified to represent such scenarios as the "Beyond 2 degrees Scenario – B2DS" of the Energy Technology Perspectives 2017 (ETP 2017)" and other scenarios from the scientific literature on renewable energy systems. The need to double zero-carbon shares in the energy system every 5.5 years as paramount for scenarios with a fair chance of compliance with 1.5°C targets, which be emphasized based on the reference: "Rockström, J., Gaffney, O., Rogelj, J., Meinshausen, M., Nakicenovic, N., Schellnhuber, H., A roadmap for rapid decarbonization, Science, Vol. 355, Issue 6331, pp. 1269-1271, 2017." The importance of energy system transitions may further be emphasized based on "Rogelj, J., Luderer, G., Pietzcker, R. Kriegler, E., Schaeffer, M., Krey, V., Riahi, K., Energy system transformations for limiting end of-century warming to below 1.5°C, Nature Climate Change, Vol. 5, pp. 519-27, 2015." [Siir KILKIS, Turkey]
Rejected - This section focusses on investment needs, not mitigation or emissions reduction requirements
13212 5 18
It is important to clarify the system boundaries of what 'supply side' includes (e.g. Oil refineries, T&D network, power plants etc) and it would also be important to mention the investments in the demand side. Please also provide more recent data. [Deger Saygin, Turkey]
Accepted - This has been clarified, and more recent data has been added.
3169 5 19 5 2
Most IAMs leave out a lot of the investments required for a full transition to a highly efficient energy system, and a complete transition to renewable energy. This should be acknowledged here, implying that any investment total that is derived by IAMs is far too law. Investments that I believe are typically omitted are: the incremental costs of high efficiency end-use technologies, the costs of converting all vehicles to electric versions and mass transit, the costs of adaptation to climate change, etc.... [Richard Rosen, Germany]
Accepted - An acknowledgement of this limitation has been made. Incidentally, the McCollum et al. (in review) paper shows that when put on a level playing field the investment estimates from the IEA and IRENA are actually on the low end of the range of the IAMs (when comparing 2C scenarios from the IAMs and IEA/IRENA).
7055 5 33 34
Our work agrees on demand side investments being uncertain and on that profitability may not be a solid parameter to determine investments in energy efficiency (Mata É, Wanemark J, Nik V, Sasic Kalagasidis A, Mitigation potentials from building retrofitting – A techno-economic study of uncertainties related to climate change scenarios in Sweden (in review)). [Érika Mata, Sweden]
Noted
3170 5 36 5 39
Do not cite any investment totals from IAMs since they are wrong, in part for the reasons cited above. Mark Jacobson and others have some numbers that are likely to be closer to the truth. (10-15% of global GDP per year to avoid overshoot?) [Richard Rosen, Germany]
Rejected - based on the evidence available to the authors and estimates of both the IEA and IAMs, investment totals do not seem to be fundamentally wrong.
3171 5 36 51 1
This report should focus on incremental investment totals, and not the absolute level in reference cases. Also, the report needs to differentiate between the investment requirements of 1.5 degree non-overshoot versus overshoot scenarios, since the former will need to be much higher, and earlier in time. [Richard Rosen, Germany]
Taken into account - in as far as data is available in the literature. We now provide an assessment of current levels of investments compared to projected investments to 2030 and 2050.
17426 5 37 5 39How about saying something about last seven years? If the trend has been approximately the needed one? [Tuomo Kalliokoski, Finland]
Accepted - a statement on recent trends has been added.
13213 5 38If historical investments were between USD 0.7-1 trillion, it would not be a 'significant upscaling' to reach USD 1.1 trillion for the period 2010-2050. [Deger Saygin, Turkey]
Accepted - We now cite different numbers from a newer study. The sentence has been reformulated.
5179 5 4 5 42
Incorrect statement. Current investments in energy systems are available in great detail. IEA, Bloomberg New Energy Finance and REN21 report regularly about investment by technology and region. (see above) [Sven Teske, Australia]
Taken into account - We have added a statement to the text to clarify that historical investment numbers are estimated and are uncertain. This is a common misconception: that investment "data" are as certain as new capacity installations or energy flows. For some sectors, the data is known, but for others it is not. Much data is not reported publically by companies, and therefore has to be estimated ex-post. This is what the both the IEA and the global models do. See the "Methodology Annex" to the IEA's "World Energy Investment 2017" report for a brief discussion.
4546 51 Fig 2.21 - Add index format to "CO2" (3x) and "Wm-2" (5x) [Radim Tolasz, Czech Republic] Editorial
6959 51 51Figure 2.21 bottom two Figures y-scales should be identical to better understand how the investment change. [Ville Tulkki, Finland]
Editorial
6960 51 1 51 2“the average investments in nuclear 1 are estimated to be similar.” based on Fig 2.21 this claim is false, as the investments in nuclear in 1.5C scenarios is approx. double of the investment in 2C scenarios. [Ville Tulkki, Finland]
Taken into account - New data has been added, so this comment no longer applies.
5180 51 12 51 15
Figure 2.21 is misleading, Investment 2010 to 2030 – the year of writing is 2017, year of planned publication is around 2020; So the presented data is neither a projection, nor it is correct. Request: Delete figures and update data to 2015 or 2016 data (available) [Sven Teske, Australia]
Taken into account - A new figure has been added, and the base-year data discussion has been updated
5913 51 12 51 29
The investment for CO2 transport and storage (CO2 T&S) is shown in the figure. Does this mean that the CO2 capture investment is not included? It would have been much more informative if the total cost of CO2 capture, transport and storage (CCS) could be presented instead. [Aage Stangeland, Norway]
Taken into account - the figure has been redesigned for clarity
Do Not Quote, Cite, or Distribute Page 99 of 129
IPCC WGI SR15 First Order Draft Review Comments And Responses - Chapter 2
Comment No From Page From Line To Page To Line Comment Response
3172 51 12 51 29
These figures are very unclear and confusing as to what is or is not included. Also, to better understand investment totals the reader needs to know all the capital cost assumptions of the technologies included in the figures, and what is left out. And the totals seem far too low....so these need to be checked is such a figure is used again in the second draft. [Richard Rosen, Germany]
Accepted - the figure has been redesigned for clarity
17480 51 15 B [Tom Gabriel Johansen, Norway] Editorial
17520 51 15 B [Angela Morelli, Norway] Editorial
4871 51 15 51 16Is the information available to develop afigure for demand side energy system investments in 1.5°C and related scenarios until mid-century. [Wilfried Maas, Netherlands]
Rejected - unfortunately no similar data is available for the demand side. We highlight the difficulties for these estimates in the text
7314 52 1 52 1 Delete the text "and carbon lock-in". [Eleni Kaditi, Austria] The section has been renamed to "2.3.5 Implications of near term action in 1.5°C pathways"
5181 52 1 52 28
The lock-in effect is certainly extremely important for the phase-out of fossil fuels later on. In that context, the author(s) must add the aspect of possible "lock-in-effects" for CCS technologies as well. New build power plants with a theoretical CCS retrofitting option, might even fast track new coal power plants. Whether or not CCS will be added is very uncertain. In the case of the coal power plant in Moorburg/Hamburg for example, the operator Vattenfall simply dropped that promise after they got the construction permit. As CCS is extremely expensive (far more than renewables), how can investors be forced to invest in CCS later on? Request: The Lock-in effect applies for CCS and needs to be discussed in this part. [Sven Teske, Australia]
While important, the authors have to rely on available literature to discuss these aspects.
3173 52 1 52 42
The issue of carbon lock-in is very important, but this section is very unclear, almost unreadable, and far too vague. It needs to inform policy makers what actions, and by when various actions, need to be taken to avoid carbon lock-in in different sectors of the economy under different scenarios. For example, it needs to tell policy makers how fast gasoline and diesel vehicles need to be phased out given their expected usable lifetimes to achieve a 1.5 degree non-overshoot scenario. Probably, the answer to this specific question is "phase out needs to begin almost immediately at 5% or more per year". [Richard Rosen, Germany]
We agree that this would be important information, but have not found literature that would address these particular issues.
9231 52 3 52 29What about IEA ETP and WEO. They discuss lock in at the detailed level? Any reason they are not assessed here? Not in the scenario database? [Glen Peters, Norway]
Time and capacity constraints of the author team
9232 52 3 52 29 How much is retired, at what cost? [Glen Peters, Norway] Good questions, yet we didn't find literature providing this information.
10442 52 3 52 3“less ambitious CO2 reductions in the near term imply” or “less ambitious CO2 reduction in the near term implies” [Jonathan Lynn, Switzerland]
Editorial
7315 52 7 52 7 Delete the text "lock-in into". [Eleni Kaditi, Austria] Rejected - lock-in is a widely used term that is appropriately used here
740 52 23 52 23Reads "starting from NDC levels" perhaps it sould read "starting from Nationally Determined Contributions (NDC) levels" [Moshe Kinn, United Kingdom (of Great Britain and Northern Ireland)]
NDCs have been introduced earlier in the report
3174 52 3This report does not consider all available 1.5 degree pathways. More have to be pulled from the literature, and this report should not just rely on those scenarios available in the IIASA database. [Richard Rosen, Germany]
More are now available in the database. The authors are always welcoming suggestions for further literature.
6915 52 3 52 37
A reference to the UNEP Emissions Gap report 2016 (and 2017 to be published this fall) is needed, as that study covers all available analyses of NDC 2030 emission levels (while the UNFCCC secretariat is just one analysis). Presenting the median numbers in addition to the range is needed. [Bert Metz, Netherlands]
A dedicated NDC box with these references is included in Chapter 4
3710 52 31 52 37
Many mitigation NDCs are specified by countries only up to 2025. You need to make clearer that modelers or authors of literature make additional assumptions, e.g. extrapolating trends beyond 2025. 'implied' goes in this direction, but the next sentence then starts "altogether" and reads too definitive. Make clearer that additional assumpttions are made by analysts, and separate clearly from what governments have put forward [Harald Winkler, South Africa]
This should be mode clear in the dedicated box on NDCs in Chapter 4
741 52 32 52 32Reads "implied by the Nationally Determined Contributions (NDCs)" perhaps it should now read "implied by the NDCs" [Moshe Kinn, United Kingdom (of Great Britain and Northern Ireland)]
Noted
9816 52 35 52 38
The range 49-58 is based on Rogelj et al, which is correct, and is based on 10 studies, including the UNFCCC secr. 2016, but it already includes Iyer et al. In line 36 it is mentioned that the range has not changed due to new studies. This is assessed each year in the UNEP Gap report. I would mention that here, that the latest UNEP Gap 2017 report does not present a fundamentally change (49.5-57). You may want to say that the dudy of Rogelj et al. assessed ten studies, including Iyer et al., and Fawcet et al., I would exclude in the list of studies Rogelj et al., 2016a, Iyer et al., 2015, Hof et al. 2017. [Michel den Elzen, Netherlands]
A dedicated NDC box with these references is included in Chapter 4
9817 52 35 52 38I would include in the list of new studies: den Elzen, M., et al. (2016a) Contribution of the G20 economies to the global impact of the Paris agreement climate proposals. Climatic Change 137, 655-665. [Michel den Elzen, Netherlands]
A dedicated NDC box with these references is included in Chapter 4
6916 52 38 52 42
The finding that "the large majority of models failed to produce " 1.5 compatible scenarios needs to be emphasised much stronger. There is a tendency to say that missing the 2030 emission levels compatible with the least cost scenarios "makes it harder and more costly" to stay below 1.5C (or 2C). And policy makers are eager to believe that they can still pull off the policies to meet the 1.5C (or 2C). This is misleading, as the results of modelling attempts show. It is time to be honest: if the 2030 emission levels consistent with 1.5C (and 2C) are not met, for all practical purposes they will not longer be possible. This message needs to figure prominently in the policy makers summery of the report. [Bert Metz, Netherlands]
This aspect is now also highlighted in the ES.
Do Not Quote, Cite, or Distribute Page 100 of 129

IPCC WGI SR15 First Order Draft Review Comments And Responses - Chapter 2
Comment No From Page From Line To Page To Line Comment Response
3175 52 46 52 55
Another reason why this report has to present and discuss non-overshoot scenarios is because these will involve less uncertainty than the longer term overshoot scenarios. This is because the non-overshoot scenarios will have to reach a stable temperature goal well before 2050, depending on the temperature level set as the goal. [Richard Rosen, Germany]
Noted - Non-overshoot scenarios have appeared in the recent literature and are now assessed.
5182 53 3 53 6
SSP 1 contains high shares of technologies which have proven to be market values. Thus a specific renewables and energy efficiency pathway is required to assess how a climate mitigation pathway with market driven and proven technologies might look like. The current SSP1 category is insufficient. [Sven Teske, Australia]
Noted - The assessment is based on literature and scenarios much broader than SSP1.
5183 53 6 53 6Reference required to back up this statement. Recommend to use a reference from a scientist which is not part of the IPCC author team. Definition of "high technological progress rate" missing. [Sven Teske, Australia]
It is not clear to us which statement is meant.
3176 53 19 66 26
This entire section will have to be shortened and completely revised to include clear comparisons between the basic kinds of scenarios that need to be included: 1.5 degree non-overshoot scenarios, 1.5 degree overshoot scenarios, and various 2.0 degree scenarios. [Richard Rosen, Germany]
Noted - The section has been re-formatted and includes the requested comparison.
6917 53 21 53 22
Here it is ated that " 1.5C pathways are brought to zero between 2040 and 2060"; elsewhere different texts appear, like "by 2050 or shortly thereafter". Make sure there is consistency throughout the chapter. This is possibly caused by the different numbers attached to 1.5 scenarios with 66% versus 50% probability; keeping these different probbaility levels separate can help eliminate the inconsistency. [Bert Metz, Netherlands]
Accepted - The chapter has been cross-checked for internal consistency.
21139 53 31 53 34
Should note here that SLCPs are crucial in the near-term to reduce the rate of warming as well as slowing or potantially avoiding passing thresholds for climate feedbacks and tipping points if the 1.5C guardrail is passed - cite to Xu and Ramanthan 2017, Well Below 2C: Mitigation strategies for avoiding dangerous to catastrophic climate changes, PNAS, doi/10.1073/pnas.1618481114; Drijfhout et al., 2015, Catalogue of abrupt shifts in Intergovernmental Panel on CLimate CHange climate models, PNAS, doi/10.1073/pnas.1511451112. [Nathan Borgford-Parnell, Switzerland]
Rejected - This Special Report focusses on mitigation in the context of 1.5°C. The issues raised by the reviewer (the rate of temperature increase) is not a key assessment topic here and thus outside the scope of this Special Report. The reviewer provides no evidence that the tipping points referred to would be more affected by the rate of change than the absolute level of warming.
10663 53 31 53 34
Reducing SLCFs is crucial in the near-term to slow the rate of warming and to stave off triggering of self-reinforcing feedbacks and surpassing irreversible tipping points that could be compromised if the 1.5ºC threshold is exceeded (Xu and Ramanathan 2017, Well below 2°C: Mitigation strategies for avoiding dangerous to catastrophic climate changes, PNAS, doi/10.1073/pnas.1618481114; Drijfhout et al. 2015, Catalogue of abrupt shifts in Intergovernmental Panel on Climate Change climate models, PNAS, doi/10.1073/pnas.1511451112). [Kristin Campbell, United States of America]
Noted
2614 53 38 53 53
perhaps mention the primary sources of the different gases and so subsequently how locked in they are? [Zoha Shawoo, United Kingdom (of Great Britain and Northern Ireland)]
Noted. CO2 emissions are attributed to sectors. We have added a discussion of CO2 commitment in Section 2.3.1. A detailed discussion of all sources for all gases is beyond the scope of this chapter and was given in AR5.
21142 53 47
Mitigation of SLCPs could avoid 0.6C of warming by 2050 and 1.2C by the end of the century - cite Hu et al 2013, Mitigation of short-lived climate pollutants slows sea-level rise, Nature Climate Change doi:10.1038/nclimate1869; Xu and Ramanathan 2017, Well below 2C: mitigation strategies for avoiding dangerous to catastrophic climate changes, PNAS, doi/10.1073/pnas.1618481114; Shindell et al. 2012, Simultaneously Mitigating Near-Term Climate Change and Improving Human Health and Food Security, Science 335:183-189 [Nathan Borgford-Parnell, Switzerland]
Rejected - It has been an editorial decision to present mitigation measures in terms of what is consistent and required for 1.5°C pathways, rather than providing differences relative to hypothetical counterfactual baselines.
10664 53 47 53 47
SLCP mitigation will avoid 0.6ºC of warming at 2050 and 1.2ºC at 2100 (Hu et al 2013, Mitigation of short-lived climate pollutants slows sea-level rise, Nature Climate Change, doi:10.1038/nclimate1869; Xu and Ramanathan 2017, Well below 2°C: Mitigation strategies for avoiding dangerous to catastrophic climate changes, PNAS, doi/10.1073/pnas.1618481114). [Kristin Campbell, United States of America]
Rejected - It has been an editorial decision to present mitigation measures in terms of what is consistent and required for 1.5°C pathways, rather than providing differences relative to hypothetical counterfactual baselines.
7445 53 49 53 53
The information used here is from before the adoption of the Kigali amendment and also from before any details of this amendment were considered. We think that it would be wery useful if this information could be updated to reflect the the new realities caused by the Kigali amendment. [Øyvind Christophersen, Norway]
Accepted - Estimates of HFC projections under implementation of the Kigali Amendment have been added to the emissions overview figure in Section 2.3.1
4547 54 Fig 2.22 - Add legend for bold black lines. [Radim Tolasz, Czech Republic] Added
9233 54 1
Figure, why are things so similar in the top panel? [Glen Peters, Norway] Because results from different models are similar for 1.5°C pathways, although some variation for CH4 and trop. O3 exist. Part of this is due to the fact that mitigation potentials are fully exploited in these scenarios.
13519 54 1 54 1
The top figure is basically good. However, a figure for 2?C pathways should be also added. On the other hand, the bar charts for each senario are not needed and they can be shown as error bars. [Toshihiko Takemura, Japan]
Bar charts are shown to highlight the contribution of individual forces to the full short lived climate forcing,. A comparison of total SLCF in 1.5°C and 2°C pathways is shown in the bottom panel.
7446 54 1 54 8
We think that the legend box to especially the upper figure panel is somewhat inconsistent with the text in the figure caption where the substances are listed in a different way. Consider to reformulate the text in the figure caption since this may arose many questions like: Since many f-gases are short-lived, should reference be made to OTHER short-lived climate forces? Are organic and black carbon and indirect aerosol effects included under aerosols (green). Are both organic carbon (negativ RF) and black carbon (positive RF) represented by the same bar? In addition consider to clarify what part of the text in the figure caption that relates to the lower panel. What is "other forcing" in the Y-axis in the lower panel - is it the forcings mentioned above, including ODS and F-gases? [Øyvind Christophersen, Norway]
Accepted. Indirect aerosol effects are included in the overall category of aerosol effects, which includes both cooling and warming species. The legend and caption have been clarified.
17481 54 3 B [Tom Gabriel Johansen, Norway] Noted
17521 54 3 B [Angela Morelli, Norway] Noted
Do Not Quote, Cite, or Distribute Page 101 of 129
IPCC WGI SR15 First Order Draft Review Comments And Responses - Chapter 2
Comment No From Page From Line To Page To Line Comment Response
6918 54 11 54 22
The message from this paragraph is that "the majority of net negative CO2 emissions comes from the energy supply sector .." This is hiwever a bias caused by the choices made in the models and the absence of several land-use relateed CDR options in these models. With different choices amongst CDR options models could very well show the opposite result, i.e. land-use CDR to be dominant. This needs to be spelled out clearly. [Bert Metz, Netherlands]
Accepted. This is spelled out now more clearly in the new section 2.3.4 on CDR.
12877 54 24 Is it correct to start a paragraph with a number? [Jorge Carrasco, Chile] Noted
4548 55 Fig 2.23 - Add legend for bold red lines. [Radim Tolasz, Czech Republic] Added
12878 55 7 Is it correct to start a paragraph with a number? [Jorge Carrasco, Chile] Noted
6919 55 7 55 15
It is very problematic that scenarios with huge negative emissions (upto 21 GT.yr) are treated equally as those with low or modest negative emissions, as land-use and/or biomass requirements are huge and possible beyond sustainability limits, as well as meaning a betting on the availability of such huge quantities which is highly uncertain. Please refer to literature that dissusses the limitation to negative emissions to provide the necessary context and then do not treat the huge negative emission scenarios equally. [Bert Metz, Netherlands]
Noted. The assessment now highlights 1.5°C pathways at the low end of CDR and BECCS deployment more strongly. The literature on limitation of negative emissions is now cited in Section 2.3.4 on CDR
7056 55 14 which "model studies"? [Érika Mata, Sweden] The 1.5°C pathway studies in the literature. Discussion has been revised.
7057 55 2 I do not understand if "these emissions" are possitive or negative. [Érika Mata, Sweden] They are positive. Discussion of the figure is revised
6920 55 2 55 22 This sentence contains a key message that needs to be in the Exec Summary (and the SPM) [Bert Metz, Netherlands] Agreed. It is included in the Exec Summary.
6921 55 28 55 29 This is a weak sentence. Can be deleted. [Bert Metz, Netherlands] Agreed. Has been deleted.
9234 55 3 What is "other supply". Make sure to describe things which are not obvious to all [Glen Peters, Norway] Accepted. Changed to Non-Elec Supply.
1947 55 3 56 3Use black median bars [Andrew Smedley, United Kingdom (of Great Britain and Northern Ireland)] Rejected. For the time being we see no clear reason why the colour black for the bars is
important.
7058 55 3 56 8I have not understood how the sectorial values (in particular those for "Res&Com" and "Res&Com&Ind": what is the difference by the way?) in Fig 2.23 have been derived. [Érika Mata, Sweden]
These are direct emissions from fossil fuel combustion in the sectors. The legend has been clarified.
4549 56 Fig 2.23 - Add legend for bold red lines. [Radim Tolasz, Czech Republic] Accepted - explanation added.
9235 56 1Figure. Can you define supply and demand. I am sure most readers will think supply equals demand… [Glen Peters, Norway] Accepted. Sectors are now explained in the caption.
17482 56 3 C [Tom Gabriel Johansen, Norway] Noted
17522 56 3 C [Angela Morelli, Norway] Noted
7447 56 1 56 1
We realize that the main focus in this section are 1.5C. However we will mention in the outlines some aspects is also highlightet. E.g. constraints related to both 1.5C and 2C. Therefore it will be useful to also include quantifications of some characteristics relevant to constraints for both 1.5C and 2C in this section. [Øyvind Christophersen, Norway]
Noted. Comparisons to 2C pathways have been included were particularly relevant.
14181 56 1 56 1
I would recommend to consider the discussions provided by POST (2013) report for section 2.4.2, if appropriate, although the future of negative emissions technologies is still very speculative to date. Reference: POST – Parliamentary Office of Science and Technology (2013). Negative Emissions Technologies. POST Note no. 447, October 2013. UK Houses of Parliament.Available at: http://www.parliament.uk/business/publications/research/briefing-papers/POST-PN-447/negative-emissions-technologies [Alexandre Strapasson, Brazil]
Noted
9553 56 1 6 1CDR is one of the important key for reaching 1.5 target.?But this descriptions are too lengthy and not easy to understand. [Shuzo Nishioka, Japan]
Accepted - Discussion has been streamlined
14933 56 1
The authors should strive for incorporation of nature-based NETs as much as possible in quickly moving literature. In particular ensure adequate coverage of the upcoming PNAS article (Griscom et al) on the topic. I would also suggest that further discussion is needed on why BECCS and AF/RF are the dominant NETs emerging from IAM model runs--is it simply because other options (biochar, SCS, blue carbon) ave not been parameterized in these models (Table 2.5 begins to get at this but doesnt answer the question directly)? If this is the case and the work cannot be completed before the cutoff for new work (due to funding, timing, or any other reason), a critical assessment must be included combining IAM results with global potential estimates (Griscom et al. forthcoming, Smith et al. 2016, Smith 2017, etc.) for NET methods that are not currently well captured by such models. The fact that combined BECCS/AF estimates come out so different from BECCS alone estimates suggests significant model sensitivity. If BECCS and AF/RF dominate the results due to assumptions about the limited potential of other options this too requires further discussion. Decision-makers must come away with a balanced picture of what is known and critically what is not known regarding different NET options. [Christopher Weber, United States of America]
Accepted - We are now discussing the lack of coverage of nature-based CDR in IAMs in the revised section on CDR (2.3.4). The underlying reason is the complexity of modelling the relevant processes, including nutrient cycles and soil carbon storage. The community is working on including these processes and nature-based CDR, but the work will not come in time for SR1.5.
9580 56 1 6 1CDR is one of the important key for reaching 1.5 target.?But this descriptions are too lengthy and not easy to understand. [Shuzo Nishioka, Japan]
Accepted - Discussion has been streamlined
Do Not Quote, Cite, or Distribute Page 102 of 129
IPCC WGI SR15 First Order Draft Review Comments And Responses - Chapter 2
Comment No From Page From Line To Page To Line Comment Response
6922 56 1 62 35
By placing this section in the part that discusses the 2050-2100 period the implicit message is that CDR does not require much attention before. This is misleading as many, if not most 1.5C scenrios require CDR to ramp up gradually from 2020-2030 onwards. And in fact this section mainly discusses the cumulative use of CDR between 2016 and 2100, so that is not the same as the 2050-2100 period. It is ok to discuss the role of CDR for the 2050-2100 period of course, but the discussion on the various options (as in 2.4.2.2) and the sustainability implications ( as in 2.4.2.3) should be discussed earlier in the chapter (in section 2.3.4). An alternative would be to take the CDR section in 2.4 outside the 2050-2100 context and make it a discussion on the cumulative use if CDR and the apportioning over different uses and different time periods. As I commented on above, integration of the CDR material from Ch4 in chapter 2 is crucial to streamline the report , avoid overlap and ensure an integrated discussion. This should then primarily be done in section 2.3.4, leaving only the late 21st centrury issues in section 2.4.2. [Bert Metz, Netherlands]
Accepted - Chapter has been restructured. CDR is now included in overview section on 1.-5C pathways
6704 56 12 56 14
Reference in the latter half of this sentence to assessing 'the use of CDR technologies for realising such overshoot behaviour' is unclear. The three questions that are then subsequently posed are clearer in their intent, but does this first sentence simply try say that it is important to assess carefully the assumptions about deployment of CDR technologies that underly each pathway? CDR would presumably never be proposed to 'realise an overshoot' per se? [Jennifer Morgan, Netherlands]
Accepted - Sentence has been removed.
5184 56 12 56 18
Not correct. There are energy pathways available which do not overshoot and thus do not require CDR (Teske et.al.2015, Jacobsen 2017, Beyer 2016). To entirely rely on CDR which is currently neither in the market, nor close to market prices is irresponsible and scientifically flawed. I therefore urge, to implement SSP0 category scenarios - all assumptions of SSP1 - but without nuclear and CCS. Nuclear does not fit in high solar- and wind scenarios because of inflexibility (system-conflict). [Sven Teske, Australia]
Rejected - The assessed pathways rely on CDR to varying degrees, none of them entirely and some of them only to a small amount. Energy pathways for specific regions cannot describe the full emissions development affecting climate change as land use and land use change emissions are an important factor.
6986 56 12 56 18
References to relevant sub-sections of Section 4.3, which assessed the current status and development of the carbon dioxide removal (CDR) technology, should be added here. The readers, especially the policymakers, should be alerted that there is huge uncertainty about large scale deployment of the CDR technology as the assesment in Sub-sections 4.3.2.3, 4.3.6.1 - 4.3.6.3 have shown. The CDR technology is still immature as this stage, and the life cycle of power stations should also be taken into account when considering mitigation pathways. [Sai Ming Lee, China]
Accepted - Cross-references to chapter 4 are provided
20467 56 14 56 14
I would suggest that there is a fourth question: "To what extent do current discussions of CDR at a later stage generate a "moral hazard" in terms of reducing the urgency with which emission cuts are pursued, and to what extent can this effect be minimised?" [Oliver Morton, United Kingdom (of Great Britain and Northern Ireland)]
Noted. We did not elevate this to the level of framing questions, as this is beyond the scope of the subsection, but we addressed it in the assessment by pointing out that the 1.5C pathway literature does not support the notion that CDR availability would resolve the need for urgent and rapid mitigation.
19310 56 14 56 18
a key question is missing: is all this technically, economically, socially feasible? If this question is treated elsewhere (chapter 4?) it might nevertheless be mentioned here, while referring reader to the relevant chapter in the report. [Marco Mazzotti, Switzerland]
Accepted - Reference to Chapter 4 included.
10443 56 21 6 1 This whole section 2.4.2.1 is quite dense and needs reviewing [Jonathan Lynn, Switzerland] Accepted - Discussion has been streamlined and simplified
6705 56 22 57 7
Here and elsewhere, it will be important to ensure that all statements regarding quantitative estimates are tied back to the fact that these are projections from models and not statements of fact that could otherwise be misinterpreted as such. This could be made clear here, for example, by adding the phrase 'under each modelled pathway.' (or something equivalent) to the end of the sentence running from line 22 to line 24 on page 56. Otherwise statements here and elsewhere in the text that relate to model outputs might read as more definitive statements of established fact. [Jennifer Morgan, Netherlands]
Accepted - Qualifying statements have been added
6923 56 22 57 25
Very complicated discussion. Needs to be simplified. Figure 2.24 that is referred to,is also way to complex to easily understand. Needs to be redesigned. Another problem is that 50% and 66% probability 1.5 scenarios are grouped, while they probably have quite different CDR characteristics. Would be important (as commented on above) to separate these classes of 1.5 scenarios. What is missing in these paragraphs is a critical discussion on the reality of huge amounts of cumulative CDR (like the 1200 GT) in light of sustainability limitations and the need to limit the risk of betting on options that have not yet been implemented at scale. Some of that is on page 60, lines 4-10, so maybe that text can be moved here. [Bert Metz, Netherlands]
Accepted - Discussion and Fig. 2.2.4 have been simplified, different scenario classes are highlighted in the Figure. Sustainability limitation are discussed in the following subsection, and a more detailed discussion is provided in Chapter 4.
10444 56 23 56 23“the total amount of fossil/geological and terrestrial carbon that is oxidized by human activity” – is there a simpler way of expressing this? [Jonathan Lynn, Switzerland]
Accepted - Different formulation chosen
10984 56 23 56 23The "oxidising" concept mat be new to poicymakers and so needs explained [Skea Jim, United Kingdom (of Great Britain and Northern Ireland)]
Accepted - We have removed this concept for better comprehensibility.
9444 56 25 56 25 add 'and stored in the deep subsurface' after 'installations' [Isabelle Czernichowski-Lauriol, France] Sentence was removed due to revision of subsection
4550 57 58Fig 2.24 - Leave out the doubled legend rectangle (black, green, grey, green, orange and blue) and add legend for bold black and red lines. [Radim Tolasz, Czech Republic]
Accepted. Legend removed, colours now explained by text.
10445 57 3 57 21 lines 3/5/21 “cumulated” unclear term [Jonathan Lynn, Switzerland] Accepted - Changed to cumulative
2214 57 13 57 17
It appears to be assumed that there are no CO2 emissions after the peak of net cumulative emissions, but surely there could be CO2 emissions after that peak (based on the assumption that there are negative emissions). [Kenneth Möllersten, Sweden]
Yes, there are. This is discussed in the text
Do Not Quote, Cite, or Distribute Page 103 of 129
IPCC WGI SR15 First Order Draft Review Comments And Responses - Chapter 2
Comment No From Page From Line To Page To Line Comment Response
5185 57 21 57 25Recommend to include additional models as the reviewed ones do not reflect current scientific discussions and current energy market development. [Sven Teske, Australia]
Noted. The integrated 1.5°C pathway literature is fully assessed and a large number of scenarios by a dozen and more modes were reported in the database for the assessment.
5186 57 21 57 25
Add discussion about risks for climate mitigation if currently unproven CDR will be unsuccessful in the market. This situation has not at all changed ovver the past decade, but the AR 6 seem to be unable to develop alternatives. [Sven Teske, Australia]
Noted. We included a new subsection 2.3.1.1 on overshoot vs. non-overshoot pathways.
6706 57 27 57 29This will, indeed, be a very important additional aspect to capture in order to test assumptions that will otherwise follow that 1.5 is not achievable without substantial reliance on CDR [Jennifer Morgan, Netherlands]
Noted
4845 57 3 58 13Explain consistency of higher cummulateive fossil CCS CO2 in Fig 2.24 for 1.5 (both wrt 2 deg C and BECCS) with Fig 2.9 middle boxes which shows lower Fossil CCS in 1.5 both wrt to 2degC and BECCS [Wilfried Maas, Netherlands]
This is a misunderstanding, Figure 2.24 did not show fossil CCS, but total CCS comprising both bioenergy and fossil CCS. We have clarified this in the new draft.
9236 57 31 I am sure this is a great and informative figure, but I don’t get it at all. [Glen Peters, Norway] Accepted. Figure has been simplified
6707 57 31 58 13
Here and elsewhere, these are very informative figures, but there is almost too much information captured in each one for them to be clear and easy to interpret. Some of the information that is critical to understand Figure 2.24, for example, and all the features it includes can only be found in the text, and some only in the legend. In the end, it might improve clarity to split this and other similar figures in to separate figures with more comprehensive labelling and legends under each, such that reference in the text can also be clearer and more specific. [Jennifer Morgan, Netherlands]
Accepted. Figure simplified
1948 57 31 58 3Use black median? bars and dot-dash for upper and lower bars. It is not clear what these signify and the legend does not comment [Andrew Smedley, United Kingdom (of Great Britain and Northern Ireland)]
The horizontal bars aim to highlight 21st century budget, peak budget and cumulative gross emissions. Explanation is now added.
9947 58 58 1 Figure 2.24 legend have extra "colour" items [Olga Alcaraz, Spain] Accepted. Legend removed, colours now explained by text.
17483 58 3 B [Tom Gabriel Johansen, Norway] Noted
17523 58 3 B [Angela Morelli, Norway] Noted
10985 58 3 58 3I found interpretation of panel 1 of this figure very hard. Difficult to follow the stacking and hatching [Skea Jim, United Kingdom (of Great Britain and Northern Ireland)]
Accepted. Figure simplified
13216 59
In addition to the information provided in Table 2.10, it would help to outline what the technology options to avoid these unmitigated emissions from these sectors and their availability are. It will help to compare the challenge for the CDR technologies. [Deger Saygin, Turkey]
Rejected. Costs of CDR measures are assessed in Chapter 4. Costs of avoiding unmitigated emissions is speculative if no well understood measures to mitigate these emissions are known.
6924 59 1 59 3The 710-900 Gt cumulative CDR use in the last row of the table is different from the 400-1200 Gt range mentioned on page 57; that is confusing [Bert Metz, Netherlands]
Noted. The range in the table is the 5th-95th percentile, the range in the section the interquartile range.
6708 59 1 59 3
From its description in the text, Table 2.10 looks to be central to the discussion and to enhance the understanding of, for example, Figure 2.24, but as it stands I find it hard to understand what it is conveying. Perhaps a more extensive legend would help, though it maybe that some greater detail in the table itself will be useful [Jennifer Morgan, Netherlands]
Accepted. Table has been edited for comprehensibility.
14325 59 1 59 3in the cell of the tenth line and of the second column, "net" should be added between "Peak" and "cumulative". [Serge PLANTON, France]
Added
9237 59 4 59 21
This is a nice paragraph to agree with Fuss 2014 and Anderson and Peters 2016. I believe they both discuss the same issue. These two papers are making a rather different point, noteably, that if we behave today like we have X GtCO2 CDR in the future, but it turns out we dont (for whatever reason), then we would have emitted too much today. That is entirely different to the delay arguement (which is another, also important issue). Based on decision making under uncertainty, one would probably mitigate even faster today than a cost optimal model would suggest, to account for the risk of CDR not working. I think it may be necessary to reread those two articles! [Glen Peters, Norway]
Accepted. We have revised the discussion.
2615 59 4 59 21perhaps mention technological barriers to CDR eg. time needed to develop the technology, effectiveness, cost, etc? [Zoha Shawoo, United Kingdom (of Great Britain and Northern Ireland)]
Accepted. Added a sentence and a reference (Nemet et al.)
2216 59 4 59 4 most attention in relation to what? This is probably a linguistic confusion. [Kenneth Möllersten, Sweden] Discussion was revised
2220 59 4 59 7
Concerns regarding postponing mitigation action based on assumptions of CDR deployment later on have been present much before AR5, eg. 1. Azar Ch, Lindgren K, Larson ED, Möllersten K (2006). Carbon capture and storage from fossil fuels and biomass – Costs and potential role in stabilising the atmosphere. Climatic Change 74 (1-3): 47–79. ("Finally, a word of caution. BECS cannot be relied upon as a panacea for dealing with climate change. Further, although BECS makes it possible to remove CO2 from the atmosphere, we should not be led to believe that we can control atmospheric CO2 concentrations and climate on decadal timescales, since it will take at least half a century before carbon removals could have a substantial impact on the atmospheric CO2 concentration and there is additional inertia in the climate system. Instead, BECS should be seen as an additional option that could help to reduce atmospheric CO2 concentrations by the year 2100 to levels lower than what could be achieved otherwise .." [Kenneth Möllersten, Sweden]
Noted. We agree with the statement that BECCS is not a panacea and think our assessment reflects it
Do Not Quote, Cite, or Distribute Page 104 of 129
IPCC WGI SR15 First Order Draft Review Comments And Responses - Chapter 2
Comment No From Page From Line To Page To Line Comment Response
5187 59 4 59 9
The use of CDR to compensate for excess emissions in the past has received most attention in the literature since the Fifth Assessment Report (Fuss et al. 2014a) and was often connected to a concern that the expectation of CDR becoming available at large scale would postpone early mitigation efforts (Anderson and Peters 2016). Its importance is significantly increased in 1.5°C pathways compared to WB2C pathways, with CO2 budget drawdowns of 300-510 GtCO2 in the former compared to 80-290 GtCO2 in the latter (interquartile range from the scenarios available in the database to this assessment). To not react and simply continue with the same strategy is fundamentally scientifically flawed and irresponsible. [Sven Teske, Australia]
Noted.
2217 59 5 59 6 was connected to a concern where and by whom? [Kenneth Möllersten, Sweden] Accepted. Discussion was revised.
20468 59 5 59 7
This concern about the effects of CDR expectations on emission cuts deserves significantly more discussion (see comment on page 56, above). As Anderson, Peters and others (eg Geden 2015) have discussed, imagned emissions reduction pathways have over the past decade become significanly more permissive (eg, peaking considerably later) on the basis of increased reliance in future CDR through unspecified technologies. [Oliver Morton, United Kingdom (of Great Britain and Northern Ireland)]
Noted. We have clarified that the pathway literature does not support the notion that stringent mitigation could be delayed because of the availability of CDR.
2218 59 6 59 6The reference to Anderson and Peters is incorrect as the paper does not explicitly review perceptions of CDR by other authors. [Kenneth Möllersten, Sweden]
Accepted. Discussion was revised.
2219 59 1 59 1 Delete the statement based on the highly subjective criteria "relaxed". [Kenneth Möllersten, Sweden] Accepted. Wordings was revised.
6370 59 1 59 13
This is a key statement for me that should be brought in bold into the executive summary: 1.5 pathways require both much more stringent action in the near term AND a significant amount of net negative emissions beyond 2050. Clarify for non-experts that 1.5 pathways are not an option that future technology can deliver for us, we need future technology as well as much more ambitious action today. [Andy Reisinger, New Zealand]
Accepted. Message brought into the Exec Summary
2221 59 1 59 1
Carefully consider whether "not relaxed" is the proper way to describe near term efforts necessary to achieve 1.5 C. This claim subjectively implies that near-term efforts may be moderate while, in reality, efforts need to go well beyond what Parties to the Paris Agreement considered as their fair contribution to ambitious global climate action. Using this language risks to downplay the challenge of attaining a 1.5 C world. Propse to delete and adopt the next sentence which tells that very stringent near term action is required. However, "very stringent" is subjective and more objective terms should be used. [Kenneth Möllersten, Sweden]
This is a misunderstanding. We have clarified the wording that stringent near term mitigation action is needed in 1.5°C pathways even if CDR is available.
10986 59 11 59 13 Elevate to the Exec Summ and make even starker. [Skea Jim, United Kingdom (of Great Britain and Northern Ireland)] Accepted. Message elevated to the Exec Summary
6925 59 14 59 19 This is a key message that needs to be in the Exec summary and the SPM. [Bert Metz, Netherlands] Accepted. Message placed in the Exec Summary.
7948 6 7 6 1The numbers should be GtCO2 cumulative not per year. [Jasmin Kemper, United Kingdom (of Great Britain and Northern Ireland)]
Corrected
6926 6 12 61 4
As suggested above the discussion of CDR options need to happen earlier in the chapter (2.3.4) and be integrted with the CDR material from ch4 (to be moved to ch2). [Bert Metz, Netherlands]
Noted - Discussion is now part of the pathway overview section. But the detailed bottom-up discussion of CDR options is an integral part of Chapter 4. Reference to Chapter 4 is included.
21159 6 12 6 12
re: cdr technlogies, refer to Williamson, P., & Bodle, R. (2016). Update on Climate Geoengineering in Relation to the Convention on Biological Diversity: Potential Impacts and Regulatory Framework. Technical Series No.84. Secretariat of the Convention on Biological Diversity, Montreal, availableat:https://www.cbd.int/doc/publications/cbd-ts-84-en.pdf; also: Williamson, P., Watson, R.T., Mace, G., Artaxo, P., Bodle, R., Galaz, V., Parker, A., Santillo, D., Vivian, C., Cooper, D., Webbe, J., Cung, A. and E. Woods (2012). Impacts of Climate-Related Geoengineering onBiological Diversity. Part I of: Geoengineering in Relation to the Convention on Biological Diversity: Technical and Regulatory Matters. Secretariat of the Convention on Biological Diversity. Montreal, Technical Series No. 66, 152 pages avaiable at: https://www.cbd.int/doc/publications/cbd-ts-66-en.pdf [David Cooper, Canada]
Noted. The reference has been included.
6710 6 12 6 33
Section 2.4.2.2 in total reads as too unqualified a listing of CDR-related proposals and could leave the impression that all are available and effective and that it is simply a policy choice to be made. In practice, some of those listed have already been studied in some considerable detail and largely discredited (see e.g. (Williamson, P., & Bodle, R. (2016). Update on Climate Geoengineering in Relation to the Convention on Biological Diversity: Potential Impacts and Regulatory Framework. Technical Series No.84. Secretariat of the Convention on Biological Diversity, Montreal, 158 pages. https://www.cbd.int/doc/publications/cbd-ts-84-en.pdf), or even explicitly legislated against (ocean fertilisation, for example - for details of Resolutions and amendments under the London Convention and Protocol, see http://www.imo.org/en/OurWork/Environment/LCLP/EmergingIssues/geoengineering/Pages/default.aspx) [Jennifer Morgan, Netherlands]
Partly accepted - Wording changed, ocean iron fertilization removed from the list, and suggested reference added in the subsection 2.3.4.2. We disagree with the notion that listed CDR measures other than OIF have already been largely discredited.
5188 6 13 6 33While the importance of CDR is claimed to increase (see page 59), most references in this section are older than 10 years. Either update or delete this entire section. [Sven Teske, Australia]
Noted - We cited the original papers proposing the CDR measure, not the most recent publications. More recent references have been added.
Do Not Quote, Cite, or Distribute Page 105 of 129

IPCC WGI SR15 First Order Draft Review Comments And Responses - Chapter 2
Comment No From Page From Line To Page To Line Comment Response
6709 6 13 6 13
This sentence reads as far too definitive a statement regarding availability, practicality, acceptability and effectiveness of CDR technologies. It is true to say that a number of approaches have been proposed, some of which have received some research and development, but it is still not the case in any practical sense that "there are a number of approaches to actively remove carbon dioxide from the atmosphere" as stated on page 2-60. In his 2012 update of the 2009 Royal Society report, Sheppard (2012) [DOI: 10.1098/rsta.2012.0186] reviewed five different CDR proposals (land-use management to protect or enhance land carbon sinks; the use of biomass for carbon sequestration as well as a carbon neutral energy source; acceleration of natural geological weathering processes that remove CO2 from the atmosphere; direct engineered capture of CO2 from ambient air; and the enhancement of oceanic uptake of CO2, for example, by fertilization of the oceans with naturally scarce nutrients, or by increasing upwelling processes) and concluded that "Of the CDR methods assessed, none has yet been demonstrated to be effective at an affordable cost, with acceptable side effects". This remains the case to date. If what is being conveyed in this sentence relates more to approaches that have been applied as assumptions in models and projections, then this could be made more explicit. [Jennifer Morgan, Netherlands]
Accepted - Wording changed. See also response to comment 1564
9166 6 16 6 2
Include capture and storage of CO2 released during fermentation in the production of biofuels (BECCS). Ref.: Moreira, Jose Roberto & Romeiro, Viviane & Fuss, Sabine & Kraxner, Florian & Pacca, Sergio. (2016). BECCS potential in Brazil: Achieving negative emissions in ethanol and electricity production based on sugar cane bagasse and other residues. Applied Energy. 179. 55-63. 10.1016/j.apenergy.2016.06.044. [Adelino Ricardo Jacintho Esparta, Brazil]
Noted - Wording changed. CDR will be discussed on a technology by technology level in Chapter 4.
2222 6 18 6 19
This information is incomplete. In addition to combustion BECCS can be based CO2 capture from gasification and fermentation. Eg, one reference that considers gasification and fermentation and which is from the same time period as the other two includedMöllersten K, Yan J, Moreira JR (2003). Potential market niches for biomass energy with CO2 capture and storage - Opportunities for energy supply with negative CO2 emissions. Biomass and Bioenergy 25 (3):273-285. [Kenneth Möllersten, Sweden]
Noted - Wording changed. CDR will be discussed on a technology by technology level in Chapter 4.
9239 6 19 Perhaps these are the first references, but potentially not the most useful references? [Glen Peters, Norway] Accepted - Newer references have been added.
19311 6 19 6 2
as CDR technology, I suggest to refer to direct air capture with carbon storage, as DACCS rather than as DAC (DAC is only the front end of the system and it has to be coupled to Carbon Dioxide Storage to become an effective CDR technology) [Marco Mazzotti, Switzerland]
Accepted - Now referred to as DACS (DAC with storage)
15678 6 19 6 33
As explained in the framing, none of the geoengineering technologies are considered mitgation nor adaptatio, so there is no reason to include them in chapter 2. None of these technologies are is compatible with sustainable development [Elenita Daño, Philippines]
Rejected - CDR is part of 1.5°C pathways and therefore also part of the assessment of these pathways.
15431 6 19 6 33
As explained in the framing, none of the geoengineering technologies are considered mitgation nor adaptatio, so there is no reason to include them in chapter 2. None of these technologies are is compatible with sustainable development [Elenita Daño, Philippines]
Rejected - CDR is part of 1.5°C pathways and therefore also part of the assessment of these pathways.
16211 6 2 6 2
These references are really dated, giving no indication of progress. These may be references for when first proposed, but it seems absurd to have them be the only references at the introduction of this idea. Other references to CDR/DAC in this paragraph seem similarly dated. [Michael MacCracken, United States of America]
Accepted - Newer references have been added
4295 6 2 6 2 solvents and sorbents as comment above [Abanades Carlos, Spain] Added
6711 6 22 6 24 There is something missing from the end of this sentence [Jennifer Morgan, Netherlands] Added
2223 6 23 6 23 Incomplete sentence [Kenneth Möllersten, Sweden] Added
12994 6 23 6 23 add "alkalinisation" after "ocean" [Caserini Stefano, Italy] Added
12754 6 23 6 23 It seems something is missing after the last occurrence of the word "ocean" [Vassilis Daioglou, Netherlands] Added
20469 6 23 6 23 Word(s) missing after second use of "ocean" [Oliver Morton, United Kingdom (of Great Britain and Northern Ireland)] Added
14326 6 23 6 23 There is a missing term after "ocean". [Serge PLANTON, France] Added
7949 6 24 6 25
This statement is too general and needs to be more specific. Not all potential CO2 utilisation products achieve sequestration of 100 years and more (especially fuels, chemicals, polymers). There is currently a hot debate whether some of these options are mitigation or rather a distraction thereof. (Chapter 4 seems to discuss this in more detail, so you might align/add from there.) [Jasmin Kemper, United Kingdom (of Great Britain and Northern Ireland)]
Agreed. We removed the introduction of CCU as a fifth group as it was tangential to the topic of the subsection.
9238 6 25What industrial products are locked away for centuries? [Glen Peters, Norway] Noted. We removed the introduction of CCU as a fifth group as it was tangential to the topic of
the subsection.
9445 6 25 6 25CCU refers mainly to the capture of CO2 from fossil and industrial plants. I would then suppress the bracket '(Carbon Capture and Usage - CCU)' [Isabelle Czernichowski-Lauriol, France]
Noted. We removed the introduction of CCU as a fifth group as it was tangential to the topic of the subsection.
6162 6 27 6 27Should add "ocean alkalisation" using the hydroxide/carbonate to bicarbonate method. Deserves a mention here, even it is not modelled. [Philip Sargent, United Kingdom (of Great Britain and Northern Ireland)]
Accepted. Has been included (and was actually included before but the word alkalinization went missing.)
13217 6 29 33
While the chapter pays attention to BECCS in detail (in both near to medium term and after mid-century), discussion of other technology options to deal with unmitigated emissions is missing. It will help to mention these and how the result would have potentially be impacted if their assessment is also included in the scenarios (e.g. potential impact on investments, energy mix etc). [Deger Saygin, Turkey]
Noted. We included more CDR measures than BECCS in the assessment, and also provide an overview over the full range of mitigation options in Section 2.3.2 and a discussion of further visions of carbon-neutral societies in Section 2.3.3.3
Do Not Quote, Cite, or Distribute Page 106 of 129
IPCC WGI SR15 First Order Draft Review Comments And Responses - Chapter 2
Comment No From Page From Line To Page To Line Comment Response
6712 6 3 6 31
To say that "some well below 2C and 1.5C pathways including additional CDR options such as Direct Air Capture are becoming available" may well be true in a purely modTo say that "some well below 2C and 1.5C pathways including additional CDR options such as Direct Air Capture are becoming available" may well be true in a purely modeling sense (i.e. DAC can be added as a theoretical option to models), but in all practical senses, DAC is not available in a way that makes sense economically or energetically. As noted by Wilcox et al. (2017) [https://doi.org/10.1088/1748-9326/aa6de5], 'reasonable opportunities' for DAC remain limited to the production of only dilute CO2 streams with restricted applications, including enhanced oil recovery, for example. [Jennifer Morgan, Netherlands]
Rejected. We speak about 1.5°C pathways including DAC becoming available, not about DAC itself becoming available large-scale overnight.
916 6 31 6 31
Some comment should be made on the state of development of direct air capture, its potential costs, and environmental issues. The danger is that it as seen as a convenient fix. [David Infield, United Kingdom (of Great Britain and Northern Ireland)]
Rejected. The costs, potentials and side effect discussion of CDR measures on a technology by technology basis is subject of Chapter 4. A reference to Chapter 4 is provided.
6713 6 31 6 32
There are clear reasons why some ocean-based CDR 'options' have not been taken up in the literature on mitigation pathways (see comment 7 above) - it is unlikely to be simply a matter of time before they are taken up in such literature [Jennifer Morgan, Netherlands]
Agreed.
21160 6 35 6 36
why does the assessment not also cover reforestation and other ecosystem restoration? [David Cooper, Canada] We have mentioned nature-based CDR in the general discussion, but cannot assess in the pathway literature as it is mostly not included in pathway modeling (except of reforestation which is included as part of afforestation). We have now noted this gap in integrated assessment modeling more clearly in Section 2.3.4. The underlying reason is the complexity of modelling the relevant processes, including nutrient cycles and soil carbon storage. The community is working on including these processes and nature-based CDR, but the work will not come in time for SR1.5.
20470 6 35 6 36
I think this choice of focus, and in particular the choice not to consider DAC, should be explicitly justified in the text. [Oliver Morton, United Kingdom (of Great Britain and Northern Ireland)]
Noted. We state in the text that BECCS and afforestation / reforestation continue to be the main CDR measures included in IAMs, despite initial 1.5°C pathway modeling with DAC. This literature is not yet robust enough to assess in detail. We will revisit this in the preparation of the final order draft.
15686 6 35 6 55
Literatures that raise concerns on the limitations of BECCS as an approach in CDR needs to be cited in the assessment to provide a more balanced presentation. See: Heck, Vera/Gerten, Dieter/Lucht, Wolfgang/Boysen, Lena R. (2016) Is extensive carbon dioxide removal a ‚green‘ form of geoengineering? A global modelling study, in: Global and Planetary Change, Vol. 137, pp. 123-130. http://www.sciencedirect.com/science/article/pii/S0921818115301612. Also: Boysen, Lena R./Lucht, Wolfang/Gerten, Dieter/Heck, Vera/Lenton, Timothy M/Schellnhuber, Hans Joachim (2017) The limits to global-warming mitigation by terrestrial carbon removal, in: Earth’s Future, Vol. 5, Issue 5, pp. 463-474. http://onlinelibrary.wiley.com/doi/10.1002/2016EF000469/full [Elenita Daño, Philippines]
Agreed. This literature is cited in Section 2.3.4.2
15439 6 35 6 55
Literatures that raise concerns on the limitations of BECCS as an approach in CDR needs to be cited in the assessment to provide a more balanced presentation. See: Heck, Vera/Gerten, Dieter/Lucht, Wolfgang/Boysen, Lena R. (2016) Is extensive carbon dioxide removal a ‚green‘ form of geoengineering? A global modelling study, in: Global and Planetary Change, Vol. 137, pp. 123-130. http://www.sciencedirect.com/science/article/pii/S0921818115301612. Also: Boysen, Lena R./Lucht, Wolfang/Gerten, Dieter/Heck, Vera/Lenton, Timothy M/Schellnhuber, Hans Joachim (2017) The limits to global-warming mitigation by terrestrial carbon removal, in: Earth’s Future, Vol. 5, Issue 5, pp. 463-474. http://onlinelibrary.wiley.com/doi/10.1002/2016EF000469/full [Elenita Daño, Philippines]
Agreed. This literature is cited in Section 2.3.4.2
16212 6 36 6 36
Given progress across the field, limiting the presentation to these two approaches seems far too limiting. [Michael MacCracken, United States of America]
Noted. Progress is being made but to date there is no robust literature on 1.5°C pathways with a whole range of CDR measures outside Afforestation / reforestation, BECCS and DAC. Will revisit this at the time of drafting the final order draft.
6714 6 47 6 5
Once again, these sentences read far too definitively as they are written in the context of the 'certainty' implied by model assumptions, and yet may come across to the reader more as statements of fact or, at least, research findings [Jennifer Morgan, Netherlands]
Accepted. Changed language accordingly.
9240 6 52How does this square with Fig 2.23, co2 supply, is transformation to other fucles? GCAM, AIM are more on electricity? [Glen Peters, Norway]
Energy supply sector includes the electricity sector.
1850 61 8
2.4.2.3 As regards the CDRs, especially the CCS, there were also some other reference in subsection 2.3.4.1.2 (e.g. Riahi et al. 2017) and like there, some more careful language would be needed here by taking into account the following: Riahi et al. 2017: „CCS plays an important role in many of the mitigation scenarios even though its deployment is subject to large uncertainties..” AR5-WGIII-SPM: ”overshoot scenarios typically rely on the availability and widespread deployment of BECCS and afforestation in the second half of the century. The .. CDR technologies and methods are, to varying degrees, associated with challenges and risks (see Section SPM 4.2) (high confidence)” [Tibor Farago, Hungary]
Noted. Language has been revised to indicate uncertainties more clearly.
6927 61 8 62 35To be integrated with material form ch 4 (to be moved to ch 2) and preferably placed earlier in the chapter (2.3.4) [Bert Metz, Netherlands]
Accepted. CDR section was brought into Section 2.3 and Chapter 4 has been more clearly cross-referenced.
Do Not Quote, Cite, or Distribute Page 107 of 129
IPCC WGI SR15 First Order Draft Review Comments And Responses - Chapter 2
Comment No From Page From Line To Page To Line Comment Response
1185 61 8 63 2
After reading Ch2, it is clear that Ch5 should discuss more compellingly the SDG implications of different CDR measures (particularly BECCS) given their prominence in M pathways consistent with the 1.5C target (section 5.4). This will require some co-ordination at LAM3. [Petra Tschakert, Australia]
Noted. We refer to Chapter 4 for an in-depth discussion of CDR technologies, but CDR effects are part of the SD assessment of pathways between Chapter 2 and 5.
6719 61 9 61 47
According to Smith et al. (2016), no NET or combination of NETs “currently available that could be implemented to meet the less than 2 degree C target without significant impact on either land, energy, water, nutrient, albedo or cost and so ‘plan A’ must be to immediately reduce GHG emissions.” http://www.nature.com/nclimate/journal/v6/n1/full/nclimate2870.html?WT.ec_id=NCLIMATE-201601&spMailingID=50320407&spUserID=MTI3MTU2ODk4MDgS1&spJobID=823491820&spReportId=ODIzNDkxODIwS0 [Jennifer Morgan, Netherlands]
Noted. The section highlights the fact that CDR is not putting off rapid and deep near-term mitigation in 1.5C pathways.
6715 61 9 61 9
Again, reference to a range of proposed CDR approaches as 'options' grants them more certainty and confidence than they should attract, given the state of knowledge on the potential effectiveness and adverse impacts of many such proposals. They may be 'options' in terms of selection for modeling assumptions and parameters, but the term can be interpreted very differently in terms of policy and public understanding (see comments 6 and 7 above). [Jennifer Morgan, Netherlands]
Accepted. Replaced options with measures.
2706 61 1 61 14
Add mention of equity issues (e.g. arising from people losing non-formal - or even formal - rights to land, and procedural justice concerns regarding how decisions are made) and a x-reference to sections in Chapters 3,4 and 5 that deal with this in more detail. [Penny Urquhart, South Africa]
Noted. We clarified that we are focusing on environmental side effects and refer the reader for a more detailed discussion of CDR measures to Chapter 4.
2565 61 15
Report"bioenergy crops can substantially increase agricultural water demand" but the infromation show in the text only discuss the irritaiton water demand, for industrial water demand, and domestic water demand in China under changing climate is also increasing, see the paper with attachment file "Impacts of climate variability and changes on domestic water use in the Yellow River Basin of China,Modeling domestic water demand in Huaihe River Basin of China under climate change and population dynamics,Adaptation to climate change impacts on water demand,Forecasting industrial water demand in Huaihe River Basin due to environmental changes" all thsese papers are very important for water demand under climate change, should also be cited in the text. [Xiaojun WANG, China]
Rejected. Discussion of climate impacts are part of Chapter 3.
2578 61 15
Report"bioenergy crops can substantially increase agricultural water demand" but the infromation show in the text only discuss the irritaiton water demand, for industrial water demand, and domestic water demand in China under changing climate is also increasing, see the paper with attachment file "Impacts of climate variability and changes on domestic water use in the Yellow River Basin of China,Modeling domestic water demand in Huaihe River Basin of China under climate change and population dynamics,Adaptation to climate change impacts on water demand,Forecasting industrial water demand in Huaihe River Basin due to environmental changes" all thsese papers are very important for water demand under climate change, should also be cited in the text. [Xiaojun WANG, China]
Rejected. Discussion of climate impacts are part of Chapter 3.
2539 61 15
Report"bioenergy crops can substantially increase agricultural water demand" but the infromation show in the text only discuss the irritaiton water demand, for industrial water demand, and domestic water demand in China under changing climate is also increasing, see the paper with attachment file "Impacts of climate variability and changes on domestic water use in the Yellow River Basin of China,Modeling domestic water demand in Huaihe River Basin of China under climate change and population dynamics,Adaptation to climate change impacts on water demand,Forecasting industrial water demand in Huaihe River Basin due to environmental changes" all thsese papers are very important for water demand under climate change, should also be cited in the text. [Xiaojun WANG, China]
Rejected. Discussion of climate impacts are part of Chapter 3.
19312 61 16 61 17
as CDR technology, I suggest to refer to direct air capture with carbon storage, as DACCS rather than as DAC (DAC is only the front end of the system and it has to be coupled to Carbon Dioxide Storage to become an effective CDR technology) [Marco Mazzotti, Switzerland]
Accepted. Now referred to as DACS (Direct Air Capture and Storage)
2566 61 17
Report"Some approaches like DAC have high energy and water demand." ,water demand not only irritaiton water demand, should also add industrial water demand, and domestic water demand, so add the literatures. [Xiaojun WANG, China]
Rejected. It was not implied that water demand is restricted to irrigation. DAC water demand is unrelated to mitigation.
2579 61 17
Report"Some approaches like DAC have high energy and water demand." ,water demand not only irritaiton water demand, should also add industrial water demand, and domestic water demand, so add the literatures. [Xiaojun WANG, China]
Rejected. It was not implied that water demand is restricted to irrigation. DAC water demand is unrelated to mitigation.
2540 61 17
Report"Some approaches like DAC have high energy and water demand." ,water demand not only irritaiton water demand, should also add industrial water demand, and domestic water demand, so add the literatures. [Xiaojun WANG, China]
Rejected. It was not implied that water demand is restricted to irrigation. DAC water demand is unrelated to mitigation.
6716 61 18 61 19The statement that enhanced weathering, a highly speculative set of CDR proposals, @may substitute parts of nitrogen fertilizer use and enhance terrestrial carbon storage' is, once again, far too definitive [Jennifer Morgan, Netherlands]
Accepted. Statement was removed for the SOD and the available literature will be re-evaluated at the time of TOR.
7950 61 19 61 22Exactly, this is why it is important to state that several CCU options are not permanent storage (apart from e.g. mineral carbonation). [Jasmin Kemper, United Kingdom (of Great Britain and Northern Ireland)]
Noted
19095 61 19 61 26
Good section. It is important to highlight the issue of permanence of retention of the CO2 from atmosphere and that different options have different timescales. Agree that geologic storage, if done correctly, can provide the longest and safest route. [Ellina Levina, France]
Noted
Do Not Quote, Cite, or Distribute Page 108 of 129

IPCC WGI SR15 First Order Draft Review Comments And Responses - Chapter 2
Comment No From Page From Line To Page To Line Comment Response
20197 61 21 …in these different pools…. [Ton Wildenborg, Netherlands] Corrected
14327 61 22 61 24The impact of soil degradation and forest fires are detailed in chapter 4; a reference to this chapter (subsections ?) could be added. [Serge PLANTON, France]
Accepted. Reference to Chapter 4 added to the paragraph.
5189 61 22 61 26
Terrestrial carbon storage is subject to particular concerns about permanence as terrestrial carbon can be returned to the atmosphere on decadal timescales by a variety of mechanisms such as soil degradation and forest fires. There are similar concerns about outgassing of CO2 from the oceans. In contrast, the risk of CO2 leakage from deep geological storage has been suggested to decline over time after CCS operations have ceased (Torvanger et al. 2012). This is a major concern and must be in the beginning of this section rather than in the end. Only one reference, add more references and discuss this topic more prominent and in depth. [Sven Teske, Australia]
Rejected. An in-depth discussion is provided in Chapter 4, a reference to Chapter 4 has been included.
1560 61 24 61 26
The risk of carbon leakage decrease in the very long term (thousands of years) but not in the short term (a few decades) : over period of several hundreds or thousands of years, CO2 is more and more strongly linked to the geological formations. However, it should be stressed that over a period of a few decades, the risk profile does not decline, as shown by INERIS (Institut National de l'Environnement Industriel et des Risques), wich states that sudden surface events (e.g. eruptions of gas) can be caused by slow underground processes (such as corrosion of the sealing of the well by injected CO2). See http://www.ineris.fr/centredoc/95145-11842b-stockage-co2-2.pdf p. 57 . INERIS also conclude that some leakage scenarios have a high probability of occurrence. So just saying that the risk of CO2 leakage decrease overtime gives a misleading picture of the dynamic of risk. [Noé Lecocq, Belgium]
Text has been replaced to give a broader discussion of the potential risk of release of CO2 in geological storage, and the management of both risk of release and potential environmental impacts should a release occur.
19096 61 25 61 26
The point on risk of CO2 storage reducing over time could be made more strongly. There is a growing literature. A useful source on improved understanding is the Special Issue of International Journal of Greenhouse Gas Control (40) 2015 published by Elsevier, which reviews the progress of CCS technologies since the 2005 IPCC Special Report. [Ellina Levina, France]
See comment 1612. As suggested, more recent references from the special issue referred to by the reviewer have been included.
12995 61 25 61 26
I believe that a single reference is too weak for a generalization like this, taking into account that the real-world CCS storage plants that operated for years and then ceased are very limited. Please add other references and also consider different views on the risk of leakage from geological storage [Caserini Stefano, Italy]
See comment 1612.
6717 61 25 61 26
The sentence on risk of CO2 leakage, which cites the paper of Torvanger et al. (2012) to support a statement that risk of CO2 leakage from deep geological storage is suggested to decline over time, may be open to question, as the risk 'of' leakage and the risk 'arising from' leakage are two quite different things. In the context of the preceding sentence, which relates to outgasing from the oceans, the sentence as it stands appears to relate to declines in risk 'of' leakage. Torvanger et al. (2012) appears to consider risk in a broader modelling context of relative impacts, based on specific assumptions about leakage rates. On risk 'of' leakage, for example, those authors warn that "more than marginal leakages from storage sites are possible" and that "Such leakages are not likely to be at a flat rate, and they may peak millennia from now". [Jennifer Morgan, Netherlands]
See comment 1612. The draft text on hypothetical magnitude of leakage risk has been removed. In addition, both the risk of and the risk arising from leakage are now discussed.
6720 61 25 61 26
This statement, as drafted, presents the risk of CO2 leakage from CCS operations as quite low. But this is a misleading statement. It ignores the potential risk of leakage during the injection phase, well blow outs, improper sealing of well casings and the potentially higher risk of leakage in former oil and gas fields (http://www.sciencedirect.com/science/article/pii/S1750583613000030), which are full of incompletely sealed and improperly sealed wells. What's more, the mechanisms of storage for CO2 in deep geological formations are only partially understood at this point. Finally, even very low leakage rates could completely negate the climate benefits of CCS. (Azar, C et al, 2006, Carbon Capture and Storage from FossilFuels and Biomass – Costs and Potential Role in Stabilizing theAtmosphere, Climactic Change vol. 74, 2006, pp. 47-79.) [Jennifer Morgan, Netherlands]
See comment 1612. The draft text on hypothetical magnitude of leakage risk has been removed.
7448 61 28 61 47
We recognize that the figure 2.25 also includes information regarding 2C, and that the focus in this para seems to be mainly resticted to 1.5C. Please consider to include more quantified information relevant for 2C pathways for comparison with 1.5C pathways. [Øyvind Christophersen, Norway]
Noted. We have included comparisons to 2°C pathways were it is most relevant, but did not provide a comparison for each aspect discussed due to page constraints and readability.
2616 61 28 61 47add reference to impacts on indigenous lands/societies? [Zoha Shawoo, United Kingdom (of Great Britain and Northern Ireland)]
Accepted. A reference to literature on impacts on local communities was added to the discussion of land use change.
6718 61 34 61 35
Again this is a very definitive statement, this time regarding the continuity of sequestration from BECCS, which is presented as factual while actually arising from modelling assumptions. While it is clear that natural carbon storage in forests can be expected to saturate as forests mature, based on empirical observations, the 'continuity' of sequestration offered by BECCS has not been determined, it has been assumed, based in turn on numerous other quite fundamental assumptions. [Jennifer Morgan, Netherlands]
Rejected. CO2 captured via BECCS is stored in geological formations and therefore its annual continuation subject to storage constraints. AFOLU effects due to bioenergy crop applications are relevant, but of different nature than the fact that the CDR potential of afforestation saturates over time. However, we made the statement less definitive by adding "assumed".
7951 61 35 61 38
I want to echo my earlier comment No.9 here. The sentence, as currently written, could imply that large-scale CDR, in the form of BECCS and AR, can only be achieved by significantly disrupting other ecosystem services. It would be neccessary to put the numbers for total land requirement in context with what is achievable through dietary change, food waste reduction, additional biomass etc. [Jasmin Kemper, United Kingdom (of Great Britain and Northern Ireland)]
Noted. The numbers for land requirements were put into context of current agricultural area. What is achievable through dietary change etc. is highly dependent on other factors, eg. Population levels and ag productivity, so ingle numbers for this cannot be given. There is a dedicated Subsection on land in the Chapter that takes up these topics (which are not only CDR topics).
Do Not Quote, Cite, or Distribute Page 109 of 129
IPCC WGI SR15 First Order Draft Review Comments And Responses - Chapter 2
Comment No From Page From Line To Page To Line Comment Response
11024 61 35 61 38
Authors should give a real-world comparison for the 800-1800 mha to make clearer how large this size really is, and they should avoid to talk about a "realization" (here: by conversion of pasture and cropland) when only talking about effects in models. In the real world, it would look quite different (see Buck 2016: Rapid scale-up of negative emissions technologies: social barriers and social implications) [Oliver Geden, Germany]
Accepted. Magnitudes were related to current agricultural area and wording changed.
17484 62 2 A [Tom Gabriel Johansen, Norway] Noted
17524 62 2 A [Angela Morelli, Norway] Noted
20198 62 6The quantity of CO2 stored in CCS and BECCS….. [Ton Wildenborg, Netherlands] It is CO2 stored in geological formations by CCS (which can be combined both with fossil fuels
and bioenergy)
6928 62 6 62 6the range of 750-1360 Gt CO2 stored (I assume form CCS) is biased by the dominant use of BECCS in most models above other CDR options. That needs to be mentioned. [Bert Metz, Netherlands]
Agreed. It is mentioned in the section that CCS use is driven by demand for BECCS.
2224 62 6 62 6This chapter is on CDR but unclear wether this figure represents CO2 stored from BECCS and CCS applied to emissions from fossil fuels. [Kenneth Möllersten, Sweden]
Accepted. The figure caption has been rewritten to clarify this.
6721 62 6 62 28
It's completely inappropriate to rely on the IPCC CCS 2005 report estimates for storage capacity as those top down assessments have been shown to wildly overestimate potential storage capacity for CCS. Bottom up assessments provide a far more accurate picture. What's more, such storage estimates don't take into account constraining factors such as injection rates and co-location of sources and sinks. Such issues have a dramatic impact both of the available storage space for CO2 as well as the costs associated with such activties. See, the 2009 Greenpeace report on this: http://www.greenpeace.org/international/Global/international/planet-2/report/2009/5/reality-check-on-carbon-storage.pdf. See also, https://link.springer.com/content/pdf/10.1007/s11053-016-9310-7.pdf. See also, http://nora.nerc.ac.uk/1477/1/CO2_storage.pdf. [Jennifer Morgan, Netherlands]
This paragraph summarizes recent assessments of storage capacity, to see how these estimates compare to the demand for storage in scenarios. As the reviewer notes, the IPCC 2005 assessment is now dated, and we do not rely solely on this assessment, but rather on a more recent and deeper literature that has appeared since the IPCC 2005. This section on sustainability does not address the cost of storage.
20199 62 17 62 18 UK English spelling preferred: 'geological' instead of 'geologic' [Ton Wildenborg, Netherlands] Corrected
4852 62 27 62 28
The assessments reported here imply that storage capacity should not be a limit on the take up of CCS in most areas of the world. [Wilfried Maas, Netherlands]
This is stated in other words in the paragraph: "found that the cumulative demand for CO2 storage was small compared to their practical capacity (as defined by Bachu et al. 2007a) of 3900 GtCO2 storage capacity worldwide."
4853 62 27 62 28
……………. practices that could further extend storage capacity estimates .The assessments reported here imply that storage capacity should not be a limit on the take up of CCS in most areas of the world. [Wilfried Maas, Netherlands]
This is stated in other words in the paragraph: "found that the cumulative demand for CO2 storage was small compared to their practical capacity (as defined by Bachu et al. 2007a) of 3900 GtCO2 storage capacity worldwide."
12996 62 28 28
I suggest to mention the difficulties in the correct identification of a storage site, that have limited the growth of CCS . As an example, according to "IEA (2014) CCS 2014. What lies in store for CCS?" the assessment of the real storage potential in saline formation is uncertain. "Available experience shows that it can take 5-10 years to qualify a new saline formation for CO2 storage, even when theoretical estimates are already available and look promising.The necessity of large up-front investment in securing storage capacity is also a critical aspect in the process of investing in CCS. The final investment decision for a large capture facility cannot be taken without a very high level of confidence that the resulting CO2 can actually be stored in the envisaged site or sites. Therefore, the whole investment framework and its various stages are either strongly influenced, or actually defined, by the development of the storage site." [Caserini Stefano, Italy]
As the reviewer suggests, site characterization is a step in developing a CO2 storage site which is part of deploying CCS which is part of, for example, transforming the electricity generation system. This section, however, is on sustainability considerations and site characterization is now mentioned in the first paragraph in this section in the context of the risk of CO2 leakage. There is a discussion on pace in section on Pace of Change in chapter 2, and further consideration on accelerating the pace in chapter 4.
6929 62 3 62 35
This discussion needs to be broadened to other , mostly lans based, CDR options. The choice is not only between BECCS and bioenergy supply; land use CDR (sinks in forests, agric soils, degraded lands) can play a major role [Bert Metz, Netherlands]
Accepted. Introductory discussion has been broadened to point to land restoration, biochar, land and soil carbon management options, and their lack of coverage in IAMs was identified.
9446 62 32 62 34I don't understand well 'CCS deployment is mosly driven by BECCS', as CCS deployment is also driven by the need to reduce emissions from fossil and industrial plants. [Isabelle Czernichowski-Lauriol, France]
Noted. We clarified that CCS deployment increases in the presence of BECCS compared to scenarios with fossil fuel CCS only.
20200 62 34 …and, if available, by DACS [Ton Wildenborg, Netherlands] Accepted. Wording revised.
4848 62 34 62 35
BECCS and, if available, DAC is a major driver for CCS deployment a in 1.5°C and WB2C pathways where both will be dependent on establishing and build out of a wider CCS industry . (the ratio BECCS/CCS in Fig 2.9 do not support mostly driven) [Wilfried Maas, Netherlands]
Accepted. Wording changed
10446 63 64in discussion of energy demand in 2.4.3.1, use of “liquids” may be confusing for non-specialists; “liquid fuels” may be better [Jonathan Lynn, Switzerland]
Accepted - has been changed
21141 63 1 63 2In the SOD, include discussion of the full life-cycle consequences of bioenergy and the debate about its ability to be carbon neutral [Nathan Borgford-Parnell, Switzerland]
Rejected. This is subject of Chapter 4.
10665 63 1 63 2
In the SOD, include discussion of the full live-cycle consequences of bioenergy and the debate about its ability to be carbon neutral, especially in the near-term when the risk of exceeding 1.5ºC (even if only temporarily) is greatest because of regional impacts (increased heat waves, change in precipitation patterns) and feedbacks and tipping points (Arctic sea ice, permafrost, increased ice sheet melting). [Kristin Campbell, United States of America]
Rejected. This is subject of Chapters 3 and 4.
Do Not Quote, Cite, or Distribute Page 110 of 129
IPCC WGI SR15 First Order Draft Review Comments And Responses - Chapter 2
Comment No From Page From Line To Page To Line Comment Response
5190 63 13 63 14
Used energy technologies for the next 20 to 30 years are not at all uncertain. As technology requires 20 to 30 years from first development to market entry, it is certain that all renewable energy technologies currently on the market - especially solar and wind technologies - will be used till 2050. While entirely new technologies, which are not yet under development, will most likely play no role in the energy market until 2050. Make this sentence either more precise, add references or delete entire paragraph. [Sven Teske, Australia]
Taken into account - the sentence stated " At the same time it is deeply uncertain which key technologies, preferences and institutions will shape the energy system 50 to 80 years out.", which is hence clearly different from the point made by the reviewer about the next 20 to 30 years. Nevertheless, we included a qualification about the smaller uncertainty surrounding technologies in the near term.
5191 63 25 63 25Include SSP 0 - new category - to reflect 100% RE pathways. [Sven Teske, Australia] Rejected - SSPs are narratives which are published and clearly described in the literature.
Inventing one is not the task of the author team.
6930 63 33 63 36Are the SSP1 scenarios included in the full range of the results reported in line 34? And what are the factors that drive down energy use in the baseline and what is the contribution of policy? [Bert Metz, Netherlands]
SSP1 scenarios are included in these ranges. As indicated earlier, the baseline energy use assumptions are exogenous to most IAMs. The contribution of policy to this is not quantified.
17433 63 4 63 43
Along with the not that "Currently defined Nationally Determined Contributions (NDCs) specified under the Paris Ageement will not be sufficient to create conditions for a 1.5C world" it should also be highlighted that current mitigation policies in the ICAO and IMO for international transport emissions are not sufficient for a 1.5C world. [Aki Kachi, Germany]
Noted - we agree with this comment, yet an assessment of these policies does not fit in this section which has a more general perspective and does not touch upon international bunker fuels.
953 63 42 63 43
Here are a couple of references to support the claim that electrification in freight will be limited. While they do not focus on 1.5 degrees, they do compare types of transport sectors and include electrification options. These papers are: S. Carrara, T. Longden, Freight futures: The potential impact of road freight on climate policy, Transportation Research Part D: Transport and Environment, Volume 55, 2017, Pages 359-372; Pietzcker, R. C., Longden, T., Chen, W., Fu, S., Kriegler, E., Kyle, P., & Luderer, G. (2014). Long-term transport energy demand and climate policy: alternative visions on transport decarbonization in energy-economy models. Energy, 64, 95-108. [Thomas Longden, Australia]
Accepted - these references have been added.
17382 63 42 63 47
Wind Propulsion in Shipping can offer substantial reductions. The maximum market potential for bulk carriers, tankers and container vessels is estimated to add up to around 3,700-10,700 installed systems until 2030, including both retrofits and installations on newbuilds, depending on the bunker fuel price, the speed of the vessels, and the discount rate applied. The use of these wind propulsion systems would then lead to CO2 savings of around 3.5-7.5 Mt CO2 in 2030. Study on the Analysis of Market Potentials & Market Barriers for Wind Propulsion Technologies for Ships (commissioned by European Commission DG Climate Action) Dagmar Nelissen, Jasper Faber, Saliha Ahdour (CE Delft), Michael Traut (Tyndall Centre) Jonathan Köhler (Fraunhofer ISI) Wengang Mao (Chalmers University), Nov 2016 – publicly available Jan 2017 http://www.cedelft.eu/publicatie/study_on_the_analysis_of_market_potentials_and_market_barriers_for_wind_propulsion_technologies_for_ships/1891 [Gavin Allwright, United Kingdom (of Great Britain and Northern Ireland)]
Noted
17435 63 43 63 43
Electriciation options should not be underestimated. The differences between the prospects for electrification of shipping and aviation are important: Kanellos, F. D., Prousalidis, J. M., & Tsekouras, G. J. (2014). Control system for fuel consumption minimization–gas emission limitation of full electric propulsion ship power systems. Proceedings of the Institution of Mechanical Engineers, Part M: Journal of Engineering for the Maritime Environment, 228(1), 17-28. [Aki Kachi, Germany]
Noted - we agree that it should not be underestimated. However, this sentence speaks to what is currently assumed in the models. A detailed discussion of this would be better placed in Section 2.4
6931 63 45 63 47 I don't understand this sentence. Please clarify. [Bert Metz, Netherlands] Taken into account - this sentence has been removed
4551 64 Fig 2.26 - Black line is dashed (up) and solid (down). Why? [Radim Tolasz, Czech Republic] This had no specific meaning. Both lines are solid now
2785 64 66
CDR and BECCS are unconvincing as technologies. The costs of CDR are minimized by capture from large, CO2 rich emissions streams such as coal-fired generation and an economic value for the stored CO2 such as enhanced oil recovery. In the 1.5oC pathways the electric generation emissions sources have limited lifetimes (virtually no new plants) and the potential use for enhanced oil recovery declines sharply as oil consumption falls. A more realistic option is capture from ambient air and combination with H2 from electrolysis using renewable electricity to produce zero net emissions liquid fuels and chemical feedstocks. The reliance of the models on BECCS is even less convincing. Suddenly after 2050 electricity generation with carbon capture with biomass fuel becomes less costly than solar and wind generation! [Erik Haites, Canada]
Noted - BECCS in the second half of the century is not only deployed because of its energy production in scenarios, but rather because it allows for CDR, a service neither solar nor wind are able to provide.
10847 64 1 64 2
Fig. 2.26: if the IEA can be added, then also the E[R] and AE[R] scenario of Greenpeace - people will laugh on the poor IPCC quality if IEA is there but Greenpeace not - and the methodology of Greenpeace is as good as the one of IEA. [Christian Breyer, Finland]
Rejected - only scenarios data available to the assessment can be shown. The Greenpeace E[R] and AE[R] were not contributed. However, a peer-reviewed low energy demand scenario was added (Grubler et al, Nature Energy)
17485 64 3 B [Tom Gabriel Johansen, Norway] Noted
17525 64 3 B [Angela Morelli, Norway] Noted
6932 64 13 64 2
The message that biomass use needs to be very high in 1.5C scenarios isdriven by the use of BECCS as almost the only CDR option in most models. If other CDR options would be taken into account this conclusion is no longer valid. So please correct. [Bert Metz, Netherlands]
The assertion is not correct. Bioenergy use is not only driven by BECCS, but also by the need for low-carbon fuels to replace fossil-fuel based liquids and gases. Therefore, bioenergy demand is also high in scenarios without BECCS.
17427 64 18 64 2
I don't understand. What kind of deep mitigation pathways there exists in the use of bioenergy without BECCS? [Tuomo Kalliokoski, Finland]
Bioenergy is not only used for BECCS, but also to a large degree to decarbonize liquid fuels or other parts of the energy system. Also in absence of BECCS deployment, mitigation pathways thus deploy bioenergy.
4779 64 23 66 9The energy supply mix and evolvement should be also presented by region. [Elena Georgopoulou, Greece] Rejected - due to space constraints the choice has been made to focus on global evolutions for
the SOD.
Do Not Quote, Cite, or Distribute Page 111 of 129
IPCC WGI SR15 First Order Draft Review Comments And Responses - Chapter 2
Comment No From Page From Line To Page To Line Comment Response
1530 64 23 54 21
What this section to me is missing is all of the second-order issues associated with these scenarios. Indeed that might be worthy of a box. For example, there are papers showing that the water demand associated with high biomass use for energy would be, arguably, catastrophic ( e.g. https://doi.org/10.1016/j.gloenvcha.2016.03.014 ). Other papers are looking seriously at how renewable energy system planning could allow for high penetration of intermittent renewables, and hence avert the need for fossil with CCS, or biomass w/o CCS (e.g. doi:10.1038/nclimate3338 ), and indeed suggest the need modeling paradigm to deal with this ( e,g, https://doi.org/10.1016/j.rser.2014.02.003 ). Of course across all of this, one needs to step outside of the IAM box, since these are issues for which IAMs provide little insight, and yet are still model driven. I challenge the authors of this chapter to do so. [Anthony Patt, Switzerland]
Accepted - a separate section which looks at the interactions between mitigation measures and sustainable development is provided in Section 2.5.3
5192 64 24 64 3 Include references to pathways without oil- and gas CCS. [Sven Teske, Australia] Accepted - reference included.
4864 64 3
With electricity being provided primarily with solar and wind, the operation of BECCS in the power system becomes problematic. Peak solar and wind interfere with dispatch of BECCS generation, which implies significant need for market reform in the electricity system and design of grids etc. Some comment along these lines would be helpful. [Wilfried Maas, Netherlands]
Noted - and agreed. However, a reference would be helpful to include this comment in the draft.
4552 65 66 Fig 2.27 - Add explanation of "w/o" and "w/" used in legend. [Radim Tolasz, Czech Republic] Now included in the legend
6961 65 1 66 8
It should be noted in the discussion of nuclear, that the three of the five scenarios investigated are designated SSP1, which, as a premise, rule out nuclear energy based on assumptions on the future society. Therefore the nuclear’s contribution should be discussed mainly in relation to MES-GLO and REM-MAg scenarios (and probably mentioned that in the first three scenarios illustrated in Fig 2.27 it was ignored due to a priori considerations). Also Kim et al. (pg 65, row 5) should be elaborated more in detail: Kim et al. state that many models constrain the nuclear with various stated reasons and they yield smaller fraction of nuclear energy, and the maximum /electricity/ generation of nuclear energy in scenarios analyzed by Kim et al. is above 200 EJ/yr (in primary energy this is above 500 EJ/yr) - but this is mentioned nowhere! While constraining nuclear share is common practice in scenario modelling, this is not evident for non-expert stakeholders and should be explicitly mentioned. In effect, in these models we are not seeing the performance of the nuclear energy, but the effect of a priori limitations put on nuclear energy by the scenario makers. [Ville Tulkki, Finland]
Accepted - this scenario assumption underlying some of the pathways has been made explicit.
14237 65 4 65 6
“Nuclear power plays a much smaller role in the electricity sector with large disagreement between models (Kim et al.). Some 1.5°C pathways no longer see a role for nuclear fission by the end of the century, while others still project 80 EJ yr-1 of nuclear power in 2100.” This statement is a gross misrepresentation of what that paper says! According to the text of the paper, only one model (MESSAGE) shows no nuclear power by 2100, and that’s with no climate mitigation policies. With climate mitigation policies nuclear has a much stronger tendency to grow. This paper needs to be read and reported properly! It will be very difficult to meet our climate goals, even the 2 C, let alone the 1.5, without substantial contributions from all low carbon technology: solar, wind, hydro and nuclear! [Jason Donev, Canada]
This statement is based both on what the paper says about 2°C pathways and what the more recent literature in line with 1.5°C says. Scenario evidence from recent studies, shows that the contribution of nuclear varies strongly between scenarios with options to limit its use to virtually zero available in the literature. We added more recent references which support this statement in context of 1.5°C pathways.
20269 65 5 Year missing from Kim et al. citation [Aaron Glenn, Canada] Noted
4207 65 5 65 5 (Kim et al.) should also have the year 2014. [Jessica Callen, Austria] Noted
5193 65 5 65 9
Almost no commonly accepted energy scenario - used in the energy industry - projects beyond 2050 and non includes nuclear fission. This sentence again proves that scientists working on climate models remain in their silo and do not talk to engineers and scientists from the energy sector. Interdisciplinary development and interaction to the energy sector is urgently required as energy pathways presented in this chapter are entirely disconnected from the development in real energy markets. [Sven Teske, Australia]
Noted
14238 65 7 65 7
Why does no one see a large scale role for nuclear power? Even if true, it needs to be addressed. With sufficient political will, nuclear power could be deployed rapidly, it’s as low carbon as wind, solar and most hydro. The lack of treatment of this scenario needs to be explained and explored. I think that there are papers that do look at the need for nuclear, for example: Pacala, Stephen, and Robert Socolow. "Stabilization wedges: solving the climate problem for the next 50 years with current technologies." Science 305, no. 5686 (2004): 968-972. Hong, Sanghyun, Corey JA Bradshaw, and Barry W. Brook. "Global zero-carbon energy pathways using viable mixes of nuclear and renewables." Applied Energy 143 (2015): 451-459. Williams, James H., Andrew DeBenedictis, Rebecca Ghanadan, Amber Mahone, Jack Moore, William R. Morrow, Snuller Price, and Margaret S. Torn. "The technology path to deep greenhouse gas emissions cuts by 2050: the pivotal role of electricity." science 335, no. 6064 (2012): 53-59. Brook, Barry W. "Could nuclear fission energy, etc., solve the greenhouse problem? The affirmative case." Energy Policy 42 (2012): 4-8. [Jason Donev, Canada]
Taken into account - it is unclear why the expert reviewer considers an 80 EJ/yr deployment of nuclear (with a maximum range to 205 EJ) to not represent a large scale role. High nuclear penetration is easier to project in developed regions, like California than in developing countries where investment risk and institutional capacity is significantly lower. In this chapter we discuss the full global scenario literature available to us. Detailed energy sector assessment is provided in Section 2.4
12755 65 14 65 14 By the end of the century, both are… [Vassilis Daioglou, Netherlands] Noted
Do Not Quote, Cite, or Distribute Page 112 of 129
IPCC WGI SR15 First Order Draft Review Comments And Responses - Chapter 2
Comment No From Page From Line To Page To Line Comment Response
12756 65 19 65 19
This sentence has to be amended. In mentions that capture rates of less than 99% are "increasingly uneconomic", however there has been no prior discussion on how capture rates differ across technologies. Furthermore, this sentence alludes to carbon taxes, without them having been mentioned so far in the report. A reference has to be made to the section in the report where these are discussed in more detail (2.5.2) [Vassilis Daioglou, Netherlands]
Taken into account. The wording has been revised.
9447 65 19 65 2I am surprised by this sentence. Is it well formulated? Rather say 'higher carbon prices make fossil fuel use with CCS increasingly uneconomic' ? [Isabelle Czernichowski-Lauriol, France]
Noted
6933 65 19 65 21
Interesting finding that fossil/CCS use becomes unattractive in 1.5C scenrios, due to the remaining emissions. However, this only applies if there is a high carbon price. In models this carbon price is assumed to increase sharply, as that is the way the models generate theuir results. But in practice such high carbon prices might not materialise. It would be good to discuss this here and show what the implications would be of lower carbon prices for the relative use of mitigation options. [Bert Metz, Netherlands]
Taken into account - we have clarified that this behaviour is due to the high carbon price, but do not have literature available that would allow us to elaborate strongly on the consequences of lower carbon prices. A clarification was, however, included.
4851 65 19 65 21
Fossil fuel use with CCS is strongly reduced in 1.5°C pathways since significantly higher carbon prices make CCS installation with capture rates below 99% increasingly uneconomic (Rogelj et al. 2017a). This is not a supported argument as - capture rates of fossil CCS plants can be increased, at a marginal costs, with economic incentives (as a high carbon price will be) and - as a small amount of biomass/gas blending in the feed can make a 90-95 % capture fossil CCS operation carbon neutral. [Wilfried Maas, Netherlands]
Accepted - this sentence has been amended to clarify this
10848 65 22 65 23
top figure: it has to be mentioned in the text where all the biomass for the REMIND scenarios for 2050 and 2100 should come from - in a sustainable way, I can hardly belief that this should be possible in a sustainable way [Christian Breyer, Finland]
Noted - this assessment is part of Chapter 4
1514 65 22 65 23 What is the blank in the right-hand side of the figure? [Ken'ichi Matsumoto, Japan] Now removed.
3177 65 22 66 7
Taken as a whole, figure 2.27 illustrates one of the fatal flaws of the six IAMs used for this first draft. The amounts of solar and wind power calculated for both 2050 and 2100 are far too low, even in scenarios where CDR technologies are used. The reasons for this must be researched and explained to the public if these results are to be relied on in the second draft, BUT THEY SHOULD NOT BE. One reason why the use of solar and wind is far to low in the future is probably because the discount rate assumed in these models is far too high - about 5% real instead of a social discount rate of 2%, or lower. Again, these models all need to be re-run with a 2% discount to determine how dramatically the results for the mix of energy technologies might change!!! [Richard Rosen, Germany]
Rejected. Far too low measured by what standard? Note also that different 1,5°C scenarios show very different levels of solar and wind energies.
14239 65 23 65 23The graph here lacks a label and seems to be missing a set of stacked bar charts on the right-hand side. [Jason Donev, Canada]
Corrected. The label other refers to other energy sources like geothermal energy
10849 66 66 2Fig. 2.27: E[R] and AE[R] scenario from Greenpeace has to be added - IEA is also there and their methodology is not better than that of Greenpeace [Christian Breyer, Finland]
Rejected. Inclusion of quantitative scenario information in figures requires submission of data to the report's database. The Greenpeace scenarios were not contributed.
17486 66 3 B [Tom Gabriel Johansen, Norway] Noted
17526 66 3 B [Angela Morelli, Norway] Noted
5233 66 4 66 4
since here only the IEA scenario is to be cited, according to the report (Notes on Page 1), it should be cited as as IEA only (not IEA/IRENA):Chapter 2 of Perspectives for the energy transition – investment needs for a low-carbon energy system ©OECD/IEA 2017 [Bianka SHOAi-TEHRANI, Japan]
Noted. The reference is IEA/IRENA, but we added a reference to Chapter 2.
4553 66 6 Add ")" [Radim Tolasz, Czech Republic] Corrected.
13218 66 9It may help to rephrase the title of section 2.4.3.3 since all visions provided in this chapter are alternative to each other. [Deger Saygin, Turkey]
Change to "Further visions" and in the text "There are a number of further visions"?
10987 66 9 66 1
Can the SSPs be used to support this point at all? [Skea Jim, United Kingdom (of Great Britain and Northern Ireland)] Noted. The SSPs are note mentioned in the subsection and are not part of content we wanted to convey here. The SSPs are more concerned with broad socio-economic developments. Broad technology can be well related to them, assumptions about individual break-through technologies less so.
6934 66 9 66 26
This is an extremely important paragraph that unfortunately is situated at the end of the chapter. The issues raised here (that are not well covered in the modelling studies apparently) deserve a much more prominent place and discussion: (1) further demand reduction in transport and manufacturing is definitely one of the options to consider in chapter 2. So move the material on this from ch 4 to ch 2 and discuss it at the appropriate place, i.e in the sections on transport and industry; (2) the role of hydrogen needs to be discussed when discussing energy supply, as there is emerging attention to power to gas (H2) in an energy asupply system with large shares of intermittent renewables; (3) Other CDR options need to be discussed in the section on CDR (as I already suggested there, moving material from ch 4 to ch 2). In other words: move the various parts of this paragraph to the respective paragraphs in the chpater so they can get proper attention. Important issues that are not covered in IAMs should not be banned to an afterthought paragraph. [Bert Metz, Netherlands]
Accepted. The section has moved into Section 2.3 before the discussion of energy and sector developments in pathways. Other CDR options are discussed in the CDR section. An extensive table on mitigation measures is included.
9241 66 9 66 26It would be great if 100% renewable scenarios could be assessed, such as the important Jacobson et al 2015 vs Clack et al 2017 (both in PNAS) debate. [Glen Peters, Norway]
Noted. The literature has now been referenced and briefly discussed (Section 2.4)
Do Not Quote, Cite, or Distribute Page 113 of 129
IPCC WGI SR15 First Order Draft Review Comments And Responses - Chapter 2
Comment No From Page From Line To Page To Line Comment Response
9307 66 1 66 11
The statement, "There are a number of alternative visions of carbon neutral energy systems with less reliance on bioenergy that are currently not yet covered by global mitigation pathway modelling" may be supported by additional references from the literature that model 100% renewable energy systems with solar, wind, and only locally available sustainable bioenergy, such as "D.F.Dominkovi?, I. Ba?ekovi?, B.?osi?, G.Kraja?i?, T.Pukšec, N.Dui?, N.Markovska, (2016) Zero carbon energy system of South East Europe in 2050, Applied Energy Volume 184, 15 December 2016, Pages 1517-1528." https://doi.org/10.1016/j.apenergy.2016.03.046 [Siir KILKIS, Turkey]
Accepted. Reference to Jacobson, 2017, has been added.
5194 66 1 66 14Include reference to the IPCC SRREN as the content is by an order of magnitude more advanced, than the content in chapter 2 in regard to energy scenarios. [Sven Teske, Australia]
Rejected. This section is not targeted to give an overview on renewable energy
5195 66 2 66 2Replace a 9-year-old reference (Zemand and Keith 2008) with a new reference (Beyer 2016, Jacobsen 2017, Teske 2015) [Sven Teske, Australia]
Accepted. Reference to Jacobson, 2017, has been added.
17428 66 22 66 23What is the net effect of BECCS without permanent storage? Delayed net emissions? Or did I got it wrong? [Tuomo Kalliokoski, Finland]
The substitution was not suggested so much based on permanence, but on a range of environmental and societal impact implications.
6163 66 24 66 24
No mention of direct biomass sequestration without trying to get energy from it, e.g. biochar sequestration, or simply storing wood in an anaerobic location (no oxidation) where it is cold (no methane production either) such as in an arctic lake. [Philip Sargent, United Kingdom (of Great Britain and Northern Ireland)]
Noted. These options are now discussed in Section 2.3.4.
2617 66 24 66 26
add more details here re: viability of these options? [Zoha Shawoo, United Kingdom (of Great Britain and Northern Ireland)] Rejected. Individual options are assessed in Chapter 4. This subsection is focused on discussing technologies not included in pathways that could change their structure if included.
7195 67
The assumption of uniform prices across countries, sectors, gases etc. fits well with the flexibility options identified in TAR WG3 Ch.10. At that time the regional policy fragmentation and the delayed implementation of global policies have been studied already. Therefore, the general introduction in line 13 "More than 10 years ago ..." is not accurate. [Nico Bauer, Germany]
Taken into account - Thanks for pointing this out. Text was revised.
1851 67 1
2.5 There is some overlap with the issues extensively discussed in Chapter 5 (SSPs, impacts of emission pathways on economy and on sustainable development etc.). All the overlapping text pieces are needed and if so, those are in coherence (in Ch.2 and Ch.5)? [Tibor Farago, Hungary]
Noted - In a nutshell, please note that the purpose of Ch2 is to assess the emerging literature on 1.5C mitigation pathways. Section 2.5 aims to highlights challenges, opportunities and co-impacts emerging this body of knowledge. When it comes to ch5, it addresses in detail the impacts of both adaptation and mitigation responses and how they interact with efforts to achieve SDGs.
1186 67 1 67 1 What are transformative mitigation pathways? The same as transformation pathways? [Petra Tschakert, Australia] Noted - Yes, both terms are used interchangeably.
10988 67 1 67 1
We keep coming back to IAMs. Are there other types of literature (socio-technical transitions) that can be used to get to the issues. The intention was never that this would be a purely modelling chapter. [Skea Jim, United Kingdom (of Great Britain and Northern Ireland)]
Taken into account - Text revised whenever available literature provide clear links with mitigation pathways. A new paragraphs has been added early in Section 2.5.1. Since the literature is very limited though, the rest of the section is dominated with IAM-type insights. However, sociotechnical aspects related to SSPs and policy aspects IAM-related studies are more clearly indicated. Conceptual aspects of socio-technical transitions are briefly treated in section 2.6.3.
6935 67 1 71 9
This section discusses a very important issue, namely non idealised model runs (using limitations the fully least cost scenarios), also elaborating on the SSP senrios that use very different socio economi futures as baselines. This materil is too important to be left to one of the final sections of the chapter. The SSP scenarios have been incorporated in the various sections earlier in the chapter, so the SSP issues should have been introduced much earlier (possibly with an appendix to cover more details). The non-optimal model runs should also be discussed in the appropriate sections earlier in thechapter and not be left to an afterthought. [Bert Metz, Netherlands]
Taken into account - While it is impossible to discuss all important aspects directly upfront in the chapter (non-optimal model runs only being one of these) we have now included a discussion of policy assumptions in scenarios in Section 2.3 so that this is introduced earlier.
14240 67 11 67 11
One challenge for a transformative mitigation pathway is people’s fear of nuclear power. The discrepancy between what people feel is dangerous (like nuclear power, small amounts of radiation etc.) and what is actually dangerous (climate change, air pollution, etc.) is creating a significant barrier to effective policies on mitigating climate change. Air pollution (indoor and outdoor combined) kills an estimated 8 million people per year, even without climate change. Nuclear power is low emissions for other pollutants too and should really be considered as part of the triple-win options. [Jason Donev, Canada]
Taken into account - behavioural aspects are or prime importance; however they are treated in detail in Ch4 (e.g. see section 4.4.5). Co-impacts of climate change policies, including air pollution are treated in Ch5.
17228 67 12 67 12
Para 2.5.1: It is important to mention about changes in policy that may occur after the facilitative dialogue in 2018 and how the 2030 scenarios will change if ambitions are enhanced in 2023 after the global stocktake. [Himangana Gupta, India]
Rejected - Thanks for mentioning this. Note, however, that these policy aspects are discussed in Ch4, which addresses "the how" and "reality checks" related to the implementation opportunities and challenges associated with a 1.5°C.
20335 67 12 68 25
In the policy discussions, carbon leakage is not mentioned, which perhaps should have a natural place for scenarios where fragmented policies are topical. The literature is vast and have many central references from last few years. [Taran Fæhn, Norway]
Taken into account - This issue is now touched upon in section 2.5.1. For further details see Chapter 4.
20330 67 12 8 27
Policy discussions in 2.5.1-2.5.2 should be introduced earlier in the chapter - before the characteristics and properties of the pathways are introduced. My suggestion follows from my two comments to CH 2 page 20-66, as I find that policy action and limitations logically appear earlier in the causality line than mitigation responses/measures taken, which are hte consequences of policies. [Taran Fæhn, Norway]
Taken into account - While it is impossible to discuss all important aspects directly upfront in the chapter, we have now included a discussion of policy assumptions in scenarios in Section 2.3 so that this is introduced earlier.
Do Not Quote, Cite, or Distribute Page 114 of 129
IPCC WGI SR15 First Order Draft Review Comments And Responses - Chapter 2
Comment No From Page From Line To Page To Line Comment Response
3178 67 12 72 32
Just summarizing the results of this IAM based research does not address many if not most of the real-world policy issues that policy makers will have to address. Also, the discussion of the SSPs does not really illuminate many policy decisions that policy makers will need to make. I would change this entire section to address more detailed real world policy issues, as discussed above. I recommend leaving out all the discussion of the SSPs, as not being very useful here. (Note that I was part of the IAMC when the SSPs were created, but I don't think they were created in a very useful way, especially if different models are used to run different SSPs. The basis for the difference in the results cannot be understood, and, therefore, they are not useful to illuminate policy decisions and choices. [Richard Rosen, Germany]
Rejected - The policy discussion in the section refers to the 1.5°C pathway literature (i.e. the policy assumptions made in these pathways). A general discussion about policies is provided in Chapter 4. Policy assumptions in the pathway literature goes well beyond the SSP-SPA assumptions and this is discussed in the Section. A discussion of the SSP-SPA assumptions is important because it shows that 1.5°C pathways can be reached under a range of these assumptions.
1531 67 12 75 37
I love that you include the idea of policy narratives, but I encourage and challenge you to go further. As Michael Grubb's book (Planetary Economics, Routledge 2015) and my own (Transforming Energy, Cambridge 2015, summarized in http://dx.doi.org/10.1016/j.erss.2017.05.023 ) both suggest, when one moves from a marginalist perspective to a system transformation perspective, the underyling economic theory providing useful insights switches from an equlibrium / optimizing one to an evolutionary and / or behavioral one. And that in turn is crucial for thinking about the entire policy narratives that are at work. As these writers have shown, as well as folks within the socio-technological transitions field, is that the nature of the policy regimes and instruments may be very different. Specifically, it may shoft us over from a preference for carbon price instruments, which work well within the optimizing framework, to technoligy support and regulatory instruments, which work well within an evolutionary or behavioral framework. I can understand your reluctance to go here, because for the latter frameworks IAMs have little useful information to offer. But my understanding of this chapter is that it is not one about IAM results, but rather mitigation pathways, for which IAMs are one of the exploratory tools. Sorry for the long comment. [Anthony Patt, Switzerland]
Taken into account - text revised in relation to socio-technical issues with direct links to mitigation pathways. The two references and the general thinking of evolutionary and / or behavioural framework is now mentioned early in Section 2.5.1, which helps highlight the limitations of policy consideration in IAMs. The aforementioned references do not seem to provide concrete insights for 1.5oC, so they are not mentioned in the Tables. Conceptual aspects of socio-technical transitions are briefly treated in section 2.6.3.
5196 67 13 67 38Delete both paragraphs. Does not add anything to the level of information provided and quotes a decade old and entirely outdated papers. [Sven Teske, Australia]
Taken into account - text was revised, shortened and emphasis on socio-technical aspects elaborated.
7196 67 18
It should be added that these scenarios form useful benchmarks since deviations from the idealized approaches induce additional problems that fall society and economy and with which policy makers have to deal. If it is assumed that such deviations cannot be avoided it is crucial to highlight that this acceptance incurs problems. [Nico Bauer, Germany]
Accepted - text has been revised in line with comment.
8006 67 3 67 31 mitigation targets is attempted to be achieved -- target [Robert Shapiro, United States of America] Editorial - corrected
11135 67 34 67 38 It seems inappropriate to speak of single model studies and then citing just one paper. [Michiel Schaeffer, Netherlands] Noted - text was revised and single study was used as example.
20334 67 35 67 38
Concerning risk of investments, more discussion could be inserted on commitment problems - see two quantifications of costs of not reducing investment risk in e.g. (i) Bosetti, V. and D. G. Victor (2011). “Politics and Economics of Second-Best Regulation of Greenhouse Gases: The Importance of Regulatory Credibility.” The Energy Journal 32(1): 1–24 and (ii) Fæhn, T. and E.T. Isaksen (2016): Diffusion of climate technologies in the presence of commitment problems, Energy Journal 37 (2), 155-180, [Taran Fæhn, Norway]
Taken into account - These issues are now captured in a new sub-section on investments. See section 2.5.2.2.
9242 67 4 67 53A table outlining the SPAs would be rather useful… Ok, Table 2.11, but something that is readable, a summary. [Glen Peters, Norway]
Taken into account - texts about SPAs and combination of SSP/SPA were revised. Key aspects are highlighted. Caption table also provides further information.
5197 67 49 67 49
Untrue. This section ignores the current RE market developments. RE is now cheaper than fossil fuel based generation and therefore expands without a price on carbon. Energy market policies such as feed-in tariffs, actioning and RPS drive the change, while carbon policies have been irrelevant for the development of RE in the energy sector over the past decade. [Sven Teske, Australia]
Rejected - It is unclear how this comment links to the text on the page and line number indicated. RE market developments are outside the scope of Chapter 2. However, even if IAMs provide a carbon price, this does not dictate the policy instrument by which these measures have to be achieved in the real world. Europe, for example, has seen a host of feed-in tariffs, and other instruments, to support RE development.
7197 67 68The distinction between (i) non-climate policies, (ii) SPAs and (iii) stabilization policies must be clarified. The reader gets confused at various instances about what the authors are actually talking. [Nico Bauer, Germany]
Taken into account - We have now clarified that the discussion refers to the SPAs and the climate (forcing) targets, i.e. to climate policy.
10989 68 1 68 9Now we're gettign to the heart of the matter! This connects to feasibility which, after all the fuss in Chapter 1, gets scant attention here. [Skea Jim, United Kingdom (of Great Britain and Northern Ireland)]
Noted
7449 68 1 7 1
Please consider presenting the characteristics of SSP3 and SSP4 in a manner similar to the presentation of SSP1, 2 and 5 in Figure 2.5. This will make assessing Tables 2.11 and 2.12 easier. It is interesting for policymakers to know the characteristics of SSPs where the SSP-SPA scenarios are unsuccessful in limiting warming to below 1.5C in 2100 (ref. Table 2.12). [Øyvind Christophersen, Norway]
Noted - More quantitative estimates and comparison between 1.5°C scenarios may be included in the next draft as more scenario design characteristics become available.
12997 68 2 2mitigation effort: in what terms? In ecnomic terms? Please specify [Caserini Stefano, Italy] Taken into account - this refers to socio-technical and economic narratives; including policy
assumptions, encompassed by the SSPs and SPAs. Text was revised.
7317 68 6 68 16The reasoning for not using SSP3 and SSP5 in the analysis should be reported earlier in the chapter. [Eleni Kaditi, Austria] Noted
12998 68 7 7
highest mitigation challenge: in what terms? In econiomic terms? Please specify [Caserini Stefano, Italy] Taken into account - this refers the mitigation challenge resulting from the combination of SSPs and SPAs and thus socio-technical and economic efforts to achieve a given climate forcing target. Text was revised.
Do Not Quote, Cite, or Distribute Page 115 of 129
IPCC WGI SR15 First Order Draft Review Comments And Responses - Chapter 2
Comment No From Page From Line To Page To Line Comment Response
11136 68 1 68 12
None of the IAMs could produce a 1.5°C scenario under SSP3/SPA3 assumptions, due to the impossibility under its policy assumptions to achieve globally coordinated mitigation action before mid-century. Actually, by looking at table 2.12 I found that in most cases this scenario was either not modelled or not attempted "because scenarios for a 2.6 Wm4 ?2 target were already found to be unachievable in an earlier study". However, I wonder if a new generation of models under the ADVANCE project, would actually lead to different results compared to earlier studies. [Michiel Schaeffer, Netherlands]
Noted - The reviewer is correct in pointing out that 1.9 W/m2 have not been attempted for SSP3 assumptions because a 2.6 W/m2 objective already turned out to be unachievable. We are not aware of any scenarios with SSP3 assumptions being developed under the ADVANCE project. However, the strong challenges to mitigation in SSP3/SPA3, particularly the assumption of delayed implementation of mitigation policies in developing countries (only being phased in fully by 2050) result in a large CO2 budget being emitted until then. In light of all evidence, the amount of CDR required to compensate for these emissions would not be able to scale up sufficiently rapidly in the second half of the century.
5198 68 12 68 12
There are no globally coordinated energy policies yet. And I would doubt, that this will ever be implemented. In contrast community based and decentralised energy policies drive the majority of low carbon development. This needs to be reflected in this paragraph. [Sven Teske, Australia]
Taken into account - text revised in line with SSPs and SPA. Note that policies in practice (i.e. outside integrated mitigation pathways in Ch2) are treated in Ch4.
7316 68 13 68 14Delete the text "locked in". [Eleni Kaditi, Austria] Rejected - this is a result from IAMs studies and thus reflects an important challenge that the
existing literature points out.
10447 68 28 71 2
2-68 lines 1-28 (and 2-71 lines 12-20) is noticeably more pessimistic about the prospects of keeping within 1.5 (in the real world NB) than the earlier sections of this chapter. If this is a correct reading then maybe this needs to be spelled out/contrasted/highlighted more clearly [Jonathan Lynn, Switzerland]
Taken into account - text was revised and needs to be read in terms of the critical conditions or assumption that mitigation pathways and related policy regimes compatible with 1.5C entail. This is the purpose of section 2.5.
4174 69
Table 2.11: If there is to be a reduction in the use of coal and traditional biomass, what energy source will substitute? You can't simply reduce it without replacing it. This leads me to question the claim of reducing energy demand due to efficiency and behavioural changes. In order to lift people out of poverty, they require electrification (energy) -it's tied into economic growth, health etc. If there are over a billion people living either in energy poverty or without access to energy at all, how will behavioural changes limit energy demand when in order to meet the SDGs we need to supply energy to those people who don't have it? Additionally, behavioural changes will not be available to some. In Northern Canada for example, it gets dark early in the winter time and there is a lot of energy required for heat-this demand will exist into the future because the amount of sunlight will not change and the temperature will not warm up that dramatically that the need for heat will be eliminated. Weather and climate drive most of the energy demand. Additionally, increasing energy costs in order to drive behavioural changes will only deviate from the SDGs, even in developed countries, where people will become poorer trying to pay for energy. It also goes against SDG goal 7: Affordable and Clean Energy. [Michelle Leslie, Canada]
Noted - Table 2.11 highlights important SPAs/SSPs assumptions, and therefore resulting mitigation challenges in the IAM literature. For aspects related to behavioural issues and energy use please see Chapter 4. For aspects related SDGs, poverty, energy access, etc. see Chapter 5.
7059 69 What do (F1), (F2),.., (LP), etc. mean? [Érika Mata, Sweden] Taken into account - text is now included in the caption.
4554 69Tab 2.11, row 4, col 2 - change format of US currency "1260 US$" to be consistent with the whole Report (see p. 2-79) [Radim Tolasz, Czech Republic]
Editorial - corrected
10448 69 7 table 2.11 what are the bolded letters F1 F2 LD LP etc? [Jonathan Lynn, Switzerland] Taken into account - text is now included in the caption.
10990 69 1 69 1
Can we build feasibility into this table? [Skea Jim, United Kingdom (of Great Britain and Northern Ireland)] Rejected - the report employs a working definition of feasibility which presents enabling conditions without making a definite statement on what is "Feasible". It is unclear to the authors how feasibility can be built into the table. Each SSP could be assessed based on its plausibility, but that would entail a political value judgment on international cooperation and level of ambition of countries. This, the authors feel, lies outside the expertise and mandate of the author team.
5199 69 1 69 2Table 2.11: Add SSP 0 - / column 3: "Increasing shares of renewable (without "and other low carbon energy carriers") [Sven Teske, Australia]
Rejected - SSP1 and SSP4 scenarios develop toward renewable and nuclear sources.
5712 69 1 7 1 In Table 2.11, F1, F2, LP, LD, LN, and LP need to be explained in the caption. [Hong Yang, Switzerland] Accepted - text is now included in the caption.
14182 71 1 71 1 Table 2.12, regarding the GCAM4 line, it should be Partial Equilibrium ("PE"). [Alexandre Strapasson, Brazil] Editorial - text was corrected.
10991 71 1 71 1
Feasibility concept!! [Skea Jim, United Kingdom (of Great Britain and Northern Ireland)] Noted - the report employs a working definition of feasibility which presents enabling conditions without making a definite statement on what is "Feasible". It is unclear to the authors how feasibility can be built into the table. Each SSP could be assessed based on its plausibility, but that would entail a political value judgment on international cooperation and level of ambition of countries. This, the authors feel, lies outside the expertise and mandate of the author team.
10449 71 6 71 6
in table 2-12 caption is “Marker implementations of each SSP1 are indicated in blue” correct i.e. is there more than one SSP1? [Jonathan Lynn, Switzerland]
Taken into account - Yes, there are, as each IAM produced one. The SSP1 from a single IAM is then chosen as the marker, with the 5 SSPs distributed across the participating IAMs (so no particular reason any SSP was assigned to a specific IAM as the marker).
7060 71 8 9 What do GE, OE, PE mean in table 2.12? [Érika Mata, Sweden] Editorial - GE: general equilibrium, PE: partial equilibrium, etc. See column "methodology".
1187 71 11 71 2
This paragraph requires a cross-reference with section 5.6.2.1 (Enabling conditions and challenges for achieving triple-win outcomes) where we discuss the implications of integrated policy response measures for achieving stringent climate and development objectives together. [Petra Tschakert, Australia]
Accepted - text was revised and cross reference with Ch5 are provided.
Do Not Quote, Cite, or Distribute Page 116 of 129

IPCC WGI SR15 First Order Draft Review Comments And Responses - Chapter 2
Comment No From Page From Line To Page To Line Comment Response
6936 71 11 75 37
As I suggested in my comments on the structure of the entire report, the question of "how" to make staying below 1.5C a relity should be concentrated in ch4. That gives ch 4 a clear purpose, eliminates overlap and allows for an integrated discussion on policy instruments. So move this whole section to Ch4 with the exception of some paragraphs that are not on policy, such as page 71 lines 12-20 (that are on the risk of inadequate coverage or delay, clearly belonging to the "where" and "when" question that is the heart of ch 2), page 72, lines 2-4 (on climate sensitivity), page 75, lines 1-16 (that is on behavioural/ lifestyle options to reduce emissions; clearly a "what" question) and page 75 lines 18-37 (a discussion on uncertainties in options to reduce emissions, clearly belonging in ch 2). [Bert Metz, Netherlands]
Rejected - Please note that these aspects focus on the outline of the entire report and related decisions. Chapter 2 deals with challenges and opportunities related to mitigation pathways, including sustainability issues. It does so by focusing on modelling studies (and related assumptions) addressing mitigation only. Ch4 addresses feasibility aspects ("reality checks") and implementation issues ("how") of both mitigation and adaptation options. Both teams continue communication efforts to reduce overlaps and increase division of labour. Cross referencing is under constant improvement.
5200 71 12 71 2
I challenge this statement. Community, state and private driven initiatives contributed most to the development of the RE industry (especially feed-in tariffs). The models do not reflect this, which is biased and unscientific. [Sven Teske, Australia]
Noted - please see Chapter 4 for aspects related to feasibility options in real-life settings, including the role of different actors and multi-level governance.
15034 71 13 71 13high robust, ambitious, and urgent transformative policy regimes -- too many characteristics here -- perhaps just "ambitious policy regimes"? [Farhan Akhtar, United States of America]
Editorial - text revised.
2472 71 24 71 27Technology alone won't save us; it is critical that people change how they think and act. [Lisa Lucero, United States of America]
Accepted - text revised and behaviour explicitly acknowledged. Please note that behavioural change is covered extensively in Ch4 (see e.g. section 4.4.5).
15035 71 26 71 27
Aggressive policies addressing energy demand appear to be central to keeping 1.5C within reach… -- this appears to be a key message; but the Exec Summ only focuses on energy supply. Would be good to bring out energy demand aspects as well. [Farhan Akhtar, United States of America]
Accepted - The Exec Summary has gone through major revisions and more aspects are highlighted, including policy issues related to energy demand.
13219 71 3Energy CO2 emissions have remained flat in the last couple of years. This may be mentioned here in relation to the peaking of global emissions by 2020. [Deger Saygin, Turkey]
Taken into account - text revised based on the latest from Global Carbon Budget figures.
15036 71 4 71 42
technology policies could have an important role… uptake of zero carbon technologies in the shorter term but that in the longer term, strong carbon pricing mechanisms seem to be necessary… -- another important message, could bring out more clearly in exec summ. But needs to be done in a way that's not policy prescriptive. [Farhan Akhtar, United States of America]
Accepted - The Exec Summary has gone through major revisions and more aspects are highlighted, including carbon pricing.
6273 72 72
Table 2.3. The largest GHG industrial emiters- cement and steel- are conservative and slow moving. That fact should be mentioned in the summary. [Milton Nogueira da Silva, Brazil]
Clarification - there is no table 2.3. in sections 2.5.1.1/2. If this refers to Table 2.13, please note that this is based on available literature. For sectoral issues see section 2.4. and Chapter 4.
21140 72 7 72 9add cite - Xu and Ramantahn 2017, Well below 2C: Mitigation strategies for avoiding dangerous to catastrophic climate changes, PNAS doi/10.1073/pnas.1618481114 [Nathan Borgford-Parnell, Switzerland]
Taken into account - literature was assessed and REF included.
10666 72 7 72 9Additional citation to Xu and Ramanathan 2017, Well below 2°C: Mitigation strategies for avoiding dangerous to catastrophic climate changes, PNAS, doi/10.1073/pnas.1618481114. [Kristin Campbell, United States of America]
Taken into account - literature was assessed and REF included.
13220 72 1 11It would also help to mention the cost of mitigation with bioenergy with and without BECCS. [Deger Saygin, Turkey] Noted - we continue updating the SR1.5C databased with reported modelling results, including
mitigation costs.
2225 72 25 72 25Unclear what is meant by "practical policy point of view". How is this different from "practical point of view"? [Kenneth Möllersten, Sweden]
Taken into account - text revised. It means policy making in practice. See also Chapter 4, where policy implementation in practice is discussed.
9948 72 28 The word "related" appears in a different font [Olga Alcaraz, Spain] Accepted - text was revised and suggestion included.
15037 72 28 72 31Long and generalized sentence -- not clear what this means -- concern over references to "real word perspective; including historical precedents". [Farhan Akhtar, United States of America]
Taken into account - text revised and links to Ch4 where how policies work in practice; including historical performance, are treated.
2226 72 29 72 3 Acceptance/public perception is missing [Kenneth Möllersten, Sweden] Editorial - text added
20270 72 35 Suggest spelling out "Integrated Assessment Models" in the sub-section title [Aaron Glenn, Canada] Editorial - IAM is spelled out
13221 72 35In this section it will help the reader to understand what would have happenned if excluded technology options are also included in the assessment. [Deger Saygin, Turkey]
Noted - we continue updating the SR1.5C databased with reported modelling results, including mitigation costs.
10850 72 36 72 45
Sorry, but this excuse is rather weak. The Greenpeace E[R] scenarios are available since many years and they had always much higher solar energy numbers. It may be also that the narrow-minded view on typically MUCH too conservative IAMs blocks a broader view. More self-criticism would be helpful in this paragraph. See also the critique of Creutzig et al. (DOI: 10.1038/nenergy.2017.140), Schellnhuber et al. (2016; nature climate change, 6, 649) and Breyer et al. (DOI: 10.1002/pip.2885), all missing in this chapter and all focussing too conservative IAMs scenarios, in particular in the field of solar PV. [Christian Breyer, Finland]
Taken into account - There is such a discussion that is referred to in the last sentence of this paragraph. Creutzig et al. is now included. Please see also section 2.3 for 100% renewables mitigation portfolios.
12999 72 37 37 add "scenario" after "1.5°C" [Caserini Stefano, Italy] Accepted - suggestion was included.
6488 72 38 72 38 Replace colon with comma [Roger Bodman, Australia] Editorial - corrected.
6489 72 39 72 39 mode' should be 'model' [Roger Bodman, Australia] Editorial - corrected.
6490 72 4 72 41 Replace 'like' with 'such as' and/or 'e.g.' [Roger Bodman, Australia] Editorial - corrected.
3179 72 41 72 43
Part of the reasons the IAMs relied on for this first draft under-estimate the penetration of solar and wind is because artificial constraints are included in most if not all the models. Without clear documentation of what those constraints are, which does not exist, presenting the earlier results that I have already commented on is completely unacceptable. As I am sure the IAM teams know. Felix Creutzig and others have received published analyses revealing why the many constraints and cost assumptions in the IAMs are not justified. [Richard Rosen, Germany]
Noted - See the Special Section on "Variable Renewable Electricity and Power Sector Dynamics in Integrated Assessment Models" in Energy Economics (Vol 64, pp. 542-684, 2017) for an extensive discussion of the current state of the art of solar and wind energy treatment in IAMs.
Do Not Quote, Cite, or Distribute Page 117 of 129

IPCC WGI SR15 First Order Draft Review Comments And Responses - Chapter 2
Comment No From Page From Line To Page To Line Comment Response
11026 72 41 72 45
As a note of caution, authors should mention that while costs and output of renewable energy technologies might have vastly outperformed earlier expectations, the share of RES (including hydro) in overall energy demand has only risen by 1-2 percentage points during the last 10 years [Oliver Geden, Germany]
Taken into - a footnote was included and links Ch4, where policies and technology issues (e.g. RET deployment) are treated in practice, are given.
5201 72 41 72 45 This underscores the need for 100% renewable 1.5 mitigation pathways in the AR6. [Sven Teske, Australia] Noted - see also sections 2.3.2 and 2.3.5
9308 72 41 72 45
The statement, "solar photovoltaic installations and renewables, has been consistently underestimated by key experts" may be supported by additional references, including "Haas, R., Lettner, G., Auer, H., Duic, N., The looming revolution: How photovoltaics will change electricity markets in Europe fundamentally, Energy, Volume 57, 2013." https://doi.org/10.1016/j.energy.2013.04.034 [Siir KILKIS, Turkey]
Noted - more literature addressing this issue has been reviewed.
7163 72 47 72 52Consider putting this paragraph and the table 2.13 in the context of SSPs. As write it suggests that for all SSP these transitions are similar, contradicting, for example, what is presented I figure 2.5 [Iulain Florin VLADU, Germany]
Noted - the text about SSP/SPA has gone under extensive revision.
11027 72 5 74table 2.13 is not providing info on what "is already happening", talking only about the future [Oliver Geden, Germany] Noted - Please see Ch4, which deals with policy, technology and social aspects (among others)
in practice.
4175 73
Table 2.13: Most urban centers have old infrastrucutre IE: Europe. Who would support the cost of making infrastructure carbon-neutral for individuals and communities to ensure they aren't prohibitive or resulting in worsening the daily conditions for citizens? [Michelle Leslie, Canada]
Noted - Please see Ch4, which deals with policy, technology and social aspects (among others) in practice; including urban aspects (section 4.3.4.).
20641 73
Table 2.13: The phase out of combustion engines seems premature in light of net emission free use of synthetic gas (methane) from power to gas technologies? In countries still using coal the net CO2 emission of e-vehicles is higher? [Hans Poertner, Germany]
Noted - The studies assessed in Table 2.13 identify crucial steps in key sectors mainly at global scale, grounded in published scenarios combined with expert judgment, including feasibility analysis/ signs for those transitions. For specific technologies, regional details and feasibility "in practice" see Ch4.
3886 73 73Table 2.13: "Coal will be about to exit the global energy mix by the end of 2020." Could this be formulated more clearly ? Exit by 2030 ? Exit before 2030 ? [Sanna Syri, Finland]
Editorial - text revised.
10339 73 73The transitions on the land are not limitted to afforestation… why the column in the table 2-13 is so narrowly labeled as afforestation? [Maria Jose Sanz Sanchez, Spain]
Taken into account - text revised and land use included.
917 73 73
Table 2.13 ((Rockström et al. 2017) includes some very ambitions assumptions, like no coal from 2020, and building construction carbon neutral or negative by 2030. These may be seen as completely infeasible: for example 2020 is 3 years off and India's coal consumption is growing at an increasing rate, China's is decreasing but nowhere near the rate required to meet this assumption. If the model assumptions are infeasible the model results are not credible. [David Infield, United Kingdom (of Great Britain and Northern Ireland)]
Noted - The studies assessed in Table 2.13 provides no guarantees but identifies crucial steps, grounded in published scenarios combined with expert judgment, to capture transformative change, disruption and nonlinear change in human behaviour. These studies include feasibility analysis/ signs.
2473 73 1 73 1
Add column to Table 2.13 on how relates to people/groups/society [Lisa Lucero, United States of America] Rejected - Table 2.13 synthesizes quantitative sectoral-level insights in key sectors at global scale, as identified in the cited studies. Societal transitions are framed in 2.6.3 in Ch2 but treated in detail in Ch4. Co-impacts of climate policies on societal subsystems are treated in Ch5.
11137 73 1 73 2
Missing information regarding the energy sector transformation from the Climate Action Tracker (which can be found in the "10 steps" study). Note also the study is in review at Climate Policy (Kuramochi et al (in review) "Ten key short-term sectoral benchmarks to limit warming to1.5°C") [Michiel Schaeffer, Netherlands]
Accepted - Thanks for pointing out this! Kuramochi et al. study has been cited in Table 2.13 together with other insights from Climate Action Tracker insights (please note that as compared to the current response in the Excel file, this "10 steps" study is not really sociotechnical).
6164 73 2 73 2
Superconducting cables in developing countries: this is far too specific a technology to deserve to appear in this document. It is also mind-numbingly idiotic, and I speak as a former managing director of a superconductors company. Long-distance superconducting cables do not save energy: they still need refrigeration. Also they have to be DC not AC because AC and superconductors don't mix well: there is an additional magnetci dissipation (i.e. energy loss). Established HVDC cables or overhead 1MV pylons are best - ditch the mention of superconducting cables. (But superconducting fault current limiters as components of smart grids are an excellent technology - but for capital cost reasons, not energy saving.) [Philip Sargent, United Kingdom (of Great Britain and Northern Ireland)]
Noted - The studies assessed in Table 2.13 identify crucial steps in key sectors mainly at global scale, grounded in published scenarios combined with expert judgment, including feasibility analysis/ signs for those transitions. For specific technologies, regional details and feasibility "in practice" see Ch4.
7061 74
I see that here there are some sectorial details, but not regional which are the most relevant. Also, do the authors want to comment on the likelihood of these transitions to happen? E.g. 3% annual building renovation to NZEB by 2020 is simply impossible, let alone globally. Renovation rates are rather high in Sweden, yet still at 2% and definitely not to NZEB standard, with the unnavailabiliy of workmaship - not funding - being a key limiting factor according to a recent study (Mata et al., 2017, Dynamic modelling of renovation scenarios for the existing multifamily buildings in Gothenburg up to year 2050). [Érika Mata, Sweden]
Noted - The studies assessed in Table 2.13 provides no likelihood but identifies crucial steps in key sectors, grounded in published scenarios combined with expert judgment, required in the short term for a 1.5°C pathway, including feasibility analysis/ signs for those transitions. These set of studies do not provide regional detail. For regional details and feasibility "in practice" see Ch4.
4555 74 Tab 2.13, row 4, col 5 - Add explanation of "BAU" and add "q" to "CO2e" [Radim Tolasz, Czech Republic] Editorial - text was added.
4556 74 Tab 2.13, row 5, col 4 - Add explanation of "EV". [Radim Tolasz, Czech Republic] Editorial - text was added.
15038 74 74
Table entries on LCTPi and Mission 2020: why include these and not others (eg SE4ALL)? Appears policy presecriptive to hand pick short term global policy goals from non-government actors. [Farhan Akhtar, United States of America]
Taken into account - Table 2.13 synthesizes recent studies that provide signs of the magnitude of the transitions required in the short term to keep the door open for a 1.5°C pathway. SE4ALL does not describe the transitions that are deemed necessary in key sectors in the short term for a 1.5°C pathway, as the other studies included in this table.
Do Not Quote, Cite, or Distribute Page 118 of 129
IPCC WGI SR15 First Order Draft Review Comments And Responses - Chapter 2
Comment No From Page From Line To Page To Line Comment Response
12465 75
Does social cost of carbon estimate consider historical carbon emission responsibility/liability? [Dr Noim UDDIN, Australia] Taken into account - Cumulative emissions and resulting atmospheric concentrations are captured in the 'climate system' module of IAMs relating CO2 emissions to temperature change (see sections 2.2 and 2.6)
17436 75 77
Not only the scientific approach for estimating a social cost of carbon should be mentioned, but also current cost etmiates : National Academies of Sciences, Engineering, and Medicine. 2017. Valuing Climate Damages: Updating Estimation of the Social Cost of Carbon Dioxide. Washington, DC: The National Academies Press. https://doi.org/10.17226/24651. [Aki Kachi, Germany]
Noted - Please note that CBA-IAM literature and SCC estimates (and further conceptual details) will be assessed in Chapter 3 to the extent it pertains to the subject of 1.5°C warming.
10450 75 77 box 2.1 very dense for the non-(economic) specialist [Jonathan Lynn, Switzerland] Noted - We continue improving the text.
2781 75 77
Box 2.1 is a long discussion of cost-benefit analysis and the social cost of carbon that is not relevant for this chapter and probably not needed for the 1.5oC Special Report. Chapter 1 concludes that cost-benefitrt analysis is not appropriate. The whole report and chapter 2 in particular focuses on pathways and scenarios for 1.5oC and 2oC. The relevant concept is cost effectiveness which is discussed in Box 2.2. I don't think all of that material is needed and the box or text might be better placed earlier in the chapter, for example p. 7 line 13 [Erik Haites, Canada]
Noted - Whereas Ch2 deals with mitigation costs (and thus cost-effective analyses of mitigation pathways), mitigation benefits (or avoided costs) also deserve attention. The IAM-CBA literature on SCC will be assessed in Chapter 3 to the extent it pertains to the subject of 1.5°C warming. Box 2.1. aims to introduce and frame these key issues. For Further details about SCC see Ch3.
12757 75 1 75 1 It is very unclear what "modelling in traditional silos" means… [Vassilis Daioglou, Netherlands] Taken into account - Text revised and changed to "modelling of individual sectors".
13000 75 5 5Please consider that it is true that a correct urban planning could reduce GHG emission, but if a city is already built, the effect of land planning is less relevant [Caserini Stefano, Italy]
Noted - See Chapter 4 for details about urban related issues.
1561 75 9 75 11This is an important message that should appear in the summary of the chapter [Noé Lecocq, Belgium] Accepted - The Exec Summary has gone through major revisions and more aspects are
highlighted, including policy issues related to energy demand.
4245 75 13 75 16
and because of endogenous preferences that render benefits and costs context-dependend (Mattauch, L., Ridgway, M., & Creutzig, F. (2016). Happy or liberal? Making sense of behavior in transport policy design. Transportation research part D: transport and environment, 45, 64-83.) Note also that Creutzig 2016 is probably meant to be Creutzig et 2016 (Creutzig, Felix, et al. "Beyond technology: demand-side solutions for climate change mitigation." Annual Review of Environment and Resources 41 (2016): 173-198) [Felix Creutzig, Germany]
Taken into account - Text revised and REF was fixed. Please note that behavioural aspects related to transport are treated in Ch4.
6165 75 2 75 2 beliefs not "believes" [Philip Sargent, United Kingdom (of Great Britain and Northern Ireland)] Editorial - corrected.
6491 75 2 75 2 Change 'believes' to 'beliefs' [Roger Bodman, Australia] Editorial - corrected.
12758 75 2 75 2 beliefs and preferences [Vassilis Daioglou, Netherlands] Editorial - corrected.
10493 75 2 75 21
The "aforementioned" behavioural changes are (line 6- 7) dietary shifts towards more healthy nutrition and food waste reduction besides improved livestock management. This should have effects not only on methane emissions but also on emissions of N2O and CO2 since less area and N-fertilizer is needed to satisfy human needs for food. [Harold Leffertstra, Norway]
Noted - Please note that behavioural aspects and related impacts (e.g. dietary changes and emissions) are treated in Ch4 and 5.
6492 75 23 75 23which reference … ' sentence is garbled [Roger Bodman, Australia] Accepted - "reference" refers to baseline or counterfactual. Text revised "because of
uncertainties in the baseline emission trajectories".
6493 75 26 75 26 Add commas ', in line with historical experience, ' [Roger Bodman, Australia] Editorial - corrected.
9309 75 31 75 31 The word "keep" in "assume keep air pollution emissions or control standards" should be "keeping." [Siir KILKIS, Turkey] Editorial - corrected.
6494 75 31 75 31and assume keep air pollution' needs re-writing in some way, eg, move keep along and write as 'are kept at some historical level' [Roger Bodman, Australia]
Taken into account - text revised in line with suggestion.
6495 75 33 75 33 Assumptions' [Roger Bodman, Australia] Editorial - corrected.
17737 75 4 77 14
Box 2.1. It could be useful also to mention that SCC estimates typically increases with increasing temperatures. [Göran Finnveden, Sweden]
Noted - Please note that CBA-IAM literature and SCC estimates (and further conceptual details) will be assessed in Chapter 3 to the extent it pertains to the subject of 1.5°C warming.
17738 75 4 77 14
Box 2.1. It could be useful also to mention that estimates of SCC and abetment costs typically increases with time, so that estimates for 2050 are higher than for 2015. See e.g. Ackerman and Stanton (2012) cited in the report and Isacs et al (2016): Journal of Cleaner Production, 127, 37-48. http://dx.doi.org/10.1016/j.jclepro.2016.03.163 [Göran Finnveden, Sweden]
Noted - Please note that CBA-IAM literature and SCC estimates (and further conceptual details) will be assessed in Chapter 3 to the extent it pertains to the subject of 1.5°C warming.
17739 75 4 77 14
Box 2.1. Could be useful alos to mention that there are estimates also significantly higher than 100 US dollars/tCO2 (see references in previosu note). [Göran Finnveden, Sweden]
Noted - Please note that CBA-IAM literature and SCC estimates (and further conceptual details) will be assessed in Chapter 3 to the extent it pertains to the subject of 1.5°C warming.
9554 75 4 77 14
Box2.1: This illustration is quite important because many IAMs only conisider "cost minimum" criteria to choose technology,which not always be the selection criteria of staleholders.Also, it can be a bridge to SDGs. The relation with SDGs are not well mentioned in the last 6 lines. It is better to refer to some trial studies already done on relations between IAM with and SDGs (P.R.Shukla's work indicated that if all the SDGs are well attained, low carbpn world is automatically reached) [Shuzo Nishioka, Japan]
Noted - text revised. See Ch5 for specific treatment of SDGs and impacts of mitigation on sustainable development.
3180 75 4 77 14
Box 2.1 on the social cost of carbon should be eliminated. It is unnecessary to a report that is not supposed to rely on cost/benefit analyses. Also, this box is not clear that one of the major determinants of the social cost of carbon is the discount rate assumed in the model, even though it briefly mentions the discount rate on page 76, line 54. It does not even state what discount rate was used to get these numbers for the social cost of carbon, nor how the results would change using a lower social discount rate. [Richard Rosen, Germany]
Noted - Whereas Ch2 deals with mitigation costs (and thus cost-effective analyses of mitigation pathways), mitigation benefits (or avoided costs) also deserve attention. The IAM-CBA literature on SCC will be assessed in Chapter 3 to the extent it pertains to the subject of 1.5°C warming. Box 2.1. aims to introduce and frame these key issues. For Further details about SCC see Ch3.
Do Not Quote, Cite, or Distribute Page 119 of 129

IPCC WGI SR15 First Order Draft Review Comments And Responses - Chapter 2
Comment No From Page From Line To Page To Line Comment Response
9581 75 4 77 14
Box2.1: This illustration is quite important because many IAMs only conisider "cost minimum" criteria to choose technology,which not always be the selection criteria of staleholders.Also, it can be a bridge to SDGs. The relation with SDGs are not well mentioned in the last 6 lines. It is better to refer to some trial studies already done on relations between IAM with and SDGs (P.R.Shukla's work indicated that if all the SDGs are well attained, low carbpn world is automatically reached) [Shuzo Nishioka, Japan]
Noted - text revised. See Ch5 for specific treatment of SDGs and impacts of mitigation on sustainable development.
2509 75 52 75 54
National Academies of Sciences, Engineering and Medicine 2017 is a more comprehensive examination of the SCC than the interim 2016 report.
National Academies of Sciences, Engineering, and Medicine (2017). Valuing Climate Damages: Updating Estimation of the Social Cost of Carbon Dioxide. The National Academies Press, 394 pp. doi:10.17226/24651. [Robert Koppu, United States of America]
Noted - Please note that CBA-IAM literature on SCC estimates (and further conceptual details) will be assessed in Chapter 3 to the extent it pertains to the subject of 1.5°C warming.
20937 75 56 76 7
It would be advisable for this chapter to clarify the conceptual scope of future generations used to formulate the Social Cost of Carbon (SCC) concept. [Erick Pajares, Peru]
Noted - Please note that that intra- and inter-generational issues from an integrated economic and ethical perspective are treated in detail in the 5th Assessment Report (see Chapter 5), which we duly integrate and reference. In addition, please also note that CBA-IAM literature and SCC estimates (and further conceptual details) will be assessed in Chapter 3 to the extent it pertains to the subject of 1.5°C warming.
21106 76 11 76 12
I do not understand how the social cost of an emission _reduction_ (as written) can be equal to SCC, in the context of CEA. Are you refering to a different definition of SCC (related to the shadow price of carbon) ? Please check and adapt or clarify. In addition, I do not have the impression that the text provides a suffiently clear definition of "shadow price of carbon", which is important since that wording is used in later paragraph. [Philippe Marbaix, Belgium]
Taken into account - We changed the wording to make clear that the marginal emissions reduction costs only equal the SCC in the CBA case. In the CEA case they equal the shadow price of carbon under the target.
2510 76 11 76 12
The social cost of carbon is the monetized impact on expected welfare of a marginal emission of CO2, expressed in terms of money per ton. This is the definition of the SCC. The shadow price of carbon under an emissions constraint is not the social cost of carbon, except in a first-best optimized carbon policy. [Robert Koppu, United States of America]
Accepted - We have clarified the language in the box.
17329 76 14 CEA, not CBA [Young-Hwan Ahn, Republic of Korea] Noted - CBA is meant. We clarified the meaning.
21107 76 14 76 15
It may not be fully clear for the reader that the entire paragraph is about CEA, so I suggest that you consider clarifying this sentence to make clear that it is about CEA, for example: In CEA, value judgments are to a large extent concentrated in the choice of climate goal, while they are (more ?) explicit in CBA. [Philippe Marbaix, Belgium]
Accepted - Sentence adjusted.
3689 76 22 76 24
Pindyck (2017) argues not only lack of empirical basis, but that there is no theoretical basis: “when it comes to the damage function, we know virtually nothing—there is no theory and are no data that we can draw from". Pindyck, R S 2017. The use and misuse of models for climate policy. Review of Environmental Economics and Policy 11 (1): 100-114 DOI: doi.org/10.1093/reep/rew012 [Harald Winkler, South Africa]
Taken into account - The literature on limitations of damage functions (concerning their use in practice and their theoretical challenges) is cited in the box.
6496 76 28 76 45
A discussion or reference to the damage function used in CBA IAMs is needed somwhere, noting limitations/sensitivity to the form of the function (eg quadratic, cube) eg Dietz and Stern (2014) CCCEP Working Paper 2014 [Roger Bodman, Australia]
Taken into account - The literature on limitations of damage functions (concerning their use in practice and their theoretical challenges) is cited in the box.
20271 76 29 Delete "integrated assessment models" and parentheses around IAMs [Aaron Glenn, Canada] Rejected - The box should be readable as a stand alone text.
954 76 38 76 41
A recent paper published in Climatic Change also indicates that the SCC and damage functions have been underestimates due to bias towards finding a stronger cold weather impact on mortality. This infers that decreases in cold-related mortality has overcompensated for increases in heat-related mortality. This paper is: Huber, V., Ibarreta, D., & Frieler, K. (2017). Cold-and heat-related mortality: a cautionary note on current damage functions with net benefits from climate change. Climatic Change, Vol. 142, No. 3-4: 407-418. [Thomas Longden, Australia]
Noted - Impact literature will be assessed in Chapter 3.
21108 76 47 76 55
This is a very interesting paragraph. To what extent does it imply that, taking into account the limitations in comparability of the approaches and uncertainties, some CBA results involves mitigation levels that are of the same order as what is found in cost-efficient 1.5 or 2°C pathways? It may be more policy relevant if it can be expressed in this manner. It is also a little unclear to what extent prices becomes comparable only when all assumptions leading to high SCC are taken into acount _together_ (= both a low discount rate and a high inequality aversion, in particular) [Philippe Marbaix, Belgium]
Noted - This will be further explored in the next round of the drafting when the literature on 1.5°C pathways and SCC estimates is consolidated.
12464 77Carbon price cant be a matric to assess economic implications. While we don’t not have a global price for common goods, its not understadnable how such price signal should be or could be realised. [Dr Noim UDDIN, Australia]
Noted - for feasibility aspects of carbon pricing see Chapter 4.
10451 77 78box 2.2 ditto, though to a lesser extent. Is it saying that mitigation costs are not really costs, just less growth than otherwise would have been the case? This needs to be spelled out more clearly [Jonathan Lynn, Switzerland]
Taken into account - text in Box 2.2 was revised.
17439 77 4 77 5
Stiglitz and Stern also make specific global price ranges for Paris compatible carbon pricing ranges: US$40–80/tCO2 by 2020 and US$50–100/tCO2 by 2030. These price ranges should be mentioned. Stiglitz & Stern (2017). Report of the High Level Commission on Carbon Prices. [Aki Kachi, Germany]
Accepted - text revised and figures included in section 2.5.2 when carbon pricing is explicitly addressed. Further details in Chapter 4
3712 77 13 77 13 Replace "Paris Agreement (Article 108)" with "Paris decision (para 108)" [Harald Winkler, South Africa] Editorial - corrected.
Do Not Quote, Cite, or Distribute Page 120 of 129

IPCC WGI SR15 First Order Draft Review Comments And Responses - Chapter 2
Comment No From Page From Line To Page To Line Comment Response
9838 77 17
The literature (K. Akimoto, F. Sano, T. Tomoda, GHG emission pathways until 2300 for the 1.5 C temperature rise target and the mitigation costs achieving the pathways, Mitigation and Adaptation Strategies for Global Change, Published online Sep. 5, 2017) provides the mitigation cost estimates for the 1.5 C pathways. This should also be referred. [Keigo Akimoto, Japan]
Taken into account - we continue assessing available 1.5C literature.
6371 77 17
I'm missing some good figures and tables in this section that summarise the cost implications, including how much costs increase relative to 2 degree pathways, and the extent to which costs depend on underlying socio-economic development. The spaghetti diagram on Fig 2.28 is not helpful, not least because the scale is dominated by a single outlier and other lines are to distinguished by socio-economic context. This will be very important information and at the moment it seems very hard to extract. Maybe that's deliberate because the authors feel that a myopic focus on costs is inappropriate, but people will want this information very clearly so it's better if the authors present this in effective ways. [Andy Reisinger, New Zealand]
Taken into account - The latest carbon pricing data submitted to SR1.5C database is now presented, including a new figure and new class of scenarios. Note, however, that text that compares both 1.5 and 2C was available in the FOD: p.78, line 53, and p.79 lines 1-24").
20336 77 17 77 32 It seems that Box 2.1. and Box 2.2. are interchanged [Taran Fæhn, Norway] Editorial - corrected.
12105 77 17 77 4
This para explains price and cost but it does not clearly mention about the difference of abatement cost, such as marginal abatement cost and average abatement cost. At policy debate, I feel that there is some misleading explanation (sometime it is intentionally did). Some additional explanation is better to be here. [Takashi Hongo, Japan]
Accepted - text revised and distinction made. See also Box 2.1 on the economics of 1.5C pathways.
21311 77 17 8 1
Section 2.5.2 should not be titled "Economic implications of 1.5 degree scenarios" because while carbon prices can be an imperfect proxy for mitigation costs, they are not a useful proxy for economic impacts of mitigation. Studies consistently show that if the revenues from carbon prices are used in productive ways, the economic impact of these policies is small, and can be positive or negative. In addition, there is a broad consenses that smart actions to improve energy efficiency and to invest in technological progress can drive more rapid economic growth by overcoming existing market barriers. The current discussion will give the reader the misleading impression that higher carbon prices lead to not only larger mitigations costs but also worse economic outcomes. The caveats provided in the textbox are not sufficient-- this should be central to any discussion of economic impacts. [Jan Corfee-Morlot, France]
Taken into account - section title slightly modified also to accommodate new sub-section on investments. Please note that discussions about social costs of carbon and avoided externalities (i.e. benefits of climate mitigation) will be treated in Ch3. Furthermore, please also note that the performance (ex-post) of carbon prices and energy efficiency measures is addressed in Ch4.
6938 77 17 8 22
I miss a thorough discussion of the maxro-economic impacts of 1.5C scenarios. That would be much more relevant than the lengthy discussion on carbon prices (a result of the way models work and irrelevant for actual policy making). When it comes to discussing carbon pricing as a rel world polcy instrument (as in the paragraphs from page 79, line 53 to page 80, line 22) then that material should be moved to chapter 4, where all policy instruments will be dicussed in an integrated way (see also my comments on the structure of the entire report) [Bert Metz, Netherlands]
Noted - A discussion of macro-economic impacts beyond Box 2.2 will be re-considered for the Third Order Draft when the literature for 1.5°C pathways has consolidated. The range of carbon prices for 1.5°C vs. 2°C scenarios provides important policy-relevant information despite the large uncertainty across models. Carbon prices were also reported in previous IPCC reports, e.g. AR5 (Clarke et al., 2014).
5202 77 18 77 4
The cited models overestimated the costs for renewables and underestimated the costs for FF and nuclear. Thus, the results do not reflect the economic reality. RE expansion is driven through economic advantages of RE. This needs to be reflected in the models. The current state of this section is outdated and incomplete. [Sven Teske, Australia]
Noted - The authors can only draw upon the literature available to the assessment. We appreciate the reviewer's call for new real-world developments to be incorporated in the models. We amended the manuscript to highlight that when real-world costs and deployment rates differ from those projected in models, carbon price trajectories might differ. See section 2.5.1.2 (about limitations of IAMs in assessing policy options).
539 77 18 77 18
An estimate of the worldwide social cost (direct + externality cost, where externalitiy costs include health and climate costs) of going to 100% clean, renewable energy, with 80% by 2030 and 100% by 2050, which will limit global warming to 1.5 C, are provided in Jacobson, M.Z., M.A. Delucchi, Z.A.F. Bauer, S.C. Goodman, W.E. Chapman, M.A. Cameron, Alphabetical: C. Bozonnat, L. Chobadi, H.A. Clonts, P. Enevoldsen, J.R. Erwin, S.N. Fobi, O.K. Goldstrom, E.M. Hennessy, J. Liu, J. Lo, C.B. Meyer, S.B. Morris, K.R. Moy, P.L. O’Neill, I. Petkov, S. Redfern, R. Schucker, M.A. Sontag, J. Wang, E. Weiner, A.S. Yachanin, 100% clean and renewable wind, water, and sunlight (WWS) all-sector energy roadmaps for 139 countries of the world, Joule, 1, doi:10.1016/j.joule.2017.07.005, 2017 [Mark Jacobson, United States of America]
Taken into account - text revised a methodological approach included in main text. Please note that estimates of social costs of carbon and avoided externalities (e.g. via mitigation measures) will be treated in Ch3 and Ch4. These links are also duly included in the main text. See also box 2.1.
1188 77 18 8 22
The emphasis on economic is justified here. At LAM3, we can discuss whether Ch4 and/or 5 want to have a parallel argument re the social implications of stringent M pathways, esp. regarding justice. On p79, it would be good to flag some differential impacts between low- and high-income countries. [Petra Tschakert, Australia]
Taken into account - A box on national case studies is under development. Depending on available literature, different countries will be included to the possible extent. Hopefully the distinction can be made.
6497 77 26 77 26 The 'Cross-Chapter Box' is Box 2.1 (?) [Roger Bodman, Australia] Editorial - corrected.
14328 77 26 77 32The references to Box 2.1 could be simplified ("see Box 2.1") and the reference to Box 2;é on line 32 sjould be replaced by a reference to Box 2.1. [Serge PLANTON, France]
Editorial - text revised.
16213 77 28 77 28
There should somewhere be a discussion of the implications (and shortcomings) of using GWP-100 versus what the models really calculate and versus using different periods for GWP and how using GWP-100 can hide and mislead about possible approaches to reducing overall radiative forcing over various time periods. [Michael MacCracken, United States of America]
Taken into account - Please note that there is such a discussion, in the box on metrics in Ch1 that is referred to at the end of this sentence.
9556 77 45 78 52 This Box is also valuable as an example of assessment by SCCs [Shuzo Nishioka, Japan] Noted
9583 77 45 78 52 This Box is also valuable as an example of assessment by SCCs [Shuzo Nishioka, Japan] Noted
Do Not Quote, Cite, or Distribute Page 121 of 129

IPCC WGI SR15 First Order Draft Review Comments And Responses - Chapter 2
Comment No From Page From Line To Page To Line Comment Response
3181 77 45
Box 2.2 should also be eliminated. This discussed of costs and benefits, and how they relate to GDP is highly biased and controversial, yet these important issues are omitted from the box. My Climate Change Economics, vol 7, no. 1, 2016 paper provides extensive discussion these issues. But this Special Report does not need to deal with these issues such as the proper interpretation of increases or decreases in GDP. It is a diversion from the main focus the report needs to have.More importantly, this report needs to address other important macro-economic implications of the scenarios discussed in it. Namely, this report should have some discussion of one of the main benefits to the world economy and unemployment that a 1.5 degree non-overshoot scenario would have compared with a 1.5 degree overshoot scenario. Namely, as in the investment build-up during the early years of World War II, the additional investment requirements of a non-overshoot scenario in the first 10-15 years of its deployment, would very likely increase economic growth and employment relative to an overshoot scenario in which the investment needs would be lower. [Richard Rosen, Germany]
Noted - Please provide references to literature that support your assertions on the economic impacts of 1.5 degree overshoot vs. non-overshoot scenarios.
6498 77 49 77 49 Also 'Box' referred to here is Box 2.1 (?) [Roger Bodman, Australia] Editorial - corrected.
9555 77 52Inseart Gross National Happiness (GNH) of Bhutan as a well known typical national specific goal [Shuzo Nishioka, Japan] Rejected - This aspect is explicitly treated in Ch4, Box 4.1: Case Study: Bhutan - mutually
enforcing economic growth, carbon neutrality and happiness.
9582 77 52Inseart Gross National Happiness (GNH) of Bhutan as a well known typical national specific goal [Shuzo Nishioka, Japan] Rejected - This aspect is explicitly treated in Ch4, Box 4.1: Case Study: Bhutan - mutually
enforcing economic growth, carbon neutrality and happiness.
17330 78 7It can be useful to use the concept of opportunity cost to explain macro-economic mitigation costs. [Young-Hwan Ahn, Republic of Korea]
Noted
16214 78 18 78 26
Somewhere here, that the choice of the "climate goal" against which to optimize is very important and must be chosen carefully. For example, in an EMF case prepared around the time of the Copenhagen 2009 science meeting, the climate goal was set to something like 2 W/m2 in 2100. This led, for example, to there being no attempt to limit black carbon emissions until 2099+ in that BC's atmospheric lifetime is less than 2 weeks, so there was no reason to start controlling it until the latest time possible and to then discount the cost of doing so over most of the century. The climate effect of this was to allow BC to contribute to global warming for essentially a century and yet this was still consistent with the goal. There was a similar problem with methane, and some models even allowed overshoots. This was not really caught until some presentations of the comparison study were done, giving some quite misleading implications for policy to spread about. While it can sometimes be mathematically challenging to implement a goal that minimizes climate change and impacts, but this cannot be resolved by choosing a "climate goal" that does not really capture the implications of climate change, sea level rise, ocean acidification, etc. [Michael MacCracken, United States of America]
Noted - Please note that we do not discuss the choice of goal, but rather the choice of policies to reach it. To some extent this issue is touched upon in box 2.1, however. At all events, see Chapter 1 (section 1.2) for a detailed discussion of the 1.5C climate goal.
21109 78 23 78 25
This sentence may give the impression that in the real world is non-climate policies and other disortions with respect to perfect competition are "the problem". The penultimate paragraph of box 2.1 has a different wording about a (presumably uniform) carbon price, including the need for a mechanism to avoid exacerbating existing inequalities in income distribution : is it also relevant here ? In this case it could be clarified (even if inequality can be regarded as a market imperfection, it looks different to refer to inequality of income rather than to distortions created by non-climate policies). [Philippe Marbaix, Belgium]
Noted - links to Ch4 and Ch5 are given where, for instance, interactions across policy portfolios and inequality are treated, respectively.
742 78 53 78 53Need a new line after Box 2.2 like that after Box 2.1 page 77 lines 15-16 [Moshe Kinn, United Kingdom (of Great Britain and Northern Ireland)]
Editorial - line space added.
5203 79 1 79 1
Outdated. RE have lower costs that conventional power generation technologies, thus the electricity sector does not require a carbon price to be economic. This must be updated and new references must be added. [Sven Teske, Australia]
Rejected - please refer to Chapter 4 (section 4.3) for the assessment of current RET options; including policy aspects (section 4.2) in real-world settings.
21110 79 1 79 4Is a discount rate applied ? I applogize I missed the information somewhere else in the report, otherwise it should be added. [Philippe Marbaix, Belgium]
Taken into account - yes, a 5% discount rate is used. See caption Figure.
6937 79 1 79 24
This paragraph clearly shows the limitations of IAMs to say something useful about policies, as the main instrument used in the models is the carbon price. Showing ranges of the carbon price of 240-32000 $/tCO2 in 2100 makes clear that this is only relevant for internal usage in the modelling discussions, but not for real world policy. It would be very important to discuss this. In addition, it is highly questionable if models that lead to such high carbon prices as a result of limited model limitations (WITCH-GLOBIOM) should really be included in the dataset. [Bert Metz, Netherlands]
Noted - Carbon prices in the models are not only internal devices. They show the marginal abatement costs under the given set of assumptions, which is very relevant for assessing the implications of long-term goals. There is also an emerging literature (discussed in the Section), where carbon pricing is combined with other policies. In these cases, resulting carbon prices are the residual pricing (after application of the other policies) needed to achieve emissions goals.
Do Not Quote, Cite, or Distribute Page 122 of 129
IPCC WGI SR15 First Order Draft Review Comments And Responses - Chapter 2
Comment No From Page From Line To Page To Line Comment Response
16215 79 1 79 5
Under what possible plausibly realistic conditions (considering not only policies and technologies, but also social inertia effects, etc.) can a carbon price as low as $1 be the result of some of these calculations (if this is a range across countries, then this needs to be explained so each policymaker will be able to get a closer estimate of the value for their country; if this is a range across scenarios that allow various magnitude overshoots, then also explain). I'm guessing that some really unusual and unlikely combination of near two-sigma assumptions leads to the result. That this kind of result is here is a consequence of using a framing where scientists put their interest in there being no chance they could possibly be wrong ahead of the policymakers interest in getting a plausible best estimate or most likely range. To my mind, this type of equivocation and unwillingness to consider and accept the decision-makers' framing that recognizes there are indeed uncertainties, but want to have a central estimate or range based on relatively likely outcomes. I just would suggest (having been on an international scientific panel convened for the UN Commission on Sustainable Development because they were so frustrated with the IPCC presentation of findings), trying to speak for decision and policy makers, that the results provided here are useless and disrespectful of their needs for advice on what would make for near-term productive policy development. [Did I miss it, or does the rest of this paragraph only discuss the conditions that give the high estimate for the indicated range of carbon prices? Where is the discussion of what justifies the low level?] [Michael MacCracken, United States of America]
Noted - Median estimates have been added to the revised version of the figure.
10452 79 3 79 3
I wonder how useful a range of $240-$32,000 is [Jonathan Lynn, Switzerland] Taken into account - data and resulting estimates are being updated in the database as participating modelling teams submit figures for the SOD. However, note that text comparing 1.5 and 2C estimates was provided in FOD (see p.78, line 53, and p.79 lines 1-24).
6372 79 16 79 21
This is a very important finding and I'm puzzled why this is buried in text and not brought out more strongly. There are other important dimensions of course but this is key information that needs to be brought out clearly (including perhaps more of a discussion of where and when those costs would fall). [Andy Reisinger, New Zealand]
Taken into account - These aspects are now more clearly highlighted and they are touched upon in the Exec. Summary. More quantitative estimates and comparison between 1.5°C scenarios may be included in the next draft as more scenario design characteristics become available.
13001 79 22 22 GH should be GHG [Caserini Stefano, Italy] Editorial - corrected.
16216 79 3 79 3 Change "that those that" to "than those that" [Michael MacCracken, United States of America] Editorial - corrected.
21111 79 31 79 32
Technology improvements reduces costs: this seems obvious, at least in a framework devoted to minimizing costs. It would be more interesting it it could link to a section or paragraph exploring that in more detail, if there is any. Do we have hints on the costs that would be if no major technology improvements could be done? [Philippe Marbaix, Belgium]
Taken into account - Cross ref with Ch4 (section 4.3). is provided in which a detailed assessment of current and emerging technologies is provided.
2618 79 53 79 54but there are several debates within the literature as to its effectiveness - have these been reviewed and addressed? [Zoha Shawoo, United Kingdom (of Great Britain and Northern Ireland)]
Noted - Please note that Ch4 deals with ex-post assessments of policy instruments (e.g. carbon pricing mechanisms) and how they work in practice.
5204 79 53 79 57
Carbon pricing did not at all contribute to the expansion of the RE markets in the past decades. Instead Feed-in tariffs and increasingly auctions drive the RE markets. (see REN21 Global Status Report Renewables 2017). Delete current statement and correct it with a new reference. [Sven Teske, Australia]
Rejected - Please note that Ch4 deals with ex-post assessments of policy instruments (e.g. carbon pricing mechanisms, FiT) and how they (have) perform(ed) in practice.
14183 79 53 8 6
I would recommend to elaborate a bit more about the current carbon prices and main bottlenecks for the carbon market, at least some few more sentences. The EU ETS, for example, has faced several difficulties so far and almost collapsed, despite historical expectations and governmental pledges. [Alexandre Strapasson, Brazil]
Rejected - Please note that Ch4 deals with ex-post assessments of policy instruments (e.g. carbon pricing mechanisms, FiT) and how they (have) perform(ed) in practice.
5234 79 55 79 5513% of global emissions: I have 12% in the World Bank/Ecofys report (page21) [Bianka SHOAi-TEHRANI, Japan] Taken into account - figures were updated based on the latest World Bank et al. report (p.25).
4296 8
I am not an expert on scenarios, but Figure 2.28 is very,very odd. Discussing on CO2 prices up to 35000 $/tCO2 may be just an indication of something seriously wrong in the model.... If there is no error, and your want to mantain the figure, at least plotthe same figure with the y-axis going only up to 5000 $/t, with some of the lines (like the current green line) going "out of scale" soon after 2050... By doing this, the figure will gain quality and resolution on the scenarios that seem more reasonable (i.e. those predicting "feasable" prices of CO2). [Abanades Carlos, Spain]
Noted - Please note that this was the latest data set being reported by participating modelling groups. New data and resulting figures are being updated in the database for the SOD.
2786 8Figure 2.28 Break the vertical scale so that the one outlier does not obscure the results for all of the other cases. [Erik Haites, Canada]
Taken into account - data and resulting estimates are being updated in the database as participating modelling teams submit figures for the SOD.
5205 8 11 8 12
This is simply wrong. RPS only exists in the USA. Feed-in tariffs shoulder the overall majority of RE development over the past decade. The references are both old (almost 10 years) and incomplete. Use new references (see REN21 Global Status Report, IEA World Energy Outlook, IRENA policy analysis) [Sven Teske, Australia]
Taken into account - text revised and expanded (e.g. tradable green certificate schemes, FiT, etc.). Note however that specific policy instruments addressing RET are assessed from an ex-post perspective in Ch4. Links to Ch4 are provided.
13002 8 2 22This sentence is not relevant and quite obvious (what does it mean "politically feasible"?). Suggest deleting it [Caserini Stefano, Italy]
Rejected - political feasibility is an important element of the 'feasibility' dimensions elaborated in Ch1. See e.g. Box 1.3, Table 1 (social and institutional dimension).
9243 8 24
If the SPAs are all fragmented, how are global C prices estimated? How do the C prices vary by region? That would be extremely useful information to show… [Glen Peters, Norway]
Noted - Global average carbon prices are calculated as emissions weighted average across regions. Carbon prices (for fossil fuel emissions) are fully converged globally in 2025 (SPA1,4), 2040 (SPA2, 5), and 2050 (SPA3). There are many more scenarios with regionally fragmented carbon prices until 2020 / 2030 / 2040 / 2050 in the database, a comprehensive assessment of the regional differentiation of these prices is left for AR6.
17487 8 25A [Tom Gabriel Johansen, Norway] Taken into account - The SR1.5C database keeps being updated and resulting figures
improved. TSU is supporting the design of figures to deliver key message(s).
Do Not Quote, Cite, or Distribute Page 123 of 129
IPCC WGI SR15 First Order Draft Review Comments And Responses - Chapter 2
Comment No From Page From Line To Page To Line Comment Response
17527 8 25A [Angela Morelli, Norway] Taken into account - The SR1.5C database keeps being updated and resulting figures
improved. TSU is supporting the design of figures to deliver key message(s).
7066 81Is the sociotechnical literature expected to be specific of the 1.5C pathways as compared to the 2C? No specific challenges have been identified. [Érika Mata, Sweden]
Section 2.6.3 made more specific on sociotechnical literature to 1.5C
6939 81 1 81 42
Move this section to chapter 5, where the sustainable development implications of 1.5 adaptation and mitigation pathways are discussed. (see also my comments on the structure of the entire report). [Bert Metz, Netherlands]
Rejected - The purpose of this subsection is to set a first order rank of the sustainability profile of different portfolios of mitigation measures found in 1.5°C pathways in this chapter (Section 2.3.4). This mapping allows to better understand the different implications for sustainable development of alternative mitigation pathways (not individual measures) towards the same 1.5°C objective. This will serve as a transition of the storyline to Ch5, where a full assessment of the synergies and trade-offs of individual mitigation measures and sustainable development goals across relevant SDGs’ outcomes is carried out.
1189 81 1 81 42Well done! Something Ch5 can build on - to be further discussed at LAM3, esp. this table (l41-42). [Petra Tschakert, Australia]
Noted
6166 81 5 81 5delete ", for example," as you have already said "includes" so this is pointless repetition. [Philip Sargent, United Kingdom (of Great Britain and Northern Ireland)]
Editorial - corrected.
4208 81 7 81 8
The wording of this sentence indicates there is the possibility of bias against nuclear energy, without fair consideration of the associated hazards and expected trade-offs for renewable energy technologies. As a general comment, it is noted that none of the authors or editors listed appear to have a background in nuclear science or engineering and yet this technology is mentioned several times in the report, although it is noted that this chapter is not oriented to assessing nuclear technology, the absence of a scientist from this field could question the report’s authority and ability to present all energy technologies in a balanced manner. It’s also unclear from the text what risks are being referred to with regard to nuclear energy and the basis for this statement (p.81, line 7). However, please note and give consideration to the following:
* The largest ionizing radiation doses to the public per unit of electricity generated are from coal and possibly geothermal energy. At the individual level, except for some rare and unusual cases, most of the exposures to ionizing radiation to the global public in the life cycle of electricity-generating technologies would all be below the levels at which health effects would be observed (UNSCEAR 2000; 2011; 2017). This latest report from UNSCEAR (2017), that assesses ionizing radiation exposure from electricity generation might be a useful reference to consider.
* Two accidents at nuclear power plants have taken place in the past approx. 40 years of operation. An accident with similar consequences as Chernobyl is no longer considered possible (GRS 1996: p.133 and WNA 2016) and the accident at the Fukushima Daiichi plant is not expected to result in a discernible increased incidence of radiation-related health effects (UNSCEAR 2014).
* The hazardous chemicals required for solar panel manufacturing combined with an absence of many PV companies addressing appropriate recycling, highlights the need for appropriate polices in place to manage this aspect of the life cycle to limit any impact it may have on health or the environment (ILO 2012; SVTC 2014a; SVTC 2014b).
* The highest number of fatalities per TWh for energy sources may be from rooftop solar due to the hazards from falling during installation and the relative high frequency of fatalities from falls (US Department of Labor 2016; 2017; Wang 2008).
* A recent report by the World Bank (2017) states that renewable technologies such as wind, solar, hydrogen and electricity systems are actually more material intensive in their composition than fossil-fuel based energy supply systems. It notes that a new set of challenges related to the sustainable development of minerals and resources is likely to result from the increased use of renewable technologies. The report warns that it will be necessary to develop appropriate policies and measures that help ensure that the transition to low carbon is managed so that it will not negatively impact sustainable development priorities, from environmental and other material impact issues to supporting continued economic and equitable growth, in developing countries. A lack of data and the need for further research and studies on this issue was also noted.
* Following a survey of photovoltaic module manufacturers, none were able to provide documentation to verify that their supply chains do not contain conflict minerals based on the due diligence guidelines set by the OECD. Thus the companies may contribute, directly or indirectly, to armed conflict, infringements of human rights and impede economic and social development SVTC 2014a; SVTC 2014c; OECD 2016). This point and the three above regarding the hazardous chemicals, challenges of sustainable development of minerals and resources, and possible fatalities can be considerd trade-offs and possible risks in the use of this mitigation technology.
Noted - the issue will be covered in Ch5 where sustainability aspects of various technologies, including nuclear, are assessed in more detail.
5206 81 8 81 9
The large technology risks of these technologies should be discussed in the beginning of this chapter - not on the last few pages. [Sven Teske, Australia]
Taken into account - the last section of the chapter is meant to address and highlight all relevant sustainability implications of the 1.5 pathways assessed along the chapter. The order of the sections does not reflect any level of importance but respond to a logical storyline along the chapter.
Do Not Quote, Cite, or Distribute Page 124 of 129

IPCC WGI SR15 First Order Draft Review Comments And Responses - Chapter 2
Comment No From Page From Line To Page To Line Comment Response
6962 81 8 81 8
No reference is given to risks of large scale deployment nuclear power. According to various life cycle analyses nuclear power externatilies even accounting for the accidents are very low and comparable to wind and solar power. While this has been used as a reason to limit the amount of nuclear power in the scenarios, it should be stated as such instead of unquestionable fact. [Ville Tulkki, Finland]
Taken into account - the purpose of this subsection is to set a first order mapping of the implications for sustainable development of different mitigation pathways, but not of individual measures or specific trade-off and risks. Ch5 will conduct a full assessment of the synergies and trade-offs of individual mitigation measures and sustainable development goals across relevant SDGs’ outcomes.
2567 81 11
Report"cooling water" is an important parts of industiral water, so the research show the industrial water is increasingand also domestic water is increasing, so this part should add them and the literatures. [Xiaojun WANG, China]
Taken into account - the purpose of this subsection is to set a first order mapping of the implications for sustainable development of different mitigation pathways, but not of individual measures or specific trade-off and risks. Ch5 will conduct a full assessment of the synergies and trade-offs of individual mitigation measures and sustainable development goals across relevant SDGs’ outcomes.
2580 81 11
Report"cooling water" is an important parts of industiral water, so the research show the industrial water is increasingand also domestic water is increasing, so this part should add them and the literatures. [Xiaojun WANG, China]
Taken into account - the purpose of this subsection is to set a first order mapping of the implications for sustainable development of different mitigation pathways, but not of individual measures or specific trade-off and risks. Ch5 will conduct a full assessment of the synergies and trade-offs of individual mitigation measures and sustainable development goals across relevant SDGs’ outcomes.
2541 81 11
Report"cooling water" is an important parts of industiral water, so the research show the industrial water is increasingand also domestic water is increasing, so this part should add them and the literatures. [Xiaojun WANG, China]
Taken into account - the purpose of this subsection is to set a first order mapping of the implications for sustainable development of different mitigation pathways, but not of individual measures or specific trade-off and risks. Ch5 will conduct a full assessment of the synergies and trade-offs of individual mitigation measures and sustainable development goals across relevant SDGs’ outcomes.
21112 81 17 81 21
This way of framing the synergies between climate and the other SDGs seems limited: in this sentence the sole reason to look for "aligned" policies is "to accept high costs of climate policy" - but sustainable development can also be a way to reduce the costs, as for example in relation with the differences between SSP1 and SSP5 baselines. [Philippe Marbaix, Belgium]
Accepted - Text revised. The synergies between climate policies and other societal goals are to be better framed.
4780 81 45 81 45
Section 2.6 would be better placed in thw beginning of the chapter. In addition, their capabilitis and weaknesses for dealing with the 1.5 oC question should be also discussed. [Elena Georgopoulou, Greece]
We decided to keep section 2.6 where it is as it is more technical and already covered in parts of AR5. However, we have edited to provide better signposting and also provide further discussion of IAMs for 1.5C
2511 81 45 84 54
The placement of this methodological chapter at the end of the chapter, after resulting using the methodological tools are assessed, seems a bit odd. [Robert Koppu, United States of America]
We decided to keep section 2.6 where it is as it is more technical and already covered in parts of AR5. However, we have edited to provide better signposting from the other sections
7062 81 47broad range of tools. Well, there is a clear focus on IAMs and, if any of references used other modelling approaches, this was generally not stated. So I would dissagree with the statement. [Érika Mata, Sweden]
Agree, text reworded to say tools rather than broad tools
14184 82 6 82 6
See also the Global Calculator model (www.globalcalculator.org), which is a system dynamics model for carbon, energy and land use change (including changes in soil carbon). There is a large number of national 2050 calculators already available as well (see full list of calculators at: www.2050.org.uk/calculators). Some countries have used their own calculators for preparing their INDCs, and therefore these models have already been used in practice to assist policy making. [Alexandre Strapasson, Brazil]
Rejected. We think that calculator pathways are not generally published and are not necessarily internally consistent when adjusted, therefore we do not think it is appropriate to assess here
1532 82 8 82 33
What is missing here is the fact that there is a new generation of energy models, and data to support such models, that address the question of how to get an energy system to actually function if the penetration of intermittent renewables is particularly high. The feature of these models is that they use extremely high resolution data on the energy system, and on the drivers of intermittency (DNI, wind speed, temperature, snow cover) to identify the features of least cost systems that surpass particular reliability thresholds. See doi:10.1038/nclimate3338 , https://doi.org/10.1016/j.rser.2014.02.003 , doi: 10.1016/j.energy.2017.07.007 , doi: 10.1016/j.apenergy.2017.03.051 , doi: 10.1016/j.energy.2016.08.068 . There are also models coming online that examine issues such as demand response, a tool to match load with intermittent output. See https://doi.org/10.1016/j.apenergy.2017.07.034 . [Anthony Patt, Switzerland]
We agree with this comment and have added further details of sector specific models. We also point to chapter 4, where they are used as part of implementation strategy
6409 82 1 82 11
it should not abolish one important sector, become: energy-economy-land-coastal/ocean-climate system, so that the IAMs would be a comprehensive model for mitigation pathway [Erlania Erlania, Indonesia]
IAMs in the literature couple energy-economy-land-climate systems to cover the largest sources of anthropogenic GHG emissions sources and drivers. Oceans are captured as part of the climate module, with a focus on their role in shaping the climate response to anthropogenic emissions.
17429 82 18 82 2So do I get it right that practically one model was applied here? Uncertainty due to that should be open up more clearly at the beginning of CH2. [Tuomo Kalliokoski, Finland]
It is not clear what text this refers to. We use MAGICC, consistently calibrated to AR5, this is more clearly explained in Section 2.2 and 2.6.2
Do Not Quote, Cite, or Distribute Page 125 of 129

IPCC WGI SR15 First Order Draft Review Comments And Responses - Chapter 2
Comment No From Page From Line To Page To Line Comment Response
7063 82 18 19
I do not find accurate that sector-specific models have been used, when only two references are given. In particular, Lucon et al (AR5 actually), is at least 5 yr old and clearly before 1.5C. I understand there are no new results from sectorial models yet, so maybe one could simply point at the need. Additionally, the capabilities of sectorial models are not identified; in particular in EU, existing dynamic partial equilibrium models (such as TIMES which is nowadays used in many MS and even regions) can explore a series of relevant questions, in combination with a multitude of sectorial bottom-up or hybrid national models (typically combining simulation and optimization). [Érika Mata, Sweden]
The references given here refer to the sector chapters of the AR5 of WG3 as overviews on the individual sectors. The comparison of integrated pathways with sector-specific model results is presented in Section 2.4 (SOD, formerly Section 2.3, FOD), for example comparisons with IEA models. For a discussion of the capabilities of sector-specific models, the reader is referred to the AR5.
3182 82 21 82 22
This sentence confirms that no estimates of climate change caused damages to either the world economy, or to ecosystems, have been included in the IAMs run to produce the scenarios reported in this first draft. Yet, the avoided damages due to more aggressive and quicker mitigation of climate change in non-overshoot versus overshoot scenarios may be one of the biggest benefits, if not the biggest benefit, of aggressively pursuing a 1.5 degree non-overshoot scenario, starting now. I repeat - this is one of many reasons why the six IAMs used for this first draft should not be used for the second draft of this Special Report. Also see the model weaknesses described on page 84, lines 9-28. Sometimes modelers claim that their models must be used for certain kinds of analyses because they are "good enough". Unfortunately, the six IAMs used here are not "good enough" to justifify their use here, especially given the lack of crucial documentation of both model structures (equations and constraints), and input assumptions such as the costs of all they key technologies. [Richard Rosen, Germany]
The profile of the emission scenarios is determined by the climate goal formulation (which can be chosen to explicitly exclude overshoot although models may no longer solve) and the assumed emissions drivers and mitigation potentials in the IAMs. We have added a sentence to Section 2.6.1 to clarify this. We have cited a new study in Section 2.6.4 (on knowledge gaps) that shows near term emissions reductions can be higher if new estimates of climate damages are taken into account. The benefit of avoiding overshoot is assessed in Chapter 3. The assessment of pathways in Chapter 2 is based on more than six IAMs, and fully covers the available literature on 1.5C pathways. References to extensive model documentation are provided.
7064 82 29 33
In line with the comment above on sectorial modelling, the authors may consider making an effort to summarize the sectorial and regional assumptions of ADVANCE project (specially since they appear as the core new modelling work of this SR), to facilitate further use in other studies. [Érika Mata, Sweden]
We have now elaborated the advances in IAM modeling since AR5 in greater detail, including the work of ADVANCE.
9244 82 29 82 33
Well, are they suitable for the task? Why are they not assessed themselves? The models are assumed perfect? I would expect a more thorough assessment at the front of the report? Or is there a reason not to assess the IAMs that are the foundation of the entire chapter? [Glen Peters, Norway]
We decided to keep section 2.6 as it is more technical and already covered in parts of AR5. However, we have edited to provide better signposting from the other sections. We have added more specific discussion of IAMs and their relevance. See also the discussion on knowledge gaps (Section 2.6.4), including a discussion of IAM limitations.
5207 82 3 82 32
The fact that the AR6 assessment and transformation pathways are not different from AR5 is deeply concerning. The data and assumptions reflect the energy technologies and costs from at least 4 years ago. The input data is most likely even older, and the technology choices are outdated. In the past 5 year, solar photovoltaic alone reduced its costs by 80%. Request: Update categories of pathways and adjust scenarios so they reflect the market reality. [Sven Teske, Australia]
IAMs have been updated since AR5. We have now provided a more detailed discussion of these updates and advances. The reference to AR5 aims to direct the reader to an overview on IAMs, including their basic structure and types. This is not repeated in the Chapter.
12825 82 37
Since TAR IPCC has been distinguishing three classes of models within the hierarchy that is used for projections: (i) the comprehensive Earth System Models (AOGCMs plus Carbon Cycle components); (ii), Earth System Models of Intermediate Complexity (EMICs), and (iii), Simple Climate Models. In WGI (i) and (ii) were evaluated and used for projections. Projections with these models were also compared to MAGICC, the model used in WGIII, in WGI Chapter 12 (12.4.1.2 and 12.4.8). The text here suggests that there are only two clasess of models, and that MAGICC and EMICs belong to the same class. This is incorrect and could create confusion to earlier reports in which models with some dynamics are EMICs, while emulators and MAGICC clearly belong to the class of Simple Climate Models. This is not a comment on model quality but an call for transparency in terminology. It is therefore recommended to keep to the terminology for the members of the model hierarchy. [Thomas Stocker, Switzerland]
WE agree and have added EMICs accordingly
1515 82 37 82 4Not only full GCM/ESM and simple models, but also ESM with medium complexity should be referred to here. [Ken'ichi Matsumoto, Japan]
WE agree and have added EMICs accordingly
2928 83 1 1.5 K should be "1.5 ºC". [MacDougall Andrew, Canada] Editorial issue
6499 83 1 83 1MAGICC's tuning to C4MIP may also under estimate the range of uncertainty in its carbon cycle response - calibration against CO2 observations suggests a wider range, Bodman et al. 2013. [Roger Bodman, Australia]
Accepted: We add further discussion of the veracity of MAGICC and its carbon cycle response
4346 83 8 83 16
In addition to hysteresis in the carbon cycle, it may be important to point out that some components of the climate system may not be reversible even if carbon is removed from the atmosphere (e.g irreversible sea level rise despite CDR; Tokarska & Zickfeld, 2015; Jones et al., 2016). References:Jones, C. D. et al. Simulating the Earth system response to negative emissions. Environ. Res. Lett. 11, 95012 (2016).Tokarska, K. B. & Zickfeld, K. The effectiveness of net negative carbon dioxide emissions in reversing anthropogenic climate change. Environ. Res. Lett. 10, 1–11 (2015). [Katarzyna B Tokarska, United Kingdom (of Great Britain and Northern Ireland)]
Accepted: We agree and have added discussion of these papers to the revised section
21113 83 25
Section 2.6.3: this section is limited to a general description of litterature availability. Could you provide more sustantial information on how what this literature says, if anything, about the feasiblity of the kind of transitions needed in 1.5 pathways, their enabling factors, etc... ? [Philippe Marbaix, Belgium]
We have edited to make the section for focussed on the needs of our chapter. See also response to comment 10992. We have added a new paragraph in 2.5.1 on insights from socio-technical literature, whereas this section 2.6.3 focuses on existing concepts/methods and knowledge gaps
Do Not Quote, Cite, or Distribute Page 126 of 129
IPCC WGI SR15 First Order Draft Review Comments And Responses - Chapter 2
Comment No From Page From Line To Page To Line Comment Response
10992 83 25 83 25
Not sure whether this should be in a catch-all section like 2.6. This has turned into WG III AR5 Chapter 6bis. To be discussed. [Skea Jim, United Kingdom (of Great Britain and Northern Ireland)]
Taken into account: We have edited to make the section for focussed on the needs of our chapter. Clarification: It is important to highlight that socio-technical issues are treated as far as clear/explicit links are identified with the pathways literature. Aspects beyond this are elaborated in ch4.In 2.6.3 we now additionally refer to behavioural literature because its insights have been mentioned in several parts of 2.3, but not 2.6.3. In Section 2.5.1, there is now also a new paragraph on socio-technical literature, which links to Section 2.6.3 to the rest of Chapter 2. The section on initiative-based learning has been excluded from 2.6.3 as this is the territory of Chapter 4.
7065 83 27 32
What about technology? Technology development is cleary underrepresented in IAMs and ESMs (as technology is assumed and broadly described), and barely mentioned in this sociotechnical literature (again implicitely assumed mixed with other drivers, the latter in focus). I do not mean technology should be in focus, but it is as important as geophysical and sectorial equilibrium (addressed in sections 2.6.1-2), and socioecononomic forces (addressed in section 2.6.3). It is somehow assumed in this SR that there is sufficient knowledge on the currect situation or baseline (the quality of the baseline is mentions in relation to IAMs but no further link is made to a need to improve the mapping of all quantifiable paramenters in our studies) as well as [Érika Mata, Sweden]
Clarification: Technology per se is mentioned (e.g. line 28, 31). At all events, technology narratives encompassed by SSPs are contained in section 2.3. Limitations associated with IAMs can be found, e.g. in sections 2.1.3, 2.6.1
743 83 37 83 41
Kinn, M. (2016). [An Analysis of the Sociotechnical Transition Process from the Existing Centralised Alternating Current Voltage Electrical System in the UK to One Where Distributed Direct Current Voltage is Used to Meet The Energy Needs of the Built Environment. (PhD), The University of Salford, Manchester.] does give a detailed future transition to a low powered electricity system. In fact the EMerge Alliance in the USA, the IEEE dc@home standard and the IET's Code of practice, provide a move in the direction of the use of extra low voltage electricity systems for the home and office environment, a system that uses less electrcity than that of alternating current voltage. [Moshe Kinn, United Kingdom (of Great Britain and Northern Ireland)]
Technology literature is now assessed. However, note that socio-technical issues are treated as far as clear/explicit links are identified with the pathways literature and this work has been cited for its methodological relevance in Chapter 2.6.3.
9310 83 43 83 47
In addition to the emphasis on initiative-based learning in local studies, the use of participatory learning objectives that are integrated with local needs, opportunities, and solutions may be emphasized based on the related literature. In addition, goal-oriented approach to foster strategic thinking is deemed to be the most critical strategy for mobilizing the capacity to shift the trends of development away from business-as-usual scenarios as underlined by "Kopnina, H., (2015) Sustainability in environmental education: new strategic thinking. Environ. Dev. Sust. 17 (15), 987-1002." In addition to this reference, uses of applied learning, action research, and envisioning are also among the tools that have a pivotal role in engaging students in real-world contexts based on "Tilbury, D., 2011. Education for Sustainable Development: an Expert Review of Processes and Learning. UNESCO, Paris." A recent example of integrating principles of circular economy into an education model is given by "K?lk?s, S., K?lk?s, B., Integrated circular economy and education model to address aspects of an energy-water-food nexus in a dairy facility and local contexts, Journal of Cleaner Production 167 (2017) 1084-1098" <http://dx.doi.org/10.1016/j.jclepro.2017.03.178> [Siir KILKIS, Turkey]
Clarification: Socio-technical aspects related to implementation are treated in ch4. In addition, aspects related to sustainability (e.g. beyond IAMs studies) are developed in ch5.
6373 84 7
I feel this section needs to be expanded to cover the treatment of technology in IAMs, and their current largely inability to consider endogenous technological change. Also (but not necessarily in this section), where is a discussion of the choice of discount rates and the extent (whether) different choices would change any of the model-based conclusions fundamentally (both about timing of options and fundamental feasibility - within the different meanings of this term)? [Andy Reisinger, New Zealand]
We have added a discussion of the role of discount rate to Section 2.6.1 and added technology availability as a knowledge gap (among others) in Section 2.6.4. We have clarified (in Section 2.6.1) that there exist a wide range of IAMs, including models with and without endogenous technological change.
16217 84 9 84 1 This is not a sentence. [Michael MacCracken, United States of America] Taken into account, text reworded
5208 84 9 84 54 Add “100% RE assessments” to knowledge gaps [Sven Teske, Australia] The 100% RE literature has now been referenced in Section 2.6.1.
6500 84 9 84 9 attempt', not 'attempting' [Roger Bodman, Australia] Accepted
10851 84 9 84 28
as mentioned earlier in this review, 60 peer-reviewed articles on 100% RE have been fully ignored, this is a massive knowledge gap. Since 80% of the GHG emissions are from the energy sector, it is not acceptable that more detailed and more progressive energy sector research is fully ignored. Much more references are needed here and the leading research teams should be referenced, such as Lund et al., Blakers et al., Jacobson et al. and Breyer et al. - a good overview on some articles can be found here (http://stanford.io/2wWrXRT). A most recent article on a full energy transition study for the power sector for the world in 145 regions in full hourly resolution has been accepted in 'Progress in Photovoltaics' from the team of Breyer et al. (accepted manuscript can be provided, upon request) [Christian Breyer, Finland]
A discussion of 100% RE scenarios from energy sector models has been added in Section 2.4. The literature has now also been acknowledged in Section 2.6.1.
6410 84 1 84 1 it is better to include Marine and Fisheries sector (coastal/ocean system) [Erlania Erlania, Indonesia] Accepted, ocean added
6501 84 12 84 12 Delete 'what' [Roger Bodman, Australia] Accepted
10581 84 13 84 28
Regional mitigation and adaptation changes can also affect the emission reduction scenarios, and unrecoverable land use type for a region can shift the production scheme, changing projections within a short period. [Elemer Briceño-Elizondo, Costa Rica]
The three systems energy, economy, land are given as examples, they are the core societal subsystems covered by IAMs.
Do Not Quote, Cite, or Distribute Page 127 of 129
IPCC WGI SR15 First Order Draft Review Comments And Responses - Chapter 2
Comment No From Page From Line To Page To Line Comment Response
744 84 15 84 16
Direct current voltage is a disruptive technology that offeres a reduced energy consumption that is an end use climate mitigation solution, see (1) Kaushik, S., Dale, M., Aggarwal, R., Smyth, A., Redfern, M., & Waite, K. (2014, 2-5 Sept. 2014). Project SoLa BRISTOL migration from "ecohome" to "integrated homes". Paper presented at the Power Engineering Conference (UPEC), 2014 49th International Universities.(2) Kinn, M. (2011a). Benefits of Direct Current Electricity Supply for Domestic Application. (MPhil Thesis), The University of Manchester. Retrieved from http://www.dcisthefuture.org/papers (3) Kinn, M. (2011b). Proposed components for the design of a smart nano-grid for a domestic electrical system that operates at below 50V DC. In2nd IEEE PES International Conference and Exhibition on Innovative Smart Grid Technologies (pp. 1-7). Manchester, England UK. Retrieved from http://ieeexplore.ieee.org/ielx5/6151917/6162607/06162674.pdf?tp=&arnumber=6162674&isnumber=6162607. doi:10.1109/ISGTEurope.2011.6162674 [Moshe Kinn, United Kingdom (of Great Britain and Northern Ireland)]
Noted. A table of classes of mitigation options is included in Section 2.3, but it is beyond the scope of this Chapter to go into greater detail. The chapter focused on mitigation technologies captured in the pathway literature and also included a discussion of additional major options that could affect the shape of mitigation pathways (Section 2.3.3.3).
2929 84 41 1.5–4.5K should be "1.5 to 4.5 ºC" [MacDougall Andrew, Canada] editorial issue
6502 84 47 84 47 such as' [Roger Bodman, Australia] editorial issue
6503 84 51 84 51 Hence the setup used here does not ….' [Roger Bodman, Australia] editorial issue
2930 84 52Change "melting" to "thawing". Ice melts, permafrost thaws. Permafrost that has melted is lava. [MacDougall Andrew, Canada]
Accepted, thawing used
14381 85 1References are a mess with some links leading to abstract pages and some to PDF files of the papers. [JACEK PISKOZUB, Poland]
Noted
12879 85 13Is it the IPCC format for reference. I think IPCC does not use "line" when author's lastname is repeated. [Jorge Carrasco, Chile]
Layout aspects of the draft are dealt with by the TSU, after chapter authors submit their draft
7223 1
The text box 2.1 does not address the econoics of climate change as suggested in the title. Rather it outlines three different analytical tools and their limitations. It needs to be clearer on strengths and weakness if it is to remain descriptive. If it is to address the economics of climate chnage it needs to talk about actual damage function and draw more heavily on Stern-Stiglitz 2017. Not clear that Box 2.2 makes any further contribution to the economics - other than referencing post-2008 green growth (which never materialised in the OECD countries proposing it). Box 2.2 might be more powerful if it drew on the recent SCC work and referenced the actual cost of fossil fuel externalites on the global economy, pointing out that at the global scale there is no such thing as an externality. Somebody pays. [Anton Cartwright, South Africa]
Noted
2215 1 1 1 3The table should account for the use of CDR to compensate for exess CO2 emissions in the past. [Kenneth Möllersten, Sweden]
No such table is available on page 100
14043 18 35What about ecological and human system tipping points??? These are missing from this section [Elvira Poloczanska, Germany]
Such tipping points are discussed extensively in Chapter 3, Section 3.5.5 of the report.
14049 113 46Other than arctic sea ice, where are marine systems at risk eg coral reefs? [Elvira Poloczanska, Germany] Please see section 3.4 for extensive discussions of ecosystems, including marine ecosystem, at
risk.
2958 119 36 121 16
Chapter 3 is a weighty 165 pages (with an annex of 63 pages!). The title is “Impacts of 1.5ºC global warming on natural and human systems”. The first 40 pages are simply not about impacts on natural and human systems, but more about impacts on the physical climate system itself. I would recommend removing the physical system from this chapter or at the very least changing the title to “Impacts of 1.5C global warmning on the physical, natural and human systems”. [Jim Haywood, United Kingdom (of Great Britain and Northern Ireland)]
It was not possible to separate physical and chemical impacts, from those associated with biological and human systems. This was due to the need for a fine scale discussion of the physical and chemical changes (and their attribution to climate change) prior to exploring the biological, socio-economic, human impacts etc. This fine scale was not the focus of any other part of the report and consequently was required in chapter 3.
15682 121 14As per the information available and reported, the expert judgement should be HIGH CONFIDENCE [Elenita Daño, Philippines]
This text is no longer included in the chapter (all SRM material is in the cross-chapter box on this topic).
15435 121 14As per the information available and reported, the expert judgement should be HIGH CONFIDENCE [Elenita Daño, Philippines]
This text is no longer included in the chapter (all SRM material is in the cross-chapter box on this topic).
15683 128 6The inclusion of an scenario on satbilization of SRM should not be included, as it is not proven or scientifically strong to affirm that this "stabilization" could happen [Elenita Daño, Philippines]
This text is no longer included in the chapter (all SRM material is in the cross-chapter box on this topic).
15436 128 6The inclusion of an scenario on satbilization of SRM should not be included, as it is not proven or scientifically strong to affirm that this "stabilization" could happen [Elenita Daño, Philippines]
This text is no longer included in the chapter (all SRM material is in the cross-chapter box on this topic).
15614 43192 24 43192 26
This sentence doesn’t quite make the important point: replace the second half of the sentence to say „…indicating that during the second half of the century active removal of CO2 from the atmosphere into long-term storage has to exceed any remaining emissions of GHGs.“ Otherwise the reader would inaccurately assume that removing some small amounts of CO2 would suffice to achieve a net reduction of atmospheric GHG concentration levels and that before 2050 no negative emissions would be needed. [Matthias Honegger, Germany]
Revised and clarified.
15616 43192 26 43192 31
This entire section describes scenarios or their carbon budgets respectively that presume reaching a net negative emissions flow at several billion tons of CO2 annually. Statements on mid-century carbon neutrality thus need to be appropriately prefaced to say: „presuming the corresponding quantities of NETs will annually be removed from the atmosphere in the second half of the century, many scenarios quantify carbon budgets available by mid-century carbon neutrality at…“ [Matthias Honegger, Germany]
Clarified that these require net negative emissions here, with further discussion of issues beyond geophysics (ie. If they can be realized) later in ES.
Do Not Quote, Cite, or Distribute Page 128 of 129

IPCC WGI SR15 First Order Draft Review Comments And Responses - Chapter 2
Comment No From Page From Line To Page To Line Comment Response
15615 43192 27 43192 27The term „carbon neutrality“ should be properly introduced and defined. It is here used to mean „reaching net zero emissions i.e. a balance of sources and sinks of GHGs“. [Matthias Honegger, Germany]
Term eliminated here to simplify ES.
15617 43192 33 43192 37
The reader can’t follow the logic here; you jump from carbon budget numbers, which are poorly explained to statement about policies: Start the paragraph on line 17 by stating that reaching 1.5 °C requires an immediate decline of global emissions with a view to full decarbonization by before mid-century along with an urgent ramping up of negative emissions reaching several GtC2-removed annually by before mid-century. Then illustrate this by the carbon budget numbers you cite. Follow this by stating that such rapid declines of emissions require – as stated in IPCC AR5 – immediate implementation of policies to price carbon as well as enhanced efforts to research and develop negative emissions technologies. [Matthias Honegger, Germany]
These sections of the ES have been reorganize (geophysics separate from transition properties) to group the material more logically.
15618 43192 39 43192 41
Please specify the ranges of the NDCs as either NDC components that are conditional on international support or unconditional NDC components, as their conditionality has grave implications to the likelihood of their achievment. [Matthias Honegger, Germany]
Seems too much detail for ES, but covered in chapter.
15619 43192 39 43192 45
We think it would be helpful for the reader to add at the end of this paragraph a synthesizing sentence such as: "Reaching 1.5°C is economically impossible if pre-2030 mitigation efforts correspond to the implementation of NDCs as they currently stand." [Matthias Honegger, Germany]
We believe that saying the models can't do this is a very similar, and more defensible, statement.
15620 43192 53 43192 53
Add: "and given uncertainties around the climate response at elevated temperature levels as well as socio-economic uncertainties around the deployment of negative emissions technologies, a greater risk of exceeding 1.5 °C by 2100" [Matthias Honegger, Germany]
Agreed, text revised.
15621 43222 5 43222 5Add: "with major milestones being reached 10-20 years earlier than in case of 2 degree compatible pathways" [Matthias Honegger, Germany]
Agreed, done.
15622 43222 26 43222 27It would be beneficial to add a percentage range of those bioenergy plants that are typically equipped with CCS in these scenarios by 2050 (or before). [Matthias Honegger, Germany]
Rejected - this information could be made available in the chapter body, yet space constraints do not warrant this inclusion.
15623 43222 5 43222 55
This paragraph is highly problematic as has been pointed out by an increasing number of scholars that are researching the topic of behaviour chances and their role for mitigating climate change: The way it is framed suggests, that consumption patterns and in particular dietary choices are independent of policies. This is clearly not the case as food choices are known to respond to the pricing of various food categories especially but not exclusively in developing countries. This paragraph should be reformulated to highlight the central point which is that food choices are important as the mentioned numbers indicate and that many scenarios have disregarded mitigation policies that aim to influence food choices.While it is understandable to an insider of IPCC scenario development i.e. the basis being the SSPs that it is not the intended meaning, the executive summary should not require such an analytical reading, but rather allow for the key insight to be conveyed in the most straightforward manner. [Matthias Honegger, Germany]
Agreed. These aspects are now highlighted as measures rather than scenario assumptions
15624 43253 6 43222 6 Add: "and atmospheric GHG concentrations" [Matthias Honegger, Germany] Rejected - we consider it not necessary to further specify this here
15625 43253 8 43222 8Suggest to add the typical range of annual removals i.e. "with annual removals amounting to between 5 and 15GtCO2 in the second half of the century". [Matthias Honegger, Germany]
Rejected - Unless figures are assessed in the chapter body, they cannot be highlighted in the ES.
15626 43253 13 43253 15
These two sentences are somewhat incompatible with each other: Are there other CDR options in some scenarios (if so which ones) or are there none? Do some scenarios not include afforestation (otherwise the first sentence is wrong)? [Matthias Honegger, Germany]
Rejected - They are actually compatible. There are other CDR options in some scenarios (like DAC), and some scenarios do not include afforestation.
15627 43253 2 43253 21Is this true? What constitutes a marked difference? Seeing the difference in both pace and cumulative volume of NETs required for 1.5°C to 2°C this statement seems debatable to say the least. [Matthias Honegger, Germany]
Accepted - we have changed this to "land-use change dynamics" and included the 2°C value further below.
15628 43253 23 43253 23We would strongly suggest to insert a percentage figure (the share of global agriculturally productive land) i.e. roughly 12% of global agricultural land. [Matthias Honegger, Germany]
Given the large uncertainty in land developments, this message has been made more general to communicate a more robust insight
15629 43253 27 43253 27
We would suggest to insert another subheader before this paragraph: The first three paragraphs are clearly describing the need for CDR, whereas the following sections are distinctly focussed on interrelations and challenges in adequate scenario development and thus those paragraphs should have their own subheader. [Matthias Honegger, Germany]
Noted. The ES was restructured in a way the authors deemed most appropriate.
15630 43253 45 43253 45Add: Furthermore, socio-political feasibility (as opposed to technical and economical feasibility) remains exogenous from scenario production and integrated assessment modeling. [Matthias Honegger, Germany]
Rejected - it is debatable whether socio-political feasibility remaining exogenous is a limitation rather than a strength
Do Not Quote, Cite, or Distribute Page 129 of 129