Faculty of Engineering Specialization: Civil Engineering - Symbiosis ...
Upload
khangminh22Category
view
0download
0
UNIVERSITÀ DEGLI STUDI DI MILANO
DEPARTMENT OF FOOD, ENVIRONMENTAL AND NUTRITIONAL SCIENCES
PHILOSOPHY DOCTORATE SCHOOL: EARTH, ENVIRONMENT AND BIODIVERSITY
PHILOSOPHY DOCTORATE COURSE IN AGRICULTURE ECOLOGY
XXVII CYCLE
PHILOSOPHY DOCTORATE THESIS
GUT-BACTERIA SYMBIOSIS IN INSECT PESTS
ERICA MARIA PROSDOCIMI NO. MATR. R09575
SUPERVISOR: PROFESSOR SARA BORIN COORDINATOR: PROFESSOR GRAZIANO ZOCCHI
ACADEMIC YEAR 2013/2014

Cover: Adult Psacothea hilaris hilaris. Photo: Daniela Lupi

Index
Summary 1
Chapter 1- Aim of the thesis 6
Chapter 2 – Microbial ecology methods to characterize the microbiome of non-model insects 9
Chapter 3 - The Acetic Acid Bacterial Microbiome of the Spotted Wing Fly, Drosophila suzukii 47
Chapter 4 - Effects of the diet on the microbiota of the Red Palm Weevil (Coleoptera: Dryophthoridae) 75
Chapter 5 - Characterization of the gut microbiota of the cerambycid beetle Psacothea hilaris hilaris and of its “symbiotic potential” 101
Chapter 6 - General conclusions 124
Supplementary materials 128
Publications and training 159
Acknowledgements 162


Summary
1
Summary
Insects are one of the most fascinating taxa on Earth: their diversity, diffusion, colonization of different niches are unparalleled in the animal kingdom. Besides, they have a remarkable impact on human life: they are parasites for people, animals and crops, vectors of diseases, pollinators, and even breeding animals (e.g. honeybees, silkworms). This extraordinary evolutionary success and diversification is partially due to the symbiotic relationships that insects have with a wide range of bacteria. These symbionts can be divided into primary, secondary symbionts and gut bacteria. Primary symbionts are found in very specialized cells (the bacteriocytes), strictly maternally transmitted and not cultivable. They are essential for their host, and vice-versa: they can actually be considered part of a single organism called “holobiont”. Secondary symbionts are not necessary for the host survival, although often beneficial, and they can inhabit various organs and tissues. In this category fall also reproductive parasites, as Wolbachia, which spreads in the population by maternal transmission, manipulating the reproduction of the host to favour the birth of infected daughters. Finally, gut bacteria are a more vague category, comprising organisms that live in the insect intestine because they are ingested with the diet, but also symbionts that establish a close relationship with the host, being essential for its survival and development. The roles of all these microorganisms are, to different extents, important for the insect physiology. Primary symbionts are generally essential to complement unbalanced diets and secondary ones contribute to the host fitness, while reproduction parasites deeply affect the reproduction mode of their hosts. Even commensals have been demonstrated to influence the development, mating choice and immune responses in Drosophila flies. For these reasons, the understanding of the biology of an insect can not do without the characterisation of its microbiota. In the second chapter of my PhD thesis, a review on the microbial ecology techniques applied to the study of insect microbial communities gives an overview on the methods that can be applied to this purpose. On one hand, molecular analyses based on the 16S gene sequencing, such as 16S rRNA barcoding (pyrotag) and Denaturing Gradient Gel Electrophoresis (DGGE) are the most powerful methods to get a complete picture of the microbial community composition and structure. Microscopic localisation of symbionts can be also achieved by Fluorescent In Situ Hybridisation. On the other hand, the isolation of bacteria allows to deeply characterize the cultivable fraction, verifying through direct in vitro tests the activities of the strains. Taking advantage of a strain collection isolated from the target insect, the symbiotic relationship can be investigated through in vivo experiments. The more common ones involve i) the labeling of the strains with fluorescent proteins and the recolonization of the insects, to evaluate their localisation and colonisation ability, ii) the assessment of the detrimental effects of symbionts deprivation on the hosts, and iii) the comparison of insects monoassociated with different strains to check the effects on host fitness. To further analyse

Summary
2
the interaction between bacteria and their hosts from a genetic point of view, advanced techniques, such as Signature Tagged Mutagenesis or In Vivo Expression Technology, can be performed. Many of these techniques have been applied in the case studies here presented, in which the microbial communities associated to three insect pests have been characterised. In the third chapter is presented a study on the spotted-wing fly Drosophila suzukii. Unlike its relative D. melanogaster, which feeds on rotten fruit, this fly feeds and lays eggs on healthy fruits. The most damaged crops are members of the Drupaceae family (e.g. cherries) and berries (strawberries, raspberries, blueberries). The bacterial community associated to this pest have been characterised with a focus on acetic acid bacteria (AAB), important symbionts of many sugar-feeding insects. According to our findings, D. suzukii harbours a diverse community of AAB, detected both in the isolate collection and in culture-independent screenings (pyrotag, DGGE). They are primarily localised in the gut, attached to the peritrophic matrix, as showed by FISH micrographs. The ability of three AAB species (Gluconobacter oxydans, Acetobacter tropicalis and Acetobacter indonesiensis) to colonise the gut has been proved by recolonization experiments of the insect using GFP-marked strains. In the fourth chapter, the bacterial community of the wood-feeding beetle Rhynchophorus ferrugineus has been analysed. Commonly named Red Palm Weevil (RPW), this insect is an important pest for palm trees. The plants are damaged mainly by the larvae, which dig tunnels in the trunks until pupation. Bacteria associated to the red palm weevil have been studied primarily by molecular means (pyrotag). Our results outline that the bacteria hosted by R. ferrugineus are mainly acquired from the environment while feeding. Indeed, a sharp difference has been registered between field-caught and bred specimens. While field caught RPW harbour more bacterial taxa which are in common with their feeding plants, the animals fed on apple in the laboratory show a higher prevalence of lactic acid and acetic acid bacteria, which presumably grow on the rotten fruit. The latter result is further confirmed by the bacterial isolations performed on apple-fed specimens. Besides, the DNA sequence of a primary symbiont, Candidatus Nardonella, has been detected. This bacterium has been shown to inhabit a wide range of insects of the same family of the RPW, Curculionidae. The fifth chapter is about the gut bacterial community of Psacothea hilaris hilaris. Native of Japan and east China, this longicorn beetle (family: Cerambicidae) arrived in Italy as a consequence of the wood trade, and settled as a stable population in a small area in Como province. Its larvae dig tunnels in the trunks of the trees of the Moraceae family, while the adults feed on leaves. The most damaged by its feeding habits are mulberry and fig trees. This beetle hosts a variegate gut microbiota, that, as shown by DGGE, greatly changes according to the diet and to the gut tract examined. The cultivable fraction of this microbiota has been tested for several activities that proved the capability of the community as a whole to exploit the food sources in the insect gut (primarily, sugars from plant cell walls) and to assist their host in carbon and nitrogen absorption. Thus, even if acquired from the environment, these bacteria seem to be adapted to a symbiotic lifestyle.

Summary
3
From the comparison among these three studies, some conclusions can be drawn. All three case studies outline the importance of the diet in shaping the insect microbial community. In detail, wild insects always show higher diversity and individual variability in their associated microbiota. Reared insects appear, on the contrary, dominated by the species that can rapidly grow on laboratory diets, such as Lactobacillales and Enterobacteriales. Secondly, these studies depict a more accurate image of the commensal bacteria, which are not merely acquired by chance through feeding, but are capable to actively colonize insect guts, and to efficiently exploit this niche to multiply and spread in the environment. Finally, the research data point out that the origin and the function of many of the organisms detected in insects are yet poorly understood. For this reason, these studies can be considered a basis to for future research, aimed to a more in-depth understanding of the roles of these bacteria and their interactions with the hosts.
Riassunto
Gli insetti sono uno dei più affascinanti taxa sulla terra: la loro varietà, diffusione, colonizzazione di diverse nicchie non hanno eguali nel regno animale. Inoltre, hanno un notevole impatto sulla vita umana: possono essere parassiti per le persone, gli animali e le piante coltivate, vettori di malattie, impollinatori e anche animali di allevamento (come ad esempio api da miele e bachi da seta). Questo straordinario successo evolutivo e diversificazione sono parzialmente dovuti alle relazioni simbiotiche che gli insetti intrattengono con una vasta gamma di batteri. I batteri simbionti si possono dividere tra simbionti primari e secondari, e batteri intestinali. I simbionti primari si localizano in cellule altamente specializzate (i batteriociti), sono trasmessi esclusivamente per via materna e non sono coltivabili. Sono essenziali per i loro ospiti e viceversa: i due possono essere a buon diritto considerati come parti di un singolo organismo chiamato “olobionte”. I simbionti secondari, invece, non sono necessari per la sopravvivenza dell’ospite, nonostante spesso gli conferiscano dei benefici, e possono colonizzare diversi organi e tessuti. In questa categoria ricadono anche i parassiti riproduttivi, come ad esempio Wolbachia, che si diffonde nelle popolazioni per trasmissione materna, manipolando la riproduzione dell’ospite per favorire la nascita di figlie infette. Infine, i batteri intestinali sono una categoria più vaga, comprendente organismi che vivono nell’intestino degli insetti perché ingeriti con il cibo, ma anche simbionti che intrattengono una stretta relazione con gli ospiti e sono essenziali per la loro sopravvivenza e il loro sviluppo. I ruoli di tutti questi microorganismi sono, importanti, in misura diversa, per la fisiologia degli insetti. I simbionti primari sono spesso essenziali per complementare diete sbilanciate e i secondari contribuiscono al benessere dell’ospite, mentre i parassiti riproduttivi ne influenzano profondamente la riproduzione. E’ stato dimostrato che anche i commensali possono condizionare lo sviluppo, la scelta del partner e le risposte immunitarie di Drosophila melenogaster. Per queste ragioni, la

Summary
4
comprensione della biologia di un insetto non può prescindere dalla caratterizzazione del suo microbiota. Nel primo capitolo della mia tesi, una review sulle tecniche di ecologia microbica applicate allo studio delle comunità batteriche degli insetti fornisce una panoramica dei metodi che possono essere applicati per raggiungere questo obiettivo. Da una parte, le analisi molecolari basate sul sequenziamento del gene codificante il 16S rRNA, come il 16S rRNA barcoding (pyrotag) e l’elettroforesi su gel in gradiente di denaturante (DGGE) costituiscono gli strumenti più efficaci per ottenere un’immagine completa della composizione e della struttura della comunità microbica. La localizzazione dei simbionti può essere poi studiata attraverso l’ibridazione in situ fluorescente (FISH). Dall’altra parte, l’isolamento in coltura dei batteri permette di caratterizzare dettagliatamente la frazione coltivabile, verificando attraverso dei saggi in vitro le attività dei singoli ceppi. Avvalendosi di una collezione di ceppi isolati dall’insetto oggetto di studio, è possibile inoltre analizzare i meccanismi dell’interazione simbiotica attraverso esperimenti in vivo. I più comuni riguardano: i) la marcatura dei batteri con proteine fluorescenti e la ricolonizzazione degli insetti, per valutarne la localizzazione e la capacità di colonizzazione, ii) la misurazione degli effetti negativi causati sull’ospite dalla mancanza del simbionte, iii) il paragone tra insetti associati a singoli ceppi per studiarne gli effetti sul benessere dell’ospite. Per approfondire ulteriormente l’interazione tra i batteri e i loro ospiti da un punto di vista genetico, possono essere applicate tecniche avanzate quali la Signature Tagged Mutagenesis (mutagenesi con sequenza marcata) o la In Vivo Expression Technology (tecnologia dell’espressione in vivo). Molte tra le tecniche citate sono state applicate ai casi studio presentati di seguito, nei quali si caratterizzano le comunità microbiche associate a tre insetti dannosi per l’agricoltura. Nel secondo capitolo è presentato uno studio sul moscerino dei piccoli frutti, Drosophila suzukii. A differenza del suo congenerico D. melanogaster, che si nutre di frutta marcescente, questo moscerino si nutre e depone le uova su frutta sana: le coltivazioni maggiormente danneggiate sono le drupacee (ad esempio le ciliegie) e i piccoli frutti a bacca (fragole, lamponi, mirtilli). La comunità batterica associata a questo parassita è stata caratterizzata focalizzandosi sui batteri acetici (AAB, acetic acid bacteria), importanti simbionti di molti insetti con diete ricche di zuccheri. Dai risultati di questa ricerca emerge che D. suzukii ospita una variegata comunità di batteri acetici, individuati sia nella collezione di isolati che nelle analisi indipendenti dalla coltivazione, quali pyrotag e DGGE. Questi batteri sono principalmente localizzati nell’intestino, adesi alla matrice peritrofica, come dimostrato dalle microfotografie FISH. La capacità da parte di tre specie di AAB (Gluconobacter oxydans, Acetobacter tropicalis e Acetobacter indonesiensis) di colonizzare l’intestino è stata dimostrata in esperimenti di ricolonizzazione degli insetti effettuati usando ceppi marcati con GFP. Nel terzo capitolo si analizza la comunità batterica del coleottero xilofago Rhynchophorus ferrugineus. Comunemente chiamato punteruolo rosso delle palme (Red Palm Weevil, RPW), questo insetto è un importante parassita delle

Summary
5
palme. Le piante sono danneggiate principalmente dalle sue larve, che scavano cunicoli nei tronchi fino all’impupamento. I batteri associati al punteruolo rosso sono stati studiati principalmente con tecniche molecolari (pyrotag). I risultati evidenziano che i batteri residenti in R. ferrugineus sono in gran parte acquisiti dall’ambiente con il cibo. Infatti, è stata registrata una netta differenza tra esemplari prelevati in campo e allevati. Mentre i punteruoli prelevati in campo ospitano più taxa in comune con le piante di cui si nutrono, gli animali nutriti in laboratorio su mela mostrano una più alta proporzione di batteri lattici e acetici, che probabilmente crescono sulla frutta marcescente. Quest’ultimo risultato è ulteriormente confermato dagli isolamenti di ceppi batterici effettuati a partire da esemplari nutriti di mela. Infine, è stata individuata la sequenza di DNA appartenente a un simbionte primario, Candidatus Nardonella. Questo batterio è associato a una vasta gamma di insetti appartenenti alla stessa famiglia del punteruolo rosso, quella dei Curculionidi. Il quinto capitolo riguarda la comunità batterica intestinale di Psacothea hilaris hilaris. Originario del Giappone e della Cina orientale, questo cerambicide è giunto in Italia con il commercio internazionale di legname e si è stanziato in una piccola area della provincia di Como. Le sue larve scavano cunicoli nel tronco degli alberi della famiglia delle Moraceae, mentre gli adulti si nutrono di foglie: i più danneggiati dalle sue abitudini alimentari sono i gelsi e i fichi. Questo coleottero ospita un microbiota variegato, che, come illustrato dalle analisi DGGE, cambia molto a seconda della dieta e del tratto intestinale esaminato. La frazione coltivabile è stata sottoposta a diversi saggi che hanno dimostrato la capacità della comunità nel suo insieme di sfruttare le risorse alimentari nell’intestino dell’insetto (soprattutto polisaccaridi che compongono parete cellulare delle cellule vegetali) e di coadiuvare il loro ospite nell’assorbimento di carbonio e azoto. Dunque, anche se acquisiti dall’ambiente, questi batteri sembrano essere adattati a uno stile di vita simbiotico. Dal confronto tra questi casi studio si possono trarre alcune conclusioni comuni. Tutti e tre sottolineano l’importanza della dieta nel dare forma alla comunità batterica degli insetti. In particolare, il microbiota associato ad insetti prelevati in campo mostra sempre una maggiore variabilità individuale e diversità tassonomica; gli insetti allevati appaiono, al contrario, dominati da quei microorgansmi che crescono più rapidamente sulle diete da laboratorio, come i membri delle famiglie Enterobacteriales e Lactobacillales. In secondo luogo, questi studi contribuiscono a dipingere un’immagine più accurata dei batteri commensali, che non sono semplicemente acquisiti casualmente con l’alimentazione ma sono in grado di colonizzare attivamente l’intestino degli insetti, e di sfruttare questa nicchia in modo efficiente per moltiplicarsi e diffondersi nell’ambiente. Infine, questa tesi evidenzia come l’origine e la funzione di molti degli organismi individuati negli insetti siano ancora poco conosciute. Per questa ragione, i risultati di questa ricerca possono essere considerati la base per una ricerca futura volta a una più profonda comprensione dei ruoli di questi batteri e delle loro interazioni con gli ospiti.

Chapter 1 - Aim of the thesis
6
Chapter 1
Aim of the thesis
The interest on bacterial symbionts has greatly increased in recent years, giving birth to impressive scientific initiatives, as the human microbiome project (1). Drosophila flies, with their simple gut bacterial community, have been used as models to investigate the relationships between the gut microbiota and the host, and the regulation of the immune response to bacterial colonization (2–6). These studies proved the great importance of the microbial symbionts, that influence the survival, development, mating choice and immune response of the insect hosts. Besides, the body of insects emerged as an interesting and new environment to investigate with the methods of microbial ecology. The importance of this class of Arthropoda on planet Earth is overwhelming, in terms of diffusion, number of taxa and colonization of different environments. This makes the insects themselves and their diversity a fascinating topic, not only as a model to investigate the interactions between the microbial symbionts and the host. Moreover, many insects are studied for their immediate impact on human life, health and economy as pests, disease vectors, pollinators or breeding animals (e.g. silkworms, honeybees). In this light, the knowledge about composition and function of the bacterial community of insects is useful to deepen our understanding of insect physiology, and to explain the extraordinary evolutionary success of this taxon. This information will allow to develop better strategies to manage dangerous and useful insects (7). In this thesis three case studies are presented, in which the microbiota associated to insect pests is characterized with different methods. In all the three cases, molecular techniques such as 16S rRNA barcoding (pyrotag) and Denaturant Gradient Gel Electrophoresis (DGGE) are applied, to obtain a complete image of the whole bacterial community. Bacterial isolations are then performed to deepen the knowledge about the cultivable fraction of the microbiota. In the third chapter is presented a study on the black-spotted wing fly Drosophila suzukii, a pest of fruits and, in particular, berries. Unlike its relative D. melanogaster, that feeds on rotten fruit, the black-spotted wing fly feeds and lays eggs on healthy fruits still on the plants. The bacterial community of this insect has been investigated with a particular focus on the acetic acid bacteria. In fact, this taxon has been recognized as widespread among insects with a sugar-rich diet, and some of its members are proved to be important for Drosophila flies development, acting on the host insulin signaling pathway (3). In this study, the presence in D. suzukii of several members of the Acetobacteraceae family, such as Gluconobacter, Gluconacetobacter and Acetobacter, has been demonstrated by pyrotag, Denaturing Gradient Gel Electrophoresis (DGGE) and Fluorescent in-situ hybridization (FISH). All the three genera have been isolated from adults and larvae. Furthermore, three of the isolates (belonging to the species

Chapter 1 - Aim of the thesis
7
Gluconacetobacter oxydans, Acetobacter tropicalis and Acetobacter indonesiensis) have been marked with the green fluorescent protein (GFP) and their ability to colonize insect gut has been shown through recolonizations. The fourth chapter is about Rhynchophorus ferrugineus, the red palm weevil, a member of the family Curculionidae. This large beetle is regarded as the major pest of palm trees: its spread from the Middle East to the Mediterranean basin is threatening, among others, the ornamental Phoenix canariensis palms on the Italian coasts, which have a great landscape and historical value. The red palm weevil lays eggs at the base of palm leaves, and its larvae dig tunnels in the trunk, feeding on wood, until they reach the length of 3 cm. Even in this case, the bacterial community of the insect has been investigated by molecular means with pyrotag. The sequencing has been performed on field-caught specimens and on specimens reared on apple. This comparison showed that the bacterial community evenness undergoes a dramatic reduction after a month of rearing, underlining the importance of the diet in shaping the gut bacterial community. Bacterial isolations have been then performed from apple-reared specimens, confirming the results of the pyrotag. In the fifth chapter another xylophagous beetle is presented. Indeed, Psacothea hilaris hilaris feeds on the trunks of mulberry and fig trees at the larval stage, and on the leaves of the same plants at the adult stage. Commonly named yellow-spotted longicorn, this member of the Cerambycidae family is endemic in eastern Asia, where its feeding habits greatly damage sericulture. In Italy, several observations of this insect have been registered, but it stably colonized only a small area of the Como province. Nevertheless, the danger of a possible spreading should not be underestimated, taking into account the importance of the fig cultivation in the Mediterranean basin. A rearing of P. h. hilaris has been established in our department, allowing us to investigate the changes in the gut bacterial community of specimens fed on different diets or field-caught, and to further verify in a different animal model the observations we made on R. ferrugineus. DGGE has been applied to investigate the bacterial community diversity of different gut tracts in wild larvae and in larvae fed with different artificial diets. Then, bacterial isolations have been performed with a focus on microorganisms capable to degrade recalcitrant plant polymers, such as cellulose, xylan and pectin. A selection of strains of the isolate collection has been subsequently tested for several activities connected to the carbon and nitrogen metabolisms. We named these activities “symbiotic potential” because they could promote a mutualistic relationship between the bacteria and the host. On an evolutionary perspective, bacterial strains which have the capability to persist in the host, to exploit the food resources in its gut and moreover contribute to its physiology should be advantaged themselves, spreading rapidly in the environment and in other hosts. The last chapter presents the conclusions and the future perspectives of this work. This thesis shows how different microbiology techniques can be successfully applied to the investigation of microbial communities in insects. All the insects treated here are important pests, and the knowledge about their bacterial community will hopefully help to effectively address the problem of their management. Indeed, for understanding the physiology of

Chapter 1 - Aim of the thesis
8
these pests, their symbiotic relationships can not be underestimated. Moreover, these exploratory analyses are the essential precondition to begin more in-depth studies that aim to elucidate the mechanisms of interaction between bacteria and non-model insects from different environments.
References
1. Turnbaugh PJ, Ley RE, Hamady M, Fraser-Liggett CM, Knight R, Gordon JI. 2007. The human microbiome project. Nature 449:804–10.
2. Ryu J-H, Kim S-H, Lee H-Y, Bai JY, Nam Y-D, Bae J-W, Lee DG, Shin SC, Ha E-M, Lee W-J. 2008. Innate immune homeostasis by the homeobox gene caudal and commensal-gut mutualism in Drosophila. Science 319:777–82.
3. Shin SC, Kim S-H, You H, Kim B, Kim AC, Lee K-A, Yoon J-H, Ryu J-H, Lee W-J. 2011. Drosophila microbiome modulates host developmental and metabolic homeostasis via insulin signaling. Science 334:670–674.
4. Storelli G, Defaye A, Erkosar B, Hols P, Royet J, Leulier F. 2011. Lactobacillus plantarum Promotes Drosophila Systemic Growth by Modulating Hormonal Signals through TOR-Dependent Nutrient Sensing. Cell Metab. 14:403–414.
5. Lee K-A, Kim S-H, Kim E-K, Ha E-M, You H, Kim B, Kim M-J, Kwon Y, Ryu J-H, Lee W-J. 2013. Bacterial-Derived Uracil as a Modulator of Mucosal Immunity and Gut-Microbe Homeostasis in Drosophila. Cell 153:797–811.
6. Sharon G, Segal D, Ringo JM, Hefetz A, Zilber-Rosenberg I, Rosenberg E. 2010. Commensal bacteria play a role in mating preference of Drosophila melenogaster. Proc. Natl. Acad. Sci. U. S. A. 107:20051–6.
7. Crotti E, Balloi A, Hamdi C, Sansonno L, Marzorati M, Gonella E, Favia G, Cherif A, Bandi C, Alma A, Daffonchio D. 2012. Microbial symbionts: a resource for the management of insect-related problems. Microb. Biotechnol. 5:307–17.
.

Chapter 2 – Microbial ecology methods
9
Chapter 2
Microbial ecology methods to characterize the microbiome of non-model insects
Abstract
Insects are an extraordinary animal group, unparalleled for diffusion, diversity and number of different niches occupied. Besides this, they raise the interest of the researchers as animal models, human and agricultural pests and disease vectors, as well as breeding species (e.g. honeybee and silkworm). So far, it has been demonstrated that insects are involved in a number of different relationships with microbial symbionts, which influence their survival and fitness, development, mating habits and immune system. Thus, the research that aims to deepen the knowledge about a particular insect species can not do without a characterization of its microbial partners. In this review, we present several microbiology and microbial ecology techniques that can be applied to the taxonomical and functional analysis of the microbiota of non-model insects. Our goal is to give to the researchers that are approaching this topic an extensive overview of the basic methods, with a focus on operational details, and a concise guide to the advanced techniques that are available to extend the research beyond the simple description of microbial communities.
Introduction
The awareness of the importance of microbial symbionts for animal physiology is growing fast, together with the increasing number of studies focusing on the non-pathogenic bacteria hosted by a wide range of organisms. Although the attention of scientists has been for decades primarily focused on the pathogenic bacteria, the vast majority of the microorganisms associated to animals are likely harmless, variable and acquired from the environment (1). Besides, a number of beneficial bacteria had been found, and among these a group of essential, vertically transmitted endosymbionts that form with their host an inseparable holobiont (2). Insects have been investigated by microbiologists as models for human-microbiota interactions, as well as for their importance as agricultural pests and disease vectors. The most studied associations between bacteria and insects can be roughly divided in two groups, i.e. heritable symbionts (including primary and secondary symbionts) (2) and gut symbionts. On one hand, most heritable bacteria are obligate symbionts (2). They can be divided into primary (P) and secondary (S) symbionts. The first category comprises bacteria that are necessary for the insect survival and/or reproduction, and inhabit highly specialized cells –the bacteriocytes- that can be interspersed in the gut

Chapter 2 – Microbial ecology methods
10
epithelium or grouped within specialized organs called bacteriomes. Typically, they share a long evolutionary history with their host, as they propagate only through maternal transmission, and they cannot colonize naïve insects. This kind of symbiosis is common in insects with poor diets, such as aphids, which feed exclusively on phloem sap. Aphids need to host in their bacteriomes a γ-proteobacterium of the genus Buchnera that is able to synthesize the amino acids that are absent in their diet (3). P-symbionts undergo to a process of “genome shrinkage”, losing genes that are necessary for a free-living habit and retaining genes that are necessary for the activities involved in the symbiotic relationship (in the case of Buchnera, synthesis of aminoacids). Secondary symbionts are not essential for host survival, although they can improve the fitness of the host, and they colonize various cells and organs, including hemolymph. They are able to infect new hosts and establish with them stable associations through maternal transmission (4). Into this category fall also the reproductive manipulators that, rather than conferring fitness benefits to the host, spread into the population by promoting the reproduction of the infected females through daughters. Given that the transmission of the symbiont is maternal, this behaviour boosts its dissemination, and can be accomplished in various ways, such as cytoplasmic incompatibility, parthenogenesis, male feminization and son-killing (5). On the other hand, gut symbionts have been extensively reviewed in Engel and Moran (6). Most of these are commensals and they reside in the gut, being not clearly harmful nor beneficial for the host (7). With the term “commensals” we can refer to a broad range of microorganisms, varying greatly even among members of the same species. These bacteria are generally not transmitted maternally, but acquired from the environment and from the diet, and selected by the chemical and physical conditions inside the gut, such as pH, oxygen availability, and retention time of the food bolus. Furthermore, host immune system plays an active role in selecting certain bacteria, as it is elicited by specific bacterial features, for example the excretion of uracil (8). Despite the extreme variability of this type of microbial consortium, there is raising evidence that commensals can critically affect host physiology, acting on the immune system (8), on the larval development (9) and even on the mate choice (10) (reviewed in (6)). These effects, despite sometimes important, cannot lead to a sharp classification of the microorganism as “mutualistic” or “pathogen” (7). For example, in many cases the simple presence of the commensal microflora itself can prevent the colonization by pathogens (11), and the alteration of the bacterial community can lead to a “dysbiosis” that is detrimental for the host (12). Moreover, some cases are known of specialized gut symbionts whose relationship with the host resembles a primary symbiosis (genome shrinkage, strict heritability (13)). In the group of hemiptera, the vertical transmission of gut simbionts, which are smeared on the eggs or encased in symbiont capsules, is well studied (14–17).

Chapter 2 – Microbial ecology methods
11
Figure 1: Schematic representation of the workflow for starting the characterization of the microbial community of an insect.
Taking into account the crucial roles of the symbionts listed above, a descriptive study of any insect can not disregard the characterization of the bacterial community associated with it. Thus, the research on emerging pests, disease vectors, or beneficial insects (e.g. honeybees and silkworms) should certainly comprise a microbiological screening. Aside from giving a more complete image of the physiology of the insect itself, this kind of survey could be the precondition to develop useful applications, such as probiotics or pest and disease control strategies (18). Looking at these potential technological developments, it is advisable not to underestimate culture-dependant assays, which, even if far less powerful than molecular methods (above all Next Generation Sequencing) in describing bacterial communities, give the promising opportunity to manipulate single cultivable strains. The aim of this review is to give to the researchers that are approaching this kind of study an overview of the microbiological methods available (see Figure 1), together with the practical considerations that are necessary to apply them to insects and to correctly interpret the results. Addressing to the scientists that are new to this field, the focus will be mainly on the best-known and more feasible techniques. Nevertheless, also some advanced techniques of genetic analysis will be presented, to suggest the possible progress of these studies beyond the simple taxonomic characterisation of the microbial community.
Sampling
Recovering insect specimens suitable to the microbial community analysis can be challenging in many ways. Depending on the target species and its habitat,

Chapter 2 – Microbial ecology methods
12
the field season is often restricted to a short period of the year and the collection and identification of samples requires time and experience. Therefore, it is important to start with a precise plan of the number and type of individuals required.
Specimen choice
The composition of the microbiota of insects, within the same species, is largely dependent on ecological parameters such as temperature, geographical location and, above all, diet. Several papers report qualitative and quantitative differences in the gut community composition of insects reared on different diets (19–23). In some cases, insects of highly divergent taxonomical groups feeding on the same substrate can harbour very similar microbial communities, overcoming the effect of the host taxonomy in shaping the microbiota (21). This is true, for example, for some species that live on decaying wood (23). Moreover, the microbiota found in guts of wild insects is generally more diverse than the one of reared insects. Studies on Drosophila melenogaster show that different laboratory populations can host diverse strains that, nevertheless, can exert important and similar physiological roles (9, 24, 25). However, wild Drosophila gut microbiotas are much more complex, with the more diverse communities present in the flower and mushroom feeders (22). Finally, it is important to note that most standard diets used in insect stocks contain preservatives and/or antibiotics that avoid the proliferation of microorganisms on the diet itself, but necessarily have an impact on the natural microbiota of the insects. Even the distribution of secondary endosymbionts such as Wolbachia, Spiroplasma, or Rickettsia can depend on ecological factors such as diet, temperature and snowfall, or even the co-occurrence of other symbionts (26). The reproduction-manipulation strategy of endosymbionts like Wolbachia can rapidly spread the bacterium across one population, determining a patchy distribution. Moreover, this behaviour can influence the frequencies of other vertically-transmitted symbionts through a hick-hiking effect (26). On the contrary, by definition, the primary symbionts are present in all the specimens of one species, as they establish a tight interdependence with the host. For all these reasons, according to the aim of the research it may be necessary to sample insects of different populations. On one side, if describing the gut bacterial community of one insect is the primary goal, it is necessary to analyse directly wild samples rather than rely on laboratory stocks. Even feeding the insects on an artificial diet for short periods can lead to important biases (27). Moreover, to explain the possible differences in the gut bacterial composition of the specimens is advisable to monitor some ecological parameters on the collection site, at least the substrate on which the samples are feeding. Unfortunately, the dissection of the guts of wild animals can be far more challenging that the dissection of specimens reared on artificial diets. In fact, the latter usually have larger amounts of good quality food available, resulting in a bigger and more swollen gut that is clearly distinguishable from surrounding tissue. Besides, to survey the presence/infestation rate of endosymbionts in one species the sampling sites should be as geographically diverse as possible. If the infestation rate is always 100% across genetically

Chapter 2 – Microbial ecology methods
13
and spatially separate populations, the hypothesis of a primary symbiosis should be verified.
Target organs.
The choice of the organs to target largely depends on the size of the specimens and thus to the ease of the dissection. While to address single organs of smaller insects is very difficult, for larger ones this could be an obliged choice. In fact, hard cuticles and high quantities of biomass can impair DNA extraction. Moreover, the gut bacterial community usually outnumbers the bacterial cells in any other body district, thus, examining the insect as a whole can give similar results as if sampling the gut only (17). Therefore, at least in the case of “dissectable” insects it is useful to know which organs are more likely to host symbionts. Gut. The gut of insects usually hosts a complex community of commensal symbionts. It can be divided at least in three tracts, named foregut, midgut and hindgut, which can host different bacterial communities. In foregut and hindgut, that are of ectodermal origin, a cuticular layer made of chitin separates the epithelium from the lumen, while midgut is the main site in which the nutrient absorption takes place. In the latter, a peritrophic matrix is secreted by the epithelial cells of many insects. This permeable envelope separates the bolus and the gut bacteria from the epithelium, allowing the transit of nutrient molecules, and is continuously replaced as it is shed. In the anterior hindgut the Malpighian tubules, insect excretory organs, deliver waste products such as uric acid, collected from the body cavity in which they extend. Therefore, in this area the mixture of nitrogen and food waste discriminate the gut environment of insects from the one of vertebrates, in which the nitrogen waste is separated. Depending on the species and the life stage, these three tracts can assume very different shapes and comprise diverticula or extremely specialized compartments, in which specific bacteria are hosted, as in the case of termites (28). Microsensor measurements in the beetle Pachnoda ephippiata show that the redox condition and the pH can vary sharply along the gut: the bacterial community composition varies accordingly (29). Therefore, the knowledge on the differences between the tracts can be critical in understanding the gut physiology. Nevertheless, dissecting the gut prior to analysis is a delicate step: a special attention is necessary to avoid the leakage or the mixing of the gut content of the different parts. Bacteriomes. Bacteriomes, or mycetomes, are organelles composed by the bacteriocytes in which most primary symbionts reside. Often associated to the external midgut (tsetse flies (30), louse (31)), they appear as whitish round shaped bodies, and their first observation can be traced back to the seventeenth century (32). Bacteriocytes can be also located in the fat body, where they can be identified by microscopy because of their cytoplasm densely populated with bacteria (33), or intercalated in the midgut tissue (34). Separating the bacteriomes from the gut tissue without breaking the gut epithelium can be difficult in smaller animals. However, the detection of endosymbionts with molecular means, as diagnostic PCR, allows the analysis

Chapter 2 – Microbial ecology methods
14
of the whole insect, avoiding this step (see below). In the case in which target of the research are primary symbionts, bacteriomes must be investigated. Gonads. Reproductive manipulators, as well as maternally transmitted mutualists, colonize ovaries where they infect trophocytes and oocytes, through which they are transmitted to the progeny (30). Moreover, in the arthropod Ixodes ricinus, an hard tick, an intra-mitochondrial endosymbiont that inhabits almost exclusively the ovaries is harboured (35). Testis also can be colonized, enabling a paternal transmission from the male to the mating female and to the offspring, as in the case of Asaia and Anopheles mosquitoes (36). Salivary glands. The presence of endosymbionts has been investigated in the salivary glands of blood-sucking insects and ticks. Asaia colonizes the salivary glands of mosquitoes, co-localizing with the malaria vector Plasmodium spp., if present (4). The presence of Midichloria mitochondrii has been demonstrated in the salivary glands of Ixodes ricinus, by which is inoculated in parasitized humans in sufficient amounts to stimulate antibody production (37). These tiny organs have been mainly examined by Fluorescent In Situ Hybridization (FISH, a technique that it will be discussed in the following section). Cuticles and Antennae. A peculiar type of symbiotic relationship exists between ants and bacteria of the genus Streptomyces. The bacterium occupies specific locations on the bacterial cuticle and produces an antifungal compound that suppresses the growth of parasitic Escovopsis, which threaten the fungal gardens grown by the ants (38). Another bacterium of the same genus plays a similar role in a symbiotic relationship with beewolves of the genus Philantus (39). Adult wasps carry the symbionts in specialized glands in the antennae and females secrete it in the brood chamber in which they lay eggs. Thanks to the antibiotic activity of the Streptomyces strain, with this behaviour the wasp protects the larva and the cocoon against bacterial pathogens that otherwise can easily grow on the prays that represent larval food (39). Other locations. Wigglesworthia glossinidia, symbiont of the tse-tse flies, is transmitted to the offspring through the secretion of the milk gland. The secretion of this gland feeds the larvae that develop inside the mother’s uterus until they reach the third instar (30).
Life stages.
Insects are characterized by a unique development, changing dramatically in morphology and lifestyle according to the life stage. Within the largest insect class, the Pterigota, there are two main types of postembryonic development. In the exopterigota group, the young individual hatched from the egg is similar in morphology to the adult. To reach the adult stage, it undergoes a series of moults, increasing his body mass without changing substantially in shape. Among exopterigota can be listed the cockroaches (Blattodea), the termites (Isoptera), crickets and grasshoppers (Orthoptera), stinkbugs, bedbugs, leafhoppers and aphids (Hemiptera). On the contrary, insects belonging to the endopterigota group are born as larvae, and are subject to a complete metamorphosis prior to the adult stage. Among them, can be

Chapter 2 – Microbial ecology methods
15
mentioned beetles (Coleoptera), butterflies (Lepidoptera), flies and mosquitoes (Diptera), ants and bees (Hymenoptera). Exopterigota (heterometabolous insects). Within this group, the modifications of the gut bacterial community during development have been studied mostly in hemiptera. In the European firebug Pyrrhocoris apterus the gut microbiota appears to be stable along the several moulting steps, with presence of the most represented bacterial taxa already within the egg (17). However, as confirmed also in another member of the same order, Riptortus pedestris, the colonization of the insect by the specific bacterial community is not completed before the third larval instar (16). During the moults, an increase in the production of antimicrobial peptides causes a drop in the bacterial load of R. pedestris midgut (40). A possible explanation is the vulnerability of the molting insect to injury and pathogens, which leads to an up-regulation of the immune system. Regarding the primary endosymbionts, in aphids it has been demonstrated that the development of the bacteriome occurs in the first embryonic stages, even in the absence of symbiotic bacteria (aposymbiont insects) (41). This particularly intimate symbiotic relationship is not affected by the insect development in any way, as the two organisms can be regarded as a single holobiont that develops as a whole. Endopterigota (holometabolous insects). The evolutionary success of holometabolous insects, that are widespread all over the word with an astonishing number of species, has been attributed on the differentiation of the food sources utilized by larvae and adults that avoids the competition between young and mature conspecifics. This differentiation is reflected in the composition of the gut community. Generally, the pupation phase implies a simplification and reduction of the gut microbiota, which, nevertheless, is not completely erased. After that, as the emerging adult starts to feed, bacteria start to grow again, comprising on one hand the species that survived the pupation and, on the other hand, new species that, according to the difference in diet, may or may not be similar to the ones in the larvae (27, 42). A particular case is the honeybee, Apis mellifera, in which, due to the cleaning behaviour of nutrices, the larvae are regarded as an almost-sterile environment and the worker bee acquires a characteristic microflora as it emerges from the brood cell, with two mechanisms: trophallaxis and contact with the hive (43). The maternal transmission of the endosymbionts that are present from the first larval stages to the reproducing adults indicates that the metamorphosis does not affect the presence of the bacteria in the bacteriomes through all the life cycle. Nevertheless, the bacterial load can change with time. The dynamic of bacteriocytes during metamorphosis has been studied in the carpenter ant Camponotus floridanus, hosting the mutualistic symbiont Blochmannia floridanus. In these ants a surprising increase of the bacterial load and of the number of bacteriocytes in the midgut epithelium takes place during metamorphosis, starting in the last larval instar (34). During the metamorphosis Blochmannia appears to colonize also non-bacteriocyte cells, while in the adults it gradually decreases. In conclusion, if surveying the presence of maternally-transmitted symbionts, the life stage of the specimens could be neglected. Otherwise, if dealing with

Chapter 2 – Microbial ecology methods
16
gut bacteria, it is necessary to pay attention to this feature, especially in the case of holometabolous insects.
Sample storage and dissection
Storage. The fate of each collected specimen has to be determined since the very beginning of the sampling. In fact, different techniques require different storage of the samples. Samples for the molecular analyses are usually stored in ethanol and kept at -20°C. Especially when cooperating with unqualified personnel or volunteers during sampling campaigns, it is important to underline that denatured ethanol is not suitable for sample preservation. To ensure the permeation of the body of larger insects with ethanol, one or more legs can be removed. If dissection is required, it is better to perform it immediately and store separate organs. In fact, the dehydration of tissues caused by ethanol could hamper the dissection even after rehydration in saline. Specimens dedicated to bacterial isolations should be immediately analysed. Regarding this, it should be remarked the fact that feeding the insects on artificial diets, even for a few days, can dramatically change their gut communities, due to the fast growth of specific bacterial contaminants on the diets. For this reason, the best option when the immediate analysis is not feasible is collecting insects together with their native feeding substrate and analysing them as soon as possible. Dissection. Prior to dissection, the insects should be killed or at least anesthetized. In fact, although the studies on nociception in Drosophila are still in the early stages, there is no doubt that insects show a pain response to mechanical, thermal and chemical noxious stimuli (44). A well established entomologic technique for killing insects is to saturate the atmosphere in their cage with chloroform or ether. This technique is suitable for molecular studies, as it is not likely to damage nucleic acids. However, to our knowledge it is not known the possible effect of these gases on living bacterial symbionts inside the insect; therefore some authors would rather use for specimens dedicated to bacterial isolation the anesthetisation (42) or sacrifice (17) by exposition to low temperatures (ice or refrigerator). To avoid the contamination by bacteria attached to the cuticle, which are likely influenced by the environment and by manipulation, most researchers perform a surface sterilization as a first step before the dissection or before the smashing for bacterial isolation purposes. In the washing procedure, the specimen is rinsed a few times in water or ethanol (42, 45), or detergents as SDS solution could be used (17). If they permeate the insect body, ethanol and detergents can affect the viability of the microbial symbionts. For this reason the timing of the exposure to these chemicals must be evaluated in relation to the insect’s body mass: for big beetles with thick cuticles this observation is irrelevant, while it can be important, for example, for small flies and mosquitoes. In any case, the ingestion of the chemicals by the insect should be avoided as possible. The dissection of larger insects is usually performed starting with the removal of the cuticle. At this point, with some experience, it is possible to visualize the native arrangement of the gut and other organs in the abdominal cavity (46). The organs of interest can then be removed. For larvae,

Chapter 2 – Microbial ecology methods
17
the cuticle is usually cut along the side of the body, and all the fat tissue is gradually removed to uncover the gut. From small insects, like mosquitoes or Drosophila flies, it is still possible to obtain entire guts by gently pulling the head with pincers until the gut slides out of the body, attached to the masticatory apparatus. It is important to notice that it is impossible to surface-sterilize single organs. Therefore, each of them can be virtually contaminated by bacteria from the haemocoel and abdominal cavity.
Culture-independent methods for community characterization
As the price of new generation sequencing (NGS) lowered in the course of the last few years, the number of papers in which bacterial communities are described exclusively by means of sequencing greatly increased. Nowadays, next generation sequencing of 16S genes amplicons (pyrotag) can be considered the principal strategy for this purpose. Besides pyrotag, other molecular techniques have been traditionally applied, and among them Denaturing Gel Gradient Electrophoresis (DGGE), although more labour-intensive, is still useful for specific tasks. The basis of these methods is the amplification through PCR and the sequencing of the well-known “molecular clock” 16S rRNA gene (47). Briefly, this highly conserved gene encompasses nine variable regions, whose sequences are informative to determine the species of one bacterium on the basis of their sequence. Among them, there are as many conserved regions that are useful to design primers annealing on 16S rRNA gene of different bacterial species. On one hand, the biggest advantage of applying molecular methods is the detection of non-cultivable species, which fairly outnumber the cultivable ones in almost every environment. In particular, insect primary endosymbionts are not cultivable. Secondly but yet importantly, samples for molecular analyses can be collected through all the field season and stored in ethanol without affecting the analysis. On the other hand, the main problem connected to PCR-based methods is the reliability of the quantitative analyses, given that the relative amplification of the templates is affected by multiple factors, which have been extensively described as reported below. Hence, this analysis can be considered semi-quantitative, as it gives an indication of the relative abundance of organisms that has to be validated by more accurate methods, such as qPCR. Although a number of steps in PCR-based methods can bias the final results, there is not accordance on the best protocols to apply, which largely depend on the environment of interest: here you will find an overview.
DNA extraction.
The first critical step is the extraction of DNA. In soil, different extraction methods result in markedly different community profiles (48, 49). Although soil is considered one of the most “difficult” substrates for DNA extraction, even in insects there are some critical factors to take into account. Generally speaking, the extraction protocols starts with the lysis, for which a combination of mechanical, enzymatic and chemical treatments is used. As a first step, for entire insects, especially those with hard cuticles, liquid

Chapter 2 – Microbial ecology methods
18
nitrogen freezing and ceramic pestle smashing is the most popular option, while single organs (e.g. guts) can be smashed as well in saline using a small, tube-fitted pestle. Bead beating or sonication are also reported (21). However, unlike in the soil, bacteria in insect guts are not so tightly associated to hard substrates, and separating them should not require an aggressive beating: Santo Domingo and coworkers report that even a single brief centrifugation could be sufficient to separate most bacteria from gut cells and other debris (19). To perform the chemical lysis, proteases, lysozyme or other lytic enzymes are added. Lysozyme treatment is advisable to enhance the release of nucleic acids from gram-positives, which, due to their harder cell wall, can have lower extraction yields. The use of specific enzymes to extract DNA from particular gram-positives is also reported: Nikodinovich et al. (50) for example recommend a chromopeptidase to improve the extraction from Streptomycetes. Finally, chemical lysis disrupts cell membranes and releases DNA: this is particularly important for endosymbionts, which are enclosed in bacteriocytes. For this purpose, the sample is treated with detergents such as CTAB or SDS. Sometimes, EDTA is added during the mechanical or chemical lysis to impair the DNAses that are naturally present in the sample. The enzymatic lysis has to be performed before the addition of detergents, because the latter denaturate the proteins preventing the enzymatic activity. After the lysis and release of nucleic acids from the cells, the DNA has to be purified. There are two main strategies to accomplish this step: i) chlorophorm-isoamilic acid extraction followed by isopropanol precipitation of DNA, ii) binding of the DNA to a silica membrane in the presence of chaotropic salts: most commercial extraction kits rely on this method (e.g. MoBio Power Soil, Qiagen Blood&tissue). The first protocol, described in (45), is usually more cost-effective although labour-intensive. However, when dealing with insects from soil, humic acids may be co-extracted with this procedure. Regarding the second method, a number of kits and protocols are available. For example, the popular Qiagen Blood&tissue kit comprises a protocol that is specific for insects. In this case, it is important to point out that the goal of this kit is extracting the DNA from the insect itself, rather than from the bacteria, and therefore at least a lysozyme pre-treatment should be added. If inhibition by humic acids is a problem, MoBio Power Soil could be a good choice. This kit has been used also for insects that live above ground (27). If using one of these kits, attention should be paid to the grinding or removal of the cuticles, which easily clog the microcolumns. Finally, DNA is eluted in water, TrisHCl or TrisEDTA buffer. A major problem in extracting DNA from insects are PCR inhibitors. A range of these compounds can be co-extracted with DNA from the insects: their type and amount vary according to the insect environment, diet and species. For example, obtaining effective PCR reactions from gut contents of soil inhabiting invertebrates seems more challenging than from above-ground livers, possibly due to the presence of humic acids in their gut or on their surface (51). Conversely, the presence of hard cuticles inhibits PCR at least with the use of direct-PCR approach (52). The presence of PCR inhibitors has been reported also for insect eyes (53) and guts (51), although both their nature and the best way to remove them are yet unclear. For this reason, it is advisable to test the presence and quality of

Chapter 2 – Microbial ecology methods
19
bacterial DNA by direct 16S rRNA gene PCR, rather than by measuring the DNA concentration in extracts photometrically or by gel electrophoresis. Moreover, in this case a high DNA yield from the extraction could not reflect a high amount of bacterial DNA, as the insect genome is always co-extracted. If the PCR fails due to inhibitors, diluting the extract could help.
Primer choice.
When amplifying the 16S rRNA gene, the critical points of a good primer choice are three: i) universality; ii) variability of the amplified region; iii) specificity for bacteria. Universality. Although in the literature a wide range of primers on 16S rRNA gene are described, none of them is truly universal, at least without many degeneracies. This problem has been addressed in depth after the diffusion of pyrosequencing, but it affects DGGE as well. Several studies test primer pairs in silico (54, 55) for their universality, proposing new couples. Since it is probably impossible to state which is the perfect couple, it is yet important to ensure that the chosen primer pairs are suitable for each research purpose. To this extent, the primer pairs can be tested for their universality using RDP ProbeMatch tool (http://rdp.cme.msu.edu/probematch/search.jsp) or Silva TestPrime (http://www.arb-silva.de/search/testprime/). Both of them are web-based tools that compare given primers with a specific 16S database, returning a list of bacterial taxa that could or could not be amplified by the given primer pair. They also support primer degeneracies. Noteworthy, most sequences in the databases are not full-length, making this tools less suitable for testing the primers in the first and last bases of the gene. However, while the Silva tool clearly points out the percentage of sequences excluded from the analysis because too short, the user of the RDP tool has to be aware of this problem, eventually restricting the search to specific regions of the gene in order to use only the sequences that comprise the target region. Variability of the amplified region. Given that for both pyrotag and DGGE should be generated an amplicon of no more than 500 base pairs, the analysis has to be restricted to one or two variable regions of the 16S rRNA gene. To these purpose, the most common choice is to select the V1-V3 or V5-V6 regions, as the major variability is registered in V1, V3 and V6 regions (56). Amplicons spanning one single variable region are not advisable because too short to correctly identify taxa. The deep analysis of Yarza and colleagues (57) shows that only the combination of two or more variable regions can lead to a full recovery of the species present in the sample. Cutting the high-quality sequences of the Silva Tree of Life Project Database, they simulated short amplicons spanning different variable regions and clustered the sequences to different percentages of similarity, corresponding to different levels of taxonomy. The best recovery of all ranks is obtained by combining two or more variable regions. Specificity for bacteria. Working with mixed eukaryotic-prokaryotic DNA, the risk of unspecific amplification should not be underestimated. In the DNA solution extracted from an insect there is a mix of bacterial DNA and DNA from the insect and its food source (e.g. from the pray, or from vegetal material). Some of the priming regions of 16S rRNA are conserved in plastid

Chapter 2 – Microbial ecology methods
20
DNA or in eukaryotic 18S rDNA (58, 59). In some cases, the size of the amplicon from eukaryotic DNA is different from the size of the prokaryotic amplicon, allowing a separation of the two by means of gel electrophoresis. When the size is similar, the problem is difficult to detect. In both cases, due to the higher proportion of eukaryotic DNA in the source sample, the bacterial amplicons will be underrepresented in the PCR product. Moreover, since in the PCR reaction reagents are limiting, rare sequences in the quote of the bacterial amplicons will be lost. To check primer pairs for this problem, PrimerBlast is a useful tool (http://www.ncbi.nlm.nih.gov/tools/primer-blast/) although it does not support primers with degeneracies. If is not possible to find a suitable primer pair, one option could be a nested-PCR approach. A first PCR amplification is performed with the primers 27F – 1492R, that are highly specific for bacteria and amplify the whole 16S rRNA gene; the result of this amplification is used as a template for a second PCR with the 16S primers of choice (59). To reduce the bias that comes from the double amplification (see following paragraph) the number of cycles in the first PCR should be reduced as possible. Another option is the design of a specific blocking primer (60), although this strategy could require a great effort for optimization. The universal bacterial PCR introduces a source of bias, determining the unreliability of the PCR-based methods for the quantification of bacterial community members. Two mechanisms produce this bias: PCR selection and PCR drift (61). The first implies a preferential amplification of certain templates at higher levels. There are several possible causes for such a “preference”: i) the presence of a mismatch in one template, even in the 5’ region (62), ii) the higher stability of the annealing of G or C variants of a degenerate primer respect to the A or T variants, (61) iii) different accessibility of the 16S rRNA genes in the bacterial genomes. The PCR drift is related to the stochastic variation in the amplification of different templates in the first cycles of PCR, and likely it has a less important effect, easily overcome by mixing replicate PCR reactions. A more important issue is the different copy number of 16S genes in bacterial genomes, recently reviewed by Vetrovsky & Baldrian (63). The authors, based on a comparative study on published bacterial genomes, point out also the presence of differences in the sequence of the copies within the same bacterium, which lead to an overestimate of the bacterial diversity in metagenomic studies.
Denaturing Gradient Gel Electrophoresis (DGGE)
Although considered by many an outdated technique, DGGE is still useful for many applications. This method is based on the separation of the different amplicons generated by a 16S rRNA PCR on a denaturing gradient gel. Briefly, a PCR reaction is performed on a mixed DNA sample using GC-clamped primers that target conserved regions of 16S rRNA gene. This generates amplicons that differ in their sequence and –as a consequence- denaturation behaviour, and reflect the diversity in the microbial community. The gradient of denaturating reagents (urea and formamide) in a polyacrylamide gel allows every amplicon subjected to electrophoresis to denaturate in a specific point of the gel. Once denaturated, the DNA molecules slow their run, creating thus a profile of bands that is viewable upon staining the gel with an intercalating

Chapter 2 – Microbial ecology methods
21
dye. It is assumed that every band corresponds to a bacterial species within the original sample, with a detection limit of 1% of the total community (64). Then, the bands can be cut and sequenced to identify the bacteria. Unlike pyrotag results, that require some bioinformatics analysis, band profiles are immediately and visually comparable, allowing the researcher to have an idea of the complexity and variability of the bacterial community within many insect samples (up to 20 in a single gel). This is useful in many cases: i) to choose the number of samples and the sequencing depth to perform a good pyrotag assay, ii) to directly compare individuals across time-scales, or different rearing condition, and to test if the factor in exam influences the bacterial community, iii) to test for the presence of recognisable patterns of bands, common to one group of samples. Compared to pyrotag, this method requires more bench work and optimization, but less bioinformatics analysis. However, it is possible to analyse the gel data both qualitatively and quantitatively with both proprietary software like Quantity One (Bio Rad) and open-source software like ImageJ. To this purpose, it is important to include markers on both sides of the gel, to make different images comparable. Laboratory-made markers can be easily obtained from a selection of DNA extracts from different isolates. If we exclude special cases, such as the highly bio-diverse gut of termites, the DGGE profile that we obtain from an insect consists of less than 20 bands. As a first trial, the denaturing gradient can be set to 40%-60% of denaturing agents. Bands originated from endosymbionts, whose genomes are usually rich in A and T, are located on the top of the gel. If looking for endosymbionts, it is advisable to choose a denaturing gradient starting from low percentages of denaturing agents (<40%) to better separate these bands. If dealing with vegetable-feeding insects, even if nested PCR has been performed to improve specificity of the amplification, bands corresponding to chloroplast can appear in the middle part of the gel. Sometimes cutting and sequencing of the bands at different heights reveals that more than one band is referable to a single species, thus, cutting and sequencing two representatives of each band height, at least in the first trials, is always advisable.
Clone library To produce a 16S library, the product of a PCR amplification of a portion of the 16S rRNA gene is ligated into a plasmid vector and used to transform a competent E. coli cells. There are a number of commercial kits comprising the essential reagents for all the phases of the work (e.g. Pgem-T systems, Promega, or TOPO-TA systems, Life Technologies). Then, the 16S gene in the plasmid is PCR-amplified and sequenced separately from each E. coli colony, allowing the separation between different 16S genes coming from different bacterial species. This technique has an output incomparably lower than pyrotag in term of number of sequences. Nevertheless, it is useful to retrieve full-length 16S rRNA gene sequences to produce accurate phylogenies and identifications for the most representative members of a bacterial community (17), even if they are uncultivable. For this reason, to take maximum advantage of this technique the primers 27F and 1492R, or other primer pairs spanning the entire 16S rRNA gene should be used. Clones can be sequenced

Chapter 2 – Microbial ecology methods
22
by Sanger method in both directions with a high level of accuracy, and the information about the whole 16S gene can be used also for the design of specific primers and probes.
Diagnostic PCR This technique consists in directly testing the presence of a specific symbiont within an insect individual performing a PCR reaction with specific primers targeting the symbiont. The research so far produced a long list of insect endosymbionts, many of which are restricted to certain taxa (especially P-symbionts), while others are widespread through diverse orders (reproduction manipulators). This knowledge has been exploited to design a number of specific primers that can be used to detect the symbiotic bacteria. This kind of screening is the easiest way to assess the presence of known primary symbionts in newly studied insects. Moreover, it is useful to assess the distribution of S-symbionts across species, sampling sites and populations (65). Specific primers can also be used to set up qPCR assays, which are the most reliable method to quantify the presence of uncultivable symbionts, whereas the pyrotag can give only an approximation of the contribution of a single species to the overall bacterial community (66). In literature it is possible to find a number of diagnostic primers for the best known symbionts: a list is present, for example, in Russell et al. (65). As an alternative, it is possible to directly design the specific primers from the 16S rRNA gene sequence of the target bacterium. Primer specificity has to be validated in silico with the over mentioned ProbeMatch or TestPrime tools and with PrimerBlast, and in control PCR reaction with both positive and negative control template DNA extracts.
Next Generation Sequencing of the 16S rRNA gene Methods based on Next Generation Sequencing (NGS) have became in the last few years the main tool to investigate microbial communities and are increasingly popular. In fact, one of the principal applications the NGS platforms is the sequencing of 16S amplicons, that is possible from almost every kind of environmental samples. To apply the NGS workflow, DNA must be extracted and PCR-amplified with 16S universal primers. DNA molecules in the PCR product are directly and individually sequenced, giving as result a number of sequences that greatly outnumbers the sequence output from DGGE or cloning studies. Amplicons from different samples can be pooled on the same sequencing plate, by adding to one or both the universal primers a sequence tag. Platform choice. For sequencing, a few different devices can be choose, among which the most used are Roche 454FLX, which was the first pyrosequencing platform available, and Illumina (HiSeq or MiSeq), which is rapidly overtaking it because of its lower cost and higher sequencing depth. The choice between the two should be driven by the aims of the study. Illumina systems are the most valuable option if we take into account the price and output in terms of number of number of sequences (in a single plate, 4000 millions with HiSeq and 25 millions with MiSeq). As a result, the coverage of the bacterial community is much deeper. However, the sequences are quite short (125 pb,

Chapter 2 – Microbial ecology methods
23
HiSeq, 300 bp, MiSeq), allowing the amplification of a single variable region of the 16S. Short sequences are not suitable for an accurate taxonomic assignment, and the description of the community is usually limited to the family level. The paired-end systems partially overcome this problem by sequencing the amplicon from both ends (2x300 bp with MiSeq). However, this requires an additional step to assemble two overlapping strands, possibly increasing the formation of chimeric sequences. 454FLX is more expensive and gives a lower number of sequences (700000 for one plate, amplicon sequencing with GS FLX Titanium XLR70) but longer (up to 700 bases in the same platform). This allows a far better taxonomic resolution, with the identification of genera and species. In summary, Illumina is designed for comparing very complex microbial communities, for which a deep sequencing is required. If we exclude some very particular cases, such as termites, this do not seem to be the situation in insects, in most of which bacterial communities are not as diverse as in environmental samples. However, the trend is towards an increasing usage of Illumina systems and there are some papers investigating insect communities with this method yet (27). In this context, Illumina technology can be successfully applied to compare bacterial communities from many different insects, and assessing the modifications of the microbiota occurring with the change of environmental parameters, populations or species. 454FLX is more suitable to study in-depth the composition of the microflora of a single insect, inferring information about its function. In fact, due to horizontal gene transfer and the rapid and complex evolution of Bacteria, members of the same genera and even the same species could have different lifestyles and metabolic features. For example, Bacillus thuringiensis produces the insecticidal Cry proteins, an important and biotechnologically exploited trait that is absent in Bacillus cereus, even if the two species are almost undistinguishable even by complete 16S sequencing. Therefore, to have some hints about the function of the bacterial consortium is necessary to reach the lowest taxonomic level possible, elongating as much as possible the sequenced region. Number of sequences required. Pilot studies. The number of sequences per sample is largely dependent on the microbial community therein. Hence, the most accurate way to determine the minimum number of sequences is to perform a pilot study and inspect the rarefaction curve that correlates the number of taxa found to the sequencing effort. Different types of rarefaction curves can be easily obtained following the Qiime alpha-diversity pipeline (see below).A pilot study to assess the community diversity can be performed also by DGGE. This method is quite laborious to set up, but if a DGGE system is already available, it can be fruitfully used to test the diversity in each sample. In fact, in some species the bacterial composition of different individuals can vary greatly. For example, when analysing whole insects, it should be noted that sometimes primary and secondary symbionts, and particularly Wolbachia, can be present at very high loads compared to other bacteria, “shadowing” the remaining diversity. For the same reason, this kind of preliminary analysis is useful to decide if it is worth to pool small insects together or not. In this respect, should be considered that pooling always

Chapter 2 – Microbial ecology methods
24
implies a loss of information on individual variability that can lead to a misinterpretation of the data. Data analysis. One of the most popular platforms for data analysis is Qiime (Quantitative Insights in Microbial Ecology, www.qiime.org) (67). It requires a Linux operating system and a basic knowledge on linux command line writing. The Qiime workflow comprises: 1) assignation of sequences to the samples based on the tag and denoising; 2) clustering of the sequences in groups (OTUs) based on similarity and picking one representative of each OTU; 3) taxonomy assignation to each OTU based on the comparison with a specialized ribosomal DNA database such as Silva (www.arb-silva.de) or Greengenes (www.greengenes.lbl.gov); 4) analysis of alpha-diversity (diversity within sample) with rarefaction curves and diversity indices; 5) analysis of beta-diversity (diversity between samples) with the Unifrac diversity matrix (www.bmf.colorado.edu/unifrac); 6) production of tables and graphs that can be exported or used for publications. The Qiime analysis pipeline can be run both in an almost totally automated way (using default parameters) or highly customized. Moreover, the software is open-source and can be modified by anyone with experience in phyton programming. Detailed tutorials are available on the website. An important note for data coming from insects regards the use of databases. In fact, Silva databases comprise eukaryotic 18S sequences, allowing the detection of possible insect sequences in the sample (originated by poor primer specificity, as seen before). On the contrary, Greengenes databases are exclusively prokaryotic: eukaryotic sequences would not be recognised and they will be shown as unassigned. An alternative to Qiime is Mothur (http://www.mothur.org). A valuable instrument to reconstruct phylogenies and identify the species from sequences is ARB (68). This software package is available on the Silva website (http://www.arb-silva.de) and requires a Linux operating system, although it is not run by command line like Qiime. ARB allows to align sequences taking into account the secondary structure of the 16S rRNA, that due to its stems and loops produces self-matching regions in the gene sequence. Moreover, it is possible to download highly curated trees of type and non-type strains, as well as constructing customized trees, and to place new sequences in the existing tree using a maximum parsimony algorithm. In this way, the taxonomy can be assigned based on evolution, and not to similarity, with the most rigorous and theoretically correct approach, and species level can be reached with a higher degree of certainty, with the method described, for example, by Franca and colleagues (69). However, compared to the Qiime pipeline, this requires much more time, experience and manual work, to inspect and evaluate the trees.
Metagenomes and Metatranscriptomes With the term “metagenomes” and “metatranscriptomes” we refer here to the shotgun sequencing of the whole DNA or RNA within a sample. The resulting sequence data can be analysed to understand both the taxonomical composition and the metabolic potential of a given bacterial community, by comparison with sequenced genes coding known enzymes. Indeed, the first developed metatranscriptomic technique is the microarray, but we will not discuss this technique here, as it requires a good knowledge of the genomes

Chapter 2 – Microbial ecology methods
25
of target organisms, being thus more suitable for model or well-known symbiotic relationships, as for example, the one of Buchnera aphidicola with pea aphids (70). To our knowledge, metagenomic/metatranscriptomic sequencing has been applied to insect symbionts by a few authors so far, with a specific interest in wood degrading systems (71, 72) or in honeybee gut physiology (73, 74). More scientific literature is available on the transcriptomic profiles of insect themselves instead, sometimes connected to bacterial colonisation (75). Scully and colleagues (72, 76) published two coupled research papers describing the metagenome and metatrascriptome of the gut of the cerambycid beetle Anoplophora glabripennis, shading light on the contribution of both the host and its bacterial community to the digestion of recalcitrant polymers. One major decision has to be taken in planning this kind of experiment: if to sequence only the bacterial DNA (RNA) or to sequence the nucleic acids from the symbionts and the host together. The DNA and RNA content of eukaryotic cells is much higher than those of prokaryotes, thus, depending on the sequencing depth, the information from bacteria could be insufficient for a proper analysis. The gut bacteria can be separated from the surrounding insect tissue mechanically, or by centrifugation (71, 72) while in the case of endosymbionts no separation is possible. It is not advisable to describe a standardized analysis pipeline for metagenomic or metatranscriptomic experiments, because the “information mining” within large quantities of sequence data depends on the specific questions of the experimenter. For example, in the above-mentioned studies on wood feeding insects, the metagenome and metatranscriptome data are compared to the CAZy database (http://www.cazy.org/) (77) to retrieve sequences related to enzymes that metabolize carbohydrates. A nice overview of the available techniques, both for the sample preparation and the data analysis can be found in the review by Julia di Bella and coworkers (78). To have a detailed idea of the technical issues involved in transcriptomic experiments we suggest the review by Westermann and colleagues (79). Although speaking about pathogens rather than symbionts, it discusses in detail the questions arising from an experimental design that involves at the same time one eukaryotic host and one or more bacterial residents. A last interesting example on the application of these methods to the insect gut symbiosis can be found in the paper by Xie and collegues (80) which detected in the Bemisia tabaci microbiota a number of genes for the resistance to xenobiotics.
Bacterial isolation and cultivation
Although there is not accordance on the estimation of the proportion of uncultivable bacterial species, it is common knowledge that they greatly outnumber cultivable ones. Therefore, a culture-based survey of a bacterial community can not claim to be complete. For example, endosymbionts are not cultivable yet, therefore the culture efforts should focus on the gut microflora. Nevertheless, handling a collection of bacterial strains, even incomplete, gives the unique opportunity to test directly, in vivo and in vitro, hypotheses on their role for the insect physiology. Nowadays there are a

Chapter 2 – Microbial ecology methods
26
number of research works describing the bacterial communities within insects, lacking in many cases hypotheses on their function. Coming back to the old-fashioned bacterial isolations, this could be the first step to fill this gap in knowledge. Finally yet importantly, isolates can be used in a range of applications beyond the pure investigation of natural environments. Bacteria have been proposed as probiotics to improve the health of useful insects like honeybees (12), or to enhance the effectiveness of the release of sterile males to control a pest population (81). On the other hand, paratransgenesis is a promising technique against vector-borne diseases (82). A drawback of the culture-dependent methods is the requirement of fresh insect specimens collected from the field, that can not be fed in the lab nor preserved after sacrifice. Thus, the isolation schedule has to be carefully planned according to the field season. Bacterial isolation is typically performed by smashing insect gut (or the whole animal) with a sterile pestle in saline, and plating or inoculating dilutions of the homogenate on various culture media. The direct plating of the homogenate on a rich culture medium (e.g. Tryptic Soy Broth, Nutrient Broth) is suitable to estimate the bacterial load, by counting and averaging the colonies arising from the same dilution of the inoculum in multriple plates (usually triplicate plates). With this strategy, would be isolated mainly the bacteria which are present in higher loads and grow faster than others. In insect guts, usually fall in this category a number of Enterobacteriales. In spite of this, with this method that does not operate a selection among bacteria (as happens in enrichment, see below) is more likely to retrieve a higher proportion of the bacterial diversity within the sample. The serial dilutions should at least span a range from undiluted to 107. More rare bacteria, or bacteria with a slower growth, become visible only on highly diluted plates, due to the overgrowth of more common and fast species on the concentrated plates. Similarly, colonies of some bacteria can take considerably more time than others to become visible. To maximize the proportion of cultivated strains, the best practice for media preparation is mimicking as close as possible the natural environment of the bacteria. To obtain information about how the gut environment does look like, in terms of physico-chemical conditions, micro-sensors have been used. As an example, Lemke et al. (29) provide a detailed description of important parameters such as pH, redox potential, gas exchange along the entire gut tract of the Pachnoda ephippiata larvae (Coleoptera: Scarabeidae). These parameters can vary both spatially (in different gut tracts) and temporally (in different life stages). The pH is actively regulated by the host. Extreme levels of alkalinity are reported in specific regions in guts of some insects feeding on soils or decaying wood (scarabeid beetles (29), termites (28, 83)). This phenomenon has been explained with the enhancement in the digestion of recalcitrant wood polymers, or, particularly for humivores, the detachment of humic acids and other organic matter from clay particles. The guts of Lepidoptera are alkaline as well, this improving the nutrient availability in tannin-rich diets. Extreme pH values do not prevent microbial colonization, but provide a selective environment to which only a small group of microorganisms is adapted. Oxygen availability in the gut can vary greatly among insects, but it is usually higher in smaller insects, while in bigger ones the gut can be almost totally

Chapter 2 – Microbial ecology methods
27
anoxic (46) or host anoxic compartments. In these case, oxygen usually enters with the food in the foregut and decreases in midgut and hindgut. Anoxic conditions for the isolation of bacteria can be obtained through the use of an anaerobic chamber or, if not available, in sealed jars with oxygen subtractors such as Anaerocult A (Merck Millipore). If looking for particular activities (such as degradation of specific substrates) or for certain species, enrichment cultures can be obtained in liquid culture media prior to plate. As an example, a range of enrichment media for cellulose degrading bacteria are reported in literature (84), containing filter paper or carboxymethyl-cellulose, while the isolation of acetic acid bacteria, widespread symbionts of sugar-feeding insects, can be performed on acid media containing high proportions of sugars or ethanol (85). Several steps of enrichment can be performed by inoculating an aliquot of the enrichment culture in fresh enrichment medium. Single colonies resulting from homogenate platings or enrichment media platings are usually picked with sterile instruments and re-streaked on fresh medium. Typically, to ensure strain purity the process is repeated three times; after that, the strains can be preserved at -80° by adding glycerol to a usual final volume of 20%. The diversity in the strain collection can be assessed with fingerprinting techniques; the most used to this purpose is Internal Transcribed Spacer (ITS)-PCR. PCR amplification of the ITS produces indeed a characteristic profile of amplicons of different sizes, usually visualized on an agarose gel, thought to be specific for a strain (86). The identification of the strains is thus achieved by sequencing the 16S rRNA gene amplified with universal primers 27F and 1492R. Forward Sanger sequencing of this amplicon typically produces a 1000 bp sequence, spanning variable regions from V1 to V5 and allowing the identification by BLAST search or other online tools such as RDP classifier (87), SINA aligner (88) or EZTaxon (89). Sequences can also be used to reconstruct phylogenies together with sequences from type and non-type strains, using ARB (68). To obtain bacterial DNA for ITS and 16S amplification, a proper DNA extraction is not required, as in the large majority of the cases boiling lysis is sufficient. For some gram-positives, in which the thick layer of peptidoglycan of the cell wall can retain the DNA inside the cell, the boiling lysis can be preceded by an incubation with lysozime.
Isolate screening Some studies infer metabolic potential of the gut microbiota from metagenomic and metatranscriptomic data (72, 74, 76). A direct screen of the isolates for specific activities is another straight and simple way to assess the possible contribution of the bacteria to the host metabolism. There are many in vitro tests that can be performed quite easily and others can be created or re-adapted from literature to fit every case study. For example, after the finding of pectate-lyases during a metagenomic survey on the honeybee gut microbiota, Engel et al. (74) verified the pectin degradation ability of the isolates from honeybee gut. Interestingly, only some strains within the Gilliamella genus possess this activity that could contribute to the digestion of pollen.
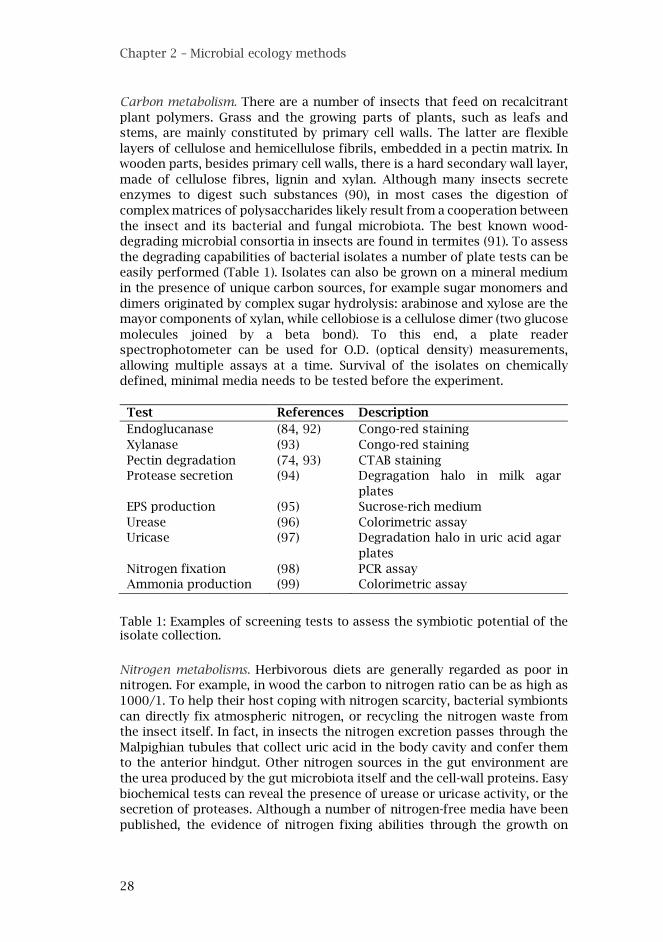
Chapter 2 – Microbial ecology methods
28
Carbon metabolism. There are a number of insects that feed on recalcitrant plant polymers. Grass and the growing parts of plants, such as leafs and stems, are mainly constituted by primary cell walls. The latter are flexible layers of cellulose and hemicellulose fibrils, embedded in a pectin matrix. In wooden parts, besides primary cell walls, there is a hard secondary wall layer, made of cellulose fibres, lignin and xylan. Although many insects secrete enzymes to digest such substances (90), in most cases the digestion of complex matrices of polysaccharides likely result from a cooperation between the insect and its bacterial and fungal microbiota. The best known wood-degrading microbial consortia in insects are found in termites (91). To assess the degrading capabilities of bacterial isolates a number of plate tests can be easily performed (Table 1). Isolates can also be grown on a mineral medium in the presence of unique carbon sources, for example sugar monomers and dimers originated by complex sugar hydrolysis: arabinose and xylose are the mayor components of xylan, while cellobiose is a cellulose dimer (two glucose molecules joined by a beta bond). To this end, a plate reader spectrophotometer can be used for O.D. (optical density) measurements, allowing multiple assays at a time. Survival of the isolates on chemically defined, minimal media needs to be tested before the experiment. Test References Description Endoglucanase (84, 92) Congo-red staining Xylanase (93) Congo-red staining Pectin degradation (74, 93) CTAB staining Protease secretion (94) Degragation halo in milk agar
plates EPS production (95) Sucrose-rich medium Urease (96) Colorimetric assay Uricase (97) Degradation halo in uric acid agar
plates Nitrogen fixation (98) PCR assay Ammonia production (99) Colorimetric assay
Table 1: Examples of screening tests to assess the symbiotic potential of the isolate collection.
Nitrogen metabolisms. Herbivorous diets are generally regarded as poor in nitrogen. For example, in wood the carbon to nitrogen ratio can be as high as 1000/1. To help their host coping with nitrogen scarcity, bacterial symbionts can directly fix atmospheric nitrogen, or recycling the nitrogen waste from the insect itself. In fact, in insects the nitrogen excretion passes through the Malpighian tubules that collect uric acid in the body cavity and confer them to the anterior hindgut. Other nitrogen sources in the gut environment are the urea produced by the gut microbiota itself and the cell-wall proteins. Easy biochemical tests can reveal the presence of urease or uricase activity, or the secretion of proteases. Although a number of nitrogen-free media have been published, the evidence of nitrogen fixing abilities through the growth on

Chapter 2 – Microbial ecology methods
29
these media can be difficult to obtain. Another option is to detect the presence of the nitrogenase gene by means of PCR (98). Ultimately, nitrogenase activity can be measured by acetylene reduction assay (100). Screening for other nutritional activities. Bacteria can be involved in the detoxification of diet compounds. Strikingly, it has been demonstrated that they can even confer resistance to pesticides (101). Many herbivorous insects specialize to feed on plants that synthesize toxic metabolites to protect themselves. A common defence against insects is the production of tannins, which reduce the protein availability in diet. Several bacteria have been showed to produce tannases (92). The survival of isolated bacteria on toxic compounds can be tested directly in liquid or agar cultures.
Fluorescent microscopy methods
Microscopy techniques are an invaluable resource to get information about symbionts localization and function. As mentioned previously, the presence of bacteria in different body districts is indicative of their role and route of transmission. Since the bacteria often inhabit very specialized sub-niches in the gut or localize in specific positions in the bacteriocytes and in the reproductive organs, microscopy is the best way to observe the situation in detail. For example, Candidatus Midichloria mitochondrii, as suggested by the name, was found to inhabit the mitochondria of the ovarian cells (35, 103) of ticks. To this purpose, the most popular method to detect a bacterial species in a sample is in situ hybridization (ISH) based on an oligonucleotide probe complementary to a small fragment of 16S rRNA gene. The visualization of the probe can be achieved by immunohistochemistry or, more often, fluorescence microscopy. In the first case, the sample is treated with a DNA probe joined to the digoxygenin antigen, which in turn is bound by an antibody conjugated with an enzyme. Finally, the activity of the latter enzyme is detected by adding a chromogenic substrate (4, 103) that is visualized with light microscopy. This method is quite labour-intensive and it has been replaced in most cases by Fluorescence In Situ Hybridization (FISH), in which a DNA probe is conjugated with a fluorescent label. FISH. Fluorescence in situ hybridization is based on the hybridisation of a DNA oligonucleotide conjugated with a fluorochrome to the bacterial DNA. This technique is a powerful method to detect bacteria directly in field-collected samples. Tissues can be preserved upon fixation, thus enabling the researchers to choose the most suitable timing for their experiments. The first step to perform FISH is to design or select from literature a specific probe. If the aim is detecting a particular species, the probe should hybridize on the 16S rRNA gene of the target species. The number of bacterial 16S rRNA gene sequences in the databases allows the researchers to design specific probes and, conversely, the high copy number of ribosomal rRNA genes inside bacterial cells provides a strong fluorescence signal. However, particular features of bacterial communities can be investigated designing FISH probes for functional genes. To design the probes for 16S rRNA, the PROBE_DESIGN tool within ARB software package can be used (68). The website of SILVA is another useful source of information about how to perform FISH

Chapter 2 – Microbial ecology methods
30
(http://www.arb-silva.de/fish-probes/). The probes can be verified in-silico also on the online tool “probe match” of RDP (http://rdp.cme.msu.edu/index.jsp, (104)) If possible, FISH probes should be then tested on bacterial isolates, or known samples, to assess the specificity and adjust the stringency conditions. This step is necessary also for probes from the literature, because different working conditions can lead to different specificity features, and, moreover, different substrates can include or not species closely related to the target – situation that requires a higher degree of stringency in the assay. It is thus important to verify that probes can detect the target species and are not cross-hybridizing with other bacterial DNA in the sample. To this purpose, FISH can be performed directly on bacterial cultures of the isolates or, if the target bacterium is unculturable, on a E. coli clone from a library, carrying the 16S of the target bacterium (105). Usually, a probe targeting all the bacteria is always included in the assay. A second preparatory step for the FISH assay consists in the observation of the target insect tissue in an epifluorescence microscope. Indeed, insect tissues can have a level of autofluorescence. Moreover, a plant-based diet usually fluoresce in the wavelengths of red in the gut sections. According to the endogenous level of fluorescence of the sample and the area in which bacteria are expected to be, the researcher can choose appropriately the fluorescent dyes conjugated to the probes. Briefly, FISH is performed after incubation in 4% paraformaldehyde to fix tissues. Samples are washed in PBS. A pepsin digestion step can be added to enhance the penetration of the probe in the tissues. The probes are hybridized ad the appropriate temperature in the presence of formamide and washed again in PBS before the observation (36). An additional DAPI staining is recommended to better localize the bacteria within tissues, using the position of eukaryotic nuclei as a reference. To the same purpose, actin filaments in the host cells can be marked using fluorescent phalloidin. For small insects, such as mosquitoes or Drosophila flies, the staining can be performed on whole organs in an Eppendorf tube and the glass slide mounted as a final step. According to their thickness, these thin samples could be observed in an epifluorescence microscope or (better) in a confocal fluorescence microscope, enabling the observation of multiple focal planes at different depths. For larger insects, organs (and particularly guts) may be too thick for the observation of a suitable focal plane on Z-axis, or to allow the penetration of the light to the desired plane. In this case, to get good images micro sections are necessary. One of the most feasible techniques to this extent is cryo-sectioning. This method preserves the tissue morphology, without the need of histological preparations that require more time and equipment, such as resin infiltrations. According to this method, after fixation in 4% paraformaldehyde, the sample is incubated in growing concentrations of sucrose, which acts as a cryoprotectant. Then, it is frozen on dry ice and embedded in an optimal cutting temperature resin (OCT). Thin sections (from 30 to 60 μm) are obtained in a cryostat and collected on microscope slides. In this case, the DAPI staining and hybridization with probes could be performed on the tissue slices on the glass slides. Unfortunately, gut sections are especially fragile, because the gut content is easily detached from the tissue during the washing and staining procedures.

Chapter 2 – Microbial ecology methods
31
For this reason, it is also possible to perform the DAPI staining and hybridization on whole organs before the freezing and to immediately observe the slides after the cut. The success of this second option depends on the penetration rate of the probe in the insect tissue, which in turn is linked to the size of the organ, and can be improved by the pepsin treatment. However, some preliminary experiments are usually required in order to choose the best visualization options for each case study.
Fluorescent strains
If an interesting strain is found among the isolates, the first step to characterize its interaction with the host could be transforming it with a plasmid carrying a fluorescent protein. The fluorescent strain can be subsequently administered to the host to investigate i) the colonization routes and timing, ii) the persistence in time and across different life stages, iii) the transmission routes (maternal, paternal, environmental) iv) the cross-colonization of different species (106, 107). This experimental set up requires on one hand a bacterial strain that is easily cultivated and transformed, on the other hand the management of a stable insect rearing. Marking systems for bacteria. In literature are described several marking systems to transform bacteria with genes encoding for fluorescent proteins: among them, each researcher has to choose according to his target species and experimental constraints. Here an overview of the principal features of these systems is reported, in order to help the researchers that are new to this field to better understand the available options. Depending on the final position of the marker gene (usually encoding a fluorescent protein, e.g. GFP) in the host strain, the marking can be chromosomal, if the marker gene is located on the bacterial chromosome, or episomal, if it is on a plasmid. The genes for fluorescent proteins are usually encoded in specific plasmids, to enable them to be transferred to the target strain, and coupled with an antibiotic resistance gene, to select cells that acquire them. If the marking is chromosomal, the plasmid lacks the replication origin that allows the plasmid to replicate in the host. Thus, it can not persist in the host cytoplasm but integrates in the host genome through molecular mechanisms derived by transposons or fagi. In some cases the insertion occurs in a specific, neutral site (such as attTn7 in tn7-based systems (108, 109)), while in others the insertion is random, raising the issue of the influence of the insertion on gene expression. Chromosomal marking is usually more stable and can allow to cultivate the bacterium without selective pressure (i.e. antibiotics). As a consequence, insects receiving the bacterial inoculum do not need to be under antibiotic treatment, thus resembling more closely the natural environment. Conversely, for the episomal marking is used a vector that carries an origin of replication recognized by the host, and thus continuously replicates in its cytosol. In this case, a continuous antibiotic selection is needed to avoid plasmid loss through generations; nevertheless, the fluorescence is much more bright, due to the multiple copies of the plasmid that can be present at the same time in a single cell. However, the level of expression of the fluorescent protein is largely dependent on the bacterial strain. Another important difference among marking systems regards the mode of delivery

Chapter 2 – Microbial ecology methods
32
of the marking gene to the bacterial cell: by transformation or by conjugation. In the first case, only two strains are involved: the target and the donor (usually E. coli). The plasmid is purified from the donor, usually using a commercial kit, while the target is grown in liquid culture and washed to obtain competent cells. The purified DNA is then directly introduced in the competent cells by heat-shock transformation or electroporation. The first technique works well with E. coli, but is generally regarded as less effective in terms of number of transformants. For this reason, electrotransformation is advisable in the case of environmental isolates. This second method requires an electroporator equipment to subject the competent cells, mixed to the plasmid DNA, to a voltage difference (111). After the transformation, the bacteria are usually grown for one hour or more in a rich liquid medium without antibiotics, and then plated on the appropriate plates added with antibiotic(s) to select the transformed cells.
Fluorophore Transformation method
Strains/plasmids required
Target bacteria Ref.
Chromosomal GFP (mini tn7); Insertion site attTn7
Conjugation and transposition
Delivery strain: E. coli XL1-Blue/miniTn7; Helper strain: E. coli HB101/pRK600; Helper strain: E. coli SM10 λpir/pUX-BF13
Pseudomonas, Asaia
(107, 108)
Chromosomal dsREd (mini tn5); Insertion site casual
Conjugation and transposition
Delivery strain: E.coli Mv1190λpir/TTN151; Helper strain: E. coli HB101/pRK600
Pseudomonas, Asaia
(36, 110)
Episomal GFP Electroporation E. coli pHM2-Gfp Gram negatives
(4)
Table 2: Some marking systems that have been used to label bacteria in insect-related studies.
The conjugation method exploits the natural horizontal DNA transfer between bacteria of different species. To transfer the DNA by conjugation a complex molecular machinery is required; thus, unless the donor strains retains all the required features, more than two strains can be involved: the donor strain, the target bacterium and one or two helper strains. All the strains are separately grown in liquid cultures, washed, mixed together in appropriate ratios and plated or spotted on filter paper. Only after the conjugation time (usually an overnight, or more) the exconjugants are exposed to the antibiotic(s) in order to select the target bacteria that acquired the marker gene. To plan a transformation experiment, a marking system has to be choose primarily according to the target bacterial species. The various marking systems that have been developed differ in many features, such as

Chapter 2 – Microbial ecology methods
33
origin of replication of the plasmids and delivery mode, primarily to be suitable to different taxa. Many are the taxon-specific characteristics that affect the transformation efficiency: recognized replication origin, methylation of the DNA, type of cell wall (i.e. Gram positives/negatives), codon usage. Prior to start the experiment it is necessary to verify the antibiotic resistance profile of the target strain: it should be sensitive to the antibiotics used in the selection of the transformed cells. If using a conjugation-based system, the target strain should have one antibiotic resistance in the genome, or should grow in special selective conditions to allow the separation from the donor strain. To this purpose, it is sometimes possible to select naturally occurring mutants that are resistant to rifampicin. Furthermore, the fluorescent protein suitable for each study has to be selected according to the natural fluorescence of target insect organs, to optimize the visualization. The bacteria themselves can also have a natural autofluorescence that should be checked. In the Table 2 there is a short list of marking systems that have been used in experiments involving insect colonisations.
In vivo experiments
The recolonization of an insect with marked symbionts can have several purposes: i) to assess the beneficial effect of the symbionts on insect growth or fitness, ii) to verify the transmission routes of the bacterium iii) to assess the localization of the bacterium within the insect. All the three aspects are nicely discussed by Kikuchi and colleagues in a study about Riptortus pedestris (112). Conversely, it could be useful to deprive the insect of a symbiont to investigate if it is necessary, beneficial or neutral to the host (113). Symbiont deprivation and monoassociated insects. The creation of “aposymbiotic” insects is the best method to assess the importance of a symbiont for the host survival and fitness. Moreover, it is the only applicable strategy when the target bacterium is an uncultivable endosymbiont, which effect can be only proved in a negative manner (by subtracting it rather than adding). Aposymbiotic insects are studied since the fifties (114) and can be obtained in various methods, reviewed by Wilkinson (115), among which the most popular and effective is the antibiotic treatment. This strategy allowed, for example, to assess the dependency of the pea aphids on the Buchnera symbionts for the production of some essential amino acids (116). Germ-free Drosophila can be produced also bleaching the embryos and rearing them on autoclaved medium, without the use of antibiotics. However, sterile conditions are very difficult to maintain, thus, the germ-free stocks are usually reared on diets supplemented by a mix of antibiotics (25). The comparison between germ-free (GF) and wild-type (WT) animals is a powerful method, but not sufficient for most scientific purposes. Indeed, aposymbionts are deprived of their entire microbiota, that is in most of cases composed by more than one species, and is thus impossible to attribute the better performance observed in WT animals to a single strain. Besides, it is difficult to prove that the antibiotic itself is harmless for the insect. For these reason,

Chapter 2 – Microbial ecology methods
34
in many studies aposymbiotic insects are used as a starting point to produce monoassociated insects, which are inoculated with a particular strain usually provided with the feeding medium. In Drosophila, this strategy allowed the screening of an entire library of mutated strains, to assess which exact bacterial genes were responsible for the beneficial properties of the tested bacterium (9). In this case, the monoassociated insects were compared to both WT and GF animals. In another study authored by Chouaia and collegues (113) a rifampicin-resistant Asaia strain is used to recolonize rifampicin-treated mosquitoes. The development of rifampicin-treated specimens was delayed, while the colonization by Asaia restored the normal development rate, showing that the longer growing time was due to the absence of the symbionts rather than to rifampicin itself. Many gut symbionts are commensals acquired from the environment, which are selected in the gut by the complex habitat created by the host and by the resident microbial community. Reasonably, these strains could be able to persist and to be beneficial to the insect also through the interactions with other members of the gut community. For these reasons, in some cases the colonization of insects with isolates can be performed directly on WT insects (117). One critical aspect of these experiments is the delivery time and mode of the bacterium. Since most cultivable symbionts are primarily located in the gut, the bacteria are usually mixed with the diet. To ensure the acquisition of the bacteria, insects can be subjected to a starvation time before being exposed to the inoculated food. Alternatively, the inoculated food is provided for a sufficient time span to ensure that the insects have at least one meal. The timing is chosen according to the size and feeding habits of the animal. For example, Kikuchi and colleagues (112) let the Riptortus pedestris nymphs without water for one night, and the animals immediately drink the inoculated water as it is given to them the following morning. Storelli and colleagues (25) allow the eggs of Drosophila flies to hatch on inoculated medium, while mosquitoes are fed with inoculated sugar diet for two hours (106). In some cases, symbionts are acquired in a specific temporal window during the development, that should be considered in planning experiments (16). Fitness measurements. The quantification of the effect of a symbiont on the host fitness is not trivial. First, in many cases the beneficial effects become visible only in situations of stress or nutrient scarcity, while insects are usually reared in controlled conditions, with plenty of food and optimal temperature and light/dark cycles. For example, the influence of Acetobacter pomorum on Drosophila fly larvae development is visible only when the amount of yeast extract in the diet is reduced (9), while in a applicative study on the fruit fly Ceratitis capitata the symbiont Klebsiella oxytoca is used to restore the fitness of γ-irradiated males (81). Second, the measurement of the “fitness” can be performed in different ways and at different life stages according to the expected effect of the bacterium. In most cases, the growth rate or the development time is measured at larval stages. In fact, holometabolous insects grow mainly as larvae, and different larval stages can be monitored observing the moults, thus registering the development time (9, 113). Insects can also be measured and weighted, or mated to assess the mean number of eggs laid as an indicator of reproductive success (112). To

Chapter 2 – Microbial ecology methods
35
specifically address the problem of mating success of males of C. capitata, Gavriel and colleagues observed the proportion of individuals that mated with WT females among inoculated, sterile males and among sterile males inoculated with dead bacteria (81). Measurements of gene expression. In addition to the fitness measurements, the immune response of the insect to the administration of a bacterium can be evaluated by measuring the expression of specific genes, such as the insect anti-microbial peptides (AMPs), using real-time PCR assays. AMPs are important and well-characterized immune effectors of insects and invertebrates in general, which lack an adaptive immune system (118) Localization and transmission routes. Having access to a marked strain of the target bacterium allows the researchers to localize it in colonized insects. To do that, it is possible to take advantage of the same microbiology techniques reviewed in the FISH paragraph. Fluorescent proteins are not affected by tissue fixation in paraformaldehyde or freezing. According to the colonization pattern observed, it is possible to make and test hypotheses about the bacterial transmission. For example, Favia, Crotti and Damiani (and colleagues) first localized the symbiont Asaia in the gut, salivary glands and gonads of Anopheles stephensi, and then demonstrated its maternal, paternal and environmental transmission, besides the capability to colonize different species (4, 36, 106).
Genetic manipulation techniques for advanced in-vivo studies
An advanced goal of the research on symbionts is the understanding of the genetic mechanisms that allow the interaction between an insect and its bacterial hosts. To this extent, besides metatranscriptomic studies, some authors started to apply advanced genetic techniques that have been primarily set up in the medical research. These methods provide elegant demonstrations in hypothesis-based experiments, as well as the possibility to apply wide screenings. However, the preconditions to set up this kind of experiments are severe. It is necessary to have a well-established breeding of the target insect, with appropriate and fast screening systems to evaluate the fitness of the animals colonized by different bacteria. Besides, the bacterium of interest should be easily cultivable and transformable. Finally, a great help comes from the availability of its sequenced genome.
Screenings based on insect phenotype
Site-specific mutations. Particular hypothesis on the interaction between bacteria and insects can be tested impairing a specific gene on the bacterial genome and assess the effect of the mutant strain on monoassociated insects. In the research group of Elke Genersch, this method has been used to validate the discovery of new virulence factors of the honeybee pathogen Paenibacillus larvae (119, 120). In their work, healthy honeybees are infected with P. larvae strains knocked-out in putative virulence genes, and the lack of a key symptom of the illness, the degradation of peritrphic matrix, is observed. With the constant increase of genomic and trascriptomic data on bacterial

Chapter 2 – Microbial ecology methods
36
symbionts will be possible to formulate and test an increasing number of specific hypotheses. As an alternative, a group of different mutants can be tested at the same time by transposon mutagenesis. Transposon mutagenesis. Shin and colleagues (9) created a library of Acetobacter pomorum in which each strain carried an insertion of a Tn5 transposon in one random position on the genome. The library was used to create cohorts of monoassociated Drosophila, which were compared according to weight and growth rate. The strains that produced slow-growing flies were subsequently analysed to understand which genes had been impaired by the insertion of the transposon. They found that 11 genes involved in the periplasmic pyrroloquinolinequinone–dependent alcohol dehydrogenase (PQQ-ADH)–dependent oxidative respiratory chain were damaged in the selected strains. This strategy allowed them to understand that the production of acetic acid by A. pomorum, mediated by the PQQ-ADH pathway, was important to enhance larval growth on a sub-optimal diet.
Screenings based on bacterial survival in the host IVET (In Vivo Expression Technology) and STM (Signature Tagged Mutagenesis), reviewed and compared in Chiang et al. (121), have been developed to discover In Vivo Induced (IVI) genes. Reasonably, pathogenic organisms encounter, as they enter the host, environmental conditions that they do not experience outside. Thus, they react to the mutated situation changing the gene expression profile, to enhance the transcription of the genes involved in colonization and pathogenesis. Therefore, many IVI genes are expected to be virulence factors. The same reasoning can be applied to symbionts. In the mutated conditions of the host body, they do not activate virulence factors but they should be able to modify their gene expression in order to escape the immune system, to colonize their specific niche in the body and to exploit the food resources therein without damaging the insect, but, possibly, giving it an advantage. For this reason, the application of these techniques to the field of insect symbiosis appears, in our opinion, very promising. Both these techniques are based on a genetic selection that is independent from the fitness of the host. STM. Signature-tagged mutagenesis consists of a large-scale screening to detect the bacterial genes that are necessary for the survival of the symbionts inside the host body. Like in the method described above, a transposon is used to impair genes at random. In this case, a number of different transposon plasmids, each containing a sequence tag, is used to produce a set of libraries of randomly mutated strains of the same bacterium. Each library is originated by a transposon with a different tag. The tags are flanked by two invariant regions, to easily amplify them by PCR with the same primers. The libraries are used to create Input Pools (IP), combining one strain from each library. Every IP is administered to a different group of animals. After the experimental time, bacteria are recovered from the animals, generating the Output Pools (OP). Strains that are mutated in genes fundamental for the in-vivo survival of the bacteria will not overcome the phase inside the host, and will not be retrieved in the OP. IP and OP are compared by dot blot, after the amplification of the tags. Strains that are present in the IP but not in the OP

Chapter 2 – Microbial ecology methods
37
are thus analysed to detect their mutated genes, which are supposed to be necessary for the permanence of the bacterium inside the host. To ensure that each gene in the bacterial genome is mutated at least in one strain, it is necessary to repeat the experiment with many input pools. STM has been successfully applied to human enteric pathogens (reviewed in (122)) as well as to the plant symbiont Sinorhizobium meliloti (123). This screening method is suitable to select the genes that are necessary for the survival of the symbiont in the host gut, among which, reasonably, would be found critical factors for colonization and interaction with the host. IVET. A more refined genetic manipulation is required for the In Vivo Expression Technology. The aim of this technique is to select the bacterial promoters that are active only in vivo, i.e. only when the bacterium is inside the host. As a first step, the genomic DNA of the target bacterium is randomly fragmented through a partial enzymatic digestion. The fragments are inserted upstream to a promoterless antibiotic resistance gene (a variant is possible using a gene to complement an auxotrophy) into a specific plasmid, that is subsequently used to transform the target bacterium. In the latter, these plasmids are not able to replicate, but can integrate in its genome through a homologous recombination event between the cloned genomic sequence and the corresponding region on the bacterial chromosome. Thus, a library of mutants is produced. As a result of the homologous recombination process, each of the mutants carries two tandem copies of a specific fragment of the genome; downstream of one of the copies lays the promoterless antibiotic-resistance gene. This library is subjected to a first screening step on antibiotic medium, to eliminate the clones that are resistant to the antibiotic in-vitro (with a replica-plating-like process). Indeed, only the bacteria in which a promoter present in the cloned genomic fragments drives the expression of the antibiotic resistance gene will survive on the antibiotic plates. These clones harbour a cloned copy of a promoter that is probably constitutive, as it is active in the optimal laboratory conditions, without any stress stimulus. These clones have to be excluded from further screenings. The remaining clones of the library of mutants are introduced in the eukaryotic host as a whole, and, as in STM, retrieved after some time. Differently from STM, for the whole duration of the experiment the animal host is subjected to an antibiotic therapy. In these conditions, only the bacteria that are able to express the antibiotic resistance gene, due to the presence of a cloned, in vivo activated promoter upstream, will survive. The bacteria in which the cloned portion of the genome coincides with inactive promoters or regions with other functions, will die or at least remain quiescent inside the host. To further refine the selection, the retrieved pool of clones can be used for a second in vivo inoculation. In the end, the output pool will contain only bacteria in which a second copy of an in vivo activated promoter is present. Further analyses are needed to sequence it and determine his native function in the genome, in order to understand which are the in vivo transcribed genes in its operon. To this extent, the knowledge of the genome of the target bacterium is very useful. Many variants of this general idea have been developed. The screening can be based on the complementation of an auxotrophy rather than on an antibiotic resistance, avoiding the need to treat the hosts with an antibiotic

Chapter 2 – Microbial ecology methods
38
(124). Finally, different methods have been developed to select against the constitutive promoters. An advancement of the IVET is called RIVET – Recombinase-based IVET – and involves a recombinase that, when expressed due to promoter activation, permanently cleaves a marker gene elsewhere in the genome. RIVET is much more sensitive and can detect promoters activated at low levels and transiently. Both IVET and RIVET are reviewed by Merrell and Camilli (125). IVET has been applied also to the research on Bacillus cereus as a pathogen of insects, using the honeycomb moth Galleria mellonella as a model (126). IVET screening is more refined than STM, giving as output only the genes that are activated selectively in vivo, and therefore are responsible of the “switch” between the free and the symbiotic lifestyle.
Conclusion
In recent years, the literature data on insect bacterial symbionts greatly increased, together with the fast development of sequencing techniques. However, a large number of works do not go beyond the description of taxa associated to insects of various genera and orders. In our opinion, this great amount of data is an important resource that, so far, have not been deeply exploited. Indeed, in most cases the function of insect symbionts is unknown. Conversely, metagenomic studies show that RNA transcripts from symbionts can exert a variety of functions, but they give only a rough idea of which bacterium is actually producing them. Connecting taxonomy to function and, possibly, to isolates constitutes a great advance for science and technology. The extraordinary evolutionary success of insects, which represent 5/6 of all the Metazoa and inhabit any type of ecological niche all over the world, is at least partially due to their symbiotic relationships. For example, insect guts are complex ecosystems in which a variety of food sources are efficiently exploited, including poor, unbalanced, toxic and difficult to digest substrates. Assessing the mechanisms through which this happens would be precious for the research on the management of wastes, including their possible reuse and exploitation, as well as for the detoxification of contaminated substrates. In this context, to manage isolated strains would be a high added value, both for deepening the knowledge and for developing applications. On the other hand, knowing the processes that underlie the survival and resistance to treatments of many agricultural pests and disease vectors could give a relevant contribution to the research on animal and plant illnesses. In insect vectors, symbionts and pathogens coexist, but their interactions are far to be fully elucidated. Besides, it is well-documented the interaction of gut symbionts with the host immune-system, which can be elicited or down-regulated by the resident microbiota possibly affecting the survival and transmission of the pathogens. Several management strategies based on symbionts (reviewed by Crotti and colleagues(18)) are already applied to control insect pests. As an example, the Sterile Insect Technique (SIT), based on the release in the environment of sterilized males to control a pest population, can be greatly improved by the use of microbial symbionts to improve the fitness of irradiated males (81).

Chapter 2 – Microbial ecology methods
39
For these reasons, insect symbionts are a promising field, to be investigated using all the techniques available, some of which are summarized in this review, not only to describe microbial diversity but also to link it to function and to enable applications.
References
1. Turnbaugh PJ, Ley RE, Hamady M, Fraser-Liggett CM, Knight R, Gordon JI. 2007. The human microbiome project. Nature 449:804–10.
2. Moran N, McCutcheon JP, Nakabachi A. 2008. Genomics and evolution of heritable bacterial symbionts. Annu. Rev. Genet. 42:165–90.
3. Akman Gündüz E, Douglas AE. 2009. Symbiotic bacteria enable insect to use a nutritionally inadequate diet. Proc. Biol. Sci. 276:987–91.
4. Favia G, Ricci I, Damiani C, Raddadi N, Crotti E, Marzorati M, Rizzi A, Urso R, Brusetti L, Borin S, Mora D, Scuppa P, Pasqualini L, Clementi E, Genchi M, Corona S, Negri I, Grandi G, Alma A, Kramer L, Esposito F, Bandi C, Sacchi L, Daffonchio D. 2007. Bacteria of the genus Asaia stably associate with Anopheles stephensi, an Asian malarial mosquito vector. Proc. Natl. Acad. Sci. U. S. A. 104:9047–51.
5. Stouthamer R, Breeuwer JA, Hurst GD. 1999. Wolbachia pipientis: microbial manipulator of arthropod reproduction. Annu. Rev. Microbiol. 53:71–102.
6. Engel P, Moran N. 2013. The gut microbiota of insects - diversity in structure and function. FEMS Microbiol. Rev. 37:699–735.
7. Dillon RJ, Dillon VM. 2004. The gut bacteria of insects: nonpathogenic interactions. Annu. Rev. Entomol. 49:71–92.
8. Lee K-A, Kim S-H, Kim E-K, Ha E-M, You H, Kim B, Kim M-J, Kwon Y, Ryu J-H, Lee W-J. 2013. Bacterial-Derived Uracil as a Modulator of Mucosal Immunity and Gut-Microbe Homeostasis in Drosophila. Cell 153:797–811.
9. Shin SC, Kim S-H, You H, Kim B, Kim AC, Lee K-A, Yoon J-H, Ryu J-H, Lee W-J. 2011. Drosophila microbiome modulates host developmental and metabolic homeostasis via insulin signaling. Science 334:670–674.
10. Sharon G, Segal D, Ringo JM, Hefetz A, Zilber-Rosenberg I, Rosenberg E. 2010. Commensal bacteria play a role in mating preference of Drosophila melenogaster. Proc. Natl. Acad. Sci. U. S. A. 107:20051–6.
11. Ryu J-H, Kim S-H, Lee H-Y, Bai JY, Nam Y-D, Bae J-W, Lee DG, Shin SC, Ha E-M, Lee W-J. 2008. Innate immune homeostasis by the homeobox gene caudal and commensal-gut mutualism in Drosophila. Science 319:777–82.
12. Hamdi C, Balloi A, Essanaa J, Crotti E, Gonella E, Raddadi N, Ricci I, Boudabous A, Borin S, Manino A, Bandi C, Alma A, Daffonchio D, Cherif A. 2011. Gut microbiome dysbiosis and honeybee health. J. Appl. Entomol. 135:524–533.
13. Hosokawa T, Kikuchi Y, Nikoh N, Shimada M, Fukatsu T. 2006. Strict host-symbiont cospeciation and reductive genome evolution in insect gut bacteria. PLoS Biol. 4:e337.
14. Fukatsu T, Hosokawa T. 2002. Capsule-transmitted gut symbiotic bacterium of the Japanese common plataspid stinkbug, Megacopta punctatissima. Appl. Environ. Microbiol. 68:389–96.
15. Prado SS, Rubinoff D, Almeida RPP. 2006. Vertical Transmission of a Pentatomid Caeca-Associated Symbiont. Ann. Entomol. Soc. Am. 99:577–585.

Chapter 2 – Microbial ecology methods
40
16. Kikuchi Y, Hosokawa T, Fukatsu T. 2011. Specific developmental window for establishment of an insect-microbe gut symbiosis. Appl. Environ. Microbiol. 77:4075–81.
17. Sudakaran S, Salem H, Kost C, Kaltenpoth M. 2012. Geographical and ecological stability of the symbiotic mid-gut microbiota in European firebugs, Pyrrhocoris apterus (Hemiptera, Pyrrhocoridae). Mol. Ecol. 21:6134–51.
18. Crotti E, Balloi A, Hamdi C, Sansonno L, Marzorati M, Gonella E, Favia G, Cherif A, Bandi C, Alma A, Daffonchio D. 2012. Microbial symbionts: a resource for the management of insect-related problems. Microb. Biotechnol. 5:307–17.
19. Santo Domingo JW, Kaufman MG, Klug MJ, Holben WE, Harris D, Tiedje JM. 1998. Influence of diet on the structure and function of the bacterial hindgut community of crickets. Mol. Ecol. 7:761–767.
20. Kane MD, Breznak JA. 1991. Effect of host diet on production of organic acids and methane by cockroach gut bacteria. Appl. Environ. Microbiol. 57:2628–34.
21. Broderick NA, Raffa KF, Goodman RM, Handelsman J. 2004. Census of the bacterial community of the gypsy moth larval midgut by using culturing and culture-independent methods. Appl. Environ. Microbiol. 70:293–300.
22. Chandler JA, Lang JM, Bhatnagar S, Eisen JA, Kopp A. 2011. Bacterial communities of diverse Drosophila species: ecological context of a host-microbe model system. PLoS Genet. 7:e1002272.
23. Colman DR, Toolson EC, Takacs-Vesbach CD. 2012. Do diet and taxonomy influence insect gut bacterial communities? Mol. Ecol. 21:5124–37.
24. Douglas AE. 2011. Is the regulation of insulin signaling multi-organismal? Sci. Signal. 4:pe46.
25. Storelli G, Defaye A, Erkosar B, Hols P, Royet J, Leulier F. 2011. Lactobacillus plantarum Promotes Drosophila Systemic Growth by Modulating Hormonal Signals through TOR-Dependent Nutrient Sensing. Cell Metab. 14:403–414.
26. Toju H, Fukatsu T. 2011. Diversity and infection prevalence of endosymbionts in natural populations of the chestnut weevil: relevance of local climate and host plants. Mol. Ecol. 20:853–68.
27. Hammer TJ, McMillan WO, Fierer N. 2014. Metamorphosis of a butterfly-associated bacterial community. PLoS One 9:e86995.
28. Köhler T, Dietrich C, Scheffrahn RH, Brune A. 2012. High-resolution analysis of gut environment and bacterial microbiota reveals functional compartmentation of the gut in wood-feeding higher termites (Nasutitermes spp.). Appl. Environ. Microbiol. 78:4691–701.
29. Lemke T, Stingl U, Egert M, Friedrich MW, Brune A. 2003. Physicochemical conditions and microbial activities in the highly alkaline gut of the humus-feeding larva of Pachnoda ephippiata (Coleoptera: Scarabaeidae). Appl. Environ. Microbiol. 69:6650–8.
30. Balmand S, Lohs C, Aksoy S, Heddi A. 2013. Tissue distribution and transmission routes for the tsetse fly endosymbionts. J. Invertebr. Pathol. 112:S116–22.
31. Perotti MA, Allen JM, Reed DL, Braig HR. 2007. Host-symbiont interactions of the primary endosymbiont of human head and body lice. FASEB J. 21:1058–66.
32. Hooke R. 1667. Micrographia: or some physiological descriptions of minute bodies made by magnifying glasses: with observations and inquiries thereupon.Eebo Editi. United States.
33. Toenshoff ER, Szabó G, Gruber D, Horn M. 2014. The pine bark Adelgid, Pineus strobi, contains two novel bacteriocyte-associated gammaproteobacterial symbionts. Appl. Environ. Microbiol. 80:878–85.

Chapter 2 – Microbial ecology methods
41
34. Stoll S, Feldhaar H, Fraunholz MJ, Gross R. 2010. Bacteriocyte dynamics during development of a holometabolous insect, the carpenter ant Camponotus floridanus. BMC Microbiol. 10:308.
35. Sassera D, Beninati T, Bandi C, Bouman E a P, Sacchi L, Fabbi M, Lo N. 2006. “Candidatus Midichloria mitochondrii”, an endosymbiont of the tick Ixodes ricinus with a unique intramitochondrial lifestyle. Int. J. Syst. Evol. Microbiol. 56:2535–40.
36. Crotti E, Damiani C, Pajoro M, Gonella E, Rizzi A, Ricci I, Negri I, Scuppa P, Rossi P, Ballarini P, Raddadi N, Marzorati M, Sacchi L, Clementi E, Genchi M, Mandrioli M, Bandi C, Favia G, Alma A, Daffonchio D. 2009. Asaia, a versatile acetic acid bacterial symbiont, capable of cross-colonizing insects of phylogenetically distant genera and orders. Environ. Microbiol. 11:3252–64.
37. Mariconti M, Epis S, Gaibani P, Dalla Valle C, Sassera D, Tomao P, Fabbi M, Castelli F, Marone P, Sambri V, Bazzocchi C, Bandi C. 2012. Humans parasitized by the hard tick Ixodes ricinus are seropositive to Midichloria mitochondrii: is Midichloria a novel pathogen, or just a marker of tick bite? Pathog. Glob. Health 106:391–6.
38. Currie CR, Scott JA, Summerbell RC, Malloch D. 1999. Fungus-growing ants use antibiotic-producing bacteria to control garden parasites 398:701–705.
39. Kaltenpoth M, Göttler W, Herzner G, Strohm E. 2005. Symbiotic bacteria protect wasp larvae from fungal infestation. Curr. Biol. 15:475–9.
40. Kim JK, Han SH, Kim C-H, Jo YH, Futahashi R, Kikuchi Y, Fukatsu T, Lee BL. 2014. Molting-associated suppression of symbiont population and up-regulation of antimicrobial activity in the midgut symbiotic organ of the Riptortus-Burkholderia symbiosis. Dev. Comp. Immunol. 43:10–4.
41. Braendle C, Miura T, Bickel R, Shingleton AW, Kambhampati S, Stern DL. 2003. Developmental origin and evolution of bacteriocytes in the aphid-Buchnera symbiosis. PLoS Biol. 1:E21.
42. Arias-Cordero E, Ping L, Reichwald K, Delb H, Platzer M, Boland W. 2012. Comparative evaluation of the gut microbiota associated with the below- and above-ground life stages (larvae and beetles) of the forest cockchafer, Melolontha hippocastani. PLoS One 7:e51557.
43. Martinson V, Moy J, Moran N. 2012. Establishment of characteristic gut bacteria during development of the honeybee worker. Appl. Environ. Microbiol. 78:2830–2840.
44. Im SH, Galko MJ. 2012. Pokes, sunburn, and hot sauce: Drosophila as an emerging model for the biology of nociception. Dev. Dyn. 241:16–26.
45. Zouache K, Raharimalala FN, Raquin V, Tran-Van V, Raveloson LHR, Ravelonandro P, Mavingui P. 2011. Bacterial diversity of field-caught mosquitoes, Aedes albopictus and Aedes aegypti, from different geographic regions of Madagascar. FEMS Microbiol. Ecol. 75:377–89.
46. Ceja-Navarro J a, Nguyen NH, Karaoz U, Gross SR, Herman DJ, Andersen GL, Bruns TD, Pett-Ridge J, Blackwell M, Brodie EL. 2014. Compartmentalized microbial composition, oxygen gradients and nitrogen fixation in the gut of Odontotaenius disjunctus. ISME J. 8:6–18.
47. Woese CR. 1987. Bacterial evolution. Microbiol. Rev. 51:221–71.
48. Feinstein LM, Sul WJ, Blackwood CB. 2009. Assessment of bias associated with incomplete extraction of microbial DNA from soil. Appl. Environ. Microbiol. 75:5428–33.
49. De Lipthay JR, Enzinger C, Johnsen K, Aamand J, Sørensen SJ. 2004. Impact of DNA extraction method on bacterial community composition measured by denaturing gradient gel electrophoresis. Soil Biol. Biochem. 36:1607–1614.
50. Nikodinovic J, Barrow KD, Chuck J-A. 2003. High yield preparation of genomic DNA from Streptomyces. Biotechniques 35:932–4, 936.

Chapter 2 – Microbial ecology methods
42
51. Juen A, Traugott M. 2006. Amplification facilitators and multiplex PCR: Tools to overcome PCR-inhibition in DNA-gut-content analysis of soil-living invertebrates. Soil Biol. Biochem. 38:1872–1879.
52. Wong WH, Tay YC, Puniamoorthy J, Balke M, Cranston PS, Meier R. 2014. “Direct PCR” optimization yields a rapid, cost-effective, nondestructive and efficient method for obtaining DNA barcodes without DNA extraction. Mol. Ecol. Resour.
53. Boncristiani H, Li J, Evans JD, Pettis J, Chen Y. 2011. Scientific note on PCR inhibitors in the compound eyes of honey bees, Apis mellifera. Apidologie 42:457–460.
54. Baker GC, Smith JJ, Cowan DA. 2003. Review and re-analysis of domain-specific 16S primers. J. Microbiol. Methods 55:541–555.
55. Wang Y, Qian P-Y. 2009. Conservative fragments in bacterial 16S rRNA genes and primer design for 16S ribosomal DNA amplicons in metagenomic studies. PLoS One 4:e7401.
56. Andersson AF, Lindberg M, Jakobsson H, Bäckhed F, Nyrén P, Engstrand L. 2008. Comparative analysis of human gut microbiota by barcoded pyrosequencing. PLoS One 3:e2836.
57. Yarza P, Yilmaz P, Pruesse E, Glöckner FO, Ludwig W, Schleifer K-H, Whitman WB, Euzéby J, Amann R, Rosselló-Móra R. 2014. Uniting the classification of cultured and uncultured bacteria and archaea using 16S rRNA gene sequences. Nat. Rev. Microbiol. 12:635–645.
58. Huys G, Vanhoutte T, Joossens M, Mahious AS, De Brandt E, Vermeire S, Swings J. 2008. Coamplification of eukaryotic DNA with 16S rRNA gene-based PCR primers: possible consequences for population fingerprinting of complex microbial communities. Curr. Microbiol. 56:553–7.
59. Prosdocimi EM, Novati S, Bruno R, Bandi C, Mulatto P, Giannico R, Casiraghi M, Ferri E. 2013. Errors in ribosomal sequence datasets generated using PCR-coupled “panbacterial” pyrosequencing, and the establishment of an improved approach. Mol. Cell. Probes 27:65–7.
60. Vestheim H, Jarman SN. 2008. Blocking primers to enhance PCR amplification of rare sequences in mixed samples - a case study on prey DNA in Antarctic krill stomachs. Front. Zool. 5:12.
61. Polz MF, Cavanaugh CM. 1998. Bias in Template-to-Product Ratios in Multitemplate PCR 64.
62. Engelbrektson A, Kunin V, Wrighton KC, Zvenigorodsky N, Chen F, Ochman H, Hugenholtz P. 2010. Experimental factors affecting PCR-based estimates of microbial species richness and evenness. ISME J. 4:642–7.
63. Větrovský T, Baldrian P. 2013. The variability of the 16S rRNA gene in bacterial genomes and its consequences for bacterial community analyses. PLoS One 8:e57923.
64. Muyzer G, de Waal EC, Uitterlinden AG. 1993. Profiling of complex microbial populations by denaturing gradient gel electrophoresis analysis of polymerase chain reaction-amplified genes coding for 16S rRNA. Appl. Environ. Microbiol. 59:695–700.
65. Russell JA, Funaro CF, Giraldo YM, Goldman-Huertas B, Suh D, Kronauer DJC, Moreau CS, Pierce NE. 2012. A veritable menagerie of heritable bacteria from ants, butterflies, and beyond: broad molecular surveys and a systematic review. PLoS One 7:e51027.
66. Amend AS, Seifert K a, Bruns TD. 2010. Quantifying microbial communities with 454 pyrosequencing: does read abundance count? Mol. Ecol. 19:5555–65.
67. Caporaso JG, Kuczynski J, Stombaugh J, Bittinger K, Bushman FD, Costello EK, Fierer N, Peña AG, Goodrich JK, Gordon JI, Huttley GA, Kelley ST, Knights D, Koenig JE, Ley RE, Lozupone CA, McDonald D, Muegge BD, Pirrung M,

Chapter 2 – Microbial ecology methods
43
Reeder J, Sevinsky JR, Turnbaugh PJ, Walters WA, Widmann J, Yatsunenko T, Zaneveld J, Knight R. 2010. QIIME allows analysis of high-throughput community sequencing data. Nat. Methods 7:335–6.
68. Ludwig W, Strunk O, Westram R, Richter L, Meier H, Yadhukumar, Buchner A, Lai T, Steppi S, Jobb G, Förster W, Brettske I, Gerber S, Ginhart AW, Gross O, Grumann S, Hermann S, Jost R, König A, Liss T, Lüssmann R, May M, Nonhoff B, Reichel B, Strehlow R, Stamatakis A, Stuckmann N, Vilbig A, Lenke M, Ludwig T, Bode A, Schleifer K-H. 2004. ARB: a software environment for sequence data. Nucleic Acids Res. 32:1363–71.
69. França L, Lopéz-Lopéz A, Rosselló-Móra R, da Costa MS. 2014. Microbial diversity and dynamics of a groundwater and a still bottled natural mineral water. Environ. Microbiol.
70. Bermingham J, Rabatel A, Calevro F, Viñuelas J, Febvay G, Charles H, Douglas A, Wilkinson T. 2009. Impact of host developmental age on the transcriptome of the symbiotic bacterium Buchnera aphidicola in the pea aphid (Acyrthosiphon pisum). Appl. Environ. Microbiol. 75:7294–7.
71. Liu N, Zhang L, Zhou H, Zhang M, Yan X, Wang Q, Long Y, Xie L, Wang S, Huang Y, Zhou Z. 2013. Metagenomic insights into metabolic capacities of the gut microbiota in a fungus-cultivating termite (Odontotermes yunnanensis). PLoS One 8:e69184.
72. Scully ED, Geib SM, Hoover K, Tien M, Tringe SG, Barry KW, Glavina del Rio T, Chovatia M, Herr JR, Carlson JE. 2013. Metagenomic profiling reveals lignocellulose degrading system in a microbial community associated with a wood-feeding beetle. PLoS One 8:e73827.
73. Lee FJ, Rusch DB, Stewart FJ, Mattila HR, Newton ILG. 2014. Saccharide breakdown and fermentation by the honey bee gut microbiome. Environ. Microbiol.
74. Engel P, Martinson VG, Moran N a. 2012. Functional diversity within the simple gut microbiota of the honey bee. Proc. Natl. Acad. Sci. U. S. A. 109:11002–7.
75. Cornman RS, Lopez D, Evans JD. 2013. Transcriptional response of honey bee larvae infected with the bacterial pathogen Paenibacillus larvae. PLoS One 8:e65424.
76. Scully ED, Hoover K, Carlson JE, Tien M, Geib SM. 2013. Midgut transcriptome profiling of Anoplophora glabripennis, a lignocellulose degrading cerambycid beetle. BMC Genomics 14:850.
77. Cantarel BL, Coutinho PM, Rancurel C, Bernard T, Lombard V, Henrissat B. 2009. The Carbohydrate-Active EnZymes database (CAZy): an expert resource for Glycogenomics. Nucleic Acids Res. 37:D233–8.
78. Di Bella JM, Bao Y, Gloor GB, Burton JP, Reid G. 2013. High throughput sequencing methods and analysis for microbiome research. J. Microbiol. Methods 95:401–14.
79. Westermann AJ, Gorski SA, Vogel J. 2012. Dual RNA-seq of pathogen and host. Nat. Rev. Microbiol. 10:618–630.
80. Xie W, Meng Q, Wu Q, Wang S, Yang X, Yang N, Li R, Jiao X, Pan H, Liu B, Su Q, Xu B, Hu S, Zhou X, Zhang Y. 2012. Pyrosequencing the Bemisia tabaci transcriptome reveals a highly diverse bacterial community and a robust system for insecticide resistance. PLoS One 7:e35181.
81. Gavriel S, Jurkevitch E, Gazit Y, Yuval B. 2011. Bacterially enriched diet improves sexual performance of sterile male Mediterranean fruit flies. J. Appl. Entomol. 135:564–573.
82. Hurwitz I, Fieck A, Read A, Hillesland H, Klein N, Kang A, Durvasula R. 2011. Paratransgenic control of vector borne diseases. Int. J. Biol. Sci. 7:1334–44.

Chapter 2 – Microbial ecology methods
44
83. Brune A. 1996. pH Profiles of the Extremely Alkaline Hindguts of Soil-Feeding Termites ( Isoptera : Termitidae ) Determined with Microelectrodes 42:1121–1127.
84. Gupta P, Samant K, Sahu A. 2012. Isolation of cellulose-degrading bacteria and determination of their cellulolytic potential. Int. J. Microbiol. 2012.
85. Lisdiyanti P, Kawasaki H, Seki T, Yamada Y, Uchimura T, Komagata K. 2001. Identification of Acetobacter strains isolated from Indonesian sources, and proposals of Acetobacter syzygii sp. nov., Acetobacter cibinongensis sp. nov., and Acetobacter orientalis sp. nov. J. Gen. Appl. Microbiol. 47:119–131.
86. Daffonchio D, Borin S, Frova G, Manachini PL, Sorlini C. 1998. PCR fingerprinting of whole genomes: the spacers between the 16S and 23S rRNA genes and of intergenic tRNA gene regions reveal a different intraspecific genomic variability of Bacillus cereus and Bacillus licheniformis [corrected]. Int. J. Syst. Bacteriol. 48 Pt 1:107–16.
87. Wang Q, Garrity GM, Tiedje JM, Cole JR. 2007. Naive Bayesian classifier for rapid assignment of rRNA sequences into the new bacterial taxonomy. Appl. Environ. Microbiol. 73:5261–7.
88. Pruesse E, Peplies J, Glöckner FO. 2012. SINA: accurate high-throughput multiple sequence alignment of ribosomal RNA genes. Bioinformatics 28:1823–9.
89. Kim O-S, Cho Y-J, Lee K, Yoon S-H, Kim M, Na H, Park S-C, Jeon YS, Lee J-H, Yi H, Won S, Chun J. 2012. Introducing EzTaxon-e: a prokaryotic 16S rRNA gene sequence database with phylotypes that represent uncultured species. Int. J. Syst. Evol. Microbiol. 62:716–21.
90. Sugimura M, Watanabe H, Lo N, Saito H. 2003. Purification, characterization, cDNA cloning and nucleotide sequencing of a cellulase from the yellow-spotted longicorn beetle, Psacothea hilaris. Eur. J. Biochem. 270:3455–3460.
91. Ohkuma M. 2003. Termite symbiotic systems: efficient bio-recycling of lignocellulose. Appl. Microbiol. Biotechnol. 61:1–9.
92. Compant S, Reiter B, Sessitsch A, Nowak J, Clément C, Barka EA. 2005. Endophytic Colonization of Vitis vinifera L. by Plant Growth-Promoting Bacterium Burkholderia sp. Strain PsJN. Appl. Environ. Microbiol. 71:1685–1693.
93. Park D-S, Oh H-W, Jeong W-J, Kim H, Park H-Y, Bae KS. 2007. A culture-based study of the bacterial communities within the guts of nine longicorn beetle species and their exo-enzyme producing properties for degrading xylan and pectin. J. Microbiol. 45:394–401.
94. Garcia-Armisen T, Vercammen K, Rimaux T, Vrancken G, Vuyst L De, Cornelis P. 2012. Identification of a five-oxidoreductase-gene cluster from Acetobacter pasteurianus conferring ethanol-dependent acidification in Escherichia coli. Microbiologyopen 1:25–32.
95. Santaella C, Schue M, Berge O, Heulin T, Achouak W. 2008. The exopolysaccharide of Rhizobium sp. YAS34 is not necessary for biofilm formation on Arabidopsis thaliana and Brassica napus roots but contributes to root colonization. Environ. Microbiol. 10:2150–63.
96. Arioli S, Monnet C, Guglielmetti S, Parini C, De Noni I, Hogenboom J, Halami PM, Mora D. 2007. Aspartate biosynthesis is essential for the growth of Streptococcus thermophilus in milk, and aspartate availability modulates the level of urease activity. Appl. Environ. Microbiol. 73:5789–96.
97. Morales-Jiménez J, Vera-Ponce de León A, García-Domínguez A, Martínez-Romero E, Zúñiga G, Hernández-Rodríguez C. 2013. Nitrogen-fixing and uricolytic bacteria associated with the gut of Dendroctonus rhizophagus and Dendroctonus valens (Curculionidae: Scolytinae). Microb. Ecol. 66:200–10.

Chapter 2 – Microbial ecology methods
45
98. Gaby JC, Buckley DH. 2012. A comprehensive evaluation of PCR primers to amplify the nifH gene of nitrogenase. PLoS One 7:e42149.
99. Cappuccino J, Sherman N. 1992. Microbiology: A Laboratory Manual, 3rd ed. Benjamin/Cummings Pub. Co., New York.
100. Hardy RW, Holsten RD, Jackson EK, Burns RC. 1968. The acetylene-ethylene assay for n(2) fixation: laboratory and field evaluation. Plant Physiol. 43:1185–207.
101. Kikuchi Y, Hayatsu M, Hosokawa T, Nagayama A, Tago K, Fukatsu T. 2012. Symbiont-mediated insecticide resistance. Proc. Natl. Acad. Sci. U. S. A. 109:8618–22.
102. Aguilar CN, Rodríguez R, Gutiérrez-Sánchez G, Augur C, Favela-Torres E, Prado-Barragan L a, Ramírez-Coronel A, Contreras-Esquivel JC. 2007. Microbial tannases: advances and perspectives. Appl. Microbiol. Biotechnol. 76:47–59.
103. Beninati T, Lo N, Sacchi L, Genchi C, Noda H, Bandi C. 2004. A novel alpha-Proteobacterium resides in the mitochondria of ovarian cells of the tick Ixodes ricinus. Appl. Environ. Microbiol. 70:2596–602.
104. Cole JR, Wang Q, Fish JA, Chai B, McGarrell DM, Sun Y, Brown CT, Porras-Alfaro A, Kuske CR, Tiedje JM. 2014. Ribosomal Database Project: data and tools for high throughput rRNA analysis. Nucleic Acids Res. 42:D633–42.
105. Schramm A, Fuchs BM, Nielsen JL, Tonolla M, Stahl DA. 2002. Fluorescence in situ hybridization of 16S rRNA gene clones (Clone-FISH) for probe validation and screening of clone libraries. Environ. Microbiol. 4:713–20.
106. Damiani C, Ricci I, Crotti E, Rossi P, Rizzi A, Scuppa P, Esposito F, Bandi C, Daffonchio D, Favia G. 2008. Paternal transmission of symbiotic bacteria in malaria vectors. Curr. Biol. 18:R1087–8.
107. Gonella E, Crotti E, Rizzi A, Mandrioli M, Favia G, Daffonchio D, Alma A. 2012. Horizontal transmission of the symbiotic bacterium Asaia sp. in the leafhopper Scaphoideus titanus Ball (Hemiptera: Cicadellidae). BMC Microbiol. 12 Suppl 1:S4.
108. Lambertsen L, Sternberg C, Molin S. 2004. Mini-Tn7 transposons for site-specific tagging of bacteria with fluorescent proteins. Environ. Microbiol. 6:726–32.
109. Choi K-H, Schweizer HP. 2006. mini-Tn7 insertion in bacteria with single attTn7 sites: example Pseudomonas aeruginosa. Nat. Protoc. 1:153–61.
110. Mølbak L, Molin S, Kroer N. 2007. Root growth and exudate production define the frequency of horizontal plasmid transfer in the Rhizosphere. FEMS Microbiol. Ecol. 59:167–76.
111. Mostafa HE, Heller KJ, Geis A. 2002. Cloning of Escherichia coli lacZ and lacY Genes and Their Expression in Gluconobacter oxydans and Acetobacter liquefaciens 68:2619–2623.
112. Kikuchi Y, Fukatsu T. 2013. Live imaging of symbiosis: spatiotemporal infection dynamics of a GFP-labelled Burkholderia symbiont in the bean bug Riptortus pedestris. Mol. Ecol.
113. Chouaia B, Rossi P, Epis S, Mosca M, Ricci I, Damiani C, Ulissi U, Crotti E, Daffonchio D, Bandi C, Favia G. 2012. Delayed larval development in Anopheles mosquitoes deprived of Asaia bacterial symbionts. BMC Microbiol. 12 Suppl 1:S2.
114. Brooks MA, Glenn Richards A. 1955. Intracellular symbiosis in cockroaches. I. Production of aposymbiotic cockroaches. Biol. Bull. Mar Biol Lab.
115. Wilkinson T. 1998. The elimination of intracellular microorganisms from insects: an analysis of antibiotic-treatment in the pea aphid (Acyrthosiphon pisum). Comp. Biochem. Physiol. Part A Mol. Integr. Physiol. 119:871–881.

Chapter 2 – Microbial ecology methods
46
116. Wilkinson TL, Ishikawa H. 2000. Injection of essential amino acids substitutes for bacterial supply in aposymbiotic pea aphids (Acyrthosiphon pisum). Entomol. Exp. Appl. 94:85–91.
117. Mitraka E, Stathopoulos S, Siden-Kiamos I, Christophides GK, Louis C. 2013. Asaia accelerates larval development of Anopheles gambiae. Pathog. Glob. Health 107:305–11.
118. Evans JD, Lopez DL. 2004. Bacterial probiotics induce an immune response in the honey bee (Hymenoptera: Apidae). J. Econ. Entomol. 97:752–6.
119. Garcia-Gonzalez E, Poppinga L, Fünfhaus A, Hertlein G, Hedtke K, Jakubowska A, Genersch E. 2014. Paenibacillus larvae chitin-degrading protein PlCBP49 is a key virulence factor in American Foulbrood of honey bees. PLoS Pathog. 10:e1004284.
120. Fünfhaus A, Poppinga L, Genersch E. 2013. Identification and characterization of two novel toxins expressed by the lethal honey bee pathogen Paenibacillus larvae, the causative agent of American foulbrood. Environ. Microbiol.
121. Chiang S, Mekalanos JJ, Holden DW. 1999. In vivo genetic analysis of bacterial virulence. Annu. Rev. Microbiol. 153: 129–154.
122. Cummins J, Gahan CGM. Signature tagged mutagenesis in the functional genetic analysis of gastrointestinal pathogens. Gut Microbes 3:93–103.
123. Pobigaylo N, Wetter D, Szymczak S, Schiller U, Kurtz S, Meyer F, Nattkemper TW, Becker A. 2006. Construction of a large signature-tagged mini-Tn5 transposon library and its application to mutagenesis of Sinorhizobium meliloti. Appl. Environ. Microbiol. 72:4329–37.
124. Gal M, Preston GM, Massey RC, Spiers AJ, Rainey PB. 2003. Genes encoding a cellulosic polymer contribute toward the ecological success of Pseudomonas fluorescens SBW25 on plant surfaces. Mol. Ecol. 12:3109–3121.
125. Merrell DS, Camilli A. 2000. Detection and analysis of gene expression during infection by in vivo expression technology. Phil. Trans. R. Soc. Lond. B 355:587–599.
126. Fedhila S, Daou N, Lereclus D, Nielsen-LeRoux C. 2006. Identification of Bacillus cereus internalin and other candidate virulence genes specifically induced during oral infection in insects. Mol. Microbiol. 62:339–55.

Chapter 3 – Spotted Wing Fly Drosophila suzukii
47
Chapter 3
The Acetic Acid Bacterial Microbiome of the Spotted Wing Fly, Drosophila suzukii
Abstract
Drosophila flies are mainly considered as secondary parasites, due to their behaviour to attack rotten fruits. They harbour an inconsistent microbiome composed of several bacterial taxa, among which the acetic acid bacteria (AAB) are found to be important modulators of insect development through insulin signalling. Conversely, the spotted wing fly Drosophila suzukii (Diptera: Drosophilidae) is a highly invasive pest, native of Eastern and South-eastern Asia, rapidly spreading in the many countries, laying eggs in healthy fruits, with a consequent economic damage. With the aim to unravel the microbiome associated to D. suzukii, reared on fruits or on artificial diet, cultivation-independent and -dependent techniques have been used, giving a particular attention to AAB symbionts. By DGGE-PCR on 16S rRNA gene, AAB of the genera Acetobacter and Gluconobacter have been frequently detected. According to 16S rRNA barcoding, the two groups of insects (reared on fruits or on artificial diet) showed to cluster separately, but in both cases sequences related to Rhodospirillales order, to whom AAB belong, were a predominant group. Isolation data evaluated the extensive presence of cultivable AAB (Acetobacter, Gluconacetobacter and Gluconobacter) in the fly body, investigating different life stages (larvae, pupae, adults). Recolonization experiments by the use of green fluorescent protein (Gfp)-labelled strains and fluorescent in situ hybridization indicated the dispersal of AAB in the insect gut. In D. suzukii larvae and adults, AAB are mainly localized on the midgut epithelium.
Introduction
The vinegar fly Drosophila suzukii Matsumura (Diptera: Drosophilidae), also known as spotted wing Drosophila in the USA, is an exotic pest, endemic to South Asia and recently introduced in the continental USA, Canada and Europe, most probably by the international trade (1–3). Characterized by a rapid spreading behaviour, this fly is an economically damaging pest, due to the ability, unlike its vinegar fly relatives that attack rotten fruits, to feed on healthy soft summer fruits, laying eggs on them, thanks to the females’ large serrated ovipositor (4). Once hatched, larvae grow in the fruit, destroying it (4, 5). D. suzukii is able to develop on many host plants either in its native and introduced habitats, with berries being the preferred hosts (3, 4, 6, 7). In most attacked countries D. suzukii causes severe economic damage to soft fruits

Chapter 3 – Spotted wing fly Drosophila suzukii
48
every year (8, 9). In particular, in Italy the most significant growers’ associations reported extensive crop losses (3). A recent increased attention has received the study of the bacterial microbiome associated to Drosophila flies. Drosophilid flies belonging to different species and with various feeding habits, reared in laboratory conditions or field-captured, have been investigated through deep sampling analysis by 16S barcoding or 16S clonal libraries (10–12). A bacterial community dominated by four families, Lactobacillales, Acetobacteraceae, Enterobacteriaceae and Enterococcaceae is commonly associated to these flies, with variations of the bacterial members at the genus level (11, 12). In lab reared and field-sampled flies, acetic acid and lactic bacteria (AAB and LAB, respectively) are dominant symbiotic taxa harboured in the intestinal tract (10, 13). In particular, AAB establish a delicate balance with the insect innate immune system, being involved in the suppression of the growth of pathogenic bacteria in healthy individuals (i.e. colonization resistance), hence contributing to the host health (13, 14). An interesting experiment conducted on the experimental model Drosophila melenogaster by the same research team (15) demonstrated AAB promotion ability of the insulin pathway, with consequent enhancement of the larval developmental rate, body size, intestinal stem cells activity and energy metabolism. AAB positive role has been also demonstrated in a different insect model, represented by anopheline mosquitoes: the acetic acid bacterium Asaia plays a beneficial role in the development of the mosquitoes and in fact, a delay in the development in Anopheles stephensi larvae was observed after antibiotic treatment; the larval development rate compared to the control one could be restored after administration of an antibiotic-resistant Asaia strain (16). Another work confirmed that Asaia administration boosted the developmental rate of An. gambiae larvae, affecting genes involved in cuticle formation (17). AAB are symbionts of insects mainly localized in the insect gastrointestinal tract (GIT) (18). Particularly, the midgut is a sugar and ethanol rich environment, and represents a specific and beneficial habitat for these bacteria (19). They own different ways of transmission, with the horizontal as the favorable one (18, 20, 21). The recent comparison of AAB genomes showed several symbiotic traits that could favor the adaptation of AAB as insect symbionts (22). In particular, cytochrome bo3 ubiquinol oxidase might be involved in AAB adaptation to the diverse oxygen levels in the arthropod gut. In fact, AAB cannot be only considered as insect symbionts; they are generally found on sugar- and ethanol-rich substrates, spread in the environment on fruits, vegetables and fermented matrices, niches that they share with insects and from which insects can re-acquire them (18). Given that strong associations are common between acetic acid bacteria and selected insect orders, in the present study we assessed the presence of this important microbial group in D. suzukii individuals, reared on fruits or artificial diet, by means of cultivation-independent and -dependent techniques. We also provided information on tissue localization of these endosymbionts. The knowledge of the bacteria associated to this insect pest could be applied in future biocontrol approaches, as discussed.

Chapter 3 – Spotted Wing Fly Drosophila suzukii
49
Materials and Methods
Insects. Wild specimens of D. suzukii were field collected as adults/larvae in Trentino Alto Adige region (Italy) and reared in laboratory condition both on fruits and on a sugar-based artificial diet (composed with 71 g of corn flour, 10 g of soy flour, 5.6 g of agar, 15 g of sucrose, 17 g of brewer’s yeast, 4.7 ml of propionic acid, 2.5 g of vitamins mix for each Kg of the preparation) at the Dipartimento di Scienze Agrarie, Forestali e Alimentari (DISAFA), University of Turin. Insects were kept in cages at 25 °C with a 14:10 h light-dark photoperiod.
DNA extraction.
Larval, pupal and adult individuals of D. suzukii were killed, washed once in ethanol 70% and twice in saline and immediately stored at -20°C in ethanol until molecular analysis. Total DNA was individually extracted from larvae, pupae and adults of the laboratory strains by sodium dodecyl sulfate-proteinase K-acethyltrimethyl ammonium bromide treatment, as described in (23).
Characterization of the bacterial community associated to D. suzukii by Denaturing Gradient Gel Electrophoresis (DGGE).
A 550 bp fragment of the 16S rRNA gene was amplified from the total DNA extracted from D. suzukii individuals, using the forward primer GC357f, containing a 40-bp GC clamp, and the reverse primer 907r, as previously described (23). Gels with a denaturant gradient of 40–60% were prepared with a gradient maker (Bio-Rad, Milan, Italy) following the manufacturer’s instructions. Bands were excised and used as template in PCR re-amplification reactions with primers 357f and 907r, as described previously (23). PCR products were sequenced (Macrogen, South Korea), and the resulting sequences were compared, using BLAST (http://www.ncbi.nlm.nih.gov/blast), with deposited sequences in the National Center for Biotechnology Information (NCBI) sequence database (24).
Characterization of the bacterial community associated to D. suzukii by 16S barcoding.
DNA extracted from fly individuals (namely DS54, DSM, DS41, DS55, Ds159, Ds164, Ds165, Ds167, FP1, FP3, LP1, LP3, MP3 and PP2, Tab. 2) were used in 454 Pyrotag sequencing. The variable regions V1–V3 of the bacterial 16S rRNA gene was amplified by MR DNA (Molecular Research LP, Texas, USA) using the universal bacterial primers 27Fmod (5’-AGR GTT TGA TCM TGG CTC AG-3’) and 519Rmodbio (5’-GTN TTA CNG CGG CKG CTG-3’) as described in Montagna et al., 2013 (25). In total, 178,856 raw reads were obtained. Pyrosequencing adaptors, low quality base calls (<30 Phred score) and size-selected (between 350 and 500 bp) were performed by using the QIIME pipeline filtering scripts (26). The resulted reads were clustered into operational taxonomic units (OTUs), applying a sequence identity threshold of 97%, using Uclust (27). A representative sequence of each OTU was, then,

Chapter 3 – Spotted wing fly Drosophila suzukii
50
aligned to Greengenes (http://greengenes.lbl.gov/) using PyNast (28). Chimeras were removed using Chimeraslayer (29). The results of OTUs assignment were then used in the diversity analyses using the various scripts of the QIIME pipeline.
Prevalence of AAB in D. suzukii specimens.
A total of 50 D. suzukii adults (25 males and 25 females), reared on fruits, were used for assessing the prevalence of different AAB. After DNA extraction from single flies following Raddadi et al. (2011) (23), samples were submitted to AAB-specific amplification of the 16SrRNA gene, followed by digestion with the restriction endonuclease TaqI (Promega, Madison, USA) (30). Pure cultures of the most representative strains isolated from D. suzukii were employed for restriction profile reference.
Localization of D. suzukii symbionts by fluorescent in situ hybridization (FISH).
FISH was carried out on tissues and organs dissected from field-collected D. suzukii adults in a sterile saline solution. The dissected organs were fixed for 2 min at 4°C in 4% paraformaldehyde and washed in PBS. All hybridization experiment steps were performed as previously described (21, 31), using fluorescent probes, specifically designed for the acetic acid bacterial group (AAB455, sequence TGCACGTATTAAATGCAGCT) and for Gluconobacter (Go15, sequence AATGCGTCTCAAATGCAGTT and Go18, sequence GTCACGTATCAAATGCAGTTCCC). Moreover, the universal eubacterial probe, Eub338 (sequence GCGGGTACCGTCATCATCGTCCCCGCT), was used to detect the localization of the overall bacterial abundance and presence in the organs analysed (32). Probes for AAB and Eubacteria were targeted at the 5’ end with the fluorochrome Texas Red (TR; absorption and emission at 595 nm and 620 nm, respectively), whereas probes Go15 and Go18 were labelled with indodicarbocyanine (Cy5; absorption and emission at 650 nm and 670 nm, respectively).
Isolation of AAB.
Insects (5 males, 6 females, a pool of 3 males and a pool of 3 females), reared on fruits, were surface sterilized by rinsing once with ethanol 70% and twice with 0.9% NaCl under sterile conditions, before being homogenized by grinding in 200 μl of 0.9% NaCl. Forty μl of each insect homogenate were inoculated in different enrichment liquid and solid media, selected for AAB growth: enrichment medium I (hereafter indicated as TA1, (33, 34)), enrichment medium II (hereafter indicated as TA2, (35)), a basal medium (hereafter indicated as TA4, (36)), Hoyer-Frateur medium (37), acid YE medium (yeast extract 2%, ethanol 2%, acetic acid 1%, pH 6). One hundred μl of serial dilutions of the insect homogenate were spread on plates containing mannitol agar medium (mannitol 2.5%, peptone 0.3%, yeast extract 0.5%, pH 7, agar 15 g/L ) or R2A agar (38), both supplemented with 0.7% CaCO3 and 0.01% cycloheximide. Other 6 insect adults reared on the artificial diet, 6 adults, 3 pupae and 3 larvae reared on fruit diet, were washed three times with deionized water and the washing water of the last step was plated on MA solid

Chapter 3 – Spotted Wing Fly Drosophila suzukii
51
medium. Pupae and larvae were smashed, as previously described, and inoculated in TA1 and TA2 enrichment media. All the enrichment liquid media were incubated at 30°C, in aerobic condition with shaking, until turbidity of the liquid media was reached. Serially dilutions were plated on MA medium, supplemented with CaCO3 (1% D-glucose, 1% glycerol, 1% bactopeptone, 0.5% yeast extract, 0.7% CaCO3, 1% ethanol, 1.5% agar, pH 6.8) and incubated at 30 °C, in aerobic conditions. For the solid media, colonies were picked up and streaked on MA solid medium, with CaCO3. Colonies capable of clearing the calcium carbonate were purified on agarized MA medium, and pure strains were conserved in 15% glycerol at -80 °C. Total DNA was extracted from the isolates by boiling protocol and stored at – 20 °C.
16S rRNA gene-based identification and fingerprinting analysis of the isolates. Internally transcribed spacer (ITS)-PCR fingerprinting was performed with primers ITSF (5’-GCC AAG GCA TCC AAC-3’) and ITSR (5’–GTC GTA ACA AGG TAG CCG TA-3’) as previously described (39). ITS-PCR amplification patterns of all the isolates were visually compared to cluster the isolates into ITS groups or profiles. At least 2 candidates for each ITS profile were selected and 16S rRNA gene was amplified and sequenced for identification by Macrogen (South Korea). 16S rRNA gene was amplified with universal bacteria 16S rRNA gene primers 27F (5’-TCG ACA TCG TTT ACG GCG TG-3’) and 1495R (5’-CTA CGG CTA CCT TGT TAC GA-3’). Reaction mixture for 16S amplification was carried out in a final volume of 50 μL , using 1 unit of Taq DNA polymerase, 1X PCR Buffer, 0.12 mM of each dNTP, 0.3 μM of each primer, 1.5 mM MgCl2 and 2 μL of DNA. Reaction was run for 4 min at 94°C, followed by 35 cycles of 1 min at 90°C, 1 min at 55°C, 2 min at 72°C and then a final extension of 10 min at 72°. 16S rRNA gene sequences were compared to the databases at the National Centre for Biotechnology Information (NCBI) using BLASTn (24) and aligned with their closest type strain relatives using Clustal W (http://align.genome.jp/).
Transformation of Gluconobacter oxydans DSF1C.9A, Acetobacter tropicalis BYea.1.23 and Acetobacter indonesiensis BTa1.1.44 with the plasmid pHM2-Gfp.
G. oxydans strain DSF1C.9A, A. tropicalis BYea.1.23 and A. indonesiensis BTa1.1.44 were transformed through electroporation introducing the plasmid pHM2-Gfp (40). Electrocompetent cells were prepared according to this procedure: exponential phase cells (OD 0.5) grown in GLY medium (2.5% glycerol, 1.0% yeast extract, pH 5) were washed twice with cold 1 mM Hepes, pH 7, and once with cold 10% glycerol. Then, cells were resuspended in cold 10% glycerol to obtain 160-fold concentrated competent cells. Aliquots were stored at -80°C. Sixty μl of competent cells were gently mixed with about 0.2 μg of plasmidic DNA, put in a cold 0.1-cm-diameter cuvette, and pulsed at 2000 V with the Electroporator 2510 (Eppendorf, Milan, Italy). After the pulse, 1 ml of GLY medium was added to the cells, which were subsequently incubated at 30°C in aerobic condition with shaking for 4 h. Transformed cells

Chapter 3 – Spotted wing fly Drosophila suzukii
52
were selected by plating serial dilutions on GLY agarized medium, supplemented with 100 μg ml-1 kanamycin, 40 μg ml-1 5-bromo-4-chloro-3-indolyl-β-D-galactopyranoside (XGal), and 0.5 mM isopropyl-β-D-thiogalactopyranoside (IPTG) for Lac+ phenotype detection. When growth occurred, transformant colonies were chosen and the Gfp expression was checked by fluorescence microscopy. ITS amplification of wild type and transformant strains was performed and compared to ensure the identity of the transformants.
Evaluation of plasmid stability.
To verify plasmid stability in the absence of selection, G. oxydans DSF1C.9A(Gfp), A. tropicalis BYea.1.23(Gfp) and A. indonesiensis BTa1.1.44(Gfp) were grown overnight in GLY medium with 100 μg ml-1 kanamycin, with shaking. When growth was visible, suitable dilutions were plated on non-selective GLY agar an incubated at 30°C till the growth of well-separated colonies. Four colonies were then chosen, resuspended in 1.0 ml of GLY medium and vortexed intensely to obtain free cells. Suitable dilutions were plated on selective and non-selective GLY agar. The proportion of kanamycin-resistant bacterial cells was determined through the ratio between the kanamycin-resistant bacterial cells and the total number of cells grown.
Colonization experiments of D. suzukii with G. oxydans DSF1C.9A(Gfp), A. tropicalis BYea.1.23(Gfp) and A. indonesiensis BTa1.1.44(Gfp).
G. oxydans DSF1C.9A(Gfp), A. tropicalis BYea.1.23(Gfp) and A. indonesiensis BTa1.1.44(Gfp) were grown in GLY medium containing 100 μg ml-1 kanamycin up to a concentration of 108 cells ml-1. Cells were harvested, then washed and resuspended in sterile water to a final concentration of 2 × 10⁸ cells ml-1 or 1 × 10⁹ cells ml-1 for colonization experiments of D. suzukii adults. Colonization experiments of adults were performed by placing the adults in a small cage. A bacterial suspension (107 or 108 cells) was added to 0.5 g of adult sterile food and small drops of the obtained mixture were placed inside the cage on parafilm-covered glass slides. Appropriate controls without the addition of bacteria were done. The insects were fed ad libitum for 48 h with a sugar solution containing the Gfp-labelled strain, and then they were allowed to feed for 20 h with honey. Organs were then dissected in Ringer solution (0.65% NaCl, 0.014% KCl, 0.02% NaHCO3, 0.012% CaCl2 2H2O, 0.001% NaH2PO4 2H2O, pH 6.8) and fixed in 4% paraformaldehyde at 4°C for 10 min, mounted in glycerol and analyzed by fluorescence (Leica Microsystems, Germany) and confocal laser scanning microscopy, Confocal Laser Scanning Microscopy (CLSM, Leica Microsystems, Germany).

Chapter 3 – Spotted Wing Fly Drosophila suzukii
53
Results
Characterization of the bacterial diversity in D. suzukii by DNA-based analysis.
The bacterial community associated to 32 D. suzukii specimens was analysed by 16S rRNA gene DGGE-PCR, using as template the DNA isolated from whole single individuals. In particular, 5 larvae (n. 1-5; Fig 1A), one pupa (n. 6; Fig 1A) and ten adults (n. 7-16; Fig 1B) reared on fruits have been analysed, as well as 4 larvae (n. 29-32), 4 pupae (n. 25-28) and 8 adults (n. 17-24) reared on the artificial diet (Fig.1C). Generally, Drosophila flies host low complexity bacterial community, with the presence of few abundant bacterial taxa (11, 12). Here, a lower variability in the community profiles was observed among larvae reared on fruits and among the specimens reared on the artificial diet (Fig. 1A-C): many bands were rather conserved among the samples respectfully to the group to which each specimen belonged. Conversely, only few conserved bands were detected among the adults reared on fruits, which showed to have more complex profiles than larvae reared on fruits or specimens from the artificial diet (Fig. 1A-C). The majority of the bands from specimens reared on fruits showed similarity with species belonging to the Alphaproteobacteria class which comprises AAB, whereas the others indicated closeness with Betaproteobacteria, Gammaproteobacteria, Firmicutes and Bacteroidetes classes (Tab.1). Among larvae reared on fruits, bands A6 and A7 were the most remarkable ones, observed in a frequency of 50% (3 larvae out of 6) and 33% (2 larvae out of 6) of the tested individuals, and with 99% similar to the 16S rRNA gene of Acetobacter tropicalis and Acetobacter persicus, respectively. In all the larvae and in the sole pupa, a sequence with 98% identity with Bacillus sp., corresponding to A3 band in the PCR-DGGE gel, was detected, while band A1, corresponding to a sequence strictly related to Paracoccus sp. of the Alphaproteobacteria, was identified only for one individual. For 33% (2 out of 6) of the larvae analysed, sequences with 99% of similarity with the genus Stenotrophomonas and with the species Enterococcus casseliflavus, which are related to bands A4 and A2 respectively, were found not give clear results (lanes 22, 23, 24; Fig. 1C). Adults reared on fruits showed a massive presence of AAB-related sequences; in particular, they showed a high sequence similarity with a Gluconobacter and several Acetobacter species (Fig. 1B and Tab. 1). Bands B1 and B5 indicate both 100% sequence identity with Gluconobacter albidus, whereas bands, such as B4, B6, B10, B11, and B12, showed identity with the genus Acetobacter. Band B4, observed for only 10% of the tested adults, showed 99% similarity with A. cibinongensis; band B6, detected in few (20%) of the tested individuals, showed 100% identity with A. tropicalis, whereas band B11, which was repeatedly found (5 out of 10) among the samples had A. aceti as the closest relative, with the 98% sequence similarity.

Chapter 3 – Spotted wing fly Drosophila suzukii
54
Band Most related species
GenBank Accession no.
% nt similarity (identical bp/total bpa
Classification No. of positive indiv./ totalb
A1 Paracoccus sp. JX515659 98%(551/561)
Alphaproteobacteria; Rhodobacterales 1/6
A2 Enterococcus casseliflavus KC150018 99%(576/580
Firmicutes; Lactobacillales 2/6
A3 Bacillus sp. AM888231 98%(550/562) Firmicutes; Bacillales 6/6
A4 Stenotrophomonas sp. KC153268 99%(583/587)
Gammaproteobacteria; Xanthomonadales 2/6
A5 Wolbachia sp. NR_074437 99%(537/542)
Alphaproteobacteria; Rickettsiales 5/6
A6 Acetobacter tropicalis AB681066 99%(542/544)
Alphaproteobacteria; Rhodospirillales 3/6
A7 Acetobacter persicus AB665071 99%(511/512)
Alphaproteobacteria; Rhodospirillales 2/6
B1 Gluconobacter albidus AB178412 100%(507/507)
Alphaproteobacteria; Rhodospirillales 3/10
B2 Acinetobacter sp. HM045831 100%(531/531)
Gammaproteobacteria; Pseudomonadales 4/10
B3 Chitinophaga sp. GQ369124 92%(487/532)
Bacteroidetes; Sphingobacteriales 7/10
B4 Acetobacter cibinongensis JN004206 99%(514/516)
Alphaproteobacteria; Rhodospirillales 1/10
B5 Gluconobacter albidus AB178412 100%(507/507)
Alphaproteobacteria; Rhodospirillales 3/10
B6 Acetobacter tropicalis JF930137 100%(516/516)
Alphaproteobacteria; Rhodospirillales 2/10
B7 Lampropedia hyalina AY291121 98%(526/536)
Betaproteobacteria; Burkholderiales 6/10
B8 Wolbachia pipientis AJ306307 514/519 (99%)
Alphaproteobacteria; Rickettsiales 7/10
B9 Ochrobactrum sp. FJ233847 517/517(100%)
Alphaproteobacteria; Rhizobiales 5/10
B10 Acetobacter pasteurianus AB608081 520/531 (98%)
Alphaproteobacteria; Rhodospirillales 7/10
B11 Acetobacter aceti AJ419840 508/509 (99%)
Alphaproteobacteria; Rhodospirillales 5/10
B12 Acetobacter senegalensis HQ711345 524/535 (98%)
Alphaproteobacteria; Rhodospirillales 6/10
C1 Ochrobactrum sp. JN571744 99%(509/510)
Alphaproteobacteria; Rhizobiales 4/16
C2 Ochrobactrum sp. KF737384 99%(499/505)
Alphaproteobacteria; Rhizobiales 4/16
C3 Acetobacter sp. AB665071 99%(476/480)
Alphaproteobacteria; Rhodospirillales 4/16
C4 Acetobacter sp. AB665071 99%(503/505)
Alphaproteobacteria; Rhodospirillales 5/16

Chapter 3 – Spotted Wing Fly Drosophila suzukii
55
Band Most related species
GenBank Accession no.
% nt similarity (identical bp/total bpa
Classification No. of positive indiv./ totalb
C5 Lactobacillus sp. JX826566 99%(512/518)
Firmicutes; Lactobacillales 1/16
C6 Lactobacillus plantarum KF225698 98%(487/496)
Firmicutes; Lactobacillales 1/16
C7 Comamonas sp. KC853135 99%(526/529)
Proteobacteria; Burkholderiales 5/16
C8 Comamonas sp. KC853135 98%(515/528)
Proteobacteria; Burkholderiales 5/16
C9 Acetobacter sp. AB665071 99%(491/493)
Alphaproteobacteria; Rhodospirillales 4/16
C10 Acetobacter sp. AB665071 99%(486/489)
Alphaproteobacteria; Rhodospirillales 4/16
C11 Lactobacillus plantarum HE646352 96%(493/512)
Firmicutes; Lactobacillales 2/16
C12 Lactobacillus plantarum KF225698 99%(509/516)
Firmicutes; Lactobacillales 3/16
C13 Lactococcus lactis KC293821 100%(464/464)
Firmicutes; Lactobacillales 2/16
C14 Comamonas sp. KC853135 100%(517/517)
Proteobacteria; Burkholderiales 9/16
C15 Ochrobactrum sp. JN853243 93%(350/376)
Proteobacteria; Rhizobiales 1/16
C16 Acetobacter sp. AB680014 99%(452/454)
Alphaproteobacteria; Rhodospirillales 15/16
C17 Acetobacter sp AB680014 99%(508/510)
Alphaproteobacteria; Rhodospirillales 13/16
C18 Acetobacter sp. AB665082 99%(470/477)
Alphaproteobacteria; Rhodospirillales 2/16
C19 Tsukamurella sp. KF499506 100%(438/438)
Actinobacteria; Actinomycetales 1/16
C20 Streptomyces sp. KF889277 100%(429/429)
Actinobacteria; Actinomycetales 1/16
C21 Propionibacterium sp. KF479576 99%(432/433)
Actinobacteria; Actinomycetales 1/16
C22 Streptomyces sp. EU551673 99%(507/509)
Actinobacteria; Actinomycetales 1/16
C23 Tsukamurella tyrosinosolvens AB478957 97%(528/544)
Actinobacteria; Actinomycetales 1/16
C24 Streptomyces sp. HM153793 99%(506/507)
Actinobacteria; Actinomycetales 1/16
Table 1: Identification of microorganisms associated to D. suzukii according to DGGE profiles in Fig. 1. a nt, nucleotide. b Number of individuals positive for the presence of the specific band in the DGGE analysis compared to the total number of individuals analyzed.

Chapter 3 – Spotted wing fly Drosophila suzukii
56
Figu
re 1
: Bac
teri
al d
iver
sity
ass
oci
ated
wit
h D
. su
zu
kii
by
DG
GE-I
TS.
DG
GE
pro
file
s, i
n 7
% p
oly
acry
lam
ide
gel
s w
ith
40 t
o 6
0%
d
enat
ura
tion
gra
die
nt,
of
par
tial
16S
rRN
A b
acte
rial
gen
es a
mp
lifi
ed f
rom
DN
A e
xtra
cted
fro
m w
hole
in
sect
s re
ared
on
fru
it
(pan
e(p
anel
s A
an
d B
) or
arti
fici
al d
iet
(pan
el C
). N
um
ber
s ab
ove
th
e la
nes
ref
er t
o t
este
d i
nd
ivid
uals
. Sp
ecim
ens
on
fru
it: 1-
5
larv
ae; 6, p
up
a; 7
-16 a
du
lts;
sp
ecim
ens
from
art
ific
ial
die
t: 1
7-24 a
du
lts;
25-
28 p
up
ae; 29-
32 l
arva
e. B
and
s m
arked
wit
h a
rrow
s w
ere
seq
uen
ced
; d
ata
refe
rred
to s
eq
uen
ces
are
giv
en i
n T
able
1.

Chapter 3 – Spotted Wing Fly Drosophila suzukii
57
Finally, bands B10 and B12 were 98% similar to the 16S rRNA gene of A. pasteurianus and A. senegalensis, respectively, with a detection frequency of 70 and 60%, respectively. Other sequences matched with Lampropedia hyaline (98%), Acinetobacter sp. (100%), Chitinophaga sp. (92%) and Ochrobactrum sp. (100%). In both larval and adult specimens reared on fruits, a remarkable presence of Wolbachia pipientis was documented, particularly in 5 out of 6 larvae and 7 out of 10 adults (bands A5 and B8 for larvae and adults, respectively, Fig. 1 and Tab. 1). Sequences had a 99% identity with Wolbachia spp. Larvae and pupae reared on the artificial diet showed a huge presence of AAB sequences clustering to Acetobacter genus (bands C3, C4, C9, C10, C16, C17 and C18 with values of 99% identity), together with sequences related to Lactobacillus genus (bands C5, C6, C11 and C12; 96-100% identity). In the case of the adults reared on artificial diet, sequences related to Ochrobactrum, Comomonas, Lactobacillus, Tsukamurella, Streptomyces and Propionibacterium were retrieved (Fig. 1C). No sequences were found to cluster with Wolbachia; however, few bands in the upper part of Fig. 1C did. To have a wide view of the bacterial community associated to the samples, 16S rRNA barcoding, by amplifying the variable regions V1-V3 of the bacterial 16S rRNA gene, was performed on 14 specimens, including both individuals reared on fruits or artificial diet and specimens from different developmental stages (larvae, pupa and adults). Intra-specimen variability among the samples was reported (Tab. 2; Fig. 2).
Table 2: Alpha diversity metrics of 16S barcoding of 14 samples, at 97% identity level. N: number of reads for each sample; OTUs: number of OTUs for each sample; Chao-1: Chao-1 values for each sample, H’: Shannon H diversity for each sample; J: Pielou’s evenness indices for each sample.
Sample
ID Age
Rearing
environ.
Barcode
sequence N OTUs Chao1 H’ J
Ds159 larva fruit ACACGACT 12851 68 92.43 1.148 0.272
Ds164 larva fruit ACACGAGA 15587 132 148.24 2.151 0.440
Ds165 larva fruit ACACGTCA 9835 170 186.73 3.137 0.611
Ds167 pupa fruit ACAGAGAC 6638 153 200.57 3.290 0.654
DS41 adult fruit AGACGACA 9324 96 109.57 2.651 0.581
DS54 adult fruit AAGGTACG 19831 154 166.55 2.848 0.565
DS55 adult fruit AGACGAGT 6537 117 136.09 3.014 0.633
DSM adult fruit AAGGCGTA 6189 53 59.0 1.761 0.444
LP1 larva diet ACACGTGT 15338 71 122.0 1.975 0.463
LP3 larva diet ACACTCTC 20032 84 85.25 1.609 0.363
PP2 pupa diet ACAGAGTG 17180 69 74.60 0.907 0.214
FP1 adult diet ACACTGTG 7298 89 104.83 2.103 0.468
FP3 adult diet ACACTGAC 10321 113 120.58 2.738 0.579
MP3 adult diet ACAGACAG 21895 40 41.0 1.162 0.315

Chapter 3 – Spotted wing fly Drosophila suzukii
58
Using the Shannon index to measure α-diversity, it was possible to visualize that all samples reached a plateau; rarefaction curves showed the saturation of the microbial diversity associated to the samples (data not shown). We obtained in total 178,856 reads after quality evaluation and chimera removal. Singletons and less significative sequences (below the 0.1% threshold) were also deleted from the analysis. Besides the number of OTUs detected for each sample, in Table 2 are reported the alpha diversity metrics of 16S barcoding of the 14 samples, at 97% identity level, i.e. Chao-1, Shannon H diversity and Pielou’s J evenness indices. On the other hand, the β-diversity related to the samples was evaluated through principal coordinates analysis (PCoA) on the phylogenetic β-diversity matrix obtained by UniFrac (Fig. 2a). The components explain 49.67% of the variation (Fig. 2a). The analysis showed that three clusters could be obtained; the first one, quite separated from the other two, contained the two larvae and the sole pupa reared on the artificial diet, the second one included the adults reared on the artificial diet and the other one was constituted by the specimens reared on fruits (Fig. 2a). By the use of this analysis, adults reared on the artificial diet clustered closer to the specimens reared on fruits than the larvae or pupa reared on the artificial diet. Looking to the sample composition, results showed a high frequency of sequences belonging to the Rhodospirillales order (average percentage of reads was 24.8 per sample), to which AAB belong. Interestingly reads clustering to Rickettsiales, to which Wolbachia belongs, were detected only in flies reared on fruits, with an average of 27.5% among the individuals, confirming results obtained by DGGE-PCR (Fig. 2b). In particular, DSM and DS54 showed massive presence of Rickettsiales sequences with percentages of 95.3% and 59.4% out of the total number of reads, respectively. It is noteworthy to underline that all the reads, clustering to the Rickettsiales order, clustered at the genus level with Wolbachia. Reads clustering within Rhodospirillales order were present in all the specimens with different loads: the major abundant presences of Rhodospirillales reads were detected in DS41, a specimen reared on fruits, and PP2, a specimen reared on the artificial diet, with percentages of 85.2% and 85.4% out of the total number of sequences for each sample, respectively. Moreover, members of other orders such as Enterobacteriales, Xanthomonadales, Lactobacillales, Rhizobiales, Burkholderiales and Sphingobacteriales constituted the most significative fractions of reads out of the total ones (Fig. 2b).

Chapter 3 – Spotted Wing Fly Drosophila suzukii
59
Figure 2: Bacterial diversity associated with D. suzukii by 16S rRNA barcoding. (A) Principal coordinate analysis (PCoA) on the phylogenetic β-diversity matrix on D. suzukii samples. With red circle are clustered fruit-fed individuals, while with blue circles specimens on the artificial diet. (B) (next page) 16S RNA barcoding describing microorganisms, at order level, associated with D. suzukii. Names, under histograms, refers to fly specimens submitted to DNA extraction and partial 16S rRNA bacterial genes amplification. In columns, the relative abundances in percentages of the orders identified.

Chapter 3 – Spotted wing fly Drosophila suzukii
60

Chapter 3 – Spotted Wing Fly Drosophila suzukii
61
Prevalence and localization of AAB.
To investigate the prevalence of AAB, at the genus level, in the analysed insects reared on fruits, infection rates of the genera Gluconobacter, Gluconacetobacter and Acetobacter were evaluated in adult flies (Fig. 3). The frequency detected for the genera Gluconobacter and Acetobacter did not show significant differences, likewise Gluconobacter and Gluconacetobacter genera that did not present significantly different values (p<0.05). Prevalence indicated Gluconobacter and Gluconacetobacter as the most prevalent genera among the samples with values of 21 and 31%, respectively.
Figure 1: AAB infection rates in adult D. suzukii. columns indicate the percentage of infected individuals within th most common genera found in mass reared flies, i. e. Acetobacter, Gluconbacter and Gluconacetobacter. Bars represent the standard error. Different letters indicate significantly different values. (ANOVA, P<0,05).
With the aim to localize AAB, fluorescent in situ hybridization (FISH) experiments were carried out using the AAB-specific probe, AAB455, on the insect dissected organs, showing positive signals for proventriculus and gut (Fig. 4). In particular, a strong signal was detected at the level of the proventriculus epithelium, as observable by merging the interferential contrast picture (Fig. 4c) with the FISH micrograph (Fig. 4b) of a midgut section near to the proventriculus. Magnification in fig. 4d allowed to visualise fluorescent AAB microcolonies adhering to the peritrophic membrane. Since Gluconobacter was one of the main genera in prevalence assays, the distribution of this genus was observed in the midgut of D. suzukii. Gluconobacter specific signal was detected in the gut (Fig. 4g) providing the evidence of the distribution of this genus in the inner side of the intestinal

Chapter 3 – Spotted wing fly Drosophila suzukii
62
lumen. Fig. 4f showed the Texas red-signal for Eubacteria, allowing to observe the distribution of Gluconobacter in relation to the dispersal of the Eubacteria in the same portion of the organ (Fig. 4e-h). Gluconobacter is localized in the intestinal tract probably surrounded by other acetic acid bacteria. Attempts to design probes specific for Gluconacetobacter or Acetobacter genera failed. AAB isolation.
Figure 2: AAB localization in the gut of D. suzukii. (a-d) FISH of the insect gut after hybridization with the Texas red-labelled probe AAB455, matching AAB. (a) Superposition of the interferential contrast picture (c) and the FISH image (b) of a midgut part close to the proventriculus (indicated by white arrows). (d) Magnification of the image in b. The massive presence of AAB adherent to the peritrophic membrane (indicated by black arrows) is observed. (e-h) FISH of D. suzukii midgut with the Texas red-labelled universal eubacterial probe Eub338 (f) and the Cy5-labelled probe specific for Gluconobacter, Go615 and Go618 (g). (e) Intestine portion pictured by interferential contrast. (h) Superposition of hybridization signals of Eubacteria (red) and Gluconobacter (blue). Bars = 50 μm.

Chapter 3 – Spotted Wing Fly Drosophila suzukii
63
Isolation trials of AAB were performed with different kinds of enrichment and selective media (De Ley and Frateur, 1974, Reasoner et al., 1979, Yamada et al., 1999; Yamada et al., 2000; Kadere, 2008). Since the condition of fruit-rearing was the most close one to the natural habit of the insect, we directed our attention manly on isolation trials from specimens reared on fruits; specimens reared on artificial diet were also included in the analysis in a lower extent. After purification, 234 isolates were obtained and subjected to de-replication analysis, clustering them in ITS fingerprinting profiles. 16S rRNA gene sequencing of the candidates chosen for each ITS fingerprinting profile showed a prevalence of bacteria belonging to Acetobacter, Gluconobacter and Gluconacetobacter genera, which constitute the 16.67%, 7.7% and 52.99%, respectively, of the total number of bacteria in the collection (Tab. 3). 22.7% of isolates did not belong to Acetobacteraceae family. Seven Acetobacter species were isolated, i.e. Acetobacter tropicalis, A. cibinongensis, A. persicus, A. peroxydans, A. indonesiensis, A. orientalis, A. orleanensis, with A. persicus being the most abundant (Tab. 3). Gluconobacter genus was found to be present with three species, i.e. G. kondonii, G. oxydans, and G. kanchanaburiensis. The single isolate of G. kondonii was collected from an adult fly fed on fruits, while G. kanchanaburiensis species were isolated from specimens reared on artificial diet. Twelve isolates, collected from the fruit-fed adults, showed high sequence similarity with G. oxydans as closest described species, with isolates belonging to different ITS profiles (Tab. 3). One hundred and twenty-three isolates were sequenced and assigned to the genus Gluconacetobacter. In particular, 66 Gluconacetobacter hansenii (41 coming from females and 25 from fruit–fed males), 14 Ga. saccharivorans, and 8 Ga. intermedius isolates were isolated from fruit–fed Drosophila. The 8 isolates of Ga. intermedius derived from the same male, DSM1, but from different media, specifically the enrichment medium I and the basal medium. Three pupae and one larva revealed to harbor Ga. liquefaciens, when smashed and plated on enrichment medium I. Twenty-six Gluconacetobacter sp. could not be discriminated with the performed analysis, due to the phylogenetic proximity of the species analyzed.
Isolates No. of isolates
ITS Larval fly
Pupal fly
AP fly
AF fly
Micrococcus sp. 5 34, 35, 38 0 0 0 5
Microbacterium foliorum 2 39 0 0 0 2
Corynebacterium sp. 1 0 0 0 1
Sphingobacterium multivorum 1 0 0 1 0
Streptococcus salivarius 1 48 0 0 1 0

Chapter 3 – Spotted wing fly Drosophila suzukii
64
Isolates No. of isolates
ITS Larval fly
Pupal fly
AP fly
AF fly
Staphylococcus sp. 13 37 0 0 1 12
Paenibacillus sp. 2 0 0 0 2
Lactococcus lactis 1 60 0 0 0 1
Lactobacillus plantarum 1 0 1 0 0
Lactobacillus brevis 2 0 1 1 0
Acetobacter tropicalis 1 46 0 0 0 1 Acetobacter orleanensis/malorum/cerevisiae 5 47, 58 0 1 0 4
Acetobacter peroxydans 1 0 0 0 1
Acetobacter indonesiensis 10
49, 50, 55, 59 0 1 1 8
Acetobacter persicus 20 51 2 2 6 10
Acetobacter orientalis 1 54 0 0 0 1
Acetobacter cibinongensis 2 53 0 0 0 2
Gluconacetobacter sp. 26
8, 15, 16, 18, 23, 24, 32, 33, 40, 44 0 0 0 26
Gluconacetobacter hansenii 66
1, 2, 6, 10, 11, 12, 42, 43 0 0 0 66
Gluconacetobacter liquefaciens 4 1 3 0 0
Gluconacetobacter europaeus 3 22 0 0 0 3
Gluconacetobacter saccharivorans 14 4, 19, 41 0 0 0 14
Gluconacetobacter intermedius 8
14, 16, 17, 20, 21, 25 0 0 0 8
Gluconacetobacter nataicola 2 7, 31 0 0 0 2
Gluconobacter kondonii 1 52 0 0 0 1
Gluconobacter oxydans 12
5, 9, 26, 27, 28, 29, 45 0 0 0 12
Gluconobacter kanchanaburiensis 5 3 1 1 0

Chapter 3 – Spotted Wing Fly Drosophila suzukii
65
Isolates No. of isolates
ITS Larval fly
Pupal fly
AP fly
AF fly
Rhodobacter sp. 1 0 0 0 1
Pseudomonas geniculata 4 0 0 1 3
Serratia sp. 12 4 7 0 1
Enterobacter sp. 7 1 0 3 3
Total 234 11 17 16 190
Table 3: Identification of cultivable microorganisms associated to D. suzukii. AP: Adults fed with artificial diet; AF: Adults fed with fruit diet.
During the isolation procedure, few isolates belonging to the phylum Firmicutes were obtained, i.e. Lactobacillus plantarum, Lactobacillus brevis, Lactococcus sp., Paenibacillus sp., Streptococcus salivarius, and Staphylococcus sp. Several isolates of Sphingobacterium multivorum, Corynebacterium sp., Micrococcus sp. and Microbacterium foliorum were also found, as well as some representatives of Proteobacteria phylum, i.e. Rhodobacter sp., Pseudomonas geniculata, Enterobacter sp., and Serratia sp.
Colonization of D. suzukii with G. oxydans DSF1C.9A(Gfp), A. tropicalis BYea.1.23(Gfp) and A. indonesiensis BTa1.1.44(Gfp).
Isolates G. oxydans DSF1C.9A, A. tropicalis BYea.1.23 and A. indonesiensis BTa1.1.44 were selected for inserting a plasmid carrying the Gfp cassette in order to label the bacteria with a fluorescent protein. Plasmid stability into the three different AAB strains was evaluated and data showed that G. oxydans DSF1C.9A showed that it was able to retain the plasmid with an high percentage (73.125%, data not shown), while plasmids inserted in A. tropicalis BYea.1.23 and A. indonesiensis BTa1.1.44 were not stably inherited (data not shown). Colonization trials of adult flies were thus performed. Because of the quite rapid loss of the plasmid, the colonization experiments were performed under antibiotic selection by administering 100 μg ml-1 kanamycin in the insect food. After the administration of the Gfp-labelled strains, Drosophila specimens were dissected and the gut analyzed by CLSM. Gfp-labelled strains were able to massively recolonize the fly foregut and midgut (Fig. 5-6). In the case of Gfp-labelled Gluconobacter, the crop, proventriculus and first part of midgut were successfully colonized by the labelled bacteria (see the magnification views of the crop and the proventriculus in Fig. 5b and 5c). It is noteworthy that the Gfp-labelled cells are clearly restricted to the epithelium side of the proventriculus, embedded in a matrix, probably of polysaccharidic nature close to the peritrophic membrane (Fig. 5c). Likely, the first tract of the intestine, also the central part represented by midgut showed massive colonization pattern (Fig. 5d-e).

Chapter 3 – Spotted wing fly Drosophila suzukii
66
Figure 3: Colonization of D. suzukii foregut and midgut by G. oxidans DSF1C.9A1 documented by confocal laser scanning microscopy. (a-c) Intestine portion including the crop, the proventriculus and the first midgut part. (b, c) Magnified views of the crop (b) and the proventriculus (c) showed in a. Masses of fluorescent cells are observed in the crop (arrows); when the marked strain reaches the proventriculus it colonizes the gut part close to peritrophic membrane. (d-e) Interferential contrast (d) and confocal laser scanning (e) pictures of the midgut of D. suzukii massively colonized by the G. oxidans strain labelled with Gfp. Small hernias (arrowhead) are shown. In some cases, the flow of the gelatinous matrix entering the hernia is composed by fluorescent cells. Bars = 50 μm.

Chapter 3 – Spotted Wing Fly Drosophila suzukii
67
Figure 4: Confocal laser scanning micrographs showing the colonization of D. suzukii foregut and midgut by A. tropicalis BYea.1.23 (A) Reconstructed image of an intestine obtained by overlapping successive sections. The gut portion includes crop, proventriculus, midgut, and Malpighian tubules. Fluorescent A. tropicalis BYea.1.23 cells are visible in the whole tract; the symbiont is especially located close to the gut walls and in the peritrophic membrane. Bar = 50 μm. (B, C) Magnification of the framed crop part in A pictured by CLSM (B) and interferential contrast (C). Masses of fluorescent bacteria are evident in the crop. Bar = 50 μm. (D-E) Interferential contrast (D) and confocal laser scanning (E) magnifications of the framed crop part in B, showing Gfp-marked A. tropicalis adhering to the crop wall. Bar = 25 μm.

Chapter 3 – Spotted wing fly Drosophila suzukii
68
Since small hernias are visible by interferential contrast (indicated by black arrowheads in Fig. 5e) and since they result Gfp-positive with CLSM, the gelatinous matrix forming the hernias appears like a gel in which the bacterial cells are completely sunk. Black filaments around the organ are the Malpighian tubules, more evident in the confocal laser scanning microscopy picture (Fig. 5d). Also in the case of A. tropicalis BYea.1.23, the colonization of the foregut and midgut was successfully performed (Fig. 6A). The labelled bacteria are present in the whole tract and especially they are located close to the gut walls and in the peritrophic membrane (Fig. 6B-E). Images related to A. indonesiensis BTa1.1.44(Gfp) were similar and thus not included here.
Discussion
The highly invasive vinegar fly Drosophila suzukii is a poliphagous species endemic to the South East Asia and now it is emerging as a dangerous pest in many Mediterranean and North America’s countries . The study of its biology, ecology and distribution is in progress, but to develop future management solutions many gaps should be filled. One of these is the characterization of insect microbiome, with particular attention to the analysis of the acetic acid bacteria, important symbionts living in association with this pest. Indeed, in other insect models, these alphaproteobacteria have been described to play important biological roles (15–17). In this work, culture-independent techniques, DGGE-PCR and 16S rRNA pyrotag in particular, gave insights on the overall bacterial community composition of D. suzukii and, notably, provided robust evidence of the stable association of AAB, underlining their constant presence in the samples under investigation. Results showed the presence of AAB belonging to the Acetobacter, Gluconacetobacter and Gluconobacter genera (Fig. 1, Fig. 2). AAB are a diverse class of organisms, widespread in nature, as a large number of AAB strains have been isolated from a variety of sources (41). AAB are recognized by their unique ability to oxidize ethanol to acetic acid in neutral and acidic (pH 4±5) media and to produce polysaccharides that are exploited at industrial level (42). Besides Drosophila flies and mosquitoes, AAB have been reported in association with bees, olive fruit flies, parasitic wasps and mealybugs (34, 43, 44). For example, Acetobacter tropicalis, whose presence was also recorded in D. suzukii by the present study, was previously described in association with the olive fruit fly Bactrocera olae, with which it establishes a strict association (34). The appearance and behaviour of this bacterium were similar to the ones showed by the Gfp-labelled strains used in the actual work: it was indeed observed in contact with the gut epithelium of the insect, entrapped in the polisaccharidic matrix. This peculiar localization in the insect body was also documented in Asaia (40) and it may suggest the importance of the AAB for the insect metabolism and gut functions’ maintenance. 16S rRNA barcoding allowed to discriminate three clusters among the samples (Fig. 2a); the first principal component (which explains 30.87% of the variance) segregates the microbiota of two groups of D. suzukii, the adults reared on the fruit and the ones on the artificial diet from the larvae and pupa

Chapter 3 – Spotted Wing Fly Drosophila suzukii
69
reared on the artificial diet, while the second component allows to discriminate the adults reared on the artificial diet from the fruit-fed ones (Fig 2a). In both results of cultivation-independent techniques, DGGE-PCR and pyrotag, Wolbachia presence was massively recorded in insects reared on fruit. Wolbachia is an intracellular reproductive manipulator already described for several insect models, including different Drosophila species (45–48). Its finding only in samples reared on fruit and not in samples reared on the artificial diet could be explained by the presence of inhibitory compounds against Wolbachia in the artificial diet (Fig. 1, Fig. 2). However, even if little is known about Drosophila suzukii microbiota (49), numerous studies have now been conducted in order to assess the microbial community residing in Drosophila melenogaster (10, 11, 13, 19, 50–55), both in the gut and in the whole body. These studies underline the simple bacterial communities in association with Drosophila, predominantly made up of Firmicutes phylum, represented by the families Lactobacillaceae and Enterococcaceae, and alpha and gamma classes of Proteobacteria, represented by Acetobacteraceae and Enterobacteriaceae families. Cox and Gilmore (19), who performed the analysis of the bacterial community of wild and laboratory-reared D. melanogaster specimens, revealing the predominant presence of Acetobacter genus, and consequent identification of A. aceti, A. cerevisiae, A. pasteurianus, A. pomorum, Gluconobacter and Gluconacetobacter species. A recent work showed that the differences in the diversity and dominance of bacterial species associated to several Drosophila species have a relationship with food source (10). Moreover, Chandler and coworkers (11) observed that all individuals of different Drosophila species reared on different food sources obtained a similar microbiome when moved to the same medium. Furthermore, Wong et al. focused on the microbial composition at different life cycle stages (10). Chandler and colleagues (49) characterized the microbiota of adult and larval D. suzukii collected from cherries, showing a high prevalence of the gamma-proteobacterium Tatumella. Gluconobacter and Acetobacter were found at lower frequency than Tatumella. In our case, high prevalence of Rhodospirillales reads was reported with an average of 24.8%, abundance percentages varying from 0.02% to 85.42% (Fig 2). No Tatumella sequences were detected among gamma-proteobacteria. AAB have been shown to be involved in the relationship between the gut microbiota and host health, underlining the importance of the correct microbial balance for the host well-being (14). The normal flora in the fly gut is sufficient to suppress the growth of pathogenic bacteria, and to regulate host immune response (13), but also to promote the insulin pathway (15). Consequently, to gain knowledge of the detailed localization of this key group, FISH was performed with AAB-specific probe (Fig.4). The localization of the AAB probe in the wall side of the midgut portion near to the proventriculus showed their distribution, not in the lumen, but in the peripheral side of the organ suggested a role of protective layer between the lumen and the surface epithelium, able to prevent the passage of bacteria. This was already proposed by Kounatidis and colleagues (34), when observing

Chapter 3 – Spotted wing fly Drosophila suzukii
70
a similar behaviour in Bactrocera oleae gut, colonized by A. tropicalis. Several studies reported that another AAB, Asaia, is able to colonize the gut and the reproductive organs of different insects, such as the leafhopper Scaphoideus titanus, and the mosquitoes Anopheles stephensi, An. gambiae and Aedes aegypti (21, 31, 40, 56). Together with the hypothesis above reported, this supports the evidence that the insect digestive system is a favourable habitat for AAB, in which they establish a strict connection with the epithelial cells (18). Recolonization data strongly supported FISH analysis: several isolates belonging to Gluconacetobacter, Gluconobacter and Acetobacter genera were targeted with a plasmid carrying the GFP (Fig.5-6). Several efforts were also made to achieve the transformation of Gluconacetobacter isolates, but no successful results were obtained. Further experiments will be planned to improve the transformation protocol. Strains G. oxydans DSF1C.9A(GFP), A. tropicalis BYea.1.23(GFP) and A. indonesiensis BTa1.1.44(GFP) were obtained and their dispersal in the fly body was followed by fluorescent microscopy on re-colonized specimens. The actual control of D. suzukii is based on insecticides that however are not very effective (4) and the promising control strategies based on interferences with communication still need more research (57). Thus a forward-looking concept like the symbiotic control approach, under investigation in the last years (58), should be taken into account. In the light of the development of future control strategies exploiting the remarkable importance of the Acetobacteraceae family for D. suzukii, further experiments have to be performed to assess their distribution pattern in the host compartments, their role and involvement in the host homeostasis and possible exploitations of their properties for the host control.
References
1. Cini A, Ioriatti C, Anfora G. 2012. A review of the invasion of Drosophila suzukii in Europe and a draft research agenda for integrated pest management 65:149–160.
2. Hauser M. 2011. A historic account of the invasion of Drosophila suzukii (Matsumura) (Diptera: Drosophilidae) in the continental United States, with remarks on their identification. Pest Manag. Sci. 67:1352–7.
3. Lee JC, Bruck DJ, Dreves AJ, Ioriatti C, Vogt H, Baufeld P. 2011. In Focus: Spotted wing Drosophila, Drosophila suzukii, across perspectives. Pest Manag. Sci. 67:1349–51.
4. Walsh DB, Bolda MP, Goodhue RE, Dreves AJ, Lee JC, Bruck DJ, Walton VM, O’Neals SD, Zalom FG. 2011. Drosophila suzukii (Diptera: Drosophilidae): Invasive pest of repening soft fruit expanding its geographic range and damage potential. J. Int. Pest. Manag. 1:1–7.
5. Mitsui H, Takahashi KH, Kimura MT. 2006. Spatial distributions and clutch sizes of Drosophila species ovipositing on cherry fruits of different stages. Popul. Ecol. 48:233–237.

Chapter 3 – Spotted Wing Fly Drosophila suzukii
71
6. Grassi A, Palmieri L, Giongo L. 2012. Drosophila (Sophophora) suzukii (Matsumura) (Diptera: Drosophilidae), new pest of soft fruits in Trentino (North-Italy) and in Europe. IOBC/wprs Bull. 70:121–128.
7. Seljak G. 2011. Spotted wing Drosophila, Drosophila suzukii (Matsumura), a new pest of berry-fruit in Slovenia. Sadjarstvo 22:3–5.
8. Goodhue RE, Bolda M, Farnsworth D, Williams JC, Zalom FG. 2011. Spotted wing Drosophila infestation of California strawberries and raspberries: economic analysis of potential revenue losses and control costs. Pest Manag. Sci. 67:1396–402.
9. Grassi A, Palmieri L, Giongo L. 2009. Nuovo fitofago per i piccoli frutti del Trentino. Terra Trent. 55:19–23.
10. Wong CNA, Ng P, Douglas AE. 2011. Low-diversity bacterial community in the gut of the fruitfly Drosophila melenogaster. Environ. Microbiol. 13:1889–900.
11. Chandler JA, Lang JM, Bhatnagar S, Eisen JA, Kopp A. 2011. Bacterial communities of diverse Drosophila species: ecological context of a host-microbe model system. PLoS Genet. 7:e1002272.
12. Wong AC-N, Chaston JM, Douglas AE. 2013. The inconstant gut microbiota of Drosophila species revealed by 16S rRNA gene analysis. ISME J. 7:1922–32.
13. Ryu J-H, Kim S-H, Lee H-Y, Bai JY, Nam Y-D, Bae J-W, Lee DG, Shin SC, Ha E-M, Lee W-J. 2008. Innate immune homeostasis by the homeobox gene caudal and commensal-gut mutualism in Drosophila. Science 319:777–82.
14. Silverman N, Paquette N. 2008. Immunology. The right resident bugs. Science 319:734–5.
15. Shin SC, Kim S-H, You H, Kim B, Kim AC, Lee K-A, Yoon J-H, Ryu J-H, Lee W-J. 2011. Drosophila microbiome modulates host developmental and metabolic homeostasis via insulin signaling. Science 334:670–674.
16. Chouaia B, Rossi P, Epis S, Mosca M, Ricci I, Damiani C, Ulissi U, Crotti E, Daffonchio D, Bandi C, Favia G. 2012. Delayed larval development in Anopheles mosquitoes deprived of Asaia bacterial symbionts. BMC Microbiol. 12 Suppl 1:S2.
17. Mitraka E, Stathopoulos S, Siden-Kiamos I, Christophides GK, Louis C. 2013. Asaia accelerates larval development of Anopheles gambiae. Pathog. Glob. Health 107:305–11.
18. Crotti E, Rizzi A, Chouaia B, Ricci I, Favia G, Alma A, Sacchi L, Bourtzis K, Mandrioli M, Cherif A, Bandi C, Daffonchio D. 2010. Acetic acid bacteria, newly emerging symbionts of insects. Appl. Environ. Microbiol. 76:6963–70.
19. Cox CR, Gilmore MS. 2007. Native microbial colonization of Drosophila melenogaster and its use as a model of Enterococcus faecalis pathogenesis. Infect. Immun. 75:1565–76.
20. Damiani C, Ricci I, Crotti E, Rossi P, Rizzi A, Scuppa P, Esposito F, Bandi C, Daffonchio D, Favia G. 2008. Paternal transmission of symbiotic bacteria in malaria vectors. Curr. Biol. 18:R1087–8.
21. Gonella E, Crotti E, Rizzi A, Mandrioli M, Favia G, Daffonchio D, Alma A. 2012. Horizontal transmission of the symbiotic bacterium Asaia sp. in the leafhopper Scaphoideus titanus Ball (Hemiptera: Cicadellidae). BMC Microbiol. 12 Suppl 1:S4.
22. Chouaia B, Gaiarsa S, Crotti E, Comandatore F, Degli Esposti M, Ricci I, Alma A, Favia G, Bandi C, Daffonchio D. 2014. Acetic acid bacteria genomes reveal functional traits for adaptation to life in insect guts. Genome Biol. Evol. 6:912–20.
23. Raddadi N, Gonella E, Camerota C, Pizzinat A, Tedeschi R, Crotti E, Mandrioli M, Bianco PA, Daffonchio D, Alma A. 2011. “Candidatus Liberibacter europaeus” sp. nov. that is associated with and transmitted by the psyllid

Chapter 3 – Spotted wing fly Drosophila suzukii
72
Cacopsylla pyri apparently behaves as an endophyte rather than a pathogen. Environ. Microbiol. 13:414–26.
24. Altschul SF, Gish W, Miller W, Myers EW, Lipman DJ. 1990. Basic local alignment search tool. J. Mol. Biol. 215:403–10.
25. Montagna M, Sassera D, Epis S, Bazzocchi C, Vannini C, Lo N, Sacchi L, Fukatsu T, Petroni G, Bandi C. 2013. “Candidatus Midichloriaceae” fam. nov. (Rickettsiales), an ecologically widespread clade of intracellular alphaproteobacteria. Appl. Environ. Microbiol. 79:3241–8.
26. Caporaso JG, Kuczynski J, Stombaugh J, Bittinger K, Bushman FD, Costello EK, Fierer N, Peña AG, Goodrich JK, Gordon JI, Huttley GA, Kelley ST, Knights D, Koenig JE, Ley RE, Lozupone CA, McDonald D, Muegge BD, Pirrung M, Reeder J, Sevinsky JR, Turnbaugh PJ, Walters WA, Widmann J, Yatsunenko T, Zaneveld J, Knight R. 2010. QIIME allows analysis of high-throughput community sequencing data. Nat. Methods 7:335–6.
27. Edgar RC. 2010. Search and clustering orders of magnitude faster than BLAST. Bioinformatics 26:2460–1.
28. Caporaso JG, Bittinger K, Bushman FD, DeSantis TZ, Andersen GL, Knight R. 2010. PyNAST: a flexible tool for aligning sequences to a template alignment. Bioinformatics 26:266–7.
29. Haas BJ, Gevers D, Earl AM, Feldgarden M, Ward D V, Giannoukos G, Ciulla D, Tabbaa D, Highlander SK, Sodergren E, Methé B, DeSantis TZ, Petrosino JF, Knight R, Birren BW. 2011. Chimeric 16S rRNA sequence formation and detection in Sanger and 454-pyrosequenced PCR amplicons. Genome Res. 21:494–504.
30. Ruiz A, Poblet M, Mas A, Guillamón JM. 2000. Identification of acetic acid bacteria by RFLP of PCR-amplified 16S rDNA and 16S-23S rDNA intergenic spacer. Int. J. Syst. Evol. Microbiol. 50 Pt 6:1981–7.
31. Crotti E, Damiani C, Pajoro M, Gonella E, Rizzi A, Ricci I, Negri I, Scuppa P, Rossi P, Ballarini P, Raddadi N, Marzorati M, Sacchi L, Clementi E, Genchi M, Mandrioli M, Bandi C, Favia G, Alma A, Daffonchio D. 2009. Asaia, a versatile acetic acid bacterial symbiont, capable of cross-colonizing insects of phylogenetically distant genera and orders. Environ. Microbiol. 11:3252–64.
32. Gonella E, Negri I, Marzorati M, Mandrioli M, Sacchi L, Pajoro M, Crotti E, Rizzi A, Clementi E, Tedeschi R, Bandi C, Alma A, Daffonchio D. 2011. Bacterial endosymbiont localization in Hyalesthes obsoletus, the insect vector of Bois noir in Vitis vinifera. Appl. Environ. Microbiol. 77:1423–35.
33. Yamada Y, Hosono R, Lisdyanti P, Widyastuti Y, Saono S, Uchimura T, Komagata K. 1999. Identification of acetic acid bacteria isolated from Indonesian sources, especially of isolates classified in the genus Gluconobacter. J. Gen. Appl. Microbiol. 45:23–28.
34. Kounatidis I, Crotti E, Sapountzis P, Sacchi L, Rizzi A, Chouaia B, Bandi C, Alma A, Daffonchio D, Mavragani-Tsipidou P, Bourtzis K. 2009. Acetobacter tropicalis is a major symbiont of the olive fruit fly (Bactrocera oleae). Appl. Environ. Microbiol. 75:3281–8.
35. Yamada Y, Katsura K, Kawasaki H, Widyastuti Y, Saono S, Seki T, Uchimura T, Komagata K. 2000. Asaia bogorensis gen. nov., sp. nov., an unusual acetic acid bacterium in the alpha-Proteobacteria. Int. J. Syst. Evol. Microbiol. 50 Pt 2:823–9.
36. Kadere T, Miyamoto`o T, Oniang`o R, Kutima P, Njoroge S. 2008. Isolation and identification of the genera Acetobacter and Gluconobacter in coconut toddy (mnazi). African J. Biotechnol. Academic Journals (Kenya).
37. De Ley J, Frateur J. 1974. Genus Acetobacter Beijerinck 1898, p. 276–278. In Buchanan, RE, Gibbons, NE (eds.), Bergey’s manual of determinative bacteriology, 8th ed. Williams and Wilkins, Baltimore.

Chapter 3 – Spotted Wing Fly Drosophila suzukii
73
38. Reasoner DJ, Blannon JC, Geldreich EE. 1979. Rapid seven-hour fecal coliform test. Appl. Environ. Microbiol. 38:229–36.
39. Daffonchio D, Borin S, Frova G, Manachini PL, Sorlini C. 1998. PCR fingerprinting of whole genomes: the spacers between the 16S and 23S rRNA genes and of intergenic tRNA gene regions reveal a different intraspecific genomic variability of Bacillus cereus and Bacillus licheniformis [corrected]. Int. J. Syst. Bacteriol. 48 Pt 1:107–16.
40. Favia G, Ricci I, Damiani C, Raddadi N, Crotti E, Marzorati M, Rizzi A, Urso R, Brusetti L, Borin S, Mora D, Scuppa P, Pasqualini L, Clementi E, Genchi M, Corona S, Negri I, Grandi G, Alma A, Kramer L, Esposito F, Bandi C, Sacchi L, Daffonchio D. 2007. Bacteria of the genus Asaia stably associate with Anopheles stephensi, an Asian malarial mosquito vector. Proc. Natl. Acad. Sci. U. S. A. 104:9047–51.
41. Kersters K, Lisdiyanti P, Komagata K, Swings J. 2006. 318. The Family Acetobacteraceae: The Genera Acetobacter, Acidomonas, Asaia, Gluconacetobacter, Gluconobacter, and Kozakia, In Dworkin, M, Falkow, S, Rosenberg, E, Stackebrandt, E (eds.), The Prokaryotes vol.5 Springer-V.
42. Kommanee J, Akaracharanya A, Tanasupawat S, Malimas T, Yukphan P, Nakagawa Y, Yamada Y. 2008. Identification of Gluconobacter strains isolated in Thailand based on 16S–23S rRNA gene ITS restriction and 16S rRNA gene sequence analyses. Ann. Microbiol. 58:741–747.
43. Ashbolt NJ, Inkerman PA. 1990. Acetic Acid Bacterial Biota of the Pink Sugar Cane Mealybug, Saccharococcus sacchari, and Its Environs. Appl. Environ. Microbiol. 56:707–12.
44. Martinson V, Danforth B. 2011. A simple and distinctive microbiota associated with honey bees and bumble bees. Mol. … 20:619–628.
45. Ravikumar H, Prakash BM, Sampathkumar S, Puttaraju HP. 2011. Molecular subgrouping of Wolbachia and bacteriophage WO infection among some Indian Drosophila species. J. Genet. 90:507–10.
46. Verspoor RL, Haddrill PR. 2011. Genetic diversity, population structure and Wolbachia infection status in a worldwide sample of Drosophila melenogaster and D. simulans populations. PLoS One 6:e26318.
47. Lee SF, White VL, Weeks AR, Hoffmann AA, Endersby NM. 2012. High-throughput PCR assays to monitor Wolbachia infection in the dengue mosquito (Aedes aegypti) and Drosophila simulans. Appl. Environ. Microbiol. 78:4740–3.
48. Siozios S, Cestaro A, Kaur R, Pertot I, Rota-Stabelli O, Anfora G. 2013. Draft Genome Sequence of the Wolbachia Endosymbiont of Drosophila suzukii. Genome Announc. 1.
49. Chandler JA, James PM, Jospin G, Lang JM. 2014. The bacterial communities of Drosophila suzukii collected from undamaged cherries. PeerJ 2:e474.
50. Brummel T, Ching A, Seroude L, Simon AF, Benzer S. 2004. Drosophila lifespan enhancement by exogenous bacteria. Proc. Natl. Acad. Sci. U. S. A. 101:12974–9.
51. Corby-Harris V, Habel KE, Ali FG, Promislow DEL. 2007. Alternative measures of response to Pseudomonas aeruginosa infection in Drosophila melenogaster. J. Evol. Biol. 20:526–33.
52. Ren C, Webster P, Finkel SE, Tower J. 2007. Increased internal and external bacterial load during Drosophila aging without life-span trade-off. Cell Metab. 6:144–52.
53. Ridley E V, Wong AC-N, Westmiller S, Douglas AE. 2012. Impact of the resident microbiota on the nutritional phenotype of Drosophila melenogaster. PLoS One 7:e36765.

Chapter 3 – Spotted wing fly Drosophila suzukii
74
54. Sharon G, Segal D, Ringo JM, Hefetz A, Zilber-Rosenberg I, Rosenberg E. 2010. Commensal bacteria play a role in mating preference of Drosophila melenogaster. Proc. Natl. Acad. Sci. U. S. A. 107:20051–6.
55. Storelli G, Defaye A, Erkosar B, Hols P, Royet J, Leulier F. 2011. Lactobacillus plantarum Promotes Drosophila Systemic Growth by Modulating Hormonal Signals through TOR-Dependent Nutrient Sensing. Cell Metab. 14:403–414.
56. Damiani C, Ricci I, Crotti E, Rossi P, Rizzi A, Scuppa P, Capone A, Ulissi U, Epis S, Genchi M, Sagnon N, Faye I, Kang A, Chouaia B, Whitehorn C, Moussa GW, Mandrioli M, Esposito F, Sacchi L, Bandi C, Daffonchio D, Favia G. 2010. Mosquito-bacteria symbiosis: the case of Anopheles gambiae and Asaia. Microb. Ecol. 60:644–54.
57. Eriksson A, Anfora G, Lucchi A, Lanzo F, Virant-Doberlet M, Mazzoni V. 2012. Exploitation of insect vibrational signals reveals a new method of pest management. PLoS One 7:e32954.
58. Bextine B, Lampe D, Lauzon C, Jackson B, Miller TA. 2005. Establishment of a genetically marked insect-derived symbiont in multiple host plants. Curr. Microbiol. 50:1–7.

Chapter 4 – Red Palm Weevil Rhynchophorus ferrugineus
75
Chapter 4
Effects of the diet on the microbiota of the Red Palm Weevil (Coleoptera: Dryophthoridae)
Abstract
Rhynchophorus ferrugineus, also known as the red palm weevil, is regarded as the major pest of palm trees. Although studies of the microbiota associated with this species have been performed in recent years, little attention has been dedicated to the influence of the diet in shaping the host bacterial community. Here, we investigated the influence of food sources (i.e. palm tissues vs apple based substrate) on the microbial diversity associated with RPW, which was compared with the microbiota associated with wild individuals of the sister species Rhynchophorus vulneratus. The bacterial characterization was performed using a culture independent approach, i.e. the 16S rRNA pyrotag, and a culture dependent approach for a subset of the samples, in order to obtain bacterial isolates from RPW tissues. The bacterial community appeared significantly influenced by diet. Proteobacteria resulted to be the most abundant clade and was present in all the specimens of the three examined weevil groups. Within Proteobacteria, Enterobacteriaceae were identified in all the organs analysed, including hemolymph and reproductive organs. The apple-fed RPWs and the wild R. vulneratus showed a second dominant taxon within Firmicutes that was scarcely present in the microbiota associated with palm-fed RPWs. A comparative analysis on the bacteria associated with the palm tissues highlighted that 12 bacterial genera out of the 13 identified in the plant tissues were also present in weevils, thus indicating that palm tissues may present a source for bacterial acquisition.
Introduction
The Red Palm Weevil (hereafter RPW), Rhynchophorus ferrugineus Olivier (Coleoptera; Dryophthoridae), is regarded today as the major pest of palm, attacking over 20 palm species belonging to 16 different genera worldwide (1). RPW is native to South Eastern Asia, but due to the international exchange of infected plant material, during the last two decades it has spread to the Middle East, Africa and the Mediterranean. In 1992 RPW was first detected in Egypt (2) then spread through the Northern Mediterranean Basin (3–5), where it attacked the highly sensitive ornamental palm Phoenix canariensis (6). More recently RPW has been detected in Australia, China, Japan and the Caribbean (7–12). Globally, the pest has a wide geographical distribution in diverse agro-climates and an extensive host range in Oceania, Asia, Africa and Europe (1). The RPW life cycle, from egg to new-born adult, occurs in the palm tree trunks

Chapter 4 – Red palm weevil Rhynchophorus ferrugineus
76
(13) in which the weevil feeds on tissues and sap. Larvae develop inside palm trees resulting in the destruction of palm tissue leading, eventually, to the death and collapse of the tree. The palm tree trunk tissues consist of more than 80% (wt. %, dry basis) of cellulose, hemicellulose and lignin (14). For this reason, they represent a non-easily digestive substrate for most eukaryotes. The role played by mutualistic bacterial consortia supporting their insect host with essential compounds missing from the diet (i.e. amino acids, vitamins and cofactors), or by contributing to the digestion of the ingested material, is well documented (15–20). In the cases of aphids and cicadellids, these contributions are provided by intracellular bacteria (respectively, Buchnera aphidicola and ‘Candidatus Sulcia muelleri’(21–24), while in termites and other insects, essential compounds are provided by complex microbial communities, in some cases including both intracellular bacteria and gut microbiota, e.g. coackroaches (15, 25, 26). Considering the economic and social impact of RPW, the interest in this pest has significantly increased in recent decades. Most studies have focused on the efficacy of different chemical and bio-control strategies (27, 28). Conversely, little attention was paid to the microbial community associated with RPW, although an intracellular primary endosymbiont has been described in weevils and classified as ‘Candidatus Nardonella’ (29–32). Regarding the gut bacterial community associated to RPW, only preliminary studies have been conducted (33–36), in some cases addressed to cultivable bacteria in order to identify potential insect pathogens useful in bio-control strategies (34, 37). Aerobic and facultative anaerobic bacteria (Bacillus sp., Salmonella sp., Enterococcus sp. and Xanthomonas sp.) and bacteria able to degrade polysaccharides and sucrose through hydrolase activity (e.g., Klebsiella pneumoniae and Lactococcus lactis) have been discovered and isolated from the RPW’s gut (33, 35). To date, no studies have investigated the existence of stable core-microbiota that may be useful for the development of efficient bio-control strategies (38, 39). The main aim of the present study is to investigate the influence of the environment (mainly food sources) in shaping the microbial diversity of RPW by i) comparing the microbiota of RPW individuals collected on palm tissues vs laboratory individuals reared on apple-based substrate; ii) comparing the endophytes of palm tissues with the weevil’s microbiota and iii) evaluating the metabolic potential of the identified microbial consortia from individuals collected on palm tissues vs laboratory ones. Moreover, the bacterial cultivable fraction associated to laboratory-reared individuals was estimated by the use of several isolation media.
Materials and Methods
Ethics statement Rhynchophorus ferrugineus and its sister species R. vulneratus, the most damaging insect pest of palms in the world, are not listed in any national or regional law as protected or endangered species. The collection of specimens in Malaysia was made in the private properties of cooperating landowners. The collection of specimens in Italy was not subjected to any restriction,

Chapter 4 – Red Palm Weevil Rhynchophorus ferrugineus
77
moreover the specimens sampling occurred in not protected areas and under the surveillance of Servizio Fitosanitario della Regione Sicilia.
Specimens sampling, dissection and DNA extraction
Male and female RPW adults, and host plant tissues were collected on Phoenix canariensis in Catania, Italy (Table 1). Among the insects, three individuals (one male and two females) were preserved in absolute ethanol, whereas six additional specimens (three males and three females) were transported to laboratory and maintained alive on diets of apple for four weeks with a natural light-dark cycle (14:10), RH = 65% and temperature = 28°C. Three adults of Rhynchophorus sp., firstly identified as R. ferrugineus, were collected using specific traps baited with the aggregation pheromone Rhyfer 220 (Intrachem Bio Italia S.p.A.) in Genting Sempah, Selangor, Malaysia (Table 1). All the collected specimens were immediately stored in absolute ethanol, furthermore, considering the size of the specimens 1 ml of absolute ethanol was injected with sterile syringes in each specimen. Before dissection, samples were surface sterilized following the protocol reported in Montagna et al. (40). Specimens, after anaesthetisation at -20° C, were dissected aseptically using sterilized scalpels and forceps under a Leica MS5 stereomicroscope. The insect content, including the whole gut, the fat body and reproductive system, was removed and homogenised for the DNA extraction. Palm tissues were dried at room temperature before DNA extraction. DNA was extracted using DNeasy Blood and Tissue Kit (Qiagen), for the animal tissues, and the DNeasy Plant Kit (Qiagen), for the palm tissues, following the manufacturer’s instructions in both cases. The final elution was realised in 300 μl of AE buffer and DNA was quantified by spectrophotometry. In 2013 Rugman-Jones et al. (41) reported the presence of two Rhynchophorus species in Malaysia: R. ferrugineus and R. vulneratus, which have been in synonymy until the publication of the cited work. Since the identification at species level starting from morphological features is sometimes impossible, we performed molecular identification of the three specimens collected in Malaysia. The following strategy has been adopted: total genomic DNA was extracted from three individuals sampled at Genting Sempah (Malaysia) and used as template to amplify a 5' upstream region of the cytochrome c oxidase subunit I gene (coxI) from the mitochondrial genome. The PCR cycle was performed using the Folmer’s primers LC01490 and HC02198 (42); complete details of the laboratory procedures are reported in Rector et al. (43). The acquired sequences, deposited at the European Nucleotide Archive with accession numbers LN612634-LN612636, were screened for identification by a blast search over the National Center for Biotechnology Information (NCBI) GenBank nucleotide collection using the Mega BLAST procedure (44) available at its website (http://www.ncbi.nlm.nih.gov/blast). Our query sequences were unequivocally assigned to R. vulneratus with high sequence identity in all cases (Identity 99-100%, 0 gaps).
Pyrosequencing and data analysis
Pyrotag assays were carried out using bacterial universal primers (27 F mod 5’ – AGR GTT TGA TCM TGG CTC AG – 3’; 519 R mod bio 5’ – GTN TTA CNG

Chapter 4 – Red palm weevil Rhynchophorus ferrugineus
78
CGG CKG CTG – 3’) targeting the variable regions of 16S rRNA V1-V3 and amplifying a fragment of approximately 400 bp. The amplified 16S rRNA regions contain enough nucleotide variability to be useful in identification of bacterial species (45, 46). Primers were modified by the addition of a GS FLX Titanium Key-Primer AGR GTT TGA TCM TGG CTC AG and a multiplex identifier (MID) sequence specific to each sample. The MID sequences (forward) were reported for the respective weevil specimen in Table 1. PCR reactions and next generation 454 pyrosequencing were performed commercially (MR DNA, Shallowater, TX – U.S.) as described in a previous work (40). A total of 345973 raw, barcoded amplicons of the V1–V3 region of the 16S rRNA gene, were obtained. The reads were trimmed to remove pyrosequencing adaptors, low quality base calls (<30 Phred score) and size-selected (between 350 and 500 bp) using the QIIME(47) pipeline filtering scripts. The total of 138738 high quality sequence reads that were not flagged as chimeras after screening with Chimeraslayer were clustered into operational taxonomic units (OTUs), based on a sequence identity threshold of 97%, using Uclust (48); drawing one sequence for each OTU, as representative, and then aligned to Greengenes (http://greengenes.lbl.gov/) using PyNast(49). Sequences representative of each OTU were taxonomically classified by BLASTn-based comparisons to the Greengenes and Silva databases within QIIME. The resulting set of OTUs was used in diversity analyses (see below). The analyses were carried out using the various scripts of the QIIME pipeline. The 16S rRNA gene sequences obtained by 454 pyrosequencing assays were deposited in European Nucleotide Archive with accession numbers PRJEB6918.
Diversity and statistical analyses The diversity indices and the following analysis (exceptions are specified) were estimated using the vegan-package “Community Ecology Package: Ordination, Diversity and Dissimilarities” (50) in the R software package (R Project 3.0.2; http://cran.r-project.org/). The Shannon H index(51), Pielou’s eveness (52) and total species richness index Chao 1 (53–55) were estimated. The significance of the differences between the analysed statistics (i.e. the number of identified OTUs within each specimen, the Shannon H diversity and Pielou’s evenness indices) were tested with the non parametric Kruskal-Wallis tests (56) after the assessment of the equality of variances adopting Levene’s test (57). In case of comparison between to two groups the Mann-Whitney test was adopted (58). These tests were performed using lawstat-package (59) in the R software package. The β-diversity matrix was computed using the script beta_diversity.py implemented in QIIME (47) and UniFrac (60), which uses as input the OTU table with the amount of the observed 16S rRNA sequences for each OTU for each weevil and the phylogenetic tree constructed using FastTree (61). Since the purpose of our ordination analysis was to reveal significant pattern of variation in the microbiota composition between the different specimens, the

Chapter 4 – Red Palm Weevil Rhynchophorus ferrugineus
79
unweighted unifrac metric was adopted (62). The obtained matrix was used as input for the Principal Coordinates Analysis (PCoA (63). The OTU table, containing the abundance of sequences clustered within each identified OTU for all of the processed insect specimens, was transformed into a presence-absence matrix in order to be processed for further analyses. The similarity between the microbial communities associated with the three groups of specimens (i.e. RPW from wild population, RPW from wild population and reared on apple for four weeks and the sister species R. vulneratus) was analysed through a hierarchical cluster analysis. This analysis was conducted using the function hclust in R stats-package (R Project 3.0.2; http://cran.r-project.org/). The dissimilarity matrix, used as input for the hierarchical cluster analysis, was estimated by vegdist using the Bray and Curtis dissimilarity index (64). In addition, to test the reliance of the obtained results the same analysis was also performed on the dissimilarity matrix obtained adopting Jaccard (65) and Kulczynski indices. In order to test the significant dissimilarity between the microbiotas associated to the groups identified by the clustering analysis (corresponding to RPWPALM, RPWAPPLE and RVULN), the dissimilarity matrices were subjected to a nonparametric one-way analysis of similarity (ANOSIM (66)) as in a previous work (67). In order to estimate the change in species composition between the bacterial communities harbored by RPWPALM and by RPWAPPLE, two components of β-diversity (i.e. species turnover and nestedness) were estimated with the R package betapart (68) using Simpson’s dissimilarity index as in Montagna et al.(40). To investigate the common OTUs present in the three groups of weevils, an analysis of commonality was performed and visualized through a Venn diagram using the gplots package in R. The impact of ecological traits (i.e., the food source and the temperature at which the samples live) on the bacterial communities associated with insects has been evaluated by correlation with results of the OTU-table Non-Metric Multi-Dimensional Scaling (NMDS(69)). The adopted procedure has been described in a previous study(40). Concerning the diet, two substrates were considered: the palm tissues and apple; while, regarding the temperature two classes have been adopted based on the monthly average temperature at the time of the sampling: 20°C for specimens collected in late October, 2012 in Catania and, > 25°C for specimens maintained in lab and for specimens collected in Malaysia in January, 2012.
Predictive functional profiling
To explore the functional profiles of our bacterial community data set, we used PiCRUST (Phylogenetic Investigation of Communities by Reconstruction of Unobserved States http://picrust.github.com, 3 July 2013 (70)). For the analysis, OTUs were closed-reference picked against the 18 May 2012 Greengenes database using QIIME v 1.6 according to the online protocol. We predicted the bacterial metagenome for each of our samples. The accuracy of metagenome predictions was measured by the Nearest Sequenced Taxon Index (NSTI), with lower values indicating a closer mean relationship (70). Our samples had NSTI values of 0.06 ± 0.02. For comparison, Langille et al. (70) found that human-associated samples had the lowest (best) NSTI values (0.03

Chapter 4 – Red palm weevil Rhynchophorus ferrugineus
80
± 0.2), while communities such as soil had a much higher NSTI value (0.17 ± 0.02). The table with the predicted gene family counts per-samples according to Cluster of Orthologous Groups (71) and identifiers adopted by KEGG Orthology (72) was cleaned removing: i) all categories not related to the bacterial physiology/metabolism in a symbiotic perspective; and ii) categories with count equal to 0. Statistical analyses (i.e. Levene’s and the non parametric Kruskal-Wallis tests) were performed among the weevil groups in order to account for the differences in the amount of counts.
Bacterial isolation Since most of the strategies adopted in biocontrol programs (e.g., the sterile insect technique or the use of bacteria as biocontrol agents) are based on insects' rearing, isolation trials were carried out in order to investigate the bacterial cultivable fraction associated to RPWAPPLE, which may be the target of such strategies. Two adults (one male and one female) sampled in Catania, Italy, and reared under lab condition on apple for 30 days (see previous paragraph for details on the rearing condition), were dissected to obtain gut, ovaries, testes, and the female hemolymph. Each organ was smashed in 500 μl 0.9% NaCl and serial dilutions were plated on agarized LB, R2A, TSB and PDB media, supplemented with 100 μg/ml cycloheximide, and incubated in aerobic conditions or in microaerophilic Gaspak at 30°C. After isolate purification, the bacterial collection was de-replicated by the analysis of internal transcribed spacer (ITS)-PCR and one or two representatives of each ITS group were identified by partial sequencing of 16S rRNA gene after DNA extraction and amplification with the primers 27F and 1492R (73). Partial 16S rRNA gene sequences were deposited in the European Nucleotide Archive under the accession numbers LN623577-LN623640.
Results
Bacterial diversity associated with weevil (α-diversity) A total of 138,738 bacterial 16S rRNA sequences have been obtained from the 12 RPW samples (median = 7599.5). The coverage of microbial α-diversity associated with each specimen was investigated through visual analysis of the rarefaction curves (α-diversity indices and observed species plotted vs simulated sequencing effort; Figures S1, S2). Using the Shannon index as a metric to measure α-diversity, all samples reached a plateau at value of ~1600 sequences per samples (except for a female specimen reared in lab for which only 1670 high-quality 16S rRNA gene sequences have been obtained), indicating that the microbial α-diversity associated with each specimen was well covered. Table 2 reports the values of the estimated diversity indices (i.e. Chao-1, Shannon H diversity and Pielou’s J evenness indices) for the bacterial communities associated with the RPW and R. vulneratus specimens. The bacterial communities associated with the specimens belonging to the three groups were found to differ significantly in terms of diversity indices (H’ χ2 = 8.69, P = 0.013; J’ χ2 = 6.85, P = 0.032).

Chapter 4 – Red Palm Weevil Rhynchophorus ferrugineus
81
Identifier Gender Collecting locality Lat/Long TAG I_palm_F1 ♀ Catania, Italy 37°31.518'N/15°05.147' E ACATCCAT
I_palm_F2 ♀ Catania, Italy 37°31.518'N/15°05.147' E ACCAACAT
I_palm_M3 ♂ Catania, Italy 37°31.518'N/15°05.147' E ACAGTGAA
I_apple_F1 ♀ Catania, Italy 37°31.518'N/15°05.147' E ACGCAACG
I_apple_F2 ♀ Catania, Italy 37°31.518'N/15°05.147' E ACGCATCG
I_apple_F3 ♀ Catania, Italy 37°31.518'N/15°05.147' E AAGGTAGC
I_apple_M3 ♂ Catania, Italy 37°31.518'N/15°05.147' E ACGAGATC
I_apple_M4 ♂ Catania, Italy 37°31.518'N/15°05.147' E ACGATCTG
I_apple_M5 ♂ Catania, Italy 37°31.518'N/15°05.147' E ACGCAACC
MYS_field_F1 ♀ Genting Sempah, Selangor, Malaysia
3°21.368' N/101°47.684' E ACGGGTAA
MYS_field_F2 ♀ Genting Sempah, Selangor, Malaysia
3°21.368' N/101°47.684' E ACGGTAAG
MYS_field_M3 ♂ Genting Sempah, Selangor, Malaysia
3°21.368' N/101°47.684' E ACGCGAAC
Table 1: Rhynchophorus specimens analysed in the present study.
Identifier Group OTUs H’ J’ Chao-1 I_palm_F1 RPWPALM 1060 5.61 0.56 1605 I_palm_F2 RPWPALM 1028 5.74 0.57 1652 I_palm_M3 RPWPALM 1142 5.69 0.56 1667 RPWPALM* 1076.7±58.8 5.68±0.07 0.56±0.01 1641.3±32.3 I_apple_F1 RPWAPPLE 722 4.4 0.46 1082 I_apple_F2 RPWAPPLE 296 3.03 0.37 485 I_apple_F3 RPWAPPLE 209 3.98 0.52 345 I_apple_M3 RPWAPPLE 404 3.62 0.42 606 I_apple_M4 RPWAPPLE 420 3.67 0.42 617 I_apple_M5 RPWAPPLE 520 4.25 0.47 707 RPWAPPLE* 428.5±179.4 3.83±0.5 0.44±0.05 640.3±250 MYS_field_F1 RVULN 134 2.98 0.42 189 MYS_field_F2 RVULN 342 3.54 0.42 473 MYS_field_M3 RVULN 633 2.56 0.27 880 RVULN* 369.7±250.6 3.03±0.49 0.37±0.08 588±347.5
Table 2: Diversity indices estimated for the bacterial communities associated with the analyzed Rhynchophorus specimens. a The mean and standard deviation of the estimated diversity indices are reported for each analyzed group of weevils; b Number of sequences obtained for each specimens after chimeric and contaminants removal.
Based on the Chao-1 index, approximately 66% of the α-diversity was recovered by our analysis. The microbiotas associated with RPWPALM, with J’= 0.56 ± 0.01, resulted more balanced than the bacterial communities associated both with lab-maintained RPWs (J’APPLE= 0.44 ± 0.05) and with the sister species R. vulneratus (J’VULN= 0.37 ± 0.08). The communities associated In particular, the bacterial communities associated with 3 specimens of RPW

Chapter 4 – Red palm weevil Rhynchophorus ferrugineus
82
directly collected from palm are significantly more diverse than that associated with the 6 specimens maintained in laboratory and fed with apple for four weeks (H’ U = 18, P = 0.024; J’ U = 18, P = 0.024). Differences were also observed in the total amount of bacterial OTUs associated to the three groups of samples (OTUs χ2 = 6.38, P = 0.0413). This trend was also observed using the Chao-1 richness estimator (data not shown). with the latter two groups were dominated by few taxa. In the high-evenness community associated with RPWPALM the dominant OTU accounts for 8.4% ± 2.4 of the insect’s microbiota respect to those explained by the dominant OTUs in RPWAPPLE and RVULN, in which they made up respectively 15.4% ± 8.1 and 33% ± 12.1 of the total microbial diversity. These results were also visually confirmed by the rank-frequency curves plot (Figure S3), in which, for each of the 12 RPW and R. vulneratus samples, the number of high-quality 16S rRNA sequences clustered into each OTUs is reported. This method allows a visual evaluation of OTU richness and evenness (74, 75). β-diversity and ecological traits The β-diversity of bacterial communities associated with the weevil specimens was investigated through a principal coordinates analysis (PCoA) carried on the phylogenetic β-diversity matrix, obtained by UniFrac. The first two components explain a total of 42.6% of the variation (1st component, 28.3%; 2nd component, 14.3%). The analysis revealed an evident clustering of the samples according to each membership group; the first principal component segregates the microbiota of the two groups of R. ferrugineus, while the second component isolates the specimens of R. vulneratus (Figure 1A). The clustering analysis performed on the OTUs’ presence-absence matrix confirms the results obtained by PCoA showing that the pattern of association of the different bacterial community was congruent with the different weevil groups (i.e. the microbiota associated to each specimen clustered together; Figure 1B). The same results were also obtained by analysing the presence-absence OTUs matrix using Jaccard index (Figure S4) and the abundance OTUs matrix adopting the Kulczynski distance (Figure S5). These results support the fact that the observed pattern in microbiota composition (i.e. the presence-absence of the different OTUs) is congruent with the grouping factor independently from the bacterial evenness associated with each community. Interestingly, microbiota from specimens of R. ferrugineus reared in laboratory clustered as the sister group of microbiota from R. vulneratus specimens. The estimated β-diversity over the two groups of RPWs, measured as Sørensen’s dissimilarity, resulted in a value of βSOR = 0.982. The two components of the β-diversity, the turnover and the nestedness, resulted in βSIM = 0.973 and in βNES = 0.009, respectively. These values indicate that high OTU turnover and a low nested component have been recovered between the two groups of RPWs, which means that ~97% of the OTUs are different in the two communities. It is interesting to note that after only 30 days of feeding on apple, the bacterial community associated with RPWAPPLE, derived from RPWPALM, dramatically changed compared to the microbiota of the original population, maintaining only a few shared OTUs.

Chapter 4 – Red Palm Weevil Rhynchophorus ferrugineus
83
The analyses on the OTUs common to the three groups of weevils showed (Figure 2) that over a total of 2386 OTUs associated with R. ferrugineus, 1369 are exclusive to RPWPALM and 702 to RPWAPPLE. Interestingly only 34 OTUs (19 unique OTUs shared between RPWPALM and RPWAPPLE plus 15 unique OTUs common to all) are shared between these two groups of weevils that descend from the same population. Considering all the three groups, only a total of 15 OTUs are shared among them (taxonomic assignment of these OTUs with a comparative analysis with bacterial OTUs isolated from palm tissues are reported below). Figure 3 reports the results of the NMDS analysis performed on the bacterial OTU table fitted with both ecological traits: i) diet consisting in apple for the lab-reared RPW and palm tissues for field collected RPW and R. vulneratus and ii) the temperatures at which the specimens have been maintained (lab) or are assumed to have developed (wild collected). Both traits significantly explain the dissimilarities among the bacterial communities associated with the three groups of weevils (diet: R2 = 0.87, P = 0.003; temperature: R2 = 0.94, P = 0.006). These results also suggest that temperature may be a confounding factor to explain the impact of different diets on the bacterial diversity and richness associated with the different weevil groups.

Chapter 4 – Red palm weevil Rhynchophorus ferrugineus
84
Figure 1 A: principal-coordinate analysis on the phylogenetic β-diversity matrix obtained starting from the OTU table. The explained variance is as follows: 28.3% 1st component, 14.3% 2nd component. B: hierarchical clustering dendrogram representing the OTU table pairwise dissimilarities between the different analyzed weevils; the pie charts represent the relative abundance of bacterial communities at phylum level.

Chapter 4 – Red Palm Weevil Rhynchophorus ferrugineus
85
Figure 2: Venn diagram showing the shared bacterial OTUs (at 97% similarity) between all studied weevils groups.
Figure 3: Biplot of the first 2 axes for the Non-Metric Multi-Dimensional Scaling representing correlations between the OTUs Chao dissimilarity index and ecological factors (i.e. diet and temperature). The black squares, the black and open circles represent respectively: RPWPALM, R. vulneratus and RPWAPPLE; while black crosses represent the identified OTUs. The vectors represent the

Chapter 4 – Red palm weevil Rhynchophorus ferrugineus
86
mean direction and strength of correlation of diet and temperature (p-value < 0.05).
Taxonomic classification of OTUs
The results of the taxonomic assignment analysis at the phylum and family levels are reported in Figure 4 (see also table S1-S2). The analysis revealed that the most abundant taxa shared by all the members of the three insect groups belong to Proteobacteria (on average c.a. 64.6% of the sequences in the specimens of RPWPALM group, 51.6% in RPWLAB and 43.3% in RVULN; Figure 4A). The specimens of the groups RPWAPPLE and RVULN harbour a second dominant taxon represented by Firmicutes (on average 39.1% and 44.1%), while members of this taxon are scarcely represented in the microbiotas associated to RPWPALM specimens (0.3%). The members of the three groups of insects harbour, with different abundance, also members of Actinobacteria (RPWPALM = 17.1%, RPWAPPLE = 1.2% and RVULN = 5.6%) and Bacteroidetes (RPWPALM = 8.2%, RPWAPPLE = 3.6% and RVULN = 4.3%). In Table 3 are reported the relative abundances of the bacterial genera (with abundance > 1%) associated with the three groups of weevils. Within the R. ferrugineus feeding on palm the most abundant taxa belong to Xanthomonadaceae (mean 13.2% ± 4.03) and Rhodobacteraceae (mean 11.9% ± 11), to which belong the genera Luteimonas (mean 6.6% ± 2) and Paracoccus (mean 7% ± 7.8), respectively. In the microbiota associated with RPWPALM specimens, but not with those reared in laboratory, members of the genus Demequina (Cellulomonadaceae) and members of Rhodobacteraceae, Phyllobacteraceae and Rhizobiales were recovered. In contrast, the most abundant genus in the bacterial community associated to RPWAPPLE and RVULN specimens was Leuconostoc, which represents respectively 17.8% (s.d. 14.1) and 37.2% (s.d. 34.1) (Table 3). This genus was not observed in the microbiota of RPWPALM specimens. Other dominant components of the RPWAPPLE microbiota are the bacteria of the genera Acetobacter (12.9% ± 9.2) and Lactococcus (9.3% ± 6.2). Bacteria of the genera Lactobacillus and Entomoplasma are present in all specimens of R. ferrugineus reared under lab conditions and in that of the sister species R. vulneratus, but are not associated with RPWPALM. Besides Leuconostoc, the dominant bacteria in the R. vulneratus microbiota belong to the family Comamonadaceae (11.2% ± 7.3) and to the genus Ralstonia (Burkholderiaceae). Table S2 reports the relative abundances of the bacterial families associated with the different weevil samples. In agreement with the results obtained by the biodiversity analysis, the higher number of bacterial families are associated with RPWPALM, while samples of R. ferrugineus reared under lab conditions and those of the sister species R. vulneratus harbour a lower number of bacterial taxa.

Chapter 4 – Red Palm Weevil Rhynchophorus ferrugineus
87
Rhyncophorus ferrugineus
Rhyncophorus ferrugineus Rhyncophorus vulneratus
palm apple palm
fa fa ma fa fa fa ma ma ma fa fa ma
Demequina 2.96 4.13 1.13 - - - - - - - - -
Gordonia 0.21 0.55 1.19 - - - - - - - 0.30 0.03
Aeromicrobium 0.74 2.99 1.50 - - - - - - - - -
Pimelobacter 0.27 0.94 3.20 - - - - - - - - -
Propionibacterium - - - 0.04 0.09 0.24 - - - 0.17 2.92 0.03
Dysgonomonas - - - 1.64 0.67 0.06 6.64 6.76 1.92 - 0.50 -
Flavobacterium - - 0.09 - - - - - - - 1.55 -
Wautersiella 0.15 1.27 0.96 - - - - - - - 0.17 -
Enterococcus - - 0.04 0.24 0.01 - 0.66 11.48 8.97 - - -
Lactobacillus - - - 2.60 0.60 1.56 0.99 0.38 0.79 0.04 0.07 0.10
Leuconostoc - - - 5.07 2.17 22.16 40.88 22.15 14.54 41.21 1.37 69.17
Lactococcus - - - 11.05 2.92 18.62 4.49 13.61 4.94 0.25 - 0.35
Clostridium - - - - - - - - - - 2.30 0.04
Erysipelothrix - - - 1.29 - - 0.07 0.01 0.41 1.53 0.14 -
Planctomyces 1.01 0.59 0.22 - - - - - - - 0.27 0.04
Asticcacaulis 1.01 0.54 0.33 - - - - - - - - -
Devosia 3.68 1.09 1.48 - - - - - - 0.17 0.95 0.07
Hyphomicrobium 0.82 1.37 0.69 - - - - - - 0.17 - -
Defluvibacter 0.02 0.06 0.06 - - - - - - - 1.29 0.06
Kaistia 1.11 0.07 0.06 - - - - - - - - 0.02
Paracoccus 1.03 15.79 4.22 0.04 0.02 - - - - 0.30 1.79 0.25
Acetobacter 0.07 - - 22.16 23.91 14.79 4.22 1.22 10.95 0.04 - 0.20
Swaminathania - - - 1.07 0.42 0.30 0.19 0.04 0.16 - - 0.17
Ralstonia - - - - - - - - - 8.37 38.90 2.38
Escherichia 0.03 0.02 0.28 0.06 0.10 - 7.25 - 1.21 0.30 - -
Gluconacetobacter - - - 0.49 0.16 1.80 0.01 0.41 0.90 - - -
Serratia - 0.02 0.50 1.28 0.19 - 1.19 1.10 2.03 - 1.65 1.39
Trabulsiella 0.02 - 0.31 4.31 0.06 - 0.02 0.52 0.55 1.57 - 0.01
Acinetobacter 0.27 0.46 5.46 0.01 0.01 0.12 - - - 0.08 2.07 0.35
Pseudomonas 1.82 1.07 4.41 0.30 - 0.12 - - - 0.04 0.26 -
Luteimonas 8.88 4.91 6.00 - - - - - - - - -
Stenotrophomonas - 0.04 0.70 - 0.01 - - - - 0.13 1.64 0.05
Thermomonas 1.68 0.44 1.76 - - - - - - - - -

Chapter 4 – Red palm weevil Rhynchophorus ferrugineus
88
Table 3: (previous page) Genera of bacteria identified in the weevil microbiotas with their relative average abundance expressed as percentage. In this table are reported the bacterial genera present with abundance > 1% in at least one specimens. The main differences in in the bacterial genera associated with apple and palm are highlighted in bold. a The gender of the specimens is reported; f: female, m: male
Interestingly, no OTUs of the R. ferrugineus primary endosymbiont “Candidatus Nardonella” were recovered in the first analysis of the data using the well-curated RDP database to taxonomically identify OTUs. A more detailed analysis of the OTUs, which were previously identified as unknown Gammaproteobacteria, performed by BLAST against known sequences of “Ca. Nardonella” allowed the identification of different OTUs as belonging to this taxon (Table S3). The identity of these OTUs was later confirmed as the primary symbiont by bidirectional BLAST with values of sequence similarity > 97%. Noteworthy, all the identified OTUs matched with the sequence FJ626262, endosymbiont of Sphenophorus levis. The prevalence of “Ca. Nardonella” was 100% in all the RPWs and R. vulneratus specimens. This result confirms the presence of “Ca. Nardonella” also in this Rhynchophorus species. The fact that the titer of the primary symbiont within the analysed samples was low can be attributed to the fact that the bacteriome and mesenteric caeca, colonized by the primary symbiont (76), represent a small fraction of the total sampled tissues colonisable by bacteria. In addition, the titer of endosymbionts has been demonstrated to vary along the life cycle of their arthropod host (e.g.,(77)).
Bacteria associated with palm tissues
The majority of the 16S rRNA sequences, 60755 out of the obtained 61189 via 454 sequencing from the palm tissues were removed from the analysis, since they matched with the chloroplast. From the three palm samples, a total of 434 16S rRNA sequences were of bacterial origin, and were clustered in 193 ± 78.5 OTUs. The taxonomic composition of the bacterial communities associated with the palm tissues is dominated by members of Firmicutes and Proteobacteria, representing on average the 62% and the 34% of the microbiota (Figure 5A). The composition of family-level microbiota associated with palm tissues is represented in the pie chart reported in Figure 5B. The genus Brevibacillus (Paenibacillaceae), detected in all the processed palm samples, is the dominant one (average 60 ± 37.7% of the obtained 16S rRNA sequences). A comparative analysis on the bacteria associated with weevil and palm samples were performed on the genus-level identified OTUs in order to detect any patterns of commonalities. Interestingly, 12 out of the 13 bacterial genera identified in the palm tissues, are recovered, with different degree of prevalence and abundance, also in the weevil microbiota (only Klebsiella is exclusive of these tissues). Brevibacillus, the dominant bacterium in the palm microbiota, is found to be associated also with two samples of RPW although with a low abundance.

Chapter 4 – Red Palm Weevil Rhynchophorus ferrugineus
89
Figure 4: Histogram representing the taxonomic assignment of bacterial 16S rRNA gene sequences associated with the analyzed weevils; A: phylum level, B: family level.

Chapter 4 – Red palm weevil Rhynchophorus ferrugineus
90
Figure 5: Pie charts representing the taxonomic assignment of bacterial 16S rRNA gene sequences associated with the analyzed the palm tissues; A: phylum level, B: family level.
Metabolic potential
In order to investigate and compare the metagenomic functional potential associated with the different bacterial communities harboured by the three groups of weevils, the 16S rRNA sequences obtained from each specimen were analysed with a dedicated bioinformatics tool (PiCRUSt, (70)). In Table S5 are reported the results of the analysis containing the predicted gene family counts per sample for all the categories that have been related to the bacterial physiology/metabolism, in light of a symbiotic relationship, such as the amino acid metabolism, the biosynthesis of secondary metabolites and the metabolism of cofactors and vitamins. The full results of the analysis are reported in Table S4. Within the cellular processes category, significant differences between all the three insect groups

Chapter 4 – Red Palm Weevil Rhynchophorus ferrugineus
91
were recovered in bacterial chemotaxis and in bacterial motility proteins (respectively Kruskal-Wallis χ2 = 6.54, df = 2, P = 0.038 and Kruskal-Wallis χ2 = 7.27, df = 2, P = 0.026). In the amino acid metabolism category, significant differences (P < 0.05) between the three groups of weevil were reported for Lys, Val, Leu and Ile degradation and for Phe, Trp and β-Ala metabolism.
Figure 6: Relative abundance of the strains isolated from the different organs of RPW. A: histogram representing the relative abundance of strains at order level isolated by different organs; B: pie chart representing the cumulative abundance of the different strains at the genus level.

Chapter 4 – Red palm weevil Rhynchophorus ferrugineus
92
None of the predictions obtained for the category of biosynthesis of other secondary metabolites resulted different based on the Kruskal-Wallis test.Interestingly, other statistically significant differences between-groups were observed in the categories of carbohydrate/energy metabolism (pentose phosphate pathway and nitrogen metabolism) and in the metabolism of cofactor and vitamins (thiamine metabolism). Pairwise comparison carried on the subsets of differentially predicted metabolic pathways, using the Mann-Whitney test, indicated that most of the differences result to be between the R. ferrugineus that were fed on palms and those fed on apples (p<0.05; Table S5). From the PICRUSt prediction, these pathways result to be present at a higher percentage in the microbiota associated with RPWPALM than in the one associated with RPWAPPLE.
Bacterial isolation from laboratory reared weevils
The bacterial cultivable fraction was investigated on RPWAPPLE.. This work allowed the isolation of a total of 103 isolates from different insect organs dissected from laboratory weevils, with the aim to investigate the bacterial diversity associated to the different body districts (Table S6). Partial 16S rRNA sequencing results showed that the majority of the isolates belonged to Proteobacteria (64%) and Firmicutes (22%, Figure 6A). Among Proteobacteria, Gamma-subdivision was the most abundant (46% in comparison to Alpha and Beta ones which accounted with 12% and 6%, respectively) with members of Enterobacteriales and Xanthomonadales. Among Firmicutes bacteria belonging to the orders Lactobacillales and Bacillales were isolated. Acetic Acid Bacteria (AAB) accounted for 9% of the total isolates (Figure 6). We did not appreciate major differences in the bacterial composition of the different organs and tissues analysed, even though an important fraction of the isolates were obtained from the intestine (no. 38) (Figure 6B; Table S6). The isolated strains belong mainly to the taxa Enterobacteraceae, Lactobacillales, Actinobacterales and Acetobacteraceae. These taxa were also observed in the metabarcoding analysis.
Discussion
The bacterial communities harboured by the three groups of weevils are dominated by members of Proteobacteria; in addition, RPWAPPLE and RVULN specimens harbour a second dominant taxon represented by Firmicutes (see Fig. 4). The unbalanced composition of the bacterial communities associated with these insect groups is reflected also in the Pielou’s evenness index, where RPWAPPLE and RVULN show significant lower values that those of RPWPALM. In fact, the microbiota associated with RPWPALM is characterized by the absence of dominant bacteria. Most of the RPWPALM exclusive taxa are present with low abundance (<1%); conversely, the microbiota associated with RPWAPPLE and RVULN
are dominated, with an average abundance of 17.85% and 37.27%, by bacteria of the genus Leuconostoc, which is absent in the microbiota of RPWPALM. The microbiota of RPWAPPLE specimens is characterized also by bacteria of the genera Acetobacter (14.47% ±13.6) and Lactococcus (9.25% ± 6.2). Interestingly the three groups of weevils shared 15 common OTUs (Table S7). Among these

Chapter 4 – Red Palm Weevil Rhynchophorus ferrugineus
93
OTUs, taxa such as Serratia and Ochrobactrum were observed. Both taxa have been described in association with several arthropod taxa (40, 78, 79)(Amblyomma rotundatum, data not shown). While Serratia plays several roles ranging from host protection against parasitoids (80) to the enhancement of host fitness (81), the role of Ochrobactrum is yet to be investigated. Noteworthy, three of these shared OTUs belonged to taxa that were present also in palm tree tissues (i.e., one belonging to Comamonadaceae and two to Stenotrophomonas). Culture-dependent methods on organs and tissues of RPWAPPLE have allowed obtaining 103 isolates, which were identified by sequencing of partial 16S rRNA gene. Interestingly, a large part of the isolates was constituted by Proteobacteria and Firmicutes, which were present in all the different dissected organs and in the hemolymph. This is in accordance with the data obtained with DNA-based method. In fact, using both cultivation dependent and independent technique, Proteobacteria and Firmicutes members resulted abundant in the laboratory population. Particularly, members of Gammaproteobacteria, with Enterobacteriales and Xanthomonadales representatives, and Firmicutes, with Lactococcus, Streptococcus, Enterococcus and Lactobacillus, were retrieved. Bacteria belonging to the genus Lactococcus were also previously isolated from wild specimens of RPW (34). It is interesting to note that members of AAB were isolated from the hemolymph. In insects, these bacteria are generally described as gut associated, but they have been shown to colonize different organs even after administration with food; this indicates that AAB are able to cross the gut barrier and reach other organs, likely through the hemolymph (81–83). Moreover, in accordance with pyrotag data, laboratory insects harbour also Actinobacteria and Betaproteobacteria, with respectively 13% and 6% of abundance. The comparative analysis performed on the bacterial consortia associated with the palm tissues with those associated with weevils highlight some patterns of commonalities: 12 bacterial genera out of the 13 identified in palm tissues were also recovered in weevils from the original palm population. Based on this finding, we can hypothesise that these bacteria are ingested by weevils along with palm tissues. Even if we cannot completely exclude that these bacteria are transient components of the weevil microbiota and do not represent stable consortia, the fact that most of them (nine out of 13) are present also in specimens reared on apple for 30 days or in R. vulneratus suggests that these are stable component of the weevil microbiota. The alternative hypothesis is that palm tissues are contaminated by weevil faeces; the shared insect-palm bacteria would thus represent contaminants from the insects. However, palm tissues examined in this study were healthy and not colonized by the weevil. Interestingly, even if the microbiota associated with weevils clearly differ among groups in terms of diversity and composition, the predicted metagenome functional potentials related to the bacterial physiology/metabolism in light of a symbiotic relationship were maintained in most aspects. Statistically significant differences among the three groups of weevils were reported for the metabolism of a few amino acids (degradation of Lys, Val, Leu and Ile; metabolism of Phe, Trp and β-Ala), in

Chapter 4 – Red palm weevil Rhynchophorus ferrugineus
94
carbohydrate/energy metabolism (pentose phosphate pathway and nitrogen metabolism) and in thiamine metabolism. These biochemical pathways are linked with the recycling of nitrogen and are thus expected to be highly represented in the microbiota of organisms feeding on nitrogen-poor food sources (e.g., palm tissues, apple). The differences in the carbohydrate/energy metabolism could be explained by the high-sugar content in the food resources dispensed to RPWs in laboratory respect to those feeding on the palm tissues. The apple-based diet provided in the laboratory enriched and selected for Lactococcus and Acetobacter. These bacteria have been observed in association with several other insects that have a sugar-rich diet(73, 83). The taxonomic composition of the microbiota associated with R. ferrugineus specimens collected in Catania (Italy) clearly differ from those described in a previous study, where a comparable approach was adopted on R. ferrugineus collected in Al-Hassa Oasis (Saudi Arabia) (35). In this study, even if a seasonal variability in the gut microbiota was observed, the dominant bacteria in adult specimens belonged to the genera Lactococcus and Acinetobacter, whereas Klebsiella and Lactococcus were detected in larvae. In our study, bacteria of the genus Lactococcus were recovered in specimens reared in laboratory on apple, while members of the genus Klebsiella were only recovered in the palm tissues. The last findings lead to the hypothesis that the pattern found by Jia and colleagues (35) could result from the effect of the bacteria transmitted to the weevil by the palm tissues. The bacterial communities associated with the three groups of weevil under study (R. ferrugineus from wild population, R. ferrugineus from wild population reared in laboratory for four weeks feeding on apple, and R. vulneratus from Malaysia) were significantly different. The specimens belonging to R. ferrugineus of the invasive population collected in Catania harboured the highest number of bacterial OTUs (OTUs = 1077), while a significant decrease in the number of harboured OTUs has been observed in the specimens reared in laboratory (OTUs = 429). This reduction has been observed after a relatively short time of maintenance (30 days) under stable environmental conditions (temperature, humidity, light-dark cycle and food resources) feeding on a sugar-rich resource as the apple. The number of OTUs identified in the sister species R. vulneratus, collected in the Rhynchophorus native area, was lower (OTUs = 370) respect to those of the two groups of R. ferrugineus. Interestingly, the number of OTUs associated with adult specimens from Saudi Arabia and to larvae reared under hot condition (i.e. 32°C) resulted of ~ 400 (35), a value comparable to those obtained for the RPWAPPLE and of R. vulneratus from Malaysia, but not with the recovered value for RPWPALM and larvae reared at 20°C (1077 and 1049, respectively). We cannot exclude that the differences in OTU number between our specimens and those from Saudi Arabia (35) are due to differences in the used 16S rRNA regions. The number of OTUs detected in the analysed weevils was higher in respect to those observed in other Coleoptera (40, 84–86). Moreover, the composition of the bacterial community associated with the three groups of weevils, which have been analysed through PCoA and ANOSIM, resulted statistically different. These results have also been confirmed by the analysis on the two components of the β-diversity, which was performed on the bacterial

Chapter 4 – Red Palm Weevil Rhynchophorus ferrugineus
95
community associated with the two groups of RPW. The hierarchical clustering grouped the bacterial community associated with RPWAPPLE together with those associated with the sister species R. vulneratus instead of with those harboured by the co-specific specimens from wild population. Based on the achieved results on the bacterial OTU diversity, integrated with those obtained by Jia and colleagues (35), we can hypothesize that high temperatures (as those of rearing facilities, of Saudi Arabia and of Malaysia) have caused a decrease in the level of bacterial diversity associated with weevil. Conversely, low temperatures (as those experienced by adults collected in Catania and larvae reared at 20°C) increase the bacterial OTU diversity associated with the insect. Both studies confirmed the high plasticity, in terms of turnover, of the microbiota associated with RPW. Based on our results, environmental abiotic factors, such as the temperature, could play an effect in shaping the diversity of weevil’s microbiota. Similar results have been obtained for another group of phytophagous beetles, in which the altitude is related with the structure of the insect’s microbiota (40). The interpretation of these findings by biological and evolutionary perspectives can be done in the light of the hologenome hypothesis (87), which argues that the real unit under natural selection is the eukaryotic host together with its associated microorganisms. Harbouring a more diverse and evenly represented microbiota, in addition to the capability to acquire new bacterial taxa from the environment, may confer selective advantages to the host in changing environments (e.g., food resources exploitation, capability to survive in polluted environments). In conclusion, our study shows that: i) the bacterial diversity and evenness decrease in a short time when RPW specimens are reared in laboratory under controlled conditions (temperature, humidity, light-dark cycle and food resources); ii) the composition of the bacterial community associated with the three weevil groups clearly differs both within the same population (influenced by the diet) and between the considered species; iii) most of the members of the bacterial community associated with palm tissues, from which the specimens of R. ferrugineus were collected, are also present in the insects microbiota; iv) bacterial isolation performed on laboratory reared weevils confirmed pyrotag data; v) both the present study and the previous one by Jia et al. (35) do not identify a fixed microbiota in RPW, suggesting the importance of the environment in shaping it. The knowledge of the bacterial community associated to this important pest, the metabolic potentials exerted by its bacterial partners, the bacterial dynamics in relation to the environment/diet and their distribution and localization, both in palm and insect organs, together with the possibility to cultivate the bacterial symbionts of this insect, could open new interesting perspectives towards the development of novel strategies for the symbiotic control of weevils.

Chapter 4 – Red palm weevil Rhynchophorus ferrugineus
96
References
1. Giblin-Davis R, Faleiro J, Jacas J, Peña J, Vidyasagar P. 2013. Biology and management of the Red Palm Weevil, Rhynchophorus ferrugineus., p. 1–34. In Peña, JE (ed.), Potential invasive pests of agricultural crops. CAB International, University of Florida, USA.
2. 2008. Rhynchophorus ferrugineus. EPPO Bull. 38:55–59.
3. Barranco P, De La Pena J. 1996. El picudo de las palmeras, Rhynchophorus ferrugineus, nueva plagas en Europa. Phytoma-Espana 67:36–40.
4. Sacchetti P, Camèra A, Granchietti A, Rosi M, Marzialetti P. 2005. Prima segnalazione in Italia del curculionide delle palme, Rhynchophorus ferrugineus. Not. del Cent. Sper. per Vivaismo di Pist. 144:6–9.
5. Sacchetti P, Camèra A, Granchietti A, Rosi M, Marzialetti P. 2006. Prima segnalazione in Italia del curculionide delle palme, Rhynchophorus ferrugineus. Inf Fitopatol 20:35–40.
6. Dembilio Ó, Jacas JA, Llácer E. 2009. Are the palms Washingtonia filifera and Chamaerops humilis suitable hosts for the red palm weevil, Rhynchophorus ferrugineus (Col. Curculionidae)? J. Appl. Entomol. 133:565–567.
7. Esteban-Duran J, Yela J, Beitia C, Jimenez A. 1998. Biology of red palm weevil, Rhynchophorus ferrugineus (Olivier) (Coleoptera: Curculionidae: Rhynchophorinae), in the laboratory and field, life cycle, biological characteristics in its zone of introduction in Spain, biological method of detection and poss. Bol. Sanid. Veg. Plagas 24:737–748.
8. Murphy ST, Briscoe BR. 1999. The red palm weevil as an alien invasive: biology and the prospects for biological control as a component of IPM. 20.
9. Zhang R, Ren L, Sun J, Wu J, Zeng R. 2003. Morphological differences of the coconut pest insect, Rhynchophorus ferrugineus (Oliv.) and its related species (Coleoptera: Curculionidae). China For. Insect Pests Dis 22:3–6.
10. Al-Ayedh H. 2008. Evaluation of date palm cultivars for rearing the red date palm weevil, Rhynchophorus ferrugineus (Coleoptera: Curculionidae). Fla Entomol 91:353–358.
11. Yuezhong L, Zeng-Rong Z, Ruiting J, Lian-Sheng W. 2009. The red palm weevil, Rhynchophorus ferrugineus (Coleoptera: Curculionidae), newly reported from Zhejiang, China and update of geographical distribution. Florida Entomol.
12. Thomas M. 2010. Giant palm weevils of the genus Rhynchophorus (Coleoptera: Curculionidae) and their threat to Florida palms. Pest Alert DACS-P-01682 1–2.
13. GiblinDavis R, Oehlschlager A, Perez A. 1996. Chemical and behavioral ecology of palm weevils (Curculionidae: Rhynchophorinae) 79:153–167.
14. Yuliansyah A, Hirajima T. 2012. Efficacy of hydrothermal treatment for production of solid fuel from oil palm wastes. In: Resource Management for Sustainable Agriculture, p. 296. In Abrol, V, Sharma, P (eds.), Resource Management for Sustainable Agriculture. InTech.
15. Douglas AE. 1998. Nutritional interactions in insect-microbial symbioses: aphids and their symbiotic bacteria Buchnera. Annu. Rev. Entomol. 43:17–37.
16. Moran NA, Plague GR, Sandström JP, Wilcox JL. 2003. A genomic perspective on nutrient provisioning by bacterial symbionts of insects. Proc. Natl. Acad. Sci. U. S. A. 100 Suppl :14543–8.
17. Moran NA. 2006. Symbiosis. Curr. Biol. 16:R866–71.
18. Douglas AE. 2009. The microbial dimension in insect nutritional ecology. Funct. Ecol. 23:38–47.
19. McCutcheon JP, McDonald BR, Moran NA. 2009. Convergent evolution of metabolic roles in bacterial co-symbionts of insects. Proc. Natl. Acad. Sci. U. S. A. 106:15394–9.

Chapter 4 – Red Palm Weevil Rhynchophorus ferrugineus
97
20. Montagna M, Sacchi L, Lo N, Clementi E, Daffonchio D, Alma A, Bandi C. 2011. Intracellular primary symbionts: the Bacteroidetes Blattabacterium and Sulcia., p. 24–99. In Zchori–Fein, E, Bourtzis, K (eds.), Manipulative Tenants: Bacteria Associated with Arthropods. CRC Press, Broken Sound Parkway, NW.
21. Takiya DM, Tran PL, Dietrich CH, Moran NA. 2006. Co-cladogenesis spanning three phyla: leafhoppers (Insecta: Hemiptera: Cicadellidae) and their dual bacterial symbionts. Mol. Ecol. 15:4175–91.
22. Baumann L, Baumann P, Moran NA, Sandström J, Thao ML. 1999. Genetic characterization of plasmids containing genes encoding enzymes of leucine biosynthesis in endosymbionts (Buchnera) of aphids. J. Mol. Evol. 48:77–85.
23. Sabree ZL, Kambhampati S, Moran NA. 2009. Nitrogen recycling and nutritional provisioning by Blattabacterium, the cockroach endosymbiont. Proc. Natl. Acad. Sci. U. S. A. 106:19521–6.
24. López-Sánchez MJ, Neef A, Peretó J, Patiño-Navarrete R, Pignatelli M, Latorre A, Moya A. 2009. Evolutionary convergence and nitrogen metabolism in Blattabacterium strain Bge, primary endosymbiont of the cockroach Blattella germanica. PLoS Genet. 5:e1000721.
25. Behar A, Yuval B, Jurkevitch E. 2005. Enterobacteria-mediated nitrogen fixation in natural populations of the fruit fly Ceratitis capitata. Mol. Ecol. 14:2637–43.
26. Köhler T, Dietrich C, Scheffrahn RH, Brune A. 2012. High-resolution analysis of gut environment and bacterial microbiota reveals functional compartmentation of the gut in wood-feeding higher termites (Nasutitermes spp.). Appl. Environ. Microbiol. 78:4691–701.
27. Llácer E, Negre M, Jacas JA. 2012. Evaluation of an oil dispersion formulation of imidacloprid as a drench against Rhynchophorus ferrugineus (Coleoptera, Curculionidae) in young palm trees. Pest Manag. Sci. 68:878–82.
28. Mazza G, Francardi V, Simoni S, Benvenuti C, Cervo R, Faleiro JR, Llácer E, Longo S, Nannelli R, Tarasco E, Roversi PF. 2014. An overview on the natural enemies of Rhynchophorus palm weevils, with focus on R. ferrugineus. Biol. Control 77:83–92.
29. Nardon P, Lefevre C, Delobel B. 2002. Occurrence of endosymbiosis in Dryophthoridae weevils: Cytological insights into bacterial symbiotic structures 33:227–241.
30. Kuriwada T, Hosokawa T, Kumano N, Shiromoto K, Haraguchi D, Fukatsu T. 2010. Biological role of Nardonella endosymbiont in its weevil host. PLoS One 5.
31. Lefèvre C, Charles H, Vallier A, Delobel B, Farrell B, Heddi A. 2004. Endosymbiont phylogenesis in the dryophthoridae weevils: evidence for bacterial replacement. Mol. Biol. Evol. 21:965–73.
32. Conord C, Despres L, Vallier A, Balmand S, Miquel C, Zundel S, Lemperiere G, Heddi A. 2008. Long-term evolutionary stability of bacterial endosymbiosis in curculionoidea: additional evidence of symbiont replacement in the dryophthoridae family. Mol. Biol. Evol. 25:859–68.
33. Khiyami M, Alyamani E. 2008. Aerobic and facultative anaerobic bacteria from gut of red palm weevil (Rhynchophorus ferrugineus). Afr J Biotechnol 7:1432–1437.
34. Valzano M, Achille G, Burzacca F, Damiani C, Scuppa P, Ricci I, Favia G. 2012. Deciphering microbiota associated to Rhynchophorus ferrugineus in Italian samples: a preliminary study. J. Entomol. Acarol. Res. 44:e16.
35. Jia S, Zhang X, Zhang G, Yin A, Zhang S, Li F, Wang L, Zhao D, Yun Q, Tala, Wang J, Sun G, Baabdullah M, Yu X, Hu S, Al-Mssallem IS, Yu J. 2013. Seasonally variable intestinal metagenomes of the red palm weevil (Rhynchophorus ferrugineus). Environ. Microbiol.

Chapter 4 – Red palm weevil Rhynchophorus ferrugineus
98
36. Tagliavia M, Messina E, Manachini B, Cappello S, Quatrini P. 2014. The gut microbiota of larvae of Rhynchophorus ferrugineus Oliver (Coleoptera: Curculionidae). BMC Microbiol. 14:136.
37. Butera G, Ferraro C, Colazza S, Alonzo G, Quatrini P. 2012. The culturable bacterial community of frass produced by larvae of Rhynchophorus ferrugineus Olivier (Coleoptera: Curculionidae) in the Canary island date palm. Lett. Appl. Microbiol. 54:530–536.
38. Hurwitz I, Hillesland H, Fieck A, Das P, Durvasula R. 2011. The paratransgenic sand fly: a platform for control of Leishmania transmission. Parasit. Vectors 4:82.
39. Ricci I, Valzano M, Ulissi U, Epis S, Cappelli A, Favia G. 2012. Symbiotic control of mosquito borne disease. Pathog. Glob. Health 106:380–5.
40. Montagna M, Gómez-Zurita J, Giorgi A, Epis S, Lozzia G, Bandi C. 2014. Metamicrobiomics in herbivore beetles of the genus Cryptocephalus (Chrysomelidae): toward the understanding of ecological determinants in insect symbiosis. Insect Sci.
41. Rugman-Jones PF, Hoddle CD, Hoddle MS, Stouthamer R. 2013. The lesser of two weevils: molecular-genetics of pest palm weevil populations confirm Rhynchophorus vulneratus (Panzer 1798) as a valid species distinct from R. ferrugineus (Olivier 1790), and reveal the global extent of both. PLoS One 8:e78379.
42. Folmer O, Black M, Hoeh W, Lutz R, Vrijenhoek R. 1994. DNA primers for amplification of mitochondrial cytochrome c oxidase subunit I from diverse metazoan invertebrates. Mol. Mar. Biol. Biotechnol. 3:294–9.
43. Rector BG, De Biase A, Cristofaro M, Primerano S, Belvedere S, Antonini G, Sobhian R. 2010. DNA Fingerprinting to Improve Data Collection Efficiency and Yield in an Open-Field Host-Specificity Test of a Weed Biological Control Candidate. Invasive Plant Sci. Manag. 3:429–439.
44. NCBI resource coordinators. 2013. Database resources of the National Center for Biotechnology Information. Nucleic Acids Res. 41:D8–D20.
45. Van de Peer Y, Chapelle S, De Wachter R. 1996. A quantitative map of nucleotide substitution rates in bacterial rRNA. Nucleic Acids Res. 24:3381–91.
46. Chakravorty S, Helb D, Burday M, Connell N, Alland D. 2007. A detailed analysis of 16S ribosomal RNA gene segments for the diagnosis of pathogenic bacteria. J. Microbiol. Methods 69:330–9.
47. Caporaso JG, Kuczynski J, Stombaugh J, Bittinger K, Bushman FD, Costello EK, Fierer N, Peña AG, Goodrich JK, Gordon JI, Huttley GA, Kelley ST, Knights D, Koenig JE, Ley RE, Lozupone CA, McDonald D, Muegge BD, Pirrung M, Reeder J, Sevinsky JR, Turnbaugh PJ, Walters WA, Widmann J, Yatsunenko T, Zaneveld J, Knight R. 2010. QIIME allows analysis of high-throughput community sequencing data. Nat. Methods 7:335–6.
48. Edgar RC. 2010. Search and clustering orders of magnitude faster than BLAST. Bioinformatics 26:2460–1.
49. Caporaso JG, Bittinger K, Bushman FD, DeSantis TZ, Andersen GL, Knight R. 2010. PyNAST: a flexible tool for aligning sequences to a template alignment. Bioinformatics 26:266–7.
50. Dixon P. 2003. VEGAN, a package of R functions for community ecology 14:927–930.
51. Shannon CE. 1948. A mathematical theory of communication. Bell Sys Tech J 27:379–423, 623–656.
52. Pielou EC. 1975. Ecological diversity. Wiley&Sons, New York.
53. Chao A. 1984. Nonparametric estimation of the number of classes in a population. Scand J Stat 11:265–270.

Chapter 4 – Red Palm Weevil Rhynchophorus ferrugineus
99
54. Smith EP, Van Belle G. 1984. Nonparametric estimation of species richness. Biometrics 40:119–129.
55. Chao A, Lee S. 1992. Estimating the number of classes via sample coverage. J. Am. Stat. Assoc. 87:210–217.
56. Kruskal W, Wallis W. 1952. Use of Ranks in One-Criterion Variance Analysis. J. Am. Stat. Assoc. 47:583–621.
57. Levene H. 1960. Robust tests for equality of variances., p. 278–292. In Olkin, I, Ghurye, S, Hoeffding, W, Madow, W, Mann, H (eds.), Contributions to Probability and Statistics: Essays in Honor of Harold Hotelling. Stanford University Press, Stanford, CA.
58. Mann H, Whitney D. 1947. On a test of whether one of two random variables is stochastically larger than the other. Ann Math Stat 18:50–60.
59. Hui W, Gel YR, Gastwirth JL. 2008. lawstat: An R Package for Law, Public Policy and Biostatistics 28:1–26.
60. Lozupone C, Hamady M, Knight R. 2006. UniFrac--an online tool for comparing microbial community diversity in a phylogenetic context. BMC Bioinformatics 7:371.
61. Price MN, Dehal PS, Arkin AP. 2009. FastTree: computing large minimum evolution trees with profiles instead of a distance matrix. Mol. Biol. Evol. 26:1641–50.
62. Lozupone CA, Hamady M, Kelley ST, Knight R. 2007. Quantitative and qualitative beta diversity measures lead to different insights into factors that structure microbial communities. Appl. Environ. Microbiol. 73:1576–85.
63. Gower J. 1966. Some distance properties of latent root and vector methods used in multivariate analysis. Biometrika 53:325–338.
64. Bray J, Curtis J. 1957. An ordination of upland forest communities of southern Wisconsin. Ecol Monogr 27:325–349.
65. Jaccard P. 1901. Étude comparative de la distribution florale dans une portion des Alpes et des Jura. Bull Soc Vaud Sci Nat 37:547–579.
66. Clarke K. 1993. Non-parametric multivariate analysis of changes in community structure. Aust J Ecol 18:117–143.
67. Montagna M, Sassera D, Epis S, Bazzocchi C, Vannini C, Lo N, Sacchi L, Fukatsu T, Petroni G, Bandi C. 2013. “Candidatus Midichloriaceae” fam. nov. (Rickettsiales), an ecologically widespread clade of intracellular alphaproteobacteria. Appl. Environ. Microbiol. 79:3241–8.
68. Baselga A, Orme CDL. 2012. betapart: an R package for the study of beta diversity 3:808–812.
69. Kruskal J. 1964. Nonmetric multidimensional scaling: a numerical method. Psychometrika 29:115–129.
70. Langille MGI, Zaneveld J, Caporaso JG, McDonald D, Knights D, Reyes JA, Clemente JC, Burkepile DE, Vega Thurber RL, Knight R, Beiko RG, Huttenhower C. 2013. Predictive functional profiling of microbial communities using 16S rRNA marker gene sequences. Nat. Biotechnol. 31:814–21.
71. Tatusov RL, Koonin E V, Lipman DJ. 1997. A genomic perspective on protein families. Science 278:631–7.
72. Kanehisa M, Goto S, Sato Y, Furumichi M, Tanabe M. 2012. KEGG for integration and interpretation of large-scale molecular data sets. Nucleic Acids Res. 40:D109–14.
73. Chouaia B, Rossi P, Montagna M, Ricci I, Crotti E, Damiani C, Epis S, Faye I, Sagnon N, Alma A, Favia G, Daffonchio D, Bandi C. 2010. Molecular evidence for multiple infections as revealed by typing of Asaia bacterial symbionts of four mosquito species. Appl. Environ. Microbiol. 76:7444–50.

Chapter 4 – Red palm weevil Rhynchophorus ferrugineus
100
74. Foster SD, Dunstan PK. 2010. The analysis of biodiversity using rank abundance distributions. Biometrics 66:186–95.
75. Montagna M, Lozzia CG, Giorgi A. 2012. Insect community structure and insect biodiversity conservation in an Alpine wetland subjected to an intermediate diversified management regime 47:242–246.
76. Login FH, Balmand S, Vallier A, Vincent-Monégat C, Vigneron A, Weiss-Gayet M, Rochat D, Heddi A. 2011. Antimicrobial peptides keep insect endosymbionts under control. Science 334:362–5.
77. Epis S, Mandrioli M, Genchi M, Montagna M, Sacchi L, Pistone D, Sassera D. 2013. Localization of the bacterial symbiont Candidatus Midichloria mitochondrii within the hard tick Ixodes ricinus by whole-mount FISH staining. Ticks Tick. Borne. Dis. 4:39–45.
78. Wang H, Jin L, Zhang H. 2011. Comparison of the diversity of the bacterial communities in the intestinal tract of adult Bactrocera dorsalis from three different populations. J. Appl. Microbiol. 110:1390–401.
79. Peccoud J, Bonhomme J, Mahéo F, de la Huerta M, Cosson O, Simon J-C. 2014. Inheritance patterns of secondary symbionts during sexual reproduction of pea aphid biotypes. Insect Sci. 21:291–300.
80. Costopoulos K, Kovacs JL, Kamins A, Gerardo NM. 2014. Aphid facultative symbionts reduce survival of the predatory lady beetle Hippodamia convergens. BMC Ecol. 14:5.
81. Lancaster JD, Mohammad B, Abebe E. 2012. Effect of the bacterium Serratia marcescens SCBI on the longevity and reproduction of the nematode Caenorhabditis briggsae KT0001. BMC Res. Notes 5:688.
82. Dong Y, Taylor HE, Dimopoulos G. 2006. AgDscam, a hypervariable immunoglobulin domain-containing receptor of the Anopheles gambiae innate immune system. PLoS Biol. 4:e229.
83. Crotti E, Rizzi A, Chouaia B, Ricci I, Favia G, Alma A, Sacchi L, Bourtzis K, Mandrioli M, Cherif A, Bandi C, Daffonchio D. 2010. Acetic acid bacteria, newly emerging symbionts of insects. Appl. Environ. Microbiol. 76:6963–70.
84. Estes AM, Hearn DJ, Snell-Rood EC, Feindler M, Feeser K, Abebe T, Dunning Hotopp JC, Moczek AP. 2013. Brood ball-mediated transmission of microbiome members in the dung beetle, Onthophagus taurus (Coleoptera: Scarabaeidae). PLoS One 8:e79061.
85. Scully ED, Geib SM, Hoover K, Tien M, Tringe SG, Barry KW, Glavina del Rio T, Chovatia M, Herr JR, Carlson JE. 2013. Metagenomic profiling reveals lignocellulose degrading system in a microbial community associated with a wood-feeding beetle. PLoS One 8:e73827.
86. Mazza G, Chouaia B, Lozzia GC, Montagna M. 2014. The bacterial community associated to an Italian population of Psacothea hilaris : a preliminary study 67:281–285.
87. Zilber-Rosenberg I, Rosenberg E. 2008. Role of microorganisms in the evolution of animals and plants: the hologenome theory of evolution. FEMS Microbiol. Rev. 32:723–35.

Chapter 5 – Yellow spotted longicorn Psacothea hilaris hilaris
101
Chapter 5
Characterization of the gut microbiota of the cerambycid beetle Psacothea hilaris hilaris and of its “symbiotic potential”.
Abstract
Psacothea hilaris hilaris is a xylophagous beetle belonging to the Cerambycidae family. Its larvae grow inside mulberry tree and fig trunks, reaching the length of up to three centimetres and damaging the plants to death. In Japan, this is a serious pest for sericulture, while its recent establishment in northern Italy could threaten the fig cultivation in the Mediterranean basin. In this study, we characterized by DGGE the bacterial communities in the guts of wild and reared P. h. hilaris larvae, assessing the significant effect of the diet and the gut tract in modifying their taxonomical composition. Moreover, we established a collection of bacterial isolates from the guts of wild larvae and we evaluated the possible contribution of the isolates to the host physiology (in terms of contribution to carbon or nitrogen absorption) through in vitro tests. From our observations, the cultivable gut bacterial community of P. h. hilaris appears to include many different commensals, mainly acquired from the environment, which are suitable to exploit the food sources in the gut and to give a contribution to the host metabolism.
Introduction
Psacothea hilaris hilaris, (Figure 1) commonly known as the yellow spotted longicorn, is a cerambicyd beetle widely spread in east Asia. The subspecies hilaris is native to China and Japan, where it is an economically relevant pest for the trees belonging to the Moraceae family, above all the fig (Ficus carica) and the mulberry (Morus spp.). In Japan, the wood-feeding larvae of P. h. hilaris represent a serious threat for sericulture, as they damage the mulberry trees that are the food source for silkworms, by boring deep tunnels in the trunk (1). Due to the international commerce of wood and trees, in the last years the insect was observed outside of the native area, in North America, Canada and United Kingdom. In northern Italy, the presence of this pest is recorded from 2005 but, according to the last observations, a stable population is present only in a small area in Como province. However, this observation should not be underestimated, taking into account the potential danger of the diffusion of the parasite for the fig culture in the Mediterranean basin (1)

Chapter 5 – Yellow spotted longicorn Psacothea hilaris hilaris
102
Figure 1: Psacothea hilaris hilaris larva (A) pupa (B) and adult (C) from the laboratory breeding. (Photo: Daniela Lupi)
One aspect of insect physiology that proved to be very important is the symbiosis with gut bacteria. Recent studies demonstrated how the bacterial communities in the gut of insects deeply affect the physiology of the hosts, influencing not only the nutritional capabilities but also the immune system (2), the larval development (3) and the mate choice (4). Even the commensal bacteria, which do not establish a permanent or essential symbiotic relationship with the host, can have relevant effects on host physiology (5). These bacteria are mainly acquired from the environment; thus, they vary respective to the diet and sampling site. However, they do not simply reflect the bacterial community in the environment in which the insect lives, because they undergo a selective process inside the gut. Commensal strains must be capable to efficiently exploit the food sources within the insect gut, to find a suitable niche in which they can persist, irrespective of the continuous flow of food bolus, and survive the particular pH conditions of the gut. Finally yet importantly, they must be able to positively interact with the host immune system (5). Indeed, they are retained inside the gut and live within the insect without causing illness and death (which turns to be disadvantageous to the bacterium itself, which loses a favourable niche). To do that, they should not strongly elicit the immune system as a pathogen (a situation that that leads to bacterial elimination or insect death), nor behave as a pathobiont, leading to a chronic production of reactive oxygen species (2). The diet of the xylophagous P. h. hilaris larvae suggests that gut commensal microbiota could have a role in the nutritional balance of the insect. In fact, a wood-based diet is generally considered to be poor in nitrogen (present mainly in cell-wall proteins) and rich in recalcitrant sugar polymers, such as cellulose and hemicellulose (6, 7). High level of activity against the principal dietary carbohydrates (including cellulose, hemicellulose and pectin) has been detected in P. h. hilaris gut extracts, although is not clear if these enzymes are secreted by the host itself or by its gut microflora (7). Indeed, at least one cellulolytic enzyme, characterized by Sugimura et al. (8), is produced and secreted by the insect. A recent study by Scully et al. (6) on a closely related cerambycid beetle (Anoplophora glabripennis) revealed the presence of a complex set of enzymes in the microbial gut community, that are hypothesized to help the host in the digestion of recalcitrant carbohydrates,

Chapter 5 – Yellow spotted longicorn Psacothea hilaris hilaris
103
as well as in nitrogen and other nutrients acquisition. Moreover, a culture-dependent study on the microbiota of eight cerambycid species, including P. hilaris, shows that these insects harbour xylanase- and pectinase-secreting bacteria (9). In this study, we aimed to characterize the gut bacterial community of P. h. hilaris larvae combining molecular and culture-dependant methods, and to describe its change in composition after feeding the larvae on different artificial diets. Moreover, we assessed in the isolated bacterial strains the presence of several metabolic capabilities, which likely allow the persistence of these microorganisms in the gut of the host as commensals and, possibly, the establishment of a mutualistic (though not essential) symbiotic relationship.
Methods
Psacothea hilaris hilaris sampling and rearing
Wild specimens of P. h. hilaris have been collected from Ponte Lambro, in northern Italy (45°50’N 9°14’E). Trunks and bigger branches of Ficus carica trees have been cut and brought to the laboratory, where the larvae were extracted. Adult specimens have been collected in the same area from the tree canopy. The reared beetles were fed during all the larval stages with a commercially available diet (10) developed for silkworms, made of mulberry leaves (increased to 40%), soy flour, wheat flour, corn starch, citrate, agar, and a vitamin mix. As preservatives, the diet includes β-sitosterol (0,5% w/w), sorbic acid (0,2%) and propionic acid (0,7%), together with the antibiotic chloramphenicol (0,01%) (10). The larvae for groups 3 and 4 (see the paragraph about DGGE) were collected in field as described above, and then reared for ten days on the same diet, but without chloramphenicol (diet without antibiotic, group 4) or without β-sitosterol, sorbic acid, propionic acid and chloramphenicol (diet without preservatives and antibiotic, group 3). The larvae were reared individually in the wells of 6-wells titer plates, and were transferred in a new well with fresh diet every three days. The climatic chamber was set to 25±0.5°C; 70% R.H. with a 16:8 light-dark photoperiod. After pupation, adults were transferred on cut fig tree branches and trunks, to allow them to mate and lay eggs.
Denaturing Gradient Gel Electrophoresis (DGGE) P. h. hilaris larvae of the third or fourth larval instar (determined by cephalic capsule measurement) were killed by putting them in a hermetic vial saturated with ether, and dissected with sterile instruments to extract the gut, after being surface sterilized by one washing in 70% ethanol and two washings in sterile water. The three parts of the gut (foregut, midgut and hindgut, Figure 2) were separated and preserved in 100% ethanol at -20°C.

Chapter 5 – Yellow spotted longicorn Psacothea hilaris hilaris
104
Figure 2: P. h. hilaris larval gut, divided in its three sections. (Photo: Davide Venegoni)
DNA extraction was performed with the chloroform-phenol method (11). A first step of PCR amplification was performed using bacterial primers 27F and 1492R, which amplify almost the whole 16S rRNA gene. The 20 µl reaction mixture contained the diluted buffer 1X, 1.5 mM MgCl2, 0.2 mM of a mixture of dNTPs, 0.3 µM of each primer, 0.8 U of Taq polymerase and 1 to 3 µl template DNA. Thermal cycle was 94°C for 5 min followed by 30 cycles of 94°C for 1 min, 55°C for 1 min and 72°C for 2 min, with a final elongation step of 10 min at 72°C. PCR products were conveniently diluted 10, 100 or 1000 folds and used as a template for the nested amplification of a smaller fragment of the 16S rRNA gene comprising the variable regions from 3 to 5. For this second PCR step, primers 907R and 357F with a GC-clamp were used (12). The nested PCR approach is necessary to overcome the aspecific amplification of the 18S rRNA gene of the insect host (13). PCR was performed in 0.2 ml tubes with a 50 µl reaction volume. The reaction mixture contained the diluted buffer 1X, 1.5 mM MgCl2, 5% DMSO, 0.12 mM of a mixture of dNTPs, 0.3 µM of each primer, 1 U Taq polymerase and 2µl of diluted template. Cycling conditions were: 94°C for 4 min, followed by 10 cycles of 94°C for 30 sec, 61°C for 1 min and 72°C for 1 min; followed by a further 20 cycles of 94°C for 0.5 min, 56°C for 1 min and 72°C for 1 min; and a final extension at 72°C for 7 min. Three microliters of a 1:5 dilution of the PCR product were visualized and quantified by electrophoresis in 1.5% agarose gel. About 80 ng of the PCR product from each sample was loaded on a polyacrylamide gel (8% of a 37:1 acrylamide–bisacrylamide mixture in a Tris acetate EDTA 1X buffer -TAE-, 0.75 mm thick, 16 × 10 cm, with a 40–60% or 35-55% denaturant gradient). The gels were run for 17 hours at 90 V in TAE 1X buffer at 60°C in a DCode apparatus (Bio-Rad, Milan, Italy) and subsequently stained with 1X Sybr Green

Chapter 5 – Yellow spotted longicorn Psacothea hilaris hilaris
105
(Life Technologies) in TAE buffer and visualized in a Gel-Doc system (BioRad). The DGGE bands were excised from the gel using a sterile scalpel and eluted in 50 µl water at 37°C for 6h. The DNA eluted from DGGE bands was PCR amplified using 907R and 357F primers without the GC-clamp, with the following protocol: 95°C for 5 min, 30 cycles of 95°C for 1 min, 56°C for 1 min, 72°C for 1 min and a final extension at 72°C for 10 min. Fragment sequencing was performed by Macrogen (South Korea), and the sequences were identified as described for isolates.
Statistical analysis of DGGE results According to the band profiles and identifications, we compiled a presence-absence matrix describing the bacterial genera retrieved in each gut section of each specimen analysed (Figure 3). This matrix was used to calculate a resemblance matrix based on the Sorensen distance, describing the dissimilarity between each possible pair of samples. Thus, the data were analysed using the PERMANOVA method, implemented in the PRIMER6 software package (14). PERMANOVA is a permutational, multivariate analysis of variance. In this case, the variables were represented by the genera identified in each gut fraction. On one hand, we assessed the effect of the diet in shaping the bacterial community of the gut fractions (main test) and the diversity between pairs of dietary groups (pairwise test). On the other hand, we assessed the effect of the gut tract (foregut, midgut or hindgut) in influencing the composition of the gut community (main test) comparing each possible combination of pairs of gut tracts (pairwise test).
Isolation of bacterial strains The isolation of cultivable bacteria was performed using P. h. hilaris larvae of the third and fourth larval instar, collected from the environment. Insects were anesthetized by incubation in ice, surface-sterilized with one washing in 70% ethanol and two washings in sterile water, and dissected with sterile instruments near a Bunsen burner. Guts were collected in Eppendorf tubes and smashed using a sterile pestle, in saline. Serial dilutions of the homogenates were plated directly on selective agar media or inoculated in liquid enrichment media, and incubated at 30°C. An aliquot of the enrichment media was serially diluted and plated as soon as bacterial growth could be observed by checking the turbidity of the medium. Enrichment media with cellulose, paper or pectin (15) contained: NaNO3 2.5 g/l, KH2PO4 2 g/l, MgSO4 0.2 g/l, NaCl 0.2 g/l CaCl2 (6H2O) 0.1 g/l and, respectively, 2 g carboxy methyl cellulose (CMC, Fluka), or 1/8 Whatman filter paper n°1, or 2 g polygalacturonic acid (Sigma-Aldrich). A different type of pectin enrichment was made according to Compant et al. (16) (NH4SO4 4 g/l, NaCl 0.1 g/l, MgSO4 0.1 g/l, CaCl2 0.1 g/l, yeast extract 0.5 g/l, Fe(III)EDTA 0.33 g/l, potassium phosphate buffer pH 7 0.05 M, polygalacturonic acid 5 g/l). Turbid cultures from CMC and paper enrichments were plated on KH2PO4 0.5 g/l, MgSO4 0.25 g/l, gelatin 2g/l, CMC 2 g/l, agar 15 g/l (15). Turbid cultures from pectin enrichments were plated on the same medium by Compant et al. (16) by adding agar 15 g/l.

Chapter 5 – Yellow spotted longicorn Psacothea hilaris hilaris
106
For a second isolation trial a pool of three intestines from field-caught P. h. hilaris larvae was used. In this case the whole procedure was performed identically both in aerobic and anaerobic condition using an anaerobic chamber with a 10% H2, 5% CO2, 85% N2 atmosphere. The intestines were smashed in a reducing solution (gelatin 2 g/l, cysteine 0.5 g/l, CaCl2 2.6 g/l, MgSo4 2 g/l, K2HPO4 10 g/l, KH2PO4 10 g/l, NaCl 20 g/l), serially diluted in the same solution and plated on BHI medium (Fluka). An aliquot of the gut homogenate was inoculated in two 30 ml vials of enrichment medium (EM) (bacto-tryptone 1 g/l, yeast extract 0.5 g/l, cysteine 1 g/l, K2HPO4 1.2 g/l, Na2HPO4 2 g/l, soil extract 100 ml/l) containing 1 g of Ficus carica sawdust and 2 cm2 of Whatman filter paper n°1. The cultures were incubated at 30°C. The enrichment vials were kept at 30°C with shaking until we observed the degradation of paper. Hence, 3 ml of the culture were diluted in 30 ml of medium in a new vial. This procedure was repeated three times; after that, the culture kept in aerobic conditions, which still showed paper degradation, was plated on three different media: EM plus agar, EM plus agar without sawdust or EM plus agar with glucose 10 g/l instead of CMC and sawdust. The anaerobic colture did not show paper degradation and therefore was not plated. All the isolation and enrichment media were supplemented with cicloexymide 0,01%. For the purification of the isolated strains we picked single colonies from the plates and we streaked them on a fresh plate of the same medium using a sterile inoculating loop. The process was repeated three times. Each strain was preserved by adding glycerol to a saturated liquid culture to the ratio of 20% and keeping it at -80°C.
Identification of isolates
DNA was isolated from bacteria by boiling lysis. A loopful of bacterial cells was suspended in 50 µl of sterile TE (10 mMTris/HCl, pH 8, 1 mM EDTA), incubated at 100°C for 8 min and centrifuged at 13000g for 10 min in a
−benchtop centrifuge. The supernatant was stored at 20°C and used as template for PCR amplification. The strain collection was analysed by fingerprinting of the rRNA 16S-23S Intergenic Transcribed Spacer (ITS) region. PCR protocol is the same as described by Cardinale et al (17). The fingerprinting profiles were visualized by performing gel electrophoresis of the PCR products on a 1.5% agarose gel. Isolates which showed the same banding pattern were grouped in ITS haplotypes. One or two isolates of each ITS profile had been identified, forward sequencing the 16S rRNA gene after amplification with universal primers 27F and 1492R. The sequencing was performed by Macrogen Inc. (Korea) with the Sanger method. The sequences were classified by comparison of three different methods: BLAST search in the GenBank database, RDP classifier (18) and SINA aligner and classifier (19).
Screening of the activities of isolates
102 strains encompassing all the haplotypes identified by ITS-PCR were selected for further analysis. Urease test. The strains were grown overnight in Tryptic Soy Broth (TSB, Difco) medium. Cells were harvested by centrifugation from 500 µl of culture and washed twice in sterile saline. The cell pellet was suspended in 470 µl of B

Chapter 5 – Yellow spotted longicorn Psacothea hilaris hilaris
107
solution (KH2PO4 0.1 g, K2HPO4 0.1 g, NaCl 0.5g, phenol red 0.2% solution 1ml, distilled water 100 ml, NiCl2 5μM) and 30 µl A solution (urea 2 g, ethanol 95% 2 ml, distilled water 4 ml). The suspension was incubated at 30°C overnight and then colour was checked. Positive strains showed a colour change from yellow to bright pink (20). Uric acid degradation test. Five microliters of an overnight TSB culture of each strain were spotted on a Nutrient Broth (DIFCO) agar plate with the addition of 0.5 % uric acid (modified from Morales-Jimènez et al. (21)). The medium has a milky appearance because uric acid is not soluble in this pH condition (pH about 6.8). After 24 hours incubation at 30°C, positive colonies showed a transparent halo due to the degradation of the uric acid. EPS (Exopolysaccharides) production test. The strains were streaked on the sucrose-rich agar medium from Santaella et al. (22) and incubated at 30°C for five days. The EPS-producing bacteria showed a glossy appearance due to the extracellular polysaccharides. Nitrogen fixation. We tested the presence of the nitrogenase gene with the PolF – PolR primer pair (23). The PCR reaction was performed in 25 µl with 1 µl of DNA solution, Taq polymerase (Invitrogen) 0.6 U/reaction, DNTPs 0.2 mM, primers 0.3 µM, Taq buffer 1X and DMSO 5%. The thermal cycle was 94° for 4’, 30 cycles of 94°, 54° and 72° for 1’each, 70° for 7’. Genomic DNA extract from Azospirillum brasiliensis was used as a positive control. Bands of the expected length (400 bp) were cut from the gel and sequenced to verify the presence of nitrogenase gene. Protease production. Five microliters of overnight culture in TSB of each strain were spotted on milk agar (casein 5 g/l, glucose 1 g/l, yeast extract 2.5 g/l, dehydrated skimmed milk 35 g/l). The plates were incubated at 30° overnight. Positive strains showed a clear transparent halo around the colony. Cellulose and xylan degradation. Cellulose and pectin degradation were assayed as described in Compant et al. (16). Briefly, strains were streaked on CMC or xylan–rich media. After five days, bacteria were removed and the plates were stained with Congo Red. Positive result was detected as a discolouration halo on Congo red plates. Pectin degradation. According the method used by Park and co-workers (9) the strains were grown on R2A agar medium supplemented with polyglacturonic acid (Sigma-Aldrich). The pH of the medium was adjusted to 7. After the growth, the plates were flooded with a 1% n-hexadecyltrimethylammonium bromide solution (CTAB) to observe the clear halos around the colonies that are indicative of pectin degradation. Ammonia production. The release of ammonia was measured as described in (24). Bacteria were grown for 72 hours on peptone water, then Nessler’s reagent was added (500 µl in 5 ml of culture). The color change was then evaluated: if the bacterium produces ammonia the culture turns orange-brown, while in the other cases it is bright yellow. Inhibition by Streptomyces isolate. Streptomyces strain 44 was inoculated on a TSB agar plate in order to trace the diameter of the plate, and incubated at 30° for 36 or 48h. Then, another strain was inoculated perpendicularly and let for additional 48 h at 30°. Strains inhibited by 44 should not grow in the vicinity of Streptomyces' colonies on the diameter of the plate.

Chapter 5 – Yellow spotted longicorn Psacothea hilaris hilaris
108
Utilization of sugars. Thirty strains able to grow on Yeast Nitrogen Base (YNB, Fluka) medium were selected for this test. Each strain was grown overnight in Tryptic soy broth (TSB) medium at 30°C. Five hundred microliters of culture were harvested by centrifugation (4°C, 4000g) and washed twice in saline. Then, the cells were suspended and diluted 1:10 in saline. YNB medium was prepared without carbon sources or with different sugars: glucose (1%), xylose (1%), arabinose (1%), cellobiose (1%) and CMC (0.5%). The pH of the medium was adjusted to 7. The test was performed in 384-wells plates using a microplate spectrophotometer (Tecan). Two microliters of cell suspension were diluted in 100 µl of medium in each well. Each combination of bacterial strain/carbon source was repeated in four separate wells. Four wells for each medium remained without any inoculum as a negative control. The optical density (O.D.) at the wavelength of 600 nm of each well was measured every 15 minutes for 48 h. Growth curves were obtained by averaging the O.D. values of the four replicates and subtracting the value of the negative control for each measurement. For every strain, the growth curves with sugars were compared to absorbance profile in the YNB medium without inoculum. The plate filling was performed by the EpMotion liquid handler (Eppendorf).
Results
DGGE analyses
To assess the effect of the diet on the microbiota of the three parts of the gut, we run three separate DGGE gels for the foregut, midgut and hindgut of the same 12 larvae (Figure 3). The larvae have been divided in four groups according to the diet:
1) Field-caught larvae 2) Larvae from the laboratory breeding, fed on an artificial diet for
generations. The diet includes chloramphenicol and, as preservatives, sorbic acid, propionic acid and β-sitosterol.
3) Larvae fed on artificial diet without chloramphenicol and preservatives for 10 days after field collection.
4) Larvae fed on artificial diet without chloramphenicol, but with preservatives, for 10 days after field collection.
According to the band profiles, the larvae of the first two groups showed a richer bacterial community, particularly in the foregut and midgut (Figure 3). The bands were cut to amplify and sequence the DNA and identify bacterial genera. Respectively 10, 10, 5 and 6 genera had been identified in the four groups (Figure 3).The PERMANOVA test identified the diet as an important factor to shape the microbial community in the gut tracts (Pseudo-F= 2,6701, df=3,35, p=0.0074) (14). More in detail, pairwise tests revealed that there was no significant difference between groups 1-2 and 3-4 (PERMANOVA p-hpt test), while in all the other group comparisons the differences were significant (Table 1). A significant difference can be also detected among the three gut tracts (PERMANOVA, Pseudo-F=2,3213, df=2,35, p=0,0325). In this case, the pairwise tests showed that the hindgut differed from the midgut, while all the other comparisons were not significant (Table 2).

Chapter 5 – Yellow spotted longicorn Psacothea hilaris hilaris
109

Chapter 5 – Yellow spotted longicorn Psacothea hilaris hilaris
110
Figure 3: (previous page). DGGE gels for the three larval gut tracts (foregut, midgut and hindgut). In the bigger squares, the ID of the larval specimens (white) and the diet group (black). Small squares and numbers identify the bands that have been cut and sequenced. In the table, a presence/absence matrix describing the distribution of the identified genera in the gut tracts. In the last column of the table, the numbers refer to the band numbers reported in the gel image. "f" refers to foregut, "m" to midgut and "h" to hindgut.
Groups t P(MonteCarlo) 1, 2 0,7905 > 0,05 1, 3 2,1113 0,009 1, 4 1,6632 0,0462 2, 3 2,3686 0,0035 2, 4 1,7502 0,0326 3, 4 < 0,01 > 0,05
Table 1: PERMANOVA post-hoc pairwise test to evaluate the contribution of the diet to explain the overall bacterial diversity in the gut tracts.
Groups t P(MonteCarlo) foregut, midgut 1,1092 0,2927 foregut, hindgut 1,6463 0,0611 midgut, hindgut 1,8324 0,0181
Table 2:. PERMANOVA post-hoc pairwise test to evaluate the contribution of the gut section (foregut, hindgut, midgut) to explain the overall bacterial diversity in the gut tracts.
The most represented genera in the larvae of 3 and 4 group were Enterococcus and Leuconostoc, belonging to the phylum Firmicutes, while in the groups 1 and 2 Proteobacteria was the more abundant phylum, represented by the genus Ralstonia and by a bacterium of the Erythrobacteraceae family.
Isolation and screening of bacterial strains In total, 210 bacterial strains have been isolated from 6 P. h. hilaris larval guts. Bacteria had been isolated from three individual specimens (ID codes 41, 43, 45) on selective media to enrich the culture with cellulose, lignin and pectin degraders. Three of the guts (88, 89, 90) were pooled together, smashed in an anaerobic chamber and used to perform bacterial isolations in aerobic and anaerobic conditions, following the same protocol, on the nutrient-rich medium BHI. We counted approximately 1,3x10⁶ CFU/gut for the anaerobic trial and 2,3x10⁶ CFU/gut for the aerobic trial. However, none of the isolates is strictly anaerobic, as they are able to grow even in the presence of oxygen. Among the isolates we identified 31 genera, belonging to the phyla Proteobacteria (52% out of the total isolates), Actinobacteria (32%) Firmicutes (13%) and Bacterioidetes (3%).The most abundant orders in the collection are represented by Enterobacteriales (32%) and Actinomycetales (21%). Together

Chapter 5 – Yellow spotted longicorn Psacothea hilaris hilaris
111
with Bacillales (9%), the Actinomycetales are present in all the four samples (Figure 4). Screening of the isolates. From the total bacterial collection, two representatives for each ITS profile (one in the case of unique strains, 102 strains overall) had been selected for the screening of the "symbiotic potential" activities, i.e urea degradation, uric acid degradation, protease secretion, nitrogen fixation, ammonia production, EPS production, cellulose degradation, pectin degradation, xylan degradation. The results are summarized Table 3. All the isolates belonging to the genus Streptomyces showed a clear halo upon Congo-red staining, both for the xylan and the CMC degradation tests. Furthermore, they were able to degrade pectin. To better identify these isolates, forward sequencing of the 16S rRNA gene was combined with reverse sequencing (1492R) to obtain the nearly full length of the 16S rRNA gene. All the sequences can be aligned obtaining 99,5% identity, thus being referable to a single species that was identified by BLAST search as Streptomyces thermocarboxydus (GenBank accession of the closest relative: KJ571048.1). Streptomyces isolate 44 has been tested for inhibitory effects towards all the 102 members of the strain selection, giving negative results in all cases.
Figure 4: Distribution of the isolates in the collection according to the order.
Utilization of different carbon sources. A selection of 31 strains has been tested for growth with the following sugars as the only carbon source:

Chapter 5 – Yellow spotted longicorn Psacothea hilaris hilaris
112
glucose, arabinose, xylose, cellobiose and CMC. The strains have been selected according to the species (determined by the closest relative found by BLAST search) and to their capability to grow on the YNB medium. Controls had been performed using the same growth medium without any sugar. We considered as a positive result all the growth curves above the threshold determined by the negative control. Results are summarized in Table 4.
Isolate ID
genus ure
a d
egra
dat
ion
uri
c ac
id d
egra
dat
ion
pro
teas
e se
cret
ion
nit
rogen
fix
atio
n
amm
on
ia p
rod
uct
ion
EPS
pro
du
ctio
n
cell
ulo
se d
egra
dat
ion
pec
tin
deg
rad
atio
n
xyla
n d
egra
dat
ion
70 Corynebacterium + - - - - - - - -
75 Corynebacterium + - - - - - - - -
154 Corynebacterium + - - - - - - - -
156 Corynebacterium + - - - - - - - -
173 Corynebacterium + - - - ++ - - - -
174 Corynebacterium + - - - - - - - +
175 Corynebacterium + - - - - - - - -
208 Gordonia - - - - - - - - -
106 Tsukamurella - - - - - - - - -
138 Tsukamurella + - - - - - - - -
223 Tsukamurella - - - - ++ - - - -
105 Rhodococcus - - - - - - - - -
181 Rhodococcus + - - - - + - - -
77 Brevibacterium - - ++ - ++ - - - -
94 Brevibacterium - + - - ++ - - - -
97 Brevibacterium - - - - ++ - - - -
99 Brevibacterium - + - - ++ - - - -
160 Brevibacterium - - - - ++ - - - -
162 Brevibacterium - - - - ++ - - - -
184 Brevibacterium - - - - ++ + - - -
192 Brevibacterium - - - - ++ - - - -
200 Brevibacterium - - - - ++ - - - -
207 Brevibacterium - - - - ++ - - - -
25 Microbacterium - + - - ++ - - - -
32 Microbacterium - - - - ++ - - - -
198 Microbacterium - - - - ++ - - - -
60 Micrococcus - - ++ - ++ - - - -
61 Micrococcus - - - - ++ - - - -
44 Streptomyces - - - - - - + + +
51 Streptomyces - - - - ++ - + + +
68 Streptomyces - ++ - - + - + - +
197 Streptomyces - - - - ++ - + - +
276 Ochrobactrum + - - - ++ - - - -
121 Rhizobium + - - - ++ + - - +
122 Rhizobium - - - - ++ + - - -

Chapter 5 – Yellow spotted longicorn Psacothea hilaris hilaris
113
Isolate ID
genus ure
a d
egra
dat
ion
uri
c ac
id d
egra
dat
ion
pro
teas
e se
cret
ion
nit
rogen
fix
atio
n
amm
on
ia p
rod
uct
ion
EPS
pro
du
ctio
n
cell
ulo
se d
egra
dat
ion
pec
tin
deg
rad
atio
n
xyla
n d
egra
dat
ion
158 Rhizobium - - - - ++ - - - -
125 Agrobacterium + - - - ++ + - - -
193 Roseomonas + - - - + - - - -
10 Comamonadaceae Bacterium + - - - - - - - -
17 Comamonadaceae Bacterium + - - - - - - - -
40 Comamonadaceae Bacterium + - - - - - - - -
55 Comamonadaceae Bacterium + - - - - - - - -
258 Comamonadaceae Bacterium - - - - + - - - -
259 Comamonadaceae Bacterium - ++ - - + - - - -
261 Comamonadaceae Bacterium - - - - - - - - -
277 Comamonadaceae Bacterium - ++ - - + - - - -
54 Comamonas + - - - - - - - -
111 Acidovorax - + - - + - - - -
112 Acidovorax - + - - + - - - -
229 Enterobacteriaceae Bacterium - - - - ++ - - - -
210 Enterobacter - - - - + + - - -
204 Enterobacter - - - - ++ + - - -
224 Enterobacter - - - - + + - -
225 Enterobacter - - - - ++ + - - -
251 Enterobacter - - - - ++ + - - -
269 Enterobacter - - - - ++ + - - -
246 Klebsiella + - - + ++ + - + -
256 Klebsiella + - - + + + - + -
90 Rahnella - - - + + - - -
186 Rahnella - - - - ++ + - - -
187 Rahnella + - - - + + - - -
189 Rahnella - - - - ++ + - - -
190 Rahnella - - - - + + - - +
191 Rahnella - - - - + + - - +
2 Enhydrobacter - - - - ++ - - - -
5 Enhydrobacter - - ++ - - - - - -
15 Acinetobacter + - - - - - - - -
58 Acinetobacter + - - - - - - - -
116 Acinetobacter + - - - - - - - -
52 Pseudomonas - + ++ - ++ + - + -
120 Pseudomonas - - ++ - ++ + - + +
238 Pseudomonas - - ++ - ++ + - - +
249 Pseudomonas - - ++ - ++ + - - +

Chapter 5 – Yellow spotted longicorn Psacothea hilaris hilaris
114
Isolate ID
genus ure
a d
egra
dat
ion
uri
c ac
id d
egra
dat
ion
pro
teas
e se
cret
ion
nit
rogen
fix
atio
n
amm
on
ia p
rod
uct
ion
EPS
pro
du
ctio
n
cell
ulo
se d
egra
dat
ion
pec
tin
deg
rad
atio
n
xyla
n d
egra
dat
ion
252 Pseudomonas - ++ - - ++ - - - -
273 Pseudomonas - ++ ++ - ++ + - - +
12 Stenotrophomonas - - ++ - ++ - - - -
16 Stenotrophomonas - - ++ - ++ - - - -
56 Stenotrophomonas - - ++ - ++ - - - -
57 Stenotrophomonas - - ++ - ++ - - - -
218 Luteimonas - - - - ++ - - + -
151 Olivibacter - - - - ++ + - - -
152 Olivibacter - - - - ++ + - - -
255 Sphingobacterium - - - - ++ - - - -
134 Epilithonimonas - - - - ++ - - + -
137 Epilithonimonas - - - - ++ - - - -
76 Bacillus - ++ - - ++ - - - -
4 Staphylococcus + - - - - - - - -
41 Staphylococcus - - - - ++ - - - -
67 Staphylococcus + - - - ++ - - - -
69 Staphylococcus + - - - + + - - -
203 Staphylococcus + - - - + - - - -
219 Staphylococcus - - - - + - - - -
220 Staphylococcus - - ++ - ++ - - - -
222 Staphylococcus - - ++ - ++ - - - -
236 Staphylococcus + - - - + - - - -
232 Enterococcus - - - - - - - - -
209 Lactococcus - - ++ - + - - - -
228 Lactococcus - - + - + - - - -
233 Lactococcus - - + - + - - - -
237 Lactococcus - - + - + - - - -
243 Lactococcus - - + - + - - - -
248 Lactococcus - - - - + - - - -
Table 3: Results of the screening of 102 isolates for the "symbiotic potential" activities.
Discussion
DGGE
The bacterial communities of larvae reared for ten days on a diet without antibiotics (groups 3 and 4) seem to be very poor and dominated by Enterococcus and Leuconostoc. These species probably overgrew on the diet without antibiotics, and entered the insect gut in large quantities together with the ingested food, replacing the native microflora. An identical situation

Chapter 5 – Yellow spotted longicorn Psacothea hilaris hilaris
115
has been observed in a paper by Montagna et al. (submitted and presented in Chapter 4) in which it is shown that in Rhinchophorus ferrugineus specimens fed on apple for a month the community evenness dramatically decreases, with the growth of bacteria that are typical of rotting fruit (as for example Acetobacteraceae and Lactobacillaceae members). Surprisingly, the P. h. hilaris larvae from the laboratory breeding, grown for generations on an artificial diet complemented with chloramphenicol and preservative compounds, seem to host a bacterial community that resembles much better the microflora from the field-caught larvae.
isolate ID
genus
glu
cose
arab
inose
xilo
se
cell
ob
iose
CM
C
70 Corynebacterium + + - - -
223 Tsukamurella + - - - -
99 Brevibacterium + - - - -
184 Brevibacterium + + + + -
200 Brevibacterium + - - - -
25 Microbacterium + + + + -
61 Micrococcus + + + + -
44 Streptomyces + + + + +
51 Streptomyces + + + + +
276 Ochrobactrum + - - - -
121 Rhizobium + + + + -
125 Agrobacterium + + + + -
10 Comamonadaceae bacterium + - - - -
40 Comamonadaceae bacterium + - - - -
54 Comamonas + - - - -
186 Rahnella + + + + -
191 Rahnella + + + + -
204 Enterobacter + + + - -
229 Enterobacteriaceae bacterium + + + - -
246 Klebsiella + + + + -
251 Enterobacter + + + + -
15 Acinetobacter + + - - -
52 Pseudomonas + + + - -
238 Pseudomonas + + - - -
151 Olivibacter + + + + -
134 Epilithonimonas + + - - -
255 Sphingobacterium + + - + -
76 Bacillus + - - - -
219 Staphylococcus + + + + -
220 Staphylococcus + - - + -
Table 4. Results for the screening of 30 isolates for the growth on different carbon sources.

Chapter 5 – Yellow spotted longicorn Psacothea hilaris hilaris
116
This could be explained with the low amount of antibiotic in the diet and the insurgence of resistance phenomena. In fact, the preparation of the diet requires cooking, a step that possibly lowers the effective concentration of chloramphenicol. Thus, the latter seems to be enough to prevent the bacterial proliferation on the diet itself, but could allow the appearance of resistant cells among the native microbiota in the gut. The bacterial community in the larvae from the rearings and in the ones collected directly from field is richer, comprising mainly Alpha- and Beta-Proteobacteria. Regarding the gut tracts, a significant difference has been shown between the midgut and the hindgut. Indeed, in midguts and, to a lesser extent, in foreguts there was a higher diversity of Proteobacteria, while hindguts were dominated by Enterococcus, belonging to the Firmicutes phylum. There are many possible explanations to this difference: in the hindgut of P. h. hilaris a higher pH has been measured than in the foregut and midgut (8). Moreover, the Malpighian tubules deliver the nitrogen waste collected in the hemocoel at the cephalic border of the hindgut. Thus, the environment in this tract is characterized by a mix of nitrogen and food waste. The group “Erythrobacteriaceae” is largely represented in foreguts and midguts of both wild and reared larvae (groups 1 and 2). This family, comprised in the Sphingomonadales order, has been recently separated from Sphingomonadaceae (25): it comprises rod-shaped bacteria that have been mainly isolated from freshwater and that contain pigments as bacterio-chlorophyll a and carotenoids. Sphingomonadaceae are known for their catabolic flexibility, as they are able to degrade a broad range of recalcitrant compounds (26). These catabolic competences are largely encoded in “megaplasmids”, which are also transferred by conjugation. All the sequences have been loaded on the pre-constructed tree of the Non Redundant 16S database downloaded from the Silva website (SSURef_NR99_119_SILVA_14_07_14) using the maximum parsimony tool of the ARB software. Interestingly, one of the sequences identified as Klebsiella in the hindgut is closely related to two sequences previously identified as Candidatus Nardonella by Rinke and colleagues (27) (accessions FJ626254 and FJ626262). Nardonella is an endosymbiont of coleoptera of the family Curculionidae, which comprises many wood-feeding insects. Similarly, other two Klebsiella sequences seem to be close to Candidatus Annandia pinicola, an endosymbiont of the pine bark adelgid Pineus strobi (28) (accession KC64418). In both cases, the bands of interest were not present in all the individuals in analysis. During the dissection, attention was paid to detect possible bacteriomes, but it we did not find any. In spite of this, the abovementioned bacterial endosymbionts (Ca. Nardonella and Annandia pinicola) can be hosted in mycetocytes intersperse in the fat body or attached to the gut external epithelium. Thus, it is possible that mycetocytes have been effectively collected in some samples and not in others. For these reason, further analyses are required to verify any hypothesis about endosymbionts in P. h. hilaris. In contrast to the bacterial isolation, that lead to the identification of nine genera of Actinobacteria, only one representative of this phylum (Propionibacterium) has been detected by the DGGE. There are two possible

Chapter 5 – Yellow spotted longicorn Psacothea hilaris hilaris
117
explanations to this observation. On one side, the extraction of DNA from some Actinobacteria, in particular Actinomycetales, could be problematic(29). On the other side, these bacteria could survive inside the gut only as spores.
Isolation and screening of bacterial strains Most of the isolates in our collection belong to Gamma-Proteobacteria. This class is widespread in the guts of insects. However, none of these genera was present in all the samples analysed. Actinomycetales were present in all the P. h. hilaris samples with 9 identified genera. Among them, Brevibacterium was present in all the four samples, while Corynebacterium and Streptomyces were present in three of them. The absence of Streptomyces in the 88-89-90 sample could be due to the different isolation method used for this sample. Notably, the Actinobacteria bacteria could persist in the gut as spores. In this case, they do not participate in a symbiotic relationship with the host but they could exploit the insect as a vector to spread over the plant tissues. Despite the isolation trial made in the anaerobic chamber, no strictly anaerobic bacterium was found, but some strains able to grow both in aerobic and anaerobic conditions identified as Enterobacter, Enterobacteriaceae bacterium and Lactococcus. This suggests that the gut environment in P. h. hilaris could be aerobic (in contrast with the observations made by Ceja-Navarro and colleagues on another large wood feeding beetle, Odontotaenius disjunctus (30)). Alternatively, we may think that the resident bacteria are all acquired randomly from the environment, in which they can survive in aerobic conditions, but some of them can as well survive in anaerobic niches in the gut. One or two representatives for each strain in the collection had been tested for several activities that could favour the persistence in the gut of the host and the insurgence of a mutualistic relationship. In fact, though insect gut communities largely consist of environmental bacteria ingested with the food, only a small portion of these bacteria can persist, due to their colonization abilities and to the selection operated by the host immune system and physical-chemical conditions in the gut tract. Moreover, commensal bacteria must be able to exploit food sources present in the insect diet, which in this case is based on wood (5). The xylem-based diet is regarded as poor in nitrogen, as the plant cell-wall proteins are generally not considered to be a sufficient nitrogen source, and the C:N ratio can be as high as 1000/1(6). Therefore, both larvae and commensals should have effective recycle systems or the ability to exploit atmospheric nitrogen. We tested the isolates for the presence of NifH gene for the fixation of nitrogen using PolF-PolR primer set (23). Only Klebsiella oxytoca (isolates tested 246 and 256) gave a positive result. All the total 11 isolates of Klebsiella belong to the 88-89-90 samples: this is possibly due to the different isolation medium used for these samples. Klebsiella has been identified also by DGGE in two individuals from the laboratory breeding. Regarding the nitrogen recycling, we tested our isolates for the ability to degrade urea and uric acid, that are, respectively, waste products of the bacterial and host metabolism. In insects, uric acid is collected from the tissues by the Malpighian tubules, that flow into the first tract of hindgut, near the midgut-

Chapter 5 – Yellow spotted longicorn Psacothea hilaris hilaris
118
hindgut border. Uric acid can be metabolized by bacteria to urea, and subsequently to ammonia and carbon dioxide. Urea is also produced by bacteria as a by-product of purine and aminoacids metabolism. Notably, 29 of the 102 isolates tested (including the previously mentioned Klebsiella oxytoca) are able to degrade urea, and 12 are able to degrade uric acid. Furthermore, most of the isolates (78 out of 102) are able to excrete ammonia derived from the peptides catabolism during the growth on peptone-water. The secretion of proteases may further improve the availability of amino acids and peptides in the gut, allowing the exploitation of the proteins released from the plant cell walls after cellulose degradation (6) or from the microorganisms themselves. Nineteen isolates showed, to a different extent, the release of proteases in the extracellular medium. About 73% of the dry weight of the mulberry tree wood on which larval P. hilaris feed is constituted by cellulose and hemicellulose (7). The major components of hemicellulose polysaccharides are xylan and xyloglucans. P. h. hilaris produces at least one cellulase that has been isolated by Sugimura et al. (8). Another study demonstrated the presence in P. hilaris gut extracts of degradative activities against several polysaccharides, comprising pectin, carboxymethyl-cellulose (CMC) and xylan (7). However, it is not clear whether these activities are due to the production of degradative enzymes by the insect itself or by its gut microflora. The isolates in our collection had been tested for CMC, pectin and xylan degradation, finding respectively 4, 8 and 12 degraders. We also tested the ability of the strains to grow on sugars derived from the degradation of plant cell walls as the only carbon source. In detail, xylose and arabinose result from the degradation of xylan, a major constituent of hemicellulose, while cellobiose is the dimeric unit of cellulose. Of the 30 strains tested, only two isolates of the same species (Streptomyces thermocarboxydus) grew on cellulose (CMC), while 15 grew on cellobiose, exploiting the degradative activity of the cellulases secreted by the host and by the Streptomyces thermocarboxydus strain. Regarding the xylan by-products, 21 strains grew on arabinose and 16 grew on both arabinose and xylose. Many strains grew on cellobiose at higher rates than on glucose (isolates 51, 151, 186, 193, 204, 219, 220, 225, 251, for identification see Table 4) or showed a well-defined preference for arabinose (15, 191 204, 219, 276) xylose (121, 125, 184, 251) or both (186, 229). In conclusion, only a few of these microorganisms can effectively degrade complex plant cell walls, but many of them can take advantage from the degradative processes carried out by other components of the microflora or by the insect itself. Finally, we tested the capability of our strains to produce an exopolysaccharides (EPS). The secretion of EPS is an important step in the formation of biofilms, and could enhance the adhesion of bacteria and their persistence on the gut epithelium. Twenty-seven strains, mainly Gamma-Proteobacteria, showed a visible enhancement in the production of extracellular matrix upon growth on sucrose, proving their ability to produce EPS.

Chapter 5 – Yellow spotted longicorn Psacothea hilaris hilaris
119
Figure 5: Growth curves of the isolate 44 (Streptomyces thermocarboxydus) on different carbon sources.
All the isolates of Streptomyces showed a wide range of degradative activities through plant sugar polymers (cellulose, pectin, xylan). This bacterium has been isolated in the first three specimens 41, 43 and 45, but not in the 88-89-90 pool, probably due to the different isolation method. On one side the nutrient-rich medium BHI favours the isolation of fast-growing gamma Proteobacteria and Staphylococci against the slow-growing Streptomyces. On the other side, from the enrichment medium in which we observed the degradation of the filter paper we did not isolate any cellulolytic bacterium, thus suggesting some bias in the isolation, possibly due to the overgrowth of other bacteria. Streptomyces can exploit as carbon sources all the tested substrates, showing a rapid growth especially on xylose and cellobiose. It is very efficient also in utilizing cellulose, though the growth starts lately, reflecting the time needed to degrade the long-chain polymer (Figure 5). Given that many Streptomyces are able to secrete antibiotics, we tested our strain for inhibitory effects against the other strains in the collection, obtaining only negative results. On the contrary, the presence of this strain could enhance the survival of other commensal bacteria that grow on by-products of cellulose degradation. However, preliminary in vivo studies demonstrated that our Streptomyces strain doesn’t have the ability to grow into larval gut and to give a selective advantage to colonized larvae (data not shown). These data suggest that it could persist in the gut as spores, exploiting the larvae as a reservoir to easily colonize the inside of trunks, in which it can easily grow on the wood matter due to its degradative abilities.
Conclusion
Both DGGE and isolation results depict P. h. hilaris bacterial gut community as a highly variable assemblage of environmental bacteria that are not shared

Chapter 5 – Yellow spotted longicorn Psacothea hilaris hilaris
120
among different individuals. They can be regarded as commensals, which are able to persist in the insect gut and to efficiently exploit the food sources therein, as well as to use the insect as a reservoir to propagate in the environment. The latter mechanism can be hypothesized primarily for sporulating bacteria, as for example the isolate 44 (Streptomyces sp.). The high variability of this bacterial community is remarked by the analysis on the larvae fed with different diets, which show great changes in their bacterial community. Interestingly, the bacteria that overgrow on the diet, like Leuconostoc, seem to replace completely the resident community. Paradoxically, the addition of a certain quantity of antimicrobial compounds to the artificial diet, rather than erasing the native gut community, better preserves it. These results help to shed light on the biology of bacterial commensals, a group of symbionts that, up to now, has been poorly investigated (5). Indeed, there are a number of research papers that describe and compare variegate communities associated to insects, but do not formulate precise hypotheses about their function (e.g. (31, 32)). Alternatively, the activities of the microflora are investigated by metagenomics (6, 33), a very powerful method that, nevertheless, makes it difficult to associate taxonomy and function. Here, we propose to verify the “symbiotic potential” of a collection of bacterial isolates through direct in vitro tests, drawing inspiration to the well-established approach that is used to characterize PGP (plant-growth promoting) symbionts of plants (34). Although it is important to consider that the response of the bacteria to the gut environment could be very different from the in vitro behaviour and that these tests exclude the large fraction of uncultivable strains, our results show that this approach can give important information about the function of commensals. In P. h. hilaris, gut bacterial symbionts can directly contribute to the cellulose digestion or exploit the by-products of the degradation of cell wall compounds, possibly becoming themselves a valuable food source for the insect. Moreover, they help their host to absorb nitrogen, converting waste molecules (uric acid and urea) or proteins to ammonia and smaller peptides, or even fixing atmospheric nitrogen. From an evolutionary point of view, the ability to live into an insect host and to help its fitness and survival greatly advantages these environmental bacteria, which can multiply in the insect gut and rapidly spread through faeces in very distant and non-colonized habitats with similar ecological features.of the same type.

Chapter 5 – Yellow spotted longicorn Psacothea hilaris hilaris
121
References
1. Lupi D, Jucker C, Colombo M. 2013. Distribution and biology of the yellow-spotted longicorn beetle Psacothea hilaris hilaris (Pascoe) in Italy. EPPO Bull. 43:316–322.
2. Lee K-A, Kim S-H, Kim E-K, Ha E-M, You H, Kim B, Kim M-J, Kwon Y, Ryu J-H, Lee W-J. 2013. Bacterial-Derived Uracil as a Modulator of Mucosal Immunity and Gut-Microbe Homeostasis in Drosophila. Cell 153:797–811.
3. Chouaia B, Rossi P, Epis S, Mosca M, Ricci I, Damiani C, Ulissi U, Crotti E, Daffonchio D, Bandi C, Favia G. 2012. Delayed larval development in Anopheles mosquitoes deprived of Asaia bacterial symbionts. BMC Microbiol. 12 Suppl 1:S2.
4. Sharon G, Segal D, Ringo JM, Hefetz A, Zilber-Rosenberg I, Rosenberg E. 2010. Commensal bacteria play a role in mating preference of Drosophila melenogaster. Proc. Natl. Acad. Sci. U. S. A. 107:20051–6.
5. Engel P, Moran N. 2013. The gut microbiota of insects - diversity in structure and function. FEMS Microbiol. Rev. 37:699–735.
6. Scully ED, Geib SM, Hoover K, Tien M, Tringe SG, Barry KW, Glavina del Rio T, Chovatia M, Herr JR, Carlson JE. 2013. Metagenomic profiling reveals lignocellulose degrading system in a microbial community associated with a wood-feeding beetle. PLoS One 8:e73827.
7. Noda H, Watanabe H, Scrivener a M. 1997. Diet and carbohydrate digestion in the yellow-spotted longicorn beetle Psacothea hilaris. J. Insect Physiol. 43:1039–1052.
8. Sugimura M, Watanabe H, Lo N, Saito H. 2003. Purification, characterization, cDNA cloning and nucleotide sequencing of a cellulase from the yellow-spotted longicorn beetle, Psacothea hilaris. Eur. J. Biochem. 270:3455–3460.
9. Park D-S, Oh H-W, Jeong W-J, Kim H, Park H-Y, Bae KS. 2007. A culture-based study of the bacterial communities within the guts of nine longicorn beetle species and their exo-enzyme producing properties for degrading xylan and pectin. J. Microbiol. 45:394–401.
10. Cappellozza L, Cappellozza S, Saviane A, Sbrenna G. 2005. Artificial diet rearing system for the silkworm Bombyx mori (Lepidoptera: Bombycidae): effect of vitamin C deprivation on larval growth and cocoon production. Appl. Entomol. Zool. 40:405–412.
11. Raddadi N, Gonella E, Camerota C, Pizzinat A, Tedeschi R, Crotti E, Mandrioli M, Bianco PA, Daffonchio D, Alma A. 2011. “Candidatus Liberibacter europaeus” sp. nov. that is associated with and transmitted by the psyllid Cacopsylla pyri apparently behaves as an endophyte rather than a pathogen. Environ. Microbiol. 13:414–26.
12. Muyzer G, de Waal EC, Uitterlinden AG. 1993. Profiling of complex microbial populations by denaturing gradient gel electrophoresis analysis of polymerase chain reaction-amplified genes coding for 16S rRNA. Appl. Environ. Microbiol. 59:695–700.
13. Prosdocimi EM, Novati S, Bruno R, Bandi C, Mulatto P, Giannico R, Casiraghi M, Ferri E. 2013. Errors in ribosomal sequence datasets generated using PCR-coupled “panbacterial” pyrosequencing, and the establishment of an improved approach. Mol. Cell. Probes 27:65–7.
14. Anderson MJ, Gorley RN. 2008. PERMANOVA for PRIMER: guide to software and statistical methods. PRIMER-E Ltd,.
15. Gupta P, Samant K, Sahu A. 2012. Isolation of cellulose-degrading bacteria and determination of their cellulolytic potential. Int. J. Microbiol. 2012.
16. Compant S, Reiter B, Sessitsch A, Nowak J, Clément C, Barka EA. 2005. Endophytic Colonization of Vitis vinifera L. by Plant Growth-Promoting

Chapter 5 – Yellow spotted longicorn Psacothea hilaris hilaris
122
Bacterium Burkholderia sp. Strain PsJN. Appl. Environ. Microbiol. 71:1685–1693.
17. Cardinale M, Brusetti L, Quatrini P, Borin S, Puglia AM, Rizzi A, Zanardini E, Sorlini C, Corselli C, Daffonchio D. 2004. Comparison of different primer sets for use in automated ribosomal intergenic spacer analysis of complex bacterial communities. Appl. Environ. Microbiol. 70:6147–56.
18. Wang Q, Garrity GM, Tiedje JM, Cole JR. 2007. Naive Bayesian classifier for rapid assignment of rRNA sequences into the new bacterial taxonomy. Appl. Environ. Microbiol. 73:5261–7.
19. Pruesse E, Peplies J, Glöckner FO. 2012. SINA: accurate high-throughput multiple sequence alignment of ribosomal RNA genes. Bioinformatics 28:1823–9.
20. Arioli S, Monnet C, Guglielmetti S, Parini C, De Noni I, Hogenboom J, Halami PM, Mora D. 2007. Aspartate biosynthesis is essential for the growth of Streptococcus thermophilus in milk, and aspartate availability modulates the level of urease activity. Appl. Environ. Microbiol. 73:5789–96.
21. Morales-Jiménez J, Vera-Ponce de León A, García-Domínguez A, Martínez-Romero E, Zúñiga G, Hernández-Rodríguez C. 2013. Nitrogen-fixing and uricolytic bacteria associated with the gut of Dendroctonus rhizophagus and Dendroctonus valens (Curculionidae: Scolytinae). Microb. Ecol. 66:200–10.
22. Santaella C, Schue M, Berge O, Heulin T, Achouak W. 2008. The exopolysaccharide of Rhizobium sp. YAS34 is not necessary for biofilm formation on Arabidopsis thaliana and Brassica napus roots but contributes to root colonization. Environ. Microbiol. 10:2150–63.
23. Poly F, Monrozier LJ, Bally R. 2001. Improvement in the RFLP procedure for studying the diversity of nifH genes in communities of nitrogen fixers in soil. Res. Microbiol. 152:95–103.
24. Cappuccino J, Sherman N. 1992. Microbiology: A Laboratory Manual, 3rd ed. Benjamin/Cummings Pub. Co., New York.
25. Lee K-B, Liu C-T, Anzai Y, Kim H, Aono T, Oyaizu H. 2005. The hierarchical system of the “Alphaproteobacteria”: description of Hyphomonadaceae fam. nov., Xanthobacteraceae fam. nov. and Erythrobacteraceae fam. nov. Int. J. Syst. Evol. Microbiol. 55:1907–19.
26. Stolz A. 2014. Degradative plasmids from sphingomonads. FEMS Microbiol. Lett. 350:9–19.
27. Rinke R, Costa a S, Fonseca FPP, Almeida LC, Delalibera Júnior I, Henrique-Silva F. 2011. Microbial diversity in the larval gut of field and laboratory populations of the sugarcane weevil Sphenophorus levis (Coleoptera, Curculionidae). Genet. Mol. Res. 10:2679–91.
28. Toenshoff ER, Szabó G, Gruber D, Horn M. 2014. The pine bark Adelgid, Pineus strobi, contains two novel bacteriocyte-associated gammaproteobacterial symbionts. Appl. Environ. Microbiol. 80:878–85.
29. Nikodinovic J, Barrow KD, Chuck J-A. 2003. High yield preparation of genomic DNA from Streptomyces. Biotechniques 35:932–4, 936.
30. Ceja-Navarro J a, Nguyen NH, Karaoz U, Gross SR, Herman DJ, Andersen GL, Bruns TD, Pett-Ridge J, Blackwell M, Brodie EL. 2014. Compartmentalized microbial composition, oxygen gradients and nitrogen fixation in the gut of Odontotaenius disjunctus. ISME J. 8:6–18.
31. Zouache K, Raharimalala FN, Raquin V, Tran-Van V, Raveloson LHR, Ravelonandro P, Mavingui P. 2011. Bacterial diversity of field-caught mosquitoes, Aedes albopictus and Aedes aegypti, from different geographic regions of Madagascar. FEMS Microbiol. Ecol. 75:377–89.

Chapter 5 – Yellow spotted longicorn Psacothea hilaris hilaris
123
32. Broderick NA, Raffa KF, Goodman RM, Handelsman J. 2004. Census of the bacterial community of the gypsy moth larval midgut by using culturing and culture-independent methods. Appl. Environ. Microbiol. 70:293–300.
33. Scully ED, Hoover K, Carlson JE, Tien M, Geib SM. 2013. Midgut transcriptome profiling of Anoplophora glabripennis, a lignocellulose degrading cerambycid beetle. BMC Genomics 14:850.
34. Rolli E, Marasco R, Vigani G, Ettoumi B, Mapelli F, Deangelis ML, Gandolfi C, Casati E, Previtali F, Gerbino R, Pierotti Cei F, Borin S, Sorlini C, Zocchi G, Daffonchio D. 2014. Improved plant resistance to drought is promoted by the root-associated microbiome as a water stress-dependent trait. Environ. Microbiol.

Chapter 6 – Conclusions
124
Chapter 6
General conclusions
This thesis, with the three case-studies presented, gives a contribution to the knowledge of the structure and function of the bacterial communities hosted in insects. All the species presented are relevant pests, belonging to very different taxa and habitats. In spite of this, some commonalities can be found and general conclusions can be drawn by comparing the results of the three studies. The most striking evidence that regards all the three examples is the effect of the different diets on the microbial colonization of the insects. In the Drosophila suzukii work, we did not analyse wild specimens, but flies reared on fruit and on an artificial diet were compared. Both pyrotag and Denaturing Gradient Gel Electrophoresis (DGGE) analyses showed a higher individual variability in insects reared on fruit, as well as a higher bacterial diversity. In the PCoA graph based on the Unifrac analysis of the pyrosequences, fruit-fed specimens clustered together, and the effect of the diet seemed to overcome the effect of the life stage in explaining the variance of the bacterial communities. A higher mean load of Lactobacillales was registered in flies fed on the diet, while in the others was immediately apparent the presence of Wolbachia and Flavobacteriales. In addition, red palm weevils, field-collected and reared on apple for one month, were analysed by pyrotag. In this case, the evenness and diversity of the bacterial communities hosted by wild specimens were remarkably higher. Fruit fed beetles hosted Acetobacter and members of the Lactobacillales order (Lactobacillus, Lactococcus and Enterococcus), which were absent in wild ones. On the contrary, they lacked bacterial taxa which are typical of soil and plants and that can be found in wild specimens (e.g. Gordonia, Devosia). Finally, the effect of the diet on the yellow-spotted longicorn gut microbiota was assessed by means of DGGE. The insects were fed with three diets, which exerted very different effects, allowing us to elucidate how the diet could shape the microbial community. In fact, the comparative DGGE analysis on larvae fed on a diet supplemented or not with antimicrobial compounds clearly suggested that some bacteria rapidly proliferated on the diet if the conditions were favourable (absence of antimicrobials) and they quickly replaced the resident microbial community as they were ingested by the insect. The overgrowing species were, in this case, Leuconostoc and Enterococcus. This kind of replacement presumably happened not only in Psacothea hilaris hilaris, but also in Rhynchophorus ferrugineus: Acetobacter and Lactobacillales colonized the apple, in which they could find an appropriate habitat. In D. suzukii study, although all the flies were reared in laboratory, the specimens fed on fruit retained a more variegate microbial community. This was probably because this kind of diet is very close to the natural one, thus, these flies could preserve a bigger proportion of the original microbiota. On the contrary, the microbiota of the flies fed on the artificial diet was replaced by the bacteria that better grew on

Chapter 6 – Conclusions
125
that medium. All these observation seem to support the hypothesis that the insect microbiota –particularly in the gut- is mainly acquired from the food. In a natural situation, insects ingest many different bacteria, most of which can colonize the gut, creating a biodiverse, ever-changing community. According to the uneven distribution of the bacteria in the environment, these insects always show a higher individual variability compared to bred ones. Microorganisms exploit the insects to spread in the environments in which they feed and defecate, or they find a favourable niche in the insect itself. The “symbiotic potential” screening of the cultivable fraction of P. h. hilaris community allowed us to verify the hypothesis that most of these bacteria are adapted to exploit the food sources in the insect gut, and to give a contribution to the host fitness. Colonization of Drosophila flies with GFP-tagged acetic acid bacteria proved the bacterial ability to adhere to the intestinal walls and to the peritrophic matrix, initiating a stable association. All these features can further advantage environmental bacteria which use them to multiply and spread through insects. Thus, “commensals” are not only microorganisms that enter insects by chance, but they possibly evolve strategies to survive in the insect gut, getting selective advantages over the others. An interesting paper by Stefanini and colleagues (1) illustrates the role of social wasps for the preservation, overwintering and diffusion of vineyard yeasts. The same mechanisms seem to happen, to a lesser extent, in guts of other insects, which preserve and spread a number of environmental bacteria. D. suzukii seems to have a role in inoculating fruits with acetic acid bacteria, which are responsible of the rotting. Psacothea carries a number of Actinomycetales, at least one of which is capable to degrade wood matter, and other bacteria that live on the by-products of wood degradation. However, while we can make hypotheses regarding the presence of some of these bacteria, for many others the situation is more vague. Considering as a whole all the species identified by the isolations and by molecular methods, it is evident that for many we are not able to understand nor the function nor the reason why we found them in such a special niche. Speaking only about isolates, for which it is possible to assign a taxonomic classification with a higher degree of certainty, we found a number of species whose closest relatives are described as coming from very different environments. As an example, Enhydrobacter sp., isolated from P. h. hilaris, has been first described in 1987 as an aquatic organism with a gas vacuole (Enhydrobacter aerosaccus, (2)). Originally affiliated to the Vibrionaceae, today it is considered part of the Moraxellaceae (even if a revision has been proposed (3)). From that moment, according to the papers recorded in the PubMed database, it has been identified twice in cheese (4, 5), once in human eyes (6), in the air of Louvre museum (7) and, finally, in the salivary glands of a mosquito (8). This is not an uncommon situation, showing how the biodiversity of bacteria that can be hosted and diffused by insects is higher than expected and yet poorly understood. The composition of the bacterial communities within the three analysed insects can be compared also from a taxonomic point of view. Despite the collection of isolates have been obtained from different enrichment media,

Chapter 6 – Conclusions
126
the cultivable fraction is always dominated by gamma-proteobacteria, and, in particular, Enterobacter and other members of Enterobacteriales. Another common feature of the three collections is the presence of Lactobacillales. These two orders show a fast growth on culture media and are the first that colonize laboratory diets. Nevertheless, they have been detected also in wild specimens and in molecular studies, showing that their association with insects is not due exclusively to the laboratory rearing, but, probably, the insects themselves inoculate them in the diet, in which they find an optimal habitat. Insects fed on fruits (flies and reared weevils) share also a variegate acetic acid microbiota, for which the same considerations can be done. The high difference between bacterial collections and the data coming from molecular studies outlines that a large fraction of the bacteria resident in insects is hardly cultivable. A detailed analysis of the phylogenetic placement of DGGE sequences from P. h. hilaris in the tree of SILVA non-redundant database revealed that in many cases they are placed in branches populated almost exclusively by uncultured bacteria. Thus, there are a number of poorly studied organisms: the knowledge of some of these does not go beyond the 16S sequence. Knowing the great importance of uncultivable primary and secondary symbionts for insects would be of great interest to deepen the knowledge about these bacteria. In conclusion, the study of the microbiota of three different, non model insects with a wide range of techniques allowed us to draw a more precise picture of the cultivable and uncultivable microbial communities that live in wild insects and of some factors that influence their composition. Three important pests have been chosen for these studies, giving a contribution to the knowledge of economically relevant and invasive species. Although the aim of this thesis is not to solve the problem raising from the spreading of these insects, this contribution will hopefully help to effectively address it. Indeed, the study of the symbiotic microbiota and of its roles is an essential step for the understanding of the insect biology. Furthermore, a number of control strategies exist based on symbionts (9). While this work was mainly focused on the taxonomic characterisation of bacterial communities, the next step in the research on insect symbionts will be the in-depth investigation of the roles of these bacteria, particularly of commensals. In literature, there are a number of works describing insect gut microbiotas, but only a few succeeded in identifying and verifying hypotheses about the origin of the microorganisms, their functions and interactions with the host, or the reasons why they can be found in this niche. The scientific papers addressing these problems mainly focus on simplified consortia present in laboratory model organisms, such as D. melanogaster flies. These works shed light on the importance of commensal bacteria, which are not only casual “passengers”, but rather they can deeply modify the host physiology. However, despite their extraordinary importance for the discovery of general mechanisms of interaction and communication between gut bacteria and their eukaryotic hosts, these findings are only partially generalizable to wild insects. Indeed, microbial communities in insects from natural populations are dramatically more complex, and even in flies reared in different laboratories different

Chapter 6 – Conclusions
127
mechanisms of interaction with bacteria have been observed (compare (10) and (11)). Thus, the relationship between commensal bacteria and insects in natural environments is still an unexplored and fascinating field, and this thesis represents only a starting point for its investigation.
References
1. Stefanini I, Dapporto L, Legras J-L, Calabretta A, Di Paola M, De Filippo C, Viola R, Capretti P, Polsinelli M, Turillazzi S, Cavalieri D. 2012. Role of social wasps in Saccharomyces cerevisiae ecology and evolution. Proc. Natl. Acad. Sci. U. S. A. 109:13398–403.
2. Staley JT, Irgens RL, Brenner DJ. 1987. Enhydrobacter aerosaccus gen. nov., sp. nov., a Gas-Vacuolated, Facultatively Anaerobic, Heterotrophic Rod. Int. J. Syst. Bacteriol. 37:289–291.
3. Kawamura Y, Fujiwara N, Naka T, Mitani A, Kubota H, Tomida J, Morita Y, Hitomi J. 2012. Genus Enhydrobacter Staley et al. 1987 should be recognized as a member of the family Rhodospirillaceae within the class Alphaproteobacteria. Microbiol. Immunol. 56:21–6.
4. Aldrete-Tapia A, Escobar-Ramírez MC, Tamplin ML, Hernández-Iturriaga M. 2014. High-throughput sequencing of microbial communities in Poro cheese, an artisanal Mexican cheese. Food Microbiol. 44:136–41.
5. Alegría A, Szczesny P, Mayo B, Bardowski J, Kowalczyk M. 2012. Biodiversity in Oscypek, a traditional Polish cheese, determined by culture-dependent and -independent approaches. Appl. Environ. Microbiol. 78:1890–8.
6. Lee SH, Oh DH, Jung JY, Kim JC, Jeon CO. 2012. Comparative ocular microbial communities in humans with and without blepharitis. Invest. Ophthalmol. Vis. Sci. 53:5585–93.
7. Gaüzère C, Moletta-Denat M, Blanquart H, Ferreira S, Moularat S, Godon J-J, Robine E. 2014. Stability of airborne microbes in the Louvre Museum over time. Indoor Air 24:29–40.
8. Sharma P, Sharma S, Maurya RK, Das De T, Thomas T, Lata S, Singh N, Pandey KC, Valecha N, Dixit R. 2014. Salivary glands harbor more diverse microbial communities than gut in Anopheles culicifacies. Parasit. Vectors 7:235.
9. Crotti E, Balloi A, Hamdi C, Sansonno L, Marzorati M, Gonella E, Favia G, Cherif A, Bandi C, Alma A, Daffonchio D. 2012. Microbial symbionts: a resource for the management of insect-related problems. Microb. Biotechnol. 5:307–17.
10. Shin SC, Kim S-H, You H, Kim B, Kim AC, Lee K-A, Yoon J-H, Ryu J-H, Lee W-J. 2011. Drosophila microbiome modulates host developmental and metabolic homeostasis via insulin signaling. Science 334:670–674.
11. Storelli G, Defaye A, Erkosar B, Hols P, Royet J, Leulier F. 2011. Lactobacillus plantarum Promotes Drosophila Systemic Growth by Modulating Hormonal Signals through TOR-Dependent Nutrient Sensing. Cell Metab. 14:403–414.

128 Supplementary materials
Supplementary materials
Chapter 4 – Rhynchophorus ferrugineus
RPW
p
alm
_m1
RPW
p
alm
_f1
RPW
p
alm
_f2
RPW
ap
ple
_m1
RPW
ap
ple
_m2
RPW
ap
ple
_m3
RPW
ap
ple
_f1
RPW
ap
ple
_f2
RPW
ap
ple
_f3
R_v
uln
f1
R_v
uln
m
1
R_v
uln
f2
Unclassified non-Bacteria 0,000 0,000 0,000 0,000 0,000 0,023 0,000 0,000 0,000 0,000 0,000 0,000 Unclassified Bacteria 4,096 2,749 1,853 0,096 0,637 0,525 0,537 0,069 0,000 0,000 0,611 0,080 Acidobacteria 0,446 0,111 0,241 0,000 0,000 0,000 0,000 0,000 0,000 0,000 0,636 0,020 Actinobacteria 11,397 21,033 18,766 0,567 0,434 0,194 1,257 3,312 1,317 3,781 9,508 3,633 Armatimonadetes 0,171 0,166 0,019 0,000 0,000 0,000 0,000 0,000 0,000 0,000 0,000 0,000 Bacteroidetes 6,135 8,690 9,893 6,693 7,109 1,940 4,395 1,019 0,299 0,850 11,003 0,939 Chloroflexi 1,662 0,996 1,649 0,000 0,014 0,000 0,000 0,000 0,000 0,000 0,000 0,000 Cyanobacteria 0,069 0,074 0,056 0,000 0,000 0,000 0,037 0,127 0,000 0,637 2,139 0,248 Fibrobacteres 3,342 0,185 0,037 0,000 0,000 0,000 0,000 0,000 0,000 0,000 0,000 0,000 Firmicutes 0,497 0,129 0,130 66,100 51,788 42,264 23,616 7,053 43,952 48,258 7,005 77,064 Fusobacteria 0,000 0,000 0,000 0,000 0,000 0,011 0,007 0,035 0,000 0,467 0,000 0,000 GN02 0,137 0,000 0,000 0,000 0,116 0,000 0,000 0,000 0,000 0,000 0,000 0,000 Gemmatimonadetes 0,051 0,055 0,056 0,000 0,000 0,000 0,000 0,000 0,000 0,000 0,000 0,003 Lentisphaerae 0,017 0,000 0,000 0,000 0,043 0,000 0,000 0,000 0,000 0,000 0,000 0,000 OD1 0,034 0,055 0,204 0,000 0,029 0,000 0,000 0,000 0,000 0,000 0,000 0,000 Planctomycetes 1,748 1,328 0,371 0,000 0,014 0,000 0,007 0,000 0,000 0,000 0,289 0,107 Proteobacteria 67,678 61,402 64,635 25,410 37,484 52,396 69,276 82,328 42,515 44,817 67,975 17,178 SAR406 0,000 0,000 0,000 0,000 1,303 0,000 0,000 0,000 0,000 0,000 0,000 0,000 SR1 0,034 0,000 0,000 0,000 0,000 0,000 0,000 0,000 0,000 0,000 0,000 0,000 Spirochaetes 0,034 0,000 0,000 0,000 0,217 0,000 0,000 0,000 0,000 0,000 0,000 0,000 TM6 0,000 0,018 0,000 0,000 0,000 0,000 0,000 0,000 0,000 0,000 0,000 0,000 TM7 0,874 2,546 1,871 0,000 0,000 0,000 0,015 0,000 0,000 0,765 0,636 0,661 Tenericutes 0,034 0,074 0,000 1,134 0,782 2,647 0,853 6,057 11,916 0,425 0,000 0,067 Thermi 0,017 0,000 0,037 0,000 0,000 0,000 0,000 0,000 0,000 0,000 0,000 0,000 Verrucomicrobia 1,422 0,166 0,167 0,000 0,029 0,000 0,000 0,000 0,000 0,000 0,198 0,000 WPS-2 0,051 0,037 0,019 0,000 0,000 0,000 0,000 0,000 0,000 0,000 0,000 0,000 WS2 0,034 0,000 0,000 0,000 0,000 0,000 0,000 0,000 0,000 0,000 0,000 0,000 WYO 0,017 0,185 0,000 0,000 0,000 0,000 0,000 0,000 0,000 0,000 0,000 0,000
Table S1: Identification at Phylum level of the bacterial communities associated with the 12 weevil samples.

Supplementary materials 129
RPW
Pal
m
m1
RPW
Pal
m
f1
RPW
Pal
m
f2
RPW
A
pp
le
m1
RPW
A
pp
le
m2
RPW
A
pp
le
m3
RPW
A
pp
le
f1
RPW
A
pp
le
f2
RPW
A
pp
le
f3
R_v
uln
m
1
R_v
uln
f1
R_v
uln
f2
Unclassified 0,00 0,00 0,00 0,00 0,00 0,02 0,00 0,00 0,00 0,00 0,00 0,00 Other Bacteria 4,30 3,06 1,93 0,10 0,64 0,52 0,57 0,20 0,00 0,33 0,64 2,75 Acidobacteria Acidobacteriaceae 0,00 0,00 0,00 0,00 0,00 0,00 0,00 0,00 0,00 0,02 0,00 0,00 RB40 0,14 0,00 0,04 0,00 0,00 0,00 0,00 0,00 0,00 0,00 0,00 0,00 mb2424 0,03 0,02 0,02 0,00 0,00 0,00 0,00 0,00 0,00 0,00 0,00 0,00 Solibacteraceae 0,07 0,00 0,00 0,00 0,00 0,00 0,00 0,00 0,00 0,00 0,00 0,00 Other Acidobacteria 0,21 0,09 0,19 0,00 0,00 0,00 0,00 0,00 0,00 0,00 0,00 0,64 Actinobacteria C111 0,03 0,00 0,02 0,00 0,00 0,00 0,00 0,00 0,00 0,00 0,00 0,00 Microthrixaceae 0,19 0,00 0,00 0,00 0,00 0,00 0,00 0,00 0,00 0,00 0,00 0,00 ZA3409c 0,00 0,00 0,00 0,00 0,13 0,00 0,00 0,00 0,00 0,00 0,00 0,00 Actinomycetaceae 0,17 0,22 0,04 0,00 0,00 0,00 0,01 0,00 0,00 0,00 0,04 0,00 Beutenbergiaceae 0,00 0,00 0,00 0,00 0,00 0,00 0,00 0,00 0,00 0,00 0,00 0,00 Brevibacteriaceae 0,00 0,00 0,00 0,00 0,00 0,00 0,00 0,00 0,00 0,03 0,00 0,00 Cellulomonadaceae 3,14 4,21 1,15 0,00 0,00 0,00 0,00 0,00 0,00 0,00 0,08 0,00 Corynebacteriaceae 0,00 0,06 0,00 0,00 0,00 0,05 0,29 0,02 0,18 0,21 0,00 0,46 Dermabacteraceae 0,00 0,00 0,00 0,00 0,00 0,00 0,00 0,00 0,00 0,10 0,00 0,00 Frankiaceae 0,00 0,00 0,04 0,00 0,00 0,00 0,00 0,00 0,00 0,00 0,00 0,00 Gordoniaceae 0,21 0,55 1,19 0,00 0,00 0,00 0,00 0,00 0,00 0,03 0,00 0,52 Intrasporangiaceae 0,02 0,02 0,07 0,00 0,00 0,00 0,00 0,00 0,00 0,00 0,00 0,00 Microbacteriaceae 1,15 6,37 6,84 0,57 0,29 0,10 0,62 3,15 0,72 2,94 3,31 1,97 Micrococcaceae 0,05 0,00 0,07 0,00 0,00 0,00 0,01 0,00 0,12 0,00 0,00 0,59 Micromonosporaceae 0,48 0,00 0,00 0,00 0,00 0,00 0,00 0,00 0,00 0,00 0,00 0,00 Mycobacteriaceae 0,00 0,11 0,07 0,00 0,00 0,00 0,00 0,00 0,00 0,00 0,00 0,12 Nakamurellaceae 0,07 0,00 0,02 0,00 0,00 0,00 0,00 0,00 0,00 0,00 0,00 0,00 Nocardioidaceae 1,59 4,41 5,74 0,00 0,00 0,00 0,00 0,00 0,00 0,02 0,08 0,00 Promicromonosporaceae 0,00 0,26 0,39 0,00 0,00 0,00 0,00 0,00 0,00 0,00 0,00 0,00 Propionibacteriaceae 0,00 0,00 0,00 0,00 0,00 0,00 0,04 0,09 0,24 0,03 0,17 2,92 Pseudonocardiaceae 0,00 0,00 0,00 0,00 0,00 0,00 0,00 0,00 0,00 0,00 0,00 0,01 Streptomycetaceae 0,02 0,07 0,89 0,00 0,00 0,00 0,00 0,00 0,00 0,05 0,00 0,00 Streptosporangiaceae 0,00 0,00 0,04 0,00 0,00 0,00 0,00 0,00 0,00 0,00 0,00 0,00 Tsukamurellaceae 0,00 0,00 0,00 0,00 0,00 0,00 0,00 0,00 0,00 0,00 0,00 0,90 Bifidobacteriaceae 0,00 0,00 0,00 0,00 0,00 0,00 0,00 0,00 0,00 0,01 0,00 0,00 AK1AB1_02E 0,09 0,22 0,00 0,00 0,00 0,00 0,00 0,00 0,00 0,00 0,00 0,00 Gaiellaceae 0,00 0,00 0,00 0,00 0,00 0,00 0,00 0,00 0,00 0,00 0,00 0,58 Patulibacteraceae 0,00 0,06 0,13 0,00 0,00 0,00 0,00 0,00 0,00 0,00 0,00 0,00 Solirubrobacteraceae 0,00 0,00 0,06 0,00 0,00 0,00 0,00 0,00 0,00 0,00 0,00 0,00 Other Actinobacteria 4,20 4,48 2,02 0,00 0,01 0,05 0,28 0,05 0,06 0,23 0,08 1,45 Armatimonadetes Armatimonadaceae 0,07 0,00 0,00 0,00 0,00 0,00 0,00 0,00 0,00 0,00 0,00 0,00 Fimbriimonadaceae 0,03 0,17 0,02 0,00 0,00 0,00 0,00 0,00 0,00 0,00 0,00 0,00 Other Armatimonadetes 0,07 0,00 0,00 0,00 0,00 0,00 0,00 0,00 0,00 0,00 0,00 0,00 Bacteroidetes Bacteroidaceae 0,00 0,00 0,00 0,01 0,10 0,00 0,16 0,00 0,24 0,00 0,00 0,00 Porphyromonadaceae 0,05 0,00 0,00 6,64 6,76 1,92 1,64 0,73 0,06 0,00 0,17 0,50

130 Supplementary materials
RPW
Pal
m
m1
RPW
Pal
m
f1
RPW
Pal
m
f2
RPW
A
pp
le
m1
RPW
A
pp
le
m2
RPW
A
pp
le
m3
RPW
A
pp
le
f1
RPW
A
pp
le
f2
RPW
A
pp
le
f3
R_v
uln
m
1
R_v
uln
f1
R_v
uln
f2
Prevotellaceae 0,02 0,07 0,00 0,00 0,00 0,01 0,00 0,00 0,00 0,00 0,04 0,00 Rikenellaceae 0,00 0,00 0,00 0,00 0,06 0,00 0,00 0,00 0,00 0,00 0,00 0,00 S24-7 0,05 0,00 0,00 0,00 0,00 0,00 0,00 0,00 0,00 0,00 0,00 0,00 VC21_Bac22 0,00 0,00 0,00 0,00 0,13 0,00 0,00 0,00 0,00 0,00 0,00 0,00 Paraprevotellaceae 0,00 0,00 0,00 0,00 0,00 0,00 0,02 0,00 0,00 0,00 0,00 0,00 Cryomorphaceae 0,09 0,00 0,20 0,00 0,00 0,00 0,00 0,00 0,00 0,00 0,00 0,00 Flavobacteriaceae 0,86 2,93 3,52 0,00 0,00 0,00 0,54 0,01 0,00 0,00 0,34 3,54 Chitinophagaceae 2,72 1,81 1,37 0,04 0,00 0,00 0,14 0,28 0,00 0,03 0,00 0,45 Flammeovirgaceae 0,75 0,54 0,09 0,00 0,00 0,00 0,00 0,00 0,00 0,00 0,00 0,01 Flexibacteraceae 0,09 0,00 1,65 0,00 0,00 0,00 0,00 0,00 0,00 0,00 0,00 0,42 Saprospiraceae 0,51 1,25 0,76 0,00 0,00 0,00 0,00 0,00 0,00 0,00 0,00 0,00 Sphingobacteriaceae 0,07 1,00 1,54 0,00 0,00 0,00 0,01 0,00 0,00 0,91 0,25 5,46 Other Bacteroidetes 0,93 1,09 0,76 0,00 0,06 0,01 1,89 0,00 0,00 0,00 0,04 0,63 Chloroflexi Anaerolinaceae 0,03 0,00 0,83 0,00 0,00 0,00 0,00 0,00 0,00 0,00 0,00 0,00 Caldilineaceae 0,12 0,55 0,43 0,00 0,00 0,00 0,00 0,00 0,00 0,00 0,00 0,00 A4b 1,27 0,04 0,06 0,00 0,00 0,00 0,00 0,00 0,00 0,00 0,00 0,00 Other Chloroflexi 0,24 0,41 0,33 0,00 0,01 0,00 0,00 0,00 0,00 0,00 0,00 0,00 Fibrobacteres Fibrobacteraceae 0,02 0,00 0,00 0,00 0,00 0,00 0,00 0,00 0,00 0,00 0,00 0,00 Other Fibrobacteres 3,32 0,18 0,04 0,00 0,00 0,00 0,00 0,00 0,00 0,00 0,00 0,00 Firmicutes Bacillaceae 0,00 0,00 0,00 0,00 0,00 0,00 0,01 0,00 0,00 0,07 0,04 0,13 Paenibacillaceae 0,14 0,07 0,00 0,00 0,00 0,00 0,03 0,42 0,00 0,00 0,00 0,66 Planococcaceae 0,00 0,00 0,00 0,00 0,00 0,00 0,01 0,00 0,00 0,00 0,00 0,00 Staphylococcaceae 0,00 0,00 0,06 0,00 0,00 0,00 0,01 0,00 0,00 0,16 0,81 0,29 Aerococcaceae 0,00 0,00 0,00 0,00 0,00 0,00 0,00 0,00 0,00 0,00 0,00 0,74 Enterococcaceae 0,00 0,00 0,04 0,68 11,52 9,03 0,24 0,01 0,00 0,00 0,00 0,00 Lactobacillaceae 0,00 0,00 0,00 15,33 2,10 5,65 3,67 0,74 2,75 6,78 2,17 0,18 Leuconostocaceae 0,00 0,00 0,00 40,88 22,15 14,54 5,07 2,17 22,16 69,19 41,21 1,37 Streptococcaceae 0,00 0,00 0,00 4,49 13,62 4,95 11,05 2,93 18,74 0,35 0,38 0,62 Catabacteriaceae 0,02 0,00 0,00 0,00 0,00 0,00 0,00 0,00 0,00 0,00 0,00 0,00 Clostridiaceae 0,00 0,00 0,00 0,01 0,00 0,00 0,00 0,02 0,00 0,04 0,00 2,30 Lachnospiraceae 0,09 0,02 0,00 3,73 1,65 6,00 1,74 0,60 0,00 0,00 0,00 0,17 Peptococcaceae 0,03 0,00 0,00 0,00 0,00 0,00 0,00 0,00 0,00 0,00 0,00 0,00 Peptostreptococcaceae 0,00 0,00 0,00 0,00 0,09 0,00 0,00 0,01 0,00 0,00 0,00 0,00 Ruminococcaceae 0,09 0,00 0,00 0,00 0,00 0,01 0,02 0,00 0,24 0,02 0,04 0,00 Veillonellaceae 0,00 0,00 0,00 0,00 0,04 0,00 0,01 0,03 0,00 0,34 0,59 0,40 Coriobacteriaceae 0,00 0,00 0,00 0,00 0,00 0,00 0,00 0,00 0,00 0,01 0,00 0,00 Erysipelotrichaceae 0,05 0,00 0,00 0,07 0,01 0,43 1,34 0,00 0,00 0,00 1,53 0,14 Other Firmicutes 0,09 0,04 0,04 0,92 0,59 1,65 0,42 0,12 0,06 0,10 1,49 0,00 Fusobacteria Fusobacteriaceae 0,00 0,00 0,00 0,00 0,00 0,01 0,01 0,03 0,00 0,00 0,47 0,00 Other Bacteria 0,24 0,11 0,26 0,00 0,19 0,00 0,00 0,00 0,00 0,00 0,00 0,00 Planctomycetes Isosphaeraceae 0,09 0,00 0,00 0,00 0,00 0,00 0,01 0,00 0,00 0,06 0,00 0,00

Supplementary materials 131
RPW
Pal
m
m1
RPW
Pal
m
f1
RPW
Pal
m
f2
RPW
A
pp
le
m1
RPW
A
pp
le
m2
RPW
A
pp
le
m3
RPW
A
pp
le
f1
RPW
A
pp
le
f2
RPW
A
pp
le
f3
R_v
uln
m
1
R_v
uln
f1
R_v
uln
f2
Pirellulaceae 0,51 0,37 0,07 0,00 0,00 0,00 0,00 0,00 0,00 0,00 0,00 0,02 Planctomycetaceae 1,01 0,59 0,22 0,00 0,00 0,00 0,00 0,00 0,00 0,04 0,00 0,27 Other Planctomycetes 0,14 0,37 0,07 0,00 0,01 0,00 0,00 0,00 0,00 0,01 0,00 0,00 Proteobacteria Caulobacteraceae 1,20 0,94 1,19 0,00 0,00 0,00 0,04 0,00 0,00 0,03 0,13 0,77 Kiloniellaceae 0,05 0,00 0,00 0,00 0,00 0,00 0,00 0,00 0,00 0,00 0,00 0,00 Aurantimonadaceae 0,03 0,07 0,02 0,00 0,00 0,00 0,00 0,00 0,00 0,00 0,00 0,00 Bradyrhizobiaceae 0,36 0,00 0,04 0,00 0,00 0,00 0,00 0,00 0,00 0,07 0,04 1,27 Brucellaceae 0,00 0,00 0,00 0,00 0,03 0,00 0,00 0,00 0,48 0,00 2,80 0,00 Hyphomicrobiaceae 6,05 3,28 2,82 0,00 0,00 0,00 0,00 0,00 0,00 0,07 0,34 0,97 Methylocystaceae 0,17 0,00 0,00 0,00 0,00 0,00 0,01 0,00 0,00 0,00 0,08 0,69 Phyllobacteriaceae 3,60 5,18 4,65 0,00 0,00 0,00 0,00 0,00 0,00 0,20 0,00 1,29 Rhizobiaceae 3,41 1,16 2,26 0,00 0,00 0,00 0,00 0,00 0,06 0,87 0,08 0,36 Xanthobacteraceae 0,00 0,00 0,04 0,00 0,00 0,00 0,00 0,00 0,00 0,12 0,00 0,37 Hyphomonadaceae 0,10 0,09 0,07 0,00 0,00 0,00 0,00 0,00 0,00 0,00 0,00 0,00 Rhodobacteraceae 2,88 24,17 8,58 0,00 0,07 0,00 0,07 0,02 0,00 0,87 0,68 2,92 Acetobacteraceae 0,17 0,22 0,20 8,94 2,81 18,28 45,98 62,71 29,64 0,62 0,25 0,34 Rhodospirillaceae 0,55 0,11 0,07 0,01 0,03 0,00 0,00 0,00 0,00 0,00 0,00 0,00 Pelagibacteraceae 0,00 0,00 0,00 0,00 0,04 0,00 0,00 0,00 0,00 0,00 0,00 0,00 mitochondria 0,05 0,04 0,00 0,00 0,03 0,00 0,02 0,01 0,00 0,02 0,21 0,03 Erythrobacteraceae 1,59 2,18 1,07 0,00 0,00 0,00 0,00 0,00 0,00 0,03 0,00 0,00 Sphingomonadaceae 0,24 0,66 1,46 0,00 0,00 0,00 0,00 0,01 0,00 0,29 0,00 0,62 Alcaligenaceae 0,07 0,00 0,07 0,00 0,00 0,00 0,00 0,00 0,00 0,03 0,00 0,23 Comamonadaceae 2,83 0,46 0,72 2,89 2,08 0,86 5,63 13,21 6,05 8,31 19,54 5,69 Oxalobacteraceae 0,00 0,00 0,00 0,00 0,01 0,00 0,01 0,00 0,00 2,39 8,41 38,94 Methylophilaceae 0,00 0,00 0,11 0,00 0,00 0,00 0,00 0,00 0,00 0,00 0,00 0,00 Neisseriaceae 0,00 0,00 0,00 0,00 0,00 0,00 0,00 0,00 0,06 0,00 0,00 0,11 Nitrosomonadaceae 0,29 0,00 0,00 0,00 0,00 0,00 0,00 0,00 0,00 0,00 0,00 0,00 Rhodocyclaceae 0,14 0,00 0,00 0,00 0,00 0,00 0,00 0,01 0,00 0,00 0,00 0,02 Bacteriovoracaceae 0,00 0,26 0,02 0,00 0,00 0,00 0,00 0,00 0,00 0,00 0,00 0,00 Bdellovibrionaceae 0,00 0,02 0,00 0,00 0,00 0,00 0,00 0,00 0,00 0,00 0,00 0,00 Nitrospinaceae 0,00 0,00 0,00 0,00 0,03 0,00 0,00 0,00 0,00 0,00 0,00 0,00 Geobacteraceae 0,00 0,00 0,00 0,00 0,00 0,01 0,00 0,00 0,30 0,00 0,00 0,00 0319-6G20 0,02 0,00 0,00 0,00 0,00 0,00 0,00 0,00 0,00 0,00 0,00 0,00 Haliangiaceae 0,02 0,00 0,00 0,00 0,00 0,00 0,00 0,00 0,00 0,00 0,00 0,00 Polyangiaceae 0,07 0,00 0,00 0,00 0,00 0,00 0,00 0,00 0,00 0,00 0,00 0,00 JTB36 0,00 0,00 0,00 0,00 0,06 0,00 0,00 0,00 0,00 0,00 0,00 0,00 Desulfobacteraceae 0,00 0,00 0,00 0,00 1,06 0,00 0,00 0,00 0,00 0,00 0,00 0,00 Syntrophobacteraceae 0,02 0,00 0,00 0,00 0,00 0,00 0,00 0,00 0,00 0,00 0,00 0,00 Campylobacteraceae 0,00 0,00 0,00 0,00 0,03 0,00 0,00 0,00 0,00 0,00 0,08 0,23 Aeromonadaceae 0,03 0,00 0,00 0,00 0,00 0,00 0,00 0,00 0,00 0,00 0,00 0,15 Succinivibrionaceae 0,07 0,00 0,00 0,00 0,00 0,00 0,00 0,00 0,00 0,00 0,00 0,00 Alteromonadaceae 0,24 0,42 0,00 0,00 0,00 0,00 0,00 0,00 0,00 0,00 0,00 0,00 Idiomarinaceae 0,00 0,00 0,00 0,00 0,01 0,00 0,00 0,00 0,00 0,00 0,00 0,00 Enterobacteriaceae 0,05 0,35 3,06 13,22 6,91 19,92 12,80 5,56 4,85 1,44 2,17 1,74 FCPT525 0,07 0,00 0,00 0,00 0,00 0,00 0,00 0,00 0,00 0,00 0,00 0,00

132 Supplementary materials
RPW
Pal
m
m1
RPW
Pal
m
f1
RPW
Pal
m
f2
RPW
A
pp
le
m1
RPW
A
pp
le
m2
RPW
A
pp
le
m3
RPW
A
pp
le
f1
RPW
A
pp
le
f2
RPW
A
pp
le
f3
R_v
uln
m
1
R_v
uln
f1
R_v
uln
f2
211ds20 0,45 0,15 0,02 0,00 0,00 0,00 0,00 0,00 0,00 0,00 0,00 0,00 Coxiellaceae 0,07 0,00 0,00 0,00 0,00 0,00 0,00 0,00 0,00 0,01 0,00 0,00 Legionellaceae 0,00 0,07 0,02 0,00 0,00 0,00 0,00 0,00 0,00 0,11 0,04 0,09 Halomonadaceae 0,00 0,00 0,00 0,00 0,07 0,00 0,00 0,00 0,00 0,00 0,00 0,00 SUP05 0,00 0,00 0,00 0,00 0,16 0,00 0,00 0,00 0,00 0,00 0,00 0,00 Pasteurellaceae 0,00 0,00 0,00 0,00 0,00 0,01 0,04 0,06 0,00 0,00 3,57 0,59 Moraxellaceae 0,27 0,46 5,78 0,00 0,00 0,00 0,04 0,02 0,12 0,38 0,08 2,62 Pseudomonadaceae 2,07 1,25 5,95 0,01 16,61 7,47 0,40 0,00 0,12 0,01 0,04 0,93 Salinisphaeraceae 0,00 0,00 0,00 0,00 0,01 0,00 0,00 0,00 0,00 0,00 0,00 0,00 Thiohalorhabdaceae 0,00 0,00 0,00 0,00 0,03 0,00 0,00 0,00 0,00 0,00 0,00 0,00 Piscirickettsiaceae 0,00 0,00 0,00 0,00 0,01 0,00 0,00 0,00 0,00 0,00 0,00 0,00 Sinobacteraceae 4,82 1,07 0,96 0,00 0,00 0,00 0,00 0,00 0,00 0,00 0,00 0,00 Xanthomonadaceae 15,85 8,60 15,15 0,10 0,09 0,15 4,02 0,52 0,18 0,13 0,13 2,18 Other Proteobacteria 19,78 10,17 10,30 0,24 7,30 5,69 0,21 0,19 0,66 1,19 6,12 4,82 SAR406 A714017 0,00 0,00 0,00 0,00 1,29 0,00 0,00 0,00 0,00 0,00 0,00 0,00 Other SAR 406 0,00 0,00 0,00 0,00 0,01 0,00 0,00 0,00 0,00 0,00 0,00 0,00 Spirochaetes Spirochaetaceae 0,03 0,00 0,00 0,00 0,00 0,00 0,00 0,00 0,00 0,00 0,00 0,00 ST-3K10 0,00 0,00 0,00 0,00 0,16 0,00 0,00 0,00 0,00 0,00 0,00 0,00 MSBL8 0,00 0,00 0,00 0,00 0,06 0,00 0,00 0,00 0,00 0,00 0,00 0,00 TM7 Rs-045 0,00 0,06 0,00 0,00 0,00 0,00 0,00 0,00 0,00 0,00 0,00 0,00 Other TM7 0,87 2,49 1,87 0,00 0,00 0,00 0,01 0,00 0,00 0,66 0,76 0,64 Tenericutes Acholeplasmataceae 0,03 0,07 0,00 0,00 0,00 0,00 0,00 0,00 0,00 0,00 0,00 0,00 Entomoplasmataceae 0,00 0,00 0,00 1,13 0,78 2,64 0,85 6,06 11,92 0,00 0,13 0,00 Mycoplasmataceae 0,00 0,00 0,00 0,00 0,00 0,00 0,00 0,00 0,00 0,02 0,00 0,00 Other Tenericutes 0,00 0,00 0,00 0,00 0,00 0,01 0,00 0,00 0,00 0,05 0,30 0,00 Thermi Deinococcaceae 0,02 0,00 0,04 0,00 0,00 0,00 0,00 0,00 0,00 0,00 0,00 0,00 Verrucomicrobia 0,00 0,00 0,00 0,00 0,00 0,00 0,00 0,00 0,00 0,00 0,00 0,00 Opitutaceae 1,06 0,15 0,09 0,00 0,00 0,00 0,00 0,00 0,00 0,00 0,00 0,00 Verrucomicrobiaceae 0,26 0,02 0,00 0,00 0,01 0,00 0,00 0,00 0,00 0,00 0,00 0,20 Chthoniobacteraceae 0,03 0,00 0,07 0,00 0,00 0,00 0,00 0,00 0,00 0,00 0,00 0,00 Other Verrucomicrobia 0,07 0,00 0,00 0,00 0,01 0,00 0,00 0,00 0,00 0,00 0,00 0,00
Table S2: Identification at Family level of the bacterial communities associated with the 12 weevil samples.

Supplementary materials 133
OT
Us
RPW
p
alm
_m1
RPW
p
alm
_f1
RPW
p
alm
_f2
RPW
ap
ple
_f1
RPW
ap
ple
_f2
RPW
ap
ple
_f3
RPW
ap
ple
_m1
RPW
ap
ple
_m2
RPW
ap
ple
_m3
R_v
uln
f1
R_v
uln
f2
R_v
ul
_m1
1 0 0 12 31 9 0 38 5 46 0 17 50
2 0 0 0 10 4 0 0 0 0 0 1 0
3 0 0 2 0 0 0 0 0 0 0 0 0
4 0 0 0 2 5 0 5 0 17 0 0 0
5 0 0 1 0 0 0 0 0 0 0 0 0
6 0 0 1 146 0 0 1 1 3 0 0 0
7 1 0 0 148 2 0 0 25 1 0 0 5
8 0 0 0 10 0 0 1 1 0 0 0 0
9 0 0 0 2 0 0 0 0 0 0 0 0
10 0 0 0 1 0 0 0 0 0 0 0 0
11 0 0 0 0 0 0 0 0 1 0 0 1
12 0 0 7 0 0 0 1 0 0 0 0 0
13 0 0 0 1 0 0 0 0 1 0 0 2
14 0 1 15 139 6 0 59 57 110 0 173 721
15 0 0 1 6 4 0 23 1 15 0 0 0
16 0 0 0 0 0 0 0 0 0 0 0 1
17 0 0 0 1 0 0 0 0 0 0 7 9
18 0 0 0 3 0 0 0 0 0 0 0 0
19 0 0 0 0 0 0 0 0 3 0 0 0
20 0 0 0 561 391 42 4 231 453 0 0 0
21 2 1 15 8 9 0 601 0 106 7 0 0
22 0 0 0 1 0 0 0 1 4 0 1 27
23 0 0 1 0 0 0 0 0 0 0 0 0
24 0 0 0 0 0 0 2 0 0 0 0 0
25 0 0 15 142 2 1 34 46 183 6 0 5
26 0 0 0 0 0 0 0 0 1 0 0 3
OT
Us
RPW
p
alm
_m1
RPW
p
alm
_f1
RPW
p
alm
_f2
RPW
ap
ple
_f1
RPW
ap
ple
_f2
RPW
ap
ple
_f3
RPW
ap
ple
_m1
RPW
ap
ple
_m2
RPW
ap
ple
_m3
R_v
uln
f1
R_v
uln
f2
R_v
ul
_m1
27 0 0 0 9 0 0 1 0 3 0 0 0
28 0 0 0 0 0 0 1 0 2 0 0 0
29 0 1 0 0 0 0 0 0 2 0 0 0
30 0 0 0 1 0 0 0 0 0 0 0 0
31 0 0 0 0 0 0 0 0 4 0 0 0
Tot 3 3 70 1222 432 43 771 368 955 13 199 824
Table S3: Bacterial OTUs identified as "Candidatus Nardonella"

134 Supplementary materials
Predicted gene family percentage / weevil sample RPW
_pal
m_m
1
RPW
_pal
m_f
1
RPW
_pal
m_f
2
RPW
_ap
ple
_m1
RPW
_ap
ple
_m2
RPW
_ap
ple
_m3
RPW
_ap
ple
_f1
RPW
_ap
ple
_f2
RPW
_ap
ple
_f3
R_v
uln
erat
us_
m1
R_v
uln
erat
us_
f1
R_v
uln
erat
us_
f2
Cellular Processes;Cell Growth and Death;
Apoptosis 0,00 0,10 0,00 0,00 0,00 0,10 0,10 0,10 0,00 0,00 0,00 0,00
Cell cycle - Caulobacter 0,50 0,50 0,50 0,40 0,60 0,50 0,60 0,50 0,90 0,60 0,80 0,40
Meiosis - yeast 0,10 0,00 0,10 0,00 0,00 0,00 0,00 0,00 0,00 0,00 0,00 0,10
p53 signaling pathway 0,00 0,10 0,00 0,00 0,00 0,00 0,00 0,00 0,00 0,00 0,00 0,00
Cellular Processes;Cell Motility;
Bacterial chemotaxis 0,60 0,70 0,60 0,10 0,40 0,20 0,10 0,20 0,40 0,30 0,10 0,50
Bacterial motility proteins 1,60 1,30 1,60 0,10 0,90 0,50 0,10 0,40 1,00 0,70 0,70 1,20
Cytoskeleton proteins 0,20 0,20 0,20 0,20 0,20 0,30 0,40 0,30 0,20 0,30 0,20 0,20
Flagellar assembly 0,70 0,70 0,70 0,00 0,40 0,20 0,00 0,20 0,80 0,30 0,50 0,50
Cellular Processes;Transport and Catabolism;
Lysosome 0,00 0,00 0,00 0,00 0,10 0,00 0,00 0,00 0,00 0,00 0,00 0,10
Peroxisome 0,20 0,20 0,20 0,10 0,20 0,10 0,10 0,20 0,10 0,20 0,10 0,30
Environmental Information Processing;
Membrane Transport;ABC transporters 3,80 5,60 4,70 3,80 3,40 2,90 2,30 2,60 5,50 5,00 4,60 4,00
Membrane Transport;Bacterial secretion system 0,90 0,60 0,90 0,40 0,80 0,60 0,70 0,70 1,50 0,80 1,20 0,70
Membrane Transport;Phosphotransferase system (PTS) 0,10 0,10 0,20 1,90 0,40 0,60 0,00 0,10 0,10 0,10 0,20 0,10
Membrane Transport;Secretion system 1,90 1,20 1,70 0,90 1,30 1,20 1,10 1,20 1,70 1,30 1,70 1,30
Membrane Transport;Transporters 6,00 8,20 7,60 9,50 6,10 5,60 3,90 4,60 8,80 8,30 7,50 6,30
Signal Transduction;MAPK signaling pathway - yeast 0,00 0,00 0,00 0,10 0,10 0,10 0,10 0,10 0,10 0,00 0,10 0,00
Signal Transduction;Phosphatidylinositol signaling system 0,10 0,10 0,10 0,10 0,10 0,10 0,10 0,10 0,10 0,10 0,10 0,10
Signal Transduction;Two-component system 2,10 1,90 2,00 1,20 1,50 1,50 1,40 1,40 1,40 1,20 1,20 1,90
Signaling Molecules and Interaction;Bacterial toxins 0,10 0,00 0,00 0,20 0,10 0,10 0,10 0,10 0,00 0,00 0,00 0,10
Signaling Molecules and Interaction;Cellular antigens 0,10 0,00 0,10 0,00 0,10 0,10 0,10 0,10 0,00 0,00 0,00 0,10
Genetic Information Processing;
Folding, Sorting and Degradation;Chaperones and folding catalysts 0,90 0,70 0,90 0,90 1,00 1,00 1,10 1,00 0,90 0,80 0,90 0,70
Folding, Sorting and Degradation;Protein export 0,50 0,40 0,50 0,50 0,60 0,60 0,60 0,60 0,60 0,80 0,80 0,40
Folding, Sorting and Degradation;RNA degradation 0,40 0,30 0,40 0,40 0,50 0,50 0,50 0,50 0,50 0,50 0,60 0,40
Folding, Sorting and Degradation;Sulfur relay system 0,30 0,30 0,30 0,20 0,30 0,30 0,40 0,30 0,20 0,30 0,20 0,30
Replication and Repair;Base excision repair 0,40 0,30 0,40 0,40 0,40 0,40 0,40 0,40 0,40 0,60 0,60 0,40
Replication and Repair;Chromosome 1,20 1,10 1,20 1,40 1,50 1,50 1,60 1,50 1,30 1,20 1,30 1,00

Supplementary materials 135
Replication and Repair;DNA repair and recombination proteins 2,10 1,80 2,10 2,60 2,70 2,30 2,30 2,40 2,50 3,00 3,10 1,80
Replication and Repair;DNA replication 0,50 0,50 0,50 0,60 0,70 0,50 0,50 0,50 0,70 0,70 0,80 0,40
Replication and Repair;DNA replication proteins 0,80 0,80 0,80 1,10 1,20 0,90 0,90 0,90 1,10 1,10 1,30 0,70
Replication and Repair;Homologous recombination 0,60 0,60 0,70 0,80 0,90 0,70 0,70 0,80 0,90 1,00 1,00 0,50
Replication and Repair;Mismatch repair 0,60 0,60 0,60 0,70 0,80 0,60 0,50 0,60 0,80 0,80 0,90 0,50
Replication and Repair;Non-homologous end-joining 0,10 0,00 0,10 0,00 0,00 0,00 0,00 0,00 0,00 0,00 0,00 0,10
Replication and Repair;Nucleotide excision repair 0,30 0,20 0,30 0,30 0,40 0,30 0,30 0,30 0,30 0,50 0,40 0,30
Transcription;RNA polymerase 0,10 0,10 0,10 0,20 0,20 0,10 0,10 0,20 0,20 0,20 0,20 0,10
Transcription;Transcription factors 1,30 1,50 1,30 1,90 1,20 1,40 1,00 1,20 1,10 1,20 1,20 1,30
Transcription;Transcription machinery 0,70 0,50 0,60 0,50 0,70 0,50 0,50 0,60 0,60 0,70 0,70 0,70
Translation;Aminoacyl-tRNA biosynthesis 0,90 0,80 0,90 1,20 1,20 1,10 1,20 1,20 1,30 1,50 1,60 0,80
Translation;RNA transport 0,10 0,00 0,10 0,20 0,10 0,10 0,10 0,10 0,00 0,00 0,00 0,00
Translation;Ribosome 1,60 1,40 1,60 2,20 2,40 1,90 1,90 2,00 2,30 2,80 2,90 1,40
Translation;Ribosome Biogenesis 1,10 0,90 1,00 1,30 1,30 1,10 1,10 1,10 1,40 1,00 1,30 0,80
Translation;Ribosome biogenesis in eukaryotes 0,00 0,00 0,00 0,00 0,00 0,00 0,00 0,00 0,00 0,10 0,10 0,00
Translation;Translation factors 0,40 0,30 0,40 0,50 0,50 0,40 0,40 0,40 0,50 0,50 0,60 0,30
Metabolism;Amino Acid Metabolism;
Alanine, aspartate and glutamate metabolism 0,80 0,90 0,90 0,80 1,10 0,90 1,00 1,00 0,80 1,10 1,00 0,80
Amino acid related enzymes 1,20 1,20 1,20 1,30 1,50 1,50 1,60 1,60 1,10 1,60 1,50 1,10
Arginine and proline metabolism 1,30 1,30 1,30 1,20 1,40 1,30 1,40 1,30 1,40 1,10 1,20 1,40
Cysteine and methionine metabolism 0,70 0,70 0,70 0,90 0,90 1,00 1,00 1,00 0,40 0,70 0,60 0,70
Glycine, serine and threonine metabolism 0,90 1,00 1,00 0,70 0,90 0,90 0,90 0,90 0,90 1,10 0,90 1,00
Histidine metabolism 0,50 0,60 0,50 0,40 0,70 0,60 0,70 0,60 0,30 0,40 0,30 0,60
Lysine biosynthesis 0,60 0,60 0,60 0,70 0,80 0,60 0,60 0,60 0,80 0,60 0,70 0,50
Lysine degradation 0,70 0,80 0,60 0,10 0,30 0,20 0,20 0,30 0,50 0,50 0,40 0,80
Phenylalanine metabolism 0,40 0,40 0,40 0,10 0,30 0,30 0,30 0,30 0,30 0,30 0,30 0,50
Phenylalanine, tyrosine and tryptophan biosynthesis 0,60 0,60 0,60 0,50 0,80 0,70 0,80 0,80 0,50 0,80 0,70 0,60
Tryptophan metabolism 0,80 0,80 0,70 0,20 0,30 0,30 0,30 0,30 0,50 0,50 0,40 0,90
Tyrosine metabolism 0,50 0,60 0,50 0,60 0,60 0,80 0,90 0,80 0,60 0,60 0,60 0,60
Valine, leucine and isoleucine biosynthesis 0,60 0,60 0,70 0,80 0,70 0,80 0,80 0,80 0,60 0,80 0,70 0,70
Valine, leucine and isoleucine degradation 1,10 1,20 1,00 0,30 0,50 0,30 0,40 0,40 0,70 0,90 0,70 1,30
Metabolism;Biosynthesis of Other Secondary Metabolites;
Butirosin and neomycin biosynthesis 0,00 0,00 0,10 0,00 0,00 0,00 0,00 0,00 0,00 0,10 0,00 0,00
Isoquinoline alkaloid biosynthesis 0,10 0,10 0,10 0,00 0,10 0,10 0,10 0,10 0,00 0,10 0,10 0,10
Novobiocin biosynthesis 0,10 0,10 0,10 0,10 0,20 0,20 0,20 0,20 0,10 0,20 0,20 0,10
Penicillin and cephalosporin biosynthesis 0,10 0,00 0,10 0,00 0,00 0,00 0,00 0,00 0,00 0,10 0,00 0,00
Phenylpropanoid biosynthesis 0,10 0,10 0,10 0,30 0,10 0,10 0,00 0,00 0,00 0,10 0,10 0,10
Stilbenoid, diarylheptanoid and gingerol biosynthesis 0,00 0,00 0,00 0,00 0,00 0,00 0,00 0,00 0,00 0,00 0,00 0,10
Streptomycin biosynthesis 0,30 0,30 0,30 0,30 0,30 0,30 0,40 0,40 0,20 0,30 0,30 0,30

136 Supplementary materials
Tropane, piperidine and pyridine alkaloid biosynthesis 0,10 0,10 0,10 0,00 0,20 0,10 0,20 0,20 0,10 0,10 0,10 0,20
beta-Lactam resistance 0,00 0,00 0,00 0,00 0,00 0,00 0,00 0,00 0,00 0,10 0,00 0,00
Metabolism;Carbohydrate Metabolism;
Amino sugar and nucleotide sugar metabolism 0,90 0,80 0,90 1,80 1,10 1,10 0,90 0,90 0,70 1,00 0,90 0,80
Ascorbate and aldarate metabolism 0,20 0,20 0,20 0,20 0,10 0,20 0,10 0,20 0,10 0,20 0,20 0,20
Butanoate metabolism 1,20 1,40 1,10 1,00 0,90 1,40 1,70 1,50 0,90 1,00 0,80 1,50
C5-Branched dibasic acid metabolism 0,30 0,30 0,30 0,30 0,20 0,30 0,30 0,30 0,20 0,30 0,30 0,30
Citrate cycle (TCA cycle) 0,80 0,70 0,80 0,70 0,80 0,70 0,70 0,80 0,90 0,80 0,90 0,90
Fructose and mannose metabolism 0,50 0,50 0,60 1,50 0,90 1,60 1,80 1,60 0,50 0,60 0,60 0,70
Galactose metabolism 0,30 0,30 0,40 1,00 0,40 0,40 0,10 0,20 0,20 0,30 0,30 0,30
Glycolysis / Gluconeogenesis 1,00 1,10 1,10 1,70 1,10 1,40 1,30 1,30 1,00 1,30 1,20 1,20
Glyoxylate and dicarboxylate metabolism 0,90 1,20 0,90 0,40 0,50 0,60 0,60 0,60 0,60 0,50 0,40 1,00
Inositol phosphate metabolism 0,20 0,10 0,20 0,10 0,10 0,20 0,30 0,30 0,20 0,10 0,10 0,20
Pentose and glucuronate interconversions 0,40 0,40 0,40 0,50 0,40 0,40 0,30 0,30 0,30 0,40 0,30 0,40
Pentose phosphate pathway 0,60 0,60 0,60 0,90 0,80 0,80 0,70 0,70 0,70 0,80 0,80 0,70
Propanoate metabolism 1,20 1,30 1,10 0,50 0,70 0,70 0,80 0,80 0,80 0,80 0,70 1,30
Pyruvate metabolism 1,10 1,40 1,20 1,30 1,20 1,30 1,40 1,30 1,30 1,10 1,10 1,40
Starch and sucrose metabolism 0,50 0,40 0,50 1,30 0,60 0,70 0,50 0,50 0,20 0,40 0,30 0,50
Metabolism;Energy Metabolism;
Carbon fixation in photosynthetic organisms 0,50 0,60 0,50 0,50 0,60 0,50 0,50 0,50 0,60 0,60 0,60 0,50
Carbon fixation pathways in prokaryotes 1,10 1,20 1,00 0,70 1,00 0,90 0,90 0,90 1,00 0,70 0,80 1,10
Methane metabolism 0,90 0,90 0,90 1,00 1,00 0,90 0,90 0,90 0,50 0,80 0,60 1,00
Nitrogen metabolism 0,80 1,00 0,80 0,60 0,70 0,60 0,60 0,60 0,50 0,60 0,50 0,80
Oxidative phosphorylation 1,40 1,20 1,40 1,10 1,30 1,50 1,70 1,60 1,80 1,30 1,60 1,20
Photosynthesis 0,30 0,20 0,20 0,30 0,30 0,30 0,30 0,30 0,40 0,40 0,50 0,20
Photosynthesis - antenna proteins 0,00 0,00 0,00 0,00 0,00 0,00 0,00 0,00 0,00 0,00 0,00 0,00
Photosynthesis proteins 0,30 0,40 0,30 0,30 0,30 0,30 0,40 0,40 0,40 0,50 0,50 0,20
Sulfur metabolism 0,30 0,30 0,30 0,30 0,30 0,40 0,50 0,40 0,10 0,20 0,10 0,30
Metabolism;Enzyme Families;
Peptidases 1,30 1,20 1,30 1,40 1,60 1,40 1,40 1,40 1,30 1,50 1,50 1,20
Protein kinases 0,30 0,30 0,30 0,20 0,20 0,30 0,30 0,30 0,20 0,30 0,30 0,40
Metabolism;Glycan Biosynthesis and Metabolism;
Glycosaminoglycan degradation 0,00 0,00 0,00 0,00 0,10 0,00 0,00 0,00 0,00 0,00 0,00 0,00
Glycosphingolipid biosynthesis - ganglio series 0,00 0,00 0,00 0,00 0,10 0,00 0,00 0,00 0,00 0,00 0,00 0,00
Glycosphingolipid biosynthesis - globo series 0,00 0,00 0,00 0,10 0,10 0,00 0,00 0,00 0,00 0,00 0,00 0,00
Glycosyltransferases 0,30 0,30 0,30 0,30 0,40 0,40 0,40 0,40 0,40 0,30 0,40 0,40
Lipopolysaccharide biosynthesis 0,30 0,20 0,30 0,10 0,40 0,40 0,40 0,40 0,40 0,10 0,30 0,20
Lipopolysaccharide biosynthesis proteins 0,40 0,30 0,40 0,10 0,50 0,50 0,50 0,50 0,40 0,30 0,40 0,30
N-Glycan biosynthesis 0,00 0,00 0,00 0,00 0,00 0,10 0,10 0,10 0,00 0,00 0,00 0,00

Supplementary materials 137
Other glycan degradation 0,00 0,00 0,00 0,20 0,20 0,10 0,00 0,00 0,00 0,00 0,00 0,00
Peptidoglycan biosynthesis 0,60 0,50 0,60 0,90 0,80 0,60 0,60 0,60 0,80 0,80 0,90 0,50
Metabolism;Lipid Metabolism;
Arachidonic acid metabolism 0,10 0,10 0,10 0,10 0,10 0,10 0,10 0,10 0,00 0,00 0,00 0,10
Biosynthesis of unsaturated fatty acids 0,30 0,20 0,20 0,10 0,20 0,10 0,10 0,10 0,20 0,20 0,20 0,40
Fatty acid biosynthesis 0,60 0,50 0,60 0,60 0,60 0,50 0,60 0,50 0,80 0,50 0,60 0,60
Fatty acid metabolism 1,00 1,00 0,80 0,30 0,40 0,40 0,40 0,40 0,60 0,70 0,60 1,20
Glycerolipid metabolism 0,30 0,40 0,40 0,50 0,30 0,40 0,40 0,40 0,30 0,30 0,30 0,40
Glycerophospholipid metabolism 0,50 0,40 0,50 0,50 0,60 0,60 0,60 0,60 0,50 0,50 0,60 0,50
Linoleic acid metabolism 0,10 0,10 0,10 0,20 0,20 0,70 1,00 0,80 0,10 0,10 0,10 0,20
Lipid biosynthesis proteins 0,80 0,70 0,70 0,50 0,60 0,60 0,60 0,60 0,80 0,60 0,70 0,90
Sphingolipid metabolism 0,00 0,00 0,00 0,10 0,10 0,10 0,10 0,10 0,00 0,00 0,00 0,10
Steroid biosynthesis 0,00 0,00 0,00 0,00 0,00 0,10 0,10 0,10 0,00 0,00 0,00 0,00
Steroid hormone biosynthesis 0,00 0,00 0,00 0,00 0,00 0,00 0,00 0,00 0,00 0,00 0,00 0,10
Synthesis and degradation of ketone bodies 0,20 0,20 0,10 0,10 0,10 0,00 0,00 0,00 0,10 0,10 0,10 0,20
alpha-Linolenic acid metabolism 0,00 0,00 0,00 0,00 0,00 0,00 0,00 0,00 0,00 0,10 0,00 0,10
Metabolism;Metabolism of Cofactors and Vitamins;
Biotin metabolism 0,10 0,10 0,10 0,10 0,20 0,20 0,20 0,20 0,10 0,10 0,10 0,10
Folate biosynthesis 0,40 0,30 0,40 0,20 0,40 0,40 0,50 0,50 0,20 0,50 0,30 0,40
Lipoic acid metabolism 0,10 0,10 0,10 0,10 0,10 0,10 0,10 0,10 0,10 0,10 0,10 0,10
Nicotinate and nicotinamide metabolism 0,40 0,40 0,40 0,30 0,40 0,40 0,40 0,40 0,40 0,50 0,40 0,40
One carbon pool by folate 0,50 0,50 0,50 0,50 0,70 0,40 0,50 0,50 0,60 0,60 0,60 0,40
Pantothenate and CoA biosynthesis 0,50 0,50 0,50 0,60 0,60 0,60 0,70 0,70 0,50 0,70 0,70 0,50
Porphyrin and chlorophyll metabolism 0,90 1,30 0,90 0,40 0,90 1,00 1,30 1,20 0,70 0,80 0,70 0,80
Retinol metabolism 0,10 0,20 0,20 0,10 0,10 0,20 0,20 0,20 0,20 0,10 0,10 0,20
Riboflavin metabolism 0,30 0,20 0,30 0,20 0,30 0,40 0,50 0,50 0,30 0,50 0,50 0,30
Thiamine metabolism 0,40 0,30 0,30 0,50 0,60 0,50 0,50 0,50 0,60 0,30 0,50 0,30
Ubiquinone and other terpenoid-quinone biosynthesis 0,30 0,20 0,30 0,30 0,30 0,20 0,20 0,20 0,40 0,40 0,40 0,20
Vitamin B6 metabolism 0,20 0,10 0,20 0,20 0,20 0,20 0,20 0,20 0,20 0,20 0,20 0,20
Metabolism;Metabolism of Other Amino Acids;
Cyanoamino acid metabolism 0,20 0,20 0,20 0,40 0,30 0,20 0,20 0,20 0,10 0,20 0,20 0,30
D-Alanine metabolism 0,10 0,10 0,10 0,20 0,10 0,10 0,10 0,10 0,10 0,20 0,10 0,10
D-Glutamine and D-glutamate metabolism 0,10 0,10 0,10 0,10 0,20 0,10 0,10 0,10 0,10 0,10 0,10 0,10
Glutathione metabolism 0,60 0,50 0,50 0,30 0,40 0,60 0,70 0,60 0,50 0,40 0,40 0,40
Phosphonate and phosphinate metabolism 0,10 0,10 0,00 0,10 0,10 0,10 0,10 0,10 0,10 0,10 0,10 0,10
Selenocompound metabolism 0,30 0,30 0,30 0,40 0,30 0,40 0,40 0,40 0,20 0,30 0,20 0,30
Taurine and hypotaurine metabolism 0,10 0,20 0,10 0,10 0,10 0,20 0,20 0,20 0,10 0,10 0,00 0,10
beta-Alanine metabolism 0,60 0,70 0,50 0,10 0,30 0,30 0,30 0,30 0,40 0,50 0,40 0,70
Metabolism;Metabolism of Terpenoids and Polyketides;

138 Supplementary materials
Biosynthesis of ansamycins 0,10 0,10 0,10 0,10 0,10 0,10 0,10 0,10 0,00 0,10 0,10 0,10
Biosynthesis of siderophore group nonribosomal peptides 0,00 0,10 0,10 0,10 0,00 0,00 0,00 0,00 0,00 0,10 0,10 0,10
Biosynthesis of vancomycin group antibiotics 0,00 0,00 0,00 0,00 0,10 0,10 0,10 0,10 0,00 0,10 0,10 0,00
Carotenoid biosynthesis 0,00 0,10 0,10 0,00 0,00 0,00 0,10 0,10 0,00 0,00 0,00 0,10
Geraniol degradation 0,50 0,50 0,40 0,00 0,20 0,10 0,10 0,20 0,30 0,30 0,20 0,60
Limonene and pinene degradation 0,60 0,60 0,50 0,20 0,30 0,30 0,30 0,30 0,50 0,40 0,30 0,80
Polyketide sugar unit biosynthesis 0,10 0,10 0,10 0,20 0,20 0,20 0,20 0,20 0,10 0,20 0,20 0,10
Prenyltransferases 0,30 0,30 0,30 0,30 0,30 0,30 0,40 0,40 0,30 0,60 0,50 0,30
Terpenoid backbone biosynthesis 0,50 0,50 0,50 0,50 0,50 0,40 0,50 0,50 0,40 0,80 0,70 0,50
Tetracycline biosynthesis 0,20 0,10 0,20 0,20 0,20 0,30 0,30 0,20 0,20 0,10 0,10 0,10
Zeatin biosynthesis 0,00 0,00 0,00 0,00 0,10 0,00 0,00 0,00 0,00 0,10 0,10 0,00
Metabolism;Nucleotide Metabolism;
Purine metabolism 1,80 1,80 1,90 2,30 2,30 2,10 2,10 2,20 2,20 2,60 2,50 1,70
Pyrimidine metabolism 1,20 1,20 1,20 1,80 1,70 1,40 1,40 1,40 1,40 1,80 1,80 1,10
Metabolism;Xenobiotics Biodegradation and Metabolism;
Aminobenzoate degradation 0,50 0,40 0,40 0,30 0,30 0,40 0,40 0,40 0,40 0,30 0,30 0,70
Atrazine degradation 0,10 0,10 0,10 0,00 0,10 0,10 0,20 0,20 0,10 0,10 0,10 0,10
Benzoate degradation 0,70 0,70 0,60 0,30 0,30 0,20 0,20 0,20 0,40 0,40 0,30 0,90
Bisphenol degradation 0,20 0,20 0,20 0,30 0,30 0,80 1,10 0,90 0,20 0,20 0,10 0,40
Caprolactam degradation 0,40 0,30 0,30 0,00 0,10 0,10 0,10 0,10 0,20 0,20 0,20 0,50
Chloroalkane and chloroalkene degradation 0,40 0,60 0,40 0,60 0,50 1,10 1,40 1,20 0,40 0,40 0,30 0,60
Chlorocyclohexane and chlorobenzene degradation 0,10 0,10 0,10 0,00 0,00 0,00 0,00 0,00 0,10 0,10 0,10 0,20
Dioxin degradation 0,10 0,00 0,10 0,10 0,00 0,10 0,00 0,00 0,00 0,00 0,00 0,10
Drug metabolism - cytochrome P450 0,30 0,30 0,30 0,20 0,20 0,30 0,40 0,30 0,40 0,20 0,20 0,30
Drug metabolism - other enzymes 0,20 0,30 0,20 0,20 0,20 0,20 0,10 0,20 0,10 0,30 0,20 0,20
Ethylbenzene degradation 0,10 0,10 0,10 0,10 0,10 0,10 0,10 0,10 0,10 0,10 0,10 0,20
Fluorobenzoate degradation 0,10 0,10 0,10 0,00 0,00 0,00 0,00 0,00 0,00 0,00 0,00 0,10
Metabolism of xenobiotics by cytochrome P450 0,30 0,30 0,30 0,20 0,20 0,30 0,40 0,30 0,40 0,20 0,20 0,30
Naphthalene degradation 0,40 0,40 0,40 0,40 0,40 0,50 0,60 0,50 0,40 0,20 0,30 0,50
Nitrotoluene degradation 0,10 0,10 0,10 0,00 0,10 0,10 0,10 0,10 0,00 0,00 0,00 0,10
Polycyclic aromatic hydrocarbon degradation 0,20 0,20 0,20 0,20 0,20 0,20 0,30 0,30 0,20 0,20 0,20 0,30
Styrene degradation 0,10 0,10 0,10 0,00 0,10 0,10 0,10 0,10 0,00 0,10 0,10 0,10
Toluene degradation 0,20 0,20 0,20 0,10 0,10 0,20 0,20 0,20 0,20 0,10 0,10 0,30
Xylene degradation 0,10 0,00 0,00 0,10 0,00 0,00 0,00 0,00 0,00 0,00 0,00 0,10
Organismal Systems;Environmental Adaptation;Plant-pathogen interaction 0,10 0,10 0,10 0,10 0,10 0,10 0,10 0,10 0,20 0,10 0,10 0,10
Other gene families 2,40 2,00 1,70 2,50 1,30 2,30 2,30 2,30 2,50 1,60 1,90 2,00
Unclassified;Cellular Processes and Signaling;
Cell division 0,10 0,10 0,10 0,00 0,10 0,10 0,10 0,10 0,20 0,00 0,10 0,10
Cell motility and secretion 0,30 0,20 0,20 0,20 0,30 0,40 0,50 0,50 0,40 0,20 0,30 0,20

Supplementary materials 139
Electron transfer carriers 0,00 0,10 0,00 0,00 0,00 0,00 0,00 0,00 0,00 0,10 0,10 0,00
Germination 0,00 0,00 0,00 0,00 0,00 0,00 0,00 0,00 0,00 0,00 0,00 0,00
Inorganic ion transport and metabolism 0,40 0,60 0,40 0,20 0,20 0,40 0,40 0,40 0,10 0,30 0,20 0,40
Membrane and intracellular structural molecules 0,80 0,80 0,80 0,40 0,70 1,00 1,20 1,10 0,90 0,30 0,60 0,60
Other ion-coupled transporters 1,00 0,80 0,90 0,90 1,00 1,00 0,90 0,90 0,60 0,60 0,70 0,90
Other transporters 0,20 0,20 0,20 0,20 0,20 0,30 0,30 0,30 0,20 0,10 0,20 0,20
Pores ion channels 0,50 0,50 0,50 0,30 0,50 0,70 0,90 0,80 0,40 0,20 0,30 0,40
Signal transduction mechanisms 0,30 0,30 0,30 0,50 0,40 0,40 0,40 0,40 0,20 0,30 0,20 0,40
Sporulation 0,00 0,00 0,00 0,00 0,10 0,00 0,00 0,00 0,00 0,10 0,00 0,10
Unclassified;Genetic Information Processing;
Protein folding and associated processing 0,70 0,80 0,70 0,50 0,70 0,80 0,90 0,80 0,70 0,60 0,70 0,70
Replication, recombination and repair proteins 0,70 0,60 0,70 0,90 0,70 0,90 1,00 0,90 0,80 0,60 0,70 0,70
Restriction enzyme 0,10 0,10 0,10 0,10 0,10 0,20 0,20 0,20 0,00 0,00 0,00 0,10
Transcription related proteins 0,00 0,00 0,00 0,00 0,00 0,00 0,00 0,00 0,10 0,00 0,10 0,00
Translation proteins 0,70 0,50 0,70 0,80 0,80 0,70 0,70 0,70 0,80 0,70 0,80 0,60
Unclassified;Metabolism;
Amino acid metabolism 0,30 0,20 0,20 0,20 0,30 0,20 0,30 0,20 0,30 0,20 0,30 0,30
Biosynthesis and biodegradation of secondary metabolites 0,10 0,10 0,10 0,00 0,00 0,00 0,00 0,00 0,10 0,00 0,00 0,10
Carbohydrate metabolism 0,10 0,10 0,10 0,20 0,10 0,10 0,10 0,10 0,00 0,10 0,10 0,10
Energy metabolism 0,70 0,60 0,60 0,70 0,80 0,80 0,90 0,80 0,40 0,50 0,40 0,80
Glycan biosynthesis and metabolism 0,10 0,00 0,10 0,00 0,10 0,10 0,10 0,10 0,10 0,00 0,10 0,00
Lipid metabolism 0,10 0,10 0,10 0,10 0,10 0,10 0,10 0,10 0,10 0,10 0,10 0,10
Metabolism of cofactors and vitamins 0,20 0,20 0,20 0,10 0,10 0,20 0,20 0,20 0,10 0,10 0,10 0,20
Nucleotide metabolism 0,00 0,00 0,00 0,00 0,00 0,00 0,00 0,00 0,00 0,00 0,10 0,00
Others 1,00 0,90 1,00 1,80 1,20 1,40 1,30 1,30 1,00 0,90 0,90 1,30
Unclassified;Poorly Characterized;
Function unknown 1,50 1,40 1,50 1,40 1,30 1,70 1,60 1,60 1,40 1,20 1,40 1,30
General function prediction only 3,20 2,90 3,10 3,40 3,10 2,90 2,70 2,70 2,70 2,40 2,50 3,10
Table S4: Predicted gene families infereed on the base of the bacterial 16S rRNA.

140 Supplementary materials
Predicted gene family percentage / weevil sample R
PW
p
alm
_m1
RPW
p
alm
_f1
RPW
p
alm
_f2
RPW
ap
ple
_m1
RPW
ap
ple
_m2
RPW
ap
ple
_m3
RPW
ap
ple
_f1
RPW
ap
ple
_f2
RPW
ap
ple
_f3
R_v
uln
m
1
R_v
uln
f1
R_v
uln
f2
χ2
p-v
alu
e
p-v
alu
e
<0.0
5
Man
n-
Wh
itn
ey U
p-v
alu
e
Man
n-
Wh
itn
ey U
p-v
alu
e
Man
n-
Wh
itn
ey U
p-v
alu
e
Cellular Processes;Cell Motility;
Bacterial chemotaxis 0,60 0,70 0,60 0,10 0,40 0,20 0,10 0,20 0,40 0,30 0,1 0,5 6,545 0,038 ** 18 0 9 0,1 7
0,7
Bacterial motility proteins 1,60 1,30 1,60 0,10 0,90 0,50 0,10 0,40 1,00 0,70 0,7 1,2 7,269 0,026 ** 18 0 9 0,1 14
0,2
Flagellar assembly 0,70 0,70 0,70 0,00 0,40 0,20 0,00 0,20 0,80 0,30 0,5 0,5 4,495 0,106
Genetic Information Processing; Folding, Sorting and Degradation;Protein export 0,50 0,40 0,50 0,50 0,60 0,60 0,60 0,60 0,60 0,80 0,8 0,4 3,878 0,144 Metabolism;Amino Acid Metabolism; Alanine, aspartate and glutamate metabolism 0,80 0,90 0,90 0,80 1,10 0,90 1,00 1,00 0,80 1,10 1 0,8 1,054 0,590
Amino acid related enzymes 1,20 1,20 1,20 1,30 1,50 1,50 1,60 1,60 1,10 1,60 1,5 1,1 2,105 0,349
Arginine and proline metabolism 1,30 1,30 1,30 1,20 1,40 1,30 1,40 1,30 1,40 1,10 1,2 1,4 1,639 0,441 Cysteine and methionine metabolism 0,70 0,70 0,70 0,90 0,90 1,00 1,00 1,00 0,40 0,70 0,6 0,7 4,172 0,124 Glycine, serine and threonine metabolism 0,90 1,00 1,00 0,70 0,90 0,90 0,90 0,90 0,90 1,10 0,9 1 5,549 0,062
Histidine metabolism 0,50 0,60 0,50 0,40 0,70 0,60 0,70 0,60 0,30 0,40 0,3 0,6 1,456 0,483
Lysine biosynthesis 0,60 0,60 0,60 0,70 0,80 0,60 0,60 0,60 0,80 0,60 0,7 0,5 2,328 0,312
Lysine degradation 0,70 0,80 0,60 0,10 0,30 0,20 0,20 0,30 0,50 0,50 0,4 0,8 7,473 0,024 ** 18 0 6,5 0,5 1,5
0,1
Phenylalanine metabolism 0,40 0,40 0,40 0,10 0,30 0,30 0,30 0,30 0,30 0,30 0,3 0,5 6,522 0,038 ** 18 0 6 0,6 5
0,2
Phenylalanine, tyrosine and tryptophan biosynthesis 0,60 0,60 0,60 0,50 0,80 0,70 0,80 0,80 0,50 0,80 0,7 0,6 1,375 0,503
Tryptophan metabolism 0,80 0,80 0,70 0,20 0,30 0,30 0,30 0,30 0,50 0,50 0,4 0,9 7,558 0,023 ** 18 0 6 0,7 1,5
0,1
Tyrosine metabolism 0,50 0,60 0,50 0,60 0,60 0,80 0,90 0,80 0,60 0,60 0,6 0,6 Not passed Levene Test Valine, leucine and isoleucine biosynthesis 0,60 0,60 0,70 0,80 0,70 0,80 0,80 0,80 0,60 0,80 0,7 0,7 4,027 0,134 Valine, leucine and isoleucine degradation 1,10 1,20 1,00 0,30 0,50 0,30 0,40 0,40 0,70 0,90 0,7 1,3 8,095 0,017 ** 18 0 6
0,7 0,5 0
Metabolism;Biosynthesis of Other Secondary Metabolites;
Isoquinoline alkaloid biosynthesis 0,10 0,10 0,10 0,00 0,10 0,10 0,10 0,10 0,00 0,10 0,1 0,1 2,200 0,333
Novobiocin biosynthesis 0,10 0,10 0,10 0,10 0,20 0,20 0,20 0,20 0,10 0,20 0,2 0,1 3,667 0,160

Supplementary materials 141
Predicted gene family percentage / weevil sample R
PW
p
alm
_m1
RPW
p
alm
_f1
RPW
p
alm
_f2
RPW
ap
ple
_m1
RPW
ap
ple
_m2
RPW
ap
ple
_m3
RPW
ap
ple
_f1
RPW
ap
ple
_f2
RPW
ap
ple
_f3
R_v
uln
m
1
R_v
uln
f1
R_v
uln
f2
χ2
p-v
alu
e
p-v
alu
e
<0.0
5
Man
n-
Wh
itn
ey U
p-v
alu
e
Man
n-
Wh
itn
ey U
p-v
alu
e
Man
n-
Wh
itn
ey U
p-v
alu
e
Penicillin and cephalosporin biosynthesis 0,10 0,00 0,10 0,00 0,00 0,00 0,00 0,00 0,00 0,10 0 0 4,482 0,106
Phenylpropanoid biosynthesis 0,10 0,10 0,10 0,30 0,10 0,10 0,00 0,00 0,00 0,10 0,1 0,1 1,952 0,377
Streptomycin biosynthesis 0,30 0,30 0,30 0,30 0,30 0,30 0,40 0,40 0,20 0,30 0,3 0,3 0,400 0,819 Tropane, piperidine and pyridine alkaloid biosynthesis 0,10 0,10 0,10 0,00 0,20 0,10 0,20 0,20 0,10 0,10 0,1 0,2 0,913 0,634 Metabolism;Carbohydrate Metabolism; Amino sugar and nucleotide sugar metabolism 0,90 0,80 0,90 1,80 1,10 1,10 0,90 0,90 0,70 1,00 0,9 0,8 1,486 0,476
Ascorbate and aldarate metabolism 0,20 0,20 0,20 0,20 0,10 0,20 0,10 0,20 0,10 0,20 0,2 0,2 Not passed Levene Test
Butanoate metabolism 1,20 1,40 1,10 1,00 0,90 1,40 1,70 1,50 0,90 1,00 0,8 1,5 0,452 0,798 C5-Branched dibasic acid metabolism 0,30 0,30 0,30 0,30 0,20 0,30 0,30 0,30 0,20 0,30 0,3 0,3 2,200 0,333
Citrate cycle (TCA cycle) 0,80 0,70 0,80 0,70 0,80 0,70 0,70 0,80 0,90 0,80 0,9 0,9 3,503 0,174
Fructose and mannose metabolism 0,50 0,50 0,60 1,50 0,90 1,60 1,80 1,60 0,50 0,60 0,6 0,7 5,321 0,070
Galactose metabolism 0,30 0,30 0,40 1,00 0,40 0,40 0,10 0,20 0,20 0,30 0,3 0,3 0,253 0,881
Glycolysis / Gluconeogenesis 1,00 1,10 1,10 1,70 1,10 1,40 1,30 1,30 1,00 1,30 1,2 1,2 3,570 0,168 Glyoxylate and dicarboxylate metabolism 0,90 1,20 0,90 0,40 0,50 0,60 0,60 0,60 0,60 0,50 0,4 1 4,741 0,093
Inositol phosphate metabolism 0,20 0,10 0,20 0,10 0,10 0,20 0,30 0,30 0,20 0,10 0,1 0,2 1,452 0,484 Pentose and glucuronate interconversions 0,40 0,40 0,40 0,50 0,40 0,40 0,30 0,30 0,30 0,40 0,3 0,4 0,913 0,634
Pentose phosphate pathway 0,60 0,60 0,60 0,90 0,80 0,80 0,70 0,70 0,70 0,80 0,8 0,7 6,812 0,033 ** 0 0 0,1 8,5 1
Propanoate metabolism 1,20 1,30 1,10 0,50 0,70 0,70 0,80 0,80 0,80 0,80 0,7 1,3 5,449 0,066
Pyruvate metabolism 1,10 1,40 1,20 1,30 1,20 1,30 1,40 1,30 1,30 1,10 1,1 1,4 1,246 0,536
Starch and sucrose metabolism 0,50 0,40 0,50 1,30 0,60 0,70 0,50 0,50 0,20 0,40 0,3 0,5 2,587 0,274
Metabolism;Energy Metabolism;
Nitrogen metabolism 0,80 1,00 0,80 0,60 0,70 0,60 0,60 0,60 0,50 0,60 0,5 0,8 5,911 0,052 * 0 8 0,2 8,5 1
Oxidative phosphorylation 1,40 1,20 1,40 1,10 1,30 1,50 1,70 1,60 1,80 1,30 1,6 1,2 1,287 0,525 Metabolism;Glycan Biosynthesis and Metabolism;
Peptidoglycan biosynthesis 0,60 0,50 0,60 0,90 0,80 0,60 0,60 0,60 0,80 0,80 0,9 0,5 2,408 0,300

142 Supplementary materials
Predicted gene family percentage / weevil sample R
PW
p
alm
_m1
RPW
p
alm
_f1
RPW
p
alm
_f2
RPW
ap
ple
_m1
RPW
ap
ple
_m2
RPW
ap
ple
_m3
RPW
ap
ple
_f1
RPW
ap
ple
_f2
RPW
ap
ple
_f3
R_v
uln
m
1
R_v
uln
f1
R_v
uln
f2
χ2
p-v
alu
e
p-v
alu
e
<0.0
5
Man
n-
Wh
itn
ey U
p-v
alu
e
Man
n-
Wh
itn
ey U
p-v
alu
e
Man
n-
Wh
itn
ey U
p-v
alu
e
Metabolism;Metabolism of Cofactors and Vitamins;
Biotin metabolism 0,10 0,10 0,10 0,10 0,20 0,20 0,20 0,20 0,10 0,10 0,1 0,1 5,500 0,064
Folate biosynthesis 0,40 0,30 0,40 0,20 0,40 0,40 0,50 0,50 0,20 0,50 0,3 0,4 0,226 0,893
Lipoic acid metabolism 0,10 0,10 0,10 0,10 0,10 0,10 0,10 0,10 0,10 0,10 0,1 0,1 Not passed Levene Test Nicotinate and nicotinamide metabolism 0,40 0,40 0,40 0,30 0,40 0,40 0,40 0,40 0,40 0,50 0,4 0,4 2,750 0,253
One carbon pool by folate 0,50 0,50 0,50 0,50 0,70 0,40 0,50 0,50 0,60 0,60 0,6 0,4 0,402 0,818
Pantothenate and CoA biosynthesis 0,50 0,50 0,50 0,60 0,60 0,60 0,70 0,70 0,50 0,70 0,7 0,5 4,321 0,115 Porphyrin and chlorophyll metabolism 0,90 1,30 0,90 0,40 0,90 1,00 1,30 1,20 0,70 0,80 0,7 0,8 2,681 0,262
Retinol metabolism 0,10 0,20 0,20 0,10 0,10 0,20 0,20 0,20 0,20 0,10 0,1 0,2 0,943 0,624
Riboflavin metabolism 0,30 0,20 0,30 0,20 0,30 0,40 0,50 0,50 0,30 0,50 0,5 0,3 3,088 0,214
Thiamine metabolism 0,40 0,30 0,30 0,50 0,60 0,50 0,50 0,50 0,60 0,30 0,5 0,3 7,492 0,024 ** 4 0,1 4 1 21
0,2
Ubiquinone and other terpenoid-quinone biosynthesis 0,30 0,20 0,30 0,30 0,30 0,20 0,20 0,20 0,40 0,40 0,4 0,2 1,179 0,555
Vitamin B6 metabolism 0,20 0,10 0,20 0,20 0,20 0,20 0,20 0,20 0,20 0,20 0,2 0,2 3,000 0,223 Metabolism;Metabolism of Other Amino Acids;
Cyanoamino acid metabolism 0,20 0,20 0,20 0,40 0,30 0,20 0,20 0,20 0,10 0,20 0,2 0,3 0,493 0,782
D-Alanine metabolism 0,10 0,10 0,10 0,20 0,10 0,10 0,10 0,10 0,10 0,20 0,1 0,1 1,100 0,577 D-Glutamine and D-glutamate metabolism 0,10 0,10 0,10 0,10 0,20 0,10 0,10 0,10 0,10 0,10 0,1 0,1 1,000 0,607
Glutathione metabolism 0,60 0,50 0,50 0,30 0,40 0,60 0,70 0,60 0,50 0,40 0,4 0,4 3,048 0,218 Phosphonate and phosphinate metabolism 0,10 0,10 0,00 0,10 0,10 0,10 0,10 0,10 0,10 0,10 0,1 0,1 3,000 0,223
Selenocompound metabolism 0,30 0,30 0,30 0,40 0,30 0,40 0,40 0,40 0,20 0,30 0,2 0,3 3,300 0,192 Taurine and hypotaurine metabolism 0,10 0,20 0,10 0,10 0,10 0,20 0,20 0,20 0,10 0,10 0 0,1 3,379 0,185
beta-Alanine metabolism 0,60 0,70 0,50 0,10 0,30 0,30 0,30 0,30 0,40 0,50 0,4 0,7 8,391 0,015 ** 18 0 6 0,7 0,5 0
Metabolism;Nucleotide Metabolism;
Purine metabolism 1,80 1,80 1,90 2,30 2,30 2,10 2,10 2,20 2,20 2,60 2,5 1,7 3,862 0,145
Pyrimidine metabolism 1,20 1,20 1,20 1,80 1,70 1,40 1,40 1,40 1,40 1,80 1,8 1,1 4,022 0,134

Supplementary materials 143
Predicted gene family percentage / weevil sample R
PW
p
alm
_m1
RPW
p
alm
_f1
RPW
p
alm
_f2
RPW
ap
ple
_m1
RPW
ap
ple
_m2
RPW
ap
ple
_m3
RPW
ap
ple
_f1
RPW
ap
ple
_f2
RPW
ap
ple
_f3
R_v
uln
m
1
R_v
uln
f1
R_v
uln
f2
χ2
p-v
alu
e
p-v
alu
e
<0.0
5
Man
n-
Wh
itn
ey U
p-v
alu
e
Man
n-
Wh
itn
ey U
p-v
alu
e
Man
n-
Wh
itn
ey U
p-v
alu
e
Unclassified;Metabolism;
Amino acid metabolism 0,30 0,20 0,20 0,20 0,30 0,20 0,30 0,20 0,30 0,20 0,3 0,3 0,611 0,737 Biosynthesis and biodegradation of secondary metabolites 0,10 0,10 0,10 0,00 0,00 0,00 0,00 0,00 0,10 0,00 0 0,1 5,343 0,069
Carbohydrate metabolism 0,10 0,10 0,10 0,20 0,10 0,10 0,10 0,10 0,00 0,10 0,1 0,1 0,000 1,000
;Energy metabolism 0,70 0,60 0,60 0,70 0,80 0,80 0,90 0,80 0,40 0,50 0,4 0,8 2,455 0,293 Glycan biosynthesis and metabolism 0,10 0,00 0,10 0,00 0,10 0,10 0,10 0,10 0,10 0,00 0,1 0 2,063 0,357 Metabolism of cofactors and vitamins 0,2 0,2 0,2 0,1 0,1 0,2 0,2 0,2 0,1 0,1 0,1 0,2 2,829 0,243
Table S5: Predicted gene families infereed on the base of the bacterial 16S rRNA and related to the bacterial physiology/metabolism, in light of a symbiotic relationship. Kruskal-Wallis, Mann-Whitney tests and p-values are reported.

Supplementary materials
144
Taxa/number of isolates and source organ
Hem
oly
mp
h
Ov
ary
Tes
tis
Gu
t
Tota
l
Actinobacteria Corynebacterium sp. 1 1 0 0 2 Kocuria sp. 0 2 0 0 2 Microbacterium sp. 0 1 0 4 5 Rothia sp. 0 0 1 0 1 Proteobacteria Acetobacter sp. 2 0 0 0 2 Asaia sp. 0 0 1 1 2 Brevundimonas sp. 0 0 0 1 1 Citrobacter sp. 0 0 1 13 14 Enterobacter sp. 1 4 0 7 12 Gluconacetobacter sp. 1 0 0 0 1 Gluconobacter sp. 2 0 2 2 6 Hafnia sp. 0 0 5 6 11 Kluyvera sp. 0 0 0 0 0 Neisseria sp. 4 0 0 0 4 Pantoea sp. 0 1 0 0 1 Paracoccus sp. 0 0 0 1 1 Pseudomonas sp. 0 0 1 0 1 Serratia sp. 0 0 0 0 0 Stenotrophomonas sp. 0 5 5 2 12 Variovorax sp. 0 0 1 0 1 Xenophilus sp. 0 2 0 0 2 Bacteroidetes Hymenobacter sp. 0 1 0 0 1 Firmicutes Bacillus sp. 0 1 0 0 1 Enterococcus sp. 0 0 0 3 3 Lactobacillus sp. 0 1 0 0 1 Lactococcus sp. 0 1 1 2 4 Paenibacillus sp. 1 0 0 0 1 Staphylococcus sp. 1 3 2 1 7 Streptococcus sp. 4 0 0 0 4
Table S6: Bacterial isolates from different insect organs dissected from laboratory weevils.

Supplementary materials
145
Bacterial taxa palm tissues Serratia absent Comamonadaceae present Stenotrophomonas present Enterobacter absent Rhodobacter absent Ochrobactrum absent Microbacterium absent Serratia absent Stenotrophomonas present Enterobacteriaceae absent Ochrobactrum absent Kluyvera absent Corynebacterium absent Brevundimonas absent Corynebacterium absent
Table S7: Bacterial OTUs shared by the three groups of weevils, the presence of these OTUs in palm tissues is reported.
Figure S1: Rarefaction curves for total bacterial communities from the different weevil samples at 3% identity cut-off. Here are reported the curves of the Shannon index.

Supplementary materials
146
Figure S2: Rarefaction curves for total bacterial communities from the different weevil samples at 3% identity cut-off. Here are reported the curves of the cumulative number of observed species.
Figure S3: Log10 transformed relative abundance–rank curves for bacterial OTUs detected in the weevil specimens.

Supplementary materials
147
Figure S4: Hierarchical clustering dendrogram representing the OTU table pairwise dissimilarities between the different analyzed weevils. Distance matrix was estimated starting from the presence-absence OTU table adopting the Jaccard index.
Figure S5: Hierarchical clustering dendrogram representing the OTU table pairwise dissimilarities between the different analyzed weevils. Distance matrix was estimated starting from the OTU table, with abundances, adopting the Kulczynski index.

Supplementary materials
148
Supplementary materials
Chapter 5 - Psacothea hilaris hilaris
stra
in I
D
Seq
uen
ce
len
gth
iden
tifi
cati
on
RD
P c
lass
ifie
r lc
a_ta
x_gre
engen
es
lca_
tax_
rdp
lc
a_ta
x_sl
v
BLA
ST-
firs
t d
escr
ibed
hit
d
escr
ipti
on
BLA
ST-
firs
t d
escr
ibed
hit
ac
cess
ion
qu
ery
cove
rage
iden
tity
2 1098 Enhydrobacter Enhydrobacter100% Enhydrobacter Enhydrobacter Enhydrobacter
Moraxella sp. BQEN3-02
FJ380954.1 100% 99%
4 1165 Staphylococcus Staphylococcus100% Staphylococcus epidermidis Staphylococcus Staphylococcus
Staphylococcus epidermidis strain CIFRI D-TSB-21-ZMA
JF799891.1 100% 100%
5 1000 Enhydrobacter Enhydrobacter100% Enhydrobacter Enhydrobacter Enhydrobacter
Moraxella sp. BQEN3-02
FJ380954.1 100% 99%
10 969 Comamonadaceae bacterium
Burkholderiales100% Comamonadaceae Xenophilus Comamonadaceae
Uncultured beta proteobacterium clone 120
GU202941.1 98% 95%
12 1015 Stenotrophomonas
Stenotrophomonas100% Xanthomonadaceae Stenotrophomonas Stenotrophomonas
Stenotrophomonas sp. Ea21
JQ977692.1 100% 99%
15 1169 Acinetobacter Acinetobacter100% Acinetobacter Acinetobacter Acinetobacter
Acinetobacter sp. NHI3-2
KC193569.1 100% 99%
16 1000 Stenotrophomonas
Stenotrophomonas99% Xanthomonadaceae Stenotrophomonas Stenotrophomonas
Stenotrophomonas sp. Ea21
JQ977692.1 100% 98%
17 887 Comamonadaceae bacterium
Burkholderiales100% Comamonadaceae Comamonadaceae Comamonadaceae
Uncultured beta proteobacterium clone 120
GU202941.1 100% 97%
18 539 Stenotrophomonas
Xanthomonadaceae100% Xanthomonadaceae Stenotrophomonas Stenotrophomonas
Stenotrophomonas sp. Ea21
JQ977692.1 100% 100%
25 1125 Microbacterium Microbacterium99% Microbacterium Microbacterium Microbacterium
Microbacterium sp. YIM 100951
KC959569.1 100% 99%
26 840 Microbacterium Microbacterium100% Microbacterium barkeri Microbacterium Microbacterium
Microbacterium sp. YIM 100951
KC959569.1 100% 99%
32 1133 Microbacterium Microbacterium100% Microbacterium Microbacterium Microbacterium
Microbacterium sp. YIM 100951
KC959569.1 100% 99%
36 1350 Streptomyces Streptomyces100% Streptomyces Streptomyces Streptomyces
Streptomyces thermocarboxydus gene for strain: C42
AB907696.1 100% 99%
40 1007 Comamonadaceae bacterium
Burkholderiales100% Comamonadaceae Comamonadaceae Comamonadaceae
Xenophilus sp. P16
JQ928371.1 100% 95%
41 1086 Staphylococcus Staphylococcus100% Staphylococcus epidermidis Staphylococcus Staphylococcus
Staphylococcus sp. U1368-101106-SW104
JQ082128.1 100% 99%

Supplementary materials
149
stra
in I
D
Seq
uen
ce
len
gth
iden
tifi
cati
on
RD
P c
lass
ifie
r lc
a_ta
x_gre
engen
es
lca_
tax_
rdp
lc
a_ta
x_sl
v
BLA
ST-
firs
t d
escr
ibed
hit
d
escr
ipti
on
BLA
ST-
firs
t d
escr
ibed
hit
ac
cess
ion
qu
ery
cove
rage
iden
tity
44 1349 Streptomyces Streptomyces100% Streptomyces Streptomyces Streptomyces
Streptomyces thermocarboxydus gene for strain: C42
AB907696.1 100% 100%
51 1030 Streptomyces Streptomyces100% Streptomyces Streptomyces Streptomyces
Streptomyces thermocarboxydus gene for strain: C42
AB907696.1 100% 99%
52 1072 Pseudomonas Pseudomonas100% Pseudomonas veronii Pseudomonas Pseudomonas
Pseudomonas fluorescens strain JJ8-3
KF727589.1 100% 100%
54 1377 Comamonas Comamonadaceae100% Comamonas Comamonas Comamonas
Uncultured Comamonas sp. clone F1-7
JQ885562.1 99% 97%
55 790 Comamonadaceae bacterium
Burkholderiales100% Comamonadaceae Comamonadaceae Comamonadaceae
Uncultured beta proteobacterium clone 120
GU202941.1 100% 96%
56 1019 Stenotrophomonas
Stenotrophomonas98% Xanthomonadaceae Stenotrophomonas Stenotrophomonas
Stenotrophomonas sp.Cza49 strain Cza49
JQ977646.1 99% 99%
57 1009 Stenotrophomonas
Stenotrophomonas99% Xanthomonadaceae Stenotrophomonas Stenotrophomonas
Stenotrophomonas sp. Cza24
JQ977638.1 99% 100%
58 1130 Acinetobacter Acinetobacter100% Acinetobacter Acinetobacter Acinetobacter
Acinetobacter sp. NHI3-2
KC193569.1 100% 99%
60 1071 Micrococcus Micrococcus100% Micrococcus luteus Micrococcus Micrococcus
Micrococcus sp. 64A3a
KJ743999.1 99% 99%
61 1001 Micrococcus Micrococcus100% Micrococcus luteus Micrococcus Micrococcus
Micrococcus sp. OS5
EF491955.1 100% 98%
67 1169 Staphylococcus Staphylococcus100% Staphylococcus epidermidis Staphylococcus Staphylococcus
Staphylococcus epidermidis strain GG10H17
JN846922.1 100% 100%
68 927 Streptomyces Streptomyces100% Streptomyces Streptomyces Streptomyces
Streptomyces thermocarboxydus gene for strain: C42
AB907696.1 100% 100%
69 831 Staphylococcus Staphylococcus100% Staphylococcus Staphylococcus Staphylococcus
Staphylococcus hominis subsp. novobiosepticus strain ALK519
KC456583.1 100% 100%
70 939 Corynebacterium
Corynebacterium99% Corynebacterium Corynebacterium Corynebacterium
Corynebacterium glycinophilum
NR_121782.1 100% 98%
75 920 Corynebacterium
Corynebacterium100% Corynebacterium Corynebacterium Corynebacterium
Corynebacterium glycinophilum
NR_121782.1 100% 98%
76 1026 Bacillus Bacillus100% Bacillaceae Bacillus Bacillus
Bacillus cereus strain B4
KM391942.1 99% 100%
77 925 Brevibacterium Brevibacterium100% Brevibacterium aureum Brevibacterium Brevibacterium
Brevibacterium avium strain SS-T4
KF876886.1 100% 98%

Supplementary materials
150
stra
in I
D
Seq
uen
ce
len
gth
iden
tifi
cati
on
RD
P c
lass
ifie
r lc
a_ta
x_gre
engen
es
lca_
tax_
rdp
lc
a_ta
x_sl
v
BLA
ST-
firs
t d
escr
ibed
hit
d
escr
ipti
on
BLA
ST-
firs
t d
escr
ibed
hit
ac
cess
ion
qu
ery
cove
rage
iden
tity
90 893 Rahnella Enterobacteriaceae100% Enterobacteriaceae Enterobacteriaceae Rahnella
Rahnella aquatilis strain AT-113
KF817725.1 99% 99%
94 1058 Brevibacterium Brevibacterium100% Brevibacterium aureum Brevibacterium Brevibacterium
Brevibacterium avium strain SS-T4
KF876886.1 100% 98%
97 947 Brevibacterium Brevibacterium100% Brevibacterium aureum Brevibacterium Brevibacterium
Brevibacterium avium strain SS-T4
KF876886.1 98% 99%
99 689 Brevibacterium Brevibacterium100% Brevibacterium aureum Brevibacterium Brevibacterium
Brevibacterium sp. SQ84A
KC921002.1 97% 99%
102 869 Luteimonas Luteimonas99% Luteimonas Luteimonas Xanthomonadaceae
Luteimonas sp. FCS-9
KM025196.1 99% 99%
105 782 Rhodococcus Corynebacterineae98% Rhodococcus Rhodococcus Rhodococcus
Uncultured Tsukamurella sp. clone UIL008
KC865711.1 91% 99%
106 1378 Tsukamurella Corynebacterineae100% Tsukamurella Tsukamurella Tsukamurella
Tsukamurella paurometabola strain DSM 20162
NR_074458.1 100% 96%
111 1009 Acidovorax Acidovorax100% Comamonadaceae Acidovorax Acidovorax
Acidovorax sp. 38a partial r gene strain 38a
HG937596.1 100% 99%
112 877 Acidovorax Acidovorax100% Comamonadaceae Acidovorax Acidovorax
Uncultured Acidovorax sp. clone Set 2-35
JQ684146.1 92% 99%
116 1018 Acinetobacter Acinetobacter100% Acinetobacter Acinetobacter Acinetobacter
Acinetobacter sp. NHI3-2
KC193569.1 99% 98%
120 1076 Pseudomonas Pseudomonas100% Pseudomonas veronii Pseudomonas Pseudomonas
Pseudomonas fluorescens strain JJ8-3
KF727589.1 100% 99%
121 954 Rhizobium Rhizobium98% Agrobacterium Rhizobium Rhizobium
Agrobacterium sp. QW10
KF737364.1 100% 98%
122 880 Rhizobium Rhizobium100% Agrobacterium Rhizobium Rhizobium
Rhizobium sp. KT34
KJ734019.1 100% 100%
124 859 Stenotrophomonas
Stenotrophomonas99% Xanthomonadaceae Stenotrophomonas Stenotrophomonas
Stenotrophomonas sp. Cza24
JQ977638.1 100% 99%
125 847 Agrobacterium Rhizobium100% Agrobacterium Rhizobium Rhizobium
Agrobacterium sp. ADU1
KF933534.1 100% 100%
134 1080 Epilithonimonas Epilithonimonas99% Chryseobacterium Epilithonimonas Epilithonimonas
Epilithonimonas sp. NSG16
KC884003.1 100% 99%
135 611 Agrobacterium Rhizobium99% Agrobacterium Rhizobium Rhizobium
Agrobacterium sp. SCAUS156
KF836041.1 100% 99%

Supplementary materials
151
stra
in I
D
Seq
uen
ce
len
gth
iden
tifi
cati
on
RD
P c
lass
ifie
r lc
a_ta
x_gre
engen
es
lca_
tax_
rdp
lc
a_ta
x_sl
v
BLA
ST-
firs
t d
escr
ibed
hit
d
escr
ipti
on
BLA
ST-
firs
t d
escr
ibed
hit
ac
cess
ion
qu
ery
cove
rage
iden
tity
137 1007 Epilithonimonas Epilithonimonas100% Chryseobacterium Epilithonimonas Epilithonimonas
Epilithonimonas lactis strain H1
NR_115989.1 100% 98%
138 1372 Tsukamurella Corynebacterineae100% Tsukamurella Tsukamurella Tsukamurella
Tsukamurella paurometabola strain DSM 20162
NR_074458.1 100% 95%
148 1024 Tsukamurella Corynebacterineae100% Tsukamurella Tsukamurella Tsukamurella
Uncultured Tsukamurella sp. clone UIL008
KC865711.1 93% 99%
151 1377 Olivibacter Olivibacter100% Olivibacter Olivibacter Olivibacter
Olivibacter ginsengisoli strain Gsoil 060
NR_041504.1 99% 97%
152 1078 Olivibacter Olivibacter100% Olivibacter Olivibacter Olivibacter
Olivibacter ginsengisoli strain Gsoil 060
NR_041504.1 100% 94%
153 1116 Corynebacterium
Corynebacterium100% Corynebacterium Corynebacterium Corynebacterium
Corynebacterium glycinophilum
NR_121782.1 100% 99%
154 997 Corynebacterium
Corynebacterium100% Corynebacterium Corynebacterium Corynebacterium
Corynebacterium glycinophilum
NR_121782.1 100% 98%
156 749 Corynebacterium
Corynebacterium100% Corynebacterium Corynebacterium Corynebacterium
Corynebacterium glycinophilum
NR_121782.1 100% 100%
158 883 Rhizobium Rhizobium100% Agrobacterium Rhizobium Rhizobium
Rhizobium sp. KT34
KJ734019.1 100% 100%
160 1144 Brevibacterium Brevibacterium100% Brevibacterium aureum Brevibacterium Brevibacterium
Brevibacterium avium strain SS-T4
KF876886.1 100% 97%
162 1130 Brevibacterium Brevibacterium100% Brevibacterium aureum Brevibacterium Brevibacterium
Brevibacterium avium strain SS-T4
KF876886.1 99% 99%
173 999 Corynebacterium
Corynebacterium100% Corynebacterium Corynebacterium Corynebacterium
Corynebacterium glycinophilum
NR_121782.1 100% 99%
174 963 Corynebacterium
Corynebacteriaceae99% Corynebacterium Corynebacterium Corynebacterium
Corynebacterium glycinophilum
NR_121782.1 99% 97%
175 888 Corynebacterium
Corynebacterium100% Corynebacterium Corynebacterium Corynebacterium
Corynebacterium glycinophilum
NR_121782.1 100% 99%
181 885 Rhodococcus Corynebacterineae99% Rhodococcus Rhodococcus Rhodococcus
Uncultured Tsukamurella sp. clone UIL008
KC865711.1 92% 99%
184 1000 Brevibacterium Brevibacterium100% Brevibacterium aureum Brevibacterium Brevibacterium
Brevibacterium avium strain SS-T4
KF876886.1 100% 99%
186 1165 Rahnella Enterobacteriaceae100% Enterobacteriaceae Enterobacteriaceae Rahnella
Rahnella aquatilis HX2 strain HX2
NR_074921.1 100% 99%

Supplementary materials
152
stra
in I
D
Seq
uen
ce
len
gth
iden
tifi
cati
on
RD
P c
lass
ifie
r lc
a_ta
x_gre
engen
es
lca_
tax_
rdp
lc
a_ta
x_sl
v
BLA
ST-
firs
t d
escr
ibed
hit
d
escr
ipti
on
BLA
ST-
firs
t d
escr
ibed
hit
ac
cess
ion
qu
ery
cove
rage
iden
tity
187 770 Rahnella Enterobacteriaceae100% Enterobacteriaceae Enterobacteriaceae Rahnella
Rahnella aquatilis strain TB-150
KF843720.1 100% 100%
188 865 Rahnella Enterobacteriaceae100% Enterobacteriaceae Enterobacteriaceae Rahnella
Rahnella aquatilis strain TB-144
KF817755.1 99% 100%
189 896 Rahnella Enterobacteriaceae100% Enterobacteriaceae Enterobacteriaceae Rahnella
Rahnella aquatilis strain AT-113
KF817725.1 99% 99%
190 870 Rahnella Enterobacteriaceae100% Enterobacteriaceae Enterobacteriaceae Rahnella
Rahnella aquatilis strain AT-117
KF817729.1 99% 99%
191 951 Rahnella Rahnella98% Enterobacteriaceae Enterobacteriaceae Rahnella
Rahnella aquatilis strain AT-113
KF817725.1 100% 97%
192 1039 Brevibacterium Brevibacterium100% Brevibacterium aureum Brevibacterium Brevibacterium
Brevibacterium avium strain SS-T4
KF876886.1 99% 98%
193 1084 Roseomonas Roseomonas100% Roseomonas mucosa Roseomonas Roseomonas
Roseomonas mucosa strain ES_21con
EU934085.1 99% 99%
197 888 Streptomyces Streptomyces100% Streptomyces Streptomyces Streptomyces
Streptomyces thermocarboxydus strain 6-1
KJ571048.1 100% 99%
198 1135 Microbacterium Microbacterium100% Microbacterium Microbacterium Microbacterium
Microbacterium sp. 3408bBRRJ
FJ200413.2 100% 98%
199 987 Microbacterium Microbacterium100% Microbacterium Microbacterium Microbacterium
Microbacterium sp. YIM 100951
KC959569.1 100% 99%
200 1034 Brevibacterium Brevibacterium100% Brevibacterium aureum Brevibacterium Brevibacterium
Brevibacterium avium strain SS-T4
KF876886.1 99% 99%
202 769 Rahnella Enterobacteriaceae100% Enterobacteriaceae Enterobacteriaceae Rahnella
Rahnella aquatilis strain TB-144
KF817755.1 99% 99%
203 1005 Staphylococcus Staphylococcus100% Staphylococcus epidermidis Staphylococcus Staphylococcus
Staphylococcus epidermidis strain GG10H17
JN846922.1 100% 99%
204 723 Enterobacter Enterobacteriaceae100% Enterobacteriaceae Enterobacteriaceae Enterobacter
Uncultured Enterobacter sp. clone F7may1.10
GQ416399.1 100% 99%
206 815 Corynebacterium
Corynebacterium100% Corynebacterium variabile Corynebacterium Corynebacterium
Uncultured Corynebacterium sp. clone Z1136
EU029393.1 100% 99%
207 1374 Brevibacterium Brevibacterium100% Brevibacterium aureum Brevibacterium Brevibacterium
Brevibacterium avium strain SS-T4
KF876886.1 100% 98%
208 905 Gordonia Gordonia100% Gordonia Gordonia Gordonia
Gordonia bronchialis strain DSM 43247
NR_027594.1 100% 99%

Supplementary materials
153
stra
in I
D
Seq
uen
ce
len
gth
iden
tifi
cati
on
RD
P c
lass
ifie
r lc
a_ta
x_gre
engen
es
lca_
tax_
rdp
lc
a_ta
x_sl
v
BLA
ST-
firs
t d
escr
ibed
hit
d
escr
ipti
on
BLA
ST-
firs
t d
escr
ibed
hit
ac
cess
ion
qu
ery
cove
rage
iden
tity
209 1050 Lactococcus Lactococcus100% Lactococcus garvieae Lactococcus Lactococcus
Lactococcus garvieae strain TUB/2013/1-2
KJ909796.1 100% 100%
210 1019 Enterobacter Enterobacteriaceae100% Enterobacteriaceae Enterobacteriaceae Enterobacter
Uncultured Enterobacter sp. clone F7may1.10
GQ416399.1 100% 100%
215 799 Enterobacter Enterobacteriaceae100% Enterobacteriaceae Enterobacter Enterobacteriaceae
Uncultured Enterobacter sp. clone F7may1.10
GQ416399.1 99% 99%
217 846 Brachybacterium Brachybacterium100% Brachybacterium conglomeratum Brachybacterium Brachybacterium
Brachybacterium sp. TMT4-14
JX949864.1 99% 99%
218 859 Luteimonas Luteimonas98% Luteimonas Luteimonas Xanthomonadaceae
Luteimonas sp. FCS-9
KM025196.1 99% 99%
219 1037 Staphylococcus Staphylococcus100% Staphylococcus epidermidis Staphylococcus Staphylococcus
Staphylococcus sp. JPR7
KM083802.1 100% 100%
220 971 Staphylococcus Staphylococcus100% Staphylococcus sciuri Staphylococcus Staphylococcus
Staphylococcus sciuri strain APSAU153
KM192140.1 99% 99%
221 1099 Staphylococcus Staphylococcus100% Staphylococcus sciuri Staphylococcus Staphylococcus
Staphylococcus sciuri strain Zagazig 9
KJ000305.1 100% 99%
222 1059 Staphylococcus Staphylococcus100% Staphylococcus sciuri Staphylococcus Staphylococcus
Staphylococcus sciuri strain CtST8.1
JF935120.1 99% 99%
223 1042 Tsukamurella Tsukamurella100% Tsukamurella Tsukamurella Tsukamurella
Tsukamurella tyrosinosolvens strain YJR102
JX154557.1 100% 99%
224 869 Enterobacter Enterobacteriaceae100% Enterobacteriaceae Enterobacteriaceae Enterobacter
Uncultured Enterobacter sp. clone F7may1.10
GQ416399.1 100% 100%
225 839 Enterobacter Enterobacteriaceae100% Enterobacteriaceae Enterobacteriaceae Enterobacter
Uncultured Enterobacter sp. clone F7may1.10
GQ416399.1 100% 100%
227 882 Enterobacter Enterobacteriaceae100% Enterobacteriaceae Enterobacter Enterobacter
Uncultured Enterobacter sp. clone F7may1.10
GQ416399.1 100% 99%
228 1049 Lactococcus Lactococcus100% Lactococcus garvieae Lactococcus Lactococcus
Lactococcus garvieae strain 29
JF831158.1 99% 99%
229 1055 Enterobacteriaceae bacterium
Enterobacteriaceae100% Enterobacteriaceae Enterobacteriaceae Enterobacteriaceae
Kluyvera sp. AaMG9
GQ915084.1 100% 99%
230 882 Enterobacter Enterobacteriaceae100% Enterobacteriaceae Enterobacter Enterobacter
Uncultured Enterobacter sp. clone F7may1.10
GQ416399.1 100% 99%
232 1089 Enterococcus Enterococcus100% Enterococcus Enterococcus Enterococcus
Enterococcus casseliflavus strain ALK061
KC456574.1 100% 99%

Supplementary materials
154
stra
in I
D
Seq
uen
ce
len
gth
iden
tifi
cati
on
RD
P c
lass
ifie
r lc
a_ta
x_gre
engen
es
lca_
tax_
rdp
lc
a_ta
x_sl
v
BLA
ST-
firs
t d
escr
ibed
hit
d
escr
ipti
on
BLA
ST-
firs
t d
escr
ibed
hit
ac
cess
ion
qu
ery
cove
rage
iden
tity
233 999 Lactococcus Lactococcus99% Lactococcus garvieae Lactococcus Lactococcus
Lactococcus garvieae strain TUB/2013/1-2
KJ909796.1 100% 99%
236 1109 Staphylococcus Staphylococcus100% Staphylococcus Staphylococcus Staphylococcus
Staphylococcus sp. MOLA 313 partial r gene culture collection MOLA:313
AM945546.1 100% 100%
237 1177 Lactococcus Lactococcus100% Lactococcus garvieae Lactococcus Lactococcus
Lactococcus garvieae strain TUB/2013/1-2
KJ909796.1 100% 100%
238 1060 Pseudomonas Pseudomonas100% Pseudomonas Pseudomonas Pseudomonas
Pseudomonas chlororaphis strain HMGU6
HF952533.1 100% 99%
243 1176 Lactococcus Lactococcus100% Lactococcus garvieae Lactococcus Lactococcus
Lactococcus garvieae strain IMAU60022
FJ215671.1 100% 100%
246 1126 Klebsiella Enterobacteriaceae100% Klebsiella Enterobacteriaceae Enterobacteriaceae
Klebsiella oxytoca strain ATCC 43863
KC155255.1 99% 99%
248 899 Lactococcus Lactococcus99% Lactococcus garvieae Lactococcus Lactococcus
Lactococcus garvieae strain TUB/2013/1-2
KJ909796.1 99% 100%
249 1090 Pseudomonas Pseudomonas100% Pseudomonas Pseudomonas Pseudomonas
Pseudomonas chlororaphis strain BS1393 (rrsA)
FJ652609.1 100% 100%
250 1166 Enterobacter Enterobacteriaceae100% Enterobacteriaceae Enterobacter Enterobacter
Enterobacter sp. XBGRY7
KJ184972.1 99% 99%
251 1151 Enterobacter Enterobacteriaceae100% Enterobacteriaceae Enterobacter Enterobacter
Enterobacter sp. XBGRY7
KJ184972.1 100% 99%
252 996 Pseudomonas Pseudomonas100% Pseudomonadaceae Pseudomonas Pseudomonas
Pseudomonas sp. ESBL391B1_13_4E
KJ831457.1 100% 99%
255 1165 Sphingobacterium
Sphingobacterium100% Sphingobacterium mizutaii Sphingobacterium Sphingobacterium
Sphingobacterium sp. LMG 8346
JF708886.1 100% 99%
256 969 Klebsiella Enterobacteriaceae100% Klebsiella Enterobacter Enterobacteriaceae
Klebsiella oxytoca strain N8
KM349413.1 100% 99%
258 1086 Comamonadaceae bacterium
Comamonadaceae 100% Comamonadaceae unclassified Comamonadaceae Comamonadaceae uncultured
Comamonas sp. BF1
EU869280.1 100% 99%
259 1093 Comamonadaceae bacterium
comamonadaceae 100% Comamonadaceae Comamonadaceae Comamonadaceae
Comamonas sp. BF1
EU869280.1 99% 98%
260 1117 Alcaligenaceae bacterium
Alcaligenaceae100% Alcaligenaceae Alcaligenaceae Alcaligenaceae
Uncultured Alcaligenaceae bacterium clone F3feb.66
GQ417650.1 100% 99%

Supplementary materials
155
stra
in I
D
Seq
uen
ce
len
gth
iden
tifi
cati
on
RD
P c
lass
ifie
r lc
a_ta
x_gre
engen
es
lca_
tax_
rdp
lc
a_ta
x_sl
v
BLA
ST-
firs
t d
escr
ibed
hit
d
escr
ipti
on
BLA
ST-
firs
t d
escr
ibed
hit
ac
cess
ion
qu
ery
cove
rage
iden
tity
261 1034 Comamonadaceae bacterium
Comamonadaceae100% Comamonadaceae Comamonadaceae Comamonadaceae
Comamonas sp. BF1
EU869280.1 99% 99%
263 899 Enterobacter Enterobacteriaceae100% Enterobacteriaceae Enterobacter Enterobacter
Enterobacter sp. XBGRY7
KJ184972.1 100% 99%
265 859 Klebsiella Enterobacter100% Klebsiella oxytoca Enterobacteriaceae Enterobacteriaceae
Klebsiella oxytoca strain NFSt18
GQ496665.1 100% 100%
269 1168 Enterobacter Enterobacteriaceae100% Enterobacteriaceae Enterobacter Enterobacter
Enterobacter asburiae L1
CP007546.1 100% 99%
273 1160 Pseudomonas Pseudomonas100% Pseudomonas Pseudomonas Pseudomonas
Pseudomonas sp. XBBRY5
KJ184971.1 100% 99%
276 1110 Ochrobactrum Ochrobactrum100% Ochrobactrum Ochrobactrum Bacteria
Ochrobactrum pseudogrignonense strain NG-T7
KF844052.1 100% 100%
277 1133 Comamonadaceae bacterium
Comamonadaceae100% Comamonadaceae Comamonadaceae Comamonadaceae uncultured
Comamonas sp. BF1
EU869280.1 100% 99%
Table S1: List of the sequenced isolates. In the forth column, a summary of the result of identification with two different tools: RDP classifier, and SINA classifier based on three different specialized databases: Greengenes, RDP and Silva.
gel
b
and
Seq
uen
ce
Len
gth
iden
tifi
cati
on
rdp
clas
sifi
er
lca_
tax_
gre
engen
es
lca_
tax_
rdp
lc
a_ta
x_sl
v
BLA
ST-
firs
t d
escr
ibed
h
it
acce
ssio
n
qu
ery
cove
rage
iden
tity
F 10
529 Bacillus Bacilli100% Bacillaceae Bacillaceae1 Bacillus
Bacillus anthracis strain UASWS0900
KF525802.1 100% 98%
F 11
538 Bacillus Bacilli100% Bacillaceae Bacillaceae2 Bacillus
Bacillus anthracis strain UASWS0900
KF525802.1 100% 98%
F 12
501 Bacillus Bacilli100% Bacillaceae Bacillus Bacillus
Bacillus cereus strain L-05
KJ534398.1 99% 99%
F 13
517 Bacillus Bacilli100% Bacillaceae Bacillus Bacillus
Bacillus cereus strain WBD10B
KF550442.1 100% 98%
F 14
491 Bacillus Bacillus100% Bacillaceae Bacillus Bacillus
Bacillus sp. 7S7 KM374750.1 100% 100%

Supplementary materials
156
gel
b
and
Seq
uen
ce
Len
gth
iden
tifi
cati
on
rdp
clas
sifi
er
lca_
tax_
gre
engen
es
lca_
tax_
rdp
lc
a_ta
x_sl
v
BLA
ST-
firs
t d
escr
ibed
h
it
acce
ssio
n
qu
ery
cove
rage
iden
tity
f 16
508 Propionibacterium Propionibacterium100% Propionibacterium acnes Propionibacterium Propionibacterium
Uncultured Propionibacterium sp. clone BDV8-11
KM355729.1 100% 99%
f 20
428 Lactobacillus Lactobacillales99% Lactobacillales Lactobacillus Lactobacillus
Lactobacillus composti for rRNA strain:NRIC 0690
AB268119. 100% 97%
f 21
536 Leuconostoc Leuconostoc100% Leuconostoc Leuconostoc Leuconostoc
Leuconostoc mesenteroides strain DISSPA71
KJ187156.1 99% 99%
f 22
529 Enterococcus Enterococcus100% Enterococcus Enterococcus Enterococcus
Enterococcus sp. 15A
HQ289888.1 99% 100%
f 31
499 Acetobacter Acetobacter100% Acetobacter Acetobacter Acetobacter
Acetobacter tropicalis strain HT-Z39-B1
KJ526825.1 100% 99%
f 34
532 Enterococcus Enterococcus100% Enterococcus Enterococcus Enterococcus
Enterococcus gallinarum strain LMG 13129
NR_104559.2 99% 99%
f 3
519 Ralstonia Ralstonia100% Ralstonia Ralstonia Ralstonia
Uncultured Ralstonia sp. clone BDV1-23
KM355741.1 100% 99%
f 40
434 Enterococcus Enterococcaceae99% Enterococcus Enterococcus Enterococcus
Uncultured Enterococcus sp. clone Enter-4
JX679639.1 99% 99%
f 8
505 Erythrobacteraceae bacterium
Erythrobacteraceae95% Sphingomonadales Altererythrobacter Erythrobacteraceae
Erythrobacteraceae bacterium K-2-3
JQ963327.1 99% 99%
h 10
466 Klebsiella Klebsiella97% Klebsiella Klebsiella Enterobacteriaceae
Klebsiella variicola strain A6128
KM275666.1 100% 100%
h 15
519 Enterococcus Enterococcus100% Enterococcus Enterococcus Enterococcus
Enterococcus sp. ZGZ2
KF747765.1 99% 100%
h 16
524 Enterococcus Enterococcus100% Enterococcus Enterococcus Enterococcus
Enterococcus casseliflavus strain Z6006
KC212047.1 99% 100%
h 19
517 Enterobacter Enterobacteriaceae100% Enterobacteriaceae Enterobacteriaceae Enterobacteriaceae
Enterobacter sp. DLB27
KF791515. 99% 100%
h 1
518 Klebsiella Klebsiella99% Klebsiella Klebsiella Enterobacteriaceae
Endosymbiont of Sphenophorus levis clone Field_clone_C03
FJ626291.1 99% 99%
h 21
514 Propionibacterium Propionibacterium100% Propionibacteriumsacnes Propionibacterium Propionibacterium
Propionibacterium sp. B4
KJ741207.1 99% 99%
h 22
320 Enterobacter Enterobacteriaceae100% Enterobacteriaceae Enterobacteriaceae Gammaproteobacteria
Enterobacter sp. C1D
JN936958.1 99% 99%
h 23
522 Enterococcus Enterococcus100% Enterococcus Enterococcus Enterococcus
Enterococcus sp. ZGZ2
KF747765.1 99% 99%

Supplementary materials
157
gel
b
and
Seq
uen
ce
Len
gth
iden
tifi
cati
on
rdp
clas
sifi
er
lca_
tax_
gre
engen
es
lca_
tax_
rdp
lc
a_ta
x_sl
v
BLA
ST-
firs
t d
escr
ibed
h
it
acce
ssio
n
qu
ery
cove
rage
iden
tity
h 24
533 Enterococcus Enterococcus100% Enterococcus Enterococcus Enterococcus
Enterococcus sp. ZGZ2
KF747765.1 99% 99%
h 25
483 Flavobacterium Flavobacterium100% Flavobacterium Flavobacterium Flavobacterium
Uncultured Flavobacterium sp. clone XJ67
EF648136.1 100% 99%
h 28
519 Staphylococcus Staphylococcus100% Staphylococcus Staphylococcus Staphylococcus
Staphylococcus succinus strain EGY-SCC2
KJ524461.1 99% 100%
h 2
390 Klebsiella Enterobacteriaceae100% Klebsiella Klebsiella Bacteria
Klebsiella variicola strain A6128
KM275666.1 100% 99%
h 30
514 Enterococcus Enterococcus100% Enterococcus Enterococcus Enterococcus
Enterococcus gallinarum strain LMG 13129
NR_104559.2 100% 100%
h 32
519 Klebsiella Klebsiella100% Klebsiella Klebsiella Klebsiella
Klebsiella variicola strain A6128
KM275666.1 99% 100%
h 33
441 Klebsiella Enterobacteriaceae100% Klebsiella Klebsiella Klebsiella
Klebsiella variicola strain A6128
KM275666. 100% 100%
h 3
491 Klebsiella Klebsiella97% Klebsiella Klebsiella Bacteria
Klebsiella sp. 2.1T AY918477.1 99% 99%
h 6
529 Erythrobacteraceae bacterium
Erythrobacteraceae96% Sphingomonadales Altererythrobacter Erythrobacteraceae
Erythrobacteraceae bacterium K-2-3
JQ963327.1 95% 99%
h 8
433 Klebsiella Enterobacteriaceae100% Klebsiella Klebsiella Enterobacteriaceae
Uncultured Klebsiella sp. clone GCL11
JX310748.1 100% 100%
h 9
438 Klebsiella Enterobacteriaceae100% Klebsiella Klebsiella Enterobacteriaceae
Klebsiella variicola strain A6128
KM275666.1 99% 100%
39 522 Enterococcus Enterococcus100% Enterococcus Enterococcus Enterococcus
Enterococcus casseliflavus strain Z6006
KC212047.1 99% 100%
m 14
491 Erythrobacteraceae bacterium.
Erythrobacteraceae95% Sphingomonadales Altererythrobacter Erythrobacteraceae
Erythrobacteraceae bacterium K-2-3
JQ963327.1 100% 99%
m 15
504 Methylobacterium Methylobacterium100% Methylobacterium Methylobacterium Methylobacterium
Methylobacterium sp. DDW-1
FJ225120.1 100% 99%
m 17
521 Comamonadaceae bacterium
Comamonadaceae98% Comamonadaceae Comamonadaceae Comamonadaceae
Burkholderiales bacterium TP402
EF636177.1 100% 96%
m 18
531 Acidobacteria Gp6 AcidobacteriaGp6100% Acidobacteria6 AcidobacteriaGp6 AcidobacteriaSubgroup6
Uncultured Acidobacteria bacterium clone AEG_08_210
HQ597176.1 99% 98%
m 19
539 Oxalobacteraceae bacterium.
Oxalobacteraceae93% Oxalobacteraceae Oxalobacteraceae Noviherbaspirillum
Uncultured Oxalobacteraceae bacterium clone PSB011.C21_P19
GU300288.1 99% 94%

Supplementary materials
158
gel
b
and
Seq
uen
ce
Len
gth
iden
tifi
cati
on
rdp
clas
sifi
er
lca_
tax_
gre
engen
es
lca_
tax_
rdp
lc
a_ta
x_sl
v
BLA
ST-
firs
t d
escr
ibed
h
it
acce
ssio
n
qu
ery
cove
rage
iden
tity
m 22
496 Acetobacter Acetobacter100% Acetobacter Acetobacter Acetobacter
Acetobacter tropicalis strain HT-Z39-B1
KJ526825.1 99% 100%
m 24
531 Enterobacter Enterobacteriaceae100% Enterobacteriaceae Enterobacteriaceae Enterobacter
Uncultured Enterobacteriaceae bacterium clone SKF008
JF733252.1 100% 97%
m 26
410 Leuconostoc Leuconostoc100% Leuconostoc Leuconostoc Leuconostoc
Leuconostoc pseudomesenteroides strain FT268
KM207839.1 100% 99%
m 27
525 Leuconostoc Leuconostoc100% Leuconostoc Leuconostoc Leuconostoc
Leuconostoc mesenteroides strain DISSPA73
KJ187158.1 99% 100%
m 28
498 Pseudomonas Pseudomonadaceae100% Pseudomonasstutzeri Pseudomonas Pseudomonas
Uncultured Pseudomonas sp. clone 1 (12)
HQ018608.1 99% 99%
m 2
409 Methylobacterium Rhizobiales100% Methylobacterium Methylobacterium Methylobacterium
Methylobacterium sp. DDW-1
FJ225120.1 100% 96%
m 30
397 Pseudomonas Gammaproteobacteria99% Pseudomonas Pseudomonas Pseudomonas
Pseudomonas putida
L37365.1 98% 97%
m 32
370 Ralstonia Ralstonia100% Ralstonia Ralstonia Ralstonia
Uncultured Ralstonia sp. clone BDV1-23
KM355741.1 99% 100%
m 33
390 Enterococcus Enterococcus100% Enterococcus Enterococcus Enterococcus
Enterococcus sp. DMB7
KM203631.1 100% 100%
m 34
396 Enterococcus Enterococcus98% Enterococcus Enterococcus Enterococcus
Enterococcus sp. DMB7
KM203631.1 99% 100%
m 35
492 Gluconobacter Acetobacteraceae100% Gluconobacter Gluconobacter Gluconobacter
Gluconobacter oxydans strain T0-PCP05
HM562996.1 99% 98%
m 3
485 Erythrobacteraceae bacterium
Sphingomonadales100% Sphingomonadales Altererythrobacter Erythrobacteraceae
Erythrobacteraceae bacterium K-2-3
JQ963327.1 99% 94%
m 40
511 Enterococcus Lactobacillales98% Enterococcus Enterococcus Lactobacillales
Enterococcus avium for isolate: 3-1-58
AB932529.1 99% 98%
m 5
519 Klebsiella Klebsiella100% Klebsiella Klebsiella Klebsiella
Endosymbiont of Sphenophorus levis clone Field_clone_C03
FJ626291.1 99% 99%
m 8
493 Erythrobacteraceae bacterium
Erythrobacteraceae98% Sphingomonadales Altererythrobacter Erythrobacteraceae
Erythrobacteraceae bacterium K-2-3
JQ963327.1 99% 99%
Table S2: List of the sequenced DGGE bands. In the forth column, a summary of the result of identification with two different tools: RDP classifier, and SINA classifier based on three different specialized databases: Greengenes, RDP and Silva.

Publications & training
159
Publications & training
Papers
• Prosdocimi EM, Novati S, Bruno R, Bandi C, Mulatto P, Giannico R, Casiraghi M, Ferri E, Errors in ribosomal sequence datasets generated using PCR-coupled 'panbacterial' pyrosequencing, and the establishment of an improved approach. Mol Cell Probes. 2013 (1):65-7.
• Crotti E, Sansonno L, Prosdocimi EM, Vacchini V, Hamdi C, Cherif A, Gonella E, Marzorati M, Balloi A, Microbial symbionts of honeybees: a promising tool to improve honeybee health. N Biotechnol. 2013 30(6):716-22.
• Sandionigi A, Vicario S, Prosdocimi EM, Galimberti A, Ferri E, Bruno A, Baluch B, Mezzasalma V, Casiraghi M, Toward a better understanding of Apis mellifera and Varroa destructor microbiomes: introducing "PhyloH" as a novel phylogenetic diversity analysis tool. Mol Ecol Res. 2014 doi: 10.1111/1755-0998.12341. [Epub ahead of print]
• Montagna M, Chouaia B, Mazza G, Prosdocimi EM, Vacchini V, Crotti E, Merighetti V, Giorgi A, De Biase A, Longo S, Cervo R, Lozzia GC, Alma A, Bandi C, Daffonchio D, Effects of the diet on the microbiota of the red palm weevil. Under revision by PLoS ONE, 2014
• Conference Paper: Chouaia B, Montagna M, Vacchini V, Epis S, Mazza G, Prosdocimi EM, Crotti E, Longo S, Sacchi L, Giorgi A, Cervo R, Daffonchio D, Lozzia G, Bandi C, Microbial symbionts of the red palm weevil, Rhynchophorus ferrugineus: Insights from 16S rRNA pyrotag studies. Entomological Society of America Annual Meeting 2013; 11/2013
Posters
• Microbial Community Associated With The Red Palm Weevil, Rhynchophorus ferrugineus. Chouaia B, Montagna M, Mazza G, Epis S, Crotti E, Prosdocimi EM, Vacchini V, Daffonchio D, Cervo R, Bandi C. ICE 2012, XXIV International Congress in Entomology. Korea, 19 - 25 August 2012.
• Acetic acid bacteria and the factors driving their roles as insect symbionts. Crotti E, Chouaia B, Vacchini V, Prosdocimi EM, Sansonno L, Daffonchio D. EU US Environmental Biotechnology Workshop. St. Louis, Missouri, USA 5 - 7 November 2012
• Investigation of the microbial symbionts of the red palm weevil, Rhynchophorus ferrugineus. Chouaia B, Montagna M, Mazza G, Crotti
Publications & training
160
E, Epis S, Prosdocimi EM, Vacchini V, Cervo R, Longo S, Bandi C, Daffonchio D. BIODESERT International Conference. Tunis 16 – 19 December 2012.
• Acetic acid bacteria and the factors driving their roles as insect symbionts. Crotti E, Gonella E, Vacchini V, Prosdocimi EM, Mazzetto F, Chouaia B, Mandrioli M, Sansonno L, Daffonchio D, Alma A. BIODESERT International Conference. Tunis - 16 – 19 December 2012
• Acetic acid microbiome associated to the spotted wing fly Drosophila suzukii. Crotti E, Gonella E, Vacchini V, Prosdocimi EM, Mazzetto F, Chouaia B, Mandrioli M, Sansonno L, Daffonchio D, Alma A. BIODESERT International Conference. Tunis- 16 – 19 December 2012
• Analysis of bacterial communities involved in the parasite symbiosis between Apis mellifera and Varroa destructor. Sandionigi A, Prosdocimi EM, Casiraghi M. MD 2013, Turin, Italy, 23 – 25 October 2013
• A hypothesis on the interactions between microbiomes in a parasitic relationship: The case of Apis mellifera and its parasite Varroa destructor. Sandionigi A, Prosdocimi EM, Casiraghi M. BioSyst.Eu 2013, 18 – 22 February 2013
Meetings attended
• IV Congresso SIBE (Società Italiana di Biologia Evoluzionistica) Milan, 2-4 September 2010. (Organizing staff)
• Next Generation Sequencing applications and future perspectives, F.I.Bio. course, Naples, 27 April 2012.
Oral presentation: “Pyro-tag for the characterization of bacterial communities”
• “Cortona procarioti 2012” Cortona 3 – 5 May 2012
• VII workshop of the PhD course “Chemistry, Biochemistry and Ecology of pesticides” DeFens, Università degli studi di Milano 21 January 2013
• “Symbiomes: systems metagenomics of host microbe interactions” Edmund Mach Foundation, San Michele all’Adige 11 – 14 March 2013
• VIII workshop of the PhD course “Chemistry, Biochemistry and Ecology of pesticides” DeFens, Università delgi studi di Milano 26-27 January 2014
Partecipation to courses
• FACILIS 2014 Summer School on microbially-driven bioremediation, Milan, 12-25 July 2014. (Organizing staff)

Publications & training
161
• 5th international course in Microbial Ecology, “Deciphering microbial diversity and function in the environment through Next Generation Sequencing” Venice, 6-10 October 2014
• ”Bioinformatics: life sciences on your computer” John Hopkins University e-learning course, accomplished with distinction, July 2014
International Training
• Molecular cloning techniques and Drosophila rearing, prof. Won-Jae Lee laboratory at the Seoul National University (South Korea), May to June 2013
Teaching
• Technical microbiology classes for the Microbial Biotechnology course. Academic years 2012-2013, 2013-2014, 2014-2015
• Technical advising for students doing their master thesis on microbial symbionts of insects.

Aknowledgements
162
Acknowledgements
First, I want to thank my supervisors, prof. Sara Borin and prof. Daniele Daffonchio, for their expert guidance and their trust.
A very special thank to Elena Crotti, who is a patient, accurate and competent teacher. I learned a lot from her, from both a scientific and a human perspective.
Many people contributed to this work, and I want to thank them all. Violetta Vacchini for the Drosophila section and the time spent together in the lab, Bessem Chouaia for the Rhynchophorus section and the bioinformatics, Elena Gonella, Matteo Montagna, Daniela Lupi, Anna Rocco e Costanza Jucker for the entomology, and many others that I can not cite extensively for space reasons. Finally, I thank the master students Alan Barozzi and Davide Venegoni for their enthusiasm and hard work.
I also thank professor Won Jae Lee and his research staff, which welcomed me in their laboratory at Seoul National University. Spending two months there was an invaluable experience that taught me much about molecular cloning, hard working and about the amazing Korean people.
My biggest aknowledgements go to my colleagues in the lab and in the Environmental Microbiology section. Thank you for sharing with me your scientific thoughts and your lives. This made me grow, and built friendships that will not be broken.
Moreover, I thank all the friends that have been at my side in these three years, sharing with me wonderful adventures, and the bird-ringing group of Pusiano. I also thank Capoeira união for helping me in keeping the balance between mind and body.
Finally but most importantly, I would thank my family for all the love they give me every day, which supports me in all the things I do.

Short communication
Errors in ribosomal sequence datasets generated using PCR-coupled ‘panbacterial’pyrosequencing, and the establishment of an improved approach
Erica M. Prosdocimi a,1, Stefano Novati b, Raffaele Bruno b, Claudio Bandi c, Patrizia Mulatto b,Riccardo Giannico a, Maurizio Casiraghi a, Emanuele Ferri a,*aBTBS, Università degli Studi di Milano-Bicocca, Piazza della Scienza, 2, 20126 Milano, Italyb Fondazione IRCCS Policlinico San Matteo/Università degli Studi di Pavia, viale Golgi 19, Pavia, ItalycDIVET, Università degli Studi di Milano, via Celoria 10, Milano, Italy
a r t i c l e i n f o
Article history:Received 12 July 2012Accepted 13 July 2012Available online 20 July 2012
Keywords:16S18SRibosomal RNABacterial identificationNext-generation sequencing (NGS)Database errors
a b s t r a c t
Universal bacterial primers are often used in PCR-coupled sequencing approaches to investigate envi-ronmental and host-associated bacterial communities. Some of these primers can also amplify eukaryoticDNA. This is leading to the submission of datasets to public databases which are erroneously annotatedas prokaryotic sequences. The present note sends a message about the risk of submitting incorrectlyannotated sequence data and suggests a reliable approach for the sequencing of 16S rRNA genes andidentification of bacteria within complex communities.
� 2012 Elsevier Ltd. All rights reserved.
Oligonucleotide primers can be designed to amplify, in a singlePCR reaction, 16S rRNA genes from a broad range of bacteria fromenvironmental samples. Using tagged PCR primers, it is possible toanalyze PCR products from different sources within single pyrose-quencing runs and then trace the origin of the sequences usingthese tags [1]. It is important that primer pairs are carefullydesigned or selected, in order to generate sequences of a length thatis adequate for the technology employed, and to amplify at leastone of the variable regions of 16S rRNA gene. The variable region V3is regarded as the most appropriate for the analysis of bacterialcommunities [2]. A pitfall of the panbacterial primers flanking theV3 region (e.g., 341F and 518R; Table 1) is that they also amplify 18SrRNA genes from eukaryotes [3]. This is critical for studies ofbacteria associated with eukaryotes, e.g., the microbiota of the gut.
In the present study, two pyrosequencing runs, using Roche454-FLX titanium, were performed on amplicons produced withprimers 341F [4] and 518R [5] (Table 1) in PCR from genomic DNAfrom human blood and mite (Varroa destructor) samples. Ninety
blood samples and 67 mites were analyzed simultaneouslyfollowing chemical multiplexing. Total DNAwas extracted using theDNeasy blood and tissue kit (Qiagen), following the pretreatmentsteps for bacteria, and a pretreatment of the columns to removecontaminating DNA ([6,7]). Primers 341F and 518R were used forthe first PCR; products from the first PCRwere used as templates fora second one. The first reaction was conducted in 20 ml volumes [8]using the following protocol: 90 s at 94 �C; 29 cycles of 20 s at 94 �C,30 s at 58 �C, 20 s at 72 �C; 10 min at 72 �C; 5 min at 60 �C. Thesecond PCR was performed using 52 bp primers, comprisingpyrosequencing adapters A or B, MID tags (sequences provided byRoche, [9]) and 518R or 341F (Table 2). PCR conditions were asabove, but with 40 cycles and primers at 0.5 pmol/ml. For eachsample, we used a unique combination of MID tags on the forwardand reverse primers. Amplicons were quantified (Bioanalyzer 2100,Agilent) and pooled in order to have in the final mixtures the samequantity of each (blood: 20 ng DNA; mites: 100 ng DNA). The twopools were then run in agarose gel, and the DNA purified from theband.
After pyrosequencing, a total of 64,853 and 70,671 sequenceswere obtained respectively from the human blood and from themites. Sequences were assigned to the samples according to theMID-tagging, and assigned to particular operational taxonomicunits (OTUs). The majority of the sequences belonged to a few
* Corresponding author. Tel.: þ39 (0)2 64483413; fax: þ39 (0)2 64483568.E-mail address: [email protected] (E. Ferri).
1 Present address: DEFENS, Università degli Studi di Milano, Via Mangiagalli 25,Milano, Italy.
Contents lists available at SciVerse ScienceDirect
Molecular and Cellular Probes
journal homepage: www.elsevier .com/locate/ymcpr
0890-8508/$ e see front matter � 2012 Elsevier Ltd. All rights reserved.http://dx.doi.org/10.1016/j.mcp.2012.07.003
Molecular and Cellular Probes 27 (2013) 65e67

OTUs. BLAST-search revealed 100% identity for the majority of thesequences with human or mite 18S rRNA. The RDP classifier tool[10] was unable to reliably identify suspected eukaryotic sequences.Less than 0.2% and 2% of the sequences, respectively for blood andmite samples (corresponding to 2% and 8% of the OTUs), were ofbacterial origin. In summary, ribosomal genes were amplifiedalmost exclusively from humans and mites.
Moreover, using the BLAST tool, we discovered that severalsequences in the GenBank database are annotated as 16S rRNA, butare actually eukaryotic 18S rRNA gene fragments. Except for theconserved priming sites, the 18S and the 16S rRNA sequences areclearly distinguishable, and can be localized to two separatebranches on a neighbor-joining tree (Fig. 1). When the human 18SrRNA sequence, obtained from blood samples, was examined,restricting the search to only bacteria, 289 hits were found. Weobserved that all of them were annotated as partial 16S rRNAsequences from uncultured bacteria, but were in fact eukaryotic(see also Fig. 1). These 289 misidentified sequences had beendeposited in the database from May 2005 to January 2011 andderive from studies of microbial communities in various samples(soil; gut content; oral cavity). Comparedwithw3million 16S rRNAsequences presently in public databases, the proportion of thesemisannotated entries is very small. Nevertheless, 289 sequences aresufficient to produce a list of incorrect BLAST results when onecompares an eukaryotic 18S rRNA sequence (obtained with 341Fand 518R or similar bacterial primers) to the GenBank bacterialsequence collection. Most of these erroneous sequences have beenpublished, and have been generated by pyrosequencing. Forexample, 239 of the sequences published as bacterial by Humblotand Guyot (2009) [11] can be identified as being of plant origin. Alsoin this study, the amplicons had been produced using primers
flanking the V3 region. We emphasize that other primers, inaddition to those surrounding V3, likely amplify eukaryotic 18SrRNA genes. Indeed, when we queried the whole human 18S rRNAsequence (GenBank ID: 225637497), using the “discontiguousmegablast” tool, restricting the search to the bacterial sequences,we retrieved several hits. Most of them were amplicons similar tothe 18S rRNA region 469e631 (i.e. the fragment amplified by 341F-518R), but some sequences annotated as being of bacterial originhad a sequence identity greater than 75% to regions 797e1708 (forexample GenBank ID: 160338043), 1187e1692 (for example Gen-Bank ID: 187692214), 1314e1711 (for example GenBank ID:326648193). It is obvious that the presence of eukaryotic sequencesdeposited as prokaryotic can led to major misinterpretations ofresults in studies of bacterial communities.
Therefore, we established a nested PCR method to selectivelyamplify products from only bacterial 16S rRNA, representing the V3region, which are suitable for pyrosequencing. The method wastested on templates prepared from human blood and fromarthropods (V. destructor and Apis mellifera). On each of the selectedtemplates (DNAs from 2 blood samples, 2 mites, and 2 honeybees)we first performed three separate PCR reactions, using primer pairsthat we assessed in silico as being specific for bacteria: 10F/807R,27F/778R and 7F/1513R (Table 1); conditions were as in the firstPCR above, but with the annealing at 55 �C. These three primerpairs amplify a fragment of the 16S rRNA gene comprising the V3region. The amplification products were then subjected to a secondPCR, using MID-tagged primers (Table 2, PCR conditions asdescribed above for tagged primers). The final PCR products (ob-tained from the combination of two PCR reactions, with primers:10F-807R followed by MID-tagged primers; 27F-778R followed byMID-tagged primers; 7F-1513R followed by MID-tagged primers)were cloned into the pGEM-T-Easy vector (Promega); the insertwas amplified using the M13 forward and reverse primers, andthen sequenced. All the sequences were trimmed, BLAST-searchedand identified as bacterial by the use of the RDP classifier tool, witha confidence level of 95%.
For the blood project, we sequenced 72 clones. One sequencewas unintelligible, while all the others were identified as bacterial:mainly Proteobacteria (90.1%), and a smaller proportion of Bacter-oidetes (7%) and Firmicutes (1.4%). From 85 clones successfullysequenced from the arthropods, we obtained 77 intelligiblebacterial sequences: Proteobacteria (57.1%) Firmicutes (7.8%), Bac-teroidetes (32.5%), Actinobacteria (2.6%). The identifications to the
Table 1Universal bacterial primers used in this work.
Name Orientation Sequence (50/30) Amplified region/lengtha
341F Forward CCTACGGGAGGCAGCAG V3/194 bp518R Reverse ATTACCGCGGCTGCTGG V3/194 bp27F Forward AGAGTTTGATCMTGGCTCAG V1, V2, V3, V4/791 bp778R Reverse AGGGTATCTAATCCTGTTTGC V1, V2, V3, V4/791 bp7F Forward GAGAGTTTGATCCTGGCTCAG Almost entire 16S/1508 bp1513R Reverse CTACGGCTACCTTGTTACGA Almost entire 16S/1508 bp10F Forward AGTTTGATCMTGGCTCAG V1, V2, V3, V4/796 bp807R Reverse GGACTACHAGGGTATCTAAT V1, V2, V3, V4/796 bp
a Amplification lengths are those in Escherichia coli.
Table 2Pyrosequencing primers used in this work.
Name Orientation Sequence (50/30)a
b1f Forward CTATGCGCCTTGCCAGCCCGCTCAGacgagtgcgtCCTACGGGAGGCAGCAGb2f CTATGCGCCTTGCCAGCCCGCTCAGacgctcgacaCCTACGGGAGGCAGCAGb4f CTATGCGCCTTGCCAGCCCGCTCAGagcactgtagCCTACGGGAGGCAGCAGb8f CTATGCGCCTTGCCAGCCCGCTCAGctcgcgtgtcCCTACGGGAGGCAGCAGb9f CTATGCGCCTTGCCAGCCCGCTCAGtagtatcagcCCTACGGGAGGCAGCAGb10f CTATGCGCCTTGCCAGCCCGCTCAGtctctatgcgCCTACGGGAGGCAGCAGb14f CTATGCGCCTTGCCAGCCCGCTCAGcgagagataCCCTACGGGAGGCAGCAGb15f CTATGCGCCTTGCCAGCCCGCTCAGatacgacgtaCCTACGGGAGGCAGCAGa1r Reverse CGTATCGCCTCCCTCGCGCCATCAGacgagtgcgtATTACCGCGGCTGCTGGa2r CGTATCGCCTCCCTCGCGCCATCAGacgctcgacaATTACCGCGGCTGCTGGa3r CGTATCGCCTCCCTCGCGCCATCAGagacgcactcATTACCGCGGCTGCTGGa4r CGTATCGCCTCCCTCGCGCCATCAGagcactgtagATTACCGCGGCTGCTGGa5r CGTATCGCCTCCCTCGCGCCATCAGatcagacacgATTACCGCGGCTGCTGGa6r CGTATCGCCTCCCTCGCGCCATCAGatatcgcgagATTACCGCGGCTGCTGGa7r CGTATCGCCTCCCTCGCGCCATCAGcgtgtctctaATTACCGCGGCTGCTGGa8r CGTATCGCCTCCCTCGCGCCATCAGctcgcgtgtcATTACCGCGGCTGCTGGa9r CGTATCGCCTCCCTCGCGCCATCAGtagtatcagcATTACCGCGGCTGCTGGa10r CGTATCGCCTCCCTCGCGCCATCAGtctctatgcgATTACCGCGGCTGCTGGa11r CGTATCGCCTCCCTCGCGCCATCAGtgatacgtctATTACCGCGGCTGCTGGa13r CGTATCGCCTCCCTCGCGCCATCAGcatagtagtgATTACCGCGGCTGCTGG
a Sequences in lowercase represent the MID identifiers.
E.M. Prosdocimi et al. / Molecular and Cellular Probes 27 (2013) 65e6766

phylum and class levels had a confidence greater than 95%,according to the RDP classifier.
In conclusion, the nested PCR approach established allowed usto generate almost exclusively V3 16S rRNA bacterial sequences,starting from animal-associated microbial communities, the samebiological samples that led to almost exclusively eukaryoticsequences after the use of standard ‘bacterial’ V3 primers.
The rapid development of pyrosequencing techniques willprobably lead, in the next few years, to an exponential growth ofbacterial 16S rRNA sequences in public databases, coming frombacterial community studies of a variety of environmental samples.The generation of large datasets from pyrosequencing often comeswith a risk of submitting erroneous sequences to public databases,which do not undergo subsequent curation. The present studysends a message about this risk of submitting incorrectly annotatedsequence data, and recommends that reliable methods, such as thatestablished here, should be used for the sequencing of 16S rRNAgenes and identification of bacteria within complex communities.
Acknowledgments
This work was supported by a grant from the Fondazione IRCCSPoliclinico San Matteo (SN).
References
[1] Dowd SE, Callaway TR, Wolcott RD, Sun Y, McKeehan T, Hagevoort RG, et al.Evaluation of the bacterial diversity in the feces of cattle using 16S rDNA
bacterial tag-encoded FLX amplicon pyrosequencing (bTEFAP). BMC Microbiol2008;8:125.
[2] Chakravorty S, Helb D, Burday M, Connell N, Alland D. A detailed analysis of16S ribosomal RNA gene segments for the diagnosis of pathogenic bacteria.J Microbiol Methods 2007;69:330e9.
[3] Huys G, Vanhoutte T, Joossens M, Mahious AS, De Brandt E, Vermeire S, et al.Coamplification of eukaryotic DNA with 16S rRNA gene-based PCR primers:possible consequences for population fingerprinting of complex microbialcommunities. Curr Microbiol 2008;56:553e7.
[4] Watanabe K, Kodama Y, Harayama S. Design and evaluation of PCR primers toamplify bacterial 16S ribosomal DNA fragments used for community finger-printing. J Microbiol Methods 2001;44:253e62.
[5] Lane DJ. 16S/23S rRNA sequencing. In: Stackebrandt E, Goodfellow M, editors.Nucleic acid techniques in bacterial systematics. New York: John Wiley andSons; 1991. p. 115e75.
[6] Evans G, Murdoch D, Anderson T, Potter H, George P, Chambers S. Contami-nation of Qiagen DNA extraction kits with Legionella DNA. J Clin Microbiol2003;41:3452e3.
[7] Mohammadi T, Reesink H, Vandenbroucke-Grauls C, Savelkoul P. Removal ofcontaminating DNA from commercial nucleic acid extraction kit reagents.J Microbiol Methods 2005;61:285e8.
[8] Ferri E, Barbuto M, Bain O, Galimberti A, Uni S, Guerrero R, et al. Integratedtaxonomy: traditional approach and DNA barcoding for the identification offilarioid worms and related parasites (Nematoda). Front Zool 2009;6:1.
[9] Using multiplex identifier (MID) adaptors for the gs flx titanium chemistry eextended MID set. TCB no. 005-2009 technical bulletin. Genome SequencerFLX System; Roche, Basel, Switzerland.
[10] Cole JR, Wang Q, Cardenas E, Fish J, Chai B, Farris RJ, et al. The ribosomaldatabase project: improved alignments and new tools for rRNA analysis.Nucleic Acids Res 2009;37:D141e5.
[11] Humblot C, Guyot J. Pyrosequencing of tagged 16S rRNA gene amplicons forrapid deciphering of the microbiomes of fermented food such as pearl milletslurries. Appl Environ Microb 2009;75:4354e61.
[12] Tamura K, Dudley J, Nei M, Kumar S. MEGA4: molecular evolutionarygenetics analysis (MEGA) software version 4.0. Mol Biol Evol 2007;24:1596e9.
Fig. 1. Neighbor-joining tree showing the clustering with eukaryotes of sequences obtained following PCR using 16S rRNA V3 bacterial primers (341F-518R), from human blood andVarroa destructor samples (black squares). In addition to the above sequences, generated in our study, sequences from the databases which have been annotated as bacterial clusterwith eukaryotic 18S rRNA (black circles: sequences from [11]; black triangle: unpublished sequence). White squares: reference sequences for eukaryotes (extracted from GenBank).White dots: reference sequences for bacteria (extracted from RDP database). The tree was generated with MEGA4 [12]; model: P-distance, insertion/deletion not taken into account;bootstrap: 500 replications.
E.M. Prosdocimi et al. / Molecular and Cellular Probes 27 (2013) 65e67 67

RESEARCH PAPER New Biotechnology � Volume 30, Number 6 � September 2013
Microbial symbionts of honeybees:a promising tool to improve honeybeehealthElena Crotti1, Luigi Sansonno1, Erica M. Prosdocimi1, Violetta Vacchini1,Chadlia Hamdi2, Ameur Cherif2, Elena Gonella3, Massimo Marzorati4 andAnnalisa Balloi1,5
1Dipartimento di Scienze per gli Alimenti, la Nutrizione e l’Ambiente (DeFENS), Universita degli Studi di Milano, Milano, Italy2 Laboratoire des Microrganismes et Biomolecules Actives (LMBA), Universite de Tunis ‘El Manar’, Tunis, Tunisia3Dipartimento di Valorizzazione e Protezione delle Risorse Agroforestali (DIVAPRA), Universita degli Studi di Torino, Grugliasco, Italy4 Laboratory of Microbial Ecology and Technology (LabMET), Faculty of Bioscience Engineering, Ghent University, Ghent, Belgium5Micro4yoU s.r.l., Milan, Italy
Among pollinators, honeybees are the most important ones and exert the essential key ecosystem service
of pollination for many crops, fruit and wild plants. Indeed, several crops are strictly dependent on
honeybee pollination. Since few decades, honeybees are facing large-scale losses worldwide, the causes of
which are found in the interaction of several biotic and abiotic factors, such as the use of pesticides, the
habitat loss, the spread of pathogens and parasites and the occurrence of climate changes. Insect
symbionts are emerging as a potential tool to protect beneficial insects, ameliorating the innate immune
homeostasis and contributing to the general insect wellbeing. A review about the microbial symbionts
associated to honeybees is here presented. The importance of the honeybee microbial commensals for
the maintenance and improvement of honeybee health is discussed. Several stressors like infestations of
Varroa mites and the use of pesticides can contribute to the occurrence of dysbiosis phenomena,
resulting in a perturbation of the microbiocenosis established in the honeybee body.
IntroductionNon-conventional habitats, among which extreme environments
(like hot or cold deserts, inland or coastal saline systems), polluted
sites and animal gut, have been less explored in terms of biodi-
versity, richness and functionality as compared to other well-
studied conventional habitats, such as soil- and water-associated
matrices. Nonetheless, they represent a considerable source of
compounds and microorganisms with interesting biological and
biotechnological potential [1,2]. Growing attention has been
recently directed to the study of these niches and, among these
various non-conventional habitats, to the animal gut or, in gen-
eral, body intended as niches in which microorganisms survive
and flourish [3].
All metazoans hosting a gut microbiota, including arthropods,
establish with their microbes complex and dynamic symbiotic
interactions, which recently have been shown to go beyond a mere
nutritional complementation of the host diet, embracing a wide
set of aspects related to the host physiology, behavior, reproduc-
tion, evolution and immunity [3,4]. Insects are the most diverse
animal group on earth and during their evolutionary history they
adapted to feed on a variety of substrates and matrices, ranging
from wood or phloem sap to blood. These nutritionally unba-
lanced diets are exploited and/or complemented through insect
microbiota [see the review 5]. Microorganisms also played a major
role in insect adaptation and evolution [6].
Among insects, honeybees are of great importance worldwide
due to their pollination activity for crops, fruit and wild plants.
They offer a key ecosystem service, essential for a sustainable
Research
Pap
er
Corresponding author: Crotti, E. ([email protected])
716 www.elsevier.com/locate/nbt 1871-6784/$ - see front matter � 2013 Elsevier B.V. All rights reserved. http://dx.doi.org/10.1016/j.nbt.2013.05.004

productive agriculture and for the maintenance of the non-agri-
cultural ecosystem. Pollination services are mandatory for the
production of crops like fruits, nuts and fibers, whereas the results
of many other agricultural crops are significantly improved by
pollination. It has been estimated that without pollinators a
decrease by more than 90% of the yields of some fruit, seed and
nut crops could occur [7]. In the case that wild bees do not exert
their pollination service in a specific agricultural crop, managed
honeybees, which are versatile, cheap and convenient, represent
the only solution to ensure pollination [8]. The dependence of
worldwide crops on pollinators is extremely deep and during 2005
the global economic value of insect pollination was estimated to
be s153 billion a year, which corresponds to 9.5% of the total
economic value of agricultural crops for human consumption [9].
Since few years, concerns are rising over honeybee health and,
consequently, over its impact on economy [10]. Large-scale losses
have been reported worldwide and related to several causes, i e, the
habitat loss of pollinators, the increasing use of agrochemicals, the
outbreak of diseases, the attacks of parasites, the alarm related to
climate change, the introduction of alien species and the interac-
tion among all of these factors [10]. Managed honeybees are facing
increasing threats of diseases, pests and reluctance among younger
generations to learn the skills of beekeeping. In the last past years,
to define and to calculate the vulnerability of world agriculture
pollinator decline have become a primary point of action
[8,9,11,12]. Recently, Colony Collapse Disorder [CCD] has
attracted the attention of academic and public opinion, but this
poorly understood syndrome is just one cause of the colony losses.
Recent studies suggest that several factors are involved in CCD, as
parasites, pathogens, pesticides (and other environmental stres-
sors) and, above all, the interactions among them [13,14].
Honeybee symbionts could be exploited to actively counteract
bee pathogens and parasites or to enhance bee immunity, and thus
indirectly to increase the protection of honeybees’ health. Probio-
tic bacteria, such as lactic acid bacteria (LAB), have been adminis-
tered in laboratory conditions to honeybees, resulting in the
stimulation of the innate immune system and the prevention of
attacks by pathogen [15]. Recent studies in the insect model
Drosophila emphasize how complex, intimate and multifaceted
is the relation subsisting between the host and the microbiota,
which, if well balanced, leads to the optimal insect wellness [4].
In this review, we present the current understanding of the
importance of honeybee symbionts for the maintenance and
improvement of the insect health. In particular, the microbiota
involvement in the stimulation of the insect immune system and
body homeostasis – with a special focus on the gut dysbiosis – and
how this may be related to the use of pesticides, the spread of
viruses and the occurrence of parasites is discussed.
Microbial community associated to the honeybee ApismelliferaCultivation-dependent and -independent approaches have been
long used to define the composition and the structure of the
honeybee microbiota, analyzing different honeybee developmen-
tal stages, such as larvae, pupae, newly emerging adults and adults;
different genders, such as females and drones; and different social
individuals, such as queens, nurses or foragers [16]. Six phyloge-
netic groups, i. e. a-, b- and g-Proteobacteria, Firmicutes, Bacter-
oidetes and Actinobacteria, have been found as the major bacterial
taxa of the honeybee bacterial community, representing moreover
the bacterial core maintained in honeybees worldwide [16].
The recent technological innovations in the genomics and
metagenomics fields revolutionized the potential of applications
and the throughput of the analyzed data, allowing DNA sequen-
cing of high numbers of nucleotides with low costs and high
accuracy. The microbial composition and structure of a specific
community can be evaluated with high sensitivity, low cost and
short times, thanks to new sequencing technologies and the
multiplexing approach [17,18]. Also honeybee microbiota has
been evaluated by the use of these techniques [19–23, Table 1].
Interestingly, eight bacterial phylotypes have been retrieved as
major constituents of honeybee bacterial community, i. e. Alpha-
1, Alpha-2, Beta, Gamma-1, Gamma-2, Firm-4, Firm-5 and Bifido,
which correspond to the six phylogenetic groups mentioned
above.
The metagenomic survey on honeybees from CCD-affected and
not affected hives performed by Cox-Foster et al. [19] revealed that
in non-affected honeybees Firmicutes and a-Proteobacteria are
more abundant than in CCD colonies. Similarly, in the work by
Cornman et al. [20], deep sequencing on honeybees showed a high
proportion of Alpha-1, Alpha-2 and Bifido phylotypes in indivi-
duals from not affected hives compared to those from CCD-
affected hives. Cloning libraries of 16S rRNA by Martinson et al.
[21] revealed that the most abundant taxon in A. mellifera samples
was represented by Firm-5 phylotype. A. mellifera showed a dis-
tinctive bacterial pattern, made up of the eight typical phylotypes,
some of which are also present in closely related corbiculate bees of
the genera Apis and Bombus. Lately, pyrotag analysis, quantitative
PCR (qPCR) and fluorescent in situ hybridization (FISH) confirmed
Beta, Firm-5 and Gamma-1 phylotypes (BFG phylotypes) as main
members of A. mellifera microbiota, with a characteristic distribu-
tion along the gastrointestinal tract [22]. The crop resulted poor in
microbial species, due to continuous filling and empting for nectar
supply, and also the midgut showed a low BFG load, due to the
presence of the digestive enzymes and the peritrophic membrane
that prevents microbial attachment. By contrast, the ileum and the
rectum were rich in microbes. The ileum showed a defined micro-
bial distribution with Gamma-1 phylotype gathered in a thick
mat, between Beta phylotypes and the ileum wall, and with Firm-5
phylotype located in small pockets along the ileum wall. The
rectum showed the majority of BFG phylotypes together with
the majority of bacterial diversity [22].
A deep sampling of gut microbiota from 40 individuals has been
performed by Moran et al. [23]. Four phylotypes were present in all
samples, even if with different frequencies, i. e. one g-Proteobac-
terium, classified as Gilliamella apicola [24], one b-Proteobacterium
corresponding to Snodgrassella alvi [24] and two Firmicutes classi-
fied in Lactobacillus genus.
Yeasts, wide spread microorganisms in the honeybee environ-
ment, such as flowers, fruits and plant leaves [25,26], are also
important components of the bee microbiota. Recently by the use
of molecular tools, sequences related to the genera Saccharomyces/
Zygosaccharomyces and to the family Saccharomycetaceae have
been identified [20], confirming previous results obtained by
cultivation-dependent methods that showed the association of
yeasts with honeybee [27].
New Biotechnology �Volume 30, Number 6 � September 2013 RESEARCH PAPER
www.elsevier.com/locate/nbt 717
ResearchPap
er

RESEARCH
PAPER
New
Biotech
nology�Volume
30,
Number
6�Sep
tember
2013
TABLE 1
Actual knowledge on the bacterial species associated to the honeybee Apis mellifera according to cultivation-independent and -dependent methods. Data from cultivation-independent studies and some data from cultivation-dependent studies are from Sabree et al. [50]. Other cultivation-dependent data are from studies that identified the isolatesby partial or complete 16S rRNA gene sequencing
Case study Origin Sample Method Total nsequences
% knownbee speciesgroupsa
Alpha-1a Alpha-2a Betaa Gamma-1a Gamma-2a Firm-4a Firm-5a Bifidoa Otherbacteria
Cultivation-independent techniquesJeyaprakash et al. [51] South Asia Dissected guts Sanger 8 n/a +(3) +(1) +(2) +(2) – – +(1) +(1) b
Mohr and Tebbe [52] Germany Dissected guts Sanger 13 n/a – +(1) +(1) +(2) – – – – b
Babendreieret al. [53]
Switzerland Midgut andhindgut
Sanger 27 n/a +(3) +(2) +(6) +(8) +(1) +(2) +(4) – b
Disayathanoowat
et al. [54]Thailand Midgut Sanger 17 n/a – – + +(1) – – +(2) +(1) b
Cox-Foster et al. [19] Australia, USA,Hawaii
Pooled wholebees
Pyrotags454
428 97.4 1.9 3.2 16.9 60.9 9.6 0.6 2.8 1.7 2.6
Martinson et al. [21] Arizona Single whole
bees
Sanger 271 98.5 0.0 1.1 11.1 11.8 0.0 10.0 63.8 0.7 1.5
Martinson et al. [21] Arizona Bacterial cellsisolated from
pooled guts
Sanger 267 98.5 0.7 0.0 3.7 9.7 0.0 10.5 60.7 13.1 1.5
Martinson et al. [22] Arizona Dissected gutsections
Pyrotags454
96,505 99.9 0.0 0.3 20.3 10.1 24.2 0.2 44.0 0.8 0.1
Sabree et al. [50] Massachusetts Dissected guts Pyrotags
454
106,344 94.8 0.0 0.0 6.74 49.10 1.12 11.05 21.36 5.41 5.2
Moran et al. [23] Arizona,Maryland
Dissected guts Pyrotags454
329,550 99.1 1.0 1.0 9.1 11.9 2.0 45.4 23.2 5.4 0.9
Engel et al. [37] Arizona Hindguts of
worker bees
Illumina
sequences
76.6 Mbd 82.4 13.8 3.4 4.9 23.9 9.7 3.4 17.6
Cultivation-dependent techniquesc
Evans and
Armstrong [55]
USA Individual
larvae
Sanger 11 n/a – – – – – – +(1) – b
Olofsson and
Vasquez [56]
Sweden Guts Sanger 17 n/a – – – +(3) +(1) +(1) +(4) +(5) b
Vasquez and
Olofsson [57]
Arizona Guts Sanger 11 n/a – – – +(1) – +(1) +(2) +(4) –
Sabate et al. [58] Argentina Pooled
intestines
Sanger 1 n/a – – – – – – – – b
Loncaric et al. [59] Austria Honey sac Sanger 11e n/a – – – – – – – – b
Carina Audisio
et al. [60]Argentina Intestines Sanger 5 n/a – – – – – – – – b
Vasquez et al. [44] Sweden
and Kenya
Dissected
honey crops
Sanger 137e n/a – – – v – +(4) +(7) +(29) b
n/a=indicates not available.
a For studies with deep sequencing methods, percent values of phylotype abundance are indicated. In those studies where methods do not allow percent representation, ‘+’ indicates the presence of a phylotype. Figures in parentheses indicate
the number of sequences associated to a bacterial group. ‘–’ indicates no presence of a phylotype.b Sequences of other bacteria, besides the phylotypes presented in the table, have been retrieved but the frequencies cannot be calculated due to the methods employed in these case studies.c Cultivation-dependent methods do not allow to represent all bacteria in the gut.d These numbers are from a dataset of metagenomic data.e These numbers are from a dataset including also, but not only, sequences from A. mellifera.
718
www.else
vier.co
m/lo
cate/nbt
ResearchPaper

Emerging stressors for honeybee healthCurrently, a renewed attention has been directed to the relation-
ship between honeybee health and the use of pesticides, the
occurrence of parasitic mites and the outbreak of viral disease,
emphasizing their interconnection in determining the insect
health status [14,28].
Pesticides, especially neonicotinoids, which are widely used for
their excellent systemic properties, are indicated by scientists to
play a role in CCD phenomenon and, in general, in weakening the
processes of the colony, interacting with other stressors, such as
parasites [28]. Honeybees are exposed to neonicotinoids at sub-
lethal doses, and this results in insect behavioral disturbances,
orientation difficulties and impairment in social activities [28,29].
Experiments to prove these difficulties have been performed not
only in laboratory conditions – by ingestion tests and indirect
contact tests [29] – but also in field trials, where honeybees were
exposed to a direct contamination with the pesticides during the
foraging activity or to an indirect contamination with the pesti-
cide-contaminated materials stored in the hive or exchanged with
the sister bees [28]. Sublethal doses of pesticides resulted to be
dangerous also for bumble bees, inducing a weight loss of the
insect, a low number of pupae and a reduced number of queens,
thus impacting lastly the bumble bee populations [30].
The worldwide-spread, obligate-ectoparasitic mite Varroa
destructor represents a severe threat for apiculture. It can lead to
a colony collapse within a two- to three-year period. Periodic
treatments with chemicals increase on the one hand the costs
for beekeeping, and on the other hand the risk of the presence of
chemical residues in the environment and in the honey [31].
Moreover, Varroa mites act as disseminators of viruses between
and within bee colonies [32]. Recent publications highlighted the
multifactorial origin of the honeybee collapse. For instance, Varroa
can destabilize Deformed Wing Virus (DWV) dynamics making the
virus a rapidly replicating killer [14]. When DWV dynamics are
destabilized, a host immunosuppressive status with the down-
regulation of the transcriptional factor NF-kB is recorded. The
authors suggest that the DWV-mediated immunosuppressive
effect shows a DWV-threshold dependency; below a certain
threshold, DWV infection is maintained under control. If a stress
factor, like Varroa, subtracts the transcriptional factor NF-kB, the
concentration of the latter becomes too low to keep under control
DWV that can finally outbreak, bringing to the collapse the bee
population [14].
Pesticides, mites and viruses have a serious impact on the health
of honeybees, but in all these studies there is a missing actor,
represented by the gut microbial community. We will show in the
next paragraphs how deeply correlated is the insect health with
the gut microbiota and the immune system. Microorganisms
could be a key element in managing and preserving honeybee
health status toward different biotic and abiotic stressors.
Roles of the microbial partnersRecent research has shown that the gut microbiota is strictly linked
to host homeostasis and metabolic diseases, e. g. diabetes and
obesity [33]. The gut microbial community is involved in several
aspects of the host life, ranging from the nutritional contribution
to the energy salvage through fermentation, from influencing
mating preferences (e.g. this is the case of the gut bacteria in
Drosophila [34]) to immunity [5]. The animal immune system
works synergistically to contain the pathogens and to preserve
the symbiotic relationships between host and microbiota. A fine
regulation of signaling networks, which control the presence of
antimicrobial compounds in the gut, allows the host to tolerate
commensals and to block the proliferation of food-borne patho-
gens [35].
As presented above, the honeybee microbiota shows a consis-
tency which leads to hypothesize the possibility of a neutral or
beneficial involvement of it, or at least with some members of the
microbiota, in the honeybee’s life. Several of the taxa identified in
honeybees are known to produce short chain fatty acids, such as
lactic or acetic acid (Lactobacilli, Bifidobacteria, Acetobacteraceae
and Simonsiella). These products may act as supplements to hon-
eybee diet. Moreover, gut bacteria could allow to degrade pollen,
which is covered by exine layers recalcitrant to most of digestive
enzymes, using then the intine as a nutrient source [36,37].
While nutritional symbioses between insects and bacteria are
well documented [5], the correlation that exists between the
proper function of insect innate immune system and its micro-
biota is less explored. Symbionts are recently receiving increasing
attention because of their recognition as strong and effective
immunomodulators of insects [38–40].
In their work Ryu et al. [38] found that there is a fine equilibrium
between the acetic acid bacterial commensals and the Drosophila
innate immune system. The normal flora suppresses the growth of
pathogenic bacteria, unless the system is perturbed. If a perturba-
tion of the gut bacterial community occurs, an increased number
of pathogenic bacteria could lead to gut apoptosis. In a normal
condition the fly’s immune system allows the dominance of an
Acetobacteraceae strain, which in turn keeps down, by competi-
tive exclusion, the proliferation of the gut apoptosis inducer.
Another case study is represented by the tsetse fly and its obligate
symbiont Wigglesworthia. The latter complements the deficient diet
of the fly with the products of its metabolism. However, the sym-
biosis at the base of tsetse–Wigglesworthia interactions goes beyond
the nutritional role: larvae deprived of Wigglesworthia are immuno-
compromised when they reach the adult stage. Weiss et al. [39] show
that in aposymbiotic tsetse flies the cellular innate immune system
is seriously compromised and consequently the insects are highly
susceptible to infections. When hemocytes from wild type indivi-
duals are transplanted in aposymbiotic adults or Wigglesworthia cell
extracts are administered to the aposymbiotic mothers, the innate
immune system functionality is restored.
Another study that highlights the multidimensionality of sym-
bionts–host interactions has been performed on the Hawaiian
squid Euprymna scolopes and the luminous bacterium Vibrio fisheri
[40]. V. fisheri is the exclusive partner of the squid light organ and
the symbiosis follows a dynamic balance of symbionts expulsion
and regrowth. The well-known mediators involved in animal–
microbe interactions, called ‘microbe associated molecular pat-
terns’ (MAMPs), specifically lipid A component of lipopolysacchar-
ide (LPS) and peptidoglycan component, interplay synergistically
with the luminescence of symbionts to sustain the host develop-
ment. Researchers found that MAMPs and luminescence interac-
tions are both crucial for the maintenance of the symbiosis.
All these findings contribute to state that a finely regulated
dialog exists among the symbiotic partners to reach a symbiostasis.
New Biotechnology �Volume 30, Number 6 � September 2013 RESEARCH PAPER
www.elsevier.com/locate/nbt 719
ResearchPap
er

This is done through the regulation of pathways implicated in the
substrate availability and pathways that govern host/symbionts
population dynamics. Recently, artificial microcosms have been
employed to prove that the high functionality of a specific system
could be maintained, even during stress events, if microorganisms
are distributed in a suitable climax community [41]. In the case of
the microbiota associated to the digestive system, the mainte-
nance and improvement of the host health against pathogens
infection depends on the functionality of the system, which lastly
relies on the presence of a suitable climax community [16]. Cox-
Foster et al. [19] showed that CCD non-affected honeybees are
mainly colonized by Firmicutes and a-Proteobacteria, while in
CCD-affected bees a high abundance of g-Proteobacteria is mea-
sured. This could be related to a case of dysbiosis, i. e. an unbalance
of the gut microbiota, with the consequent loss of the proper
functionality, which in turn negatively impacts the health status.
Further studies are needed to unveil the strict and dynamic inter-
play existing between host and symbionts.
Microbial involvement in the general insect healthstatusRecent publications highlighted that in different Drosophila strains
two taxonomically different bacteria, i. e. Acetobacter pomorum and
Lactobacillus plantarum, modulate the insulin signaling and TOR
pathway, respectively, through different bacterial products
[4,42,43]. In A. pomorum, the acetic acid produced by the activity
of the pyrroloquinoline quinone-dependent alcohol deydrogen-
ase (PQQ-ADH) modulates the insulin signaling which in turn
controls several host homeostatic programs, as the developmental
rate, the body size, the energy metabolism and the intestinal stem
cell activity [42]. By contrast, L. plantarum promotes protein
assimilation from the diet, regulating diet-derived branched-chain
amino acid (BCAA) levels in the hemolymph. BCCA activates TOR
signaling: (i) in the fat bodies, which results downstream into the
promotion of growth rate and (ii) in the protoracic glands, which
has an impact downstream on the length of growth phase [43]. In
fat bodies TOR pathway normally acts stimulating the systemic
production of insulin-like peptides and thus promoting the
growth. It has been hypothesized that (1) the stimulation of the
insulin signaling in presence of commensals could be the result of
the evolution conflict between the host and its microbiota; (2)
bacterial metabolites are cues for the host to be informed on the
environmental nutritional availability for the host development
[4]. Thus according to this second hypothesis the host would
exploit its microbiota to sense the environment. Bacteria are
known to communicate through quorum sensing which allows
the regulation of their activity and physiological processes.
Quorum sensing outcomes in important advantages for bacteria,
i. e. host colonization, formation of biofilms, defense against
competitors, and adaptation to changing environments. The kind
of interaction here hypothesized implies a higher level of inter-
action between symbionts and hosts.
The molecular mechanisms that regulate the host microbe
crosstalk are still poorly understood. However, all these studies
highlight the key role of microbial partners in influencing the
systemic growth of the host and preserving its health. As in
Drosophila, it is possible to hypothesize that commensals in hon-
eybee could have a higher level of interaction with the host, acting
on the growth regulation of the insect. Components of Drosophila
microbiota, as Lactobacillales and Acetobacteraceae members, are
widespread in A. mellifera. LAB have been shown to exert a pro-
biotic effect on honeybee larvae, eliciting the innate immune
system to overcome pathogen attacks [15], and have been indi-
cated as major modulators of honeybee health [44]. Like LAB, well-
known for their ability to produce antimicrobial factors, other
symbionts such as sporeforming bacteria are indicated as produ-
cers of peptide antibiotics and antibiotic-like compounds, which
in some case possess antagonistic activity [45,46]. Finally, acetic
acid bacteria (AAB), widespread in nature [47], can compete with
the pathogen along the host epithelia, physically occupying the
available niches and nutritionally competing with the pathogens.
Moreover, acid and exopolysaccharide production may contribute
to AAB successful colonization of the insect gut [48,49].
PerspectivesThere is increasing evidence that there is a strict interconnection
between the intestinal microbiota balance and the health status of
the host [4]. Commensal microbiota drives immune and health
RESEARCH PAPER New Biotechnology � Volume 30, Number 6 � September 2013
FIGURE 1
A graphical representation of the ecological concept of Symbiont Resource Management (SRM) which foresees the management of the insect gut microbiome toimprove host health.
720 www.elsevier.com/locate/nbt
Research
Pap
er

homeostasis by mechanisms that are yet poorly understood and a
great effort has to be done in this direction. Insect symbionts are
indeed emerging as a potential tool in biocontrol programs to
protect beneficial insects, ameliorating the innate immune home-
ostasis and contributing to the general insect wellbeing [4]. The
employment and exploitation of microorganisms in a defined
environment or niche to solve practical problems have been
termed as Microbial Resource Management (MRM) and MRM
concepts are applicable to the maintenance and promotion of
insect health [3]. A novel MRM application, the Symbiont
Resource Management (SRM), can be defined as the application
of microbial symbionts to manage insect-related problems [3;
Fig. 1]. Symbiotic microorganisms can exert their beneficial con-
tribution toward the host to sustain its health in different ways, i.e.
by competitive exclusion, production of antibiotic compounds,
activation/stimulation of the innate immune system and commu-
nication to the host of the environmental conditions. However,
to ecome able to manage these complex microbial communities
within the body of the insects it is imperative to understand how
they interact with the host. Therefore, further research has to be
conducted to clarify the molecular mechanisms at the base of the
symbiosis.
AcknowledgementsThe authors thank the European Union in the ambit of project
BIODESERT (European Community’s Seventh Framework
Programme CSA-SA REGPOT-2008-2 under grant agreement no.
245746) and the Ministry for Research (MIUR), in the ambit of
projects PRIN 2009 (Interazioni tra insetti vettori. e. microrganismi
simbionti: nuove prospettive per il biocontrollo dei patogeni
trasmessi alle piante, agli animali. e. all’uomo) for financial
support. C.H. was supported for a Short Term Scientific Mission to
the University of Milan by Cost Action FA0701: ‘Arthropod
Symbiosis: From Fundamental Studies to Pest and Disease
Management’. M.M. is a Postdoctoral Fellow of the Research
Foundation – Flanders (FWO, Belgium).
References
[1] Canganella F, Wiegel J. Extremophiles: from abyssal to terrestrial ecosystemsand possibly beyond. Naturwissenschaften 2011;98:253–79.
[2] Mapelli F, Marasco R, Balloi A, Rolli E, Cappitelli F, Daffonchio D, et al. Mineral–microbe interactions: biotechnological potential of bioweathering. Journal ofBiotechnology 2012;157:473–81.
[3] Crotti E, Balloi A, Hamdi C, Sansonno L, Marzorati M, Gonella E, et al. Microbialsymbionts: a resource for the management of insect-related problems. MicrobialBiotechnology 2012;5(3):307–17.
[4] Douglas A. Is the regulation of insulin signaling multi-organismal? ScienceSignaling 2011;4. pe46.
[5] Dale C, Moran NA. Molecular interactions between bacterial symbionts andtheir hosts. Cell 2006;126:453–65.
[6] Rosenberg E, Zilber-Rosenberg I. Symbiosis and development the hologenomeconcept. Birth Defects Research Part C 2011;93:56–66.
[7] Southwick EE, Southwick Jr L. Estimating the economic value of honey bees(Hymenoptera: Apidae) as agricultural pollinators in the United States. Journalof Economic Entomology 1992;85:621–33.
[8] Klein A-M, Vaissiere BE, Cane JH, Steffan-Dewenter I, Cunningham SA, KremenC, et al. Importance of pollinators in changing landscapes for world crops.Proceedings of the Royal Society B Biological Sciences 2007;274:303–13.
[9] Gallai N, Salles J-M, Settele J, Vaissiere BE. Economic valuation of the vulner-ability of world agriculture confronted with pollinator decline. EcologicalEconomics 2009;68:810–21.
[10] Potts SG, Biesmeijer JC, Kremen C, Neumann P, Schweiger O, Kunin WE. Globalpollinator declines: trends, impacts and drivers. Trends in Ecology & Evolution2010;25:345–53.
[11] Gallai N, Vaissiere BE. Guidelines for the economic valuation of pollinationservices at a national scale. Rome: FAO; 2009.
[12] Hein L. The economic value of the pollination service, a review across scales. TheOpen Ecology Journal 2009;2:74–82.
[13] Johnson R. Honey bee Colony Collapse Disorder. CRS report for congress.Congressional Research Service; 2010: 1–17.
[14] Nazzi F, Brown SP, Annoscia D, Del Piccolo F, Di Prisco G, Varricchio P, et al.Synergistic parasite–pathogen interactions mediated by host immunity candrive the collapse of honeybee colonies. PLoS Pathogens 2012;8:e1002735.
[15] Evans JD, Lopez DL. Bacterial probiotics induce an immune response in thehoney bee (Hymenoptera: Apidae). Journal of Economic Entomology2004;97:752–6.
[16] Hamdi C, Balloi A, Essanaa J, Crotti E, Gonella E, Raddadi N, et al. Gutmicrobiome dysbiosis and honeybee health. Journal of Applied Entomology2011;7:524–33.
[17] Dowd SE, Callaway TR, Wolcott RD, Sun Y, McKeehan T, Hagevoort RG, et al.Evaluation of the bacterial diversity in the feces of cattle using 16S rDNAbacterial tag-encoded FLX amplicon pyrosequencing (bTEFAP). BMC Microbiol-ogy 2008;8:125.
[18] Sogin ML, Morrison HG, Huber JA, Mark Welch D, Huse SM, Neal PR, et al.Microbial diversity in the deep sea and the underexplored rare biosphere.Proceedings of the National Academy of Sciences of the United States of America2006;103(32):12115–20.
[19] Cox-Foster DL, Conlan S, Holmes EC, Palacios G, Evans JD, Moran NA, et al. Ametagenomic survey of microbes in honey bee colony collapse disorder. Science2007;318:283–7.
[20] Cornman RS, Tarpy DR, Chen Y, Jeffreys L, Lopez D, Pettis JS, et al. Pathogenwebs in collapsing honey bee colonies. PLoS ONE 2012;7:e43562.
[21] Martinson VG, Danforth BN, Minckley RL, Rueppell O, Tingek S, Moran NA. Asimple and distinctive microbiota associated with honey bees and bumble bees.Molecular Ecology 2011;20:619–28.
[22] Martinson VG, Moy J, Moran NA. Establishment of characteristic gut bacteriaduring development of the honeybee worker. Applied and EnvironmentalMicrobiology 2012;78(8):2830–40.
[23] Moran NA, Hansen AK, Powell JE, Sabree ZL. Distinctive gut microbiota of honeybees assessed using deep sampling from individual worker bees. PLoS ONE2012;7:e36393.
[24] Kwong WK, Moran NA. Cultivation and characterization of the gut symbionts ofhoney bees and bumble bees: Snodgrassella alvi gen. nov., sp. nov., a member ofthe Neisseriaceae family of the Betaproteobacteria; and Gilliamella apicola gen.nov., sp. nov., a member of Orbaceae fam. nov., Orbales ord. nov., a sister taxonto the Enterobacteriales order of the Gammaproteobacteria. International Jour-nal of Systematic and Evolutionary Microbiology 2012. http://dx.doi.org/10.1099/ijs.0.044875-0.
[25] Senses-Ergul S, Karasu-Yalcin S, Yesim Ozbas Z. Molecular identification of someyeast strains isolated from various sugary foods. Annals of Microbiology2012;62:1501–16.
[26] Slavikova E, Vadkertiova R, Vranova D. Yeasts colonizing the leaves of fruit trees.Annals of Microbiology 2009;59:419–24.
[27] Gilliam M. Identification and roles of non-pathogenic microflora associatedwith honey bees. FEMS Microbiology Letters 1997;155:1.
[28] Henry M, Beguin M, Requier F, Rollin O, Odoux J-F, Aupinel P, et al. A commonpesticide decreases foraging success and survival in honey bees. Science2012;336:348–50.
[29] Laurino D, Porporato M, Patetta Manino A. Toxicity of neonicotinoid insecti-cides to honey bees: laboratory tests. Bulletin of Insectology 2011;64:107–13.
[30] Whitehorn PR, O’Connor S, Wackers FL, Goulson D. Neonicotinoid pesticidereduces bumble bee colony growth and queen production. Science2012;336:351–2.
[31] Rosenkranz P, Aumeier P, Ziegelmann B. Biology and control of Varroa destruc-tor. Journal of Invertebrate Pathology 2010;103:S96–119.
[32] Genersch E, Aubert M. Emerging and re-emerging viruses of the honey bee (Apismellifera L.). Veterinary Research 2010;41(6):54.
[33] Turnbaugh PJ, Ley RE, Mahowald MA, Magrini V, Mardis ER, Gordon JI. Anobesity-associated gut microbiome with increased capacity for energy harvest.Nature 2006;444:1027–31.
[34] Sharon G, Segal D, Ringo J, Hefez A, Ziber-Rosenberg I, Rosenberg E. Commensalbacteria play a role in mating preference of Drosophila melanogaster. Proceedingsof the National Academy of Sciences of the United States of America2010;107:2051–6.
[35] Leulier F, Royet J. Maintaining immune homeostasis in fly gut. Nature Immu-nology 2009;10:936–8.
[36] Roulston TH, Cane JH. Pollen nutritional content and digestibility for animals.Plant Systematics and Evolution 2000;222:187–209.
[37] Engel P, Martinson VG, Moran NA. Functional diversity within the simple gutmicrobiota of the honey bee. Proceedings of the National Academy of Sciencesof the United States of America 2012;109:11002–07.
[38] Ryu JH, Kim SH, Lee HY, Bai JY, Nam YD, Bae JW, et al. Innate immunehomeostasis by the homeobox gene caudal and commensal-gut mutualismin Drosophila. Science 2008;319:777–82.
[39] Weiss BL, Maltz M, Aksoy S. Obligate symbionts activate immune systemdevelopment in the tsetse fly. Journal of Immunology 2012;188:3395–403.
New Biotechnology �Volume 30, Number 6 � September 2013 RESEARCH PAPER
www.elsevier.com/locate/nbt 721
ResearchPap
er

[40] McFall-Ngai M, Heath-Heckman EAC, Gillette AA, Peyer SM, Harvie EA. Thesecret languages of coevolved symbiosies: insights from the Euprymna scolopes–Vibrio fisheri symbiosis. Seminars in Immunology 2012;24:3–8.
[41] Wittebolle L, Marzorati M, Clement L, Balloi A, Daffonchio D, Heylen K, et al.Initial community evenness favors functionality under selective stress. Nature2009;458:623–6.
[42] Shin SC, Kin S-H, You H, Kim B, Kim AC, Lee K-A, et al. Drosophila microbiomemodulates host developmental and metabolic homeostasis via insulin signal-ling. Science 2012;334:670–4.
[43] Storelli G, Defaye A, Erkosar B, Hols P, Royet J, Leulier F. Lactobacillus plantarumpromotes Drosophila systemic growth by modulating hormonal signals throughTOR-dependent nutrient sensing. Cell Metabolism 2012;14:403–14.
[44] Vasquez A, Forsgren E, Fries I, Paxton RJ, Flaberg E, Szekely L, et al. Symbionts asmajor modulators of insect health: lactic acid bacteria and honeybees. PLoS ONE2012;7:e33188.
[45] Cherif A, Rezgui W, Raddadi N, Daffonchio D, Boudabous A. Characterizationand partial purification of entomocin 110, a newly identified bacteriocin fromBacillus thuringiensis subsp. Entomocidus HD110. Microbiological Research2008;163:684–92.
[46] Li G, Liu B, Shang Y, Yu Z, Zhang R. Novel activity evaluation and subsequentpartial purification of antimicrobial peptides produced by Bacillus subtilisLFB112. Annals of Microbiology 2012;62:667–74.
[47] Kommanee J, Akaracharanya A, Tanasupawat S, Malimas T, Yukphan P, Naka-gawa Y, et al. Identification of Gluconobacter strains isolated in Thailand basedon 16S–23S rRNA gene ITS restriction and 16S rRNA gene sequence analyses.Annals of Microbiology 2008;58:741–7.
[48] Crotti E, Rizzi A, Chouaia B, Ricci I, Favia G, Alma A, et al. Acetic acid bacteria,newly emerging symbionts of insects. Applied and Environmental Microbiology2010;76:6963–70.
[49] Kounatidis I, Crotti E, Sapountzis P, Sacchi L, Rizzi A, Chouaia B, et al. Acet-obacter tropicalis is a major symbiont of the olive fruit fly (Bactrocera oleae).Applied and Environmental Microbiology 2009;75:3281–328.
[50] Sabree ZL, Hansen AK, Moran NA. Independent studies using deep sequencingresolve the same set of core bacterial species dominating gut communities ofhoney bees. PLoS ONE 2012;7:e41250.
[51] Jeyaprakash A, Hoy MA, Allsopp MH. Bacterial diversity in worker adults ofApis mellifera capensis and Apis mellifera scutellata (Insecta: Hymenoptera)assessed using 16S rRNA sequences. Journal of Invertebrate Pathology 2003;84:96–103.
[52] Mohr KI, Tebbe CC. Diversity and phylotype consistency of bacteria in the gutsof three bee species (Apoidea) at an oilseed rape field. Environmental Micro-biology 2006;8:258–72.
[53] Babendreier D, Joller D, Romeis J, Bigler F, Widmer F. Bacterial communitystructures in honeybee intestines and their response to two insecticidal proteins.FEMS Microbiology Ecology 2007;59:600–10.
[54] Disayathanoowat T, Young JP, Helgason T, Chantawannakul P. T-RFLP analysisof bacterial communities in the midguts of Apis mellifera and Apis cerana honeybees in Thailand. FEMS Microbiology Ecology 2012;79:273–81.
[55] Evans JD, Armstrong TN. Antagonistic interactions between honey bee bacterialsymbionts and implications for disease. BMC Ecology 2006;6:4.
[56] Olofsson TC, Vasquez A. Detection and identification of a novel lactic acidbacterial flora within the honey stomach of the honey bee Apis mellifera. CurrentMicrobiology 2008;57:356–63.
[57] Vasquez A, Olofsson TC. The lactic acid bacteria involved in the production ofbee pollen and bee bread. Journal of Apicultural Research 2009;48:189–95.
[58] Sabate DC, Carrillo L, Audisio MC. Inhibition of Paenibacillus larvae and Asco-sphaera apis by Bacillus subtilis isolated from honeybee gut and honey samples.Research in Microbiology 2009;160:193–9.
[59] Loncaric I, Ruppitsch W, Licek E, Moosbeckhofer R, Busse H-J, Rosengarten R.Characterization of selected Gram-negative non-fermenting bacteria isolatedfrom honey bees (Apis mellifera carnica). Apidologie 2011;42:312–25.
[60] Carina Audisio M, Torres MJ, Sabate DC, Ibarguren C, Apella MC. Properties ofdifferent lactic acid bacteria isolated from Apis mellifera L. bee-gut. Microbio-logical Research 2011;166:1–13.
RESEARCH PAPER New Biotechnology � Volume 30, Number 6 � September 2013
722 www.elsevier.com/locate/nbt
Research
Pap
er

Towards a better understanding of Apis mellifera and Varroadestructor microbiomes: introducing ‘PHYLOH’ as a novelphylogenetic diversity analysis tool
A. SANDIONIGI,*1 S. VICARIO,†1 E. M. PROSDOCIMI,‡ A. GALIMBERTI,* E. FERRI,*
A. BRUNO,* B. BALECH,§ V. MEZZASALMA* and M. CASIRAGHI*
*ZooPlantLab, Department of Biotechnology and Biosciences, University of Milan-Bicocca, Piazza della Scienza 2, 20126 Milan,
Italy, †Institute of Biomedical and Technologies (ITB), National Research Council (CNR), Via Giovanni Amendola, 122/D, 70126
Bari, Italy, ‡DEFENS, University of Milan, Via Mangiagalli, 25, 20133 Milan, Italy, §Institute of Biomembrane and Bioenergetics
(IBBE), National Research Council (CNR), Via Giovanni Amendola, 165/A, 70126 Bari, Italy
Abstract
The study of diversity in biological communities is an intriguing field. Huge amount of data are nowadays available
(provided by the innovative DNA sequencing techniques), and management, analysis and display of results are not
trivial. Here, we propose for the first time the use of phylogenetic entropy as a measure of bacterial diversity in stud-
ies of microbial community structure. We then compared our new method (i.e. the web tool PHYLOH) for partitioning
phylogenetic diversity with the traditional approach in diversity analyses of bacteria communities. We tested PHYLOH
to characterize microbiome in the honeybee (Apis mellifera, Insecta: Hymenoptera) and its parasitic mite varroa (Var-
roa destructor, Arachnida: Parasitiformes). The rationale is that the comparative analysis of honeybee and varroa mi-
crobiomes could open new perspectives concerning the role of the parasites on honeybee colonies health. Our
results showed a dramatic change of the honeybee microbiome when varroa occurs, suggesting that this parasite is
able to influence host microbiome. Among the different approaches used, only the entropy method, in conjunction
with phylogenetic constraint as implemented in PHYLOH, was able to discriminate varroa microbiome from that of par-
asitized honeybees. In conclusion, we foresee that the use of phylogenetic entropy could become a new standard in
the analyses of community structure, in particular to prove the contribution of each biological entity to the overall
diversity.
Keywords: bioinformatics, high-throughput DNA sequencing, microbial community structure, phylogenetic entropy,
symbioses
Received 10 July 2014; revision received 23 October 2014; accepted 24 October 2014
Introduction
In ecology, the analysis and interpretation of community
diversity is a hot topic. In particular, with the advent of
high-throughput DNA sequencing (HTS), the attention
of the researchers on this topic dramatically increased.
Among communities, symbioses, and particularly host–
parasite interactions, are intriguing themes. In a symbi-
otic relationship, the partners reciprocally influence their
physiology and, in general, their evolution. Nowadays,
the characterization of the microbiome (intended as the
sum of microscopic living beings found in a symbiotic
relationship in different host body compounds, ranging
from the gut to the skin) is considered pivotal to under-
stand physiological changes occurring in a symbiosis
(Mazmanian et al. 2005). In recent years, the scientific
researchers focused on microbiome composition and var-
iation in different hosts or physiological/environmental
conditions using HTS (Sanchez et al. 2012; Dimitriu et al.
2013; Meriweather et al. 2013). The link between microbi-
ome diversity and host health condition was discernible
since the first published manuscripts. For instance, there
is evidence that humans and mice subjected to different
kind of stresses (such as diseases, parasites or ecological
factors) show intense modifications in their own microbi-
omes in terms of initial colonization, final composition
and overall stabilization (Candela et al. 2012; Lozupone
et al. 2012).
However, the comprehension of mechanisms and
dynamics influencing microbial diversity in hosts and
Correspondence: Maurizio Casiraghi, Fax: +39-02-64483568;
E-mail: [email protected]
1These authors contributed equally to this work.
© 2014 John Wiley & Sons Ltd
Molecular Ecology Resources (2014) doi: 10.1111/1755-0998.12341

symbionts is much more complicated due to (i) the
occurrence of several interacting variables (both abiotic
and biotic) and (ii) the neglected contribution of the evo-
lutionary history of single biological entities on the over-
all diversity when conventional analytical methods are
applied (Fig. S1, Supporting information). Currently,
researchers have just started incorporating historical con-
straints (represented as phylogenies) into their analyses.
This innovation is motivated by the aim of filling the gap
between evolutionary and ecological analyses of micro-
bial communities (Lozupone et al. 2007, 2011).
Here we tested two classes of approaches for microbial
community analysis: distance method approaches (DMAs)
and partitioning phylogenetic diversity (PPD). DMAs
became a standard in microbiome analyses, whereas PPD,
which uses the phylogenetic entropy as a measure of mi-
crobiome diversity (Jost 2007; Chao et al. 2010), is here
applied for the first time. The phylogenetic entropy is a
generalization of Shannon entropy based on the fact that
different observed categories are not all equally different
from each others, having a similar structure that could be
modelled using a phylogenetic tree. We implemented
PPD in the user-friendly web application, PHYLOH.
We applied DMAs and PPD to characterize microbio-
mes in the model honeybee (Apis mellifera) and its para-
sitic mite varroa (Varroa destructor, Arachnida:
Varroidae). The rationale is that the comparative analysis
of both honeybee and the parasitic varroa microbiomes
could open new perspectives about the role of the para-
site on health of honeybee colonies. Indeed, Varroa de-
structor is considered responsible of the increasing
incidence of deformed wing virus (M€ockel et al. 2011),
and it was reported as a vector of bacterial pathogens
causing for example the European foulbrood (e.g.Melisso-
coccus plutonius) (Forsgren 2010; Evans & Schwarz 2011).
Varroa destructor parasites honeybee larvae in their
brood cells, where female mites feed on honeybee hae-
molymph and lay eggs. Mites have a large dispersal
capability and, in absence of reiterate chemical and/or
antibiotic treatments, infested honeybee colonies typi-
cally collapse in few years. For these reasons, the occur-
rence of varroa has serious consequences on ecological,
social and economic contexts (Rinderer et al. 2010;
Rosenkranz et al. 2010; Annoscia et al. 2012; Guzman-
Novoa et al. 2012).
In spite of the interest, the ecological dynamics of the
honeybee–varroa parasitic symbiosis are still largely
unknown. Studies conducted on adult honeybees
showed a characteristic microbiome (Jeyaprakash et al.
2003; Dillon & Dillon 2004; Mohr & Tebbe 2006; Martin-
son et al. 2011; Sabree et al. 2012). However, the microbi-
ome of the larval stages, as well as that of the parasitic
mite, remains largely unexplored, excluding few
researches on the transmission of specific pathogens
(Mouches et al. 1984; Cornman et al. 2010; Forsgren 2010;
Martinson et al. 2012). At the light of present knowledge,
alterations of honeybee microbiome due to the symbiosis
with varroa are expected, even if several aspects influ-
ence the final outcome. The honeybee microbiome
undergoes a peculiar dynamic over the life cycle of the
insect: the pupa is almost sterile, as a consequence of the
physiologic characteristics of the gut tract and the diet of
mature larvae during the 6 days before capping (i.e. the
closure of the brood cell) (Martinson et al. 2012). It is rea-
sonable to assume that the bacterial load within the
brood cells partially reflects the total bacterial count of
the hives and that microbial communities characterizing
the hives are partially present in the cells even after cap-
ping (Martinson et al. 2012). But, what happens when
varroa alters this equilibrium? The perturbation caused
by varroa in the developmental phase of honeybee lar-
vae, and the consequent formation of the nutrition hole
caused by the parasite, could lead to the intrusion of
external bacteria (both from a potential vector or from
the environment) into the larva, with a substantial modi-
fication of the original microbial community. The
hypothesis is that varroa mites play a fundamental role
in the alteration of bacterial composition of honeybee lar-
vae, acting not only as a vector, but also as a sort of
‘swing door’ through which exogenous bacteria can
enter into the larva and alter the mechanisms of primary
succession of honeybee microbiome.
To validate our hypothesis, we studied varroa and
honeybee bacterial communities through DNA-barcoded
amplicon pyrosequencing, taking advantage of the HTS
methods (Blow 2008; Metzker 2009), which also allow the
detection of uncultured bacteria. We compared the results
of the phylogenetic entropy-based approach (imple-
mented in PHYLOH) with a classical method based on pair-
wise distances. We critically evaluated the strength and
weakness of both approaches and the importance of phy-
logenetic constraint. At the same time, we aimed to reach
a more complete vision of the relationships between hon-
eybee and varroa in the microbiome interchange.
Materials and methods
A schematic overview of the experimental pipeline is
shown in Fig. 1. Our work is divided into three sections
as follows: (i) laboratory procedures including sampling;
(ii) DNA extraction, amplification and pyrosequencing;
(iii) sequence analysis and microbial community differ-
ential analysis.
Laboratory procedures
Sampling—Honeybee larvae and varroa mites were
sampled directly from capped brood cells in eight
© 2014 John Wiley & Sons Ltd
2 A. SANDIONIGI ET AL .

apiaries in Northern Italy. We performed our analyses
on a total of 21 individuals of honeybee larvae from
seven different apiaries, and 21 varroa mites found in
the same brood cells. As a negative control, a pool of
five healthy honeybee larvae from a noninfected site
was analysed.
Opercula of cells were opened with sterile instru-
ments. Honeybee larvae and varroa were immediately
removed and put in 2-mL tubes filled with absolute
ethanol. The samples were stored at �20 °C until DNA
extraction. In the study area, V. destructor is abundant
and widespread, and consequently, we found only one
noninfested apiary. This apiary was determined to be
healthy after a careful inspection of all the hives by
expert bee-keepers. The same experts determined that
the presence of varroa in the other seven apiaries was
Fig. 1 Workflow of the procedures used
in our project. Our work is divided into
three sections: (i) laboratory procedures;
(ii) sequence analysis; and (iii) microbial
community analysis. In particular, the
microbial community analysis was con-
ducted following two approaches: micro-
bial diversity analyses and partitioning
phylogenetic distances.
© 2014 John Wiley & Sons Ltd
PHYLOH , A WEB TOOL FOR DIVERSITY ANALYSIS 3

high. In absence of preventive acaricide treatments, these
honeybee colonies would have certainly collapsed before
winter.
DNA extraction—All the extraction steps were performed
in a sterile laminar flow cabinet. After the removal of the
head, only the first segments of A. mellifera specimens
(after cuticular removal) were used for the DNA extrac-
tion, while for V. destructor, DNA was extracted from the
whole organism. The dissections were made in sterile
conditions with a scalpel in a Petri dish. Each sample
was then rehydrated for 4 h in sterile water at room tem-
perature, and mechanically grinded with the scalpel.
Total DNA was then extracted using a commercial kit
(DNeasy Blood and Tissue Kit; Qiagen, Milan, Italy) and
eluted in 50 lL sterile water. A pretreatment of Qiagen
columns was performed to wash away any trace of con-
taminating bacterial DNA (Evans et al. 2003; Moham-
madi et al. 2005). DNA extracts of the five larvae from
the noninfested apiary were pooled.
16S rRNA amplification and pyrosequencing—The 16S
rDNA gene fragment corresponding to the V3 hypervari-
able region was PCR-amplified with Roche 454 FLX
(Titanium reagents) using the primer pair 341F (50-CCTACGGGAGGCAGCAG-30) and 518R (50-ATTACCGC
GGCTGCTGG-30) (Watanabe et al. 2001). The reaction
was performed in a 20 lL volume with the following
reagents: 1X Taq-buffer with MgCl2 1,5 mM, dNTPs
2 mM, forward and reverse primers 1 lM each, Taq po-
limerase 0.5 U, DNA 50 ng, milliQ H2O to the volume.
The thermal cycle was: 94 °C for 90 s, 29 cycles at 94 °Cfor 20 s, 58 °C for 30 s, 72 °C for 20 s followed by a final
extension at 72 °C for 10 min and 60 °C for 5 min.
A subsequent nested PCR step using the products of
the first one as template was performed with standard
52 bp primers, comprising pyrosequencing primers A or
B, multiplex identifiers (MID) and 518R or 341F primers.
PCR mix and reaction volumes were the same as
described above, except for the primers (10 lM). The
thermal cycle was 94 °C for 90 s, 40 cycles at 94 °C for
20 s, 58 °C for 30 s, 72 °C for 20 s and a final extension
at 72 °C for 10 min and 60 °C for 5 min.
For each sample, we used a unique combination of
MIDs on the forward and reverse primers. PCR products
were quantified using Bioanalyzer 2100 (Agilent) and
normalized for quantity. Pyrosequencing was then per-
formed on Roche 454 GS-FLX titanium by BMR Genom-
ics Service at the Interdepartmental Biotechnology
Centre of the University of Padua (CRIBI).
Sequences analysis—Sequence analysis was performed
according to the following steps: (i) reads denoising;
(ii) operational taxonomic units (OTUs) definition;
(iii) OTUs taxon assignment; (iv) phylogenetic analysis;
(v) OTUs splitting based on reads frequencies.
(i)All reads were trimmed, filtered and assigned to the
corresponding sample according to their tag. Sequences
shorter than 100 bp with quality average <30 or contain-
ing unresolved nucleotides were removed from the data
set. ACACIA software version 1.52 (Bragg et al. 2012) was
used for pyrosequencing noise removal considering Bal-
zer error model and a maximum k-mer distance between
reads of 13 (default parameter for error correction). The
detection of chimera reads was performed using a pipe-
line based on USEARCH (Edgar 2010) and UCHIME (Edgar
et al. 2011) included in Quantitative Insights Into Micro-
bial Ecology (QIIME) software suite (version 1.7.0) (Capor-
aso et al. 2010).
(ii)UCLUST wrapper was used to cluster sequences into
OTUs, based on 97% sequence similarity. For each OTU,
a cluster centroid (i.e. a representative sequence) was
chosen. To estimate diversity and reduce noise in pat-
terns of beta diversity, singleton OTUs (i.e. OTUs repre-
sented by a single sequence) were removed before
community analysis (Zhou et al. 2011).
(iii)Using a PYTHON2.7 script, we merged the Greengenes
16S rRNA database prefiltered at 97% identity (McDon-
ald et al. 2011) with a bacterial OTUs data set constituted
by symbionts previously described in studies conducted
on Apis mellifera (Mohr & Tebbe 2006; Martinson et al.
2011, 2012; Mattila et al. 2012; Moran et al. 2012; Sabree
et al. 2012). To create a reference database for taxonomic
assignment, bacterial 16S rRNA sequences were
retrieved from GenBank and clustered using UCLUST at
97% sequence similarity. The taxonomic attribution of
cluster centroid sequences was carried out using RDP
Bayesian classifier (Wang et al. 2007) with the new
merged data set obtained using a 0.8 confidence level.
OTUs were assigned by the RDP classifier, considering
the fifth and sixth taxonomic levels wherever possible,
which, in most cases, corresponded to family and genus
ranks. If RDP assignment was uncertain (probability
between 0.8 and 0.9), the QIIME-selected representative
sequence was used to query with blastn algorithm on
NCBI nucleotide database. Only in case of perfect match
(i.e. max identity 100%, query coverage 100%), the NCBI
taxonomy was used (results are shown in Table S1 in
Supporting information and/or DRYAD entry doi:10.
5061/dryad.j4d15).
(iv)A maximum-likelihood (ML) phylogenetic tree was
built according to default parameters using FASTTREE soft-
ware (Price et al. 2010) integrated in QIIME.
(v)The community abundance profile, produced by UC-
LUST and labelled by RDP Bayesian classifier, was split
into two groups, as their global frequency was lower or
higher than 1%. This threshold is the advised value in
QIIME manual; it is often used in the literature and
© 2014 John Wiley & Sons Ltd
4 A. SANDIONIGI ET AL .

matches a gap in the frequency distribution of this data
set (see Supporting information and/or DRYAD entry
doi:10.5061/dryad.j4d15).
After this step, three data sets were produced: ‘All
Frequency Cluster’ (i.e. AFC, including all OTUs), ‘Low
Frequency Cluster’ (i.e. LFC, including OTUs with fre-
quency lower than 1%) and ‘High Frequency Clusters’
(i.e. HFC, including OTUs with frequency higher than
1%). This partitioning allowed us to explore the effect of
dominant and rare taxa among the microbiomes of
honeybee and varroa.
Microbial community analyses
Microbial communities were examined using two
approaches: the conventional distance matrices analysis
(DMA) and the partitioning phylogenetic diversity
(PPD). The last method was here applied for the very
first time to the analysis of microbiomes.
Distance matrices analysis, coupled with ANOVA fam-
ily statistics, is a well-known statistical framework in
microbial community analysis that allows comparing the
effect of different explanatory variables. This method is
sensitive to unbalanced sampling, and it requires data
rarefaction. In a HTS framework, the term ‘unbalanced
sampling’ refers to the amount of sequences generated
for each biological sample (e.g. if you get 100 000
sequences from the organism 1 and 50 000 sequences
from the organism 2, the randomization leads to a loss of
information from the larger sample). The principal pitfall
of this approach is that it does not take into account the
influence of rare OTUs on the global diversity of a sam-
ple (see also Fig. S1, Supporting information). To over-
come this limit, we here propose the use of a PPD
approach (Chao et al. 2010). PPD is being framed within
information theory and can deal directly with discrete
values, without producing distance matrices. It can also
incorporate information deriving from unbalanced sam-
pling, therefore avoiding a preliminary step of data rare-
faction. Finally, being based on the phylogenetic
structure of the data, PPD takes into account the influ-
ence of rare lineages on the microbial composition. In
fact, similar sequences with low counts can build up con-
sistent contribution to beta diversity on the branch lead-
ing to their most recent common ancestor.
The distribution of variability among bacterial com-
munities was described for three environmental vari-
ables: (i) ‘Cells’ to show differences between single
honeybee and the corresponding parasite found in the
same brood cell, highlighting possible relationships
between host and parasite microbiomes; (ii) ‘Localities’
to draw attention to differences existing between the
microbiome of the seven apiaries; (iii) ‘Status’ to show
microbiome differences among the pools of healthy hon-
eybees, parasitized honeybees and mites.
Distance method approach
All the analyses were performed on the rarefied OTU
tables to permit comparisons of diversity patterns within
and between communities. The number of OTUs (based
on the 97% sequences similarity) was determined for
each sample. As depicted in Fig. 1, community analyses
were performed with qualitative (jaccard and unweighted
UniFrac (Lozupone et al. 2011) and quantitative distance
metrics [squared chord (Cavalli Sforza & Edwards 1967;
Orloci 1967) and weighted UniFrac (Lozupone et al. 2011)]
using QIIME and R for statistical computing (R Develop-
ment Core Team 2012).
Jaccard and squared chord were chosen as complemen-
tary metrics to unweighted and weighted UniFrac to test
how the community pattern changes with or without
phylogenetic information. We chose the squared-chord
distance because it was identified in previous works as a
metric fitting well at an exploratory analysis of commu-
nities where sampling was conducted blindly [see for
example (Legendre & Gallagher 2001)].
To interpret the distance matrix, we used UPGMA
hierarchical clustering method and we tested the robust-
ness of results with jackknife analysis (1000 permuta-
tions). Further, to determine whether the grouping of
samples by a given category was statistically significant,
we used adonis (Oksanen et al. 2007) a permutational MA-
NOVA allowing the use of distance matrix as dependent
variable. This procedure is included within the QIIME
suite and was implemented in vegan R package. The
model used in adonis was the following:
Dist ði; jÞ� Statusþ Localitiesþ Cells
where i and j are all possible pairs of samples without
redundancy and identity.
In this model, distances were considered as the
response variable, whereas each of the environmental
variables was considered as predictor.
We identified the microbial core community in honey-
bee and in the mite using compute_core_microbiome.py
script from QIIME. OTUs were grouped according to their
occurrence in a specific percentage of the total samples.
The grouping steps were defined as elevens threshold
between 0.5 and 1, corresponding to the 50% and 100%
of the samples, respectively. This allowed defining the
core community of each host species and more specifi-
cally to recognize the OTUs present in the majority of the
samples of a given host.
Figures S2 and S3 (Supporting information and/or
DRYAD entry doi:10.5061/dryad.j4d15), showing the
© 2014 John Wiley & Sons Ltd
PHYLOH , A WEB TOOL FOR DIVERSITY ANALYSIS 5

taxonomic assignment and the abundance distribu-
tion, were generated with phyloseq (McMurdie &
Holmes 2013) and ggplot2 (Wickham 2009) R pack-
ages.
Partitioning phylogenetic diversity
Following the framework proposed by Jost (2007), it is
possible to parse the total phylogenetic entropy of a data
set (c component), in intragroups entropy (a component,
and intergroups entropy (b component). Jost (2007) dis-
tinguishes between entropy measures, having bit has
unit (or nats, or bans, depending on the logarithm base),
and diversity measure having as unit the number of
equally abundant categories that would produce the
same amount of entropy.
Partitioning operations are performed using entropy
components, while the final result is transformed into
diversity by elevating to the base of the used logarithm.
Assuming that cluster label of observation is collected in
vector X and that group label is collected in vector Y, this
framework allows to define Hc as entropy of X, Ha as
entropy of X conditional to Y, and Hb entropy as
Hc � Ha, defined also as the mutual information
between X and Y (MacKay 2003).
It is important to notice that beta diversity (Db),
the exponential of Hb, has as unit the number of
equally abundant and different samples (the catego-
ries of Y), while Dc and Da are measured in number
of equally abundant clusters (the categories of X).
Within microbial community analysis, the interest lays
generally in estimating Db. To assess whether this
measure was significantly different from 1 (i.e. the
diversity value under the hypothesis of no difference
among groups), we compared the realized statistics
with a null distribution obtained by a permutation of
X values onto Y ones. This procedure keeps a con-
stant number of observations per group, allowing
accounting for different sampling efforts. As described
here, this procedure does not consider the phyloge-
netic structure that links the categories of the vector
X. This limitation is critical for biological data.
Indeed, radically different findings from a biological
perspective would produce the same Shannon-based
beta diversity (see Fig. S1, Supporting information).
This becomes possible using the phylogenetic entropy.
The phylogenetic entropy is a generalization of Shan-
non entropy where the different observed categories
are not all equally different from each other, but have
a similarity structure that could be modelled using a
phylogenetic tree. Following Chao et al. (2010), we
assume that variable X is the abundance distribution
of the clusters defined by UCLUST, and its similarity
structure can be modelled with a phylogenetic tree t.
The phylogenetic entropy measure could be defined
as follows:
HpðXÞ ¼ �X
i2Bt
LiTpi log pi
where Li is the value of the branch length for the ith
branch while T is the average distance from tip observa-
tion to root in the tree, as defined by the formula
T ¼X
Lipi
where i 2 Bt is the set of branches of the tree t, and pi is
the frequency of the descendant of branch i. Once this
point is set, to generalize the partitioning of diversity to
include phylogenetic information, it is sufficient to apply
the previous definition of c, a, b diversity using the phy-
logenetic entropy instead of the Shannon entropy. Phylo-
genetic entropy c (Hc) is equal to Hp (X), while
phylogenetic entropy a is equal to the weighted mean of
the phylogenetic entropies per group, where weights are
proportional to the number observation carried out in
each group. More formally, this can be written as fol-
lows:
Hpa ¼X
y2Ypy
X
x2XHpðX jY ¼ yÞ ð1Þ
where py is the relative frequency of observation in each
group while
X
x2XHpðX jY ¼ yÞ ð2Þ
is the phylogenetic entropy measured in the different
group y defined in vector Y. Phylogenetic entropy beta
(Hpb) remains defined as the Hpc � Hpa. This phyloge-
netic entropy beta, or phylogenetic mutual information,
behaves in analogous way as Shannon-based mutual
information given the Kullback–Leiber divergence. This
matches the different way to estimate the classical
mutual information (Marcon et al. 2012).
Given that the Hpb is a difference of two summations
in which each term is relative to a branch in the tree, it is
possible to reorder the terms and obtain the contribution
of each branch in the final Hpb.
The mutual information Hpb, or its exponential Db,
cannot be directly compared across different grouping
variable Y, given that the cardinality of each variable Y
(the number of possible states) defines a different upper
boundary to the value of each b diversity. To normalize
diversity measures across different partitioning vari-
ables, it is necessary to transform diversity in overlap or
effective average proportion of shared lineages in an
© 2014 John Wiley & Sons Ltd
6 A. SANDIONIGI ET AL .

individual environment. The value ranges from 1 (all
lineages are shared) to 0 according to the following
formula:
Overlap ¼ ðHb �maxHbÞmaxHb
where the maximum value of Hb is the logarithm of the
number of groups or the entropy of Y depending on
whether differential sampling needs to be included in
the measure or not.
In this work, this approach was applied using the tree
obtained from FASTTREE (Price et al. 2010) and the tree
with the same topology, but internal branches with
length 0 and terminal branches with length 1. The latter
modified tree is used to perform the Shannon entropy
analysis without taking into account the phylogenetic
information, using the same software implementation. In
fact, setting all internal branch lengths to zero leaves in
the summation only the terms present in Shannon
entropy formula. These two alternative settings allow to
better evaluating the importance of phylogeny when
interpreting the results.
Note that fractions of overlap are always higher in
the phylogenetic entropy case, given that there are
some phylogenetic similarities between different
OTUs, while the classic Shannon-based approach
assumes that each OTU is totally different from the
others.
The mutual information (i.e. the beta entropy) deals
with the covariation between two variables, so we
explored the relationship between sequences and a sin-
gle explanatory variable at the time. Within the frame-
work of information theory, it could be possible to take
into account the network of multiple interactions, but its
application to phylogenetic entropy requires further
investigations.
Partitioning phylogenetic diversity approach was
implemented as a stand-alone Python script (PHYLOH
available at https://github.com/svicario/phyloH) and
includes a visualization routine based on ITOL (Letunic
& Bork 2007) that allows to visualize the distribution of
diversity and the contribution of the different OTUs to
the partition as an html file. Input format follows PHYLO-
COM input standard (Webb et al. 2008). To facilitate the
use for the microbiologist community, we wrapped in a
Web Service (https://www.biodiversitycatalogue.org/
rest_methods/143) the script coupling it within a work-
flow (http://www.myexperiment.org/workflows/3570.
html) with some parsing script enabling the use of out-
put files from QIIME suite as input. The workflow could
be run locally using a TAVERNA desktop engine (Wolsten-
croft et al. 2013) or as web application in the BioVeL por-
tal. Access to the portal could be obtained from the
BioVel website (www.biovel.eu) or contacting directly
the authors.
Results
Results are organized according to the pipeline showed
in Fig. 1.
Sequence analysis
Define OTUs—After sorting sequence reads for quality
scores, sequencing errors and chimeras, we obtained
34 816 sequences. UCLUST returned 295 OTUs (data set
AFC).
Taxonomic assignment—The complete list of OTUs, with
corresponding taxa names and acronyms, is provided as
Supporting information and/or DRYAD entry doi:10.
5061/dryad.j4d15 (Table S1, Supporting information).
Taxon assignment at family level of the three types of
organisms involved (healthy honeybee, parasitized hon-
eybee and varroa) is shown in Fig. 2.
Split OTUs by sequence frequency—Of 295 OTUs, 21
exceeded the threshold of 1% of minimum total
observations (data set ‘HFC’, total sequences: 24 005),
and 274 were defined as a rare OTUs not reaching
the 1% threshold (data set ‘LFC’, tot sequences:
10 811).
Phylogenetic analysis—The maximum-likelihood tree gen-
erated by FASTTREE is shown as internal tree in PHYLOH out-
put (see Supporting information and/or DRYAD entry
doi:10.5061/dryad.j4d15).
Microbial community analysis
Distance method approach—The UPGMA analysis, consid-
ering jaccard distances for all the three sets of observa-
tions (AFC, HFC, LFC), shows a single cluster including
all samples belonging to parasitized honeybees and
mites and a separate cluster including the pool of healthy
honeybees. On the contrary, with squared-chord metrics,
which consider abundances information of OTUs in HFC
and AFC, the analysis shows two different groups
between parasitized honeybees and mites. These results
are partially replicated with UniFrac (both weighted and
unweighted), although separation is less sharp (see Fig.
S4, Supporting information).
The adonis test was performed separately for each var-
iable (Cells, Localities and Status) and using all variables
together without interactions. Results were highly simi-
lar; for this reason only the coefficients of the model with
all predictors combined are reported (Supporting
© 2014 John Wiley & Sons Ltd
PHYLOH , A WEB TOOL FOR DIVERSITY ANALYSIS 7

information Table S2 and/or DRYAD entry doi:10.5061/
dryad.j4d15).
The adonis test grouping the samples for brood
cells (Cells) has limited significance (P-values between
0.05 and 0.01) and small effect compared to degrees
of freedom used up (34–35% explained variance, 1.6%
the mean value for single cell). In addition, adonis test
is significant only using the jaccard distance and un-
weighted UniFrac in the LFC data set. We found the
same variance in the AFC data set, but only using
the unweighted UniFrac (35% variance explained and
P-value of 0.04).
A slightly stronger signal is detected in Localities,
where jaccard, unweighted UniFrac and squared chord show
a significant grouping in the AFC data set (P-value <0.01and effect 17–20% with per-Localities mean variance
explained between 3% and 2%). Similar signal is also vis-
ible with HFC and LFC, but only jaccard is significant
(Supporting information Table S2 and/or DRYAD entry
doi:10.5061/dryad.j4d15).
The Status grouping shows a very different pattern.
The mean variance explained per state of Status builds
up to 4–5% in the AFC data set and 9% for the weighted
UniFrac in HFC. Only the LFC subset is not significant
for the majority of distances used, and in any case the
mean variance explained is quite low (1%).
Microbial core communities. In healthy honeybees, we
found only three OTUs, one of them (Proteo-7, a member
of the genus Serratia) accounting for the 99% of
sequences. The remaining 1% is shared between two
OTUs: Proteo-2 and Firmi-7, respectively, identified as
Achromobacter sp. and Lactobacillus sp.
On the curves returned by QIIME script, we defined the
host and parasite core microbiomes using a 0.8 threshold
(Fig. S5, Supporting information). The threshold was
chosen according to the steepest point in the curve,
namely the point in which the least addition of OTU in
the core ensures the largest fraction of samples to be
compliant with the core representation. This means that
a single OTU has to be present in the 80% of samples of a
certain species to be considered ‘core’ for that species.
The OTUs considered as microbial core for honeybee
and varroa are shown in Table 1.
Partitioning phylogenetic diversity—We used PHYLOH to
perform partitioning tests on three environmental vari-
ables (Cells, Localities and Status) for the three frequency
data sets (AFC or LFC or HFC) considering the
1.0
0.75
0.5
0.25
0
ActinomycetalesPropionibacteriaceaeFlavobacteriaceaeWeeksellaceaeBacillalesBacillaceaeLactobacillaceaeStreptococcaceaeClostridialesAcetobacteraceaeAlcaligenaceaeRhodocyclaceaeEnterobacteriaceaeMoraxellaceaePseudomonadaceae
Healthy larva
Parasitizedlarva
Varroa mite
Fig. 2 Structure of microbiomes from
healthy and parasitized honeybees and
varroas. The histogram shows the 15 fam-
ilies detected and relative abundances. In
two cases (Bacillales and Clostridiales),
the family rank was not assigned, and
consequently, the order rank is shown.
© 2014 John Wiley & Sons Ltd
8 A. SANDIONIGI ET AL .

phylogenetic information available or not. We can
observe several qualitative differences among the 18
analyses transforming the mutual information into per-
centage of overlapping to allow a comparison among
variables. As shown in Fig. 3, Localities and Cells vari-
ables are not heavily influenced by phylogenetic infor-
mation. The relative position of LFC, HFC and AFC,
measured in fraction of overlap counted in OTUs or lin-
eages, is similar. In fact, LFC has, in both cases, low over-
lap, whereas AFC and HFC data sets show the
maximum overlapping.
The variable Status describes a very different pat-
tern from the previous two. Taking into account phy-
logeny, HFC differentiates more among groups
(overlap 0.87), with the other two data sets showing
about 0.91 overlapping. On the contrary, if phyloge-
netic information is not considered, the pattern is
similar to the other two variables. The biggest differ-
ence is observable in LFC, while the smallest differ-
ence is observable in HFC.
The contribution of the branches to the mutual information
between sequences and the Status variable. The experimental
design output and the numerical partitioning of phyloge-
netic diversity for Status variable considering all OTUs
found (AFC) are shown in Table 2. A general overview
of the branches contribution to beta diversity across
groups is shown in Fig. 4. The 295 AFC OTUs are well
distributed on the phylogenetic tree, and consequently,
their impact on the phylogenetic index is higher. It is
observable that Bacte-1, -2, -3 are more typical of the var-
roa and are all grouped in the same lineage (L208). On
the contrary, in Proteobacteria and Firmicutes, it is possi-
ble to find OTUs preferentially found in honeybee or var-
roa. Proteo-12, Proteo-14, Proteo-46, Proteo-24 and
Proteo-17 OTUs belong to lineage L268 and are preferen-
tially present in honeybee. There are three isolated OTUs
preferentially found in varroa (Proteo-3, Proteo-4 and
Proteo-5). Firmi-1, Firmi-9 and Firmi-4, typical of honey-
bee, are mixed with varroa’s OTUs Firmi-6, Firmi-14,
Firmi-2, Firmi-8 (both descending from lineage L387).
This lack of strong phylogenetic signal could be
caused by recent specialization or random community
assembly, given that Firmi-6 has a lower frequency sister
taxa Firmi-14 also present mainly in varroa we prefer the
first hypothesis.
Discussion
The analysis of complex communities (such as microbio-
mes) is today standard in different fields of biology and
medicine. The number of published works is increasing
daily, but there are some concerns on the real quality of
the results showed. We are here comparing a ‘traditional’
approach to the community analysis [i.e. distance
method approach (DMA)], vs. the innovative partition-
ing phylogenetic diversity (PPD, here implemented in
Table 1 OTUs associated with healthy and parasitized honey-
bees and varroa by compute_core_microbiome.py script
Parasitized honeybee Varroa mite Shared
Propionibacterium
sp. (Actino-1)
Chryseobacterium
sp. (Bacte-1)
Chryseobacterium
sp. (Bacte-1)
Chryseobacterium
sp. (Bacte-1)
Flavobacteriaceae
(Bacte-2)
Streptococcus
sp. (Firmi-1)
Streptococcus
sp. (Firmi-1)
Streptococcus
sp. (Firmi-1)
Lactobacillus
sp. (Firmi-7)
Clostridiales
(Firmi-3)
Bacillus
sp. (Firmi-2)
Hydrogenophilus
sp. (Proteo-1)
Lactobacillus sp.
(Firmi-7)
Geobacillus
(Firmi-5)
Achromobacter
sp. (Proteo-2)
Hydrogenophilus
sp. (Proteo-1)
Anoxybacillus
(Firmi-6)
Achromobacter
sp. (Proteo-2)
Lactobacillus
sp. (Firmi-7)
Escherichia
sp. (Proteo-6)
Hydrogenophilus
sp. (Proteo-1)
Achromobacter
sp. (Proteo-2)
Pseudomonas
sp. (Proteo-4)
Escherichia
sp. (Proteo-6)
Fig. 3 Comparison of the percentage of overlap of the six data
sets with or without taking into account the phylogenetic infor-
mation. The percentage of overlap was calculated using estimate
of beta diversity and phylogenetic beta diversity for AFC, HFC,
LFC cluster frequencies and Cells, Localities, Status environmen-
tal variables.
© 2014 John Wiley & Sons Ltd
PHYLOH , A WEB TOOL FOR DIVERSITY ANALYSIS 9

our newly proposed software PHYLOH). The final aim is to
propose our approach as a new standard in community
diversity analysis. We tested the performance and utility
of DMAs and PPD in the case of honeybee and varroa
microbiomes, a biological scenario intriguing and com-
plex at the same time. Our results showed that healthy
honeybees have a simplified microbiome, constituted of
few bacterial OTUs, while varroa is characterized by a
more complex microbiome, qualitatively not different
from that of parasitized honeybee. A simple conclusion
could be that varroa microbes infected honeybees. How-
ever, the most abundant OTUs of parasitized honeybee
do not derive directly from the mite, but are generalist or
environmental bacteria. This is undoubtedly a peculiar
result suggesting that these microbes could play a role of
pioneer species, with a potential pathogenic activity (i.e.
Firmi-1, -9, L387, Streptococcus; Firmi-4, -14, L387, Clos-
tridiales) (Lozupone et al. 2012).
Our results show that both DMAs and PPD approach
give comparable results, but only PPD shows explicit
support and allows, within the same statistical frame-
work, to observe our data both from the general pattern
to the contribution of single or group of OTUs.
We partitioned data according to three environmen-
tal variables, which represent three different forces
shaping microbiome diversity: Localities, Cells and Sta-
tus. When Localities variable is considered, in DMAs
approach, the UPGMA method and the adonis test
analyses show a weak, but significant signal for most
of the distances and data set used. When all OTUs
(AFC) combined with unweighted UniFrac are consid-
ered, the signal is stronger.
Table 2 Variability in reads count for each sample. Variability in reads count and sample number in groups. Overall gamma in each
group. Overall alpha and contribution to alpha in each group. Beta across samples within groups and between groups. E is always
within S, given that each sample belongs to only one environment type or sample group
Experimental design diversity: entropy and diversity of observation in the different groups
H_Environment
H(E) MaxDiversity Diversity
0.691 2 2
Experimental design diversity: entropy and diversity of observation in the sample within the groups
H_Sample
H(E) MaxDiversity Diversity
3.68 42 39.5
Gamma diversity: diversity using all data and in each group
H_gamma H_gamma_parasitized_honeybee H_gamma_mite
H(T) alpha_Diversity H(T|E = host_p) gamma_Diversity H(T|E = pars) gamma_Diversity
1.76 5.83 1.75 5.73 1.69 5.42
Alpha diversity: mean within group diversity
H_alphaByEnvironment H_alphaBySamples
H(T|E) alpha_Diversity H(T|S) alpha_Diversity
1.72 5.56 1.35 3.85
Beta diversity or mutual information between the phylogeny and a given grouping: diversity across group and across sample within
same group
MI_treeAndEnvironment MI_treeAndSampleGivenEnvironment
I(T,E) beta_Diversity Percentage_Overlap P value I(T,S|E) beta_Diversity Percentage_Overlap P value
0.0465 1.05 0.933 0 0.369 1.45 0.466 0
Difference of each group from total: phylogenetic Kullback–Leiber divergence between each group and the overall sample
KL_of_host_p KL_of_pars
Observed Observed
0.0162 0.0303
H_gamma = H_alphabyEnvironment + H_beta = H(T) = H(T|E) + I(T,E) while taking into account sample info: H_gamma = H_al-
phaBySample + H_betabySamplegivenEnvironment+H_beta = H(T) = H(T|S) + I(T,S|E) + I(T,E).
© 2014 John Wiley & Sons Ltd
10 A. SANDIONIGI ET AL .

The results are similar using PPD, but with a stronger
support. In fact, the variable Localities produces a
significant effect, although this is better appreciable for
rare OTUs (LFC) rather than considering the most abun-
dant OTUs (HFC). In other words, low-frequency OTUs
(better defined using PPD) represent the fraction of bac-
teria characterizing the single apiary. This finding is in
agreement with previous results, showing that
geographical distance is not crucial in shaping the core
microbiome of beehives (Sabree et al. 2012).
In our hypothesis, the bacteria are transmitted from
varroas to the honeybee larvae. This is corroborated by
the analysis of the variable Cells, where differences
between each larva and the corresponding mite were
estimated. This grouping has limited effects in terms of
mean explained variance when the DMA approach is
used, but it is still significant for some distances in AFC
and LFC data sets. In PPD, the overlap across categories
is obtained by Cells with the LFC data set, showing a
strong effect. This situation is difficult to explain: only
the more frequent bacteria are shared among cells,
whereas rare bacteria are not. However, the rare bacteria
are more interesting because they act as a clear signature
to discriminate different apiaries.
Considering the variable Status, both DMAs and PPD
approaches can discriminate the three different catego-
ries: healthy honeybees, parasitized honeybees and var-
roas. Healthy honeybees have a simply and distinctive
community with only one dominant OTU and two other
low-frequency OTUs. The most representative phylotype
(Proteo-7) belongs to the genus Serratia that was isolated
from the intestinal contents of healthy foraging worker
honeybees (Jeyaprakash et al. 2003), a well-known sym-
biont (generally harmless) in many insect taxa (Dillon &
Dillon 2004).
The scarcity of bacteria in the healthy larvae could be
attributed to their particular gut morphology, physiology
and nutrition (Martinson et al. 2012). Indeed, the larva
retains its faeces from the early days of development,
due to the temporary absence of a connection between
the large mid-gut and the hindgut. The mature larva def-
aecates just before spinning a cocoon, when the capping
has already happened. As the cocooned pupa does not
eat, we can assume that there is no further colonization
by bacteria present in the brood cell. Through these
mechanisms, the early microbiome characterizing honey-
bee larvae is maintained constant in composition and
ubiquitous in space (Jeyaprakash et al. 2003; Mohr &
Tebbe 2006).
The higher level of bacterial communities diversity
showed in varroa and parasitized larvae suggests a
transmission from parasite to the host. These two micro-
biomes are identical from a qualitative point of view
(taking into account the HFC), but the relative abun-
dance of the different OTUs clearly differentiates the two
bacterial communities. When phylogenetic information
is included, the level of discrimination between parasit-
ized larvae and varroa is even higher. In fact, only using
Fig. 4 In the figure are shown the main tips and relative branches of one of the most discriminating lineages across Status groups [L387,
see tree.html (Appendix S1) in Supporting information and/or DRYAD entry doi:10.5061/dryad.j4d15 for further details] as example of
the ‘hairy pacman graphical output’ derived from a PHYLOH analysis. Three types of data are shown on the tree: (i) the cyan colour of the
branches indicates a significant contribution to I(T|E) (beta entropy or mutual information); (ii) the background of each branch is a gra-
dient (colour range) from yellow to red for increased contribution to I(T|E); (iii) bar plot on each tip indicates the number of reads count
in each group. For more details, see README file (Appendix S1) in Supporting information and/or DRYAD entry doi:10.5061/dryad.
j4d15.
© 2014 John Wiley & Sons Ltd
PHYLOH , A WEB TOOL FOR DIVERSITY ANALYSIS 11

PPD and weighted UniFrac in DMA (i.e. the approaches
that take into account the phylogenetic signal), the two
clusters are highly discriminated. However, only in PPD,
it is possible to show the contribution of the single OTU
and groups of OTUs to the differences observed among
samples.
The enhanced performance of PPD is exemplified in
PHYLOH output tree [Supporting information tree.html
(Appendix S1) and/or DRYAD entry doi:10.5061/dryad.
j4d15 and as an example Fig. 4] where the lineages L208,
L268 and L387 are those discriminating the microbiome
of varroa and infected honeybee. In particular, L208 lin-
eage encompasses OTUs present in varroa, while L268
and L387 contain OTUs present in both varroa and hon-
eybees. The most discriminating OTUs of lineage L208
belong to the genus Chryseobacterium (Bacte-1, -2, -3). In
contrast to the majority of bacteria belonging to Flavo-
bacteria, typically found in soil and water environments,
two (Bacte-1, -2) of these three OTUs were found as
pathogens of soft ticks (Bure�sov�a et al. 2006). Given the
phylogenetic closeness between mites and ticks, it would
be interesting to investigate the role of this genus in
mites. The OTUs belonging to the lineage L268 were
assigned to genus Haemophilus, in which bacteria recog-
nized as pathogenic to bees but not associated with the
presence of varroa were found. Indeed, there are numer-
ous studies related to the antimicrobial properties of
honey with references to Haemophilus (i.e. Jeffrey & Echa-
zarreta 1996; Ant�unez et al. 2008; Al-Waili et al. 2011).
Proteo-4 (genus Pseudomonas) is strongly present in
varroa, probably because it is common on the mite cuti-
cle (Tang et al. 2012), which had not been removed in
our study.
Lineage L387 (Bacillaceae: Firmi-6, -8) includes OTUs
associated with honeybee (Mohr & Tebbe 2006; Evans &
Schwarz 2011; Moran et al. 2012), but here we found
associated mainly with varroa. It is possible that these
bacteria may be generalist present in the hive.
In conclusion, we would like to underline that the
partitioning of phylogenetic diversity is a powerful
method to analyse community diversity. Using PPD, it is
possible to evaluate the different analyses using the per-
centage of overlap across groups as a comparable statis-
tic. The use of relative read frequencies as distance
among samples, instead of the summary statistics typical
of DMAs, allows to identify which lineages, or groups of
lineages, generate the significant differences. Further-
more, the permutation procedure on all sequences pre-
vents any subsampling procedure (i.e. rarefaction), a
practice that has been recently criticized because it
reduces the resolution power hiding the signal coming
from rare OTUs (McMurdie & Holmes 2014).
Recently, Chiu et al. (2014) proposed a different for-
mulation for alpha diversity than the one proposed in
Jost (2006, 2007). Here, the alpha entropy becomes the
joint entropy of observation and environment minus the
logarithm of the number of environments. The new for-
mulation allows beta diversity to reach its theoretical
maximum (number of environments) whatever unbal-
anced design is used, but it causes the lower bound of
the beta diversity to be higher than 1 depending on sam-
pling design. Furthermore, the alpha diversity does not
match anymore the concept of mean diversity within
each environment. Consequently, we are not following
this new formulation because it is distant from the
canonical information theory and further evaluations are
needed.
A brief example could illustrate the reason of our
preference. Let us assume two communities with the
same six equal abundant species, but one locality has
100 observations and the other 1000. According to our
definitions, alpha and beta diversities values are, respec-
tively, 6 and 1, while according to Chiu et al. (2014) defi-
nition corresponding values are 4.07 and 1.475. We
think much more logic, and close to the original infor-
mation theory realm, the values of 6 and 1 that reflect
the fact that in each environment we expect to find six
species and that the two samples behave as 1. Chiu et al.
(2014) could oppose that using a very similar example,
but with the six species being different in the two envi-
ronments, the value of beta diversity would be 1.35 for
the formulation of this article and 2.00 for theirs. This
apparent mismatch could be corrected by realizing that
the real maximum beta diversity is given by the expo-
nential of the entropy of the sampling vector that is
exactly 1.35.
Partitioning phylogenetic diversity method was here
implemented in our newly proposed tool PHYLOH. We
tested our analytic software using large trees (i.e. consti-
tuted by several thousand tips) with no significant delay.
The only problem we observed is related to the number
of permutation that is proportional to the number of
observations following the rule of Nlog(N) permutation
for N observations. There are no possibilities to avoid
this, and several thousands of observations require hours
of computations. However, the service, given by the
National Institute for Nuclear Physics (INFN), allows
24 h as maximal running time, sufficient to cope with
medium–large data sets. Larger data sets could be han-
dled downloading the software and using it in local
computation facilities.
The software is not parallelizable, and replicates can-
not be distributed on several CPUs. We do not think that
parallelization is needed, but we will work on distribut-
ing permutations on several CPUs. A complete tutorial
of PHYLOH is available on Biovel web page. Input data
used in the present article are available on DRYAD entry
doi:10.5061/dryad.j4d15.
© 2014 John Wiley & Sons Ltd
12 A. SANDIONIGI ET AL .

On the whole, we think that PHYLOH will be a rele-
vant innovation to study community diversity, a field
where data analysis is complex, but representation of
results is even more difficult. Indeed, PHYLOH produces
clear vectorial graphical outputs, in html format, that
are easy to explore using functions such as text finder
and zoom without reducing image quality. PHYLOH
shows its performances when large amounts of inter-
linked data are available. This is the case of the
researches involving high-throughput DNA sequencing,
such as our pilot study on microbiomes. Furthermore, it
can be used whenever a depth analysis of diversity dis-
tribution, from microorganisms to macroorganisms, is
required.
Acknowledgements
This work was supported by Fondazione Cariplo Grant
C91H09000010003 with the project entitled ‘Insetti Pronubi:
mezzi di connessione e diffusione di specie vegetali rare ed en-
demiche del parco regionale della Grigna Settentrionale’. The
funders had no role in study design, data collection and analy-
sis, decision to publish, or preparation of the manuscript. We
are thankful to BIOVEL (FP7 project no. 283359) for funding and
Stefano Pagnotta (University of Sannio) for early discussion on
the use of phylogenetic entropy. A special thank is for all the
bee-keepers who gave us the possibility to obtain biological
samples from their hives. Finally, we would like to thank the
anonymous reviewers for their helpful and stimulating
comments.
References
Al-Waili NS, Salom K, Butler G, Al Ghamdi AA (2011) Honey and micro-
bial infections: a review supporting the use of honey for microbial con-
trol. Journal of Medicinal Food, 14, 1079–1096.
Annoscia D, Del Piccolo F, Nazzi F (2012) How does the mite Varroa
destructor kill the honeybee Apis mellifera? Alteration of cuticular
hydrocarbons and water loss in infested honeybees. Journal of Insect
Physiology, 58, 1548–1555.
Ant�unez K, Harriet J, Gende L, Maggi M, Eguaras M, Zunino P (2008)
Efficacy of natural propolis extract in the control of American Foul-
brood. Veterinary Microbiology, 131, 324–331.
Blow N (2008) Metagenomics: exploring unseen communities. Nature,
453, 687–690.
Bragg L, Stone G, Imelfort M, Hugenholtz P, Tyson GW (2012) Fast, accu-
rate error correction of amplicon pyrosequences using Acacia. Nature
Methods, 9, 425–426.
Bure�sov�a V, Franta Z, Kop�a�cek P (2006) A comparison of Chryseobacte-
rium indologenes pathogenicity to the soft tick Ornithodoros moubata
and hard tick Ixodes ricinus. Journal of Invertebrate Pathology, 93, 96–
104.
Candela M, Biagi E, Maccaferri S, Turroni S, Brigidi P (2012) Intestinal
microbiota is a plastic factor responding to environmental changes.
Trends in Microbiology, 20, 385–391.
Caporaso JG, Kuczynski J, Stombaugh J et al. (2010) QIIME allows analysis
of high throughput community sequencing data. Nature Methods, 7,
335–336.
Cavalli Sforza LL, Edwards AW (1967) Phylogenetic analysis. Models
and estimation procedures. American Journal of Human Genetics, 19(3 Pt
1), 233.
Chao A, Chiu CH, Jost L (2010) Phylogenetic diversity measures based
on Hill numbers. Philosophical Transactions of the Royal Society B: Biologi-
cal Sciences, 365, 3599–3609.
Chiu CH, Jost L, Chao A (2014) Phylogenetic beta diversity, similarity,
and differentiation measures based on Hill numbers. Ecological Mono-
graphs, 84, 21–44.
Cornman RS, Schatz MC, Johnston JS et al. (2010) Genomic survey of the
ectoparasitic mite Varroa destructor, a major pest of the honey bee Apis
mellifera. Bmc Genomics, 11, 602.
Dillon RJ, Dillon VM (2004) The gut bacteria of insects: nonpathogenic
interactions. Annual Reviews in Entomology, 49, 71–92.
Dimitriu PA, Boyce G, Samarakoon A, Hartmann M, Johnson P, Mohn
WW (2013) Temporal stability of the mouse gut microbiota in relation
to innate and adaptive immunity. Environmental Microbiology Reports,
5, 200–210.
Edgar RC (2010) Search and clustering orders of magnitude faster than
BLAST. Bioinformatics, 26, 2460–2461.
Edgar RC, Haas BJ, Clemente JC, Quince C, Knight R (2011) UCHIME
improves sensitivity and speed of chimera detection. Bioinformatics, 27,
2194–2200.
Evans JD, Schwarz RS (2011) Bees brought to their knees: microbes affect-
ing honey bee health. Trends in Microbiology, 19, 614–620.
Evans GE, Murdoch DR, Anderson TP, Potter HC, George PM, Chambers
ST (2003) Contamination of Qiagen DNA extraction kits with Legionel-
la DNA. Journal of Clinical Microbiology, 41, 3452–3453.
Forsgren E (2010) European foulbrood in honey bees. Journal of Inverte-
brate Pathology, 103, S5S9.
Guzman-Novoa E, Emsen B, Unger P, EspinosaMonta~no LG, Petukhova
T (2012) Genotypic variability and relationships between mite infesta-
tion levels, mite damage, grooming intensity, and removal of Varroa
destructor mites in selected strains of worker honey bees (Apis mellifera
L.). Journal of Invertebrate Pathology, 110, 314–320.
Jeffrey AE, Echazarreta CM (1996) Medical uses of honey. Revista Biomed-
ica, 7, 4349.
Jeyaprakash A, Hoy MA, Allsopp MH (2003) Bacterial diversity in
worker adults of Apis mellifera capensis, Apis mellifera scutellata (Insecta:
Hymenoptera) assessed using 16S rRNA sequences. Journal of Inverte-
brate Pathology, 84, 96–103.
Jost L (2006) Entropy and diversity. Oikos, 113, 363–375.
Jost L (2007) Partitioning diversity into independent alpha and beta
components. Ecology, 88, 2427–2439.
Legendre P, Gallagher ED (2001) Ecologically meaningful transforma-
tions for ordination of species data. Oecologia, 129, 271–280.
Letunic I, Bork P (2007) Interactive Tree Of Life (iTOL): an online tool for
phylogenetic tree display and annotation. Bioinformatics, 23, 127–128.
Lozupone CA, Hamady M, Kelley ST, Knight R (2007) Quantitative and
qualitative b diversity measures lead to different insights into factors
that structure microbial communities. Applied and Environmental Micro-
biology, 73, 1576–1585.
Lozupone C, Lladser ME, Knights D, Stombaugh J, Knight R (2011) Uni-
Frac: an effective distance metric for microbial community compari-
son. The ISME Journal, 5, 169.
Lozupone C, Faust K, Raes J et al. (2012) Identifying genomic and meta-
bolic features that can underlie early successional and opportunistic
lifestyles of human gut symbionts. Genome Research, 22, 1974–1984.
MacKay DJ (2003) Information Theory, Inference, and Learning Algorithms,
vol. 7. Cambridge University Press, Cambridge.
Marcon E, H�erault B, Baraloto C, Lang G (2012) The decomposition of
Shannon’s entropy and a confidence interval for beta diversity. Oikos,
121, 516–522.
Martinson VG, Danforth BN, Minckley RL, Rueppell O, Tingek S, Moran
NA (2011) A simple and distinctive microbiota associated with honey
bees and bumble bees. Molecular Ecology, 20, 619–628.
Martinson VG, Moy J, Moran NA (2012) Establishment of characteristic
gut bacteria during development of the honeybee worker. Applied and
Environmental Microbiology, 78, 2830–2840.
Mattila HR, Rios D, WalkerSperling VE, Roeselers G, Newton IL (2012)
Characterization of the active microbiotas associated with honey bees
© 2014 John Wiley & Sons Ltd
PHYLOH , A WEB TOOL FOR DIVERSITY ANALYSIS 13

reveals healthier and broader communities when colonies are geneti-
cally diverse. PLoS One, 7, e32962.
Mazmanian SK, Liu CH, Tzianabos AO, Kasper DL (2005) An immuno-
modulatory molecule of symbiotic bacteria directs maturation of the
host immune system. Cell, 122, 107–118.
McDonald D, Price MN, Goodrich J et al. (2011) An improved Greeng-
enes taxonomy with explicit ranks for ecological and evolutionary
analyses of bacteria and archaea. The ISME Journal, 6, 610–618.
McMurdie PJ, Holmes S (2013) phyloseq: an R package for reproducible
interactive analysis and graphics of microbiome census data. PLoS
One, 8, e61217.
McMurdie PJ, Holmes S (2014) Waste not, want not: why rarefying mi-
crobiome data is inadmissible. PLoS Computational Biology, 10,
e1003531.
Meriweather M, Matthews S, Rio R, Baucom RS (2013) A 454 Survey
reveals the community composition and core microbiome of the com-
mon bed bug (Cimex lectularius) across an urban landscape. PLoS One,
8, e61465.
Metzker ML (2009) Sequencing technologies—the next generation. Nature
Reviews Genetics, 11, 31–46.
M€ockel N, Gisder S, Genersch E (2011) Horizontal transmission of
deformed wing virus: pathological consequences in adult bees (Apis
mellifera) depend on the transmission route. Journal of General Virology,
92, 370–377.
Mohammadi T, Reesink HW, Vandenbroucke-Grauls CM, Savelkoul PH
(2005) Removal of contaminating DNA from commercial nucleic acid
extraction kit reagents. Journal of Microbiological Methods, 61, 285–288.
Mohr KI, Tebbe CC (2006) Diversity and phylotype consistency of bacte-
ria in the guts of three bee species (Apoidea) at an oilseed rape field.
Environmental Microbiology, 8, 258–272.
Moran NA, Hansen AK, Powell JE, Sabree ZL (2012) Distinctive gut mic-
robiota of honey bees assessed using deep sampling from individual
worker bees. PLoS One, 7, e36393.
Mouches C, Bov�e JM, Albisetti J (1984) Pathogenicity of Spiroplasma apis
and other spiroplasmas for honey-bees in Southwestern France.
Annales de l’Institut Pasteur/Microbiologie, 135, 151–155.
Oksanen J, Kindt R, Legendre P, O’Hara B (2007) Vegan: community
ecology package. R package version 1.8-5. Available from http://cran.
r-project.org/ (accessed 07 November 2014).
Orloci L (1967) An agglomerative method for classification of plant
communities. The Journal of Ecology, 55, 193–206.
Price MN, Dehal PS, Arkin AP (2010) FASTTREE 2–approximately maxi-
mum-likelihood trees for large alignments. PLoS One, 5, e9490.
R Development Core Team (2012) R: A language and environment for
statistical computing. R Development Core Team, Vienna, Austria.
Available from http://www.r-project.org/ (accessed 07 November
2014).
Rinderer TE, Harris JW, Hunt GJ, de Guzman LI (2010) Breeding for resis-
tance to Varroa destructor in North America. Apidologie, 41, 409–424.
Rosenkranz P, Aumeier P, Ziegelmann B (2010) Biology and control of
Varroa destructor. Journal of Invertebrate Pathology, 103, S96–S119.
Sabree ZL, Hansen AK, Moran NA (2012) Independent studies using
deep sequencing resolve the same set of core bacterial species domi-
nating gut communities of honey bees. PLoS One, 7, e41250.
Sanchez LM, Wong WR, Riener RM, Schulze CJ, Linington RG (2012)
Examining the fish microbiome: vertebrate-derived bacteria as an envi-
ronmental niche for the discovery of unique marine natural products.
PLoS One, 7, e35398.
Tang X, Freitak D, Vogel H et al. (2012) Complexity and variability of gut
commensal microbiota in polyphagous lepidopteran larvae. PLoS One,
7, e36978.
Wang Q, Garrity GM, Tiedje JM, Cole JR (2007) Naive Bayesian classifier
for rapid assignment of rRNA sequences into the new bacterial taxon-
omy. Applied and Environmental Microbiology, 73, 5261–5267.
Watanabe K, Kodama Y, Harayama S (2001) Design and evaluation of
PCR primers to amplify bacterial 16S ribosomal DNA fragments used
for community fingerprinting. Journal of Microbiological Methods, 44,
253–262.
Webb CO, Ackerly DD, Kembel SW (2008) PHYLOCOM: software for the
analysis of phylogenetic community structure and trait evolution.
Bioinformatics, 24, 2098–2100.
Wickham H (2009) ggplot2: Elegant graphics for data analysis. Available
from http://cran.r-project.org/ (accessed 07 November 2014).
Wolstencroft K, Haines R, Fellows D et al. (2013) The TAVERNA workflow
suite: designing and executing workflows of Web Services on the desk-
top, web or in the cloud. Nucleic Acids Research, 41, W557.
Zhou J, Wu L, Deng Y et al. (2011) Reproducibility and quantitation
of amplicon sequencing-based detection. The ISME Journal, 5, 1303–
1313.
A.S., S.V. and M.C. wrote the manuscript. E.M.P., A.G.,
E.F., A.B. and B.B. implemented the manuscript. E.M.P.,
E.F. and M.C. designed the project. S.V. designed and
implemented the software PHYLOH. A.S., S.V. and B.B.
evaluated the codes. A.S., A.G., E.F., A.B., V.M. and M.C.
provided biological background.
Data Accessibility
DNA sequences: NCBI SRA: SRP046312.
Source code of PHYLOH, user manual and example data
set are available on github: https://github.com/svica
rio/phyloH.
Access to the web page of PHYLOH: https://www.bi
odiversitycatalogue.org/rest_methods/143.
Input and output data of PHYLOH, Supporting informa-
tion Figures and Tables: DRYAD entry doi:10.5061/
dryad.j4d15.
Supporting Information
Additional Supporting Information may be found in the online
version of this article:
Fig. S1 The figure depicts how Shannon entropy is totally blind
to some meaningful biological pattern.
Fig. S2 Distribution of OTUs of High Frequency Cluster (HFC)
between parasitised honey bee and varroa considering relative
abundance.
Fig. S3 Distribution of OTUs of High Frequency Cluster (HFC)
between healthy and parasitised honey bee and varroa.
Fig. S4 UPMGA trees showing the different relationships among
samples for all the distance metrics considered in DMA (jaccard,
squared-chord, unweighted UniFrac and weighted UniFrac), consid-
ering Localities and Status variables.
Fig. S5 Output of the script compute_core_microbiome.py.
Table S1 Summary of all OTUs taxon assignment.
Table S2 Summary of results of adonis statistic.
Appendix S1 PHYLOH output in html format for ‘Status’ variable.
Appendix S2 Phylogenetic tree used in PHYLOH analysis in
Newick tree format.
© 2014 John Wiley & Sons Ltd
14 A. SANDIONIGI ET AL .
Copyright © 2022 FDOKUMEN