Distribution of dissolved labile and particulate iron and copper in Terra Nova Bay polynya (Ross...
11
Research papers Distribution of dissolved labile and particulate iron and copper in Terra Nova Bay polynya (Ross Sea, Antarctica) surface waters in relation to nutrients and phytoplankton growth Paola Rivaro a,n , Carmela Ianni a , Serena Massolo a , M. Luisa Abelmoschi a , Cinzia De Vittor b , Roberto Frache a a Dipartimento di Chimica e Chimica Industriale, Universit a di Genova, via Dodecaneso 31, 16146 Genova, Italy b Dipartimento di Oceanografia Biologica, Istituto Nazionale di Oceanografia e Geofisica Sperimentale, via A. Piccard 54, 34014 Trieste, Italy article info Article history: Received 23 December 2009 Received in revised form 26 November 2010 Accepted 16 February 2011 Available online 4 March 2011 Keywords: Iron Copper Total particulate matter Antarctica Ross Sea Terra Nova Bay polynya abstract The distribution of the dissolved labile and of the particulate Fe and Cu together with dissolved oxygen, nutrients, chlorophyll a and total particulate matter was investigated in the surface waters of Terra Nova Bay polynya in mid-January 2003. The measurements were conducted within the framework of the Italian Climatic Long-term Interactions of the Mass balance in Antarctica (CLIMA) Project activities. The labile dissolved fraction was operationally defined by employing the chelating resin Chelex-100, which retains free and loosely bound trace metal species. The dissolved labile Fe ranges from below the detection limit (0.15 nM) to 3.71 nM, while the dissolved labile Cu from below the detection limit (0.10 nM) to 0.90 nM. The lowest concentrations for both metals were observed at 20 m depth (the shallowest depth for which metals were measured). The concentration of the particulate Fe was about 5 times higher than the dissolved Fe concentration, ranging from 0.56 to 24.83 nM with an average of 6.45 nM. The concentration of the particulate Cu ranged from 0.01 to 0.71 nM with an average of 0.17 nM. The values are in agreement with the previous data collected in the same area. We evaluated the role of the Fe and Cu as biolimiting metals. The N:dissolved labile Fe ratios (18,900–130,666) would or would not allow a complete nitrate removal, on the basis of the N:Fe requirement ratios that we calculated considering the N:P and the C:P ratios estimated for diatoms. This finding partially agrees with the Si:N ratio that we found (2.29). Moreover we considered a possible influence of the dissolved labile Cu on the Fe uptake process. & 2011 Elsevier Ltd. All rights reserved. 1. Introduction The Ross Sea is one of the most productive areas of the Southern Ocean, which is the largest high-nutrient low-chloro- phyll (HNLC) region. Substantial rates of primary production ( 4 1gCm 2 d 1 ) are often associated in the shelf area with polynyas, fronts and marginal ice zones (Arrigo and Van Dijken, 2003; Smith et al., 2003). Nevertheless, the phytoplankton growth in the Ross Sea waters has been noted as lower than expected in view of the high concentration of major inorganic nutrients, even in summer, when the light and the water column stability provide the favourable environmental conditions for its development. The macronutrients remain high throughout the Ross Sea, except in isolated locations (Nelson and Smith, 1986; Smith et al., 2003). Several factors are important in controlling the algal blooms and the taxa development including the vertical stability of the upper mixed layer, the seeding by the sea-ice algae, the grazing by zooplankton, the light limitation and the availability of micro- nutrients such as iron (Sedwick et al., 2000). Martin et al. (1990a) hypothesized that the high iron concen- tration measured in the neritic Gerlache Strait waters facilitates the phytoplankton blooming and the nutrient removal. Fitzwater et al. (2000) examined the natural levels of productivity in regions of the Ross Sea differing in dissolved iron abundance and concluded that iron is an important factor controlling the location of phytoplankton blooms. The iron-limitation hypothesis is sup- ported by the results of the iron-enrichment experiments con- ducted as bottle incubations in the Weddell and Scotia Seas (Martin et al., 1990a, b; de Baar et al., 1990; Buma et al., 1991; Van Leeuve et al., 1997; Scharek et al., 1997), by the direct measurements in different areas characterized by a different content of the trace elements (Sedwick and Di Tullio, 1997; Contents lists available at ScienceDirect journal homepage: www.elsevier.com/locate/csr Continental Shelf Research 0278-4343/$ - see front matter & 2011 Elsevier Ltd. All rights reserved. doi:10.1016/j.csr.2011.02.013 n Corresponding author. Tel.: þ39 010 3536172; fax: þ39 010 3536190. E-mail addresses: [email protected] (P. Rivaro), [email protected] (C. Ianni), [email protected] (S. Massolo), [email protected] (M.L. Abelmoschi), [email protected] (C. De Vittor), [email protected] (R. Frache). Continental Shelf Research 31 (2011) 879–889
-
Upload
independent -
Category
Documents
-
view
0 -
download
0
Transcript of Distribution of dissolved labile and particulate iron and copper in Terra Nova Bay polynya (Ross...

Continental Shelf Research 31 (2011) 879–889
Contents lists available at ScienceDirect
Continental Shelf Research
0278-43
doi:10.1
n Corr
E-m
ianni@c
abel@ch
frache@
journal homepage: www.elsevier.com/locate/csr
Research papers
Distribution of dissolved labile and particulate iron and copper in Terra NovaBay polynya (Ross Sea, Antarctica) surface waters in relation to nutrients andphytoplankton growth
Paola Rivaro a,n, Carmela Ianni a, Serena Massolo a, M. Luisa Abelmoschi a, Cinzia De Vittor b,Roberto Frache a
a Dipartimento di Chimica e Chimica Industriale, Universit �a di Genova, via Dodecaneso 31, 16146 Genova, Italyb Dipartimento di Oceanografia Biologica, Istituto Nazionale di Oceanografia e Geofisica Sperimentale, via A. Piccard 54, 34014 Trieste, Italy
a r t i c l e i n f o
Article history:
Received 23 December 2009
Received in revised form
26 November 2010
Accepted 16 February 2011Available online 4 March 2011
Keywords:
Iron
Copper
Total particulate matter
Antarctica
Ross Sea
Terra Nova Bay polynya
43/$ - see front matter & 2011 Elsevier Ltd. A
016/j.csr.2011.02.013
esponding author. Tel.: þ39 010 3536172; fa
ail addresses: [email protected] (P. Riva
himica.unige.it (C. Ianni), [email protected]
imica.unige.it (M.L. Abelmoschi), cdevittor@o
chimica.unige.it (R. Frache).
a b s t r a c t
The distribution of the dissolved labile and of the particulate Fe and Cu together with dissolved oxygen,
nutrients, chlorophyll a and total particulate matter was investigated in the surface waters of Terra
Nova Bay polynya in mid-January 2003. The measurements were conducted within the framework of
the Italian Climatic Long-term Interactions of the Mass balance in Antarctica (CLIMA) Project activities.
The labile dissolved fraction was operationally defined by employing the chelating resin Chelex-100,
which retains free and loosely bound trace metal species. The dissolved labile Fe ranges from below the
detection limit (0.15 nM) to 3.71 nM, while the dissolved labile Cu from below the detection limit
(0.10 nM) to 0.90 nM. The lowest concentrations for both metals were observed at 20 m depth (the
shallowest depth for which metals were measured). The concentration of the particulate Fe was about
5 times higher than the dissolved Fe concentration, ranging from 0.56 to 24.83 nM with an average of
6.45 nM. The concentration of the particulate Cu ranged from 0.01 to 0.71 nM with an average of
0.17 nM. The values are in agreement with the previous data collected in the same area. We evaluated
the role of the Fe and Cu as biolimiting metals. The N:dissolved labile Fe ratios (18,900–130,666) would
or would not allow a complete nitrate removal, on the basis of the N:Fe requirement ratios that we
calculated considering the N:P and the C:P ratios estimated for diatoms. This finding partially agrees
with the Si:N ratio that we found (2.29). Moreover we considered a possible influence of the dissolved
labile Cu on the Fe uptake process.
& 2011 Elsevier Ltd. All rights reserved.
1. Introduction
The Ross Sea is one of the most productive areas of theSouthern Ocean, which is the largest high-nutrient low-chloro-phyll (HNLC) region. Substantial rates of primary production(4 1 g C m�2 d�1) are often associated in the shelf area withpolynyas, fronts and marginal ice zones (Arrigo and Van Dijken,2003; Smith et al., 2003). Nevertheless, the phytoplankton growthin the Ross Sea waters has been noted as lower than expected inview of the high concentration of major inorganic nutrients, evenin summer, when the light and the water column stability providethe favourable environmental conditions for its development. Themacronutrients remain high throughout the Ross Sea, except in
ll rights reserved.
x: þ39 010 3536190.
ro),
nige.it (S. Massolo),
gs.trieste.it (C. De Vittor),
isolated locations (Nelson and Smith, 1986; Smith et al., 2003).Several factors are important in controlling the algal blooms andthe taxa development including the vertical stability of the uppermixed layer, the seeding by the sea-ice algae, the grazing byzooplankton, the light limitation and the availability of micro-nutrients such as iron (Sedwick et al., 2000).
Martin et al. (1990a) hypothesized that the high iron concen-tration measured in the neritic Gerlache Strait waters facilitatesthe phytoplankton blooming and the nutrient removal. Fitzwateret al. (2000) examined the natural levels of productivity in regionsof the Ross Sea differing in dissolved iron abundance andconcluded that iron is an important factor controlling the locationof phytoplankton blooms. The iron-limitation hypothesis is sup-ported by the results of the iron-enrichment experiments con-ducted as bottle incubations in the Weddell and Scotia Seas(Martin et al., 1990a, b; de Baar et al., 1990; Buma et al., 1991;Van Leeuve et al., 1997; Scharek et al., 1997), by the directmeasurements in different areas characterized by a differentcontent of the trace elements (Sedwick and Di Tullio, 1997;

P. Rivaro et al. / Continental Shelf Research 31 (2011) 879–889880
Sedwick et al., 2000; Boye et al., 2001; Frew et al., 2001; Grottiet al., 2001) and by iron fertilizations experiments conducted inthe high-nutrient low chlorophyll (HNLC) regions of the globalocean including the Southern Ocean (Boyd and Law, 2001; Coaleet al., 2004). These studies have demonstrated the limiting role ofiron on phytoplankton growth in these areas and have revealedsome unique information about the dynamical processes affectingiron cycling, but uncertainties still remain in the understanding ofthe biogeochemical cycling of iron in the ocean and of the role ofthe ligands. The dissolved iron mean concentration in surfacewaters of the south-western Ross Sea (0.5 nM) is higher than theones reported for open Southern Ocean (o0.2 nM) and it is evengreater in the proximity of the melting sea-ice (41 nM) andalong the coastal areas (0.4–4.2 nM), probably due to the atmo-spheric dust input from land (Sedwick and Di Tullio, 1997; Grottiet al., 2001; Tagliabue and Arrigo, 2005). The available data ondissolved Fe are obtained by different analytical procedures;therefore each of them determines a different ‘‘operationallydefined’’ speciation, making the data comparison difficult. Ironhas a complicated cycle in seawater and its speciation is con-trolled by several biogeochemical processes. Most dissolved ironin the ocean’s oxidizing conditions exists as Fe3þ and over 99% ofFe3þ is complexed by organic ligands (Boye et al., 2001; Tagliabueand Arrigo, 2006). Therefore, the iron hypothesis has beenextended taking into account that most of the dissolved iron inthe water column is strongly complexed by organic matter,suggesting that algal growth may be limited not only by a generallack of iron but also by its unavailability (Measures and Vink,2001). The bioavailability of iron complexes for a given phyto-plankton taxon seems to depend on the specific ligands (Hutchinset al., 1999; Maldonado et al., 2005).
The behaviour of copper as a micronutrient has been investigatedtoo, even if the data on this metal in the Southern Ocean are scarce(Nolting et al., 1991; Loscher, 1999; Fitzwater et al., 2000; Frewet al., 2001; Morel and Price, 2003). A strong Cu:Si correlation wasfound in the Polar Front region, with differences in the slope of therelationship related to differences in the export production (Loscher,1999). Various metabolic functions for copper have been identified:at least one oceanic diatom uses plastocyanin, a Cu-containingprotein, to shuttle electrons between photosystems II and I (Peersand Price, 2006), and high affinity iron uptake in numerous diatomspecies is mediated by a multi-copper oxidase (Maldonado et al.,2006; Kustka et al., 2007), resulting in a high biological demand forcopper by laboratory monocultures (Annett et al., 2008), and by fieldphytoplankton communities (Kinugasa et al., 2005; Semeniuk et al.,2009). Due to the copper role, its speciation is of great interest; inparticular, the importance of organic complexation by a strongligand class has been recognized (van den Berg, 1984; Sunda andHanson, 1987; Coale and Bruland, 1988). Nevertheless, very little isknown about the forms of dissolved Cu that are available toeukaryotic phytoplankton for growth. Most studies show thatbiological activity is proportional to free Cu2þconcentration(Sunda and Guillard, 1976; Sunda and Huntsman, 1995), but somerecent observations suggest that organic complexes may also beused (Hudson, 1998; Quigg et al., 2006; Annett et al., 2008;Semeniuk et al., 2009). Diatoms are able to reduce Cu2þ bound toorganic ligands (Jones et al., 1987) and may be able to use thesespecies of Cu for growth just as they do for Fe.
Terra Nova Bay (TNB) polynya develops in the south westernRoss Sea and it is a substantial ice free coastal area. This regionhas been identified as the area where the High Salinity ShelfWater (HSSW) is generated by the continual formation andremoval of new ice, which increases seawater salinity (Budillonet al., 2003). Differently from what is observed for the mostproductive Ross Sea polynya (RSP), the phytoplankton bloomsdevelop later in the year and they are dominated by diatoms.
A high chlorophyll maximum is observed in late December orJanuary, followed by a temporary decrease in phytoplanktonbiomass and by another maximum in February (Innamoratiet al., 1999). The primary production varies remarkably, withthe highest biomass observed in association with highly stratifiedsurface waters, suggesting that the stratification plays an impor-tant role in determining the diatom bloom (Catalano et al., 1997;Saggiomo et al., 2002). However, trace elements may play a role inmodulating the primary production at TNB polynya. Our previousworks analyzed the trace element distribution in this area duringthe austral summer 1998–2001 and reported dissolved Fe rangingfrom below 1 nM to 2 nM and dissolved Cu from 0.1 nM to 1 nMin correspondence to the fluorescence maxima or minima. Unfor-tunately, our data were not sufficient to draw any conclusion onthe role of these elements as biolimiting factors (Ianni et al., 2002;Saggiomo et al., 2003).
The study of the biogeochemical processes occurring in theRoss Sea coastal water masses is one of the general objectives ofthe Climatic Long-term Interactions of the Mass-balance inAntarctica (CLIMA) project. In this paper we present the data oniron and copper in surface water at Terra Nova Bay polynya inaustral summer 2003 in terms of both labile dissolved fraction-obtained by employing the chelating resin Chelex-100- andparticulate fraction. The Chelex-100 retains free metal ions andloosely bound trace metals, but not the strong organic complexes.Although the labile dissolved metal fraction obtained by Chelex-100 is operationally defined, it provides for a simple and effectivemeans of measuring the labile metal concentrations in an aquaticsystem (Wen et al., 2006). The trace metal distribution, in bothdissolved (labile species) and particulate form and their relation-ship with nutrients, chlorophyll a (chl a) and total particulatematter (TPM) are presented and discussed.
2. Materials and methods
2.1. Sampling
The water samples were collected during the austral summer2002–03 RV Italica cruise, in the framework of CLIMA project ofthe Programma Nazionale di Ricerca in Antartide (Italian NationalProgram for Antarctic Research; PNRA) activities. 8 casts consist-ing of 5 depths (2–100 m) were synoptically sampled from 17thto 19th January 2003 in Terra Nova Bay polynya area (Fig. 1). Thesampling depths were chosen according to the fluorescenceprofile. Two meter depth was not sampled for the metal analyses.
Hydrological casts and water sampling were carried out usinga SBE 9/11 Plus CTD, with double temperature and conductivitysensors, coupled with a SBE 32 plastic coated carousel sampler, onwhich 12-L Niskin bottles equipped with internal rubber springswere mounted. The Niskin rosette frame and system was carefullychecked and inspected for cracks and abrasions prior to each castfor metal sampling in order to avoid Fe contamination problems.At station 4 water samples for metal determination were col-lected using both Niskin bottles and the in-situ filtration systemFIS500 (Grotti et al., 2003a). No concentration differences werefound, suggesting that the sampling using Niskin bottles did notadd any detectable Fe or Cu to the samples (Soggia, personalcommunication).
2.2. Analytical procedures
2.2.1. Dissolved oxygen, nutrients and pigment analysis
Dissolved oxygen (O2) was measured on board according tothe Winkler method by automated micro-titrations (Grasshoff,1983) with a potentiometric detection of the end point using a

160Longitude (°E)
78
77
76
75
74
73
72
71
Lat
itude
(°S
)
175 W 170 W
Victoria Land
Ross Ice Shelf
Terra NovaBay Polynya
160Longitude °E
76
75
74
Lat
itude
°S
48
91011
12
13 14
Drygalski Ice Tongue
MZS
165 170 175 180
162 164 166 168
Fig. 1. Map of the sampling stations.
P. Rivaro et al. / Continental Shelf Research 31 (2011) 879–889 881
Methohm 719 titroprocessor. The sub-samples for the determina-tion of nutrients (silicate, phosphate, nitrate, nitrite) were filteredthrough 0.7 mm GFF filter and stored at –30 1C in 100 ml LDPE(Low Density Poly-Ethylene) containers. The samples were ana-lyzed using a five-channel continuous flow Technicons Autoana-lyzer II, according to the method described by Hansen andGrasshoff (1983). The accuracy and the precision of method werechecked by Certified Reference Material (CRM) MOOS-1 (SeawaterCertified Reference Material for Nutrients; http://inms-ienm.
nrccnrc.gc.ca/calserv/chemical_metrology_e.html). The nutrientconcentrations measured in the CRM MOOS-1 were not signifi-cantly different (po0.05) from the certified values. Therefore, ourmethod was accurate for the determination of the nutrients inseawater samples. The precision of the method was measured byanalyzing five homogeneous aliquots of the CRM and itwas70.10 mM for nitrate, 70.01 mM for nitrite, 70.03 mM forsilicic acid and 70.07 mM for phosphate. The pigment analyseswere performed on board by a LS50B Perkin Elmer spectro-fluorometer, according to the Lorenzen and Jeffrey (1980)method.
2.2.2. Iron and copper analysis
The sub-samples for metal determination were collected in 2 LLDPE bottles. The sample bottles have been thoroughly cleanedbefore use as follows. They were washed with a detergent, rinsedwith Milli-Q water, cleaned by soakings in 2 M HNO3 andwrapped in plastic bags for transport to the ship. Immediatelybefore use, the bottles were rinsed three times using Milli-Qwater and sample water. The sub-samples for trace metal deter-mination were filtered using a suitable clean filtration systemthrough 0.4 mM polycarbonate (PC) membrane filters. This cus-tom-built filtration apparatus consists of two independent units,each made of a Plexiglas vacuum chamber containing the LDPEsampling bottle. The chamber is connected by a silicone tubedirectly to the sampling bottle, through the filtration cartridgecontaining the PC filters. This system has been successfully testedfor trace metal analysis of Antarctic water samples (Grotti et al.,2005). Filtered seawater and suspended particulate matter sam-ples were stored at –20 1C until treatment and analyses, per-formed at the Dipartimento di Chimica e Chimica Industriale ofthe Universit�a di Genova, Genova. The storage procedure offiltered non-acidified seawater samples was previously tested inthe framework of PNRA activities by Capodaglio et al. (1995).
The determination of the dissolved trace elements in seawaterwas carried out according to a previously reported procedure (Grottiet al., 2003b). Briefly, micro-columns filled with Chelex 100, astyrene-divinylbenzene copolymer with iminodiacetate functionalgroups, (IC Chelate plus, Alltech, Deerfield U.S.A.) were used for thepreconcentration, then the samples were eluted with 1 M HNO3. Inour conditions, Chelex-100 chelates quantitatively the Fe complexeswith a conditional stability constant log K(L0 ,Fe3þ ) lower than8.7 and the Cu complexes with a log K(L0 ,Cu2þ ) lower than 10–12(Biesuz et al., 2006). The concentration of the eluted metals wasdetermined by a Varian Vista PRO Inductively Coupled PlasmaOptical Emission Spectrometer (ICP-OES) with simultaneous CCDdetection system (Varian Vista PRO). The sample preparation andthe preconcentration procedures were performed in a laminar flowwork area. All the reagents were of suprapurs grade quality (Merck)and they were used without any further purification. The accuracyof the procedure was tested using the certified reference materialNASS-5 seawater (National Research Council, Canada). Both theblank and detection limit values were low and allowed an accuratedetermination of Fe and Cu, as proved by the analysis of the certifiedreference material. Fe and Cu detection limits were 150 pM and107 pM, respectively, low enough to guarantee their reliablequantification.
The suspended particulate matter was solubilized with 8 MHNO3 (suprapurs grade quality, Merck), using a microwavedigestion system (CEM DS2000). The multi-element determina-tion in the solutions was performed by ICP-OES. The quantifica-tion was carried out by working out standard solutions prepareddaily by proper dilution of stock standard solution with Milli-Qwater (Millipore, USA). Stock standard solutions (1 mg mL�1)of all the considered elements were purchased from Merck

P. Rivaro et al. / Continental Shelf Research 31 (2011) 879–889882
(Darmstadt, Germany). The accuracy of the procedure was testedusing the certified reference material CRM 414 marine plankton(Community Bureau of Reference, Bruxelles). The detection limitwas 450 pM for Fe and 31.5 pM for Cu, respectively.
Table 2Vertical stability (N2(z) max), depth of the pycnocline (Z(UML)), meltwater
percentage in the Upper Mixed Layer and nutrient drawdown values (DNO3,
DSi(OH)4, DPO4) in the investigated stations.
Station N2(z) max(*105 s�2)
Z(UML)(m)
meltwater(%)
DNO3
(lM)DSi(OH)4
(lM)DPO4
(lM)
4 34.8 19 0.22 2.71 4.62 0.07
8 18.0 44 0.29 4.19 15.12 0.45
9 18.4 26 0.42 6.58 9.55 0.66
10 13.2 46 0.11 5.62 11.10 0.41
11 5.9 34 0.14 6.48 18.01 0.51
12 18.1 17 0.17 2.76 18.61 0.43
13 15.9 45 0.22 5.84 8.34 0.48
14 18.8 38 0.31 5.42 13.38 0.91
3. Results and discussion
3.1. Hydrographic and biogeochemical characteristics
The water column of the TNB polynya consists of two types ofwater: the Antarctic Surface Water (AASW, y up toþ2 1C, So34.5)from surface down to more than 100 m depth and the High SalinityShelf Water (HSSW, y near the sea surface freezing point,S434.75; Jacobs and Giulivi, 1999) below the AASW down to thebottom. The surface samples display a high variability of hydro-graphic parameters (Table 1), because they are strongly influencedby the sea–ice–atmosphere interactions. Following Catalano et al.(1997), we calculated the meltwater percentage (MW%) consideringthe difference between the salinity measured at each depth (Smeas)and the salinity measured in the same station at greater depth(Sdeep), surely not influenced by sea-ice dilution, assuming anaverage sea-ice salinity of 6
MW%¼ 1�Smeas�6
Sdeep�6
� ��100:
In 2003 the TNB area was completely ice-free and the calcu-lated meltwater percentage was low (mean value 0.2470.10%).The highest percentage of meltwater was calculated for stations 8,
Table 1
Potential temperature (y), salinity (S), dissolved oxygen (O2), nutrients (NH4, NO3, Si(OH
total particulate matter (TPM) values in the investigated stations.
Station Lat (1S) Long(1E)
Depth(m)
h (1C) S O2
(lM)
4 75.1138 164.4957 0 0.131 34.611 392
4 20 �0.800 34.630 352
4 50 �1.824 34.703 306
4 75 �1.848 34.703 300
4 100 �1.892 34.714 299
8 75.2032 165.2193 0 �0.954 34.549 346
8 20 �0.962 34.553 347
8 40 �1.275 34.630 318
8 100 �1.888 34.708 296
9 74.9873 165.2274 0 �0.396 34.502 369
9 20 �0.457 34.541 362
9 80 �1.894 34.698 295
9 100 �1.881 34.707 299
10 74.9286 164.8948 0 �0.397 34.655 361
10 20 �0.392 34.657 363
10 40 �0.744 34.690 320
10 100 �1.886 34.715 297
11 �74.9088 164.3043 0 �0.683 34.650 356
11 20 �0.646 34.668 352
11 40 �1.131 34.677 328
11 80 �1.863 34.712 297
11 100 �1.873 34.714 296
12 75.3733 164.0733 0 �0.460 34.634 364
12 20 �1.005 34.660 350
12 40 �1.771 34.692 304
12 100 �1.872 34.715 296
13 75.1963 163.807 0 �0.660 34.601 332
13 20 �0.665 34.607 360
13 40 �1.057 34.634 314
13 100 �1.871 34.703 285
14 75.2249 164.5845 0 �0.541 34.583 364
14 20 �0.532 34.591 333
14 60 �1.887 34.691 291
14 100 �1.878 34.707 294
NaN¼Not available Number.
9 and 14 (0.29, 0.42 and 0.31%, respectively), where the lowestsalinity was also measured (Table 2). The solar heating and thesalinity decrease due to the ice melting are responsible for theformation of the Upper Mixed Layer (UML), which in summeroccurs within the upper 100 m. Following Mitchell and Holm-Hansen (1991), an increase of in situ density (st)40.05 over 5 mdepth interval was the criterion that we used to establish thedepth of the pycnocline (Z(UML)). The mean Z(UML) depth was�34 m, but a high variability was observed among the stations(Table 2).
The vertical stability of the water column is proportional to theBrunt–Vaisala buoyancy frequency N2(z), which represents thestrength of the density stratification. The depth at which N2(z)was estimated to be maximal represents the depth of maximum
)4, PO4), chlorophyll a (chl a), phaeopigments/chlorophyll a ratio (phaeo/chl a) and
NH4
(lM)NO3
(lM)Si(OH)4
(lM)PO4
(lM)chl a(lg L�1)
phaeo/chl a
TPM(mg L�1)
NaN NaN NaN NaN 1.58 1.41 NaN
0.65 19.4 44.0 0.97 3.58 0.26 1.35
1.15 27.0 57.0 1.17 0.59 0.55 0.24
od.l. 30.0 68.0 1.90 0.12 0.78 0.13
1.95 31.2 73.0 2.07 0.06 1.34 0.08
NaN 23.9 54.6 1.27 2.39 0.56 NaN
9.50 21.2 42.2 1.26 3.67 0.04 0.59
4.00 23.9 62.2 1.55 1.20 0.03 0.50
0.50 33.4 77.6 2.29 0.06 1.63 0.15
2.60 21.1 58.0 0.94 3.11 0.87 NaN
2.60 22.0 61.6 1.17 3.03 0.73 1.71
0.70 29.7 69.3 2.64 0.13 1.44 0.11
2.40 31.3 74.2 2.02 0.07 1.37 0.11
NaN 11.0 28.8 0.62 2.31 1.00 NaN
6.90 15.7 39.2 0.82 1.93 0.94 1.45
2.80 17.4 40.7 1.07 1.19 1.21 0.83
8.35 32.5 74.6 1.16 0.07 2.09 0.21
2.30 19.2 34.5 NaN 1.75 0.98 NaN
2.20 27.8 44.5 0.88 1.59 0.88 0.92
0.70 29.0 67.0 0.91 0.70 1.28 0.85
0.90 30.1 66.7 1.29 NaN NaN 0.22
4.10 31.3 68.5 2.30 0.16 5.17 0.12
0.30 23.1 55.9 NaN 1.63 0.81 NaN
0.35 25.0 57.8 0.91 1.88 0.79 1.03
0.30 29.5 67.0 1.29 0.54 0.64 0.40
0.90 31.0 73.3 1.56 0.04 2.43 0.68
0.90 19.6 46.6 1.08 3.33 0.65 NaN
0.80 24.0 63.7 1.47 3.32 0.71 2.03
0.60 29.9 64.5 2.48 1.85 0.67 0.84
0.30 31.9 71.8 2.14 0.27 2.72 0.06
0.60 18.6 41.2 1.02 5.08 0.66 NaN
0.40 22.9 56.4 1.36 3.43 0.58 0.06
0.75 30.3 66.4 1.83 0.72 0.68 0.10
2.70 31.0 72.6 2.02 0.05 4.09 0.10
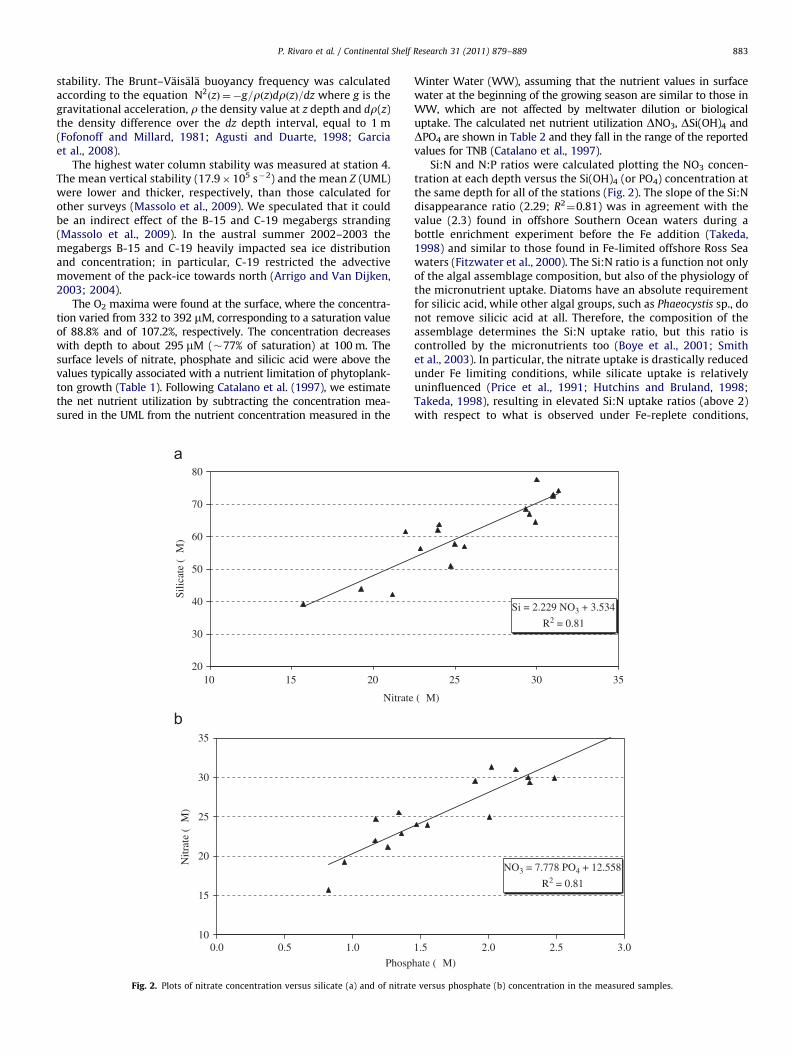
P. Rivaro et al. / Continental Shelf Research 31 (2011) 879–889 883
stability. The Brunt–Vaisala buoyancy frequency was calculatedaccording to the equation N2
ðzÞ ¼�g=rðzÞdrðzÞ=dz where g is thegravitational acceleration, r the density value at z depth and dr(z)the density difference over the dz depth interval, equal to 1 m(Fofonoff and Millard, 1981; Agusti and Duarte, 1998; Garciaet al., 2008).
The highest water column stability was measured at station 4.The mean vertical stability (17.9�105 s�2) and the mean Z (UML)were lower and thicker, respectively, than those calculated forother surveys (Massolo et al., 2009). We speculated that it couldbe an indirect effect of the B-15 and C-19 megabergs stranding(Massolo et al., 2009). In the austral summer 2002–2003 themegabergs B-15 and C-19 heavily impacted sea ice distributionand concentration; in particular, C-19 restricted the advectivemovement of the pack-ice towards north (Arrigo and Van Dijken,2003; 2004).
The O2 maxima were found at the surface, where the concentra-tion varied from 332 to 392 mM, corresponding to a saturation valueof 88.8% and of 107.2%, respectively. The concentration decreaseswith depth to about 295 mM (�77% of saturation) at 100 m. Thesurface levels of nitrate, phosphate and silicic acid were above thevalues typically associated with a nutrient limitation of phytoplank-ton growth (Table 1). Following Catalano et al. (1997), we estimatethe net nutrient utilization by subtracting the concentration mea-sured in the UML from the nutrient concentration measured in the
10
15
20
25
30
35
0.0
Phosp
Nitr
ate
(µM
)
20
30
40
50
60
70
80
10
Nitrate
Silic
ate
(µM
)
15 20
0.5 1.0
Fig. 2. Plots of nitrate concentration versus silicate (a) and of nitrat
Winter Water (WW), assuming that the nutrient values in surfacewater at the beginning of the growing season are similar to those inWW, which are not affected by meltwater dilution or biologicaluptake. The calculated net nutrient utilization DNO3, DSi(OH)4 andDPO4 are shown in Table 2 and they fall in the range of the reportedvalues for TNB (Catalano et al., 1997).
Si:N and N:P ratios were calculated plotting the NO3 concen-tration at each depth versus the Si(OH)4 (or PO4) concentration atthe same depth for all of the stations (Fig. 2). The slope of the Si:Ndisappearance ratio (2.29; R2
¼0.81) was in agreement with thevalue (2.3) found in offshore Southern Ocean waters during abottle enrichment experiment before the Fe addition (Takeda,1998) and similar to those found in Fe-limited offshore Ross Seawaters (Fitzwater et al., 2000). The Si:N ratio is a function not onlyof the algal assemblage composition, but also of the physiology ofthe micronutrient uptake. Diatoms have an absolute requirementfor silicic acid, while other algal groups, such as Phaeocystis sp., donot remove silicic acid at all. Therefore, the composition of theassemblage determines the Si:N uptake ratio, but this ratio iscontrolled by the micronutrients too (Boye et al., 2001; Smithet al., 2003). In particular, the nitrate uptake is drastically reducedunder Fe limiting conditions, while silicate uptake is relativelyuninfluenced (Price et al., 1991; Hutchins and Bruland, 1998;Takeda, 1998), resulting in elevated Si:N uptake ratios (above 2)with respect to what is observed under Fe-replete conditions,
NO3 = 7.778 PO4 + 12.558
R2 = 0.81
hate (µM)
Si = 2.229 NO3 + 3.534
R2 = 0.81
(µM)
25 30 35
1.5 2.0 2.5 3.0
e versus phosphate (b) concentration in the measured samples.

Table 3Dissolved labile Fe (Fe d), dissolved labile Cu (Cu d), particulate Fe (Fe p),
particulate Cu (Cu p) concentrations and Fe:Al ratio in total particulate matter
in the analyzed samples.
Station Depth(m)
Fe d(nM)
Cu d(nM)
Fe p(nM)
Cu p(nM)
Fe:Al
4 20 od.l. od.l. 3.36 0.03 1.54
4 50 2.31 0.85 8.22 0.19 0.92
4 75 2.83 0.65 17.32 0.26 0.71
4 100 3.71 0.90 3.90 0.73 2.58
8 20 0.95 0.80 2.20 0.04 1.15
8 40 0.82 0.54 3.16 0.06 1.04
8 100 0.68 0.35 14.56 0.14 1.06
9 20 0.72 0.33 1.67 0.02 2.31
9 80 0.82 0.46 9.48 0.15 0.80
9 100 0.72 0.27 8.81 0.10 0.78
10 20 0.77 0.49 1.57 0.04 1.55
10 40 0.75 0.39 1.24 0.06 0.99
10 100 1.00 0.82 8.51 0.15 0.51
11 20 0.88 0.55 1.58 0.04 1.48
11 40 0.91 0.54 0.91 0.02 0.71
11 80 0.84 0.52 6.33 0.19 1.17
11 100 0.93 0.55 5.82 0.09 0.88
12 20 0.91 0.46 0.95 0.03 1.19
12 40 1.29 0.61 1.76 0.05 1.62
12 100 1.56 0.74 20.45 0.21 1.22
13 20 1.27 0.65 0.65 0.02 1.09
13 40 2.29 0.63 1.63 0.06 2.08
13 100 1.79 0.57 24.83 0.36 1.31
14 20 0.95 0.63 0.56 0.02 1.72
14 60 2.74 0.82 10.76 0.16 1.43
14 100 2.69 0.72 14.55 0.13 1.32
P. Rivaro et al. / Continental Shelf Research 31 (2011) 879–889884
when the Si:N uptake ratio is about 1:1 (Hutchins and Bruland,1998). Although the Si:N ratio 41 suggests that TNB wasFe-limited during our sampling, an alternative explanation couldbe that the ratio is influenced, for instance, by the advection ofmelt water or deeper water with different Si:NO3 ratio comparedto AASW. The meltwater percentage calculated in our sampleswas negligible and therefore we can suppose that it does not alterthe Si:N ratio. As regards deeper water intrusions, as previouslysaid, the vertical structure of the water column in TNB can beconsidered as being two-layered: the AASW occupies the upperlayer and below it the water column is occupied by the HSSW. Inthe quasi-isothermal layer of HSSW, a water mass with tempera-tures o�1.92 1C and salinity between 34.74 and 34.82 has beendetected at intermediate depths. This water mass is called TerraNova Bay Ice Shelf Water (TISW) and it has been observed overthe whole area of TNB even though characterized by differentdepths and thickness (Budillon and Spezie, 2000). In our dataset(Cf. Table 1) TISW was not present on the basis of its physicalproperties. Finally, Modified Circumpolar Deep Water (MCDW)intrusions close to the TNB area are expected when the atmo-spheric forcing and brine release are greater and when massivequantities of HSSW are formed. This occurs typically during thestrong katabatic surge events in winter, but there is not anyevidence of such intrusions in summer (Budillon and Spezie,2000). Therefore, we can conclude that advection of melt wateror deeper water did not influence the Si:N ratio found in oursamples.
The N:P disappearance ratio (7.78, R2¼0.81) falls in the range
of the values reported for surface waters characterized by diatompopulation. Arrigo et al. (1999) found that N:P ratio for the RossSea changes, shifting from 9.69 for a diatom-dominated commu-nity to 19.2 for a Prymnesiophyceae—dominated community.A mean N:P ratio of 11 was reported for TNB when it is adiatom-dominated area (Saggiomo et al., 2002). In our study,Fragilariopsis dominates the algal community and it reached amaximum abundance of 105 cells L�1, lower than previous sur-veys carried out at TNB in mid-January (Cabrini, personal com-munication). The chl a concentration varied from 0.04 to5.08 mg L�1 (Table 1) and is comparable with values collected atTNB in several surveys (Fonda Umani et al., 2002; Saggiomo et al.,2002).
Usually, lower chl a concentrations are measured in TNB inJanuary compared to February, when a late summer bloom oftenoccurs, although a high interannual variability has been observed.For instance, in January 2001, the integrated chl a values for theupper 100 m (102 mg m�2) were 2.5 times higher than thosemeasured in January 1990 and 1996 (Mangoni et al., 2004). Thepheopigment/chlorophyll a (phaeo/chl a) ratio ranged between0.03 and 5.17 (Table 1). Since pheopigments are a decompositionproduct of chlorophyll, an increase in phaeo/chl a ratio suggestsan advanced bloom phase and/or an increasing importance ofgrazing, while a ratio decrease suggests physiologically favour-able conditions to phytoplankton. The TPM was more concen-trated in the surface layer and it ranged from 0.06 to 2.02 mg L�1,with a mean value of 0.57 mg L�1 (Table 1).
3.2. Iron and copper distribution
The Chelex 100 columns used in this study collect the labilemetal fraction (i.e. the hydrated ions, the cationic metal com-plexes and the organic complexes that are kinetically labile andweaker than the Chelex-metal complex). The dissolved labile Feranged from 0.15 nM (detection limit) to 3.71 nM, with anaverage of 1.43 nM (n¼25) (Table 3). These values are lower,even if in the same range, than those obtained through a similar
procedure for a near shore station inside the Gerlache Inlet(0.4–4.2 nM), which is more influenced by the atmospheric inputsfrom land and from pack ice melting (Grotti et al., 2001). On theother hand, our data are higher than those measured in the RossSea offshore waters (Sedwick and Di Tullio, 1997; Fitzwater et al.,2000; Sedwick et al., 2000). Recent data on the total Fe in Ross Seaseawater samples obtained by ICP-MS measurement allowed usto estimate that the Fe fraction bound by the Chelex represents20–80% of the total Fe (Grotti et al., 2009).
The dissolved labile Cu ranged from 0.10 (detection limit) to0.90 nM, with an average of 0.57 nM. Our data are lower thanthose reported by Grotti et al. (2001) (0.5–11.6 nM), but they fallin the same range reported for the Southern Ocean (1.2–1.3 nM)and the Ross Sea (1.6–2.3 nM) surface waters (Frew et al., 2001;Corami et al., 2005). In particular, the latter range refers to totalCu in filtered water sampled in Terra Nova Bay polynya. There-fore, we can assume that in our study the Cu complexed by theChelex-100 presumably covers 30–40% of the total dissolvedmetal. The lowest dissolved Fe and Cu concentrations were foundat station 4 at a depth of 20 m, where the nutrients were at theirminimum and the chl a at its maximum (cf. Table 1). The station14 exhibits the highest concentrations in the whole mixed layer(0.95–2.74 nM Fe and 0.63–0.82 nM Cu). Considering that in thisstation the highest meltwater percentage was found (cf. Table 2),we hypothesize that the sea-ice melting provided a local input ofthe metals. Indeed, several papers report that local sea-icemelting can increase the Fe concentration up to 42 nM in theupper 30 m (Sedwick and Di Tullio, 1997; Arrigo and van Dijken,2004; Tagliabue and Arrigo, 2005).
The concentration of the particulate Fe was about 5 timeshigher than the dissolved Fe concentration, ranging from 0.56 to24.83 nM with an average of 6.45 nM. The concentration of theparticulate Cu ranged from 0.01 to 0.71 nM with an average of0.17 nM, which represents about one third of dissolved labile Cu.The values are in agreement with previous TNB coastal waterdata (Frache et al., 1997; Grotti et al., 2001; Ianni et al., 2002).

Table 4
Correlation matrix (Pearson’s coefficients) among physical variables (potential temperature, y; salinity, S), chemical variables (dissolved oxygen, O2; nitrate, NO3; silicate,
Si; phosphate PO4; labile dissolved Fe, Fe d; labile dissolved Cu, Cu d; particulate Fe, Fe p; particulate Cu, Cu p), total particulate matter (TPM) and chlorophyll a (chl a) l.
The significant correlations (po0.05) are shown in boldface. The correlation matrix and statistical significance of the correlations were calculated using Statistica software.
(a) Samples above 40 m (n¼13) and (b) samples below 40 m (n¼12).
h S O2 NO3 Si PO4 chl a TPM Fe d Cu d Fe p Cu p
(a)
h 1.00 �0.41 0.76 �0.61 �0.51 �0.27 0.58 0.49 �0.32 �0.25 �0.26 �0.44
S 1.00 �0.45 0.23 �0.02 �0.22 �0.81 �0.19 0.06 �0.14 �0.11 0.41
O2 1.00 �0.48 �0.41 �0.48 0.63 0.72 �0.45 �0.25 �0.08 �0.63NO3 1.00 0.74 0.41 �0.42 �0.29 0.62 0.40 �0.20 0.03
Si 1.00 0.47 �0.28 �0.06 0.51 0.24 �0.24 �0.16
PO4 1.00 0.05 �0.17 0.82 0.39 0.05 0.42
chl a 1.00 0.31 �0.22 �0.06 0.07 �0.51
TPM 1.00 �0.15 �0.39 �0.06 �0.39
Fe d 1.00 0.62 �0.34 0.34
Cu d 1.00 �0.39 0.13
Fe p 1.00 0.42
Cu p 1.00
(b)
h 1.00 �0.09 0.51 �0.69 �0.75 �0.51 0.39 0.20 0.23 0.25 0.17 �0.10
S 1.00 0.26 0.43 0.46 �0.21 �0.70 0.39 �0.17 0.08 �0.14 0.20
O2 1.00 �0.51 �0.40 �0.42 �0.03 0.20 0.10 0.16 �0.55 �0.00
NO3 1.00 0.92 0.29 �0.58 �0.08 �0.36 �0.37 0.20 0.02
Si 1.00 0.33 �0.76 0.03 �0.33 �0.41 0.21 0.08
PO4 1.00 �0.30 �0.46 �0.20 �0.62 0.03 0.05
chl a 1.00 �0.14 0.29 0.37 �0.08 �0.11
TPM 1.00 �0.14 0.22 0.31 �0.13
Fe d 1.00 0.73 �0.03 0.67Cu d 1.00 �0.15 0.45
Fe p 1.00 �0.07
Cu p 1.00
P. Rivaro et al. / Continental Shelf Research 31 (2011) 879–889 885
Few data on particulate iron in the Ross Sea are available(Fitzwater et al., 2000; Ianni et al., 2002; Corami et al., 2005);the concentration ranges from 0.4 to 3.3 nM in subsurface waters.The contribution of particulate matter from resuspended sedimentsin pack ice, which affects the trace metal concentration in coastalzones (Grotti et al., 2005), is not relevant in the more offshore areathat we investigated. The values of both metals increased withdepth showing the highest concentration below the pycnocline,where the Fe:Al ratio (Table 3) was lower than in subsurface waters,but still higher than the crustal value (0.19–0.21). Therefore, wehypothesize a different origin and composition of this particulatematter, which might influence the metal content. The area ofpermanent polynya is close to the Drygalski ice tongue fed by theDavid Glacier. Hence, water erosion of the basal glacial ice, under thepycnocline, can scour lithogenic material, which can be an impor-tant factor influencing the particulate metal distribution in theintermediate layer of the water column. On the other hand,resuspension from sediments is negligible in the upper mixed layersince the mean depth of the area is 4900 m. In this regard, thebottom waters are in general considered as a potentially importantsource of trace metals to the upper water column in shelfarea o500 m depth (Sedwick et al., 2000).
3.3. Iron and copper as bioactive elements
It has been established that irradiance (e.g. mixed layer depth)and iron availability are two of the main factors affectingphytoplankton dynamics in the Southern Ocean (Feng et al.,2010 and herein references). In particular, the mixed layer depthseems able to determine the dominant species in the Ross Seaarea, being diatoms usually most abundant in areas of shallowermixed layer depth and more stratified waters (Arrigo et al., 1999;Arrigo, 2007). In fact a strong and shallow pycnocline allowsphytoplankton cells to remain in the euphotic layer. As pre-
viously said, during our survey, the mean vertical stability(N2(z)¼17.9�105 s�2) and the mean Z (UML) were lower andthicker, respectively, than those calculated for other surveys(Massolo et al., 2009). In particular, the calculated mean valueof N2(z) corresponding to E(Z(UML))¼9) was lower than the value(E(Z(UML)¼25) over which Catalano et al. (1997) measuredenhanced nutrient utilization and high biomass. Therefore, thephysical properties were less favourable to the phytoplanktondevelopment than those we measured in other surveys. On theother hand, the mixed layer depths at TNB were shallower orabout 40 m consisting with previous finding on the relationshipbetween chl a concentration in surface waters of coastal regionsin the Antarctic and UML depth, which showed that high chl a
concentrations occur only when the UML is shallower than about40 m (Holm-Hansen et al., 2004).
Besides physical factors and light, other factors, such as grazingpressure and micronutrient availability, may play a major role inregulating the primary production. In this context, we evaluated thepossible role of Fe and Cu as bioactive elements. First, we evaluatedtheir correlation with respect to the other variables (potentialtemperature, salinity, O2, nutrients, chl a and TPM). Surface sampleswere excluded from the dataset because the metals had not beendetermined at this depth and we separated values above and below40 m, chosen as an approximate cut-off for the mixed layer depths.Table 4 (a) and (b) summarize the Pearson’s linear correlationcoefficients (Box et al., 2005). As concerns the samples o40 m,the dissolved labile Fe significantly and positively co-varied withNO3, PO4 and dissolved labile Cu; therefore, they likely have acommon source. Moreover, the positive correlation between NO3
and dissolved labile Fe suggests that low NO3 utilization could notreflect a Fe limitation. As concerns the samples440 m, the dis-solved labile Fe positively and significantly co-varied with dissolvedlabile and particulate Cu only. Therefore, the analysis of the mixedlayer of the entire dataset suggests that dissolved labile Fe and Cuhad generally a little impact on the distribution of chl a or

P. Rivaro et al. / Continental Shelf Research 31 (2011) 879–889886
macronutrients in TNB, although we measured a Si:N ratio 41,which could indicate a Fe-deplete condition.
Secondly, we considered the Fe and Cu distribution at 20 mtogether with those of nitrate and chl a within the upper mixedlayer in all of the stations to evaluate any local difference. Thecontour plots are shown in Fig. 3. The dissolved labile Fe (seepanel a) ranges from the detection limit (0.15 nM) to 1.27 nM. Thedifferences in the Fe concentrations are not due to the localchanges of the physical parameters, because the salinity and thetemperature did not differ significantly among the stations. The
162°00Long
75.50'S
74.50'S
Lat 4
8
91011
12
13 14
MZS
0.1
0.4
0.7
1.0
1.3
Fe d (nM)
162°00Long
75.50° S
74.50° S
Lat 4
8
91011
12
13 14
MZS
15
19
23
27
NO3 (uM)
162.00°Long
75.50°S
74.50°S
Lat 4
8
91011
12
13 14
MZS
0.1
0.3
0.5
0.7
Cu d (nM)
164.00° 166.00°
164°00 166°00
164°00 166°00
Fig. 3. 20 m contour plot of dissolved labile Fe (a), particulate Fe (b)
highest concentrations were measured at stations 12 and 13,where the input from atmospheric dust could be more relevant.Conversely, the lowest concentration, below the detection limit,was found at station 4, where the highest particulate Fe concen-tration and high chl a were measured too (3.36 nM and3.58 mg L�1, respectively) (see panel b and d). NO3
� (panel c)ranges from 15.7 to 27.8 mM, with the highest concentration inthe more coastal stations, and the lowest at station 10. NO3
�
concentration at station 4 was 19.4 mM, higher than the valuesassociated with nutrient limitation of the phytoplankton growth.
162°00Long
75.50°S
74.50°S
Lat 4
8
91011
12
13 14
MZS
1.6
2.1
2.6
3.1
3.6
Chl-a (ug/l)
162°00Long
75.50° S
74.50° S
Lat 4
8
91011
12
13 14
MZS
0.6
1.3
2.0
2.7
3.4
Fe p (nM)
162.00°
Long
75.50°S
74.50°S
Lat 4
8
91011
12
13 14
MZS
0.02
0.03
0.04
Cu p (nM)
164.00° 166.00°
164°00 166°00
164°00 166°00
NO3 (c), chl a (d), dissolved labile Cu (e) and particulate Cu (f).

P. Rivaro et al. / Continental Shelf Research 31 (2011) 879–889 887
The Fe concentration regulates the magnitude of the macronu-trient utilization, whereas, as previously said, the differences inthe N:P ratio are controlled by phytoplankton taxonomic compo-sition. Phaeocystis antarctica and diatoms exhibited differentratios of C to nutrient drawdown also. Arrigo et al. (1999)measured a disappearance ratio of total inorganic carbon (CT) toPO4 significantly higher for Phaeocystis antarctica (147726.7)than for diatoms (94.3720.1). Following Arrigo et al. (1999),we can assume that any reduction in CT is a result of drawdown ofCO2 by phytoplankton. CT measurements were carried out at TNBin 2003 (Sandrini, personal communication) and the disappear-ance ratio of CT to PO4 was evaluated for the upper mixed layer.The relationship was : CT¼76.64 PO4þ2112 (R2
¼0.71; n¼29).Therefore, the slope felt in the range proposed by Arrigo et al.(1999) for diatom-dominated waters.
A considerable uncertainty exists about the phytoplankton Feparameters; in particular the Fe demand is highly variabledepending on the phytoplankton taxa, the Fe availability andthe incident light (Tagliabue and Arrigo, 2005). Tagliabue andArrigo (2005) observed differences in the C:Fe, C:P and C:N ratiosmeasured in both laboratory and field experiments and derivedthe ratios for the Ross Sea. They assigned the molar C:Fe uptakeratios of 450,000 and 100,000 to Phaeocystis antarctica anddiatoms, respectively. The algal population at TNB during oursurvey was mainly composed of diatoms, as suggested by the N:Pand by the C:P ratios and as confirmed by the species compositionanalysis. In our study, the adequate N:Fe ratio should be �10000considering the mean N:P and C:P ratio measured in this study(7.87 and 76.63, respectively) and the C:Fe proposed by Tagliabueand Arrigo (2005) for diatoms (100,000). The N:labile Fe ratiocalculated at 20 m ranges between 18,900 (station 13) and130,666 (station 4) (Table 5). This means that, taking into accountthe more available dissolved Fe fraction only, TNB experienced aFe limited condition during our sampling. This finding agrees withthe Si:N ratio that we found (2.29), which suggests Fe limitedconditions. Lane et al. (2009) examined the effect of Fe-limitationon the Cd:PO4
3� quotas of several species of cultured diatoms andprymnesiophytes, including two species from the SouthernOcean. In particular, the taxa were cultured under varying con-centrations of Fe and the corresponding growth rates, and cellularFe:C ratios were determined. Although the species differed intheir response to Fe-limitation, all of them reduced their growthrates in Fe-limiting conditions. The non-Fe-limited Fe:C quotas ofthe Southern Ocean species were lower (�3 mmol Fe mol�1 C)than sub-arctic or mid latitude species. Moreover, the SouthernOcean species showed the lowest cellular Fe:C ratios measured todate (�0.6 mmol Fe mol�1 C) under Fe-limited culture medium.The 3 mmol Fe mol�1 C corresponds to a C:Fe ratio of �330,000.Using this value instead of 100,000, the adequate N:Fe ratioshould be �34,000, suggesting that the sampled area was notFe-limited apart station 4. Therefore, taking into account all of theremarks that we have done on macronutrients and labile
Table 5N:labile Fe ratio and N:Fe ratios assuming 20% and the 80% recovery of the total
dissolved Fe at 20 m in the investigated stations.
Station N:Fe labile N:Fe 20% tot N:Fe 80% tot
4 130,667 26,133 104,533
8 22,279 4456 17,823
9 30,510 6102 24,408
10 20,396 4079 16,316
11 31,534 6307 25,227
12 27,444 5489 21,955
13 18,916 3783 15,133
14 24,074 4815 19,259
dissolved Fe and Cu, we found a borderline condition at TNB. Infact, the Si:N and a lower C:Fe suggested a Fe-deplete condition inall of the sampled stations. On the contrary, when correlationcoefficients between macronutrients and the labile fraction of thedissolved Cu and Fe were considered or a higher C:Fe ratio wasused, TNB sampled area appeared Fe-replete except at station 4.
The Fe–Chelex bound that we measured is the most assimilableby the phytoplankton (i.e. the hydrated ions, the cationic metalcomplexes and the organic complexes that are kinetically labile andweaker than the Chelex–metal complex). Over 99% of the dissolvedFe in the Southern Ocean is bound to organic ligands (Nolting et al.,1998; Boye et al., 2001). The hypothesis that the strong iron-bindingligands in the Southern Ocean (log K(L0 ,Fe3þ )¼22.1) could be side-rophores was first suggested by Rue and Bruland (1997). In contrast,the porphyrin-type molecules might be the source of the weakerligands, which occur at greater concentration than the strong ones.The uptake of complexed Fe is consistent with the uptake of thesiderophore or porphyrin-bound iron; the former has been demon-strated for cyanobacteria, whereas it is less available to eukaryoticorganisms, which tend to take up inorganic or porphyrin bound Fepreferentially (Hutchins et al., 1999). It has been demonstrated thatFe–siderophore complexes are available to diatoms. Diatoms areknown to reduce Fe3þ extracellularly from complexes, such assiderophores, through an enzymatic system on the cell surface. Thisreduction allows diatoms to access a pool of iron that wouldotherwise be unavailable (Maldonado and Price, 2000; Morel andPrice, 2003; Shaked et al., 2005). In our study, as the algal populationis mainly composed of diatoms, the strong Fe complexes should beassimilated. Grotti et al. (2009) found that the total Fe in the TNBseawater samples ranges from 0.47 to 3.01 nM. In this case, the totaldissolved Fe burden could sustain the phytoplankton biomass. Aspreviously said, we estimated that the Fe fraction bound by theChelex represents 20–80% of the total dissolved Fe concentrationreported by Grotti et al. (2009). Therefore, we recalculated the N:Feratios at 20 m depth assuming both 20% and 80% recovery of thetotal dissolved Fe (Table 5). Considering the adequate N:Fe ratioscalculated following Tagliabue and Arrigo (2005) and Lane et al.(2009) (�10,000 and �34,000, respectively) it can be seen that nostation apart from station 4 was in Fe-limited condition.
Recent studies suggest that Cu may play a critical role in thephysiology of open ocean phytoplankton, and that Cu require-ments may be higher when the organisms experience Fe-limita-tion. In fact, Fe-limited marine diatoms possess a high affinitytransport system with Cu-dependent cell surface oxidases whichallows them to access Fe bound within strong organic complexes(Maldonado et al., 2006). The effect of the Cu limitation on this Fetransport system was evaluated in laboratory experiments withcultured cells. The results showed that in low Fe regimes, Culimitation can exacerbate Fe limitation, because the Cu-depen-dent oxidase does not work properly (Maldonado et al., 2006).Evidence for the importance of Cu in natural communities ofphytoplankton was obtained from an incubation experimentperformed in the Fe-limited basin of the Bering Sea (Peers et al.,2005). Nevertheless, very little is known about the speciation ofthe dissolved Cu and about the forms available to the phyto-plankton for growth in surface waters. As with other bioactivetrace elements (Fe, Zn), 98% of Cu is complexed by organicligands, presumably of biological origin, resulting in low inorganicmetal concentrations (van den Berg, 1984; Moffett, 1995). Severalpapers suggested that only inorganic metal complexes werebioavailable (Anderson and Morel, 1982; Hudson and Morel,1990; Sunda and Huntsman, 1995), but recent studies demon-strate that organic metal complexes of Cu are also available foruptake (Quigg et al., 2006; Annett et al., 2008; Semeniuk et al.,2009). In our study, the dissolved labile Cu concentration at 20 m(Fig. 3 panel e) ranges from below the detection limit (0.10 nM) to

P. Rivaro et al. / Continental Shelf Research 31 (2011) 879–889888
0.80 nM, with the lowest values at station 4 (below the detectionlimit) and 9 (0.33 nM). The concentration of the dissolved labileCu in surface water is lower than those used as low-Cu media([Cutot]¼1.96 nmol L�1) in experiments on Cu limitation in dia-tom culture (Maldonado et al., 2006; Annett et al., 2008). Our dataindicate that Cu could be playing an important role as a bioactiveelement at TNB polynya, particularly at Station 4. In fact, at 20 m,the Chelex-bound Fe and Cu concentrations were the lowest(od.l. for both the metals), as well as the NO3
� , but the relativelyhigh chl a (3.58 mg L�1) and the low phaeo/chl a ratio (0.26)suggest that the phytoplankton community had just bloomed,effectively drawing down the dissolved Fe, Cu and the macro-nutrients. At the moment we cannot draw any speculations aboutan additional level of stress to Fe-limited conditions imparted bythe low Cu.
4. Conclusions
The distribution of Fe and Cu in Antarctic Surface Waters ofTNB polynya in early summer 2003 has been described takinginto account the chemical, physical and biological characteristicsof the surface waters. Although our data were a snapshot in timeand space, they allowed us to draw some conclusions on the roleof the trace elements in modulating the primary production atTNB. Over the investigated period, the water column stability waslow, because of the presence of B-15 and C-19 megabergs,resulting in reduced development of the phytoplankton bloom.The nutrients were reduced but not depleted. The high Si:N wastypical of Fe limiting conditions and the N:P and C:P reflected thediatom dominance in the algal population. The labile dissolvedChelex-bound Fe that we measured would or would not allowcomplete nitrate removal, on the basis of the N:Fe requirementratios that we calculated considering the N:P and the C:P ratiosestimated for diatoms. The Cu data collected in this study indicatethat Cu could play an important role as a bioactive element inTerra Nova Bay environment. An improvement would be achievedby going into details of the Fe and Cu chemical speciation tobetter understand how it could influence their bioavailability tomarine phytoplankton. The results of this study show the need forongoing research to establish a trace metal long-term monitoringof this area. Significant interannual variations in physical char-acteristics of the surface waters, such as sea-ice coverage andmeltwater percentage, can affect both the stability of the watercolumn and the trace metal distribution and speciation.
Acknowledgements
This study was carried out as part of the Italian NationalProgram for Research in Antarctica (CLIMA Project) and wasfunded by ENEA through a joint research program. The help ofthe crew on the R.V. Italica is kindly acknowledged. We aregrateful to the group of Giancarlo Spezie, scientific chief of theCLIMA Project and of the 2003 Antarctic Italian Cruise, forCTD data.
Thanks are due to Francesco Soggia for FIS data. Our gratitudegoes to Marina Cabrini for providing information on the phyto-plaktonic population and to Silvia Sandrini for CT data.
The comments and the suggestions of the two anonymousreferees were greatly appreciated and improved this paper.
References
Agusti, S., Duarte, C.M., 1998. Phytoplankton chlorophyll a distribution and watercolumn stability in the central Atlantic Ocean. Oceanologica Acta 22 (2),193–203.
Anderson, M.A., Morel, F.M.M., 1982. The influence of aqueous iron chemistry onthe uptake of iron by the coastal diatom Thalassiosira weissflogii. Limnologyand Oceanography 27, 789–813.
Annett, A.L., Lapi, S., Ruth, T.J., Maldonado, M.T., 2008. The effects of Cu and Feavailability on the growth and Cu:C ratios of marine diatoms. Limnology andOceanography 53, 2451–2461.
Arrigo, K.R., Robinson, D.H., Worthen, D.L., Dumbar, R.B., Di Tullio, G.R.,van Woerth, M., Lizotte, M.P., 1999. Phytoplankton community structure andthe drawdown of nutrient and CO2 in the Southern Ocean. Science 283,365–367.
Arrigo, K.R., Van Dijken, G.L., 2003. Impact of iceberg C-19 on Ross Sea primaryproduction. Geophysical Research Letters 30 (16), 1836.
Arrigo, K.R., Van Dijken, G.L., 2004. Annual changes in sea-ice, chlorophyll a, andprimary production in the Ross Sea, Antarctica. Deep-Sea Research II 51,117–138.
Arrigo, K.R., 2007. Physical control of primary productivity in Arctic and Antarcticpolynyas. In: Smith Jr, W.O., Barber, D.G. (Eds.), Polynyas: Windows to theWorld. Elsevier Oceanography Series, 74. Elsevier, Amsterdam (The Nether-lands), pp. 223–238.
Biesuz, R., Alberti, G., D’Agostino, G., Magi, E., Pesavento, M., 2006. Determinationof cadmium(II), copper(II), manganese(II) and nickel(II) species in Antarcticseawater with complexing resins. Marine Chemistry 101, 180–189.
Boyd, P.W., Law, C.S., 2001. The Southern Ocean Iron RElease Experiment (SOIREE)introduction and summary. Deep-Sea Research II 48, 2425–2438.
Boye, M., van den Berg, C.M.G., de Jong, J.T.M., Leach, H., Croot, P., de Baar, H.J.W.,2001. Organic complexation of iron in the Southern Ocean. Deep-Sea ResearchI 48, 1477–1497.
Box, G.E.P., Hunter, J.S., Hunter, W.G., 2005. Statistics for experimenters, Design,innovation and discovery 2nd Ed. John Wiley & Sons, New Jersey.
Budillon, G., Spezie, G., 2000. Thermohaline structure and variability in the TerraNova Bay polynya, Ross Sea. Antarctic Science 12, 493–508.
Budillon, G., Pacciaroni, M., Cozzi, S., Rivaro, P., Catalano, G., Ianni, C., Cantoni, C.,2003. An optimum multiparameter mixing analysis of the shelf waters in theRoss Sea. Antarctic Science 15 (1), 105–118.
Buma, A.G.J., de Baar, H.J.W., Nolting, R.F., van Bennekom, A.J., 1991. Metalenrichment experiments in the Weddell-Scotia Seas, effects of iron andmanganese on various plankton communities. Limnology and Oceanography36, 1865–1878.
Capodaglio, G., Scarponi, G., Toscano, G., Barbante, C., Cescon, P., 1995. Speciationof trace metals in seawater by anodic stripping voltammetry, critical analyticalstep. Journal of Analytical Chemistry 351, 386–392.
Catalano, G., Povero, P., Fabiano, M., Benedetti, F., Goffart, A., 1997. Nutrientutilisation and particulate organic matter changes during summer in theupper mixed layer (Ross Sea, Antarctica). Deep-Sea Research 44, 97–112.
Coale, K.H., Bruland, K.W., 1988. Copper complexation in the Northeast Pacific.Limnology and Oceanography 33, 1084–1101.
Coale, K.H., Johnson, K.S., Chavez, F.P., Buesseler, K.O., Barber, R.T., Brzezinski, M.A.,Cochlan, W.P., Millero, F.J., Falkowski, P.G., Bauer, J.E., Wanninkhof, R.H., Kudela,R.M., Altabet, M.A., Hales, B.E., Takahashi, T., Landry, M.R., Bidigare, R.R., Wang, X.,Chase, Z., Strutton, P.G., Friederich, G.E., Gorbunov, M.Y., Lance, V.P., Hilting, A.K.,Hiscock, M.R., Demarest, M., Hiscock, W.T., Sullivan, K.F., Tanner, S.J., Gordon,R.M., Hunter, C.N., Elrod, V.A., Fitzwater, S.E., Jones, J.L., Tozzi, S., Koblizek, M.,Roberts, A.E., Herndon, J., Brewster, J., Ladizinsky, N., Smith, G., Cooper, D.,Timothy, D., Brown, S.L., Selph, K.E., Sheridan, C.C., Twining, B.S., Johnson, Z.I.,2004. Southern ocean iron enrichment experiment: carbon cycling in high- andlow-Si waters. Science 304, 408–414.
Corami, F., Capodaglio, G., Turetta, C., Soggia, F., Magi, E., Grotti, M., 2005. Summerdistribution of trace metals in the western sector of the Ross Sea, Antarctica.Journal of Environmental Monitoring 7, 1256–1264.
de Baar, H.J.W., Buma, A., Nolting, R.B., Jacques, G., Treguer, P., 1990. On ironlimitation of the Southern Ocean, experimental observation in the Weddelland Scotia sea. Marine Ecology Progress Series 65, 105–122.
Feng, Y., Hare, C.E., Rose, J.M., Handy, S.M., Di Tullio, G.R., Lee, P.A., Smith Jr., W.O.,Peloquin, J., Tozzi, S., Sun, J., Zhang, Y., Dunbar, R.B., Long, M.C., Sohst, B., Lohan,M., Hutchins, D.A., 2010. Interactive effects of iron, irradiance and CO2 on RossSea phytoplankton. Deep-Sea Research I 57, 368–383.
Fitzwater, S.E., Johnson, K.S., Gordon, R.M., Coale, K.H., Smith Jr., W.O., 2000. Tracemetal concentrations in the Ross Sea and their relationship with nutrients andphytoplankton growth. Deep-Sea Research II 47, 3159–3179.
Fofonoff, N.P., Millard, R.C., 1981. Algorithms for computation of fundamentalproperties of seawater. UNESCO Technical Paper 44, p. 160.
Fonda Umani, S., Accornero, A., Budillon, G., Capello, M., Tucci, S., Cabrini, M.,Del Negro, P., Monti, M., De Vittor, C., 2002. Particulate matter and planktondynamics in the Ross Sea Polynya of Terra Nova Bay during the AustralSummer 1997/98. Journal of Marine Systems 36, 29–49.
Frache, R., Baffi, F., Ianni, C., Soggia, F., 1997. Dissolved and particulate metals inthe pack ice melting process in the Ross Sea Antarctica. Annali di Chimica(Rome) 87, 367–374.
Frew, R., Bowie, A., Crooth, P., Pickmere, S., 2001. Macronutrient and trace metalgeochemistry of an in-situ iron induced Southern Ocean bloom. Deep-SeaResearch II 48, 2467–2481.
Garcia, V.M.T., Garcia, C.A.E., Mata, M.M., Pollery, R.C., Piola, A.R., Signorini, S.R.,McClain, C.R., Iglesias-Rodriguez, M.D., 2008. Environmental factors control-ling the phytoplankton blooms at the Patagonia shelf-break in spring. Deep-Sea Research I 55, 1150–1166.

P. Rivaro et al. / Continental Shelf Research 31 (2011) 879–889 889
Grasshoff, K., 1983. Determination of oxygen. In: Grasshoff, K., Ehrhardt, M.,Kremling, K. (Eds.), Methods of seawater analysis. WeinheimVerlag Chemie,pp. 61–72.
Grotti, M., Soggia, F., Abelmoschi, M.L., Rivaro, P., Magi, E., Frache, R., 2001.Temporal distribution of trace metals in Antarctic coastal waters. MarineChemistry 76, 189–209.
Grotti, M., Soggia, F., Dalla Riva, S., Magi, E., Frache, R., 2003a. An in situ filtrationsystem for trace element determination in suspended particulate matter.Analytica Chimica Acta 498, 165–173.
Grotti, M., Abelmoschi, M.L., Soggia, F., Frache, R., 2003b. Determination ofultratrace elements in natural waters by solid-phase extraction and atomicspectrometry methods. Analytical Bioanalytical Chemistry 375, 242–247.
Grotti, M., Soggia, F., Ianni, C., Frache, R., 2005. Trace metal distribution in coastalsea ice of Terra Nova Bay, Ross Sea, Antarctica. Antarctic Science 17, 289–300.
Grotti, M., Soggia, F., Ardini, F., Frache, R., 2009. Determination of sub-nanomolarlevels of iron in sea-water using reaction cell inductively coupled plasma massspectrometry after Mg(OH)2 coprecipitation. Journal of Analytical AtomicSpectrometry 24, 522–527.
Hansen, H.P., Grasshoff, K., 1983. Automated chemical analysis. In: Grasshoff, K.,Ehrhardt, M., Kremling, K. (Eds.), Methods of seawater analysis. WeinheimVerlag Chemie, pp. 347–370.
Holm-Hansen, O., Naganobu, M., Kawaguchi, S., Kameda, T., Krasovskic, I.,Tchernyshkovc, P., Priddle, J., Korb, R., Brandon, M., Demer, D., Hewitt, R.P.,Kahrua, M., Hewes, C.D., 2004. Factors influencing the distribution, biomass,and productivity of phytoplankton in the Scotia Sea and adjoining waters.Deep-Sea Research II 51, 1333–1350.
Hudson, R.J.M., Morel, F.M.M., 1990. Iron transport in marine phytoplankton:Kinetics of cellular and medium coordination reactions. Limnology andOceanography 35, 1002–1020.
Hudson, R.J.M., 1998. Which aqueous species control the rates of trace metaluptake by aquatic biota? Observations and predictions of non-equilibriumeffects. The Science of the Total Environment 219, 95–115.
Hutchins, D.A., Bruland, K.W., 1998. Iron-limited diatom growth and Si, N uptakeratios in a coastal upwelling regime. Nature 393, 561–564.
Hutchins, D.A., Witter, A.E., Butler, A., Luther III, G.W., 1999. Competition amongmarine phytoplankton for different chelated iron species. Nature 400,858–861.
Ianni, C., Rivaro, P., Frache, R., 2002. Distribution of dissolved and particulate iron,copper and manganese in the shelf waters of the Ross Sea (Antarctica). MarineEcology 23, 210–219.
Innamorati, M., Mori, C., Massi, L., Lazzara, L., Nuccio, C., 1999. Phytoplanktonbiomass related to environmental factors in the Ross Sea. In: Faranda, F.M.,Guglielmo, L., Ianora, A. (Eds.), Ross Sea Ecology. Springer-Verlag, Berlin, pp.217–230.
Jacobs, S.S., Giulivi, C.F., 1999. Thermohaline data and ocean circulation on theRoss Sea continental shelf. In: Spezie, G., Manzella, G.M.R. (Eds.), Oceanogra-phy of the Ross Sea, Antarctica. Springer, Berlin, pp. 3–16.
Jones, G.J., Palenik, B.P., Morel, F.M.M., 1987. Trace metal reduction by phyto-plankton: the role of plasmalemma redox enzymes. Journal of Phycology 23,237–244.
Kinugasa, M., Ishita, T., Sohrin, Y., Okamura, K., Takeda, S., Nishioka, J., Tsuda, A.,2005. Dynamics of trace metals during the subarctic Pacific iron experimentfor ecosystem dynamics study (SEEDS2001). Progress in Oceanography 64,129–147.
Kustka, A.B., Allen, A., Morel, F.M.M., 2007. Sequence analysis and regulation ofiron acquisition genes in two marine diatoms. Journal of Phycology 43,715–729.
Lane, E.S., Semeniuk, D.M., Strzepek, R.F., Cullen, J.T., Maldonado, M.T., 2009.Effects of iron limitation on intracellular cadmium of cultured phytoplankton:implications for surface dissolved cadmium to phosphate ratios. MarineChemistry 115, 155–162.
Lorenzen, C.J., Jeffrey, S., 1980. Determination of chlorophyll in seawater. SCORUNESCO, Technical Paper Marine Science, vol. 35, pp. 1–20.
Loscher, B.M., 1999. Relationships among Ni, Cu, Zn, and major nutrients in theSouthern Ocean. Marine Chemistry 67, 67–102.
Maldonado, M.T., Price, N.M., 2000. Nitrate regulation of Fe reduction andtransport by Fe-limited Thalassiosira oceanica. Limnology and Oceanography45, 814–826.
Maldonado, M.T., Strzepek, R.F., Sander, S., Boyd, P.W., 2005. Acquisition of ironbound to strong organic complexes, with different Fe binding groups andphotochemical reactivities, by plankton communities in Fe-limited subantarc-tic waters. Global Biogeochemical Cycles 19, GB4S23.
Maldonado, M.T., Allen, A.E., Chong, J.S., Lin, K., Leus, D., Karpenko, N., Harris, S.L.,2006. Copper-dependent iron transport in coastal and oceanic diatoms.Limnology and Oceanography 51 (4), 1729–1743.
Mangoni, O., Modigh, M., Conversano, F., Carrada, G.C., Saggiomo, V., 2004. Effectsof summer ice coverage on phytoplankton assemblages in the Ross Sea,Antarctica. Deep-Sea Research I 51, 1601–1617.
Martin, J.H., Fitzwater, S.E., Gordon, R.M., 1990a. Iron limits phytoplankton growthin Antarctic waters. Global Biogeochemical Cycle 4, 52–55.
Martin, J.H., Gordon, R.M., Fitzwater, S.E., 1990b. Iron in Antarctic waters. Nature345, 156–158.
Massolo, S., Messa, R., Rivaro, P., Leardi, R., 2009. Annual and spatial variations ofchemical and physical properties in the Ross Sea surface waters (Antarctica).Continental Shelf Research 29, 2333–2344.
Measures, C.I., Vink, S., 2001. Dissolved Fe in the upper waters of the Pacific sectorof the Southern Ocean. Deep-Sea Research II 48, 3913–3941.
Mitchell, B.G., Holm-Hansen, O., 1991. Observation and modelling of the Antarcticphytoplankton crop in relation to mixing depth. Deep-Sea Research 38,981–1007.
Moffett, J.W., 1995. Temporal and spatial variability of copper complexation bystrong chelators in the Sargasso Sea. Deep-Sea Research 42, 1273–1295.
Morel, F.M.M., Price, N.M., 2003. The biogeochemical cycles of trace metals in theoceans. Science 300, 944–947.
Nelson, D.M., Smith Jr., W.O., 1986. Phytoplankton bloom dynamics of the westernRoss Sea II. Mesoscale cycling of nitrogen and silicon. Deep-Sea Research 33,1389–1412.
Nolting, R.F., De Baar, H.J.W., Van Bennekom, A.J., Masson, A., 1991. Cadmium,copper and iron in the Scotia Sea, Weddell Sea And Weddell/Scotia Confluence(Antarctica). Marine Chemistry 35, 219–243.
Nolting, R.F., Gerringa, L.J.A, Swagerman, M.J.W., Timmermans, K.R., de Baar,H.J.W., 1998. Fe (III) speciation in the high nutrient, low chlorophyll Pacificregion of the Southern Ocean. Marine Chemistry 62, 335–352.
Peers, G., Quesnel, S.A., Price, N.M., 2005. Copper requirements for iron acquisitionand growth of coastal and oceanic diatoms. Limnology and Oceanography 50(4), 1149–1158.
Peers, G., Price, N.M., 2006. Copper-containing plastocyanin used for electrontransport by an oceanic diatom. Nature 441, 341–344.
Price, N.M., Andersen, L.F., Morel, F.M.M., 1991. Iron and nitrogen nutrition ofequatorial Pacific plankton. Deep-Sea Research Part A 38, 1361–1378.
Quigg, A., Reinfelder, J.R., Fisher, N.S., 2006. Copper-uptake kinetics in diversemarine phytoplankton. Limnology and Oceanography 51, 893–899.
Rue, E.L., Bruland, K.W., 1997. The role of organic complexation on ambient ironchemistry in the equatorial Pacific ocean and the response of a mesoscale ironaddition experiment. Limnology and Oceanography 42, 901–910.
Saggiomo, V., Catalano, G., Mangoni, O., Budillon, G., Carrada, G.C., 2002. Primaryproduction processes in ice-free waters of the Ross Sea (Antarctica) during theaustral summer 1996. Deep-Sea Research II 49, 1787–1801.
Saggiomo, V., Mangoni, O., Modigh, M., Ianni, C., Rivaro, P., 2003. Primaryproduction processes in the Ross Sea (Antarctica), limiting factors and systemcarrying capacity. In: Proceedings of the ‘‘A sea change, JGOFS accomplishmentand the future of ocean biogeochemistry’’ meeting Washington D.C., U.S.A.
Scharek, R., Van Leeuwe, M.A., de Baar, H.J.W., 1997. Responses of Southern Oceanphytoplankton to the addition of trace metals. Deep-Sea Research II 44,208–228.
Sedwick, P.N., Di Tullio, G.R., 1997. Regulation of algal blooms in Antarctic shelfwaters by the release of iron from melting sea ice. Geophysical ResearchLetters 24, 2515–2518.
Sedwick, P.N., Di Tullio, G.R., Mackey, D.J., 2000. Iron and manganese in the RossSea, Antarctica, seasonal iron limitation in Antarctic shelf waters. Journal ofGeophysical Research 105, 11321–11336.
Semeniuk, D.M., Cullen, J.T., Johnson, W.K., Gagnon, K., Ruth, T.J., Maldonado, M.T.,2009. Plankton copper requirements and uptake in the subarctic NortheastPacific Ocean. Deep-Sea Research 56, 1130–1142.
Shaked, Y., Kustka, A.B., Morel, F.M.M., 2005. A general kinetic model for ironacquisition by eukaryotic phytoplankton. Limnology and Oceanography 50,872–882.
Smith Jr., W.O., Dinniman, M.S., Klinck, J.M., Hofmann, E., 2003. Biogeochemicalclimatologies in the Ross Sea, Antarctica, seasonal patterns of nutrients andbiomass. Deep-Sea Research II 50, 3083–3101.
Sunda, W.G., Guillard, R.R.L., 1976. The relationship between cupric ion activityand the toxicity of copper to phytoplankton. Journal of Marine Research 34,511–529.
Sunda, W.G., Hanson, A.K., 1987. Measurement of free cupric ion concentration inseawater by a ligand competition technique involving copper sorption onto C18 SEP-PAK cartridges. Limnology and Oceanography 32, 537–551.
Sunda, W.G., Huntsman, S.A., 1995. Cobalt and zinc inter-replacement in marinephytoplankton: biological and geochemical implications. Limnology andOceanography 40, 1404–1417.
Tagliabue, A., Arrigo, K.R., 2005. Iron in the Ross Sea, 1. impact on CO2 fluxes viavariation in phytoplankton functional group and non-Redfield stoichiometry.Journal of Geophysical Research 110, C03009. doi:10.1029/2004JC002531.
Tagliabue, A., Arrigo, K.R., 2006. Processes governing the supply of iron tophytoplankton in stratified Seas. Journal of Geophysical Research 111, C06019.
Takeda, S., 1998. Influence of iron availability on nutrient consumption ratio ofdiatoms in oceanic waters. Nature 393, 774–777.
Van den Berg, C.M.G., 1984. Determination of the complexing capacity andconditional stability constants of complexes of copper(II) with natural organicligands in seawater by cathodic stripping voltammetry of copper-catecholcomplex ions. Marine Chemistry 15, 1–18.
Van Leeuve, M.A., Scharek, R., de Baar, H.J.W., de Jong, J.T.M., Goyens, L., 1997. Ironenrichment experiments in the Southern Ocean, physiological responses ofphytoplankton community. Deep-Sea Research II 44, 189–208.
Wen, L.S., Jiann, K.T., Santschi, P.H., 2006. Physicochemical speciation of bioactivetrace metals (Cd, Cu, Fe, Ni) in the oligotrophic South China Sea. MarineChemistry 101 (1–2), 104–129.