Effects of tree species composition on within-forest distribution of understorey species
The University of Chicago
Evolutionarily Labile Species Interactions and Spatial Spread of Invasive Species.Author(s): T. Alex PerkinsReviewed work(s):Source: The American Naturalist, Vol. 179, No. 2 (February 2012), pp. E37-E54Published by: The University of Chicago Press for The American Society of NaturalistsStable URL: http://www.jstor.org/stable/10.1086/663682 .
Accessed: 26/11/2012 15:55
Your use of the JSTOR archive indicates your acceptance of the Terms & Conditions of Use, available at .http://www.jstor.org/page/info/about/policies/terms.jsp
.JSTOR is a not-for-profit service that helps scholars, researchers, and students discover, use, and build upon a wide range ofcontent in a trusted digital archive. We use information technology and tools to increase productivity and facilitate new formsof scholarship. For more information about JSTOR, please contact [email protected].
.
The University of Chicago Press, The American Society of Naturalists, The University of Chicago arecollaborating with JSTOR to digitize, preserve and extend access to The American Naturalist.
http://www.jstor.org
This content downloaded by the authorized user from 192.168.52.73 on Mon, 26 Nov 2012 15:55:18 PMAll use subject to JSTOR Terms and Conditions
vol. 179, no. 2 the american naturalist february 2012
E-Article
Evolutionarily Labile Species Interactions and
Spatial Spread of Invasive Species
T. Alex Perkins*
Center for Population Biology, University of California, Davis, California 95616
Submitted October 15, 2010; Accepted September 27, 2011; Electronically published December 17, 2011
Online enhancement: appendix.
abstract: Both exotic and native species have been shown to evolvein response to invasions, yet the impacts of rapidly evolving inter-actions between novel species pairs have been largely ignored instudies of invasive species spread. Here, I use a mathematical modelof an interacting invasive predator and its native prey to determinewhen and how evolutionary lability in one or both species mightimpact the dynamics of the invader’s spatial advance. The modelshows that evolutionarily labile invaders continually evolve betteradapted phenotypes along the moving invasion front, offering anexplanation for accelerating spread and spatial phenotype clines fol-lowing invasion. I then analytically derive a formula to estimate therelative change in spread rate due to evolution. Using parameterestimates from the literature, this formula shows that moderate her-itabilities and selection strengths are sufficient to account for changesin spread rates observed in historical and ongoing invasions. Evo-lutionarily labile native species can slow invader spread when genesflow from native populations with exposure to the invader into nativepopulations ahead of the invasion front. This outcome is more likelyin systems with highly diffuse native dispersal, net directional move-ment of natives toward the invasion front, or human inoculation ofuninvaded native populations.
Keywords: adaptation, exotic species, lag phase, range expansion,victim-exploiter interactions.
Introduction
As recently as 1996, a prominent textbook in invasionbiology stated, “Invasions are fast, evolution is slow’’ (Wil-liamson 1996, p. 168). Evolution has since gained recog-nition for its significance in exotic species invasions (Cox2004) and is most often invoked for its role in the colo-nization (Lee and Gelembiuk 2008), establishment (Blos-sey and Notzold 1995; Ellstrand and Schierenbeck 2000),eventual extent (Sakai et al. 2001; Dietz and Edwards2006), and long-term impacts (Mooney and Cleland 2001;
* E-mail: [email protected].
Am. Nat. 2012. Vol. 179, pp. E37–E54. � 2011 by The University of Chicago.
0003-0147/2012/17902-52553$15.00. All rights reserved.
DOI: 10.1086/663682
Strauss et al. 2006) of invasive species. The role of evo-lution in the spread phase of invasions has received lessconsideration. Spatial spread is a transient, rapidly un-folding process (Williamson 1996), and the importance ofrapid evolution on timescales relevant to population dy-namics has only recently gained widespread attention andacceptance (Thompson 1998; Pelletier et al. 2009). None-theless, recent work has begun to demonstrate the im-portance of evolutionary processes in the spread phase ofexotic species invasions.
Rates of spatial spread are determined by a demographicand a dispersal component (Skellam 1951), so evolution-ary changes in either could potentially alter the dynamicsof spread (Crooks and Soule 1999). A number of theo-retical and empirical studies have shown that evolution ofdispersal ability can (Travis and Dytham 2002; Phillips etal. 2008) and has (Simmons and Thomas 2004; Phillipset al. 2006; Hughes et al. 2007) altered spatial spread dy-namics in a few decades or less. Likewise, a few studieshave acknowledged that the demographic component ofspread may be sensitive to evolutionary forces, but thesestudies have mostly focused on the special case of spreadalong an environmental gradient (Garcia-Ramos and Rod-riguez 2002; Butin et al. 2005; Filin et al. 2008).
At the same time, the impacts of evolutionarily labilespecies interactions on spatial spread dynamics are un-known. Species interactions strongly influence invader de-mography and spatial spread (Shigesada and Kawasaki1997; Lockwood et al. 2007) and often evolve followingexotic species invasions. Examples of invader evolutionfollowing introduction are diverse, including the expan-sion of host use (Cox 2004), increased disease virulence(Fenner 1959), altered defense strategies against exploiters(Rogers and Siemann 2004), and both character displace-ment (King 1991) and increased competitive ability (Blos-sey and Notzold 1995). An equally impressive bestiary ofevolutionarily labile native species has been documented.Examples include insects evolving better host exploitation
This content downloaded by the authorized user from 192.168.52.73 on Mon, 26 Nov 2012 15:55:18 PMAll use subject to JSTOR Terms and Conditions
E38 The American Naturalist
(Carroll et al. 2005), marine invertebrates gaining bol-stered defenses against predators (Freeman and Byers2006), vertebrate predators acquiring genetically basedavoidance of toxic prey (Phillips and Shine 2006), hostsacquiring heightened defenses against pathogens (Marshalland Fenner 1958), and grasses evolving greater competitiveability (Leger 2008).
These and other examples of evolution by invasive andnative species engaged in novel interactions have all oc-curred on timescales coincident with the process of in-vasion itself. As such, a great potential exists for evolu-tionarily labile species interactions to affect spatial spread,and understanding these dynamics is crucial for effectivemanagement (Epanchin-Niell and Hastings 2010). Beforereal-world applications can be realized, more basic ques-tions must be answered. These include (1) how the in-tensification or abatement of interactions due to evolutionmay affect the dynamics of an advancing wavefront and(2) what characteristics predispose a species to these ef-fects. Additionally, it is clear from empirical work thatinteractions between invasive and native species evolvequickly, but the question remains (3) whether realistic lev-els of selection strength and genetic variance allow forimpacts on timescales relevant to spatial spread.
To answer these questions, I followed a long traditionof theoretical work on spread (Hastings et al. 2005) byanalyzing a standard reaction-diffusion model with theadded complexities of both demographic and phenotypicdynamics of an invasive and a native species. Similar mod-els have been applied to study range limits on environ-mental gradients (Case and Taper 2000; Case et al. 2005;Goldberg and Lande 2007), but they have focused on equi-librium dynamics and are seldom applied to the transientdynamics of spread (but see Garcia-Ramos and Rodriguez2002; Filin et al. 2008). The model here is simple in thesense that it applies to a single, environmentally homo-geneous spatial dimension, but importantly, it incorpo-rates the interaction between local adaptation and geneflow, which is often antagonistic and relevant to ecology(Kirkpatrick and Barton 1997; Garcia-Ramos and Rodri-guez 2002; Forde et al. 2007). Using numerical solutionsof these models, I show that rates of spatial spread maybe sensitive to the evolution of invaders, natives, or both.I then provide an analytical approximation for the spreadrate of an evolving invader and qualitative requirementsnecessary for native evolution to impact invader spread.In addition to detailing the effects of evolutionary labilityon spread in this model, I analytically derive a more gen-eral formula for the relative change in spread rate due toinvader evolution. I then assess the potential magnitudeof invader evolution for spread in natural systems by ap-plying observed estimates of linear selection gradients(Kingsolver et al. 2001) and demographic parameters from
well-known invasions to the newly derived formula forrelative change in spread.
Model
Verbal Description
The model features two species: a native prey and an in-vasive predator that specializes on it. The model also in-cludes a quantitative trait in each species that is relevantto their interaction, such as bill depth and seed size incrossbills and pines (Benkman 1999). Before the invader’sintroduction, the native occupies a one-dimensional land-scape (e.g., a coastline) at its carrying capacity everywherealong the landscape. Individuals continually follow ran-dom walks about the landscape such that dispersal is char-acterized by a diffusion process. Births and deaths alsooccur continually; both species therefore experience over-lapping generations.
Births and deaths enter the model as contributions toor detractions from per-capita, per-generation populationgrowth rates, or Malthusian fitnesses, for each species anddepend on three independent fitness components. First, astabilizing selection fitness component penalizes fitness ifan individual’s phenotype is so extreme as to interfere withaspects of its lifestyle external to the interaction (e.g., ex-cessively large cane toads are plagued by arthritis; Brownet al. 2007). Second, a within-species fitness componentaccounts for births and deaths that occur independentfrom the invader-native interaction. I assume a Lotka-Volterra predator-prey relationship such that the preda-tor’s constant death rate and the prey’s logistic birth raterepresent the within-species fitness components. Third, abetween-species fitness component accounts for births anddeaths due to the interaction. Predators with more suitablephenotypes for catching prey contribute more to the pop-ulation’s birth rate, and prey with phenotypes better suitedfor predator evasion contribute less to their population’sdeath rate. The suitability of a predator with a given phe-notype for capturing a prey with a given phenotype isassessed using a function for interaction strength. I assumethat predators are best able to capture and consume preywhen their phenotypes match, as in the case of crossbillsand pine seeds (Benkman 1999). Other interaction func-tions exist (e.g., Nuismer et al. 2007), but their distinctionis more relevant to long-term equilibrium dynamics thanit is to the transient dynamics of spread.
Mathematical Description of the Modeling Framework
The scenario described heuristically above of two inter-acting species inhabiting a one-dimensional landscape iscommonly modeled using a system of reaction-diffusion
This content downloaded by the authorized user from 192.168.52.73 on Mon, 26 Nov 2012 15:55:18 PMAll use subject to JSTOR Terms and Conditions
Interaction Evolution and Spatial Spread E39
equations. A careful derivation of these equations in anecological setting is provided by Okubo and Levin (2001),and their application to invasive species is detailed by Shi-gesada and Kawasaki (1997). Here, such a model accountsfor invader and native population sizes andI(t, x)
specified continuously for all points in time t andN(t, x)space x (the notation for which is now omitted for brevity).The equations governing each species’ population dynam-ics are
2 2�I j � II ¯p � m I, (1a)I2�t 2 �x
2 2�N j � NN ¯p � m N, (1b)N2�t 2 �x
where is the per-generation mean squared displacement2ji
of species i (hereafter dispersal coefficient) and ism (t, x)i
its mean Malthusian fitness averaged across all phenotypes. Mean Malthusian fitness represents the averagez (t, x)i
per-capita, per-generation population growth rate of in-dividuals at a given time t in a given location x. It istherefore dynamic, and its dependencies on other variablesand parameters are described in more detail below.
The interaction traits of each species are quantitativezi
characters that impact births and deaths but do not affectmovement. Biologically, this means that this model is con-cerned with traits such as bill depth and seed size (Benk-man 1999) or claw size and shell thickness (Freeman andByers 2006) as opposed to searching or avoidance behavior.Mathematically, this means that the dispersal coefficientof each species remains unchanged by the interaction. Areaction-diffusion model for traits such as these was pre-sented by Pease et al. (1989), developed further by Kirk-patrick and Barton (1997), and has since been applied tointeracting species (Case and Taper 2000) and spatialspread of a single species (Garcia-Ramos and Rodriguez2002). This model makes the same assumptions about lifehistory and dispersal as ecological reaction-diffusion equa-tions but goes further and acknowledges a trait withzi
normal distribution , dynamic mean , and fixed¯f (z ) zi i i
phenotypic variance . Such a formulation is consistentVP, i
with the infinitesimal model of quantitative genetics,which assumes that phenotypes are determined by iden-zi
tically small additive effects from a large number of un-linked loci and a normally distributed source of environ-mental variation (Bulmer 1980). According to thisdescription, the system of equations for interaction traitdynamics in time and space is
2 2¯ ¯ ¯ ¯�z j � z � ln I �z �mI I I I I2p � j � V , (2a)I A, I2 ¯�t 2 �x �x �x �zI
2 2¯ ¯ ¯ ¯�z j � z � ln N �z �mN N N N N2p � j � V , (2b)N A, N2 ¯�t 2 �x �x �x �zN
where is additive genetic variance (derived in the ap-VA, i
pendix of Pease et al. 1989). In words, the phenotypiccomposition of a population inhabiting point x on thelandscape at time t changes in response to two forces: (1)gene flow from nearby populations (first and second termsof the right-hand side) and (2) selection that occurs locallywithin that population (third term of the right-hand side).The first gene flow term accounts for diffusive rearrange-ment of mean phenotypes, and the second weighs thatrearrangement according to uneven population sizesacross space. Based on the breeder’s equation (Lande1976), the local selection term is an approximation of theevolutionary dynamics of a quantitative trait rather thanan exact model. Even so, it accurately captures evolution-ary change in trait means in the face of strong selection(Turelli and Barton 1994).
Tailoring the Model to Invasive Predators and Native Prey
As described thus far, the model in equations (1) and (2)could apply to any type of interaction. From here on,however, I restrict my analysis to the case of an invasivepredator and a native prey species with Lotka-Volterradynamics. Invasive predators are of particular interest be-cause they tend to be some of the most disruptive invaders(Schoener and Spiller 1999; Blackburn et al. 2004; Green-lees et al. 2006; Pangle et al. 2007) and because victim-exploiter interactions are especially prone to selection andcoevolution (Abrams 2000).
Mathematically, species interactions enter the model inequations (1) and (2) through the specification of meanMalthusian fitness . I assume that stabilizing selectionmi
and selection from within- and between-species interac-tions act on fitness independently. It follows that meanMalthusian fitness is equal to the sum
¯ ¯ ¯ ¯m p m � m � m (3)i i, stab i, within i, between
of the stabilizing, within-species, and between-species fit-ness component means (Gavrilets 1997).
The model for stabilizing selection assumes that thereis an intermediate, optimal phenotype conferring max-vi
imal fitness and that values too inadequate or too far inexcess of that optimum suffer a fitness cost. Selection forthese intermediate, optimal phenotypes has nothing to dowith interaction between the model’s focal species. Instead,it acts to constrain the range of phenotypes accessible toevolution and accounts for fitness trade-offs that may se-lect against extreme phenotypes. These trade-offs could berelated to energetic demands, the ability to find or attractmates, or vulnerability in interactions with other species.Accordingly, the stabilizing selection fitness componentmean for each species is defined mathematically as
This content downloaded by the authorized user from 192.168.52.73 on Mon, 26 Nov 2012 15:55:18 PMAll use subject to JSTOR Terms and Conditions
E40 The American Naturalist
2m p {exp [�k (z � v ) ] � 1}f(z )dz , (4)i, stab � i i i i i
where is a normally distributed phenotype distri-f(z )ibution with mean and variance . Henceforth,z V v pi P, i I
and for simplicity.v v p 0N
Within-species interactions in the model are consistentwith the basic Lotka-Volterra predator-prey model. In-vasive predators die at a density-independent rate d, andnative prey display logistic growth at rate r up to a localcarrying capacity K. Hence, the within-species fitness com-ponent means are and¯ ¯m p �d m p r(1 �I, within N, within
.N/K)The between-species fitness component is also consis-
tent with a Lotka-Volterra predator-prey formulation butincludes an additional coefficient S that weakens the in-teraction if predators of phenotype are ill-suited forzI
capturing prey of phenotype . Modifying species inter-zN
actions in this way for quantitative interaction traits suchas and has its roots in models of competitive inter-z zI N
actions (MacArthur and Levins 1967; Bulmer 1974; Slatkin1980; Taper and Case 1985), but the same idea can beapplied to predator-prey interactions (Abrams 2001). Idefine S consistent with the phenotype matching modelof species interaction strength, wherein the interaction isintensified by closer correspondence between trait values.Examples in nature include crossbills with appropriatelysized beaks being the most effective foragers on locallyplentiful seed sizes (Benkman 1999) and cuckoos’ successas nest parasites being optimized when egg coloration pat-terns match those of their hosts (Davies and Brooke 1989).Mathematically, the interaction strength coefficient
depends on the phenotype distribution of eachS(f , f ) fI N i
species and takes the mathematical form
2S p {exp [�a(z � z ) ]f (z )dz }f (z )dz , (5)�� I N I I I N N N
where a is the species interaction selection strength. Largevalues of a correspond to a highly specialized interactionwhere predators feed successfully only on like prey,whereas small values of a result in a diffuse interactionwhere phenotype values are largely irrelevant to predationsuccess. With the interaction strength coefficient in hand,the between-species fitness component means are then
m p abNS, (6a)I, between
m p �aIS, (6b)N, between
with a the attack rate and b the efficiency with whichpredators convert prey deaths into predator births.
Parameters and Scaling
Numerical solutions calculated equations (4) and (5) di-rectly. However, making approximations of and Smi, stab
was necessary to simplify the range of parameter combi-nations for numerical evaluation and to proceed with an-alytical work. Motivated by this, I simplified the expo-nential kernel in each expression by performing a Taylorapproximation about in equation (4) and aboutz p vi i
in equation (5), resulting in quadratic ex-z � z p 0I N
pressions. Because the model assumes that the phenotypedistribution of each species is normal with mean and¯f zi i
variance , I was able to calculate the integrals in equa-VP, i
tions (4) and (5) exactly to obtain the approximations
2¯ ¯m ≈ �k [V � (z � v ) ], (7a)i, stab i P, i i i
2¯ ¯S ≈ 1 � a[V � V � (z � z ) ]. (7b)P, I P, N N I
Inserting these approximations into equations (3) and (6)yields a simplified version of the model suitable for math-ematical analysis.
One use of the simplified model is reducing the numberof parameters. Predator-prey dynamics are complicatedenough without the addition of evolutionary dynamics, soit is desirable to simplify the relationships among param-eters that account for the model’s range of dynamic be-haviors. In the context of spatial spread, it is well knownthat behavior at the invasion front, where invaders are atlow densities and natives in greater abundance, is key. Itfollows that one of the most important characteristics ofpredator-prey dynamics for spatial spread is how rapidlyinvasive predators at low density deplete native prey. Givenvalues of all the other parameters, there is an attack rate
2(d � k V )I P, Ia p (8)ˆbSNIF
that optimizes equilibrium predator densities along a spec-trum of more or less voracious attack rates that lead tolower or higher equilibrium prey densities (Roughgarden1979; is the equilibrium prey pop-N p K(1 � k V /r)IF N P, N
ulation size in the absence of predation). Predator-preydynamics can then be characterized simply by the degreeto which a exceeds or falls short of , providing a bench-amark for the model’s ecological dynamics regardless of thevalues of other parameters on the right-hand side of equa-tion (8).
Another use of the simplified model is establishing bi-ologically informative scales for the model’s variables.Equilibrium population sizes are a natural scale on whichto interpret the values of I and N. It is less clear what tconstitutes a short amount of time, what x is a far distance,or what difference between native and invaderFz � z FN I
phenotype means is of any consequence. Recalling that
This content downloaded by the authorized user from 192.168.52.73 on Mon, 26 Nov 2012 15:55:18 PMAll use subject to JSTOR Terms and Conditions
Interaction Evolution and Spatial Spread E41
disparity between invader and native phenotypes leads toinvader failure in this model, a quantity of special interestin phenotypic units is the threshold difference D betweeninvader and native phenotypes beyond which the invader’sgrowth rate falls below 0. Plugging equations (6) and (7)into equation (3), equating with 0, and solving formI
reveal that¯ ¯Fz � z FI N
1 d � k VI P, I�D ≈ � � V � V . (9)P, I P, Nˆa abN aIF
Although it is not strictly true given the complications ofspatial mixing, when is true at a given lo-¯ ¯Fz � z F 1 DI N
cation, the invasion generally will not proceed past thatpoint, and otherwise it will. This quantity naturally givesrise to a quantity in time units of special interest: theamount of time T it takes for a native to evolve to suchzN
that . In the absence of gene flow and invaderFz � z F 1 DI N
evolution, native evolution is governed by the reducedversion of equation (2b), . This¯ ¯ ¯�z /�t p V (�m /�z )N A, N N N
equation can then be solved to find that
1 v � DT ≈ � ln 1 � , (10)( )P z � Q /PN N NN
where the composite parameters are defined as Q pN
and . Finally, a re-ˆ ˆ�2V aI az P p 2V k � 2V aI aA, N CE N A, N N A, N CEI
lated spatial quantity X can be defined as
X ≈ cT, (11)
where c is some estimate of the invader’s spread rate. Thequantity X corresponds to the distance spread by the in-vader in the time it takes the native to mount an adaptiveresponse. This is useful to keep in mind because if X farexceeds the potential range size of the invader, then nativeevolution is unlikely to have much of an impact on spreaddynamics. However, if X is small compared with the in-vader’s potential range size, then at least some natives willadapt to combat invaders and potentially slow spread.
Model Analysis
I made analytical approximations wherever possible. How-ever, exact solutions of the model are analytically intrac-table. I therefore verified the analytical results with nu-merical solutions of the full model and also used thosesolutions to address topics that were otherwise inacces-sible. Details of the numerical implementation of themodel are discussed in appendix A.
Results
Here I present the results of examining four general casesof the model where neither, either, or both the invaderand native are evolutionarily labile. In the two cases wherethe native is not evolutionarily labile (hereafter static), Iderived an analytical approximation for the invader’s as-ymptotic spread rate that accurately represents the tran-sient spread rate of the evolving invader when viewed asa function of a dynamically evolving phenotype under thismodel. Given this result, I then derived a more generalestimate of transient changes in spread due to invaderevolution and quantified that estimate with empiricallyestimated parameter values from the literature. Resultsabout evolutionary consequences of ecologically distinctinvaders are also shown. The derivation of biologicallyinformative variable scales is instructive about native prop-erties that increase their potential for slowing spread, andnumerical solutions of the model illustrate qualitative re-sults about the dispersal characteristics of native speciesrequired for slowing invader spread.
Case 1: Static Invader, Static Native
A well-known property of diffusion-based spatial spreadmodels is that the asymptotic spread rate c equals
, where is population growth rate at low2 1/2¯ ¯(2m(0)j ) m(0)abundance (Skellam 1951). Using the approximations inequation (7), the implication for this model is that in theabsence of evolutionary change, invader spread shouldproceed at a constant rate
2 2ˆ� ¯c ≈ 2{�k [V � (z � v) ] � d � abSN }j . (12)I P, I I IF I
Even though phenotypes do not evolve in this case, thedegree of phenotype matching between invaders and na-tives at the onset of invasion has a perceptible impact onspread through its effect on S (see eq. [7b]). If the invaderphenotype is within D phenotypic units of the native phe-notype, spread proceeds; otherwise, the invasion fails. Agood match between invader and native phenotypes resultsin fast asymptotic spread of the invader.
Case 2: Labile Invader, Static Native
In the case where an invasive species has the capacity forevolutionary change and a native species does not, theinvader’s phenotype dynamics at low density on the in-vasion front are approximated by the spatially implicitmodel (app. B). Invader¯ ¯ ¯(�/�t)z (t, x � ct) ≈ V (�m /�z )I A, I I I
phenotypes at the invasion front thus follow the trajectory
This content downloaded by the authorized user from 192.168.52.73 on Mon, 26 Nov 2012 15:55:18 PMAll use subject to JSTOR Terms and Conditions
E42 The American Naturalist
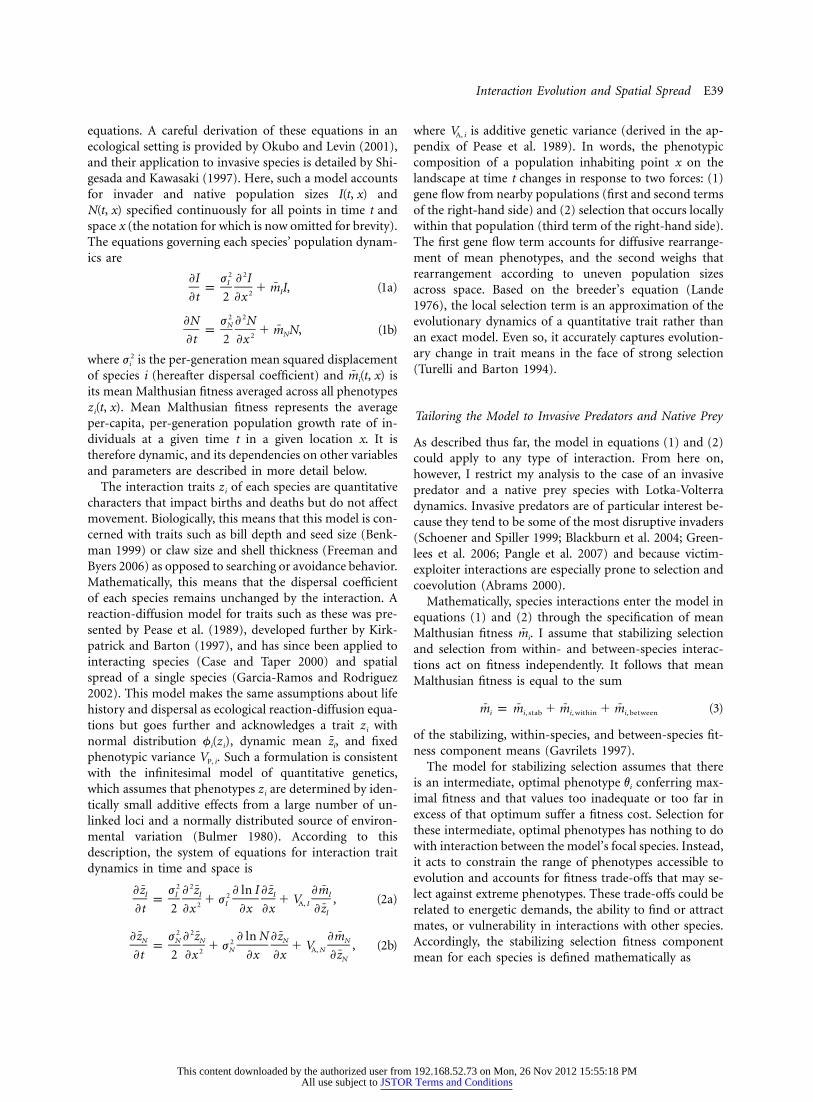
Figure 1: Progression of invasion front when invader is evolution-arily static (a; ) or labile (c; ). Invader evo-V p 0 V p (1/4)VA, I A, I P, I
lution at the invasion front (b; black vs. gray) accounts for the ac-celeration in spread (c vs. a). For ease of visual interpretation, eachline from left to right in a and c shows the invasion profile at suc-cessive points in time and is drawn from the peak of the invasionprofile on the left to in the uninvaded region on the right.I p 0Wide (narrow) lines occur in increments of 10 (1) time units between3 and 63 from left to right in a and c.
Q QI Iz (t, x � ct) ≈ v � exp (�Pt) � , (13)I I( )P PI I
where andˆQ p 2V k v � 2V abN az P p 2V k �I A, I I A, I IF I A, I IN
. This approximation shows that mean invaderˆ2V abN aA, I IF
phenotype evolves continually at rate at the invasionPI
front until a fitness-maximizing phenotype of is at-Q /PI I
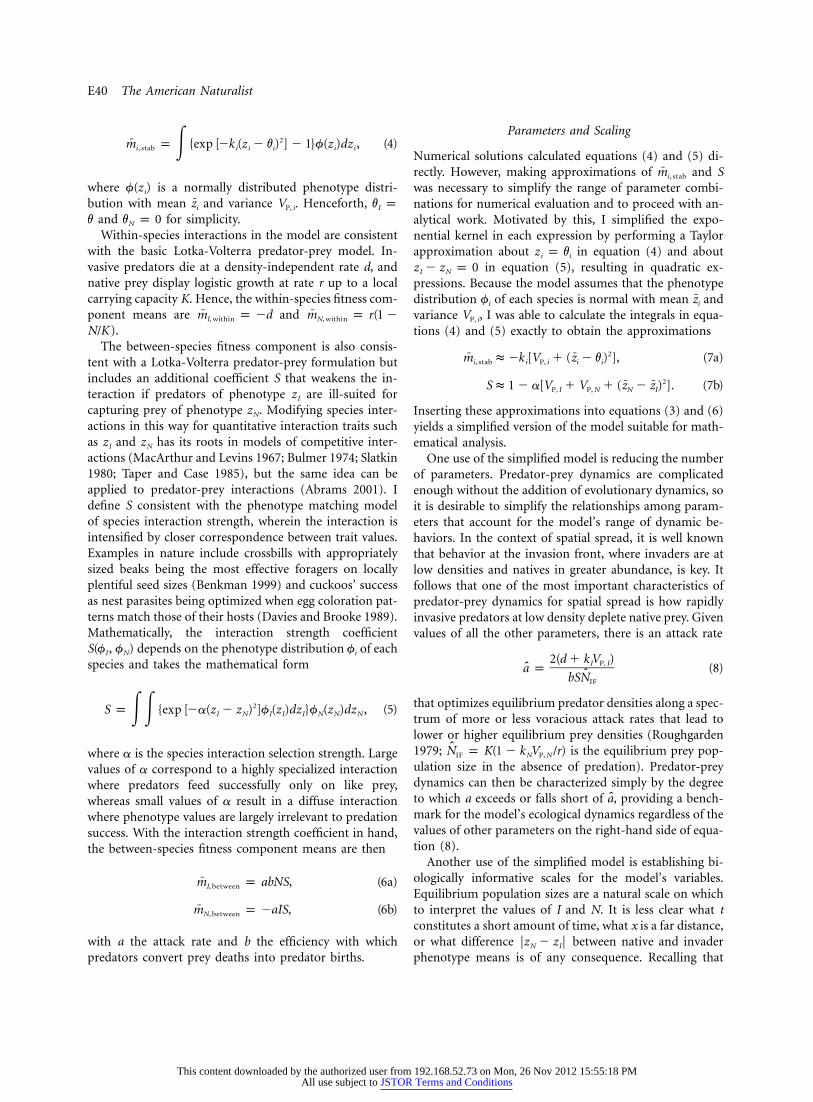
tained (black line in fig. 1b). Numerical results validatethis approximation (correspondence between lines and cir-cles in left column of fig. 2).
A result of invader evolution at the invasion front is anincrease in spread rate over time (front progresses fartherin fig. 1c than in fig. 1a in the same amount of time). Anapproximate solution of spread rate as a function of timeduring the transient, evolutionarily sensitive phase ofspread can be attained by plugging the solution for invaderphenotype at the invasion front from equation (13) intothe asymptotic spread rate approximation in equation (12)via equation (7b). Numerical solutions of the full modelshow that this approximation provides a useful caricatureof the transient spread dynamics of evolutionarily labileinvaders (correspondence between lines and circles in rightcolumn of fig. 2). Whether calculated numerically or ap-proximated analytically, the dynamic spread rate ofc (t)evol
an evolutionarily labile invader can be compared with thefixed asymptotic spread rate c parameterized with phe-notypes from the onset of invasion ( , ) to¯ ¯z p v z p 0I N
study the effects of evolutionary lability on spreaddynamics.
The response of to the manipulation of keyc (t)/cevol
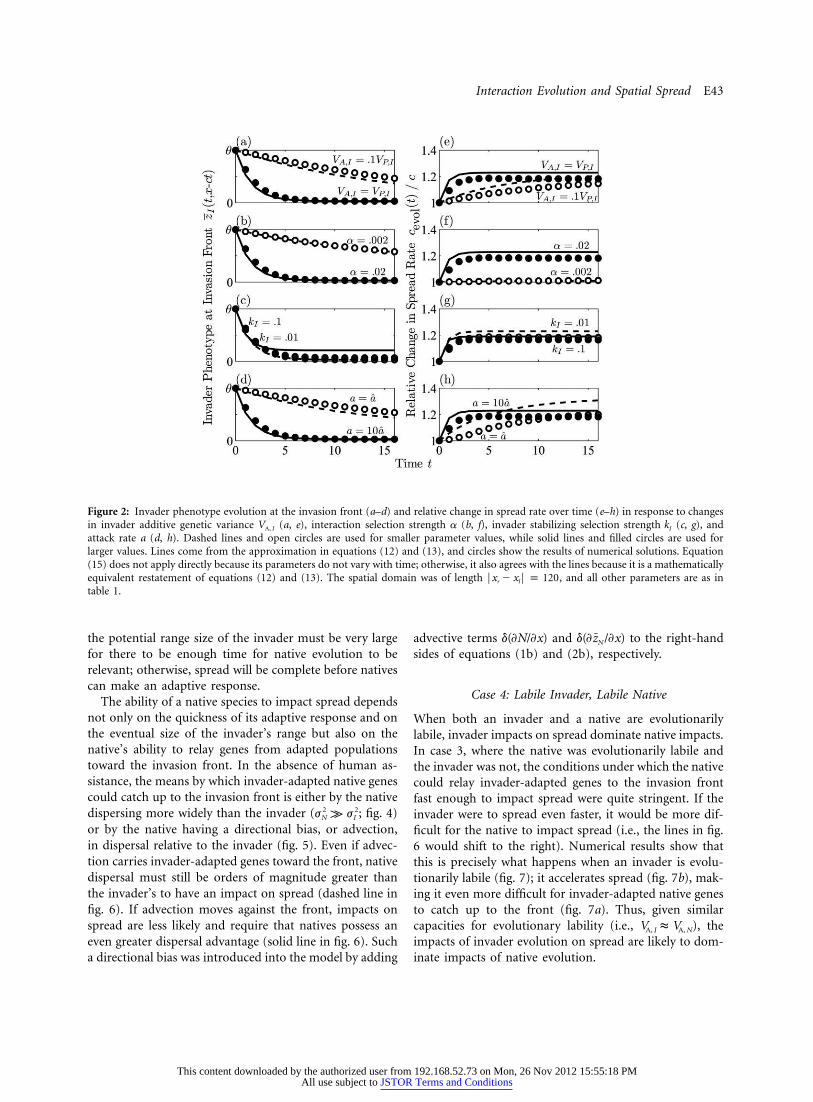
parameter values provides insight into the effects of in-vader evolution on transient spread dynamics. Greater val-ues of genetic variance and interaction selectionVA, I
strength a accelerate both evolution toward the optimalphenotype at the invasion front (fig. 2a, 2b) and the ad-vance of the front itself (fig. 2e, 2f). High genetic variationand a highly specialized interaction are thus two factorsthat predispose invaders to evolutionary impacts onspread. On the other hand, stabilizing selection has littlekI
effect on accelerating either phenotype evolution or spreadbut does influence the phenotype and asymptotic spreadrate that can ultimately be attained (fig. 2c, 2g). In fact, ifstabilizing selection is strong enough, invader evolutionand spread acceleration are stifled altogether. Greater at-tack rates a also accelerate spread more rapidly when evo-lution acts, but this enhanced transient acceleration comesat the cost of a reduced asymptotic spread rate (fig. 2d,2h). This reduction in asymptotic spread results from sta-bilizing selection acting on the more extreme phenotypesproduced when .ˆa k a
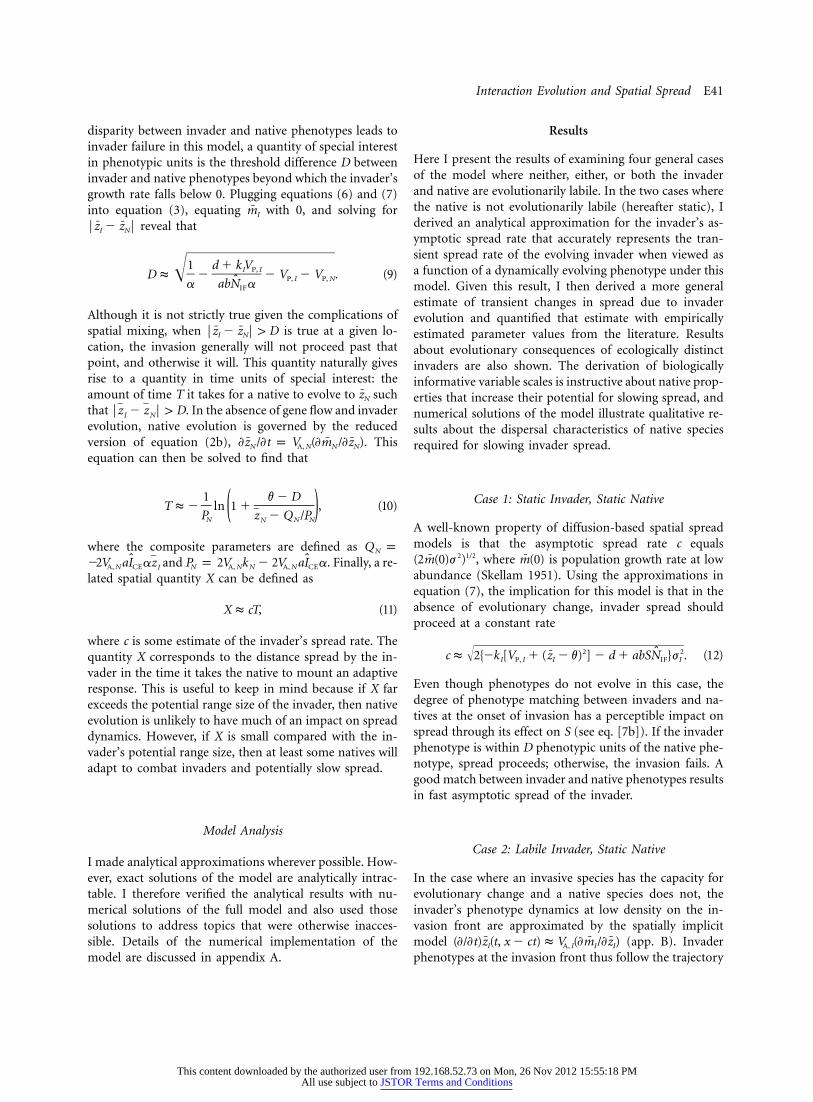
Invader evolution impacts phenotype dynamics not onlyat the invasion front but also in its wake. One novel pattern
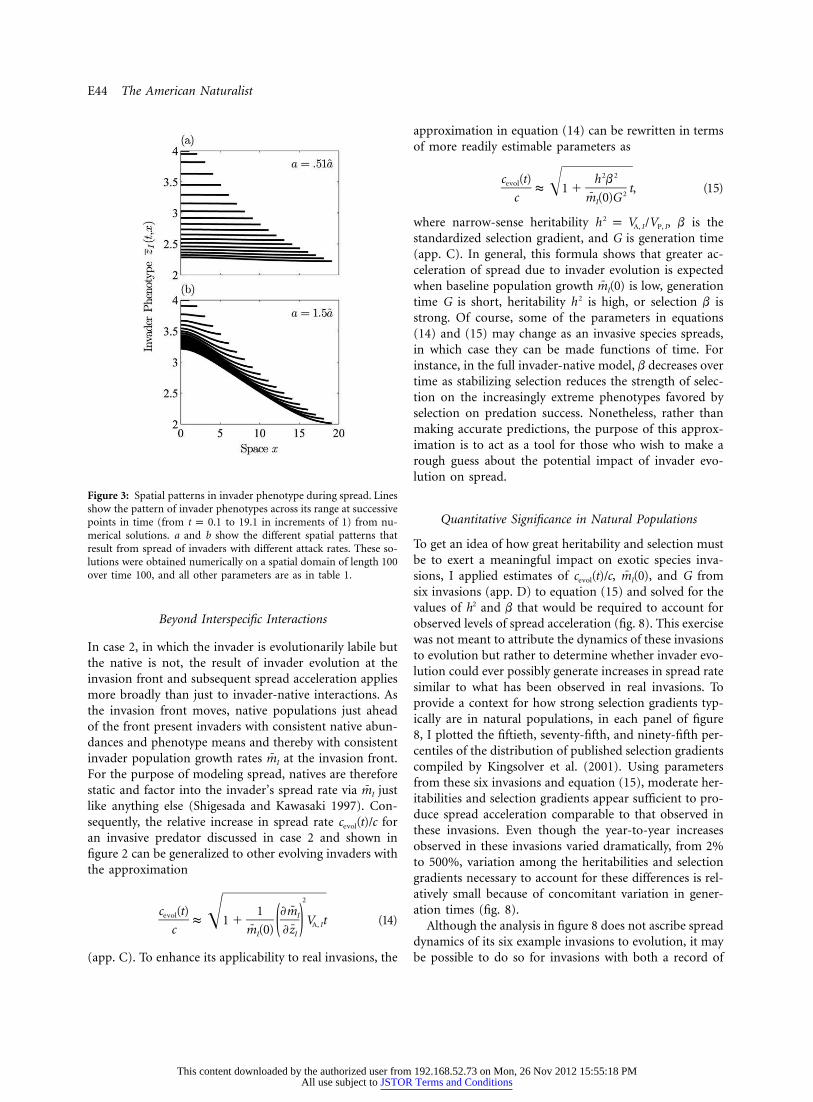
emerging here is the formation of invader phenotype clinesbehind the invasion front (fig. 3). The general requirementfor this result is that selection pressures differ at and be-hind the invasion front. At the invasion front, native preypopulations are consistently at their carrying capacity,whereas populations behind the front become increasinglydepressed from invader exploitation over time. This dif-ference in native population sizes at and behind the in-vasion front results in differing selection pressures on in-vader phenotypes there, because interaction strengthdepends on native population size in equation (5). As aresult, higher predator attack rates a depress native pop-ulations behind the invasion front more quickly and se-verely, leading to steeper invader phenotype clines in thewake of spread (cf. fig. 3a, 3b).
Case 3: Static Invader, Labile Native
The temporal and spatial scales T and X defined in equa-tions (10) and (11) provide insight into when it is possiblefor native evolution to impact spread. As one example,small v means that the invader and native are phenotyp-ically very similar at the onset of invasion, so accordingto equation (10), it will take a relatively long time for thenative to evolve a phenotype capable of reducing invaderpopulation growth below 0. As another example, equation(11) shows that if the invader spreads quickly (large c),
This content downloaded by the authorized user from 192.168.52.73 on Mon, 26 Nov 2012 15:55:18 PMAll use subject to JSTOR Terms and Conditions
Interaction Evolution and Spatial Spread E43
Figure 2: Invader phenotype evolution at the invasion front (a–d) and relative change in spread rate over time (e–h) in response to changesin invader additive genetic variance (a, e), interaction selection strength a (b, f), invader stabilizing selection strength (c, g), andV kA, I I
attack rate a (d, h). Dashed lines and open circles are used for smaller parameter values, while solid lines and filled circles are used forlarger values. Lines come from the approximation in equations (12) and (13), and circles show the results of numerical solutions. Equation(15) does not apply directly because its parameters do not vary with time; otherwise, it also agrees with the lines because it is a mathematicallyequivalent restatement of equations (12) and (13). The spatial domain was of length , and all other parameters are as inFx � x F p 120r l
table 1.
the potential range size of the invader must be very largefor there to be enough time for native evolution to berelevant; otherwise, spread will be complete before nativescan make an adaptive response.
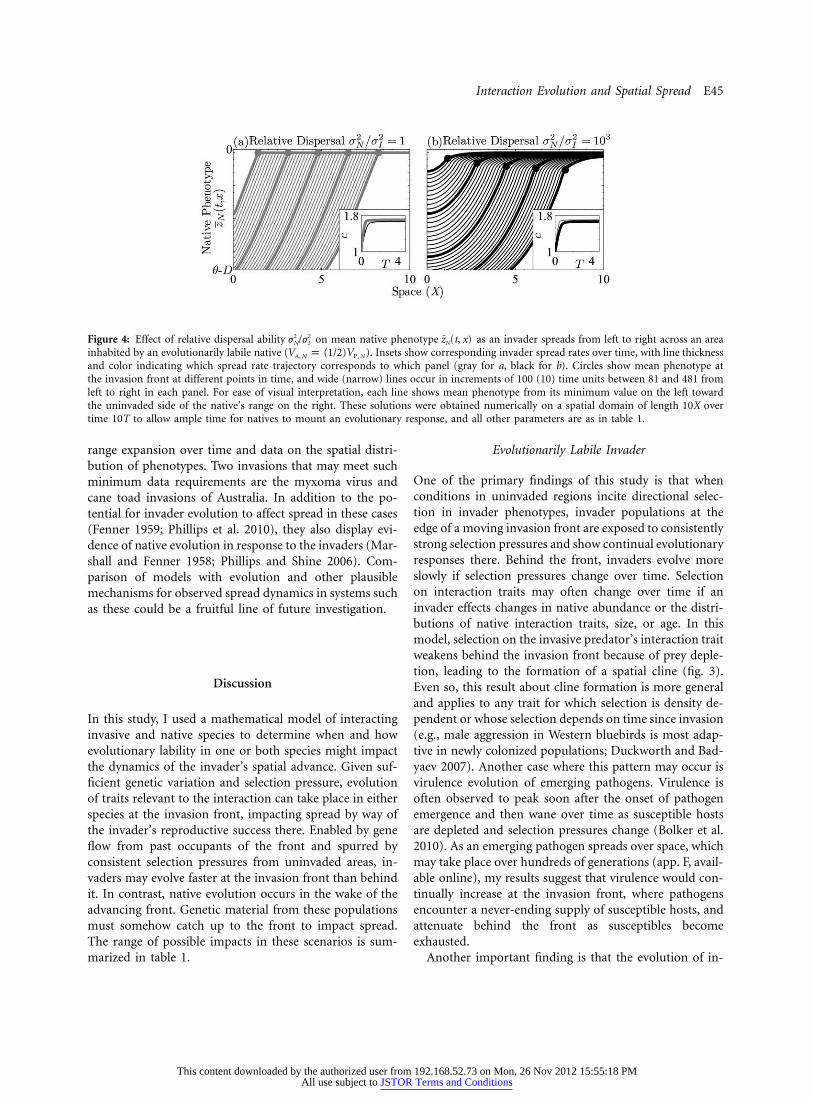
The ability of a native species to impact spread dependsnot only on the quickness of its adaptive response and onthe eventual size of the invader’s range but also on thenative’s ability to relay genes from adapted populationstoward the invasion front. In the absence of human as-sistance, the means by which invader-adapted native genescould catch up to the invasion front is either by the nativedispersing more widely than the invader ( ; fig. 4)2 2j k jN I
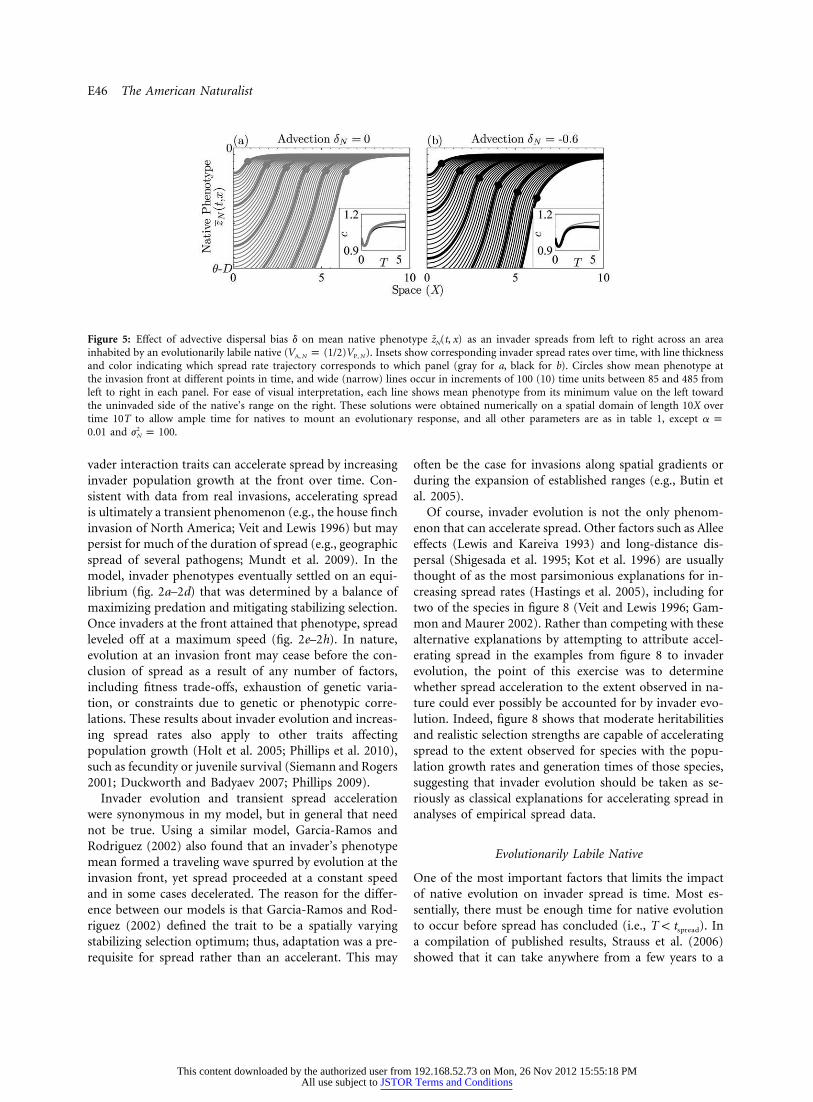
or by the native having a directional bias, or advection,in dispersal relative to the invader (fig. 5). Even if advec-tion carries invader-adapted genes toward the front, nativedispersal must still be orders of magnitude greater thanthe invader’s to have an impact on spread (dashed line infig. 6). If advection moves against the front, impacts onspread are less likely and require that natives possess aneven greater dispersal advantage (solid line in fig. 6). Sucha directional bias was introduced into the model by adding
advective terms and to the right-hand¯d(�N/�x) d(�z /�x)N
sides of equations (1b) and (2b), respectively.
Case 4: Labile Invader, Labile Native
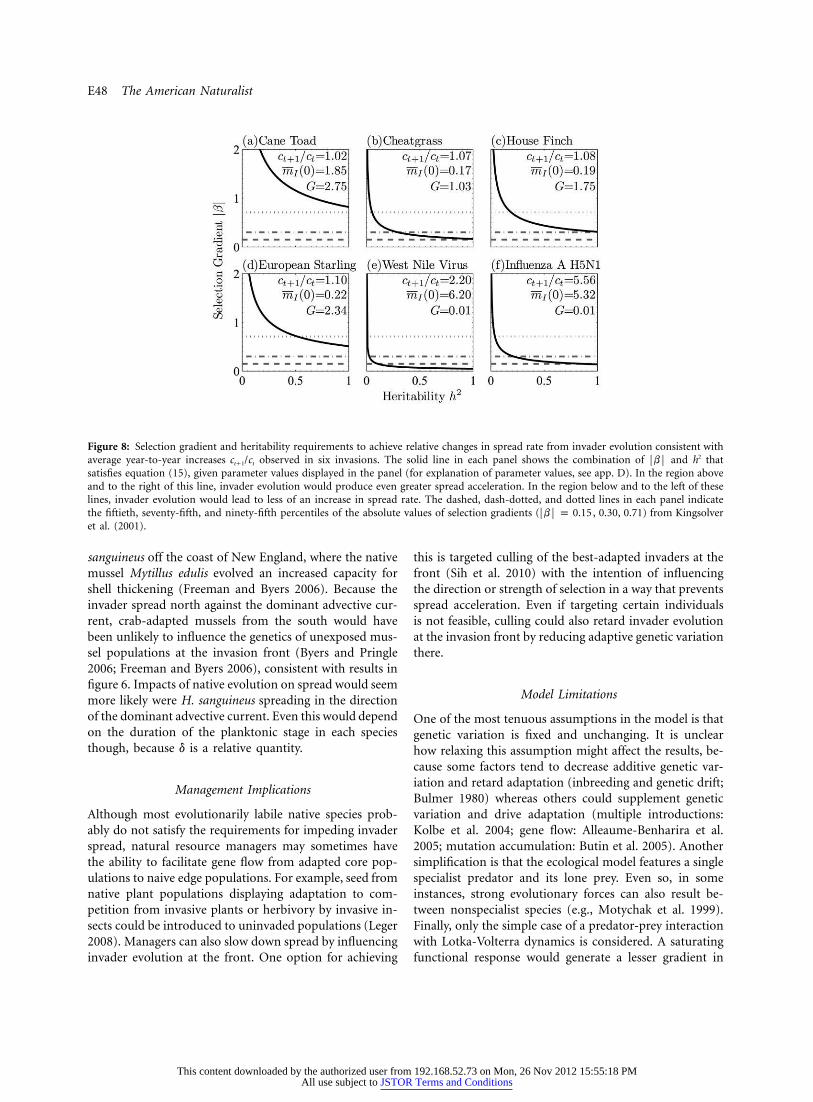
When both an invader and a native are evolutionarilylabile, invader impacts on spread dominate native impacts.In case 3, where the native was evolutionarily labile andthe invader was not, the conditions under which the nativecould relay invader-adapted genes to the invasion frontfast enough to impact spread were quite stringent. If theinvader were to spread even faster, it would be more dif-ficult for the native to impact spread (i.e., the lines in fig.6 would shift to the right). Numerical results show thatthis is precisely what happens when an invader is evolu-tionarily labile (fig. 7); it accelerates spread (fig. 7b), mak-ing it even more difficult for invader-adapted native genesto catch up to the front (fig. 7a). Thus, given similarcapacities for evolutionary lability (i.e., ), theV ≈ VA, I A, N
impacts of invader evolution on spread are likely to dom-inate impacts of native evolution.
This content downloaded by the authorized user from 192.168.52.73 on Mon, 26 Nov 2012 15:55:18 PMAll use subject to JSTOR Terms and Conditions
E44 The American Naturalist
Figure 3: Spatial patterns in invader phenotype during spread. Linesshow the pattern of invader phenotypes across its range at successivepoints in time (from to 19.1 in increments of 1) from nu-t p 0.1merical solutions. a and b show the different spatial patterns thatresult from spread of invaders with different attack rates. These so-lutions were obtained numerically on a spatial domain of length 100over time 100, and all other parameters are as in table 1.
Beyond Interspecific Interactions
In case 2, in which the invader is evolutionarily labile butthe native is not, the result of invader evolution at theinvasion front and subsequent spread acceleration appliesmore broadly than just to invader-native interactions. Asthe invasion front moves, native populations just aheadof the front present invaders with consistent native abun-dances and phenotype means and thereby with consistentinvader population growth rates at the invasion front.mI
For the purpose of modeling spread, natives are thereforestatic and factor into the invader’s spread rate via justmI
like anything else (Shigesada and Kawasaki 1997). Con-sequently, the relative increase in spread rate forc (t)/cevol
an invasive predator discussed in case 2 and shown infigure 2 can be generalized to other evolving invaders withthe approximation
2
¯c (t) 1 �mevol I�≈ 1 � V t (14)A, I( )¯ ¯c m (0) �zI I
(app. C). To enhance its applicability to real invasions, the
approximation in equation (14) can be rewritten in termsof more readily estimable parameters as
2 2c (t) h bevol �≈ 1 � t, (15)2¯c m (0)GI
where narrow-sense heritability , b is the2h p V /VA, I P, I
standardized selection gradient, and G is generation time(app. C). In general, this formula shows that greater ac-celeration of spread due to invader evolution is expectedwhen baseline population growth is low, generationm (0)I
time G is short, heritability is high, or selection b is2hstrong. Of course, some of the parameters in equations(14) and (15) may change as an invasive species spreads,in which case they can be made functions of time. Forinstance, in the full invader-native model, b decreases overtime as stabilizing selection reduces the strength of selec-tion on the increasingly extreme phenotypes favored byselection on predation success. Nonetheless, rather thanmaking accurate predictions, the purpose of this approx-imation is to act as a tool for those who wish to make arough guess about the potential impact of invader evo-lution on spread.
Quantitative Significance in Natural Populations
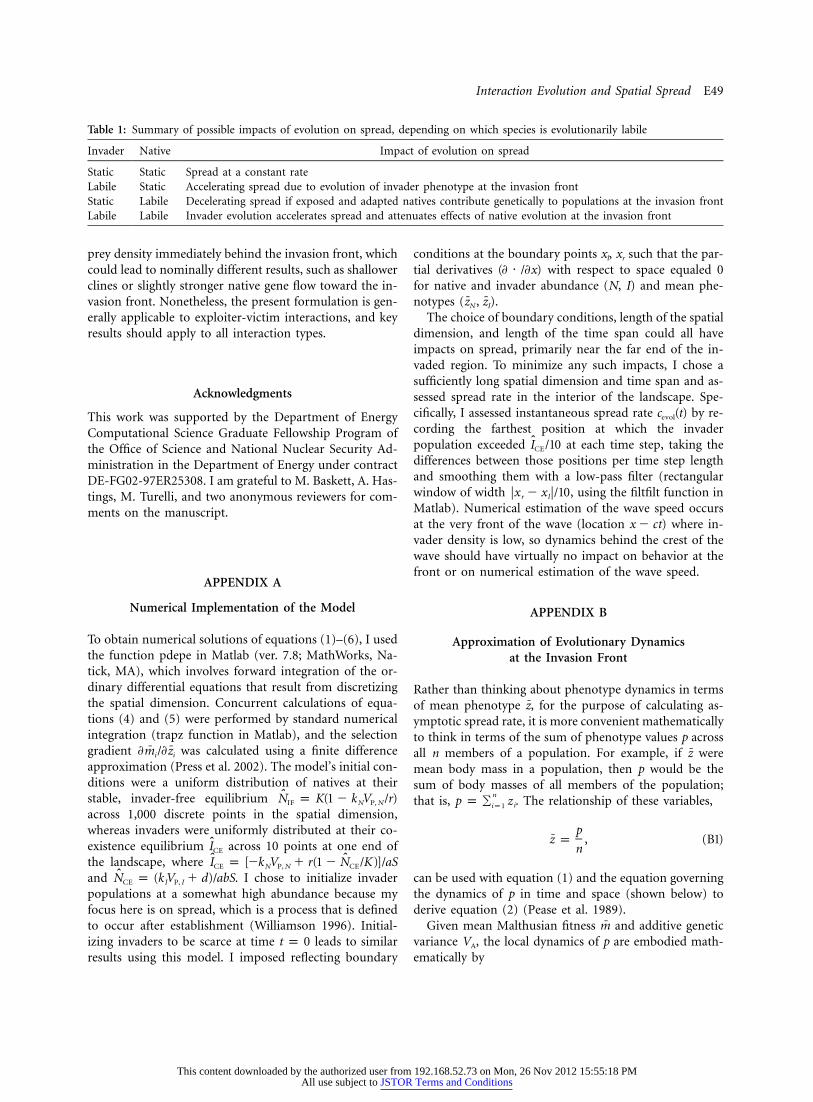
To get an idea of how great heritability and selection mustbe to exert a meaningful impact on exotic species inva-sions, I applied estimates of , , and G from¯c (t)/c m (0)evol I
six invasions (app. D) to equation (15) and solved for thevalues of h2 and b that would be required to account forobserved levels of spread acceleration (fig. 8). This exercisewas not meant to attribute the dynamics of these invasionsto evolution but rather to determine whether invader evo-lution could ever possibly generate increases in spread ratesimilar to what has been observed in real invasions. Toprovide a context for how strong selection gradients typ-ically are in natural populations, in each panel of figure8, I plotted the fiftieth, seventy-fifth, and ninety-fifth per-centiles of the distribution of published selection gradientscompiled by Kingsolver et al. (2001). Using parametersfrom these six invasions and equation (15), moderate her-itabilities and selection gradients appear sufficient to pro-duce spread acceleration comparable to that observed inthese invasions. Even though the year-to-year increasesobserved in these invasions varied dramatically, from 2%to 500%, variation among the heritabilities and selectiongradients necessary to account for these differences is rel-atively small because of concomitant variation in gener-ation times (fig. 8).
Although the analysis in figure 8 does not ascribe spreaddynamics of its six example invasions to evolution, it maybe possible to do so for invasions with both a record of
This content downloaded by the authorized user from 192.168.52.73 on Mon, 26 Nov 2012 15:55:18 PMAll use subject to JSTOR Terms and Conditions
Interaction Evolution and Spatial Spread E45
Figure 4: Effect of relative dispersal ability on mean native phenotype as an invader spreads from left to right across an area2 2 ¯j /j z (t, x)N I N
inhabited by an evolutionarily labile native ( ). Insets show corresponding invader spread rates over time, with line thicknessV p (1/2)VA, N P, N
and color indicating which spread rate trajectory corresponds to which panel (gray for a, black for b). Circles show mean phenotype atthe invasion front at different points in time, and wide (narrow) lines occur in increments of 100 (10) time units between 81 and 481 fromleft to right in each panel. For ease of visual interpretation, each line shows mean phenotype from its minimum value on the left towardthe uninvaded side of the native’s range on the right. These solutions were obtained numerically on a spatial domain of length 10X overtime 10T to allow ample time for natives to mount an evolutionary response, and all other parameters are as in table 1.
range expansion over time and data on the spatial distri-bution of phenotypes. Two invasions that may meet suchminimum data requirements are the myxoma virus andcane toad invasions of Australia. In addition to the po-tential for invader evolution to affect spread in these cases(Fenner 1959; Phillips et al. 2010), they also display evi-dence of native evolution in response to the invaders (Mar-shall and Fenner 1958; Phillips and Shine 2006). Com-parison of models with evolution and other plausiblemechanisms for observed spread dynamics in systems suchas these could be a fruitful line of future investigation.
Discussion
In this study, I used a mathematical model of interactinginvasive and native species to determine when and howevolutionary lability in one or both species might impactthe dynamics of the invader’s spatial advance. Given suf-ficient genetic variation and selection pressure, evolutionof traits relevant to the interaction can take place in eitherspecies at the invasion front, impacting spread by way ofthe invader’s reproductive success there. Enabled by geneflow from past occupants of the front and spurred byconsistent selection pressures from uninvaded areas, in-vaders may evolve faster at the invasion front than behindit. In contrast, native evolution occurs in the wake of theadvancing front. Genetic material from these populationsmust somehow catch up to the front to impact spread.The range of possible impacts in these scenarios is sum-marized in table 1.
Evolutionarily Labile Invader
One of the primary findings of this study is that whenconditions in uninvaded regions incite directional selec-tion in invader phenotypes, invader populations at theedge of a moving invasion front are exposed to consistentlystrong selection pressures and show continual evolutionaryresponses there. Behind the front, invaders evolve moreslowly if selection pressures change over time. Selectionon interaction traits may often change over time if aninvader effects changes in native abundance or the distri-butions of native interaction traits, size, or age. In thismodel, selection on the invasive predator’s interaction traitweakens behind the invasion front because of prey deple-tion, leading to the formation of a spatial cline (fig. 3).Even so, this result about cline formation is more generaland applies to any trait for which selection is density de-pendent or whose selection depends on time since invasion(e.g., male aggression in Western bluebirds is most adap-tive in newly colonized populations; Duckworth and Bad-yaev 2007). Another case where this pattern may occur isvirulence evolution of emerging pathogens. Virulence isoften observed to peak soon after the onset of pathogenemergence and then wane over time as susceptible hostsare depleted and selection pressures change (Bolker et al.2010). As an emerging pathogen spreads over space, whichmay take place over hundreds of generations (app. F, avail-able online), my results suggest that virulence would con-tinually increase at the invasion front, where pathogensencounter a never-ending supply of susceptible hosts, andattenuate behind the front as susceptibles becomeexhausted.
Another important finding is that the evolution of in-
This content downloaded by the authorized user from 192.168.52.73 on Mon, 26 Nov 2012 15:55:18 PMAll use subject to JSTOR Terms and Conditions
E46 The American Naturalist
Figure 5: Effect of advective dispersal bias d on mean native phenotype as an invader spreads from left to right across an areaz (t, x)N
inhabited by an evolutionarily labile native ( ). Insets show corresponding invader spread rates over time, with line thicknessV p (1/2)VA, N P, N
and color indicating which spread rate trajectory corresponds to which panel (gray for a, black for b). Circles show mean phenotype atthe invasion front at different points in time, and wide (narrow) lines occur in increments of 100 (10) time units between 85 and 485 fromleft to right in each panel. For ease of visual interpretation, each line shows mean phenotype from its minimum value on the left towardthe uninvaded side of the native’s range on the right. These solutions were obtained numerically on a spatial domain of length 10X overtime 10T to allow ample time for natives to mount an evolutionary response, and all other parameters are as in table 1, except a p
and .20.01 j p 100N
vader interaction traits can accelerate spread by increasinginvader population growth at the front over time. Con-sistent with data from real invasions, accelerating spreadis ultimately a transient phenomenon (e.g., the house finchinvasion of North America; Veit and Lewis 1996) but maypersist for much of the duration of spread (e.g., geographicspread of several pathogens; Mundt et al. 2009). In themodel, invader phenotypes eventually settled on an equi-librium (fig. 2a–2d) that was determined by a balance ofmaximizing predation and mitigating stabilizing selection.Once invaders at the front attained that phenotype, spreadleveled off at a maximum speed (fig. 2e–2h). In nature,evolution at an invasion front may cease before the con-clusion of spread as a result of any number of factors,including fitness trade-offs, exhaustion of genetic varia-tion, or constraints due to genetic or phenotypic corre-lations. These results about invader evolution and increas-ing spread rates also apply to other traits affectingpopulation growth (Holt et al. 2005; Phillips et al. 2010),such as fecundity or juvenile survival (Siemann and Rogers2001; Duckworth and Badyaev 2007; Phillips 2009).
Invader evolution and transient spread accelerationwere synonymous in my model, but in general that neednot be true. Using a similar model, Garcia-Ramos andRodriguez (2002) also found that an invader’s phenotypemean formed a traveling wave spurred by evolution at theinvasion front, yet spread proceeded at a constant speedand in some cases decelerated. The reason for the differ-ence between our models is that Garcia-Ramos and Rod-riguez (2002) defined the trait to be a spatially varyingstabilizing selection optimum; thus, adaptation was a pre-requisite for spread rather than an accelerant. This may
often be the case for invasions along spatial gradients orduring the expansion of established ranges (e.g., Butin etal. 2005).
Of course, invader evolution is not the only phenom-enon that can accelerate spread. Other factors such as Alleeeffects (Lewis and Kareiva 1993) and long-distance dis-persal (Shigesada et al. 1995; Kot et al. 1996) are usuallythought of as the most parsimonious explanations for in-creasing spread rates (Hastings et al. 2005), including fortwo of the species in figure 8 (Veit and Lewis 1996; Gam-mon and Maurer 2002). Rather than competing with thesealternative explanations by attempting to attribute accel-erating spread in the examples from figure 8 to invaderevolution, the point of this exercise was to determinewhether spread acceleration to the extent observed in na-ture could ever possibly be accounted for by invader evo-lution. Indeed, figure 8 shows that moderate heritabilitiesand realistic selection strengths are capable of acceleratingspread to the extent observed for species with the popu-lation growth rates and generation times of those species,suggesting that invader evolution should be taken as se-riously as classical explanations for accelerating spread inanalyses of empirical spread data.
Evolutionarily Labile Native
One of the most important factors that limits the impactof native evolution on invader spread is time. Most es-sentially, there must be enough time for native evolutionto occur before spread has concluded (i.e., ). InT ! tspread
a compilation of published results, Strauss et al. (2006)showed that it can take anywhere from a few years to a
This content downloaded by the authorized user from 192.168.52.73 on Mon, 26 Nov 2012 15:55:18 PMAll use subject to JSTOR Terms and Conditions
Interaction Evolution and Spatial Spread E47
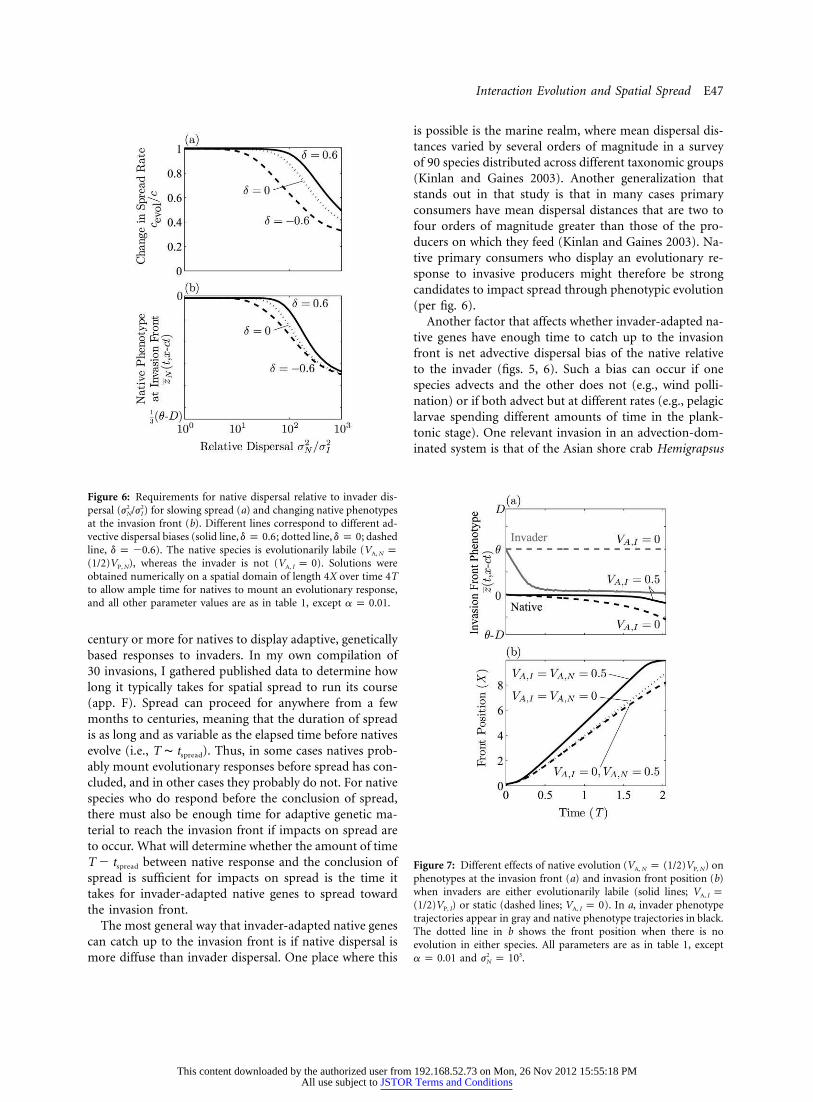
Figure 6: Requirements for native dispersal relative to invader dis-persal ( ) for slowing spread (a) and changing native phenotypes2 2j /jN I
at the invasion front (b). Different lines correspond to different ad-vective dispersal biases (solid line, ; dotted line, ; dashedd p 0.6 d p 0line, ). The native species is evolutionarily labile (d p �0.6 V pA, N
), whereas the invader is not ( ). Solutions were(1/2)V V p 0P, N A, I
obtained numerically on a spatial domain of length 4X over time 4Tto allow ample time for natives to mount an evolutionary response,and all other parameter values are as in table 1, except .a p 0.01
Figure 7: Different effects of native evolution ( ) onV p (1/2)VA, N P, N
phenotypes at the invasion front (a) and invasion front position (b)when invaders are either evolutionarily labile (solid lines; V pA, I
) or static (dashed lines; ). In a, invader phenotype(1/2)V V p 0P, I A, I
trajectories appear in gray and native phenotype trajectories in black.The dotted line in b shows the front position when there is noevolution in either species. All parameters are as in table 1, except
and .2 3a p 0.01 j p 10N
century or more for natives to display adaptive, geneticallybased responses to invaders. In my own compilation of30 invasions, I gathered published data to determine howlong it typically takes for spatial spread to run its course(app. F). Spread can proceed for anywhere from a fewmonths to centuries, meaning that the duration of spreadis as long and as variable as the elapsed time before nativesevolve (i.e., ). Thus, in some cases natives prob-T ∼ tspread
ably mount evolutionary responses before spread has con-cluded, and in other cases they probably do not. For nativespecies who do respond before the conclusion of spread,there must also be enough time for adaptive genetic ma-terial to reach the invasion front if impacts on spread areto occur. What will determine whether the amount of time
between native response and the conclusion ofT � tspread
spread is sufficient for impacts on spread is the time ittakes for invader-adapted native genes to spread towardthe invasion front.
The most general way that invader-adapted native genescan catch up to the invasion front is if native dispersal ismore diffuse than invader dispersal. One place where this
is possible is the marine realm, where mean dispersal dis-tances varied by several orders of magnitude in a surveyof 90 species distributed across different taxonomic groups(Kinlan and Gaines 2003). Another generalization thatstands out in that study is that in many cases primaryconsumers have mean dispersal distances that are two tofour orders of magnitude greater than those of the pro-ducers on which they feed (Kinlan and Gaines 2003). Na-tive primary consumers who display an evolutionary re-sponse to invasive producers might therefore be strongcandidates to impact spread through phenotypic evolution(per fig. 6).
Another factor that affects whether invader-adapted na-tive genes have enough time to catch up to the invasionfront is net advective dispersal bias of the native relativeto the invader (figs. 5, 6). Such a bias can occur if onespecies advects and the other does not (e.g., wind polli-nation) or if both advect but at different rates (e.g., pelagiclarvae spending different amounts of time in the plank-tonic stage). One relevant invasion in an advection-dom-inated system is that of the Asian shore crab Hemigrapsus
This content downloaded by the authorized user from 192.168.52.73 on Mon, 26 Nov 2012 15:55:18 PMAll use subject to JSTOR Terms and Conditions
E48 The American Naturalist
Figure 8: Selection gradient and heritability requirements to achieve relative changes in spread rate from invader evolution consistent withaverage year-to-year increases observed in six invasions. The solid line in each panel shows the combination of and h2 thatc /c FbFt�1 t
satisfies equation (15), given parameter values displayed in the panel (for explanation of parameter values, see app. D). In the region aboveand to the right of this line, invader evolution would produce even greater spread acceleration. In the region below and to the left of theselines, invader evolution would lead to less of an increase in spread rate. The dashed, dash-dotted, and dotted lines in each panel indicatethe fiftieth, seventy-fifth, and ninety-fifth percentiles of the absolute values of selection gradients ( , 0.30, 0.71) from KingsolverFbF p 0.15et al. (2001).
sanguineus off the coast of New England, where the nativemussel Mytillus edulis evolved an increased capacity forshell thickening (Freeman and Byers 2006). Because theinvader spread north against the dominant advective cur-rent, crab-adapted mussels from the south would havebeen unlikely to influence the genetics of unexposed mus-sel populations at the invasion front (Byers and Pringle2006; Freeman and Byers 2006), consistent with results infigure 6. Impacts of native evolution on spread would seemmore likely were H. sanguineus spreading in the directionof the dominant advective current. Even this would dependon the duration of the planktonic stage in each speciesthough, because d is a relative quantity.
Management Implications
Although most evolutionarily labile native species prob-ably do not satisfy the requirements for impeding invaderspread, natural resource managers may sometimes havethe ability to facilitate gene flow from adapted core pop-ulations to naive edge populations. For example, seed fromnative plant populations displaying adaptation to com-petition from invasive plants or herbivory by invasive in-sects could be introduced to uninvaded populations (Leger2008). Managers can also slow down spread by influencinginvader evolution at the front. One option for achieving
this is targeted culling of the best-adapted invaders at thefront (Sih et al. 2010) with the intention of influencingthe direction or strength of selection in a way that preventsspread acceleration. Even if targeting certain individualsis not feasible, culling could also retard invader evolutionat the invasion front by reducing adaptive genetic variationthere.
Model Limitations
One of the most tenuous assumptions in the model is thatgenetic variation is fixed and unchanging. It is unclearhow relaxing this assumption might affect the results, be-cause some factors tend to decrease additive genetic var-iation and retard adaptation (inbreeding and genetic drift;Bulmer 1980) whereas others could supplement geneticvariation and drive adaptation (multiple introductions:Kolbe et al. 2004; gene flow: Alleaume-Benharira et al.2005; mutation accumulation: Butin et al. 2005). Anothersimplification is that the ecological model features a singlespecialist predator and its lone prey. Even so, in someinstances, strong evolutionary forces can also result be-tween nonspecialist species (e.g., Motychak et al. 1999).Finally, only the simple case of a predator-prey interactionwith Lotka-Volterra dynamics is considered. A saturatingfunctional response would generate a lesser gradient in
This content downloaded by the authorized user from 192.168.52.73 on Mon, 26 Nov 2012 15:55:18 PMAll use subject to JSTOR Terms and Conditions
Interaction Evolution and Spatial Spread E49
Table 1: Summary of possible impacts of evolution on spread, depending on which species is evolutionarily labile
Invader Native Impact of evolution on spread
Static Static Spread at a constant rateLabile Static Accelerating spread due to evolution of invader phenotype at the invasion frontStatic Labile Decelerating spread if exposed and adapted natives contribute genetically to populations at the invasion frontLabile Labile Invader evolution accelerates spread and attenuates effects of native evolution at the invasion front
prey density immediately behind the invasion front, whichcould lead to nominally different results, such as shallowerclines or slightly stronger native gene flow toward the in-vasion front. Nonetheless, the present formulation is gen-erally applicable to exploiter-victim interactions, and keyresults should apply to all interaction types.
Acknowledgments
This work was supported by the Department of EnergyComputational Science Graduate Fellowship Program ofthe Office of Science and National Nuclear Security Ad-ministration in the Department of Energy under contractDE-FG02-97ER25308. I am grateful to M. Baskett, A. Has-tings, M. Turelli, and two anonymous reviewers for com-ments on the manuscript.
APPENDIX A
Numerical Implementation of the Model
To obtain numerical solutions of equations (1)–(6), I usedthe function pdepe in Matlab (ver. 7.8; MathWorks, Na-tick, MA), which involves forward integration of the or-dinary differential equations that result from discretizingthe spatial dimension. Concurrent calculations of equa-tions (4) and (5) were performed by standard numericalintegration (trapz function in Matlab), and the selectiongradient was calculated using a finite difference¯ ¯�m /�zi i
approximation (Press et al. 2002). The model’s initial con-ditions were a uniform distribution of natives at theirstable, invader-free equilibrium N p K(1 � k V /r)IF N P, N
across 1,000 discrete points in the spatial dimension,whereas invaders were uniformly distributed at their co-existence equilibrium across 10 points at one end ofICE
the landscape, where ˆ ˆI p [�k V � r(1 � N /K)]/aSCE N P, N CE
and . I chose to initialize invaderN p (k V � d)/abSCE I P, I
populations at a somewhat high abundance because myfocus here is on spread, which is a process that is definedto occur after establishment (Williamson 1996). Initial-izing invaders to be scarce at time leads to similart p 0results using this model. I imposed reflecting boundary
conditions at the boundary points xl, xr such that the par-tial derivatives with respect to space equaled 0(� 7 /�x)for native and invader abundance (N, I) and mean phe-notypes ( ).¯ ¯z , zN I
The choice of boundary conditions, length of the spatialdimension, and length of the time span could all haveimpacts on spread, primarily near the far end of the in-vaded region. To minimize any such impacts, I chose asufficiently long spatial dimension and time span and as-sessed spread rate in the interior of the landscape. Spe-cifically, I assessed instantaneous spread rate by re-c (t)evol
cording the farthest position at which the invaderpopulation exceeded at each time step, taking theI /10CE
differences between those positions per time step lengthand smoothing them with a low-pass filter (rectangularwindow of width , using the filtfilt function inFx � x F/10r l
Matlab). Numerical estimation of the wave speed occursat the very front of the wave (location ) where in-x � ctvader density is low, so dynamics behind the crest of thewave should have virtually no impact on behavior at thefront or on numerical estimation of the wave speed.
APPENDIX B
Approximation of Evolutionary Dynamicsat the Invasion Front
Rather than thinking about phenotype dynamics in termsof mean phenotype , for the purpose of calculating as-zymptotic spread rate, it is more convenient mathematicallyto think in terms of the sum of phenotype values p acrossall n members of a population. For example, if werezmean body mass in a population, then p would be thesum of body masses of all members of the population;that is, . The relationship of these variables,
np p � ziip1
pz p , (B1)
n
can be used with equation (1) and the equation governingthe dynamics of p in time and space (shown below) toderive equation (2) (Pease et al. 1989).
Given mean Malthusian fitness and additive geneticmvariance VA, the local dynamics of p are embodied math-ematically by
This content downloaded by the authorized user from 192.168.52.73 on Mon, 26 Nov 2012 15:55:18 PMAll use subject to JSTOR Terms and Conditions
E50 The American Naturalist
¯�p �m¯p mp � V n, (B2)A
�t �z
which is consistent with equation (B1) and the last termson the right-hand sides of equations (1) and (2). Biolog-ically, the first term on the right-hand side of equation(B2) accounts for changes in population size n that in-crease or decrease p without changing the mean phenotype, and the second term represents evolution by naturalz
selection that increases or decreases the mean phenotype.z
In the model for p, the sum of phenotypes p shouldredistribute itself according to a diffusion process withmean squared displacement per time j2, irrespective ofindividuals’ phenotypes, as is the case in equations (1) and(2). Adding a diffusion term to equation (B2) then resultsin
2 2 ¯�p j � p �m¯p � mp � V n, (B3)A2 ¯�t 2 �x �z
which, combined with
2 2�n j � n¯p � mn, (B4)
2�t 2 �x
describes the dynamics of p and n in time and space (Na-gylaki 1975).
If there is little genetic variance or selection pressure(i.e., small VA and ) at the invasion front of a species¯ ¯�m/�zspreading according to equations (B3) and (B4), then cal-culation of the spread rate of p and n is straightforward(Murray 2002): . In this scenario with no2 1/2¯c p (2mj )evolution, the sum of phenotype values p simply increasesat the invasion front as the number of individuals thereincreases. However, if there is appreciable genetic varianceand selection pressure, the term ensures that¯ ¯V (�m/�z)nA
some additional p—beyond increases in p owing to pop-ulation growth—will accrue at the front as a result ofevolution. These changes in p due to evolution in turnchange at the invasion front at rate , as in¯ ¯ ¯z V (�m/�z)A
equation (13). The accuracy of this approximation and itsimpact on spatial spread are corroborated by numericalsolutions of the model (fig. 2).
APPENDIX C
Derivation of the Formula for Change in Spread Rate
Taking the result that mean phenotype dynamics at theinvasion front are described by ¯(�/�t)z (t, x � ct) ≈I
from appendix B and making the simplifying¯ ¯V (�m /�z )A, I I I
assumption that additive genetic variance and the se-VA, I
lection gradient are constants, we obtain a related¯ ¯(�m /�z )I I
solution to equation (13) of
¯�mI¯ ¯z (t, x � ct) p z (0) � V t. (C1)I I A, I ¯�zI
Because linear selection gradients encapsulate how phe-notype changes affect fitness over time, it follows fromlinearizing fitness about the mean phenotype that
¯�mI¯ ¯ ¯ ¯m (t) p m (0) � [z (t, x � ct) � z (0)]. (C2)I I I I¯�zI
With this formula describing how Malthusian fitnesschanges at the invasion front over time, it follows that therelative change in spread rate over time due to invaderevolution is
2� ¯2m (t)jI Ic (t)evol p2� ¯c 2m (0)jI I
2
¯1 �mI�p 1 � V t. (C3)A, I( )¯ ¯m (0) �zI I
More readily estimable parameters can be applied to equa-tion (C3) by substituting the strength of selection
with the standardized selection gradient¯ ¯�m /�z b pI I
, where G is generation time. The change�¯ ¯(�m /�z ) V GI I P, I
in spread rate over t years due to invader evolution is thensimplified to
2 2c (t) h bevol �p 1 � t, (C4)2¯c m (0)GI
where narrow-sense heritability .2h p V /VA, I P, I
Assuming that evolutionary change in the native speciesis negligible at the invasion front, will depend onlym (0)I
on properties of the invader. In that case, the derivationin this appendix is generally applicable to any spreadinginvader with a quantitative trait that affects Malthusianfitness and is under selection at the invasion front.
APPENDIX D
Calculation of Observed Year-to-YearIncreases in Spread Rate
Calculating year-to-year increases in spread rate for theNorth American cheatgrass, house finch, and starling in-vasions assumed that spread accelerated at a constant rate.Data for these invasions were time series of range radiiover the course of each invasion (Wing 1943; Mack 1981;Veit and Lewis 1996). First, I performed a linear regressionof the log of each time series. Where m is the slope andb the intercept of this regression, the instantaneous spreadrate is . The change in spread rate from one yearb mtme eto the next is then , which is 1.0713 for cheatgrass,me
This content downloaded by the authorized user from 192.168.52.73 on Mon, 26 Nov 2012 15:55:18 PMAll use subject to JSTOR Terms and Conditions
Interaction Evolution and Spatial Spread E51
1.0788 for house finches, and 1.1030 for starlings. Mundtet al. (2009) performed the same type of regression onspatial spread data for West Nile virus and influenza A(H5N1), which suggested respective yearly changes inspread rate of 2.2034 and 5.5622 for those invasions. Cal-culating year-to-year increase in spread rate for the canetoad invasion of Australia made use of the initial spreadrate (10 km year�1), a more recent spread rate (55 kmyear�1), and the time since introduction to Australia (73years; Urban et al. 2008). Assuming that spread rate in-creases by the same percent each year, the year-to-yearincrease in cane toad spread rate was (1/73)(55/10) p
.1.0236
Estimates of demographic parameters displayed in fig-ure 8 also come from diverse sources. Population growthrate was calculated explicitly for starlings by van denm(0)Bosch et al. (1992). For cane toads, cheatgrass, influenza,and West Nile virus, one or more estimates of R0 (Lampoand De Leo 1998; Cruz-Pacheco et al. 2005; Ward et al.2009; Griffith 2010) were used to calculate populationgrowth rate as . Mean an-
Nm(0) p ln {[(1/N) � R ]/G}0, iip1
nual population increase in house finches was reported byRobbins et al. (1986), the log of which is equal to .m(0)The procedures I used to obtain values of generation timeG are discussed in appendix F, available online.
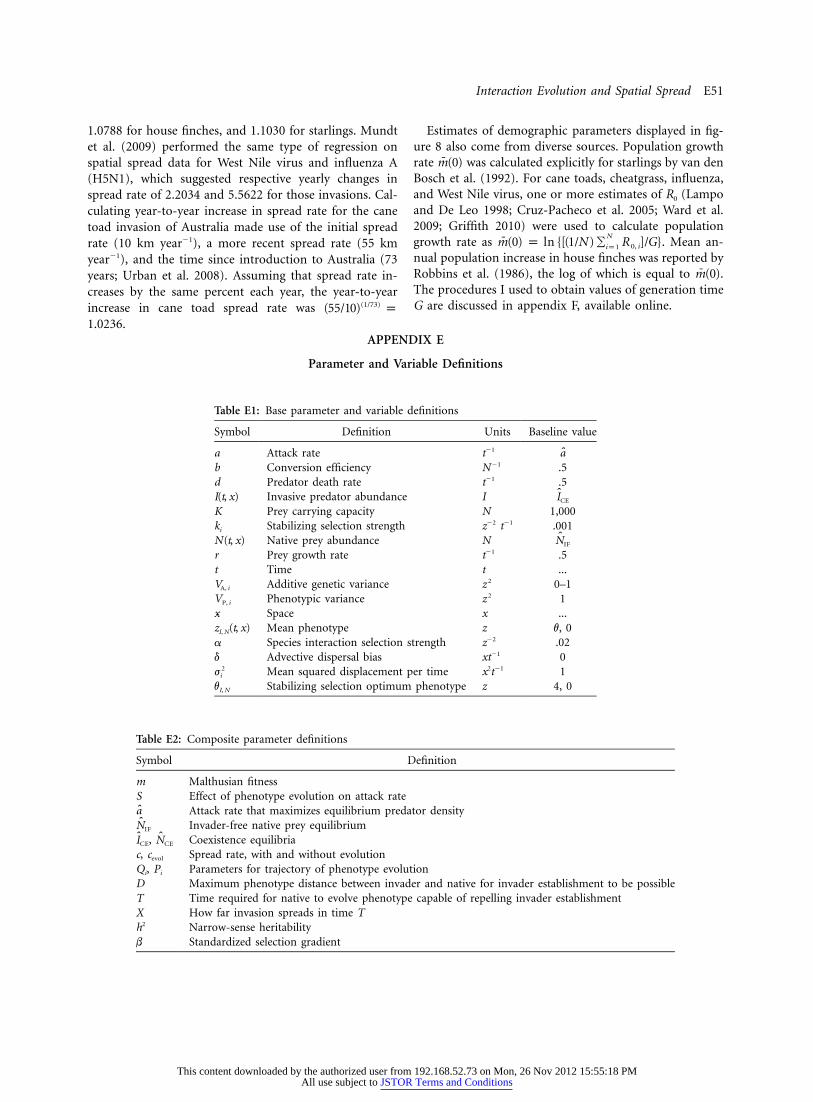
APPENDIX E
Parameter and Variable Definitions
Table E1: Base parameter and variable definitions
Symbol Definition Units Baseline value
a Attack rate t�1 ab Conversion efficiency N�1 .5d Predator death rate t�1 .5I(t, x) Invasive predator abundance I ICE
K Prey carrying capacity N 1,000ki Stabilizing selection strength z�2 t�1 .001N(t, x) Native prey abundance N NIF
r Prey growth rate t�1 .5t Time t ...VA, i Additive genetic variance 2z 0–1VP, i Phenotypic variance 2z 1x Space x ...¯z (t, x)I, N Mean phenotype z v, 0a Species interaction selection strength z�2 .02d Advective dispersal bias xt�1 0
2ji Mean squared displacement per time x2t�1 1vI, N Stabilizing selection optimum phenotype z 4, 0
Table E2: Composite parameter definitions
Symbol Definition
m Malthusian fitnessS Effect of phenotype evolution on attack ratea Attack rate that maximizes equilibrium predator densityNIF Invader-free native prey equilibrium
,ˆ ˆI NCE CE Coexistence equilibriac, cevol Spread rate, with and without evolutionQi, Pi Parameters for trajectory of phenotype evolutionD Maximum phenotype distance between invader and native for invader establishment to be possibleT Time required for native to evolve phenotype capable of repelling invader establishmentX How far invasion spreads in time Th2 Narrow-sense heritabilityb Standardized selection gradient
This content downloaded by the authorized user from 192.168.52.73 on Mon, 26 Nov 2012 15:55:18 PMAll use subject to JSTOR Terms and Conditions
E52 The American Naturalist
Literature Cited
Abrams, P. A. 2001. Modelling the adaptive dynamics of traits in-volved in inter- and intraspecific interactions: an assessment ofthree methods. Ecology Letters 4:166–175.
———. 2000. The evolution of predator-prey interactions: theoryand evidence. Annual Review of Ecology and Systematics 31:79–105.
Alleaume-Benharira, M., I. Pen, and O. Ronce. 2005. Geographicalpatterns of adaptation within a species’ range: interactions betweendrift and gene flow. Journal of Evolutionary Biology 19:203–215.
Benkman, C. W. 1999. The selection mosaic and diversifying coevo-lution between crossbills and lodgepole pine. American Naturalist153(suppl.):S75–S91.
Blackburn, T. M., P. Cassey, R. P. Duncan, K. L. Evans, and K. J.Gaston. 2004. Avian extinction and mammalian introductions onoceanic islands. Science 305:1955–1958.
Blossey, B., and R. Notzold. 1995. Evolution of increased competitiveability in invasive nonindigenous plants: a hypothesis. Journal ofEcology 83:887–889.
Bolker, B. M., A. Nanda, and D. Shah. 2010. Transient virulence ofemerging pathogens. Journal of the Royal Society Interface 7:811–822.
Brown, G. P., C. Shilton, B. L. Phillips, and R. Shine. 2007. Invasion,stress, and spinal arthritis in cane toads. Proceedings of the Na-tional Academy of Sciences of the USA 104:17698–17700.
Bulmer, M. G. 1974. Density-dependent selection and character dis-placement. American Naturalist 108:45–58.
———. 1980. The mathematical theory of quantitative genetics.Clarendon, Oxford.
Butin, E., A. Porter, and J. Elkinton. 2005. Adaptation during bio-logical invasions and the case of Adelges tsugae. Evolutionary Ecol-ogy Research 7:887–900.
Byers, J. E., and J. Pringle. 2006. Going against the flow: retention,range limits and invasions in advective environments. MarineEcology Progress Series 313:27–41.
Carroll, S. P., J. E. Loye, H. Dingle, M. Mathieson, T. R. Famula, andM. P. Zalucki. 2005. And the beak shall inherit: evolution in re-sponse to invasion. Ecology Letters 8:944–951.
Case, T. J., and M. L. Taper. 2000. Interspecific competition, envi-ronmental gradients, gene flow, and the coevolution of species’borders. American Naturalist 155:583–605.
Case, T. J., R. D. Holt, M. A. McPeek, and T. H. Keitt. 2005. Thecommunity context of species’ borders: ecological and evolution-ary perspectives. Oikos 108:28–46.
Cox, G. 2004. Alien species and evolution. Island, Washington, DC.Crooks, J., and M. Soule. 1999. Lag times in population explosions
of invasive species: causes and implications. Pages 103–125 in O.Sandlund, P. Schei, and A. Viken, eds. Invasive species and bio-diversity management. Kluwer, Dordrecht.
Cruz-Pacheco, G., L. Esteva, J. Montano-Hirose, and C. Vargas. 2005.Modelling the dynamics of West Nile virus. Bulletin of Mathe-matical Biology 67:1157–1172, doi:10.1016/j.bulm.2004.11.008.
Davies, N. B., and M. D. Brooke. 1989. An experimental study ofcoevolution between the cuckoo, Cuculus canorus, and its hosts.1. Host egg discrimination. Journal of Animal Ecology 58:207–224.
Dietz, H., and P. J. Edwards. 2006. Recognition that causal processeschange during plant invasion helps explain conflicts in evidence.Ecology 87:1359–1367.
Duckworth, R. A., and A. V. Badyaev. 2007. Coupling of dispersaland aggression facilitates the rapid range expansion of a passerinebird. Proceedings of the National Academy of Sciences of the USA104:15017–15022.
Ellstrand, N. C., and K. A. Schierenbeck. 2000. Hybridization as astimulus for the evolution of invasiveness in plants? Proceedingsof the National Academy of Sciences of the USA 97:7043–7050.
Epanchin-Niell, R., and A. Hastings. 2010. Controlling establishedinvaders: integrating economics and spread dynamics to determineoptimal management. Ecology Letters 13:528–541.
Fenner, F. 1959. Myxomatosis. British Medical Bulletin 15:240–245.Filin, I., R. Holt, and M. Barfield. 2008. The relation of density
regulation to habitat specialization, evolution of a species’ range,and the dynamics of biological invasions. American Naturalist 172:233–247.
Forde, S. E., J. N. Thompson, and B. J. M. Bohannan. 2007. Geneflow reverses an adaptive cline in a coevolving host-parasitoidinteraction. American Naturalist 169:794–801.
Freeman, A. S., and J. E. Byers. 2006. Divergent induced responsesto an invasive predator in marine mussel populations. Science 313:831–833.
Gammon, D. E., and B. A. Maurer. 2002. Evidence for non-uniformdispersal in the biological invasions of two naturalized NorthAmerican bird species. Global Ecology and Biogeography 11:155–161.
Garcia-Ramos, G., and D. Rodriguez. 2002. Evolutionary speed ofspecies invasions. Evolution 56:661–668.
Gavrilets, S. 1997. Coevolutionary chase in exploiter-victim systemswith polygenic characters. Journal of Theoretical Biology 186:527–534.
Goldberg, E. E., and R. Lande. 2007. Species’ borders and dispersalbarriers. American Naturalist 170:297–304.
Greenlees, M. J., G. P. Brown, J. K. Webb, B. L. Phillips, and R. Shine.2006. Effects of an invasive anuran [the cane toad (Bufo marinus)]on the invertebrate fauna of a tropical Australian floodplain. An-imal Conservation 9:431–438.
Griffith, A. B. 2010. Positive effects of native shrubs on Bromustectorum demography. Ecology 91:141–154.
Hastings, A., K. Cuddington, K. F. Davies, C. J. Dugaw, S. Elmendorf,A. Freestone, S. Harrison, et al. 2005. The spatial spread of in-vasions: new developments in theory and evidence. Ecology Letters8:91–101.
Holt, R. D., M. Barfield, and R. Gomulkiewicz. 2005. Theories ofniche conservatism and evolution: could exotic species be potentialtests? Pages 259–290 in D. Sax, J. Stachowicz, and S. D. Gaines,eds. Species invasions: insights into ecology, evolution, and bio-geography. Sinauer, Sunderland, MA.
Hughes, C., C. Dytham, and J. Hill. 2007. Modelling and analysingevolution of dispersal in populations at expanding range bound-aries. Ecological Entomology 32:437–445.
King, C. M. 1991. Body size–prey size relationships in European stoatsMustela erminea: a test case. Holarctic Ecology 14:173–185.
Kingsolver, J. G., H. E. Hoekstra, J. M. Hoekstra, D. Berrigan, S. N.Vignieri, C. E. Hill, A. Hoang, P. Gibert, and P. Beerli. 2001. Thestrength of phenotypic selection in natural populations. AmericanNaturalist 157:245–261.
Kinlan, B. P., and S. D. Gaines. 2003. Propagule dispersal in marineand terrestrial environments: a community perspective. Ecology84:2007–2020.
This content downloaded by the authorized user from 192.168.52.73 on Mon, 26 Nov 2012 15:55:18 PMAll use subject to JSTOR Terms and Conditions
Interaction Evolution and Spatial Spread E53
Kirkpatrick, M., and N. H. Barton. 1997. Evolution of a species’range. American Naturalist 150:1–23.
Kolbe, J. J., R. E. Glor, L. R. Schettino, A. C. Lara, A. Larson, andJ. B. Losos. 2004. Genetic variation increases during biologicalinvasion by a Cuban lizard. Nature 431:177–181.
Kot, M., M. Lewis, and P. van den Dreissche. 1996. Dispersal dataand the spread of invading organisms. Ecology 77:2027–2042.
Lampo, M., and G. De Leo. 1998. The invasion ecology of the toadBufo marinus: from South America to Australia. Ecological Ap-plications 8:388–396.
Lande, R. 1976. Natural selection and random genetic drift in phe-notypic evolution. Evolution 30:314–334.
Lee, C. E., and G. W. Gelembiuk. 2008. Evolutionary origins ofinvasive populations. Evolutionary Applications 1:427–448.
Leger, E. A. 2008. The adaptive value of remnant native plants ininvaded communities: an example from the Great Basin. EcologicalApplications 18:1226–1235.
Lewis, M., and P. Kareiva. 1993. Allee dynamics and the spread ofinvading organisms. Theoretical Population Biology 43:141–158.
Lockwood, J. L., M. F. Hoopes, and M. P. Marchetti. 2007. Invasionecology. Blackwell, Oxford.
MacArthur, R., and R. Levins. 1967. The limiting similarity, con-vergence, and divergence of coexisting species. American Naturalist101:377–385.
Mack, R. N. 1981. Invasion of Bromus tectorum L. into western NorthAmerica: an ecological chronicle. Agro-Ecosystems 7:145–165.
Marshall, I., and F. Fenner. 1958. Studies in the infectious epide-miology of myxomatosis of rabbits. V. Changes in the innate re-sistance of Australian rabbits exposed to myxomatosis. Journal ofHygiene 56:288–302.
Mooney, H. A., and E. E. Cleland. 2001. The evolutionary impact ofinvasive species. Proceedings of the National Academy of Sciencesof the USA 98:5446–5451.
Motychak, J. E., E. D. Brodie Jr., and E. D. Brodie III. 1999. Evo-lutionary response of predators to dangerous prey: preadaptationand the evolution of tetrodotoxin resistance in garter snakes. Evo-lution 53:1528–1535.
Mundt, C., K. Sackett, L. Wallace, C. Cowger, and J. Dudley. 2009.Long-distance dispersal and accelerating waves of disease: empir-ical relationships. American Naturalist 173:456–466.
Murray, J. 2002. Mathematical biology. I. An introduction. 3rd ed.Springer, Berlin.
Nagylaki, T. 1975. Conditions for existence of clines. Genetics 80:595–615.
Nuismer, S. L., B. J. Ridenhour, and B. P. Oswald. 2007. Antagonisticcoevolution mediated by phenotypic differences between quanti-tative traits. Evolution 61:1823–1834.
Okubo, A., and S. Levin, eds. 2001. Diffusion and ecological prob-lems: modern perspectives. 2nd ed. Springer, Berlin.
Pangle, K. L., S. D. Peacor, and O. E. Johannsson. 2007. Large non-lethal effects of an invasive invertebrate predator on zooplanktonpopulation growth rate. Ecology 88:402–412.
Pease, C. M., R. Lande, and J. J. Bull. 1989. A model of populationgrowth, dispersal and evolution in a changing environment. Ecol-ogy 70:1657–1664.
Pelletier, F., D. Garant, and A. Hendry. 2009. Eco-evolutionary dy-namics. Philosophical Transactions of the Royal Society B: Bio-logical Sciences 364:1483–1489.
Phillips, B. L. 2009. The evolution of growth rates on an expandingrange edge. Biology Letters 5:802–804.
Phillips, B. L., and R. Shine. 2006. An invasive species induces rapidadaptive change in a native predator: cane toads and black snakesin Australia. Proceedings of the Royal Society B: Biological Sciences273:1545–1550.
Phillips, B. L., G. P. Brown, J. K. Webb, and R. Shine. 2006. Invasionand the evolution of speed in toads. Nature 439:803.
Phillips, B. L., G. P. Brown, J. M. J. Travis, and R. Shine. 2008. Reid’sparadox revisited: the evolution of dispersal kernels during rangeexpansion. American Naturalist 172(suppl.):S34–S48.
Phillips, B. L., G. Brown, and R. Shine. 2010. Life-history evolutionin range-shifting populations. Ecology 91:1617–1627.
Press, W. H., S. A. Teukolsky, W. T. Vetterling, and B. P. Flannery.2002. Numerical recipes in C��: the art of scientific computing.Cambridge University Press, Cambridge.
Robbins, C., D. Bystrak, and P. Geissler. 1986. The Breeding BirdSurvey: its first fifteen years, 1965–1979. U.S. Department of theInterior Fish and Wildlife Service Resource Publication 157.
Rogers, W. E., and E. Siemann. 2004. Invasive ecotypes tolerate her-bivory more effectively than native ecotypes of the Chinese tallowtree Sapium sebiferum. Journal of Applied Ecology 41:561–570.
Roughgarden, J. 1979. Theory of population genetics and evolution-ary ecology: an introduction. MacMillan, New York.
Sakai, A. K., F. W. Allendorf, J. S. Holt, D. M. Lodge, J. Molofsky,K. A. With, S. Baughman, et al. 2001. The population biology ofinvasive species. Annual Review of Ecology and Systematics 32:305–332.
Schoener, T. W., and D. A. Spiller. 1999. Indirect effects in an ex-perimentally staged invasion by a major predator. American Nat-uralist 153:347–358.
Shigesada, N., and K. Kawasaki. 1997. Biological invasions: theoryand practice. Oxford University Press.
Shigesada, N., K. Kawasaki, and Y. Takeda. 1995. Modeling stratifieddiffusion in biological invasions. American Naturalist 146:229–251.
Siemann, E., and W. Rogers. 2001. Genetic differences in growth ofan invasive tree species. Ecology Letters 4:514–518.
Sih, A., D. I. Bolnick, B. Luttbeg, J. L. Orrock, S. D. Peacor, L. M.Pintor, E. Preisser, J. S. Rehage, and J. R. Vonesh. 2010. Predator-prey naivete, antipredator behavior, and the ecology of predatorinvasions. Oikos 119:610–621.
Simmons, A. D., and C. D. Thomas. 2004. Changes in dispersalduring species’ range expansions. American Naturalist 164:378–395.
Skellam, J. G. 1951. Random dispersal in theoretical populations.Biometrika 38:196–218.
Slatkin, M. 1980. Ecological character displacement. Ecology 61:163–177.
Strauss, S. Y., J. A. Lau, and S. P. Carroll. 2006. Evolutionary responsesof natives to introduced species: what do introductions tell usabout natural communities? Ecology Letters 9:357–374.
Taper, M. L., and T. J. Case. 1985. Quantitative genetic models forthe coevolution of character displacement. Ecology 66:355–371.
Thompson, J. N. 1998. Rapid evolution as an ecological process.Trends in Ecology & Evolution 13:329–332.
Travis, J. M. J., and C. Dytham. 2002. Dispersal evolution duringinvasions. Evolutionary Ecology Research 4:1119–1129.
Turelli, M., and N. Barton. 1994. Genetic and statistical analyses ofstrong selection on polygenic traits: what, me normal? Genetics138:913–941.
Urban, M. C., B. L. Phillips, D. K. Skelly, and R. Shine. 2008. The
This content downloaded by the authorized user from 192.168.52.73 on Mon, 26 Nov 2012 15:55:18 PMAll use subject to JSTOR Terms and Conditions
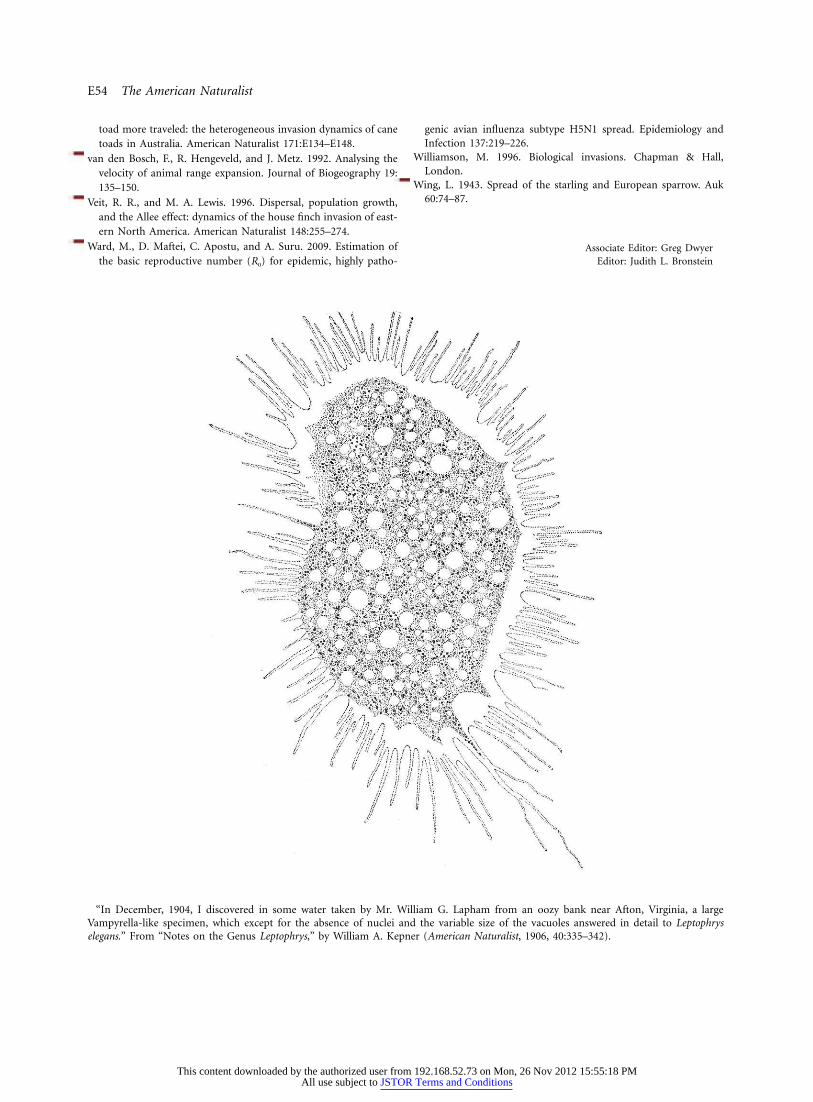
E54 The American Naturalist
toad more traveled: the heterogeneous invasion dynamics of canetoads in Australia. American Naturalist 171:E134–E148.
van den Bosch, F., R. Hengeveld, and J. Metz. 1992. Analysing thevelocity of animal range expansion. Journal of Biogeography 19:135–150.
Veit, R. R., and M. A. Lewis. 1996. Dispersal, population growth,and the Allee effect: dynamics of the house finch invasion of east-ern North America. American Naturalist 148:255–274.
Ward, M., D. Maftei, C. Apostu, and A. Suru. 2009. Estimation ofthe basic reproductive number (R0) for epidemic, highly patho-
genic avian influenza subtype H5N1 spread. Epidemiology andInfection 137:219–226.
Williamson, M. 1996. Biological invasions. Chapman & Hall,London.
Wing, L. 1943. Spread of the starling and European sparrow. Auk60:74–87.
Associate Editor: Greg DwyerEditor: Judith L. Bronstein
“In December, 1904, I discovered in some water taken by Mr. William G. Lapham from an oozy bank near Afton, Virginia, a largeVampyrella-like specimen, which except for the absence of nuclei and the variable size of the vacuoles answered in detail to Leptophryselegans.” From “Notes on the Genus Leptophrys,” by William A. Kepner (American Naturalist, 1906, 40:335–342).
This content downloaded by the authorized user from 192.168.52.73 on Mon, 26 Nov 2012 15:55:18 PMAll use subject to JSTOR Terms and Conditions
Copyright © 2022 FDOKUMEN