Does the addition of labile substrate destabilise old soil ...
13
HAL Id: hal-01268955 https://hal.archives-ouvertes.fr/hal-01268955 Submitted on 28 May 2020 HAL is a multi-disciplinary open access archive for the deposit and dissemination of sci- entific research documents, whether they are pub- lished or not. The documents may come from teaching and research institutions in France or abroad, or from public or private research centers. L’archive ouverte pluridisciplinaire HAL, est destinée au dépôt et à la diffusion de documents scientifiques de niveau recherche, publiés ou non, émanant des établissements d’enseignement et de recherche français ou étrangers, des laboratoires publics ou privés. Does the addition of labile substrate destabilise old soil organic matter? Delphine Derrien, Caroline Plain, Pierre-Emmanuel Courty, Louisette Gelhaye, Tanja C. W. Moerdijk-Poortvliet, Fabien Thomas, Antoine Versini, Bernhard Zeller, Lydie-Stella Koutika, Henricus T. S. Boschker, et al. To cite this version: Delphine Derrien, Caroline Plain, Pierre-Emmanuel Courty, Louisette Gelhaye, Tanja C. W. Moerdijk- Poortvliet, et al.. Does the addition of labile substrate destabilise old soil organic matter?. Soil Biology and Biochemistry, Elsevier, 2014, 76, pp.149 - 160. 10.1016/j.soilbio.2014.04.030. hal-01268955
-
Upload
khangminh22 -
Category
Documents
-
view
0 -
download
0
Transcript of Does the addition of labile substrate destabilise old soil ...

HAL Id: hal-01268955https://hal.archives-ouvertes.fr/hal-01268955
Submitted on 28 May 2020
HAL is a multi-disciplinary open accessarchive for the deposit and dissemination of sci-entific research documents, whether they are pub-lished or not. The documents may come fromteaching and research institutions in France orabroad, or from public or private research centers.
L’archive ouverte pluridisciplinaire HAL, estdestinée au dépôt et à la diffusion de documentsscientifiques de niveau recherche, publiés ou non,émanant des établissements d’enseignement et derecherche français ou étrangers, des laboratoirespublics ou privés.
Does the addition of labile substrate destabilise old soilorganic matter?
Delphine Derrien, Caroline Plain, Pierre-Emmanuel Courty, LouisetteGelhaye, Tanja C. W. Moerdijk-Poortvliet, Fabien Thomas, Antoine Versini,
Bernhard Zeller, Lydie-Stella Koutika, Henricus T. S. Boschker, et al.
To cite this version:Delphine Derrien, Caroline Plain, Pierre-Emmanuel Courty, Louisette Gelhaye, Tanja C. W. Moerdijk-Poortvliet, et al.. Does the addition of labile substrate destabilise old soil organic matter?. Soil Biologyand Biochemistry, Elsevier, 2014, 76, pp.149 - 160. �10.1016/j.soilbio.2014.04.030�. �hal-01268955�

lable at ScienceDirect
Soil Biology & Biochemistry 76 (2014) 149e160
Contents lists avai
Soil Biology & Biochemistry
journal homepage: www.elsevier .com/locate/soi lb io
Does the addition of labile substrate destabilise old soil organicmatter?
Delphine Derrien a,*,1, Caroline Plain b,c,1, Pierre-Emmanuel Courty d, Louisette Gelhaye a,Tanja C.W. Moerdijk-Poortvliet e, Fabien Thomas a, Antoine Versini a, Bernhard Zeller a,Lydie-Stella Koutika f, Henricus T.S. Boschker e, Daniel Epron b,c, f,g
a INRA, Biogéochimie des Ecosystèmes Forestiers, UR1138, Champenoux F-54280, FrancebUniversité de Lorraine, Ecologie et Ecophysiologie Forestières, UMR1137, Vandoeuvre Les Nancy F-54500, Francec INRA, Ecologie et Ecophysiologie Forestières, UMR1137, Champenoux F-54280, Franced Zurich-Basel Plant Science Center, Department of Environmental Sciences, Botany, University of Basel, Basel CH-4056, SwitzerlandeRoyal Netherlands Institute for Sea Research (NIOZ), Korringaweg 7, 4401 NT Yerseke, the NetherlandsfCentre de Recherche sur la Durabilité et la Productivité des Plantations Industrielles, BP 1291 Pointe-Noire, People’s Republic of CongogCIRAD, UMR Eco&Sols, Ecologie Fonctionnelle & Biogéochimie des Sols & Agro-écosystèmes, F-34060 Montpellier, France
a r t i c l e i n f o
Article history:Received 18 December 2013Received in revised form25 April 2014Accepted 29 April 2014Available online 17 May 2014
Keywords:Priming effectTriggeringSoil organic matter destabilisationStable isotope spectroscopyPLFABiolog test
* Corresponding author. Tel.: þ33 3 83 39 41 46.E-mail address: [email protected] (D
1 Both authors equally contributed.
http://dx.doi.org/10.1016/j.soilbio.2014.04.0300038-0717/� 2014 Elsevier Ltd. All rights reserved.
a b s t r a c t
Input of organic matter to soil may stimulate microbial activity and alter soil carbon storage by modifyingthe mineralization of native soil organic carbon (SOC). Assessing the age of SOC affected by the alteredmineralization is a major challenge as the destabilisation of old SOC would be much more damageablefor the overall carbon budget than the mobilization of recent SOC.
Here, we investigated the microbial populations sequentially activated after the addition of a labilesubstrate. We questioned whether they have distinct metabolic potential and we characterised the age ofthe native SOC they primed. We used soils from Congolese Eucalyptus plantations that were previouslyunder savannah and which old and recent SOC exhibited different d13C. Soils were amended withglucose, in an amount sufficient to induce microbe growth, and incubated for one week. The d13C ofrespired CO2 was continuously recorded using a tuneable diode laser spectrometer (TDLS). The combi-nation of two glucose treatments with different d13C signatures allowed partitioning the various sourcesof CO2 over time (recent SOC, old SOC and glucose). This was combined with phospholipids fatty acids(PLFA) analyses and potential metabolic activities measurements after 40 h and seven days of incubation.
A peak of glucose mineralization occurred after 17 h of incubation. Before this peak (Stage 1), somespecific communities with a strong feeding preference for recent SOC were activated. After the glucosepeak (Stage 2), over-mineralization of native SOC occurred for some days. The recent C3 SOC was firstpreferentially used (Stage 3), while the old C4 SOC was destabilised in a later stage (Stage 4). Metabolicfunctions and composition of microbial communities also differed between Stages 3 and 4. Microbialpopulations collected at Stage 4 were slower compared to Stage 3, but more efficient in decomposingnutrient-containing substrates. Gram negative bacteria (16:1w7c and 18:1w7c) were stimulated at Stage3 only, while Gram negative bacteria (cy17:0) were stimulated at both Stages 3 and 4.
Our results demonstrated that the input of labile substrate alters the microbial community compo-sition, potential metabolic activities, and the SOC pools utilisation. They pointed out the necessity toassess the age of destabilised SOC when investigating the impact of priming on carbon storage in soil.
� 2014 Elsevier Ltd. All rights reserved.
. Derrien).
1. Introduction
Agricultural practices favouring the return of plant residues tosoil are recommended by the International Panel for ClimateChange (IPCC, 2004) as ameans tomitigate the raise of atmosphericcarbon (C) responsible for climate change. Indeed it is generally

Table 1Characteristics of soil samples collected in the 0e5 cm horizon. *Data from Epron etal., 2009.
Soil Time sinceafforestationyears
C-contentg kg�1
d13C & N-contentg kg�1
7 yr Euca Soil 7 5.9 � 0.4 �19.2 � 0.5 0.38 � 0.0117 yr Euca Soil 17, two
rotations9.2 � 0.5 �23.7 � 0.1 0.52 � 0.02
Native savannah e 5.7 � 0.7 �14.8 � 0.3* 0.36 � 0.07
D. Derrien et al. / Soil Biology & Biochemistry 76 (2014) 149e160150
admitted that the additional input of fresh organic matter increasessoil C stocks (Lal, 2005), and improves soil fertility through therelease of nutrients from the additional input. In turn, this alsoincreases primary production and C sequestration in plant biomass(Versini et al., 2013). However, the entrance of easily mobilizableorganic substrates, (i.e. glucose, cellulose) into the soil can tem-porary activate diverse microbial populations and affect the cyclingof soil organic carbon (SOC) (Kuzyakov, 2010). Such effect could beespecially harmful to the environment and opposite to the ex-pected goal when SOC is over-mineralized in an amount exceedingthe stabilisation of the added substrate, but also if stable SOC isdestabilised.
The short-term change in SOC dynamics induced by adding asubstrate is called “priming effect” (PE) (Löhnis, 1926). Two types ofPE occur within a temporal sequence. The first type of PE is an earlyphenomenon called “apparent priming effect” occurring during thefirst hours after the substrate addition (Blagodatkaya and Kuzyakov,2008). Dormant and potentially active microorganisms are trig-gered: they accelerate their metabolism by mineralizing theirstorage compounds (de Nobili et al., 2001). The activity of thetriggered microbial populations stops quickly when the energyprovided by the added substrate is insufficient to synthesize en-zymes and to grow. If the degradation of the added substrate allowsenzymes production, the second type of PE called “real primingeffect” is induced. The real priming effect is negative when theactivatedmicroorganismsmobilize the added substrate only. In thiscase, the mineralization of SOC temporary decreases until thecomplete consumption of the preferred substrate. In contrast, thereal priming effect is positive when the activated microorganismsmineralise both the SOC and the added substrate.
A theory developed by Fontaine and coauthors in 2003 receiveda favourable echo in the soil science community. They hypothesizedthat the increase of SOC mineralization after labile substrate addi-tion involves the succession of different microbial communities.The labile substrate favours the activity and development of fastgrowing microbes, called r-strategists, compared to slow growingmicrobes called K-strategists. After labile substrate consumption,the r-strategists may prolong their activity by using labile SOC for afew days. In the meanwhile, the K-strategists that benefit from r-strategist necromass or hydrolysis sub-products are slowly acti-vated. They display enzymes necessary to mineralise complexcompounds and are responsible for enhanced mineralization ofrecalcitrant SOC.
The hypothesis of Fontaine et al. (2003) has not been fullyvalidated yet. Some changes in the structure of microbial pop-ulations have been shown after the addition of substrate (e.g.Nottingham et al., 2009; Bird et al., 2011; Dungait et al., 2011).However most studies only permitted to identify two sources forthe mineralised CO2: the added substrate and the native SOC. Nodistinction was made between the relative contributions of oldrecalcitrant and recent labile sources in the overmineralization ofnative SOC in spite of their importance for the overall C balance.Only few studies were designed to identify more than two CO2sources (Kuzyakov and Bol, 2004; Blagodatskaya et al., 2011, 2014),but they did not focused on the temporal evolution of these SOCsources.
In our study we tested the hypothesis that glucose additiondestabilizes old SOC by sequentially activating different microbialpopulations, the first ones feeding on recent labile SOC and thesecond ones on old recalcitrant SOC. Here, we applied a glucosesolution on soils sampled from two adjacent C3 Eucalyptus plan-tations afforested on a former C4 savannah. The isotopic compo-sition of CO2 released from the soil was recorded with a hightemporal resolution (every 30 min) using isotope infrared spec-troscopy to determine the relative contribution of CO2 sources. The
combination of two glucose treatments with different d13C signa-tures allowed partitioning the various sources of CO2 over time(recent C3 SOC, old C4 SOC and glucose). To relate changes of CO2sources with functional changes of microbial populations, we alsomeasured phospholipid fatty acid (PLFA) known as biomarker ofmicrobial communities (Amelung et al., 2008), and we determinedmetabolic profiles of microorganisms using Biolog EcoPlates.
2. Materials and methods
2.1. Soil samples
The studied sites are two Eucalyptus plantations established on anative savannah at the experimental station of Kondi (CRDPI e
CIRAD) in Congo (4�350 S, 11�750E). Mean air temperature is 25 �Cwith very low seasonal variations. Annual precipitations average1200 mm with a dry season from mid-May to end of September.The soil is a Ferralic Arenosol (FAO) containing more than 80% ofsand. Two adjacent plots of a native savannah were planted withEucalyptus. Plot 1 was planted with the clone PF1 1-41 (density of530 trees per hectare) in January 1992, harvested and afforested asecond time in 2001with themost commonly used hybrid in Congo(E. urophylla x E. grandis, clone UG 18-52; density of 800 trees perhectare). Plot 2 was afforested in 2001 with the Eucalyptus clonePF11-41 (density of 530 trees per hectare). The starter fertilizationat the afforestation of the native savannah in 1992 or 2001 was:10.3 kg ha�1 of N, 10.3 kg ha�1 of P and 16.7 kg ha�1 of K. For thesecond rotation of Plot 1 in 2001, 43.2 kg N ha�1 were also added.Despite low SOC and nitrogen contents (Table 1), the mean primaryproduction over a 7-year rotation is about 20 m3 ha�1 yr�1 for theclone PF1 1-41 and 30 m3 ha�1 yr�1 for the UG 18-52 clone.
The first five centimetres of the mineral soil were collected inDecember 2008, after almost 17 years and 7 years of afforestationwith Eucalyptus growing in Plot 1 and Plot 2, respectively. Thecollected soils were named accordingly 17 yr Euca soil (Plot 1) and7 yr Euca soil (Plot 2). 7 yr Euca soil was less enriched in recent C3SOC (d13C ¼ �19.2&) compared to 17 yr Euca soil (d13C ¼ �23.7&)as a direct consequence of the time elapsed since the conversion ofsavannah into Eucalyptus plantation (Table 1).
2.2. Soil incubation
The 7 yr and the 17 yr Euca soils were air-dried after sampling,sieved (<4 mm) and pre-incubated at 20 �C and 11.5% moisturecontent for six weeks. The isotopic composition of the CO2 waspromptly measured during the preincubation period (see below formethod description). It was�24.7& and of�26.7& for the 7 yr and17 yr Euca soil, respectively. This illustrated that the recent C3 SOCcontributed more to the respiration than the old C4 SOC (65%e70%in the 7 yr Euca soil, and 80e85% in the 17 yr Euca soil - valuesdepending on the choice of C3 and C4 end-members for the linearmixing model). Subsequently, any increment in the low flux of C4CO2 will induced a larger shift in CO2-d13C than the same increment
D. Derrien et al. / Soil Biology & Biochemistry 76 (2014) 149e160 151
in the high flux of C3 CO2. The effect will bemore pronounced in the17 yr Euca soil where C4-SOC respiration is very low. For thisreason, we expect C4 priming to be more easily detected in 17 yrEuca soil and C3 priming in 7 yr Euca soils.
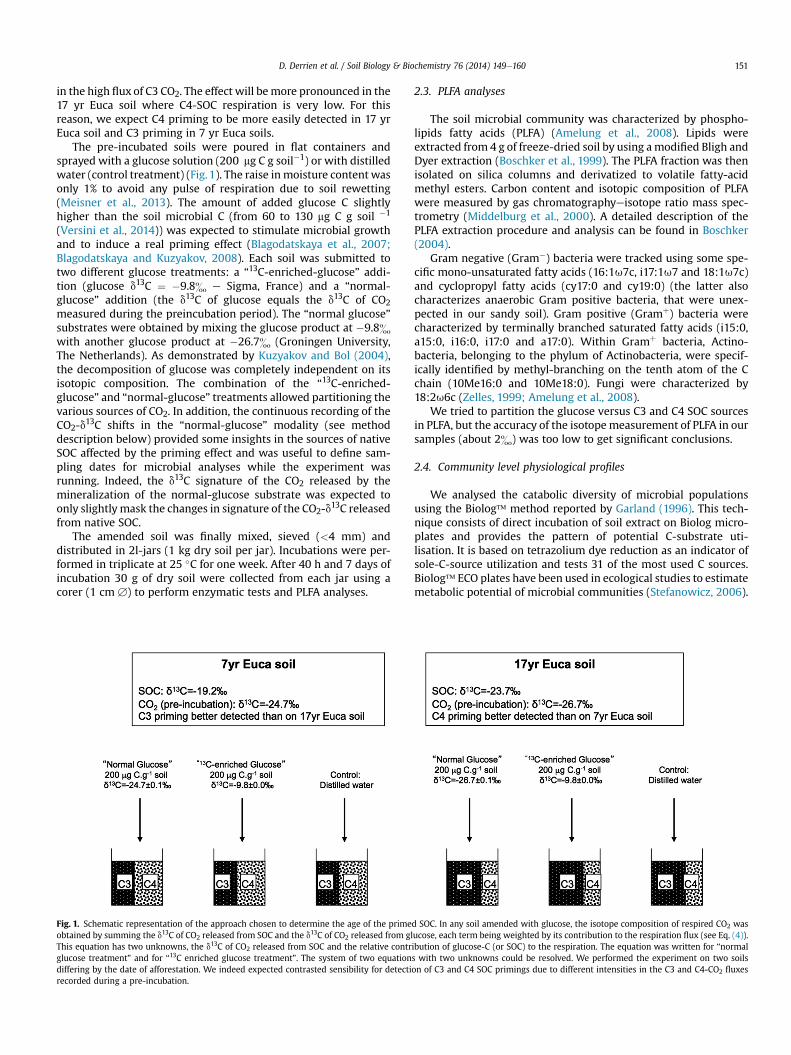
The pre-incubated soils were poured in flat containers andsprayed with a glucose solution (200 mg C g soil�1) or with distilledwater (control treatment) (Fig.1). The raise inmoisture contentwasonly 1% to avoid any pulse of respiration due to soil rewetting(Meisner et al., 2013). The amount of added glucose C slightlyhigher than the soil microbial C (from 60 to 130 mg C g soil �1
(Versini et al., 2014)) was expected to stimulate microbial growthand to induce a real priming effect (Blagodatskaya et al., 2007;Blagodatskaya and Kuzyakov, 2008). Each soil was submitted totwo different glucose treatments: a “13C-enriched-glucose” addi-tion (glucose d13C ¼ �9.8& e Sigma, France) and a “normal-glucose” addition (the d13C of glucose equals the d13C of CO2measured during the preincubation period). The “normal glucose”substrates were obtained by mixing the glucose product at �9.8&with another glucose product at �26.7& (Groningen University,The Netherlands). As demonstrated by Kuzyakov and Bol (2004),the decomposition of glucose was completely independent on itsisotopic composition. The combination of the “13C-enriched-glucose” and “normal-glucose” treatments allowed partitioning thevarious sources of CO2. In addition, the continuous recording of theCO2-d13C shifts in the “normal-glucose” modality (see methoddescription below) provided some insights in the sources of nativeSOC affected by the priming effect and was useful to define sam-pling dates for microbial analyses while the experiment wasrunning. Indeed, the d13C signature of the CO2 released by themineralization of the normal-glucose substrate was expected toonly slightlymask the changes in signature of the CO2-d13C releasedfrom native SOC.
The amended soil was finally mixed, sieved (<4 mm) anddistributed in 2l-jars (1 kg dry soil per jar). Incubations were per-formed in triplicate at 25 �C for one week. After 40 h and 7 days ofincubation 30 g of dry soil were collected from each jar using acorer (1 cm B) to perform enzymatic tests and PLFA analyses.
Fig. 1. Schematic representation of the approach chosen to determine the age of the primeobtained by summing the d13C of CO2 released from SOC and the d13C of CO2 released from glThis equation has two unknowns, the d13C of CO2 released from SOC and the relative contrglucose treatment” and for “13C enriched glucose treatment”. The system of two equationdiffering by the date of afforestation. We indeed expected contrasted sensibility for detectirecorded during a pre-incubation.
2.3. PLFA analyses
The soil microbial community was characterized by phospho-lipids fatty acids (PLFA) (Amelung et al., 2008). Lipids wereextracted from 4 g of freeze-dried soil by using amodified Bligh andDyer extraction (Boschker et al., 1999). The PLFA fraction was thenisolated on silica columns and derivatized to volatile fatty-acidmethyl esters. Carbon content and isotopic composition of PLFAwere measured by gas chromatographyeisotope ratio mass spec-trometry (Middelburg et al., 2000). A detailed description of thePLFA extraction procedure and analysis can be found in Boschker(2004).
Gram negative (Gram�) bacteria were tracked using some spe-cific mono-unsaturated fatty acids (16:1u7c, i17:1u7 and 18:1u7c)and cyclopropyl fatty acids (cy17:0 and cy19:0) (the latter alsocharacterizes anaerobic Gram positive bacteria, that were unex-pected in our sandy soil). Gram positive (Gramþ) bacteria werecharacterized by terminally branched saturated fatty acids (i15:0,a15:0, i16:0, i17:0 and a17:0). Within Gramþ bacteria, Actino-bacteria, belonging to the phylum of Actinobacteria, were specif-ically identified by methyl-branching on the tenth atom of the Cchain (10Me16:0 and 10Me18:0). Fungi were characterized by18:2u6c (Zelles, 1999; Amelung et al., 2008).
We tried to partition the glucose versus C3 and C4 SOC sourcesin PLFA, but the accuracy of the isotopemeasurement of PLFA in oursamples (about 2&) was too low to get significant conclusions.
2.4. Community level physiological profiles
We analysed the catabolic diversity of microbial populationsusing the Biolog� method reported by Garland (1996). This tech-nique consists of direct incubation of soil extract on Biolog micro-plates and provides the pattern of potential C-substrate uti-lisation. It is based on tetrazolium dye reduction as an indicator ofsole-C-source utilization and tests 31 of the most used C sources.Biolog� ECO plates have been used in ecological studies to estimatemetabolic potential of microbial communities (Stefanowicz, 2006).
d SOC. In any soil amended with glucose, the isotope composition of respired CO2 wasucose, each term being weighted by its contribution to the respiration flux (see Eq. (4)).ibution of glucose-C (or SOC) to the respiration. The equation was written for “normals with two unknowns could be resolved. We performed the experiment on two soilson of C3 and C4 SOC primings due to different intensities in the C3 and C4-CO2 fluxes

D. Derrien et al. / Soil Biology & Biochemistry 76 (2014) 149e160152
One gram of freshly ground soil was suspended in 10 ml of sodiumpyrophosphate (0.1%) solution and shaken for 20 min. Samplesuspensions settled for 10 min, were then decanted and diluted to1/10 with a NaCl solution (0.85%). Each well of Biolog plates wasinoculated with 150 ml of sample supernatant. Three analyticalreplicates were performed for each substrate. Plates were incu-bated at 25 �C and the optical density was read for each plate at 16-h intervals over a period of 160 h. The average well colour de-velopments (AWCD) of the different replicates were calculatedaccording to Garland (1996) where AWCD equals the sum of thedifference between the optical density of control (no substrate) andsubstrate wells divided by 31 (number of substrate wells in ECOplates). AWCD 0.5 (55-h maximum slope) was also used in statis-tical analyses.
2.5. Soil CO2 efflux and d13C
Soil respiration and CO2 isotopic composition were determinedusing a Tuneable Diode Laser Spectroscopy (TDLS) (TGA100A;Campbell Scientific Inc.) coupled with a multiplexer measuringalternatively the three replicates of each treatment: control,“normal glucose” and “13C-enriched glucose”. In comparison withIRMS, laser spectroscopy has the advantage to allow automaticrecording of the C isotopes in CO2 at a very high frequency (Baiet al., 2011). In our device each replicate was measured duringone minute every 30 min. Briefly, the diode laser produced linearwavelength scans centred on selected absorption lines of 12CO2 and13CO2. The laser radiation was absorbed proportionally to theconcentration of these gases in the sample cell. Three gas standardtanks were used for calibration (Air Product, 0.5% certified for CO2concentrations), they were measured during one minute every fiveminutes (Marron et al., 2009). The 12CO2 and 13CO2 concentrationsof the standards were respectively 297.21/3.19, 397.22/4.28 and1189.17/12.83 mmol mol�1 (measurements done by PTEF-INRALorraine).
Total soil CO2 efflux (CO2_tot) and its d13C (d13CCO2_tot) werecalculated using the two following equations:
CCO2 tot ¼ CO2½ �out � CO2½ �in� �� P � F
8:314� T �W(1)
where [CO2]in and [CO2]out are the CO2 concentrations in the incu-bator influx and outflux, P is the atmospheric pressure, F is the flowinside the bottle, W is the weight of soil incubated in each bottle, Tis the temperature (�K), 8.314 J mol�1 is the ideal gas constant.and
d13CCO2 tot ¼½13CO2�out�½13CO2�in½12CO2�out�½12CO2�in
RPDB� 1 (2)
where R is isotopic ratio of VPDB (0.011179602).In order to gain in d13C sensitivity in the measurement of low
respiration fluxes, a tank of compressed air was used to stabilize the12CO2 and 13CO2 concentrations of the incoming gas instead ofusing the ambient atmosphere, and the influx was set to270 ml min�1. Moisture content was readjusted every day tocompensate the flush of air circulating in the incubators. Data wereexcluded when they deviated by more than 5% from a runningaverage computed from three consecutive measurements on thesame incubator (what typically happened during and after periodsof incubator opening or due to instrument malfunctions).
For glucose treatments, data are given as mean and standarddeviation of the one-minute measurement made on the three in-dependent replicates.
For control treatment, as the respiration signal was low, wecomputed for each replicate the average values of CO2 efflux andd13C and their 95% confident interval from data recorded over thewhole incubation period. These averaged values were further usedto determine if the SOC mineralization in amended treatments wassignificantly different from the SOC mineralization in the controltreatments.
2.6. Analysis of data recorded by the tuneable diode laser
The isotopic composition of the total produced CO2, d13CeCO2_tot, was partitioned into SOC and glucose substrate sourcesaccording to the following equation
d13CCO2 tot ¼ d13CCO2 glc � fglc þ d13CCO2 SOC ��1� fglc
�(3)
with f glc the fraction of CO2 efflux corresponding to glucosemineralization, d13CCO2_glc the isotopic composition of the CO2produced from glucose and d13CCO2_SOC the isotopic composition ofthe CO2 produced from SOC.
Assuming no or negligible fractionation during glucose miner-alization (Ekblad et al., 2002), Eq. (3) becomes:
d13CCO2 tot ¼ d13Cglc � fglc þ d13CCO2 SOC ��1� fglc
�(4)
Eq. (4) written for the two modalities of glucose addition(“normal glucose”, glcnormal, and “13C-enriched glucose”, glcenriched)provided a system of two equations with two unknowns, f glc andd13CCO2_SOC:8<:d13CCO2 totðglcnormalÞ
¼ d13Cglcnormal� fglcþd13CCO2�SOC�
�1� fglc
�d13CCO2 totðglcenrichedÞ
¼ d13Cglcenriched � fglcþd13CCO2�SOC��1� fglc
�
Solving the system, we get for any time:
f glc ¼d13CCO2 tot glcnormalð Þ � d13CCO2 tot glcenrichedð Þ
d13Cglcnormal� d13Cglcenriched
(5)
and whatever the modality of glucose addition:
d13CCO2 SOC¼ d13CCO2�tot
� d13Cglc � fglc�1� fglc
� (6)
The respiration from native SOC, CCO2_SOC, was computed asfollows:
CCO2 SOC ¼ CCO2 tot ��1� fglc
�(7)
To assess the uncertainty in source partitioning, first orderTaylor series approximations of the variances of f glc, d
13CCO2_SOCand CCO2_SOC were calculated using partial derivatives (Phillips andGregg, 2001). Detailed calculations are given in Appendix:
s2f glc ¼s2
d13CCO2 tot glcnormalð Þ
þ s2d13CCO2 tot glcenrichedlð Þ
d13Cglcnormal� d13Cglcenriched
� �2 (8)
and
s2d13CCO2 SOC
¼s2d13Cglcnormal
$�d13CCO2 totðglcenrichedÞ
� d13CCO2 SOC
�2 þ s2d13Cglcenriched
$�d13CCO2 totðglcnormalÞ
� d13CCO2 SOC
�2�d13Cglcnormal
� d13Cglcenriched � d13CCO2 totðglcnormalÞþ d13CCO2 totðglcenrichedÞ
�2
þs2d13CCO2 totðglcnormalÞ
$�d13Cglcenriched � d13CCO2 SOC
�2 þ s2d13CCO2 totðglcenrichedÞ
$�d13Cglcnormal
� d13CCO2�SOC
�2�d13Cglcnormal
� d13Cglcenriched � d13CCO2 totðglcnormalÞþ d13CCO2 totðglcenrichedÞ
�2 (9)
D. Derrien et al. / Soil Biology & Biochemistry 76 (2014) 149e160 153
s2CCO2 SOC¼ CCO2 tot� �2 � s2f glc þ s2CCO2 tot
� 1� f glc
� �2(10)
As the values and uncertainties for flux and d13C of SOC respira-tion in amended treatments were not measured but derived fromthe resolution of equations, classical statistical tests could not beused to compare amended treatments with control treatments. Wethen considered that control and amended treatments were signif-icantly different when their 95% confidence intervals did not overlap.
3. Results
3.1. Changes in CO2 efflux and isotopic composition
Soil respiration for control treatment was about 0.12 and0.15 mg C kg soil�1 h�1 for 7 yr and 17 yr Euca soil, respectively(Table 2). Glucose addition induced a strong emission of CO2emission 17 h after the incubation started (peak of 10mg C kg soil�1
h�1, Fig. 2). Respiration sharply dropped to 1 mg C kg soil�1 h�1
after 20 h of incubation and continued to slightly decrease until theend of the incubation.
In the control treatments the mean CO2-d13C was �23.6& and�27.0& in the 7 yr and the 17 yr Euca soil, respectively (Table 2).Large variations around the mean values were due to the lowsensitivity of the TDLS for such low respiration. The CO2-d13C wasstrongly affected by glucose addition. Signal from soils amendedwith “13C enriched glucose” at �9.8& tended towards this value atthe peak of CO2 emission (Fig. 2e top). The d13C decreased after thepeak, but remained above the d13C of CO2 from the control soilsover the 7 days of monitoring.
The d13C of CO2 from soils amended with “normal-glucose”substrate showed a different pattern (Fig. 2 e bottom). Four stageswere identified. Stage 1 corresponded to the first six hours of in-cubation during which the d13C of CO2 decreased towards about�30&. In Stage 2, between 6 h of incubation and the peak of CO2efflux, the isotopic composition rapidly increased to reach aboutthe d13C value of the added glucose (�24.7& and�26.7& for 7 and17 yr Euca soil, respectively), supporting the assumption of none or
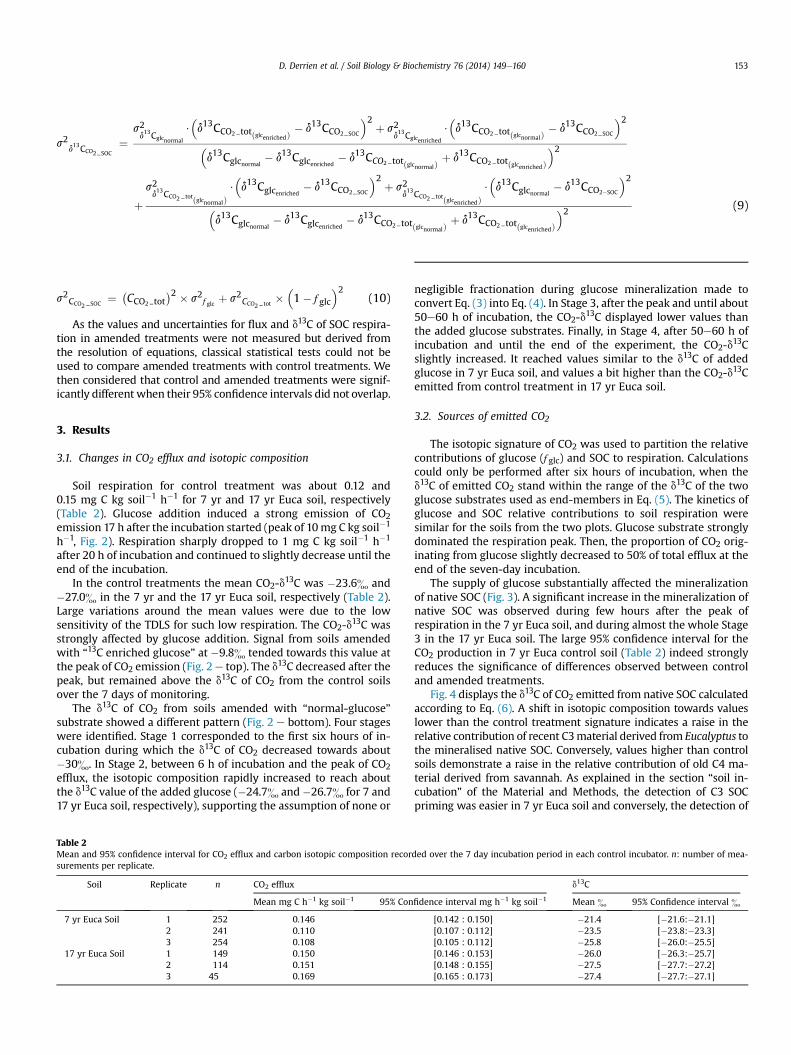
Table 2Mean and 95% confidence interval for CO2 efflux and carbon isotopic composition recorsurements per replicate.
Soil Replicate n CO2 efflux
Mean mg C h�1 kg soil�1 95% Con
7 yr Euca Soil 1 252 0.1462 241 0.1103 254 0.108
17 yr Euca Soil 1 149 0.1502 114 0.1513 45 0.169
negligible fractionation during glucose mineralization made toconvert Eq. (3) into Eq. (4). In Stage 3, after the peak and until about50e60 h of incubation, the CO2-d13C displayed lower values thanthe added glucose substrates. Finally, in Stage 4, after 50e60 h ofincubation and until the end of the experiment, the CO2-d13Cslightly increased. It reached values similar to the d13C of addedglucose in 7 yr Euca soil, and values a bit higher than the CO2-d13Cemitted from control treatment in 17 yr Euca soil.
3.2. Sources of emitted CO2
The isotopic signature of CO2 was used to partition the relativecontributions of glucose (f glc) and SOC to respiration. Calculationscould only be performed after six hours of incubation, when thed13C of emitted CO2 stand within the range of the d13C of the twoglucose substrates used as end-members in Eq. (5). The kinetics ofglucose and SOC relative contributions to soil respiration weresimilar for the soils from the two plots. Glucose substrate stronglydominated the respiration peak. Then, the proportion of CO2 orig-inating from glucose slightly decreased to 50% of total efflux at theend of the seven-day incubation.
The supply of glucose substantially affected the mineralizationof native SOC (Fig. 3). A significant increase in the mineralization ofnative SOC was observed during few hours after the peak ofrespiration in the 7 yr Euca soil, and during almost the whole Stage3 in the 17 yr Euca soil. The large 95% confidence interval for theCO2 production in 7 yr Euca control soil (Table 2) indeed stronglyreduces the significance of differences observed between controland amended treatments.
Fig. 4 displays the d13C of CO2 emitted from native SOC calculatedaccording to Eq. (6). A shift in isotopic composition towards valueslower than the control treatment signature indicates a raise in therelative contribution of recent C3material derived from Eucalyptus tothe mineralised native SOC. Conversely, values higher than controlsoils demonstrate a raise in the relative contribution of old C4 ma-terial derived from savannah. As explained in the section “soil in-cubation” of the Material and Methods, the detection of C3 SOCpriming was easier in 7 yr Euca soil and conversely, the detection of
ded over the 7 day incubation period in each control incubator. n: number of mea-
d13C
fidence interval mg h�1 kg soil�1 Mean & 95% Confidence interval &
[0.142 : 0.150] �21.4 [�21.6:�21.1][0.107 : 0.112] �23.5 [�23.8:�23.3][0.105 : 0.112] �25.8 [�26.0:�25.5][0.146 : 0.153] �26.0 [�26.3:�25.7][0.148 : 0.155] �27.5 [�27.7:�27.2][0.165 : 0.173] �27.4 [�27.7:�27.1]

Fig. 2. CO2 efflux rate and isotopic composition recorded every 30 min, after addition of “13C-enriched-glucose” (top panel), or “normal-glucose” (bottom panel). Data recorded onsoils from the plot afforested in Eucalyptus for 7 years are on the left, data recorded on soils sampled from the plot afforested in Eucalyptus for 17 years are on the right. Foramended soils, the grey area shows the standard deviation around the mean black curve (n ¼ 3). The blue line indicates the mean isotopic composition measured over the wholeincubation period in control soils, and also gives the CO2 isotope composition of amended soil before glucose addition. The bars on the left of the graphics indicate the standarddeviation of the mean CO2-d13C of control soils. The green dash-double dot line provides the isotopic composition of the added glucose substrate. Four stages, referred as Stages 1, 2,3 and 4, were identified from the direct visualisation of the shift in CO2-d13C in the “normal-glucose” modality - as the d13C of CO2 emitted from native SOC was not masked by thed13C of CO2 emitted from the glucose. Stage 1 corresponds to the triggering phase, Stage 2 to the peak of respiration, Stage 3 to a phase of decrease in d13C of CO2 emitted from nativeSOC compared to controls, Stage 4 to a phase of increase in d13C.
D. Derrien et al. / Soil Biology & Biochemistry 76 (2014) 149e160154
C4 SOC priming was easier in 17 yr Euca soil. An increase in therelative contribution of recent C3 SOC was showed in both 7 yr and17 yr Euca soil amended with glucose after the peak of respiration. Itwas significant for 60 h in 7 yr Euca soil but only for few hours in17 yr Euca soil. A significant raise in the relative contribution of oldC4 SOC was then observed during Stage 4 in 17 yr Euca soil.
3.3. PLFA profiles
PLFA data were first utilised to estimate the microbial biomass(Blagodatskaya and Kuzyakov, 2013). Using the conversion factorprovided by Bailey et al. (2002) who observed that 1 nmol PLFAcorrespond to a flush of 2.4 mg C released by fumigation, and the0.45 factor for the efficiency of the biomass extraction by fumiga-tion (Jenkinson et al., 2004), we estimated that microbial biomassaccounted for about 90 mg C.g soil�1 in the control treatments. Inthe 7 yr Euca soil, the addition of glucose increased the PLFA by 73%
at Stage 3, and 29% at stage 4 (Table 3). In the 17 yr Euca soil, theaddition of glucose increased the microbial biomass by ca 20% atboth Stages 3 and 4. Analysis of individual PLFA biomarkersrevealed that Gram� bacteria were strongly stimulated by glucoseaddition (Table 3, Fig. 5). Gramþ bacteria were also stimulatedduring Stage 3, but only in 7 yr Euca soil. No changes were observedin PLFA specific of Actinobacteria and Fungi.
3.4. Changes in enzymatic activity
Effects of glucose addition on catabolic diversity of soil microbialpopulations were evaluated by substrate utilization patterns, usingBiolog tests. Glucose addition significantly reduced the latencystage and the time to reach AWCD 0.5 whatever the stage and thesoil sample (Table 4a). Moreover, the latency stage and the delay toreach AWCD 0.5 were significantly lower at Stage 3 compared toStage 4 whatever the soil sample (Table 4a). For glucose treatments,

Fig. 3. CO2 produced from the incubated glucose (top panel) and of the native SOC (bottom panel) calculated according to Eq. (5) from data recorded every 30 min. Results for 7 yrEuca Soil are on the left, results for 17 yr Euca Soil are on the right. Fluxes are presented with the associated uncertainty as a grey area (see Section 2.6). The CO2 efflux from controlsoil is also given on graphics showing CO2 production from native SOC, as a 95% confidence interval standing within the dashed lines.
Fig. 4. Change in d13C of CO2 emitted from native SOC after glucose addition. Dark dots stand for d13C values computed from Eq. (6). Grey crosses showed the uncertainty associatedwith calculation as given by Eq. (9). Results for 7 yr Euca Soil are on the left panel, for the 17 yr Euca Soil on the right. The dark line separating the grey and white area indicates themean d13C of CO2 from control soils, and also give the d13C of CO2 from amended soil before glucose addition. The dash-lines indicate the 95% confidence interval of d13C of CO2 incontrol soils. Any shift into the grey zone shows a relative increase in the contribution of C3 recent C to the bulk SOC mineralization. Conversely, any shift into the white zone showsa relative increase in the contribution of C4 old C to the bulk SOC mineralization. Control and amended treatments are significantly different in d13C when the 95% confident intervalof the control and the uncertainty computed for glucose treatment do not overlap.
D. Derrien et al. / Soil Biology & Biochemistry 76 (2014) 149e160 155
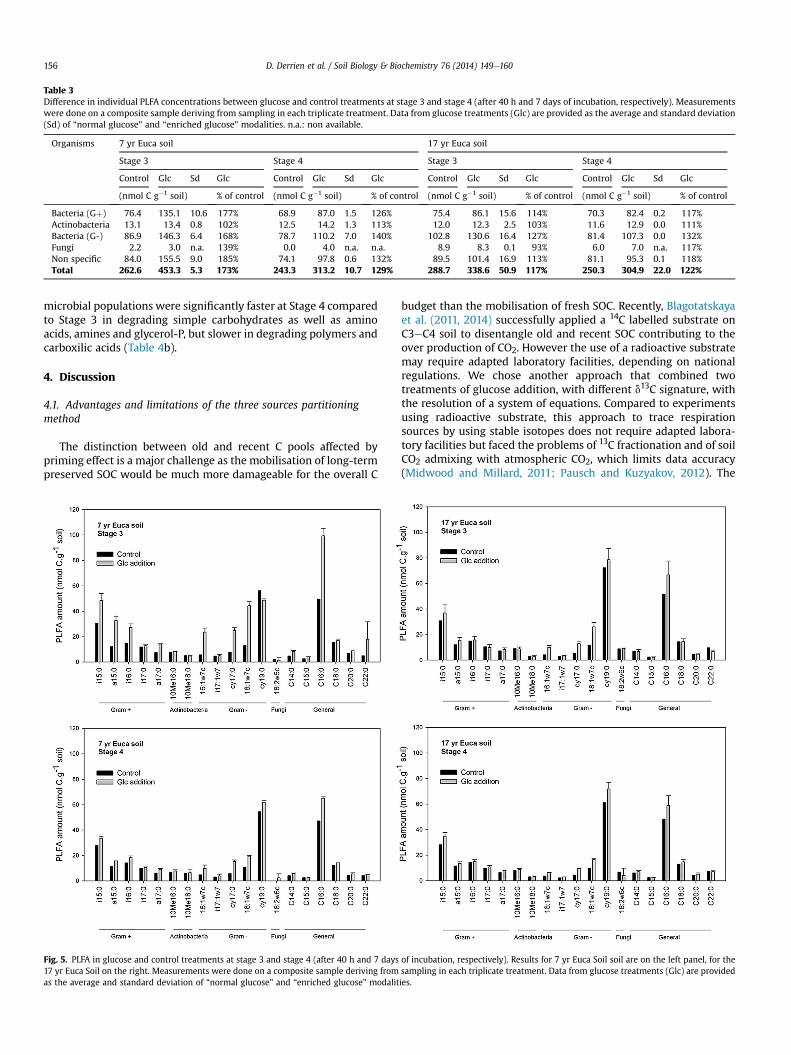
Table 3Difference in individual PLFA concentrations between glucose and control treatments at stage 3 and stage 4 (after 40 h and 7 days of incubation, respectively). Measurementswere done on a composite sample deriving from sampling in each triplicate treatment. Data from glucose treatments (Glc) are provided as the average and standard deviation(Sd) of “normal glucose” and “enriched glucose” modalities. n.a.: non available.
Organisms 7 yr Euca soil 17 yr Euca soil
Stage 3 Stage 4 Stage 3 Stage 4
Control Glc Sd Glc Control Glc Sd Glc Control Glc Sd Glc Control Glc Sd Glc
(nmol C g�1 soil) % of control (nmol C g�1 soil) % of control (nmol C g�1 soil) % of control (nmol C g�1 soil) % of control
Bacteria (Gþ) 76.4 135.1 10.6 177% 68.9 87.0 1.5 126% 75.4 86.1 15.6 114% 70.3 82.4 0.2 117%Actinobacteria 13.1 13.4 0.8 102% 12.5 14.2 1.3 113% 12.0 12.3 2.5 103% 11.6 12.9 0.0 111%Bacteria (G-) 86.9 146.3 6.4 168% 78.7 110.2 7.0 140% 102.8 130.6 16.4 127% 81.4 107.3 0.0 132%Fungi 2.2 3.0 n.a. 139% 0.0 4.0 n.a. n.a. 8.9 8.3 0.1 93% 6.0 7.0 n.a. 117%Non specific 84.0 155.5 9.0 185% 74.1 97.8 0.6 132% 89.5 101.4 16.9 113% 81.1 95.3 0.1 118%Total 262.6 453.3 5.3 173% 243.3 313.2 10.7 129% 288.7 338.6 50.9 117% 250.3 304.9 22.0 122%
D. Derrien et al. / Soil Biology & Biochemistry 76 (2014) 149e160156
microbial populations were significantly faster at Stage 4 comparedto Stage 3 in degrading simple carbohydrates as well as aminoacids, amines and glycerol-P, but slower in degrading polymers andcarboxilic acids (Table 4b).
4. Discussion
4.1. Advantages and limitations of the three sources partitioningmethod
The distinction between old and recent C pools affected bypriming effect is a major challenge as the mobilisation of long-termpreserved SOC would be much more damageable for the overall C
Fig. 5. PLFA in glucose and control treatments at stage 3 and stage 4 (after 40 h and 7 days17 yr Euca Soil on the right. Measurements were done on a composite sample deriving fromas the average and standard deviation of “normal glucose” and “enriched glucose” modalit
budget than the mobilisation of fresh SOC. Recently, Blagotatskayaet al. (2011, 2014) successfully applied a 14C labelled substrate onC3eC4 soil to disentangle old and recent SOC contributing to theover production of CO2. However the use of a radioactive substratemay require adapted laboratory facilities, depending on nationalregulations. We chose another approach that combined twotreatments of glucose addition, with different d13C signature, withthe resolution of a system of equations. Compared to experimentsusing radioactive substrate, this approach to trace respirationsources by using stable isotopes does not require adapted labora-tory facilities but faced the problems of 13C fractionation and of soilCO2 admixing with atmospheric CO2, which limits data accuracy(Midwood and Millard, 2011; Pausch and Kuzyakov, 2012). The
of incubation, respectively). Results for 7 yr Euca Soil soil are on the left panel, for thesampling in each triplicate treatment. Data from glucose treatments (Glc) are providedies.

Table 4aComparison of soil microbial metabolic responses (AWCD 0.5 and latency stage) of 7 yr and 17 yr Euca soil. Mean and standard deviation of AWCD and latency stages werecalculated from triplicate 7 yr and 17 yr Euca Soil plates by using three soil suspension. For each soil sample and each stage, differences in AWCD 0.5 and latency stage betweenthe control and glucose treatments were performed with a one-way ANOVA (Scheffe’s F test). Bold values indicate a p-value <0.05.
Soil sample 7 yr Euca soil 17 yr Euca soil
Stage Stage 3 Stage 4 Stage 3 Stage 4
Modalities Control Glucose Control Glucose Control Glucose Control Glucose
AWCD 0.5 (days) 4.6 � 0.4 3.0 ± 0.1 6.0 � 0.2 3.4 ± 0.1 4.7 � 0.2 3.0 ± 0.2 7.4 � 0.1 3.3 ± 0.2Latency stage (days) 2.0 � 0.1 1.2 ± 0.1 4.1 � 0.2 2.1 ± 0.2 2.2 � 0.1 1.2 ± 0.2 3.8 � 0.4 2.1 ± 0.2
D. Derrien et al. / Soil Biology & Biochemistry 76 (2014) 149e160 157
continuous record by the TDLS of the 12CO2 and 13CO2 concentra-tions in the incoming air flushing the incubators reduced the un-certainty related to atmospheric CO2 contribution to the isotopesignal. It indeed provides the atmosphere background, what atraditional IRMS cannot do. However, inevitably, the accuracy of C-sources partitioning decreased over the course of our experiment,as respiration decreased. Nevertheless, we were able to determinethe contribution of glucose and glucose derived metabolites to CO2emission versus SOC contribution with less than 5% of uncertaintyduring the first days of the experiment, and with around 10e20% ofuncertainty at the end of the incubation. The good accuracy in theisotope signature further allowed reporting significant changes inthe relative contributions of recent C3 or old C4 to the minerali-zation of SOC. As the recent C3 SOC contributed less to the basalrespiration in 7 yr Euca soil than in 17 yr Euca soil, the sensitivity fordetecting an increase in C3 respirationwas better in 7 yr Euca soils,yet. Conversely, the sensitivity for detecting an increase in C4respiration was better in 17 yr Euca soils.
Table 4bSubstrates preferentially consumed (Biolog microplates) by soil microbial populationswhatever the soil between the modalities 40 h (stage 3) and 7 days (stage 4).
Substrate Stage 3 vsStage 4
p-value
Miscellaneous Pyruvic Acid Methyl Ester ¼ 0.124Glucose-1- Phosphate ¼ 0.064D,L-a-Glycerol Phosphate < 0.039
Polymeres Tween 40 > 0.024Tween 80 > 0.036a- Cyclodextrin ¼ 0.739Glycogen > 0.037
Carbohydrates D-Cellobiose < 0.023a-D-Lactose < 0.043b-Methyl-D- Glucoside ¼ 0.056D-Xylose < 0.039i-Erythritol ¼ 0.874D-Mannitol < 0.000N-Acetyl-D- Glucosamine [ 0.140
Carboxilic acids D- Glucosaminic Acid > 0.001D-Galactonic Acid g-Lactone > 0.002D- Galacturonic Acid ¼ 0.2842-Hydroxy Benzoic Acid > 0.0034-Hydroxy Benzoic Acid > 0.003g-Hydroxybutyric Acid ¼ 0.419Itaconic Acid ¼ 0.294a-Ketobutyric Acid ¼ 0.429D-Malic Acid ¼ 0.356
Amino acids L-Arginine ¼ 0.147L-Asparagine < 0.041L- Phenylalanine < 0.026L-Serine < 0.043L-Threonine < 0.028Glycyl-L- Glutamic Acid ¼ 0.425
Amines Amides Phenylethyl- amine < 0.032Putrescine < 0.029
Difference in the substrates consumption between stage 3 and 4 was performed atAWCD 0.5 with a one-way ANOVA (Scheffe’s F test, n ¼ 3). Bold values indicate a p-value < 0.05. Legend: ¼ , not significant differences; > significantly more consumedat stage 3; < significantly more consumed at stage 4.
4.2. Evidence of triggering on microbial populations feeding onrecent C3 SOC
In our experiment, the use of a laser spectrometry offered theunique opportunity to capture changes in the respiration sources ata hour timescale (Griffis et al., 2004; Plain et al., 2009; Epron et al.,2011), while studies on priming sources traditionally collect CO2trapped inNaOH vessels at a daily orweekly timescale. During Stage1, themineralization of glucose had started, as demonstrated by theshift towards glucose d13C in the “enriched glucose” treatment(Fig. 2), where the glucose d13C clearly differed from the d13C of CO2produced in control soil. But the glucose mineralization was quitelow yet. Such a lag phase in glucose mineralization was already re-ported in other studies and interpreted as a phase of microbereactivation and growth (De Nobili et al., 2001; Schneckenbergeret al., 2008; Zyakun et al., 2013), what was confirmed by the raisein PLFA amounts (Table 3). A strong decrease of d13C of CO2 duringStage 1was observed in the “normal-glucose” treatments (Fig. 2). Inthese “normal-glucose” treatments the added glucose had a Cisotope composition similar to the d13C of CO2 produced in controlsoil. The d13C decrease resulted either (i) from a change in sources ofmineralised SOC immediately after glucose addition or (ii) fromisotope fractionation during glucose mineralisation. We posit thatthe main reason would be the preferential utilisation of the recentC3 organic matter. Not all microbes responsible for the basal respi-ration would be rapidly triggered by the glucose addition, but onlysome specific microbial populations feeding on C3material. Zyakunet al. (2013) indeed demonstrated by measuring respiratory coeffi-cient that the reactivation of microbes occurring rapidly afterglucose addition involves themineralization of stored lipids, knownto be 13C depleted. This interpretation of a sole stimulation of somemicrobe feeding on recent C3 SOC would be consistent with thefurther observation that themicrobial communities active at stage 3after the peak of glucose consumption preferentially utilise C3 SOC.If any isotope fractionation occured at Stage 1 it would be due tokinetics effect. Measurements of CO2 d
13C performed at the peak ofglucose consumption (Stage 2) indeed indicated that thermody-namic fractionation during glucose mineralisation was minor.
4.3. Characteristics of microbial populations sequentially active
The triggered populations utilised the added glucose-C at Stage2 and the recent C3 SOC at Stage 3 as glucose-C became rapidlyincluded in microbial metabolites and less accessible (Derrien et al.,2007; Hill et al., 2008). At Stage 4, changes in the isotopic signatureof mineralised SOC in the 17 yr Euca soil amended with glucoseindicated that the active populations preferentially mineralised theold C4 SOC. In the conditions of the Biolog test, these populationscollected at Stage 4 consumed the tested substrates slower thanpopulations from Stage 3, and interestingly they exhibited a higherpotential for the decomposition of nutrient-containing substrates(Table 4a and 4b). The soils of our experiment are known to be poorin available nitrogen (Mareschal et al., 2013). We postulated that

D. Derrien et al. / Soil Biology & Biochemistry 76 (2014) 149e160158
the populations efficient in N mining outcompeted the populationsactive at Stage 3 when available nitrogen became limiting. Theyfound their N-resource in the old C4 SOC, old soil organic matterbeing N-rich compared with recent one due to nitrogen immobi-lisation by microbes during decomposition (von Lützow et al.,2007). The relation between old SOC mining and N availability isnot univocal, yet. Blagodatskaya et al. (2011) invoked the mining ofold SOC to meet needs in N as we did, but Waldrop and Firestone(2004a) showed that addition of mineral N can enhanced old SOCmineralization through an increase oxidative activity. Theseopposite responses indicate that the enhanced mineralization ofold SOC depends on the factor limiting the activity of the microbialpopulations, e.g. energy, nitrogen . (Hamer and Marschner, 2005;Fontaine et al., 2011; Nottingham et al., 2012; Sullivan and Hart,2013).
Gram� bacteria were particularly important in the response tosubstrate addition, as also found by other authors (Waldrop andFirestone, 2004b; Notthingham et al., 2009; Bastida et al., 2013;Dungait et al., 2013) and could be designed as r-strategists. Acomplementary experiment that we performed adding 200 mg C.soil�1 of 99% 13C labelled glucose in 17 yr Euca soil revealed that thegrowth of microbe was supported by glucose substrate at Stage 3while native SOC was also included in the newly formed biomass atStage 4 (See Supplementary). PLFA markers for Gramþ bacteriaexperiment did not exhibit the same dynamics in the two soils ofour experiment. Observations made by other groups indicate theyusually do not rapidly take advantage of labile substrate addition.Waldrop and Firestone (2004b) and Bird et al. (2011) observed aresponse of Gramþ populations several months after substrateaddition whereas Bastida et al. (2013) revealed a response onlydelayed by few days compared to Gram� populations. In line withthese priming experiments, Kramer and Gleixner (2008) demon-strated that at the steady state Gram� bacteria preferentially userecent SOC and Gramþ bacteria old SOC.
4.4. Implications of pulse-addition of labile substrates on thepreservation of carbon in soil
After seven days of incubation 50% of the glucose-C was stillretained in soil (ca.100mg g�1 of soil), largelyexceeding the amountofnative SOC that had been over-mineralised (ca. 10 mg g�1 of soil). Atthe end of the experiment it can be reasonably assumed that theglucose-Cwas included inmicrobialmetabolites and that inaverage itwill be preserved over years to decades (Derrien et al., 2006).Balancing the C input into the soil by the output is not sufficient toassess the soil storage potential yet. Changes in the duration of SOCstorage must also be inspected. The shifts in the isotope compositionof respired native SOC showed that the glucose addition induced firsta destabilisation of the recent pool of native SOC for a couple of daysand then a destabilisation of the old pool of native SOC (Fig. 4). Thelatter may seriously impact the C storage in our soils. We couldneither precisely determine the age of the old organics that weredestabilised (apart than they were older than 7 or 17 yr old,depending on the soil), nor determine if the destabilisation occurredfor a few days or persisted over time. Even if the effect is short, it is ofprimary importance to consider it as pulse additionof labile substratefrequently occurs inmost plant-soil systems. Pulse-inputs are typicalfor root exudation and breaking-down of dead microbial cellsreleasing soluble compounds in the rhizosphere (Kuzyakov, 2010).Solubleextracellularenzymesalso scavenge substrates away fromtherhizosphere and generate flush of easily available compounds.Therefore, the potential of a soil to preserve C is strongly dependenton the age of the SOC utilised by microbes after sporadic but regularsupplyof labile substrate. Someprevious studies (Blagodatskaya et al.,2008, 2011) reported that the rate of C input determines the intensity
of the priming: (i) low input is insufficient to inducemicrobe growthand solely causes amicrobe biomass turnover, (ii) input in an amountsimilar to microbe biomass induces a positive priming e as in ourexperiment, (iii) while input several time higher than the microbebiomass induces a zero or negative priming due to the preferentialuseof the added substrate rather thanSOC. Blagodatskayaet al. (2011)reported that higher biomass turnover caused by a low input onlyaffects the recent SOC, in accordance with our observations duringStage 1. We may also expect that despite a balance favouring Csequestration, a high substrate addition may alter the duration of Cstorage. Recent SOC would be less mobilised than in normal condi-tions due to the great accessibility of added substrate, but a highamount of nutriments would be required, leading to a destabilisationof old SOC in nutrient-poor soil.
5. Conclusions
To assess the impact of pulse-addition of labile substrate on theC storage in soil, the amount of preserved substrate should becompared to the over-mineralized SOC, but shifts in the age ofmineralised SOC should also be investigated. Our study demon-strated that the pulse input of glucose induced major changes inmicrobial community structure and SOC utilisation patterns,inducing first a preferential use of recent SOC but then a destabi-lisation of old SOC. This study making use of TDLS to partition thenative SOC sources of respired CO2 at a very high frequency calls forother experiments using the same kind of device, preferentially insoils with a high basal respiration so that to gain in signal sensi-tivity, and if possible on longer period of time.
Nutrient limitation could be responsible for the shift from recentto old SOC sources and would then exert a strong control on theduration of carbon preservation in soil. It appears crucial to verifythis idea on soils with different levels of fertility.
Ackowledgements
This work was funded by the Fabelor research program(12000176A ). The UMR 1137 and the UR 1138 are supported by theFrench National Research Agency through the Laboratory ofExcellence ARBRE (ANR-12- LABXARBRE-01). We thank the tech-nical staff of the CR2PI for taking care over years of the C3C4chronosequence in Congo, Jacques Ranger for helping with soilsampling, Nicolas Richet and André Clerc for technical support,Frans Stellaard for offering its C3-glucose, Mélanie Maître andCharlotte Burgault for data treatment, Jean-Paul Laclau, Rémid’Annunzio and Louis Mareschal for discussions and the two ref-erees for their comments. Pierre-Emmanuel Courty gratefullyacknowledge the Swiss National Science Foundation (ambizionegrant PZ00P3_136651). Special thoughts to Anna and Paulette.
Appendix A. Supplementary data
Supplementary data related to this article can be found at http://dx.doi.org/10.1016/j.soilbio.2014.04.030.
Appendix
The solution (Eq. (8)) to the general Taylor series equation forthe variance of f glc (Eq. (5)) can be determined as follows
fglc ¼d13CCO2 totðglcnormalÞ
� d13CCO2 totðglcenrichedÞ
d13Cglcnormal� d13Cglcenriched
(A1)
Let’s denote

D. Derrien et al. / Soil Biology & Biochemistry 76 (2014) 149e160 159
d13CCO2 totðglcnormal Þ; d13CCO2_N
d13CCO2 totðglcenrichedÞ; d13CCO2_E
d13Cglcnormal; d13Cglc_N
d13Cglcenriched ; d13Cglc_E
The partial derivatives for f glc are:
vfglc
vd13CCO2 N
¼ 1
d13Cglc_N � d13Cglc_E
vfglc
vd13CCO2_E
¼ �1
d13Cglc_N � d13Cglc_E
vfglc
vd13Cglc_N¼
��d13CCO2_N � d13CCO2_E
��d13Cglc_N � d13Cglc_E
�2vfglc
vd13Cglc_E¼�d13CCO2_N � d13CCO2_E
��d13Cglc_N � d13Cglc_E
�2
(A2)
These derivatives are substituted into
s2fglc ¼
vfglc
vd13CCO2_N
!2
$s2d13CCO2_N
þ
vfglc
vd13CCO2_E
!2
$s2d13CCO2_E
þ
vfglc
vd13Cglc_N
!2
$s2d13Cglc_N
þ
vfglc
vd13Cglc_E
!2
$s2d13Cglc_E
(A3)
to give
s2fglc ¼s2d13CCO2 N
þ s2d13CCO2 E�
d13Cglc N � d13Cglc E
�2
þ
�s2d13Cglc N
þ s2d13Cglc E
�:�d13CCO2 N � d13CCO2 E
�2�d13Cglc N � d13Cglc E
�4(A4)
This equation can be approximated by
s2fglc ¼s2d13CCO2_N
þ s2d13CCO2_E�
d13Cglc_N � d13Cglc_E�2 (A5)
s2d13CCO2_SOC ¼s2d13Cglc_N
$�d13CCO2_E�
d13Cgl
þs2d13CCO2_N
$�d13Cglc�
d13
Similarly, the solution (Eq. (9)) to the general Taylor seriesequation for the variance of v13C (Eq. (6)) can be determine
CO2_SOCas follows:For the normal glucose modality, we have
d13CCO2_SOC ¼ d13CCO2_N � d13Cglc_N � fglc�1� fglc
� (A6)
with fglc ¼ d13CCO2_N�d
13CCO2_E
d13Cglc_N�d
13Cglc_E
Eq. (A6) can also be written as
d13CCO2_SOC ¼ d13Cglc_N � d13CCO2_E � d13Cglc_E � d13CCO2_N
d13Cglc_N � d13Cglc_E � d13CCO2_N þ d13CCO2_E
(A7)
Let’s denote
a ¼ d13Cglc N � d13CCO2 E � d13Cglc E � d13CCO2 N
b ¼ d13Cglc N � d13Cglc E � d13CCO2 N þ d13CCO2 E
The partial derivatives for v13CCO2_SOC are:
vd13CCO2_SOC
vd13Cglc_N¼ b:d13CCO2_E � a
b2¼ d13CCO2_E � d13CCO2_SOC
b
vd13CCO2_SOC
vd13Cglc_E¼ �b:d13CCO2_N þ a
b2¼ �d13CCO2 N � d13CCO2_SOC
b
vd13CCO2_SOC
vd13CCO2_N
¼ �b:d13Cglc_E þ a
b2¼ �d13Cglc_E � d13CCO2_SOC
b
vd13CCO2_SOC
vd13CCO2_E
¼ b:d13Cglc_N � a
b2¼ d13Cglc_N � d13CCO2_SOC
b
(A8)
These derivatives are substituted into
s2d13CCO2 SOC¼ vd13CCO2 SOC
vd13Cglc N
!2
$s2d13Cglc N
þ vd13CCO2_SOC
vd13Cglc_E
!2
$s2d13Cglc_E
þ vd13CCO2_SOC
vd13CCO2_N
!2
$s2d13CCO2_N
þ vd13CCO2_SOC
vd13CCO2_E
!2
$s2d13CCO2_E
(A9)
to give
� d13CCO2_SOC
�2 þ s2d13Cglc_E
$�d13CCO2_N � d13CCO2_SOC
�2c_N � d13Cglc_E � d13CCO2_N þ d13CCO2_E
�2_E � d13CCO2_SOC
�2 þ s2d13CCO2_E
$�d13Cglc_N � d13CCO2_SOC
�2Cglc_N � d13Cglc_E � d13CCO2_N þ d13CCO2_E
�2 (A10)

D. Derrien et al. / Soil Biology & Biochemistry 76 (2014) 149e160160
References
Amelung, W., Brodowski, S., Sandhage-Hofmann, A., Bol, R., 2008. CombiningBiomarker with Stable Isotope Analyses for Assessing the Transformation andTurnover of Soil Organic Matter. In: Advances in Agronomy. Academic Press,Burlington, pp. 155e250.
Bai, M., Köstler, M., Kunstmann, J., Wilske, B., Gattinger, A., Frede, H.G., Breuer, L.,2011. Biodegradability screening of soil amendments through coupling ofwavelength-scanned cavity ring-down spectroscopy to multiple dynamicchamber. Rapid Communications in Mass Spectrometry 25, 3683e3689.
Bailey, V.L., Peacock, A.D., Smith, J.L., Bolton Jr., H., 2002. Relationships between soilmicrobial biomass determined by chloroform fumigation-extraction, substrateinduced respiration, and phospholipid fatty acid analysis. Soil Biology andBiochemistry 34, 1385e1389.
Bastida, F., Torres, I.F., Hernandez, T., Bombach, P., Richnow, H.H., Garcia, C., 2013.Can the labile carbon contribute to carbon immobilization in semiarid soils?Priming effects and microbial community dynamics. Soil Biology andBiochemistry 57, 892e902.
Bird, J.A., Herman, D.J., Firestone, M.K., 2011. Rhizosphere priming of soil organicmatter by bacterial groups in a grassland soil. Soil Biology and Biochemistry 43,718e725.
Blagodatskaya, E.V., Blagodatsky, S.A., Anderson, T.-H., Kuzyakov, Y., 2007. Primingeffects in Chernozem induced by glucose and N in relation to microbial growthstrategies. Applied Soil Ecology 37, 95e105.
Blagodatskaya, E.V., Kuzyakov, Y., 2008. Mechanisms of real and apparent primingeffects and their dependence on soil microbial biomass and communitystructure: critical review. Biology and Fertility of Soils 45, 115e131.
Blagodatskaya, E.V., Yuyukina, T., Blagodatsky, S.A., Kuzyakov, Y., 2011. Three-source-partitioning of microbial biomass and of CO2 efflux from soil to evaluatemechanisms of priming effects. Soil Biology and Biochemistry 43, 778e786.
Blagodatskaya, E.V., Kuzyakov, Y., 2013. Active microorganisms in soil: critical re-view of estimation criteria and approaches. Soil Biology and Biochemistry 67,192e211.
Blagodatskaya, E.V., Khomyakov, N., Myachina, O., Bogomolova, I., Blagodatsky, S.A.,Kuzyakov, Y., 2014. Microbial interactions affect sources of priming induced bycellulose. Soil Biology and Biochemistry 74, 39e49.
Boschker, H.T.S., Moerdijk-Poortvliet, T.C.W., van Breugel, P., Houtekamer, M.,Middelburg, J.J., 1999. A versatile method for stable carbon isotope analysis ofcarbohydrate by high-performance liquid chromatography/isotope ratio massspectrometry. Rapid Communications in Mass Spectrometry 22, 1e7.
Boschker, H.T.S., 2004. Linking microbial community structure and functioning:stable isotope (13C) labeling in combination with PLFA analysis. In:Kowalchuk, G.A., de Bruijn, F.J., Head, I.M., Akkermans, A.D., van Elsas, J.D. (Eds.),Microbial Ecology. Kluwer Academic Publishers, Dordrecht, The Netherlands,pp. 1673e1688.
De Nobili, M., Contin, M., Mondini, C., Brooks, P.C., 2001. Soil microbial biomass istriggered into activity by trace amounts of substrate. Soil Biology andBiochemistry 33, 1163e1170.
Derrien, D., Marol, C., Balabane, M., Balesdent, J., 2006. The turnover of carbohy-drates in a cultivated soil estimated by 13C natural abundances. EuropeanJournal of Soil Science 57, 547e557.
Derrien, D., Marol, C., Balesdent, J., 2007. Microbial biosyntheses of individualneutral sugars among a set of substrates and soils. Geoderma 139, 190e197.
Dungait, J.A.J., Kemmitt, S.J., Michallon, L., Guo, S., Wen, Q., Brooks, P.C.,Evershed, R.P., 2011. Variable responses of the soil microbial biomass to traceconcentrations of 13C-labelled glucose, using 13C-PLFA analysis. EuropeanJournal of Soil Science 62, 117e126.
Dungait, J.A.J., Kemmitt, S.J., Michallon, L., Guo, S., Wen, Q., Brooks, P.C.,Evershed, R.P., 2013. The variable response of soil microorganisms to traceconcentrations of low molecular weight organic substrates of increasingcomplexity. Soil Biology and Biochemistry 64, 57e64.
Ekblad, A., Nyberg, G., Högberg, P., 2002. 13C-discrimination during microbialrespiration of added C3-, C4- and 13C-labelled sugars to a C3-forest soil.Oecologia 131, 245e249.
Epron, D., Marsden, C., Thongo M’Bou, A., Saint-Andre, L., d’Annunzio, R.,Nouvellon, Y., 2009. Soil carbon dynamics following afforestation of a tropicalsavannah with Eucalyptus in Congo. Plant Soil 323, 309e322.
Epron, D., Ngao, J., Dannoura, M., Bakker, M.R., Zeller, B., Bazot, S., Bosc, A., Plain, C.,Lata, J.C., Priault, P., Barthes, L., Loustau, D., 2011. Seasonal variations ofbelowground carbon transfer assessed by in situ 13CO2 pulse labelling of trees.Biogeosciences 8 (5), 1153e1168.
Fontaine, S., Mariotti, A., Abbadie, L., 2003. The priming effect of organic matter: aquestion of microbial competition? Soil Biology and Biochemistry 35, 837e843.
Fontaine, S., Henault, C., Aamor, A., Bdioui, N., Bloor, J.M.G., Maire, V., Mary, B.,Revaillot, S., Maron, P.A., 2011. Fungi mediate long term sequestration of carbonand nitrogen in soil through their priming effect. Soil Biology and Biochemistry43, 86e96.
Garland, J.L., 1996. Analytical approaches to the characterization of samples ofmicrobial communities using patterns of potential C source utilization. SoilBiology and Biochemistry 28, 213e221.
Griffis, T.J., Baker, J.M., Sargent, S.D., Tanner, B.D., Zhang, J., 2004. Measuring field-scale isotopic CO2 fluxes with tunable diode laser absorption spectroscopy
and micrometeorological techniques. Agricultural and Forest Meteorology 124(1e2), 15e29.
Hamer, U., Marschner, B., 2005. Priming effects in different soil types induced byfructose, alanine, oxalic acid and catechol additions. Soil Biology andBiochemistry 37, 445e454.
Hill, P.W., Farrar, J.F., Jones, D.L., 2008. Decoupling of microbial glucose uptake andmineralization in soil. Soil Biology and Biochemistry 40, 616e624.
IPCC, 2004. Good Practice Guidance for Land Use, Land-use Change and Forestry,Intergovernmental Panel on Climate Change.
Jenkinson, D.S., Brooks, P.C., Powlson, D.S., 2004. Measuring soil microbial biomass.Soil Biology and Biochemistry 36, 5e7.
Kramer, C., Gleixner, G., 2008. Soil organic matter in soil depth profiles: distinctcarbon preference of microbial groups during carbon transformation. SoilBiology and Biochemistry 40, 425e433.
Kuzyakov, Y., 2010. Priming effects: interactions between living and dead organicmatter. Soil Biology and Biochemistry 42, 1363e1371.
Kuzyakov, Y., Bol, R., 2004. Using natural 13C abundances to differentiate betweenthree CO2 sources during incubation of a grassland soil amended with slurryand sugar. Journal of Plant Nutrition and Soil Science 167, 669e677.
Lal, R., 2005. Forest soils and carbon sequestration. Forest Ecol. Manag 220, 242e248.Löhnis, F., 1926. Nitrogen availability of green manures. Soil Science 22, 171e177.Mareschal, L., Laclau, J.P., Nzila, J.D.D., Versini, A., Koutika, L.S., Mazoumbou, J.C.,
Deleporte,P.,Bouillet, J.-P.,Ranger, J., 2013.Nutrient leachinganddeepdrainageunderEucalyptus plantations managed in short rotations after afforestation of an Africansavanna: two 7-year time series. Forest Ecology and Management 307, 242e254.
Marron, N., Plain, C., Longdoz, B., Epron, D., 2009. Seasonal and daily time course ofthe 13C composition in soil CO2 efflux recorded with a tunable diode laserspectrophotometer (TDLS). Plant Soil 318, 137e151.
Meisner, A., Baath, E., Rousk, J., 2013. Microbial growth responses upon rewettingsoil dried for four days or one year. Soil Biology and Biochemistry 66, 188e192.
Middelburg, J.J., Barranguet, C., Boschker, H.T.S., Herman, P.M.J., Moens, T.,Heip, C.H.R., 2000. The fate of intertidal microphytobenthos carbon: an in situ13C-Labeling study. Limnology and Oceanography 45, 1224e1225.
Midwood, A.J., Millard, P., 2011. Challenges in measuring the d13C of the soil surfaceCO2 efflux. Rapid Communications in Mass Spectrometry 25, 232e242.
Nottingham, A.T., Griffith, H., Chamberlain, P.M., Scott, A.W., Tanner, A.V.J., 2009.Soil priming by sugar and leaf-litter substrates: a link to microbial groups.Applied Soil Ecology 42, 183e190.
Nottingham, A.T., Turner, L.B., Chamberlain, P.M., Scott, A.W., Tanner, A.V.J., 2012.Priming and microbial nutrient limitation in lowland tropical forest soils ofcontrasted fertility. Biogeochemistry 111, 219e237.
Pausch, J., Kuzyakov, Y., 2012. Soil organic carbon decomposition from recentlyadded and older sources estimated by d13C values and organic matter. SoilBiology and Biochemistry 55, 40e47.
Phillips, D.L., Gregg, J.W., 2001. Uncertainty in source partitioning using stableisotopes. Oecologia 127, 171e179.
Plain, C., Gérant, D., Maillard, P., Dannoura, M., Dong, Y., Zeller, B., Priault, P.,Parent, F., Epron, D., 2009. Tracing of recently assimilated carbon in respirationat high temporal resolution in the field with a tuneable diode laser absorptionspectrometer after in situ 13CO2 pulse labelling of 20-year-old beech trees. TreePhysiol 29, 1433e1447.
Schneckenberger, K., Demin, D., Kuzyakov, Y., 2008. Microbial utilization and min-eralisation of [14C]glucose added in six orders of concentration to soil. SoilBiology and Biochemistry 40, 1981e1988.
Stefanowicz, A., 2006. The biolog plates technique as a tool in ecological studies ofmicrobial communities. Polish Journal of Environmental Studies 15, 669e676.
Sullivan, B.W., Hart, S.C., 2013. Evaluation of mechanisms controlling the priming ofsoil carbon along a substrate age gradient. Soil Biology and Biochemistry 58,293e301.
Versini, A., Nouvellon, Y., Laclau, J.-P., Kinana, A., Mareschal, L., Zeller, B., Ranger, J.,Epron, D., 2013. The manipulation of organic residues affects tree growth andheterotrophic CO2 efflux in a tropical Eucalyptus plantation. Forest Ecology andManagement 301, 79e88.
Versini, A., Zeller, B., Derrien, D., Mazoumbou, J.C., Mareschal, L., Saint-André, L.,Ranger, J., Laclau, J.P., 2014. The role of harvest residues to sustain tree growth andsoil nitrogen stocks in a tropical Eucalyptus plantation. Plant Soil 376, 245e260.
von Lützow, M., Kögel-Knabner, I., Ekschmitt, K., Flessa, H., Guggenberg, G.,Matzner, E., Marschner, B., 2007. SOM fractionation methods: relevance tofunctional pools and stabilization mechanisms. Soil Biology and Biochemistry39, 2183e2207.
Waldrop, M.P., Firestone, M.K., 2004a. Altered utilization patterns of young and oldsoil C by microorganisms caused by temperature shifts and N additions.Biogeochemistry 67, 235e248.
Waldrop, M.P., Firestone, M.K., 2004b. Microbial community utilization of recalci-trant and simple carbon compounds: impact of oak-woodland plant commu-nities. Oecologia 138, 275e284.
Zelles, L., 1999. Fatty acid patterns of phospholipids and lipopolysaccharides in thecharacterisation of microbial communities in soil: a review. Biology and Fertilityof Soils 29, 111e129.
Zyakun, A.M., Kochetkov, V.V., Baskunov, B.P., Zakharchenko, V.N., Peshenko, V.P.,Laurinavichius, K.S., Anokhina, T.O., Siunova, T.V., Sizova, O.I., Boronin, A.M.,2013. Use of glucose and carbon isotope fractionation by microbial cellsimmobilized on solid-phase surface. Microbiology 82, 280e289.