Complementary Function and Integrated Wiring of the Evolutionarily Distinct Drosophila Olfactory...
19
Cellular/Molecular Complementary Function and Integrated Wiring of the Evolutionarily Distinct Drosophila Olfactory Subsystems Ana F. Silbering, 1 * Raphael Rytz, 1 * Yael Grosjean, 1 * Liliane Abuin, 1 Pavan Ramdya, 1,2 Gregory S. X. E. Jefferis, 3 and Richard Benton 1 1 Center for Integrative Genomics, Faculty of Biology and Medicine, University of Lausanne, CH-1015, Lausanne, Switzerland, 2 Laboratory of Intelligent Systems, Microengineering Department, E ´ cole Polytechnique Fe ´de ´rale de Lausanne, CH-1015, Lausanne, Switzerland, and 3 Division of Neurobiology, Medical Research Council Laboratory of Molecular Biology, Cambridge CB2 0QH, United Kingdom To sense myriad environmental odors, animals have evolved multiple, large families of divergent olfactory receptors. How and why distinct receptor repertoires and their associated circuits are functionally and anatomically integrated is essentially unknown. We have addressed these questions through comprehensive comparative analysis of the Drosophila olfactory subsystems that express the iono- tropic receptors (IRs) and odorant receptors (ORs). We identify ligands for most IR neuron classes, revealing their specificity for select amines and acids, which complements the broader tuning of ORs for esters and alcohols. IR and OR sensory neurons exhibit glomerular convergence in segregated, although interconnected, zones of the primary olfactory center, but these circuits are extensively interdigi- tated in higher brain regions. Consistently, behavioral responses to odors arise from an interplay between IR- and OR-dependent pathways. We integrate knowledge on the different phylogenetic and developmental properties of these receptors and circuits to propose models for the functional contributions and evolution of these distinct olfactory subsystems. Introduction Animal olfactory systems have evolved to extract vital informa- tion from the vast universe of environmental volatiles with sen- sitivity, specificity, and short- and long-term flexibility. The challenges of odor detection are met by large repertoires of diver- gent odorant receptors (ORs) (Spehr and Munger, 2009; Tou- hara and Vosshall, 2009). In phylogenetically diverse species, individual olfactory sensory neurons (OSNs) generally express a single OR (Fuss and Ray, 2009), which is the primary determi- nant of odor response specificity. The axons of OSNs expressing the same receptor converge onto segregated regions of neuropil called glomeruli in the olfactory bulb (or antennal lobe in insects) (Hansson et al., 1992; Mombaerts et al., 1996; Zou et al., 2009). Here, OSNs synapse with projection neurons (PNs) that transmit odor-evoked signals to higher brain regions (Mori et al., 1999; Masse et al., 2009), as well as with local interneurons (LNs) that modulate OSN input and PN output activity within and between glomeruli (Christensen et al., 1993; Wachowiak and Shipley, 2006; Chou et al., 2010b). Multiple families of olfactory receptors exist in diverse species, including five classes of olfactory G-protein-coupled receptors (GPCRs) in vertebrates: ORs, V1Rs, V2Rs, TAARs and FPRs (Spehr and Munger, 2009). These families are expressed in OSNs that are located in different peripheral olfactory organs and proj- ect to segregated brain regions, suggesting that they fulfill distinct functions such as food or pheromone detection. However, only a very small number of individual vertebrate olfactory receptors and circuits have been analyzed in vivo (Spehr and Munger, 2009; Touhara and Vosshall, 2009). The olfactory system of adult Drosophila melanogaster has similar organizational principles to that of vertebrates, at a greatly reduced scale (45 ORs compared with 1300 in mice) (Vosshall and Stocker, 2007; Touhara and Vosshall, 2009). This numerical simplic- ity has permitted comprehensive characterization of the Drosophila olfactory pathways (Benton, 2007; Vosshall and Stocker, 2007; Su et al., 2009). However, these studies revealed a substantial gap in our knowledge, because 25% of OSNs do not express ORs (Couto et al., 2005; Fishilevich and Vosshall, 2005). We recently described a second family of insect olfactory recep- tors called the ionotropic receptors (IRs), which are expressed in the complementary set of non-OR OSNs in the major olfactory organ, the antenna (Benton et al., 2009). In contrast to insect ORs, which define an insect-specific class of polytopic transmembrane proteins Received May 11, 2011; revised June 15, 2011; accepted July 1, 2011. Author contributions: A.F.S., R.R., Y.G., G.S.X.E.J., and R.B. designed research; A.F.S., R.R., Y.G., L.A., G.S.X.E.J., and R.B. performed research; A.F.S., R.R., Y.G., P.R., G.S.X.E.J., and R.B. contributed unpublished reagents/analytic tools; A.F.S., R.R., Y.G., L.A., G.S.X.E.J., and R.B. analyzed data; R.B. wrote the paper. R.R. was funded by a Roche Research Foundation Fellowship, P.R. by a Human Frontier Science Program Long- Term Fellowship, and Y.G. by the Centre National de la Recherche Scientifique (France). G.S.X.E.J. is supported by the Medical Research Council and a European Research Council Starting Investigator Grant. Research in the laboratory of R.B. is supported by the University of Lausanne, a European Research Council Starting Independent Researcher Grant, and the Swiss National Science Foundation. We acknowledge Hubert Amrein and the Bloomington Stock Center for provision of Drosophila strains, Jing Wang, Allan Wong, and Richard Axel for raw image data, and Elissa Hallem for OR response data. We are grateful to Alexandre Wicky and Cristina Leoni for assistance in preliminary behavioral assays, Gilles Boss for valuable help in equipment construction, Fre ´de ´ric Schu ¨tz for advice on statistics, and Tadeusz Kawecki for provision of facilities for behavioral experiments. We thank Giovanni Galizia, Sophie Martin, and members of the Benton laboratory for discussions and comments on this manuscript. The authors declare no competing financial interests. *A.F.S., R.R., and Y.G. contributed equally to this work. Correspondence should be addressed to Richard Benton, Center for Integrative Genomics, Faculty of Biology and Medicine, University of Lausanne, CH-1015 Lausanne, Switzerland. E-mail: [email protected]. Y. Grosjean’s present address: Centre des Sciences du Gou ˆt et de l’Alimentation, UMR-6265 CNRS, UMR-1324 Institut National de la Recherche Agronomique, Universite ´ de Bourgogne, 6 Boulevard Gabriel, 21000 Dijon, France. DOI:10.1523/JNEUROSCI.2360-11.2011 Copyright © 2011 the authors 0270-6474/11/3113357-19$15.00/0 The Journal of Neuroscience, September 21, 2011 • 31(38):13357–13375 • 13357
Transcript of Complementary Function and Integrated Wiring of the Evolutionarily Distinct Drosophila Olfactory...

Cellular/Molecular
Complementary Function and Integrated Wiring of theEvolutionarily Distinct Drosophila Olfactory Subsystems
Ana F. Silbering,1* Raphael Rytz,1* Yael Grosjean,1* Liliane Abuin,1 Pavan Ramdya,1,2 Gregory S. X. E. Jefferis,3
and Richard Benton1
1Center for Integrative Genomics, Faculty of Biology and Medicine, University of Lausanne, CH-1015, Lausanne, Switzerland, 2Laboratory of IntelligentSystems, Microengineering Department, Ecole Polytechnique Federale de Lausanne, CH-1015, Lausanne, Switzerland, and 3Division of Neurobiology,Medical Research Council Laboratory of Molecular Biology, Cambridge CB2 0QH, United Kingdom
To sense myriad environmental odors, animals have evolved multiple, large families of divergent olfactory receptors. How and whydistinct receptor repertoires and their associated circuits are functionally and anatomically integrated is essentially unknown. We haveaddressed these questions through comprehensive comparative analysis of the Drosophila olfactory subsystems that express the iono-tropic receptors (IRs) and odorant receptors (ORs). We identify ligands for most IR neuron classes, revealing their specificity for selectamines and acids, which complements the broader tuning of ORs for esters and alcohols. IR and OR sensory neurons exhibit glomerularconvergence in segregated, although interconnected, zones of the primary olfactory center, but these circuits are extensively interdigi-tated in higher brain regions. Consistently, behavioral responses to odors arise from an interplay between IR- and OR-dependentpathways. We integrate knowledge on the different phylogenetic and developmental properties of these receptors and circuits to proposemodels for the functional contributions and evolution of these distinct olfactory subsystems.
IntroductionAnimal olfactory systems have evolved to extract vital informa-tion from the vast universe of environmental volatiles with sen-sitivity, specificity, and short- and long-term flexibility. Thechallenges of odor detection are met by large repertoires of diver-gent odorant receptors (ORs) (Spehr and Munger, 2009; Tou-hara and Vosshall, 2009). In phylogenetically diverse species,individual olfactory sensory neurons (OSNs) generally express asingle OR (Fuss and Ray, 2009), which is the primary determi-nant of odor response specificity. The axons of OSNs expressingthe same receptor converge onto segregated regions of neuropilcalled glomeruli in the olfactory bulb (or antennal lobe in insects)
(Hansson et al., 1992; Mombaerts et al., 1996; Zou et al., 2009).Here, OSNs synapse with projection neurons (PNs) that transmitodor-evoked signals to higher brain regions (Mori et al., 1999;Masse et al., 2009), as well as with local interneurons (LNs) thatmodulate OSN input and PN output activity within and betweenglomeruli (Christensen et al., 1993; Wachowiak and Shipley,2006; Chou et al., 2010b).
Multiple families of olfactory receptors exist in diverse species,including five classes of olfactory G-protein-coupled receptors(GPCRs) in vertebrates: ORs, V1Rs, V2Rs, TAARs and FPRs(Spehr and Munger, 2009). These families are expressed in OSNsthat are located in different peripheral olfactory organs and proj-ect to segregated brain regions, suggesting that they fulfill distinctfunctions such as food or pheromone detection. However, only avery small number of individual vertebrate olfactory receptorsand circuits have been analyzed in vivo (Spehr and Munger, 2009;Touhara and Vosshall, 2009).
The olfactory system of adult Drosophila melanogaster has similarorganizational principles to that of vertebrates, at a greatly reducedscale (�45 ORs compared with �1300 in mice) (Vosshall andStocker, 2007; Touhara and Vosshall, 2009). This numerical simplic-ity has permitted comprehensive characterization of the Drosophilaolfactory pathways (Benton, 2007; Vosshall and Stocker, 2007; Su etal., 2009). However, these studies revealed a substantial gap in ourknowledge, because �25% of OSNs do not express ORs (Couto etal., 2005; Fishilevich and Vosshall, 2005).
We recently described a second family of insect olfactory recep-tors called the ionotropic receptors (IRs), which are expressed in thecomplementary set of non-OR OSNs in the major olfactory organ,the antenna (Benton et al., 2009). In contrast to insect ORs, whichdefine an insect-specific class of polytopic transmembrane proteins
Received May 11, 2011; revised June 15, 2011; accepted July 1, 2011.Author contributions: A.F.S., R.R., Y.G., G.S.X.E.J., and R.B. designed research; A.F.S., R.R., Y.G., L.A., G.S.X.E.J.,
and R.B. performed research; A.F.S., R.R., Y.G., P.R., G.S.X.E.J., and R.B. contributed unpublished reagents/analytictools; A.F.S., R.R., Y.G., L.A., G.S.X.E.J., and R.B. analyzed data; R.B. wrote the paper.
R.R. was funded by a Roche Research Foundation Fellowship, P.R. by a Human Frontier Science Program Long-Term Fellowship, and Y.G. by the Centre National de la Recherche Scientifique (France). G.S.X.E.J. is supported by theMedical Research Council and a European Research Council Starting Investigator Grant. Research in the laboratory ofR.B. is supported by the University of Lausanne, a European Research Council Starting Independent ResearcherGrant, and the Swiss National Science Foundation. We acknowledge Hubert Amrein and the Bloomington StockCenter for provision of Drosophila strains, Jing Wang, Allan Wong, and Richard Axel for raw image data, and ElissaHallem for OR response data. We are grateful to Alexandre Wicky and Cristina Leoni for assistance in preliminarybehavioral assays, Gilles Boss for valuable help in equipment construction, Frederic Schutz for advice on statistics,and Tadeusz Kawecki for provision of facilities for behavioral experiments. We thank Giovanni Galizia, Sophie Martin,and members of the Benton laboratory for discussions and comments on this manuscript.
The authors declare no competing financial interests.*A.F.S., R.R., and Y.G. contributed equally to this work.Correspondence should be addressed to Richard Benton, Center for Integrative Genomics, Faculty of Biology and
Medicine, University of Lausanne, CH-1015 Lausanne, Switzerland. E-mail: [email protected]. Grosjean’s present address: Centre des Sciences du Gout et de l’Alimentation, UMR-6265 CNRS, UMR-1324
Institut National de la Recherche Agronomique, Universite de Bourgogne, 6 Boulevard Gabriel, 21000 Dijon, France.DOI:10.1523/JNEUROSCI.2360-11.2011
Copyright © 2011 the authors 0270-6474/11/3113357-19$15.00/0
The Journal of Neuroscience, September 21, 2011 • 31(38):13357–13375 • 13357

unrelated to GPCRs (Benton et al., 2006), IRs have derived fromionotropic glutamate receptors (iGluRs) and are found across theprotostomian branch of the animal kingdom (Croset et al., 2010).Moreover, whereas OR repertoires are primarily species specific(Robertson and Wanner, 2006; Carey et al., 2010), many IRs areconserved in most or all insects (Croset et al., 2010). The distinctmolecular, expression and evolutionary properties of ORs and IRssuggest that these repertoires may play different roles in olfactorydetection. In this work, we present systematic analyses of the neuro-anatomical and physiological properties of IR olfactory circuits,which provide insights into the contrasting origins, evolution, andfunction of these olfactory subsystems.
Materials and MethodsDrosophila genetics. Drosophila stocks were maintained on conventionalfood medium under a 12 h light/dark cycle at 25°C (or 22°C for flies forimaging and behavioral analysis). The wild-type strain for the electro-physiological screen was the genome-sequenced strain (BloomingtonStock Center stock number 2057) (Adams et al., 2000) and an isogenizedw1118 strain for the behavioral experiments. We used the following mu-tant and transgenic strains: IR8a1, IR8a–GAL4, IR25a–GAL4 (Abuin etal., 2011), IR25a2 (Benton et al., 2009), Orco1 (formerly OR83b1)(Larsson et al., 2004), OR35af02057 (Yao et al., 2005), IR64a–GAL4 (Ai etal., 2010), IR76a–GAL4 (Benton et al., 2009), OR35a–GAL4 (Fishilevichand Vosshall, 2005), GR28b.d–GAL4 (Thorne and Amrein, 2008), UAS–nls:GFP (Sachse et al., 2007), UAS–mCD8:GFP (Lee and Luo, 1999),UAS–nsyb:GFP (Vosshall et al., 2000), and UAS–DTI (diphtheria toxin)(Han et al., 2000).
New transgenic Drosophila strains were generated by standard proce-dures with either P-element-mediated transformation (most IRpromoter-GAL4 lines) or, for all other transgenes, the phiC31-based in-tegration system using attP-3B VK00038 (X chromosome), attP40 (sec-ond chromosome), or attP2 (third chromosome) landing sites (Bischofet al., 2007; Markstein et al., 2008) (Genetic Services).
Molecular biology. For all plasmid constructs, desired products wereamplified using the Expand High Fidelity PLUS PCR system (Roche)from Oregon-R genomic DNA, T:A cloned into pGEM-T Easy (Pro-mega), sequenced, and subcloned—with restriction enzymes whose siteswere incorporated into the PCR primers—into appropriate vectors asdescribed below:
IR promoter–GAL4 transgenes. For most IRs, the indicated length ofDNA immediately upstream of the predicted IR start codon was clonedinto pCaSpeR–AUG–Gal4 (Vosshall et al., 2000): IR31a–GAL4 (583 bp),IR40a–GAL4 (3011 bp), IR75d–GAL4 (1995 bp), IR76b–GAL4 (916 bp),IR84a–GAL4 (1964 bp), and IR92a–GAL4 (4113 bp). For IR75a–GAL4,7833 bp immediately upstream and 1921 bp downstream of the predictedORF were cloned 5� and 3� of GAL4 in pED36 (Demir and Dickson, 2005),respectively. For IR41a–GAL4, 2474 bp immediately upstream of the pre-dicted start codon were cloned into pattB GAL4 (Croset et al., 2010).
UAS– gypsyGCaMP1.6gypsy. To generate a more highly GAL4-inducible GCaMP1.6 transgene, we flanked the GCaMP1.6 coding se-quence (Ohkura et al., 2005) with gypsy insulator sequences (Marksteinet al., 2008) in pUAST attB (Bischof et al., 2007). Comparison of basalfluorescence levels of this transgene and a UAS–GCaMP1.6 transgene(Reiff et al., 2005) induced by Orco–GAL4 (Wang et al., 2003) indicated�2.5-fold higher expression levels (data not shown).
IR8a rescue transgene (IR8arescue). The IR8a promoter (Abuin et al.,2011) was cloned directly upstream of the full-length IR8a cDNA (Abuinet al., 2011) in pattB (Bischof et al., 2007). Restoration of IR8a expressionfrom this transgene was verified in an IR8a null mutant background(data not shown).
Orco rescue transgene (Orcorescue). Because Orco–GAL4-driven UAS–Orco does not fully recapitulate wild-type levels of Orco expression(Larsson et al., 2004), we generated a rescue construct consisting of thebacterial artificial chromosome CH322– 81L19, which carries a 20 Mbregion of genomic DNA spanning the Orco locus (Venken et al., 2009)(BACPAC Resources Center, Children’s Hospital Oakland Research In-
stitute). Restoration of Orco expression from this transgene was verifiedin an Orco null mutant background (data not shown).
Electrophysiology. Extracellular recordings in single sensilla of 1- to14-d-old flies were performed essentially as described (Benton et al.,2007). Odors (Sigma and Fluka) were diluted to 1% (v/v) unless other-wise noted in the figures; L-glycine and L-glutamic acid were diluted to 1M and gaseous carbon dioxide was used at 100%. CAS numbers, solvents,and purities for odorants will be provided on request. Coeloconic sensillaclasses were identified by their characteristic morphology, their stereo-typical distribution on the antennal surface, and their responses to one ormore diagnostic odors (Yao et al., 2005; Benton et al., 2009).
Corrected responses were quantified by counting all spikes recordedfrom an individual sensillum [because of difficulties in reliably distin-guishing spikes from individual neurons (Yao et al., 2005)] during a 0.5 swindow starting 150 –200 ms after the stimulus trigger. This period wasdefined precisely for each recording session with a control odor responseand represents principally the time for the odor to reach the preparation.From this spike value, we subtracted the number of spontaneous spikesin a 0.5 s window before stimulation and doubled the result to obtain theodor-evoked spikes per second. To obtain a solvent-corrected response,we subtracted the spike frequency evoked by the corresponding solventfor each odor.
To compare OR and IR response profiles, we used a subset of data fromour electrophysiological screen and that of a screen for OR ligands (Hallemand Carlson, 2006), corresponding to the 85 common odor stimuli. Theshape of the tuning curves was quantified by calculating lifetime kurtosis
(KL), using the following formula: KL � � 1
M�
i�1M �ri � �r
�r�4� � 3, where
M is the number of stimuli presented, r1 … rM are the sensillum responses,and r� and �r are the mean and the SD of the responses (Willmore andTolhurst, 2001). We compared lifetime kurtosis values for IR sensilla withboth individual ORs, as well as with OR sensilla, in which we summed theodor-evoked responses of all ORs expressed in neurons of each sensillumclass according to published expression maps (Couto et al., 2005).
To compare the physicochemical properties of IR and OR ligands, wedefined a set of the strongest agonists for IR and OR repertoires as thosethat provoked an increase of the spiking frequency of at least 35% of theincrease provoked by the best IR or OR ligand, respectively. This thresh-old corresponded to 61 spikes/s for IR ligands (including 15 of 168 testedodors) and 100 spikes/s for OR ligands (including 68 of 110 tested odors).For these chemicals, we retrieved a set of 32 DRAGON descriptors(http://vcclab.org/lab/edragon/start.html), which are optimized for vol-atile odor ligands (Haddad et al., 2008). The descriptors were normalizedfor additional analyses using z-scores (raw score minus mean score, di-vided by the SD). Principal component analysis (PCA) and hierarchicalcluster analysis of the DRAGON descriptors were performed using PAST(Hammer et al., 2001; Carey et al., 2010). PCA was performed using thecorrelation matrix, and Ward’s method based on Euclidean distances wasused to perform the hierarchical cluster analysis.
Histology. We used the following primary antibodies: mouse mono-clonal nc82 at 1:10 (provided by A. Hofbauer, University of Regensburg,Regensburg, Germany), rabbit �-GFP at 1:1000 (Invitrogen), mouse�-GFP at 1:500 (Invitrogen), rabbit �-Orco at 1:10,000 (Larsson et al.,2004), and guinea pig �-IR8a at 1:1000 (Abuin et al., 2011). Goat second-ary antibodies—Alexa Fluor 488-, Cy3-, and Cy5-conjugated�-mouse, rabbit, and guinea pig IgG (Invitrogen; Jackson Immu-noResearch)—were used at either 1:1000 (for combined FISH/immu-nofluorescence on antennal sections) or 1:100 (for whole-mountbrain immunofluorescence).
Immunofluorescence on whole-mount brains. Flies, with appendagesremoved, were fixed for 40 min in 4% formaldehyde in PBS (all steps atroom temperature unless otherwise stated), rinsed twice, and washedtwo times for 30 min in PBS plus 0.2% Triton X-100 (P/T). Brains weredissected in 5% heat-inactivated normal goat serum in P/T (P/T/S),blocked for at least an additional 30 min in P/T/S and incubated inprimary antibodies diluted in P/T/S for 48 h at 4°C. After washing threetimes for 30 min in P/T, secondary antibodies diluted in P/T/S wereapplied and left overnight at 4°C. Brains were washed three times for 30
13358 • J. Neurosci., September 21, 2011 • 31(38):13357–13375 Silbering et al. • Insect Olfactory Subsystem Function and Evolution

min in P/T and mounted on slides with bridge coverslips in Vectashield(Vector Laboratories).
Immunofluorescence on antennae. Immunofluorescence on antennalcryosections was performed as described (Abuin et al., 2011). For visu-alization of endogenous nls:GFP fluorescence in whole-mount antennae,tissue was dissected from the head in P/T, fixed for 10 min with 4%formaldehyde in P/T, washed three times for 10 min in P/T, andmounted directly in Vectashield.
Combined fluorescent RNA in situ hybridization and immunofluores-cence. Fourteen micrometer antennal cryosections in OCT (Tissue-Tek)were collected on slides and fixed for 10 min in 4% formaldehyde in PBS.After washing three times for 3 min in PBS, sections were acetylated for10 min (9.25 g of triethanolamine HCl and 1.12 ml of 10N NaOH in 500ml of H2O), washed three times for 5 min in PBS, and incubated for 1 hat 65°C in hybridization solution (50% formamide, 5� SSC, 5� Den-hardt’s solution, 50 �g/ml yeast tRNA, 100 �g/ml herring sperm DNA,50 �g/ml heparin, 2.5 mM EDTA, 0.1% Tween 20, and 0.25% CHAPS).Digoxygenin-labeled RNA probes for IR genes (Benton et al., 2009) werediluted in hybridization solution and applied to slides, which were over-laid with a coverslip to reduce evaporation and incubated in a humidifiedchamber for 16 –24 h at 65°C. Coverslips were removed by soaking slidesin 5� SSC prewarmed to 65°C and washed three times for 20 min in 0.2�SSC at 65°C. After 5 min rinsing in TN buffer (100 mM Tris-HCl, pH 7.5,150 mM NaCl), sections were incubated for 30 min in 0.5% blockingreagent (PerkinElmer Life and Analytical Sciences) in TN (TNB). Pri-mary antibodies (anti-DIG–peroxidase and anti-GFP) were diluted inTNB and incubated on slides overnight at 4°C. After three washes for 5min in TN buffer plus 0.05% Tween-20 (TNT), FITC–tyramide diluted1:50 in amplification reagent (TSA kit; PerkinElmer Life and AnalyticalSciences) was incubated with slides for 10 min. Slides were washed threetimes for 5 min in TNT, and the secondary antibody diluted in TNB wasapplied and left for 2 h. Sections were washed three times for 5 min inTNT and mounted in Vectashield. All microscopy was performed using aCarl Zeiss LSM 510 Laser Scanning Confocal Microscope. The three-dimensional reconstruction of the antennal lobe and analysis of interglo-merular distances were performed using Imaris version 6.4 (BitplaneScientific Software).
Optical imaging. Imaging experiments were performed essentially asdescribed (Pelz et al., 2006; Silbering and Galizia, 2007). In brief, 1- to3-week-old female flies were cold-anesthetized and fixed to Plexiglaschambers by their neck. Antennae were pulled forward using fine wire(Rediohm-800; H. P. Reid) to allow visual access to the antennal lobes.The head was covered by a thin foil held by a perforated plastic coverslipand sealed with two-component silicon to prevent leakage and keep theantennae dry (KwikSil; World Precision Instruments). A drop of Ringer’ssaline (in mM: 130 NaCl, 5 KCl, 2 MgCl2, 2 CaCl2, 36 saccharose, and 5HEPES, pH 7.3) was placed on the head, a square region of cuticle be-tween the eyes (to the sides) and the ocelli and antennae (to the back andfront) was excised, and the air sacs and fat bodies removed. The prepa-ration was rinsed several times with Ringer’s solution and placed under amicroscope for imaging.
Images were acquired with a CCD camera (CoolSNAP-HQ2 DigitalCamera System) mounted on a fluorescence microscope (upright fixed stageCarl Zeiss Axio Examiner D1) equipped with a 20� water-immersion ob-jective (W “Plan-Apochromat” 20�/1,0 M27 DIC). Excitation light of 470nm was produced with a monochromator (VisiChrome). Light was guidedthrough a filter block consisting of a 450–490 nm excitation filter, a dichroicmirror (T495LP), and a 500–550 nm emission filter (Chroma ET). Binnedimage size was 350 � 225 pixels on the chip, corresponding to 210 � 135 �min the preparation. Exposure time varied between 40 and 100 ms to adjust fordifferent basal fluorescence values across preparations. Ten-second filmswere recorded with an acquisition rate of 4 Hz. Metafluor software (Visitron)was used to control the camera, light, and data acquisition.
Odors were delivered with a custom-made olfactometer. A main airstream (1 L/min) was directed to the fly through a 0.4 mm inner diametertubing, placed �0.5 cm from the fly head. At 27 cm upstream of the exitof the tubing, a secondary air stream (1 L/min) was added. Both airstreams were generated by vacuum pumps (KNF Neuberger), and theflow rate was controlled by two independent rotameters (Analyt). The
secondary air stream was guided either through an empty 2 ml syringe orthrough a 2 ml syringe containing 20 �l of odor (diluted 1% v/v, unlessstated otherwise) or solvent on a small cellulose pad (Kettenbach) togenerate 1 s odor pulses. To switch between control or odor stimulusapplication, a three-way magnetic valve (The Lee Company) was con-trolled by the acquisition software (Metafluor) via a VC6 valve controllerunit (Harvard Apparatus). Odor stimulation occurred during frames 16through 19 of the acquisition.
Data were processed using NIH ImageJ (with a Mac biophotonicsplug-in; www.macbiophotonics.ca) and custom-written programs inMatlab and R. Time-series images corresponding to one experiment(�25 measurements of 40 frames taken from one fly) were first alignedusing StackReg/TurboReg (http://bigwww.epfl.ch/thevenaz/stackreg/)in NIH ImageJ. Raw images were then segmented in individual 40-framemeasurements. Each measurement was bleach corrected by fitting adouble-exponential function to the relative mean fluorescence in thelabeled glomeruli over time, excluding the frames covering 5 s after stim-ulus onset.
We then calculated the relative change in fluorescence (�F/F ) for eachframe of each measurement as (Fi � F0)/F0 � 100, where F0 is the meanfluorescence value of frames 6 –14 (before odor presentation), and Fi isthe fluorescence value for the ith frame of the measurement. Activitytraces were produced calculating the mean �F/F within a circular regionof interest with a diameter of 10 pixels and transformed into heat mapsusing NIH ImageJ. The same region of interest was used for all measure-ments from the same animal.
Projection neuron analysis. PN images from three different sources(Wong et al., 2002; Jefferis et al., 2007; Chiang et al., 2011) were broughtinto a common reference space for analysis. The common template(“Cell07”) was that of Jefferis et al. (2007), so 236 PN images from thatstudy did not require additional processing. The anti-Discs large (anti-Dlg) channel of 35 confocal images from Chiang et al. (2011) was regis-tered to a single female template brain (flycircuit id 6475, “FC6475”),chosen for good quality staining and imaging, using the CMTK toolkit(www.nitrc.org/projects/cmtk) as described previously (Cachero et al.,2010). The FC6475 template brain was then registered to the Cell07 brainusing a landmarks registration based on 24 manually chosen anatomicallandmarks visible in both anti-Dlg and nc82 staining. This landmarksregistration used the pnreg command of the IRTK toolkit (www.doc.ic.ac.uk/�dr/software), which uses nonlinear third-order B-spline regis-tration (Rueckert et al., 1999). The per axis registration accuracy forindependent landmarks (not used during the registration) was 3.3 �m,which is comparable with that of previous studies (Jefferis et al., 2007; Yuet al., 2010b).
Three VL2a projection neuron images from Wong et al. (2002) wereeach registered using 10 –14 landmarks to the Cell07 template. Althoughthose brains had weak nc82 staining, the only reliable marker wasGH146 –GAL4-driven expression of a CD2 reporter. We therefore used atwo-channel confocal image of an nc82-stained brain containingGH146-driven mCD8:GFP expression that had been registered via itsnc82 channel to the Cell07 template to help choose landmarks. Land-marks registration was again via the pnreg command of IRTK.
Neuronal tracing was performed in Amira (www.amira.com) with thehxskeletonize plugin (Evers et al., 2005). The 3D coordinates of neuronaltracings were then transformed from their respective original image co-ordinates using the CMTK gregxform tool (flycircuit images3 FC6475template) and the IRTK ptransform tool (FC64753 Cell07, three VL2aimages 3 FC6475). The underlying tools were called via custom codewritten in R (www.r-project.org), which was also used for 2D plots and3D visualization of the transformed neuronal tracings using the Analy-sisSuite R package (Jefferis et al., 2007). R source code, landmark files,and template brain images will be available on publication athttp://flybrain.mrc-lmb.cam.ac.uk.
Behavioral analysis. We adapted the T-maze olfactory choice assay(Helfand and Carlson, 1989). All mutant strains were backcrossed forfive generations to our isogenic w1118 stock before behavioral analysis.Adult flies (2– 8 d old) were starved in glass vials with humidified tissuepaper for 24 h and transferred to empty 10 ml polystyrene assay tubes(Semadeni 2168) 2 h before the experiment.
Silbering et al. • Insect Olfactory Subsystem Function and Evolution J. Neurosci., September 21, 2011 • 31(38):13357–13375 • 13359

corrected response (spikes/s)
1500-100 -100-50 50 100 -50 0 50 100 150 200 1500-50 50 100 1500-50 50 100
IR75d IR92aIR76b
IR31a
ac1IR75d IR76a
IR76bIR84a
ac4OR35a
IR76bOR83b
IR75aIR75b
(IR75c)
ac3
amines
acids
aldehydes
ketones
esters
alcohols
others
carbon dioxidemethyl sulphide
eugenol methyl ethermyrcene
3−careneterpinolene
alpha−terpinenemethyl salicylate(−)−beta−pinene
(R)−(+)−limonene(S)−(−)−limonene
indoleanisole
ethylbenzeneheptanetoluenehexane
pyrazine(Z)−11−octadecenyl acetate
hexyl hexanoateethyl decaonategeranyl acetate
neryl acetatelinalyl acetate
geranyl formateethyl cinnamate
diethyl succinatehexyl butyrate
ethyl octaonatemethyl octanoate
benzyl acetateethyl benzoate
ethyl hexanoatehexyl acetatebutyl butyrate
cis−3−hexenyl acetatemethyl benzoate
ethyl−3−hydroxybutyrateisoamyl acetate
pentyl acetatemethyl hexanoate
propyl butyratebutyl acetate
isobutyl acetateethyl butyrate
ethyl trans−2−butenoatemethyl butyratepropyl acetate
ethyl propionateethyl acetate
methyl acetategeranyl acetone
l−fenchoner−carvone
(S)−(+)−carvone2−nonanone
phenylacetone3−octanone2−octanone
6−methyl−5−hepten−2−one3−acetylpyridine
acetophenone2−heptanone
gamma−hexalactone2−hexanone
gamma−valerolactonecyclohexanone
acetoin2−pentanone
gamma−butyrolactone2,3−butanedione
2−butanoneacetone
(−)−beta−citronellolethanolaminelinalool oxide
geraniol(−)−linalool
linalool4−ethylguaiacol4−methylphenol3−methylphenol2−methylphenol
2−ethylfencholeugenoldecanol
DL−mentholeucalyptol
nonanol3−octanol
octanol1,3−octenol
2−phenylethanolheptanol
1−methylcyclohexanol4−methylcyclohexanol
benzyl alcohol3−(methylthio)−1−propanol
2−hexanol3−hexanol
hexanoltrans−2−hexen−1−ol
cis−3−hexen−1−olcyclohexanol
glycerol2,3−butanediol
2−pentanolpentanol
3−methyl−1−butanolisobutanol
butanolpropanol
ethanolmethanol
cis−11−hexadecenaldecanal
citralvanillin
piperonalnonanaloctanal
phenylacetaldehydeheptanal
benzaldehydehexanal
2−hexenalfurfural
valeraldehydebutyraldehyde
propionaldehydeacetaldehyde
sperminespermidine
phenylethylaminebenzyl cyanide
heptylaminecadaverine
N−methylpiperidinecyclohexylamine
1,4−diaminobutanepentylamine
isoamylaminepyridine
butylaminepyrrolidine
trimethylamineethylamine
dimethylamineammonia
nonanoic acidL-glutamic acid
2−ethylhexanoic acidoctanoic acid
phenylacetic acidheptanoic acidhexanoic acid
2−oxopentanoic acidisovaleric acid
valeric acid2−oxobutyric acid
DL−lactic acidisobutyric acid
butyric acidpyruvic acid
L-glycinepropionic acid
acetic acidhydrogen chloride
IR75dIR76b
IR75a
ac2IR41a
carbon dioxidemethyl sulphideeugenol methyl ethermyrcene3−careneterpinolenealpha−terpinenemethyl salicylate(−)−beta−pinene(R)−(+)−limonene(S)−(−)−limoneneindoleanisoleethylbenzeneheptanetoluenehexanepyrazine(Z)−11−octadecenyl acetatehexyl hexanoateethyl decaonategeranyl acetateneryl acetatelinalyl acetategeranyl formateethyl cinnamatediethyl succinatehexyl butyrateethyl octaonatemethyl octanoatebenzyl acetateethyl benzoateethyl hexanoatehexyl acetatebutyl butyratecis−3−hexenyl acetatemethyl benzoateethyl−3−hydroxybutyrateisoamyl acetatepentyl acetatemethyl hexanoatepropyl butyratebutyl acetateisobutyl acetateethyl butyrateethyl trans−2−butenoatemethyl butyratepropyl acetateethyl propionateethyl acetatemethyl acetategeranyl acetonel−fenchoner−carvone(S)−(+)−carvone2−nonanonephenylacetone3−octanone2−octanone6−methyl−5−hepten−2−one3−acetylpyridineacetophenone2−heptanonegamma−hexalactone2−hexanonegamma−valerolactonecyclohexanoneacetoin2−pentanonegamma−butyrolactone2,3−butanedione2−butanoneacetone(−)−beta−citronellolethanolaminelinalool oxidegeraniol(−)−linaloollinalool4−ethylguaiacol4−methylphenol3−methylphenol2−methylphenol2−ethylfencholeugenoldecanolDL−mentholeucalyptolnonanol3−octanoloctanol1,3−octenol2−phenylethanolheptanol1−methylcyclohexanol4−methylcyclohexanolbenzyl alcohol3−(methylthio)−1−propanol2−hexanol3−hexanolhexanoltrans−2−hexen−1−olcis−3−hexen−1−olcyclohexanolglycerol2,3−butanediol2−pentanolpentanol3−methyl−1−butanolisobutanolbutanolpropanolethanolmethanolcis−11−hexadecenaldecanalcitralvanillinpiperonalnonanaloctanalphenylacetaldehydeheptanalbenzaldehydehexanal2−hexenalfurfuralvaleraldehydebutyraldehydepropionaldehydeacetaldehydesperminespermidinephenylethylaminebenzyl cyanideheptylaminecadaverineN−methylpiperidinecyclohexylamine1,4−diaminobutanepentylamineisoamylaminepyridinebutylaminepyrrolidinetrimethylamineethylaminedimethylamineammonianonanoic acidL-glutamic acid2−ethylhexanoic acidoctanoic acidphenylacetic acidheptanoic acidhexanoic acid2−oxopentanoic acidisovaleric acidvaleric acid2−oxobutyric acidDL−lactic acidisobutyric acidbutyric acidpyruvic acidL-glycinepropionic acidacetic acidhydrogen chloride
Figure 1. Odor response profiles of IR-expressing coeloconic sensilla neurons. Electrophysiological responses in the four antennal coeloconic sensilla classes (ac1–ac4) to 168 odors (mean�SEM;n � 4, mixed genders), representing the summed, solvent-corrected activities of the IR-expressing neurons they house, indicated in the diagrams (Figure legend continues.)
13360 • J. Neurosci., September 21, 2011 • 31(38):13357–13375 Silbering et al. • Insect Olfactory Subsystem Function and Evolution

Odors were diluted in distilled water or paraffin oil to 10% v/v, exceptphenylacetic acid, which was diluted to 15 g/L. Two hundred microlitersof odor or solvent were loaded onto 4 � 3.5 cm filter papers and placed in14 ml culture tubes (Falcon 352059, Milian), which were plugged ontopolystyrene assay tubes with perforated bottoms and fitted on the sideholes of the T-maze for odor delivery during the experiment. Odor de-livery occurred by passive diffusion of the odor molecules into the tube,without additional airflow.
Twenty-five to 45 flies (median 33, q25 � 30, q75 � 36) were gentlytapped into the elevator of a T-maze, which was then lowered to thechoice point, offering flies the opportunity to select the arm containingan odor or the arm containing the solvent during 1 min. After this time,the elevator was lifted, and the flies in the three compartments (odor side,solvent side, and elevator) were quantified. The response index (RI) wascalculated as follows: [(number of flies in the odor compartment) �(number of flies in the solvent compartment)]/total number of flies as-sayed (including those remaining in the elevator). All experiments wereconducted under red light.
Data were analyzed using R software. The Mann–Whitney U test wasused to compare the samples of the two genotypes for one odor. TheBenjamini–Hochberg method was used to correct the p values for mul-tiple comparisons. Differences were considered significant if the adjustedp value was 0.05.
ResultsOR and IR sensory neurons are tuned to complementarychemical classes of odorsWe first determined the odor response profile of IR-expressingOSNs by extending a previous electrophysiological screen of 45odors (Yao et al., 2005) to a set of 168 structurally diverse chem-icals (Fig. 1). Drosophila OSNs project their sensory dendritesinto porous hairs called sensilla on the surface of the antenna(Benton, 2007; Vosshall and Stocker, 2007). Antennal sensillacomprise three morphological classes (Shanbhag et al., 1999):basiconic and trichoid, which are innervated by OR-expressingOSNs, and coeloconic sensilla, into which IR OSNs extend theirdendrites (Stocker, 2001; Yao et al., 2005; Benton et al., 2009).There are four classes of coeloconic sensilla (ac1–ac4), whichhouse two or three neurons each (Yao et al., 2005). We havepreviously defined nine classes of coeloconic neurons, which ex-press distinct and stereotyped combinations of IR genes (Fig. 1)(Benton et al., 2009), as well as one or both of the broadly ex-pressed coreceptors IR8a and IR25a (Abuin et al., 2011). Extracellu-lar recordings from individual sensilla thus permit simultaneousanalysis of the activities of several OSNs [reliable spike sorting toidentify individual neurons is not possible (Fig. 1 legend) (Yao et al.,
2005)]. In addition to the sensilla on the antennal surface, IRs areexpressed in sensory neurons in two structures, the sacculus andarista, that are inaccessible to peripheral physiological recordings(see below) (Benton et al., 2009). Because ac3 sensilla contain aneuron also expressing a broadly tuned OR, OR35a (Yao et al.,2005), we performed our screen of this sensillum class in OR35amutants to remove contributions of this receptor to the analyzedodor responses (Fig. 1).
Our screen confirmed and extended the previous smaller-scale analysis (Yao et al., 2005): robust odor responses (�50spikes/s) were extremely sparse, encompassing 3% of odor–sensilla combinations (Figs. 1, 2A). Nevertheless, we identifiedseveral new agonists for IR neurons, including dimethylaminein ac1, 2,3-butanedione, acetic acid, and pyridine in ac2,2-oxopentanoic acid in ac3, and phenylethylamine and phe-nylacetic acid in ac4. Notably, the vast majority of IR neuronagonists belong to two chemical classes: amines and carboxylicacids (Figs. 1, 2 A). We also identified a number of antagonists,which reduce the spontaneous firing frequency of these neu-rons; the most potent of these were amines (Fig. 1).
To compare the odor response profiles of IR OSNs with thoseof ORs, we retrieved physiological data available for 24 of 39antennal ORs (Hallem and Carlson, 2006; Vosshall and Stocker,2007). We first compared the tuning profiles of these receptorrepertoires by computing lifetime kurtosis for the subset of 85odors common to these two datasets (see Materials and Methods)(Willmore and Tolhurst, 2001) (Fig. 2B). IR sensilla have higherlifetime kurtosis values—reflecting narrower tuning breadth—than the vast majority of ORs (Fig. 2B). This measure is likely torepresent a significant underestimate of the higher selectivity ofIR OSNs, because it reflects a comparison of IR sensilla, whichcontain one to three differently tuned neurons (see below), withresponses of individual ORs (Hallem et al., 2004). Indeed, com-putation of lifetime kurtosis for OR sensilla (by summing theresponses of all ORs within a common sensillum) further high-lighted the distinction in tuning breadth compared with IR sen-silla (Fig. 2B).
We next compared the identity of odor ligands recognized byIR and OR neurons through two different approaches. First, wegenerated a “summed response profile” of the ORs and IRs for the85 common odor stimuli tested by adding together odor-evokedspike responses for all individual ORs and for all IR sensilla (Fig.2C). Although absolute summed responses for individual odorsare difficult to compare quantitatively because of the larger size ofthe OR repertoire, this analysis offers a qualitative view of ligandpreferences for these different receptors. When ordered by de-scending OR response, we observed that the most potent ligandsfor this receptor class were esters, alcohols, and ketones, whichevoke no or very low responses in IR sensilla (Fig. 2C). As de-scribed above, the best IR ligands were predominantly carboxylicacids and amines; notably, these chemical classes evoke little orno activity in the OR repertoire (Fig. 2C).
Second, we compared the distributions of OR and IR ligandsin physicochemical space by using an odor metric of 32 opti-mized molecular descriptors (Haddad et al., 2008)—such as thearomaticity index and global topological charge—for the ago-nists of these receptor repertoires. The position of individualodors within this 32-dimensional coordinate system can be di-mensionally reduced and visualized by PCA (Fig. 2D). Odorswith similar physicochemical properties cluster more closely to-gether than those that are dissimilar, providing an alternative tothe International Union of Pure and Applied Chemistry (IUPAC)classification scheme (Fig. 1) (Panico et al., 1993), which might
4
(Figure legend continued.) at the top [the broadly expressed IR8a and IR25a coreceptors are notindicated (Abuin et al., 2011)]. We quantified summed responses because the small and over-lapping spike amplitude of coeloconic neurons makes reliable spike sorting extremely difficult(Benton et al., 2009); a previous analysis was able to distinguish only two of the three neuronsin ac1 and ac2 sensilla and was unable to discriminate the three OSNs in ac4 (Yao et al., 2005).Negative values indicate responses smaller than those evoked by the corresponding solvent,most likely attributable to suppression of basal activity in these neurons (Yao et al., 2005).Solvent responses are as follows: ac1, water, 19.69 � 3.06; paraffin oil, 19.69 � 3.25; ac2,water, 23.33�4.79; paraffin oil, 28.22�4.92; ac3, water, 14.39�2.47; paraffin oil, 16.48�2.16; ac4, water, 6.06 � 1.91; paraffin oil, 1.56 � 1.36. The summing of responses fromneurons within a sensillum that display opposite changes in spike frequency will unavoidablylead to underestimations of evoked responses, but this is likely to affect only a very smallminority of odor/neuron pairs. Odorants are color coded by functional group; chemicals contain-ing multiple distinct functional groups were classified according to the IUPAC nomenclature oforganic chemistry (Panico et al., 1993). We used a wild-type strain for all sensilla except for ac3,in which we recorded from a mutant line, OR35af02057, which lacks the function of this broadlytuned OR (Yao et al., 2005). Data for ac4 sensilla are in part adapted from our unpublishedobservations (Y.G., R.R., and R.B.).
Silbering et al. • Insect Olfactory Subsystem Function and Evolution J. Neurosci., September 21, 2011 • 31(38):13357–13375 • 13361

-100
-50
150
100
50
0
ethy
lam
ine
sper
mid
ine
2-ox
open
tano
ic a
cid
sper
min
e amm
onia
dim
ethy
lam
ine
cada
verin
eet
hano
lam
ine
trim
ethy
lam
ine
pyrid
ine
150
100
50
0
ac1
corr
ecte
d re
spon
se (s
pike
s/se
c)A
-100
-50
150
100
50
0
200
ac2
prop
iona
ldeh
yde
2,3-
buta
nedi
one
cada
verin
eac
etic
aci
dpy
ridin
e1,
4-di
amin
obut
ane
sper
mid
ine
prop
ioni
c ac
idpy
rrol
idin
e2-
oxob
utyr
ic a
cid
150
100
50
0
200
-100
-50
150
100
50
0
ac3
phen
ylet
hyla
min
epr
opio
nald
ehyd
e2-
hexe
nal
2-ox
open
tano
ic a
cid
buty
rald
ehyd
ebu
tyric
aci
dpr
opio
nic
acid
vale
rald
ehyd
epe
ntyl
amin
eis
oval
eric
aci
d150
100
50
0
B
C
-100
-50
150
100
50
0
amm
onia
buty
lam
ine
pent
ylam
ine
phen
ylet
hyla
min
eph
enyl
acet
ic a
cid
phen
ylac
etal
dehy
deet
hyla
min
ehe
xano
ic a
cid
2-he
xena
lva
leric
aci
d
150
100
50
0
ac4
hexanolpentanol
butyl acetateethyl-3-hydroxybutyrate
pentyl acetateisoamyl acetate
2-pentanolisobutyl acetate
2-heptanonepropyl acetateethyl butyrate
methyl butyrate1,3-octenol
ethyl trans-2-butenoatemethyl hexanoate
6-methyl-5-hepten-2-one2-hexenal
butanol3-methyl-1-butanol
hexanalethyl propionate
furfural2-pentanone
benzaldehydehexyl acetate
methyl benzoate3-(methylthio)-1-propanol
acetophenoneethyl acetate
2,3-butanedioneethyl benzoate
gamma-hexalactoneacetaldehyde
ethyl hexanoate2-phenylethanol
butyric acidpropanol
2-butanonelinalool
valeraldehydehexyl butyrate
phenylacetaldehyde2,3-butanediol
diethyl succinatelinalool oxide
benzyl alcoholoctanol
gamma-butyrolactonemethyl acetatebutyraldehydehexanoic acid
methyl salicylatemethyl octanoate
geranyl acetate(R)-(+)-limonene2-methylphenol
ethanolmethanol
terpinolenegeraniol
isovaleric acidpropionic acid
pyruvic acidisobutyric acid
(-)-beta-citronellolacetone
3-carenehexyl hexanoate
DL-lactic acidacetic acid
eugenol2-ethylhexanoic acid
ammoniamyrcene
(-)-beta-pineneethyl cinnamate4-ethylguaiacolheptanoic acid
methyl sulphidepropionaldehyde
cadaverineoctanoic acid
nonanoic acidglycerol
1,4-diaminobutane
200010000-1000
2001000-100
summed IR response (spikes/s)
summed OR response (spikes/s)
lifet
ime
kurto
sis
35
30
25
20
15
10
5
0
-5
−3 −2 −1 0 1 2−3
−2
−1
0
1
2
3
−3
−2
−1
0
1
2
3
PC3
PC1
PC
2
D
IR sensillavs ORs
IR sensillavs OR sensilla
OR ligand OR ligand, IR response untestedIR ligand IR ligand, OR response untestedOR and IR ligand
brea
dth
of tu
ning
−3 −2 −1 0 1 2−3
−2
−1
0
1
2
3
−3
−2
−1
0
1
2
3
PC3
PC1
PC
2
ketonesacidsalcohols
aminesaldehydes
estersothers
ac4
ac1
ac3ac2
ab6
OR82a
OR49b
OR85a
OR59b
Figure 2. Comparison of the odor tuning properties of IR and OR repertoires. A, Tuning curves of coeloconic sensilla classes. The 168 odorants are displayed along the x-axis according to themagnitude of response they elicit, with the best agonists placed near the center of the distribution and the weakest agonists toward the edges. The top 10 odor ligands for each sensillum class areshown in the magnification of the central portion of the distribution. B, Lifetime kurtosis of the four classes of coeloconic sensilla (green) compared with that of individual ORs (magenta, left)and of the sensilla classes housing OR-expressing neurons (magenta, right), calculated from data in Figure 1 and the study by Hallem and Carlson (Figure legend continues.)
13362 • J. Neurosci., September 21, 2011 • 31(38):13357–13375 Silbering et al. • Insect Olfactory Subsystem Function and Evolution

not take into account all relevant properties of odorants (seeMaterials and Methods). The majority of OR ligands clusterwithin a single region in the three-dimensional PC space, corre-sponding to esters and alcohols (Fig. 2D). In contrast, IR agonistsare dispersed in this space, indicating that although these recep-tors recognize only a very small number of ligands, these odorshave very diverse physicochemical properties. Similar conclu-sions were also made by an analysis using a larger set of 1664molecular descriptors (Haddad et al., 2008) as well as an inde-pendent hierarchical cluster analysis of the same data (data notshown). Together, these analyses indicate that OR and IR reper-toires have distinct physiological properties: although the formerare generally broadly tuned to many esters and alcohols, IRs arenarrowly tuned to select, but diverse, acids and amines.
Peripheral and central spatial maps of IR olfactorysensory neuronsTo characterize the anatomy and function of individual populationsof IR neurons and compare these properties with the organization ofthe OR sensory pathways, we generated and verified the fidelity of apanel of IR promoter–GAL4 driver transgenes for the antennal-expressed IRs (see Materials and Methods and data not shown)(Benton et al., 2009; Croset et al., 2010). IR-expressing coeloconicOSNs and OR-expressing basiconic and trichoid OSNs are highlyintermingled in this peripheral sensory organ (Shanbhag et al.,1999). We visualized the distribution of different coeloconic sen-silla classes (ac1–ac4) with a class-specific IR–GAL4-driven nu-clear GFP reporter (Fig. 3A). As observed for OR sensilla (deBruyne et al., 2001), we found that ac1–ac4 each occupy uniqueand stereotyped, but overlapping, regions of the antenna (Fig.3A) (Benton et al., 2009).
Previous analysis of IR OSNs demonstrated that one (IR76a)projects to one glomerulus, whereas another (IR64a), unusually,innervates two glomeruli (Benton et al., 2009; Ai et al., 2010). Todetermine the global anatomical organization of this olfactorysubsystem, we traced the axons of each individual population ofIR-expressing OSN class using a GAL4-responsive membrane-targeted mCD8:GFP reporter. Seven types of coeloconic OSNs,expressing different IRs, were identified that innervate single,morphologically distinct glomeruli (Fig. 3B, Table 1) (Laissue etal., 1999). Although most receptors are expressed in a uniquecoeloconic sensillum class, IR75d is expressed in OSNs housed inac1, ac2, and ac4 (Fig. 1). The convergence of IR75d neurons to asingle glomerulus suggests that all neurons have the same sensoryfunction, despite their segregated peripheral expression. IR75a isexpressed in neurons in two sensilla classes: ac2, in which it ap-pears to be the unique odor-specific receptor, and ac3, in which it
is coexpressed with IR75b and IR75c (Fig. 1) (Benton et al., 2009).Our IR75a–GAL4 driver appears to reproduce expression only inac2 sensilla, because it labels IR75a-positive neurons that do notexpress IR75b (data not shown); subsequent optical imaging ex-periments indicated that IR75a/IR75b/IR75c neurons in ac3—for which we do not have a specific driver—are likely to target thedistinct DL2 glomerulus (see below).
Two receptors, IR40a and IR64a, are expressed in neuronsthat extend dendrites to the sacculus, a multichamber internalpocket with putative functions in chemosensation, hygrosensa-tion, and thermosensation (Shanbhag et al., 1995). As shownpreviously (Ai et al., 2010), IR64a neurons project to two glom-eruli, DC4 and DP1m (Fig. 3C). IR40a neurons have a complexinnervation pattern, consisting of a dorsoventral “column” in thecenter of the antennal lobe and a mediolateral “arm” at the pos-terior (Fig. 3C). IR40a OSNs also very weakly express IR93a (Ben-ton et al., 2009), but we did not obtain a faithful reporter for thisgene (data not shown). Similarly, our attempts to construct afunctional reporter for IR21a, which is expressed in neurons inthe arista and sacculus (Benton et al., 2009), were unsuccessful(data not shown). However, these cells may correspond to thoselabeled by an enhancer trap near the brivido1 gene [encoding atransient receptor potential (TRP) channel] that— consistentwith previous backfill studies (Stocker et al., 1983)—project tothe VP3 glomerulus at the posterior of the antennal lobe (alsoreferred to as the proximal antennal protocerebrum) (Gallio etal., 2011). Finally, the neurons expressing two IR coreceptors,IR8a and IR25a, as well as IR76b, which is expressed in one cell ineach coeloconic sensillum class (Fig. 1), innervate multiple glom-eruli (Fig. 3D), consistent with their coexpression with more se-lectively expressed IRs in multiple classes of antennal OSNs(Benton et al., 2009; Abuin et al., 2011).
Like OR OSNs, the expression and innervation pattern of IROSNs were comparable in both sexes (data not shown), and allwere bilaterally symmetric. In contrast, although all OR OSNshave bilateral projections (i.e., neurons from one antenna projectto both left and right antennal lobes) (Vosshall et al., 2000; Coutoet al., 2005), we identified—through a series of unilateral anten-nal deafferation experiments—a subset of IR OSNs that exclu-sively project ipsilaterally (Fig. 3E). These include IR75d (VL1),consistent with previous cobalt backfill analyses (Stocker et al.,1983), and the IR40a axons innervating the column but not mostof the arm (Fig. 3E). Aristal neurons are also strictly ipsilateral(Stocker et al., 1983).
Knowledge of these IR projections, together with previousmaps of OR innervations (Couto et al., 2005; Fishilevich andVosshall, 2005), essentially complete the molecular atlas of an-tennal lobe sensory input (Fig. 3F, Table 1). Importantly, weobserved no convergence of OR and IR neurons on commonglomeruli. Moreover, in contrast to the intermingling of OSNsomata in the antenna, OR and IR glomeruli are spatially segre-gated to anterior and posterior zones in the antennal lobe, respec-tively (Fig. 3F). IR OSNs housed in the same sensillum classproject to fairly dispersed glomeruli in the antennal lobe (Fig.3G). Sacculus and aristal neuron projections appear, however, tocluster within a large posterior– central zone (Fig. 3G). Glomerulireceiving exclusively ipsilateral input, including the V glomerulusinnervated by GR21a/GR63a neurons (Stocker et al., 1983; Scottet al., 2001; Couto et al., 2005; Jones et al., 2007; Kwon et al.,2007), are also grouped together in a posterior–ventral portion ofthe lobe (Fig. 3H). Notably, the set of IR glomeruli in the Dro-sophila antennal lobe may represent a homologous compartmentto a putatively conserved and segregated cluster of glomeruli
4
(Figure legend continued.) (2006). Horizontal bars represent the median values. To calculatethe response profiles of sensilla housing OR-expressing neurons, we summed the re-sponses of all OR-expressing neurons housed in the same sensillum class (see Materialsand Methods). The functional significance, if any, of the more narrowly tuned ORs (life-time kurtosis values �10) is unknown; the high lifetime kurtosis value for the ab6 sen-sillum is likely an artifact because this value reflects the tuning of only one of two ORs inthis sensillum [OR49b; the other has not been identified (Couto et al., 2005)]. C, Summedresponses of OR (magenta) (Hallem and Carlson, 2006) and IR (green) OSNs to a set ofodors common to both studies. Odor names are color coded by functional group as inFigure 1. D, PCA of the physicochemical properties of the best OR and IR ligands (seeMaterials and Methods). Top, Data points are colored according to the receptor family theyactivate; open circles indicate that the respective odor was present in only the IR or ORdataset. Bottom, Data points are colored according to their functional group. PC1, PC2,and PC3 explain 21, 18, and 14% of the variance, respectively.
Silbering et al. • Insect Olfactory Subsystem Function and Evolution J. Neurosci., September 21, 2011 • 31(38):13357–13375 • 13363
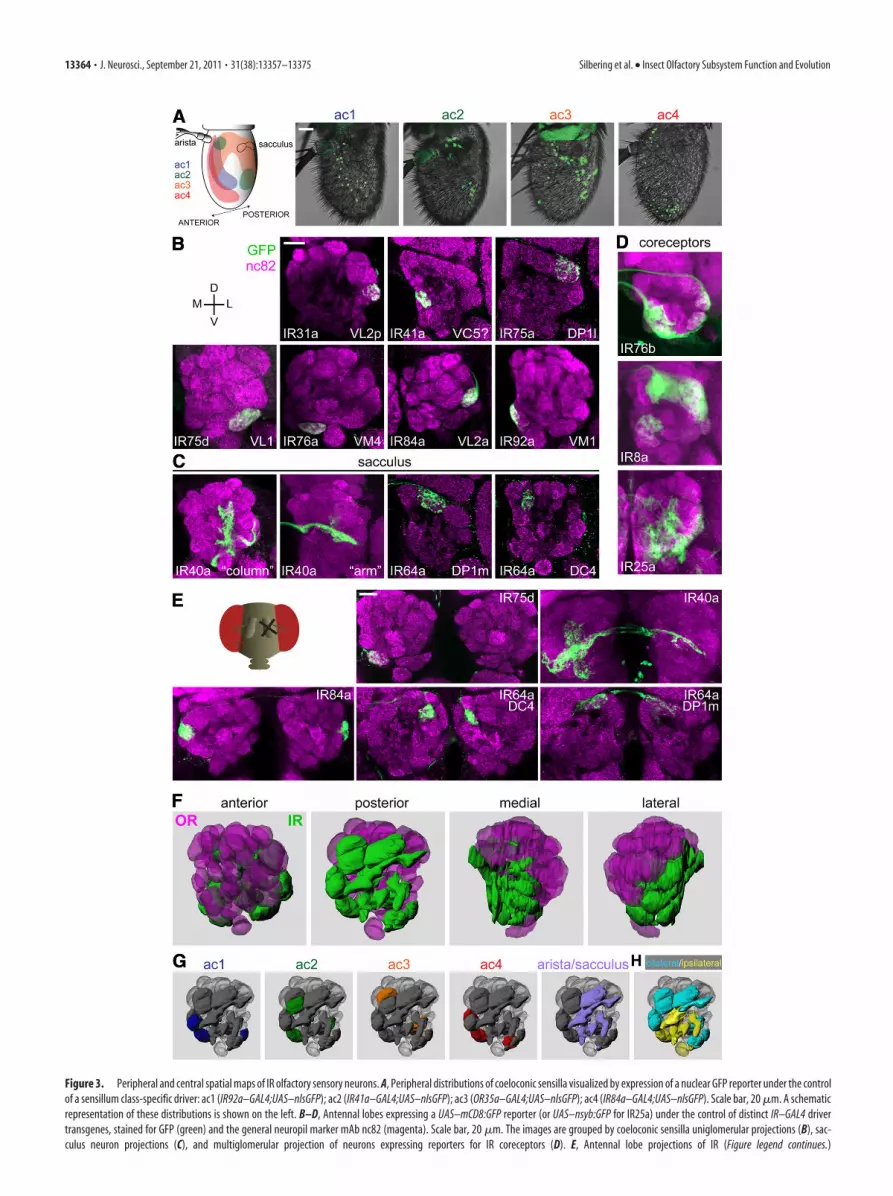
Figure 3. Peripheral and central spatial maps of IR olfactory sensory neurons. A, Peripheral distributions of coeloconic sensilla visualized by expression of a nuclear GFP reporter under the controlof a sensillum class-specific driver: ac1 (IR92a–GAL4;UAS–nlsGFP); ac2 (IR41a–GAL4;UAS–nlsGFP); ac3 (OR35a–GAL4;UAS–nlsGFP); ac4 (IR84a–GAL4;UAS–nlsGFP). Scale bar, 20 �m. A schematicrepresentation of these distributions is shown on the left. B–D, Antennal lobes expressing a UAS–mCD8:GFP reporter (or UAS–nsyb:GFP for IR25a) under the control of distinct IR–GAL4 drivertransgenes, stained for GFP (green) and the general neuropil marker mAb nc82 (magenta). Scale bar, 20 �m. The images are grouped by coeloconic sensilla uniglomerular projections (B), sac-culus neuron projections (C), and multiglomerular projection of neurons expressing reporters for IR coreceptors (D). E, Antennal lobe projections of IR (Figure legend continues.)
13364 • J. Neurosci., September 21, 2011 • 31(38):13357–13375 Silbering et al. • Insect Olfactory Subsystem Function and Evolution

present in the antennal lobes of honeybees (T4 glomeruli), cock-roaches (T10 glomeruli), and ants (T7 glomeruli) (Zube et al.,2008; Nishino et al., 2009; Galizia and Rossler, 2010; Watanabe etal., 2010).
Definition of IR neuron odor specificityTo assign odor ligands identified in our electrophysiologicalscreen to specific IR OSNs, we performed a series of functionalimaging experiments in the antennal lobe (Fig. 4). We ex-pressed the genetically encoded fluorescent calcium sensorGCaMP1.6 (Ohkura et al., 2005) in defined subpopulations ofIR OSNs using IR–GAL4 drivers. For each IR population, wescreened the subset of odors shown to evoke electrophysiolog-ical activity in the corresponding sensillum class in the an-tenna (Figs. 1, 2 A).
Overall, we found excellent correspondence between odor-evoked peripheral electrophysiological responses in OSN den-drites (Figs. 1, 2A) and calcium responses in axon termini (Fig.4). In ac1, IR31a neurons responded to 2-oxopentanoic acid,whereas IR92a neurons were stimulated, albeit somewhat vari-ably, by ammonia, pyrrolidine, and dimethylamine. IR75d neu-rons, which are common to ac1, ac2, and ac4 sensilla, respondedto pyrrolidine, consistent with responses to this odor in all threeof these sensillum classes (Fig. 1). In ac2, IR41a neurons wereactivated by all amine ligands (pyridine, 1,4-diaminobutane, ca-daverine, spermidine, and pyrrolidine). In contrast, IR75a neu-rons responded robustly to the acid ligands (acetic acid andpropionic acid) as well as to 2,3-butanedione.
We imaged the activity of ac3 IR75a/IR75b/IR75c neurons,for which we lack a GAL4 line, using the driver line for IR8a,which is an essential coreceptor in these neurons (Abuin et al.,2011). Among the �10 glomeruli expressing GCaMP, weidentified one displaying physiological responsiveness that isdistinct from ac2 IR75a (DP1l) neurons and concordant withperipheral responses of the ac3 neuron, with strong activationby propionic acid, butyric acid, and butyraldehyde (Fig. 4).The position of this glomerulus suggested that this corre-sponds to DL2 (Laissue et al., 1999), although unequivocalmorphological demarcation from its immediate neighborswas not possible. Finally, in ac4, we observed responses ofIR76a neurons to several amines (including pyrrolidine andphenylethylamine) and responses of IR84a neurons to pheny-lacetic acid and phenylacetaldehyde (Fig. 4), consistent withour previous functional analysis of this receptor (Benton et al.,2009; Abuin et al., 2011).
We confirmed these ligand/OSN assignments by targeted cellablation, in which we used IR drivers to express the cell-autonomous diphtheria toxin in select IR populations and exam-ined the corresponding loss of peripheral electrophysiologicalresponsiveness (data not shown). The only exception was ob-served in ac1 sensilla in flies expressing diphtheria toxin underthe control of IR92a–GAL4, in which responses to ammonia per-
sisted (data not shown), suggesting either incomplete ablation ofthese neurons or the existence of an unidentified ammonia-responsive cell in this sensillum.
For sacculus IR OSNs, which are inaccessible for electrophys-iological recordings at the periphery, we confirmed that IR64aneurons comprise two physiologically distinct populations: oneis responsive to many organic acids and other odors and projectsto DP1m, and the other is selective for free protons and projectsto DC4 (Ai et al., 2010) (data not shown). Although several otherIR neurons respond to carboxylic acids (Figs. 1, 4), only IR64aDC4 neurons display strong responses to the inorganic acid hy-drogen chloride, confirming their special role as an olfactoryproton sensor (Fig. 1) (Ai et al., 2010). Stimuli for IR40a or thearistal-expressed IR21a are unknown. Recent physiologicalexperiments have found that aristal neurons respond to eitherincreases or decreases in temperature (Gallio et al., 2011);cooling responses, at least, depend on TRP channels (Gallio etal., 2011), and the contribution of IR21a to thermosensation,if any, is unclear.
Functional and developmental organization of IRsensory inputWith knowledge of odor ligands for nearly all IR OSN popu-lations, we generated a functional map of IR sensory represen-tation in the antennal lobe (Fig. 5A). This map revealed anotable chemotopic organization of this olfactory subsystem,in which acid-responsive glomeruli were clustered in the dor-sal–posterior region, whereas amine-responsive glomeruliwere located more ventrally (Fig. 5B). Furthermore, the dorsalgroup of IR glomeruli appeared to correspond closely with thesubset innervated by neurons strongly expressing the IR8acoreceptor (Fig. 3D). Indeed, genetic analysis of IR8a mutantshas shown that IR64a, IR75a, and IR84a acid-sensing recep-tors depend on this IR8a for their localization and/or function(Abuin et al., 2011). We additionally confirmed that IR31a neuronresponses to the newly identified ligand, 2-oxopentanoic acid, are alsodependent on IR8a (data not shown). Thus, IR8a appears to be adedicated coreceptor for acid-sensitive IRs, and the correspond-ing OSNs project to a cluster of glomeruli in the antennal lobe(Fig. 5B,C).
Conversely, we showed previously that the second corecep-tor, IR25a, is essential for 1,4-diaminobutane responses in ac2(here shown to correspond to IR41a neurons) and phenyleth-ylamine responses of IR76a neurons in ac4 (Abuin et al.,2011). Moreover, we also established that IR75d neuron pyr-rolidine responses in ac4 are also IR25a dependent (data notshown). IR25a thus may represent a universal coreceptor foramine-sensing IRs, possibly in collaboration with IR76b,which is coexpressed in all of these IR subpopulations (Bentonet al., 2009; Abuin et al., 2011) (Fig. 1). The correspondingIR25a-dependent neurons target a ventral group of glomeruliwithin the antennal lobe (Fig. 5C).
In addition to the spatial and functional dichotomy of thesetwo groups of IR neurons, we noticed that they are also distin-guished developmentally by their requirement for the activity ofNotch signaling. The Notch pathway is required to differentiatethe receptor expression profile and glomerular projections ofOSNs derived from the two daughter cells of a common precur-sor (Endo et al., 2007); this occurs through a process of lateralinhibition, in which one daughter acquires a high level of Notchactivity and thereby suppresses Notch activity in its sibling (Ro-drigues and Hummel, 2008). We observed that, when data isavailable, all IR25a-dependent OSNs (four of four populations)
4
(Figure legend continued.) neurons, visualized as in B–D, in animals subject to unilateral (left)deafferation 10 d before staining. Scale bar, 20 �m. F, Three-dimensional reconstruction of afemale left antennal lobe, orientated from different viewpoints, illustrating segregation of OR(purple) and IR (green) OSN-innervated glomeruli. G, Posterior view of the 3D reconstructionshown in F in which glomeruli innervated by neurons housed in the same antennal structure arehighlighted. H, Distribution of antennal lobe glomeruli receiving bilateral (cyan) or exclusivelyipsilateral (yellow) sensory input, as determined by the unilateral deafferation experimentsshown in E. D, Dorsal; L, lateral; M, medial; V, ventral.
Silbering et al. • Insect Olfactory Subsystem Function and Evolution J. Neurosci., September 21, 2011 • 31(38):13357–13375 • 13365

correspond to those deriving from a daughter cell with highNotch activity (“Notch ON”), whereas all IR8a-dependentOSNs (five of five populations) derive from the daughter withlow Notch activity (“Notch OFF”) (Fig. 5D, Table 1) (Endo etal., 2007). Thus, within IR OSNs, Notch signaling may serve todistinguish acid-sensing/IR8a-dependent and amine-sensing/IR25a-dependent OSNs in several different lineages. TheNotch-dependent functional diversification of IR OSNs mayprovide a simple developmental mechanism to couple phar-macologically distinct OSNs within individual sensilla and sooffer a potential means to increase the dynamic range of indi-vidual neurons (Vermeulen and Rospars, 2004). Indeed, ago-nists for one neuron in a sensillum often antagonize activity inanother [e.g., in ac4, amine ligands for IR76a/IR76b stronglyreduce calcium signals in IR84a neurons (Fig. 4)]. Such an“opponent signaling” strategy may also enhance odor discrim-ination (French et al., 2011).
Other mechanisms must presumably exist to control the se-lection and glomerular targeting of the precise odor-specific IR ineach sensillar class. These may include Hedgehog signaling,
which is required in a mosaic (but stereotyped) set of glomerulithat do not correlate with the acid/IR8a amine/IR25a groups (Fig.5E) (Chou et al., 2010a).
Evolutionary insights into the functional and anatomicaldiversification of the IR olfactory subsystemIn contrast to OR repertoires, which are highly divergent acrosseven phylogenetically close families of insects, such as fruit fliesand mosquitoes (Hill et al., 2002), the deeper conservation of IRsoffers a possibility to consider how the stepwise expansion of thisreceptor repertoire during evolution is linked to the functionaland anatomical diversification of this olfactory subsystem(Table 1). We first mapped the defined ligand specificitiesonto a phylogenetic tree of antennal IRs and iGluRs (Fig. 5F)(Croset et al., 2010). This revealed an intimate relationshipbetween receptor evolution and function: IR8a/IR25a core-ceptor, acid-sensing, and amine-sensing (except IR75d) IRsbelong to three distinct clades (Fig. 5F ), suggestive of theirderivation from ancestral IRs that already exhibited this func-tional specialization.
Table 1. Pharmacological, molecular, evolutionary, and anatomical properties of the IR olfactory pathways
Receptor
Evolutionary conservationa
Main agonists Coreceptor
Peripheral
expression
OSN central
innervations
Notch
On/Offb
Ipsilateral/
bilateral
Engrailed
Patchedc PN tractdDmel Dgri Agam Cqui Bmor Tcas Amel Nvit Apis Pbar Phum Dpul Isca
IR25a Coreceptor — ac1–ac4, sacculus I II, arista many — — — —
IR8a Coreceptor — ac1–ac4, sacculus III many — — — —
IR76b Coreceptor — ac1–ac4 VM1, VM4, VC3, VC5 — — — —
IR93a ? IR25a?i sacculus I II VP1? novelj — — — ?
IR40a ? IR25a?i sacculus I II VP1? novelj ? I B ? ?
IR21a ?h IR25a?i arista, sacculus III? VP3?k ? In En ?
IR75d Pyrrolidine IR25a ac1,ac2,ac4 VL1 ON I Ptc mACT
IR75a Propionic acid, acetic acid IR8a ac2 DP1l OFF B Ptc iACT
IR41ae 1,4-diaminobutane IR25a ac2 VC5?l ON B ? ?
IR64a ?f free protons IR8a sacculus III DC4 ? B En ?
IR64a acids other odors IR8a sacculus III DP1m OFF B En iACT
IR92a Ammonia, dimethylamine IR25a ac1 VM1 ON B En iACT
IR75abc Butyric acid IR8a ac3 DL2?m OFF B Ptc/- (d/v)o iACT
IR76a Phenylethylamine IR25a ac4 VM4 ON B Ptc iACT
IR84a Phenylacetic acid IR8a ac4 VL2a OFF B Ptc iACT mACT
IR31a 2-Oxopentanoic acid IR8a ac1 VL2p OFF B En iACT mACT
OR35ag Many odors Orco ac3 VC3 ON B Ptc iACT
aSensory channels are ordered by the approximate time of their evolution, as predicted by the conservation across Protostomia of the receptors they express. Data for the sole member of the OR family expressed in coeloconic sensilla, OR35a,are also shown (Yao et al., 2005). Unless otherwise indicated, all data come from this work or from Benton et al. (2009). Presence of putative receptor orthologs in a species is indicated by a shaded cell. Bioinformatic data is taken from Crosetet al. (2010) and Smith et al. (2011). Dmel, Drosophila melanogaster; Dgri, Drosophila grimshawi; Agam, Anopheles gambiae; Cqui, Culex quinquefasciatus; Bmor, Bombyx mori; Tcas, Tribolium castaneum; Amel, Apis mellifera; Nvit, Nasoniavitripennis; Apis, Acyrthosiphon pisum; Pbar, Pogonomyrmex barbatus; Phum, Pediculus humanus humanus; Dpul, Daphnia pulex; Isca, Ixodes scapularis. Note that the absence of certain genes in inner insect lineages (e.g., AmelIR40a andNvitIR40a) may reflect either loss of these genes or simply gaps in the available genome sequence.bData from Endo et al. (2007).cData from Chou et al. (2010a).dData from Marin et al. (2002), Wong et al. (2002), Jefferis et al. (2007), and Chiang et al. (2011). PNs arising from anterodorsal and lateral neuroblasts project their axons via the inner antennocerebral tract (iACT), sending collaterals to themushroom body calyx and terminating in the lateral horn. Axons of PNs arising from the ventral neuroblast project via the middle antennocerebral tract (mACT) directly to the lateral horn, bypassing the mushroom body completely (Fig. 6 A).eIR41a was not detected by RNA in situ hybridization in our previous analysis (Benton et al., 2009), but reannotation of the gene structure (Croset et al., 2010) and subsequent RNA probe redesign revealed coexpression of IR41a with IR76bin ac2 neurons (data not shown).fIR64a is necessary for responses of DC4 neurons to acid stimuli (free protons) but is not sufficient to confer acid responses when misexpressed (Ai et al., 2010), suggesting the existence of an additional receptor.gData from Couto et al. (2005), Fishilevich and Vosshall (2005), and Yao et al. (2005).hAristal neurons have been shown to function as thermosensors (Gallio et al., 2011), but the role of IR21a in mediating physiological responses to temperature changes, if any, is unknown.iThe coreceptor IR25a, but not IR8a, is robustly expressed in these populations of neurons (Benton et al., 2009), suggesting that it may act as a coreceptor for these sacculus and aristal IRs.jVP1 was originally described, through cobalt backfill analysis, as one of the five glomeruli receiving unilateral input located between VP2 and VP3 (Stocker et al., 1983). The complete morphology of this glomerulus has not been reported,however, and the inability to visualize this neuropil with nc82 staining has led to subsequent antennal lobe maps either excluding VP1 (Laissue et al., 1999; Couto et al., 2005) or presenting different representations of its position (Chou etal., 2010a; Yu et al., 2010a). The location and unilateral innervation of the column part of the IR40a axonal arbors in the antennal lobe suggests that a subset of these neurons could correspond to the “VP1 neurons” described by Stocker etal. (1983) but that IR40a-expressing OSNs comprise a heterogeneous population with more extensive and novel innervations in the antennal lobe. Although a faithful GAL4 reporter for IR93a is not available, coexpression of endogenous IR93aand IR40a in the sacculus (Benton et al., 2009) allows us to infer the central projections of IR93a neurons.kAristal neurons were shown to innervate VP2 and VP3 glomeruli by cobalt backfill analysis (Stocker et al., 1983). A GAL4 reporter for GR28b.d is expressed in a subpopulation of aristal neurons and innervates the medial VP2 glomerulus(Thorne and Amrein, 2008). We found that IR21a mRNA is expressed in the complementary set of aristal neurons to this reporter line (data not shown), suggesting that IR21a neurons correspond to those innervating the lateral VP3glomerulus.lIR41a projections may correspond to the novel glomerulus described by Endo et al. (2007).mThe innervation of IR75a/IR75b/IR75c ac3 neurons was deduced by correlation of peripheral electrophysiological and central optical imaging data (Figs. 1, 4) but could not be verified by a specific GAL4 line.nIpsilateral projections of aristal neurons were demonstrated in cobalt backfill analysis (Stocker et al., 1983).oSeveral analyses divide the DL2 glomerulus morphologically into dorsal (d) and ventral (v) compartments (Laissue et al., 1999), although their functional distinction, if any, is unknown.? and — indicate when data are unavailable or inapplicable, respectively.
13366 • J. Neurosci., September 21, 2011 • 31(38):13357–13375 Silbering et al. • Insect Olfactory Subsystem Function and Evolution
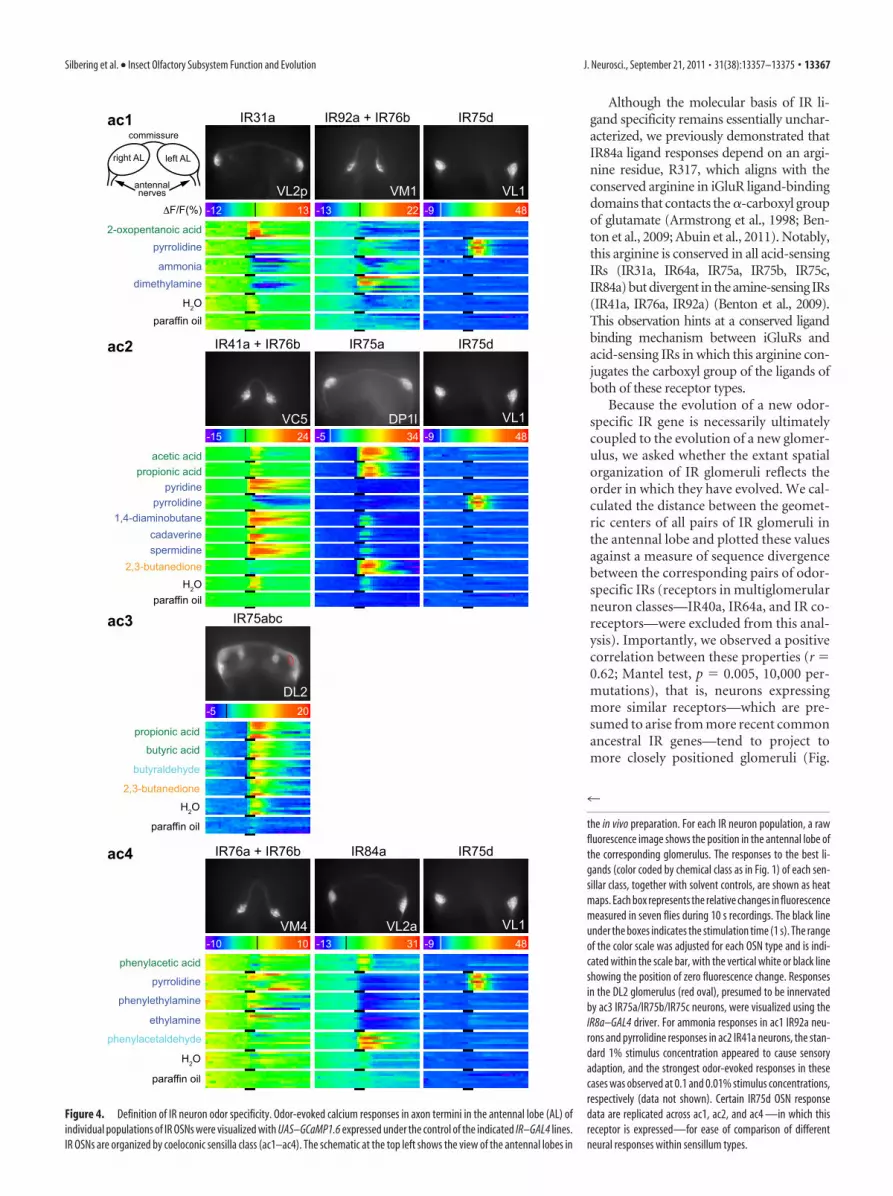
Although the molecular basis of IR li-gand specificity remains essentially unchar-acterized, we previously demonstrated thatIR84a ligand responses depend on an argi-nine residue, R317, which aligns with theconserved arginine in iGluR ligand-bindingdomains that contacts the �-carboxyl groupof glutamate (Armstrong et al., 1998; Ben-ton et al., 2009; Abuin et al., 2011). Notably,this arginine is conserved in all acid-sensingIRs (IR31a, IR64a, IR75a, IR75b, IR75c,IR84a) but divergent in the amine-sensing IRs(IR41a, IR76a, IR92a) (Benton et al., 2009).This observation hints at a conserved ligandbinding mechanism between iGluRs andacid-sensing IRs in which this arginine con-jugates the carboxyl group of the ligands ofboth of these receptor types.
Because the evolution of a new odor-specific IR gene is necessarily ultimatelycoupled to the evolution of a new glomer-ulus, we asked whether the extant spatialorganization of IR glomeruli reflects theorder in which they have evolved. We cal-culated the distance between the geomet-ric centers of all pairs of IR glomeruli inthe antennal lobe and plotted these valuesagainst a measure of sequence divergencebetween the corresponding pairs of odor-specific IRs (receptors in multiglomerularneuron classes—IR40a, IR64a, and IR co-receptors—were excluded from this anal-ysis). Importantly, we observed a positivecorrelation between these properties (r �0.62; Mantel test, p � 0.005, 10,000 per-mutations), that is, neurons expressingmore similar receptors—which are pre-sumed to arise from more recent commonancestral IR genes—tend to project tomore closely positioned glomeruli (Fig.
IR76a + IR76b
-10 VM4
IR84a
VL2a
IR75a
DP1l
2-oxopentanoic acidpyrrolidine
ammoniadimethylamine
H2O
paraffin oil
F/F(%) -12 13
IR31a
VL2p
IR92a + IR76b
-13 22
VM1
IR75d
-9 48
VL1
-5 34
IR41a + IR76b
-15 24 VC5
acetic acidpropionic acid
pyridinepyrrolidine
1,4-diaminobutanecadaverinespermidine
2,3-butanedione
H2Oparaffin oil
propionic acid
2,3-butanedione
H2O
paraffin oil
butyric acid
butyraldehyde
IR75abc
-5 20
DL2
ac1
ac2
ac3
10 31-13
phenylacetic acid
pyrrolidine
phenylethylamine
ethylamine
H2O
paraffin oil
ac4
right AL left AL
commissure
antennalnerves
phenylacetaldehyde
IR75d
-9 48
VL1
IR75d
-9 48
VL1
Figure 4. Definition of IR neuron odor specificity. Odor-evoked calcium responses in axon termini in the antennal lobe (AL) ofindividual populations of IR OSNs were visualized with UAS–GCaMP1.6 expressed under the control of the indicated IR–GAL4 lines.IR OSNs are organized by coeloconic sensilla class (ac1–ac4). The schematic at the top left shows the view of the antennal lobes in
4
the in vivo preparation. For each IR neuron population, a rawfluorescence image shows the position in the antennal lobe ofthe corresponding glomerulus. The responses to the best li-gands (color coded by chemical class as in Fig. 1) of each sen-sillar class, together with solvent controls, are shown as heatmaps. Each box represents the relative changes in fluorescencemeasured in seven flies during 10 s recordings. The black lineunder the boxes indicates the stimulation time (1 s). The rangeof the color scale was adjusted for each OSN type and is indi-cated within the scale bar, with the vertical white or black lineshowing the position of zero fluorescence change. Responsesin the DL2 glomerulus (red oval), presumed to be innervatedby ac3 IR75a/IR75b/IR75c neurons, were visualized using theIR8a–GAL4 driver. For ammonia responses in ac1 IR92a neu-rons and pyrrolidine responses in ac2 IR41a neurons, the stan-dard 1% stimulus concentration appeared to cause sensoryadaption, and the strongest odor-evoked responses in thesecases was observed at 0.1 and 0.01% stimulus concentrations,respectively (data not shown). Certain IR75d OSN responsedata are replicated across ac1, ac2, and ac4 —in which thisreceptor is expressed—for ease of comparison of differentneural responses within sensillum types.
Silbering et al. • Insect Olfactory Subsystem Function and Evolution J. Neurosci., September 21, 2011 • 31(38):13357–13375 • 13367

5G). A similar relationship has been de-scribed for glomeruli innervated by basi-conic sensilla ORs (Couto et al., 2005).These observations suggest a model inwhich new glomeruli arise from the seg-regation of axons of OSNs expressingrecently duplicated receptor genes withina “parental” glomerulus (discussed inRamdya and Benton, 2010).
Anatomy of processing and higher-order representations of IR and ORolfactory pathwaysOSNs synapse with both LNs, whose pro-cesses are restricted to the antennal lobe,and PNs, which connect the primary ol-factory center with the mushroom body(MB) and lateral horn (LH) of the proto-cerebrum (Fig. 6A) (Masse et al., 2009).Recent large-scale anatomical analyses ofLNs and PNs (Wong et al., 2002; Jefferis etal., 2007; Lin et al., 2007; Chou et al.,2010b; Yu et al., 2010a; Chiang et al.,2011) allowed us to examine the organiza-tion of these elements of the olfactory cir-cuits receiving input from IR-expressingOSNs and compare this with OR-dependent olfactory circuitry.
A minimum of 100 ipsilaterally and100 bilaterally projecting LNs are esti-mated to innervate each antennal lobe(Chou et al., 2010b). The probable major-ity of these express the inhibitory neu-rotransmitter GABA, but a significantfraction are likely to be excitatory (eitherglutamatergic or cholinergic) (Olsen etal., 2007; Shang et al., 2007; Grosjean etal., 2008; Chou et al., 2010b). Detailedmorphological analysis of individual LNsreveals considerable diversity in their glo-merular innervation patterns (Chou et al.,2010b; Seki et al., 2010). We askedwhether any LNs selectively discriminatebetween OR and IR glomeruli by repeat-ing the hierarchical cluster analysis of glo-merular innervation patterns for the set of1489 single-labeled unilateral LNs and 43single-labeled bilateral LNs (Chou et al.,2010b) and segregating these by OR andIR glomerular classes (Fig. 6B). The vastmajority of LNs display broad innervationof many glomeruli in the antennal lobeand do not discriminate between the ORand IR glomerular domains. However,subsets of unilateral and bilateral LNs (la-beled “1” in Fig. 6B) are almost exclu-sively restricted to the posteriormostglomeruli (VP1–VP3), which receive in-put from sacculus and aristal sensory neu-rons. Furthermore, we also note theexistence of both unilateral and bilateralLNs that innervate known acid-sensing(DL2, DP1m, DP1l, VL2a, VL2p) but not
B C IR25a IR25a?IR8a
amine acid
NOTCH ONNOTCH OFF
D EngrailedPatched
E
F G
1.0amine receptorsIR25a-dependent
acid receptorsIR8a-dependent
IR76b
IR21a
IR93a
IR40a
IR76
a
IR41
aIR92a
IR68a
IR75d
IR84a
IR64
a
IR75
cIR75
a
IR75
b
IR31a
IR25a
IR8a
GluR1B
Glu
RIIE
GluRIIA
core
cept
ors
molecular distance
glom
erul
ar s
epar
atio
n (μ
m)
0
10
20
30
40
50
60
0.5 1.5 2.5 3.5 4.5
r = 0.62
IR84a - VL2aphenylacetic acid
phenylacetaldehyde
IR64a - DP1mmany acids+ other odors
IR75a - DP1lpropionic acid
acetic acid
IR31a - VL2p2-oxopentanoic acid
IR75d - VL1pyrrolidine
IR76a - VM4phenylethylamine
IR92a - VM1ammonia dimethylamine
IR41a - VC5?1,4-diaminobutane + other amines
IR64a - DC4acids (free protons)
IR75abc - DL2?propionic acid
butyric acid
A
D
VML
butyraldehyde
Figure 5. Evolutionary, developmental, and functional organization of IR sensory input. A, A functional map of the antennallobe summarizing the principal ligands and receptors corresponding to each IR glomerulus. B, Distribution of target glomerulireceiving input from acid-sensitive (red) and amine-sensitive (blue) OSNs. Dark gray glomeruli, in this and subsequent panels,represent IR glomeruli for which data is unavailable; light gray glomeruli correspond to those innervated by OR-expressing OSNs.C, Distribution of target glomeruli receiving input from IR8a-dependent (red) and IR25a-dependent (blue) OSNs. The innervationsof IR40a neurons are shown in light blue because these neurons robustly coexpress IR25a, but not IR8a, although their function andcoreceptor dependency is unknown. D, Distribution of target glomeruli receiving input from OSNs in which Notch signaling isinactive (Notch OFF) (red) or active (Notch ON) (blue), based on data from Endo et al. (2007). E, Distribution of target glomerulireceiving input from OSNs in which a Patched (magenta) or Engrailed (green) reporter is active, representing proteins that receiveor regulate Hedgehog signals, respectively, based on data from Chou et al. (2010a). F, Phylogenetic tree of antennal IRs andselected iGluRs. The sequences were aligned with ProbCons (Do et al., 2005). The tree was built using PhyML (Guindon and Gascuel,2003) based on a manually cleaned alignment with 1000 bootstrap replicates. Filled circles indicate a bootstrap support of �90,open circles indicate a bootstrap support between 70 and 90. iTOL (Letunic and Bork, 2007) was used to view and graphically editthe tree. The phylogeny was rooted using the iGluRs. The scale bar represents the expected number of substitutions per site. G,Scatter plot of glomerular separation (distance between geometric centers) versus molecular distance (a measure of primarysequence divergence) for all 36 pairwise combinations of uniglomerular IRs. The sequences were aligned using ProbCons (proba-bilistic consistency), and the JTT (Jones, Taylor, and Thornton) method as implemented in MEGA (Tamura et al., 2007) was used tocalculate the pairwise molecular distances. D, Dorsal; L, lateral; M, medial; V, ventral.
13368 • J. Neurosci., September 21, 2011 • 31(38):13357–13375 Silbering et al. • Insect Olfactory Subsystem Function and Evolution
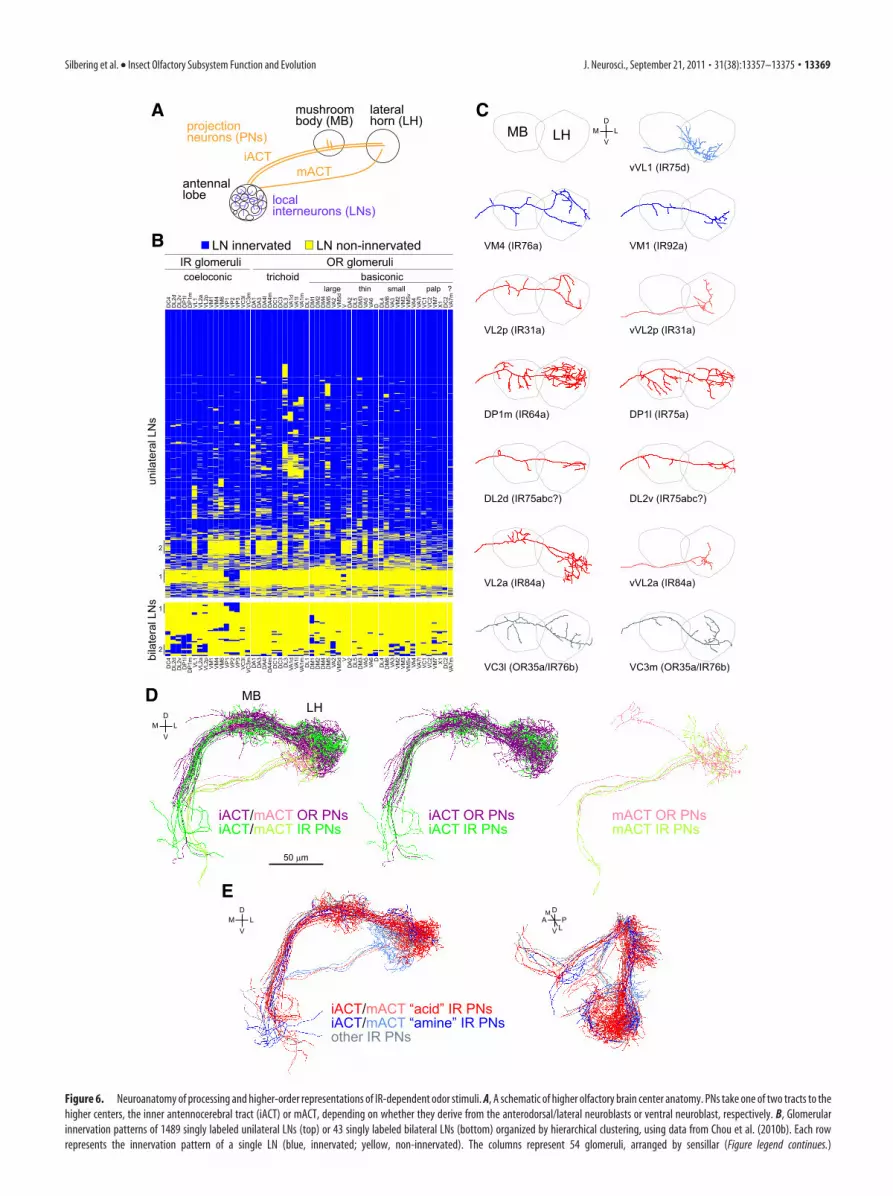
DC
4D
L2d
DL2
vD
P1l
DP
1mV
L1V
L2a
VL2
pV
M1
VM
4V
M6
VP
1V
P2
VP
3V
C3l
VC
3mD
A1
DA
3D
A4l
DA
4mD
C1
DC
3D
L3VA
1dVA
1lVA
1mD
L1D
M1
DM
2D
M4
DM
5VA
2V
M5d
V DA
2D
L5D
M3
VA5
VA6
D DL4
DM
6VA
3V
M2
VM
3V
M5v
VA4
VA7l
VC
1V
C2
VM
7X
1D
C2
VA7m
coeloconic trichoidlarge thin small palp
DC
4D
L2d
DL2
vD
P1l
DP
1m VL1
VL2
aV
L2p
VM
1V
M4
VM
6V
P1
VP
2V
P3
VC
3lV
C3m DA
1D
A3
DA
4lD
A4m DC
1D
C3
DL3
VA1d
VA1l
VA1m DL1
DM
1D
M2
DM
4D
M5
VA2
VM
5d VD
A2
DL5
DM
3VA
5VA
6 DD
L4D
M6
VA3
VM
2V
M3
VM
5vVA
4VA
7lV
C1
VC
2V
M7
X1
DC
2VA
7m
unila
tera
l LN
sbi
late
ral L
Ns
B
A
D
IR glomeruli OR glomerulibasiconic
?
2
2
1
DL2d (IR75abc?) DL2v (IR75abc?)
DP1l (IR75a)DP1m (IR64a)
VC3l (OR35a/IR76b) VC3m (OR35a/IR76b)
VL2a (IR84a)
VL2p (IR31a)
VM1 (IR92a)VM4 (IR76a)
vVL1 (IR75d)
vVL2a (IR84a)
vVL2p (IR31a)
antennallobe local
interneurons (LNs)
projectionneurons (PNs)
mushroombody (MB)
lateralhorn (LH)
iACTmACT
MB LH
E
iACT/mACT OR PNsiACT/mACT IR PNs
iACT OR PNsiACT IR PNs
mACT OR PNsmACT IR PNs
MBLH
iACT/mACT “acid” IR PNsiACT/mACT “amine” IR PNsother IR PNs
1
D
VLM
D
VLM
50 µm
LN innervated LN non-innervated
D
VLM
L
M D
VPA
C
Figure 6. Neuroanatomy of processing and higher-order representations of IR-dependent odor stimuli. A, A schematic of higher olfactory brain center anatomy. PNs take one of two tracts to thehigher centers, the inner antennocerebral tract (iACT) or mACT, depending on whether they derive from the anterodorsal/lateral neuroblasts or ventral neuroblast, respectively. B, Glomerularinnervation patterns of 1489 singly labeled unilateral LNs (top) or 43 singly labeled bilateral LNs (bottom) organized by hierarchical clustering, using data from Chou et al. (2010b). Each rowrepresents the innervation pattern of a single LN (blue, innervated; yellow, non-innervated). The columns represent 54 glomeruli, arranged by sensillar (Figure legend continues.)
Silbering et al. • Insect Olfactory Subsystem Function and Evolution J. Neurosci., September 21, 2011 • 31(38):13357–13375 • 13369
amine-sensing (VL1, VM1, VM4) IR glomeruli (labeled “2” inFig. 6B), suggesting the possibility for selective modulationwithin this functional class of glomeruli. However, these LNs alsoinnervate many OR glomeruli. We conclude that, although ORand IR sensory inputs are spatially segregated in the antennal lobe(Fig. 3F), extensive lateral inhibitory and excitatory interactionsmediated by LNs are likely to occur between OR and IRglomeruli.
Most PN dendrites, like OSN axons, innervate single glomer-uli (Vosshall and Stocker, 2007; Masse et al., 2009). The axons ofPNs innervating the same glomerulus (typically three to five neu-rons) display stereotyped innervations of the LH and/or MB(Marin et al., 2002; Wong et al., 2002; Jefferis et al., 2007). Themap of odor representation in higher brain centers formed by PNaxons receiving input from OR glomeruli is characterized by sig-nificant spatial convergence and divergence, which may reflect inte-gration and segregation of olfactory information detected by distinctORs (Marin et al., 2002; Wong et al., 2002). For example, within theLH, PN partners of OSNs expressing fruit odor-responsive ORs haveclustered axonal projections, and these segregate from PNs receivinginput from candidate pheromone-responsive OSNs (Jefferis et al.,2007). Optical imaging of PN responses suggest that OSN responsesare generally faithfully transmitted to these second-order neurons(Ng et al., 2002; Wang et al., 2003), although electrophysiologicalanalyses indicate that significant transformations occur in at leastsome OSN–PN synapses to increase reliability and separability ofodor-evoked PN activity patterns (Wilson et al., 2004; Bhanda-wat et al., 2007).
Having defined novel IR-dependent sensory inputs to previ-ously orphan glomeruli, we analyzed the spatial organization oftheir partner PNs in the MB and LH. We integrated data fromWong et al. (2002), Jefferis et al. (2007), and Chiang et al. (2011),which together allowed us to map 13 PN classes innervating 9glomeruli that receive input from 9 of 13 IR-positive OSN classes(Fig. 6C), permitting broad comparison of their properties withPNs receiving input from OR glomeruli (Fig. 6D). Several poly-glomerular PN classes that exclusively innervate IR glomerulihave also been identified (poly[L1–L4]) (Yu et al., 2010a), but therole of such neurons in olfactory processing is unknown, and wedo not consider them further here.
Like OR PNs, IR PNs originating from the same glomerulushad very similar axon projection patterns in the LH (Wong et al.,2002; Jefferis et al., 2007) (data not shown), suggesting that they
also provide anatomically stereotyped input to this olfactory cen-ter. Such morphological stereotypy may also exist in the MB butis harder to visualize (Jefferis et al., 2007). Importantly, axonaltermini of IR and OR PNs are extensively interdigitated withinboth the MB and the LH (Fig. 6D). Thus, although IR- and OR-dependent sensory signals are initially physically segregatedwithin the antennal lobe (Fig. 3F), this information is likely to bereintegrated in higher olfactory centers. We note, however, thatsome regions of the LH are spared by the IR PNs that we mapped,in particular the most dorsal part of this center.
We next asked whether functionally related subgroups of IRPNs might target discrete regions of the LH, revealing additionaltopography in this structure. We therefore examined the relativeprojection patterns of PNs connected to acid-sensing/IR8a-dependent and amine-sensing/IR25a-dependent glomeruli (Fig.6E). Although there are too few PN classes for a formal statisticalanalysis, the terminals of amine-sensing IR PNs are primarilyrestricted to a posterior ventral region of the lateral horn. If thisorganization is confirmed, it may represent functional specializa-tion of this region, or perhaps a relic of development or evolution.
We also note that several IR PN classes (vVL2a, vVL2p, vVL1)derive from the ventral neuroblast and therefore follow the me-dial antennocerebral axon tract (mACT) that bypasses the MBand targets directly the LH (Fig. 6A,C, Table 1). The pursuit ofthis tract may be behaviorally significant for the olfactory infor-mation these pathways transduce, because the MB is a locus ofolfactory learning whereas the LH is generally considered to me-diate innate odor-evoked behaviors (Heisenberg, 2003). Indeed,the only other known uniglomerular vPN classes, vDA1 andvVA1lm, are those implicated in regulation of the innate malecourtship ritual (Stockinger et al., 2005; Jefferis et al., 2007).Thus, we speculate that these three IR circuits also control innateolfactory behaviors. VL2a and VL2p are also innervated by PNsthat follow the inner antennocerebral tract and project to boththe MB and LH, indicating that stimuli detected by these olfac-tory channels have two distinct neural representations in higherbrain centers (Fig. 6C).
Behavioral integration of odor stimuli by OR and IRsensory channelsWe investigated the contribution of IR circuits to odor-evokedbehaviors by screening for innate responses of flies to IR odorligands in a T-maze choice assay (Helfand and Carlson, 1989). Tofocus on responses potentially mediated by IR sensory input, westudied the behavior of flies mutant for the OR coreceptor Orco(formerly called OR83b), which lack the function of the entireOR repertoire (Larsson et al., 2004) and are often described asanosmic. These flies displayed responses to a number of IR li-gands that varied both in magnitude and valence: for example,carboxylic acids evoked different degrees of behavioral aversion,whereas ammonia was moderately attractive (Fig. 7A). Thus,knowledge of ligands for the IR olfactory subsystem has allowedus to uncover significant olfactory capacity of animals that aredevoid of OR sensory input. We note that the valence and mag-nitude of behavioral responses observed are very likely to dependon the olfactory assay and the animal’s internal state; acids, forexample, can be attractive in other experimental contexts (Becheret al., 2010; Ibba et al., 2010).
When odor-evoked responses of Orco mutants were com-pared with those of wild-type flies, we observed varying typesof modifications to these behaviors (Fig. 7A). Some responses,such as those to pyrrolidine, were unchanged, suggesting nocontribution of OR circuits to detection of this odor. In con-
4
(Figure legend continued.) class to broadly demarcate the IR and OR olfactory subsystems. VA7m(marked with a “?”) is innervated by a molecularly undefined population of OSNs. Vertical linesto the left of the table mark subsets of LNs with notable glomerular innervations (see Results).Cluster analysis, using complete linkage and Euclidean distances, was performed using R soft-ware (www.r-project.org). C, Plots of single representative traced neurons, after registration,for 13 available PN classes innervating IR glomeruli. PN classes are ordered by putative func-tional classes (defined by corresponding IR OSN inputs) and then by IR gene name. VL2a andVL2p are innervated by PNs derived from both lateral and ventral neuroblasts that follow theiACT and mACT tracts, respectively; the “v” suffix denotes the latter type. PNs are colored ac-cording to the classes described in E. Raw image data for different PN classes are from thefollowing sources: VL2a (Wong et al., 2002); vVL1, VL2p, VM1 (Jefferis et al., 2007); DL2d, DL2v,DP1l, VC3l, VC3m, vVL2a, vVL2p, VM1, VM4 (Chiang et al., 2011). D, 3D renderings of tracings forall registered OR (purple/pink) and IR (dark/light green) PN classes. Separate renderings for iACTand mACT PNs (in paler colors) are shown to the right. Data for OR PNs is adapted from Jefferiset al. (2007). E, 3D renderings of tracings for all registered IR PNs innervating IR8a-dependent/acid-responsive glomeruli (red: IR31a/VL2p, IR64a/DP1m, IR75a/DP1l, IR75abc/DL2, IR84a/VL2a), IR25a-dependent/amine-responsive glomeruli (blue: IR76b/VM4, IR75d/VL1, IR92a/VM1), and PNs innervating other IR-positive glomeruli (gray: IR76b/OR35a/VC3). Paler red andblue colors are used for mACT neurons. D, Dorsal; L, lateral; M, medial; V, ventral.
13370 • J. Neurosci., September 21, 2011 • 31(38):13357–13375 Silbering et al. • Insect Olfactory Subsystem Function and Evolution
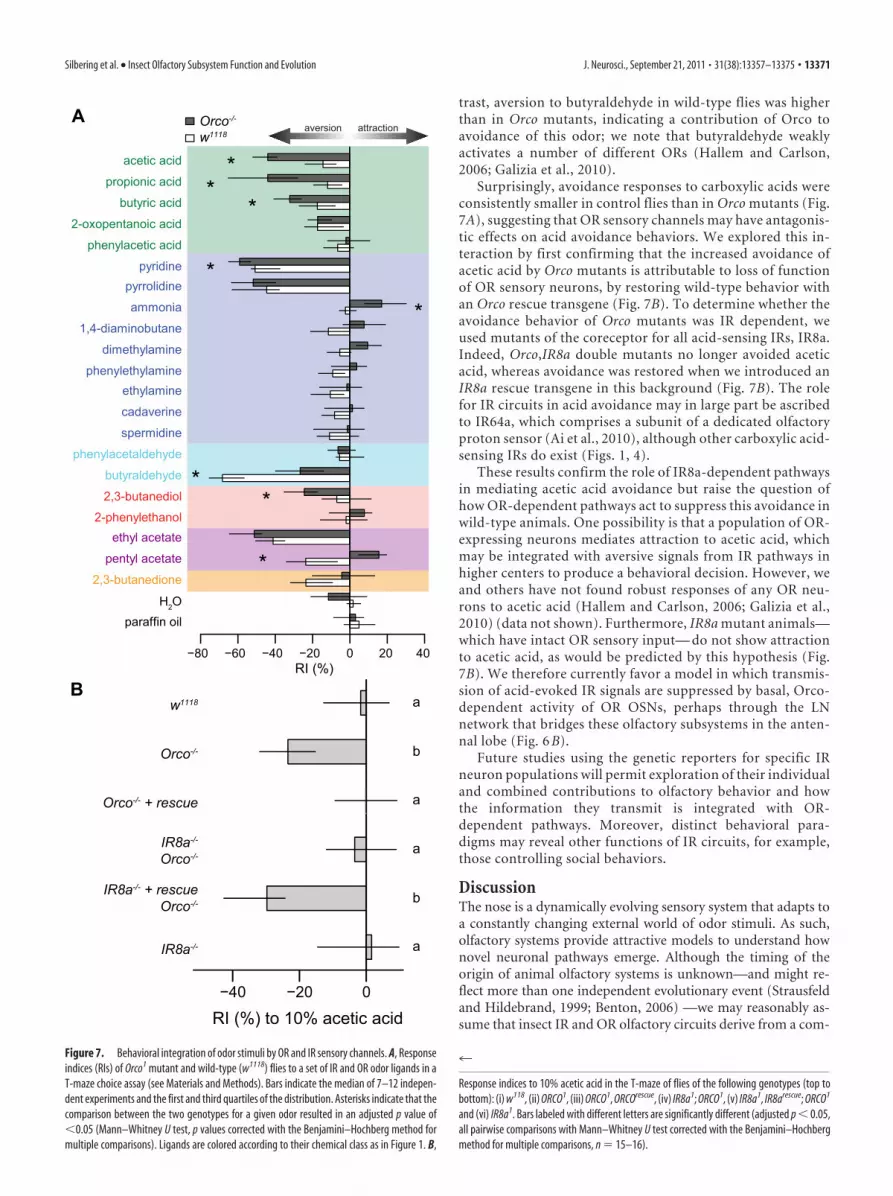
trast, aversion to butyraldehyde in wild-type flies was higherthan in Orco mutants, indicating a contribution of Orco toavoidance of this odor; we note that butyraldehyde weaklyactivates a number of different ORs (Hallem and Carlson,2006; Galizia et al., 2010).
Surprisingly, avoidance responses to carboxylic acids wereconsistently smaller in control flies than in Orco mutants (Fig.7A), suggesting that OR sensory channels may have antagonis-tic effects on acid avoidance behaviors. We explored this in-teraction by first confirming that the increased avoidance ofacetic acid by Orco mutants is attributable to loss of functionof OR sensory neurons, by restoring wild-type behavior withan Orco rescue transgene (Fig. 7B). To determine whether theavoidance behavior of Orco mutants was IR dependent, weused mutants of the coreceptor for all acid-sensing IRs, IR8a.Indeed, Orco,IR8a double mutants no longer avoided aceticacid, whereas avoidance was restored when we introduced anIR8a rescue transgene in this background (Fig. 7B). The rolefor IR circuits in acid avoidance may in large part be ascribedto IR64a, which comprises a subunit of a dedicated olfactoryproton sensor (Ai et al., 2010), although other carboxylic acid-sensing IRs do exist (Figs. 1, 4).
These results confirm the role of IR8a-dependent pathwaysin mediating acetic acid avoidance but raise the question ofhow OR-dependent pathways act to suppress this avoidance inwild-type animals. One possibility is that a population of OR-expressing neurons mediates attraction to acetic acid, whichmay be integrated with aversive signals from IR pathways inhigher centers to produce a behavioral decision. However, weand others have not found robust responses of any OR neu-rons to acetic acid (Hallem and Carlson, 2006; Galizia et al.,2010) (data not shown). Furthermore, IR8a mutant animals—which have intact OR sensory input— do not show attractionto acetic acid, as would be predicted by this hypothesis (Fig.7B). We therefore currently favor a model in which transmis-sion of acid-evoked IR signals are suppressed by basal, Orco-dependent activity of OR OSNs, perhaps through the LNnetwork that bridges these olfactory subsystems in the anten-nal lobe (Fig. 6 B).
Future studies using the genetic reporters for specific IRneuron populations will permit exploration of their individualand combined contributions to olfactory behavior and howthe information they transmit is integrated with OR-dependent pathways. Moreover, distinct behavioral para-digms may reveal other functions of IR circuits, for example,those controlling social behaviors.
DiscussionThe nose is a dynamically evolving sensory system that adapts toa constantly changing external world of odor stimuli. As such,olfactory systems provide attractive models to understand hownovel neuronal pathways emerge. Although the timing of theorigin of animal olfactory systems is unknown—and might re-flect more than one independent evolutionary event (Strausfeldand Hildebrand, 1999; Benton, 2006) —we may reasonably as-sume that insect IR and OR olfactory circuits derive from a com-
RI (%)−80 −60 −40 −20 0 20 40
acetic acid
propionic acid
butyric acid
2-oxopentanoic acid
phenylacetic acid
pyridinepyrrolidine
ammonia
1,4-diaminobutane
dimethylamine
phenylethylamineethylamine
cadaverine
spermidine
phenylacetaldehyde
butyraldehyde
2,3-butanediol
2-phenylethanolethyl acetate
pentyl acetate
2,3-butanedione
H2Oparaffin oil
Orco-/-
w1118attractionaversion
A
Bw1118
Orco-/-
Orco-/- + rescue
IR8a-/-
Orco-/-
IR8a-/- + rescueOrco-/-
IR8a-/-
RI (%) to 10% acetic acid−40 −20 0
**
*
*
*
*
*
*
a
a
a
a
b
b
Figure 7. Behavioral integration of odor stimuli by OR and IR sensory channels. A, Responseindices (RIs) of Orco1 mutant and wild-type (w1118) flies to a set of IR and OR odor ligands in aT-maze choice assay (see Materials and Methods). Bars indicate the median of 7–12 indepen-dent experiments and the first and third quartiles of the distribution. Asterisks indicate that thecomparison between the two genotypes for a given odor resulted in an adjusted p value of0.05 (Mann–Whitney U test, p values corrected with the Benjamini–Hochberg method formultiple comparisons). Ligands are colored according to their chemical class as in Figure 1. B,
4
Response indices to 10% acetic acid in the T-maze of flies of the following genotypes (top tobottom): (i) w118, (ii) ORCO1, (iii) ORCO1, ORCOrescue, (iv) IR8a1; ORCO1, (v) IR8a1, IR8arescue; ORCO1
and (vi) IR8a1. Bars labeled with different letters are significantly different (adjusted p 0.05,all pairwise comparisons with Mann–Whitney U test corrected with the Benjamini–Hochbergmethod for multiple comparisons, n � 15–16).
Silbering et al. • Insect Olfactory Subsystem Function and Evolution J. Neurosci., September 21, 2011 • 31(38):13357–13375 • 13371

mon chemosensory system in the ancestral insect. What insightscan our physiological and anatomical analyses of these extantolfactory sensory pathways in Drosophila offer into how and whytheir spectacular functional diversity has arisen?
Ontogeny and phylogeny in olfactorysystem neuroarchitectureThe broad protostome conservation of IRs contrasts with therestriction of ORs to insect genomes and suggests that IRs werethe first olfactory receptor repertoire in insects (Robertson et al.,2003; Croset et al., 2010). This hypothesis is further supported bydevelopmental properties of these olfactory subsystems: IR(coeloconic sacculus arista) and OR (basiconic trichoid) sensory structures in the antenna are specified inde-pendently by the related basic helix–loop– helix transcriptionfactors Atonal and Amos, respectively (Gupta and Rodrigues,1997; Goulding et al., 2000; zur Lage et al., 2003; Benton et al.,2009). Atonal is probably the ancestral olfactory proneuralgene, because it has functional orthologs in mammals (Wanget al., 2002), whereas Amos appears to be the product of aninsect-specific duplication event (Goulding et al., 2000;Maung and Jarman, 2007). Thus, the order of evolution ofthese upstream developmental regulators correlates with thatof the sensory receptor repertoires they ultimately induce. Thedevelopmental timing of IR and OR circuit specification is alsostaggered: Atonal-expressing sensory organ precursors differ-entiate before those expressing Amos (zur Lage et al., 2003).This sequence may be important because Atonal (IR-expressing) OSNs are thought to pioneer glomerular forma-tion in the adult antennal lobe (Jhaveri and Rodrigues, 2002).Although IRs, like ORs, are not themselves required for OSNaxon guidance (Ai et al., 2010) (Y.G. and R.B., unpublishedobservations), the development of the peripheral olfactorysystem may be an example of “ontogeny recapitulating phy-logeny” (Gould, 1977), that is, where more recently evolvedstructures—in this case, OR olfactory pathways—appear laterin development. Such developmental properties may also existin central olfactory circuit elements: PNs are born in a strictlydefined order during embryonic and larval development (Jef-feris et al., 2001; Yu et al., 2010a), and among the six PN classesinnervating IR glomeruli for which birth time is known, fiveare specified in the earliest steps of this lineage in the embryobefore the vast majority of OR PN classes (Yu et al., 2010a).The functional significance of the observed spatial separationof OR and IR olfactory subsystems, as well as the ipsilateral/bilateral innervation patterns are unknown; it is possible that theseproperties are simply a consequence of the developmental origins ofthe antennal lobe.
The “two noses” of the flyWhat selective advantages have insects gained from evolvingtwo independent olfactory subsystems? Although many ana-tomical properties of the circuits are conserved in these twosubsystems, IR and OR sensory channels are most clearly dis-tinguished by their ligand-tuning properties. The preferentialrecognition of water-soluble, hydrophilic acids and amines byIRs is consistent with these classes of molecules being the pre-dominant chemical signals detected by the aquatic ancestor ofprotostomes, and many are metabolic derivatives of aminoacids that are common chemosensory signals for extantaquatic animals (Derby and Sorensen, 2008). The tuning ofIRs to volatile chemicals bearing amine and carboxyl sidechains probably reflects the derivation of these chemosensory
receptors from amino acid-binding iGluRs (Croset et al.,2010).
The distinction in ligand preferences of OR and IR repertoiresis likely to be conserved in other insect species. For example, theOR repertoire of the malaria mosquito, Anopheles gambiae, issensitive to many different chemical classes of odors but not car-boxylic acids or amines (Carey et al., 2010). Mosquito antennaebear sensilla tuned to acids and amines (Qiu et al., 2006), and wesuggest that these house neurons expressing mosquito IR or-thologs (Croset et al., 2010; Liu et al., 2010). Although carboxylicacids and amines are critical for mammalian host-seeking behav-ior in mosquitoes (Smallegange et al., 2005), their ecological sig-nificance in Drosophila is less clear. Acids and amines may, forexample, signal over-fermentation (Ai et al., 2010) or sources ofproteins, respectively, in the food substrates of these flies. Alter-natively, these odors—in contrast to their effect on mosquitoes—may repel insects from non-useful (and potentially dangerous)mammals (Hill et al., 2010).
ORs appear to have derived from the gustatory receptorfamily of contact chemosensors (Robertson et al., 2003),which have been identified in insects as well as in aquaticarthropods (Penalva-Arana et al., 2009). One possible drivingforce for the evolution of this second family of olfactory re-ceptors is the evolution of terrestrial insects from aquatic ar-thropod ancestors 400 – 450 million years ago (Robertson etal., 2003; Engel and Grimaldi, 2004). Such a dramatic changein environmental media would have exposed the insect ances-tor to several new classes of chemicals, including those that arewater insoluble. Many of these novel odors are likely to havebeen produced by plants, whose colonization of land at �450 –500 million years ago may have just preceded the evolution ofinsects (Rubinstein et al., 2010). Indeed, the preferential li-gands of most Drosophila ORs are hydrophobic esters andalcohols that are abundant in vegetal tissues (Nijssen, 2004;Hallem and Carlson, 2006).
Beyond the appearance of different olfactory receptor rep-ertoires, our comparative genomics (Croset et al., 2010), mo-lecular (Abuin et al., 2011), and present physiological andneuroanatomical studies provide a comprehensive view intothe functional evolution of the IR repertoire itself. The clearerphylogenetic relationships of IR genes across divergent speciesallows predictions to be made about the precise order in whichindividual olfactory pathways have evolved and open the pos-sibility for future comparative studies of “older” and“younger” olfactory pathways to define the genetic basis andfunctional significance of olfactory circuit evolution.
ReferencesAbuin L, Bargeton B, Ulbrich MH, Isacoff EY, Kellenberger S, Benton R
(2011) Functional architecture of olfactory ionotropic glutamate recep-tors. Neuron 69:44 – 60.
Adams MD, Celniker SE, Holt RA, Evans CA, Gocayne JD, Amanatides PG,Scherer SE, Li PW, Hoskins RA, Galle RF, George RA, Lewis SE, RichardsS, Ashburner M, Henderson SN, Sutton GG, Wortman JR, Yandell MD,Zhang Q, Chen LX, et al. (2000) The genome sequence of Drosophilamelanogaster. Science 287:2185–2195.
Ai M, Min S, Grosjean Y, Leblanc C, Bell R, Benton R, Suh GS (2010) Acidsensing by the Drosophila olfactory system. Nature 468:691– 695.
Armstrong N, Sun Y, Chen GQ, Gouaux E (1998) Structure of a glutamate-receptor ligand-binding core in complex with kainate. Nature 395:913–917.
Becher PG, Bengtsson M, Hansson BS, Witzgall P (2010) Flying the fly:long-range flight behavior of Drosophila melanogaster to attractive odors.J Chem Ecol 36:599 – 607.
13372 • J. Neurosci., September 21, 2011 • 31(38):13357–13375 Silbering et al. • Insect Olfactory Subsystem Function and Evolution
Benton R (2006) On the ORigin of smell: odorant receptors in insects. CellMol Life Sci 63:1579 –1585.
Benton R (2007) Sensitivity and specificity in Drosophila pheromone per-ception. Trends Neurosci 30:512–519.
Benton R, Sachse S, Michnick SW, Vosshall LB (2006) Atypical membranetopology and heteromeric function of Drosophila odorant receptors invivo. PLoS Biol 4:e20.
Benton R, Vannice KS, Vosshall LB (2007) An essential role for a CD36-related receptor in pheromone detection in Drosophila. Nature 450:289 –293.
Benton R, Vannice KS, Gomez-Diaz C, Vosshall LB (2009) Variant iono-tropic glutamate receptors as chemosensory receptors in Drosophila. Cell136:149 –162.
Bhandawat V, Olsen SR, Gouwens NW, Schlief ML, Wilson RI (2007)Sensory processing in the Drosophila antennal lobe increases reliabilityand separability of ensemble odor representations. Nat Neurosci10:1474 –1482.
Bischof J, Maeda RK, Hediger M, Karch F, Basler K (2007) An optimizedtransgenesis system for Drosophila using germ-line-specific phiC31 inte-grases. Proc Natl Acad Sci U S A 104:3312–3317.
Cachero S, Ostrovsky AD, Yu JY, Dickson BJ, Jefferis GS (2010) Sexual di-morphism in the fly brain. Curr Biol 20:1589 –1601.
Carey AF, Wang G, Su CY, Zwiebel LJ, Carlson JR (2010) Odorant receptionin the malaria mosquito Anopheles gambiae. Nature 464:66 –71.
Chiang AS, Lin CY, Chuang CC, Chang HM, Hsieh CH, Yeh CW, Shih CT,Wu JJ, Wang GT, Chen YC, Wu CC, Chen GY, Ching YT, Lee PC, Lin CY,Lin HH, Wu CC, Hsu HW, Huang YA, Chen JY, et al. (2011) Three-dimensional reconstruction of brain-wide wiring networks in Drosophilaat single-cell resolution. Curr Biol 21:1–11.
Chou YH, Zheng X, Beachy PA, Luo L (2010a) Patterning axon targeting ofolfactory receptor neurons by coupled hedgehog signaling at two distinctsteps. Cell 142:954 –966.
Chou YH, Spletter ML, Yaksi E, Leong JC, Wilson RI, Luo L (2010b) Diver-sity and wiring variability of olfactory local interneurons in the Drosophilaantennal lobe. Nat Neurosci 13:439 – 449.
Christensen TA, Waldrop BR, Harrow ID, Hildebrand JG (1993) Local in-terneurons and information processing in the olfactory glomeruli of themoth Manduca sexta. J Comp Physiol A Neuroethol Sens Neural BehavPhysiol 173:385–399.
Couto A, Alenius M, Dickson BJ (2005) Molecular, anatomical, andfunctional organization of the Drosophila olfactory system. Curr Biol15:1535–1547.
Croset V, Rytz R, Cummins SF, Budd A, Brawand D, Kaessmann H, GibsonTJ, Benton R (2010) Ancient protostome origin of chemosensory iono-tropic glutamate receptors and the evolution of insect taste and olfaction.PLoS Genet 6:e1001064.
de Bruyne M, Foster K, Carlson JR (2001) Odor coding in the Drosophilaantenna. Neuron 30:537–552.
Demir E, Dickson BJ (2005) fruitless splicing specifies male courtship be-havior in Drosophila. Cell 121:785–794.
Derby CD, Sorensen PW (2008) Neural processing, perception, and behav-ioral responses to natural chemical stimuli by fish and crustaceans.J Chem Ecol 34:898 –914.
Do CB, Mahabhashyam MS, Brudno M, Batzoglou S (2005) ProbCons:Probabilistic consistency-based multiple sequence alignment. GenomeRes 15:330 –340.
Endo K, Aoki T, Yoda Y, Kimura K, Hama C (2007) Notch signal organizesthe Drosophila olfactory circuitry by diversifying the sensory neuronallineages. Nat Neurosci 10:153–160.
Engel MS, Grimaldi DA (2004) New light shed on the oldest insect. Nature427:627– 630.
Evers JF, Schmitt S, Sibila M, Duch C (2005) Progress in functional neuro-anatomy: precise automatic geometric reconstruction of neuronal mor-phology from confocal image stacks. J Neurophysiol 93:2331–2342.
Fishilevich E, Vosshall LB (2005) Genetic and functional subdivision of theDrosophila antennal lobe. Curr Biol 15:1548 –1553.
French AS, Torkkeli PH, Schuckel J (2011) Dynamic characterization ofDrosophila antennal olfactory neurons indicates multiple opponentsignaling pathways in odor discrimination. J Neurosci 31:861– 869.
Fuss SH, Ray A (2009) Mechanisms of odorant receptor gene choice in Dro-sophila and vertebrates. Mol Cell Neurosci 41:101–112.
Galizia CG, Rossler W (2010) Parallel olfactory systems in insects: anatomyand function. Annu Rev Entomol 55:399 – 420.
Galizia CG, Munch D, Strauch M, Nissler A, Ma S (2010) Integrating heter-ogeneous odor response data into a common response model: a DoOR tothe complete olfactome. Chem Senses 35:551–563.
Gallio M, Ofstad TA, Macpherson LJ, Wang JW, Zuker CS (2011) The cod-ing of temperature in the Drosophila brain. Cell 144:614 – 624.
Gould SJ (1977) Ontogeny and phylogeny. Cambridge, MA: Belknap Pressof Harvard UP.
Goulding SE, zur Lage P, Jarman AP (2000) amos, a proneural gene forDrosophila olfactory sense organs that is regulated by lozenge. Neuron25:69 –78.
Grosjean Y, Grillet M, Augustin H, Ferveur JF, Featherstone DE (2008) Aglial amino-acid transporter controls synapse strength and courtship inDrosophila. Nat Neurosci 11:54 – 61.
Guindon S, Gascuel O (2003) A simple, fast, and accurate algorithm to es-timate large phylogenies by maximum likelihood. Syst Biol 52:696 –704.
Gupta BP, Rodrigues V (1997) Atonal is a proneural gene for a subset ofolfactory sense organs in Drosophila. Genes Cells 2:225–233.
Haddad R, Khan R, Takahashi YK, Mori K, Harel D, Sobel N (2008) Ametric for odorant comparison. Nat Methods 5:425– 429.
Hallem EA, Carlson JR (2006) Coding of odors by a receptor repertoire. Cell125:143–160.
Hallem EA, Ho MG, Carlson JR (2004) The molecular basis of odor codingin the Drosophila antenna. Cell 117:965–979.
Hammer O, Harper DAT, Ryan PD (2001) PAST: paleontological statis-tics software package for education and data analysis. Palaeontol Elec-tronica 4:9.
Han DD, Stein D, Stevens LM (2000) Investigating the function of fol-licular subpopulations during Drosophila oogenesis throughhormone-dependent enhancer-targeted cell ablation. Development127:573–583.
Hansson BS, Ljungberg H, Hallberg E, Lofstedt C (1992) Functional special-ization of olfactory glomeruli in a moth. Science 256:1313–1315.
Heisenberg M (2003) Mushroom body memoir: from maps to models. NatRev Neurosci 4:266 –275.
Helfand SL, Carlson JR (1989) Isolation and characterization of an olfactorymutant in Drosophila with a chemically specific defect. Proc Natl Acad SciU S A 86:2908 –2912.
Hill CA, Fox AN, Pitts RJ, Kent LB, Tan PL, Chrystal MA, Cravchik A, CollinsFH, Robertson HM, Zwiebel LJ (2002) G protein-coupled receptors inAnopheles gambiae. Science 298:176 –178.
Hill SR, Zaspel J, Weller S, Hansson BS, Ignell R (2010) To be or not to be. avampire: a matter of sensillum numbers in Calyptra thalictri? ArthropodStruct Dev 39:322–333.
Ibba I, Angioy AM, Hansson BS, Dekker T (2010) Macroglomeruli for fruitodors change blend preference in Drosophila. Die Naturwissenschaften97:1059 –1066.
Jefferis GS, Marin EC, Stocker RF, Luo L (2001) Target neuron prespecifi-cation in the olfactory map of Drosophila. Nature 414:204 –208.
Jefferis GS, Potter CJ, Chan AM, Marin EC, Rohlfing T, Maurer CR Jr, LuoL (2007) Comprehensive maps of Drosophila higher olfactory cen-ters: spatially segregated fruit and pheromone representation. Cell128:1187–1203.
Jhaveri D, Rodrigues V (2002) Sensory neurons of the Atonal lineage pio-neer the formation of glomeruli within the adult Drosophila olfactorylobe. Development 129:1251–1260.
Jones WD, Cayirlioglu P, Kadow IG, Vosshall LB (2007) Two chemosensoryreceptors together mediate carbon dioxide detection in Drosophila. Na-ture 445:86 –90.
Kwon JY, Dahanukar A, Weiss LA, Carlson JR (2007) The molecularbasis of CO2 reception in Drosophila. Proc Natl Acad Sci U S A104:3574 –3578.
Laissue PP, Reiter C, Hiesinger PR, Halter S, Fischbach KF, Stocker RF(1999) Three-dimensional reconstruction of the antennal lobe in Dro-sophila melanogaster. J Comp Neurol 405:543–552.
Larsson MC, Domingos AI, Jones WD, Chiappe ME, Amrein H, Vosshall LB(2004) Or83b encodes a broadly expressed odorant receptor essential forDrosophila olfaction. Neuron 43:703–714.
Lee T, Luo L (1999) Mosaic analysis with a repressible cell marker for studiesof gene function in neuronal morphogenesis. Neuron 22:451– 461.
Silbering et al. • Insect Olfactory Subsystem Function and Evolution J. Neurosci., September 21, 2011 • 31(38):13357–13375 • 13373
Letunic I, Bork P (2007) Interactive Tree Of Life (iTOL): an online tool forphylogenetic tree display and annotation. Bioinformatics 23:127–128.
Lin HH, Lai JS, Chin AL, Chen YC, Chiang AS (2007) A map of olfactoryrepresentation in the Drosophila mushroom body. Cell 128:1205–1217.
Liu C, Pitts RJ, Bohbot JD, Jones PL, Wang G, Zwiebel LJ (2010) Distinctolfactory signaling mechanisms in the malaria vector mosquito Anophelesgambiae. PLoS Biol 8: e1000467.
Marin EC, Jefferis GS, Komiyama T, Zhu H, Luo L (2002) Representa-tion of the glomerular olfactory map in the Drosophila brain. Cell109:243–255.
Markstein M, Pitsouli C, Villalta C, Celniker SE, Perrimon N (2008) Ex-ploiting position effects and the gypsy retrovirus insulator to engineerprecisely expressed transgenes. Nat Genet 40:476 – 483.
Masse NY, Turner GC, Jefferis GS (2009) Olfactory information processingin Drosophila. Curr Biol 19:R700 –R713.
Maung SM, Jarman AP (2007) Functional distinctness of closely relatedtranscription factors: a comparison of the Atonal and Amos proneuralfactors. Mech Dev 124:647– 656.
Mombaerts P, Wang F, Dulac C, Chao SK, Nemes A, Mendelsohn M, Ed-mondson J, Axel R (1996) Visualizing an olfactory sensory map. Cell87:675– 686.
Mori K, Nagao H, Yoshihara Y (1999) The olfactory bulb: coding and pro-cessing of odor molecule information. Science 286:711–715.
Ng M, Roorda RD, Lima SQ, Zemelman BV, Morcillo P, Miesenbock G(2002) Transmission of olfactory information between three popula-tions of neurons in the antennal lobe of the fly. Neuron 36:463– 474.
Nijssen LM, van Ingen-Visscher CA, Donders JJ eds (2004) Volatilecompounds in food: qualitative and quantitative data. Zeist, TheNetherlands: TNO-CIVO Food Analysis Institute.
Nishino H, Nishikawa M, Mizunami M, Yokohari F (2009) Functional andtopographic segregation of glomeruli revealed by local staining of anten-nal sensory neurons in the honeybee Apis mellifera. J Comp Neurol515:161–180.
Ohkura M, Matsuzaki M, Kasai H, Imoto K, Nakai J (2005) Geneticallyencoded bright Ca 2 probe applicable for dynamic Ca 2 imaging ofdendritic spines. Anal Chem 77:5861–5869.
Olsen SR, Bhandawat V, Wilson RI (2007) Excitatory interactions betweenolfactory processing channels in the Drosophila antennal lobe. Neuron54:89 –103.
Panico R, Powell WH, Richer J-C (1993) A guide to IUPAC nomenclatureof organic compounds. Oxford: Blackwell Scientific.
Pelz D, Roeske T, Syed Z, de Bruyne M, Galizia CG (2006) The molecularreceptive range of an olfactory receptor in vivo (Drosophila melanogasterOr22a). J Neurobiol 66:1544 –1563.
Penalva-Arana DC, Lynch M, Robertson HM (2009) The chemoreceptorgenes of the waterflea Daphnia pulex: many Grs but no Ors. BMC EvolBiol 9:79.
Qiu YT, van Loon JJ, Takken W, Meijerink J, Smid HM (2006) Olfactorycoding in antennal neurons of the malaria mosquito, Anopheles gambiae.Chem Senses 31:845– 863.
Ramdya P, Benton R (2010) Evolving olfactory systems on the fly. TrendsGenet 26:307–316.
Reiff DF, Ihring A, Guerrero G, Isacoff EY, Joesch M, Nakai J, Borst A (2005)In vivo performance of genetically encoded indicators of neural activity inflies. J Neurosci 25:4766 – 4778.
Robertson HM, Wanner KW (2006) The chemoreceptor superfamily in thehoney bee, Apis mellifera: expansion of the odorant, but not gustatory,receptor family. Genome Res 16:1395–1403.
Robertson HM, Warr CG, Carlson JR (2003) Molecular evolution of theinsect chemoreceptor gene superfamily in Drosophila melanogaster. ProcNatl Acad Sci U S A 100 [Suppl 2]:14537–14542.
Rodrigues V, Hummel T (2008) Development of the Drosophila olfactorysystem. Adv Exp Med Biol 628:82–101.
Rubinstein CV, Gerrienne P, de la Puente GS, Astini RA, Steemans P (2010)Early Middle Ordovician evidence for land plants in Argentina (easternGondwana). New Phytol 188:365–369.
Rueckert D, Sonoda LI, Hayes C, Hill DL, Leach MO, Hawkes DJ (1999)Nonrigid registration using free-form deformations: application to breastMR images. IEEE Trans Med Imaging 18:712–721.
Sachse S, Rueckert E, Keller A, Okada R, Tanaka NK, Ito K, Vosshall LB(2007) Activity-dependent plasticity in an olfactory circuit. Neuron56:838 – 850.
Scott K, Brady R Jr, Cravchik A, Morozov P, Rzhetsky A, Zuker C, Axel R(2001) A chemosensory gene family encoding candidate gustatory andolfactory receptors in Drosophila. Cell 104:661– 673.
Seki Y, Rybak J, Wicher D, Sachse S, Hansson BS (2010) Physiological andmorphological characterization of local interneurons in the Drosophilaantennal lobe. J Neurophysiol 104:1007–1019.
Shanbhag SR, Singh K, Singh RN (1995) Fine structure and primary sensoryprojections of sensilla located in the sacculus of the antenna of Drosophilamelanogaster. Cell Tissue Res 282:237–249.
Shanbhag SR, Muller B, Steinbrecht RA (1999) Atlas of olfactory organs ofDrosophila melanogaster. 1. Types, external organization, innervation anddistribution of olfactory sensilla. Int J Insect Morphol Embryol 28:377–397.
Shang Y, Claridge-Chang A, Sjulson L, Pypaert M, Miesenbock G (2007)Excitatory local circuits and their implications for olfactory processing inthe fly antennal lobe. Cell 128:601– 612.
Silbering AF, Galizia CG (2007) Processing of odor mixtures in the Drosoph-ila antennal lobe reveals both global inhibition and glomerulus-specificinteractions. J Neurosci 27:11966 –11977.
Smallegange RC, Qiu YT, van Loon JJ, Takken W (2005) Synergism betweenammonia, lactic acid and carboxylic acids as kairomones in the host-seeking behaviour of the malaria mosquito Anopheles gambiae sensustricto (Diptera: Culicidae). Chem Senses 30:145–152.
Smith CR, Smith CD, Robertson HM, Helmkampf M, Zimin A, Yandell M,Holt C, Hu H, Abouheif E, Benton R, Cash E, Croset V, Currie CR, ElhaikE, Elsik CG, Fave MJ, Fernandes V, Gibson JD, Graur D, Gronenberg W,et al. (2011) Draft genome of the red harvester ant Pogonomyrmex bar-batus. Proc Natl Acad Sci U S A 108:5667–5672.
Spehr M, Munger SD (2009) Olfactory receptors: G protein-coupled recep-tors and beyond. J Neurochem 109:1570 –1583.
Stocker RF (2001) Drosophila as a focus in olfactory research: mapping ofolfactory sensilla by fine structure, odor specificity, odorant receptor ex-pression, and central connectivity. Microsc Res Tech 55:284 –296.
Stocker RF, Singh RN, Schorderet M, Siddiqi O (1983) Projection pat-terns of different types of antennal sensilla in the antennal glomeruli ofDrosophila melanogaster. Cell Tissue Res 232:237–248.
Stockinger P, Kvitsiani D, Rotkopf S, Tirian L, Dickson BJ (2005) Neuralcircuitry that governs Drosophila male courtship behavior. Cell121:795– 807.
Strausfeld NJ, Hildebrand JG (1999) Olfactory systems: common design,uncommon origins? Curr Opin Neurobiol 9:634 – 639.
Su CY, Menuz K, Carlson JR (2009) Olfactory perception: receptors, cells,and circuits. Cell 139:45–59.
Tamura K, Dudley J, Nei M, Kumar S (2007) MEGA4: molecular evolution-ary genetics analysis (MEGA) software version 4.0. Mol Biol Evol24:1596 –1599.
Thorne N, Amrein H (2008) Atypical expression of Drosophila gustatoryreceptor genes in sensory and central neurons. J Comp Neurol506:548 –568.
Touhara K, Vosshall LB (2009) Sensing odorants and pheromones withchemosensory receptors. Annu Rev Physiol 71:307–332.
Venken KJ, Carlson JW, Schulze KL, Pan H, He Y, Spokony R, Wan KH,Koriabine M, de Jong PJ, White KP, Bellen HJ, Hoskins RA (2009) Ver-satile P[acman] BAC libraries for transgenesis studies in Drosophila mela-nogaster. Nat Methods 6:431– 434.
Vermeulen A, Rospars JP (2004) Why are insect olfactory receptor neu-rons grouped into sensilla? The teachings of a model investigating theeffects of the electrical interaction between neurons on the transepi-thelial potential and the neuronal transmembrane potential. Eur Bio-phys J 33:633– 643.
Vosshall LB, Stocker RF (2007) Molecular architecture of smell and taste inDrosophila. Annu Rev Neurosci 30:505–533.
Vosshall LB, Wong AM, Axel R (2000) An olfactory sensory map in the flybrain. Cell 102:147–159.
Wachowiak M, Shipley MT (2006) Coding and synaptic processing of sen-sory information in the glomerular layer of the olfactory bulb. Semin CellDev Biol 17:411– 423.
Wang JW, Wong AM, Flores J, Vosshall LB, Axel R (2003) Two-photoncalcium imaging reveals an odor-evoked map of activity in the fly brain.Cell 112:271–282.
Wang VY, Hassan BA, Bellen HJ, Zoghbi HY (2002) Drosophila atonal fully
13374 • J. Neurosci., September 21, 2011 • 31(38):13357–13375 Silbering et al. • Insect Olfactory Subsystem Function and Evolution

rescues the phenotype of Math1 null mice: new functions evolve in newcellular contexts. Curr Biol 12:1611–1616.
Watanabe H, Nishino H, Nishikawa M, Mizunami M, Yokohari F (2010)Complete mapping of glomeruli based on sensory nerve branching pat-tern in the primary olfactory center of the cockroach Periplaneta ameri-cana. J Comp Neurol 518:3907–3930.
Willmore B, Tolhurst DJ (2001) Characterizing the sparseness of neuralcodes. Network 12:255–270.
Wilson RI, Turner GC, Laurent G (2004) Transformation of olfactoryrepresentations in the Drosophila antennal lobe. Science 303:366 –370.
Wong AM, Wang JW, Axel R (2002) Spatial representation of the glomeru-lar map in the Drosophila protocerebrum. Cell 109:229 –241.
Yao CA, Ignell R, Carlson JR (2005) Chemosensory coding by neurons in thecoeloconic sensilla of the Drosophila antenna. J Neurosci 25:8359–8367.
Yu HH, Kao CF, He Y, Ding P, Kao JC, Lee T (2010a) A complete develop-mental sequence of a Drosophila neuronal lineage as revealed by twin-spotMARCM. PLoS Biol 8:e1000461.
Yu JY, Kanai MI, Demir E, Jefferis GS, Dickson BJ (2010b) Cellular organi-zation of the neural circuit that drives Drosophila courtship behavior.Curr Biol 20:1602–1614.
Zou DJ, Chesler A, Firestein S (2009) How the olfactory bulb got its glom-eruli: a just so story? Nat Rev Neurosci 10:611– 618.
Zube C, Kleineidam CJ, Kirschner S, Neef J, Rossler W (2008) Organizationof the olfactory pathway and odor processing in the antennal lobe of theant Camponotus floridanus. J Comp Neurol 506:425– 441.
zur Lage PI, Prentice DR, Holohan EE, Jarman AP (2003) The Drosophilaproneural gene amos promotes olfactory sensillum formation and sup-presses bristle formation. Development 130:4683– 4693.
Silbering et al. • Insect Olfactory Subsystem Function and Evolution J. Neurosci., September 21, 2011 • 31(38):13357–13375 • 13375