A Global Trend towards the Loss of Evolutionarily Unique Species in Mangrove Ecosystems
9
A Global Trend towards the Loss of Evolutionarily Unique Species in Mangrove Ecosystems Barnabas H. Daru 1 * . , Kowiyou Yessoufou 1. , Ledile T. Mankga 1 , T. Jonathan Davies 2 1 African Centre for DNA Barcoding, University of Johannesburg, Johannesburg, South Africa, 2 Department of Biology, McGill University, Montreal, Canada Abstract The mangrove biome stands out as a distinct forest type at the interface between terrestrial, estuarine, and near-shore marine ecosystems. However, mangrove species are increasingly threatened and experiencing range contraction across the globe that requires urgent conservation action. Here, we assess the spatial distribution of mangrove species richness and evolutionary diversity, and evaluate potential predictors of global declines and risk of extinction. We found that human pressure, measured as the number of different uses associated with mangroves, correlated strongly, but negatively, with extinction probability, whereas species ages were the best predictor of global decline, explaining 15% of variation in extinction risk. Although the majority of mangrove species are categorised by the IUCN as Least Concern, our finding that the more threatened species also tend to be those that are more evolutionarily unique is of concern because their extinction would result in a greater loss of phylogenetic diversity. Finally, we identified biogeographic regions that are relatively species-poor but rich in evolutionary history, and suggest these regions deserve greater conservation priority. Our study provides phylogenetic information that is important for developing a unified management plan for mangrove ecosystems worldwide. Citation: Daru BH, Yessoufou K, Mankga LT, Davies TJ (2013) A Global Trend towards the Loss of Evolutionarily Unique Species in Mangrove Ecosystems. PLoS ONE 8(6): e66686. doi:10.1371/journal.pone.0066686 Editor: Matteo Convertino, University of Florida, United States of America Received March 6, 2013; Accepted May 10, 2013; Published June 21, 2013 Copyright: ß 2013 Daru et al. This is an open-access article distributed under the terms of the Creative Commons Attribution License, which permits unrestricted use, distribution, and reproduction in any medium, provided the original author and source are credited. Funding: The University of Johannesburg through the African Centre for DNA Barcoding provide logistics and financial support to the first two authors. The funders had no role in study design, data collection and analysis, decision to publish, or preparation of the manuscript. Competing Interests: The authors have declared that no competing interests exist. * E-mail: [email protected] . These authors contributed equally to this work. Introduction Preserving ecosystem services – the benefits humans derive directly and indirectly from nature (e.g. food production, plant pollination, medicinal plants, clean water, nutrient cycling, carbon sequestration, climate stability, recreation and tourism) – is a major challenge [1,2]. Human welfare is intrinsically dependent on the sustainable delivery of such services; however, they are being rapidly eroded due to the unprecedented rate at which species – the service providers – are being lost through extinctions. For example, early studies suggested that rates of species loss might be about 1000–10 000 times greater than past extinction rates [3,4] with particularly elevated rates in tropical biomes [5], a unique reservoir of life-form diversity. To date, studies of extinction risk have tended to be focused on vertebrates (e.g. [6–14]). However, studies on terrestrial plants are becoming more commonplace (e.g. [15–18]). Although the taxonomic distribution of extinction risk is generally non-random [6,7,15,16], the tree of animal life and that for plants are not pruned the same way. For instance, in vertebrates the majority of at-risk species are members of species-poor clades, and it has been suggested that their extinction would result in a disproportionate loss of evolutionary history [19,20]. However, for terrestrial plants, extinction drivers appear to target particularly young and fast- evolving plant lineages [16], and at-risk species tend to fall within species-rich clades [21]; their extinction might therefore have a less pronounced impact on the plant phylogeny (but see [15]). Whilst evidence suggests that many aquatic plants are highly threatened [22–26], and perform valuable ecosystem services [27], the phylogenetic ‘fingerprint’ of extinction risks in such systems, for example, the mangrove biome, has been less well studied. We know little about the forces relevant to community assembly in mangrove systems or about the phylogenetic basis of risk factors that predispose some mangrove species to higher extinction risk. A more detailed understanding of the phylogenetic structure of mangrove assemblages will aid in the development of management practices aimed at safeguarding their evolutionary future, and ensuring the sustainable delivery of ecosystem services [2,28]. To date, predictive models of extinction risk at global scales tend to explain only a small amount of the variation in threat status (,30% for mammals [10]; and ,10% for tropical angiosperms [29]). It is therefore urgent that we work to improve our understanding of extinction risk, especially in understudied ecosystems, given current rates of species loss [1]. Mangroves have a tropical and subtropical distribution, and are linked to multiple ecosystem services (e.g. carbon sequestration and nutrient cycling [30]), act as keystone species [31,32], and provide direct and indirect economic benefits (e.g. almost 80% of global fish catches are dependent to some extent on mangroves [33,34], and indirect benefits may even be greater). Overall, the ecosystem services provided by mangrove forests are estimated to be worth at least US$1.6 billion per year worldwide [27,35]. Given these large ecological and economic benefits, the recent findings of a global trend towards a reduction of range extent across PLOS ONE | www.plosone.org 1 June 2013 | Volume 8 | Issue 6 | e66686
Transcript of A Global Trend towards the Loss of Evolutionarily Unique Species in Mangrove Ecosystems
A Global Trend towards the Loss of Evolutionarily UniqueSpecies in Mangrove EcosystemsBarnabas H. Daru1*., Kowiyou Yessoufou1., Ledile T. Mankga1, T. Jonathan Davies2
1African Centre for DNA Barcoding, University of Johannesburg, Johannesburg, South Africa, 2Department of Biology, McGill University, Montreal, Canada
Abstract
The mangrove biome stands out as a distinct forest type at the interface between terrestrial, estuarine, and near-shoremarine ecosystems. However, mangrove species are increasingly threatened and experiencing range contraction across theglobe that requires urgent conservation action. Here, we assess the spatial distribution of mangrove species richness andevolutionary diversity, and evaluate potential predictors of global declines and risk of extinction. We found that humanpressure, measured as the number of different uses associated with mangroves, correlated strongly, but negatively, withextinction probability, whereas species ages were the best predictor of global decline, explaining 15% of variation inextinction risk. Although the majority of mangrove species are categorised by the IUCN as Least Concern, our finding thatthe more threatened species also tend to be those that are more evolutionarily unique is of concern because theirextinction would result in a greater loss of phylogenetic diversity. Finally, we identified biogeographic regions that arerelatively species-poor but rich in evolutionary history, and suggest these regions deserve greater conservation priority. Ourstudy provides phylogenetic information that is important for developing a unified management plan for mangroveecosystems worldwide.
Citation: Daru BH, Yessoufou K, Mankga LT, Davies TJ (2013) A Global Trend towards the Loss of Evolutionarily Unique Species in Mangrove Ecosystems. PLoSONE 8(6): e66686. doi:10.1371/journal.pone.0066686
Editor: Matteo Convertino, University of Florida, United States of America
Received March 6, 2013; Accepted May 10, 2013; Published June 21, 2013
Copyright: ! 2013 Daru et al. This is an open-access article distributed under the terms of the Creative Commons Attribution License, which permitsunrestricted use, distribution, and reproduction in any medium, provided the original author and source are credited.
Funding: The University of Johannesburg through the African Centre for DNA Barcoding provide logistics and financial support to the first two authors. Thefunders had no role in study design, data collection and analysis, decision to publish, or preparation of the manuscript.
Competing Interests: The authors have declared that no competing interests exist.
* E-mail: [email protected]
. These authors contributed equally to this work.
Introduction
Preserving ecosystem services – the benefits humans derivedirectly and indirectly from nature (e.g. food production, plantpollination, medicinal plants, clean water, nutrient cycling, carbonsequestration, climate stability, recreation and tourism) – is amajor challenge [1,2]. Human welfare is intrinsically dependenton the sustainable delivery of such services; however, they arebeing rapidly eroded due to the unprecedented rate at whichspecies – the service providers – are being lost through extinctions.For example, early studies suggested that rates of species loss mightbe about 1000–10 000 times greater than past extinction rates[3,4] with particularly elevated rates in tropical biomes [5], aunique reservoir of life-form diversity.To date, studies of extinction risk have tended to be focused on
vertebrates (e.g. [6–14]). However, studies on terrestrial plants arebecoming more commonplace (e.g. [15–18]). Although thetaxonomic distribution of extinction risk is generally non-random[6,7,15,16], the tree of animal life and that for plants are notpruned the same way. For instance, in vertebrates the majority ofat-risk species are members of species-poor clades, and it has beensuggested that their extinction would result in a disproportionateloss of evolutionary history [19,20]. However, for terrestrial plants,extinction drivers appear to target particularly young and fast-evolving plant lineages [16], and at-risk species tend to fall withinspecies-rich clades [21]; their extinction might therefore have a lesspronounced impact on the plant phylogeny (but see [15]).
Whilst evidence suggests that many aquatic plants are highlythreatened [22–26], and perform valuable ecosystem services [27],the phylogenetic ‘fingerprint’ of extinction risks in such systems,for example, the mangrove biome, has been less well studied. Weknow little about the forces relevant to community assembly inmangrove systems or about the phylogenetic basis of risk factorsthat predispose some mangrove species to higher extinction risk. Amore detailed understanding of the phylogenetic structure ofmangrove assemblages will aid in the development of managementpractices aimed at safeguarding their evolutionary future, andensuring the sustainable delivery of ecosystem services [2,28]. Todate, predictive models of extinction risk at global scales tend toexplain only a small amount of the variation in threat status(,30% for mammals [10]; and ,10% for tropical angiosperms[29]). It is therefore urgent that we work to improve ourunderstanding of extinction risk, especially in understudiedecosystems, given current rates of species loss [1].Mangroves have a tropical and subtropical distribution, and are
linked to multiple ecosystem services (e.g. carbon sequestrationand nutrient cycling [30]), act as keystone species [31,32], andprovide direct and indirect economic benefits (e.g. almost 80% ofglobal fish catches are dependent to some extent on mangroves[33,34], and indirect benefits may even be greater). Overall, theecosystem services provided by mangrove forests are estimated tobe worth at least US$1.6 billion per year worldwide [27,35]. Giventhese large ecological and economic benefits, the recent findings ofa global trend towards a reduction of range extent across
PLOS ONE | www.plosone.org 1 June 2013 | Volume 8 | Issue 6 | e66686
mangrove biome due to human activities [24,36] and climatechange [37] is of major concern. It is estimated that we are losing1–8% of mangrove cover each year [36,38,39], and that if currenttrends continue, the entire mangrove biome may be lost within thenext 100 years [31]. One major consequence of this reduction inmangrove extent that we are already experiencing is theconcomitant loss of associated species diversity – today, almost40% of mangrove-dependent animal species are considered to beat higher risk of extinction [40].In this study, we contrast the global distribution of mangrove
species richness and threatened species richness with thedistribution of phylogenetic diversity. We then construct alterna-tive models of global decline (proportion of global population indecline) and extinction risk (derived from IUCN Red Listcategories) to identify key drivers of threat. We show that areasrich in evolutionarily unique species (subtending from longphylogenetic branches) match to those with highest global decline,and that human pressure and species ages are important predictorsof risk of extinction in mangrove ecosystems.
Results
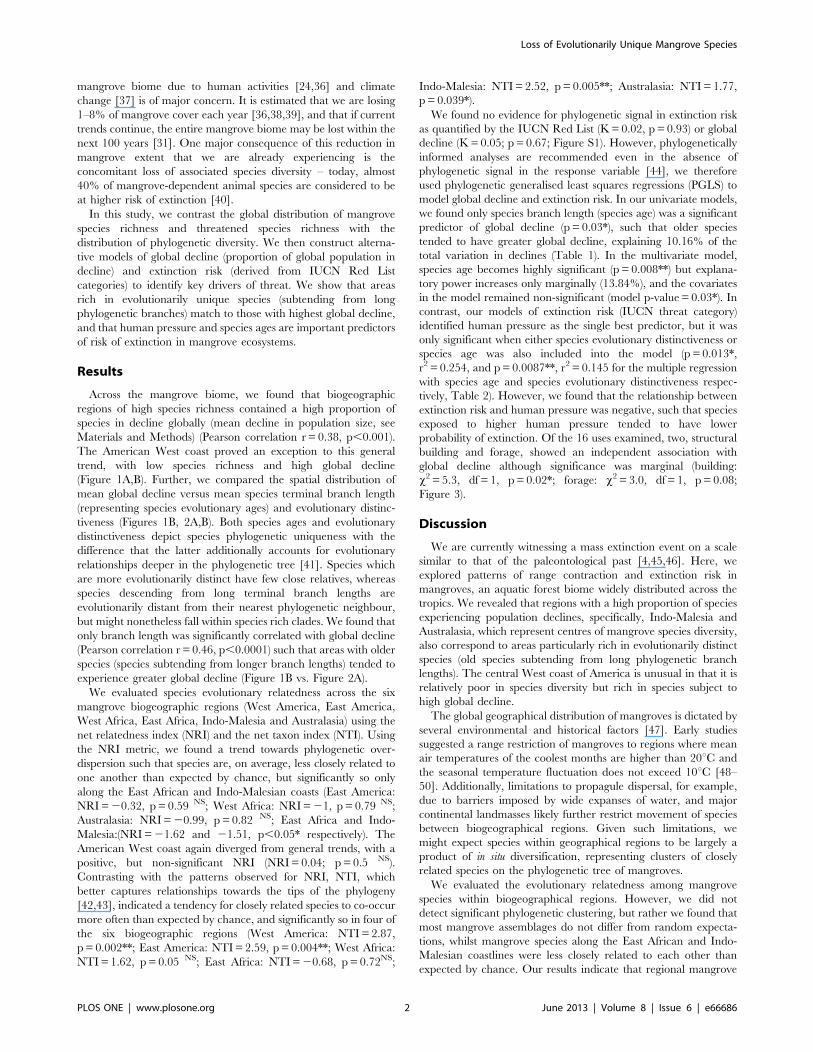
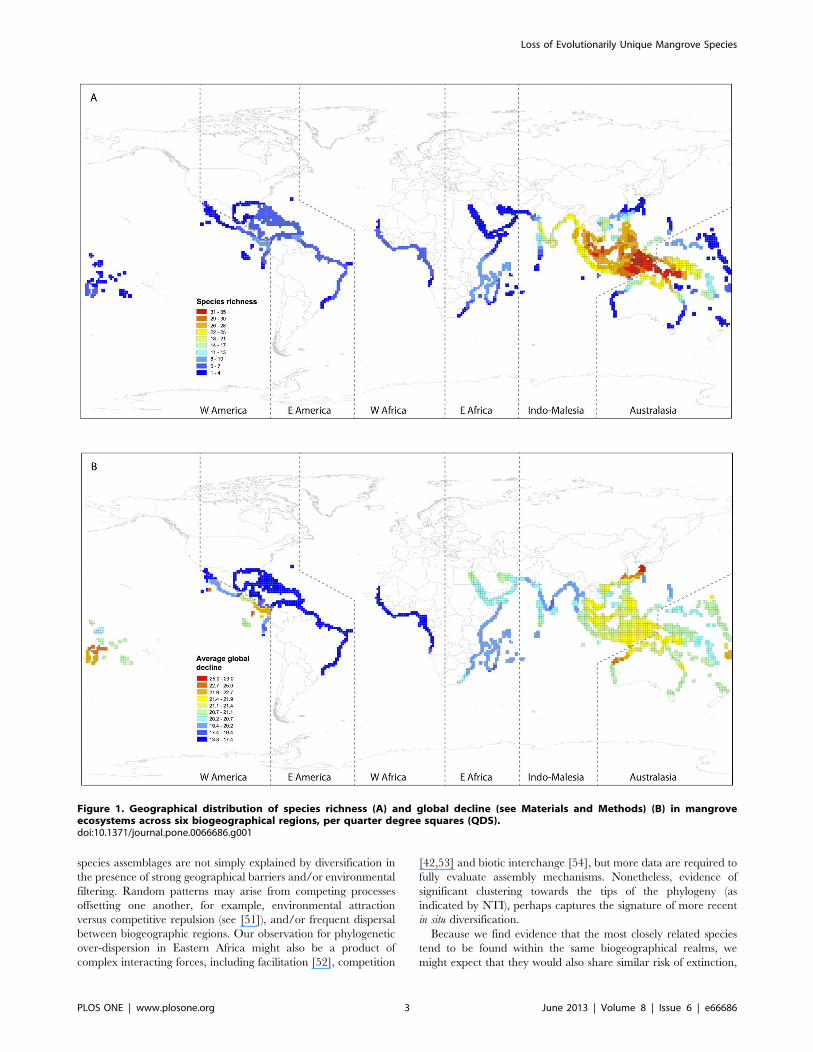
Across the mangrove biome, we found that biogeographicregions of high species richness contained a high proportion ofspecies in decline globally (mean decline in population size, seeMaterials and Methods) (Pearson correlation r = 0.38, p,0.001).The American West coast proved an exception to this generaltrend, with low species richness and high global decline(Figure 1A,B). Further, we compared the spatial distribution ofmean global decline versus mean species terminal branch length(representing species evolutionary ages) and evolutionary distinc-tiveness (Figures 1B, 2A,B). Both species ages and evolutionarydistinctiveness depict species phylogenetic uniqueness with thedifference that the latter additionally accounts for evolutionaryrelationships deeper in the phylogenetic tree [41]. Species whichare more evolutionarily distinct have few close relatives, whereasspecies descending from long terminal branch lengths areevolutionarily distant from their nearest phylogenetic neighbour,but might nonetheless fall within species rich clades. We found thatonly branch length was significantly correlated with global decline(Pearson correlation r = 0.46, p,0.0001) such that areas with olderspecies (species subtending from longer branch lengths) tended toexperience greater global decline (Figure 1B vs. Figure 2A).We evaluated species evolutionary relatedness across the six
mangrove biogeographic regions (West America, East America,West Africa, East Africa, Indo-Malesia and Australasia) using thenet relatedness index (NRI) and the net taxon index (NTI). Usingthe NRI metric, we found a trend towards phylogenetic over-dispersion such that species are, on average, less closely related toone another than expected by chance, but significantly so onlyalong the East African and Indo-Malesian coasts (East America:NRI=20.32, p= 0.59 NS; West Africa: NRI=21, p = 0.79 NS;Australasia: NRI=20.99, p = 0.82 NS; East Africa and Indo-Malesia:(NRI=21.62 and 21.51, p,0.05* respectively). TheAmerican West coast again diverged from general trends, with apositive, but non-significant NRI (NRI= 0.04; p = 0.5 NS).Contrasting with the patterns observed for NRI, NTI, whichbetter captures relationships towards the tips of the phylogeny[42,43], indicated a tendency for closely related species to co-occurmore often than expected by chance, and significantly so in four ofthe six biogeographic regions (West America: NTI= 2.87,p = 0.002**; East America: NTI= 2.59, p = 0.004**; West Africa:NTI= 1.62, p = 0.05 NS; East Africa: NTI=20.68, p= 0.72NS;
Indo-Malesia: NTI= 2.52, p = 0.005**; Australasia: NTI= 1.77,p = 0.039*).We found no evidence for phylogenetic signal in extinction risk
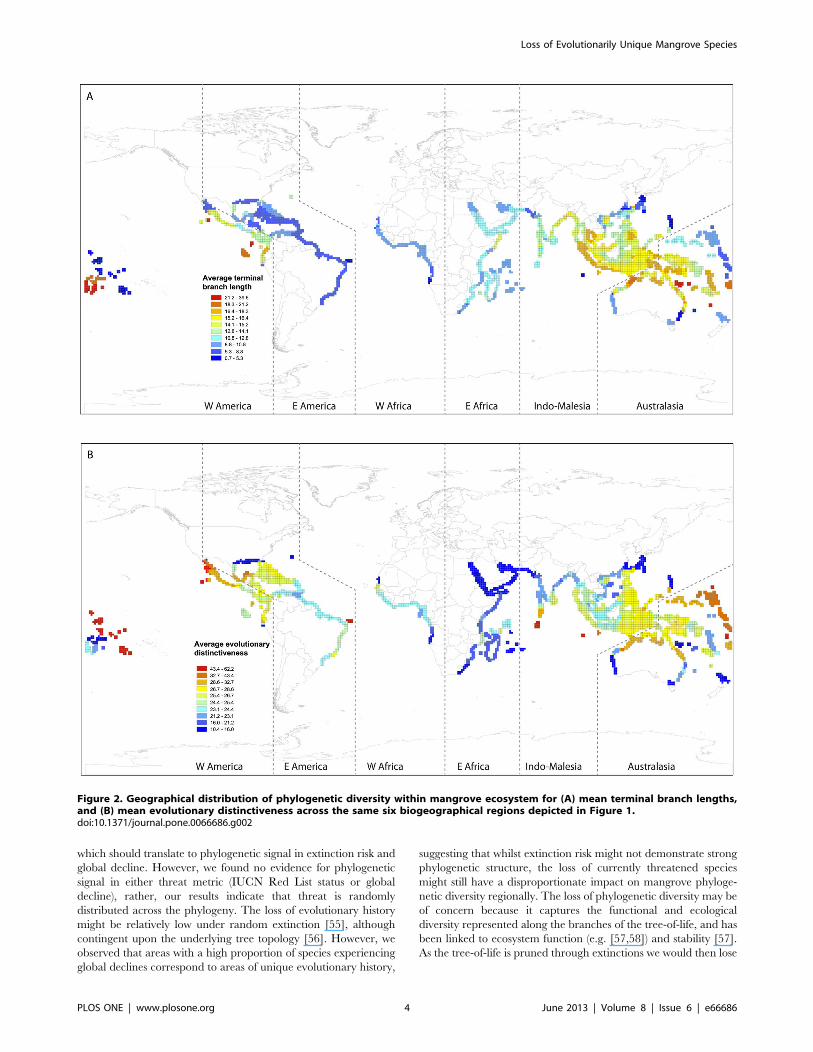
as quantified by the IUCN Red List (K= 0.02, p = 0.93) or globaldecline (K= 0.05; p = 0.67; Figure S1). However, phylogeneticallyinformed analyses are recommended even in the absence ofphylogenetic signal in the response variable [44], we thereforeused phylogenetic generalised least squares regressions (PGLS) tomodel global decline and extinction risk. In our univariate models,we found only species branch length (species age) was a significantpredictor of global decline (p = 0.03*), such that older speciestended to have greater global decline, explaining 10.16% of thetotal variation in declines (Table 1). In the multivariate model,species age becomes highly significant (p = 0.008**) but explana-tory power increases only marginally (13.84%), and the covariatesin the model remained non-significant (model p-value = 0.03*). Incontrast, our models of extinction risk (IUCN threat category)identified human pressure as the single best predictor, but it wasonly significant when either species evolutionary distinctiveness orspecies age was also included into the model (p = 0.013*,r2 = 0.254, and p= 0.0087**, r2 = 0.145 for the multiple regressionwith species age and species evolutionary distinctiveness respec-tively, Table 2). However, we found that the relationship betweenextinction risk and human pressure was negative, such that speciesexposed to higher human pressure tended to have lowerprobability of extinction. Of the 16 uses examined, two, structuralbuilding and forage, showed an independent association withglobal decline although significance was marginal (building:x2 = 5.3, df = 1, p = 0.02*; forage: x2 = 3.0, df = 1, p= 0.08;Figure 3).
Discussion
We are currently witnessing a mass extinction event on a scalesimilar to that of the paleontological past [4,45,46]. Here, weexplored patterns of range contraction and extinction risk inmangroves, an aquatic forest biome widely distributed across thetropics. We revealed that regions with a high proportion of speciesexperiencing population declines, specifically, Indo-Malesia andAustralasia, which represent centres of mangrove species diversity,also correspond to areas particularly rich in evolutionarily distinctspecies (old species subtending from long phylogenetic branchlengths). The central West coast of America is unusual in that it isrelatively poor in species diversity but rich in species subject tohigh global decline.The global geographical distribution of mangroves is dictated by
several environmental and historical factors [47]. Early studiessuggested a range restriction of mangroves to regions where meanair temperatures of the coolest months are higher than 20uC andthe seasonal temperature fluctuation does not exceed 10uC [48–50]. Additionally, limitations to propagule dispersal, for example,due to barriers imposed by wide expanses of water, and majorcontinental landmasses likely further restrict movement of speciesbetween biogeographical regions. Given such limitations, wemight expect species within geographical regions to be largely aproduct of in situ diversification, representing clusters of closelyrelated species on the phylogenetic tree of mangroves.We evaluated the evolutionary relatedness among mangrove
species within biogeographical regions. However, we did notdetect significant phylogenetic clustering, but rather we found thatmost mangrove assemblages do not differ from random expecta-tions, whilst mangrove species along the East African and Indo-Malesian coastlines were less closely related to each other thanexpected by chance. Our results indicate that regional mangrove
Loss of Evolutionarily Unique Mangrove Species
PLOS ONE | www.plosone.org 2 June 2013 | Volume 8 | Issue 6 | e66686
species assemblages are not simply explained by diversification inthe presence of strong geographical barriers and/or environmentalfiltering. Random patterns may arise from competing processesoffsetting one another, for example, environmental attractionversus competitive repulsion (see [51]), and/or frequent dispersalbetween biogeographic regions. Our observation for phylogeneticover-dispersion in Eastern Africa might also be a product ofcomplex interacting forces, including facilitation [52], competition
[42,53] and biotic interchange [54], but more data are required tofully evaluate assembly mechanisms. Nonetheless, evidence ofsignificant clustering towards the tips of the phylogeny (asindicated by NTI), perhaps captures the signature of more recentin situ diversification.Because we find evidence that the most closely related species
tend to be found within the same biogeographical realms, wemight expect that they would also share similar risk of extinction,
Figure 1. Geographical distribution of species richness (A) and global decline (see Materials and Methods) (B) in mangroveecosystems across six biogeographical regions, per quarter degree squares (QDS).doi:10.1371/journal.pone.0066686.g001
Loss of Evolutionarily Unique Mangrove Species
PLOS ONE | www.plosone.org 3 June 2013 | Volume 8 | Issue 6 | e66686
which should translate to phylogenetic signal in extinction risk andglobal decline. However, we found no evidence for phylogeneticsignal in either threat metric (IUCN Red List status or globaldecline), rather, our results indicate that threat is randomlydistributed across the phylogeny. The loss of evolutionary historymight be relatively low under random extinction [55], althoughcontingent upon the underlying tree topology [56]. However, weobserved that areas with a high proportion of species experiencingglobal declines correspond to areas of unique evolutionary history,
suggesting that whilst extinction risk might not demonstrate strongphylogenetic structure, the loss of currently threatened speciesmight still have a disproportionate impact on mangrove phyloge-netic diversity regionally. The loss of phylogenetic diversity may beof concern because it captures the functional and ecologicaldiversity represented along the branches of the tree-of-life, and hasbeen linked to ecosystem function (e.g. [57,58]) and stability [57].As the tree-of-life is pruned through extinctions we would then lose
Figure 2. Geographical distribution of phylogenetic diversity within mangrove ecosystem for (A) mean terminal branch lengths,and (B) mean evolutionary distinctiveness across the same six biogeographical regions depicted in Figure 1.doi:10.1371/journal.pone.0066686.g002
Loss of Evolutionarily Unique Mangrove Species
PLOS ONE | www.plosone.org 4 June 2013 | Volume 8 | Issue 6 | e66686
these services associated with the functional and ecologicaldiversity represented along its branches.We evaluated various predictors of threat, including plant
height, propagule size, human pressure, and two evolutionaryvariables, species age and evolutionary distinctiveness. We foundthat species age was a significant correlate of global decline whilsthuman pressure was the best predictor of extinction risk. In allcases, less than 15% of the variation in species threat wasexplained, suggesting other factors not included in our model mustbe important in determining species declines. Our findings weresomewhat surprising in that we did not find any evidence linkingmorphological characters (i.e. plant height and propagule size) tothreat status; other life-history traits might therefore be missing inour models.Contrary to expectations, we found species exposed to higher
human pressure (here defined as the total number of uses perspecies) had lower probability of extinction. The negativecorrelation between human activities and extinction risk may belinked to our definition of human pressure. We considered thetotal number of uses recorded for each species as indicative of thelevel of human pressure. Such surrogacy may be misleading: forinstance, a species known to fill one common need in a given area
may be subject to greater pressure than species with multiple butless extractive uses. Further, it is likely that our list of uses is notcomprehensive, and some important uses might not be includeddespite our best efforts. In addition, we separately tested theinfluence of each use on global decline. We found that only usesassociated with building and forage show strong relationships ontheir own. It is possible that species which are currently morecommon (i.e. those that have not yet declined) are preferablyutilised for more intensive building and forage purposes (Figure 3),than species that are already in decline. Whilst such species are notthreatened now, if current trends continue, the negative correla-tions might turn positive in the future.In addition, we found that older species tended to be more
threatened, in contrast to recent finding for terrestrial plants [16].There are several explanations for why extinction risk is greater forolder species. First, the ‘taxon cycle’ of Wilson [59] predicts thatolder species should have higher extinction probabilities as speciesexpand and contract in their geographical distributions over theirevolutionary lifetimes. Second, the trend for higher risk in olderspecies might reflect the pattern of historical extinctions, in whicholder species represent survivors of once more diverse clades [7].Third, it is possible that older species are for some reason less well
Figure 3. Stacked histograms of the proportion of species declining globally when used for (A) structural building, and (B) forage.doi:10.1371/journal.pone.0066686.g003
Loss of Evolutionarily Unique Mangrove Species
PLOS ONE | www.plosone.org 5 June 2013 | Volume 8 | Issue 6 | e66686

suited to the ongoing changes in environment, resulting in greaterrisk.Mangrove species have evolved a unique suite of specialisations
to tidal environments [60], where they provide importantecosystem services [24]. A comprehensive species-level analysis
of richness and extinction risk has recently been conducted [24].Our study adds to this body of work information on thephylogeography of mangrove forests and the likely phylogeneticconsequences of potential extinctions in these ecosystems. Specif-ically, our study indicates that species evolutionary history may be
Table 1. Model coefficients for the PGLS models of global decline in mangrove ecosystems.
Univariate models (log10-transformed) Predictors (log10-transformed) P values Multiple R-squared Slope Intercept
Human pressure 0.098 0.0635 20.3820 4.041
BL 0.032 0.1016 0.0470 2.917
ED 0.920 0.0002 20.0063 3.036
FD 0.920 0.0002 0.0285 2.948
Hmax 0.530 0.0089 20.0238 3.075
Propagule size 0.820 0.0012 20.0232 3.045
Multivariate models (log10-transformed) Predictors (log10-transformed) P values Adjusted R-squared Slope Intercept
Global decline , Propagule size+Hmax+BL+Human pressure (model p-value = 0.03)
Propagule size 0.920 0.1384 0.0103 4.0215
Hmax 0.230 20.0525
BL 0.008 0.0622
Human pressure 0.089 20.3804
Global decline , Propagule size+Hmax+ED+Humanpressure(model p-value = 0.5847)
Propagule size 0.951 20.0224 0.00719 4.1876
Hmax 0.770 20.0127
ED 0.630 20.0312
Human pressure 0.110 20.3920
BL, terminal branch length; ED, evolutionary distinctiveness; Hmax, maximum plant height. For all models the ML estimate of Lambda = 0.doi:10.1371/journal.pone.0066686.t001
Table 2. Model coefficients for the PGLS models of extinction risk in mangrove ecosystems.
(b) Extinction probabilityUnivariate models (log10-transformed) Predictors (log10-transformed) P values Multiple R-squared Slope Intercept
Human pressure 0.053 0.0841 23.9970 1.467
BL 0.250 0.0302 0.2320 29.728
ED 0.390 0.0168 20.4870 27.698
FD 0.230 0.0321 23.0890 21.929
Hmax 0.088 0.0661 0.5890 210.708
Propagule size 0.320 0.0228 0.9200 210.395
Multivariate models (log10-transformed) Predictors (log10-transformed) P values Adjusted R-squared Slope Intercept
extinction probability , Propagule size+Hmax+BL+Human pressure (model p-value = 0.04)
Propagule size 0.740 0.1254 0.3203 2.2520
Hmax 0.110 0.6483
BL 0.540 0.1238
Human pressure 0.013 25.1415
extinction probability , Propagule size+Hmax+ED+Human pressure (model p-value = 0.03 )
Propagule size 0.890 0.145 0.1361 5.5950
Hmax 0.057 0.7253
ED 0.260 20.6234
Human pressure 0.009 25.5424
BL, terminal branch length; ED, evolutionary distinctiveness; Hmax, maximum plant height. For all models the ML estimate of Lambda = 0.doi:10.1371/journal.pone.0066686.t002
Loss of Evolutionarily Unique Mangrove Species
PLOS ONE | www.plosone.org 6 June 2013 | Volume 8 | Issue 6 | e66686
an important predictor of extinction risk, although the underlyingmechanisms remain to be identified. We observe a worryingoverlap between regions in which species are undergoing declinesand regions rich in evolutionarily distinct species. We suggest thatto safeguard the provisioning of the many and valuable ecosystemservices provided by mangrove forests, conservation efforts shouldfocus not only on preserving species, but also upon maintainingtheir evolutionary diversity.
Materials and Methods
Sampling, Morphological Traits and Human PressureDataMangrove forests comprise 70 species widely distributed in
tropical and subtropical regions. Recent studies have explored thepatterns of IUCN categories and global decline among mangrovespecies [24,47] distributed across six biogeographical coastalregions: West America, East America, West Africa, East Africa,Indo-Malesia and Australasia ([61]; Figures 1 and 2). Here wefocus on the phylogenetic ecology of mangrove ecosystems, andincluded in our study the 54 species for which DNA sequences areavailable, thereby allowing us to construct a robust phylogenetictree depicting evolutionary relationships within the group.We recorded from the literature two plant life-history traits,
plant maximum height and propagule size, which are linked toplant dispersal ability [24,47,60,62]. Our measures of extinctionrisk and global decline follow Polidoro et al. [24], and are derivedfrom IUCN Red List categories, and comprehensive data onmangrove taxonomy, distribution, population trends, ecology, life-history traits, past and current threats, and conservation actionsfor each species. In addition, we recorded the different usesassociated with each mangrove species, including firewood andcharcoal, building and structural, carving, cultural, spiritual, food,forage and fodder, medicinal, ornamental, shade or chemicalcompounds, and medicinal [34,35,60,63–74]. We used the totalnumber of uses recorded for each species as an indirect measure ofhuman pressure on that species.
Phylogeny Reconstruction and Divergence TimeEstimationWe retrieved from GenBank/EBI DNA sequences for three
genes, rbcL, ITS and 18S (see Table S1 for accession numbers) for54 of the 70 mangrove species. DNA sequences were aligned usingMultiple Sequence Comparison by Log-Expectation (MUSCLEv.3.8.31; [75]) and manually edited. The aligned sequences werethen concatenated in a single matrix. Phylogeny reconstructionwas performed using BEAST v.1.7.4 assuming a relaxed-clockmodel [76] and a GTR+I+C model of sequence evolution for eachpartition, selected based on Akaike information criterion (AIC)using Modeltest v.2.3 [77]. The tree prior was estimated assuminga speciation model following a Yule process with an uncorrelatedlognormal model for rate variation among branches. Forcalibration purpose, we added to the mangrove matrix membersof the families Oleaceae, Moraceae, Malvaceae and Vitaceae.These families were used as secondary calibration points with anormal prior distribution based on Bell et al. [78] as follows:Oleaceae crown node (41 Ma, SD 6 Ma), Moraceae crown node(31 Ma, SD 4 Ma), Malvaceae crown node (39 Ma, SD 4 Ma),Vitaceae crown node (43 Ma, SD 9 Ma), angiosperm crown(149 Ma, SD 3 Ma). We included Amborella trichopoda and Nymphaeaalba as outgroups, following Schneider et al. [79]. Monte CarloMarcov Chains were run for 100 million generations samplingevery 1000 generations. Convergence was checked using Tracerv.1.5, and of the resulting 100001 trees, we removed 15000 as
burnin, the remaining 85001 trees were combined usingtreeAnnotator v.1.7.1.
Data AnalysisFirst, for each of the mangrove species represented in the
phylogenetic tree, we extracted range map data from the IUCNRed List database (http://www.iucnredlist.org). Species distribu-tions were then projected onto a Behrmann equal-area cylindricalprojection in ArcMap v.10, and gridded at a resolution of0.25u60.25u (approximately 27.5627.5 km at the equator). Wethen generated a series of maps to capture spatial variation inspecies richness (SR), global decline, species evolutionary distinc-tiveness (ED), and mean species age. Species richness simplycaptures the number of species occupying a grid cell. Globaldecline represents information on the mean decline in populationsize of each species and was recorded from Polidoro et al. [24].Evolutionary distinctiveness was calculated using the R libraryPicante [80]. This metric partitions branch lengths by the totalnumber of species subtending it and was evaluated using thefunction ‘evol.distinct’ based on fair proportions [41]. Species ageswere calculated as the terminal branch length (BL) connectingeach species to the phylogeny, and captures species evolutionaryuniqueness (unshared branch lengths).Second, we evaluated the phylogenetic structure within
biogeographic regions using the net relatedness index (NRI) andnet taxon index (NTI; [42,43]) to compare observed pair-wisephylogenetic distances against expectations from random speciesassemblage. This comparison provides insights into communityassembly mechanisms (e.g. competition vs. habitat filtering, [42])within mangrove ecosystems. For this purpose, we used allmangrove species included in our phylogenetic tree as the regionalpool (null model "phylogeny.pool" in R library Picante [80]). NRIdescribes a tree-wide pattern of dispersion, whereas NTI is moresensitive to phylogenetic structure towards the tips of thephylogeny. A strong negative value of NRI or NTI indicates thatcommunities are composed of less related species whereas a strongpositive value indicates clustering of closely related species. Valuesof NRI and NTI that do not depart significantly from zero indicaterandom species assemblages [42].Finally, we tested for a phylogenetic signal in extinction risk and
global decline using Blomberg’s K statistics [81], and constructed aseries of regression models to explore predictors of threat usingphylogenetic GLS models [82,83]. Extinction risk and globaldecline data were recorded from Polidoro et al. [24] andconverted into extinction probabilities using the extinctionprobability IUCN50 (see [84]). Regression models were generatedusing the function ‘pgls’ implemented in the R package ‘Caper’[85]. For both extinction risk and global decline, we evaluated fourexplanatory variables: plant maximum height, propagule size(measured as propagule volume recorded from Duke et al. [46]),human pressure (measured as total number of uses recorded foreach species), and species ages or species evolutionary distinctive-ness (see above). In addition, we explored separately whetherdifferent uses had varying levels of impact on global decline usingPearson’s Chi-squared test with Yates’ continuity correction.
Supporting Information
Figure S1 The 50% majority rule consensus treeshowing distribution of global decline within mangrovespecies obtained from a Bayesian analysis of thecombined dataset (rbcL+ITS +18S). Numbers above branch-es are posterior probability above 50%. Outgroups and taxa usedfor calibration were pruned from the tree prior to further analyses.
Loss of Evolutionarily Unique Mangrove Species
PLOS ONE | www.plosone.org 7 June 2013 | Volume 8 | Issue 6 | e66686
(TIFF)
Table S1 Voucher table with GenBank accession num-bers for the gene regions used in phylogeny reconstruc-tion, IUCN categories, extinction probabilities, globaldecline, life history traits (maximum plant height andpropagule size), and human pressure for the mangrovespecies included in our analysis.(DOC)
Acknowledgments
The University of Johannesburg through the African Centre for DNABarcoding provide logistics and financial support to the first three authors.We thank an anonymous reviewer for comments on an earlier version ofthe manuscript.
Author Contributions
Conceived and designed the experiments: BHD KY TJD. Performed theexperiments: BHD KY LTM. Analyzed the data: BHD KY TJD.Contributed reagents/materials/analysis tools: BHD KY LTM TJD.Wrote the paper: BHD KY TJD.
References
1. Worm B, Barbier EB, Beaumont N, Duffy JE, Folke C, et al. (2006) Impacts ofbiodiversity loss on ocean ecosystem services. Science 314: 787–790.
2. Faith DP, Magallon S, Hendry AP, Conti E, Yahara T, et al. (2010) Evosystemservices: an evolutionary perspective on the links between biodiversity andhuman well-being. Curr Opin Environ Sustainability 2: 1–9.
3. Pimm SL, Russell GJ, Gittleman JL, Brooks TM (1995) The future ofbiodiversity. Science 269: 347–350.
4. Millennium Ecosystem Assessment (2005) Ecosystems and human well-being:Synthesis. Washington DC: Island Press. 137 pp.
5. Vamosi JC, Vamosi SM (2008) Extinction risk escalates in the tropics. PLoSONE 3: e3886.
6. Owens IPF, Bennett PM (2000) Ecological basis of extinction risk in birds:Habitat loss versus human persecution and introduced predators. Proc NatlAcad Sci U S A 97: 12144–12148.
7. Purvis A, Agapow PM, Gittleman JL, Mace GM (2000a) Nonrandom extinctionand the loss of evolutionary history. Science 288: 328–330.
8. Cardillo M, Purvis A, Sechrest W, Gittleman JL, Biebly J, et al. (2004) Humanpopulation density and extinction risk in the world’s carnivores. PLoS Biol 2:e197.
9. Cardillo M, Mace GM, Jones KE, Biebly J, Bininda-Edmonds ORP, et al. (2005)Multiple causes of high extinction risk in large mammal species. Science 309:1239–1241.
10. Cardillo M, Mace GM, Gittleman JL, Jones KE, Biebly J, et al. (2008) Thepredictability of extinction: biological and external correlates of decline inmammals. Proc R Soc B 275: 1441–1448.
11. Davies RG, Orme CDL, Olson V, Thomas GH, Ross SG, et al. (2006) Humanimpacts and the global distribution of extinction risk. Proc R Soc B 273: 2127–2133.
12. Cooper N, Bielby J, Thomas GH, Purvis A (2008) Macroecology and extinctionrisk correlates of frogs. Glob Ecol Biogeogr 17: 211–221.
13. Lee TM, Jetz W (2010) Unravelling the structure of species extinction risk forpredictive conservation science. Proc R Soc B 278: 1329–1338.
14. Huang S, Gittleman JG, Davies TJ (2012) How global extinctions impactregional biodiversity in mammals. Biol Lett 8: 222–225.
15. Vamosi JC, Wilson JRU (2008) Nonrandom extinction leads to elevated loss ofangiosperm evolutionary history. Ecol Lett 11: 1047–1053.
16. Davies TJ, Smith GF, Bellstedt DU, Boatwright JS, Bytebier B, et al. (2011)Extinction risk and diversification are linked in a plant biodiversity hotspot.PLoS Biol 9: e1000620.
17. Fordham DA, Akaya HRA, Araujo MB, Elith J, Keith DA, Pearson R, et al.(2012) Plant extinction risk under climate change: are forecast range shifts alonea good indicator of species vulnerability to global warming? Glob Change Biol18: 1357–1371.
18. Yessoufou K, Daru BH, Davies TJ (2012) Phylogenetic patterns of extinction riskin the Eastern Arc ecosystems, an African biodiversity hotspot. PLoS ONE 7:e47082.
19. Russell GJ, Brooks TM, McKinney MM, Anderson CG (1998) Present andfuture taxonomic selectivity in birds and mammal extinctions. Conserv Biol 12:1365–1376.
20. Purvis A, Gittleman JL, Cowlishaw G, Mace GM (2000b) Predicting extinctionrisk in declining species. Proc R Soc B 267: 1947–1952.
21. Schwartz MW, Simberloff D (2001) Taxon size predicts rarity in vascular plants.Ecol Lett 4: 464–469.
22. Liu X, Wang JY, Wang QF (2005) Current status and conservation strategies forIsoetes in China: a case study for the conservation of threatened aquatic plants.Oryx 39: 335–338.
23. Garcıa N, Cuttelod A, Abdul Malak D, editors (2010). The status anddistribution of freshwater biodiversity in Northern Africa. Gland, Switzerland,Cambridge, UK, and Malaga, Spain : IUCN, 2010. xiii, 141pp.
24. Polidoro BA, Carpenter KE, Collins L, Duke NC, Ellison AM, et al. (2010) Theloss of species: mangrove extinction risk and geographic areas of global concern.PLoS ONE 5: e10095.
25. Short FT, Polidoro B, Livingstone SR, Carpenter KE, Bandeira S, et al. (2011)Extinction risk assessment of the world’s seagrass species. Biol Conserv 144:1961–1971.
26. IUCN (2012) The IUCN Red List of Threatened Species. Version 2012.2.,http://www.iucnredlist.org.. Downloaded on 17 November 2012.
27. Field CB, Osborn JG, Hoffman LL, Polsenberg JF, Ackerly DD, et al. (1998)Mangrove biodiversity and ecosystem function. Global Ecol Biogeog Let 7: 3–14.
28. Forest F, Grenyer R, Rouget M, Davies J, Cowling RM, et al. (2007) Preservingthe evolutionary potential of floras in biodiversity hotspots. Nature 445: 757–760.
29. Sodhi NS, Koh LP, Peh KS-H, Tan HTW, Chazdon RL, et al. (2008)Correlates of extinction proneness in tropical angiosperms. Divers Distrib 14: 1–10.
30. Ong JE (1993) Mangroves – a carbon source and sink. Chemosphere 27: 1097–1107.
31. Duke NC, Meynecke JO, Dittmann S, Ellison AM, Anger K, et al. (2007) Aworld without mangroves? Science 317: 41–42.
32. Dorenbosch M, van Riel MC, Nagelkerken I, van der Velde G (2004) Therelationship of reef fish densities to the proximity of mangrove and seagrassnurseries. Estuar Coast Shelf Sci 60: 37–48.
33. Ellison AM (2008) Managing mangroves with benthic biodiversity in mind:moving beyond roving banditry. J Sea Res 59: 2–15.
34. Sullivan C (2005) The importance of mangroves Available: www.vi_shandwildlife.com/Education/FactSheet/PDF_Docs/28Mangroves.pdf.Accessed 2009 June 1.
35. Costanza R, d’Arge R, de Groot R, Farber S, Grasso M, et al. (1997) The valueof the world’s ecosystem services and natural capital. Nature 387: 253–260.
36. FAO (2007) The World’s Mangroves 1980–2005, FAO Forestry Paper 153.Rome: Forest Resources Division, FAO. 77 pp.
37. Ellison J (2005) Holocene palynology and sea-level change in two estuaries inSouthern Irian Jaya. Palaeogeog Palaeoclim Palaeoecol 220: 291–309.
38. FAO (2003) Status and trends in mangrove area extent worldwide. In: WilkieML, Fortuna S, editors. Forest Resources Assessment Working Paper No. 63.Rome: Forest Resources Division, FAO. Available: http://www.fao.org/docrep/007/j1533e/j1533e00.HTM. Accessed 2009 August 1.
39. Miththapala S (2008) Mangroves. Coastal Ecosystems Series Volume 2.Colombo Sri Lanka: Ecosystems and Livelihoods Group Asia IUCN 28.
40. Luther D, Greenburg R (2009) Mangroves: a global perspective on the evolutionand conservation of their terrestrial vertebrates. Bioscience 59: 602–612.
41. Isaac NJB, Turvey ST, Collen B, Waterman C, Baillie JEM (2007). Mammals onthe EDGE: conservation priorities based on threat and phylogeny. PLoS ONE2: e296.
42. Webb CO, Ackerly DD, McPeek MA, Donoghue MJ (2002) Phylogenies andcommunity ecology. Annu Rev Ecol Syst 33: 475–505.
43. Webb CO, Ackerly DD, Kembel SW (2008) PHYLOCOM: software for theanalysis of phylogenetic community structure and trait evolution. Bioinformatics24: 2098–2100.
44. Purvis A (2008) Phylogenetic approaches to the study of extinction. Annu RevEcol Evol Syst 39: 301–319.
45. May RM, Lawton JH, Stork NE (1995) Assessing extinction rates. In: LawtonJH, May RM, editors. Extinction rates. Oxford University Press, Oxford, UK.1–24.
46. Butchart SHM, Bird JP (2010) Data Deficient birds on the IUCN Red List: whatdon’t we know and why does it matter? Biol Conserv 143: 239–247.
47. Duke NC, Ball MC, Ellison JC (1998) Factors influencing biodiversity anddistributional gradients in mangroves. Global Ecol Biogeog Let 7: 27–47.
48. Walsh GE (1974) Mangroves: a review. In: Reimhold RJ, Queen WH, editors.Ecology of halophytes. Academic Press, New York. 31–174.
49. Chapman VJ (1975) Mangrove biogeography: In: Walsh GE, Snedaker SC,Teas HJ, editors. Proceedings of the International symposium on biology andmanagement of mangroves. University of Florida, Gainesville. 1, 3–21.
50. Chapman VJ (1977) Introduction. In: Chapman VJ, editor. Wet coastalecosystems: ecosystems of the world. Elsevier, New York. 1, 1–29.
51. Helmus MR, Savage K, Diebel MW, Maxted JT, Ives AR (2007) Separating thedeterminants of phylogenetic community structure. Ecol Lett 10: 917–25.
52. Valiente-Banuet A, Verdu M (2007) Facilitation can increase the phylogeneticdiversity of plant communities. Ecol Lett 10: 1029–1036.
Loss of Evolutionarily Unique Mangrove Species
PLOS ONE | www.plosone.org 8 June 2013 | Volume 8 | Issue 6 | e66686
53. Mayfield MM, Levine J (2010) Opposing effects of competitive exclusion on thephylogenetic structure of communities. Ecol Lett 13: 1085–1093.
54. Kissling WD, Eiserhardt WL, Baker WJ, Borchsenius F, Couvreur TLP, et al.(2012) Cenozoic imprints on the phylogenetic structure of palm speciesassemblages worldwide. Proc Natl Acad Sci U S A 109: 7379–7384.
55. Nee S, May RM (1997) Extinction and the loss of evolutionary history. Science278: 692–694.
56. Parhar RK, Mooers AØ (2011) Phylogenetically clustered extinction risks do notsubstantially prune the tree of life. PLoS ONE 6: e23528.
57. Cadotte MW, Cavender-Bares J, Tilman D, Oakley TH (2009) Usingphylogenetic, functional and trait diversity to understand patterns of plantcommunity productivity. PLoS ONE 4: e5695.
58. Flynn DFB, Mirotchnick N, Jain M, Palmer MI, Naeem S (2011) Functional andphylogenetic diversity as predictors of biodiversity–ecosystem-function relation-ships. Ecology 92: 1573–1581.
59. Wilson EO (1961) The nature of the taxon cycle in the Melanesian ant fauna.Am Nat 95: 169–193.
60. Tomlinson PB (1986) The botany of mangroves. Cambridge, UK: CambridgeUniversity Press. 413 pp.
61. Duke NC (1992) Mangrove floristics and biogeography. In: Robertson AI,Alongi DM, editors. Tropical mangrove ecosystems American GeophysicalUnion, Washington DC. 63–100.
62. Duke NC (2006) Australia’s Mangroves. The authoritative guide to Australia’smangrove plants. University of Queensland, Brisbane.
63. Clough BF (1993) The status and value of the mangrove forests in Indonesia,Malaysia and Thailand: Summary. In: Clough BF, editor. The economic andenvironmental values of mangrove forests and their present state of conservationin the south-east Asia/Pacific region. ITTO/ISME/JIA Project PD 71/89 Rev.1, 1–10.
64. Aksornkoae S, Paphavasit N, Wattayakorn G (1993) Mangroves of Thailand:present status of conservation, use and management. In The economic andenvironment value of mangrove forests and their present state of conservation.International Tropical Timber Organisation/Japan International Associationfor Mangroves/International Society for Mangrove Ecosystems Japan.
65. Michie M (1993) The use of mangroves by Aborigines in northern Australia.Channel Island Field Study Centre Occasional Paper, No.5.
66. Siddiqi NA (1994) The importance of mangroves to the people in the coastalareas of Bangladesh. Proceedings VII Pacific Science International Congress,Mangrove Session organised by International Society for Mangrove Ecosystems(ISME), Okinawa, 1–2 July 1993, Japan.
67. Goulder LH, Kennedy D (1997) Valuing ecosystem services: philosophical basesand empirical methods. In: Daily G, editor. Nature’s services. Societaldependence on natural ecosystems. Island Press, Washington. 23–47.
68. Rasolofo MV (1997) Use of mangroves by traditional fishermen in Madagascar.Mangr Salt Marsh 1: 243–253.
69. Ewel KC, Twilley RR, Ong JE (1998) Different kinds of mangrove forestsprovide different goods and services. Glob Ecol Biogeogr Let 7: 83–94.
70. Dahdouh-Guebas F, Mathenge C, Kairo JG, Koedam N (2000) Utilization ofmangrove wood products around Mida Creek (Kenya) amongst subsistence andcommercial users. Econ Bot 54: 513–527.
71. Walters BB (2003) People and mangroves in the Philippines: Fifty years ofcoastal environmental change. Environ Conserv 30: 293–303.
72. Hauff RD, Ewel KC, Jack J (2006) Tracking human disturbance in mangroves:Estimating harvest rates on a Micronesian island. Wetlands Ecol Manag, 14: 95–105.
73. Ndenecho EN (2007) Economic value and management of mangrove forests inCameroon. Int J Sust Dev World 14: 618–625.
74. Das S, Vincent JR (2009) Mangroves protected villages and reduce death tollduring Indian super cyclone. Proc Natl Acad Sci U S A 106: 7357–7360.
75. Edgar RC (2004) MUSCLE: multiple sequence alignment with high accuracyand high throughput. Nucleic Acids Res 32: 1792–97.
76. Drummond AJ, Rambaut A (2007) BEAST: Bayesian evolutionary analysis bysampling trees. BMC Evol Biol 7: 214.
77. Nylander JAA (2004) Modeltest v2. Program distributed by the author(Evolutionary Biology Centre, Uppsala University).
78. Bell CD, Soltis DE, Soltis PS (2010) The age and diversification of theangiosperms re-revisited. Am J Bot 97: 1296–1303.
79. Schneider H, Schuettpelz E, Pryer KM, Cranfill R, Magallon S, et al. (2004).Ferns diversified in the shadow of angiosperms. Nature 428: 553–557.
80. Kembel SW, Cowan PD, Helmus MR, Cornwell WK, Morlon H (2010)Picante: R tools for integrating phylogenies and ecology. Bioinformatics 26:1463–1464.
81. Blomberg SP, Garland TJR, Ives AR (2003) Testing for phylogenetic signal incomparative data: behavioural traits are more labile. Evolution 57: 717–745.
82. Grafen A (1989) The phylogenetic regression. Phil Trans R Soc B 326: 119–157.83. Martins EP (1997) Phylogenies and the comparative method: a general approach
to incorporating phylogenetic information into the analysis of interspecific data.Am Nat 149: 646–67.
84. Mooers AØ, Faith DP, Maddison WP (2008) Converting endangered speciescategories to probabilities of extinction for phylogenetic conservation prioriti-zation. PLoS ONE 3: e3700.
85. Orme D, Freckleton R, Thomas G, Petzoldt T, Fritz S, et al. (2012) caper:Comparative Analyses of Phylogenetics and Evolution in R. R package version0.5.http://CRAN.R-project.org/package = caper.
Loss of Evolutionarily Unique Mangrove Species
PLOS ONE | www.plosone.org 9 June 2013 | Volume 8 | Issue 6 | e66686