Zooplankton assemblages and hydrography in the spawning area of anchovy (Engraulis anchoita) off Rio...
14
Marine Freshwater Research Publishing Marine and Freshwater Research CSIRO Publishing PO Box 1139 (150 Oxford St) Collingwood, Vic. 3066, Australia Telephone: +61 3 9662 7618 Fax: +61 3 9662 7611 Email: [email protected] Published by CSIRO Publishing for CSIRO and the Australian Academy of Science www.publish.csiro.au/journals/mfr All enquiries and manuscripts should be directed to: Volume 53, 2002 © CSIRO 2002 A journal for the publication of original contributions in physical oceanography, marine chemistry, marine and estuarine biology and limnology
-
Upload
independent -
Category
Documents
-
view
6 -
download
0
Transcript of Zooplankton assemblages and hydrography in the spawning area of anchovy (Engraulis anchoita) off Rio...
MarineFreshwaterResearch
P u b l i s h i n g
Marine and Freshwater ResearchCSIRO PublishingPO Box 1139 (150 Oxford St)Collingwood, Vic. 3066, Australia
Telephone: +61 3 9662 7618Fax: +61 3 9662 7611Email: [email protected]
Published by CSIRO Publishing for CSIRO and the Australian Academy of Science
w w w . p u b l i s h . c s i r o . a u / j o u r n a l s / m f r
All enquiries and manuscripts should be directed to:
Volume 53, 2002© CSIRO 2002
A journal for the publication of original contributionsin physical oceanography, marine chemistry,marine and estuarine biology and limnology

© CSIRO 2002 10.1071/MF00105 1323-1650/02/061031
Marine and Freshwater Research, 2002, 53, 1031–1043
MF00105Anchovy spaw ni ng areas, zoopl ankt on and hydr ogr aphyM. D. Vi ñaset al .
Zooplankton assemblages and hydrography in the spawning area of anchovy (Engraulis anchoita) off Río de la Plata estuary
(Argentina–Uruguay)
María Delia ViñasA,B,C,D, Rubén M. NegriA,C, Fernando C. Ramírez A,B and Daniel Hernández A
AInstituto Nacional de Investigación y Desarrollo Pesquero (INIDEP), Paseo V.Ocampo N 1, 7600 Mar del Plata, Argentina.
BConsejo Nacional de Investigaciones Científicas y Técnicas (CONICET).CUniversidad Nacional de Mar del Plata (UNMDP).
DCorresponding author; email: [email protected]
Abstract. The massive spawning of anchovy (Engraulis anchoita) in Argentine waters takes place in spring in thecoastal sector off the Buenos Aires Province, with the highest concentrations of spawners occurring in front of theRío de la Plata mouth. In October 1995, the size structure, composition and abundance of the zooplanktoncommunity was analyzed and related to the hydrography and the abundance of anchovy eggs. Oceanographicconditions were different from the recorded means for the season. A higher proportion of the colder and more salineshelf waters were present in the coastal area and strong haloclines were not observed. High values of planktonbiomass were observed in the estuarine frontal area and in the weakly stratified waters of the median shelf. Thecluster analysis of the stations gave rise to the formation of coastal (CA), transitional (TA) and shelf (SA) faunisticareas. Mesozooplankton smaller than 1 mm total length (TL) dominated the whole area.
The copepods, Paracalanus spp. and Oithona similis, and the cladocerans, Evadne nordmanni and Podon spp.,constituted the bulk of this mesozooplankton fraction. Oithona similis was the dominant species in the SA. Thecopepod, Acartia tonsa (1–2 mm TL), was extremely abundant in the estuarine front (more than 17600 individualsm–3) followed by appendicularians, members of Pseudocalanidae, anchovy eggs and decapod larvae. Species ofCalanidae (Calanoides carinatus and Calanus simillimus), the amphipod hyperiid, Themisto gaudichaudii, and theeuphausiid, Euphausia lucens, largely dominated the macrozooplankton (>2 mm TL) in the TA and SA. In the CA,significant positive correlations between the abundance of small copepods (size ranges <1 and 1–2 mm) andanchovy eggs were found. Trophic implications of these findings for first-feeding anchovy larvae were discussed.The adequacy of the TA and SA as feeding ground for adults of anchovy was evaluated.
Extra keywords: south-western Atlantic Ocean, mesozooplankton, Copepoda, Cladocera, Amphipoda,Euphausiacea, zooplankton–anchovy linkage.
IntroductionEngraulis anchoita is the most abundant anchovy species inthe south-western Atlantic Ocean. It occurs from Cabo Frío(23°S) to San Jorge Gulf (47°S). The spawning of thisspecies is associated with productive upwelling regions(Cabo Frío) and estuarine (Río de la Plata), tidal (PeninsulaValdés) and shelf fronts (Bakun and Parrish 1991; Sánchezand Ciechomski 1995).
In Argentine waters, E. anchoita plays a key role in thepelagic ecosystem. Its importance is based not only on itshigh biomass but also on its position in the pelagic foodchain. During its lifespan, E. anchoita feeds mostly onzooplankton (Angelescu 1982; Viñas and Ramírez 1996;
Pájaro 1998) and constitute the main component of the dietof several important commercial species such as hake, squidand chub mackerel (Angelescu 1982).
In spring, massive spawning occurs in coastal sectors offthe Buenos Aires Province, mostly in waters shallower than50 m (Sánchez and Ciechomski 1995; Pájaro 1998), with thehighest concentrations of spawners usually recorded off theRío de la Plata estuary, associated with high thermohalinegradients (Hansen and Madirolas 1996). Although othergeneral studies on the plankton distribution and compositionhave been performed in the area (Negri et al. 1988;Fernández Aráoz et al. 1991, 1994), none have focused onanchovy spawning.
1032 M. D. Viñas et al.
In this study, the spatial distribution of zooplanktonassemblages and their composition, abundance, sizestructure and ecology were analyzed in relation to anchovyegg distribution in order to improve our understanding of theregion as a larval feeding ground.
The distribution patterns of the zooplankton wereinterpreted according to the general hydrography and surfacedistribution of chlorophyll a. Hydrographic discontinuitieshave been especially taken into account because of theirrelevance in larval prey production for pelagic fishes(Kiørboe 1991; Mann 1993).
Material and methods
Study site
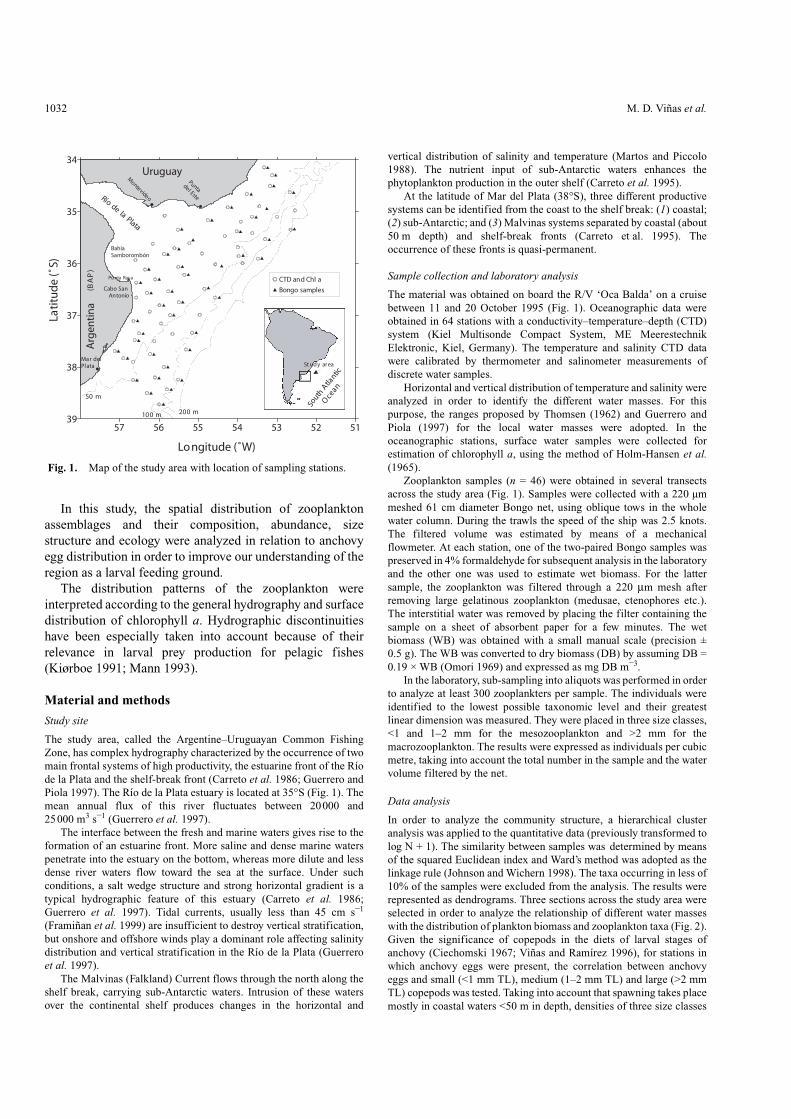
The study area, called the Argentine–Uruguayan Common FishingZone, has complex hydrography characterized by the occurrence of twomain frontal systems of high productivity, the estuarine front of the Ríode la Plata and the shelf-break front (Carreto et al. 1986; Guerrero andPiola 1997). The Río de la Plata estuary is located at 35°S (Fig. 1). Themean annual flux of this river fluctuates between 20000 and25000 m3 s–1 (Guerrero et al. 1997).
The interface between the fresh and marine waters gives rise to theformation of an estuarine front. More saline and dense marine waterspenetrate into the estuary on the bottom, whereas more dilute and lessdense river waters flow toward the sea at the surface. Under suchconditions, a salt wedge structure and strong horizontal gradient is atypical hydrographic feature of this estuary (Carreto et al. 1986;Guerrero et al. 1997). Tidal currents, usually less than 45 cm s–1
(Framiñan et al. 1999) are insufficient to destroy vertical stratification,but onshore and offshore winds play a dominant role affecting salinitydistribution and vertical stratification in the Río de la Plata (Guerreroet al. 1997).
The Malvinas (Falkland) Current flows through the north along theshelf break, carrying sub-Antarctic waters. Intrusion of these watersover the continental shelf produces changes in the horizontal and
vertical distribution of salinity and temperature (Martos and Piccolo1988). The nutrient input of sub-Antarctic waters enhances thephytoplankton production in the outer shelf (Carreto et al. 1995).
At the latitude of Mar del Plata (38°S), three different productivesystems can be identified from the coast to the shelf break: (1) coastal;(2) sub-Antarctic; and (3) Malvinas systems separated by coastal (about50 m depth) and shelf-break fronts (Carreto et al. 1995). Theoccurrence of these fronts is quasi-permanent.
Sample collection and laboratory analysis
The material was obtained on board the R/V ‘Oca Balda’ on a cruisebetween 11 and 20 October 1995 (Fig. 1). Oceanographic data wereobtained in 64 stations with a conductivity–temperature–depth (CTD)system (Kiel Multisonde Compact System, ME MeerestechnikElektronic, Kiel, Germany). The temperature and salinity CTD datawere calibrated by thermometer and salinometer measurements ofdiscrete water samples.
Horizontal and vertical distribution of temperature and salinity wereanalyzed in order to identify the different water masses. For thispurpose, the ranges proposed by Thomsen (1962) and Guerrero andPiola (1997) for the local water masses were adopted. In theoceanographic stations, surface water samples were collected forestimation of chlorophyll a, using the method of Holm-Hansen et al.(1965).
Zooplankton samples (n = 46) were obtained in several transectsacross the study area (Fig. 1). Samples were collected with a 220 µmmeshed 61 cm diameter Bongo net, using oblique tows in the wholewater column. During the trawls the speed of the ship was 2.5 knots.The filtered volume was estimated by means of a mechanicalflowmeter. At each station, one of the two-paired Bongo samples waspreserved in 4% formaldehyde for subsequent analysis in the laboratoryand the other one was used to estimate wet biomass. For the lattersample, the zooplankton was filtered through a 220 µm mesh afterremoving large gelatinous zooplankton (medusae, ctenophores etc.).The interstitial water was removed by placing the filter containing thesample on a sheet of absorbent paper for a few minutes. The wetbiomass (WB) was obtained with a small manual scale (precision ±0.5 g). The WB was converted to dry biomass (DB) by assuming DB =0.19 × WB (Omori 1969) and expressed as mg DB m–3.
In the laboratory, sub-sampling into aliquots was performed in orderto analyze at least 300 zooplankters per sample. The individuals wereidentified to the lowest possible taxonomic level and their greatestlinear dimension was measured. They were placed in three size classes,<1 and 1–2 mm for the mesozooplankton and >2 mm for themacrozooplankton. The results were expressed as individuals per cubicmetre, taking into account the total number in the sample and the watervolume filtered by the net.
Data analysis
In order to analyze the community structure, a hierarchical clusteranalysis was applied to the quantitative data (previously transformed tolog N + 1). The similarity between samples was determined by meansof the squared Euclidean index and Ward’s method was adopted as thelinkage rule (Johnson and Wichern 1998). The taxa occurring in less of10% of the samples were excluded from the analysis. The results wererepresented as dendrograms. Three sections across the study area wereselected in order to analyze the relationship of different water masseswith the distribution of plankton biomass and zooplankton taxa (Fig. 2).Given the significance of copepods in the diets of larval stages ofanchovy (Ciechomski 1967; Viñas and Ramírez 1996), for stations inwhich anchovy eggs were present, the correlation between anchovyeggs and small (<1 mm TL), medium (1–2 mm TL) and large (>2 mmTL) copepods was tested. Taking into account that spawning takes placemostly in coastal waters <50 m in depth, densities of three size classes
57 56 55 54 53 52 51
Longitude (˚W)
39
38
37
36
35
34
Lati
tud
e (˚
S)
Río de la Plata
Arg
enti
na
Uruguay
Mar delPl ata
BahíaSamborombón
Montevideo
Puntadel Este
Pu nta Ras a
50 m
100 m 200 m
Cabo SanAntonio
Bongo samples
CTD and Chl a
(BA
P)
South
Atlantic
Oce
an
St udy ar ea
Fig. 1. Map of the study area with location of sampling stations.
Anchovy spawning areas, zooplankton and hydrography 1033
of copepods in depths of < and > 50 m were compared by using theMann–Whitney non-parametric test (Zar 1996).
Results
Hydrography and plankton biomass
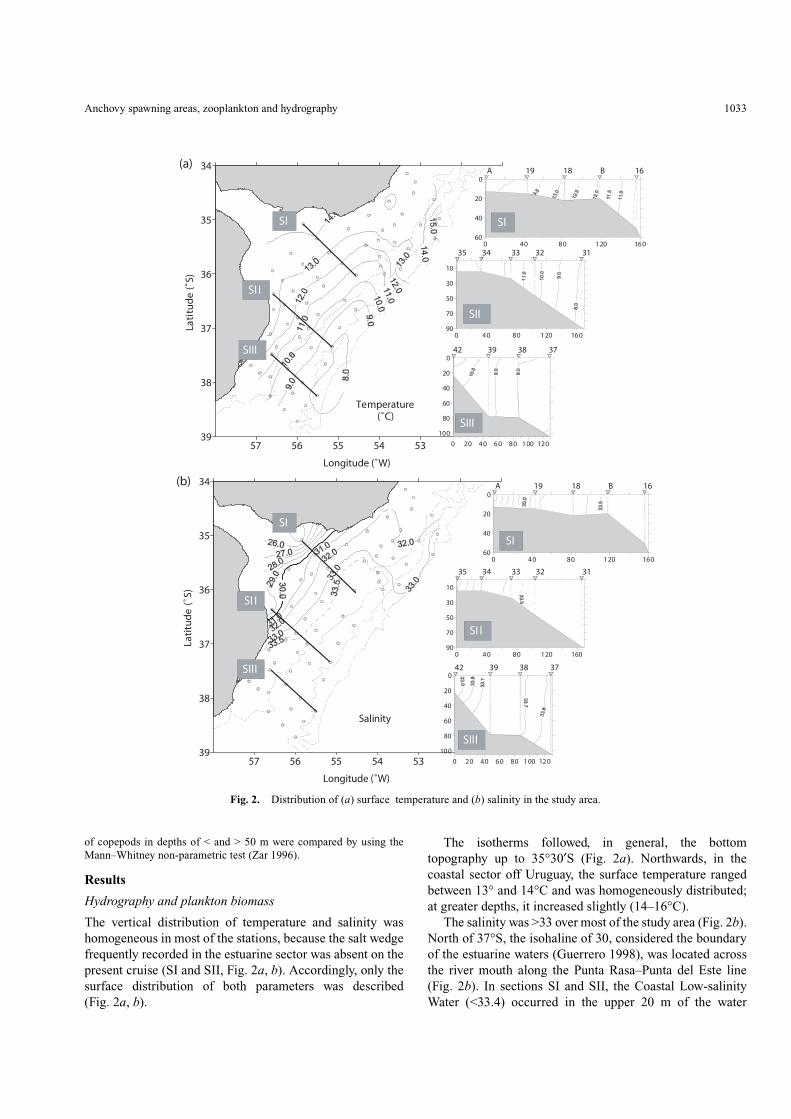
The vertical distribution of temperature and salinity washomogeneous in most of the stations, because the salt wedgefrequently recorded in the estuarine sector was absent on thepresent cruise (SI and SII, Fig. 2a, b). Accordingly, only thesurface distribution of both parameters was described(Fig. 2a, b).
The isotherms followed, in general, the bottomtopography up to 35°30′S (Fig. 2a). Northwards, in thecoastal sector off Uruguay, the surface temperature rangedbetween 13° and 14°C and was homogeneously distributed;at greater depths, it increased slightly (14–16°C).
The salinity was >33 over most of the study area (Fig. 2b).North of 37°S, the isohaline of 30, considered the boundaryof the estuarine waters (Guerrero 1998), was located acrossthe river mouth along the Punta Rasa–Punta del Este line(Fig. 2b). In sections SI and SII, the Coastal Low-salinityWater (<33.4) occurred in the upper 20 m of the water
57 56 55 54 53
Longitude (˚W)
39
38
37
36
35
34
Lati
tud
e (˚
S)
Temperature (˚C)
57 56 55 54 53
Longitude (˚W)
39
38
37
36
35
34
Lati
tud
e (
˚S)
Salinity
(a)
(b)
A 19 18 B 16
0 40 80 120 16060
40
20
0
A 19 18 B 16
0 40 80 120 16060
40
20
0
35 34 33 32 31
0 40 80 120 16090
70
50
30
10
35 34 33 32 31
0 40 80 120 16090
70
50
30
10
0 20 40 60 80 100 120
100
80
60
40
20
042 39 38 37
0 20 40 60 80 100 120
100
80
60
40
20
042 39 38 37
SIII
SI I
SI
SIII
SII
SI
SIII
SI I
SI I
SI
SI
SIII
Fig. 2. Distribution of (a) surface temperature and (b) salinity in the study area.
1034 M. D. Viñas et al.
column. Deeper, Median Shelf Waters (33.4–33.7) wereidentified (SI and SII, Fig. 2b).
Within the frontal zone, at the mouth of the Río de laPlata, the highest salinity gradient (0.17 salinity km–1)occurred in front of the Uruguayan coast, betweenMontevideo and Punta del Este (SI, Fig. 2b). Another salinitygradient (0.11 salinity km–1) was observed south ofSamborombón Bay (SII, Fig. 2b).
The beginning of the seasonal thermal stratification wasobserved in some of the shelf stations in the upper 10 m ofthe water column (SIII, Fig. 2a). The isohalines showed the
three different water masses typical for the region (Guerreroand Piola 1997): Saline Coastal Waters (33.8–34.0); MedianShelf Waters (33.4–33.7); and Outer Shelf Waters(33.7–34.0).
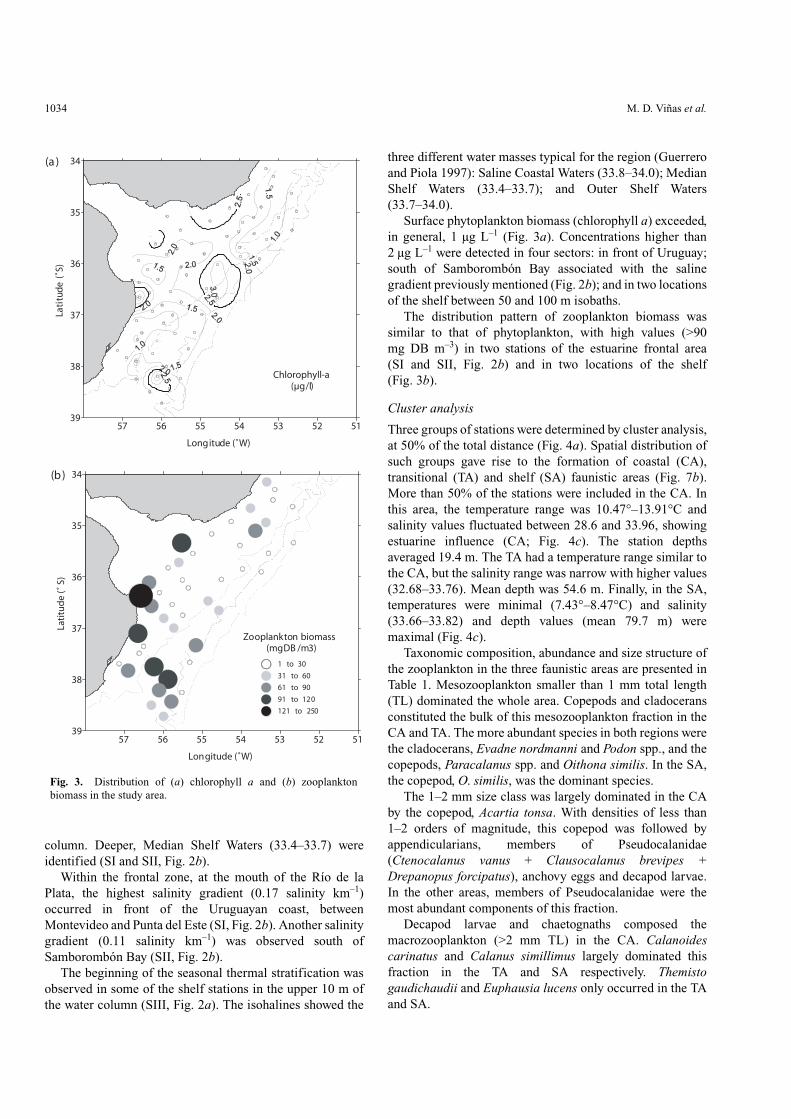
Surface phytoplankton biomass (chlorophyll a) exceeded,in general, 1 µg L–1 (Fig. 3a). Concentrations higher than2 µg L–1 were detected in four sectors: in front of Uruguay;south of Samborombón Bay associated with the salinegradient previously mentioned (Fig. 2b); and in two locationsof the shelf between 50 and 100 m isobaths.
The distribution pattern of zooplankton biomass wassimilar to that of phytoplankton, with high values (>90mg DB m–3) in two stations of the estuarine frontal area(SI and SII, Fig. 2b) and in two locations of the shelf(Fig. 3b).
Cluster analysis
Three groups of stations were determined by cluster analysis,at 50% of the total distance (Fig. 4a). Spatial distribution ofsuch groups gave rise to the formation of coastal (CA),transitional (TA) and shelf (SA) faunistic areas (Fig. 7b).More than 50% of the stations were included in the CA. Inthis area, the temperature range was 10.47°–13.91°C andsalinity values fluctuated between 28.6 and 33.96, showingestuarine influence (CA; Fig. 4c). The station depthsaveraged 19.4 m. The TA had a temperature range similar tothe CA, but the salinity range was narrow with higher values(32.68–33.76). Mean depth was 54.6 m. Finally, in the SA,temperatures were minimal (7.43°–8.47°C) and salinity(33.66–33.82) and depth values (mean 79.7 m) weremaximal (Fig. 4c).
Taxonomic composition, abundance and size structure ofthe zooplankton in the three faunistic areas are presented inTable 1. Mesozooplankton smaller than 1 mm total length(TL) dominated the whole area. Copepods and cladoceransconstituted the bulk of this mesozooplankton fraction in theCA and TA. The more abundant species in both regions werethe cladocerans, Evadne nordmanni and Podon spp., and thecopepods, Paracalanus spp. and Oithona similis. In the SA,the copepod, O. similis, was the dominant species.
The 1–2 mm size class was largely dominated in the CAby the copepod, Acartia tonsa. With densities of less than1–2 orders of magnitude, this copepod was followed byappendicularians, members of Pseudocalanidae(Ctenocalanus vanus + Clausocalanus brevipes +Drepanopus forcipatus), anchovy eggs and decapod larvae.In the other areas, members of Pseudocalanidae were themost abundant components of this fraction.
Decapod larvae and chaetognaths composed themacrozooplankton (>2 mm TL) in the CA. Calanoidescarinatus and Calanus simillimus largely dominated thisfraction in the TA and SA respectively. Themistogaudichaudii and Euphausia lucens only occurred in the TAand SA.
57 56 55 54 53 52 51
Longitude (˚W)
39
38
37
36
35
34
Lati
tud
e (
˚S)
Chlorophyll-a(µg/l)
57 56 55 54 53 52 51
Longitude (˚W)
39
38
37
36
35
34
Lati
tud
e (˚
S)
Zooplankton biomass (mgDB /m3)
1 to 30
31 to 60
61 to 90
91 to 120
121 to 250
(b)
(a )
Fig. 3. Distribution of (a) chlorophyll a and (b) zooplanktonbiomass in the study area.

Anchovy spawning areas, zooplankton and hydrography 1035
Ecological preferences of the species
The relative abundance of the species in the faunistic areas isshown in Fig. 5. Four different ecological groups can beobserved.
(1) Coastal species (C) mostly composed by zooplanktersof small size like the copepods (Acartia tonsa,Euterpina acutifrons, Oithona nana), anchovy eggs,appendicularians and the cladocerans, Podon spp. andEvadne nordmanni. The copepod, Labidocerafluviatilis, the chaetognath, Sagitta friderici, andlamellibranch larvae were other components of thisgroup.
(2) Shelf species (S) composed by: the copepods,Drepanopus forcipatus, Calanus australis, Calanussimillimus, Oithona atlantica; the chaetognath,Sagitta tasmanica; the amphipod, Themistogaudichaudii; and the euphausiid, Euphausia lucens.
(3) Widely distributed species (W) mostly represented bythe copepods, Oithona similis, Clausocalanusbrevipes and Ctenocalanus vanus.
(4) Transition species (T), which comprised the copepods,Calanoides carinatus and Centropages brachiatus,and the chaetognath, Sagitta gazellae.
The relative importance of each ecological group differedbetween size assemblages. Thus, the smaller fraction of thezooplankton (<1 mm; Fig. 5) was clearly dominated bycoastal species, the 1–2 mm fraction included the fourdifferent ecological groups of species and themacrozooplankton fraction (>2 mm) was mostly comprisedof shelf species.
Analysis by sections
Changes in the distribution and abundance patterns of thespecies are clearly evident in the analysis by sections. In
Dis
tan
ce
0
50
100
150
200
250
37 45 46 31 38 22 47 39 33 14 12 32 9 35 26 24 21 34 48 11 19 7 15 4 42 41 2 16 6 25 18 1
SA TA CA
(b)
26 27 28 29 30 31 32 33 34 35
Salinity
8
9
10
11
12
13
14
15
16
Tem
pe
ratu
re(°
C)
26 27 28 29 30 31 32 33 34 35
Salinity
8
9
10
11
12
13
14
15
16
Te
mp
era
ture
(°C
)
26 27 28 29 30 31 32 33 34 35
Salinity
8
9
10
11
12
13
14
15
16Tem
pera
ture
(°C
)
TA
CA
SA
(a)D
ista
nce
58 56 54 52
38
36
9
1214
32
33
39
47
22
31
37
38
45
46
1
2
4
6
7
11
15
16
18
19
21
2425
26
34
35
4142
48
CA
TA
SA
(c)
Fig. 4. Results of the cluster analysis of stations with indication of (a) dendrogram with groups of stations, (b)localization of the station groups in faunistic areas and (c) temperature and salinity values corresponding to eachfaunistic area. SA, Shelf area; TA, transition area; and CA, coastal area.

1036 M. D. Viñas et al.
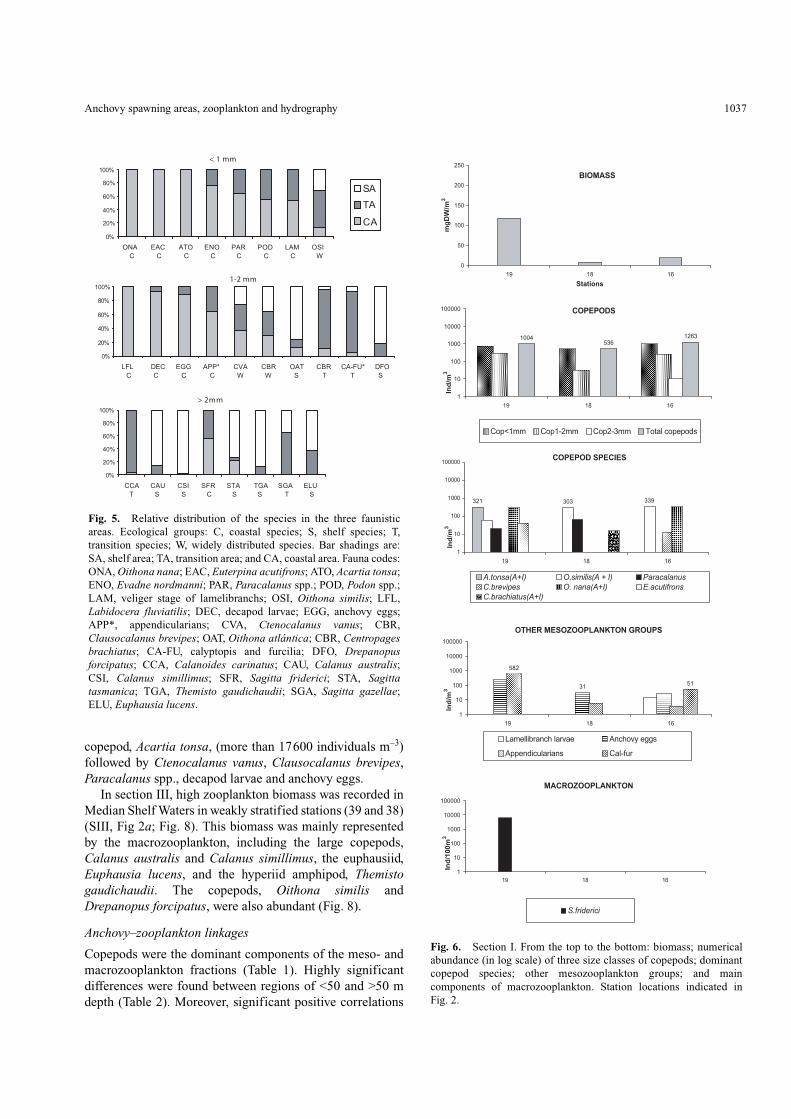
section I (Fig. 6), the three stations were included in the CA.The highest value of biomass (118 mg m–3) occurred in theCoastal Low-salinity Waters (station 19) in coincidence withmaximal density of chaetognaths (Sagitta friderici). Smallcopepods (<1 and 1–2) dominated the mesozooplankton inthe three stations. Among them, Acartia tonsa and Euterpinaacutifrons were only present in the innermost station;Paracalanus sp. was absent in the outer station (MedianShelf Waters), in which large copepod species, mostly
copepodites, occurred. Oithona similis was found in thethree stations. The abundance of appendicularians andanchovy eggs decreased from the coast toward the shelfbreak. Calyptopis and furcilia of euphausiids only occurredin the outermost station located in Median Shelf Waters.
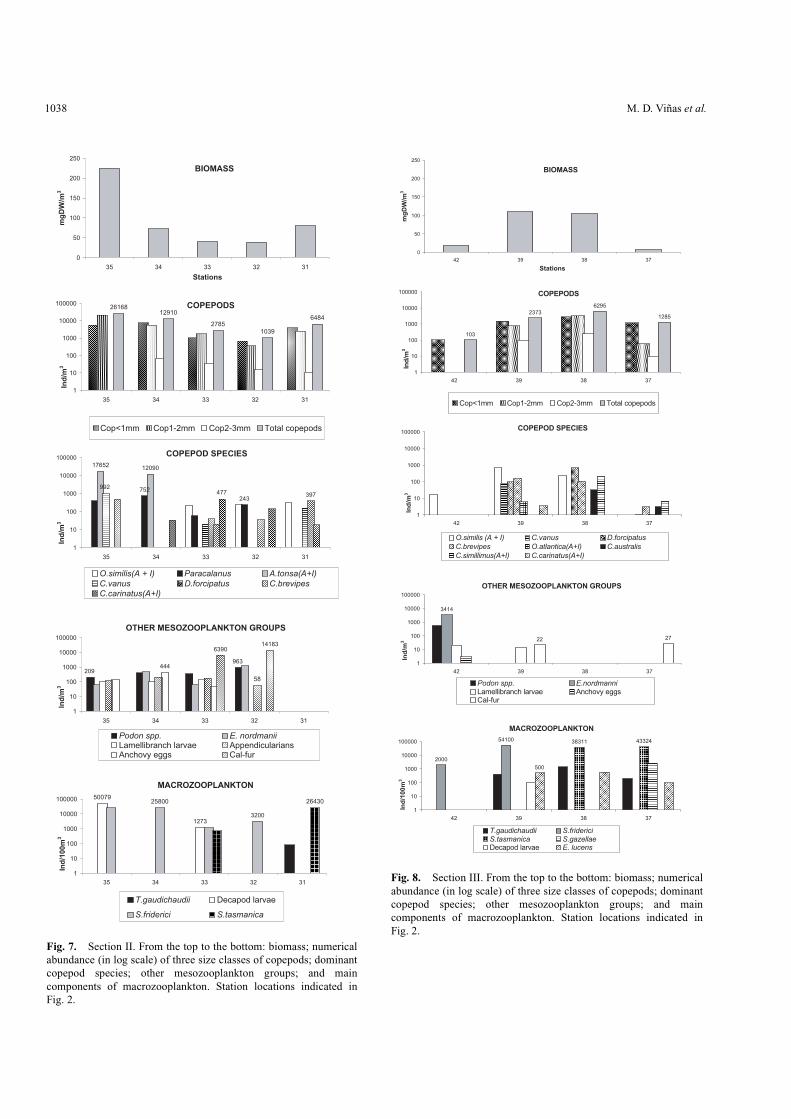
In section II, the maximal value of biomass occurred atstation 35 in Coastal Low-salinity Waters due to the highestdensities of meso- and macrozooplankton observed duringthe cruise (Fig. 7). The dominant component was largely the
Table 1. Taxonomic composition and abundance (individuals m–3) of the zooplankton in the coastal (CA), transition (TA) and shelf (SA) faunistic areas
*Adult and copepodite stages; **euphausiids; ***adult and juvenile stages; adults are without indication; sd, standard deviation
Taxa CA TA SAMean sd Mean sd Mean sd
Mesozooplankton < 1 mm 3953 5947 2925 1930 2752 1182Copepods * 1108 2023 1579 1031 2693 1218
Oithona similis * 0135 0140 0495 0333 0284 0239O. nana * 0054 0113 0000 0000 0000 0000Paracalanus spp. 0100 0201 0060 0091 0000 0000Euterpina acutifrons 0027 0092 0000 0000 0000 0000Calanoida copepodites 0377 1124 0699 0547 2207 1464
Cladocerans 1385 2939 0641 0831 0000 0000Evadne nordmanni 0995 2586 0316 0513 0000 0000Podon spp. 0411 0489 0325 0340 0000 0000
Appendicularians 0013 0039 0000 0000 0000 0000Calyptopis and furcilia ** 0002 0007 0023 0031 0005 0011Veliger stage of Lamelibranchs 0026 0041 0024 0057 0000 0000
Mesozooplankton 1-2 mm 1629 5100 0873 0596 1541 1241Copepods * 1465 4926 0785 0516 1540 1241
Centropages brachiatus * 0014 0018 0046 0065 0002 0004Labidocera fluviatilis * 0002 0008 0000 0000 0000 0000Acartia tonsa 1682 4866 0000 0000 0000 0000Ctenocalanus vanus 0064 0232 0069 0112 0045 0066Clausocalanus brevipes 0029 0117 0034 0057 0035 0043Drepanopus forcipatus 0011 0048 0061 0072 0274 0281Oithona atlantica * 0001 0004 0001 0002 0006 0008Calanoida copepodites 0139 0354 0475 0376 1038 0851
Anchovy eggs 0062 0111 0008 0019 0000 0000Appendicularians 0071 0150 0042 0065 0000 0000Calyptopis and furcilia ** 0001 0005 0038 0046 0000 0000Decapod larvae 0026 0115 0000 0000 0000 0000
Macrozooplankton > 2 mm 0080 0155 0066 0050 0101 0102Copepods * 0004 0015 0034 0034 0092 0091
Calanus australis 0001 0001 0001 0001 0007 0012C. simillimus 0000 0000 0001 0002 0076 0083Calanoides carinatus * 0004 0011 0115 0174 0000 0000Calanoida copepodites 0002 0007 0154 0168 0148 0110
Themisto gaudichaudii *** 0000 0000 0001 0002 0004 0005Chaetognaths 0022 0055 0002 0005 0001 0001Appendicularians 0007 0014 0018 0028 0000 0000
Euphausia lucens 0000 0000 0001 0002 0001 0003Mysids 0000 0000 0001 0001 0000 0000Decapod larvae 0027 0112 0002 0005 0000 0000Calyptopis and furcilia ** 0000 0000 0003 0006 0000 0000
Anchovy spawning areas, zooplankton and hydrography 1037
copepod, Acartia tonsa, (more than 17600 individuals m–3)followed by Ctenocalanus vanus, Clausocalanus brevipes,Paracalanus spp., decapod larvae and anchovy eggs.
In section III, high zooplankton biomass was recorded inMedian Shelf Waters in weakly stratified stations (39 and 38)(SIII, Fig 2a; Fig. 8). This biomass was mainly representedby the macrozooplankton, including the large copepods,Calanus australis and Calanus simillimus, the euphausiid,Euphausia lucens, and the hyperiid amphipod, Themistogaudichaudii. The copepods, Oithona similis andDrepanopus forcipatus, were also abundant (Fig. 8).
Anchovy–zooplankton linkages
Copepods were the dominant components of the meso- andmacrozooplankton fractions (Table 1). Highly significantdifferences were found between regions of <50 and >50 mdepth (Table 2). Moreover, significant positive correlations
< 1mm
< 1 mm
0%
20%
40%
60%
80%
100%
ONA
C
EAC
C
ATO
C
ENO
C
PAR
C
POD
C
LAM
C
OSI
W
SA
TA
CA
> 2mm
0%
20%
40%
60%
80%
100%
CCA
T
CAU
S
CSI
S
SFR
C
STA
S
TGA
S
SGA
T
ELU
S
1-2 mm
0%
20%
40%
60%
80%
100%
LFL
C
DEC
C
EGG
C
APP*
C
CVA
W
CBR
W
OAT
S
CBR
T
CA-FU*
T
DFO
S
Fig. 5. Relative distribution of the species in the three faunisticareas. Ecological groups: C, coastal species; S, shelf species; T,transition species; W, widely distributed species. Bar shadings are:SA, shelf area; TA, transition area; and CA, coastal area. Fauna codes:ONA, Oithona nana; EAC, Euterpina acutifrons; ATO, Acartia tonsa;ENO, Evadne nordmanni; PAR, Paracalanus spp.; POD, Podon spp.;LAM, veliger stage of lamelibranchs; OSI, Oithona similis; LFL,Labidocera fluviatilis; DEC, decapod larvae; EGG, anchovy eggs;APP*, appendicularians; CVA, Ctenocalanus vanus; CBR,Clausocalanus brevipes; OAT, Oithona atlántica; CBR, Centropagesbrachiatus; CA-FU, calyptopis and furcilia; DFO, Drepanopusforcipatus; CCA, Calanoides carinatus; CAU, Calanus australis;CSI, Calanus simillimus; SFR, Sagitta friderici; STA, Sagittatasmanica; TGA, Themisto gaudichaudii; SGA, Sagitta gazellae;ELU, Euphausia lucens.
COPEPODS
53612631004
1
10
100
1000
10000
100000
19 18 16
Ind
/m3
Cop<1mm Cop1-2mm Cop2-3mm Total copepods
OTHER MESOZOOPLANKTON GROUPS
31
582
51
1
10
100
1000
10000
100000
19 18 16
Ind
/m3
Lamellibranch larvae Anchovy eggs
Appendicularians Cal-fur
COPEPOD SPECIES
321 339303
1
10
100
1000
10000
100000
19 18 16
Ind
/m3
A.tonsa(A+I) O.similis(A + I) Paracalanus
C.brevipes O. nana(A+I) E.acutifrons
C.brachiatus(A+I)
MACROZOOPLANKTON
1
10
100
1000
10000
100000
19 18 16
Ind
/10
0m
3
S.friderici
BIOMASS
0
50
100
150
200
250
19 18 16
Stations
mg
DW
/m3
Fig. 6. Section I. From the top to the bottom: biomass; numericalabundance (in log scale) of three size classes of copepods; dominantcopepod species; other mesozooplankton groups; and maincomponents of macrozooplankton. Station locations indicated inFig. 2.
1038 M. D. Viñas et al.
COPEPODS
6484
1039
2785
1291026168
1
10
100
1000
10000
100000
35 34 33 32 31
Ind
/m3
Cop<1mm Cop1-2mm Cop2-3mm Total copepods
OTHER MESOZOOPLANKTON GROUPS
209
963
58
444
639014183
1
10
100
1000
10000
100000
35 34 33 32 31
Ind
/m3
Podon spp. E. nordmaniiLamellibranch larvae AppendiculariansAnchovy eggs Cal-fur
COPEPOD SPECIES
243
752
1209017652
477 397
992
1
10
100
1000
10000
100000
35 34 33 32 31
Ind
/m3
O.similis(A + I) Paracalanus A.tonsa(A+I)
C.vanus D.forcipatus C.brevipes
C.carinatus(A+I)
MACROZOOPLANKTON
1273
50079
3200
25800 26430
1
10
100
1000
10000
100000
35 34 33 32 31
Ind
/100m
3
T.gaudichaudii Decapod larvae
S.friderici S.tasmanica
BIOMASS
0
50
100
150
200
250
35 34 33 32 31
Stations
mg
DW
/m3
Fig. 7. Section II. From the top to the bottom: biomass; numericalabundance (in log scale) of three size classes of copepods; dominantcopepod species; other mesozooplankton groups; and maincomponents of macrozooplankton. Station locations indicated inFig. 2.
COPEPODS
103
2373
6295
1285
1
10
100
1000
10000
100000
42 39 38 37
Ind
/m3
Cop<1mm Cop1-2mm Cop2-3mm Total copepods
OTHER MESOZOOPLANKTON GROUPS
3414
2722
1
10
100
1000
10000
100000
42 39 38 37
Ind
/m3
Podon spp. E.nordmanniLamellibranch larvae Anchovy eggsCal-fur
COPEPOD SPECIES
1
10
100
1000
10000
100000
42 39 38 37
Ind
/m3
O.similis (A + I) C.vanus D.forcipatus
C.brevipes O.atlantica(A+I) C.australis
C.simillimus(A+I) C.carinatus(A+I)
MACROZOOPLANKTON
54100
2000
4332438311
500
1
10
100
1000
10000
100000
42 39 38 37
Ind
/10
0m
3
T.gaudichaudii S.fridericiS.tasmanica S.gazellaeDecapod larvae E. lucens
BIOMASS
0
50
100
150
200
250
42 39 38 37
Stations
mg
DW
/m3
Fig. 8. Section III. From the top to the bottom: biomass; numericalabundance (in log scale) of three size classes of copepods; dominantcopepod species; other mesozooplankton groups; and maincomponents of macrozooplankton. Station locations indicated inFig. 2.

Anchovy spawning areas, zooplankton and hydrography 1039
were also found between the abundance of anchovy eggs andthose of small- (F1,19, P < 0.00027) and medium-sized (F1,19,P < 0.00003) copepods (Fig. 9).
Discussion
Oceanographic conditions
During the cruise, no vertical stratification was observed inthe estuarine sector and the location of the frontal area wasindicated by the horizontal gradients of salinity in the mouthof the river. It is possible that the strong winds of 13 m s–1
from the SE and ESE (very frequent in the region) producedthe vertical mixing and disruption of water-columnstratification for a few days (Guerrero et al. 1997).
In the coastal sector, temperature values were lower thanthe historical means and salinity values were higher. Theposition of the isohaline of 30, considered as the outer limitof the estuarine system (Guerrero 1998), indicated adecrease in river runoff. Consequently, a greater volume ofcolder and more saline waters was present in the coastal area.
The faunistic areas
The detection of three faunistic areas (coastal, transition andshelf) is in general agreement with previous observations inthe same study area (Fernández Aráoz et al. 1991, 1994) orclose to it (Santos and Ramírez 1991). However, the presentstudy included a higher number of zooplankton taxa andcovered the coastal area (<50 m depth) more intensively thanprevious reports, resulting in a better definition of thezooplankton assemblages inhabiting this sector. On the otherhand, neither the outer shelf nor the shelf-break areas, wellsampled in previous works, were covered in the presentpaper.
1. Coastal area
Adults and development stages of small copepod species(i.e. Acartia tonsa, Paracalanus spp. Oithona nana etc.)dominated the coastal areas. These species, known to bepredominantly omnivorous (Mauchline 1998 and referencestherein; Paffenhöfer 1993), are able to reproduce atmaximum rates independent of phytoplankton availability.They act as strong filters of environmental variability inenergy transfer to higher levels of the food chain (Runge1988).
The dominance of small copepod species inhomogeneous coastal waters, a common finding in theArgentine Sea up to 47°S (Ramírez 1981; Santos andRamírez 1991; Fernández Aráoz et al. 1994; Viñas et al.1992), is also found in various regions of Europe (Williamset al. 1994).
Cladocerans also occurred exclusively in coastal waters,with the highest abundance associated with 10–13°Ctemperature ranges and salinity over 33. Such temperatureconditions were within the optimum reported for the species,Pleopis polyphemoides and Evadne nordmanni, by Ramírezand Pérez Seijas (1985) in coastal waters off Buenos Airesprovince.
Within the coastal area, only the outer boundary of theestuarine frontal system was sampled in the present study.Highest values of chlorophyll a were observed in the frontalarea in accordance with previous findings (Carreto et al.1986). High concentrations of zooplankton were alsodetected in such areas (stations 19, 34 and 35). Theaggregation of zooplankton, ichthyoplankton and fish is arecurrent feature at this front (Hansen and Madirolas 1996;Lasta and Acha 1996; Madirolas et al. 1997). This commonfeature of estuarine fronts is caused by convergence, mixingand local upwelling phenomena. Discontinuities of this kind
(a )
ln y = -1.62 + 0.77 * ln xr = 0.71
0
1
2
3
4
5
6
7
0 2 4 6 8 10 12
Copepo ds < 1mm (ln in d. m -3 )
(b)
ln y = 1.06 + 0.45 * ln xr = 0.77
0
1
2
3
4
5
6
7
0 2 4 6 8 10 12
Copepods 1-2 mm (l n ind. +1 m-3 )
Anc
hovy
egg
s (ln
ind.
m
)-3
Anc
hovy
egg
s (ln
ind.
m
)-3
Table 2. Comparison between the abundance (individuals m–3) of three size classes of copepods in <50 and >50 m depth
sd, Standard deviation; CV, coefficient of variation
<1 mm 1–2 mm >2 mm<50 m >50 m <50 m >50 m <50 m >50 m
Mean 1096 2322 1490 1149 006 067sd 1921 1183 4669 1010 016 075CV (%) 0175 0051 0313 0088 260 111
Fig. 9. Relationship between the abundance of anchovy eggs andthe abundance of copepods in (a) the size range <1 mm and (b) 1–2mm total length.
1040 M. D. Viñas et al.
have a high frequency of recurrence and play an importantrole in the local trophic network by aggregating prey andpredator (Runge and Simard 1990).
Acartia tonsa largely dominated the mesozooplankton inthe estuarine area, with extremely high densities in the salinefront south of Samborombón Bay. Within the estuary, highconcentrations of the species have been found at the head ofthe salt wedge in Samborombón Bay and in the outermixohaline region (Mianzan et al. 2001). The dominance ofA. tonsa in the estuarine area is associated with its capabilityto feed, even in highly turbid waters, where it can consumeapproximately 152% of its body carbon per day, includingdetritus (Tester and Turner 1989).
The appendicularians, known to feed mainly onnanoplankton and bacterioplankton (King et al. 1980), wereamong the most abundant groups in the estuarine area. Theymay, in some instances, ingest 100% of their weight ofbacterioplankton (King et al. 1980) and transferbacterioplankton carbon via their bodies to juvenile fish andto grazers of large particles via their houses (Alldredge1972). The high densities of appendicularians recorded inthe coastal region constitute an important food resource foranchovy during the reproductive period (Capitanio et al.1997).
South of 37ºS, the lowest phytoplankton biomass (about1 µg L–1 chlorophyll a) was recorded. In this sector, theriverine influence becomes minimal and mixing produced bywinds and tides causes vertically homogeneous watersduring the whole year. The amplitude of variation ofchlorophyll a biomass is small, with the highestconcentrations occurring in spring (2–4 mg m–3; Carretoet al. 1995). Our chlorophyll a values were lower than thosereported by these authors, possibly because of the lowertemperature recorded in our study and the consequent delayof the seasonal phytoplankton bloom.
Consistent with the pattern of chlorophyll a distribution,zooplankton biomass had a mean of 29.6 mg DB m–3
(s.e. = 14.67) in this sector, lower than values recorded in thefrontal area (mean 158.2 mg DB m–3 s.e. = 62.50) and in themedian-shelf (mean 78.2 mg DB m–3 s.e. = 10.50) sectors.
2. The shelf area
The shelf area was poorly represented in this cruise andalmost all samples were from south of 37°S. In this latitude,the mixed coastal waters are separated from the stratifiedshelf waters by a coastal front (Carreto et al. 1995). Thetypical development and break down cycle of the seasonalthermocline characterize the shelf system (Carreto et al.1986, 1995). The beginning of the phytoplanktonicproduction in spring is associated with the start of the surfacewarming of the water column and nutrient supply bysub-Antarctic waters. Nitrate concentrations are higher thanin the coastal system (Carreto et al. 1995). In the presentstudy, the beginning of the seasonal stratification of the
water column was observed in some stations of the medianshelf. In these locations, the chlorophyll a values wereamong the highest of the cruise. However, phytoplanktonbiomass was lower than those reported by Carreto et al.(1995), as explained previously.
South of 37°30′, out of the estuarine influence,zooplankton biomass increased from the coast to the shelf ingeneral agreement with the pattern described for the region(Carreto et al. 1981; Perrotta et al. 2001). Highest mean sizeof the zooplankton was recorded in the shelf sector as aconsequence of the occurrence of relatively higher densitiesof macrozooplankton species (i.e. Themisto gaudichaudii,Euphausia lucens and large calanoid copepods of the genusCalanus). Fernández Aráoz et al. (1991, 1994) and Ramírezand Santos (1994) also noticed this in the study area duringspring–summer. Themisto gaudichaudii largely dominatesthe amphipods of the Argentine Sea (Ramírez and Viñas1985). Highest densities of this species have been recordedin the colder shelf waters (Fernández Aráoz et al. 1991),which is in agreement with the present results.
Euphausia lucens is the most widely distributedeuphausiid species in the Argentine shelf, especially insub-Antarctic waters at temperatures of 4–8°C (Ramírez1971). These water masses were not sampled in our study,but the abundance of E. lucens increased in progressivelycolder waters from the coast toward the shelf.
The copepods in the genus Calanus are mostly herbivores(Mauchline 1998) and their life history appears to be wellsuited for effective utilization of the seasonal phytoplanktonproduction in temperate oceans (Runge 1985). In shelfwaters, Calanus australis and C. simillimus would be actingas a key intermediary link between primary production andfish production. They are the most important prey foranchovy (Pájaro 1998; Tresguerres et al. 2001) in this sector.
Thus, the shelf system seems to be characterized by aclassical food web type (diatoms-copepods-fish; sensuCushing 1989) to which other components, such asEuphausia lucens (herbivorous) and Themisto gaudichaudii(carnivorous), are added. Accordingly, the zooplanktoncommunities of the stratified shelf waters from severalregions of Europe are dominated by a few species of largeherbivorous copepods (i.e. Calanus spp.) and euphausiids(Williams et al. 1994). Those crustaceans are considered totransfer the production of the spring diatom bloom directly tothe fish populations (Cushing 1989; Runge 1988).
3. The transition area
The transition area constituted a narrow band on the 50 misobath. It is the area in which the seasonal coastal frontseparates coastal mixed waters from thermally stratifiedshelf waters (Carreto et al. 1995).
A high number of herbivorous zooplankton, such ascopepodites of Calanoida, adults and copepodites ofCalanoides carinatus, adults of Ctenocalanus vanus,

Anchovy spawning areas, zooplankton and hydrography 1041
euphausiids and appendicularians, were recorded in thisarea. Calanoides carinatus was the most abundant species.In the Argentine Sea, the distribution of this copepod hasbeen associated to other frontal systems: the tidal front offPeninsula Valdés (Viñas et al. 1992; Santos and Ramírez1995) and the upwelled waters of the coastal front (Santosand Ramírez 1991; Ramírez and Sabatini 2000).
The life strategy of this species, which has the most rapiddevelopment rate of any copepod species studied to date(Peterson and Painting 1990), is adapted to take advantage ofthe highly variable environmental systems in which itinhabits, i.e. the upwelling off Cabo Frío, Brazil (Valentin etal. 1987) and Benguela, South Africa (Peterson and Painting1990).
Physical oceanography and links between zooplankton and anchovy
In this study, anchovy egg abundance was positivelycorrelated with the abundance of small copepod species. Thelatter usually dominate in coastal waters and produce eggsand nauplii in the optimum size range of prey forfirst-feeding anchovy larvae (Viñas and Ramírez 1996).They are capable of maintaining similar interannual densities(Mazzocchi and Ribera d’Alcalá 1995).
Aggregations of small copepod species were associatedwith saline discontinuities of the estuarine front. It may bethat high concentrations of chlorophyll a andbacterioplankton (>7 × 10³ CFU mL–1 of total bacteria;M. Costagliola and V. Jurquiza, personal communication)observed in these sectors allow these copepods to reproduceat high rates, producing high densities of larval prey (eggsand nauplii) for first-feeding fish. It has been suggested thatthe production of planktivorous fish, as well as growth andsurvival of fish larvae (and thus, fisheries recruitment),depend primarily on mesozooplankton production atspatio-temporal oceanographic discontinuities (Kiørboe1991; Mann 1993). The high frequency of temporal andspatial occurrence of discontinuities in the estuarine frontalarea may improve the anchovy larval survival, as observed inother pelagic fishes (Kiørboe 1991).
In addition to copepod nauplii, a high incidence of ciliates(tintinnids) has been observed in food contents of anchovylarvae caught in this region (Scarlato 1990). Populations ofciliates are also abundant all year in the CA, with higherpulses in spring (R. Akselman, personal communication).These protozoa, which also constitute an important prey forcopepods (i.e. Acartia tonsa, Pierce and Turner 1992),directly or indirectly generate a food source for larvae incoastal waters.
On the other hand, in this latitude, the inshore direction ofthe Eckman transport (Bakun and Parrish 1991) wouldcontribute to the retention of anchovy larvae in the CA. Latestages (post-larvae and juveniles) also remain within the areato grow (Angelescu 1982).
Based on the present findings and regional literatureconcerning the feeding ecology of the species (Angelescu1982; Schwingel and Castello 1994; Capitanio et al. 1997;Pájaro 1998; Tresguerres et al. 2001), we can postulate thatduring the spawning period, adult anchovy adopt twocomplementary feeding strategies according to thezooplankton characteristics. In the CA, fish ingest byfiltration small-sized food, such as copepods, cladoceransand appendicularians, and benefit from the patchydistribution of these prey items in the estuarine front. In TAand SA, anchovies ingest larger prey, richer in lipids, likecalanoid copepods, amphipods and euphausiids thatcontribute to recovering energy expended in reproduction.
Acknowledgments
We are grateful to Dr Jorge Hansen, Director of the AnchovyProject of INIDEP, for his support during the elaboration ofthis work. We gratefully acknowledge the collaboration ofAux. Ing. Daniel Cucchi Colleoni for chl a determinationsand Dr Cristina Daponte for chaetognath identification.
References
Alldredge, A. L. (1972). Abandoned larvacean houses: a unique foodsource in the pelagic environment. Science 177, 885–7.
Angelescu, V. (1982). ‘Ecología Trófica de la Anchoíta del MarArgentino (Engraulidae, Engraulis anchoíta). Parte II.Alimentación, Comportamiento y Relaciones Tróficas en elEcosistema.’ Serie Contribuciones 409, INIDEP. (Instituto Nacionalde Investigación y Desarrollo Pesquero: Mar del Plata, Argentina.)
Bakun, A., and Parrish, R. H. (1991). Comparative studies of coastalpelagic fish reproductive habitats: the anchovy (Engraulis anchoita)of the southwestern Atlantic. ICES Journal of Marine Sciences 48,343–61.
Capitanio, F. L., Pájaro, M., and Esnal, G. B. (1997). Appendicularians(Chordata: Tunicata) in the diet of anchovy (Engraulis anchoita) inthe Argentine Sea. Scientia Marina 61, 9–15.
Carreto, J. I., Ramírez, F., and Dato, C. (1981). Zooplancton yproducción secundaria. Parte II. Distribución y variación estacionalde la biomasa zooplanctónica. In ‘Campañas de InvestigaciónPesquera realizadas en el Mar Argentino por los B/I ‘Shinkai Maru’y ‘Walther Herwig’ y el B/I ‘Marburg’, años 1978 y 1979.Resultados de la Parte Argentina’. Serie Contribuciones 383,INIDEP. (Instituto Nacional de Investigación y DesarrolloPesquero: Mar del Plata, Argentina.)
Carreto, J. I., Negri, R. M., and Benavídes, H. R. (1986). Algunascaracterísticas del florecimiento del fitoplancton en el frente del Ríode la Plata. I: Los sistemas nutritivos. Revista de Investigación yDesarrollo Pesquero de INIDEP, Mar del Plata, Argentina 5, 7–29.
Carreto, J. I., Lutz, V., Carignan, M., Cucchi Colleoni, A. D., and DeMarco, S. (1995). Hydrography and chlorophyll a in a transect fromthe coast to the shelf-break in the Argentinean Sea. ContinentalShelf Research 15, 315–36.
Ciechomski, J. D. (1967). Investigations on food and feeding habits oflarvae and juveniles of the Argentine anchovy Engraulis anchoita.California Cooperative Oceanic Fisheries Investigations Report 11,72–81.
Cushing, D. H. (1989). A difference in structure between ecosystems instrongly stratified and in those weakly stratified. Journal ofPlankton Research 11, 1–13.

1042 M. D. Viñas et al.
Fernández Aráoz, N. C, Pérez Seijas, G. M., Viñas, M. D., and Reta, R.(1991). Asociaciones zooplanctónicas de la Zona Común de Pescaargentino-uruguaya en relación con parámetros ambientales.Primavera 1986. Frente Marítimo, Montevideo, Uruguay 8, 85–99.
Fernández Aráoz, N. C., Santos, B. A., and Ramírez, F. C. (1994).Análisis ecológico de la distribución de los copépodos planctónicos,de una campaña de primavera, en la Zona Común de Pesca, FrenteMarítimo, Montevideo, Uruguay 15, 133–40.
Framiñan, M. B., Etala, M., Acha, E. M., Guerrero, R. A., Lasta, C. A.,Brown, O. B. (1999). Physical characteristics and processes of theRío de la Plata estuary. In ‘Estuaries of South America, TheirGeomorphology and Dynamics’. (Eds G. M. Perillo, M. C. Piccoloand M. Pino-Quivira.) pp. 161–91. (Springer Verlag: New York,USA.)
Guerrero, R. A. (1998). Oceanografía física del estuario del Río de laPlata y el sistema costero de El Rincón. Noviembre 1994. INIDEPInformes Técnicos 21. pp. 29–54. (Instituto Nacional deInvestigación y Desarrollo Pesquero: Mar del Plata, Argentina.)
Guerrero, R. A., and Piola, A. R. (1997). Masas de agua en laplataforma continental. In ‘El Mar Argentino y sus RecursosPesqueros’. Vol. 1. (Ed. E. Boschi.) pp. 107–18. (Instituto Nacionalde Investigación y Desarrollo Pesquero: Mar del Plata, Argentina.)
Guerrero, R. A., Acha, E. M. Framiñan, M. B., and Lasta, C. A. (1997).Physical oceanography of the Río de la Plata Estuary, Argentina.Continental Shelf Research 17, 727–42.
Hansen, J. E., and Madirolas, A. (1996). Distribución, evaluaciónacústica y estructura poblacional de la anchoíta. Resultados de lascampañas del año 1993. Revista de Investigación y DesarrolloPesquero, Mar del Plata, Argentina 10, 5–21.
Holm-Hansen, O., Lorensen, C. J., Holmes, R. W., and Strickland, J. D.H. (1965). Fluorometric determination of chlorophyll. Journal duconseil permanent international pour la Exploration de la Mer 30,3–15.
Johnson, R. A., and Wichern, D. W. (1998). ‘Applied MultivariateStatistical Analysis.’ (Prentice Hall: New Jersey, USA.)
King, K. R., Hollibaugh, J. T., and Azam, F. (1980). Predator-preyinteractions between the larvacean O. dioica and bacterioplanktonin enclosed water columns. Marine Biology 56, 49–57.
Kiørboe, T. (1991). Pelagic fisheries and spatio-temporal variability inzooplankton productivity. In ‘Proceedings of the FourthInternational Conference on Copepoda’. Bulletin Plankton SocietyJapan, Special Volume. pp. 229–49.
Lasta, C., and Acha, E. M. (1996). Cabo San Antonio: Su importanciaen el patrón reproductivo de peces marinos. Frente Marítimo,Montevideo, Uruguay 16, 3–45.
Madirolas, A., Acha, E. M. Guerrero, R. A., and Lasta, C. (1997).Sources of acoustic scattering near a halocline in an estuarinefrontal system. Scientia Marina 61, 431–8.
Mann, K. H. (1993). Physical oceanography, food chains, and fishstocks: a review. ICES Journal of Marine Science 50, 105–19.
Martos, P., and Piccolo, M. C. (1988). Hydrography of the argentinecontinental shelf between 38° and 42°S. Continental Shelf Research8, 1043–56.
Mauchline, J. (1998). ‘The Biology of Calanoid Copepods. Advances inMarine Biology. Vol. 33.’ (Eds J. H. S. Blaxter, A. J. Southward andP. A. Tyler.) (Academic Press: San Diego, USA.)
Mazzocchi, M. G., and Ribera d´Alcalá, M. (1995). Recurrent patternsin zooplankton structure and succession in a variable coastalenvironment. ICES Journal of Marine Science 52, 679–91.
Mianzan, H. W., Lasta, C., Acha, M., Guerrero, R., Macchi, G., andBremec, C. (2001). The Río de la Plata Estuary, Argentina-Uruguay.In ‘Coastal Marine Ecosystems of Latin America, EcologicalStudies’. (Eds U. Seeliger and B. Kherfve.) pp. 185–204.(Springer-Verlag: Berlin, Germany.)
Negri, R. M., Benavides, H. R., and Carreto, J. I. (1988). Algunascaracterísticas del florecimiento del fitoplancton en el frente del Ríode la Plata. II: Las asociaciones fitoplanctónicas. PublicaciónComisión Técnica Mixta del Frente Marítimo, Montevideo,Uruguay 4, 151–61.
Omori, M. (1969). Weight and chemical composition of someimportant oceanic zooplankton in the North Pacific Ocean. MarineBiology 3, 4–10.
Paffenhöfer, G. A. (1993). On the ecology of marine cyclopoidcopepods (Crustacea, Copepoda). Journal of Plankton Research 15,37–55.
Pájaro, M. (1998). ‘El Canibalismo Como Mecanismo ReguladorDenso-dependiente de Mortalidad Natural en la Anchoíta Argentina(Engraulis anchoita). Su Relación con las EstrategiasReproductivas de la Especie.’ Unpublished Doctoral Thesis.(Universidad Nacional de Mar del Plata: Mar del Plata, Argentina.)
Perrotta, R. G., Viñas, M. D., Hernández, D. R., and Tringali, L. S.(2001). Temperature conditions in the Argentine chub mackerel(Scomber japonicus) fishing ground: implications for fisherymanagement. Fisheries Oceanography 10, 275–83.
Peterson, W. T., and Painting, S. J. (1990). Development rates of thecopepods Calanus australis and Calanoides carinatus in thelaboratory, with discussion of methods used for calculation ofdevelopment time. Journal of Plankton Research 12, 283–93.
Pierce, R. W., and Turner, J. T. (1992). Ecology of planktonic ciliates inmarine food webs. Reviews in Aquatic Sciences 6, 139–81.
Ramírez, F. C. (1971). Eufáusidos de algunos sectores del AtlánticoSudoccidental. Physis, Bueno Aries 30, 385–405.
Ramírez, F. C. (1981). Zooplancton y producción secundaria. Parte I:Variación y distribución estacional de los copépodos. Contribucióndel Instituto Nacional de Investigación y Desarrollo Pesquero 383,202–12.
Ramírez, F. C., and Pérez Seijas, G. M. (1985). New data on theecological distribution of cladocerans and first local observationson reproduction of Evadne nordmanni and Podon intermedius(Crustacea, Cladocera) in Argentine Sea waters. Physis, BuenosAires 43, 131–43.
Ramírez, F. C., and Sabatini, M. E. (2000). The occurrence of Calanidaespecies in waters off Argentina. Hydrobiologia 439, 21–42.
Ramírez, F. C., and Santos, B. A. (1994). Análisis del zooplancton de laplataforma bonaerense en relación con algunas variablesambientales. Campañas ‘Transección’ de 1987. Frente Marítimo,Montevideo, Uruguay 15, 141–56.
Ramírez, F. C., and Viñas, M. D. (1985). Hyperiid amphipods found inArgentine shelf waters. Physis, 43, 25–37.
Runge, J. A. (1985) Relationship of egg production of Calanuspacificus to seasonal changes in phytoplankton availability inPuget Sound, Washington. Limnology and Oceanography 30,382–96.
Runge, J. A. (1988). Should we expect a relationship between primaryproduction and fisheries? The role of copepod dynamics as a filterof trophic variability. Hydrobiologia 167/168, 61–71.
Runge, J. A., and Simard, Y. (1990). Zooplankton of the St. LawrenceEstuary: the imprint of physical processes on its composition anddistribution. In ‘Oceanography of a Large-scale Estuarine System.The St. Lawrence’. (Eds M. I. El-Sabh and N. Silverberg.) Coastaland Estuarine Studies 39. pp. 297–320. (Springer-Verlag: NewYork, USA.)
Sánchez, R. P., and Ciechomski, J. D. (1995). Spawning and nurserygrounds of pelagic fish species in the sea-shelf off Argentina andadjacent areas. Scientia Marina 59, 455–78.
Santos, B. A., and Ramírez, F. C. (1991). Variación estacional de lasasociaciones de copépodos en una transecta de la plataformaArgentina. Boletim Instituto Oceanografico São Paulo 39 71–86.

Anchovy spawning areas, zooplankton and hydrography 1043
http://www.publish.csiro.au/journals/mfr
Santos, B. A., and Ramírez, F. C. (1995). Distribución y abundancia decopépodos en el sistema frontal de Península Valdés duranteflorecimientos fitoplanctónicos. Thalassas 11, 133–42.
Scarlato, N. A. (1990). ‘Algunos Aspectos de la Ecología Trófica de lasLarvas de Primera Alimentación de Engraulis anchoita (Hubbs;Marini) (Pisces, Engraulidae) en los Distintos Ecosistemas Marinosde la Provincia de Buenos Aires.’ Tesis de grado Licenciatura enCiencias Biológicas. (Universidad Nacional de Mar del Plata:Argentina.)
Schwingel, R. P., and Castello, J. P. (1994). Alimentación de la anchoíta(Engraulis anchoita) en el sur de Brasil. Frente Marítimo,Montevideo, Uruguay 15, 67–85.
Tester, P. A., and Turner, J. T. (1989) Zooplankton feeding ecology:feeding rates of the copepods Acartia tonsa, Centropages velificatusand Eucalanus pileatus in relation to the suspended sediments in theplume of the Mississippi River (Northern Gulf of Mexicocontinental shelf). Scientia Marina 53, 231–7.
Thomsen, H. (1962). ‘Masas de Agua Características del OcéanoAtlántico.’ (Servicio de Hidrografía Naval 632: Buenos Aires,Argentina.)
Tresguerres, M., Curelovich, J., and Pájaro, M. (2001) Alimentación dela población bonaerense de anchoíta argentina (Engraulis anchoita),durante la época de puesta, primavera de 1999. Estimación de lamortalidad embrionaria por canibalismo. In ‘ResúmenesAmpliados IX Colacmar, San Andrés Isla, Colombia’. CDROMnumber 076. (Universidad Nacional de Colombia, Instituto deEstudios Caribeños: San Andrés, Colombia.)
Valentín, J. L., Monteiro-Ribas, W. M., Mureb, M. A., and Pessotti, E.(1987). Sur quelques zooplanctontes abondants dans l´upwelling decabo Frío (Brésil). Journal of Plankton Research 9, 1195–216.
Viñas, M. D., and Ramírez, F. C. (1996). Gut analysis of first-feedinganchovy larvae from Patagonian spawning area in relation to foodavailability. Archive of Fishery and Marine Research 43, 231–56.
Viñas, M. D., Ramírez, F. C., Santos, B. A., and Pérez Seijas, G. M.(1992). Zooplancton distribuído en el área de desove y de crianzanorpatagónica de la merluza (Merluccius hubbsi). Frente Marítimo,Montevideo, Uruguay 11, 105–13.
Williams, R., Conway, D. V. P., and Hunt, H. G. (1994). The role ofcopepods in the planktonic ecosystems of mixed and stratifiedwaters of the European shelf seas. Hydrobiologia 292/293, 521–30.
Zar, J. H. (1996). ‘Biostatistical Analysis.’ Third Edition. (PrenticeHall: New Jersey, USA.)
Manuscript received 9 August 2001; revised and accepted 10 April 2002