Year-round energy dynamics of sardine and anchovy in the ...
35
1 2 Year-round energy dynamics of sardine and anchovy in the north-western 3 Mediterranean Sea 4 5 Marta Albo-Puigserver 1* , Sonia SÆnchez 2 , Marta Coll 1 , Miguel Bernal 3 , Raquel SÆez- 6 Liante 1 , Joan Navarro 1 , Isabel Palomera 1 7 8 1 Institut de CiLncies del Mar (ICM-CSIC), 08003 Barcelona, Spain 9 2 School of Biological Sciences, Monash University, Clayton, Victoria 3800, Australia 10 3 Centro OceanogrÆfico de CÆdiz, Instituto Espaæol de Oceanografa, 11006 CÆdiz, 11 Spain 12 13 Running Title: Energetic dynamics of sardine and anchovy 14 15 *Corresponding author: [email protected] 16 17
-
Upload
khangminh22 -
Category
Documents
-
view
0 -
download
0
Transcript of Year-round energy dynamics of sardine and anchovy in the ...
1
2
Year-round energy dynamics of sardine and anchovy in the north-western 3
Mediterranean Sea 4
5
Marta Albo-Puigserver1*, Sonia Sánchez2, Marta Coll1, Miguel Bernal3, Raquel Sáez-6
Liante1, Joan Navarro1, Isabel Palomera1 7
8
1Institut de Ciències del Mar (ICM-CSIC), 08003 Barcelona, Spain 9
2School of Biological Sciences, Monash University, Clayton, Victoria 3800, Australia 10
3Centro Oceanográfico de Cádiz, Instituto Español de Oceanografía, 11006 Cádiz, 11
Spain 12
13
Running Title: Energetic dynamics of sardine and anchovy 14
15
*Corresponding author: [email protected]
17

Abstract 18
Variability in body condition and energy storage has important implications for fish 19
recruitment and ecosystem structure. Understanding strategies for energy allocation to 20
maintenance, reproduction and growth is essential to evaluate the state of the fish 21
stocks. In this study, we address the energetics dynamics of the annual cycle of 22
anchovies (Engraulis encrasicolus) and sardines (Sardina pilchardus) in the north-23
western Mediterranean Sea using indirect and direct condition indices. We assessed and 24
validated the use of morphometric, biochemical and energetic indices for both species. 25
Annual patterns of the relative condition index (Kn), gonadosomatic index (GSI), lipid 26
content (% lipids) and energy density (ED) were linked to the energy allocation 27
strategy. Our results highlight that anchovy mainly rely on income energy to reproduce, 28
while sardine accumulate the energy during the resting period to be used in the 29
reproduction period. Consequently, variability in the lipid content and ED between 30
seasons was lower in anchovy than in sardine. In both species, we observed an early 31
decline in energy reserves in late summer-early fall, which may be related to 32
unfavourable environmental conditions during spring and summer. Regarding the use of 33
different condition indices, both direct indices, lipid content and ED, were highly 34
correlated with Kn for sardine. ED was better correlated with Kn than lipid content for 35
anchovy. For the first time, a relationship between ED of gonads and GSI for sardine 36
and anchovy was provided, highlighting the importance of the energy invested in 37
reproduction. This work provides new insights into the energy dynamics of sardine and 38
anchovy. We also demonstrate which are the most suitable indices to measure changes 39
in the physiological condition of both species, providing tools for the future monitoring 40
of the populations of these two commercially and ecologically important fish species. 41
42

Key-words: anchovy, sardine, capital breeder, income breeder, condition, energy 43
allocation, energy density, lipids. 44
1. Introduction 45
Small pelagic fish are a key component of pelagic ecosystems and support important 46
fisheries worldwide (Cury et al., 2000; FAO, 2018). Their significant biomass at mid-47
trophic levels makes these forage fish a main prey for numerous marine predators, thus 48
playing a major role in energy transfer from lower to higher trophic levels (Bakun, 49
1996; Cury et al., 2011). The two most important small pelagic fish in the 50
Mediterranean Sea, in terms of biomass and commercial interest, are European anchovy 51
(Engraulis encrasicolus, hereafter anchovy) and European pilchard (Sardina 52
pilchardus, hereafter sardine) (Palomera et al., 2007). However, in recent decades, 53
important changes in abundance, landings and biological features (such as growth and 54
body condition) have been reported for both species in the north-western Mediterranean 55
Sea (Brosset et al., 2017; Quattrocchi and Maynou, 2017). These changes have been 56
partially attributed to variations in particular oceanographic parameters and increases in 57
fishing pressure (Brosset et al., 2017; Coll et al., 2019; Saraux et al., 2019; Van Beveren 58
et al., 2014). 59
Previous studies have highlighted that the decline in body condition of sardine and 60
anchovy observed in the last decade in the Mediterranean Sea may have long-lasting 61
negative effects on their populations (Brosset et al., 2017). Therefore, understanding 62
how these species allocate their energetic resources over the year is fundamental to 63
predict the responses of small pelagic fish to environmental variability and changes, as 64
well as the ultimate effects on marine food webs. These factors hold direct informative 65
value for the management of marine resources and ecosystems. 66

Marine organisms have developed several strategies for energy acquisition and 67
allocation to reproduction related to the annual and seasonal fluctuation of the pelagic 68
marine environment. The classical division of these strategies is made between capital 69
and income breeders (Drent and Daan, 1980; Stearns, 1989). In capital breeders, the 70
primary energy source for reproduction comes from reserves stored prior to the 71
spawning season, while in income breeders, reproduction is fully supplied by concurrent 72
energy intake, i.e. current feeding. In practice, life-history strategies are represented 73
along the whole continuum of these two extremes (McBride et al., 2015). 74
According to previous studies in the Mediterranean Sea, anchovy, which spawns in 75
spring and summer, seems to mainly be an income breeder (Brosset et al., 2015b; 76
Pethybridge et al., 2014; Somarakis, 2005; Somarakis et al., 2004), while sardine, which 77
spawns in fall and winter, seems to mainly be a capital breeder (Ganias, 2009; Ganias et 78
al., 2007; Mustać and Sinovčić, 2009; Pethybridge et al., 2014). In the northwestern 79
Mediterranean Sea, seasonal variability in lipid and energy density has been described 80
in sardine and anchovy with both species presenting higher values in spring and summer 81
(Albo-Puigserver et al., 2017; Brosset et al., 2015a; 2015b; Pethybridge et al., 2014). 82
However, the different breeding strategies lead to a higher energy content and higher 83
seasonal variability in sardine than in anchovy (Albo-Puigserver et al. 2017; Brosset et 84
al., 2015b). Due to their different strategies of energy allocation to growth, reproduction 85
and maintenance, and their opposite reproduction periods, it is plausible to expect that 86
the two species will have different ecological responses to environmental change 87
currently underway in the Mediterranean Sea, such as an increase in sea surface 88
temperature and changes in primary productivity (Giorgi, 2006; Hoegh-Guldberg et al., 89
2018; Oliver et al., 2018; Piroddi et al., 2017). Yet, it is not well known how these 90
changes affect energy acquisition and allocation in anchovy and sardine populations, 91
ultimately affecting their reproduction and growth (Nunes et al., 2011). Brosset et al., 92
(2015b) found a change in the annual peak of sardine’s condition in the Gulf of Lions, 93
which shifted from the beginning of autumn between 1971 and1978, to the beginning of 94
summer between 1993 and 2013. The authors hypothesized that this change could be 95
related to a lower quality or quantity of food available in summer (Brosset et al., 96
2015b). These results highlight the importance of considering the monthly body 97
condition in order to better understand the inter-annual dynamics of these short-lived 98
species. 99
Individuals in better physiological condition, meaning higher nutritional reserves, may 100
have higher growth and survival rates and greater reproductive success (Brosset et al., 101
2015b). Therefore, the evaluation of the nutritional and physiological state of a 102
population is increasingly used as an indicator of fish stock state (Brosset et al., 2017; 103
Lloret et al., 2013; Rosa et al., 2010). To evaluate the physiological state of fishes, 104
several condition indices are available (Lloret et al., 2013). Fish condition is a measure 105
of stored energy that can be evaluated with direct condition indices (e.g., energy density 106
and lipid content) or indirect condition indices (e.g., morphometric or organosomatic 107
indices) (Gatti et al., 2018; Lloret et al., 2013; Schloesser and Fabrizio, 2017). 108
In general terms, lipids are the preferred source of metabolic energy for growth, 109
reproduction, and swimming in fish and the first macro-molecule to be catabolised 110
(Shulman and Love, 1999; Tocher, 2003). On the other hand, proteins and 111
carbohydrates, which are the main compounds of body structure, usually remain rather 112
constant and are less energetic than lipids (Anthony et al., 2000). However, in cases of 113
high lipid depletion, proteins can be mobilised and used as an energy source (Black and 114
Love, 1986). Although the measurement of lipid content has been preferably used in the 115
study of small pelagic fish condition (Rosa et al., 2010; Pethybridge et al., 2014; 116

Brosset et al., 2015a, 2017), the amount of energy per unit of mass (Energy Density; 117
ED) is the only measure that directly provides information on the average energy of the 118
proximate composition of fish (weighted average of protein, lipid and carbohydrates 119
energy densities; Gatti et al. 2018). 120
When using condition indices, it is important to understand what the index is measuring 121
and to validate it with other measurements (Gatti et al., 2018; McPherson et al., 2011). 122
The use of lipid content, fatmeter (indirect measure of lipids) and morphometric indices 123
(e.g. relative condition factor; Kn), have been recently validated as measures of 124
condition in sardine and anchovy, but there was a week correlation between 125
morphometric indices and lipid content in certain periods of the year (Brosset et al., 126
2015a). Different studies have proposed that morphometric indices do not only reflect 127
the quantity of reserves, but also changes in proteins (Brosset et al., 2015a; Schloesser 128
and Fabrizio, 2017, Sutton et al., 2000). Therefore, the validation of morphometric 129
indices with a measure of energy density, that integrates an average of the proximate 130
composition, could be more appropriate for certain species. In sardine and anchovy, the 131
use of ED, has never been compared and validated with indirect and direct condition 132
indices in this study area (Albo-Puigserver et al., 2017; Tirelli et al., 2006). 133
Considering all of the above, the main aims of the present study were (1) to assess 134
seasonal dynamics of the body condition and energy allocation to reproduction in 135
sardine and anchovy in the north-western Mediterranean Sea, and (2) to determine 136
which of the condition measurements better captures the variability in the physiological 137
state of small pelagic fish populations. Specifically, analysis of indirect condition 138
indices and direct condition indices of sardine and anchovy were performed. 139
140
2. Material and Methods 141

Figure 1. Map of the study area where the individuals were collected (A). The sampling
area (dashed line) and the fishing harbors where most of the samples were landed are
indicated with black circles. Position of the study area in the Mediterranean Basin is
also indicated (B).
2.1. Sampling and study area 142
Anchovy and sardine samples were 143
collected monthly from purse-seine 144
landings off the Tarragona harbour 145
(Spain; north-western Mediterranean; 146
Fig. 1) which operated in the Ebro 147
Delta continental shelf area from April 148
2012 to March 2014. Due to fishing 149
closures, no samples were collected for 150
January 2013 and January 2014. The 151
Ebro Delta continental shelf is a major spawning ground for anchovy and sardine 152
(Giannoulaki et al., 2014; Palomera, 1992; Tugores et al., 2011). The primary 153
productivity in this area is largely subjected to the environmental variations of the 154
region. In this area, there is typically a late winter-early spring phytoplankton bloom, 155
enhanced by strong riverine nutrient inputs (Lloret et al., 2004, 2001; Salat, 1996), 156
followed by a spring increase in zooplankton (Sabatés et al., 2007;). Anchovy spawns in 157
warm waters, with temperatures between 17 and 23 ºC. These temperatures are found in 158
the waters of the north-western Mediterranean beginning at the end of spring and 159
extending throughout the summer (April – September) (Palomera, 1992; Palomera et 160
al., 2007). Sardine prefers colder waters to spawn, between 12 and 14ºC; therefore, the 161
spawning period of sardine in the north-western Mediterranean is from middle fall until 162

the end of winter (November – March; Palomera & Olivar, 1996; Palomera et al., 163
2007). All sampled individuals were collected in the harbour, kept in a fridge (4ºC) and 164
dissected in the lab within 24-48h after being fished. 165
166
2.2. Condition indices 167
A total of 2,078 anchovies and 1,957 sardines were analysed in this study, between 70 168
and 100 individuals per month were dissected between April 2012 and March 2014 169
(Table 1). Total body length (TL, ± 0.1 cm), total weight (TW, ± 0.01 g), gutted weight 170
(GW, ± 0.01 g), sex (M = male, F = female) and gonad weight (WG, ± 0.1 mg) were 171
recorded for all fish. The macroscopic maturity phase was determined for all individuals 172
using the anchovy and sardine maturity stage keys of (ICES, 2008): 1 = immature; 2 = 173
developing; 3 = spawning capable; 4 = spawning; 5 = post-spawning/spent, 6 = resting. 174
Only individuals with higher TL than the minimum landing size (TL ≥ 9 cm for 175
anchovy and TL ≥ 11 cm for sardine; Ganias et al. 2007) were used in the analysis in 176
order to avoid possible size-related bias due to variation in monthly length frequency 177
distributions of smaller individuals. After dissection, individuals were immediately 178
stored at -20ºC. Specifically, from all individuals processed in the first year of sampling 179
(from April 2012 to March 2013), 20 per month were entirely frozen for further 180
calorimetric analysis. Then, from other 20 individuals stored per month a piece of 181
muscle was extracted and frozen at -20ºC for lipid extraction of muscle and the gonad 182
of these individuals and other individuals dissected but not used for calorimetry 183
analysis, were frozen separately for calorimetric analysis of the gonad (Table 1). 184
Table 1. Summary of indirect and direct condition indices measured in European sardine and anchovy. For each index the number of samples analyzed (n), the mean total length (TL mean; cm) of the individuals and minimum and maximum length

(min-max; cm) are reported.
Condition indices
European anchovy European sardine
n TL mean
(cm)
min-max
(cm) n
TL mean
(cm)
min-max
(cm)
Indirect (monthly)
Kn gutted 2078 12.19 9-16.5 1957 13.42 11-19.6
GSI gonad 2035 12.20 9-16.5 1924 13.45 11-19.6
Direct (seasonal)
Lipid muscle 75 12.60 9-16.2 74 13.90 11-18.6
ED individual 80 13.03 9.7-16.1 82 14.34 11.4-17.6
ED gonad 129 12.35 9.2-16.2 131 14.08 11-18.6
185
2.2.1. Indirect condition indices 186
The somatic body condition of both species was evaluated by calculating the relative 187
condition factor (Kn, Le Cren 1951). The Kn was obtained as the ratio of the gutted 188
weight (GW) to the corresponding predicted gutted weight (Wp) for a fish of the same 189
length (Le Cren, 1951): 190
(1) Kn � ����
191
The Wp was obtained by performing a nonlinear regression of GW as a function of 192
a·TLb, where a and b are coefficients estimated from all fish sampled during the years 193
2012–2014 (with values for anchovies: a = 0.0029, b = 3.2538; and for sardines; a = 194
0.0037, b = 3.2309). We used the Kn index as a proxy of somatic condition for fish. 195
Gutted weight is preferred to the total weight to avoid the influence of gonad 196
development on the true somatic condition of individuals (Millán, 1999; Nunes et al., 197
2011). The Kn was calculated for all individuals sampled of sardine and anchovy (Table 198
1). 199
To relate the reproductive cycle with the relative condition factors (Kn), the 200
gonadosomatic index (GSI) and the percentage of reproductively active individuals 201
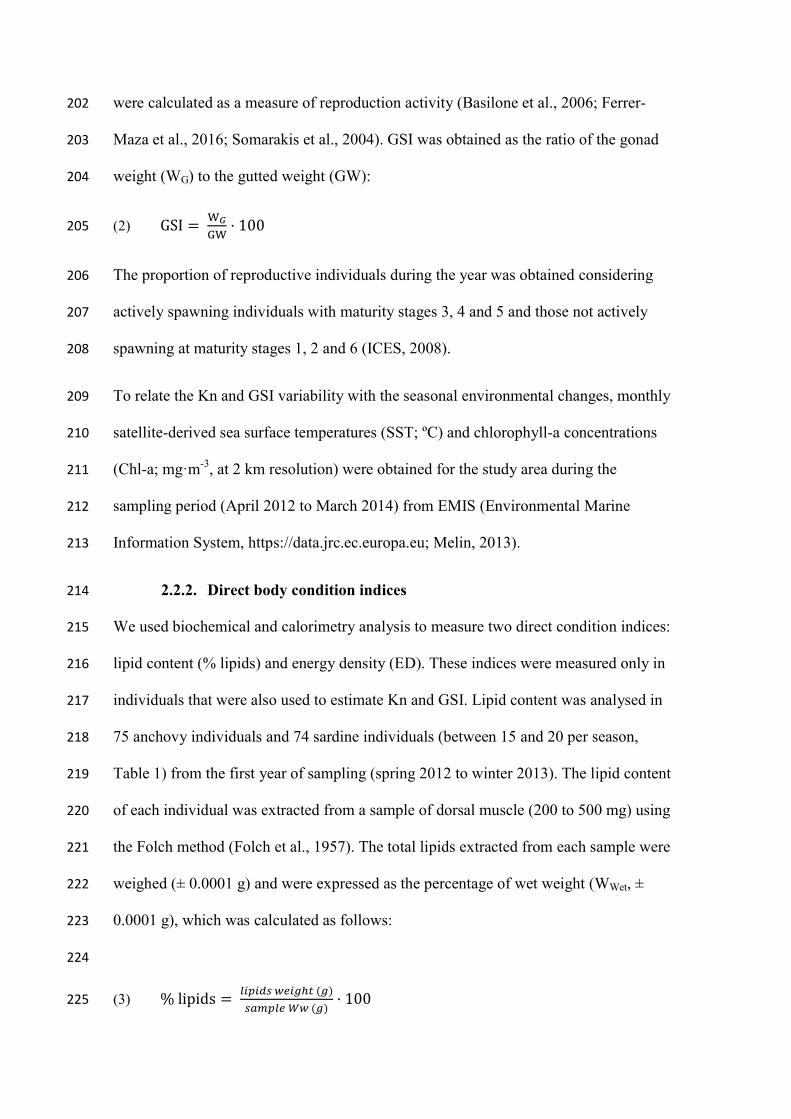
were calculated as a measure of reproduction activity (Basilone et al., 2006; Ferrer-202
Maza et al., 2016; Somarakis et al., 2004). GSI was obtained as the ratio of the gonad 203
weight (WG) to the gutted weight (GW): 204
(2) GSI � ����
� 100205
The proportion of reproductive individuals during the year was obtained considering 206
actively spawning individuals with maturity stages 3, 4 and 5 and those not actively 207
spawning at maturity stages 1, 2 and 6 (ICES, 2008). 208
To relate the Kn and GSI variability with the seasonal environmental changes, monthly 209
satellite-derived sea surface temperatures (SST; ºC) and chlorophyll-a concentrations 210
(Chl-a; mg·m-3, at 2 km resolution) were obtained for the study area during the 211
sampling period (April 2012 to March 2014) from EMIS (Environmental Marine 212
Information System, https://data.jrc.ec.europa.eu; Melin, 2013). 213
2.2.2. Direct body condition indices 214
We used biochemical and calorimetry analysis to measure two direct condition indices: 215
lipid content (% lipids) and energy density (ED). These indices were measured only in 216
individuals that were also used to estimate Kn and GSI. Lipid content was analysed in 217
75 anchovy individuals and 74 sardine individuals (between 15 and 20 per season, 218
Table 1) from the first year of sampling (spring 2012 to winter 2013). The lipid content 219
of each individual was extracted from a sample of dorsal muscle (200 to 500 mg) using 220
the Folch method (Folch et al., 1957). The total lipids extracted from each sample were 221
weighed (± 0.0001 g) and were expressed as the percentage of wet weight (WWet, ± 222
0.0001 g), which was calculated as follows: 223
224
(3) % lipids � ��� ���� �������� � ���
� 100225

226
Analyses of the energy density (ED, kJ·g-1WWet) were performed on anchovy and 227
sardine specimens from the first year of sampling by direct calorimetry using a Parr 228
6725 Semimicro Oxygen Bomb Calorimeter (Moline, Illinois, USA). The ED of the 229
entire individual and the ED of gonads were estimated on different individual fish as 230
follows. We used 80 specimens of anchovy and 82 of sardine previously oven-dried (20 231
per season, Table 1) to estimate the ED of the entire individual using the whole 232
ungutted fish, i.e. including mesenteric fat and gonads. With a different objective, the 233
data on ED of individuals was previously presented aggregated in Albo-Puigserver et 234
al., (2017). ED was determined individually according to the protocol used in previous 235
studies (Albo-Puigserver et al., 2017; Dubreuil and Petitgas, 2009; Tirelli et al., 2006). 236
The oven-dried individuals were mixed to obtain a homogenised powder of each 237
individual, from which pellets of 150 to 200 mg were obtained with a press. Two of 238
these pellets were used for the determination of the ED, and if the values differed by 239
more than 3%, a third pellet was combusted. The average of the two or three samples 240
was used to estimate the ED of each individual. The ED was converted to a wet-weight 241
basis (kJ g-1WWet) using the proportion of dry weight (WDry= WDry⁄ WWet) of each fish. 242
In the case of ED analysis of gonads, if the gonads of an individual fish were not large 243
enough to perform the analysis (the calorimeter can only process samples that range 244
from 25 to 200 mg), they were pooled by sex, body length and maturity stage to obtain 245
an adequate weight for the analysis (gonad weight: WG). The analysis was determined 246
for 129 anchovies (29 from spring, 33 from summer, 37 from autumn, and 30 from 247
winter) and 131 sardines (45 from spring, 27 from summer, 29 from autumn and 30 248
from winter). The same protocol described above for the entire individuals was 249
followed for the gonads’ ED determination (from an individual or group). 250

2.3. Statistical analyses 251
Differences in Kn and GSI of anchovy and sardine between months and sexes were 252
statistically compared using PERMANOVA tests (two-way semi-parametric 253
permutation multivariate analyses of variance) based on Euclidean distance matrices 254
with a previous square-root transformation (Anderson et al., 2008). The Spearman’s 255
rank non-parametric correlation test between pair of variables was used to examine the 256
relationships between Kn, GSI, sea surface temperature (SST; ºC) and chlorophyll-a 257
concentrations (Chl-a; mg·m-3, at 2 km resolution) obtained from EMIS (Environmental 258
Marine Information System, https://data.jrc.ec.europa.eu; Melin, 2013). 259
Differences in lipid content and energy density between seasons, sexes or between 260
maturity stages, in the case of gonad analysis, for sardine and anchovy and between 261
species were also tested using PERMANOVA tests based on Euclidean distance 262
matrices with a previous square-root transformation (Anderson et al., 2008). In the case 263
of significant differences, pairwise tests were performed. Analyses were run using 264
PRIMER-E v6 software (Clarke and Gorley, 2006). 265
The correlations between the relative condition index (Kn) and the direct condition 266
indexes (% lipids and ED) were examined using Spearman’s rank tests. Relationships 267
between energy density of gonads and the percentage of the gonadosomatic index were 268
explored using logarithmic regressions. Spearman’s rank non-parametric correlation 269
tests and linear regression analyses were performed with R v3.3.2. (R Development 270
Core Team, 2018). In all cases, we adopted a significance level of p< 0.05. 271
272
3. Results 273
3.1. Variation in the indirect condition indices 274

Monthly variation in the GSI values throughout the year showed opposite annual 275
patterns for anchovy and sardine for both sexes (Fig. 2). GSI of anchovy reached the 276
maximum values between April and August while sardine reached maximum values 277
between November and March (Fig. 2B and 2D). Differences between sexes in GSI 278
were observed in both species (anchovy: Pseudo-F1,1985=2760.4, p=0.001; sardine: 279
Pseudo-F1,1866=105.61, p<0.001). 280
The percentage of active spawning individuals showed similar patterns to GSI and was 281
related to environmental changes (Fig. 3 and 4). Correlation analysis between 282
environmental variables and GSI showed a positive correlation of anchovy and a 283
negative of sardine with SST and the invers pattern with Chl-a (Fig. 3). Active 284
spawning individuals of anchovy were observed from April, one month after the peak of 285
Chl-a and when SST started to increase, to October, when SST started to decrease (Fig. 286
2A and 4). More than 90% of females were actively spawning in June and July of 2012 287
and in July, August and September of 2013, coinciding with the period of higher SST 288
and lower Chl-a concentrations (Fig. 2A and 4). 289
Sardine actively spawned from October to March, coinciding with the decrease in SST. 290
However, in April and May of 2012, the proportion of active spawning individuals 291
reached almost 50% and 40%, respectively. The peak of active spawning individuals of 292
sardine was in December and February of 2012 and December 2013 when SST was at 293
its lowest and Chl-a concentration started to increase (Fig. 2A and 4). 294

295
Figure 2. Monthly mean sea surface temperature (SST; orange line) and chlorophyll a 296
concentration (Chl- a; green line) of the area of study (source: EMIS JRC, 297
https://data.jrc.ec.europa.eu/) (A). Mean and standard deviation of monthly variation of 298
gonadosomatic index (GSI) and relative condition index (Kn) for females (red) and 299
males (blue) of anchovy (B and C) and sardine (D and E), respectively. 300
301
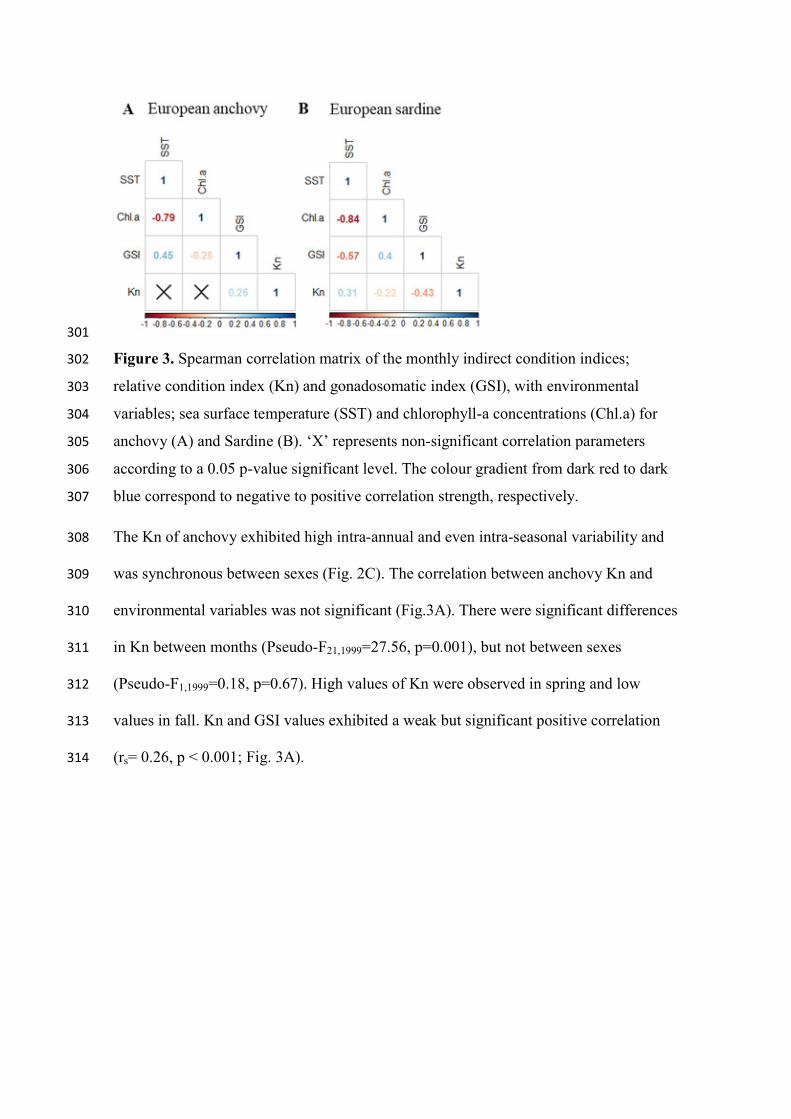
Figure 3. Spearman correlation matrix of the monthly indirect condition indices; 302
relative condition index (Kn) and gonadosomatic index (GSI), with environmental 303
variables; sea surface temperature (SST) and chlorophyll-a concentrations (Chl.a) for 304
anchovy (A) and Sardine (B). ‘X’ represents non-significant correlation parameters 305
according to a 0.05 p-value significant level. The colour gradient from dark red to dark 306
blue correspond to negative to positive correlation strength, respectively. 307
The Kn of anchovy exhibited high intra-annual and even intra-seasonal variability and 308
was synchronous between sexes (Fig. 2C). The correlation between anchovy Kn and 309
environmental variables was not significant (Fig.3A). There were significant differences 310
in Kn between months (Pseudo-F21,1999=27.56, p=0.001), but not between sexes 311
(Pseudo-F1,1999=0.18, p=0.67). High values of Kn were observed in spring and low 312
values in fall. Kn and GSI values exhibited a weak but significant positive correlation 313
(rs= 0.26, p < 0.001; Fig. 3A). 314

315
Figure 4. Monthly variation of the percentage of mature active individuals in blue 316
(maturity stage 3, 4 and 5) and immature and resting individuals in green (maturity 317
stage 1, 2 and 6) for anchovy (A) and sardine (B). Females (F) and males (M) 318
proportions are represented separately. Maturity stages were classified following ICES 319
(2008).320
For sardine, significant differences in Kn between months and sexes were observed 321
(Pseudo-F21,1877=67.45, p=0.001; Pseudo-F1,1877=5.77, p=0.02, respectively) (Fig. 2E). 322
However, the differences between sexes were only observed in August 2013 (pairwise 323
comparison t=2.36, p=0.02). Individuals had higher Kn values during spring and 324
summer and lower values during fall and winter and positive correlation between SST 325
and Kn were found (Fig. 2D, E, 3B). Kn and GSI exhibited a significant negative 326
correlation (rs= 0.44, p < 0.001). 327

3.2. Variation in the direct condition indices 328
In both species, significant seasonal variations in lipid content were observed (Pseudo-329
F3,71=20.33, p=0.0001; Pseudo-F3,70=19.15, p=0.0001, for anchovy and sardine, 330
respectively). In the case of anchovy, only spring had significantly higher lipid content 331
(Fig. 5A). Regarding sardine, lipid content in spring and summer was similar and 332
significantly higher than in fall and winter (Fig. 5B). Lipid fraction in the muscle of 333
anchovy and sardine was similar between sexes (Pseudo-F1,73=3.69, p=0.05; Pseudo-334
F1,72=1.44, p=0.24, for anchovy and sardine, respectively). 335
Similar to lipid content, in both species differences in ED were only found between 336
seasons (Pseudo-F3,71=8.55, p=0.0001 for anchovy and Pseudo-F1,73=21.21, p=0.0001 337
for sardine) and not between sexes (Pseudo-F2,71=0.35, p=0.67 for anchovy and Pseudo-338
F1,73=1.94, p=0.14 for sardine). In the case of anchovy, the pairwise comparison of ED 339
between seasons showed that ED was at a maximum in spring and declined in summer 340
and fall with significantly different ED values, while in winter the ED of anchovy was 341
similar to the ED levels of summer (Fig. 5C). For sardine, in spring and summer on the 342
one hand and in fall and winter on the other hand the individuals had similar ED values. 343
Between the two periods (spring-summer and fall-winter) significant differences were 344
found in ED, similar to that observed for lipid content (Fig. 5D). 345
Comparing the two species, the lipid content of sardine in spring, summer and winter 346
was significantly higher than in anchovy (Pseudo-F1,141=64.98, p=0.0001), and no 347
differences in the lipid content was observed in fall between the two species (Figs. 5A 348
and 5B). Similarly, in the case of ED, sardine values were significantly higher in spring, 349
summer and fall than in anchovy (Pseudo-F1,154=35.18, p=0.0001), and no differences in 350

ED was observed in winter between species (Figs. 5C and 5D). 351
352
Figure 5. Boxplots of seasonal lipid content (A-B) (% lipids·g-1 wet weight) and energy 353
density (C-D) (kJ·g-1 wet weight) of anchovy and sardine. Female and males individuals 354
are indicated in red and males, respectively. Box length represent interquartile range, 355
bar length represent range and horizontal lines represent median values, dots are 356
outliers. Number in brackets are the sample size of each boxplot. Pairs of means 357
differing significantly (P < 0.05) by pairwise test between seasons within each graph 358
and both sexes together are indicated by letters- seasons with the same letter were not 359
significantly different. 360
In the case of the direct index related to reproduction activity, the calorimetry of gonads, 361
anchovy and sardine had similar ED values in gonads (Pseudo-F1,210=1.95, p=0.16, 362
Figure 6). For both species, energy density of gonads varied between reproduction 363
stages, with higher values of EDgonads in actively spawning individuals (reproduction 364

stage 3, 4 and 5) than for immature or resting individuals (reproduction stage 1, 2 and 6) 365
(Pseudo-F5,210=49.18, p=0.0001; Table 2, Figure 6). No significant differences were 366
detected between sexes in the EDgonads of anchovy (Pseudo-F1,101=7.29, p=0.79), while 367
sardine did present differences in EDgonads between sexes (Pseudo-F1,109=15.07, 368
p=0.0005). 369
370
Figure 6. Boxplot of Energy Density (ED; kJ g−1 of wet weight) measured in gonads of 371
active spawning individuals (reproduction stage 3, 4 and 5) and inactive individuals 372
including immature and resting individuals (reproduction stage 1,2 and 6) for females 373
(F) and males (M) of European anchovy (A) and sardine (B). 374
375
376
377
378
379
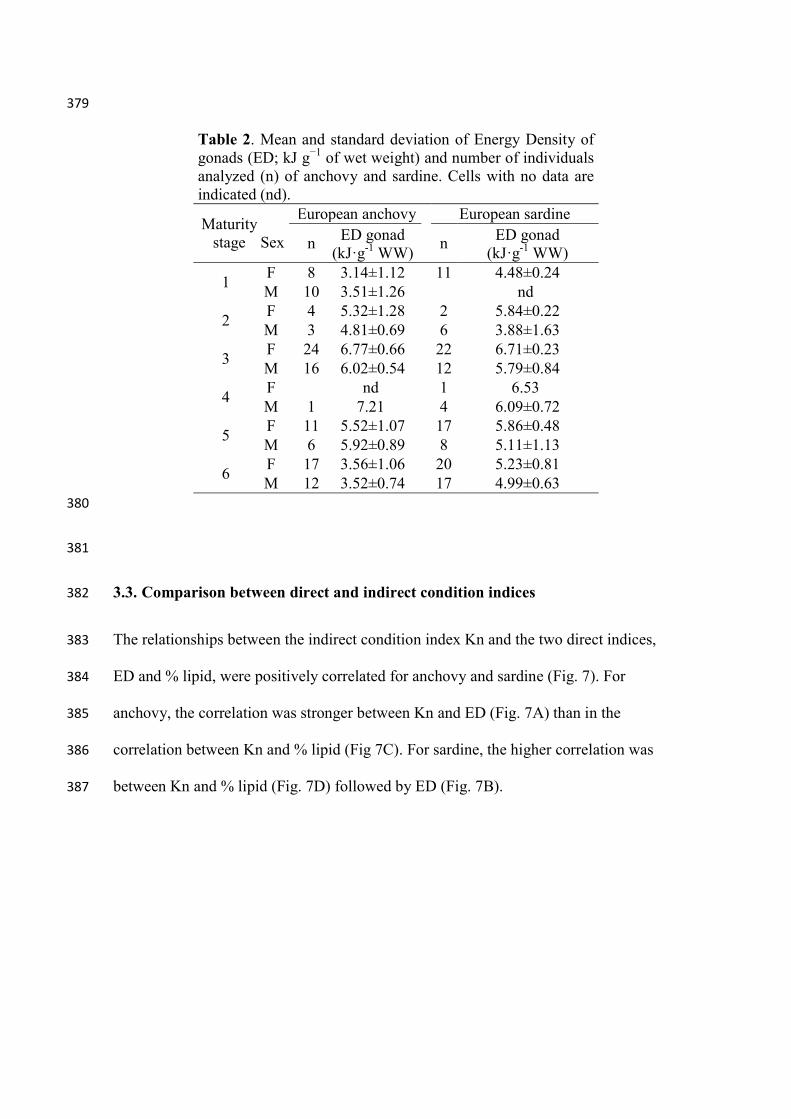
Table 2. Mean and standard deviation of Energy Density of gonads (ED; kJ g−1 of wet weight) and number of individuals analyzed (n) of anchovy and sardine. Cells with no data are indicated (nd).
Maturity stage Sex
European anchovy European sardine
n ED gonad (kJ·g-1 WW) n ED gonad
(kJ·g-1 WW)
1 F 8 3.14±1.12 11 4.48±0.24 M 10 3.51±1.26 nd
2 F 4 5.32±1.28 2 5.84±0.22 M 3 4.81±0.69 6 3.88±1.63
3 F 24 6.77±0.66 22 6.71±0.23 M 16 6.02±0.54 12 5.79±0.84
4 F nd 1 6.53 M 1 7.21 4 6.09±0.72
5 F 11 5.52±1.07 17 5.86±0.48 M 6 5.92±0.89 8 5.11±1.13
6 F 17 3.56±1.06 20 5.23±0.81 M 12 3.52±0.74 17 4.99±0.63
380
381
3.3. Comparison between direct and indirect condition indices 382
The relationships between the indirect condition index Kn and the two direct indices, 383
ED and % lipid, were positively correlated for anchovy and sardine (Fig. 7). For 384
anchovy, the correlation was stronger between Kn and ED (Fig. 7A) than in the 385
correlation between Kn and % lipid (Fig 7C). For sardine, the higher correlation was 386
between Kn and % lipid (Fig. 7D) followed by ED (Fig. 7B). 387

388
Figure 7. Relationships between the relative condition factor (Kn) and energy density 389
(ED; KJg-1 wet weight) and lipid content (% Lipids) for anchovy (A, C) and sardine (B, 390
D), respectively. Spearman correlation and the level of significance are indicated (r; p). 391
Lines indicate significant correlations. 392
When comparing direct and indirect indices of the energy invested in reproduction, 393
EDgonads of anchovy and the GSI showed a strong positive correlation for both sexes 394
(rs=0.85, p< 0.001; rs=0.80, p< 0.001, for females and males, respectively). The 395
relationship fitted to a logarithmic regression explained 69% and 62% of the variance in 396
anchovy females and males, respectively (Fig. 8A). Sardine also showed a positive 397
correlation between EDgonads of females and males and GSI (rs=0.86, p< 0.001; rs=0.64, 398
p<0.001, for females and males, respectively). The logarithmic regression of sardine 399
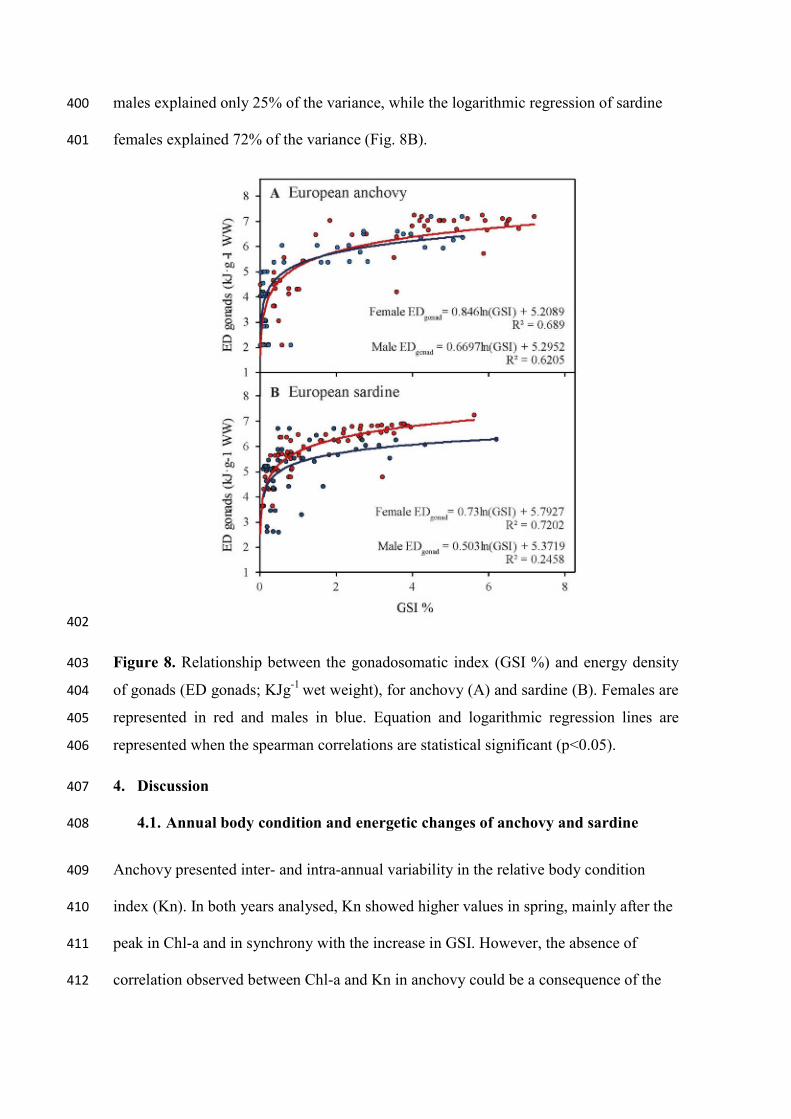
males explained only 25% of the variance, while the logarithmic regression of sardine 400
females explained 72% of the variance (Fig. 8B). 401
402
Figure 8. Relationship between the gonadosomatic index (GSI %) and energy density 403
of gonads (ED gonads; KJg-1 wet weight), for anchovy (A) and sardine (B). Females are 404
represented in red and males in blue. Equation and logarithmic regression lines are 405
represented when the spearman correlations are statistical significant (p<0.05). 406
4. Discussion 407
4.1. Annual body condition and energetic changes of anchovy and sardine 408
Anchovy presented inter- and intra-annual variability in the relative body condition 409
index (Kn). In both years analysed, Kn showed higher values in spring, mainly after the 410
peak in Chl-a and in synchrony with the increase in GSI. However, the absence of 411
correlation observed between Chl-a and Kn in anchovy could be a consequence of the 412

temporal lag of phytoplankton-zooplankton phenology succession. The higher values of 413
Kn at the beginning of spring were in accordance with the higher lipid content and ED 414
values observed for anchovy in spring in the present study. These results seem to 415
indicate that anchovy relied in large part on current food intake for reproduction. 416
Therefore, as described in previous studies, anchovy mainly exhibited an income 417
breeder strategy (Brosset et al., 2017; McBride et al., 2015). 418
Anchovy ED, lipid content and Kn showed the lowest values after the spawning season, 419
suggesting that the final balance between energy intake and reproductive costs was 420
negative and led to a deterioration of anchovy body condition. We observed a depletion 421
in lipid content as early as summer before the end of reproduction activity, whereas the 422
decline in ED showed a progressive change with minimum values after the reproduction 423
period. Taking into account that lipids were measured in the muscle and ED in the 424
entire individual, these results suggest that lipids in muscle were the first source of 425
energy to be mobilized for the development of gonads in spring. In previous studies 426
conducted in the Mediterranean Sea (in the Gulf of Lions and the Strait of Sicily), body 427
condition of small pelagic fish was positively related to river run-off, Chl-a, and 428
diatoms and meso-zooplankton concentrations (Basilone et al., 2006; Brosset et al., 429
2015b). Basilone et al. (2006) noted that the energy gained and stored before the 430
spawning period could affect the reproductive output of anchovy in the Strait of Sicily. 431
Therefore, the low lipid content and ED observed in our study at the end of the 432
reproduction period could reflect unfavourable environmental conditions during the 433
reproduction period in the spawning season of 2012 and 2013. Although in our study it 434
is not possible to determine if the observed pattern is year-specific or is representative 435
of other years, the low lipid and ED values observed are in line with the decline in body 436

condition observed in anchovy in the last decade in the Mediterranean Sea (Albo-437
Puigserver et al., 2019; Brosset et al., 2017; Van Beveren et al., 2014). 438
On the contrary, all condition indexes (Kn, ED, lipid) measured in sardine had a highly 439
marked seasonality, with inverse patterns between Kn and GSI. The sardine spawning 440
season covered the colder months of the year, peaking between December and February, 441
as already described in previous studies (Palomera, 1992; Palomera et al., 2007; 442
Palomera and Olivar, 1996). During the reproduction period, Kn, ED and lipids were at 443
their lowest values. Rapidly after the end of the reproduction period, coinciding with the 444
spring increase in zooplankton enhanced by strong riverine nutrient input at the Ebro 445
Delta continental shelf (Lloret et al., 2004; Salat et al., 2002), a strong increase in Kn, 446
ED and lipids was observed for sardine. Similar to previous studies (Brosset et al., 447
2015a; Ganias et al., 2007; Nunes et al., 2011), sardine accumulated energy during the 448
resting period and seemed to supply reproduction costs with stored resources, 449
presenting a clear capital breeding strategy. 450
Nevertheless, Kn in sardine peaked in June, but was not maintained at high levels until 451
the reproduction period, as would be expected in a capital breeder (McBride et al., 452
2015). In August 2013, Kn was under one while reproductive activity started in October 453
(GSI). In contrast, previous studies of body condition found, that Kn was maintained at 454
a high level until an increase in GSI due to the mobilization of fat reserves for the 455
development of gonads (Brosset et al., 2015b; Ganias et al., 2007; Nunes et al., 2011). 456
Thus, as in the hypothesis proposed for anchovy, the decrease in Kn in sardine before 457
the reproduction period could also be related to unfavourable environmental conditions 458
preventing an accumulation of sufficient energy reserves during spring and summer. 459
Similar patterns of a decline in condition at the end of summer were described for 460
sardine in the Gulf of Lions, and this was attributed to a change in phenology of primary 461
and secondary production (Brosset et al., 2015b). The low energy reserves observed at 462
the beginning of the reproduction period could suggest that sardine may also rely on 463
direct food intake towards the end of the reproduction period. Therefore, sardine would 464
be able to deploy both capital and income breeder strategies as was previously 465
suggested for sardine in the eastern Mediterranean (Ganias, 2009) and Atlantic (Garrido 466
et al., 2007). Also, the low levels of fat reserves that the sardine accumulated prior to 467
the spawning season during our study years could have had an important effect on the 468
quantity or quality of eggs produced during the spawning season, as was demonstrated 469
for the Iberian sardine in Portugal (Garrido et al., 2007). In both species, EDgonads was 470
high for males and females during reproductively active stages with high GSI values, 471
when female oocytes are hydrated and males produce sperm, highlighting the high 472
energetic investment required by reproduction activity in both sexes and similar 473
(Garrido et al., 2008; Wang and Houde, 1994). Short-lived species, could prioritize 474
energy investment in reproduction instead of growth and maintenance, as it has been 475
suggested for sardine and anchovy in the Gulf of Lions (Brosset et al., 2016). Therefore, 476
assessment of GSI and energy invested in gonads is key to understand the changes in 477
life history traits. Changes in GSI and ED with size in anchovy and sardine have been 478
also described. In the Bay of Biscay, a dome shaped relationship in ED with size was 479
found (Gatti et al. 2018). Although, not evaluated here size could be an important factor 480
to include in future studies, particularly in light of the decline in the body condition of 481
sardine and anchovy in the Mediterranean (Albo-Puigserver et al., 2019; Brosset et al., 482
2017; Van Beveren et al., 2014), and the importance of large females to replenish fish 483
populations (Berneche et al. 2018). 484
4.2. Indirect and direct condition indices in small pelagic fish 485

In sardine, both direct methods (% lipid and ED) were highly correlated to the indirect 486
method Kn, and all of them successfully captured the variability in energy reserves 487
between the reproduction and the resting period of sardine (spring-summer and fall-488
winter, respectively). In anchovy, ED was better correlated to Kn, than % lipid, 489
suggesting that ED and Kn better captured changes in body condition than lipid content. 490
However, we expected a better correlation between Kn and lipid content in the muscle 491
as Kn was calculated from gutted individuals, whereas ED was measured in entire 492
individuals, including mesenteric fat and gonads. Therefore, these result suggest that Kn 493
reflected other changes rather (e.g. changes in protein content) than changes in lipid 494
content only. 495
The better correlation of lipid content to Kn in sardine is explained by the higher 496
variability of lipids in sardine than in anchovy due to their opposite breeding strategies 497
(Albo-Puigserver et al., 2017). Sardine accumulates a high quantity of lipids in the 498
muscle as well as mesenteric fat during the resting period, which are used subsequently 499
for reproduction (Albo-Puigserver et al., 2017; Brosset et al., 2015a; Pethybridge et al., 500
2014). On the other hand, anchovy accumulates less energy, since the energy gain is 501
used directly for reproduction and less energy is allocated to reserves and also has 502
smaller size at a given age that could imply less energetic requirements (Albo-503
Puigserver et al., 2017; Gatti et al., 2018). While lipid content analysis of muscle only 504
measures the bulk of lipids in the muscle of the individual, direct calorimetry analysis of 505
entire individuals measures the mesenteric fat and the lipids in gonads. Moreover, also 506
measures changes in other compounds such as proteins, which are usually mobilized 507
when lipids are low. Thus, in fish species that do not accumulate high quantities of 508
lipids, like anchovy, direct calorimetry analysis to obtain ED measurements could 509
provide a more integrative measure of changes in proximate composition than lipid 510
content analysis. These results highlight the importance of validating the indirect 511
condition indices. Similar to our results, Brosset et al., (2015) found a weak correlation 512
between lipid content and Kn of anchovy in the Gulf of Lions, potentially due to 513
changes in protein composition. In our study, we demonstrated that the morphometric 514
index Kn better reflects the seasonal changes in ED than lipid content, and Kn can be 515
used as an indirect measure of ED for both species. Similar to previous studies on other 516
fish species (Schloesser and Fabrizio, 2017), our results support that in species that store 517
high quantities of energy, such as sardine, both lipid content and direct calorimetry are 518
appropriate methods to study body condition variability. 519
In the case of the evaluation of ED in gonads, we observed high variability in EDgonad 520
depending on reproduction stage and sex. This was expected, because lipid content of 521
the gonad increases when the oocytes are hydrated and also the egg quality depends on 522
female lipid content (Garrido et al., 2007, Brosset et al., 2016). For this reason, the 523
correlation between the GSI and the EDgonad was high for anchovy and sardine females 524
and males. This is the first time that the ED of gonads has been assessed in relation to 525
the GSI, and the equation provided could be used for further studies and for 526
bioenergetics models (Pethybridge et al., 2013). Yet, it is important to note that 527
calculating the energy invested in reproduction is difficult since sardine and anchovy are 528
batch spawner species, and the energy measured at a certain moment in time does not 529
correspond to the total energy that will be invested. Moreover, the energy measured in 530
gonads corresponds to energy invested in reproduction, but also in less proportion to 531
gonad structure (Kooijman, 2010). Thus, gonad ED cannot be directly used as a 532
measure of energy allocated to reproduction, but variation in the EDgonad can be used as 533
an indirect measure of changes in energy invested in reproduction, providing a starting 534

point in bioenergetics model parameterisation (Gatti et al., 2017; Pethybridge et al., 535
2013). 536
537
5. Conclusions 538
This study highlights the importance of seasonal energetic variation in small pelagic 539
fish in understanding their population dynamics and the need to validate the methods 540
used to measure body condition. The annual body condition and energetic cycle of both 541
species were related to the temporal lag between spawning seasons and the late winter-542
early spring phytoplankton bloom as has been described in other Mediterranean areas 543
(Basilone et al., 2006; Brosset et al., 2015b; Pethybridge et al., 2014). In line with the 544
observed energy dynamics of sardine and anchovy in the Gulf of Lions (Brosset et al., 545
2016), the populations of the Ebro river Delta area presented low energy reserves at the 546
end of summer and beginning of fall. This could support the hypothesis related to 547
changes in the phenology of plankton, as being an important driver of these species 548
declines (Saraux et al., 2019). Therefore, a continuous monitoring of the monthly 549
variability in body condition over several years in relation to changes in environmental 550
parameters is needed to further explore this hypothesis (Albo-Puigserver et al., 2019; 551
Brosset et al., 2017). In addition, the comparison between direct and indirect condition 552
indexes revealed that ED and Kn are the preferable methods to capture seasonal 553
variability in condition for anchovy. For sardine, all direct and indirect methods 554
assessed are suitable for evaluating condition variability. Considering the likely current 555
overexploited stock status of sardine and anchovy in the northwestern Mediterranean 556
Sea (Coll et al., 2019), and the observed decline of body condition in several areas of 557
the basin in the last two decades (Brosset et al., 2017), the continuous evaluation of the 558
life history traits of small pelagic fish is needed to improve the management advice 559

(Lloret et al., 2012). Our study presents important data in this direction, which can be 560
relevant for future comparison. Of special importance is the monitoring of the energy 561
reserves in critical periods (e.g. before the reproduction period) to detect if it recovers or 562
declines in the northwestern Mediterranean Sea. 563
564
Acknowledgements 565
We would like to thank all of the participants of the ECOTRANS Project, fishermen 566
and crew on board the R.V. Ángeles Alvariño. This study was funded by ECOTRANS 567
(CTM2011-26333) and PELWEB (ES-PN-2017-CTM2017-88939-R) projects. M.A.-P. 568
was funded by a FPI grant (BES-2012–054267, Spanish Ministry of Economy and 569
Competitiveness). J.N was funded by a Ramon y Cajal contract (RYC-2015-17809) of 570
the Spanish Government. 571
Literature cited 572
Albo-Puigserver, M., Giraldez, A., Hidalgo, M., Ramírez, J.G., Torres, P., Massaro, A., 573 Sbrana, M., Bellido, J.M., Coll, M., 2019. Report on historical reproductive pattern 574 (Size and age at first maturity and reproductive period). Evaluation of the 575 population status and specific management alternatives for the small pelagic fish 576 stocks in the Northwestern Mediterranean Sea (SPELMED) . Barcelona, Spain. 577
Albo-Puigserver, M., Muñoz, A., Navarro, J., Coll, M., Pethybridge, H., Sánchez, S., 578 Palomera, I., 2017. Ecological energetics of forage fish from the Mediterranean 579 Sea: Seasonal dynamics and interspecific differences. Deep. Res. Part II Top. Stud. 580 Oceanogr. 140. https://doi.org/10.1016/j.dsr2.2017.03.002 581
Anderson, M., Gorley, R., Clarke, K., 2008. PERMANOVA for PRIMER: guide to 582 software and statistical methods. PRIMER-E Ltd., Plymouth, United Kingdom. 583
Anthony, J. a., Roby, D.D., Turco, K.R., 2000. Lipid content and energy density of 584 forage fishes from the northern Gulf of Alaska. J. Exp. Mar. Bio. Ecol. 248, 53–78. 585 https://doi.org/10.1016/S0022-0981(00)00159-3 586
Bakun, A., 1996. Patterns in the ocean: ocean processes and marine population 587 dynamics. California Sea Grant College System, National Oceanic and 588 Atmospheric Administration in cooperation with Centro de Investigaciones 589 Biológicas del Noroeste. https://doi.org/10.1016/s0278-4343(97)00037-x 590
Barneche, D. R., Robertson, D. R., White, C. R., Marshall, D. J. (2018). Fish 591

reproductive-energy output increases disproportionately with body size. Science, 592 360, 642-645. https://doi.org/10.1126/science.aao6868 593
Basilone, G., Guisande, C., Patti, B., Mazzola, S., Cuttitta, A., Bonanno, A., Vergara, 594 A.R., Maneiro, I., 2006. Effect of habitat conditions on reproduction of the 595 European anchovy (Engraulis encrasicolus) in the Strait of Sicily. Fish. Oceanogr. 596 15, 271–280. https://doi.org/10.1111/j.1365-2419.2005.00391.x 597
Black, D., Love, R.M., 1986. The sequential mobilisation and restoration of energy 598 reserves in tissues of Atlantic cod during starvation and refeeding. J. Comp. 599 Physiol. B 156, 469–479. https://doi.org/10.1007/BF00691032 600
Brosset, P., Fromentin, J.-M., Ménard, F., Pernet, F., Bourdeix, J.-H., Bigot, J.L., Van 601 Beveren, E., Pérez Roda, M.A., Choy, S., Saraux, C., 2015a. Measurement and 602 analysis of small pelagic fish condition: A suitable method for rapid evaluation in 603 the field. J. Exp. Mar. Bio. Ecol. 462, 90–97. 604 https://doi.org/10.1016/j.jembe.2014.10.016 605
Brosset, P., Fromentin, J.M., Van Beveren, E., Lloret, J., Marques, V., Basilone, G., 606 Bonanno, A., Carpi, P., Donato, F., Čikeš Keč, V., De Felice, A., Ferreri, R., 607 Gašparević, D., Giráldez, A., Gücü, A., Iglesias, M., Leonori, I., Palomera, I., 608 Somarakis, S., Tičina, V., Torres, P., Ventero, A., Zorica, B., Ménard, F., Saraux, 609 C., 2017. Spatio-temporal patterns and environmental controls of small pelagic fish 610 body condition from contrasted Mediterranean areas. Prog. Oceanogr. 151, 149–611 162. https://doi.org/10.1016/j.pocean.2016.12.002 612
Brosset, P., Lloret, J., Munoz, M., Fauvel, C., Van Beveren, E., Marques, V., 613 Fromentin, J.-M., Ménard, F., Saraux, C., 2016. Body reserves mediate trade-offs 614 between life-history traits: new insights from small pelagic fish reproduction. R. 615 Soc. Open Sci. 3. 160202. http://dx.doi.org/10.1098/rsos.160202 616
Brosset, P., Ménard, F., Fromentin, J., Bonhommeau, S., Ulses, C., Bourdeix, J., Bigot, 617 J., Van Beveren, E., Roos, D., Saraux, C., 2015b. Influence of environmental 618 variability and age on the body condition of small pelagic fish in the Gulf of Lions. 619 Mar. Ecol. Prog. Ser. 529, 219–231. https://doi.org/10.3354/meps11275 620
Clarke, K., Gorley, R., 2006. PRIMER v6: user manual/tutorial. PRIMER-E, Plymouth, 621 United Kingdom. 622
Coll, M., Albo-Puigserver, M., Navarro, J., Palomera, I., Dambacher, J.M., 2019. Who 623 is to blame? Plausible pressures on small pelagic fish population changes in the 624 northwestern Mediterranean Sea. Mar. Ecol. Prog. Ser. 617–618, 277–294. 625 https://doi.org/10.3354/meps12591 626
Cury, P., Bakun, A., Crawford, R.J.M., Jarre, A., Quiñones, R.A., Shannon, L.J., 627 Verheye, H.M., 2000. Small pelagics in upwelling systems: patterns of interaction 628 and structural changes in “wasp-waist” ecosystems. ICES J. Mar. Sci. 57, 603–618. 629 https://doi.org/10.1006/jmsc.2000.0712 630
Cury, P.M., Boyd, I.L., Bonhommeau, S., Anker-Nilssen, T., Crawford, R.J.M., 631 Furness, R.W., Mills, J.A., Murphy, E.J., Osterblom, H., Paleczny, M., Piatt, J.F., 632 Roux, J.-P., Shannon, L., Sydeman, W.J., 2011. Global Seabird Response to 633 Forage Fish Depletion--One-Third for the Birds. Science (80-. ). 334, 1703–1706. 634 https://doi.org/10.1126/science.1212928 635

Drent, R.H., Daan, S., 1980. The Prudent Parent: Energetic Adjustments in Avian 636 Breeding. Ardea 55, 225–252. https://doi.org/10.5253/arde.v68.p225 637
Dubreuil, J., Petitgas, P., 2009. Energy density of anchovy Engraulis encrasicolus in the 638 Bay of Biscay. J. Fish Biol. 74, 521–534. https://doi.org/10.1111/j.1095-639 8649.2008.02143.x 640
FAO, 2018. FAO yearbook. Fisheries and Aquaculture Statistics 2016, Fao. Rome. 641 https://doi.org/10.5860/CHOICE.50-5350 642
Ferrer-Maza, D., Lloret, J., Faliex, E., Sasal, P., 2016. Links between parasitism , 643 energy reserves and fecundity of European anchovy , Engraulis encrasicolus , in 644 the northwestern Mediterranean Sea. Conserv. Physiol. 4, 1–13. 645 https://doi.org/10.1093/conphys/cov069.Introduction 646
Folch, J., Lees, M., Sloane Stanley, G.H., 1957. A simple method for the isolation and 647 purification of total lipides from animal tissues. J. Biol. Chem. 226, 497–509. 648
Ganias, K., 2009. Linking sardine spawning dynamics to environmental variability. 649 Estuar. Coast. Shelf Sci. 84, 402–408. https://doi.org/10.1016/j.ecss.2009.07.004 650
Ganias, K., Somarakis, S., Koutsikopoulos, C., Machias, A., 2007. Factors affecting the 651 spawning period of sardine in two highly oligotrophic Seas. Mar. Biol. 151, 1559–652 1569. https://doi.org/10.1007/s00227-006-0601-0 653
Garrido, S., Rosa, R., Ben-Hamadou, R., Cunha, M.E., Chícharo, M.A., van der Lingen, 654 C.D., 2007. Effect of maternal fat reserves on the fatty acid composition of sardine 655 (Sardina pilchardus) oocytes. Comp. Biochem. Physiol. B. Biochem. Mol. Biol. 656 148, 398–409. https://doi.org/10.1016/j.cbpb.2007.07.008 657
Garrido, S., Rosa, R., Ben-Hamadou, R., Cunha, M.E., Chícharo, M.A., van der Lingen 658 C.D., 2008. Spatio-temporal variability in fatty acid trophic biomarkers in stomach 659 contents and muscle of Iberian sardine (Sardina pilchardus) and its relationship 660 with spawning. Mar Biol 154: 1053-1065. https://doi.org/10.1007/s00227-008-661 0999-7 662
Gatti, P., Cominassi, L., Duhamel, E., Grellier, P., Le Delliou, H., Le Mestre, S., 663 Rabiller, M., Spitz, J., Huret, M., 2018. Bioenergetic condition of anchovy and 664 sardine in the Bay of Biscay and English Channel. Prog. Oceanogr. 166, 129–138. 665 https://doi.org/10.1016/J.POCEAN.2017.12.006 666
Gatti, P., Petitgas, P., Huret, M., 2017. Comparing biological traits of anchovy and 667 sardine in the Bay of Biscay: A modelling approach with the Dynamic Energy 668 Budget. Ecol. Modell. 348, 93–109. 669 https://doi.org/10.1016/J.ECOLMODEL.2016.12.018 670
Giannoulaki, M., Schismenou, E., Pyrounaki, M.-M., 2014. Habitat Characterization 671 and Migrations, in: Biology and Ecology of Sardines and Anchovies. CRC Press, 672 pp. 285–307. https://doi.org/10.1201/b16682-11 673
Giorgi, F., 2006. Climate change hot-spots. Geophys. Res. Lett. 33, L08707. 674 https://doi.org/10.1029/2006GL025734 675
Hoegh-Guldberg, O., Jacob, D., Taylor, M., Bindi, M., Brown, S., Camilloni, A., 676 Diedhiou, A., Djalante, R., Ebi, K.L., Engelbrecht, F., Guiot, J., Hijioka, Y., 677 Mehrotra, S., Payne, A., S.I., S., Thomas, A., Warren, R., Zhou, G., 2018. Impacts 678
of 1.5°C of Global Warming on Natural and Human Systems, in: Global Warming 679 of 1.5°C. An IPCC Special Report on the Impacts of Global Warming of 1.5°C 680 above Pre-Industrial Levels and Related Global Greenhouse Gas Emission 681 Pathways, in the Context of Strengthening the Global Response to the Threat of 682 Climate Change,. pp. 175–311. 683
ICES, 2008. Report of the Workshop on Small Pelagics (Sardina pilchardus, Engraulis 684 encrasicolus) maturity stages (WKSPMAT), 10-14 November 2008, Mazara del 685 Vallo, Italy. 686
Kooijman, S.A.L.M., 2010. Dynamic Energy Budgets Theory for Metabolic 687 Organization, 3rd editio. ed. Cambridge University Press, Great Britain. 688
Le Cren, E.D., 1951. The Length-Weight Relationship and Seasonal Cycle in Gonad 689 Weight and Condition in the Perch (Perca fluviatilis). J. Anim. Ecol. 20, 201. 690 https://doi.org/10.2307/1540 691
Lloret, J., Lleonart, J., Solé, I., Fromentin, J.-M., 2001. Fluctuations of landings and 692 environment conditios in the north-western Mediterranean Sea. Fish. Oceanogr. 10, 693 33–50. https://doi.org/10.1046/j.1365-2419.2001.00151.x 694
Lloret, J., Palomera, I., Salat, J., Solé, I., 2004. Impact of freshwater input and wind on 695 landings of anchovy (Engraulis encrasicolus) and sardine (Sardina pilchardus) in 696 shelf waters surrounding the Ebre (Ebro) River delta (north-western 697 Mediterranean). Fish. Oceanogr. 13, 102–110. 698
Lloret, J., Faliex, E., Shulman, G.E., Raga, J.-A., Sasal, P., Muñoz, M., Casadevall, 699 A.E., Ahuir-Baraja, A.E., Montero, F.E., Repullés-Albelda, A., Cardinale, M., 700 Rätz H.-J., Vola, S., Ferrer, D., 2012. Fish Health and Fisheries, Implications for 701 Stock Assessment and Management: The Mediterranean Example, Reviews in 702 Fish Sci, 20:3, 165-180. http://dx.doi.org/10.1080/10641262.2012.695817 703
Lloret, J., Shulman, G., Love, R.M., 2013. Condition and Health Indicators of Exploited 704 Marine Fishes, Condition and Health Indicators of Exploited Marine Fishes. John 705 Wiley & Sons, Oxford. https://doi.org/10.1002/9781118752777 706
McBride, R.S., Somarakis, S., Fitzhugh, G.R., Albert, A., Yaragina, N.A., Wuenschel, 707 M.J., Alonso-Fernández, A., Basilone, G., 2015. Energy acquisition and allocation 708 to egg production in relation to fish reproductive strategies. Fish Fish. 16, 23–57. 709 https://doi.org/10.1111/faf.12043 710
McPherson, L.R., Slotte, A., Kvamme, C., Meier, S., Marshall, C.T., 2011. 711 Inconsistencies in measurement of fish condition: a comparison of four indices of 712 fat reserves for Atlantic herring (Clupea harengus). ICES J. Mar. Sci. 68, 52–60. 713 https://doi.org/10.1093/icesjms/fsq148 714
Melin, F., 2013. EMIS - PATHFINDER Monthly climatology sea surface temperature 715 (4km) in degree-C. European Commission, Joint Research Centre (JRC) [Dataset] 716 PID: http://data.europa.eu/89h/5838224e-174e-4172-8035-b6c17f07748b 717
Millán, M., 1999. Reproductive characteristics and condition status of anchovy 718 Engraulis encrasicolus L. from the Bay of Cadiz (SW Spain). Fish. Res. 41, 73–719 86. https://doi.org/10.1016/S0165-7836(99)00010-7 720
Mustać, B., Sinovčić, G., 2009. Comparison of mesenteric and tissue fat content in 721

relation to sexual cycle of the sardine, Sardina pilchardus (Walb., 1792), in the 722 eastern Middle Adriatic fishery grounds (Croatia). J. Appl. Ichthyol. 25, 595–599. 723 https://doi.org/10.1111/j.1439-0426.2009.01285.x 724
Nunes, C., Silva, A., Soares, E., Ganias, K., 2011. The use of hepatic and somatic 725 indices and histological information to characterize the reproductive dynamics of 726 Atlantic sardine sardina pilchardus from the Portuguese coast. Mar. Coast. Fish. 3, 727 127–144. https://doi.org/10.1080/19425120.2011.556911 728
Oliver, E.C.J., Donat, M.G., Burrows, M.T., Moore, P.J., Smale, D.A., Alexander, L. 729 V., Benthuysen, J.A., Feng, M., Sen Gupta, A., Hobday, A.J., Holbrook, N.J., 730 Perkins-Kirkpatrick, S.E., Scannell, H.A., Straub, S.C., Wernberg, T., 2018. 731 Longer and more frequent marine heatwaves over the past century. Nat. Commun. 732 9, 1324. https://doi.org/10.1038/s41467-018-03732-9 733
Palomera, I., 1992. Spawning of anchovy Engraulis encrasicolus in the northwestern 734 Mediterranean relative to hydrographic features in the region. Mar. Ecol. Prog. Ser. 735 79, 215–223. https://doi.org/10.3354/meps079215 736
Palomera, I., Olivar, M.P., 1996. Nearshore ichthyoplankton off the Costa Brava 737 (Northwest Mediterranean). Publ. Espec. Inst. Esp. Ocean. 22, 71–75. 738
Palomera, I., Olivar, M.P., Salat, J., Sabatés, a., Coll, M., García, a., Morales-Nin, B., 739 2007. Small pelagic fish in the NW Mediterranean Sea: An ecological review. 740 Prog. Oceanogr. 74, 377–396. https://doi.org/10.1016/j.pocean.2007.04.012 741
Pethybridge, H., Bodin, N., Arsenault-Pernet, E.J., Bourdeix, J.H., Brisset, B., Bigot, 742 J.L., Roos, D., Peter, M., 2014. Temporal and inter-specific variations in forage 743 fish feeding conditions in the NW Mediterranean: lipid content and fatty acid 744 compositional changes. Mar. Ecol. Prog. Ser. 512, 39–54. 745 https://doi.org/10.3354/meps10864 746
Pethybridge, H., Roos, D., Loizeau, V., Pecquerie, L., Bacher, C., 2013. Responses of 747 European anchovy vital rates and population growth to environmental fluctuations: 748 An individual-based modeling approach. Ecol. Modell. 250, 370–383. 749 https://doi.org/10.1016/j.ecolmodel.2012.11.017 750
Piroddi, C., Coll, M., Liquete, C., Macias, D., Greer, K., Buszowski, J., Steenbeek, J., 751 Danovaro, R., Christensen, V., 2017. Historical changes of the Mediterranean Sea 752 ecosystem: modelling the role and impact of primary productivity and fisheries 753 changes over time. Sci. Rep. 7, 44491. https://doi.org/10.1038/srep44491 754
Quattrocchi, F., Maynou, F., 2017. Environmental drivers of sardine (Sardina 755 pilchardus) in the Catalan Sea (NW Mediterranean Sea). Mar. Biol. Res. 13, 1003–756 1014. https://doi.org/10.1080/17451000.2017.1331039 757
R Development Core Team, 2018. R: a language and environment for statistical 758 computing. R Found. Stat. Comput. Vienna, Austria 3-900051-07-0. 759
Rosa, R., Gonzalez, L., Broitman, B., Garrido, S., Santos, A., Nunes, M., 2010. 760 Bioenergetics of small pelagic fishes in upwelling systems: relationship between 761 fish condition, coastal ecosystem dynamics and fisheries. Mar. Ecol. Prog. Ser. 762 410, 205–218. https://doi.org/10.3354/meps08635 763
Sabatés, A., Olivar, M.P., Salat, J., Palomera, I., Alemany, F., 2007. Physical and 764

biological processes controlling the distribution of fish larvae in the NW 765 Mediterranean. Prog. Oceanogr. 74, 355–376. 766 https://doi.org/10.1016/J.POCEAN.2007.04.017 767
Salat, J., 1996. Review of hydrographic environmental factors that may influence 768 anchovy habitats in northwestern Mediterranean. Sci. Mar. 60, 21–32. 769
Salat, J., Garcia, M. a., Cruzado, A., Palanques, A., Arín, L., Gomis, D., Guillén, J., De 770 León, A., Puigdefàbregas, J., Sospedra, J., Velásquez, Z.R., 2002. Seasonal 771 changes of water mass structure and shelf slope exchanges at the Ebro shelf (NW 772 Mediterranean). Cont. Shelf Res. 22, 327–348. https://doi.org/10.1016/S0278-773 4343(01)00031-0 774
Saraux, C., Van Beveren, E., Brosset, P., Queiros, Q., Bourdeix, J.-H., Dutto, G., 775 Gasset, E., Jac, C., Bonhommeau, S., Fromentin, J.-M., 2019. Small pelagic fish 776 dynamics: A review of mechanisms in the Gulf of Lions. Deep Sea Res. Part II 777 Top. Stud. Oceanogr. 159, 52–61. https://doi.org/10.1016/J.DSR2.2018.02.010 778
Schloesser, R.W., Fabrizio, M.C., 2017. Condition Indices as Surrogates of Energy 779 Density and Lipid Content in Juveniles of Three Fish Species. Trans. Am. Fish. 780 Soc. 146, 1058–1069. https://doi.org/10.1080/00028487.2017.1324523 781
Shulman, G.E., Love, R.M., 1999. The biochemical ecology of marine fishes. Advances 782 in marine biology. Volume 36,. Academic Press. 783
Somarakis, S., 2005. Marked interannual differences in reproductive parameters and 784 daily egg production of anchovy in the northern Aegean Sea. Belgian J. Zool. 135, 785 247–252. 786
Somarakis, S., Ganias, K., Tserpes, G., Koutsikopoulos, C., 2004. Ovarian allometry 787 and the use of the gonosomatic index: A case study in the Mediterranean sardine, 788 Sardina pilchardus. Mar. Biol. 146, 181–189. https://doi.org/10.1007/s00227-004-789 1419-2 790
Stearns, S.C., 1989. The Evolutionary Significance of Phenotypic Plasticity. Bioscience 791 39, 436–445. https://doi.org/10.2307/1311135 792
Sutton, S.G., 2011. Relationship among fat weight, body weight, water weight, and 793 condition factors in wild Atlantic salmon Parr. Trans. Am. Fish. Soc.129, 527–794 538. https://doi.org/10.1577/1548-8659(2000)129<0527:RAFWBW>2.0.CO;2 795
Tirelli, V., Borme, D., Tulli, F., Cigar, M., Fonda Umani, S., Brandt, S.B., 2006. Energy 796 density of anchovy Engraulis encrasicolus L. in the Adriatic Sea. J. Fish Biol. 797 982–989. https://doi.org/10.1111/j.1095-8649.2005.00987.x 798
Tocher, D.R., 2003. Metabolism and Functions of Lipids and Fatty Acids in Teleost 799 Fish. Rev. Fish. Sci. 11, 107–184. https://doi.org/10.1080/713610925 800
Tugores, P., Giannoulaki, M., Iglesias, M., Bonanno, A., Tičina, V., Leonori, I., 801 MacHias, A., Tsagarakis, K., Díaz, N., Giráldez, A., Patti, B., De Felice, A., 802 Basilone, G., Valavanis, V., 2011. Habitat suitability modelling for sardine Sardina 803 pilchardus in a highly diverse ecosystem: The Mediterranean Sea. Mar. Ecol. Prog. 804 Ser. 443, 181–205. https://doi.org/10.3354/meps09366 805
Van Beveren, E., Bonhommeau, S., Fromentin, J.-M., Bigot, J.-L., Bourdeix, J.-H., 806 Brosset, P., Roos, D., Saraux, C., 2014. Rapid changes in growth, condition, size 807

and age of small pelagic fish in the Mediterranean. Mar. Biol. 161, 1809–1822. 808 https://doi.org/10.1007/s00227-014-2463-1 809
Wang, S.B., Houde, E.D., 1994. Energy storage and dynamics in bay anchovy Anchoa 810 mitchilli. Mar. Biol. 121, 219–227. https://doi.org/10.1007/BF00346729 811
812