Induced spawning in perch, Perca fluviatilis L. using carp pituitary extract and HCG

This article was published in an Elsevier journal. The attached copyis furnished to the author for non-commercial research and
education use, including for instruction at the author’s institution,sharing with colleagues and providing to institution administration.
Other uses, including reproduction and distribution, or selling orlicensing copies, or posting to personal, institutional or third party
websites are prohibited.
In most cases authors are permitted to post their version of thearticle (e.g. in Word or Tex form) to their personal website orinstitutional repository. Authors requiring further information
regarding Elsevier’s archiving and manuscript policies areencouraged to visit:
http://www.elsevier.com/copyright

Author's personal copy
Fisheries Research 86 (2007) 228–240
Spawning, daily egg production, and spawning stock biomass estimationfor common sardine (Strangomera bentincki) and anchovy
(Engraulis ringens) off central southern Chile in 2002
Luis A. Cubillos a,∗, Patricia Ruiz b, Gabriel Claramunt c, Santiago Gacitua a, Sergio Nunez b,Leonardo R. Castro a, Katty Riquelme a, Carolina Alarcon a,
Ciro Oyarzun a, Aquiles Sepulveda b
a Departamento de Oceanografıa, Facultad de Ciencias Naturales y Oceanograficas, Universidad de Concepcion, Casilla 160-C, Concepcion, Chileb Departamento de Pesquerıas, Instituto de Investigacion Pesquera, Casilla 350, Talcahuano, Chile
c Departamento de Ciencias del Mar, Universidad Arturo Prat, Casilla 121, Iquique, Chile
Received 16 September 2006; received in revised form 30 May 2007; accepted 7 June 2007
Abstract
In this paper, the first daily egg production method (DEPM) parameters were estimated for anchovy and common sardine stocks distributed inthe central-south area off Chile (33–40◦S). The study area was stratified according to the topography, shape and orientation of the coastal line, andthe survey was carried out on the continental shelf during the main spawning peak (August–September, 2002). The bulk of the spawning of bothspecies was successfully covered, which was characterized by a coastal distribution within the first 20 nautical miles, and following the inner zoneassociated with the 100 m bottom depth. The coastal distribution of the spawning can be related to the oceanographic conditions occurring duringthe transition from winter to spring (southern Hemisphere), which are characterized by the alternation between northerly and southerly winds.Probably, these factors are interacting to produce enrichment, concentration and retention of egg in coastal zones in the study area. The daily eggproduction rate (P0) was estimated for two geographic strata, and was different in each region. Also, the length frequency and adult reproductiveparameters were different between geographic strata, specially the daily spawning fraction. For anchovy, the P0 was lower in comparison withavailable estimates for the same species in Peru and in the north area off Chile. Also, the relative fecundity of anchovy was lower, probably becauseanchovy in the study area have bigger eggs as compared with the anchovy in Northern Chile. The DEPM parameters estimated for common sardinein the investigated area were similar to the range of existing values for the Engraulis genus in other upwelling areas. The stratified spawning stockbiomass estimate was 133,031 t (CV = 44%) for anchovy and 706,792 t (CV = 68%) for common sardine. Probably, daily egg production and adultreproductive parameters of both species are highly variables and further research is suggested for improvements future DEPM application for thespecies.© 2007 Elsevier B.V. All rights reserved.
Keywords: Daily egg production; Spawning; Reproductive parameters; Small pelagic fish; DEPM; Central-south Chile
1. Introduction
Two small pelagic fish, locally known as common sardine(Strangomera bentincki) and anchovy (Engraulis ringens), areimportant fish resources for both industrial and small-scalepurse-seine fleet in the central-south area off Chile (34–40◦S),with Talcahuano as the main port for landings (Cubillos etal., 1998, 2002). S. bentincki is an endemic species distributed
∗ Corresponding author. Tel.: +56 41 2207233; fax: +56 41 2256571.E-mail address: [email protected] (L.A. Cubillos).
from northern Coquimbo (29◦S) to Puerto Montt (42◦S), whileE. ringens is distributed from northern Peru to southern Chile(Arrizaga, 1981; Serra, 1983). In the central-south area off Chile,these small pelagic species are caught together by fishermenbecause anchovy and common sardine are co-occurring speciesand aggregated in mixed schools (Gerlotto et al., 2004). In addi-tion, the biological characteristics are similar in terms of thespatial distribution, growth rate, reproduction time, spawningarea, and recruitment time (Cubillos et al., 2001, 2002).
The spawning season of the species tends to occur in win-ter (southern Hemisphere) and extends from July to September,with a peak between August and September (Cubillos et al.,
0165-7836/$ – see front matter © 2007 Elsevier B.V. All rights reserved.doi:10.1016/j.fishres.2007.06.007

Author's personal copy
L.A. Cubillos et al. / Fisheries Research 86 (2007) 228–240 229
1999). Three to four months after the spawning, the surviv-ing juveniles are recruiting into the population from Novemberto January at a modal length between 5 and 6 cm total length(Cubillos et al., 2001, 2002). The fishery is heavily dependenton the annual pulse of recruitment, which is due to the higherabundance, availability and accessibility of recruits in bays andgulfs from January to March (Cubillos et al., 1998).
Stock assessments of common sardine and anchovy havebeen done through cohort analysis on a monthly basis due totheir short-life cycle and the seasonal behavior of the fishery(Cubillos et al., 2002). Since 2000, hydroacoustic surveys havebeen carried out to assess the annual pulse of recruitment inJanuary every year (Castillo et al., 2001, 2002, 2003a,b, 2004),and only one hydroacoustic survey was carried out in August2001 to estimate total and spawning stock biomasses (Castilloet al., 2002). In the former, the acoustic survey estimated a totalbiomass of 564 thousand t for anchovy and 261,000 t for com-mon sardine, from which 41 and 60% represented the maturebiomass of anchovy and common sardine respectively (Castilloet al., 2002).
However, the spawning stock biomass of both species can beassessed by applying the daily egg production method (DEPM,Lasker, 1985; Hunter and Lo, 1993). In fact, both species have acoastal and well defined spawning area (Castro et al., 1997),and they are species with asynchronous oocyte development(undetermined fecundity) (Arancibia et al., 1994; Cubillos etal., 1999). Biomass estimation by DEPM has several advan-tages over hydroacoustic assessment because DEPM providesinformation about the reproductive condition of females, dis-tribution of the spawning, reproductive habitat, egg productionand mortality during the peak of spawning. These parametersare important for stock assessment and fisheries management ifDEPM estimates can be keeping on sufficiently long-time peri-ods, and particularly when DEPM parameters can be comparedacross species and genus (Alheit, 1993; Somarakis et al., 2004).
In 2002, a DEPM was applied for spawning stock biomassestimation of common sardine and anchovy off central southernChile. This is the first application of DEPM for the southernstocks of anchovy and common sardine in the Humboldt Cur-rent System, providing important and new information in termsof the spatial distribution of the spawning, the daily egg produc-tion, egg mortality, as well as the reproductive adult parameters.In this paper, results are compared with the daily egg produc-tion and the adult reproductive parameters available for otherclupeoids stocks in upwelling areas particularly on Northernanchovy (E. mordax) off California, E. ringens off Peru andnorthern Chile, and E. encrasicolus off South Africa.
2. Materials and methods
2.1. Study area and survey description
The study area was located off central southern Chile(33–40◦S) covering 27,837 km2, which represents the mainspawning area for both species. According to Cubillos et al.(1999, 2001), spawning extends from July to September, peakingbetween August and September for both anchovy and common
Fig. 1. Study area showing the location of the plankton stations and depthcontour.
sardine. In this way, a single survey is enough to characterizethe spawning process of the two species. The study area wasdivided in three strata: (a) northern zone, from Valparaiso tonorthern Constitucion (33–35◦S), (b) central zone, from Consti-tucion to Gulf of Arauco (35–37◦10′S), and (c) south zone, fromLebu to south of Corral (37◦28′–40◦S) (Fig. 1). Plankton stationswere distributed regularly on the continental shelf (200 m depth)with stations spaced by two nautical miles apart along E–W tran-sects, and transects separated by five nautical miles. The northernzone was considered an exploratory area in which transects werespaced by 10 nautical miles apart, because egg abundance prac-tically has been not observed in this zone previously (Castro etal., 1997; Castillo et al., 2002). During 15 August–9 Septem-ber 2002, two ships were used to collect ichthyoplanktonic databy means of vertical hauls of Pairovet nets (25 cm diameter,0.150 mm mesh size, Smith et al., 1985) from 70 m or nearthe seabed in depth less than 70 m. The research vessel “KAYKAY” of the “Universidad de Concepcion” operated in the cen-tral zone, while the fishing vessel “FOX” operated in northernand southern zones.
In addition, 10 small purse-seine boats (18 m length) wereused to obtain adult samples of anchovy and common sardineduring the study period. Five boats were allocated to the centralzone and five to the southern zone. A total of 106 fishing setswere conducted from which 17 were without fish, and the major-ity of the sets occurred in the daytime, mainly between 6:30 and18:00 h. The sets covered a wide geographic area between Con-
Author's personal copy
230 L.A. Cubillos et al. / Fisheries Research 86 (2007) 228–240
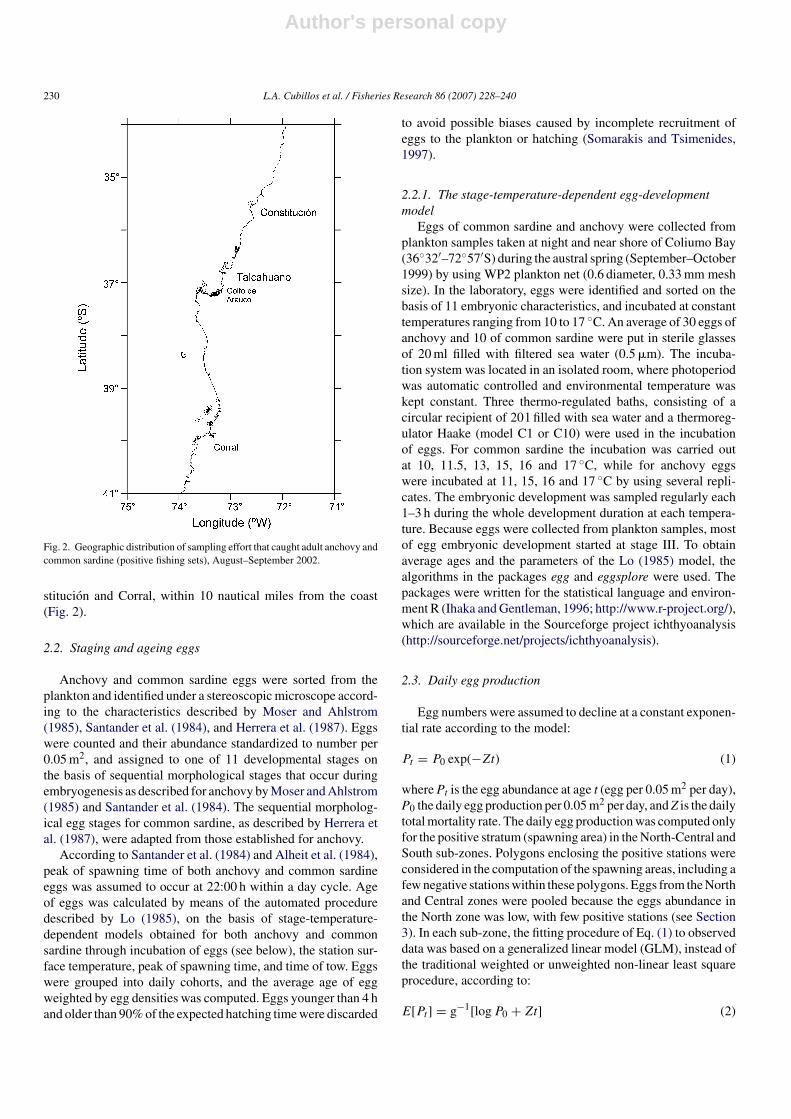
Fig. 2. Geographic distribution of sampling effort that caught adult anchovy andcommon sardine (positive fishing sets), August–September 2002.
stitucion and Corral, within 10 nautical miles from the coast(Fig. 2).
2.2. Staging and ageing eggs
Anchovy and common sardine eggs were sorted from theplankton and identified under a stereoscopic microscope accord-ing to the characteristics described by Moser and Ahlstrom(1985), Santander et al. (1984), and Herrera et al. (1987). Eggswere counted and their abundance standardized to number per0.05 m2, and assigned to one of 11 developmental stages onthe basis of sequential morphological stages that occur duringembryogenesis as described for anchovy by Moser and Ahlstrom(1985) and Santander et al. (1984). The sequential morpholog-ical egg stages for common sardine, as described by Herrera etal. (1987), were adapted from those established for anchovy.
According to Santander et al. (1984) and Alheit et al. (1984),peak of spawning time of both anchovy and common sardineeggs was assumed to occur at 22:00 h within a day cycle. Ageof eggs was calculated by means of the automated proceduredescribed by Lo (1985), on the basis of stage-temperature-dependent models obtained for both anchovy and commonsardine through incubation of eggs (see below), the station sur-face temperature, peak of spawning time, and time of tow. Eggswere grouped into daily cohorts, and the average age of eggweighted by egg densities was computed. Eggs younger than 4 hand older than 90% of the expected hatching time were discarded
to avoid possible biases caused by incomplete recruitment ofeggs to the plankton or hatching (Somarakis and Tsimenides,1997).
2.2.1. The stage-temperature-dependent egg-developmentmodel
Eggs of common sardine and anchovy were collected fromplankton samples taken at night and near shore of Coliumo Bay(36◦32′–72◦57′S) during the austral spring (September–October1999) by using WP2 plankton net (0.6 diameter, 0.33 mm meshsize). In the laboratory, eggs were identified and sorted on thebasis of 11 embryonic characteristics, and incubated at constanttemperatures ranging from 10 to 17 ◦C. An average of 30 eggs ofanchovy and 10 of common sardine were put in sterile glassesof 20 ml filled with filtered sea water (0.5 �m). The incuba-tion system was located in an isolated room, where photoperiodwas automatic controlled and environmental temperature waskept constant. Three thermo-regulated baths, consisting of acircular recipient of 20 l filled with sea water and a thermoreg-ulator Haake (model C1 or C10) were used in the incubationof eggs. For common sardine the incubation was carried outat 10, 11.5, 13, 15, 16 and 17 ◦C, while for anchovy eggswere incubated at 11, 15, 16 and 17 ◦C by using several repli-cates. The embryonic development was sampled regularly each1–3 h during the whole development duration at each tempera-ture. Because eggs were collected from plankton samples, mostof egg embryonic development started at stage III. To obtainaverage ages and the parameters of the Lo (1985) model, thealgorithms in the packages egg and eggsplore were used. Thepackages were written for the statistical language and environ-ment R (Ihaka and Gentleman, 1996; http://www.r-project.org/),which are available in the Sourceforge project ichthyoanalysis(http://sourceforge.net/projects/ichthyoanalysis).
2.3. Daily egg production
Egg numbers were assumed to decline at a constant exponen-tial rate according to the model:
Pt = P0 exp(−Zt) (1)
where Pt is the egg abundance at age t (egg per 0.05 m2 per day),P0 the daily egg production per 0.05 m2 per day, and Z is the dailytotal mortality rate. The daily egg production was computed onlyfor the positive stratum (spawning area) in the North-Central andSouth sub-zones. Polygons enclosing the positive stations wereconsidered in the computation of the spawning areas, including afew negative stations within these polygons. Eggs from the Northand Central zones were pooled because the eggs abundance inthe North zone was low, with few positive stations (see Section3). In each sub-zone, the fitting procedure of Eq. (1) to observeddata was based on a generalized linear model (GLM), instead ofthe traditional weighted or unweighted non-linear least squareprocedure, according to:
E[Pt] = g−1[log P0 + Zt] (2)

Author's personal copy
L.A. Cubillos et al. / Fisheries Research 86 (2007) 228–240 231
where E[Pt] is the expected value of the density of eggs ofage t and g−1 is the inverse of the link function. In the fit-ting procedure, the link function used natural logarithm and anegative binomial family, which accounts for increasing vari-ance as the density of eggs increases (Bernal et al., 2001). Thenegative binomial distribution has an extra parameter, whichwas iteratively estimated in the fitting procedure according withVenables and Ripley (2002). The parameters, log(P0) and Z,are estimated as intercept and slope of the GLM model. Thedaily egg production is estimated as the exponential of the inter-cept of the model. We used the package MASS (Venables andRipley, 2002), written for the statistical language and environ-ment R (Ihaka and Gentleman, 1996; http://www.r-project.org).Finally, the stratified estimates of daily egg production and vari-ance in the total survey area of each stratum were computedaccording to procedures described in Picquelle and Stauffer(1985).
2.4. Adult sampling and laboratory procedures
On board, adult anchovy and common sardine were randomlysampled from 32 and 52 fishing sets, respectively. In the Cen-tral zone, 14 fishing sets were available for anchovy and 32for sardine, while in the South sector 18 fishing sets were foranchovy and 20 for sardine. Total length (cm) of adult fish wasmeasured with the aim of obtaining length-frequency distribu-tions by sex. A random sub-sample of mature females was takenfrom each set, and each fish was dissected by mid-ventral inci-sion, and preserved in 10% buffered formaldehyde solution forsubsequent histological analysis of the ovary. In addition, anyextra females macroscopically detected with hydrated ovarieswere preserved in formaldehyde solution for subsequent anal-ysis of batch fecundity. These extra females were not usedin adult parameter analysis. Finally, a random sub-sample of200 fish was also preserved to determine sex proportion byweight.
Each preserved adult sub-samples was analyzed in the labo-ratory by measuring total length and both total and gonad freeweight (body weight). Also, the sex of every fish was determinedand each ovary from the mature females in each sub-sample wasweighed (±0.01 g) and preserved in 10% buffered formalde-hyde solution, and subjected to histological analysis. Ovaries ofmature females were sectioned and stained with haematoxylinand eosin. Oocyte development and maturation was subdi-vided into eight stages according to characteristics describedby Wallace and Selman (1981). Similarly, ovaries of hydratedfemales available for batch fecundity estimation were weighedand preserved to subsequent histological analysis to confirm thisparticular stage according to Hunter et al. (1985) and Hunter andMacewicz (1985). A correction factor was obtained to convertformalin weight to alive wet weight based on a sample of 30fish per species according to procedures described by Hunter(1985). On average, preservation in 10% buffered formalde-hyde solution caused a 5.2% increase in anchovy wet weightand a 3.91% increase in sardine wet weight during a period of63 days.
2.5. Adult parameters
The mean weight (W) of mature females in the ith fish-ing set was computed and corrected by factors associated topreservation, as well as the total weight of hydrated femaleswas corrected for the increase in weight due to hydration ofthe ovaries. The sex ratio (R) in the ith fishing set was com-puted from the weight of females divided by the sum of totalweight of females and males. The weight of males was alsocorrected by factors associated to preservation in formaldehydesolution.
The spawning fraction (S), i.e. the fraction of mature femalesspawning per day in each sample, was assessed by ageing pos-tovulatory follicles (POFs) according to the criteria developedby Hunter and Goldberg (1980) and Hunter and Macewicz(1985). Day-0, day-1 and day-2 POFs were observed. Day-0POFs are females that spawned in the night of capture (0–9 h),day-1 and day-2 between 9 and 32 (the night before the capture)and 33–56 h after the spawning peak respectively (Alheit et al.,1984). Spawning fraction was estimated from the proportion of1-day old POFs for samples captured mainly during daytime(mainly from 6:30 to 18:00 h). We used day-1 because day-2POFs may appear the same in histology for a longer period than24 h. This is just an inaccuracy in ageing old POFs, and not abias that needs to be adjusted. In this way, we do not apply anyadjust to the number of mature females and spawning fractionwas estimated as the proportion between day-1 POF and maturefemales.
The batch fecundity (F, number of eggs to be spawned asa batch) of females with hydrated oocytes was estimated usingthe gravimetric method suggested by Hunter et al. (1985). Onlyovaries with hydrated oocytes (early hydratation, fully hydrated)but no POFs were used which had previously been analyzedthrough histology of one ovary. Three sub-sections were cut froman ovary, weighed, and the number of hydrated oocytes in eachcounted. The total number of eggs per batch was computed bymultiplying the mean number of oocytes per gram of ovary sub-section by the total weight of the ovaries. Batch fecundity wasrelated to ovary-free weight of hydrated females by consideringa linear model, i.e.
Fj = a + bW∗j (3)
where W∗j is the ovary-free weight of the jth female, a and
b are parameters estimated by linear regression. The meanbatch fecundity for mature females in each set was estimatedby
Fi = 1
mi
mi∑
j=1
Fij (4)
where Fij is the estimate batch fecundity for the jth female inthe ith fishing set, computed from Eq. (3). The whole populationbatch fecundity (F ) was estimated through ratio estimator (Eq.(6)), while variance estimator of the batch fecundity was givenby

Author's personal copy
232 L.A. Cubillos et al. / Fisheries Research 86 (2007) 228–240
Hunter et al. (1985), i.e.
Var(F )=∑n
i=1
[(Fi − F )
2/(n − 1)+s2
h/nh+(W∗i − W∗
h )s2b
](∑n
i=1(mi/n))2
n(5)
where s2h is the variance about the regression (Eq. (3)), nh the
number of hydrated females used to fit the regression, W∗i the
average ovary-free weight in the ith fishing set, W∗h the aver-
age ovary-free weight of the nh hydrated females, and s2b is the
variance of the slope of the regression (Eq. (3)).The whole population adult parameters were computed by
ratio estimator (Picquelle and Stauffer, 1985), i.e.
¯y =∑n
i=1miyi∑ni=1mi
(6)
and sample variance
Var( ¯y) =∑n
i=1m2i (yi − ¯y)2
(m)2n(n − 1)(7)
where ¯y is the estimate of the population mean for adultparameters (W, R, S, and F), n the number of fishing set,y = ∑mi
j=1yij/mi the mean of the ith fishing set, mi the num-ber of mature females sampled in each fishing set, and yij thevalue computed for the jth female in the ith fishing set.
2.6. Spawning biomass
The daily egg production model was used to estimate thespawning stock biomass, which according to Stauffer andPicquelle (1980) is expressed by
B = P0AW
RSFk (7)
where B is the spawning stock biomass (t), P0 the daily eggproduction (number of eggs per m2 per day), A the total surveyarea (m2), W the average weight of mature females (g), k theconversion factor from grams to tons, R the fraction of maturefemales by weight, S the fraction of mature females spawningper day, and F is the batch fecundity (mean number of eggs permature female per spawning). Variance estimator for spawningbiomass was computed by
Var(B) ∼= �B2 × (CV(P0)2+CV(W)2+CV(F )2 + CV(S)2
+ CV(R)2 + 2COVS) (8)
where CV denotes coefficient of variation and COVS the sum ofterms involving covariance. The covariance formulas are stan-dard, and are expressed by
COVS =∑
i
∑
i<j
signCOV(xi, xj)
xixj
(9)
where x represents adult parameters, and i and j are indices fordifferent parameters, e.g. xi = F (fecundity) and xj = W (femaleweight). The term sign denotes the sign, positive when bothparameters are in the numerator or in the denominator, and
negative in any other case. The correlation function is thevariance–covariance matrix, e.g. the correlation between fecun-dity (F) and weight (W) is given by
r( ¯F, ¯W) =∑
imi(Fi − ¯F )ki(Wi − ¯W)
{mkn(n − 1)}σFσW
(10)
where mi and ki represent the number of mature females inthe ith fishing set for each parameter, and σ the standard errorof each parameter (Eq. (7)). Without considering the standarderror product in the denominator, the equation represents thecovariance.
3. Results
3.1. Spawning patterns and environmental conditions
A description of the egg survey is summarized in Table 1.The spawning of both species was very sparse in the north witha few positive stations of very low egg abundance (Fig. 3). Inthe central sector, the average eggs abundance of common sar-dine was higher than anchovy eggs (Table 1), but the spawningdistribution of anchovy was more continuous along the coast(Fig. 3). In the South sector, the spawning of both species wasvery coastal (Fig. 3), and the average abundance of anchovy waslower than sardine (Table 1). Basically, the bulk of the spawn-ing distribution of both species was fully covered by the survey(Fig. 3).
The spatial distribution of sea surface temperature (SST)revealed typical winter conditions for the study area, with SSTranging between 7 ◦C in the South sector to 13.8 ◦C in offshore
Fig. 3. Distribution of anchovy and common sardine eggs (egg per 0.05 m2) inthe surveyed area.

Author's personal copy
L.A. Cubillos et al. / Fisheries Research 86 (2007) 228–240 233
Table 1Description of the egg survey carried out off central southern Chile in 2002
Study area (33◦S–40◦S)
North sector (33◦00′S–35◦15′S) Central sector (35◦19′S–37◦09′S) South sector (37◦30′S–40◦00′S)
Date 15 August–18 August 29 August–9 September 21 August–30 AugustTransect lines 17 23 31Number of stations 129 308 358
Positive stationsAnchovy 8 (6.2%) 82 (26.6%) 103 (28.8%)Common sardine 2 (1.6%) 25 (8.1%) 84 (23.5%)
Average density and S.D. (egg/0.05 m2)Anchovy 0.3 (0.3) 4.0 (18.1) 9.9 (38.9)Common sardine 2.3 (19.8) 8.5 (86.2) 12.2 (86.6)Sea surface temperature (◦C) and range 12.4 (11.8–13.3) 12.4 (10.0–13.8) 11.6 (7.0–13.1)
waters in the North-Central sector of the study area (Fig. 4).The SST in the central sector (35◦20′S–37◦10′S) showed sur-face frontal structures associated with the runoff of freshwateror plumes of the main rivers like the Itata and Bio–Bio rivers.Nevertheless, a great area of the central sector presented SSTlower than 12.5 ◦C (ranging between 11.5 and 12.5 ◦C), excepta small area within the Gulf of Arauco with SST higher than13 ◦C. In the South sector (37◦30′S–40◦S), the SST distribu-tion showed two different zones. The first one was located to thenorth of 39 ◦S with SST higher than 11.5 ◦C (range 11.5–12 ◦C),and the second one located to the south of 39 ◦S with SST lowerthan 11.5 ◦C. In the latter, the lowest SST was registered nearthe coast (7–9 ◦C, 39◦30′S–73◦20′W).
During the survey, wind conditions were characterized byan alternation between northerly and southerly winds with peri-ods ranging between 2 and 3 days. The southerly winds weremore important in the central zone. These winds were mod-erate, and related with offshore transport and weak upwellingevents. On the contrary, northerly winds were related with con-vergence events in the coast, and they were active in both the
north and south zones of the study area, with 2–3 days ofduration.
3.2. Egg development model from incubation
The results obtained from the incubation experimentsare showed in Figs. 5 and 6 for anchovy and commonsardine, respectively. The temperature-stage dependent egg-development model for anchovy was:
YD,T = 19.39 exp(−0.0876T − 0.0557D)D1.346
and for common sardine expressed by:
YD,T = 15.21 exp(−0.0593T − 0.0192D)D1.038
where YD,T is the age (hours) of eggs, as a function of thedevelopment stage (D) and temperature (T). All coefficients ofthe models were significant at p < 0.05, with residual standarderror of 2.562 for anchovy (29 degrees of freedom) and 2.58 forcommon sardine (39 degrees of freedom).
Fig. 4. Horizontal distribution of sea surface temperature (◦C) in the three sub-areas of the study area.

Author's personal copy
234 L.A. Cubillos et al. / Fisheries Research 86 (2007) 228–240
Fig. 5. Anchovy temperature-dependent egg-development obtained from incubation experiments.
3.3. Daily egg production
In the North-Central sector, the positive spawning area ofanchovy was estimated as 2737 km2 (17.8% of the stratum),while the common sardine spawning area was estimated as999 km2 and covered only 6.3% of the stratum. In the Southsector, the spawning area was estimated as 4553 and 3528 km2
for anchovy and common sardine respectively (Table 2).The daily egg production was computed for two zones, the
North-Central and South sectors. The North-Central stratumincluded the few positive stations observed in the north sub-zone
(Table 1). A plot of eggs density against the mean age withineach daily cohort for each sampled station in the spawning areais shown in Fig. 7, with the density axis in log scale to allowfor better interpretation. In anchovy, the density of eggs withages less than 24 h was lower than sardine (Fig. 7). The dailyegg production (P0) was estimated as 5.5 eggs per 0.05 m2 perday for anchovy, and 93.7 eggs per 0.05 m2 per day for commonsardine in the positive North-Central area. In the South sector,the P0 of anchovy was estimated as 16.9 egg per 0.05 m2 perday, while the P0 of common sardine was estimated as 46.8 eggper 0.05 m2 per day (Table 2). The estimates of mortality rate
Fig. 6. Common sardine temperature-dependent egg-development obtained from incubation experiments.

Author's personal copy
L.A. Cubillos et al. / Fisheries Research 86 (2007) 228–240 235
Table 2Estimates of daily egg production (P0) and daily total mortality rate (Z) for anchovy and common sardine using GLM with binomial negative family and log link inthe spawning area (A1) of each stratum
Anchovy Common sardine
North and Central South North and Central South
Survey area (A, km2) 15367 12468 15367 12468Spawning area, (A1, km2) 2737 4553 999 3528P0 (egg/0.05 m2/day) 5.5 (0.281) 16.9 (0.275) 93.7 (0.615) 46.8 (0.331)Z (day−1) 0.22a (0.660) 0.47 (0.285) 0.98 (0.343) 0.80 (0.201)Dispersion parameter for binomial negative (θ) 0.183 0.132 0.105 0.137P0 (egg/m2 day) 19.7 (0.666) 123.6 (0.457) 121.8 (2.416) 264.6 (0.549)
The coefficient of variation is shown in parenthesis, and the stratified daily egg production for the survey area in each stratum.a Non-significant.
ranged between 0.22 and 0.47 day−1 for anchovy, and between0.8 and 0.98 day−1 for common sardine. Only the mortalityrate of anchovy was not significant in the North-Central sector(Table 2). Finally, the daily egg production for the whole sur-veyed area in each stratum ranged between 19.7 and 123.6 eggper m2 per day for anchovy and between 121.8 and 264.6 eggper m2 per day for common sardine (Table 2).
Fig. 7. Log-transformed egg density (eggs per m2) against average age of dailycohorts for anchovy and common sardine in the spawning area of each geo-graphic area of the study area.
3.4. Adult reproductive parameters and spawning biomassestimation
The length structure of anchovy was estimated from 4884specimens ranging from 6 to 17.5 cm total length, with 2501males and 2383 females. In the central sector, anchovy pre-sented a mode at 10 cm while in the South sector the mode waslocated at 14.5 cm for males and 15.5 cm for females (Fig. 8).In the case of common sardine, the length composition wasdetermined from 11569 specimens ranging from 6 to 17.5 cm,with 6321 males and 5248 females. Clearly, the length struc-ture among strata differ for anchovy, while common sardinepresented a similar length structure among zones, with a mainmode centered at 10 cm and a secondary mode between 14 and15 cm (Fig. 8).
The main reproductive parameters, as used in the DEPM,were evaluated from 1384 mature females in 32 fishing sets ofanchovy, from which 14 were allocated in the North-Centralstratum and 18 in the South sector (Table 3). In the caseof common sardine, reproductive parameters were evaluatedfrom 1265 mature females in 52 fishing sets, from 32 allo-cated in the North-Central sector and 20 in the South sector(Table 3).
During the survey, females of both species were repro-ductively active and collected mainly during daytime, andhence very few new postovulatory follicles (day-0 POFs) wereobserved. The spawning fraction computed on the basis of day-2 POFs was 1.8 times larger than day-1 POFs for anchovy inthe South sector and for common sardine in the North-Centralsector (Table 3). Instead, in the South sector, the spawningfraction of sardine based on day-2 was 3.1 times larger thanspawning fraction based on day-1 POFs. The higher incidenceof day-2 POFs might be due to inaccuracy in ageing olderPOFs. In this way, the spawning fraction estimates must bebased on day-1 POFs. The estimates of spawning fraction werelower for both species in the South stratum, and were signif-icantly different among geographic areas (ANOVA based onbinomial family and logit link in a generalized linear model,p < 0.01).
The average weight of mature females was higher for theSouth sector in both species (Table 3). A linear relationshipbetween batch fecundity and body weight was established, from158 anchovy and 116 sardine females (Fig. 9). Because the low

Author's personal copy
236 L.A. Cubillos et al. / Fisheries Research 86 (2007) 228–240
Fig. 8. Length frequency distribution per sex of anchovy and common sardine in each geographic area of the study area.
number of hydrated specimens, it was not possible to estimate adifferent relationship for each sub-zone. However, the averagebatch fecundity is computed from mature female body weight.In this way, the average batch fecundity was estimated as 4989for anchovy (CV = 12.3%) in the North-Central, and 8497 eggsper females in the South sector (CV = 4.9%). In the case of com-mon sardine, the average batch fecundity ranged between 8239(CV = 4.8%) and 10414 (CV = 3.2%) eggs per females for theNorth-Central and South sectors, respectively (Table 3). Thefraction of females by weight of anchovy ranged between 49and 51% for anchovy, and between 52 and 40% for commonsardine.
A summary of the reproductive parameters used as inputin the daily egg production method for estimating spawningstock biomass is showed in Table 4. Clearly, the daily egg pro-duction and the reproductive parameters differed between theNorth-Central and South sectors. Therefore, the spawning stockbiomass was estimated for each stratum and these can be con-sidered as independent estimates. The estimates of spawningstock biomass were higher in the South sector of the study areafor both species. The total stratified biomass estimates, whichare the sum of the biomass, were 133,031 t for anchovy and706,792 t for common sardine.
4. Discussion
During the survey period, the weather conditions were char-acterized by an alternation between northerly and southerlywinds with at least 2 to 3 days of duration each one. The northerlywinds are typical in winter time, and they are able to produceonshore transport and convergence in the coast, particularlywhen the wind intensity is strong (Arcos and Navarro, 1986).Cubillos et al. (2001) concluded that the reproductive strategy ofanchovy and common sardine is to spawn at the end of the australwinter (August), when oceanographic conditions are producingretention and concentration of eggs and larvae near the coast (i.e.onshore transport and convergence by northerly winds). Theseconditions are alternating with moderate southerly winds, whichare able to produce moderate upwelling events. One month later,only southerly winds are dominating and the enrichment of thecoastal waters by upwelling takes place (Arcos and Navarro,1986; Castro et al., 2000; Cubillos et al., 2001).
In 2002, during the winter-to-spring transition (southernHemisphere), the bulk of the spawning of anchovy and com-mon sardine was very coastal, within 20 nautical miles and atdepths less than 100 m bottom depth. In this context, the designof the grid stations successfully covered the spawning area of
Table 3Summary of the average adult reproductive parameters for anchovy and common sardine, obtained from samples collected during daytime (mainly 6:30 to 18:00 h)between 19 and 31 August (North-Central sector) and between 31 August and 9 September (South sector)
Parameters Anchovy Common sardine
North-Central South North-Central South
Spawning fraction, Day-1 females, S1 0.15 (0.220) 0.07 (0.151) 0.14 (0.169) 0.03 (0.427)Spawning fraction, Day-2 females, S2 0.15 (0.201) 0.12 (0.136) 0.24 (0.100) 0.09 (0.160)Weight of mature females, W (g) 14.2 (0.108) 22.2 (0.040) 19.5 (0.052) 24.6 (0.031)Batch fecundity, F (egg per mature female) 4989 (0.123) 8239 (0.048) 8497 (0.049) 10414 (0.032)Fraction of females by weight, R 0.49 (0.044) 0.52 (0.056) 0.51 (0.036) 0.40 (0.056)No. of fishing set 14 18 32 20No. of mature females 459 702 771 494

Author's personal copy
L.A. Cubillos et al. / Fisheries Research 86 (2007) 228–240 237
Table 4DEPM parameter and spawning stock biomass estimates for anchovy and common sardine in the “North-Central” and “South” strata off central southern Chile(August–September 2002)
DEPM Parameters Anchovy Common sardine
North-Central South North-Central South
Daily egg production, P0 (egg/m2/day) 19.7 123.6 121.8 264.6Weight of mature females, W (g) 14.2 22.2 19.5 24.6Sex ratio, R (fraction of females by weight) 0.49 0.52 0.51 0.40Batch fecundity, F (eggs per mature females) 4989 8239 8497 10414Spawning fraction, S 0.15 0.07 0.14 0.03Relative fecundity, RFa (eggs per g) 351 371 436 424Daily specific fecundity, DSFb (eggs per g) 25.6 12.7 30.4 5.1Survey area, A (km2) 15367 12468 15367 12468Spawning biomass, B (t) 11840 (0.70) 121191 (0.48) 61635 (2.42) 645157 (0.71)Total spawning stock biomass, B (t) 133031 (0.44) 706792 (0.68)
The coefficient of variation is shown in parenthesis for the spawning stock biomass estimates.a RF = F/W.b DSF = SFR/W.
the species. The coastal shape and the bottom depth seem to beimportant factors for the spawning distribution of both species.In the central sector, the continental shelf is wide and the threebays located there (“Golfo de Arauco”, “Bahıa de Concepcion”,and “Bahıa Coliumo”) are acting as important spawning zonesprobably through retention and concentration processes (Bakun,1996). In the South sector, the coastal shape is also acting as abig bay between 38◦30′ and 40◦S.
The spawning distribution is in agreement with recent resultsavailable in terms of the spatial distribution of eggs, larvae,recruits, and adults (Castro et al., 1997; Castillo et al., 2002,2003a,b, 2004). These studies have revealed the absence ofrecruits and adults of anchovy and common sardine in the north-ern sector of the study area, i.e. from Valparaiso (33◦S) to34◦30′S (northward Constitucion). Castro et al. (1997) foundhigher eggs concentrations of both species in neritic zones (con-tinental shelf), with nuclei well defined around the mouth of
Fig. 9. Regressions of batch fecundity on ovary-free weight of females ofanchovy and common sardine.
the Itata river (36◦05′S–36◦45′S), within the Gulf of Arauco,and between 37◦40′S and 39◦40′S. Although these results areconfirmed in this study, we used a more dense grid of stationsand therefore obtained a better spatial resolution of the spawn-ing. According to Castillo et al. (2002), the biomass quantifiedacoustically in winter 2001 (August) was mainly confined tothe neritic sector of the study area, with 100% of the biomassof both species concentrated between the coast and 10 nauticalmiles offshore.
Although the survey revealed two main important spawningareas, one located in the central sector from Constitucion to Gulfof Arauco (34◦30′S–37◦10′S) and the other one located in theSouth sector between 37◦20′S and 40◦S, the daily egg produc-tion was higher in the central sector for common sardine and inthe South sector for anchovy. Nevertheless, the spatial distribu-tion of the spawning of common sardine was more continuous inthe South sector. In fact, the spawning of common sardine waspatchy with two very high eggs density nuclei in the central sec-tor. In contrast, the spawning of anchovy showed a continuousdistribution along the coast in both sectors.
This is the first study in estimating the parameters of theDaily Egg Production Method for anchovy and common sar-dine in the central-south area off Chile. Estimates of the dailyegg production were different in the two geographic areas sam-pled, and also the adult reproductive parameters, particularlythe spawning fraction. In this way, the survey area had to begeographically stratified and we estimated DEPM parametersseparately for the North-Central and South strata of the surveyedarea. The daily egg production (P0) of anchovy ranged between5.5 and 16.9 eggs per 0.05 m2 in the positive area. These val-ues are low as compared with P0 estimates available for thesame species off northern Chile, but they are within the rangeof values reported for the same species in Peru, E. mordax inCalifornia, and E. encrasicolus in South Africa (Table 5). In thenorth area off Chile (18◦20′S–24◦S), the daily mortality rate hasbeen estimated between 0.44 and 1.15 per day, which is higherwhen compared to our estimation of 0.22 to 0.47 per day foranchovy off central southern Chile. In the case of the commonsardine, the P0 found in this species ranged between 46.8 and
Author's personal copy
238 L.A. Cubillos et al. / Fisheries Research 86 (2007) 228–240
Table 5Summary of DEPM data for Engraulis genus in upwelling regions. P = daily egg production (eggs per 0.05 m2 per day), Z = mortality rate (day−1), W = averageweight of mature females (g), F = average batch fecundity (eggs per mature females), S = average spawning fraction, R = fraction of females by weight, DSF = dailyspecific fecundity (eggs per g)
Species Area Year P Z W F S R DSF
E. mordax Californiaa 1980 11.1 0.45 17.4 7751 0.14 0.48 30.31981 8.0 0.14 13.4 8329 0.11 0.50 33.01982 3.3 0.16 18.8 10845 0.12 0.47 32.51983 5.6 0.18 11.2 5297 0.09 0.55 24.41984 3.8 0.17 12.0 5485 0.16 0.58 42.41985 4.8 0.29 14.5 7343 0.12 0.61 37.1
E. ringens Perub 1981 23.7 1.04 25.8 15401 0.16 0.56 53.41990 3.0 1.30 26.7 13487 0.05 0.51 12.91994 15.1 1.14 23.3 12723 0.08 0.53 22.01995 19.0 0.63 25.6 12701 0.12 0.54 32.21996 n.a n.a 29.8 18495 0.09 0.52 25.2
E. ringens Northern Chilec 1992 41.8 1.15 20.7 14917 0.16 0.48 55.3(18◦20′S–24◦S) 1995 20.0 0.63 29.2 15405 0.18 0.42 39.9
1996 15.8 0.48 30.0 19658 0.19 0.46 57.21997 14.9 0.44 21.7 12102 0.13 0.51 37.21999 23.0 0.78 22.7 10600 0.17 0.46 36.52000 29.7 0.77 30.9 16279 0.19 0.50 50.12001 30.2 0.80 32.4 15911 0.19 0.47 43.32002 15.9 0.62 21.3 16761 0.14 0.51 55.22003 37.1 0.83 25.2 13327 0.18 0.49 47.1
E. encrasicolus South Africad 1984 19.5 0.02 15.1 7953 0.15 0.51 40.11985 16.3 0.22 14.2 7991 0.19 0.48 50.31986 24.4 0.28 11.7 5627 0.10 0.55 25.31987 15.2 0.26 11.0 6490 0.08 0.56 26.51988 15.7 0.40 12.0 5878 0.09 0.55 22.71989 8.7 0.06 14.6 9045 0.13 0.49 37.91990 17.7 0.13 11.5 6967 0.06 0.55 21.1
a Picquelle and Stauffer (1985) and Lo (1997).b Santander et al. (1984), Hunter and Lo (1997), Lo (1997) and Ayon and Buitron (1997).c Braun et al. (2004).d Armstrong et al. (1988) and Shelton et al. (1993).
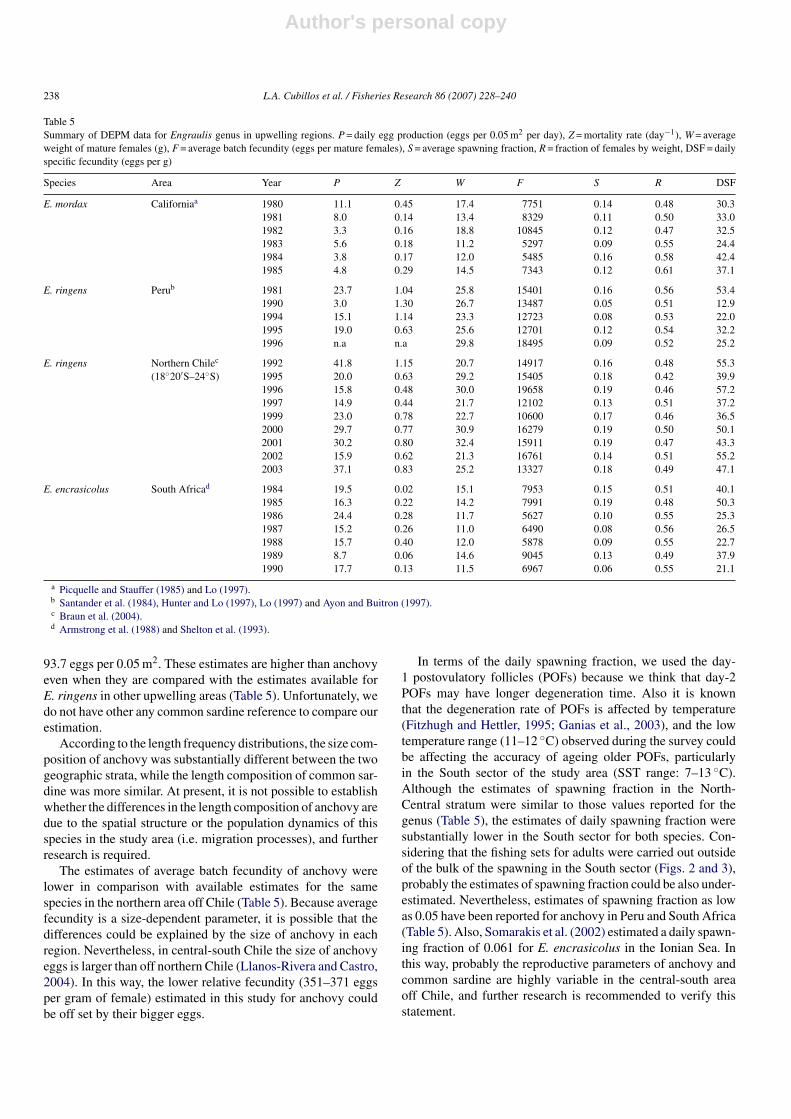
93.7 eggs per 0.05 m2. These estimates are higher than anchovyeven when they are compared with the estimates available forE. ringens in other upwelling areas (Table 5). Unfortunately, wedo not have other any common sardine reference to compare ourestimation.
According to the length frequency distributions, the size com-position of anchovy was substantially different between the twogeographic strata, while the length composition of common sar-dine was more similar. At present, it is not possible to establishwhether the differences in the length composition of anchovy aredue to the spatial structure or the population dynamics of thisspecies in the study area (i.e. migration processes), and furtherresearch is required.
The estimates of average batch fecundity of anchovy werelower in comparison with available estimates for the samespecies in the northern area off Chile (Table 5). Because averagefecundity is a size-dependent parameter, it is possible that thedifferences could be explained by the size of anchovy in eachregion. Nevertheless, in central-south Chile the size of anchovyeggs is larger than off northern Chile (Llanos-Rivera and Castro,2004). In this way, the lower relative fecundity (351–371 eggsper gram of female) estimated in this study for anchovy couldbe off set by their bigger eggs.
In terms of the daily spawning fraction, we used the day-1 postovulatory follicles (POFs) because we think that day-2POFs may have longer degeneration time. Also it is knownthat the degeneration rate of POFs is affected by temperature(Fitzhugh and Hettler, 1995; Ganias et al., 2003), and the lowtemperature range (11–12 ◦C) observed during the survey couldbe affecting the accuracy of ageing older POFs, particularlyin the South sector of the study area (SST range: 7–13 ◦C).Although the estimates of spawning fraction in the North-Central stratum were similar to those values reported for thegenus (Table 5), the estimates of daily spawning fraction weresubstantially lower in the South sector for both species. Con-sidering that the fishing sets for adults were carried out outsideof the bulk of the spawning in the South sector (Figs. 2 and 3),probably the estimates of spawning fraction could be also under-estimated. Nevertheless, estimates of spawning fraction as lowas 0.05 have been reported for anchovy in Peru and South Africa(Table 5). Also, Somarakis et al. (2002) estimated a daily spawn-ing fraction of 0.061 for E. encrasicolus in the Ionian Sea. Inthis way, probably the reproductive parameters of anchovy andcommon sardine are highly variable in the central-south areaoff Chile, and further research is recommended to verify thisstatement.

Author's personal copy
L.A. Cubillos et al. / Fisheries Research 86 (2007) 228–240 239
The total stratified spawning stock biomass estimate wasapproximately 133,000 t for anchovy, and 707,000 t for commonsardine. Acoustic biomass estimates carried out in January 2002were 1.5 and 0.87 million t for anchovy and common sardine,respectively (Castillo et al., 2003a). It must be mentioned thatboth species are recruiting from November to January in central-south Chile. In this way, the acoustic biomass carried out at thebeginning of the year is characterized by a high proportion ofrecruits (51% in anchovy and 99% in common sardine, Castilloet al., 2003a). Also, the fishery is strongly dependent on theannual pulse of recruitment with the highest catches obtainedbetween January and April, contributing to at least 75% of totalannual catch (Cubillos et al., 1998, 2002). In this context, thesurviving adult biomass at the beginning of the spawning sea-son must be strongly reduced by fishing and natural mortality. Inaddition, Cubillos et al. (2002) carried out monthly biomass esti-mates through cohort analysis. The estimates of total biomassfor August in the period 1990–1998 ranged between 173 and586,000 t in common sardine, and between 285 and 781,000 tfor anchovy. In consequence, our estimates of spawning biomassseem to be reasonable according to previous assessment, and theseasonal changes occurring in the abundance of the species inthe central-south area off Chile.
Finally, we want to note that this is the first DEPM applied totwo small pelagic fish off central southern Chile. In this way,some suggestions for improvements are necessary for futureDEPM estimation. It will be necessary to keep the stratifiedscheme developed in this study, particularly to verify the dif-ferences founded in the daily egg production and the adultreproductive parameters. Estimates of spawning fraction requirespecial attention because of inaccuracy in ageing older POFs,and probably a review of the criteria used deserves care foranchovy and common sardine, specially the former. Experi-ments of degeneration rate of POFs are highly recommendedby considering the low environmental temperature founded inthe spawning habitat of the species. Adult reproductive param-eters will improve with every annual repetition, as well as dailyegg production. In fact, the DEPM estimates are better for stockassessment and fishery management when they are kept for asufficiently long period.
Acknowledgements
We thank Nancy C.H. Lo, Andres Uriarte, and BeverlyMacewicz for their collaboration and help in reviewing theresults contained in our research. Thanks also go to the crewof the fishing vessels (“FOX”, “VICTOR GUILLERMO”,“ACHERNAR”, “RIVEIRA”, “HURACAN”, “RIO MAIPOII”, “MARGARITA DEL MAR”, “RAMIRO M.”, “NELLY”,“ARLEKIN”, and “SAMARITANO”), as well as the crewof the research vessel “KAY KAY” of the Universidad deConcepcion. Thank to the technicians participating on board,particularly Hernan Rebolledo, Francisco Gomez, MaximilianoReyes, Claudio Pino, and Claudio Toro. We want to thank toMarcelo Pavez, Ivan Veas, Marıa Krautz, Alejandra Llanos ofLOPEL (Universidad de Concepcion), for collecting and pro-cessing plankton samples, and to Gustavo Aedo, Erik Daza,
Elson Leal, Paola Gonzalez, Gustavo Herrera, Yasna Munoz,Victor Baros, Jorge Oliva, Eduardo Dıaz for collaboration inprocessing adult samples. This research was funded by the“Fondo de Investigacion Pesquera” (http://www.fip.cl/) throughResearch Project FIP No. 2002-14. Authors also thank to tworeferees for useful comments and suggestions.
References
Alheit, J., 1993. Use of the daily egg production method for estimating biomassof clupeoid fishes: a review and evaluation. Bull. Mar. Sci. 53, 750–767.
Alheit, J., Alarcon, V.H., Macewicz, B.J., 1984. Spawning frequency and sexratio in the Peruvian anchoveta Engraulis ringens. CalCOFI Rep. 25, 43–52.
Arancibia, H., Cubillos, L., Remaggi, J., Alarcon, R., 1994. Determinacion dela talla de madurez sexual y fecundidad parcial en la sardina comun, Stran-gomera bentincki (Norman, 1936), del area de Talcahuano, Chile. Biol. Pesq.23, 11–17.
Arcos, D.F., Navarro, N., 1986. Analisis de un ındice de surgencia para la zonade Talcahuano Chile (Lat. 37◦S). Invest. Pesq. (Chile) 33, 91–98.
Armstrong, M.P., Shelton, P.A., Hampton, I., Jolly, G., Melo, Y., 1988. Eggproduction estimates of anchovy biomass in the southern Benguela system.CalCOFI Rep. 29, 137–157.
Arrizaga, A., 1981. Nuevos antecedentes biologicos para la sardina comun,comun Clupea (Strangomera) bentincki Norman 1936. Bol. Soc. Biol. Con-cepcion 52, 5–66.
Ayon, P., Buitron, B., 1997. Estimacion de la biomasa desovante del stock norte-centro de la anchoveta por el metodo de la produccion de huevos, durante elinvierno de 1996. In: Crucero de la biomasa desovante de la anchoveta, BICHumboldt 9608-09. IMARPE, CEE-VECEP ALA 92/43. Informe N 123,pp. 13–19.
Bakun, A., 1996. Patterns in the Ocean: Ocean Processes and Marine PopulationDynamics. University of California Sea Grant, UCSD, San Diego, CA andCentro de Investigaciones Biologicas de Noroeste, La Paz, Baja, California,p. 323.
Bernal, M., Borchers, D.L., Valdes, L., Lago de Lanzos, A., Buckland, S.T.,2001. A new ageing method for eggs of fish species with daily spawningsynchronicity. Can. J. Fish Aquat. Sci. 58, 2330–2340.
Braun, M., Claramunt, G., Reyes, H., Cataste, V., Montenegro, C., Baros, V.,Dıaz, E., Pizarro, J., Pizarro, P., 2004. Evaluacion del stock desovante deanchoveta en la I y II regiones, ano 2003. Inf. Tec. FIP-IT/2003–07, 124 pp.(available on line at http://www.fip.cl/).
Castillo, J., Barbieri, M.A., Espejo, M., Catasti, V., 2001. Evaluacion acustica dela biomasa, abundancia y distribucion espacial de anchoveta y sardina comunen el periodo de reclutamiento, verano 2001. In: Evaluacion acustica delreclutamiento de anchoveta y sardina comun en la zona centro-sur, ano 2000.Inf. Tec. FIP-IT/2000–09, 151 pp. (available on line at http://www.fip.cl/).
Castillo, J., Barbieri, M.A., Espejo, M., Saavedra, A., Catasti, V., 2002.Evaluacion acustica de la biomasa, abundancia, distribucion espacial y car-acterizacion de las agregaciones de anchoveta y sardina comun en el periodode desove, invierno 2001. In: Evaluacion hidroacustica del stock desovantede anchoveta y sardina comun, centro-sur, 2001, Inf. Tec. FIP-IT/2001–14,241 pp. (available on line at http://www.fip.cl/).
Castillo, J., Saavedra, A., Espejo, M., Cordova, J., Galvez, P., Barbieri, M.A.,2003a. Evaluacion acustica de la biomasa, abundancia, distribucion espa-cial de anchoveta y sardina comun, y caracterizacion de cardumenes duranteel periodo de reclutamiento, zona centro-sur, verano 2002. In: Evaluacionacustica del reclutamiento de anchoveta y sardina comun en la zona centro-sur, ano 2002. Inf. Tec. FIP-IT/2001–13, 206 pp. (available on line athttp://www.fip.cl/).
Castillo, J., Saavedra, A., Gavez, P., Espejo, M., Baribieri, M.A., 2003b. Eval-uacion acustica biomasa, abundancia, distribucion espacial de anchoveta ysardina comun, y caracterizacion de cardumenes durante el perıodo de reclu-tamiento. In: Evaluacion hidroacustica del reclutamiento de anchoveta ysardina comun entre la V y X Regiones, ano 2002. Inf. Tec. FIP-IT/2002–13,203 pp. (available on line at http://www.fip.cl/).

Author's personal copy
240 L.A. Cubillos et al. / Fisheries Research 86 (2007) 228–240
Castillo, J., Saavedra, A., Gavez, P., Barrıa, P., Espejo, M., Baribieri, M.A.,2004. Evaluacion acustica biomasa, abundancia, distribucion espacial y car-acterizacion de cardumenes. In: Evaluacion hidroacustica del reclutamientode anchoveta y sardina comun entre la V y X Regiones, ano 2003. Inf. Tec.FIP-IT/2003–08, 178 pp. (available on line at http://www.fip.cl/).
Castro, L., Roa, R., Figueroa, D., Arancibia, H., Sobarzo, M., Quinones, R.,Retamal, M., 1997. Areas de desove de anchoveta y sardina comun en lazona central. Inf. Tec. FIP-IT/96–11, 114 pp. (available on line at http://www.fip.cl/).
Castro, L.R., Hernandez, E.H., Salinas, G.R., 2000. Environmental influenceson winter spawning of the anchoveta Engraulis ringens off central Chile.Mar. Ecol. Prog. Ser. 197, 247–258.
Cubillos, L., Canales, M., Hernandez, A., Bucarey, D., Vilugron, L., Miranda,L., 1998. Poder de pesca, esfuerzo de pesca y cambios estacionales e interan-uales en la abundancia relativa de Strangomera bentincki y Engraulis ringensen el area frente a Talcahuano Chile (1990–97). Invest. Mar. Valparaıso 26,3–14.
Cubillos, L., Canales, M., Bucarey, D., Rojas, A., Alarcon, R., 1999. Epocareproductiva y talla media de primera madurez sexual de Strangomerabentincki y Engraulis ringens en la zona centro-sur de Chile en el perıodo1993–1997. Invest. Mar. Valparaıso 27, 73–86.
Cubillos, L.A., Arcos, D.F., Canales, M., Bucarey, D., 2001. Seasonal growthof small pelagic fish off Talcahuano (37◦S–73◦W) Chile: a consequence oftheir reproductive strategy to seasonal upwelling? Aquat. Living Resour. 14,115–124.
Cubillos, L.A., Bucarey, D.A., Canales, M., 2002. Monthly abundance esti-mation for common sardine Strangomera bentincki and anchovy Engraulisringens in the central-south Chile (34–40◦S). Fish. Res. 57, 117–130.
Fitzhugh, G.R., Hettler, W.F., 1995. Temperature influence on postovulatoryfollicle degeneration in Atlantic menhaden, Brevoortia tyrannus. Fish. Bull.93, 568–572.
Ganias, K., Somarakis, S., Machias, A., Theodorou, A.J., 2003. Evaluationof spawning frequency in a Mediterranean sardine population (Sardinapilchardus sardina). Mar. Biol. 142, 1169–1179.
Gerlotto, F., Castillo, J., Saavedra, A., Barbieri, M.A., Espejo, M., Cotel, P.,2004. Three-dimensional structure and avoidance behaviour of anchovy andcommon sardine schools in central southern Chile. ICES J. Mar. Sci. 61,1120–1126.
Herrera, G., Tarifeno, E., Orellana, M.C., 1987. Descripcion de huevos yprimeras fases larvales de la sardina comun (Strangomera bentincki) y delmachuelo (Ethmidium maculatum). Biol. Pesq. 16, 107–113.
Hunter, J.R., Goldberg, S.R., 1980. Spawning incidence and batch fecundity innorthern anchovy Engraulis mordax. Fish. Bull. 77, 641–652.
Hunter, J.R., Lo, N.C.H., Leong, R.J.H., 1985. Batch fecundity in multiplespawning fishes. In: R. Lasker (Ed.),. An egg production method for estimat-ing spawning biomass of pelagic fish: application to the northern anchovy,Engraulis mordax. U.S. Dep. Commer., NOAA Tech. Rep. NMFS 36, pp.67–77.
Hunter, J.R. and Macewicz, B., 1985. Measurements of spawning frequencyin multiple spawning fish. In: R. Lasker (Ed.), An egg production methodfor estimating spawning biomass of pelagic fish: Application to the northernanchovy, Engraulis mordax. U.S., Dep. Commer., NOAA Tech. Rep. NMFS36, pp. 79–94.
Hunter, J.R., Lo, N.C.-H., 1993. Ichthyoplankton methods for estimating fishbiomass introduction and terminology. Bull. Mar. Sci. 53, 723–727.
Hunter, J.R., Lo, N.C.-H., 1997. The daily egg production method of biomassestimation: some problems and potential improvements. Ozeanografika 2,41–69.
Hunter, J.R., 1985. Preservation of Northern anchovy in formaldehyde solu-tion. In: R. Lasker (Ed.), An egg production method for estimating
spawning biomass of pelagic fish: application to the northern anchovy,Engraulis mordax. U.S. Dep. Commer., NOAA Tech. Rep. NMFS 36,pp. 63–66.
Ihaka, R., Gentleman, R., 1996. R: a language for data analysis and graphics. J.Comput. Graph. Stat. 5, 299–314.
Lasker, R., (Ed.) (1985) An egg production method for estimating spawningbiomass of pelagic fish: application to the northern anchovy, Engraulismordax. U.S. Dep. Commer., NOAA Tech. Rep. NMFS 36.
Llanos-Rivera, A., Castro, L., 2004. Latitudinal and seasonal egg-size variationof the anchoveta (Engraulis ringens) off the Chilean coast. Fish Bull. 102,207–212.
Lo, N.C.H., 1985. A model for temperature-dependent northern anchovy eggdevelopment. In: R. Lasker (Ed.), An egg production method for estimat-ing spawning biomass of pelagic fish: application to the northern anchovy,Engraulis mordax. U.S. Dep. Commer., NOAA Tech. Rep. NMFS 36, pp.43–50.
Lo, N.C.H., 1997. Empirical analyses of the precision of regression estimatesof daily egg production and egg mortality of pelagic fish for daily eggproduction method. Ozeanografika 2, 71–89.
Moser, H. G., Ahlstrom, E. H., 1985. Staging anchovy eggs. In: R. Lasker (Ed.),An egg production method for estimating spawning biomass of pelagic fish:application to the northern anchovy, Engraulis mordax. U.S. Dep. Commer.,NOAA Tech. Rep. NMFS 36, pp. 37–41.
Picquelle, S.J., Stauffer, G., 1985. Parameter estimation for an egg productionmethod of northern anchovy biomass assessment. In: R. Lasker (Ed.), Anegg production method for estimating spawning biomass of pelagic fish:application to the northern anchovy, Engraulis mordax. U.S. Dep. Commer.,NOAA Tech. Rep. NMFS 36, pp. 7–15.
Santander, H., Alheit, J., Smith, P.E., 1984. Estimacion de la biomasa de lapoblacion desovante de anchoveta peruana, Engraulis ringens, en 1981 poraplicacion del “Metodo de Produccion de Huevos. Bol. Inst. Mar Peru 8,209–250.
Serra, J.R., 1983. Changes in the abundance of pelagic resources along theChilean coast. In: Sharp, G.D., Csirke, J. (Eds.), Proceedings of the ExpertConsultation to Examine Changes in Abundance and Species Compositionof Neritic Fish Resources. FAO Fish. Rep 291 (2), 255–284.
Shelton, P.A., Armstrong, M.J., Roel, B.A., 1993. An overview of the applicationof the daily egg production method in the assessment of anchovy in thesoutheast Atlantic. Bull. Mar. Sci. 53, 778–794.
Smith, P. E., Flerx, W., Hewitt, R. P., 1985. The CalCOFI vertical egg tow(CalVET) net. In: R. Lasker (Ed.), An egg production method for estimat-ing spawning biomass of pelagic fish: application to the northern anchovy,Engraulis mordax. U.S. Dep. Commer., NOAA Tech. Rep. NMFS 36, pp.27–32.
Somarakis, S., Tsimenides, N., 1997. A daily egg production method biomassestimate of the northern aegean sea anchovy stock. Ozeanografika 2,133–148.
Somarakis, S., Koutsikopoulos, C., Machias, A., Tsimenides, N., 2002. Apply-ing the daily egg production method (DEPM) to small stock in highlyheterogeneous seas. Fish. Res. 55, 193–204.
Somarakis, S., Palomera, I., Garcıa, A., Quintanilla, L., Koutsikopoulos, C.,Uriarte, A., Motos, L., 2004. Daily egg production of anchovy in Europeanwaters. ICES J. Mar. Sci. 61, 944–958.
Stauffer, G.D., Picquelle, S.J., 1980. Estimates of the 1980 spawning biomassof the central subpopulation of northern anchovy. Natl. Mar. Fish. Serv.,NOAA, Southw. Fish. Cent. Admin. Rep. LJ - 80-09, 41 pp.
Venables, W.N., Ripley, B.D., 2002. Modern Applied Statistics with S, 4th ed.Springer-Verlag, New York.
Wallace, R., Selman, K., 1981. Cellular and dynamic aspects of oocyte growthin teleosts. Am. Zool. 21, 325–343.
Copyright © 2022 FDOKUMEN