Shadow allometry: Estimating tree structural parameters using hyperspatial image analysis

RESEARCH ARTICLE
Spawning pattern and type of fecundity in relation to ovarianallometry in the round herring Etrumeus teres
Guido Plaza Æ Hideo Sakaji Æ Hitoshi Honda ÆYuichi Hirota Æ Kazuya Nashida
Received: 1 February 2006 / Accepted: 14 June 2007 / Published online: 18 July 2007
� Springer-Verlag 2007
Abstract Spawning pattern (assessed by seasonal chan-
ges in ovarian developmental stages) and type of fecundity
(assessed by analysis of oocyte-size frequency distribu-
tions) of the round herring Etrumeus teres were studied
in relation to ovarian growth and seasonal changes in
the gonadosomatic (GSI), hepatosomatic (HSI) and lipo-
somatic (LSI) index as well as the somatic condition of
spawners (CS) in a spawning ground of southern Japan.
Except for summer, mature and recently spawned ovaries
occurred all year round. Oogonia and primary oocytes were
present in all ovaries, and cortical alveoli stage (CA) oo-
cytes occurred in all mature, hydrated and partially spent
(PS) females (PS: females containing post-ovulatory folli-
cles). Before hydration, a clutch of larger yolked oocytes,
undergoing synchronous growth (range 0.7–1.1 mm), was
present in mature ovaries which was completely separated
from a more heterogeneous clutch of oogonia, primary and
secondary oocytes (<0.150 mm) and oocytes in the CA
stage (range 0.15–0.60 mm). As vitellogenesis progressed,
the yolked clutch increased in size but the CA oocytes
remained arrested. The latter entered into the secondary
growth phase when hydration started in the advanced
batch. Ovarian growth was isometric in all developmental
stages, validating the use of GSI, which showed a consis-
tent monthly evolution among years. Spawning stopped in
summer (July and August) and peaked in winter and spring.
HSI correlated positively with GSI on both a monthly mean
basis (r = 0.76) and individual fish basis (liver weight ex-
plained 67–83% of the variability in ovary weight when
females were grouped into 1-unit GSI intervals) suggesting
a significant role of liver in vitellogenesis. LSI and CS also
showed marked seasonal changes peaking from summer
to middle autumn. Overall results suggest that E. teres
is a multiple spawner with a group-synchronous ovarian
development and indeterminate annual fecundity, with the
three processes linked to an isometric growth of the ovary.
We propose that such a reproductive pattern is an adapta-
tion to produce batches of large pelagic eggs through a
protracted spawning season.
Introduction
The number of spawning episodes during a reproductive
season and the pattern of ovarian development normally
Communicated by S. Nishida.
G. Plaza (&)
Escuela de Ciencias del Mar, Facultad de Recursos Naturales,
Pontificia Universidad Catolica de Valparaıso,
Avenida Altamirano 1480, Valparaıso, Chile
e-mail: [email protected]
H. Sakaji � Y. Hirota � K. Nashida
Kochi Kuroshio Research Laboratory,
National Research Institute of Fisheries Science (NRIFS),
Fisheries Research Agency (FRA), Sanbashi-dori 6-1-21,
Kochi 780-8010, Japan
H. Sakaji
Stock Assessment Division,
National Research Institute of Fisheries Science (NRIFS),
Fisheries Research Agency (FRA), 2-12-4 Fukuura, Kanazawa,
Yokohama, Kanagawa 236-8648, Japan
H. Honda
Research Promotion and Development Department, FRA,
Minato-Mirai 2-3-3, Nishi-Ku, Yokohama 220-6115, Japan
H. Honda
Tropical Tuna Resources Division,
National Research Institute of Far Seas Fisheries (NRIFSF),
Fisheries Research Agency (FRA), 5-7-1 Orido, Shimizu,
Shizuoka, Shizuoka 424-8633, Japan
123
Mar Biol (2007) 152:1051–1064
DOI 10.1007/s00227-007-0756-3

determine the spawning strategy in teleosts. Fishes
spawning only once develop their oocytes synchronously
from oogonia to immature oocytes, vitellogenesis and final
maturation (i.e. fishes with synchronous ovarian organi-
zation; Marza 1938; Wallace and Selman 1981). Other
fishes spawn several times during the spawning period
release clutches or batches of eggs at discrete intervals
(Maddock and Burton 1998; Stequert et al. 2003) through
either a group-synchronous or asynchronous oocyte
development. Multiple-spawning fishes with group-
synchronous ovaries have a discrete size distribution of
oocytes with a distinctive gap between immature and
advanced yolked oocytes prior to spawning in common.
The existence of such a gap has been considered as
indicative of determinate fecundity, i.e., all oocytes in the
advanced batch will be released during the spawning
season in successive batches (Marza 1938; Wallace and
Selman 1981; Horwood and Walker, 1990; Kjesbu et al.
1990; Hunter et al. 1992; Hesp et al. 2004). For these
fishes, the annual fecundity can be estimated from the
stock of yolked oocytes at the onset of the spawning
season. Conversely, multiple-spawning fishes with asyn-
chronous oocyte development show a continuous size
frequency distribution of oocytes in mature ovaries without
a dominant population, except during hydration when hy-
drated oocytes appear clearly separated from non-hydrated
oocytes. For these fishes, termed as indeterminate spaw-
ners, the annual fecundity can only be estimated by the
product of batch fecundity and the number of spawnings
per season (Marza 1938; Hunter and Goldberg 1980;
Wallace and Selman 1981; Hunter and Macewicz 1985;
Lowerre-Barbieri et al. 1996; Militelli and Macchi 2004).
When addressing the spawning strategy, it is also
important to consider the ovarian growth as season pro-
gresses, because reproductive cycles are coupled with
pronounced changes in gonadal size (Somarakis et al.
2004). A widely used method for such a purpose is the
calculation of the gonadosmatic index (GSI). The latter
should not be used without proper validation (DeVlamming
et al. 1982; Somarakis et al. 2004). Validation of GSI re-
quires to test for isometry, i.e., to confirm that the slope of
the relationship: log(body weight) = log(a) + b log(ovary
weight), is not significantly different from ‘‘1’’, and this
pattern does not change among ovarian developmental
stages (Somarakis et al. 2004). Further justification for
studying ovarian allometry in a given species rises from the
evidence presented in a recent publication (Somarakis et al.
2004), that the pattern of ovarian allometry might reflect
the pattern of oocyte growth (i.e., isometric vs. allometric
ovarian growth could reflect group-synchronous vs. asyn-
chronous oocyte development).
Round herring [Etrumeus teres (DeKay 1842)] is a
commercially important clupeoid, distributed extensively
in subtropical and tropical waters, with several separate
populations in the Red Sea, eastern Africa, Japan,
southern Australia, eastern Pacific, and western Atlantic
Oceans. Around the Japanese archipelago, the round
herring inhabits southern Japan with two distinctive
stocks: the Tsushima warm current stock and the southern
Pacific stock. Total annual catch of the round herring in
Japanese waters has ranged from 20,000 to 60,000 tons in
the last decade and the stock size of this species seems to
be more stable than other clupeoids (Ishida et al. 2004;
Ohshimo 2004). Despite its commercial importance and
extensive geographic distribution, only few studies on its
ecology and reproductive biology have been carried out to
date (Chullarson et al. 1977; Hara 1977; Yamada 1994;
Yanagawa 1996; Honda et al. 2002). These studies sug-
gest that this species is likely to be a multiple-spawner,
reaching first maturity at around 16 cm body length and
7 months of age, and that it has an asymptotic length
from 22 to 24 cm and a life span from 2 to 4 years. Many
aspects of its reproductive and life history traits remain
still unknown, in particular, the spawning pattern and type
of fecundity and how both processes are related to
ovarian growth.
The aim of this study was to highlight the pattern of
oocyte growth (i.e., asynchronous or group-synchronous)
and the type of fecundity (i.e., determinate or indetermi-
nate) in E. teres and their relationships to the ovarian
growth pattern (i.e., allometric or isometric) as well as to
the seasonal evolution of the gonadosomatic index (GSI),
the hepatosomatic index (HSI), the liposomatic index (LSI)
and the somatic condition of females.
Materials and methods
Biological data and reproductive parameters
Female E. teres were collected by angling and gill nets in
Tosa Bay (southern Japan) onboard research vessels of the
National Research Institute of Fisheries Science. Tosa Bay,
located in the southwestern part of Shikoku Inland, is one
the main spawning grounds for the round herring and for
many other commercial important fishes (Hayashi et al.
1988; Honda et al. 2002).
A total of 1,933 females, ranging from 16 to 30 cm,
were collected and analyzed over a period 56 months from
September 1999 to September 2004 (Table 1). Angling
samples consisted 90% of total catches and were taken at
daytime from 11:00 to 17:00 hours. The remaining per-
centage corresponded to gill net samples taken at night
from 22:00 to 24:00 hours. For each fish, total length (TL),
total body weight (BW), eviscerated body weight (EBW),
ovary weight (OW), liver weight (LW) and wet visceral fat
1052 Mar Biol (2007) 152:1051–1064
123

weight (FW) were recorded. Visceral fat (adhered to the
dorsal part of the abdominal cavity, and around the stom-
ach and gut) was carefully removed using forceps and
weighted using an analytical balance. All measurements of
size and weight were made to the nearest 0.1 mm and
0.01 mg. The seasonal fluctuation in OW, LW, and FW
were analyzed on a monthly basis using three indices cal-
culated by the following general formula:
Indexi ¼MV
ðBW� OWÞ � 100 ð1Þ
where i = gonadosomatic index (GSI), hepatosomatic in-
dex (HSI), liposomatic index, (LSI), MV = weight of the
respective variable, i.e., OW, LW, or FW. Subsamples
of fish were further analyzed in order to assess: (a) the
histological appearance of the ovary and its relation to
macroscopic classification, (b) ovarian growth, (c) pattern
of oocyte development, and (d) seasonal fluctuations of
reproductive and condition indices.
Histological appearance of the ovary and its relation
to macroscopic classification
To determine the spawning pattern, ovaries of 1,090 fe-
males collected from January 2003 to September 2004
were classified into macroscopic maturity stages according
to the criteria of Table 2 and fixed in 10% neutralized
formalin. To evaluate the reliability of macroscopic clas-
sification histological sections were prepared and analyzed
for a sub-sample of 280 females. Pieces of ovarian tissue
were embedded in paraffin, sectioned to 6–9 lm and
stained with Harris’s hematoxylin and eosin Y.
Ovarian growth
Ovarian growth was assessed in a random sample of 600
females collected from January 2003 to September 2004.
All females were assigned to 1-mm intervals of mean oo-
cyte diameter of the most advanced mode (MODAM, see
below), i.e., 0.4–05; 05–06; 06–07; 0.8–09; 09–1, 1–1.1,
and >1.2 mm. The traditional assumption for a valid GSI is
that the slope from the relationship, log(BW) = log(a) + b
log(OW), is not significantly different from unity in the
different maturity stages (Somarakis et al. 2004). Hence,
t tests were used to test for isometry (b = 1) and ANCOVA
models to test for homogeneity of slopes and intercepts
among MODAM classes (Sokal and Rohlf 1997).
Pattern of oocyte development
The pattern of oocyte development was assessed by size
frequency distributions of oocytes in random samples of
200 oocytes per ovary. For this purpose, we first tested for
differences in oocyte size between ovarian lobes and
among three ovarian positions (anterior, middle, posterior).
Since no significant differences were detected (two-way
ANOVA, P > 0.05) a random portion was photographed
under a stereo microscope with a digital camera under a
constant light setting. Yolked oocytes were yellowish in
mature ovaries (opaque under transmitted light) and easily
recognizable from the unyolked oocytes (see Fig. 4c in
‘‘Results’’). After suitable calibrations, the oocytes were
measured using the Image-Pro software. The fixative af-
fected the roundness of the oocytes in some females, par-
ticularly as development progressed. Hence, the average
from the shortest and longest axis from 50 oocytes was
Table 1 Statistics for female Etremeus teres collected in Tosa Bay, southern Japan, grouped on a monthly basis
1999 2000 2001 2002 2003 2004
Month A ± SE (N) A ± SE (N) A ± SE (N) A ± SE (N) A ± SE (N) A ± SE (N)
January 203 ± 8 (4) 200 ± 2 (95) 226 ± 1 (161) 206 ± 3 (41)
February 205 ± 3 (51) 199 ± 3 (39) 207 ± 3 (28) 224 ± 2 (56)
March 194 ± 12 (5) 213 ± 5 (14) 230 ± 12 (4) 204 ± 4 (33)
April 192 ± 5 (11) 199 ± 6 (09) 191 ± 4 (16) 205 ± 3 (40) 198 ± 4 (26)
May 211 ± 7 (6) 204 ± 3 (31) 204 ± 17 (2) 207 ± 3 (37) 199 ± 4 (27)
June 195 ± 5 (24) 205 ± 3 (24) 205 ± 3 (30) 212 ± 2 (71) 213 ± 4 (39)
July 211 ± 5 (20) 200 ± 4 (16) 208 ± 4 (16) 207 ± 2 (61) 201 ± 5 (10)
August 216 ± 4 (29) 232 ± 4 (31) 204 ± 3 (29) 207 ± 2 (56)
September 195 ± 4 (23) 192 ± 4 (16) 202 ± 4 (26) 212 ± 3 (32) 211 ± 2 (56) 202 ± 4 (29)
October 183 ± 4 (18) 221 ± 17 (8) 232 ± 2 (79) 219 ± 2 (168)
November 207 ± 7 (7) 206 ± 3 (26) 212 ± 6 (7) 221 ± 3 (32) 223 ± 2 (92)
December 202 ± 4 (22) 207 ± 6 (8) 212 ± 3 (32) 233 ± 5 (30) 209 ± 3 (30)
No sampling was carried out in months with empty cells
A average TL, SE one standard error; N sample size
Mar Biol (2007) 152:1051–1064 1053
123

considered as an individual measurement of the mean oo-
cyte diameter of the most advanced mode (MODAM).
MODAMs were used for further comparisons with the
histological sections of the ovary tissues. The unyolked
mode consisted of cortical alveoli oocytes (CA), which
appeared hyaline under induced light, primary oocytes and
oogonias. The latter two groups were very abundant and
mostly <150 lm and hence were not included in the graphs
to better illustrate the frequency of CA and yolked modes.
It must be pointed out here that there was not a gap
between CA oocytes and the less developed groups (see
Fig. 3b in ‘‘Results’’). The modal progression was studied
by grouping females according to MODAM.
Seasonal fluctuations of reproductive and condition indices
The seasonal fluctuation in GSI, HSI, LSI and somatic
condition was studied in females collected from January
2002 to September 2004, months in which a more com-
prehensive and continuous data set was available (March
and May 2002 were not included due to small sample si-
zes). A previous evaluation of the TL–EBW relationships
showed that the slope of the regression varied significantly
among months. Hence, neither the Fulton condition factor
nor the relative condition factors were appropriate to
describe the condition of spawners as season progressed
(see Cone 1989 for details). In consequence, the seasonal
fluctuation in the somatic condition of fish was assessed
through the index suggested by Patterson (1992) (Eq. 2):
LogðEBWÞi ¼ a0 þ am þ b log Li þ ei ð2Þ
where ‘‘EBW’’ is the eviscerated body weight, ‘‘ao’’ is the
overall intercept, ‘‘am’’ is the monthly effect, ‘‘L’’ is the
total length, and ‘‘ei’’ in the error term. In this analysis a
common weighted mean slope was forced but data from
different months were allowed a have a different intercept.
Then, the residual error can be considered an index of fish
condition irrespective of the length and month in which the
samples were taken (see Patterson 1992 for details).
For a descriptive purpose least square means for GSI,
HSI, and LSI from similar GLMs with month as a fixed
effect were also estimated.
Integrated analysis
To test if the monthly fluctuations of maturity and condi-
tion indices over an annual cycle were not merely a result
of differences in sampling size and data variation, an
overall analysis pooling the entire data set of Table 1 was
carried out. For this purpose, the following GLM model
was applied for ovary, liver and fat weight:
logðMViÞ ¼ ao þ am þ by þ cs þ b log EBWi
þ am log EBWi þ by log EBWi
þ cy log EBWi þ ei ð3Þ
where ‘‘MV’’ is the weight of the respective measured
variable (i.e., OW, LW, or FW), ‘‘ao’’ is the overall inter-
cept, ‘‘am’’ is the monthly effect, ‘‘by’’ is the year effect,
‘‘cs’’ is a dummy variable used as indicator of reproductive
condition of ovaries (active and/or resting), and ‘‘EBW’’ is
the eviscerated body weight. The model also includes the
Table 2 Etremeus teres: maturity stages of ovaries based on macroscopic and microscopic examination
Stage Macroscopic appearance Microscopic appearance
Resting Translucent, no opaque oocytes visible to naked eye,
size <1/4; mean GSI = 0.3 % (range 0.18–0.61)
Og and Po <200 lm present, may have other larger
oocytes in late atresia, Ow = thick
Maturing Yellowish, firm with opaque oocytes easily detected.
Size (1/3–2/3). Granular appearance. Little and/or
medium vascularization. Mean GSI = 6% (3–10)
Og, Pr, Ca. oocytes present. Mainly either Ay or
Mns oocytes, Pof can be occasionally present.
Range mean MODAM = 0.6–1.1 lm
Hydrated Hyaline appearance but reddish with high
vascularization. Size (2/3–1). Hyaline oocytes
visible among opaque oocytes (yellowish). Mean
GSI = 11% (range 8–18)
Og, Pr, Ca, Py, Mn, and Hy oocytes present. Ay and
Pof absent. Gradual hydration, Hy oocytes with
yolk coalesced without Gv (full hyaline) and/or or
Mns undergoing hydration. Large fat drops; range
mean MODAM = 1.2–1.4 lm
Spawning Smaller and more flaccid than hydrated ovaries. Size
(1/4–2/3). Hyaline oocytes may run with slight
pressure
Og, Pr, Ca, Py, and Hy oocytes present. Mns and Pof
present. Mean MODAM as hydrated ovaries
Partially-spent Flaccid and with blood. Small size (1/4). Color
reddish and/yellowish (varying with season).
Opaque oocytes visible. Mean GSI = 3 %
(range 2–5)
Og, Pr, Ca, and Py present. May have remnant Hy
oocytes. Pof well distinctive present. Thick ovary
wall. MODAM = 0.61 ± 0.11 (0.4–0.6) lm
Gv Germinative vesicle; Og oogonia; Pr primary oocytes (basophilic plasma and nuclei with many nucleoli); Ca cortical alveoli (yolk vesicles in
the periphery of the ooplasma and oil droplets around the Gv); Py partially-yolked oocytes (a few yolk globules around the Gv and presence of
lipid drops); Ay advanced yolked oocytes (yolk globules covering the entire area of the oocyte but with central Gv); Mns migratory nucleus stage;
Pof postovulatory follicles; Ow ovary wall; MODAM mean oocyte diameter of the most advanced mode
1054 Mar Biol (2007) 152:1051–1064
123

interactions between fixed factors (am; by; and cs) and the
covariate (log EBW). A backward stepwise method was
used to select the final model. The resulting monthly least
square means (LSM) was used to assess the seasonal vari-
ation of OW, LW, and FW, and the Bonferroni test was used
for multiple comparisons in LSMs over the annual cycle.
Similar analysis of the condition of spawners was made
by using Eq. 1, but adding a year effect (by) with no
interaction terms. Females with hydrated oocytes were
excluded from all GLM analyses, because hydrated fe-
males were not collected consistently during all months.
Results
Maturity stages
Seasonal occurrence of the macroscopic maturity stages
showed a protracted spawning season (Fig. 1). Maturing and
recently spawned ovaries occurred almost all year round
expect for summer; in particular, in August when repro-
duction of the entire population ceased. Oogonia and pri-
mary oocytes were present in all ovaries examined, and in
resting ovaries some oocytes were in the initial phase of the
cortical alveoli stage (Fig. 2). Oocytes in the late cortical
alveoli stage were present in all maturing, hydrated,
spawning and postspawning females (Table 2). Females
classified macroscopically as ‘‘maturing’’ encompassed a
wide range of oocytes, but almost all had central vesicle,
20% had POFs in late phase and 6% were in the migratory
nucleus stage (MNS). MNS oocytes, however, were ob-
served in all ovaries undergoing hydration, which also
contained yellowish partially yolked oocytes. The spawning
stages showed a low occurrence through the entire study
period, and hence they were not included in further analyses.
Ovarian allometry
EBW and OW were isometrically related in all MODAM
classes, with slopes homogenous (ANOVA F(7, 559) = 0.64,
P = 0.76) and not significantly different from 1. (all
P > 0.05) (Table 3). The intercepts varied significantly
among MODAM classes (ANOVA F(7,566) = 338.65,
P < 0.001). All allometric equations were highly signifi-
cant, with F values ranging from 59 to 441 (P < 0.001) and
with female weight explaining more than 50% of the var-
iability in ovary weight (Table 3).
Pattern of oocyte development
Figure 3a illustrates the modal progression of 60 females
collected during January 2004, sequentially sorted by the
mean oocyte diameter of the most advanced mode (MO-
DAM). The onset of the modal progression corresponds to
0
0,2
0,4
0,6
0,8
1
J F M A M J J A S O N D J F M A M J J A S
Resting Maturing Hydrated Spent
2003 2004
Fig. 1 Etrumeus teres.Seasonal variation in the
percentage of maturity stages
based on macroscopic
appearance of ovaries.
Spawning females were
not included because they
occurred infrequently
OgPo
CaPy
AyMn
Pf
eR
stin
g
aM
turin
g
Hy
rdta
de
P-s
tn ep
00,10,2
0,3
0,40,5
0,6
0,7
0,8
0,9
1
Resting Maturing Hydrated P-spentn=40 n=117 n=20 n=123
Fig. 2 Etrumeus teres. Frequency of occurrence of oocyte develop-
mental stages and other histological structures in the four macro-
scopic maturity stages for a random sample of females collected from
April 2003 to March 2004. Og Oogonia; Po primary oocytes; Cacortical alveoli oocytes; Py partially-yolked oocytes; Ay fully yolked
oocytes; Mn migratory nucleus oocytes; Pf post ovulatory follicles
present. P-spent postspawning
Mar Biol (2007) 152:1051–1064 1055
123

ovaries of pre-spawning or partially spawned females.
Histological observations of partially spawned ovaries
showed the occurrence of post-ovulatory follicles (Fig. 4a).
As vitellogenesis progresses the larger clutch of yolked
oocytes increases in size (Fig. 4b) but the smaller oocytes
remain temporally detained. The less developed oocytes
appeared hyaline under induced light (Fig. 4c) and corre-
sponded to cortical alveoli oocytes, which are not fully
separated from an undeveloped group encompassing
oogonias and primary oocytes (Fig. 3b). Just when hydra-
tion begins the distinctive clutch of cortical alveoli oocytes
seem to move to the true vitellogenesis stage, with ovaries
in MNS stage ranging from 0.99 to 1.09 mm in MODAM.
A fraction of the less developed mode turns yellowish
(opaque under induced light; Fig. 4c). Histological exam-
ination confirmed that the yellowish opaque oocytes in
hydrated ovaries were in early vitellogenesis. Hydration
seemed to be gradual showing hyaline oocytes with dif-
ferent levels of yolk coalescence (Fig. 4d). Hydrated oo-
cytes ranged from 1.1 to 1.5 mm, with the mean oocyte
Table 3 Etrumeus teres: parameters ‘‘log(a)’’ and ‘‘b’’, t statistic and probability for isometry (i.e., H0: b = 1) of the allometric models of OW-
on-BW for maturity stages based on mean oocyte diameter of the most advanced mode (ODAM)
ODAM classes Mean (l) ODAM CV (%) Log (a) b r2 t N P
0.4–0.5 510.63 9.18 –1.11 1.18 0.63 1.06 70 0.29
0.5–0.6 615.87 14.77 –1.91 1.16 0.67 1.84 102 0.07
0.6–0.7 713.56 8.90 –1.45 1.02 0.78 0.96 100 0.34
0.7–0.8 781.12 8.63 –1.48 1.10 0.82 1.04 107 0.30
0.8–0.9 892.23 5.56 –1.45 1..09 0.81 0.91 107 0.36
0.9–1 975.89 6.32 –1.23 1.07 0.86 0.92 40 0.36
1–1.1 1,067.29 4.70 1.13 1.05 0.87 0.91 38 0.37
>1.2 1,236.21 8.87 –1.21 1.14 0.59 0.98 36 0.33
CV Coefficient of variation for ODAM, N sample size
0,1 0,3 0,5 0,7 0,9 1,1
0.94
0.88
0.82
0.74
0.59
0.51
0,1 0,3 0,5 0,7 0,9 1,1 1,3 1,5
1.40
1.32
1.29
1.25
1.20
0.90
0.86
0.79
0.68
0.59
Oocyte diameter (mm)
Me
nacoo
yte
maidet
refo
the
mos
tad
vanc
edm
oed
(mm
)
(a)
(c)
(b)
0,05 0,2 0,35 0,5 0,65 0,8
0
10
20
30
40
Oocyte Diameter (mm)
N=600
Fr
qeeu
cny
(%)Fig. 3 Etrumeus teres. a Modal
progression (MP) of the
frequency distribution of
intraovarian oocytes sorted by
the mean diameter of the most
advanced mode of oocytes
(MODAM) in 60 females E.teres collected in January 2004.
Light grey areas ovaries with Py
oocytes; dark grey areas ovaries
with Ay; White areas hydrated
ovaries. b Oocyte size
frequency distribution in a
maturing fish. Striped barsdenote oogonia and oocytes in
primary and secondary growth
phase smaller than 0.15 mm
that were excluded from MP
analyses. Open bars denote
cortical alveoli oocytes and
filled bars yolked oocytes. c MP
analysis in 30 mature females
collected in June 2003, a month
close to the resting period. Yaxes were not drawn in MP
graphs to make them easier to
understand
1056 Mar Biol (2007) 152:1051–1064
123

diameter ranging from 1.2 to 1.4 mm corresponding to an
increase in egg volume from 1.78 to 2.1 times (i.e., 43–
50%) due to hydration. In addition, the less advanced batch
becomes bimodal. The distinctive gap found between the
smaller oocytes and the clutch of larger yolked oocytes
undergoing synchronous growth was also observed when
mature ovaries were analysed in June 2003, a month rep-
resentative of ovaries close to the resting period (Fig. 3c).
Seasonal variation in maturity and condition indices
Least square means of GSI showed seasonal fluctuations
(Fig. 5a), during the protracted spawning season. Repro-
ductive activity lasted for about 10 months, practically
with no reproductive activity in August. HSI index showed
similar seasonal variation (Fig. 5b) although somewhat
more variable than GSI. LW and OW were positively re-
gressed, but a great variability was observed for pooled
data (Fig. 6 pooled) and also on a monthly and annual basis
(results not shown here). However when females were
grouped by 1-unit GSI interval, the LW explained from 67
to 83% of the variability in OW (Fig. 6, GSI 2–9) except
for females with GSI <2 units (i.e., resting ovaries occur-
ring mainly in July and August). The slopes of the
regressions were not homogenous as ovary development
progressed (ANCOVA interaction GSI code · LW;
F(8,1230) = 52.19 P < 0.001). Mean monthly GSI and HSI
were positively correlated, and the correlation was at a
maximum when both the data from July and August were
excluded and more than 30 observations by month were
used (r = 0.76 F(1,20) = 26.27, P < 0.001).
LSM of LSI ranged from 0 to 2% showing a marked
seasonal pattern (Fig. 5c) with a major peak in the accu-
mulation of intra-visceral fat in summer, and with a small
peak from May to June during 2004. The condition of the
spawners evaluated through the monthly effect GLM
model showed a somewhat more variable seasonal pattern
than the LSI, (Fig. 5d), but coinciding in summer during
the resting period. The model explained 97% of the vari-
ation in the eviscerated body weight.
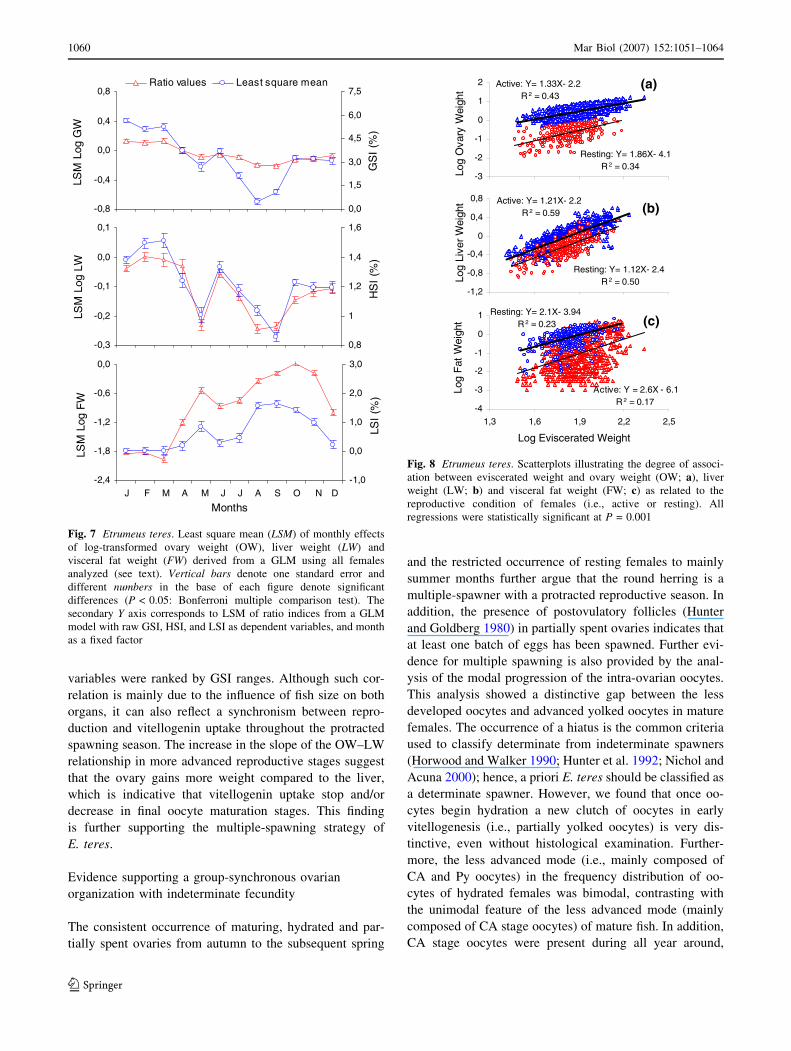
Overall analysis of seasonal variation in maturity
and condition indices
The results using pooled data showed the following three
general patterns: (a) significant monthly fluctuations in
LSM of OW, LW and FW (Table 4) closely matching to
their respective ratio indices (i.e., GSI, HSI, and LSI;
Fig. 7), (2) an inverse pattern between FW (LSI) with OW
(GSI) and LW (LSI) for both the resting period of summer
and the small peak of FW in autumn (Fig. 7), and (3) a
significant but small contribution of the year effect on the
modeled variability. The GLMs explained 83, 68 and 73%
of the total variation in OW, LW and FW, respectively.
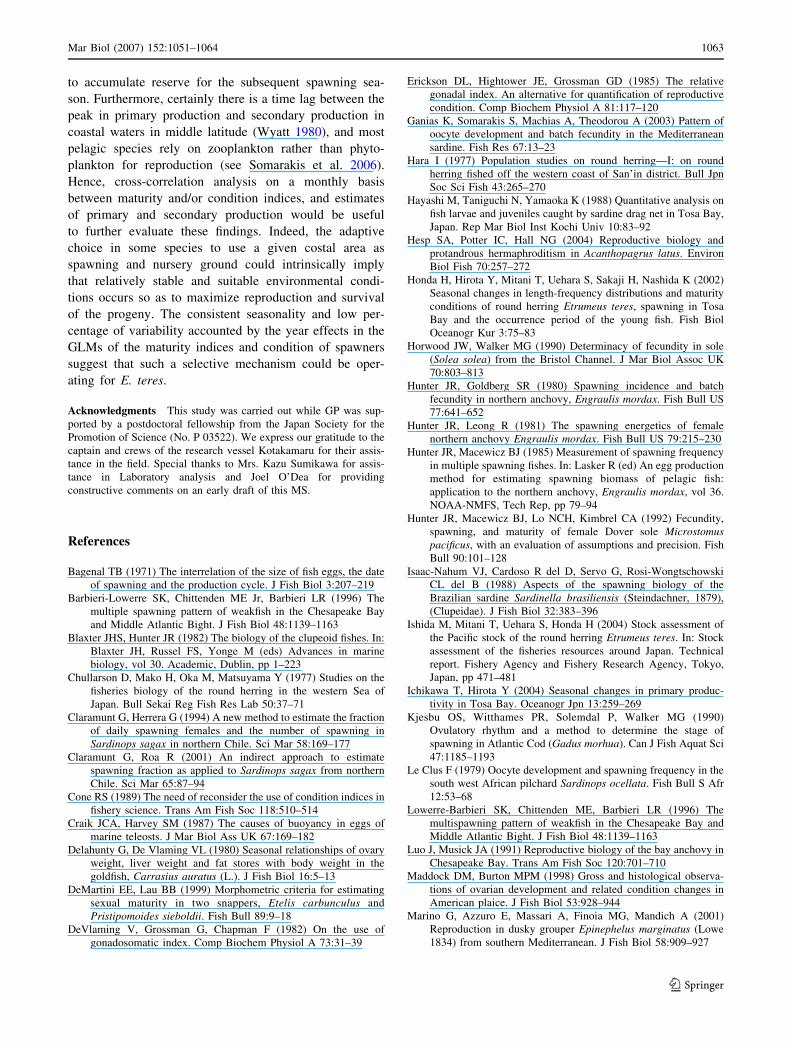
Stepwise regression analyses showed that the effect of
reproductive condition (main effect) was only highly sig-
nificant for ovary weight owing to its marked differences
between active and resting females (Fig. 8a), although the
interaction was not statistically significant (Table 4). Final
stepwise model for liver weight was similar to Eq. 3 but
did not included reproductive condition as fixed factor
(main factor and interaction were left out as part of the
Fig. 4 Etrumeus teres.
Histological sections of a
postspawning (a) and mature
(b) female along with intact
sections under induced light of
mature (c) and hydrated (d)
ovaries. Po primary oocyte;
Ca cortical alveoli stage;
Py partially-yolked oocytes;
Pof post-ovulatory follicles;
Ay advanced yolked stage;
hydrated oocyte with low (H1)
and high (H2) levels of lipid
coalescence. Scale
bar = 0.5 mm
Mar Biol (2007) 152:1051–1064 1057
123

stepwise process: Table 4 and Fig. 8b), while for visceral
fat only an additive model was enough with am; by; and cs
as main factors, due to the low correlation and high vari-
ance in the FW–EBW relationship (Table 4; Fig. 8c). The
monthly effect of condition of spawners showed significant
differences (F = 153.85, P < 0.001) following the same
seasonal pattern as FW and LSI ratio (Table 5). The model
accounted by 95% of the variability in eviscerated body
weight, with only a 2% of the modeled variability ac-
counted for by the year effect.
Discussion
Reproductive strategy
The following evidence support that E. teres is a multiple-
spawner fish: (a) the protracted spawning season shown
by the monthly evolution of gonad weight and somatic
indices which imply that the population is reproductively
active almost all year round except for summer; (b) the
temporal pattern of occurrence of macroscopic and
microscopic stages of ovaries; (c) the presence of post
ovulatory follicles in partially spent ovaries, and (d) the
dynamics of growth of intraovarian oocytes determining
the type of fecundity (i.e., group synchronous spawner with
indeterminate fecundity).
The gonadosomatic index has been widely used as a low
cost indicator of reproductive condition in fishes. However,
whereas some studies have recommended their use
(Barbieri et al. 1996; Claramunt and Roa 2001), others
have found that GSI is a poor indicator of spawning
activity, particularly in multiple-spawners fishes with asyn-
chronous ovarian organization (DeVlaming et al. 1982;
Erickson et al. 1985; DeMartini and Lau 1999). For E. teres,
however, ovarian growth was isometric, suggesting that
0
2
4
6
8
SG
IS
HI
oC
nditi
on
(c)
2002 2003 2004
0
0.5
1
1.5
2
2.5
0
0.5
1
1.5
2
2.5
-0.09
-0.06
-0.03
0.00
0.03
0.06
0.09
SL
I
(d)
(b)
(a)
J F M A M J J A S O N D J F M A M J J A S O N D J F M A M J J A S
Fig. 5 Etrumeus teres. Seasonal and interannual fluctuations in least
square mean (LSM) derived from three general linear models (GLM)
with gonadosomatic index (GSI; a), Hepatosomatic index (HSI; b)
and Liposomatic index (LSI; c) as dependent variable and month as a
fixed factor. Condition of spawners (d) corresponds to monthly effects
from a GLM of the form Log (EBW)I = ao + am + b log Li + ei
where ‘‘EBW’’ is the eviscerated body weight, ‘‘ao’’ is the overall
intercept, ‘‘am’’ is the monthly effect, ‘‘L’’ is the total length, and ‘‘e’’
in an error terms
1058 Mar Biol (2007) 152:1051–1064
123

GSI represent well the dynamics of ovarian development.
Recently, Somarakis et al. (2004), found that ovarian
development was also isometric in the Mediterranean sar-
dine, Sardina pilchardus, which is a group-synchronous
spawner with indeterminate fecundity (Ganias et al. 2003).
Based on Sardina pilchardus and the results reported for
the common snook, Centropomus undecimalis (a species
with a similar reproductive strategy), Somarakis et al.
(2004) suggested that a relationships could exist between
the pattern of oocyte development and the pattern of ovarian
allometry, i.e., isometric versus allometric ovarian devel-
opment could reflect group-synchronous versus asynchro-
nous oocyte development. The results of the present study on
E. teres fully support this hypothesis.
A significant correlation was found across months be-
tween HSI and GSI. For most teleosts the liver is where the
precursor of yolk (vitellogenin) is synthesized. Hence, the
liver might enlarge during the female reproductive season
as a response to vitellogenin needs (Wallace and Selman
1979). However, the relationship between liver and ovary
weight is not always as strong and positive as could be
expected (Yoneda et al. 1998). This is because the liver is
also associated with storing reserves and the hepatosomatic
index is also an indicator of recent feeding activity (Del-
ahunty and DeVlaming 1980; Maddock and Burton 1998;
Tomasini et al. 1999). For E. teres, however, a strong and
positive correlation between liver weight and ovary weight
was found, and correlation was stronger when both
WG = 1.10W L + 0.55R2 = 0.67
WG = 1.42WL + 0.91R2 = 0.74
WG = 1.80W L + 1.30R2 = 0.82
0
36
912
15WG = 2.18W L + 1.73
R 2 = 0.80
WG= 2.93WL+ 1.83
R2 = 0.69
0
3
69
12
15
0 1 2 3
WG = 2.64WL + 2.75R2 = 0.79
= 3.95WL + 2.6R2 = 0.83
0 1 2 3
WG = 4.72WL + 2.9R2 = 0.81
0 1 2 3
03
69
1215
Liver Weight (g)
Ova
ryw
eig
th(
)g
GSI=2 GSI=3
GSI=5 GSI=6
GSI=8 GSI=9
GSI=4
GSI=7
Pooled
WG
Fig. 6 Etrumeus teres. Linear
relationships of ovary weight on
liver weight categorized by one
unit-GSI interval of females
collected from October 1999 to
September 2004 in Tosa Bay,
northern Japan
Table 4 Etremeus teres: statistical significance and percentage of
variation accounted by main and interaction effects for three general
lineal models (GLM) with ovary weight (log[OW]), liver weight
(log[LW]) and visceral fat weight (log[FW]) as dependent variables;
and eviscerated body weight (log[EBW]), month and year as
explanatory variables
Source F P values gp2
OW LW FW OW LW FW OW LW FW
Main effect
Log EBW 435.10 388.99 a <0.001 <0.001 a 0.21 0.38 a
Month 6.02 7.28 184.83 <0.001 <0.001 <0.001 0.03 0.05 0.62
Year 6.24 20.11 20.81 <0.001 <0.001 <0.001 0.02 0.02 0.08
RC 1943.20 2.48 34.12 <0.001 0.12 <0.001 0.52 a 0.03
Interaction
Month · Log EBW 4.8 7.1 a <0.001 <0.001 a 0.02 0.05 a
Year · Log EBW 5.4 22.1 a <0.001 <0.001 a 0.02 0.02 a
RC · Log EBW 0.1 0.0 a 0.741 0.87 a b b a
R2 0.83 0.68 0.73
gp2 Partial-eta squared (proportion of the effect + error variance that is attributable to the effect); ‘‘a’’ denotes effect that was not included in the
model; ‘‘b’’ denotes effect that were left out by the stepwise technique; RC reproductive condition
Mar Biol (2007) 152:1051–1064 1059
123
variables were ranked by GSI ranges. Although such cor-
relation is mainly due to the influence of fish size on both
organs, it can also reflect a synchronism between repro-
duction and vitellogenin uptake throughout the protracted
spawning season. The increase in the slope of the OW–LW
relationship in more advanced reproductive stages suggest
that the ovary gains more weight compared to the liver,
which is indicative that vitellogenin uptake stop and/or
decrease in final oocyte maturation stages. This finding
is further supporting the multiple-spawning strategy of
E. teres.
Evidence supporting a group-synchronous ovarian
organization with indeterminate fecundity
The consistent occurrence of maturing, hydrated and par-
tially spent ovaries from autumn to the subsequent spring
and the restricted occurrence of resting females to mainly
summer months further argue that the round herring is a
multiple-spawner with a protracted reproductive season. In
addition, the presence of postovulatory follicles (Hunter
and Goldberg 1980) in partially spent ovaries indicates that
at least one batch of eggs has been spawned. Further evi-
dence for multiple spawning is also provided by the anal-
ysis of the modal progression of the intra-ovarian oocytes.
This analysis showed a distinctive gap between the less
developed oocytes and advanced yolked oocytes in mature
females. The occurrence of a hiatus is the common criteria
used to classify determinate from indeterminate spawners
(Horwood and Walker 1990; Hunter et al. 1992; Nichol and
Acuna 2000); hence, a priori E. teres should be classified as
a determinate spawner. However, we found that once oo-
cytes begin hydration a new clutch of oocytes in early
vitellogenesis (i.e., partially yolked oocytes) is very dis-
tinctive, even without histological examination. Further-
more, the less advanced mode (i.e., mainly composed of
CA and Py oocytes) in the frequency distribution of oo-
cytes of hydrated females was bimodal, contrasting with
the unimodal feature of the less advanced mode (mainly
composed of CA stage oocytes) of mature fish. In addition,
CA stage oocytes were present during all year around,
-0,8
-0,4
0,0
0,4
0,8
0,0
1,5
3,0
4,5
6,0
7,5Ratio values Least square mean
-0,3
-0,2
-0,1
0,0
0,1
0,8
1
1,2
1,4
1,6
-2,4
-1,8
-1,2
-0,6
0,0
-1,0
0,0
1,0
2,0
3,0
LSM
oLG
gW
SLM
oLL
gW
LSM
oLF
gW
SG
I(%
)LS
I%(
)S
HI
%()
J F M A M J J A S O N D
Months
Fig. 7 Etrumeus teres. Least square mean (LSM) of monthly effects
of log-transformed ovary weight (OW), liver weight (LW) and
visceral fat weight (FW) derived from a GLM using all females
analyzed (see text). Vertical bars denote one standard error and
different numbers in the base of each figure denote significant
differences (P < 0.05: Bonferroni multiple comparison test). The
secondary Y axis corresponds to LSM of ratio indices from a GLM
model with raw GSI, HSI, and LSI as dependent variables, and month
as a fixed factor
Active: Y = 2.6X - 6.1R 2 = 0.17
Resting: Y= 2.1X- 3.94R 2 = 0.23
-4
-3
-2
-1
0
1
1,3 1,6 1,9 2,2 2,5
Resting: Y= 1.12X- 2.4R 2 = 0.50
Active: Y= 1.21X- 2.2R 2 = 0.59
-1,2
-0,8
-0,4
0
0,4
0,8
Resting: Y= 1.86X- 4.1R 2 = 0.34
Active: Y= 1.33X- 2.2R 2 = 0.43
-3
-2
-1
0
1
2
Log Eviscerated Weight
oLF
gat
Wei
ght
Log
iLve
Wr
eig
thoL
Og
vyra
ieW
ght (a)
(b)
(c)
Fig. 8 Etrumeus teres. Scatterplots illustrating the degree of associ-
ation between eviscerated weight and ovary weight (OW; a), liver
weight (LW; b) and visceral fat weight (FW; c) as related to the
reproductive condition of females (i.e., active or resting). All
regressions were statistically significant at P = 0.001
1060 Mar Biol (2007) 152:1051–1064
123

decreasing significantly only during the resting months.
These three observations indicate that Py oocytes are
indeed being recruited into vitellogenesis from cortical
alveoli and primary oocytes to be spawned as subsequent
batches. In addition, hydration seems to be gradual, with no
evidence of bimodality in the frequency distribution of
hydrated oocytes, which is indicative that all hyaline oo-
cytes will be spawned simultaneously. All these observa-
tions suggest that E. teres has a group-synchronous ovarian
development but indeterminate fecundity.
Most clupeoids are multiple spawners with indeterminate
fecundity having more than one group of yolked oocytes co-
existing in mature ovaries, and showing a continuous fre-
quency distribution of oocyte size for mature ovaries (see
Blaxter and Hunter 1982 and references there in). However,
recruitment of a distinct clutch from pre-vitellogenic to
vitellogenic stages has also been reported in other three
clupeoids: the Brazilian sardine (Sardinella brasiliensis,
Isaac-Nahum et al. 1988), a tropical anchovy (Encrasich-
olina heteroloba, Wright 1992), the bay anchovy (Anchoa
mitchilli, Luo and Musick 1991), and the Mediterranean
sardine, Sardina pilchardus. In addition, group-synchro-
nous reproductive strategy with indeterminate fecundity has
also been reported in several other fishes (e.g., in two spe-
cies of sticklebacks (Gasterosteus aculeatus and Apeltes
quadracus, Wallace and Sellman 1979), the American
plaice Hippoglossoides platessoides (Maddock and Burton
1998), the common snook, Centropomus undecimalis
(Taylor et al. 1998), the dusky grouper, Epinephelus mar-
ginatus (Marino et al. 2001); and the swordfish, Xiphias
gladius (Taylor and Murphy 1992). It is reasonable to
hypothesize that any reproductive strategy in fishes should
be linked to the final output product, i.e., the egg size. In the
case of round herring we found that the hydrated oocyte
ranged from 1.2 to 1.4 mm in winter, which falls within the
size range of planktonic eggs reported for this species.
Certainly, comparison of intraovarian egg size among
species can be spurious owing to the influence on egg size of
fixatives, seasonal changes, and/or female size. Despite
these limitations, however, the egg size of E. teres seems to
Table 5 Etremeus teres: results of the overall GLM for condition of spawners with eviscerated body weight (log[EBW]) as dependent variable
and total length (log[TL]), month and year as explanatory variables
Parameter Estimate SE t P 95% Confidence interval gp2
Lower Upper
Log TL 2.957 0.017 169.295 0.000 2.923 2.991 0.943
Intercept –5.053 0.041 –123.712 0.000 –5.133 –4.973 0.898
Monthly effect
January –0.031 0.003 –9.170 0.000 –0.038 –0.025 0.046
February –0.019 0.004 –5.097 0.000 –0.026 –0.012 0.015
March –0.035 0.004 –8.149 0.000 –0.043 –0.026 0.037
April –0.007 0.004 –1.654 0.098 –0.016 0.001 0.002
May 0.015 0.005 3.165 0.002 0.006 0.024 0.006
June 0.004 0.004 1.145 0.251 –0.003 0.012 0.001
July 0.007 0.004 1.778 0.076 –0.001 0.015 0.002
August 0.036 0.004 9.182 0.000 0.028 0.044 0.046
September 0.040 0.004 11.234 0.000 0.033 0.047 0.068
October 0.039 0.003 11.446 0.000 0.032 0.046 0.070
November 0.030 0.004 8.289 0.000 0.023 0.037 0.038
December * * * * * * *
Year effects
1999 –0.010 0.004 –2.503 0.012 –0.019 –0.002 0.004
2000 –0.014 0.004 –3.870 0.000 –0.021 –0.007 0.009
2001 0.005 0.003 1.874 0.061 0.000 0.010 0.002
2002 –0.005 0.002 –1.896 0.058 –0.009 0.000 0.002
2003 –0.006 0.002 –2.705 0.007 –0.010 –0.002 0.004
2004 * * * * * * *
P > 0.05, not significantly different from the overall mean
gp2 Partial-eta squared
* This parameter is set to zero because it is redundant
Mar Biol (2007) 152:1051–1064 1061
123

be larger than for other multiple-spawning clupeoids with
pelagic eggs (Table 6, see also Bagenal 1971). In addition,
we also found that the percentage of increase in egg volume
due to hydration varied from 35 to 51% which is lower than
that of the four/five fold increase suggested for fishes with
pelagic eggs (Wallace and Selman 1981; Craik and Harvey
1987). Unquestionably, the increase in volume due to
hydration could be a limiting factor to produce large eggs
due to the physical limitations of the abdominal cavity,
particularly for relatively long-shaped small fishes such as
E. teres.
The production of larger eggs intrinsically implies a
reduction in batch fecundity. This seems to be true for E.
teres, which exhibits lower batch fecundity (range 4,700–
20,350 eggs; Plaza et al. unpublished data) in comparison
to the Japanese sardine (Sardinops melanostictus; range
16,000–40,000 eggs; Morimoto 1998), when both species
co-occur in the same spawning ground. Therefore, the
adaptive strategy of developing series of clutches of eggs
from smaller oocytes arrested at the cortical alveoli stage,
seems to be advantageous to produce a series of larger eggs
throughout a protracted spawning season.
Seasonality in maturity indices and condition
of spawners
The analyses of maturity and condition of E. teres showed
a protracted reproductive period extending from early
autumn, continuing throughout winter and reaching the
lowest level in summer, when population reached their best
condition. However, the combined analysis (pooled data)
also revealed a significant decrease in May in estimates of
GW and LW as well as in their respective ratios (i.e., GSI,
HSI), both of which matched the increase in fat weight and
LSI. Although GLM removed variability associated to
reproductive condition, eviscerated weight, and year, this
finding is hard to explain and likely due to small sample
size, spatial heterogeneity in the distribution of spawning,
or another unknown effect.
One aspect to consider irrespective of fish size is that
the intravascular fat seems to be an important reserve to
support reproduction during the winter spawning for this
species. For multiple-spawning clupeoids length of the
spawning season depends upon the availability of forage
(Hunter and Leong 1981; Blaxter and Hunter 1982), and
likewise forage depends upon environmental variables in
the spawning area. For the case of Tosa Bay, three peaks
in chlorophyll a have been recognized, i.e., a minor peak
in autumn, the main peak from winter to middle spring,
and a secondary major peak in summer (Ichikawa and
Hirota 2004). Hence, this species seems to match repro-
duction to the singular production pattern of this bay, i.e.,
a multiple-spawning pattern with a minor activity in au-
tumn, the highest level in reproduction coinciding with
the spring bloom in primary production, and the resting
period matching the summer peak of chlorophyll a, so as
Table 6 Etrumeus teres: statistics of egg volume (estimated as (4/3)pr3) from hydrated females collected during January 2004 in Tosa Bay,
southern Japan
Species Ovarian
organization
Type of
fecundity
N Fixative Season Egg volume (mm3)
Min Max
Etrumeus teresa (1) G-S In 50 F January 0.95 1.60
Sardinella pilchardus pilchardusa (2) G-S In 8 F Winter 0.31 0.45
Sardinops ocellatab (3) ? ? ? F Winter 1.95 2.00
Ecrasicholina heterolobab (4) G-S In ? G Winter 0.35 0.49
Sardinella braziliensisa (5) G-S In ? F Winter 0.27 0.46
Sardinops sagaxb (6) A In ? F Winter 0.11 0.45
Alosa fallax fallaxb (7) A In ? F Winter 0.27 1.44
Sardinops melanostictusb (8) ? ? 63 F Winter 0.57 0.76
Sprattus sprattusb (9) (10) ? ? ? F Winter 0.60 1.00
Clupea harengusb (10) G-S T ? ? Winter 3.51 3.75
Engraulis mordaxb (10) A In ? ? Winter 1.2 1.40
Engraulis anchoitab (10) A In ? ? Winter 0.98 1.00
(1) Current study; (2) Ganias et al. 2003; (3) Le Clus 1979; (4) Wright 1992; (5) Isaac-Nahum et al 1988; (6) Claramunt and Herrera 1994; (7)
Pina et al. 2003; (8) Morimoto (1998); (9) Bagenal 1971; (10) Blaxter and Hunter 1982 (approximate values from Fig. 7)
Min Minimum mean volume, Max maximum mean volume, F 10% neutralized formalin, G Gilson’s solution, G-S group-synchronous,
A asynchronous, In indeterminate, D determinate, ? unknown, N number of fish useda Comparison with published information for other species was based on size frequency distributions of oocytes in the hydrated stageb Reported range of hydrated oocytes sizes
1062 Mar Biol (2007) 152:1051–1064
123
to accumulate reserve for the subsequent spawning sea-
son. Furthermore, certainly there is a time lag between the
peak in primary production and secondary production in
coastal waters in middle latitude (Wyatt 1980), and most
pelagic species rely on zooplankton rather than phyto-
plankton for reproduction (see Somarakis et al. 2006).
Hence, cross-correlation analysis on a monthly basis
between maturity and/or condition indices, and estimates
of primary and secondary production would be useful
to further evaluate these findings. Indeed, the adaptive
choice in some species to use a given costal area as
spawning and nursery ground could intrinsically imply
that relatively stable and suitable environmental condi-
tions occurs so as to maximize reproduction and survival
of the progeny. The consistent seasonality and low per-
centage of variability accounted by the year effects in the
GLMs of the maturity indices and condition of spawners
suggest that such a selective mechanism could be oper-
ating for E. teres.
Acknowledgments This study was carried out while GP was sup-
ported by a postdoctoral fellowship from the Japan Society for the
Promotion of Science (No. P 03522). We express our gratitude to the
captain and crews of the research vessel Kotakamaru for their assis-
tance in the field. Special thanks to Mrs. Kazu Sumikawa for assis-
tance in Laboratory analysis and Joel O’Dea for providing
constructive comments on an early draft of this MS.
References
Bagenal TB (1971) The interrelation of the size of fish eggs, the date
of spawning and the production cycle. J Fish Biol 3:207–219
Barbieri-Lowerre SK, Chittenden ME Jr, Barbieri LR (1996) The
multiple spawning pattern of weakfish in the Chesapeake Bay
and Middle Atlantic Bight. J Fish Biol 48:1139–1163
Blaxter JHS, Hunter JR (1982) The biology of the clupeoid fishes. In:
Blaxter JH, Russel FS, Yonge M (eds) Advances in marine
biology, vol 30. Academic, Dublin, pp 1–223
Chullarson D, Mako H, Oka M, Matsuyama Y (1977) Studies on the
fisheries biology of the round herring in the western Sea of
Japan. Bull Sekai Reg Fish Res Lab 50:37–71
Claramunt G, Herrera G (1994) A new method to estimate the fraction
of daily spawning females and the number of spawning in
Sardinops sagax in northern Chile. Sci Mar 58:169–177
Claramunt G, Roa R (2001) An indirect approach to estimate
spawning fraction as applied to Sardinops sagax from northern
Chile. Sci Mar 65:87–94
Cone RS (1989) The need of reconsider the use of condition indices in
fishery science. Trans Am Fish Soc 118:510–514
Craik JCA, Harvey SM (1987) The causes of buoyancy in eggs of
marine teleosts. J Mar Biol Ass UK 67:169–182
Delahunty G, De Vlaming VL (1980) Seasonal relationships of ovary
weight, liver weight and fat stores with body weight in the
goldfish, Carrasius auratus (L.). J Fish Biol 16:5–13
DeMartini EE, Lau BB (1999) Morphometric criteria for estimating
sexual maturity in two snappers, Etelis carbunculus and
Pristipomoides sieboldii. Fish Bull 89:9–18
DeVlaming V, Grossman G, Chapman F (1982) On the use of
gonadosomatic index. Comp Biochem Physiol A 73:31–39
Erickson DL, Hightower JE, Grossman GD (1985) The relative
gonadal index. An alternative for quantification of reproductive
condition. Comp Biochem Physiol A 81:117–120
Ganias K, Somarakis S, Machias A, Theodorou A (2003) Pattern of
oocyte development and batch fecundity in the Mediterranean
sardine. Fish Res 67:13–23
Hara I (1977) Population studies on round herring—I: on round
herring fished off the western coast of San’in district. Bull Jpn
Soc Sci Fish 43:265–270
Hayashi M, Taniguchi N, Yamaoka K (1988) Quantitative analysis on
fish larvae and juveniles caught by sardine drag net in Tosa Bay,
Japan. Rep Mar Biol Inst Kochi Univ 10:83–92
Hesp SA, Potter IC, Hall NG (2004) Reproductive biology and
protandrous hermaphroditism in Acanthopagrus latus. Environ
Biol Fish 70:257–272
Honda H, Hirota Y, Mitani T, Uehara S, Sakaji H, Nashida K (2002)
Seasonal changes in length-frequency distributions and maturity
conditions of round herring Etrumeus teres, spawning in Tosa
Bay and the occurrence period of the young fish. Fish Biol
Oceanogr Kur 3:75–83
Horwood JW, Walker MG (1990) Determinacy of fecundity in sole
(Solea solea) from the Bristol Channel. J Mar Biol Assoc UK
70:803–813
Hunter JR, Goldberg SR (1980) Spawning incidence and batch
fecundity in northern anchovy, Engraulis mordax. Fish Bull US
77:641–652
Hunter JR, Leong R (1981) The spawning energetics of female
northern anchovy Engraulis mordax. Fish Bull US 79:215–230
Hunter JR, Macewicz BJ (1985) Measurement of spawning frequency
in multiple spawning fishes. In: Lasker R (ed) An egg production
method for estimating spawning biomass of pelagic fish:
application to the northern anchovy, Engraulis mordax, vol 36.
NOAA-NMFS, Tech Rep, pp 79–94
Hunter JR, Macewicz BJ, Lo NCH, Kimbrel CA (1992) Fecundity,
spawning, and maturity of female Dover sole Microstomuspacificus, with an evaluation of assumptions and precision. Fish
Bull 90:101–128
Isaac-Nahum VJ, Cardoso R del D, Servo G, Rosi-Wongtschowski
CL del B (1988) Aspects of the spawning biology of the
Brazilian sardine Sardinella brasiliensis (Steindachner, 1879),
(Clupeidae). J Fish Biol 32:383–396
Ishida M, Mitani T, Uehara S, Honda H (2004) Stock assessment of
the Pacific stock of the round herring Etrumeus teres. In: Stock
assessment of the fisheries resources around Japan. Technical
report. Fishery Agency and Fishery Research Agency, Tokyo,
Japan, pp 471–481
Ichikawa T, Hirota Y (2004) Seasonal changes in primary produc-
tivity in Tosa Bay. Oceanogr Jpn 13:259–269
Kjesbu OS, Witthames PR, Solemdal P, Walker MG (1990)
Ovulatory rhythm and a method to determine the stage of
spawning in Atlantic Cod (Gadus morhua). Can J Fish Aquat Sci
47:1185–1193
Le Clus F (1979) Oocyte development and spawning frequency in the
south west African pilchard Sardinops ocellata. Fish Bull S Afr
12:53–68
Lowerre-Barbieri SK, Chittenden ME, Barbieri LR (1996) The
multispawning pattern of weakfish in the Chesapeake Bay and
Middle Atlantic Bight. J Fish Biol 48:1139–1163
Luo J, Musick JA (1991) Reproductive biology of the bay anchovy in
Chesapeake Bay. Trans Am Fish Soc 120:701–710
Maddock DM, Burton MPM (1998) Gross and histological observa-
tions of ovarian development and related condition changes in
American plaice. J Fish Biol 53:928–944
Marino G, Azzuro E, Massari A, Finoia MG, Mandich A (2001)
Reproduction in dusky grouper Epinephelus marginatus (Lowe
1834) from southern Mediterranean. J Fish Biol 58:909–927
Mar Biol (2007) 152:1051–1064 1063
123
Marza VD (1938) Histophysiologie de l’ovogenese. Herman, Paris
Militelli MI, Macchi GJ (2004) Spawning and fecundity of king
weakfish, Macrodon ancylodon, in the Rio de la Plata estuary,
Argentina—Uruguay. J Mar Biol Assoc UK 84:443–447
Morimoto H (1998) Relationship between batch fecundity and egg
size in Japanese sardine Sardinops melanostictus in Tosa Bay
and off Kii Channel, southwestern Japan form 1990 to 1993. Fish
Sci 64:220–227
Nichol GD, Acuna EI (2000) Annual and batch fecundity of the
yellowfin sole, Limanda aspera, in the eastern Bering Sea. Fish
Bull 99:108–122
Ohshimo S (2004) Stock assessment of the Pacific stock of the round
herring Etrumeus teres. In: Stock assessment of the fisheries
resources around Japan. Technical report. Fishery Agency and
Fishery Research Agency. Tokyo, Japan, pp 482–497
Patterson KR (1992) An improved method for studying the condition
of fish, with an example using Pacific sardine Sardinops sagax(Jenyns). J Fish Biol 40:821–831
Pina T, Esteves E, Andrade JP (2003) Gross and histological
observation of ovarian development in twaite shad, Alosa fallaxfallax, from the rivers Mira and Guadiana (Portugal). Sci Mar
67:313–322
Sokal RR, Rohlf FJ (1997) Biometry, 3rd edn. W. H. Freeman, San
Francisco 887 p
Somarakis S, Ganias K, Tsepes G, Koutsikopoulos (2004) Ovarian
allometry and the use of gonadosomatic index: a case of study in
the Mediterranean sardine, Sardina pilchardus. Mar Biol
146:181–189
Somarakis S, Ganias K, Slapatis A, Koutsikopolus C, Machias S,
Papaconstantinou C (2006) Spawning habitat and daily egg
production of sardine (Sardina pilchardus) in the eastern
Mediterranean. Fisher Ocenogr 15:281–292
Stequert B, Menard F, Marchal E (2003) Reproductive biology of
Vinciguerria nimbaria in the equatorial waters of the eastern
Atlantic Ocean. J Fish Biol 62:1116–1136
Taylor RG, Murphy M (1992) Reproductive biology of swordfish
Xiphias gladius in the Straits of Florida and adjacent waters. Fish
Bull US 90:809–816
Taylor RG, Grier HJ, Whittington JA (1998) Spawning rhythms of
common snook in Florida. J Fish Biol 53:502–520
Tomasini JA, Collart D, Quignard JP (1999) Reserve management
strategy for the sand smelt from brackish lagoons in southern
France. J Mar Biol Assoc UK 79:145–151
Wallace RA, Selman K (1979) Physiological aspects of oogenesis in
two species sticklebacks, Gasterosteus aculeatus L. and Apeltesquadracus (Mitchill). J Fish Biol 14:551–564
Wallace RA, Selman K (1981) Cellular and dynamic aspects of
oocyte size in teleosts. Am Zool 21:325–343
Wright PJ (1992) Ovarian development, spawning frequency and
batch fecundity in Encrasicholina heteroloba (Ruppell, 1858).
J Fish Biol 40:833–844
Wyatt T (1980) The growth season in the sea. J Plank Res 2:81–91
Yamada H (1994) Ecology of round herring Etrumeus teres in
Kumano-nada Sea. Bull Jpn Soc Fish Oceanogr 58:286–291
Yanagawa S (1996) Batch fecundity and spawning period of the
round herring in Tosa Bay. In: Report of stock assessment of
fishery resource by prefectures in southwestern Japan, vol 4, pp
43–53
Yoneda M, Tokimura M, Fujita H, Takeshita N, Takeshita K,
Matsuyama M, Matsuura S (1998) Reproductive cycle and
sexual maturity of the anglerfish Lophiomus setigerus in the East
China Sea with a note on specialized spermatogenesis. J Fish
Biol 53:164–178
1064 Mar Biol (2007) 152:1051–1064
123

Mar Biol (2008) 153:1005–1006
DOI 10.1007/s00227-007-0876-9ERRATUM
Spawning pattern and type of fecundity in relation to ovarian allometry in the round herring Etrumeus teres
Guido Plaza · Hideo Sakaji · Hitoshi Honda · Yuichi Hirota · Kazuya Nashida
Published online: 10 January 2008© Springer-Verlag 2007
Erratum to: Mar Biol (2007) 152:1051–1064 DOI 10.1007/s00227-007-0756-3
Unfortunately, some of the authors’ aYliations were incor-rect and the legend to Fig. 3 did not correspond to the colorversion. The correct aYliations as well as the correct legendto Fig. 3 are given below.
AYliations
G. Plaza (&)
Escuela de Ciencias del Mar, Facultad de RecursosNaturales, PontiWcia Universidad Católica de Valparaíso,Avenida Altamirano 1480, Valparaíso, Chile
H. SakajiNational Research Institute of Fisheries Science (NRIFS),Fisheries Research Agency (FRA), 2-14-4 Fukuura,Kanazawa, Yokohama, Kanagawa 236-8648, Japan
Y. Hirota · K. NashidaNRIFS, FRA, Kochi Kuroshio Research Laboratory,Sanbashi-dori 6-1-21, Kochi 780-8010, Japan
H. HondaTropical Tuna Resources Division, National ResearchInstitute of Far Seas Fisheries, FRA, 5-7-1 Orido, Shimizu,Shizuoka 424-8633, Japan
Legend to Fig. 3
The online version of the original article can be found under doi:10.1007/s00227-007-0756-3.
G. Plaza (&)Escuela de Ciencias del Mar, Facultad de Recursos Naturales, PontiWcia Universidad Católica de Valparaíso, Avenida Altamirano 1480, Valparaíso, Chilee-mail: [email protected]
H. SakajiNational Research Institute of Fisheries Science (NRIFS), Fisheries Research Agency (FRA), 2-14-4 Fukuura, Kanazawa, Yokohama, Kanagawa 236-8648, Japan
Y. Hirota · K. NashidaKochi Kuroshio Research Laboratory, NRIFS, FRA, Sanbashi-dori 6-1-21, Kochi 780-8010, Japan
H. HondaTropical Tuna Resources Division, National Research Institute of Far Seas Fisheries, FRA, 5-7-1 Orido, Shimizu, Shizuoka 424-8633, Japan
123

1006 Mar Biol (2008) 153:1005–1006
Fig. 3 Etrumeus teres. a Modal progression (MP) of the frequency distribution of intraovarian oocytes sorted by the mean diameter of the most advanced mode of oocytes (MODAM) in 60 females collected in January 2004. Dark green areas ovaries with Py oocytes; yellowish areas ovaries with Ay; sky blue areas hydrated ovaries. b Oocyte size frequency distribution in a maturing Wsh. Brown bars denote oogonia and oocytes in primary and secondary growth phase smaller than 0.15 mm that were excluded from MP analyses. Dark green bars denote cortical alveoli oocytes and yellow bars yolked oocytes. c MP analysis in 30 mature females collected in June 2003, a month close to the resting period. Y-axes were not drawn in MP graphs to make them easier to understand
0,1 0,3 0,5 0,7 0,9 1,1
0.94
0.88
0.82
0.74
0.59
0.51
0,1 0,3 0,5 0,7 0,9 1,1 1,3 1,5
1.40
1.32
1.29
1.25
1.20
0.90
0.86
0.79
0.68
0.59
Oocyte diameter (mm)
Me
nacoo
yte
maidet
refo
the
mos
tad
vanc
edm
oed
(mm
)
(a)
(c)
(b)
0,05 0,2 0,35 0,5 0,65 0,8
0
10
20
30
40
Oocyte Diameter (mm)
N=600
Fr
qeeu
cny
(%)
123
Copyright © 2022 FDOKUMEN