
The reproductive success of pike, Esox lucius: aspects of fecundity, egg density and survival
Upload
khangminh22Category
view
0download
0
Aquat. Living Resour., 1995, 8, 9 1 - 109
Determinacy of fecundity and oocyte atresia in sole (Solea solea) from the Channel, the North Sea and the Irish Sea
Peter R. Witthames and Michael Greer Walker
Minictq of Ap'culture, Fishm'es und Food, Directorute of Fi5hm.e.s Risparch, Fishm'es Lubomio?y, Loweslojt, NR33 OHT, Suffolk, U.K
Received January 26, 1994; accepted December 12, 1994.
Witthames P. R., M. Greer Walkcr. Aquat. Living Resour., 1995, 8, 91-109.
Abstract Changes in the morphology of the ovary are described during maturation and it is established that it is a homogeneous structure for sampling purposes at maturity stages four and five. Several aspects of vitellogenic oocyte growth and recruitement were exarnined as criteria to ascertain whether the annual fecundity can be determined in Solea solea just prior to spawning. The first criterion was whether a hiatus develops in the size frequency distribution between the previtellogenic and vitellogenic oocytes just prior to spawning. We were unable to demonstrate this feature in sole frorn division VlId (N = 5) or IVc (N = 5) but it was present in two out of five fish from division VIIe and al1 fish examined from division VIIa (N = 5) and IVb West (N = 5). The hiates occurred between 175 and 250 ,um (cohort size 25 /hm) in the size frequency distribution and measured between 25 and 75 Irm. Oocyte size frequency distribution from mid spawning and late spawning-spent sole from division 1Vc showed a hiatus in 9 out of 10 fish which became wider as the residual annual potential fecundity declined. Next the rate of recruitment and growth of vitellogenic oocytes was studied in sole sampled at monthly intervals (July 1993 to February 1994) from division VIId in relation to the start and duration of the annual spawning season. The growth rate of the leading oocyte cohort was 2.73 x mm3 per day on 20 September and increased to 3.91 x at a mean diameter of 839 /Lm by 10 February just pnor to spawning. However, the observed maximum growth rate, even when adjusted for the positive influence of temperature, allowed little scope for previtellogenic oocytes to complete maturation during a spawning period of 60 days. The recruitment of viltellogenic oocytes was 3013 oocytes per day on 3 August and declined rapidly as spawning approached. In the three months prior to spawning no significant increase was found in the annual potential fecundity. An analysis of a sample of spawning fish from IVc demonstrated that 88% had less than 50% of their predicted potential fecundity remaining in the ovary. The mean batch fecundity was 8 400 (SE f 13 363) and in conjunction with existing data on spawning frequency and duration gave a realised fecundity close to the potential fecundity. It is concluded that for al1 practical purposes the sole can be regarded as having a determinate fecundity in al1 the areas studied. The regulation of potential fecundity by follicular atresia was assessed in pre-spawning and spawning sole. In ICES areas IV and VI1 the prevalence of atretic oocytes in pre-spawning fish varied between 0.04 and 0.69 and the relative intensity varied between 0.017 and 0.076. During spawning in division IVc the prevalence of atresia varied between 0.45 and 0.57 and the relative intensity between 0.022 and 0.058. If we assume a turnover rate of 9 days the loss from the potential annual fecundity, during spawning, in division IVc would be 12.4%.
Keywords: Determinacy, atresia, oocytes, fecundity, spawning season, maturity, vitellogenesis, Solea solea.
Aquat. Living Resour. ISSN 0990-7740/951011$ 4.0010 British Crown copyright 1995
P. R. Witthames and M. Greer Walker
I)éterminution de lu j<condité et de I'utré.sie des ovocjtes chez lu sole (Solca solea) de ICI Manche, de lu mer du Nord et de lu mer d'Irlande.
Résumé Les changements dans la morphologie dcs ovaires sont décrits durant la maturation et il est établi qu'il s'agit d'une structure homogène, permettant I'échantillonnagc, aux stades de maturité 4 et 5. Plusieurs a\pects de la croissance et du rccrutcmcnt dcs ovocytes vitellogéniques ont été examinés en tant quc critères pour certifier si la fécondité annuelle pouvait étre déterminée juste avant la ponte. Le 1" critère était de voir si une discontinuité ie développait dans la distribution des fréquences de taille entre les ovocytes pré- et vitellogéniques juite avant la ponte. Nous n'avons pas été capables de démontrer cela chcz la sole des divisions Vlld ( N = 5) ou IVc (N = 5) mais cela a été observé chcz 2 dcs 5 poissons de la division Vlle et c h e ~ tous les poissons examinés des divisions VIIa (N = 5) et IVb ouest ( N = 5). Les discontinuités apparaissent entrc 175 ct 250 Irm ct mcsurcnt cntrc 25 et 75 Irm. Les distributions de fréquence de taille des ovocytes à« mi-ponte » et en fin dc pontc chcz les soles de la division IVc ont montré une discontinuité chcz 9 dcs 10 poissons qui augmente au fur et à mesure que le potentiel annuel résiduel de fécondité diminue. Ensuite, les taux de recrutement et la croissance des ovocytes vitellogénique ont été étudiés tous les mois (de juillet 1093 à février 1994) pour la divi5ion VIld en relation avec le début dc la saison de ponte annuelle. Ide taux de croissance de la cohorte d'ovocytes les plu\ grands était de 2,73 x 10 mm' par jour le 20 scptcmbre ct augmentait à 3,91 x pour un diamètre moyen de 839 /Lm au 10 févricr justc avant la pontc. Cependant, le taux maximum de croissance, même ajusté à une , température Savorablc, pcrmct un intcrvalle de 60 jours entre 2 pontes pour la maturation des ovocytes prévitellogéniquc. Le recrutement des ovocytes vitellogéniques était de 3 013 ovocytes par jour, le 3 août ct diminuait rapidement avec l'approche de la ponte. Ilans les 3 mois avant la ponte, i l n'y avait pas d'augmentation significative de la fécondité potentielle annuelle. Une analyse d'un Lchantillon de poisson de la division IVc démontra que 88% avait moins de 50% de leur Sécondité potenticllc préditc rcstant dans leurs ovaires. Ida fécondité moyenne par pontc était de 8400 (SE f. 1 363) et, en conjonction avec les données existantes sur la fréquencc des pontcs et leur durée, donne une fécondité proche de la fécondité potentiellc. En conclusion, on peut considérer que la sole a une fécondité déterminée pour chaque zone étudiée. Lc mécanisme, d'après lequel la fécondité potentielle par atrésie folliculaire, est établi chez les soles en pré-ponte et en ponte. Ilans les zones IV et VI1 du CIEM, la proportion des ovocytes atrétiqucs chez les poissons en pré-pontes varient entre 0 3 4 et 0.69 et l'intensité relativc cntrc 0,017 ct 0,076. Durant la ponte, dans la division IVc, la proportion d'atrésie varic cntrc 0,45 ct 0,57 et l'intensité relative entre 0,022 et 0,058. En supposant un rcnouvellcmcnt dc 9 jours, la perte de fécondité potentielle annuelle, durant la pontc, scrait dc 12,4% dans la division IVc.
Mots-clés : Atrésie, ovocytes, saison de ponte, maturité sexuelle, vitcllogcnCse, Soleu solea.
INTRODUCTION
The southerly extent of the distribution of sole is along the Mediterranean coast and as far south as Senegal (30' north) on the eastem Atlantic coast (Whitehead et al., 1986). The northem limit is bounded by the western Baltic Sea, Trondheim Fjord on the Nonvay coast (60' north) and the Faroe Islands. The stocks around the British Isles are thus towards the northem limit of the range of this species. Rijinsdorp et ul. (1992) and Horwood (1993) have recently reviewed the biology of the sole and the fishery. An asynchronous pattern of oocyte development, and the release of mature oocytes in a series of batches during the spawning season, has been described by Ramos (1983) and Urban (1991).
The assessment of sole stocks for management purposes is presently done by virtual population analysis (Pope and Shepherd, 1988) using catch-at-age data from commercial vessels. An alternative method can be used, in which the total number of eggs in the plankton is estimated using a research vesse1 survey and divided by the number of eggs produced per female. This method can only be used if the total annual fecundity is present and can be counted prior
to spawning. If this is the case, the fecundity is termed determinate. If, however, some previtellogenic oocytes commcncc viltellogensis and develop to ovulation for somc pcriod during spawning, then the fecundity measured before spawning does not represent the true fecundity and is tcrmed indeterminate. In the latter case, the daily egg production method can be used for assessment (Parker, 1980). In the past, it has been assumed that the sole has a determinate fecundity. The criterion for his assumption has been the presence of a gap or hiatus in the size frcquency distribution of oocytes between the previtellogenic oocytes which mature in subsequent years and the maturing (vitellogenic) oocytes which mature and are spawned in the current year. Horwood and Greer Walker (1990) showed that a hiatus developed prior to spawning in sole from the Bristol Channel (ICES division VIIf) and concluded that the fecundity of sole from that area was determinate. However, Urban (1991) found no hiatus in the size frequency distribution of oocytes from German Bight sole (ICES division IVb east) and concluded that the fecundity was therefore indeterminate. During a discussion of these differences between stocks, Urban (1 99 1) pointed out that the two stocks may have different
Aquat. Living Rewur.. Vol. 8, no 1 - 1995
Fecundity and oocyte atresia in Solea solea
spawning strategies. It is also apparent that the sole from the Gerrnan Bight were small fish, possibly in their first spawning season, and caught at the end of the spawning season (late June). Under these circumstances they may not be considered representative of the whole spawning population.
MATERIAIS AND METHODS
Collection of fish
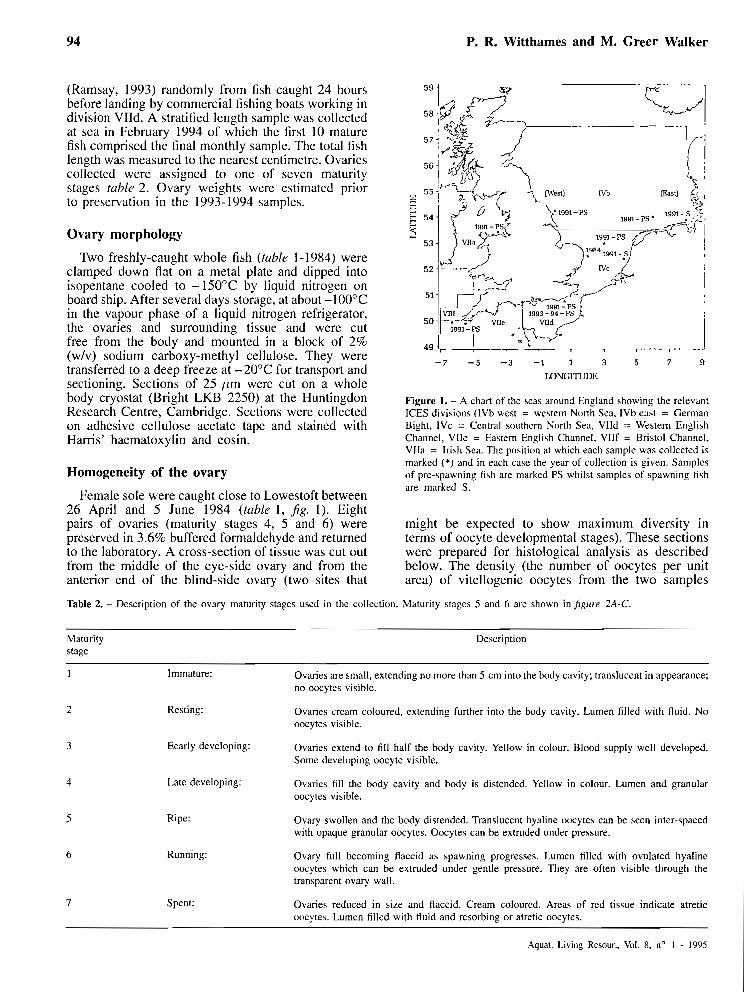
Collections of female sole, detailed in tuhle 1 and jïfigure 1, were made between 1984 and 1994. Samples collected from division IVc during 1984 were used to study gross ovarian morphology. During 1991, female sole were collected from several places in ICES arcas IV and VI1 to give a comprehensive geographic coverage in one year. Fish were collected at a time just before spawning, which was January in division VIIe, Fcbruary in VIId and March in area IV (De Clerck, 1974) to study hiatus development and oocyte atresia. Spawning fish were also collected in area IV to continue the study of hiatus development, and estimate oocyte atresia and batch fecundity. Finally, samples were collected during the period from July 1993 to February 1994 from ICES division VIId to measure the rates of increase in fecundity and growth in size of the leading cohort of vitellogenic oocytes cohort prior to spawning. In 1991, stratified length samples were generally taken from the catch at sea and the ovaries dissected out and preservcd immediately after the fish were caught. However, some of the fish sampled in division VIIe were selected after landing but from a part of the catch made 24 h bcfore the return to port. From July 1993 until January 1994 10 recovering-maturing fish per month were selected
In the present work we have studied changes in ovary morphology in relation to maturity stage to verify sampling procedures. Primarily we set out to establish whether or not sole stocks from the Channel (ICES divisions VIId and VIIe), the North Sea (ICES divisions IVb West, IVb east and IVc) and the Irish Sea (ICES division VIIa) have a determinate fecundity. To this end three lines of evidence werc examined:
1. the development of a gap or hiatus in the size frequency distribution between previtellogenic and vitellogenic oocytes prior to and during spawning;
2. the rate of recruitment and growth of vitellogenic oocytes in relation to the length of the spawning season;
3. changes in the number of vitellogenic oocytes in the ovary during spawning.
Finally as an adjunct to the main objective we have quantified atresia (the resorption of oocytes) in sole from al1 the ICES areas mentioned above prior to spawning (maturity stage 4) and in ICES division IVc during spawning.
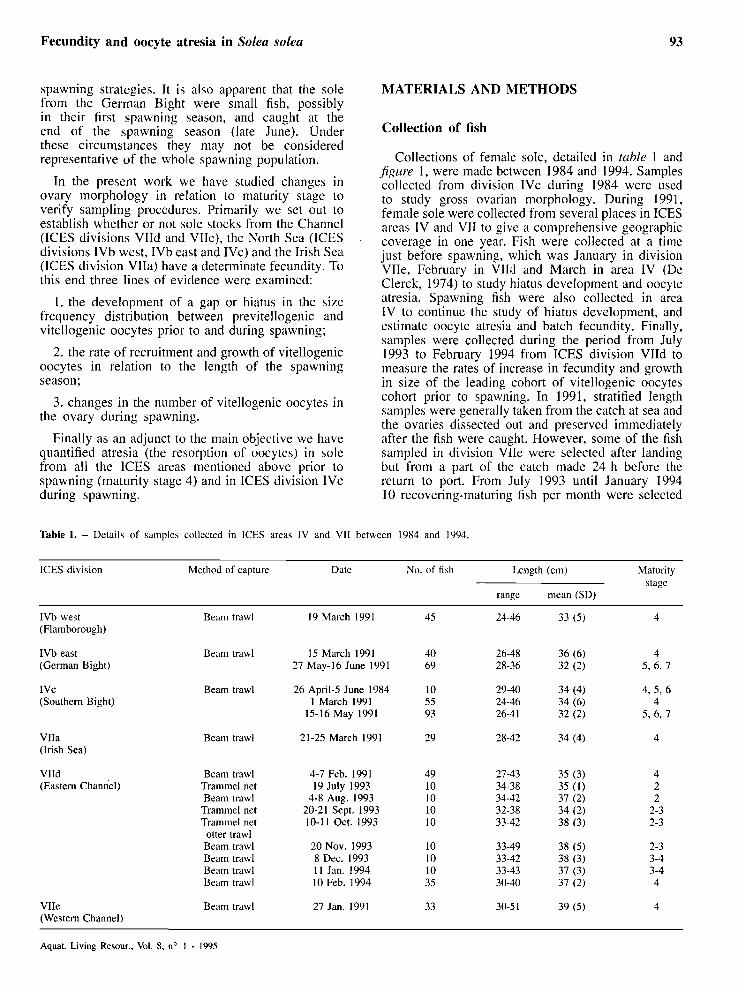
Table 1. - Details of samples collected in ICES areas IV and VI1 between 1984 and 1994.
ICES division Method of capture Date No. of fish Length (cm) Maturity stage
range mean (SD)
IVb West (Flamborough)
Beam trawl 19 March 1991
IVb east (German Bight)
Beam trawl 15 March 1991 27 May-16 June 1991
1 v c (Southem Bight)
Beam trawl 26 April-5 June 1984 1 March 1991
15-16 May 1991
VIIa (Irish Sea)
Beam trawl 21-25 March 1991
VIId (Eastern Channel)
Beam trawl Trammel net Beam trawl
Trammel net Trammel net
otter trawl Beam trawl Beam trawl Beam trawl Beam trawl
4-7 Feb. 1991 19 July 1993
4-8 Aug. 1993 20-21 Sept. 1993 10-1 1 Oct. 1993
20 Nov. 1993 8 Dec. 1993 11 Jan. 1994 10 Feb. 1994
VIIe (Western Channel)
Beam trawl 27 Jan. 1991
Aquat. Living Resour., Vol. 8, no 1 - 1995
Y 4 P. R. Witthames and M. Greer Walker
(Ramsay, 1993) randomly from fish caught 24 hours before landing by commercial fishing boats working in division VIId. A stratified length sample was collected at sea in February 1994 of which the first 10 mature fish comprised the final monthly sample. The total fish length was measured to the nearest centimetre. Ovaries collected were assigned to one of seven maturity stages table 2. Ovary weights were estimated prior to preservation in the 1993- 1994 samples.
Ovary morphology
Two freshly-caught whole fish (table 1 - 1984) were clamped down flat on a metal plate and dipped into isopentane cooled to -150°C by liquid nitrogen on board ship. After several days storage, at about -100°C in the vapour phase of a liquid nitrogen refrigerator, the ovaries and surrounding tissue and were cut free from the body and mounted in a block of 2% (w/v) sodium carboxy-methyl cellulose. They were transferred to a deep freeze at -20°C for transport and sectioning. Sections of 25 /Lm were cut on a whole body cryostat (Bright LKB 2250) at the Huntingdon Research Centre, Cambridge. Sections were collected on adhesive cellulose acetate tape and stained with Harris' haematoxylin and eosin.
Homogeneity of the ovary
Female sole were caught close to Lowestoft between 26 April and 5 June 1984 (table 1, Jig. 1). Eight pairs of ovaries (maturity stages 4, 5 and 6) were preserved in 3.6% buffered formaldehyde and returned to the laboratory. A cross-section of tissue was cut out from the middle of the eye-side ovary and from the anterior end of the blind-side ovary (two sites that
Table 2. - Description of the ovary maturity stages used in the colle(
-7 -5 -3 -1 1 3 5 7 9
LONGITUDE
Figure 1. - A chart of the seas around England showing the relevant ICES divisions llVb wcst = wcstcrn North Sea, IVb east = German Bight, 1Vc = Central southern North Sea, VIId = Western English Channel, Vllc = Eastcrn English Channel, VIIf = Bristol Channel, Vlla = Iri\h Sea. The position at which each sample was collected is markcd (*) and in each case the year of collection is given. Samples of pre-spawning fish are marked PS whilst samples of spawning fish are marked S.
might be expected to show maximum diversity in terms of oocyte developmental stages). These sections were prepared for histological analysis as described below. The density (the number of oocytes per unit area) of vitellogenic oocytes from the two samples
:lion. Maturity stages 5 and 6 are shown in figure 2A-C.
Maturity stage
Description
Immature: Ovaries are small, extcnding no more than 5 cm into the body cavity; translucent in appearance; no oocytes visible.
Resting: Ovaries cream coloured, cxtending further into the body cavity. Lumen filled with fluid. No oocytes visible.
Eearly developing: Ovaries extend to fiIl half the body cavity. Yellow in colour. Blood supply well developed. Some developing oocyte visible.
Late developing: Ovaries fil1 the body cavity and body is distendcd. Ycllow in colour. Lumen and granular oocytes visible.
Ripe:
Running:
Spent:
Ovary swollen and the body distendcd. Translucent hyaline oocytes can be seen inter-spaced with opaque granular oocytcs. Oocytes can be extmded under pressure.
Ovary full becoming flaccid as spawning progresses. Lumen filled with ovulated hyaline oocytes which can be extmded under gentle pressure. They are often visiblc through the transparent ovary wall.
Ovaries reduced in size and flaccid. Cream coloured. Areas of rcd tissue indicate atretic oocytes. Lumen filled with fluid and resorbing or atrctic oocytes.
Aquat. I.iving Rerour., Vol. 8, no 1 - 1995
Fecundity and oocyte atresia in Solea solea
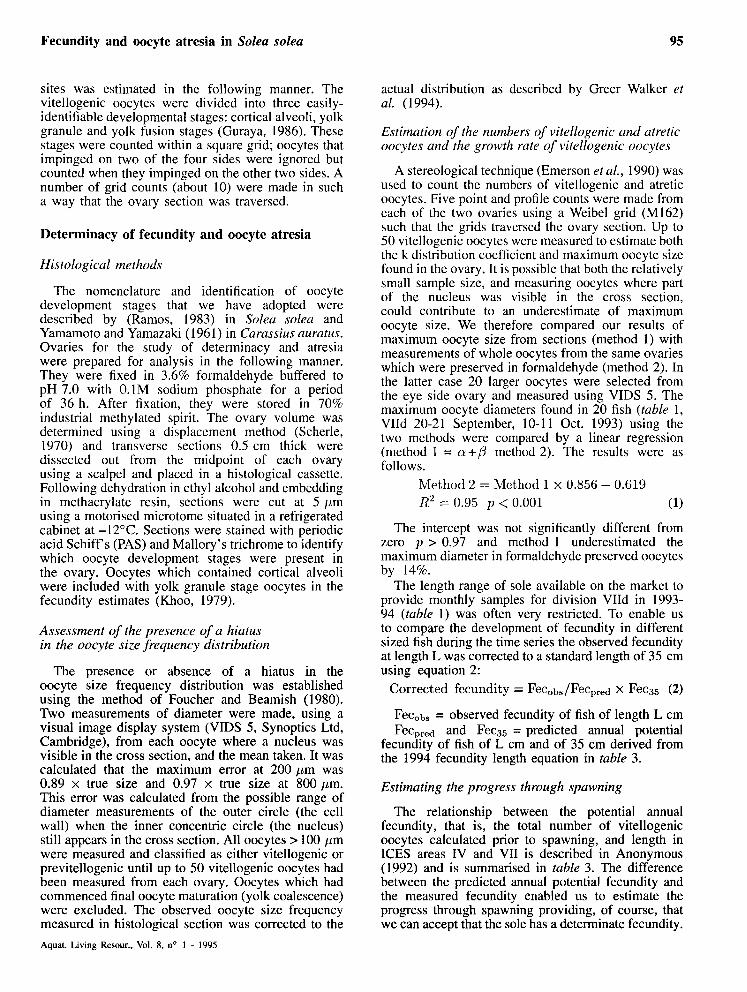
sites was estimated in the following manner. The vitellogenic oocytes were divided into three easily- identifiable developmental stages: cortical alveoli, yolk granule and yolk fusion stages (Guraya, 1986). These stages were counted within a square grid; oocytes that impinged on two of the four sides were ignored but counted when they impinged on the other two sides. A number of grid counts (about 10) were made in such a way that the ovary section was traversed.
Determinacy of fecundity and oocyte atresia
Histological methods
The nomenclature and identification of oocyte development stages that we have adopted were described by (Ramos, 1983) in Soleu solea and Yamamoto and Yamazaki (1 96 1) in Carassius auratus. Ovaries for the study of determinacy and atresia were prepared for analysis in the following manner. They were fixed in 3.6% formaldehyde buffered to pH 7.0 with 0.1M sodium phosphate for a period of 36 h. After fixation, they were stored in 70% industrial methylated spirit. The ovary volume was determined using a displacement method (Scherle, 1970) and transverse sections 0.5 cm thick were dissected out from the midpoint of each ovary using a scalpel and placed in a histological cassette. Following dehydration in ethyl alcohol and embedding in methacrylate resin, sections were cut at 5 jrm using a motorised microtome situated in a refrigerated cabinet at -12°C. Sections were stained with periodic acid Schiff s (PAS) and Mallory's trichrome to identify which oocyte development stages were present in the ovary. Oocytes which contained cortical alveoli were included with yolk granule stage oocytes in the fecundity estimates (Khoo, 1979).
Assessrnent of the presence of u hiatus in the oocyte size frequency distribution
The presence or absence of a hiatus in the oocyte size frequency distribution was established using the method of Foucher and Beamish (1980). Two measurements of diameter were made, using a visual image display system (VIDS 5, Synoptics Ltd, Cambridge), from each oocyte where a nucleus was visible in the cross section, and the mean taken. It was calculated that the maximum error at 200 pm was 0.89 x tnie size and 0.97 x tme size at 800 /Lm. This error was calculated from the possible range of diameter measurements of the outer circle (the ce11 wall) when the inner concentric circle (the nucleus) still appears in the cross section. Al1 oocytes > 100 pm were measured and classified as either vitellogenic or previtellogenic until up to 50 vitellogenic oocytes had been measured from each ovary. Oocytes which had commenced final oocyte maturation (yolk coalescence) were excluded. The observed oocyte size frequency measured in histological section was corrected to the
actual distribution as described by Greer Walker et al. (1994).
Estimation of the numbers of vitellogenic and atretic oocytes and the growth rate of vitellogenic oocytes
A stereological technique (Emerson et al., 1990) was used to count the numbers of vitellogenic and atretic oocytes. Five point and profile counts were made from each of the two ovaries using a Weibel grid (M162) such that the grids traversed the ovary section. Up to 50 vitellogenic oocytes were measured to estimate both the k distribution coefficient and maximum oocyte size found in the ovary. Tt is possible that both the relatively small sample size, and measuring oocytes where part of the nucleus was visible in the cross section, could contribute to an underestimate of maximum oocyte size. We therefore compared Our results of maximum oocyte size from sections (method 1) with measurements of whole oocytes from the same ovaries which were preserved in formaldehyde (method 2). In the latter case 20 larger oocytes were selected from the eye side ovary and measured using VIDS 5. The maximum oocyte diameters found in 20 fish (table 1, VIId 20-21 September, 10-11 Oct. 1993) using the two methods were compared by a linear regression (method 1 = a+p method 2). The results were as follows.
Method 2 = Mcthod 1 x 0.856 - 0.619 R' = 0.95 p < 0.001 (1)
The intercept was not significantly different from zero p > 0.97 and method 1 underestimated the maximum diameter in formaldehyde preserved oocytes by 14%.
The length range of sole available on the market to provide monthly samples for division VIId in 1993- 94 (table 1) was often very restricted. To enable us to compare the development of fecundity in different sized fish during the time series the observed fecundity at length L was corrected to a standard length of 35 cm using equation 2:
Corrected fccundity = F e ~ , ~ , / F e c ~ , , ~ x Fecas (2)
FecOb, = observed fecundity of fish of length L cm FecPred and Feca5 = predicted annual potential
fecundity of fish of L cm and of 35 cm derived from the 1994 fecundity length equation in table 3.
Estimating the progress through spawning
The relationship between the potential annual fecundity, that is, the total number of vitellogenic oocytes calculated prior to spawning, and length in ICES areas IV and VI1 is described in Anonymous (1992) and is summarised in table 3. The difference between the predicted annual potential fecundity and the measured fecundity enabled us to estimate the progress through spawning providing, of course, that we can accept that the sole has a determinate fecundity.
Aquat. Living Resour., Vol. 8, no 1 - 1995

P. R. Witthames and M. Greer Walker
Tahle 3. - The relation5hip between the potential annual fecundity (defined as the number of oocytes at or beyund the cortical alveoli stage of development irnrnediately before spawning) and length of \olei frum ICES areai IV and VII. All collectioni were made during 1991 except in VIId where collectioni were made in 1991 and 1994. The regression parameters titting thc model Ln fecundity = h + aLn length arc givcn with the predicted fecundity at a length of 35 cm.
Prcdictcd lC tS fecundity division at 35 cm Date N a b ~2 (th«uiand\)
IVb east 40 3.7407 -0.2986 0.90 443 15 March
1 Vc 55 3.8065 -0.5617 0.88 330 1 March
IVb wcst 45 4.2851 -2.7495 0.88 264 19 March
VlIa 29 3.9531 - 1.3122 0.72 342 21-25 March
Vlld 49 4.1699 -2.1270 0.76 327 4-7 Peh. 1991
Vllc 33 3.3365 -6.3090 0.74 258 27 Jan.
VIId 35 4.1702 -2.2147 0.56 300 10 Feb. 1994
Batch fecundity
The batch fecundity was estimated using the hydrated oocyte method (Hunter and Goldberg, 1980). Fish were collected (table 1) from ICES division IVc between 15 and 16 May 1991 (N = 93) and IVb east between 27 May and 16 June 1991 (N = 69). Al1 the ovaries fro6 maturity stage 5 fish were screened histologically and those with fresh post-ovulatory follicles were rejccted as, in these cases, ovulation had clcarly commenced. Fresh follicles were identified by their cord-like appearance. Degenerating folliclcs from previous batches were recognised because of their ce11 hypertrophy and their more compact appearance. A full description is given by Hunter and Macewicz (1985~). A total of 38 fish measuring between 28 and 36 cm were selected after screening. The number of hydrated oocytes, present in each of two weighed sub-samples per fish, was counted using an adapted Zeiss microfiche reader (magnification x 6.5) and subsequently raised to the weight of the whole ovary.
Identification of atresia
The nomenclature and general characteristics used to identify atretic stages follow those of Bretschneider and Duyvene de Wit (1947) and Lambert (1970). Estimation of the number of atretic oocytes which still retained some characterislics of cortical alveolie
or yolk granule oocytes was based on the first part of the alpha stage. The truncated alpha stage was more suitable for stereological estimation because it is the end of this stage, the structure's boundary becomes diffuse and poorly defined. The following criterion were used:
Cortical alveoli stage ÿig. 3A and B)
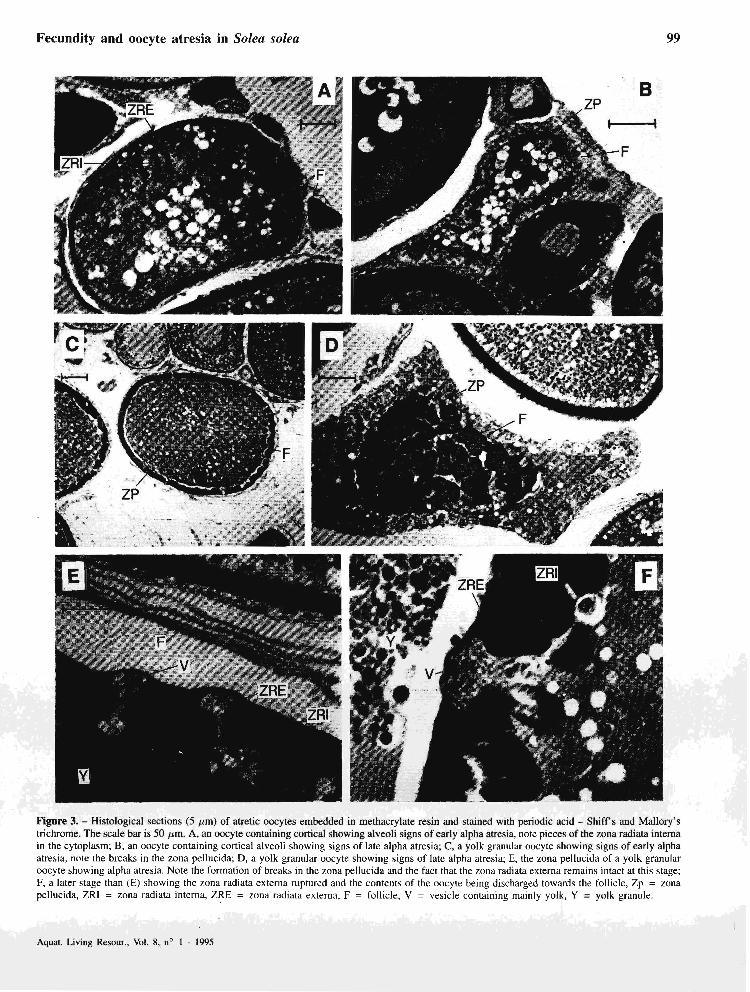
The first visible signs of alpha atresia are a folded and pitted zona pellucida, increased vacuolation, a disorganised ooplasm and intense PAS staining. At the end of this stage the cell is reduced in size, highly vacuolated and the zona pellucida having migrated towards the centre of the ccll has al1 but disappcarcd. The folliclc is hypertrophied.
Yolk granule stage @g. 3C, D, E and F)
The first visible signs of alpha atresia occur in the zona pellucida which shrinks, thickens and takes on a wavy outline. Fissures occur in the zona radiata interna and in the early stages yolk products from the ooplasm form vesicles inside the zona radiata externa which remains intact for a while. These vesiclcs discharge thcir products through breaks in the zona radiata externa towards the follicle. As atresia progresses, these fissures enlarge and larger granules pass through. The zona pellucida shrinks towards the centre of the oocyte and at the end of the alpha stage the ce11 is much reduced in size, no yolk remains, the follicle is hypertrophied, promincnt vacuoles are present and only remnants of the zona pellucida remain. This definition for the end of the alpha atretic stage implies a somewhat shorter period of dcvelopmental time than that describcd for the northern anchovy (Engraulis mordm) by Hunter and Macewicz (1985~). In the latter case, the end of the alpha stage was taken as being when the resorption of the oocyte including yolk, cytoplasm and the zona pellucida was complete.
The termin~logy used to describe oocyte atresia is as follow:
Prevalence. The proportion of female fish with alpha atretic oocytes.
Intensity. The number of alpha atretic oocytes found in ovaries from an individual fish.
Relative inlensity. The number of alpha atretic oocytes divided by the predicted potential annual fecundity calculated from fish length (table 3). It should be noted that estimates of potential fecundity do not include atretic oocytes.
RESULTS
Ovary morphology
In the ripe and running fish ( jg . 2A and B) the eye-side ovary is approximately twice the size of
Aquat. Libing Kewur.. Vol. 8 . n" 1 - 1995
Fecundity and oocyte atresia in Solea solea 97
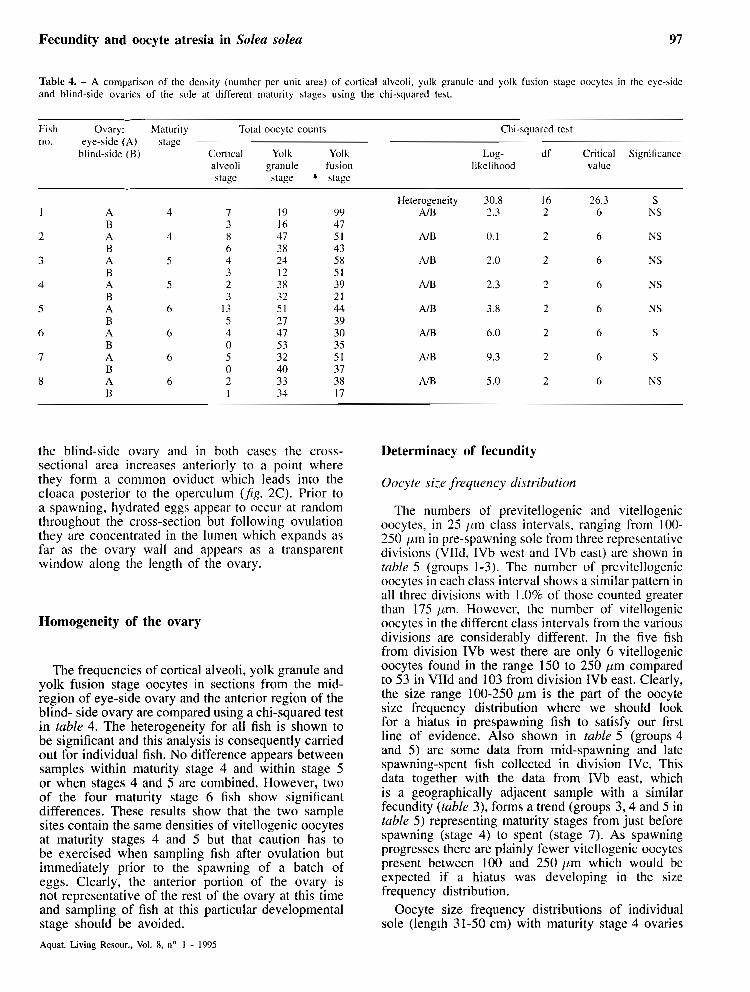
Table 4. - A comparison of the density (numher per unit area) of cortical alveoli, yolk granule and yolk fu\ion stage oocytes in the eye-side and blind-side ovaries of the sole at different maturity stages using the chi-squared test.
Fish Ovary: Maturity Total oocytc couiits Chi-squared test no. eye-side (A) stage
blind-side (B) Cortical Yol k Yolk Log- df Critical Significance alveoli granule fusion likelihood value stage stage • stage
Heterogeneity AIR
A/B
AIB
A/B
AlB
An3
AIB
N B
the blind-side ovary and in both cases the cross- sectional area increases anteriorly to a point where they form a common oviduct which leads into the cloaca posterior to the operculum (Jig. 2C). Prior to a spawning, hydrated eggs appear to occur at random throughout the cross-section but following ovulation they are concentrated in the lumen which expands as far as the ovary wall and appears as a transparent window along the length of the ovary.
Homogeneity of the ovary
The frequencies of cortical alveoli, yolk granule and yolk fusion stage oocytes in sections from the mid- region of eye-side ovary and the anterior region of the blind- side ovary are compared using a chi-squared test in table 4. The heterogeneity for al1 fish is shown to be significant and this analysis is consequently carried out for individual fish. No difference appears between samples within maturity stage 4 and within stage 5 or when stages 4 and 5 are combined. However, two of the four maturity stage 6 fish show significant differences. These results show that the two sample sites contain the same densities of vitellogenic oocytes at maturity stages 4 and 5 but that caution has to be exercised when sampling fish after ovulation but immediately prior to the spawning of a batch of eggs. Clearly, the anterior portion of the ovary is not representative of the rest of the ovary at this time and sampling of fish at this particular developmental stage should be avoided.
Determinacy of fecundity
Oocyte size frequency distribution
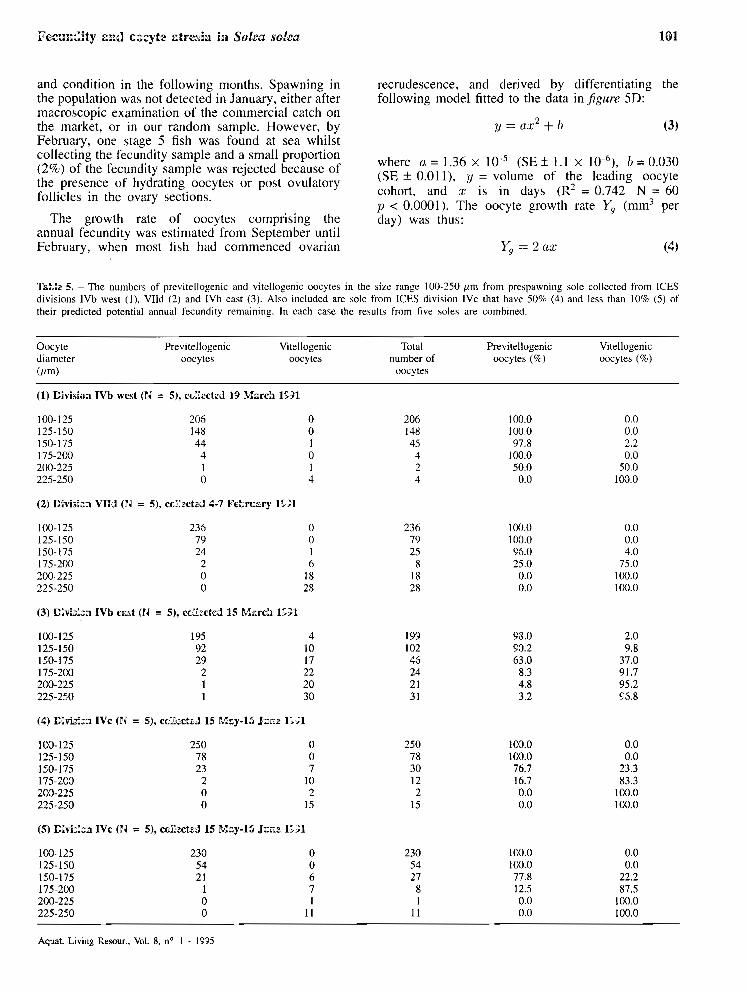
The numbers of previtellogenic and vitellogenic oocytes, in 25 Irm class intervals, ranging from 100- 250 pm in pre-spawning sole from three representative divisions (VIId, IVb West and IVb east) are shown in table 5 (groups 1-3). The number of previtellogenic oocytes in each class interval shows a similar pattern in al1 three divisions with 1.0% of those counted greater than 175 pm. However, the number of vitellogenic oocytes in the different class intervals from the various divisions are considerably different. In the five fish from division IVb West there are only 6 vitellogenic oocytes found in the range 150 to 250 pm compared to 53 in VIId and 103 from division IVb east. Clearly, the size range 100-250 pm is the part of the oocyte size frequency distribution where we should look for a hiatus in prespawning fish to satisfy Our first line of evidence. Also shown in table 5 (groups 4 and 5 ) are some data from rnid-spawning and late spawning-spent fish collected in division IVc. This data together with the data from IVb east, which is a geographically adjacent sample with a similar fecundity (tuble 3), forms a trend (groups 3 , 4 and 5 in table 5) representing maturity stages from just before spawning (stage 4) to spent (stage 7). As spawning progresses there are plainly fewer vitellogenic oocytes present between 100 and 250 /j,m which would be expected if a hiatus was developing in the size frequency distribution.
Oocyte size frequency distributions of individual sole (length 31-50 cm) with maturity stage 4 ovaries
Aquat. Living Resour., Vol. 8, n o 1 - 1995

P. R. Witthames and M. Greer Walker
Figure 2. - Cryostat sections (25 Pm) of whole ovaries from spawning sole (maturity stage 5 (A) and 6 (B + C) stained with H and E. The c a l e bar is 1 cm. A, a transverse ~cction of sole ovaries showing the Iarger eye-side ovary and the widely dispersed hydrated oocytes; B, a transverse section of sole ovaries showing the lumen tilling with ovulated hyaline oocytes and the presence of the hyaline window in the ovary wall; C, a longitudinal section of the anterior end of a ~ o l e ovary showing an accumulation of hyaline oocytes in the lumen and the oviduct lcading to the cloaca. ES = eye-side ovary, BS = blind side ovary, HW = hyaline window, L = lumen, O = oviduct.
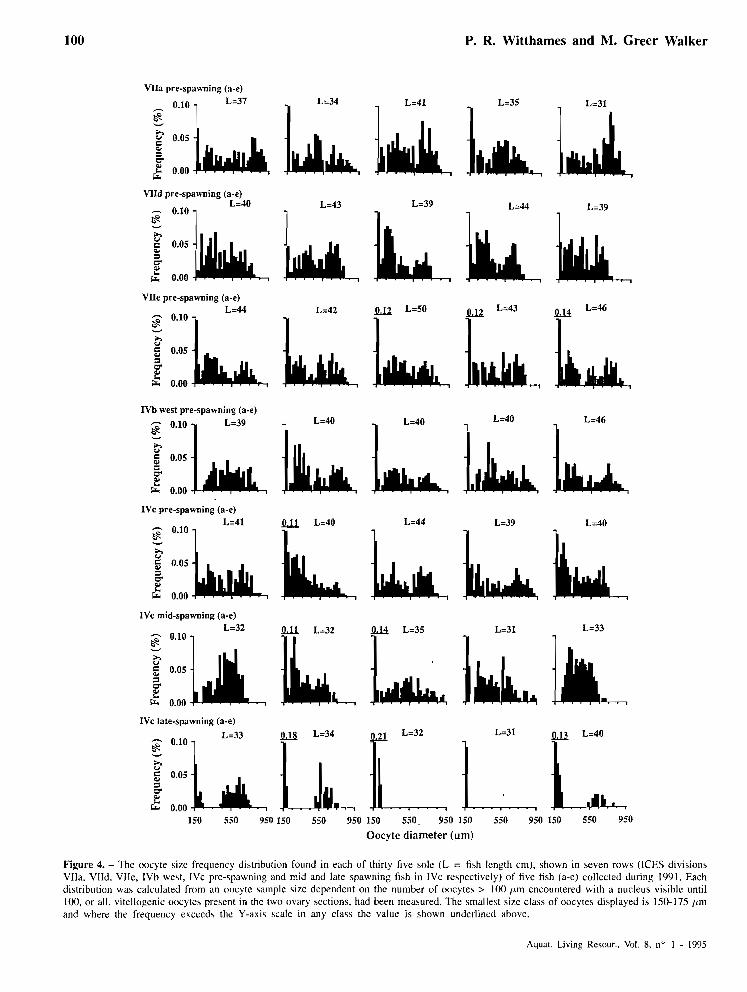
from divisions VIIa, VIId, VIIe, IVb west, and IVc are shown injgure 4. In none of the ovaries examined were post-ovulatory follicles present and the maximum vitellogcnic oocyte diameter was 750 pm or more in al1 the divisions, indicating that the sole were close to but not yet spawning. An inspection of the histograms (,fig. 4) reveals some regional differences. A hiatus
in the oocyte size frequency distribution between 100 and 250 IJ,m is not present in any of the sole from divisions VIId and IVc but in division VIIe 25 pm hiates are found in two of the five fish ( j g . 4, row 3c-200-225 and d-175-200 pm). In divisions VIIa and IVb West al1 the sole show a hiatus in the oocyte size frequency distribution between 175 and 250 Irm. In most cases it is 25 Ism in size but on two occasions (VIIa, e, 175-225 pm and IVb west, a, 175-250 lrm) it is larger. Also shown in jïgure 4 are size frequency distributions from spawning fish (50% or more of the predicted annual potential fecundity remaining) and late spawning-spent fish (< 10% of the predicted annual potential fecundity remaining) collected from division IVc. This series of distributions from IVc make an interesting comparison. We found no hiates in the pre-spawning sole but four (jîfig. 4 row 6 a, c-e) of the five sole caught in mid spawning have hiates in the oocyte size distributions, one of 25 /Lm (c), two of 50 pm (a and d) and one of 75 pm (e). In the sample labelled as late spawning-spent, two sole ( j g . 4 row 7, c and d) have no vitellogenic oocytes > 250 pm remaining while the three other sole have a reduced distribution of vitellogenic oocytes with hiates of between 175 (a), 275 (e) and 300 /Lm (b).
We can conclude that sole from divisions IVc and VIId show no hiates in the oocyte size frequency distribution but two out of five do in VIIe and al1 five sole in VIIa and IVb west. However, these hiates are only of the order of 25 or 50 Irm and may not therefore constitute a true hiatus. The series of samples from 1Vc (pre-spawning, spawning and spent) however shows that the hiatus develops during spawning. In the near-spent sole a well developed hiatus is present and in the fully spent fish no vitellogenic oocytes remain.
Rate of recruitment and growth of vitellogenic oocytes in relation to the length of the spawning season
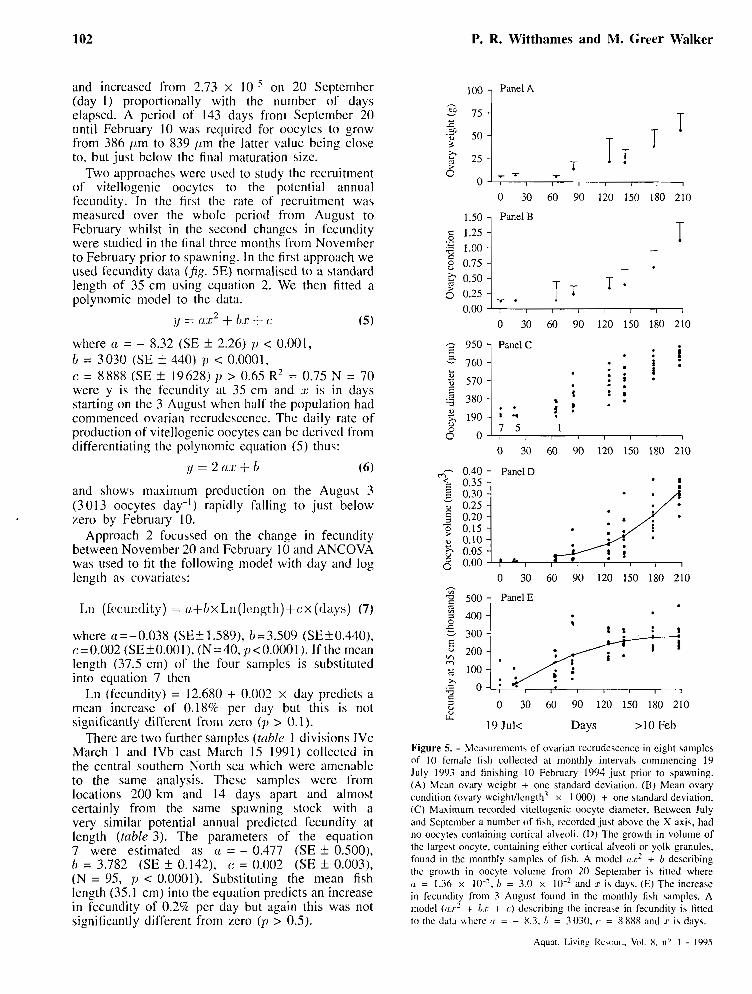
The samples collected from division VIId between July 1993 and February 1994 are summarised in table 1 . Little change in ovary weight and condition (ovary weightnength" 1000) was seen between July and September (jîg. 5A, B) but this coincided with a steady increase in the proportion of fish (July 30% August 50%, and September 90%) which have commenced ovarian recrudescence ( jîg. 5C). Ovarian recrudescence started with the appearance of cortical alveoli stage oocytes but no oocytes with yolk granules were visible. Those fish without cortical alveoli stage oocytes al1 contain lipid vesicle stage previtellogenic oocytes except one fish in the July sample which only had perinuclear stage previtellogenic oocytes. In several fish there were residual signs of the previous annual spawning in the form of advanced gamma atresia. Between September and October the proportion of fish with yolk granules increased from 20 to 90% respectively marking the start of exogenous vitellogenesis and associated increase in ovary weight
Aquat. Living Kewur., Vol. 8, no 1 - 1995
Fecundity and oocyte atresia in Solea solea
Figure 3. - Histological sections (5 pm) of atretic oocytes embedded in methacrylate resin and stained with periodic acid - Shiff's and Mallory's trichrome. The scale bar is 50 Pm. A, an oocyte containing cortical showing alveoli signs of early alpha atresia, note pieces of the zona radiata interna in the cytoplasm; B. an oocyte containing cortical alveoli showing signs of late alpha atresia; C, a yolk granular oocyte showing signs of early alpha atresia, note the breaks in the zona pellucida; D, a yolk granular oocyte showing signs of late alpha atresia; E, the zona pellucida of a yolk granular oocyte showing alpha atresia. Note the formation of breaks in the zona pellucida and the fact that the zona radiata externa remains intact at this stage; F, a later stage than (E) showing thc zona radiata extema ruptured and the contents of the oocyte being discharged towards the follicle, Zp = zona pellucida, ZR1 = zona radiata intema, ZRE = zona radiata externa, F = follicle, V = vesicle containing mainly yolk, Y = yolk granule.
Aquat. Living Resour., Vol. 8, no I - 1995
P. R. Witthames and M. Greer Walker
Vlla pre-spawning (a-e)
W d pre-spamiing (a-e) L=40 L=39
3 8 & 0.00
W e pre-spawning (a-e)
N b west vre-svawnine (a-e)
IVc pre-spawning (a-e)
WC mid-spawning (a-e)
lLbL L=32 l!& L=35
3 u 2
0.00
IVc late-spawning (a-e)
150 550 950 150 550 950 150 550. 950 150 550 950 150 550 950
Oocyte diamete r (pm)
Figure 4. - The oocyte si7e frequency distribution fouiid in each of thirty five sole (1, = fi\h length cm), shown in seven rows (ICES divisions VIIa, VIId, VIIe, IVh we\t, IVc prc-5pawning and mid and late spawning fish in IVc re\pectively) of five fish (a-e) collected during 1991. Each distribution was calculated from an oocyte sample sire dcpendent on the number of oocytes > 100 Irm encountered with a nucleus visihle until 100, or all, vitellogenic oocytes present in the two ovary sections, had been measured. The smalle\t size class of oocytes displayed is 150-175 /Lm and where the frequency exceeds the Y-axis scale in any class the value is shown underlined ahove.
Aquat. Living Rcsour., Vol. 8, no 1 - 1995
and condition in the following months. Spawning in the population was not detected in January, either after mzcroscopic examination of the commercial catch on the market, or in our random sample. However, by February, one stage 5 fish was found at sea whilst collecting the fecundity sample and a small proportion (2%) of the fecundity sample was rejected because of the presence of hydrating oocytes or post ovulatory follicles in the ovary sections.
The growth rzte of oocytes comprising the annual fecundity was estimated from September until February, when most fish had commenced ovarian
recrudescence, and derived by differentiating the following mode1 fitted to the data in figure 5D:
where a = 1.36 x l w 5 (SE* 1 . 1 x 1o4), i,=0.030 (SE f 0.01 l), y = volume of the leading oocyte cohort, and x is in days ( R ~ = 0.742 N = 60 p < 0.0001). The oocyte growth rzte Y, (mm3 per day) was thus:
Ta% 5. - The numbers of previtellogenic and vitellogenic oocytes in the size range 100-250 /Lm from prespawning sole collected from ICES divisions 1Vb West ( l ) , VIId (2) and IVb east (3). Also includcd are sole from ICES division IVc that have 50% (4) and less than 10% ( 5 ) of their predicted potential annual fecundity remaining. In each case the r e ~ l t s frorn five soles are cornhined.
Oocyte diameter (,lm)
Previtellogenic Vitellogenic Total Previtellogenic Vitellogenic oocytes oocytes number of oocytes (%) oocytes (%)
oocytes - -
(1) Civisiù~a IVh west (N = 5), c<,::rcted 19 M?rrch 1531
(3) C;virirn IVb erst (Ii = 5), cc:::eted 15 F~:arch 1;31
(4) C;virira IVc (ri = S), cc:::etzJ 15 Mzy-15 k z 2 1';l
(5 ) C;V~:I;I IVC (r i = s), cc::sctd 1s ~ e y - 1 1 , J Ï ~ Z 1/31
Aq~at. Living Resour., Vol. 8, no 1 - 1975
P. R. Witthames and M. Greer Walker
and increased from 2.73 x 10 bon 20 September (day 1) proportionally with the number of days elapsed. A period of 143 days fronl September 20 until February 10 was rcquired for oocytes to grow from 386 ,um to 839 /Lm the latter value bcing close to, but just bclow the final maturation size.
Two approaches wcrc uscd to study the recruitment of vitellogenic oocytes to the potcntial annual fecundity. In the first the rate of recruitrnent wa\ measured over the wholc period from August to Fcbruary whilst in the second changes in fccundity were studicd in the final three months from Novernbcr to February prior to spawning. In the first approach we used fecundity data (Jig. 5E) normalised to a standard length of 35 cm using cquation 2. We then fitted a polynomic model to the data.
where a = - 8.32 (SE I 2.26) p < 0.001, h = 3030 (SE +_ 440) 11 < 0.0001, c = 8 888 (SE + 19628) ï, > 0.65 R~ = 0.75 N = 70 were y is the fecundity at 35 ctn and :I: is in days starting on the 3 Augu5t when half the population had commenced ovarian recrudescence. Thc daily rate of production of vitellogenic oocytes can be derivcd from differentiating the polynomic equation ( 5 ) thus:
and shows maximum production on the August 3 (3013 oocytes day-l) rapidly falling to just below zero by February 10.
Approach 2 focussed on the change in fecundity between November 20 and Fcbruary 10 and ANCOVA was used to fit the following model with day and log length as covariatcs:
where IL =-0.038 ( S E I 1.589), h = 3.509 (SE-I0.440), c = 0.002 (SE? 0.00 l) , (N = 4 0 , ~ ) < 0.000 1). If the mcan length (37.5 cm) of the four samples is substituted into equation 7 then
Ln (fecundity) = 12.680 + 0.002 x day prcdicts a mcan increasc of 0.18% per day but this is not significantly differcnt from zero ( p > 0.1).
There are two further samples (tuhlc I divisions IVc March 1 and 1Vb east March 15 1991) collected in the central southem North sea which were amenable to the same analysis. These samplcs wcrc from locations 200 km and 14 days apart and almost certainly from the same spawning stock with a very similar potential annual prcdictcd fecundity at length (table 3). The parameters of the equation 7 were estimated as (L = - 0.477 (SE f 0.500), b = 3.782 (SE & 0.142), (: = 0.002 (SE I 0.003), (N = 95, p < 0.0001). Substituting the mean fish length (35.1 cm) into the equation predicts an increase in fecundity of 0.2% pcr day but again this was not significantly different from zero ( p > 0.5).
100 , Panel A
1.50 - g 1.25- 14 1.00 - 2 2 0.75 - 2 0.50 - 5 0.25 -
Panel B
1 T
_ _ T T - 950 - 5 760 -
570 -
380 -
1 9 0 - '
0" 0 ,
'6 2 500 1 Panel E
0.00 , I , I I 1
0 30 60 90 120 150 180 210
Panel C . : I . * i * : i .
f t r . . ? ! 7 5 1
,- 0.40 - < 0.35
0.30 : y 0.25 - 5 0.20 - - 2 0.15- 0 0.10- - 3 0.05 -
CLI
19 Julc Days >IO Feb
I 1 1 1
Panel D 8 a
Figure 5. - Measureiiient of ovarian recrudesccncc in cight samples of 10 fcmalc fish collected at rrionthly intervals commcncing 19 July 1993 and tinishing 10 February 1994 just prior to spawning. (A) Mean ovary wcight + one standard deviation. (BJ Mean ovary condition (ovary weight/lcngth3 x 1000) + one standard deviation. (C) Maximum recorded vitcllogcnic oocyte diameter. Between July and September a number of fi\h, rccordcd just above the X axi5, had no oocytes containing cortical alveoli. (0) Thc growth in volume of the largcst oocyte, containing either cortical alveoli or yolk granules, found in thc monthly samples of fish. A model n.r2 + 1> dcscribing the growth in oocyte volume from 20 September is tittcd where o = 1.36 x IO-', 1, = 3.0 x 1W2 and L is days. (E) The increase in fecundity from 3 August found in the monthly fish samplc~. A niodel (o.r2 + b.r + (.) describing the increase in fecundity is fittcd Io the diita ~ h e r e 11 = - 8.3. 11 = 1030. r. = X 888 and .r is days.
0 0.00 - : " 1 1 4 1 1
0 30 60 90 120 150 180 210
Aquat. Living I<e\our.. Vol. 8 , n" 1 - 1995

Fecundity and oocyte atresia in Solea solea
Changes in the number of vitellogenic oocytes in the ovury during spuwning in sole from ICES division IVc
In order to study the change in the numbers of vitellogenic oocytes during the spawning season, two samples were compared (table 1), the first collected prior to the spawning season (1 March 1991, N = 55) and the second around peak spawning (15116 May 1991, N = 93). The ratio of the observed to the expected fecundity (table 3) at length in the first sample was 1.00, SD I 0.25 and in the second sample it was 0.27, SD 5 0.20, demonstrating a reduction in the number of oocytes present. We then examined the sample collected towards the end of the spawning season in more detail ( j g . 6). 88% of the sample retained half or less of their predicted annual potential fecundity which included 22% near or completely spent fish the latter having no cortical alveoli or yolk granule stage oocytes.
I< prespawning spent >
1.0 0.8 0.6 0.4 0.2 0.0
Proportion of potential fecundity remaining
Figure 6. - Analysis of a sample of sole (N = 93) collected from ICES division IVc on 15/16 May 1991 showing the proportion of the potential annual fecundity remaining in the ovary.
Batch fecundity
Estimates of batch fecundity from 38 fish ( j g . 7) varied between 1000 and 20000 oocytes, but there is no signifiant relationship between batch fecundity and fish length ( R ~ = 0.12). The mean batch fecundity was 8400 (SE f 1363) oocytes at a mean fish length of 3 1.6 cm. The majority (88%) of fish were 4 years old and contained 0.333 (SE f 0.005) of their predicted annual fecundity.
26 28 30 32 34 36 38
Fish lcngth (cm)
Figure 7. - The relation between batch fccundity and the fish Icngth in sole from ICES division IVc (collcctcd 15-16 May 1991) and IVb east (collected 27 May-16 June 1991).
Estimation of atresia
Levels of utresia prior to .~pawning
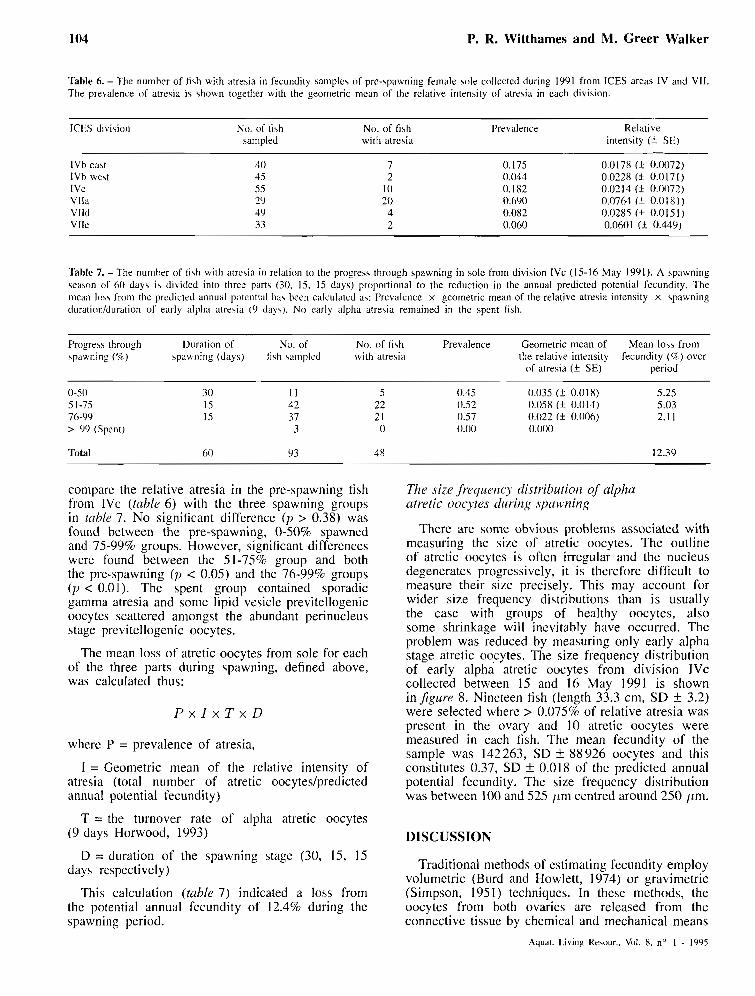
The prevalence and relative intensity of atresia in fecundity samples collected prior to spawning in areas IV and VI1 are shown in tuble 6. The prevalence varied between the lowest value (0.044) found in IVb west and the highest (0.690) in VIIa. lntermediate values were found in IVc (0.1 82), IVb east (0.175), VIId (0.082) and VIIe (0.060).
In ovaries with atresia the relative intensity was low. The highest value was recorded in sole from division VIIa (0.076) with values from other divisions varying between 0.017 and 0.060.
Levels of atresia during spawning
If we can again accept that the sole has a determinate fecundity then progress through spawning can be measured by the decline in standing stock of vitellogenic oocytes during spawning. On this basis, the spawning period can be divided into three parts based on the portion of the predicted annual potential fecundity remaining in the ovary: pre-spawning to 50% spawned, 51 to 75% spawned, and 76-99% spawned. The results from division IVc are shown in table 7 with the 3 completely spent fish appended. The prevalence of atresia increased slightly as spawning progressed from 0.45 in the first half, through 0.52 in the middle to 0.57 in the final stages of spawning but declining to zero in the spent group. However, the relative intensity of atresia rises from 0.035 in the first period to a peak of 0.058 during the second portion and declines to 0.022 during the final portion. A one way ANOVA was used to
Aquat. Living Resour., Vol. 8, no 1 - 1995
P. R. Witthames and M. Greer Walker
Table 6. - The numhcr of tish with atresia in fecundity samplc\ of pre-spawning female sole collccted during 199 1 frorn ICES areas IV and VII. The prekalence of atreiia is 5hown together with the geometric mcan of the relative inteniity of a i d a in each division.
ICt,S division No. of fi5h No. of fiih Prevalence Relative sampled with atrc\ia intensity ( f SE)
IVh cait IVb we\t 1 v c Vlla Vlld VJle
'Iàhle 7. - The numher of tish with atrcsia in relation to the progrci\ through spawning in sole from division IVc (15-16 May 1991). A spawning \ca\»n of 60 day\ is dibided into thrcc part\ (30, 15. 15 days) proportional to the reduction in the annual predicted potential fecundity. The mcaii Ioii froin the predicted annual potcntial ha\ been calculated as: Prevalencc x gcometric mean of the relative atreaia intensity x spawning durationlduration of early alpha atre\ia ( O day\). No early alpha atresia remained in thc spent fish.
Progress through Duration of No. of No. of fish Prevalence Geometric mean of Mcan 105s from ipawning (%) spawning (days) tish saiiiplcd with atresia the relative intensity fecundity (%) ovcr
of atresia ( I SE) period
0-50 30 1 1 5 51-75 15 42 22 76-99 15 37 2 1 > 99 (Spcnt) 3 0
Total 60 93 48
conipare the relative atresia in the pre-spawning fish from IVc (table 6) with the three spawning groups in table 7. No significant difference ( p > 0.38) was found between the pre-spawning, 0-50% spawned and 75-99% groups. However, significant differences were found between the 51-75% group and both the pre-spawning ( p < 0.05) and the 76-99% groups (11 < 0.01). The spent group contained sporadic gamma atresia and some lipid vesicle previtellogenic oocytes scattered amongst the abundant perinucleus stage previtellogenic oocytes.
The mean loss of atretic oocytes from sole for each of the three parts during spawning, defined above, was calculated thus:
wherc P = prevalence of atresia,
1 = Geometric mean of the relative intensity of atresia (total number of atretic oocytes/predicted annual potential fecundity)
T = the turnover rate of alpha atretic oocytes (9 days Horwood, 1993)
D = duration of the spawning stage (30, 15, 15 days respectively)
This calculation (table 7) indicated a loss from the potential annual fecundity of 12.4% during the spawning period.
The size Jrequency distribution of alpha atretic oocytes during .vpuwning
There are sorne obvious ~roblems associated with 1
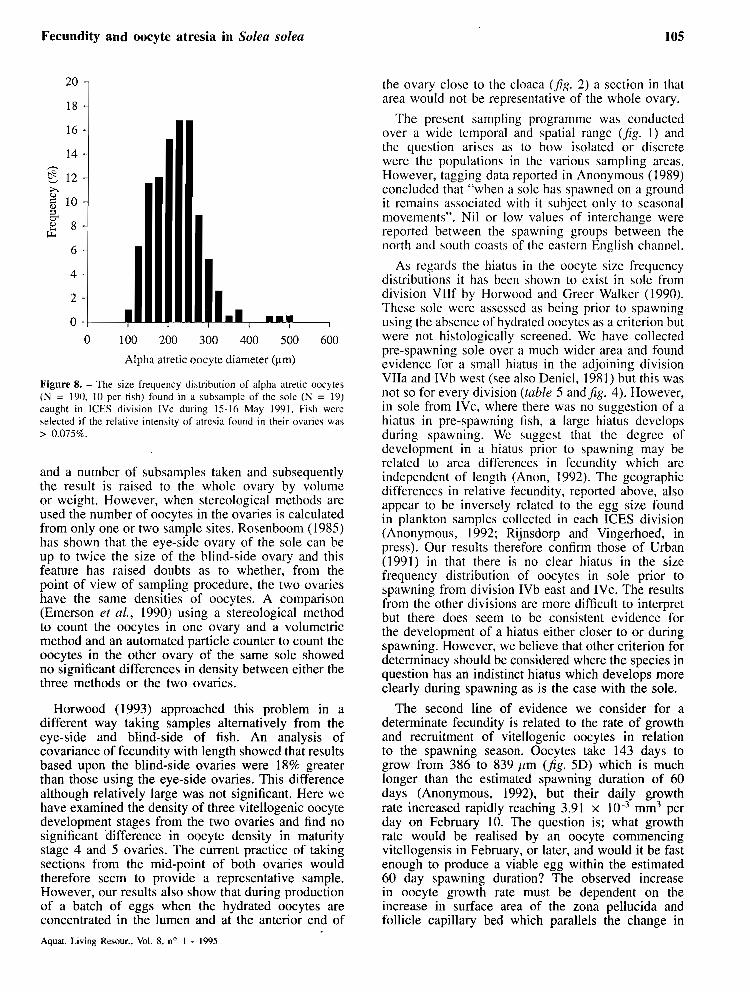
measuring the size of atretic oocytes. The outline of atretic oocytes is often irrcgular and the nucleus degenerates progressively, it is therefore difficult to measure their size precisely. This may account for wider size frequency distributions than is usually the case with groups of healthy oocytes, also some shrinkage will inevitably have occurred. The problem was reduced by measuring only early alpha stage atretic o ~ y t e s . The size frequency distribution of early alpha atretic oocytes from division 1Vc collected between 15 and 16 May 199 1 is shown in jgure 8. Nineteen fish (length 33.3 cm, SD tr 3.2) were selected where > 0.075% of relative atresia was present in the ovary and 10 atretic oocytes were measured in each fish. The mean fecundity of the sample was 142 263, SD f 88 926 oocytes and this constitutes 0.37, SD rt: 0.018 of the prcdicted annual potential fecundity. The size frequency distribution was between 100 and 525 /Lm centred around 250 /hm.
DISCUSSION
Traditional methods of estimating fecundity employ volurnetric (Burd and Howlett, 1974) or gravimetric (Simpson, 1951) techniques. In these methods, the oocytes from both ovaries are released from the connective tissue by chemical and mechanical means
Aquat. Living Re\our.. Vol. 8, no 1 - 1995
Fecundity and oocyte atresia in Solea solea
the ovary close to the cloaca (Jig. 2) a section in that area would not be representative of the whole ovary.
Alpha atretic oocyte diameter (pm)
Figure 8. - The size frequency distribution of alpha atretic oocytes ( N = 190, 10 pcr fish) found in a subsample of the sole ( N = 19) caught in ICkS division 1Vc during 15-16 May 1991. Fiih wcrc selected if the relative intensity of atrciia found in their ovarics was > 0.075%.
and a number of subsamples taken and subsequently the result is raised to the whole ovary by volume or weight. However, whcn stereological mcthods arc used the number of oocytes in the ovaries is calculated from only one or two sample sites. Rosenboom (1985) has shown that the eye-side ovary of the sole can be up to twice the size of the blind-side ovary and this feature has raised doubts as to whether, from the point of view of sampling procedure, the two ovaries have the same densities of oocytes. A comparison (Emerson et al., 1990) using a stereological method to count the oocytes in one ovary and a volumetrie method and an automated particle counter to count the oocytes in the other ovary of the same sole showed no significant differences in density between either the three methods or the two ovaries.
Horwood (1993) approached this problem in a different way taking samples alternatively from the eye-side and blind-side of fish. An analysis of covariance of fecundity with length showed that results based upon the blind-side ovaries were 18% greater than those using the eye-side ovaries. This difference although relatively large was not significant. Here we have examined the density of three vitellogenic oocyte development stages from the two ovaries and find no significant difference in oocyte density in maturity stage 4 and 5 ovaries. The current practice of taking sections from the mid-point of both ovaries would therefore seem to provide a representative sample. However, Our results also show that during production of a batch of eggs when the hydrated oocytes are concentrated in the lumen and at the anterior end of
The present sampling programme was conducted over a wide temporal and spatial range ( j g . 1) and the question arises as to how isolated or discrete were the populations in the various sampling areas. However, tagging data reported in Anonymous (1989) concluded that "when a sole has spawned on a ground i t rcmains associated with i t subject only to seasonal movements". Nil or low values of interchange were reported between the spawning groups between the north and south coasts of the castern English channel.
As regards the hiatus in the oocyte size frequency distributions it has been shown to exist in sole from division VIIf by Horwood and Greer Walker (1990). These sole were assessed as being prior to spawning using the absence of hydrated oocytes as a criterion but were not histologically screened. We have collected pre-spawning sole over a much wider area and found evidence for a small hiatus in the adjoining division VIIa and IVb West (see also Deniel, 1981) but this was not so for every division (table 5 andjg. 4). However, in sole from IVc, where there was no suggestion of a hiatus in pre-spawning iîsh, a large hiatus develops during spawning. We suggest that the degree of development in a hiatus prior to spawning may be related to area diffcrences in fccundity which are independent of length (Anon, 1992). The geographic differences in relative fecundity, reported above, also appear to be inversely related to the egg size found in plankton samples collected in each ICES division (Anonymous, 1992; Rijnsdorp and Vingerhoed, in press). Our results therefore confirm those of Urban (1991) in that there is no clear hiatus in the size frequency distribution of oocytes in sole prior to spawning from division IVb east and IVc. The results from the other divisions are more difficult to interpret but there does seem to be consistent evidence for the development of a hiatus either closer to or during spawning. However, we believe that other criterion for determinacy should be considered where the species in question has an indistinct hiatus which develops more clearly during spawning as is the case with the sole.
The second line of evidence we consider for a determinate fecundity is related to the rate of growth and recruitment of vitellogenic oocytes in relation to the spawning season. Oocytes take 143 days to grow from 386 to 839 pm (Jig. 5D) which is much longer than the estimated spawning duration of 60 days (Anonymous, 1992), but their daily growth rate increased rapidly reaching 3.91 x mm3 per day on February 10. The question is; what growth rate would be realised by an oocyte commencing vitellogensis in February, or later, and would it be fast enough to produce a viable egg within the estimated 60 day spawning duration? The observed increase in oocyte growth rate must be dependent on the increase in surface area of the zona pellucida and follicle capillary bed which parallels the change in
Aquat. Living Resour., Vol. 8, n o I - 1995
P. R. Witthames and M. Greer Walker
oocyte volume. We must also consider the effect of seasonal temperature changes which increased 3.7"C from 5.0°C on February 10 to a mean of 8.7"C during the March-April spawning period (Directorate of Fisheries Research Lowestoft sea surface temperature database). Several cellular processes associated with vitellogenesis are influenccd by the metabolic rate (Mommsen and Walsh, 1988) and therefore the oocyte growth rate should be adjusted for changes in temperature using the Qio equation (Schmidt-Niesen, 1975; Kjesbu, 1994).
where Qlo is 2.3, RI is the rate at temperature Tl , and RZ is the rate temperature at Tl. If we assume a 60 day spawning duration, at a mean temperature of 8.7"C, then a mean daily growth rate of 5.08 x mm per day would be required for an vitellogenic oocyte to grow from 200 pm to maturity at 839 /hm. Applying a temperature correction amounting to 3.7OC in equation 8 the revised growth rate of 3.74 x 1 0 - h o u l d be equivalent to that measured at 137 days (equation 4) which was found in oocytes of 8 17 pm using equation 3. It would appear therefore that the maximum growth rate found would only just allow the smallest oocyte comprising the potential annual fecundity in February to reach maturity. Thus the asynchronous pattern of oocyte development in the sole originates from both vitellogenic oocyte recruitment, which takes place over several wecks (fig. 5E), and the accclcration of oocyte growth rate during development.
The fecundity recruitment rate of 3013 oocytes per day measured on August 3 is probably an underestimate because the sample comprises some individuals which have still to start the recruitment process. We observed a steady increase in the proportion of fish commencing ovarian recrudescence from July 19 to September 20. In early August 50% of the population had not commenced production of cortical alveoli oocytes and they would suppress the observed fecundity recruitment rate. However, in the three months prior to spawning, from November to February, we found no evidence that sole from division VIId produced any significant increase in fecundity. A similar result was obtained in divisions IVb east and IVc. The small but not significant increase in fecundity with time, which was detected, may stem from fish which are the last individuals in the population to commence vitellogenesis. These individuals can be identified by the relatively small size of oocytes comprising the leading oocyte size cohort (Kjesbu, 1994). We conclude that the oocyte recruitment process appears to have finished well before spawning commences. Although this does not prove that recruitment of vitellogenic oocytes does not occur during spawning when taken together with the information we have on oocyte growth rates and the developing hiatus it would seem highly unlikely they could mature during a 60 day spawning period.
In Our third line of evidence we consider the spawning process. We observed a marked decline in the number of vitellogenic oocytes in the ovary during spawning (fig. 6). This sample taken on the 15th May was probably taken from a population which we estimate had been spawning for 5 to 6 weeks based on data in Anonymous, 1992.
A cornparison with other species which have been classcd as having an indeterminate annual fecundity is also useful in assessment of the spawning strategy of Solea solea. A study of the gonadosomatic index has shown that the closely rclatcd sand sole, S. lu.vcuri.r and S. impur, from western Brittany have estimated spawning seasons of 135 and 105 days respectively (Deniel et al., 1989). These two species show a continuous recruitment of oocytes into vitellogenesis during the spawning season and therefore an indeterminate fecundity. The continued maturation of these oocytes is presumably possible because of the longer spawning season and warmer watcr temperatures. More extreme examples of fish with indeterminate fecundities are the northem anchovy (Engruulis mordux) and the queenfish (Seriphu.~ politus) which have spawning seasons of 150 days (Lasker and Smith, 1977) and 180 days (De Martini and Fontaine, 1981) respectively. In both cases the number of eggs spawned is more than an order of magnitude greater than the standing stock of oocytes prescnt prior to spawning (De Martini and Fontaine, 1981). However, sole from division IVb east (and possible IVc also) appear to develop a hiatus after the beginning of spawning and we have suggested that this late developing hiatus could be associated with the larger potential fecundities found in these areas possibly because the more fecund fish produce vitellogenic oocytes over a longer time period, and closer to spawning, such that the hiatus develops later. Alternatively, it is possible that as the wintcr temperatures (Jones and Jeffs, 1991) and therefore the oocyte growth rates are higher in the West of the study area that the hiatus in the oocyte size frequency distribution may develop earlier. In this respect, it would be interesting to compare the oocyte growth rates in the different areas; it would seem unlikely that the sole would have determinate and indeterminate fecundities in adjacent stocks.
It is possible in division IVb east to compare the potential annual fecundity prior to spawning with the realised fecundity calculated from the product of the batch fecundity, the batch frequency and the duration of the spawning season. The mean batch fecundity (8400, SE $r 1 363) was found to be independent of length and therefore atypical to data published on other teleosts. (Hunter and Goldberg, 1980; Urban, 1991 ; Watson et ul., 1992). A similar result (mean batch fecundity 7 600 SE f 1 035 and independent of length) was reported by Urban (1991). We conclude like Urban (1991) that the low variability of batch fecundity with length maybe attribuable to the narrow size range of small fish which were also caught towards the
Aquat. Living Re\our., Vol. 8, n o I - 1995

Fecundity and oocyte atresia in Solea solea
end of their annual spawning season. Devauchelle et al. (1987) measured the batch size in captive sole (Solea solea) varying both the temperature and the day length. The results showed that batch size was highly variable (1 500-138000 eggs per batch) and in some circumstances much larger than that recorded in wild populations. There is little information available on batch frequency. Houghton et ul. (1985) reported that three captive sole in the same tank in the laboratory spawned on 22 nights over a period of 47 nights and on this basis a frequency of two days was adopted which is consistent with the incidence of fresh postovulatory follicles in sole from the German Bight (Anonymous, 1992). Le Bec (1983) has suggested that sole from the Gulf of Gascony produce between 8 and 12 batches of oocytes during the spawning season on a weekly basis but there are no direct measurements to support this conclusion. As regards the duration of spawning. Horwood (1993) used a duration of 40 days for sole from division VIIf as being compatible with the available evidence from that area. However, cumulative frequency plots of maturity stages 5 and 6 from the Dutch market sampling programme (1970- 79) indicate a spawning duration of 60 days in the Southern Bight and the German Bight (Anonymous, 1992) and this was thought to be more relevant on a geographical basis to the present investigation. The realised annual fecundity based on the product of batch size, spawning frequency and duration is 252 000 which is + 94% and - 30% respectively around the predicted potential annual fecundity (178 000-480 000) for the sampled length range (table 3). The predicted potential fecundity (which does not include losses through atresia, table 7) for most of the population is thus above or about the same as the batch size based estimate and these results are consistent with the fact that the fecundity of sole from division IVb east is determined prior to spawning. We therefore reach the same conclusion as Deniel et al. (1989) that for al1 practical purposes the sole should be regarded as having a determinate fecundity over the geographic range studied.
Follicular atresia has been described in a wide range of species (Guraya, 1986) but little attention has been paid to studying atresia as a method of regulating fecundity. In order to quantify oocyte losses through atresia it is necessary to estimate the rate of turnover, bearing in mind that small numbers with a rapid rate of turnover found at any instant in a preserved ovary, could significantly alter our estimate of the number of oocytes resorbed and that the process is temperature dependent. Turnover rates have been estimated as 7-9 days in anchovy (Hunter and Macewicz, 1985b), 10 days in cod (Gudus morhua) (Kjesbu et al., 1991) and 7.5 days in mackerel (Scomber scombrus) (Anonymous, 1993) at ambient temperatures. We adopted a stage duration of 9 days as used by Horwood (1993) but the truncated stage may have
a shorter duration and this is the subject of current research.
We surveyed the extent of atresia in pre-spawning (table 6) and spawning sole populations tuhle 7. The prevalence of atresia in pre-spawning fish (maturity stage 4) in divisions IVb-c, VIId + e ranged from 0.04-0.18 (N = 222), and in division VIIa 0.69 (N = 29). The value for prevalence in division VIIa is obviously high and this is also the case when the values for relative intensity from the various divisions are compared (division VIIa = 0.076, area IV and VI1 range of 0.017-0.06). These values compare with a prevalence of 0.10 and relative intensity of 0.01 (N = 50) in division VIIf during 1990 (Horwood, 1993). A comparison of atresia in spawning fish caught in division 1Vc in 1991 and VIlf in 1990 strongly suggests area and or annual differences in the degree of fecundity regulation by atresia. A prevalence in IVc of 0.45, 0.52, and 0.57 depending on spawning progress compared with 0.50 and 0.90 in maturity stages 5 and 6 sole respectively from VIIf. The relative atresia in sole from division IVc appeared to be much less abundant with values of 0.035, 0.058, and 0.022, depending on spawning progress, compared to 0.069 in maturity stage 5-6 sole reported by Horwood (1993) for VIIf in 1990. We found a similar trend in the relative intensity of atresia as Greer Walker et al. (1994) in mackerel (Scomber scomber L.) which suggests that this may have a more general role in the regulation of fecundity and spawning strategy in some species that have a determinate fecundity. The anchovy, in contrast, which has a indeterminate spawning strategy shows maximum levels of atresia towards the end of spawning (Hunter and Macewicz, 1985b).
Our measurements of alpha atretic oocytes in spawning fish clearly show a narrow size frequency distribution with a peak around 250 pm (Jig. 8) when compared with the oocytes comprising the residual potential fecundity (Jig. 4 division IVc spawning). These smaller oocytes may become atretic as a consequence of the relatively slow growth rate in the smallest (200-350 pm) cortical alveoli stage oocytes. It is unlikely that they could maintain a growth rate equivalent to an oocyte of 817 pm diameter to reach maturity during the 60 days spawning season and there maybe insufficient supplies of yolk present (Kjesbu et al., 1991). Whatever the cause of their demise their removal would contribute to the formation of an increasingly large hiatus in the oocyte size frequency distribution between previtellogenic and vitellogenic oocytes.
Our results can be compared with those of Horwood (1993) from the Bristol Channel (division VIIf) who reported the predicted annual potential fecundity would be reduced by 30.5% due to atresia. In the case of mackerel (Anonymous, 1993), it was calculated that the reduction would be 8.8%. An extreme instance of fecundity regulation through atresia was found in tank-held cod which accumulated a potential annual fecundity that is more than twice that of wild cod but
Aquat. Living Resour., Vol. 8, no 1 - 1995

P. R. Witthames and M. Greer Walker
36% of the eggs were lost through atresia (Kjesbu et al., 1991).
Some major differences in the values of atresia are therefore evident as the ovary passes from maturity stage 4 to 7 which may differ between geographic areas within one year, and possibly between years. Clearly, high levels of atresia in the ovaries would
seem t o be a n inefficient use of resources and it is likely that atresia plays some part in regulating the potential fecundity. Anthropurgic effects on ovarian recrudescence and occurrence of atresia have been reported in specific cases (Brule, 1987; Johnson et al., 1992), and this too may interact with the natural regulation.
Acknowledgements
We are grateful to our colleagues J. Horwood, A. D. Rijnsdorp, M. Pawson, R. Millner and anonymous referees for comments on the manuscript. Lynne Howell and M. Nicholson for statistical advice and Barbara Colman for histological support.
REFERENCES
Anonymous, 1989. Report of ad hoc study group on juvenile sole tagging ICES C.M. 1989/G:21.
Anonymous, 1992. Report of the study group on the fecundity of sole in subareas IV and VIII. ICES C.M. 1992/G:16.
Anonymous, 1993. Report of the mackerellhorse mackerel egg production workshop. ICES C.M. 1993/H:4.
Bretschneider L. H., J. J. Duyvene de Wit, 1947. Sexual endocrinology of non mammalian vertebrates. Monogr. Prog. Res. Vol. II, Elsevier, N.Y.
Brulé T., 1987. The reproductive biology and the pathological changes of the plaice Pleuronectes platessa (L.) after the Amoco Cadiz oil spill along the north-west coast of Brittany. J. Mar. Biol. Assoc. U.K., 67, 37-247.
Burd A.C., G.J. Howlett, 1974. Fecundity studies on the North Sea herring. J. Cons. int. Explor. Mer., 35, 107-120.
De Clerck R., 1974. A note on the spawning season of sole in the Irish Sea, the Bristol Channel and the Southern Bight. ICES C.M. 1974/F:31.
De Martini E.E., R.K. Fontaine, 1981. Ovarian cycling, frequency and batch fecundity in the queenfish, Seriphus politus: attributes representative of serial spawning fishes. Fish. Bull., 79, 547-560.
Deniel C., 1981. Les poissons plats en baie de Douarnenez. Reproduction, croissance et migration des Bothidae, Scophthalmidae, Pleuronectidae et Soleidae. Thèse dr. d'Etat. Univ. Brest, 476 p.
Deniel C., C. Le Blanc, A. Rodriguez, 1989. Comparative study of sexual cycles, oogenesis and spawning of the two Soleidae, Solea lascaris (Risso, 1810) and Solea impar (Bennet, 1831) on the western coast of Brittany. J. Fish. Biol., 35, 49-58.
Devauchelle M., J. C. Alexandre, N. Le Carre, Y. Letty, 1987. Spawning of sole (Solea solea) in captivity. Aquaculture, 66, 125- 147.
Emerson L. S., M. Greer Walker, P. R. Witthames, 1990. A stereological method for estimating fish fecundity. J. Fi.~h. Biol., 36, 721-730.
Foucher R. P., R. J. Beamish, 1980. Production of non- viable oocytes by Pacific hake (Merluccius productus). Cun. J. bï.rh. Ayuat. Sci., 37, 41-48.
Greer Walker M., P. R. Witthames, J. 1. Bautista de los Santos, 1994. 1s the fecundity of the Atlantic mackerel (Scomher scromhrus Scombridae) determinate ? Sarsia, 79, 13-26.
Guraya S.S., 1986. The cell and molecular biology of fish oogenesis. Monographs in Developmental Biology, Vol. 18. Karger, Basel, 223 p.
Horwood J., 1993. The Bristol Channel Sole (Soleu solea (L.)): A Fisheries Case Study. Adv. Mar. Biol., 29, 215-367.
Horwood J. W., M. Greer Walker, 1990. Determinacy of fecundity in sole (Solea solea) from the Bristol Channel. J. Mar. Biol. Assoc. U.K., 70, 803-813.
Houghton R. G., J. M. Last, P. J. Bromley, 1985. Fecundity and egg size of sole (Solea solea L.) spawning in captivity. J. Cons. Int. Explor. Mer., 42, 162-165.
Hunter J. R., S. R. Goldberg, 1980. Spawning incidence and batch fecundity in northern anchovy (Engraulis mordax). Fish. Hull., 77, 641-652.
Hunter J. R., B. J. Macewicz, 198.5~. Rates of atresia in the ovary of captive and wild northern anchovy. Engrauli.~ mordax. Fish. Bull., 83, 1 19-136.
Hunter J. R., B. J. Macewicz, 1985h. Measurement of spawning frequency in multiple spawning fishes. In : Production for estimating spawning biomass of pelagic fish: application to the northern anchovy (Engraulis mordax), Lasker R. ed. NOAA Tech. Kep., NMFS, 36, 79-94.
Johnson L. L., J. E. Stein, T. K. Collier, E. Casillas, B. McCain, U. Varanasi, 1993. Bioindicators of contaminant exposure, liver pathology, and reproductive development in pre-spawning female winter flounder (Pleuronectes arnericunus) from urban and non-urban estuaries on the north-east Atlantic coast. Technical Memorandum NMFS-NWFSC-1 Northwest Fisheries Science Centre Environmental Division, Seattle, WA 98 1 12.
Jones S. R., T. M. Jeffs, 1991. Near-surface sea temperatures in coastal waters of the North Sea, English Channel
Aquat. I.iving R e ~ u r . , Vol. 8, no 1 - 1995
Copyright © 2022 FDOKUMEN