Seasonal variations in proximate and fatty acid compositions of female common sole ( Solea solea
14
Journal of Aquatic Food Product Technology, 20:233–246, 2011 Copyright © Taylor & Francis Group, LLC ISSN: 1049-8850 print / 1547-0636 online DOI: 10.1080/10498850.2011.560365 Seasonal Variations in Proximate and Fatty Acid Composition of Viscera of Sardinella aurita, Sarpa salpa, and Sepia officinalis from Tunisia MOHAMED KACEM, 1 MOHAMED SELLAMI, 1 WASSIM KAMMOUN, 2 FAKHER FRIKHA, 1 NABIL MILED, 1 AND FAOUZI BEN REBAH 2 1 Laboratoire de Biochimie et de Génie Enzymatique des Lipases, ENIS, Sfax, Tunisia 2 Institut National des Sciences et Technologies de la Mer, Sfax, Tunisia Seasonal variations of the proximate composition and fatty acid profiles in viscera from Sardinella aurita, Sarpa salpa, and Sepia officinalis were studied. Significant seasonal variations were observed in the amounts of moisture, lipid, protein, and ash between species. Viscera protein content undergoes large fluctuations. This tendency is different from results observed for the edible parts or for the whole body of many marine species. Ash content also showed significant differences. Lipid contents varied with seasons, in a proportionally inverse manner to water contents. Fatty acid composition showed sig- nificant differences from October to December. Interestingly, the highest total omega-3 contents were comparable to many commercial marine fish oils. Keywords Sardinella aurita, Sarpa salpa, Sepia officinalis, proximate composition, fish oil, PUFAs, omega-3 fatty acids Introduction Fish processing industries generate large amounts of waste material including viscera, which represent an important part of the animal mass (about 15 to 25% of the original catch depending on the season; Kechaou et al., 2009). The disposal and/or utilization of these wastes represent environmental and health problems. However, this material can be a valuable bioresource from which waste represents an important commercial loss. Recently, many alternative methods of fish viscera processing have been examined including enzyme extraction (Kishimura et al., 2006; Kurtovic et al., 2006; Bougatef et al., 2007; Klomklao et al., 2007; Klomklao et al., 2009; Aryee et al., 2009; Castillo-Yañez et al., 2009) and preparation of protein hydrolysates, utilizable as feed in aquaculture diets (Wang et al., 2008) or for microbial growth (Aspmo et al., 2005; Horn et al., 2007; Vázquez et al., 2008). Fish wastes also have great potential to be used in producing peptides with biological properties beneficial for human health (Bougatef et al., 2010). Moreover, lipids in vis- cera represent a potential valuable fraction with several beneficial health effects (Dyerberg et al., 1978; Lee et al., 1994; Vanschoonbeek et al., 2003; Kechaou et al., 2009). A potential Mohamed Sellami and Mohamed Kacem have participated equally to this work. Address correspondence to Faouzi Ben Rebah, Institut National des Sciences et Technologies de la Mer, Sfax B. P. 1035, Sfax 3018, Tunisia. E-mail: [email protected] 233 Downloaded By: [Ben Rebah, Faouzi] At: 15:01 13 April 2011
-
Upload
independent -
Category
Documents
-
view
2 -
download
0
Transcript of Seasonal variations in proximate and fatty acid compositions of female common sole ( Solea solea
Journal of Aquatic Food Product Technology, 20:233–246, 2011Copyright © Taylor & Francis Group, LLCISSN: 1049-8850 print / 1547-0636 onlineDOI: 10.1080/10498850.2011.560365
Seasonal Variations in Proximate and Fatty AcidComposition of Viscera of Sardinella aurita, Sarpa
salpa, and Sepia officinalis from Tunisia
MOHAMED KACEM,1 MOHAMED SELLAMI,1 WASSIMKAMMOUN,2 FAKHER FRIKHA,1 NABIL MILED,1 ANDFAOUZI BEN REBAH2
1Laboratoire de Biochimie et de Génie Enzymatique des Lipases, ENIS, Sfax,Tunisia2Institut National des Sciences et Technologies de la Mer, Sfax, Tunisia
Seasonal variations of the proximate composition and fatty acid profiles in viscera fromSardinella aurita, Sarpa salpa, and Sepia officinalis were studied. Significant seasonalvariations were observed in the amounts of moisture, lipid, protein, and ash betweenspecies. Viscera protein content undergoes large fluctuations. This tendency is differentfrom results observed for the edible parts or for the whole body of many marine species.Ash content also showed significant differences. Lipid contents varied with seasons, ina proportionally inverse manner to water contents. Fatty acid composition showed sig-nificant differences from October to December. Interestingly, the highest total omega-3contents were comparable to many commercial marine fish oils.
Keywords Sardinella aurita, Sarpa salpa, Sepia officinalis, proximate composition,fish oil, PUFAs, omega-3 fatty acids
Introduction
Fish processing industries generate large amounts of waste material including viscera,which represent an important part of the animal mass (about 15 to 25% of the originalcatch depending on the season; Kechaou et al., 2009). The disposal and/or utilization ofthese wastes represent environmental and health problems. However, this material can be avaluable bioresource from which waste represents an important commercial loss. Recently,many alternative methods of fish viscera processing have been examined including enzymeextraction (Kishimura et al., 2006; Kurtovic et al., 2006; Bougatef et al., 2007; Klomklaoet al., 2007; Klomklao et al., 2009; Aryee et al., 2009; Castillo-Yañez et al., 2009) andpreparation of protein hydrolysates, utilizable as feed in aquaculture diets (Wang et al.,2008) or for microbial growth (Aspmo et al., 2005; Horn et al., 2007; Vázquez et al., 2008).Fish wastes also have great potential to be used in producing peptides with biologicalproperties beneficial for human health (Bougatef et al., 2010). Moreover, lipids in vis-cera represent a potential valuable fraction with several beneficial health effects (Dyerberget al., 1978; Lee et al., 1994; Vanschoonbeek et al., 2003; Kechaou et al., 2009). A potential
Mohamed Sellami and Mohamed Kacem have participated equally to this work.Address correspondence to Faouzi Ben Rebah, Institut National des Sciences et Technologies
de la Mer, Sfax B. P. 1035, Sfax 3018, Tunisia. E-mail: [email protected]
233
Downloaded By: [Ben Rebah, Faouzi] At: 15:01 13 April 2011
234 M. Kacem et al.
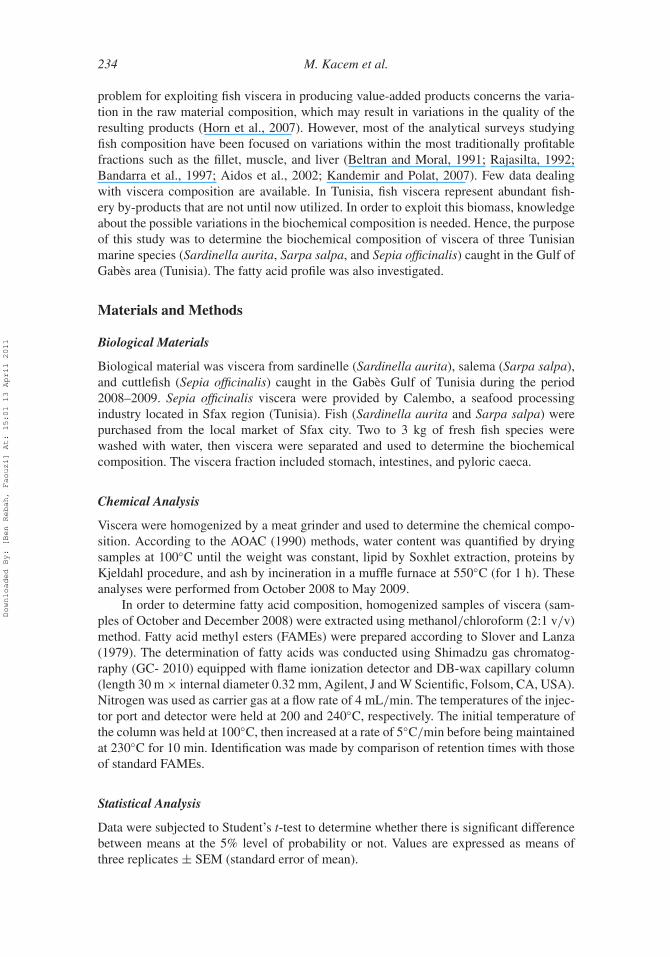
problem for exploiting fish viscera in producing value-added products concerns the varia-tion in the raw material composition, which may result in variations in the quality of theresulting products (Horn et al., 2007). However, most of the analytical surveys studyingfish composition have been focused on variations within the most traditionally profitablefractions such as the fillet, muscle, and liver (Beltran and Moral, 1991; Rajasilta, 1992;Bandarra et al., 1997; Aidos et al., 2002; Kandemir and Polat, 2007). Few data dealingwith viscera composition are available. In Tunisia, fish viscera represent abundant fish-ery by-products that are not until now utilized. In order to exploit this biomass, knowledgeabout the possible variations in the biochemical composition is needed. Hence, the purposeof this study was to determine the biochemical composition of viscera of three Tunisianmarine species (Sardinella aurita, Sarpa salpa, and Sepia officinalis) caught in the Gulf ofGabès area (Tunisia). The fatty acid profile was also investigated.
Materials and Methods
Biological Materials
Biological material was viscera from sardinelle (Sardinella aurita), salema (Sarpa salpa),and cuttlefish (Sepia officinalis) caught in the Gabès Gulf of Tunisia during the period2008–2009. Sepia officinalis viscera were provided by Calembo, a seafood processingindustry located in Sfax region (Tunisia). Fish (Sardinella aurita and Sarpa salpa) werepurchased from the local market of Sfax city. Two to 3 kg of fresh fish species werewashed with water, then viscera were separated and used to determine the biochemicalcomposition. The viscera fraction included stomach, intestines, and pyloric caeca.
Chemical Analysis
Viscera were homogenized by a meat grinder and used to determine the chemical compo-sition. According to the AOAC (1990) methods, water content was quantified by dryingsamples at 100◦C until the weight was constant, lipid by Soxhlet extraction, proteins byKjeldahl procedure, and ash by incineration in a muffle furnace at 550◦C (for 1 h). Theseanalyses were performed from October 2008 to May 2009.
In order to determine fatty acid composition, homogenized samples of viscera (sam-ples of October and December 2008) were extracted using methanol/chloroform (2:1 v/v)method. Fatty acid methyl esters (FAMEs) were prepared according to Slover and Lanza(1979). The determination of fatty acids was conducted using Shimadzu gas chromatog-raphy (GC- 2010) equipped with flame ionization detector and DB-wax capillary column(length 30 m × internal diameter 0.32 mm, Agilent, J and W Scientific, Folsom, CA, USA).Nitrogen was used as carrier gas at a flow rate of 4 mL/min. The temperatures of the injec-tor port and detector were held at 200 and 240◦C, respectively. The initial temperature ofthe column was held at 100◦C, then increased at a rate of 5◦C/min before being maintainedat 230◦C for 10 min. Identification was made by comparison of retention times with thoseof standard FAMEs.
Statistical Analysis
Data were subjected to Student’s t-test to determine whether there is significant differencebetween means at the 5% level of probability or not. Values are expressed as means ofthree replicates ± SEM (standard error of mean).
Downloaded By: [Ben Rebah, Faouzi] At: 15:01 13 April 2011
Chemical Composition of Marine Species’ Viscera 235
Results
Proximate Composition
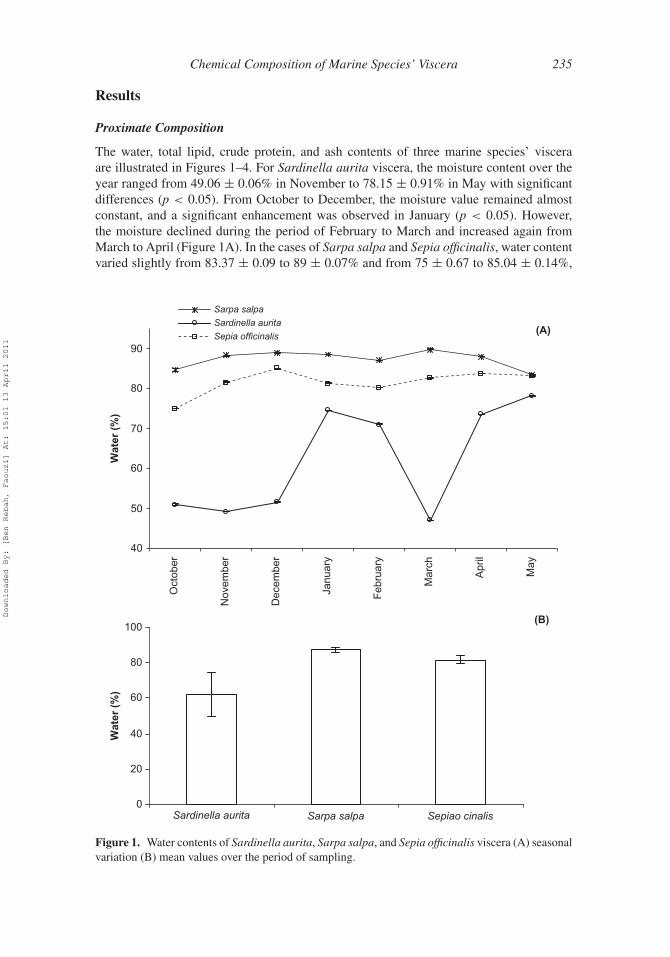
The water, total lipid, crude protein, and ash contents of three marine species’ visceraare illustrated in Figures 1–4. For Sardinella aurita viscera, the moisture content over theyear ranged from 49.06 ± 0.06% in November to 78.15 ± 0.91% in May with significantdifferences (p < 0.05). From October to December, the moisture value remained almostconstant, and a significant enhancement was observed in January (p < 0.05). However,the moisture declined during the period of February to March and increased again fromMarch to April (Figure 1A). In the cases of Sarpa salpa and Sepia officinalis, water contentvaried slightly from 83.37 ± 0.09 to 89 ± 0.07% and from 75 ± 0.67 to 85.04 ± 0.14%,
40
50
60
70
80
90
Oct
ober
Nov
embe
r
Dec
embe
r
Janu
ary
Feb
ruar
y
Mar
ch
Apr
il
May
Wat
er (
%)
Sarpa salpa
Sardinella aurita
Sepia officinalis (A)
0Sarpa salpa Sepiao cinalisSardinella aurita
20
40
60
80
100
Wat
er (
%)
(B)
Figure 1. Water contents of Sardinella aurita, Sarpa salpa, and Sepia officinalis viscera (A) seasonalvariation (B) mean values over the period of sampling.
Downloaded By: [Ben Rebah, Faouzi] At: 15:01 13 April 2011
236 M. Kacem et al.
0
5
10
15
20
25
Oct
ober
Nov
embe
r
Dec
embe
r
Janu
ary
Feb
ruar
y
Mar
ch
Apr
il
May
Lip
ids
(%)
Sarpa salpaSardinella auritaSepia officinalis
(A)
0Sarpa salpa Sepia officinalisSardinella aurita
4
8
12
16
20
24
28
Lip
ids
(%)
(B)
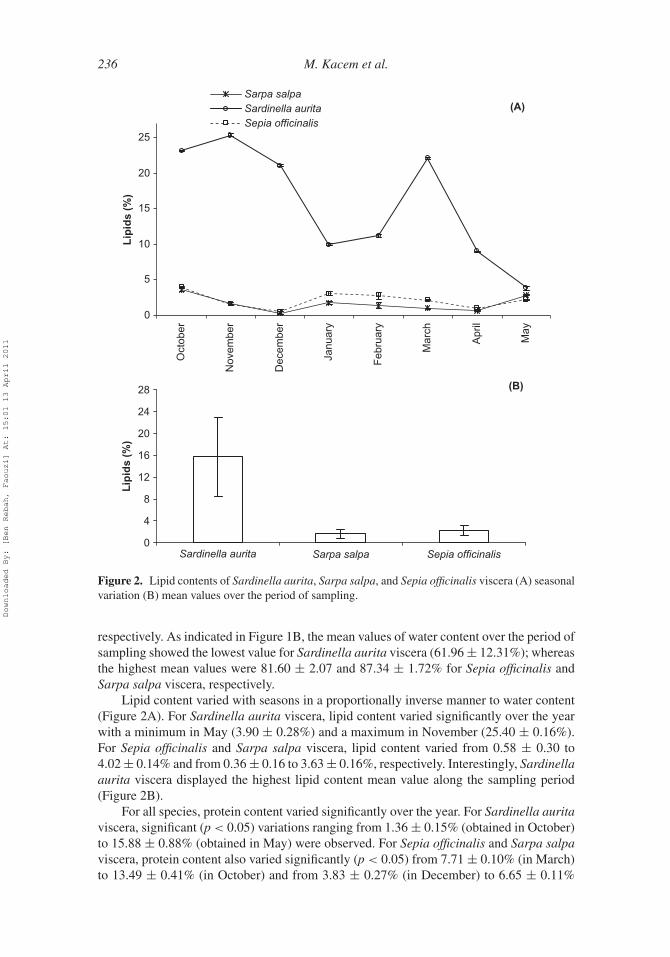
Figure 2. Lipid contents of Sardinella aurita, Sarpa salpa, and Sepia officinalis viscera (A) seasonalvariation (B) mean values over the period of sampling.
respectively. As indicated in Figure 1B, the mean values of water content over the period ofsampling showed the lowest value for Sardinella aurita viscera (61.96 ± 12.31%); whereasthe highest mean values were 81.60 ± 2.07 and 87.34 ± 1.72% for Sepia officinalis andSarpa salpa viscera, respectively.
Lipid content varied with seasons in a proportionally inverse manner to water content(Figure 2A). For Sardinella aurita viscera, lipid content varied significantly over the yearwith a minimum in May (3.90 ± 0.28%) and a maximum in November (25.40 ± 0.16%).For Sepia officinalis and Sarpa salpa viscera, lipid content varied from 0.58 ± 0.30 to4.02 ± 0.14% and from 0.36 ± 0.16 to 3.63 ± 0.16%, respectively. Interestingly, Sardinellaaurita viscera displayed the highest lipid content mean value along the sampling period(Figure 2B).
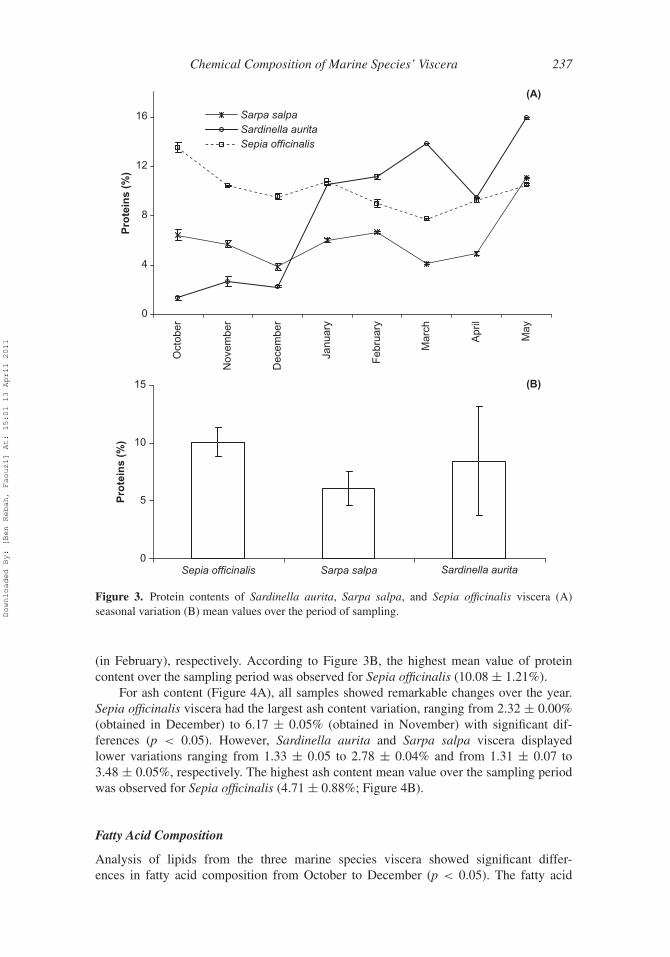
For all species, protein content varied significantly over the year. For Sardinella auritaviscera, significant (p < 0.05) variations ranging from 1.36 ± 0.15% (obtained in October)to 15.88 ± 0.88% (obtained in May) were observed. For Sepia officinalis and Sarpa salpaviscera, protein content also varied significantly (p < 0.05) from 7.71 ± 0.10% (in March)to 13.49 ± 0.41% (in October) and from 3.83 ± 0.27% (in December) to 6.65 ± 0.11%
Downloaded By: [Ben Rebah, Faouzi] At: 15:01 13 April 2011
Chemical Composition of Marine Species’ Viscera 237
0
4
8
12
16
Oct
ober
Nov
embe
r
Dec
embe
r
Janu
ary
Feb
ruar
y
Mar
ch
Apr
il
May
Pro
tein
s (%
)
(A)
0
5
10
15
Pro
tein
s (%
)
(B)
Sarpa salpaSepia officinalis Sardinella aurita
Sarpa salpaSardinella auritaSepia officinalis
Figure 3. Protein contents of Sardinella aurita, Sarpa salpa, and Sepia officinalis viscera (A)seasonal variation (B) mean values over the period of sampling.
(in February), respectively. According to Figure 3B, the highest mean value of proteincontent over the sampling period was observed for Sepia officinalis (10.08 ± 1.21%).
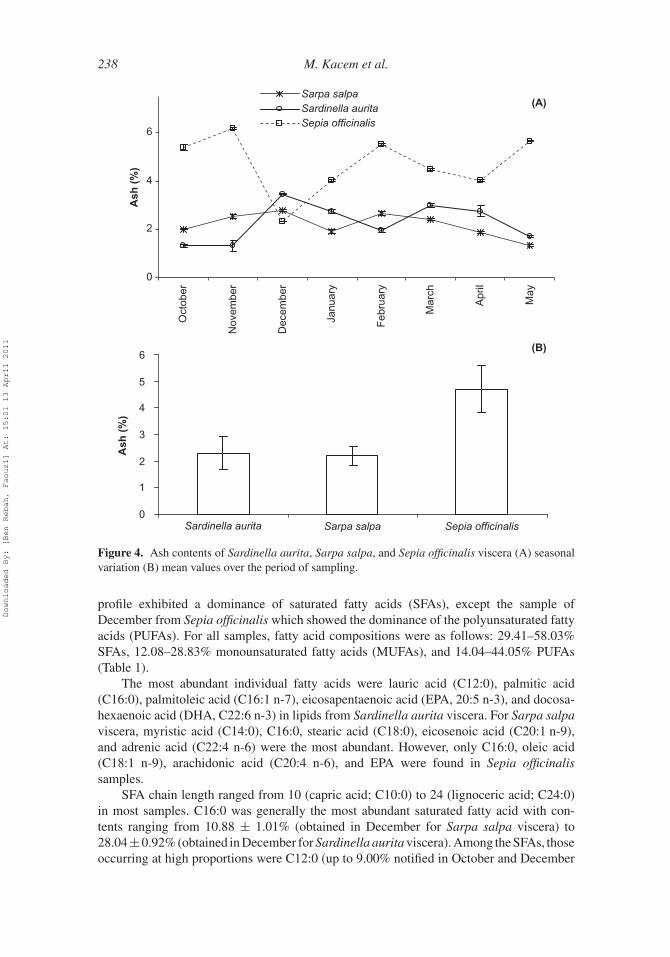
For ash content (Figure 4A), all samples showed remarkable changes over the year.Sepia officinalis viscera had the largest ash content variation, ranging from 2.32 ± 0.00%(obtained in December) to 6.17 ± 0.05% (obtained in November) with significant dif-ferences (p < 0.05). However, Sardinella aurita and Sarpa salpa viscera displayedlower variations ranging from 1.33 ± 0.05 to 2.78 ± 0.04% and from 1.31 ± 0.07 to3.48 ± 0.05%, respectively. The highest ash content mean value over the sampling periodwas observed for Sepia officinalis (4.71 ± 0.88%; Figure 4B).
Fatty Acid Composition
Analysis of lipids from the three marine species viscera showed significant differ-ences in fatty acid composition from October to December (p < 0.05). The fatty acid
Downloaded By: [Ben Rebah, Faouzi] At: 15:01 13 April 2011
238 M. Kacem et al.
0
1
2
3
4
5
6
Ash
(%
)
(B)
Sarpa salpa Sepia officinalisSardinella aurita
0
2
4
6
Oct
ober
Nov
embe
r
Dec
embe
r
Janu
ary
Feb
ruar
y
Mar
ch
Apr
il
May
Ash
(%
)
(A)Sarpa salpaSardinella auritaSepia officinalis
Figure 4. Ash contents of Sardinella aurita, Sarpa salpa, and Sepia officinalis viscera (A) seasonalvariation (B) mean values over the period of sampling.
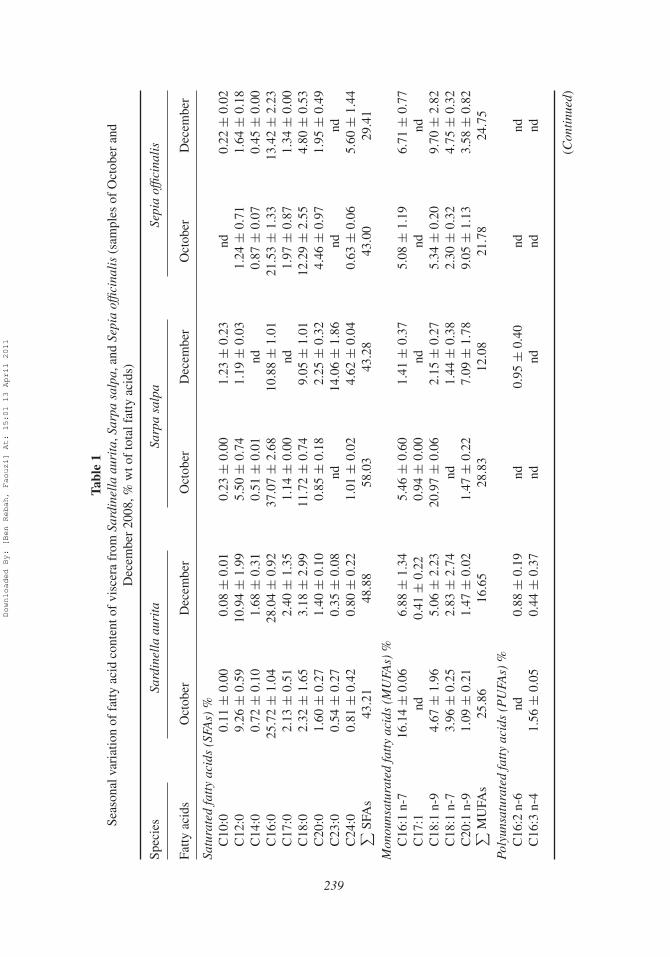
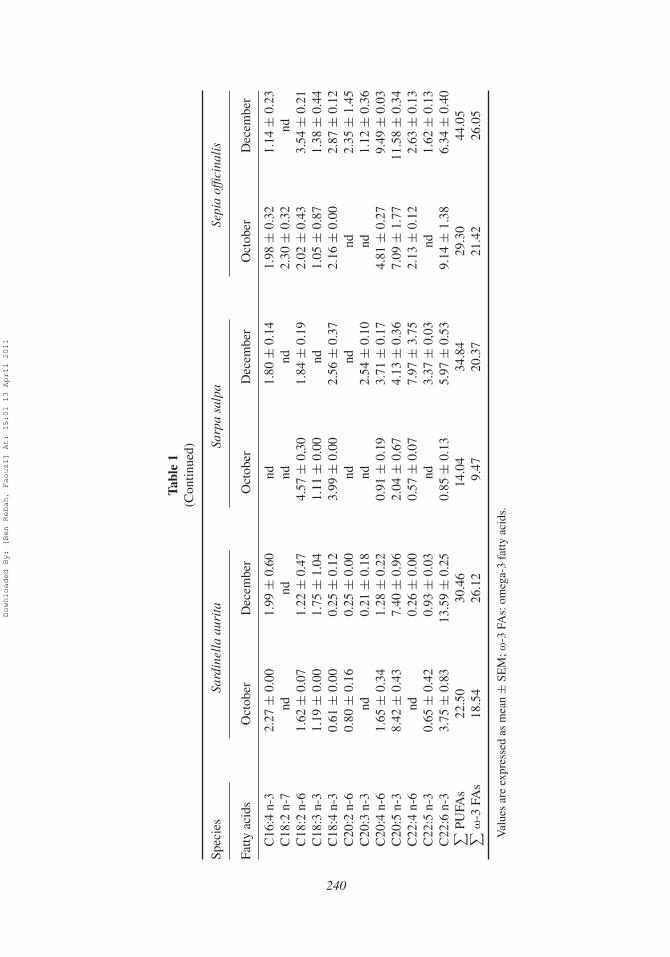
profile exhibited a dominance of saturated fatty acids (SFAs), except the sample ofDecember from Sepia officinalis which showed the dominance of the polyunsaturated fattyacids (PUFAs). For all samples, fatty acid compositions were as follows: 29.41–58.03%SFAs, 12.08–28.83% monounsaturated fatty acids (MUFAs), and 14.04–44.05% PUFAs(Table 1).
The most abundant individual fatty acids were lauric acid (C12:0), palmitic acid(C16:0), palmitoleic acid (C16:1 n-7), eicosapentaenoic acid (EPA, 20:5 n-3), and docosa-hexaenoic acid (DHA, C22:6 n-3) in lipids from Sardinella aurita viscera. For Sarpa salpaviscera, myristic acid (C14:0), C16:0, stearic acid (C18:0), eicosenoic acid (C20:1 n-9),and adrenic acid (C22:4 n-6) were the most abundant. However, only C16:0, oleic acid(C18:1 n-9), arachidonic acid (C20:4 n-6), and EPA were found in Sepia officinalissamples.
SFA chain length ranged from 10 (capric acid; C10:0) to 24 (lignoceric acid; C24:0)in most samples. C16:0 was generally the most abundant saturated fatty acid with con-tents ranging from 10.88 ± 1.01% (obtained in December for Sarpa salpa viscera) to28.04±0.92% (obtained in December for Sardinella aurita viscera). Among the SFAs, thoseoccurring at high proportions were C12:0 (up to 9.00% notified in October and December
Downloaded By: [Ben Rebah, Faouzi] At: 15:01 13 April 2011
Tabl
e1
Seas
onal
vari
atio
nof
fatty
acid
cont
ento
fvi
scer
afr
omSa
rdin
ella
auri
ta,S
arpa
salp
a,an
dSe
pia
offic
inal
is(s
ampl
esof
Oct
ober
and
Dec
embe
r20
08,%
wto
fto
talf
atty
acid
s)
Spec
ies
Sard
inel
laau
rita
Sarp
asa
lpa
Sepi
aof
ficin
alis
Fatty
acid
sO
ctob
erD
ecem
ber
Oct
ober
Dec
embe
rO
ctob
erD
ecem
ber
Satu
rate
dfa
tty
acid
s(S
FAs)
%C
10:0
0.11
±0.
000.
08±
0.01
0.23
±0.
001.
23±
0.23
nd0.
22±
0.02
C12
:09.
26±
0.59
10.9
4±
1.99
5.50
±0.
741.
19±
0.03
1.24
±0.
711.
64±
0.18
C14
:00.
72±
0.10
1.68
±0.
310.
51±
0.01
nd0.
87±
0.07
0.45
±0.
00C
16:0
25.7
2±
1.04
28.0
4±
0.92
37.0
7±
2.68
10.8
8±
1.01
21.5
3±
1.33
13.4
2±
2.23
C17
:02.
13±
0.51
2.40
±1.
351.
14±
0.00
nd1.
97±
0.87
1.34
±0.
00C
18:0
2.32
±1.
653.
18±
2.99
11.7
2±
0.74
9.05
±1.
0112
.29
±2.
554.
80±
0.53
C20
:01.
60±
0.27
1.40
±0.
100.
85±
0.18
2.25
±0.
324.
46±
0.97
1.95
±0.
49C
23:0
0.54
±0.
270.
35±
0.08
nd14
.06
±1.
86nd
ndC
24:0
0.81
±0.
420.
80±
0.22
1.01
±0.
024.
62±
0.04
0.63
±0.
065.
60±
1.44
∑SF
As
43.2
148
.88
58.0
343
.28
43.0
029
.41
Mon
ouns
atur
ated
fatt
yac
ids
(MU
FAs)
%C
16:1
n-7
16.1
4±
0.06
6.88
±1.
345.
46±
0.60
1.41
±0.
375.
08±
1.19
6.71
±0.
77C
17:1
nd0.
41±
0.22
0.94
±0.
00nd
ndnd
C18
:1n-
94.
67±
1.96
5.06
±2.
2320
.97
±0.
062.
15±
0.27
5.34
±0.
209.
70±
2.82
C18
:1n-
73.
96±
0.25
2.83
±2.
74nd
1.44
±0.
382.
30±
0.32
4.75
±0.
32C
20:1
n-9
1.09
±0.
211.
47±
0.02
1.47
±0.
227.
09±
1.78
9.05
±1.
133.
58±
0.82
∑M
UFA
s25
.86
16.6
528
.83
12.0
821
.78
24.7
5
Poly
unsa
tura
ted
fatt
yac
ids
(PU
FAs)
%C
16:2
n-6
nd0.
88±
0.19
nd0.
95±
0.40
ndnd
C16
:3n-
41.
56±
0.05
0.44
±0.
37nd
ndnd
nd
(Con
tinu
ed)
239
Downloaded By: [Ben Rebah, Faouzi] At: 15:01 13 April 2011
Tabl
e1
(Con
tinue
d)
Spec
ies
Sard
inel
laau
rita
Sarp
asa
lpa
Sepi
aof
ficin
alis
Fatty
acid
sO
ctob
erD
ecem
ber
Oct
ober
Dec
embe
rO
ctob
erD
ecem
ber
C16
:4n-
32.
27±
0.00
1.99
±0.
60nd
1.80
±0.
141.
98±
0.32
1.14
±0.
23C
18:2
n-7
ndnd
ndnd
2.30
±0.
32nd
C18
:2n-
61.
62±
0.07
1.22
±0.
474.
57±
0,30
1.84
±0.
192.
02±
0.43
3.54
±0.
21C
18:3
n-3
1.19
±0.
001.
75±
1.04
1.11
±0.
00nd
1.05
±0.
871.
38±
0.44
C18
:4n-
30.
61±
0.00
0.25
±0.
123.
99±
0.00
2.56
±0.
372.
16±
0.00
2.87
±0.
12C
20:2
n-6
0.80
±0.
160.
25±
0.00
ndnd
nd2.
35±
1.45
C20
:3n-
3nd
0.21
±0.
18nd
2.54
±0.
10nd
1.12
±0.
36C
20:4
n-6
1.65
±0.
341.
28±
0.22
0.91
±0.
193.
71±
0.17
4.81
±0.
279.
49±
0.03
C20
:5n-
38.
42±
0.43
7.40
±0.
962.
04±
0.67
4.13
±0.
367.
09±
1.77
11.5
8±
0.34
C22
:4n-
6nd
0.26
±0.
000.
57±
0.07
7.97
±3.
752.
13±
0.12
2.63
±0.
13C
22:5
n-3
0.65
±0.
420.
93±
0.03
nd3.
37±
0,03
nd1.
62±
0.13
C22
:6n-
33.
75±
0.83
13.5
9±
0.25
0.85
±0.
135.
97±
0.53
9.14
±1.
386.
34±
0.40
∑PU
FAs
22.5
030
.46
14.0
434
.84
29.3
044
.05
∑ω
-3FA
s18
.54
26.1
29.
4720
.37
21.4
226
.05
Val
ues
are
expr
esse
das
mea
n±
SEM
;ω-3
FAs:
omeg
a-3
fatty
acid
s.
240
Downloaded By: [Ben Rebah, Faouzi] At: 15:01 13 April 2011
Chemical Composition of Marine Species’ Viscera 241
samples from Sardinella aurita viscera) and C18:0 (reached 11.72 ± 0.74 and12.29 ± 2.55% in October for Sarpa salpa and Sepia officinalis viscera, respectively).The tricosanoic acid (C23:0) was also found at a high proportion only in the Octobersample from Sarpa salpa (14.06 ± 1.86%). For MUFAs, the most abundant fatty acidobserved in samples from Sardinella aurita viscera was C16:1 n-7 with a content varyingfrom 6.88 ± 1.34% (in December) to 16.14 ± 0.06% (in October). The highest contentin C18:1 n-9 was observed for Sarpa salpa sample during October (20.97 ± 0.06%).However, in the case of Sepia officinalis, the most abundant MUFAs were C18:1 n-9and C20:1 n-9 which contents reached in December 9.70 ± 2.82 and 9.05 ± 1.13%,respectively.
Among the PUFAs, EPA (7.04 ± 0.96–8.42 ± 0.43%) and DHA (3.75 ±0.83–13.59 ± 0.25%) were the major fatty acids in the lipidic fraction from Sardinellaaurita viscera. These two fatty acids were found at high proportions in Sepia officinalisviscera oil with maximum contents of 11.58 ± 0.34% (in December) and 9.14 ± 1.38%(in October) for EPA and DHA, respectively. For the samples from Sarpa salpa viscera,the most abundant fatty acids were EPA (4.13 ± 0.36%), DHA (5.97 ± 0.53%), andC22: 4 n-6 (7.97 ± 3.75%) observed during December.
Discussion
The proximate composition of viscera from three marine species (Sardinella aurita, Sarpasalpa, and Sepia officinalis) was investigated. We have observed seasonal variations in themoisture, lipid, protein, and ash contents in response to various factors. Commonly, thevariation of the chemical composition has been described for different fish species andwas reported to be related to many factors such as season, temperature, location, breedingcycle, diet, age, size, and sex (Rajasilta, 1992; Bandarra et al., 1997).
The protein content of viscera undergoes large fluctuations among the studied marineorganisms and over the period of sampling, with significant differences (p < 0.05). Thistendency is different from results obtained for the edible parts or for the whole body ofmany marine species. For example, for the entire body of Sardinella aurita, protein contentremains constant at a high level over the year (Ben Rebah et al., 2009). Furthermore, it wasreported that fish protein content changes very little with season (Emokpae, 1983; Njinkoueet al., 2002; Tzikas et al., 2007). As observed for proteins, ash content also showed sig-nificant differences (p < 0.05) for all samples (ranged from 1.31 to 6.16%). Likewise, thetotal lipid contents of Sardinella aurita, Sarpa salpa, and Sepia officinalis viscera showedwide variations with seasons. This tendency was clear for Sardinella aurita viscera whoselipid content ranged between 3.90 and 25.40%. For all samples, lipid content varied ininverse proportions to water content. This fact was widely recognized in many pelagicfishes (Méndez and González, 1997; Grigorakis et al., 2002; Love, 1980). For example,in the case of Sardinella aurita viscera, lower lipid content (3.90%) and higher moisture(78.15%) were observed in May. A similar tendency was reported by Ben Rebah et al.(2009) for the entire body of Sardinella aurita indicating the fact that during the warmseason, lipid contents decreased considerably dropping to 2.50% in July (Ben Rebah et al.,2009). For Sarpa salpa and Sepia officinalis viscera, lipid contents did not exceed 5%.These low values could be explained by the fact that lipids accumulate in other organssuch as liver, as reported for many marine species (Njinkoue et al., 2002; Ben Rebah et al.,2009). In our study, Sepia officinalis viscera lipid contents were higher than those reportedfor the cuttlefish mantle (lower than 1% over the year; Ozyurt et al., 2006). Generally, lipidand water contents are closely related to the growth and the reproduction patterns (degree
Downloaded By: [Ben Rebah, Faouzi] At: 15:01 13 April 2011
242 M. Kacem et al.
of maturity of gonads) of each species, as well as their exploitation in food resources,which are highly influenced by the dynamics of upwelling systems (Rajasilta, 1992).
It is very important to indicate the fact that the proximate composition of vis-cera is influenced by previous nutritional history. This makes it difficult to compare thecomposition between viscera. Hence, under natural conditions, Sarpa salpa is mostlyherbivorous, changing its food habit by the age and flesh chemistry (Gerking, 1984;Havelange et al., 1997). For Sepia officinalis, food consists of small molluscs, crabs,shrimps, other cuttlefishes, and juvenile fishes (Guerra, 1985; Castro and Guerra, 1989).However, Sardinella aurita feeds mainly on zooplankton, especially copepods and somephytoplankton (Tsikliras et al., 2005).
Concerning the fatty acid profiles, the composition varied with seasons among thestudied marine organisms. These results are in line with other studies dealing with vis-cera or with the edible parts of fish (Falch et al., 2006; Kandemir and Polat, 2007; BenRebah et al., 2009). For almost all samples, C16:0 was reported as the most abundant fattyacid for both October and December. These results are in agreement with other studieson Mediterranean fishes (Karakoltsidis et al., 1995; Saglik and Imre, 2001; Zlatanos andLaskaridis, 2007; Ben Rebah et al., 2009). In fact, palmitic acid is the key metabolite infish (Andrade et al., 1995). However, apart from C16:0, the fatty acids reported to havethe highest percentages vary among the studied species. This variability suggests differentbiological functions in fishes for the various fatty acids (Zlatanos and Laskaridis, 2007).
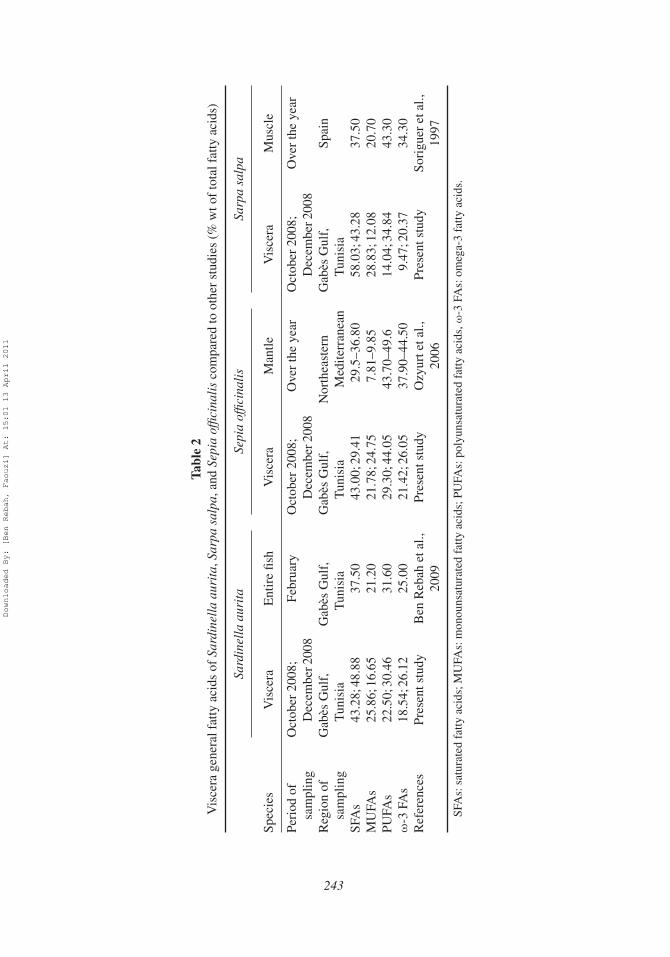
Generally, the amount and type of fatty acids in viscera differ slightly from thoseobtained for the edible parts or for the entire organisms (Table 2). For example, comparedto viscera, the entire Sardinella aurita fish (captured in February) contains higher concen-trations of C16:0, C16:1 n-7, C20:5 n-3, C22:6 n-3, and C14:0 and lower concentration ofC12:0 (Ben Rebah et al., 2009). For Sepia officinalis, the major fatty acids in viscera wereC16:0, C18:0, C20:5 n-3, and C22:6 n-3, which are similar to those reported for the man-tle of cuttlefish captured from the Northeastern Mediterranean. However, the proportionsof SFAs, MUFAs, and PUFAs in mantle were found to display differences as comparedto viscera (Ozyurt et al., 2006). Therefore, fatty acid profiles in various organs of marineorganisms could be controlled by many factors (sex, size, age, reproduction, water tem-perature, degree of pollution, nutritional condition, genetic differences between species,geographical location, handling, processing, storage, and distribution; Pigott and Tucker,1987; Luzia et al., 2003; Ozyurt et al., 2006; Sun et al., 2006; Kandemir and Polat, 2007).
The percentages of PUFAs found in viscera of the three marine organisms were impor-tant. The highest levels of PUFAs were observed for Sepia officinalis samples (rangingfrom 29.30 to 44.05%) with DHA and EPA being the major ones. For all samples, the totalomega-3 contents (ranged from 20.37 to 26.12% in December) were comparable to manycommercial marine fish oils such as that of Atlantic mackerel, Scomber scombrus (18.8%)and Japanese sardine, Sardinops melanosticta (25.9%; Ackman, 1990). Therefore, visceraseem to be a good source of omega-3 fatty acids recognized for their health benefits.
Conclusion
The study of the seasonal variation of the composition of viscera is important andmay provide information useful in the production of higher value-added products fromviscera—such as silage, hydrolysates, bioactive compounds, enzymes, and oil. This vari-ation could considerably affect the quality of the value-added product (Horn et al., 2007).Our results indicate that these marine by-products are interesting for the extraction of oilin view of commercial exploitation. One advantage of oil from viscera is that it is much
Downloaded By: [Ben Rebah, Faouzi] At: 15:01 13 April 2011
Tabl
e2
Vis
cera
gene
ralf
atty
acid
sof
Sard
inel
laau
rita
,Sar
pasa
lpa,
and
Sepi
aof
ficin
alis
com
pare
dto
othe
rst
udie
s(%
wto
fto
talf
atty
acid
s)
Sard
inel
laau
rita
Sepi
aof
ficin
alis
Sarp
asa
lpa
Spec
ies
Vis
cera
Ent
ire
fish
Vis
cera
Man
tleV
isce
raM
uscl
e
Peri
odof
sam
plin
gO
ctob
er20
08;
Dec
embe
r200
8Fe
brua
ryO
ctob
er20
08;
Dec
embe
r200
8O
ver
the
year
Oct
ober
2008
;D
ecem
ber2
008
Ove
rth
eye
ar
Reg
ion
ofsa
mpl
ing
Gab
èsG
ulf,
Tun
isia
Gab
èsG
ulf,
Tun
isia
Gab
èsG
ulf,
Tun
isia
Nor
thea
ster
nM
edite
rran
ean
Gab
èsG
ulf,
Tun
isia
Spai
n
SFA
s43
.28;
48.8
837
.50
43.0
0;29
.41
29.5
–36.
8058
.03;
43.2
837
.50
MU
FAs
25.8
6;16
.65
21.2
021
.78;
24.7
57.
81–9
.85
28.8
3;12
.08
20.7
0PU
FAs
22.5
0;30
.46
31.6
029
.30;
44.0
543
.70–
49.6
14.0
4;34
.84
43.3
0ω
-3FA
s18
.54;
26.1
225
.00
21.4
2;26
.05
37.9
0–44
.50
9.47
;20.
3734
.30
Ref
eren
ces
Pres
ents
tudy
Ben
Reb
ahet
al.,
2009
Pres
ents
tudy
Ozy
urte
tal.,
2006
Pres
ents
tudy
Sori
guer
etal
.,19
97
SFA
s:sa
tura
ted
fatty
acid
s;M
UFA
s:m
onou
nsat
urat
edfa
ttyac
ids;
PUFA
s:po
lyun
satu
rate
dfa
ttyac
ids,
ω-3
FAs:
omeg
a-3
fatty
acid
s.
243
Downloaded By: [Ben Rebah, Faouzi] At: 15:01 13 April 2011
244 M. Kacem et al.
cheaper compared with the traditionally produced fish oil. The higher level of EPA andDHA in visceral oil could make it more competitive than other oil in various applications.These applications include the animal feed industry and the production of nutraceuticalfoods with high level of PUFAs that could potentially lower cholesterol levels and preventheart diseases (Jacobson, 2006; Kris-Etherton et al., 2006). Moreover, the use of viscera asa source for producing value-added products can also benefit the environment by reducingthe discarding of waste.
References
Ackman, R. G. 1990. Sea food lipids and fatty acids. Food Rev. Int. 6: 617–646.Aidos, I., Van Der Padt, A., Luten, J. B., and Boom, R. M. 2002. Seasonal changes in crude and lipid
composition of herring fillets, by-products, and respective produced oils. J. Agr. Food Chem. 50:4589–4599.
Andrade, A. D., Rubira, A. F., Matsushita, M., and Souza, N. E. 1995. Omega-3 fatty acids infreshwater fish from South Brazil. J. Am. Oil Chem. Soc. 72: 1207–1210.
AOAC. 1990. Official Methods of Analysis of the Association of Official Analytical Chemists.5th ed. Arlington, VA: Author.
Aryee, A. N. A., Simpson, B. K., and Villalonga, R. 2007. Lipase fraction from the viscera ofgrey mullet (Mugil cephalus): Isolation, partial purification and some biochemical characteristics.Enzyme Microb. Tech. 40: 394–402.
Aspmo, S. I., Horn, S. J., and Eijsink, V. G. H. 2005. Use of hydrolysates from Atlantic cod (Gadusmorhua L.) viscera as a complex nitrogen source for lactic acid bacteria. FEMS Microbiol. Lett.248: 65–68.
Bandarra, N. M., Batista, I., Nunes, M. L., Empis, J. M., and Christie, W. W. 1997. Seasonal changesin lipid composition of sardine (Sardina pilchardus). J. Food Sci. 62: 40–42.
Beltran, A., and Moral, A. 1991. Changes in fatty acid composition of fresh and frozen sardine(Sardina pilchardus) during smoking. Food Chem. 42: 99–109.
Ben Rebah, F., Abdelmouleh, A., Kammoun, W., and Yezza, A. 2009. Seasonal variation of lipidcontent and fatty acid composition of Sardinella aurita from the Tunisian coast. J. Mar. Biol.Assoc. UK. 90: 569–573.
Bougatef, A., Nedjar-Arroume, N., Manni, L., Ravallec, R., Barkia, A., Guillochon, D., and Nasri, M.2010. Purification and identification of novel antioxidant peptides from enzymatic hydrolysatesof sardinelle (Sardinella aurita) by-products proteins. Food Chem. 118: 559–565.
Bougatef, A., Souissi, N., Fakhfakh, N., Ellouz-Triki, Y., and Nasri, M. 2007. Purification andcharacterization of trypsin from the viscera of sardine (Sardina pilchardus). Food Chem. 102:343–350.
Castillo-Yañez, F. J., Pacheco-Aguilar, R., Lugo-Sanchez, M. E., Garcia-Sanchez, G., and Quintero-Reyes, I. E. 2009. Biochemical characterization of an isoform of chymotrypsin from the viscera ofMonterey sardine (Sardinops sagax caerulea), and comparison with bovine chymotrypsin. FoodChem. 112: 634–639.
Castro, B. G., and Guerra, A. 1989. Feeding pattern of Sepia officinalis (Cephalopoda Sepioidea) inthe Ria de Vigo (NW Spain). J. Mar. Biol. Assoc. UK. 69: 545–553.
Dyerberg, J., Bang, H. O., Stoffersen, E., Monkada, S., and Vane, J. R. 1978. Eicosapentaenoic acidand prevention of thrombosis atherosclerosis. Lancet 2: 117–119.
Emokpae, A. O. 1983. Preliminary studies on the chemical and weight composition of some com-mercially important species of fish caught in the Nigerian inshore waters. J. Food Sci. 18:271–283.
Falch, E., Rustad, T., Jonsdottir, R., Shaw, N. B., Dumay, J., Berge, J. P., Arason, S., Kerry, J. P.,Sandbakk, M., and Aursand, M. 2006. Geographical and seasonal differences in lipid compositionand relative weight of by-products from gadiform species. J. Food Compos. Anal. 19: 727–736.
Downloaded By: [Ben Rebah, Faouzi] At: 15:01 13 April 2011
Chemical Composition of Marine Species’ Viscera 245
Gerking, S. D. 1984. Assimilation and maintenance ration of an herbivorous fish, Sarpa salpa,feeding on a green alga. T. Am. Fish. Soc. 113: 378–387.
Grigorakis, K., Alexis, M. N., Taylor, K. D. A., and Hole, M. 2002. Comparison of wild and culturedgilthead sea bream (Sparus aurata); composition, appearance and seasonal variations. Int. J. FoodSci. Tech. 37: 477–484.
Guerra, A. 1985. Food of the cuttlefish Sepia officinalis and Sepia elegans in the Ria de Vigo (NWSpain) (Mollusca: Cephalopoda). J. Zool. 207: 511–519.
Havelange, S., Lepoint, G., Dauby, P., and Bouquegneau, J. M. 1997. Feeding of the sparid fish Sarpasalpa in a seagrass ecosystem. Mar. Ecol. 18: 289–297.
Horn, S. J., Aspmo, S. I., and Eijsink, V. G. H. 2007. Evaluation of different cod viscera fractionsand their seasonal variation used in a growth medium for lactic acid bacteria. Enzyme Microb.Tech. 40: 1328–1334.
Jacobson, T. A. 2006. Secondary prevention of coronary heart disease with omega-3 fatty acids. Am.J. Cardiol. 98: 61–70.
Kandemir, S., Polat, and N. 2007. Seasonal variation of total lipid and total fatty acid in muscle andliver of rainbow trout (Oncorhynchus mykiss W., 1792) reared in Derbent Dam Lake. Turk. J.Fish. Aquat. Sci. 7: 27–31.
Karakoltsidis, P. A., Zotos, A., and Constantinides, S. M. 1995. Composition of the commerciallyimportant Mediterranean finfish, crustaceans and molluscs. J. Food Compos. Anal. 8: 258–273.
Kechaou, E. S., Dumay, J., Donnay-Moreno, C., Jaouen, P., Gouggou, J. P., Bergé, J. P., and Amar,R. B. 2009. Enzymatic hydrolysis of cuttlefish (Sepia officinalis) and sardine (Sardina pichardus)viscera using commercial proteases: Effects on lipid distribution and amino acid composition. J.Biosci. Bioeng. 107:158–164.
Kishimura, H., Hayashi, K., Miyashita, Y., and Nonami, Y. 2006. Characteristics of trypsins fromthe viscera of true sardine (Sardinops melanostictus) and the pyloric ceca of arabesque greenling(Pleuroprammus azonus). Food Chem. 97: 65–70.
Klomklao, S., Kishimura, H., Nonami, Y., and Benjakul, S. 2009. Biochemical properties of two iso-forms of trypsin purified from the intestine of skipjack tuna (Katsuwonus pelamis). Food Chem.115: 155–162.
Klomklao, S., Kishimura, H., Yabe, M., and Benjakul, S. 2007. Purification and characterizationof two pepsins from the stomach of pectoral rattail (Coryphaenoides pectoralis). Comp. Bioch.Phys. B-Biochem. Mol. Biol. 147: 682–689.
Kris-Etherton, P., Psota, T. L., and Gebauer, S. K. 2006. Dietary omega-3 fatty acid intake andcardiovascular risk. Am. J. Cardiol. 98: 3–18.
Kurtovic, I., Marshall, S. N., and Simpson, B. K. 2006. Isolation and characterization of a trypsinfraction from the pyloric ceca of chinook salmon (Oncorhynchus tshawytscha). Comp. Bioch.Phys. B-Biochem. Mol. Biol. 143: 432–440.
Lee, P. G., Turk, P. E., Yang, W. T., and Hanlon, R. T. 1994. Biological characteristics and biomedicalapplications of the squid Sepioteuthis lessoniana cultured through multiple generations. Biol.Bull. 186: 328–341.
Love, R. M. 1980. The Chemical Biology of Fishes. London: Academic Press.Luzia, L. A., Sampaio, G. R., Castellucci, C. M. N., and Toreres, E. A. F. S. 2003. The influence of
season on the lipid profiles of five commercially important species of Brazilian fish. Food Chem.83: 93–97.
Méndez, E., and González, M. R. 1997. Seasonal changes in the chemical and lipid composition offillets of the Southeast Atlantic hake (Merluccius hubbsi). Food Chem. 59: 213–217.
Njinkoue, J. M., Barnathan, G., Miralles, J., Gaydoud, E. M., and Sambe, A. 2002. Lipids andfatty acids in muscle, liver and skin of three edible fish from the Senegalese coast: Sardinellamaderensis, Sardinella aurita and Cephalopholis taeniops. Comp. Biochem. Physiol. 131:395–402.
Ozyurt, G., Duysak, O., Akamca, E., and Tureli, C. 2006. Changes of fatty acids of cuttlefish Sepiaofficinalis L. (Mollusca: Cephalopoda) in the north eastern Mediterranean sea. Food Chem. 95:382–385.
Downloaded By: [Ben Rebah, Faouzi] At: 15:01 13 April 2011
246 M. Kacem et al.
Pigott, G. M., and Tucker, B. W. 1987.Science opens new horizons or Marine lipids in humannutrition. Food Rev. Int. 3: 105–138.
Rajasilta, M. 1992. Relationship between food, fat, sexual maturation, and spawning time of balticherring (Clupea harengus membras) in the archipelago sea. Can. J. Fish Aquat. Sci. 9: 644–654.
Saglik, S., and Imre, S. 2001. ω3-Fatty acids in some fish species from Turkey. J. Food Sci. 66:210–212.
Slover, H. T., and Lanza, E. 1979. Quantitative analysis of food fatty acids by capillary gaschromatography. J. Am. Oil Chem. Soc. 56: 933–943.
Soriguer, F., Serna, S., Valverde, E., Hernando, J., Martin-Reyes, A., Soriguer, M., Pareja, A.,Tina-Hones, F., and Esteva, I. 1997. Lipid, protein, and caloric content of different Atlantic andMediterranean shellfish and molluscs commonly eaten in the South of Spain. Eur. J. Epidemiol.13: 451–463.
Sun, T., Xu, Z., and Prinyawiwatkul, W. 2006. FA composition of the oil extracted from farmedAtlantic Salmon (Salmo salar L.) viscera. J. Am. Oil Chem. Soc. 83: 615–619.
Tsikliras, A. C., Torre, M., and Stergiou, K. 2005. Feeding habits and trophic level of round sardinella(Sardinella aurita) in the northeastern Mediterranean (Aegean Sea, Greece). J. Biol. Res. 3:67–75.
Tzikas, Z., Amvrosiadis, I., Soultos, N., and Georgakis, S. P. 2007. Seasonal variation in the chem-ical composition and microbiological condition of Mediterranean horse mackerel (Trachurusmediterraneus) muscle from the North Aegean Sea (Greece). J. Food Cont. 18: 251–257.
Vanschoonbeek, K., De Maat, M. P. M., and Heemskerk, J. W. M. 2003. Fish oil consumption andreduction of arterial disease. Nutrition 133: 657–660.
Vázquez, J. A., Docasal, S. F., Prieto, M. A., González, M. P., and Murado, M. A. 2008. Growth andmetabolic features of lactic acid bacteria in media with hydrolysed fish viscera. An approach tobio-silage of fishing by-products. Bioresource Technol. 99: 6246–6257.
Wang, Y., Li, K., Han, H., Zheng, Z. X., and Bureau, D. P. 2008. Potential of using a blend of renderedanimal protein ingredients to replace fish meal in practical diets for malabar grouper (Epinephelusmalabricus). Aquaculture 281: 113–117.
Zlatanos, S., and Laskaridis, K. 2007. Seasonal variation in the fatty acid composition of threeMediterranean fish—Sardine (Sardina pilchardus), anchovy (Engraulis encrasicholus) andpicarel (Spicara smaris). Food Chem. 103: 725–728.
Downloaded By: [Ben Rebah, Faouzi] At: 15:01 13 April 2011
All in-text references underlined in blue are linked to publications on ResearchGate, letting you access and read them immediately.