
PROXIMATE DETERMINANTS OF SEX RATIO AND ITS ...
24
PROXIMATE DETERMINANTS OF SEX RATIO AND ITS REGIONAL VARIATIONS IN INDIA CEPED-CICRED-INED Seminar on Female Deficit in Asia: Trends and Perspectives, Singapore, 5-7 December 2005. Draft paper before publication; please do not use it as reference. PROXIMATE DETERMINANTS OF SEX RATIO AND ITS REGIONAL VARIATIONS IN INDIA Dr. P. K. Bhargava: Director Population Research Centre, JSS, Institute of Economic Research, Dharwad India Email: [email protected] Dr. G.M. Hiremath: Computor Population Research Centre, JSS, Institute of Economic Research, Dharwad India Email: [email protected]
-
Upload
khangminh22 -
Category
Documents
-
view
4 -
download
0
Transcript of PROXIMATE DETERMINANTS OF SEX RATIO AND ITS ...
PROXIMATE DETERMINANTS OF SEX RATIO AND ITS REGIONAL VARIATIONS IN INDIA CEPED-CICRED-INED Seminar on Female Deficit in Asia: Trends and Perspectives, Singapore, 5-7 December 2005. Draft paper before publication; please do not use it as reference.
PROXIMATE DETERMINANTS OF SEX RATIO AND ITS REGIONAL VARIATIONS IN
INDIA
Dr. P. K. Bhargava: Director Population Research Centre, JSS, Institute of Economic
Research, Dharwad India Email: [email protected]
Dr. G.M. Hiremath: Computor Population Research Centre, JSS, Institute of Economic Research, Dharwad India Email: [email protected]
PROXIMATE DETERMINANTS OF SEX RATIO AND ITS REGIONAL VARIATIONS IN INDIA
2
Abstract
Paper analyzes the regional variations in the overall and child sex ratios, female mortality disadvantage and their impact of decline in female population in India using data from Census of India, SRS, and NFHS II. An index developed by Hill and Upchurch (1995) used to estimate region-wise female mortality disadvantage. The results show that the highest decline in the child sex ratio observed in north/ north-west part of India. In this region in many states the sex ratio at birth sharply decline even from the first order birth and continue decline up to third order birth. In southern region in most of the states the sex ratio at birth decline after second order birth. The median value of the female mortality disadvantage is highest in north/ northwest followed by central/ western region, south and lowest in east/northeast. More than half missing child females belonged to north/ northwest region, followed by one third in central & western region. South and east/northeast regions shared relatively low proportion of missing female child population. Multivariate regression analysis shows that gender mortality differentials at childhood age, proportions of Hindu population, urban population and cultivators have influenced the decline in child sex ratio.
PROXIMATE DETERMINANTS OF SEX RATIO AND ITS REGIONAL VARIATIONS IN INDIA
3
Introduction: One of the significant contributors to the adverse child sex ratio in India is the
practice of elimination of female foetus. In the context of fertility transition, sex composition of the children in the family also depend on the perceived desire for ideal number of children particularly the males due to strong son preference by the society. The prevalence of patriarchy especially, in many states of northern part of India and huge dowry demand has negative influence on the desire for daughters that leads to termination of female foetus and thus unfavorable sex ratio for female. Empirical evidences indicated that the phenomenon of sex determination and sex selective abortion is now concentrating not only in towns and cities but also approaching in rural areas with the availability of better road and transport facilities (Babita Sinha, P.N. Mari Bhat and S.C. Gulati 2005).
The development of science and technologies made available Prenatal Diagnostic
Technology such as ultrasound imaging foetoscopy, alpha-fetoprotein measurement and chronic villi sampling or biopsy for detecting the sex of the foetus and termination of female foetus. Arnold, Kishore and Roy (2002), using NFHS-I & II data, indirectly estimated more than 100,000 sex selective abortion annually that are followed by ultrasound or amniocentesis in India. For curbing the menace of female foeticide, the government of India brought into force the Pre-natal Diagnostic Techniques (Regulation and Prevention of Misuse) Act on 20th September 1994. The act came into force with effect from 1.1.1996). Though, Government of India has undertaken various steps to prevent the practices of female infanticide and foeticide. Unfortunately, sex determination tests have continued and, in fact, spread more rapidly even to remote areas with the advent of ultrasound. The acts and rules framed hereunder were, therefore amended and the same came in force with effect from 14th February 2003 and title of the act changed to “Pre-conception and Pre-natal Diagnostic Techniques (Prohibition of Sex-selection) Act (PC & PNDT Act)”. It prescribes stringent punishment to those who misuse them for sex selection.
2001 Census of India shocked the whole nation by reporting a sharp decline in the child sex ratio (0-6) in the past decade. It has declined from 976 in 1961 to 927 in 2001. In India, which is mainly strong patriarchal and patrilineal society, the preference for son is determined by their socio-cultural, economic, religious and legal utility. However, there does existed variation in the son preference from north to south parts of India depending on how above factors play their roles. In the context of fertility decline in India, the desire for at least one son is more prominent. It leads to adopt permanent method of contraception if the 2nd order birth is also male as the couple will rarely go for third child and thus it contributes to unfavorable sex ratio. The imbalances in sex composition of children i.e. unfavorable for females; further aggravated due to gender differential treatment of the girl’s child leading to relatively high infant and child morbidity and mortality. The higher child mortality for girls than that of boys clearly indicates the existence of female disadvantage in the society.
Empirical analyses (Retherford and Roy, 2003) also indicated that in India sex
selective abortion is higher among urban women, middle and higher educated women and
PROXIMATE DETERMINANTS OF SEX RATIO AND ITS REGIONAL VARIATIONS IN INDIA
4
women living in households with high standard of living. They attributed this phenomenon to more awareness and access to sex determination and abortion services, birth planning and greater use of contraception. This phenomenon found strong in North, West and East groups of States than in South group of states. In fact, the mentality of sex selective abortion is diffusing from higher socio-economic status group to lower socio-economic status and if the stringent measures are not taken up it will diffuse in most part of India leading to further imbalance in sex- ratio and thus lead to long term impact on demographic imbalance.
Objectives: The main objectives of the present paper are:
(a) To analyze the regional variations in the overall and child sex ratios; (b) To estimate region-wise the female mortality disadvantage; (c) To analyze the impact of decline in sex ratio on missing females at the regional as
well as at national level; and (d) To measure the proximate determinants of sex ratio.
Data
Data for the present study has been taken from Census of India 1991 and 2001. In addition information collected from the reports of Central Bureau of Health Intelligence (CBHI), Sample Registration System (SRS) office of the Registrar General of India, National Family Health Survey II (NFHS II) and Human Development Reports. Methodology
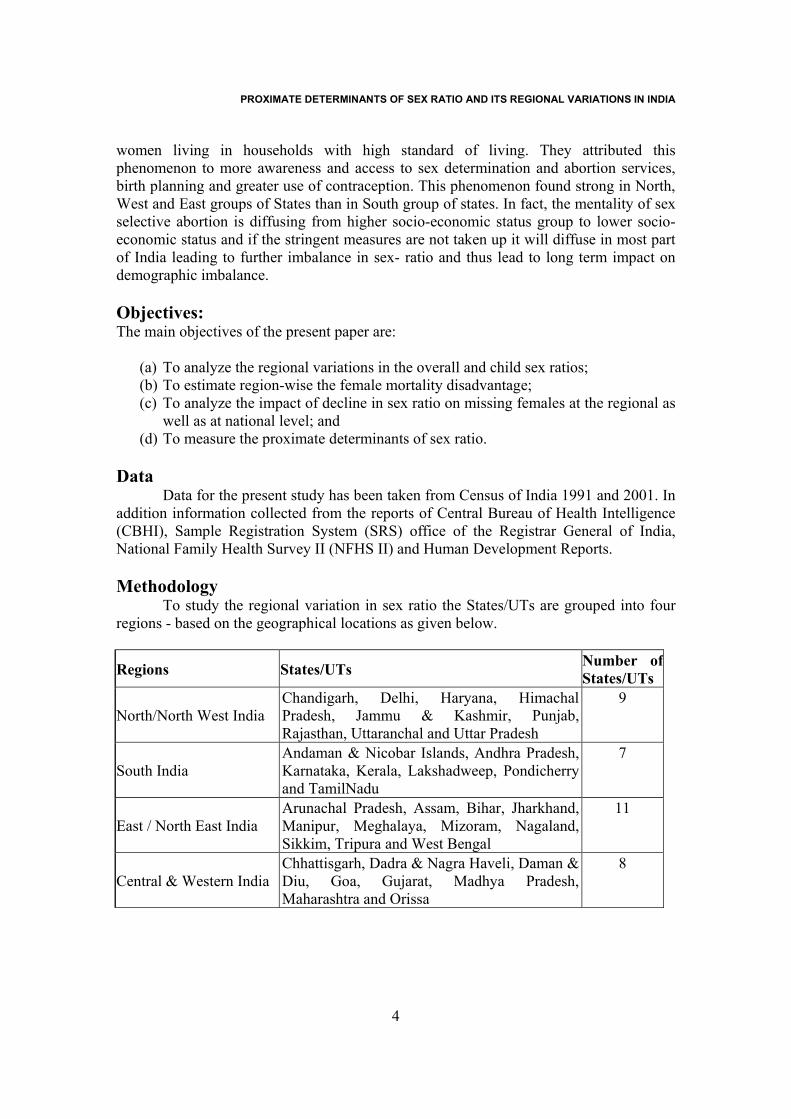
To study the regional variation in sex ratio the States/UTs are grouped into four regions - based on the geographical locations as given below.
Regions States/UTs Number of States/UTs
North/North West India Chandigarh, Delhi, Haryana, Himachal Pradesh, Jammu & Kashmir, Punjab, Rajasthan, Uttaranchal and Uttar Pradesh
9
South India Andaman & Nicobar Islands, Andhra Pradesh, Karnataka, Kerala, Lakshadweep, Pondicherry and TamilNadu
7
East / North East India Arunachal Pradesh, Assam, Bihar, Jharkhand, Manipur, Meghalaya, Mizoram, Nagaland, Sikkim, Tripura and West Bengal
11
Central & Western India Chhattisgarh, Dadra & Nagra Haveli, Daman & Diu, Goa, Gujarat, Madhya Pradesh, Maharashtra and Orissa
8
PROXIMATE DETERMINANTS OF SEX RATIO AND ITS REGIONAL VARIATIONS IN INDIA
5
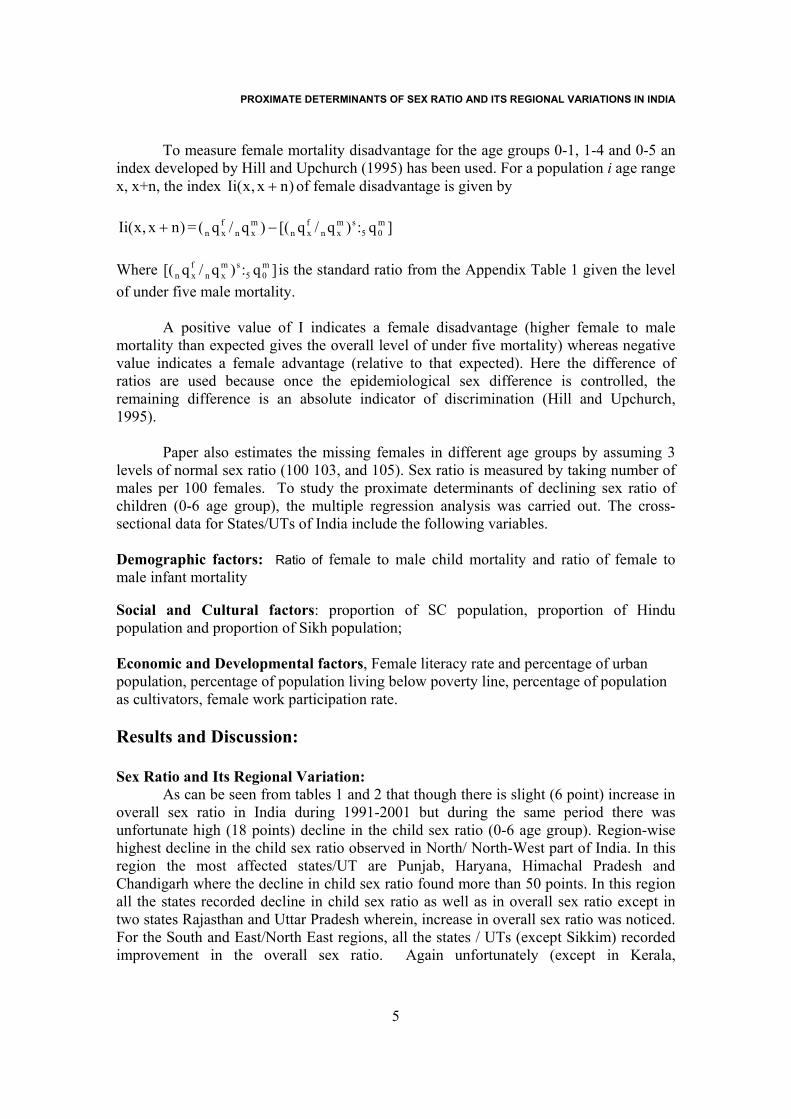
To measure female mortality disadvantage for the age groups 0-1, 1-4 and 0-5 an index developed by Hill and Upchurch (1995) has been used. For a population i age range x, x+n, the index )nx,x(Ii + of female disadvantage is given by
)nx,x(Ii + = ]q:)q/q[()q/q( m05
smxn
fxn
mxn
fxn −
Where ]q:)q/q[( m
05sm
xnfxn is the standard ratio from the Appendix Table 1 given the level
of under five male mortality.
A positive value of I indicates a female disadvantage (higher female to male mortality than expected gives the overall level of under five mortality) whereas negative value indicates a female advantage (relative to that expected). Here the difference of ratios are used because once the epidemiological sex difference is controlled, the remaining difference is an absolute indicator of discrimination (Hill and Upchurch, 1995).
Paper also estimates the missing females in different age groups by assuming 3 levels of normal sex ratio (100 103, and 105). Sex ratio is measured by taking number of males per 100 females. To study the proximate determinants of declining sex ratio of children (0-6 age group), the multiple regression analysis was carried out. The cross-sectional data for States/UTs of India include the following variables. Demographic factors: Ratio of female to male child mortality and ratio of female to male infant mortality Social and Cultural factors: proportion of SC population, proportion of Hindu population and proportion of Sikh population; Economic and Developmental factors, Female literacy rate and percentage of urban population, percentage of population living below poverty line, percentage of population as cultivators, female work participation rate. Results and Discussion: Sex Ratio and Its Regional Variation:
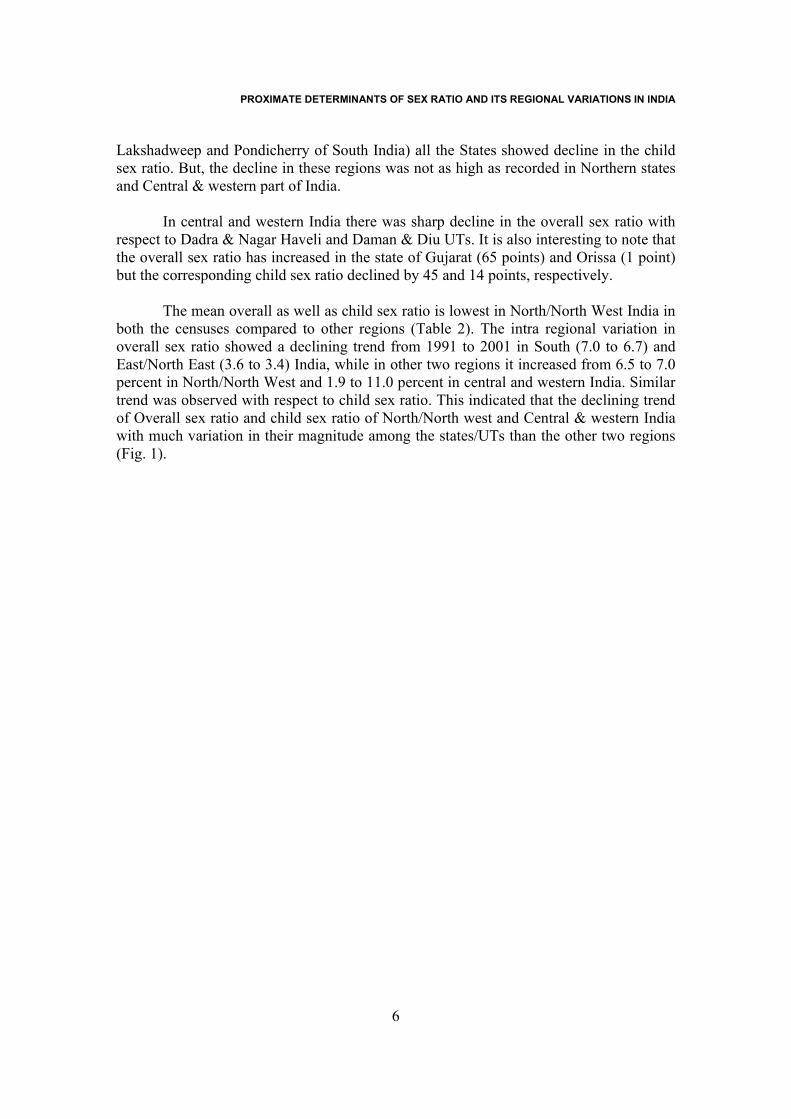
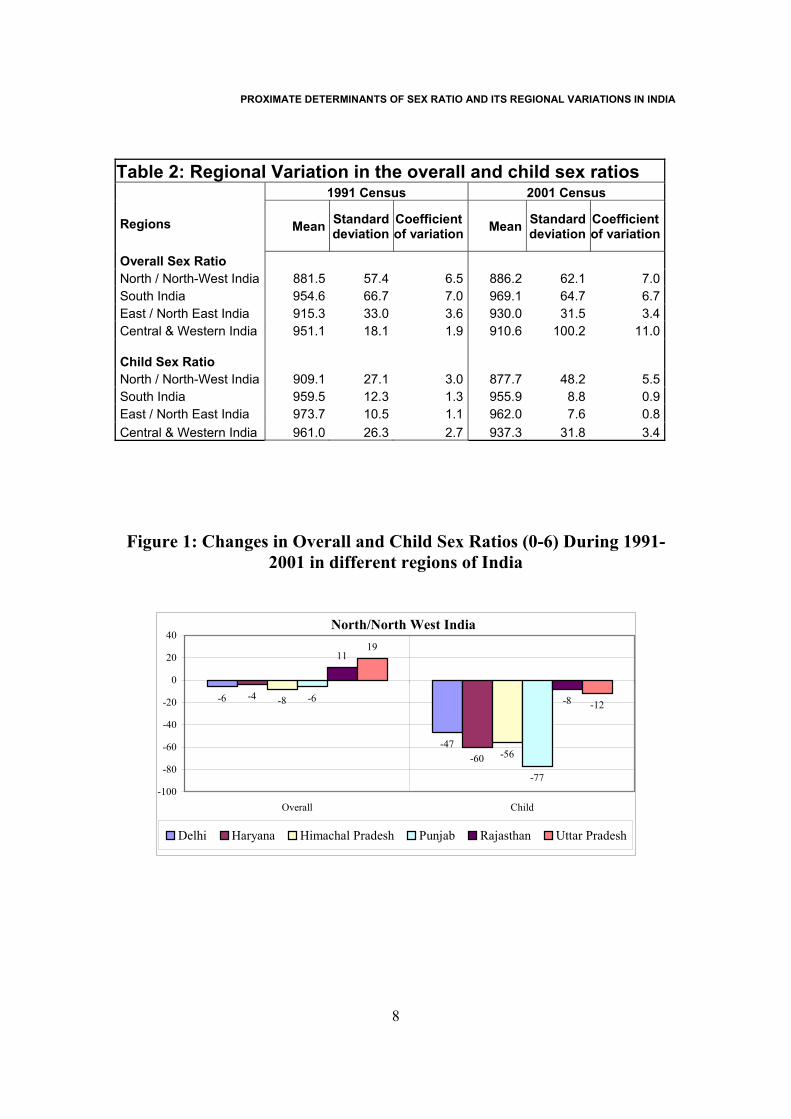
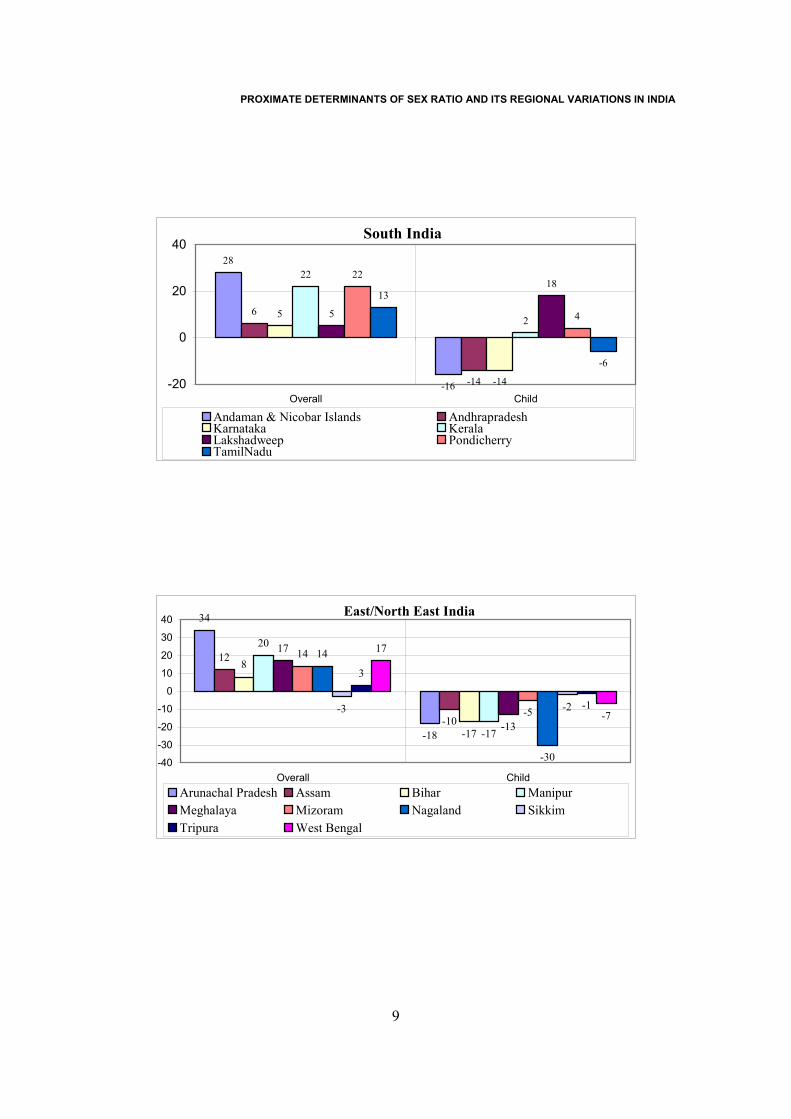
As can be seen from tables 1 and 2 that though there is slight (6 point) increase in overall sex ratio in India during 1991-2001 but during the same period there was unfortunate high (18 points) decline in the child sex ratio (0-6 age group). Region-wise highest decline in the child sex ratio observed in North/ North-West part of India. In this region the most affected states/UT are Punjab, Haryana, Himachal Pradesh and Chandigarh where the decline in child sex ratio found more than 50 points. In this region all the states recorded decline in child sex ratio as well as in overall sex ratio except in two states Rajasthan and Uttar Pradesh wherein, increase in overall sex ratio was noticed. For the South and East/North East regions, all the states / UTs (except Sikkim) recorded improvement in the overall sex ratio. Again unfortunately (except in Kerala,
PROXIMATE DETERMINANTS OF SEX RATIO AND ITS REGIONAL VARIATIONS IN INDIA
6
Lakshadweep and Pondicherry of South India) all the States showed decline in the child sex ratio. But, the decline in these regions was not as high as recorded in Northern states and Central & western part of India.
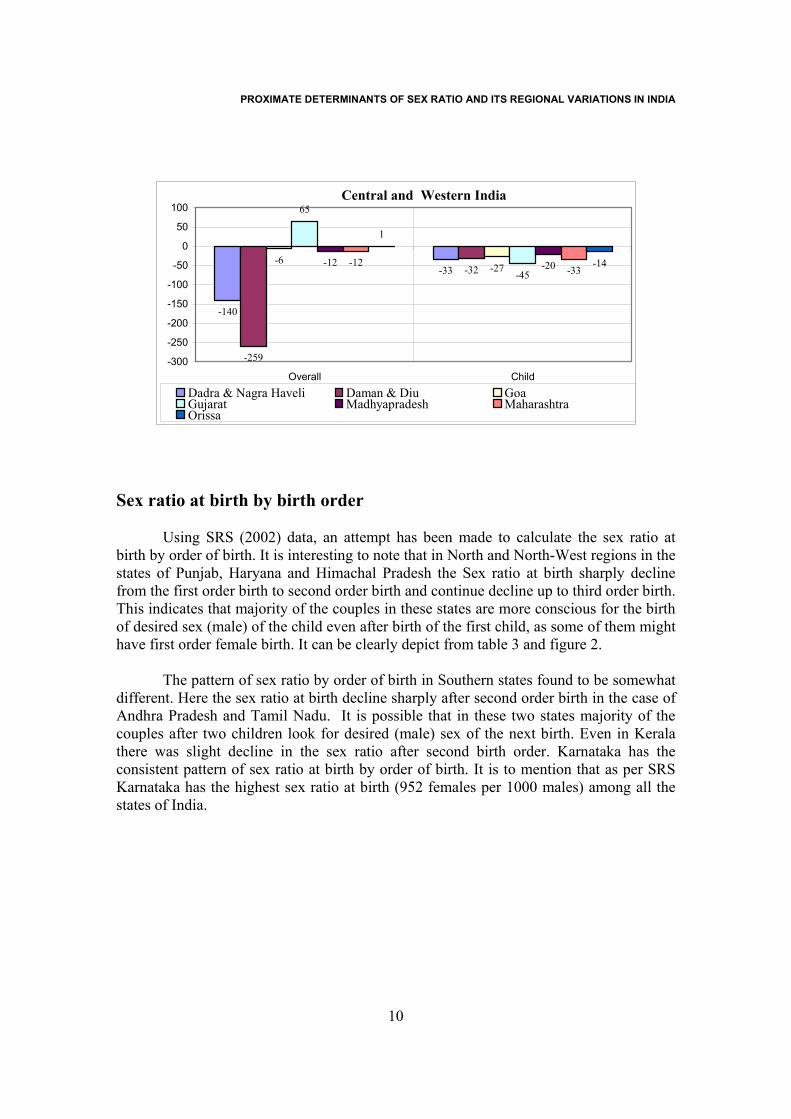
In central and western India there was sharp decline in the overall sex ratio with respect to Dadra & Nagar Haveli and Daman & Diu UTs. It is also interesting to note that the overall sex ratio has increased in the state of Gujarat (65 points) and Orissa (1 point) but the corresponding child sex ratio declined by 45 and 14 points, respectively.
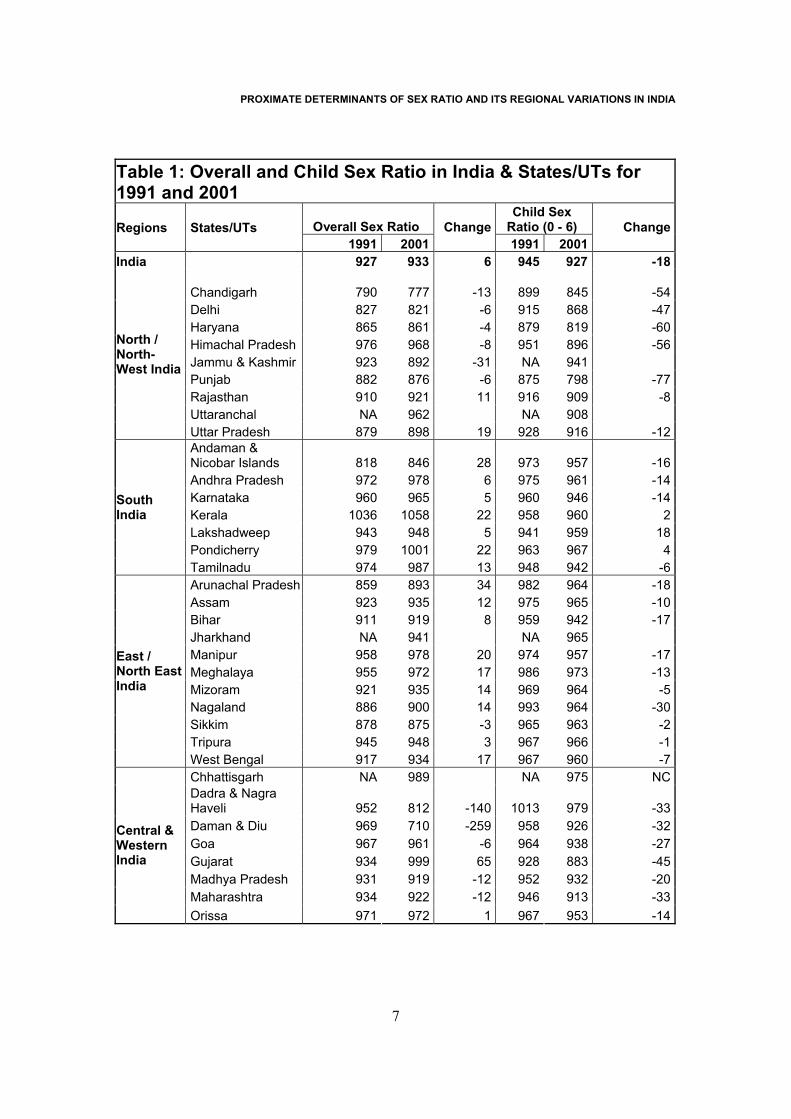
The mean overall as well as child sex ratio is lowest in North/North West India in both the censuses compared to other regions (Table 2). The intra regional variation in overall sex ratio showed a declining trend from 1991 to 2001 in South (7.0 to 6.7) and East/North East (3.6 to 3.4) India, while in other two regions it increased from 6.5 to 7.0 percent in North/North West and 1.9 to 11.0 percent in central and western India. Similar trend was observed with respect to child sex ratio. This indicated that the declining trend of Overall sex ratio and child sex ratio of North/North west and Central & western India with much variation in their magnitude among the states/UTs than the other two regions (Fig. 1).
PROXIMATE DETERMINANTS OF SEX RATIO AND ITS REGIONAL VARIATIONS IN INDIA
7
Table 1: Overall and Child Sex Ratio in India & States/UTs for 1991 and 2001
Overall Sex Ratio Child Sex
Ratio (0 - 6) Regions
States/UTs 1991 2001
Change1991 2001
Change
India 927 933 6 945 927 -18 Chandigarh 790 777 -13 899 845 -54Delhi 827 821 -6 915 868 -47Haryana 865 861 -4 879 819 -60Himachal Pradesh 976 968 -8 951 896 -56Jammu & Kashmir 923 892 -31 NA 941 Punjab 882 876 -6 875 798 -77Rajasthan 910 921 11 916 909 -8Uttaranchal NA 962 NA 908
North / North-West India
Uttar Pradesh 879 898 19 928 916 -12Andaman & Nicobar Islands 818 846 28 973 957 -16Andhra Pradesh 972 978 6 975 961 -14Karnataka 960 965 5 960 946 -14Kerala 1036 1058 22 958 960 2Lakshadweep 943 948 5 941 959 18Pondicherry 979 1001 22 963 967 4
South India
Tamilnadu 974 987 13 948 942 -6Arunachal Pradesh 859 893 34 982 964 -18Assam 923 935 12 975 965 -10Bihar 911 919 8 959 942 -17Jharkhand NA 941 NA 965 Manipur 958 978 20 974 957 -17Meghalaya 955 972 17 986 973 -13Mizoram 921 935 14 969 964 -5Nagaland 886 900 14 993 964 -30Sikkim 878 875 -3 965 963 -2Tripura 945 948 3 967 966 -1
East / North East India
West Bengal 917 934 17 967 960 -7Chhattisgarh NA 989 NA 975 NCDadra & Nagra Haveli 952 812 -140 1013 979 -33Daman & Diu 969 710 -259 958 926 -32Goa 967 961 -6 964 938 -27Gujarat 934 999 65 928 883 -45Madhya Pradesh 931 919 -12 952 932 -20Maharashtra 934 922 -12 946 913 -33
Central & Western India
Orissa 971 972 1 967 953 -14
PROXIMATE DETERMINANTS OF SEX RATIO AND ITS REGIONAL VARIATIONS IN INDIA
8
Table 2: Regional Variation in the overall and child sex ratios
1991 Census 2001 Census Regions Mean Standard
deviationCoefficient of variation Mean Standard
deviation Coefficient of variation
Overall Sex Ratio North / North-West India 881.5 57.4 6.5 886.2 62.1 7.0South India 954.6 66.7 7.0 969.1 64.7 6.7East / North East India 915.3 33.0 3.6 930.0 31.5 3.4Central & Western India 951.1 18.1 1.9 910.6 100.2 11.0 Child Sex Ratio North / North-West India 909.1 27.1 3.0 877.7 48.2 5.5South India 959.5 12.3 1.3 955.9 8.8 0.9East / North East India 973.7 10.5 1.1 962.0 7.6 0.8Central & Western India 961.0 26.3 2.7 937.3 31.8 3.4
Figure 1: Changes in Overall and Child Sex Ratios (0-6) During 1991-2001 in different regions of India
North/North West India
-6
-47
-4
-60
-8
-56
-6
-77
11
-8
19
-12
-100
-80
-60
-40
-20
0
20
40
Overall Child
Delhi Haryana Himachal Pradesh Punjab Rajasthan Uttar Pradesh
PROXIMATE DETERMINANTS OF SEX RATIO AND ITS REGIONAL VARIATIONS IN INDIA
9
South India28
-16
6
-14
5
-14
22
25
1822
4
13
-6
-20
0
20
40
Overall Child
Andaman & Nicobar Islands AndhrapradeshKarnataka KeralaLakshadweep PondicherryTamilNadu
East/North East India34
-18
12
-10
8
-17
20
-17
17
-13
14
-5
14
-30
-3 -2
3
-1
17
-7
-40
-30
-20
-10
0
10
20
30
40
Overall ChildArunachal Pradesh Assam Bihar ManipurMeghalaya Mizoram Nagaland SikkimTripura West Bengal
PROXIMATE DETERMINANTS OF SEX RATIO AND ITS REGIONAL VARIATIONS IN INDIA
10
Central and Western India
-140
-33
-259
-32-6
-27
65
-45-12 -20-12
-33
1
-14
-300
-250
-200
-150
-100
-50
0
50
100
Overall ChildDadra & Nagra Haveli Daman & Diu GoaGujarat Madhyapradesh MaharashtraOrissa
Sex ratio at birth by birth order
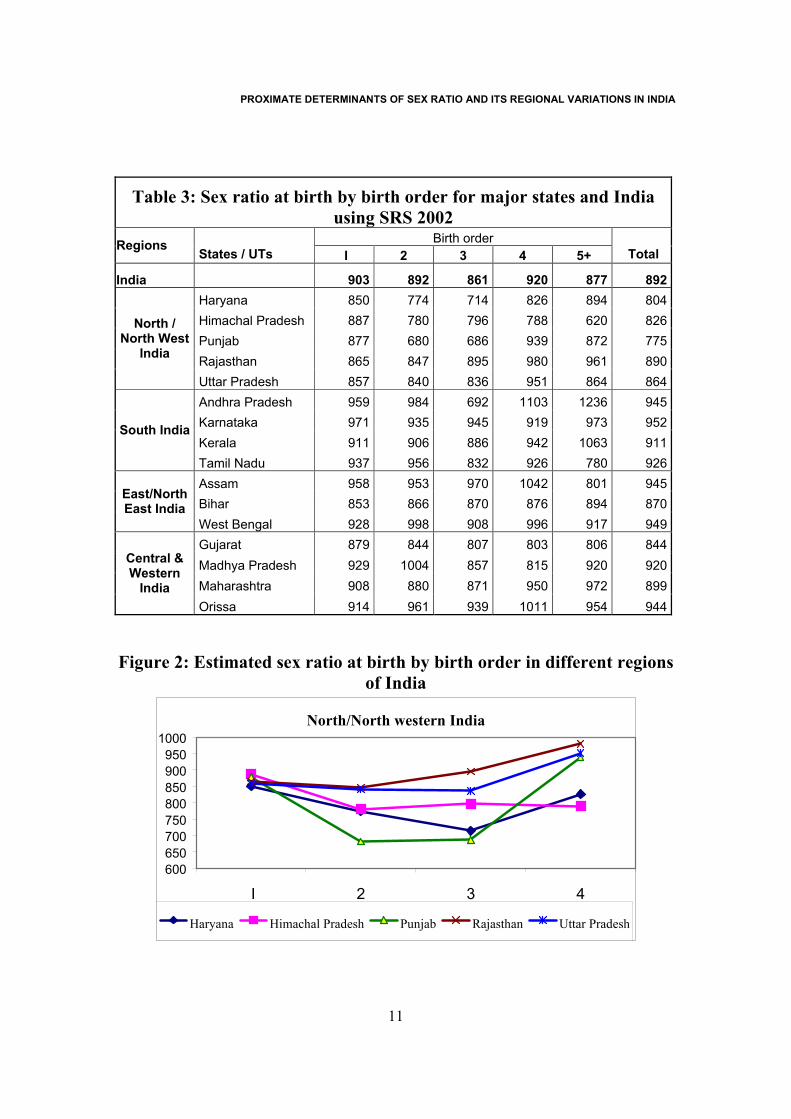
Using SRS (2002) data, an attempt has been made to calculate the sex ratio at birth by order of birth. It is interesting to note that in North and North-West regions in the states of Punjab, Haryana and Himachal Pradesh the Sex ratio at birth sharply decline from the first order birth to second order birth and continue decline up to third order birth. This indicates that majority of the couples in these states are more conscious for the birth of desired sex (male) of the child even after birth of the first child, as some of them might have first order female birth. It can be clearly depict from table 3 and figure 2.
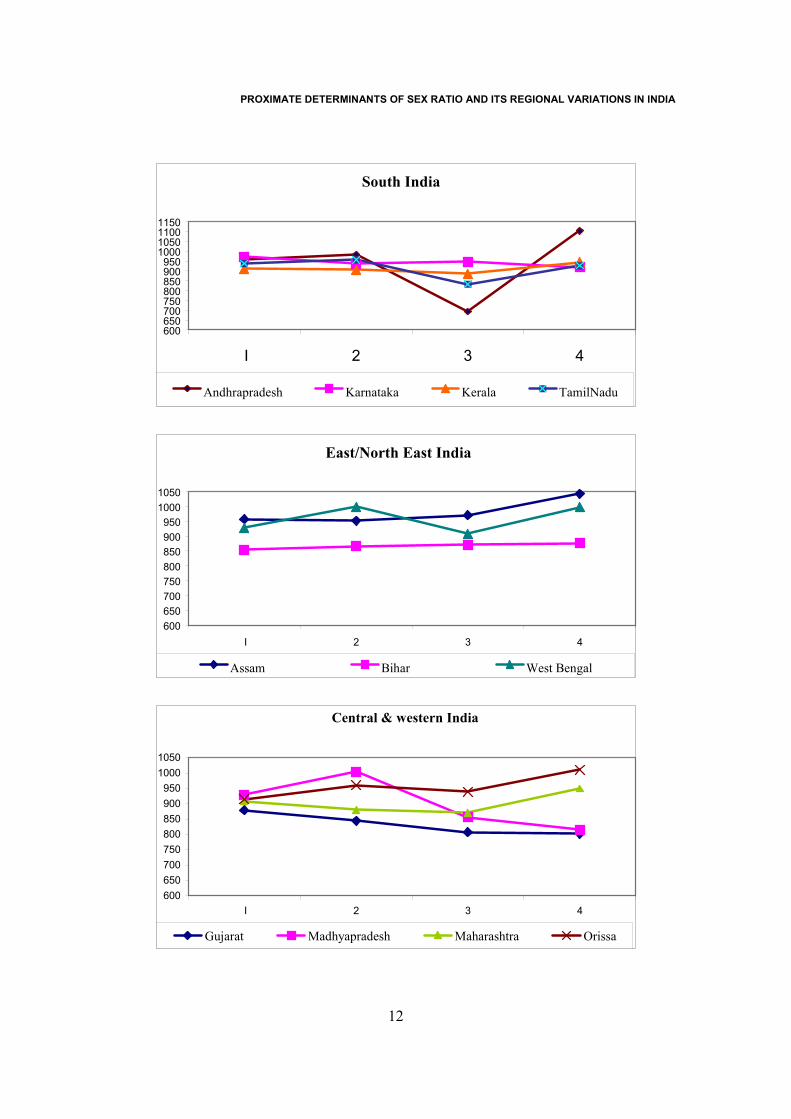
The pattern of sex ratio by order of birth in Southern states found to be somewhat different. Here the sex ratio at birth decline sharply after second order birth in the case of Andhra Pradesh and Tamil Nadu. It is possible that in these two states majority of the couples after two children look for desired (male) sex of the next birth. Even in Kerala there was slight decline in the sex ratio after second birth order. Karnataka has the consistent pattern of sex ratio at birth by order of birth. It is to mention that as per SRS Karnataka has the highest sex ratio at birth (952 females per 1000 males) among all the states of India.
PROXIMATE DETERMINANTS OF SEX RATIO AND ITS REGIONAL VARIATIONS IN INDIA
11
Table 3: Sex ratio at birth by birth order for major states and India using SRS 2002
Birth order Regions States / UTs I 2 3 4 5+ Total
India 903 892 861 920 877 892Haryana 850 774 714 826 894 804Himachal Pradesh 887 780 796 788 620 826Punjab 877 680 686 939 872 775Rajasthan 865 847 895 980 961 890
North / North West
India
Uttar Pradesh 857 840 836 951 864 864Andhra Pradesh 959 984 692 1103 1236 945Karnataka 971 935 945 919 973 952Kerala 911 906 886 942 1063 911
South India
Tamil Nadu 937 956 832 926 780 926Assam 958 953 970 1042 801 945Bihar 853 866 870 876 894 870
East/North East India
West Bengal 928 998 908 996 917 949Gujarat 879 844 807 803 806 844Madhya Pradesh 929 1004 857 815 920 920Maharashtra 908 880 871 950 972 899
Central & Western
India Orissa 914 961 939 1011 954 944
Figure 2: Estimated sex ratio at birth by birth order in different regions
of India
North/North western India
600650700750800850900950
1000
I 2 3 4
Haryana Himachal Pradesh Punjab Rajasthan Uttar Pradesh
PROXIMATE DETERMINANTS OF SEX RATIO AND ITS REGIONAL VARIATIONS IN INDIA
12
South India
600650700750800850900950
1000105011001150
I 2 3 4
Andhrapradesh Karnataka Kerala TamilNadu
East/North East India
600650700750800850900950
10001050
I 2 3 4
Assam Bihar West Bengal
Central & western India
600650700750800850900950
10001050
I 2 3 4
Gujarat Madhyapradesh Maharashtra Orissa
PROXIMATE DETERMINANTS OF SEX RATIO AND ITS REGIONAL VARIATIONS IN INDIA
13
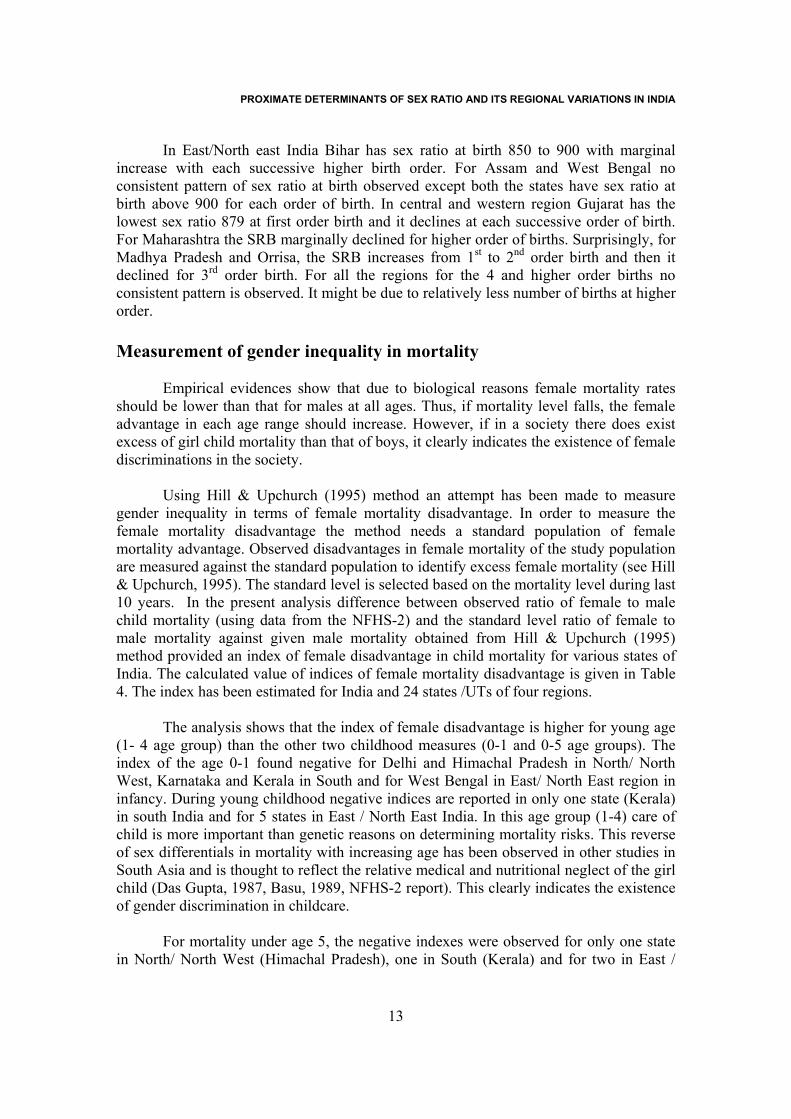
In East/North east India Bihar has sex ratio at birth 850 to 900 with marginal increase with each successive higher birth order. For Assam and West Bengal no consistent pattern of sex ratio at birth observed except both the states have sex ratio at birth above 900 for each order of birth. In central and western region Gujarat has the lowest sex ratio 879 at first order birth and it declines at each successive order of birth. For Maharashtra the SRB marginally declined for higher order of births. Surprisingly, for Madhya Pradesh and Orrisa, the SRB increases from 1st to 2nd order birth and then it declined for 3rd order birth. For all the regions for the 4 and higher order births no consistent pattern is observed. It might be due to relatively less number of births at higher order. Measurement of gender inequality in mortality
Empirical evidences show that due to biological reasons female mortality rates should be lower than that for males at all ages. Thus, if mortality level falls, the female advantage in each age range should increase. However, if in a society there does exist excess of girl child mortality than that of boys, it clearly indicates the existence of female discriminations in the society.
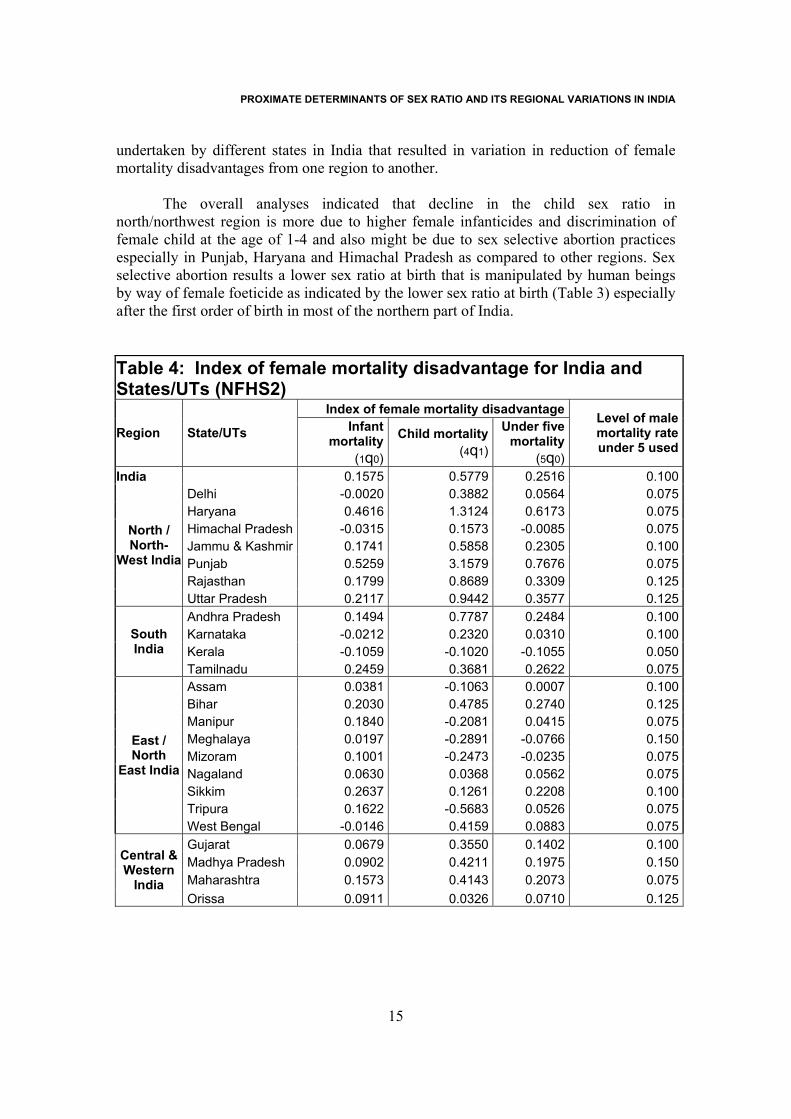
Using Hill & Upchurch (1995) method an attempt has been made to measure gender inequality in terms of female mortality disadvantage. In order to measure the female mortality disadvantage the method needs a standard population of female mortality advantage. Observed disadvantages in female mortality of the study population are measured against the standard population to identify excess female mortality (see Hill & Upchurch, 1995). The standard level is selected based on the mortality level during last 10 years. In the present analysis difference between observed ratio of female to male child mortality (using data from the NFHS-2) and the standard level ratio of female to male mortality against given male mortality obtained from Hill & Upchurch (1995) method provided an index of female disadvantage in child mortality for various states of India. The calculated value of indices of female mortality disadvantage is given in Table 4. The index has been estimated for India and 24 states /UTs of four regions.
The analysis shows that the index of female disadvantage is higher for young age (1- 4 age group) than the other two childhood measures (0-1 and 0-5 age groups). The index of the age 0-1 found negative for Delhi and Himachal Pradesh in North/ North West, Karnataka and Kerala in South and for West Bengal in East/ North East region in infancy. During young childhood negative indices are reported in only one state (Kerala) in south India and for 5 states in East / North East India. In this age group (1-4) care of child is more important than genetic reasons on determining mortality risks. This reverse of sex differentials in mortality with increasing age has been observed in other studies in South Asia and is thought to reflect the relative medical and nutritional neglect of the girl child (Das Gupta, 1987, Basu, 1989, NFHS-2 report). This clearly indicates the existence of gender discrimination in childcare.
For mortality under age 5, the negative indexes were observed for only one state in North/ North West (Himachal Pradesh), one in South (Kerala) and for two in East /
PROXIMATE DETERMINANTS OF SEX RATIO AND ITS REGIONAL VARIATIONS IN INDIA
14
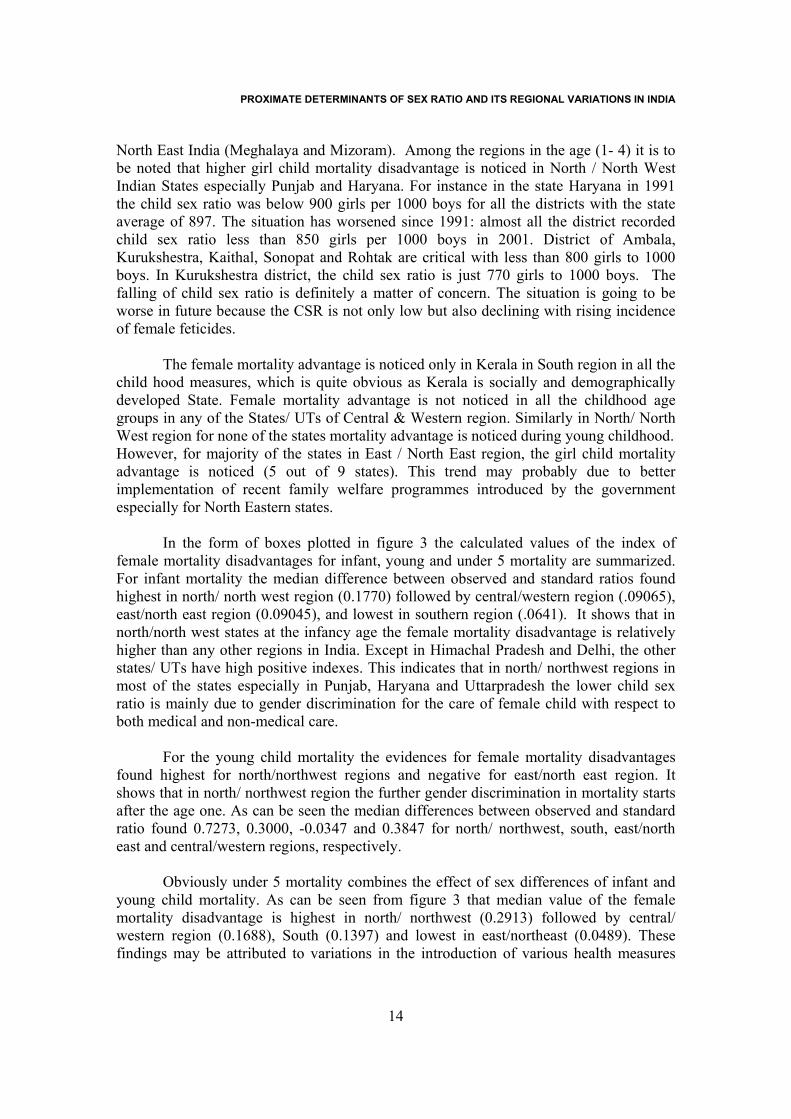
North East India (Meghalaya and Mizoram). Among the regions in the age (1- 4) it is to be noted that higher girl child mortality disadvantage is noticed in North / North West Indian States especially Punjab and Haryana. For instance in the state Haryana in 1991 the child sex ratio was below 900 girls per 1000 boys for all the districts with the state average of 897. The situation has worsened since 1991: almost all the district recorded child sex ratio less than 850 girls per 1000 boys in 2001. District of Ambala, Kurukshestra, Kaithal, Sonopat and Rohtak are critical with less than 800 girls to 1000 boys. In Kurukshestra district, the child sex ratio is just 770 girls to 1000 boys. The falling of child sex ratio is definitely a matter of concern. The situation is going to be worse in future because the CSR is not only low but also declining with rising incidence of female feticides.
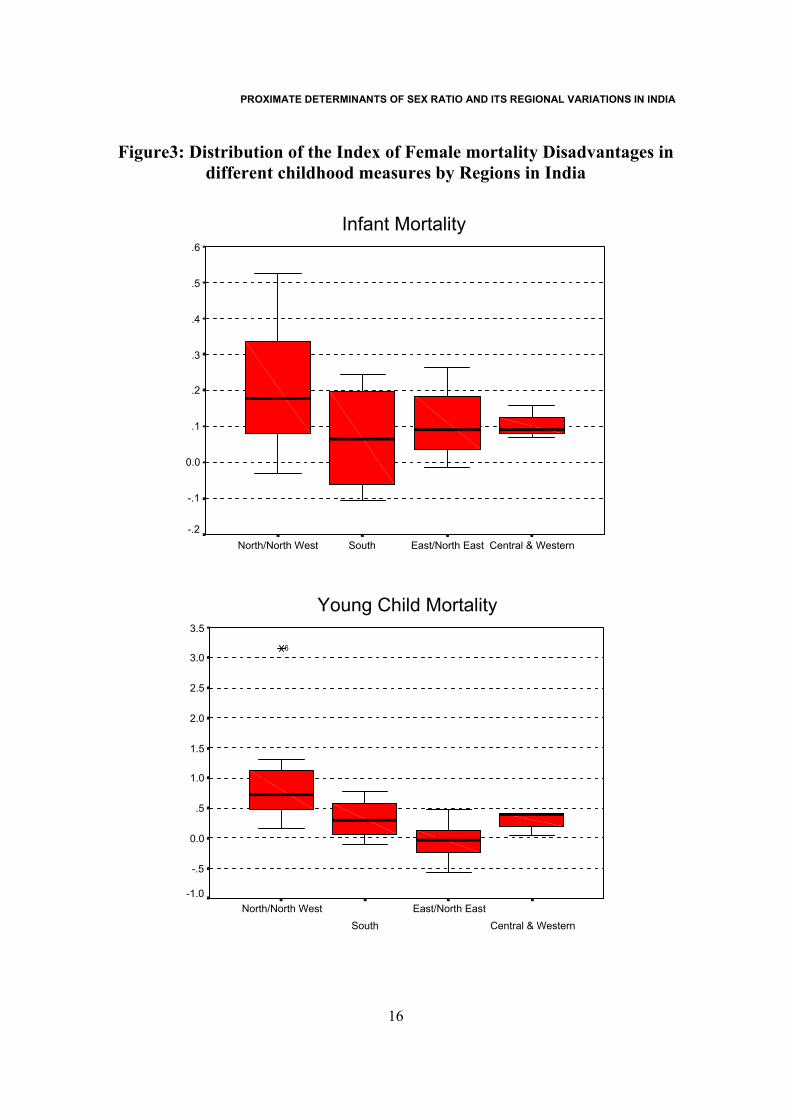
The female mortality advantage is noticed only in Kerala in South region in all the child hood measures, which is quite obvious as Kerala is socially and demographically developed State. Female mortality advantage is not noticed in all the childhood age groups in any of the States/ UTs of Central & Western region. Similarly in North/ North West region for none of the states mortality advantage is noticed during young childhood. However, for majority of the states in East / North East region, the girl child mortality advantage is noticed (5 out of 9 states). This trend may probably due to better implementation of recent family welfare programmes introduced by the government especially for North Eastern states. In the form of boxes plotted in figure 3 the calculated values of the index of female mortality disadvantages for infant, young and under 5 mortality are summarized. For infant mortality the median difference between observed and standard ratios found highest in north/ north west region (0.1770) followed by central/western region (.09065), east/north east region (0.09045), and lowest in southern region (.0641). It shows that in north/north west states at the infancy age the female mortality disadvantage is relatively higher than any other regions in India. Except in Himachal Pradesh and Delhi, the other states/ UTs have high positive indexes. This indicates that in north/ northwest regions in most of the states especially in Punjab, Haryana and Uttarpradesh the lower child sex ratio is mainly due to gender discrimination for the care of female child with respect to both medical and non-medical care. For the young child mortality the evidences for female mortality disadvantages found highest for north/northwest regions and negative for east/north east region. It shows that in north/ northwest region the further gender discrimination in mortality starts after the age one. As can be seen the median differences between observed and standard ratio found 0.7273, 0.3000, -0.0347 and 0.3847 for north/ northwest, south, east/north east and central/western regions, respectively.
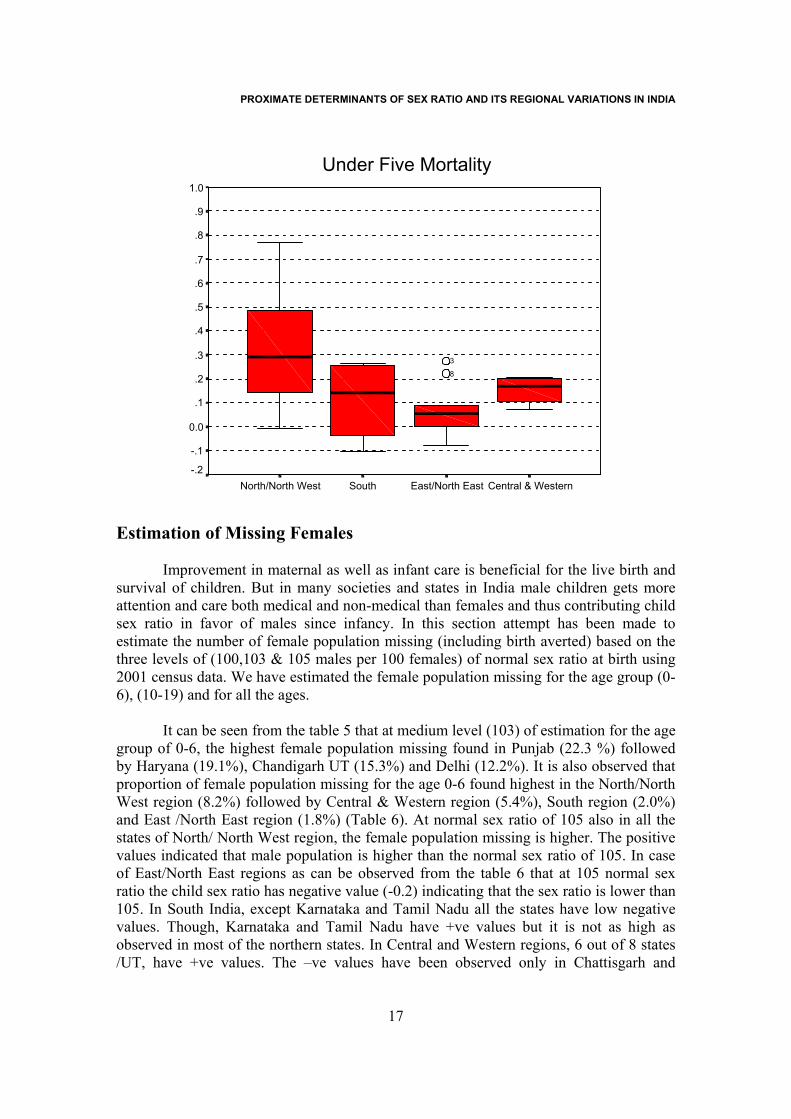
Obviously under 5 mortality combines the effect of sex differences of infant and young child mortality. As can be seen from figure 3 that median value of the female mortality disadvantage is highest in north/ northwest (0.2913) followed by central/ western region (0.1688), South (0.1397) and lowest in east/northeast (0.0489). These findings may be attributed to variations in the introduction of various health measures
PROXIMATE DETERMINANTS OF SEX RATIO AND ITS REGIONAL VARIATIONS IN INDIA
15
undertaken by different states in India that resulted in variation in reduction of female mortality disadvantages from one region to another.
The overall analyses indicated that decline in the child sex ratio in north/northwest region is more due to higher female infanticides and discrimination of female child at the age of 1-4 and also might be due to sex selective abortion practices especially in Punjab, Haryana and Himachal Pradesh as compared to other regions. Sex selective abortion results a lower sex ratio at birth that is manipulated by human beings by way of female foeticide as indicated by the lower sex ratio at birth (Table 3) especially after the first order of birth in most of the northern part of India. Table 4: Index of female mortality disadvantage for India and States/UTs (NFHS2)
Index of female mortality disadvantage
Region State/UTs Infant mortality
(1q0)
Child mortality (4q1)
Under five mortality
(5q0)
Level of male mortality rate under 5 used
India 0.1575 0.5779 0.2516 0.100Delhi -0.0020 0.3882 0.0564 0.075Haryana 0.4616 1.3124 0.6173 0.075Himachal Pradesh -0.0315 0.1573 -0.0085 0.075Jammu & Kashmir 0.1741 0.5858 0.2305 0.100Punjab 0.5259 3.1579 0.7676 0.075Rajasthan 0.1799 0.8689 0.3309 0.125
North / North-
West India
Uttar Pradesh 0.2117 0.9442 0.3577 0.125Andhra Pradesh 0.1494 0.7787 0.2484 0.100Karnataka -0.0212 0.2320 0.0310 0.100Kerala -0.1059 -0.1020 -0.1055 0.050
South India
Tamilnadu 0.2459 0.3681 0.2622 0.075Assam 0.0381 -0.1063 0.0007 0.100Bihar 0.2030 0.4785 0.2740 0.125Manipur 0.1840 -0.2081 0.0415 0.075Meghalaya 0.0197 -0.2891 -0.0766 0.150Mizoram 0.1001 -0.2473 -0.0235 0.075Nagaland 0.0630 0.0368 0.0562 0.075Sikkim 0.2637 0.1261 0.2208 0.100Tripura 0.1622 -0.5683 0.0526 0.075
East / North
East India
West Bengal -0.0146 0.4159 0.0883 0.075Gujarat 0.0679 0.3550 0.1402 0.100Madhya Pradesh 0.0902 0.4211 0.1975 0.150Maharashtra 0.1573 0.4143 0.2073 0.075
Central & Western
India Orissa 0.0911 0.0326 0.0710 0.125
PROXIMATE DETERMINANTS OF SEX RATIO AND ITS REGIONAL VARIATIONS IN INDIA
16
Figure3: Distribution of the Index of Female mortality Disadvantages in different childhood measures by Regions in India
Infant Mortality
Central & WesternEast/North EastSouthNorth/North West
.6
.5
.4
.3
.2
.1
0.0
-.1
-.2
Young Child Mortality
Central & WesternEast/North East
SouthNorth/North West
3.5
3.0
2.5
2.0
1.5
1.0
.5
0.0
-.5
-1.0
6
PROXIMATE DETERMINANTS OF SEX RATIO AND ITS REGIONAL VARIATIONS IN INDIA
17
Under Five Mortality
Central & WesternEast/North EastSouthNorth/North West
1.0
.9
.8
.7
.6
.5
.4
.3
.2
.1
0.0
-.1
-.2
8
3
Estimation of Missing Females
Improvement in maternal as well as infant care is beneficial for the live birth and survival of children. But in many societies and states in India male children gets more attention and care both medical and non-medical than females and thus contributing child sex ratio in favor of males since infancy. In this section attempt has been made to estimate the number of female population missing (including birth averted) based on the three levels of (100,103 & 105 males per 100 females) of normal sex ratio at birth using 2001 census data. We have estimated the female population missing for the age group (0-6), (10-19) and for all the ages.
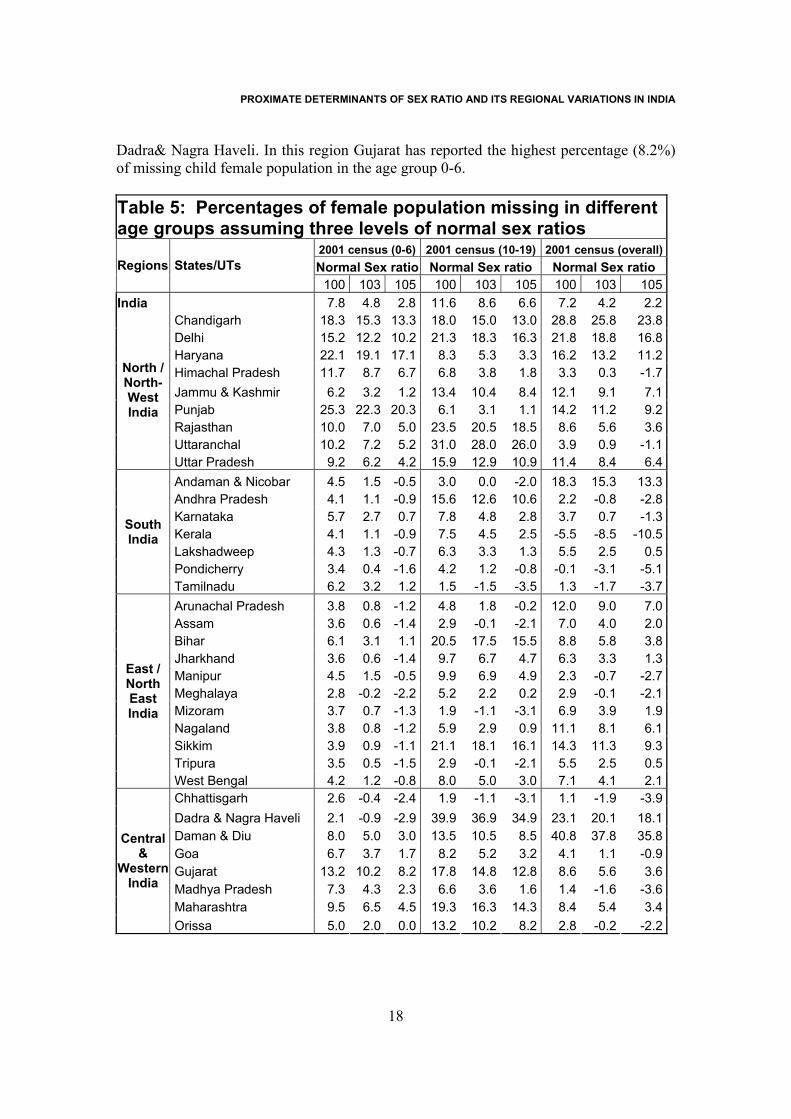
It can be seen from the table 5 that at medium level (103) of estimation for the age group of 0-6, the highest female population missing found in Punjab (22.3 %) followed by Haryana (19.1%), Chandigarh UT (15.3%) and Delhi (12.2%). It is also observed that proportion of female population missing for the age 0-6 found highest in the North/North West region (8.2%) followed by Central & Western region (5.4%), South region (2.0%) and East /North East region (1.8%) (Table 6). At normal sex ratio of 105 also in all the states of North/ North West region, the female population missing is higher. The positive values indicated that male population is higher than the normal sex ratio of 105. In case of East/North East regions as can be observed from the table 6 that at 105 normal sex ratio the child sex ratio has negative value (-0.2) indicating that the sex ratio is lower than 105. In South India, except Karnataka and Tamil Nadu all the states have low negative values. Though, Karnataka and Tamil Nadu have +ve values but it is not as high as observed in most of the northern states. In Central and Western regions, 6 out of 8 states /UT, have +ve values. The –ve values have been observed only in Chattisgarh and
PROXIMATE DETERMINANTS OF SEX RATIO AND ITS REGIONAL VARIATIONS IN INDIA
18
Dadra& Nagra Haveli. In this region Gujarat has reported the highest percentage (8.2%) of missing child female population in the age group 0-6.
Table 5: Percentages of female population missing in different age groups assuming three levels of normal sex ratios
2001 census (0-6) 2001 census (10-19) 2001 census (overall)Normal Sex ratio Normal Sex ratio Normal Sex ratio Regions States/UTs
100 103 105 100 103 105 100 103 105India 7.8 4.8 2.8 11.6 8.6 6.6 7.2 4.2 2.2
Chandigarh 18.3 15.3 13.3 18.0 15.0 13.0 28.8 25.8 23.8Delhi 15.2 12.2 10.2 21.3 18.3 16.3 21.8 18.8 16.8Haryana 22.1 19.1 17.1 8.3 5.3 3.3 16.2 13.2 11.2Himachal Pradesh 11.7 8.7 6.7 6.8 3.8 1.8 3.3 0.3 -1.7Jammu & Kashmir 6.2 3.2 1.2 13.4 10.4 8.4 12.1 9.1 7.1Punjab 25.3 22.3 20.3 6.1 3.1 1.1 14.2 11.2 9.2Rajasthan 10.0 7.0 5.0 23.5 20.5 18.5 8.6 5.6 3.6Uttaranchal 10.2 7.2 5.2 31.0 28.0 26.0 3.9 0.9 -1.1
North / North-West India
Uttar Pradesh 9.2 6.2 4.2 15.9 12.9 10.9 11.4 8.4 6.4Andaman & Nicobar 4.5 1.5 -0.5 3.0 0.0 -2.0 18.3 15.3 13.3Andhra Pradesh 4.1 1.1 -0.9 15.6 12.6 10.6 2.2 -0.8 -2.8Karnataka 5.7 2.7 0.7 7.8 4.8 2.8 3.7 0.7 -1.3Kerala 4.1 1.1 -0.9 7.5 4.5 2.5 -5.5 -8.5 -10.5Lakshadweep 4.3 1.3 -0.7 6.3 3.3 1.3 5.5 2.5 0.5Pondicherry 3.4 0.4 -1.6 4.2 1.2 -0.8 -0.1 -3.1 -5.1
South India
Tamilnadu 6.2 3.2 1.2 1.5 -1.5 -3.5 1.3 -1.7 -3.7Arunachal Pradesh 3.8 0.8 -1.2 4.8 1.8 -0.2 12.0 9.0 7.0Assam 3.6 0.6 -1.4 2.9 -0.1 -2.1 7.0 4.0 2.0Bihar 6.1 3.1 1.1 20.5 17.5 15.5 8.8 5.8 3.8Jharkhand 3.6 0.6 -1.4 9.7 6.7 4.7 6.3 3.3 1.3Manipur 4.5 1.5 -0.5 9.9 6.9 4.9 2.3 -0.7 -2.7Meghalaya 2.8 -0.2 -2.2 5.2 2.2 0.2 2.9 -0.1 -2.1Mizoram 3.7 0.7 -1.3 1.9 -1.1 -3.1 6.9 3.9 1.9Nagaland 3.8 0.8 -1.2 5.9 2.9 0.9 11.1 8.1 6.1Sikkim 3.9 0.9 -1.1 21.1 18.1 16.1 14.3 11.3 9.3Tripura 3.5 0.5 -1.5 2.9 -0.1 -2.1 5.5 2.5 0.5
East / North East India
West Bengal 4.2 1.2 -0.8 8.0 5.0 3.0 7.1 4.1 2.1Chhattisgarh 2.6 -0.4 -2.4 1.9 -1.1 -3.1 1.1 -1.9 -3.9Dadra & Nagra Haveli 2.1 -0.9 -2.9 39.9 36.9 34.9 23.1 20.1 18.1Daman & Diu 8.0 5.0 3.0 13.5 10.5 8.5 40.8 37.8 35.8Goa 6.7 3.7 1.7 8.2 5.2 3.2 4.1 1.1 -0.9Gujarat 13.2 10.2 8.2 17.8 14.8 12.8 8.6 5.6 3.6Madhya Pradesh 7.3 4.3 2.3 6.6 3.6 1.6 1.4 -1.6 -3.6Maharashtra 9.5 6.5 4.5 19.3 16.3 14.3 8.4 5.4 3.4
Central &
Western India
Orissa 5.0 2.0 0.0 13.2 10.2 8.2 2.8 -0.2 -2.2
PROXIMATE DETERMINANTS OF SEX RATIO AND ITS REGIONAL VARIATIONS IN INDIA
19
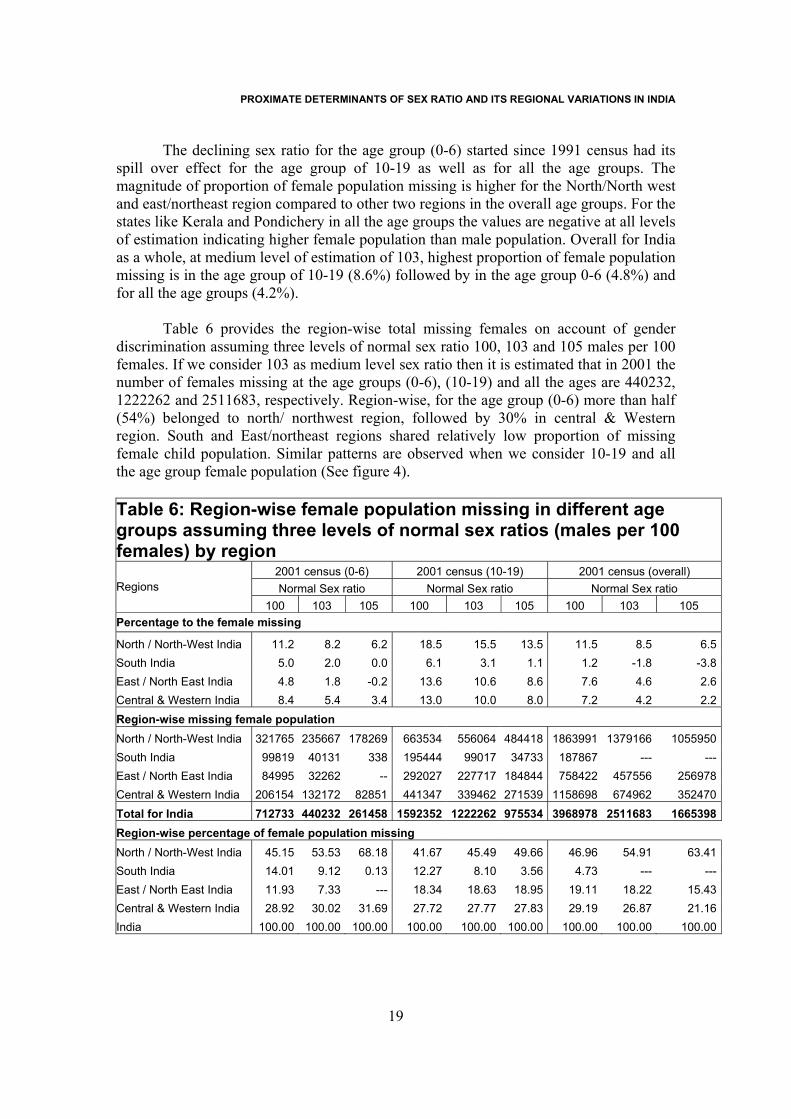
The declining sex ratio for the age group (0-6) started since 1991 census had its spill over effect for the age group of 10-19 as well as for all the age groups. The magnitude of proportion of female population missing is higher for the North/North west and east/northeast region compared to other two regions in the overall age groups. For the states like Kerala and Pondichery in all the age groups the values are negative at all levels of estimation indicating higher female population than male population. Overall for India as a whole, at medium level of estimation of 103, highest proportion of female population missing is in the age group of 10-19 (8.6%) followed by in the age group 0-6 (4.8%) and for all the age groups (4.2%).
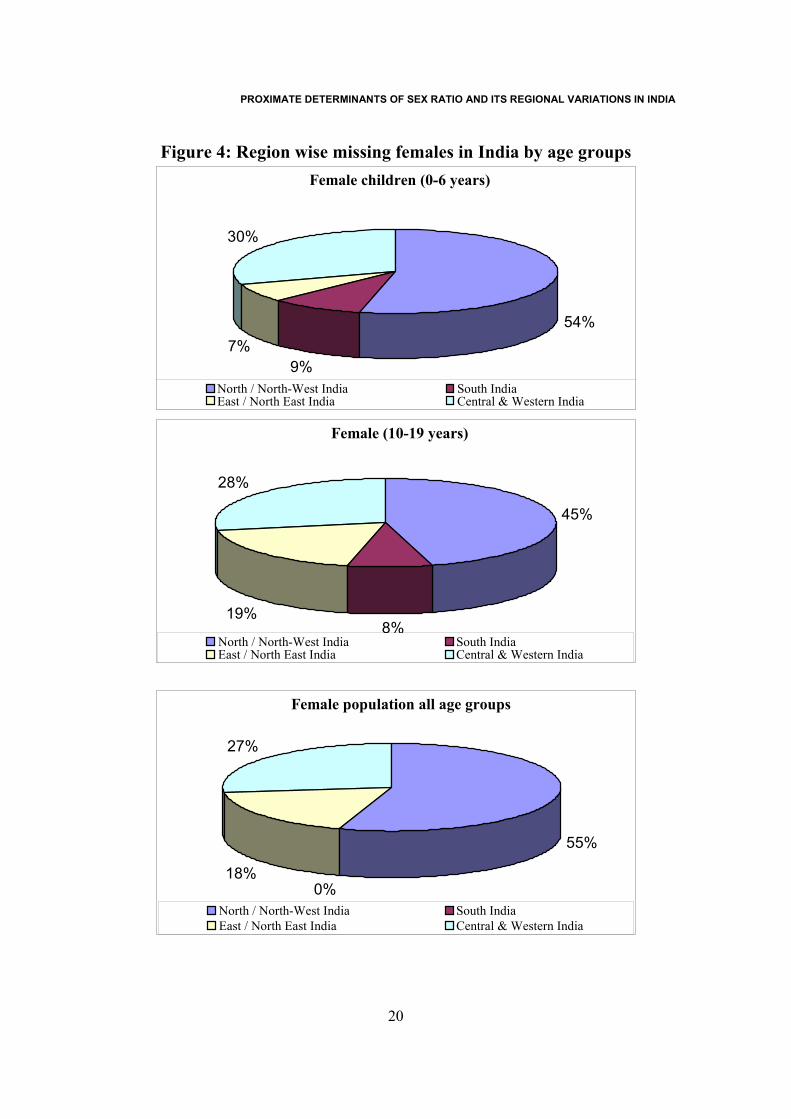
Table 6 provides the region-wise total missing females on account of gender discrimination assuming three levels of normal sex ratio 100, 103 and 105 males per 100 females. If we consider 103 as medium level sex ratio then it is estimated that in 2001 the number of females missing at the age groups (0-6), (10-19) and all the ages are 440232, 1222262 and 2511683, respectively. Region-wise, for the age group (0-6) more than half (54%) belonged to north/ northwest region, followed by 30% in central & Western region. South and East/northeast regions shared relatively low proportion of missing female child population. Similar patterns are observed when we consider 10-19 and all the age group female population (See figure 4). Table 6: Region-wise female population missing in different age groups assuming three levels of normal sex ratios (males per 100 females) by region
2001 census (0-6) 2001 census (10-19) 2001 census (overall) Normal Sex ratio Normal Sex ratio Normal Sex ratio Regions
100 103 105 100 103 105 100 103 105 Percentage to the female missing
North / North-West India 11.2 8.2 6.2 18.5 15.5 13.5 11.5 8.5 6.5South India 5.0 2.0 0.0 6.1 3.1 1.1 1.2 -1.8 -3.8East / North East India 4.8 1.8 -0.2 13.6 10.6 8.6 7.6 4.6 2.6Central & Western India 8.4 5.4 3.4 13.0 10.0 8.0 7.2 4.2 2.2Region-wise missing female population North / North-West India 321765 235667 178269 663534 556064 484418 1863991 1379166 1055950South India 99819 40131 338 195444 99017 34733 187867 --- ---East / North East India 84995 32262 -- 292027 227717 184844 758422 457556 256978Central & Western India 206154 132172 82851 441347 339462 271539 1158698 674962 352470Total for India 712733 440232 261458 1592352 1222262 975534 3968978 2511683 1665398Region-wise percentage of female population missing North / North-West India 45.15 53.53 68.18 41.67 45.49 49.66 46.96 54.91 63.41South India 14.01 9.12 0.13 12.27 8.10 3.56 4.73 --- ---East / North East India 11.93 7.33 --- 18.34 18.63 18.95 19.11 18.22 15.43Central & Western India 28.92 30.02 31.69 27.72 27.77 27.83 29.19 26.87 21.16India 100.00 100.00 100.00 100.00 100.00 100.00 100.00 100.00 100.00
PROXIMATE DETERMINANTS OF SEX RATIO AND ITS REGIONAL VARIATIONS IN INDIA
20
Figure 4: Region wise missing females in India by age groups Female children (0-6 years)
54%
9%7%
30%
North / North-West India South IndiaEast / North East India Central & Western India
Female (10-19 years)
45%
8%19%
28%
North / North-West India South IndiaEast / North East India Central & Western India
Female population all age groups
55%
0%18%
27%
North / North-West India South IndiaEast / North East India Central & Western India
PROXIMATE DETERMINANTS OF SEX RATIO AND ITS REGIONAL VARIATIONS IN INDIA
21
The determinants of child sex ratio:
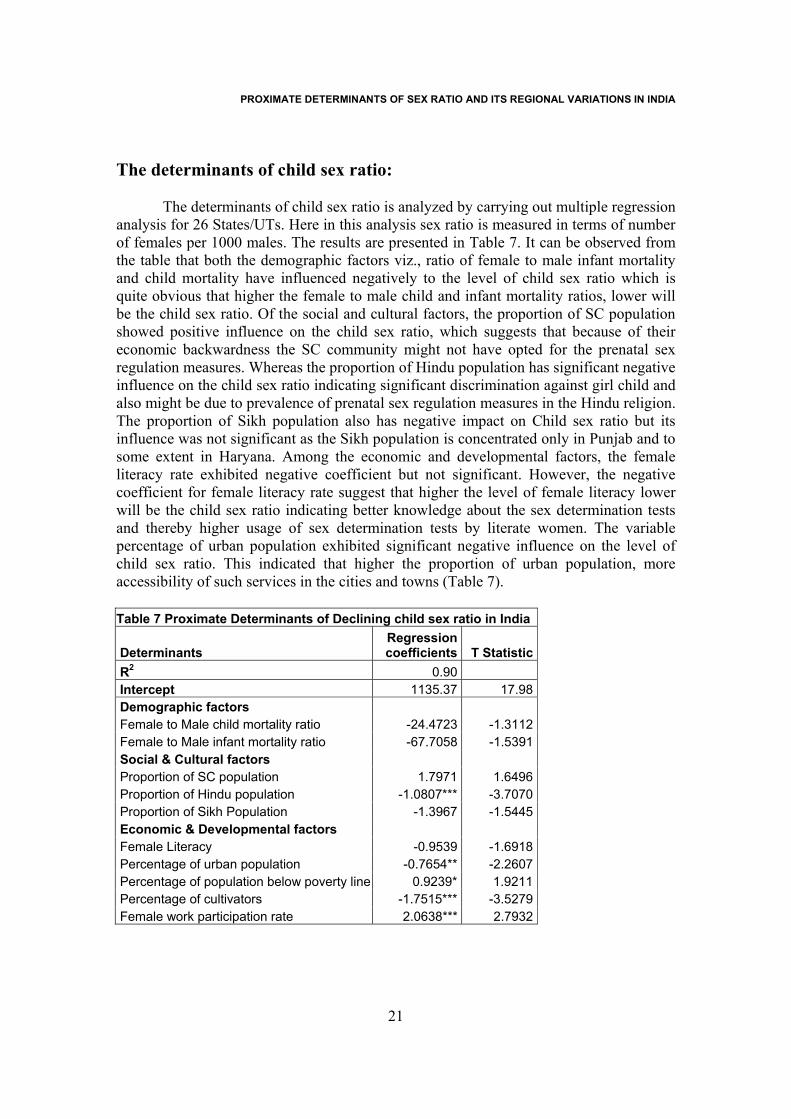
The determinants of child sex ratio is analyzed by carrying out multiple regression analysis for 26 States/UTs. Here in this analysis sex ratio is measured in terms of number of females per 1000 males. The results are presented in Table 7. It can be observed from the table that both the demographic factors viz., ratio of female to male infant mortality and child mortality have influenced negatively to the level of child sex ratio which is quite obvious that higher the female to male child and infant mortality ratios, lower will be the child sex ratio. Of the social and cultural factors, the proportion of SC population showed positive influence on the child sex ratio, which suggests that because of their economic backwardness the SC community might not have opted for the prenatal sex regulation measures. Whereas the proportion of Hindu population has significant negative influence on the child sex ratio indicating significant discrimination against girl child and also might be due to prevalence of prenatal sex regulation measures in the Hindu religion. The proportion of Sikh population also has negative impact on Child sex ratio but its influence was not significant as the Sikh population is concentrated only in Punjab and to some extent in Haryana. Among the economic and developmental factors, the female literacy rate exhibited negative coefficient but not significant. However, the negative coefficient for female literacy rate suggest that higher the level of female literacy lower will be the child sex ratio indicating better knowledge about the sex determination tests and thereby higher usage of sex determination tests by literate women. The variable percentage of urban population exhibited significant negative influence on the level of child sex ratio. This indicated that higher the proportion of urban population, more accessibility of such services in the cities and towns (Table 7). Table 7 Proximate Determinants of Declining child sex ratio in India
Determinants Regression coefficients T Statistic
R2 0.90 Intercept 1135.37 17.98Demographic factors Female to Male child mortality ratio -24.4723 -1.3112Female to Male infant mortality ratio -67.7058 -1.5391Social & Cultural factors Proportion of SC population 1.7971 1.6496Proportion of Hindu population -1.0807*** -3.7070Proportion of Sikh Population -1.3967 -1.5445Economic & Developmental factors Female Literacy -0.9539 -1.6918Percentage of urban population -0.7654** -2.2607Percentage of population below poverty line 0.9239* 1.9211Percentage of cultivators -1.7515*** -3.5279Female work participation rate 2.0638*** 2.7932
PROXIMATE DETERMINANTS OF SEX RATIO AND ITS REGIONAL VARIATIONS IN INDIA
22
The economic factor like percentage of cultivators population has significant negative influence on the level of child sex ratio which suggests that agriculture dominated families have strong son preference. The percentage of population Below Poverty Line (BPL) has positive significant influence on the level of child sex ratio. This means that the people of BPL might not have discrimination for male or female child because of their economic position to undertake such facilities. The sex selective tests are very costly and it is not easily accessible and affordable for poor people. The female work participation rate also showed positive significant influence indicating female advantageous position. It indicates that higher the female work participation rate lower will be the discrimination against girl child especially for health and nutrition. The coefficient of multiple determination (R2) is 0.90 indicating 90% of the variation in the dependent variable (child sex ratio) is explained by the various factors included in the model. Conclusions
The results show that the highest decline in the child sex ratio observed in north/ north-west part of India. In these states the sex ratio at birth sharply decline from the first order birth and continue declined up to third order birth. This indicates that majority of the couples in various states of this region are more conscious for the birth of desired sex (male) of the child even after birth of the first child, as some of them might have first order female birth. The pattern of sex ratio by order of birth in southern states found to be somewhat different. Here, in most of the states the sex ratio at birth decline after second order birth. The analysis shows that the index of female disadvantage is higher for young age (1- 4) that clearly indicates the existence of gender discrimination in childcare. In India more than half missing child females (0-6) belonged to north/ northwest region, followed by one third in central & western region. South and east/northeast regions shared relatively low proportion of missing female child population. The child sex ratio in north/northwest region is more due to higher female infanticides and discrimination of female child at the age of 1-4 and also might be due to sex selective abortion practices especially in Punjab, Haryana and Himachal Pradesh as compared to other regions. Sex selective abortion results a lower sex ratio at birth that is manipulated by human beings by way of female foeticide as indicated by the lower sex ratio at birth especially after the first order of birth in most of the northern part of India.
The falling of child sex ratio is definitely a matter of concern. The situation is going to be worse in future because the CSR is not only low but also declining with rising incidence of female feticides. In the Indian context, there is strong preference for sons. This preference is influenced by various socio-cultural and economic factors; such as the son being responsible for carrying forward the family name and occupation especially in the agricultural sector. Sons are desired because they are considered as a source of support during old age and for performing religious rites at the time of cremation and subsequently. The practice of dowry and daughter being viewed as “paraya dhan” (to be married and sent away) is yet another reason why sons are preferred to daughters. If this phenomenon continues, then a stage will reach when it would difficult to make up for the missing girls. Society needs to recognize this discrimination. Girls have right to live just
PROXIMATE DETERMINANTS OF SEX RATIO AND ITS REGIONAL VARIATIONS IN INDIA
23
as boys do. If the stringent measures are not taken up it will lead to further imbalance in sex- ratio and will have long-term impact on demographic imbalance.
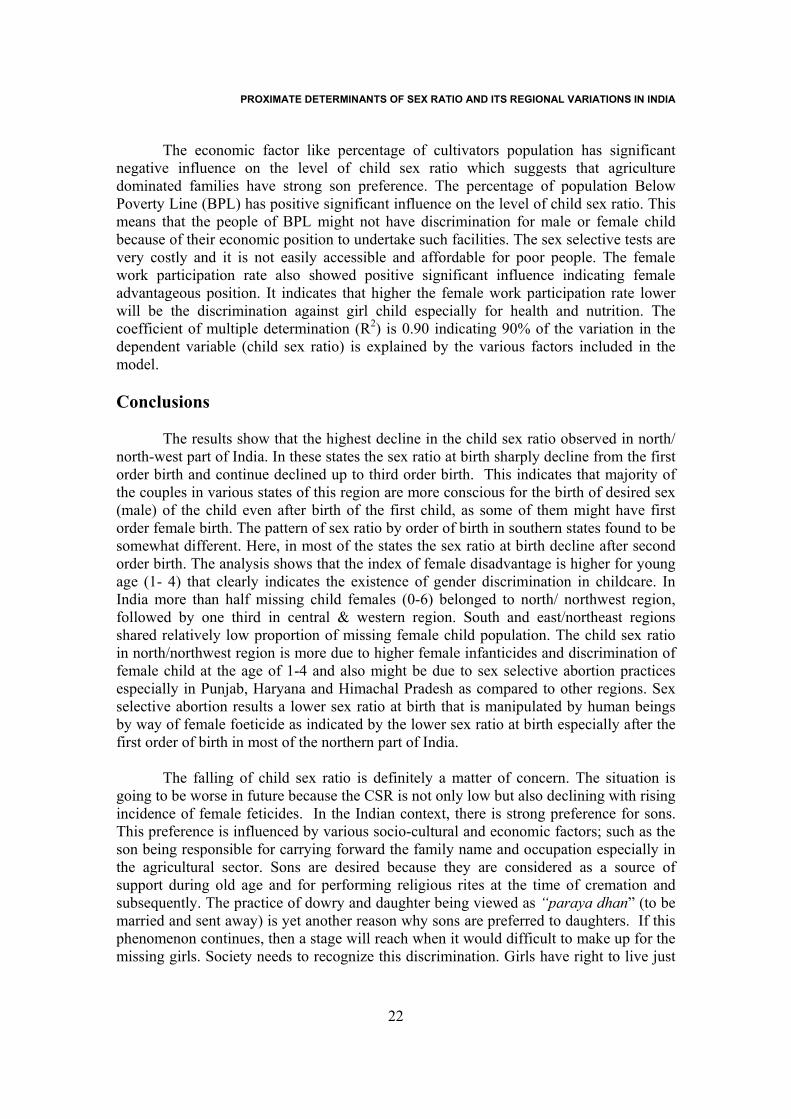
Appendix 1
Expected Sex Ratio of Infant, Young and Under Five Mortality for Specified Levels of Male Under Five mortality - Historical Experience of North Western
Europe (1820-1964)
Male under Five mortality Infant mortality
(1q0) Young child mortality
(4q1) Under five mortality
(5q0) 0.025 0.767 0.814 0.774 0.050 0.778 0.852 0.795 0.075 0.786 0.876 0.810 0.100 0.793 0.896 0.823 0.125 0.801 0.910 0.835 0.150 0.810 0.921 0.847 0.175 0.817 0.930 0.857 0.200 0.823 0.941 0.867 0.225 0.830 0.950 0.877 0.250 0.837 0.958 0.887 0.275 0.843 0.964 0.894 0.300 0.846 0.966 0.899
Reproduced from: Population and Development Review (1995), 21 (1)
PROXIMATE DETERMINANTS OF SEX RATIO AND ITS REGIONAL VARIATIONS IN INDIA
24
References: Annual Report (2005): Ministry of Health and family welfare, Government of India (2004-2005) Arnold, Fred, Sunita Kishor, and T.K. Roy (2002). Sex selective Abortion in India, Population and Development review 28(4) Babita Sinha, P.N. Mari Bhat and S.C. Gulati (2005). Son Preference and Gender Bias in Demographic Behaviour, Report No. 6. PRC. Institute of Economic Growth, Delhi, India. Basu, Alaka Malawade, 1989, Is discrimination in food really necessary for explaining sex differentials in childhood mortality? Population Studies 43 (2): 193-210. Das Gupta, Monica, 1987, Selective discrimination against female children in rural Punjab, India. Population and Development Review 13(1): 77-100. Department of Family Welfare, Government of India (2003) “Handbook on PNDT Act, 1994 & Amendments (Revised Addition). New Delhi Hill, K. and Upchurch, D.M., 1995, Gender differences in child health: Evidence from the demographic and health surveys. Population and Development Review 21(1): 127-154 International Institute for Population Sciences (IIPS) and Macro, 2000. National Family Health Survey (NFHS-II): India, Mumbai: International Institute for Population Sciences. International Institute for Population Sciences (IIPS), 2001, National Family Health Survey, Karnataka 1998-99. Mumbai: IIPS Mohanchandran Nair, P., 1996, Imbalance of sex ratio of children in India, Demography India 25(2): 177-187 Robert D. Retherford and T.K. Roy (2003). Factors Affecting Sex-Selective Abortion in India and 17 Major States. National family Health Survey Subject Reports Number 21, January 2003. International Institute for Population Sciences, Mumbai, India and East-West center Program on Population, Honolulu, Hawaii, USA.