DETERMINANTS OF DIVIDEND PAYOUT RATIO OF FAMILY ...
131
The copyright © of this thesis belongs to its rightful author and/or other copyright owner. Copies can be accessed and downloaded for non-commercial or learning purposes without any charge and permission. The thesis cannot be reproduced or quoted as a whole without the permission from its rightful owner. No alteration or changes in format is allowed without permission from its rightful owner.
-
Upload
khangminh22 -
Category
Documents
-
view
0 -
download
0
Transcript of DETERMINANTS OF DIVIDEND PAYOUT RATIO OF FAMILY ...
The copyright © of this thesis belongs to its rightful author and/or other copyright
owner. Copies can be accessed and downloaded for non-commercial or learning
purposes without any charge and permission. The thesis cannot be reproduced or
quoted as a whole without the permission from its rightful owner. No alteration or
changes in format is allowed without permission from its rightful owner.
DETERMINANTS OF DIVIDEND PAYOUT RATIO
OF FAMILY-OWNED PUBLIC LISTED COMPANIES IN MALAYSIA
BY MUSFIRAH BINTI MAZLAN
MASTER OF SCIENCE (FINANCE) UNIVERSITI UTARA MALAYSIA
DECEMBER 2018
DETERMINANTS OF DIVIDEND PAYOUT RATIO OF
FAMILY-OWNED PUBLIC LISTED COMPANIES IN MALAYSIA
MUSFIRAH BINTI MAZLAN 818112
Thesis Submitted To School of Economics, Finance & Banking
Universiti Utara Malaysia

i
PERMISSION TO USE
In presenting this thesis in fulfilment of the requirements for a
postgraduate degree from Universiti Utara Malaysia, I agree that the
University Library may make it freely available for inspection. I further
agree that permission for the copying of this thesis in any manner, in
whole or in part, for scholarly purpose may be granted by my supervisor(s)
or, in their absence, by the Dean of Othman Yeop Abdullah Graduate
School of Business. It is understood that any copying or publication or use
of this thesis or parts thereof for financial gain shall not be allowed
without my written permission. It is also understood that due recognition
shall be given to me and to Universiti Utara Malaysia for any scholarly use
which may be made of any material from my thesis.
Requests for permission to copy or to make other use of materials in this
thesis, in whole or in part should be addressed to:
Dean of School of Economics, Finance and Banking Universiti Utara Malaysia
06010 UUM Sintok Kedah Darul Aman
ii
ABSTRACT
This study is to examine the significant determinants of dividend payout ratio comprising five factors namely profitability, leverage, asset growth, company size and free cash flow. The study was conducted on 30 family-owned companies listed on the Bursa Malaysia during the period between 2011 and 2015. The data used in the study were secondary data collected from the financial statements in the annual reports for each financial year. Each of the variable is denoted by a few proxies: return on equity for profitability, debt-to-equity ratio for leverage, the change of total assets for assets growth, natural log of total assets for company size, operation cost less capital expenditure for free cash flow, and the dividend per share to earnings per share ratio for dividend payout ratio. The data were analysed using several statistical analyses including descriptive analysis, Pearson’s correlation coefficient and multiple regressions. Based on the descriptive results, family-owned companies were found as paying the highest dividend in the financial year 2013, whereas the lowest dividend was paid in 2011. Results from the correlation analysis reveal significant relationship between profitability, leverage, asset growth, firm size and free cash flow with dividend payout ratio. In addition, the regression analysis reveals that only two factors were significant determinants for dividend payout ratio, namely asset growth and free cash flow. The significant effect of asset growth to dividend payout ratio in this study confirms the existence of high transaction cost in the family-owned companies. Furthermore, the influence of free cash flow to dividend payout ratio implies agency cost problem among the family-owned companies. The result suggests the family-owned companies to adopt more proper governance to reduce the transaction cost and agency problem within their organisations. Keywords: Dividend payout ratio, profitability, leverage, asset growth, company size and free cash flow.
iii
ABSTRAK
Kajian ini adalah untuk memeriksa penentu yang signifikan kepada nisbah pembayaran dividen daripada lima faktor iaitu keuntungan, hutang, pertumbuhan aset, saiz syarikat dan aliran tunai percuma. Kajian ini dijalankan terhadap 30 syarikat milik keluarga yang tersenarai di Bursa Malaysia dalam tempoh antara tahun 2011 dan 2015. Data yang digunakan dalam kajian ini adalah data tahap kedua yang dikutip dari penyata kewangan dalam laporan tahunan untuk setiap tahun kewangan.Wakil yang digunakan untuk mewakili setiap pembolehubah adalah pulangan ke atas ekuiti untuk keuntungan, nisbah pinjaman kepada ekuiti untuk hutang, perubahan jumlah aset untuk pertumbuhan aset, log semula jadi jumlah aset bagi saiz syarikat, kos operasi tolak perbelanjaan modal untuk aliran tunai percuma dan nisbah dividen sesaham kepada pendapatan sesaham untuk nisbah pembayaran dividen. Data dianalisis dengan menggunakan beberapa analisis statistik termasuk analisis deskriptif, pekali perkaitan Pearson dan regresi berganda. Berdasarkan hasil analisis terperinci, didapati syarikat milik keluarga membayar dividen tertinggi pada tahun kewangan 2013, sedangkan yang paling rendah pada tahun kewangan 2011. Hasil daripada analisis perkaitan mendedahkan bahawa terdapat hubungan antara nisbah keuntungan, hutang, pertumbuhan aset, saiz firma dan aliran tunai percuma dengan nisbah pembayaran dividen. Di samping itu, analisis regresi mendedahkan bahawa hanya dua faktor penentu yang signifikan kepada nisbah pembayaran dividen, iaitu pertumbuhan aset dan aliran tunai percuma. Kesan pertumbuhan aset kepada nisbah pembayaran dividen dalam kajian ini menegaskan bahawa wujudnya kos urusniaga yang tinggi di kalangan syarikat milik keluarga. Tambahan lagi bagi aliran tunai percuma terhadap nisbah pembayaran dividen menunjukkan masalah kos agensi di kalangan syarikat milik keluarga. Hasil kajian ini menunjukkan bahawa syarikat milik keluarga perlu mengamalkan tadbir urus yang lebih baik untuk mengurangkan kos transaksi dan masalah agensi. Kata Kunci: Nisbah pembayaran dividen keuntungan, hutang, pertumbuhan aset, saiz syarikat dan aliran tunai percuma.
iv
ACKNOWLEDGEMENT
Praise to Allah, the Most Gracious and the Most Merciful who gave me the
physical, mental and spiritual strength to complete this thesis amidst many
difficulties. My highest and most sincere appreciation goes to my mother,
Hjh Eshah Binti Hj Abdul Rahman whom without my mother’s love and
support would have not make possible for me to pursue my education. My
thought always to my late father, Hj Mazlan Bin Abdul Rahim, my friends
and colleagues who always encourage and guide me to be independent and
strong.
My special thanks and appreciation to my teacher and mentor for this
research paper Dr Norshafizah Binti Hanafi who is very supportive and
kind enough to make me feel at ease in completing this paper. Without her
smile and take is easy approach, I would not have been able to complete
this paper. Thanks again to everyone, including those who I have probably
forgotten mention here.
Alhamdullilah
v
TABLE OF CONTENTS
Page
Permission to Use i
Abstract ii
Abstrak iii
Acknowledgement iv
Table of Contents v
List of Figures viii
List of Tables ix
CHAPTER ONE: INTRODUCTION
1.1 Research Background 1
1.2 Problem Statement 3
1.3 Research Questions 5
1.4 Research Objectives 5
1.5 Significant of the Study 6
1.6 Scopes of Research 7
1.7 Limitations of Research 8
1.8 Organization of Chapters 9
CHAPTER TWO: LITERATURE REVIEW
2.1 Introduction 10
2.1.1 Theory of Dividend Policy 10
2.1.2 Agency Cost Theory 11
2.2 Dividend 12
2.3 Dividend Payout Ratio (DPR) 13
2.4 Determinants of Dividend Payout Ratio 14
2.5 Influential Factors 17
2.5.1 Profitability 17
2.5.2 Leverage 19
2.5.3 Growth 21

vi
2.5.4 Company Size 22
2.5.5 Free Cash Flow 24
2.6 Summary 25
CHAPTER THREE: RESEARCH METHODOLOGY
3.1 Introduction 26
3.2 Theoretical Framework 26
3.3 Hypothesis Development 27
3.3.1 Profitability 28
3.3.2 Leverage 29
3.3.3 Asset Growth 30
3.3.4 Company Size 31
3.3.5 Free Cash Flow 32
3.4 Operational Definition of Variables 33
3.4.1 Dividend Payout Ratio 33
3.4.2 Profitability 34
3.4.3 Leverage 35
3.4.4 Asset Growth 35
3.4.5 Company Size 36
3.4.6 Free Cash Flow 37
3.5 Research Design 37
3.6 Sample Size 39
3.7 Instruments / Measures 40
3.7.1 Descriptive Statistics 40
3.7.2 Multiple Regression 41
3.7.3 Pearson’s Correlation Analysis 42
3.8 Summary 43
vii
CHAPTER FOUR: RESULTS
4.1 Introduction 44
4.2 Descriptive Analysis 44
4.2.1 Overall Mean 44
4.2.2 Mean by Financial Year 46
4.3 Correlation with Dividend Payout Ratio 50
4.4 Multicollinearity: Tolerance and Variance Inflation Factor (VIF) 52
4.5 Regression Analysis: Determinant of Dividend Payout Ratio 53
4.6 Summary 55
CHAPTER FIVE: SUMMARY, IMPLICATIONS AND RECOMMENDATIONS
5.1 Discussions 56
5.2 Dividend Payout in Family-Owned Companies 56
5.2.1 Relationship between Profitability and Dividend Payout Ratio 57
5.2.2 Relationship between Leverage and Dividend Payout Ratio 58
5.2.3 Relationship between Growth and Dividend Payout Ratio 59
5.2.4 Relationship between Company Size and Dividend Payout Ratio 59
5.2.5 Relationship between Free Cash Flow and Dividend Payout Ratio
60
5.3 Determinant of Dividend Payout Ratio 61
5.4 Implications of Research 66
5.5 Recommendation 67
5.6 Conclusions of study 68
References 69
Appendix 74
viii
LIST OF FIGURES
Figure Page
Figure 3.1 Theoretical framework
Independent Variables & Dependent Variable
27
ix
LIST OF TABLES
Table Page
Table 3.1 Correlation’s magnitude interpretation 41
Table 4.1 Mean of variables according to company types 46
Table 4.2 Mean of variables according to financial year 48
Table 4.3 Pearson’s coefficient of correlation between variables with
dividend payout ratio for the family-owned companies
52
Table 4.4 Tolerance and variance inflation factor (VIF) statistics for
multicollinearity based on normal scores (transformed
data)
53
Table 4.5 Regression result on determinant of dividend payout ratio
for the entire sample companies
54

1
CHAPTER ONE
INTRODUCTION
1.1 Background of Research
Dividend policy is a fundamental part and very important because the
dividend has a distinct attraction for investors (Hatta, 2002). Dividend is
paid to the shareholders from the profit earnings made by the company for
a given financial year. The board of directors of a company bears the
responsibilities to decide on the dividend payments to the shareholders,
distribution of companies profit to the shareholders, and the portion to be
allocated for reinvestment. Accordingly, dividend payout usually
represents the payments made to the shareholders from a portion of the
total net income usually declared by the board of directors at the annual
general meetings of the company (Agyei & Marfo-Yiadom, 2011).
In this notion, the payout ratio refers to the percentage of a company’s
profits being distributed to the shareholders as dividends. Generally, new
and fast-growing companies pay little or nothing out of their profits as
dividend because they need to reinvest the cash into the business (John,
2013).
Meanwhile, cyclical companies with fluctuating earnings tend to pay very
low payout ratios as the nature of their business hinders them from
sustaining high dividends in bad times (John, 2013; Waswa, 2013).
2
At the other end of the scale, mature companies are able to pay out at
relatively higher ratio due to their steady and predictable earnings as well
as strong cash flows (Waswa, 2013).
The dividend payout issue has been a debatable topic in the financial
management literature. Many researchers have carried out studies in this
area to clarify some of the issues pertaining to dividend payout. Among the
areas of studies are: (1) the reasons for paying dividends to shareholders
and the importance to maintain a dividend pay-out ratio; and (2) the
possible association between shareholders’ investment decision and
dividend payment. It is also of significant importance for the company to
apprehend the need for the best dividend payout ratio, which can help to
safeguard its investments as well as to maximise the shareholders' wealth
(Abdullah et al., 2005).
Understanding dividend payout ratio is crucial as it provides clues
concerning the sustainability of a company’s dividend and its potential
growth (John, 2013). However, some of the most successful companies
such as Apple and Google have undertaken different route by not paying
dividends (Ciaccia, 2012), proving the possibility of success without
paying dividends. Therefore, it is questionable as to why companies are
still paying dividends and the factors underlying the distribution process.
Therefore, it is imperative to further focus on the dividend payout stream
in order to improve the understanding regarding this subject matter.
3
1.2 Problem Statement
Many studies highlighted the dividend payout policy as the most
controversial topic within the corporate finance among the scholars,
academicians, or stakeholders (Gill, Biger & Tibrewala, 2010; Ahmed &
Muktadir-Al-Mukit, 2014; Echchabi & Azouzi, 2016; Khan & Ahmad,
2017).
It has been the focus of multiple debates by researchers who came out with
various theories, empirical evidence, and mixed results. However, no
general consensus has been found (Baker, 2009) and it remains as
“dividend puzzle” as coined by Black (1976). Yet, dividend is not a new
phenomenon as it has been a standard procedure in the corporate world to
pay dividends to its shareholders (Baker, 2009). While dividend policy
maintained as one of the ten major unsolved problems of corporate finance
(Brealy et al., 2008), dividend decision is simultaneously recognised as the
third major financial decision of a company (Pandey, 2008). Therefore, the
subject regarding dividend payout deserves more research considering the
aggregate importance of dividend within the company’s framework.
There were various studies conducted to understand the phenomenon of
dividend payout through various standpoints. In fact, research conducted
within the same country and incorporated almost similar variables across
different industries somehow demonstrated different results (Gill et al.,
2010). Other studies have undertaken different perspectives such as by
comparing large and small companies (Hellstrom & Inagambaev, 2012),
within similar industries (Khan & Ahmad, 2017), and between financial
4
and non-financial firms (Nuhu et al., 2014). However, there was no general
understanding on the factors that determined dividend payout in the
companies.
One dimension that is found to be scarcely explored in the dividend payout
domain is the nature of dividend payout ratio and what factors constitute as
the determinants of dividend in family-owned companies. This is an
interesting aspect to be explored as the shares of family-owned companies
are largely held among the family members (Amran & Che Ahmad, 2011).
Hence, the study might contribute to different approach in the decision of
dividend payout and the potential factors that are attributable to the
process. Besides, the CEOs of the family-owned companies might also
hold the chairman position which are perceived to manage the company
better than non-family CEO and lower the agency cost (Amran & CHe
Ahmad, 2011; Ibrahim & Samad, 2011).
While there some other research domains that used family-owned
companies in Malaysia as their research sample (Amran & Che Ahmad,
2009, 2011; Ibrahim & Samad, 2011), there were very scarce research
regarding dividend policy that used family-owned companies as the
sample. Although some studies introduced ownership structure as the
factor in the relationship with dividend payout policy, the ownership
structure is only concerned on the amount of government share-holding
instead of categorising the companies as family-owned (Ahmed & Javid,
2008; Al-Kuwari, 2009).
Among the 919 public listed companies in Bursa Saham Malaysia, 46%
(423 firms) are constituted by the family-owned companies in both the
5
main and ACE markets. Inevitably, the proportion invites the interest to
conduct an analysis of the potential determinants of dividend payout ratio
in family-owned companies. Therefore, this study is conducted to
investigate the determinants that significantly affect dividend payout ratio
in family-owned Malaysian public listed companies. This study aims to
investigate which factors that influence family-owned companies’
dividend payout policy in terms of profitability, leverage, asset growth,
company size, and free cash flow.
1.3 Research Questions
The research questions developed in this study include:
i. What is the relationship between profitability and dividend payout
ratio in family-owned companies?
ii. What is the relationship between leverage and dividend payout ratio in
family-owned companies?
iii. What is the relationship between asset growth and dividend payout
ratio in family-owned companies?
iv. What is the relationship between company size and dividend payout
ratio in family-owned companies?
v. What is the relationship between free cash flow and dividend payout
ratio in family-owned companies?
1.4 Research Objectives
The main purpose of this study is to determine the determinants of
dividend payout ratio in public listed family-owned companies in
6
Malaysia.
The specific objectives to be achieved in this study are as the following:
a. To examine the relationship between profitability and dividend payout
ratio in family-owned companies.
b. To determine the relationship between leverage and dividend payout
ratio in family-owned companies.
c. To investigate the relationship between asset growth and dividend
payout ratio in family-owned companies.
d. To examine the relationship between company size and dividend
payout ratio in family-owned companies.
e. To examine the relationship between free cash flow and dividend
payout ratio in family-owned companies.
1.5 Significance of the Study
This study mainly contributes to the body of knowledge regarding the
determinants of dividend payout ratio among the public corporates in
Malaysia from the family-owned companies’ standpoint. As part of
academic purpose, this study mainly focuses on the financial knowledge
among higher learning institutions in Malaysia and can be widely spread
among the educators and students in terms of company’s income analysis.
This is in line with the scarce knowledge regarding the determinants of
dividend payout ratio particularly among the family-owned companies. In
addition, most studies tend to focus on public listed companies in general
or compare the companies across industries.
Secondly, this study is noteworthy among the industry practitioner

7
particularly on the information behind the financial managers’ decision in
the distribution of dividend to the shareholders in the family-owned
companies. Ascertaining the influential determinants on the appropriate
amount of dividend will help in the establishment of dividend payout
policy which does not only maximise the shareholders’ wealth, but also
takes into account the retained income for company growth purpose.
Additionally, the global economy seems set to confront serious challenges
in the months and years ahead, making dividend as one of the crucial
factors of a company performance. Henceforth, this study would provide
good information on the baseline especially for economists.
1.6 Scopes of Research The scopes of this study only cover to find the determinants of dividend
payout ratio of public listed companies on the main and ACE market of
Bursa Malaysia. The obtained data focus on five financial years from 2011
to 2015 due to the inconsistency of available financial statements as each
of the companies was listed at different years.
In addition, the selection of companies for this study was conducted in
random manner whereby some of the companies have yet to publish their
2016 financial report. Thus, the selection of financial year was confined to
2011 to 2015 as the timeframe of this study.
Furthermore, this study includes five factors to be analysed as the
determinants of dividend payout ratio, namely profitably (ROE), leverage,
asset growth, company size and free cash flow. While there were many
8
other factors that were adopted by past research as the determinants of
dividend payout ratio, this study only focuses on the effect of factors that
are characterised by the company’s financial performance and competency.
The selection will facilitate understanding on the financial attributes in
family-owned companies that contribute to the dividend payout decision.
1.7 Limitations of Research
There are several limitations that should be noted in this study. The first
limitation arises from the use of secondary data which may impose the
lack of validity, quality and data precision as the data were the result of
analysis that have been collected and interpreted by a primary source
(Andersen, Prause & Silver, 2011). In this case, the data obtained from the
annual reports rely on the detailed information presented by the companies
in their annual reports. Therefore, the collection of data only utilises the
annual reports published in Bursa Malaysia in order to reduce this
limitation. The practice will ensure the details and information presented
in each annual report is consistent, concise, and fulfils the requirement
imposed by Bursa Malaysia for annual reports.
Besides, the limitation may have occurred in terms of sample size in this
study. The samples used in this research were 30 family-owned companies
identifiable through the detailed list from Bursa Malaysia. Based on the
data from Bursa Malaysia, there are currently a total of 919 public listed
companies, from which 423 are family-owned companies. The number
indicates the total sample companies in this research only comprises 7.1%
of total public listed family-owned companies.
9
Additionally, this study adopted the correlational and non-experimental
design analyses, thus, the causal effect between the company factors and
dividend payout ratio cannot be definitively established. Therefore, the
study suggests utilising the regression analysis to link the influence of the
factors.
1.8 Organisation of Chapters
This dissertation consists of five chapters. Chapter One describes the
background issues, problem statement, research objectives, research
questions, contribution of research, and the scopes of the study. Chapter
Two outlines the review of available literatures pertaining to the concept of
dividend, dividend policy and dividend payout ratio. Previous studies and
findings regarding the effect of companies’ selected factors towards
dividend payout ratio is also presented in this chapter. Chapter Three lies
out the methodology undertaken to conduct this study. The chapter
includes the description of research sample, research data, conceptual
framework, research hypotheses, data collection methods, and data
analysis techniques. Chapter Four presents the results and findings
obtained from the analysis. Besides, this chapter also presents the
discussion of the main findings. Finally, Chapter Five summarises the
overall research and findings, discusses the implications of the research,
defines the limitations of research, as well as proposes recommendations
for future research.
10
CHAPTER TWO
LITERATURE REVIEW
2.1 Introduction
This chapter provides the review of relevant literature pertaining to
dividend policy, Dividend Signalling Theory as the underlying theory for
dividend policy, the characteristics and roles of dividend stability, the
concept of dividend payout ratio, and companies’ selected characteristics
that denote the significant determinants of dividend payout ratio in past
studies.
2.1.1 Theory of Dividend Policy
In general, investors in the stock market require a variety of
meaningful information when deciding to invest in a company,
particularly information regarding the dividend announcement.
There are many theories regarding the dividend payout policy
introduced by different scholars which became the underlying
explanation to the relationship between different determinants with
dividend payout. In this study, the relationship between the
companies’ selected factors were explained using three prominent
theories, namely the Dividend Signalling Theory (Battacharya,
1979), Transaction Cost Theory (Higgins, 1972), and Agency Cost
Theory (Jensen & Meckling, 1976).
11
2.1.2 Agency Cost Theory
The agency theory is one of the most widely recognised and used
dividend theories which has been extensively debated among
various scholars. Jensen and Meckling (1976) coined the agency
theory with one of the most influential studies regarding agency
costs. The study presented a refreshing view pertaining to agency
problem became the benchmark for most subsequent studies
concerning agency cost. Jensen and Meckling (1976) defined
agency cost as “a cost that arises between the principals
(shareholders) and the agents (management)”. The problem arises
when the managers take actions that only satisfy their own
self-interest rather than benefiting the shareholders.
Two factors affecting the agency cost in a company which are the
monitoring costs and the risk aversion preferences of managers
(Eastbrook, 1984). The monitoring cost is defined as the costs
incurred by the shareholders to supervise the managers to
maximise the value of shareholders’ equity and prevent them from
acting based on their personal agendas (Eastbrook, 1984).
Meanwhile, the risk aversion preferences of managers prompt the
managers to be more risk averse compared to the shareholders due
to conflict of interest. Therefore, the managers may reject
potentially high value project due to their risk aversion preferences
(Eastbrook, 1984). These agency costs can be reduced by paying
dividend to the shareholders.
12
2.2 Dividend
Dividend is the share of the company’s profits that is distributed to the
shareholders (Seneque, 1978). The proportion is decided and agreed by the
board of directors on the declaration date (Labhane & Das, 2015). Most
people referred the term divided as the cash payments to the shareholders,
while it can also be paid in another payment form known as stock
dividends (Hellstrom & Inagambaev, 2012). A stock dividend is similar to
stock split where the number of the company’s asset remain the same
despite higher number of outstanding share (Keown et. al, 2007).
The management decides whether the profits earned by the company for a
period of time should be entirely distributed to the shareholders or only a
portion should be distributed while retaining another part of the earnings.
Dividend decision is important for the shareholders as the investors and
also for the survival of the company itself.
Some issues that are taken into account in deciding the distribution of
income to the shareholders include the size of after-tax distributable
income proportion, either the dividend distribution is made in cash or stock
dividends, whether to pass the cash to shareholders by buying back some
stock, and the stability of the distribution decision (Gill et al., 2010).
Miller and Modigliani (1961) mentioned how the management made the
decision by considering available investment opportunities that would be
beneficial to increase company’s future earnings. However, absence of
such opportunities will only prompt the management to distribute the
earnings to the shareholders.

13
There are two types of dividends, namely the preferred stock dividends
that is fixed in a certain amount, and the common stock dividends that are
paid to the shareholders if the company make some profits (Brechner &
Bergerman, 2014). Thus, the number of dividends will increase in value
based on the company’s share price. As such, every company has different
policies that will determine the dividend payment to their shareholders.
The management is required to take serious consideration on the matter
related with dividend policies since it plays an important role in
determining the value of the company (Alzomaia & Alkhadhiri, 2013).
Naturally, stockholders (shareholders) will view dividend as a signal of the
company’s ability to increase revenue.
Dividend payout is important for investors for several reasons: i) dividend
offers certainty about the company’s financial well-being, ii) dividend
attracts investors who are looking to secure current income, and iii)
dividend maintains the market price of the company’s share (Gill et al.,
2010). In this case, the financial managers hold very crucial role and
should be able to make optimal dividend policy which is able to balance
out the current dividend and future dividend growth. The decision will
enable improvement in the value of the company.
2.3 Dividend Payout Ratio (DPR)
Cash dividend is the share of profit distributed to the shareholders whereas
the percentage of profits to be distributed as cash dividend refers as the
dividend payout ratio (DPR) (Labhane & Das, 2015). Higher dividend
payout ratio induces smaller portion of available funds to be re-invested

14
into the company as profit is held (Echchabi & Azouzi, 2016). When
deciding on how much cash to be distributed to the shareholders, the
financial manager must always remember that the goal of the company is
to maximise the shareholders’ value. Hence, the target of payout ratio
should be largely based on investors’ preference for dividend versus
capital gains. In this sense, investors may prefer to allow the company to
distribute profits as dividend in cash, or allow the repurchase of shares or
reinvest profits into the business. However, both options will eventually
result in capital gains (Rehman & Takumi, 2012).
2.4 Determinants of Dividend Payout Ratio
Over the past few decades, great attention was given to the study regarding
the factors that influence the dividend payout policy. The earliest traceable
study was by Lintner (1956) who studied the American companies in the
mid-1960s. The study concluded that current profitability and dividends of
previous year are factors that affect the dividend decision of the sample
companies. The past decades have witnessed growing studies searching to
find the empirical evidence on the effect of company’s characteristics
towards dividend payout. Amidu and Abor (2006) studied the determinants
of dividend payout ratio in Ghana by examining the companies listed on
the stock exchange over six years period.
Their findings indicated the presence of positive relationship between
dividend payout ratio and profitability, cash flow, and tax, while negative
relationship is found for growth and market-to-book value. Meanwhile,
Anil and Kapoor (2008) observed the determinants of dividend payout in
15
IT sector in India and found that variables other than profitability such as
cash flow, corporate tax, sales growth and market-to-book ratio determined
the dividend payout of the sample companies.
Gill et al. (2010) extended the study by Amida and Abor (2006) and Anil
and Kapoor (2008) by examining the determinants of dividend payout ratio
using the data of American service and manufacturing companies in 2007.
The result revealed that corporate tax and profitability were significant
determinants of the dividend payout ratio in manufacturing industry,
whereas sales growth was found significant in-service industry.
Another study by Mehta (2012) exhibited profitability and firm’s size as
the key factors that significantly determined the dividend payout decision
in various industries including construction, real estate, energy, healthcare
and telecommunication in Abu Dhabi Stock Exchange for five financial
years from 2005 to 2009. The study of association between dividend
payout and ownership structure by Ahmad and Javid (2010) concluded that
the two variables were significant associated in the context of
non-financial sector.
A study conducted in Malaysia by Mohamed et al. (2008) involving 200
companies with highest market capitalisation in Malaysian capital market
utilised profitability and liquidity as the determinants. The study found
both variables as significant determinants of dividend payout and
concluded that companies with higher profits and liquid possessed more
tendencies to declare dividends. In a much earlier research in Malaysian
setting of companies listed in Kuala Lumpur Stock Exchange (KLSE),
16
firm’s dividend decision was shown to be partially dependent on their
current profits and past dividends. Henceforth, companies conditioned
their long-term target dividend upon their earning ability (Annuar &
Shamser, 1993).
Meanwhile, another study conducted on 174 public listed firms on the
main board of Bursa Malaysia for the period of 1999 to 2004 found that
firm size and growth had significant positive impact to dividend payout
negative effect was shown for leverage.
A recent study by Khan and Ahmad (2017) studied the impact of
profitability, growth opportunity, risk, liquidity, firm size leverage, taxation
and audit type on the dividend payout within Pakistani corporate
environment. The key determinants of dividend payout in the study were
audit type, liquidity, growth opportunities and profitability while other
variables were insignificant. The study by King’ware (2015) in Kenya
revealed that growth rate, debt ratios and firm size had negative impact to
dividend payout ratio, while earnings, market-to-book ratio and retained
earnings to total asset ratio showed positive impact.
Mistry (2010) discussed their findings based on the pharmacy sector in
India whereby the positive relationship between cash flow and dividend
suggested higher payout ratio for companies with enough cash from
operational activities to. Meanwhile, negative relationship with liquidity
indicated that management had the ultimate decision as whether to
distribute the dividend or retain the earnings even when the companies had
extra cash. Meanwhile, Jozwiak (2014) conducted a study on the factors
17
influencing the dividend policy of nonfinancial companies in the Warsaw
Stock Exchange of Poland. The study managed to provide evidence that
firms with high profitability tended to pay low dividend in order to retain
their capital for future investment, while firms with high leverage also paid
low dividend for the purpose of interest payments.
2.5 Influential Factors
2.5.1 Profitability
According to Alahyari (2014), profit is the indicator to assess the
success of a business. Recognising the importance of profitability
in characterising the company’s value to shareholders, numerous
studies have adopted profitability as the factor that influences
dividend policy. Company profit is among the key factors that
identifies the effect of profit on dividend payout to shareholders of
the companies (Gill et al., 2010; Rehman & Takumi, 2012; Khan &
Ahmad, 2017).
A recent study by Jabbouri (2016) on the main factors influencing
dividend policy in MENA emerging market between 2004 and
2013 found that current profit had significant positive relationship
with dividend payout, indicating instability of dividend in these
markets. Ahmed and Javid (2008) showed how profitable firms
with more stable net earnings could afford to pay larger dividends
due to larger excess of cash flows.
Rehman and Takumi (2012) further found significant positive
18
relationship between profitability by examining the companies
listed on the largest stock exchange market if Pakistan which is the
Karachi Stock Exchange (KSE). Al-Kuwari (2009) noted that
companies in developed countries with unstable dividend policy
relied on the firm’s profitability for the given year in determining
their dividend policy. Nuhu et al. (2014) and Forti et al. (2015) also
concurred on the positive relationship between profitability and
dividend payout in their study.
On the contrary, a few findings revealed that profitability had
negative effect on dividend payout policy (Ahmed &
Muktadir-Al-Mukit, 2014; Maladjian & El Khoury, 2014).
Maladjian and El Khoury (2014) asserted the negative relationship
was due to the firms’ decision to retain most of their surplus
earning for and growth purposes. Meanwhile, firms also paid
dividend even when they had negative earning (Maladjian & El
Khoury, 2014).
Numerous studies proved that profit was a significant factor in
influencing dividend payout to their shareholders (Amidu & Abor
2006; Anil & Kapoor, 2008; Gill et al., 2010; Rehman & Takumi,
2012; Khan & Ahmad, 2017).
Interestingly, Issa (2015) demonstrated that profitability measured
using the ROA was a significant determinant for dividend payout
ratio in four sectors namely construction, consumer products,
properties and telecommunication sectors. However, the study
19
failed to provide empirical evidence on the significance of
profitability in industrial, technological and financial sectors.
Fatemaian and Hooshyarzadeh (2016) additionally found
profitability as as significant determinant for both domestic and
multinational companies. Mehta (2012) used ROE as the indicator
for profitability and found the variable as one of the most important
considerations in the dividend payout decisions among UAE firms.
While most studies revealed profitability is the significant
determinant of dividend payout decision, a few studies found
contradictory results.
Both study by Jozwiak (2015) and Khan and Ahmad (2017)
highlighted the positive relationship between profitability and
dividend payout among their sample companies. Still, their
findings showed profitability was not the significant determinant of
dividend policy. Similar finding was also found in the study by
Hellstrom and Inagambaev (2012) which ruled out profitability as
the determinant of dividend payout ratio for both Swedish large-
and medium-sized companies.
2.5.2 Leverage
Financial leverage is one of the key indicators of a company’s
financial health, which corresponds to the ratio of debt to its equity
(Hellstrom & Inagambaev, 2012). There was a growing number of
studies that used leverage as the factor of dividend payout ratio.
20
The underlying interest is to justify that a firm with large debt may
not be able to give high dividends due to the lack of cash flow
required to meet company’s obligations to the creditors (Singhania
& Gupta, 2012).
Previous studies showed that lower leverage usually contributes to
higher dividend payout to the shareholders (Ahmed &
Muktadir-Al-Mukit, 2014; Nuhu et al., 2014; Kingware, 2015).
Some studies found evidence of negative relationship between
leverage and dividend payout ratio (Rehman & Takumi, 2012; Forti
et al., 2015; Labhane & Das, 2015; Jozwiak, 2015). This includes
the study conducted by Al-Kuwari (2009) which found strong
negative correlation between leverage and the dividend payout
ratio.
Fatemaian and Hooshyarzadeh (2016) in their comparative study of
domestic and multinational companies demonstrated that leverage
was a significant determinant of dividend payout ratio for both
types of companies. Gill et al. (2010) studied the factors
influencing dividend payout ratio in different sectors in the U.S and
found significant negative influence of leverage to dividend payout
ratio in all sectors.
In contrast, even though some studies posited firms with higher
leverage tend to pay lower dividend to its shareholders, leverage
was found to be insignificant factor of dividend payout ratio
(Ahmed & Javid, 2008; Alzomaia & Al Khadiri, 2013; Zameer et

21
al., 2013; Khan & Ahmad, 2017).
2.5.3 Growth
From one side, companies are inclined to use their internal
resources to finance their investment projects. Therefore, firms
experiencing higher growth tend to reduce their dividends in order
to keep the profit and share lower dividends to shareholders
(Fatemaian & Hooshyarzadeh, 2016). Therefore, company’s
growth usually was assigned with negative relationship towards
dividend payout ratio (Al-Kuwari, 2009).
There is rising interests in the literature to use growth as one of the
determinants for the dividend policy. Several studies found
significant negative influence of asset growth towards dividend
payout ratio (Gill et al., 2010; Hellstrom & Inagambaev, 2012;
Labhane & Das, 2015; Kingwara, 2015; Jabbouri, 2016).
Apparently, these studies used different ways to characterise the
company’s growth, such as sales or revenue growth, assets growth
as well as growth opportunities which was measured using the
future growth. The most common justification for the negative
relationship between growth and dividend payout policy was that
growing companies need to retain their earnings to finance the
increased investments in parallel to the growth of the company
(Hellstrom & Inagambaev, 2012).
Nevertheless, there were some studies that revealed a positive
relationship between growth and dividend payout decision
22
(Al-Kuwari, 2009; Musiega et al., 2013; Zameer et al., 2013;
Zaman, 2014). In the study by Musiega et al. (2013), company’s
growth was a significant positive determinant to dividend payout
policy whereby the sample companies in the research avoided
reducing dividend payout which created positive relationship with
company’s growth.
(Some of the variables already discussed the agency cost theory,
either by inclusion of new variables to support the theory or by
adding more literature review and evidences to the current
variables).
2.5.4 Company Size
Ability to obtain funds depends on the types of external financing
demonstrated by the company’s ability to borrow. A company is
said to have a relatively good financial flexibility if it can obtain
loan within a short time frame (Arif & Akbar, 2013). The ability to
borrow depends on credit limit or a streak of bank credit
agreements, in addition to credit extension from the financial
institutions (Labhane & Das, 2015). In addition, financial
flexibility can also be observed from the company’s ability to
penetrate the capital markets by issuing bonds (Mehta, 2012).
Hence, bigger and stronger company stands better chance to enter
the capital market, providing the company the ability to borrow
with greater financial flexibility and ability to pay dividends
(Al-Kuwari, 2009; Fatemaian & Hooshyarzadeh, 2016; Jabbouri,
23
2016).
Therefore, company with large total assets is purported to have
higher dividend payout ratio. This has been evidenced in many
results of previous studies where direct relationship was found
between company size and dividend payout decision (Hellstrom &
Inagambaev, 2012; Maladjian & El Khoury, 2014; Kingwara, 2015;
Forti et al., 2015; Labhne & Das, 2015; Jabbouri, 2016).
The positive trends among the studies justified the postulate that
larger companies tend to distribute more net profit in the form of
dividend compared to smaller companies (Fatemaian &
Hooshyarzadeh, 2016). As most of the studies used public listed
companies as the research sample, they also included the issue of
ownership dispersion existing in large corporations. Thus, high
dividend was paid as the solution (Al-Kuwari, 2009).
On the other hand, there were quite a number of studies connoting
negative relationship between company size and dividend payout
(Ahmed & Javed, 2008; Arif & Akbar, 2013; Zameer et al., 2013;
Zaman, 2014; King’wara, 2015; Khan & Ahmad, 2017) to indicate
that larger firms in these studies prefer to pay lesser dividends than
smaller companies. This result induced the deduction that smaller
companies pay higher dividend to the shareholders as a form of
assurance of the future growth and maintaining the obligations to
creditors.
24
2.5.5 Free Cash Flow
According to Jensen (1986), the increase of free cash flow leads to
the conflicts of interest between managers and shareholders, which
subsequently increases agency costs and inefficiency. The
shareholders expect the managers to maximise the value of their
shares, whereas the managers may tend to use the profit for their
own benefits. Therefore, higher dividend is recommended during
higher free cash flow to reduce the conflict (Al-Kuwari, 2009;
Labhane & Das, 2015).
Previous studies attempted to identify the relationship between the
company’s cash position and the dividend payout ratio. Many
scholars had the same opinions and findings about the relationship
between cash flow and dividend payment. Among the studies are
Amidu & Abor (2006), Labhane and Das (2015) and Echchabi and
Azouzi (2016). The studies found cash flow was a major
determinant of the firm’s dividend payout ratio and should
therefore be taken into consideration.
Significant positive relationship between free cash flow and
dividend payout decision (Al-Kuwari, 2009; He et al., 2009;
Echchabi & Azouzi, 2016) illustrates the companies’ decision to
use higher free cash flow to pay higher dividend to their
shareholders. On the other hand, some other studies revealed
significant negative relationship between free cash flow and
dividend payout (Fatemaian & Hooshyarzadeh, 2016; Jabbouri,
25
2016).
Additionally, Hellstrom and Inagambaev (2012) managed to point
the positive relationship between free cash flow and dividend
payout for large corporation, whereas the medium-sized
corporation showed negative relationship. The negative
relationship may be attributed to the agency problem existing
within the companies whereby the managers use the free cash flow
to finance other interests rather than distributing it as dividend to
the shareholders.
2.6 Summary
In this chapter, a review on the related literature are discussed based on the
concept of dividend, dividend policy and dividend payout ratio.
Additionally, this chapter also reviewed the literature regarding companies’
selected factors in determining the dividend payout ratio such as
profitability, leverage, asset growth, company size and free cash flow.
Furthermore, this chapter also outlined three theories related to dividend
payout policy namely the Dividend Signalling Theory, Transaction Cost
Theory and Agency Cost Theory. The theories underlie the selection of
companies’ selected factors that are related with the dividend payout ratio
in this study.
26
CHAPTER THREE
RESEARCH METHODOLOGY
3.1 Introduction
This chapter explains the methods used to conduct the research. The
aspects discussed in this chapter include the theoretical framework,
hypothesis development, and the research design which encapsulates the
sample size, data source and types. Besides, this chapter also outlines the
methods to measure the variables, as well as the statistical analysis used to
obtain the results of the study.
3.2 Theoretical Framework
The main aim of the study is to find the significant determinants of
dividend payout ratio based on the companies’ selected factors.
Additionally, the nature and extent of relationship between the companies’
selected factors with dividend payout ratio are also investigated.
27
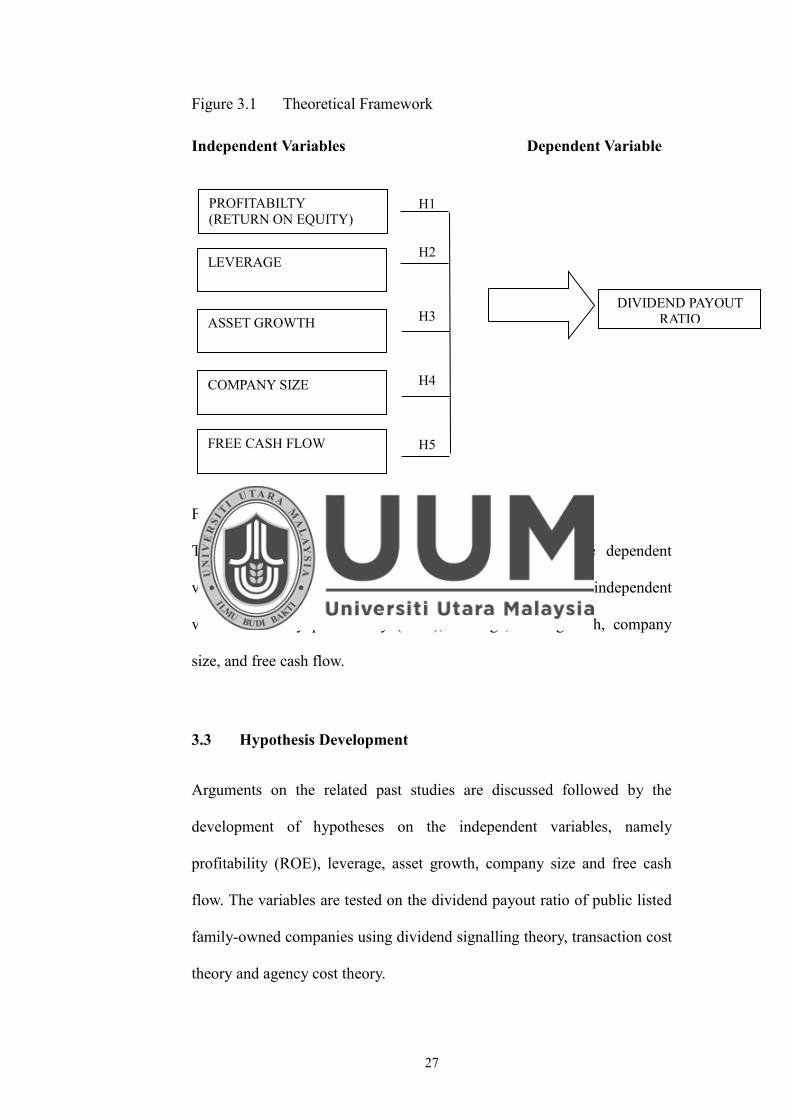
Figure 3.1 Theoretical Framework Independent Variables Dependent Variable
Figure 3.1 presents the theoretical framework of this study.
The framework consists of dividend payout ratio as the dependent
variable, whereas companies’ selected factors are the independent
variables namely profitability (ROE), leverage, asset growth, company
size, and free cash flow.
3.3 Hypothesis Development
Arguments on the related past studies are discussed followed by the
development of hypotheses on the independent variables, namely
profitability (ROE), leverage, asset growth, company size and free cash
flow. The variables are tested on the dividend payout ratio of public listed
family-owned companies using dividend signalling theory, transaction cost
theory and agency cost theory.
PROFITABILTY (RETURN ON EQUITY)
DIVIDEND PAYOUT RATIO
H1 H2 H3 H4 H5
LEVERAGE
ASSET GROWTH
COMPANY SIZE
FREE CASH FLOW
28
3.3.1 Profitability
Profitability has been found as one of the most essential
determinants of dividend payout policy across numerous empirical
studies in the literature (e.g., Al-Kuwari, 2009; Gill et al., 2010;
Mehta, 2012; Labhane & Das, 2015; King’wara, 2015; Jabbouri,
2016). Many studies posited positive relationship between
profitability with dividend payout policy (Amidu & Abor, 2006;
Ahmed & Javid, 2008; Rehman, & Takumi, 2012; Zameer et al.,
2013; Nuhu et al., 2014; Forti et al., 2015). According to the
signalling theory of dividend policy, companies with higher
profitability are more willing to pay higher dividend to signal their
good financial performance to the shareholders (Bhattacharya,
1979).
The positive influence of profitability to dividend payout policy
has been used by different studies to illustrate the companies under
different types (Nuhu et al., 2014), sizes (Fatemaian &
Hooshyarzadeh, 2016) and sectors (Gill et al., 2010; Issa et al.,
2015) took into account profitability in their dividend policy.
Nonetheless, some other research found profitability had negative
effect on the dividend payout policy (Ahmed &
Muktadir-Al-Mukit, 2014; Maladjian & El Khoury, 2014).
Myers (1977) explained the negative effect as due to the agency
problem in which the managers preferred to use the company’s
profit for investment rather than paying dividend. As most of the
29
research confided with the positive influence of profitability to
dividend payout policy, therefore, this study hypothesises that:
H1: Profitability has a positive relationship with the dividend
payout ratio.
3.3.2 Leverage
Numerous past studies demonstrated that companies’ leverage
negatively affected the dividend payout policy (Al-Kuwari, 2009;
Nuhu et al., 2014; Ahmed & Murtaza, 2015; Jozwiak, 2015;
King’wara, 2015; Fatemiaian & Hooshyarzadeh, 2016). These
researches inferred that companies with higher debt ratio preferred
to keep cash flows within the company in order to pay for the taxes
and interest (Nuhu et al., 2014; Fatemiaian & Hooshyarzadeh,
2016). The transaction cost theory explained that companies with
higher debt financing ration from its total capital will incur higher
commitment from paying the fixed interest charges. Hence, the
manager will reduce the dividend payment to the shareholders
(Higgins, 1972).
Despite a few studies managed to highlightthw positive
relationship between leverage and dividend payout ratio, the
relationship was apparently insignificant (Mehta, 2012; Khan &
Ahmad, 2017). As the majority of the negative findings are based
on the transaction cost theory, the following hypothesis is
established in this study:
30
H2: Leverage has a negative relationship on the dividend payout
ratio.
3.3.3 Asset Growth
Growth has been widely studied as the determinant of dividend
payout policy. Some research proposed companies’ growth as a
negative determinant of dividend payout policies (Amidu & Abor;
2006; Singhania & Gupta, 2012; Waswa, 2013; Maladjian & El
Khoury, 2014; Labhane & Das, 2015; Jabbouri, 2016). The
negative relationship is associated with transaction cost theory
where company tends to use internal funding sources to finance
investment projects and assets to acquire the growth opportunities.
Thus, such firms decided to pay fewer dividends in reducing its
dependency on costly external financing or debt (Jensen, 1986).
Meanwhile, companies with slower growth tend to pay higher
dividends to prevent the managers from over-investing the
company cash, thus removing the agency costs from the company’s
free cash flow (Jensen et al., 1992).
A few other studies found positive effect of growth to the dividend
payout policy (Al-Kuwari, 2009; Musiega et al., 2013, Zaman,
2014), inferring the positive relationship was due to reduced
agency cost as managers ae barred from over-spending the
company’s free cash flows on unnecessary investments or assets.
Following the transaction cost theory where most research found
negative effect of growth to dividend payout policy, this study

31
hypothesises:
H3: Asset growth has negative relationship with the dividend
payout ratio.
3.3.4 Company Size
There were interesting mixed findings regarding the relationship
between company size and dividend payout policy in the literature.
Some research revealed positive influence of company size to the
dividend payout policy (Al-Kuwari, 2009; Hellstrom &
Inagambaev, 2012; Forti et al., 2015; Labhane & Das, 2015;
Jabbouri, 2016). Hence, larger companies are more likely to
increase their dividend payouts in order to decrease the agency
costs. Al-Kuwari (2009) explained the increasing information
asymmetry in larger companies was due to diverse holding of
company’s share and disperse ownership. Thus, decreasing the
shareholders’ ability to monitor internal and external activities will
result in lack of management control. Jensen (1992) emphasised
resolving such agency problem through high dividend payment to
increase the need for external financing. Thus, the existence of
creditors increases the monitoring of large companies.
Nonetheless, some other studies demonstrated that firm size
negatively affected the dividend payout policy (Ahmed & Javid,
2008; Waswa, 2013; King’wara, 2015). This study pointed out the
agency problem existing in their sample companies in which the
shareholders did not gain control on the companies’ activities. As
32
the results, the managers tended to use the cash to expand the
company mainly for recognition purpose and simultaneously
reduced the dividend payout to shareholders. In this study, the
hypothesis established for company size is as follows:
H4: Company size has a positive relationship with the dividend
payout ratio.
3.3.5 Free Cash Flow
Jensen (1986) emphasised that the agency cost theory postulated an
increase of free cash flow will raise the agency conflict of interest
between the management and the shareholders. While shareholders
desire maximum potentially dividend from any available extra
cash, the managers may have different interests and preferences in
using the cash flows to derive other benefits for themselves.
Therefore, it is suggested that firms with large amount of free cash
flow should pay more dividends to reduce the agency costs of the
free cash flow (Jensen, 1986, Jensen et al., 1992). Quite a number
of contemporary studies presented positive effects of free cash flow
towards dividend payout policy (Al-Kuwari, 2009; He et al., 2009;
Labhane & Das, 2015; Echchabi & Azouzi, 2016). In this study,
larger free cash flow was used to maximise the shareholders’ share
value by paying higher dividend. However, several other studies
connoted negative effect of free cash flow to dividend payout
policy (Rehman & Takumi, 2012; Fatemiaian & Hooshyarzadeh,
2016; Jabbouri, 2016).
33
These studies inferred that their sample companies faced agency
problems due to clashing desires and interest between the managers
and shareholders. Besides, Hellstrom and Inagambaev (2012)
supported the positive relationship between the free cash flow and
the dividend policy in large corporation, but found negative effect
among the medium-sized corporation. Based on the agency cost
theory which postulates the use of free cash flow to increase the
dividend payout to shareholders, this study hypothesises that:
H5: Free cash flow has a positive relationship with the dividend
payout ratio.
3.4 Operational Definition of Variables
3.4.1 Dividend Payout Ratio
Dividend payout ratio is the dependent variable investigated in this
study. Dividend payout ratio denotes the percentage of company
profit that is distributed among the shareholders (Nuhu et al, 2014).
Studies pertaining the dividend policy and determinants of
dividend payout ratio mainly used two formulas to represent the
variable. Some studies used the ratio between yearly dividend and
net income to obtain the dividend payout ratio (Rehman & Rakumi,
2012; Ahmed & Muktadir-Al-Mukit, 2014; Khan & Ahmad, 2017).
Meanwhile, other studies adopted the formula provided by Penman
(2009, p. 264) to determine the dividend payout ratio (Amidu &
Abor, 2006; Hellstrom & Inagambaev, 2012; Nuhu et al., 2014),
which is also being employed in this study. From the following
34
formula, the calculation of dividend payout ratio only takes the
internal factors into considerations and the measurement is
therefore independent of external factors (Penman, 2009):
Dividend Pay-out Ratios = Dividend per share / Earning per
share
3.4.2 Profitability
Company profit is the key in financial report or statement because
it has been extensively used to identify the relationship between the
factors affecting the dividend being paid to shareholders of the
companies (Gill et al., 2010; Rehman & Takumi, 2012; Khan &
Ahmad, 2017). Many studies have proven the importance of profit
as the major factor in influencing the dividend pay-out towards
their shareholders (Amidu & Abor 2006; Anil & Kapoor, 2008; Gill
et al., 2010; Rehman & Takumi, 2012; Khan & Ahmad, 2017). As
such, various measurements were introduced to measure the profit
of a company depending on the nature of the firm.
There are many measurements included to calculate or measure
company’s profitability such as return on asset (ROA) or return on
equity (ROE). Al-Kuwari (2009) stated that ROE was one of the
best measurements of company’s profit considering it also
showcases the company’s capacity to generate internal cash.
Therefore, this research considers ROE ratio to denote the
company’s profitability.
Return on Equity (ROE) = Total asset / Total equity
35
3.4.3 Leverage
The financial leverage corresponds to the level of debt relative to
the level of equity or asset in the company’s balance sheet. It is
based on the available surplus payment in managing their financial
purpose. Several studies investigated leverage as the determinant of
dividend payout ratio (Al-Kuwari, 2009; Ahmed &
Muktadir-Al-Mukit, 2014; Nuhu et al., 2014; Kingware, 2015)
while others used the total debt to total equity ratio to measure the
leverage (e.g., Al-Kuwari, 2009). There are also studies that
denoted leverage using the total debt to total asset ratio (Nuhu et
al., 2014).
In this study, leverage is measured as the ration of total debt to total
asset.
Leverage = Total Debt / Total Asset
3.4.4 Asset Growth
Asset growth can be defined as an annual asset change of total
asset (Brigham & Houston, 2011). This is evidenced from the
increasing assets of a growing company which also contributes to
the expansion of the company (Bhutta & Hassan, 2013). While
studies in relation to dividend payout ratio used sales or revenue as
the proxy for growth variable (Gill et al., 2010; Hellstrom &
Inagambaev, 2012; Kingwara, 2015), this study resorts to employ
the assets growth to denote the company’s growth. This is in line
36
with many other empirical studies which used asset growth as the
proxy for company’s growth (Bhutta & Hassan, 2013; Al-Jafari &
Al-Samman, 2015; Sritharan, 2015).
The concept of asset growth is based on two arguments. First, asset
growth is different from the sales growth since every effort directly
brings implications to the acceptance. The growth of assets reflects
longer timeframe compared to sales growth which is in line with
the five-year data timeframe of this study. Secondly, investing in
assets takes time before its operation, hence the activities are not
related to the acceptance (Kaaro, 2002). In other words, asset
growth shows the growth of the company in terms of property
owned by the company.
Therefore, asset growth in this study can be formulated as follows:
Asset Growth = Total Asset year t – Total Asset year (t - 1)
3.4.5 Company Size
Size is a measure that describes the scale of large and small enterprise
which is determined by several characteristics such as the natural log of
market capitalisation (Al-Kuwari, 2009; Hellstrom & Inagambaev, 2012;
Labhane & Das, 2015), natural log of total assets (Kingwara, 2015; Khan
& Ahmad, 2017) and natural log of total sales (Waswa, 2013). Established
company will have easy access to the capital markets and possess greater
flexibility and ability to obtain funds. Henceforth, the company will be
able to distribute higher dividend payout ratio (Brechner & Bergerman,
2014).

37
In this study, the company size (size) is calculated by using the
following formula:
Size = Natural Log (Ln) of total assets
3.4.6 Free Cash Flow
Basically, cash flow is the cash that firm produces through their
operations after excluding the capital expenditure (Al-Kuwari,
2009; Gill et al., 2010). The free cash flow needs to be calculated
manually as the book value of this variable is not readily available
in the annual reports. The calculation of free cash flow in this study
did not consider the expenditures concerning taxes due to its
complexity. Thus, the measurement must involve simplified
formula with obtainable components from the annual reports.
Therefore, the free cash flow in this study is calculated using the
formula provided by Fabozzi (2009, p. 233):
Free Cash Flow = Operation Cost – Capital expenditure
3.5 Research Design
A research design is the plan and strategies to obtain answers to the
research questions regarding the phenomenon being investigated (Kothari,
2009). This study was designed based on the descriptive and
cross-sectional research design. According to Sekaran and Bougie (2016),
descriptive research is useful to ascertain and describe the characteristics
of the variables included in the study. On the other hand, cross-sectional
design is an approach involving data collection at one point of time
38
(McKenna et al., 2010).
The data used in this study were secondary data which were obtained from
the Bursa Malaysia website. Most previous studies on the determinants of
dividend payout ratio used secondary data included in the financial
statements from companies’ annual report (Gill et al., 2010; Hellstrom &
Inagambaev, 2012; Waswa, 2013; Rehman & Takumi, 2012; Labhane &
Das, 2015; Khan & Ahmad, 2017). The annual report is a formal document
that reports the details of the financial and non-financial performance of
the company. They provide the essential information to the shareholders,
potential investors and other stakeholders regarding the company’s
performance. Annual report is the most easily accessible report which is
understandable by ‘layman’ standard (Tilt, 1994).
Some of the advantages of collecting data from annual report include:
a) Annual report provides information with minimum bias as there is no
media interference.
b) the use of annual report was considerably cost effective for this study
as both financial and non-financial information could be obtained in
one document.
c) annual report is a document that has high credibility and reliability as
the disclosed information is subject to specific statutory requirements
and compliance, as well as having gone through third-party audit (Tilt,
1994).
39
The data collected in this study are panel data which combined the time
series and cross-sectional data. Time series data involved the same units
that are collected over a period of time, whereby cross-sectional data were
collected on several different units at a time (Alahyari, 2014).
Accordingly, the data of this study involved the measurement of dividend
payout ratio and five companies selected factors namely profitability,
leverage, asset growth, company size and free cash flow from 2011 to
2015. Hence, the regression is deemed as the most appropriate method to
be employed in this study as the data included several different
measurement units over five-year financial period.
3.6 Sample Size
The study was carried out using a total of 30 public listed family-owned
companies on the main and ACE board of Bursa Malaysia as the sample of
the study. Previous studies also identified public listed companies as their
research sample in their respective countries (Hellstrom & Inagambaev,
2012; Rehman & Takumi, 2012; Labhane & Das, 2015; Khan & Ahmad,
2017). The sample companies in this study were selected through a
separate list categorised as the family-owned companies obtained from the
Bursa Malaysia. There were a total of 423 listed family-owned companies.
The selection of 30 sample companies was carried out in random manner
provided that the annual reports of the selected company are available
from 2011 to 2015.
40
3.7 Instruments / Measures
The data were extracted from the company’s annual report to carry out the
calculations of the dividend payout ratio, ROE, leverage, asset growth,
company size and free cash flow were. The values were then keyed-in to
Eview and IBM Statistical Package of Social Science (SPSS version 20)
software for data organisation purpose. Several types of statistical analysis
techniques were used to achieve the objectives and examine the
hypotheses of the study. The statistical analyses included the descriptive
statistics and inferential statistics.
3.7.1 Descriptive Statistics
Descriptive statistics is a statistical procedure meant to summarise,
organise and obtain the meanings of a set of scores. Pallant (2016)
proposed a few measures to describe the data set included the
central tendency (mean) and measures of variability or dispersion.
In this study, descriptive analysis was used to get a summary of
dividend payout ratio and companies’ selected factors in the form
of mean and standard deviation. Based on the descriptive analysis,
the trends and characteristics of dividend payout ratio among the
companies over five financial years were identified.
41
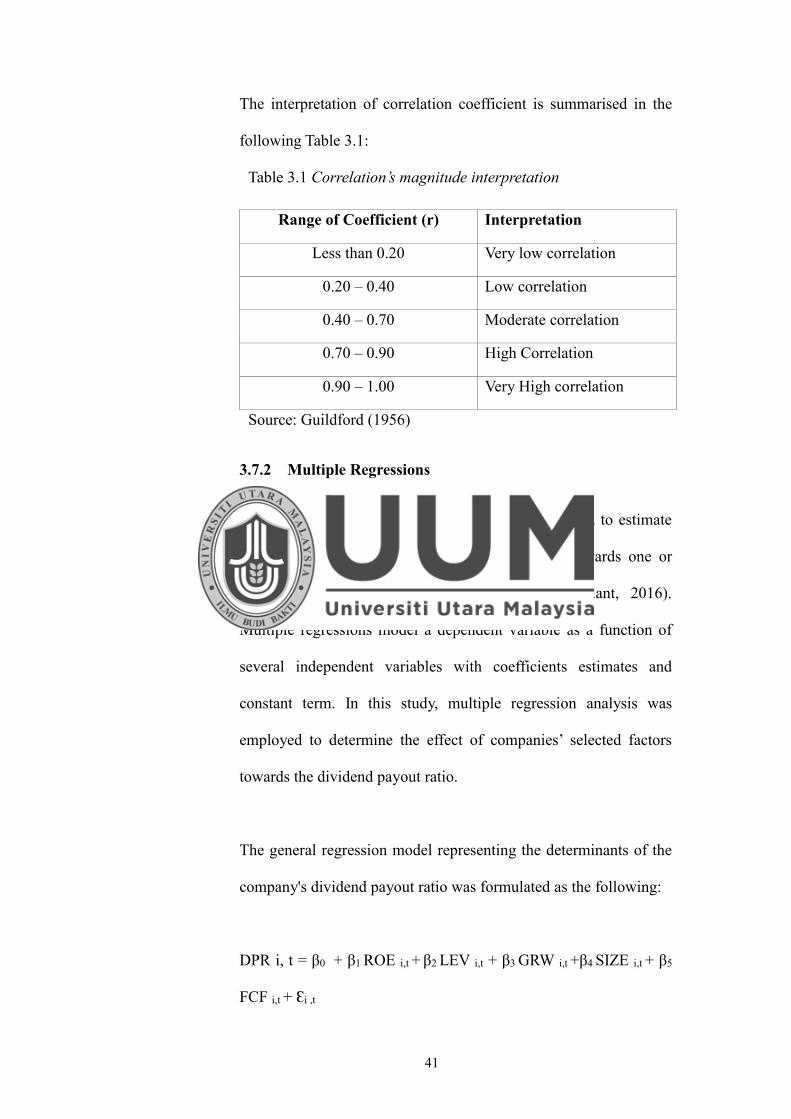
The interpretation of correlation coefficient is summarised in the
following Table 3.1:
Table 3.1 Correlation’s magnitude interpretation
Range of Coefficient (r) Interpretation
Less than 0.20 Very low correlation
0.20 – 0.40 Low correlation
0.40 – 0.70 Moderate correlation
0.70 – 0.90 High Correlation
0.90 – 1.00 Very High correlation
Source: Guildford (1956)
3.7.2 Multiple Regressions
Regression analysis is a statistical process that is used to estimate
the effect of one or more independent variables towards one or
more dependent variables being investigated (Pallant, 2016).
Multiple regressions model a dependent variable as a function of
several independent variables with coefficients estimates and
constant term. In this study, multiple regression analysis was
employed to determine the effect of companies’ selected factors
towards the dividend payout ratio.
The general regression model representing the determinants of the
company's dividend payout ratio was formulated as the following:
DPR i, t = β0 + β1 ROE i,t + β2 LEV i,t + β3 GRW i,t +β4 SIZE i,t + β5
FCF i,t + Ɛi ,t

42
where,
DPR : Dividend payout ratio
ROE : Profitability (return on equity)
LEV : Leverage
GRW : Asset growth
SIZE : Company size
FCF : Free cash flow
β0 : constant
: error
i, t : for company i in period t
βn : coefficient of variable regression (n = 1,2,…5)
3.7.3 Pearson’s Correlation Analysis
Pearson’s correlation analysis is a form of multivariate analysis that
is often used to find the relationship between two or more variables
(Hair et al., 2010). Pallant (2016) explained that the correlation
between the variables is identified by the magnitude and direction
of the relationship represented by the correlation coefficient (r). In
this study, Pearson’s correlation analysis was used to determine the
respective relationship between profitability, leverage, asset
growth, company size and free cash flow with dividend payout
ratio. The analysis also served to test some of the hypotheses
established in the prior section.
43
3.8 Summary
This chapter presents the methods used to carry out this study. Research
design and sample size were described in the earlier section of this chapter.
In addition, framework of the dependent and independent variables was
also illustrated along with the development of the research hypotheses.
This chapter also describes the type of software used to analyse the data to
achieve the objectives and test the hypotheses of the study.

44
CHAPTER FOUR
RESULTS AND DISCUSSIONS
4.1 Introduction
This chapter outlines the results and findings obtained from the analysis
performed on the data. Both descriptive analysis and inferential analysis
were employed in order to achieve the objectives of the study and test the
research hypotheses.
4.2 Descriptive Analysis
Descriptive analysis was employed to determine the minimum and
maximum values of the variables, as well as obtaining the mean and
standard deviation. The results were determined from the overall samples
in accordance to each financial year.
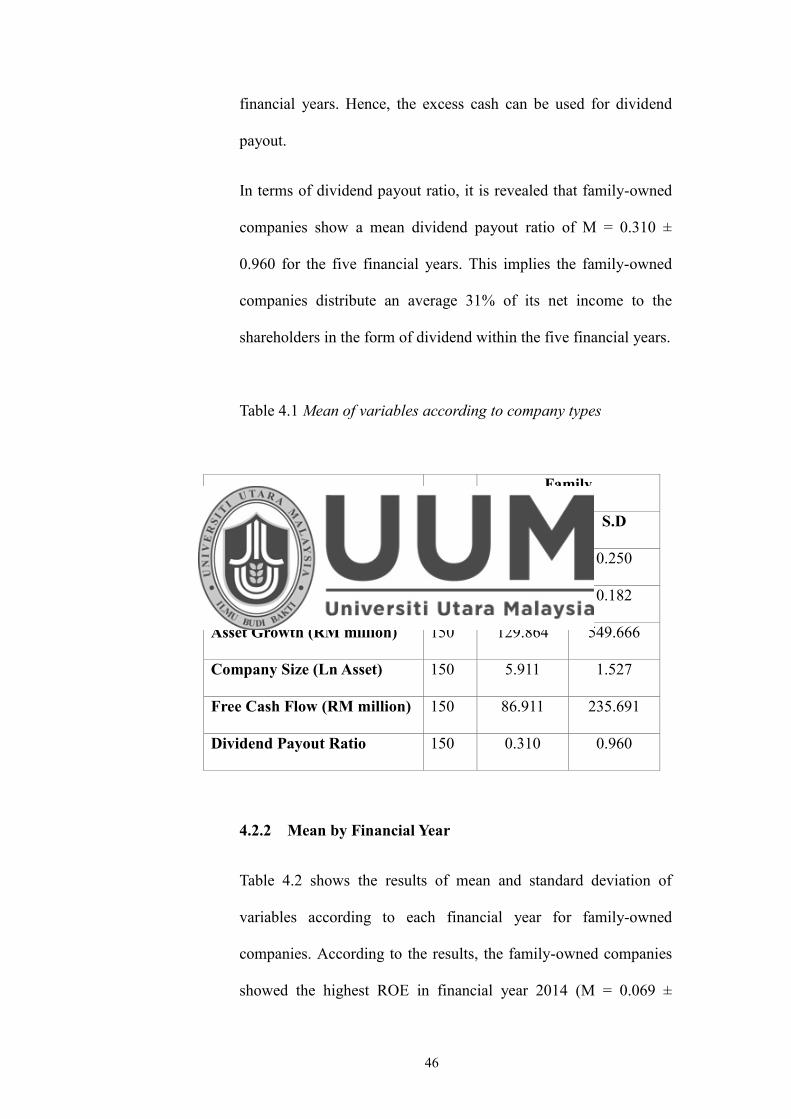
4.2.1 Overall Mean
Table 4.1 presents the mean and standard deviation for each
variable investigated in this study. The result shows the
family-owned companies in this study have the mean Return on
Equity (ROE) of M = 0.047 ± 0.250. Since thr ROE measures the
ratio of the company’s return for the financial year as a ratio of the
equity capital, the mean value that is less than 1 indicates the
family-owned companies have a return less than their equity capital
in the five financial years.
45
Additionally, it also indicates that the companies have positive
returns of 4.7% from their equity capital.
As for leverage, the family-owned companies showed the overall
mean of leverage ratio is M = 0.381 ± 0.182. As the number is
lower than 0.5, the companies are considered to have good leverage
ratio since less than half of the company’s asset is financed by debt
and other liabilities. Furthermore, it also means that these
family-owned companies have strong ability to meet their
companies’ financial obligations.
In terms of asset growth, the family-owned companies were found
to have the mean asset growth of M = RM129.863 ± 549.666
million for the five financial years. The positive mean growth
indicates growth in the family-owned companies’ assets value
within the five financial years.
Meanwhile, the results for company size reveal that family-owned
companies have the mean assets valuation of M = 5.911 ± 1.527.
The value implies growth of the total assets in the family-owned
companies, thus the growth of company size within five financial
years.
Furthermore, the results illustrate the family-owned companies
have mean free cash flow of M = RM86.911 ± 235.691 million for
five financial years. The positive free cash flow mean signals the
family-owned companies’ ability to generate more money after
retaining some amount to maintain or expand its asset base in five
46
financial years. Hence, the excess cash can be used for dividend
payout.
In terms of dividend payout ratio, it is revealed that family-owned
companies show a mean dividend payout ratio of M = 0.310 ±
0.960 for the five financial years. This implies the family-owned
companies distribute an average 31% of its net income to the
shareholders in the form of dividend within the five financial years.
Table 4.1 Mean of variables according to company types
Variables Family
N Mean S.D
ROE 150 0.047 0.250
Leverage 150 0.381 0.182
Asset Growth (RM million) 150 129.864 549.666
Company Size (Ln Asset) 150 5.911 1.527
Free Cash Flow (RM million) 150 86.911 235.691
Dividend Payout Ratio 150 0.310 0.960
4.2.2 Mean by Financial Year
Table 4.2 shows the results of mean and standard deviation of
variables according to each financial year for family-owned
companies. According to the results, the family-owned companies
showed the highest ROE in financial year 2014 (M = 0.069 ±
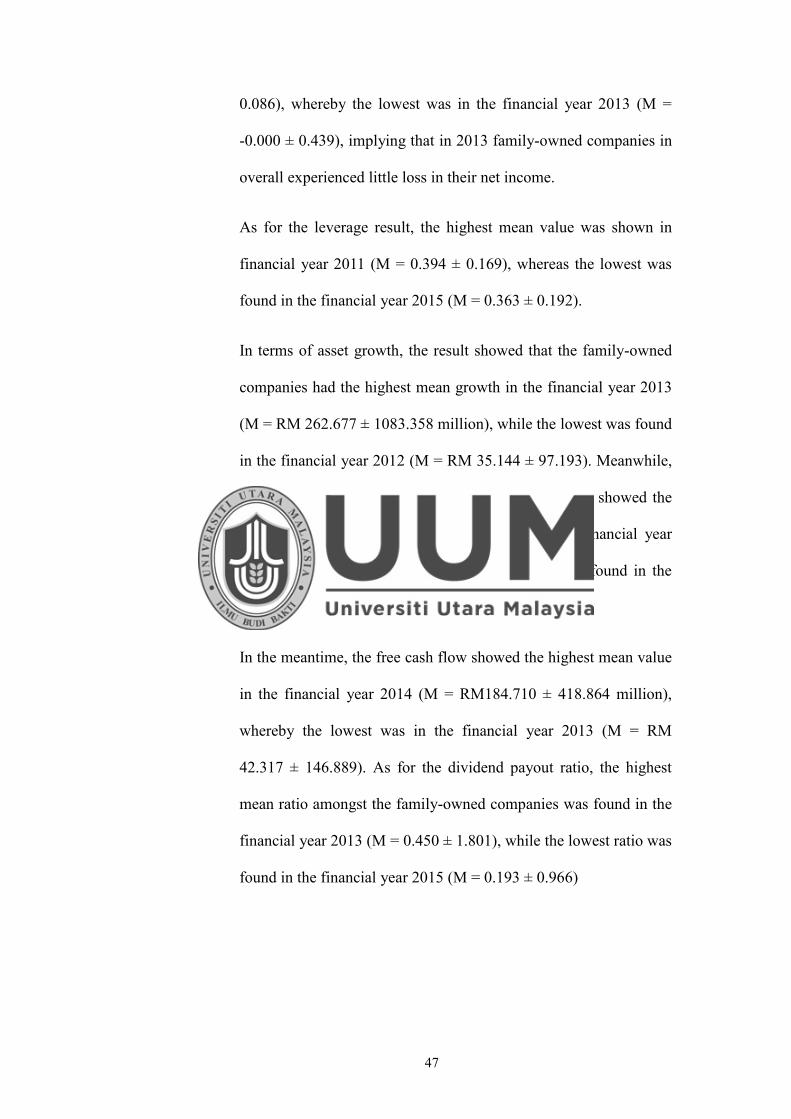
47
0.086), whereby the lowest was in the financial year 2013 (M =
-0.000 ± 0.439), implying that in 2013 family-owned companies in
overall experienced little loss in their net income.
As for the leverage result, the highest mean value was shown in
financial year 2011 (M = 0.394 ± 0.169), whereas the lowest was
found in the financial year 2015 (M = 0.363 ± 0.192).
In terms of asset growth, the result showed that the family-owned
companies had the highest mean growth in the financial year 2013
(M = RM 262.677 ± 1083.358 million), while the lowest was found
in the financial year 2012 (M = RM 35.144 ± 97.193). Meanwhile,
it was also revealed that the family-owned companies showed the
highest value of company size mean value in the financial year
2015 (M = 6.082 ± 1.616), whereas the lowest was found in the
financial year 2011 (M = 5.768 ± 1.431).
In the meantime, the free cash flow showed the highest mean value
in the financial year 2014 (M = RM184.710 ± 418.864 million),
whereby the lowest was in the financial year 2013 (M = RM
42.317 ± 146.889). As for the dividend payout ratio, the highest
mean ratio amongst the family-owned companies was found in the
financial year 2013 (M = 0.450 ± 1.801), while the lowest ratio was
found in the financial year 2015 (M = 0.193 ± 0.966)
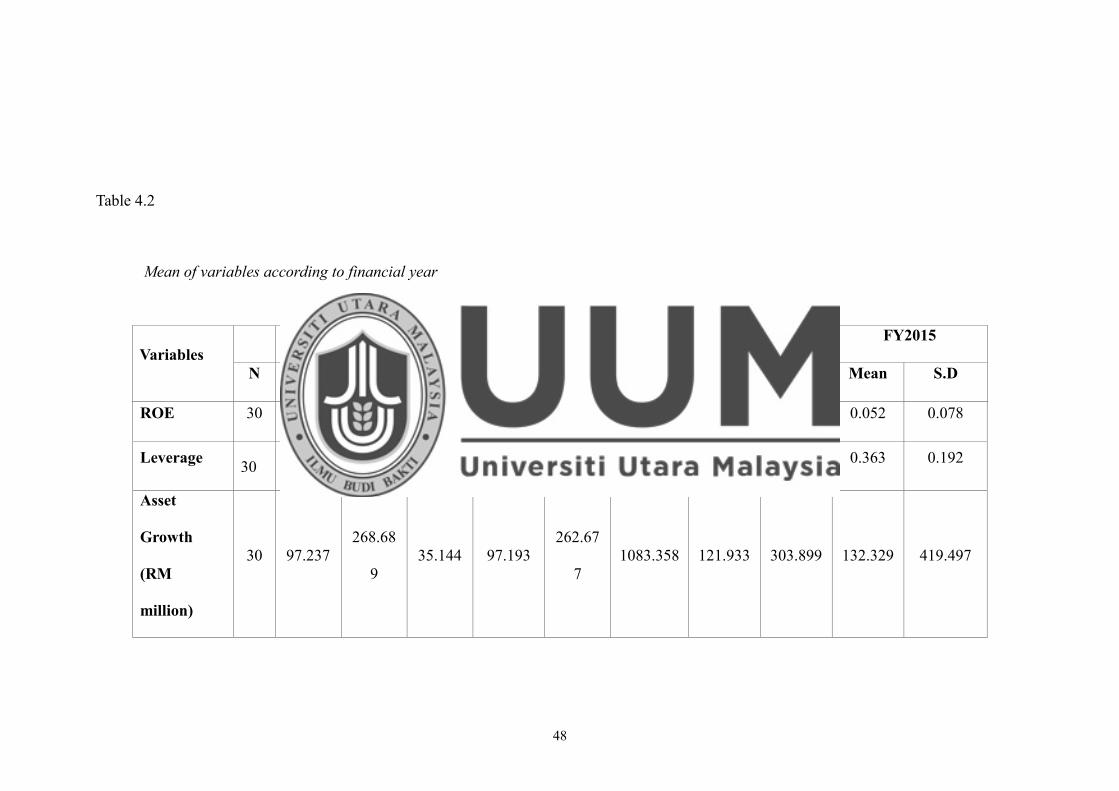
48
Table 4.2
Mean of variables according to financial year
Variables FY2011 FY2012 FY2013 FY2014 FY2015
N Mean S.D Mean S.D Mean S.D Mean S.D Mean S.D
ROE 30 0.057 0.303 0.059 0.139 -0.000 0.439 0.069 0.086 0.052 0.078
Leverage 30 0.394 0.169 0.384 0.177 0.377 0.196 0.389 0.187 0.363 0.192
Asset
Growth
(RM
million)
30 97.237 268.68
9 35.144 97.193
262.67
7 1083.358 121.933 303.899 132.329 419.497
49
Company
Size (Ln
Asset)
30 5.768 1.431 5.815 1.462 5.885 1.601 6.007 1.600 6.082 1.616
Free Cash
Flow (RM
million)
30 61.699 111.204 81.306 181.103 42.317 146.889 184.710 418.864 64.525 173.392
Dividend
Payout
Ratio
30 0.193 0.966 0.350 0.469 0.450 1.801 0.279 0.359 0.278 0.409
50
Meanwhile, another log10 transformation was also employed for the Free
Cash Flow. The transformed data were renamed into “Log10FreeCash”.
Finally, the data for dividend payout ratio was also transformed by using the
log10 function to get a series of transformed data renamed as “Log10DPR”.
Table 4.4 shows the result for normality test for the variables after being
transformed to normal scores.
4.3 Correlation with Dividend Payout Ratio
Pearson correlation analysis was used to determine the magnitude and
direction of the relationship between the variables investigated in this study.
Table 4.6 shows the result of correlation analysis of company’s characteristics
variables investigated with the dividend payout ratio for the family-owned
companies. The result revealed that companies’ ROE have very low positive
correlation with the dividend payout ratio (r = 0.022). The positive correlation
indicates the family-owned companies recorded higher return on equity ratio
and possess lower tendency to distribute higher dividend. Nonetheless, the
correlation was found to be not significant (p > 0.05).
The leverage ratio of the family-owned companies was found to have low,
negative correlation with the dividend payout ratio (r = -0.284). This negative
correlation implied that higher leverage ratio in the family-owned companies
prompt the will on the other hands have lower dividend payout ratio at low
tendency. Although the correlation is at low level, it was found to be
statistically significant in this study (p < 0.05).

51
As for the relationship between asset growth and dividend payout ratio, the
result of Pearson’s correlation shows that there is moderate and negative
correlation (r = -0.524) found between the two variables. This indicates that as
the companies’ asset continues to grow larger, the dividend payout ratio tends
to be lower at a moderate strength. Moreover, this negative correlation was
found to be significant (p < 0.05).
Meanwhile, in terms of the relationship between company size and dividend
payout ratio, the result revealed that there is moderate but negative correlation
(r = -0.456) between the two variables. The negative correlation indicates that
as the companies grow larger in size in terms of total assets, the dividend
payout ratio tends to be lower at a moderate strength. This correlation
apparently found to be statistically significant (p < 0.05).
The fifth company’s characteristics being investigated in this study, the free
cash flow, found to have low and negative correlation (r = -0.344) with
dividend payout ratio. This means the family-owned companies have lower
dividend payout ratio at low tendency as free cash flow increases.
Interestingly, this correlation was found to be statistically significant (p <
0.05).

52
Table 4.3 Pearson’s coefficient of correlation between variables with dividend payout ratio for the family-owned companies
Variables
N
Dividend Payout Ratio
Coefficient (r)
Sig. (2-tailed)
ROE 150 0.022 0.786
Leverage 150 -0.284** 0.000
Asset Growth 150 -0.524** 0.000
Company Size 150 -0.456** 0.000
Free Cash Flow 150 -0.344** 0.000
4.4 Multicollinearity: Tolerance and Variance Inflation Factor (VIF)
The multicollinearity issue was examined using the tolerance and variance
inflation factor (VIF). In this study, multicollinearity exists when tolerance
value is less than 0.1 and the VIF is more than 5. Table 4.7 shows the result of
multicollinearity test employing the tolerance and VIF statistics based on the
normal scores derived by SPSS for the dependent variables. The results show
the tolerance statistic for respective variable is more than 0.1, whereas the VIF
statistic for respective variable is found to be less than 5. Hence, there is no
multicollinearity issue existing in the relationship between the variables.
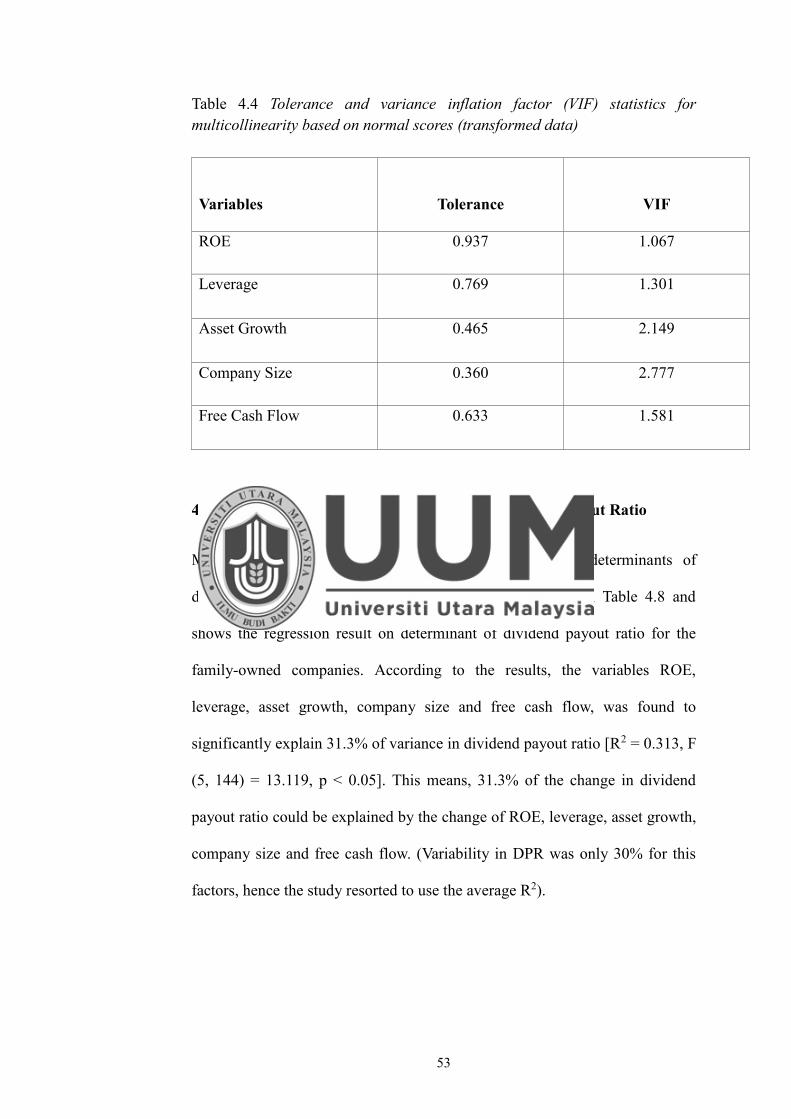
53
Table 4.4 Tolerance and variance inflation factor (VIF) statistics for multicollinearity based on normal scores (transformed data)
Variables
Tolerance
VIF
ROE 0.937 1.067
Leverage 0.769 1.301
Asset Growth 0.465 2.149
Company Size 0.360 2.777
Free Cash Flow 0.633 1.581
4.5 Regression Analysis: Determinant of Dividend Payout Ratio
Multiple linear regressions were employed to find the determinants of
dividend payout ratio. The analysis results are presented in Table 4.8 and
shows the regression result on determinant of dividend payout ratio for the
family-owned companies. According to the results, the variables ROE,
leverage, asset growth, company size and free cash flow, was found to
significantly explain 31.3% of variance in dividend payout ratio [R2 = 0.313, F
(5, 144) = 13.119, p < 0.05]. This means, 31.3% of the change in dividend
payout ratio could be explained by the change of ROE, leverage, asset growth,
company size and free cash flow. (Variability in DPR was only 30% for this
factors, hence the study resorted to use the average R2).
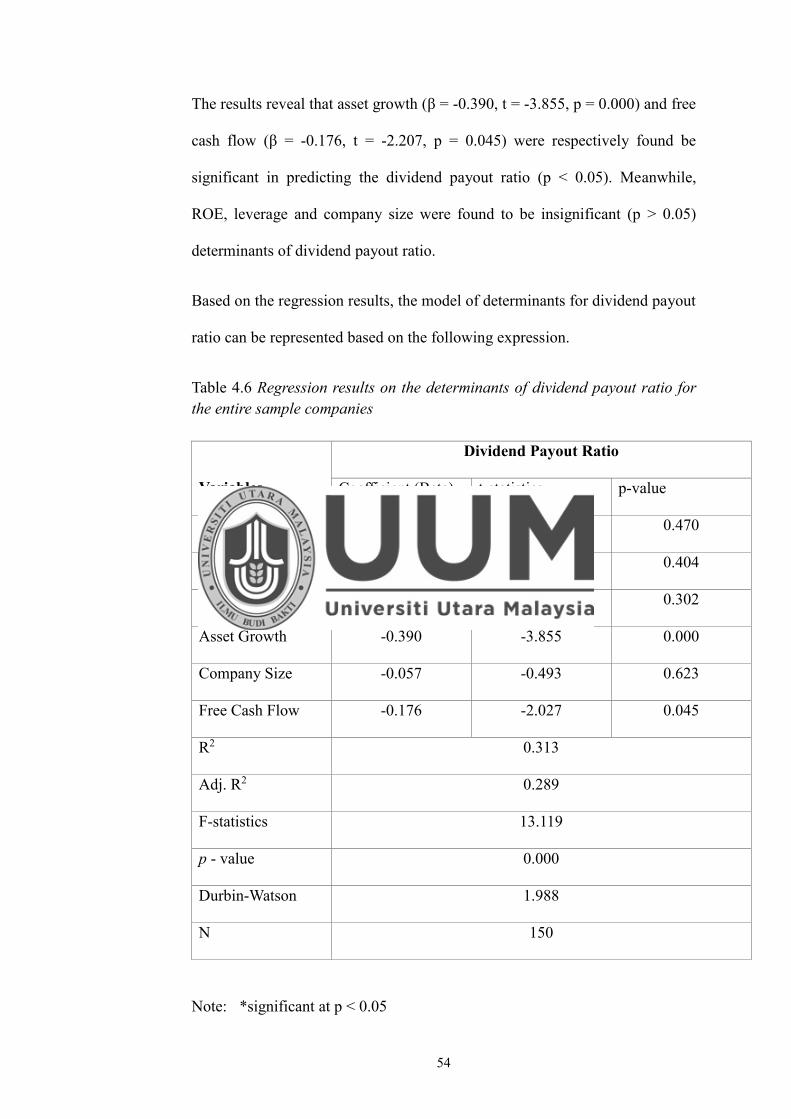
54
The results reveal that asset growth (β = -0.390, t = -3.855, p = 0.000) and free
cash flow (β = -0.176, t = -2.207, p = 0.045) were respectively found be
significant in predicting the dividend payout ratio (p < 0.05). Meanwhile,
ROE, leverage and company size were found to be insignificant (p > 0.05)
determinants of dividend payout ratio.
Based on the regression results, the model of determinants for dividend payout
ratio can be represented based on the following expression.
Table 4.6 Regression results on the determinants of dividend payout ratio for the entire sample companies
Variables
Dividend Payout Ratio
Coefficient (Beta) t-statistics p-value
Intercept 0.091 0.724 0.470
ROE -0.060 -0.837 0.404
Leverage -0.082 -1.035 0.302
Asset Growth -0.390 -3.855 0.000
Company Size -0.057 -0.493 0.623
Free Cash Flow -0.176 -2.027 0.045
R2 0.313
Adj. R2 0.289
F-statistics 13.119
p - value 0.000
Durbin-Watson 1.988
N 150
Note: *significant at p < 0.05

55
4.6 Summary
This chapter outlines the analysis results. The results found there positively
insignificant relationship between profitability and dividend payout ratio.
Meanwhile, negative but significant relationship was found between leverage,
asset growth, firm size and free cash flow with dividend payout ratio. In
addition, the regression analysis also reveals that only two factors were
significant determinant for dividend payout ratio, namely asset growth and
free cash flow. The significant effect of asset growth to dividend payout ratio
in this study confirms the existence of high transaction cost among the
family-owned companies. Furthermore, the significant negative influence of
free cash flow to dividend payout ratio implied agency cost problem among
the family-owned companies.

56
CHAPTER FIVE
CONCLUSION, IMPLICATIONS AND RECOMMENDATIONS
5.1 Discussions
This section discusses the findings obtained from the result analysis. The
discussions are divided into three parts. The first part elaborates on the trend
of dividend payout among family-owned companies. The second part
discusses the findings on the direction of relationship between profitability,
leverage, asset growth, company size and free cash flow with the dividend
payout ratio. Lastly, the third part of discussion entails on the factors that
influence the dividend payout ratio.
5.2 Dividend Payout in Family-Owned Companies
Based on the result of descriptive analysis, the dividend payout ratio among
the public listed family-owned companies was the highest in financial year
2013 and the lowest in financial year 2011. According to Gill et al. (2010), the
difference in dividend payout policies among the companies was influenced
by the different sectors of the companies. Therefore, there is possibility that
the variations of dividend payout policies in family-owned companies are
rather different than the other organisational types. Hellstrom and Inagambaev
(2012) and Nuhu et al. (2014) provided evidence that the difference between
the companies’ industries was actually influential to the dividend payout
policies.
57
Furthermore, comparative studies on the determinants of dividend payout ratio
have been conducted according to size of capitalisation (Hellstrom &
Inagambaev, 2012), industry sectors (Gill e al., 2010), and financial and
non-financial companies (Hellstrom & Inagambaev, 2012; Nuhu et al., 2014).
Therefore, there is an opportunity to explore further on the characterisation of
companies’ types in determining the differences in dividend policy among the
public listed companies in Malaysia.
5.2.1 Relationship between Profitability and Dividend Payout
Ratio
Based on the correlation analysis, the profitability of family-owned
companies in this study is measured using the ROE. Profitability is
shown to have positive relationship with dividend payout ratio. The
positive relationship signals higher dividend payout by companies with
higher profitable.
This result is consistent with many previous studies that also found
positive relationship between profitability and dividend payout (Amidu
& Abor, 2006; Ahmed & Javid, 2008; Rehman, & Takumi, 2012;
Zameer et al., 2013; Nuhu et al., 2014; Forti et al., 2015). Particularly,
the study by Al-Kuwari (2009) and Mehta (2012) which employed
ROE as the profitability measure also revealed positive relationship
between ROE and dividend payout ratio.
However, the insignificant positive relationship found in this study
contradicts most of the aforementioned positively related research.
58
However, there were a few past studies that also found no significant
relationship between profitability and dividend payout (Hellstrom &
Inagambaev, 2012; Singhania & Gupta, 2012; Jozwiak, 2015;
Echchabi & Azouzi, 2016; Khan & Ahmad, 2017). On the other hand,
the negative relationship found in a few studies contradict the result of
the present study (Gill et al., 2010; Maladjian & El Khoury, 2014;
Ahmed & Muktadir-Al-Mukit, 2015).
5.2.2 Relationship between Leverage and Dividend Payout Ratio
Findings in the correlation analysis showcase negative correlation
between the leverage of family-owned companies with dividend
payout ratio. In addition, the negative relationship is found to be
significant and indicates firms with higher leverage ratio tend to pay
lower amount of dividend to their shareholders. This result is
supported by most previous studies which also found negative and
significant relationship between the attributes (Al-Kuwari, 2009; Nuhu
et al., 2014; Forti et al., 2015; King’wara, 2015; Labhane & Das, 2015;
Jabbouri, 2016).
Nonetheless, a few other studies found negative relationship between
leverage and dividend payout in which the relationship is insignificant
(Ahmed & Javid, 2008; Waswa, 2013; Zameer et al., 2013; Ahmed &
Muktadir-Al-Mukit, 2014). Furthermore, the negative and significant
relationship in this study contradicts a few studies that found positive
relationship between leverage and dividend payout (Mehta, 2012;
Rehman & Takumi, 2012; Khan & Ahmad, 2017).

59
5.2.3 Relationship between Growth and Dividend Payout Ratio
There is significant negative correlation found in this study between
asset growth and dividend payout ratio among the family-owned
companies. The negative relationship implies that companies with
higher growth in assets tend to pay lower dividend than those with
lower assets growth. This result is consistent with numerous other
studies that investigated the relationship between company’s growth
and dividend payout such as by Amidu and Abor (2006), Waswa
(2013), Maladjian and El Khoury (2014), Labhane and Das (2015),
King’wara (2015) and Jabbouri (2016). Meanwhile, the study by
Hellstrom and Inagambaev (2012) asserted the negative relationship
between growth and dividend payout ratio only existed in large-sized
companies, while the medium-sized companies showed opposite result.
On the contrary, this result contradicts several other investigations that
found significant positive relationship between company’s growth and
dividend payout ratio (Al-Kuwari, 2009; Musiega et al., 2013; Zameer
et al., 2013; Zaman, 2014).
5.2.4 Relationship between Company Size and Dividend Payout
Ratio
The results of correlation analysis reveal significant negative
correlation between company size and dividend payout ratio. The
negative relationship indicates larger companies tend to pay smaller
dividend to the shareholders. The result is consistent with the findings
from a few other studies the found negative and significant relationship
60
between firm size and dividend payout ratio (Ahmed & Javid, 2008;
Waswa, 2013; King’wara, 2015). Meanwhile, few other studies also
demonstrated negative relationship between size and dividend but
failed to provide evidence of significant relationship between the
variables (Arif & Akbar, 2013; Zaman, 2014; Khan & Ahmad, 2017).
Interestingly, the negative relationship apparently contradicts the result
of numerous studies, which instead found positive and significant
relationship between company size and dividend payout ratio
(Al-Kuwari, 2009; Mehta, 2012; Maladjian & El Khoury, 2014; Forti
et al., 2015; Labhane & Das, 2015; Jabbouri, 2016). These studies
contended that larger companies with more cash flow are willing to
pay higher dividend to their shareholders compared to smaller
companies. However, the study by Hellstrom and Inagambaev (2012)
found that only medium-sized firms showed significant positive
relationship between firm size and dividend payout, while large
corporation showed opposite result with no significance.
5.2.5 Relationship between Free Cash Flow and Dividend Payout
Ratio
The findings from the correlation analysis revealed that free cash flow
has significant negative relationship with dividend payout ratio, which
indicates higher dividend payout among the family-owned companies
with more free cash flow. The relationship between free cash flow and
dividend payout ratio were examined by many studies. However, most
of the results from previous studies revealed positive relationship
61
between free cash flow and dividend payout ratio (Amidu & Abor,
2006; Al-Kuwari, 2009; Labhane & Das, 2015; Issa et al., 2015;
Echchabi & Azouzi, 2016), which contradicts the result of the present
study.
Nevertheless, there were a few studies that supported the negative
finding between free cash flow and dividend payout in this study
(Fatemaian & Hooshyarzadeh, 2016; Jabbouri, 2016). Interestingly,
large-sized companies in the study by Hellstrom and Inagambaev
(2012) showed positive relationship between free cash flow and
dividend and indicated that large companies channelled their cash flow
in the form of dividends to shareholders. Meanwhile, medium-sized
companies showed the opposite negative relationship which implied
smaller sized companies tended to use their free cash flow for other
purposes such as expansion, assets buying, and project financing
instead of paying dividend.
5.3 Determinants of Dividend Payout Ratio
There were five companies’ selected factors investigated as the determinants
of dividend payout ratio among the family-owned companies, namely
profitability, leverage, asset growth, company size and free cash flow.
Combination of these factors was found to significantly predict 31.3% of the
variance in dividend payout ratio, which means the change in these factors
would influence the change in dividend payout ratio. The regression results in
this study demonstrate that only asset growth and free cash flow are significant
determinants of dividend payout ratio, whereas profitability, leverage and
62
company size are insignificant determinants.
Despite the positive effect of profitability (ROE) towards the dividend payout
ratio as shown by the multiple regression results, hypothesis H1 cannot be
verified as the positive effect was not significant (p > 0.05). This result is not
in line with other studies that found profitability as significant positive
determinant for dividend payout (Amidu & Abor, 2006; Ahmed & Javid, 2008;
Rehman, & Takumi, 2012; Zameer et al., 2013; Nuhu et al., 2014; Forti et al.,
2015). However, the small positive effect of profitability towards dividend
payout ratio confirms the slight effort from the family-owned companies to
pay higher dividend following higher profitability to signal the companies’
good financial position to the shareholders.
On the other hand, the study found negative effect exerted by leverage on
dividend payout ratio, which is in favour with the hypothesis H2 in this study.
However, the hypothesis could be accepted as the effect was not significant.
The result complies with many studies that posited negative influence of
leverage on dividend payout ratio (Al-Kuwari, 2009; Nuhu et al., 2014; Forti
et al., 2015; King’wara, 2015; Labhane & Das, 2015; Jabbouri, 2016).
Fatemiaian and Hooshyzardeh (2016) revealed that leverage was the
significant determinant to both domestic and multinational companies, in
which company with high leverage experienced higher cost of external
financing than its internal financing (Hellstrom & Inagambaev, 2012).
Therefore, companies with high leverage tend to incur higher transaction cost
and prefer to maintain their internal fund within the company instead of
paying dividend to the shareholders (Al-Kuwari, 2009). The negative effect of
63
leverage for family-owned companies in this study shows that the
family-owned companies have to rely on the retained earnings in meeting their
obligations to pay for the external financing. Therefore, high transaction cost
of external financing is incurred by the family-owned companies in Malaysia
for sustenance and growth purposes.
A significant determinant found in this study was the asset growth, which
exerts negative effect to dividend payout ratio. Therefore, the hypothesis H3 is
accepted in this study. The result is consistent with other studies that asserted
growth as the factor that negatively influences the dividend payout ratio
(Amidu and Abor, 2006; Waswa, 2013; Maladjian & El Khoury, 2014;
Labhane & Das, 2015; King’wara, 2015; Jabbouri, 2016).
The negative effect of growth to dividend payout can be explained by the fact
that growing companies prefer to retain their earnings internally instead of
distributing to shareholders (Jabbouri, 2016). This could indicate that most of
the family-owned companies in Malaysia consist of growing companies, as
growing companies usually increase their investments to spurt more growth in
the company (Singhania & Gupta, 2012). However, investment is often
expensive while external financial is very costly, which force the company to
reduce other cash outflows. As the dividend is often reduced to increase their
investments, the high transaction cost for a growing company is postulated to
lower the dividend payout to the shareholders (Labhane & Das, 2015).
Another important finding was the negative effect of firm size on dividend
payout ratio. The negative influence of firm size on dividend payout ratio
contradicts the proposed hypothesis H4 in this study. However, the hypothesis
64
cannot be rejected as the effect was not significant. The result supports
previous findings from a few studies that connoted negative effect of firm size
to dividend payout in their sample companies (Ahmed & Javid, 2008; Waswa,
2013; King’wara, 2015). Interestingly, more studies also found positive
relationship between firm size and dividend payout (Al-Kuwari, 2009; Mehta,
2012; Maladjian & El Khoury, 2014; Forti et al., 2015; Labhane & Das, 2015;
Jabbouri, 2016).
The negative influence of firm size on dividend payout ratio in this study
reveals a concern on the existence of agency problem in family-owned
companies. The agency problem tends to proportionately increase with the
company size since size and insider ownership are commonly inversely related
(Hellstrom & Inagambaev, 2012).
The widespread group of shareholders in larger companies especially among
the public listed companies usually indicate small or no incentives by the
shareholders to supervise the managers. Hence, higher dividend is paid to
reduce the agency cost. However, the major shareholders of family-owned
companies in this study are mainly consisted of the family members in which
the management is also run by the family member themselves (Amran & Che
Ahmad, 2011; Ibrahim & Samad, 2011). Therefore, the managers of these
family-owned companies may not be focusing on paying higher dividend to
the shareholders as the control comes from the same family.
Finally, the regression analysis also reports another interesting finding whereas
the free cash flow has significant negative influence on the dividend payout
ratio. This makes the free cash flow as the significant determinant to dividend
65
payout ratio. The negative effect of free cash flow to dividend payout ratio
thus rejects the hypothesis H5 in this study. Apparently, this result contradicts
numerous studies that found positive effect of free cash flow to the dividend
payout ratio (Amidu & Abor, 2006; Al-Kuwari, 2009; Labhane & Das, 2015;
Issa et al., 2015; Echchabi & Azouzi, 2016). However, it is consistent with a
few studies which indeed found negative influence of free cash flow to
dividend payout (Fatemaian & Hooshyarzadeh, 2016; Jabbouri, 2016).
The premise that free cash flow should have positive effect to dividend payout
ratio is based on the agency conflict between managers and shareholders
pertaining to the decision on how to spend the free cash flow. The conflict
occurs as the shareholders tend to desire for higher dividends whereas the
managers prefer to retain the earnings in the event of excess free cash flow
(Al-Kuwari, 2009).
The dividend is seen as the method to alleviate the agency conflict by reducing
the free cash flow available to managers (Amidu & Abor, 2006). In this study,
the negative effect of free cash flow to dividend payout ratio suggests the
existence of high agency problem in family-owned companies which includes
investing the available cash to projects with least value and diversion. Jensen
(1986) highlighted that managers were reluctance to disgorge the free cash
flow to the investors and tended to entirely invest in the business.
66
This perspective might agree with the nature of family-owned companies as
the managers coming from the same family background are eager to use the
excess cash flow to unnecessarily expand the companies. This in turns requires
the family-owned companies to add value to their companies in term of proper
governance at the firm level as the company generates substantial free cash
flow.
5.4 Implication of Research
The result obtained from this research found that asset growth and free cash
flow were the significant determinants of dividend payout ratio for the entire
sample. Hence, the results provide information to the stakeholders such as
financial managers or shareholders regarding the general influence of the
company’s selected factors in the decision regarding the distribution of the
company income.
Besides, the results also highlight the approaches that have to be considered
while deciding the best and optimal dividend payout in balancing the company
future growth purpose and maximising the shareholders wealth. The negative
influence of free cash flow to the dividend payout ratio should alert the
shareholders of family-owned companies to adopt more proper governance.
With this, adoption of better governance will retain optimal amount of cash
flow for investment and business enhancement purpose while maximising the
shareholders’ wealth.

67
5.5 Recommendation of Future Research
Future endeavor may attempt the similar study on the public listed non-family
companies and compare the findings with the current research. This
comparison could be interesting since the structure of shares holding between
the two types of companies are different with family-owned companies in
which the family members act as the major shareholders. Therefore, it is
presumed that there will be deviation in the results obtained between the
family-owned and non-family companies.
Other than that, future study may also extent the research by comparing the
different determinants of dividend payout policy according to different sectors.
The comparison could extend the body of literature regarding dividend payout
ratio in Malaysia, as well as recognising the different factors that influence
dividend payout ratio in each sector.
It is also recommended that the replication of this study should include
additional variables as the possible determinants (independent variables). The
recommended variables include the industry or sector profiles, market-to-book
ratio, and tax payment or exemption. Many previous studies have included
these variables and found significant influences of these variables towards
dividend payout ratio. Since the findings from this study reveal that the five
factors constitute 31.3% of the variance in the dividend payout ratio, it is
undeniable that more factors are potentially the determinants of the dividend
payout ratio.

68
5.6 Conclusion of Study
This study attempts to identify the significant determinants of dividend payout
ratio in public listed family-owned companies from Bursa Malaysia during the
period between 2011 and 2015. The analysis of the study reveals that leverage,
asset growth, company size and free cash flow show significant negative
relationship with dividend payout ratio, whereas profitability on the other hand
shows positive but insignificant relationship with dividend payout ratio. The
regression results exhibit that only asset growth and free cash flow show
significant negative influence to dividend payout ratio.
The negative relationship between growth and dividend payout ratio indicates
the family-owned companies experienced high transaction cost within the five
financial years as the shareholders are confident with on their ability to share
company’s profit for its future growth. Meanwhile, negative effect of free cash
flow to dividend payout ratio may raise the alarm about serious agency
problems in the family-owned companies. In overall, both high transaction
cost and agency conflict in the family-owned companies may be reduced if the
companies adopt proper governance mechanisms. Good governance is
believed to provide control and optimise the spending of the generated cash
flow to attend both shareholders’ desire for wealth maximisation and
managers’ agendas for company’s future investments and business expansion.
As the Eview analysis gives the same result as SPSS, hence the SPSS is used
for this study.
69
REFERENCES Agyei, S.K. & Marfo-Yiadom, E. (2011). Dividend policy and bank
performance in Ghana. International Journal of Economics and Finance, 3 (4), 202-207.
Aharony, J. & Swary, I. (1980). Quarterly dividend and earnings
announcements and stockhloders’ returns: an empirical analysis. Journal of Finance, 35, 1-35.
Ahmad, H., & Javid, D. A. (2010). The Ownership structure and dividend
payout policy in Pakistan (Evidence from Karachi stock Exchange 100 Index). journal of Business Management and Economic Research , I (1), 58-69.
Ahmed, M.R. & Muktadir-Al-Mukit, D. (2014). Determinants of dividend
payout ratio: Evidence from Dhaka Stock Exchange. ASA University Review, 8 (2), 281-289.
Ahmed, S. & Murtza, H. (2015). Critical Analysis of the Factors Affecting the
Dividend Payout: Evidence from Pakistan. International Journal of Economics, Finance and Management Science, 3 (3), 204 – 212. doi: 10.11648/j.ijefm.20150303.17
Aivazian, V., Booth, L. & Cleary, S. (2003). Do emerging market firms follow
different dividend policies from US firms? Journal of Financial Research, 26(3), 371-387.
Al Shabibi, B. K., & Ramesh, G. (2011). An Empirical Study on the
Determinants of dividend policy in the UK. International Research Journal of Finance and Economics (80), 105-120.
Alahyari, A. (2014). Determinants of profitability in the airline industry: A
Comparison with Turkish Airlines. Tesis Sarjana, Eastern Mediterranean University.
Al-Kuwari, D. (2009). Determinants of the Dividend Policy in Emerging
Stock Exchanges: The Case of GCC Countries. Global Economy & Finance Journal, 2 (2), 38-63.
Alzomala, T.S.F., & Al-Khadhiri, A. (2013). Determination of dividend policy:
The evidence from Saudi Arabia. International Journal of Business and Social Science, 4 (1), 181-192.
Amemiya, T. (1985). Advanced Econometrics. Cambridge MA: Harvard
University Press. Amidu, M., & Abor, J. (2006). Determinants of dividend payout ratios in
Ghana. The Journal of Risk Finance, 7 (2), 136-145.
70
Amidu, M., & Abor, J. (2006). Determinants of Dividend Payout Ratios in Ghana. Journal of Risk and Finance , VII, 136-145.
Amran, N.A., & Che Ahmad, A. (2011). Board Mechanisms and malaysian
family companies performance. Asian Journal of Accounting Governance, 26, 15–26
Ang, A., & Bekaert, G. (2006). Stock Return Predictability: Is it There? The
Review of Financial Studies, 20 (3), 651-707. Anil , K., & Kapoor, S. (2008). Determinants of Dividend Payout Ratios-A
Study of Indian Information Technology Sector. International Research Journal of Finance and Economics (15), 63-71.
Anil, K., & Kapoor, S. (2008). Determinants of Dividend Payout Ratios - a
Study of Indian Information Technology Sector. International Research Journal of Finance and Economics (15).
Annuar, M. N. & Shamsher, M. (1993). The dividend and earnings behavior of
firms on the Kuala Lumpur Stock Exchange. Pertanika Journal of Social Sciences and Humanities, 1(2), 171-177.
Annuar, M.N. & Shamsher, M. (1993). The dividend and earnings behaviour
of firms on the Kuala Lumpur Stock Exchange. Pertanika J. Soc. Sci & Hum., 1 (2), 171-177.
Arif, A., & Akbar, F. (2013). Determinants of Dividend Policy: A Sectoral
Analysis from Pakistan. International Journal of Business and Behavioral Sciences, 3 (9), 16-33.
Baker, H. K. (2009). Dividends and Dividend Policy: An Overview, in
Dividends and Dividend Policy. Hoboken, NJ: John Wiley & Sons, Inc. Baker, H. K., Farrelly, G. E. & Edelman, R. B. (1985). A survey of
management views of dividend policy. Financial Management, 14(3), 78-84.
Baker. H. K. & Powell, G. E. (2000). Determinants of corporate dividend
policy: A survey of NYSE firms. Financial Practice and Education, 10, 29-40.
Biermann, L. (2006). An investigation into stock market predictions using
neural networks applied to fundamental financial data. Research Report, University of Bath.
Black, F. (1976). The dividend puzzle. Journal of Portfolio Management, 2
(2), 5-8. Brealey, R. A., Myers, S. C., & Allen, F. (2008). Principles of Corporate
Finance. (9th ed). New York: McGraw-Hill Education.
71
Brechner, R. & Bergerman, G. (2014). Contemporary Mathematics for business and consumers (7th ed.). Stamford, USA: Cengage Learning.
Brigham, E. F., & Houston, J. F. (2011). Fundamentals of Financial
Management. (7th ed). Mason: South-Western. Echchabi, A. & Azouzi, D. (2016). Determinants of dividend payout ratios in
Tunusia: Insights in light of the Jasmine Revolution. Journal of Accounting, Finance and Auditing Studies, 2 (1), 1-13.
Fatemian, F. & Hooshyarzadeh, M. (2016). Role of dividend policy
determinants in multinational and domestic companies, evidence from Iran. Problems and Perspectives in Management, 14(3-si), 332 – 340. doi:10.21511/ppm.14(3-si).2016.05.
Forti, C.A.B., Peixoto, F.M., & Alves, D.L. (2015). Determinant factors of
dividend payments in Brazil. R. Cont. Fin., 26 (68), 167 – 180. Gill., A., Biger, N. & Tiberwala, R. (2010). Determinants of dividend payout
ratios: Evidence from United States. The Open Business Journal, 3, 8-14.
Hair, J.F, Black, W.C, Babin, B.J, & Anderson, R.E. (2010). Multivariate Data
Analysis, A Global Perspective (7th ed.). New Jersey: Pearson. Hatta, A.J. (2002). Faktor-Faktor yang Mempengaruhi Kebijakan Deviden:
Investigasi Pengaruh Teori Stakeholder. JAAI, 6 (2). He, X., Li., M., Shi, J., & Twite, G. (2009). Determinants of Dividend Policy
in Chinese Firms: Cash versus Stock Dividends. Journal of Corporate Finance Special Conference on Emerging Markets, 1 – 41.
Hellstrom, G. & Inagambaev, G. (2012). Determinants of divident payout
ratios: A study of Swedish Large and Medium caps. Umea School of Business and Economics, Umea University.
Ibrahim, H., & Samad, F. (2011). Agency costs , corporate governance
mechanisms and performance of public listed family firms in Malaysia. South Africa Journal Business Management, 42(3), 17–26.
Issa, A.I.F. (2015). The Determinants of Dividend Policy: Evidence from
Malaysian Firms. Research Journal of Finance and Accounting, 6 (18), 69-86.
Jabbouri, I. (2016). Determinants of corporate dividend policy in emerging
markets: Evidence from MENA stock markets. Research in International Business and Finance, 37, 283 – 298. Doi: 10.1016/j.ribaf.2016.01.018
72
Jozwiak, B.K. (2015). Determinants of Dividend Policy: Evidence from Polish Listed Companies. Procedia Economica and Finance, 23, 473-477.
Keown, A. J., Martin, J. D., Petty, J. W., & Scott, D. F. (2007). Foundations of
Finance: The Logic and Practice of Financial Management. (6th ed). London: Pearson Prentice Hall.
Khan, F.A. & Ahmad, N. (2017). An empirical study of phamaceutical
companies of Pakistan Stock Exchange (PSX). Journal of Financial Studies & Research, 2017 (2017), 1-16.
Kingwara, R. (2015). Determinants of dividend payout ratios in Kenya.
Research Journal of Finance and Accounting, 6 (1), 48-51. Labhane, N.B. & Das, R.C. (2015). Determinants of dividend payout ratio:
Evidence from Indian companies. Business and Economic Research, 5 (2), 217-241.
Linter, J. (1956). Distribution of incomes of corporations among dividends,
retained earnings and taxes. American Economic Review, 46 (2), 97-113.
Liu, S. & Hu, Y. (2005). Empirical analysis of cash dividend payment in
Chinese listed companies. Nature and Science, 3(1), 65-70. Maladjian, C. & El Khoury, R. (2014). Determinants of the dividend policy:
An empirical study on the Lebanese listed banks. International Journal of Economics and Finance, 6 (4), 240-256.
Mckenna, H., Hasson, F. Keeney, S. (2010). Survey. Wiley Blackwell:
Oxford. Mehta, A. (2012). An empirical analysis of determinants of dividend policy -
Evidence from the UAE Companies. Global Review of Accounting and Finance, 3 (1), 18-31.
Miller, M. H., & Modigliani, F. (1961). Dividend Policy, Growth, and the
Valuation of Shares. The Journal of Business , XXXIV (4), 411-433. Mistry, D. S. (2010). Determinants of Dividend Payout Ratio: A firm Level
Study of Major Pharma Players in India. The NEHU Journal , VIII (2). Mohamed, N., Hui, W. S., Omar, N. H., Rahman, R. A., Mastuki, N., Azis, M.
A., et al. (2008). Empirical analysis of determinants of dividend payment: Profitability and liquidity.
Musiega, M.G., Alala, O.B., Douglas, M., Christopher, M.O., & Robert, E.
(2013) Determinants of dividend payout policy among non-financial firms on Nairobi Securities Exchange, Kenya. International Journal of Scientific & Technology Research, 2 (10), 253-266.
73
Norhayati, M. (2005). Information signalling and dividend policies in Malaysia. Unpublished Ph.D. Thesis, Universiti Putra Malaysia.
Normah, O., Rashidah, A. R., Wee, S. H., Nor’azam, M., Norhayati, M., Wan
Azmimi, W. M., & Maz Ainy, A. A. (2006). Dividend survey 2006. Kuala Lumpur: MSWG and UiTM.
Nuhu, E., Musah, A. & Senyo, D.B. (2014). Determinants of dividend payout
of financial firms and non-financial firms in Ghana. International Journal of Academic Research in Accounting, Finance and Management Sciences, 4 (3), 109-118.
Pallant, J (2016) SPSS: Survival Manual (6th ed). Berkshire: McGraw Hill. Pandey, I. M., (2008). Financial Management. Delhi, India: UBS Publishers’
Modern Printers. Penman, S. (2009). Accounting for intangible assets: There is also an income
statement. Abacus, 45, 359-371. Rehman, A. & Takumi, H. (2012). Determinants of dividend payout ratio:
Evidence from Karachi Stock Exchange (KSE). Journal of Contemporary Issues in Business Research, 1 (1), 20-27.
Sekaran, U., & Bougie, R. (2016). Research methods for business: A skill
building approach (7th ed.). United Kingdom: John Wiley and Sons. Seneque, P. J. C. (1978). A review of factors affecting the dividend policy of
the firm. The Investment Analysts Journal, 12, 8–17. Singhania, M., & Gupta, A. (2012). Determinants of corporate dividend
policy: A Tobit model approach. Vision, 16 (3), 153-162. DOI: 10.1177/0972262912460152
Waswa, C.W. (2013). Analysis of determinants of dividend payout by
agricultural firms listed in the Nairobi Security Exchange. Master’s Thesis, School of Business, Kenyatta University.
Zaman, S. (2014). Dividend policy determinants of a private commercial bank
in Bangladesh: Which is the strongest, Profitability, Growth, or Size? World Journal of Social Sciences, 4 (3), 117-125.
Zameer, H., Rasool, S., Iqbal, S. & Arshad, U. (2013). Determinants of
dividend policy: A case of banking sector in Pakistan. Middle-East Journal of Scientific Research, 18 (3), 410-424. DOI: 10.5829/idosi.mejsr.2013.18.3.12200
74
APPENDIXES
A Correlation
B Means
C Regression
D Descriptive Analysis
E List of Main Board Company in Malaysia
E Family-Owned Company's Data from 2011 until 2015
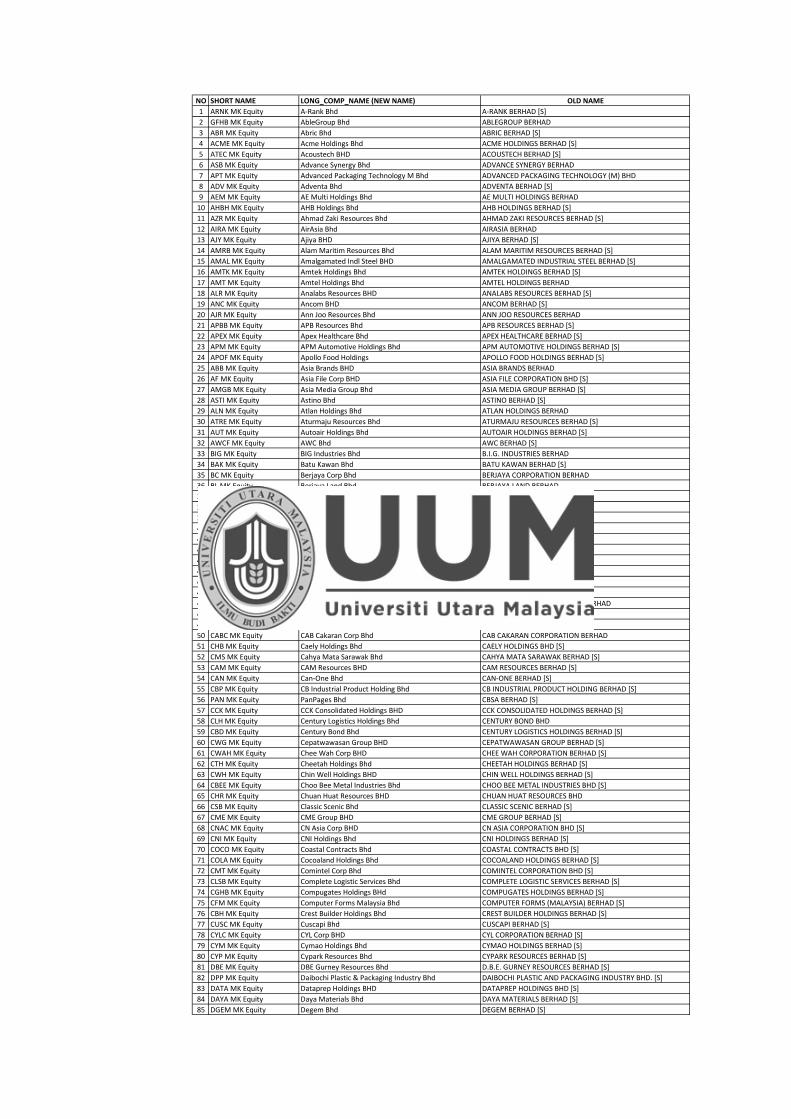
NO SHORT NAME LONG_COMP_NAME (NEW NAME) OLD NAME
1 ARNK MK Equity A-Rank Bhd A-RANK BERHAD [S]
2 GFHB MK Equity AbleGroup Bhd ABLEGROUP BERHAD
3 ABR MK Equity Abric Bhd ABRIC BERHAD [S]
4 ACME MK Equity Acme Holdings Bhd ACME HOLDINGS BERHAD [S]
5 ATEC MK Equity Acoustech BHD ACOUSTECH BERHAD [S]
6 ASB MK Equity Advance Synergy Bhd ADVANCE SYNERGY BERHAD
7 APT MK Equity Advanced Packaging Technology M Bhd ADVANCED PACKAGING TECHNOLOGY (M) BHD
8 ADV MK Equity Adventa Bhd ADVENTA BERHAD [S]
9 AEM MK Equity AE Multi Holdings Bhd AE MULTI HOLDINGS BERHAD
10 AHBH MK Equity AHB Holdings Bhd AHB HOLDINGS BERHAD [S]
11 AZR MK Equity Ahmad Zaki Resources Bhd AHMAD ZAKI RESOURCES BERHAD [S]
12 AIRA MK Equity AirAsia Bhd AIRASIA BERHAD
13 AJY MK Equity Ajiya BHD AJIYA BERHAD [S]
14 AMRB MK Equity Alam Maritim Resources Bhd ALAM MARITIM RESOURCES BERHAD [S]
15 AMAL MK Equity Amalgamated Indl Steel BHD AMALGAMATED INDUSTRIAL STEEL BERHAD [S]
16 AMTK MK Equity Amtek Holdings Bhd AMTEK HOLDINGS BERHAD [S]
17 AMT MK Equity Amtel Holdings Bhd AMTEL HOLDINGS BERHAD
18 ALR MK Equity Analabs Resources BHD ANALABS RESOURCES BERHAD [S]
19 ANC MK Equity Ancom BHD ANCOM BERHAD [S]
20 AJR MK Equity Ann Joo Resources Bhd ANN JOO RESOURCES BERHAD
21 APBB MK Equity APB Resources Bhd APB RESOURCES BERHAD [S]
22 APEX MK Equity Apex Healthcare Bhd APEX HEALTHCARE BERHAD [S]
23 APM MK Equity APM Automotive Holdings Bhd APM AUTOMOTIVE HOLDINGS BERHAD [S]
24 APOF MK Equity Apollo Food Holdings APOLLO FOOD HOLDINGS BERHAD [S]
25 ABB MK Equity Asia Brands BHD ASIA BRANDS BERHAD
26 AF MK Equity Asia File Corp BHD ASIA FILE CORPORATION BHD [S]
27 AMGB MK Equity Asia Media Group Bhd ASIA MEDIA GROUP BERHAD [S]
28 ASTI MK Equity Astino Bhd ASTINO BERHAD [S]
29 ALN MK Equity Atlan Holdings Bhd ATLAN HOLDINGS BERHAD
30 ATRE MK Equity Aturmaju Resources Bhd ATURMAJU RESOURCES BERHAD [S]
31 AUT MK Equity Autoair Holdings Bhd AUTOAIR HOLDINGS BERHAD [S]
32 AWCF MK Equity AWC Bhd AWC BERHAD [S]
33 BIG MK Equity BIG Industries Bhd B.I.G. INDUSTRIES BERHAD
34 BAK MK Equity Batu Kawan Bhd BATU KAWAN BERHAD [S]
35 BC MK Equity Berjaya Corp Bhd BERJAYA CORPORATION BERHAD
36 BL MK Equity Berjaya Land Bhd BERJAYA LAND BERHAD
37 BMED MK Equity Berjaya Media Bhd BERJAYA MEDIA BERHAD [S]
38 BST MK Equity Berjaya Sports Toto Bhd BERJAYA SPORTS TOTO BERHAD
39 BHSI MK Equity BHS Industries Bhd BHS INDUSTRIES BERHAD [S]
40 BGB MK Equity Bina Goodyear Bhd BINA GOODYEAR BERHAD [S]
41 BIN MK Equity Bina Puri Holdings BHD BINA PURI HOLDINGS BHD
42 BLDP MK Equity BLD Plantation Bhd BLD PLANTATION BHD. [S]
43 BOKG MK Equity Boon Koon Group Bhd BOON KOON GROUP BERHAD
44 BPP MK Equity BP Plastics Holding Bhd BP PLASTICS HOLDING BHD [S]
45 BRAH MK Equity Brahim's Holdings Bhd BRAHIM'S HOLDINGS BERHAD [S]
46 BREM MK Equity Brem Holding Bhd BREM HOLDING BERHAD
47 BPKG MK Equity Bright Packaging Industry Bhd BRIGHT PACKAGING INDUSTRY BERHAD
48 BSLC MK Equity BSL Corp Bhd BSL CORPORATION BERHAD [S]
49 BTM MK Equity BTM Resources BHD BTM RESOURCES BERHAD [S]
50 CABC MK Equity CAB Cakaran Corp Bhd CAB CAKARAN CORPORATION BERHAD
51 CHB MK Equity Caely Holdings Bhd CAELY HOLDINGS BHD [S]
52 CMS MK Equity Cahya Mata Sarawak Bhd CAHYA MATA SARAWAK BERHAD [S]
53 CAM MK Equity CAM Resources BHD CAM RESOURCES BERHAD [S]
54 CAN MK Equity Can-One Bhd CAN-ONE BERHAD [S]
55 CBP MK Equity CB Industrial Product Holding Bhd CB INDUSTRIAL PRODUCT HOLDING BERHAD [S]
56 PAN MK Equity PanPages Bhd CBSA BERHAD [S]
57 CCK MK Equity CCK Consolidated Holdings BHD CCK CONSOLIDATED HOLDINGS BERHAD [S]
58 CLH MK Equity Century Logistics Holdings Bhd CENTURY BOND BHD
59 CBD MK Equity Century Bond Bhd CENTURY LOGISTICS HOLDINGS BERHAD [S]
60 CWG MK Equity Cepatwawasan Group BHD CEPATWAWASAN GROUP BERHAD [S]
61 CWAH MK Equity Chee Wah Corp BHD CHEE WAH CORPORATION BERHAD [S]
62 CTH MK Equity Cheetah Holdings Bhd CHEETAH HOLDINGS BERHAD [S]
63 CWH MK Equity Chin Well Holdings BHD CHIN WELL HOLDINGS BERHAD [S]
64 CBEE MK Equity Choo Bee Metal Industries Bhd CHOO BEE METAL INDUSTRIES BHD [S]
65 CHR MK Equity Chuan Huat Resources BHD CHUAN HUAT RESOURCES BHD
66 CSB MK Equity Classic Scenic Bhd CLASSIC SCENIC BERHAD [S]
67 CME MK Equity CME Group BHD CME GROUP BERHAD [S]
68 CNAC MK Equity CN Asia Corp BHD CN ASIA CORPORATION BHD [S]
69 CNI MK Equity CNI Holdings Bhd CNI HOLDINGS BERHAD [S]
70 COCO MK Equity Coastal Contracts Bhd COASTAL CONTRACTS BHD [S]
71 COLA MK Equity Cocoaland Holdings Bhd COCOALAND HOLDINGS BERHAD [S]
72 CMT MK Equity Comintel Corp Bhd COMINTEL CORPORATION BHD [S]
73 CLSB MK Equity Complete Logistic Services Bhd COMPLETE LOGISTIC SERVICES BERHAD [S]
74 CGHB MK Equity Compugates Holdings BHd COMPUGATES HOLDINGS BERHAD [S]
75 CFM MK Equity Computer Forms Malaysia Bhd COMPUTER FORMS (MALAYSIA) BERHAD [S]
76 CBH MK Equity Crest Builder Holdings Bhd CREST BUILDER HOLDINGS BERHAD [S]
77 CUSC MK Equity Cuscapi Bhd CUSCAPI BERHAD [S]
78 CYLC MK Equity CYL Corp BHD CYL CORPORATION BERHAD [S]
79 CYM MK Equity Cymao Holdings Bhd CYMAO HOLDINGS BERHAD [S]
80 CYP MK Equity Cypark Resources Bhd CYPARK RESOURCES BERHAD [S]
81 DBE MK Equity DBE Gurney Resources Bhd D.B.E. GURNEY RESOURCES BERHAD [S]
82 DPP MK Equity Daibochi Plastic & Packaging Industry Bhd DAIBOCHI PLASTIC AND PACKAGING INDUSTRY BHD. [S]
83 DATA MK Equity Dataprep Holdings BHD DATAPREP HOLDINGS BHD [S]
84 DAYA MK Equity Daya Materials Bhd DAYA MATERIALS BERHAD [S]
85 DGEM MK Equity Degem Bhd DEGEM BERHAD [S]
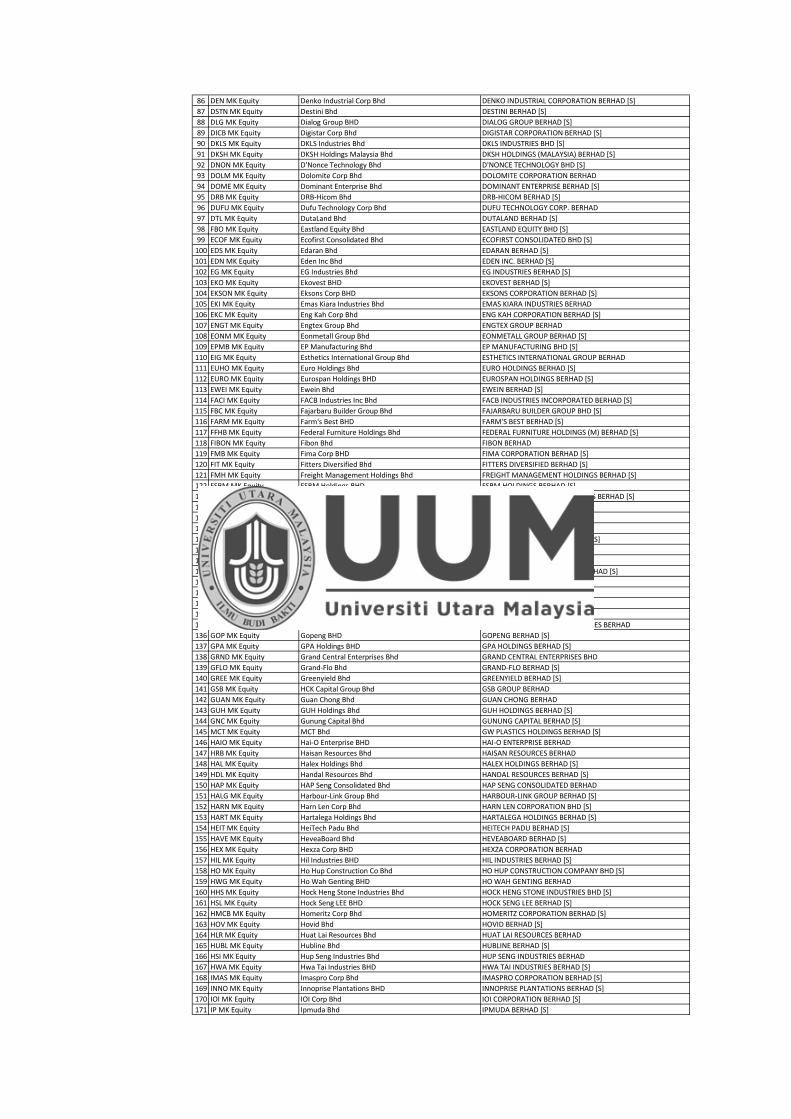
86 DEN MK Equity Denko Industrial Corp Bhd DENKO INDUSTRIAL CORPORATION BERHAD [S]
87 DSTN MK Equity Destini Bhd DESTINI BERHAD [S]
88 DLG MK Equity Dialog Group BHD DIALOG GROUP BERHAD [S]
89 DICB MK Equity Digistar Corp Bhd DIGISTAR CORPORATION BERHAD [S]
90 DKLS MK Equity DKLS Industries Bhd DKLS INDUSTRIES BHD [S]
91 DKSH MK Equity DKSH Holdings Malaysia Bhd DKSH HOLDINGS (MALAYSIA) BERHAD [S]
92 DNON MK Equity D'Nonce Technology Bhd D'NONCE TECHNOLOGY BHD [S]
93 DOLM MK Equity Dolomite Corp Bhd DOLOMITE CORPORATION BERHAD
94 DOME MK Equity Dominant Enterprise Bhd DOMINANT ENTERPRISE BERHAD [S]
95 DRB MK Equity DRB-Hicom Bhd DRB-HICOM BERHAD [S]
96 DUFU MK Equity Dufu Technology Corp Bhd DUFU TECHNOLOGY CORP. BERHAD
97 DTL MK Equity DutaLand Bhd DUTALAND BERHAD [S]
98 FBO MK Equity Eastland Equity Bhd EASTLAND EQUITY BHD [S]
99 ECOF MK Equity Ecofirst Consolidated Bhd ECOFIRST CONSOLIDATED BHD [S]
100 EDS MK Equity Edaran Bhd EDARAN BERHAD [S]
101 EDN MK Equity Eden Inc Bhd EDEN INC. BERHAD [S]
102 EG MK Equity EG Industries Bhd EG INDUSTRIES BERHAD [S]
103 EKO MK Equity Ekovest BHD EKOVEST BERHAD [S]
104 EKSON MK Equity Eksons Corp BHD EKSONS CORPORATION BERHAD [S]
105 EKI MK Equity Emas Kiara Industries Bhd EMAS KIARA INDUSTRIES BERHAD
106 EKC MK Equity Eng Kah Corp Bhd ENG KAH CORPORATION BERHAD [S]
107 ENGT MK Equity Engtex Group Bhd ENGTEX GROUP BERHAD
108 EONM MK Equity Eonmetall Group Bhd EONMETALL GROUP BERHAD [S]
109 EPMB MK Equity EP Manufacturing Bhd EP MANUFACTURING BHD [S]
110 EIG MK Equity Esthetics International Group Bhd ESTHETICS INTERNATIONAL GROUP BERHAD
111 EUHO MK Equity Euro Holdings Bhd EURO HOLDINGS BERHAD [S]
112 EURO MK Equity Eurospan Holdings BHD EUROSPAN HOLDINGS BERHAD [S]
113 EWEI MK Equity Ewein Bhd EWEIN BERHAD [S]
114 FACI MK Equity FACB Industries Inc Bhd FACB INDUSTRIES INCORPORATED BERHAD [S]
115 FBC MK Equity Fajarbaru Builder Group Bhd FAJARBARU BUILDER GROUP BHD [S]
116 FARM MK Equity Farm's Best BHD FARM'S BEST BERHAD [S]
117 FFHB MK Equity Federal Furniture Holdings Bhd FEDERAL FURNITURE HOLDINGS (M) BERHAD [S]
118 FIBON MK Equity Fibon Bhd FIBON BERHAD
119 FMB MK Equity Fima Corp BHD FIMA CORPORATION BERHAD [S]
120 FIT MK Equity Fitters Diversified Bhd FITTERS DIVERSIFIED BERHAD [S]
121 FMH MK Equity Freight Management Holdings Bhd FREIGHT MANAGEMENT HOLDINGS BERHAD [S]
122 FSBM MK Equity FSBM Holdings BHD FSBM HOLDINGS BERHAD [S]
123 PRG MK Equity PRG Holdings BHD FURNIWEB INDUSTRIAL PRODUCTS BERHAD [S]
124 KPG MK Equity Kerjaya Prospek Group Bhd FUTUTECH BERHAD
125 GADG MK Equity Gadang Holdings BHD GADANG HOLDINGS BHD [S]
126 GDX MK Equity GD Express Carrier Bhd GD EXPRESS CARRIER BERHAD [S]
127 GSCB MK Equity Ge-Shen Corp Bhd GE-SHEN CORPORATION BERHAD [S]
128 GENT MK Equity Genting Bhd GENTING BERHAD
129 GHLS MK Equity GHL Systems Bhd GHL SYSTEMS BERHAD [S]
130 GTB MK Equity Globetronics Technology BHD GLOBETRONICS TECHNOLOGY BERHAD [S]
131 GBH MK Equity Goh Ban Huat Bhd GOH BAN HUAT BERHAD [S]
132 GLBH MK Equity Golden Land Bhd GOLDEN LAND BERHAD [S]
133 GPB MK Equity Golden Pharos BHD GOLDEN PHAROS BERHAD [S]
134 GOLD MK Equity Goldis Bhd GOLDIS BERHAD
135 GII MK Equity Goodway Integrated Industries Bhd GOODWAY INTEGRATED INDUSTRIES BERHAD
136 GOP MK Equity Gopeng BHD GOPENG BERHAD [S]
137 GPA MK Equity GPA Holdings BHD GPA HOLDINGS BERHAD [S]
138 GRND MK Equity Grand Central Enterprises Bhd GRAND CENTRAL ENTERPRISES BHD
139 GFLO MK Equity Grand-Flo Bhd GRAND-FLO BERHAD [S]
140 GREE MK Equity Greenyield Bhd GREENYIELD BERHAD [S]
141 GSB MK Equity HCK Capital Group Bhd GSB GROUP BERHAD
142 GUAN MK Equity Guan Chong Bhd GUAN CHONG BERHAD
143 GUH MK Equity GUH Holdings Bhd GUH HOLDINGS BERHAD [S]
144 GNC MK Equity Gunung Capital Bhd GUNUNG CAPITAL BERHAD [S]
145 MCT MK Equity MCT Bhd GW PLASTICS HOLDINGS BERHAD [S]
146 HAIO MK Equity Hai-O Enterprise BHD HAI-O ENTERPRISE BERHAD
147 HRB MK Equity Haisan Resources Bhd HAISAN RESOURCES BERHAD
148 HAL MK Equity Halex Holdings Bhd HALEX HOLDINGS BERHAD [S]
149 HDL MK Equity Handal Resources Bhd HANDAL RESOURCES BERHAD [S]
150 HAP MK Equity HAP Seng Consolidated Bhd HAP SENG CONSOLIDATED BERHAD
151 HALG MK Equity Harbour-Link Group Bhd HARBOUR-LINK GROUP BERHAD [S]
152 HARN MK Equity Harn Len Corp Bhd HARN LEN CORPORATION BHD [S]
153 HART MK Equity Hartalega Holdings Bhd HARTALEGA HOLDINGS BERHAD [S]
154 HEIT MK Equity HeiTech Padu Bhd HEITECH PADU BERHAD [S]
155 HAVE MK Equity HeveaBoard Bhd HEVEABOARD BERHAD [S]
156 HEX MK Equity Hexza Corp BHD HEXZA CORPORATION BERHAD
157 HIL MK Equity Hil Industries BHD HIL INDUSTRIES BERHAD [S]
158 HO MK Equity Ho Hup Construction Co Bhd HO HUP CONSTRUCTION COMPANY BHD [S]
159 HWG MK Equity Ho Wah Genting BHD HO WAH GENTING BERHAD
160 HHS MK Equity Hock Heng Stone Industries Bhd HOCK HENG STONE INDUSTRIES BHD [S]
161 HSL MK Equity Hock Seng LEE BHD HOCK SENG LEE BERHAD [S]
162 HMCB MK Equity Homeritz Corp Bhd HOMERITZ CORPORATION BERHAD [S]
163 HOV MK Equity Hovid Bhd HOVID BERHAD [S]
164 HLR MK Equity Huat Lai Resources Bhd HUAT LAI RESOURCES BERHAD
165 HUBL MK Equity Hubline Bhd HUBLINE BERHAD [S]
166 HSI MK Equity Hup Seng Industries Bhd HUP SENG INDUSTRIES BERHAD
167 HWA MK Equity Hwa Tai Industries BHD HWA TAI INDUSTRIES BERHAD [S]
168 IMAS MK Equity Imaspro Corp Bhd IMASPRO CORPORATION BERHAD [S]
169 INNO MK Equity Innoprise Plantations BHD INNOPRISE PLANTATIONS BERHAD [S]
170 IOI MK Equity IOI Corp Bhd IOI CORPORATION BERHAD [S]
171 IP MK Equity Ipmuda Bhd IPMUDA BERHAD [S]
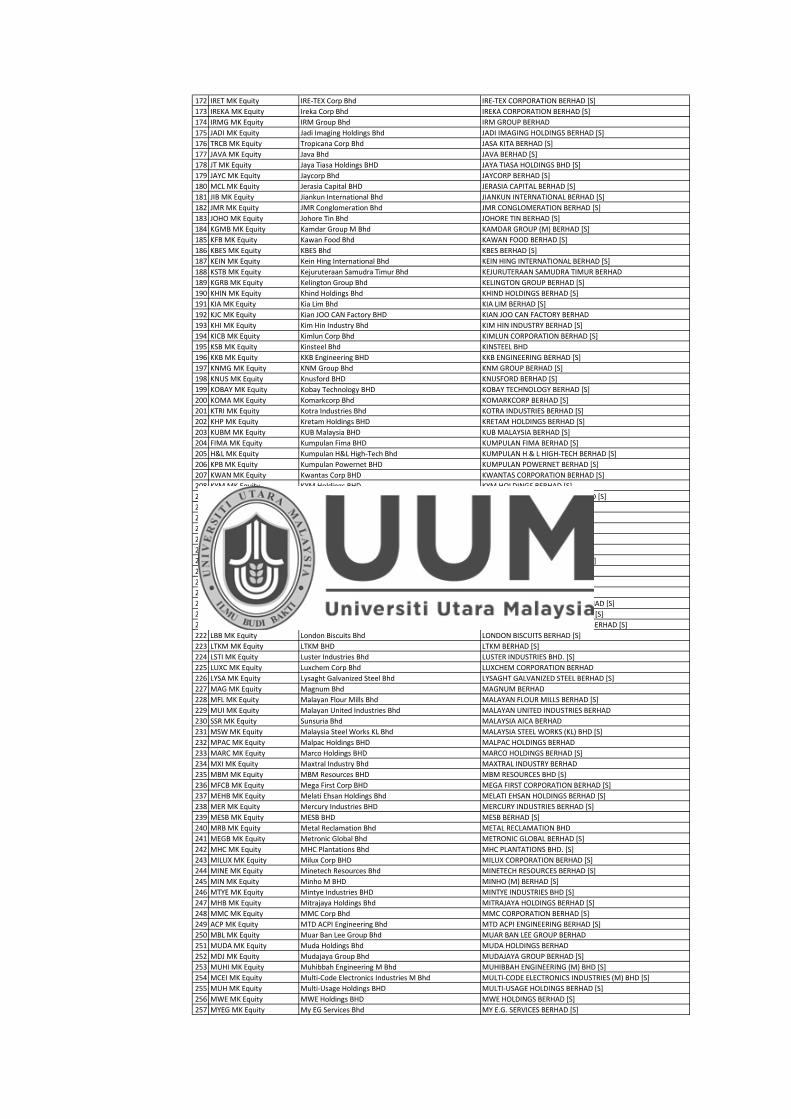
172 IRET MK Equity IRE-TEX Corp Bhd IRE-TEX CORPORATION BERHAD [S]
173 IREKA MK Equity Ireka Corp Bhd IREKA CORPORATION BERHAD [S]
174 IRMG MK Equity IRM Group Bhd IRM GROUP BERHAD
175 JADI MK Equity Jadi Imaging Holdings Bhd JADI IMAGING HOLDINGS BERHAD [S]
176 TRCB MK Equity Tropicana Corp Bhd JASA KITA BERHAD [S]
177 JAVA MK Equity Java Bhd JAVA BERHAD [S]
178 JT MK Equity Jaya Tiasa Holdings BHD JAYA TIASA HOLDINGS BHD [S]
179 JAYC MK Equity Jaycorp Bhd JAYCORP BERHAD [S]
180 MCL MK Equity Jerasia Capital BHD JERASIA CAPITAL BERHAD [S]
181 JIB MK Equity Jiankun International Bhd JIANKUN INTERNATIONAL BERHAD [S]
182 JMR MK Equity JMR Conglomeration Bhd JMR CONGLOMERATION BERHAD [S]
183 JOHO MK Equity Johore Tin Bhd JOHORE TIN BERHAD [S]
184 KGMB MK Equity Kamdar Group M Bhd KAMDAR GROUP (M) BERHAD [S]
185 KFB MK Equity Kawan Food Bhd KAWAN FOOD BERHAD [S]
186 KBES MK Equity KBES Bhd KBES BERHAD [S]
187 KEIN MK Equity Kein Hing International Bhd KEIN HING INTERNATIONAL BERHAD [S]
188 KSTB MK Equity Kejuruteraan Samudra Timur Bhd KEJURUTERAAN SAMUDRA TIMUR BERHAD
189 KGRB MK Equity Kelington Group Bhd KELINGTON GROUP BERHAD [S]
190 KHIN MK Equity Khind Holdings Bhd KHIND HOLDINGS BERHAD [S]
191 KIA MK Equity Kia Lim Bhd KIA LIM BERHAD [S]
192 KJC MK Equity Kian JOO CAN Factory BHD KIAN JOO CAN FACTORY BERHAD
193 KHI MK Equity Kim Hin Industry Bhd KIM HIN INDUSTRY BERHAD [S]
194 KICB MK Equity Kimlun Corp Bhd KIMLUN CORPORATION BERHAD [S]
195 KSB MK Equity Kinsteel Bhd KINSTEEL BHD
196 KKB MK Equity KKB Engineering BHD KKB ENGINEERING BERHAD [S]
197 KNMG MK Equity KNM Group Bhd KNM GROUP BERHAD [S]
198 KNUS MK Equity Knusford BHD KNUSFORD BERHAD [S]
199 KOBAY MK Equity Kobay Technology BHD KOBAY TECHNOLOGY BERHAD [S]
200 KOMA MK Equity Komarkcorp Bhd KOMARKCORP BERHAD [S]
201 KTRI MK Equity Kotra Industries Bhd KOTRA INDUSTRIES BERHAD [S]
202 KHP MK Equity Kretam Holdings BHD KRETAM HOLDINGS BERHAD [S]
203 KUBM MK Equity KUB Malaysia BHD KUB MALAYSIA BERHAD [S]
204 FIMA MK Equity Kumpulan Fima BHD KUMPULAN FIMA BERHAD [S]
205 H&L MK Equity Kumpulan H&L High-Tech Bhd KUMPULAN H & L HIGH-TECH BERHAD [S]
206 KPB MK Equity Kumpulan Powernet BHD KUMPULAN POWERNET BERHAD [S]
207 KWAN MK Equity Kwantas Corp BHD KWANTAS CORPORATION BERHAD [S]
208 KYM MK Equity KYM Holdings BHD KYM HOLDINGS BERHAD [S]
209 LATI MK Equity Latitude Tree Holdings BHD LATITUDE TREE HOLDINGS BERHAD [S]
210 LAY MK Equity Lay Hong BHD LAY HONG BERHAD [S]
211 LBA MK Equity LB Aluminium BHD LB ALUMINIUM BERHAD [S]
212 LDST MK Equity Leader Steel Holdings BHD LEADER STEEL HOLDINGS BERHAD
213 LDB MK Equity Lebtech Bhd LEBTECH BERHAD [S]
214 LSKG MK Equity Lee Swee Kiat Group Bhd LEE SWEE KIAT GROUP BERHAD [S]
215 LEN MK Equity LEN Cheong Holding BHD LEN CHEONG HOLDING BERHAD [S]
216 LFE MK Equity LFE Corp Bhd LFE CORPORATION BERHAD [S]
217 LHI MK Equity Lii Hen Industries BHD LII HEN INDUSTRIES BHD. [S]
218 LION MK Equity Lion Corp Bhd LION CORPORATION BERHAD
219 LDHB MK Equity Lion Diversified Holdings Bhd LION DIVERSIFIED HOLDINGS BERHAD [S]
220 POS MK Equity Lion Forest Industries Bhd LION FOREST INDUSTRIES BERHAD [S]
221 LLB MK Equity Lion Industries Corp Bhd LION INDUSTRIES CORPORATION BERHAD [S]
222 LBB MK Equity London Biscuits Bhd LONDON BISCUITS BERHAD [S]
223 LTKM MK Equity LTKM BHD LTKM BERHAD [S]
224 LSTI MK Equity Luster Industries Bhd LUSTER INDUSTRIES BHD. [S]
225 LUXC MK Equity Luxchem Corp Bhd LUXCHEM CORPORATION BERHAD
226 LYSA MK Equity Lysaght Galvanized Steel Bhd LYSAGHT GALVANIZED STEEL BERHAD [S]
227 MAG MK Equity Magnum Bhd MAGNUM BERHAD
228 MFL MK Equity Malayan Flour Mills Bhd MALAYAN FLOUR MILLS BERHAD [S]
229 MUI MK Equity Malayan United Industries Bhd MALAYAN UNITED INDUSTRIES BERHAD
230 SSR MK Equity Sunsuria Bhd MALAYSIA AICA BERHAD
231 MSW MK Equity Malaysia Steel Works KL Bhd MALAYSIA STEEL WORKS (KL) BHD [S]
232 MPAC MK Equity Malpac Holdings BHD MALPAC HOLDINGS BERHAD
233 MARC MK Equity Marco Holdings BHD MARCO HOLDINGS BERHAD [S]
234 MXI MK Equity Maxtral Industry Bhd MAXTRAL INDUSTRY BERHAD
235 MBM MK Equity MBM Resources BHD MBM RESOURCES BHD [S]
236 MFCB MK Equity Mega First Corp BHD MEGA FIRST CORPORATION BERHAD [S]
237 MEHB MK Equity Melati Ehsan Holdings Bhd MELATI EHSAN HOLDINGS BERHAD [S]
238 MER MK Equity Mercury Industries BHD MERCURY INDUSTRIES BERHAD [S]
239 MESB MK Equity MESB BHD MESB BERHAD [S]
240 MRB MK Equity Metal Reclamation Bhd METAL RECLAMATION BHD
241 MEGB MK Equity Metronic Global Bhd METRONIC GLOBAL BERHAD [S]
242 MHC MK Equity MHC Plantations Bhd MHC PLANTATIONS BHD. [S]
243 MILUX MK Equity Milux Corp BHD MILUX CORPORATION BERHAD [S]
244 MINE MK Equity Minetech Resources Bhd MINETECH RESOURCES BERHAD [S]
245 MIN MK Equity Minho M BHD MINHO (M) BERHAD [S]
246 MTYE MK Equity Mintye Industries BHD MINTYE INDUSTRIES BHD [S]
247 MHB MK Equity Mitrajaya Holdings Bhd MITRAJAYA HOLDINGS BERHAD [S]
248 MMC MK Equity MMC Corp Bhd MMC CORPORATION BERHAD [S]
249 ACP MK Equity MTD ACPI Engineering Bhd MTD ACPI ENGINEERING BERHAD [S]
250 MBL MK Equity Muar Ban Lee Group Bhd MUAR BAN LEE GROUP BERHAD
251 MUDA MK Equity Muda Holdings Bhd MUDA HOLDINGS BERHAD
252 MDJ MK Equity Mudajaya Group Bhd MUDAJAYA GROUP BERHAD [S]
253 MUHI MK Equity Muhibbah Engineering M Bhd MUHIBBAH ENGINEERING (M) BHD [S]
254 MCEI MK Equity Multi-Code Electronics Industries M Bhd MULTI-CODE ELECTRONICS INDUSTRIES (M) BHD [S]
255 MUH MK Equity Multi-Usage Holdings BHD MULTI-USAGE HOLDINGS BERHAD [S]
256 MWE MK Equity MWE Holdings BHD MWE HOLDINGS BERHAD [S]
257 MYEG MK Equity My EG Services Bhd MY E.G. SERVICES BERHAD [S]
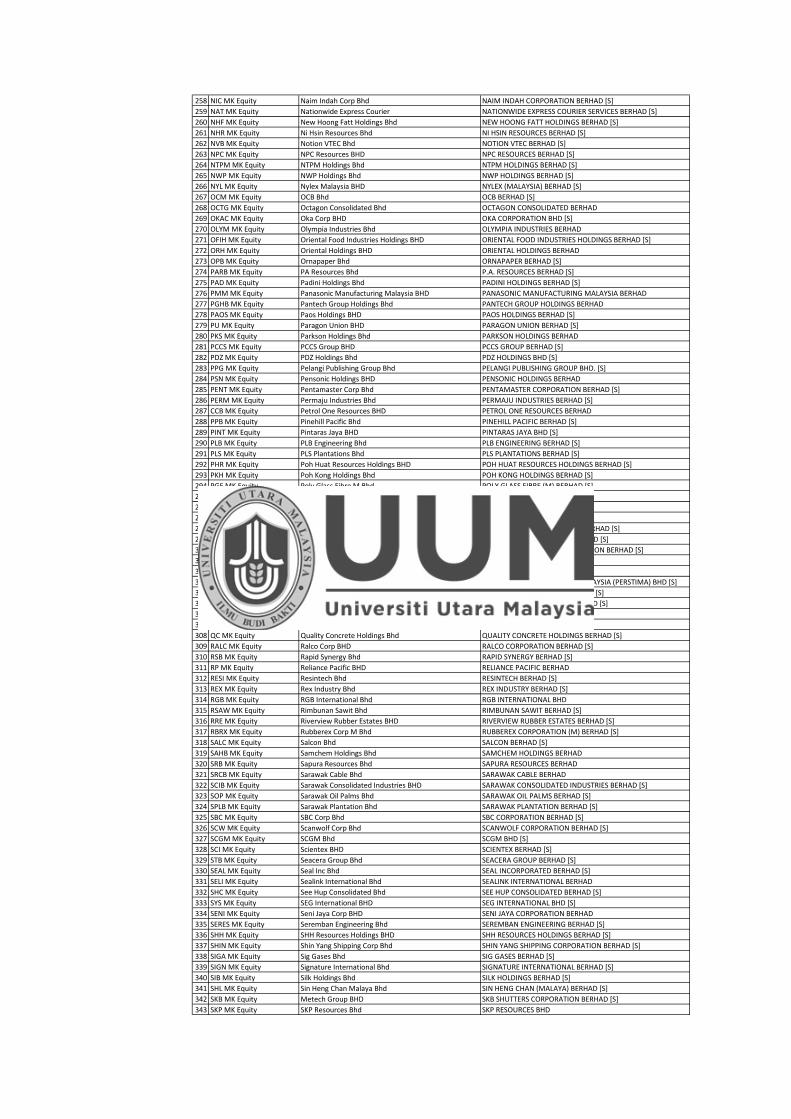
258 NIC MK Equity Naim Indah Corp Bhd NAIM INDAH CORPORATION BERHAD [S]
259 NAT MK Equity Nationwide Express Courier NATIONWIDE EXPRESS COURIER SERVICES BERHAD [S]
260 NHF MK Equity New Hoong Fatt Holdings Bhd NEW HOONG FATT HOLDINGS BERHAD [S]
261 NHR MK Equity Ni Hsin Resources Bhd NI HSIN RESOURCES BERHAD [S]
262 NVB MK Equity Notion VTEC Bhd NOTION VTEC BERHAD [S]
263 NPC MK Equity NPC Resources BHD NPC RESOURCES BERHAD [S]
264 NTPM MK Equity NTPM Holdings Bhd NTPM HOLDINGS BERHAD [S]
265 NWP MK Equity NWP Holdings Bhd NWP HOLDINGS BERHAD [S]
266 NYL MK Equity Nylex Malaysia BHD NYLEX (MALAYSIA) BERHAD [S]
267 OCM MK Equity OCB Bhd OCB BERHAD [S]
268 OCTG MK Equity Octagon Consolidated Bhd OCTAGON CONSOLIDATED BERHAD
269 OKAC MK Equity Oka Corp BHD OKA CORPORATION BHD [S]
270 OLYM MK Equity Olympia Industries Bhd OLYMPIA INDUSTRIES BERHAD
271 OFIH MK Equity Oriental Food Industries Holdings BHD ORIENTAL FOOD INDUSTRIES HOLDINGS BERHAD [S]
272 ORH MK Equity Oriental Holdings BHD ORIENTAL HOLDINGS BERHAD
273 OPB MK Equity Ornapaper Bhd ORNAPAPER BERHAD [S]
274 PARB MK Equity PA Resources Bhd P.A. RESOURCES BERHAD [S]
275 PAD MK Equity Padini Holdings Bhd PADINI HOLDINGS BERHAD [S]
276 PMM MK Equity Panasonic Manufacturing Malaysia BHD PANASONIC MANUFACTURING MALAYSIA BERHAD
277 PGHB MK Equity Pantech Group Holdings Bhd PANTECH GROUP HOLDINGS BERHAD
278 PAOS MK Equity Paos Holdings BHD PAOS HOLDINGS BERHAD [S]
279 PU MK Equity Paragon Union BHD PARAGON UNION BERHAD [S]
280 PKS MK Equity Parkson Holdings Bhd PARKSON HOLDINGS BERHAD
281 PCCS MK Equity PCCS Group BHD PCCS GROUP BERHAD [S]
282 PDZ MK Equity PDZ Holdings Bhd PDZ HOLDINGS BHD [S]
283 PPG MK Equity Pelangi Publishing Group Bhd PELANGI PUBLISHING GROUP BHD. [S]
284 PSN MK Equity Pensonic Holdings BHD PENSONIC HOLDINGS BERHAD
285 PENT MK Equity Pentamaster Corp Bhd PENTAMASTER CORPORATION BERHAD [S]
286 PERM MK Equity Permaju Industries Bhd PERMAJU INDUSTRIES BERHAD [S]
287 CCB MK Equity Petrol One Resources BHD PETROL ONE RESOURCES BERHAD
288 PPB MK Equity Pinehill Pacific Bhd PINEHILL PACIFIC BERHAD [S]
289 PINT MK Equity Pintaras Jaya BHD PINTARAS JAYA BHD [S]
290 PLB MK Equity PLB Engineering Bhd PLB ENGINEERING BERHAD [S]
291 PLS MK Equity PLS Plantations Bhd PLS PLANTATIONS BERHAD [S]
292 PHR MK Equity Poh Huat Resources Holdings BHD POH HUAT RESOURCES HOLDINGS BERHAD [S]
293 PKH MK Equity Poh Kong Holdings Bhd POH KONG HOLDINGS BERHAD [S]
294 PGF MK Equity Poly Glass Fibre M Bhd POLY GLASS FIBRE (M) BERHAD [S]
295 PEP MK Equity PPB Group Bhd PPB GROUP BERHAD [S]
296 PRESS MK Equity Press Metal Bhd PRESS METAL BERHAD
297 PRST MK Equity Prestar Resources Bhd PRESTAR RESOURCES BERHAD
298 PWP MK Equity Priceworth International Bhd PRICEWORTH INTERNATIONAL BERHAD [S]
299 PSIP MK Equity Prinsiptek Corp Bhd PRINSIPTEK CORPORATION BERHAD [S]
300 PICB MK Equity Progressive Impact Corp Bhd PROGRESSIVE IMPACT CORPORATION BERHAD [S]
301 PROL MK Equity Prolexus BHD PROLEXUS BERHAD [S]
302 PRTA MK Equity Protasco Bhd PROTASCO BERHAD [S]
303 PER MK Equity Perusahaan Sadur Timah Malaysia PERSTIMA Bhd PERUSAHAAN SADUR TIMAH MALAYSIA (PERSTIMA) BHD [S]
304 PP MK Equity Public Packages Holdings Bhd PUBLIC PACKAGES HOLDINGS BHD [S]
305 PNH MK Equity Puncak Niaga Holdings Bhd PUNCAK NIAGA HOLDINGS BERHAD [S]
306 PW MK Equity PWF Consolidated Bhd PW CONSOLIDATED BHD [S]
307 QLG MK Equity QL Resources Bhd QL RESOURCES BERHAD [S]
308 QC MK Equity Quality Concrete Holdings Bhd QUALITY CONCRETE HOLDINGS BERHAD [S]
309 RALC MK Equity Ralco Corp BHD RALCO CORPORATION BERHAD [S]
310 RSB MK Equity Rapid Synergy Bhd RAPID SYNERGY BERHAD [S]
311 RP MK Equity Reliance Pacific BHD RELIANCE PACIFIC BERHAD
312 RESI MK Equity Resintech Bhd RESINTECH BERHAD [S]
313 REX MK Equity Rex Industry Bhd REX INDUSTRY BERHAD [S]
314 RGB MK Equity RGB International Bhd RGB INTERNATIONAL BHD
315 RSAW MK Equity Rimbunan Sawit Bhd RIMBUNAN SAWIT BERHAD [S]
316 RRE MK Equity Riverview Rubber Estates BHD RIVERVIEW RUBBER ESTATES BERHAD [S]
317 RBRX MK Equity Rubberex Corp M Bhd RUBBEREX CORPORATION (M) BERHAD [S]
318 SALC MK Equity Salcon Bhd SALCON BERHAD [S]
319 SAHB MK Equity Samchem Holdings Bhd SAMCHEM HOLDINGS BERHAD
320 SRB MK Equity Sapura Resources Bhd SAPURA RESOURCES BERHAD
321 SRCB MK Equity Sarawak Cable Bhd SARAWAK CABLE BERHAD
322 SCIB MK Equity Sarawak Consolidated Industries BHD SARAWAK CONSOLIDATED INDUSTRIES BERHAD [S]
323 SOP MK Equity Sarawak Oil Palms Bhd SARAWAK OIL PALMS BERHAD [S]
324 SPLB MK Equity Sarawak Plantation Bhd SARAWAK PLANTATION BERHAD [S]
325 SBC MK Equity SBC Corp Bhd SBC CORPORATION BERHAD [S]
326 SCW MK Equity Scanwolf Corp Bhd SCANWOLF CORPORATION BERHAD [S]
327 SCGM MK Equity SCGM Bhd SCGM BHD [S]
328 SCI MK Equity Scientex BHD SCIENTEX BERHAD [S]
329 STB MK Equity Seacera Group Bhd SEACERA GROUP BERHAD [S]
330 SEAL MK Equity Seal Inc Bhd SEAL INCORPORATED BERHAD [S]
331 SELI MK Equity Sealink International Bhd SEALINK INTERNATIONAL BERHAD
332 SHC MK Equity See Hup Consolidated Bhd SEE HUP CONSOLIDATED BERHAD [S]
333 SYS MK Equity SEG International BHD SEG INTERNATIONAL BHD [S]
334 SENI MK Equity Seni Jaya Corp BHD SENI JAYA CORPORATION BERHAD
335 SERES MK Equity Seremban Engineering Bhd SEREMBAN ENGINEERING BERHAD [S]
336 SHH MK Equity SHH Resources Holdings BHD SHH RESOURCES HOLDINGS BERHAD [S]
337 SHIN MK Equity Shin Yang Shipping Corp Bhd SHIN YANG SHIPPING CORPORATION BERHAD [S]
338 SIGA MK Equity Sig Gases Bhd SIG GASES BERHAD [S]
339 SIGN MK Equity Signature International Bhd SIGNATURE INTERNATIONAL BERHAD [S]
340 SIB MK Equity Silk Holdings Bhd SILK HOLDINGS BERHAD [S]
341 SHL MK Equity Sin Heng Chan Malaya Bhd SIN HENG CHAN (MALAYA) BERHAD [S]
342 SKB MK Equity Metech Group BHD SKB SHUTTERS CORPORATION BERHAD [S]
343 SKP MK Equity SKP Resources Bhd SKP RESOURCES BHD
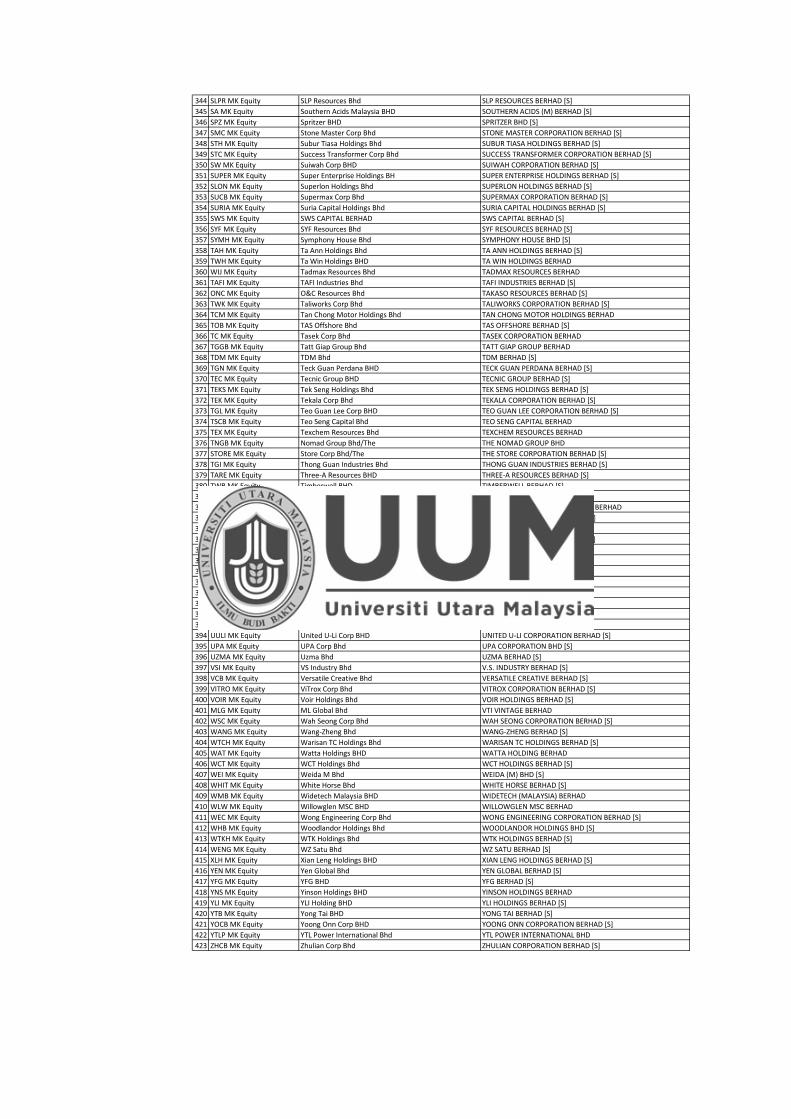
344 SLPR MK Equity SLP Resources Bhd SLP RESOURCES BERHAD [S]
345 SA MK Equity Southern Acids Malaysia BHD SOUTHERN ACIDS (M) BERHAD [S]
346 SPZ MK Equity Spritzer BHD SPRITZER BHD [S]
347 SMC MK Equity Stone Master Corp Bhd STONE MASTER CORPORATION BERHAD [S]
348 STH MK Equity Subur Tiasa Holdings Bhd SUBUR TIASA HOLDINGS BERHAD [S]
349 STC MK Equity Success Transformer Corp Bhd SUCCESS TRANSFORMER CORPORATION BERHAD [S]
350 SW MK Equity Suiwah Corp BHD SUIWAH CORPORATION BERHAD [S]
351 SUPER MK Equity Super Enterprise Holdings BH SUPER ENTERPRISE HOLDINGS BERHAD [S]
352 SLON MK Equity Superlon Holdings Bhd SUPERLON HOLDINGS BERHAD [S]
353 SUCB MK Equity Supermax Corp Bhd SUPERMAX CORPORATION BERHAD [S]
354 SURIA MK Equity Suria Capital Holdings Bhd SURIA CAPITAL HOLDINGS BERHAD [S]
355 SWS MK Equity SWS CAPITAL BERHAD SWS CAPITAL BERHAD [S]
356 SYF MK Equity SYF Resources Bhd SYF RESOURCES BERHAD [S]
357 SYMH MK Equity Symphony House Bhd SYMPHONY HOUSE BHD [S]
358 TAH MK Equity Ta Ann Holdings Bhd TA ANN HOLDINGS BERHAD [S]
359 TWH MK Equity Ta Win Holdings BHD TA WIN HOLDINGS BERHAD
360 WIJ MK Equity Tadmax Resources Bhd TADMAX RESOURCES BERHAD
361 TAFI MK Equity TAFI Industries Bhd TAFI INDUSTRIES BERHAD [S]
362 ONC MK Equity O&C Resources Bhd TAKASO RESOURCES BERHAD [S]
363 TWK MK Equity Taliworks Corp Bhd TALIWORKS CORPORATION BERHAD [S]
364 TCM MK Equity Tan Chong Motor Holdings Bhd TAN CHONG MOTOR HOLDINGS BERHAD
365 TOB MK Equity TAS Offshore Bhd TAS OFFSHORE BERHAD [S]
366 TC MK Equity Tasek Corp Bhd TASEK CORPORATION BERHAD
367 TGGB MK Equity Tatt Giap Group Bhd TATT GIAP GROUP BERHAD
368 TDM MK Equity TDM Bhd TDM BERHAD [S]
369 TGN MK Equity Teck Guan Perdana BHD TECK GUAN PERDANA BERHAD [S]
370 TEC MK Equity Tecnic Group BHD TECNIC GROUP BERHAD [S]
371 TEKS MK Equity Tek Seng Holdings Bhd TEK SENG HOLDINGS BERHAD [S]
372 TEK MK Equity Tekala Corp Bhd TEKALA CORPORATION BERHAD [S]
373 TGL MK Equity Teo Guan Lee Corp BHD TEO GUAN LEE CORPORATION BERHAD [S]
374 TSCB MK Equity Teo Seng Capital Bhd TEO SENG CAPITAL BERHAD
375 TEX MK Equity Texchem Resources Bhd TEXCHEM RESOURCES BERHAD
376 TNGB MK Equity Nomad Group Bhd/The THE NOMAD GROUP BHD
377 STORE MK Equity Store Corp Bhd/The THE STORE CORPORATION BERHAD [S]
378 TGI MK Equity Thong Guan Industries Bhd THONG GUAN INDUSTRIES BERHAD [S]
379 TARE MK Equity Three-A Resources BHD THREE-A RESOURCES BERHAD [S]
380 TWB MK Equity Timberwell BHD TIMBERWELL BERHAD [S]
381 TDC MK Equity TIME dotCom Bhd TIME DOTCOM BERHAD [S]
382 TNL MK Equity Tiong NAM Logistics Holdings TIONG NAM LOGISTICS HOLDINGS BERHAD
383 TOME MK Equity Tomei Consolidated Bhd TOMEI CONSOLIDATED BERHAD [S]
384 TOMY MK Equity Tomypak Holdings BHD TOMYPAK HOLDINGS BERHAD [S]
385 TOPG MK Equity Top Glove Corp Bhd TOP GLOVE CORPORATION BHD [S]
386 TRC MK Equity TRC Synergy Bhd TRC SYNERGY BERHAD [S]
387 TSH MK Equity TSH Resources Bhd TSH RESOURCES BERHAD [S]
388 TMB MK Equity Turbo-Mech Bhd TURBO-MECH BERHAD
389 UMS MK Equity UMS Holdings BHD UMS HOLDINGS BERHAD [S]
390 UMSN MK Equity UMS-Neiken Group Bhd UMS-NEIKEN GROUP BERHAD [S]
391 UGB MK Equity Unimech Group Bhd UNIMECH GROUP BERHAD [S]
392 UNI MK Equity Unisem M Bhd UNISEM (M) BERHAD [S]
393 IUB MK Equity Ideal United Bintang Bhd UNITED BINTANG BERHAD [S]
394 UULI MK Equity United U-Li Corp BHD UNITED U-LI CORPORATION BERHAD [S]
395 UPA MK Equity UPA Corp Bhd UPA CORPORATION BHD [S]
396 UZMA MK Equity Uzma Bhd UZMA BERHAD [S]
397 VSI MK Equity VS Industry Bhd V.S. INDUSTRY BERHAD [S]
398 VCB MK Equity Versatile Creative Bhd VERSATILE CREATIVE BERHAD [S]
399 VITRO MK Equity ViTrox Corp Bhd VITROX CORPORATION BERHAD [S]
400 VOIR MK Equity Voir Holdings Bhd VOIR HOLDINGS BERHAD [S]
401 MLG MK Equity ML Global Bhd VTI VINTAGE BERHAD
402 WSC MK Equity Wah Seong Corp Bhd WAH SEONG CORPORATION BERHAD [S]
403 WANG MK Equity Wang-Zheng Bhd WANG-ZHENG BERHAD [S]
404 WTCH MK Equity Warisan TC Holdings Bhd WARISAN TC HOLDINGS BERHAD [S]
405 WAT MK Equity Watta Holdings BHD WATTA HOLDING BERHAD
406 WCT MK Equity WCT Holdings Bhd WCT HOLDINGS BERHAD [S]
407 WEI MK Equity Weida M Bhd WEIDA (M) BHD [S]
408 WHIT MK Equity White Horse Bhd WHITE HORSE BERHAD [S]
409 WMB MK Equity Widetech Malaysia BHD WIDETECH (MALAYSIA) BERHAD
410 WLW MK Equity Willowglen MSC BHD WILLOWGLEN MSC BERHAD
411 WEC MK Equity Wong Engineering Corp Bhd WONG ENGINEERING CORPORATION BERHAD [S]
412 WHB MK Equity Woodlandor Holdings Bhd WOODLANDOR HOLDINGS BHD [S]
413 WTKH MK Equity WTK Holdings Bhd WTK HOLDINGS BERHAD [S]
414 WENG MK Equity WZ Satu Bhd WZ SATU BERHAD [S]
415 XLH MK Equity Xian Leng Holdings BHD XIAN LENG HOLDINGS BERHAD [S]
416 YEN MK Equity Yen Global Bhd YEN GLOBAL BERHAD [S]
417 YFG MK Equity YFG BHD YFG BERHAD [S]
418 YNS MK Equity Yinson Holdings BHD YINSON HOLDINGS BERHAD
419 YLI MK Equity YLI Holding BHD YLI HOLDINGS BERHAD [S]
420 YTB MK Equity Yong Tai BHD YONG TAI BERHAD [S]
421 YOCB MK Equity Yoong Onn Corp BHD YOONG ONN CORPORATION BERHAD [S]
422 YTLP MK Equity YTL Power International Bhd YTL POWER INTERNATIONAL BHD
423 ZHCB MK Equity Zhulian Corp Bhd ZHULIAN CORPORATION BERHAD [S]
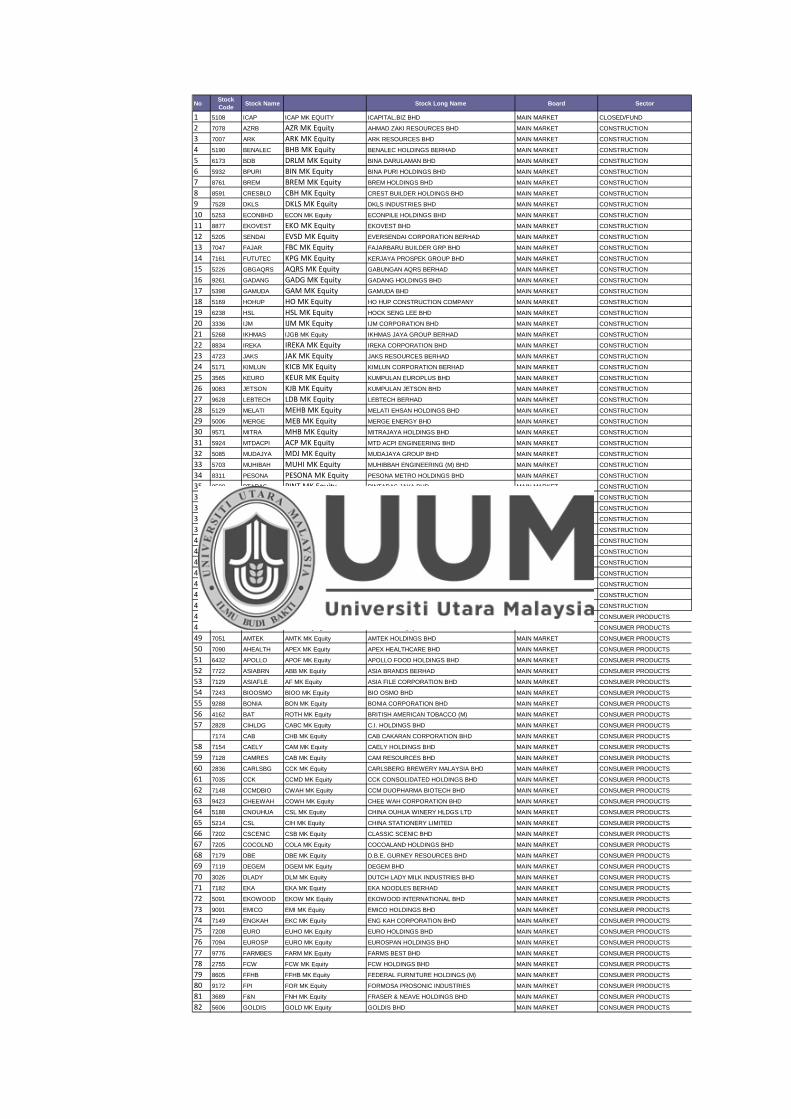
NoStock
CodeStock Name Stock Long Name Board Sector
1 5108 ICAP ICAP MK EQUITY ICAPITAL.BIZ BHD MAIN MARKET CLOSED/FUND
2 7078 AZRB AZR MK Equity AHMAD ZAKI RESOURCES BHD MAIN MARKET CONSTRUCTION
3 7007 ARK ARK MK Equity ARK RESOURCES BHD MAIN MARKET CONSTRUCTION
4 5190 BENALEC BHB MK Equity BENALEC HOLDINGS BERHAD MAIN MARKET CONSTRUCTION
5 6173 BDB DRLM MK Equity BINA DARULAMAN BHD MAIN MARKET CONSTRUCTION
6 5932 BPURI BIN MK Equity BINA PURI HOLDINGS BHD MAIN MARKET CONSTRUCTION
7 8761 BREM BREM MK Equity BREM HOLDINGS BHD MAIN MARKET CONSTRUCTION
8 8591 CRESBLD CBH MK Equity CREST BUILDER HOLDINGS BHD MAIN MARKET CONSTRUCTION
9 7528 DKLS DKLS MK Equity DKLS INDUSTRIES BHD MAIN MARKET CONSTRUCTION
10 5253 ECONBHD ECON MK Equity ECONPILE HOLDINGS BHD MAIN MARKET CONSTRUCTION
11 8877 EKOVEST EKO MK Equity EKOVEST BHD MAIN MARKET CONSTRUCTION
12 5205 SENDAI EVSD MK Equity EVERSENDAI CORPORATION BERHAD MAIN MARKET CONSTRUCTION
13 7047 FAJAR FBC MK Equity FAJARBARU BUILDER GRP BHD MAIN MARKET CONSTRUCTION
14 7161 FUTUTEC KPG MK Equity KERJAYA PROSPEK GROUP BHD MAIN MARKET CONSTRUCTION
15 5226 GBGAQRS AQRS MK Equity GABUNGAN AQRS BERHAD MAIN MARKET CONSTRUCTION
16 9261 GADANG GADG MK Equity GADANG HOLDINGS BHD MAIN MARKET CONSTRUCTION
17 5398 GAMUDA GAM MK Equity GAMUDA BHD MAIN MARKET CONSTRUCTION
18 5169 HOHUP HO MK Equity HO HUP CONSTRUCTION COMPANY MAIN MARKET CONSTRUCTION
19 6238 HSL HSL MK Equity HOCK SENG LEE BHD MAIN MARKET CONSTRUCTION
20 3336 IJM IJM MK Equity IJM CORPORATION BHD MAIN MARKET CONSTRUCTION
21 5268 IKHMAS IJGB MK Equity IKHMAS JAYA GROUP BERHAD MAIN MARKET CONSTRUCTION
22 8834 IREKA IREKA MK Equity IREKA CORPORATION BHD MAIN MARKET CONSTRUCTION
23 4723 JAKS JAK MK Equity JAKS RESOURCES BERHAD MAIN MARKET CONSTRUCTION
24 5171 KIMLUN KICB MK Equity KIMLUN CORPORATION BERHAD MAIN MARKET CONSTRUCTION
25 3565 KEURO KEUR MK Equity KUMPULAN EUROPLUS BHD MAIN MARKET CONSTRUCTION
26 9083 JETSON KJB MK Equity KUMPULAN JETSON BHD MAIN MARKET CONSTRUCTION
27 9628 LEBTECH LDB MK Equity LEBTECH BERHAD MAIN MARKET CONSTRUCTION
28 5129 MELATI MEHB MK Equity MELATI EHSAN HOLDINGS BHD MAIN MARKET CONSTRUCTION
29 5006 MERGE MEB MK Equity MERGE ENERGY BHD MAIN MARKET CONSTRUCTION
30 9571 MITRA MHB MK Equity MITRAJAYA HOLDINGS BHD MAIN MARKET CONSTRUCTION
31 5924 MTDACPI ACP MK Equity MTD ACPI ENGINEERING BHD MAIN MARKET CONSTRUCTION
32 5085 MUDAJYA MDJ MK Equity MUDAJAYA GROUP BHD MAIN MARKET CONSTRUCTION
33 5703 MUHIBAH MUHI MK Equity MUHIBBAH ENGINEERING (M) BHD MAIN MARKET CONSTRUCTION
34 8311 PESONA PESONA MK Equity PESONA METRO HOLDINGS BHD MAIN MARKET CONSTRUCTION
35 9598 PTARAS PINT MK Equity PINTARAS JAYA BHD MAIN MARKET CONSTRUCTION
36 7145 PSIPTEK PSIP MK Equity PRINSIPTEK CORPORATION BHD MAIN MARKET CONSTRUCTION
37 5070 PRTASCO PRTA MK Equity PROTASCO BHD MAIN MARKET CONSTRUCTION
38 6807 PUNCAK PNH MK Equity PUNCAK NIAGA HOLDINGS BHD MAIN MARKET CONSTRUCTION
39 5263 SUNCON SCGB MK Equity SUNWAY CONSTRUCTION GROUP BERHAD MAIN MARKET CONSTRUCTION
40 9717 SYCAL SYC MK Equity SYCAL VENTURES BHD MAIN MARKET CONSTRUCTION
41 5054 TRC TRC MK Equity TRC SYNERGY BHD MAIN MARKET CONSTRUCTION
42 5622 TRIPLC TRIB MK Equity TRIPLC BHD MAIN MARKET CONSTRUCTION
43 5042 TSRCAP TSRC MK Equity TSR CAPITAL BHD MAIN MARKET CONSTRUCTION
44 9679 WCT WCTHG MK Equity WCT HOLDINGS BERHAD MAIN MARKET CONSTRUCTION
45 7028 ZECON ZEC MK Equity ZECON BHD MAIN MARKET CONSTRUCTION
46 2283 ZELAN ZELN MK Equity ZELAN BHD MAIN MARKET CONSTRUCTION
47 7120 ACOSTEC ATEC MK Equity ACOUSTECH BHD MAIN MARKET CONSUMER PRODUCTS
48 2658 AJI AJI MK Equity AJINOMOTO (M) BHD MAIN MARKET CONSUMER PRODUCTS
49 7051 AMTEK AMTK MK Equity AMTEK HOLDINGS BHD MAIN MARKET CONSUMER PRODUCTS
50 7090 AHEALTH APEX MK Equity APEX HEALTHCARE BHD MAIN MARKET CONSUMER PRODUCTS
51 6432 APOLLO APOF MK Equity APOLLO FOOD HOLDINGS BHD MAIN MARKET CONSUMER PRODUCTS
52 7722 ASIABRN ABB MK Equity ASIA BRANDS BERHAD MAIN MARKET CONSUMER PRODUCTS
53 7129 ASIAFLE AF MK Equity ASIA FILE CORPORATION BHD MAIN MARKET CONSUMER PRODUCTS
54 7243 BIOOSMO BIOO MK Equity BIO OSMO BHD MAIN MARKET CONSUMER PRODUCTS
55 9288 BONIA BON MK Equity BONIA CORPORATION BHD MAIN MARKET CONSUMER PRODUCTS
56 4162 BAT ROTH MK Equity BRITISH AMERICAN TOBACCO (M) MAIN MARKET CONSUMER PRODUCTS
57 2828 CIHLDG CABC MK Equity C.I. HOLDINGS BHD MAIN MARKET CONSUMER PRODUCTS
7174 CAB CHB MK Equity CAB CAKARAN CORPORATION BHD MAIN MARKET CONSUMER PRODUCTS
58 7154 CAELY CAM MK Equity CAELY HOLDINGS BHD MAIN MARKET CONSUMER PRODUCTS
59 7128 CAMRES CAB MK Equity CAM RESOURCES BHD MAIN MARKET CONSUMER PRODUCTS
60 2836 CARLSBG CCK MK Equity CARLSBERG BREWERY MALAYSIA BHD MAIN MARKET CONSUMER PRODUCTS
61 7035 CCK CCMD MK Equity CCK CONSOLIDATED HOLDINGS BHD MAIN MARKET CONSUMER PRODUCTS
62 7148 CCMDBIO CWAH MK Equity CCM DUOPHARMA BIOTECH BHD MAIN MARKET CONSUMER PRODUCTS
63 9423 CHEEWAH COWH MK Equity CHEE WAH CORPORATION BHD MAIN MARKET CONSUMER PRODUCTS
64 5188 CNOUHUA CSL MK Equity CHINA OUHUA WINERY HLDGS LTD MAIN MARKET CONSUMER PRODUCTS
65 5214 CSL CIH MK Equity CHINA STATIONERY LIMITED MAIN MARKET CONSUMER PRODUCTS
66 7202 CSCENIC CSB MK Equity CLASSIC SCENIC BHD MAIN MARKET CONSUMER PRODUCTS
67 7205 COCOLND COLA MK Equity COCOALAND HOLDINGS BHD MAIN MARKET CONSUMER PRODUCTS
68 7179 DBE DBE MK Equity D.B.E. GURNEY RESOURCES BHD MAIN MARKET CONSUMER PRODUCTS
69 7119 DEGEM DGEM MK Equity DEGEM BHD MAIN MARKET CONSUMER PRODUCTS
70 3026 DLADY DLM MK Equity DUTCH LADY MILK INDUSTRIES BHD MAIN MARKET CONSUMER PRODUCTS
71 7182 EKA EKA MK Equity EKA NOODLES BERHAD MAIN MARKET CONSUMER PRODUCTS
72 5091 EKOWOOD EKOW MK Equity EKOWOOD INTERNATIONAL BHD MAIN MARKET CONSUMER PRODUCTS
73 9091 EMICO EMI MK Equity EMICO HOLDINGS BHD MAIN MARKET CONSUMER PRODUCTS
74 7149 ENGKAH EKC MK Equity ENG KAH CORPORATION BHD MAIN MARKET CONSUMER PRODUCTS
75 7208 EURO EUHO MK Equity EURO HOLDINGS BHD MAIN MARKET CONSUMER PRODUCTS
76 7094 EUROSP EURO MK Equity EUROSPAN HOLDINGS BHD MAIN MARKET CONSUMER PRODUCTS
77 9776 FARMBES FARM MK Equity FARMS BEST BHD MAIN MARKET CONSUMER PRODUCTS
78 2755 FCW FCW MK Equity FCW HOLDINGS BHD MAIN MARKET CONSUMER PRODUCTS
79 8605 FFHB FFHB MK Equity FEDERAL FURNITURE HOLDINGS (M) MAIN MARKET CONSUMER PRODUCTS
80 9172 FPI FOR MK Equity FORMOSA PROSONIC INDUSTRIES MAIN MARKET CONSUMER PRODUCTS
81 3689 F&N FNH MK Equity FRASER & NEAVE HOLDINGS BHD MAIN MARKET CONSUMER PRODUCTS
82 5606 GOLDIS GOLD MK Equity GOLDIS BHD MAIN MARKET CONSUMER PRODUCTS

83 5102 GCB GUAN MK Equity GUAN CHONG BHD MAIN MARKET CONSUMER PRODUCTS
84 3255 GAB GUIN MK Equity GUINNESS ANCHOR BHD MAIN MARKET CONSUMER PRODUCTS
85 5187 HBGLOB HBGLOB MK Equity HB GLOBAL LIMITED MAIN MARKET CONSUMER PRODUCTS
86 5160 HOMERIZ HMCB MK Equity HOMERITZ CORPORATION BERHAD MAIN MARKET CONSUMER PRODUCTS
87 3301 HLIND HLI MK Equity HONG LEONG INDUSTRIES BHD MAIN MARKET CONSUMER PRODUCTS
88 7213 HOVID HOV MK Equity HOVID BHD MAIN MARKET CONSUMER PRODUCTS
89 7141 HUATLAI HLR MK Equity HUAT LAI RESOURCES BHD MAIN MARKET CONSUMER PRODUCTS
90 5024 HUPSENG HSI MK Equity HUP SENG INDUSTRIES BHD MAIN MARKET CONSUMER PRODUCTS
91 8478 HWATAI HWA MK Equity HWA TAI INDUSTRIES BHD MAIN MARKET CONSUMER PRODUCTS
92 5107 IQGROUP IQGH MK Equity IQ GROUP HOLDINGS BHD MAIN MARKET CONSUMER PRODUCTS
93 7152 JAYCORP JAYC MK Equity JAYCORP BHD MAIN MARKET CONSUMER PRODUCTS
94 8931 JERASIA MCL MK Equity JERASIA CAPITAL BHD MAIN MARKET CONSUMER PRODUCTS
95 5247 KAREX KAREX MK Equity KAREX BERHAD MAIN MARKET CONSUMER PRODUCTS
96 7216 KAWAN KFB MK Equity KAWAN FOOD BHD MAIN MARKET CONSUMER PRODUCTS
97 6203 KHEESAN KHEE MK Equity KHEE SAN BHD MAIN MARKET CONSUMER PRODUCTS
98 7062 KHIND KHIN MK Equity KHIND HOLDINGS BHD MAIN MARKET CONSUMER PRODUCTS
99 0002 KOTRA KTRI MK Equity KOTRA INDUSTRIES BHD MAIN MARKET CONSUMER PRODUCTS
100 5172 KSTAR KSTR MK Equity K-STAR SPORTS LIMITED MAIN MARKET CONSUMER PRODUCTS
101 8303 KFM KFM MK Equity KUANTAN FLOUR MILLS BHD MAIN MARKET CONSUMER PRODUCTS
102 7006 LATITUD LATI MK Equity LATITUDE TREE HOLDINGS BHD MAIN MARKET CONSUMER PRODUCTS
103 9385 LAYHONG LAY MK Equity LAY HONG BHD MAIN MARKET CONSUMER PRODUCTS
104 8079 LEESK LSKG MK Equity LEE SWEE KIAT GROUP BHD MAIN MARKET CONSUMER PRODUCTS
105 7943 LCHEONG LEN MK Equity LEN CHEONG HOLDING BHD MAIN MARKET CONSUMER PRODUCTS
106 7089 LIIHEN LHI MK Equity LII HEN INDUSTRIES BHD MAIN MARKET CONSUMER PRODUCTS
107 7126 LONBISC LBB MK Equity LONDON BISCUITS BHD MAIN MARKET CONSUMER PRODUCTS
108 7085 LTKM LTKM MK Equity LTKM BHD MAIN MARKET CONSUMER PRODUCTS
109 7087 MAGNI MTI MK Equity MAGNI-TECH INDUSTRIES BHD MAIN MARKET CONSUMER PRODUCTS
110 3662 MFLOUR MFL MK Equity MALAYAN FLOUR MILLS BHD MAIN MARKET CONSUMER PRODUCTS
111 5189 MAXWELL MAXWLL MK Equity MAXWELL INT HOLDINGS BERHAD MAIN MARKET CONSUMER PRODUCTS
112 7935 MILUX MILUX MK Equity MILUX CORPORATION BHD MAIN MARKET CONSUMER PRODUCTS
113 5886 MINTYE MTYE MK Equity MINTYE INDUSTRIES BHD MAIN MARKET CONSUMER PRODUCTS
114 5202 MSM MSM MK Equity MSM MALAYSIA HOLDINGS BERHAD MAIN MARKET CONSUMER PRODUCTS
115 5150 MSPORTS MSH MK Equity MULTI SPORTS HOLDINGS LTD MAIN MARKET CONSUMER PRODUCTS
116 3921 MWE MWE MK Equity MWE HOLDINGS BHD MAIN MARKET CONSUMER PRODUCTS
117 4707 NESTLE NESZ MK Equity NESTLE (M) BHD MAIN MARKET CONSUMER PRODUCTS
118 7060 NHFATT NHF MK Equity NEW HOONG FATT HOLDINGS BHD MAIN MARKET CONSUMER PRODUCTS
119 7215 NIHSIN NHR MK Equity NI HSIN RESOURCES BHD MAIN MARKET CONSUMER PRODUCTS
120 7139 NICE NCHB MK Equity NICHE CAPITAL EMAS HLDG BHD MAIN MARKET CONSUMER PRODUCTS
121 5066 NTPM NTPM MK Equity NTPM HOLDINGS BHD MAIN MARKET CONSUMER PRODUCTS
122 7071 OCR ONC MK Equity O&C RESOURCES BERHAD MAIN MARKET CONSUMER PRODUCTS
123 7107 OFI OFIH MK Equity ORIENTAL FOOD INDUSTRIES HLDG MAIN MARKET CONSUMER PRODUCTS
124 4006 ORIENT ORH MK Equity ORIENTAL HOLDINGS BHD MAIN MARKET CONSUMER PRODUCTS
125 7052 PADINI PAD MK Equity PADINI HOLDINGS BHD MAIN MARKET CONSUMER PRODUCTS
126 4081 PMCORP PMC MK Equity PAN MALAYSIA CORPORATION BHD MAIN MARKET CONSUMER PRODUCTS
127 3719 PANAMY PMM MK Equity PANASONIC MANUFACTURING MSIA MAIN MARKET CONSUMER PRODUCTS
128 5022 PAOS PAOS MK Equity PAOS HOLDINGS BHD MAIN MARKET CONSUMER PRODUCTS
129 9407 PARAGON PU MK Equity PARAGON UNION BHD MAIN MARKET CONSUMER PRODUCTS
130 6068 PCCS PCCS MK Equity PCCS GROUP BHD MAIN MARKET CONSUMER PRODUCTS
131 7190 PPG PPG MK Equity PELANGI PUBLISHING GROUP BHD MAIN MARKET CONSUMER PRODUCTS
132 5231 PELIKAN PELI MK Equity PELIKAN INT.CORPORATION BHD MAIN MARKET CONSUMER PRODUCTS
133 9997 PENSONI PSN MK Equity PENSONIC HOLDINGS BHD MAIN MARKET CONSUMER PRODUCTS
134 7088 POHUAT PHR MK Equity POH HUAT RESOURCES HOLDINGS MAIN MARKET CONSUMER PRODUCTS
135 5080 POHKONG PKH MK Equity POH KONG HOLDINGS BHD MAIN MARKET CONSUMER PRODUCTS
136 7237 PWROOT PWRT MK Equity POWER ROOT BERHAD MAIN MARKET CONSUMER PRODUCTS
137 4065 PPB PEP MK Equity PPB GROUP BHD MAIN MARKET CONSUMER PRODUCTS
138 8966 PRLEXUS PROL MK Equity PROLEXUS BHD MAIN MARKET CONSUMER PRODUCTS
139 7134 PWF PW MK Equity PWF CONSOLIDATED BERHAD MAIN MARKET CONSUMER PRODUCTS
140 7084 QL QLG MK Equity QL RESOURCES BHD MAIN MARKET CONSUMER PRODUCTS
141 9946 REX REX MK Equity REX INDUSTRY BHD MAIN MARKET CONSUMER PRODUCTS
142 5252 SASBADI SASB MK Equity SASBADI HOLDINGS BHD MAIN MARKET CONSUMER PRODUCTS
143 5157 SAUDEE SAUD MK Equity SAUDEE GROUP BERHAD MAIN MARKET CONSUMER PRODUCTS
144 7180 SERNKOU SKOU MK Equity SERN KOU RESOURCES BHD MAIN MARKET CONSUMER PRODUCTS
145 7412 SHH SHH MK Equity SHH RESOURCES HOLDINGS BHD MAIN MARKET CONSUMER PRODUCTS
146 7246 SIGN SIGN MK Equity SIGNATURE INTERNATIONAL BHD MAIN MARKET CONSUMER PRODUCTS
147 8532 SINOTOP SNHB MK Equity SINOTOP HOLDINGS BERHAD MAIN MARKET CONSUMER PRODUCTS
148 7165 SGB SPRG MK Equity SPRING GALLERY BERHAD MAIN MARKET CONSUMER PRODUCTS
149 7103 SPRITZER SPZ MK Equity SPRITZER BHD MAIN MARKET CONSUMER PRODUCTS
150 7186 SWSCAP SWS MK Equity SWS CAPITAL BERHAD MAIN MARKET CONSUMER PRODUCTS
151 7082 SYF SYF MK Equity SYF RESOURCES BHD MAIN MARKET CONSUMER PRODUCTS
152 7211 TAFI TAFI MK Equity TAFI INDUSTRIES BHD MAIN MARKET CONSUMER PRODUCTS
153 4405 TCHONG TCM MK Equity TAN CHONG MOTOR HOLDINGS BHD MAIN MARKET CONSUMER PRODUCTS
154 7200 TEKSENG TEKS MK Equity TEK SENG HOLDINGS BHD MAIN MARKET CONSUMER PRODUCTS
155 9369 TGL TGL MK Equity TEO GUAN LEE CORPORATION BHD MAIN MARKET CONSUMER PRODUCTS
156 7252 TEOSENG TSCB MK Equity TEO SENG CAPITAL BHD MAIN MARKET CONSUMER PRODUCTS
157 7230 TOMEI TOME MK Equity TOMEI CONSOLIDATED BHD MAIN MARKET CONSUMER PRODUCTS
158 7176 TPC TPC MK Equity TPC PLUS BHD MAIN MARKET CONSUMER PRODUCTS
159 4588 UMW UMWH MK Equity UMW HOLDINGS BHD MAIN MARKET CONSUMER PRODUCTS
160 7757 UPA UPA MK Equity UPA CORPORATION BHD MAIN MARKET CONSUMER PRODUCTS
161 7203 WANGZNG WANG MK Equity WANG-ZHENG BHD MAIN MARKET CONSUMER PRODUCTS
162 7121 XIANLNG XLH MK Equity XIAN LENG HOLDINGS BHD MAIN MARKET CONSUMER PRODUCTS
163 5156 XDL XIDE MK Equity XIDELANG HOLDINGS LTD MAIN MARKET CONSUMER PRODUCTS
164 5155 XINQUAN XISH MK Equity XINGQUAN INT SPORTS HLDG LTD MAIN MARKET CONSUMER PRODUCTS
165 7178 YSPSAH YEE MK Equity Y.S.P.SOUTHEAST ASIA HOLDING MAIN MARKET CONSUMER PRODUCTS
166 5584 YEELEE YEN MK Equity YEE LEE CORPORATION BHD MAIN MARKET CONSUMER PRODUCTS
167 7184 YEN YOCB MK Equity YEN GLOBAL BERHAD MAIN MARKET CONSUMER PRODUCTS
168 5159 YOCB YSP MK Equity YOONG ONN CORPORATION BERHAD MAIN MARKET CONSUMER PRODUCTS
169 5131 ZHULIAN ZHCB MK Equity ZHULIAN CORPORATION BHD MAIN MARKET CONSUMER PRODUCTS
171 5139 AEONCR ACSM MK Equity AEON CREDIT SERVICE (M) BHD MAIN MARKET FINANCE
172 5185 AFFIN AHB MK Equity AFFIN HOLDINGS BHD MAIN MARKET FINANCE
173 2488 AFG AFG MK Equity ALLIANCE FINANCIAL GROUP BHD MAIN MARKET FINANCE
174 1163 ALLIANZ ALLZ MK Equity ALLIANZ MALAYSIA BHD MAIN MARKET FINANCE
175 1015 AMBANK AMM MK Equity AMMB HOLDINGS BHD MAIN MARKET FINANCE
176 5088 APEX APX MK Equity APEX EQUITY HOLDINGS BHD MAIN MARKET FINANCE
177 5258 BIMB BIMB MK Equity BIMB HOLDINGS BHD MAIN MARKET FINANCE
178 1818 BURSA BURSA MK Equity BURSA MALAYSIA BHD MAIN MARKET FINANCE
179 1023 CIMB CIMB MK Equity CIMB GROUP HOLDINGS BERHAD MAIN MARKET FINANCE
180 2143 ECM ECML MK Equity ECM LIBRA FINANCIAL GRP BHD MAIN MARKET FINANCE
181 5228 ELKDESA ELK MK Equity ELK-DESA RESOURCES BERHAD MAIN MARKET FINANCE
182 5819 HLBANK HLBK MK Equity HONG LEONG BANK BHD MAIN MARKET FINANCE
183 5274 HLCAP HLG MK Equity HONG LEONG CAPITAL BERHAD MAIN MARKET FINANCE
184 1082 HLFG HLFG MK Equity HONG LEONG FINANCIAL GROUP BHD MAIN MARKET FINANCE
185 6688 HWANG HDBS MK Equity HWANG CAPITAL (MALAYSIA) BERHAD MAIN MARKET FINANCE
186 3379 INSAS INS MK Equity INSAS BHD MAIN MARKET FINANCE
187 3441 JOHAN JOH MK Equity JOHAN HOLDINGS BHD MAIN MARKET FINANCE
188 6483 KENANGA KNK MK Equity K & N KENANGA HOLDINGS BHD MAIN MARKET FINANCE
189 5096 KAF KAF MK Equity KAF-SEAGROATT & CAMPBELL BHD MAIN MARKET FINANCE
190 8621 LPI LPI MK Equity LPI CAPITAL BHD MAIN MARKET FINANCE
191 1198 MAA MAA MK Equity MAA GROUP BERHAD MAIN MARKET FINANCE
192 1155 MAYBANK MAY MK Equity MALAYAN BANKING BHD MAIN MARKET FINANCE
193 1171 MBSB MBS MK Equity MALAYSIA BUILDING SOCIETY BHD MAIN MARKET FINANCE
194 1058 MANULFE MHBS MK Equity MANULIFE HOLDINGS BERHAD MAIN MARKET FINANCE
195 6459 MNRB MNRB MK Equity MNRB HOLDINGS BHD MAIN MARKET FINANCE
196 5237 MPHBCAP MPHB MK EQUITY MPHB Capital Berhad MAIN MARKET FINANCE
197 6009 P&O PO MK Equity PACIFIC & ORIENT BHD MAIN MARKET FINANCE
198 1295 PBBANK PBK MK Equity PUBLIC BANK BHD MAIN MARKET FINANCE
199 9296 RCECAP RCE MK Equity RCE CAPITAL BHD MAIN MARKET FINANCE
200 1066 RHBCAP RHBC MK Equity RHB CAPITAL BHD MAIN MARKET FINANCE
201 6139 TAKAFUL STMB MK Equity SYARIKAT TAKAFUL MALAYSIA BHD MAIN MARKET FINANCE
202 4898 TA TAE MK Equity TA ENTERPRISE BHD MAIN MARKET FINANCE
203 5230 TUNEPRO TIH MK EQUITY TUNE PROTECT GROUP BERHAD MAIN MARKET FINANCE
204 1287 PMHLDG PGKH MK EQUITY PAN MALAYSIA HOLDINGS BHD MAIN MARKET HOTEL
205 1643 LANDMRK LMK MK EQUITY LANDMARKS BHD MAIN MARKET HOTEL
206 5517 SHANG SHMB MK EQUITY SHANGRI-LA HOTELS (M) BHD MAIN MARKET HOTEL
207 5592 GCE GRND MK EQUITY GRAND CENTRAL ENTERPRISES BHD MAIN MARKET HOTEL
208 7086 ABLEGRP GFHB MK Equity ABLEGROUP BERHAD MAIN MARKET INDUSTRIAL PRODUCTS
209 5198 AFUJIYA ABM MK EQUITY ABM FUJIYA BERHAD MAIN MARKET INDUSTRIAL PRODUCTS
210 7061 ABRIC ABR MK Equity ABRIC BHD MAIN MARKET INDUSTRIAL PRODUCTS
211 7131 ACME ACME MK Equity ACME HOLDINGS BERHAD MAIN MARKET INDUSTRIAL PRODUCTS
212 9148 ADVPKG APT MK Equity ADVANCED PACKAGING TECHNOLOGY MAIN MARKET INDUSTRIAL PRODUCTS
213 7191 ADVENTA ADV MK Equity ADVENTA BHD MAIN MARKET INDUSTRIAL PRODUCTS
214 7146 AEM AEM MK Equity AE MULTI HOLDINGS BHD MAIN MARKET INDUSTRIAL PRODUCTS
215 7609 AJIYA AJY MK Equity AJIYA BHD MAIN MARKET INDUSTRIAL PRODUCTS
216 2674 ALCOM ALC MK Equity ALUMINIUM COMPANY OF MALAYSIA MAIN MARKET INDUSTRIAL PRODUCTS
217 2682 AISB AMAL MK Equity AMALGAMATED INDUSTRIAL STEEL MAIN MARKET INDUSTRIAL PRODUCTS
218 4758 ANCOM ANC MK Equity ANCOM BHD MAIN MARKET INDUSTRIAL PRODUCTS
219 6556 ANNJOO AJR MK Equity ANN JOO RESOURCES BHD MAIN MARKET INDUSTRIAL PRODUCTS
220 9342 ANZO ANZO MK Equity ANZO HOLDINGS BERHAD MAIN MARKET INDUSTRIAL PRODUCTS
221 5568 APB APBB MK Equity APB RESOURCES BHD MAIN MARKET INDUSTRIAL PRODUCTS
222 5015 APM APM MK Equity APM AUTOMOTIVE HOLDINGS BHD MAIN MARKET INDUSTRIAL PRODUCTS
223 7214 ARANK ARNK MK Equity A-RANK BHD MAIN MARKET INDUSTRIAL PRODUCTS
224 9954 AKNIGHT ASK MK Equity ASIA KNIGHT BERHAD MAIN MARKET INDUSTRIAL PRODUCTS
225 7162 ASTINO ASTI MK Equity ASTINO BHD MAIN MARKET INDUSTRIAL PRODUCTS
226 7070 ASUPREM ASUP MK Equity ASTRAL SUPREME BHD MAIN MARKET INDUSTRIAL PRODUCTS
227 7099 ATTA AGG MK Equity ATTA GLOBAL GROUP BERHAD MAIN MARKET INDUSTRIAL PRODUCTS
228 7181 ATURMJU ATRE MK Equity ATURMAJU RESOURCES BHD MAIN MARKET INDUSTRIAL PRODUCTS
229 7005 BIG BIG MK Equity B.I.G. INDUSTRIES BHD MAIN MARKET INDUSTRIAL PRODUCTS
230 0168 BOILERM BMHB MK Equity BOILERMECH HOLDINGS BHD MAIN MARKET INDUSTRIAL PRODUCTS
231 7187 BKOON BOKG MK Equity BOON KOON GROUP BHD MAIN MARKET INDUSTRIAL PRODUCTS
232 8133 BHIC BHIC MK Equity BOUSTEAD HEAVY INDUSTRIES CORP MAIN MARKET INDUSTRIAL PRODUCTS
233 6297 BOXPAK BPAK MK Equity BOX-PAK (MALAYSIA) BHD MAIN MARKET INDUSTRIAL PRODUCTS
234 5100 BPPLAS BPP MK Equity BP PLASTICS HOLDING BHD MAIN MARKET INDUSTRIAL PRODUCTS
235 9938 BRIGHT BPKG MK Equity BRIGHT PACKAGING INDUSTRY BHD MAIN MARKET INDUSTRIAL PRODUCTS
236 7221 BSLCORP BSLC MK Equity BSL CORPORATION BERHAD MAIN MARKET INDUSTRIAL PRODUCTS
237 7188 BTM BTM MK Equity BTM RESOURCES BHD MAIN MARKET INDUSTRIAL PRODUCTS
238 2852 CMSB CMS MK Equity CAHYA MATA SARAWAK BHD MAIN MARKET INDUSTRIAL PRODUCTS
239 5105 CANONE CAN MK Equity CAN-ONE BHD MAIN MARKET INDUSTRIAL PRODUCTS
240 7076 CBIP CBP MK Equity CB INDUSTRIAL PRODUCT HOLDING MAIN MARKET INDUSTRIAL PRODUCTS
241 8052 CICB CIC MK Equity CENTRAL INDUSTRIAL CORPORATION MAIN MARKET INDUSTRIAL PRODUCTS
242 7171 CENBOND CBD MK Equity CENTURY BOND BHD MAIN MARKET INDUSTRIAL PRODUCTS
243 2879 CCM CCM MK Equity CHEMICAL COMPANY OF MALAYSIA MAIN MARKET INDUSTRIAL PRODUCTS
244 5007 CHINWEL CWH MK Equity CHIN WELL HOLDINGS BHD MAIN MARKET INDUSTRIAL PRODUCTS
245 5229 CAP CAP MK EQUITY CHINA AUTOMOBILE PARTS HLD LTD MAIN MARKET INDUSTRIAL PRODUCTS
246 5797 CHOOBEE CBEE MK Equity CHOO BEE METAL INDUSTRIES BHD MAIN MARKET INDUSTRIAL PRODUCTS
247 7018 CME CME MK Equity CME GROUP BHD MAIN MARKET INDUSTRIAL PRODUCTS
248 7986 CNASIA CNAC MK Equity CN ASIA CORPORATION BHD MAIN MARKET INDUSTRIAL PRODUCTS
249 5071 COASTAL COCO MK Equity COASTAL CONTRACTS BHD MAIN MARKET INDUSTRIAL PRODUCTS
250 2127 COMFORT CG MK Equity COMFORT GLOVES BERHAD MAIN MARKET INDUSTRIAL PRODUCTS
251 7195 COMCORP CMT MK Equity COMINTEL CORPORATION BHD MAIN MARKET INDUSTRIAL PRODUCTS
252 8044 CFM CFM MK Equity COMPUTER FORMS (M) BHD MAIN MARKET INDUSTRIAL PRODUCTS
253 8435 CEPCO CEP MK Equity CONCRETE ENGINEERING PRODUCTS MAIN MARKET INDUSTRIAL PRODUCTS
254 5094 CSCSTEL CSCS MK Equity CSC STEEL HOLDINGS BERHAD MAIN MARKET INDUSTRIAL PRODUCTS
255 7157 CYL CYLC MK Equity CYL CORPORATION BHD MAIN MARKET INDUSTRIAL PRODUCTS
256 5082 CYMAO CYM MK Equity CYMAO HOLDINGS BHD MAIN MARKET INDUSTRIAL PRODUCTS
257 8125 DAIBOCI DPP MK Equity DAIBOCHI PLASTIC & PACKAGING MAIN MARKET INDUSTRIAL PRODUCTS
258 8176 DENKO DEN MK Equity DENKO INDUSTRIAL CORPORATION MAIN MARKET INDUSTRIAL PRODUCTS
259 7114 DNONCE DNON MK Equity DNONCE TECHNOLOGY BHD MAIN MARKET INDUSTRIAL PRODUCTS
260 5835 DOLMITE DOLM MK Equity DOLOMITE CORPORATION BHD MAIN MARKET INDUSTRIAL PRODUCTS
261 5265 DOLPHIN DOL MK Equity DOLPHIN INTERNATIONAL BERHAD MAIN MARKET INDUSTRIAL PRODUCTS
262 7169 DOMINAN DOME MK Equity DOMINANT ENTERPRISE BHD MAIN MARKET INDUSTRIAL PRODUCTS
263 1619 DRBHCOM DRB MK Equity DRB-HICOM BHD MAIN MARKET INDUSTRIAL PRODUCTS
264 7233 DUFU DUFU MK Equity DUFU TECHNOLOGY CORP. BHD MAIN MARKET INDUSTRIAL PRODUCTS
265 8907 EG EG MK Equity EG INDUSTRIES BHD MAIN MARKET INDUSTRIAL PRODUCTS
266 9016 EKSONS EKSON MK Equity EKSONS CORPORATION BHD MAIN MARKET INDUSTRIAL PRODUCTS
267 7217 EMETALL EONM MK Equity EONMETALL GROUP BHD MAIN MARKET INDUSTRIAL PRODUCTS
268 7773 EPMB EPMB MK Equity EP MANUFACTURING BHD MAIN MARKET INDUSTRIAL PRODUCTS
269 5101 EVERGRN EVF MK Equity EVERGREEN FIBREBOARD BHD MAIN MARKET INDUSTRIAL PRODUCTS
270 2984 FACBIND FACI MK Equity FACB INDUSTRIES INCORPORATED MAIN MARKET INDUSTRIAL PRODUCTS
271 7229 FAVCO FFB MK Equity FAVELLE FAVCO BHD MAIN MARKET INDUSTRIAL PRODUCTS
272 0149 FIBON FIBON MK Equity FIBON BERHAD MAIN MARKET INDUSTRIAL PRODUCTS
273 3107 FIMACOR FMB MK Equity FIMA CORPORATION BHD MAIN MARKET INDUSTRIAL PRODUCTS
274 5197 FLBHD FLB MK Equity FOCUS LUMBER BERHAD MAIN MARKET INDUSTRIAL PRODUCTS
275 7197 GESHEN GSCB MK Equity GE-SHEN CORPORATION BHD MAIN MARKET INDUSTRIAL PRODUCTS
276 5220 GLOTEC GBLF MK Equity GLOBALTEC FORMATION BERHAD MAIN MARKET INDUSTRIAL PRODUCTS
277 3611 GBH GBH MK Equity GOH BAN HUAT BHD MAIN MARKET INDUSTRIAL PRODUCTS
278 5649 GPHAROS GPB MK Equity GOLDEN PHAROS BHD MAIN MARKET INDUSTRIAL PRODUCTS
279 7192 GOODWAY GII MK Equity GOODWAY INTEGRATED INDUSTRIES MAIN MARKET INDUSTRIAL PRODUCTS
280 7096 GPA GPA MK Equity GPA HOLDINGS BHD MAIN MARKET INDUSTRIAL PRODUCTS
281 0136 GREENYB GREE MK Equity GREENYIELD BHD MAIN MARKET INDUSTRIAL PRODUCTS
282 3247 GUH GUH MK Equity GUH HOLDINGS BHD MAIN MARKET INDUSTRIAL PRODUCTS
283 5151 HALEX HAL MK Equity HALEX HOLDINGS BERHAD MAIN MARKET INDUSTRIAL PRODUCTS
284 5168 HARTA HART MK Equity HARTALEGA HOLDINGS BHD MAIN MARKET INDUSTRIAL PRODUCTS
285 5095 HEVEA HAVE MK Equity HEVEABOARD BHD MAIN MARKET INDUSTRIAL PRODUCTS
286 3298 HEXZA HEX MK Equity HEXZA CORPORATION BHD MAIN MARKET INDUSTRIAL PRODUCTS
287 5072 HIAPTEK HTVB MK Equity HIAP TECK VENTURE BHD MAIN MARKET INDUSTRIAL PRODUCTS
288 5199 HIBISCS HIBI MK Equity HIBISCUS PETROLEUM BHD MAIN MARKET INDUSTRIAL PRODUCTS
289 8443 HIL HIL MK Equity HIL INDUSTRIES BHD MAIN MARKET INDUSTRIAL PRODUCTS
290 9601 HWGB HWG MK Equity HO WAH GENTING BHD MAIN MARKET INDUSTRIAL PRODUCTS
291 5165 HOKHENG HHS MK Equity HOCK HENG STONE INDUSTRIES BHD MAIN MARKET INDUSTRIAL PRODUCTS
292 5000 HUMEIND HUME MK Equity HUME INDUSTRIES BHD MAIN MARKET INDUSTRIAL PRODUCTS
293 9687 IDEALUBB IUB MK Equity IDEAL UNITED BINTANG BHD MAIN MARKET INDUSTRIAL PRODUCTS
294 7222 IMASPRO IMAS MK Equity IMASPRO CORPORATION BHD MAIN MARKET INDUSTRIAL PRODUCTS
295 7183 IRETEX IRET MK Equity IRE-TEX CORPORATION BHD MAIN MARKET INDUSTRIAL PRODUCTS
296 7223 JADI JADI MK Equity JADI IMAGING HOLDINGS BHD MAIN MARKET INDUSTRIAL PRODUCTS
297 8648 JASKITA JKB MK Equity JASA KITA BHD MAIN MARKET INDUSTRIAL PRODUCTS
298 2747 JAVA JAVA MK Equity JAVA BERHAD MAIN MARKET INDUSTRIAL PRODUCTS
299 4383 JTIASA JT MK Equity JAYA TIASA HOLDINGS BHD MAIN MARKET INDUSTRIAL PRODUCTS
300 7043 JMR JMR MK Equity JMR CONGLOMERATION BHD MAIN MARKET INDUSTRIAL PRODUCTS
301 7167 JOHOTIN JOHO MK Equity JOHORE TIN BHD MAIN MARKET INDUSTRIAL PRODUCTS
302 5192 KSSC KSSC MK Equity K. SENG SENG CORPORATION BHD MAIN MARKET INDUSTRIAL PRODUCTS
303 0054 KARYON KARY MK Equity KARYON INDUSTRIES BHD MAIN MARKET INDUSTRIAL PRODUCTS
304 3476 KSENG KS MK Equity KECK SENG (M) BHD MAIN MARKET INDUSTRIAL PRODUCTS
305 7199 KEINHIN KEIN MK Equity KEIN HING INTERNATIONAL BHD MAIN MARKET INDUSTRIAL PRODUCTS
306 6211 KIALIM KIA MK Equity KIA LIM BHD MAIN MARKET INDUSTRIAL PRODUCTS
307 3522 KIANJOO KJC MK Equity KIAN JOO CAN FACTORY BHD MAIN MARKET INDUSTRIAL PRODUCTS
308 5371 KIMHIN KHI MK Equity KIM HIN INDUSTRY BHD MAIN MARKET INDUSTRIAL PRODUCTS
309 5060 KINSTEL KSB MK Equity KINSTEEL BHD MAIN MARKET INDUSTRIAL PRODUCTS
310 9466 KKB KKB MK Equity KKB ENGINEERING BHD MAIN MARKET INDUSTRIAL PRODUCTS
311 7164 KNM KNMG MK Equity KNM GROUP BHD MAIN MARKET INDUSTRIAL PRODUCTS
312 6971 KOBAY KOBAY MK Equity KOBAY TECHNOLOGY BHD MAIN MARKET INDUSTRIAL PRODUCTS
313 7017 KOMARK KOMA MK Equity KOMARKCORP BHD MAIN MARKET INDUSTRIAL PRODUCTS
314 7153 KOSSAN KRI MK Equity KOSSAN RUBBER INDUSTRIES BHD MAIN MARKET INDUSTRIAL PRODUCTS
315 7033 HIGHTEC KPB MK Equity KUMPULAN H&L HIGH-TECH BHD MAIN MARKET INDUSTRIAL PRODUCTS
316 7130 KPOWER H&L MK Equity KUMPULAN POWERNET BHD MAIN MARKET INDUSTRIAL PRODUCTS
317 8362 KYM KYM MK Equity KYM HOLDINGS BHD MAIN MARKET INDUSTRIAL PRODUCTS
318 3794 LAFMSIA LMC MK Equity LAFARGE MALAYSIA BERHAD MAIN MARKET INDUSTRIAL PRODUCTS
319 9326 LBALUM LBA MK Equity LB ALUMINIUM BHD MAIN MARKET INDUSTRIAL PRODUCTS
320 5092 LCTH LCTH MK Equity LCTH CORPORATION BHD MAIN MARKET INDUSTRIAL PRODUCTS
321 9881 LSTEEL LDST MK Equity LEADER STEEL HOLDINGS BHD MAIN MARKET INDUSTRIAL PRODUCTS
322 5232 LEONFB LEFU MK EQUITY LEON FUAT BERHAD MAIN MARKET INDUSTRIAL PRODUCTS
323 8745 LEWEKO LEWE MK Equity LEWEKO RESOURCES BHD MAIN MARKET INDUSTRIAL PRODUCTS
324 3581 LIONCOR LION MK Equity LION CORPORATION BHD MAIN MARKET INDUSTRIAL PRODUCTS
325 2887 LIONDIV LDHB MK Equity LION DIVERSIFIED HOLDINGS BHD MAIN MARKET INDUSTRIAL PRODUCTS
326 4235 LIONIND LLB MK Equity LION INDUSTRIES CORPORATION MAIN MARKET INDUSTRIAL PRODUCTS
327 5068 LUSTER LSTI MK Equity LUSTER INDUSTRIES BHD MAIN MARKET INDUSTRIAL PRODUCTS
328 9199 LYSAGHT LYSA MK Equity LYSAGHT GALVANIZED STEEL BHD MAIN MARKET INDUSTRIAL PRODUCTS
329 8095 MAYPAK MPAK MK Equity MALAYSIA PACKAGING INDUSTRY MAIN MARKET INDUSTRIAL PRODUCTS
330 5916 MSC SMELT MK Equity MALAYSIA SMELTING CORPORATION MAIN MARKET INDUSTRIAL PRODUCTS
331 5098 MASTEEL MSW MK Equity MALAYSIA STEEL WORKS (KL)BHD MAIN MARKET INDUSTRIAL PRODUCTS
332 7029 MASTER MPG MK Equity MASTER-PACK GROUP BERHAD MAIN MARKET INDUSTRIAL PRODUCTS
333 3778 MELEWAR MIG MK Equity MELEWAR INDUSTRIAL GROUP BHD MAIN MARKET INDUSTRIAL PRODUCTS
334 5223 MENTIGA MENT MK Equity MENTIGA CORPORATION BHD MAIN MARKET INDUSTRIAL PRODUCTS
335 8192 MERCURY MER MK Equity MERCURY INDUSTRIES BHD MAIN MARKET INDUSTRIAL PRODUCTS
336 6149 METROD MTRD MK Equity METROD HOLDINGS BERHAD MAIN MARKET INDUSTRIAL PRODUCTS
337 5001 MIECO MIEC MK Equity MIECO CHIPBOARD BHD MAIN MARKET INDUSTRIAL PRODUCTS
338 7219 MINETEC MINE MK Equity MINETECH RESOURCES BHD MAIN MARKET INDUSTRIAL PRODUCTS
339 5576 MINHO MIN MK Equity MINHO (M) BHD MAIN MARKET INDUSTRIAL PRODUCTS
340 7595 MLGLOBAL MLG MK Equity ML GLOBAL BERHAD MAIN MARKET INDUSTRIAL PRODUCTS
341 5152 MBL MBL MK Equity MUAR BAN LEE GROUP BERHAD MAIN MARKET INDUSTRIAL PRODUCTS
342 3883 MUDA MUD MK Equity MUDA HOLDINGS BHD MAIN MARKET INDUSTRIAL PRODUCTS
343 7004 MULTICO MCEI MK Equity MULTI-CODE ELECTRONICS INDS MAIN MARKET INDUSTRIAL PRODUCTS
344 5087 MYCRON MSB MK Equity MYCRON STEEL BHD MAIN MARKET INDUSTRIAL PRODUCTS
345 7002 NAKA NAK MK Equity NAKAMICHI CORPORATION BHD MAIN MARKET INDUSTRIAL PRODUCTS
346 5025 NWP NWP MK Equity NWP HOLDINGS BHD MAIN MARKET INDUSTRIAL PRODUCTS
347 4944 NYLEX NYL MK Equity NYLEX (M) BHD MAIN MARKET INDUSTRIAL PRODUCTS
348 7140 OKA OKAC MK Equity OKA CORPORATION BHD MAIN MARKET INDUSTRIAL PRODUCTS
349 5065 ORNA OPB MK Equity ORNAPAPER BHD MAIN MARKET INDUSTRIAL PRODUCTS
350 7225 PA PARB MK Equity P.A. RESOURCES BHD MAIN MARKET INDUSTRIAL PRODUCTS
351 7095 PIE PIE MK Equity P.I.E. INDUSTRIAL BHD MAIN MARKET INDUSTRIAL PRODUCTS
352 5146 PERWAJA PERH MK Equity PERWAJA HOLDINGS BERHAD MAIN MARKET INDUSTRIAL PRODUCTS
353 3042 PETRONM PETRONM MK Equity PETRON MSIA REFINING& MKTG BHD MAIN MARKET INDUSTRIAL PRODUCTS
354 5183 PCHEM PCHEM MK Equity PETRONAS CHEMICALS GROUP BHD MAIN MARKET INDUSTRIAL PRODUCTS
355 6033 PETGAS PTG MK Equity PETRONAS GAS BHD MAIN MARKET INDUSTRIAL PRODUCTS
356 7172 PMBTECH PMBT MK Equity PMB TECHNOLOGY BHD MAIN MARKET INDUSTRIAL PRODUCTS
357 6637 PNEPCB PNE MK Equity PNE PCB BHD MAIN MARKET INDUSTRIAL PRODUCTS
358 8117 POLY PGF MK Equity POLY GLASS FIBRE (M) BHD MAIN MARKET INDUSTRIAL PRODUCTS
359 9458 PREMIER PRNB MK Equity PREMIER NALFIN BERHAD MAIN MARKET INDUSTRIAL PRODUCTS
360 8869 PMETAL PRESS MK Equity PRESS METAL BHD MAIN MARKET INDUSTRIAL PRODUCTS
361 9873 PRESTAR PRST MK Equity PRESTAR RESOURCES BHD MAIN MARKET INDUSTRIAL PRODUCTS
362 7168 PRG PRG MK Equity PRG HOLDINGS BERHAD MAIN MARKET INDUSTRIAL PRODUCTS
363 7123 PWORTH PWP MK Equity PRICEWORTH INTERNATIONAL BHD MAIN MARKET INDUSTRIAL PRODUCTS
364 5436 PERSTIM PER MK Equity PSAHAAN SADUR TIMAH MSIA MAIN MARKET INDUSTRIAL PRODUCTS
365 8273 PPHB PP MK Equity PUBLIC PACKAGES HOLDINGS BHD MAIN MARKET INDUSTRIAL PRODUCTS
366 7544 QUALITY QC MK Equity QUALITY CONCRETE HOLDINGS BHD MAIN MARKET INDUSTRIAL PRODUCTS
367 7498 RALCO RALC MK Equity RALCO CORPORATION BHD MAIN MARKET INDUSTRIAL PRODUCTS
368 7765 RAPID RSB MK Equity RAPID SYNERGY BHD MAIN MARKET INDUSTRIAL PRODUCTS
369 7232 RESINTC RESI MK Equity RESINTECH BHD MAIN MARKET INDUSTRIAL PRODUCTS
370 7803 RUBEREX RBRX MK Equity RUBBEREX CORPORATION (M) BHD MAIN MARKET INDUSTRIAL PRODUCTS
371 9822 SAM SEQB MK Equity SAM ENGINEERING & EQUIPMENT MAIN MARKET INDUSTRIAL PRODUCTS
372 7811 SAPIND SAPU MK Equity SAPURA INDUSTRIAL BHD MAIN MARKET INDUSTRIAL PRODUCTS
373 5170 SCABLE SRCB MK Equity SARAWAK CABLE BERHAD MAIN MARKET INDUSTRIAL PRODUCTS
374 9237 SCIB SCIB MK Equity SARAWAK CONSOLIDATED IND BHD MAIN MARKET INDUSTRIAL PRODUCTS
375 7239 SCNWOLF SCW MK Equity SCANWOLF CORPORATION BHD MAIN MARKET INDUSTRIAL PRODUCTS
376 7247 SCGM SCGM MK Equity SCGM BHD MAIN MARKET INDUSTRIAL PRODUCTS
377 4731 SCIENTX SCI MK Equity SCIENTEX BERHAD MAIN MARKET INDUSTRIAL PRODUCTS
378 7366 SCOMIEN SEB MK Equity SCOMI ENGINEERING BHD MAIN MARKET INDUSTRIAL PRODUCTS
379 7073 SEACERA STB MK Equity SEACERA GROUP BERHAD MAIN MARKET INDUSTRIAL PRODUCTS
380 5145 SEALINK SELI MK Equity SEALINK INTERNATIONAL BHD MAIN MARKET INDUSTRIAL PRODUCTS
381 5163 SEB SERES MK Equity SEREMBAN ENGINEERING BERHAD MAIN MARKET INDUSTRIAL PRODUCTS
382 4324 SHELL SHELL MK Equity SHELL REFINING CO (F.O.M.) BHD MAIN MARKET INDUSTRIAL PRODUCTS
383 5181 SIGGAS SIGA MK Equity SIG GASES BERHAD MAIN MARKET INDUSTRIAL PRODUCTS
384 2739 HUAAN HUAAN MK Equity SINO HUA-AN INTERNATIONAL BHD MAIN MARKET INDUSTRIAL PRODUCTS
385 7115 SKBSHUT SKBS MK Equity SKB SHUTTERS CORPORATION BHD MAIN MARKET INDUSTRIAL PRODUCTS
386 7155 SKPRES SKP MK Equity SKP RESOURCES BHD MAIN MARKET INDUSTRIAL PRODUCTS
387 7248 SLP SLPR MK Equity SLP RESOURCES BHD MAIN MARKET INDUSTRIAL PRODUCTS
388 7132 SMISCOR SMIS MK Equity SMIS CORPORATION BHD MAIN MARKET INDUSTRIAL PRODUCTS
389 5134 SAB SA MK Equity SOUTHERN ACIDS (M) BHD MAIN MARKET INDUSTRIAL PRODUCTS
390 5665 SSTEEL SSB MK Equity SOUTHERN STEEL BHD MAIN MARKET INDUSTRIAL PRODUCTS
391 7143 STONE SMC MK Equity STONE MASTER CORPORATION BHD MAIN MARKET INDUSTRIAL PRODUCTS
392 6904 SUBUR STH MK Equity SUBUR TIASA HOLDINGS BHD MAIN MARKET INDUSTRIAL PRODUCTS
393 7207 SUCCESS STC MK Equity SUCCESS TRANSFORMER CORP BHD MAIN MARKET INDUSTRIAL PRODUCTS
394 7235 SUPERLN SLON MK Equity SUPERLON HOLDINGS BHD MAIN MARKET INDUSTRIAL PRODUCTS
395 7106 SUPERMX SUCB MK Equity SUPERMAX CORPORATION BHD MAIN MARKET INDUSTRIAL PRODUCTS
396 5012 TAANN TAH MK Equity TA ANN HOLDINGS BHD MAIN MARKET INDUSTRIAL PRODUCTS
397 7097 TAWIN TWH MK Equity TA WIN HOLDINGS BHD MAIN MARKET INDUSTRIAL PRODUCTS
398 5149 TAS TOB MK Equity TAS OFFSHORE BERHAD MAIN MARKET INDUSTRIAL PRODUCTS
399 4448 TASEK TC MK Equity TASEK CORPORATION BHD MAIN MARKET INDUSTRIAL PRODUCTS
400 5178 TATGIAP TGGB MK Equity TATT GIAP GROUP BERHAD MAIN MARKET INDUSTRIAL PRODUCTS
401 7439 TECGUAN TGN MK Equity TECK GUAN PERDANA BHD MAIN MARKET INDUSTRIAL PRODUCTS
402 9741 TECNIC TEC MK Equity TECNIC GROUP BERHAD MAIN MARKET INDUSTRIAL PRODUCTS
403 6378 TEKALA TEK MK Equity TEKALA CORPORATION BHD MAIN MARKET INDUSTRIAL PRODUCTS
404 7034 TGUAN TGI MK Equity THONG GUAN INDUSTRIES BHD MAIN MARKET INDUSTRIAL PRODUCTS
405 0012 3A TARE MK Equity THREE-A RESOURCES BHD MAIN MARKET INDUSTRIAL PRODUCTS
406 7374 TIENWAH TWP MK Equity TIEN WAH PRESS HOLDINGS BHD MAIN MARKET INDUSTRIAL PRODUCTS
407 7854 TIMWELL TWB MK Equity TIMBERWELL BHD MAIN MARKET INDUSTRIAL PRODUCTS
408 7285 TOMYPAK TOMY MK Equity TOMYPAK HOLDINGS BHD MAIN MARKET INDUSTRIAL PRODUCTS
409 5010 TONGHER THR MK Equity TONG HERR RESOURCES BHD MAIN MARKET INDUSTRIAL PRODUCTS
410 7113 TOPGLOV TOPG MK Equity TOP GLOVE CORPORATION BHD MAIN MARKET INDUSTRIAL PRODUCTS
411 7173 TOYOINK TOYO MK Equity TOYO INK GROUP BHD MAIN MARKET INDUSTRIAL PRODUCTS
412 4359 TURIYA TURI MK Equity TURIYA BHD MAIN MARKET INDUSTRIAL PRODUCTS
413 7100 UCHITEC UCHI MK Equity UCHI TECHNOLOGIES BHD MAIN MARKET INDUSTRIAL PRODUCTS
414 7227 UMSNGB UMSN MK Equity UMS-NEIKEN GROUP BHD MAIN MARKET INDUSTRIAL PRODUCTS
415 7133 ULICORP UULI MK Equity UNITED U-LI CORPORATION BHD MAIN MARKET INDUSTRIAL PRODUCTS
416 6963 VS VSI MK Equity V.S INDUSTRY BHD MAIN MARKET INDUSTRIAL PRODUCTS
417 4995 VERSATL VCB MK Equity VERSATILE CREATIVE BHD MAIN MARKET INDUSTRIAL PRODUCTS
418 5142 WASEONG WSC MK Equity WAH SEONG CORPORATION BHD MAIN MARKET INDUSTRIAL PRODUCTS
419 7226 WATTA WAT MK Equity WATTA HOLDING BHD MAIN MARKET INDUSTRIAL PRODUCTS
420 7111 WEIDA WEI MK Equity WEIDA (M) BHD MAIN MARKET INDUSTRIAL PRODUCTS
421 7231 WELLCAL WELL MK Equity WELLCALL HOLDINGS BHD MAIN MARKET INDUSTRIAL PRODUCTS
422 5009 WTHORSE WHIT MK Equity WHITE HORSE BHD MAIN MARKET INDUSTRIAL PRODUCTS
423 7050 WONG WEC MK Equity WONG ENGINEERING CORPORATION MAIN MARKET INDUSTRIAL PRODUCTS
424 7025 WOODLAN WHB MK Equity WOODLANDOR HOLDINGS BHD MAIN MARKET INDUSTRIAL PRODUCTS
425 4243 WTK WTKH MK Equity WTK HOLDINGS BHD MAIN MARKET INDUSTRIAL PRODUCTS
426 7245 WZSATU WENG MK Equity WZ SATU BERHAD MAIN MARKET INDUSTRIAL PRODUCTS
427 5048 YILAI YLAI MK Equity YI-LAI BHD MAIN MARKET INDUSTRIAL PRODUCTS
428 7020 YKGI YKGI MK Equity YKGI HOLDINGS BERHAD MAIN MARKET INDUSTRIAL PRODUCTS
429 7014 YLI YLI MK Equity YLI HOLDINGS BHD MAIN MARKET INDUSTRIAL PRODUCTS
430 5031 TIMECOM TDC MK EQUITY TIME DOTCOM BHD MAIN MARKET INFRASTRUCTURE PROJECT COS.
431 5078 SILKHLD SIB MK EQUITY SILK HOLDINGS BERHAD MAIN MARKET INFRASTRUCTURE PROJECT COS.
432 6645 LITRAK LTK MK EQUITY LINGKARAN TRANS KOTA HOLDINGS MAIN MARKET INFRASTRUCTURE PROJECT COS.
433 6742 YTLPOWR YTLP MK EQUITY YTL POWER INTERNATIONAL BHD MAIN MARKET INFRASTRUCTURE PROJECT COS.
434 6947 DIGI DIGI MK EQUITY DIGI.COM BHD MAIN MARKET INFRASTRUCTURE PROJECT COS.
435 2186 KUCHAI KUD MK Equity KUCHAI DEVELOPMENT BHD MAIN MARKET MINING
436 7054 AASIA AAB MK Equity ASTRAL ASIA BHD MAIN MARKET PLANTATION
437 1899 BKAWAN BAK MK Equity BATU KAWAN BHD MAIN MARKET PLANTATION
438 5069 BLDPLNT BLDP MK Equity BLD PLANTATION BHD MAIN MARKET PLANTATION
439 5254 BPLANT BPLANT MK Equity BOUSTEAD PLANTATIONS BHD MAIN MARKET PLANTATION
440 8982 CEPAT CWG MK Equity CEPATWAWASAN GROUP BHD MAIN MARKET PLANTATION
441 1929 CHINTEK CTP MK Equity CHIN TECK PLANTATIONS BHD MAIN MARKET PLANTATION
442 3948 DUTALND DTL MK Equity DUTALAND BHD MAIN MARKET PLANTATION
443 5029 FAREAST FEH MK Equity FAR EAST HOLDINGS BHD MAIN MARKET PLANTATION
444 5222 FGV FGV MK Equity FELDA GLOBAL VENTURES HLDG BHD MAIN MARKET PLANTATION
445 2291 GENP GENP MK Equity GENTING PLANTATIONS BERHAD MAIN MARKET PLANTATION
446 7382 GLBHD GLBH MK Equity GOLDEN LAND BERHAD MAIN MARKET PLANTATION
447 2135 GOPENG GOP MK Equity GOPENG BHD MAIN MARKET PLANTATION
448 5138 HSPLANT HAPL MK Equity HAP SENG PLANTATIONS HOLDINGS MAIN MARKET PLANTATION
449 7501 HARNLEN HARN MK Equity HARN LEN CORPORATION BHD MAIN MARKET PLANTATION
450 2216 IJMPLNT IJMP MK Equity IJM PLANTATIONS BHD MAIN MARKET PLANTATION
451 2607 INCKEN IKEN MK Equity INCH KENNETH KAJANG RUBBER PLC MAIN MARKET PLANTATION
452 6262 INNO INNO MK Equity INNOPRISE PLANTATIONS BERHAD MAIN MARKET PLANTATION
453 1961 IOICORP IOI MK Equity IOI CORPORATION BHD MAIN MARKET PLANTATION
454 5027 KMLOONG KIML MK Equity KIM LOONG RESOURCES BHD MAIN MARKET PLANTATION
455 2453 KLUANG KLR MK Equity KLUANG RUBBER CO (M) BHD MAIN MARKET PLANTATION
456 1996 KRETAM KHP MK Equity KRETAM HOLDINGS BHD MAIN MARKET PLANTATION
457 2445 KLK KLK MK Equity KUALA LUMPUR KEPONG BHD MAIN MARKET PLANTATION
458 2003 KULIM KUL MK Equity KULIM (M) BHD MAIN MARKET PLANTATION
459 6572 KWANTAS KWAN MK Equity KWANTAS CORPORATION BHD MAIN MARKET PLANTATION
460 4936 MALPAC MPAC MK Equity MALPAC HOLDINGS BHD MAIN MARKET PLANTATION
461 5026 MHC MHC MK Equity MHC PLANTATIONS BHD MAIN MARKET PLANTATION
462 2038 NSOP NSOP MK Equity NEGRI SEMBILAN OIL PALMS BHD MAIN MARKET PLANTATION
463 5047 NPC NPC MK Equity NPC RESOURCES BHD MAIN MARKET PLANTATION
464 1902 PINEPAC PPB MK Equity PINEHILL PACIFIC BERHAD MAIN MARKET PLANTATION
465 9695 PLS PLS MK Equity PLS PLANTATIONS BERHAD MAIN MARKET PLANTATION
466 5113 RSAWIT RSAW MK Equity RIMBUNAN SAWIT BHD MAIN MARKET PLANTATION
467 2542 RVIEW RRE MK Equity RIVERVIEW RUBBER ESTATES BHD MAIN MARKET PLANTATION
468 5126 SOP SOP MK Equity SARAWAK OIL PALMS BHD MAIN MARKET PLANTATION
469 5135 SWKPLNT SPLB MK Equity SARAWAK PLANTATION BHD MAIN MARKET PLANTATION
470 4316 SHCHAN SHL MK Equity SIN HENG CHAN (MALAYA) BHD MAIN MARKET PLANTATION
471 2569 SBAGAN SBR MK Equity SUNGEI BAGAN RUBBER CO (M) BHD MAIN MARKET PLANTATION
472 5251 TMAKMUR TMK MK Equity TANAH MAKMUR BERHAD MAIN MARKET PLANTATION
473 2054 TDM TDM MK Equity TDM BHD MAIN MARKET PLANTATION
474 5112 THPLANT THP MK Equity TH PLANTATIONS BHD MAIN MARKET PLANTATION
475 9059 TSH TSH MK Equity TSH RESOURCES BHD MAIN MARKET PLANTATION
476 2593 UMCCA UMR MK Equity UNITED MALACCA BHD MAIN MARKET PLANTATION
477 2089 UTDPLT UPL MK Equity UNITED PLANTATIONS BHD MAIN MARKET PLANTATION
478 5959 A&M AM MK Equity A & M REALTY BHD MAIN MARKET PROPERTY
479 1007 AMPROP APRO MK Equity AMCORP PROPERTIES BERHAD MAIN MARKET PROPERTY
480 4057 ASIAPAC APH MK Equity ASIAN PAC HOLDINGS BHD MAIN MARKET PROPERTY
481 6602 BCB BCB MK Equity BCB BHD MAIN MARKET PROPERTY
482 3239 BJASSET BJAB MK Equity BERJAYA ASSETS BERHAD MAIN MARKET PROPERTY
483 9814 BERTAM BERT MK Equity BERTAM ALLIANCE BHD MAIN MARKET PROPERTY
484 5738 CHHB CHH MK Equity COUNTRY HEIGHTS HOLDINGS BHD MAIN MARKET PROPERTY
485 5049 CVIEW CVB MK Equity COUNTRY VIEW BHD MAIN MARKET PROPERTY
486 6718 CRESNDO CCDO MK Equity CRESCENDO CORPORATION BHD MAIN MARKET PROPERTY
487 5355 DAIMAN DD MK Equity DAIMAN DEVELOPMENT BHD MAIN MARKET PROPERTY
488 3484 DBHD DR MK Equity DAMANSARA REALTY BHD MAIN MARKET PROPERTY
489 7198 DPS DPS MK Equity DPS RESOURCES BHD MAIN MARKET PROPERTY
490 3417 E&O EAST MK Equity EASTERN & ORIENTAL BHD MAIN MARKET PROPERTY
491 8206 ECOWLD ECW MK Equity ECO WORLD DEVELOPMENT GROUP BERHAD MAIN MARKET PROPERTY
492 3557 ECOFIRS ECOF MK Equity ECOFIRST CONSOLIDATED BHD MAIN MARKET PROPERTY
493 6076 ENCORP ENCO MK Equity ENCORP BHD MAIN MARKET PROPERTY
494 8613 ENRA ENRA MK Equity ENRA GROUP BERHAD MAIN MARKET PROPERTY
495 6815 EUPE EUPE MK Equity EUPE CORPORATION BHD MAIN MARKET PROPERTY
496 7249 EWEIN EWEI MK Equity EWEIN BERHAD MAIN MARKET PROPERTY
497 6041 FARLIM FG MK Equity FARLIM GROUP (M) BHD MAIN MARKET PROPERTY
498 1147 GOB GOB MK Equity GLOBAL ORIENTAL BERHAD MAIN MARKET PROPERTY
499 5020 GLOMAC GLMC MK Equity GLOMAC BHD MAIN MARKET PROPERTY
500 2968 GPLUS GPH MK EQUITY GOLDEN PLUS HOLDINGS BHD MAIN MARKET PROPERTY
501 7010 HOOVER GHB MK Equity GRAND HOOVER BHD MAIN MARKET PROPERTY
502 9962 GMUTUAL GMUT MK Equity GROMUTUAL BHD MAIN MARKET PROPERTY
503 7077 GSB GSBG MK Equity GSB GROUP BHD MAIN MARKET PROPERTY
504 1503 GUOCO GUOL MK Equity GUOCOLAND (MALAYSIA) BHD MAIN MARKET PROPERTY
505 7105 HCK HCK MK Equity HCK CAPITAL GROUP BERHAD MAIN MARKET PROPERTY
506 5062 HUAYANG HYB MK Equity HUA YANG BHD MAIN MARKET PROPERTY
507 5018 HUNZPTY HPB MK Equity HUNZA PROPERTIES BHD MAIN MARKET PROPERTY
508 4251 IBHD IBHD MK Equity I-BHD MAIN MARKET PROPERTY
509 5084 IBRACO IBRA MK Equity IBRACO BHD MAIN MARKET PROPERTY
510 1597 IGB IGB MK Equity IGB CORPORATION BHD MAIN MARKET PROPERTY
511 5249 IOIPG IOIPG MK Equity IOI PROPERTIES GROUP BERHAD MAIN MARKET PROPERTY
512 1589 IWCITY IWCB MK Equity ISKANDAR WATERFRONT CITY BERHAD MAIN MARKET PROPERTY
513 5175 IVORY IVORY MK Equity IVORY PROPERTIES GROUP BERHAD MAIN MARKET PROPERTY
514 8923 JIANKUN JIB MK Equity JIANKUN INTERNATIONAL BERHAD MAIN MARKET PROPERTY
515 6769 JKGLAND JKG MK Equity JKG LAND BERHAD MAIN MARKET PROPERTY
516 3115 KBUNAI KRBN MK Equity KARAMBUNAI CORP BHD MAIN MARKET PROPERTY
517 7323 KEN KEN MK Equity KEN HOLDINGS BHD MAIN MARKET PROPERTY
518 5038 KSL KSL MK Equity KSL HOLDINGS BHD MAIN MARKET PROPERTY
519 3174 L&G LGH MK Equity LAND & GENERAL BHD MAIN MARKET PROPERTY
520 8494 LBICAP LBIC MK Equity LBI CAPITAL BHD MAIN MARKET PROPERTY
521 5789 LBS LBS MK Equity LBS BINA GROUP BHD MAIN MARKET PROPERTY
522 3573 LIENHOE LHC MK Equity LIEN HOE CORPORATION BHD MAIN MARKET PROPERTY
523 7617 MAGNA MAGNA MK Equity MAGNA PRIMA BHD MAIN MARKET PROPERTY
524 8583 MAHSING MSGB MK Equity MAH SING GROUP BHD MAIN MARKET PROPERTY
525 8141 MJPERAK MJPR MK Equity MAJUPERAK HOLDINGS BHD MAIN MARKET PROPERTY
526 6548 MPCORP MPL MK Equity MALAYSIA PACIFIC CORP BHD MAIN MARKET PROPERTY
527 1651 MRCB MRC MK Equity MALAYSIAN RESOURCES CORP MAIN MARKET PROPERTY
528 6181 MALTON MALT MK Equity MALTON BHD MAIN MARKET PROPERTY
529 5236 MATRIX MCH MK EQUITY MATRIX CONCEPTS HOLDINGS BHD MAIN MARKET PROPERTY
530 5182 MCT MCT MK Equity MCT BERHAD MAIN MARKET PROPERTY
531 5040 MEDAINC MEDA MK Equity MEDA INC. BHD MAIN MARKET PROPERTY
532 1694 MENANG MEN MK Equity MENANG CORPORATION (M) BHD MAIN MARKET PROPERTY
533 8893 MKLAND MKL MK Equity MK LAND HOLDINGS BHD MAIN MARKET PROPERTY
534 6114 MKH MKH MK Equity MKH BERHAD MAIN MARKET PROPERTY
535 3913 MUIPROP MUIP MK Equity MUI PROPERTIES BHD MAIN MARKET PROPERTY
536 9539 MUH MUH MK Equity MULTI-USAGE HOLDINGS BHD MAIN MARKET PROPERTY
537 5073 NAIM NHB MK Equity NAIM HOLDINGS BHD MAIN MARKET PROPERTY
538 5827 OIB OIB MK Equity ORIENTAL INTEREST BHD MAIN MARKET PROPERTY
539 5053 OSK OSK MK Equity OSK HOLDINGS BHD MAIN MARKET PROPERTY
540 1724 PARAMON PAR MK Equity PARAMOUNT CORPORATION BHD MAIN MARKET PROPERTY
541 6912 PASDEC PSD MK Equity PASDEC HOLDINGS BHD MAIN MARKET PROPERTY
542 2208 PTGTIN PEG MK Equity PETALING TIN BHD MAIN MARKET PROPERTY
543 1945 PJDEV PJD MK Equity PJ DEVELOPMENT HOLDINGS BHD MAIN MARKET PROPERTY
544 7055 PLB PLB MK Equity PLB ENGINEERING BHD MAIN MARKET PROPERTY
545 5075 PLENITU PLEN MK Equity PLENITUDE BHD MAIN MARKET PROPERTY
546 4596 SAPRES SRB MK Equity SAPURA RESOURCES BHD MAIN MARKET PROPERTY
547 5207 SBCCORP SBC MK Equity SBC CORPORATION BHD MAIN MARKET PROPERTY
548 4286 SEAL SEAL MK Equity SEAL INCORPORATED BHD MAIN MARKET PROPERTY
549 2224 SDRED SDR MK Equity SELANGOR DREDGING BHD MAIN MARKET PROPERTY
550 1783 SPB SPR MK Equity SELANGOR PROPERTIES BHD MAIN MARKET PROPERTY
551 5213 SNTORIA SNT MK Equity SENTORIA GROUP BERHAD MAIN MARKET PROPERTY
552 6017 SHL SHLC MK Equity SHL CONSOLIDATED BHD MAIN MARKET PROPERTY
553 4375 SMI SMI MK Equity SOUTH MALAYSIA INDUSTRIES BHD MAIN MARKET PROPERTY
554 8664 SPSETIA SPSB MK Equity SP SETIA BHD MAIN MARKET PROPERTY
555 3743 SUNSURIA SSR MK Equity SUNSURIA BERHAD MAIN MARKET PROPERTY
556 5211 SUNWAY SWB MK Equity SUNWAY BERHAD MAIN MARKET PROPERTY
557 1538 SYMLIFE SYML MK Equity SYMPHONY LIFE BERHAD MAIN MARKET PROPERTY
558 5158 TAGB TAGB MK Equity TA GLOBAL BHD MAIN MARKET PROPERTY
559 4022 TADMAX WIJ MK Equity TADMAX RESOURCES BERHAD MAIN MARKET PROPERTY
560 2305 TAHPS THPS MK Equity TAHPS GROUP BHD MAIN MARKET PROPERTY
561 2259 TALAMT TALA MK Equity TALAM TRANSFORM BERHAD MAIN MARKET PROPERTY
562 5191 TAMBUN TILB MK Equity TAMBUN INDAH LAND BERHAD MAIN MARKET PROPERTY
563 2429 TANCO TANC MK Equity TANCO HOLDINGS BHD MAIN MARKET PROPERTY
564 7889 THRIVEN TGB MK Equity THRIVEN GLOBAL BERHAD MAIN MARKET PROPERTY
565 7079 TIGER TIG MK EQUITY TIGER SYNERGY BERHAD MAIN MARKET PROPERTY
566 5239 TITIJYA TTJ MK Equity TITIJAYA LAND BERHAD MAIN MARKET PROPERTY
567 5401 TROP TRCB MK Equity TROPICANA CORPORATION BERHAD MAIN MARKET PROPERTY
568 5148 UEMS UEMS MK Equity UEM SUNRISE BERHAD MAIN MARKET PROPERTY
569 5200 UOADEV UOAD MK Equity UOA DEVELOPMENT BERHAD MAIN MARKET PROPERTY
570 2976 WINGTM WING MK Equity WING TAI MALAYSIA BERHAD MAIN MARKET PROPERTY
571 7003 Y&G YGCB MK Equity Y&G CORPORATION BHD MAIN MARKET PROPERTY
572 3158 YNHPROP YNHB MK Equity YNH PROPERTY BHD MAIN MARKET PROPERTY
573 2577 YTLLAND YTLL MK Equity YTL LAND & DEVELOPMENT BHD MAIN MARKET PROPERTY
574 4952 AHP AHP MK Equity AMANAH HARTA TANAH PNB MAIN MARKET REITS
575 5116 ALAQAR AQAR MK EQUITY AL-AQAR HEALTHCARE REIT MAIN MARKET REITS
576 5269 ALSREIT SALAM MK Equity AL-SALAM REAL ESTATE INVESTMENT TRUST MAIN MARKET REITS
577 5127 ARREIT AARET MK EQUITY AMANAHRAYA REITS MAIN MARKET REITS
578 5120 AMFIRST ARET MK EQUITY AMFIRST REITS MAIN MARKET REITS
579 5130 ATRIUM ATRM MK EQUITY ATRIUM REITS MAIN MARKET REITS
580 5106 AXREIT AXRB MK EQUITY AXIS REITS MAIN MARKET REITS
581 5180 CMMT CMMT MK EQUITY CAPITALAND MALAYSIA MALL TRUST MAIN MARKET REITS
582 5234 CLIQ CLIQ MK Equity CLIQ ENERGY BERHAD MAIN MARKET REITS
583 5121 HEKTAR HEKT MK EQUITY HEKTAR REITS MAIN MARKET REITS
584 5227 IGBREIT IGBREIT MK EQUITY IGB REAL ESTATE INV TRUST MAIN MARKET REITS
585 5123 MQREIT MQREIT MK EQUITY MRCB-QUILL REIT MAIN MARKET REITS
586 5212 PAVREIT PREIT MK EQUITY PAVILION REAL ESTATE INV TRUST MAIN MARKET REITS
587 5256 REACH REB MK Equity REACH ENERGY BHD MAIN MARKET REITS
588 5270 RSENA RSENA MK Equity RED SENA BERHAD MAIN MARKET REITS
589 5241 SONA SONA MK Equity SONA PETROLEUM BERHAD MAIN MARKET REITS
590 5176 SUNREIT SREIT MK EQUITY SUNWAY REAL ESTATE INVT TRUST MAIN MARKET SPAC
591 5111 TWRREIT TRET MK EQUITY TOWER REITS MAIN MARKET SPAC
592 5110 UOAREIT UOAR MK EQUITY UOA REITS MAIN MARKET SPAC
593 5109 YTLREIT YTLREIT MK Equity YTL HOSPITALITY REIT MAIN MARKET SPAC
594 7031 AMTEL AMT MK Equity AMTEL HOLDINGS BHD MAIN MARKET TECHNOLOGY
595 5195 CENSOF CSHB MK Equity CENSOF HOLDINGS BERHAD MAIN MARKET TECHNOLOGY
596 0051 CUSCAPI CUSC MK Equity CUSCAPI BHD MAIN MARKET TECHNOLOGY
597 7204 D&O DOGT MK Equity D&O GREEN TECHNOLOGIES BERHAD MAIN MARKET TECHNOLOGY
598 4456 DNEX DNEX MK Equity DAGANG NEXCHANGE BERHAD MAIN MARKET TECHNOLOGY
599 8338 DATAPRP DATA MK Equity DATAPREP HOLDINGS BHD MAIN MARKET TECHNOLOGY
600 0029 DIGISTA DICB MK Equity DIGISTAR CORPORATION BHD MAIN MARKET TECHNOLOGY
601 5162 ECS ECS MK Equity ECS ICT BERHAD MAIN MARKET TECHNOLOGY
602 0090 ELSOFT ELSR MK Equity ELSOFT RESEARCH BHD MAIN MARKET TECHNOLOGY
603 0065 EFORCE EFM MK Equity EXCEL FORCE MSC BHD MAIN MARKET TECHNOLOGY
604 0021 GHLSYS GHLS MK Equity GHL SYSTEMS BHD MAIN MARKET TECHNOLOGY
605 7022 GTRONIC GTB MK Equity GLOBETRONICS TECHNOLOGY BHD MAIN MARKET TECHNOLOGY
606 0056 GRANFLO GFLO MK Equity GRAND-FLO BERHAD MAIN MARKET TECHNOLOGY
607 0082 GPACKET GRPB MK Equity GREEN PACKET BHD MAIN MARKET TECHNOLOGY
608 5028 HTPADU HEIT MK Equity HEITECH PADU BHD MAIN MARKET TECHNOLOGY
609 0166 INARI INRI MK Equity INARI AMERTRON BERHAD MAIN MARKET TECHNOLOGY
610 9393 ITRONIC INDU MK Equity INDUSTRONICS BHD MAIN MARKET TECHNOLOGY
611 5161 JCY JCYH MK Equity JCY INTERNATIONAL BERHAD MAIN MARKET TECHNOLOGY
612 9334 KESM KESM MK Equity KESM INDUSTRIES BHD MAIN MARKET TECHNOLOGY
613 0143 KEYASIC KEYA MK Equity KEY ASIC BHD MAIN MARKET TECHNOLOGY
614 3867 MPI MPI MK Equity MALAYSIAN PACIFIC INDUSTRIES MAIN MARKET TECHNOLOGY
615 5011 MSNIAGA MESI MK Equity MESINIAGA BHD MAIN MARKET TECHNOLOGY
616 0083 NOTION NVB MK Equity NOTION VTEC BHD MAIN MARKET TECHNOLOGY
617 9008 OMESTI OMST MK Equity OMESTI BHD MAIN MARKET TECHNOLOGY
618 0041 PANPAGE PAN MK Equity PANPAGES BERHAD MAIN MARKET TECHNOLOGY
619 7160 PENTA PENT MK Equity PENTAMASTER CORPORATION BHD MAIN MARKET TECHNOLOGY
620 9075 THETA THETA MK Equity THETA EDGE BERHAD MAIN MARKET TECHNOLOGY
621 0118 TRIVE TRIV MK Equity TRIVE PROPERTY GROUP BERHAD MAIN MARKET TECHNOLOGY
622 5005 UNISEM UNI MK Equity UNISEM (M) BHD MAIN MARKET TECHNOLOGY
623 0097 VITROX VITRO MK Equity VITROX CORPORATION BHD MAIN MARKET TECHNOLOGY
624 0008 WILLOW WLW MK Equity WILLOWGLEN MSC BHD MAIN MARKET TECHNOLOGY
625 5250 SEM SEM MK Equity 7-ELEVEN MALAYSIA HOLDINGS BERHAD MAIN MARKET TRADING/SERVICES
626 1481 ASB ASB MK Equity ADVANCE SYNERGY BHD MAIN MARKET TRADING/SERVICES
627 6599 AEON AEON MK Equity AEON CO. (M) BHD MAIN MARKET TRADING/SERVICES
628 7315 AHB AHBH MK Equity AHB HOLDINGS BHD MAIN MARKET TRADING/SERVICES
629 5099 AIRASIA AIRA MK Equity AIRASIA BHD MAIN MARKET TRADING/SERVICES
630 5238 AAX AAX MK Equity AIRASIA X BERHAD MAIN MARKET TRADING/SERVICES
631 5115 ALAM AMRB MK Equity ALAM MARITIM RESOURCES BHD MAIN MARKET TRADING/SERVICES
632 6351 AMWAY AMW MK Equity AMWAY (M) HOLDINGS BHD MAIN MARKET TRADING/SERVICES
633 7083 ANALABS ALR MK Equity ANALABS RESOURCES BHD MAIN MARKET TRADING/SERVICES
634 5194 APFT APFT MK Equity APFT BERHAD MAIN MARKET TRADING/SERVICES
635 0159 AMEDIA AMGB MK Equity ASIA MEDIA GROUP BERHAD MAIN MARKET TRADING/SERVICES
636 5166 AEGB AEG MK Equity ASIAMET EDUCATION GROUP BERHAD MAIN MARKET TRADING/SERVICES
637 6399 ASTRO ASTRO MK Equity ASTRO MALAYSIA HOLDINGS BERHAD MAIN MARKET TRADING/SERVICES
638 7048 ATLAN ALN MK Equity ATLAN HOLDINGS BHD MAIN MARKET TRADING/SERVICES
639 7579 AWC AWCF MK Equity AWC BERHAD MAIN MARKET TRADING/SERVICES
640 6888 AXIATA AXIATA MK Equity AXIATA GROUP BERHAD MAIN MARKET TRADING/SERVICES
641 5021 AYS AYS MK Equity AYS VENTURES BHD MAIN MARKET TRADING/SERVICES
642 7251 BARAKAH BARAKAH MK Equity BARAKAH OFFSHORE PETROLEUM BHD MAIN MARKET TRADING/SERVICES
643 5248 BJAUTO BAUTO MK Equity BERJAYA AUTO BERHAD MAIN MARKET TRADING/SERVICES
644 3395 BJCORP BC MK Equity BERJAYA CORPORATION BHD MAIN MARKET TRADING/SERVICES
645 5196 BJFOOD BFD MK Equity BERJAYA FOOD BERHAD MAIN MARKET TRADING/SERVICES
646 4219 BJLAND BL MK Equity BERJAYA LAND BHD MAIN MARKET TRADING/SERVICES
647 6025 BJMEDIA BMED MK Equity BERJAYA MEDIA BHD MAIN MARKET TRADING/SERVICES
648 1562 BJTOTO BST MK Equity BERJAYA SPORTS TOTO BHD MAIN MARKET TRADING/SERVICES
649 7241 BHS BHSI MK Equity BHS INDUSTRIES BHD MAIN MARKET TRADING/SERVICES
650 6998 BINTAI BKC MK Equity BINTAI KINDEN CORPORATION BHD MAIN MARKET TRADING/SERVICES
651 5032 BIPORT BPH MK Equity BINTULU PORT HOLDINGS BHD MAIN MARKET TRADING/SERVICES
652 7036 BORNOIL BORNO MK Equity BORNEO OIL BHD MAIN MARKET TRADING/SERVICES
653 2771 BSTEAD BOUS MK Equity BOUSTEAD HOLDINGS BHD MAIN MARKET TRADING/SERVICES
654 9474 BRAHIMS BRAH MK Equity BRAHIMS HOLDINGS BERHAD MAIN MARKET TRADING/SERVICES
655 5210 ARMADA BAB MK Equity BUMI ARMADA BERHAD MAIN MARKET TRADING/SERVICES
656 5257 CARIMIN CARIP MK Equity CARIMIN PETROLEUM BERHAD MAIN MARKET TRADING/SERVICES
657 5245 CARING CARING MK Equity CARING PHARMACY GROUP BERHAD MAIN MARKET TRADING/SERVICES
658 7117 CENTURY CLH MK Equity CENTURY LOGISTICS HOLDINGS BHD MAIN MARKET TRADING/SERVICES
659 7209 CHEETAH CTH MK Equity CHEETAH HOLDINGS BHD MAIN MARKET TRADING/SERVICES
660 7016 CHUAN CHR MK Equity CHUAN HUAT RESOURCES BHD MAIN MARKET TRADING/SERVICES
661 5104 CNI CNI MK Equity CNI HOLDINGS BHD MAIN MARKET TRADING/SERVICES
662 5136 COMPLET CLSB MK Equity COMPLETE LOGISTIC SERVICES BHD MAIN MARKET TRADING/SERVICES
663 5037 COMPUGT CGHB MK Equity COMPUGATES HOLDINGS BHD MAIN MARKET TRADING/SERVICES
664 2925 CCB CNCB MK Equity CYCLE & CARRIAGE BINTANG BHD MAIN MARKET TRADING/SERVICES
665 5184 CYPARK CYP MK Equity CYPARK RESOURCES BERHAD MAIN MARKET TRADING/SERVICES
666 5216 DSONIC DSON MK Equity DATASONIC GROUP BERHAD MAIN MARKET TRADING/SERVICES
667 0091 DAYA DAYA MK Equity DAYA MATERIALS BHD MAIN MARKET TRADING/SERVICES
668 5141 DAYANG DEHB MK Equity DAYANG ENTERPRISE HOLDINGS BHD MAIN MARKET TRADING/SERVICES
669 5132 DELEUM DLUM MK Equity DELEUM BHD MAIN MARKET TRADING/SERVICES
670 7212 DESTINI DSTN MK Equity DESTINI BERHAD MAIN MARKET TRADING/SERVICES
671 7277 DIALOG DLG MK Equity DIALOG GROUP BHD MAIN MARKET TRADING/SERVICES
672 5908 DKSH DKSH MK Equity DKSH HOLDINGS(M)BHD MAIN MARKET TRADING/SERVICES
673 5259 EATECH EATECH MK Equity E.A.TECHNIQUE (M) BERHAD MAIN MARKET TRADING/SERVICES
674 2097 EASTLND FBO MK Equity EASTLAND EQUITY BHD MAIN MARKET TRADING/SERVICES
675 5036 EDARAN EDS MK Equity EDARAN BHD MAIN MARKET TRADING/SERVICES
676 7471 EDEN EDN MK Equity EDEN INC. BHD MAIN MARKET TRADING/SERVICES
677 0064 EFFICEN EES MK Equity EFFICIENT E-SOLUTIONS BHD MAIN MARKET TRADING/SERVICES
678 5208 EITA EITA MK Equity EITA RESOURCES BERHAD MAIN MARKET TRADING/SERVICES
679 7189 EKIB EKI MK Equity EMAS KIARA INDUSTRIES BHD MAIN MARKET TRADING/SERVICES
680 5056 ENGTEX ENGT MK Equity ENGTEX GROUP BHD MAIN MARKET TRADING/SERVICES
681 5081 EIG EIG MK Equity ESTHETICS INTERNATIONAL GROUP MAIN MARKET TRADING/SERVICES
682 6939 FIAMMA FHB MK Equity FIAMMA HOLDINGS BHD MAIN MARKET TRADING/SERVICES
683 9318 FITTERS FIT MK Equity FITTERS DIVERSIFIED BHD MAIN MARKET TRADING/SERVICES
684 7210 FREIGHT FMH MK Equity FREIGHT MANAGEMENT HLDGS BHD MAIN MARKET TRADING/SERVICES
685 0128 FRONTKN FRCB MK Equity FRONTKEN CORPORATION BHD MAIN MARKET TRADING/SERVICES
686 9377 FSBM FSBM MK Equity FSBM HOLDINGS BHD MAIN MARKET TRADING/SERVICES
687 5209 GASMSIA GMB MK Equity GAS MALAYSIA BERHAD MAIN MARKET TRADING/SERVICES
688 0078 GDEX GDX MK EQUITY GD EXPRESS CARRIER BHD MAIN MARKET TRADING/SERVICES
689 3182 GENTING GENT MK Equity GENTING BHD MAIN MARKET TRADING/SERVICES
690 4715 GENM GENM MK Equity GENTING MALAYSIA BERHAD MAIN MARKET TRADING/SERVICES
691 3204 GKENT GKEN MK Equity GEORGE KENT (M) BHD MAIN MARKET TRADING/SERVICES
692 7676 GUNUNG GNC MK Equity GUNUNG CAPITAL BERHAD MAIN MARKET TRADING/SERVICES
693 7668 HAIO HAIO MK Equity HAI-O ENTERPRISE BHD MAIN MARKET TRADING/SERVICES
694 7110 HAISAN HRB MK Equity HAISAN RESOURCES BHD MAIN MARKET TRADING/SERVICES
695 7253 HANDAL HDL MK Equity HANDAL RESOURCES BERHAD MAIN MARKET TRADING/SERVICES
696 3034 HAPSENG HAP MK Equity HAP SENG CONSOLIDATED BHD MAIN MARKET TRADING/SERVICES
697 2062 HARBOUR HALG MK Equity HARBOUR-LINK GROUP BHD MAIN MARKET TRADING/SERVICES
698 5008 HARISON HHM MK Equity HARRISONS HOLDINGS (M) BHD MAIN MARKET TRADING/SERVICES
699 7013 HUBLINE HUBL MK Equity HUBLINE BHD MAIN MARKET TRADING/SERVICES
700 5255 ICON ICON MK Equity ICON OFFSHORE BERHAD MAIN MARKET TRADING/SERVICES
701 5225 IHH IHH MK Equity IHH HEALTHCARE BERHAD MAIN MARKET TRADING/SERVICES
702 5614 ILB ILB MK Equity INTEGRATED LOGISTICS BHD MAIN MARKET TRADING/SERVICES
703 5673 IPMUDA IP MK Equity IPMUDA BHD MAIN MARKET TRADING/SERVICES
704 0058 JOBST JOBS MK Equity JOBSTREET CORPORATION BHD MAIN MARKET TRADING/SERVICES
705 8672 KAMDAR KGMB MK Equity KAMDAR GROUP(M)BHD MAIN MARKET TRADING/SERVICES
706 5079 KBES KBES MK Equity KBES BHD MAIN MARKET TRADING/SERVICES
707 7185 SAMUDRA KSTB MK Equity KEJURUTERAAN SAMUDRA TIMUR BHD MAIN MARKET TRADING/SERVICES
708 0151 KGB KGRB MK Equity KELINGTON GROUP BERHAD MAIN MARKET TRADING/SERVICES
709 5035 KNUSFOR KNUS MK Equity KNUSFORD BHD MAIN MARKET TRADING/SERVICES
710 4847 KTB KTN MK Equity KONSORTIUM TRANSNASIONAL BHD MAIN MARKET TRADING/SERVICES
711 5878 KPJ KPJ MK Equity KPJ HEALTHCARE BHD MAIN MARKET TRADING/SERVICES
712 9121 KPSCB KPS MK Equity KPS CONSORTIUM BHD MAIN MARKET TRADING/SERVICES
713 6874 KUB KUBM MK Equity KUB MALAYSIA BHD MAIN MARKET TRADING/SERVICES
714 6491 KFIMA FIMA MK Equity KUMPULAN FIMA BHD MAIN MARKET TRADING/SERVICES
715 5843 KPS KUPS MK Equity KUMPULAN PERANGSANG SELANGOR MAIN MARKET TRADING/SERVICES
716 7170 LFECORP LFE MK Equity LFE CORPORATION BHD MAIN MARKET TRADING/SERVICES
717 8486 LIONFIB POS MK Equity LION FOREST INDUSTRIES BHD MAIN MARKET TRADING/SERVICES
718 5143 LUXCHEM LUXC MK Equity LUXCHEM CORPORATION BHD MAIN MARKET TRADING/SERVICES
719 3859 MAGNUM MAG MK Equity MAGNUM BERHAD MAIN MARKET TRADING/SERVICES
720 5264 MALAKOF MLK MK Equity MALAKOFF CORPORATION BERHAD MAIN MARKET TRADING/SERVICES
721 3891 MUIIND MUI MK Equity MALAYAN UNITED INDUSTRIES BHD MAIN MARKET TRADING/SERVICES
722 5014 AIRPORT MAHB MK Equity MALAYSIA AIRPORTS HOLDINGS BHD MAIN MARKET TRADING/SERVICES
723 5186 MHB MMHE MK Equity MALAYSIA MARINE AND HEAVY ENG MAIN MARKET TRADING/SERVICES
724 5077 MAYBULK MBC MK Equity MALAYSIAN BULK CARRIERS BHD MAIN MARKET TRADING/SERVICES
725 3514 MARCO MARC MK Equity MARCO HOLDINGS BHD MAIN MARKET TRADING/SERVICES
726 6012 MAXIS MAXIS MK Equity MAXIS BERHAD MAIN MARKET TRADING/SERVICES
727 5983 MBMR MBM MK Equity MBM RESOURCES BHD MAIN MARKET TRADING/SERVICES
728 5090 MEDIAC MCIL MK EQUITY MEDIA CHINESE INTERNATIONAL LT MAIN MARKET TRADING/SERVICES
729 4502 MEDIA MPR MK Equity MEDIA PRIMA BHD MAIN MARKET TRADING/SERVICES
730 3069 MFCB MFCB MK Equity MEGA FIRST CORPORATION BHD MAIN MARKET TRADING/SERVICES
731 7234 MESB MESB MK Equity MESB BHD MAIN MARKET TRADING/SERVICES
732 0043 MTRONIC MEGB MK Equity METRONIC GLOBAL BHD MAIN MARKET TRADING/SERVICES
733 3816 MISC MISC MK Equity MISC BHD MAIN MARKET TRADING/SERVICES
734 2194 MMCCORP MMC MK Equity MMC CORPORATION BHD MAIN MARKET TRADING/SERVICES
735 0059 MMODE MMB MK Equity M-MODE BHD MAIN MARKET TRADING/SERVICES
736 3905 MULPHA MIT MK Equity MULPHA INTERNATIONAL BHD MAIN MARKET TRADING/SERVICES
737 0138 MYEG MYEG MK Equity MY E.G. SERVICES BHD MAIN MARKET TRADING/SERVICES
738 4464 NICORP NIC MK Equity NAIM INDAH CORPORATION BHD MAIN MARKET TRADING/SERVICES
739 9806 NATWIDE NAT MK Equity NATIONWIDE EXPRESS COURIER SER MAIN MARKET TRADING/SERVICES
740 5509 NCB NCB MK Equity NCB HOLDINGS BHD MAIN MARKET TRADING/SERVICES
741 5533 OCB OCM MK Equity OCB BHD MAIN MARKET TRADING/SERVICES
742 0172 OCK OCK MK Equity OCK GROUP BERHAD MAIN MARKET TRADING/SERVICES
743 5201 OLDTOWN OTB MK Equity OLDTOWN BERHAD MAIN MARKET TRADING/SERVICES
744 3018 OLYMPIA OLYM MK Equity OLYMPIA INDUSTRIES BHD MAIN MARKET TRADING/SERVICES
745 5260 OWG OWG MK Equity ONLY WORLD GROUP HOLDINGS BERHAD MAIN MARKET TRADING/SERVICES
746 8419 PANSAR PNSR MK Equity PANSAR BERHAD MAIN MARKET TRADING/SERVICES
747 5125 PANTECH PGHB MK Equity PANTECH GROUP HOLDINGS BHD MAIN MARKET TRADING/SERVICES
748 5657 PARKSON PKS MK Equity PARKSON HOLDINGS BHD MAIN MARKET TRADING/SERVICES
749 5041 PBA PBAH MK Equity PBA HOLDINGS BHD MAIN MARKET TRADING/SERVICES
750 6254 PDZ PDZ MK Equity PDZ HOLDINGS BHD MAIN MARKET TRADING/SERVICES
751 8346 PRKCORP PRK MK Equity PERAK CORPORATION BHD MAIN MARKET TRADING/SERVICES
752 7108 PERDANA PETR MK Equity PERDANA PETROLEUM BERHAD MAIN MARKET TRADING/SERVICES
753 0047 PERISAI PPT MK Equity PERISAI PETROLEUM TEKNOLOGI MAIN MARKET TRADING/SERVICES
754 7080 PERMAJU PERM MK Equity PERMAJU INDUSTRIES BHD MAIN MARKET TRADING/SERVICES
755 5219 PESTECH PEST MK Equity PESTECH INTERNATIONAL BERHAD MAIN MARKET TRADING/SERVICES
756 5133 PENERGY PENB MK Equity PETRA ENERGY BHD MAIN MARKET TRADING/SERVICES
757 7027 PETONE PORB MK Equity PETROL ONE RESOURCES BHD MAIN MARKET TRADING/SERVICES
758 5681 PETDAG PETD MK Equity PETRONAS DAGANGAN BHD MAIN MARKET TRADING/SERVICES
759 7081 PHARMA PHRM MK Equity PHARMANIAGA BHD MAIN MARKET TRADING/SERVICES
760 7163 PJBUMI PJSB MK Equity PJBUMI BHD MAIN MARKET TRADING/SERVICES
761 4634 POS POSM MK Equity POS MALAYSIA BHD MAIN MARKET TRADING/SERVICES
762 5204 PRESBHD PRES MK Equity PRESTARIANG BERHAD MAIN MARKET TRADING/SERVICES
763 7201 PICORP PICB MK Equity PROGRESSIVE IMPACT CORPORATION MAIN MARKET TRADING/SERVICES
764 5272 RANHILL RAHH MK Equity RANHILL HOLDINGS BERHAD MAIN MARKET TRADING/SERVICES
765 8885 RPB RP MK Equity RELIANCE PACIFIC BHD MAIN MARKET TRADING/SERVICES
766 0037 RGB RGB MK Equity RGB INTERNATIONAL BHD MAIN MARKET TRADING/SERVICES
767 8567 SALCON SALC MK Equity SALCON BHD MAIN MARKET TRADING/SERVICES
768 5147 SAMCHEM SAHB MK Equity SAMCHEM HOLDINGS BERHAD MAIN MARKET TRADING/SERVICES
769 9113 SANBUMI SBUMI MK Equity SANBUMI HOLDINGS BHD MAIN MARKET TRADING/SERVICES
770 5218 SKPETRO SAKP MK Equity SAPURAKENCANA PETROLEUM BHD MAIN MARKET TRADING/SERVICES
771 0099 SCICOM SCIC MK Equity SCICOM (MSC) BHD MAIN MARKET TRADING/SERVICES
772 7045 SCOMIES SES MK Equity SCOMI ENERGY SERVICES BHD MAIN MARKET TRADING/SERVICES
773 7158 SCOMI SGB MK Equity SCOMI GROUP BHD MAIN MARKET TRADING/SERVICES
774 7053 SEEHUP SHC MK Equity SEE HUP CONSOLIDATED BHD MAIN MARKET TRADING/SERVICES
775 9792 SEG SYS MK Equity SEG INTERNATIONAL BHD MAIN MARKET TRADING/SERVICES
776 9431 SJC SENI MK Equity SENI JAYA CORPORATION BHD MAIN MARKET TRADING/SERVICES
777 5173 SYSCORP SHIN MK Equity SHIN YANG SHIPPING CORP BHD MAIN MARKET TRADING/SERVICES
778 4197 SIME SIME MK Equity SIME DARBY BHD MAIN MARKET TRADING/SERVICES
779 5242 SOLID SOLID MK Equity SOLID AUTOMOTIVE BHD MAIN MARKET TRADING/SERVICES
780 6084 STAR STAR MK Equity STAR MEDIA GROUP BERHAD MAIN MARKET TRADING/SERVICES
781 9865 SUIWAH SW MK Equity SUIWAH CORPORATION BHD MAIN MARKET TRADING/SERVICES
782 1201 SUMATEC SMTC MK Equity SUMATEC RESOURCES BHD MAIN MARKET TRADING/SERVICES
783 6521 SURIA SURIA MK Equity SURIA CAPITAL HOLDINGS BHD MAIN MARKET TRADING/SERVICES
784 8524 TALIWRK CI MK Equity TALIWORKS CORPORATION BHD MAIN MARKET TRADING/SERVICES
785 7228 TGOFFS TOFF MK Equity TANJUNG OFFSHORE BHD MAIN MARKET TRADING/SERVICES
786 5140 TASCO TASCO MK Equity TASCO BERHAD MAIN MARKET TRADING/SERVICES
787 4863 TM T MK Equity TELEKOM MALAYSIA BHD MAIN MARKET TRADING/SERVICES
788 5347 TENAGA TNB MK Equity TENAGA NASIONAL BHD MAIN MARKET TRADING/SERVICES
789 8702 TEXCHEM TEX MK Equity TEXCHEM RESOURCES BHD MAIN MARKET TRADING/SERVICES
790 7206 THHEAVY RH MK Equity TH HEAVY ENGINEERING BERHAD MAIN MARKET TRADING/SERVICES
791 5711 TSTORE STORE MK EQUITY THE STORE CORPORATION BHD MAIN MARKET TRADING/SERVICES
792 8397 TNLOGIS TNL MK Equity TIONG NAM LOGISTICS HOLDINGS MAIN MARKET TRADING/SERVICES
793 0101 TMCLIFE TMCL MK Equity TMC LIFE SCIENCES BHD MAIN MARKET TRADING/SERVICES
794 7218 TOCEAN TRO MK Equity TRANSOCEAN HOLDINGS BHD MAIN MARKET TRADING/SERVICES
795 5167 TURBO TMB MK Equity TURBO-MECH BERHAD MAIN MARKET TRADING/SERVICES
796 1368 EDGENTA UEME MK Equity UEM EDGENTA BERHAD MAIN MARKET TRADING/SERVICES
797 7137 UMS UMS MK Equity UMS HOLDINGS BHD MAIN MARKET TRADING/SERVICES
798 5243 UMWOG UMWOG MK Equity UMW OIL & GAS CORPORATION BHD MAIN MARKET TRADING/SERVICES
799 7091 UNIMECH UGB MK Equity UNIMECH GROUP BHD MAIN MARKET TRADING/SERVICES
800 5754 UTUSAN UTUS MK Equity UTUSAN MELAYU (M) BHD MAIN MARKET TRADING/SERVICES
801 7250 UZMA UZMA MK Equity UZMA BHD MAIN MARKET TRADING/SERVICES
802 7240 VOIR VOIR MK Equity VOIR HOLDINGS BHD MAIN MARKET TRADING/SERVICES
803 5016 WARISAN WTCH MK Equity WARISAN TC HOLDINGS BHD MAIN MARKET TRADING/SERVICES
804 5246 WPRTS WPRTS MK Equity WESTPORTS HOLDINGS BERHAD MAIN MARKET TRADING/SERVICES
805 7692 WIDETEC WMB MK Equity WIDETECH (M) BHD MAIN MARKET TRADING/SERVICES
806 5267 XINHWA XINH MK Equity XIN HWA HOLDINGS BERHAD MAIN MARKET TRADING/SERVICES
807 7122 YFG YFG MK Equity YFG BERHAD MAIN MARKET TRADING/SERVICES
808 7293 YINSON YNS MK Equity YINSON HOLDINGS BHD MAIN MARKET TRADING/SERVICES
809 7066 YONGTAI YTB MK Equity YONG TAI BHD MAIN MARKET TRADING/SERVICES
810 4677 YTL YTL MK Equity YTL CORPORATION BHD MAIN MARKET TRADING/SERVICES
811 0179 BIOHLDG BIOA MK Equity BIOALPHA HOLDINGS BERHAD ACE MARKET CONSUMER PRODUCTS
812 0170 KANGER KANGER MK Equity KANGER INTERNATIONAL BERHAD ACE MARKET CONSUMER PRODUCTS
813 0148 SUNZEN SUNZ MK Equity SUNZEN BIOTECH BHD ACE MARKET CONSUMER PRODUCTS
814 0095 XINGHE XHB MK Equity XINGHE HOLDINGS BERHAD ACE MARKET CONSUMER PRODUCTS
815 0053 OSKVI OSKV MK Equity OSK VENTURES INTERNATIONAL BHD ACE MARKET FINANCE
816 0105 ASIAPLY ASPO MK Equity ASIA POLY HOLDINGS BHD ACE MARKET INDUSTRIAL PRODUCTS
817 0072 AT ATSY MK Equity AT SYSTEMATIZATION BHD ACE MARKET INDUSTRIAL PRODUCTS
818 0163 CAREPLS CPG MK Equity CAREPLUS GROUP BERHAD ACE MARKET INDUSTRIAL PRODUCTS
819 0102 CONNECT CCHB MK Equity CONNECTCOUNTY HOLDINGS BHD ACE MARKET INDUSTRIAL PRODUCTS
820 0100 ESCERAM ESC MK Equity ES CERAMICS TECHNOLOGY BHD ACE MARKET INDUSTRIAL PRODUCTS
821 0109 FLONIC FLON MK Equity FLONIC HI-TEC BHD ACE MARKET INDUSTRIAL PRODUCTS
822 0175 HHGROUP HHR MK Equity HENG HUAT RESOURCES GROUP BHD ACE MARKET INDUSTRIAL PRODUCTS
823 0160 HHHCORP HHH MK Equity HIAP HUAT HOLDINGS BHD ACE MARKET INDUSTRIAL PRODUCTS
824 0162 IJACOBS IDJ MK Equity IDEAL JACOBS (M) CORPORATION B ACE MARKET INDUSTRIAL PRODUCTS
825 0024 JAG JAG MK Equity JAG BERHAD ACE MARKET INDUSTRIAL PRODUCTS
826 0025 LNGRES LNGR MK Equity LNG RESOURCES BHD ACE MARKET INDUSTRIAL PRODUCTS
827 0070 MQTECH MQ MK Equity MQ TECHNOLOGY BHD ACE MARKET INDUSTRIAL PRODUCTS
828 0049 OCNCASH OCP MK Equity OCEANCASH PACIFIC BHD ACE MARKET INDUSTRIAL PRODUCTS
829 0038 PTB PTB MK Equity PLASTRADE TECHNOLOGY BHD ACE MARKET INDUSTRIAL PRODUCTS
830 0133 SANICHI SANI MK Equity SANICHI TECHNOLOGY BHD ACE MARKET INDUSTRIAL PRODUCTS
831 0028 SCOPE SCP MK Equity SCOPE INDUSTRIES BHD ACE MARKET INDUSTRIAL PRODUCTS
832 0055 SERSOL SER MK Equity SERSOL BERHAD ACE MARKET INDUSTRIAL PRODUCTS
833 0001 SCOMNET SCT MK Equity SUPERCOMNET TECHNOLOGIES BHD ACE MARKET INDUSTRIAL PRODUCTS
834 0084 TECFAST TECF MK Equity TECHFAST HOLDINGS BHD ACE MARKET INDUSTRIAL PRODUCTS
835 0181 AEMULUS AMLS MK Equity AEMULUS HOLDINGS BERHAD ACE MARKET TECHNOLOGY
836 0119 APPASIA APP MK Equity APPASIA BERHAD ACE MARKET TECHNOLOGY
837 0068 ASDION ASD MK Equity ASDION BHD ACE MARKET TECHNOLOGY
838 0039 ASIAEP ASRB MK Equity ASIAEP RESOURCES BERHAD ACE MARKET TECHNOLOGY
839 0098 BAHVEST BORN MK Equity BORNEO AQUA HARVEST BHD ACE MARKET TECHNOLOGY
840 0079 ORI MK Equity CWORKS SYSTEMS BHD ACE MARKET TECHNOLOGY
841 0022 CYBERT CYBT MK Equity CYBERTOWERS BHD ACE MARKET TECHNOLOGY
842 0152 DGB DGB MK Equity DGB ASIA BERHAD ACE MARKET TECHNOLOGY
843 0131 DGSB DGSB MK Equity DIVERSIFIED GATEWAY SOLUTIONS ACE MARKET TECHNOLOGY
844 0154 EAH EAHB MK Equity EA HOLDINGS BERHAD ACE MARKET TECHNOLOGY
845 0107 EDUSPEC EDHB MK Equity EDUSPEC HOLDINGS BERHAD ACE MARKET TECHNOLOGY
846 0116 FOCUS FDTB MK Equity FOCUS DYNAMICS GROUP BERHAD ACE MARKET TECHNOLOGY
847 0045 GNB GNB MK Equity G NEPTUNE BERHAD ACE MARKET TECHNOLOGY
848 0104 GENETEC GENE MK Equity GENETEC TECHNOLOGY BERHAD ACE MARKET TECHNOLOGY
849 0074 GOCEAN GOCB MK Equity GREEN OCEAN CORPORATION BERHAD ACE MARKET TECHNOLOGY
850 0174 IDMENSN IDC MK Equity iDIMENSION CONSOLIDATED BHD ACE MARKET TECHNOLOGY
851 0023 IFCAMSC IFCA MK Equity IFCA MSC BHD ACE MARKET TECHNOLOGY
852 0034 INGENCO MMAG MK Equity MMAG HOLDINGS BHD ACE MARKET TECHNOLOGY
853 0094 INIX INIX MK Equity INIX TECHNOLOGIES HOLDINGS BHD ACE MARKET TECHNOLOGY
854 0069 VIVO MK Equity VIVOCOM INTERNATIONAL HOLDINGS BHD ACE MARKET TECHNOLOGY
855 0010 IRIS ICB MK Equity IRIS CORPORATION BHD ACE MARKET TECHNOLOGY
856 0146 JFTECH JFTB MK Equity JF TECHNOLOGY BHD ACE MARKET TECHNOLOGY
857 0127 JHM JHMC MK Equity JHM CONSOLIDATION BHD ACE MARKET TECHNOLOGY
858 0036 KGROUP KAG MK Equity KEY ALLIANCE GROUP BERHAD ACE MARKET TECHNOLOGY
859 0111 K1 KONE MK Equity K-ONE TECHNOLOGY BHD ACE MARKET TECHNOLOGY
860 0176 KRONO KAB MK Equity KRONOLOGI ASIA BERHAD ACE MARKET TECHNOLOGY
861 0017 M3TECH M3T MK Equity M3 TECHNOLOGIES(ASIA)BHD ACE MARKET TECHNOLOGY
862 0156 MPAY MPSB MK Equity MANAGEPAY SYSTEMS BERHAD ACE MARKET TECHNOLOGY
863 0075 MEXTER MEXT MK Equity MEXTER TECHNOLOGY BHD ACE MARKET TECHNOLOGY
864 0126 MICROLN MICL MK Equity MICROLINK SOLUTIONS BHD ACE MARKET TECHNOLOGY
865 0112 MIKROMB MKRMB MK Equity MIKRO MSC BERHAD ACE MARKET TECHNOLOGY
866 0085 MLAB MLAB MK Equity MLABS SYSTEMS BHD ACE MARKET TECHNOLOGY
867 0113 MMSV MMSV MK Equity MMS VENTURES BHD ACE MARKET TECHNOLOGY
868 0103 MNC MNCW MK Equity MNC WIRELESS BHD ACE MARKET TECHNOLOGY
869 0155 MGRC MGRC MK Equity MSIAN GENOMICS RES CENTRE BHD ACE MARKET TECHNOLOGY
870 0092 MTOUCHE MTTB MK Equity MTOUCHE TECHNOLOGY BHD ACE MARKET TECHNOLOGY
871 0108 N2N N2N MK Equity N2N CONNECT BHD ACE MARKET TECHNOLOGY
872 0020 NETX NETX MK Equity NETX HOLDINGS BHD ACE MARKET TECHNOLOGY
873 0096 NEXGRAM NNCB MK Equity NEXGRAM HOLDINGS BERHAD ACE MARKET TECHNOLOGY
874 0026 NOVAMSC NOVM MK Equity NOVA MSC BHD ACE MARKET TECHNOLOGY
875 0035 OPCOM OHB MK Equity OPCOM HOLDINGS BHD ACE MARKET TECHNOLOGY
876 0040 OPENSYS OPEN MK Equity OPENSYS (M) BHD ACE MARKET TECHNOLOGY
877 0018 ACC MK Equity ACCSOFT TECHNOLOGY BERHAD ACE MARKET TECHNOLOGY
878 0005 PALETTE PMB MK Equity PALETTE MULTIMEDIA BHD ACE MARKET TECHNOLOGY
879 0123 PRIVA PRTB MK Equity PRIVASIA TECHNOLOGY BERHAD ACE MARKET TECHNOLOGY
880 0007 PUC PUCF MK Equity PUC FOUNDER (MSC) BHD ACE MARKET TECHNOLOGY
881 0106 REXIT REXI MK Equity REXIT BHD ACE MARKET TECHNOLOGY
882 0135 SCN SCAN MK Equity SCAN ASSOCIATES BHD ACE MARKET TECHNOLOGY
883 0178 SEDANIA SDNA MK Equity SEDANIA INNOVATOR BERHAD ACE MARKET TECHNOLOGY
884 0129 SRIDGE SRHB MK Equity SILVER RIDGE HOLDINGS BHD ACE MARKET TECHNOLOGY
885 0117 SMRT SMRT MK Equity SMRT HOLDINGS BERHAD ACE MARKET TECHNOLOGY
886 0169 SMTRACK SMTG MK Equity SMTRACK BERHAD ACE MARKET TECHNOLOGY
887 0093 SOLUTN SOLE MK Equity SOLUTION ENGINEERING HOLDINGS ACE MARKET TECHNOLOGY
888 0050 SYSTECH SYTC MK Equity SYSTECH BHD ACE MARKET TECHNOLOGY
889 0132 TDEX TDEX MK Equity TECHNODEX BHD ACE MARKET TECHNOLOGY
890 0060 TMS SKH MK Equity SKH CONSORTIUM BHD ACE MARKET TECHNOLOGY
891 0120 VIS VHB MK Equity VISDYNAMICS HOLDINGS BHD ACE MARKET TECHNOLOGY
892 0066 VSOLAR VSOL MK Equity VSOLAR GROUP BERHAD ACE MARKET TECHNOLOGY
893 0141 WINTONI WINT MK Equity WINTONI GROUP BHD ACE MARKET TECHNOLOGY
894 0086 YGL YGLC MK Equity YGL CONVERGENCE BHD ACE MARKET TECHNOLOGY
895 0009 YTLE YTLE MK Equity YTL E-SOLUTIONS BHD ACE MARKET TECHNOLOGY
896 0140 UTOPIA STL MK Equity STERLING PROGRESS BHD ACE MARKET TRADING/SERVICES
897 0122 AIM AIMB MK Equity ADVANCE INFORMATION MARKETING ACE MARKET TRADING/SERVICES
898 0048 ANCOMLB ALB MK Equity ANCOM LOGISTICS BERHAD ACE MARKET TRADING/SERVICES
899 0150 ASIABIO ABIO MK Equity ASIA BIOENERGY TECH BHD ACE MARKET TRADING/SERVICES
900 0011 BTECH BTEC MK Equity BRITE-TECH BHD ACE MARKET TRADING/SERVICES
901 0157 FOCUSP FPHB MK Equity FOCUS POINT HOLDINGS BERHAD ACE MARKET TRADING/SERVICES
902 0081 IDEAL IDEAL MK Equity IDEAL SUN CITY HOLDINGS BERHAD ACE MARKET TRADING/SERVICES
903 0147 INNITY INNC MK Equity INNITY CORPORATION BHD ACE MARKET TRADING/SERVICES
904 0180 KTC KTCC MK Equity KIM TECK CHEONG CONSOLIDATED BERHAD ACE MARKET TRADING/SERVICES
905 0167 MCLEAN MTB MK Equity MCLEAN TECHNOLOGIES BERHAD ACE MARKET TRADING/SERVICES
906 0153 OVERSEA OVSE MK Equity OVERSEA ENTERPRISE BERHAD ACE MARKET TRADING/SERVICES
907 0177 PASUKGB PSK MK Equity PASUKHAS GROUP BERHAD ACE MARKET TRADING/SERVICES
908 0171 PLABS PLAB MK Equity PETERLABS HOLDINGS BHD ACE MARKET TRADING/SERVICES
909 0006 PINEAPP PINE MK Equity PINEAPPLE RESOURCES BHD ACE MARKET TRADING/SERVICES
910 0110 RA RATG MK Equity R&A TELECOMMUNICATION GRP BHD ACE MARKET TRADING/SERVICES
911 0080 RAYA RAYA MK Equity RAYA INTERNATIONAL BERHAD ACE MARKET TRADING/SERVICES
912 0032 REDTONE RIB MK Equity REDTONE INTERNATIONAL BHD ACE MARKET TRADING/SERVICES
913 0173 REV REV MK Equity REV ASIA BERHAD ACE MARKET TRADING/SERVICES
914 0158 SCC SCHB MK Equity SCC HOLDINGS BERHAD ACE MARKET TRADING/SERVICES
915 0161 SCH SCHG MK Equity SCH GROUP BERHAD ACE MARKET TRADING/SERVICES
916 0137 STEMLFE STEM MK Equity STEMLIFE BHD ACE MARKET TRADING/SERVICES
917 0089 TEXCYCL TEXC MK Equity TEX CYCLE TECHNOLOGY (M) BHD ACE MARKET TRADING/SERVICES
918 0145 TFP TFPS MK Equity TFP SOLUTIONS BHD ACE MARKET TRADING/SERVICES
919 0165 XOX XOX MK Equity XOX BHD ACE MARKET TRADING/SERVICES
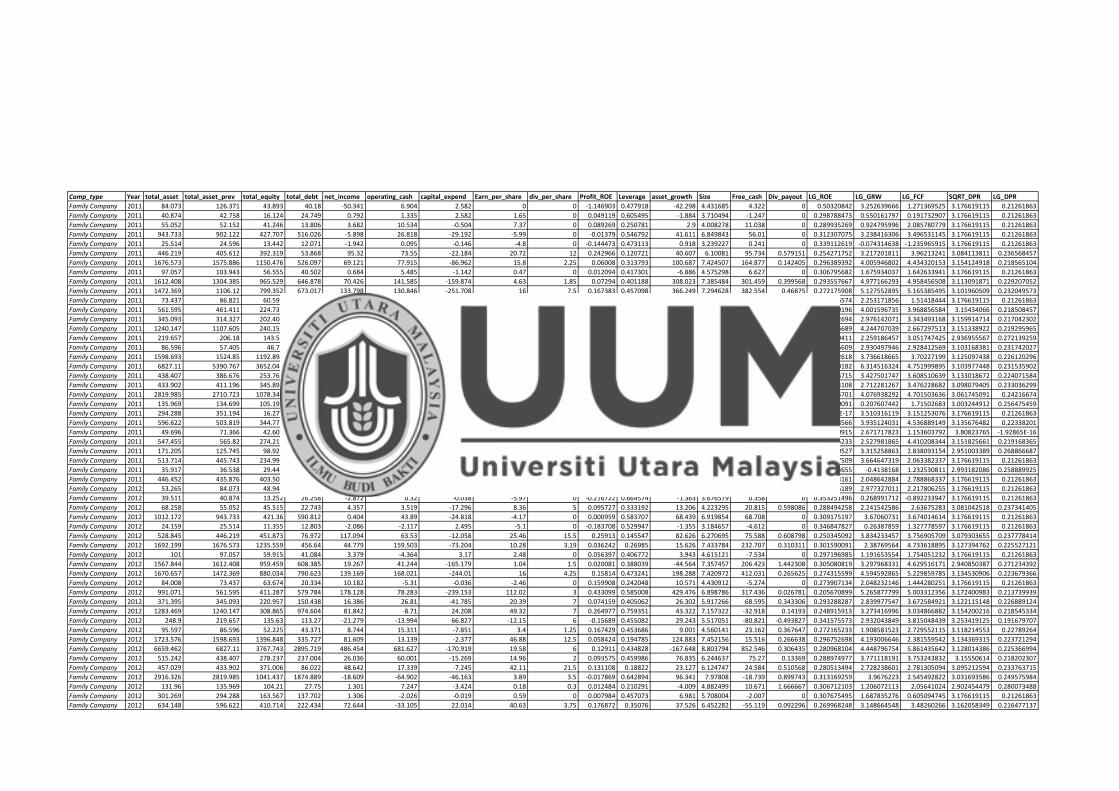
Comp_type Year total_asset total_asset_prev total_equity total_debt net_income operating_cash capital_expend Earn_per_share div_per_share Profit_ROE Leverage asset_growth Size Free_cash Div_payout LG_ROE LG_GRW LG_FCF SQRT_DPR LG_DPR
Family Company 2011 84.073 126.371 43.893 40.18 -50.341 6.904 2.582 0 0 -1.146903 0.477918 -42.298 4.431685 4.322 0 0.50320842 3.252639666 1.271369525 3.176619115 0.21261863
Family Company 2011 40.874 42.758 16.124 24.749 0.792 1.335 2.582 1.65 0 0.049119 0.605495 -1.884 3.710494 -1.247 0 0.298788473 0.550161797 0.191732907 3.176619115 0.21261863
Family Company 2011 55.052 52.152 41.246 13.806 3.682 10.534 -0.504 7.37 0 0.089269 0.250781 2.9 4.008278 11.038 0 0.289935269 0.924795996 2.085780779 3.176619115 0.21261863
Family Company 2011 943.733 902.122 427.707 516.026 -5.898 26.818 -29.192 -5.99 0 -0.01379 0.546792 41.611 6.849843 56.01 0 0.312307075 3.238416306 3.496531145 3.176619115 0.21261863
Family Company 2011 25.514 24.596 13.442 12.071 -1.942 0.095 -0.146 -4.8 0 -0.144473 0.473113 0.918 3.239227 0.241 0 0.339112619 -0.074314638 -1.235965915 3.176619115 0.21261863
Family Company 2011 446.219 405.612 392.319 53.868 95.32 73.55 -22.184 20.72 12 0.242966 0.120721 40.607 6.10081 95.734 0.579151 0.254271752 3.217201811 3.96213241 3.084113811 0.236568457
Family Company 2011 1676.573 1575.886 1150.476 526.097 69.121 77.915 -86.962 15.8 2.25 0.06008 0.313793 100.687 7.424507 164.877 0.142405 0.296389392 4.005946802 4.434320153 3.154124918 0.218565104
Family Company 2011 97.057 103.943 56.555 40.502 0.684 5.485 -1.142 0.47 0 0.012094 0.417301 -6.886 4.575298 6.627 0 0.306795682 1.675934037 1.642633941 3.176619115 0.21261863
Family Company 2011 1612.408 1304.385 965.529 646.878 70.426 141.585 -159.874 4.63 1.85 0.07294 0.401188 308.023 7.385484 301.459 0.399568 0.293557667 4.977166293 4.958456508 3.113091871 0.229207052
Family Company 2011 1472.369 1106.12 799.352 673.017 133.798 130.846 -251.708 16 7.5 0.167383 0.457098 366.249 7.294628 382.554 0.46875 0.272175908 5.127552895 5.165385495 3.101960509 0.232049573
Family Company 2011 73.437 86.821 60.597 12.839 -10.257 -5.921 -0.205 -12.82 0 -0.169266 0.17483 -13.384 4.296428 -5.716 0 0.344016574 2.253171856 1.51418444 3.176619115 0.21261863
Family Company 2011 561.595 461.411 224.737 336.856 34.522 30.799 -65.679 21.27 3 0.153611 0.59982 100.184 6.330781 96.478 0.141044 0.275360196 4.001596735 3.968856584 3.15434066 0.218508457
Family Company 2011 345.093 314.327 202.404 142.689 29.425 28.135 -18.827 37.79 4 0.145378 0.41348 30.766 5.843814 46.962 0.105848 0.277252694 2.976142071 3.343493168 3.159914714 0.217042302
Family Company 2011 1240.147 1107.605 240.159 999.988 49.142 15.435 -6.125 28.13 4.5 0.204623 0.806346 132.542 7.122985 21.56 0.159972 0.263446689 4.244707039 2.667297513 3.151338922 0.219295965
Family Company 2011 219.657 206.18 143.59 76.066 13.703 6.738 -26.826 8.19 12 0.095431 0.346294 13.477 5.392067 33.564 1.465201 0.288560411 2.259186457 3.051747425 2.936955567 0.272139259
Family Company 2011 86.596 57.405 46.73 39.868 6.976 7.668 -21.453 2.71 1.25 0.149283 0.460391 29.191 4.461254 29.121 0.461255 0.27635609 2.930497946 2.928412569 3.103168381 0.231742027
Family Company 2011 1598.693 1524.85 1192.894 405.798 57.642 3.968 -67.012 3.85 1.25 0.048321 0.253831 73.843 7.376942 70.98 0.324675 0.298962618 3.736618665 3.70227199 3.125097438 0.226120296
Family Company 2011 6827.11 5390.767 3652.048 3175.062 493.127 -365.132 -127.448 18.85 8.6 0.135028 0.465067 1436.343 8.828657 -237.684 0.456233 0.279620182 6.314516324 4.751999895 3.103977448 0.231535902
Family Company 2011 438.407 386.676 253.769 184.637 13.257 15.394 -48.323 7.27 2 0.05224 0.421154 51.731 6.083148 63.717 0.275103 0.298106715 3.427501747 3.608510639 3.133018672 0.224071584
Family Company 2011 433.902 411.196 345.895 88.007 50.389 50.865 -3.851 43.83 21.6 0.145677 0.202827 22.706 6.072819 54.716 0.492813 0.277184108 2.712281267 3.476228682 3.098079405 0.233036299
Family Company 2011 2819.985 2710.723 1078.348 1741.637 62.195 105.508 -118.752 12.21 8.75 0.057676 0.617605 109.262 7.944487 224.26 0.716626 0.296916701 4.076938292 4.701503636 3.061745091 0.24216674
Family Company 2011 135.969 134.699 105.192 30.777 2.01 3.976 -3.227 0.28 0.3 0.019108 0.226353 1.27 4.912427 7.203 1.071429 0.305290091 0.207607442 1.71502683 3.003244912 0.256475459
Family Company 2011 294.288 351.194 16.279 132.009 16.911 44.1 6.462 7.57 0 1.038823 0.448571 -56.906 5.684559 37.638 0 -9.64327E-17 3.510316119 3.151253076 3.176619115 0.21261863
Family Company 2011 596.622 503.819 344.775 251.847 24.35 75.651 -109.892 14.51 3.75 0.070626 0.422122 92.803 6.391284 185.543 0.258442 0.294068566 3.935124031 4.536889149 3.135676482 0.22338201
Family Company 2011 49.696 71.366 42.601 7.094 -4.644 -6.156 -2.382 -10.88 48 -0.109012 0.142748 -21.67 3.905924 -3.774 -4.411765 0.332000915 2.671717823 1.153603792 3.80823765 -1.92865E-16
Family Company 2011 547.455 565.82 274.213 273.242 38.377 119.283 -41.08 23.9 3.75 0.139953 0.499113 -18.365 6.30528 160.363 0.156904 0.278495233 2.527981865 4.410208344 3.151825661 0.219168365
Family Company 2011 171.205 125.745 98.927 72.278 3.037 9.624 -16.621 2.17 3 0.030699 0.422172 45.46 5.142862 26.245 1.382488 0.302790527 3.315258863 2.838093154 2.951003389 0.268866687
Family Company 2011 513.714 445.743 234.998 278.715 -4.175 -20.14 -9.383 -2.58 0 -0.017766 0.542549 67.971 6.241667 -10.757 0 0.313147509 3.664647319 2.063382337 3.176619115 0.21261863
Family Company 2011 35.917 36.538 29.443 6.473 2.394 4.252 0.119 12.37 14 0.08131 0.180221 -0.621 3.581211 4.133 1.13177 0.291704655 -0.4138168 1.232530811 2.993182086 0.258889925
Family Company 2011 446.452 435.876 403.505 42.946 24.015 18.58 -6.219 22 0 0.059516 0.096194 10.576 6.101332 24.799 0 0.296513161 2.048642884 2.788868337 3.176619115 0.21261863
Family Company 2012 53.265 84.073 48.948 4.317 -8.457 -6.559 6.291 0 0 -0.172775 0.081048 -30.808 3.975279 -12.85 0 0.344706189 2.977327011 2.217806255 3.176619115 0.21261863
Family Company 2012 39.511 40.874 13.252 26.258 -2.872 0.32 -0.038 -5.97 0 -0.216722 0.664574 -1.363 3.676579 0.358 0 0.353251496 0.268991712 -0.892233947 3.176619115 0.21261863
Family Company 2012 68.258 55.052 45.515 22.743 4.357 3.519 -17.296 8.36 5 0.095727 0.333192 13.206 4.223295 20.815 0.598086 0.288494258 2.241542586 2.63675283 3.081042518 0.237341405
Family Company 2012 1012.172 943.733 421.36 590.812 0.404 43.89 -24.818 -4.17 0 0.000959 0.583707 68.439 6.919854 68.708 0 0.309175197 3.67060731 3.674014614 3.176619115 0.21261863
Family Company 2012 24.159 25.514 11.355 12.803 -2.086 -2.117 2.495 -5.1 0 -0.183708 0.529947 -1.355 3.184657 -4.612 0 0.346847827 0.26387859 1.327778597 3.176619115 0.21261863
Family Company 2012 528.845 446.219 451.873 76.972 117.094 63.53 -12.058 25.46 15.5 0.25913 0.145547 82.626 6.270695 75.588 0.608798 0.250345092 3.834233457 3.756905709 3.079303655 0.237778414
Family Company 2012 1692.199 1676.573 1235.559 456.64 44.779 159.503 -73.204 10.28 3.19 0.036242 0.26985 15.626 7.433784 232.707 0.310311 0.301590091 2.38769564 4.733618895 3.127394762 0.225527121
Family Company 2012 101 97.057 59.915 41.084 3.379 -4.364 3.17 2.48 0 0.056397 0.406772 3.943 4.615121 -7.534 0 0.297196985 1.191653554 1.754051232 3.176619115 0.21261863
Family Company 2012 1567.844 1612.408 959.459 608.385 19.267 41.244 -165.179 1.04 1.5 0.020081 0.388039 -44.564 7.357457 206.423 1.442308 0.305080819 3.297968331 4.629516171 2.940850387 0.271234392
Family Company 2012 1670.657 1472.369 880.034 790.623 139.169 168.021 -244.01 16 4.25 0.15814 0.473241 198.288 7.420972 412.031 0.265625 0.274315599 4.594592865 5.229859785 3.134530906 0.223679366
Family Company 2012 84.008 73.437 63.674 20.334 10.182 -5.31 -0.036 -2.46 0 0.159908 0.242048 10.571 4.430912 -5.274 0 0.273907134 2.048232146 1.444280251 3.176619115 0.21261863
Family Company 2012 991.071 561.595 411.287 579.784 178.128 78.283 -239.153 112.02 3 0.433099 0.585008 429.476 6.898786 317.436 0.026781 0.205670899 5.265877799 5.003312356 3.172400983 0.213739939
Family Company 2012 371.395 345.093 220.957 150.438 16.386 26.81 -41.785 20.39 7 0.074159 0.405062 26.302 5.917266 68.595 0.343306 0.293288287 2.839977547 3.672584921 3.122115148 0.226889124
Family Company 2012 1283.469 1240.147 308.865 974.604 81.842 -8.71 24.208 49.32 7 0.264977 0.759351 43.322 7.157322 -32.918 0.14193 0.248915913 3.273416996 3.034866882 3.154200216 0.218545334
Family Company 2012 248.9 219.657 135.63 113.27 -21.279 -13.994 66.827 -12.15 6 -0.15689 0.455082 29.243 5.517051 -80.821 -0.493827 0.341575573 2.932043849 3.815048439 3.253419125 0.191679707
Family Company 2012 95.597 86.596 52.225 43.371 8.744 15.311 -7.851 3.4 1.25 0.167429 0.453686 9.001 4.560141 23.162 0.367647 0.272165233 1.908581523 2.729552115 3.118214553 0.22789264
Family Company 2012 1723.576 1598.693 1396.848 335.727 81.609 13.139 -2.377 46.88 12.5 0.058424 0.194785 124.883 7.452156 15.516 0.266638 0.296752698 4.193006646 2.381559542 3.134369315 0.223721294
Family Company 2012 6659.462 6827.11 3767.743 2895.719 486.454 681.627 -170.919 19.58 6 0.12911 0.434828 -167.648 8.803794 852.546 0.306435 0.280968104 4.448796754 5.861435642 3.128014386 0.225366994
Family Company 2012 515.242 438.407 278.237 237.004 26.036 60.001 -15.269 14.96 2 0.093575 0.459986 76.835 6.244637 75.27 0.13369 0.288974977 3.771118191 3.753243832 3.15550614 0.218202307
Family Company 2012 457.029 433.902 371.006 86.022 48.642 17.339 -7.245 42.11 21.5 0.131108 0.18822 23.127 6.124747 24.584 0.510568 0.280513494 2.728238601 2.781305094 3.095212594 0.233763715
Family Company 2012 2916.326 2819.985 1041.437 1874.889 -18.609 -64.902 -46.163 3.89 3.5 -0.017869 0.642894 96.341 7.97808 -18.739 0.899743 0.313169259 3.9676223 2.545492822 3.031693586 0.249575984
Family Company 2012 131.96 135.969 104.21 27.75 1.301 7.247 -3.424 0.18 0.3 0.012484 0.210291 -4.009 4.882499 10.671 1.666667 0.306712103 1.206072113 2.05641024 2.902454479 0.280073488
Family Company 2012 301.269 294.288 163.567 137.702 1.306 -2.026 -0.019 0.59 0 0.007984 0.457073 6.981 5.708004 -2.007 0 0.307675495 1.687835276 0.605094745 3.176619115 0.21261863
Family Company 2012 634.148 596.622 410.714 222.434 72.644 -33.105 22.014 40.63 3.75 0.176872 0.35076 37.526 6.452282 -55.119 0.092296 0.269968248 3.148664548 3.48260266 3.162058349 0.216477137
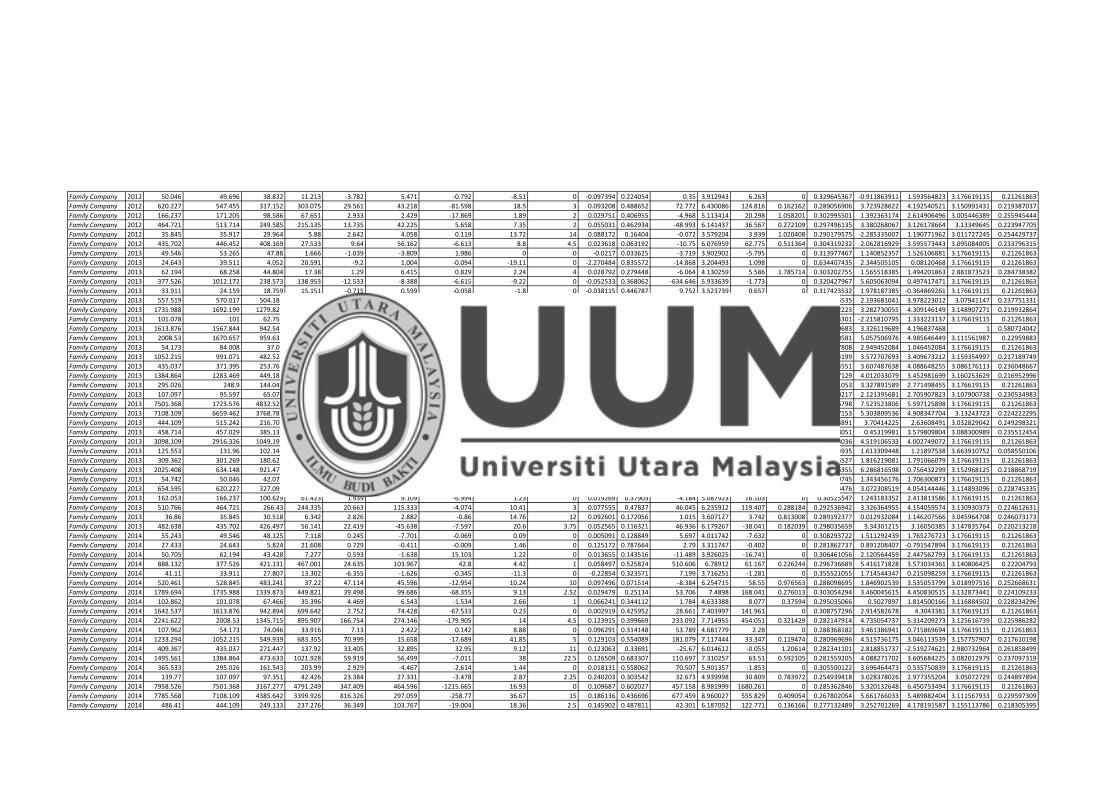
Family Company 2012 50.046 49.696 38.832 11.213 -3.782 5.471 -0.792 -8.51 0 -0.097394 0.224054 0.35 3.912943 6.263 0 0.329645367 -0.911863911 1.593564823 3.176619115 0.21261863
Family Company 2012 620.227 547.455 317.152 303.075 29.561 43.218 -81.598 18.5 3 0.093208 0.488652 72.772 6.430086 124.816 0.162162 0.289056906 3.723928622 4.192540521 3.150991431 0.219387037
Family Company 2012 166.237 171.205 98.586 67.651 2.933 2.429 -17.869 1.89 2 0.029751 0.406955 -4.968 5.113414 20.298 1.058201 0.302995501 1.392363174 2.614906496 3.005446389 0.255945444
Family Company 2012 464.721 513.714 249.585 215.135 13.735 42.225 5.658 7.35 2 0.055031 0.462934 -48.993 6.141437 36.567 0.272109 0.297496135 3.380268067 3.126178664 3.13349645 0.223947705
Family Company 2012 35.845 35.917 29.964 5.88 2.642 4.058 0.119 13.72 14 0.088172 0.16404 -0.072 3.579204 3.939 1.020408 0.290179575 -2.285335007 1.190771962 3.011727245 0.254429737
Family Company 2012 435.702 446.452 408.169 27.533 9.64 56.162 -6.613 8.8 4.5 0.023618 0.063192 -10.75 6.076959 62.775 0.511364 0.304319232 2.062816929 3.595573443 3.095084005 0.233796315
Family Company 2013 49.546 53.265 47.88 1.666 -1.039 -3.809 1.986 0 0 -0.0217 0.033625 -3.719 3.902902 -5.795 0 0.313977467 1.140852357 1.526106881 3.176619115 0.21261863
Family Company 2013 24.643 39.511 4.052 20.591 -9.2 1.004 -0.094 -19.11 0 -2.270484 0.835572 -14.868 3.204493 1.098 0 0.634407435 2.344505105 0.08120468 3.176619115 0.21261863
Family Company 2013 62.194 68.258 44.804 17.38 1.29 6.415 0.829 2.24 4 0.028792 0.279448 -6.064 4.130259 5.586 1.785714 0.303202755 1.565518385 1.494201863 2.881873523 0.284738382
Family Company 2013 377.526 1012.172 238.573 138.953 -12.533 -8.388 -6.615 -9.22 0 -0.052533 0.368062 -634.646 5.933639 -1.773 0 0.320427967 5.605063094 0.497417471 3.176619115 0.21261863
Family Company 2013 33.911 24.159 18.759 15.151 -0.715 0.599 -0.058 -1.8 0 -0.038115 0.446787 9.752 3.523739 0.657 0 0.317423532 1.978187385 -0.364869261 3.176619115 0.21261863
Family Company 2013 557.519 570.017 504.184 53.345 121.01 86.976 -10.548 26.31 16 0.240012 0.095683 -12.498 6.323497 97.524 0.608134 0.254985535 2.193681041 3.978223012 3.07941147 0.237751331
Family Company 2013 1735.988 1692.199 1279.823 456.165 52.266 84.07 -58.679 11.98 2.1 0.040838 0.26277 43.789 7.459332 142.749 0.175292 0.300592223 3.282730055 4.309146149 3.148907271 0.219932864
Family Company 2013 101.078 101 62.757 0.1 2.842 4.775 0.134 2.01 0 0.045286 0.000989 0.078 4.615892 4.641 0 0.299624301 -2.215810795 1.333223137 3.176619115 0.21261863
Family Company 2013 1613.876 1567.844 942.541 671.334 -1.892 25.749 -99.686 0.11 1 -0.002007 0.415976 46.032 7.386394 125.435 9.090909 0.30980683 3.326119689 4.196837468 1 0.580724042
Family Company 2013 2008.53 1670.657 959.638 1048.892 137.552 119.066 -191.979 11 4.5 0.143337 0.522219 337.873 7.605158 311.045 0.409091 0.277720581 5.057506976 4.985646449 3.111561987 0.22959883
Family Company 2013 54.173 84.008 37.09 17.083 5.767 -4.099 -0.763 0 0 0.155487 0.315342 -29.835 3.992183 -3.336 0 0.274927808 2.949452084 1.046452084 3.176619115 0.21261863
Family Company 2013 1052.215 991.071 482.524 569.691 77.27 43.971 -6.709 45.71 5 0.160137 0.541421 61.144 6.958653 50.68 0.109385 0.273854199 3.572707693 3.409673212 3.159354997 0.217189749
Family Company 2013 435.037 371.395 253.768 181.269 21.571 52.12 -58.625 19.42 11 0.085003 0.416675 63.642 6.075431 110.745 0.566426 0.290884551 3.607487638 4.088648255 3.086176113 0.236048667
Family Company 2013 1384.864 1283.469 449.187 934.836 178.326 63.576 116.847 110.89 11.5 0.396997 0.675038 101.395 7.233357 -53.271 0.103706 0.215327129 4.012033079 3.452981699 3.160253629 0.216952996
Family Company 2013 295.026 248.9 144.041 150.984 4.175 -31.418 -7.11 2.22 0 0.028985 0.511765 46.126 5.687063 -24.308 0 0.303161053 3.327891589 2.771498455 3.176619115 0.21261863
Family Company 2013 107.097 95.597 65.071 42.026 13.616 18.093 -4.447 5.21 2.25 0.209248 0.392411 11.5 4.673735 22.54 0.431862 0.262350217 2.121395681 2.705907823 3.107900738 0.230534983
Family Company 2013 7501.368 1723.576 4832.529 2668.839 329.945 289.853 -339.02 17.39 0 0.068276 0.35578 5777.792 8.922841 628.873 0 0.294586798 7.523523806 5.597125898 3.176619115 0.21261863
Family Company 2013 7108.109 6659.462 3768.787 3339.322 635.842 72.102 356.662 28.7 8 0.168713 0.46979 448.647 8.868992 -284.56 0.278746 0.271867153 5.303809536 4.908347704 3.13243723 0.224222295
Family Company 2013 444.109 515.242 216.701 227.407 6.549 -18.564 2.235 2.8 2.5 0.030221 0.512052 -71.133 6.09607 -20.799 0.892857 0.302893891 3.70414225 2.63608491 3.032829042 0.249298321
Family Company 2013 458.714 457.029 385.137 73.576 43.24 38.836 -22.81 37.05 20.5 0.112272 0.160396 1.685 6.128427 61.646 0.553306 0.28478051 0.45319981 3.579809804 3.088300989 0.235512454
Family Company 2013 3098.109 2916.326 1049.195 2048.914 12.457 -115.929 -15.612 2.45 0 0.011873 0.661343 181.783 8.038547 -100.317 0 0.306843036 4.519106533 4.002749072 3.176619115 0.21261863
Family Company 2013 125.553 131.96 102.148 23.404 -0.651 -3.669 0.4 -0.09 0.3 -0.006373 0.186407 -6.407 4.832728 -4.069 -3.333333 0.310734935 1.613309448 1.21897538 3.663910752 0.058550106
Family Company 2013 309.362 301.269 180.627 128.734 5.073 -7.86 0.002 2.22 0 0.028086 0.416127 8.093 5.734512 -7.862 0 0.30335527 1.816219081 1.791066079 3.176619115 0.21261863
Family Company 2013 2025.408 634.148 921.477 1103.931 50.035 -23.942 -21.553 25.05 3.75 0.054299 0.545041 1391.26 7.613526 -2.389 0.149701 0.297656355 6.286816598 0.756432299 3.152968125 0.218868719
Family Company 2013 54.742 50.046 42.075 12.667 3.236 3.118 -4.013 7.3 0 0.07691 0.231395 4.696 4.002631 7.131 0 0.292679745 1.343456176 1.706300873 3.176619115 0.21261863
Family Company 2013 654.595 620.227 327.092 327.503 16.327 50.824 -55.608 10.3 4 0.049916 0.500314 34.368 6.484017 106.432 0.38835 0.298614476 3.072308519 4.054144446 3.114893096 0.228745335
Family Company 2013 162.053 166.237 100.629 61.423 1.939 9.109 -6.994 1.23 0 0.019269 0.37903 -4.184 5.087923 16.103 0 0.30525547 1.243183352 2.413813586 3.176619115 0.21261863
Family Company 2013 510.766 464.721 266.43 244.335 20.663 115.333 -4.074 10.41 3 0.077555 0.47837 46.045 6.235912 119.407 0.288184 0.292536942 3.326364955 4.154059574 3.130930373 0.224612631
Family Company 2013 36.86 35.845 30.518 6.342 2.826 2.882 -0.86 14.76 12 0.092601 0.172056 1.015 3.607127 3.742 0.813008 0.289192377 0.012932084 1.146207566 3.045964708 0.246073173
Family Company 2013 482.638 435.702 426.497 56.141 22.419 -45.638 -7.597 20.6 3.75 0.052565 0.116321 46.936 6.179267 -38.041 0.182039 0.298035659 3.34301215 3.16050385 3.147835764 0.220213218
Family Company 2014 55.243 49.546 48.125 7.118 0.245 -7.701 -0.069 0.09 0 0.005091 0.128849 5.697 4.011742 -7.632 0 0.308293722 1.511292439 1.765276723 3.176619115 0.21261863
Family Company 2014 27.433 24.643 5.824 21.608 0.729 -0.411 -0.009 1.46 0 0.125172 0.787664 2.79 3.311747 -0.402 0 0.281862737 0.891208407 -0.791547894 3.176619115 0.21261863
Family Company 2014 50.705 62.194 43.428 7.277 0.593 -1.638 15.103 1.22 0 0.013655 0.143516 -11.489 3.926025 -16.741 0 0.306461056 2.120564459 2.447562793 3.176619115 0.21261863
Family Company 2014 888.132 377.526 421.131 467.001 24.635 103.967 42.8 4.42 1 0.058497 0.525824 510.606 6.78912 61.167 0.226244 0.296736689 5.416171828 3.573034361 3.140806425 0.22204793
Family Company 2014 41.11 33.911 27.807 13.302 -6.355 -1.626 -0.345 -11.3 0 -0.22854 0.323571 7.199 3.716251 -1.281 0 0.355521055 1.714544347 0.215098259 3.176619115 0.21261863
Family Company 2014 520.461 528.845 483.241 37.22 47.114 45.596 -12.954 10.24 10 0.097496 0.071514 -8.384 6.254715 58.55 0.976563 0.288098695 1.846902539 3.535053799 3.018997516 0.252668631
Family Company 2014 1789.694 1735.988 1339.873 449.821 39.498 99.686 -68.355 9.13 2.52 0.029479 0.25134 53.706 7.4898 168.041 0.276013 0.303054294 3.460045615 4.450830515 3.132873441 0.224109233
Family Company 2014 102.862 101.078 67.466 35.396 4.469 6.543 -1.534 2.66 1 0.066241 0.344112 1.784 4.633388 8.077 0.37594 0.295035066 0.5027897 1.814500166 3.116884502 0.228234296
Family Company 2014 1642.537 1613.876 942.894 699.642 2.752 74.428 -67.533 0.23 0 0.002919 0.425952 28.661 7.403997 141.961 0 0.308757296 2.914582678 4.3043381 3.176619115 0.21261863
Family Company 2014 2241.622 2008.53 1345.715 895.907 166.754 274.146 -179.905 14 4.5 0.123915 0.399669 233.092 7.714955 454.051 0.321429 0.282147914 4.735054737 5.314209273 3.125616739 0.225986282
Family Company 2014 107.962 54.173 74.046 33.916 7.13 2.422 0.142 8.88 0 0.096291 0.314148 53.789 4.681779 2.28 0 0.288368182 3.461386941 0.715869694 3.176619115 0.21261863
Family Company 2014 1233.294 1052.215 549.939 683.355 70.999 15.658 -17.689 41.85 5 0.129103 0.554089 181.079 7.117444 33.347 0.119474 0.280969696 4.515736175 3.046113539 3.157757907 0.217610198
Family Company 2014 409.367 435.037 271.447 137.92 33.405 32.895 32.95 9.12 11 0.123063 0.33691 -25.67 6.014612 -0.055 1.20614 0.282341101 2.818851737 -2.519274621 2.980732964 0.261858499
Family Company 2014 1495.561 1384.864 473.633 1021.928 59.919 56.499 -7.011 38 22.5 0.126509 0.683307 110.697 7.310257 63.51 0.592105 0.281559205 4.088271702 3.605684225 3.082012979 0.237097319
Family Company 2014 365.533 295.026 161.543 203.99 2.929 -4.467 -2.614 1.44 0 0.018131 0.558062 70.507 5.901357 -1.853 0 0.305500122 3.696464473 0.535750839 3.176619115 0.21261863
Family Company 2014 139.77 107.097 97.351 42.426 23.384 27.331 -3.478 2.87 2.25 0.240203 0.303542 32.673 4.939998 30.809 0.783972 0.254939418 3.028378026 2.977355204 3.05072729 0.244897894
Family Company 2014 7958.526 7501.368 3167.277 4791.249 347.409 464.596 -1215.665 16.93 0 0.109687 0.602027 457.158 8.981999 1680.261 0 0.285362846 5.320132648 6.450753494 3.176619115 0.21261863
Family Company 2014 7785.568 7108.109 4385.642 3399.926 816.326 297.059 -258.77 36.67 15 0.186136 0.436696 677.459 8.960027 555.829 0.409054 0.267802054 5.661766033 5.489882404 3.111567933 0.229597309
Family Company 2014 486.41 444.109 249.133 237.276 36.349 103.767 -19.004 18.36 2.5 0.145902 0.487811 42.301 6.187052 122.771 0.136166 0.277132489 3.252701269 4.178191587 3.155113786 0.218305395

Family Company 2014 536.565 458.714 435.813 100.751 60.55 64.557 -14.507 32.58 22.5 0.138936 0.18777 77.851 6.285188 79.064 0.690608 0.278727771 3.782528391 3.795957565 3.065991031 0.241109631
Family Company 2014 2721.632 3098.109 1063.493 1658.139 24.369 370.761 -10.192 4.67 2 0.022914 0.609244 -376.477 7.908987 380.953 0.428266 0.304470924 5.151476898 5.161742796 3.10847921 0.230387206
Family Company 2014 116.696 125.553 92.828 23.868 -6.612 1.9 -3.617 -0.93 0.3 -0.071229 0.204531 -8.857 4.759572 5.517 -0.322581 0.324293158 1.894573289 1.483405968 3.226993957 0.198998806
Family Company 2014 317.501 309.362 187.331 130.169 6.703 -31.441 0.909 2.73 0 0.035782 0.40998 8.139 5.760481 -32.35 0 0.301689839 1.821142097 3.01974857 3.176619115 0.21261863
Family Company 2014 3413.147 2025.408 1101.786 2311.361 13.2 86.883 -1500.183 7.23 1 0.011981 0.677194 1387.739 8.13539 1587.066 0.138313 0.306819895 6.284615587 6.401189976 3.154773526 0.218394776
Family Company 2014 61.7 54.742 47.751 13.948 5.674 10.114 -2.895 12.77 0 0.118825 0.226062 6.958 4.122284 13.009 0 0.283300776 1.684968849 2.228487827 3.176619115 0.21261863
Family Company 2014 696.475 654.595 339.296 357.179 18.606 63.546 -82.811 11.7 4 0.054837 0.512838 41.88 6.546032 146.357 0.34188 0.297538603 3.244013346 4.330826998 3.122343511 0.226830301
Family Company 2014 170.474 162.053 106.849 63.624 6.22 14.476 -6.81 3.93 0 0.058213 0.373218 8.421 5.138583 21.286 0 0.296798967 1.850727335 2.656188116 3.176619115 0.21261863
Family Company 2014 580.835 510.766 301.331 279.503 44.378 -39.139 3.875 21.98 4 0.147273 0.481209 70.069 6.364467 -43.014 0.181984 0.276817826 3.691051839 3.267219662 3.147844501 0.220210933
Family Company 2014 37.044 36.86 30.211 6.832 2.018 1.95 0.169 10.55 10 0.066797 0.184429 0.184 3.612106 1.781 0.947867 0.294912637 -1.470364354 0.501327839 3.023746352 0.251514435
Family Company 2014 501.058 482.638 432.083 68.975 12.126 12.019 -16.91 11.1 6 0.028064 0.137659 18.42 6.216722 28.929 0.540541 0.303360021 2.530579252 2.922666843 3.090366969 0.234990468
Family Company 2015 56.305 55.243 46.698 9.607 -1.425 -1.255 0.127 -0.54 0 -0.030515 0.170624 1.062 4.030783 -1.382 0 0.315831433 0.052249033 0.281016086 3.176619115 0.21261863
Family Company 2015 29.885 27.433 27.354 2.53 0.964 -14.142 -0.005 0.72 0 0.035242 0.084658 2.452 3.397357 -14.137 0 0.301806905 0.779040932 2.300714516 3.176619115 0.21261863
Family Company 2015 63.712 50.705 44.277 19.435 0.59 -4.391 0.702 1.66 0 0.013325 0.305045 13.007 4.154373 -5.093 0 0.306531819 2.22835428 1.413947352 3.176619115 0.21261863
Family Company 2015 924.557 888.132 421.961 502.596 5.261 51.01 -55.731 1 0 0.012468 0.543607 36.425 6.829315 106.741 0 0.306715532 3.122799121 4.056662534 3.176619115 0.21261863
Family Company 2015 39.394 41.11 25.795 13.599 -2.632 -2.911 -3.211 -2.1 0 -0.102035 0.345205 -1.716 3.673614 0.3 0 0.330587862 0.469034567 -1.045757491 3.176619115 0.21261863
Family Company 2015 570.017 520.461 529.093 40.924 53.045 36.938 -12.908 11.53 6 0.100256 0.071794 49.556 6.345666 49.846 0.520382 0.287480816 3.390192489 3.395260626 3.093626836 0.234165559
Family Company 2015 1872.628 1789.694 1393.062 479.566 58.55 89.982 -29.975 12.47 1.83 0.04203 0.256093 82.934 7.535098 119.957 0.146752 0.300333046 3.837465225 4.158051192 3.153435745 0.218746012
Family Company 2015 104.579 102.862 67.282 3.873 1.081 7.443 -2.625 0.24 0 0.016067 0.037034 1.717 4.649943 10.068 0 0.305943498 0.46954059 2.005886414 3.176619115 0.21261863
Family Company 2015 1652.814 1642.537 868.957 783.857 -67.174 43.796 -92.456 -2.94 0 -0.077304 0.474256 10.277 7.410235 136.252 0 0.325541728 2.023732713 4.268685772 3.176619115 0.21261863
Family Company 2015 2585.268 2241.622 1499.45 1085.818 195.94 225.11 -277.429 15 3.5 0.130675 0.420002 343.646 7.857584 502.539 0.233333 0.280612056 5.072222586 5.402339542 3.13967769 0.222341818
Family Company 2015 131.924 107.962 76.883 55.04 3.637 -7.778 -0.065 4.73 1 0.047306 0.41721 23.962 4.882226 -7.713 0.211416 0.299184018 2.759046128 1.774446663 3.143166079 0.221432906
Family Company 2015 1336.694 1233.294 661.558 675.136 81.031 27.179 -59.451 44.34 5 0.122485 0.505079 103.4 7.197955 86.63 0.112765 0.282472112 4.029041078 3.875336629 3.158820033 0.217330629
Family Company 2015 438.614 409.367 289.732 148.882 31.979 44.374 -39.989 8.63 5.5 0.110374 0.339437 29.247 6.08362 84.363 0.637312 0.285208158 2.93216265 3.85230403 3.074670226 0.238940737
Family Company 2015 1818.71 1495.561 495.579 1323.131 36.924 -19.184 -21.044 23.36 9.5 0.074507 0.727511 323.149 7.505883 1.86 0.406678 0.293211354 5.018805633 0.539025888 3.11194971 0.229499574
Family Company 2015 457.275 365.533 209.044 248.23 -0.095 -45.709 3.524 -0.84 0 -0.000454 0.542846 91.742 6.125285 -49.233 0 0.309476221 3.925136407 3.3845126 3.176619115 0.21261863
Family Company 2015 189.185 139.77 141.359 47.825 28.296 21.351 -20.087 2.43 2 0.200171 0.252795 49.415 5.242725 41.438 0.823045 0.264499538 3.387717599 3.234797572 3.044316672 0.246479125
Family Company 2015 8268.622 7958.526 3685.885 4582.737 286.893 355.242 -299.612 17.96 2 0.077836 0.554232 310.096 9.020223 654.854 0.111359 0.292474715 4.982992328 5.632288969 3.159042576 0.217272029
Family Company 2015 10034.932 7785.568 4841.394 5193.538 969.385 -450.871 -50.048 42.26 10 0.200228 0.517546 2249.364 9.213827 -400.823 0.23663 0.264486075 6.70411948 5.205905268 3.139152593 0.222478469
Family Company 2015 582.898 486.41 298.873 284.025 54.641 78.069 -20.488 28.46 5.5 0.182823 0.487264 96.488 6.368012 98.557 0.193254 0.268577972 3.968946609 3.987374951 3.146053877 0.220679038
Family Company 2015 564.667 536.565 462.387 102.279 50.207 53.877 -4.38 26.5 19.5 0.108582 0.181132 28.102 6.336236 58.257 0.735849 0.285611536 2.897474459 3.530696233 3.058604257 0.242947059
Family Company 2015 2445.545 2721.632 926.576 1518.969 -0.989 135.508 -9.652 -27.06 3 -0.001067 0.621117 -276.087 7.802023 145.16 -0.110865 0.309606749 4.882091915 4.323693919 3.194021603 0.20796166
Family Company 2015 108.927 116.696 83.779 25.148 -6.163 0.191 3.448 -0.86 0.3 -0.073563 0.23087 -7.769 4.690678 -3.257 -0.348837 0.324773281 1.780730243 1.025635517 3.231059579 0.19788073
Family Company 2015 285.809 317.501 196.095 89.713 8.764 12.043 -3.556 3.57 0 0.044693 0.313891 -31.692 5.655324 15.599 0 0.299753467 3.001899295 2.386193516 3.176619115 0.21261863
Family Company 2015 3670.85 3413.147 1187.136 2483.714 20.006 -136.655 -52.02 2.16 2 0.016852 0.676605 257.703 8.208179 -84.635 0.925926 0.305774922 4.822238949 3.855099997 3.027372293 0.250631086
Family Company 2015 59.708 61.7 47.155 12.552 -0.892 -0.595 -6.404 -1.87 0 -0.018916 0.210223 -1.992 4.089466 5.809 0 0.313390289 0.598578668 1.528202753 3.176619115 0.21261863
Family Company 2015 675.612 696.475 337.277 338.335 3.566 76.744 -56.117 2.5 3.5 0.010573 0.500783 -20.863 6.515619 132.861 1.4 0.307121485 2.638753516 4.246795034 2.948034769 0.269560313
Family Company 2015 176.287 170.474 112.391 63.895 5.542 3.439 -4.118 3.47 0 0.04931 0.362449 5.813 5.172113 7.557 0 0.298746781 1.528800646 1.756698844 3.176619115 0.21261863
Family Company 2015 826.103 580.835 388.386 437.716 60.781 93.22 -43.359 27.79 5 0.156496 0.529856 245.268 6.716719 136.579 0.179921 0.274695072 4.779281779 4.270767857 3.148172168 0.220125219
Family Company 2015 37.028 37.044 30.699 6.328 2.79 2.823 -0.274 14.6 12 0.090882 0.170898 -0.016 3.611674 3.097 0.821918 0.289575799 -3.591760035 0.981882411 3.044501765 0.246433551
Family Company 2015 456.246 501.058 431.473 24.773 5.93 90.236 -13.474 5.44 6 0.013744 0.054297 -44.812 6.123032 103.71 1.102941 0.30644197 3.302788655 4.031641269 2.997993996 0.257737034

CORRELATIONS /VARIABLES=log10_ROE Leverage log10assetgrwRef Size freecashRsqrt Div_payout
/PRINT=TWOTAIL NOSIG
/MISSING=PAIRWISE.
Correlations
Company Type = Family Company
Correlationsa
log10_ROE Leverage
log10_ROE Pearson Correlation
Sig. (2-tailed)
N
Leverage Pearson Correlation
Sig. (2-tailed)
N
log10assetgrwRef Pearson Correlation
Sig. (2-tailed)
N
Pearson Correlation
Sig. (2-tailed)
N
freecashRsqrt Pearson Correlation
Sig. (2-tailed)
N
Dividend Payout Ratio Pearson Correlation
Sig. (2-tailed)
N
1 -.155 -.077 .246**
.057 .352 .002
150 150 150 150
-.155 1 -.144 .383**
.057 .078 .000
150 150 150 150
-.077 -.144 1 -.341**
.352 .078 .000
150 150 150 150
.246** .383** -.341** 1
.002 .000 .000
150 150 150 150
.065 .168* -.193* .417**
.427 .040 .018 .000
150 150 150 150
.060 .006 -.005 .140
.468 .937 .954 .088
150 150 150 150
Page 1
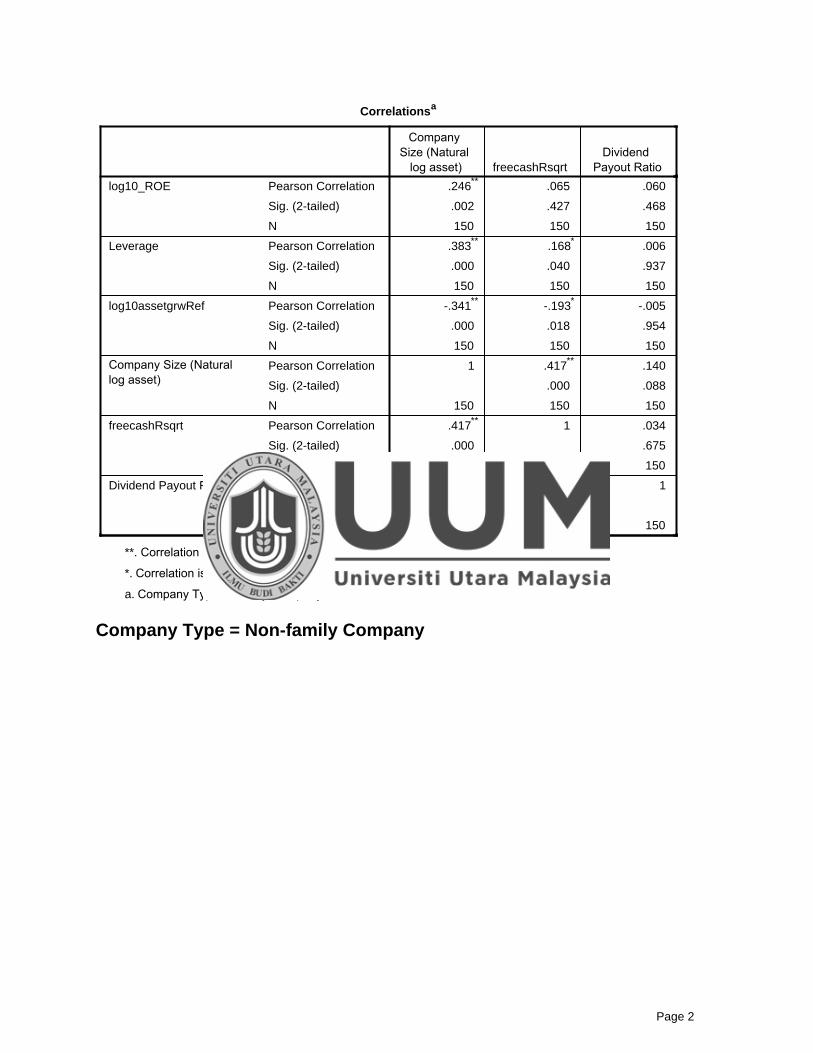
Correlationsa
freecashRsqrt
log10_ROE Pearson Correlation
Sig. (2-tailed)
N
Leverage Pearson Correlation
Sig. (2-tailed)
N
log10assetgrwRef Pearson Correlation
Sig. (2-tailed)
N
Pearson Correlation
Sig. (2-tailed)
N
freecashRsqrt Pearson Correlation
Sig. (2-tailed)
N
Dividend Payout Ratio Pearson Correlation
Sig. (2-tailed)
N
.246** .065 .060
.002 .427 .468
150 150 150
.383** .168* .006
.000 .040 .937
150 150 150
-.341** -.193* -.005
.000 .018 .954
150 150 150
1 .417** .140
.000 .088
150 150 150
.417** 1 .034
.000 .675
150 150 150
.140 .034 1
.088 .675
150 150 150
**.
*.
a.
Company Type = Non-family Company
Page 2
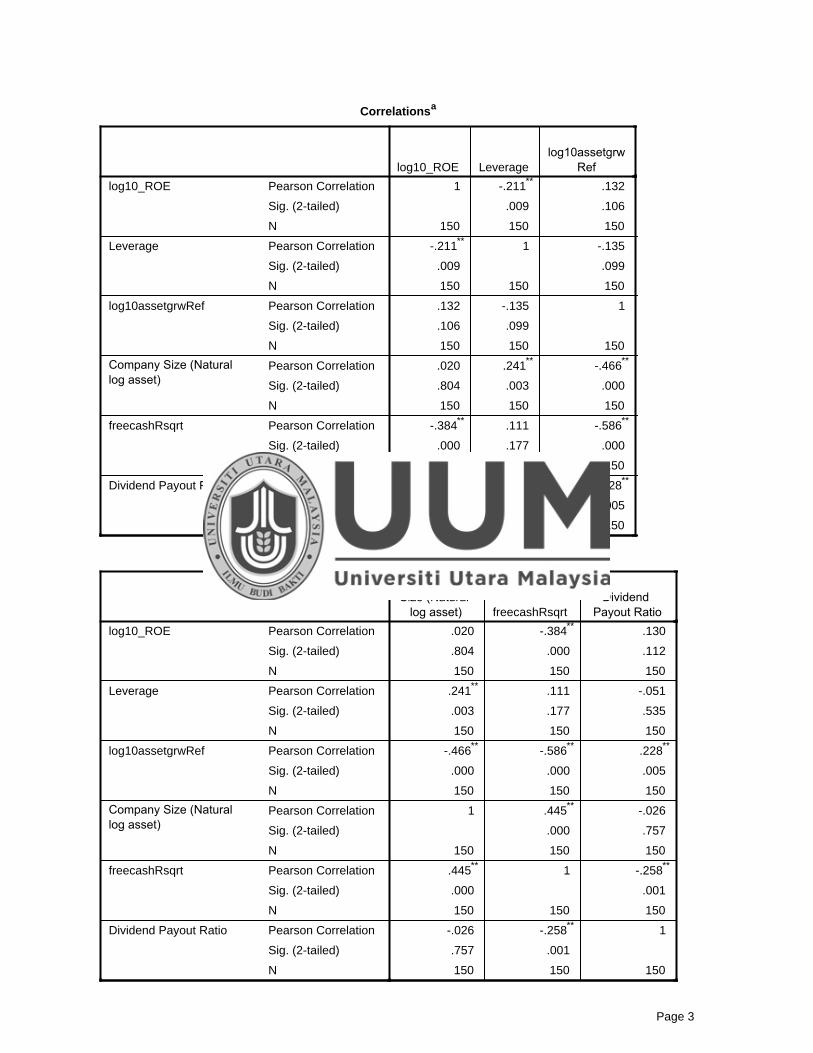
Correlationsa
log10_ROE Leverage
log10_ROE Pearson Correlation
Sig. (2-tailed)
N
Leverage Pearson Correlation
Sig. (2-tailed)
N
log10assetgrwRef Pearson Correlation
Sig. (2-tailed)
N
Pearson Correlation
Sig. (2-tailed)
N
freecashRsqrt Pearson Correlation
Sig. (2-tailed)
N
Dividend Payout Ratio Pearson Correlation
Sig. (2-tailed)
N
1 -.211** .132 .020
.009 .106 .804
150 150 150 150
-.211** 1 -.135 .241**
.009 .099 .003
150 150 150 150
.132 -.135 1 -.466**
.106 .099 .000
150 150 150 150
.020 .241** -.466** 1
.804 .003 .000
150 150 150 150
-.384** .111 -.586** .445**
.000 .177 .000 .000
150 150 150 150
.130 -.051 .228** -.026
.112 .535 .005 .757
150 150 150 150
Correlationsa
freecashRsqrt
log10_ROE Pearson Correlation
Sig. (2-tailed)
N
Leverage Pearson Correlation
Sig. (2-tailed)
N
log10assetgrwRef Pearson Correlation
Sig. (2-tailed)
N
Pearson Correlation
Sig. (2-tailed)
N
freecashRsqrt Pearson Correlation
Sig. (2-tailed)
N
Dividend Payout Ratio Pearson Correlation
Sig. (2-tailed)
N
.020 -.384** .130
.804 .000 .112
150 150 150
.241** .111 -.051
.003 .177 .535
150 150 150
-.466** -.586** .228**
.000 .000 .005
150 150 150
1 .445** -.026
.000 .757
150 150 150
.445** 1 -.258**
.000 .001
150 150 150
-.026 -.258** 1
.757 .001
150 150 150
Page 3
**.
a.
Page 4
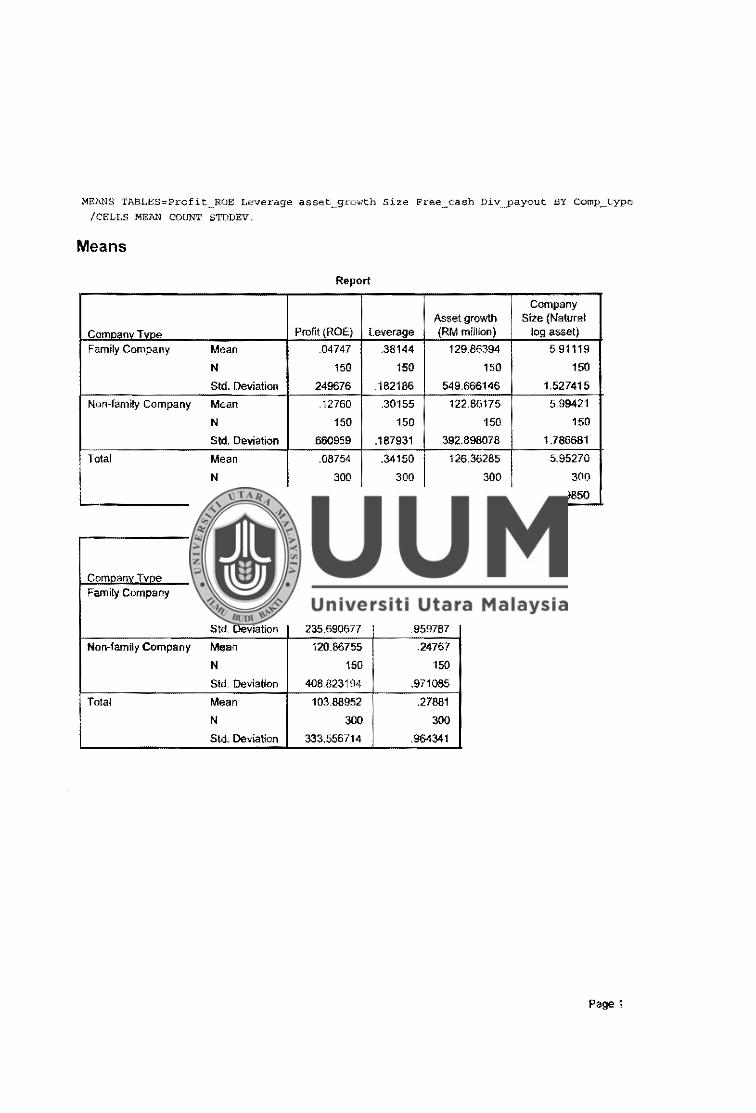
MEANS TABLES=Profit_ROE I,everage asset_growth Size Free_cash Div ... .Payout BY Comp_type
/CELLS MEAN COUNT STDDEV.
Means
Report
Company Asset growth Sile (Natural
Com"'""nv T.,nn. Profit (ROE) leverage (RM million) log asset)
Family Company Mean .04747 .38144 129.86394 5.91119
N 150 150 150 150
Std. Deviation .249676 .182186 549.666146 1.527415
Non-ramity Company Mean .12760 .30155 122.86175 5.99421
N 150 150 150 150
Std. Deviation .660959 .187931 392.898078 1.786681
Total Mean .08754 .34150 126.36285 5.95270
N 300 300 300 300
Std. Deviation .500379 .189054 476.969395 1.659850
Report
Free Cash Flow(RM Dividend
Comoanv-r-..... ,,,. mlllion) Payout Ratio
Family Company Mean 86.91149 .30995
N 150 150
Std, Deviation 235.690677 959787
Non-family Company Mean 120.86755 .24767
N 150 150
Std. Deviation 408.823194 .971085
Total Mean 103.88952 .27881
N 300 300 Std. Deviation 333.556714 .964341
Page 1
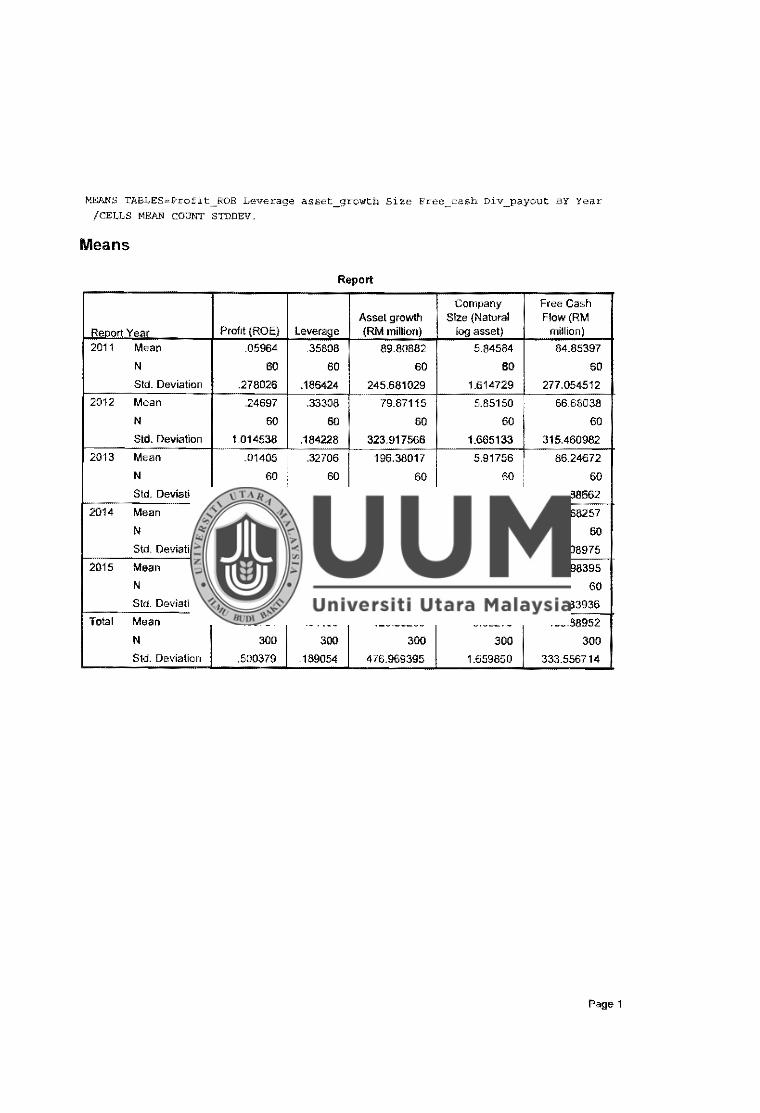
MEANS TABLES""Profit_ROE Leverage asset_growth Size Free_cash Div_payout BY Year /CELLS MEAN COUNT STDDEV.
Means
Report
Company Frne Cash Asset growth Size (Natural Flow(RM
Re"'ort Year Profit (ROE) Leverage (RM million) log asset) million)
2011 Mean .05964 .35808 89.80882 5.84584 84.85397
N 60 60 60 60 60
Std. Deviation .278026 .186424 245.681029 1.614729 277.054512
2012 Mean .24697 .33308 79.87115 5.85150 66.68038
N 60 60 60 60 60
Std. Deviation 1.014538 .184228 323.917566 1.665133 315.460982
2013 Mean .01405 .32706 196.38017 5.91756 86.24672
N 60 60 60 60 60
Std. Deviation .324665 .196463 847.431220 1.699545 214.388662
2014 Mean .05521 .34492 116.64137 6.01508 185.68257
N 60 60 60 60 60
Std. Deviation .121239 .186375 341.181226 1692087 425.608975
2015 Mean .06181 .34434 149.11273 6.13351 95.98395
N 60 60 60 60 60
Std. Deviation ,091139 .196264 379.383397 1.664387 389.233936
Total Mean .08754 .34150 126.36285 5.95270 103.88952
N 300 300 300 300 300
Std. Deviation .500379 .189054 476.969395 1.659850 333.556714
Page 1

Report
Dividend
Renart Year Payout Ratio
2011 Mean .22340
N 60
Std. Deviation .702782
2012 Mean .26169
N 60
Std. Deviation .586790
2013 Mean .43888
N 60
Std. Deviation 1.375942
2014 Mean .33926
N 60
Std. Deviation .775883
2015 Mean .13082
N 60
Std. Deviation 1.150617
Total Mean .27881
N 300
Std. Deviation .964341
Page 2
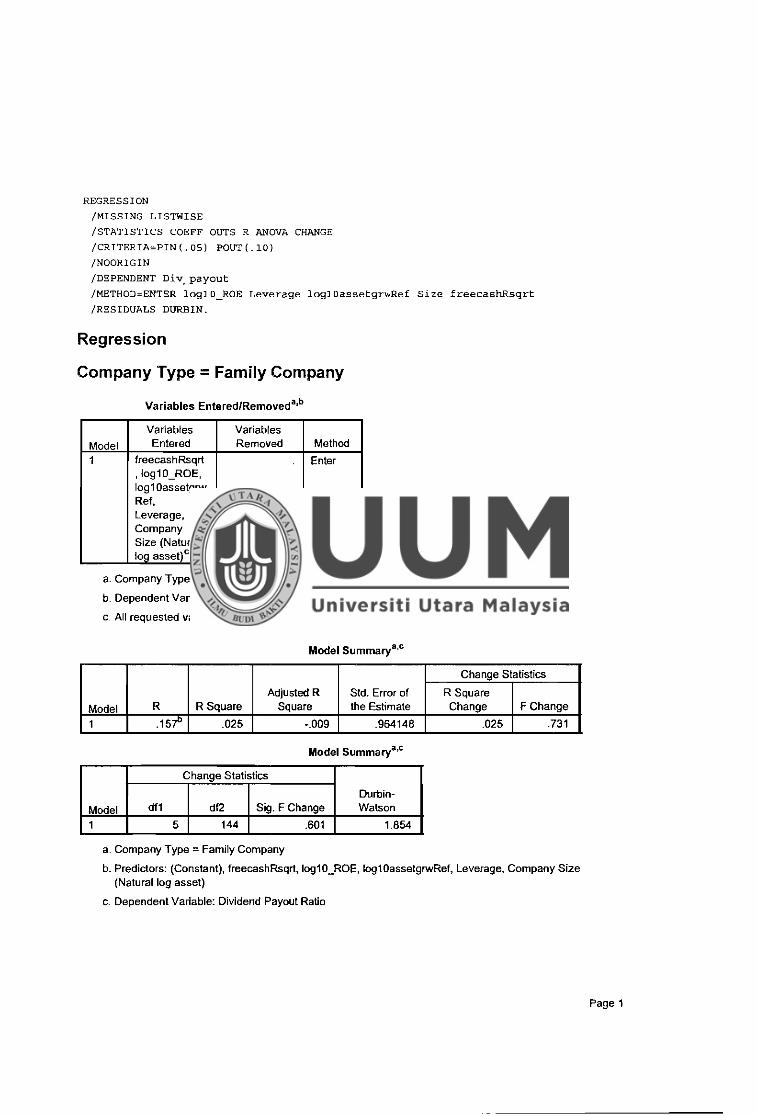
REGRESSION
/MISSING LISTWISE
/STATISTICS COEFF OUTS R ANOVA CHANGE
/CRITERIA~PIN(.05) POtIT(.10)
/NOORI GIN
/DEPENDENT Div_payout
/METHOD=ENTER logl0_ROE Leverage logl0assetgrwRef Size freecashRsqrt
/RESIDUALS DURBIN.
Regression
Company Type = Family Company
Variables Entered/Removeda,b
Variables Variables
Model Entered Removed Method
1 freecashRsqrt Enter , log10_ROE, log 1 0assetgrw Ref, Leverage, Company Size (Natural loQ asset)c
a. Company Type= Family Company
b. Dependent Variable: Dividend Payout Ratio
c All requested variables entered.
Model Summarya,c
Adjusted R Std. Error or
Change Statistics
R Square
Model R R Square Square the Estimate Change F Change
1 .15, .025 -.009 .964148 .025 .731
Model Summarya,c
Change Statistics
Durbin-
Model df1 df2 Sig. F Change Watson
1 5 144 .601 1.854
a. Company Type= Family Company
b. Predictors: (Constant), freecashRsqrt, log10_ROE, log10assetgrwRef, Leverage, Company Size (Natural log asset)
c. Dependent Variable: Dividend Payout Ratio
Page 1
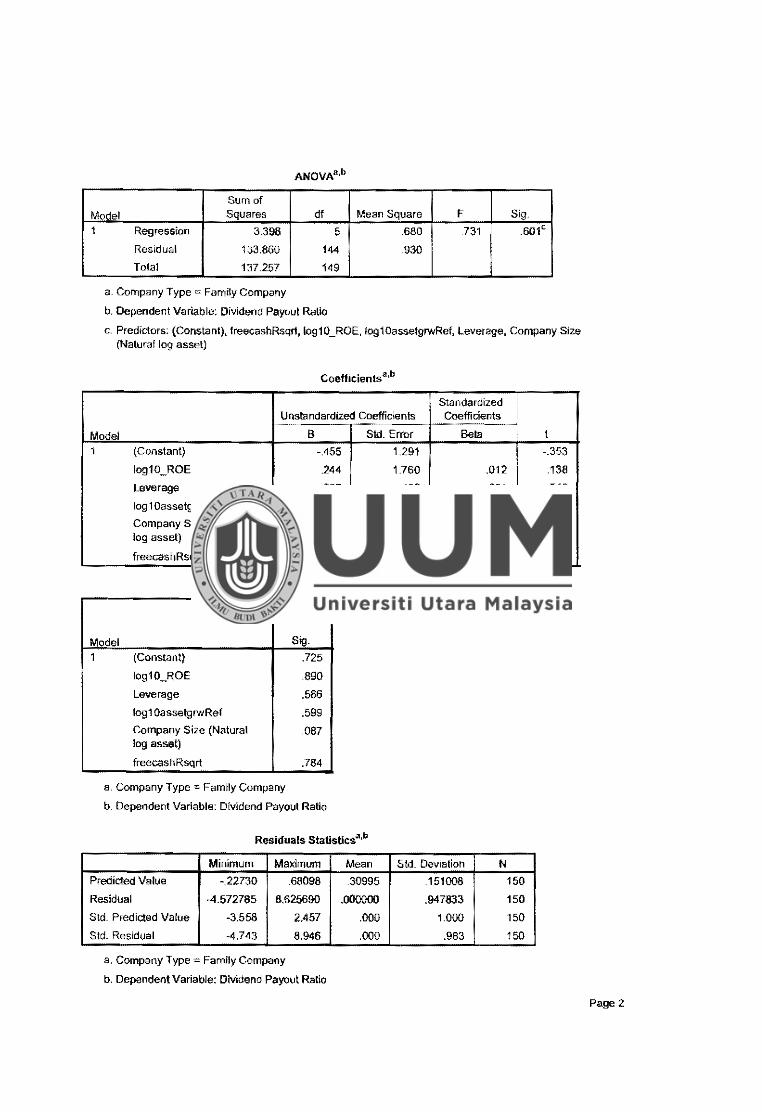
ANOVA3 'b
Sum of
Model Squares df Mean Square F Sig.
1 Regression 3.398 5 .680 731 .601c
Residual 133.860 144 .930
Total 137.257 149
a. Company Type::::: Family Company
b. Dependent Variable: Dividend Payout Ratio
c. Predictors; (Constant), freecashRsqrt, log10_ROE, log10assetg,wRef, Leverage, Company Size (Natural log asset)
Coefficientsa,b
Standardized ! Unstandardized Coefficients Coefficients
Model B Std. Error Beta t 1 (Constant) -.455 1.291 -.353
log10_ROE .244 1.760 .012 .138
Leverage -.267 .489 -.051 -.545
log 1 OassetgrwRef .920 1.747 046 .527
Company Size (Natural .114 .066 .182 1.722 log asset)
freecashRsqrt -.007 .026 -.025 -.274
Coefficientsa,b
Model Sig.
1 (Constant) .725
log10_ROE .890
Leverage .586
log10assetgrwRef .599
Company Size (Natural .087 log asset)
freecashRsqrt .784
a. Company Type= Family Company
b. Dependent Variable: DMdend Payout Ratio
Residuals Statistics•·•
Minimum Maximum Mean Std. Deviation N Predicted Value -.22730 .68098 .30995 .151008 150
Residual -4.572785 8.625690 .000000 .947833 150
Std. Predicted Value -3.558 2.457 .000 1.000 150
Std. Residual -4.743 8.946 .000 .983 150
a. Company Type= Family Company
b. Dependent Variable: Dividend Payout Ratlo
Page2
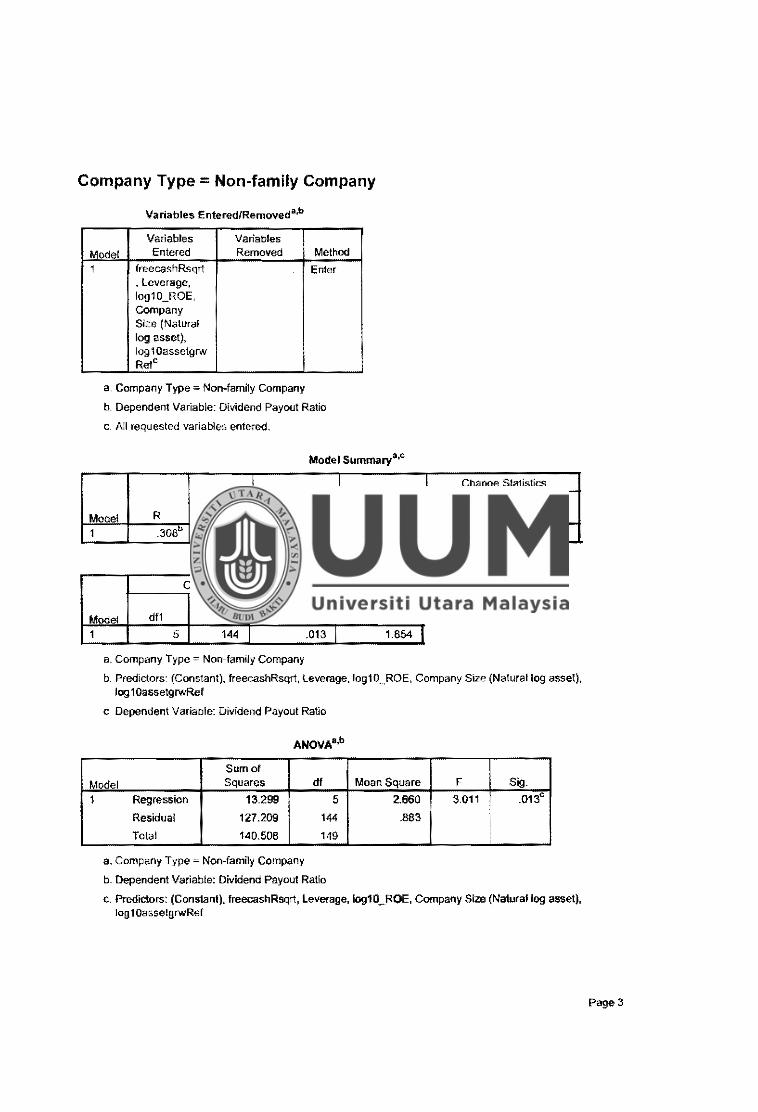
Company Type= Non-family Company
Variables Entered/Removeda,b
Variables Variables
Model Entered Removed Method
1 freecashRsqrt Enter • Leverage, log10_ROE, Company Size (Natural log asset), log10assetgrw Relc
a, Company Type Non-family Company
b. Dependent Variable: Dtvidend Payout Ratio
c, All requested. variables entered.
Model Summarya,e
Adjusted R Std. Error of
Model R R Square Square 1he Estimate
1 .308" .095 .063 .939892
Modei Summary•.c
Change Statistics
Durbin-Model df1 df2 Sig. F Change Watson
1 5 144 .013 1.854
a. Company Type= Non-family Company
Change Statistics
R Square Change FChange
.095 3.011
b. Predictors: (Constant), freecashRsqrt, Leverage, log10 __ ROE, Company Size (Natural log asset), log 1 0assetgrwRef
c Dependent Variable: Dividend Payout Ratio
Sum of
Model Squares df Mean Square F Sig.
1 Regression 13.299 5 2.660 3.011 .013c
Residual 127.209 144 .883
Total 140.508 149 i
a. Company Type = Non-family Company
b. Dependent Variable: Dividend Payout Ratio
c. Prediclors: (Constant), freecashRsqrt, Leve,age, log10_ROE, Company Size (Natural log asset). log1 OassetgrwRef
Page3
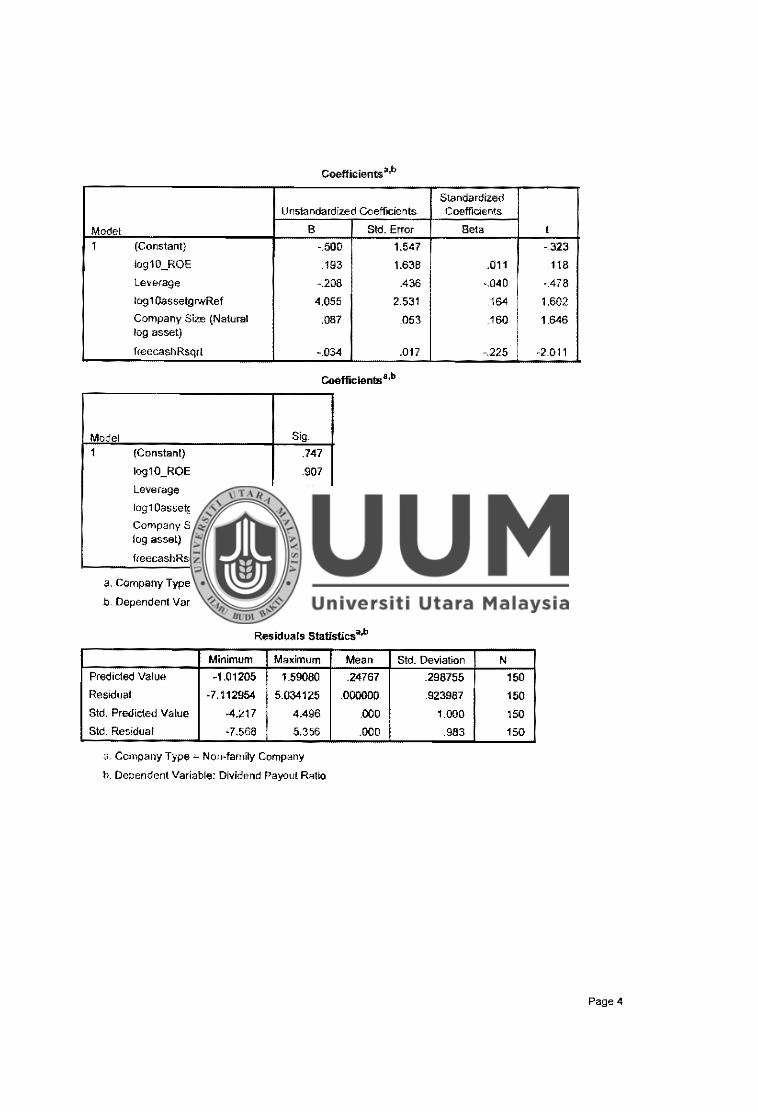
Coefficients3'b
Standardized Unstandardized CoeffJcients Coefficients
Model 8 Std. Error Beta t
1 (Constant) -.500 1.547 -.323
log10_ROE .193 1.638 .011 .118
Leverage -.208 .436 -.040 -.478
log10assetg,wRef 4.055 2.531 .154 1.602
Company Size (Natural .087 .053 .160 1.546 log asset)
freecashRsqrt -.034 .017 -.225 -2.011
Coefficientsa,b
Model Sig.
1 {Constant} .747
log10_ROE .907
Leverage .634
log10assetgrwRef .111
Company Size (Natural .102 log asset)
freecashRsqrt .046
a. Company Type = Non~family Company
b. Dependent Variable: Dividend Payout Ratio
Residuals Statistics•.h
Minimum Maximum Mean Std. Deviation N
Predicted Value -1.01205 1.59080 .24767 .298755 150
Residual -7.112954 5.034125 .000000 .923987 150
Std. Predicted Value -4.217 4.496 .000 1.000 150
Std. Residual -7.568 5.356 .000 .983 150
a- Company Type ;;:; Non-family Company
b. Dependent Variable: Dividend Payout Ratio
Page 4
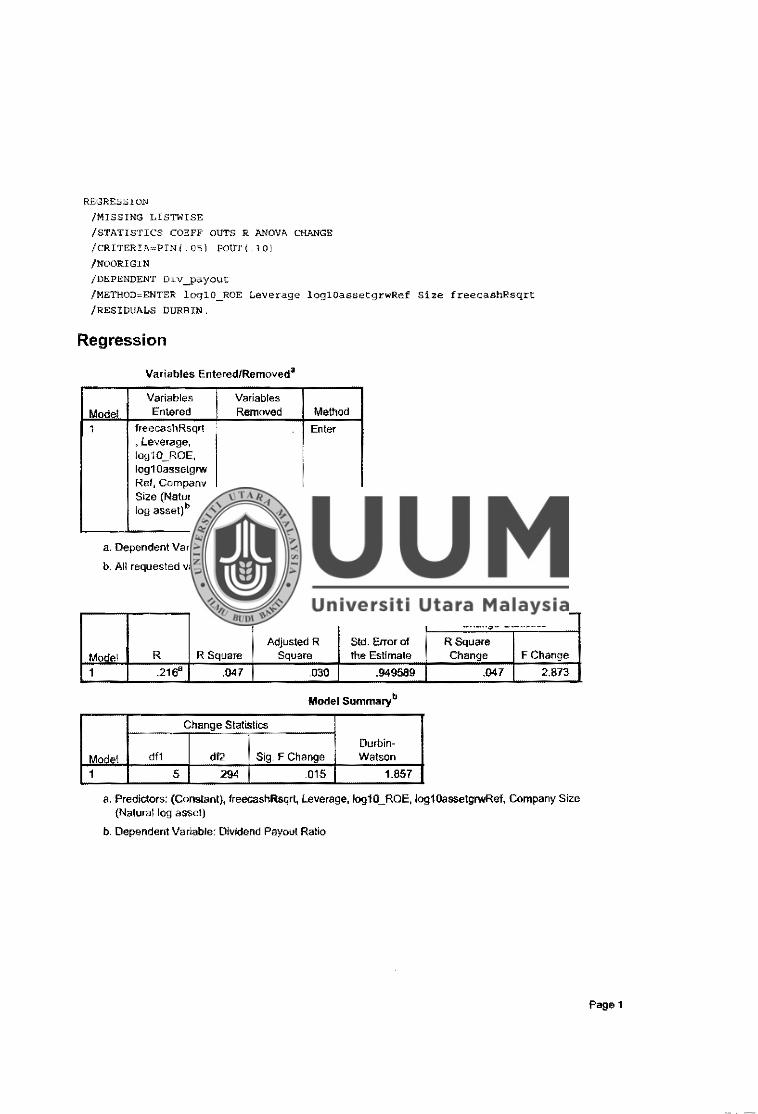
REGRESSION
/MISSING LISTWISE
/STATISTICS COEFF OUTS R AN.OVA CHANGE
/CRITERIA""'PIN(.05} POtrl'(.10)
/NOORI GIN
/DEPENDENT Div_payout
/METHO~~ENTER loglO_ROE Leverage loglOassetgrwRef Size freecashRsqrt
/RESIDUALS DURBIN.
Regression
Variables Entered/Removeda
Variables Variables
Mod~I Entered Removed Method
1 freec.ashRsqrt Enter , Leverage, log10_ROE, log10asselgrw Ref, Company Size (Natural log asset)b
.a. Dependent Variable: Dividend Payout Ratio
b. All requested variables entered.
Model Summaryb
Adjusted R Std. Error of
Mndel R R Square Square the Estimate
1 .216" .047 .030 .949589
Model Summaryb
Change Statistics
Durbin~
"""~I df1 df2 Sig. F Change Watson
1 5 294 .015 1.857
Change Statistics
RSquare Change F Change
.047 2.873
a. Predictors: (Constant), freecashRsqrt, Leverage, log10_ROE, log1QassetgrwRef, Company Size (Natural log asset)
b. Dependent Variable: Dividend Payout Ratio
Page 1
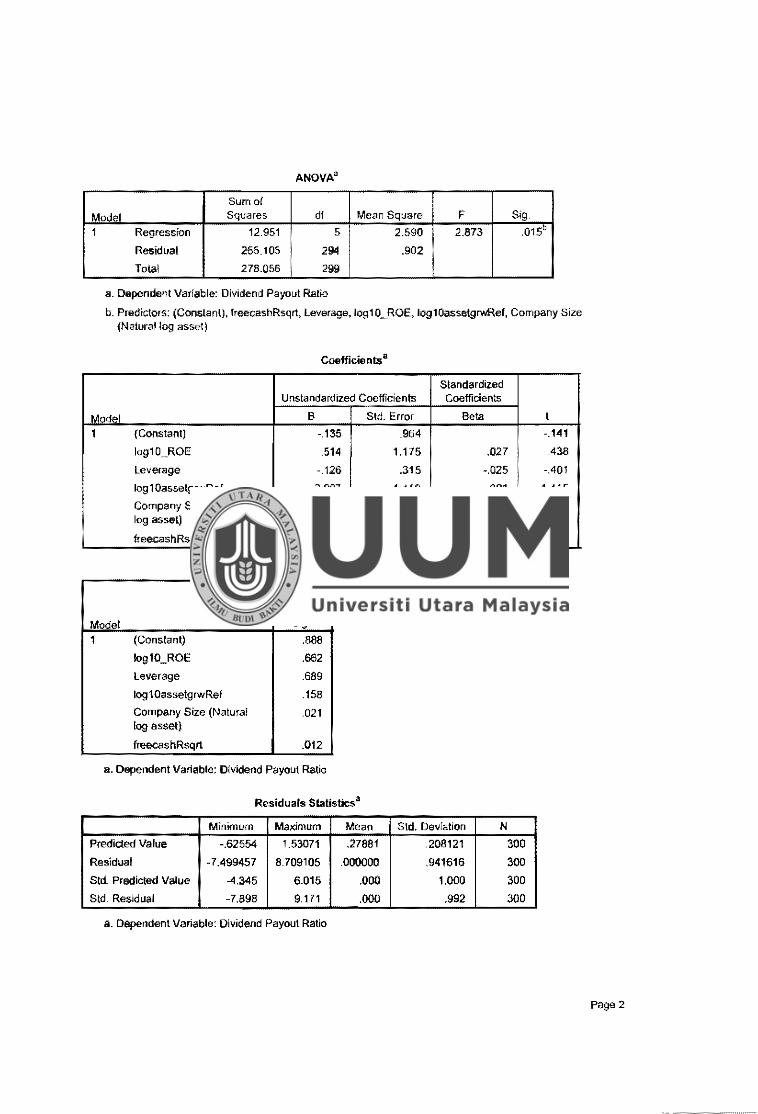
ANOVA'
Sumo(
Model Squares df Mean Square F Sig.
1 Regression 12.951 5 2.590 2.873 .015°
Residual 265.105 294 .902
Tola! 278.056 299
a. Dependent Variable: Dividend Payout Ratio
b. Predictors: (Constant), lreecashRsqrt, Leverage, log10_ROE, log10assetgrv.Rel, Company Size (Natural log asset)
Coefficient:s8
Standardized Unstandardized Coefficients Coefficients
"~dPI B Std. Error Beta t
1 (Constant) -.135 .964 -.141
log10_ROE .514 1.175 .027 .438
Leverage -.126 ,315 -.025 -.401
log 1 OassetgrwRef 2.007 1.418 .091 1.415
Company Size (Natural .095 .041 .164 2.313 log asset)
freecashRsqrt -.033 .013 -.175 -2.535
Coefficients a
Model Sig.
1 (Constant) .888
log10_ROE ,662
Leverage .689
log10assetgrwRef .158
Company Size (Natural .021 log asset)
freecashRsqrt .012
a, Dependent Variable; Dfvldend Payout Ratio
Residuals Statistics3
Minimum Maximum Mean Std. Deviation N
Predicted Value ·.62554 1.53071 .27881 .208121 300
Residual .7.499457 8.709105 .000000 .941616 300
Std. Predicted Value -4.345 6.015 .000 1.000 300
Std. Residual -7.898 9.171 .000 ,992 300
a. Dependent Variable: Dividend Payout Ratio
Page2
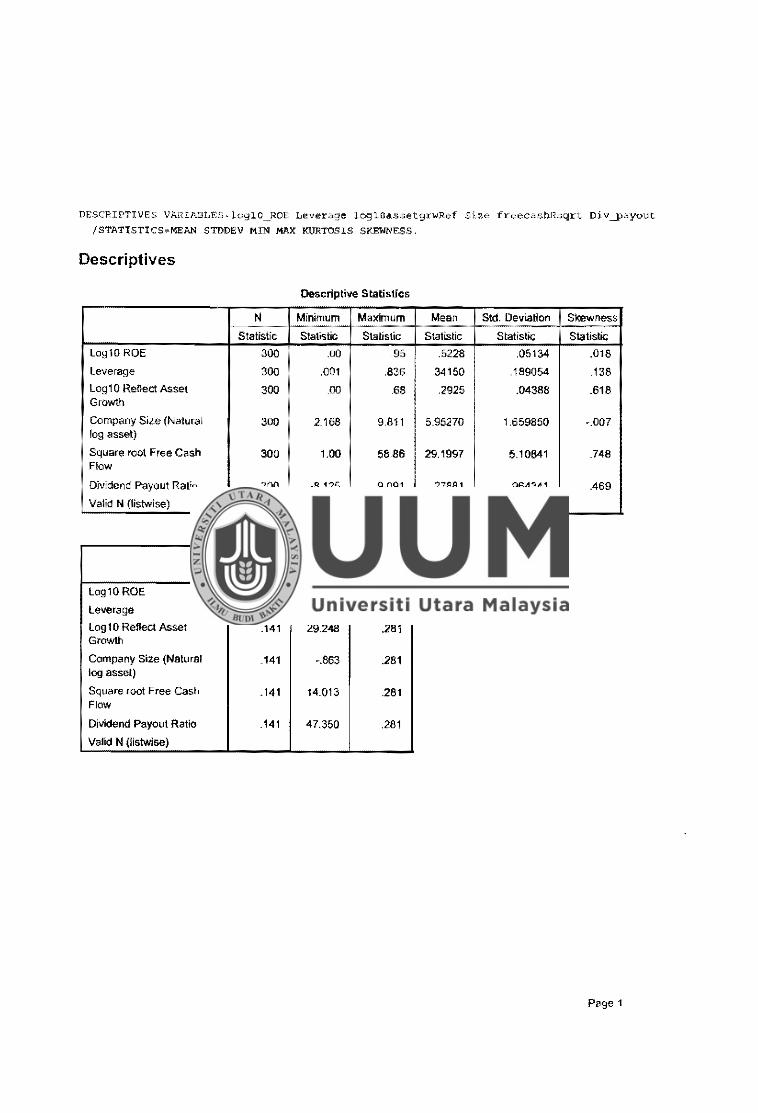
DESCRIPTIVES VARIABLESilogl0_ROE Leverage logl0assetgrwRef Size freecasbRsqrt Div__payout /STATISTICSeMEAN STDDEV MIN MAX KURTOSIS SKEWNESS,
Descriptives
Descriptive Statistics
N Minimum Maximum Mean St<t Deviation Skewness
Statistic Statistic Statistic Statistic Statistic Statistic
log10 ROE 300 .00 95 .5228 .05134 .018
Leverage 300 .001 .836 34150 .189054 .138
Log 1 0 Reflect Asset 300 .00 .68 .2925 .04388 .618 Growth
Company Size (Natural 300 2.168 9.811 5.95270 1.659850 -.007 log asset)
Square root Free Cash 300 1.00 5886 29.1997 5.10841 .748 Flow
Dividend Payout Ratio 300 ·8.125 9.091 .27881 .964341 .469
Valid N (listwise) 300
Descriptive Statistics
Skewness Kurtosis
Std. Error Statistic Sid. Error
log10ROE .141 67.300 .281
Leverage .141 -.889 .281
Log10 Reflect Asset .141 29.248 .281 Growth
Company Size {Natural .141 -.863 .281 log asset)
Square root Free Gash .141 14.013 .281 Flaw
Dividend Payout Ratio .141 47.350 .281
Valid N (listwise)
Page 1
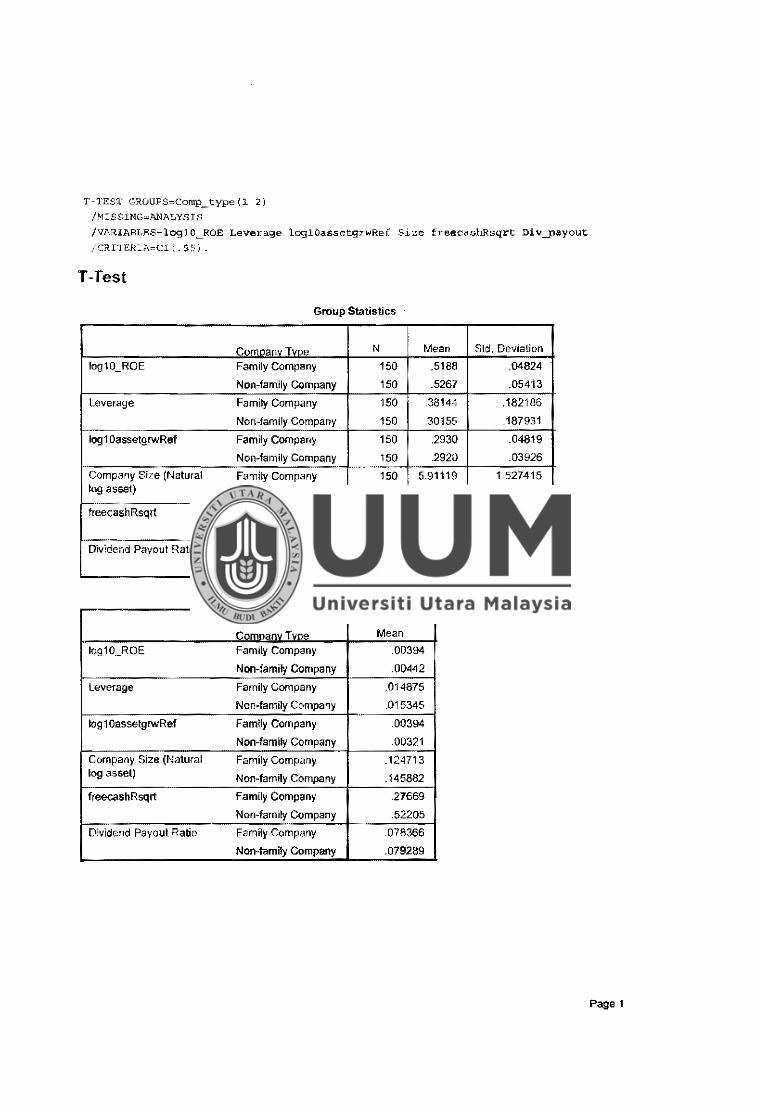
T-TEST GROUPS=:Comp_type(l 2) /M:SSING~ANA~YSTS
/VARIABLES,,,,logl0_ROE Leverage logl0assetgrwRef Size freecashRsqrt Div_payout
/CRITER:A.,,,Cl { 95) _
T-Test
Group Statistics
,...,,.,,... ... anv T""e N Mean Std. Deviation
log10_ROE Family Company 150 .5188 .04824
Non-family company 150 .5267 .05413
Leverage Family Company 150 .38144 .182186
Non-family Company 150 .30155 .187931
tog10asselgrwRef Family Company 150 .2930 .04819
Non-family Company 150 .2920 .03926
Company Size (Natural Family Company 150 591119 1.527415 tog asset)
Non-family Company 150 5.99421 1.786681
freecashRsqrt Family Company 150 29.1590 3.38871
Non-family Company 150 29.2404 6.39376
Dividend Payout Ratio Family Company 150 .30995 .959787
Non-family Company 150 .24767 .971085
Group Statistics
Sid. Error Ct"lmn.,,,.nv T vno Mean
log10_ROE Family Company .00394
Non-family Company .00442
Leverage Family Company .014875
Non-family Company .015345
log 1 0assetgrwRef Family Company .00394
Non-family Company .00321
Company Size (Natural Family Company .124713 log asset) Non~family Company .145882
freecashRsqrt Family Company .27669
Non-famity Company .52205
Dividend Payout Ralio Family Company .078366
Non-family Company .079289
Page 1
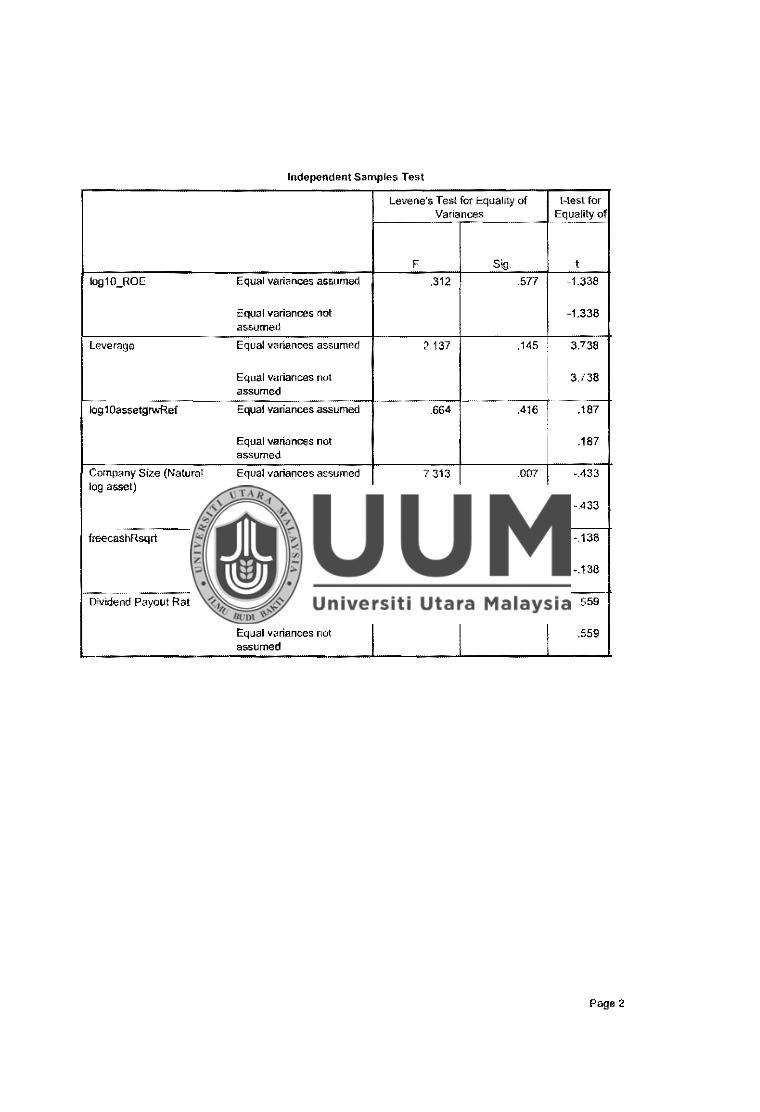
Independent Samples Test
Levene's Test for Equality of t-lest for Variances Equality of
F Sig. I
log10_ROE Eqoal variances assumed .312 .577 -1.338
Equal variances not -1.338 assumed
Leverage Equal variances assumed 2.137 .145 3,738
Equal variances not 3.738 assumed
log10assetgrwRef Equal variances assumed .664 .416 I .187
Equal variances not
I
.187 assumed
Company Size (Natural Equal variances assumed 7.313 .007 -.433 log asset)
Equal variances not -.433 assumed
freecashRsqrt Equal variances assumed 7.655 .006 -.138
Equal variances not -.138 assumed
Dividend Payout Ratio Equal variances assumed .032 .858 .559
Equal variances not ,559 assumed
Page 2
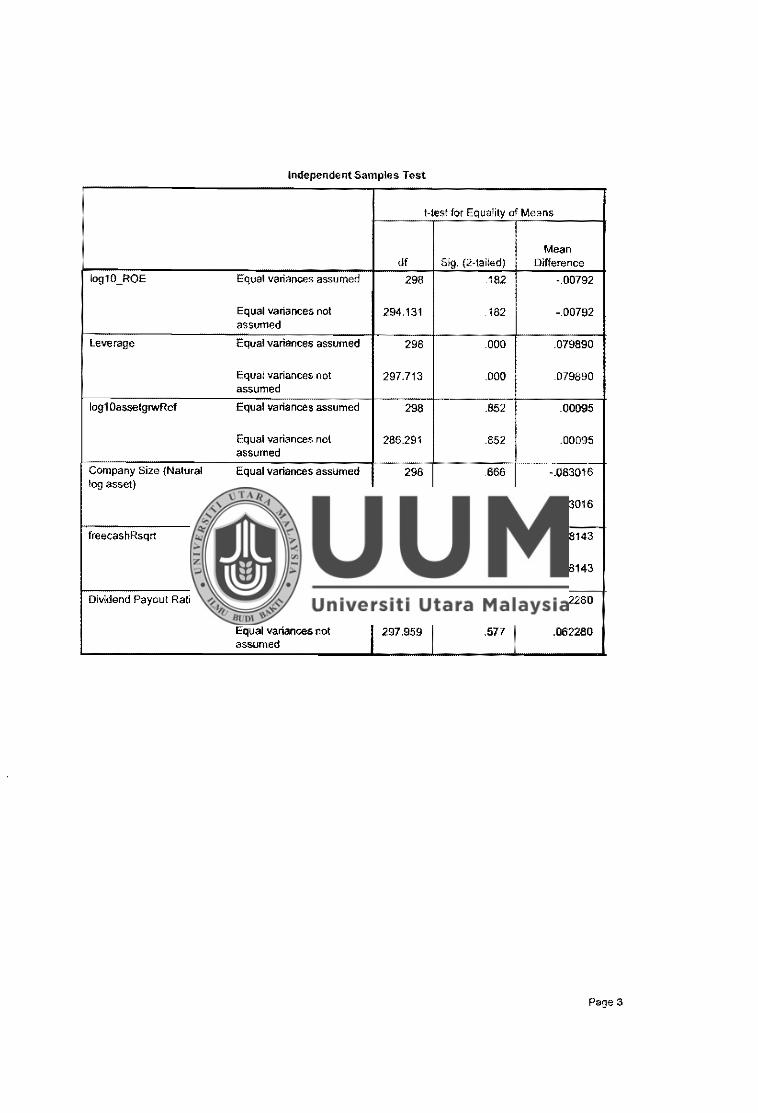
Independent Samples Test
t-test for Equality of Means
Mean df Sig. (2-tailed) Difference
log10_ROE Equal variances assumed 298 .182 -.00792
Equal variances not 294.131 182 - 00792 assumed
Leverage Equal variances assumed 298 .000 .079890
Equal variances not 297.713 .000 079890 assumed
log1 0asselgrwRef Equal variances assumed 298 .852 .00095
Equal variances nol 286.291 .852 .00095 assumed
Company Size (Natural Equal variances assumed 298 .666 •.083016 log asset)
Equal variances not 290.963 .666 -.083016 assumed
freecashRsqrt Equal variances assumed 298 890 -.08143
Equal variances nol 226.587 .891 -.08143 assumed
Dividend Payout Ratio Equaf variances assumed 298 .577 .062280
Equal variances not 297.959 .577 .062280 assumed
Page 3
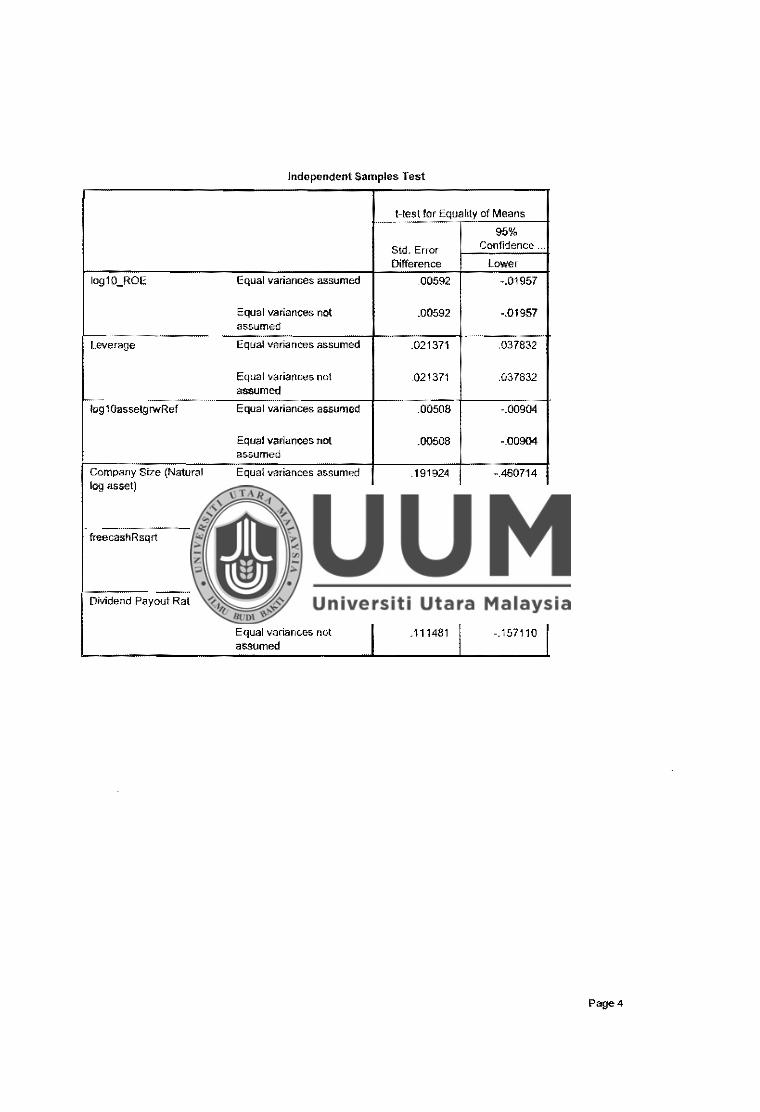
Independent Samples Test
t-test for Equality of Means
95%
Std. Error Confidence ...
Difference Lower
log10_ROE Equal variances assumed .00592 -.01957
Equal variances not .00592 -.01957 assumed
Leverage Equal variances assumed .021371 .037832
Equal variances not 021371 .037832 assumed
log 1 Oassetg rwRef Equal variances assumed .00508 -.00904
Equal variances not .00508 -.00904 assumed
company Size (Natural Equal variances assumed .191924 -.460714 log asset)
Equal variances not .191924 -.460751 assumed
freecashRsqrt Equar variances assumed .59084 -1.24417
Equal variances not .59084 -1.24567 assumed
Dividend Payout Ratio Equal variances assumed .111481 I -.157109
Equal variances not .111481 -.157110 assumed
Page4
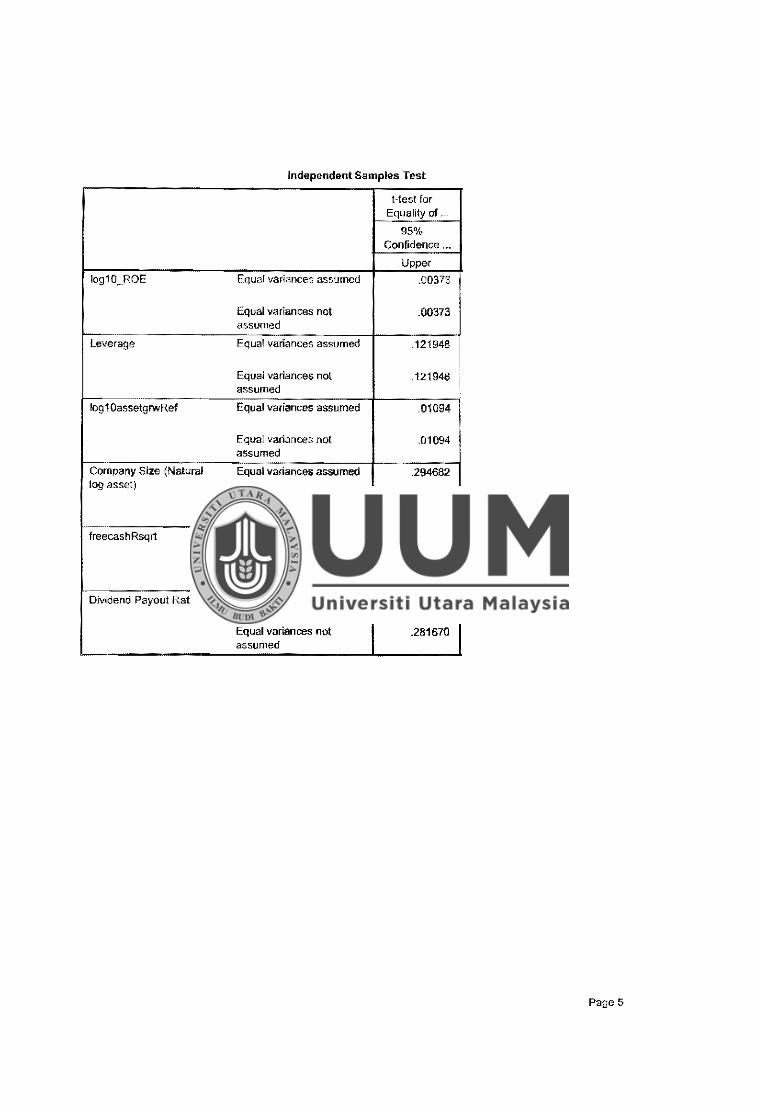
Independent Samples Test
Hest for Equality of ___
95°/o Confidence ...
Upper
log10_ROE Equar variances assumed .00373
Equal variances not .00373 assumed
Leverage Equal variances assumed .121948
Equal variances not .121948 assumed
log 1 0assetgrwRef Equal variances assumed .01094
Equal variances not .01094 assumed
Company Size (Natural Equal variances assumed .294682 log asset)
Equal variances not .294720 assumed
freecashRsqrt Equal variances assumed 1.08132
Equal variances not 1.08281 assumed
Dividend Payout Ratio Equal variances assumed .281670
Equal variances not -281670 assumed
Pages

MEANS TABLES=Profit_ROE Leverage asset_growth Size Free cash Div__payout BY Year
/CELLS MEAN COUNT STDDEV.
Means
Report
Asset growth Comoanv Tvne Re□ort Year Profit (ROE) Leverage (RM million)
Family Company 2011 Mean .05733 .39353 97.23687
N 30 30 30
Std. Deviation .303214 .169212 268.688990
2012 Mean .05934 .38416 35.14427
N 30 30 30
Std. Deviation .139076 .176672 97.192605
2013 Mean -.00048 .37661 262.67657
N 30 30 30
Std. Deviation .438589 .196195 1083.357993
2014 Mean .06938 .38942 121.93273
N 30 30 30
Std. Deviation .085927 .186694 303.898579
2015 Mean .05177 .36348 132.32927
N 30 30 30
Std. Deviation .078254 .191734 419.496807
Total Mean .Q4747 .38144 129.86394
N 150 150 150
Std. Deviation .249676 .182186 549.666146
Non-family Company 2011 Mean .06194 .32263 82.38077
N 30 30 30
Std. Deviation .255564 .198679 224.703709
2012 Mean .43460 .28200 124.59803
N 30 30 30
Std. Deviation 1.414880 .180108 447.077000
2013 Mean .02858 .27752 130.08377
N 30 30 30
Std. Deviation .147147 .186963 527.526963
2014 Mean .04104 .30041 111.35000
N 30 30 30
Std. Deviation .148681 .178089 380.014389
2015 Mean .07185 .32520 165.89620
N 30 30 30
Std. Deviation .102795 .202107 340.978476
Page 1

Report
Company Fme Cash Size (Natural Flow (RM Dividend
Cornnon .. Tvne Renort Y ,::i.ar log asset} million) Payout Ratio
Family Company 2011 Mean 5.76801 61.69887 .19260
N 30 30 30
Std, Deviation 1.430640 111.203543 .966319
2012 Mean 5.81531 81.30647 .35037
! N 30 30 30
Sid. Deviation 1.461513 181.102767 .468768
2013 Mean 5.88461 42.31713 .44978
! N 30 30 30
Std. Deviation 1.600533 146.888881 1.801387
2014 Mean 600654 184.70960 .27900 ! N 30 i 30 30
Std. Deviation 1.599974 I 418.863927 .358866
2015 Mean 6.08149 64.52537 .27799
! N 30 30 30
Std. Deviation 1.616026 173.391923 .409275
Total Mean 5.91119 86.91149 .30995
N 150 150 150
Std. Deviation 1.527415 235.690677 .959787
Non-family Company 2011 Mean 5.92368 108.00907 .25420
N 30 30 30
Std. Deviation 1.801483 377.742972 .262870
2012 Mean 5.88768 52.05430 ,17300
N 30 30 30
Std. Deviation 1.871420 411.366048 .681544
2013 Mean 5.95052 130.17630 .42799
N 30 30 30
Std. Deviation 1.820043 260.654676 ,778763
2014 Mean 6.02363 186.65553 .39951
N 30 30 30
Std. Deviation 1.806926 439.412520 1.043288
2015 Mean 6.18552 127.44253 -.01635
N 30 30 30
Std. Deviation 1.737456 525.469373 1.575173
Report
Asset growth
Comoanv Tvoe Reoort Year Profit (ROE) Leverage (RM million)
Total Mean 12760 ,30155 122.86175
N 150 150 150
Std. Deviation .660959 , 187931 392.898078
Page 2
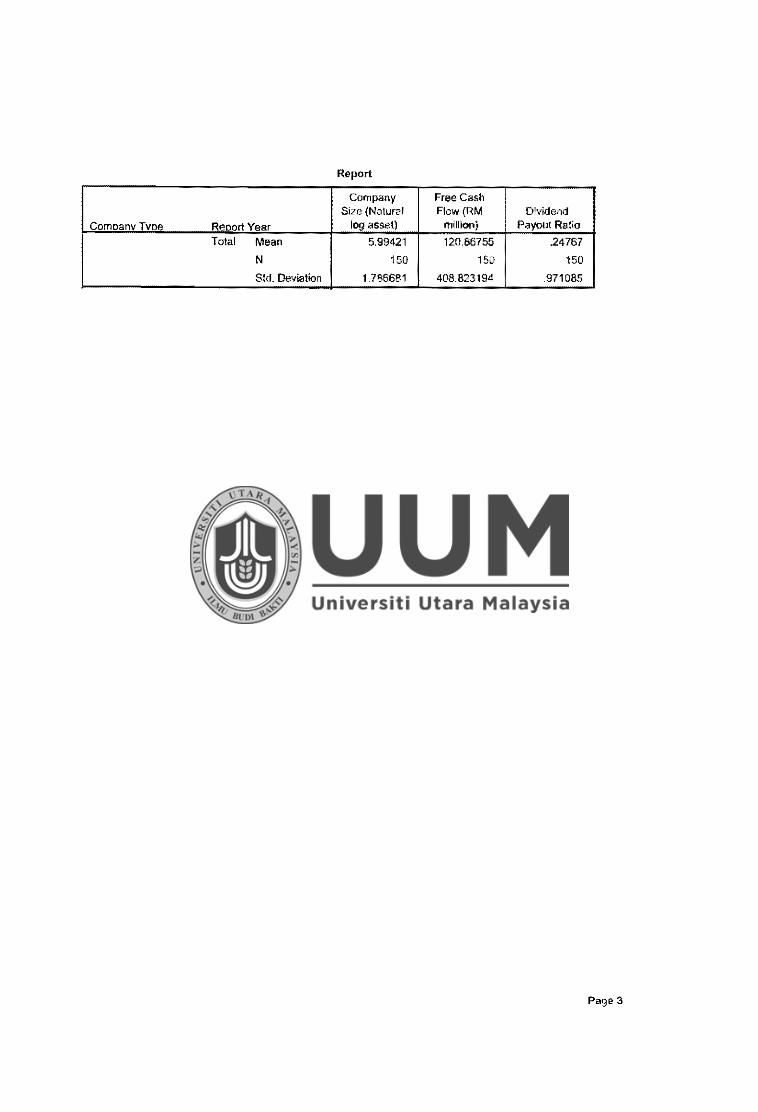
Report
Company Free Cash Size (Natural Flow(RM Dividend
Comoanv Tvoe Oanort Year log asse!) million) Payout Ratio
Total Mean 5.99421 120.86755 .24767
N 150 150 150
Std. Deviation 1.786681 408.823194 .971085
Page 3
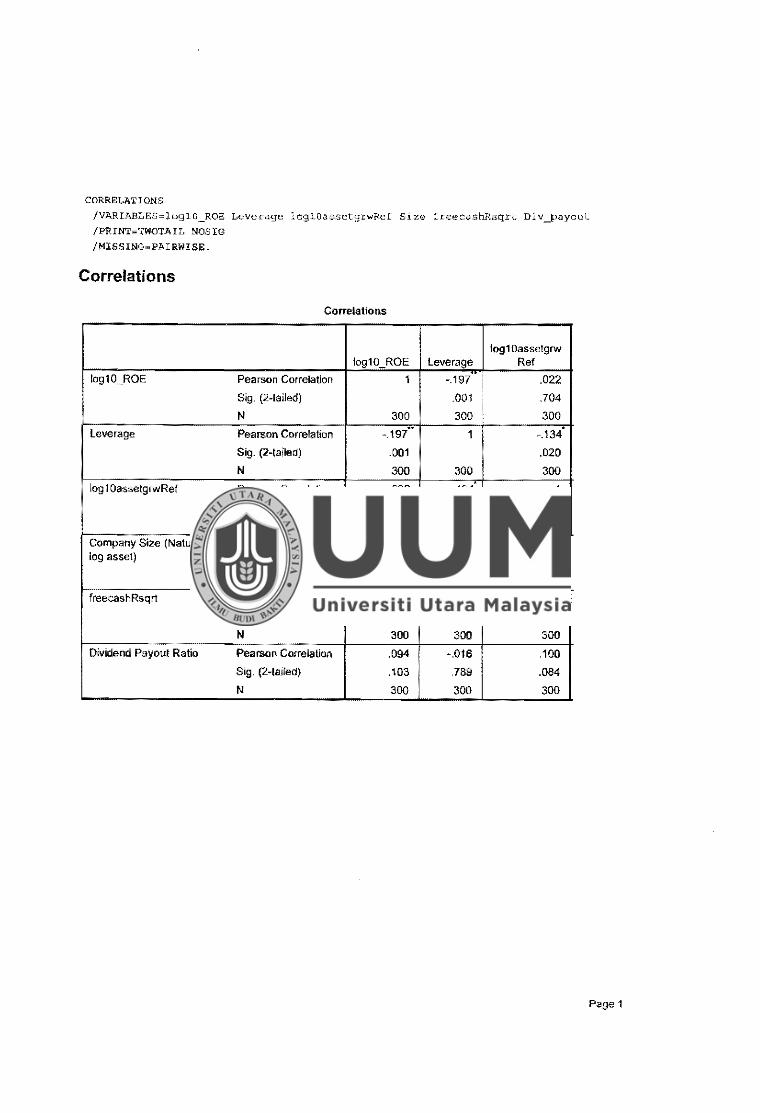
CORRELATIONS
/VARIABLES=logl0 ROE Leverage iagl0assetgrwRef Size freecashRsqrt Div_payout
/PRINT""'fWOTAIL ~OSIG
/MISSING~PA:RWISE.
Correlations
Correlations
log10assetgrw log10 ROE Leverage Ref
log10_ROE Pearson Correlation 1 ·.197 : .022
Sig. (2-laile<I) .001 .704
N 300 300 300
Leverage Pearson Correlation -.197. 1 -.13l
Sig. (2-tailed) .001 .020
N 300 300 300
log 1 0assetgiwRef Pearson Correlation .022 -.134 1
Sig. (2-tailed) .704 .020
N 300 300 300
Company Size (Natural Pearson Correlation . -~ ..
.119 .292 -.396 log asset) Sig. (2-tailed) .039 .000 .000
N 300 300 300
freecashRsqrt Pearson Correlation ·.232 .121 -.397
Sig. {2-tailed) .000 .037 .000
N 300 300 300
Dividend Payout Ratio Pearson Correlation .094 -.016 .100
Sig. (2-tailed) .103 .789 .084
N 300 300 300
Page 1
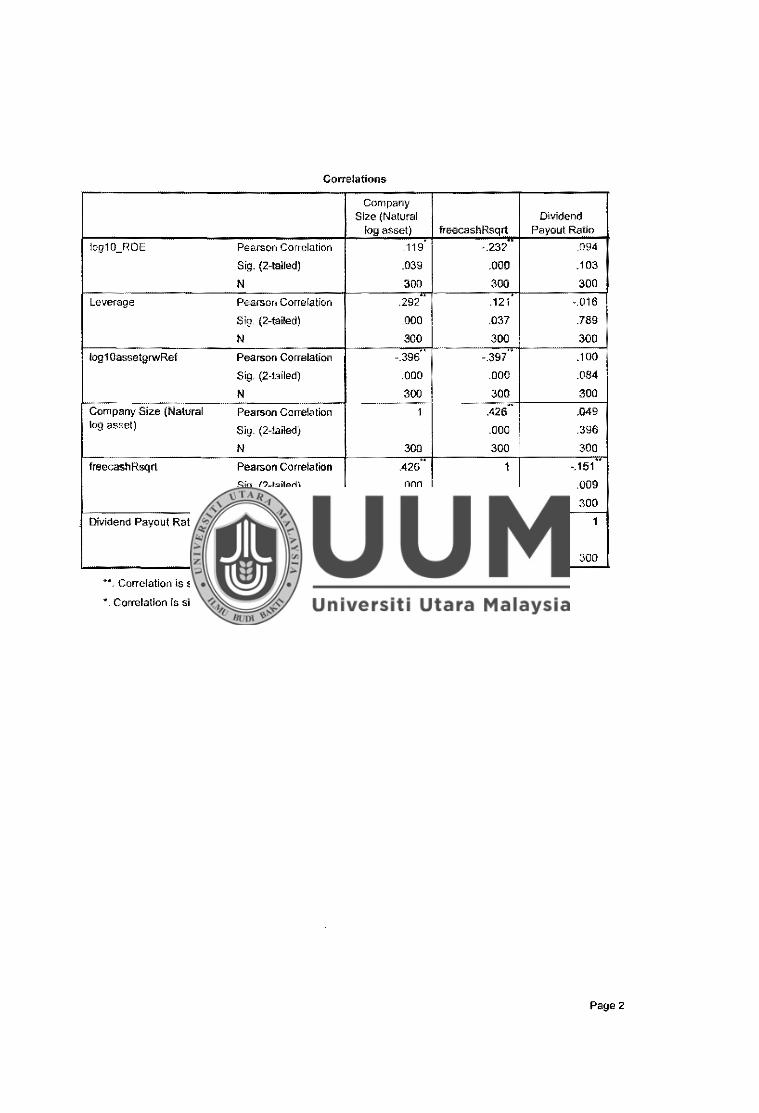
Correlations
Company Size (Natural
log10_ROE Pearson Correlation
Sig. (2-lailed)
N
Leverage Pearson Correlation
Sig. (2-tailed)
N
log10asselgrwRef Pearson Correlation
Sig. (2-tailed)
N
Company Size (Natural Pearson Correlation log asset) Sig. (2-!ailed)
N
freecashRsqrt Pearson Correlation
Sig. (2-tai!ed)
N
Dividend Payout Ratio Pearson Correlation
Sig. (2-tailed)
N
**. Correlation is significant at the 0.01 level (2-talled).
". Correlation is significant at the 0.05 level {2~tailed}.
log asset)
.119
.039
300
,292H
.000
300
-.396
.000
300
1
300 .. .426
.000
300
.049
396
300
Dividend freecashRsqrt Payout Ratio
-.232 .094
.000 .103
300 300
.121· -.016
.037 .789
300 300
-.397 .100
.000 .084
300 300
.426- .049
.000 .396
300 300 .. 1 ·.151
.009
300 300 .. •, 151 1
.009
i 300 300
Page 2
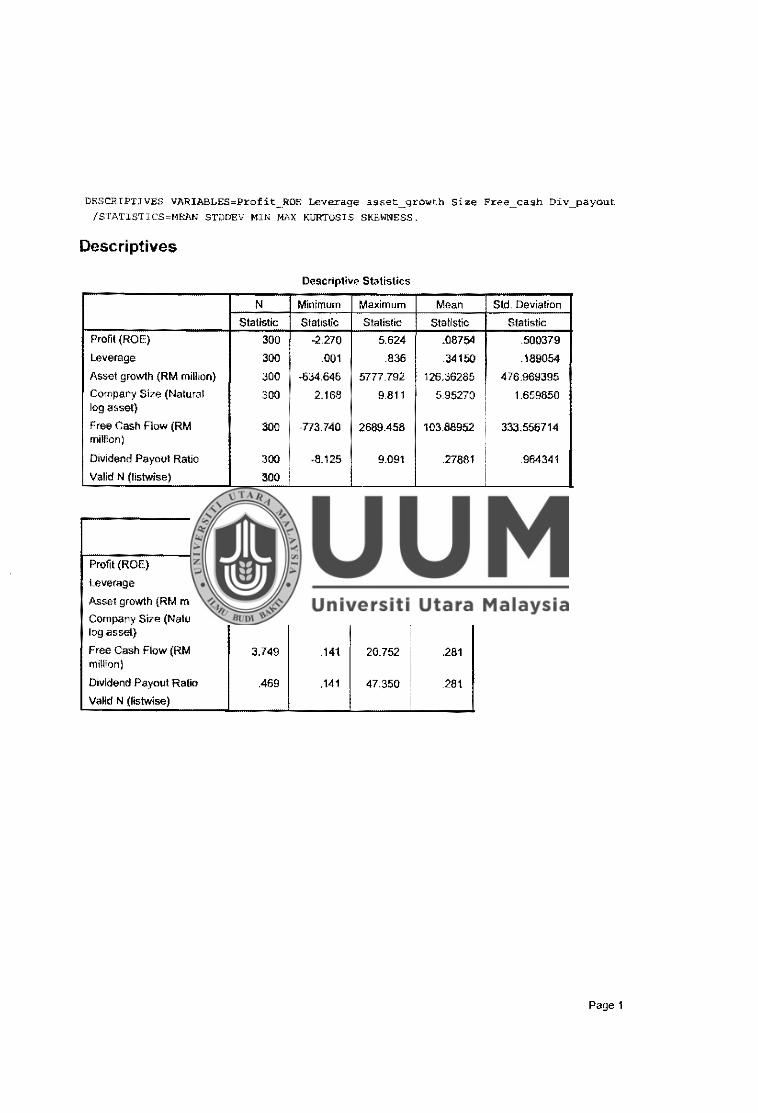
DESC!UPTlVES VARIP..BLES=Prof it _ . .ROE Leverage asset _growth Size Free - cash Div _payout
/STATlSTICS=MEAN STDDEV MlN MAX KURTOSIS SKEWNESS.
Descriptives
Descriptive Statistics
N Minimum Maximum Mean Std. Deviation
Statistic Statistic Statistic Statistic Statistic
Profit (ROE) 300 -2.270 5.624 .08754 500379
Leverage 300 .001 .836 34150 .189054
Asset growth (RM million) 300 -634.646 5777.792 126.36285 476.969395
Company Size (Natural 300 2.168 9.811 5.95270 1.659850 log asset)
Free Cash Flow (RM 300 -TT3.740 2689.458 103.88952 333.556714 million)
Dividend Payout Ratio 300 -8.125 9.091 .27881 .964341
Valid N (listwise) 300
Descriptive Statistics
Skewness Kurtosis
Statistic Std. Error Statistic Std. Error
Profit (ROE) 8,692 .141 101.170 .281
Leverage .138 .141 -.889 .281
Asset growth (RM million) 7.148 .141 71.274 .281
Company Size {Natural -.007 .141 -.863 .281 log asset)
Free Cash Flow {RM 3.749 .141 20.752 281 million)
Dividend Payout Ratio .469 ,141 47.350 .281
Valid N (listwise)
Page 1