
Relationship Between Stock Return, Dividend-Price Ratio, Price Earnings Ratio, Size, Market to book...
50
Waikato Management School Dept of Finance FINA511-13A RESEARCH PAPER Relationship Between Stock Return, Dividend-Price Ratio, Price Earnings Ratio, Size, Market to book Ratio, and Payout Ratio Name :-Niranjan Sant 1 | Page
Transcript of Relationship Between Stock Return, Dividend-Price Ratio, Price Earnings Ratio, Size, Market to book...

Waikato Management School
Dept of Finance
FINA511-13A RESEARCH PAPER
Relationship Between Stock Return,Dividend-Price Ratio, Price
Earnings Ratio, Size, Market tobook Ratio, and Payout Ratio
Name :-Niranjan Sant1 | P a g e

ID :- 1198724
ContentsAbstract..................................................................3
1. Introduction...........................................................42. Literature Review......................................................6
3. Data and Sample........................................................93.1 Banking Sector.....................................................10
3.2 General Industrials................................................103.3 Industrial Engineering.............................................10
3.4 Software and Computer services.....................................114. Methodology...........................................................11
4.1 Dividend Price Ratio...............................................114.2 Price Earnings Ratio...............................................12
4.3 Size...............................................................124.4 Market to Book Ratio...............................................12
4.5 Payout Ratio.......................................................134.6 Stock Return.......................................................13
4.7 Regression Model...................................................145. Empirical Results.....................................................15
5.1 Summary Statistics.................................................155.2 Pearson Correlation Matrix.........................................16
5.3 Regression Result..................................................176. Conclusion............................................................25
References...............................................................28Appendix.................................................................31
2 | P a g e

Abstract
In this paper, I have examined the relationship between stock
returns and five variables, Dividend price ratio, Price Earnings
ratio, Size, Market to book ratio and Payout ratio, by examining
this relationship I have attempted to analyze investors approach
and choice towards investing their money in stock market. I have
also tried to analyze what factors investors do take into
consideration while investing in any particular security or
stock. For this study I have collected the sample of 357 firms
from Indian stock market and divide the sample in four different
sectors Banking Sector, General industrials sector, Industrial
engineering and Software and computer services sector. I have
used OLS regression in this study to study this relationship.
Results and findings of this paper show that, some variables are
statistically significant with stock return for each sector.
Result of each sector is different from each other. Investors
approach is also different in each industry and changes according
to industry. There are different factors in each sector which
3 | P a g e

investors take into consideration, so therefore their strategies
and choices regarding investment differ from one sector to other.
4 | P a g e

1.Introduction
There are many studies in Corporate finance literature who have
focused and examined the relationship between stock return and
other performance variables. In this paper I have attempted to
use Dividend Price ratio, Price Earnings Ratio, Size, Market to
book ratio, and Payout Ratio. Many studies in literature have
focused on developed markets but very few studies have focused on
Indian stock market, which is emerging and developing market.
This study has focused on Indian stock market, I have examined
three major sectors in Indian stock market General Industrial,
Industrial Engineering and Software and computer services. These
three sectors contain major industries in India like Tata Motors,
Infosys, SKF, ABB, Thermax and many others. I have attempted to
analyze these sectors because these three sectors have their
major impact on Indian Stock market as I mentioned earlier, these
three sectors contain major Indian companies.
The main aim of this paper is to examine the predictability and
relationship between stock returns, D/P ratio, Price Earnings
Ratio, Size, Market to book ratio and Payout ratio. This study
also examines the predictability of these ratios to forecast the
future stock returns. I have used the market to book ratio in
this study, this is motivated by findings of Fama and
French(1992) that shows that market to book ratio of individual
5 | P a g e
stock can explain the cross-sectional variation in stock returns.
For determining market prices and earnings of the stocks, book
value and dividend could be very useful for predicting stock
price behavior and behavior of stock returns in future. Due to
this, one can construct very profitable and fruitful strategies
on the basis of dividend, book value and earnings.
According to the mispricing view, P/E effect mentions that stocks
which have low P/E ratio earn significantly higher returns than
that of stocks which have high P/E ratios. Thus according to this
mispricing view, there is inverse relationship between portfolio
return and P/E ratio. By using this approach investor can earn
significantly higher returns by investing in the stocks which
have low P/E ratio. In case of Market to book ratio,MtB effect
states that, stocks with high MtB ratio consistently obtain lower
returns than those securities which have high MtB ratio. Book
value proxy for future cash flow could be the one explanation for
Market to book ratio's ability to predict future stock return.
Coming to Dividend price ratio, High D/P ratio shows that the
market is undervalued. Predictive power of D/P ratio is depends
on role of dividend in capturing some components in price which
are permanent, whereas predictability of P/E is because earnings
is a very good measure of business conditions, which explains the
counter cyclic risk aversion. D/P defines variation in real stock
return in a much better manner on value weighted index. Three
ratios Price to earnings ratio, Market to book ratio, and
dividend price ratio have some same features one of the feature
6 | P a g e

is that all the ratios measure stock prices relative to
fundamentals. So in this respect this study is contributing in
literature by showing the ability of these ratios to predict
stock returns.
With the help of this relationship of Stock return and different
ratios, I will also predict the choices of the investors and the
preferences of the investor regarding all this three sectors,
whether investors are looking for capital gain or they are
looking for Dividend earnings. In case of these three sectors
investors have different approach towards investing in these
sectors, some sectors show that investors are more interested in
capital gain whereas in case of some sectors investors are
holding these stocks for long term basis and looking for Dividend
gains. I have used dividend price ratio and its relationship with
stock return to examine whether investors are looking for long
term investment and looking for Dividend gain. Price earnings
ratio is used to examine whether investors are just looking for
capital gain, Size is used to measure the magnitude of the
company and ultimately of that sector, Size and Stock return
relationship has been used to examine investors approach toward
magnitude of the company and its market capitalization, this has
been used to examine whether investors are looking for high
magnitude stocks and whether size matters for them or not.
So main contribution of this paper is to elaborate the
relationship between stock returns and Dividend price ratio,
7 | P a g e
Price earnings ratio, Size, Market to book ratio, Payout ratio
and examine the predictability of this variables of future stock
returns. And by comparing these variables to stock return I am
also analyzing investors approach towards selecting the stock and
towards their investment choices I have attempted to distinguish
three sectors and investor’s choices towards purchasing stocks
from all these three sectors.
Rest of the paper is the structured as, in section 2 Literature
review and what other papers have examined about stock return and
its relationship with these ratios, section 3 includes Data and
sample used for this study and from where the this data has
obtained, Section 4 has Methodology used to calculate all the
ratios used and the most important stock returns. Section 5
contains Empirical results and last Conclusion of the paper and
future scope of research in the same area.
2. Literature Review
There are many studies in corporate finance literature who have
observed the relationship between stock return and various
financial ratios, but there are very few studies who have
observed this relationship in Indian context in financial crisis
period of 2008 - 2009 hence, my study will be focusing on Indian
markets finding the relationship between stock returns and
various performance variables.
8 | P a g e

According to the Banz(1981), small size firms have higher average
stock returns, but in case of average size and large size firms
this size effect is not consistent. He also mentioned that size
effect exists but it is not clear why this effect exist, he was
not clear with the fact that, size is a factor or it is just a
proxy for one or more true but unknown factors correlated with
size.
Jeffrey Jaffe, Donald B. Keim and Randolph Westerfield(1989),
concluded that, there is significant earning price and size
effects in US market when estimated across all months during the
1951-1986 period. This study also added that, there is difference
between January and the rest of the year as the coefficient on
both E/P and Size are significant in January but in case of other
months, only E/P coefficient is significant outside January.
In Guler Aras and Mustafa Kemal Yilmaz(2008) they examined the
predictability of stock return taking into consideration 12
emerging markets around the world. They have used, price-earnings
ratio, dividend yield and market-to-book ratio as predictable
variables and covered the period of 1997 to 2003. This study
finds variation in their findings, Market to book ratio shows
significant result in predicting stock return for one year period
for most of the emerging countries, But overall investor can
forecast the potential stock market return for one year period
up-to certain extent by using Market to book ratio, partially
9 | P a g e

dividend yield ratio and price earnings ratio. According to the
authors investor can improve their predictability by adding other
variables like, consumer price index which shows the
macroeconomic changes in predicting stock return in the market.
Robert H. Litzenberger and Krishna Ramaswamy(1982) studied the
relationship between dividend yield and stock return. According
to this study,their results show that, there is positive but non-
linear relationship between dividend yield and stock return. But
study also says that significant dividend yield effects cannot
pinned to information content in the prior knowledge that firm
will declare dividend of unknown magnitude.
Keith S. K. Lam(2002) studied the relationship between stock
return and β Size (ME), Leverage, book to market equity ratio and
earning price ratio in Hong Kong stock market, in this study he
has used Fama and French (FF) approach. Result from this study
shows that, three accounting variables book to market, E/P, ratio
and size really captured the cross sectional variation in average
returns over the period. Other variables like book and market
leverage also captured the cross sectional variation but effects
of those variables are dominated by Size, book to market equity
and E/P ratio, Hence those cannot be considered.
Pradosh Simlai(2009), In this paper Author has examined and
reinvestigated the performance of common stock return with two
10 | P a g e

popular variables Size and book to Market Ratio. According to
their findings incorporation of time varying conditional
variance can significantly supports the impact of the three risk
factors, he also concluded that, because of this findings Fama
and French model is successful and unaffected by the
incorporation of time varying investment opportunity set. His
study also finds positive and significant relationship between
size and Stock return.
In the study of Jeffrey Pontiff and Lawrence D. Schall(1995) they
have examined the predictive ability of the book to market ratio
in Dow Jones industrial average. According to their findings,
Dow Jones Industrial average book to market ratio is good
predictor of market return than the other variables like dividend
yield, and interest rates. Author also mention that, their
findings are sample specific where predictive power of book to
market ratio occurs only before 1960. As after 1960 there is no
significant relationship.
Ian McManus, Owain AP Gwilym and Stephen thomas(2004) they
observed the relationship between stock return and dividend yield
in UK stock market, they have introduced the data related to
earning to the asset pricing model in the form of payout ratio.
In this study they have introduced payout ratio and examines the
relationship between payout ratio, dividend yield and stock
11 | P a g e

return. According to the result of this study, payout ratio does
have impact on dividend yield itself in explaining stock return.
Gabriel Perez-Quiros and Allan Timmermann (2000) have observed
difference ofvariation in stock return in different economic
conditions and tried to examine stock returns of both small firms
and large firms. In that study they have considered three factors
firm size, economic and market condition for analyzing and
capturing sensitivity of expected risk and returns. According to
the findings of this paper, Interest rate is the vital factor for
sensitivity of stock return volatility, expected returns of the
firm is also very sensitive to this interest factor. In the
recession phase stock return of small firms are mostly affected,
large firms stock returns also get affected in such situation but
compared to small firms it is less sensitive.
Kee Hong Bae, Jeong-Bon Kim(1998) in their study, they have taken
the sample data of Japanese firms. The main aim of their study
was to examine the usefulness of the two fundamentals, accrual
earnings and book value of equity share for the purpose of
predicting stock returns. According to the result of this study,
both accrual earnings and book value of equity can predict the
stock return and investors and policy makers can build profitable
strategies by using this approach. Paper also mentioned that,
book value captures some aspects of equity value of stock which
are not captured by earnings.
12 | P a g e

Raj AggarwalTakatoHiraki and Ramesh P Rao(1992) examined the
price to book ratio effect in Japanese market. In this study they
have observed that stocks with high price to book value ratio
have earn low returns whereas stocks with low price to book ratio
have high low stock returns. This study has observed inverse
relationship between stock return and price to book ratio in
Japanese market. The result of this study also shows that,
accounting data is useful for deciding trading strategies in
Japanese stock market because investors can actually predict the
stock return by calculating price to book ratio.
JYH-LIN WU, YU-HAU HU and CHINGNUN LEE (2011) this paper tried to
solve the question whether dividend yield can actually predict
the stock return without short rates in UK stock market. For this
study they have collected monthly stock data for the period of
1923 to 2007. According to the findings of this study, dividend
yield can actually be predicted without short rates but only if
the forecast horizon is more than four months.
ChakerAloui, DucKhuong Nguyen and HassenNjeh(2012) in this paper
they have examined the impact of oil prices on Stock return in
emerging stock markets. In this study they have segregated the
countries according to the countries which are the largest
importer of Oil, countries which are moderately depend on oil and
the countries which are largest exporter of oil. In their study
13 | P a g e

they have used data from 25 different countries for the period of
1997 to 2007. According to their findings relevance of oil price
risk is conditional in case of emerging markets, also there is
asymmetry in case of stock return and significant when oil prices
are rising. Their results also show significant relationship
between global market betas and stock returns of emerging stock
markets. But however they have also mentioned that, this
relationship Is negative when world market was falling down.
3. Data and Sample
For this paper I have collected all the data from DataStream
database, I have segregated the data sample in three sectors,
Banking sector, General Industrials, Industrial Engineering,
Software and Computer services. I have collected the data sample
for the period of May 2003 to May 2013. All the ratios which,
used as independent variables have been calculated individually.
All the data which is required to calculate these ratios have
been obtained from DataStream. Three sectors in total constitute
357 firms altogether. This data consists of monthly average of
Dividend price ratio, Price Earnings ratio, Market to book ratio,
Payout ratio and Size from May 2003 to May 2013.
Stock returns are calculated by dividend adjusted approach. For
calculating the return for the month of May 2003, I have
downloaded the data for the month of April 2003 as an Initial
14 | P a g e

price of stock. After calculating all the returns for every
month, I have taken the average of all the returns of all firms
from May 2003 to May 2013.
Sectors Sample Size Banking Sector 33 General Industrials 48 Industrials Engineering 146 Software And ComputerServices 130 Total Sample Size 357
3.1 Banking Sector
In banking sector, I have included all nationalized banks in
Indian stock market. This sector includes some banking giants
like, State bank of India, Punjab National Bank, Bank of India,
and Bank of Baroda. In this sector I have included some major
private banks like ICICI, Indusind Bank, HDFC bank, these private
banks are also have good market cap and these are also some of
the giant banks in India.
3.2 General Industrials
This sector covers some wide variety of data as various
manufacturing companies are included in this sector. This sector
has several companies dealing in different areas of products like
15 | P a g e

construction material, retail goods product, and many others.
This sector also includes some conglomerate like 3M India.
3.3 Industrial Engineering
As name suggests, this sector includes engineering companies and
also some forging companies. This sector includes some major
automobile companies like, Tata Motors, Ashok Leyland, Forbes,
Mahindra and Mahindra, these some companies are major players in
Indian stock market with huge market capitalization and have huge
impact on index movement. Some government owned companies are
also there in this sector like, Bharat heavy electrical, Bharat
Bijlee, BEML, Nelco etc. Forging companies like Bharat forge
which is largest forging company in Asia became world’s second
largest forging company after acquiring Carl Dan Peddinghaus GmbH
(CDP), one of the largest forging companies in Germany, for an
undisclosed sum.
3.4 Software and Computer services
In last several years software and IT sector in India has rapidly
grown up and now it is one of the important sector for Indian
Stock market, so I have included this sector in my study to
analyze. Indian IT sector is in boom for last several years and
developing rapidly. In this sector, there are some IT giants like
Infosys, Wipro, Satyam computer services, Zensar Technologies,
16 | P a g e

Rolta India, HCL technologies etc. This sector is one of those
sectors which have huge impact on Indian stock market movements.
4. Methodology
This study shows the relationship between stock return and
various performance variables like, Dividend price ratio, Earning
price ratio, Market to Book Ratio, Payout Ratio and Size. For
calculating stock returns dividend adjusted. I have calculated
each ratio on monthly basis for every company and then took the
average of those ratios for each month for entire sample period.
4.1 Dividend Price Ratio
For calculating this ratio, I have obtained monthly prices for
all of the firms in data sample and dividend per share from
DataStream. Dividend data which is obtained from DataStream is 12
moth rolling basis data.
Dividend Price Ratio = Dividend per Share / Price per
Equity Share
Dividend price Ratio is company's annual gross dividend paid
divided by its market cap or the dividend per share divided by
price per share. This dividend price ratio is typically used by
researchers in finance where the study of variability of this
ratio is main concern.
17 | P a g e

4.2 Price Earnings Ratio
In general, high P/E ratio suggests that investors are expecting
high earning growth in future compared to the companies with low
P/E Ratio. P/E ratio has been calculated by dividing price per
share with the EPS (Earning per share) of that particular share.
P/E ratio also calculated for every single firm in sample and
then average of P/E ratio is calculated. EPS for each firm in the
data sample is obtained from DataStream for 357 firms in all
three sectors.
Price Earnings Ratio has been calculated as:
Price Earnings Ratio = Market Value per Share /
Earning Per Share
4.3 Size
Size which is also known as a market capitalization of the
company. Size represents the magnitude of that company. I have
used size in my study to examine its relationship with stock
returns. I have also examined whether investors make their
investment decisions on the basis of Size or Market Cap of the
company. For calculating Size I have downloaded monthly prices of
the equities and number of outstanding shares from DataStream.
Size is calculated as:
Size = NOSH × Market Price of Equity share
18 | P a g e

Size also represents the total market price of the company.
4.4 Market to Book Ratio
Market to book ratio compares the book value and market value of
the stock. MtB ratio also indicates that whether stock is
undervalued overvalued. Low MtB ratio represents that stock is
undervalued. With the help of this ratio, investors can also
access whether they are paying too much for the stock, if company
goes bankrupt immediately. This Ratio is obtained from DataStream
database, to examine its relationship with stock return. MtB
ratio is also useful to examine the window dressing in stock
market.
Ratio is calculated as:
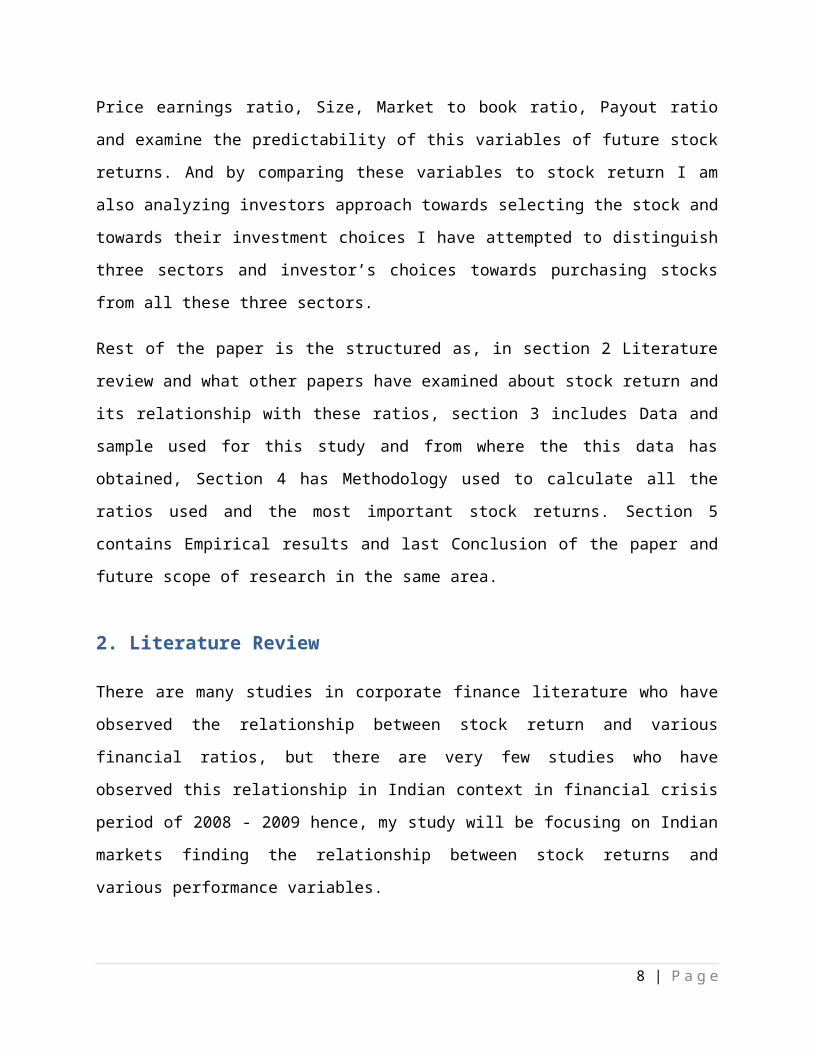
4.5 Payout Ratio
Payout ratio briefly represents the earning paid to the
shareholders of the company. This ratio can be used by investors
to know what company is doing with its earning, whether company
is retaining this earnings or paying out to its shareholders. Low
19 | P a g e
Payout ratio represents that company is not paying out its
earning and retaining them for future expansion plans or for
future needs of the company, whereas high payout represents that
company is paying out dividends. This ratio also indicates how
earnings are supported by dividends. This ratio is also obtained
from DataStream database.
It is calculated as:
4.6 Stock Return
Stock return or rate of return also known as return on Investment
is a ratio which calculates the gain or lost of money on any
investment relative to the the initial money invested. In this
paper I have calculated stock returns by using dividend adjusted
approach. I have obtained all the stock prices and dividend paid
per share data from DataStream database.
20 | P a g e

According to this formula I have calculated stock returns for all
the 357 companies in my dataset for the period of May 2003 to May
2013. This formula calculates appreciation by increase in stock
price plus dividend paid if any, and then divided by initial or
Original also known as Opening stock price of the stock. Main
sources of income for any investor in stock market is the
Increase in a stock price of the company and Dividend paid by the
company on investment, numerator of this formula shows total gain
or loss and dividend earned on investment and denominator shows
initial stock price or opening stock price.
4.7Regression Model
To examine the correlation between stock return and predictive
variables I have used OLS (ordinary least squares) regression.
The regression equation can be expressed as follow:
Y = α + β1X1 + β2X2 + β3X3 + β4 X4 + β5X5
Where,
Y =Dependent variable that is Stock Return.
α =Indicates the value of Y when all the values of
explanatory variables are zero.
21 | P a g e

β =this parameter indicates the average change in
Y that is associated with unit change in
variable X.
X= Independent Variable.
X1 Dividend price ratio, X2 is Price earnings ratio, X3 is Size
Variable, X4 is Market to book ratio and X5 is a payout ratio, as
mentioned before Y is dependent variable that is Stock return.
5. Empirical Results
In this section I have tried to examine the relationship between
stock return and other variables like Dividend Price ratio, Price
earnings Ratio, Size, Market to Book Ratio and Payout ratio. In
this section I examine the correlation between stock return and
predictive variables to analyze their predictive ability. I have
used this correlation to analyze investors approach towards each
sector and whether they invest in those sectors for capital gain
or for Dividend earning.
5.1 Summary StatisticsTo begin with, Table 1 Shows summary statistics for all the five
variables used in this study, and also the stock return. This
table also includes the mean and standard deviation for stock
returns and all other independent variables. According to this
table General industrial sector has highest average stock return
and also standard deviation, whereas banking sector has lowest
stock return and standard deviation in all sectors. But in case
22 | P a g e

of Dividend price ratio, Industrial engineering has the highest
D/P ratio and banking sector has the lowest one. Looking at the
Size factor, banking sector is huge in Size compared to any other
sector and also way ahead of all the sectors mentioned. From this
we can conclude that Indian banking sector has huge magnitude
effect on Indian stock market. After banking, software sector
comes at number two in case of Size, IT sector is in boom in
India and its effect is clearly seen on Size and magnitude of
that sector, So after banking, Software sector is the next most
affecting sector in Indian stock market. As i have mentioned
earlier in this paper, I have covered this three sectors because
this sectors constitute the major Indian companies and giants. In
Banking all the nationalized banks and major banks have been
covered like, State bank of India, Punjab National Bank, Bank of
Baroda, Bank of India etc, and in software and computer service
sector I have covered all the major software giants in India like
Wipro, Infosys, etc. Due to this Size factors affects a lot.
Table. 1 Summary Statistics for all Sectors from May2003 to May 2013
23 | P a g e
Sectors M ean SD M ean SD M ean SD M ean SD M ean SD M ean SD
Banking Sector 0.054 0.118 0.029 0.009 9.833 3.349 109803237 6.50E+07 1.199 0.264 17.480 1.288
General Industrials 0.115 0.433 0.043 0.019 17.946 13.861 2052537 1.27E+06 1.443 0.539 17.180 5.708
Industrial Engineering 0.099 0.165 0.054 0.023 22.885 10.410 9518441 6.06E+06 2.263 1.056 19.530 2.264
Software and Com puter Services 0.088 0.246 0.043 0.017 43.780 21.183 16844239 9.27E+06 2.257 1.049 12.111 4.459
Stock Return P/E Ratio Size M tB Payout RatioD/P ratio
Note:- This table includes average monthly stock returns for all the sectors used in this study and also thestandard deviation.
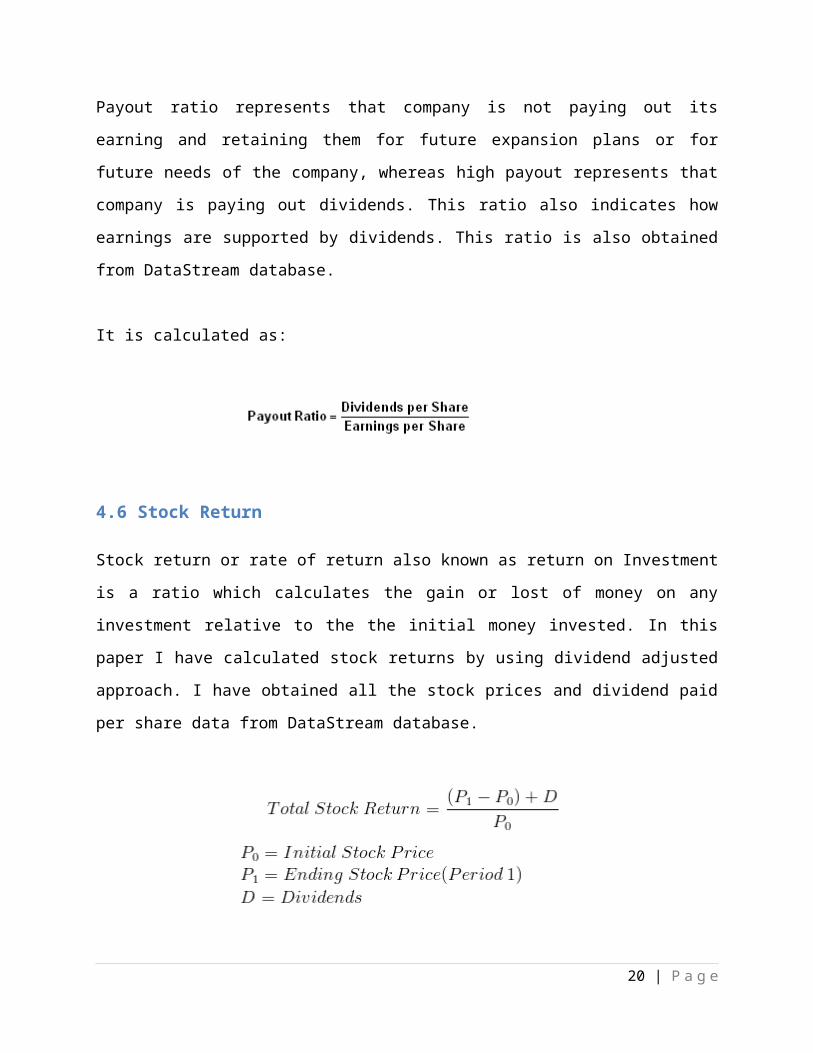
5.2 Pearson Correlation Matrix
Coming to correlation among the predictive variables for all the
sectors, to observe this correlation among all this independent
variable I have prepared Pearson correlation Matrix from May 2003
to May 2013 for every sector and for each independent variables
Table.2Banking Sector
Dividend.Price.Ratio PE.Ratio Size M arket.to.Book.Ratio Payout.RatioDividend.Price.Ratio 1 -0.7965 -0.1876 -0.7371 -0.1746
PE.Ratio -0.7965 1 0.2235736 0.7319 0.275Size -0.1876 0.2235 1 0.2268 -0.3992
M arket.to.Book.Ratio -0.7371 0.7319 0.2268349 1 0.12192339Payout.Ratio -0.1746 0.275 -0.3992567 0.1219 1
Note :-This table shows the correlation between all the variables for Banking sector.
24 | P a g e

Table.3General Industrials
Dividend.Price PE.Ratio Size M arket.to.Book.Ratio Payout.RatioDividend.Price 1 -0.3121946 -0.7324208 -0.1190192 0.7020803
PE.Ratio -0.3121946 1 0.2526798 0.1715212 -0.1207696Size -0.7324208 0.2526798 1 -0.2570843 -0.7541131
M arket.to.Book.Ratio -0.1190192 0.1715212 -0.2570843 1 0.4097802Payout.Ratio 0.7020803 -0.1207696 -0.7541131 0.4097802 1
Note :- This table shows the correlation between all the variables for General Industrials. Table.4
Industrial EngineeringDividend.Price.Ratio PE.Ratio Size M arket.to.Book.Ratio Payout.Ratio
Dividend.Price.Ratio 1 -0.5439804 -0.8359583 0.004464535 0.5860022PE.Ratio -0.543980408 1 0.248454 0.288080558 -0.2707581Size -0.835958327 0.248454 1 -0.154825759 -0.6504607
M arket.to.Book.Ratio 0.004464535 0.2880806 -0.1548258 1 -0.2460164Payout.Ratio 0.586002176 -0.2707581 -0.6504607 -0.246016406 1
Note :- This table shows the correlation between all the variables for Industrial Engineering.Table.5 5
Software and Com puter ServicesDividend.Price.Ratio PE.Ratio Size M arket.to.Book.Ratio Payout.Ratio
Dividend.Price.Ratio 1 -0.2541287 -0.1269445 -0.3495384 0.1849232PE.Ratio -0.2541287 1 0.3267063 -0.1372427 -0.3347966Size -0.1269445 0.3267063 1 -0.6376264 -0.7559005
M arket.to.Book.Ratio -0.3495384 -0.1372427 -0.6376264 1 0.7246725Payout.Ratio 0.1849232 -0.3347966 -0.7559005 0.7246725 1
Note :- This table shows the correlation between all the variables for Software and Computer Services.
These all table show high level of correlation among all the
independent variables used in this study, also these variables
are statistically significant.
25 | P a g e

5.3 Regression Result
After examining the correlation between all the independent
variables now I can go for regression result. I have used OLS
regression for this study, where stock return is my Dependent
variable (Y), and I have used five independent variables namely,
Dividend Price ratio, Price earnings ratio, Size, Market to book
ratio, and Payout ratio to examine the relationship between these
variables and stock returns for all the sectors from the period
May 2003 to May 2013.
Table.6Regression results for VariablesSector Constant PE D/P Size MtB Payout Ratio R Squared Adj R Squared F-Statistics N
Banking Sector 0.055 0.348 0.840 0.036 0.838 0.053 0.050 0.009 1.222 121[1.937359] [0.9434] [-0.202609][-2.121051][-0.204389] [-1.956304]
General Industrials 0.013 0.202 0.000 0.129 0.208 0.431 0.17 0.14 4.768 121[-2.518] [1.281] [3.837] [1.528] [1.265] [-0.789]
Industrial Engineering 0.446 0.012 0.051 0.975 0.390 0.969 0.14 0.11 3.832 121[-0.764] [2.561] [1.974] [0.031] [0.862] [0.039]
Software and Com puter Services 0.490 0.001 0.694 0.499 0.670 0.962 0.11 0.07 2.826 121[-0.693] [3.607] [0.394] [-0.678] [0.427] [0.047]
Note :- In this table coefficients in parenthesis show the P values. Figures in Bracket show the t-statistics
value for each variabl. This table represents the result for average stock returns, D/P, P/E, Size, MtB,
Payout ratio for four sectors for the period of 2003 to 2013.
Table 6 shows the result of my regression test which constitutes
four major sectors in Indian market and five variables.
Banking Sector
26 | P a g e

Starting with banking sector, Size is statistically significant
with P value of 0.036, so according to the result Size has
positive significant relationship with stock return. So size or
magnitude of the company has positive and significant impact on
stock return. So this results actually supporting the results of
PradoshSimlai(2009) as in his study on US market he found
positive relationship between Stock return and Size variable. So
from this result I can say that in Indian market Size is very
important factor for investors when they are investing in a stock
from Banking Sector. This result shows that Indian investors look
for market value when investing in Banking sector rather than
other things.
Another Significant variable is payout ratio in case of banking
sector, which represents positive and statistically significant
relationship among stock returns and Payout ratio. Higher the
Payout ratio better is for the earnings from earning means when
Payout ratio it indicates that company is paying dividend rather
than retaining it. In banking sector significant payout ratio
shows that Investors can predict future stock returns using this
variable, and accordingly they could decide their strategies for
investment in this particular sector. Positive and significant
payout ratio also indicates that investors are more concern about
dividend payout by banks while investing in this sector, as this
ratio represents how much dividend company is paying and how much
27 | P a g e

earnings company is retaining. Investors are looking for Dividend
earnings while investing in this sector.
Other variable like P/E ratio which shows positive but
insignificant relationship with stock return, According to Guler
Aras and Mustafa Kemal Yilmaz(2008)P/E ratio can predict the
stock return for the period of 1 year in four emerging markets,
but markets which have been targeted in that study are not big
markets and those markets are not liquid like Indian market.
Indian market is also an developing market but size wise Indian
market is way bigger than those emerging markets targeted in that
study. BSE which is the 10th largest stock exchange in the world
in terms of Market capitalization, So results in Indian context
is different. P/E ratio does not seem to predict stock return in
Indian stock market particularly in case of banking sector. From
the investor’s perspective, P/E ratio shows that Investors are
not looking for capital gain on banking stock rather they are
going for Long term investment and dividend earning is more
important for them than that of Capital gain. Market to book
ratio which is also highly insignificant in case of banking
sector shows that, MtB cannot predict stock returns in Banking
sector, also Investors are not concern with book value of the
banking stock, Market value is more important factor for them
while investing in this sector.
General Industrials
28 | P a g e

In case of General Industrials, Dividend price ratio is highly
significant with t-statistics value of 3.837, this shows positive
and statistically significant relationship between stock return
and dividend price ratio. According to the result, Dividend price
ratio can predict the stock return for general industrials stocks
as there is positive and highly significant relationship between
stock return and this ratio, this findings are supporting the
view of Robert H. Litzenberger and Krishna Ramaswamy(1982) as in
their study as well they find significant relationship between
stock return and dividend yield. Dividend price ratio helps
investor to know how much effective return he is going to get on
his investment in future, In this case positive and significant
D/P ratio shows that investors while investing in this sector are
more likely looking for dividends and returns on their investment
through dividends.
Another significant variable in this sector is Size with t-
statistics value of1.528. It is significant and positive which
shows positive and significant relationship between stock return
and Size. Size is the magnitude of the company or market value of
the company, Size is another important factor for investors while
investing in these stocks. Company size is total market
capitalization of the company and results shows that for
investors Size is very important factor.
29 | P a g e

But in this sector Payout ratio is not significant as well as
Market to book ratio. Price earnings ratio which is also
insignificant in case of this sector. This result represents
that, Payout Ratio, Market to book ratio and price earnings ratio
have no significant relationship with stock return and cannot
predict stock return. But this result of Market to book ratio is
contradictory to the findings of Raj AggarwalTakatoHiraki and
Ramesh P Rao(1992), in their study on Japanese stock market they
found positive and significant relationship between price to
book ratio and stock return, they have also mentioned that
investors can build their strategies according to their findings.
But in Indian market, particularly about General industrial
sector MtB ratio does not seem significant. Raj
AggarwalTakatoHiraki and Ramesh P Rao(1992) have considered the
whole Japanese stock market, whereas my result is for particular
sector hence results could be different in case of Indian
context.
Industrial Engineering
Industrial Engineering is next sector in my regression result.
Price earnings ratio for this sector is highly significant, Price
earnings representthe expectations of the investors regarding the
earnings from the stock, high P/E ratio represents that investors
are expecting higher earnings growth. According to the result
there is positive and statistically significant relationship
between stock returns and price earnings ratio. So in case of
30 | P a g e

this sector Price earnings ratio can predict the future stock
returns. Each industry sectors have different growth prospects,
and according to these prospects investors invest their money in
particular industry. This significant Price earnings ratio shows
that investor are looking for capital gain when they are
investing in the stocks from this sector of Industrial
engineering.
This Industrial engineering sector has included with some of the
major companies in Indian stock market, which are giant in their
particular field, some of the companies from this sector are ABB,
Bharat Forge, Bharat Heavy electrical, Mahindra and Mahindra,
Nelco, SKF India, Tata Motors and Thermax. ABB is Zurich,
Switzerland based multinational company operating in robotics and
mainly automation and power areas, It is one of the largest
engineering company in the world with presence in more than 100
companies. Price earnings ratio of ABB was consistently very high
starting from 14.60 in 2003, It was highest in 2011, whereas in
2008 due to recession and bad market condition Price earnings
ratio falls down as expected, In recession investors become
pessimistic about growth prospect of the company and it had
clearly reflected on company's Price earnings ratio in the period
of 2007 - 2008 where Price earnings ratio of this company had
hampered badly. But otherwise Price earnings ratio was
consistently high showing investors are expecting significantly
high returns from the company's stock. Bharat forge which is also
31 | P a g e

in this sector, this is also another Giant in the field of
forging industry. Forbes has rated Bharat Forge as the best
forging company in Asia, Price earnings ratio for this company
was consistently high except in recession phase. Bharat heavy
electrical is government owned company and another big company in
Indian stock market, Tata Motors is another example from this
industry with high Price earnings ratio.
This consistent high price earnings ratio shows that investors
are expecting high returns from these stocks, this represents
that investors are looking for capital gain on their investments
in this sector. Result for price earning from my regression
result is somehow supporting the findings of Guler Aras and
Mustafa Kemal Yilmaz(2008), because in their research also they
found significant price earnings ratio in case of most of the
stock markets, where P/E ratio is positively and statistically
significant with stock return and can predict the stock return.
Dividend price ratio is another significant variable in this
sector. Result for this sector shows positive and statistically
significant relationship among dividend price ratio and stock
return, Dividend price ratio is another variable which can
predict the stock return for this particular sector. D/P is
significant with t-statistic value of 1.97, which show that
investors can use this variable as predictive variable for stock
return, Price earnings ratio is another predictive variable in
32 | P a g e

case of this sector. D/P ratio represents how much company pays
out earnings as dividend each year relative to its share price.
Positive and significant dividend price ratio shows that,
Investors are looking for dividend earnings from the stocks in
this sector, while investing in this sector investors are more
concern about dividends they will be getting from their
investments.
Overall in this sector investors are looking for capital gains as
well as dividend earnings while investing in this sector as Price
earnings ratio and Dividend price ratio both show positive and
statistically significant relationship with stock returns. Other
three variables like Size, Market to Book ratio and Payout ratio
which are statistically insignificant in case of this sectors
shows that, there is not relationship among these variables and
stock return, hence MtB, Size and Payout ratio cannot predict
stock return for this particular sector. Insignificant MtB ratio
shows that investors are not concern about whether stock is
overvalued or undervalued compared to its book value. They are
just looking for Capital gains and dividend earnings out of their
investment in this particular sector as P/E and D/P ratios are
positive and statistically significant. Size also insignificant
and cannot predict stock return for this sector, result is same
in case of payout ratio for this sector.
Software and Computer Services
33 | P a g e

Taking Software and Computer services Sector into consideration,
only price earnings ratio is the significant variable out of all
five variables used in this study. Price earnings ratio is
significant with t-statistic value of 3.607, this shows that only
P/E ratio can predict the stock return for Software and computer
services sector. This significant P/E ratio shows that, investors
are just looking for capital gains from software stocks, they are
just concern about the earnings through the increase in the price
of stock. While investing in this sector investors are not
concern about book value of the stock as market to book ratio is
insignificant, they are just concern about market price of the
stocks, hence stocks from this sectors are mostly inflated than
its book value. Dividend price ratio is insignificant and shows
no relationship with stock return,
Unlike industrial engineering in this sector dividend price ratio
is insignificant therefore investors are not concern about
dividend earning in this sector, they are looking for capital
gain on their investment. As investors are looking for capital
gain most of the stocks from this sector are very volatile and
show sudden ups and downs in their prices. Stocks like Infosys,
Wipro which are highly efficient and flexible to new information
and new events in the market. Ups and downs of the prices of
these stocks are totally depend on the favorable and unfavorable
information hitting stock market time to time. Due to this
approach of investors who are just looking for capital gain from
34 | P a g e

the stocks, these stock prices are very volatile. Dividend price
ratio which is highly insignificant in case of software industry
which shows that, there is not relationship between stock returns
and D/P ratio for this sector, and ultimately this D/P ratio
cannot be used as predicable variable for stock return or for
predicting stock return. Dividend price ratio is used by
investors to assess how much returns they are getting in form of
dividend from their investment in that stock by comparing the
returns to the actual stock price, D/P ratio is nothing but
comparing stock returns in the form of dividend to the market
price of the stock. From this ratio investors can actually
evaluate the returns they are getting out of their investment. My
regression results show insignificant D/P ratio and insignificant
relationship among D/P and stock return which means this variable
cannot predict the stock returns for Software sector.
This insignificant relationship between D/P and stock return also
shows that investors are not worried and concern about the
returns or dividends while investing in this particular sector,
they are only looking for capital gains or gains from increase in
stock price as the price earnings ratio is significant. Size,
Market to book ratio, and Payout ratio all these variable seem
insignificant according to my regression result and show no
relationship of these variables with stock return, So in this
software sector these variables like MtB, Size, and Payout ratio
cannot predict stock returns. From the investors prospective as
35 | P a g e
well, Investors don't look for Book value, size or payout ratio
of any company while investing their money in this sector and
findings regarding this three variables are not supporting the
findings of Kee Hong Bae, Jeong-Bon Kim(1998), the main reason
for this contradictory results could be different markets
altogether, My study is focused on Indian stock market and this
particular result is only for one particular sector that is
Software and Computer services sector whereas Kee Hong Bae,
Jeong-Bon Kim(1998) have focused on Japanese stock market and
that too they have focused on whole market. Japanese market is
developed stock market and is way different than Indian stock
market in case of regulations and governance matter, hence this
possibility cannot be neglected and hence result from one sector
of Indian stock market is different than Japanese stock market.
Overall, my results are supporting some previous studies in case
of some sectors and in case of some variables but not completely.
This difference in result is observed due to different phases
each market is experiencing, Indian market is emerging market and
need to develop in many ways. Developed markets are well
regulated and well governed but in case of emerging market these
factors differ, Indian market is big and huge in terms of market
capitalization but they are many aspects which need to be
improved in Indian market like, Regulation, Governance mechanism
and many other regulatory aspects. Due to this differences
36 | P a g e
results from Indian stock market are somewhat different from
other developed markets like Japan, UK, and US.
Another aspect is Indian stock market is very efficient and
flexible to new information and new events in global market, you
can observe immediate effect of any unfavorable or favorable news
or events on Indian stock market. Major markets around the world
like New York Stock Exchange, American Stock Exchange, London
stock exchange have significant impact on Indian stock market, It
shows fluctuation according to these major markets so taking into
consideration all these effects and impacts of global markets it
is very difficult to examine why exactly some results and
findings from this paper is not supporting other literatures and
studies in finance based on other market. Due to this sensitivity
of the Stock market sometimes it experiences bullish or bearish
movements depending on favorable or unfavorable information.
Satyam computer services scandal which actually did hamper a
stock market a lot that too in a period of global financial
crisis. Due to this scandal investors become more pessimistic and
feel insecure about their investments in the stock market and
pulled out all of their money invested out of stock market which
cause major stock market crash and Sensex closed at 8,160.40
lowest close since 2nd November 2005. Satyam computers scandal
was biggest scandal in IT industry in India, On 7th January 2009
company's CEO RamalingaRaju had resigned and confessed that he
37 | P a g e

had manipulated the accounts by $1.47 billion. The whole global
and corporate community was shattered because of this scandal and
this scandal hampered Indian stock market badly. Such unfavorable
events make the stock market unstable and therefore it is very
difficult to find consistency in results for all the stock
exchanges around the world.
6. Conclusion
In this study I have observed the relationship between stock
returns and five different variables namely Dividend price ratio,
Price earnings ratio, Size, Market to Book ratio, and payout
ratio. I have collected the total data sample of 357 firms in
total from four different sectors, I have observed this
relationship according to the sector. Paper also tried to examine
the investors choice and approach towards investment and how and
what variables do matter for them while investing in any
particular stock.
According to the findings some variables are significant and show
significant positive relationship with stock return, on the other
hand some variables from some sectors are highly insignificant
and show no relationship with stock return. In case of banking
sector Size and payout ratio are positive and significant which
show positive and significant relationship between stock return
and these variables. Investors who are investing in banking
38 | P a g e

sector would be concern about these variables while investing in
this particular sector, other variables like, D/P, MtB, and P/E
ratio are insignificant and do not show any significant
relationship with stock return. I have also examined the general
industrial sector, this sector constitutes all the major
manufacturing industries in India like, 3M India, Sharp
Industries. Result for this sector shows that D/P ratio is highly
significant and have positive significant relationship with stock
return, which represents that D/P ratio can actually predict the
stock returns for the stocks from this sectors. Another variable
which is significant for this particular sector is Size, which is
also shows positive significant relationship with stock return.
Investors while investing in this general industrial sector
would be looking for Dividend earning and the returns from the
stocks in which they have invested, another important factor for
investors would be Size while investing in this Sector, other
variables like P/E ratio, MtB ratio, and Payout ratio for General
Industrials are not significant and therefore show no
relationship with stock return, this result also shows that
investors while investing in this sector are not concern about
capital gain or increase in stock price they are looking for
Dividend and want to hold the stock for long term period,
insignificant MtB ratio shows that investors are not concern
about book value of the stocks particularly for this sector.
These finding for General industrial sector are supporting the
view of Robert H. Litzenberger and Krishna Ramaswamy(1982).
39 | P a g e
In case of Industrial engineering sector, P/E and D/P ratios are
positive and significant which show positive and significant
relationship with stock return, these two variables can predict
the stock return for this sector. By using these variables
investors can decide their investment strategies. Results
regarding Price earnings ratio for Industrial Engineering are
supporting the results of Guler Aras and Mustafa Kemal
Yilmaz(2008), in their study as well they found significant
relationship between P/E ratio and Stock return.
According to the results of Software and Computer services sector
I found only Price earnings ratio as a significant variable out
of five variables used. This is mainly because IT sector is
continuously and rapidly growing which has increased the
expectations of investors regarding their investments and
therefore price earnings ratio is positively significant, high
P/E ratio shows that investors are expectin higher growth from
stock and ultimately capital gain. From this result it is clear
that, investors who are investing in software industry are
investing money in stock just to take the advantage of stock
price increase.
Overall my study contributes to the corporate finance literature
by examining the relationship between all five variables and
stock return of four different sectors of Indian stock market. I
have also examined the investors choices and approaches towards
investing in these four sectors. In case of some sectors like
40 | P a g e

Software and computer services sector and Industrial Engineering
sector investors are looking for capital gain and only concern
about the increase in a price of stock, which is supported by my
findings regarding P/E ratio, where In both the sectors namely
Software and Industrial Engineering P/E ratio is positive and
statistically significant. But in Banking sector investors are
concern about magnitude of the company that is Size variable
hence, Size variable can predict stock return for banking
industry. For General Industrial D/P ratio is significant
variable which can predict stock return for this industry and
also investors which are investing in this industry are concern
about dividend and returns from their investments. In this study
I have analyzed five variables and four different major sectors
of Indian stock market. Some of the findings from this paper are
supporting literature and some findings are not supporting. In
these four sectors, for each sectors some variables Which I found
significant and some insignificant which do not have any
relationship with stock return.
Further research could be done on the same topic by adding some
more variables and by covering some more data period. Further
research study could include some new variables like Leverage,
book to market ratio etc. In this paper I have not covered the
impact of other major stock markets on Indian stock market in
detail, so in further research this point could be of more focus
and one can analyze and examine the detail effect of other stock
exchanges on Indian stock market. This paper also not covered the
41 | P a g e

impact of regional and local events on stock market such as
scandals, changes in Interest rates, Changes in Government
policies etc which could be covered in further research. Such
events news and new information make the stock market unstable
for some time and because of such instabilities sometimes
research result could be bias and cannot evaluate and find the
actual results and findings.
References
42 | P a g e

Robert H Litzenberger and Krishna Ramaswamy.(1982).The effects of
Dividends on common stock prices Tax effects or Information
Effects ? . Journal Of Finance. Retrieved From
http://www.jstor.org.ezproxy.waikato.ac.nz/stable/2327346
Guler Aras and Mustafa Kemal Yilmaz.(2008). Price-Earnings Ratio,
Dividend Yield, and Market to Book Ratio to predict return
on stock Market: Evidence from the emerging markets. Journal
of Global Business and Technology, Volume. 4, Number 1. Retrieved From
http://search.proquest.com.ezproxy.waikato.ac.nz/docview/
216940328?accountid=17287
Keith S.K. Lam .(2002). The relationship between Size, book to
market equity ratio, earning Price ratio, and return for
the Hong Kong Stock market. Global Finance Journal 13. Retrieved
from
http://www.sciencedirect.com/science/article/pii/
S1044028302000492
Rolf W. Banz.(1980). The relationship between return and market
value of common stock.Journal of Financial economics 9.Retrieved
from
http://www.sciencedirect.com.ezproxy.waikato.ac.nz/science/
article/pii/0304405X81900180
43 | P a g e

JaffreJafffe, Donald B Keim, and Randolph Westerfield.(1989).
Earning Yields, Market Value, and Stock return. Journal Of
Finance. Retrieved from
http://onlinelibrary.wiley.com/doi/10.1111/j.1540-
6261.1989.tb02408.x/abstract
PradoshSimlai.(2009). Stock Return, Size, and book to market
equity. Journal of Economies and Finance Vol 26.Retrieved from
http://www.emeraldinsight.com.ezproxy.waikato.ac.nz/journals.htm?
articleid=1801391&show=abstract
Jeffrey Pontiff and Lawrence D. Schall.(1997). Book to market
ratios as predictors of market returns.Journal of Financial
Economics 49. Retrieved From
http://www.sciencedirect.com.ezproxy.waikato.ac.nz/science/
article/pii/S0304405X98000208
Ian McManus, Owain AP Gwilym and Stephen Thomas.(2004). The role
of payout ratio in the relationship between stock return
and dividend yield.Journal of Business and Accounting 31(9)&(10).
Retrieved from
http://onlinelibrary.wiley.com.ezproxy.waikato.ac.nz/doi/
10.1111/j.0306-686X.2004.00577.x/abstract
44 | P a g e

Gabriel Perez-Quiros and Allan Timmermann .(2000). Firm size and
cyclical variations in stock return. The Journal of Finance Vol.
LV, No 3.Retrieved from
http://www.jstor.org.ezproxy.waikato.ac.nz/stable/222451
Kee Hong Bae, Jeong-Bon Kim.(1998). The usefulness of earnings
versus book value for predicting stock returns and cross
corporate ownership in Japan.Japan and the World Economy 10 (1998)
467-485. Retrieved from
http://www.sciencedirect.com.ezproxy.waikato.ac.nz/science/
article/pii/S0922142598000292
Raj AggarwalTakatoHiraki and Ramesh P Rao.(1992). Price/book
value ratios and equity returns on the Tokyo stock
exchange: Empirical evidence of an Anomalous Regularities.
The Financial Review Vol 27 No. 4.Retrieved from
http://search.proquest.com.ezproxy.waikato.ac.nz/docview/20
8182720
JYH-LIN WU, YU-HAU HU and CHINGNUN LEE .(2011). Can dividend
yields out predict UK stock return without short rates. The
Manchester School Vol 29 No. 6 1179-1196. Retrieved From
http://onlinelibrary.wiley.com.ezproxy.waikato.ac.nz/doi/
10.1111/j.1467-9957.2010.02218.x/abstract
45 | P a g e

ChakerAloui, DucKhuong Nguyen and HassenNjeh.(2012). Assessing
the impacts of oil price fluctuations on stock returns in
emerging markets.Economic Modeling 29(2012) 2686-2695. Retrieved
from
http://www.sciencedirect.com.ezproxy.waikato.ac.nz/science/
article/pii/S0264999312003963
46 | P a g e

Appendix
Table. 7 Regression Result For Banking Sector
Banking Sector
Dependent Variable: STOCK_RETURNM ethod: Least SquaresDate: 06/07/13 Tim e: 19:41Sam ple: 2003M 05 2013M 05Included observations: 121
Variable Coefficient Std. Error t-Statistic Prob.
SIZE -4.13E-10 1.95E-10 -2.121051 0.0361PE_RATIO 5.66E-03 6.00E-03 0.9434 0.3475PAYOUT_RATIO -1.96E-02 1.00E-02 -1.956304 0.0529M ARKET_TO_BOOK_RATIO-1.32E-02 6.48E-02 -0.204389 0.8384DIVIDEND_PRICE_RATIO-4.42E-01 2.18E+00 -2.03E-01 0.8398C 4.14E-01 2.14E-01 1.937359 0.0552
R-squared 0.050446 M ean dependent var 0.053825Adjusted R-squared0.009161 S.D. dependent var 0.118069S.E. of regression 1.18E-01 Akaike info criterion -1.395982Sum squared resid 1.59E+00 Schwarz criterion -1.257348Log likelihood 90.45692 Hannan-Quinn criter. -1.339678F-statistic 1.22E+00 Durbin-W atson stat 1.807331Prob(F-statistic) 0.303345
47 | P a g e

Table. 8 Regression Result for General Industrials
General Industrials
Dependent Variable: STOCK_RETURNM ethod: Least SquaresDate: 06/06/13 Tim e: 14:57Sam ple: 2003M 05 2013M 05Included observations: 121
Variable Coefficient Std. Error t-Statistic Prob.
SIZE 7.86E-08 5.14E-08 1.528731 0.1291PE_RATIO 0.003659 0.002854 1.281938 0.2024PAYOUT_RATIO -0.010273 0.01301 -0.789656 0.4314M ARKET_TO_BOOK_RATIO0.126357 0.099817 1.265887 0.2081DIVIDEND_PRICE 15.48725 4.036018 3.83726 0.0002C -0.786248 0.312132 -2.518957 0.0131
R-squared 0.171712 M ean dependent var 0.114726Adjusted R-squared0.135699 S.D. dependent var 0.432677S.E. of regression 0.40225 Akaike info criterion 1.064828Sum squared resid18.60756 Schwarz criterion 1.203462Log likelihood -58.4221 Hannan-Quinn criter. 1.121133F-statistic 4.768116 Durbin-W atson stat 1.109891Prob(F-statistic) 0.000537
48 | P a g e
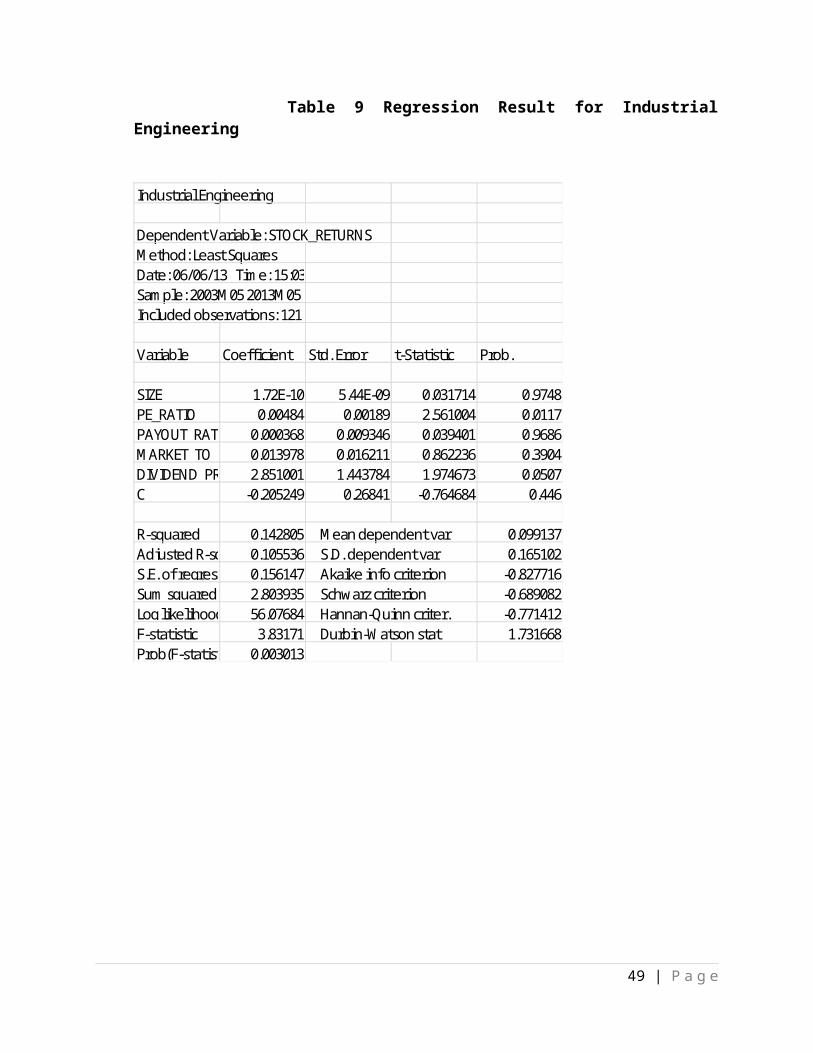
Table 9 Regression Result for IndustrialEngineering
Industrial Engineering
Dependent Variable: STOCK_RETURNSM ethod: Least SquaresDate: 06/06/13 Tim e: 15:03Sam ple: 2003M 05 2013M 05Included observations: 121
Variable Coefficient Std. Error t-Statistic Prob.
SIZE 1.72E-10 5.44E-09 0.031714 0.9748PE_RATIO 0.00484 0.00189 2.561004 0.0117PAYOUT_RATIO 0.000368 0.009346 0.039401 0.9686M ARKET_TO_BOOK_RATIO0.013978 0.016211 0.862236 0.3904DIVIDEND_PRICE_RATIO2.851001 1.443784 1.974673 0.0507C -0.205249 0.26841 -0.764684 0.446
R-squared 0.142805 M ean dependent var 0.099137Adjusted R-squared0.105536 S.D. dependent var 0.165102S.E. of regression 0.156147 Akaike info criterion -0.827716Sum squared resid2.803935 Schwarz criterion -0.689082Log likelihood 56.07684 Hannan-Quinn criter. -0.771412F-statistic 3.83171 Durbin-W atson stat 1.731668Prob(F-statistic) 0.003013
49 | P a g e

Table 10 Regression Result for Software and Computer Services
Software and Com puter Services
Dependent Variable: STOCK_RETURNM ethod: Least SquaresDate: 06/06/13 Tim e: 15:11Sam ple: 2003M 05 2013M 05Included observations: 121
Variable Coefficient Std. Error t-Statistic Prob.
SIZE -2.53E-09 3.73E-09 -0.678082 0.4991PE_RATIO 0.004034 0.001118 3.607497 0.0005PAYOUT_RATIO 0.00049 0.010307 0.047496 0.9622M ARKET_TO_BOOK_RATIO0.018982 0.044363 0.427871 0.6695DIVIDEND_PRICE_RATIO7.45E-01 1.89E+00 0.394984 0.6936C -0.127423 0.183819 -0.6932 0.4896
R-squared 0.109412 M ean dependent var 0.087699Adjusted R-squared0.070691 S.D. dependent var 0.245729S.E. of regression0.236884 Akaike info criterion 0.005823Sum squared resid6.453116 Schwarz criterion 0.144457Log likelihood 5.647695 Hannan-Quinn criter. 0.062128F-statistic 2.825633 Durbin-W atson stat 1.45394Prob(F-statistic)0.019143
50 | P a g e