Steel Price Tracker
22
Steel Price Tracker Steel Steel Periodical Europe Austria France Industry Steel Price Tracker Date 29 November 2017 Deutsche Bank Markets Research US prices rise - coking coal keeps edging up Will steel prices fall or maintain their strength? Steel equities continue to be volatile, driven by macro woes and commodity price movements. Although current spot conditions remain strong, we still expect cost support to fade and, thus, European prices to fall (current spot conditions would imply further significant earnings upgrades across the space). Our top picks are 1) ArcelorMittal, which looks attractive to us based on strong cash flow (7-12% FCF yield), valuation and additional upside optionality; and 2) Voestalpine, which we believe has more room for upgrades, generates strong underlying CF (9-10% FCF yield) and has a less volatile business model. HRC: N. European prices down E1 Figure 1: HRC prices 200 250 300 350 400 450 500 550 600 650 700 750 800 850 900 950 1,000 1,050 Nov 13 Mar 14 Jul 14 Nov 14 Mar 15 Jul 15 Nov 15 Mar 16 Jul 16 Nov 16 Mar 17 Jul 17 Nov 17 Northern Europe USA China exports to Europe USD/t Source: The Steel Index Last week, N. European prices were down E1 to E537 (up USD1 to USD633) and S. European prices were down E1 to E500 (stable in USD terms at USD590). Prices have fallen E10 in the past three months. US HRC prices up USD14; Chinese export prices stable US HRC prices were up USD14 last week following the USD40/t price increase of several US players. The price gap with Europe rose to USD56/t, while the price differential with China increased to USD143/t. Chinese HRC prices were stable at USD546. The spread between Chinese and S. European prices was also stable at USD44, less than the two-year average spread of USD58, with Chinese prices down E5 (down USD6) in the past three months. Plate: N. European prices up E1 Figure 2: Raw material prices 150 200 250 300 350 400 450 500 550 30 50 70 90 110 130 150 170 190 210 Nov 14 Feb 15 May 15 Aug 15 Nov 15 Feb 16 May 16 Aug 16 Nov 16 Feb 17 May 17 Aug 17 Nov 17 Iron ore Fines 62% Fe, CFR Tianjin, China Shredded scrap, US (RHS) USD/t USD/t Source: The Steel Index N. European prices were up E1 to E575 (up USD3 to USD678). Prices fell E15 in the past month. S. European prices were stable at E537 (up USD2 to USD633). US prices were stable at USD759 (also stable in euro terms at E648). Iron ore: Fines 62% Fe prices up USD2/dmt; coking coal: prices up USD5 The prices of Fines 62% rose by USD2/dmt WoW to USD67/dmt. Chinese steel output decreased 0.7% WoW to 1.80mt/day in the first 10 days of November. Prices of premium coking coal (Australian exports) increased by USD5 to USD201 last week. They also increased in euro terms by E2 to E168. Scrap: European prices stable We value MT using an equal blend of forward EBITDA and DCF and VOES using DCF. Risks: weaker steel prices and demand divergence from our steel sector scenario. European prices were stable at USD290/t, while Turkish prices were up USD5 to USD315/t last week. If current prices were to remain stable until end-Q4, the QoQ price decrease for European scrap in Q4 would be USD24. Bastian Synagowitz Research Analyst +41-44-227-3377 Top picks ArcelorMittal (MT.AS),EUR24.78 Buy Voestalpine (VOES.VI),EUR47.78 Buy Source: Deutsche Bank Deutsche Bank AG/London Deutsche Bank does and seeks to do business with companies covered in its research reports. Thus, investors should be aware that the firm may have a conflict of interest that could affect the objectivity of this report. Investors should consider this report as only a single factor in making their investment decision. DISCLOSURES AND ANALYST CERTIFICATIONS ARE LOCATED IN APPENDIX 1. MCI (P) 083/04/2017. Distributed on: 29/11/2017 01:03:09 GMT 0bed7b6cf11c
-
Upload
khangminh22 -
Category
Documents
-
view
9 -
download
0
Transcript of Steel Price Tracker

29 November 2017
Steel
Steel Price Tracker
SteelSteel
Periodical
EuropeAustriaFrance
Industry
Steel Price TrackerDate29 November 2017
Deutsche BankMarkets Research
US prices rise - coking coal keepsedging upWill steel prices fall or maintain their strength?Steel equities continue to be volatile, driven by macro woes and commodity pricemovements. Although current spot conditions remain strong, we still expect costsupport to fade and, thus, European prices to fall (current spot conditions wouldimply further significant earnings upgrades across the space). Our top picks are1) ArcelorMittal, which looks attractive to us based on strong cash flow (7-12%FCF yield), valuation and additional upside optionality; and 2) Voestalpine, whichwe believe has more room for upgrades, generates strong underlying CF (9-10%FCF yield) and has a less volatile business model.
HRC: N. European prices down E1
Figure 1: HRC prices
200
250
300
350
400
450
500
550
600
650
700
750
800
850
900
950
1,000
1,050
Nov
13
Mar
14
Jul
14
Nov
14
Mar
15
Jul
15
Nov
15
Mar
16
Jul
16
Nov
16
Mar
17
Jul
17
Nov
17
Northern Europe USA China exports to Europe
USD/t
Source: The Steel Index
Last week, N. European prices were down E1 to E537 (up USD1 to USD633) andS. European prices were down E1 to E500 (stable in USD terms at USD590). Priceshave fallen E10 in the past three months.
US HRC prices up USD14; Chinese export prices stableUS HRC prices were up USD14 last week following the USD40/t price increaseof several US players. The price gap with Europe rose to USD56/t, while the pricedifferential with China increased to USD143/t. Chinese HRC prices were stableat USD546. The spread between Chinese and S. European prices was also stableat USD44, less than the two-year average spread of USD58, with Chinese pricesdown E5 (down USD6) in the past three months.
Plate: N. European prices up E1
Figure 2: Raw material prices
150
200
250
300
350
400
450
500
550
30
50
70
90
110
130
150
170
190
210
Nov14
Feb15
May15
Aug15
Nov15
Feb16
May16
Aug16
Nov16
Feb17
May17
Aug17
Nov17
Iron ore Fines 62% Fe, CFR Tianjin, China Shredded scrap, US (RHS)USD/t USD/t
Source: The Steel Index
N. European prices were up E1 to E575 (up USD3 to USD678). Prices fell E15 inthe past month. S. European prices were stable at E537 (up USD2 to USD633).US prices were stable at USD759 (also stable in euro terms at E648).
Iron ore: Fines 62% Fe prices up USD2/dmt; coking coal: prices up USD5The prices of Fines 62% rose by USD2/dmt WoW to USD67/dmt. Chinese steeloutput decreased 0.7% WoW to 1.80mt/day in the first 10 days of November.Prices of premium coking coal (Australian exports) increased by USD5 to USD201last week. They also increased in euro terms by E2 to E168.
Scrap: European prices stableWe value MT using an equal blend offorward EBITDA and DCF and VOES usingDCF. Risks: weaker steel prices and demanddivergence from our steel sector scenario.
European prices were stable at USD290/t, while Turkish prices were up USD5 toUSD315/t last week. If current prices were to remain stable until end-Q4, the QoQprice decrease for European scrap in Q4 would be USD24.
Bastian Synagowitz
Research Analyst
+41-44-227-3377
Top picks
ArcelorMittal (MT.AS),EUR24.78 Buy
Voestalpine (VOES.VI),EUR47.78 BuySource: Deutsche Bank
Deutsche Bank AG/London
Deutsche Bank does and seeks to do business with companies covered in its research reports. Thus, investors should beaware that the firm may have a conflict of interest that could affect the objectivity of this report. Investors should considerthis report as only a single factor in making their investment decision. DISCLOSURES AND ANALYST CERTIFICATIONSARE LOCATED IN APPENDIX 1. MCI (P) 083/04/2017.
Distributed on: 29/11/2017 01:03:09 GMT
0bed7b6cf11c

29 November 2017
Steel
Steel Price Tracker
Deutsche Bank Steel &Mining team
Page 2 Deutsche Bank AG/London

29 November 2017
Steel
Steel Price Tracker
Steel price summaryFigure 3: Steel price summaryPrices for the week Nov 13 - Nov 20 Bloomberg Price per tonne Absolute change (USD) % change (USD) Absolute change (EUR) % change (EUR)
Index Ticker USD EUR 1w 1m 3m ytd y/y 1w 1m 3m ytd y/y 1w 1m 3m ytd y/y 1w 1m 3m ytd y/y
Hot Rolled Coil (HRC)
N. Europe TSIPNEHR 633 537 1 -1 4 57 109 0 0 1 10 21 -1 -4 10 -13 43 0 -1 2 -2 9
S. Europe TSIPSEHR 590 500 0 -10 -18 36 106 0 -2 -3 6 22 -1 -11 -10 -29 43 0 -2 -2 -5 9
Turkey TSIPTKHR 552 468 -9 -31 35 8 48 -2 -5 7 1 9 -9 -29 35 -51 -8 -2 -6 8 -10 -2
USA TSIPUSHR 689 584 14 20 0 44 130 2 3 0 7 23 11 13 6 -32 56 2 2 1 -5 11
Chinese exports TSIPCXHR 546 463 0 -5 -6 51 92 0 -1 -1 10 20 -1 -7 -5 -12 46 0 -2 -1 -2 11
Cold Reduced Coil (CRC)
N. Europe TSIPNECR 732 620 4 -3 -16 48 95 1 0 -2 7 15 2 -6 -6 -33 19 0 -1 -1 -5 3
S. Europe TSIPSECR 689 584 6 -1 -5 21 58 1 0 -1 3 9 4 -5 2 -54 -11 1 -1 0 -8 -2
Turkey TSIPTKCR 660 560 0 -15 32 35 76 0 -2 5 6 13 -2 -16 33 -38 9 0 -3 6 -6 2
USA TSIPUSCR 867 735 -1 -20 -38 -20 73 0 -2 -4 -2 9 -3 -21 -24 -112 -14 0 -3 -3 -13 -2
Chinese exports TSIPCXCR 590 500 3 0 -8 3 33 1 0 -1 1 6 1 -3 -1 -59 -16 0 -1 0 -11 -3
Hot Dipped Galvanised Coil (HDG)
N. Europe TSIPNEGV 767 650 2 0 -12 20 90 0 0 -2 3 13 0 -4 -3 -63 11 0 -1 0 -9 2
S. Europe TSIPSEGV 717 608 20 5 -12 -9 45 3 1 -2 -1 7 16 1 -3 -85 -26 3 0 0 -12 -4
USA TSIPUSGV 949 806 0 -5 26 7 94 0 0 3 1 11 0 -2 32 -94 -1 0 0 4 -10 0
Plate
N. Europe TSIPNEPL 678 575 3 -13 -33 95 123 0 -2 -5 16 22 1 -15 -23 18 51 0 -2 -4 3 10
S. Europe TSIPSEPL 633 537 2 -22 -25 66 130 0 -3 -4 12 26 0 -22 -15 -4 62 0 -4 -3 -1 13
USA TSIPUSPL 759 648 0 0 24 110 201 0 0 3 17 36 0 0 32 28 122 0 0 5 4 23
Rebar
N. Europe TSIPNERB 656 557 11 4 97 169 195 2 1 17 35 42 8 1 88 92 122 1 0 19 20 28
S. Europe TSIPSERB 542 463 0 0 -1 86 118 0 0 0 19 28 0 0 8 28 63 0 0 2 6 16
USA NA 617 523 0 0 11 33 61 0 0 2 6 11 -2 -4 14 -34 -2 0 -1 3 -6 0
Iron ore as of November 27, 2017
Fines 62% Fe TSIPIO62 67 56 2 9 -9 -10 -9 3 15 -12 -13 -12 1 6 -7 -17 -16 2 12 -12 -24 -22
Fines 58% Fe TSIPIO58 47 39 -1 2 -9 -20 -19 -1 3 -16 -30 -29 -1 0 -8 -25 -23 -2 1 -16 -39 -37
Scrap as of 23 November 2017
US TSIPUSFS 274 232 0 -8 -37 -8 40 0 -3 -12 -3 17 -1 -11 -31 -35 12 0 -5 -12 -13 5
Europe MBSFRSHR 290 243 0 8 -46 8 26 0 3 -14 3 10 -3 -1 -40 -24 -6 -1 0 -14 -9 -2
Turkey TSIPTIFS 315 267 5 11 -40 24 44 2 4 -11 8 16 4 8 -30 -11 11 1 3 -10 -4 4
Coking coal as of 27 November 2017
Premium Coking Coal / Australian Exports NA 201 168 5 23 -9 -12 -107 3 13 -4 -5 -35 2 15 -7 -35 -122 1 10 -4 -17 -42
Source: The Steel Index, Bloomberg Finance LP
Industry valuation and risksWe use various methodologies to value the steel companies under our coverage– from a DCF-based valuation to a normalised earnings approach and a sum-of-the-parts (SOTP) analysis. Key industry risks include 1) global economic growthnot meeting expectations; 2) lower-than-expected steel prices, which could resultin an erosion of earnings; 3) higher raw material and other operating costs, whichcould limit earnings growth; 4) the political influence of governments in the steeltrade; 5) expansion projects not progressing as expected; and 6) M&A valuationand integration risks.
Deutsche Bank AG/London Page 3

29 November 2017
Steel
Steel Price Tracker
Steel price announcementsFigure 4: Recent price changes
Product CategoryDate of
announcementCompany Country Details
16 November 2017 SSAB Americas US SSAB increased its plate prices by another $40/st, effective immediately.
15 November 2017 Nucor US Nucor increased its base prices on sheet steel orders by $30/st, effective
immediately.
15 November 2017 ArcelorMittal USA US ArcelorMittal increased its base prices on sheet steel orders by $30/st,
effective immediately.
15 November 2017 NLMK USA US NLMK USA increased its base prices on sheet steel orders by $30/st,
effective immediately.
27 November 2017 Icdas Turkey Icdas increased its selling price for 12-32mm diameter rebar by Lira 30
($7.60)/mt to Lira 2,560/mt ex-works for Istanbul, and TRY 2,530/mt ex-
works for Biga equivalent to $550/mt and $543/mt respectively excluding
VAT. The company’s price for 10mm diameter rebar rose to Lira 2,570/mt
ex-works, while 8mm diameter rebar is now at Lira 2,580/mt ex-work for
Istanbul.
23 November 2017 Kardemir Turkey Kardemir increased its sales price for both round bar and rebar by Lira 130
($33)/mt to Lira 2,177 ($556)/mt ex-works and Lira 2,160 ($552)/mt ex-
works respectively. It also increased its 5.5mm diameter mesh quality wire
rod price by Lira 85 ($21.7)/mt to Lira 2,305 ($588)/mt. All prices are
exclusive of 18% VAT.
22 November 2017 Hesteel Group China Hesteel Group increased its domestic rebar list prices by Yuan 50/mt. As a
result, the prices of 18mm, 20-22mm and 25mm rebar rose to Yuan
4,050/mt for the November 21-30 period. All prices are inclusive of VAT.
20 November 2017 Tokyo Steel
Manufacturing
Japan Tokyo Steel Manufacturing increased some of its long product prices by
Yen 3,000/mt for December contracts. As a result, its prices for senior-
sized H-beams increased to Yen 84,000 ($750/mt) and 13-25mm rebar to
Yen 65,000/mt.
23 November 2017 Outokumpu Finland Outokumpu increased its December alloy adjustment factor for type 304
(4301) flat products by €100/mt to €1,362/mt ($1,614/mt) and also
increased its December surcharge for molybdenum-bearing type 316
(4401) flat products by €135 from November to €1,919/mt. It also
increased surcharge for nickel-free type 430 flat products remains stable at
€677/mt.
23 November 2017 Aperam Luxembourg Aperam increased its December alloy adjustment factor for type 304
(4301) flat products by €94/mt to €1,360/mt and also increased its
December surcharge for molybdenum-bearing type 316 (4401) flat
products by €125 to €1,916/mt. For nickel-free type 430 flat products,
Aperam's December surcharge was up by €3 to €665/mt.
10 November 2017 Nisshin Steel Japan Nisshin Steel increased its domestic prices of austenitic CRC by Yen
20,000/mt ($177/mt) for November contracts.
07 November 2017 Nippon Steel & Sumikin
Stainless (NSSC)
Japan Nippon Steel & Sumikin Stainless increased its domestic stainless
austenitic CRC and plate prices by Yen 15,000/mt ($131/mt) respectively
for November contracts. It also increased ferritic CRC by Yen 5,000/mt.
Flats
Longs
Stainless
Source: Steel Business Briefing
Page 4 Deutsche Bank AG/London

29 November 2017
Steel
Steel Price Tracker
Hot-rolled coil prices
Figure 5: Northern Europe Figure 6: QoQ performance
2
3
4
5
6
7
8
9
10
300
350
400
450
500
550
600
650
700
750
800
850
900
950
Nov14
Jan15
Mar15
May15
Jul15
Sep15
Nov15
Jan16
Mar16
May16
Jul16
Sep16
Nov16
Jan17
Mar17
May17
Jul17
Sep17
Nov17
HRC price (USD/t) HRC price (EUR/t) Lead time (weeks)
-51-3
79
2067 69
-30 -16
24
Q4 15 Q1 16 Q2 16 Q3 16 Q4 16 Q1 17 Q2 17 Q3 17 Q4 17
QoQ absolute performance (EUR/t)
-13%
-1%
24%
5%
16% 14%
-5% -3%
5%
QoQ relative performance
Source: The Steel Index Source: The Steel Index
Figure 7: Southern Europe Figure 8: QoQ performance
1
2
3
4
5
6
7
8
9
10
250
300
350
400
450
500
550
600
650
700
750
800
850
900
950
Nov14
Jan15
Mar15
May15
Jul15
Sep15
Nov15
Jan16
Mar16
May16
Jul16
Sep16
Nov16
Jan17
Mar17
May17
Jul17
Sep17
Nov17
HRC price (USD/t) HRC price (EUR/t) Lead time (weeks)
-63
10
102
-5
67 73
-47
0 18
Q4 15 Q1 16 Q2 16 Q3 16 Q4 16 Q1 17 Q2 17 Q3 17 Q4 17
QoQ absolute performance (EUR/t)
-18%
3%
34%
-1%
17% 16%
-9%
0% 4%
QoQ relative performance
Source: The Steel Index Source: The Steel Index
Figure 9: Turkey Figure 10: QoQ performance
0
1
2
3
4
5
6
7
8
9
10
250
300
350
400
450
500
550
600
650
700
750
800
850
900
Nov14
Jan15
Mar15
May15
Jul15
Sep15
Nov15
Jan16
Mar16
May16
Jul16
Sep16
Nov16
Jan17
Mar17
May17
Jul17
Sep17
Nov17
HRC price (USD/t) HRC price (EUR/t) Lead time (weeks)
-35
90
-18
33
121
-55
Q2 09 Q3 09 Q4 09 Q1 10 Q2 10 Q3 10
QoQ absolute performance (EUR/t)
-47
20
135
-75
7645
-41
9 18
Q4 15 Q1 16 Q2 16 Q3 16 Q4 16 Q1 17 Q2 17 Q3 17 Q4 17
QoQ absolute performance (EUR/t)
-14%
7%
43%
-17%
20%
10%
-8%
2% 4%
QoQ relative performance
Source: The Steel Index Source: The Steel Index
Deutsche Bank AG/London Page 5

29 November 2017
Steel
Steel Price Tracker
Figure 11: United States Figure 12: QoQ performance
2
3
4
5
6
7
8
9
10
350
450
550
650
750
850
950
1,050
Nov14
Jan15
Mar15
May15
Jul15
Sep15
Nov15
Jan16
Mar16
May16
Jul16
Sep16
Nov16
Jan17
Mar17
May17
Jul17
Sep17
Nov17
HRC price (USD/t) Lead time (weeks)
-77
16
184
29
-85
115
-2 -3 -4
Q4 15 Q1 16 Q2 16 Q3 16 Q4 16 Q1 17 Q2 17 Q3 17 Q4 17
QoQ absolute performance (USD/t)
-15%
4%
41%
5%
-13%
20%
0% 0% -1%
QoQ relative performance
Source: The Steel Index Source: The Steel Index
Figure 13: Chinese exports Figure 14: QoQ performance
0
5
10
15
20
25
0
50
100
150
200
250
300
350
400
450
500
550
600
650
700
750
800
850
Nov14
Jan15
Mar15
May15
Jul15
Sep15
Nov15
Jan16
Mar16
May16
Jul16
Sep16
Nov16
Jan17
Mar17
May17
Jul17
Sep17
Nov17
HRC price (USD/t) HRC price (EUR/t) Lead time (weeks)
-31
3263
-1
7757
-71
59
10
Q4 15 Q1 16 Q2 16 Q3 16 Q4 16 Q1 17 Q2 17 Q3 17 Q4 17
QoQ absolute performance (EUR/t)
-11%
13%
23%
0%
23%
14%
-15%
15%
2%
QoQ relative performance
Source: The Steel Index Source: The Steel Index
Page 6 Deutsche Bank AG/London

29 November 2017
Steel
Steel Price Tracker
Plate pricesFigure 15: Northern Europe Figure 16: QoQ performance
0
1
2
3
4
5
6
7
8
9
10
11
300
400
500
600
700
800
900
1,000
1,100
1,200
1,300
Nov14
Jan15
Mar15
May15
Jul15
Sep15
Nov15
Jan16
Mar16
May16
Jul16
Sep16
Nov16
Jan17
Mar17
May17
Jul17
Sep17
Nov17
Plate price (USD/t) Plate price (EUR/t) Lead time (weeks)
-58-17
115
5 1863
-1
2 0
Q4 15 Q1 16 Q2 16 Q3 16 Q4 16 Q1 17 Q2 17 Q3 17 Q4 17
QoQ absolute performance (EUR/t)
-13%-4%
30%
1% 4%12%
0%
0% 0%
QoQ relative performance
Source: The Steel Index Source: The Steel Index
Figure 17: Southern Europe Figure 18: QoQ performance
2
3
4
5
6
7
8
9
10
11
12
300
400
500
600
700
800
900
1,000
1,100
Nov14
Jan15
Mar15
May15
Jul15
Sep15
Nov15
Jan16
Mar16
May16
Jul16
Sep16
Nov16
Jan17
Mar17
May17
Jul17
Sep17
Nov17
Plate price (USD/t) Plate price (EUR/t) Lead time (weeks)
-75-14
144
-36
3769
2
-10
3
Q4 15 Q1 16 Q2 16 Q3 16 Q4 16 Q1 17 Q2 17 Q3 17 Q4 17
QoQ absolute performance (EUR/t)
`
-18%
-4%
43%
-8%
8%14%
0%
-2%
1%
QoQ relative performance
Source: The Steel Index Source: The Steel Index
Figure 19: United States Figure 20: QoQ performance
0
1
2
3
4
5
6
7
8
9
10
400
500
600
700
800
900
1,000
1,100
1,200
1,300
Nov14
Jan15
Mar15
May15
Jul15
Sep15
Nov15
Jan16
Mar16
May16
Jul16
Sep16
Nov16
Jan17
Mar17
May17
Jul17
Sep17
Nov17
Plate price (USD/t) Lead time (weeks)
-70-13
157
-11-81
14770
-42-6
Q4 15 Q1 16 Q2 16 Q3 16 Q4 16 Q1 17 Q2 17 Q3 17 Q4 17
QoQ absolute performance (USD/t)
-12%
-2%
30%
-2%
-12%
25%
10%
-5%-1%
QoQ relative performance
Source: The Steel Index Source: The Steel Index
Deutsche Bank AG/London Page 7

29 November 2017
Steel
Steel Price Tracker
Rebar prices
Figure 21: Northern Europe Figure 22: QoQ performance
0.0
1.0
2.0
3.0
4.0
5.0
6.0
200
300
400
500
600
700
800
900
Nov14
Jan15
Mar15
May15
Jul15
Sep15
Nov15
Jan16
Mar16
May16
Jul16
Sep16
Nov16
Jan17
Mar17
May17
Jul17
Sep17
Nov17
Rebar price (USD/t) Rebar price (EUR/t) Lead time (weeks)
-44-5
101
-16 -13
43
-21
24
82
Q4 15 Q1 16 Q2 16 Q3 16 Q4 16 Q1 17 Q2 17 Q3 17 Q4 17
QoQ absolute performance (EUR/t)
-11%-1%
29%
-4% -3%
10%
-4%
5%
17%
QoQ relative performance
Source: The Steel Index Source: The Steel Index
Figure 23: Southern Europe Figure 24: QoQ performance
0.0
0.5
1.0
1.5
2.0
2.5
3.0
3.5
4.0
4.5
5.0
300
400
500
600
700
800
900
Nov14
Jan15
Mar15
May15
Jul15
Sep15
Nov15
Jan16
Mar16
May16
Jul16
Sep16
Nov16
Jan17
Mar17
May17
Jul17
Sep17
Nov17
Rebar price (USD/t) Rebar price (EUR/t) Lead time (weeks)
-18
19
-18
41
102
-37-10
81
Q2 09 Q3 09 Q4 09 Q1 10 Q2 10 Q3 10 Q4 10 Q1 11
QoQ absolute performance (EUR/t)
-45-13
95
-44
438
-18
21 23
Q4 15 Q1 16 Q2 16 Q3 16 Q4 16 Q1 17 Q2 17 Q3 17 Q4 17
QoQ absolute performance (EUR/t)
-11%
-4%
28%
-10%
1%
9%
-4%
5% 5%
QoQ relative performance
Source: The Steel Index Source: The Steel Index
Figure 25: United States Figure 26: QoQ performance
0.00
1.00
2.00
3.00
4.00
5.00
6.00
7.00
8.00
300
400
500
600
700
800
900
1,000
Nov14
Jan15
Mar15
May15
Jul15
Sep15
Nov15
Jan16
Mar16
May16
Jul16
Sep16
Nov16
Jan17
Mar17
May17
Jul17
Sep17
Nov17
Rebar price (USD/t) Lead time (weeks)
-54 -24
70
-17 -26
50
-1 -3
23
Q4 15 Q1 16 Q2 16 Q3 16 Q4 16 Q1 17 Q2 17 Q3 17 Q4 17
QoQ absolute performance (USD/t)
-9%-4%
13%
-3% -5%
9%
0% 0%
4%
QoQ relative performance
Source: The Steel Index Source: The Steel Index
Page 8 Deutsche Bank AG/London

29 November 2017
Steel
Steel Price Tracker
Iron ore and coking coalpricesFigure 27: Fines 62% Fe, CFR Tianjin Port, China Figure 28: QoQ performance
30
50
70
90
110
130
150
170
190
210
Nov14
Jan15
Mar15
May15
Jul15
Sep15
Nov15
Jan16
Mar16
May16
Jul16
Sep16
Nov16
Jan17
Mar17
May17
Jul17
Sep17
Nov17
Fines 62% Fe USD/t Fines 62% Fe EUR/t
-9
2 7 312 15
-23
8
-7
Q4 15 Q1 16 Q2 16 Q3 16 Q4 16 Q1 17 Q2 17 Q3 17 Q4 17
QoQ absolute performance (USD/t)
-16%
5%
15%
5%
21% 21%
-27%
14%
-10%
QoQ relative performance
Source: The Steel Index Source: The Steel Index
Figure 29: Fines 58% Fe, CFR Qingdao Port, China Figure 30: QoQ performance
30
50
70
90
110
130
150
170
190
Nov14
Jan15
Mar15
May15
Jul15
Sep15
Nov15
Jan16
Mar16
May16
Jul16
Sep16
Nov16
Jan17
Mar17
May17
Jul17
Sep17
Nov17
Fines 58% Fe USD/t
-8
1 4 112 10
0 0 0
Q4 15 Q1 16 Q2 16 Q3 16 Q4 16 Q1 17 Q2 17 Q3 17 Q4 17
QoQ absolute performance (USD/t)
-15%
2%10%
3%
24%17%
-35%
14%
-11%
QoQ relative performance
Source: The Steel Index Source: The Steel Index
Figure 31: Premium coking coal (Australian exports) Figure 32: QoQ performance
30
80
130
180
230
280
330
Nov14
Jan15
Mar15
May15
Jul15
Sep15
Nov15
Jan16
Mar16
May16
Jul16
Sep16
Nov16
Jan17
Mar17
May17
Jul17
Sep17
Nov17
Premium Coking Coal USD/t
Premium Coking Coal EUR/t
-7
2 1243
132
-98
26
-4
1
Q4 15 Q1 16 Q2 16 Q3 16 Q4 16 Q1 17 Q2 17 Q3 17 Q4 17
QoQ absolute performance (USD/t)
-8%
2%15%
47%
99%
-37%
15%
-2%
1%
QoQ relative performance
Source: The Steel Index Source: The Steel Index
Deutsche Bank AG/London Page 9

29 November 2017
Steel
Steel Price Tracker
Scrap pricesFigure 33: Europe Figure 34: QoQ performance
100
150
200
250
300
350
400
450
500
550
Nov14
Jan15
Mar15
May15
Jul15
Sep15
Nov15
Jan16
Mar16
May16
Jul16
Sep16
Nov16
Jan17
Mar17
May17
Jul17
Sep17
Nov17
Shredded Scrap (EUR/t) Shredded Scrap (USD/t)
-33
14
76
-54
35
9
-1
56
-24
Q4 15 Q1 16 Q2 16 Q3 16 Q4 16 Q1 17 Q2 17 Q3 17 Q4 17
QoQ absolute performance (USD/t)
-16%
8%
39%
-20%
16%
4%
0%
22%
-8%
QoQ relative performance
Source: The Steel Index Source: The Steel Index
Figure 35: United States Figure 36: QoQ performance
0
100
200
300
400
500
600
700
Nov14
Jan15
Mar15
May15
Jul15
Sep15
Nov15
Jan16
Mar16
May16
Jul16
Sep16
Nov16
Jan17
Mar17
May17
Jul17
Sep17
Nov17
Shredded scrap (USD/t)
-65
22
67
-29
9
62
-3
7
-25
Q4 15 Q1 16 Q2 16 Q3 16 Q4 16 Q1 17 Q2 17 Q3 17 Q4 17
QoQ absolute performance (USD/t)
-28%
13%
35%
-11%
4%
26%
-1%
2%
-8%
QoQ relative performance
Source: The Steel Index Source: The Steel Index
Page 10 Deutsche Bank AG/London
29 November 2017
Steel
Steel Price Tracker
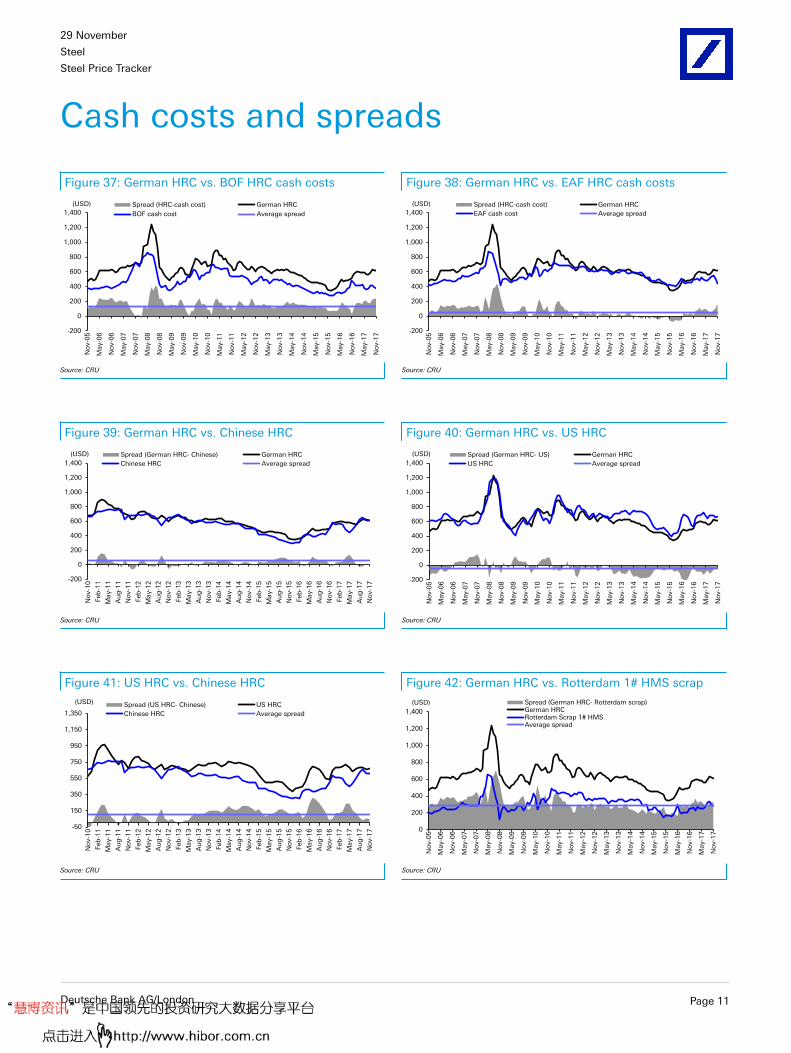
Cash costs and spreads
Figure 37: German HRC vs. BOF HRC cash costs Figure 38: German HRC vs. EAF HRC cash costs
-200
0
200
400
600
800
1,000
1,200
1,400
No
v-0
5
May-0
6
No
v-0
6
May-0
7
No
v-0
7
May-0
8
No
v-0
8
May-0
9
No
v-0
9
May-1
0
No
v-1
0
May-1
1
No
v-1
1
May-1
2
No
v-1
2
May-1
3
No
v-1
3
May-1
4
No
v-1
4
May-1
5
No
v-1
5
May-1
6
No
v-1
6
May-1
7
No
v-1
7
(USD) Spread (HRC-cash cost) German HRC
BOF cash cost Average spread
-200
0
200
400
600
800
1,000
1,200
1,400
No
v-0
5
May-0
6
No
v-0
6
May-0
7
No
v-0
7
May-0
8
No
v-0
8
May-0
9
No
v-0
9
May-1
0
No
v-1
0
May-1
1
No
v-1
1
May-1
2
No
v-1
2
May-1
3
No
v-1
3
May-1
4
No
v-1
4
May-1
5
No
v-1
5
May-1
6
No
v-1
6
May-1
7
No
v-1
7
(USD) Spread (HRC-cash cost) German HRC
EAF cash cost Average spread
Source: CRU Source: CRU
Figure 39: German HRC vs. Chinese HRC Figure 40: German HRC vs. US HRC
-200
0
200
400
600
800
1,000
1,200
1,400
Nov-1
0
Feb
-11
May-1
1
Au
g-1
1
Nov-1
1
Feb
-12
May-1
2
Au
g-1
2
Nov-1
2
Feb
-13
May-1
3
Au
g-1
3
Nov-1
3
Feb
-14
May-1
4
Au
g-1
4
Nov-1
4
Feb
-15
May-1
5
Au
g-1
5
Nov-1
5
Feb
-16
May-1
6
Au
g-1
6
Nov-1
6
Feb
-17
May-1
7
Au
g-1
7
Nov-1
7
(USD) Spread (German HRC- Chinese) German HRC
Chinese HRC Average spread
-200
0
200
400
600
800
1,000
1,200
1,400
Nov-0
5
May-0
6
Nov-0
6
May-0
7
Nov-0
7
May-0
8
Nov-0
8
May-0
9
Nov-0
9
May-1
0
Nov-1
0
May-1
1
Nov-1
1
May-1
2
Nov-1
2
May-1
3
Nov-1
3
May-1
4
Nov-1
4
May-1
5
Nov-1
5
May-1
6
Nov-1
6
May-1
7
Nov-1
7
(USD) Spread (German HRC- US) German HRC
US HRC Average spread
Source: CRU Source: CRU
Figure 41: US HRC vs. Chinese HRC Figure 42: German HRC vs. Rotterdam 1# HMS scrap
-50
150
350
550
750
950
1,150
1,350
No
v-1
0
Feb
-11
May-1
1
Au
g-1
1
No
v-1
1
Feb
-12
May-1
2
Au
g-1
2
No
v-1
2
Feb
-13
May-1
3
Au
g-1
3
No
v-1
3
Feb
-14
May-1
4
Au
g-1
4
No
v-1
4
Feb
-15
May-1
5
Au
g-1
5
No
v-1
5
Feb
-16
May-1
6
Au
g-1
6
No
v-1
6
Feb
-17
May-1
7
Au
g-1
7
No
v-1
7
(USD) Spread (US HRC- Chinese) US HRC
Chinese HRC Average spread
0
200
400
600
800
1,000
1,200
1,400
No
v-0
5
May-0
6
No
v-0
6
May-0
7
No
v-0
7
May-0
8
No
v-0
8
May-0
9
No
v-0
9
May-1
0
No
v-1
0
May-1
1
No
v-1
1
May-1
2
No
v-1
2
May-1
3
No
v-1
3
May-1
4
No
v-1
4
May-1
5
No
v-1
5
May-1
6
No
v-1
6
May-1
7
No
v-1
7
(USD) Spread (German HRC- Rotterdam scrap)German HRCRotterdam Scrap 1# HMSAverage spread
Source: CRU Source: CRU
Deutsche Bank AG/London Page 11

29 November 2017
Steel
Steel Price Tracker
Valuation and risksValuation and risks for ArcelorMittal (MT.AS, Buy, targetprice E33, current price E24.78)
We use an equal blend of forward EBITDA (6.0x 2018E) and DCF (7.9% WACC,1.1 beta, 6.5% market risk premium, 2.5% risk-free rate and 2% terminal growthto reflect limited industry growth prospects). Key downside risks: macro, traderegulation, steel prices, raw material costs, project development and FX rates.
Valuation and risks for Voestalpine (VOES.VI, Buy, targetprice E54, current price E47.78)
Our DCF-based target price is E54. We use a WACC of 7.7% and a terminal growthrate of 1.0% to reflect the limited growth prospects for the sector. We assume arisk-free rate of 2.5% (German bund) and an equity risk premium of 5.0% (in linewith the sector) for our WACC. Risks include lower steel prices/demand, higher-than-expected raw material costs and the execution of upcoming growth projects.
Page 12 Deutsche Bank AG/London

29 November 2017
Steel
Steel Price Tracker
Model updated: 08 November 2017
Running the numbersEuropeAustriaSteel
VoestalpineReuters: VOES.VI Bloomberg: VOE AV
BuyPrice (27 Nov 17) EUR 47.79
Target Price EUR 54.00
52 Week range EUR 35.04 - 49.18
Market cap (m) EURm 8,359.9 USDm 9,967.6
Company ProfileVoestalpine AG produces, processes, and distributes steelproducts. The Company supplies flat and long steel products tothe automotive, household appliance, railroad equipment, and oiland gas industries.
Price Performance
Voestalpine DJ (.STOXXE) (Rebased)
Jan '15 Jul '15 Jan '16 Jul '16 Jan '17 Jul '1720
30
40
50
60
Margin Trends
EBITDA Margin EBIT Margin
15 16 17 18E 19E 20E5
7.510
12.515
17.5
Growth & Profitibility
Sales growth (LHS) ROE (RHS)
15 16 17 18E 19E 20E
05
10
-5
1520
91011121314
Solvency
Net debt/equity (LHS) Net interest cover (RHS)
15 16 17 18E 19E 20E0
25
50
75
100
10
5
7.5
12.5
15
Bastian Synagowitz+41 44 227-3377 [email protected]
Fiscal year end 31-Mar 2015 2016 2017 2018E 2019E 2020E
Financial SummaryDB EPS (EUR) 2.86 2.80 2.91 4.16 4.66 5.25Reported EPS (EUR) 3.11 3.34 2.84 4.16 4.66 5.25DPS (EUR) 1.00 1.05 1.10 1.20 1.30 1.40BVPS (EUR) 26.0 28.4 30.8 34.2 38.0 42.2Weighted average shares (m) 172 175 175 175 175 175Average market cap (EURm) 5,666 5,731 5,882 8,360 8,360 8,360Enterprise value (EURm) 9,694 10,059 10,335 12,682 11,775 11,245
Valuation MetricsP/E (DB) (x) 11.5 11.7 11.5 11.5 10.2 9.1P/E (Reported) (x) 10.6 9.8 11.8 11.5 10.2 9.1P/BV (x) 1.31 1.03 1.20 1.40 1.26 1.13FCF Yield (%) 1.6 0.3 1.7 3.6 13.1 8.8Dividend Yield (%) 3.0 3.2 3.3 2.5 2.7 2.9EV/Sales (x) 0.9 0.9 0.9 1.0 0.9 0.8EV/EBITDA (x) 6.5 6.7 6.6 6.6 5.8 5.2EV/EBIT (x) 11.5 13.0 12.6 11.1 9.6 8.2
Income Statement (EURm)Sales revenue 11,190 11,069 11,294 12,507 12,760 13,251Gross profit 2,931 3,210 3,266 3,514 3,639 3,837EBITDA 1,485 1,509 1,557 1,932 2,025 2,161Depreciation 642 695 717 784 793 793Amortisation 2 43 17 0 0 0EBIT 841 771 823 1,147 1,231 1,367Net interest income(expense) -145 -138 -123 -136 -103 -103Associates/affiliates 0 0 0 0 0 0Exceptionals/extraordinaries 45 118 0 0 0 0Other pre-tax income/(expense) 0 0 0 0 0 0Profit before tax 741 751 700 1,011 1,128 1,264Income tax expense 147 149 173 253 282 316Minorities 58 17 30 30 30 30Other post-tax income/(expense) 0 0 0 0 0 0Net profit 536 585 497 728 816 918DB adjustments (including dilution) -44 -95 12 0 0 0DB Net profit 492 490 509 728 816 918
Cash Flow (EURm)Cash flow from operations 1,120 1,282 1,150 1,151 2,024 1,666Net Capex -1,028 -1,267 -1,053 -850 -930 -930Free cash flow 92 15 98 301 1,094 736Equity raised/(bought back) -510 83 52 52 52 52Dividends paid -244 -251 -230 -231 -248 -266Net inc/(dec) in borrowings 464 429 -189 0 0 0Other investing/financing cash flows 130 34 -3 0 0 0Net cash flow -68 310 -271 123 898 522Change in working capital -56 114 -99 -392 385 -76
Balance Sheet (EURm)Cash and other liquid assets 971 1,282 1,010 1,133 2,031 2,553Tangible fixed assets 5,328 6,007 6,372 6,437 6,574 6,711Goodwill/intangible assets 1,818 1,959 1,969 1,969 1,969 1,969Associates/investments 710 538 527 527 527 527Other assets 4,467 4,222 4,829 5,197 4,900 5,100Total assets 13,295 14,007 14,708 15,264 16,002 16,860Interest bearing debt 4,393 4,739 4,596 4,596 4,596 4,596Other liabilities 4,298 4,114 4,550 4,526 4,614 4,738Total liabilities 8,690 8,853 9,145 9,122 9,210 9,333Shareholders' equity 4,540 4,974 5,394 5,982 6,640 7,383Minorities 64 180 168 160 152 144Total shareholders' equity 4,605 5,154 5,562 6,142 6,792 7,527Net debt 3,421 3,457 3,585 3,463 2,564 2,042
Key Company MetricsSales growth (%) -0.3 -1.1 2.0 10.7 2.0 3.8DB EPS growth (%) 8.4 -2.0 4.0 43.0 12.0 12.5EBITDA Margin (%) 13.3 13.6 13.8 15.4 15.9 16.3EBIT Margin (%) 7.5 7.0 7.3 9.2 9.6 10.3Payout ratio (%) 32.2 31.4 38.7 28.8 27.9 26.7ROE (%) 12.3 12.3 9.6 12.8 12.9 13.1Capex/sales (%) 9.5 11.6 9.5 6.8 7.3 7.0Capex/depreciation (x) 1.7 1.8 1.5 1.1 1.2 1.2Net debt/equity (%) 74.3 67.1 64.5 56.4 37.8 27.1Net interest cover (x) 5.8 5.6 6.7 8.5 12.0 13.3
Source: Company data, Deutsche Securities estimates
Deutsche Bank AG/London Page 13

29 November 2017
Steel
Steel Price Tracker
Model updated: 10 November 2017
Running the numbersEuropeLuxembourgSteel
ArcelorMittalReuters: MT.AS Bloomberg: MT NA
BuyPrice (27 Nov 17) EUR 24.78
Target Price EUR 33.00
52 Week range EUR 17.84 - 26.30
Market cap (m) EURm 25,276 USDm 30,136
Company ProfileArcelorMittal is the global steel leader, with production in fivecontinents. Its product exposure spans both flat and long steels,and the company has a strong position in value-added andattractive markets, such as automotive. MT owns and operatesiron ore mines in Kazakhstan, Ukraine, Africa, Latin America, andNorth America which, along with strategic contracts, supply ~50%of its iron ore requirements. The company has significant leverageto rising steel and iron ore prices.
Price Performance
ArcelorMittal DJ (.STOXXE) (Rebased)
Jan '15 Jul '15 Jan '16 Jul '16 Jan '17 Jul '17
10
20
30
0
Margin Trends
EBITDA Margin EBIT Margin
14 15 16 17E 18E 19E-10
-505
1015
Growth & Profitibility
Sales growth (LHS) ROE (RHS)
14 15 16 17E 18E 19E
-200
20
-40
4060
-30-20-1001020
Solvency
Net debt/equity (LHS) Net interest cover (RHS)
14 15 16 17E 18E 19E0
20
40
60
80
0
2
4
6
8
Bastian Synagowitz+41 44 227-3377 [email protected]
Fiscal year end 31-Dec 2014 2015 2016 2017E 2018E 2019E
Financial SummaryDB EPS (USD) -1.78 -10.41 0.99 3.61 2.93 3.63Reported EPS (USD) -1.88 -13.06 1.86 3.61 2.93 3.63DPS (USD) 0.60 0.00 0.00 0.30 0.40 1.00BVPS (USD) 70.5 42.2 31.6 33.3 36.0 39.3Weighted average shares (m) 597 598 953 1,020 1,020 1,020Average market cap (USDm) 19,808 11,686 15,334 30,136 30,136 30,136Enterprise value (USDm) 42,904 33,973 32,583 45,975 43,592 40,607
Valuation MetricsP/E (DB) (x) nm nm 16.2 8.2 10.1 8.1P/E (Reported) (x) nm nm 8.6 8.2 10.1 8.1P/BV (x) 0.36 0.23 0.70 0.89 0.82 0.75FCF Yield (%) 4.0 nm 1.7 3.7 9.6 12.0Dividend Yield (%) 1.8 0.0 0.0 1.0 1.4 3.4EV/Sales (x) 0.5 0.5 0.6 0.7 0.6 0.6EV/EBITDA (x) 5.9 6.5 5.2 5.5 5.2 4.4EV/EBIT (x) 14.3 nm 9.8 8.3 7.9 6.4
Income Statement (USDm)Sales revenue 79,283 63,578 56,791 68,523 72,552 72,602Gross profit 9,978 1,192 9,014 10,905 11,148 12,026EBITDA 7,237 5,231 6,255 8,333 8,425 9,301Depreciation 4,233 7,956 2,927 2,786 2,900 2,975Amortisation 0 0 0 0 0 0EBIT 3,004 -2,725 3,328 5,547 5,524 6,326Net interest income(expense) -3,382 -2,858 -2,056 -846 -1,506 -1,396Associates/affiliates -172 -502 615 325 50 50Exceptionals/extraordinaries -60 -1,661 832 0 0 0Other pre-tax income/(expense) 0 0 0 0 0 0Profit before tax -610 -7,746 2,719 5,026 4,068 4,980Income tax expense 454 902 986 1,206 936 1,096Minorities 112 -477 -45 30 63 78Other post-tax income/(expense) 0 0 0 0 0 0Net profit -1,176 -8,171 1,778 3,790 3,070 3,807DB adjustments (including dilution) 60 1,661 -832 0 0 0DB Net profit -1,116 -6,510 946 3,790 3,070 3,807
Cash Flow (USDm)Cash flow from operations 3,870 1,995 2,709 4,015 6,502 7,221Net Capex -3,077 -2,170 -2,444 -2,900 -3,600 -3,600Free cash flow 793 -175 265 1,115 2,902 3,621Equity raised/(bought back) 0 0 3,115 0 0 0Dividends paid -458 -416 -61 0 -307 -409Net inc/(dec) in borrowings -1,553 808 -6,007 -303 -303 -303Other investing/financing cash flows -961 -264 -113 0 -200 -200Net cash flow -2,179 -47 -2,801 812 2,093 2,710Change in working capital 368 -31 -1,023 -2,216 601 213
Balance Sheet (USDm)Cash and other liquid assets 4,016 4,102 2,615 3,427 5,520 8,230Tangible fixed assets 46,593 35,780 34,831 34,945 35,844 36,669Goodwill/intangible assets 8,104 5,592 5,651 5,651 5,651 5,651Associates/investments 5,833 4,911 4,297 4,622 4,672 4,722Other assets 34,633 26,461 27,748 29,295 29,339 29,134Total assets 99,179 76,846 75,142 77,939 81,026 84,406Interest bearing debt 19,797 19,786 13,674 13,371 13,069 12,766Other liabilities 34,222 29,490 29,143 28,423 28,987 29,194Total liabilities 54,019 49,276 42,817 41,795 42,055 41,960Shareholders' equity 42,086 25,272 30,135 33,925 36,688 40,086Minorities 3,074 2,298 2,190 2,220 2,283 2,360Total shareholders' equity 45,160 27,570 32,325 36,145 38,971 42,447Net debt 15,781 15,684 11,059 9,944 7,549 4,536
Key Company MetricsSales growth (%) -0.2 -19.8 -10.7 20.7 5.9 0.1DB EPS growth (%) 46.5 -483.3 na 264.5 -19.0 24.0EBITDA Margin (%) 9.1 8.2 11.0 12.2 11.6 12.8EBIT Margin (%) 3.8 -4.3 5.9 8.1 7.6 8.7Payout ratio (%) nm nm 0.0 8.1 13.3 26.8ROE (%) -2.6 -24.3 6.4 11.8 8.7 9.9Capex/sales (%) 4.6 4.3 4.3 4.2 5.0 5.0Capex/depreciation (x) 0.9 0.3 0.8 1.0 1.2 1.2Net debt/equity (%) 34.9 56.9 34.2 27.5 19.4 10.7Net interest cover (x) 0.9 nm 1.6 6.6 3.7 4.5
Source: Company data, Deutsche Securities estimates
Page 14 Deutsche Bank AG/London

29 November 2017
Steel
Steel Price Tracker
Appendix 1
Important Disclosures
*Other information available upon request
Disclosure checklistCompany Ticker Recent price* Disclosure
ArcelorMittal MT.AS 24.78 (EUR) 27 Nov 2017 7, 8, 14
Voestalpine VOES.VI 47.78 (EUR) 27 Nov 2017 6, 9, 14*Prices are current as of the end of the previous trading session unless otherwise indicated and are sourced from local exchanges via Reuters, Bloomberg, and other vendors. Otherinformation is sourced from Deutsche Bank, subject companies, and other sources. For disclosures pertaining to recommendations or estimates made on securities other than theprimary subject of this research, please see the most recently published company report or visit our global disclosure look-up page on our website at http://gm.db.com/ger/disclosure/DisclosureDirectory.eqsr. Aside from within this report, important conflict disclosures can also be found at https://gm/db.com/equities under the "Disclosures Lookup" and "Legal"tabs. Investors are strongly encouraged to review this information before investing.
Important Disclosures Required by U.S. RegulatorsDisclosures marked with an asterisk may also be required by at least one jurisdiction in addition to the United States.See Important Disclosures Required by Non-US Regulators and Explanatory Notes.
6. Deutsche Bank and/or its affiliate(s) owns one percent or more of a class of common equity securities of thiscompany calculated under computational methods required by US law.
7. Deutsche Bank and/or its affiliate(s) has received compensation from this company for the provision ofinvestment banking or financial advisory services within the past year.
8. Deutsche Bank and/or its affiliate(s) expects to receive, or intends to seek, compensation for investment bankingservices from this company in the next three months.
14. Deutsche Bank and/or its affiliate(s) has received non-investment banking related compensation from thiscompany within the past year.
Important Disclosures Required by Non-U.S. RegulatorsDisclosures marked with an asterisk may also be required by at least one jurisdiction in addition to the United States.See Important Disclosures Required by Non-US Regulators and Explanatory Notes.
6. Deutsche Bank and/or its affiliate(s) owns one percent or more of a class of common equity securities of thiscompany calculated under computational methods required by US law.
7. Deutsche Bank and/or its affiliate(s) has received compensation from this company for the provision ofinvestment banking or financial advisory services within the past year.
9. Deutsche Bank and/or its affiliate(s) owns one percent or more of any class of common equity securities of thiscompany calculated under computational methods required by India law.
For disclosures pertaining to recommendations or estimates made on securities other than the primary subject of thisresearch, please see the most recently published company report or visit our global disclosure look-up page on our websiteat http://gm.db.com/ger/disclosure/DisclosureDirectory.eqsr
Analyst Certification
The views expressed in this report accurately reflect the personal views of the undersigned lead analyst about the subjectissuers and the securities of those issuers. In addition, the undersigned lead analyst has not and will not receive anycompensation for providing a specific recommendation or view in this report. Bastian Synagowitz
Deutsche Bank AG/London Page 15

29 November 2017
Steel
Steel Price Tracker
Historical recommendations and target price. ArcelorMittal (MT.AS)
(as of 11/27/2017)
Current RecommendationsBuyHoldSellNot RatedSuspended Rating
** Analyst is no longer atDeutsche Bank
Date
Secu
rity
pric
e
1 2 3
4 56 7
8 9
10 11
12 13
1415
Jan '15 Jul '15 Jan '16 Jul '16 Jan '17 Jul '170.00
5.00
10.00
15.00
20.00
25.00
30.00
1. 01/12/2015 Hold, Target Price Change EUR 10,50 BastianSynagowitz
9. 07/20/2016 Hold, Target Price Change EUR 5,50 BastianSynagowitz
2. 04/10/2015 Hold, Target Price Change EUR 10,00 BastianSynagowitz
10. 01/10/2017 Hold, Target Price Change EUR 7,50 BastianSynagowitz
3. 07/14/2015 Hold, Target Price Change EUR 9,50 BastianSynagowitz
11. 02/10/2017 Hold, Target Price Change EUR 8,00 BastianSynagowitz
4. 10/20/2015 Hold, Target Price Change EUR 7,00 BastianSynagowitz
12. 05/22/2017 Hold, Target Price Change EUR 23,00 BastianSynagowitz
5. 11/06/2015 Hold, Target Price Change EUR 6,00 BastianSynagowitz
13. 07/12/2017 Upgraded to Buy, Target Price Change EUR 28,00Bastian Synagowitz
6. 01/08/2016 Hold, Target Price Change EUR 4,50 BastianSynagowitz
14. 11/01/2017 Buy, Target Price Change EUR 31,00 BastianSynagowitz
7. 02/08/2016 Hold, Target Price Change EUR 4,00 BastianSynagowitz
15. 11/10/2017 Buy, Target Price Change EUR 33,00 BastianSynagowitz
8. 05/08/2016 Hold, Target Price Change EUR 4,50 BastianSynagowitz
§§§§$$$$$§§§§§
Page 16 Deutsche Bank AG/London

29 November 2017
Steel
Steel Price Tracker
Historical recommendations and target price. Voestalpine (VOES.VI)
(as of 11/27/2017)
Current RecommendationsBuyHoldSellNot RatedSuspended Rating
** Analyst is no longer atDeutsche Bank
Date
Secu
rity
pric
e 1 2
3 4
5
67
8 9
1011
121314
Jan '15 Jul '15 Jan '16 Jul '16 Jan '17 Jul '170.00
10.00
20.00
30.00
40.00
50.00
60.00
1. 05/01/2015 Hold, Target Price Change EUR 35,00 BastianSynagowitz
8. 08/09/2016 Hold, Target Price Change EUR 34,00 BastianSynagowitz
2. 06/04/2015 Hold, Target Price Change EUR 38,00 BastianSynagowitz
9. 11/04/2016 Upgraded to Buy, Target Price Change EUR 40,00Bastian Synagowitz
3. 10/28/2015 Hold, Target Price Change EUR 34,00 BastianSynagowitz
10. 01/10/2017 Buy, Target Price Change EUR 45,00 BastianSynagowitz
4. 11/12/2015 Hold, Target Price Change EUR 31,00 BastianSynagowitz
11. 06/01/2017 Buy, Target Price Change EUR 48,00 BastianSynagowitz
5. 02/10/2016 Hold, Target Price Change EUR 28,00 BastianSynagowitz
12. 08/09/2017 Buy, Target Price Change EUR 50,00 BastianSynagowitz
6. 04/29/2016 Hold, Target Price Change EUR 30,00 BastianSynagowitz
13. 11/01/2017 Buy, Target Price Change EUR 53,00 BastianSynagowitz
7. 06/02/2016 Hold, Target Price Change EUR 33,00 BastianSynagowitz
14. 11/08/2017 Buy, Target Price Change EUR 54,00 BastianSynagowitz
§§§§$$$$$§§§§§
Equity Rating Key Equity rating dispersion and banking relationships
Buy: Based on a current 12- month view of total share-holderreturn (TSR = percentage change in share price from currentprice to projected target price plus pro-jected dividend yield ) ,we recommend that investors buy the stock.Sell: Based on a current 12-month view of total share-holderreturn, we recommend that investors sell the stock.Hold: We take a neutral view on the stock 12-months out and,based on this time horizon, do not recommend either a Buyor Sell.
Newly issued research recommendations and target pricessupersede previously published research.
Deutsche Bank AG/London Page 17

29 November 2017
Steel
Steel Price Tracker
Additional Information
The information and opinions in this report were prepared by Deutsche Bank AG or one of its affiliates (collectively"Deutsche Bank"). Though the information herein is believed to be reliable and has been obtained from public sourcesbelieved to be reliable, Deutsche Bank makes no representation as to its accuracy or completeness. Hyperlinks to third-party websites in this report are provided for reader convenience only. Deutsche Bank neither endorses the content noris responsible for the accuracy or security controls of those websites.??If you use the services of Deutsche Bank in connection with a purchase or sale of a security that is discussed in this report,or is included or discussed in another communication (oral or written) from a Deutsche Bank analyst, Deutsche Bank mayact as principal for its own account or as agent for another person.??Deutsche Bank may consider this report in deciding to trade as principal. It may also engage in transactions, for itsown account or with customers, in a manner inconsistent with the views taken in this research report. Others withinDeutsche Bank, including strategists, sales staff and other analysts, may take views that are inconsistent with those takenin this research report. Deutsche Bank issues a variety of research products, including fundamental analysis, equity-linkedanalysis, quantitative analysis and trade ideas. Recommendations contained in one type of communication may differfrom recommendations contained in others, whether as a result of differing time horizons, methodologies, perspectivesor otherwise. Deutsche Bank and/or its affiliates may also be holding debt or equity securities of the issuers it writeson. Analysts are paid in part based on the profitability of Deutsche Bank AG and its affiliates, which includes investmentbanking, trading and principal trading revenues.??Opinions, estimates and projections constitute the current judgment of the author as of the date of this report. They donot necessarily reflect the opinions of Deutsche Bank and are subject to change without notice. Deutsche Bank providesliquidity for buyers and sellers of securities issued by the companies it covers. Deutsche Bank research analysts sometimeshave shorter-term trade ideas that may be inconsistent with Deutsche Bank's existing longer-term ratings. Trade ideasfor equities can be found at the SOLAR link at http://gm.db.com. A SOLAR idea represents a high-conviction belief by ananalyst that a stock will outperform or underperform the market and/or a specified sector over a time frame of no less thantwo weeks and no more than six months. In addition to SOLAR ideas, analysts may occasionally discuss with our clients,and with Deutsche Bank salespersons and traders, trading strategies or ideas that reference catalysts or events that mayhave a near-term or medium-term impact on the market price of the securities discussed in this report, which impactmay be directionally counter to the analysts' current 12-month view of total return or investment return as describedherein. Deutsche Bank has no obligation to update, modify or amend this report or to otherwise notify a recipient thereofif an opinion, forecast or estimate changes or becomes inaccurate. Coverage and the frequency of changes in marketconditions and in both general and company-specific economic prospects make it difficult to update research at definedintervals. Updates are at the sole discretion of the coverage analyst or of the Research Department Management, and themajority of reports are published at irregular intervals. This report is provided for informational purposes only and doesnot take into account the particular investment objectives, financial situations, or needs of individual clients. It is not anoffer or a solicitation of an offer to buy or sell any financial instruments or to participate in any particular trading strategy.Target prices are inherently imprecise and a product of the analyst ’ s judgment. The financial instruments discussedin this report may not be suitable for all investors, and investors must make their own informed investment decisions.Prices and availability of financial instruments are subject to change without notice, and investment transactions can leadto losses as a result of price fluctuations and other factors. If a financial instrument is denominated in a currency otherthan an investor's currency, a change in exchange rates may adversely affect the investment. Past performance is notnecessarily indicative of future results. Performance calculations exclude transaction costs, unless otherwise indicated.Unless otherwise indicated, prices are current as of the end of the previous trading session and are sourced from localexchanges via Reuters, Bloomberg and other vendors. Data is also sourced from Deutsche Bank, subject companies, andother parties.??The Deutsche Bank Research Department is independent of other business divisions of the Bank. Details regardingorganizational arrangements and information barriers we have established to prevent and avoid conflicts of interest withrespect to our research are available on our website under Disclaimer, found on the Legal tab.??
Page 18 Deutsche Bank AG/London

29 November 2017
Steel
Steel Price Tracker
Macroeconomic fluctuations often account for most of the risks associated with exposures to instruments that promiseto pay fixed or variable interest rates. For an investor who is long fixed-rate instruments (thus receiving these cashflows), increases in interest rates naturally lift the discount factors applied to the expected cash flows and thuscause a loss. The longer the maturity of a certain cash flow and the higher the move in the discount factor, thehigher will be the loss. Upside surprises in inflation, fiscal funding needs, and FX depreciation rates are among themost common adverse macroeconomic shocks to receivers. But counterparty exposure, issuer creditworthiness, clientsegmentation, regulation (including changes in assets holding limits for different types of investors), changes in taxpolicies, currency convertibility (which may constrain currency conversion, repatriation of profits and/or liquidation ofpositions), and settlement issues related to local clearing houses are also important risk factors. The sensitivity of fixed-income instruments to macroeconomic shocks may be mitigated by indexing the contracted cash flows to inflation, toFX depreciation, or to specified interest rates – these are common in emerging markets. The index fixings may – byconstruction – lag or mis-measure the actual move in the underlying variables they are intended to track. The choice ofthe proper fixing (or metric) is particularly important in swaps markets, where floating coupon rates (i.e., coupons indexedto a typically short-dated interest rate reference index) are exchanged for fixed coupons. Funding in a currency that differsfrom the currency in which coupons are denominated carries FX risk. Options on swaps (swaptions) the risks typical tooptions in addition to the risks related to rates movements.??Derivative transactions involve numerous risks including market, counterparty default and illiquidity risk. Theappropriateness of these products for use by investors depends on the investors' own circumstances, including theirtax position, their regulatory environment and the nature of their other assets and liabilities; as such, investors shouldtake expert legal and financial advice before entering into any transaction similar to or inspired by the contents of thispublication. The risk of loss in futures trading and options, foreign or domestic, can be substantial. As a result of thehigh degree of leverage obtainable in futures and options trading, losses may be incurred that are greater than theamount of funds initially deposited – up to theoretically unlimited losses. Trading in options involves risk and is notsuitable for all investors. Prior to buying or selling an option, investors must review the "Characteristics and Risks ofStandardized Options”, at http://www.optionsclearing.com/about/publications/character-risks.jsp. If you are unable toaccess the website, please contact your Deutsche Bank representative for a copy of this important document.??Participants in foreign exchange transactions may incur risks arising from several factors, including: (i) exchange rates canbe volatile and are subject to large fluctuations; (ii) the value of currencies may be affected by numerous market factors,including world and national economic, political and regulatory events, events in equity and debt markets and changes ininterest rates; and (iii) currencies may be subject to devaluation or government-imposed exchange controls, which couldaffect the value of the currency. Investors in securities such as ADRs, whose values are affected by the currency of anunderlying security, effectively assume currency risk.??Deutsche Bank is not acting as a financial adviser, consultant or fiduciary to you or any of your agents with respect toany information provided in this report. Deutsche Bank does not provide investment, legal, tax or accounting advice, andis not acting as an impartial adviser. Information contained herein is being provided on the basis that the recipient willmake an independent assessment of the merits of any investment decision, and is not meant for retirement accounts orfor any specific person or account type. The information we provide is directed only to persons we believe to be financiallysophisticated, who are capable of evaluating investment risks independently, both in general and with regard to particulartransactions and investment strategies, and who understand that Deutsche Bank has financial interests in the offering ofits products and services. If this is not the case, or if you or your agent are an IRA or other retail investor receiving thisdirectly from us, we ask that you inform us immediately.
Unless governing law provides otherwise, all transactions should be executed through the Deutsche Bank entity in theinvestor's home jurisdiction. Aside from within this report, important risk and conflict disclosures can also be found athttps://gm.db.com on each company ’ s research page and under the "Disclosures Lookup" and "Legal" tabs. Investorsare strongly encouraged to review this information before investing.
United States: Approved and/or distributed by Deutsche Bank Securities Incorporated, a member of FINRA, NFA and SIPC.Analysts located outside of the United States are employed by non-US affiliates that are not subject to FINRA regulations,including those regarding contacts with issuer companies.??
Deutsche Bank AG/London Page 19

29 November 2017
Steel
Steel Price Tracker
Germany: Approved and/or distributed by Deutsche Bank AG, a joint stock corporation with limited liability incorporatedin the Federal Republic of Germany with its principal office in Frankfurt am Main. Deutsche Bank AG is authorized underGerman Banking Law and is subject to supervision by the European Central Bank and by BaFin, Germany ’ s FederalFinancial Supervisory Authority.??United Kingdom: Approved and/or distributed by Deutsche Bank AG acting through its London Branch at WinchesterHouse, 1 Great Winchester Street, London EC2N 2DB. Deutsche Bank AG in the United Kingdom is authorised by thePrudential Regulation Authority and is subject to limited regulation by the Prudential Regulation Authority and FinancialConduct Authority. Details about the extent of our authorisation and regulation are available on request.??Hong Kong: Distributed by Deutsche Bank AG, Hong Kong Branch or Deutsche Securities Asia Limited.??India: Prepared by Deutsche Equities India Private Limited (DEIPL) having CIN: U65990MH2002PTC137431 and registeredoffice at 14th Floor, The Capital, C-70, G Block, Bandra Kurla Complex Mumbai (India) 400051. Tel: + 91 22 71804444. It is registered by the Securities and Exchange Board of India (SEBI) as a Stock broker bearing registrationnos.: NSE (Capital Market Segment) - INB231196834, NSE (F&O Segment) INF231196834, NSE (Currency DerivativesSegment) INE231196834, BSE (Capital Market Segment) INB011196830; Merchant Banker bearing SEBI Registrationno.: INM000010833 and Research Analyst bearing SEBI Registration no.: INH000001741. DEIPL may have receivedadministrative warnings from the SEBI for breaches of Indian regulations. Deutsche Bank and/or its affiliate(s) mayhave debt holdings or positions in the subject company. With regard to information on associates, please refer to the“Shareholdings” section in the Annual Report at: https://www.db.com/ir/en/annual-reports.htm.??Japan: Approved and/or distributed by Deutsche Securities Inc.(DSI). Registration number - Registered as a financialinstruments dealer by the Head of the Kanto Local Finance Bureau (Kinsho) No. 117. Member of associations: JSDA, TypeII Financial Instruments Firms Association and The Financial Futures Association of Japan. Commissions and risks involvedin stock transactions - for stock transactions, we charge stock commissions and consumption tax by multiplying thetransaction amount by the commission rate agreed with each customer. Stock transactions can lead to losses as a resultof share price fluctuations and other factors. Transactions in foreign stocks can lead to additional losses stemming fromforeign exchange fluctuations. We may also charge commissions and fees for certain categories of investment advice,products and services. Recommended investment strategies, products and services carry the risk of losses to principaland other losses as a result of changes in market and/or economic trends, and/or fluctuations in market value. Beforedeciding on the purchase of financial products and/or services, customers should carefully read the relevant disclosures,prospectuses and other documentation. "Moody's", "Standard & Poor's", and "Fitch" mentioned in this report are notregistered credit rating agencies in Japan unless Japan or "Nippon" is specifically designated in the name of the entity.Reports on Japanese listed companies not written by analysts of DSI are written by Deutsche Bank Group's analysts withthe coverage companies specified by DSI. Some of the foreign securities stated on this report are not disclosed accordingto the Financial Instruments and Exchange Law of Japan. Target prices set by Deutsche Bank's equity analysts are basedon a 12-month forecast period..??Korea: Distributed by Deutsche Securities Korea Co.??South Africa: Deutsche Bank AG Johannesburg is incorporated in the Federal Republic of Germany (Branch RegisterNumber in South Africa: 1998/003298/10).??Singapore: This report is issued by Deutsche Bank AG, Singapore Branch or Deutsche Securities Asia Limited, SingaporeBranch (One Raffles Quay #18-00 South Tower Singapore 048583, +65 6423 8001), which may be contacted in respectof any matters arising from, or in connection with, this report. Where this report is issued or promulgated by DeutscheBank in Singapore to a person who is not an accredited investor, expert investor or institutional investor (as defined in theapplicable Singapore laws and regulations), they accept legal responsibility to such person for its contents.??Taiwan: Information on securities/investments that trade in Taiwan is for your reference only. Readers shouldindependently evaluate investment risks and are solely responsible for their investment decisions. Deutsche Bank researchmay not be distributed to the Taiwan public media or quoted or used by the Taiwan public media without written consent.Information on securities/instruments that do not trade in Taiwan is for informational purposes only and is not to be
Page 20 Deutsche Bank AG/London

29 November 2017
Steel
Steel Price Tracker
construed as a recommendation to trade in such securities/instruments. Deutsche Securities Asia Limited, Taipei Branchmay not execute transactions for clients in these securities/instruments.??Qatar: Deutsche Bank AG in the Qatar Financial Centre (registered no. 00032) is regulated by the Qatar Financial CentreRegulatory Authority. Deutsche Bank AG - QFC Branch may undertake only the financial services activities that fall withinthe scope of its existing QFCRA license. Its principal place of business in the QFC: Qatar Financial Centre, Tower, WestBay, Level 5, PO Box 14928, Doha, Qatar. This information has been distributed by Deutsche Bank AG. Related financialproducts or services are only available only to Business Customers, as defined by the Qatar Financial Centre RegulatoryAuthority.??Russia: The information, interpretation and opinions submitted herein are not in the context of, and do not constitute, anyappraisal or evaluation activity requiring a license in the Russian Federation.
Kingdom of Saudi Arabia: Deutsche Securities Saudi Arabia LLC Company (registered no. 07073-37) is regulated by theCapital Market Authority. Deutsche Securities Saudi Arabia may undertake only the financial services activities that fallwithin the scope of its existing CMA license. Its principal place of business in Saudi Arabia: King Fahad Road, Al OlayaDistrict, P.O. Box 301809, Faisaliah Tower - 17th Floor, 11372 Riyadh, Saudi Arabia.??United Arab Emirates: Deutsche Bank AG in the Dubai International Financial Centre (registered no. 00045) is regulatedby the Dubai Financial Services Authority. Deutsche Bank AG - DIFC Branch may undertake only the financial servicesactivities that fall within the scope of its existing DFSA license. Its principal place of business in the DIFC: DubaiInternational Financial Centre, The Gate Village, Building 5, PO Box 504902, Dubai, U.A.E. This information has beendistributed by Deutsche Bank AG. Related financial products or services are available only to Professional Clients, asdefined by the Dubai Financial Services Authority.??Australia: Retail clients should obtain a copy of a Product Disclosure Statement (PDS) relating to any financial productreferred to in this report and consider the PDS before making any decision about whether to acquire the product.Please refer to Australia-specific research disclosures and related information at https://australia.db.com/australia/content/research-information.html??Australia and New Zealand: This research is intended only for "wholesale clients" within the meaning of the AustralianCorporations Act and New Zealand Financial Advisors Act, respectively.??Additional information relative to securities, other financial products or issuers discussed in this report is available uponrequest. This report may not be reproduced, distributed or published without Deutsche Bank's prior written consent.Copyright © 2017 Deutsche Bank AG
Deutsche Bank AG/London Page 21

David Folkerts-LandauGroup Chief Economist and Global Head of Research
Raj HindochaGlobal Chief Operating Officer
Research
Michael SpencerHead of APAC Research
Global Head of Economics
Steve PollardHead of Americas Research
Global Head of Equity Research
Anthony KlarmanGlobal Head ofDebt Research
Paul ReynoldsHead of EMEA
Equity Research
Dave ClarkHead of APAC
Equity Research
Pam FinelliGlobal Head of
Equity Derivatives Research
Andreas NeubauerHead of Research - Germany
Spyros MesomerisGlobal Head of Quantitative
and QIS Research
International locations
Deutsche Bank AGDeutsche Bank PlaceLevel 16Corner of Hunter & Phillip StreetsSydney, NSW 2000AustraliaTel: (61) 2 8258 1234
Deutsche Bank AGMainzer Landstrasse 11-1760329 Frankfurt am MainGermanyTel: (49) 69 910 00
Deutsche Bank AGFiliale HongkongInternational Commerce Centre,1 Austin Road West,Kowloon,Hong KongTel: (852) 2203 8888
Deutsche Securities Inc.2-11-1 NagatachoSanno Park TowerChiyoda-ku, Tokyo 100-6171JapanTel: (81) 3 5156 6770
Deutsche Bank AG London1 Great Winchester StreetLondon EC2N 2EQUnited KingdomTel: (44) 20 7545 8000
Deutsche Bank Securities Inc.60 Wall StreetNew York, NY 10005United States of AmericaTel: (1) 212 250 2500