determinants of undergraduate students' academic ...
87
DETERMINANTS OF UNDERGRADUATE STUDENTS’ ACADEMIC PERFORMANCE IN EXAMINATION AT ARDHI UNIVERSITY By: Zaituni Shabani A Dissertation Submitted to Mzumbe University in Partial Fulfillment of the Requirements for the Award of Master of Public Administration (MPA) of Mzumbe University 2013
-
Upload
khangminh22 -
Category
Documents
-
view
4 -
download
0
Transcript of determinants of undergraduate students' academic ...
DETERMINANTS OF UNDERGRADUATE STUDENTS’
ACADEMIC PERFORMANCE IN EXAMINATION AT ARDHI
UNIVERSITY
By:Zaituni Shabani
A Dissertation Submitted to Mzumbe University in Partial Fulfillment of the
Requirements for the Award of Master of Public Administration (MPA) of
Mzumbe University
2013
ii
CERTIFICATION
We, the undersigned, certify that we have read and hereby recommend for acceptance
by the Mzumbe University, a dissertation entitled: Determinants of Undergraduate
Student’s Performance in Examinations at Ardhi University in fulfillment of the
requirement for the degree of Master of Public Administration (MPA) of Mzumbe
University.
……………………………………….
Major Supervisor
……………………………………….
Internal Examiner
Accepted for the Board of …..……………………………………
________________________________________________
DEAN/DIRECTOR/FACULTY/DIRECTORATE/SCHOOL/BOARD

iii
DECLARATION AND COPYRIGHT
I Zaituni Shabani, declare that this dissertation is my own original work, and that it has
not been presented and will not be presented to any other university for a similar degree
qualification or any other degree award.
Signature: ……………………….
Date: ……………………………
© 2013
This dissertation is a copyright material protected under the Berne Convention, the
Copyright and neghbouring Act (CAP 218 R.E 2002) and other international and
national enactments, in that behalf, on intellectual property. It may not be reproduced
by any means in full or in part, except for short extracts in fair dealings, for research or
private study, critical scholarly review or discourse with an acknowledgement, without
the written permission of Mzumbe University, on behalf of the author.
iv
ACKNOWLEDGEMENTS
I highly thank God Almighty who helped me in every step of my studies. Special
thanks should go to my lovely mother, the late Fatuma Omari Mihambo. She was my
role model and she was ready to take any risk to ensure that I reach my dreams. It
would have been good if you were here today to witness my achievements. May your
soul rest in eternal peace! Amin!
My deepest gratitude go to my father Mr Maheke J Z Gikene whom I shall always
remain greatly indebted to for his financial and material support, untiring moral, love
advice and who laid down a concrete foundation of my education. I say “Thank you
Father”.
My profound gratitude to my supervisor, Dr. M. Madale, for his tirelessness, guidance,
patience, constructive criticism moral support and understanding from the initial stage
of writing the proposal up to the time of production of this dissertation.
I also extend my deepest appreciation to my Aunt whom I am indebted to call her my
“mother” Shadia Battan. Thank you very much for being very close to me and your
tireless support whenever I needed you. Once again thank you “mama”.
Special thanks are further extended to my uncle Ally Battan and aunties Mariam,
Rehema, Hamida and Yusra for their moral support and care. Moreover my brothers
Zacharia and Omari and my son King George whose prayers, love and care have always
been a source of strength and encouragement. May the Almighty God bless you always.
Furthermore, I thank the Management of Ardhi University for allowing me to conduct
the study at Ardhi University. I would also like to convey special thanks to all Ardhi
University staff members including Deans and Directors and the staff members from
office of Dean of Students for their support and assistance which made this study a
success.

v
The completion of this work was only possible due to the cooperation and support of
many people although it is difficult to mention each and every one of them. To all those
who freely offered their support and encouragement deepest from my heart I am
grateful I say thank you all.
vi
DEDICATION
This dissertation is dedicated to my late mother, Ms Fatuma Omari Mihambo You were
ready to take risk to ensure that I reach my dreams. The late Alfred George my sons’
father and my lovely son King George Alfred I want him to follow in my footsteps.
vii
LIST OF ACRONYMS
A/Lecturer Assistant Lecturer
A. Prof. Associate Professor
A/R/Fellow Assistant Research Fellow
ANOVA Analysis of Variance
ARIS Academic Records Information System
ARU Ardhi University
CPA Certified Public Accountant
GPA Grade Point Average
HELSB Higher Education Student’s Loan Board
IHSS Institute Human Settlement Studies
MPA Master of Public Administration
NECTA National Examination Council of Tanzania.
PGD Post-graduate Diploma
PhD Doctor of Philosophy
Prof. Professor
R/Fellow Research Fellow
SADE School of Architecture and Design
SCEM School of Construction Economics and Management
SES Social Economic Status
SEST School of Environmental Sciences and Technology
SGST School of Geospatial Sciences and Technology
S/Lecturer Senior Lecturer
SPSS Statistical Package for Social Science
SRES School of Real Estates Studies
S/R/Fellow Senior Research Fellow
SURP School of Urban and Regional Planning
TEA Tanzania Education Authority
TCU Tanzania Commission for Universities
UCLAS University College of Land and Architectural Studies
viii
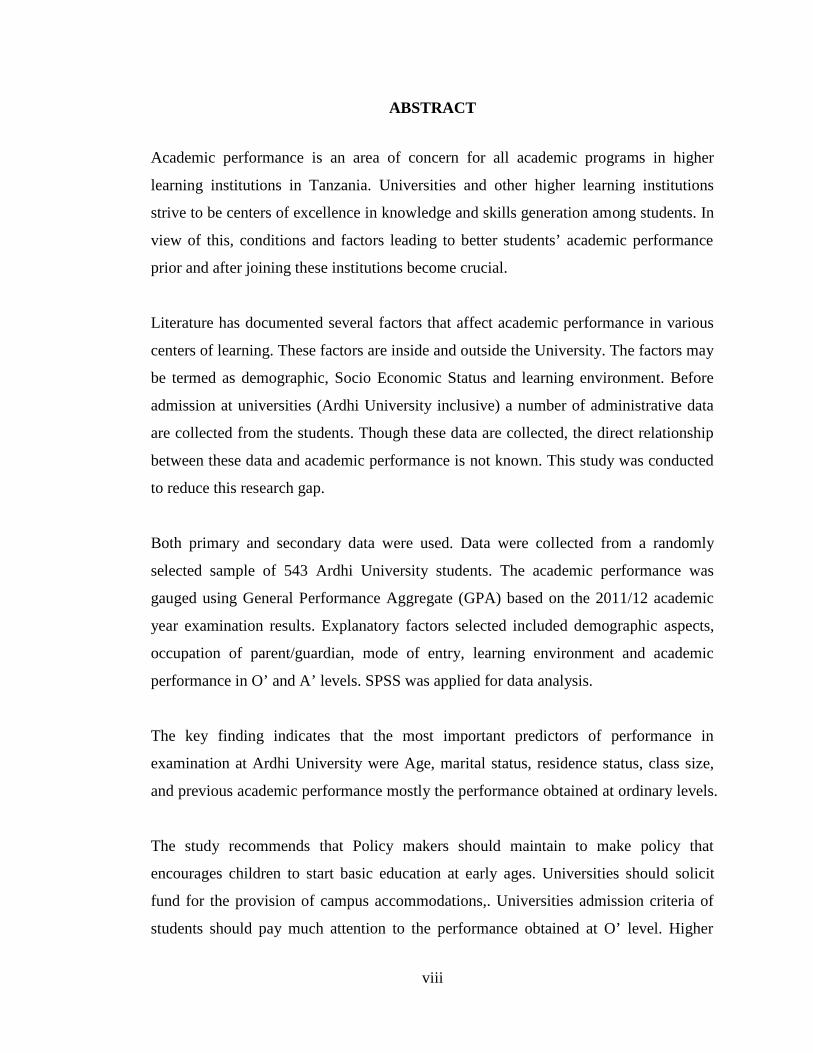
ABSTRACT
Academic performance is an area of concern for all academic programs in higher
learning institutions in Tanzania. Universities and other higher learning institutions
strive to be centers of excellence in knowledge and skills generation among students. In
view of this, conditions and factors leading to better students’ academic performance
prior and after joining these institutions become crucial.
Literature has documented several factors that affect academic performance in various
centers of learning. These factors are inside and outside the University. The factors may
be termed as demographic, Socio Economic Status and learning environment. Before
admission at universities (Ardhi University inclusive) a number of administrative data
are collected from the students. Though these data are collected, the direct relationship
between these data and academic performance is not known. This study was conducted
to reduce this research gap.
Both primary and secondary data were used. Data were collected from a randomly
selected sample of 543 Ardhi University students. The academic performance was
gauged using General Performance Aggregate (GPA) based on the 2011/12 academic
year examination results. Explanatory factors selected included demographic aspects,
occupation of parent/guardian, mode of entry, learning environment and academic
performance in O’ and A’ levels. SPSS was applied for data analysis.
The key finding indicates that the most important predictors of performance in
examination at Ardhi University were Age, marital status, residence status, class size,
and previous academic performance mostly the performance obtained at ordinary levels.
The study recommends that Policy makers should maintain to make policy that
encourages children to start basic education at early ages. Universities should solicit
fund for the provision of campus accommodations,. Universities admission criteria of
students should pay much attention to the performance obtained at O’ level. Higher

ix
learning institution students should shy away from establishing marital relationship
while still at the university.
x
TABLE OF CONTENTS
CERTIFICATION ...........................................................Error! Bookmark not defined.
ACKNOWLEDGEMENTS ..............................................................................................iv
DEDICATION ..................................................................................................................vi
LIST OF ACRONYMS .................................................................................................. vii
ABSTRACT................................................................................................................... viii
TABLE OF CONTENTS...................................................................................................x
LIST OF TABLES ......................................................................................................... xiii
LIST OF FIGURES ........................................................................................................xiv
CHAPTER ONE ..............................................................................................................1
1.0 INTRODUCTION......................................................................................................1
1.1 Background of the Study..............................................................................................1
1.2 Statement of the Problem.............................................................................................2
1.3 Research Objectives .....................................................................................................3
1.3.1 General Objectives ....................................................................................................3
1.3.2 Specific Objectives....................................................................................................4
1.4 Research Questions ......................................................................................................4
1.5 Significance of the Study .............................................................................................4
1.6 Scope of the study ........................................................................................................4
1.7 Conceptual Framework ................................................................................................5
1.8 Challenges and limitation of this study........................................................................8
CHAPTER TWO .............................................................................................................9
LITERATURE REVIEW................................................................................................9
2.0 Introduction ..................................................................................................................9
2.1 Academic Performance: Defined .................................................................................9
2.2 Theoretical issues related to students academic performance....................................10
2.3 Determinants of Students Academic Performance ....................................................11
xi
2.3.1 Students performance in Developed Countries.......................................................13
2.3.2 Students performance in Developing Countries .....................................................13
2.3.3 Students performance in Tanzania ..........................................................................16
2.3.3.1 Students performance in relation to learning environment ..................................17
2.3.3.2 Students performance in relation academic staff performance ............................18
2.3.3.3 Students performance in relation to sex. ..............................................................18
2.3.3.4 Students performance in relation to former school background ..........................19
2.3.3.5 Students performance in relation to socio-economic status. ................................19
2.3.3.6 Students performance in relation to the mode of entry. .......................................20
2.4 Research gaps.............................................................................................................21
CHAPTER THREE .......................................................................................................22
METHODOLOGY.........................................................................................................22
3.0 Introduction ................................................................................................................22
3.1 Study Area..................................................................................................................22
3.2 Research design..........................................................................................................24
3.3 Sampling Procedures..................................................................................................24
3.3.1 Study Population .....................................................................................................24
3.3.2 Sample Size.............................................................................................................25
3.3.3 Sampling Method ....................................................................................................25
3.4 Data Collection Procedures........................................................................................27
3.4.1 Primary data ............................................................................................................27
3.4.2 Secondary data ........................................................................................................27
3.4 Data Management Procedures....................................................................................28
3.5.1 Data Processing.......................................................................................................29
3.6 Ethical Considerations ...............................................................................................29
CHAPTER FOUR..........................................................................................................30
RESULTS AND DISCUSSION ....................................................................................30
4.1 Introduction ................................................................................................................30
4.2 Characteristics of the sample .....................................................................................30

xii
4.3 Status of academic performance ................................................................................34
4.4 Factors contributing to undergraduate performance in examination at ARU ............36
4.4.1 Background variables and academic performance..................................................36
4.4.2 Demographic factors and academic performance ...................................................37
4.4.3 Socio-economic status and academic performance.................................................39
4.4.4 Previous academic background and the performance attained at University .........40
4.4.5 Mode of entry and academic performance..............................................................44
4.4.6 Learning Environment and academic performance ................................................45
4.5 Multivariate analysis of determinants of academic status performance ....................50
CHAPTER FIVE............................................................................................................57
SUMMARY, CONCLUSIONS AND RECOMMENDATIONS ...............................57
5.0 Introduction .......................................................................................................... 575.1 Summary of the Major findings .................................................................................57
5.1.1 General characteristics ............................................................................................57
5.1.2 Determinants of academic performance..................................................................59
5.2 Conclusions ................................................................................................................60
5.3 Recommendations ......................................................................................................61
5.4 Areas for future research............................................................................................62
REFERENCES...............................................................................................................63
Appendix 1: Interview guides for students ..................................................................67
Appendix 2: Interview guides for Key informants .....................................................68
Appendix 3: Student Registration Form......................................................................69
Appendix 4.: Regression Analysis Table of Coefficients ...........................................73

xiii
LIST OF TABLES
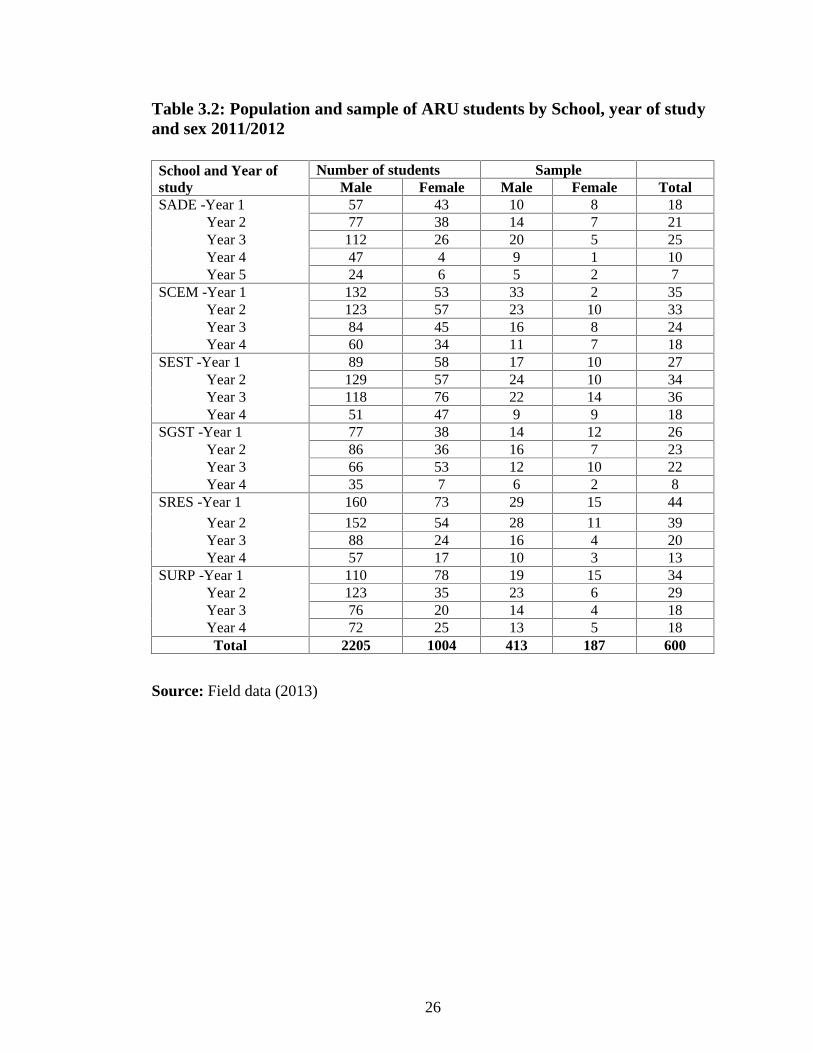
Table 3.2: Population and sample of ARU students by School, year of study and sex
2011/2012....................................................................................................................... 26
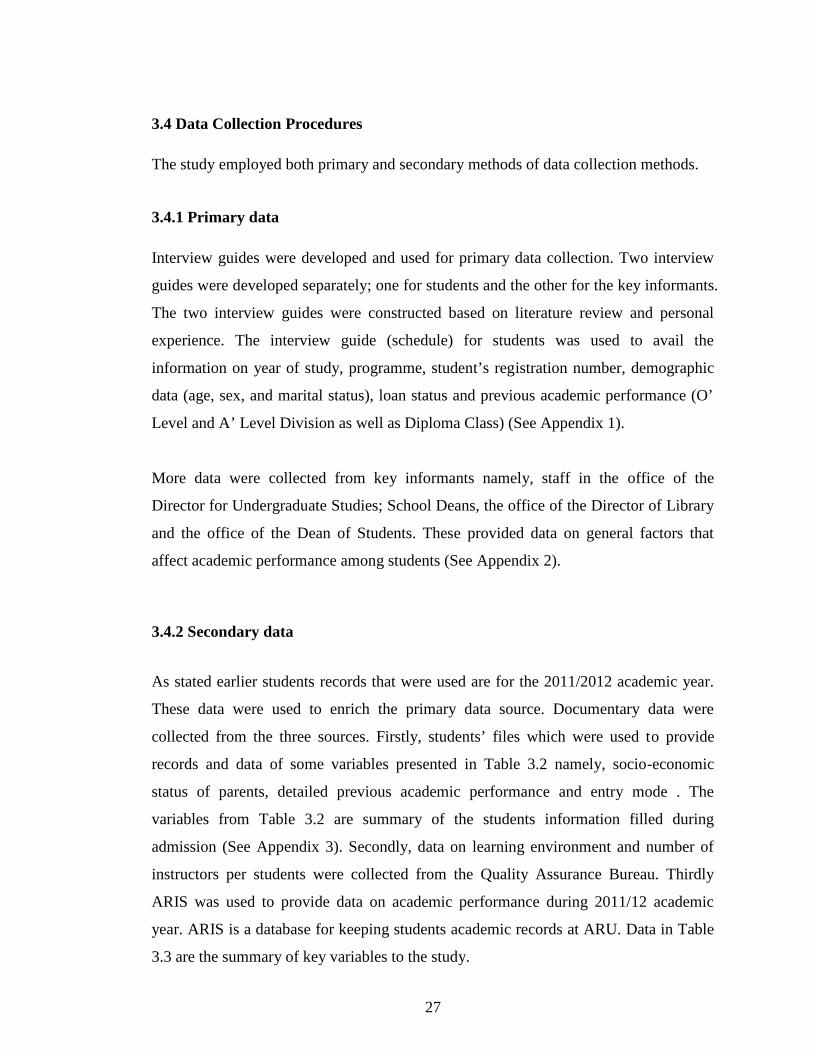
Table 3.3: List of key variables for the study and their indicators................................. 28
Table 4.1: Characteristics of the sampled students. ....................................................... 32
Table 4.2: Status of students’ performance in 2011/2012 examination at ARU ........... 35
Table 4.3: Background variables and performance in examination at ARU. ................ 37
Table 4.4 Demographic variables and academic performance ...................................... 38
Table 4.5: Socio-economic factors and Academic performance ................................... 40
Table 4.7: Mode of entry and student’s academic performance at ARU ....................... 45
Table 4.8: Academic Staff by Rank, and School in the year (2011/12)......................... 46
Table 4.9: Administrative Staff by Qualification and Sex in the year 2011/12............. 47
Table 4.10: Correlation between learning environment and academic performance..... 49
Table 4.11: Dummy Variables for Regression Analysis................................................ 53
Table 4.12: Regression Analysis Model Summary........................................................ 54
Table 4.13 Regression Analysis ANOVA Summary Table........................................... 55
xiv
LIST OF FIGURES
Figure 1.1: Conceptual Framework for the Determinants Undergraduate Students’
Academic Performance .................................................................................................... 6
Figure 3.1: Location Map of Ardhi University .............................................................. 23
Figure 4.1: Sex distribution of the sampled students ..................................................... 33
Figure 4.2: Status of students’ performance in 2011/2012 examination at ARU .......... 35
Figure 4.3: Academic performance by age .................................................................... 38
Figure 4.4 Academic performance by residence status.................................................. 40
Figure 4.5: O-level performance and academic performance at ARU........................... 44
Figure 4.6: Academic Staff Distribution by Qualification 2011/12............................... 46
Figure 4.7: Administrative Staff by Qualification in the year 2011/12 ......................... 48
1
CHAPTER ONE
1.0 INTRODUCTION
1.1 Background of the Study
The issues of academic achievement and retention are areas of concern for all
undergraduate academic programs in higher learning institutions in Tanzania.
Administrators in undergraduate programs desire to see their students succeed, and
these academic programs have a high probability of fostering such success if
administered correctly. In order to succeed in the classroom, students must place a
certain level of value on academic achievement.
The growth of any economy depends on the human capital in terms of knowledge.
Institutions of higher learning are centers of excellence for producing human resources
necessary for social economic development of a country. The importance of tertiary
education in efforts to reduce poverty and stimulate socio-economic development in
Africa is generally recognized. In recent years, knowledge has become more and more
acknowledged as an important factor for economic development (World Bank, 2008). In
this respect, tertiary education has an important contribution to economic growth as it is
likely to produce skilled and qualified labour force as well as technological development.
Academic programs in institutions of higher learning (or tertiary education level) vary
in focus, size, and even in the demands that they place on students. One common thread
among academic administrators is the desire for their students to operate at a high level
and achieve academic success throughout the program. Graduation rates are
fundamental to administrators as well, as it is important for academic programs to
produce competent students who are well prepared to work as professionals in their
chosen fields. There are many challenges to meeting these goals, however. Many
academic programs have extremely high attrition rates, and the reasons for such
attrition rates vary. Because of these challenges, many studies have been conducted
examining the determinants of students’ academic achievement and students’ intention
to successfully complete their studies (Kuh, Kinzie, Buckley, Bridges, and Hayek 2007;
Ullah and Wilson 2007; and Weiss and Amorose2008).
2
Self-efficacy and task value are constructs that have emerged as being strong predictors
of academic motivation and performance (Bong, 2001). Along with self-efficacy and
task value, many other factors have been found to predict academic achievement.
Different scholars have attempted to identify the variables that predict academic
success. Kuh et al (2007) did so when they stated that student success should include
five variables. The first variable is student background characteristics, such as
demographic and other pre-college experiences. The second variable is the structural
characteristics of the institution, such as its size, mission and admission criteria. The
third variable pertains to student-faculty interactions, interactions with university staff,
and interactions with peers. The fourth variable is the student’s perception of the
learning environment. The final variable is the quality of effort, or achievement
behaviors, of students in educationally purposeful situations.
Besides these five variables socioeconomic status is one of the most researched and
debated factor among educational professionals that contribute towards the academic
performance of students (Duke, 2000). The most prevalent argument is that the
socioeconomic status of learners affects the quality of their academic performance.
Most of the experts argue that the low socioeconomic status has negative effect on the
academic performance of students because the basic needs of students remain
unfulfilled and hence they do not perform better academically (Adams, 1996). The low
socioeconomic status causes environmental deficiencies which results in low self
esteem of students. More specifically, this study aims at identifying the factors
contributing to undergraduates students performance in examination at ARU
1.2 Statement of the Problem
Universities and other higher learning institutions, Ardhi University (ARU) inclusive,
strive to be centers of excellence in knowledge and skills generation among students.
This is always stated in their visions. ARU considers itself as a unique institution in
Tanzania and Africa due to offering integrated training as well as research related to
land, the built environment and other environmental related matters under one roof
(ARU Prospectus, 2012/2013). In order to achieve this, the ARU vision is to become a
centre of excellence in seeking and disseminating knowledge to various
3
beneficiaries at all levels nationally and internationally (ARU Corporate Plan, 2010). In
view of this, conditions leading to better students’ academic performance prior and
after joining ARU become crucial. During admission at ARU a number of
administrative data/information from the students are collected (See Appendix 1).
These data include demographic, socio-economic status, academic background and
resident status. Though these data are collected during every admission, they have not
been analyzed in relation to the student’s performance. As such there is inadequate
information showing the linkage between these data and the academic performance of
the student after joining the university.
However the direct relationship between those variables and academic performance is
not known. For example it is not known as to whether the previous performance,
including the subject opted, has any effect to performance after admission. In addition
the role of learning environment and academic performance is unclear. In some
incidences universities require candidates to have certain pass mark in certain subjects
to qualify for admission in some programmes. For example at ARU, in order for a
candidate to be admitted in Bachelor of Architecture, together with other qualifications
candidates must have at least C grade in Mathematics at O’ level (ARU Prospectus,
2012/2013). However, there is no empirical evidence to support this requirement.
Most universities in Tanzania collect data for these characteristics as well as data on the
students’ academic performance. However, the linkage between these factors and the
students’ academic performance is lacking. The purpose of this study is to address this
gap focusing on academic performance of undergraduate students at ARU.
1.3 Research Objectives
1.3.1 General Objectives
The general objective of the study is to establish the determinants of undergraduate
students’ academic performance in examination at Ardhi University. Such information
is expected to assist academic managers and administrators to design relevant policies
and procedures.
4
1.3.2 Specific Objectives
With respect to undergraduate students the study specifically seeks to:
i) Indicate the status of student’s performance in examination at Ardhi University
ii) Show the factors contributing to undergraduates students performance in
examination at ARU
iii) Recommend the appropriate strategies that can improve performance of
undergraduate students at ARU.
1.4 Research Questions
The study was guided by the following research questions.
i) What is the state of the undergraduate student’s performance in examinations at
ARU?
ii) What are the factors contributing to student’s performance in examination at
ARU?
iii) What are the recommended appropriate strategies that can improve performance
of undergraduate students at ARU?
1.5 Significance of the Study
The findings of the study will help managers and academic administrators in tertiary
level education as well educationists in making relevant recommendation to the policy
makers especially those dealing with quality assurance and the central admissions. The
findings will reveal what relevant policies and strategies need to be employed to
improve academic performance at higher learning institutions. The findings will help
the University Academic office to review its methods of admitting students in order to
improve academic performance.
1.6 Scope of the study
The study was conducted at Ardhi University, using first to fifth year students from all
the six Schools at ARU. Variables attributing to students academic performance in
examination at ARU focus on factors such as learning environment, demographic,
socio-economic status, student previous academic performance, and admission criteria
which affect academic performance of undergraduate students. The study covered the
period of academic year 2011/2012.
5
1.7 Conceptual Framework
This section proposes a conceptual framework (see Figure 1) within which the concept,
academic performance is treated in this study. It is arrived at basing on the System’s
Theory Input-Output Model advanced by Ludwig Von Bertalanffy in 1956. The
selection of the model is based on the belief that, the quality of input invariably affects
quality of output in this case performance in examination (Acato, 2006)
6
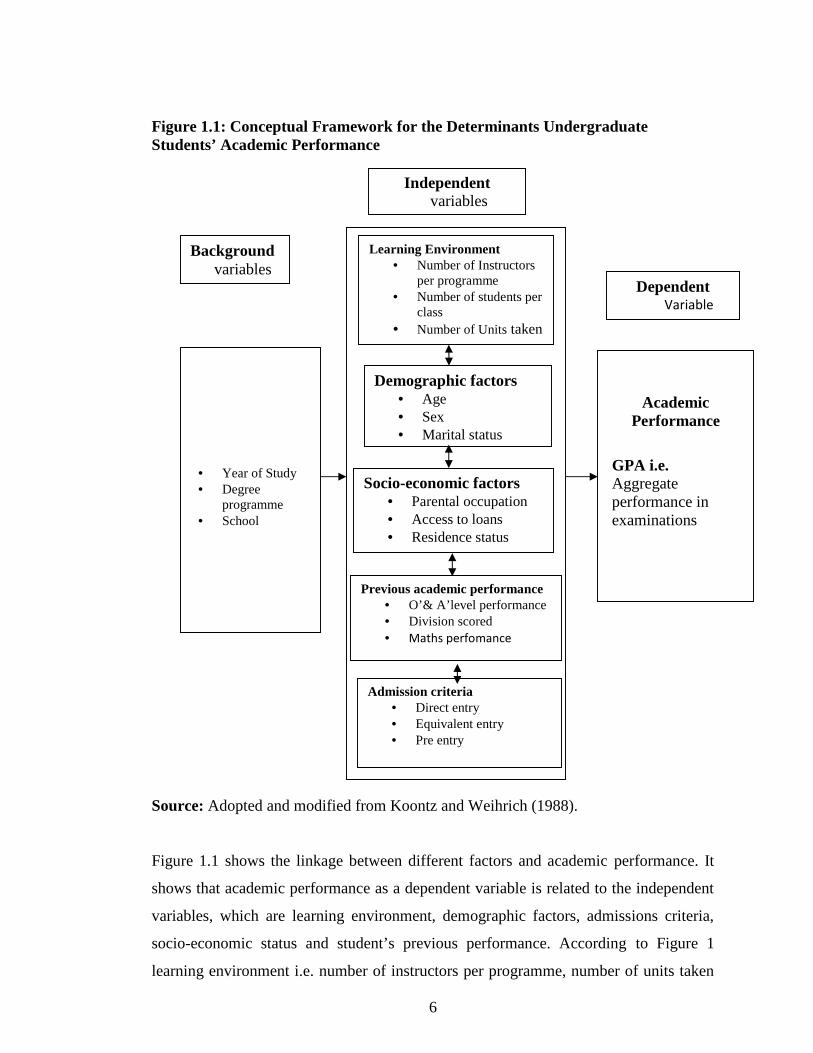
Figure 1.1: Conceptual Framework for the Determinants UndergraduateStudents’ Academic Performance
Source: Adopted and modified from Koontz and Weihrich (1988).
Figure 1.1 shows the linkage between different factors and academic performance. It
shows that academic performance as a dependent variable is related to the independent
variables, which are learning environment, demographic factors, admissions criteria,
socio-economic status and student’s previous performance. According to Figure 1
learning environment i.e. number of instructors per programme, number of units taken
Independentvariables
Backgroundvariables
Learning Environment Number of Instructors
per programme Number of students per
class Number of Units taken
Demographic factors Age Sex Marital status
Socio-economic factors Parental occupation Access to loans Residence status
Previous academic performance O’& A’level performance Division scored Maths perfomance
Admission criteria Direct entry Equivalent entry Pre entry
AcademicPerformance
GPA i.e.Aggregateperformance inexaminations
DependentVariable
Year of Study Degree
programme School
7
by students per programme and class size (number of students per class) The Figure
shows that learning environment as independent variables linked to student academic
performance which is the dependent variable. These variables are part of the input and
process explained in the Ludwig’s Input-Output Model. They play a role in bringing
out the output, which is academic performance. If these variables are not controlled,
they may interfere with the results of the students’ academic performance.
More over Figure 1 shows demographic factors such as age, sex and marital status
affects performance. It is expected that age wise performance will decrease with age.
Likewise due socio-cultural considerations prevailing in Tanzania and most African
countries male students will perform better than female students. In terms of marital
status the unmarried are expected to perform better than their counterparts due to
minimum family responsibilities.
In addition according to Figure.1, admission criteria which include direct entry points
and equivalent (diploma) points are linked to academic performance. If the admission
points are high, then the academic performance is likely to be high and vice versa. This
argument is supported by Geiser ans Santelics (2007), Staffolani and Bratti (2002) and
McDonald et al (2001). The studies of these authors revealed that previous performance
affects future academic performance.
Socio-economic status is conceptualized as parents’ occupation, student’s residence
status and access to loan. The Figure shows that academic performance is dependent on
socio- economic status. That is students from high socio- economic backgrounds will
perform better than their counter parts. This is supported by Dills (2006) and Owens
(1999). It is also in line with Hansen and Mastekaasa (2006) who argued that according
to the cultural capital theory one could expect students from families closest to the
academic culture to have greatest success.
Another independent variable is previous academic performance, which is
conceptualized as the prior performance academic status of the former school and
linked to academic performance of students. That is the way the students perform
previously is likely to contribute to their academic performance of the student in

8
future. Students who performed well in their previous studies are likely to perform well
due to the fact that they attended those schools. An argument supported by Considine
and Zappala (2002) Kwesiga (2002).
1.8 Challenges and limitation of this study
a) Availability of fund was a big problem since this research was done on private
sponsorship basis.
b) Another challenge faced in this study was missing of some files for the sampled
students files. In addition, in some few files important records of students were
missing for example, parental/guardian occupation and residence status. Such files
were dropped in the study. Eventually the study accessed 543 students’ files out of
600 files expected
c) Moreover the assessment of performance depended only on GPA. GPA is
sometimes considered as to be influenced by instructors. As presented earlier
students performance has other indicators for example, attitude and behavior.

9
CHAPTER TWO
LITERATURE REVIEW
2.0 Introduction
In this Chapter the literature review related to the study is presented. The review begins
by defining the concept academic performance and its indicator. This is followed by
some theoretical issues and empirical evidence on determinants of academic
performance. Finally research gaps are presented.
2.1 Academic Performance: Defined
Academic performance could be defined in various ways. Academic performance can
be defined as how students deal with their studies and how they cope with or
accomplish different tasks given to them by their instructors. It also could mean the
ability to study and remember facts and being able to communicate the knowledge
verbally or down on paperto others. Academic performance could also mean, the
academic successes or failures that a student experiences in one’s course work (House,
2002). Academic could also mean the result of academic work undertaken by a student
and is defined as the ability to display through speaking or writing what one has learnt
in the classroom (Kadeghe, 2000).
Academic performance could be measured in various ways. These include using
standardized tests, involvement in extra-curricular activities example sports, behavior
and grades. The latter is the most common one.
Grades are most often a tallying or average of assignment and test scores students get.
Grading systems vary greatly by country and school; common scales include a
percentage from 1-100, lettering systems from A-F, and grade point averages (GPA)
from 0-4.0 or above. GPA is regarded as a measure of the consistent academic
achievement of a student across terms (Brashears and Baker, 2003). In addition, the
value of using GPA as a measure of academic achievement has been
10
highlighted as GPA has been found to be a significant predictor of persistence
performance (Allen, 1999; Mitchel, Goldman,& Smith, 1999; Murtaugh, Burns, &
Schuster, 1999). It is also argued that GPA serves as one indication of the degree to
which students have responded to the institutional environment (McGrath & Braunstein,
1997;Tinto, 1993; Tross, Harper, Osher, and Kneidinger, 2000).
2.2 Theoretical issues related to students academic performance
There are several theories or model related to students’ academic performance. These
include the Eccles’ Expectancy- Value and Input-Output Model. Eccles and her
colleagues developed a model that delineates the factors influencing participation in the
fields of sport and academics (Eccles & Harold, 1991; Fredricks and Eccles, 2005).
This model is commonly referred to as the Eccles value model of activity behaviors
(Weiss and Amorose, 2008).
The Eccles’ expectancy-value model of activity behaviors is a model in which
predictors of achievement activity behaviors are shown to be predictable based on
many factors within one’s life. These include past experiences, socializers’ thoughts
and beliefs, perceived gender roles, and ultimately, one’s self-efficacy and task value
regarding an activity (Eccles and Harold, 1991). This model is a clear fit for predicting
undergraduate students’ academic achievement behaviors and intentions to successfully
complete their course of study. The model weighs all of the factors that lead students to
make decisions regarding their achievement while in college.
The Input-Output Model was developed by Ludwing Von Bertalaffy in 1956. This is
the theory adopted by this study. Kootz and Weihrich, (1988) explain that an organized
enterprise does not exist in a vacuum; it is dependent on its environment in which it is
established. They add that the inputs from the environment are received by the
organization, which then transform them into outputs. As adapted from this study the
student (input) are admitted into the University, with different admission qualification,
from different social economic back grounds, when they get into the university system.
However the management of the university transforms them through the process of
teaching and learning and the student output is seen through their performance in
examinations.
11
Robbins (1980) argued that organizations were increasingly desirable as absorbers,
processors and generators and that that the organizational system could be envisioned
as made up of several interdependent factors. System advocate according to Robbins
(1980) have recognized that a change in any factor within the organization has an
impact on all other organization or subsystem components. Thus the inputs the
possessor and the generators should function well to achieve the desired outcome.
In order to achieve the overall goals all system must work in harmony Saleemi (1997)
in agreement with Robbins argued. According to the output model it is, it is assumed
that that the student with high qualification during admission, high social economic
background and good school background will perform well if the University facilities
are good, the lectures and the University management is good which may not always be
the case and this is the shortcoming of this theory. According to Oso and Onen (2005),
the interrelation among part of the system has to be understood by all parties involved.
This theory requires a shared vision so that all people in the university have an idea of
what they are trying to achieve from all parties involved, a task that is not easy to
achieve.
2.3 Determinants of Students Academic Performance
Students’ academic performance is a top priority for educators. Educators, trainers and
researchers have long being interested in exploring variables contributing effectively
for quality of performance of learners. These variables are inside and outside the
University. These factors may be termed as demographic, family characteristics,
learning behavior, learning environment and health related factors. Crosnoe, Johnson &
Elder, (2004) termed these factors as students’, school, family and peer factors.
Several studies have been carried out to identify and analyze the numerous factors that
affect academic performance in various centers of learning (Siegfried &Fels, 1979;
Anderson & Benjamin, 1994. Their findings identify students’ effort, previous
schooling parents’ education, family income self motivation, age of student, learning
preferences, class attendance and entry qualifications as factors that have a significant
effect on the students’ academic performance in various settings. The utility of these
studies lies in the need to undertake corrective measures that improve the academic
12
performance of students, especially in public funded institutions. The throughput of
public-funded institutions is under scrutiny especially because of the current global
economic downturn which demands that governments improve efficiency in financial
resource allocation and utilization.
Although there has been considerable debate about the determinants of academic
performance among educators, policymakers, academics, and other stakeholders, it is
generally agreed that the impact of these determinants vary (in terms of extent and
direction) with context, for example, culture, institution, course of study etc. Since not
all factors are relevant for a particular context, it is imperative that formal studies be
carried out to identify the context-specific determinants for sound decision making.
This literature review provides a brief examination of some of the factors that influence
academic performance. The choice of factors reviewed here is based on their
importance to the current study.
Some external factors may also have an influence on students’ performance. For
example, Tinto (1993) has identified the external commitments and obligations as some
of the factors that may affect students’ progress. These may include family
commitments, job commitments and other external obligations that an individual may
have during the college period. In this case, it may happen that a student may devote
more time to fulfill his/her external commitments and fails to meet the college demands.
As a result, the student is likely to perform poorly. However, he noted that the effects of
external factors may depend on the individual’s goals and commitments and the
institutional learning environments. In this respect, external factors may influence low
performance if the student values external factors more than learning activities. He also
noted that external factors may have positive effects on academic performance through
support and encouragement from the family members and community.
A recent study in Turkey (Bahar, 2010) showed that support from family influenced the
level of performance. Lowe and Gayle (2007) also observed that family support may
help students to manage and balance their external obligations and academic activities.
In this study they reported that despite the conflicting responsibilities some students
were able to manage work, family commitments and studies due to the support they
13
received from family and employers. Conversely, they found that those who did not
have support experienced stress caused by conflicting priorities.
2.3.1 Students performance in Developed Countries
According to Betts et al, (2003), their study concluded that, one of the many
achievement gaps identified by their report is the English-language-fluent, the level of
class size which appeared to be twice as effective at improving performance and
teacher qualification.
Rose & Austine (1999) examined the existence of an empirical link between various
factors and academic performance. The authors concluded that regardless of the
students’ socio-economic status, racial/ethnic status minority or nonminority, college
GPA exerts the largest influence on how students perform better in the previous studies.
The study by Terenzini, et al (1984) identified the high school achievement, gender
ethnicity, parental education and parental income as the determinants of academic
performance.
Betts, Zau and Rice (2003) using regression analysis revealed that several factors
affected academic performance of students in the US. The study revealed that time a
student spent at school had significant effect towards achievement. The study found
that, the percentage of days a student become absent from school was a strong negative
predictor of academic in math and reading. In addition, the authors found that peer
influence, class size and qualifications of instructors had significant effects to academic
performance. While class size appeared to have significant influence towards lower
levels of education, the study concluded that achievement of students responded
positively to higher teacher qualifications.
2.3.2 Students performance in Developing Countries
In developing countries many researchers have discussed the different factor that
affects the student academic performance in their research. According to Mushtaq and
Khan (2012) there are two types of factors that affect the students’ academic
performance. These are internal and external classroom factors. Internal classroom
14
factors include students competence in communication, class schedules, class size,
learning facilities, complexity of the course material, teachers role in the class,
technology used in the class and exams systems. External classroom factors include
extracurricular activities, family problems, work and financial, social and other
problems.
Harb and El-Shaarawi (2006) found that the most important factor with positive effect
on students' performance is student's competence in communication. The authors found
that if the students have strong communication skills and have strong grip on English,
academic performance increased. The performance of the student is affected by
communication skills; it is possible to see communication as a variable which may be
positively related to performance of the student in open learning.
Karemera (2003) found that students' performance is significantly correlated with
satisfaction with academic environment and the facilities of library and computer lab in
the institution. The author also found a positive effect of high school performance and
school achievement. Proper use of the facilities provided by the institution to the
student, positively affects the student's performance (Norhidayah et. al., 2009). In
addition, Young (1999), noted that student performances were linked with use of
library. The author concluded that use of the library positively affected the student
performance.
Schiefelbein and Simmon, (1981) identified socio-economic status (SES) as a
significant predictor of school outcomes. It is usually a composite measure of parents
occupation, incomes and education. Upper income children may tend to learn the
language skills and other behaviors rewarded by schools. They also have access to
books, literate parents, toys and other conditions at home. Parent training of the poor
could offset some of these advantages. Their finding also reveals that the optimal
number of students per class is an important policy issue because of its cost
implications. In 9 of 14 studies relating the effects of class size to student achievement,
larger class size was associated with lower student’s performance.
In their study Farooq et al, (2011) concluded that the higher level of SES is the best
15
indicator contributing towards the quality of students’ achievement. Family
characteristics like socio economic status are significant predictors for students’
performance at school besides the other school factors, peer factors and student factors.
Higher SES levels lead to higher performance of students in studies, and vice versa
(Hanes, 2008). Parental education also has effects on students’ academic performance.
Parental occupation has little effect on their child’s performance in studies than their
education. Student’s gender strongly affects their academic performance, with girls
performing better in the subjects of Mathematics, and English as well as cumulatively.
Girls usually show more efforts leading towards better grades at school (Ceballo,
McLoyd & Toyokawa, 2004). It is very important to have comprehensible
understanding of the factors that benefit and hinder the academic progress of an
individual’s education. However, Karemera (2003) found no statistical evidence of
significant association between family income level and academic performance of the
student.
Kasirye (2009) found that the most important determinants are: the number of teachers
with the mandatory two years of teacher training; a child having an own place to sit. On
the other hand, parental education matters partially—the impact of higher education
attainment for fathers on learning is only significant for male learning achievement.
However, most of the other teacher characteristics as well as those relating to the head
teacher do not appear to significantly influence learning. Consequently, with the
considerable success in providing “hard” school infrastructure. Hijaz and Naqvi (2006)
observed that there is a negative relationship between the family income and students’
performance in private colleges in Pakistan.
Most recent study by Mushtaq and Khan (2012) in Islamabad, Pakistan, measured the
determinants of academic performance. The study found that communication, learning
facilities, proper guidance and family stress are the factors that affect the student
performance. Communication, learning facilities and proper guidance showed a
significant positive impact on the student performance while family stress had negative
impact on the student performance. Family stress was found to reduce the performance
of the student.
16
2.3.3 Students performance in Tanzania
Most language experts in Tanzania have so far been considering English as a factor for
underachievement of most students at higher levels of education because students fail
to learn effectively through the sole medium of English. In this case, teachers are forced
to use Kiswahili to clarify the lesson (Jones, Rubagumya and Mwansoko, 1998). Hence,
in most of the classes Kiswahili is used unofficially in teaching academic subjects such
as English, Biology, Chemistry, General Studies, Mathematics, etc.
According to Nyakunga (2011), in her study she found that there is a weakness in
academic preparedness in some subjects particularly English and Mathematics.
Although Mathematics and English were compulsory subjects until O-level, students
continued to face problems in these subjects even in higher education. In Tanzania
Mathematics, English and other science subjects are common problems for most
students not only in higher education but also since lower levels. In addition, the study
observed also some courses did not have any linkage with their academic
background/foundation and career. Lack of foundation in some courses also contributed
to surface learning because students struggled to understand these courses, hence they
read by cramming.
The study conducted by Mvungi (1982), revealed that English language proficiency is
an important factor in academic performance and that lack of proficiency in English
would result in poor performance in academic subjects.
Many students are interested in simple things like teachers’ notes and handouts. They
usually prefer to read strategically on specific issues and materials that they thought
were likely to provide answers to their examinations thus students did not have interest
in reading books and other materials that could help them to expand their knowledge.
However the lack of adequate resources in a number of educational institutions
constrains provision of high quality education (Nyakunga, 2011).
17
2.3.3.1 Students performance in relation to learning environment
Factors relating to the learning environment have been identified to influence students’
performance. Such factors include the nature of the teaching and learning processes, the
availability of learning resources such as library, class rooms (lecturer theatres), support
from teachers and peers, social services and extra-curricular activities (Tinto 1993;
Thomas 2002).
Thomas (2002) analysed the role of institutional practices on students’ retention and
found that if there is a match between institutional practices and students from different
socio-cultural background, this can prevent students from withdrawing. Two factors
were identified as being important for students’ decisions to persist: academic and
social experiences. Academic experiences include staff attitudes, teaching and learning
and assessment methods. Social experiences were identified as the ability of students to
build friendships, mutual support and social networks.
Furthermore, Yorke (1999) identified additional learning environmental factors such as
location of an institution (rural or urban). The results showed that those who were far
from the cities were dissatisfied with the institutional learning environment because
they did not have access to cities’ social life. Other factors were homesickness,
accommodation problems and difficulty in making friends. However, location of the
institution may be of minor importance if institutional experiences are satisfactory
(Tinto, 1993). In addition, if students get support from peers and teachers, this may
reduce stress and increase interaction, which is also important for academic
performance. Students may be free to express themselves and become more engaged in
academic activities. A study conducted by Ali, Jusoff, Ali, Mokhtar, and Salamat
(2009) in Malaysia has observed that students’ engagement in extra-curricular activities
such as sports was one of the factors positively related to academic performance. This
is believed to reduce stress, refresh students’ minds and increase concentration in class.
18
2.3.3.2 Students performance in relation academic staff performance
Marsha (2005) in his study revealed that students performed better in courses in which
instructors were approachable and where strong linkages existed between the subject
matter and course organisation. Additionally, Komarraju et al. (2010) found that
students who interacted with faculty members were more likely to have confidence in
their academic skills and be motivated both intrinsically and extrinsically. Conversely,
those who felt distant from faculty members reported feeling discouraged and apathetic.
2.3.3.3 Students performance in relation to sex.
There has been much debate and research on the topics of which sex is more intelligent.
However, intelligence tests are not good indicators of which sex is smarter because they
are carefully developed so that no sex is favored and so there will be no average overall
difference between male and females (Tsigie, 1991). Also, school achievement is not an
appropriate way to determine which sex is smarter because many factors other than
intellectual ability have an impact on grades (Tsigie, 1991).
Gender is one among the characteristic that has been explored in relation to academic
achievement and much of that literature is related to females (Betts and Morell, 1999;
Pike, Schroeder, and Berry, 1997). However, conflicting findings have been found
regarding females and academic achievement. For example, a consistent pattern
emerged in the literature indicating that females perform to a lesser degree than males
in terms of academic achievement in science (Campbell, Hambo and Mazzeo, 2000)
The work of Campbell et al. (2000) is particularly important in that these researchers
examined student achievement in the United States over time and concluded that males
consistently score higher in science than females, regardless of age. Yet, other findings
suggest that females exhibit more curiosity, which is associated with better
achievement, than their male counterparts (Rouse and Austin, 2002) and that female
students tend to have higher grade point averages.
There do not appear to be significant differences in intelligence between males and
females but there are some sex related cognitive ability differences that are consistently
found. It is important to remember that these are generalizations for males and females
students and they do not apply individually to all males and females students. Females
19
earn higher grades than male and some possible explanation have been proposed by
researchers. The reasons proposed are both biological and environmental. In carefully
controlled studies of learning liabilities, males have been found to have more learning
disabilities, than females by a ratio of two to one. Males are classified as emotionally
disturbed at four times the rate of females. The review also estimated that males are 10
time more likely to exhibit stuttering; a language problem. There are four to five males
times more males who are dyslexic than females (Halpern, 2000).
The study by Chem, et. Al. (2008) shows that undergraduate female engineering
student perform better than their male counterparts by all measures, contrary to all
previous studies of gender differences in engineering academic performance.
2.3.3.4 Students performance in relation to former school background
Educational experiences prior to higher education can contribute to students’ academic
performance in higher education, in the sense that the performance of students in higher
education may depend on academic preparedness and the linkage between higher
education programmes and lower schools. Conley (2005) pointed out that the structure
and content of high school programmes of instruction are very important to college
success. In his literature review he found that students from high quality and academically
intense high school curricula had higher completion rates than racial and ethnic minority
students who attended poor schools. Similar results were observed by Archer et al. (2003)
who indicated that students associated their failure in higher education with the failure in
prior education.
Different researchers have made attempts to identify the factors that affect student
performance in lower and higher Institution. Anderson et al. (1994), conclude that
students who received better scores in high school also perform better in college.
2.3.3.5 Students performance in relation to socio-economic status.
The effects of socio-economic status (SES) are still prevalent at the individual level this
is according to Capraro, M., Capraro, R., and Wigggins, (2000). The SES can be
deliberately in number of different ways; it is most often calculated by looking at
parental education, occupation income, and facilities used by individual separately
20
or collectively. Parent education and family SES have positive correlations with the
student’s quality achievement. The student with high level of SES perform better than
the middle class student and middle class student perform better than the student with
low level of SES (Garzon, 2006; Kahlenberg, 2006; Kirkup, 2008)
2.3.3.6 Students performance in relation to the mode of entry.
The main admission criterion to universities is prior performance either at O’ Level, A’
level, or at Diploma This is being practiced word wide, admission board elsewhere in
the word use prior academic performance to select student. Measures of prior education
performance are the most important determinants of student’s performance.
Ringland and Pearson (2003) carried out a study on the differences between diploma
entrants and direct A’ level entrants and how each category performed. They sampled
608 respondents of which 154 were diploma entrants, and found that there were no
significant differences between groups in terms of academic performance and
concluded that performance of one prior to university affected performance at
university. The findings of Ringland and Pearson (2003) are supported by Wheeler
(2006) whose results in the study on success of non-traditional students in an
undergraduate program showed that there was no difference in performance of non-
traditional entrants and traditional entrants as long as both categories had performed
well at their previous qualifications.
21
2.4 Research gaps
The review of literature has shown that there is a relationship between the learning
environment and academic performance, that admission points and academic
performance of undergraduate students, that parents’ social economic status is related
to academic performance and that school background is related to academic
performance of the student. However, there is inadequate information on how these
factors affect performance in Tanzanian higher learning institutions. This study would
therefore like to establish the relationship between the learning environment, admission
mode or mode of entry, demographic factors like age, sex, and marital status to the
students’ academic performance. The relationship between parent’s social economic
status and former school background with reference to undergraduate students
‘academic performance at Ardhi University
22
CHAPTER THREE
METHODOLOGY
3.0 Introduction
This chapter outlines the manner in which the study was conducted. The key components
are the description of the study, research design, and procedures for sampling, data
collection as well as data management.
3.1 Study Area
The study was conducted at the Ardhi University (ARU). ARU has been chosen since
such study has never been conducted as stated earlier. Moreover, ARU is among the
newly established public universities in Tanzania. The findings from such a study will
be beneficial to the University in designing future admission policies and regulations in
order to improve academic performance among students. In addition, financial as well
as personnel costs have necessitated selection of ARU in order to minimize costs.
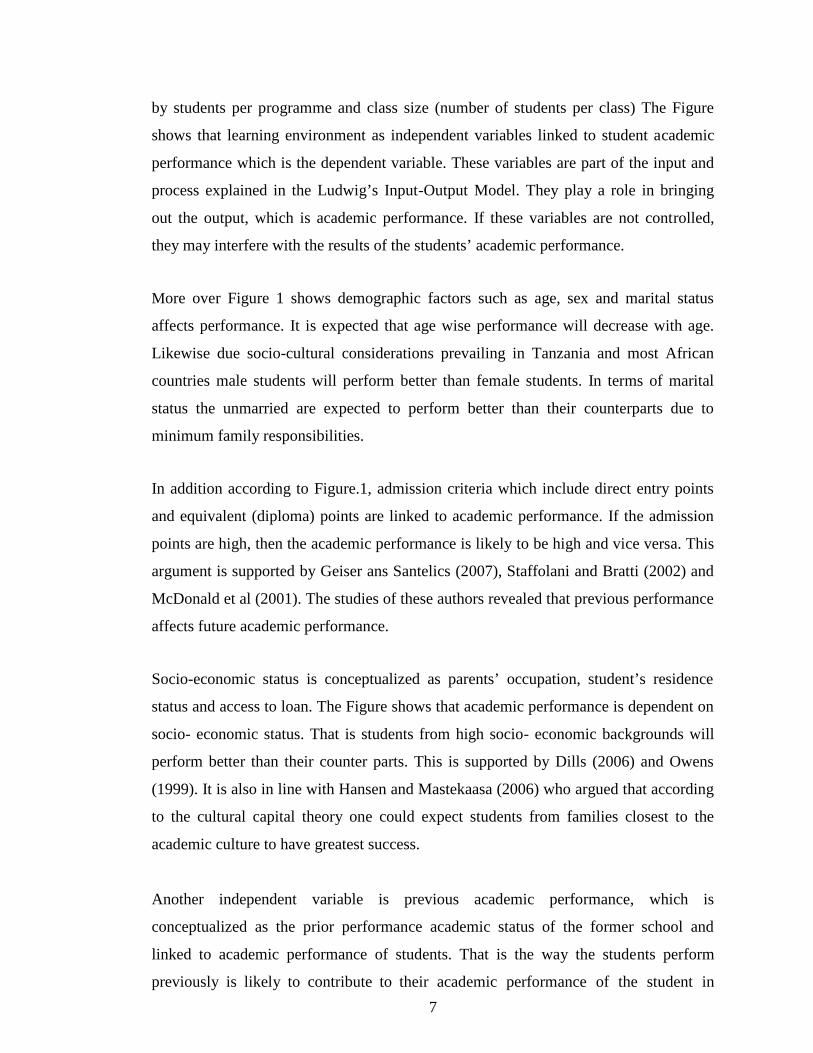
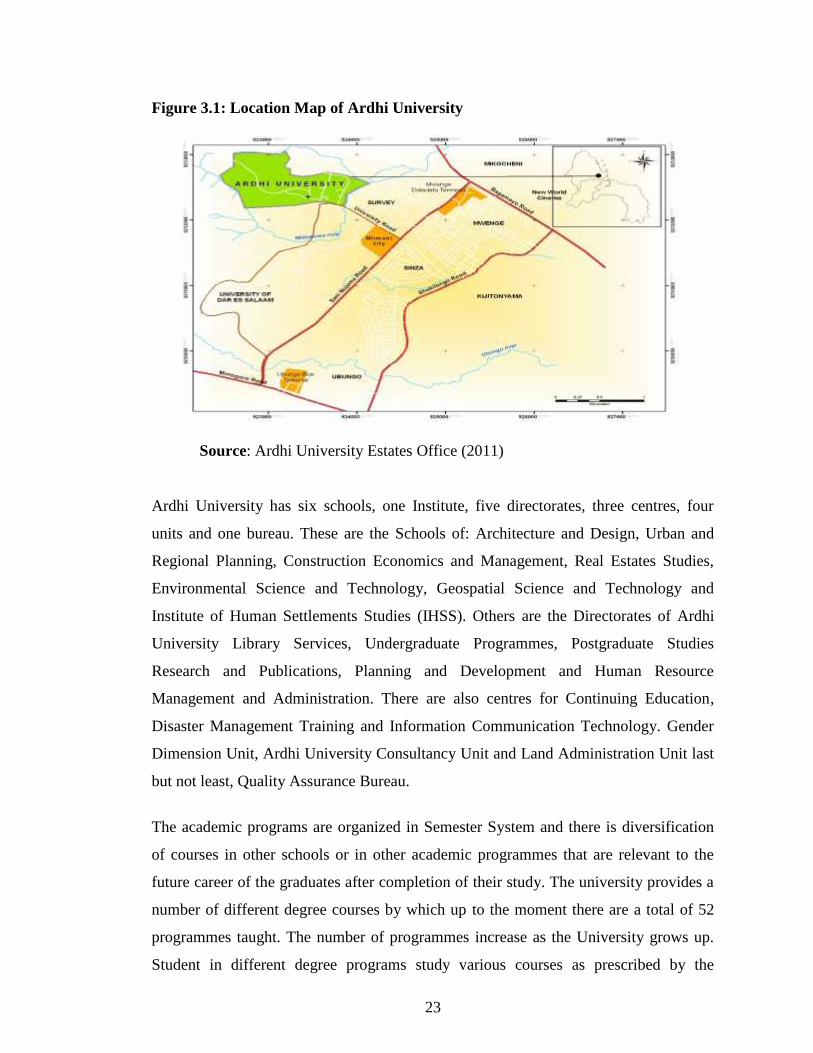
ARU is situated on the western side of the City of Dar es Salaam (Figure 2). The
University was established by ARU Charter 2007 to replace the former University
College of Lands and Architectural Studies (UCLAS) by then the Constituent College
of the University of Dar es Salaam. ARU is a pioneer in the studies and practice
pertaining to land, human settlements, environment, and other land related issues.
23
Figure 3.1: Location Map of Ardhi University
Source: Ardhi University Estates Office (2011)
Ardhi University has six schools, one Institute, five directorates, three centres, four
units and one bureau. These are the Schools of: Architecture and Design, Urban and
Regional Planning, Construction Economics and Management, Real Estates Studies,
Environmental Science and Technology, Geospatial Science and Technology and
Institute of Human Settlements Studies (IHSS). Others are the Directorates of Ardhi
University Library Services, Undergraduate Programmes, Postgraduate Studies
Research and Publications, Planning and Development and Human Resource
Management and Administration. There are also centres for Continuing Education,
Disaster Management Training and Information Communication Technology. Gender
Dimension Unit, Ardhi University Consultancy Unit and Land Administration Unit last
but not least, Quality Assurance Bureau.
The academic programs are organized in Semester System and there is diversification
of courses in other schools or in other academic programmes that are relevant to the
future career of the graduates after completion of their study. The university provides a
number of different degree courses by which up to the moment there are a total of 52
programmes taught. The number of programmes increase as the University grows up.
Student in different degree programs study various courses as prescribed by the
24
University, but which are relevant to their future careers between three, and five years.
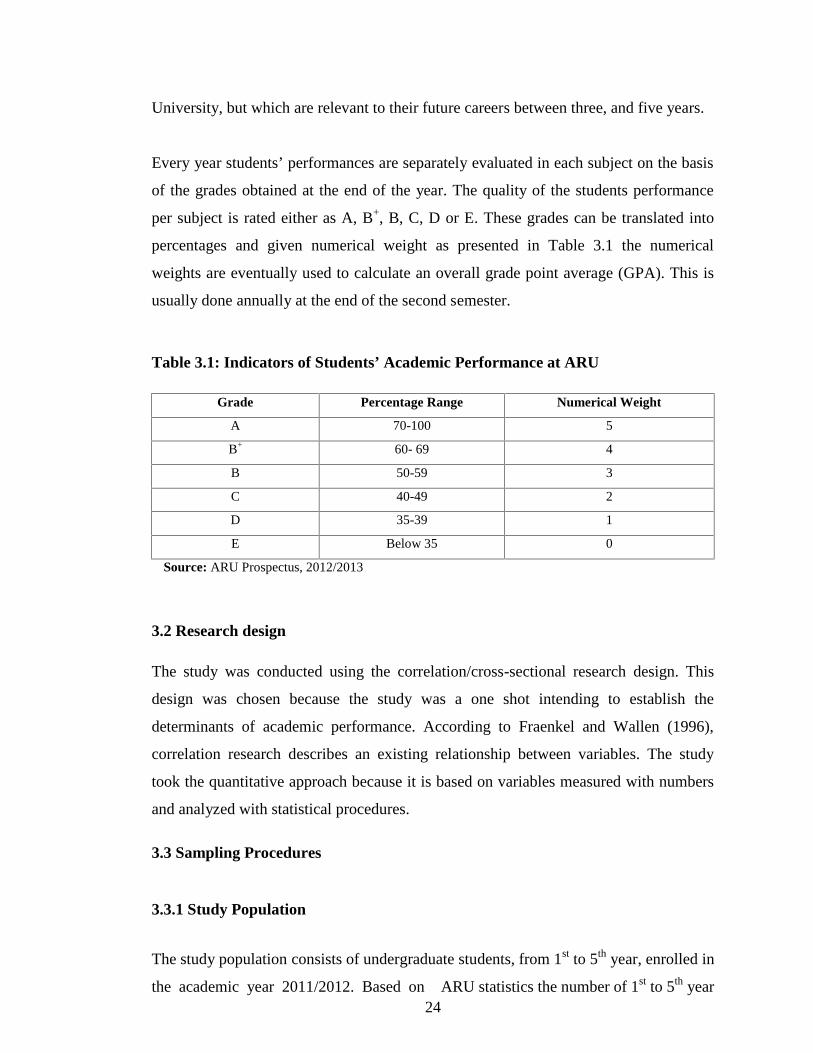
Every year students’ performances are separately evaluated in each subject on the basis
of the grades obtained at the end of the year. The quality of the students performance
per subject is rated either as A, B+, B, C, D or E. These grades can be translated into
percentages and given numerical weight as presented in Table 3.1 the numerical
weights are eventually used to calculate an overall grade point average (GPA). This is
usually done annually at the end of the second semester.
Table 3.1: Indicators of Students’ Academic Performance at ARU
Grade Percentage Range Numerical Weight
A 70-100 5
B+ 60- 69 4
B 50-59 3
C 40-49 2
D 35-39 1
E Below 35 0
Source: ARU Prospectus, 2012/2013
3.2 Research design
The study was conducted using the correlation/cross-sectional research design. This
design was chosen because the study was a one shot intending to establish the
determinants of academic performance. According to Fraenkel and Wallen (1996),
correlation research describes an existing relationship between variables. The study
took the quantitative approach because it is based on variables measured with numbers
and analyzed with statistical procedures.
3.3 Sampling Procedures
3.3.1 Study Population
The study population consists of undergraduate students, from 1st to 5th year, enrolled in
the academic year 2011/2012. Based on ARU statistics the number of 1st to 5th year
25
undergraduate students enrolled during the year was 3,226. The respondents in this
study are undergraduate students because they are the majority at ARU.
3.3.2 Sample Size
The sampling unit was all undergraduate students during the academic 2011/2012. A
sample size of 600 students was used for the study. The sample size was determined by
using the following formula proposed by Shajan, (2011):
Z 2 * (p) * (q)/c 2
Whereby:Z = Z value (e.g. 1.96 or simply 2.0 for 95% confidence level)p = percentage of population estimated to have a particular characteristic
expressed as decimal (if unknown use 0.5 i.e. 50%)
q= 1-p
c = confidence interval (degree of accuracy required), expressed as decimal, set
at 0.05
Based on this formula the sample size required is 400 students. In order to make it more
representative 50% of this sample i.e. 200 students were added. However, eventually, a
sample of 543 (90.5%) students was obtained. This was due to unavailability of records
to some of the sampled students.
3.3.3 Sampling Method
Multistage sampling strategies were employed in this study. Firstly purposive sampling was
used in selecting undergraduate students due to the focus of the study. Secondly, stratified
random sampling was employed whereby all students were categorized into schools as
well as year of study and then selected proportionately using a sampling fraction. In
order to ensure more representation, the sample was also proportionately stratified by
sex. The sample used for each School by sex and year of study was presented in Table
3.2.
26
Table 3.2: Population and sample of ARU students by School, year of studyand sex 2011/2012
Source: Field data (2013)
School and Year ofstudy
Number of students SampleMale Female Male Female Total
SADE -Year 1 57 43 10 8 18Year 2 77 38 14 7 21Year 3 112 26 20 5 25Year 4 47 4 9 1 10Year 5 24 6 5 2 7
SCEM -Year 1 132 53 33 2 35Year 2 123 57 23 10 33Year 3 84 45 16 8 24Year 4 60 34 11 7 18
SEST -Year 1 89 58 17 10 27Year 2 129 57 24 10 34Year 3 118 76 22 14 36Year 4 51 47 9 9 18
SGST -Year 1 77 38 14 12 26Year 2 86 36 16 7 23Year 3 66 53 12 10 22Year 4 35 7 6 2 8
SRES -Year 1 160 73 29 15 44
Year 2 152 54 28 11 39Year 3 88 24 16 4 20Year 4 57 17 10 3 13
SURP -Year 1 110 78 19 15 34Year 2 123 35 23 6 29Year 3 76 20 14 4 18Year 4 72 25 13 5 18Total 2205 1004 413 187 600
27
3.4 Data Collection Procedures
The study employed both primary and secondary methods of data collection methods.
3.4.1 Primary data
Interview guides were developed and used for primary data collection. Two interview
guides were developed separately; one for students and the other for the key informants.
The two interview guides were constructed based on literature review and personal
experience. The interview guide (schedule) for students was used to avail the
information on year of study, programme, student’s registration number, demographic
data (age, sex, and marital status), loan status and previous academic performance (O’
Level and A’ Level Division as well as Diploma Class) (See Appendix 1).
More data were collected from key informants namely, staff in the office of the
Director for Undergraduate Studies; School Deans, the office of the Director of Library
and the office of the Dean of Students. These provided data on general factors that
affect academic performance among students (See Appendix 2).
3.4.2 Secondary data
As stated earlier students records that were used are for the 2011/2012 academic year.
These data were used to enrich the primary data source. Documentary data were
collected from the three sources. Firstly, students’ files which were used to provide
records and data of some variables presented in Table 3.2 namely, socio-economic
status of parents, detailed previous academic performance and entry mode . The
variables from Table 3.2 are summary of the students information filled during
admission (See Appendix 3). Secondly, data on learning environment and number of
instructors per students were collected from the Quality Assurance Bureau. Thirdly
ARIS was used to provide data on academic performance during 2011/12 academic
year. ARIS is a database for keeping students academic records at ARU. Data in Table
3.3 are the summary of key variables to the study.
28
Table 3.3: List of key variables for the study and their indicators
Source: Field data (2013)
3.4 Data Management Procedures
Quantitative data were processed and analyzed using a computerized data analysis
package known as Statistical Package for Social Science (SPSS) Version 16. The SPSS
was also used to clean entered data before analysis which was done at ARU. Data from
key informants was analysed used content analysis approach.
S/NO Category Variable Indicator1 Learning
EnvironmentUniversityfacilities
Number of students per class
Number oflecturers
Number of instructor per class
Units Total number of units taken per programme
2 Demographicfactors
Age Number of years since birth
Sex Biological differences between male and female
Marital status Marital status as stated by students e.g. marriedor single
3 Socioeconomicfactors
Parentaloccupation
Employment status of parents as reported bystudents
Access to loan Whether the student is a loan beneficiary fromHESLEB
Residence Status Students place of domicile while at ARU
4 Previousacademicperformance
O’LevelDivision
NECTA Division Level attained
A’LevelDivision
NECTA Division Level attained
Diplomadivision
Class obtained at diploma level
O level Mathsperformance
Mathematics grade obtained at O level
A level Mathsperformance
Mathematics grade obtained at A level
5 Admissioncriteria
Mode of entryof the student atadmission.
Mode of entry of the student at admission, that isdirect, equivalent and pre-entry
6 Performance Academicperformance
GPA obtained at ARU in 2011/2012 academicyear
29
3.5.1 Data Processing
Univariate analysis was employed to describe the distribution of various variables of
the study. Bivariate analysis was employed to establish the relationship between
learning environment, demographic factors, admission points, mode of entry, parents’
social economic status, school background and students’ academic performance.
3.5.2 Data Analysis
Multivariate analysis employed linear regression model for establishing relationship
between students’ academic performance and proposed explanatory factors. The
proposed linear regression model used is as follows:
Y= b1 + b2 X1 + b3 X2 + b4 X3 + b5 X4 + b6 X5 + b7X6 + bnXn
Where, Y is the dependent variable and it represents academic performance of the
students and b1to bnare the coefficients and X1 to Xn are explanatory (independent)
variables of the students.
3.6 Ethical Considerations
Students’ admission and academic performance records are property of the university.
Therefore permission was sought from the Deputy Vice Chancellor, Academic Affairs,
to make use of the data. Strictly academic confidentiality was observed during data
collection and analysis. The data used in this study were anonymously coded and
therefore will not easily traced back to individual students.

30
CHAPTER FOUR
RESULTS AND DISCUSSION
4.1 Introduction
In this chapter, the results of the study are presented and discussed in line with the
study objectives. The main purpose of this chapter is to provide detailed information on
the determinants of undergraduate student’s performance in examination at Ardhi
University. The chapter is divided into eight sections. Section One, presents
background characteristics of the sampled study, Section Two describes the status of
student’s performance in examination at ARU in 2011/2013 academic year. Section
Three describe the relationship between demographic factors and students performance.
Section Four discuss the relationship between social economic factors and student’s
performance. Section Five presents the relationship between previous academic
performance with the performance obtained at the University. Section Six provide the
relationship between mode of entry with the academic performance. Section Seven
describe the relationship between learning environment and academic performance.
Lastly, section Eight describe the multivariate analysis of determinants of academics
status performance
4.2 Characteristics of the sample
The characteristics of this study were based on 543 students randomly picked in each of
the six school at ARU from year one to year 5 in SADE and from year one to year four
from other schools, the demographic features discussed in this section are age, sex,
schools, and year of study.
The summary of the characteristics of the sample is presented in Table 4.1. According
to data presented in Table 4.1 sex wise male students were many than female. Out of
543 student 70% were male and 30% were female. This distribution reflects social
cultural factors and the nature of the degree programmes provided by the

31
University. This may be due to gender differences during enrollment. In many African
societies preference is given to sons than daughters in many spheres consequently
during applications there are more male applicants than female applicants. In addition,
most of the programmes offered at ARU are generally considered as male based
programmes. These programmes include Architecture, Surveying and Civil
Engineering. This gender differences in terms of sex is not only unique Ardhi
University but also across many other higher learning institutions in Tanzania.
32
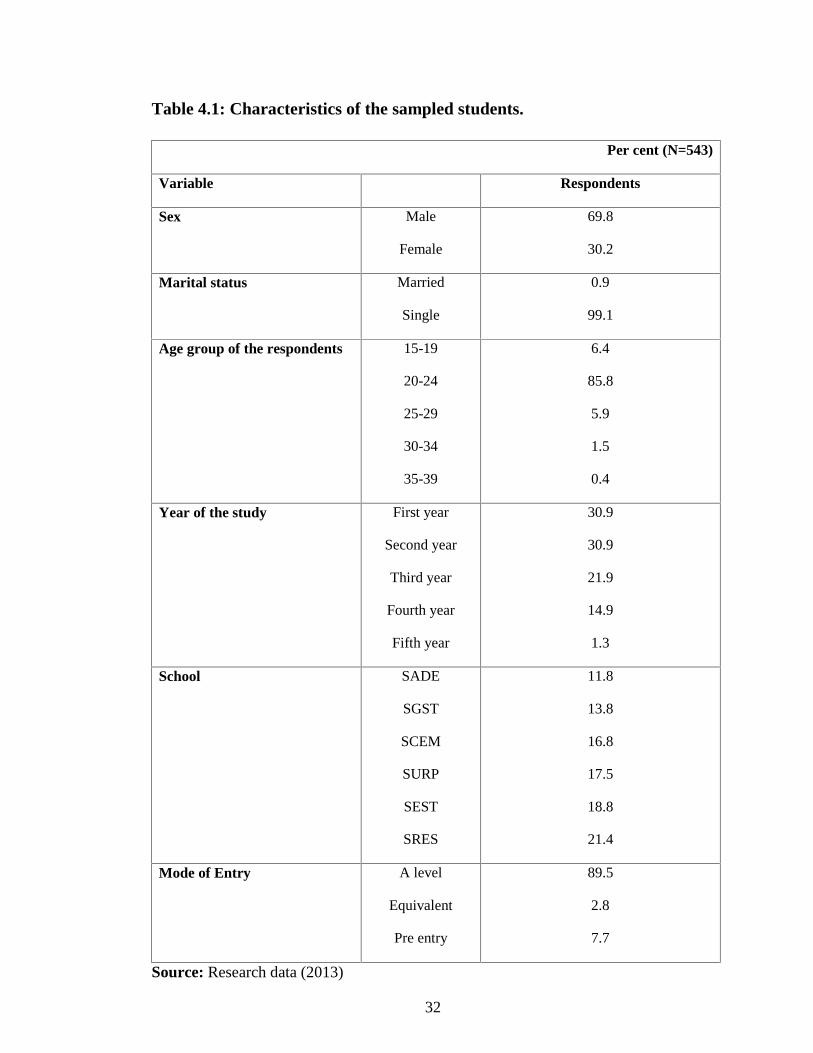
Table 4.1: Characteristics of the sampled students.
Per cent (N=543)
Variable Respondents
Sex Male
Female
69.8
30.2
Marital status Married
Single
0.9
99.1
Age group of the respondents 15-19
20-24
25-29
30-34
35-39
6.4
85.8
5.9
1.5
0.4
Year of the study First year
Second year
Third year
Fourth year
Fifth year
30.9
30.9
21.9
14.9
1.3
School SADE
SGST
SCEM
SURP
SEST
SRES
11.8
13.8
16.8
17.5
18.8
21.4
Mode of Entry A level
Equivalent
Pre entry
89.5
2.8
7.7
Source: Research data (2013)

33
With regards to marital status single students were many than married one. This is
because the large number of the students enrolled to the University are direct from
schools. As regards to age the majority of the sampled students lie between 20 to 24
years, followed by 15-19 years. The mean age was 22 years. According to the data age
ranged from 18 to 39 years, a range of 21 years. This means that there is reasonably a
big age difference between the youngest and the eldest student at the University.
According to the year of study, first and second year posses the greater number of
students followed by third, fourth and fifth year consecutively. School wise many
students came from the School of Real Estate Studies followed by the School of
Environmental Science and Technology, School of Urban and Regional Planning,
School of Construction Economics, Management and the School of Architecture and
Design. These distributions reflect preference of students during selection. In addition,
these degree programmes have been traditionally dominating at ARU in terms of
enrolling many students.
Figure 4.1: Sex distribution of the sampled students
Source: Research data (2013)

34
As per the mode of entry the majority of the sampled students entered into the
University with A level qualification 89% followed by the pre entry 8% and lastly those
with equivalent qualifications 3%. This is expected since currently many students in
Tanzania directly proceed from A' level studies to higher learning institutions.
4.3 Status of academic performance
At ARU students’ performance in examinations is assessed per semester. Examinations
include continuous assessment and final semester university exams. Continuous
assessment includes tests, assignments, and seminar presentations. Students with
respect to continuous assessment are required, in each semester, to do two written tests
(under examination conditions), two homework or practical/fieldwork exercises or
laboratory reports or quizzes.
University semester examinations include written, practical and oral exams. The scores
per subject in examinations are awarded in raw marks in per cent. The scores are then
respectively graded as A, B+, B, C, D or E. These grades are then given numerical
weights as presented in Table 1. The numerical weights are eventually used to calculate
an overall GPA. The GPA is calculated annually at the end of the second semester. The
annual GPAs are then used to generate an overall GPA at the end of the programme.
The GPAs are finally classified into five categories namely First Class (4.4 – 5.0),
Second Upper Class (3.5-4.3), Second Lower Class (2.7-3.4), Pass (2.0-2.6) and Fail
(below 2.0). The academic performance of each student at ARU is determined by the
University Senate.
The status of the student’s performance in examination at Ardhi University during the
2011/12 academic year was one of the objectives of this study. In addition this formed
the dependent variable of the study. The summary of the students’ performance in
examination is presented in Table 4.2 and Figure 4.2. According to data in Figure 2 and
the five categories presented earlier the performance of the students revealed a normal
distribution. Very few students failed or obtained a First Class. Majority of the students
were in the Upper Second Class category (43%) followed closely by the Lower Second
Class. The overall performance of the students was classified as Lower Second.

35
Table 4.2: Status of students’ performance in 2011/2012 examination atARU
Source: Research data (2013)
Figure 4.2: Status of students’ performance in 2011/2012 examination at ARU
Source: Research data (2013)
Further analysis of the performance during examinations showed that the minimum
GPA was 0.8 while the maximum GPA was 4.7. This gives a range of 3.9 between the
lowest and the highest performance of the students during examinations. The mean and
the mode GPA was 3.3. This means that majority of the students generally performed
well in their annual examinations.
As reported area GPA was used as the dependent variable of the study. In view of this,
subsequent sections have used this mean as an index for establishing the
GPA Per cent (n=543) Classification
Below 2.0 1.8 Fail
2.0-2.6 11.8 Pass
2.7-3.4 40.3 Second Lower Class
3.5-4.3 42.9 Second Upper Class
4.4-5.0 3.1 First Class
Mean GPA 3.3

36
relationship between various variables and the dependent variable, namely academic
performance.
4.4 Factors contributing to undergraduate performance in examination at ARU
4.4.1 Background variables and academic performance.
The students’ academic performance was then compared with the background variables.
Background variables used include school (programme) and year of study. The purpose
was to establish if the background of sampled students has any effect to academic
performance.
The results are presented in Table 4.3. According to data in Table 4.3 school wise the
highest performance was for the students in the School of Environmental Science and
Technology (SEST) and School of Urban and Regional Planning (SURP). Students in
School of Architecture and Design (SADE) and the School of Geospatial Science and
Technology SGST had the lowest performance).
In terms of year of study the highest performance was in year 4 followed by year one.
Year five experienced the lowest performance. Generally the trend academic of
performance increased by year save for the two exceptions. Probably because of
increase in experience among students of university environment as time goes. It is
important to note that the relationship between background variables was statistically
significant.
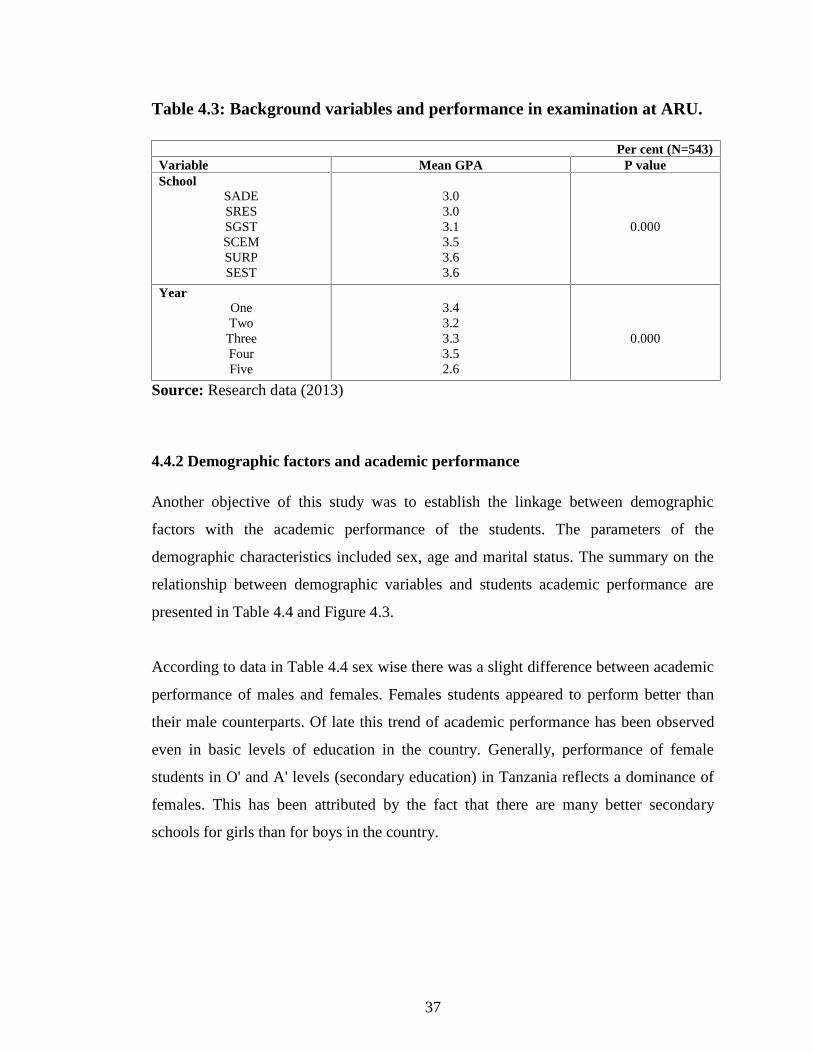
37
Table 4.3: Background variables and performance in examination at ARU.
Per cent (N=543)Variable Mean GPA P valueSchool
SADESRESSGSTSCEMSURPSEST
3.03.03.13.53.63.6
0.000
YearOneTwo
ThreeFourFive
3.43.23.33.52.6
0.000
Source: Research data (2013)
4.4.2 Demographic factors and academic performance
Another objective of this study was to establish the linkage between demographic
factors with the academic performance of the students. The parameters of the
demographic characteristics included sex, age and marital status. The summary on the
relationship between demographic variables and students academic performance are
presented in Table 4.4 and Figure 4.3.
According to data in Table 4.4 sex wise there was a slight difference between academic
performance of males and females. Females students appeared to perform better than
their male counterparts. Of late this trend of academic performance has been observed
even in basic levels of education in the country. Generally, performance of female
students in O' and A' levels (secondary education) in Tanzania reflects a dominance of
females. This has been attributed by the fact that there are many better secondary
schools for girls than for boys in the country.

38
Table 4.4 Demographic variables and academic performance
Source: Research data (2013)
Figure 4.3: Academic performance by age
Source: Research data (2013)
As regards marital status single students slightly performed better than the married ones.
Presumably this reflects the family obligations that married students’ experience.
However, the relationship between sex and marital status was not significantly related
with academic performance.
Percent (N=543)Variable N% Mean P value
SexMaleFemale
69.830.2
3.33.4
0.201
Marital statusMarriedSingle
0.999.0
3.33.5 0.371
Age15-1920 - 2425 - 2930 - 3435- 39
6.485.85.91.50.4
3.63.33.13.23.3
0.009
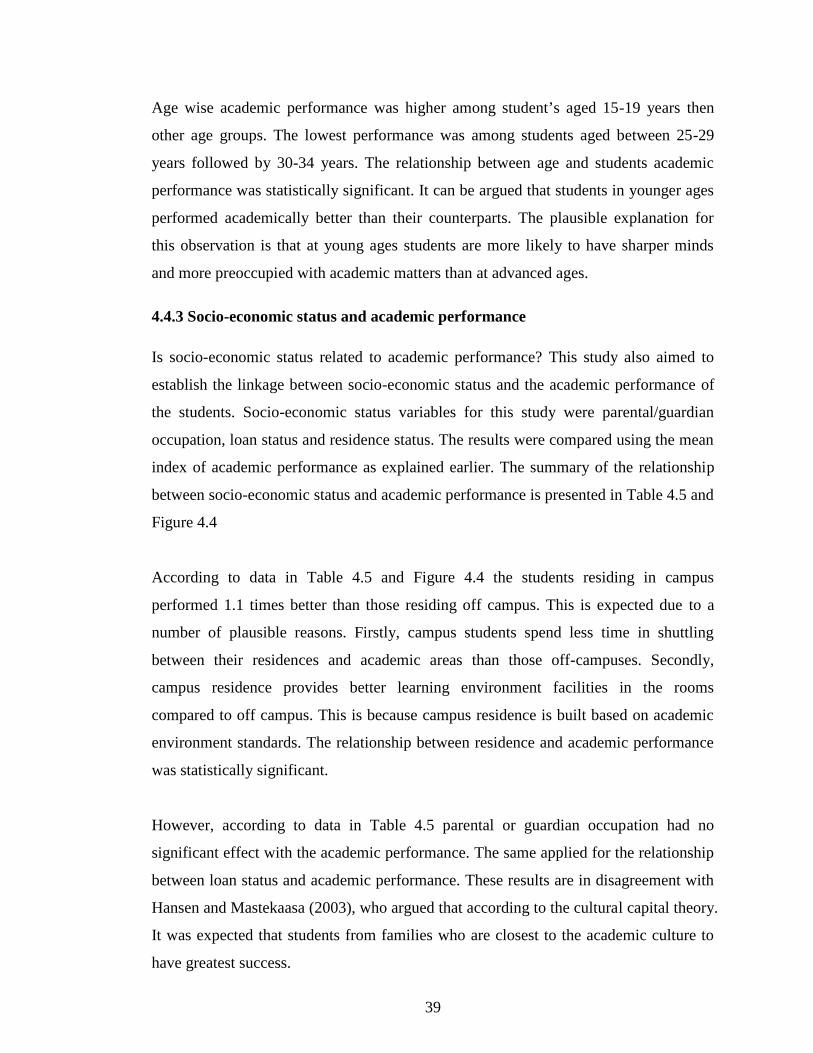
39
Age wise academic performance was higher among student’s aged 15-19 years then
other age groups. The lowest performance was among students aged between 25-29
years followed by 30-34 years. The relationship between age and students academic
performance was statistically significant. It can be argued that students in younger ages
performed academically better than their counterparts. The plausible explanation for
this observation is that at young ages students are more likely to have sharper minds
and more preoccupied with academic matters than at advanced ages.
4.4.3 Socio-economic status and academic performance
Is socio-economic status related to academic performance? This study also aimed to
establish the linkage between socio-economic status and the academic performance of
the students. Socio-economic status variables for this study were parental/guardian
occupation, loan status and residence status. The results were compared using the mean
index of academic performance as explained earlier. The summary of the relationship
between socio-economic status and academic performance is presented in Table 4.5 and
Figure 4.4
According to data in Table 4.5 and Figure 4.4 the students residing in campus
performed 1.1 times better than those residing off campus. This is expected due to a
number of plausible reasons. Firstly, campus students spend less time in shuttling
between their residences and academic areas than those off-campuses. Secondly,
campus residence provides better learning environment facilities in the rooms
compared to off campus. This is because campus residence is built based on academic
environment standards. The relationship between residence and academic performance
was statistically significant.
However, according to data in Table 4.5 parental or guardian occupation had no
significant effect with the academic performance. The same applied for the relationship
between loan status and academic performance. These results are in disagreement with
Hansen and Mastekaasa (2003), who argued that according to the cultural capital theory.
It was expected that students from families who are closest to the academic culture to
have greatest success.
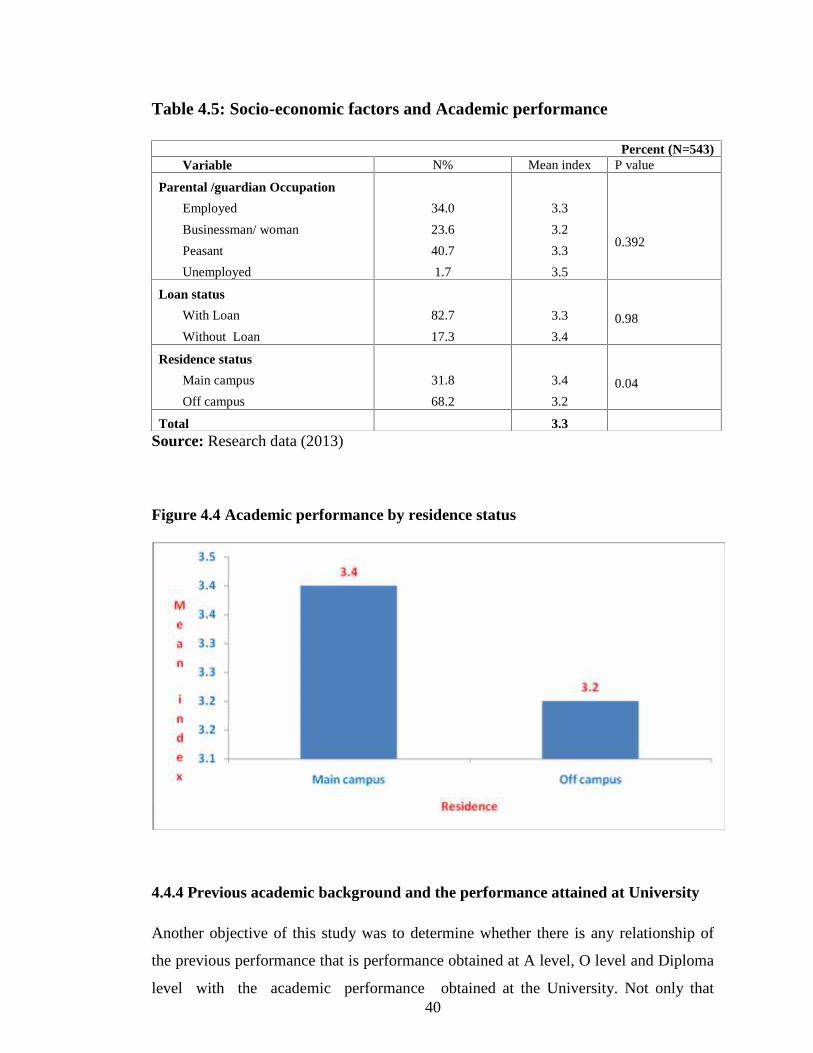
40
Table 4.5: Socio-economic factors and Academic performance
Source: Research data (2013)
Figure 4.4 Academic performance by residence status
4.4.4 Previous academic background and the performance attained at University
Another objective of this study was to determine whether there is any relationship of
the previous performance that is performance obtained at A level, O level and Diploma
level with the academic performance obtained at the University. Not only that
Percent (N=543)Variable N% Mean index P value
Parental /guardian Occupation
Employed
Businessman/ woman
Peasant
Unemployed
34.0
23.6
40.7
1.7
3.3
3.2
3.3
3.5
0.392
Loan status
With Loan
Without Loan
82.7
17.3
3.3
3.40.98
Residence status
Main campus
Off campus
31.8
68.2
3.4
3.20.04
Total 3.3
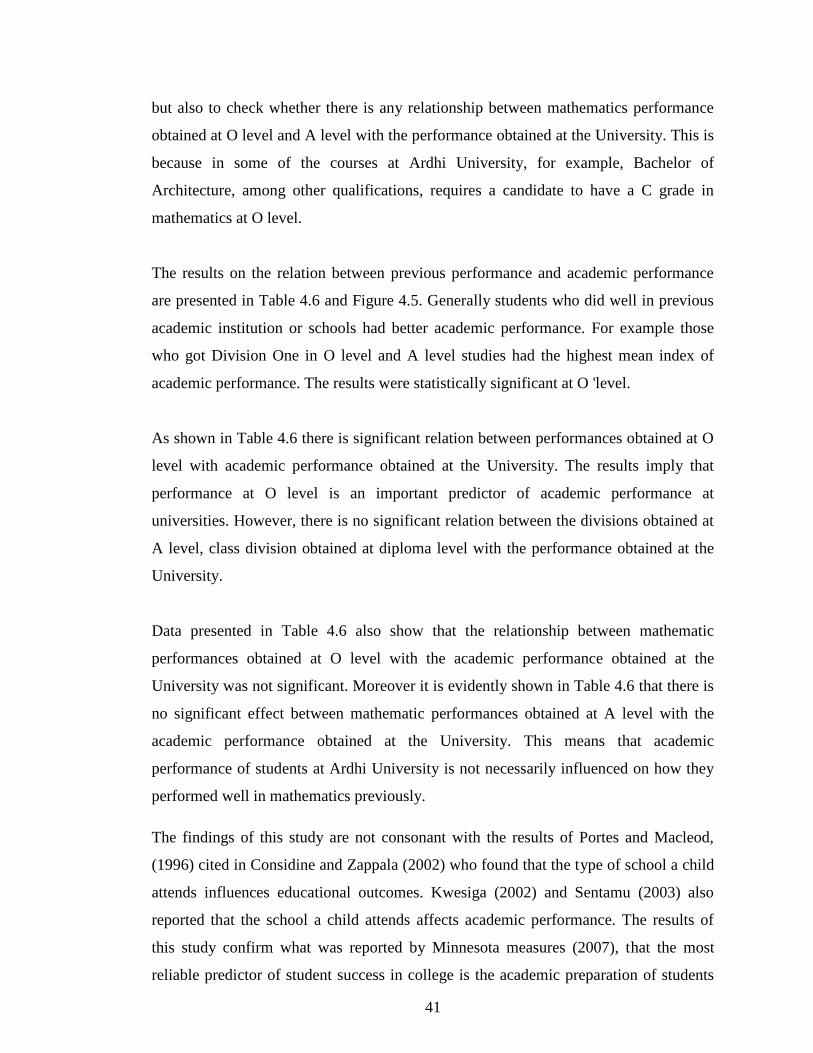
41
but also to check whether there is any relationship between mathematics performance
obtained at O level and A level with the performance obtained at the University. This is
because in some of the courses at Ardhi University, for example, Bachelor of
Architecture, among other qualifications, requires a candidate to have a C grade in
mathematics at O level.
The results on the relation between previous performance and academic performance
are presented in Table 4.6 and Figure 4.5. Generally students who did well in previous
academic institution or schools had better academic performance. For example those
who got Division One in O level and A level studies had the highest mean index of
academic performance. The results were statistically significant at O 'level.
As shown in Table 4.6 there is significant relation between performances obtained at O
level with academic performance obtained at the University. The results imply that
performance at O level is an important predictor of academic performance at
universities. However, there is no significant relation between the divisions obtained at
A level, class division obtained at diploma level with the performance obtained at the
University.
Data presented in Table 4.6 also show that the relationship between mathematic
performances obtained at O level with the academic performance obtained at the
University was not significant. Moreover it is evidently shown in Table 4.6 that there is
no significant effect between mathematic performances obtained at A level with the
academic performance obtained at the University. This means that academic
performance of students at Ardhi University is not necessarily influenced on how they
performed well in mathematics previously.
The findings of this study are not consonant with the results of Portes and Macleod,
(1996) cited in Considine and Zappala (2002) who found that the type of school a child
attends influences educational outcomes. Kwesiga (2002) and Sentamu (2003) also
reported that the school a child attends affects academic performance. The results of
this study confirm what was reported by Minnesota measures (2007), that the most
reliable predictor of student success in college is the academic preparation of students

42
in high school. This could owe to the fact that background performance have an
independent effect on student attainment and that the previous performance effect is
likely to operate through variation in quality and attitudes, so teachers at disadvantaged
schools often hold low expectations of their students which compound the low
expectations the students have, hence leading to poor performance by the students.
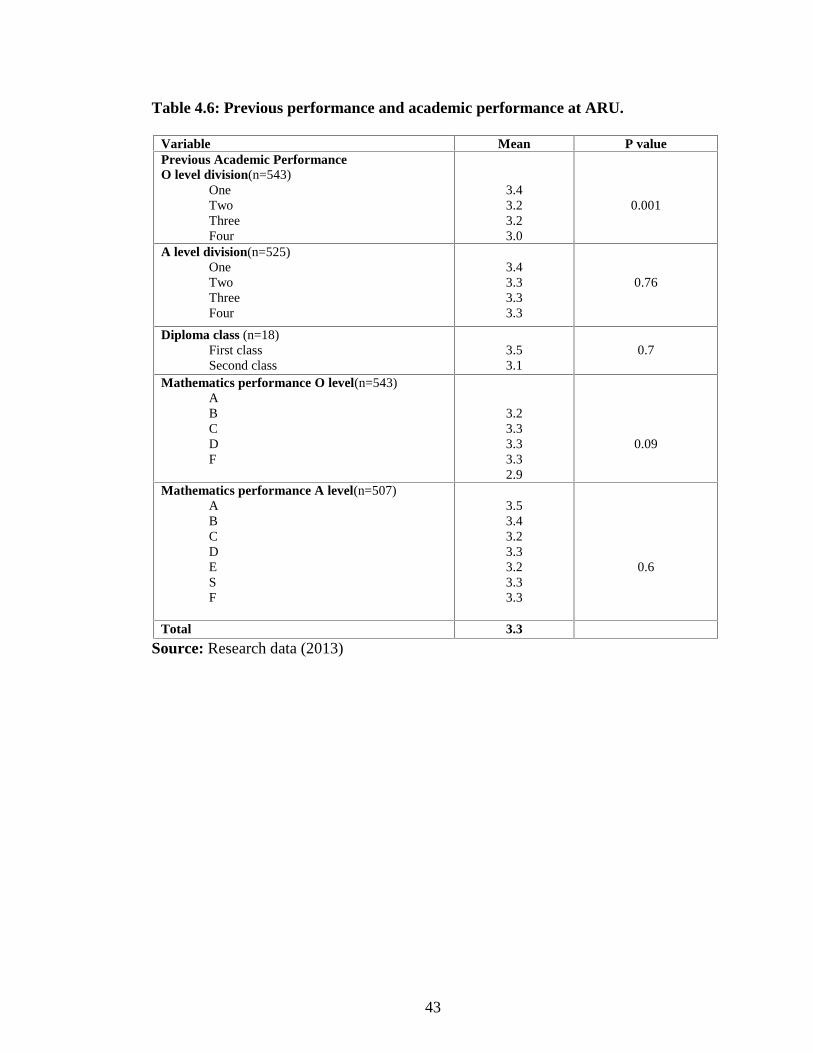
43
Table 4.6: Previous performance and academic performance at ARU.
Source: Research data (2013)
Variable Mean P valuePrevious Academic PerformanceO level division(n=543)
OneTwoThreeFour
3.43.23.23.0
0.001
A level division(n=525)OneTwoThreeFour
3.43.33.33.3
0.76
Diploma class (n=18)First classSecond class
3.53.1
0.7
Mathematics performance O level(n=543)ABCDF
3.23.33.33.32.9
0.09
Mathematics performance A level(n=507)ABCDESF
3.53.43.23.33.23.33.3
0.6
Total 3.3
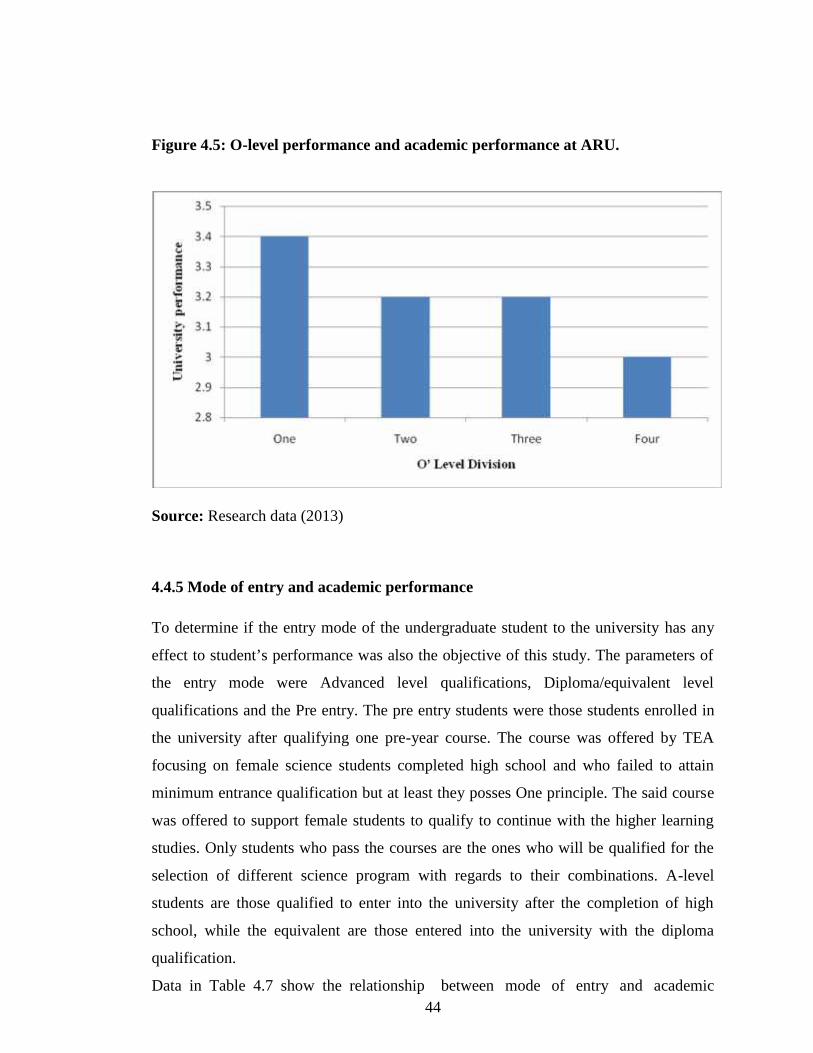
44
Figure 4.5: O-level performance and academic performance at ARU.
Source: Research data (2013)
4.4.5 Mode of entry and academic performance
To determine if the entry mode of the undergraduate student to the university has any
effect to student’s performance was also the objective of this study. The parameters of
the entry mode were Advanced level qualifications, Diploma/equivalent level
qualifications and the Pre entry. The pre entry students were those students enrolled in
the university after qualifying one pre-year course. The course was offered by TEA
focusing on female science students completed high school and who failed to attain
minimum entrance qualification but at least they posses One principle. The said course
was offered to support female students to qualify to continue with the higher learning
studies. Only students who pass the courses are the ones who will be qualified for the
selection of different science program with regards to their combinations. A-level
students are those qualified to enter into the university after the completion of high
school, while the equivalent are those entered into the university with the diploma
qualification.
Data in Table 4.7 show the relationship between mode of entry and academic
45
performance. The results were compared once again using the mean index. According
to data presented in Table 4.7 academic performance. Was slightly higher among those
with A level qualification than other categories. However the relationship was not
significant. The mode of entry was not a predicator of academic performance.
Table 4.7: Mode of entry and student’s academic performance at ARU
Percent (N=543)Mode of entry Mean N P value
With A level qualifications 3.4 496
0.14With equivalent qualifications 3.2 15With pre entry qualifications 3.1 32Total 3.3 543
Source: Research data (2013)
4.4.6 Learning Environment and academic performance
The relationship between learning environment and academic performance was also
another objective of this study. Learning environment parameters included University
facilities based on number of instructors per School, the total number of unit taken by
the students with regards to their programme and the number of students per class. The
total number of unit is the combination of all units in each course taken per programme
in the year 2011/2012 by the students.
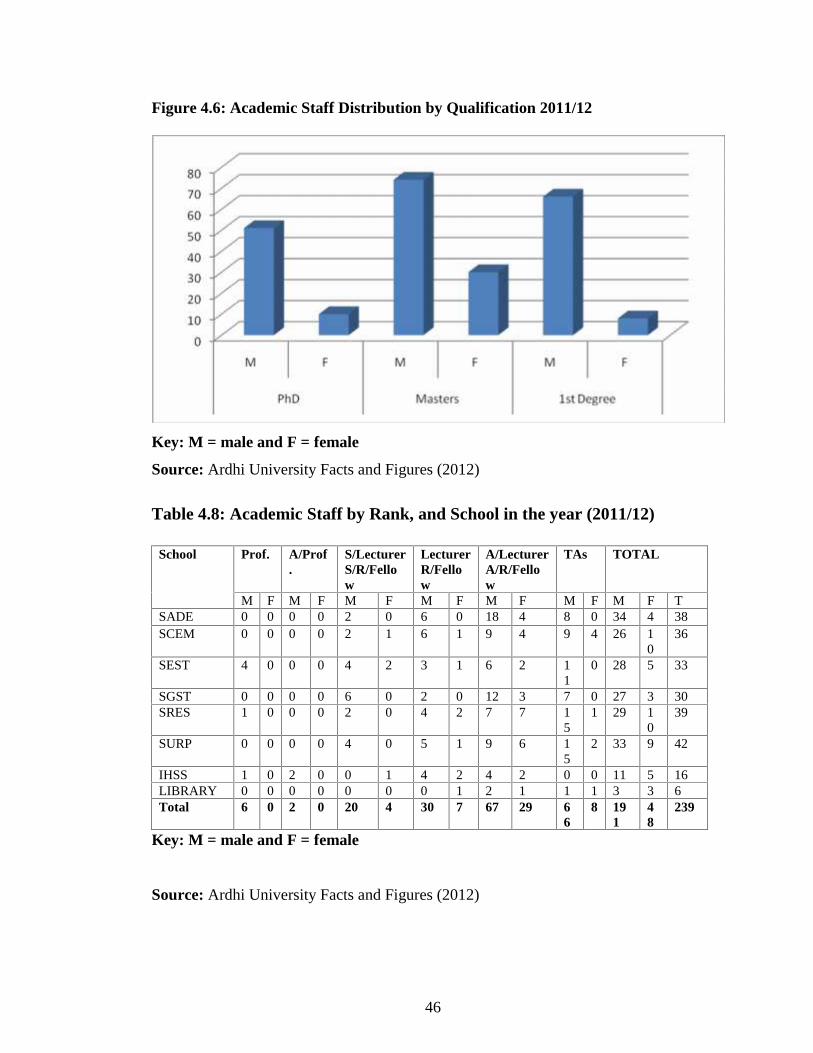
46
Figure 4.6: Academic Staff Distribution by Qualification 2011/12
Key: M = male and F = female
Source: Ardhi University Facts and Figures (2012)
Table 4.8: Academic Staff by Rank, and School in the year (2011/12)
School Prof. A/Prof.
S/LecturerS/R/Fellow
LecturerR/Fellow
A/LecturerA/R/Fellow
TAs TOTAL
M F M F M F M F M F M F M F TSADE 0 0 0 0 2 0 6 0 18 4 8 0 34 4 38SCEM 0 0 0 0 2 1 6 1 9 4 9 4 26 1
036
SEST 4 0 0 0 4 2 3 1 6 2 11
0 28 5 33
SGST 0 0 0 0 6 0 2 0 12 3 7 0 27 3 30SRES 1 0 0 0 2 0 4 2 7 7 1
51 29 1
039
SURP 0 0 0 0 4 0 5 1 9 6 15
2 33 9 42
IHSS 1 0 2 0 0 1 4 2 4 2 0 0 11 5 16LIBRARY 0 0 0 0 0 0 0 1 2 1 1 1 3 3 6Total 6 0 2 0 20 4 30 7 67 29 6
68 19
148
239
Key: M = male and F = female
Source: Ardhi University Facts and Figures (2012)
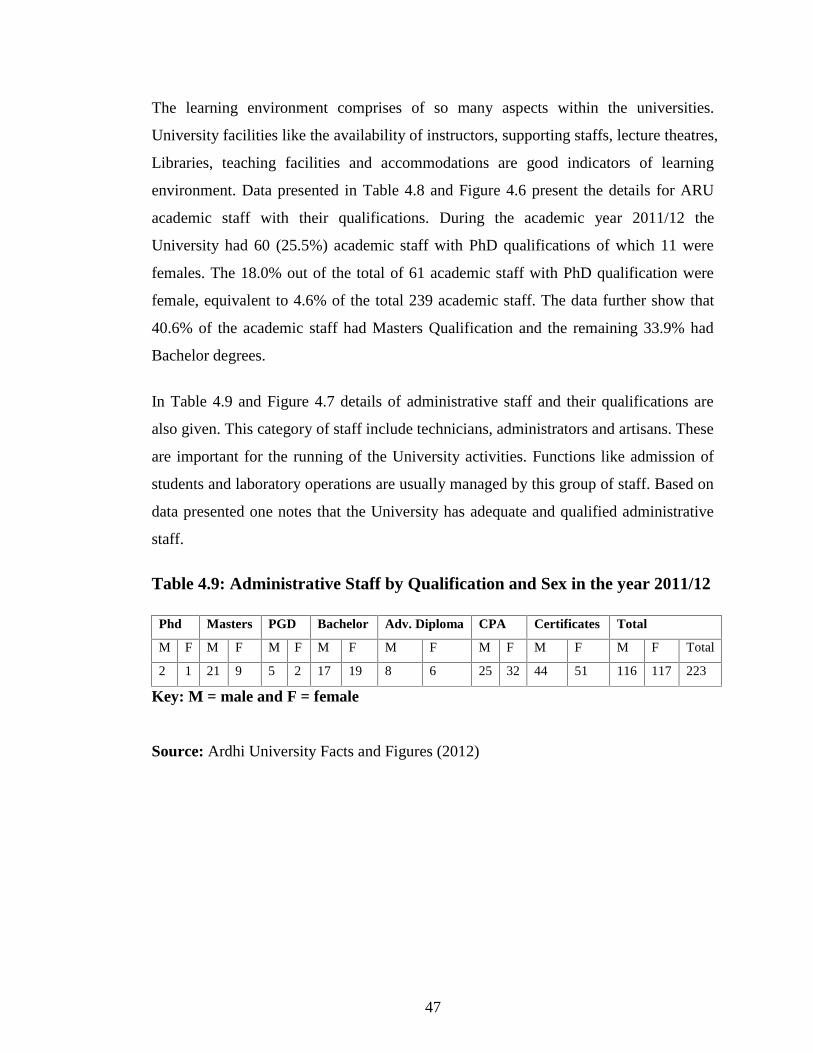
47
The learning environment comprises of so many aspects within the universities.
University facilities like the availability of instructors, supporting staffs, lecture theatres,
Libraries, teaching facilities and accommodations are good indicators of learning
environment. Data presented in Table 4.8 and Figure 4.6 present the details for ARU
academic staff with their qualifications. During the academic year 2011/12 the
University had 60 (25.5%) academic staff with PhD qualifications of which 11 were
females. The 18.0% out of the total of 61 academic staff with PhD qualification were
female, equivalent to 4.6% of the total 239 academic staff. The data further show that
40.6% of the academic staff had Masters Qualification and the remaining 33.9% had
Bachelor degrees.
In Table 4.9 and Figure 4.7 details of administrative staff and their qualifications are
also given. This category of staff include technicians, administrators and artisans. These
are important for the running of the University activities. Functions like admission of
students and laboratory operations are usually managed by this group of staff. Based on
data presented one notes that the University has adequate and qualified administrative
staff.
Table 4.9: Administrative Staff by Qualification and Sex in the year 2011/12
Phd Masters PGD Bachelor Adv. Diploma CPA Certificates Total
M F M F M F M F M F M F M F M F Total
2 1 21 9 5 2 17 19 8 6 25 32 44 51 116 117 223
Key: M = male and F = female
Source: Ardhi University Facts and Figures (2012)
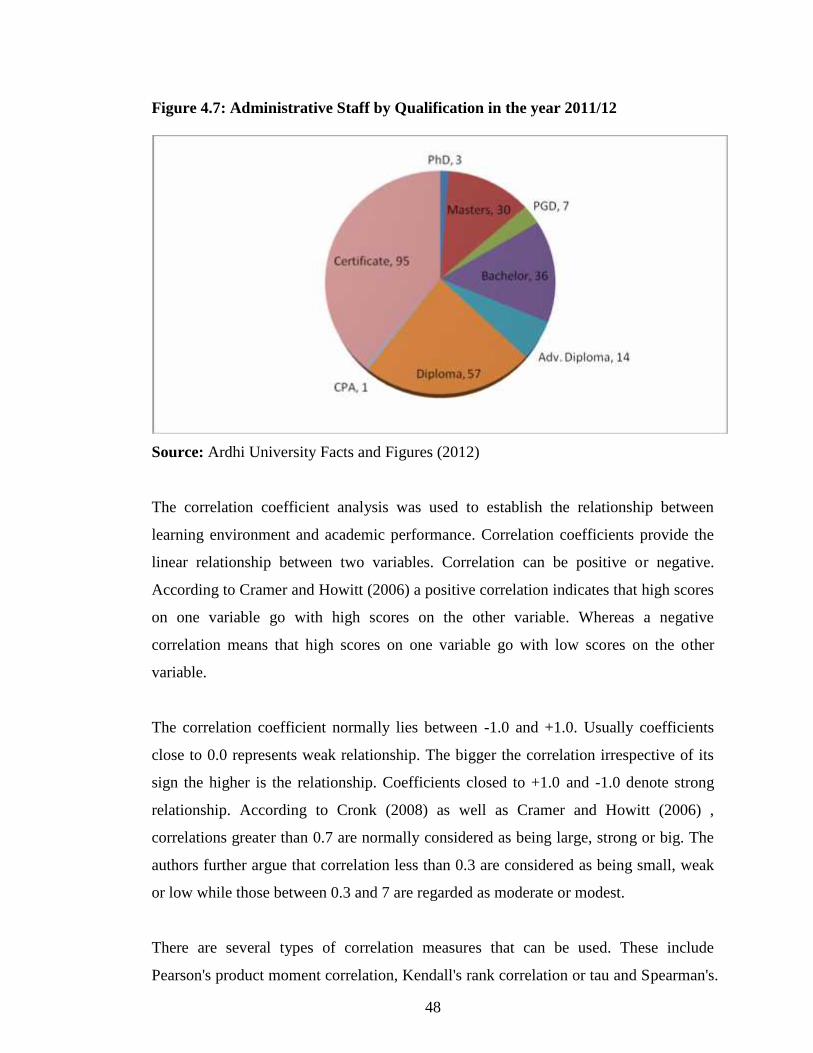
48
Figure 4.7: Administrative Staff by Qualification in the year 2011/12
Source: Ardhi University Facts and Figures (2012)
The correlation coefficient analysis was used to establish the relationship between
learning environment and academic performance. Correlation coefficients provide the
linear relationship between two variables. Correlation can be positive or negative.
According to Cramer and Howitt (2006) a positive correlation indicates that high scores
on one variable go with high scores on the other variable. Whereas a negative
correlation means that high scores on one variable go with low scores on the other
variable.
The correlation coefficient normally lies between -1.0 and +1.0. Usually coefficients
close to 0.0 represents weak relationship. The bigger the correlation irrespective of its
sign the higher is the relationship. Coefficients closed to +1.0 and -1.0 denote strong
relationship. According to Cronk (2008) as well as Cramer and Howitt (2006) ,
correlations greater than 0.7 are normally considered as being large, strong or big. The
authors further argue that correlation less than 0.3 are considered as being small, weak
or low while those between 0.3 and 7 are regarded as moderate or modest.
There are several types of correlation measures that can be used. These include
Pearson's product moment correlation, Kendall's rank correlation or tau and Spearman's.
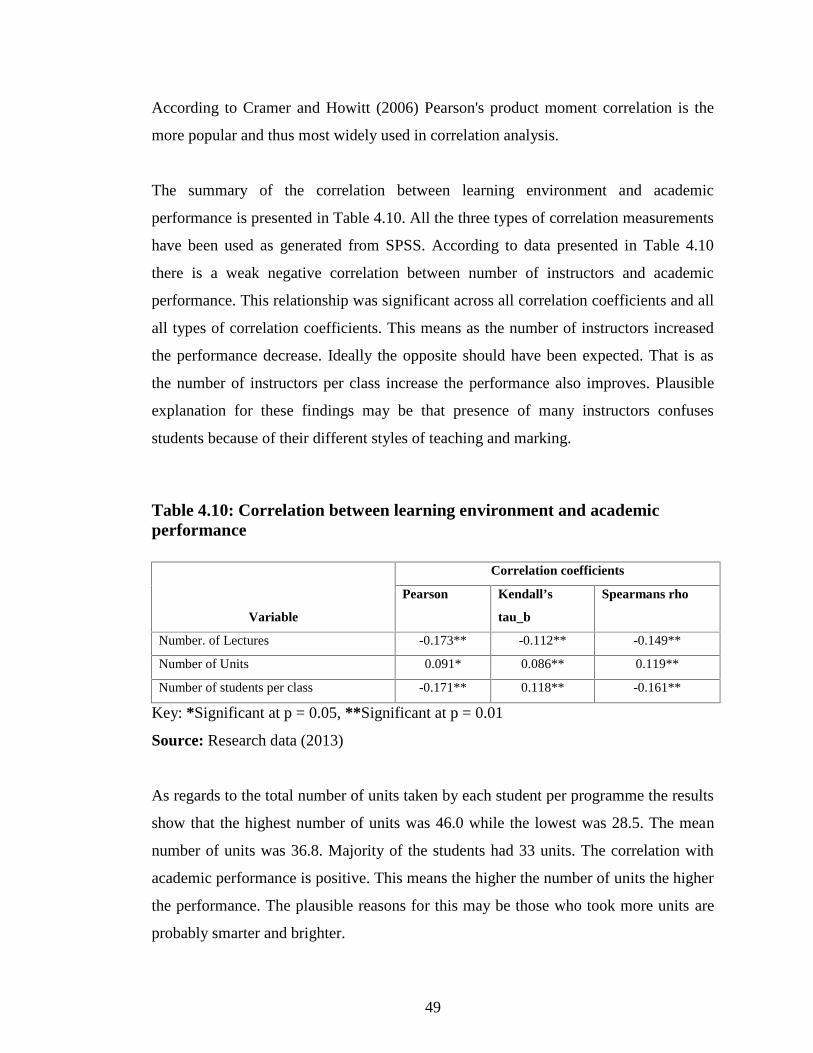
49
According to Cramer and Howitt (2006) Pearson's product moment correlation is the
more popular and thus most widely used in correlation analysis.
The summary of the correlation between learning environment and academic
performance is presented in Table 4.10. All the three types of correlation measurements
have been used as generated from SPSS. According to data presented in Table 4.10
there is a weak negative correlation between number of instructors and academic
performance. This relationship was significant across all correlation coefficients and all
all types of correlation coefficients. This means as the number of instructors increased
the performance decrease. Ideally the opposite should have been expected. That is as
the number of instructors per class increase the performance also improves. Plausible
explanation for these findings may be that presence of many instructors confuses
students because of their different styles of teaching and marking.
Table 4.10: Correlation between learning environment and academicperformance
Variable
Correlation coefficients
Pearson Kendall’s
tau_b
Spearmans rho
Number. of Lectures -0.173** -0.112** -0.149**
Number of Units 0.091* 0.086** 0.119**
Number of students per class -0.171** 0.118** -0.161**
Key: *Significant at p = 0.05, **Significant at p = 0.01
Source: Research data (2013)
As regards to the total number of units taken by each student per programme the results
show that the highest number of units was 46.0 while the lowest was 28.5. The mean
number of units was 36.8. Majority of the students had 33 units. The correlation with
academic performance is positive. This means the higher the number of units the higher
the performance. The plausible reasons for this may be those who took more units are
probably smarter and brighter.
50
According to class size the results shows that the correlation between number of
students per class with academic performance are negative. This means that the larger
the class the lower the performance. The plausible explanation for this large classes
crate management problem during teaching especially because the infrastructure at
ARU is not conducive for large classes. For example there is in adequate public address
system for large classes. In addition close supervision of students becomes challenge if
large classes are managed by a single instructor.
The results of this study are consonant with the studies of Tinto (1993) and Thomas
(2002).who reported that among other factors contributed to academic performance,
factors relating to the learning environment have been identified to influence students’
performance. Such factors include the nature of the teaching and learning processes, the
availability of learning resources such as library, class rooms (lecturer theatres), support
from teachers and peers, social services and extra-curricular activities
4.5 Multivariate analysis of determinants of academic status performance
Multivariate analysis employed multiple linear regression models for establishing
relationship between students’ academic performance and proposed explanatory factors.
Multiple linear regression analysis allows the prediction of one variable from several
other variables.
Multiple regression is an extension of simple linear regression. It is usually used when
one wants to predict value of a variable based on the value of two or more other
variables. The variable intended for prediction is called the dependent variable.
Sometimes this variable is also called the outcome, target, explained, response,
predicted or criterion variable. The variables used to predict the value of the dependent
variable are called independent variables. These are also known as the predictor,
control, explanatory or regressor variables.
Multiple regression analysis is a method designed to measure linear relationship
between dependent variable and two or more (mutiple) independent or predictor
variables. According to Cramer, and Howitt (2006) the predictor variables
51
could be qualitative or quantitative. The authors further argue that if the predictors are
qualitative they have to be transformed into dichotomous variables known as dummy
variables. Usually during this process the dummy variables are made one less than the
number of categories making the qualitative variable. Multiple regression allows one to
determine the fitness of the model and the relative contribution of each of the predictors
to the total variance explained.
This study intended to show the independent influence of several variables to the
dependent variable that is academic performance. The proposed linear regression model
used was as follows:
Y= ba + b1 X1 + b2 X2 + b3 X3 + b4 X4 + b5 X5 + b6X6 + bnXn + ci
Where, Y is the dependent variable and it represents academic performance of the
students, ba is constant, b1 to bn are the coefficients, X1 to Xn are explanatory
(independent) variables for the academic performance of students and ci is the standard
error.
In this study 15 independent variables were proposed, namely: class size, number of
lecturers, number of units taken, age, sex, marital status, parental occupation, access to
loan, residence status, O’ Level division, A’ Level division, Diploma class, math’s
performance O’ Level, math’s performance A’ Level and mode of entry. These
variables were used in the equation representing X1 to X15 as follows:
X1 = Number of students per class
X2 = Number of lecturers
X3 = Number of units taken
X4 = Age
X5 = Sex
X6 = Marital status
X7 = Parental occupation
X8 = Access to loan
X9 = Residence status
X10 =O’ Level division
X11 = A’ Level division

52
X12 = Diploma class
X13 = Math’s performance O’ Level
X14 = Math’s performance A’ Level
X15 = Mode of entry
Multiple regression assume that all values of the variables are interval or ratio scaled. In
view of this, and as stated previously, as some of the variables were nominal
(qualitative) these were transformed into dummy variables (interval) to allow multiple
linear regression analysis. The variables used for regression analysis and their
characteristics are presented in Table 13.
There are several methods in SPSS that can be used for multivariate regression analysis.
These include ‘Enter’, ‘Stepwise’, ‘Remove’, ‘Backward’ and ‘Forward’. All the above
variables were analysed using ‘Enter’ method of the SPSS. This method is most widely
used in regression analysis (Cronk, 2008) and is sometimes known as the standard
multiple regression (Cramer and Howitt, 2006). The method puts all the variables in the
equation and determines whether they are significant or not. When the variables were
entered one variable, ‘Diploma class division’ was rejected by the programme. In view
of this, the variable was removed in the analysis.
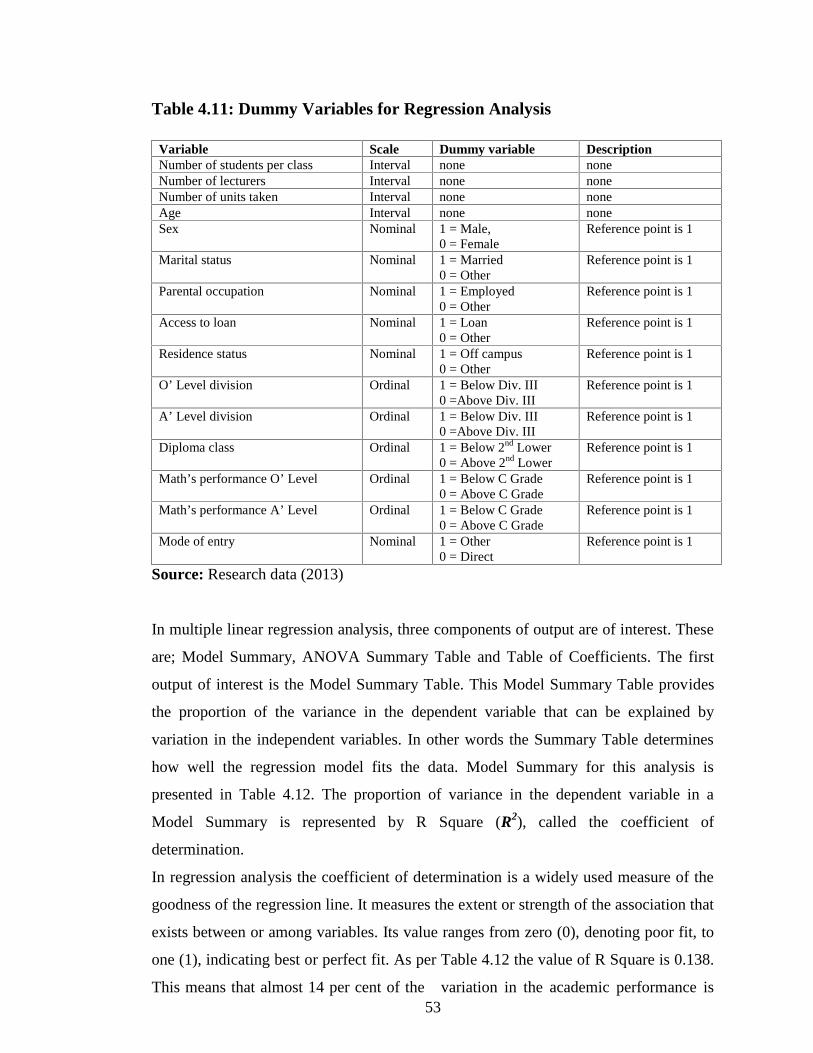
53
Table 4.11: Dummy Variables for Regression Analysis
Variable Scale Dummy variable DescriptionNumber of students per class Interval none noneNumber of lecturers Interval none noneNumber of units taken Interval none noneAge Interval none noneSex Nominal 1 = Male,
0 = FemaleReference point is 1
Marital status Nominal 1 = Married0 = Other
Reference point is 1
Parental occupation Nominal 1 = Employed0 = Other
Reference point is 1
Access to loan Nominal 1 = Loan0 = Other
Reference point is 1
Residence status Nominal 1 = Off campus0 = Other
Reference point is 1
O’ Level division Ordinal 1 = Below Div. III0 =Above Div. III
Reference point is 1
A’ Level division Ordinal 1 = Below Div. III0 =Above Div. III
Reference point is 1
Diploma class Ordinal 1 = Below 2nd Lower0 = Above 2nd Lower
Reference point is 1
Math’s performance O’ Level Ordinal 1 = Below C Grade0 = Above C Grade
Reference point is 1
Math’s performance A’ Level Ordinal 1 = Below C Grade0 = Above C Grade
Reference point is 1
Mode of entry Nominal 1 = Other0 = Direct
Reference point is 1
Source: Research data (2013)
In multiple linear regression analysis, three components of output are of interest. These
are; Model Summary, ANOVA Summary Table and Table of Coefficients. The first
output of interest is the Model Summary Table. This Model Summary Table provides
the proportion of the variance in the dependent variable that can be explained by
variation in the independent variables. In other words the Summary Table determines
how well the regression model fits the data. Model Summary for this analysis is
presented in Table 4.12. The proportion of variance in the dependent variable in a
Model Summary is represented by R Square (R2), called the coefficient of
determination.
In regression analysis the coefficient of determination is a widely used measure of the
goodness of the regression line. It measures the extent or strength of the association that
exists between or among variables. Its value ranges from zero (0), denoting poor fit, to
one (1), indicating best or perfect fit. As per Table 4.12 the value of R Square is 0.138.
This means that almost 14 per cent of the variation in the academic performance is
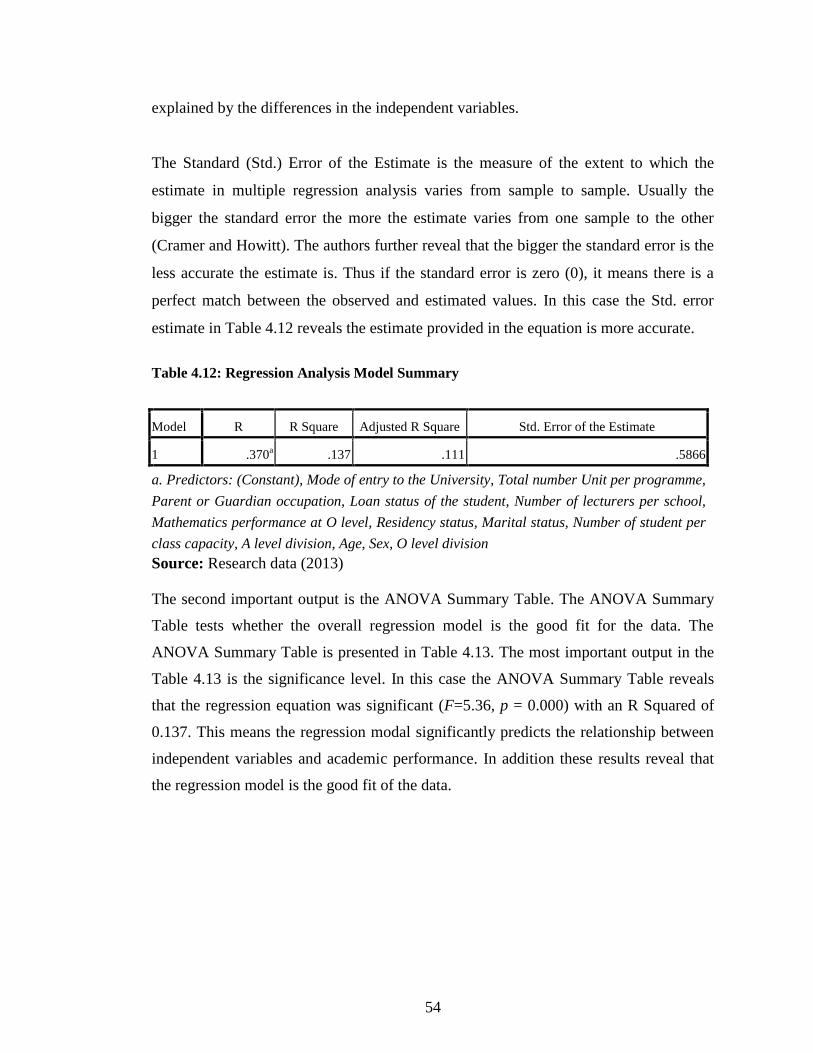
54
explained by the differences in the independent variables.
The Standard (Std.) Error of the Estimate is the measure of the extent to which the
estimate in multiple regression analysis varies from sample to sample. Usually the
bigger the standard error the more the estimate varies from one sample to the other
(Cramer and Howitt). The authors further reveal that the bigger the standard error is the
less accurate the estimate is. Thus if the standard error is zero (0), it means there is a
perfect match between the observed and estimated values. In this case the Std. error
estimate in Table 4.12 reveals the estimate provided in the equation is more accurate.
Source: Research data (2013)
The second important output is the ANOVA Summary Table. The ANOVA Summary
Table tests whether the overall regression model is the good fit for the data. The
ANOVA Summary Table is presented in Table 4.13. The most important output in the
Table 4.13 is the significance level. In this case the ANOVA Summary Table reveals
that the regression equation was significant (F=5.36, p = 0.000) with an R Squared of
0.137. This means the regression modal significantly predicts the relationship between
independent variables and academic performance. In addition these results reveal that
the regression model is the good fit of the data.
Table 4.12: Regression Analysis Model Summary
Model R R Square Adjusted R Square Std. Error of the Estimate
1 .370a .137 .111 .5866
a. Predictors: (Constant), Mode of entry to the University, Total number Unit per programme,
Parent or Guardian occupation, Loan status of the student, Number of lecturers per school,
Mathematics performance at O level, Residency status, Marital status, Number of student per
class capacity, A level division, Age, Sex, O level division
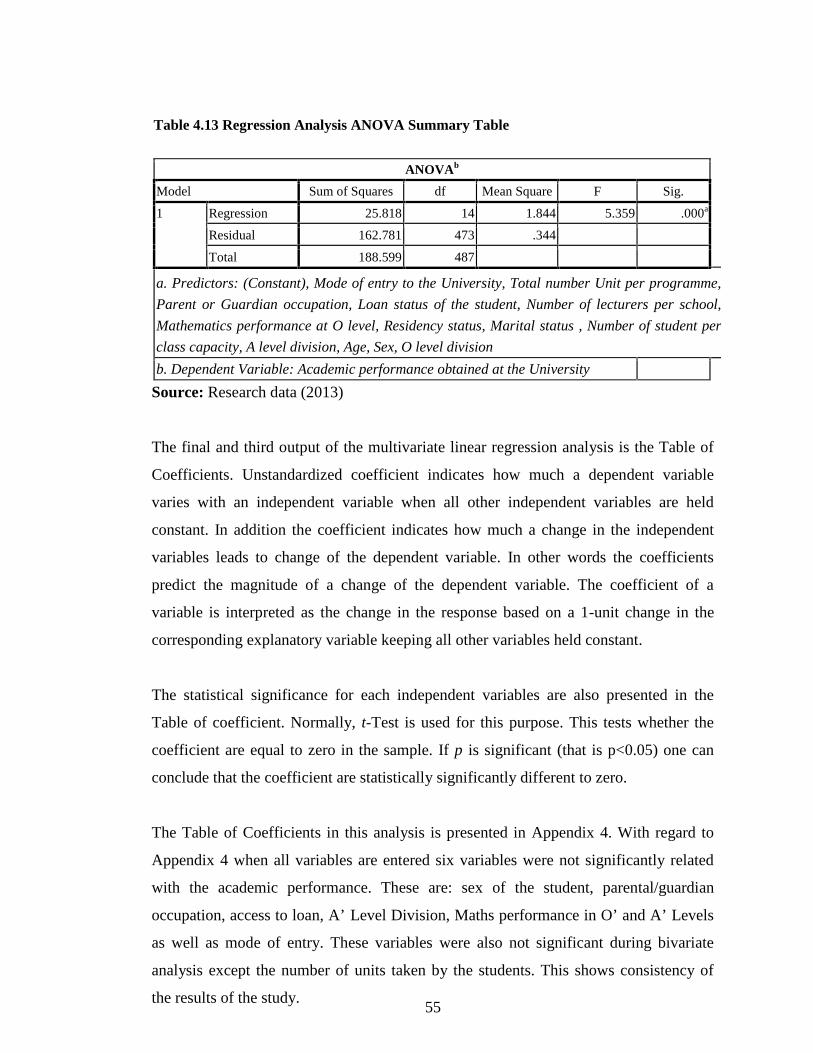
55
Table 4.13 Regression Analysis ANOVA Summary Table
ANOVAb
Model Sum of Squares df Mean Square F Sig.
1 Regression 25.818 14 1.844 5.359 .000a
Residual 162.781 473 .344
Total 188.599 487
a. Predictors: (Constant), Mode of entry to the University, Total number Unit per programme,
Parent or Guardian occupation, Loan status of the student, Number of lecturers per school,
Mathematics performance at O level, Residency status, Marital status , Number of student per
class capacity, A level division, Age, Sex, O level division
b. Dependent Variable: Academic performance obtained at the University
Source: Research data (2013)
The final and third output of the multivariate linear regression analysis is the Table of
Coefficients. Unstandardized coefficient indicates how much a dependent variable
varies with an independent variable when all other independent variables are held
constant. In addition the coefficient indicates how much a change in the independent
variables leads to change of the dependent variable. In other words the coefficients
predict the magnitude of a change of the dependent variable. The coefficient of a
variable is interpreted as the change in the response based on a 1-unit change in the
corresponding explanatory variable keeping all other variables held constant.
The statistical significance for each independent variables are also presented in the
Table of coefficient. Normally, t-Test is used for this purpose. This tests whether the
coefficient are equal to zero in the sample. If p is significant (that is p<0.05) one can
conclude that the coefficient are statistically significantly different to zero.
The Table of Coefficients in this analysis is presented in Appendix 4. With regard to
Appendix 4 when all variables are entered six variables were not significantly related
with the academic performance. These are: sex of the student, parental/guardian
occupation, access to loan, A’ Level Division, Maths performance in O’ and A’ Levels
as well as mode of entry. These variables were also not significant during bivariate
analysis except the number of units taken by the students. This shows consistency of
the results of the study.
56
Further analysis in Appendix 4 reveals that consistently class size, number of
instructors, age, marital status, residence status and performance during O’ level are
significantly related with academic performance at Ardhi University. The same
relationship was also established during bivariate analysis. These results further
confirm the consistency of the findings obtained in the study.
The results in Appendix 4 further show that as the class size and number of instructors
increase the academic performance declines. Likewise married students and those
residing off campus performed poorly than their counterparts. Furthermore, those who
performed well in O’ level did well at the university.
All in all according to Beta coefficients presented in Appendix4 the most important
predictors of academic performance at Ardhi University were marital status, residence
status and O’ level performance. Marital status of students cause 63 per cent of the
variation in academic performance among students. Residence status of the students
causes 12.6 per cent of the variation while performance in O' level leads to 10.5 per
cent of the variation in academic performance of students in examination at Ardhi
University. The contribution of other significant variables is less than 5 per cent of
variation in academic performance.
57
CHAPTER FIVE
SUMMARY, CONCLUSIONS AND RECOMMENDATIONS
5.0 IntroductionThe main objective of this study was to analyze the determinants of undergraduate
academic performance in examination at Ardhi University. The study involved the
students enrolled in the academic year 2011/2012. Along with this, different variables
such as age, sex marital status, socio-economic status, previous education performance,
loan status residency and mode of entry were used to determine the status of academic
performance in examination at ARU. Mean index of academic performance was used to
test significant association between undergraduate performance and the predictor
variables. In this Chapter summary of the major findings of study, conclusions and
recommendations are presented.
5.1 Summary of the Major findings
The summary of the major findings are presented in two parts namely the general and
bivariate and regression analysis results. The general parts involve the findings such as
background, demographic, learning environment, socio-economic previous academic
and admission criteria. The bivariate analysis findings show the relationship between
the independent variable of the study and academic performance in examinations. The
regression analysis results combine all the factors in order to establish their association
with academic performance in examination at ARU.
5.1.1 General characteristics
The study has shown that majority of the sampled students come from the school of
Real Estate Studies. With regards to the year of study the number of the sampled
students decreased from year two to year five thus the majority were from year One to
year Two. As per the degree programme it has been reported that the majority of the
58
sampled students come from the school of Real Estate Studies. This is because they are
the majority at ARU.
The performance in examination at ARU was based on the GPA scored by every
sampled student at the end of the academic year 2011/2012. The said GPA were then
grouped and classified into five classes as per University system. The study shows that
the majority of the sampled students were in the Upper Second category followed by
the Lower Second classes. The academic performance during examinations portrayed a
normal distribution. Very few students either got First Class or failed.
The study has also revealed that due socio-cultural consideration, as expected, the male
sampled students were more than female. In terms of marital status most of students
were single. With regards to age the study revealed that the majority of the samples
students were young ranging between 20 and 24. The mean age was 22 years. The
youngest student was aged 18 years while the eldest reached 39 years. The results also
revealed that female students were more likely to be younger than their counterparts.
It was noted that the majority of the parents/guardian of the sampled students were
peasants followed by the employed and businessmen/women. Very few
parents/guardians of the student were unemployed. As regards to access to loans it is
revealed that the majority of the students were loan beneficiaries from the Government.
With regards to residence status only majority of the students were off campus. This
reflects the problem of accommodation for students at ARU.
The study findings also revealed that the majority of the sampled students were enrolled
at the university via A’ level qualifications. Those who entered under the pre entry
programme followed. It should be noted that pre-entry programme was only for female
students. Very few students joined the university under equivalent qualifications.
It has been revealed that the majority of the students may have been in the same year
same class with different course units. The academic units taken by the students were
between 46.0 and 28.5. The study also revealed that the majority of the students were
had 33 units in their programmes. However, it has also been revealed that there is a
difference in class size and in numbers of instructors per programme.
59
5.1.2 Determinants of academic performance
It was observed that the age group of 15-19 years had higher performance in
examination than the other age groups. Likewise married students performed better
than their counterparts. Although female students seemed to perform better than male
students the results were not statistically significant.
The study has revealed that the students with the unemployed parents or guardians
performed better than their counterparts. The main reason for this may be due to loan
provided by the Government to the majority of ARU students. It was observed that the
majority of the students have access to the Government loans. Furthermore it was
observed that students who secured residence at the main campus had better
performance in examination than the others.
The study show that the sampled students who performed better in O- level also
performed better at the university. The results were statistically significant. Student
who did well in A level and Diploma level though seemed to perform better at higher
learning institution the results were not statistically significantly related. In addition the
study also revealed that those who performed better in Mathematics at O’ level also did
the same in examination at University. As regards to the mode of entry it was observed
that the students who were enrolled with A level qualifications had better performance
in examination than other mode although statistically the results were not significantly
related.
Not only that but also there was the link between class size and academic performance
of undergraduate student in examination. Students in large classes had lower
performance than their counterparts. Not only that but also there seemed to be a link
between the total number of units taken by each student per programme with the
academic performance. However there is negative link between the number of
instructors with the academic performance.
The multivariate linear regression analysis revealed that six variables were not
significantly related with the academic performance. These were: sex of the student,

60
parental/guardian occupation, access to loan, A’ Level Division, mathematic
performance in O’ and A’ Levels as well as mode of entry. It should be recalled these
variables were also not significantly related academic performance during bivariate
analysis. The findings revealed that class size, number of instructors, age, residence
status, marital status and performance during O’ level are related with academic
performance. Almost confirming with bivariate analysis results.
Multivariate regression analysis also showed that as the class size and numbers of
instructors increase the academic performance declines. Furthermore, married students,
and those residing off campus performed poorly than their counterparts. Good
performance at O’ level continued to be a predictor of good performance at the
university. The most important predictors of academic performance at Ardhi University
based on regression analysis were class size, number of instructors, age and O’level
performance.
5.2 Conclusions
The following conclusions are made from the findings of the study;
a) To start with demographic factors, the study revealed that age and marital was the
predictor for academic performance during examinations at ARU. As age increases
performance decrease. This is perhaps because at young age the brain is sharper
than at the older ages. As regards to marital status the married appear to perform
somehow lower in academics than single students. It appears family obligations
affects performance of the married students.
b) Based on the results of this study parental/guardian socio-economic status is not
necessarily related to academic performance of undergraduate students at ARU.
However it appears that access to campus accommodation is an important factor for
academic performance Therefore the study concluded that residence is the predictor
for undergraduate performance in examination
c) The study confirmed that there is a positive relationship between previous O’ level
performance with the performance obtained at university level. Performance

61
obtained at A’ level and Diploma level, and mathematics performance obtained at
the previous levels are not related with the academic performance in examination at
ARU.
d) The study has also established that class size and number of lectures affects
performance of undergraduate students in examination at ARU. Contrary to
expectations increase in the number of instructors per programme is not related with
academic performance.
5.3 Recommendations
The study recommends the following:
a) Recommendation to the Policy makers.
It is recommended that the policy makers should maintain to make policy that
encouraged children to start basic education at early ages.
b) Recommendation to the government.
Ministry responsible for education should ensure that O level secondary schools are
well maintained to enable them produce good outputs. Not only that but also the
Government should invest more in Public universities to improve accommodation.
c) Recommendation to the University administration.
It is advisable to the University to solicit fund for the provision of campus
accommodations. In addition the universities should ensure that congestion of
classes is avoided. Not only that but also universities should continue admitting
students at early ages. Moreover university admission criteria of students should
pay much attention to the performance obtained at O’ level. Academic
administrators of universities should insure that students’ registration forms are
dully filled.

62
d) Recommendation to the regulatory authority.
It is advisable for Tanzania commission for Universities during the establishment of
the universities, students class ration should be taken into consideration. Not only
had that but also insured considerable level of campus accommodation before the
university is allowed to be registered.
e) Recommendation to the students
Students should shy away from establishing marital relationship while still at the
university It is recommended that the students should be educated on the
importance of filling well registration forms
5.4 Areas for future research
The study recommends the following for future research
a) The study was confined to Ardhi University only. This could have a limitation in its
application by other universities because the experience at Ardhi University may be
different from other universities in the country
b) The study was also conducted based on undergraduate students’ performance in
examination. In future such a study could also be looked at postgraduate students.
63
REFERENCES
Adams, A. (1996). Even basic needs of young are not met. Retrieved April, 15th, 2013
from http://tc.education. pitt.edu/library/Self Esteem 609-621.
Anderson, G., Benjamim, D. and Fuss, M (1994), “The determinants of Success in
University Introduction Economics Course”, The Journal of Economic Education,
25: 99-120
Archer, L., Hutchings, M., and Ross, A. (2003).Higher Education and Social Class:
Issues of Exclusion and Inclusion. London and New York: Routledge.
Ardhi University Corporate Plan (2010)
Ardhi University Prospectus (2012/2013)
Bahar, H. H. (2010). The Effect of Gender, Perceived Social Support and Sociometric
Status on Academic Success. Procedia Social and Behavioural Sciences, 2, 3801-3805.
Bandura, A. (1977). Self-Efficacy: Towards a Unifying Theory of Behavioural Change.
Psychological Review, 84(2), 191-215.
Betts, J. R., & Morell, D. (1999).The determinants of undergraduate grade point
average. The Journal of Human Resources, 34, 268-293.
Betts, J. R., Zau , A. C, Rice L.A. (2003) Determinants of students achievement: New
Evidence from San Diego. California.
Bong, M. (2001). Role of self-efficacy and task-value in predicting college students
‘course performance and future enrollment intentions, Journal of Contemporary
Educational Psychology.26, 553-570.
Campbell, J. R., Hombo, C. M., Mazzeo, J. (2000). Trends in academic progress:
Three decades of student performance. National Center for Education Statistics,
Washington, DC.
Chem, J.C.S., Ofori,O. and Devdas, P, (2008), A study of Academic performance in
Mechanical Engineering, North Carolina A & T State University
Conley, D. T. (2005).College Knowledge. San Francisco: Jossey-Bass.
Considine, G., and Zappalà, G. (2002).The Influence of Social and Economic
64
Disadvantage in the Academic Performance of School Students in Australia.
Journal of Sociology, 38(2), 129-148.
Cramer, D and Howitt, D (2006) The SAGE Dictionary of Statistics, SAGE, London.
Cronk, B.C (2008) How to use SPSS: A Step by Step Guide to Analysis and
Interpretation. 5th Edition, Fred Pyrczak, California.
Duke, N. (2000). For the rich it’s richer: Print environments and experiences offered to
first-grade students in very low- and very high-SES school districts. American
Educational Research Journal, 37(2), 456–457.
Farooq, M. S. Chaundry, A.H, Shafiq M,Berhanu G (2011)Factors Affecting student’s
quality of academic Performance: A case of secondary level. Journal of Quality and
Technology Management, Vol VII.
House, J. D. (2002). The independent effects of student characteristics and instructional
activities on achievement: An application of the input-environment-outcome
assessment model. International Journal of Instructional Media, 29(2).225-239.
Kadeghe, M. Y. (2000). The implication of bilingual education in learning and
teaching: The case of Tanzanian secondary schools. Unpublished PhD Thesis.
University of Dar es Salaam, Tanzania.
Kasirye. I (2009) Determinants of learning achievement in Uganda. Economic Policy
Research Centre, Uganda.
Komarraju, M., Musulkin, S., & Bhattacharya, G. (2010).Role of Student-Faculty
Interaction in Developing College Students’ Academic Self Concept, Motivation,
and Achievement. Journal of College Student Development, 51(3), 332-342.
Koontz, H, Weihrich, H .(1988). Management, McGraw-Hill, INC. New York.
Kuh, G. D., Kinzie, J., Buckley, J., Bridges, B., Hayek, and J. C. (2007) .Piecing
together the student success puzzle: Research, propositions, and
recommendations.ASHE Higher Education Report, 32(5). San Francisco: Jossey-
Bass.
Kwesiga, C.J. (2002). Women’s access to higher education in Africa: Uganda’s
experience. Kampala: Fountain publishers Ltd.
65
Lowe, J., & Gayle, V. (2007). Exploring the Work/Life/Study Balance: The Experience of
Higher Education Students in a Scottish Further Education College. Journal of Further
and Higher Education, 31(3), 225-238.
Marsha, L. (2005). The Importance of Classroom Environments in Assessment of
Learning Community Outcomes. Journal of College Student Development, 46(4),
341-356.
Mushtaq, I and Khan, S (2012) Factors affecting students academic performance,
Global Journal of Management and Business Research, Volume 12 Issue 9 Version
1.0 June.
Mvungi, M. M. (1982). Relationship between performance in instructional medium and
performance in selected school subjects in Tanzania secondary schools.
Unpublished PhD Thesis. University of Dar es Salaam, Tanzania.
Nyankunga, R.Z, (2011) Cost sharing and academic performance. UnpublishedMaster’s Thesis Oslo University
Oso, W.Y and Onen, D. (2005).A general guide to writing research proposal andreport. A handbook for beginning researchers. Options press and publishers.
Pike, G. R., Schroeder, C. C., and Berry, T. R. (1997).Enhancing the education impact
of residence halls: The relationship between residential learning communities and
first-year college experiences and persistence. The Journal of College Student
Development, 38,
Ringland, C, Pearson, S.A (2003).Graduate entry to medical school: Testing some
assumptions. Faculty of Medicine and Health sciences, University of Newcastle,
Australia.
Rouse, K.A.G., Austin, J.T. (2002). The relationship of gender and academic
performance to motivation: Within-ethnic-group variations. The Urban Review,
34(4), 293-316.
Rubagumya, C., Jones, C., Mwansoko, H. (1998). Language for learning and teaching
in Tanzania. Dar es Salaam: British Council.
Schiefelbein, E and Simmon,J (1981) The determinants of school Achievement; A
review of Research Developing Countries, IDRC Ottawa Canada.
66
Shajan,S. (2011) Research Methods for Management, 4th Edition, JAICO, Mumbai
Siegfried, J., Fels, R. (1979).Research on teaching college economics: A Survey.
Journal of Economic Literature, 17(3), 923 – 939.
Staffolani, S, Bratti, M. (2002). Student time allocation and education production
functions. Retrieved March, 22nd ,2013 from http://
ideas.repec.org/p/wpa/wuwphe/0207001.html - 16k
Terenzini, P.T., Theophilides, C., Lorang, W. (1984). Influences on students’
perception of their personal development during the first three years of college.
Researching Higher Education 21, 178–194.
Thomas, L. (2002). Student Retention in Higher Education: The Role of Institutional
Habitus. Journal of Education Policy, 17(4), 423-442.
Tinto, V. (1993).Leaving College: Rethinking the Causes and Cures of Student Attrition
(2nded.). Chicago and London: The University of Chicago Press.
Tsigie, H (1991),An assessment of the academic performance of female students in
higher education Institutions, Addis Ababa, Ethiopia
Ullah, H., & Wilson, M. (2007). Students’ academic success and its association to
student involvement with learning and relationships with faculty and peers. College
Student, 41(4), 1192-1202.
Weiss, & Amorose (2008). Motivational orientations and sport behavior. In Horn, T91
(Eds.), Advances in sport psychology (pp. 139-147). Champaign, IL: Human
Kinetics.
World Bank. (2008). Accelerating Catch-up: Tertiary Education for Growth in Sub-
Saharan Africa - Synopsis. Washington DC: The World Bank
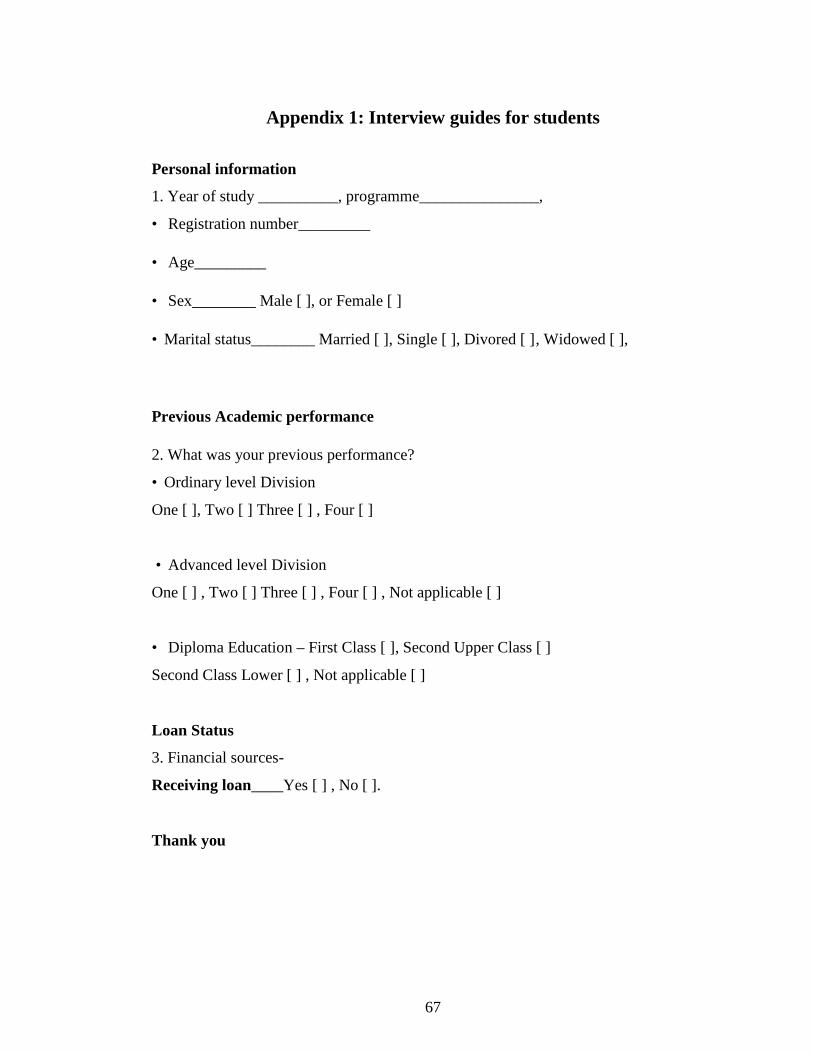
67
Appendix 1: Interview guides for students
Personal information
1. Year of study __________, programme_______________,
Registration number_________
Age_________
Sex________ Male [ ], or Female [ ]
Marital status________ Married [ ], Single [ ], Divored [ ], Widowed [ ],
Previous Academic performance
2. What was your previous performance?
Ordinary level Division
One [ ], Two [ ] Three [ ] , Four [ ]
Advanced level Division
One [ ] , Two [ ] Three [ ] , Four [ ] , Not applicable [ ]
Diploma Education – First Class [ ], Second Upper Class [ ]
Second Class Lower [ ] , Not applicable [ ]
Loan Status
3. Financial sources-
Receiving loan____Yes [ ] , No [ ].
Thank you
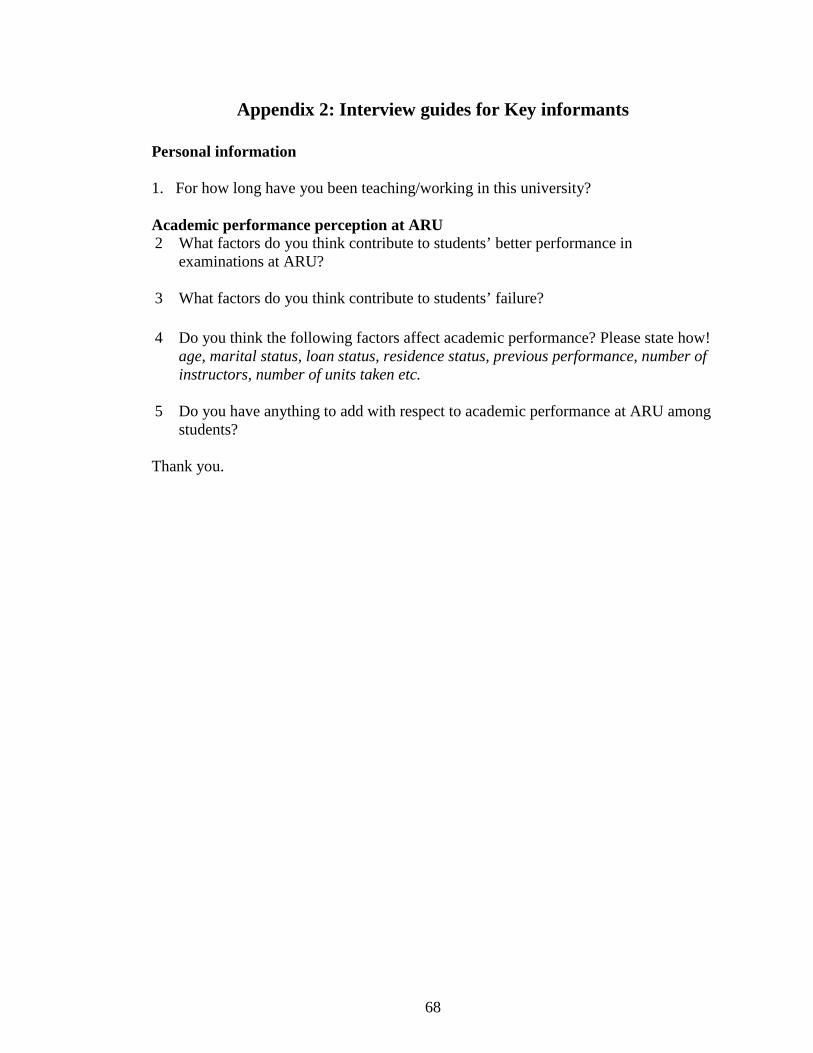
68
Appendix 2: Interview guides for Key informants
Personal information
1. For how long have you been teaching/working in this university?
Academic performance perception at ARU2 What factors do you think contribute to students’ better performance in
examinations at ARU?
3 What factors do you think contribute to students’ failure?
4 Do you think the following factors affect academic performance? Please state how!age, marital status, loan status, residence status, previous performance, number ofinstructors, number of units taken etc.
5 Do you have anything to add with respect to academic performance at ARU amongstudents?
Thank you.

69
Appendix 3
ARDHI UNIVERSITY
STUDENT REGISTRATION FORM(FRESH UNDERGRADUATE STUDENTS)
Your Registration No: Degree:
(Degree for which registration is sought must be the same as that appearing in your student identity
card)
SCHOOL
1. Surname (Block Capitals) Mr/Mrs/Miss
(The names entered on this form must be the same as those on your “A” level Certificate orequivalent documents offered as an entry qualification. If you have changed your name, attachedphotocopy of affidavit or Marriage Certificate).
2. First name (Block Capitals)
Middle names (Block Capitals
3. Date of Birth 4. Age at Entry
Day Month Year
AttachPhotograph
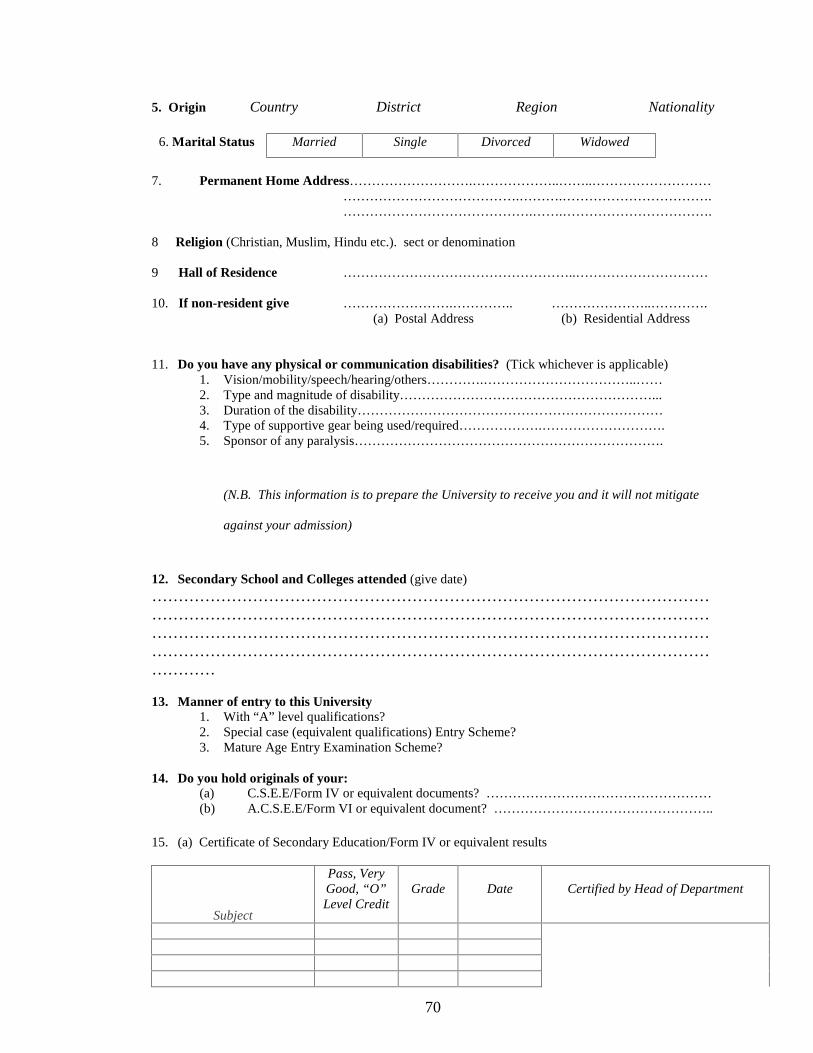
70
5. Origin Country District Region Nationality
6. Marital Status Married Single Divorced Widowed
7. Permanent Home Address……………………….………………..……..………………………………………………………….……….…………………………….…………………………………….…….…………………………….
8 Religion (Christian, Muslim, Hindu etc.). sect or denomination
9 Hall of Residence ……………………………………………..…………………………
10. If non-resident give …………………….………….. …………………..………….(a) Postal Address (b) Residential Address
11. Do you have any physical or communication disabilities? (Tick whichever is applicable)1. Vision/mobility/speech/hearing/others………….……………………………..……2. Type and magnitude of disability…………………………………………………...3. Duration of the disability……………………………………………………………4. Type of supportive gear being used/required……………….……………………….5. Sponsor of any paralysis…………………………………………………………….
(N.B. This information is to prepare the University to receive you and it will not mitigate
against your admission)
12. Secondary School and Colleges attended (give date)………………………………………………………………………………………………………………………………………………………………………………………………………………………………………………………………………………………………………………………………………………………………………………………………
13. Manner of entry to this University1. With “A” level qualifications?2. Special case (equivalent qualifications) Entry Scheme?3. Mature Age Entry Examination Scheme?
14. Do you hold originals of your:(a) C.S.E.E/Form IV or equivalent documents? ……………………………………………(b) A.C.S.E.E/Form VI or equivalent document? …………………………………………..
15. (a) Certificate of Secondary Education/Form IV or equivalent results
Subject
Pass, VeryGood, “O”Level Credit
Grade Date Certified by Head of Department
71
Examination Authority Index No.
Examination Centre (School) Country
Division
(b) Advanced Certificate of Secondary Education/Form VI or equivalent results:
Subject
Principal orSubsidiary
LevelGrade Date Certified by Head of Department
Examination Authority Index No.
Examination Centre (School) Country
Division
16. Any other University entrance qualifications (e.g. Diploma/F.T.C. etc.)………………………………
17. (a) If prior to your admission you were a working person, have you been officially released by your
employer?
………………………………………………………………………………………….
(b) If yes, attach documentary evidence.
18. (a) What are your extra curricular activities?……………………………………………………………………………………………………
….
……………………………………………………………………………………………………
…(b) Indicate organization(s) of which you are a member citing the number of your membership card
as well as posts held
Name of Organisation Membership Card No. Posts Held in the Organization
72
19. (a) Name of father/guardian (state relationship)………………………………………………...
(b) Post address of this person…………………………………………………………...……….…
………………………………………….………...…………..….…
(c) Occupation of this person……………………………………………………………….……….
20.(a) Name of next of kin (state relationship) ……………………………………………..…………..
(b) Postal Address ……………………………………………….…..……..
(d) Occupation of this person………………………………………………………………..….….
21. State who should be contacted in Dar es Salaam in case of emergency.
Name :…………………………………………………………………………………..……………..
Address :………………………………….. Tel No…………………………………..…………….Relationship ………………………………………………………………………………………….
If you are a student direct from school, state which firm/department you have been working for
………………………………………………………………………………………………….…….
………………………………………………………………………………………………….…….
Certificate of Enrolment Academic Year …………………….
Registration No.
Mr/Mrs/Miss(First Names)
Surname
Course (Year I, II, III, IV, V)
Date Student’s Signature
Registration Officer
I Certify that the above mentioned student has completed registration formalities with the Admission Office
……………………………………………………….For: DEPUTY VICE CHANCELLOR ACADEMIC AFFAIRS
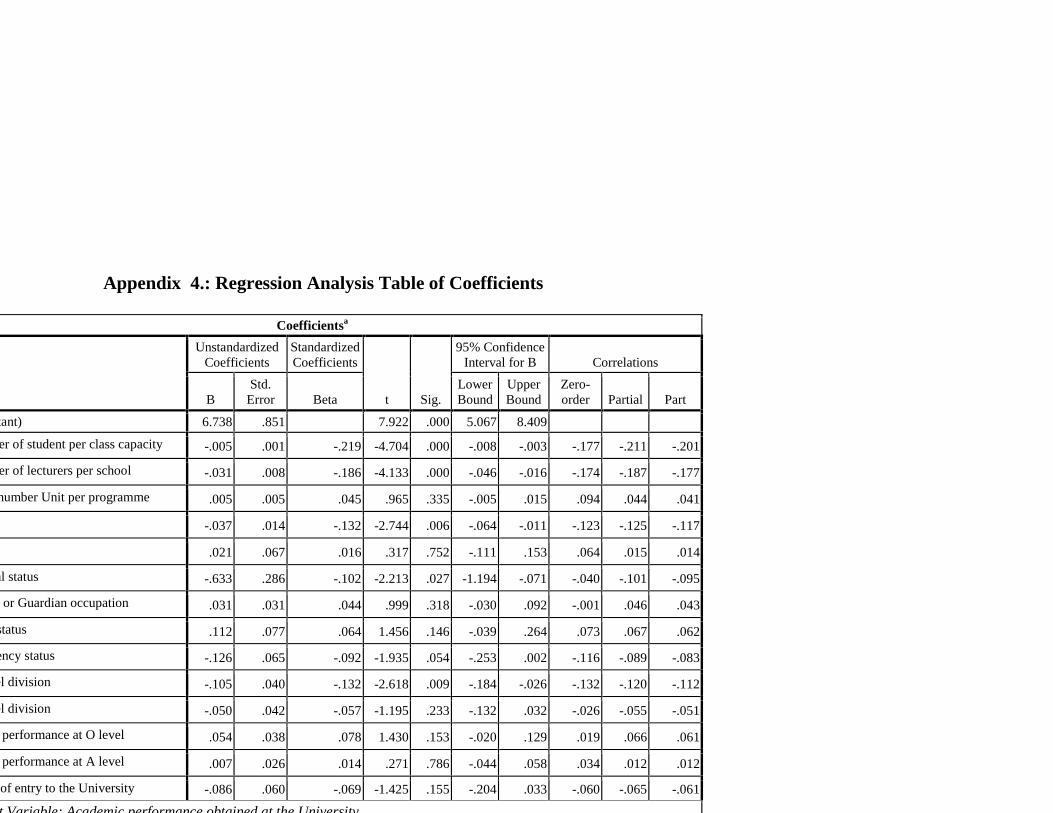
73
Appendix 4.: Regression Analysis Table of Coefficients
Coefficientsa
Model
UnstandardizedCoefficients
StandardizedCoefficients
t Sig.
95% ConfidenceInterval for B Correlations
BStd.
Error BetaLowerBound
UpperBound
Zero-order Partial Part
1 (Constant) 6.738 .851 7.922 .000 5.067 8.409
Number of student per class capacity -.005 .001 -.219 -4.704 .000 -.008 -.003 -.177 -.211 -.201
Number of lecturers per school -.031 .008 -.186 -4.133 .000 -.046 -.016 -.174 -.187 -.177
Total number Unit per programme .005 .005 .045 .965 .335 -.005 .015 .094 .044 .041
Age -.037 .014 -.132 -2.744 .006 -.064 -.011 -.123 -.125 -.117
Sex .021 .067 .016 .317 .752 -.111 .153 .064 .015 .014
Marital status -.633 .286 -.102 -2.213 .027 -1.194 -.071 -.040 -.101 -.095
Parent or Guardian occupation .031 .031 .044 .999 .318 -.030 .092 -.001 .046 .043
Loan status .112 .077 .064 1.456 .146 -.039 .264 .073 .067 .062
Residency status -.126 .065 -.092 -1.935 .054 -.253 .002 -.116 -.089 -.083
O level division -.105 .040 -.132 -2.618 .009 -.184 -.026 -.132 -.120 -.112
A level division -.050 .042 -.057 -1.195 .233 -.132 .032 -.026 -.055 -.051
Maths performance at O level .054 .038 .078 1.430 .153 -.020 .129 .019 .066 .061
Maths performance at A level .007 .026 .014 .271 .786 -.044 .058 .034 .012 .012
Mode of entry to the University -.086 .060 -.069 -1.425 .155 -.204 .033 -.060 -.065 -.061
a. Dependent Variable: Academic performance obtained at the University
Source: Research data (2013)