The Determinants of the Students’ Academic Performance in Accountancy Courses: Evidence from...
43
The Determinants of the Students’ Academic Performance in Accountancy Courses: Evidence from Brazil 1. Introduction 1 The standardized large-scale tests, so-called Achievement Tests, were instituted by the Brazilian government on the second half of the 90-ies. The first test was the National Exam of Courses (ENC) so-called Provão that was accomplished over the period from 1996 to 2003 and was subsequently replaced by the National Exam of the Students’ Performance (Enade). According to the Instituto Nacional de Estudos e Pesquisas Educacionais AnísioTeixeira (INEP), the agency responsible for elaboration of the tests and promotion of the studies, research and evaluations on Brazilian Educational System, those tests were instituted as part of the evaluative policy of the courses offered by the Higher Education Institutions (IES). The main objective of both tests is to verify if the knowledge, academic skills and professional competencies of each area under evaluation were developed by students throughout the course. Those knowledge, skills and competences are previously defined by national educational guidelines. More than 470,000 students graduated in 6,5 thousand courses of 26 areas participated in the last edition of the ENC-Provão conducted in 2003 (INEP, 2004). This study focuses on the Brazilian Accountancy students, who participated in either Provão (2002 and 2003) and Enade (2006 and 2009). According to INEP, 22,694 graduating students of the Accountancy course participated in 22,694 exams in 2002, 22,976 in 2003 and 19,040 in 2006. In the Higher Education Census (CES) relative to 2009, the number of students who completed the course was 34,557. The main objective is to analyze the effect from individual and institutional characteristics on academic performance of the undergraduate students in Accountancy, by using the results of the tests accomplished in 2002, 2003 and 2006. The research question guiding this study is: how the students’ characteristics, the background your family, and Higher Education Institutions affect the accounting students’ academic performance? 1 This study was financially supported by CAPES.
Transcript of The Determinants of the Students’ Academic Performance in Accountancy Courses: Evidence from...

The Determinants of the Students’ Academic Performance in Accountancy
Courses: Evidence from Brazil
1. Introduction1
The standardized large-scale tests, so-called Achievement Tests, were instituted
by the Brazilian government on the second half of the 90-ies. The first test was the
National Exam of Courses (ENC) so-called Provão that was accomplished over the
period from 1996 to 2003 and was subsequently replaced by the National Exam of the
Students’ Performance (Enade). According to the Instituto Nacional de Estudos e
Pesquisas Educacionais AnísioTeixeira (INEP), the agency responsible for elaboration
of the tests and promotion of the studies, research and evaluations on Brazilian
Educational System, those tests were instituted as part of the evaluative policy of the
courses offered by the Higher Education Institutions (IES). The main objective of both
tests is to verify if the knowledge, academic skills and professional competencies of
each area under evaluation were developed by students throughout the course. Those
knowledge, skills and competences are previously defined by national educational
guidelines. More than 470,000 students graduated in 6,5 thousand courses of 26 areas
participated in the last edition of the ENC-Provão conducted in 2003 (INEP, 2004).
This study focuses on the Brazilian Accountancy students, who participated in
either Provão (2002 and 2003) and Enade (2006 and 2009). According to INEP, 22,694
graduating students of the Accountancy course participated in 22,694 exams in 2002,
22,976 in 2003 and 19,040 in 2006. In the Higher Education Census (CES) relative to
2009, the number of students who completed the course was 34,557. The main objective
is to analyze the effect from individual and institutional characteristics on academic
performance of the undergraduate students in Accountancy, by using the results of the
tests accomplished in 2002, 2003 and 2006. The research question guiding this study is:
how the students’ characteristics, the background your family, and Higher Education
Institutions affect the accounting students’ academic performance?
1 This study was financially supported by CAPES.
2
To answer this question, it is intended to verify the following: (1) the personal
aspects such as color, gender, age of the students are related to their academic
performance; (2) the academic performance is positively related to socioeconomic
status; (3) the characteristics of the course, such as participation in extracurricular
activities, the type of the academic material used and other inputs are related to
students’ academic performance; (4) the characteristics of the faculty in the educational
institutions, such as higher proportion of teachers with master and doctoral qualification
and the work scheme type among other aspects have a positive effect on students’
performance; and (5) how the educational institution is organized as an university or is
linked to public or private system has significant effect on students' academic
performance.
The relevance of this paper is related to low average result of the Accountancy
students at those tests, as compared to other areas evaluated in 2002, 2003 and 2006.
According to INEP (2003, 2004), the Provão editions 2002 and 2003 consisted of 40
multiple-choice objective questions with five response options, as corresponding to 60%
the exam total value, and three discursive questions corresponding to remaining 40%.
The general average of the Accountancy students was 32.0 on scale from 0 to 100, in
the Provão editions 2002 and 2003. The Enade/2006 is divided into two components.
The first component is General Training (FG) comprising eight multiple-choice
questions and two discursive questions, as corresponding to 25% the total exam. The
second part so-called Specific Component (CE), which includes 26 multiple-choice
questions and four discursive questions, corresponds to 75% the total exam value. This
exam was applied to students who were entering or graduating2 in the area. The general
average, that includes both freshmen and graduating students, was 44.1 in exam of the
General Training (FG) and 25.7 in exam of the Specific Knowledge (CE) (INEP,
2007a). In this last component, the average of the graduating students was 30.0. Among
all 15 areas3 under evaluation, the performance of the Accountancy area in FG was only
ahead Administration (42.1). Moreover, the students obtained the lowest general
average in CE, among all 15 areas3 under evaluation in 2006. This performance of the
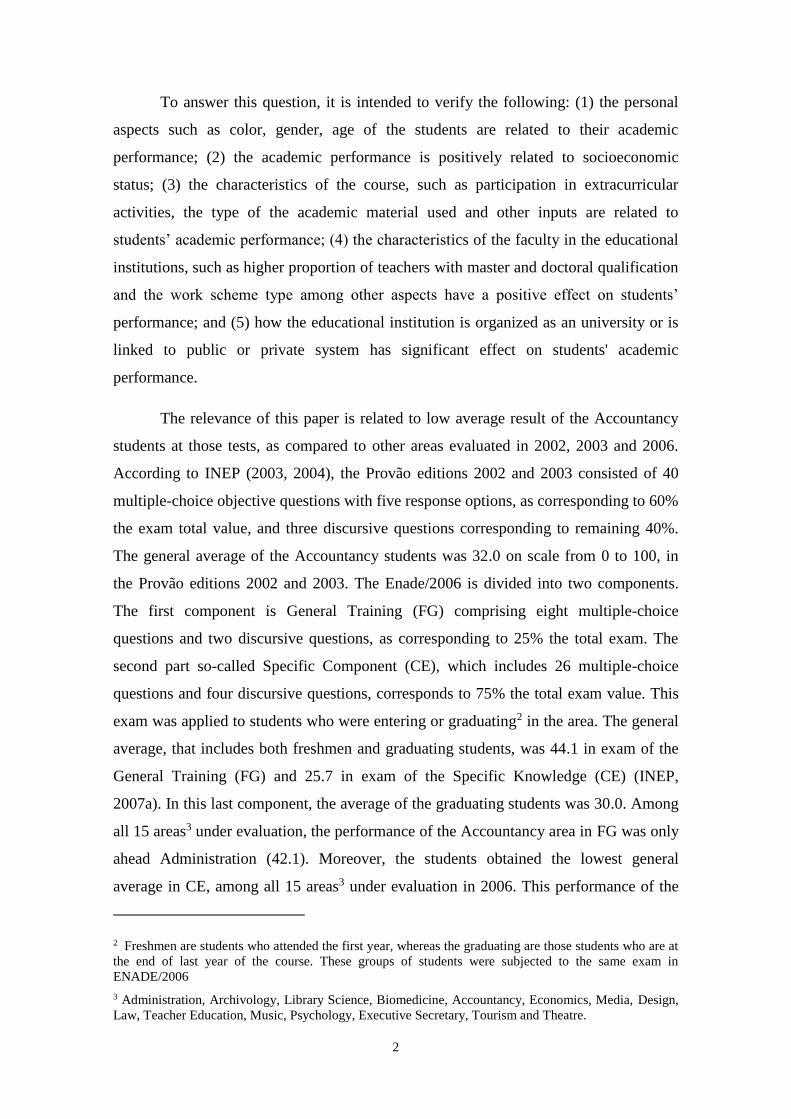
2 Freshmen are students who attended the first year, whereas the graduating are those students who are at
the end of last year of the course. These groups of students were subjected to the same exam in
ENADE/2006
3 Administration, Archivology, Library Science, Biomedicine, Accountancy, Economics, Media, Design,
Law, Teacher Education, Music, Psychology, Executive Secretary, Tourism and Theatre.

3
area is among the worst ones, when compared to 15 areas evaluated in 2006 (INEP,
2007). In 2009, the general average achieved by graduating students in Enade was 39.9
in FG exam and 32.6 in CE exam (INEP, 2011).
Em 2009, a média geral obtida pelos estudantes concluintes da área no Enade foi
39,9, na prova de FG, e 32,6, no teste de CE (INEP, 2011). Em 2012, a média geral
obtida pelos estudantes concluintes da área no Enade foi 39,4, na prova de FG, e 32,8,
no teste de CE (INEP, 2011). Na prova de conhecimento específico da área a média dos
concluintes de 2009 foi inferior a 50,0.
However, in either Provão 2002/2003 and Enade/2006, the students indicated
difficulties to answer the exam questions4. The main options noted in Provão/2003
were: they studied the most test contents, but have already forgotten them (34.4%) since
there was a long time they studied most of them; and they studied many of those
contents during the course, but with little understanding (44.2%) (INEP, 2004). In
Enade/2006, a change occurred in the response pattern: only 4.5% graduating students
pointed out non-acquaintance of the content as factor explaining their performance. The
most frequently mentioned reasons were the different way to approach the content in
relation to what is usually used (41.1%) and lack of motivation (35.4%) (INEP, 2007a).
In Provão/2003, the percentages relative to those aspects were 50.6% and 18.8%,
respectively (INEP, 2004). These results of the students' perceptions are evidence for
possible problems in the teaching process, which may have negatively affected the
results of the evaluations.
The accountancy course has strong credencialism characteristics. The
professionals have their privileges guaranteed by legal act. For this reason, the large-
scale evaluations are so important. According to data from the Conselho Federal de
Contabilidade (CFC) relative to 2010a, (the brazilian agency that resembles the
American Institute of Certified Public Accountants - AICPA), there were 292,390 active
accountant records and 76,283 active organizations registered, as being 48,731 under
individual scheme and 27,552 as companies. It is important to emphasize the tendency
for more rigorous requirements concerning to professional accounting practice in Brazil.
The next students graduating in Accountancy will face other mechanisms that will
4 At the end of the test, there is a section in which students express their opinion on this evaluation tool.
4
restrict their entry and permanence in the labor market as Accountants, such as the
Sufficiency Exam and continuing education programs established by Law n. 12249
(2010). According to CFC, in the first edition of the Sufficiency Exam accomplished in
2011, only 30.83% participants who required the Accountant registration were
approved, a percentage considered low by CFC committee members responsible for
accomplishment of the Exam (CFC, 2010). This exam is similar to that accomplished by
AICPA for obtainment of the Certified Public Accountants (CPA).
This scenario provides evidence that professional training and qualification can
have preoccupying deficiencies. In Brazil, as pointed out by Crespo and Reis (2009), a
reduction in importance of the employee to have only a bachelor’s degree (in terms of
the remuneration differential) occurred over the period from 1982 to 2004, due to the
increased supply of qualified professionals. This fact, coupled with the increased
requirements for professional practice, emphasizes the importance of the accounting
education quality.
The main scientific works that motivated the use of the theoretical framework of
the economics of education were Hanushek (1979, 1987) and Hanushek and
Woessmann (2011). In Brazil, the studies conducted by Albernaz, Ferreira and Franco
(2002), Machado et al. (2008), Franco and Menezes-Filho (2009) particularly in
economics area have emphasized the primary education. It is possible to identify
internationally and in the case of Brazil, a pattern of results that points out a positive
and significant effect of the socioeconomic background on students` performance at all
educational levels.
There is significant international literature on education at higher level. For
example, Betts and Morell (1999), using the data from 5,000 undergraduate students at
the University of California, concluded that the personal background, the origin of high
school and the experience level of the high-school teachers significantly affect the
students’ performance in Grade Point Average (GPA). Cohn, Cohn, Balch and Bradley
Jr. (2004) evaluated the degree at which the score in the Scholastic Aptitude Test
(SAT), the average score in GPA and a categorical classification of the secondary
schools predict student performance on GPA, based on data from University of South
Carolina relative to period from 2000 to 2001. The results suggest the SAT score to be
related to academic success at graduation level. However, its requirement can reduce the
5
chances of the men and non-white students to be selected for a scholarship. Horowitz
and Spector (2005) used the GPA in order to verify the impact of the secondary school
(public x private) upon performance of 15,270 students enrolled at Ball State University
and proceeding from secondary school (public x private), during a semester in 2002.
The authors concluded that, although the effect is small, the students from religious
secondary schools achieved better performance than the students from private and
public schools. However, this effect disappears during graduation.
In Brazil, it is highlighted the scientific works carried out by Soares, Ribeiro
and Castro (2001), Gracioso (2006), Diaz (2007), Moreira (2010) and Rezende (2010),
who focused on context of other knowledge areas. Soares, Ribeiro and Castro (2001)
compared the score obtained by students in the selection test (vestibular) for higher
education at the Federal University of Minas Gerais State, with Provões of Law,
Administration and Civil Engineering courses, which were accomplished over the
period from 1996 to 1999. The evidences suggested a significant influence from the
socioeconomic conditions and previous performance of the students on their academic
performance. Gracioso (2006) focused upon effect of the school and concluded that the
use of microcomputers by students, the skills developed throughout the course and
English skills are important to explain the performance of the Administration Course’
students in Provão 2003. Moreira (2010) investigated the effect from the institutional
factors on students’ performance in areas of Biology, Civil Engineering, History and
Pedagogy in Enade 2005. The author found significant variations among the effects
from the institutional factors upon performance, as depending on the course and
administrative IES category. Diaz (2007) focused on performance of the higher
education students in the Management, Law and Civil Engineering courses, who
participated in Provão 2000. The family income has significant influence, but in a
nonlinear way. The institutional factors such as qualification and working conditions of
the faculty and the use of research activities as strategy for teaching/learning were
significant, but with reduced magnitude. Rezende (2010) analyzed the effect from
policy adoption of an accountability system in Higher Education, particularly during the
ENC period, from 1996 to 2003, upon IES performance. The evidences of this study
indicated that ENC policy had positive effect on the proportion of the teachers’
exclusive dedication, number of the vacancies offered, candidates inscribed, and

6
students registered. According to the author, this effect is differentiated according to
IES organizational structure.
In Accountancy context, the studies carried out by Andrade and Corrar (2007),
Cruz, Corrar and Slomski (2008) and Souza (2008) are distinguished. Andrade and
Corrar (2007) also used the data from Provão 2002 and, by mean tests, he concluded
that the academic (research activities, dedication to studies) and economic variables
(income, parental education level) are related to different academic performance of the
students, except for different races (majority x minorities) and frequency in using the
library. Cruz, Corrar and Slomski (2008) used the mean tests and concluded the updated
domain of the discipline contents, the teaching technique employed and the type of the
didactic resource used in classroom to be significantly associated with differences in the
educational performance achieved by students in Provão 2002. Souza (2008) used the
Course Performance Index (IDC) of Enade 2006 as proxy for educational outcome.
According to results, the following variables significantly affected the students´
academic performance: the high school from which students came, the father's
educational level, the student’s personal effort in the course, the fact the student to work
or not and family income. Another finding was the negative correlation between
maternal education and performance in the course. However, on the whole, it was
observed that parental education has positive influence on prediction of the students’
performance in the accountancy courses, in Enade. However, those studies were not
based on education economy field and their analyses were based on mean tests and
cross-section regressions.
This study aims to provide an original contribution, when basing the analyses on
more recent nationwide database and focusing on a test used as political evaluation of
the academic knowledge obtained during the undergraduate course and not on a test for
Admission of students to graduation. Furthermore, this article focus on student’s
performance in Accountancy in Brazil during the years 2002, 2003 and 2006, by using
the theoretical framework of the economics of educations. In general, our results
suggest the existence of significant association between the graduating students’
academic performance with certain characteristics, such as hours dedicated to studies, to
have attended the public high school, and some inputs from educational institutions
such as teachers who master properly the content of the courses. Those results can be

7
helpful to analyze the implications of either individual choices and educational policies
adopted by institutions concerning to students’ performance.
This article has four sections, besides this introduction. The next section
describes the Brazilian Higher Education System and the academic achievement tests.
The third section presents the hierarchical linear models of the academic performance.
The fourth section describes the data set and analyzes the results. The fifth section
presents the final comments.
2. The Higher Education System and Tests of the Brazilian Academic Performance
2.1. The Brazilian System of Higher Education
In Brazil, the courses offered by the Higher Education System (SES) are
distributed between the public and private IES. These undergraduate courses are offered
under the following modalities: presential, on-line courses (EAD) and regular courses.
The SES places are offered by different organizational structures, by
administrative category and academic organization. The classification based on
administrative categories encompasses the federal, state, municipal and private
institutions, whereas the categorization by academic organization comprises the
universities, university centers, integrated colleges, colleges, superior schools and
institutes and technical education centers. The knowledge areas offered by SES are
heterogeneous and generally refer to traditional careers in the labor market, such as
Medicine, Nursing, Administration, Civil Engineering, etc.
The Brazilian government has continuously adopted policies to increase the
supply of places and expansion of SES. According to CES consolidated data, this policy
was evident from the 70s. The actions of those policies are reflected on evolution of the
number of places offered for Superior Education (ES); in 1970, they totalized 145,000,
whereas in 1971 they reached 202,110, as increasing 39.4% and ending the decade with
402,694 places offered in 1979. Despite the slower rhythm, this growth trend continued
in the 80s, with 15.3% increase in places offered, that is 404,814 in 1980 to 466,794 in
1989. In the 90s, the increase was 92.8%. The outcomes from those policies can also be
observed in the enrollment growth rate between 1995 and 2009 in SES courses.
According to Fig. 1, it increased over the period from 1997 to 2002, as reaching a peak
of 14.8%. From 2003 to 2009, however, there was a downward trend and, in last year, a
8
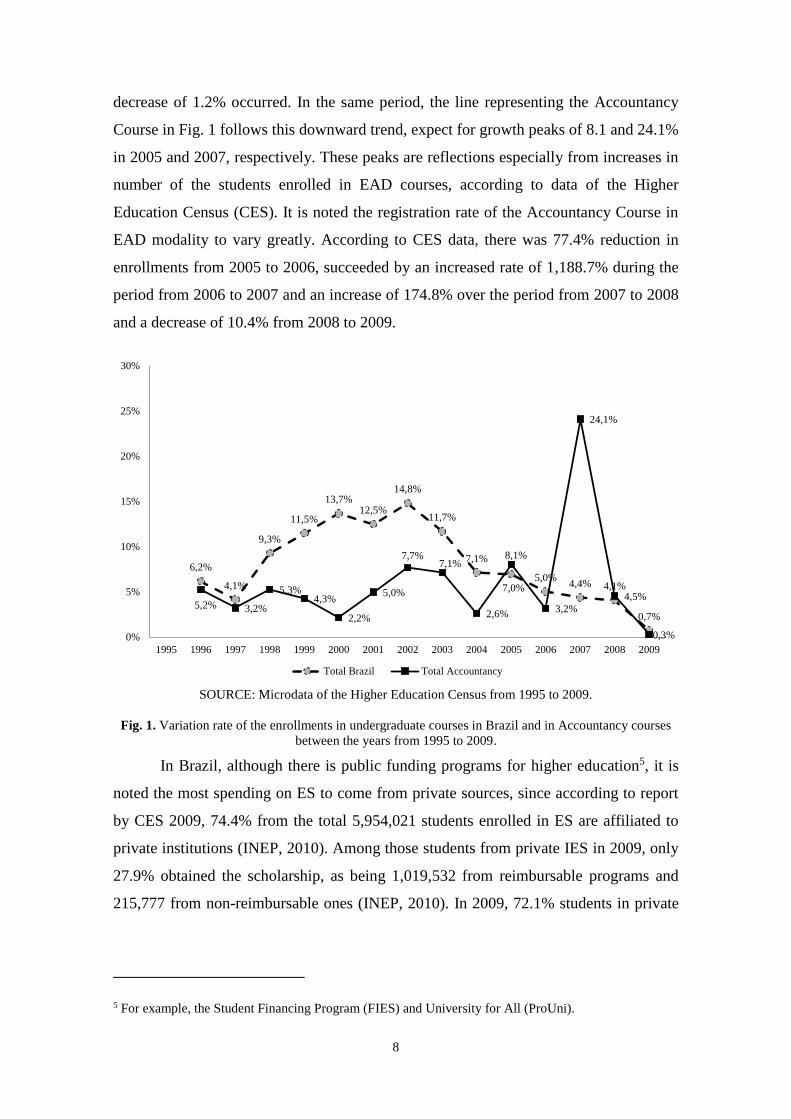
decrease of 1.2% occurred. In the same period, the line representing the Accountancy
Course in Fig. 1 follows this downward trend, expect for growth peaks of 8.1 and 24.1%
in 2005 and 2007, respectively. These peaks are reflections especially from increases in
number of the students enrolled in EAD courses, according to data of the Higher
Education Census (CES). It is noted the registration rate of the Accountancy Course in
EAD modality to vary greatly. According to CES data, there was 77.4% reduction in
enrollments from 2005 to 2006, succeeded by an increased rate of 1,188.7% during the
period from 2006 to 2007 and an increase of 174.8% over the period from 2007 to 2008
and a decrease of 10.4% from 2008 to 2009.
SOURCE: Microdata of the Higher Education Census from 1995 to 2009.
Fig. 1. Variation rate of the enrollments in undergraduate courses in Brazil and in Accountancy courses
between the years from 1995 to 2009.
In Brazil, although there is public funding programs for higher education5, it is
noted the most spending on ES to come from private sources, since according to report
by CES 2009, 74.4% from the total 5,954,021 students enrolled in ES are affiliated to
private institutions (INEP, 2010). Among those students from private IES in 2009, only
27.9% obtained the scholarship, as being 1,019,532 from reimbursable programs and
215,777 from non-reimbursable ones (INEP, 2010). In 2009, 72.1% students in private
5 For example, the Student Financing Program (FIES) and University for All (ProUni).
6,2%
4,1%
9,3%
11,5%
13,7%12,5%
14,8%
11,7%
7,1%
7,0%5,0%
4,4% 4,1%
0,7%5,2% 3,2%
5,3%4,3%
2,2%
5,0%
7,7%7,1%
2,6%
8,1%
3,2%
24,1%
4,5%
0,3%0%
5%
10%
15%
20%
25%
30%
1995 1996 1997 1998 1999 2000 2001 2002 2003 2004 2005 2006 2007 2008 2009
Total Brazil Total Accountancy
9
IES paid their studies with their own resources, with their family support or through
other sources.
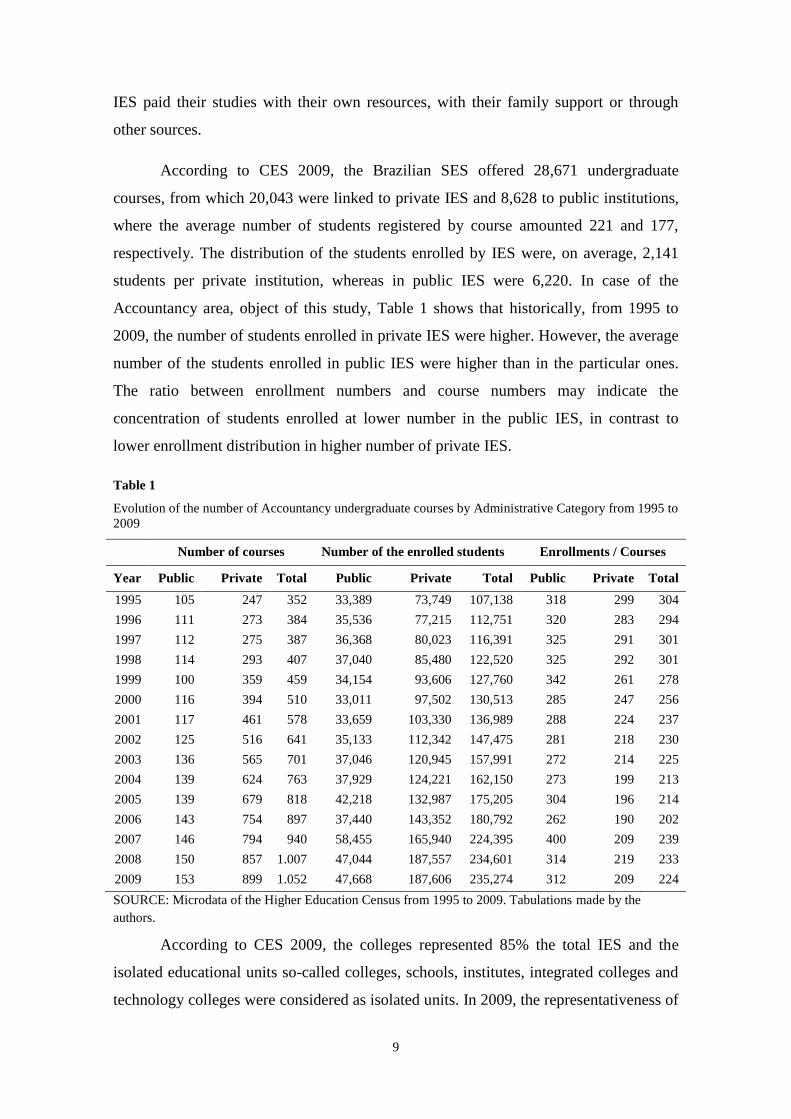
According to CES 2009, the Brazilian SES offered 28,671 undergraduate
courses, from which 20,043 were linked to private IES and 8,628 to public institutions,
where the average number of students registered by course amounted 221 and 177,
respectively. The distribution of the students enrolled by IES were, on average, 2,141
students per private institution, whereas in public IES were 6,220. In case of the
Accountancy area, object of this study, Table 1 shows that historically, from 1995 to
2009, the number of students enrolled in private IES were higher. However, the average
number of the students enrolled in public IES were higher than in the particular ones.
The ratio between enrollment numbers and course numbers may indicate the
concentration of students enrolled at lower number in the public IES, in contrast to
lower enrollment distribution in higher number of private IES.
Table 1
Evolution of the number of Accountancy undergraduate courses by Administrative Category from 1995 to
2009
Number of courses Number of the enrolled students Enrollments / Courses
Year Public Private Total Public Private Total Public Private Total
1995 105 247 352 33,389 73,749 107,138 318 299 304
1996 111 273 384 35,536 77,215 112,751 320 283 294
1997 112 275 387 36,368 80,023 116,391 325 291 301
1998 114 293 407 37,040 85,480 122,520 325 292 301
1999 100 359 459 34,154 93,606 127,760 342 261 278
2000 116 394 510 33,011 97,502 130,513 285 247 256
2001 117 461 578 33,659 103,330 136,989 288 224 237
2002 125 516 641 35,133 112,342 147,475 281 218 230
2003 136 565 701 37,046 120,945 157,991 272 214 225
2004 139 624 763 37,929 124,221 162,150 273 199 213
2005 139 679 818 42,218 132,987 175,205 304 196 214
2006 143 754 897 37,440 143,352 180,792 262 190 202
2007 146 794 940 58,455 165,940 224,395 400 209 239
2008 150 857 1.007 47,044 187,557 234,601 314 219 233
2009 153 899 1.052 47,668 187,606 235,274 312 209 224
SOURCE: Microdata of the Higher Education Census from 1995 to 2009. Tabulations made by the
authors.
According to CES 2009, the colleges represented 85% the total IES and the
isolated educational units so-called colleges, schools, institutes, integrated colleges and
technology colleges were considered as isolated units. In 2009, the representativeness of
10
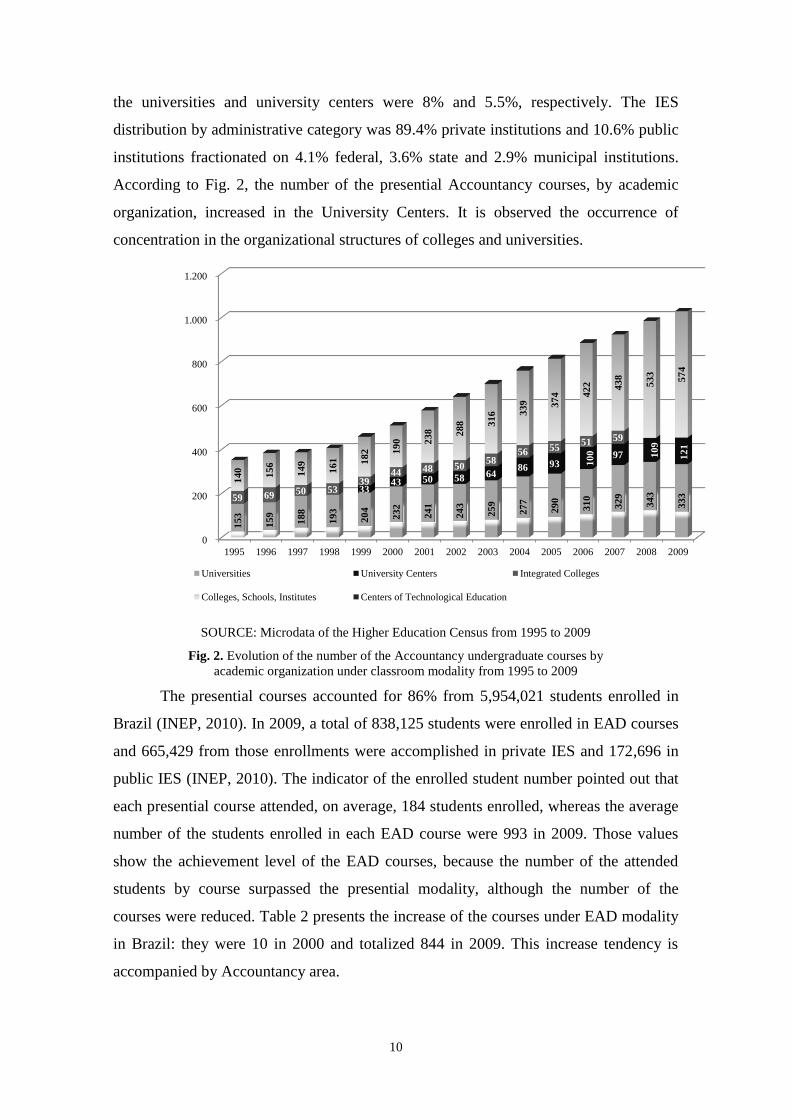
the universities and university centers were 8% and 5.5%, respectively. The IES
distribution by administrative category was 89.4% private institutions and 10.6% public
institutions fractionated on 4.1% federal, 3.6% state and 2.9% municipal institutions.
According to Fig. 2, the number of the presential Accountancy courses, by academic
organization, increased in the University Centers. It is observed the occurrence of
concentration in the organizational structures of colleges and universities.
0
200
400
600
800
1.000
1.200
1995 1996 1997 1998 1999 2000 2001 2002 2003 2004 2005 2006 2007 2008 2009
15
3
15
9
18
8
19
3
20
4
23
2
24
1
24
3
25
9
27
7
29
0
31
0
32
9
34
3
33
3 33
43 50 58 64 86 93 1
00
97 10
9
12
1
59 69 50 53 39
44 48 50 58
56 55 51 59
14
0
15
6
14
9
16
1
18
2
19
0
23
8
28
8
31
6
33
9
37
4
42
2
43
8
53
3
57
4
Universities University Centers Integrated Colleges
Colleges, Schools, Institutes Centers of Technological Education
SOURCE: Microdata of the Higher Education Census from 1995 to 2009
Fig. 2. Evolution of the number of the Accountancy undergraduate courses by
academic organization under classroom modality from 1995 to 2009
The presential courses accounted for 86% from 5,954,021 students enrolled in
Brazil (INEP, 2010). In 2009, a total of 838,125 students were enrolled in EAD courses
and 665,429 from those enrollments were accomplished in private IES and 172,696 in
public IES (INEP, 2010). The indicator of the enrolled student number pointed out that
each presential course attended, on average, 184 students enrolled, whereas the average
number of the students enrolled in each EAD course were 993 in 2009. Those values
show the achievement level of the EAD courses, because the number of the attended
students by course surpassed the presential modality, although the number of the
courses were reduced. Table 2 presents the increase of the courses under EAD modality
in Brazil: they were 10 in 2000 and totalized 844 in 2009. This increase tendency is
accompanied by Accountancy area.

11
Table 2
Evolution of the number of undergraduate courses in Brazil and the Accountancy Course in classroom
and without the presence in classroom over the period from 1995 to 2009.
Total Accountancy Course Representativeness
Year Presential EAD Total Presential EAD Total %
Presential
%
EAD
%
Total
1995 6,252 0 6,252 352 0 352 6 0 6
1996 6,644 0 6,644 384 0 384 6 0 6
1997 6,132 0 6,132 387 0 387 6 0 6
1998 6,950 0 6,950 407 0 407 6 0 6
1999 8,878 0 8,878 459 0 459 5 0 5
2000 10,585 10 10,595 510 0 510 5 0 5
2001 12,155 14 12,169 578 0 578 5 0 5
2002 14,399 46 14,445 641 0 641 4 0 4
2003 16,453 52 16,505 701 0 701 4 0 4
2004 18,644 107 18,751 763 0 763 4 0 4
2005 20,407 189 20,596 816 2 818 4 1 4
2006 22,101 349 22,450 886 11 897 4 3 4
2007 23,488 408 23,896 923 17 940 4 4 4
2008 24,719 647 25,366 985 22 1,007 4 3 4
2009 27,827 844 28,671 1,028 24 1,052 4 3 4
SOURCE: Census microdata of the Higher Education from 1995 to 2009. Own tabs.
Along the period under study, most IES are private; there is lower concentration
of the students enrolled in public IES, who are also at lower number; and the enrollment
rate tends to decline. This reduction may be due to existence of idleness, since
occupancy rates show that over 50% places are not filled in ES. This context can
generate the SES closing and merging of institutions, possible adjustment of costs and
fees charged by private IES for their services and the loosening of the selection process
of future students.
It is emphasized that the scenario presented above refers to the period after
implementation of the SES regulatory policies, that were institutionalized especially in
the 90s. Those policies helped the implementation of either measurement tools and
evaluation of the players involved in the SES. Those tools were developed in order to
create quality of education indicators to subsidize the systematization of the evaluation
process of the quality of Higher Education and the national policies.
12
2.2. The Brazilian Academic Performance Tests
In order to evaluate the skills and academic performance in SES ambit, some
tests were institutionalized by the Brazilian government through Law no. 9131 (1995),
which created the National Course Exam (ENC). This exam so-called Provão was
conducted during the period from 1996 to 2003 and can be considered as starting point
for implementation of an evaluation system of the higher education in the country.
Besides ENC, later the Higher Education Census (CES) and the Evaluation of the
Education Conditions (ACE) were created, through visits of the external committees to
Higher Education Institutions (IES). INEP, a federal agency affiliated to Ministry of
Education and Sports, the current Ministry of Education (MEC), has the responsibility
for accomplishing periodic evaluations in institutions and higher level courses. This
process is intended to evaluate the quality and efficiency of teaching, research and
extension.
In 1996, INEP started the implementation of the Provão, by applying the first
exam for courses in Management, Law, and Civil Engineering. Until the end of the
exam in 2003, twenty six areas of knowledge participated in the test (INEP, 2004, p. 5).
The organization, elaboration and application of the exams were in charge of INEP in
partnership with other institutions. The ENC-Provão was annual and should include
minimum contents established and reported previously, for each course. The inclusion
of minimum contents aimed to assess the knowledge, skills and abilities acquired by
students at completion stage of the undergraduate courses (INEP, 2002, 2003). The
exams could be composed by multiple choice questions and discursive ones or exams
entirely consisting of discursive questions (INEP, 2003a). The adopted exam model was
under responsibility of each Course Commission (INEP, 2003a).
The Law n. 9131 (1995) defined the results from evaluation of the courses to be
broadly divulged to society by MEC. Those results were recorded on the student's report
description, concepts from A to E. The results from Exam and the reports by experts
affiliated to MEC were the basis for the Board of Higher Education (CES) to decide
about IES periodic recertification, according to Law n. 9131 (1995). This determination
allowed for decertification of courses that, according to CES, were not meeting the
educational quality standards previously established by MEC. For example, those
courses that obtained the concepts D and E in the last three exams could be closed.
13
In addition to Exam, each enrolled student received in advance, at his/her
residence, a questionnaire-survey, which should be devolved on exam day, from which
the goal was to collect the sociocultural and socioeconomic data and the student´
expectations regarding the characteristics of the courses, the resources and available
facilities, curriculum structure and teacher performance (INEP, 2003a). Students also
completed a questionnaire of impressions soon after exam, in order to generate
information that aimed at improving the next exams, particularly in relation to their "[...]
clarity and objectivity of statements, adequacy of information provided for resolution of
the questions, adequacy of the time for accomplishment of the exam and the difficulty
level and extent of the exam "(INEP, 2003a, p. 44).
In 2004, through Law no. 10861 (2004) which established the National System
of Higher Education Evaluation (SINAES), the Brazilian government made changes in
ES evaluation process and replaced the ENC by the National Exam of Student
Performance (Enade). Both exams aim to get knowledge, academic skills and
professional competencies, previously defined by educational guidelines developed by
the students along the course. Those aspects were evaluated at different stages of the
student’academic life. In the case of Provão, the exam was applied to graduating
students.
There are two important differences in Enade. The first one is that two distinct
groups of students, at different graduation times, are selected at random to participate in
exam. The first group, considered as entering students, must be coursed until the end of
the first year. The second group, the graduating students, are at the end of the last year
of the course. Both groups answer the same questions. The INEP purpose is to evaluate
the students’ performance throughout the course, with regard to knowledge, academic
abilities and professional skills.
The second difference is that Enade is divided into two components: General
Education (FG) and the Specific Component (EC). The questions of the General
Education component, common to all courses, seek to evaluate "the formation of an
ethical and competent professional who is committed to society in which he lives"
(INEP, 2007). The questions of the Specific Knowledge component seek to evaluate
whether students have developed, in the training process, the knowledge, skills and
14
competencies predefined by specialist committees, which are based on the National
Curriculum Guidelines for each course under evaluation.
For elaboration of the exam and definition of the desired objectives in relation to
attributes cited, INEP relies on specialist committees composed by teachers with
minimum Master title and yearly appointed by INEP. As FG exam is unique, only one
committee is responsible for its elaboration.
Thus, based on definition by Ryans and Frederiksen (1955), it is observed the
tests such as Provão and Enade to function as tools for measuring the educational
standards from which the objects or phenomena to be measured are the knowledge,
skills and individual achievements. In this study, the term ‘academic achievement’ will
be characterized according to Helmke and Schrader (2001), as the result from cognitive
learning produced by the process of education or cognitive knowledge that is intended
to teach in the school context. According to the authors, those cognitive results mainly
comprise the declarative knowledge of how to make and the individual ability to solve
problems and develop strategies.
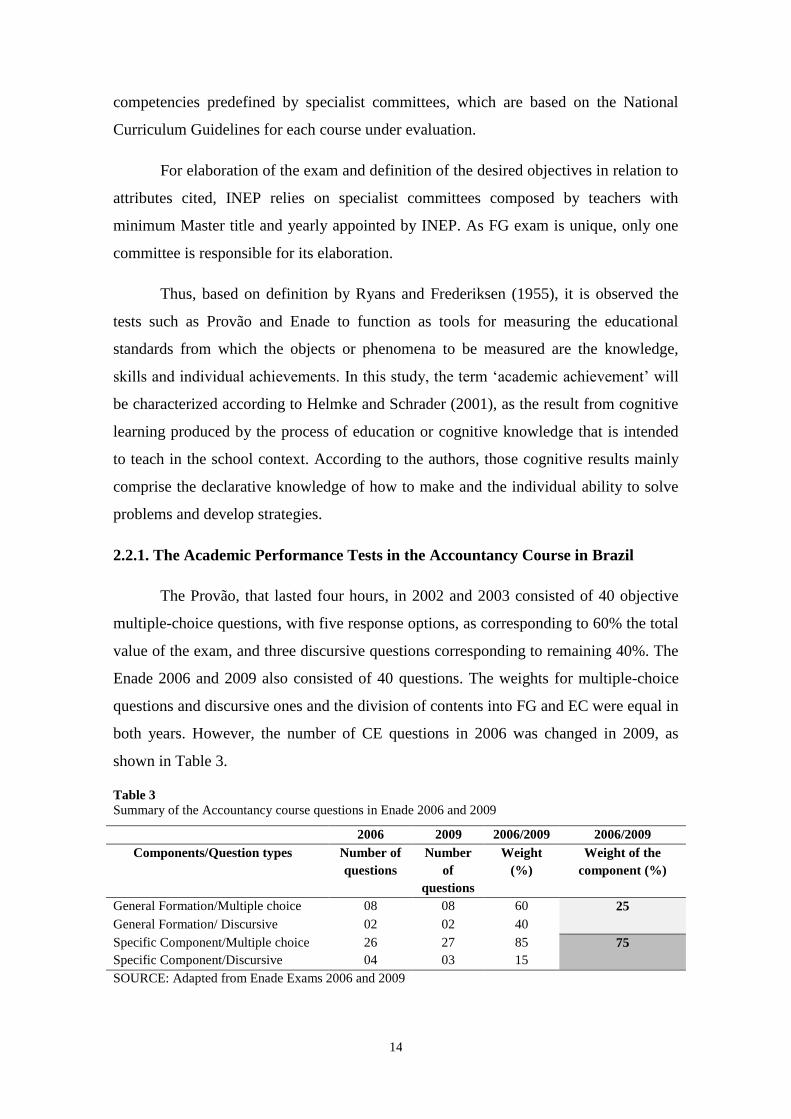
2.2.1. The Academic Performance Tests in the Accountancy Course in Brazil
The Provão, that lasted four hours, in 2002 and 2003 consisted of 40 objective
multiple-choice questions, with five response options, as corresponding to 60% the total
value of the exam, and three discursive questions corresponding to remaining 40%. The
Enade 2006 and 2009 also consisted of 40 questions. The weights for multiple-choice
questions and discursive ones and the division of contents into FG and EC were equal in
both years. However, the number of CE questions in 2006 was changed in 2009, as
shown in Table 3.
Table 3
Summary of the Accountancy course questions in Enade 2006 and 2009
2006 2009 2006/2009 2006/2009
Components/Question types Number of
questions
Number
of
questions
Weight
(%)
Weight of the
component (%)
General Formation/Multiple choice 08 08 60 25
General Formation/ Discursive 02 02 40
Specific Component/Multiple choice 26 27 85 75
Specific Component/Discursive 04 03 15
SOURCE: Adapted from Enade Exams 2006 and 2009

15
Based on Ministerial Ordinances n. 2250 (2001) and n. 3187 (2002) and INEP n.
80 (2006) and n. 83 (2009), it may be noted that all committees responsible for
elaborating the guidelines for knowledge question contents in the Accountancy area
were composed by teachers with at least Master degree, from different Brazilian regions
and different types of institutions. In addition, an INEP-conducted study analyzed the
educational projects of the courses under evaluation for the commission to establish
guidelines for elaboration of the exam (INEP, 2004).
Furthermore, by means of guidelines of the Provão 2002/2003 established by
Ministerial Decrees n. 3018 (2001a) and n. 3818 (2002a), it was verified that no great
changes occurred in their content over the period from 2002 to 2003. It is only noted a
more detailed specification of the desired profile, skills and abilities to be evaluated. In
the guidelines established by INEP Ordinances n. 121 (2006a) and n. 125 (2009) in
Enade years, the increase referring to component of the FG exam occurred. The main
changes in formats of both Provão and Enade were decided by committees, especially in
relation to specific knowledge.
Those guidelines were the basis for guiding the elaborators of the exams on how
to evaluate the contents. For example, in all tests, there was no specific question to
evaluate the student's competence to adequately express in Portuguese (language spoken
in Brazil). In the discursive questions, however, this competence was required. The
ethical behavior and the contents of Administration, Economics and Law were broached
in questions with focus on Accountancy, but with interdisciplinary nature. The
knowledge of mathematics and statistics were required to solve questions of other
topics. So, besides seeking to verify the content knowledge, each question was designed
to capture a set of interdisciplinary skills. For example, in Provão 2002, in the same
question were collected knowledge in law, professional ethics and also logical
reasoning, analysis and emission of critical judgments.
3. The Hierarchical Linear Model of Academic Performance
An econometric technique often used to estimate the educational production
function is the regression by Ordinary Least Squares (OLS) (Betts & Morell, 1999;
Cohn, Cohn, Balch, & Bradley JR., 2004; Horowitz & Spector, 2005). However, some
authors such as Hanushek and Woessmann (2011) show that although the robustness of
the method, its estimates need to be cautiously interpreted when a broad range of inputs

16
is used because it can generate estimation biases in the coefficients of variables because
endogeneity. Due to this fact, some studies have used the regression techniques with
hierarchical structure (Soares, Ribeiro, & Castro, 2001; Albernaz, Ferreira, & Franco,
2002; Diaz, 2007). According to Raudenbush and Bryk (2002), the Hierarchical Linear
Models (HLM) enable the analysis of data which structure indicates the existent of
correlation among individuals pertaining to the same group.
There are different HLM6 models. This study uses the general model with two
levels, which is composed by two sub-models so-called Level 1 and Level 2
(Raudenbush & Bryk, 2002) in order to estimate the educational production function for
each period under analysis. In this model, the data referring to each student (i) are
contained within IES representing (j) groups of students. The Level 1 model reproduces
the relationship between an explanatory variable (Xij) with a dependent variable (Tij) and
the Level 2 Model captures the influence from IES factors. Formally, there are i=1, .., n,
units of the Level 1 within j = 1, ..., J units of the Level 2. In Eq. (1) and (2) we to show
the general model equations of two levels, with the use of the notation by Raudenbush
and Bryk (2002) and the framework of the educational production function (Todd &
Wolpin, 2003; Harris, 2010; Hanushek & Woessmann, 2011):
Level 1 (students) rXRPFAT ijpijpjijjijjijjijjjij ...43210
, (1)
Level 2 (IES) uW...IRP qjhjqhj33qj22qj11q0qqj . (2)
The terms β0j, ... βpj are coefficients of the Level 1 and the terms γq0, ... yqh are
coefficients of the Level 2, which can be understood as fixed effects. The term Xij is the
exogenous variable of the Level 1, which represents the students’ individual skills (Aij),
their personal characteristics, their family background (Fij), possible effects from the
pairs (Pij) and school resources (Rij). The term Wj represents the exogenous variable of
the Level 2, which may be linked to effects of the pairs (P1j), to school resources (R2j)
and to institutional peculiarities of either school and education system (I3j). There are p
exogenous variables (Xij ) for Level 1 and h explanatory variables (Wj) for Level 2. The
equations present intercept and slope grade random (βqj) for all p exogenous variables
(X i j) Level 1, explained by h variables (Wj) Level 2. The term ri j are the random effects
of the Level 1and in the case of Level 2 it is represented by the term µq j. The terms of
6 The other models are described in: Raudenbush; Bryk (2002), Raudenbush; Bryk; Congdon (2007) and
Rabe-Hensketh; Skrondal (2008).
17
errors rij and µq j must be mutually independent with normal distribution and zero mean.
The variance (σ²) Level 1 (within groups) is represented by the term rij. The variance
and covariance (τ00, τ01) of the components Level 2, also so-called variance between
groups, refer to the term µq j referring to group level.
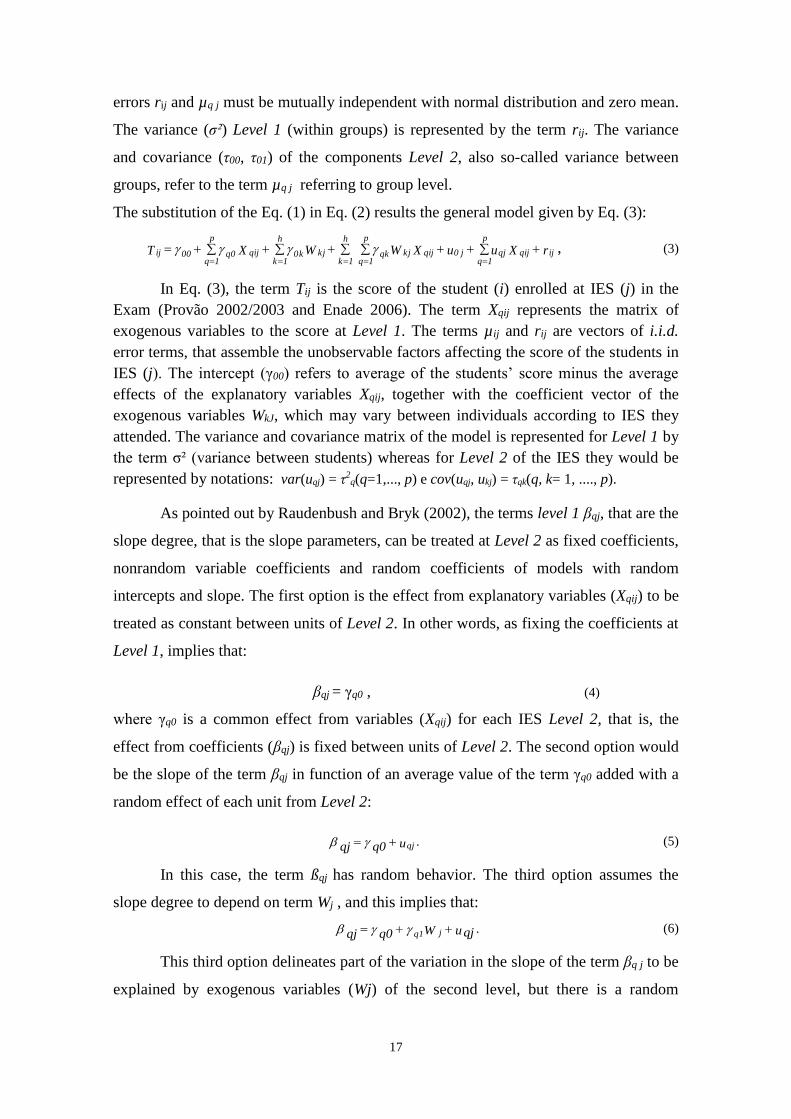
The substitution of the Eq. (1) in Eq. (2) results the general model given by Eq. (3):
rXuuXWWXT ij
p
1qqijqjj0
p
1qqijkjqk
h
1k
h
1kkjk0
p
1qqij0q00ij
, (3)
In Eq. (3), the term Tij is the score of the student (i) enrolled at IES (j) in the
Exam (Provão 2002/2003 and Enade 2006). The term Xqij represents the matrix of
exogenous variables to the score at Level 1. The terms µij and rij are vectors of i.i.d.
error terms, that assemble the unobservable factors affecting the score of the students in
IES (j). The intercept (γ00) refers to average of the students’ score minus the average
effects of the explanatory variables Xqij, together with the coefficient vector of the
exogenous variables WkJ, which may vary between individuals according to IES they
attended. The variance and covariance matrix of the model is represented for Level 1 by
the term σ² (variance between students) whereas for Level 2 of the IES they would be
represented by notations: var(uqj) = τ2q(q=1,..., p) e cov(uqj, ukj) = τqk(q, k= 1, ...., p).
As pointed out by Raudenbush and Bryk (2002), the terms level 1 βqj, that are the
slope degree, that is the slope parameters, can be treated at Level 2 as fixed coefficients,
nonrandom variable coefficients and random coefficients of models with random
intercepts and slope. The first option is the effect from explanatory variables (Xqij) to be
treated as constant between units of Level 2. In other words, as fixing the coefficients at
Level 1, implies that:
βqj = γq0 , (4)
where γq0 is a common effect from variables (Xqij) for each IES Level 2, that is, the
effect from coefficients (βqj) is fixed between units of Level 2. The second option would
be the slope of the term βqj in function of an average value of the term γq0 added with a
random effect of each unit from Level 2:
.u0qqj qj (5)
In this case, the term ßqj has random behavior. The third option assumes the
slope degree to depend on term Wj , and this implies that:
.uqjW0qqj j1q (6)
This third option delineates part of the variation in the slope of the term βq j to be
explained by exogenous variables (Wj) of the second level, but there is a random

18
component (uqj) that is the error term. In this case, the effect from term Wj is considered
in the model and the residual variation in term βq j which is Var (uqj) = τqj is
insignificant.
Raudenbush, Bryk and Congdon (2007) affirm that the dimension of the T
matrix depends on the number of the coefficients at Level 2, which are specified with
random variation. It is assumed that the set of the different explanatory variables of
Level 2 can be used in each equation (Q + 1) of the Model at Level 2.Although the
coefficients (γqo) Level 2 may vary according to IES attended by students, in this work
only the intercept Level 1 (β0j) presents random variation, according to IES. This means
to adopt the model that estimate different intercepts for IEs and for each explanatory
variable, either Level 1 and Level 2, for which different coefficients are separately
estimated for each IES.
Raudenbush and Bryk (2002) suggest the use of the maximum likelihood
method for unbalanced data, that is, when there are different sample sizes at Level 1 for
each organizational unit Level 2. In such cases, the integral maximum likelihood
method generates more consistent and efficient estimators. Based on this
recommendation, the maximum likelihood method, in full or integral concept, is used in
the present study in order to estimate the coefficients because unbalanced structure of
the micro data. According to Favero et al. (2009), this method estimates the variance
and covariance parameters and the fixed effect coefficients of Level 2 by maximizing
their joint probability.
Raudenbush and Bryk (2002) pointed out the need for performing some of the
tests: fixed effect coefficients, random coefficients of Level 1 and variance-covariance
for all components. The first test is carried out to verify whether there is intra-class
correlation as well as the occurrence of one more residual term. The accomplishment of
this test requires the estimation of the unconditional or null model, from which the
specification is given by Eq. (7) and (8):
ry ijj0ij , (7)
u j000j0 , (8)
This null model allows to calculate the variance of the Level 1 (σ²) or between
students and the variance of the Level 2 (τ0²). With the terms related to variances of the
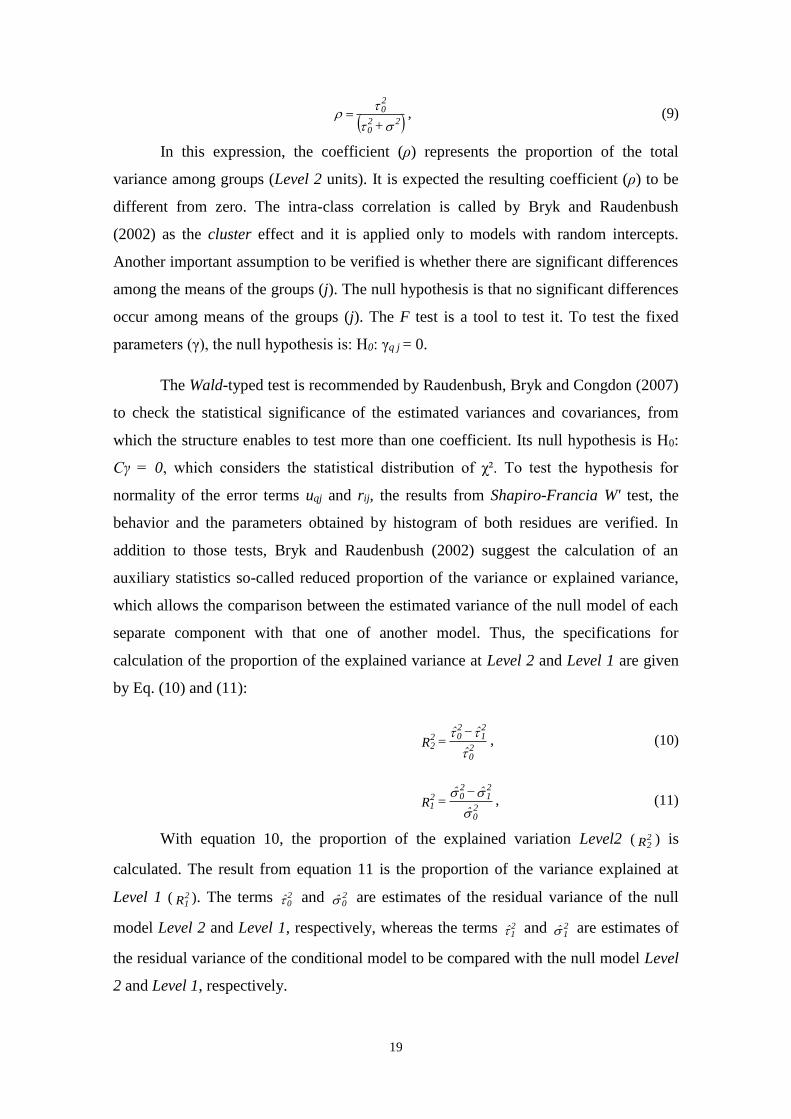
Level 1 and Level 2, the intraclass correlation is calculated based on Eq. (9).
19
220
20
, (9)
In this expression, the coefficient (ρ) represents the proportion of the total
variance among groups (Level 2 units). It is expected the resulting coefficient (ρ) to be
different from zero. The intra-class correlation is called by Bryk and Raudenbush
(2002) as the cluster effect and it is applied only to models with random intercepts.
Another important assumption to be verified is whether there are significant differences
among the means of the groups (j). The null hypothesis is that no significant differences
occur among means of the groups (j). The F test is a tool to test it. To test the fixed
parameters (γ), the null hypothesis is: H0: γq j = 0.
The Wald-typed test is recommended by Raudenbush, Bryk and Congdon (2007)
to check the statistical significance of the estimated variances and covariances, from
which the structure enables to test more than one coefficient. Its null hypothesis is H0:
Cγ = 0, which considers the statistical distribution of χ². To test the hypothesis for
normality of the error terms uqj and rij, the results from Shapiro-Francia W' test, the
behavior and the parameters obtained by histogram of both residues are verified. In
addition to those tests, Bryk and Raudenbush (2002) suggest the calculation of an
auxiliary statistics so-called reduced proportion of the variance or explained variance,
which allows the comparison between the estimated variance of the null model of each
separate component with that one of another model. Thus, the specifications for
calculation of the proportion of the explained variance at Level 2 and Level 1 are given
by Eq. (10) and (11):
ˆ
ˆˆR 2
0
21
202
2
, (10)
ˆ
ˆˆR 2
0
21
202
1
, (11)
With equation 10, the proportion of the explained variation Level2 ( R22
) is
calculated. The result from equation 11 is the proportion of the variance explained at
Level 1 ( R21
). The terms ̂ 20
and ̂ 20
are estimates of the residual variance of the null
model Level 2 and Level 1, respectively, whereas the terms ̂ 21
and ̂ 21
are estimates of
the residual variance of the conditional model to be compared with the null model Level
2 and Level 1, respectively.

20
According to Todd and Wolpin (2003), the models of the educational production
function are potentially subjected to endogeneity problems, especially due to absence of
unobservable inputs or explanatory variables omitted, such as students’ innate ability. In
this context, the recommendations by Rabe-Hensketh and Skrondal (2008) were
followed. According to those authors, the Hausman test should be used in order to
check the consistency of the estimators and the possible specification problems through
hypothesis for endogeny. The null hypothesis of the test allows to verify between
estimates of two distinct models which one is efficient, consistent and more adequately
specified. This test also indicates whether the most appropriate model is the one of fixed
effects or random effects. The adoption of the fixed effect model allows to use only the
information within groups. The authors suggest more accurate estimates of the
coefficients to be obtained, when information from both models within and among
groups are used. The Hausman test is used in case of the hierarchical models, especially
for evaluating the efficiency and consistency of the parameters estimated.
Taking into account this research objectives, the information concerning to
either large-scale tests and structure of the hierarchical linear model, the data referring
to each student (i) are contained within IES (j), that represent (j) groups of students at
first level and the data of the courses and institutions (j) as second level.
4. DATA AND RESULTS
4.1. Data
The main sources of the data used in this study were the micro data from Provão
(1997 to 2003), Enade (2006) and CES (2006 to 2009), provided by INEP. The data of
either Provão and Enade not allow for identification of the students. However, it is
possible to know the undergraduate course and IES to which the students were
affiliated. CES beheld data of the courses and institutions of the higher education
system and are divided into two files. The first file consists of data from each
undergraduate course. The second file provides information on institutions to which the
courses were affiliated. This form of the data availability allowed the information to be
considered with a hierarchical structure required to make estimates using HLM.
The micro data from Provão and Enade include the students’ responses to
socioeconomic questionnaires. There are information concerning to students, such as
21
personal characteristics, socioeconomic and cultural conditions, habits of reading and
study, as well as about courses such as facilities and resources available in institutions,
curricular structure, didactic-pedagogic organization and teachers’ performance. There
were issues common to all courses involved in the evaluation process and other ones
specific to the Accountancy course. There are more than 100 questions (INEP, 2004;
2007a). On exam day, the students also express their perception in relation to exam: the
resolution difficulty, extension, time sufficiency, statement of questions, personal
problems to resolve it, and whether the content was charged during course.
The analysis universe were the students graduating in Accountancy courses, who
attended and participated in the exams. In 2002, a total of 22,694 students were present;
in 2003, 23,495; and in 2006, 19,633. It was decided to remove from database those
students whose exam was not answered, in order to avoid the zero scores from
distorting the results, since it is possible the profile of the students who delivered the
exam in blank to be different from students who resolve the test, in terms of
commitment, dedication, etc. Then, the universe of analysis was reduced to 22,659,
23,451 and 19,497 graduating students, respectively. A total of 408 and 454 courses
participated of Provão in 2002 and 2003, respectively, as well as 811 courses in the case
of Enade/2006 (INEP, 2004; 2007a).
3.2. Descriptive analysis
In the hierarchical model, the dependent variable (Tij), which represents a proxy
of the academic performance of students graduating in Accountancy courses, always
varies at Level 1. The explanatory variables may vary among students’ observations
Level 1, among groups formed at Level 2 (of IES) and only in one of the levels (Rabe-
Hesketh & Skrondal, 2008). For example, the variable of gender varies among students,
whereas the variable indicating the type of administrative category to which the student
is affiliated (e.g., College) is constant among students and varies among IES. These
distinct variations entre among explanatory variables allow to calculate values with
central tendency and general dispersion, as considering each level.
Rabe-Hesketh and Skrondal (2008) recommend to calculate three standard
deviations for each variable. The first one is the overall or global standard deviation,
defined as the square root of the mean squared deviation of the observations, in relation
to general average. The standard deviation between groups is the square root of the
22
squared mean deviation of the group mean, in relation to general average. And the
standard deviation within is the square root of the mean squared deviation of the
observations, in relation to means of the groups. Three different maximum and
minimum values are also described: general, between and within. In addition, the
following values are presented: the total number of observations (N), the number (n) of
groups (j) formed and the average number of students (i) in each IES, from which the
symbol is reported in Tables 3, A1 and A2 is T-bar (Rabe-Hesketh & Skrondal, 2008).
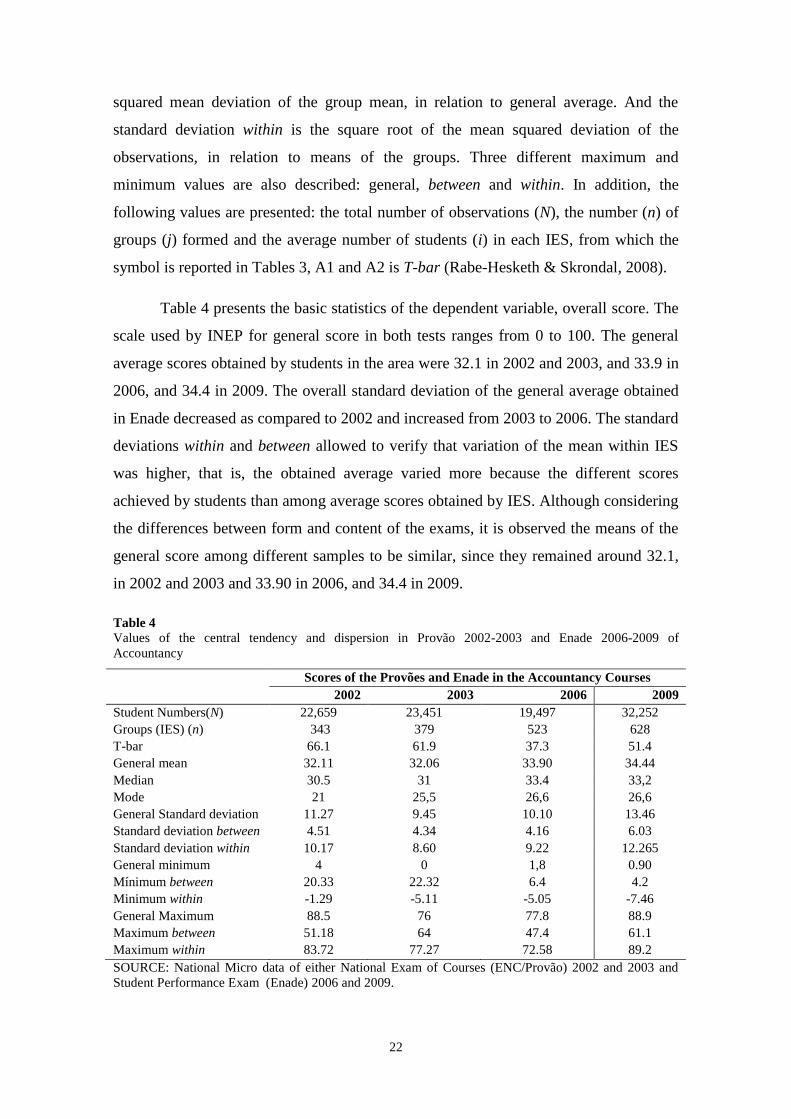
Table 4 presents the basic statistics of the dependent variable, overall score. The
scale used by INEP for general score in both tests ranges from 0 to 100. The general
average scores obtained by students in the area were 32.1 in 2002 and 2003, and 33.9 in
2006, and 34.4 in 2009. The overall standard deviation of the general average obtained
in Enade decreased as compared to 2002 and increased from 2003 to 2006. The standard
deviations within and between allowed to verify that variation of the mean within IES
was higher, that is, the obtained average varied more because the different scores
achieved by students than among average scores obtained by IES. Although considering
the differences between form and content of the exams, it is observed the means of the
general score among different samples to be similar, since they remained around 32.1,
in 2002 and 2003 and 33.90 in 2006, and 34.4 in 2009.
Table 4
Values of the central tendency and dispersion in Provão 2002-2003 and Enade 2006-2009 of
Accountancy
Scores of the Provões and Enade in the Accountancy Courses
2002 2003 2006 2009
Student Numbers(N) 22,659 23,451 19,497 32,252
Groups (IES) (n) 343 379 523 628
T-bar 66.1 61.9 37.3 51.4
General mean 32.11 32.06 33.90 34.44
Median 30.5 31 33.4 33,2
Mode 21 25,5 26,6 26,6
General Standard deviation 11.27 9.45 10.10 13.46
Standard deviation between 4.51 4.34 4.16 6.03
Standard deviation within 10.17 8.60 9.22 12.265
General minimum 4 0 1,8 0.90
Mínimum between 20.33 22.32 6.4 4.2
Minimum within -1.29 -5.11 -5.05 -7.46
General Maximum 88.5 76 77.8 88.9
Maximum between 51.18 64 47.4 61.1
Maximum within 83.72 77.27 72.58 89.2
SOURCE: National Micro data of either National Exam of Courses (ENC/Provão) 2002 and 2003 and
Student Performance Exam (Enade) 2006 and 2009.
23
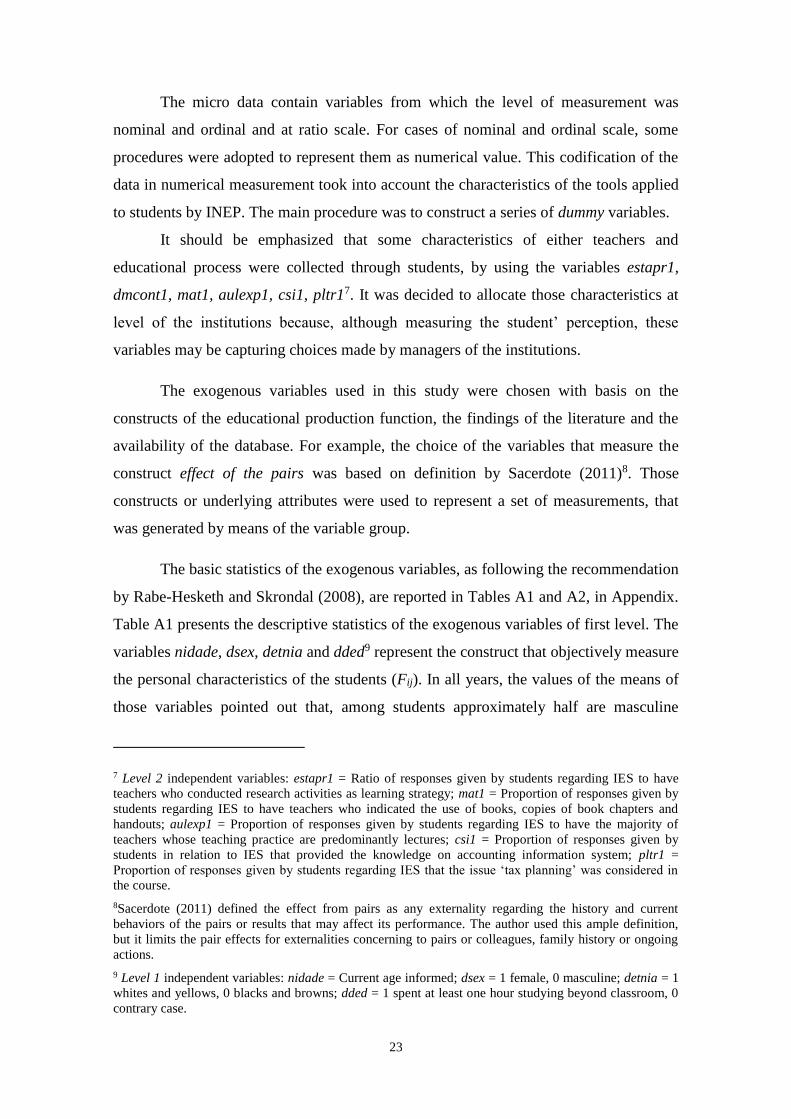
The micro data contain variables from which the level of measurement was
nominal and ordinal and at ratio scale. For cases of nominal and ordinal scale, some
procedures were adopted to represent them as numerical value. This codification of the
data in numerical measurement took into account the characteristics of the tools applied
to students by INEP. The main procedure was to construct a series of dummy variables.
It should be emphasized that some characteristics of either teachers and
educational process were collected through students, by using the variables estapr1,
dmcont1, mat1, aulexp1, csi1, pltr17. It was decided to allocate those characteristics at
level of the institutions because, although measuring the student’ perception, these
variables may be capturing choices made by managers of the institutions.
The exogenous variables used in this study were chosen with basis on the
constructs of the educational production function, the findings of the literature and the
availability of the database. For example, the choice of the variables that measure the
construct effect of the pairs was based on definition by Sacerdote (2011)8. Those
constructs or underlying attributes were used to represent a set of measurements, that
was generated by means of the variable group.
The basic statistics of the exogenous variables, as following the recommendation
by Rabe-Hesketh and Skrondal (2008), are reported in Tables A1 and A2, in Appendix.
Table A1 presents the descriptive statistics of the exogenous variables of first level. The
variables nidade, dsex, detnia and dded9 represent the construct that objectively measure
the personal characteristics of the students (Fij). In all years, the values of the means of
those variables pointed out that, among students approximately half are masculine
7 Level 2 independent variables: estapr1 = Ratio of responses given by students regarding IES to have
teachers who conducted research activities as learning strategy; mat1 = Proportion of responses given by
students regarding IES to have teachers who indicated the use of books, copies of book chapters and
handouts; aulexp1 = Proportion of responses given by students regarding IES to have the majority of
teachers whose teaching practice are predominantly lectures; csi1 = Proportion of responses given by
students in relation to IES that provided the knowledge on accounting information system; pltr1 =
Proportion of responses given by students regarding IES that the issue ‘tax planning’ was considered in
the course.
8Sacerdote (2011) defined the effect from pairs as any externality regarding the history and current
behaviors of the pairs or results that may affect its performance. The author used this ample definition,
but it limits the pair effects for externalities concerning to pairs or colleagues, family history or ongoing
actions.
9 Level 1 independent variables: nidade = Current age informed; dsex = 1 female, 0 masculine; detnia = 1
whites and yellows, 0 blacks and browns; dded = 1 spent at least one hour studying beyond classroom, 0
contrary case.

24
gender, more than half reported to be White and/or Yellow and spent at least one hour
daily to study. In each sample, the average age of students ranged from 28 to 29 years.
The standard deviations of the variables listed in Table A1 rather suggest that dispersion
around mean to have no significant changes over the years. The values of the standard
deviations within indicate the variation of those variables to be higher within than
among IES.
It is assumed the effect of the pairs (Pij) in the context of the students can be
apprehended by variables dfilhos, and dirmão decivil10. Table A1 shows that more than
half of the total students declared to be single, childless and over 90% reported to have
siblings. The dispersion of the variables reported in Table A1 was also higher within
IES than among IES.
The family and socioeconomic factors (Fij) were measured by means of the
exogenous variables despai1, desmãe, enmdpúb11 and the family income. The means of
those variables, shown in Table A1, suggest that over 80% students reported to be
children of parents who have not attained higher education, and more than half attended
the high school integrally or mostly in public school. The income ranges 6 and 7 were
reported only for 2006 in Table A1 because they were added to socioeconomic
questionnaire this year. During the periods under analysis, the mean increased in the
income ranges 1, 3 and 5. In the income range 2, the mean decreased and there was no
concentration in any income range. It was observed that the values of the means of the
income ranges 1, 3, 2 and 4 from 2003 to 2006 have changed significantly. In Table 2,
the values of the standard deviations within and between show the variations to be
greater within IES than among IES.
10 Level 1 independent variables: = dfilhos = 1 has son/daughter (s), 0 otherwise; dirmão = 1 if has sibling
(s), 0 otherwise; decivil = 1 unmarried, 0 married, separated, widowed and others.
11 Level 1 independent variables: = despai1 father with higher education, 0 otherwise; desmãe = 1 mother
with higher education, 0 otherwise; enmdpúb = 1 attended the high school in the public school, 0
otherwise. income_1 = 1 family income range up to R$ 720.00, and 0 otherwise; income _2 = 1 family
income range from R$ 721.00 to R $ 2,400.00, 0 otherwise; income_3 = 1 family income range from R$
2,401.00 to R$ 4,800.00, 0 otherwise; income_4 = 1 family income range from R$ 4,801.00 to R$
7,200.00, 0 otherwise; income 5 = 1 family income range more than R$ 7,201.00. Values of the level 1
independent variables Enade 2006: 0 otherwise. income_1 = 1 family income range up to three minimum
wages, and 0 otherwise; income _2 = 1 family income range more than 3 to 5 minimum wages; 0
otherwise; income_3 = 1 family income range more than 5 up to 10 minimum wages, 0 otherwise; income
4 = 1 family income range over 10 to 15 minimum wages, 0 otherwise; income_5 = 1 family income
range over 15 to 20 minimum wages, 0 otherwise; income_6 = 1 family income range more than 20 to 30
minimum wages, 0 otherwise; income _7 = 1 family income range more than 30 minimum wages.

25
In general, the option to participate in extension and scientific initiation
activities arises within IES and the students choose it or not. The way this choice uses
school resources (Rij) was captured through variables reported in Table A1. In this
context, it should be noted that the dispersion of those variables within IES was higher
among IES. It is emphasized that the average of the variable measuring the participation
into scientific initiation increased from 0.06 in 2002 to 0.27 in 2006. This might be a
reflection of the increase in supply of this activity by IES, which generated greater
student participation. I is noted the mean and the dispersion values referring to
extension activity were similar over the years.
Table A2 presents the descriptive statistics of the second-leveled exogenous
variables. The within standard deviation of the variables measured at second level is
zero. Because construction, those variables vary only among IES and not among
students. Therefore, they are constant at Level 1 (Rabe-Hesketh & Skrondal, 2008).
Table A2 shows the variables referring to main characteristics of the teachers, as
considered as school resource (R2J), and the organizational form of either IES and
educational system (I3j). The mean proportions of teachers with master and doctorate
titles, full-time working hours and content domain increased over the period from 2002
to 2006. The variance of the md variable referring to proportion of the teachers with
master and doctorate degrees in the institutions decreased from 0.05 to 0.04 over the
period from 2002 to 2003. It is possible the changes in those values to be related with
the need for institutions to fulfill the percent teachers with those titles determined by
MEC. The behavior of both average ratio and standard deviation among IES of the
academic organization (dorgac) was heterogeneous. The increase in values of the
variable dorgac is related to an increased number of Universities and University centers
throughout the years. It is observed the mean and standard deviation between IES and
other variables to be similar in this period.
The statistics related to main aspects of the educational process, that were
adopted in the courses, are reported in Table A2. The values of the standard deviations
among groups of those variables were generally low. The average proportion of either
teachers who conducted research activities as teaching and learning strategy and
teachers who used lecture as teaching practice decreased over the period from 2003 to
2006. In 2006, the dispersion among IES concerning to have lecture was nonexistent
The values of the variables csi1 and pltr1 showed that the contents of the accountable

26
information system and tributary planning were included in the courses, either in 2002
and 2003. The statistics of the other variables were similar over this period.
Table A2 presents the descriptive statistics of the environmental or context
variables so-called effects of the pairs (P1j). The results of either means and standard
deviations among groups showed homogeneous character. Despite differences in
number of the observations, groups (IES) and mean number of observations within
groups (T-bar), there were little changes during the period under study.
According to data presented in Tables 3 and 4, there is high probability the most
students to compose the first generation of the family, as attending an undergraduate
course, since 80% students were sons/daughters of parents with no training in higher
education. Other uniformities were observed, such as similarity of the distribution by
gender and by frequent use of the textbooks and/or manuals and handouts as didactic
material by teachers of the course. Moreover, according to the report by INEP, the
students’ perception, certain basic contents covered on the exam were given, but the
given approach was different from the one charged (INEP, 2004). Concerning to
teachers, according to the students' perceptions of the area, the most frequent
characteristics were content domain and the use of research activity as learning strategy.
Another point was the high use of lectures or lecture with student participation, such as
technical education, with approximately 80% total responses. On average: 60% teachers
worked as hourly employees and 37% were still experts, despite the increased number
of the master and doctor teachers.
3.2. Results from estimations of the Hierarchical Linear Models
A production function of the educational course in Accounting was estimated for
each year using hierarchical linear models, with the maximum likelihood method and
based on the previously established hypotheses. The econometric procedure was done
in software Stata, version 9.1. The order for presentation of the estimates in Table 5 was
based on the literature of hierarchical models (Raudenbush & Bryk, 2002; Rabe-
Hesketh & Skrondal, 2008; Fávero et al., 2009).
The first estimate is done with the unconditional or null model without
explanatory variables. According to Fávero et al. (2009), the estimation of this model
allows to verify the following hypotheses: (1) there is significant variability in

27
performance among students of the same IES; and (2) there is significant variability in
performance among students from different IES. These assumptions allowed to evaluate
whether there were differences in performance among students and among IES.
The results from estimates of the null or unconditional model referring to Provão
2002/2003 and Enade 2006/2009 are presented in Table 5. Those estimates allowed to
calculate the IES average performance in tests (β0j) as a function of the overall average
of all IES (γ00), added with a random component (u0j). Initially, it is considered the IES
average performance did not vary from institution to institution and was treated as
constant. The results showed the expected average performance of the students, that is,
31.29 in Provão 2002, 31.67 in Provão 2003 and 33.25 in Enade/2006 and 33.94 in
Enade/2009. The residual standard deviations of Level 1 were 10.25 in Provão 2002,
8.67 in Provão 2003 and 9.35 in Enade/2006 and 12.38 in Enade/2009. The standard
deviations of the random intercepts of Level 2 were 4.26 in Provão 2002, 3.62 in Provão
2003 and 3.60 in Enade/2006 and 5.16 in Enade/2009.
The variance of the overall score in Provão/2002 among students was 104.96
(Level 1) and among institutions was 18.15 (Level 2). The sum of those variances
generated a total value of 123.11. In Provão 2003, the calculated variance for Level 1
was 75.21 whereas for Level 2 was 13.11, therefore its sum corresponds to total 88.32.
The variance of the overall score in Enade/2006 among students was 87.39 (Level 1)
and the variance among institutions was 12.97 (Level 2), and their sum equals a total
variance of 100.36. The variance of the overall score in Enade/2009 among students
was 153.44 (Level 1) and the variance among institutions was 26.67 (Level 2), and their
sum equals a total variance of 180.11. These results indicate that most variation in
overall score in each year occurred in Level 1, that is among students.
Those proportions of the level variances allowed to calculate the intraclass
variance, which indicates the proportion of the total variance due to IES groups as
defined in Level 2 (Raudenbush & Bryk, 2002; Rabe-Hesketh & Skrondal, 2008; Fávero
et al., 2009). The values of the intraclass correlation coefficients (ρ) of the null model in
Provão/2002 was 0.147, in Provão/2003 was 0.148 and in Enade/2006 was 0.129 and in
Enade/2009 was 0.148. These values suggest that part from proportion of the total
variance can be attributed to IES peculiarities. Thus, it is possible to include specific
variables of the institution level in the model, that is, at second level. This indicates
28
adequacy of the hierarchical models for estimating the educational production function
of the Accountancy area. Besides, it shows that most of the variation of the overall score
in Provão/2002, Provão/2003, Enade/2006 and Enade/2009 occurred more within IES
than among institutions. It is observed the value of the intraclass correlation of the
unconditional model of 2003 and 2002 to be higher than the estimated value in 2006
and 2009.
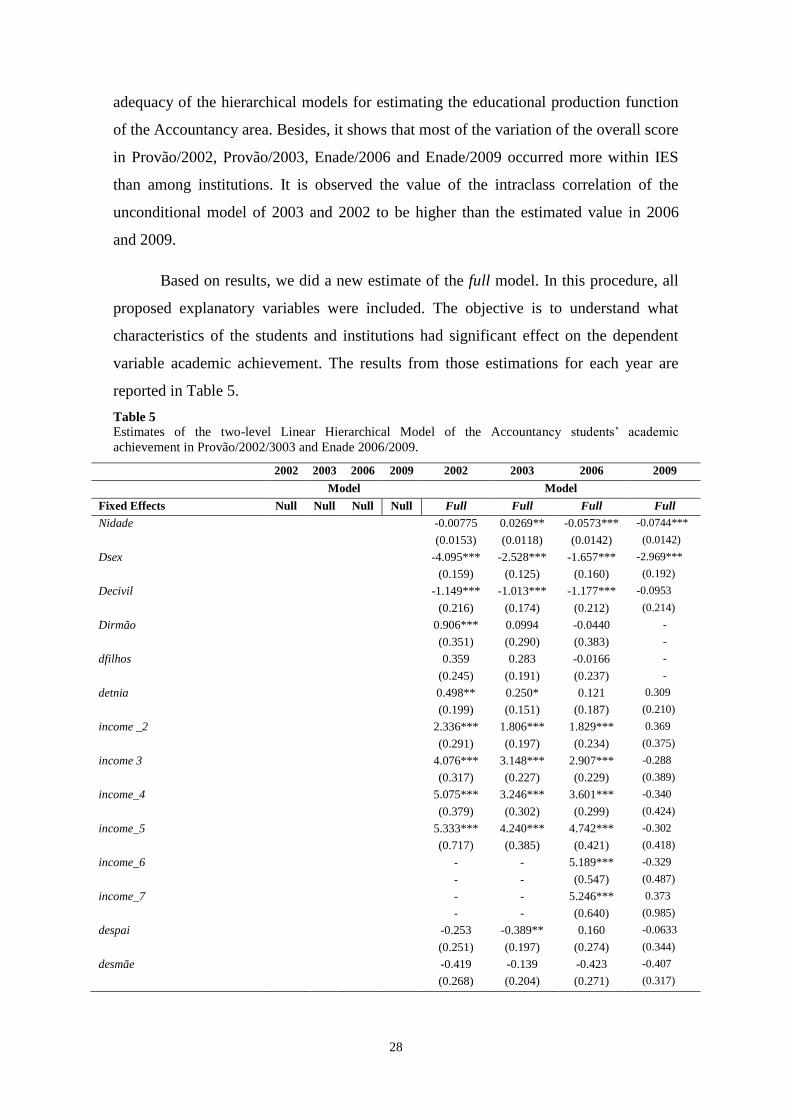
Based on results, we did a new estimate of the full model. In this procedure, all
proposed explanatory variables were included. The objective is to understand what
characteristics of the students and institutions had significant effect on the dependent
variable academic achievement. The results from those estimations for each year are
reported in Table 5.
Table 5
Estimates of the two-level Linear Hierarchical Model of the Accountancy students’ academic
achievement in Provão/2002/3003 and Enade 2006/2009.
2002 2003 2006 2009 2002 2003 2006 2009
Model Model
Fixed Effects Null Null Null Null Full Full Full Full
Nidade -0.00775 0.0269** -0.0573*** -0.0744***
(0.0153) (0.0118) (0.0142) (0.0142)
Dsex -4.095*** -2.528*** -1.657*** -2.969***
(0.159) (0.125) (0.160) (0.192)
Decivil -1.149*** -1.013*** -1.177*** -0.0953
(0.216) (0.174) (0.212) (0.214)
Dirmão 0.906*** 0.0994 -0.0440 -
(0.351) (0.290) (0.383) -
dfilhos 0.359 0.283 -0.0166 -
(0.245) (0.191) (0.237) -
detnia 0.498** 0.250* 0.121 0.309
(0.199) (0.151) (0.187) (0.210)
income _2 2.336*** 1.806*** 1.829*** 0.369
(0.291) (0.197) (0.234) (0.375)
income 3 4.076*** 3.148*** 2.907*** -0.288
(0.317) (0.227) (0.229) (0.389)
income_4 5.075*** 3.246*** 3.601*** -0.340
(0.379) (0.302) (0.299) (0.424)
income_5 5.333*** 4.240*** 4.742*** -0.302
(0.717) (0.385) (0.421) (0.418)
income_6 - - 5.189*** -0.329
- - (0.547) (0.487)
income_7 - - 5.246*** 0.373
- - (0.640) (0.985)
despai -0.253 -0.389** 0.160 -0.0633
(0.251) (0.197) (0.274) (0.344)
desmãe -0.419 -0.139 -0.423 -0.407
(0.268) (0.204) (0.271) (0.317)

29
2002 2003 2006 2009 2002 2003 2006 2009
Modelo Modelo
Null Null Null Null Full Full Full Full
Fixed Effects Coef. Coef. Coef. Coef. Coef. Coef. Coef. Coef.
enmdpúb 0.866*** 0.850*** 0.383** -0.0623
(0.180) (0.142) (0.191) (0.254)
dded -
1.687***
1.807*** 1.406*** 0.433
(0.326) (0.193) (0.246) (0.281)
dexten 0.451* -0.300 -0.199 0.145
(0.264) (0.208) (0.246) (0.254)
dic 0.193 -0.809*** -0.492** 0.150
(0.339) (0.153) (0.192) (0.223)
dorgac 0.301 0.835** 0.813** 1.992***
(0.697) (0.409) (0.363) (0.489)
dcatad -1.367 -1.783*** -1.131* -
3.367***
(0.997) (0.661) (0.585) (0.686)
Md 0.742 3.088*** 3.716*** 4.345***
(1.184) (1.185) (1.006) (0.711)
v_intg -2.258 1.683* 4.280*** -0.146
(1.401) (1.000) (0.917) (0.752)
aulexp1 12.88*** 6.698*** 741.2*** -
(2.165) (1.771) (163.2) -
estapr1 0.0362 5.835** 6.251*** -3.092
(5.216) (2.816) (1.886) (2.205)
mat1 9.605*** 3.535 -1.406 0.487
(3.370) (3.017) (2.646) (2.503)
dmcont1 5.895** 5.951*** 5.918*** 0.487
(2.792) (2.200) (2.052) (2.503)
csi1 2.675 1.657 - -
(2.043) (1.614) - -
pltr1 0.432 -1.019 - -
(2.505) (1.946) - -
espai1 5.170 5.484** 5.995*** 0.447
(3.494) (2.542) (2.281) (2.241)
esmãe1 4.222 -8.659*** -
6.569***
-2.358
(4.295) (2.793) (2.436) (2.043)
Midade 0.0339 0.00762 -0.0519 -0.165***
(0.103) (0.0734) (0.0610) (0.0713)
Constant 31.29*** 31.67*** 33.25*** 33.94*** 10.71* 11.93*** 21.68*** 42.89***
(0.247) (0.201) (0.176) (0.226) (6.368) (4.194) (3.591) (2.246)
Random Effects
sd(_cons) 4.260*** 3.621*** 3.602*** 5.164*** 3.619*** 2.773*** 2.380*** 4.219***
(0.183) (0.151) (0.135) (0.173) (0.183) (0.136) (0.127) (0.179)
sd(Residual) 10.25*** 8.672*** 9.348*** 12.38*** 9.954*** 8.482*** 9.253*** 12.253***
(0.0485) (0.0404) (0.0480) (0.492) (0.0549) (0.0432) (0.0554) (0.0554)
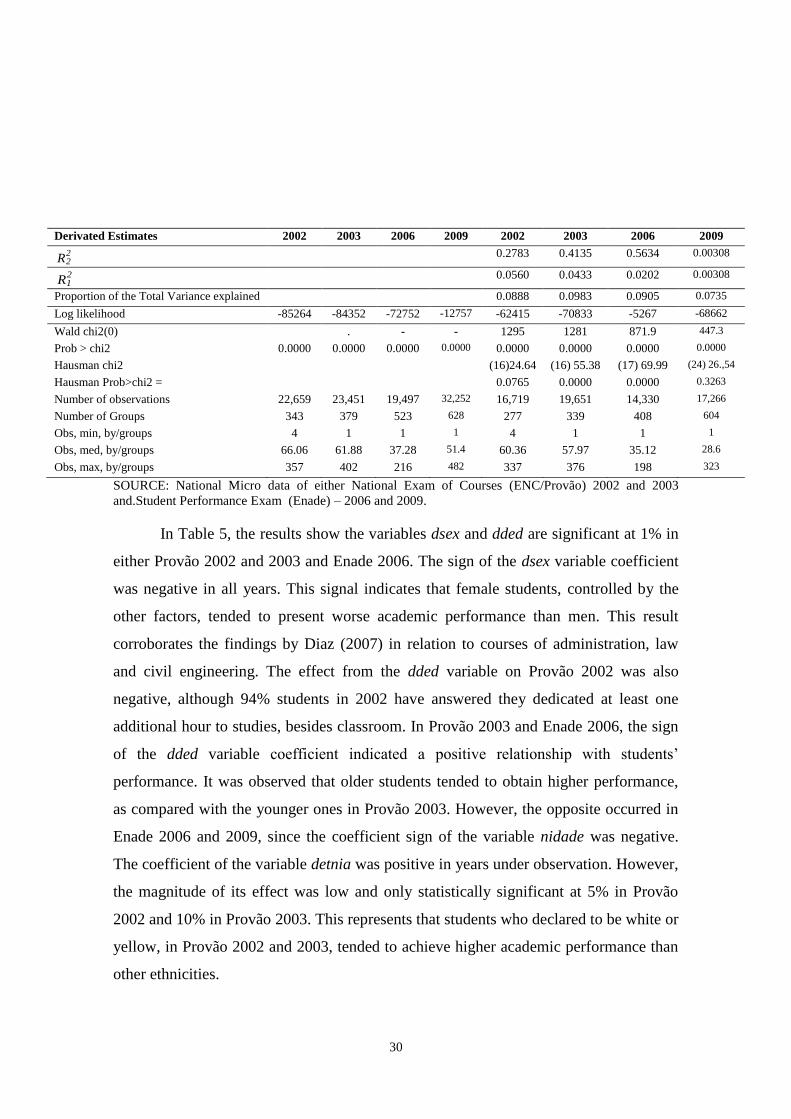
Derivated Estimates
R² 0.00 0.00 0.0000 0.00 0.00981 0.00810 0.00705 0.00308
Ρ 0.147 0.148 0.129 0.148 0.117 0.0966 0.0620 0.1061
Prob >= chibar2 0.0000 0.0000 0.0000 0.0000 0.0000 0.0000 0.0000 0.0000
Variance of the Level 2 18.15 13.112 12.974 26.671 13.10 7.680 5.664 17.798
variance of the Level 1 104.96 75.204 87.385 153.443 99.08 71.944 85.618 149.983
Total Variance 123.11 88.315 100.359 180.114 112.18 79.634 91.282 167.782
30
Derivated Estimates 2002 2003 2006 2009 2002 2003 2006 2009
R22
0.2783 0.4135 0.5634 0.00308
R21
0.0560 0.0433 0.0202 0.00308
Proportion of the Total Variance explained 0.0888 0.0983 0.0905 0.0735
Log likelihood -85264 -84352 -72752 -12757 -62415 -70833 -5267 -68662
Wald chi2(0) . - - 1295 1281 871.9 447.3
Prob > chi2 0.0000 0.0000 0.0000 0.0000 0.0000 0.0000 0.0000 0.0000
Hausman chi2 (16)24.64 (16) 55.38 (17) 69.99 (24) 26.,54
Hausman Prob>chi2 = 0.0765 0.0000 0.0000 0.3263
Number of observations 22,659 23,451 19,497 32,252 16,719 19,651 14,330 17,266
Number of Groups 343 379 523 628 277 339 408 604
Obs, min, by/groups 4 1 1 1 4 1 1 1
Obs, med, by/groups 66.06 61.88 37.28 51.4 60.36 57.97 35.12 28.6
Obs, max, by/groups 357 402 216 482 337 376 198 323
SOURCE: National Micro data of either National Exam of Courses (ENC/Provão) 2002 and 2003
and.Student Performance Exam (Enade) – 2006 and 2009.
In Table 5, the results show the variables dsex and dded are significant at 1% in
either Provão 2002 and 2003 and Enade 2006. The sign of the dsex variable coefficient
was negative in all years. This signal indicates that female students, controlled by the
other factors, tended to present worse academic performance than men. This result
corroborates the findings by Diaz (2007) in relation to courses of administration, law
and civil engineering. The effect from the dded variable on Provão 2002 was also
negative, although 94% students in 2002 have answered they dedicated at least one
additional hour to studies, besides classroom. In Provão 2003 and Enade 2006, the sign
of the dded variable coefficient indicated a positive relationship with students’
performance. It was observed that older students tended to obtain higher performance,
as compared with the younger ones in Provão 2003. However, the opposite occurred in
Enade 2006 and 2009, since the coefficient sign of the variable nidade was negative.
The coefficient of the variable detnia was positive in years under observation. However,
the magnitude of its effect was low and only statistically significant at 5% in Provão
2002 and 10% in Provão 2003. This represents that students who declared to be white or
yellow, in Provão 2002 and 2003, tended to achieve higher academic performance than
other ethnicities.
31
It is observed that the effect produced by the fact the student to be single was
negative in Provões (2002 and 2003) and Enade (2006). However, in the estimated
model of the Provão 2002, there is a possibility for this negative effect to be partially
compensated among students who have siblings.
The coefficients of the socioeconomic and households’ factors were positive in
all regressions, except in 2009. It is observed the coefficients of the income ranges to be
higher for higher levels. Moreover, a positive effect upon student performance was
observed, when the student had studied totally or part of the high school in public
school. The overall results also allow to infer that there is a positive association between
family background variables and the student’ academic performance.
The variables referring to educational levels of the mother and father were
statistically significant only in some models. In Provão 2003, the effect from despai
variable coefficient was negative, but its magnitude is low. In contrast, the effect from
the espail variable coefficient was positive in Provão 2003 and Enade 2006. Diaz
(2007) obtained similar results for father's educational level, in courses of
administration, law and civil engineering. However, the author found negative
coefficients in both Provão 2003 and Enade 2006 for the context variable esmãe1 which
captures the proportion of mothers with higher education in IES. These results may be
be related from high frequency (about 85%) of students whose father had no higher
education at the time (espai1) and around 88% mothers had no higher education at the
time, in all years. These results indicate that students have underperformed in IES, with
low proportion of students whose mothers have higher education. However, this effect
may be compensated in IES with higher proportion of students whose parents have
higher education. Besides, this high percentage of students with parents without higher
education rather suggests they may have been the first individuals from one family
generation to have access to higher education.
After analyzing the characteristics of the students, the next step was to verify the
influence from the resources provided by IES, according to students’ responses. For the
estimated model of Provão 2002, only the variable dexten was significant and positive
at 10%. Despite low magnitude of the coefficient, this result suggests the participation
of the students in extension activities to improve their performance. The student
participation in activities related to undergraduate research (ddic) was negatively
32
associated with performance of the students in both Provão 2003 and Enade 2006, after
its effect to be controlled by other factors. The negative effect from this coefficient
should be cautiously interpreted, since the frequency of the students participating in the
undergraduate research activity was low, that is approximately 25%, whereas the
variance among IES was 0.03 in 2003 and 27% in 2006.
Among variables referring to typical resources of the course educational process,
it is observed the variable mat1 to be significant and positive only in 2002. This showed
the improved performance of the students in IES, where the proportion of teachers who
use more frequently the textbooks, manuals, handouts, summaries, copies of sections or
chapters of books were higher. The variables aulexp1 (all years) and estapr1 (2003 and
2006) were also statistically significant. The coefficients of the variable
aulexp1indicated that, if all other variables were kept constant, an increase in proportion
of teachers who use lecture in IES would be associated with students’ improved
performance in either Provões (2002 and 2003) and Enade ( 2006). The interpretation of
the value 741,2 of the coefficient of the variable aulexp1, from which the standard error
was 163,2, deserves caution. This high value of the standard error can be explained by
the lacked dispersion of this variable among IES in 2006, since the standard deviation
among institutions was 0,001 and the average was 0.002. The sign of the estapr1
variable coefficient indicated the increase in students’ performance in Provão 2003 and
Enade 2006 would be positively related with the increase in proportion of teachers who
requested the accomplishment of the research activity as learning strategy.
The coefficient of the variable dmcont1, which aimed to capture, under students’
perception, the content domain by the faculty in IES, was significant and had positive
sign in all regressions, except in 2009. This result indicates that students’ performance
tended to be higher among IES with higher frequency of teachers who demonstrated the
mastery of content. The variables md, v_integ, dorgac and dcatad were statistically
significant in estimates of the HLM models in Provão 2003 and Enade 2006. Among
these variables, only v_integ coefficient wasn’t significant in 2009. The coefficients of
md and v_integ can be interpreted together, since they represent characteristics of the
faculty affiliated to IES. The results show that students’ performance tend to be
significantly positive in IES which have higher proportion of teachers with full-time
working hours as well as master and doctor degree. The effect on performance was also
positive, when the student was affiliated to universities or university centers (dorgac),
33
as other factors are held constant. This positive effect is reduced among students
affiliated to particular IES.
The diagnosis of the distribution of the residuals derived from full models each
year was based on either histogram of the residues and the test Shapiro-Francia W. The
results do not reject the multivariate distribution of the residues generated by fixed and
random effects from models to be normal. It was also verified whether the set of
estimators of the full model was not efficient, by using the Hausman test. The obtained
result indicates the set of the full model specifications to be effective, in 2002. In 2009,
the result was similar to 2002, with chi2 of the 26.54 and Prob> chi2 of the 0.3263.
However, the result from Hausman test, reported in Table 2, brought evidence of
endogeneity12 for estimation of the full model 2003 and Enade 2006. Despite the result
from Hausman test, it was opted to present the model with fixed and random effects in
order to report the information from the estimates accomplished.
In the full models 2002, 2003, 2006 and 2009, there was reduction in either total
variance and intraclass correlation (ρ), as compared with the value obtained by
unconditional models. Those results suggest the correlation among students of the same
IES to be reduced, as corroborated by controls based on individual and institutional
aspects. This reduction also occurred in relation to variances achieved at Level 1 and
Level 2. Those decreases in the values of the variances and intraclass correlation (ρ)
between unconditional model and full model rather indicated the variables included in
the final model to explain part of the variance occurring among students and among
institutions. Based on those results, it is possible to accept the hypotheses that there are:
(3) students’ characteristics explaining the variability in performance within the same
IES; (4) students’ characteristics explaining the variability in performance among IES;
and (5) course characteristics explaining the differences in performance among students.
5. FINAL COMMENTS
The objective of this study was to analyze the effect from individual and
institutional characteristics upon students’ academic performance in Accountancy, in
Brazil, through the results achieved in either ENC-Provão 2002 and 2003 and Enade-
2006/2009. The main empirical evidences were obtained through estimates of the
educational production function, as employing Hierarchical Linear Models.

34
Based on comparison of the estimates obtained with full models and those
obtained with unconditional model (reported in Table 5), it was observed a reduction of
the total variance values. This reduction occurred at both levels, but the proportion of
the explained variance was higher at Level 2. This result indicates the effect from all
variables related to IES upon variation in academic performance of the students
graduating in the area, in years 2002, 2003, 2006 and 2009, to be significant in
comparison to proportion of the variance explained by the set of variables Level 1
associated with the level of the student.
The main results suggest a significant association between the academic
performance of students graduating in Accountancy in years 2002, 2003 and 2006 and
certain characteristics, own or from family, such as gender, hours dedicated to studies,
family income range, have studied in public high school. In IES ambit, it is emphasized
to have had teachers with content domain besides adopting the lecture as predominant
teaching practice. In the category ‘effects from pairs’, in all years under observation, a
negative and significant relationship of the student’ academic performance was found
because being single, except in 2009. The findings indicate that the effect on students’
performance tended to be positive in the institutions from which the teachers had master
or doctoral titles and full-day working hours (40h), or exclusive dedication to teaching,
who more frequently used the research as educational strategy in 2003 and 2006.
The evidences concerning to parental education and the student participated in
the undergraduate research activity rather suggest the need for more detailed exam. In
the first case, the different signs of the coefficients of those variables may come from
low mean proportion of students whose mothers and fathers have higher education
lower than 20% in all years under analysis. In the second case, the effect was negative.
However, it was expected the involvement of the students in research activities to
support the improvement of their academic performance. Therefore, it seems necessary
to investigate more closely this group of students in order to verify whether the time
devoted to this activity is negatively interfering on their performance or there are other
factors explaining the aggravation of the results.
Despite the magnitude of the coefficients have been low, the negative effect on
performance of the students affiliated to private IES and the positive effect on
performance of the students affiliated to Universities may be related to profile of the
35
student selected by IES. There is possibility that the selection process used by
Universities has selected those students whose academic profile is more appropriate
than the one of the private IES.
It was observed that most variables showed to be relevant to explain the
academic performance of the students graduating in Accountancy courses, particularly
in 2003 and 2006. However, the low proportion of the explained total variance, that is
0,088 in 2002, 0,098 in 2003 and 0,091 in 2006, and the results from Hausman tests that
showed endogenous problems for estimates of the hierarchical linear model in 2003 and
2006 eventually suggest the specification of the model could be improved through
inclusion of other explanatory variables. A possible alternative to eliminate endogeny
could be the use of instrumental variables, as mentioned by Ludwig and Bassi (1999)
and Todd and Wolpin (2003). It is possible to construct other variables based on
available databases or to improve the data collection tools in order to make better the
available measures or to insert, for example, the variable “classroom size” suggested by
Ludwig and Bassi (1999 ).
This study showed evidence for possible indicators and their effects on academic
performance of the students graduating in Accountancy, in Brazil. In addition, it directs
the attention to reflect on quality of the training that students are receiving, since those
students will have great insertion and professional performance in the labor market in
Brazil.
References
Albernaz, A., Ferreira, F. H. G., & Franco, C. (2002). Qualidade e Equidade na
Educação Fundamental Brasileiro. Pesquisa e Planejamento Econômico (PPE),
32(3), 453-476.
Andrade, J. X., & Corrar, L. J. (2008). Condicionantes do desempenho dos estudantes
de contabilidade: evidências empíricas de natureza acadêmica, demográfica e
econômica. Revista de Contabilidade da UFBA, 1, 62-74.
Betts, J. R., & Morell, D. (1999). The determinants of undergraduate grade point
average: The relative importance of family background, high school resources, and
peer group effects. Journal of Human Resources, 34(2), 268–293.
Conselho Federal de Contabilidade (2010a). Accessed from:
http://www.cfc.org.br/conteudo.aspx?codMenu=64 , 2010.
Conselho Federal de Contabilidade (2010). Accessed from:
http://www.cfc.org.br/conteudo.aspx?codMenu=67&codConteudo=5702
, 2011.
36
Cohn, E., Cohn, S., Balch, D. C., & Bradley JR., J. (2004). Determinants of
undergraduate GPAs: SAT scores, high-school GPA and high-school rank. Economics
of Education Review, 23, 577–586.
Crespo, A.; & Reis, M. C. (2009). Sheepskin effects and the relationship between
earnings and education: analyzing their evolution over time in Brazil. Revista
Brasileira de Economia, 63( 3), 209-231.
Cruz, C. V. O. A., Corrar, L. J., & Slomski, V. (2008). A docência e o desempenho dos
estudantes dos cursos de graduação em contabilidade no Brasil. Contabilidade
Vista & Revista, 19, 15-37.
Diaz, M. D. M. (2007). Efetividade no ensino superior brasileiro: aplicação de modelos
multinível à análise dos resultados do exame nacional de cursos. Revista
EconomiA, 8(1), p. 93-120.
Fávero, L. P. L., Belfiore, P. P., Chan, B. L., & Silva, F. L. da (2009). Análise de dados:
modelagem multivariada para tomada de decisões. Rio de Janeiro: Elsevier.
Franco, A. M. de P.; & Menezes-Filho, N. A. (2009). Os determinantes do aprendizado
com dados de um painel de escolas do SAEB. Anais do Encontro Nacional de
Economia, Foz do Iguaçu, PA, Brasil, 38.
Gracioso, A. (2006) Análise da Eficácia Escolar e do Efeito-Escola nos Cursos de
Administração de Empresas no Brasil. Tese de doutorado em Administração de
Empresas, Programa de Pós-Graduação em Administração de Empresas da Escola
de Administração de Empresas de São Paulo da Fundação Getúlio Vargas, São
Paulo, SP, Brasil.
Hanushek, E. A (1979). Conceptual and empirical issues in the estimation of
educational production functions. The Journal of Human Resources, 14 (3), 351-
388. Retrieved from https://www.jstor.org/stable/145575
Hanushek, E. A. Educational production functions (1987). In Psacharopoulos, G. (Ed.).
Economics of education research and studies (1nd ed., p. 33-42) New York:
Pegarmon Press.
Hanushek, E. A., & Woessmann, L. (2011). The economics of international differences
in educational achievement. In Hanushek, E., Machin, S., & Woessmann, L. (Eds.).
Handbook of the economics of education (1nd ed., 3 v., p. 89-200). Oxford (UK):
Elsevier Science.
Harris, D. N (2010). Education production functions: concepts. In Brewer, D. J., &
Mcewan, P. J. (Eds.). Economics of education (1nd ed., p. 127-131). Oxford (UK):
Elsevier Academic Press.
Horowitz, J. B., & Spector, L. (2005). Is there a difference between private and public
education on college performance? Economics of Education Review, 24, 189–195.
Instituto Nacional de Estudos e Pesquisas Educacionais Anísio Teixeira. (2009).
Brasília, DF. Retrieved from http://portal.inep.gov.br/web/censo-da-educacao-
superior/evolucao-1980-a-2007
Instituto Nacional de Estudos e Pesquisas Educacionais Anísio Teixeira. (2010).
Brasília, DF. Retrieved from http://portal.inep.gov.br/basica-levantamentos-
microdados
Instituto Nacional de Estudos e Pesquisas Educacionais Anísio Teixeira. (2003).
Sistema Nacional de Avaliação da Educação Superior (Sinaes): bases para uma
proposta de avaliação da educação superior brasileira. Brasília, DF. Retrieved
from http://unifesp.br/reitoria/orgaos/comissoes/avaliacao/sinaes.pdf
Instituto Nacional de Estudos e Pesquisas Educacionais Anísio Teixeira. (2004).
Relatório do Exame Nacional de Cursos 2003: Ciências Contábeis. (v. 6). Brasília,
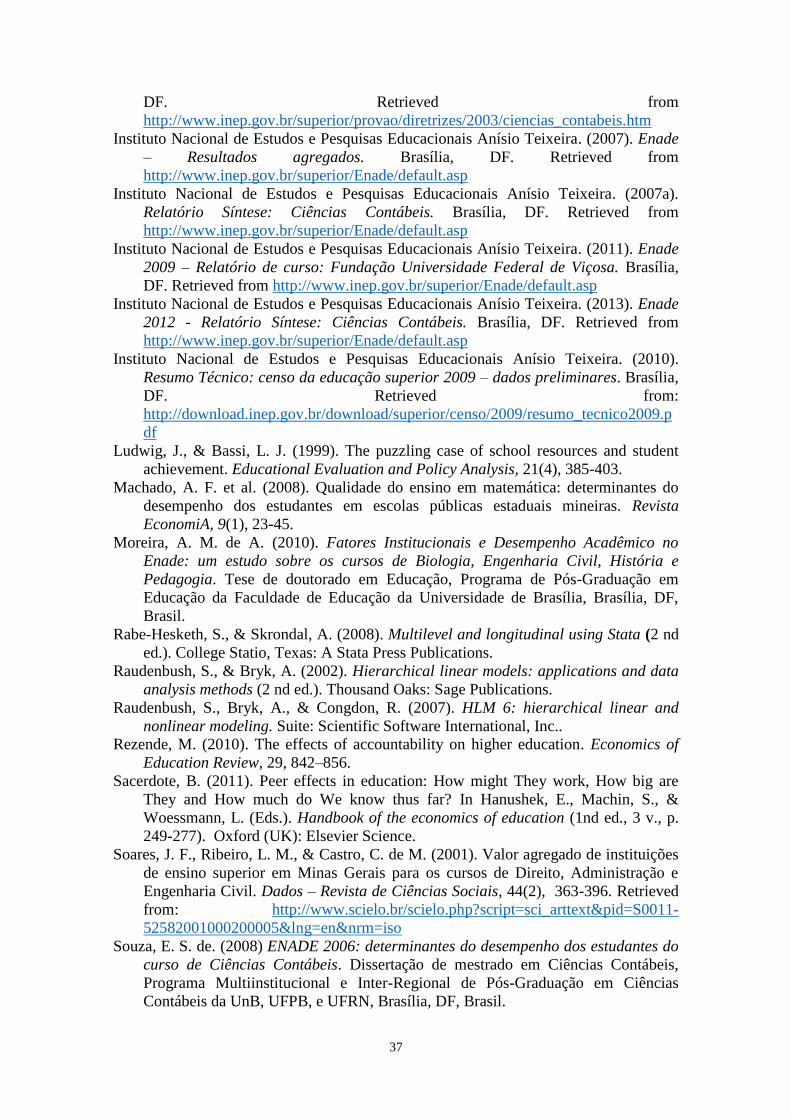
37
DF. Retrieved from
http://www.inep.gov.br/superior/provao/diretrizes/2003/ciencias_contabeis.htm
Instituto Nacional de Estudos e Pesquisas Educacionais Anísio Teixeira. (2007). Enade
– Resultados agregados. Brasília, DF. Retrieved from
http://www.inep.gov.br/superior/Enade/default.asp
Instituto Nacional de Estudos e Pesquisas Educacionais Anísio Teixeira. (2007a).
Relatório Síntese: Ciências Contábeis. Brasília, DF. Retrieved from
http://www.inep.gov.br/superior/Enade/default.asp
Instituto Nacional de Estudos e Pesquisas Educacionais Anísio Teixeira. (2011). Enade
2009 – Relatório de curso: Fundação Universidade Federal de Viçosa. Brasília,
DF. Retrieved from http://www.inep.gov.br/superior/Enade/default.asp
Instituto Nacional de Estudos e Pesquisas Educacionais Anísio Teixeira. (2013). Enade
2012 - Relatório Síntese: Ciências Contábeis. Brasília, DF. Retrieved from
http://www.inep.gov.br/superior/Enade/default.asp
Instituto Nacional de Estudos e Pesquisas Educacionais Anísio Teixeira. (2010).
Resumo Técnico: censo da educação superior 2009 – dados preliminares. Brasília,
DF. Retrieved from:
http://download.inep.gov.br/download/superior/censo/2009/resumo_tecnico2009.p
df
Ludwig, J., & Bassi, L. J. (1999). The puzzling case of school resources and student
achievement. Educational Evaluation and Policy Analysis, 21(4), 385-403.
Machado, A. F. et al. (2008). Qualidade do ensino em matemática: determinantes do
desempenho dos estudantes em escolas públicas estaduais mineiras. Revista
EconomiA, 9(1), 23-45.
Moreira, A. M. de A. (2010). Fatores Institucionais e Desempenho Acadêmico no
Enade: um estudo sobre os cursos de Biologia, Engenharia Civil, História e
Pedagogia. Tese de doutorado em Educação, Programa de Pós-Graduação em
Educação da Faculdade de Educação da Universidade de Brasília, Brasília, DF,
Brasil.
Rabe-Hesketh, S., & Skrondal, A. (2008). Multilevel and longitudinal using Stata (2 nd
ed.). College Statio, Texas: A Stata Press Publications.
Raudenbush, S., & Bryk, A. (2002). Hierarchical linear models: applications and data
analysis methods (2 nd ed.). Thousand Oaks: Sage Publications.
Raudenbush, S., Bryk, A., & Congdon, R. (2007). HLM 6: hierarchical linear and
nonlinear modeling. Suite: Scientific Software International, Inc..
Rezende, M. (2010). The effects of accountability on higher education. Economics of
Education Review, 29, 842–856.
Sacerdote, B. (2011). Peer effects in education: How might They work, How big are
They and How much do We know thus far? In Hanushek, E., Machin, S., &
Woessmann, L. (Eds.). Handbook of the economics of education (1nd ed., 3 v., p.
249-277). Oxford (UK): Elsevier Science.
Soares, J. F., Ribeiro, L. M., & Castro, C. de M. (2001). Valor agregado de instituições
de ensino superior em Minas Gerais para os cursos de Direito, Administração e
Engenharia Civil. Dados – Revista de Ciências Sociais, 44(2), 363-396. Retrieved
from: http://www.scielo.br/scielo.php?script=sci_arttext&pid=S0011-
52582001000200005&lng=en&nrm=iso
Souza, E. S. de. (2008) ENADE 2006: determinantes do desempenho dos estudantes do
curso de Ciências Contábeis. Dissertação de mestrado em Ciências Contábeis,
Programa Multiinstitucional e Inter-Regional de Pós-Graduação em Ciências
Contábeis da UnB, UFPB, e UFRN, Brasília, DF, Brasil.

38
Todd, P. E., & Wolpin, K. I. On the Specification and Estimation of the Production
Function for Cognitive Achievement. The Economic Journal, 113(485), F3-F33.
Retrieved from: http://www.jstor.org/stable/3590137

APPENDIX - Table A1 Summary statistics of the exogenous variables of Provão 2002/2003 and Enade/2006 of Accountancy of Level 1 - Students.
Variables 2002 2003 2006
Mean SD Variance Min. Max. Observations Mean SD Variance Min. Max. Observations Mean SD Variance Min. Max. Observations
Construct: F – Personal characteristics
nidade
overall 27.88 6.59 43.43 0 75 N 22,659 28.68 6.81 46.38 0 75 N 23,451 29.04 7.35 54.02 10 87 N 19,497
between 2.56 6.55 22.95 39.89 n 343 2.64 6.97 23.13 42.5 n 379 2.94 8.64 22.96 48 n 523
within 6.27 39.31 0.67 76.23 T-bar 66.1 6.49 42.12 3.52 72.74 T-bar 61.9 6.88 47.33 7.16 87.32 T-bar 37.3
dsex
overall 0.51 0.50 0.25 0 1 N 22,659 0.49 0.50 0.25 0 1 N 23,451 0.53 0.50 0.25 0 1 N 19,497
between 0.11 0.01 0 0.82 n 343 0.13 0.02 0 0.86 n 379 0.13 0.02 0 1 n 523
within 0.49 0.24 -0.31 1.29 T-bar 66.1 0.49 0.24 -0.36 1.35 T-bar 61.9 0.49 0.24 -0.39 1.43 T-bar 37.3
detnia
overall 0.78 0.42 0.18 0 1 N 21,282 0.75 0.44 0.19 0 1 N 22,020 0.71 0.46 0.21 0 1 N 17,451
between 0.15 0.02 0.30 1 n 342 0.18 0.03 0 1 n 379 0.21 0.04 0 1 n 518
within 0.39 0.15 -0.22 1.47 T-bar 62.2 0.40 0.16 -0.24 1.45 T-bar 58.1 0.41 0.17 -0.28 1.54 T-bar 33.7
Dded
overall 0.94 0.24 0.06 0 1 N 21,262 0.88 0.32 0.10 0 1 N 22,017 0.88 0.33 0.11 0 1 N 17,462
between 0.06 0.00 0.29 1 n 342 0.09 0.01 0.5 1 n 379 0.09 0.01 0.5 1 n 518
within 0.23 0.05 -0.05 1.65 T-bar 62.2 0.32 0.10 -0.10 1.38 T-bar 58.1 0.32 0.10 -0.11 1.38 T-bar 33.7
Constructo: P - Effect pairs
dfilhos
overall 0.27 0.45 0.20 0 1 N 21,259 0.29 0.46 0.21 0 1 N 21,972 0.31 0.46 0.21 0 1 N 17,438
between 0.14 0.02 0 0.78 n 342 0.15 0.02 0 1 n 379 0.16 0.03 0 1 n 518
within 0.43 0.18 -0.51 1.22 T-bar 62.2 0.44 0.19 -0.53 1.25 T-bar 58 0.44 0.19 -0.61 1.27 T-bar 33.7
dirmão
overall 0.95 0.23 0.05 0 1 N 21,221 0.94 0.21 0.04 0 1 N 21,975 0.96 0.20 0.04 0 1 N 17,434
between 0.05 0.00 0.67 1 n 342 0.05 0.00 0.67 1 n 379 0.04 0.00 0.79 1 n 518
within 0.22 0.05 -0.04 1.28 T-bar 62.1 0.21 0.04 -0.04 1.29 T-bar 58 0.20 0.04 -0.04 1.27 T-bar 33.7
decivil
overall 0.62 0.49 0.24 0 1 N 21,121 0.62 0.49 0.24 0 1 N 21,970 0.62 0.49 0.24 0 1 N 17,442
between 0.14 0.02 0 1 n 342 0.15 0.02 0 1 n 379 0.15 0.02 0 1 n 518
within 0.47 0.22 -0.27 1.42 T-bar 61.8 0.47 0.22 -0.30 1.42 T-bar 58 0.47 0.22 -0.34 1.55 T-bar 33.7
Construct: F - Family and socioeconomic factors
despai
overall 0.15 0.35 0.12 0 1 N 21,204 0.15 0.35 0.12 0 1 N 21,943 0.12 0.33 0.11 0 1 N 17,371
between 0.10 0.01 0 0.59 n 342 0.10 0.01 0 0.67 n 379 0.10 0.01 0 0.51 n 518
Within 0.34 0.12 -0.44 1.13 T-bar 62 0.33 0.11 -0.52 1.13 T-bar 58 0.31 0.10 -0.38 1.11 T-bar 33.5
desmãe
Overall 0.12 0.32 0.10 0 1 N 21,167 0.13 0.33 0.11 0 1 N 22,001 0.12 0.32 0.10 0 1 N 17,433
Between 0.08 0.01 0 0.53 n 342 0.09 0.01 0 0.65 n 379 0.09 0.01 0 0.53 n 518
Within 0.31 0.10 -0.41 1.10 T-bar 62.2 0.32 0.10 -0.52 1.12 T-bar 58.1 0.31 0.10 -0.41 1.10 T-bar 33.7
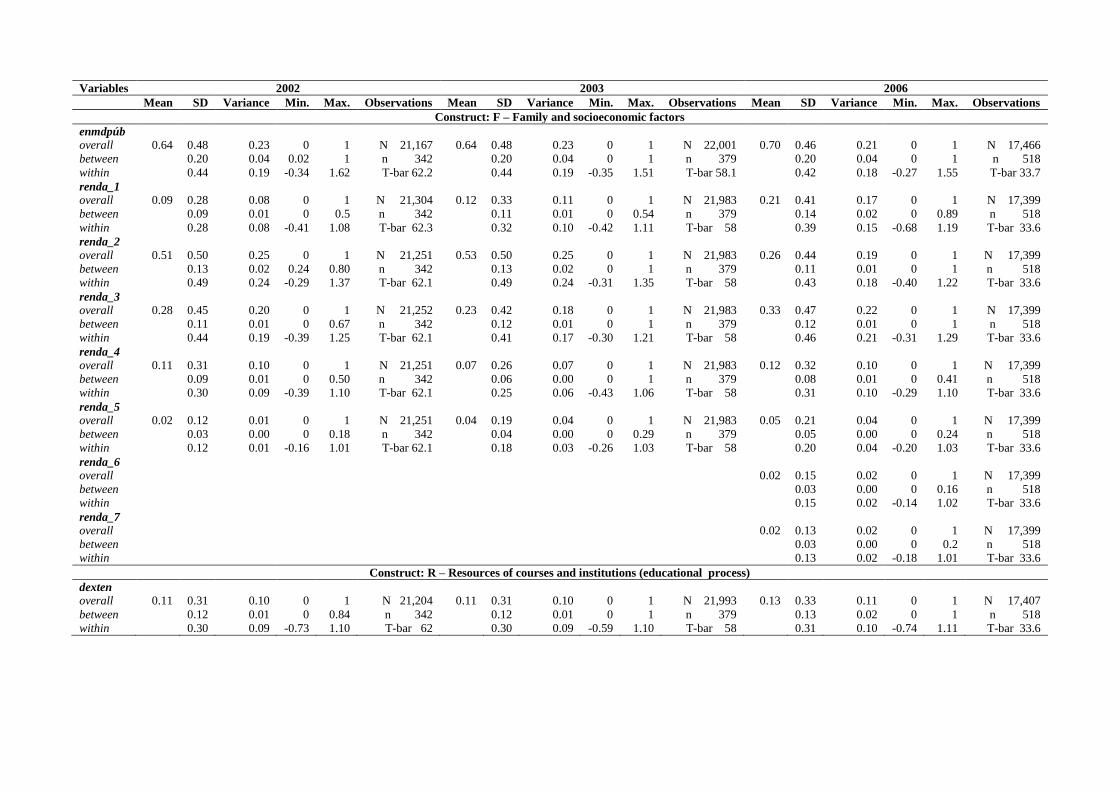
Variables 2002 2003 2006
Mean SD Variance Min. Max. Observations Mean SD Variance Min. Max. Observations Mean SD Variance Min. Max. Observations
Construct: F – Family and socioeconomic factors
enmdpúb
overall 0.64 0.48 0.23 0 1 N 21,167 0.64 0.48 0.23 0 1 N 22,001 0.70 0.46 0.21 0 1 N 17,466
between 0.20 0.04 0.02 1 n 342 0.20 0.04 0 1 n 379 0.20 0.04 0 1 n 518
within 0.44 0.19 -0.34 1.62 T-bar 62.2 0.44 0.19 -0.35 1.51 T-bar 58.1 0.42 0.18 -0.27 1.55 T-bar 33.7
renda_1
overall 0.09 0.28 0.08 0 1 N 21,304 0.12 0.33 0.11 0 1 N 21,983 0.21 0.41 0.17 0 1 N 17,399
between 0.09 0.01 0 0.5 n 342 0.11 0.01 0 0.54 n 379 0.14 0.02 0 0.89 n 518
within 0.28 0.08 -0.41 1.08 T-bar 62.3 0.32 0.10 -0.42 1.11 T-bar 58 0.39 0.15 -0.68 1.19 T-bar 33.6
renda_2
overall 0.51 0.50 0.25 0 1 N 21,251 0.53 0.50 0.25 0 1 N 21,983 0.26 0.44 0.19 0 1 N 17,399
between 0.13 0.02 0.24 0.80 n 342 0.13 0.02 0 1 n 379 0.11 0.01 0 1 n 518
within 0.49 0.24 -0.29 1.37 T-bar 62.1 0.49 0.24 -0.31 1.35 T-bar 58 0.43 0.18 -0.40 1.22 T-bar 33.6
renda_3
overall 0.28 0.45 0.20 0 1 N 21,252 0.23 0.42 0.18 0 1 N 21,983 0.33 0.47 0.22 0 1 N 17,399
between 0.11 0.01 0 0.67 n 342 0.12 0.01 0 1 n 379 0.12 0.01 0 1 n 518
within 0.44 0.19 -0.39 1.25 T-bar 62.1 0.41 0.17 -0.30 1.21 T-bar 58 0.46 0.21 -0.31 1.29 T-bar 33.6
renda_4
overall 0.11 0.31 0.10 0 1 N 21,251 0.07 0.26 0.07 0 1 N 21,983 0.12 0.32 0.10 0 1 N 17,399
between 0.09 0.01 0 0.50 n 342 0.06 0.00 0 1 n 379 0.08 0.01 0 0.41 n 518
within 0.30 0.09 -0.39 1.10 T-bar 62.1 0.25 0.06 -0.43 1.06 T-bar 58 0.31 0.10 -0.29 1.10 T-bar 33.6
renda_5
overall 0.02 0.12 0.01 0 1 N 21,251 0.04 0.19 0.04 0 1 N 21,983 0.05 0.21 0.04 0 1 N 17,399
between 0.03 0.00 0 0.18 n 342 0.04 0.00 0 0.29 n 379 0.05 0.00 0 0.24 n 518
within 0.12 0.01 -0.16 1.01 T-bar 62.1 0.18 0.03 -0.26 1.03 T-bar 58 0.20 0.04 -0.20 1.03 T-bar 33.6
renda_6
overall 0.02 0.15 0.02 0 1 N 17,399
between 0.03 0.00 0 0.16 n 518
within 0.15 0.02 -0.14 1.02 T-bar 33.6
renda_7
overall 0.02 0.13 0.02 0 1 N 17,399
between 0.03 0.00 0 0.2 n 518
within 0.13 0.02 -0.18 1.01 T-bar 33.6
Construct: R – Resources of courses and institutions (educational process)
dexten
overall 0.11 0.31 0.10 0 1 N 21,204 0.11 0.31 0.10 0 1 N 21,993 0.13 0.33 0.11 0 1 N 17,407
between 0.12 0.01 0 0.84 n 342 0.12 0.01 0 1 n 379 0.13 0.02 0 1 n 518
within 0.30 0.09 -0.73 1.10 T-bar 62 0.30 0.09 -0.59 1.10 T-bar 58 0.31 0.10 -0.74 1.11 T-bar 33.6
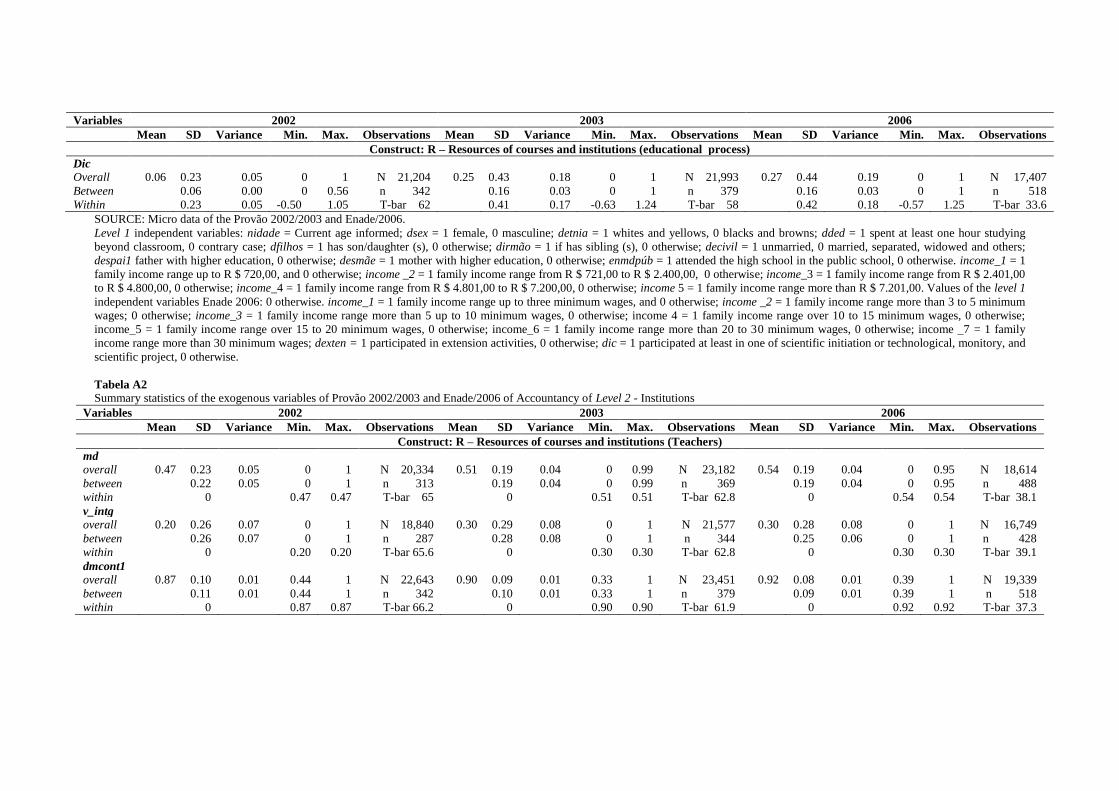
Variables 2002 2003 2006
Mean SD Variance Min. Max. Observations Mean SD Variance Min. Max. Observations Mean SD Variance Min. Max. Observations
Construct: R – Resources of courses and institutions (educational process)
Dic
Overall 0.06 0.23 0.05 0 1 N 21,204 0.25 0.43 0.18 0 1 N 21,993 0.27 0.44 0.19 0 1 N 17,407
Between 0.06 0.00 0 0.56 n 342 0.16 0.03 0 1 n 379 0.16 0.03 0 1 n 518
Within 0.23 0.05 -0.50 1.05 T-bar 62 0.41 0.17 -0.63 1.24 T-bar 58 0.42 0.18 -0.57 1.25 T-bar 33.6
SOURCE: Micro data of the Provão 2002/2003 and Enade/2006.
Level 1 independent variables: nidade = Current age informed; dsex = 1 female, 0 masculine; detnia = 1 whites and yellows, 0 blacks and browns; dded = 1 spent at least one hour studying
beyond classroom, 0 contrary case; dfilhos = 1 has son/daughter (s), 0 otherwise; dirmão = 1 if has sibling (s), 0 otherwise; decivil = 1 unmarried, 0 married, separated, widowed and others;
despai1 father with higher education, 0 otherwise; desmãe = 1 mother with higher education, 0 otherwise; enmdpúb = 1 attended the high school in the public school, 0 otherwise. income_1 = 1
family income range up to R $ 720,00, and 0 otherwise; income _2 = 1 family income range from R $ 721,00 to R $ 2.400,00, 0 otherwise; income_3 = 1 family income range from R $ 2.401,00
to R $ 4.800,00, 0 otherwise; income_4 = 1 family income range from R $ 4.801,00 to R $ 7.200,00, 0 otherwise; income 5 = 1 family income range more than R $ 7.201,00. Values of the level 1
independent variables Enade 2006: 0 otherwise. income_1 = 1 family income range up to three minimum wages, and 0 otherwise; income _2 = 1 family income range more than 3 to 5 minimum
wages; 0 otherwise; income_3 = 1 family income range more than 5 up to 10 minimum wages, 0 otherwise; income 4 = 1 family income range over 10 to 15 minimum wages, 0 otherwise;
income_5 = 1 family income range over 15 to 20 minimum wages, 0 otherwise; income_6 = 1 family income range more than 20 to 30 minimum wages, 0 otherwise; income _7 = 1 family
income range more than 30 minimum wages; dexten = 1 participated in extension activities, 0 otherwise; dic = 1 participated at least in one of scientific initiation or technological, monitory, and
scientific project, 0 otherwise.
Tabela A2
Summary statistics of the exogenous variables of Provão 2002/2003 and Enade/2006 of Accountancy of Level 2 - Institutions
Variables 2002 2003 2006
Mean SD Variance Min. Max. Observations Mean SD Variance Min. Max. Observations Mean SD Variance Min. Max. Observations
Construct: R – Resources of courses and institutions (Teachers)
md
overall 0.47 0.23 0.05 0 1 N 20,334 0.51 0.19 0.04 0 0.99 N 23,182 0.54 0.19 0.04 0 0.95 N 18,614
between 0.22 0.05 0 1 n 313 0.19 0.04 0 0.99 n 369 0.19 0.04 0 0.95 n 488
within 0 0.47 0.47 T-bar 65 0 0.51 0.51 T-bar 62.8 0 0.54 0.54 T-bar 38.1
v_intg
overall 0.20 0.26 0.07 0 1 N 18,840 0.30 0.29 0.08 0 1 N 21,577 0.30 0.28 0.08 0 1 N 16,749
between 0.26 0.07 0 1 n 287 0.28 0.08 0 1 n 344 0.25 0.06 0 1 n 428
within 0 0.20 0.20 T-bar 65.6 0 0.30 0.30 T-bar 62.8 0 0.30 0.30 T-bar 39.1
dmcont1
overall 0.87 0.10 0.01 0.44 1 N 22,643 0.90 0.09 0.01 0.33 1 N 23,451 0.92 0.08 0.01 0.39 1 N 19,339
between 0.11 0.01 0.44 1 n 342 0.10 0.01 0.33 1 n 379 0.09 0.01 0.39 1 n 518
within 0 0.87 0.87 T-bar 66.2 0 0.90 0.90 T-bar 61.9 0 0.92 0.92 T-bar 37.3

42
Variables 2002 2003 2006
Mean SD Variance Min. Max. Observations Mean SD Variance Min. Max. Observations Mean SD Variance Min. Max. Observations
Construct: I – Characteristics of the educational system
dorgac
Overall 0.17 0.37 0.14 0 1 N 22,659 0.62 0.49 0.24 0 1 N 23,401 0.55 0.50 0.25 0 1 N 19,497
between 0.37 0.14 0 1 n 343 0.50 0.25 0 1 n 377 0.49 0.24 0 1 n 523
within 0 0.17 0.17 T-bar 66.1 0 0.62 0.62 T-bar 62.1 0 0.55 0.55 T-bar 37.3
dcatad
overall 0.86 0.34 0.12 0 1 N 22,659 0.76 0.43 0.18 0 1 N 23,401 0.80 0.40 0.16 0 1 N 19,497
between 0.34 0.12 0 1 n 343 0.39 0.15 0 1 n 377 0.35 0.12 0 1 n 523
within 0 0.86 0.86 T-bar 66.1 0 0.76 0.76 T-bar 61.9 0 0.80 0.80 T-bar 37.3
Construct: R – Resources of courses and institutions (educational process)
estapr1
overall 0.92 0.05 0.67 1 N 22,643 0.90 0.06 0.5 1 N 23,451 0.84 0.08 0.5 1 N 19,339
between 0.06 0.00 0.67 1 n 342 0.08 0.00 0.5 1 n 379 0.09 0.01 0.5 1 n 518
within 0 0.00 0.92 0.92 T-bar 66.2 0 0.01 0.90 0.90 T-bar 61.9 0 0.01 0.84 0.84 T-bar 37.3
mat1
overall 0.93 0.07 0.33 1 N 22,643 0.94 0.06 0.5 1 N 23,451 0.95 0.06 0.67 1 N 19,339
between 0.08 0.00 0.33 1 n 342 0.07 0.00 0.5 1 n 379 0.06 0.00 0.67 1 n 518
within 0 0.01 0.93 093 T-bar 66.2 0 0.00 0.94 0.94 T-bar 61.9 0 0.00 0.95 0.95 T-bar 37.3
aulexp1
overall 0.27 0.13 0 0.65 N 22,643 0.23 0.11 0 1 N 23,451 0.002 0.001 0 0.006 N 19,339
between 0.13 0.02 0 0.65 n 342 0.13 0.01 0 1 n 379 0.001 0.00 0 0.006 n 518
within 0 0.02 0.27 0.27 T-bar 66.2 0 0.02 0.23 023 T-bar 61.9 0 0.00 0.002 0.002 T-bar 37.3
csi1
overall 0.86 0.12 0.13 1 N 22,643 0.88 0.11 0.41 1 N 23,451
between 0.14 0.01 0.13 1 n 342 0.12 0.01 0.41 1 n 379
within 0 0.02 0.86 0.86 T-bar 66.2 0 0.01 0.88 0.88 T-bar 61.9
pltr1
overall 0.87 0.10 0.21 1 N 22,643 0.89 0.09 0.49 1 N 23,451
between 0.11 0.01 0.21 1 n 342 0.10 0.01 0.49 1 n 379
within 0 0.01 0.87 0.87 T-bar 66.2 0 0.01 0.89 0.89 T-bar 61.9
Construct: P – Effects of the pairs
esmãe1
overall 0.12 0.08 0.01 0 0.53 N 22,643 0.13 0.09 0.01 0 0.65 N 23,451 0.12 0.09 0.01 0 0.53 N 19,339
between 0.08 0.01 0 0.53 n 342 0.09 0.01 0 0.65 n 379 0.09 0.01 0 0.53 n 518
within 0 0.12 0.12 T-bar 66.2 0 0.13 0.13 T-bar 61.9 0 0.12 0.12 T-bar 37.3

43
Variables 2002 2003 2006
Mean SD Variance Min. Max. Observations Mean SD Variance Min. Max. Observations Mean SD Variance Min. Max. Observations
Construct: P – Effects of the pairs
espai1
overall 0.15 0.10 0.01 0 0.59 N 22,643 0.15 0.10 0.01 0 0.67 N 23,451 0.12 0.10 0.01 0 0.51 N 19,339
between 0.10 0.01 0 0.59 n 342 0.10 0.01 0 0.67 n 379 0.10 0.01 0 0.51 n 518
within 0 0.15 0.15 T-bar 66.2 0 0.15 0.15 T-bar 61.9 0 0.12 0.12 T-bar 37.3
midade
overall 27.88 2.03 4.12 23 39.89 N 22,615 28.68 2.07 4.28 23.13 42.5 N 23,451 29.04 2.56 6.55 22.96 48 N 19,339
between 2.57 6.60 23 39.89 n 342 2.64 6.97 23.13 42.5 n 379 2.94 8.64 22.96 48 n 518
within 0 27.88 27.88 T-bar 66.1 0 28.68 28.68 T-bar 61.9 0 29.04 29.04 T-bar 37.3
SOURCE: Micro data of the Provão 2002/2003 and Enade/2006
Level 2 independent variables: md = Proportion of teachers with master and doctor degree; v_intg = Proportion of teachers with full-time working; dmcont1 = Proportion of responses given by
students regarding IES to have teachers who demonstrated the mastery of content; dorgac = 1 Universities or University Centers, 0 for cases to be Integrated Colleges, Colleges, Schools, and
Institutes, Tecnological Education Centers; estapr1 = Ratio of responses given by students regarding IES to have teachers who conducted research activities as learning strategy; mat1 =
Proportion of responses given by students regarding IES to have teachers who indicated the use of books, copies of book chapters and handouts; aulexp1 = Proportion of responses given by
students regarding IES to have the majority of teachers whose teaching practice are predominantly lectures; csi1 = Proportion of responses given by students in relation to IES that provided the
knowledge on accounting information system; pltr1 = Proportion of responses given by students regarding IES that the issue ‘tax planning’ was considered in the course; espai1= Proportion of
fathers with higher education in IES; esmãe1 = Proportion of mothers with higher education in IES; midade = Students’ mean age in IES.