Ratio analysis of the insurance company
20
1.0 Introduction 1.1 Objective of the report As a course requirement of Risk management & insurance, we are making this report. In this report we have analyzed five years data of four different insurance companies. Our intension was to do some ratio analysis and interpret of those analyses and comparing those analyses among the insurance companies we have worked on. Our focus was on the presentation of the data of different ratios in a meaningful manner so that can help us to interpret the overall situation of Agrani Insurance Company, Dhaka Insurance Limited, and Bangladesh General Insurance co. 1.2 Methodology Data Source: We have used secondary data as the data source of this report. We have collected Annual reports and other information of three insurance companies from their web site and Dhaka Stock Exchange. Data Analysis and Presentation: We have used different ratios to analyze data. Basically those ratios focus on their liquidity position, Underwriting ratios, Profitability ratios, Leverage ratios, and Market ratios. We have presented the findings in a table for each company, and finally, we did comparison of the findings between four banks using graph, and presented interpretation of graphs. 1.3 Limitations & Delimitations 6
Transcript of Ratio analysis of the insurance company
1.0 Introduction
1.1 Objective of the report
As a course requirement of Risk management & insurance, we aremaking this report. In this report we have analyzed five yearsdata of four different insurance companies. Our intension was todo some ratio analysis and interpret of those analyses andcomparing those analyses among the insurance companies we haveworked on. Our focus was on the presentation of the data ofdifferent ratios in a meaningful manner so that can help us tointerpret the overall situation of Agrani Insurance Company,Dhaka Insurance Limited, and Bangladesh General Insurance co.
1.2 Methodology
Data Source: We have used secondary data as the data source of thisreport. We have collected Annual reports and other information ofthree insurance companies from their web site and Dhaka StockExchange.
Data Analysis and Presentation: We have used different ratios to analyzedata. Basically those ratios focus on their liquidity position,Underwriting ratios, Profitability ratios, Leverage ratios, andMarket ratios. We have presented the findings in a table for eachcompany, and finally, we did comparison of the findings betweenfour banks using graph, and presented interpretation of graphs.
1.3 Limitations & Delimitations
6
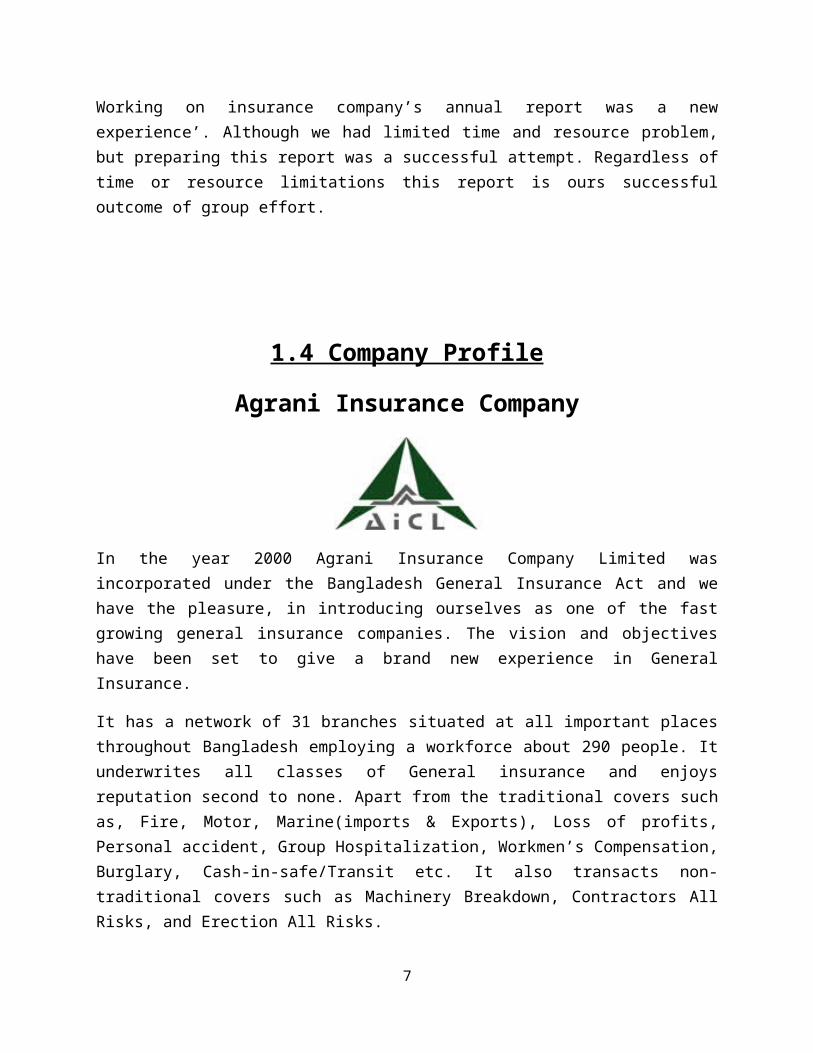
Working on insurance company’s annual report was a newexperience’. Although we had limited time and resource problem,but preparing this report was a successful attempt. Regardless oftime or resource limitations this report is ours successfuloutcome of group effort.
1.4 Company Profile
Agrani Insurance Company
In the year 2000 Agrani Insurance Company Limited wasincorporated under the Bangladesh General Insurance Act and wehave the pleasure, in introducing ourselves as one of the fastgrowing general insurance companies. The vision and objectiveshave been set to give a brand new experience in GeneralInsurance.
It has a network of 31 branches situated at all important placesthroughout Bangladesh employing a workforce about 290 people. Itunderwrites all classes of General insurance and enjoysreputation second to none. Apart from the traditional covers suchas, Fire, Motor, Marine(imports & Exports), Loss of profits,Personal accident, Group Hospitalization, Workmen’s Compensation,Burglary, Cash-in-safe/Transit etc. It also transacts non-traditional covers such as Machinery Breakdown, Contractors AllRisks, and Erection All Risks.
7
For handling insurance of Technological and multi-dimensionalprojects and placement of re-insurance in the world market,insurer needs support of multinational insurance broker. Thecompany has taken out necessary re-insurance protection fromSadharan Bima Corporation at home and some other reputed foreignre-insurers for the full protection of risk.
Vision
To be recognized as professional and management business entitycommitted to play a meaningful role in the development ofinsurance industry in Bangladesh and to safe the legitimatestakeholders, namely policy-holders, shareholders, reinsurers,employees and all the business associates.
Mission
To provide quality service and protection to its clients aimingat achieving a respectable volume of business and become aprominent player through a good governance and soundprofessionalism focusing to become a well- known and respectedcorporate company in the eye of society and government.
Almighty Allah has blessed mankind with knowledge, talent andability to perform so as to harvest these infinite resourcesand enjoy rewards. Yet our today, tomorrow and days that liebeyond, confront us because they are unpredictable. We faceformidable hurdles in uncertainty, risk and insecurity. Everyventure in this world is inherently vulnerable and obviously
8
requires stability in assurance.
Business, commerce, industry and area of production arevehicles of living and livelihood. Their dynamism and well –being are keys to our stable and prosperous future. Assuranceis an essential condition, a great facilitator and an importantsupport for all endeavors of this trade, like our companybusiness and the practitioners of this trade, like our company,offer this vital support and are regarded as valued andimportant partner of business, trade, commerce and production.A business or an industrial house therefore chooses thispartner of assurance with much care because it is as importantas the business itself.
It is an Insurance Company that solicits business. At the sametime we believe in your valued right of knowing us and judgingus. It believes, it will come to know its customers better,judge itself well and hope to be rewarded with insurancebusiness. With these words they are presenting Dhaka InsuranceLimited – The Trusted House of Insurance. Date of Incorporation4th January, 2000Date of Commencement of Business4th January, 2000Date of Registration to Carry on General Insurance Business2nd February, 2000Registered Office115/7-A, Distillary RoadGandaria, DhakaHead OfficeAmin Court (8th Floor) 62-63,Motijheel C/A, Dhaka-1000
Bangladesh General Insurance co.
9
BGIC's Background
Bangladesh general insurance company Ltd. or "BGIC Ltd" is thefirst general insurance company in Bangladesh in the privatesector. BGIC was incorporated as a public limited company andstarted business on 29 July, 1985 with an authorized capital ofTk. 100 million divided into 1,000,000 ordinary shares of Tk. 100each. The company runs the business operation under thesupervision of board of Director and legal frame work of theinsurance Act, 1938 and the insurance rules, 1958 as a amendedfrom time to time. Its initial paid up capital was Taka 30million. In May 1989, the company's paid up capital was increasedto Tk. 60 million by offering Tk.30 million worth of share forpublic subscription, the paid-up capital was increased to Tk. 72million in 1998, and by December 2008, BGIC's paid up capitalstood at Tk. 176.97 million. BGIC is listed with both Dhaka andChittagong stock exchanges. In December 2008, the numbers ofshareholders of the company was 7,708, who held 1,769,705 shares.BGIC has since developed substantially with all the strengths anddetails prudently essential of an insurance company. It isprimarily staffed with professionals of longest experience,qualified insurance technocrats of highest order of internationalrepute and a team of highly educated and skilled personnel ofcommendable status. The equity structure of the company wascarefully selected, not only for the financial benefit, but tosupport the growth of a dynamic company with the goal a majorplayer both in the domestic and international insurance markets.
10

The company ownership is prudently distributed to sponsorDirector 22.94%, public Director 1.64%, Institutions 14.67%, and60.75% General public shareholders.
BGIC's Vision
To transform the company into an ideal insurance company, with larger growing equity base, that will provide more opprotunities and options for utilization of funds in a prudent manner and helpto increase profitability through economy of scale, better resource mobilization and reduction in operational costs, to provide better services to our clients and policy holders and to promote the confidence of both shareholders and policy holders.
1.5 Theoretical review on ratio analysis
Ratio Analysis is a form of Financial Statement Analysis that isused to obtain a quick indication of a firm's financialperformance in several key areas. Ratios are used to measuredifferent aspect of the organization, for example; profitability,Underwriting ability, market risk of Insurance Company etc. RatioAnalysis as a tool possesses several important features. Thedata, which are provided by financial statements, are readilyavailable. The computation of ratios facilitates the comparisonof firms which differ in size and nature. Ratios can be used tocompare a firm's financial performance with industry averages. Inaddition, ratios can be used in a form of trend analysis toidentify areas where performance has improved or deterioratedover time. Values used in calculating financial ratios are taken from thebalance sheet, income statement, and statement of cash flows.These comprise the firm's "accounting statements" or financialstatements. The statements' data is based on the accountingmethod and accounting standards used by the organization.Financial ratios quantify many aspects of a business and are an
11
integral part of the financial statement analysis. Financialratios are categorized according to the financial aspect of thebusiness which the ratio measures.
Ratios we are using:
In the following section short description of these ratios are given:
a) Liquidity analysis
Current Ratio:Current ratio is a liquidity ratio that measures a company's ability to pay short-term obligations. The ratio is mainly used to give an idea of the company's ability to pay back itsshort-term liabilities (debt and payables) with its short-term assets (cash, inventory, receivables). The higher the current ratio, the more capable the company is of paying its obligations.
b) Underwriting ratios Loss rate Ratio: The amount of a company's net premiums thatwere allocated to underwriting costs, like commissions toagents and brokers, state and municipal taxes, salaries,benefits and other operational expenses. This ratio isdetermined by dividing the underwriting expenses total by netpremiums earned. It is the measure of an insurer's businessefficiency to investor, the lower the Loss rate ratio, whichindicates the company is more efficient.Expense Ratio: It is a measure of what it costs an investmentcompany to operate a mutual fund. An expense ratio isdetermined through an annual calculation, where a fund'soperating expenses are divided by Net premium. The lower theratio the company
12

Combined Ratio: Combined ratio is the addition of loss ratioand expense ratio, which shows in together how an efficientinsurance company is to select the policy as well as controlthe underwriting expense. The lower the ratio the betterefficiency it indicates.
c) Profitability ratios
Return on Revenue:
It is a measure of a corporation's profitability that compares net income to revenue. Return on revenue is calculated by dividing net operating income by revenue. This ratio indicates onthe total revenue earned what portion is turning into profit. Thehigher the ratio the better it is for the company.
Return on Equity Capital (ROE) This ratio measures how much profit the shareholder’s investment has generated. A higher ROE percentage indicates that shareholders are receiving a better return on their investment.
Return on Assets (ROA) This ratio measures how profitable a company is relative to its total assets. A high ROA indicates that management is effectivelyutilizing the company’s assets to generate profit.
Investment Yield: It indicates how much the company is earning from investmentagainst its investment. Company would like earn higher income onlower amount of investment. So, lower the ratio better investmentefficiency it indicates.
d) Leverage ratios
Debt to Equity Ratio13
It measure of a company's financial leverage calculated bydividing its total liabilities by stockholders' equity. Itindicates what proportion of equity and debt the company is usingto finance its assets. A high debt/equity ratio generally meansthat a company has been aggressive in financing its growth withdebt.
e) Market ratios
Price Earnings Ratio:
A valuation ratio of a company's current share price comparedto its per-share earnings. In general, a high P/E suggeststhat investors are expecting higher earnings growth in thefuture compared to companies with a lower P/E. However, theP/E ratio doesn't tell us the whole story by itself. It'susually more useful to compare the P/E ratios of one companyto other companies in the same industry, to the market ingeneral or against the company's own historical P/E.
Market Value to book value
This ratio indicates according to the record of the companywhat should be value of each share. Book value of sharechanges as per number share changes. If market value isgreater than book value the ratio will be greater than 1. Onthe other hand in opposite case, when the ratio is lower than1, it indicates the company reputation and shareholderexpectations in the market is not favorable.
14

1 2.0 Ratio analysis of insurance company
Agrani Insurance Company:
Serialno.
Ratio2012 2011 2010 2009 2008
1. Current Ratio 3.392543654
2.909586039
3.673812539
3.346410513
4.31535678
2. Loss Rate Ratio
0.108247154
0.809756631
0.132853074
0.140850039
0.134326226
3. Expense Ratio 0.040356311
0.044905998
0.046637421
0.050745142
0.048767312
4. Combined Ratio
0.148603465
0.854662629
0.179490495
0.191595181
0.183093538
5. Return on Revenue
0.155913166
0.222139305
0.165718074
0.215639702
0.267404202
1 Calculations are mentioned in detail at reference section.
15
6. Return on Asset
0.120330339
0.095015867
0.117693936
0.097220042
0.082566927
7. Return on Equity
0.297832293
0.21950263
0.262675609
0.209285448
0.205423373
8. Investment Yield
2.948001714
3.542196678
1.439102938
1.48702683
0.042418561
9. Debt to Equity Ratio
0.628627826
0.528166907
0.479073251
0.516029206
0.54740746
10. Price Earnings Ratio
5.780346821
7.352941176
4.194630872
5.790387956
6.489292667
11. Market Value to book value
2.276711518
2.50438267
1.101928375
1.212121212
1.333333333
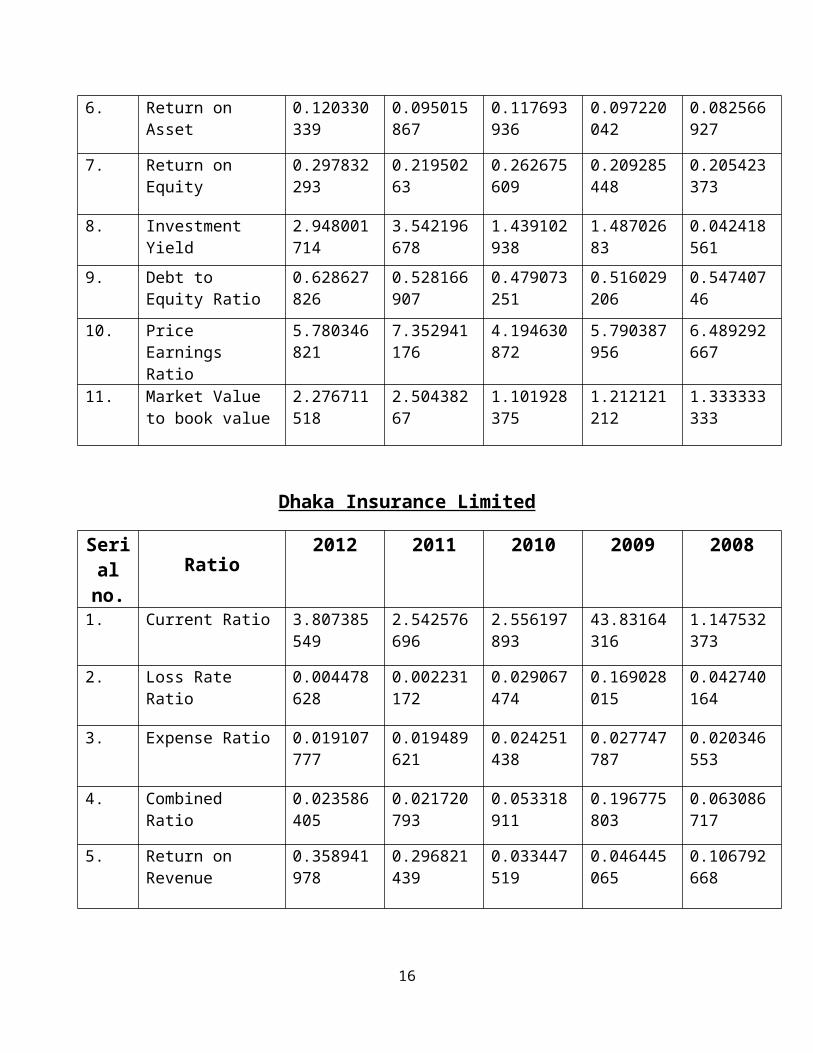
Dhaka Insurance Limited
Serialno.
Ratio2012 2011 2010 2009 2008
1. Current Ratio 3.807385549
2.542576696
2.556197893
43.83164316
1.147532373
2. Loss Rate Ratio
0.004478628
0.002231172
0.029067474
0.169028015
0.042740164
3. Expense Ratio 0.019107777
0.019489621
0.024251438
0.027747787
0.020346553
4. Combined Ratio
0.023586405
0.021720793
0.053318911
0.196775803
0.063086717
5. Return on Revenue
0.358941978
0.296821439
0.033447519
0.046445065
0.106792668
16
6. Return on Asset
0.114480335
0.12805926
0.248913148
0.016295287
0.072402943
7. Return on Equity
0.354227598
0.392054233
1.138573232
1.6158222
0.432015417
8. Investment Yield
0.164946105
0.268695721
0.329116895
0.71459645
0.680207636
9. Debt to Equity Ratio
0.90118326
0.858323223
1.332388167
95.24989473
5.3999761
10. Price Earnings Ratio
8.620689655
1.605136437
1.045585964
2.062933244
7.715774032
11. Market Value to book value
3.053435115
3.773584906
1.19047619
3.333333333
3.333333333
Bangladesh General Insurance Company (BGIC)
Serialno.
Ratio2012 2011 2010 2009 2008
1. Current Ratio 3.041874145
2.367532535
3.435680826
6.926209201
1.389027572
2. Loss Rate Ratio
0.07346731
0.052775349
0.025451018
0.052228613
3.081932362
3. Expense Ratio 0.082347915
0.080906284
0.079088362
0.098100199
0.132715652
4. Combined Ratio
0.155815225
0.133681633
0.104539381
0.150328812
3.214648014
5. Return on 0.185074 0.169271 0.131561 0.247585 0.220414
17
Revenue 542 028 426 545 759
6. Return on Asset
0.086464323
0.090239436
0.114394785
0.057183313
0.09812248
7. Return on Equity
0.119230991
0.125038995
0.150757263
0.06727809
0.166136744
8. Investment Yield
6.381752135
8.129637021
8.780047846
4.025387508
3.406456246
9. Debt to Equity Ratio
1.304069713
1.321913102
1.264627035
1.149071177
0.974379339
10. Price Earnings Ratio
7.800812737
7.723942048
7.001087521
17.70297241
0.793083726
11. Market Value to book value
0.930098634
0.965793948
1.055464794
1.191022168
0.131760348
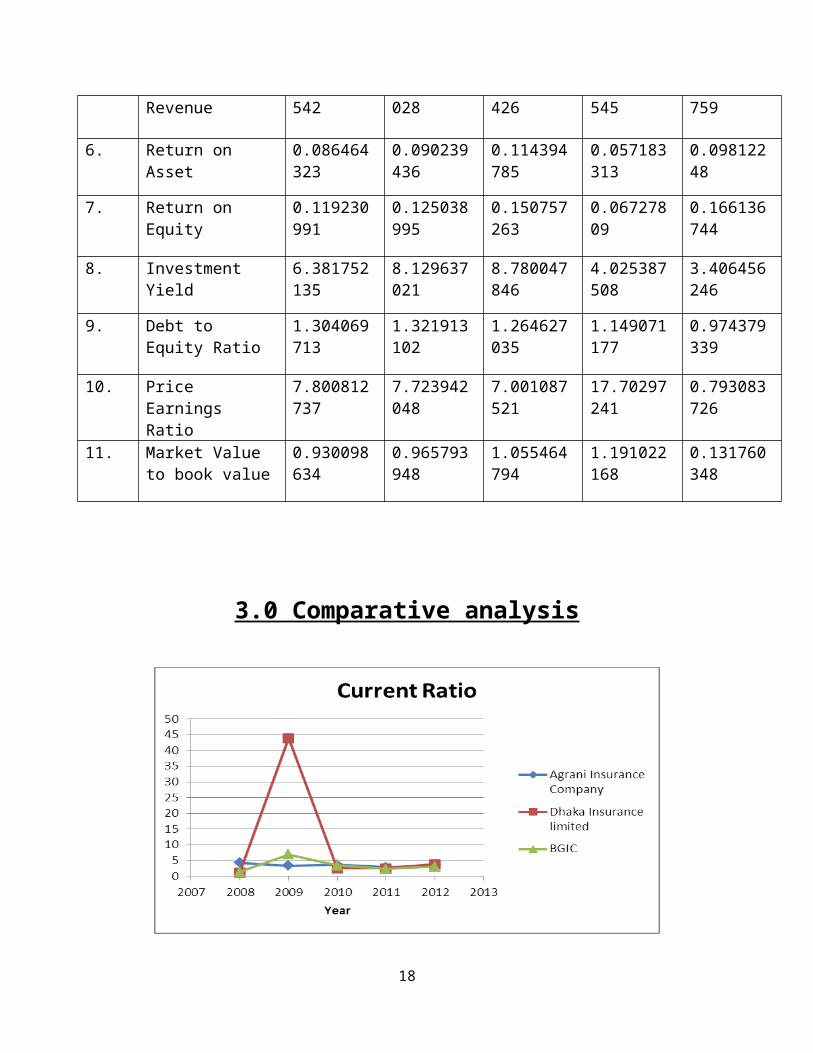
3.0 Comparative analysis
18

Interpretation:
According to the chart we can see that Dhaka insurance limited CurrentRatio is higher than Agrani Insurance Company and BGIC. We can saythat all the insurance company has enough liquidity to make a paymentof their creditor.
Interpretation:
According to the chart we can see that BGIC Loss Rate Ratio ishigher than Agrani Insurance Company and Dhaka Insurance Limited.We can say that all the insurance company has enough Efficient tomake a judgment.
19

Interpretation:
According to the chart we can see that BGIC Expense Ratio ishigher than Agrani Insurance Company and Dhaka Insurance Limited.We can see that insurance companies were collecting adequatepremium to make the payment of underwriting expenses
Interpretation:
According to the chart we can see that BGIC combined Ratio ishigher than Agrani Insurance Company and Dhaka Insurance Limited.We can see that insurance companies are efficient to controltheir expenses, and none of them has benchmark for this ratio.
20

Interpretation:
According to the chart we can see that Dhaka insurance limitedReturn on Revenue Ratio is higher than Agrani Insurance Companyand BGIC. We can say that all the insurance company has enoughprofit. They are gaining enough profit.
Interpretation:
According to the chart we can see that Dhaka insurance limitedReturn on Asset Ratio is higher than Agrani Insurance Company andBGIC. We can say that all the insurance company has enough incomeon their total asset.
21
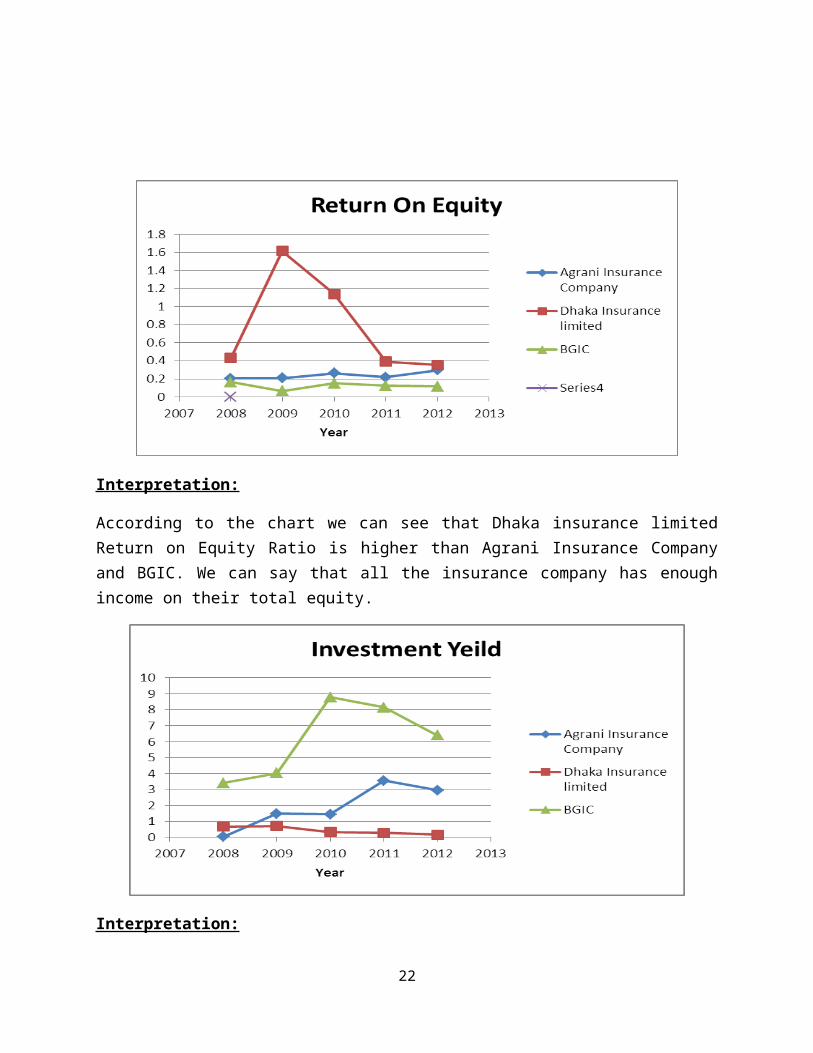
Interpretation:
According to the chart we can see that Dhaka insurance limitedReturn on Equity Ratio is higher than Agrani Insurance Companyand BGIC. We can say that all the insurance company has enoughincome on their total equity.
Interpretation:
22
According to the chart we can see that BGIC Investment Ratio ishigher than Agrani Insurance Company and Dhaka Insurance Limited.According to the chart Dhaka insurance have lower yield so theydoesn’t earn enough income in investment.
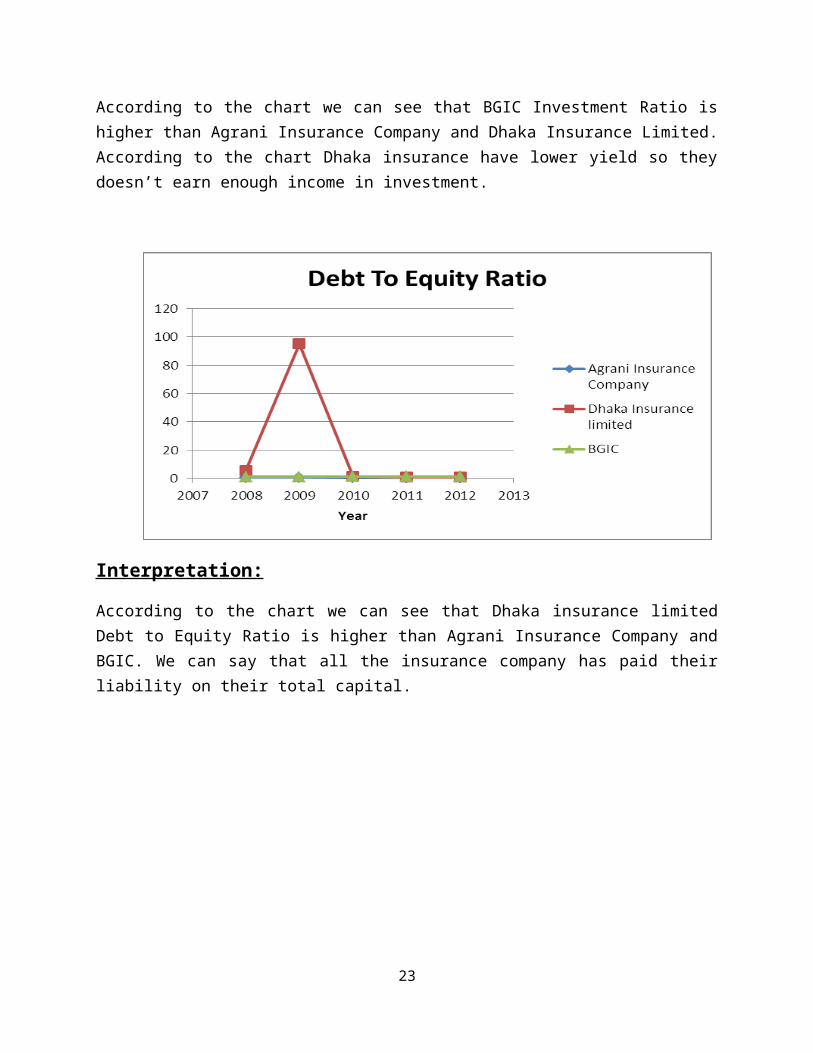
Interpretation:
According to the chart we can see that Dhaka insurance limitedDebt to Equity Ratio is higher than Agrani Insurance Company andBGIC. We can say that all the insurance company has paid theirliability on their total capital.
23

Interpretation:
According to the chart we can see that BGIC Price Earnings Ratiois higher than Agrani Insurance Company and Dhaka InsuranceLimited. According to the chart we can say that all the insurancecompany has good market reputation but BGIC stock price iscomparatively higher than other two insurance companies.
Interpretation:
24

According to the chart we can see that Dhaka insurance limitedMarket Value to Book Value Ratio is higher than Agrani InsuranceCompany and BGIC. We see that Dhaka Insurance Limited is payingmore to their shareholder comparing to other insurance company,so we can tell that their share price is comparatively higherthan other two insurance companies.
25